UNITED STATES SECURITIES AND EXCHANGE COMMISSION
Washington, D.C. 20549
FORM N-CSR
CERTIFIED SHAREHOLDER REPORT OF REGISTERED MANAGEMENT
INVESTMENT COMPANIES
| Investment Company Act file number: | | 811-06322 |
| | |
| Exact name of registrant as specified in charter: | | Delaware Pooled® Trust |
| | |
| Address of principal executive offices: | | 2005 Market Street |
| | Philadelphia, PA 19103 |
| | |
| Name and address of agent for service: | | David F. Connor, Esq. |
| | 2005 Market Street |
| | Philadelphia, PA 19103 |
| | |
| Registrant’s telephone number, including area code: | | (800) 523-1918 |
| | |
| Date of fiscal year end: | | October 31 |
| | |
| Date of reporting period: | | October 31, 2012 |
Item 1. Reports to Stockholders

| Annual report 2012 |
| |
| October 31, 2012 |
| | | |
| | | |
| U.S. equities | | International equities |
| The Large-Cap Value Equity Portfolio | | The International Equity Portfolio |
| The Select 20 Portfolio | | The Labor Select International Equity Portfolio |
| The Large-Cap Growth Equity Portfolio | | The Emerging Markets Portfolio |
| The Focus Smid-Cap Growth Equity Portfolio | | The Emerging Markets Portfolio II |
| The Real Estate Investment Trust Portfolio II | | |
| | | |
| U.S. fixed income | | |
| The Core Focus Fixed Income Portfolio | | |
| The High-Yield Bond Portfolio | | |
| The Core Plus Fixed Income Portfolio | | |
| Contents | |
| |
| Portfolio objectives | 2 |
| The Large-Cap Value Equity Portfolio | 4 |
| The Select 20 Portfolio | 8 |
| The Large-Cap Growth Equity Portfolio | 12 |
| The Focus Smid-Cap Growth Equity Portfolio | 16 |
| The Real Estate Investment Trust Portfolio II | 20 |
| The Core Focus Fixed Income Portfolio | 24 |
| The High-Yield Bond Portfolio | 28 |
| The Core Plus Fixed Income Portfolio | 32 |
| The International Equity Portfolio | 36 |
| The Labor Select International Equity Portfolio | 40 |
| The Emerging Markets Portfolio | 44 |
| The Emerging Markets Portfolio II | 48 |
| Disclosure of Portfolio expenses | 52 |
| Security type, sector allocations, country allocations, | |
| and top 10 equity holdings | 54 |
| Statements of net assets | 64 |
| Statements of operations | 102 |
| Statements of changes in net assets | 105 |
| Financial highlights | 109 |
| Notes to financial statements | 121 |
| Report of independent registered | |
| public accounting firm | 141 |
| Other Portfolio information | 142 |
| Board of trustees/directors and officers addendum | 154 |
Delaware Pooled® Trust
Delaware Pooled Trust, based in Philadelphia, is a registered investment company that offers no-load, open-end equity and fixed income mutual funds to institutional and high net worth individual investors.
Delaware Management Company, a series of Delaware Management Business Trust, serves as investment advisor for the Portfolios. Mondrian Investment Partners Limited serves as investment sub-advisor for The International Equity,* Labor Select International Equity, and Emerging Markets* Portfolios.
The performance quoted in this report represents past performance and does not guarantee future results. Investment return and principal value of an investment will fluctuate so that shares, when redeemed, may be worth more or less than their original cost. Current performance may be lower or higher than the performance quoted. Performance data current to the most recent month end may be obtained by calling 800 231-8002 or visiting delawareinvestments.com/institutional/performance. Carefully consider the Portfolios’ investment objectives, risk factors, charges, and expenses before investing. This and other information can be found in the Portfolios’ prospectus and, if available, their summary prospectuses, which may be obtained by visiting delawareinvestments.com or calling 800 231-8002. Investors should read the prospectus and, if available, the summary prospectus carefully before investing. Performance includes reinvestment of all distributions.
Funds are not FDIC insured and are not guaranteed. It is possible to lose the principal amount invested. Mutual fund advisory services are provided by Delaware Management Company, a series of Delaware Management Business Trust (DMBT), which is a registered investment advisor. Delaware Investments is the marketing name of Delaware Management Holdings, Inc. (DMHI) and its subsidiaries.
Investments in the Portfolios are not and will not be deposits with or liabilities of Macquarie Bank Limited ABN 46 008 583 542 and its holding companies, including their subsidiaries or related companies (Macquarie Group), and are subject to investment risk, including possible delays in repayment and loss of income and capital invested. No Macquarie Group company guarantees or will guarantee the performance of the Portfolios, the repayment of capital from the Portfolios, or any particular rate of return.
| *Closed to new investors. | |
| ©2012 Delaware Management Holdings, Inc. | 2012 Annual report · Delaware Pooled Trust |
| All third-party marks cited are the property of their respective owners. | |
1
Portfolio objectives
The Large-Cap Value Equity Portfolio seeks long-term capital appreciation. The Portfolio invests primarily in securities of large-capitalization companies that we believe have long-term capital appreciation potential. The Portfolio currently defines large-capitalization stocks as those with market capitalizations of $5 billion or greater at the time of purchase. Typically, we seek to select securities that we believe are undervalued in relation to their intrinsic value as indicated by multiple factors.
The Select 20 Portfolio seeks long-term capital appreciation. The Portfolio seeks to achieve its objective by investing in a portfolio of twenty (20) securities, primarily common stocks of companies that we believe have long-term capital appreciation potential and are expected to grow faster than the U.S. economy.
The Large-Cap Growth Equity Portfolio seeks capital appreciation. The Portfolio invests primarily in common stocks of growth-oriented companies that we believe have long-term capital appreciation potential and expect to grow faster than the U.S. economy. For purposes of the Portfolio, we generally consider large-capitalization companies to be those that, at the time of purchase, have total market capitalizations within the range of market capitalizations of companies in the Russell 1000® Growth Index.
The Focus Smid-Cap Growth Equity Portfolio seeks long-term capital appreciation. The Portfolio invests primarily in common stocks of growth-oriented companies that we believe have long-term capital appreciation potential and expect to grow faster than the U.S. economy. For purposes of this Portfolio, small-market capitalization companies are those companies whose market capitalization is similar to the market capitalization of companies in the Russell 2000® Growth Index, and mid-market capitalization companies are those companies whose market capitalization is similar to the market capitalization of companies in the Russell Midcap® Growth Index. The two indices listed above are for purposes of determining range and not for targeting portfolio management.
The Real Estate Investment Trust Portfolio II seeks maximum long-term total return, with capital appreciation as a secondary objective. The Portfolio invests primarily in securities of companies principally engaged in the real estate industry.
The Core Focus Fixed Income Portfolio seeks maximum long-term total return, consistent with reasonable risk. The Portfolio will invest primarily in a diversified portfolio of investment grade, fixed income obligations, including securities issued or guaranteed by the U.S. government, its agencies or instrumentalities (U.S. government securities), mortgage-backed securities, asset-backed securities, corporate bonds, and other fixed income securities.
The High-Yield Bond Portfolio seeks high total return. The Portfolio will primarily invest its assets at the time of purchase in: (1) corporate bonds rated BB or lower by Standard & Poor’s (S&P) or similarly rated by another nationally recognized statistical rating organization; (2) securities issued or guaranteed by the U.S. government, its agencies or instrumentalities; or (3) commercial paper of companies rated A-1 or A-2 by S&P, rated P-1 or P-2 by Moody’s Investors Service, Inc., or unrated but considered to be of comparable quality.
The Core Plus Fixed Income Portfolio seeks maximum long-term total return, consistent with reasonable risk. The Portfolio allocates its investments principally among three sectors of the fixed income securities markets: U.S. investment grade sector, U.S. high yield sector, and international sector.
The International Equity Portfolio seeks maximum long-term total return. The Portfolio invests primarily in equity securities of companies that are organized, have a majority of their assets, or derive most of their operating income outside the United States, and that, in our opinion, are undervalued at the time of purchase based on our fundamental analysis. Investments will be made mainly in marketable securities of companies in developed countries. The International Equity Portfolio is presently closed to new investors.
The Labor Select International Equity Portfolio seeks maximum long-term total return. The Portfolio invests primarily in equity securities of companies that are organized, have a majority of their assets, or derive most of their operating income outside of the United States, and that, in our opinion, are undervalued at the time of purchase based on the rigorous fundamental analysis that we employ. In addition to following these quantitative guidelines, we will select securities of issuers that present certain characteristics that are compatible or operate in accordance with certain investment policies or restrictions followed by organized labor.
2012 Annual report · Delaware Pooled Trust
2
The Emerging Markets Portfolio seeks long-term capital appreciation. The Portfolio, an international fund, generally invests in equity securities of companies that are organized in, have a majority of their assets in, or derive a majority of their operating income from emerging countries. The Emerging Markets Portfolio is presently closed to new investors.
The Emerging Markets Portfolio II seeks long-term capital appreciation. The Portfolio invests primarily in equity securities of issuers from emerging or developing foreign countries. Under normal market conditions, at least 80% of the Portfolio’s total assets will be invested in equity securities of issuers from countries whose economies are considered to be emerging.
Carefully consider the Portfolios’ investment objectives, risk factors, charges, and expenses before investing. This and other information can be found in Portfolios’ prospectus and, if available, their summary prospectuses, which may be obtained by visiting delawareinvestments.com or calling 800 231-8002. Investors should read the applicable prospectus and, if available, the applicable summary prospectus carefully before investing.
The Portfolios of Delaware Pooled® Trust (DPT) are designed exclusively for institutional investors and high net worth individuals.
International investments entail risks not ordinarily associated with U.S. investments including fluctuation in currency values, differences in accounting principles, or economic or political instability in other nations. Investing in emerging markets can be riskier than investing in established foreign markets due to increased volatility and lower trading volume.
Narrowly focused investments may exhibit higher volatility than investments in multiple industry sectors.
REIT investments are subject to many of the risks associated with direct real estate ownership, including changes in economic conditions, credit risk, and interest rate fluctuations.
A REIT fund’s tax status as a regulated investment company could be jeopardized if it holds real estate directly, as a result of defaults, or receives rental income from real estate holdings.
The Portfolios’ share prices and yields will fluctuate in response to movements in stock prices.
Fixed income securities and bond funds can lose value, and investors can lose principal, as interest rates rise. They also may be affected by economic conditions that hinder an issuer’s ability to make interest and principal payments on its debt.
The Portfolios may also be subject to prepayment risk, the risk that the principal of a fixed income security that is held by the Portfolios may be prepaid prior to maturity, potentially forcing the Portfolios to reinvest that money at a lower interest rate.
Securities in the lowest of the rating categories considered to be investment grade (that is, Baa or BBB) have some speculative characteristics.
High yielding, noninvestment grade bonds (junk bonds) involve higher risk than investment grade bonds.
The high yield secondary market is particularly susceptible to liquidity problems when institutional investors, such as mutual funds and certain other financial institutions, temporarily stop buying bonds for regulatory, financial, or other reasons. In addition, a less liquid secondary market makes it more difficult for a Portfolio to obtain precise valuations of the high yield securities in its portfolio.
Because the Portfolios expect to hold a concentrated portfolio of a limited number of securities, the Portfolios’ risk is increased because each investment has a greater effect on the Portfolios’ overall performance.
The Real Estate Investment Trust II and The Select 20 Portfolios are considered “nondiversified” as defined in the Investment Company Act of 1940. “Nondiversified” Portfolios may allocate more of their net assets to investments in single securities than “diversified” Portfolios. Resulting adverse effects may subject these Portfolios to greater risks and volatility.
2012 Annual report · Delaware Pooled Trust
3
Portfolio management review
Delaware Pooled® Trust — The Large-Cap Value Equity Portfolio
November 6, 2012
For the fiscal year ended Oct. 31, 2012, Delaware Pooled Trust — The Large-Cap Value Equity Portfolio returned +17.12% at net asset value (NAV) with all distributions reinvested. The Portfolio outperformed its benchmark, the Russell 1000® Value Index, which rose 16.89% during the same time period. Complete annualized performance for The Large-Cap Value Equity Portfolio is shown on the table on page 6.
The Portfolio’s fiscal year saw favorable stock market performance, despite continued economic challenges, both in the United States and abroad. In general, markets responded well to economic stimulus measures, including low interest rates and a third round of “quantitative easing” by the U.S. Federal Reserve, which was intended to boost flagging economic activity.
In the U.S., we continued to see slow growth in the economy. The country’s gross domestic product (GDP), which measures the goods and services the nation produces, began the Portfolio’s fiscal year growing a healthy 4.1% in the fourth quarter of 2011. However, GDP growth tailed off in subsequent quarters, dipping below its historical average and finishing the third quarter of 2012 at a modest 2.0%. (Source: U.S. Commerce Department.)
In our view, the biggest challenge facing the U.S. economy continued to be high unemployment, which began the Portfolio’s fiscal year at 9.0% but fell to a still historically high 7.9% by the end of October 2012. We believe that the slow improvement in unemployment, coupled with evidence of more favorable housing market conditions, gave many investors increased confidence throughout much of the Portfolio’s fiscal year, which, in turn, led to the positive results turned in by stocks and other riskier assets (such as corporate bonds and high yield debt).
The primary driver of the Portfolio’s performance was relatively good stock selection, especially in the consumer discretionary, energy, and financials sectors, which compensated for disappointing returns among our technology and consumer staples selections. On the other hand, the Portfolio’s limited exposure to the outperforming financials group and an overweight allocation to the sluggish information technology sector were not beneficial.
The Portfolio’s strong stock selection in the energy sector was led by a position in Williams Companies, whose shares rose along with a surge in natural gas prices in the third quarter of 2012. Williams operates a large gas pipeline system, which closely ties its financial results to natural gas prices. Near the end of its fiscal year, we sold the Portfolio’s position in Williams after the stock hit our price target, which essentially doubled in value during our ownership of the security.
In the consumer discretionary sector, home-improvement superstore Lowe’s and media company Comcast both added considerable value. Lowe’s shares were lifted by improvements in consumer spending, as well as investors’ generally increased optimism about the company’s expectations for a turnaround. Meanwhile, Comcast, whose shares gained the most in absolute terms of any stock in the Portfolio, benefited from an uptick in broadband subscriptions and shareholder-friendly financial management to which investors responded favorably.
One of the Portfolio’s biggest detractors in relative terms was technology stock Xerox. As a leader in digital imaging — and the largest relative individual detractor of the fiscal year — the stock was held back for the most part because of its exposure to Europe, a financially troubled region that represents a sizeable portion of the company’s sales.
Another meaningful detractor was Safeway, a grocery store chain in the consumer staples sector that was burdened by increased competition from mass-market merchandisers and higher food costs that have squeezed profit margins. Of final note, in the healthcare sector, drug distributor Cardinal Health saw its shares decline, due
The views expressed are current as of the date of this report and are subject to change.
2012 Annual report · Delaware Pooled Trust
4
in part to an uncertain outcome to contract negotiations with leading pharmacy chains. In the case of all three of these underperforming companies, we remained confident in our view of their long-term value potential and therefore continued to hold them in the Portfolio at the end of the fiscal year.
Throughout this fiscal year, the Portfolio’s positioning remained essentially intact. Given the number of risks we saw in the economic and market environments, we maintained the Portfolio’s elevated allocation to stocks in defensive sectors, a positioning that struck us as prudent.
At the end of the fiscal year, for example, the Portfolio was significantly overweighted in healthcare and consumer staples stocks compared with the benchmark, as well as modestly so in the telecommunication services group, where we were able to find stocks with, in our view, good dividend yields and defensive characteristics. Similarly, the Portfolio was underexposed relative to the benchmark in more economically sensitive sectors, especially financials and consumer discretionary.
In light of the global stock market’s rally during the past year, it became more challenging to find attractively valued securities to add to the Portfolio. A number of the Portfolio’s holdings were nearing our price targets, but we were identifying relatively few good investment opportunities that fit our parameters of low valuations coupled with, in our view, solid business fundamentals.
Due to the market’s gains over the past year, we believe investors’ expectations for absolute performance in the coming year should be tempered. That said, we will continue to look to invest in what we believe are undeservedly inexpensive stocks with potential to rebound, as we maintain our commitment to companies with what we view as stronger balance sheets and relatively consistent cash flows and earnings.
2012 Annual report · Delaware Pooled Trust
5
Performance summary
Delaware Pooled® Trust — The Large-Cap Value Equity Portfolio
The performance data quoted represent past performance; past performance does not guarantee future results. Investment return and principal value will fluctuate so your shares, when redeemed, may be worth more or less than their original cost. Current performance may be lower or higher than the performance data quoted. Please obtain the performance data for the most recent month end by calling 800 231-8002 or visiting our website at delawareinvestments.com.
Carefully consider the Portfolio’s investment objectives, risk factors, charges, and expenses before investing. This and other information can be found in the Portfolio’s prospectus and, if available, its summary prospectus, which may be obtained by visiting delawareinvestments.com or calling 800 231-8002. Investors should read the prospectus and, if available, the summary prospectus carefully before investing.
| Portfolio performance | | | | | | | | | | |
| Average annual total returns | | | | | | | | | | |
| Periods ended Oct. 31, 2012 | | 1 year | | 3 years | | 5 years | �� | 10 years | | Lifetime |
| | +17.12% | | +15.62% | | +1.29% | | +7.42% | | +9.11% |
| Portfolio profile |
| Oct. 31, 2012 |
| |
| Total net assets |
| $8.4 million |
| |
| Number of holdings |
| 36 |
| |
| Inception date |
| Feb. 3, 1992 |
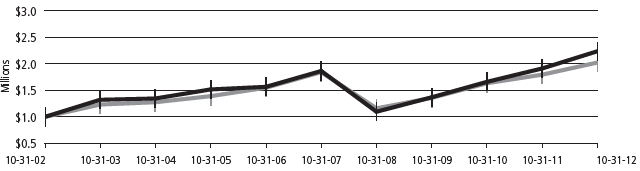
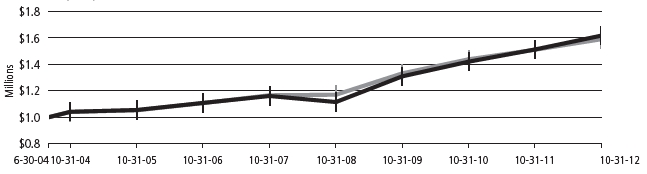
Growth of $1,000,000

| | | | Starting value (Oct. 31, 2002) | | Ending value (Oct. 31, 2012) |
| | The Large-Cap Value Equity Portfolio | | $1,000,000 | | $2,045,046 |
| | Russell 1000 Value Index | | $1,000,000 | | $2,031,217 |
2012 Annual report · Delaware Pooled Trust
6
The performance graph assumes $1 million invested on Oct. 31, 2002, and includes reinvestment of all distributions. The performance graph does not reflect the deduction of taxes the shareholder would pay on Portfolio distributions or redemptions of Portfolio shares.
Total return assumes reinvestment of dividends and capital gains, but does not reflect reductions for taxes. Returns and share values will fluctuate so that shares, when redeemed, may be worth more or less than their original cost.
The most recent prospectus designated the Portfolio’s total operating expenses as 1.24%. Management has contractually agreed to reimburse certain expenses and/or waive its management fees from Feb. 28, 2012, through Feb. 28, 2013, in order to prevent total annual Portfolio operating expenses (with certain exclusions) from exceeding, in an aggregate amount, 0.70% of the Portfolio’s average daily net assets, as described in the most recent prospectus.
Expense limitations were in effect during the period shown. Performance would have been lower had the expense limitations not been in effect.
The Russell 1000 Value Index measures the performance of the large-cap value segment of the U.S. equity universe. It includes those Russell 1000 companies with lower price-to-book ratios and lower forecasted growth values.
Index performance returns do not reflect any management fees, transaction costs, or expenses. Indices are unmanaged and one cannot invest directly in an index.
Investing involves risk, including the possible loss of principal.
Past performance is not a guarantee of future results.
2012 Annual report · Delaware Pooled Trust
7
Portfolio management review
Delaware Pooled® Trust — The Select 20 Portfolio
November 6, 2012
Delaware Pooled Trust — The Select 20 Portfolio returned +16.99% at net asset value (NAV) with all distributions reinvested for the fiscal year ended Oct. 31, 2012. The Portfolio’s benchmark, the Russell 3000® Growth Index, returned +12.76% for the same time period. Complete annualized performance for The Select 20 Portfolio is shown in the table on page 10.
Early in the Portfolio’s fiscal year, the U.S. economy seemed poised for significant growth as investors were generally encouraged by positive reports about labor markets, manufacturing, and consumer demand. With those favorable tailwinds, U.S. equity markets rose in the fall and winter of 2011. In Europe, economic conditions slowed, as the euro zone initiated additional austerity measures. Nevertheless, international stocks (both developed and emerging markets) managed to eke out gains during those months.
In April 2012, the U.S. Federal Reserve reaffirmed it would keep its key interest rate in its current low range, probably for two years. The spring and early summer months, however, featured renewed volatility, primarily caused by political and economic uncertainty. Worries included speculation about Greece’s potential exit from the euro; additional evidence of deterioration within Spain’s banks; and uncertainty about upcoming political policies and elections in several euro-zone countries and in the United States. Many investors also fretted about a slowing global growth environment, along with persistently high rates of unemployment in the U.S.
Sentiment improved in June as European leaders signaled a more comprehensive approach to stabilizing banks and sovereign credits. In the summer and early fall, domestic stock performance received a boost from the latest bond-buying programs by the Fed and the European Central Bank, along with the Chinese government’s impending stimulus. The U.S. economy was able to maintain a moderate growth pace, thanks to an improvement in housing and a positive report about manufacturing.
Crown Castle International, which operates and leases wireless towers for firms such as Verizon and AT&T throughout the U.S., was a contributor to performance. Wireless has been one of the few relatively strong growth areas in the past few years as consumers transmit more and more data via cellular networks on smartphones and tablets. Perceptions about the company improved during the Portfolio’s fiscal year when purported telecommunication industry consolidation among the companies that purchase and lease Crown Castle’s wireless towers did not occur because mergers could have slowed, or even reduced, corporate plans for infrastructure spending.
Similarly, shares of Visa also rallied after concerns about government regulation of debt transactions proved to be exaggerated. Many investors, anticipating reform measures, punished the stock more than what was justified, in our opinion. Since these issues were resolved in late 2010, the stock price has been on an upward trajectory. Visa also continued to benefit from the growing global trend of consumers shifting from paper to plastic when making purchases, especially in emerging markets, which has helped to offset slower growth in developed markets.
Apollo Group was one of the largest detractors from performance during the fiscal year. We sold the Portfolio’s position in this for-profit education company to focus on companies that have, in our opinion, stronger growth opportunities. The shares declined during the fiscal year as greater government scrutiny of the for-profit education industry caused many investors to question the viability of the sector’s reliance on federally guaranteed student loans, forcing companies within the industry to significantly alter their business models. In our view, this may be beneficial for the industry in the long run, but it may also mean that many of these companies may not grow as quickly in the near term as changes are implemented.
Polycom, one of two major suppliers of videoconferencing equipment to large corporate clients, detracted from Portfolio performance during the fiscal
The views expressed are current as of the date of this report and are subject to change.
2012 Annual report · Delaware Pooled Trust
8
year. The company, which we believe may have grown too quickly relative to the corporate infrastructure and personnel necessary to support that growth, continues to work through key personnel changes in important roles. Despite the current slower sales environment, we continue to maintain a relatively small position in Polycom due to our belief that videoconferencing is now a crucial aspect of conducting business for many large corporate enterprises, and demand for the company’s product appears likely to bounce back as the economy improves.
Regardless of the economy, we remain consistent in our long-term investment philosophy: We want to own what we view as strong secular-growth companies. We seek companies with solid business models and competitive positions that we believe can grow market share, and which have the potential to deliver shareholder value in a variety of market environments.
2012 Annual report · Delaware Pooled Trust
9
Performance summary
Delaware Pooled® Trust — The Select 20 Portfolio
The performance data quoted represent past performance; past performance does not guarantee future results. Investment return and principal value will fluctuate so your shares, when redeemed, may be worth more or less than their original cost. Current performance may be lower or higher than the performance data quoted. Please obtain the performance data for the most recent month end by calling 800 231-8002 or visiting our website at delawareinvestments.com.
Carefully consider the Portfolio’s investment objectives, risk factors, charges, and expenses before investing. This and other information can be found in the Portfolio’s prospectus and, if available, its summary prospectus, which may be obtained by visiting delawareinvestments.com or calling 800 231-8002. Investors should read the prospectus and, if available, the summary prospectus carefully before investing.
| Portfolio performance | | | | | | | | | | |
| Average annual total returns | | | | | | | | | | |
| Periods ended Oct. 31, 2012 | | 1 year | | 3 years | | 5 years | | 10 years | | Lifetime |
| | +16.99% | | +17.81% | | +3.50% | | +8.41% | | -0.33% |
Portfolio profile
Oct. 31, 2012
| Total net assets |
| $124.5 million |
| Inception date |
| March 31, 2000 |
Growth of $1,000,000
| | | | Starting value (Oct. 31, 2002) | | Ending value (Oct. 31, 2012) |
| | The Select 20 Portfolio | | $1,000,000 | | $2,241,264 |
| | Russell 3000 Growth Index | | $1,000,000 | | $2,027,609 |
2012 Annual report · Delaware Pooled Trust
10
The performance graph assumes $1 million invested on Oct. 31, 2002, and includes reinvestment of all distributions. The performance graph does not reflect the deduction of taxes the shareholder would pay on Portfolio distributions or redemptions of Portfolio shares.
Total return assumes reinvestment of dividends and capital gains, but does not reflect reductions for taxes. Returns and share values will fluctuate so that shares, when redeemed, may be worth more or less than their original cost.
The most recent prospectus designated the Portfolio’s total operating expenses as 1.02%. Management has contractually agreed to reimburse certain expenses and/or waive its management fees from Feb. 28, 2012, through Feb. 28, 2013, in order to prevent total annual Portfolio operating expenses (with certain exceptions) from exceeding, in an aggregate amount, 0.89% of the Portfolio’s average daily net assets, as described in the most recent prospectus.
Expense limitations were in effect during the period shown. Performance would have been lower had the expense limitations not been in effect.
The Russell 3000 Growth Index measures the performance of the broad growth segment of the U.S. equity universe. It includes those Russell 3000 companies with higher price-to-book ratios and higher forecasted growth values.
Index performance returns do not reflect any management fees, transaction costs, or expenses. Indices are unmanaged and one cannot invest directly in an index.
Investing involves risk, including the possible loss of principal.
Past performance is not a guarantee of future results.
Because the Portfolio expects to hold a concentrated portfolio of a limited number of securities, the Portfolio's risk is increased because each investment has a greater effect on the Portfolio's overall performance.
Investments in small and/or medium-sized companies typically exhibit greater risk and higher volatility than larger, more established companies.
“Nondiversified” Portfolios may allocate more of their net assets to investments in single securities than “diversified” Portfolios. Resulting adverse effects may subject these Portfolios to greater risks and volatility.
On Feb. 28, 2008, the Portfolio changed its investment strategy to limit its investments to no less than 15 securities and no more than 25 securities. The performance prior to Feb. 28, 2008 is that of the Portfolio’s predecessor, The All-Cap Growth Equity Portfolio.
2012 Annual report · Delaware Pooled Trust
11
Portfolio management review
Delaware Pooled® Trust — The Large-Cap Growth Equity Portfolio
November 6, 2012
Delaware Pooled Trust — The Large-Cap Growth Equity Portfolio returned +16.40% at net asset value (NAV) with all distributions reinvested for the fiscal year ended Oct. 31, 2012. The Portfolio’s benchmark, the Russell 1000® Growth Index, returned +13.01% for the same time period. Complete annualized performance for The Large-Cap Growth Equity Portfolio is shown in the table on page 14.
Early in the Portfolio’s fiscal year, the U.S. economy seemed poised for significant growth as investors were generally encouraged by positive reports about labor markets, manufacturing, and consumer demand. With those favorable tailwinds, U.S. equity markets rose in the fall and winter of 2011. In Europe, economic conditions slowed, as the euro zone initiated additional austerity measures. Nevertheless, international stocks (both developed and emerging markets) managed to eke out gains during those months.
In April 2012, the U.S. Federal Reserve reaffirmed it would keep its key interest rate in its current low range, probably for two years. The spring and early summer months, however, featured renewed volatility, primarily caused by political and economic uncertainty. Worries included speculation about Greece’s potential exit from the euro; additional evidence of deterioration within Spain’s banks; and uncertainty about upcoming political policies and elections in several euro-zone countries and in the United States. Many investors also fretted about a slowing global growth environment, along with persistently high rates of unemployment in the U.S.
Sentiment improved in June as European leaders signaled a more comprehensive approach to stabilizing banks and sovereign credits. In the summer and early fall, domestic stock performance received a boost from the latest bond-buying programs by the Fed and the European Central Bank, along with the Chinese government’s impending stimulus. The U.S. economy was able to maintain a moderate growth pace, thanks to an improvement in housing and a positive report about manufacturing.
Crown Castle International, which operates and leases wireless towers for firms such as Verizon and AT&T throughout the U.S., was a contributor to performance. Wireless has been one of the few relatively strong growth areas in the past few years as consumers transmit more and more data via cellular networks on smartphones and tablets. Perceptions about the company improved during the fiscal year when rumored telecommunication industry consolidation among the companies that purchase and lease Crown Castle’s wireless towers did not occur because mergers could have slowed, or even reduced, corporate plans for infrastructure spending.
Similarly, shares of Visa also rallied after concerns about government regulation of debt transactions proved to be exaggerated. Many investors, anticipating reform measures, punished the stock more than what was justified, in our opinion. Since these issues were resolved in late 2010, the stock price has been on an upward trajectory. Visa also continued to benefit from the growing global trend of consumers shifting from paper to plastic when making purchases, especially in emerging markets, which has helped to offset slower growth in developed markets.
Apollo Group was one of the largest detractors from performance during the fiscal year. We sold the Portfolio’s position in this for-profit education company to focus on companies that have, in our opinion, stronger growth opportunities. The shares declined during the fiscal year as greater government scrutiny of the for-profit education industry caused many investors to question the viability of the sector’s reliance on federally guaranteed student loans, forcing companies within the industry to significantly alter their business models. In our view, this may be beneficial for the industry in the long run, but it may also mean that many of these companies may not grow as quickly in the near term as changes are implemented.
Polycom, one of two major suppliers of videoconferencing equipment to large corporate clients, detracted from Portfolio performance during the fiscal year. The company, which we believe may have grown too quickly relative
The views expressed are current as of the date of this report and are subject to change.
2012 Annual report · Delaware Pooled Trust
12
to the corporate infrastructure and personnel necessary to support that growth, continues to work through key personnel changes in important roles. Despite the current slower sales environment, we continue to maintain a relatively small position in Polycom due to our belief that videoconferencing is now a crucial aspect of conducting business for many large corporate enterprises, and demand for the company’s product appears likely to bounce back as the economy improves.
Regardless of the economic outcome, we remain consistent in our long-term investment philosophy: We want to own what we view as strong secular-growth companies with solid business models and competitive positions that we believe can grow market share and have the potential to deliver shareholder value in a variety of market environments.
2012 Annual report · Delaware Pooled Trust
13
Performance summary
Delaware Pooled® Trust — The Large-Cap Growth Equity Portfolio
The performance data quoted represent past performance; past performance does not guarantee future results. Investment return and principal value will fluctuate so your shares, when redeemed, may be worth more or less than their original cost. Current performance may be lower or higher than the performance data quoted. Please obtain the performance data for the most recent month end by calling 800 231-8002 or visiting our website at delawareinvestments.com.
Carefully consider the Portfolio’s investment objectives, risk factors, charges, and expenses before investing. This and other information can be found in the Portfolio’s prospectus and, if available, its summary prospectus, which may be obtained by visiting delawareinvestments.com or calling 800 231-8002. Investors should read the prospectus and, if available, the summary prospectus carefully before investing.
| Portfolio performance | | | | | | | | |
| Average annual total returns | | | | | | | | |
| Periods ended Oct. 31, 2012 | | 1 year | | 3 years | | 5 years | | Lifetime |
| | +16.40% | | +16.32% | | +2.14% | | +4.73% |
Portfolio profile
Oct. 31, 2012
| Total net assets |
| $216.5 million |
| Inception date |
| Nov. 1, 2005 |
Growth of $1,000,000
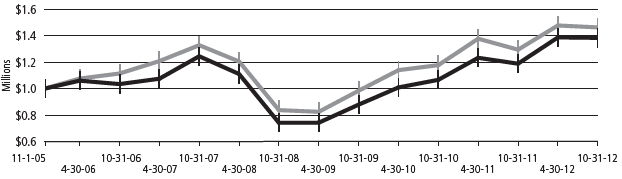
| | | | Starting value (Nov. 1, 2005) | | Ending value (Oct. 31, 2012) |
| | Russell 1000 Growth Index | | $1,000,000 | | $1,461,742 |
| | The Large-Cap Growth Equity Portfolio | | $1,000,000 | | $1,382,381 |
2012 Annual report · Delaware Pooled Trust
14
The performance graph assumes $1 million invested on Nov. 1, 2005, and includes reinvestment of all distributions. The performance graph does not reflect the deduction of taxes the shareholder would pay on Portfolio distributions or redemptions of Portfolio shares.
Total return assumes reinvestment of dividends and capital gains, but does not reflect reductions for taxes. Returns and share values will fluctuate so that shares, when redeemed, may be worth more or less than their original cost.
The most recent prospectus designated the Portfolio’s total operating expenses as 0.64%. Management has contractually agreed to reimburse certain expenses and/or waive its management fees from Feb. 28, 2012, through Feb. 28, 2013, in order to prevent total annual Portfolio operating expenses (with certain exceptions) from exceeding, in an aggregate amount, 0.65% of the Portfolio’s average daily net assets, as described in the most recent prospectus.
Expense limitations were in effect during the period shown. Performance would have been lower had the expense limitations not been in effect.
The Russell 1000 Growth Index measures the performance of the large-cap growth segment of the U.S. equity universe. It includes those Russell 1000 companies with higher price-to-book ratios and higher forecasted growth values.
Index performance returns do not reflect any management fees, transaction costs, or expenses. Indices are unmanaged and one cannot invest directly in an index.
Investing involves risk, including the possible loss of principal.
Past performance is not a guarantee of future results.
Because the Portfolio expects to hold a concentrated portfolio of a limited number of securities, the Portfolio's risk is increased because each investment has a greater effect on the Portfolio's overall performance.
2012 Annual report · Delaware Pooled Trust
15
Portfolio management review
Delaware Pooled® Trust — The Focus Smid-Cap Growth Equity Portfolio
November 6, 2012
Delaware Pooled Trust — The Focus Smid-Cap Growth Equity Portfolio returned +4.74% at net asset value (NAV) with all distributions reinvested for the fiscal year ended Oct. 31, 2012. The Portfolio’s benchmark, the Russell 2500™ Growth Index, returned +10.08% for the same period. Complete annualized performance for The Focus Smid-Cap Growth Equity Portfolio is shown in the table on page 18.
Early in the Portfolio’s fiscal year, the U.S. economy seemed poised for significant growth as investors were generally encouraged by positive reports about labor markets, manufacturing, and consumer demand. With those favorable tailwinds, U.S. equity markets rose in the fall and winter of 2011. In Europe, economic conditions slowed, as the euro zone initiated additional austerity measures. Nevertheless, international stocks (both developed and emerging markets) managed to eke out gains during those months.
In April 2012, the U.S. Federal Reserve reaffirmed it would keep its key interest rate in its current low range, probably for two years. The spring and early summer months, however, featured renewed volatility, primarily caused by political and economic uncertainty. Worries included speculation about Greece’s potential exit from the euro; additional evidence of deterioration within Spain’s banks; and uncertainty about upcoming political policies and elections in several euro-zone countries and in the United States. Many investors also fretted about a slowing global growth environment, along with persistently high rates of unemployment in the U.S.
Sentiment improved in June as European leaders signaled a more comprehensive approach to stabilizing banks and sovereign credits. In the summer and early fall, domestic stock performance received a boost from the latest bond-buying programs by the Fed and the European Central Bank, along with the Chinese government’s impending stimulus. The U.S. economy was able to maintain a moderate growth pace, thanks to an improvement in housing and a positive report about manufacturing.
SBA Communications, an owner of wireless towers in North America, was the Portfolio’s top contributor. In our view, the company appears poised to benefit if the robust secular growth of wireless devices (smartphones and tablets) endures. Throughout its fiscal year, the company continued to report strong earnings and growth projections, which we believe were buoyed by its key position as an infrastructure provider for wireless services.
Athenahealth was another strong performer in the Portfolio. The company has continued to report earnings and forward guidance that surpass investor expectations. In our view, athenahealth has an attractive competitive position within the healthcare services industry. The firm provides internet-based billing services for physician groups — an attractive solution for managing costs and information in this market segment. The company also successfully boosted its rate of growth after migrating from a provider of services for individual physician groups to larger clients such as hospitals and hospital chains.
Polycom, one of two major suppliers of videoconferencing equipment to large corporate clients, detracted from Portfolio performance during the fiscal year. The company, which we believe may have grown too quickly relative to the corporate infrastructure and personnel necessary to support that growth, continues to work through key personnel changes in important roles. These changes are happening within a generally difficult environment in technology spending, as well as an industry-wide transformation in videoconferencing from primarily hardware solutions to systems driven by software. Despite the current slower sales environment, we continue to maintain a relatively small position in Polycom due to our belief that videoconferencing is now
The views expressed are current as of the date of this report and are subject to change.
2012 Annual report · Delaware Pooled Trust
16
a crucial aspect of conducting business for many large corporate enterprises, and demand for the company’s product appears likely to bounce back as the economy improves.
Shares of VeriFone Systems, the industry leader in payment terminals, have declined due largely to investors’ concerns that emerging technologies in mobile payment systems (for example, paying for goods and services via smartphones) will be detrimental. In addition, the company’s increased capital investment spending in new business areas also heightened worries about the company’s long-term growth opportunities and profitability. We believe that many investors have overreacted to the company’s competitive issues, and also believe that new market segmentation and investment spending plans appear reasonable in the context of the large market opportunity. We continue to hold the Portfolio’s position in the stock.
Regardless of the economy, we remain consistent in our long-term investment philosophy: We want to own what we view as strong secular-growth companies. We seek companies with solid business models and competitive positions that we believe can grow market share, and which have the potential to deliver shareholder value in a variety of market environments.
2012 Annual report · Delaware Pooled Trust
17
Performance summary
Delaware Pooled® Trust — The Focus Smid-Cap Growth Equity Portfolio
The performance data quoted represent past performance; past performance does not guarantee future results. Investment return and principal value will fluctuate so your shares, when redeemed, may be worth more or less than their original cost. Current performance may be lower or higher than the performance data quoted. Please obtain the performance data for the most recent month end by calling 800 231-8002 or visiting our website at delawareinvestments.com.
Carefully consider the Portfolio’s investment objectives, risk factors, charges, and expenses before investing. This and other information can be found in the Portfolio’s prospectus and, if available, its summary prospectus, which may be obtained by visiting delawareinvestments.com or calling 800 231-8002. Investors should read the prospectus and, if available, the summary prospectus carefully before investing.
| Portfolio performance | | | | | | | | |
| Average annual total returns | | | | | | | | |
| Periods ended Oct. 31, 2012 | | 1 year | | 3 years | | 5 years | | Lifetime |
| | +4.74% | | +21.53% | | +8.46% | | +8.69% |
Portfolio profile
Oct. 31, 2012
| Total net assets |
| $17.9 million |
| Inception date |
| Dec. 1, 2003 |
Growth of $1,000,000
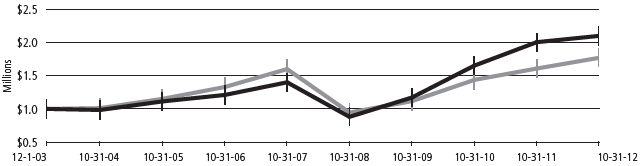
| | | | Starting value (Dec. 1, 2003) | | Ending value (Oct. 31, 2012) |
| | The Focus Smid-Cap Growth Equity Portfolio | | $1,000,000 | | $2,103,048 |
| | Russell 2500 Growth Index | | $1,000,000 | | $1,771,629 |
2012 Annual report · Delaware Pooled Trust
18
The performance graph assumes $1 million invested on Dec. 1, 2003, and includes reinvestment of all distributions. The performance graph does not reflect the deduction of taxes the shareholder would pay on Portfolio distributions or redemptions of Portfolio shares.
Total return assumes reinvestment of dividends and capital gains, but does not reflect reductions for taxes. Returns and share values will fluctuate so that shares, when redeemed, may be worth more or less than their original cost.
The most recent prospectus designated the Portfolio’s total operating expenses as 1.05%. Management has contractually agreed to reimburse certain expenses and/or waive its management fees from Feb. 28, 2012, through Feb. 28, 2013, in order to prevent total annual Portfolio operating expenses (with certain exceptions) from exceeding, in an aggregate amount, 0.92% of the Portfolio’s average daily net assets, as described in the most recent prospectus.
Expense limitations were in effect during the period shown. Performance would have been lower had the expense limitations not been in effect.
The Russell 2500 Growth Index measures the performance of the small- to mid-cap growth segment of the U.S. equity universe. It includes those Russell 2500 companies with higher price-to-book ratios and higher forecasted growth values.
Index performance returns do not reflect any management fees, transaction costs, or expenses. Indices are unmanaged and one cannot invest directly in an index.
Investing involves risk, including the possible loss of principal.
Past performance is not a guarantee of future results.
Investments in small and/or medium-sized companies typically exhibit greater risk and higher volatility than larger, more established companies.
Because the Portfolio expects to hold a concentrated portfolio of a limited number of securities, the Portfolio’s risk is increased because each investment has a greater effect on the Portfolio’s overall performance.
2012 Annual report · Delaware Pooled Trust
19
Portfolio management review
Delaware Pooled® Trust — The Real Estate Investment Trust Portfolio II
November 6, 2012
For the fiscal year ended Oct. 31, 2012, Delaware Pooled Trust — The Real Estate Investment Trust Portfolio II returned +13.72% at net asset value (NAV) with all distributions reinvested. In comparison, the Portfolio’s benchmark, the FTSE NAREIT Equity REITs Index, rose 14.94% during the same period. Complete annualized performance for The Real Estate Investment Trust Portfolio II is shown on the table on page 22.
As the Portfolio’s fiscal year began in November 2011, real estate investment trust (REIT) prices were well below their highs achieved several months earlier. However, REITs rose through most of the remainder of the Portfolio’s fiscal year and generated strong gains overall.
REIT prices generally moved in tandem with increased optimism about global economic conditions, fueled by the aggressive actions taken by central banks around the world to boost economic performance through lowering the cost of credit. As leveraged investments, REITs generally benefit directly when financing is readily available and relatively inexpensive. Accordingly, as credit became more accessible throughout the Portfolio’s fiscal year, REITs generally responded well.
In this favorable environment, all REIT sectors enjoyed positive absolute returns. Malls and shopping center companies were bolstered by growing strength in consumer spending and tight supplies relative to demand, which resulted in rising rents and strong tenant occupancy levels. In contrast, apartment REITs generated only sluggish gains, in part because other areas of the market that had previously underperformed began to draw more investor attention.
Hurt by modest small-cap exposure
The Portfolio provided solid absolute returns during its fiscal year. Portfolio performance was hampered, however, by holdings that included Strategic Hotels & Resorts, an owner of luxury hotel properties. Its stock price fell slightly during the past year — even as the overall market generated a double-digit gain — as investors appeared unwilling to pay a premium for the company’s growth prospects. That said, we believe the stock continued to offer investors relatively good value and we continue to hold the stock in the Portfolio. Another lackluster performer was BRE Properties, an apartment owner and operator focused on the California market, whose stock price fluctuated widely and finished the period down modestly.
On a relative basis, the Portfolio’s results were dampened by its underweight exposure to smaller-cap real estate securities, a number of which benefited amid the highly favorable market conditions for REITs. For example, the Portfolio lacked any exposure to healthcare property company Sabra Health Care REIT and regional mall operator Pennsylvania Real Estate Investment Trust, two benchmark constituents whose shares were up sharply.
Effective stock picking among mall operators, office REITs
The negative results mentioned above were offset somewhat by positive factors that included the Portfolio’s exposure to General Growth Properties and CBL & Associates Properties, in our view, two high-quality regional mall operators whose added levels of debt helped boost their performance relative to less-leveraged mall companies. The Portfolio’s position in National Retail Properties, whose shares were up more than 20% during the Portfolio’s fiscal year, also added to performance.
The Portfolio’s position in self-storage operator Extra Space Storage proved helpful as well. As one of the leading companies in its industry, it continued to gain market share, while tight supply within the industry helped the company maintain pricing power. The Portfolio’s holdings in Kilroy Realty also had a positive effect on performance versus the benchmark index. This company’s presence in the San Francisco market, coupled with its strong balance sheet, enabled it to take advantage of constructive market conditions, which in turn supported its stock price.
The views expressed are current as of the date of this report and are subject to change.
2012 Annual report · Delaware Pooled Trust
20
The Portfolio also benefited from maintaining relatively limited exposure (compared with the benchmark) to suburban office REITs, a category that did not perform well.
Maintaining our approach
During the Portfolio’s fiscal year, we again concentrated on what we viewed as high-quality, attractively valued REITs, while selling stocks whose prices we believed had become too expensive relative to the underlying companies’ growth prospects. While our basic strategy remained unchanged, we positioned the Portfolio somewhat more defensively than usual, with a smaller emphasis on REITs in the more economically sensitive sectors, such as hotel and industrial REITs, and a greater focus on REITs with solid balance sheets and lower levels of debt. We adopted this positioning throughout the Portfolio’s fiscal year, and continued to maintain it as this period came to a close.
2012 Annual report · Delaware Pooled Trust
21
Performance summary
Delaware Pooled® Trust — The Real Estate Investment Trust Portfolio II
The performance data quoted represent past performance; past performance does not guarantee future results. Investment return and principal value will fluctuate so your shares, when redeemed, may be worth more or less than their original cost. Current performance may be lower or higher than the performance data quoted. Please obtain the performance data for the most recent month end by calling 800 231-8002 or visiting our website at delawareinvestments.com.
Carefully consider the Portfolio’s investment objectives, risk factors, charges, and expenses before investing. This and other information can be found in the Portfolio’s prospectus and, if available, its summary prospectus, which may be obtained by visiting delawareinvestments.com or calling 800 231-8002. Investors should read the prospectus and, if available, the summary prospectus carefully before investing.
| Portfolio performance | | | | | | | | | | |
| Average annual total returns | | | | | | | | | | |
| Periods ended Oct. 31, 2012 | | 1 year | | 3 years | | 5 years | | 10 years | | Lifetime |
| | +13.72% | | +21.25% | | +1.71% | | +10.94% | | +8.98% |
Portfolio profile |
Oct. 31, 2012 |
| |
| Total net assets |
| $3.5 million |
| Inception date |
| Nov. 4, 1997 |
Growth of $1,000,000
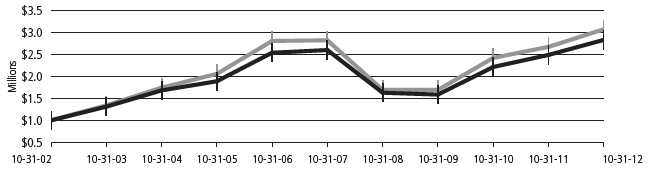
| | | Starting value (Oct. 31, 2002) | | Ending value (Oct. 31, 2012) |
| | FTSE NAREIT Equity REITs Index | $1,000,000 | | $3,064,032 |
| | The Real Estate Investment Trust Portfolio II | $1,000,000 | | $2,823,558 |
2012 Annual report · Delaware Pooled Trust
22
The performance graph assumes $1 million invested on Oct. 31, 2002, and includes reinvestment of all distributions. The performance graph does not reflect the deduction of taxes the shareholder would pay on Portfolio distributions or redemptions of Portfolio shares.
Total return assumes reinvestment of dividends and capital gains, but does not reflect reductions for taxes. Returns and share values will fluctuate so that shares, when redeemed, may be worth more or less than their original cost.
The most recent prospectus designated the Portfolio’s total operating expenses as 2.03%. Management has contractually agreed to reimburse certain expenses and/or waive its management fees from Feb. 28, 2012, through Feb. 28, 2013, in order to prevent total annual Portfolio operating expenses (with certain exceptions) from exceeding, in an aggregate amount, 0.95% of the Portfolio’s average daily net assets, as described in the most recent prospectus.
Expense limitations were in effect during the period shown. Performance would have been lower had the expense limitations not been in effect.
The FTSE NAREIT Equity REITs Index measures the performance of all publicly traded equity real estate investment trusts (REITs) traded on U.S. exchanges, excluding timber REITs.
Index performance returns do not reflect any management fees, transaction costs, or expenses. Indices are unmanaged and one cannot invest directly in an index.
Investing involves risk, including the possible loss of principal.
Past performance is not a guarantee of future results.
“Nondiversified” Portfolios may allocate more of their net assets to investments in single securities than “diversified” Portfolios. Resulting adverse effects may subject Portfolios to greater risks and volatility.
Narrowly focused investments may exhibit higher volatility than investments in multiple industry sectors.
REIT investments are subject to many of the risks associated with direct real estate ownership, including changes in economic conditions, credit risk, and interest rate fluctuations. A REIT fund’s tax status as a regulated investment company could be jeopardized if it holds real estate directly, as a result of defaults, or receives rental income from real estate holdings.
2012 Annual report · Delaware Pooled Trust
23
Portfolio management review
Delaware Pooled® Trust — The Core Focus Fixed Income Portfolio
November 6, 2012
For the fiscal year ended Oct. 31, 2012, Delaware Pooled Trust — The Core Focus Fixed Income Portfolio returned +6.93% at net asset value (NAV) with all distributions reinvested. The Portfolio’s benchmark, the Barclays U.S. Aggregate Index, returned +5.25% for the same period. Complete annualized performance for The Core Focus Fixed Income Portfolio is shown in the table on page 26.
The tenuous nature of the global economic recovery was clearly evident in the performance of U.S. fixed income markets throughout the Portfolio’s fiscal year.
Due to the unsettled macroeconomic and political environment, there was a notable disparity in performance across various fixed income sectors, especially concerning short periods. Though extraordinarily accommodative monetary policy offered broad support to bond prices, sharp shifts in sentiment caused investors to flip between a “risk on” and “risk off” mentality.
During periods when investors generally eschewed risk, Treasurys and government-backed mortgages outperformed while credit-based areas such as commercial mortgage-backed securities and lower-rated investment grade corporates lagged. Relative performance reversed when risk appetite returned, although the “haven” nature of U.S. Treasury debt, combined with the tepid pace of economic growth and lack of core inflationary pressure, kept government yields contained in a relatively tight trading range.
As the Portfolio’s fiscal year began, risk aversion was on the rise amid growing indications that the long-simmering debt crisis in the euro zone could soon trigger another global credit crunch and a possible breakup of the region’s troubled experiment with monetary union. Those fears abated, however, after the European Central Bank (ECB) initiated in December 2011 the first of two longer-term refinancing operations designed to give financially strapped banks and sovereigns more time to get their financial houses in order.
The outperformance of credit-based sectors lasted until early spring 2012, when haven assets again took the lead; it became apparent at that time that the U.S. economy was decelerating, European output was contracting, and China was struggling to restore rapid growth. Those concerns crested in June, plunging U.S. Treasury yields to near-record lows and some German short-term interest rates to below zero. By July, however, fears of a synchronized global recession were replaced by a broad consensus that the ECB would do, in the words of its president Mario Draghi, “whatever it takes” to keep the euro experiment alive.
Investors also believed that economic conditions had become so weak in the United States that the Federal Reserve would have no choice but to launch a third round of quantitative easing. Indeed, the Fed initiated additional monetary easing in September 2012, but this latest round was notable for its open-ended nature tied to meaningful progress in the labor market. (The program was subsequently dubbed QE Infinity.) The Fed also pledged to keep benchmark interest rates at virtually zero until at least mid-2015.
In general, the Portfolio’s significant underweight to Treasury securities — a sector we deemed expensive given low nominal yields and negative real yields — detracted from relative performance for the fiscal year. Conversely, our overweight allocation to lower-rated intermediate-term investment grade corporates contributed to relative returns. The Portfolio’s underweight position in government mortgage-backed securities (MBS) and collateralized mortgage obligations (CMOs) also contributed to its relative performance throughout this period.
The views expressed are current as of the date of this report and are subject to change.
2012 Annual report · Delaware Pooled Trust
24
To a remarkable degree, financial markets remained hostage throughout the fiscal year to deeply entrenched political factions in the U.S. and Europe, groups that have shown virtually no willingness to compromise in the recent past. With this dynamic in mind, the Portfolio entered its new fiscal year with its holdings in a so-called barbell configuration, with the bulk of its assets invested either in securities rated AAA (investment grade) or in bonds rated BBB (the lowest rung on the investment grade credit ladder) or A (investment grade).
2012 Annual report · Delaware Pooled Trust
25
Performance summary
Delaware Pooled® Trust — The Core Focus Fixed Income Portfolio
The performance data quoted represent past performance; past performance does not guarantee future results. Investment return and principal value will fluctuate so your shares, when redeemed, may be worth more or less than their original cost. Current performance may be lower or higher than the performance data quoted. Please obtain the performance data for the most recent month end by calling 800 231-8002 or visiting our website at delawareinvestments.com.
Carefully consider the Portfolio’s investment objectives, risk factors, charges, and expenses before investing. This and other information can be found in the Portfolio’s prospectus and, if available, its summary prospectus, which may be obtained by visiting delawareinvestments.com or calling 800 231-8002. Investors should read the prospectus and, if available, the summary prospectus carefully before investing.
| Portfolio performance | | | | | | | | |
| Average annual total returns | | | | | | | | |
| Periods ended Oct. 31, 2012 | | 1 year | | 3 years | | 5 years | | Lifetime |
| | +6.93% | | +7.29% | | +6.86% | | +5.93% |
Portfolio profile |
Oct. 31, 2012 |
| |
| Total net assets |
| $6.3 million |
| Inception date |
| June 30, 2004 |
Growth of $1,000,000
| | | Starting value (June 30, 2004) | | Ending value (Oct. 31, 2012) |
| | The Core Focus Fixed Income Portfolio | $1,000,000 | | $1,616,816 |
| | Barclays U.S. Aggregate Index | $1,000,000 | | $1,589,361 |
2012 Annual report · Delaware Pooled Trust
26
The performance graph assumes $1 million invested on June 30, 2004, and includes reinvestment of all distributions. The performance graph does not reflect the deduction of taxes the shareholder would pay on Portfolio distributions or redemptions of Portfolio shares.
Total return assumes reinvestment of dividends and capital gains, but does not reflect reductions for taxes. Returns and share values will fluctuate so that shares, when redeemed, may be worth more or less than their original cost.
The most recent prospectus designated the Portfolio’s total operating expenses as 0.96%. Management has contractually agreed to reimburse certain expenses and/or waive its management fees from Feb. 28, 2012, through Feb. 28, 2013, in order to prevent total annual Portfolio operating expenses (with certain exceptions) from exceeding, in an aggregate amount, 0.43% of the Portfolio’s average daily net assets, as described in the most recent prospectus.
Expense limitations were in effect during the period shown. Performance would have been lower had the expense limitations not been in effect.
The Barclays U.S. Aggregate Index is a broad composite that tracks the investment grade domestic bond market.
Index performance returns do not reflect any management fees, transaction costs, or expenses. Indices are unmanaged and one cannot invest directly in an index.
Investing involves risk, including the possible loss of principal.
Past performance is not a guarantee of future results.
Fixed income securities and bond funds can lose value, and investors can lose principal, as interest rates rise. They also may be affected by economic conditions that hinder an issuer’s ability to make interest and principal payments on its debt.
The Portfolio may also be subject to prepayment risk, the risk that the principal of a fixed income security that is held by the Portfolio may be prepaid prior to maturity, potentially forcing the Portfolio to reinvest that money at a lower interest rate.
The Portfolio may invest in derivatives, which may involve additional expenses and are subject to risk, including the risk that an underlying security or securities index moves in the opposite direction from what the portfolio manager anticipated. A derivative transaction depends upon the counterparties’ ability to fulfill their contractual obligations.
International investments entail risks not ordinarily associated with U.S. investments including fluctuation in currency values, differences in accounting principles, or economic or political instability in other nations. Investing in emerging markets can be riskier than investing in established foreign markets due to increased volatility and lower trading volume.
The Portfolio may be invested in foreign corporate bonds, which have special risks not ordinarily associated with domestic investments, such as currency fluctuations, economic and political change, and different accounting standards.
The Portfolio may experience portfolio turnover in excess of 100%, which could result in higher transaction costs and tax liability.
2012 Annual report · Delaware Pooled Trust
27
Portfolio management review
Delaware Pooled® Trust — The High-Yield Bond Portfolio
November 6, 2012
For the fiscal year ended Oct. 31, 2012, Delaware Pooled Trust — The High-Yield Bond Portfolio returned +15.31% at net asset value (NAV) with all distributions reinvested. For the same period, the Portfolio’s benchmark, the BofA Merrill Lynch U.S. High Yield Constrained Index, returned +13.15%. Complete annualized performance for The High-Yield Bond Portfolio is shown in the table on page 30.
Volatility in the high yield market was driven more by global macroeconomic concerns than by widespread weakness in underlying corporate fundamentals. Sentiment toward the high yield asset class alternately warmed and cooled as the European debt crisis periodically disappeared and reappeared in the headlines. Still, many high yield bonds posted solid total returns, reflecting below-average default rates, attractive relative yields, low and stable benchmark interest rates, and the financial soundness of the U.S. corporate sector.
As the Portfolio’s fiscal year began, high yield bonds sold off sharply amid fears that the euro zone was on the verge of breaking apart. During this volatile period, fixed income investors worldwide took refuge in “haven” assets, which included debt backed by the United States or Germany. As fears crested, strong demand for U.S. Treasury securities pushed yields to record lows, while some German short-term rates actually plunged below zero.
However, global risk appetite soon returned in December 2011, after the European Central Bank (ECB) initiated the first of two well-received longer-term refinancing operations. The operations effectively forestalled a liquidity crunch in the region and created a surge in high yield bond prices which continued until spring 2012, when it became apparent that decelerating economic growth in the U.S. and China raised the prospect of another synchronized global recession.
Paradoxically, the rally in risk assets resumed during the summer as investors concluded that economic conditions had weakened sufficiently to compel the U.S. Federal Reserve to undertake a third round of quantitative easing. A pledge by ECB President Mario Draghi in July 2012 to do “whatever it takes” to preserve monetary union also bolstered sentiment. By August, renewed strong demand for high yield debt had driven down average yields to near-record lows.
The Fed’s announcement in September 2012 that it would begin another round of open-ended asset purchases tied to unambiguous signs of sustained progress in the labor market helped further support high yield prices as the Portfolio’s fiscal year concluded. Investors also appeared to draw comfort from the Fed’s promise to maintain benchmark interest rates at virtually zero until at least mid-2015, and by indications that the nation’s long-suffering housing market had finally bottomed and turned up.
Overall, returns in high yield and leveraged loan markets were driven by a quest for income in an exceptionally low rate environment, and by expectations that default rates would remain below the long-run average despite tepid economic growth. Though new issuance reached record highs, most businesses used the proceeds to refinance debt at favorable rates rather than undertake leveraged acquisitions, which have historically been riskier.
Relative to its benchmark, the Portfolio benefited from its consistent overweight to CCC-rated bonds (which are at the lower end of the credit quality spectrum), despite holding securities within that category that often were, in our opinion, of higher quality (and thus lower yield) than those within that component of the index. It’s important to note that, at time during the fiscal year, particularly when investors embraced a “risk on” mode, this focus on what we viewed to be higher-quality bonds caused the Portfolio to generate milder returns than those of the broader high yield market. Over the course of the year, however, except for those occasions when risk aversion spiked, bonds rated CCC and B generally outperformed the (higher-rated) BB-rated segment of the sub-investment-grade universe. On
The views expressed are current as of the date of this report and are subject to change.
2012 Annual report · Delaware Pooled Trust
28
a sector level, the Portfolio’s holdings in banking, capital goods, and energy contributed to relative performance while our allocation to healthcare, utilities, and metals and mining mostly detracted from relative returns.
At fiscal year close, the Portfolio was positioned in a slightly more conservative, risk-aware manner, with just over three-quarters of its assets invested in securities rated B or BB, the two highest rungs of the sub-investment-grade credit ladder. From a sector standpoint, the Portfolio held overweight allocations to basic industry, insurance, media, consumer cyclical, technology and electric, automotive, and emerging markets. The Portfolio also maintained a modest cash position to guard against volatility and redemptions, and to provide buying power as opportunities arise in the new issuance or secondary markets. Conversely, the Portfolio ended its fiscal year with underweight allocations in energy, services, telecommunications, healthcare, capital goods, banking, financial services, and utilities. As always, we arrived at these credit and sector weightings through a combination of top-down macroeconomic analysis and bottom-up, bond-by-bond credit research.
2012 Annual report · Delaware Pooled Trust
29
Performance summary
Delaware Pooled® Trust — The High-Yield Bond Portfolio
The performance data quoted represent past performance; past performance does not guarantee future results. Investment return and principal value will fluctuate so your shares, when redeemed, may be worth more or less than their original cost. Current performance may be lower or higher than the performance data quoted. Please obtain the performance data for the most recent month end by calling 800 231-8002 or visiting our website at delawareinvestments.com.
Carefully consider the Portfolio’s investment objectives, risk factors, charges, and expenses before investing. This and other information can be found in the Portfolio’s prospectus and, if available, its summary prospectus, which may be obtained by visiting delawareinvestments.com or calling 800 231-8002. Investors should read the prospectus and, if available, the summary prospectus carefully before investing.
| Portfolio performance | | | | | | | | | | |
| Average annual total returns | | | | | | | | | | |
| Periods ended Oct. 31, 2012 | | 1 year | | 3 years | | 5 years | | 10 years | | Lifetime |
| | +15.31% | | +13.35% | | +9.80% | | +12.34% | | +8.44% |
| Portfolio profile |
| Oct. 31, 2012 |
| |
| Total net assets |
| $113 million |
| |
| Number of holdings |
| 287 |
| |
| Inception date |
| Dec. 2, 1996 |
Growth of $1,000,000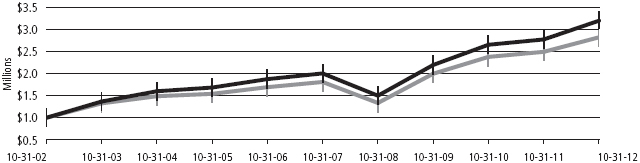
| | | | Starting value (Oct. 31, 2002) | | Ending value (Oct. 31, 2012) |
| | The High-Yield Bond Portfolio | | $1,000,000 | | $3,200,584 |
| | BofA Merrill Lynch U.S. High Yield Constrained Index | | $1,000,000 | | $2,824,466 |
2012 Annual report · Delaware Pooled Trust
30
The performance graph assumes $1 million invested on Oct. 31, 2002, and includes reinvestment of all distributions. The performance graph does not reflect the deduction of taxes the shareholder would pay on Portfolio distributions or redemptions of Portfolio shares.
Total return assumes reinvestment of dividends and capital gains, but does not reflect reductions for taxes. Returns and share values will fluctuate so that shares, when redeemed, may be worth more or less than their original cost.
The most recent prospectus designated the Portfolio’s total operating expenses as 0.60%. Management has contractually agreed to reimburse certain expenses and/or waive its management fees from Feb. 28, 2012, through Feb. 28, 2013, in order to prevent total annual Portfolio operating expenses (with certain exceptions) from exceeding, in an aggregate amount, 0.59% of the Portfolio’s average daily net assets, as described in the most recent prospectus.
Expense limitations were in effect during the period shown. Performance would have been lower had the expense limitations not been in effect.
The BofA Merrill Lynch U.S. High Yield Constrained Index tracks the performance of U.S. dollar–denominated high yield corporate debt publicly issued in the U.S. domestic market, but caps individual issuer exposure at 2% of the benchmark.
Index performance returns do not reflect any management fees, transaction costs, or expenses. Indices are unmanaged and one cannot invest directly in an index.
Investing involves risk, including the possible loss of principal.
Past performance is not a guarantee of future results.
Fixed income securities and bond funds can lose value, and investors can lose principal, as interest rates rise. They also may be affected by economic conditions that hinder an issuer’s ability to make interest and principal payments on its debt.
The Portfolio may also be subject to prepayment risk, the risk that the principal of a fixed income security that is held by the Portfolio may be prepaid prior to maturity, potentially forcing the Portfolio to reinvest that money at a lower interest rate.
High yielding, noninvestment grade bonds (junk bonds) involve higher risk than investment grade bonds. The high yield secondary market is particularly susceptible to liquidity problems when institutional investors, such as mutual funds and certain other financial institutions, temporarily stop buying bonds for regulatory, financial, or other reasons. In addition, a less liquid secondary market makes it more difficult for the Fund to obtain precise valuations of the high yield securities in its portfolio.
The Portfolio may invest in derivatives, which may involve additional expenses and are subject to risk, including the risk that an underlying security or securities index moves in the opposite direction from what the portfolio manager anticipated. A derivative transaction depends upon the counterparties’ ability to fulfill their contractual obligations.
International investments entail risks not ordinarily associated with U.S. investments including fluctuation in currency values, differences in accounting principles, or economic or political instability in other nations. Investing in emerging markets can be riskier than investing in established foreign markets due to increased volatility and lower trading volume.
If and when the Portfolio invests in forward foreign currency contracts or uses other investments to hedge against currency risks, the Portfolio will be subject to special risks, including counterparty risk.
The Portfolio may experience portfolio turnover in excess of 100%, which could result in higher transaction costs and tax liability.
Bond ratings are determined by a nationally recognized statistical rating organization (NRSRO).
2012 Annual report · Delaware Pooled Trust
31
Portfolio management review
Delaware Pooled® Trust — The Core Plus Fixed Income Portfolio
November 6, 2012
For the fiscal year ended Oct. 31, 2012, Delaware Pooled Trust — The Core Plus Fixed Income Portfolio returned +7.95% at net asset value (NAV) with all distributions reinvested. The Portfolio’s benchmark, the Barclays U.S. Aggregate Index, returned +5.25% for the same period. Complete annualized performance for The Core Plus Fixed Income Portfolio is shown in the table on page 34.
The unsettled economic and political environment held sway over global bond markets during the Portfolio’s fiscal year, with various fixed income sectors diverging sharply as investor risk appetite waxed and waned.
As the Portfolio’s fiscal year began, the euro zone was sliding toward a possible breakup, triggering a worldwide flight to safety that pushed yields on “core” government bonds like those in the United States and Germany to near-record lows. Meanwhile, economically sensitive sectors such as domestic high yield and emerging market debt underperformed. In December 2011, however, the European Central Bank (ECB) launched the first of two longer-term refinancing operations designed to avert a liquidity crisis in Greece, Spain, and Italy. Investors interpreted the ECB’s actions as sufficient to remove the risk of an imminent credit crunch and the demise of the single currency experiment.
With confidence restored, “haven” assets such as U.S. Treasurys and German government bonds lagged credit-sensitive sectors for the next several months — that is, until the lack of political progress toward achieving a regulatory and fiscal solution in Europe became apparent once again. In early summer 2012, a steep rise in the bond yields of troubled euro-zone members caused ECB President Mario Draghi to proclaim that the central bank would do “whatever it takes” to preserve the euro.
Draghi’s declaration, combined with a growing consensus that the Federal Reserve would respond to a pronounced economic deceleration in the U.S. with another round of quantitative easing, most fixed income sectors finished the Portfolio’s fiscal year on a positive note. Importantly, the Fed indeed undertook another round of quantitative easing (also known as QE), pledging to keep benchmark interest rates near zero until at least mid-2015, while buying up to $40 billion in government and mortgage-backed securities each month until the domestic labor market has clearly mended in the eyes of the Fed.
Though some investors worried that the Fed’s latest quantitative easing program (dubbed QE Infinity) would ultimately spark inflation, it nonetheless had the immediate effect of pushing most bond prices higher (and yields lower) as many investors lengthened average durations and moved into credit-sensitive sectors.
The Portfolio’s large underweight to Treasury securities during the bulk of the fiscal year detracted from relative performance. In general, we viewed the sector as expensive due to historically low real and nominal yields. Still, its haven status in the context of global economic turbulence and unrelenting central bank support kept government yields down (and prices up), even during periods when risk appetite returned.
However, the Portfolio’s corresponding overweight allocation to credit and economically sensitive segments of the fixed income market more than compensated for the underperformance of its Treasury positions. Specifically, the Portfolio benefited from a significant overweight to U.S. investment grade and high yield bonds as well as from strong security selection and yield curve (duration) decisions within those sectors. It’s important to note, however, that we generally maintained a focus on what we viewed as higher-quality bonds within the high yield market. At times during the fiscal year, particularly when investors embraced a “risk on” mode, this focus caused the Portfolio’s high yield holdings to generate milder returns than those of the broader high yield market.
Relative performance also benefited from the Portfolio’s overweight allocation toward emerging market debt, which rallied during “risk on” periods due to, what we consider, the sector’s generous yields and relatively strong fiscal positions. The Portfolio’s underweight position in government
The views expressed are current as of the date of this report and are subject to change.
2012 Annual report · Delaware Pooled Trust
32
mortgage-backed securities (MBS) and collateralized mortgage obligations (CMOs) also contributed to its relative performance throughout the fiscal year.
To a remarkable degree, financial markets remained hostage throughout the fiscal year to deeply entrenched political factions in the U.S. and Europe, groups that have shown virtually no willingness to compromise in the recent past. With this dynamic in mind, the Portfolio entered its new fiscal year with its holdings in a so-called barbell configuration, with nearly three quarters of assets invested in securities rated AAA (investment grade) and nearly all of the remainder in bonds rated BBB (the lowest rung on the investment grade credit ladder) or A (investment grade).
2012 Annual report · Delaware Pooled Trust
33
Performance summary
Delaware Pooled® Trust — The Core Plus Fixed Income Portfolio
The performance data quoted represent past performance; past performance does not guarantee future results. Investment return and principal value will fluctuate so your shares, when redeemed, may be worth more or less than their original cost. Current performance may be lower or higher than the performance data quoted. Please obtain the performance data for the most recent month end by calling 800 231-8002 or visiting our website at delawareinvestments.com.
Carefully consider the Portfolio’s investment objectives, risk factors, charges, and expenses before investing. This and other information can be found in the Portfolio’s prospectus and, if available, its summary prospectus, which may be obtained by visiting delawareinvestments.com or calling 800 231-8002. Investors should read the prospectus and, if available, the summary prospectus carefully before investing.
| Portfolio performance | | | | | | | | | | |
| Average annual total returns | | | | | | | | | | |
| Periods ended Oct. 31, 2012 | | 1 year | | 3 years | | 5 years | | 10 years | | Lifetime |
| | +7.95% | | +8.23% | | +8.43% | | +7.12% | | +7.23% |
| Portfolio profile |
| Oct. 31, 2012 |
| |
| Total net assets |
| $60.3 million |
| |
| Number of holdings |
| 438 |
| |
| Inception date |
| June 28, 2002 |
Growth of $1,000,000
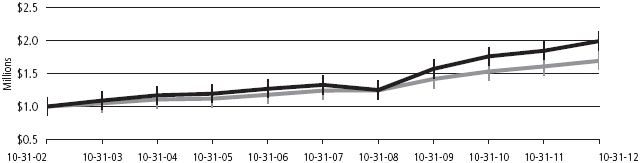
| | | | Starting value (Oct. 31, 2002) | | Ending value (Oct. 31, 2012) |
| | The Core Plus Fixed Income Portfolio | | $1,000,000 | | $1,989,450 |
| | Barclays U.S. Aggregate Index | | $1,000,000 | | $1,690,905 |
2012 Annual report · Delaware Pooled Trust
34
The performance graph assumes $1 million invested on Oct. 31, 2002, and includes reinvestment of all distributions. The performance graph does not reflect the deduction of taxes the shareholder would pay on Portfolio distributions or redemptions of Portfolio shares.
Total return assumes reinvestment of dividends and capital gains, but does not reflect reductions for taxes. Returns and share values will fluctuate so that shares, when redeemed, may be worth more or less than their original cost.
The most recent prospectus designated the Portfolio’s total operating expenses as 0.64%. Management has contractually agreed to reimburse certain expenses and/or waive its management fees from Feb. 28, 2012, through Feb. 28, 2013, in order to prevent total annual Portfolio operating expenses (with certain exceptions) from exceeding, in an aggregate amount, 0.45% of the Portfolio’s average daily net assets, as described in the most recent prospectus.
Expense limitations were in effect during the period shown. Performance would have been lower had the expense limitations not been in effect.
The Barclays U.S. Aggregate Index is a broad composite that tracks the investment grade domestic bond market.
Index performance returns do not reflect any management fees, transaction costs, or expenses. Indices are unmanaged and one cannot invest directly in an index.
Investing involves risk, including the possible loss of principal.
Past performance is not a guarantee of future results.
Fixed income securities and bond funds can lose value, and investors can lose principal, as interest rates rise. They also may be affected by economic conditions that hinder an issuer’s ability to make interest and principal payments on its debt.
The Portfolio may also be subject to prepayment risk, the risk that the principal of a fixed income security that is held by the Portfolio may be prepaid prior to maturity, potentially forcing the Portfolio to reinvest that money at a lower interest rate.
The Portfolio may invest in derivatives, which may involve additional expenses and are subject to risk, including the risk that an underlying security or securities index moves in the opposite direction from what the portfolio manager anticipated. A derivative transaction depends upon the counterparties’ ability to fulfill their contractual obligations.
International investments entail risks not ordinarily associated with U.S. investments including fluctuation in currency values, differences in accounting principles, or economic or political instability in other nations. Investing in emerging markets can be riskier than investing in established foreign markets due to increased volatility and lower trading volume.
The Portfolio may be invested in foreign corporate bonds, which have special risks not ordinarily associated with domestic investments, such as currency fluctuations, economic and political change, and different accounting standards.
High yielding, noninvestment grade bonds (junk bonds) involve higher risk than investment grade bonds. The high yield secondary market is particularly susceptible to liquidity problems when institutional investors, such as mutual funds and certain other financial institutions, temporarily stop buying bonds for regulatory, financial, or other reasons. In addition, a less liquid secondary market makes it more difficult for the Fund to obtain precise valuations of the high yield securities in its portfolio.
The Portfolio may experience portfolio turnover in excess of 100%, which could result in higher transaction costs and tax liability.
Bond ratings are determined by a nationally recognized statistical rating organization (NRSRO).
2012 Annual report · Delaware Pooled Trust
35
Portfolio management review
Delaware Pooled® Trust — The International Equity Portfolio
November 6, 2012
Delaware Pooled Trust — The International Equity Portfolio returned +2.26% at net asset value (NAV) with all distributions reinvested for the fiscal year ended Oct. 31, 2012. The Portfolio’s benchmark, the MSCI EAFE Index, returned +5.15% (gross) and +4.61% (net) for the same period. Complete annualized performance for The International Equity Portfolio is shown on the table on page 38.
Investors in international equities weathered a difficult period during the fiscal year. The Portfolio’s modestly positive result tends to mask a period of exceptional volatility. Downside risk was high, given widespread fears about the possible exit of Greece from the euro zone, contagion to larger markets including Spain and Italy, and even the possible dissolution of the European Union (EU). Negative sentiment was temporarily delayed at various points throughout the fiscal year by a series of central bank interventions. These included long-term refinancing operations (LTRO, which were stimulus operations enacted by the European Central Bank), inflation targeting, quantitative easing (stimulus actions, also known as QE, enacted by the Bank of England), and peripheral European bond purchases. Each action, in turn, supported asset prices for a month or two, until pessimism reasserted itself. In this volatile environment, we found opportunities to invest in what we viewed as good stocks at attractive values. At the same time, we recognized the increased importance of analyzing worst-case scenarios in each market, and for each individual security in the Portfolio. The resulting defensive posture, which we believed to be prudent in such a volatile environment, largely accounts for the Portfolio’s relative underperformance versus its benchmark during the fiscal year.
Turning to regions and individual countries, we note that countries in northern Europe generally fared better than those in southern Europe. Denmark and Belgium, for example, led the way with returns of 26.9% and 26.6%, respectively. The two biggest markets, the United Kingdom and Germany, also generated strong returns. German stocks advanced 9.8% — Germany is widely regarded as the most stable member of the EU. In the U.K., the Bank of England’s QE efforts and other growth initiatives successfully boosted sentiment, and equities rose 8.4%. In contrast, new French President François Hollande introduced austerity measures that were generally not well received, and that market declined 2.2%. Greece was the worst performer in Europe, down 27.9%.
In the Asia-Pacific region, most countries outperformed the benchmark with the notable exception of Japan, which declined 3.3%; Japan’s performance was driven largely by weakness in its currency. After decades of persistent deflation, the Bank of Japan adopted an explicit inflation target designed to stimulate price growth. In addition, slowing demand for technology products worldwide hurt the information technology sector, which included many Japanese companies.
Overall, the Portfolio’s country allocation decisions held back returns during its fiscal year. An overweight position in the Netherlands and a nonbenchmark position in Taiwan were positive. But a large position in Spain detracted from the Portfolio’s results, as did underexposure to German stocks, and no positions in strong-performing stocks in Denmark and Belgium.
The views expressed are current as of the date of this report and are subject to change.
2012 Annual report · Delaware Pooled Trust
36
Two of the Portfolio’s best performing stocks came from the healthcare sector. Astellas is a Japanese pharmaceutical company that gained investors’ confidence in its product pipeline. Astellas received approval for two new drugs, one to treat prostate cancer and the second for patients with overactive bladders. The stock rose 38.4%. France-based pharmaceutical stock, Sanofi, also had an outstanding year. It has a strong presence in emerging markets and benefited from solid growth there. Key drugs in Sanofi’s pipeline performed relatively well and the stock rose 26%.
Taiwan Semiconductor is an example of our bottom-up (stock-by-stock) selection process. Though Taiwan is considered an emerging market country, our bottom-up process drew our attention to Taiwan Semiconductor because it is an established enterprise. In spite of general weakness in the technology sector, the company benefited from strong demand for its best-in-class chips for smartphones and tablet computers. As a result, the stock increased by 27.6%.
The Portfolio’s three poorest-performing holdings were in the technology and telecommunications sectors, where companies struggled due largely to increased competition. With a weak economic backdrop, both France Telecom (-28.9%) and Telefonica (-31.0%), reduced their guidance for shareholder distributions. Both were paying dividends in excess of 10% per year, which needed to be reduced to sustainable levels. However, as the national telecommunications providers in France and Spain, respectively, with well-diversified geographical exposure, we believe that these companies may still have the potential for good long-term value.
In Japan, shares of Canon lagged the market due primarily to slowing global demand for office equipment. In addition, investors worried about the stability of Canon’s relationship with Hewlett-Packard (HP). Canon builds the engines for HP’s copiers and laser printers, and some observers worry that this relationship could change due to restructuring at HP. As a result, Canon’s stock price declined 26.9%. We acted on what we viewed as a value opportunity, and added to the Portfolio’s position in the stock during the fiscal year.
2012 Annual report · Delaware Pooled Trust
37
Performance summary
Delaware Pooled® Trust — The International Equity Portfolio
The performance data quoted represent past performance; past performance does not guarantee future results. Investment return and principal value will fluctuate so your shares, when redeemed, may be worth more or less than their original cost. Current performance may be lower or higher than the performance data quoted. Please obtain the performance data for the most recent month end by calling 800 231-8002 or visiting our website at delawareinvestments.com.
Carefully consider the Portfolio’s investment objectives, risk factors, charges, and expenses before investing. This and other information can be found in the Portfolio’s prospectus and, if available, its summary prospectus, which may be obtained by visiting delawareinvestments.com or calling 800 231-8002. Investors should read the prospectus and, if available, the summary prospectus carefully before investing.
| Portfolio performance | | | | | | | | | | |
| Average annual total returns | | | | | | | | | | |
| Periods ended Oct. 31, 2012 | | 1 year | | 3 years | | 5 years | | 10 years | | Lifetime |
| | +2.26% | | +3.30% | | -5.26% | | +8.50% | | +7.60% |
| Portfolio profile |
| Oct. 31, 2012 |
| |
| Total net assets |
| $467.8 million |
| |
| Number of holdings |
| 54 |
| |
| Inception date |
| Feb. 4, 1992 |
Growth of $1,000,000
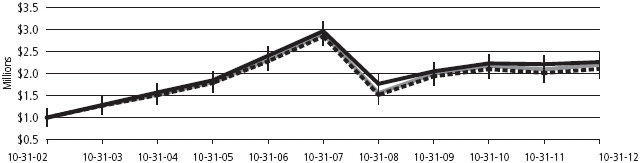
| | | | | Starting value (Oct. 31, 2002) | | Ending value (Oct. 31, 2012) |
| | The International Equity Portfolio | | $1,000,000 | | $2,260,046 |
| | MSCI EAFE Index (gross) | | $1,000,000 | | $2,201,351 |
| | MSCI EAFE Index (net) | | $1,000,000 | | $2,104,496 |
2012 Annual report · Delaware Pooled Trust
38
The performance graph assumes $1 million invested on Oct. 31, 2002, and includes reinvestment of all distributions. The performance graph does not reflect the deduction of taxes the shareholder would pay on Portfolio distributions or redemptions of Portfolio shares.
Total return assumes reinvestment of dividends and capital gains, but does not reflect reductions for taxes. Returns and share values will fluctuate so that shares, when redeemed, may be worth more or less than their original cost.
The most recent prospectus designated the Portfolio’s total operating expenses as 0.87%.
The MSCI EAFE Index measures equity market performance across developed market countries in Europe, Australasia, and the Far East. Index “gross” return approximates the maximum possible dividend reinvestment. Index “net” return approximates the minimum possible dividend reinvestment, after deduction of withholding tax at the highest possible rate.
Index performance returns do not reflect any management fees, transaction costs, or expenses. Indices are unmanaged and one cannot invest directly in an index.
Investing involves risk, including the possible loss of principal.
Past performance is not a guarantee of future results.
International investments entail risks not ordinarily associated with U.S. investments including fluctuation in currency values, differences in accounting principles, or economic or political instability in other nations. Investing in emerging markets can be riskier than investing in established foreign markets due to increased volatility and lower trading volume.
If and when the Portfolio invests in forward foreign currency contracts or uses other investments to hedge against currency risks, the Portfolio will be subject to special risks, including counterparty risk.
The Portfolio is presently closed to new investors.
2012 Annual report · Delaware Pooled Trust
39
Portfolio management review
Delaware Pooled® Trust — The Labor Select International Equity Portfolio
November 6, 2012
Delaware Pooled Trust — The Labor Select International Equity Portfolio returned +2.40% at net asset value (NAV) with all distributions reinvested for the fiscal year ended Oct. 31, 2012. The Portfolio’s benchmark, the MSCI EAFE Index, returned +5.15% (gross) and +4.61% (net) for the same period. Complete annualized performance for The Labor Select International Equity Portfolio is shown on the table on page 42.
Investors in international equities weathered a difficult period over the fiscal year. The Portfolio’s modestly positive result tends to mask a period of exceptional volatility. Downside risk was high, given widespread fears about the possible exit of Greece from the euro zone, contagion to larger markets including Spain and Italy, and even the possible dissolution of the European Union (EU). Negative sentiment was temporarily delayed at various points throughout the fiscal year by a series of central bank interventions. These included long-term refinancing operations (more commonly known as LTRO, these were stimulus operations enacted by the European Central Bank), inflation targeting, quantitative easing (stimulus actions, also known as QE, enacted by the Bank of England), and peripheral European bond purchases. Each action, in turn, supported asset prices for a month or two, until pessimism reasserted itself. In this volatile environment, we found opportunities to invest in what we viewed as good stocks at attractive values. At the same time, we recognized the increased importance of analyzing worst-case scenarios in each market, and for each individual security in the Portfolio. The resulting defensive posture, which we believed to be prudent in such a volatile environment, largely accounts for the Portfolio’s relative underperformance versus its benchmark during the fiscal year.
Turning to regions and individual countries, we note that countries in northern Europe generally fared better than those in southern Europe. Denmark and Belgium, for example, led the way with returns of 26.9% and 26.6%, respectively. The two biggest markets, the United Kingdom and Germany, also generated strong returns. German stocks advanced 9.8% — Germany is widely regarded as the most stable member of the EU. In the U.K., the Bank of England’s QE efforts and other growth initiatives successfully boosted sentiment, and equities rose 8.4%. In contrast, new French President François Hollande introduced austerity measures that were generally not well received and that market declined 2.2%. Greece was the worst performer in Europe, down 27.9%.
In the Asia-Pacific region, most countries outperformed the benchmark with the notable exception of Japan, which declined 3.3%; Japan’s performance was driven largely by weakness in its currency. After decades of persistent deflation, the Bank of Japan adopted an explicit inflation target designed to stimulate price growth. In addition, slowing demand for technology products worldwide hurt the information technology sector, which included many Japanese companies.
Overall, the Portfolio’s country allocation decisions held back returns during its fiscal year. An overweight position in the Netherlands and no exposure to the weak Finnish market were positive. But a large position in Spain detracted from the Portfolio’s results, as did underexposure to German stocks, and no positions in strong-performing stocks in Denmark and Belgium.
Two of the Portfolio’s best performing stocks came from the health care sector. Astellas is a Japanese pharmaceutical company that gained investors’ confidence in its product pipeline. Astellas received approval for two new drugs, one to treat prostate cancer and the second for patients with overactive bladders. The stock rose 38.4%. France-based pharmaceutical stock, Sanofi, also had an outstanding year. It has a strong presence in emerging markets and benefited from solid growth there. Key drugs in Sanofi’s pipeline performed relatively well and the stock rose 26%.
The views expressed are current as of the date of this report and are subject to change.
2012 Annual report · Delaware Pooled Trust
40
Compass Group is the world’s largest food services provider. As more and more companies, hospitals, and other organizations outsource their food preparation and service needs, we believe Compass may be in the dominant position to capture their business. As of the end of the fiscal year, the firm was 40% larger than its closest competitor and the company’s shares advanced 23.4%.
The Portfolio’s three poorest-performing holdings were in the technology and telecommunications sectors, where companies struggled due largely to increased competition. With a weak economic backdrop, both France Telecom (-28.9%) and Telefonica (-31%), reduced their guidance for shareholder distributions. Both were paying dividends in excess of 10% per year, which needed to be reduced to sustainable levels. However, as the national telecommunications providers in France and Spain, respectively, with well-diversified geographical exposure, we believe that these companies may still have the potential for good long-term value.
In Japan, shares of Canon lagged the market due primarily to slowing global demand for office equipment. In addition, investors worried about the stability of Canon’s relationship with Hewlett-Packard (HP). Canon builds the engines for HP’s copiers and laser printers, and some observers worry that this relationship could change due to restructuring at HP. As a result, Canon’s stock price declined 26.9%. We took advantage of what we viewed as a value opportunity, and added to the Portfolio’s position in the stock during the fiscal year.
2012 Annual report · Delaware Pooled Trust
41
Performance summary
Delaware Pooled® Trust — The Labor Select International Equity Portfolio
The performance data quoted represent past performance; past performance does not guarantee future results. Investment return and principal value will fluctuate so your shares, when redeemed, may be worth more or less than their original cost. Current performance may be lower or higher than the performance data quoted. Please obtain the performance data for the most recent month end by calling 800 231-8002 or visiting our website at delawareinvestments.com.
Carefully consider the Portfolio’s investment objectives, risk factors, charges, and expenses before investing. This and other information can be found in the Portfolio’s prospectus and, if available, its summary prospectus, which may be obtained by visiting delawareinvestments.com or calling 800 231-8002. Investors should read the prospectus and, if available, the summary prospectus carefully before investing.
| Portfolio performance | | | | | | | | | |
| Average annual total returns | | | | | | | | | |
| Periods ended Oct. 31, 2012 | 1 year | | 3 years | | 5 years | | 10 years | | Lifetime |
| +2.40% | | +2.79% | | -5.41% | | +8.31% | | +7.27% |
Portfolio profile |
Oct. 31, 2012 |
| |
| Total net assets |
$509.5 million |
| Inception date |
| Dec. 19, 1995 |
Growth of $1,000,000
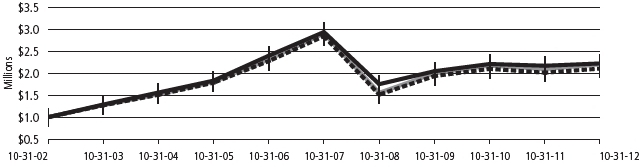
| | | Starting value (Oct. 31, 2002) | | Ending value (Oct. 31, 2012) |
| | The Labor Select International Equity Portfolio | $1,000,000 | | $2,221,182 |
| | MSCI EAFE Index (gross) | $1,000,000 | | $2,201,351 |
| | MSCI EAFE Index (net) | $1,000,000 | | $2,104,496 |
2012 Annual report · Delaware Pooled Trust
42
The performance graph assumes $1 million invested on Oct. 31, 2002, and includes reinvestment of all distributions. The performance graph does not reflect the deduction of taxes the shareholder would pay on Portfolio distributions or redemptions of Portfolio shares.
Total return assumes reinvestment of dividends and capital gains, but does not reflect reductions for taxes. Returns and share values will fluctuate so that shares, when redeemed, may be worth more or less than their original cost.
The most recent prospectus designated the Portfolio’s total operating expenses as 0.87%.
The MSCI EAFE Index measures equity market performance across developed market countries in Europe, Australasia, and the Far East. Index “gross” return approximates the maximum possible dividend reinvestment. Index “net” return approximates the minimum possible dividend reinvestment, after deduction of withholding tax at the highest possible rate.
Index performance returns do not reflect any management fees, transaction costs, or expenses. Indices are unmanaged and one cannot invest directly in an index.
Investing involves risk, including the possible loss of principal.
Past performance is not a guarantee of future results.
International investments entail risks not ordinarily associated with U.S. investments including fluctuation in currency values, differences in accounting principles, or economic or political instability in other nations. Investing in emerging markets can be riskier than investing in established foreign markets due to increased volatility and lower trading volume.
If and when the Portfolio invests in forward foreign currency contracts or uses other investments to hedge against currency risks, the Portfolio will be subject to special risks, including counterparty risk.
2012 Annual report · Delaware Pooled Trust
43
Portfolio management review
Delaware Pooled® Trust — The Emerging Markets Portfolio
November 6, 2012
Delaware Pooled Trust — The Emerging Markets Portfolio returned +7.81% at net asset value (NAV) with all distributions reinvested or the fiscal year ended Oct. 31, 2012. The Portfolio’s benchmark, the MSCI Emerging Markets Index, returned +2.98% (gross) and +2.63% (net). Complete annualized performance for The Emerging Markets Portfolio is shown on the table on page 46.
For the second straight year, emerging market economies continued to experience stronger growth rates than developed markets. Yet the emerging markets asset class again lagged its developed markets counterparts. Additionally, the Portfolio’s fiscal year saw a huge diversity in the returns delivered by individual emerging market economies. For example, Turkey ended this period with a return of more than 32%, while Brazil was down more than 12% (in U.S. dollar terms). As a region, Asian emerging markets generally fared well. Asian markets were led by some of the smaller markets, including the Philippines and Thailand, which were up about 31% and 24%, respectively. With the exception of Hungary, which was up nearly 14%, most Eastern European markets performed relatively poorly.
The Portfolio’s country weights yielded positive relative performances versus the benchmark. Yet the primary driver of the Portfolio’s strong relative performance was individual stock selection. In fact, many of the better-performing stocks in relative terms were based in two of the worst-performing markets for the fiscal year: Brazil and India.
The Indian market, for example, was down nearly 5% for the fiscal year. Yet the majority of Portfolio holdings in India outperformed significantly. Software company HCL Technologies, for example, rose more than 20% while Tata Motors rose 16%. Brazilian stocks declined 12% during the fiscal year, yet we were able to ride out the headwinds of its hard-hit commodities sector in fairly good shape. The Portfolio’s Brazilian stock holdings were down just 4.7% — a relative performance of approximately eight percentage points more than the benchmark. Strong Brazilian stock performances for the Portfolio included toll road operator CCR, which was up more than 26% over the year. CCR is moving into other services such as subway systems, which we believe may give it a similar revenue stream. A second toll road operator we bought into during this period is EcoRodovias Infraestruturae Logistica. The stock rose 13.9% for the entire fiscal year, and the Portfolio’s position rose 2.6%.
The pain felt by Brazil’s commodities sector came as no surprise to us, as it was forced to contend with China’s slowing growth and appetite for raw materials, as well as slowing growth across the globe. Two of the largest companies in this sector, Vale, a diversified mining and metals supplier, and Petrobras, the national oil company, both suffered badly. We had holdings in these companies and both detracted from performance.
Though we saw Vale’s stock price decline nearly 26%, we continue to think the company’s long-term story appears promising. The company has access to sizeable mineral reserves, and we don’t believe that China’s demand is fully saturated. China’s economy is still growing, though we believe it will likely settle at a lower rate of economic growth than seen during its previous boom. We believe that once China works through its overbought raw materials, it may be back in the commodities market and looking to buy from cheap suppliers like Vale.
One of the Portfolio’s worst-performing stocks, the Brazilian steel producer Cia Siderurgica Nacional (CSN), was down nearly 42%. We sold out of this position during the fiscal year — we had viewed CSN as a good integrated model, but over time, it began to buy other companies outside of its industry, and we became concerned that its dividends could become compromised.
The views expressed are current as of the date of this report and are subject to change.
2012 Annual report · Delaware Pooled Trust
44
Conversely, China Shipping Development, a regional Chinese shipping firm, was a poor performer that we held at the start of the fiscal year but subsequently sold. China Shipping transports raw materials for the steel industry; negative investor sentiment towards commodities-related businesses affected its stock price. We had maintained a modest position in this stock but successfully sold it early at a marginal gain over the starting value.
There remains a certain degree of indecision in investors’ minds on China — nervousness over whether the “China miracle” will run into a brick wall. In our view, China’s growth is by no means finished, and indeed a slightly slower level of onward growth would probably be healthier. The authorities wanted to cool the economy; they have successfully done so, in our view, and we believe they may now be in a position to give the Chinese economy a bit more stimulus again going forward.
2012 Annual report · Delaware Pooled Trust
45
Performance summary
Delaware Pooled® Trust — The Emerging Markets Portfolio
The performance data quoted represent past performance; past performance does not guarantee future results. Investment return and principal value will fluctuate so your shares, when redeemed, may be worth more or less than their original cost. Current performance may be lower or higher than the performance data quoted. Please obtain the performance data for the most recent month end by calling 800 231-8002 or visiting our website at delawareinvestments.com.
Carefully consider the Portfolio’s investment objectives, risk factors, charges, and expenses before investing. This and other information can be found in the Portfolio’s prospectus and, if available, its summary prospectus, which may be obtained by visiting delawareinvestments.com or calling 800 231-8002. Investors should read the prospectus and, if available, the summary prospectus carefully before investing.
| Portfolio performance | | | | | | | | | |
| Average annual total returns | | | | | | | | | |
| Periods ended Oct. 31, 2012 | 1 year | | 3 years | | 5 years | | 10 years | | Lifetime |
| +7.81% | | +8.15% | | +0.59% | | +18.78% | | +9.65% |
| Portfolio profile |
| Oct. 31, 2012 |
| |
| Total net assets |
| $316.8 million |
| |
| Number of holdings |
| 75 |
| Inception date |
| April 16, 1997 |
Growth of $1,000,000

| | | Starting value (Oct. 31, 2002) | | Ending value (Oct. 31, 2012) |
| | The Emerging Markets Portfolio | $1,000,000 | | $5,589,239 |
| | MSCI Emerging Markets Index (gross) | $1,000,000 | | $4,629,646 |
| | MSCI Emerging Markets Index (net) | $1,000,000 | | $4,486,466 |
2012 Annual report · Delaware Pooled Trust
46
The performance graph assumes $1 million invested on Oct. 31, 2002, and includes reinvestment of all distributions. The performance graph does not reflect the deduction of taxes the shareholder would pay on Portfolio distributions or redemptions of Portfolio shares.
Total return assumes reinvestment of dividends and capital gains, but does not reflect reductions for taxes. Returns and share values will fluctuate so that shares, when redeemed, may be worth more or less than their original cost.
The most recent prospectus designated the Portfolio’s total operating expenses as 1.17%. The purchase reimbursement fee (0.55%) and redemption reimbursement fee (0.55%) are paid to the Portfolio. The fees are designed to reflect an approximation of the brokerage and other transaction costs associated with the investment of an investor’s purchase amount or the disposition of assets to meet redemptions, and to limit the extent to which the Portfolio (and, indirectly, the Portfolio’s existing shareholders) would have to bear such costs. In lieu of the reimbursement fees, investors in The Emerging Markets Portfolio may be permitted to utilize alternative purchase and redemption methods designed to accomplish the same economic effect as the reimbursement fees. Reimbursement fees applicable to purchases and redemptions of shares of the Portfolio are not reflected in the “Performance of $1,000,000” chart.
The MSCI Emerging Markets Index measures equity market performance across emerging market countries worldwide. Index “gross” return approximates the maximum possible dividend reinvestment. Index “net” return approximates the minimum possible dividend reinvestment, after deduction of withholding tax at the highest possible rate.
Index performance returns do not reflect any management fees, transaction costs, or expenses. Indices are unmanaged and one cannot invest directly in an index.
Investing involves risk, including the possible loss of principal.
Past performance is not a guarantee of future results.
Fixed income securities and bond funds can lose value, and investors can lose principal, as interest rates rise. They also may be affected by economic conditions that hinder an issuer’s ability to make interest and principal payments on its debt.
The Portfolio may also be subject to prepayment risk, the risk that the principal of a fixed income security that is held by the Portfolio may be prepaid prior to maturity, potentially forcing the Portfolio to reinvest that money at a lower interest rate.
High yielding, noninvestment grade bonds (junk bonds) involve higher risk than investment grade bonds.
The Portfolio may invest in derivatives, which may involve additional expenses and are subject to risk, including the risk that an underlying security or securities index moves in the opposite direction from what the portfolio manager anticipated. A derivative transaction depends upon the counterparties’ ability to fulfill their contractual obligations.
International investments entail risks not ordinarily associated with U.S. investments including fluctuation in currency values, differences in accounting principles, or economic or political instability in other nations. Investing in emerging markets can be riskier than investing in established foreign markets due to increased volatility and lower trading volume.
If and when the Portfolio invests in forward foreign currency contracts or uses other investments to hedge against currency risks, the Portfolio will be subject to special risks, including counterparty risk.
The Portfolio is presently closed to new investors.
2012 Annual report · Delaware Pooled Trust
47
Portfolio management review
Delaware Pooled® Trust — The Emerging Markets Portfolio II
November 6, 2012
For the fiscal year ended Oct. 31, 2012, Delaware Pooled Trust — The Emerging Markets Portfolio II returned +0.89% at net asset value (NAV) with all distributions invested. The Portfolio’s benchmark, the MSCI Emerging Markets Index, returned +2.98% (gross) and +2.63% (net) for the same period. Complete annualized performance for The Emerging Markets Portfolio II is shown in the table on page 50.
The Portfolio’s fiscal year was a volatile one for emerging markets. Investors contended with numerous uncertainties, including the ongoing sovereign debt crisis in Europe as well as growing concerns about slowing economic growth in China and several other major emerging market economies.
After recovering from a low point in late November 2011, emerging markets generally posted strong advances from mid-December until early March 2012. Markets rallied on the (then) more positive U.S. economic data, which in turn eased concerns about an economic slowing in China. At that time, the outlook for a resolution of the euro zone’s debt crisis also appeared to be improving.
Resolution in the euro-zone region, however, proved elusive. This, coupled with uncertainty about growth in China, introduced a measure of volatility into global markets for much of the rest of the Portfolio’s fiscal year. Toward the end of the fiscal year, global equity markets staged a broad rally as central banks in Asia, Europe, and the United States announced new stimulus measures to offset slowing economic growth.
In terms of the Portfolio’s relative performance for the fiscal year, an underweight allocation in China, together with the negative effects of stock selection, were among the significant factors behind the Portfolio’s underperformance. By way of example, China’s equity markets were up 8.3% for the fiscal year, while the Portfolio’s Chinese holdings posted a mildly negative rate of return. The Portfolio’s investments in Argentina also detracted from performance, as its Argentine holdings posted a collective decline of nearly 50%. The country of Argentina is not represented within the benchmark, thereby amplifying the negative effects of this particular group of securities on the Portfolio’s relative performance.
The negative factors noted above were offset somewhat by the positive effects of the Portfolio’s overweight position and stock selection in Mexico. The Portfolio’s Mexican holdings posted an advance of more than 30%, while benchmark constituents generated a return of slightly more than 15%. The Portfolio’s significant overweight in South Korea, as well as the positive effects of stock selection there, was another source of positive performance versus the index. The Portfolio’s South Korean holdings advanced by more than 15%, while index constituents gained nearly 3.5%.
On an individual stock basis, the Portfolio’s position in Sohu.com was among the weakest performers. Sohu is a leading Chinese internet portal company whose core businesses include online advertising and games; its shares were down by slightly more than 25% for the Portfolio’s fiscal year. We originally initiated the position based on our view that the company had a strong franchise in a rapidly developing Chinese sector. We also remained aware that in the near term, Chinese online advertising markets faced potential slowdowns. At this writing, we remain comfortable with Sohu’s long-term prospects.
Another holding that had a notably negative effect on performance was YPF, the Argentina-based oil company. YPF’s stock price came under pressure early in 2012 when the Argentine government nationalized the company; YPF shares ended the Portfolio’s fiscal year with a decline of more than 65%.
A number of the Portfolio’s holdings in Mexico yielded notable gains. Our confidence in those Mexican companies in which we saw long-term competitive advantages and intrinsic value served us well. Among the strongest performers was Cemex, Mexico’s leading cement
The views expressed are current as of the date of this report and are subject to change.
2012 Annual report · Delaware Pooled Trust
48
producer and one of the largest across all emerging markets. Cemex shares returned an unusual 115% for the Portfolio’s fiscal year, in large part due to what were viewed as improving growth prospects for the U.S. economy.
Many of the Portfolio’s South Korean holdings were standout performers. Overall, South Korean enterprises ended the Portfolio’s fiscal year on an upbeat note, largely due to strength in the technology sector, which benefited from robust end-user demand for smartphones and tablets. Among the Portfolio’s South Korean holdings in this sector, SK Telecom was a noteworthy performer. We believe it’s likely that the company’s low valuation and high dividend yield were attractive to many investors, particularly amid indications that so-called 4G networks were gaining traction in the mobile marketplace.
Broadly speaking, investors have remained vulnerable to negative news flow, and we believe this has been inevitable, considering the ongoing concerns about slowing global growth and the inability of the euro zone to mend its sovereign debt crisis.
Nonetheless, we are encouraged by the recent rebound within emerging markets, which were supported in no small part by the latest round of global monetary easing. We are also mindful that equity values are currently much higher than those seen in previous periods of central bank easing, and we therefore believe that further market gains could depend on strong prospects for improved earnings at the company level. Thus, we think our disciplined investment process may prove critical. We are committed to our fundamental, company-by-company approach that seeks to capture companies’ potential for long-term earnings power — at a price that we believe is attractive relative to our assessment of their true underlying value.
2012 Annual report · Delaware Pooled Trust
49
Performance summary
Delaware Pooled® Trust — The Emerging Markets Portfolio II
The performance data quoted represent past performance; past performance does not guarantee future results. Investment return and principal value will fluctuate so your shares, when redeemed, may be worth more or less than their original cost. Current performance may be lower or higher than the performance data quoted. Please obtain the performance data for the most recent month end by calling 800 231-8002 or visiting our website at delawareinvestments.com.
Carefully consider the Portfolio’s investment objectives, risk factors, charges, and expenses before investing. This and other information can be found in the Portfolio’s prospectus and, if available, its summary prospectus, which may be obtained by visiting delawareinvestments.com or calling 800 231-8002. Investors should read the prospectus and, if available, the summary prospectus carefully before investing.
| Portfolio performance | | | | |
| Average annual total returns | | | | |
| Periods ended Oct. 31, 2012 | | 1 year | | Lifetime |
| | +0.89% | | +1.06% |
| Portfolio profile |
| Oct. 31, 2012 |
| |
| Total net assets |
| $29.7 million |
| Inception date |
| June 23, 2010 |
Growth of $1,000,000
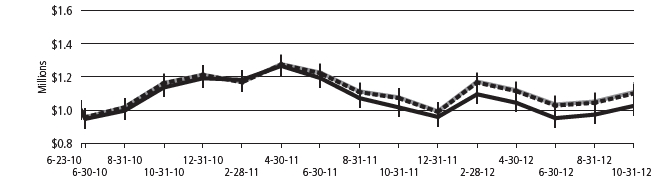
| | | | Starting value (June 23, 2010) | | Ending value (Oct. 31, 2012) |
| MSCI Emerging Markets Index (gross) | | $1,000,000 | | $1,108,769 |
| MSCI Emerging Markets Index (net) | | $1,000,000 | | $1,100,381 |
| The Emerging Markets Portfolio II | | $1,000,000 | | $1,025,279 |
2012 Annual report · Delaware Pooled Trust
50
The performance graph assumes $1 million invested on June 23, 2010, and includes reinvestment of all distributions. The performance graph does not reflect the deduction of taxes the shareholder would pay on Portfolio distributions or redemptions of Portfolio shares.
Total return assumes reinvestment of dividends and capital gains, but does not reflect reductions for taxes. Returns and share values will fluctuate so that shares, when redeemed, may be worth more or less than their original cost.
The most recent prospectus designated the Portfolio’s total operating expenses as 1.64%. Management has contractually agreed to reimburse certain expenses and/or waive its management fees from Feb. 28, 2012, through Feb. 28, 2013, in order to prevent total annual Portfolio operating expenses (with certain exceptions) from exceeding, in an aggregate amount, 1.20% of the Portfolio’s average daily net assets, as described in the most recent prospectus.
Expense limitations were in effect during the period shown. Performance would have been lower had the expense limitations not been in effect.
The MSCI Emerging Markets Index measures equity market performance across emerging market countries worldwide. Index “gross” return approximates the maximum possible dividend reinvestment. Index “net” return approximates the minimum possible dividend reinvestment, after deduction of withholding tax at the highest possible rate.
Index performance returns do not reflect any management fees, transaction costs, or expenses. Indices are unmanaged and one cannot invest directly in an index.
Investing involves risk, including the possible loss of principal.
Past performance is not a guarantee of future results.
Fixed income securities and bond funds can lose value, and investors can lose principal, as interest rates rise. They also may be affected by economic conditions that hinder an issuer’s ability to make interest and principal payments on its debt.
The Portfolio may also be subject to prepayment risk, the risk that the principal of a fixed income security that is held by the Portfolio may be prepaid prior to maturity, potentially forcing the Portfolio to reinvest that money at a lower interest rate.
High yielding, noninvestment grade bonds (junk bonds) involve higher risk than investment grade bonds.
The Portfolio may invest in derivatives, which may involve additional expenses and are subject to risk, including the risk that an underlying security or securities index moves in the opposite direction from what the portfolio manager anticipated. A derivative transaction depends upon the counterparties’ ability to fulfill their contractual obligations.
International investments entail risks not ordinarily associated with U.S. investments including fluctuation in currency values, differences in accounting principles, or economic or political instability in other nations. Investing in emerging markets can be riskier than investing in established foreign markets due to increased volatility and lower trading volume.
If and when the Portfolio invests in forward foreign currency contracts or uses other investments to hedge against currency risks, the Portfolio will be subject to special risks, including counterparty risk.
The Portfolio may experience portfolio turnover in excess of 100%, which could result in higher transaction costs and tax liability.
2012 Annual report · Delaware Pooled Trust
51
Disclosure of Portfolio expenses
For the six month period from May 1, 2012 to October 31, 2012 (Unaudited)
As a shareholder of a Portfolio, you incur two types of costs: (1) transaction costs, including reimbursement fees on The Emerging Markets Portfolio; and (2) ongoing costs, including management fees and other Portfolio expenses. The following examples are intended to help you understand your ongoing costs (in dollars) of investing in a Portfolio and to compare these costs with the ongoing costs of investing in other mutual funds.
The Examples are based on an investment of $1,000 invested at the beginning of the period and held for the entire six month period from May 1, 2012 to October 31, 2012.
Actual Expenses
The first section of the table shown, “Actual Portfolio Return,” provides information about actual account values and actual expenses. You may use the information in this table, together with the amount you invested, to estimate the expenses that you paid over the period. Simply divide your account value by $1,000 (for example, an $8,600 account value divided by $1,000 = 8.6), then multiply the result by the number in the first section under the heading entitled “Expenses Paid During Period” to estimate the expenses you paid on your account during the period.
Hypothetical Example for Comparison Purposes
The second section of the table shown, “Hypothetical 5% Return,” provides information about hypothetical account values and hypothetical expenses based on a Portfolio’s actual expense ratio and an assumed rate of return of 5% per year before expenses, which is not the Portfolio’s actual return. The hypothetical account values and expenses may not be used to estimate the actual ending account balance or expenses you paid for the period. You may use this information to compare the ongoing costs of investing in the Portfolio and other funds. To do so, compare this 5% hypothetical example with the 5% hypothetical examples that appear in the shareholder reports of other funds.
Please note that the expenses shown in the table are meant to highlight your ongoing costs only and do not reflect any transactional costs. Therefore, the second section of the table is useful in comparing ongoing costs only, and will not help you determine the relative total costs of owning different funds. In addition, if these transactional costs were included, your costs would have been higher. Certain of the Portfolios’ actual expenses shown in the table reflect fee waivers in effect. The expenses shown in the table assume reinvestment of all dividends and distributions.
In each case, “Expenses Paid During Period” are equal to the relevant Portfolio’s annualized expense ratio, multiplied by the average account value over the period, multiplied by 184/366 (to reflect the one-half year period).
Delaware Pooled® Trust
Expense Analysis of an Investment of $1,000
| | | | | | | | | | | | | Expenses |
| Beginning | | Ending | | | | Paid During |
| Account | | Account | | Annualized | | Period |
| Value | | Value | | Expense | | 5/1/12 to |
| 5/1/12 | | 10/31/12 | | Ratio | | 10/31/12 |
| Actual Portfolio Return† | | | | | | | | | | | | | |
| The Large-Cap | | | | | | | | | | | | | | | | |
| Value Equity | | | | | | | | | | | | | | | | |
| Portfolio | | $ | 1,000.00 | | | | $ | 1,038.30 | | | 0.70% | | | $ | 3.59 | |
| The Select 20 | | | | | | | | | | | | | | | | |
| Portfolio | | | 1,000.00 | | | | | 1,001.20 | | | 0.84% | | | | 4.23 | |
| The Large-Cap | | | | | | | | | | | | | | | | |
| Growth Equity | | | | | | | | | | | | | | | | |
| Portfolio | | | 1,000.00 | | | | | 997.40 | | | 0.66% | | | | 3.31 | |
| The Focus Smid-Cap | | | | | | | | | | | | | | | | |
| Growth Equity | | | | | | | | | | | | | | | | |
| Portfolio | | | 1,000.00 | | | | | 929.30 | | | 0.92% | | | | 4.46 | |
| The Real Estate | | | | | | | | | | | | | | | | |
| Investment Trust | | | | | | | | | | | | | | | | |
| Portfolio II | | | 1,000.00 | | | | | 993.10 | | | 0.95% | | | | 4.76 | |
| The Core Focus | | | | | | | | | | | | | | | | |
| Fixed Income | | | | | | | | | | | | | | | | |
| Portfolio | | | 1,000.00 | | | | | 1,035.90 | | | 0.43% | | | | 2.20 | |
| The High-Yield | | | | | | | | | | | | | | | | |
| Bond Portfolio | | | 1,000.00 | | | | | 1,063.70 | | | 0.57% | | | | 2.96 | |
| The Core Plus | | | | | | | | | | | | | | | | |
| Fixed Income | | | | | | | | | | | | | | | | |
| Portfolio | | | 1,000.00 | | | | | 1,039.40 | | | 0.45% | | | | 2.31 | |
| The International | | | | | | | | | | | | | | | | |
| Equity Portfolio | | | 1,000.00 | | | | | 1,023.90 | | | 0.88% | | | | 4.48 | |
| The Labor Select | | | | | | | | | | | | | | | | |
| International | | | | | | | | | | | | | | | | |
| Equity Portfolio | | | 1,000.00 | | | | | 1,019.30 | | | 0.87% | | | | 4.42 | |
| The Emerging | | | | | | | | | | | | | | | | |
| Markets Portfolio | | | 1,000.00 | | | | | 1,008.90 | | | 1.19% | | | | 6.01 | |
| The Emerging | | | | | | | | | | | | | | | | |
| Markets Portfolio II | | | 1,000.00 | | | | | 982.00 | | | 1.20% | | | | 5.98 | |
2012 Annual report · Delaware Pooled Trust
52
| | | | | | | | | | | | | Expenses |
| Beginning | | Ending | | | | Paid During |
| Account | | Account | | Annualized | | Period |
| Value | | Value | | Expense | | 5/1/12 to |
| 5/1/12 | | 10/31/12 | | Ratio | | 10/31/12 |
| Hypothetical 5% Return (5% return before expenses) | | | | | |
| The Large-Cap | | | | | | | | | | | | | | | | |
| Value Equity | | | | | | | | | | | | | | | | |
| Portfolio | | $ | 1,000.00 | | | | $ | 1,021.62 | | | 0.70% | | | $ | 3.56 | |
| The Select 20 | | | | | | | | | | | | | | | | |
| Portfolio | | | 1,000.00 | | | | | 1,020.91 | | | 0.84% | | | | 4.27 | |
| The Large-Cap | | | | | | | | | | | | | | | | |
| Growth Equity | | | | | | | | | | | | | | | | |
| Portfolio | | | 1,000.00 | | | | | 1,021.82 | | | 0.66% | | | | 3.35 | |
| The Focus Smid-Cap | | | | | | | | | | | | | | | | |
| Growth Equity | | | | | | | | | | | | | | | | |
| Portfolio | | | 1,000.00 | | | | | 1,020.51 | | | 0.92% | | | | 4.67 | |
| The Real Estate | | | | | | | | | | | | | | | | |
| Investment Trust | | | | | | | | | | | | | | | | |
| Portfolio II | | | 1,000.00 | | | | | 1,020.36 | | | 0.95% | | | | 4.82 | |
| The Core Focus | | | | | | | | | | | | | | | | |
| Fixed Income | | | | | | | | | | | | | | | | |
| Portfolio | | | 1,000.00 | | | | | 1,022.97 | | | 0.43% | | | | 2.19 | |
| The High-Yield | | | | | | | | | | | | | | | | |
| Bond Portfolio | | | 1,000.00 | | | | | 1,022.27 | | | 0.57% | | | | 2.90 | |
| The Core Plus | | | | | | | | | | | | | | | | |
| Fixed Income | | | | | | | | | | | | | | | | |
| Portfolio | | | 1,000.00 | | | | | 1,022.87 | | | 0.45% | | | | 2.29 | |
| The International | | | | | | | | | | | | | | | | |
| Equity Portfolio | | | 1,000.00 | | | | | 1,020.71 | | | 0.88% | | | | 4.47 | |
| The Labor Select | | | | | | | | | | | | | | | | |
| International | | | | | | | | | | | | | | | | |
| Equity Portfolio | | | 1,000.00 | | | | | 1,020.76 | | | 0.87% | | | | 4.42 | |
| The Emerging | | | | | | | | | | | | | | | | |
| Markets Portfolio | | | 1,000.00 | | | | | 1,019.15 | | | 1.19% | | | | 6.04 | |
| The Emerging | | | | | | | | | | | | | | | | |
| Markets Portfolio II | | | 1,000.00 | | | | | 1,019.10 | | | 1.20% | | | | 6.09 | |
†Because actual returns reflect only the most recent six month period, the returns shown may differ significantly from fiscal year returns.
2012 Annual report · Delaware Pooled Trust
53
Security type/sector allocations and
top 10 equity holdings
Delaware Pooled® Trust
As of October 31, 2012 (Unaudited)
Sector designations may be different than the sector designations presented in other Portfolio materials. The sector designations may represent the investment manager’s internal sector classifications, which may result in the sector designations for one portfolio being different than another portfolio’s sector designations.
The Large-Cap Value Equity Portfolio
| Percentage |
| Security type/Sector | of Net Assets |
| Common Stock | 98.74 | % |
| Consumer Discretionary | 6.35 | % |
| Consumer Staples | 14.36 | % |
| Energy | 15.06 | % |
| Financials | 12.52 | % |
| Healthcare | 18.25 | % |
| Industrials | 9.33 | % |
| Information Technology | 11.71 | % |
| Materials | 2.64 | % |
| Telecommunications | 5.56 | % |
| Utilities | 2.96 | % |
| Short-Term Investments | 1.19 | % |
| Total Value of Securities | 99.93 | % |
| Receivables and Other Assets Net of Liabilities | 0.07 | % |
| Total Net Assets | 100.00 | % |
Holdings are for informational purposes only and are subject to change at any time. They are not a recommendation to buy, sell, or hold any security.
| Percentage |
| Top 10 Equity Holdings | of Net Assets |
| Bank of New York Mellon | 3.29 | % |
| Cardinal Health | 3.27 | % |
| Marathon Oil | 3.25 | % |
| Lowe’s | 3.23 | % |
| Travelers | 3.20 | % |
| Motorola Solutions | 3.19 | % |
| Raytheon | 3.16 | % |
| Waste Management | 3.15 | % |
| Baxter International | 3.13 | % |
| Comcast Class A | 3.12 | % |
The Select 20 Portfolio
| Percentage |
| Security type/Sector | of Net Assets |
| ²Common Stock | 99.15 | % |
| Consumer Discretionary | 8.38 | % |
| Energy | 9.47 | % |
| Financial Services | 15.39 | % |
| Healthcare | 10.24 | % |
| Materials & Processing | 4.39 | % |
| Technology | 47.23 | % |
| Utilities | 4.05 | % |
| Short-Term Investments | 0.94 | % |
| Total Value of Securities | 100.09 | % |
| Liabilities Net of Receivables and Other Assets | (0.09 | %) |
| Total Net Assets | 100.00 | % |
²Narrow industries are utilized for compliance purposes for diversification whereas broad sectors are used for financial reporting.
Holdings are for informational purposes only and are subject to change at any time. They are not a recommendation to buy, sell, or hold any security.
| Percentage |
| Top 10 Equity Holdings | of Net Assets |
| Apple | 10.08 | % |
| Allergan | 6.17 | % |
| Visa Class A | 6.06 | % |
| Crown Castle International | 5.91 | % |
| QUALCOMM | 5.56 | % |
| VeriFone Systems | 5.40 | % |
| Weight Watchers International | 5.40 | % |
| EOG Resources | 4.99 | % |
| IntercontinentalExchange | 4.80 | % |
| Google Class A | 4.78 | % |
2012 Annual report · Delaware Pooled Trust
54
Delaware Pooled® Trust
As of October 31, 2012 (Unaudited)
Sector designations may be different than the sector designations presented in other Portfolio materials. The sector designations may represent the investment manager’s internal sector classifications, which may result in the sector designations for one portfolio being different than another portfolio’s sector designations.
The Large-Cap Growth Equity Portfolio
| Percentage |
| Security type/Sector | of Net Assets |
| ²Common Stock | 98.56 | % |
| Consumer Discretionary | 11.30 | % |
| Consumer Staples | 3.24 | % |
| Energy | 9.89 | % |
| Financial Services | 18.82 | % |
| Healthcare | 10.20 | % |
| Materials & Processing | 3.12 | % |
| Producer Durables | 1.44 | % |
| Technology | 40.55 | % |
| Warrant | 0.19 | % |
| Short-Term Investments | 1.40 | % |
| Securities Lending Collateral | 0.08 | % |
| Total Value of Securities | 100.23 | % |
| Obligation to Return Securities Lending Collateral | (0.18 | %) |
| Other Liabilities Net of Receivables and Other Assets | (0.05 | %) |
| Total Net Assets | 100.00 | % |
²Narrow industries are utilized for compliance purposes for diversification whereas broad sectors are used for financial reporting.
Holdings are for informational purposes only and are subject to change at any time. They are not a recommendation to buy, sell, or hold any security.
| Percentage |
| Top 10 Equity Holdings | of Net Assets |
| Apple | 8.10 | % |
| EOG Resources | 5.38 | % |
| Crown Castle International | 5.27 | % |
| Visa Class A | 5.06 | % |
| QUALCOMM | 4.81 | % |
| MasterCard Class A | 4.69 | % |
| Kinder Morgan | 4.52 | % |
| Allergen | 4.37 | % |
| Google Class A | 4.03 | % |
| Intuit | 3.90 | % |
The Focus Smid-Cap Growth Equity Portfolio
| Percentage |
| Security type/Sector | of Net Assets |
| Common Stock | 95.62 | % |
| Consumer Discretionary | 19.94 | % |
| Energy | 4.72 | % |
| Financials | 17.86 | % |
| Healthcare | 11.62 | % |
| Producer Durables | 12.54 | % |
| Technology | 24.38 | % |
| Utilities | 4.56 | % |
| Short-Term Investments | 4.63 | % |
| Total Value of Securities | 100.25 | % |
| Liabilities Net of Receivables and Other Assets | (0.25 | %) |
| Total Net Assets | 100.00 | % |
Holdings are for informational purposes only and are subject to change at any time. They are not a recommendation to buy, sell, or hold any security.
| Percentage |
| Top 10 Equity Holdings | of Net Assets |
| SBA Communications Class A | 5.92 | % |
| Affiliated Managers Group | 5.62 | % |
| Weight Watchers International | 5.27 | % |
| DineEquity | 4.95 | % |
| Graco | 4.94 | % |
| VeriFone Systems | 4.92 | % |
| Core Laboratories | 4.72 | % |
| Techne | 4.65 | % |
| j2 Global | 4.56 | % |
| NeuStar Class A | 4.35 | % |
2012 Annual report · Delaware Pooled Trust
(continues) 55
Security type/sector allocations and
top 10 equity holdings
Delaware Pooled® Trust — The Real Estate Investment Trust Portfolio II
As of October 31, 2012 (Unaudited)
Sector designations may be different than the sector designations presented in other Portfolio materials. The sector designations may represent the investment manager’s internal sector classifications, which may result in the sector designations for one portfolio being different than another portfolio’s sector designations.
| Percentage |
| Security type/Sector | of Net Assets |
| Common Stock | 97.44 | % |
| Diversified REITs | 3.49 | % |
| Healthcare REITs | 13.40 | % |
| Hotel REITs | 4.20 | % |
| Industrial REITs | 6.73 | % |
| Mall REITs | 19.68 | % |
| Manufactured Housing REIT | 1.01 | % |
| Multifamily REITs | 16.21 | % |
| Office REITs | 10.00 | % |
| Office/Industrial REITs | 4.40 | % |
| Self-Storage REITs | 5.35 | % |
| Shopping Center REITs | 8.97 | % |
| Single Tenant REIT | 1.98 | % |
| Specialty REITs | 2.02 | % |
| Short-Term Investments | 2.93 | % |
| Total Value of Securities | 100.37 | % |
| Liabilities Net of Receivables and Other Assets | (0.37 | %) |
| Total Net Assets | 100.00 | % |
Holdings are for informational purposes only and are subject to change at any time. They are not a recommendation to buy, sell, or hold any security.
| Percentage |
| Top 10 Equity Holdings | of Net Assets |
| Simon Property Group | 12.63 | % |
| Boston Properties | 4.87 | % |
| Public Storage | 4.39 | % |
| Ventas | 4.22 | % |
| ProLogis | 4.16 | % |
| HCP | 4.10 | % |
| Equity Residential | 4.00 | % |
| Health Care REIT | 3.13 | % |
| Macerich | 3.10 | % |
| AvalonBay Communities | 2.87 | % |
2012 Annual report · Delaware Pooled Trust
56
Security type/sector allocations
Delaware Pooled® Trust — The Core Focus Fixed Income Portfolio
As of October 31, 2012 (Unaudited)
Sector designations may be different than the sector designations presented in other Portfolio materials. The sector designations may represent the investment manager’s internal sector classifications, which may result in the sector designations for one portfolio being different than another portfolio’s sector designations.
| Percentage |
| Security type/Sector | of Net Assets |
| Agency Asset-Backed Security | 0.31 | % |
| Agency Collateralized Mortgage Obligations | 2.05 | % |
| Agency Mortgage-Backed Securities | 29.92 | % |
| Commercial Mortgage-Backed Securities | 3.90 | % |
| Corporate Bonds | 27.09 | % |
| Banking | 4.38 | % |
| Basic Industry | 2.49 | % |
| Brokerage | 0.61 | % |
| Communications | 2.32 | % |
| Consumer Cyclical | 1.62 | % |
| Consumer Non-Cyclical | 2.33 | % |
| Electric | 2.68 | % |
| Energy | 1.98 | % |
| Finance Companies | 0.76 | % |
| Insurance | 2.35 | % |
| Natural Gas | 2.21 | % |
| Real Estate | 1.75 | % |
| Technology | 1.04 | % |
| Transportation | 0.57 | % |
| Non-Agency Asset Backed Securities | 0.34 | % |
| Non-Agency Collateralized Mortgage Obligation | 0.10 | % |
| Regional Bonds | 0.55 | % |
| U.S. Treasury Obligations | 29.69 | % |
| Preferred Stock | 0.45 | % |
| Option Purchased | 0.01 | % |
| Short-Term Investments | 28.60 | % |
| Securities Lending Collateral | 0.56 | % |
| Total Value of Securities | 123.57 | % |
| Obligation to Return Securities Lending Collateral | (1.22 | %) |
| Other Liabilities Net of Receivables and Other Assets | (22.35 | %) |
| Total Net Assets | 100.00 | % |
2012 Annual report · Delaware Pooled Trust
(continues) 57
Security type/sector allocations
Delaware Pooled® Trust — The High-Yield Bond Portfolio
As of October 31, 2012 (Unaudited)
Sector designations may be different than the sector designations presented in other Portfolio materials. The sector designations may represent the investment manager’s internal sector classifications, which may result in the sector designations for one portfolio being different than another portfolio’s sector designations.
| Percentage |
| Security type/Sector | of Net Assets |
| Convertible Bond | 0.25 | % |
| Corporate Bonds | 89.00 | % |
| Automobiles | 2.22 | % |
| Banking | 1.65 | % |
| Basic Industry | 11.68 | % |
| Capital Goods | 4.40 | % |
| Consumer Cyclical | 7.21 | % |
| Consumer Non-Cyclical | 2.69 | % |
| Energy | 11.69 | % |
| Financials | 1.85 | % |
| Healthcare | 6.66 | % |
| Insurance | 3.64 | % |
| Media | 8.61 | % |
| Services | 10.85 | % |
| Technology | 6.05 | % |
| Telecommunications | 8.76 | % |
| Utilities | 1.04 | % |
| Senior Secured Loans | 4.20 | % |
| Common Stock | 0.09 | % |
| Preferred Stock | 1.46 | % |
| Warrant | 0.00 | % |
| Short-Term Investments | 7.55 | % |
| Securities Lending Collateral | 0.02 | % |
| Total Value of Securities | 102.57 | % |
| Obligation to Return Securities Lending Collateral | (0.05 | %) |
| Other Liabilities Net of Receivables and Other Assets | (2.52 | %) |
| Total Net Assets | 100.00 | % |
2012 Annual report · Delaware Pooled Trust
58
Delaware Pooled® Trust — The Core Plus Fixed Income Portfolio
As of October 31, 2012 (Unaudited)
Sector designations may be different than the sector designations presented in other Portfolio materials. The sector designations may represent the investment manager’s internal sector classifications, which may result in the sector designations for one portfolio being different than another portfolio’s sector designations.
| Percentage |
| Security type/Sector | of Net Assets |
| Agency Asset-Backed Security | 0.23 | % |
| Agency Collateralized Mortgage Obligations | 2.20 | % |
| Agency Mortgage-Backed Securities | 21.96 | % |
| Commercial Mortgage-Backed Securities | 5.11 | % |
| Corporate Bonds | 42.03 | % |
| Banking | 5.68 | % |
| Basic Industry | 3.73 | % |
| Brokerage | 0.38 | % |
| Capital Goods | 0.69 | % |
| Communications | 5.46 | % |
| Consumer Cyclical | 2.78 | % |
| Consumer Non-Cyclical | 4.22 | % |
| Electric | 3.61 | % |
| Energy | 3.90 | % |
| Finance Companies | 2.55 | % |
| Insurance | 1.90 | % |
| Natural Gas | 2.47 | % |
| Real Estate | 2.32 | % |
| Technology | 1.40 | % |
| Transportation | 0.94 | % |
| Non-Agency Asset-Backed Securities | 3.50 | % |
| Non-Agency Collateralized Mortgage Obligations | 0.08 | % |
| Regional Bonds | 2.33 | % |
| Senior Secured Loans | 4.68 | % |
| Sovereign Bonds | 3.55 | % |
| Supranational Banks | 0.18 | % |
| U.S. Treasury Obligations | 9.01 | % |
| Preferred Stock | 0.44 | % |
| Option Purchased | 0.00 | % |
| Short-Term Investments | 20.89 | % |
| Securities Lending Collateral | 0.07 | % |
| Total Value of Securities | 116.26 | % |
| Obligation to Return Securities Lending Collateral | (0.15 | %) |
| Other Liabilities Net of Receivables and Other Assets | (16.11 | %) |
| Total Net Assets | 100.00 | % |
2012 Annual report · Delaware Pooled Trust
(continues) 59
Security type/country and sector allocations
Delaware Pooled® Trust — The International Equity Portfolio
As of October 31, 2012 (Unaudited)
Sector designations may be different than the sector designations presented in other Portfolio materials. The sector designations may represent the investment manager’s or sub-adviser’s internal sector classifications, which may result in the sector designations for one portfolio being different than another portfolio’s sector designations.
| Security type/Country | Percentage
of Net Assets |
| Common Stock | | 99.30 | % | |
| Australia | | 5.38 | % | |
| Belgium | | 0.00 | % | |
| France | | 15.80 | % | |
| Germany | | 6.76 | % | |
| Israel | | 2.32 | % | |
| Italy | | 3.61 | % | |
| Japan | | 21.13 | % | |
| Netherlands | | 3.97 | % | |
| Singapore | | 4.34 | % | |
| Spain | | 6.79 | % | |
| Switzerland | | 7.37 | % | |
| Taiwan | | 1.71 | % | |
| United Kingdom | | 20.12 | % | |
| Short-Term Investments | | 0.73 | % | |
| Securities Lending Collateral | | 1.58 | % | |
| Total Value of Securities | | 101.61 | % | |
| Obligation to Return Securities Lending Collateral | | (1.89 | %) | |
| Receivables and Other Assets Net of Other Liabilities | | 0.28 | % | |
| Total Net Assets | | 100.00 | % | |
| Common Stock by Sector | Percentage
of Net Assets |
| Consumer Discretionary | | 6.16 | % | |
| Consumer Staples | | 15.15 | % | |
| Energy | | 11.74 | % | |
| Financials | | 13.19 | % | |
| Healthcare | | 16.31 | % | |
| Industrials | | 7.79 | % | |
| Information Technology | | 7.90 | % | |
| Materials | | 2.38 | % | |
| Telecommunication Services | | 10.97 | % | |
| Utilities | | 7.71 | % | |
| Total | | 99.30 | % | |
2012 Annual report · Delaware Pooled Trust
60
Delaware Pooled® Trust — The Labor Select International Equity Portfolio
As of October 31, 2012 (Unaudited)
Sector designations may be different than the sector designations presented in other Portfolio materials. The sector designations may represent the investment manager’s or sub-adviser’s internal sector classifications, which may result in the sector designations for one portfolio being different than another portfolio’s sector designations.
| Security type/Country | Percentage
of Net Assets |
| Common Stock | | 98.82 | % | |
| Australia | | 5.46 | % | |
| Belgium | | 0.00 | % | |
| France | | 17.83 | % | |
| Germany | | 5.58 | % | |
| Israel | | 2.41 | % | |
| Italy | | 1.35 | % | |
| Japan | | 20.61 | % | |
| Netherlands | | 7.75 | % | |
| Singapore | | 4.70 | % | |
| Spain | | 6.99 | % | |
| Switzerland | | 7.85 | % | |
| United Kingdom | | 18.29 | % | |
| Short-Term Investments | | 0.79 | % | |
| Securities Lending Collateral | | 0.91 | % | |
| Total Value of Securities | | 100.52 | % | |
| Obligation to Return Securities Lending Collateral | | (1.01 | %) | |
| Receivables and Other Assets Net of Other Liabilities | | 0.49 | % | |
| Total Net Assets | | 100.00 | % | |
| Common Stock by Sector | Percentage
of Net Assets |
| Consumer Discretionary | | 4.98 | % | |
| Consumer Staples | | 14.30 | % | |
| Energy | | 10.22 | % | |
| Financials | | 15.32 | % | |
| Healthcare | | 17.03 | % | |
| Industrials | | 6.63 | % | |
| Information Technology | | 6.39 | % | |
| Materials | | 2.46 | % | |
| Telecommunication Services | | 10.74 | % | |
| Utilities | | 10.75 | % | |
| Total | | 98.82 | % | |
2012 Annual report · Delaware Pooled Trust
(continues) 61
Security type/country and sector allocations
Delaware Pooled® Trust — The Emerging Markets Portfolio
As of October 31, 2012 (Unaudited)
Sector designations may be different than the sector designations presented in other Portfolio materials. The sector designations may represent the investment manager’s or sub-adviser’s internal sector classifications, which may result in the sector designations for one portfolio being different than another portfolio’s sector designations.
| Security type/Country | Percentage
of Net Assets |
| Common Stock | | 91.33 | % | |
| Brazil | | 7.47 | % | |
| Chile | | 2.85 | % | |
| China | | 21.95 | % | |
| Colombia | | 0.50 | % | |
| India | | 10.92 | % | |
| Indonesia | | 6.72 | % | |
| Kazakhstan | | 0.82 | % | |
| Mexico | | 8.06 | % | |
| Peru | | 2.38 | % | |
| Philippines | | 1.83 | % | |
| Republic of Korea | | 7.44 | % | |
| Russia | | 4.19 | % | |
| South Africa | | 2.64 | % | |
| Taiwan | | 2.95 | % | |
| Thailand | | 3.68 | % | |
| Turkey | | 6.01 | % | |
| United Kingdom | | 0.92 | % | |
| Preferred Stock | | 8.22 | % | |
| Brazil | | 7.10 | % | |
| Republic of Korea | | 1.12 | % | |
| Short-Term Investments | | 1.07 | % | |
| Securities Lending Collateral | | 2.31 | % | |
| Total Value of Securities | | 102.93 | % | |
| Obligation to Return Securities Lending Collateral | | (2.48 | %) | |
| Other Liabilities Net of Receivables and Other Assets | | (0.45 | %) | |
| Total Net Assets | | 100.00 | % | |
| Common and Preferred Stock by Sector | Percentage
of Net Assets |
| Consumer Discretionary | | 13.89 | % | |
| Consumer Staples | | 6.62 | % | |
| Energy | | 14.95 | % | |
| Financials | | 24.19 | % | |
| Healthcare | | 0.86 | % | |
| Industrials | | 9.67 | % | |
| Information Technology | | 8.00 | % | |
| Materials | | 5.66 | % | |
| Telecommunication Services | | 6.99 | % | |
| Utilities | | 8.72 | % | |
| Total | | 99.55 | % | |
2012 Annual report · Delaware Pooled Trust
62
Delaware Pooled® Trust — The Emerging Markets Portfolio II
As of October 31, 2012 (Unaudited)
Sector designations may be different than the sector designations presented in other Portfolio materials. The sector designations may represent the investment manager’s internal sector classifications, which may result in the sector designations for one portfolio being different than another portfolio’s sector designations.
| Security type/Country | Percentage
of Net Assets |
| Common Stock | | 95.81 | % | |
| Argentina | | 0.60 | % | |
| Bahrain | | 0.04 | % | |
| Brazil | | 15.33 | % | |
| China/Hong Kong | | 10.95 | % | |
| India | | 6.93 | % | |
| Indonesia | | 1.11 | % | |
| Israel | | 0.63 | % | |
| Malaysia | | 1.48 | % | |
| Mexico | | 8.77 | % | |
| Peru | | 0.52 | % | |
| Poland | | 0.64 | % | |
| Republic of Korea | | 20.16 | % | |
| Russia | | 5.19 | % | |
| South Africa | | 3.38 | % | |
| Switzerland | | 0.97 | % | |
| Taiwan | | 4.75 | % | |
| Thailand | | 2.22 | % | |
| Turkey | | 2.13 | % | |
| United Kingdom | | 0.53 | % | |
| United States | | 9.48 | % | |
| Exchange-Traded Fund | | 2.21 | % | |
| Preferred Stock | | 1.10 | % | |
| Republic of Korea | | 1.10 | % | |
| Short-Term Investments | | 0.91 | % | |
| Securities Lending Collateral | | 12.70 | % | |
| Total Value of Securities | | 112.73 | % | |
| Obligation to Return Securities Lending Collateral | | (12.70 | %) | |
| Other Liabilities Net of Receivables and Other Assets | | (0.03 | %) | |
| Total Net Assets | | 100.00 | % | |
| Common and Preferred Stock by Sector | Percentage
of Net Assets |
| Consumer Discretionary | | 5.75 | % | |
| Consumer Staples | | 15.56 | % | |
| Energy | | 16.83 | % | |
| Financials | | 15.25 | % | |
| Industrials | | 4.08 | % | |
| Information Technology | | 17.36 | % | |
| Materials | | 10.10 | % | |
| Telecommunication Services | | 11.58 | % | |
| Utilities | | 0.40 | % | |
| Total | | 96.91 | % | |
2012 Annual report · Delaware Pooled Trust
63
Statements of net assets
Delaware Pooled® Trust — The Large-Cap Value Equity Portfolio
October 31, 2012
| | | Number of
Shares | | Value | |
| Common Stock – 98.74% | | | | | | |
| Consumer Discretionary – 6.35% | | | | | | |
| Comcast Class A | | 7,000 | | $ | 262,570 | |
| Lowe’s | | 8,400 | | | 271,992 | |
| | | | | | 534,562 | |
| Consumer Staples – 14.36% | | | | | | |
| Archer-Daniels-Midland | | 9,600 | | | 257,664 | |
| CVS Caremark | | 5,000 | | | 232,000 | |
| Kimberly-Clark | | 2,700 | | | 225,315 | |
| † | Kraft Foods Group | | 2,033 | | | 92,461 | |
| Mondelez International Class A | | 6,100 | | | 161,894 | |
| Safeway | | 14,700 | | | 239,757 | |
| | | | | | 1,209,091 | |
| Energy – 15.06% | | | | | | |
| Chevron | | 2,200 | | | 242,462 | |
| ConocoPhillips | | 4,400 | | | 254,540 | |
| Halliburton | | 7,800 | | | 251,862 | |
| Marathon Oil | | 9,100 | | | 273,546 | |
| Occidental Petroleum | | 3,100 | | | 244,776 | |
| | | | | | 1,267,186 | |
| Financials – 12.52% | | | | | | |
| Allstate | | 6,400 | | | 255,872 | |
| Bank of New York Mellon | | 11,200 | | | 276,752 | |
| Marsh & McLennan | | 7,400 | | | 251,822 | |
| Travelers | | 3,800 | | | 269,572 | |
| | | | | | 1,054,018 | |
| Healthcare – 18.25% | | | | | | |
| Baxter International | | 4,200 | | | 263,046 | |
| Cardinal Health | | 6,700 | | | 275,570 | |
| Johnson & Johnson | | 3,500 | | | 247,870 | |
| Merck | | 5,500 | | | 250,965 | |
| Pfizer | | 10,311 | | | 256,435 | |
| Quest Diagnostics | | 4,200 | | | 242,424 | |
| | | | | | 1,536,310 | |
| Industrials – 9.33% | | | | | | |
| Northrop Grumman | | 3,700 | | | 254,153 | |
| Raytheon | | 4,700 | | | 265,832 | |
| Waste Management | | 8,100 | | | 265,194 | |
| | | | | | 785,179 | |
| Information Technology – 11.71% | | | | | | |
| Cisco Systems | | 14,500 | | | 248,530 | |
| Intel | | 11,200 | | | 242,200 | |
| Motorola Solutions | | 5,200 | | | 268,736 | |
| Xerox | | 35,100 | | | 226,044 | |
| | | | | | 985,510 | |
| Materials – 2.64% | | | | | | |
| duPont (E.I.) deNemours | | 5,000 | | | 222,600 | |
| | | | | | 222,600 | |
| Telecommunications – 5.56% | | | | | | |
| AT&T | | 6,700 | | | 231,753 | |
| Verizon Communications | | 5,300 | | | 236,592 | |
| | | | | | 468,345 | |
| Utilities – 2.96% | | | | | | |
| Edison International | | 5,300 | | | 248,782 | |
| | | | | | 248,782 | |
| Total Common Stock | | | | | | |
| (cost $7,689,406) | | | | | 8,311,583 | |
| |
| | Principal
Amount | | | | |
| Short-Term Investments – 1.19% | | | | | | |
| ≠Discount Note – 0.06% | | | | | | |
| Federal Home Loan Bank | | | | | | |
| 0.095% 11/28/12 | $ | 5,070 | | | 5,070 | |
| | | | | | 5,070 | |
| Repurchase Agreements – 0.90% | | | | | | |
| Bank of America 0.24%, dated | | | | | | |
| 10/31/12, to be repurchased | | | | | | |
| on 11/1/12, repurchase price | | | | | | |
| $29,449 (collateralized by U.S. | | | | | | |
| government obligations | | | | | | |
| 0.00%-1.25% 1/10/13-8/31/16; | | | | | | |
| market value $30,038) | | 29,449 | | | 29,449 | |
| BNP Paribas 0.28%, dated | | | | | | |
| 10/31/12, to be repurchased | | | | | | |
| on 11/1/12, repurchase price | | | | | | |
| $46,551 (collateralized by U.S. | | | | | | |
| government obligations | | | | | | |
| 0.00-2.00% 1/24/13-4/15/16; | | | | | | |
| market value $47,482) | | 46,551 | | | 46,551 | |
| | | | | | 76,000 | |
| ≠U.S. Treasury Obligation – 0.23% | | | | | | |
| U.S. Treasury Bills 0.05% 11/15/12 | | 19,017 | | | 19,016 | |
| | | | | | 19,016 | |
| Total Short-Term Investments | | | | | | |
| (cost $100,086) | | | | | 100,086 | |
| |
| Total Value of Securities – 99.93% | | | | | | |
| (cost $7,789,492) | | | | | 8,411,669 | |
| Receivables and Other Assets | | | | | | |
| Net of Liabilities – 0.07% | | | | | 5,653 | |
| Net Assets Applicable 443,742 | | | | | | |
| Shares Outstanding; Equivalent to | | | | | | |
| $18.97 Per Share – 100.00% | | | | $ | 8,417,322 | |
| |
| Components of Net Assets at October 31, 2012: | | | | |
| Shares of beneficial interest | | | | | | |
| (unlimited authorization – no par) | | | | $ | 8,615,529 | |
| Undistributed net investment income | | | | | 135,326 | |
| Accumulated net realized loss on investments | | | | | (955,710 | ) |
| Net unrealized appreciation of investments | | | | | 622,177 | |
| Total net assets | | | | $ | 8,417,322 | |
| † | Non income producing security. |
| ≠ | The rate shown is the effective yield at time of purchase. |
See accompanying notes, which are an integral part of the financial statements.
2012 Annual report · Delaware Pooled Trust
64
Delaware Pooled® Trust — The Select 20 Portfolio
October 31, 2012
| | | Number of
Shares | | Value | |
| ²Common Stock – 99.15% | | | | | | |
| Consumer Discretionary – 8.38% | | | | | | |
| † | priceline.com | | 6,475 | | $ | 3,715,161 | |
| Weight Watchers International | | 133,800 | | | 6,723,450 | |
| | | | | | 10,438,611 | |
| Energy – 9.47% | | | | | | |
| EOG Resources | | 53,325 | | | 6,211,829 | |
| Kinder Morgan | | 160,825 | | | 5,582,236 | |
| | | | | | 11,794,065 | |
| Financial Services – 15.39% | | | | | | |
| † | IntercontinentalExchange | | 45,625 | | | 5,976,875 | |
| Progressive | | 252,450 | | | 5,629,635 | |
| Visa Class A | | 54,400 | | | 7,548,544 | |
| | | | | | 19,155,054 | |
| Healthcare – 10.24% | | | | | | |
| Allergan | | 85,500 | | | 7,688,160 | |
| Novo Nordisk ADR | | 31,600 | | | 5,065,164 | |
| | | | | | 12,753,324 | |
| Materials & Processing – 4.39% | | | | | | |
| Syngenta ADR | | 70,075 | | | 5,463,047 | |
| | | | | | 5,463,047 | |
| Technology – 47.23% | | | | | | |
| † | Adobe Systems | | 170,275 | | | 5,789,350 | |
| Apple | | 21,100 | | | 12,556,609 | |
| † | BMC Software | | 130,725 | | | 5,320,508 | |
| † | Crown Castle International | | 110,175 | | | 7,354,180 | |
| † | Google Class A | | 8,750 | | | 5,947,988 | |
| Intuit | | 96,375 | | | 5,726,603 | |
| † | Polycom | | 246,025 | | | 2,465,171 | |
| QUALCOMM | | 118,150 | | | 6,920,636 | |
| † | VeriFone Systems | | 227,050 | | | 6,729,762 | |
| | | | | | 58,810,807 | |
| Utilities – 4.05% | | | | | | |
| j2 Global | | 167,675 | | | 5,036,957 | |
| | | | | | 5,036,957 | |
| Total Common Stock | | | | | | |
| (cost $110,591,270) | | | | | 123,451,865 | |
| | |
| | Principal
Amount | | | | |
| Short-Term Investments – 0.94% | | | | | | |
| Repurchase Agreements – 0.66% | | | | | | |
| Bank of America 0.24%, dated | | | | | | |
| 10/31/12, to be repurchased | | | | | | |
| on 11/1/12, repurchase price | | | | | | |
| $320,065 (collateralized by | | | | | | |
| U.S. government obligations | | | | | | |
| 0.00%-1.25% 1/10/13-8/31/16; | | | | | | |
| market value $326,464) | $ | 320,063 | | | 320,063 | |
| BNP Paribas 0.28%, dated | | | | | | |
| 10/31/12, to be repurchased | | | | | | |
| on 11/1/12, repurchase price | | | | | | |
| $505,941 (collateralized by | | | | | | |
| U.S. government obligations | | | | | | |
| 0.00-2.00% 1/24/13-4/15/16; | | | | | | |
| market value $516,056) | | 505,937 | | | 505,937 | |
| | | | | | 826,000 | |
| ≠U.S. Treasury Obligation – 0.28% | | | | | | |
| U.S. Treasury Bill 0.05% 11/15/12 | | 342,324 | | | 342,317 | |
| | | | | | 342,317 | |
| Total Short-Term Investments | | | | | | |
| (cost $1,168,317) | | | | | 1,168,317 | |
| |
| Total Value of Securities – 100.09% | | | | | | |
| (cost $111,759,587) | | | | | 124,620,182 | |
| Liabilities Net of Receivables | | | | | | |
| and Other Assets – (0.09%) | | | | | (109,291 | ) |
| Net Assets Applicable 15,300,254 | | | | | | |
| Shares Outstanding; Equivalent to | | | | | | |
| $8.14 Per Share – 100.00% | | | | $ | 124,510,891 | |
| |
| Components of Net Assets at October 31, 2012: | | | | |
| Shares of beneficial interest | | | | | | |
| (unlimited authorization – no par) | | | | $ | 112,458,016 | |
| Accumulated net realized loss on investments | | | | | (807,720 | ) |
| Net unrealized appreciation of investments | | | | | 12,860,595 | |
| Total net assets | | | | $ | 124,510,891 | |
| ² | Narrow industries are utilized for compliance purposes for diversification whereas broad sectors are used for financial reporting. |
| † | Non income producing security. |
| ≠ | The rate shown is the effective yield at time of purchase. |
ADR — American Depositary Receipt
See accompanying notes, which are an integral part of the financial statements.
2012 Annual report · Delaware Pooled Trust
(continues) 65
Statements of net assets
Delaware Pooled® Trust — The Large-Cap Growth Equity Portfolio
October 31, 2012
| | | Number of
Shares | | Value | |
| ²Common Stock – 98.56% | | | | | | |
| Consumer Discretionary – 11.30% | | | | | | |
| † | Liberty Interactive Class A | | 412,500 | | $ | 8,249,999 | |
| NIKE Class B | | 59,350 | | | 5,423,403 | |
| † | priceline.com | | 12,250 | | | 7,028,683 | |
| † | Sally Beauty | | 5,000 | | | 120,400 | |
| * | Staples | | 316,075 | | | 3,639,604 | |
| | | | | | 24,462,089 | |
| Consumer Staples – 3.24% | | | | | | |
| Walgreen | | 198,975 | | | 7,009,889 | |
| | | | | | 7,009,889 | |
| Energy – 9.89% | | | | | | |
| EOG Resources | | 99,900 | | | 11,637,351 | |
| Kinder Morgan | | 281,921 | | | 9,785,478 | |
| | | | | | 21,422,829 | |
| Financial Services – 18.82% | | | | | | |
| CME Group | | 81,925 | | | 4,582,065 | |
| † | IntercontinentalExchange | | 57,475 | | | 7,529,225 | |
| MasterCard Class A | | 22,015 | | | 10,147,374 | |
| Progressive | | 337,225 | | | 7,520,118 | |
| Visa Class A | | 78,950 | | | 10,955,102 | |
| | | | | | 40,733,884 | |
| Healthcare – 10.20% | | | | | | |
| Allergan | | 105,100 | | | 9,450,591 | |
| Novo Nordisk ADR | | 50,175 | | | 8,042,551 | |
| Perrigo | | 39,850 | | | 4,583,149 | |
| | | | | | 22,076,291 | |
| Materials & Processing – 3.12% | | | | | | |
| Syngenta ADR | | 86,725 | | | 6,761,081 | |
| | | | | | 6,761,081 | |
| Producer Durables – 1.44% | | | | | | |
| Caterpillar | | 36,750 | | | 3,116,768 | |
| | | | | | 3,116,768 | |
| Technology – 40.55% | | | | | | |
| † | Adobe Systems | | 226,525 | | | 7,701,850 | |
| Apple | | 29,450 | | | 17,525,694 | |
| † | BMC Software | | 189,600 | | | 7,716,720 | |
| † | Crown Castle International | | 170,800 | | | 11,400,900 | |
| † | Google Class A | | 12,840 | | | 8,728,247 | |
| Intuit | | 142,100 | | | 8,443,582 | |
| † | Polycom | | 215,325 | | | 2,157,557 | |
| QUALCOMM | | 177,900 | | | 10,420,493 | |
| † | Teradata | | 86,100 | | | 5,881,491 | |
| † | VeriFone Systems | | 89,825 | | | 2,662,413 | |
| † | VeriSign | | 138,475 | | | 5,133,268 | |
| | | | | | 87,772,215 | |
| Total Common Stock | | | | | | |
| (cost $162,806,626) | | | | | 213,355,046 | |
| | |
| Warrant – 0.19% | | | | | | |
| † | Kinder Morgan | | 103,776 | | | 399,538 | |
| Total Warrant (cost $198,584) | | | | | 399,538 | |
| | | | | | | | |
| | | Principal
Amount | | | | |
| Short-Term Investments – 1.40% | | | | | | |
| ≠Discount Note – 0.07% | | | | | | |
| Federal Home Loan Bank | | | | | | |
| 0.095% 11/28/12 | $ | 157,737 | | | 157,728 | |
| | | | | | 157,728 | |
| Repurchase Agreements – 1.13% | | | | | | |
| Bank of America 0.24%, dated | | | | | | |
| 10/31/12, to be repurchased | | | | | | |
| on 11/1/12, repurchase price | | | | | | |
| $950,508 (collateralized by | | | | | | |
| U.S. government obligations | | | | | | |
| 0.00%-1.25% 1/10/13-8/31/16; | | | | | | |
| market value $969,512) | | 950,502 | | | 950,502 | |
| BNP Paribas 0.28%, dated | | | | | | |
| 9/28/12, to be repurchased | | | | | | |
| on 11/1/12, repurchase price | | | | | | |
| $1,502,510 (collateralized by | | | | | | |
| U.S. government obligations | | | | | | |
| 0.00%-2.00% 1/24/13-4/15/16; | | | | | | |
| market value $1,532,548) | | 1,502,498 | | | 1,502,498 | |
| | | | | | 2,453,000 | |
| ≠U.S. Treasury Obligations – 0.20% | | | | | | |
| U.S. Treasury Bills | | | | | | |
| 0.05% 11/15/12 | | 426,660 | | | 426,651 | |
| | | | | | 426,651 | |
| Total Short-Term Investments | | | | | | |
| (cost $3,037,370) | | | | | 3,037,379 | |
| |
| Total Value of Securities Before Securities | | | | |
| Lending Collateral – 100.15% | | | | | | |
| (cost $166,042,580) | | | | | 216,791,963 | |
| |
| | Number of
Shares | | | | |
| **Securities Lending Collateral – 0.08% | | | | | | |
| Investment Companies | | | | | | |
| Delaware Investments Collateral | | | | | | |
| Fund No. 1 | | 182,082 | | | 182,082 | |
| †@ | Mellon GSL Reinvestment Trust II | | 213,107 | | | 0 | |
| Total Securities Lending Collateral | | | | | | |
| (cost $395,189) | | | | | 182,082 | |
| |
| Total Value of Securities – 100.23% | | | | | | |
| (cost $166,437,769) | | | | | 216,974,045 | © |
| **Obligation to Return Securities | | | | | | |
| Lending Collateral – (0.18%) | | | | | (395,189 | ) |
| Other Liabilities Net of Receivables | | | | | | |
| and Other Assets – (0.05%) | | | | | (111,375 | ) |
| Net Assets Applicable to 18,868,150 | | | | | | |
| Shares Outstanding; Equivalent to | | | | | | |
| $11.47 Per Share – 100.00% | | | | $ | 216,467,481 | |
2012 Annual report · Delaware Pooled Trust
66
| | | | |
| Components of Net Assets at October 31, 2012: | | | |
| Shares of beneficial interest | | | |
| (unlimited authorization – no par) | $ | 204,405,546 | |
| Undistributed net investment income | | 444,855 | |
| Accumulated net realized loss on investments | | (38,919,196 | ) |
| Net unrealized appreciation of investments | | 50,536,276 | |
| Total net assets | $ | 216,467,481 | |
| ² | Narrow industries are utilized for compliance purposes for diversification whereas broad sectors are used for financial reporting. |
| † | Non income producing security. |
| ≠ | The rate shown is the effective yield at the time of purchase. |
| * | Fully or partially on loan. |
| ** | See Note 10 in “Notes to financial statements” for additional information on securities lending collateral. |
| © | Includes $388,908 of securities loaned. |
| @ | Illiquid security. At October 31, 2012, the aggregate value of illiquid securities was $0, which represented 0.00% of the Portfolio’s net assets. See Note 11 in “Notes to financial statements.” |
ADR — American Depositary Receipt
See accompanying notes, which are an integral part of the financial statements.
2012 Annual report · Delaware Pooled Trust
(continues) 67
Statements of net assets
Delaware Pooled® Trust — The Focus Smid-Cap Growth Equity Portfolio
October 31, 2012
| | | Number of
Shares | | Value | |
| Common Stock – 95.62% | | | | | | |
| Consumer Discretionary – 19.94% | | | | | | |
| † | DineEquity | | 14,100 | | $ | 884,070 | |
| Gentex | | 27,250 | | | 469,245 | |
| Interval Leisure Group | | 19,975 | | | 380,724 | |
| † | K12 | | 28,900 | | | 591,583 | |
| † | Sally Beauty Holdings | | 1,200 | | | 28,896 | |
| Strayer Education | | 4,600 | | | 264,316 | |
| Weight Watchers International | | 18,725 | | | 940,931 | |
| | | | | | 3,559,765 | |
| Energy – 4.72% | | | | | | |
| Core Laboratories | | 8,125 | | | 842,238 | |
| | | | | | 842,238 | |
| Financials – 17.86% | | | | | | |
| † | Affiliated Managers Group | | 7,925 | | | 1,002,513 | |
| Heartland Payment Systems | | 25,750 | | | 671,560 | |
| † | IntercontinentalExchange | | 5,725 | | | 749,975 | |
| † | MSCI Class A | | 28,350 | | | 763,749 | |
| | | | | | 3,187,797 | |
| Healthcare – 11.62% | | | | | | |
| † | ABIOMED | | 25,000 | | | 495,500 | |
| † | athenahealth | | 4,050 | | | 260,375 | |
| Perrigo | | 4,250 | | | 488,793 | |
| Techne | | 12,325 | | | 830,211 | |
| | | | | | 2,074,879 | |
| Producer Durables – 12.54% | | | | | | |
| Expeditors International of Washington | | 19,775 | | | 723,963 | |
| Graco | | 18,350 | | | 881,901 | |
| Ritchie Bros Auctioneers | | 28,125 | | | 632,531 | |
| | | | | | 2,238,395 | |
| Technology – 24.38% | | | | | | |
| Blackbaud | | 23,675 | | | 562,755 | |
| † | NeuStar Class A | | 21,200 | | | 775,708 | |
| † | Polycom | | 39,475 | | | 395,540 | |
| † | SBA Communications Class A | | 15,875 | | | 1,057,750 | |
| † | VeriFone Systems | | 29,625 | | | 878,084 | |
| † | VeriSign | | 18,425 | | | 683,015 | |
| | | | | | 4,352,852 | |
| Utilities – 4.56% | | | | | | |
| j2 Global | | 27,125 | | | 814,835 | |
| | | | | | 814,835 | |
| Total Common Stock | | | | | | |
| (cost $15,553,981) | | | | | 17,070,761 | |
| | | | | | | |
| | | Principal
Amount | | | |
| Short-Term Investments – 4.63% | | | | | | |
| ≠Discount Note – 0.55% | | | | | | |
| Federal Home Loan Bank | | | | | | |
| 0.095% 11/28/12 | $ | 97,599 | | | 97,594 | |
| | | | | | 97,594 | |
| Repurchase Agreements – 3.35% | | | | | | |
| Bank of America 0.24%, dated | | | | | | |
| 10/31/12, to be repurchased | | | | | | |
| on 11/1/12, repurchase price | | | | | | |
| $232,105 (collateralized by U.S. | | | | | | |
| government obligations 0.00%- | | | | | | |
| 1.25% 1/10/13-8/31/16; market | | | | | | |
| value $236,746) | | 232,104 | | | 232,104 | |
| BNP Paribas 0.28%, dated | | | | | | |
| 10/31/12, to be repurchased | | | | | | |
| on 11/1/12, repurchase price | | | | | | |
| $366,899 (collateralized by U.S. | | | | | | |
| government obligations 0.00%- | | | | | | |
| 2.00% 1/24/13-4/15/16; market | | | | | | |
| value $374,234) | | 366,896 | | | 366,896 | |
| | | | | | 599,000 | |
| ≠U.S. Treasury Obligation – 0.73% | | | | | | |
| U.S. Treasury Bill 0.05% 11/15/12 | | 130,244 | | | 130,241 | |
| | | | | | 130,241 | |
| Total Short-Term Investments | | | | | | |
| (cost $826,833) | | | | | 826,835 | |
| |
| Total Value of Securities – 100.25% | | | | | | |
| (cost $16,380,814) | | | | | 17,897,596 | |
| Liabilities Net of Receivables and | | | | | | |
| Other Assets – (0.25%) | | | | | (45,003 | ) |
| Net Assets Applicable 1,151,661 | | | | | | |
| Shares Outstanding; Equivalent to | | | | | | |
| $15.50 Per Share – 100.00% | | | | $ | 17,852,593 | |
| |
| Components of Net Assets at October 31, 2012: | | | | |
| Shares of beneficial interest | | | | | | |
| (unlimited authorization – no par) | | | | $ | 16,886,240 | |
| Distributions in excess of net investment income | | | | | (23,667 | ) |
| Accumulated net realized loss on investments | | | | | (526,762 | ) |
| Net unrealized appreciation of investments | | | | | 1,516,782 | |
| Total net assets | | | | $ | 17,852,593 | |
| † | Non income producing security. |
| ≠ | The rate shown is the effective yield at the time of purchase. |
See accompanying notes, which are an integral part of the financial statements.
2012 Annual report · Delaware Pooled Trust
68
Delaware Pooled® Trust — The Real Estate Investment Trust Portfolio II
October 31, 2012
| | | Number of
Shares | | Value |
| Common Stock – 97.44% | | | | | |
| Diversified REITs – 3.49% | | | | | |
| Lexington Realty Trust | | 3,900 | | $ | 37,011 |
| Vornado Realty Trust | | 1,075 | | | 86,226 |
| | | | | | 123,237 |
| Healthcare REITs – 13.40% | | | | | |
| HCP | | 3,270 | | | 144,861 |
| Health Care REIT | | 1,860 | | | 110,540 |
| Healthcare Realty Trust | | 2,270 | | | 53,322 |
| Senior Housing Properties Trust | | 725 | | | 15,936 |
| Ventas | | 2,355 | | | 149,000 |
| | | | | | 473,659 |
| Hotel REITs – 4.20% | | | | | |
| Host Hotels & Resorts | | 5,933 | | | 85,791 |
| Starwood Hotels & Resorts Worldwide | | 280 | | | 14,518 |
| † | Strategic Hotels & Resorts | | 4,335 | | | 23,799 |
| Summit Hotel Properties | | 1,525 | | | 12,597 |
| † | Sunstone Hotel Investors | | 1,190 | | | 11,757 |
| | | | | | 148,462 |
| Industrial REITs – 6.73% | | | | | |
| DCT Industrial Trust | | 3,790 | | | 24,446 |
| EastGroup Properties | | 655 | | | 34,099 |
| † | First Industrial Realty Trust | | 2,415 | | | 32,240 |
| ProLogis | | 4,290 | | | 147,104 |
| | | | | | 237,889 |
| Mall REITs – 19.68% | | | | | |
| CBL & Associates Properties | | 1,550 | | | 34,674 |
| General Growth Properties | | 3,638 | | | 71,523 |
| Macerich | | 1,923 | | | 109,611 |
| Simon Property Group | | 2,931 | | | 446,128 |
| Taubman Centers | | 425 | | | 33,384 |
| | | | | | 695,320 |
| Manufactured Housing REIT – 1.01% | | | | | |
| Equity Lifestyle Properties | | 530 | | | 35,685 |
| | | | | | 35,685 |
| Multifamily REITs – 16.21% | | | | | |
| American Campus Communities | | 415 | | | 18,804 |
| Apartment Investment & Management | | 1,820 | | | 48,576 |
| AvalonBay Communities | | 747 | | | 101,263 |
| BRE Properties | | 425 | | | 20,549 |
| Camden Property Trust | | 1,325 | | | 86,960 |
| Colonial Properties Trust | | 1,940 | | | 41,962 |
| Education Realty Trust | | 3,070 | | | 32,327 |
| Equity Residential | | 2,460 | | | 141,228 |
| Essex Property Trust | | 389 | | | 58,350 |
| UDR | | 941 | | | 22,838 |
| | | | | | 572,857 |
| Office REITs – 10.00% | | | | | |
| Boston Properties | | 1,620 | | | 172,205 |
| Corporate Office Properties Trust | | 2,010 | | | 50,150 |
| Douglas Emmett | | 675 | | | 15,829 |
| Kilroy Realty | | 865 | | | 38,415 |
| Parkway Properties | | 1,320 | | | 18,176 |
| SL Green Realty | | 780 | | | 58,734 |
| | | | | | 353,509 |
| Office/Industrial REITs – 4.40% | | | | | |
| Digital Realty Trust | | 435 | | | 26,722 |
| Duke Realty | | 1,315 | | | 19,041 |
| Liberty Property Trust | | 1,970 | | | 69,187 |
| PS Business Parks | | 630 | | | 40,402 |
| | | | | | 155,352 |
| Self-Storage REITs – 5.35% | | | | | |
| Extra Space Storage | | 975 | | | 33,628 |
| Public Storage | | 1,120 | | | 155,265 |
| | | | | | 188,893 |
| Shopping Center REITs – 8.97% | | | | | |
| DDR | | 3,590 | | | 55,142 |
| Federal Realty Investment Trust | | 558 | | | 60,169 |
| Kimco Realty | | 3,145 | | | 61,391 |
| Ramco-Gershenson Properties Trust | | 2,395 | | | 31,039 |
| Regency Centers | | 1,400 | | | 67,229 |
| Tanger Factory Outlet Centers | | 1,335 | | | 42,012 |
| | | | | | 316,982 |
| Single Tenant REIT – 1.98% | | | | | |
| National Retail Properties | | 2,205 | | | 69,854 |
| | | | | | 69,854 |
| Specialty REITs – 2.02% | | | | | |
| American Tower | | 580 | | | 43,668 |
| Rayonier | | 562 | | | 27,544 |
| | | | | | 71,212 |
| Total Common Stock (cost $3,119,025) | | | | | 3,442,911 |
| |
| | Principal
Amount | | | |
| Short-Term Investments – 2.93% | | | | | |
| ≠Discount Note – 0.23% | | | | | |
| Federal Home Loan Bank | | | | | |
| 0.095% 11/28/12 | $ | 8,168 | | | 8,168 |
| | | | | | 8,168 |
| Repurchase Agreements – 2.12% | | | | | |
| Bank of America 0.24%, dated | | | | | |
| 10/31/12, to be repurchased on | | | | | |
| 11/1/12, repurchase price $29,062 | | | | | |
| (collateralized by U.S. government | | | | | |
| obligations 0.00%-1.25% 1/10/13- | | | | | |
| 8/31/16; market value $29,643) | | 29,061 | | | 29,061 |
| BNP Paribas 0.28%, dated 10/31/12, | | | | | |
| to be repurchased on 11/1/12, | | | | | |
| repurchase price $45,939 | | | | | |
| (collateralized by U.S. government | | | | | |
| obligations 0.00-2.00% 1/24/13- | | | | | |
| 4/15/16; market value $46,857) | | 45,939 | | | 45,939 |
| | | | | | 75,000 |
2012 Annual report · Delaware Pooled Trust
(continues) 69
Statements of net assets
Delaware Pooled® Trust — The Real Estate Investment Trust Portfolio II
| | Principal | | | | |
| | | Amount | | Value | |
| Short-Term Investments (continued) | | | | | |
| ≠U.S. Treasury Obligation – 0.58% | | | | | |
| | U.S. Treasury Bills 0.05% 11/15/12 | $20,498 | | $ | 20,497 | |
| | | | | 20,497 | |
| Total Short-Term Investments | | | | | |
| (cost $103,665) | | | | 103,665 | |
| |
| Total Value of Securities – 100.37% | | | | | |
| (cost $3,222,690) | | | | 3,546,576 | |
| Liabilities Net of Receivables and | | | | | |
| Other Assets – (0.37%) | | | | (13,079 | ) |
| Net Assets Applicable 488,143 Shares | | | | | |
| Outstanding; Equivalent to $7.24 | | | | | |
| Per Share – 100.00% | | | $ | 3,533,497 | |
| | |
| Components of Net Assets at October 31, 2012: | | | | |
| Shares of beneficial interest | | | | | |
| (unlimited authorization – no par) | | | $ | 5,591,638 | |
| Undistributed net investment income | | | | 37,510 | |
| Accumulated net realized loss on investments | | | | (2,419,537 | ) |
| Net unrealized appreciation of investments | | | | 323,886 | |
| Total net assets | | | $ | 3,533,497 | |
†Non income producing security.
≠The rate shown is the effective yield at time of purchase.
REIT — Real Estate Investment Trust
See accompanying notes, which are an integral part of the financial statements.
2012 Annual report · Delaware Pooled Trust
70
Delaware Pooled® Trust — The Core Focus Fixed Income Portfolio
October 31, 2012
| | Principal | | Value |
| | | Amount (U.S. $) | | (U.S. $) |
| Agency Asset-Backed Security – 0.31% | | | |
| | Fannie Mae Grantor Trust Series | | | | | |
| 2003-T4 2A5 5.407% 9/26/33 | $ | 19,257 | | $ | 19,542 |
| Total Agency Asset-Backed Security | | | | | |
| (cost $19,070) | | | | | 19,542 |
| |
| Agency Collateralized Mortgage Obligations – 2.05% | | | |
| Fannie Mae REMICs | | | | | |
| Series 2010-35 AB | | | | | |
| 5.00% 11/25/49 | | 16,668 | | | 17,823 |
| •Series 2011-105 FP | | | | | |
| 0.611% 6/25/41 | | 52,426 | | | 52,526 |
• | Freddie Mac REMICs Series 3800 AF | | | | | |
| 0.714% 2/15/41 | | 58,906 | | | 59,403 |
| Total Agency Collateralized | | | | | |
| Mortgage Obligations | | | | | |
| (cost $129,140) | | | | | 129,752 |
| |
| Agency Mortgage-Backed Securities – 29.92% | | | |
| Fannie Mae S.F. 15 yr | | | | | |
| 3.00% 3/1/27 | | 154,054 | | | 163,648 |
| 4.00% 11/1/25 | | 71,574 | | | 77,708 |
| 4.50% 8/1/19 | | 3,749 | | | 4,050 |
| 5.00% 1/1/20 | | 3,286 | | | 3,584 |
| 5.00% 6/1/20 | | 520 | | | 567 |
| 5.00% 2/1/21 | | 2,789 | | | 3,039 |
| Fannie Mae S.F. 15 yr TBA | | | | | |
| 2.50% 11/1/27 | | 206,000 | | | 215,593 |
| 3.00% 11/1/27 | | 151,000 | | | 159,281 |
| Fannie Mae S.F. 20 yr | | | | | |
| 5.50% 12/1/29 | | 1,989 | | | 2,184 |
| Fannie Mae S.F. 30 yr | | | | | |
| 5.00% 2/1/35 | | 31,650 | | | 34,769 |
| 6.00% 10/1/35 | | 12,186 | | | 13,748 |
| 6.00% 8/1/36 | | 1,573 | | | 1,748 |
| 6.00% 9/1/36 | | 5,521 | | | 6,134 |
| 6.00% 5/1/38 | | 4,849 | | | 5,388 |
| 6.00% 7/1/38 | | 5,479 | | | 6,087 |
| 6.00% 12/1/38 | | 38,086 | | | 42,312 |
| 6.00% 10/1/39 | | 37,807 | | | 42,005 |
| 6.00% 11/1/39 | | 38,409 | | | 42,674 |
| 6.00% 1/1/40 | | 39,387 | | | 43,761 |
| 6.00% 4/1/40 | | 6,888 | | | 7,645 |
| 6.00% 6/1/40 | | 101,432 | | | 112,695 |
| 6.00% 7/1/40 | | 6,024 | | | 6,693 |
| 6.00% 2/1/41 | | 26,479 | | | 29,644 |
| Fannie Mae S.F. 30 yr TBA | | | | | |
| 3.00% 11/1/42 | | 143,000 | | | 149,949 |
| 3.50% 11/1/42 | | 333,000 | | | 354,698 |
| Freddie Mac S.F. 15 yr | | | | | |
| 5.50% 7/1/24 | | 63,033 | | | 68,709 |
| Freddie Mac S.F. 30 yr | | | | | |
| 5.50% 5/1/38 | | 22,706 | | | 24,688 |
| 5.50% 5/1/40 | | 17,915 | | | 19,496 |
| 5.50% 7/1/40 | | 80,587 | | | 87,848 |
| 6.00% 8/1/38 | | 20,194 | | | 22,467 |
| 6.00% 9/1/38 | | 8,195 | | | 9,020 |
| 6.00% 10/1/38 | | 28,901 | | | 32,154 |
| 6.00% 5/1/40 | | 91,345 | | | 100,543 |
| Total Agency Mortgage-Backed | | | | | |
| Securities (cost $1,880,149) | | | | | 1,894,529 |
| |
| Commercial Mortgage-Backed Securities – 3.90% | | | |
• | BAML Commercial Mortgage | | | | | |
| Securities Series 2005-6 A4 | | | | | |
| 5.19% 9/10/47 | | 35,000 | | | 39,290 |
• | Bear Stearns Commercial Mortgage | | | | | |
| Securities Series 2006-PW12 A4 | | | | | |
| 5.712% 9/11/38 | | 20,000 | | | 22,956 |
t• | Commercial Mortgage Pass | | | | | |
| Through Certificates Series | | | | | |
| 2005-C6 A5A 5.116% 6/10/44 | | 10,000 | | | 11,084 |
• | Credit Suisse Mortgage Capital | | | | | |
| Certificates Series 2006-C1 AAB | | | | | |
| 5.41% 2/15/39 | | 18,251 | | | 19,044 |
| Goldman Sachs Mortgage Securities II | | | | | |
| Series 2005-GG4 A4A | | | | | |
| 4.751% 7/10/39 | | 25,000 | | | 27,153 |
| Series 2005-GG4 A4 | | | | | |
| 4.761% 7/10/39 | | 35,000 | | | 37,652 |
• | JPMorgan Chase Commercial | | | | | |
| Mortgage Securities | | | | | |
| Series 2005-LDP3 A4A | | | | | |
| 4.936% 8/15/42 | | 25,000 | | | 27,606 |
| Series 2005-LDP5 A4 | | | | | |
| 5.20% 12/15/44 | | 20,000 | | | 22,417 |
• | Morgan Stanley Capital I Series | | | | | |
| 2007-T27 A4 5.653% 6/11/42 | | 25,000 | | | 29,737 |
| WF-RBS Commercial Mortgage | | | | | |
| Trust Series 2012-C9 A3 | | | | | |
| 2.87% 11/15/45 | | 10,000 | | | 10,314 |
| Total Commercial Mortgage-Backed | | | | | |
| Securities (cost $210,734) | | | | | 247,253 |
| |
| Corporate Bonds – 27.09% | | | | | |
| Banking – 4.38% | | | | | |
| Abbey National Treasury Services | | | | | |
| 4.00% 4/27/16 | | 15,000 | | | 15,750 |
| #Bank Nederlandse Gemeenten | | | | | |
| 144A 1.375% 9/27/17 | | 10,000 | | | 10,055 |
| Bank of America | | | | | |
| 3.75% 7/12/16 | | 20,000 | | | 21,451 |
| 5.70% 1/24/22 | | 10,000 | | | 11,919 |
2012 Annual report • Delaware Pooled Trust
(continues) 71
Statements of net assets
Delaware Pooled® Trust — The Core Focus Fixed Income Portfolio
| | Principal | | Value |
| | | Amount (U.S. $) | | (U.S. $) |
| Corporate Bonds (continued) | | | | | |
| Banking (continued) | | | | | |
| City National 5.25% 9/15/20 | $ | 10,000 | | $ | 11,041 |
| HSBC Holdings 4.00% 3/30/22 | | 15,000 | | | 16,464 |
| JPMorgan Chase 2.00% 8/15/17 | | 20,000 | | | 20,237 |
| KeyCorp 5.10% 3/24/21 | | 20,000 | | | 23,711 |
| Morgan Stanley 4.875% 11/1/22 | | 10,000 | | | 10,129 |
| PNC Funding 5.625% 2/1/17 | | 23,000 | | | 26,749 |
| Santander Holdings USA | | | | | |
| | 4.625% 4/19/16 | | 5,000 | | | 5,231 |
| SunTrust Banks 3.60% 4/15/16 | | 5,000 | | | 5,365 |
| SVB Financial Group | | | | | |
| 5.375% 9/15/20 | | 15,000 | | | 17,043 |
| US Bancorp 2.95% 7/15/22 | | 20,000 | | | 20,676 |
| Wachovia | | | | | |
| •0.71% 10/15/16 | | 5,000 | | | 4,869 |
| 5.25% 8/1/14 | | 5,000 | | | 5,369 |
| 5.625% 10/15/16 | | 35,000 | | | 40,788 |
| Zions Bancorp 4.50% 3/27/17 | | 10,000 | | | 10,473 |
| | | | | | 277,320 |
| Basic Industry – 2.49% | | | | | |
* | Alcoa 6.75% 7/15/18 | | 10,000 | | | 11,558 |
| ArcelorMittal | | | | | |
| *6.50% 2/25/22 | | 5,000 | | | 4,920 |
| 10.10% 6/1/19 | | 5,000 | | | 5,885 |
| Cabot 2.55% 1/15/18 | | 20,000 | | | 20,600 |
| CF Industries 6.875% 5/1/18 | | 20,000 | | | 24,589 |
| Domtar 4.40% 4/1/22 | | 5,000 | | | 5,179 |
| Dow Chemical 8.55% 5/15/19 | | 10,000 | | | 13,579 |
| Georgia-Pacific 8.00% 1/15/24 | | 20,000 | | | 28,136 |
| International Paper 4.75% 2/15/22 | | 10,000 | | | 11,408 |
| Lubrizol 5.50% 10/1/14 | | 5,000 | | | 5,457 |
| Rio Tinto Finance USA | | | | | |
| 2.875% 8/21/22 | | 10,000 | | | 10,097 |
| Vale Overseas 4.375% 1/11/22 | | 15,000 | | | 16,042 |
| | | | | | 157,450 |
| Brokerage – 0.61% | | | | | |
| Jefferies Group | | | | | |
| 6.25% 1/15/36 | | 5,000 | | | 5,050 |
| 6.45% 6/8/27 | | 19,000 | | | 20,009 |
| Lazard Group 6.85% 6/15/17 | | 12,000 | | | 13,621 |
| | | | | | 38,680 |
| Communications – 2.32% | | | | | |
| American Tower | | | | | |
| 4.70% 3/15/22 | | 5,000 | | | 5,534 |
| 5.90% 11/1/21 | | 15,000 | | | 17,998 |
| Comcast 4.65% 7/15/42 | | 5,000 | | | 5,421 |
# | Crown Castle Towers 144A | | | | | |
| 4.883% 8/15/20 | | 20,000 | | | 22,891 |
| DIRECTV Holdings 5.15% 3/15/42 | | 10,000 | | | 10,500 |
| Interpublic Group 4.00% 3/15/22 | | 20,000 | | | 21,018 |
| NBCUniversal Media | | | | | |
| 4.45% 1/15/43 | | 15,000 | | | 15,563 |
| Qwest 6.75% 12/1/21 | | 5,000 | | | 5,991 |
| Telefonica Emisiones | | | | | |
| 5.462% 2/16/21 | | 5,000 | | | 5,094 |
| Time Warner Cable | | | | | |
| 5.85% 5/1/17 | | 10,000 | | | 11,978 |
| 8.25% 4/1/19 | | 10,000 | | | 13,538 |
# | Vivendi 144A 6.625% 4/4/18 | | 10,000 | | | 11,614 |
| | | | | | 147,140 |
| Consumer Cyclical – 1.62% | | | | | |
| Darden Restaurants 3.35% 11/1/22 | | 15,000 | | | 15,049 |
| eBay 4.00% 7/15/42 | | 20,000 | | | 20,140 |
| Historic TW 6.875% 6/15/18 | | 20,000 | | | 25,578 |
| Lowe’s 3.12% 4/15/22 | | 20,000 | | | 21,163 |
| Walgreen 1.80% 9/15/17 | | 15,000 | | | 15,217 |
| Wyndham Worldwide | | | | | |
| 4.25% 3/1/22 | | 5,000 | | | 5,226 |
| | | | | | 102,373 |
| Consumer Non-Cyclical – 2.33% | | | | | |
| Amgen 5.375% 5/15/43 | | 15,000 | | | 18,082 |
| CareFusion 6.375% 8/1/19 | | 10,000 | | | 11,936 |
| Celgene 3.95% 10/15/20 | | 10,000 | | | 10,917 |
| Energizer Holdings 4.70% 5/24/22 | | 15,000 | | | 16,121 |
# | Express Scripts Holding 144A | | | | | |
| 2.65% 2/15/17 | | 10,000 | | | 10,449 |
# | Heineken 144A 3.40% 4/1/22 | | 10,000 | | | 10,706 |
# | Kraft Foods Group 144A | | | | | |
| 5.00% 6/4/42 | | 10,000 | | | 11,727 |
| Laboratory Corporation of America | | | | | |
| Holdings 3.75% 8/23/22 | | 20,000 | | | 21,305 |
| Reynolds American | | | | | |
| 3.25% 11/1/22 | | 10,000 | | | 10,136 |
| 4.75% 11/1/42 | | 5,000 | | | 5,114 |
* | Safeway 4.75% 12/1/21 | | 10,000 | | | 10,480 |
# | Woolworths 144A 3.15% 4/12/16 | | 10,000 | | | 10,451 |
| | | | | | 147,424 |
| Electric – 2.68% | | | | | |
| Ameren Illinois 9.75% 11/15/18 | | 35,000 | | | 48,664 |
# | American Transmission Systems | | | | | |
| 144A 5.25% 1/15/22 | | 5,000 | | | 5,806 |
| CenterPoint Energy 5.95% 2/1/17 | | 10,000 | | | 11,691 |
| Great Plains Energy | | | | | |
| 5.292% 6/15/22 | | 20,000 | | | 22,972 |
• | Integrys Energy Group | | | | | |
| 6.11% 12/1/66 | | 10,000 | | | 10,509 |
| LG&E & KU Energy | | | | | |
| 3.75% 11/15/20 | | 10,000 | | | 10,379 |
| 4.375% 10/1/21 | | 10,000 | | | 11,058 |
| Pennsylvania Electric 5.20% 4/1/20 | | 10,000 | | | 11,436 |
| SCANA 4.125% 2/1/22 | | 20,000 | | | 21,042 |
• | Wisconsin Energy 6.25% 5/15/67 | | 15,000 | | | 16,103 |
| | | | | | 169,660 |
2012 Annual report • Delaware Pooled Trust
72
| | Principal | | Value |
| | | Amount (U.S. $) | | (U.S. $) |
| Corporate Bonds (continued) | | | | | |
| Energy – 1.98% | | | | | |
| Petrobras International Finance | | | | | |
| | 3.875% 1/27/16 | $ | 10,000 | | $ | 10,673 |
| 5.375% 1/27/21 | | 5,000 | | | 5,695 |
| Pride International 6.875% 8/15/20 | | 20,000 | | | 25,755 |
| Talisman Energy 5.50% 5/15/42 | | 20,000 | | | 23,399 |
| Transocean 5.05% 12/15/16 | | 25,000 | | | 28,026 |
| Weatherford Bermuda | | | | | |
| 4.50% 4/15/22 | | 5,000 | | | 5,333 |
| 9.625% 3/1/19 | | 10,000 | | | 13,265 |
# | Woodside Finance 144A | | | | | |
| 8.75% 3/1/19 | | 10,000 | | | 13,401 |
| | | | | | 125,547 |
| Finance Companies – 0.76% | | | | | |
| General Electric Capital | | | | | |
| 5.55% 5/4/20 | | 5,000 | | | 5,957 |
| 5.625% 5/1/18 | | 20,000 | | | 23,785 |
| 5.875% 1/14/38 | | 15,000 | | | 18,535 |
| | | | | | 48,277 |
| Insurance – 2.35% | | | | | |
| Alleghany 4.95% 6/27/22 | | 5,000 | | | 5,588 |
| American International Group | | | | | |
| | 6.40% 12/15/20 | | 20,000 | | | 24,602 |
• | Chubb 6.375% 3/29/67 | | 5,000 | | | 5,450 |
# | Highmark 144A 4.75% 5/15/21 | | 5,000 | | | 5,116 |
# | ING US 144A 5.50% 7/15/22 | | 15,000 | | | 16,338 |
# | Liberty Mutual Group 144A | | | | | |
| 6.50% 5/1/42 | | 20,000 | | | 22,873 |
| MetLife 6.40% 12/15/36 | | 20,000 | | | 21,841 |
| Montpelier Re Holdings | | | | | |
| 4.70% 10/15/22 | | 5,000 | | | 5,135 |
| Prudential Financial | | | | | |
| 3.875% 1/14/15 | | 5,000 | | | 5,319 |
| •5.875% 9/15/42 | | 10,000 | | | 10,563 |
| 6.00% 12/1/17 | | 5,000 | | | 6,054 |
| WellPoint 1.875% 1/15/18 | | 20,000 | | | 20,292 |
| | | | | | 149,171 |
| Natural Gas – 2.21% | | | | | |
| El Paso Pipeline Partners Operating | | | | | |
| 6.50% 4/1/20 | | 15,000 | | | 18,442 |
| Enterprise Products Operating | | | | | |
| 9.75% 1/31/14 | | 10,000 | | | 11,093 |
# | GDF Suez 144A 2.875% 10/10/22 | | 10,000 | | | 10,063 |
| Kinder Morgan Energy Partners | | | | | |
| 3.45% 2/15/23 | | 10,000 | | | 10,510 |
| 9.00% 2/1/19 | | 5,000 | | | 6,776 |
| ONEOK Partners 2.00% 10/1/17 | | 20,000 | | | 20,433 |
| Plains All American Pipeline | | | | | |
| 8.75% 5/1/19 | | 5,000 | | | 6,789 |
| Sempra Energy 2.875% 10/1/22 | | 20,000 | | | 20,546 |
• | TransCanada Pipelines | | | | | |
| 6.35% 5/15/67 | | 10,000 | | | 10,757 |
| Williams Partners 7.25% 2/1/17 | | 20,000 | | | 24,622 |
| | | | | | 140,031 |
| Real Estate – 1.75% | | | | | |
| Alexandria Real Estate Equities | | | | | |
| 4.60% 4/1/22 | | 10,000 | | | 10,846 |
| Brandywine Operating Partnership | | | | | |
| 4.95% 4/15/18 | | 10,000 | | | 10,978 |
| BRE Properties 3.375% 1/15/23 | | 10,000 | | | 10,054 |
| Digital Realty Trust | | | | | |
| 5.25% 3/15/21 | | 10,000 | | | 11,328 |
| 5.875% 2/1/20 | | 5,000 | | | 5,826 |
| Liberty Property 4.125% 6/15/22 | | 15,000 | | | 15,976 |
| Mack-Cali Realty 4.50% 4/18/22 | | 20,000 | | | 21,567 |
| Regency Centers 5.875% 6/15/17 | | 7,000 | | | 8,125 |
# | WEA Finance 144A | | | | | |
| 3.375% 10/3/22 | | 5,000 | | | 5,078 |
| 4.625% 5/10/21 | | 10,000 | | | 11,025 |
| | | | | | 110,803 |
| Technology – 1.04% | | | | | |
* | Motorola Solutions 3.75% 5/15/22 | | 15,000 | | | 15,634 |
| National Semiconductor | | | | | |
| 6.60% 6/15/17 | | 10,000 | | | 12,425 |
| Oracle 2.50% 10/15/22 | | 15,000 | | | 15,304 |
# | Seagate Technology International | | | | | |
| 144A 10.00% 5/1/14 | | 5,000 | | | 5,450 |
| Xerox 5.625% 12/15/19 | | 15,000 | | | 17,031 |
| | | | | | 65,844 |
| Transportation – 0.57% | | | | | |
# | ERAC USA Finance 144A | | | | | |
| 2.75% 3/15/17 | | 15,000 | | | 15,698 |
# | Penske Truck Leasing 144A | | | | | |
| 3.375% 3/15/18 | | 10,000 | | | 9,968 |
| 4.875% 7/11/22 | | 10,000 | | | 10,243 |
| | | | | | 35,909 |
| Total Corporate Bonds | | | | | |
| (cost $1,603,495) | | | | | 1,715,629 |
| |
| Non-Agency Asset Backed Securities – 0.34% | | | |
| John Deere Owner Trust Series | | | | | |
| 2011-A A4 1.96% 4/16/18 | | 10,000 | | | 10,250 |
| Mid-State Trust Series 11 A1 | | | | | |
| 4.864% 7/15/38 | | 10,896 | | | 11,241 |
| Total Non-Agency Asset Backed | | | | | |
| Securities (cost $20,419) | | | | | 21,491 |
| |
| Non-Agency Collateralized Mortgage Obligation – 0.10% |
•# | MASTR Specialized Loan Trust | | | | | |
| Series 2005-2 A2 144A | | | | | |
| 5.006% 7/25/35 | | 5,908 | | | 6,003 |
| Total Non-Agency Collateralized | | | | | |
| Mortgage Obligation | | | | | |
| (cost $5,908) | | | | | 6,003 |
2012 Annual report • Delaware Pooled Trust
(continues) 73
Statements of net assets
Delaware Pooled® Trust — The Core Focus Fixed Income Portfolio
| | Principal | | Value | |
| �� | | Amount (U.S. $) | | (U.S. $) | |
| ΔRegional Bonds – 0.55% | | | | | | |
| Canada – 0.55% | | | | | | |
| Province of British Columbia | | | | | | |
| 2.00% 10/23/22 | $ | 20,000 | | $ | 19,962 | |
| Province of Manitoba 2.10% 9/6/22 | | 15,000 | | | 15,052 | |
| Total Regional Bonds (cost $34,890) | | | | | 35,014 | |
| | |
| U.S. Treasury Obligations – 29.69% | | | | | | |
| U.S. Treasury Bond 3.00% 5/15/42 | | 290,000 | | | 299,606 | |
| U.S. Treasury Notes | | | | | | |
| 0.75% 10/31/17 | | 550,000 | | | 551,031 | |
| *1.625% 8/15/22 | | 1,035,000 | | | 1,029,503 | |
| Total U.S. Treasury Obligations | | | | | | |
| (cost $1,880,649) | | | | | 1,880,140 | |
| | |
| | Number of | | | | |
| | Shares | | | | |
| Preferred Stock – 0.45% | | | | | | |
| *Alabama Power 5.625% | | 620 | | | 15,828 | |
| *BB&T 5.85% | | 175 | | | 4,590 | |
| •PNC Financial Services Group 8.25% | | 8,000 | | | 8,326 | |
| Total Preferred Stock (cost $25,956) | | | | | 28,744 | |
| | |
| | Number of | | | | |
| | Contracts | | | | |
| Option Purchased – 0.01% | | | | | | |
| Call Option – 0.01% | | | | | | |
| U.S. 10 yr Future, Strike Price | | | | | | |
| $15.625, Expires 11/23/12 (AFI) | | 6 | | | 469 | |
| Total Purchased Option (cost $1,611) | | | | | 469 | |
| | |
| | Principal | | | | |
| | Amount (U.S. $) | | | | |
| Short-Term Investments – 28.60% | | | | | | |
| ≠Discount Note – 4.16% | | | | | | |
| Federal Home Loan Bank | | | | | | |
| 0.095% 11/28/12 | $ | 263,082 | | | 263,068 | |
| | | | | | 263,068 | |
| Repurchase Agreements – 16.55% | | | | | | |
| Bank of America 0.24%, dated | | | | | | |
| 10/31/12, to be repurchased | | | | | | |
| on 11/1/12, repurchase price | | | | | | |
| $406,088 (collateralized by U.S. | | | | | | |
| government obligations | | | | | | |
| 0.00%-1.25% 1/10/13-8/31/16; | | | | | | |
| market value $414,207) | | 406,085 | | | 406,085 | |
| BNP Paribas 0.28%, dated | | | | | | |
| 10/31/12, to be repurchased | | | | | | |
| on 11/1/12, repurchase price | | | | | | |
| $641,920 (collateralized by U.S. | | | | | | |
| government obligations | | | | | | |
| 0.00-2.00% 1/24/13-4/15/16; | | | | | | |
| market value $654,753) | | 641,915 | | | 641,915 | |
| | | | | | 1,048,000 | |
| ≠U.S. Treasury Obligation – 7.89% | | | | | | |
| U.S. Treasury Bill 0.05% 11/15/12 | | 499,892 | | | 499,881 | |
| | | | | | 499,881 | |
| Total Short-Term Investments | | | | | | |
| (cost $1,810,940) | | | | | 1,810,949 | |
| |
| Total Value of Securities | | | | | | |
| Before Securities Lending | | | | | | |
| Collateral – 123.01% (cost $7,622,961) | | | | | 7,789,515 | |
| |
| | Number of | | | | |
| | Shares | | | | |
| **Securities Lending Collateral – 0.56% | | | | | | |
| Investment Companies | | | | | | |
| Delaware Investments Collateral | | | | | | |
| Fund No 1 | | 35,253 | | | 35,253 | |
| †@ | Mellon GSL Reinvestment Trust II | | 41,609 | | | 0 | |
| Total Securities Lending Collateral | | | | | | |
| (cost $76,862) | | | | | 35,253 | |
| | |
| Total Value of Securities – 123.57% | | | | | | |
| (cost $7,699,823) | | | | | 7,824,768 | © |
| **Obligation to Return Securities | | | | | | |
| Lending Collateral – (1.22%) | | | | | (76,862 | ) |
| Other Liabilities Net of Receivables | | | | | | |
| and Other Assets – (22.35%) | | | | | (1,415,436 | ) |
| Net Assets Applicable to 627,314; | | | | | | |
| Equivalent to $10.09 | | | | | | |
| Per Share – 100.00% | | | | $ | 6,332,470 | |
| |
| Components of Net Assets at October 31, 2012: | | | | |
| Shares of beneficial interest | | | | | | |
| (unlimited authorization – no par) | | | | $ | 5,832,181 | |
| Undistributed net investment income | | | | | 124,631 | |
| Accumulated net realized gain on investments | | | | | 250,713 | |
| Net unrealized appreciation of investments | | | | | 124,945 | |
| Total net assets | | | | $ | 6,332,470 | |
2012 Annual report • Delaware Pooled Trust
74
| | |
• | Variable rate security. The rate shown is the rate as of October 31, 2012. Interest rates reset periodically. |
t | Pass Through Agreement. Security represents the contractual right to receive a proportionate amount of underlying payments due to the counterparty pursuant to various agreements related to the rescheduling of obligations and the exchange of certain notes. |
# | Security exempt from registration under Rule 144A of the Securities Act of 1933, as amended. At October 31, 2012, the aggregate value of Rule 144A securities was $224,955, which represented 3.55% of the Portfolio’s net assets. See Note 11 in “Notes to financial statements.” |
* | Fully or partially on loan. |
Δ | Securities have been classified by country of origin. |
≠ | The rate shown is the effective yield at the time of purchase. |
** | See Note 10 in “Notes to financial statements” for additional information on securities lending collateral. |
† | Non income producing security. |
@ | Illiquid security. At October 31, 2012, the aggregate value of illiquid securities was $0, which represented 0.00% of the Portfolio’s net assets. See Note 11 in “Notes to financial statements.” |
| © | Includes $74,467 of securities loaned. |
Summary of Abbreviations:
AFI — Advantage Futures Inc.
BAML — Bank of America Merrill Lynch
MASTR — Mortgage Asset Securitization Transactions, Inc.
REMIC — Real Estate Mortgage Investment Conduit
S.F. — Single Family
TBA — To be announced
yr — Year
See accompanying notes, which are an integral part of the financial statements.
The Core Focus Fixed Income Portfolio
Statement of Assets and Liabilities
October 31, 2012
| Assets: | | | |
| Investments, at value1 | | $ | 5,978,566 |
| Short-term investments, at value | | | 1,810,949 |
| Short-term investments held as | | | |
| collateral for loaned securities, at value | | | 35,253 |
| Receivable for securities sold | | | 1,371,352 |
| Dividends, interest and | | | |
| securities lending income receivable | | | 35,033 |
| Total assets | | | 9,231,153 |
| |
| Liabilities: | | | |
| Cash overdraft | | | 548,166 |
| Payable for securities purchased | | | 2,257,399 |
| Due to manager and affiliates | | | 3,525 |
| Other accrued expenses | | | 12,731 |
| Obligation to return securities lending collateral | | | 76,862 |
| Total liabilities | | | 2,898,683 |
| |
| Total net assets | | $ | 6,332,470 |
| |
| Investments, at cost | | $ | 5,812,021 |
| Short-term investments, at cost | | | 1,810,940 |
| Short-term investments held as | | | |
| collateral for loaned securities, at cost | | | 76,862 |
| |
| 1Including securities on loan | | $ | 74,467 |
See accompanying notes, which are an integral part of the financial statements.
2012 Annual report • Delaware Pooled Trust
(continues) 75
Statements of net assets
Delaware Pooled® Trust — The High-Yield Bond Portfolio
October 31, 2012
| | Principal | | Value |
| | | Amount (U.S. $) | | (U.S. $) |
| Convertible Bond – 0.25% | | | | | |
ϕ | ArvinMeritor 4.00% exercise | | | | | |
| price $26.73, expiration | | | | | |
| date 2/15/27 | $ | 371,000 | | $ | 275,931 |
| Total Convertible Bond | | | | | |
| (cost $276,054) | | | | | 275,931 |
| |
| Corporate Bonds – 89.00% | | | | | |
| Automobiles – 2.22% | | | | | |
| American Axle & Manufacturing | | | | | |
| *7.75% 11/15/19 | | 318,000 | | | 345,428 |
| | 7.875% 3/1/17 | | 141,000 | | | 146,464 |
| ArvinMeritor 8.125% 9/15/15 | | 360,000 | | | 363,600 |
| Chrysler Group 8.25% 6/15/21 | | 815,000 | | | 875,105 |
# | International Automotive | | | | | |
| Components Group 144A | | | | | |
| 9.125% 6/1/18 | | 478,000 | | | 463,063 |
# | Jaguar Land Rover 144A | | | | | |
| 8.125% 5/15/21 | | 290,000 | | | 313,925 |
| | | | | | 2,507,585 |
| Banking – 1.65% | | | | | |
•# | HBOS Capital Funding 144A | | | | | |
| 6.071% 6/29/49 | | 942,000 | | | 779,505 |
• | Regions Financing Trust ll | | | | | |
| 6.625% 5/15/47 | | 1,083,000 | | | 1,087,115 |
| | | | | | 1,866,620 |
| Basic Industry – 11.68% | | | | | |
| AK Steel 7.625% 5/15/20 | | 294,000 | | | 255,780 |
# | APERAM 144A 7.75% 4/1/18 | | 220,000 | | | 181,500 |
# | Cemex Espana Luxembourg | | | | | |
| 144A 9.25% 5/12/20 | | 418,000 | | | 438,900 |
# | Essar Steel Algoma 144A | | | | | |
| 9.375% 3/15/15 | | 297,000 | | | 281,408 |
| 9.875% 6/15/15 | | 359,000 | | | 281,815 |
# | FMG Resources August 2006 144A | | | | | |
| 6.875% 2/1/18 | | 98,000 | | | 95,183 |
| *6.875% 4/1/22 | | 477,000 | | | 450,169 |
# | HD Supply 144A | | | | | |
| 11.00% 4/15/20 | | 469,000 | | | 535,833 |
| Headwaters 7.625% 4/1/19 | | 426,000 | | | 437,715 |
| Hexion US Finance | | | | | |
| 8.875% 2/1/18 | | 78,000 | | | 79,170 |
| 9.00% 11/15/20 | | 242,000 | | | 218,405 |
| Immucor 11.125% 8/15/19 | | 429,000 | | | 478,335 |
# | INEOS Group Holdings 144A | | | | | |
| 8.50% 2/15/16 | | 1,033,000 | | | 1,002,009 |
# | Inmet Mining 144A | | | | | |
| 8.75% 6/1/20 | | 514,000 | | | 535,845 |
| Interface 7.625% 12/1/18 | | 331,000 | | | 359,549 |
# | JMC Steel Group 144A | | | | | |
| 8.25% 3/15/18 | | 445,000 | | | 453,900 |
# | Kinove German Bondco 144A | | | | | |
| 9.625% 6/15/18 | | 350,000 | | | 386,750 |
# | Longview Fibre Paper & Packaging | | | | | |
| 144A 8.00% 6/1/16 | | 471,000 | | | 493,373 |
| LyondellBasell Industries | | | | | |
| 5.75% 4/15/24 | | 255,000 | | | 296,438 |
| 6.00% 11/15/21 | | 155,000 | | | 179,994 |
# | MacDermid 144A 9.50% 4/15/17 | | 514,000 | | | 539,699 |
# | Masonite International 144A | | | | | |
| 8.25% 4/15/21 | | 625,000 | | | 665,624 |
| Millar Western Forest Products | | | | | |
| 8.50% 4/1/21 | | 335,000 | | | 287,263 |
| #Murray Energy 144A | | | | | |
| 10.25% 10/15/15 | | 426,000 | | | 419,610 |
| Norcraft Finance | | | | | |
| 10.50% 12/15/15 | | 310,000 | | | 312,325 |
| Nortek 8.50% 4/15/21 | | 486,000 | | | 524,880 |
| Peabody Energy 6.25% 11/15/21 | | 310,000 | | | 321,625 |
# | Ply Gem Industries 144A | | | | | |
| 9.375% 4/15/17 | | 271,000 | | | 285,228 |
=@ | Port Townsend 12.431% 8/27/13 | | 13,062 | | | 1,437 |
| Rockwood Specialties Group | | | | | |
| 4.625% 10/15/20 | | 524,000 | | | 541,684 |
# | Ryerson 144A | | | | | |
| 9.00% 10/15/17 | | 348,000 | | | 356,265 |
| 11.25% 10/15/18 | | 151,000 | | | 147,036 |
# | Sappi Papier Holding 144A | | | | | |
| 8.375% 6/15/19 | | 400,000 | | | 423,500 |
# | Taminco Global Chemical 144A | | | | | |
| 9.75% 3/31/20 | | 852,000 | | | 928,679 |
| | | | | | 13,196,926 |
| Capital Goods – 4.40% | | | | | |
| Anixter 10.00% 3/15/14 | | 53,000 | | | 57,903 |
| Berry Plastics | | | | | |
| 9.75% 1/15/21 | | 287,000 | | | 327,180 |
| 10.25% 3/1/16 | | 258,000 | | | 265,740 |
# | Cequel Communications Escrow | | | | | |
| 1 144A 6.375% 9/15/20 | | 355,000 | | | 361,213 |
# | Consolidated Container 144A | | | | | |
| 10.125% 7/15/20 | | 517,000 | | | 551,897 |
| Kratos Defense & Security | | | | | |
| Solutions 10.00% 6/1/17 | | 447,000 | | | 484,995 |
| Manitowoc 9.50% 2/15/18 | | 290,000 | | | 325,525 |
| Mueller Water Products | | | | | |
| 7.375% 6/1/17 | | 472,000 | | | 488,520 |
| Reynolds Group Issuer | | | | | |
| #144A 5.75% 10/15/20 | | 478,000 | | | 483,975 |
| 8.25% 2/15/21 | | 100,000 | | | 98,750 |
| 9.00% 4/15/19 | | 325,000 | | | 330,688 |
| 9.875% 8/15/19 | | 655,000 | | | 689,387 |
# | Sealed Air 144A | | | | | |
| 8.125% 9/15/19 | | 101,000 | | | 110,848 |
| 8.375% 9/15/21 | | 363,000 | | | 401,115 |
| | | | | | 4,977,736 |
2012 Annual report • Delaware Pooled Trust
76
| | Principal | | Value |
| | | Amount (U.S. $) | | (U.S. $) |
| Corporate Bonds (continued) | | | | | |
| Consumer Cyclical – 7.21% | | | | | |
| Burlington Coat Factory | | | | | |
| Warehouse 10.00% 2/15/19 | $ | 548,000 | | $ | 607,595 |
# | CDR DB Sub 144A | | | | | |
| | 7.75% 10/15/20 | | 645,000 | | | 639,356 |
| CKE Restaurants | | | | | |
| 11.375% 7/15/18 | | 328,000 | | | 379,250 |
| Dave & Buster’s | | | | | |
| ^#144A 8.914% 2/15/16 | | 678,000 | | | 504,263 |
| 11.00% 6/1/18 | | 529,000 | | | 595,786 |
| DineEquity 9.50% 10/30/18 | | 668,000 | | | 755,674 |
| Express 8.75% 3/1/18 | | 270,000 | | | 293,625 |
# | Landry’s 144A 9.375% 5/1/20 | | 532,000 | | | 563,255 |
| Levi Strauss | | | | | |
| 6.875% 5/1/22 | | 2,000 | | | 2,088 |
| 7.625% 5/15/20 | | 150,000 | | | 164,625 |
| Michaels Stores | | | | | |
| 11.375% 11/1/16 | | 145,000 | | | 151,706 |
| 13.00% 11/1/16 | | 165,000 | | | 172,149 |
# | Pantry 144A 8.375% 8/1/20 | | 539,000 | | | 563,255 |
# | Party City Holdings 144A | | | | | |
| 8.875% 8/1/20 | | 577,000 | | | 615,948 |
* | Quiksilver 6.875% 4/15/15 | | 153,000 | | | 147,454 |
| Rite Aid 9.25% 3/15/20 | | 493,000 | | | 506,558 |
* | Sealy Mattress 8.25% 6/15/14 | | 506,000 | | | 511,060 |
| Tops Holdings 10.125% 10/15/15 | | 433,000 | | | 457,086 |
# | Wok Acquisition 144A | | | | | |
| 10.25% 6/30/20 | | 487,000 | | | 521,090 |
| | | | | | 8,151,823 |
| Consumer Non-Cyclical – 2.69% | | | | | |
# | Alphabet Holding PIK 144A | | | | | |
| 7.75% 11/1/17 | | 210,000 | | | 212,363 |
| Constellation Brands | | | | | |
| 4.625% 3/1/23 | | 263,000 | | | 269,246 |
| Dean Foods 7.00% 6/1/16 | | 296,000 | | | 320,050 |
| Del Monte 7.625% 2/15/19 | | 496,000 | | | 512,120 |
# | JBS USA 144A 8.25% 2/1/20 | | 473,000 | | | 490,738 |
| NBTY 9.00% 10/1/18 | | 567,000 | | | 637,875 |
| Scotts Miracle-Gro | | | | | |
| 6.625% 12/15/20 | | 77,000 | | | 84,026 |
| Smithfield Foods | | | | | |
| 6.625% 8/15/22 | | 245,000 | | | 257,250 |
| Visant 10.00% 10/1/17 | | 269,000 | | | 261,266 |
| | | | | | 3,044,934 |
| Energy – 11.69% | | | | | |
| American Petroleum Tankers | | | | | |
| Parent 10.25% 5/1/15 | | 361,000 | | | 379,050 |
| AmeriGas Finance | | | | | |
| 7.00% 5/20/22 | | 503,000 | | | 548,899 |
| AmeriGas Partners | | | | | |
| 6.50% 5/20/21 | | 9,000 | | | 9,585 |
| Antero Resources Finance | | | | | |
| 9.375% 12/1/17 | | 408,000 | | | 451,860 |
| Calumet Specialty Products | | | | | |
| Partners 9.375% 5/1/19 | | 726,000 | | | 784,079 |
| Chaparral Energy 8.25% 9/1/21 | | 576,000 | | | 632,159 |
| Chesapeake Energy | | | | | |
| 6.125% 2/15/21 | | 92,000 | | | 93,610 |
| 6.625% 8/15/20 | | 468,000 | | | 493,740 |
| Comstock Resources | | | | | |
| 7.75% 4/1/19 | | 276,000 | | | 281,520 |
| Copano Energy | | | | | |
| 7.125% 4/1/21 | | 147,000 | | | 155,453 |
| 7.75% 6/1/18 | | 281,000 | | | 296,455 |
| Crosstex Energy | | | | | |
| #144A 7.125% 6/1/22 | | 277,000 | | | 279,770 |
| 8.875% 2/15/18 | | 313,000 | | | 337,258 |
# | Drill Rigs Holdings 144A | | | | | |
| 6.50% 10/1/17 | | 569,000 | | | 569,000 |
| Frontier Oil 6.875% 11/15/18 | | 129,000 | | | 138,030 |
# | Halcon Resources 144A | | | | | |
| 8.875% 5/15/21 | | 365,000 | | | 370,931 |
# | Helix Energy Solutions Group | | | | | |
| 144A 9.50% 1/15/16 | | 87,000 | | | 90,154 |
# | Hercules Offshore 144A | | | | | |
| 10.50% 10/15/17 | | 766,000 | | | 811,959 |
# | Hilcorp Energy I 144A | | | | | |
| 8.00% 2/15/20 | | 439,000 | | | 482,900 |
| Holly 9.875% 6/15/17 | | 188,000 | | | 205,860 |
| # | Holly Energy Partners 144A | | | | | |
| 6.50% 3/1/20 | | 141,000 | | | 148,755 |
# | Key Energy 144A 6.75% 3/1/21 | | 225,000 | | | 223,875 |
# | Kodiak Oil & Gas 144A | | | | | |
| 8.125% 12/1/19 | | 488,000 | | | 534,360 |
| Laredo Petroleum | | | | | |
| 7.375% 5/1/22 | | 132,000 | | | 144,540 |
| 9.50% 2/15/19 | | 496,000 | | | 565,440 |
| Linn Energy | | | | | |
| 6.50% 5/15/19 | | 87,000 | | | 88,088 |
| 8.625% 4/15/20 | | 365,000 | | | 401,044 |
| Oasis Petroleum 7.25% 2/1/19 | | 391,000 | | | 420,325 |
| Offshore Group Investments | | | | | |
| 11.50% 8/1/15 | | 218,000 | | | 240,073 |
| PDC Energy | | | | | |
| #144A 7.75% 10/15/22 | | 258,000 | | | 263,805 |
| 12.00% 2/15/18 | | 298,000 | | | 325,930 |
| Pioneer Drilling 9.875% 3/15/18 | | 539,000 | | | 586,162 |
| Quicksilver Resources | | | | | |
| 9.125% 8/15/19 | | 280,000 | | | 274,400 |
| Range Resources 5.00% 8/15/22 | | 491,000 | | | 515,550 |
# | Samson Investment 144A | | | | | |
| 9.75% 2/15/20 | | 473,000 | | | 501,380 |
2012 Annual report • Delaware Pooled Trust
(continues) 77
Statements of net assets
Delaware Pooled® Trust — The High-Yield Bond Portfolio
| | | Principal | | Value |
| | | Amount (U.S. $) | | (U.S. $) |
| Corporate Bonds (continued) | | | | | |
| Energy (continued) | | | | | |
| SandRidge Energy | | | | | |
| 7.50% 3/15/21 | $ | 116,000 | | $ | 121,220 |
| #144A 8.125% 10/15/22 | | 298,000 | | | 321,840 |
| 8.75% 1/15/20 | | 114,000 | | | 123,690 |
| | | | | | 13,212,749 |
| Financials – 1.85% | | | | | |
| E Trade Financial | | | | | |
| 12.50% 11/30/17 | | 243,000 | | | 276,413 |
•# | ILFC E-Capital Trust I 144A | | | | | |
| 4.52% 12/21/65 | | 350,000 | | | 250,250 |
•# | ILFC E-Capital Trust II 144A | | | | | |
| 6.25% 12/21/65 | | 250,000 | | | 208,750 |
| International Lease Finance | | | | | |
| 5.875% 4/1/19 | | 451,000 | | | 480,053 |
# | Neuberger Berman Group 144A | | | | | |
| 5.625% 3/15/20 | | 95,000 | | | 100,225 |
| 5.875% 3/15/22 | | 189,000 | | | 202,230 |
# | Nuveen Investments 144A | | | | | |
| 9.50% 10/15/20 | | 569,000 | | | 576,113 |
| | | | | | 2,094,034 |
| Healthcare – 6.66% | | | | | |
| Air Medical Group Holdings | | | | | |
| 9.25% 11/1/18 | | 431,000 | | | 466,558 |
| Alere 9.00% 5/15/16 | | 426,000 | | | 452,093 |
# | Biomet 144A 6.50% 10/1/20 | | 560,000 | | | 547,400 |
# | CDRT Holding PIK 144A | | | | | |
| 9.25% 10/1/17 | | 277,000 | | | 267,305 |
| Community Health Systems | | | | | |
| 7.125% 7/15/20 | | 325,000 | | | 344,094 |
| 8.00% 11/15/19 | | 424,000 | | | 459,510 |
| HCA 7.50% 2/15/22 | | 140,000 | | | 157,150 |
| HCA Holdings 7.75% 5/15/21 | | 155,000 | | | 167,788 |
| HealthSouth 7.75% 9/15/22 | | 91,000 | | | 100,100 |
# | Hologic 144A 6.25% 8/1/20 | | 520,000 | | | 553,800 |
# | Kinetic Concepts 144A | | | | | |
| 10.50% 11/1/18 | | 411,000 | | | 439,770 |
| 12.50% 11/1/19 | | 358,000 | | | 345,470 |
# | MultiPlan 144A 9.875% 9/1/18 | | 671,000 | | | 741,454 |
| Radnet Management | | | | | |
| 10.375% 4/1/18 | | 358,000 | | | 361,580 |
# | Sky Growth Acquisition 144A | | | | | |
| 7.375% 10/15/20 | | 849,000 | | | 848,999 |
# | STHI Holding 144A | | | | | |
| 8.00% 3/15/18 | | 435,000 | | | 467,625 |
# | Truven Health Analytics 144A | | | | | |
| 10.625% 6/1/20 | | 212,000 | | | 228,430 |
# | Valeant Pharmaceuticals | | | | | |
| International 144A | | | | | |
| 6.375% 10/15/20 | | 112,000 | | | 118,160 |
# | VPI Escrow 144A | | | | | |
| 6.375% 10/15/20 | | 439,000 | | | 464,243 |
| | | | | | 7,531,529 |
| Insurance – 3.64% | | | | | |
• | American International Group | | | | | |
| 8.175% 5/15/58 | | 691,000 | | | 865,478 |
# | Hub International 144A | | | | | |
| 8.125% 10/15/18 | | 638,000 | | | 658,735 |
• | ING Groep 5.775% 12/29/49 | | 1,136,000 | | | 1,079,199 |
•# | Liberty Mutual Group 144A | | | | | |
| 7.00% 3/15/37 | | 675,000 | | | 673,313 |
• | XL Group 6.50% 12/29/49 | | 900,000 | | | 839,250 |
| | | | | | 4,115,975 |
| Media – 8.61% | | | | | |
| AMC Networks 7.75% 7/15/21 | | 294,000 | | | 334,425 |
| Cablevision Systems | | | | | |
| 8.00% 4/15/20 | | 411,000 | | | 463,403 |
| CCO Holdings | | | | | |
| 5.25% 9/30/22 | | 539,000 | | | 544,390 |
| 7.00% 1/15/19 | | 42,000 | | | 45,360 |
| Clear Channel Communications | | | | | |
| 9.00% 3/1/21 | | 1,037,000 | | | 909,967 |
| Clear Channel Worldwide | | | | | |
| Holdings 7.625% 3/15/20 | | 395,000 | | | 377,763 |
| DISH DBS | | | | | |
| 5.875% 7/15/22 | | 192,000 | | | 202,560 |
| 7.875% 9/1/19 | | 289,000 | | | 340,298 |
| Entravision Communications | | | | | |
| 8.75% 8/1/17 | | 271,000 | | | 294,374 |
# | Griffey Intermediate 144A | | | | | |
| 7.00% 10/15/20 | | 430,000 | | | 438,600 |
| MDC Partners 11.00% 11/1/16 | | 595,000 | | | 651,524 |
# | Nara Cable Funding 144A | | | | | |
| 8.875% 12/1/18 | | 500,000 | | | 472,000 |
# | Nexstar Broadcasting 144A | | | | | |
| 6.875% 11/15/20 | | 415,000 | | | 418,113 |
# | Nielsen Finance 144A | | | | | |
| 4.50% 10/1/20 | | 266,000 | | | 266,000 |
# | ONO Finance II 144A | | | | | |
| 10.875% 7/15/19 | | 415,000 | | | 363,125 |
# | Quebecor Media 144A | | | | | |
| 5.75% 1/15/23 | | 485,000 | | | 497,125 |
# | Sinclair Television Group 144A | | | | | |
| 6.125% 10/1/22 | | 480,000 | | | 498,000 |
# | Sirius XM Radio 144A | | | | | |
| 5.25% 8/15/22 | | 275,000 | | | 276,375 |
# | Univision Communications 144A | | | | | |
| 6.75% 9/15/22 | | 538,000 | | | 540,690 |
| 8.50% 5/15/21 | | 1,011,000 | | | 1,021,109 |
# | UPC Holding 144A | | | | | |
| 9.875% 4/15/18 | | 200,000 | | | 225,500 |
# | UPCB Finance VI 144A | | | | | |
| 6.875% 1/15/22 | | 150,000 | | | 161,250 |
| Virgin Media Finance | | | | | |
| 4.875% 2/15/22 | | 270,000 | | | 274,050 |
| 8.375% 10/15/19 | | 100,000 | | | 115,500 |
| | | | | | 9,731,501 |
2012 Annual report • Delaware Pooled Trust
78
| | Principal | | Value |
| | | Amount (U.S. $) | | (U.S. $) |
| Corporate Bonds (continued) | | | | | |
| Services – 10.85% | | | | | |
# | Algeco Scotsman Global Finance | | | | | |
| 144A 8.50% 10/15/18 | $ | 970,000 | | $ | 1,003,949 |
# | Caesars Entertainment Operating | | | | | |
| 144A 8.50% 2/15/20 | | 508,000 | | | 500,380 |
| Cardtronics 8.25% 9/1/18 | | 195,000 | | | 219,375 |
# | Carlson Wagonlit 144A | | | | | |
| 6.875% 6/15/19 | | 335,000 | | | 351,750 |
# | CEVA Group 144A | | | | | |
| 8.375% 12/1/17 | | 575,000 | | | 559,187 |
| CityCenter Holdings PIK | | | | | |
| 10.75% 1/15/17 | | 270,000 | | | 286,875 |
# | Clean Harbors 144A | | | | | |
| 5.25% 8/1/20 | | 305,000 | | | 314,150 |
# | Equinox Holdings 144A | | | | | |
| 9.50% 2/1/16 | | 386,000 | | | 412,055 |
| Geo Group 6.625% 2/15/21 | | 83,000 | | | 89,848 |
# | H&E Equipment Services 144A | | | | | |
| 7.00% 9/1/22 | | 469,000 | | | 490,105 |
| Iron Mountain 8.375% 8/15/21 | | 34,000 | | | 37,740 |
| Kansas City Southern de Mexico | | | | | |
| 6.125% 6/15/21 | | 134,000 | | | 150,415 |
| 8.00% 2/1/18 | | 271,000 | | | 303,520 |
| M/I Homes 8.625% 11/15/18 | | 708,000 | | | 769,949 |
| Meritage Homes 7.00% 4/1/22 | | 107,000 | | | 116,095 |
| MGM Resorts International | | | | | |
| #144A 6.75% 10/1/20 | | 280,000 | | | 278,600 |
| 7.75% 3/15/22 | | 257,000 | | | 266,959 |
| 11.375% 3/1/18 | | 954,000 | | | 1,125,720 |
| Monitronics International | | | | | |
| 9.125% 4/1/20 | | 230,000 | | | 241,569 |
| NCL 9.50% 11/15/18 | | 89,000 | | | 98,790 |
| PHH | | | | | |
| 7.375% 9/1/19 | | 288,000 | | | 309,600 |
| 9.25% 3/1/16 | | 272,000 | | | 315,520 |
| Pinnacle Entertainment | | | | | |
| 7.75% 4/1/22 | | 204,000 | | | 221,850 |
| 8.75% 5/15/20 | | 35,000 | | | 38,413 |
| Seven Seas Cruises | | | | | |
| 9.125% 5/15/19 | | 486,000 | | | 507,263 |
| Standard Pacific | | | | | |
| 8.375% 5/15/18 | | 28,000 | | | 32,760 |
| 10.75% 9/15/16 | | 174,000 | | | 216,630 |
| Swift Services Holdings | | | | | |
| 10.00% 11/15/18 | | 533,000 | | | 574,307 |
# | Taylor Morrison Communities | | | | | |
| 144A 7.75% 4/15/20 | | 543,000 | | | 581,010 |
# | United Air Lines 144A | | | | | |
| 9.875% 8/1/13 | | 19,000 | | | 19,475 |
| 12.00% 11/1/13 | | 472,000 | | | 486,160 |
| United Rentals North America | | | | | |
| 6.125% 6/15/23 | | 105,000 | | | 106,575 |
| UR Merger Sub | | | | | |
| #144A 5.75% 7/15/18 | | 94,000 | | | 101,403 |
| #144A 7.625% 4/15/22 | | 137,000 | | | 150,529 |
| 8.25% 2/1/21 | | 393,000 | | | 436,230 |
| 10.25% 11/15/19 | | 73,000 | | | 84,680 |
| West 7.875% 1/15/19 | | 455,000 | | | 466,375 |
| | | | | | 12,265,811 |
| Technology – 6.05% | | | | | |
| Aspect Software | | | | | |
| 10.625% 5/15/17 | | 411,000 | | | 388,395 |
| Avaya | | | | | |
| 9.75% 11/1/15 | | 70,000 | | | 62,650 |
| 10.125% 11/1/15 | | 468,000 | | | 417,690 |
| CDW | | | | | |
| 8.50% 4/1/19 | | 314,000 | | | 336,765 |
| 12.535% 10/12/17 | | 301,000 | | | 323,951 |
| Fidelity National Information | | | | | |
| Services 7.875% 7/15/20 | | 49,000 | | | 55,003 |
| First Data | | | | | |
| 10.55% 9/24/15 | | 50,000 | | | 51,500 |
| *11.25% 3/31/16 | | 1,136,000 | | | 1,116,119 |
| GXS Worldwide 9.75% 6/15/15 | | 504,000 | | | 523,530 |
| iGate 9.00% 5/1/16 | | 459,000 | | | 503,753 |
| Infor US 9.375% 4/1/19 | | 647,000 | | | 718,170 |
# | j2 Global 144A 8.00% 8/1/20 | | 777,000 | | | 804,195 |
# | Legend Acquisition Sub 144A | | | | | |
| 10.75% 8/15/20 | | 433,000 | | | 424,340 |
| MagnaChip Semiconductor | | | | | |
| 10.50% 4/15/18 | | 459,000 | | | 518,670 |
# | Nuance Communications 144A | | | | | |
| 5.375% 8/15/20 | | 106,000 | | | 108,650 |
# | Viasystems 144A 7.875% 5/1/19 | | 497,000 | | | 488,303 |
| | | | | | 6,841,684 |
| Telecommunications – 8.76% | | | | | |
# | Clearwire Communications 144A | | | | | |
| 14.75% 12/1/16 | | 261,000 | | | 327,555 |
# | Columbus International 144A | | | | | |
| 11.50% 11/20/14 | | 310,000 | | | 350,300 |
| Cricket Communications | | | | | |
| 7.75% 5/15/16 | | 21,000 | | | 22,313 |
| 7.75% 10/15/20 | | 277,000 | | | 287,041 |
# | Crown Castle International 144A | | | | | |
| 5.25% 1/15/23 | | 1,000,000 | | | 1,038,749 |
# | Digicel Group 144A | | | | | |
| 8.25% 9/30/20 | | 200,000 | | | 216,500 |
| 10.50% 4/15/18 | | 415,000 | | | 462,725 |
| Hughes Satellite Systems | | | | | |
| 7.625% 6/15/21 | | 486,000 | | | 543,105 |
# | Integra Telecom Holdings 144A | | | | | |
| 10.75% 4/15/16 | | 269,000 | | | 275,725 |
2012 Annual report • Delaware Pooled Trust
(continues) 79
Statements of net assets
Delaware Pooled® Trust — The High-Yield Bond Portfolio
| | | Principal | | Value |
| | | Amount (U.S. $) | | (U.S. $) |
| Corporate Bonds (continued) | | | | | |
| Telecommunications (continued) | | | | | |
| Intelsat Bermuda | | | | | |
| 11.25% 2/4/17 | $ | 837,000 | | $ | 881,989 |
| PIK 11.50% 2/4/17 | | 517,432 | | | 546,538 |
| Intelsat Jackson Holdings | | | | | |
| #144A 7.25% 10/15/20 | | 226,000 | | | 240,690 |
| 7.50% 4/1/21 | | 32,000 | | | 34,480 |
| Level 3 Communications | | | | | |
| #144A 8.875% 6/1/19 | | 227,000 | | | 239,201 |
| 11.875% 2/1/19 | | 489,000 | | | 558,683 |
# | Level 3 Financing 144A | | | | | |
| 7.00% 6/1/20 | | 265,000 | | | 270,631 |
| NII Capital | | | | | |
| 7.625% 4/1/21 | | 213,000 | | | 169,335 |
| 8.875% 12/15/19 | | 12,000 | | | 10,140 |
| Satmex Escrow 9.50% 5/15/17 | | 249,000 | | | 266,430 |
| Sprint Capital 8.75% 3/15/32 | | 293,000 | | | 347,205 |
| Sprint Nextel | | | | | |
| 8.375% 8/15/17 | | 403,000 | | | 469,495 |
| 9.125% 3/1/17 | | 571,000 | | | 673,780 |
# | Wind Acquisition Finance 144A | | | | | |
| 7.25% 2/15/18 | | 650,000 | | | 635,900 |
| 11.75% 7/15/17 | | 210,000 | | | 205,800 |
| Windstream | | | | | |
| 7.50% 6/1/22 | | 327,000 | | | 348,255 |
| 7.50% 4/1/23 | | 10,000 | | | 10,575 |
| Zayo Group 10.125% 7/1/20 | | 420,000 | | | 471,450 |
| | | | | | 9,904,590 |
| Utilities – 1.04% | | | | | |
| AES 7.375% 7/1/21 | | 231,000 | | | 259,298 |
| Elwood Energy 8.159% 7/5/26 | | 51,202 | | | 52,674 |
| GenOn Energy 9.875% 10/15/20 | | 617,000 | | | 695,667 |
• | Puget Sound Energy | | | | | |
| 6.974% 6/1/67 | | 155,000 | | | 163,649 |
| | | | | | 1,171,288 |
| Total Corporate Bonds | | | | | |
| (cost $97,181,743) | | | | | 100,614,785 |
| |
| «Senior Secured Loans – 4.20% | | | | | |
| BJ’s Wholesale Club 2nd Lien | | | | | |
| 9.75% 3/29/19 | | 95,000 | | | 97,791 |
| Brock Holdings III | | | | | |
| 10.00% 2/15/18 | | 80,000 | | | 80,800 |
| Dynegy Power 1st Lien | | | | | |
| 9.25% 8/5/16 | | 138,600 | | | 144,924 |
| Equipower Resources Holdings | | | | | |
| 2nd Lien 10.00% 5/23/19 | | 165,000 | | | 168,782 |
§@ | GenCorp 9.00% 7/22/13 | | 600,000 | | | 600,000 |
§@ | Hertz 6.375% 8/26/13 | | 675,000 | | | 676,688 |
| PQ 6.74% 7/30/15 | | 345,000 | | | 343,275 |
§@ | Silver II Acquisition | | | | | |
| 8.00% 9/25/20 | | 785,000 | | | 785,000 |
§@ | Spectrum Brands Holdings | | | | | |
| 7.75% 10/10/13 | | 540,000 | | | 540,000 |
| Supervalu Tranche B | | | | | |
| 8.00% 8/1/18 | | 194,513 | | | 196,321 |
§@ | TPC Group 8.25% 8/27/13 | | 855,000 | | | 855,000 |
| WideOpenWest Finance | | | | | |
| 6.25% 7/17/18 | | 259,350 | | | 262,204 |
| Total Senior Secured Loans | | | | | |
| (cost $4,688,164) | | | | | 4,750,785 |
| |
| | Number of | | | |
| | Shares | | | |
| Common Stock – 0.09% | | | | | |
† | Alliance HealthCare Services | | 5,166 | | | 7,129 |
=† | Century Communications | | 60,000 | | | 0 |
† | DIRECTV Class A | | 1,200 | | | 61,332 |
† | Flextronics International | | 3,700 | | | 21,349 |
† | GenOn Energy | | 59 | | | 152 |
† | GeoEye | | 450 | | | 14,117 |
=∏† | PT Holdings | | 40 | | | 0 |
| Total Common Stock | | | | | |
| (cost $110,650) | | | | | 104,079 |
| |
| Preferred Stock – 1.46% | | | | | |
| Ally Financial | | | | | |
| #144A 7.00% | | 800 | | | 770,950 |
| •∏8.50% | | 5,000 | | | 125,250 |
• | GMAC Capital Trust I 8.25% | | 7,000 | | | 182,980 |
= | PT Holdings | | 8 | | | 0 |
| Regions Financial 6.375% | | 23,000 | | | 571,550 |
| Total Preferred Stock | | | | | |
| (cost $1,477,212) | | | | | 1,650,730 |
| |
| Warrant – 0.00% | | | | | |
=@∏† | PT Holdings | | 8 | | | 0 |
| Total Warrant (cost $192) | | | | | 0 |
| |
| | Principal | | | |
| | Amount (U.S. $) | | | |
| Short-Term Investments – 7.55% | | | | | |
| Repurchase Agreements – 7.55% | | | | | |
| Bank of America 0.24%, dated | | | | | |
| 10/31/12, to be repurchased | | | | | |
| on 11/1/12, repurchase price | | | | | |
| $3,307,599 (collateralized | | | | | |
| by U.S. government | | | | | |
| obligations 0.00%-1.25% | | | | | |
| 1/10/13-8/31/16; market | | | | | |
| value $3,373,728) | $ | 3,307,577 | | | 3,307,577 |
2012 Annual report • Delaware Pooled Trust
80
| | Principal | | Value | |
| | | Amount (U.S. $) | | (U.S. $) | |
| Short-Term Investments (continued) | | | | | | |
| Repurchase Agreements (continued) | | | | | | |
| BNP Paribas 0.28%, dated | | | | | | |
| 10/31/12, to be repurchased | | | | | | |
| on 11/1/12, repurchase price | | | | | | |
| $5,228,464 (collateralized by | | | | | | |
| U.S. government obligations | | | | | | |
| 0.00-2.00% 1/24/13-4/15/16; | | | | | | |
| market value $5,332,992) | | $5,228,423 | | $ | 5,228,423 | |
| Total Repurchase Agreements | | | | | | |
| (cost $8,536,000) | | | | | 8,536,000 | |
| |
| Total Value of Securities Before Securities | | | | |
| Lending Collateral – 102.55% | | | | | | |
| (cost $112,270,015) | | | | | 115,932,310 | |
| |
| | Number of | | | | |
| | Shares | | | | |
| **Securities Lending Collateral – 0.02% | | | | | | |
| Investment Companies | | | | | | |
| Delaware Investments | | | | | | |
| Collateral Fund No. 1 | | 27,203 | | | 27,203 | |
| @† | Mellon GSL Reinvestment Trust II | | 31,196 | | | 0 | |
| Total Securities Lending Collateral | | | | | | |
| (cost $58,399) | | | | | 27,203 | |
| |
| Total Value of Securities – 102.57% | | | | | | |
| (cost $112,328,414) | | | | | 115,959,513 | © |
| **Obligation to Return Securities | | | | | | |
| Lending Collateral – (0.05%) | | | | | (58,399 | ) |
| Other Liabilities Net of Receivables | | | | | | |
| | and Other Assets – (2.52%) | | | | | (2,853,468 | ) |
| Net Assets Applicable to 13,541,385 | | | | | | |
| Shares Outstanding; Equivalent to | | | | | | |
| $8.35 Per Share – 100.00% | | | | $ | 113,047,646 | |
| |
| Components of Net Assets at October 31, 2012: | | | | |
| Shares of beneficial interest | | | | | | |
| (unlimited authorization – no par) | | | | $ | 107,890,010 | |
| Undistributed net investment income | | | | | 4,937,564 | |
| Accumulated net realized loss on investments | | | (3,411,027 | ) |
| Net unrealized appreciation of investments | | | | | 3,631,099 | |
| Total net assets | | | | $ | 113,047,646 | |
| ϕ | Step coupon bond. Coupon increases periodically based on a predetermined schedule. Stated rate in effect at October 31, 2012. |
| # | Security exempt from registration under Rule 144A of the Securities Act of 1933, as amended. At October 31, 2012, the aggregate value of Rule 144A securities was $46,055,990, which represented 40.74% of the Portfolio’s net assets. See Note 11 in “Notes to financial statements.” |
| • | Variable rate security. The rate shown is the rate as of October 31, 2012. Interest rates reset periodically. |
| = | Security is being fair valued in accordance with the Portfolio’s fair valuation policy. At October 31, 2012, the aggregate value of fair valued securities was $1,437, which represented 0.00% of the Portfolio’s net assets. See Note 1 in “Notes to financial statements.” |
| @ | Illiquid security. At October 31, 2012, the aggregate value of illiquid securities was $3,458,125, which represented 3.06% of the Portfolio’s net assets. See Note 11 in “Notes to financial statements.” |
| ^ | Zero coupon security. The rate shown is the yield at the time of purchase. |
| * | Fully or partially on loan. |
| « | Senior Secured Loans generally pay interest at rates which are periodically redetermined by reference to a base lending rate plus a premium. These base lending rates are generally: (i) the prime rate offered by one or more United States banks, (ii) the lending rate offered by one or more European banks such as the London Inter-Bank Offered Rate (LIBOR), and (iii) the certificate of deposit rate. Senior Secured Loans may be subject to restrictions on resale. Stated rate in effect at October 31, 2012. |
| † | Non income producing security. |
| ∏ | Restricted security. These investments are in securities not registered under the Securities Act of 1933, as amended, and have certain restrictions on resale which may limit their liquidity. At October 31, 2012, the aggregate value of restricted securities was $125,250, which represented 0.11% of the Portfolio’s net assets. |
| § | All or a portion of this holding is subject to unfunded loan commitments. See Note 7 in “Notes to financial statements.“ |
| ** | See Note 10 in “Notes to financial statements” for additional information on securities lending collateral. |
| © | Includes $55,644 of securities loaned. |
PIK — Pay-in-kind
See accompanying notes, which are an integral part of the financial statements.
2012 Annual report · Delaware Pooled Trust
(continues) 81
Statements of net assets
Delaware Pooled® Trust — The Core Plus Fixed Income Bond Portfolio
October 31, 2012
| | Principal | | Value |
| | | Amount° | | (U.S. $) |
| Agency Asset-Backed Security – 0.23% | | | | | | |
| • | Fannie Mae Grantor Trust | | | | | | |
| Series 2003-T4 2A5 | | | | | | |
| 5.407% 9/26/33 | USD | | 134,798 | | $ | 136,796 |
| Total Agency Asset-Backed Security | | | | | | |
| (cost $133,708) | | | | | | 136,796 |
| |
| Agency Collateralized Mortgage Obligations – 2.20% | | | |
| Fannie Mae REMICs | | | | | | |
| Series 2002-90 A1 | | | | | | |
| 6.50% 6/25/42 | | | 18,868 | | | 22,182 |
| Series 2002-90 A2 | | | | | | |
| 6.50% 11/25/42 | | | 45,667 | | | 52,824 |
| Series 2003-122 AJ | | | | | | |
| 4.50% 2/25/28 | | | 23,186 | | | 23,424 |
| Fannie Mae Whole Loan | | | | | | |
| Series 2004-W11 1A2 | | | | | | |
| 6.50% 5/25/44 | | | 38,129 | | | 43,092 |
| Freddie Mac REMICs | | | | | | |
| Series 1730 Z | | | | | | |
| 7.00% 5/15/24 | | | 99,082 | | | 114,026 |
| Series 2326 ZQ | | | | | | |
| 6.50% 6/15/31 | | | 91,048 | | | 104,164 |
| Series 3123 HT | | | | | | |
| 5.00% 3/15/26 | | | 270,000 | | | 302,655 |
| Series 3131 MC | | | | | | |
| 5.50% 4/15/33 | | | 295,473 | | | 302,155 |
| Series 3656 PM | | | | | | |
| 5.00% 4/15/40 | | | 125,000 | | | 140,097 |
| •# | FREMF Mortgage Trust | | | | | | |
| Series 2012-K21 B 144A | | | | | | |
| 3.94% 7/25/45 | | | 35,000 | | | 35,700 |
| GNMA Series 2010-113 KE | | | | | | |
| 4.50% 9/20/40 | | | 125,000 | | | 143,180 |
| NCUA Guaranteed Notes | | | | | | |
| Series 2010-C1 A2 | | | | | | |
| 2.90% 10/29/20 | | | 40,000 | | | 42,631 |
| Total Agency Collateralized | | | | | | |
| Mortgage Obligations | | | | | | |
| (cost $1,212,837) | | | | | | 1,326,130 |
| |
| Agency Mortgage-Backed Securities – 21.96% | | | |
| Fannie Mae 6.50% 8/1/17 | | | 15,389 | | | 17,047 |
| • | Fannie Mae ARM | | | | | | |
| 2.632% 8/1/34 | | | 58,895 | | | 62,902 |
| 2.78% 4/1/36 | | | 56,047 | | | 60,007 |
| 4.681% 3/1/38 | | | 80,180 | | | 85,475 |
| Fannie Mae Relocation 30 yr | | | | | | |
| 5.00% 11/1/33 | | | 8,391 | | | 9,071 |
| 5.00% 1/1/34 | | | 10,616 | | | 11,476 |
| 5.00% 11/1/34 | | | 28,300 | | | 30,594 |
| 5.00% 10/1/35 | | | 38,062 | | | 41,147 |
| 5.00% 1/1/36 | | | 58,474 | | | 63,215 |
| Fannie Mae S.F. 15 yr | | | | | | |
| 4.00% 11/1/25 | | | 139,382 | | | 151,327 |
| 4.50% 1/1/20 | | | 15,550 | | | 16,801 |
| 5.00% 5/1/20 | | | 21,495 | | | 23,485 |
| 5.00% 7/1/20 | | | 5,332 | | | 5,815 |
| 5.00% 5/1/21 | | | 4,348 | | | 4,741 |
| 5.50% 5/1/20 | | | 639 | | | 695 |
| 5.50% 6/1/23 | | | 117,891 | | | 128,323 |
| 6.00% 8/1/22 | | | 70,288 | | | 77,246 |
| Fannie Mae S.F. 15 yr TBA | | | | | | |
| 2.50% 11/1/27 | | | 1,605,000 | | | 1,679,733 |
| 3.00% 11/1/27 | | | 2,024,000 | | | 2,135,004 |
| Fannie Mae S.F. 20 yr | | | | | | |
| 5.50% 8/1/28 | | | 163,399 | | | 179,398 |
| 5.50% 12/1/29 | | | 7,957 | | | 8,736 |
| Fannie Mae S.F. 30 yr | | | | | | |
| 5.00% 3/1/34 | | | 11,235 | | | 12,342 |
| 5.00% 2/1/35 | | | 119,630 | | | 131,421 |
| 5.00% 3/1/35 | | | 33,601 | | | 36,761 |
| 5.00% 5/1/35 | | | 18,454 | | | 20,181 |
| 5.00% 6/1/35 | | | 23,212 | | | 25,603 |
| 5.00% 7/1/35 | | | 15,840 | | | 17,322 |
| 5.50% 2/1/37 | | | 20,580 | | | 22,595 |
| 6.00% 8/1/36 | | | 8,214 | | | 9,126 |
| 6.00% 9/1/36 | | | 17,320 | | | 19,243 |
| 6.00% 3/1/37 | | | 3,956 | | | 4,423 |
| 6.00% 8/1/37 | | | 19,844 | | | 22,047 |
| 6.00% 12/1/38 | | | 1,690 | | | 1,874 |
| 6.00% 11/1/39 | | | 14,513 | | | 16,124 |
| 6.00% 1/1/40 | | | 123,433 | | | 137,139 |
| 6.00% 4/1/40 | | | 22,031 | | | 24,455 |
| 6.00% 6/1/40 | | | 173,233 | | | 192,468 |
| 6.00% 7/1/40 | | | 9,037 | | | 10,040 |
| 6.00% 2/1/41 | | | 83,145 | | | 93,081 |
| 7.00% 12/1/33 | | | 15,572 | | | 18,607 |
| 7.00% 5/1/35 | | | 2,747 | | | 3,261 |
| 7.00% 6/1/35 | | | 6,133 | | | 7,281 |
| 7.00% 12/1/37 | | | 51,357 | | | 61,115 |
| 7.50% 6/1/31 | | | 2,160 | | | 2,639 |
| 7.50% 6/1/34 | | | 29,347 | | | 36,108 |
| Fannie Mae S.F. 30 yr TBA | | | | | | |
| 3.00% 11/1/42 | | | 2,165,000 | | | 2,270,206 |
| 3.50% 11/1/42 | | | 3,589,000 | | | 3,822,847 |
| • | Freddie Mac ARM 2.649% 4/1/34 | | | 5,363 | | | 5,731 |
| Freddie Mac Relocation 30 yr | | | | | | |
| 5.00% 9/1/33 | | | 5,237 | | | 5,631 |
| Freddie Mac S.F. 30 yr | | | | | | |
| 5.50% 12/1/37 | | | 1,671 | | | 1,818 |
| 5.50% 7/1/38 | | | 21,066 | | | 22,905 |
| 5.50% 8/1/38 | | | 145,220 | | | 158,305 |
| 5.50% 7/1/40 | | | 478,961 | | | 522,116 |
| 6.00% 4/1/37 | | | 76,566 | | | 84,276 |
| 6.00% 8/1/38 | | | 63,589 | | | 70,747 |
| 6.00% 10/1/38 | | | 91,004 | | | 101,249 |
2012 Annual report · Delaware Pooled Trust
82
| | Principal | | Value |
| | | Amount° | | (U.S. $) |
| Agency Mortgage-Backed Securities (continued) | | | |
| Freddie Mac S.F. 30 yr (continued) | | | | | | |
| 6.00% 5/1/40 | USD | | 159,854 | | $ | 175,951 |
| 7.00% 11/1/33 | | | 2,167 | | | 2,553 |
| GNMA I S.F. 30 yr | | | | | | |
| 7.00% 12/15/34 | | | 241,973 | | | 284,237 |
| 7.50% 12/15/31 | | | 553 | | | 684 |
| 7.50% 2/15/32 | | | 520 | | | 636 |
| Total Agency Mortgage-Backed | | | | | | |
| Securities (cost $13,123,127) | | | | | | 13,247,386 |
| |
| Commercial Mortgage-Backed Securities – 5.11% | | | |
| # | American Tower Trust | | | | | | |
| Series 2007-1A AFX 144A | | | | | | |
| 5.42% 4/15/37 | | | 95,000 | | | 99,462 |
| • | Bear Stearns Commercial | | | | | | |
| Mortgage Securities | | | | | | |
| Series 2005-T20 A4A | | | | | | |
| 5.15% 10/12/42 | | | 30,000 | | | 33,672 |
| Series 2006-PW12 A4 | | | | | | |
| 5.712% 9/11/38 | | | 45,000 | | | 51,652 |
| • | Credit Suisse Mortgage | | | | | | |
| Capital Certificates | | | | | | |
| | Series 2006-C1 AAB | | | | | | |
| 5.41% 2/15/39 | | | 103,421 | | | 107,916 |
| # | DBUBS Mortgage Trust | | | | | | |
| Series 2011-LC1A A3 144A | | | | | | |
| 5.002% 11/10/46 | | | 300,000 | | | 357,373 |
| Goldman Sachs Mortgage | | | | | | |
| Securities II | | | | | | |
| Series 2005-GG4 A4 | | | | | | |
| 4.761% 7/10/39 | | | 250,000 | | | 268,942 |
| Series 2005-GG4 A4A | | | | | | |
| 4.751% 7/10/39 | | | 365,000 | | | 396,429 |
| •Series 2006-GG6 A4 | | | | | | |
| 5.553% 4/10/38 | | | 55,000 | | | 62,234 |
| #Series 2010-C1 A2 144A | | | | | | |
| 4.592% 8/10/43 | | | 100,000 | | | 116,880 |
| •#Series 2010-C1 C 144A | | | | | | |
| 5.635% 8/10/43 | | | 100,000 | | | 116,846 |
| •#Series 2011-GC3 C 144A | | | | | | |
| 5.543% 3/10/44 | | | 100,000 | | | 113,650 |
| JPMorgan Chase Commercial | | | | | | |
| Mortgage Securities | | | | | | |
| •Series 2005-LDP3 A4A | | | | | | |
| 4.936% 8/15/42 | | | 75,000 | | | 82,817 |
| •Series 2005-LDP4 A4 | | | | | | |
| 4.918% 10/15/42 | | | 65,000 | | | 71,071 |
| •Series 2005-LDP5 A4 | | | | | | |
| 5.20% 12/15/44 | | | 55,000 | | | 61,648 |
| Series 2011-C5 A3 | | | | | | |
| 4.171% 8/15/46 | | | 90,000 | | | 102,924 |
| Lehman Brothers-UBS | | | | | | |
| Commercial Mortgage | | | | | | |
| Trust Series 2004-C1 A4 | | | | | | |
| 4.568% 1/15/31 | | | 35,000 | | | 36,555 |
| Morgan Stanley Capital I | | | | | | |
| Series 2005-HQ6 A4A | | | | | | |
| 4.989% 8/13/42 | | | 50,000 | | | 55,004 |
| •Series 2007-T27 A4 | | | | | | |
| 5.653% 6/11/42 | | | 335,000 | | | 398,480 |
| •# | Morgan Stanley Dean | | | | | | |
| Witter Capital I | | | | | | |
| Series 2001-TOP1 E 144A | | | | | | |
| 7.39% 2/15/33 | | | 100,000 | | | 99,528 |
| •# | Nationslink Funding | | | | | | |
| Series 1998-2 F 144A | | | | | | |
| 7.028% 8/20/30 | | | 15,759 | | | 16,019 |
| # | OBP Depositor Trust | | | | | | |
| Series 2010-OBP A 144A | | | | | | |
| 4.646% 7/15/45 | | | 100,000 | | | 117,848 |
| # | Timberstar Trust | | | | | | |
| Series 2006-1A A 144A | | | | | | |
| 5.668% 10/15/36 | | | 205,000 | | | 231,379 |
| WF-RBS Commercial | | | | | | |
| Mortgage Trust | | | | | | |
| Series 2012-C9 A3 | | | | | | |
| 2.87% 11/15/45 | | | 70,000 | | | 72,198 |
| Series 2012-C9 B | | | | | | |
| 3.84% 11/15/45 | | | 15,000 | | | 15,532 |
| Total Commercial Mortgage-Backed | | | | | | |
| Securities (cost $2,817,462) | | | | | | 3,086,059 |
| |
| Corporate Bonds – 42.03% | | | | | | |
| Banking – 5.68% | | | | | | |
| Abbey National Treasury | | | | | | |
| Services 4.00% 4/27/16 | | | 60,000 | | | 63,001 |
| Bancolombia 5.125% 9/11/22 | | | 48,000 | | | 50,400 |
| # | Bank Nederlandse | | | | | | |
| Gemeenten 144A | | | | | | |
| 1.375% 9/27/17 | | | 68,000 | | | 68,373 |
| Bank of America | | | | | | |
| 3.75% 7/12/16 | | | 55,000 | | | 58,991 |
| 5.70% 1/24/22 | | | 65,000 | | | 77,475 |
| BB&T 5.25% 11/1/19 | | | 322,000 | | | 371,077 |
| • | Bear Stearns 4.00% 12/7/12 | AUD | | 110,000 | | | 114,137 |
| City National 5.25% 9/15/20 | USD | | 80,000 | | | 88,324 |
| # | CoBank 144A 7.875% 4/16/18 | | | 250,000 | | | 312,390 |
| • | Fifth Third Capital Trust IV | | | | | | |
| 6.50% 4/15/37 | | | 115,000 | | | 115,719 |
| # | HSBC Bank 144A 4.75% 1/19/21 | | | 150,000 | | | 173,795 |
| HSBC Holdings 4.00% 3/30/22 | | | 15,000 | | | 16,464 |
| JPMorgan Chase | | | | | | |
| 2.00% 8/15/17 | | | 230,000 | | | 232,728 |
| 2.92% 9/19/17 | CAD | | 124,000 | | | 124,670 |
| KeyBank 5.45% 3/3/16 | USD | | 250,000 | | | 281,892 |
| Morgan Stanley 4.875% 11/1/22 | | | 80,000 | | | 81,033 |
| PNC Bank 6.875% 4/1/18 | | | 250,000 | | | 317,134 |
| PNC Funding 5.125% 2/8/20 | | | 115,000 | | | 138,209 |
| US Bancorp 2.95% 7/15/22 | | | 40,000 | | | 41,352 |
| • | USB Capital IX 3.50% 10/29/49 | | | 355,000 | | | 319,103 |
2012 Annual report · Delaware Pooled Trust
(continues) 83
Statements of net assets
Delaware Pooled® Trust — The Core Plus Fixed Income Bond Portfolio
| | Principal | | Value |
| | | Amount° | | (U.S. $) |
| Corporate Bonds (continued) | | | |
| Banking (continued) | | | | | | |
| Wachovia | | | | | | |
| •0.71% 10/15/16 | USD | | 50,000 | | $ | 48,686 |
| 5.25% 8/1/14 | | | 55,000 | | | 59,058 |
| 5.625% 10/15/16 | | | 150,000 | | | 174,802 |
| Wells Fargo 3.50% 3/8/22 | | | 20,000 | | | 21,396 |
| Zions Bancorp | | | | | | |
| 4.50% 3/27/17 | | | 20,000 | | | 20,947 |
| 7.75% 9/23/14 | | | 50,000 | | | 55,115 |
| | | | | | | 3,426,271 |
| Basic Industry – 3.73% | | | | | | |
| Alcoa | | | | | | |
| 5.40% 4/15/21 | | | 45,000 | | | 46,662 |
| 6.75% 7/15/18 | | | 85,000 | | | 98,243 |
| ArcelorMittal 10.10% 6/1/19 | | | 150,000 | | | 176,559 |
| Barrick Gold 3.85% 4/1/22 | | | 110,000 | | | 117,508 |
| Barrick North America Finance | | | | | | |
| 4.40% 5/30/21 | | | 35,000 | | | 38,815 |
| Cabot | | | | | | |
| 2.55% 1/15/18 | | | 75,000 | | | 77,249 |
| 3.70% 7/15/22 | | | 40,000 | | | 41,246 |
| CF Industries | | | | | | |
| 6.875% 5/1/18 | | | 30,000 | | | 36,883 |
| 7.125% 5/1/20 | | | 125,000 | | | 158,672 |
| Domtar 4.40% 4/1/22 | | | 45,000 | | | 46,610 |
| Dow Chemical 8.55% 5/15/19 | | | 184,000 | | | 249,854 |
| Freeport-McMoRan Copper & | | | | | | |
| Gold 3.55% 3/1/22 | | | 55,000 | | | 56,109 |
| Georgia-Pacific 8.00% 1/15/24 | | | 150,000 | | | 211,020 |
| Hexion U.S. Finance | | | | | | |
| 8.875% 2/1/18 | | | 85,000 | | | 86,275 |
| International Paper | | | | | | |
| 4.75% 2/15/22 | | | 60,000 | | | 68,448 |
| 6.00% 11/15/41 | | | 25,000 | | | 30,718 |
| 9.375% 5/15/19 | | | 15,000 | | | 20,672 |
| Lyondellbasell Industries | | | | | | |
| 5.75% 4/15/24 | | | 200,000 | | | 232,500 |
| Novelis 8.75% 12/15/20 | | | 65,000 | | | 71,988 |
| Rio Tinto Finance USA | | | | | | |
| 2.875% 8/21/22 | | | 180,000 | | | 181,746 |
| Teck Resources | | | | | | |
| 3.00% 3/1/19 | | | 35,000 | | | 35,659 |
| 3.75% 2/1/23 | | | 45,000 | | | 45,684 |
| Vale Overseas 4.375% 1/11/22 | | | 85,000 | | | 90,903 |
| # | Xstrata Finance Canada 144A | | | | | | |
| 4.00% 10/25/22 | | | 15,000 | | | 15,097 |
| 5.30% 10/25/42 | | | 15,000 | | | 15,092 |
| | | | | | | 2,250,212 |
| Brokerage – 0.38% | | | | | | |
| Jefferies Group | | | | | | |
| 6.25% 1/15/36 | | | 5,000 | | | 5,050 |
| 6.45% 6/8/27 | | | 25,000 | | | 26,328 |
| Lazard Group 6.85% 6/15/17 | | | 174,000 | | | 197,504 |
| | | | | | | 228,882 |
| Capital Goods – 0.69% | | | | | | |
| Ball 5.75% 5/15/21 | | | 250,000 | | | 270,000 |
| •# | Cemex SAB 144A | | | | | | |
| 5.362% 9/30/15 | | | 150,000 | | | 146,625 |
| | | | | | | 416,625 |
| Communications – 5.46% | | | | | | |
| America Movil SAB | | | | | | |
| 5.00% 3/30/20 | | | 105,000 | | | 124,047 |
| American Tower | | | | | | |
| 4.70% 3/15/22 | | | 30,000 | | | 33,202 |
| 5.90% 11/1/21 | | | 180,000 | | | 215,975 |
| CenturyLink 5.80% 3/15/22 | | | 100,000 | | | 105,449 |
| # | Clearwire Communications | | | | | | |
| 144A 12.00% 12/1/15 | | | 105,000 | | | 112,350 |
| Comcast 4.65% 7/15/42 | | | 20,000 | | | 21,682 |
| * | Cricket Communications | | | | | | |
| 7.75% 10/15/20 | | | 75,000 | | | 77,719 |
| # | Crown Castle Towers 144A | | | | | | |
| 4.883% 8/15/20 | | | 240,000 | | | 274,705 |
| # | Deutsche Telekom | | | | | | |
| International Finance | | | | | | |
| 144A 2.25% 3/6/17 | | | 150,000 | | | 153,813 |
| DIRECTV Holdings | | | | | | |
| 3.80% 3/15/22 | | | 150,000 | | | 156,596 |
| 5.15% 3/15/42 | | | 25,000 | | | 26,251 |
| DISH DBS 7.875% 9/1/19 | | | 110,000 | | | 129,525 |
| Intelsat Bermuda 11.25% 2/4/17 | | | 260,000 | | | 273,975 |
| Interpublic Group 4.00% 3/15/22 | | | 95,000 | | | 99,838 |
| NBCUniversal Media | | | | | | |
| 4.45% 1/15/43 | | | 125,000 | | | 129,689 |
| Qwest 6.75% 12/1/21 | | | 55,000 | | | 65,897 |
| Sprint Nextel | | | | | | |
| 6.00% 12/1/16 | | | 55,000 | | | 59,400 |
| 8.375% 8/15/17 | | | 65,000 | | | 75,725 |
| Telecom Italia Capital | | | | | | |
| 5.25% 10/1/15 | | | 190,000 | | | 201,638 |
| Telefonica Emisiones | | | | | | |
| 5.462% 2/16/21 | | | 50,000 | | | 50,938 |
| 6.421% 6/20/16 | | | 50,000 | | | 54,375 |
| Time Warner Cable | | | | | | |
| 5.85% 5/1/17 | | | 20,000 | | | 23,955 |
| 8.25% 4/1/19 | | | 100,000 | | | 135,382 |
| # | UPCB Finance III 144A | | | | | | |
| 6.625% 7/1/20 | | | 150,000 | | | 161,250 |
| Virgin Media Secured Finance | | | | | | |
| 6.50% 1/15/18 | | | 300,000 | | | 326,999 |
| # | Vivendi 144A | | | | | | |
| 3.45% 1/12/18 | | | 70,000 | | | 71,730 |
| 6.625% 4/4/18 | | | 115,000 | | | 133,564 |
| | | | | | | 3,295,669 |
2012 Annual report · Delaware Pooled Trust
84
| | Principal | | Value |
| | | Amount° | | (U.S. $) |
| Corporate Bonds (continued) | | | |
| Consumer Cyclical – 2.78% | | | | | | |
| # | Daimler Finance North America | | | | | | |
| 144A 2.25% 7/31/19 | USD | | 150,000 | | $ | 150,362 |
| Darden Restaurants | | | | | | |
| 3.35% 11/1/22 | | | 110,000 | | | 110,358 |
| Dollar General 4.125% 7/15/17 | | | 15,000 | | | 15,750 |
| eBay 4.00% 7/15/42 | | | 170,000 | | | 171,193 |
| Ford Motor Credit | | | | | | |
| 12.00% 5/15/15 | | | 100,000 | | | 124,000 |
| Historic TW 6.875% 6/15/18 | | | 170,000 | | | 217,413 |
| Host Hotels & Resorts | | | | | | |
| *4.75% 3/1/23 | | | 70,000 | | | 74,550 |
| 5.25% 3/15/22 | | | 5,000 | | | 5,550 |
| 5.875% 6/15/19 | | | 40,000 | | | 44,200 |
| Lowe’s 3.12% 4/15/22 | | | 85,000 | | | 89,944 |
| Macy’s Retail Holdings | | | | | | |
| 5.90% 12/1/16 | | | 82,000 | | | 96,698 |
| MGM Resorts International | | | | | | |
| 11.125% 11/15/17 | | | 120,000 | | | 132,900 |
| 11.375% 3/1/18 | | | 60,000 | | | 70,800 |
| 13.00% 11/15/13 | | | 15,000 | | | 16,800 |
| Walgreen 3.10% 9/15/22 | | | 125,000 | | | 127,548 |
| Western Union 3.65% 8/22/18 | | | 100,000 | | | 110,139 |
| Wyndham Worldwide | | | | | | |
| 4.25% 3/1/22 | | | 30,000 | | | 31,353 |
| 5.625% 3/1/21 | | | 35,000 | | | 39,119 |
| 5.75% 2/1/18 | | | 40,000 | | | 44,800 |
| | | | | | | 1,673,477 |
| Consumer Non-Cyclical – 4.22% | | | | | | |
| Amgen | | | | | | |
| 3.625% 5/15/22 | | | 65,000 | | | 70,012 |
| 3.875% 11/15/21 | | | 35,000 | | | 38,537 |
| 5.375% 5/15/43 | | | 40,000 | | | 48,219 |
| Boston Scientific 6.00% 1/15/20 | | | 45,000 | | | 53,480 |
| CareFusion 6.375% 8/1/19 | | | 255,000 | | | 304,378 |
| Celgene | | | | | | |
| 2.45% 10/15/15 | | | 30,000 | | | 31,299 |
| 3.25% 8/15/22 | | | 15,000 | | | 15,494 |
| 3.95% 10/15/20 | | | 75,000 | | | 81,881 |
| Del Monte 7.625% 2/15/19 | | | 45,000 | | | 46,463 |
| Energizer Holdings | | | | | | |
| 4.70% 5/24/22 | | | 120,000 | | | 128,970 |
| # | Express Scripts Holding 144A | | | | | | |
| 2.65% 2/15/17 | | | 30,000 | | | 31,348 |
| # | Heineken 144A | | | | | | |
| 2.75% 4/1/23 | | | 40,000 | | | 40,504 |
| 3.40% 4/1/22 | | | 85,000 | | | 90,999 |
| # | Kraft Foods Group 144A | | | | | | |
| 5.00% 6/4/42 | | | 55,000 | | | 64,498 |
| Laboratory Corporation of | | | | | | |
| America Holdings | | | | | | |
| 2.20% 8/23/17 | | | 90,000 | | | 92,864 |
| 3.75% 8/23/22 | | | 80,000 | | | 85,217 |
| # | Mylan 144A 6.00% 11/15/18 | | | 120,000 | | | 128,400 |
| # | Pernod-Ricard 144A | | | | | | |
| 2.95% 1/15/17 | | | 150,000 | | | 158,361 |
| Quest Diagnostics 4.70% 4/1/21 | | | 90,000 | | | 101,712 |
| Reynolds American | | | | | | |
| 3.25% 11/1/22 | | | 65,000 | | | 65,882 |
| 4.75% 11/1/42 | | | 50,000 | | | 51,139 |
| # | SABMiller Holdings 144A | | | | | | |
| 3.75% 1/15/22 | | | 200,000 | | | 220,399 |
| * | Safeway 4.75% 12/1/21 | | | 90,000 | | | 94,316 |
| Tyson Foods 4.50% 6/15/22 | | | 35,000 | | | 37,275 |
| # | Woolworths 144A 3.15% 4/12/16 | | | 75,000 | | | 78,384 |
| Yale University 2.90% 10/15/14 | | | 160,000 | | | 167,657 |
| Zimmer Holdings | | | | | | |
| 3.375% 11/30/21 | | | 85,000 | | | 88,858 |
| 4.625% 11/30/19 | | | 110,000 | | | 126,126 |
| | | | | | | 2,542,672 |
| Electric – 3.61% | | | | | | |
| Ameren Illinois 9.75% 11/15/18 | | | 285,000 | | | 396,269 |
| # | American Transmission Systems | | | | | | |
| 144A 5.25% 1/15/22 | | | 130,000 | | | 150,953 |
| # | APT Pipelines 144A | | | | | | |
| 3.875% 10/11/22 | | | 50,000 | | | 49,934 |
| CenterPoint Energy 5.95% 2/1/17 | | | 70,000 | | | 81,834 |
| CMS Energy | | | | | | |
| 4.25% 9/30/15 | | | 45,000 | | | 48,092 |
| 6.25% 2/1/20 | | | 30,000 | | | 35,942 |
| ComEd Financing III | | | | | | |
| 6.35% 3/15/33 | | | 60,000 | | | 62,400 |
| • | FPL Group Capital 6.65% 6/15/67 | | | 5,000 | | | 5,418 |
| Great Plains Energy | | | | | | |
| 5.292% 6/15/22 | | | 105,000 | | | 120,601 |
| • | Integrys Energy Group | | | | | | |
| 6.11% 12/1/66 | | | 70,000 | | | 73,566 |
| Ipalco Enterprises 5.00% 5/1/18 | | | 35,000 | | | 37,014 |
| LG&E & KU Energy | | | | | | |
| 3.75% 11/15/20 | | | 80,000 | | | 83,030 |
| 4.375% 10/1/21 | | | 155,000 | | | 171,404 |
| • | NextEra Energy Capital | | | | | | |
| Holdings 6.35% 10/1/66 | | | 110,000 | | | 116,701 |
| Pennsylvania Electric | | | | | | |
| 5.20% 4/1/20 | | | 75,000 | | | 85,770 |
| PPL Capital Funding | | | | | | |
| 4.20% 6/15/22 | | | 20,000 | | | 21,538 |
| •6.70% 3/30/67 | | | 40,000 | | | 42,190 |
| Public Service Company of | | | | | | |
| Oklahoma 5.15% 12/1/19 | | | 115,000 | | | 133,339 |
| Puget Energy 6.00% 9/1/21 | | | 30,000 | | | 33,768 |
| • | Puget Sound Energy | | | | | | |
| 6.974% 6/1/67 | | | 110,000 | | | 116,138 |
| SCANA 4.125% 2/1/22 | | | 160,000 | | | 168,333 |
| • | Wisconsin Energy 6.25% 5/15/67 | | | 135,000 | | | 144,930 |
| | | | | | | 2,179,164 |
2012 Annual report · Delaware Pooled Trust
(continues) 85
Statements of net assets
Delaware Pooled® Trust — The Core Plus Fixed Income Bond Portfolio
| | Principal | | Value |
| | | Amount° | | (U.S. $) |
| Corporate Bonds (continued) | | | |
| Energy – 3.90% | | | | | | |
| Ecopetrol 7.625% 7/23/19 | USD | | 102,000 | | $ | 132,600 |
| # | ENI 144A 4.15% 10/1/20 | | | 100,000 | | | 102,610 |
| Pemex Project Funding Master | | | | | | |
| Trust 6.625% 6/15/35 | | | 50,000 | | | 62,625 |
| Petrobras International Finance | | | | | | |
| 3.875% 1/27/16 | | | 65,000 | | | 69,377 |
| 5.375% 1/27/21 | | | 115,000 | | | 130,991 |
| Petrohawk Energy 7.25% 8/15/18 | | | 160,000 | | | 182,612 |
| Petroleos de Venezuela | | | | | | |
| 9.00% 11/17/21 | | | 140,000 | | | 116,550 |
| Petroleos Mexicanos | | | | | | |
| 5.50% 6/27/44 | | | 70,000 | | | 76,475 |
| Pride International | | | | | | |
| 6.875% 8/15/20 | | | 240,000 | | | 309,059 |
| Range Resources 8.00% 5/15/19 | | | 110,000 | | | 122,100 |
| SandRidge Energy 8.75% 1/15/20 | | | 115,000 | | | 124,775 |
| Talisman Energy 5.50% 5/15/42 | | | 140,000 | | | 163,794 |
| # | TNK-BP Finance 144A | | | | | | |
| 7.50% 7/18/16 | | | 100,000 | | | 114,735 |
| Transocean | | | | | | |
| 3.80% 10/15/22 | | | 125,000 | | | 128,108 |
| 5.05% 12/15/16 | | | 130,000 | | | 145,735 |
| Weatherford Bermuda | | | | | | |
| 4.50% 4/15/22 | | | 105,000 | | | 111,996 |
| 9.625% 3/1/19 | | | 70,000 | | | 92,853 |
| # | Woodside Finance 144A | | | | | | |
| 8.125% 3/1/14 | | | 5,000 | | | 5,449 |
| 8.75% 3/1/19 | | | 120,000 | | | 160,806 |
| | | | | | | 2,353,250 |
| Finance Companies – 2.55% | | | | | | |
| # | CDP Financial 144A | | | | | | |
| 4.40% 11/25/19 | | | 250,000 | | | 289,991 |
| General Electric Capital | | | | | | |
| 5.55% 5/4/20 | | | 55,000 | | | 65,529 |
| 5.625% 5/1/18 | | | 20,000 | | | 23,785 |
| 6.00% 8/7/19 | | | 425,000 | | | 521,331 |
| •7.125% 12/15/49 | | | 100,000 | | | 114,867 |
| •# | ILFC E-Capital Trust II 144A | | | | | | |
| 6.25% 12/21/65 | | | 130,000 | | | 108,550 |
| International Lease Finance | | | | | | |
| 5.875% 4/1/19 | | | 25,000 | | | 26,610 |
| 6.25% 5/15/19 | | | 53,000 | | | 57,386 |
| 8.75% 3/15/17 | | | 15,000 | | | 17,590 |
| # | IPIC GMTN 144A 5.50% 3/1/22 | | | 200,000 | | | 231,500 |
| PHH 9.25% 3/1/16 | | | 70,000 | | | 81,200 |
| | | | | | | 1,538,339 |
| Insurance – 1.90% | | | | | | |
| Alleghany 4.95% 6/27/22 | | | 45,000 | | | 50,296 |
| • | Chubb 6.375% 3/29/67 | | | 85,000 | | | 92,650 |
| # | Highmark 144A | | | | | | |
| 4.75% 5/15/21 | | | 40,000 | | | 40,926 |
| 6.125% 5/15/41 | | | 15,000 | | | 15,764 |
| *• | ING Groep 5.775% 12/29/49 | | | 40,000 | | | 38,000 |
| # | ING US 144A 5.50% 7/15/22 | | | 65,000 | | | 70,798 |
| # | Liberty Mutual Group 144A | | | | | | |
| 4.95% 5/1/22 | | | 65,000 | | | 71,120 |
| 6.50% 5/1/42 | | | 75,000 | | | 85,774 |
| MetLife | | | | | | |
| 3.048% 12/15/22 | | | 115,000 | | | 116,882 |
| 6.817% 8/15/18 | | | 35,000 | | | 44,286 |
| # | Metropolitan Life Global | | | | | | |
| Funding I 144A | | | | | | |
| 3.875% 4/11/22 | | | 115,000 | | | 127,083 |
| Montpelier Re Holdings | | | | | | |
| 4.70% 10/15/22 | | | 60,000 | | | 61,624 |
| Prudential Financial | | | | | | |
| 3.875% 1/14/15 | | | 60,000 | | | 63,831 |
| 6.00% 12/1/17 | | | 115,000 | | | 139,243 |
| =•‡t# | Twin Reefs Pass | | | | | | |
| Through Trust 144A | | | | | | |
| 0.00% 12/29/49 | | | 300,000 | | | 0 |
| WellPoint 3.30% 1/15/23 | | | 125,000 | | | 129,578 |
| | | | | | | 1,147,855 |
| Natural Gas – 2.47% | | | | | | |
| El Paso Pipeline Partners | | | | | | |
| Operating 6.50% 4/1/20 | | | 85,000 | | | 104,502 |
| • | Enbridge Energy Partners | | | | | | |
| 8.05% 10/1/37 | | | 115,000 | | | 131,523 |
| Energy Transfer Partners | | | | | | |
| 9.70% 3/15/19 | | | 54,000 | | | 72,790 |
| Enterprise Products Operating | | | | | | |
| 4.05% 2/15/22 | | | 120,000 | | | 134,143 |
| •7.034% 1/15/68 | | | 140,000 | | | 160,127 |
| 9.75% 1/31/14 | | | 60,000 | | | 66,559 |
| # | GDF Suez 144A 2.875% 10/10/22 | | | 65,000 | | | 65,411 |
| Kinder Morgan Energy Partners | | | | | | |
| 3.45% 2/15/23 | | | 35,000 | | | 36,786 |
| 9.00% 2/1/19 | | | 105,000 | | | 142,301 |
| Nisource Finance 5.80% 2/1/42 | | | 65,000 | | | 78,081 |
| Plains All American Pipeline | | | | | | |
| 8.75% 5/1/19 | | | 90,000 | | | 122,205 |
| Sempra Energy 2.875% 10/1/22 | | | 85,000 | | | 87,320 |
| • | TransCanada Pipelines | | | | | | |
| 6.35% 5/15/67 | | | 180,000 | | | 193,623 |
| Williams Partners 7.25% 2/1/17 | | | 75,000 | | | 92,332 |
| | | | | | | 1,487,703 |
| Real Estate – 2.32% | | | | | | |
| Alexandria Real Estate | | | | | | |
| Equities 4.60% 4/1/22 | | | 90,000 | | | 97,618 |
| Boston Properties 3.85% 2/1/23 | | | 65,000 | | | 70,257 |
| Brandywine Operating Partnership | | | | | | |
| 4.95% 4/15/18 | | | 65,000 | | | 71,356 |
| BRE Properties 3.375% 1/15/23 | | | 65,000 | | | 65,351 |
2012 Annual report · Delaware Pooled Trust
86
| | Principal | | Value |
| | | Amount° | | (U.S. $) |
| Corporate Bonds (continued) | | | |
| Real Estate (continued) | | | | | | |
| Developers Diversified Realty | | | | | | |
| 4.625% 7/15/22 | USD | | 25,000 | | $ | 27,752 |
| 7.875% 9/1/20 | | | 160,000 | | | 208,407 |
| 9.625% 3/15/16 | | | 105,000 | | | 130,352 |
| Digital Realty Trust | | | | | | |
| 5.25% 3/15/21 | | | 115,000 | | | 130,267 |
| 5.875% 2/1/20 | | | 50,000 | | | 58,259 |
| Liberty Property 4.125% 6/15/22 | | | 40,000 | | | 42,603 |
| Mack-Cali Realty 4.50% 4/18/22 | | | 55,000 | | | 59,311 |
| National Retail Properties | | | | | | |
| 3.80% 10/15/22 | | | 30,000 | | | 31,130 |
| Realty Income | | | | | | |
| 2.00% 1/31/18 | | | 40,000 | | | 40,390 |
| 3.25% 10/15/22 | | | 45,000 | | | 45,145 |
| Regency Centers 5.875% 6/15/17 | | | 93,000 | | | 107,951 |
| UDR 4.625% 1/10/22 | | | 85,000 | | | 94,967 |
| # | WEA Finance 144A | | | | | | |
| 3.375% 10/3/22 | | | 45,000 | | | 45,698 |
| 4.625% 5/10/21 | | | 65,000 | | | 71,664 |
| | | | | | | 1,398,478 |
| Technology – 1.40% | | | | | | |
| Fiserv 3.50% 10/1/22 | | | 50,000 | | | 50,983 |
| GXS Worldwide 9.75% 6/15/15 | | | 120,000 | | | 124,650 |
| Motorola Solutions | | | | | | |
| 3.75% 5/15/22 | | | 135,000 | | | 140,706 |
| National Semiconductor | | | | | | |
| 6.60% 6/15/17 | | | 140,000 | | | 173,954 |
| Oracle | | | | | | |
| 2.50% 10/15/22 | | | 120,000 | | | 122,434 |
| 5.75% 4/15/18 | | | 5,000 | | | 6,163 |
| # | Seagate Technology | | | | | | |
| International 144A | | | | | | |
| 10.00% 5/1/14 | | | 73,000 | | | 79,570 |
| Symantec 4.20% 9/15/20 | | | 10,000 | | | 10,646 |
| Xerox 6.35% 5/15/18 | | | 115,000 | | | 134,936 |
| | | | | | | 844,042 |
| Transportation – 0.94% | | | | | | |
| # | Brambles USA 144A | | | | | | |
| 3.95% 4/1/15 | | | 65,000 | | | 67,954 |
| 5.35% 4/1/20 | | | 115,000 | | | 129,081 |
| # | ERAC USA Finance 144A | | | | | | |
| 5.25% 10/1/20 | | | 215,000 | | | 247,004 |
| # | Penske Truck Leasing 144A | | | | | | |
| 3.375% 3/15/18 | | | 30,000 | | | 29,905 |
| 4.875% 7/11/22 | | | 90,000 | | | 92,187 |
| | | | | | | 566,131 |
| Total Corporate Bonds | | | | | | |
| (cost $23,597,731) | | | | | | 25,348,770 |
| | | | |
| Non-Agency Asset-Backed Securities – 3.50% | | | |
| AEP Texas Central Transition | | | | | | |
| Funding Series 2012-1 A2 | | | | | | |
| 1.976% 6/1/21 | | | 115,000 | | | 118,907 |
| • | Ally Master Owner Trust | | | | | | |
| Series 2011-1 A1 | | | | | | |
| 1.084% 1/15/16 | | | 100,000 | | | 100,757 |
| # | Avis Budget Rental Car | | | | | | |
| Funding AESOP | | | | | | |
| Series 2011-2A A 144A | | | | | | |
| 2.37% 11/20/14 | | | 100,000 | | | 102,762 |
| Bank of America Auto Trust | | | | | | |
| Series 2012-1 A3 | | | | | | |
| 0.78% 6/15/16 | | | 130,000 | | | 130,715 |
| Capital One Multi-Asset | | | | | | |
| Execution Trust | | | | | | |
| •Series 2007-A1 A1 | | | | | | |
| 0.264% 11/15/19 | | | 100,000 | | | 99,263 |
| Series 2007-A7 A7 | | | | | | |
| 5.75% 7/15/20 | | | 100,000 | | | 122,250 |
| CenterPoint Energy Transition | | | | | | |
| Bond Series 2012-1 A2 | | | | | | |
| 2.161% 10/15/21 | | | 100,000 | | | 104,706 |
| • | Citicorp Residential Mortgage | | | | | | |
| Securities Series 2006-3 A5 | | | | | | |
| 5.948% 11/25/36 | | | 300,000 | | | 271,744 |
| Ford Credit Auto Lease Trust | | | | | | |
| Series 2012-A A4 | | | | | | |
| 1.03% 4/15/15 | | | 115,000 | | | 115,830 |
| GE Capital Credit Card Master | | | | | | |
| Note Trust Series 2012-6 A | | | | | | |
| 1.36% 8/17/20 | | | 100,000 | | | 100,953 |
| # | Golden Credit Card Trust 144A | | | | | | |
| Series 2012-2A A1 | | | | | | |
| 1.77% 1/15/19 | | | 100,000 | | | 102,859 |
| Series 2012-5A A | | | | | | |
| 0.79% 9/15/17 | | | 100,000 | | | 100,000 |
| John Deere Owner Trust | | | | | | |
| Series 2011-A A4 | | | | | | |
| 1.96% 4/16/18 | | | 70,000 | | | 71,750 |
| # | Master Credit Card Trust | | | | | | |
| Series 2012-2A A 144A | | | | | | |
| 0.78% 4/21/17 | | | 100,000 | | | 99,980 |
| Mid-State Trust Series 11 A1 | | | | | | |
| 4.864% 7/15/38 | | | 13,076 | | | 13,489 |
| # | Navistar Financial Owner Trust | | | | | | |
| Series 2012-A A2 144A | | | | | | |
| 0.85% 3/18/15 | | | 90,000 | | | 90,116 |
| # | Sonic Capital Series 2011-1A A2 | | | | | | |
| 144A 5.438% 5/20/41 | | | 95,750 | | | 106,854 |
| •# | Trafigura Securitisation Finance | | | | | | |
| Series 2012-1A A 144A | | | | | | |
| 2.614% 10/15/15 | | | 45,000 | | | 45,731 |
| # | Volvo Financial Equipment | | | | | | |
| Series 2012-1A A4 144A | | | | | | |
| 1.09% 8/15/17 | | | 95,000 | | | 95,734 |
2012 Annual report · Delaware Pooled Trust
(continues) 87
Statements of net assets
Delaware Pooled® Trust — The Core Plus Fixed Income Bond Portfolio
| | Principal | | Value |
| | | Amount° | | (U.S. $) |
| Non-Agency Asset-Backed Securities (continued) | | | |
| World Financial Network | | | | | | |
| Credit Card Master Trust | | | | | | |
| Series 2012-B A | | | | | | |
| 1.76% 5/17/21 | USD | | 45,000 | | $ | 45,210 |
| World Omni Automobile | | | | | | |
| Lease Securitization Trust | | | | | | |
| Series 2012-A A3 | | | | | | |
| 0.93% 11/16/15 | | | 70,000 | | | 70,475 |
| Total Non-Agency Asset-Backed | | | | | | |
| Securities (cost $2,064,390) | | | | | | 2,110,085 |
| |
| Non-Agency Collateralized Mortgage Obligations – 0.08% |
| Citicorp Mortgage Securities | | | | | | |
| Series 2006-4 3A1 | | | | | | |
| 5.50% 8/25/21 | | | 1,617 | | | 1,684 |
| •# | MASTR Specialized Loan Trust | | | | | | |
| Series 2005-2 A2 144A | | | | | | |
| 5.006% 7/25/35 | | | 44,898 | | | 45,621 |
| Total Non-Agency Collateralized | | | | | | |
| Mortgage Obligations | | | | | | |
| (cost $46,398) | | | | | | 47,305 |
| |
| ΔRegional Bonds – 2.33% | | | | | | |
| Australia – 1.54% | | | | | | |
| New South Wales Treasury | | | | | | |
| 6.00% 4/1/19 | AUD | | 166,000 | | | 198,047 |
| 6.00% 3/1/22 | AUD | | 110,000 | | | 133,508 |
| Queensland Treasury | | | | | | |
| 6.25% 6/14/19 | AUD | | 294,000 | | | 354,925 |
| Treasury Corporation of | | | | | | |
| Victoria 6.00% 10/17/22 | AUD | | 195,000 | | | 239,593 |
| | | | | | | 926,073 |
| Canada – 0.79% | | | | | | |
| Province of British Columbia | | | | | | |
| 2.00% 10/23/22 | USD | | 115,000 | | | 114,783 |
| Province of Manitoba | | | | | | |
| 2.10% 9/6/22 | USD | | 95,000 | | | 95,330 |
| Province of Ontario | | | | | | |
| 3.15% 6/2/22 | CAD | | 248,000 | | | 256,977 |
| Province of Quebec | | | | | | |
| 4.25% 12/1/21 | CAD | | 11,000 | | | 12,339 |
| | | | | | | 479,429 |
| Total Regional Bonds | | | | | | |
| (cost $1,341,096) | | | | | | 1,405,502 |
| |
| «Senior Secured Loans – 4.68% | | | | | | |
| Bausch & Lomb Tranche B | | | | | | |
| 4.75% 4/17/19 | USD | | 59,850 | | | 60,620 |
| BNY ConvergEx Group | | | | | | |
| 8.75% 12/16/17 | | | 35,221 | | | 32,858 |
| (EZE Castle Software) | | | | | | |
| 8.75% 11/29/17 | | | 14,779 | | | 13,788 |
| Brickman Group Holdings | | | | | | |
| Tranche B1 5.50% 10/14/16 | | | 47,879 | | | 48,537 |
| Burlington Coat Factory | | | | | | |
| Warehouse 5.75% 5/1/17 | | | 224,076 | | | 226,281 |
| Caesars Entertainment | | | | | | |
| Operating Tranche B1 | | | | | | |
| 5.494% 1/28/18 | | | 96,000 | | | 86,316 |
| Chrysler Group 6.00% 5/24/17 | | | 154,339 | | | 157,983 |
| Clear Channel | | | | | | |
| Communications Tranche A | | | | | | |
| 3.639% 7/30/14 | | | 133,594 | | | 130,171 |
| DaVita | | | | | | |
| Tranche B 4.50% 10/20/16 | | | 59,696 | | | 60,188 |
| Tranche B2 4.00% 8/1/19 | | | 90,000 | | | 90,225 |
| Delos Aircraft 4.75% 3/17/16 | | | 200,000 | | | 203,000 |
| Dynegy Power 1st Lien | | | | | | |
| 9.25% 8/5/16 | | | 59,549 | | | 62,266 |
| Emdeon Tranche B | | | | | | |
| 5.00% 11/2/18 | | | 109,176 | | | 110,623 |
| First Data 5.00% 3/24/17 | | | 84,068 | | | 82,912 |
| Getty Images Tranche B | | | | | | |
| 4.75% 9/19/19 | | | 120,000 | | | 120,550 |
| Goodman Global Tranche B | | | | | | |
| 5.75% 10/28/16 | | | 41,542 | | | 41,697 |
| Houghton International | | | | | | |
| Tranche B 6.75% 1/11/16 | | | 44,046 | | | 44,486 |
| IASIS Healthcare Tranche B | | | | | | |
| 5.00% 5/3/18 | | | 29,848 | | | 29,970 |
| Immucor 5.75% 8/9/19 | | | 189,200 | | | 191,407 |
| Infor US Tranche B2 | | | | | | |
| 4.00% 4/5/18 | | | 59,850 | | | 60,626 |
| Intelsat Jackson Holdings | | | | | | |
| Tranche B1 4.50% 4/2/18 | | | 49,874 | | | 50,294 |
| Level 3 Financing Tranche B | | | | | | |
| 1st Lien 4.75% 8/1/19 | | | 115,000 | | | 115,883 |
| Multiplan Tranche B | | | | | | |
| 4.75% 8/26/17 | | | 12,542 | | | 12,618 |
| Nuveen Investments | | | | | | |
| 5.863% 5/13/17 | | | 100,000 | | | 100,110 |
| 8.25% 3/1/19 | | | 65,000 | | | 66,300 |
| OSI Restaurant Partners Tranche B | | | | | | |
| 1st Lien 3.50% 10/5/19 | | | 150,000 | | | 150,985 |
| PQ 6.74% 7/30/15 | | | 50,000 | | | 49,750 |
| Toys R US Tranche B | | | | | | |
| 6.00% 9/1/16 | | | 73,810 | | | 73,810 |
| Truven Health Tranche B | | | | | | |
| 5.75% 5/23/19 | | | 90,000 | | | 90,225 |
| Univision Communications | | | | | | |
| 4.489% 3/31/17 | | | 64,888 | | | 63,580 |
| Vantage Drilling Tranche B | | | | | | |
| 6.25% 10/17/17 | | | 60,000 | | | 58,286 |
| Visant 5.25% 12/22/16 | | | 94,188 | | | 90,460 |
| Zayo Group Tranche B 1st | | | | | | |
| Lien 5.25% 7/2/19 | | | 45,000 | | | 45,270 |
| Total Senior Secured Loans | | | | | | |
| (cost $2,788,685) | | | | | | 2,822,075 |
2012 Annual report · Delaware Pooled Trust
88
| | Principal | | Value |
| | | Amount° | | (U.S. $) |
| ΔSovereign Bonds – 3.55% | | | |
| Brazil – 0.14% | | | | | | |
| Brazilian Government | | | | | | |
| International | | | | | | |
| 8.875% 10/14/19 | USD | | 60,000 | | $ | 86,700 |
| | | | | | | 86,700 |
| Finland – 0.15% | | | | | | |
| Finland Government | | | | | | |
| 4.00% 7/4/25 | EUR | | 56,000 | | | 88,246 |
| | | | | | | 88,246 |
| Indonesia – 0.49% | | | | | | |
| Indonesia Treasury Bonds | | | | | | |
| 7.00% 5/15/22 | IDR | | 1,569,000,000 | | | 179,341 |
| 7.00% 5/15/27 | IDR | | 632,000,000 | | | 70,897 |
| 11.00% 11/15/20 | IDR | | 338,000,000 | | | 47,226 |
| | | | | | | 297,464 |
| Mexico – 0.37% | | | | | | |
| Mexican Bonos | | | | | | |
| 8.00% 12/17/15 | MXN | | 2,012,000 | | | 166,542 |
| Mexico Government | | | | | | |
| International | | | | | | |
| 4.75% 3/8/44 | USD | | 50,000 | | | 55,625 |
| | | | | | | 222,167 |
| Norway – 0.86% | | | | | | |
| # | Kommunalbanken 144A | | | | | | |
| 1.00% 9/26/17 | | | 100,000 | | | 99,905 |
| Norway Government | | | | | | |
| 4.25% 5/19/17 | NOK | | 189,000 | | | 37,115 |
| 4.50% 5/22/19 | NOK | | 799,000 | | | 164,348 |
| 5.00% 5/15/15 | NOK | | 1,150,000 | | | 219,465 |
| | | | | | | 520,833 |
| Peru – 0.07% | | | | | | |
| Peru Government | | | | | | |
| International | | | | | | |
| 5.625% 11/18/50 | USD | | 30,000 | | | 39,000 |
| | | | | | | 39,000 |
| Philippines – 0.25% | | | | | | |
| Philippine Government | | | | | | |
| International | | | | | | |
| 9.50% 10/21/24 | | | 90,000 | | | 147,600 |
| | | | | | | 147,600 |
| Poland – 0.15% | | | | | | |
| Poland Government | | | | | | |
| 5.75% 10/25/21 | PLN | | 259,000 | | | 88,606 |
| | | | | | | 88,606 |
| South Africa – 0.38% | | | | | | |
| South Africa Government | | | | | | |
| 7.25% 1/15/20 | ZAR | | 446,000 | | | 53,764 |
| 8.00% 12/21/18 | ZAR | | 507,000 | | | 64,015 |
| 10.50% 12/21/26 | ZAR | | 795,000 | | | 113,462 |
| | | | | | | 231,241 |
| Turkey – 0.11% | | | | | | |
| Turkey Government Bond | | | | | | |
| 9.00% 3/5/14 | TRY | | 117,000 | | | 67,321 |
| | | | | | | 67,321 |
| United Kingdom – 0.58% | | | | | | |
| United Kingdom Gilt | | | | | | |
| 4.00% 3/7/22 | GBP | | 55,349 | | $ | 107,241 |
| 4.25% 12/7/27 | GBP | | 43,000 | | | 85,891 |
| 4.75% 3/7/20 | GBP | | 79,000 | | | 158,257 |
| | | | | | | 351,389 |
| Total Sovereign Bonds | | | | | | |
| (cost $2,032,946) | | | | | | 2,140,567 |
| |
| Supranational Banks – 0.18% | | | | | | |
| Andina de Fomento | | | | | | |
| 4.375% 6/15/22 | USD | | 60,000 | | | 65,542 |
| International Bank for | | | | | | |
| Reconstruction & | | | | | | |
| Development | | | | | | |
| 3.375% 4/30/15 | NOK | | 250,000 | | | 45,587 |
| Total Supranational Banks | | | | | | |
| (cost $110,629) | | | | | | 111,129 |
| |
| U.S. Treasury Obligations – 9.01% | | | | | | |
| U.S. Treasury Bond | | | | | | |
| 3.00% 5/15/42 | | | 1,870,000 | | | 1,931,944 |
| U.S. Treasury Notes | | | | | | |
| 0.75% 10/31/17 | | | 85,000 | | | 85,159 |
| ∞1.625% 8/15/22 | | | 3,435,000 | | | 3,416,753 |
| Total U.S. Treasury Obligations | | | | | | |
| (cost $5,422,205) | | | | | | 5,433,856 |
| |
| | | | Number of | | | |
| | | | Shares | | | |
| Preferred Stock – 0.44% | | | | | | |
| Alabama Power 5.625% | | | 1,855 | | | 47,358 |
| BB&T 5.85% | | | 1,450 | | | 38,034 |
| • | PNC Financial Services | | | | | | |
| Group 8.25% | | | 110,000 | | | 114,477 |
| • | US Bancorp 6.50% | | | 200 | | | 5,914 |
| * | Wells Fargo 5.20% | | | 2,400 | | | 61,416 |
| Total Preferred Stock | | | | | | |
| (cost $254,833) | | | | | | 267,199 |
| |
| | | | Number of | | | |
| | | | Contracts | | | |
| Option Purchased – 0.00% | | | | | | |
| Put Option – 0.00% | | | | | | |
| AUD, strike price $1.00, | | | | | | |
| expires 11/14/12 (BAML) | | | 167,000 | | | 39 |
| Total Option Purchased | | | | | | |
| (cost $1,645) | | | | | | 39 |
2012 Annual report · Delaware Pooled Trust
(continues) 89
Statements of net assets
Delaware Pooled® Trust — The Core Plus Fixed Income Bond Portfolio
| | Principal | | Value | |
| | | Amount° | | (U.S. $) | |
| Short-Term Investments – 20.89% | | | | | | | |
| Repurchase Agreements – 20.89% | | | | | | | |
| Bank of America 0.24%, | | | | | | | |
| dated 10/31/12, | | | | | | | |
| to be repurchased on | | | | | | | |
| 11/1/12, repurchase | | | | | | | |
| price $4,881,188 | | | | | | | |
| (collateralized by U.S. | | | | | | | |
| government obligations | | | | | | | |
| 0.00%-1.25% | | | | | | | |
| 1/10/13-8/31/16; | | | | | | | |
| market value $4,978,779) | USD | | 4,881,156 | | $ | 4,881,156 | |
| | BNP Paribas 0.28%, | | | | | | | |
| dated 10/31/12, | | | | | | | |
| to be repurchased on | | | | | | | |
| 11/1/12, repurchase | | | | | | | |
| price $7,715,904 | | | | | | | |
| (collateralized by U.S. | | | | | | | |
| government obligations | | | | | | | |
| 0.00-2.00% | | | | | | | |
| 1/24/13-4/15/16; | | | | | | | |
| market value $7,870,161) | | | 7,715,844 | | | 7,715,844 | |
| Total Short-Term Investments | | | | | | | |
| (cost $12,597,000) | | | | | | 12,597,000 | |
| |
| Total Value of Securities – 116.19% | | | | | | | |
| (cost $67,544,692) | | | | | | 70,079,898 | |
| |
| | | | Number of | | | | |
| | | | Shares | | | | |
| **Securities Lending Collateral – 0.07% | | | | | | | |
| Investment Companies | | | | | | | |
| Delaware Investments | | | | | | | |
| Collateral Fund No. 1 | | | 43,642 | | | 43,642 | |
| †@ | Mellon GSL Reinvestment | | | | | | | |
| Trust II | | | 49,094 | | | 0 | |
| Total Securities Lending Collateral | | | | | | | |
| (cost $92,736) | | | | | | 43,642 | |
| |
| Total Value of Securities – 116.26% | | | | | | | |
| (cost $67,637,428) | | | | | | 70,123,540 | © |
| Obligation to Return Securities | | | | | | | |
| Lending Collateral – (0.15%) | | | | | | (92,736 | ) |
| «Other Liabilities Net of Receivables | | | | | | | |
| and Other Assets – (16.11%) | | | | | | (9,717,701 | ) |
| Net Assets Applicable to 5,723,046 | | | | | | | |
| Shares Outstanding; Equivalent | | | | | | | |
| to $10.54 Per Share – 100.00% | | | | | $ | 60,313,103 | |
| Components of Net Assets at October 31, 2012: | | | |
| Shares of beneficial interest | | | |
| (unlimited authorization – no par) | $ | 58,130,441 | |
| Undistributed net investment income | | 1,450,407 | |
| Accumulated net realized loss on investments | | | |
| and derivatives | | (1,731,375 | ) |
| Net unrealized appreciation of investments | | | |
| and derivatives | | 2,463,630 | |
| Total net assets | $ | 60,313,103 | |
| ° | Principal amount is stated in the currency in which each security is denominated. |
| • | Variable rate security. The rate shown is the rate as of October 31, 2012. Interest rates reset periodically. |
| # | Security exempt from registration under Rule 144A of the Securities Act of 1933, as amended. At October 31, 2012, the aggregate value of Rule 144A securities was $7,250,753 which represented 12.02% of the Portfolio’s net assets. See Note 11 in “Notes to financial statements.” |
| t | Pass Through Agreement. Security represents the contractual right to receive a proportionate amount of underlying payments due to the counterparty pursuant to various agreements related to the rescheduling of obligations and the exchange of certain notes. |
| @ | Illiquid security. At October 31, 2012, the aggregate value of illiquid securities was $0 which represented 0.00% of the Portfolio’s net assets. See Note 11 in “Notes to financial statements.” |
| * | Fully or partially on loan. |
| = | Security is being fair valued in accordance with the Portfolio’s fair valuation policy. At October 31, 2012, the aggregate value of fair valued securities was $0, which represented 0.00% of the Portfolio’s net assets. See Note 1 in “Notes to Financial Statements.” |
| ‡ | Non income producing security. Security is currently in default. |
| Δ | Securities have been classified by country of origin. |
| « | Senior Secured Loans generally pay interest at rates which are periodically redetermined by reference to a base lending rate plus a premium. These base lending rates are generally: (i) the prime rate offered by one or more United States banks, (ii) the lending rate offered by one or more European banks such as the London Inter-Bank Offered Rate (LIBOR), and (iii) the certificate of deposit rate. Senior Secured Loans may be subject to restrictions on resale. Stated rate in effect at October 31, 2012. |
| ∞ | Fully or partially pledged as collateral for futures contracts. |
| ** | See Note 10 in “Notes to financial statements” for additional information on securities lending collateral. |
| † | Non income producing security. |
| © | Includes $89,365 of securities loaned. |
| « | Includes foreign currency valued at $89,505 with a cost of $89,183. |
2012 Annual report · Delaware Pooled Trust
90
| |
The following foreign currency exchange contracts, futures contracts and swap contracts were outstanding at October 31, 2012:1 |
Foreign Currency Exchange Contracts
| | | | | | | | | | | | | | Unrealized |
| | Contracts to | | | | | | | Settlement | | Appreciation |
| Counterparty | | Receive (Deliver) | | In Exchange For | | Date | | (Depreciation) |
| BAML | | AUD | | (371,521 | ) | | USD | | 383,475 | | | 12/14/12 | | | $ | (606 | ) | |
| BAML | | BRL | | 53,196 | | | USD | | (26,050 | ) | | 12/14/12 | | | | (28 | ) | |
| BAML | | CAD | | 118,428 | | | USD | | (118,297 | ) | | 12/14/12 | | | | 138 | | |
| BAML | | COP | | 125,377,000 | | | USD | | (68,177 | ) | | 12/14/12 | | | | 150 | | |
| BAML | | EUR | | (392,323 | ) | | USD | | 507,607 | | | 12/14/12 | | | | (991 | ) | |
| BAML | | JPY | | 2,958,050 | | | USD | | (37,133 | ) | | 12/14/12 | | | | (54 | ) | |
| BAML | | PHP | | 2,081,050 | | | USD | | (50,535 | ) | | 12/14/12 | | | | 76 | | |
| BAML | | TRY | | 160,407 | | | USD | | (88,544 | ) | | 12/14/12 | | | | 402 | | |
| BAML | | ZAR | | (2,060,436 | ) | | USD | | 235,470 | | | 12/14/12 | | | | (595 | ) | |
| CITI | | CLP | | 28,572,000 | | | USD | | (59,192 | ) | | 12/14/12 | | | | (190 | ) | |
| CITI | | TRY | | 160,407 | | | USD | | (88,599 | ) | | 12/14/12 | | | | 347 | | |
| GSC | | BRL | | 418,368 | | | USD | | (204,881 | ) | | 12/14/12 | | | | (234 | ) | |
| GSC | | GBP | | (108,495 | ) | | USD | | 174,035 | | | 12/14/12 | | | | (1,018 | ) | |
| HSBC | | EUR | | (27,325 | ) | | USD | | 35,281 | | | 12/14/12 | | | | (143 | ) | |
| HSBC | | GBP | | (57,745 | ) | | USD | | 92,616 | | | 12/14/12 | | | | (553 | ) | |
| HSBC | | JPY | | 7,308,450 | | | USD | | (91,842 | ) | | 12/14/12 | | | | (234 | ) | |
| HSBC | | MXN | | (1,425,853 | ) | | USD | | 108,737 | | | 12/14/12 | | | | 366 | | |
| HSBC | | PHP | | 2,081,050 | | | USD | | (50,597 | ) | | 12/14/12 | | | | 15 | | |
| HSBC | | TRY | | 72,640 | | | USD | | (40,119 | ) | | 12/14/12 | | | | 160 | | |
| JPMC | | BRL | | 213,000 | | | USD | | (104,315) | | | 12/14/12 | | | | (124 | ) | |
| JPMC | | EUR | | (139,506 | ) | | USD | | 180,088 | | | 12/14/12 | | | | (764 | ) | |
| JPMC | | NOK | | (453,396 | ) | | USD | | 78,453 | | | 12/14/12 | | | | (923 | ) | |
| MNB | | GBP | | (170 | ) | | USD | | 274 | | | 11/1/12 | | | | 0 | | |
| MSC | | BRL | | 188,208 | | | USD | | (92,250 | ) | | 12/14/12 | | | | (186 | ) | |
| MSC | | JPY | | (6,420,240 | ) | | USD | | 80,674 | | | 12/14/12 | | | | 198 | | |
| MSC | | NOK | | (387,527 | ) | | USD | | 67,060 | | | 12/14/12 | | | | (784 | ) | |
| MSC | | PHP | | 2,080,250 | | | USD | | (50,553 | ) | | 12/14/12 | | | | 40 | | |
| | | | | | | | | | | | | | | $ | (5,535 | ) | |
Futures Contracts
| | | | | | | | | | Notional | | | | | | | | Unrealized |
| Contracts | | | Cost | | Notional | | Expiration | | Appreciation |
| to Buy (Sell) | | | | | | (Proceeds) | | Value | | Date | | (Depreciation) |
| 1 | | Long Gilt | | $ | 190,980 | | | $ | 192,256 | | | 1/1/13 | | | $ | 1,276 | | |
| (2) | | U.S. Long Bond | | | (291,869 | ) | | | (298,625 | ) | | 1/1/13 | | | | (6,756 | ) | |
| (5) | | U.S. Treasury | | | | | | | | | | | | | | | | |
| | 10 yr Notes | | | (660,455 | ) | | | (665,156 | ) | | 12/20/12 | | | | (4,701 | ) | |
| | | | $ | (761,344 | ) | | | | | | | | | $ | (10,181 | ) | |
Swap Contracts
CDS Contracts
| | | | | | | Annual | | | | Unrealized |
| | Swap & | | Notional | | Protection | | Termination | | Appreciation |
| Counterparty | | Referenced Obligation | | Value | | Payments | | Date | | (Depreciation) |
| | Protection Purchased: | | | | | | | | | | | | | |
| | ITRAXX Europe | | | | | | | | | | | | | |
| | Crossover | | | | | | | | | | | | | |
| JPMC | | 18.1 5 yr CDS | | EUR | 80,000 | | 5.00% | | 12/20/17 | | | $ | (372 | ) | |
| JPMC | | 18.1 5 yr CDS | | | 115,000 | | 5.00% | | 12/20/17 | | | | (875 | ) | |
| JPMC | | 18.1 5 yr CDS | | | 230,000 | | 5.00% | | 12/20/17 | | | | (343 | ) | |
| | | | | | | | | | | | $ | (1,590 | ) | |
The use of foreign currency exchange contracts, futures contracts and swap contracts involves elements of market risk and risks in excess of the amounts recognized in the financial statements. The notional values and foreign currency exchange contracts presented above represent the Portfolio’s total exposure in such contracts, whereas only the net unrealized appreciation (depreciation) is reflected in the Portfolio’s net assets.
1See Note 9 in “Notes to financial statements.”
Summary of Abbreviations:
ARM — Adjustable Rate Mortgage
AUD — Australian Dollar
BAML — Bank of America Merrill Lynch
BRL — Brazilian Real
CAD — Canadian Dollar
CDS — Credit Default Swap
CITI — Citigroup Global Markets
CLP — Chilean Peso
COP — Colombian Peso
EUR — European Monetary Unit
GBP — British Pound Sterling
GNMA — Government National Mortgage Association
GSC — Goldman Sachs Capital
HSBC — Hong Kong Shanghai Bank
IDR — Indonesian Rupiah
JPMC — JPMorgan Chase Bank
JPY — Japanese Yen
MNB — Mellon National Bank
MASTR — Mortgage Asset Securitization Transactions, Inc.
MSC — Morgan Stanley Capital
MXN — Mexican Peso
NCUA — National Credit Union Administration
NOK — Norwegian Krone
PHP — Philippine Peso
PLN — Polish Zloty
REMIC — Real Estate Mortgage Investment Conduit
S.F. — Single Family
TBA — To be announced
TRY— Turkish Lira
USD — United States Dollar
yr — Year
ZAR — South African Rand
See accompanying notes, which are an integral part of the financial statements.
2012 Annual report · Delaware Pooled Trust
(continues) 91
Statements of net assets
Delaware Pooled® Trust — The International Equity Portfolio
October 31, 2012
| | | | Number of | | Value |
| | | Shares | | (U.S. $) |
| ΔCommon Stock – 99.30% | | | | | | |
| Australia – 5.38% | | | | | | |
| Amcor | | | 948,010 | | $ | 7,770,125 |
| AMP | | | 2,031,703 | | | 9,675,222 |
| QBE Insurance Group | | | 565,989 | | | 7,739,473 |
| | | | | | | 25,184,820 |
| Belgium – 0.00% | | | | | | |
| û† | Ageas VVPR Strip | | | 36,617 | | | 285 |
| | | | | | | 285 |
| France – 15.80% | | | | | | |
| Carrefour | | | 404,739 | | | 9,775,949 |
| * | Cie de Saint-Gobain | | | 276,290 | | | 9,734,471 |
| France Telecom | | | 1,019,620 | | | 11,365,165 |
| † | GDF Suez | | | 162,519 | | | 211 |
| Sanofi | | | 150,229 | | | 13,202,297 |
| Societe Generale | | | 135,079 | | | 4,292,742 |
| Total | | | 276,063 | | | 13,886,784 |
| * | Vallourec | | | 99,539 | | | 4,093,264 |
| Vinci | | | 170,578 | | | 7,547,239 |
| | | | | | | 73,898,122 |
| Germany – 6.76% | | | | | | |
| Daimler | | | 95,456 | | | 4,456,000 |
| Deutsche Telekom | | | 1,021,118 | | | 11,655,758 |
| RWE | | | 339,247 | | | 15,497,966 |
| | | | | | | 31,609,724 |
| Israel – 2.32% | | | | | | |
| Teva Pharmaceutical Industries ADR | | | 268,116 | | | 10,837,249 |
| | | | | | | 10,837,249 |
| Italy – 3.61% | | | | | | |
| ENI | | | 504,634 | | | 11,580,653 |
| Intesa Sanpaolo | | | 3,306,594 | | | 5,308,724 |
| | | | | | | 16,889,377 |
| Japan – 21.13% | | | | | | |
| Astellas Pharma | | | 233,600 | | | 11,604,636 |
| Canon | | | 422,100 | | | 13,633,699 |
| Hoya | | | 202,000 | | | 4,089,858 |
| Kao | | | 378,100 | | | 10,620,813 |
| Nintendo | | | 29,600 | | | 3,812,416 |
| Seven & I Holdings | | | 388,773 | | | 11,992,221 |
| Shin-Etsu Chemical | | | 59,600 | | | 3,360,271 |
| Takeda Pharmaceutical | | | 293,000 | | | 13,619,370 |
| Tokio Marine Holdings | | | 402,052 | | | 10,643,812 |
| * | Tokyo Electron | | | 111,600 | | | 5,012,667 |
| Toyota Motor | | | 208,700 | | | 8,014,352 |
| Trend Micro | | | 87,000 | | | 2,437,286 |
| | | | | | | 98,841,401 |
| Netherlands – 3.97% | | | | | | |
| Koninklijke Ahold | | | 917,234 | | | 11,675,144 |
| Reed Elsevier | | | 515,584 | | | 6,924,792 |
| | | | | | | 18,599,936 |
| Singapore – 4.34% | | | | | | |
| Jardine Matheson Holdings | | | 100,415 | | | 6,185,564 |
| Singapore Telecommunications | | | 2,663,602 | | | 7,028,722 |
| United Overseas Bank | | | 473,642 | | | 7,091,530 |
| | | | | | | 20,305,816 |
| Spain – 6.79% | | | | | | |
| | Banco Santander | | | 753,323 | | | 5,650,967 |
| Iberdrola | | | 2,863,497 | | | 14,804,972 |
| Telefonica | | | 859,560 | | | 11,316,389 |
| | | | | | | 31,772,328 |
| Switzerland – 7.37% | | | | | | |
| † | ABB | | | 492,910 | | | 8,880,689 |
| Novartis | | | 237,281 | | | 14,279,917 |
| † | Zurich Financial Services | | | 45,908 | | | 11,312,488 |
| | | | | | | 34,473,094 |
| Taiwan – 1.71% | | | | | | |
| Taiwan Semiconductor | | | | | | |
| Manufacturing ADR | | | 502,632 | | | 7,991,849 |
| | | | | | | 7,991,849 |
| United Kingdom – 20.12% | | | | | | |
| BG Group | | | 413,417 | | | 7,655,328 |
| BP | | | 1,580,213 | | | 11,304,104 |
| Compass Group | | | 857,690 | | | 9,411,570 |
| GlaxoSmithKline | | | 570,409 | | | 12,762,303 |
| National Grid | | | 506,234 | | | 5,771,468 |
| Royal Dutch Shell Class A | | | 305,666 | | | 10,478,349 |
| Tesco | | | 2,697,736 | | | 13,924,146 |
| Unilever | | | 345,631 | | | 12,889,481 |
| Vodafone Group | | | 3,667,640 | | | 9,957,827 |
| | | | | | | 94,154,576 |
| Total Common Stock | | | | | | |
| (cost $468,550,220) | | | | | | 464,558,577 |
| |
| | | Principal | | | |
| | | Amount (U.S. $) | | | |
| Short-Term Investments – 0.73% | | | | | | |
| ≠Discount Note – 0.00% | | | | | | |
| Federal Home Loan Bank | | | | | | |
| 0.095% 11/28/12 | | $ | 16,196 | | | 16,195 |
| | | | | | | 16,195 |
| Repurchase Agreements – 0.63% | | | | | | |
| Bank of America 0.24%, dated | | | | | | |
| 10/31/12, to be repurchased | | | | | | |
| on 11/1/12, repurchase price | | | | | | |
| $1,133,791 (collateralized by | | | | | | |
| U.S. government obligations | | | | | | |
| 0.00%-1.25% 1/10/13-8/31/16; | | | | | | |
| market value $1,156,459) | | | 1,133,783 | | | 1,133,783 |
| BNP Paribas 0.28%, dated | | | | | | |
| 10/31/12, to be repurchased | | | | | | |
| on 11/1/12, repurchase price | | | | | | |
| $1,792,232 (collateralized by | | | | | | |
| U.S. government obligations | | | | | | |
| 0.00%-2.00% 1/24/13-4/15/16; | | | | | | |
| market value $1,828,062) | | | 1,792,218 | | | 1,792,218 |
| | | | | | | 2,926,001 |
2012 Annual report · Delaware Pooled Trust
92
| | | Principal | | Value | |
| | | | Amount (U.S. $) | | (U.S. $) | |
| Short-Term Investments (continued) | | | | | | | |
| ≠U.S. Treasury Obligation – 0.10% | | | | | | | |
| U.S. Treasury Bill 0.05% 11/15/12 | | $ | 452,507 | | $ | 452,497 | |
| | | | | | | 452,497 | |
| Total Short-Term Investments | | | | | | | |
| (cost $3,394,681) | | | | | | 3,394,693 | |
| |
| Total Value of Securities Before Securities | | | | |
| Lending Collateral – 100.03% | | | | | | | |
| (cost $471,944,901) | | | | | | 467,953,270 | |
| |
| | | Number of | | | | |
| | | | Shares | | | | |
| **Securities Lending Collateral – 1.58% | | | | | | | |
| Investment Companies | | | | | | | |
| Delaware Investments | | | | | | | |
| Collateral Fund No. 1 | | 7,418,748 | | | 7,418,748 | |
| †@ | Mellon GSL Reinvestment Trust II | | 1,430,950 | | | 0 | |
| Total Securities Lending Collateral | | | | | | | |
| (cost $8,849,698) | | | | | | 7,418,748 | |
| |
| Total Value of Securities – 101.61% | | | | | | | |
| (cost $480,794,599) | | | | | | 475,372,018 | © |
| **Obligation to Return Securities | | | | | | | |
| Lending Collateral – (1.89%) | | | | | | (8,849,698 | ) |
| «Receivables and Other Assets | | | | | | | |
| Net of Other Liabilities – 0.28% | | | | | | 1,304,822 | |
| Net Assets Applicable to 36,446,886 | | | | | | | |
| Shares Outstanding; Equivalent | | | | | | | |
| to $12.84 Per Share – 100.00% | | | | | $ | 467,827,142 | |
| |
| Components of Net Assets at October 31, 2012: | | | | |
| Shares of beneficial interest | | | | | | | |
| (unlimited authorization – no par) | | | | | $ | 635,942,965 | |
| Undistributed net investment income | | | | | | 17,315,130 | |
| Accumulated net realized loss on investments | | | | |
| and derivatives | | | | | | (179,801,349 | ) |
| Net unrealized depreciation of investments | | | | | | | |
| and derivatives | | | | | | (5,629,604 | ) |
| Total net assets | | | | | $ | 467,827,142 | |
| Δ | Securities have been classified by country of origin. Classification by type of business has been presented on page 60 in “Security type/country and sector allocations.” |
| @ | Illiquid security. At October 31, 2012, the aggregate value of illiquid securities was $0, which represented 0% of the Portfolio’s net assets. See Note 11 in “Notes to financial statements.” |
| û | Dividend coupon which when presented with the corresponding coupon of the share benefits from a reduced withholding tax of 15% (rather than 25%) on dividends paid. |
| † | Non income producing security. |
| * | Fully or partially on loan. |
| ≠ | The rate shown is the effective yield at the time of purchase. |
| ** | See Note 10 in “Notes to financial statements” for additional information on securities lending collateral. |
| © | Includes $8,342,116 of securities loaned. |
| « | Includes foreign currency valued at $496,220 with a cost of $681,301. |
The following foreign currency exchange contracts were outstanding at October 31, 2012:1
Foreign Currency Exchange Contracts
| | | | | | | | | | | | | Unrealized |
| | | Contracts to | | | | | | Settlement | | Appreciation |
| Counterparty | | | Receive (Deliver) | | In Exchange For | | Date | | (Depreciation) |
| MNB | | | AUD | (19,999,500 | ) | | USD | 20,571,686 | | | 1/31/13 | | | $ | (22,369 | ) |
| MNB | | | GBP | 65,928 | | | USD | (105,979 | ) | | 11/1/12 | | | | 408 | |
| | | | | | | | | | | | | | $ | (21,961 | ) |
The use of foreign currency exchange contracts involves elements of market risk and risks in excess of the amounts recognized in the financial statements. The foreign currency exchange contracts presented above represent the Portfolio’s total exposure in such contracts, whereas only the net unrealized appreciation (depreciation) is reflected in the Portfolio’s net assets.
1See Note 9 in “Notes to financial statements”
Summary of Abbreviations:
ADR — American Depositary Receipt
AUD — Australian Dollar
GBP — British Pound Sterling
MNB — Mellon National Bank
USD — United States Dollar
VVPR Strip — Dividend Coupon
See accompanying notes, which are an integral part of the financial statements.
2012 Annual report · Delaware Pooled Trust
(continues) 93
Statements of net assets
Delaware Pooled® Trust — The Labor Select International Equity Portfolio
October 31, 2012
| | | | Number of | | Value |
| | | Shares | | (U.S. $) |
| ΔCommon Stock – 98.82% | | | | | | |
| Australia – 5.46% | | | | | | |
| Amcor | | | 1,077,178 | | $ | 8,828,818 |
| AMP | | | 2,172,059 | | | 10,343,614 |
| QBE Insurance Group | | | 631,280 | | | 8,632,279 |
| | | | | | | 27,804,711 |
| Belgium – 0.00% | | | | | | |
| û† | Ageas VVPR Strip | | | 15,275 | | | 119 |
| | | | | | | 119 |
| France – 17.83% | | | | | | |
| Carrefour | | | 440,496 | | | 10,639,613 |
| * | Cie de Saint-Gobain | | | 310,078 | | | 10,924,917 |
| France Telecom | | | 1,108,737 | | | 12,358,505 |
| GDF Suez | | | 604,368 | | | 13,865,494 |
| † | GDF Suez Strip | | | 101,871 | | | 132 |
| † | Sanofi | | | 186,485 | | | 16,388,517 |
| Societe Generale | | | 165,247 | | | 5,251,466 |
| Total | | | 164,165 | | | 8,257,985 |
| * | Vallourec | | | 112,025 | | | 4,606,716 |
| Vinci | | | 193,118 | | | 8,544,523 |
| | | | | | | 90,837,868 |
| Germany – 5.58% | | | | | | |
| Daimler | | | 103,889 | | | 4,849,663 |
| RWE | | | 403,559 | | | 18,435,958 |
| † | Telefonica Deutschland Holding | | | 675,813 | | | 5,157,106 |
| | | | | | | 28,442,727 |
| Israel – 2.41% | | | | | | |
| Teva Pharmaceutical Industries ADR | | | 303,500 | | | 12,267,470 |
| | | | | | | 12,267,470 |
| Italy – 1.35% | | | | | | |
| Intesa Sanpaolo | | | 4,289,670 | | | 6,887,049 |
| | | | | | | 6,887,049 |
| Japan – 20.61% | | | | | | |
| Astellas Pharma | | | 254,300 | | | 12,632,957 |
| Canon | | | 450,700 | | | 14,557,471 |
| Hoya | | | 249,000 | | | 5,041,458 |
| Kao | | | 415,100 | | | 11,660,142 |
| Nintendo | | | 37,000 | | | 4,765,520 |
| Seven & I Holdings | | | 544,800 | | | 16,805,081 |
| Shin-Etsu Chemical | | | 65,300 | | | 3,681,639 |
| Takeda Pharmaceutical | | | 307,400 | | | 14,288,718 |
| Tokio Marine Holdings | | | 505,900 | | | 13,393,055 |
| Tokyo Electron | | | 123,800 | | | 5,560,647 |
| Trend Micro | | | 94,300 | | | 2,641,794 |
| | | | | | | 105,028,482 |
| Netherlands – 7.75% | | | | | | |
| Koninklijke Ahold | | | 1,097,494 | | | 13,969,609 |
| Reed Elsevier | | | 748,382 | | | 10,051,494 |
| Royal Dutch Shell Class A | | | 450,673 | | | 15,449,246 |
| | | | | | | 39,470,349 |
| Singapore – 4.70% | | | | | | |
| Singapore Telecommunications | | | 3,985,000 | | | 10,515,632 |
| United Overseas Bank | | | 898,705 | | | 13,455,718 |
| | | | | | | 23,971,350 |
| Spain – 6.99% | | | | | | |
| Banco Santander | | | 860,963 | | | 6,458,416 |
| Iberdrola | | | 3,212,730 | | | 16,610,591 |
| Telefonica | | | 953,190 | | | 12,549,059 |
| | | | | | | 35,618,066 |
| Switzerland – 7.85% | | | | | | |
| † | ABB | | | 539,081 | | | 9,712,545 |
| Novartis | | | 276,574 | | | 16,644,627 |
| Zurich Insurance Group | | | 55,267 | | | 13,618,700 |
| | | | | | | 39,975,872 |
| United Kingdom – 18.29% | | | | | | |
| BG Group | | | 719,152 | | | 13,316,687 |
| BP | | | 2,100,888 | | | 15,028,769 |
| Compass Group | | | 953,614 | | | 10,464,159 |
| GlaxoSmithKline | | | 651,315 | | | 14,572,490 |
| National Grid | | | 514,388 | | | 5,864,430 |
| Sainsbury (J.) | | | 1,104,640 | | | 6,320,949 |
| Unilever | | | 361,598 | | | 13,484,932 |
| Vodafone Group | | | 5,212,407 | | | 14,151,947 |
| | | | | | | 93,204,363 |
| Total Common Stock | | | | | | |
| (cost $530,240,436) | | | | | | 503,508,426 |
| |
| | | Principal | | | |
| | | Amount (U.S. $) | | | |
| Short-Term Investments – 0.79% | | | | | | |
| ≠Discount Note – 0.10% | | | | | | |
| Federal Home Loan Bank | | | | | | |
| 0.095% 11/28/12 | | $ | 499,123 | | | 499,097 |
| | | | | | | 499,097 |
| Repurchase Agreements – 0.48% | | | | | | |
| Bank of America 0.24%, dated | | | | | | |
| 10/31/12, to be repurchased | | | | | | |
| on 11/1/12, repurchase price | | | | | | |
| $960,583 (collateralized by | | | | | | |
| U.S. government obligations | | | | | | |
| 0.00%-1.25% 1/10/13-8/31/16; | | | | | | |
| market value $979,788) | | | 960,577 | | | 960,577 |
| BNP Paribas 0.28%, dated | | | | | | |
| 10/31/12, to be repurchased | | | | | | |
| on 11/1/12, repurchase price | | | | | | |
| $1,518,435 (collateralized by | | | | | | |
| U.S. government obligations | | | | | | |
| 0.00-2.00% 1/24/13-4/15/16; | | | | | | |
| market value $1,548,792) | | | 1,518,423 | | | 1,518,423 |
| | | | | | | 2,479,000 |
| ≠U.S. Treasury Obligation – 0.21% | | | | | | |
| U.S. Treasury Bill 0.05% 11/15/12 | | | 1,066,429 | | | 1,066,406 |
| | | | | | | 1,066,406 |
| Total Short-Term Investments | | | | | | |
| (cost $4,044,480) | | | | | | 4,044,503 |
2012 Annual report · Delaware Pooled Trust
94
| | | | | | Value | |
| | | | | (U.S. $) | |
| | | | | | | |
| Total Value of Securities Before Securities | | | | |
| Lending Collateral – 99.61% | | | | | | |
| (cost $534,284,916) | | | | $ | 507,552,929 | |
| | |
| | | Number of | | | | |
| | | Shares | | | | |
| **Securities Lending Collateral – 0.91% | | | | | | |
| Investment Companies | | | | | | |
| Delaware Investments | | | | | | |
| Collateral Fund No. 1 | | 4,646,573 | | | 4,646,573 | |
| †@ | Mellon GSL Reinvestment Trust II | | 494,977 | | | 0 | |
| Total Securities Lending Collateral | | | | | | |
| (cost $5,141,550) | | | | | 4,646,573 | |
| |
| Total Value of Securities – 100.52% | | | | | | |
| (cost $539,426,466) | | | | | 512,199,502 | © |
| **Obligation to Return Securities | | | | | | |
| Lending Collateral – (1.01%) | | | | | (5,141,550 | ) |
| «Receivables and Other Assets | | | | | | |
| Net of Other Liabilities – 0.49% | | | | | 2,469,487 | |
| Net Assets Applicable to 40,266,420 | | | | | | |
| Shares Outstanding; Equivalent to | | | | | | |
| $12.65 per share – 100.00% | | | | $ | 509,527,439 | |
| |
| Components of Net Assets at October 31, 2012: | | | | |
| Shares of beneficial interest | | | | | | |
| (unlimited authorization – no par) | | | | $ | 616,814,299 | |
| Undistributed net investment income | | | | | 15,977,834 | |
| Accumulated net realized loss on investments | | | | |
| and derivatives | | | | | (95,999,436 | ) |
| Net unrealized depreciation of investments | | | | | | |
| and derivatives | | | | | (27,265,258 | ) |
| Total net assets | | | | $ | 509,527,439 | |
| Δ | Securities have been classified by country of origin. Classification by type of business has been presented on page 61 in “Security type/country and sector allocations.” |
| û | Dividend coupon which when presented with the corresponding coupon of the share benefits from a reduced withholding tax of 15% (rather than 25%) on dividends paid. |
| † | Non income producing security. |
| * | Fully or partially on loan. |
| ≠ | The rate shown is the effective yield at time of purchase. |
| ** | See Note 10 in “Notes to financial statements” for additional information on securities lending collateral.” |
| @ | Illiquid security. At October 31, 2012, the aggregate value of illiquid securities was $0, which represented 0.00% of the Portfolio’s net assets. See Note 11 in “Notes to financial statements.” |
| © | Includes $4,832,615 of securities loaned. |
| « | Includes foreign currency valued at $1,158,905 with a cost of $1,156,225. |
The following foreign currency exchange contracts were outstanding at October 31, 2012:1
Foreign Currency Exchange Contracts
| | | | | | | | | | | | | Unrealized |
| | | Contracts to | | | | | | Settlement | | Appreciation |
| Counterparty | | | Receive (Deliver) | | In Exchange For | | Date | | (Depreciation) |
| MNB | | | AUD | (3,186,315 | ) | | USD | 3,309,467 | | | 11/5/12 | | | $ | 5,017 | |
| MNB | | | AUD | (21,586,500 | ) | | USD | 22,204,090 | | | 1/31/13 | | | | (24,144 | ) |
| MNB | | | EUR | 1,890,477 | | | USD | (2,459,492 | ) | | 11/1/12 | | | | (9,790 | ) |
| MNB | | | GBP | (1,277,754 | ) | | USD | 2,058,845 | | | 11/1/12 | | | | (3,060 | ) |
| MNB | | | JPY | (22,447,802 | ) | | USD | 281,195 | | | 11/1/12 | | | | (55 | ) |
| | | | | | | | | | | | | | $ | (32,032 | ) |
The use of foreign currency exchange contracts involves elements of market risk and risks in excess of the amount disclosed in the financial statements. The foreign currency exchange contracts presented above represent the Portfolio’s total exposure in such contracts, whereas only the net unrealized appreciation (depreciation) is reflected in the Portfolio’s net assets.
1See Note 9 in “Notes to financial statements.”
Summary of Abbreviations:
ADR — American Depositary Receipt
AUD — Australian Dollar
EUR — European Monetary Unit
GBP — British Pound Sterling
JPY — Japanese Yen
MNB — Mellon National Bank
USD — United States Dollar
VVPR Strip — Dividend Coupon
See accompanying notes, which are an integral part of the financial statements.
2012 Annual report · Delaware Pooled Trust
(continues) 95
Statements of net assets
Delaware Pooled® Trust — The Emerging Markets Portfolio
October 31, 2012
| | | | Number of | | Value |
| | | Shares | | (U.S. $) |
| ΔCommon Stock – 91.33% | | | | | |
| Brazil – 7.47% | | | | | |
| CCR | | 656,900 | | $ | 5,774,447 |
| Cielo | | 158,708 | | | 3,925,226 |
| CPFL Energia | | 317,880 | | | 3,692,368 |
| Diagnosticos da America | | 184,200 | | | 1,223,920 |
| Ecorodovias Infraestrutura | | | | | |
| e Logistica | | 344,100 | | | 3,004,471 |
| Itau Unibanco Holding ADR | | 208,800 | | | 3,044,304 |
| Transmissora Alianca | | | | | |
| de Energia Eletrica | | 49,300 | | | 1,625,741 |
| Vale ADR | | 74,700 | | | 1,368,504 |
| | | | | | 23,658,981 |
| Chile – 2.85% | | | | | |
| Banco Santander ADR | | 113,770 | | | 3,093,406 |
| Enersis ADR | | 289,100 | | | 4,897,355 |
| # | Inversiones Aguas Metropolitan | | | | | |
| 144A ADR | | 27,500 | | | 1,022,007 |
| | | | | | 9,012,768 |
| nChina – 21.95% | | | | | |
| Beijing Enterprises Holdings | | 540,999 | | | 3,493,784 |
| Belle International Holdings | | 3,992,515 | | | 7,438,909 |
| China BlueChemical Class H | | 4,079,000 | | | 2,584,227 |
| China Construction Bank Class H | | 4,754,770 | | | 3,582,926 |
| China Gas Holdings | | 4,969,331 | | | 2,705,863 |
| China Merchants | | | | | |
| Holdings International | | 1,368,000 | | | 4,536,435 |
| China Mobile | | 724,500 | | | 8,034,888 |
| China Resources Power Holdings | | 1,786,000 | | | 3,825,472 |
| China Shenhua Energy Class H | | 1,848,500 | | | 7,870,981 |
| ENN Energy Holdings | | 318,000 | | | 1,323,282 |
| Hengan International Group | | 385,000 | | | 3,507,203 |
| * | Huabao International Holdings | | 3,982,000 | | | 1,988,418 |
| Industrial & Commercial Bank of | | | | | |
| China Class H | | 5,184,803 | | | 3,431,983 |
| Jiangsu Expressway | | 3,846,000 | | | 3,314,982 |
| Sands China | | 2,106,000 | | | 7,921,227 |
| * | Want Want China Holdings | | 2,898,000 | | | 3,963,691 |
| | | | | | 69,524,271 |
| Colombia – 0.50% | | | | | |
| BanColombia ADR | | 24,900 | | | 1,594,098 |
| | | | | | 1,594,098 |
| India – 10.92% | | | | | |
| Axis Bank | | 253,319 | | | 5,567,792 |
| GAIL India | | 193,331 | | | 1,253,660 |
| HCL Technologies | | 154,992 | | | 1,751,420 |
| Housing Development Finance | | 443,096 | | | 6,278,120 |
| Larsen & Toubro | | 284,187 | | | 8,592,689 |
| Rural Electrification | | 1,290,143 | | | 5,163,689 |
| Tata Motors | | 1,267,872 | | | 6,002,981 |
| | | | | | 34,610,351 |
| Indonesia – 6.72% | | | | | |
| Astra International | | 7,697,000 | | | 6,450,895 |
| Bank Rakyat Indonesia | | 9,800,500 | | | 7,550,620 |
| Perusahaan Gas Negara | | 15,025,000 | | | 7,273,946 |
| | | | | | 21,275,461 |
| Kazakhstan – 0.82% | | | | | |
| KazMunaiGas Exploration | | | | | |
| Production GDR | | 147,166 | | | 2,612,197 |
| | | | | | 2,612,197 |
| Mexico – 8.06% | | | | | |
| America Movil ADR | | 165,800 | | | 4,193,082 |
| Compartamos | | 2,240,500 | | | 3,019,127 |
| Grupo Aeroportuario del | | | | | |
| Pacifico ADR | | 40,300 | | | 1,919,086 |
| † | Grupo Financiero Santander | | | | | |
| Mexico ADR | | 605,200 | | | 8,273,083 |
| Grupo Mexico Series B | | 1,947,044 | | | 6,243,337 |
| Kimberly-Clark de Mexico Class A | | 773,000 | | | 1,873,174 |
| | | | | | 25,520,889 |
| Peru – 2.38% | | | | | |
| Credicorp | | 58,330 | | | 7,544,402 |
| | | | | | 7,544,402 |
| Philippines – 1.83% | | | | | |
| Philippine Long Distance | | | | | |
| Telephone ADR | | 91,300 | | | 5,800,289 |
| | | | | | 5,800,289 |
| Republic of Korea – 7.44% | | | | | |
| Hyundai Mobis | | 33,465 | | | 8,532,606 |
| Kangwon Land | | 112,530 | | | 2,621,489 |
| KB Financial Group | | 119,934 | | | 4,080,959 |
| Samsung Electronics | | 6,941 | | | 8,339,487 |
| | | | | | 23,574,541 |
| Russia – 4.19% | | | | | |
| Gazprom ADR | | 611,103 | | | 5,582,426 |
| LUKOIL ADR | | 127,718 | | | 7,688,624 |
| | | | | | 13,271,050 |
| South Africa – 2.64% | | | | | |
| * | Clicks Group | | 257,911 | | | 1,778,379 |
| Life Healthcare Group Holdings | | 398,720 | | | 1,508,023 |
| Sasol | | 50,730 | | | 2,165,036 |
| * | Tiger Brands | | 92,020 | | | 2,925,228 |
| | | | | | 8,376,666 |
| Taiwan – 2.95% | | | | | |
| Quanta Computer | | 757,000 | | | 1,731,174 |
| Taiwan Semiconductor Manufacturing | | 2,240,588 | | | 6,803,840 |
| Wistron | | 843,292 | | | 809,803 |
| | | | | | 9,344,817 |
| Thailand – 3.68% | | | | | |
| Kasikornbank Foreign | | 178,754 | | | 1,048,752 |
| Kasikornbank NVDR | | 753,500 | | | 4,396,235 |
| PTT | | 599,900 | | | 6,217,999 |
| | | | | | 11,662,986 |
2012 Annual report · Delaware Pooled Trust
96
| | | | Number of | | Value | |
| | | Shares | | (U.S. $) | |
| ΔCommon Stock (continued) | | | | | | | |
| Turkey – 6.01% | | | | | | | |
| Tofas Turk Otomobil Fabrikasi | | | 302,727 | | $ | 1,688,665 | |
| Tupras Turkiye Petrol Rafinerileri | | | 337,104 | | | 8,236,266 | |
| Turk Telekomunikasyon | | | 1,052,996 | | | 4,111,660 | |
| Turkiye Garanti Bankasi | | | 1,045,449 | | | 4,991,936 | |
| | | | | | | 19,028,527 | |
| United Kingdom – 0.92% | | | | | | | |
| SABMiller | | | 68,583 | | | 2,929,332 | |
| | | | | | | 2,929,332 | |
| Total Common Stock | | | | | | | |
| (cost $264,575,422) | | | | | | 289,341,626 | |
| | |
| Preferred Stock – 8.22% | | | | | | | |
| Brazil – 7.10% | | | | | | | |
| AmBev ADR | | | 142,000 | | | 5,792,180 | |
| Investimentos Itau | | | 907,433 | | | 3,974,973 | |
| Petroleo Brasiliero | | | 684,000 | | | 7,002,436 | |
| Vale ADR | | | 322,700 | | | 5,740,833 | |
| | | | | | | 22,510,422 | |
| Republic of Korea – 1.12% | | | | | | | |
| Hyundai Motor | | | 23,810 | | | 1,561,390 | |
| Samsung Electronics | | | 2,720 | | | 1,975,787 | |
| | | | | | | 3,537,177 | |
| Total Preferred Stock | | | | | | | |
| (cost $26,488,531) | | | | | | 26,047,599 | |
| | |
| | | Principal | | | | |
| | | Amount | | | | |
| Short-Term Investments – 1.07% | | | | | | | |
| ≠Discount Note – 0.31% | | | | | | | |
| Federal Home Loan Bank | | | | | | | |
| 0.095% 11/28/12 | | $ | 977,262 | | | 977,211 | |
| | | | | | | 977,211 | |
| Repurchase Agreements – 0.19% | | | | | | | |
| Bank of America 0.24%, dated | | | | | | | |
| 10/31/12, to be repurchased | | | | | | | |
| on 11/1/12, repurchase price | | | | | | | |
| $235,205 (collateralized by U.S. | | | | | | | |
| government obligations | | | | | | | |
| 0.00%-1.25% 1/10/13-8/31/16; | | | | | | | |
| market value $239,908) | | | 235,204 | | | 235,204 | |
| BNP Paribas 0.28%, dated | | | | | | | |
| 10/31/12, to be repurchased | | | | | | | |
| on 11/1/12, repurchase price | | | | | | | |
| $371,799 (collateralized by U.S. | | | | | | | |
| government obligations | | | | | | | |
| 0.00-2.00% 1/24/13-4/15/16; | | | | | | | |
| | market value $379,232) | | | 371,796 | | | 371,796 | |
| | | | | | | 607,000 | |
| ≠U.S. Treasury Obligation – 0.57% | | | | | | | |
| | U.S. Treasury Bill 0.05% 11/15/12 | | | 1,806,556 | | | 1,806,516 | |
| | | | | | | 1,806,516 | |
| Total Short-Term Investments | | | | | | | |
| (cost $3,390,704) | | | | | | 3,390,727 | |
| |
| Total Value of Securities Before Securities | | | | |
| Lending Collateral – 100.62% | | | | | | | |
| (cost $294,454,657) | | | | | | 318,779,952 | |
| |
| | | Number of | | | | |
| | | Shares | | | | |
| **Securities Lending Collateral – 2.31% | | | | | | | |
| Investment Companies | | | | | | | |
| Delaware Investments | | | | | | | |
| Collateral Fund No. 1 | | | 7,312,346 | | | 7,312,346 | |
| †@ | Mellon GSL Reinvestment Trust II | | | 546,716 | | | 0 | |
| Total Securities Lending Collateral | | | | | | | |
| (cost $7,859,062) | | | | | | 7,312,346 | |
| |
| Total Value of Securities – 102.93% | | | | | | | |
| (cost $302,313,719) | | | | | | 326,092,298 | © |
| **Obligation to Return Securities | | | | | | | |
| Lending Collateral – (2.48%) | | | | | | (7,859,062 | ) |
| «Other Liabilities Net of Receivables | | | | | | | |
| and Other Assets – (0.45%) | | | | | | (1,423,910 | ) |
| Net Assets Applicable to 31,176,629 | | | | | | | |
| Shares Outstanding; Equivalent | | | | | | | |
| to $10.16 per share – 100.00% | | | | | $ | 316,809,326 | |
| |
| Components of Net Assets at October 31, 2012: | | | | |
| Shares of beneficial interest | | | | | | | |
| (unlimited authorization - no par) | | | | | $ | 282,840,183 | |
| Undistributed net investment income | | | | | | 7,397,868 | |
| Accumulated net realized gain on investments | | | | |
| and derivatives | | | | | | 3,510,072 | |
| Net unrealized appreciation of investments | | | | | | | |
| and derivatives | | | | | | 23,061,203 | |
| Total net assets | | | | | $ | 316,809,326 | |
2012 Annual report · Delaware Pooled Trust
(continues) 97
Statements of net assets
Delaware Pooled® Trust — The Emerging Markets Portfolio
| | |
| Δ | Securities have been classified by country of origin. Classification by type of business has been presented on page 62 in “Security type/country and sector allocations.” |
| @ | Illiquid security. At October 31, 2012, the aggregate value of illiquid securities was $0, which represented 0.00% of the Portfolio’s net assets. See Note 11 in “Notes to financial statements.” |
| # | Security exempt from registration under Rule 144A of the Securities Act of 1933, as amended. At October 31, 2012, the aggregate value of Rule 144A securities was $1,022,007 which represented 0.32% of the Portfolio’s net assets. See Note 11 in “Notes to financial statements.” |
| n | Securities listed and traded on the Hong Kong Stock Exchange. These securities have significant business operations in China. |
| * | Fully or partially on loan. |
| ≠ | The rate shown is the effective yield at the time of purchase. |
| ** | See Note 10 in “Notes to financial statements” for additional information on securities lending collateral. |
| † | Non income producing security. |
| © | Includes $7,386,526 of securities loaned. |
| « | Includes foreign currency valued at $314,033 with a cost of $314,832. |
The following foreign currency exchange contracts were outstanding at October 31, 2012:1
Foreign Currency Exchange Contracts
| | | | | | | | | | | | Unrealized |
| | | Contracts to | | | | | | Settlement | | Appreciation |
| Counterparty | | | Receive (Deliver) | | In Exchange For | | Date | | (Depreciation) |
| MNB | | | ZAR | 1,210,753 | | USD | (139,435 | ) | | 11/1/12 | | | $ | 199 | |
| MNB | | | ZAR | 2,000,118 | | USD | (230,606 | ) | | 11/2/12 | | | | 28 | |
| MNB | | | ZAR | 983,304 | | USD | (113,682 | ) | | 11/5/12 | | | | (347 | ) |
| MNB | | | ZAR | 1,771,974 | | USD | (204,295 | ) | | 11/6/12 | | | | (90 | ) |
| | | | | | | | | | | | | $ | (210 | ) |
The use of foreign currency exchange contracts involves elements of market risk and risks in excess of the amount disclosed in the financial statements. The foreign currency exchange contracts presented above represent the Portfolio’s total exposure in such contracts, whereas only the net unrealized appreciation (depreciation) is reflected in the Portfolio’s net assets.
1See Note 9 in “Notes to financial statements.”
Summary of Abbreviations:
ADR — American Depositary Receipt
GDR — Global Depositary Receipt
MNB — Mellon National Bank
NVDR — Non-Voting Depositary Receipt
USD — United States Dollar
ZAR — South African Rand
See accompanying notes, which are an integral part of the financial statements.
2012 Annual report · Delaware Pooled Trust
98
Delaware Pooled® Trust — The Emerging Markets Portfolio II
October 31, 2012
| | | | Number of | | Value |
| | | Shares | | (U.S. $) |
| ΔCommon Stock – 95.81% | | | | | |
| Argentina – 0.60% | | | | | |
| @ | Cresud ADR | | 7,700 | | $ | 61,677 |
| @ | IRSA Inversiones y Representaciones ADR | | 3,800 | | | 27,436 |
| | YPF ADR | | 8,000 | | | 89,360 |
| | | | | | 178,473 |
| Bahrain – 0.04% | | | | | |
| @# | Aluminium Bahrain 144A GDR | | 1,800 | | | 11,457 |
| | | | | | 11,457 |
| Brazil – 15.33% | | | | | |
| All America Latina Logistica | | 15,413 | | | 70,095 |
| † | B2W Cia Global Do Varejo | | 13,500 | | | 65,648 |
| Banco Bradesco ADR | | 6,430 | | | 100,694 |
| Banco Santander Brasil ADR | | 45,800 | | | 311,440 |
| * | Brasil Foods ADR | | 16,100 | | | 294,952 |
| * | Braskem ADR | | 10,200 | | | 133,416 |
| Centrais Eletricas Brasileiras ADR | | 21,300 | | | 118,428 |
| * | Cia Brasileira de Distribuicao Grupo | | | | | |
| Pao de Acucar ADR | | 2,200 | | | 102,828 |
| Cyrela Brazil Realty | | | | | |
| Empreendimentos e Participacoes | | 15,780 | | | 133,743 |
| *@† | Fibria Celulose ADR | | 41,000 | | | 361,210 |
| @ | Gerdau | | 11,700 | | | 85,054 |
| Gerdau ADR | | 13,000 | | | 114,270 |
| *† | Gol Linhas Aereas Inteligentes ADR | | 43,200 | | | 215,568 |
| † | Hypermarcas | | 19,800 | | | 157,386 |
| Itau Unibanco Holding ADR | | 34,400 | | | 501,552 |
| Petroleo Brasileiro SA ADR | | 50,800 | | | 1,077,468 |
| Santos Brasil Participacoes | | 5,900 | | | 84,794 |
| Telefonica Brasil ADR | | 3,255 | | | 71,675 |
| Tim Participacoes ADR | | 17,900 | | | 311,102 |
| Vale ADR | | 13,100 | | | 239,992 |
| | | | | | 4,551,315 |
| China/Hong Kong – 10.95% | | | | | |
| † | Baidu ADR | | 1,000 | | | 106,620 |
| Bank of China | | 222,000 | | | 91,377 |
| China Construction Bank | | 202,590 | | | 152,660 |
| * | China Mengniu Dairy | | 64,000 | | | 194,063 |
| China Mobile ADR | | 6,900 | | | 382,192 |
| * | China Petroleum & Chemical ADR | | 2,800 | | | 294,588 |
| China Telecom | | 470,000 | | | 279,572 |
| * | China Unicom Hong Kong ADR | | 13,900 | | | 223,651 |
| CNOOC ADR | | 1,500 | | | 308,325 |
| Industrial & Commercial Bank of China | | 390,999 | | | 258,814 |
| PetroChina ADR | | 1,600 | | | 217,216 |
| *† | SINA | | 1,900 | | | 103,797 |
| † | Sohu.com | | 9,800 | | | 372,205 |
| @† | Tianjin Development Holdings | | 56,000 | | | 26,663 |
| Tingyi Cayman Islands Holding | | 40,000 | | | 118,967 |
| Tsingtao Brewery | | 22,000 | | | 118,941 |
| | | | | | 3,249,651 |
| India – 6.93% | | | | | |
| † | Cairn India | | 74,000 | | | 462,801 |
| ICICI Bank ADR | | 2,500 | | | 98,125 |
| # | Reliance Industries 144A GDR | | 24,900 | | | 738,285 |
| Steel Authority of India | | 49,589 | | | 73,962 |
| Tata Chemicals | | 59,647 | | | 350,809 |
| Ultratech Cement | | 2,658 | | | 98,614 |
| United Spirits | | 10,793 | | | 235,849 |
| | | | | | 2,058,445 |
| Indonesia – 1.11% | | | | | |
| Tambang Batubara Bukit Asam Persero | | 113,000 | | | 188,236 |
| United Tractors | | 64,106 | | | 140,826 |
| | | | | | 329,062 |
| Israel – 0.63% | | | | | |
| Israel Chemicals | | 14,900 | | | 186,456 |
| | | | | | 186,456 |
| Malaysia – 1.48% | | | | | |
| KLCC Property Holdings | | 104,600 | | | 203,637 |
| @† | UEM Land Holdings | | 340,000 | | | 236,638 |
| | | | | | 440,275 |
| Mexico – 8.77% | | | | | |
| America Movil Class L ADR | | 8,300 | | | 209,907 |
| Cemex ADR | | 59,718 | | | 539,851 |
| *† | Desarrolladora Homex ADR | | 22,900 | | | 303,425 |
| *† | Empresas ICA ADR | | 27,200 | | | 235,008 |
| Fomento Economico Mexicano ADR | | 2,500 | | | 226,525 |
| Grupo Financiero Banorte | | 23,200 | | | 128,947 |
| † | Grupo Financiero Santander Mexico | | | | | |
| Class B ADR | | 18,500 | | | 252,895 |
| Grupo Televisa ADR | | 23,700 | | | 535,620 |
| Wal-Mart de Mexico | | 58,850 | | | 173,116 |
| | | | | | 2,605,294 |
| Peru – 0.52% | | | | | |
| Cia de Minas Buenaventura ADR | | 4,300 | | | 153,768 |
| | | | | | 153,768 |
| Poland – 0.64% | | | | | |
| Jastrzebska Spolka Weglowa | | 2,926 | | | 79,531 |
| † | Polski Koncern Naftowy Orlen | | 8,079 | | | 110,808 |
| | | | | | 190,339 |
| Republic of Korea – 20.16% | | | | | |
| @ | KB Financial Group ADR | | 13,500 | | | 459,675 |
| @ | KCC | | 1,389 | | | 389,825 |
| @ | KT ADR | | 28,300 | | | 479,685 |
| KT&G | | 5,281 | | | 402,498 |
| † | LG Display ADR | | 17,000 | | | 252,280 |
| LG Electronics | | 4,877 | | | 339,501 |
| LG Uplus | | 26,937 | | | 172,198 |
| Lotte Chilsung Beverage | | 406 | | | 530,624 |
| Lotte Confectionery | | 245 | | | 353,011 |
| Samsung Electronics | | 1,267 | | | 1,522,277 |
2012 Annual report · Delaware Pooled Trust
(continues) 99
Statements of net assets
Delaware Pooled® Trust — The Emerging Markets Portfolio II
| | | | Number of | | Value |
| | | Shares | | (U.S. $) |
| ΔCommon Stock (continued) | | | | | | |
| Republic of Korea (continued) | | | | | | |
| Samsung Life Insurance | | | 4,080 | | $ | 351,750 |
| SK Telecom ADR | | | 46,700 | | | 729,921 |
| | | | | | | 5,983,245 |
| Russia – 5.19% | | | | | | |
| Gazprom ADR | | | 29,100 | | | 265,829 |
| LUKOIL ADR | | | 3,400 | | | 204,680 |
| LUKOIL ADR | | | | | | |
| (London International Exchange) | | | 3,400 | | | 205,530 |
| MMC Norilsk Nickel ADR | | | 3,740 | | | 57,372 |
| Mobile Telesystems ADR | | | 4,100 | | | 70,274 |
| Rosneft Oil GDR | | | 30,600 | | | 226,440 |
| = | Sberbank | | | 134,733 | | | 394,214 |
| * | VTB Bank GDR | | | 33,800 | | | 116,475 |
| | | | | | | 1,540,814 |
| South Africa – 3.38% | | | | | | |
| * | Anglo American Platinum | | | 1,687 | | | 78,419 |
| *@ | ArcelorMittal South Africa | | | 27,354 | | | 105,382 |
| * | Impala Platinum Holdings | | | 4,413 | | | 79,407 |
| Sasol ADR | | | 5,000 | | | 212,050 |
| Standard Bank Group | | | 26,038 | | | 321,688 |
| * | Vodacom Group | | | 16,484 | | | 207,817 |
| | | | | | | 1,004,763 |
| Switzerland – 0.97% | | | | | | |
| Transocean | | | 6,300 | | | 287,847 |
| | | | | | | 287,847 |
| Taiwan – 4.75% | | | | | | |
| Hon Hai Precision Industry | | | 228,413 | | | 693,607 |
| Taiwan Semiconductor | | | | | | |
| Manufacturing | | | 91,000 | | | 276,333 |
| Taiwan Semiconductor | | | | | | |
| Manufacturing ADR | | | 12,800 | | | 203,520 |
| United Microelectronics | | | 634,000 | | | 235,498 |
| | | | | | | 1,408,958 |
| Thailand – 2.22% | | | | | | |
| Bangkok Bank | | | 35,399 | | | 204,225 |
| PTT | | | 25,960 | | | 269,076 |
| PTT Exploration & Production | | | 11,600 | | | 62,764 |
| Siam Cement NVDR | | | 10,000 | | | 121,904 |
| | | | | | | 657,969 |
| Turkey – 2.13% | | | | | | |
| Anadolu Efes Biracilik Ve Malt Sanayii | | | 19,012 | | | 285,281 |
| † | Turkcell Iletisim Hizmetleri ADR | | | 19,700 | | | 299,243 |
| Turkiye Sise ve Cam Fabrikalari | | | 32,654 | | | 47,723 |
| | | | | | | 632,247 |
| United Kingdom – 0.53% | | | | | | |
| Anglo American ADR | | | 8,400 | | | 128,765 |
| =#† | Etalon Group GDR 144A | | | 4,800 | | | 27,744 |
| | | | | | | 156,509 |
| United States – 9.48% | | | | | | |
| Archer-Daniels-Midland | | | 11,400 | | | 305,976 |
| Avon Products | | | 57,100 | | | 884,479 |
| Bunge | | | 3,300 | | | 234,399 |
| † | MEMC Electronic Materials | | | 8,100 | | | 20,412 |
| † | Yahoo | | | 81,400 | | | 1,368,334 |
| | | | | | | | 2,813,600 |
| Total Common Stock | | | | | | |
| (cost $29,946,086) | | | | | | 28,440,487 |
| |
| Exchange-Traded Fund – 2.21% | | | | | | |
| * | iShares MSCI Brazil Index Fund | | | 12,300 | | | 655,836 |
| Total Exchange-Traded Fund | | | | | | |
| (cost $718,413) | | | | | | 655,836 |
| |
| Preferred Stock – 1.10% | | | | | | |
| Republic of Korea – 1.10% | | | | | | |
| LG Electronics | | | 17,861 | | | 327,629 |
| Total Preferred Stock | | | | | | |
| (cost $307,186) | | | | | | 327,629 |
| |
| | | Principal | | | |
| | | Amount (U.S. $) | | | |
| Short-Term Investments – 0.91% | | | | | | |
| Repurchase Agreements – 0.91% | | | | | | |
| Bank of America 0.24%, dated | | | | | | |
| 10/31/12, to be repurchased | | | | | | |
| on 11/1/12, repurchase price | | | | | | |
| $105,009 (collateralized by U.S. | | | | | | |
| government obligations | | | | | | |
| 0.00%-1.25% 1/10/13-8/31/16; | | | | | | |
| market value $107,109) | | $ | 105,009 | | | 105,009 |
| BNP Paribas 0.28%, dated | | | | | | |
| 10/31/12, to be repurchased | | | | | | |
| on 11/1/12, repurchase price | | | | | | |
| $165,993 (collateralized by U.S. | | | | | | |
| government obligations | | | | | | |
| 0.00-2.00% 1/24/13-4/15/16; | | | | | | |
| market value $169,311) | | | 165,991 | | | 165,991 |
| Total Short-Term Investments | | | | | | |
| (cost $271,000) | | | | | | 271,000 |
| Total Value of Securities Before Securities | | | |
| Lending Collateral – 100.03% | | | | | | |
| (cost $31,242,685) | | | | | | 29,694,952 |
| |
| | | Number of | | | |
| | | Shares | | | |
| **Securities Lending Collateral – 12.10% | | | |
| Investment Companies | | | | | | |
| Delaware Investments | | | | | | |
| Collateral Fund No.1 | | | 3,771,452 | | | 3,771,452 |
| Total Securities Lending Collateral | | | | | | |
| (cost $3,771,452) | | | | | | 3,771,452 |
2012 Annual report · Delaware Pooled Trust
100
| | | | | |
| Total Value of Securities – 112.73% | | | |
| | (cost $35,014,137) | $ | 33,466,404 | © |
| **Obligation to Return Securities | | | |
| Lending Collateral – (12.70%) | | (3,771,452 | ) |
| «Other Liabilities Net of Receivables | | | |
| and Other Assets – (0.03%) | | (8,838 | ) |
| Net Assets Applicable to 3,635,301 | | | |
| Shares Outstanding; Equivalent to | | | |
| $8.17 Per Share – 100.00% | $ | 29,686,114 | |
| |
| Components of Net Assets at October 31, 2012: | | | |
| Shares of beneficial interest | | | |
| (unlimited authorization – no par) | $ | 31,430,563 | |
| Undistributed net investment income | | 12,133 | |
| Accumulated net realized loss on investments and derivatives | | (199,118 | ) |
| Net unrealized depreciation of investments | | | |
| and derivatives | | (1,557,464 | ) |
| Total net assets | $ | 29,686,114 | |
| Δ | Securities have been classified by country of origin. Classification by type of business has been presented on page 63 in “Security type/country and sector allocations.” |
| * | Fully or partially on loan. |
| @ | Illiquid security. At October 31, 2012, the aggregate value of illiquid securities was $2,244,702, which represented 7.56% of the Portfolio’s net assets. See Note 11 in “Notes to financial statements.” |
| # | Security exempt from registration under Rule 144A of the Securities Act of 1933, as amended. At October 31, 2012, the aggregate value of Rule 144A securities was $777,486, which represented 2.62% of Portfolio’s net assets. See Note 11 in “Notes to financial statements.” |
| † | Non income producing security. |
| = | Security is being fair valued in accordance with the Portfolio’s fair valuation policy. At October 31, 2012, the aggregate value of fair valued securities was $421,958, which represented 1.42% of the Portfolio’s net assets. See Note 1 in “Notes to financial statements.” |
| ** | See Note 10 in “Notes to financial statements” for additional information on securities lending collateral. |
| © | Includes $3,610,528 of securities loaned. |
| « | Includes foreign currency valued at $5,217 with a cost of $5,197. |
The following foreign currency exchange contract was outstanding at October 31, 2012:1
Foreign Currency Exchange Contract
| | | | | | | | | | | | Unrealized |
| | | Contract to | | | | | Settlement | | Appreciation |
| Counterparty | | | Receive (Deliver) | | In Exchange For | | Date | | (Depreciation) |
| MNB | | | MYR | (13,982 | ) | | USD | 4,568 | | 11/1/12 | | | $ | (22 | ) |
The use of foreign currency exchange contracts involves elements of market risk and risks in excess of the amount disclosed in the financial statements. The foreign currency exchange contract presented above represents the Portfolio’s total exposure in such contracts, whereas only the net unrealized appreciation (depreciation) is reflected in the Portfolio’s net assets.
1See Note 9 in “Notes to financial statements.”
Summary of Abbreviations:
ADR — American Depositary Receipt
GDR — Global Depositary Receipt
MNB — Mellon National Bank
MYR — Malaysian Ringgit
NVDR — Non-Voting Depositary Receipt
USD — United States Dollar
See accompanying notes, which are an integral part of the financial statements.
2012 Annual report · Delaware Pooled Trust
(continues) 101
Statements of operations
Delaware Pooled® Trust
Year ended October 31, 2012
| The | | | | | | | The | | The |
| Large-Cap | | The | | Large-Cap | | Focus Smid-Cap |
| Value Equity | | Select 20 | | Growth Equity | | Growth Equity |
| Portfolio | | Portfolio | | Portfolio | | Portfolio |
| Investment Income: | | | | | | | | | | | | | | | | | | | |
| Dividends | | $ | 217,011 | | | | $ | 744,711 | | | | $ | 1,646,285 | | | | $ | 129,850 | |
| Interest | | | 233 | | | | | 5,191 | | | | | 2,871 | | | | | 678 | |
| Securities lending income | | | — | | | | | — | | | | | 103,775 | | | | | — | |
| Foreign tax withheld | | | — | | | | | (21,139 | ) | | | | (38,821 | ) | | | | (2,305 | ) |
| | | | 217,244 | | | | | 728,763 | | | | | 1,714,110 | | | | | 128,223 | |
| |
| Expenses: | | | | | | | | | | | | | | | | | | | |
| Management fees | | | 41,113 | | | | | 649,842 | | | | | 1,056,371 | | | | | 122,891 | |
| Registration fees | | | 18,299 | | | | | 19,043 | | | | | 20,951 | | | | | 2,778 | |
| Audit and tax | | | 10,853 | | | | | 14,682 | | | | | 12,685 | | | | | 11,756 | |
| Dues and services | | | 3,738 | | | | | 3,893 | | | | | 4,669 | | | | | 1,951 | |
| Accounting and administration expenses | | | 2,922 | | | | | 33,849 | | | | | 75,080 | | | | | 6,406 | |
| Reports and statements to shareholders | | | 1,393 | | | | | 3,630 | | | | | 7,996 | | | | | 2,010 | |
| Dividend disbursing and transfer agent fees and expenses | | | 869 | | | | | 9,790 | | | | | 21,546 | | | | | 1,959 | |
| Legal fees | | | 786 | | | | | 9,080 | | | | | 21,684 | | | | | 1,775 | |
| Pricing fees | | | 761 | | | | | 673 | | | | | 747 | | | | | 721 | |
| Trustees’ fees | | | 345 | | | | | 3,744 | | | | | 8,836 | | | | | 771 | |
| Custodian fees | | | 304 | | | | | 3,061 | | | | | 7,095 | | | | | 1,083 | |
| Insurance fees | | | 124 | | | | | 732 | | | | | 3,045 | | | | | 281 | |
| Consulting fees | | | 65 | | | | | 793 | | | | | 1,498 | | | | | 155 | |
| Trustees’ expenses | | | 21 | | | | | 196 | | | | | 536 | | | | | 43 | |
| | | | 81,593 | | | | | 753,008 | | | | | 1,242,739 | | | | | 154,580 | |
| Less fees waived | | | (29,280 | ) | | | | (5,076 | ) | | | | — | | | | | (3,836 | ) |
| Less expense paid indirectly | | | — | | | | | (1 | ) | | | | (1 | ) | | | | — | |
| |
| Total operating expenses | | | 52,313 | | | | | 747,931 | | | | | 1,242,738 | | | | | 150,744 | |
| |
| Net Investment Income (Loss) | | | 164,931 | | | | | (19,168 | ) | | | | 471,372 | | | | | (22,521 | ) |
| |
| Net Realized and Unrealized Gain (Loss): | | | | | | | | | | | | | | | | | | | |
| Net realized gain (loss) on: | | | | | | | | | | | | | | | | | | | |
| Investments | | | 231,924 | | | | | 2,202,784 | | | | | 16,620,268 | | | | | 571,916 | |
| Foreign currencies | | | — | | | | | (161 | ) | | | | (1,979 | ) | | | | — | |
| Net realized gain | | | 231,924 | | | | | 2,202,623 | | | | | 16,618,289 | | | | | 571,916 | |
| Net change in unrealized appreciation (depreciation) of investments | | | 775,932 | | | | | 8,843,677 | | | | | 11,322,232 | | | | | 121,263 | |
| Net Realized and Unrealized Gain | | | 1,007,856 | | | | | 11,046,300 | | | | | 27,940,521 | | | | | 693,179 | |
| |
| Net Increase In Net Assets Resulting from Operations | | $ | 1,172,787 | | | | $ | 11,027,132 | | | | $ | 28,411,893 | | | | $ | 670,658 | |
See accompanying notes, which are an integral part of the financial statements.
2012 Annual report · Delaware Pooled Trust
102
| The | | The | | | | | | | | |
| Real Estate | | Core Focus | | The | | The |
| Investment | | Fixed | | High-Yield | | Core Plus |
| Trust | | Income | | Bond | | Fixed Income |
| Portfolio II | | Portfolio | | Portfolio | | Portfolio |
| Investment Income: | | | | | | | | | | | | | | | |
| Dividends | $ | 69,834 | | | $ | 1,660 | | | $ | 73,453 | | | $ | 12,980 | |
| Interest | | 136 | | | | 148,580 | | | | 5,895,339 | | | | 2,075,462 | |
| Securities lending income | | — | | | | 319 | | | | 11,822 | | | | 2,967 | |
| Foreign tax withheld | | — | | | | — | | | | — | | | | — | |
| | 69,970 | | | | 150,559 | | | | 5,980,614 | | | | 2,091,409 | |
| |
| Expenses: | | | | | | | | | | | | | | | |
| Management fees | | 25,443 | | | | 28,534 | | | | 332,160 | | | | 250,760 | |
| Registration fees | | 12,111 | | | | 16,892 | | | | 11,596 | | | | 17,742 | |
| Audit and tax | | 11,053 | | | | 10,465 | | | | 14,865 | | | | 12,152 | |
| Dues and services | | 3,483 | | | | 3,881 | | | | 3,400 | | | | 4,037 | |
| Reports and statements to shareholders | | 2,787 | | | | 505 | | | | 3,570 | | | | 2,514 | |
| Custodian fees | | 1,606 | | | | 2,636 | | | | 4,147 | | | | 15,367 | |
| Accounting and administration expenses | | 1,326 | | | | 2,788 | | | | 28,845 | | | | 22,799 | |
| Pricing fees | | 886 | | | | 6,951 | | | | 5,186 | | | | 18,067 | |
| Dividend disbursing and transfer agent fees and expenses | | 406 | | | | 849 | | | | 8,284 | | | | 6,573 | |
| Legal fees | | 383 | | | | 770 | | | | 7,878 | | | | 6,551 | |
| Trustees’ fees | | 159 | | | | 325 | | | | 3,282 | | | | 2,739 | |
| Insurance fees | | 60 | | | | 122 | | | | 987 | | | | 903 | |
| Consulting fees | | 32 | | | | 48 | | | | 687 | | | | 524 | |
| Trustees’ expenses | | 10 | | | | 22 | | | | 186 | | | | 165 | |
| | 59,745 | | | | 74,788 | | | | 425,073 | | | | 360,893 | |
| Less fees waived | | (27,531 | ) | | | (44,041 | ) | | | — | | | | (98,345 | ) |
| |
| Total operating expenses | | 32,214 | | | | 30,747 | | | | 425,073 | | | | 262,548 | |
| |
| Net Investment Income | | 37,756 | | | | 119,812 | | | | 5,555,541 | | | | 1,828,861 | |
| |
| Net Realized and Unrealized Gain (Loss): | | | | | | | | | | | | | | | |
| Net realized gain (loss) on: | | | | | | | | | | | | | | | |
| Investments | | 346,919 | | | | 294,677 | | | | (308,276 | ) | | | 1,790,270 | |
| Futures contracts | | — | | | | — | | | | — | | | | (15,249 | ) |
| Swap contracts | | — | | | | — | | | | — | | | | (638,739 | ) |
| Foreign currencies | | — | | | | (11 | ) | | | — | | | | 6,635 | |
| Foreign currency exchange contracts | | — | | | | — | | | | — | | | | (50,826 | ) |
| Options written | | — | | | | — | | | | — | | | | 65,519 | |
| Net realized gain (loss) | | 346,919 | | | | 294,666 | | | | (308,276 | ) | | | 1,157,610 | |
| Net change in unrealized appreciation (depreciation) of: | | | | | | | | | | | | | | | |
| Investments | | 38,559 | | | | 39,838 | | | | 5,307,798 | | | | 1,417,875 | |
| Futures contracts | | — | | | | — | | | | — | | | | (93,633 | ) |
| Swap contracts | | — | | | | — | | | | — | | | | 161,376 | |
| Foreign currencies | | — | | | | — | | | | — | | | | 284 | |
| Foreign currency exchange contracts | | — | | | | — | | | | — | | | | (59,872 | ) |
| Net change in unrealized appreciation (depreciation) | | 38,559 | | | | 39,838 | | | | 5,307,798 | | | | 1,426,030 | |
| |
| Net Realized and Unrealized Gain | | 385,478 | | | | 334,504 | | | | 4,999,522 | | | | 2,583,640 | |
| |
| Net Increase In Net Assets Resulting from Operations | $ | 423,234 | | | $ | 454,316 | | | $ | 10,555,063 | | | $ | 4,412,501 | |
See accompanying notes, which are an integral part of the financial statements.
2012 Annual report · Delaware Pooled Trust
(continues) 103
Statements of operations
Delaware Pooled® Trust
| | | | | The | | | | | | | | |
| The | | Labor Select | | The | | The |
| International | | International | | Emerging | | Emerging |
| Equity | | Equity | | Markets | | Markets |
| Portfolio | | Portfolio | | Portfolio | | Portfolio II |
| Investment Income: | | | | | | | | | | | | | | | |
| Dividends | $ | 24,965,558 | | | $ | 24,475,310 | | | $ | 14,924,458 | | | $ | 447,040 | |
| Interest | | 24,109 | | | | 8,483 | | | | 7,427 | | | | 797 | |
| Securities lending income | | 636,677 | | | | 817,648 | | | | 206,520 | | | | 9,309 | |
| Foreign tax withheld | | (2,082,112 | ) | | | (2,126,789 | ) | | | (1,469,047 | ) | | | (37,297 | ) |
| | 23,544,232 | | | | 23,174,652 | | | | 13,669,358 | | | | 419,849 | |
| |
| Expenses: | | | | | | | | | | | | | | | |
| Management fees | | 3,886,979 | | | | 3,895,004 | | | | 4,562,176 | | | | 202,864 | |
| Accounting and administration expenses | | 211,078 | | | | 203,076 | | | | 178,462 | | | | 7,927 | |
| Custodian fees | | 193,715 | | | | 183,889 | | | | 487,609 | | | | 22,012 | |
| Legal fees | | 62,531 | | | | 58,347 | | | | 54,659 | | | | 2,887 | |
| Dividend disbursing and transfer agent fees and expenses | | 60,199 | | | | 58,506 | | | | 51,373 | | | | 2,319 | |
| Trustees’ fees | | 25,776 | | | | 24,935 | | | | 22,179 | | | | 915 | |
| Reports and statements to shareholders | | 23,106 | | | | 21,168 | | | | 24,069 | | | | 2,564 | |
| Audit and tax | | 18,893 | | | | 21,806 | | | | 41,691 | | | | 18,320 | |
| Registration fees | | 16,450 | | | | 15,832 | | | | 14,017 | | | | 19,359 | |
| Insurance fees | | 10,870 | | | | 10,528 | | | | 9,751 | | | | 260 | |
| Dues and services | | 7,750 | | | | 7,143 | | | | 6,793 | | | | 4,170 | |
| Consulting fees | | 4,576 | | | | 4,479 | | | | 3,913 | | | | 182 | |
| Pricing fees | | 2,249 | | | | 2,145 | | | | 2,619 | | | | 2,696 | |
| Trustees’ expenses | | 1,584 | | | | 1,526 | | | | 1,441 | | | | 47 | |
| | 4,525,756 | | | | 4,508,384 | | | | 5,460,752 | | | | 286,522 | |
| Less fees waived | | — | | | | — | | | | — | | | | (43,488 | ) |
| Less expense paid indirectly | | (4 | ) | | | (2 | ) | | | (1 | ) | | | — | |
| |
| Total operating expenses | | 4,525,752 | | | | 4,508,382 | | | | 5,460,751 | | | | 243,034 | |
| |
| Net Investment Income | | 19,018,480 | | | | 18,666,270 | | | | 8,208,607 | | | | 176,815 | |
| |
| Net Realized and Unrealized Gain (Loss): | | | | | | | | | | | | | | | |
| Net realized gain (loss) on: | | | | | | | | | | | | | | | |
| Investments | | (5,111,690 | ) | | | (4,381,305 | ) | | | 5,096,680 | | | | (195,135 | ) |
| Redemptions in kind* | | (930,500 | ) | | | — | | | | 19,277,619 | | | | — | |
| Foreign currencies | | 217,946 | | | | (147,717 | ) | | | 494,855 | | | | (6,267 | ) |
| Foreign currency exchange contracts | | 410,521 | | | | 430,987 | | | | (881,464 | ) | | | (19,377 | ) |
| Net realized gain (loss) | | (5,413,723 | ) | | | (4,098,035 | ) | | | 23,987,690 | | | | (220,779 | ) |
| Net change in unrealized appreciation (depreciation) of: | | | | | | | | | | | | | | | |
| Investments | | (5,145,858 | ) | | | (4,313,812 | ) | | | 8,743,816 | | | | (258,247 | ) |
| Foreign currencies | | (342,992 | ) | | | (77,370 | ) | | | (598,361 | ) | | | (664 | ) |
| Foreign currency exchange contracts | | 93,420 | | | | 63,416 | | | | 6,857 | | | | (22 | ) |
| Net change in unrealized appreciation (depreciation) | | (5,395,430 | ) | | | (4,327,766 | ) | | | 8,152,312 | | | | (258,933 | ) |
| |
| Net Realized and Unrealized Gain (Loss) | | (10,809,153 | ) | | | (8,425,801 | ) | | | 32,140,002 | | | | (479,712 | ) |
| |
| Net Increase (Decrease) In Net Assets Resulting from Operations | $ | 8,209,327 | | | $ | 10,240,469 | | | $ | 40,348,609 | | | $ | (302,897 | ) |
*See Note 12 in “Notes to financial statements.”
See accompanying notes, which are an integral part of the financial statements.
2012 Annual report · Delaware Pooled Trust
104
Statements of changes in net assets
Delaware Pooled® Trust
| The | | | | | | | | | | The |
| Large-Cap | | The | | Large-Cap |
| Value Equity | | Select 20 | | Growth Equity |
| Portfolio | | Portfolio | | Portfolio |
| Year | | Year | | Year | | Year | | Year | | Year |
| Ended | | Ended | | Ended | | Ended | | Ended | | Ended |
| 10/31/12 | | 10/31/11 | | 10/31/12 | | 10/31/11 | | 10/31/12 | | 10/31/11 |
| Increase (Decrease) in Net Assets | | | | | | | | | | | | | | | | | | | | | | | |
| from Operations: | | | | | | | | | | | | | | | | | | | | | | | |
| Net investment income (loss) | $ | 164,931 | | | $ | 143,410 | | | $ | (19,168 | ) | | $ | 10,052 | | | $ | 471,372 | | | $ | 1,088,164 | |
| Net realized gain | | 231,924 | | | | 1,503,263 | | | | 2,202,623 | | | | 209,856 | | | | 16,618,289 | | | | 26,325,273 | |
| Net change in unrealized | | | | | | | | | | | | | | | | | | | | | | | |
| appreciation (depreciation) | | 775,932 | | | | (838,965 | ) | | | 8,843,677 | | | | 2,150,173 | | | | 11,322,232 | | | | (3,280,481 | ) |
| Net increase in net assets | | | | | | | | | | | | | | | | | | | | | | | |
| resulting from operations | | 1,172,787 | | | | 807,708 | | | | 11,027,132 | | | | 2,370,081 | | | | 28,411,893 | | | | 24,132,956 | |
| |
| Dividends and Distributions to | | | | | | | | | | | | | | | | | | | | | | | |
| Shareholders from: | | | | | | | | | | | | | | | | | | | | | | | |
| Net investment income | | (149,499 | ) | | | (211,314 | ) | | | (15,848 | ) | | | — | | | | (450,961 | ) | | | (826,516 | ) |
| | (149,499 | ) | | | (211,314 | ) | | | (15,848 | ) | | | — | | | | (450,961 | ) | | | (826,516 | ) |
| Capital Share Transactions: | | | | | | | | | | | | | | | | | | | | | | | |
| Proceeds from shares sold | | 605,768 | | | | 7,593,991 | | | | 90,036,441 | | | | 34,840,063 | | | | 63,467,089 | | | | 5,377,033 | |
| Net asset value of shares issued upon | | | | | | | | | | | | | | | | | | | | | | | |
| reinvestment of dividends and distributions | | 147,498 | | | | 211,314 | | | | 11,750 | | | | — | | | | 381,424 | | | | 707,154 | |
| | 753,266 | | | | 7,805,305 | | | | 90,048,191 | | | | 34,840,063 | | | | 63,848,513 | | | | 6,084,187 | |
| Cost of shares redeemed | | — | | | | (8,353,164 | ) | | | (22,526,515 | ) | | | (2,694,982 | ) | | | (45,873,085 | ) | | | (102,983,563 | ) |
| Increase (decrease) in net assets derived | | | | | | | | | | | | | | | | | | | | | | | |
| from capital share transactions | | 753,266 | | | | (547,859 | ) | | | 67,521,676 | | | | 32,145,081 | | | | 17,975,428 | | | | (96,899,376 | ) |
| |
| Net Increase (Decrease) In Net Assets | | 1,776,554 | | | | 48,535 | | | | 78,532,960 | | | | 34,515,162 | | | | 45,936,360 | | | | (73,592,936 | ) |
| |
| Net Assets: | | | | | | | | | | | | | | | | | | | | | | | |
| Beginning of year | | 6,640,768 | | | | 6,592,233 | | | | 45,977,931 | | | | 11,462,769 | | | | 170,531,121 | | | | 244,124,057 | |
| End of year | $ | 8,417,322 | | | $ | 6,640,768 | | | $ | 124,510,891 | | | $ | 45,977,931 | | | $ | 216,467,481 | | | $ | 170,531,121 | |
| |
| Undistributed net investment income | $ | 135,326 | | | $ | 119,894 | | | $ | — | | | $ | 10,052 | | | $ | 444,855 | | | $ | 426,423 | |
See accompanying notes, which are an integral part of the financial statements.
2012 Annual report · Delaware Pooled Trust
(continues) 105
Statements of changes in net assets
Delaware Pooled® Trust
| The | | The | | The |
| Focus Smid-Cap | | Real Estate | | Core Focus |
| Growth Equity | | Investment Trust | | Fixed Income |
| Portfolio | | Portfolio II | | Portfolio |
| Year | | Year | | Year | | Year | | Year | | Year |
| Ended | | Ended | | Ended | | Ended | | Ended | | Ended |
| 10/31/12 | | 10/31/11 | | 10/31/12 | | 10/31/11 | | 10/31/12 | | 10/31/11 |
| Increase (Decrease) in Net Assets | | | | | | | | | | | | | | | | | | | | | | | |
| from Operations: | | | | | | | | | | | | | | | | | | | | | | | |
| Net investment income (loss) | $ | (22,521 | ) | | $ | 52,718 | | | $ | 37,756 | | | $ | 30,451 | | | $ | 119,812 | | | $ | 249,674 | |
| Net realized gain | | 571,916 | | | | 218,423 | | | | 346,919 | | | | 352,467 | | | | 294,666 | | | | 542,819 | |
| Net change in unrealized | | | | | | | | | | | | | | | | | | | | | | | |
| appreciation (depreciation) | | 121,263 | | | | 383,099 | | | | 38,559 | | | | (38,811 | ) | | | 39,838 | | | | (642,762 | ) |
| Net increase in net assets | | | | | | | | | | | | | | | | | | | | | | | |
| resulting from operations | | 670,658 | | | | 654,240 | | | | 423,234 | | | | 344,107 | | | | 454,316 | | | | 149,731 | |
| |
| Dividends and Distributions to | | | | | | | | | | | | | | | | | | | | | | | |
| Shareholders from: | | | | | | | | | | | | | | | | | | | | | | | |
| Net investment income | | (11,997 | ) | | | (41,867 | ) | | | (20,364 | ) | | | (40,124 | ) | | | (201,820 | ) | | | (567,674 | ) |
| | (11,997 | ) | | | (41,867 | ) | | | (20,364 | ) | | | (40,124 | ) | | | (201,820 | ) | | | (567,674 | ) |
| Capital Share Transactions: | | | | | | | | | | | | | | | | | | | | | | | |
| Proceeds from shares sold | | 3,845,500 | | | | 11,706,628 | | | | 3 | | | | — | | | | 3,153,296 | | | | 575,000 | |
| Net asset value of shares issued upon | | | | | | | | | | | | | | | | | | | | | | | |
| reinvestment of dividends and distributions | | 10,558 | | | | 35,984 | | | | 20,364 | | | | 40,124 | | | | 201,820 | | | | 567,674 | |
| | 3,856,058 | | | | 11,742,612 | | | | 20,367 | | | | 40,124 | | | | 3,355,116 | | | | 1,142,674 | |
| Cost of shares redeemed | | (3,383,510 | ) | | | (246,877 | ) | | | — | | | | — | | | | (3,500,000 | ) | | | (13,707,750 | ) |
| Increase (decrease) in net assets derived | | | | | | | | | | | | | | | | | | | | | | | |
| from capital share transactions | | 472,548 | | | | 11,495,735 | | | | 20,367 | | | | 40,124 | | | | (144,884 | ) | | | (12,565,076 | ) |
| |
| Net Increase (Decrease) In Net Assets | | 1,131,209 | | | | 12,108,108 | | | | 423,237 | | | | 344,107 | | | | 107,612 | | | | (12,983,019 | ) |
| |
| Net Assets: | | | | | | | | | | | | | | | | | | | | | | | |
| Beginning of year | | 16,721,384 | | | | 4,613,276 | | | | 3,110,260 | | | | 2,766,153 | | | | 6,224,858 | | | | 19,207,877 | |
| End of year | $ | 17,852,593 | | | $ | 16,721,384 | | | $ | 3,533,497 | | | $ | 3,110,260 | | | $ | 6,332,470 | | | $ | 6,224,858 | |
| |
| Undistributed (distributions in excess of) | | | | | | | | | | | | | | | | | | | | | | | |
| net investment income | $ | (23,667 | ) | | $ | 10,851 | | | $ | 37,510 | | | $ | 20,118 | | | $ | 124,631 | | | $ | 179,918 | |
See accompanying notes, which are an integral part of the financial statements.
2012 Annual report · Delaware Pooled Trust
106
| The | | The | | The |
| High-Yield | | Core Plus | | International |
| Bond | | Fixed Income | | Equity |
| Portfolio | | Portfolio | | Portfolio |
| Year | | Year | | Year | | Year | | Year | | Year |
| Ended | | Ended | | Ended | | Ended | | Ended | | Ended |
| 10/31/12 | | 10/31/11 | | 10/31/12 | | 10/31/11 | | 10/31/12 | | 10/31/11 |
| Increase (Decrease) in Net Assets | | | | | | | | | | | | | | | | | | | | | | | |
| from Operations: | | | | | | | | | | | | | | | | | | | | | | | |
| Net investment income | $ | 5,555,541 | | | $ | 3,735,540 | | | $ | 1,828,861 | | | $ | 1,863,687 | | | $ | 19,018,480 | | | $ | 24,407,993 | |
| Net realized gain (loss) | | (308,276 | ) | | | 883,160 | | | | 1,157,610 | | | | 1,854,159 | | | | (5,413,723 | ) | | | 8,769,257 | |
| Net change in unrealized | | | | | | | | | | | | | | | | | | | | | | | |
| appreciation (depreciation) | | 5,307,798 | | | | (3,496,322 | ) | | | 1,426,030 | | | | (1,347,247 | ) | | | (5,395,430 | ) | | | (36,036,582 | ) |
| Net increase (decrease) in net assets | | | | | | | | | | | | | | | | | | | | | | | |
| resulting from operations | | 10,555,063 | | | | 1,122,378 | | | | 4,412,501 | | | | 2,370,599 | | | | 8,209,327 | | | | (2,859,332 | ) |
| |
| Dividends and Distributions to | | | | | | | | | | | | | | | | | | | | | | | |
| Shareholders from: | | | | | | | | | | | | | | | | | | | | | | | |
| Net investment income | | (4,332,406 | ) | | | (2,250,664 | ) | | | (1,548,743 | ) | | | (2,534,908 | ) | | | (23,845,189 | ) | | | (25,012,020 | ) |
| | | (4,332,406 | ) | | | (2,250,664 | ) | | | (1,548,743 | ) | | | (2,534,908 | ) | | | (23,845,189 | ) | | | (25,012,020 | ) |
| Capital Share Transactions: | | | | | | | | | | | | | | | | | | | | | | | |
| Proceeds from shares sold | | 50,842,955 | | | | 32,392,897 | | | | 4,314,545 | | | | 6,140,001 | | | | 45,805,783 | | | | 34,030,531 | |
| Net asset value of shares issued upon | | | | | | | | | | | | | | | | | | | | | | | |
| reinvestment of dividends and distributions | | 4,332,405 | | | | 2,250,663 | | | | 1,548,742 | | | | 2,534,907 | | | | 14,607,714 | | | | 13,948,935 | |
| | 55,175,360 | | | | 34,643,560 | | | | 5,863,287 | | | | 8,674,908 | | | | 60,413,497 | | | | 47,979,466 | |
| Cost of shares redeemed | | (6,190,646 | ) | | | (5,111,965 | ) | | | (2,265,000 | ) | | | (4,965,000 | ) | | | (166,059,657 | ) | | | (240,010,080 | ) |
| Increase (decrease) in net assets derived | | | | | | | | | | | | | | | | | | | | | | | |
| from capital share transactions | | 48,984,714 | | | | 29,531,595 | | | | 3,598,287 | | | | 3,709,908 | | | | (105,646,160 | ) | | | (192,030,614 | ) |
| |
| Net Increase (Decrease) In Net Assets | | 55,207,371 | | | | 28,403,309 | | | | 6,462,045 | | | | 3,545,599 | | | | (121,282,022 | ) | | | (219,901,966 | ) |
| |
| Net Assets: | | | | | | | | | | | | | | | | | | | | | | | |
| Beginning of year | | 57,840,275 | | | | 29,436,966 | | | | 53,851,058 | | | | 50,305,459 | | | | 589,109,164 | | | | 809,011,130 | |
| End of year | $ | 113,047,646 | | | $ | 57,840,275 | | | $ | 60,313,103 | | | $ | 53,851,058 | | | $ | 467,827,142 | | | $ | 589,109,164 | |
| |
| Undistributed net investment income | $ | 4,937,564 | | | $ | 3,521,603 | | | $ | 1,450,407 | | | $ | 1,490,239 | | | $ | 17,315,130 | | | $ | 21,513,372 | |
See accompanying notes, which are an integral part of the financial statements.
2012 Annual report · Delaware Pooled Trust
(continues) 107
Statements of changes in net assets
Delaware Pooled® Trust
| The | | The | | The |
| Labor Select | | Emerging | | Emerging |
| International Equity | | Markets | | Markets |
| Portfolio | | Portfolio | | Portfolio II |
| Year | | Year | | Year | | Year | | Year | | Year |
| Ended | | Ended | | Ended | | Ended | | Ended | | Ended |
| 10/31/12 | | 10/31/11 | | 10/31/12 | | 10/31/11 | | 10/31/12 | | 10/31/11 |
| Increase (Decrease) in Net Assets | | | | | | | | | | | | | | | | | | | | | | | |
| from Operations: | | | | | | | | | | | | | | | | | | | | | | | |
| Net investment income | $ | 18,666,270 | | | $ | 22,680,370 | | | $ | 8,208,607 | | | $ | 14,121,041 | | | $ | 176,815 | | | $ | 129,514 | |
| Net realized gain (loss) | | (4,098,035 | ) | | | 11,639,805 | | | | 23,987,690 | | | | 66,690,810 | | | | (220,779 | ) | | | 506,436 | |
| Net change in unrealized | | | | | | | | | | | | | | | | | | | | | | | |
| appreciation (depreciation) | | (4,327,766 | ) | | | (39,040,237 | ) | | | 8,152,312 | | | | (107,193,261 | ) | | | (258,933 | ) | | | (2,562,825 | ) |
| Net increase (decrease) in net assets | | | | | | | | | | | | | | | | | | | | | | | |
| resulting from operations | | 10,240,469 | | | | (4,720,062 | ) | | | 40,348,609 | | | | (26,381,410 | ) | | | (302,897 | ) | | | (1,926,875 | ) |
| |
| Dividends and Distributions to | | | | | | | | | | | | | | | | | | | | | | | |
| Shareholders from: | | | | | | | | | | | | | | | | | | | | | | | |
| Net investment income | | (22,684,826 | ) | | | (22,010,265 | ) | | | (11,672,380 | ) | | | (16,918,513 | ) | | | (234,141 | ) | | | (30,588 | ) |
| Net realized gain on investments | | — | | | | — | | | | (42,338,904 | ) | | | — | | | | (527,349 | ) | | | (87,059 | ) |
| | (22,684,826 | ) | | | (22,010,265 | ) | | | (54,011,284 | ) | | | (16,918,513 | ) | | | (761,490 | ) | | | (117,647 | ) |
| Capital Share Transactions: | | | | | | | | | | | | | | | | | | | | | | | |
| Proceeds from shares sold | | 9,369,021 | | | | 14,449,698 | | | | 64,985,419 | | | | 52,338,384 | | | | 14,650,019 | | | | 6,955,569 | |
| Purchase reimbursement fees | | — | | | | — | | | | 289,564 | | | | 290,352 | | | | — | | | | — | |
| Net asset value of shares issued upon | | | | | | | | | | | | | | | | | | | | | | | |
| reinvestment of dividends and distributions | | 22,684,825 | | | | 22,010,264 | | | | 50,816,576 | | | | 16,562,741 | | | | 761,490 | | | | 117,647 | |
| | 32,053,846 | | | | 36,459,962 | | | | 116,091,559 | | | | 69,191,477 | | | | 15,411,509 | | | | 7,073,216 | |
| Cost of shares redeemed | | (82,724,173 | ) | | | (178,039,136 | ) | | | (317,967,106 | ) | | | (245,725,632 | ) | | | — | | | | (1,054,179 | ) |
| Redemption reimbursement fees | | — | | | | — | | | | 820,953 | | | | 1,170,221 | | | | — | | | | — | |
| | (82,724,173 | ) | | | (178,039,136 | ) | | | (317,146,153 | ) | | | (244,555,411 | ) | | | — | | | | (1,054,179 | ) |
| Increase (decrease) in net assets derived | | | | | | | | | | | | | | | | | | | | | | | |
| from capital share transactions | | (50,670,327 | ) | | | (141,579,174 | ) | | | (201,054,594 | ) | | | (175,363,934 | ) | | | 15,411,509 | | | | 6,019,037 | |
| |
| Net Increase (Decrease) In Net Assets | | (63,114,684 | ) | | | (168,309,501 | ) | | | (214,717,269 | ) | | | (218,663,857 | ) | | | 14,347,122 | | | | 3,974,515 | |
| |
| Net Assets: | | | | | | | | | | | | | | | | | | | | | | | |
| Beginning of year | | 572,642,123 | | | | 740,951,624 | | | | 531,526,595 | | | | 750,190,452 | | | | 15,338,992 | | | | 11,364,477 | |
| End of year | $ | 509,527,439 | | | $ | 572,642,123 | | | $ | 316,809,326 | | | $ | 531,526,595 | | | $ | 29,686,114 | | | $ | 15,338,992 | |
| |
| Undistributed net investment income | $ | 15,977,834 | | | $ | 19,713,120 | | | $ | 7,397,868 | | | $ | 11,016,448 | | | $ | 12,133 | | | $ | 95,191 | |
See accompanying notes, which are an integral part of the financial statements.
2012 Annual report · Delaware Pooled Trust
108
Financial highlights
Delaware Pooled® Trust — The Large-Cap Value Equity Portfolio
Selected data for each share of the Portfolio outstanding throughout each period were as follows:
| | Year Ended | |
| | 10/31/12 | | | 10/31/11 | | | 10/31/10 | | | 10/31/09 | | | 10/31/08 | | |
| Net asset value, beginning of period | | $16.570 | | | $15.130 | | | $13.290 | | | $12.190 | | | $22.370 | | |
| | |
| Income (loss) from investment operations: | | | | | | | | | | | | | | | | |
| Net investment income1 | | 0.394 | | | 0.346 | | | 0.343 | | | 0.354 | | | 0.403 | | |
| Net realized and unrealized gain (loss) | | 2.379 | | | 1.579 | | | 1.851 | | | 1.067 | | | (8.186 | ) | |
| Total from investment operations | | 2.773 | | | 1.925 | | | 2.194 | | | 1.421 | | | (7.783 | ) | |
| | |
| Less dividends and distributions from: | | | | | | | | | | | | | | | | |
| Net investment income | | (0.373 | ) | | (0.485 | ) | | (0.354 | ) | | (0.321 | ) | | (0.613 | ) | |
| Net realized gain | | — | | | — | | | — | | | — | | | (1.784 | ) | |
| Total dividends and distributions | | (0.373 | ) | | (0.485 | ) | | (0.354 | ) | | (0.321 | ) | | (2.397 | ) | |
| | |
| Net asset value, end of period | | $18.970 | | | $16.570 | | | $15.130 | | | $13.290 | | | $12.190 | | |
| | |
| Total return2 | | 17.12% | | | 12.98% | | | 16.80% | | | 12.12% | | | (38.48% | ) | |
| | |
| Ratios and supplemental data: | | | | | | | | | | | | | | | | |
| Net assets, end of period (000 omitted) | | $8,417 | | | $6,641 | | | $6,592 | | | $10,105 | | | $8,988 | | |
| Ratio of expenses to average net assets | | 0.70% | | | 0.70% | | | 0.70% | | | 0.69% | | | 0.68% | | |
| Ratio of expenses to average net assets | | | | | | | | | | | | | | | | |
| prior to fees waived | | 1.09% | | | 1.24% | | | 1.02% | | | 0.98% | | | 1.16% | | |
| Ratio of net investment income to average net assets | | 2.21% | | | 2.15% | | | 2.46% | | | 2.99% | | | 2.43% | | |
| Ratio of net investment income to average net assets | | | | | | | | | | | | | | | | |
| prior to fees waived | | 1.82% | | | 1.61% | | | 2.14% | | | 2.70% | | | 1.95% | | |
| Portfolio turnover | | 14% | | | 133% | | | 42% | | | 26% | | | 34% | | |
| 1 The average shares outstanding method has been applied for per share information. |
| 2 Total investment return is based on the change in net asset value of a share during the period and assumes reinvestment of dividends and distributions at net asset value. Total investment return during all of the periods shown reflects a waiver by the manager. Performance would have been lower had the waiver not been in effect. |
See accompanying notes, which are an integral part of the financial statements.
2012 Annual report · Delaware Pooled Trust
(continues) 109
Financial highlights
Delaware Pooled® Trust — The Select 20 Portfolio
Selected data for each share of the Portfolio outstanding throughout each period were as follows:
| | Year Ended | |
| | 10/31/12 | | | 10/31/11 | | | 10/31/10 | | | 10/31/09 | | | 10/31/08 | | |
| Net asset value, beginning of period | | $6.960 | | | $6.040 | | | $4.980 | | | $4.040 | | | $6.880 | | |
| | | |
| Income (loss) from investment operations: | | | | | | | | | | | | | | | | |
| Net investment income (loss)1 | | (0.002 | ) | | 0.003 | | | (0.019 | ) | | (0.012 | ) | | 0.008 | | |
| Net realized and unrealized gain (loss) | | 1.184 | | | 0.917 | | | 1.079 | | | 0.959 | | | (2.848 | ) | |
| Total from investment operations | | 1.182 | | | 0.920 | | | 1.060 | | | 0.947 | | | (2.840 | ) | |
| | | |
| Less dividends and distributions from: | | | | | | | | | | | | | | | | |
| Net investment income | | (0.002 | ) | | — | | | — | | | (0.004 | ) | | — | | |
| Return of capital | | — | | | — | | | — | | | (0.003 | ) | | — | | |
| Total dividends and distributions | | (0.002 | ) | | — | | | — | | | (0.007 | ) | | — | | |
| | | |
| Net asset value, end of period | | $8.140 | | | $6.960 | | | $6.040 | | | $4.980 | | | $4.040 | | |
| | | |
| Total return2 | | 16.99% | | | 15.23% | | | 21.29% | | | 23.51% | | | (41.28% | ) | |
| | | |
| Ratios and supplemental data: | | | | | | | | | | | | | | | | |
| Net assets, end of period (000 omitted) | | $124,511 | | | $45,978 | | | $11,463 | | | $10,204 | | | $8,933 | | |
| Ratio of expenses to average net assets | | 0.86% | | | 0.89% | | | 0.89% | | | 0.89% | | | 0.89% | | |
| Ratio of expenses to average net assets | | | | | | | | | | | | | | | | |
| prior to fees waived | | 0.87% | | | 1.02% | | | 1.24% | | | 1.18% | | | 1.64% | | |
| Ratio of net investment income (loss) to average net assets | | (0.02% | ) | | 0.04% | | | (0.35% | ) | | (0.29% | ) | | 0.15% | | |
| Ratio of net investment loss to average net assets | | | | | | | | | | | | | | | | |
| prior to fees waived | | (0.03% | ) | | (0.09% | ) | | (0.70% | ) | | (0.58% | ) | | (0.60% | ) | |
| Portfolio turnover | | 42% | | | 26% | | | 80% | | | 53% | | | 61% | | |
| 1 The average shares outstanding method has been applied for per share information. |
| 2 Total investment return is based on the change in net asset value of a share during the period and assumes reinvestment of dividends and distributions at net asset value. Total investment return during all of the periods shown reflects a waiver by the manager. Performance would have been lower had the waiver not been in effect. |
See accompanying notes, which are an integral part of the financial statements.
2012 Annual report · Delaware Pooled Trust
110
Delaware Pooled® Trust — The Large-Cap Growth Equity Portfolio
Selected data for each share of the Portfolio outstanding throughout each period were as follows:
| | Year Ended | |
| | 10/31/12 | | | 10/31/11 | | | 10/31/10 | | | 10/31/09 | | | 10/31/08 | | |
| Net asset value, beginning of period | | $9.880 | | | $8.900 | | | $7.350 | | | $6.220 | | | $10.560 | | |
| | | |
| Income (loss) from investment operations: | | | | | | | | | | | | | | | | |
| Net investment income1 | | 0.027 | | | 0.053 | | | 0.008 | | | 0.020 | | | 0.018 | | |
| Net realized and unrealized gain (loss) | | 1.589 | | | 0.962 | | | 1.559 | | | 1.135 | | | (4.256 | ) | |
| Total from investment operations | | 1.616 | | | 1.015 | | | 1.567 | | | 1.155 | | | (4.238 | ) | |
| | | |
| Less dividends and distributions from: | | | | | | | | | | | | | | | | |
| Net investment income | | (0.026 | ) | | (0.035 | ) | | (0.017 | ) | | (0.025 | ) | | (0.014 | ) | |
| Net realized gain | | — | | | — | | | — | | | — | | | (0.088 | ) | |
| Total dividends and distributions | | (0.026 | ) | | (0.035 | ) | | (0.017 | ) | | (0.025 | ) | | (0.102 | ) | |
| | | |
| Net asset value, end of period | | $11.470 | | | $9.880 | | | $8.900 | | | $7.350 | | | $6.220 | | |
| | | |
| Total return2 | | 16.40% | | | 11.43% | | | 21.35% | | | 18.51% | | | (40.50% | ) | |
| | | |
| Ratios and supplemental data: | | | | | | | | | | | | | | | | |
| Net assets, end of period (000 omitted) | | $216,467 | | | $170,531 | | | $244,124 | | | $251,017 | | | $258,526 | | |
| Ratio of expenses to average net assets | | 0.65% | | | 0.64% | | | 0.65% | | | 0.65% | | | 0.65% | | |
| Ratio of expenses to average net assets | | | | | | | | | | | | | | | | |
| prior to fees waived | | 0.65% | | | 0.64% | | | 0.65% | | | 0.66% | | | 0.65% | | |
| Ratio of net investment income to average net assets | | 0.25% | | | 0.55% | | | 0.10% | | | 0.32% | | | 0.20% | | |
| Ratio of net investment income to average net assets | | | | | | | | | | | | | | | | |
| prior to fees waived | | 0.25% | | | 0.55% | | | 0.10% | | | 0.31% | | | 0.20% | | |
| Portfolio turnover | | 40% | 3 | | 19% | | | 22% | | | 30% | | | 38% | | |
| 1 The average shares outstanding method has been applied for per share information. |
| 2 Total investment return is based on the change in net asset value of a share during the period and assumes reinvestment of dividends and distributions at net asset value. Total investment return during some of the periods shown reflects a waiver by the manager. Performance would have been lower had the waiver not been in effect. |
| 3 Excludes the value of portfolio securities received or delivered as a result of in-kind purchases or redemptions of the Portfolio’s capital shares. |
See accompanying notes, which are an integral part of the financial statements.
2012 Annual report · Delaware Pooled Trust
(continues) 111
Financial highlights
Delaware Pooled® Trust — The Focus Smid-Cap Growth Equity Portfolio
Selected data for each share of the Portfolio outstanding throughout each period were as follows:
| | Year Ended | |
| | 10/31/12 | | | 10/31/11 | | | 10/31/10 | | | 10/31/09 | | | 10/31/08 | | |
| | |
| Net asset value, beginning of period | | $14.810 | | | $12.290 | | | $8.710 | | | $6.580 | | | $11.360 | | |
| | | |
| Income (loss) from investment operations: | | | | | | | | | | | | | | | | |
| Net investment income (loss)1 | | (0.022 | ) | | 0.079 | | | (0.031 | ) | | 0.013 | | | 0.056 | | |
| Net realized and unrealized gain (loss) | | 0.723 | | | 2.547 | | | 3.611 | | | 2.173 | | | (4.079 | ) | |
| Total from investment operations | | 0.701 | | | 2.626 | | | 3.580 | | | 2.186 | | | (4.023 | ) | |
| | | |
| Less dividends and distributions from: | | | | | | | | | | | | | | | | |
| Net investment income | | (0.011 | ) | | (0.106 | ) | | — | | | (0.056 | ) | | (0.031 | ) | |
| Net realized gain | | — | | | — | | | — | | | — | | | (0.726 | ) | |
| Total dividends and distributions | | (0.011 | ) | | (0.106 | ) | | — | | | (0.056 | ) | | (0.757 | ) | |
| | | |
| Net asset value, end of period | | $15.500 | | | $14.810 | | | $12.290 | | | $8.710 | | | $6.580 | | |
| | | |
| Total return2 | | 4.74% | | | 21.44% | | | 41.10% | | | 33.07% | | | (37.44% | ) | |
| | | |
| Ratios and supplemental data: | | | | | | | | | | | | | | | | |
| Net assets, end of period (000 omitted) | | $17,853 | | | $16,721 | | | $4,613 | | | $3,450 | | | $4,305 | | |
| Ratio of expenses to average net assets | | 0.92% | | | 0.92% | | | 0.92% | | | 0.92% | | | 0.92% | | |
| Ratio of expenses to average net assets | | | | | | | | | | | | | | | | |
| prior to fees waived | | 0.94% | | | 1.05% | | | 1.44% | | | 1.48% | | | 1.12% | | |
| Ratio of net investment income (loss) to average net assets | | (0.14% | ) | | 0.54% | | | (0.30% | ) | | 0.19% | | | 0.63% | | |
| Ratio of net investment income (loss) to average net assets | | | | | | | | | | | | | | | | |
| prior to fees waived | | (0.16% | ) | | 0.41% | | | (0.82% | ) | | (0.37% | ) | | 0.43% | | |
| Portfolio turnover | | 44% | | | 16% | | | 86% | | | 51% | | | 43% | | |
| 1 The average shares outstanding method has been applied for per share information. |
| 2 Total investment return is based on the change in net asset value of a share during the period and assumes reinvestment of dividends and distributions at net asset value. Total investment return during all of the periods shown reflects a waiver by the manager. Performance would have been lower had the waiver not been in effect. |
See accompanying notes, which are an integral part of the financial statements.
2012 Annual report · Delaware Pooled Trust
112
Delaware Pooled® Trust — The Real Estate Investment Trust Portfolio II
Selected data for each share of the Portfolio outstanding throughout each period were as follows:
| | Year Ended | |
| | 10/31/12 | | | 10/31/11 | | | 10/31/10 | | | 10/31/09 | | | 10/31/08 | | |
| Net asset value, beginning of period | | $6.410 | | | $5.790 | | | $4.260 | | | $4.680 | | | $13.600 | | |
| | | |
| Income (loss) from investment operations: | | | | | | | | | | | | | | | | |
| Net investment income1 | | 0.077 | | | 0.063 | | | 0.090 | | | 0.129 | | | 0.157 | | |
| Net realized and unrealized gain (loss) | | 0.795 | | | 0.641 | | | 1.561 | | | (0.290 | ) | | (3.806 | ) | |
| Total from investment operations | | 0.872 | | | 0.704 | | | 1.651 | | | (0.161 | ) | | (3.649 | ) | |
| | | |
| Less dividends and distributions from: | | | | | | | | | | | | | | | | |
| Net investment income | | (0.042 | ) | | (0.084 | ) | | (0.121 | ) | | (0.259 | ) | | (0.124 | ) | |
| Net realized gain | | — | | | — | | | — | | | — | | | (5.147 | ) | |
| Total dividends and distributions | | (0.042 | ) | | (0.084 | ) | | (0.121 | ) | | (0.259 | ) | | (5.271 | ) | |
| | | |
| Net asset value, end of period | | $7.240 | | | $6.410 | | | $5.790 | | | $4.260 | | | $4.680 | | |
| | | |
| Total return2 | | 13.72% | | | 12.37% | | | 39.51% | | | (2.62% | ) | | (37.42% | ) | |
| | | |
| Ratios and supplemental data: | | | | | | | | | | | | | | | | |
| Net assets, end of period (000 omitted) | | $3,533 | | | $3,110 | | | $2,766 | | | $5,231 | | | $5,346 | | |
| Ratio of expenses to average net assets | | 0.95% | | | 0.95% | | | 0.95% | | | 0.91% | | | 0.86% | | |
| Ratio of expenses to average net assets | | | | | | | | | | | | | | | | |
| prior to fees waived | | 1.76% | | | 2.03% | | | 1.81% | | | 1.53% | | | 1.20% | | |
| Ratio of net investment income to average net assets | | 1.11% | | | 1.03% | | | 1.82% | | | 3.57% | | | 2.27% | | |
| Ratio of net investment income (loss) to average net assets | | | | | | | | | | | | | | | | |
| prior to fees waived | | 0.30% | | | (0.05% | ) | | 0.96% | | | 2.95% | | | 1.93% | | |
| Portfolio turnover | | 88% | | | 138% | | | 192% | | | 169% | | | 121% | | |
| 1 The average shares outstanding method has been applied for per share information. |
| 2 Total investment return is based on the change in net asset value of a share during the period and assumes reinvestment of dividends and distributions at net asset value. Total investment return during all of the periods shown reflects a waiver by the manager. Performance would have been lower had the waiver not been in effect. |
See accompanying notes, which are an integral part of the financial statements.
2012 Annual report · Delaware Pooled Trust
(continues) 113
Financial highlights
Delaware Pooled® Trust — The Core Focus Fixed Income Portfolio
Selected data for each share of the Portfolio outstanding throughout each period were as follows:
| Year Ended |
| | 10/31/12 | | 10/31/11 | | 10/31/10 | | 10/31/09 | | 10/31/08 | |
| Net asset value, beginning of period | | | $9.750 | | | | $9.440 | | | | $9.120 | | | | $8.150 | | | | $9.140 | | |
| | |
| Income (loss) from investment operations: | | | | | | | | | | | | | | | | | | | | | |
| Net investment income1 | | | 0.165 | | | | 0.234 | | | | 0.284 | | | | 0.414 | | | | 0.403 | | |
| Net realized and unrealized gain (loss) | | | 0.491 | | | | 0.355 | | | | 0.456 | | | | 0.968 | | | | (0.753 | ) | |
| Total from investment operations | | | 0.656 | | | | 0.589 | | | | 0.740 | | | | 1.382 | | | | (0.350 | ) | |
| | |
| Less dividends and distributions from: | | | | | | | | | | | | | | | | | | | | | |
| Net investment income | | | (0.316 | ) | | | (0.279 | ) | | | (0.420 | ) | | | (0.412 | ) | | | (0.640 | ) | |
| Total dividends and distributions | | | (0.316 | ) | | | (0.279 | ) | | | (0.420 | ) | | | (0.412 | ) | | | (0.640 | ) | |
| | |
| Net asset value, end of period | | | $10.090 | | | | $9.750 | | | | $9.440 | | | | $9.120 | | | | $8.150 | | |
| | |
| Total return2 | | | 6.93% | | | | 6.49% | | | | 8.46% | | | | 17.41% | | | | (4.13% | ) | |
| | |
| Ratios and supplemental data: | | | | | | | | | | | | | | | | | | | | | |
| Net assets, end of period (000 omitted) | | | $6,332 | | | | $6,225 | | | | $19,208 | | | | $20,550 | | | | $30,111 | | |
| Ratio of expenses to average net assets | | | 0.43% | | | | 0.43% | | | | 0.43% | | | | 0.43% | | | | 0.42% | | |
| Ratio of expenses to average net assets | | | | | | | | | | | | | | | | | | | | | |
| prior to fees waived | | | 1.05% | | | | 0.96% | | | | 0.76% | | | | 0.71% | | | | 0.63% | | |
| Ratio of net investment income to average net assets | | | 1.68% | | | | 2.53% | | | | 3.13% | | | | 4.94% | | | | 4.63% | | |
| Ratio of net investment income to average net assets | | | | | | | | | | | | | | | | | | | | | |
| prior to fees waived | | | 1.06% | | | | 2.00% | | | | 2.80% | | | | 4.66% | | | | 4.39% | | |
| Portfolio turnover | | | 586% | | | | 535% | | | | 437% | | | | 299% | | | | 359% | | |
1 The average shares outstanding method has been applied for per share information.
2 Total investment return is based on the change in net asset value of a share during the period and assumes reinvestment of dividends and distributions at net asset value. Total investment return during all of the periods shown reflects a waiver by the manager. Performance would have been lower had the waiver not been in effect.
See accompanying notes, which are an integral part of the financial statements.
2012 Annual report • Delaware Pooled Trust
114
Delaware Pooled® Trust — The High-Yield Bond Portfolio
Selected data for each share of the Portfolio outstanding throughout each period were as follows:
| Year Ended |
| | 10/31/12 | | 10/31/11 | | 10/31/10 | | 10/31/09 | | 10/31/08 | |
| Net asset value, beginning of period | | | $7.830 | | | | $8.110 | | | | $7.350 | | | | $5.580 | | | | $8.060 | | |
| | |
| Income (loss) from investment operations: | | | | | | | | | | | | | | | | | | | | | |
| Net investment income1 | | | 0.592 | | | | 0.613 | | | | 0.691 | | | | 0.656 | | | | 0.590 | | |
| Net realized and unrealized gain (loss) | | | 0.511 | | | | (0.274 | ) | | | 0.731 | | | | 1.634 | | | | (2.492 | ) | |
| Total from investment operations | | | 1.103 | | | | 0.339 | | | | 1.422 | | | | 2.290 | | | | (1.902 | ) | |
| | |
| Less dividends and distributions from: | | | | | | | | | | | | | | | | | | | | | |
| Net investment income | | | (0.583 | ) | | | (0.619 | ) | | | (0.662 | ) | | | (0.520 | ) | | | (0.578 | ) | |
| Total dividends and distributions | | | (0.583 | ) | | | (0.619 | ) | | | (0.662 | ) | | | (0.520 | ) | | | (0.578 | ) | |
| | |
| Net asset value, end of period | | | $8.350 | | | | $7.830 | | | | $8.110 | | | | $7.350 | | | | $5.580 | | |
| | |
| Total return2 | | | 15.31% | | | | 4.52% | | | | 20.85% | | | | 46.38% | | | | (25.30% | ) | |
| | |
| Ratios and supplemental data: | | | | | | | | | | | | | | | | | | | | | |
| Net assets, end of period (000 omitted) | | | $113,048 | | | | $57,840 | | | | $29,437 | | | | $23,617 | | | | $19,814 | | |
| Ratio of expenses to average net assets | | | 0.58% | | | | 0.59% | | | | 0.59% | | | | 0.59% | | | | 0.54% | | |
| Ratio of expenses to average net assets | | | | | | | | | | | | | | | | | | | | | |
| prior to fees waived | | | 0.58% | | | | 0.60% | | | | 0.74% | | | | 0.78% | | | | 0.77% | | |
| Ratio of net investment income to average net assets | | | 7.53% | | | | 7.82% | | | | 9.29% | | | | 11.05% | | | | 8.25% | | |
| Ratio of net investment income to average net assets | | | | | | | | | | | | | | | | | | | | | |
| prior to fees waived | | | 7.53% | | | | 7.81% | | | | 9.14% | | | | 10.86% | | | | 8.02% | | |
| Portfolio turnover | | | 68% | | | | 77% | | | | 144% | | | | 119% | | | | 132% | | |
1 The average shares outstanding method has been applied for per share information.
2 Total investment return is based on the change in net asset value of a share during the period and assumes reinvestment of dividends and distributions at net asset value. Total investment return during some of the periods shown reflects a waiver by the manager. Performance would have been lower had the waiver not been in effect.
See accompanying notes, which are an integral part of the financial statements.
2012 Annual report • Delaware Pooled Trust
(continues) 115
Financial highlights
Delaware Pooled® Trust — The Core Plus Fixed Income Portfolio
Selected data for each share of the Portfolio outstanding throughout each period were as follows:
| Year Ended |
| | 10/31/12 | | 10/31/11 | | 10/31/10 | | 10/31/09 | | 10/31/08 | |
| Net asset value, beginning of period | | | $10.050 | | | | $10.130 | | | | $9.700 | | | | $8.290 | | | | $9.540 | | |
| | |
| Income (loss) from investment operations: | | | | | | | | | | | | | | | | | | | | | |
| Net investment income1 | | | 0.320 | | | | 0.369 | | | | 0.463 | | | | 0.506 | | | | 0.467 | | |
| Net realized and unrealized gain (loss) | | | 0.460 | | | | 0.081 | | | | 0.660 | | | | 1.474 | | | | (0.991 | ) | |
| Total from investment operations | | | 0.780 | | | | 0.450 | | | | 1.123 | | | | 1.980 | | | | (0.524 | ) | |
| | |
| Less dividends and distributions from: | | | | | | | | | | | | | | | | | | | | | |
| Net investment income | | | (0.290 | ) | | | (0.530 | ) | | | (0.693 | ) | | | (0.570 | ) | | | (0.726 | ) | |
| Total dividends and distributions | | | (0.290 | ) | | | (0.530 | ) | | | (0.693 | ) | | | (0.570 | ) | | | (0.726 | ) | |
| | |
| Net asset value, end of period | | | $10.540 | | | | $10.050 | | | | $10.130 | | | | $9.700 | | | | $8.290 | | |
| | |
| Total return2 | | | 7.95% | | | | 4.80% | | | | 12.05% | | | | 25.55% | | | | (5.91% | ) | |
| | |
| Ratios and supplemental data: | | | | | | | | | | | | | | | | | | | | | |
| Net assets, end of period (000 omitted) | | | $60,313 | | | | $53,851 | | | | $50,305 | | | | $53,603 | | | | $111,496 | | |
| Ratio of expenses to average net assets | | | 0.45% | | | | 0.45% | | | | 0.45% | | | | 0.45% | | | | 0.42% | | |
| Ratio of expenses to average net assets | | | | | | | | | | | | | | | | | | | | | |
| prior to fees waived | | | 0.62% | | | | 0.64% | | | | 0.65% | | | | 0.61% | | | | 0.57% | | |
| Ratio of net investment income to average net assets | | | 3.14% | | | | 3.77% | | | | 4.80% | | | | 5.95% | | | | 5.19% | | |
| Ratio of net investment income to average net assets | | | | | | | | | | | | | | | | | | | | | |
| prior to fees waived | | | 2.97% | | | | 3.58% | | | | 4.60% | | | | 5.79% | | | | 5.03% | | |
| Portfolio turnover | | | 327% | | | | 273% | | | | 239% | | | | 218% | | | | 315% | | |
1 The average shares outstanding method has been applied for per share information.
2 Total investment return is based on the change in net asset value of a share during the period and assumes reinvestment of dividends and distributions at net asset value. Total investment return during all of the periods shown reflects a waiver by the manager. Performance would have been lower had the waiver not been in effect.
See accompanying notes, which are an integral part of the financial statements.
2012 Annual report • Delaware Pooled Trust
116
Delaware Pooled® Trust — The International Equity Portfolio
Selected data for each share of the Portfolio outstanding throughout each period were as follows:
| Year Ended |
| | 10/31/12 | | 10/31/11 | | 10/31/10 | | 10/31/09 | | 10/31/08 | |
| Net asset value, beginning of period | | | $13.120 | | | | $13.680 | | | | $12.980 | | | | $14.480 | | | | $27.200 | | |
| | |
| Income (loss) from investment operations: | | | | | | | | | | | | | | | | | | | | | |
| Net investment income1 | | | 0.441 | | | | 0.471 | | | | 0.406 | | | | 0.382 | | | | 0.757 | | |
| Net realized and unrealized gain (loss) | | | (0.183 | ) | | | (0.596 | ) | | | 0.712 | | | | 1.296 | | | | (10.746 | ) | |
| Total from investment operations | | | 0.258 | | | | (0.125 | ) | | | 1.118 | | | | 1.678 | | | | (9.989 | ) | |
| | |
| Less dividends and distributions from: | | | | | | | | | | | | | | | | | | | | | |
| Net investment income | | | (0.538 | ) | | | (0.435 | ) | | | (0.418 | ) | | | (1.383 | ) | | | (0.574 | ) | |
| Net realized gain | | | — | | | | — | | | | — | | | | (1.795 | ) | | | (2.157 | ) | |
| Total dividends and distributions | | | (0.538 | ) | | | (0.435 | ) | | | (0.418 | ) | | | (3.178 | ) | | | (2.731 | ) | |
| | |
| Net asset value, end of period | | | $12.840 | | | | $13.120 | | | | $13.680 | | | | $12.980 | | | | $14.480 | | |
| | |
| Total return2 | | | 2.26% | | | | (0.88% | ) | | | 8.77% | | | | 16.11% | | | | (40.40% | ) | |
| | |
| Ratios and supplemental data: | | | | | | | | | | | | | | | | | | | | | |
| Net assets, end of period (000 omitted) | | | $467,827 | | | | $589,109 | | | | $809,011 | | | | $913,056 | | | | $1,086,795 | | |
| Ratio of expenses to average net assets | | | 0.85% | | | | 0.77% | | | | 0.87% | | | | 0.88% | | | | 0.87% | | |
| Ratio of net investment income to average net assets | | | 3.56% | | | | 3.48% | | | | 3.18% | | | | 3.35% | | | | 3.58% | | |
| Portfolio turnover | | | 16% | 3 | | | 22% | | | | 18% | | | | 18% | | | | 9% | | |
1 The average shares outstanding method has been applied for per share information.
2 Total investment return is based on the change in net asset value of a share during the period and assumes reinvestment of dividends and distributions at net asset value.
3 Excludes the value of portfolio securities received or delivered as a result of in-kind purchases or redemptions of the Portfolio’s capital shares.
See accompanying notes, which are an integral part of the financial statements.
2012 Annual report • Delaware Pooled Trust
(continues) 117
Financial highlights
Delaware Pooled® Trust — The Labor Select International Equity Portfolio
Selected data for each share of the Portfolio outstanding throughout each period were as follows:
| Year Ended |
| | 10/31/12 | | 10/31/11 | | 10/31/10 | | 10/31/09 | | 10/31/08 | |
| Net asset value, beginning of period | | | $12.920 | | | | $13.570 | | | | $12.930 | | | | $12.410 | | | | $24.530 | | |
| | |
| Income (loss) from investment operations: | | | | | | | | | | | | | | | | | | | | | |
| Net investment income1 | | | 0.441 | | | | 0.451 | | | | 0.390 | | | | 0.364 | | | | 0.647 | | |
| Net realized and unrealized gain (loss) | | | (0.176 | ) | | | (0.695 | ) | | | 0.626 | | | | 1.445 | | | | (9.221 | ) | |
| Total from investment operations | | | 0.265 | | | | (0.244 | ) | | | 1.016 | | | | 1.809 | | | | (8.574 | ) | |
| | |
| Less dividends and distributions from: | | | | | | | | | | | | | | | | | | | | | |
| Net investment income | | | (0.535 | ) | | | (0.406 | ) | | | (0.376 | ) | | | (0.869 | ) | | | (0.473 | ) | |
| Net realized gain | | | — | | | | — | | | | — | | | | (0.420 | ) | | | (3.073 | ) | |
| Total dividends and distributions | | | (0.535 | ) | | | (0.406 | ) | | | (0.376 | ) | | | (1.289 | ) | | | (3.546 | ) | |
| | |
| Net asset value, end of period | | | $12.650 | | | | $12.920 | | | | $13.570 | | | | $12.930 | | | | $12.410 | | |
| | |
| Total return2 | | | 2.40% | | | | (1.79% | ) | | | 8.00% | | | | 16.76% | | | | (40.31% | ) | |
| | |
| Ratios and supplemental data: | | | | | | | | | | | | | | | | | | | | | |
| Net assets, end of period (000 omitted) | | | $509,527 | | | | $572,642 | | | | $740,952 | | | | $797,718 | | | | $639,519 | | |
| Ratio of expenses to average net assets | | | 0.87% | | | | 0.85% | | | | 0.87% | | | | 0.88% | | | | 0.87% | | |
| Ratio of net investment income to average net assets | | | 3.59% | | | | 3.37% | | | | 3.07% | | | | 3.26% | | | | 3.59% | | |
| Portfolio turnover | | | 17% | | | | 20% | | | | 13% | | | | 11% | | | | 10% | | |
1 The average shares outstanding method has been applied for per share information.
2 Total investment return is based on the change in net asset value of a share during the period and assumes reinvestment of dividends and distributions at net asset value.
See accompanying notes, which are an integral part of the financial statements.
2012 Annual report • Delaware Pooled Trust
118
Delaware Pooled® Trust — The Emerging Markets Portfolio
Selected data for each share of the Portfolio outstanding throughout each period were as follows:
| Year Ended |
| | 10/31/12 | | 10/31/11 | | 10/31/10 | | 10/31/09 | | 10/31/08 | |
| Net asset value, beginning of period | | | $10.510 | | | | $11.420 | | | | $9.430 | | | | $7.580 | | | | $18.780 | | |
| | |
| Income (loss) from investment operations: | | | | | | | | | | | | | | | | | | | | | |
| Net investment income1 | | | 0.177 | | | | 0.266 | | | | 0.259 | | | | 0.200 | | | | 0.347 | | |
| Net realized and unrealized gain (loss) | | | 0.467 | | | | (0.873 | ) | | | 1.926 | | | | 3.208 | | | | (7.707 | ) | |
| Total from investment operations | | | 0.644 | | | | (0.607 | ) | | | 2.185 | | | | 3.408 | | | | (7.360 | ) | |
| | |
| Less dividends and distributions from: | | | | | | | | | | | | | | | | | | | | | |
| Net investment income | | | (0.220 | ) | | | (0.330 | ) | | | (0.212 | ) | | | (0.303 | ) | | | (0.402 | ) | |
| Net realized gain | | | (0.798 | ) | | | — | | | | — | | | | (1.268 | ) | | | (3.447 | ) | |
| Total dividends and distributions | | | (1.018 | ) | | | (0.330 | ) | | | (0.212 | ) | | | (1.571 | ) | | | (3.849 | ) | |
| | |
| Reimbursement fees: | | | | | | | | | | | | | | | | | | | | | |
| Purchase reimbursement fees1,2 | | | 0.006 | | | | 0.005 | | | | 0.009 | | | | 0.002 | | | | 0.002 | | |
| Redemption reimbursement fees1,2 | | | 0.018 | | | | 0.022 | | | | 0.008 | | | | 0.011 | | | | 0.007 | | |
| | | | 0.024 | | | | 0.027 | | | | 0.017 | | | | 0.013 | | | | 0.009 | | |
| | |
| Net asset value, end of period | | | $10.160 | | | | $10.510 | | | | $11.420 | | | | $9.430 | | | | $7.580 | | |
| | |
| Total return3 | | | 7.81% | | | | (5.22% | ) | | | 23.79% | | | | 57.05% | | | | (48.23% | ) | |
| | |
| Ratios and supplemental data: | | | | | | | | | | | | | | | | | | | | | |
| Net assets, end of period (000 omitted) | | | $316,809 | | | | $531,527 | | | | $750,190 | | | | $597,638 | | | | $469,392 | | |
| Ratio of expenses to average net assets | | | 1.20% | | | | 1.14% | | | | 1.17% | | | | 1.16% | | | | 1.15% | | |
| Ratio of net investment income to average net assets | | | 1.80% | | | | 2.41% | | | | 2.57% | | | | 2.71% | | | | 2.66% | | |
| Portfolio turnover | | | 38% | 4 | | | 39% | | | | 39% | | | | 40% | | | | 43% | | |
1 The average shares outstanding method has been applied for per share information.
2 The Portfolio charges a 0.55% purchase reimbursement fee and a 0.55% redemption reimbursement fee, which are retained by the Portfolio.
3 Total investment return is based on the change in net asset value of a share during the period and assumes reinvestment of dividends and distributions at net asset value. Total investment return does not reflect the purchase reimbursement fee and redemption reimbursement fee.
4 Excludes the value of portfolio securities received or delivered as a result of in-kind purchases or redemptions of the Portfolio’s capital shares.
See accompanying notes, which are an integral part of the financial statements.
2012 Annual report • Delaware Pooled Trust
(continues) 119
Financial highlights
Delaware Pooled® Trust — The Emerging Markets Portfolio II
Selected data for each share of the Portfolio outstanding throughout each period were as follows:
| | Year | | Year | | 6/23/101 | |
| | Ended | | Ended | | to | |
| | 10/31/12 | | 10/31/11 | | 10/31/10 | |
| Net asset value, beginning of period | | | $8.550 | | | | $9.660 | | | | $8.500 | | |
| | |
| Income (loss) from investment operations: | | | | | | | | | | | | | |
| Net investment income2 | | | 0.070 | | | | 0.089 | | | | 0.019 | | |
| Net realized and unrealized gain (loss) | | | (0.028 | ) | | | (1.099 | ) | | | 1.141 | | |
| Total from investment operations | | | 0.042 | | | | (1.010 | ) | | | 1.160 | | |
| | |
| Less dividends and distributions from: | | | | | | | | | | | | | |
| Net investment income | | | (0.128 | ) | | | (0.026 | ) | | | — | | |
| Net realized gain | | | (0.294 | ) | | | (0.074 | ) | | | — | | |
| Total dividends and distributions | | | (0.422 | ) | | | (0.100 | ) | | | — | | |
| | |
| Net asset value, end of period | | | $8.170 | | | | $8.550 | | | | $9.660 | | |
| | |
| Total return3 | | | 0.89% | | | | (10.58% | ) | | | 13.65% | | |
| | |
| Ratios and supplemental data: | | | | | | | | | | | | | |
| Net assets, end of period (000 omitted) | | | $29,686 | | | | $15,339 | | | | $11,364 | | |
| Ratio of expenses to average net assets | | | 1.20% | | | | 1.25% | | | | 1.40% | | |
| Ratio of expenses to average net assets | | | | | | | | | | | | | |
| prior to fees waived | | | 1.41% | | | | 1.64% | | | | 2.17% | | |
| Ratio of net investment income to average net assets | | | 0.87% | | | | 0.94% | | | | 0.59% | | |
| Ratio of net investment income (loss) to average net assets | | | | | | | | | | | | | |
| prior to fees waived | | | 0.66% | | | | 0.55% | | | | (0.18% | ) | |
| Portfolio turnover | | | 12% | | | | 23% | | | | 9% | | |
1 Date of commencement of operations; ratios have been annualized and total return and portfolio turnover have not been annualized.
2 The average shares outstanding method has been applied for per share information.
3 Total investment return is based on the change in net asset value of a share during the period and assumes reinvestment of dividends and distributions at net asset value. Total investment return during all of the periods shown reflects a waiver by the manager. Performance would have been lower had the waiver not been in effect.
See accompanying notes, which are an integral part of the financial statements.
2012 Annual report ��� Delaware Pooled Trust
120
Notes to financial statements
Delaware Pooled® Trust
October 31, 2012
Delaware Pooled Trust (Trust) is organized as a Delaware statutory trust and offers 13 separate Portfolios. These financial statements and the related notes pertain to The Large-Cap Value Equity Portfolio, The Select 20 Portfolio, The Large-Cap Growth Equity Portfolio, The Focus Smid-Cap Growth Equity Portfolio, The Real Estate Investment Trust Portfolio II, The Core Focus Fixed Income Portfolio, The High-Yield Bond Portfolio, The Core Plus Fixed Income Portfolio, The International Equity Portfolio, The Labor Select International Equity Portfolio, The Emerging Markets Portfolio, and The Emerging Markets Portfolio II (each, a Portfolio, or collectively, Portfolios). The Real Estate Investment Trust Portfolio is included in a separate report. The Trust is an open-end investment company. Each Portfolio is considered diversified under the Investment Company Act of 1940, as amended, except for The Select 20 Portfolio and The Real Estate Investment Trust II Portfolio which are nondiversified. Each Portfolio offers one class of shares.
The investment objective of The Large-Cap Value Equity Portfolio is to seek long-term capital appreciation.
The investment objective of The Select 20 Portfolio is to seek long-term capital appreciation.
The investment objective of The Large-Cap Growth Equity Portfolio is to seek capital appreciation.
The investment objective of The Focus Smid-Cap Growth Equity Portfolio is to seek long-term capital appreciation.
The investment objective of The Real Estate Investment Trust Portfolio II is to seek maximum long-term total return, with capital appreciation as a secondary objective.
The investment objective of The Core Focus Fixed Income Portfolio is to seek maximum long-term total return, consistent with reasonable risk.
The investment objective of The High-Yield Bond Portfolio is to seek high total return.
The investment objective of The Core Plus Fixed Income Portfolio is to seek maximum long-term total return, consistent with reasonable risk.
The investment objective of The International Equity Portfolio is to seek maximum long-term total return.
The investment objective of The Labor Select International Equity Portfolio is to seek maximum long-term total return.
The investment objective of The Emerging Markets Portfolio is to seek long-term capital appreciation.
The investment objective of The Emerging Markets Portfolio II is to seek long-term capital appreciation.
1. Significant Accounting Policies
The following accounting policies are in accordance with U.S. generally accepted accounting principles (U.S. GAAP) and are consistently followed by the Portfolios.
Security Valuation — Equity securities, except those traded on the Nasdaq Stock Market, Inc. (Nasdaq), are valued at the last quoted sales price as of the time of the regular close of the New York Stock Exchange (NYSE) on the valuation date. Securities traded on the Nasdaq are valued in accordance with the Nasdaq Official Closing Price, which may not be the last sales price. If on a particular day an equity security does not trade, then the mean between the bid and ask prices will be used, which approximates fair value. Securities listed on a foreign exchange are normally valued at the last quoted sales price on the valuation date. Debt securities, credit default swap (CDS) contracts and interest rate swap contracts are valued based upon valuations provided by an independent pricing service or broker and reviewed by management. U.S. government and agency securities are valued at the mean between the bid and ask prices, which approximates fair value. To the extent current market prices are not available, the pricing service may take into account developments related to the specific security, as well as transactions in comparable securities. Valuations for fixed income securities utilize matrix systems, which reflect such factors as security prices, yields, maturities, and ratings, and are supplemented by dealer and exchange quotations. Swap prices are derived using daily swap curves and models that incorporate a number of market date factors, such as discounted cash flows, trades and values of the underlying reference instruments. Investment company securities are valued at net asset value per share, as reported by the underlying investment company. Foreign currency exchange contracts and foreign cross currency exchange contracts are valued at the mean between the bid and ask prices, which approximates fair value. Interpolated values are derived when the settlement date of the contract is an interim date for which quotations are not available. Futures contracts and options on futures contracts are valued at the daily quoted settlement prices. Exchange-traded options are valued at the last reported sale price or, if no sales are reported, at the mean between the last reported bid and ask prices, which approximates fair value. Generally, other securities and assets for which market quotations are not readily available are valued at fair value as determined in good faith under the direction of the Trust’s Board of Trustees (Board). In determining whether market quotations are readily available or fair valuation will be used, various factors will be taken into consideration, such as market closures or suspension of trading in a security. The Portfolios may use fair value pricing more frequently for securities traded primarily in non-U.S. markets because, among other things, most foreign markets close well before the Portfolios value their securities, generally as of 4:00 p.m. Eastern time. The earlier close of these foreign markets gives rise to the possibility that significant events, including broad market moves, government actions or pronouncements, aftermarket trading, or news events may have occurred in the interim. To account for this, the Portfolios may frequently value foreign securities using fair value prices based on third-party vendor modeling tools (international fair value pricing).
2012 Annual report • Delaware Pooled Trust
(continues) 121
Notes to financial statements
Delaware Pooled® Trust
1. Significant Accounting Policies (continued)
Federal Income Taxes — No provision for federal income taxes has been made as each Portfolio intends to continue to qualify for federal income tax purposes as a regulated investment company under Subchapter M of the Internal Revenue Code of 1986, as amended, and make the requisite distributions to shareholders. The Portfolios evaluate tax positions taken or expected to be taken in the course of preparing the Portfolios’ tax returns to determine whether the tax positions are “more-likely-than-not” of being sustained by the applicable tax authority. Tax positions not deemed to meet the more-likely-than-not threshold are recorded as a tax benefit or expense in the current year. Management has analyzed the Portfolios’ tax positions taken for all open federal income tax years (October 31, 2009 – October 31, 2012, as applicable), and has concluded that no provision for federal income tax is required in the Portfolios’ financial statements.
Repurchase Agreements — Each Portfolio may purchase certain U.S. government securities subject to the counterparty’s agreement to repurchase them at an agreed upon date and price. The counterparty will be required on a daily basis to maintain the value of the collateral subject to the agreement at not less than the repurchase price (including accrued interest). The agreements are conditioned upon the collateral being deposited under the Federal Reserve book-entry system with the Portfolios’ custodian or a third-party sub-custodian. In the event of default or bankruptcy by the other party to the agreement, retention of the collateral may be subject to legal proceedings. All open repurchase agreements as of the date of this report were entered into on October 31, 2012.
To Be Announced Trades — The Portfolios may contract to purchase securities for a fixed price at a transaction date beyond the customary settlement period (e.g., “when issued,” “delayed delivery,” “forward commitment,” or “TBA transactions”) consistent with the Portfolios’ ability to manage their investment portfolios and meet redemption requests. These transactions involve a commitment by the Portfolios to purchase securities for a predetermined price or yield with payment and delivery taking place more than three days in the future, or after a period longer than the customary settlement period for that type of security. No interest will be earned by the Portfolios on such purchases until the securities are delivered; however the market value may change prior to delivery.
Foreign Currency Transactions — Transactions denominated in foreign currencies are recorded at the prevailing exchange rates on the valuation date in accordance with the Portfolios’ prospectus. The value of all assets and liabilities denominated in foreign currencies is translated into U.S. dollars at the exchange rate of such currencies against the U.S. dollar daily. Transaction gains or losses resulting from changes in exchange rates during the reporting period or upon settlement of the foreign currency transaction are reported in operations for the current period. The Portfolios generally isolate that portion of realized gains and losses on investments in debt securities which is due to changes in foreign exchange rates from that which is due to changes in market prices of debt securities. For foreign equity securities, these changes are included in net realized and unrealized gain or loss on investments. The Portfolios report certain foreign currency related transactions as components of realized gains (losses) for financial reporting purposes, whereas such components are treated as ordinary income (loss) for federal income tax purposes.
Use of Estimates — The preparation of financial statements in conformity with U.S. GAAP requires management to make estimates and assumptions that affect the fair value of investments, the reported amounts of assets and liabilities and disclosure of contingent assets and liabilities at the date of the financial statements and the reported amounts of revenues and expenses during the reporting period. Actual results could differ from those estimates and the differences could be material.
Reimbursement Fees — The Emerging Markets Portfolio may charge a 0.55% purchase reimbursement fee and a 0.55% redemption reimbursement fee. These fees are designed to reflect an approximation of the brokerage and other transaction costs associated with the investment of an investor’s purchase amount or the disposition of assets to meet redemptions, and to limit the extent to which the Portfolio (and, indirectly, the Portfolio’s existing shareholders) would have to bear such costs. These fees are accounted for as an addition to paid-in capital for the Portfolio in the statements of changes in net assets.
Other — Expenses directly attributable to the Portfolios are charged directly to the Portfolios. Other expenses common to various funds within the Delaware Investments® Family of Funds are generally allocated among such funds on the basis of average net assets. Management fees and some other expenses are paid monthly. Security transactions are recorded on the date the securities are purchased or sold (trade date) for financial reporting purposes. Costs used in calculating realized gains and losses on the sale of investment securities are those of the specific securities sold. Interest income is recorded on the accrual basis. Discounts and premiums on debt securities are amortized to interest income over the lives of the respective securities using the effective interest method. Dividend income is recorded on the ex-dividend date. Realized gains (losses) on paydowns of mortgage- and asset-backed securities are classified as interest income. Distributions received from investments in Real Estate Investment Trusts (REITs) are recorded as dividend income on the ex-dividend date, subject to reclassification upon notice of the character of such distribution by the issuer. The financial statements reflect an estimate of the reclassification of the distribution character for The Real Estate Investment Trust Portfolio II. Foreign dividends are also recorded on the ex-dividend date or as soon after the ex-dividend date that a Portfolio is aware of such dividends, net of all non-rebatable tax withholdings. Withholding taxes on foreign dividends have been recorded in accordance with each Portfolio’s understanding of the applicable country’s tax rules and rates.
2012 Annual report • Delaware Pooled Trust
122
Each Portfolio declares and pays dividends from net investment income, if any, annually. All Portfolios declare and pay distributions from net realized gain on investments, if any, annually. Dividends and distributions, if any, are recorded on the ex-dividend date. Each Portfolio may distribute income dividends and capital gains more frequently, if necessary for tax purposes.
Subject to seeking best execution, the Portfolios may direct certain security trades to brokers who have agreed to rebate a portion of the related brokerage commission to each Portfolio in cash. In general, best execution refers to many factors, including the price paid or received for a security, the commission charged, the promptness and reliability of execution, the confidentiality and placement accorded the order, and other factors affecting the overall benefit obtained by the Portfolio on the transaction. Such commission rebates are included in realized gain on investments in the accompanying financial statements. The total commission rebates for the year ended October 31, 2012 are as follows:
| Commission Rebates |
| The Select 20 Portfolio | | $ | 1,148 | |
| The Large-Cap Growth Equity Portfolio | | | 1,394 | |
The Portfolios may receive earnings credits from their custodian when positive cash balances are maintained, which are used to offset custody fees. There were no earnings credits for the year ended October 31, 2012.
The Portfolios may receive earnings credits from their transfer agent when positive cash balances are maintained, which are used to offset transfer agent fees. The expense paid under this arrangement is included in dividend disbursing and transfer agent fees and expenses on the statements of operations with the corresponding expense offset shown as “expense paid indirectly.”
2. Investment Management, Administration Agreements, and Other Transactions with Affiliates
In accordance with the terms of the investment management agreements, Delaware Management Company (DMC), a series of Delaware Management Business Trust and the investment manager of the Portfolios, will receive an annual fee, which is calculated daily based on the average daily net assets of each Portfolio.
DMC has contractually agreed to waive that portion, if any, of its management fees and reimburse each Portfolio (except for The International Equity Portfolio, The Labor Select International Equity Portfolio and The Emerging Markets Portfolio) to the extent necessary to ensure that annual operating expenses, (excluding any 12b-1 plan and certain other expenses) do not exceed specified percentages of average daily net assets of each Portfolio until February 28, 2013. For purposes of these waivers and reimbursements, nonroutine expenses may also include such additional costs and expenses as may be agreed upon from time to time by the Portfolios’ Board and DMC. These expense waivers and reimbursements apply only to expenses paid directly by the Portfolios.
The management fee rates and the operating expense limitation rates in effect for the year ended October 31, 2012 are as follows:
| | | | Contractual |
| | | | operating expense |
| | Management | | limitation as |
| | fee as a percentage | | a percentage |
| | of average daily | | of average daily |
| | net assets (per annum) | | net assets (per annum)† |
| The Large-Cap Value Equity Portfolio | | 0.55% | | 0.70% |
| The Select 20 Portfolio | | 0.75% | | 0.89% |
| The Large-Cap Growth Equity Portfolio | | 0.55% | | 0.65% |
| The Focus Smid-Cap Growth Equity Portfolio | | 0.75% | | 0.92% |
| The Real Estate Investment Trust Portfolio II | | 0.75% | | 0.95% |
| The Core Focus Fixed Income Portfolio | | 0.40% | | 0.43% |
| The High-Yield Bond Portfolio | | 0.45% | | 0.59% |
| The Core Plus Fixed Income Portfolio | | 0.43% | | 0.45% |
| The International Equity Portfolio | | 0.75% | | — |
| The Labor Select International Equity Portfolio | | 0.75% | | — |
| The Emerging Markets Portfolio | | 1.00% | | — |
| The Emerging Markets Portfolio II | | 1.00% | | 1.20% |
†These operating expense limitations exclude certain expenses, such as 12b-1 plan expenses, taxes, interest, inverse floater program expenses, brokerage fees, certain insurance costs, and nonroutine expenses or costs, including, but not limited to, those relating to reorganizations, litigation, conducting shareholder meetings, and liquidations.
2012 Annual report • Delaware Pooled Trust
(continues) 123
Notes to financial statements
Delaware Pooled® Trust
2. Investment Management, Administration Agreements, and Other Transactions with Affiliates (continued)
Mondrian Investment Partners Limited (Mondrian) furnishes investment sub-advisory services to The International Equity Portfolio, The Labor Select International Equity Portfolio and The Emerging Markets Portfolio. For these services, DMC, not the Portfolios, pays Mondrian the following percentages of the Portfolios’ average daily net assets.
| | Sub-advisory fee as a |
| | percentage of average daily |
| | net assets (per annum) |
| The International Equity Portfolio | | 0.36% |
| The Labor Select International Equity Portfolio | | 0.30% |
| The Emerging Markets Portfolio | | 0.75% |
Delaware Service Company, Inc. (DSC), an affiliate of DMC, provides fund accounting and financial administration oversight services to the Portfolios. For these services, the Portfolios pay DSC fees based on the aggregate daily net assets of the Delaware Investments® Family of Funds at the following annual rate: 0.0050% of the first $30 billion; 0.0045% of the next $10 billion; 0.0040% of the next $10 billion; and 0.0025% of aggregate average daily net assets in excess of $50 billion. The fees payable to DSC under the service agreement described above are allocated among all Funds in the Delaware Investments® Family of Funds on a relative net asset value basis. For the year ended October 31, 2012, the Portfolios were charged for these services as follows:
| The Large-Cap Value Equity Portfolio | | $ | 367 |
| The Select 20 Portfolio | | | 4,245 |
| The Large-Cap Growth Equity Portfolio | | | 9,418 |
| The Focus Smid-Cap Growth Equity Portfolio | | | 804 |
| The Real Estate Investment Trust Portfolio II | | | 166 |
| The Core Focus Fixed Income Portfolio | | | 350 |
| The High-Yield Bond Portfolio | | | 3,618 |
| The Core Plus Fixed Income Portfolio | | | 2,860 |
| The International Equity Portfolio | | | 26,236 |
| The Labor Select International Equity Portfolio | | | 25,477 |
| The Emerging Markets Portfolio | | | 22,393 |
| The Emerging Markets Portfolio II | | | 994 |
DSC is also the transfer agent and dividend disbursing agent of the Portfolios. The Portfolios pay DSC a monthly asset-based fee for these services. Pursuant to a sub-transfer agency agreement between DSC and BNY Mellon Investment Servicing (US) Inc. (BNYMIS), BNYMIS provides certain sub-transfer agency services to the Portfolios. Sub-transfer agency fees are passed on to and paid directly by the Portfolios.
2012 Annual report • Delaware Pooled Trust
124
At October 31, 2012, each Portfolio had liabilities payable to affiliates as follows:
| | Investment management
fee payable to
DMC | | Dividend
disbursing,
transfer
agent and
fund accounting
oversight
fees, and
other expenses
payable to DSC | | Other expenses
payable to
DMC and affiliates* |
| The Large-Cap Value Equity Portfolio | | | $ | 2,023 | | | | $ | 89 | | | | $ | 163 | |
| The Select 20 Portfolio | | | | 79,879 | | | | | 1,318 | | | | | 1,256 | |
| The Large-Cap Growth Equity Portfolio | | | | 102,724 | | | | | 2,312 | | | | | 2,190 | |
| The Focus Smid-Cap Growth Equity Portfolio | | | | 11,229 | | | | | 182 | | | | | 238 | |
| The Real Estate Investment Trust Portfolio II | | | | 2,376 | | | | | 37 | | | | | 154 | |
| The Core Focus Fixed Income Portfolio | | | | 1,609 | | | | | 92 | | | | | 1,824 | |
| The High-Yield Bond Portfolio | | | | 42,375 | | | | | 1,166 | | | | | 1,820 | |
| The Core Plus Fixed Income Portfolio | | | | 12,092 | | | | | 631 | | | | | 5,151 | |
| The International Equity Portfolio | | | | 308,135 | | | | | 5,085 | | | | | 5,354 | |
| The Labor Select International Equity Portfolio | | | | 326,345 | | | | | 5,386 | | | | | 5,349 | |
| The Emerging Markets Portfolio | | | | 268,531 | | | | | 3,324 | | | | | 3,633 | |
| The Emerging Markets Portfolio II | | | | 17,093 | | | | | 311 | | | | | 825 | |
*DMC, as part of its administrative services, pays operating expenses on behalf of the Portfolios and is reimbursed on a periodic basis. Expenses include items such as printing of shareholder reports, fees for audit, legal and tax services, registration fees, and trustees’ fees.
As provided in the investment management agreement, the Portfolios bear the cost of certain legal and tax services, including internal legal and tax services provided to the Portfolios by DMC and/or its affiliates’ employees. For the year ended October 31, 2012, the Portfolios were charged for internal legal and tax services provided by DMC and/or its affiliates’ employees as follows:
| The Large-Cap Value Equity Portfolio | $ | 408 |
| The Select 20 Portfolio | | 4,826 |
| The Large-Cap Growth Equity Portfolio | | 10,575 |
| The Focus Smid-Cap Growth Equity Portfolio | | 901 |
| The Real Estate Investment Trust Portfolio II | | 191 |
| The Core Focus Fixed Income Portfolio | | 387 |
| The High-Yield Bond Portfolio | | 4,022 |
| The Core Plus Fixed Income Portfolio | | 3,207 |
| The International Equity Portfolio | | 29,639 |
| The Labor Select International Equity Portfolio | | 28,709 |
| The Emerging Markets Portfolio | | 25,447 |
| The Emerging Markets Portfolio II | | 1,098 |
Trustees’ fees include expenses accrued by each Portfolio for each Trustee’s retainer and meeting fees. Certain officers of DMC, DSC, and DDLP are officers and/or Trustees of the Trust. These officers and Trustees are paid no compensation by the Portfolios.
2012 Annual report · Delaware Pooled Trust
(continues) 125
Notes to financial statements
Delaware Pooled® Trust
3. Investments
For the year ended October 31, 2012, each Portfolio made purchases and sales of investment securities other than short-term investments as follows:
| | Purchases
other than
U.S. government
securities | | Purchases of
U.S. government
securities | | Sales
other than
U.S. government
securities | | Sales of
U.S. government
securities |
| The Large-Cap Value Equity Portfolio | | | $ | 1,837,433 | | | | $ | — | | | | $ | 1,002,377 | | | | $ | — | |
| The Select 20 Portfolio | | | | 103,202,184 | | | | | — | | | | | 35,379,039 | | | | | — | |
| The Large-Cap Growth Equity Portfolio | | | | 92,534,048 | | | | | — | | | | | 75,514,762 | | | | | — | |
| The Focus Smid-Cap Growth Equity Portfolio | | | | 7,350,091 | | | | | — | | | | | 6,912,017 | | | | | — | |
| The Real Estate Investment Trust Portfolio II | | | | 2,994,021 | | | | | — | | | | | 2,866,515 | | | | | — | |
| The Core Focus Fixed Income Portfolio | | | | 21,431,643 | | | | | 17,658,672 | | | | | 21,764,766 | | | | | 17,190,015 | |
| The High-Yield Bond Portfolio | | | | 92,229,415 | | | | | — | | | | | 47,716,276 | | | | | — | |
| The Core Plus Fixed Income Portfolio | | | | 127,862,736 | | | | | 59,120,674 | | | | | 121,780,793 | | | | | 61,090,575 | |
| The International Equity Portfolio | | | | 84,048,610 | | | | | — | | | | | 189,814,465 | | | | | — | |
| The Labor Select International Equity Portfolio | | | | 87,829,458 | | | | | — | | | | | 129,163,976 | | | | | — | |
| The Emerging Markets Portfolio | | | | 165,419,917 | | | | | — | | | | | 407,158,045 | | | | | — | |
| The Emerging Markets Portfolio II | | | | 17,307,641 | | | | | — | | | | | 2,435,870 | | | | | — | |
At October 31, 2012, the cost of investments and unrealized appreciation (depreciation) for federal income tax purposes for each Portfolio were as follows:
| | Cost of
investments | | Aggregate
unrealized
appreciation | | Aggregate
unrealized
depreciation | | Net unrealized
appreciation
(depreciation) |
| The Large-Cap Value Equity Portfolio | | | $ | 7,907,311 | | | | $ | 860,663 | | | | $ | (356,305 | ) | | | | $ | 504,358 | | |
| The Select 20 Portfolio | | | | 112,854,140 | | | | | 15,829,166 | | | | | (4,063,124 | ) | | | | | 11,766,042 | | |
| The Large-Cap Growth Equity Portfolio | | | | 169,491,967 | | | | | 53,866,193 | | | | | (6,384,115 | ) | | | | | 47,482,078 | | |
| The Focus Smid-Cap Growth Equity Portfolio | | | | 16,879,109 | | | | | 2,425,237 | | | | | (1,406,750 | ) | | | | | 1,018,487 | | |
| The Real Estate Investment Trust Portfolio II | | | | 3,350,091 | | | | | 359,537 | | | | | (163,052 | ) | | | | | 196,485 | | |
| The Core Focus Fixed Income Portfolio | | | | 7,705,972 | | | | | 172,686 | | | | | (53,890 | ) | | | | | 118,796 | | |
| The High-Yield Bond Portfolio | | | | 112,545,966 | | | | | 4,294,413 | | | | | (880,866 | ) | | | | | 3,413,547 | | |
| The Core Plus Fixed Income Portfolio | | | | 67,713,974 | | | | | 2,933,206 | | | | | (523,640 | ) | | | | | 2,409,566 | | |
| The International Equity Portfolio | | | | 486,774,198 | | | | | 70,080,637 | | | | | (81,482,817 | ) | | | | | (11,402,180 | ) | |
| The Labor Select International Equity Portfolio | | | | 542,043,718 | | | | | 73,720,821 | | | | | (103,565,037 | ) | | | | | (29,844,216 | ) | |
| The Emerging Markets Portfolio | | | | 303,957,533 | | | | | 45,661,531 | | | | | (23,526,766 | ) | | | | | 22,134,765 | | |
| The Emerging Markets Portfolio II | | | | 35,127,046 | | | | | 1,885,079 | | | | | (3,545,721 | ) | | | | | (1,660,642 | ) | |
U. S. GAAP defines fair value as the price that each Portfolio would receive to sell an asset or pay to transfer a liability in an orderly transaction between market participants at the measurement date under current market conditions. A three level hierarchy for fair value measurements has been established based upon the transparency of inputs to the valuation of an asset or liability. Inputs may be observable or unobservable and refer broadly to the assumptions that market participants would use in pricing the asset or liability. Observable inputs reflect the assumptions market participants would use in pricing the asset or liability based on market data obtained from sources independent of the reporting entity. Unobservable inputs reflect the reporting entity’s own assumptions about the assumptions that market participants would use in pricing the asset or liability developed based on the best information available under the circumstances. Each Portfolio’s investment in its entirety is assigned a level based upon the observability of the inputs, which are significant to the overall valuation. The three level hierarchy of inputs is summarized below.
| Level 1 – | inputs are quoted prices in active markets for identical investments (e.g., equity securities, open-end investment companies, futures contracts, exchange-traded options contracts) |
| |
| Level 2 – | other observable inputs (including, but not limited to: quoted prices for similar assets or liabilities in markets that are active, quoted prices for identical or similar assets or liabilities in markets that are not active, inputs other than quoted prices that are observable for the assets or liabilities (such as interest rates, yield curves, volatilities, prepayment speeds, loss severities, credit risks and default rates) or other market-corroborated inputs) (e.g., debt securities, government securities, swap contracts, foreign currency exchange contracts, foreign securities utilizing international fair value pricing, broker-quoted securities, fair valued securities) |
2012 Annual report · Delaware Pooled Trust
126
| Level 3 – | inputs are significant unobservable inputs (including the Portfolios’ own assumptions used to determine the fair value of investments) (e.g., broker-quoted securities, fair valued securities) |
Level 3 investments are valued using significant unobservable inputs. The Portfolios may also use an income-based valuation approach in which the anticipated future cash flows of the investment are discounted to calculate fair value. Discounts may also be applied due to the nature or duration of any restrictions on the disposition of the investments. Valuations may also be based upon current market prices of securities that are comparable in coupon, rating, maturity and industry. The derived value of a Level 3 investment may not represent the value which is received upon disposition and this could impact the results of operations.
The following table summarizes the valuation of The Large-Cap Value Equity Portfolio’s investments by fair value hierarchy levels as of October 31, 2012:
| | Level 1 | | Level 2 | | Total |
| Common Stock | | $ | 8,311,583 | | $ | — | | $ | 8,311,583 |
| Short-Term Investments | | | — | | | 100,086 | | | 100,086 |
| Total | | $ | 8,311,583 | | $ | 100,086 | | $ | 8,411,669 |
The following table summarizes the valuation of The Select 20 Portfolio’s investments by fair value hierarchy levels as of October 31, 2012:
| | Level 1 | | Level 2 | | Total |
| Common Stock | | $ | 123,451,865 | | $ | — | | $ | 123,451,865 |
| Short-Term Investments | | | — | | | 1,168,317 | | | 1,168,317 |
| Total | | $ | 123,451,865 | | $ | 1,168,317 | | $ | 124,620,182 |
The following table summarizes the valuation of The Large-Cap Growth Equity Portfolio’s investments by fair value hierarchy levels as of October 31, 2012:
| | Level 1 | | Level 2 | | Level 3 | | Total |
| Common Stock | | $ | 213,355,046 | | $ | — | | | $— | | | $ | 213,355,046 |
| Warrant | | | 399,538 | | | — | | | — | | | | 399,538 |
| Short-Term Investments | | | — | | | 3,037,379 | | | — | | | | 3,037,379 |
| Securities Lending Collateral | | | — | | | 182,082 | | | — | | | | 182,082 |
| Total | | $ | 213,754,584 | | $ | 3,219,461 | | | $— | | | $ | 216,974,045 |
The following table summarizes the valuation of The Focus Smid-Cap Growth Equity Portfolio’s investments by fair value hierarchy levels as of October 31, 2012:
| | Level 1 | | Level 2 | | Total |
| Common Stock | | $ | 17,070,761 | | $ | — | | $ | 17,070,761 |
| Short-Term Investments | | | — | | | 826,835 | | | 826,835 |
| Total | | $ | 17,070,761 | | $ | 826,835 | | $ | 17,897,596 |
The following table summarizes the valuation of The Real Estate Investment Trust Portfolio II’s investments by fair value hierarchy levels as of October 31, 2012:
| | Level 1 | | Level 2 | | Total |
| Common Stock | | $ | 3,442,911 | | $ | — | | $ | 3,442,911 |
| Short-Term Investments | | | — | | | 103,665 | | | 103,665 |
| Total | | $ | 3,442,911 | | $ | 103,665 | | $ | 3,546,576 |
2012 Annual report · Delaware Pooled Trust
(continues) 127
Notes to financial statements
Delaware Pooled® Trust
3. Investments (continued)
The following table summarizes the valuation of The Core Focus Fixed Income Portfolio’s investments by fair value hierarchy levels as of October 31, 2012:
| | Level 1 | | Level 2 | | Level 3 | | Total |
| Agency, Asset-Backed and Mortgage-Backed Securities | | $ | — | | $ | 2,308,256 | | $ | 10,314 | | $ | 2,318,570 |
| Corporate Debt | | | — | | | 1,715,629 | | | — | | | 1,715,629 |
| Foreign Debt | | | — | | | 35,014 | | | — | | | 35,014 |
| U.S. Treasury Obligations | | | — | | | 1,880,140 | | | — | | | 1,880,140 |
| Short-Term Investments | | | | | | 1,810,949 | | | — | | | 1,810,949 |
| Securities Lending Collateral | | | — | | | 35,253 | | | — | | | 35,253 |
| Preferred Stock | | | 20,418 | | | 8,326 | | | — | | | 28,744 |
| Option Purchased | | | 469 | | | — | | | — | | | 469 |
| Total | | $ | 20,887 | | $ | 7,793,567 | | $ | 10,314 | | $ | 7,824,768 |
The following table summarizes the valuation of The High-Yield Bond Portfolio’s investments by fair value hierarchy levels as of October 31, 2012:
| | Level 1 | | Level 2 | | Level 3 | | Total |
| Common Stock | | $ | 104,079 | | $ | — | | $ | — | | $ | 104,079 |
| Corporate Debt | | | — | | | 105,040,064 | | | 601,437 | | | 105,641,501 |
| Other | | | 879,780 | | | 770,950 | | | — | | | 1,650,730 |
| Short-Term Investment | | | — | | | 8,536,000 | | | — | | | 8,536,000 |
| Securities Lending Collateral | | | — | | | 27,203 | | | — | | | 27,203 |
| Total | | $ | 983,859 | | $ | 114,374,217 | | $ | 601,437 | | $ | 115,959,513 |
The following is a reconciliation of investments in which significant unobservable inputs (Level 3) were used in determining fair value:
| | The High-Yield Bond Portfolio |
| | | | | | | | | | Securities | | | | |
| | Corporate | | Common | | Lending | | | | |
| | Debt | | Stock | | Collateral | | Total |
| Balance as of 10/31/11 | | $ | 5,451 | | | $ | — | | | | $— | | | $ | 5,451 | |
| Purchases | | | 600,492 | | | | — | | | | — | | | | 600,492 | |
| Sales | | | — | | | | — | | | | — | | | | — | |
| Net realized loss | | | — | | | | (13,605 | ) | | | — | | | | (13,605 | ) |
| Net change in unrealized appreciation (depreciation) | | | (4,506 | ) | | | 13,605 | | | | — | | | | 9,099 | |
| Balance as of 10/31/12 | | $ | 601,437 | | | $ | — | | | | $— | | | $ | 601,437 | |
| |
| Net change in unrealized appreciation (depreciation) | | | | | | | | | | | | | | | | |
| from investments still held as of 10/31/12 | | $ | (4,506 | ) | | $ | — | | | | $— | | | $ | (4,506 | ) |
2012 Annual report · Delaware Pooled Trust
128
The following table summarizes the valuation of The Core Plus Fixed Income Portfolio’s investments by fair value hierarchy levels as of October 31, 2012:
| | Level 1 | | Level 2 | | Level 3 | | Total |
| Agency, Asset-Backed and Mortgage-Backed Securities | | $ | — | | | $ | 19,684,619 | | | $ | 269,142 | | $ | 19,953,761 | |
| Corporate Debt | | | — | | | | 28,170,845 | | | | — | | | 28,170,845 | |
| Foreign Debt | | | — | | | | 3,657,198 | | | | — | | | 3,657,198 | |
| U.S. Treasury Obligations | | | — | | | | 5,433,856 | | | | — | | | 5,433,856 | |
| Short-Term Investments | | | — | | | | 12,597,000 | | | | — | | | 12,597,000 | |
| Securities Lending Collateral | | | — | | | | 43,642 | | | | — | | | 43,642 | |
| Preferred Stock | | | 152,722 | | | | 114,477 | | | | — | | | 267,199 | |
| Option Purchased | | | — | | | | 39 | | | | — | | | 39 | |
| Total | | $ | 152,722 | | | $ | 69,701,676 | | | $ | 269,142 | | $ | 70,123,540 | |
| |
| Foreign Currency Exchange Contracts | | $ | — | | | $ | (5,535 | ) | | $ | — | | $ | (5,535 | ) |
| Futures Contracts | | | (10,181 | ) | | | — | | | | — | | | (10,181 | ) |
| Swap Contracts | | | — | | | | (1,590 | ) | | | — | | | (1,590 | ) |
The following table summarizes the valuation of The International Equity Portfolio’s investments by fair value hierarchy levels as of October 31, 2012:
| | Level 1 | | Level 2 | | Level 3 | | Total |
| Common Stock | | $ | 464,558,577 | | $ | — | | | | $— | | | $ | 464,558,577 | |
| Short-Term Investments | | | — | | | 3,394,693 | | | | — | | | | 3,394,693 | |
| Securities Lending Collateral | | | — | | | 7,418,748 | | | | — | | | | 7,418,748 | |
| Total | | $ | 464,558,577 | | $ | 10,813,441 | | | | $— | | | $ | 475,372,018 | |
| |
| Foreign Currency Exchange Contracts | | $ | — | | $ | (21,961 | ) | | | — | | | $ | (21,961 | ) |
The following table summarizes the valuation of The Labor Select International Equity Portfolio’s investments by fair value hierarchy levels as of October 31, 2012:
| | Level 1 | | Level 2 | | Level 3 | | Total |
| Common Stock | | $ | 503,508,426 | | $ | — | | | | $— | | | $ | 503,508,426 | |
| Short-Term Investments | | | — | | | 4,044,503 | | | | — | | | | 4,044,503 | |
| Securities Lending Collateral | | | — | | | 4,646,573 | | | | — | | | | 4,646,573 | |
| Total | | $ | 503,508,426 | | $ | 8,691,076 | | | | $— | | | $ | 512,199,502 | |
| |
| Foreign Currency Exchange Contracts | | $ | — | | $ | (32,032 | ) | | | $— | | | $ | (32,032 | ) |
The following table summarizes the valuation of The Emerging Market Portfolio’s investments by fair value hierarchy levels as of October 31, 2012:
| | Level 1 | | Level 2 | | Level 3 | | Total |
| Common Stock | | $ | 294,060,451 | | $ | 1,022,008 | | | | $— | | | $ | 295,082,459 | |
| Preferred Stock | | | 20,306,766 | | | — | | | | — | | | | 20,306,766 | |
| Short-Term Investments | | | — | | | 3,390,727 | | | | — | | | | 3,390,727 | |
| Securities Lending Collateral | | | — | | | 7,312,346 | | | | — | | | | 7,312,346 | |
| Total | | $ | 314,367,217 | | $ | 11,725,081 | | | | $— | | | $ | 326,092,298 | |
| |
| Foreign Currency Exchange Contracts | | $ | — | | $ | (210 | ) | | | $— | | | $ | (210 | ) |
2012 Annual report · Delaware Pooled Trust
(continues) 129
Notes to financial statements
Delaware Pooled® Trust
3. Investments (continued)
The following table summarizes the valuation of The Emerging Market Portfolio II’s investments by fair value hierarchy levels as of October 31, 2012:
| | Level 1 | | Level 2 | | Level 3 | | Total |
| Common Stock | | $ | 27,878,305 | | $ | 562,182 | | | | $— | | | $ | 28,440,487 | |
| Investment Company | | | 655,836 | | | — | | | | — | | | | 655,836 | |
| Preferred Stock | | | 327,629 | | | — | | | | — | | | | 327,629 | |
| Short-Term Investments | | | — | | | 271,000 | | | | — | | | | 271,000 | |
| Securities Lending Collateral | | | — | | | 3,771,452 | | | | — | | | | 3,771,452 | |
| Total | | $ | 28,861,770 | | $ | 4,604,634 | | | | $— | | | $ | 33,466,404 | |
| |
| Foreign Currency Exchange Contracts | | $ | — | | $ | (22 | ) | | | $— | | | $ | (22 | ) |
The securities deemed worthless on the Statements of net assets have been included as level 3 securities within the fair value hierarchy.
A reconciliation of Level 3 investments is presented when a Portfolio has a significant amount of Level 3 investments at the beginning, interim or end of the period in relation to net assets.
During the year ended October 31, 2012, the following Portfolios had transfers that had a material impact to the Portfolios.
| | The
International
Equity
Portfolio | | The
Labor Select
International
Equity
Portfolio | | The
Emerging
Markets
Portfolio | | The
Emerging
Markets
Portfolio II |
| From Level 3 investments to Level 2 investments as a result of utilizing the | | | | | | | | | | | | |
| price of a similar asset with observable inputs that had been utilizing a | | | | | | | | | | | | |
| significant unobservable input | | $ | — | | $ | — | | $ | — | | $ | 23,606 |
| From Level 2 investments to Level 1 investments as a result of utilizing | | | | | | | | | | | | |
| international fair value pricing at the beginning of the period | | | 522,650,297 | | | 502,170,488 | | | 290,465,855 | | | 5,239,137 |
| From Level 1 investments to Level 2 investments as a result of utilizing the | | | | | | | | | | | | |
| price of a similar asset with an observable input | | $ | — | | $ | — | | $ | — | | $ | 209,977 |
In accordance with the fair valuation procedures described in Note 1, international fair value pricing uses other observable market-based inputs in place of the closing exchange price due to the events occurring after the close of the exchange or market on which the investment is principally traded causing a change in classification between levels.
The Portfolios’ policy is to recognize transfers between levels at the beginning of the reporting period.
Management has determined not to provide additional disclosure under ASU No. 2011-04 since the Level 3 investments are not considered material to the Portfolios’ net assets at the end of the period.
2012 Annual report · Delaware Pooled Trust
130
4. Dividend and Distribution Information
Income and long-term capital gain distributions are determined in accordance with federal income tax regulations, which may differ from U.S. GAAP. Additionally, distributions from net gains on foreign currency transactions and net short-term gains on sales of investment securities are treated as ordinary income for federal income tax purposes. The tax character of dividends and distributions paid during the years ended October 31, 2012 and 2011 was as follows:
| | | | Ordinary
income | | Long-term
capital gain |
| Year ended October 31, 2012: | | | | | | |
| The Large-Cap Value Equity Portfolio | | $ | 149,499 | | $ | — |
| The Select 20 Portfolio | | | 15,848 | | | — |
| The Large-Cap Growth Equity Portfolio | | | 450,961 | | | — |
| The Focus Smid-Cap Growth Equity Portfolio | | | 11,997 | | | — |
| The Real Estate Investment Trust Portfolio II | | | 20,364 | | | — |
| The Core Focus Fixed Income Portfolio | | | 201,820 | | | — |
| The High-Yield Bond Portfolio | | | 4,332,406 | | | — |
| The Core Plus Fixed Income Portfolio | | | 1,548,743 | | | — |
| The International Equity Portfolio | | | 23,845,189 | | | — |
| The Labor Select International Equity Portfolio | | | 22,684,826 | | | — |
| The Emerging Markets Portfolio | | | 11,672,380 | | | 42,338,904 |
| The Emerging Markets Portfolio II | | | 760,618 | | | 872 |
| | | | Ordinary
income |
| Year ended October 31, 2011: | | | |
| The Large-Cap Value Equity Portfolio | | $ | 211,314 |
| The Large-Cap Growth Equity Portfolio | | | 826,516 |
| The Focus Smid-Cap Growth Equity Portfolio | | | 41,867 |
| The Real Estate Investment Trust Portfolio II | | | 40,124 |
| The Core Focus Fixed Income Portfolio | | | 567,674 |
| The High-Yield Bond Portfolio | | | 2,250,664 |
| The Core Plus Fixed Income Portfolio | | | 2,534,908 |
| The International Equity Portfolio | | | 25,012,020 |
| The Labor Select International Equity Portfolio | | | 22,010,265 |
| The Emerging Markets Portfolio | | | 16,918,513 |
| The Emerging Markets Portfolio II | | | 117,647 |
2012 Annual report · Delaware Pooled Trust
(continues) 131
Notes to financial statements
Delaware Pooled ® Trust
5. Components of Net Assets on a Tax Basis
As of October 31, 2012, the components of net assets on a tax basis were as follows:
| | The
Large-Cap
Value Equity
Portfolio | | The
Select 20
Portfolio | | The
Large-Cap
Growth Equity
Portfolio | | The
Focus Smid-Cap
Growth Equity
Portfolio |
| Shares of beneficial interest | | | $ | 8,615,529 | | | | | $ | 112,458,016 | | | | | $ | 204,405,546 | | | | | $ | 16,886,240 | | |
| Undistributed ordinary income | | | | 135,326 | | | | | | 370,417 | | | | | | 444,855 | | | | | | — | | |
| Undistributed long-term capital gain | | | | — | | | | | | 1,610,022 | | | | | | — | | | | | | 355,446 | | |
| Capital loss carryforwards | | | | (837,891 | ) | | | | | (1,693,606 | ) | | | | | (35,864,998 | ) | | | | | (383,913 | ) | |
| Qualified late year losses deferred | | | | — | | | | | | — | | | | | | — | | | | | | (23,667 | ) | |
| Unrealized appreciation | | | | 504,358 | | | | | | 11,766,042 | | | | | | 47,482,078 | | | | | | 1,018,487 | | |
| Net assets | | | $ | 8,417,322 | | | | | $ | 124,510,891 | | | | | $ | 216,467,481 | | | | | $ | 17,852,593 | | |
| | The
Real Estate
Investment Trust
Portfolio II* | | The
Core Focus
Fixed Income
Portfolio | | The
High-Yield
Bond
Portfolio | | The
Core Plus
Fixed Income
Portfolio |
| Shares of beneficial interest | | | $ | 5,591,638 | | | | | $ | 5,832,181 | | | | $ | 107,890,010 | | | | | $ | 58,130,441 | | |
| Undistributed ordinary income | | | | 37,510 | | | | | | 314,735 | | | | | 4,939,675 | | | | | | 1,552,493 | | |
| Undistributed tax-exempt income | | | | — | | | | | | — | | | | | — | | | | | | — | | |
| Undistributed long-term capital gain | | | | — | | | | | | 66,758 | | | | | — | | | | | | — | | |
| Capital loss carryforwards | | | | (2,292,136 | ) | | | | | — | | | | | (3,195,586 | ) | | | | | (1,651,753 | ) | |
| Other temporary differences | | | | — | | | | | | — | | | | | — | | | | | | (123,600 | ) | |
| Unrealized appreciation | | | | 196,485 | | | | | | 118,796 | | | | | 3,413,547 | | | | | | 2,405,522 | | |
| Net assets | | | $ | 3,533,497 | | | | | $ | 6,332,470 | | | | $ | 113,047,646 | | | | | $ | 60,313,103 | | |
| | The
International
Equity
Portfolio | | Labor Select
International
Equity
Portfolio | | | The
Emerging
Markets
Portfolio | | The
Emerging
Markets
Portfolio II |
| Shares of beneficial interest | | | $ | 635,942,965 | | | | | $ | 616,814,299 | | | | | $ | 282,840,183 | | | | $ | 31,430,563 | | |
| Undistributed ordinary income | | | | 17,293,169 | | | | | | 15,958,707 | | | | | | 7,438,830 | | | | | 120,999 | | |
| Undistributed long-term capital gain | | | | — | | | | | | — | | | | | | 5,112,714 | | | | | — | | |
| Capital loss carryforwards | | | | (173,821,750 | ) | | | | | (93,382,184 | ) | | | | | — | | | | | (195,075 | ) | |
| Unrealized appreciation (depreciation) | | | | (11,587,242 | ) | | | | | (29,863,383 | ) | | | | | 21,417,599 | | | | | (1,670,373 | ) | |
| Net assets | | | $ | 467,827,142 | | | | | $ | 509,527,439 | | | | | $ | 316,809,326 | | | | $ | 29,686,114 | | |
*The undistributed earnings for The Real Estate Investment Trust Portfolio II are estimated pending final notification of the tax character of distributions received from investments in Real Estate Investment Trusts.
The differences between book basis and tax basis components of net assets are primarily attributable to tax deferral of losses on wash sales, mark-to-market on futures contracts, mark-to-market on forward foreign currency contracts, straddle loss deferrals, tax recognition of unrealized gain on passive foreign investment companies, contingent payment debt instruments, the tax treatment of market discount and premium on debt instruments, and CDS contracts.
Qualified late year losses deferred represent ordinary losses realized on investment transactions from January 1, 2012 through October 31, 2012 that, in accordance with federal income tax regulations, the Portfolios have elected to defer and treat as having arisen on the first day of the following fiscal year.
2012 Annual report · Delaware Pooled Trust
132
For financial reporting purposes, capital accounts are adjusted to reflect the tax character of permanent book/tax differences. Reclassifications are primarily due to tax treatment of net operating losses, gain (loss) on foreign currency transactions, dividends and distributions, market discount and premium on certain debt instruments, passive foreign investment companies, CDS and interest rate swaps, tax treatment of Brazilian taxes, gains/losses from redemptions in-kind and paydown gains (losses) on mortgage- and asset-backed securities. Results of operations and net assets were not affected by these reclassifications. For year ended October 31, 2012, the following Portfolios recorded the following reclassifications.
| | Undistributed
(distributions in excess of)
net investment income (loss) | | Accumulated
net realized
gain (loss) | | Paid-in
Capital |
| The Select 20 Portfolio | | $ | 24,964 | | | $ | (24,964 | ) | | $ | — | |
| The Large-Cap Growth Equity Portfolio | | | (1,979 | ) | | | 1,979 | | | | — | |
| The Core Focus Fixed Income Portfolio | | | 26,721 | | | | (26,721 | ) | | | — | |
| The High-Yield Bond Portfolio | | | 192,826 | | | | (192,826 | ) | | | — | |
| The Core Plus Fixed Income Portfolio | | | (319,950 | ) | | | 319,950 | | | | — | |
| The International Equity Portfolio | | | 628,467 | | | | 302,033 | | | | (930,500 | ) |
| The Labor Select International Equity Portfolio | | | 283,270 | | | | (283,270 | ) | | | — | |
| The Emerging Markets Portfolio | | | (154,807 | ) | | | (18,071,087 | ) | | | 18,225,894 | |
| The Emerging Markets Portfolio II | | | (25,732 | ) | | | 25,732 | | | | — | |
For federal income tax purposes, capital loss carryforwards may be carried forward and applied against future gains.
In 2012, the following Portfolios utilized capital loss carryforwards as follows:
| Capital loss
carryforwards
utilized |
| The Large-Cap Value Equity Portfolio | $ | 194,141 |
| The Select 20 Portfolio | | 1,119,848 |
| The Large-Cap Growth Equity Portfolio | | 15,511,673 |
| The Focus Smid-Cap Growth Equity Portfolio | | 432,006 |
| The Real Estate Investment Trust Portfolio II | | 265,829 |
| The Core Focus Fixed Income Portfolio | | 16,340 |
| The Core Plus Fixed Income Portfolio | | 1,442,188 |
Capital loss carryforwards remaining at October 31, 2012 for the following Portfolios will expire as follows:
| | Year of expiration |
| | 2016 | | 2017 | | 2018 | | Total |
| The Large-Cap Value Equity Portfolio | | $ | 86,681 | | $ | 751,210 | | $ | — | | $ | 837,891 |
| The Select 20 Portfolio | | | — | | | 1,693,606 | | | — | | | 1,693,606 |
| The Large-Cap Growth Equity Portfolio | | | — | | | 33,672,045 | | | 2,192,953 | | | 35,864,998 |
| The Focus Smid-Cap Growth Equity Portfolio | | | — | | | 383,913 | | | — | | | 383,913 |
| The Real Estate Investment Trust Portfolio II | | | 748,336 | | | 1,521,902 | | | 21,898 | | | 2,292,136 |
| The High-Yield Bond Portfolio | | | 602,258 | | | 2,215,341 | | | — | | | 2,817,599 |
| The Core Plus Fixed Income Portfolio | | | — | | | 1,651,753 | | | — | | | 1,651,753 |
| The International Equity Portfolio | | | — | | | 156,031,998 | | | 13,859,481 | | | 169,891,479 |
| The Labor Select International Equity Portfolio | | | — | | | 71,586,349 | | | 18,475,802 | | | 90,062,151 |
On December 22, 2010, the Regulated Investment Company Modernization Act of 2010 (Act) was enacted, which changed various technical rules governing the tax treatment of regulated investment companies. The changes were generally effective for taxable years beginning after the date of enactment. Under the Act, the Portfolios are permitted to carry forward capital losses incurred in taxable years beginning after the date of enactment for an unlimited period. However, any losses incurred during those future taxable years will be required to be utilized prior to the losses incurred in pre-enactment taxable years, which carry an expiration date. As a result of this ordering rule, pre-enactment capital loss carryforwards may be more likely to expire unused. Additionally, post-enactment capital loss carryforwards will retain their character as either short-term or long-term capital losses rather than being considered all short-term as permitted under previous regulation.
2012 Annual report · Delaware Pooled Trust
(continues) 133
Notes to financial statements
Delaware Pooled® Trust
5. Components of Net Assets on a Tax Basis (continued)
Losses incurred by the following Portfolios that will be carried forward under the Act are as follows:
| | Loss carryforward character |
| | Short-term | | Long-term |
| The High-Yield Bond Portfolio | | $ | — | | $ | 377,987 |
| The International Equity Portfolio | | | 348,917 | | | 3,581,354 |
| The Labor Select International Equity Portfolio | | | — | | | 3,320,033 |
| The Emerging Markets Portfolio II | | | 153,461 | | | 41,614 |
6. Capital Shares
| | | | Shares
sold | | Shares issued
upon reinvestment
of dividends
and distributions | | Shares
redeemed | | Net
increase
(decrease) |
| Year ended October 31, 2012: | | | | | | | | | | | |
| The Large-Cap Value Equity Portfolio | | 33,823 | | | 9,116 | | — | | | 42,939 | |
| The Select 20 Portfolio | | 11,672,512 | | | 1,679 | | (2,977,874 | ) | | 8,696,317 | |
| The Large-Cap Growth Equity Portfolio | | 5,712,872 | | | 39,201 | | (4,139,049 | ) | | 1,613,024 | |
| The Focus Smid-Cap Growth Equity Portfolio | | 246,180 | | | 748 | | (223,964 | ) | | 22,964 | |
| The Real Estate Investment Trust Portfolio II | | — | * | | 3,295 | | — | | | 3,295 | |
| The Core Focus Fixed Income Portfolio | | 319,676 | | | 21,222 | | (352,255 | ) | | (11,357 | ) |
| The High-Yield Bond Portfolio | | 6,356,298 | | | 604,241 | | (803,451 | ) | | 6,157,088 | |
| The Core Plus Fixed Income Portfolio | | 434,435 | | | 156,438 | | (225,160 | ) | | 365,713 | |
| The International Equity Portfolio | | 3,694,638 | | | 1,240,044 | | (13,393,678 | ) | | (8,458,996 | ) |
| The Labor Select International Equity Portfolio | | 752,137 | | | 1,945,525 | | (6,740,855 | ) | | (4,043,193 | ) |
| The Emerging Markets Portfolio | | 6,625,470 | | | 5,754,992 | | (31,797,749 | ) | | (19,417,287 | ) |
| The Emerging Markets Portfolio II | | 1,741,437 | | | 100,160 | | — | | | 1,841,597 | |
| |
| Year ended October 31, 2011: | | | | | | | | | | | |
| The Large-Cap Value Equity Portfolio | | 456,892 | | | 13,757 | | (505,546 | ) | | (34,897 | ) |
| The Select 20 Portfolio | | 5,104,499 | | | — | | (399,742 | ) | | 4,704,757 | |
| The Large-Cap Growth Equity Portfolio | | 557,240 | | | 76,367 | | (10,795,913 | ) | | (10,162,306 | ) |
| The Focus Smid-Cap Growth Equity Portfolio | | 769,111 | | | 2,648 | | (18,535 | ) | | 753,224 | |
| The Real Estate Investment Trust Portfolio II | | — | | | 7,178 | | — | | | 7,178 | |
| The Core Focus Fixed Income Portfolio | | 61,040 | | | 63,215 | | (1,520,258 | ) | | (1,396,003 | ) |
| The High-Yield Bond Portfolio | | 4,099,938 | | | 300,088 | | (645,896 | ) | | 3,754,130 | |
| The Core Plus Fixed Income Portfolio | | 625,535 | | | 269,671 | | (505,487 | ) | | 389,719 | |
| The International Equity Portfolio | | 2,513,236 | | | 1,072,995 | | (17,810,194 | ) | | (14,223,963 | ) |
| The Labor Select International Equity Portfolio | | 1,109,058 | | | 1,706,222 | | (13,111,471 | ) | | (10,296,191 | ) |
| The Emerging Markets Portfolio | | 4,894,763 | | | 1,497,535 | | (21,496,933 | ) | | (15,104,635 | ) |
| The Emerging Markets Portfolio II | | 709,618 | | | 12,091 | | (104,478 | ) | | 617,231 | |
*Less than one share
7. Unfunded Commitments
The Portfolios may invest in floating rate loans. In connection with these investments, the Portfolios may also enter into unfunded corporate loan commitments (commitments). Commitments may obligate the Portfolios to furnish temporary financing to a borrower until permanent financing can be arranged. In connection with these commitments, the Portfolios earn a commitment fee, typically set as a percentage of the commitment amount.
2012 Annual report · Delaware Pooled Trust
134
As of October 31, 2012, The High-Yield Bond Portfolio had the following unfunded loan commitments:
| Borrower | | Unfunded Loan
Commitment |
| Gencorp | | | $ | 600,000 | |
| Hertz | | | | 676,688 | |
| Silver II Acquisition | | | | 785,000 | |
| Spectrum Brands Holdings | | | | 540,000 | |
| TPC Group | | | | 855,000 | |
8. Line of Credit
The Portfolios, along with certain other funds in the Delaware Investments® Family of Funds (Participants), were participants in a $100,000,000 revolving line of credit to be used for temporary or emergency purposes as an additional source of liquidity to fund redemptions of investor shares. Under the agreement, the Participants were charged an annual commitment fee, which was allocated across the Participants on the basis of each Participant’s allocation of the entire facility. The Participants were permitted to borrow up to a maximum of one third of their net assets under the agreement. Each Participant was individually, and not jointly, liable for its particular advances, if any, under the line of credit. The line of credit under the agreement expired on November 15, 2011.
On November 15, 2011, the Portfolios, along with the other Participants, entered into an amendment to the agreement for a $125,000,000 revolving line of credit. The agreement is to be used as described above and operates in substantially the same manner as the original agreement. The line of credit available under the agreement expired on November 13, 2012.
On November 13, 2012, the Portfolios, along with the other Participants, entered into an amendment to the agreement for a $125,000,000 revolving line of credit. The agreement is to be used as described above and operates in substantially the same manner as the original agreement. The line of credit available under the agreement expires on November 12, 2013. The Portfolios had no amounts outstanding as of October 31, 2012 or at any time during the year then ended.
9. Derivatives
U.S. GAAP requires disclosures that enable investors to understand: 1) how and why an entity uses derivatives; 2) how they are accounted for; and 3) how they affect an entity’s results of operations and financial position.
Foreign Currency Exchange Contracts — Each Portfolio may enter into foreign currency exchange contracts and foreign cross-currency exchange contracts as a way of managing foreign exchange rate risk. The Portfolios may enter into these contracts to fix the U.S. dollar value of a security that they have agreed to buy or sell for the period between the date the trade was entered into and the date the security is delivered and paid for. The Portfolios may also use these contracts to hedge the U.S. dollar value of securities they already own that are denominated in foreign currencies. The change in value is recorded as an unrealized gain or loss. When the contract is closed, a realized gain or loss is recorded equal to the difference between the value of the contract at the time it was opened and the value at the time it was closed.
The use of foreign currency exchange contracts and foreign cross-currency exchange contracts does not eliminate fluctuations in the underlying prices of the securities, but does establish a rate of exchange that can be achieved in the future. Although foreign currency exchange contracts limit the risk of loss due to an unfavorable change in the value of the hedged currency, they also limit any potential gain that might result should the value of the currency change favorably. In addition, the Portfolios could be exposed to risks if the counterparties to the contracts are unable to meet the terms of their contracts. The Portfolios’ maximum risk of loss from counterparty credit risk is the value of its currency exchanged with the counterparty. The risk is generally mitigated by having a netting arrangement between a Portfolio and the counterparty and by the posting of collateral by the counterparty to a Portfolio to cover a Portfolio’s exposure to the counterparty.
Futures Contracts — A futures contract is an agreement in which the writer (or seller) of the contract agrees to deliver to the buyer an amount of cash or securities equal to a specific dollar amount times the difference between the value of a specific security or index at the close of the last trading day of the contract and the price at which the agreement is made. The Select 20, The Large-Cap Growth Equity, The Focus Smid-Cap Growth Equity, The Real Estate Investment Trust II, The Core Focus Fixed Income, The Core Plus Fixed Income, The Emerging Markets, and The Emerging Markets II Portfolios may use futures in the normal course of pursuing their investment objectives. Each Portfolio may invest in financial futures contracts to hedge their existing portfolio securities against fluctuations in fair value caused by changes in prevailing market interest rates. Upon entering into a futures contract, a Portfolio deposits cash or pledges U.S. government securities to a broker, equal to the minimum “initial margin” requirements of the exchange on which the contract is traded. Subsequent payments are received from the broker or paid to the broker each day, based on the daily fluctuation in the market value of the contract. These receipts or payments are known as “variation margin” and are recorded daily by each Portfolio as unrealized gains or
2012 Annual report · Delaware Pooled Trust
(continues) 135
Notes to financial statements
Delaware Pooled® Trust
9. Derivatives (continued)
losses until the contracts are closed. When the contracts are closed, the Portfolio records a realized gain or loss equal to the difference between the value of the contract at the time it was opened and the value at the time it was closed. Risks of entering into futures contracts include potential imperfect correlation between the futures contracts and the underlying securities and the possibility of an illiquid secondary market for these instruments. When investing in futures, there is minimal counterparty credit risk to a Portfolio because futures are exchange-traded and the exchange’s clearinghouse, as counterparty to all exchange-traded futures, guarantees against default.
Options Contracts — The Portfolios may buy or write options contracts for any number of reasons, including without limitation: to manage a Portfolio’s exposure to changes in securities prices and foreign currencies; as an efficient means of adjusting a Portfolio’s overall exposure to certain markets; to protect the value of portfolio securities; and as a cash management tool. A Portfolio may buy or write call or put options on securities, financial indices, and foreign currencies. When a Portfolio buys an option, a premium is paid and an asset is recorded and adjusted on a daily basis to reflect the current market value of the options purchased. When a Portfolio writes an option, a premium is received and a liability is recorded and adjusted on a daily basis to reflect the current market value of the options written. Premiums received from writing options that expire unexercised are treated by a Portfolio on the expiration date as realized gains. The difference between the premium received and the amount paid on effecting a closing purchase transaction, including brokerage commissions, is treated as realized gain or loss. If a call option is exercised, the premium is added to the proceeds from the sale of the underlying security in determining whether the Portfolio has a realized gain or loss. If a put option is exercised, the premium reduces the cost basis of the securities purchased by the Portfolio. A Portfolio, as writer of an option, bears the market risk of an unfavorable change in the price of the security underlying the written option. When writing options, a Portfolio is subject to minimal counterparty risk because the counterparty is only obligated to pay premiums and does not bear the market risk of an unfavorable market change.
Transactions in options written during the year ended October 31, 2012 for The Core Plus Fixed Income Portfolio were as follows:
| | Number of | | | | |
| | Contracts | | Premium |
| Options outstanding at October 31, 2011 | | | — | | | | $ | — | |
| Options written | | | 60 | | | | | 63,461 | |
| Options terminated in closing purchase transactions | | | (32 | ) | | | | (38,191 | ) |
| Options expired | | | (28 | ) | | | | (25,270 | ) |
| Options outstanding at October 31, 2012 | | | — | | | | $ | — | |
Swap Contracts — The Core Focus Fixed Income Portfolio, The High-Yield Bond Portfolio and The Core Plus Fixed Income Portfolio may enter into credit default swap (CDS) contracts in accordance with their investment objectives. The Portfolios may enter into CDS contracts in order to hedge against a credit event, to enhance total return, or to gain exposure to certain securities or markets. The Portfolios will not be permitted to enter into any swap transactions unless, at the time of entering into such transactions, the unsecured long-term debt of the actual counterparty combined with any credit enhancements, is rated at least BBB- by S&P or Baa3 by Moody’s or is determined to be of equivalent quality by the manager.
Credit Default Swaps. A CDS contract is a risk-transfer instrument through which one party (purchaser of protection) transfers to another party (seller of protection) the financial risk of a credit event (as defined in the CDS agreement), as it relates to a particular reference security or basket of securities (such as an index). In exchange for the protection offered by the seller of protection, the purchaser of protection agrees to pay the seller of protection a periodic amount at a stated rate that is applied to the notional amount of the CDS contract. In addition, an upfront payment may be made or received by a Portfolio in connection with an unwinding or assignment of a CDS contract. Upon the occurrence of a credit event, the seller of protection would pay the par (or other agreed-upon) value of the reference security (or basket of securities) to the counterparty. Credit events generally include, among others, bankruptcy, failure to pay, and obligation default.
During the year ended October 31, 2012, the Portfolios entered into CDS contracts as purchasers and sellers of protection. Periodic payments (receipts) on such contracts are accrued daily and recorded as unrealized losses (gains) on swap contracts. Upon payment (receipt), such amounts are recorded as realized losses (gains) on swap contracts. Upfront payments made or received in connection with CDS contracts are amortized over the expected life of the CDS contracts as unrealized losses (gains) on swap contracts. The change in value of CDS contracts is recorded as unrealized appreciation or depreciation daily. A realized gain or loss is recorded upon a credit event (as defined in the CDS agreement) or the maturity or termination of the agreement.
2012 Annual report · Delaware Pooled Trust
136
The Core Plus Fixed Income Portfolio had posted $110,000 as collateral for certain open derivatives.
CDS contracts may involve greater risks than if a Portfolio had invested in the reference obligation directly. CDS contracts are subject to general market risk, liquidity risk, counterparty risk and credit risk. A Portfolio’s maximum risk of loss from counterparty credit risk, either as the seller of protection or the buyer of protection, is the fair value of the contract. This risk is mitigated by having a netting arrangement between a Portfolio and the counterparty and by the posting of collateral by the counterparty to a Portfolio to cover a Portfolio’s exposure to the counterparty.
Swaps Generally. Because there are generally no organized markets for swap contracts, the value of open swaps may differ from that which would be realized in the event a Portfolio terminated its position in the agreement. Risks of entering into these contracts include the potential inability of the counterparty to meet the terms of the contracts. This type of risk is generally limited to the amount of favorable movements in the value of the underlying security, instrument, or basket of instruments, if any, at the day of default. Risks also arise from potential losses from adverse market movements and such losses could exceed the unrealized amounts shown on the statements of net assets.
Fair values of derivative instruments as of October 31, 2012 were as follows:
| | The Core Plus Fixed Income Portfolio | |
| | Asset Derivatives | | Liability Derivatives |
| | Statement of Net Assets Location | | Fair Value | | Statement of Net Assets Location | | Fair Value |
| Forward currency exchange contracts | | Other liabilities net of receivables | | | | | | | | Other liabilities net of receivables | | | | | |
| (Foreign currency exchange contracts) | | and other assets | | | $ | 1,892 | | | | and other assets | | | $ | 7,427 | |
| Interest rate contracts | | Other liabilities net of receivables | | | | | | | | Other liabilities net of receivables | | | | | |
| (Futures contracts) | | and other assets | | | | 1,276 | * | | | and other assets | | | | 11,457 | * |
| Credit and inflation contracts | | Other liabilities net of receivables | | | | | | | | Other liabilities net of receivables | | | | | |
| (Swap contracts) | | and other assets | | | | — | | | | and other assets | | | | 1,590 | |
| Total | | | | | $ | 3,168 | | | | | | | $ | 20,474 | |
*Includes cumulative appreciation or depreciation of futures contracts from the date the contracts are opened through October 31, 2012. Only current day variation margin is reported with the Portfolio’s other liabilities net of receivables and other assets in the Statement of Net Assets.
The effect of derivative instruments on the statement of operations for the year ended October 31, 2012 was as follows:
| | The Core Plus Fixed Income Portfolio | |
| | | | | | | | | | Change in Unrealized |
| | | | | | | | | | Appreciation |
| | | | Realized Gain or | | or Depreciation |
| | | | Loss on Derivatives | | on Derivatives |
| | Location of Gain or Loss on Derivatives Recognized in Income | | Recognized in Income | | Recognized in Income |
Forward currency exchange contracts
(Foreign currency exchange contracts) | | Net realized loss on foreign currency exchange contracts and net change in unrealized appreciation (depreciation) of foreign currency exchange contracts | | | $ | (50,826 | ) | | | | $ | (59,872 | ) | |
Interest rate contracts
(Futures contracts) | | Net realized loss on futures contracts and net change in unrealized appreciation (depreciation) of futures contracts | | | | (15,249 | ) | | | | | (93,633 | ) | |
Equity Contracts
(Options written) | | Net realized gain on options written and net change in unrealized appreciation (depreciation) of options written | | | | 65,519 | | | | | | — | | |
Credit contracts
(Swap and Inflation contracts) | | Net realized loss on swap contracts and net change in unrealized appreciation (depreciation) of swap contracts | | | | (638,739 | ) | | | | | 161,376 | | |
| Total | | | | | $ | (639,295 | ) | | | | $ | 7,871 | | |
2012 Annual report · Delaware Pooled Trust
(continues) 137
Notes to financial statements
Delaware Pooled® Trust
9. Derivatives (continued)
Derivatives Generally. The table below summarizes the average balance of derivative holdings by each Portfolio during the year ended October 31, 2012. The average balance of derivatives held is generally similar to the volume of derivative activity for the year ended October 31, 2012.
| | Long Derivative Volume |
| | Forward Foreign | | Futures | | Option | | Swap |
| | Currency | | Contracts | | Contracts | | Contracts — Buying |
| | Contracts | | (Average | | (Average | | Protection (Average |
| | (Average Cost) | | Notional Value) | | Notional Value) | | Notional Value) |
| The Core Focus Fixed Income Portfolio | | USD | | — | | USD | | — | | USD | | 1,540 | | USD | | — |
| The Core Plus Fixed Income Portfolio | | | | 1,037,953 | | | | 1,844,032 | | | | 1,336 | | | | 2,297,935 |
| | | | — | | | | — | | | | — | | EUR | | 1,598,696 |
| The International Equity Portfolio | | | | 180,266 | | | | — | | | | — | | | | — |
| The Labor Select International Equity Portfolio | | | | 212,624 | | | | — | | | | — | | | | — |
| The Emerging Markets Portfolio | | | | 286,001 | | | | — | | | | — | | | | — |
| The Emerging Markets Portfolio II | | | | 30,167 | | | | — | | | | — | | | | — |
| |
| | Short Derivative Volume |
| | Forward Foreign | | Futures | | Option | | Swap |
| | Currency | | Contracts | | Contracts | | Contracts — Selling |
| | Contracts | | (Average | | (Average | | Protection (Average |
| | (Average Cost) | | Notional Value) | | Notional Value) | | Notional Value) |
| The Core Focus Fixed Income Portfolio | | USD | | — | | USD | | — | | USD | | — | | USD | | — |
| The Core Plus Fixed Income Portfolio | | | | 3,120,721 | | | | 1,060,931 | | | | 5,134 | | | | 99,348 |
| The International Equity Portfolio | | 28,055,192 | | | | — | | | | — | | | | — |
| The Labor Select International Equity Portfolio | | 30,616,052 | | | | — | | | | — | | | | — |
| The Emerging Markets Portfolio | | | | 583,520 | | | | — | | | | — | | | | — |
| The Emerging Markets Portfolio II | | | | 7,364 | | | | — | | | | — | | | | — |
10. Securities Lending
The Portfolios, along with other funds in the Delaware Investments® Family of Funds, may lend their securities pursuant to a security lending agreement (Lending Agreement) with The Bank of New York Mellon (BNY Mellon). At the time a security is loaned, the borrower must post collateral equal to the required percentage of the market value of the loaned security, including any accrued interest. The required percentage is: (i) 102% with respect to U.S. securities and foreign securities that are denominated and payable in U.S. dollars; and (ii) 105% with respect to foreign securities. With respect to each loan, if on any business day the aggregate market value of securities collateral plus cash collateral held is less than the aggregate market value of the securities which are the subject of such loan, the borrower will be notified to provide additional collateral by the end of the following business day which, together with the collateral already held, will be not less than the applicable initial collateral requirements for such security loan. If the aggregate market value of securities collateral and cash collateral held with respect to a security loan exceeds the applicable initial collateral requirement, upon request of the borrower BNY Mellon must return enough collateral to the borrower by the end of the following business day to reduce the value of the remaining collateral to the applicable initial collateral requirement for such security loan. As a result of the foregoing, the value of the collateral held with respect to a loaned security may be temporarily more or less than the value of security on loan.
Cash collateral received is generally invested in the Delaware Investments Collateral Fund No. 1 (Collective Trust) established by BNY Mellon for the purpose of investment on behalf of funds managed by DMC that participate in BNY Mellon’s securities lending program. The Collective Trust may invest in U.S. government securities and high quality corporate debt, asset-backed and other money market securities and in repurchase agreements collateralized by such securities, provided that the Collective Trust will generally have a dollar-weighted average portfolio maturity of 60 days or less. In October 2008, BNY Mellon transferred certain distressed securities from the Portfolios’ previous collateral investment pool into the Mellon GSL Reinvestment Trust II. The Portfolios can also accept U.S. government securities and letters of credit (non-cash collateral) in connection with securities loans. In the event of default or bankruptcy by the lending agent, realization and/or retention of the collateral may be subject to legal proceedings. In the event the borrower fails to return loaned securities and the collateral received is insufficient to cover the value of the loaned securities and provided such collateral shortfall is not the result of investment losses, the lending agent has agreed to pay the amount of the shortfall to the Portfolios or, at the discretion of the lending agent, replace the loaned securities. The Portfolios continue to record dividends or interest, as applicable, on the securities loaned and are subject to changes in value of the securities loaned that may occur during the term of the loan. The Portfolios have the right under the Lending Agreement to recover the securities from the borrower on demand. With respect to security loans collateralized by non-cash collateral, the Portfolios receive loan
2012 Annual report · Delaware Pooled Trust
138
premiums paid by the borrower. With respect to security loans collateralized by cash collateral, the earnings from the collateral investments are shared among the Portfolios, the security lending agent and the borrower. The Portfolios record security lending income net of allocations to the security lending agent and the borrower.
The Collective Trust used for the investment of cash collateral received from borrowers of securities seeks to maintain a net asset value per unit of $1.00, but there can be no assurance that it will always be able to do so. The Portfolios may incur investment losses as a result of investing securities lending collateral in the Collective Trust or another collateral investment pool. This could occur if an investment in a collateral investment pool defaulted or if it were necessary to liquidate assets in the collateral investment pool to meet returns on outstanding security loans at a time when the collateral investment pool’s net asset value per unit was less than $1.00. Under those circumstances, the Portfolios may not receive an amount from the collateral investment pool that is equal in amount to the collateral the Fund would be required to return to the borrower of the securities and the Portfolios would be required to make up for this shortfall.
At October 31, 2012, the value of securities on loan and the value of invested collateral are presented below, for which the following Portfolios received cash collateral. Investments purchased with cash collateral are presented on the statements of net assets under the caption “Securities Lending Collateral.”
| | Value | | Cash | | Value of |
| | of securities | | collateral | | invested |
| | on loan | | received | | collateral |
| The Large-Cap Growth Equity Portfolio | | $ | 388,908 | | $ | 395,189 | | $ | 182,082 |
| The Core Focus Fixed Income Portfolio | | | 74,467 | | | 76,862 | | | 35,253 |
| The High-Yield Bond Portfolio | | | 55,644 | | | 58,399 | | | 27,203 |
| The Core Plus Fixed Income Portfolio | | | 89,365 | | | 92,736 | | | 43,642 |
| The International Equity Portfolio | | | 8,342,116 | | | 8,849,698 | | | 7,418,748 |
| The Labor Select International Equity Portfolio | | | 4,832,615 | | | 5,141,550 | | | 4,646,573 |
| The Emerging Markets Portfolio | | | 7,386,526 | | | 7,859,062 | | | 7,312,346 |
| The Emerging Markets Portfolio II | | | 3,610,528 | | | 3,771,452 | | | 3,771,452 |
11. Credit and Market Risk
Some countries in which The International Equity, The Labor Select International Equity, The Emerging Markets, and The Emerging Markets II Portfolios invest require governmental approval for the repatriation of investment income, capital or the proceeds of sales of securities by foreign investors. In addition, if there is deterioration in a country’s balance of payments or for other reasons, a country may impose temporary restrictions on foreign capital remittances abroad.
The securities exchanges of certain foreign markets are substantially smaller, less liquid and more volatile than the major securities markets in the United States. Consequently, acquisition and disposition of securities by the Portfolios may be inhibited. In addition, a significant portion of the aggregate market value of equity securities listed on the major securities exchanges in emerging markets is held by a smaller number of investors. This may limit the number of shares available for acquisition or disposition by the Portfolios.
The High Yield Bond Portfolio invests a portion of its assets in high yield fixed income securities which are securities rated lower than BBB- by Standard & Poor’s (S&P) and Baa3 by Moody’s Investors Service (Moody’s), or similarly rated by another nationally recognized statistical rating organization. The Core Plus Fixed Income Portfolio invests a portion of its assets in high yield fixed income securities which are securities rated BB or lower by S&P and Ba or lower by Moody’s, or similarly rated by another nationally recognized statistical rating organization. Investments in these higher yielding securities are generally accompanied by a greater degree of credit risk than higher rated securities. Additionally, lower rated securities may be more susceptible to adverse economic and competitive industry conditions than investment grade securities.
The Core Focus Fixed Income and The Core Plus Fixed Income Portfolios invest in fixed income securities whose value is derived from an underlying pool of mortgages or consumer loans. The value of these securities is sensitive to changes in economic conditions, including delinquencies and/or defaults, and may be adversely affected by shifts in the market’s perception of the issuers and changes in interest rates. Investors receive principal and interest payments as the underlying mortgages and consumer loans are paid back. Some of these securities are collateralized mortgage obligations (CMOs). CMOs are debt securities issued by U.S. government agencies or by financial institutions and other mortgage lenders, which are collateralized by a pool of mortgages held under an indenture. Prepayment of mortgages may shorten the stated maturity of the obligations and can result in a loss of premium, if any has been paid. Certain of these securities may be stripped (securities which provide only the principal or interest feature of the underlying security). The yield to maturity on an interest-only CMO is extremely sensitive not only to changes in prevailing interest rates, but also to the rate of principal payments (including prepayments) on the related underlying mortgage assets. A rapid rate of principal payments may have a material adverse effect on the Portfolios’ yield to maturity. If the underlying mortgage assets experience greater than anticipated prepayments of principal, the Portfolios may fail to fully recoup their initial investments in these securities even if the securities are rated in the highest rating categories.
2012 Annual report · Delaware Pooled Trust
(continues) 139
Notes to financial statements
Delaware Pooled®Trust
11. Credit and Market Risk (continued)
The International Equity Portfolio may invest up to 10% its net assets in illiquid securities, which may include securities with contractual restrictions on resale, securities exempt from registration under Rule 144A of the Securities Act of 1933, as amended, and other securities, which may not be readily marketable. The Large-Cap Value Equity, The Select 20, The Large-Cap Growth Equity, The Focus Smid-Cap Growth Equity, The Real Estate Investment Trust II, The Core Focus Fixed Income, The High-Yield Bond, The Core Plus Fixed Income, The Labor Select International Equity, The Emerging Markets, and The Emerging Markets II Portfolios may invest up to 15% of each Portfolio’s net assets in such securities. The relative illiquidity of these securities may impair each Portfolio from disposing of them in a timely manner and at a fair price when it is necessary or desirable to do so. While maintaining oversight, the Portfolios’ Board of Trustees has delegated to DMC the day-to-day functions of determining whether individual securities are liquid for purposes of the Portfolios’ limitation on investments in illiquid securities. Securities eligible for resale pursuant to Rule 144A, which are determined to be liquid, are not subject to the Portfolios’ limit on investments in illiquid securities. Rule 144A and illiquid securities have been identified on the statements of net assets.
The Select 20 and The Focus Smid-Cap Growth Equity Portfolios invest a significant portion of their assets in small- and mid-sized companies and may be subject to certain risks associated with ownership of securities of such companies. Investments in small- or mid-sized companies may be more volatile than investments in larger companies for a number of reasons, which include more limited financial resources or a dependence on narrow product lines.
The Real Estate Investment Trust Portfolio II concentrates its investments in the real estate industry and is subject to the risks associated with that industry. If the Portfolio holds real estate directly as a result of defaults or receives rental income directly from real estate holdings, its tax status as a regulated investment company may be jeopardized. The Portfolio is also affected by interest rate changes, particularly if the real estate investment trusts it holds use floating rate debt to finance their ongoing operations. The Portfolio’s investments may also tend to fluctuate more in value than a portfolio that invests in a broader range of industries.
12. Contractual Obligations
The Portfolios enter into contracts in the normal course of business that contain a variety of indemnifications. The Portfolios’ maximum exposure under these arrangements is unknown. However, the Portfolios have not had prior claims or losses pursuant to these contracts. Management has reviewed the Portfolios’ existing contracts and expects the risk of loss to be remote.
13. In-Kind Redemptions
During the year ended October 31, 2012, the following Portfolios satisfied withdrawal requests with transfers of securities and cash, resulting in net realized gain (loss).
| | Securities and cash | | Net realized gain (loss) |
| The International Equity Portfolio | | | $ | 9,653,323 | | | | $ | (930,500 | ) | |
| The Emerging Markets Portfolio | | | | 251,102,001 | | | | | 19,277,619 | | |
14. Subsequent Events
Except as described in Note 7, management has determined that no material events or transactions occurred subsequent to October 31, 2012 that would require recognition or disclosure in the Portfolios’ financial statements.
2012 Annual report · Delaware Pooled Trust
140
Report of independent
registered public accounting firm
To the Board of Trustees of Delaware Pooled® Trust and the Shareholders of The Large-Cap Value Equity Portfolio, The Select 20 Portfolio, The Large-Cap Growth Equity Portfolio, The Focus Smid-Cap Growth Equity Portfolio, The Real Estate Investment Trust Portfolio II, The Core Focus Fixed Income Portfolio, The High-Yield Bond Portfolio, The Core Plus Fixed Income Portfolio, The International Equity Portfolio, The Labor Select International Equity Portfolio, The Emerging Markets Portfolio and The Emerging Markets Portfolio II:
In our opinion, the accompanying statements of net assets, statement of assets and liabilities and the related statements of operations and of changes in net assets and the financial highlights present fairly, in all material respects, the financial position of The Large-Cap Value Equity Portfolio, The Select 20 Portfolio, The Large-Cap Growth Equity Portfolio, The Focus Smid-Cap Growth Equity Portfolio, The Real Estate Investment Trust Portfolio II, The Core Focus Fixed Income Portfolio, The High-Yield Bond Portfolio, The Core Plus Fixed Income Portfolio, The International Equity Portfolio, The Labor Select International Equity Portfolio, The Emerging Markets Portfolio and The Emerging Markets Portfolio II (twelve of the series constituting Delaware Pooled Trust, hereafter collectively referred to as the “Funds”) at October 31, 2012, the results of each of their operations for the year then ended, the changes in each of their net assets for each of the two years in the period then ended and the financial highlights for each of the three periods then ended, in conformity with accounting principles generally accepted in the United States of America. These financial statements and financial highlights (hereafter referred to as “financial statements”) are the responsibility of the Funds’ management; our responsibility is to express an opinion on these financial statements based on our audits. We conducted our audits of these financial statements in accordance with the standards of the Public Company Accounting Oversight Board (United States). Those standards require that we plan and perform the audit to obtain reasonable assurance about whether the financial statements are free of material misstatement. An audit includes examining, on a test basis, evidence supporting the amounts and disclosures in the financial statements, assessing the accounting principles used and significant estimates made by management, and evaluating the overall financial statement presentation. We believe that our audits, which included confirmation of securities at October 31, 2012 by correspondence with the custodian and brokers, provide a reasonable basis for our opinion. The financial highlights for the year ended October 31, 2009 and for all prior periods presented were audited by other independent accountants whose report dated December 22, 2009 expressed an unqualified opinion on those statements.
PricewaterhouseCoopers LLP
Philadelphia, Pennsylvania
December 19, 2012
2012 Annual report · Delaware Pooled Trust
141
Other Portfolio information
(Unaudited)
Delaware Pooled® Trust
Board Consideration of Investment Advisory Agreements
At a meeting held on August 21-23, 2012 (the “Annual Meeting”), the Board of Trustees (the “Board”), including a majority of disinterested or independent Trustees, approved the renewal of the Investment Advisory Agreements and Sub-Advisory Agreements, as applicable, for each of the series of Delaware Pooled Trust (each, a “Portfolio” and together, the “Portfolios”). In making its decision, the Board considered information furnished at regular quarterly Board meetings, including reports detailing Portfolio performance, investment strategies and expenses, as well as information prepared specifically in connection with the renewal of the investment advisory and sub-advisory contracts. Information furnished specifically in connection with the renewal of the Investment Advisory Agreement with Delaware Management Company (“DMC”) and Sub-Advisory Agreement with Mondrian Investment Partners Limited (“Mondrian”)included materials provided by DMC and its affiliates (“Delaware Investments”) and Mondrian, as applicable, concerning, among other things, the nature, extent and quality of services provided to the Portfolios, the costs of such services to the Portfolios, economies of scale and the financial condition and profitability of Delaware Investments. In addition, in connection with the Annual Meeting, reports were provided in May 2012 and included independent historical and comparative reports provided by Lipper, Inc., an independent statistical compilation organization (“Lipper”). The Lipper reports compared each Portfolio’s investment performance and expenses with those of other comparable mutual funds. The Independent Trustees reviewed and discussed the Lipper reports with independent legal counsel to the Independent Trustees. The Board requested and received information regarding DMC’s policy with respect to advisory fee levels and its breakpoint philosophy; the structure of portfolio manager compensation; the investment manager’s profitability; comparative client fee information; and any constraints or limitations on the availability of securities in certain investment styles, which had in the past year inhibited, or which were likely in the future to inhibit, DMC’s or Mondrian’s ability to invest fully in accordance with Portfolio policies.
In considering information relating to the approval of each Portfolio’s advisory and sub-advisory agreements, as applicable, the Independent Trustees received assistance and advice from and met separately with independent legal counsel to the Independent Trustees. Although the Board gave attention to all information furnished, the following discussion identifies, under separate headings, the primary factors taken into account by the Board during its contract renewal considerations.
Nature, Extent and Quality Of Service. The Board considered the services provided by Delaware Investments to the Portfolios and their shareholders. In reviewing the nature, extent and quality of services, the Board considered reports furnished to it throughout the year, which covered matters such as the relative performance of each Portfolio, compliance of portfolio managers with the investment policies, strategies and restrictions for each Portfolio, compliance by DMC and Delaware Distributors, L.P. (together, “Management”) personnel with the Code of Ethics adopted throughout the Delaware Investments Family of Funds complex and adherence to fair value pricing procedures as established by the Board. The Board was pleased with the current staffing of the Portfolios’ investment advisor and the emphasis placed on research in the investment process. The Board recognized DMC’s receipt of several industry distinctions. The Board gave favorable consideration to DMC’s efforts to control expenditures while maintaining service levels committed to fund matters. The Board noted that in July 2011 Management implemented measures to reduce overall costs and improve transfer agent and shareholder servicing functions through outsourcing. The Board once again noted the benefits provided to Portfolio shareholders through each shareholder’s ability to exchange investments between Portfolios or the institutional class shares of other Delaware Investments funds and to reinvest Portfolio dividends into additional shares of the Portfolio or into additional shares of other Delaware Investments funds. The Board was satisfied with the nature, extent and quality of the overall services provided by Delaware Investments.
Nature, Extent and Quality Of Service. The Board considered the services to be provided by Mondrian to the Portfolios and their shareholders. In reviewing the nature, extent and quality of services, the Board noted that reports will be furnished to it throughout the year at regular Board Meetings covering matters such as relative performance of the Portfolios, compliance of portfolio managers with the investment policies, strategies and restrictions for the portfolios, the compliance of Mondrian personnel with the Code of Ethics and adherence to fair value pricing procedures as established by the Board. The Board was pleased with the current staffing of Mondrian and the emphasis placed on research in the investment process. The Board was satisfied with the nature, extent and quality of the overall services proposed to be provided by Mondrian.
Investment Performance. The Board placed significant emphasis on the investment performance of the Portfolios in view of the importance of investment performance to shareholders. Although the Board gave appropriate consideration to performance reports and discussions with portfolio managers at Board meetings throughout the year, the Board gave particular weight to the Lipper reports furnished for the Annual Meeting. The Lipper reports prepared for each Portfolio showed the investment performance of its shares in comparison to a group of similar funds as selected by Lipper (the “Performance Universe”). A fund with the best performance ranked first, and a fund with the poorest performance ranked last. The highest/best performing 25% of funds in the Performance Universe make up the first quartile; the next 25%, the second quartile; the next 25%, the third quartile; and the poorest/worst performing 25% of funds in the Performance Universe make up the fourth quartile. Comparative annualized performance for the Portfolios was shown for the past one-, three-, five- and ten-year periods, as applicable, ended March 31, 2012. The Board’s objective is that each Portfolio’s performance for the periods considered be at or above the median of its Performance Universe. The following paragraphs summarize the performance results for the Portfolios and the Board’s view of such performance.
2012 Annual report · Delaware Pooled Trust
142
The Core Focus Fixed Income Portfolio – The Performance Universe for the Portfolio consisted of the Portfolio and all retail and institutional intermediate investment-grade debt funds as selected by Lipper. The Lipper report comparison showed that the Portfolio’s total return for the one-year period was in the first quartile of its Performance Universe. The report further showed that the Portfolio’s total return for the three- and five-year periods was in the second quartile. The Board was satisfied with performance.
The Core Plus Fixed Income Portfolio – The Performance Universe for the Portfolio consisted of the Portfolio and all retail and institutional intermediate investment-grade debt funds as selected by Lipper. The Lipper report comparison showed that the Portfolio’s total return for the one-, three- and five-year periods was in the first quartile of its Performance Universe. The Board was satisfied with performance.
The Emerging Markets Portfolio – The Performance Universe for the Portfolio consisted of the Portfolio and all retail and institutional emerging markets funds as selected by Lipper. The Lipper report comparison showed that the Portfolio’s total return for the one-, five- and ten-year periods was in the first quartile of its Performance Universe. The report further showed that the Portfolio’s total return for the three-year period was in the second quartile. The Board was satisfied with performance.
The Emerging Markets Portfolio II – The Performance Universe for the Portfolio consisted of the Portfolio and all retail and institutional emerging markets funds as selected by Lipper. The Lipper report comparison showed that the Portfolio’s total return for the one-year period was in the third quartile. The Board noted that the Portfolio’s performance results were not in line with the Board’s objective. In evaluating the Portfolio’s performance, the Board considered the Portfolio’s recent inception. The Board also considered the numerous investment and performance reports delivered by Management personnel to the Board’s Investments Committee. The Board was satisfied that Management was taking action to improve Portfolio performance and meet the Board’s performance objective.
The Focus Smid-Cap Growth Equity Portfolio – The Performance Universe for the Portfolio consisted of the Portfolio and all retail and institutional mid cap growth funds as selected by Lipper. The Lipper report comparison showed that the Portfolio’s total return for the one-, three- and five-year periods was in the first quartile of its Performance Universe. The Board was satisfied with performance.
The High-Yield Bond Portfolio – The Performance Universe for the Portfolio consisted of the Portfolio and all retail and institutional high current yield funds as selected by Lipper. The Lipper report comparison showed that the Portfolio’s total return for the one-, three-, five- and ten-year periods was in the first quartile of its Performance Universe. The Board was satisfied with performance.
The International Equity Portfolio – The Performance Universe for the Portfolio consisted of the Portfolio and all retail and institutional international large cap value funds as selected by Lipper. The Lipper report comparison showed that the Portfolio’s total return for the one-, five- and ten-year periods was in the first quartile of its Performance Universe. The report further showed that the Portfolio’s total return for the three-year period was in the second quartile. The Board was satisfied with performance.
The Labor Select International Equity Portfolio – The Performance Universe for the Portfolio consisted of the Portfolio and all retail and institutional international large cap core funds as selected by Lipper. The Lipper report comparison showed that the Portfolio’s total return for the one- and ten-year periods was in the first quartile of its Performance Universe. The report further showed that the Portfolio’s total return for the three- and five-year periods was in the third and second quartiles, respectively. The Board was satisfied with performance.
The Large-Cap Growth Equity Portfolio – The Performance Universe for the Portfolio consisted of the Portfolio and all retail and institutional large cap growth funds as selected by Lipper. The Lipper report comparison showed that the Portfolio’s total return for the one-, three- and five-year periods was in the first quartile of its Performance Universe. The Board was satisfied with performance.
The Large-Cap Value Equity Portfolio – The Performance Universe for the Portfolio consisted of the Portfolio and all retail and institutional large-cap value funds as selected by Lipper. The Lipper report comparison showed that the Portfolio’s total return for the one-, three-, five- and ten-year periods was in the first quartile of its Performance Universe. The Board was satisfied with performance.
The Real Estate Investment Trust Portfolio II – The Performance Universe for the Portfolio consisted of the Portfolio and all retail and institutional real estate funds as selected by Lipper. The Lipper report comparison showed that the Portfolio’s total return for the one-year period was in the first quartile of its Performance Universe. The report further showed that the Portfolio’s total return for the three- and ten-year periods was in the third quartile and the Portfolio’s total return for the five-year period was in the second quartile. The Portfolio’s performance results were mixed but tended toward median, which was acceptable.
2012 Annual report · Delaware Pooled Trust
(continues) 143
Other Portfolio information
(Unaudited)
Delaware Pooled® Trust
Board Consideration of Investment Advisory Agreements (continued)
The Select 20 Portfolio – The Performance Universe for the Portfolio consisted of the Portfolio and all retail and institutional multi-cap growth funds as selected by Lipper. The Lipper report comparison showed that the Portfolio’s total return for the one-, three- and five-year periods was in the first quartile of its Performance Universe. The report further showed that the Portfolio’s total return for the ten-year period was in the third quartile. The Board was satisfied with performance.
Comparative Expenses. The Board considered expense comparison data for the Delaware Investments Family of Funds. Management provided the Board with information on pricing levels and fee structures for the Portfolios as of its most recent fiscal year end. The Board also focused on the comparative analysis of effective management fees and total expense ratios of each Portfolio versus effective management fees and expense ratios of a group of similar funds as selected by Lipper (the “Expense Group”). In reviewing comparative costs, each Portfolio’s contractual management fee and the actual management fee incurred by the Portfolio were compared with the contractual management fees (assuming all funds in the Expense Group were similar in size to the Portfolio) and actual management fees (as reported by each fund) within the Expense Group, taking into account any applicable breakpoints and fee waivers. Each Portfolio’s total expenses were also compared with those of its Expense Group. The Board considered fees paid to Delaware Investments for non-management services. The Board’s objective is to limit each Portfolio’s total expense ratio to be competitive with that of the Expense Group. The following paragraphs summarize the expense results for the Portfolios and the Board’s view of such expenses.
The Core Focus Fixed Income Portfolio – The expense comparisons for the Portfolio showed that its contractual management fee and total expenses were in the quartile with the lowest expenses of its Expense Group. The Board was satisfied with the management fee and total expenses of the Portfolio in comparison to those of its Expense Group.
The Core Plus Fixed Income Portfolio – The expense comparisons for the Portfolio showed that its actual management fee was in the quartile with the second lowest expenses of its Expense Group and its total expenses were in the quartile with the lowest expenses of its Expense Group. The Board was satisfied with the management fee and total expenses of the Portfolio in comparison to those of its Expense Group.
The Emerging Markets Portfolio – The expense comparisons for the Portfolio showed that its actual management fee and total expenses were in the quartile with the lowest expenses of its Expense Group. The Board was satisfied with the management fee and total expenses of the Portfolio in comparison to those of its Expense Group.
The Emerging Markets Portfolio II – The expense comparisons for the Portfolio showed that its actual management fee and total expenses were in the quartile with the second lowest expenses of its Expense Group. The Board was satisfied with the management fee and total expenses of the Portfolio in comparison to those of its Expense Group.
The Focus Smid-Cap Growth Equity Portfolio – The expense comparisons for the Portfolio showed that its actual management fee was in the quartile with the second lowest expenses of its Expense Group and its total expenses were in the quartile with the lowest expenses of its Expense Group. The Board was satisfied with the management fee and total expenses of the Portfolio in comparison to those of its Expense Groups.
The High-Yield Bond Portfolio – The expense comparisons for the Portfolio showed that its actual management fee was in the quartile with the second lowest expenses of its Expense Group and its total expenses were in the quartile with the lowest expenses of its Expense Group. The Board was satisfied with the management fee and total expenses of the Portfolio in comparison to those of its Expense Group.
The International Equity Portfolio – The expense comparisons for the Portfolio showed that its actual management fee and total expenses were in the quartile with the lowest expenses of its Expense Group. The Board was satisfied with the management fee and total expenses of the Portfolio in comparison to those of its Expense Group.
The Labor Select International Equity Portfolio – The expense comparisons for the Portfolio showed that its actual management fee and total expenses were in the quartile with the second lowest expenses of its Expense Group. The Board was satisfied with the management fee and total expenses of the Portfolio in comparison to those of its Expense Group.
The Large-Cap Growth Equity Portfolio – The expense comparisons for the Portfolio showed that its actual management fee and total expenses were in the quartile with the lowest expenses of its Expense Group. The Board was satisfied with the management fee and total expenses of the Portfolio in comparison to those of its Expense Group.
2012 Annual report · Delaware Pooled Trust
144
The Large-Cap Value Equity Portfolio – The expense comparisons for the Portfolio showed that its actual management fee and total expenses were in the quartile with the lowest expenses of its Expense Group. The Board was satisfied with the management fee and total expenses of the Portfolio in comparison to those of its Expense Group.
The Real Estate Investment Trust Portfolio II – The expense comparisons for the Portfolio showed that its contractual management fee and total expenses were in the quartile with the lowest expenses of the Expense Group. The Board was satisfied with the management fee and total expenses of the Portfolio in comparison to those of its Expense Group.
The Select 20 Portfolio – The expense comparisons for the Portfolio showed that its actual management fee was in the quartile with the second lowest expenses of its Expense Group and its total expenses were in the quartile with the lowest expense of its Expense Group. The Board was satisfied with the management fee and total expenses of the Portfolio in comparison to those of its Expense Group.
Management Profitability. The Board considered the level of profits, if any, realized by Delaware Investments in connection with the operation of the Portfolios. In this respect, the Board reviewed the Investment Management profitability analysis that addressed the overall profitability of Delaware Investments’ business in providing management and other services to each of the individual funds and the Delaware Investments Family of Funds as a whole. Specific attention was given to the methodology followed in allocating costs for the purpose of determining profitability. Management stated that the level of profits of Delaware Investments, to a certain extent, reflects recent operational cost savings and efficiencies initiated by Delaware Investments. The Board considered Delaware Investments’ efforts to improve services provided to fund shareholders and to meet additional regulatory and compliance requirements resulting from recent industry-wide Securities and Exchange Commission initiatives. The Board also considered the extent to which Delaware Investments might derive ancillary benefits from fund operations, including the potential for procuring additional business as a result of the prestige and visibility associated with its role as service provider to the Delaware Investments Family of Funds and the benefits from allocation of fund brokerage to improve trading efficiencies. The Board found that the management fees were reasonable in light of the services rendered and the profitability of Delaware Investments.
Management Profitability. The Board considered the level of profits realized by Mondrian in connection with the operation of The Emerging Markets Portfolio, The International Equity Portfolio and The Labor Select International Equity Portfolio. In this respect, the Board reviewed the profitability analysis that addressed the overall profitability of Mondrian in providing management and other services to the Portfolios. Specific attention was given to the methodology followed in allocating costs for the purpose of determining profitability. The Board also considered the extent to which Mondrian might derive ancillary benefits from fund operations, including the potential for procuring additional business as a result of the prestige and visibility associated with its role as service provider to the Delaware Investments Family of Funds and the benefits from allocation of fund brokerage to improve trading efficiencies. The Board found that the management fees were reasonable in light of the services rendered and the level of profitability of Mondrian.
Economies of Scale. The Trustees considered whether economies of scale are realized by Delaware Investments as each Portfolio’s assets increase and the extent to which any economies of scale are reflected in the level of management fees charged. The Trustees reviewed the standardized advisory fee pricing and structure approved by the Board and shareholders which, may include breakpoints. Breakpoints in the advisory fee occur when the advisory fee rate is reduced on assets in excess of specified levels. Breakpoints result in a lower advisory fee than would otherwise be the case on all assets when the asset levels specified are exceeded. Benchmarking analysis indicated that less than one quarter of competing funds in the institutional market employ breakpoints. Management believed, and the Board agreed, that the Portfolios were priced with relatively low management fees to reflect potential economies of scale at all asset levels. The Board noted that the fee under the management contracts for The Core Plus Fixed Income Portfolio did not fall within the standard structure. With respect to The Core Plus Fixed Income Portfolio, Management explained that the portfolio management fee was priced slightly lower than the standard fee rate for special domestic funds.
2012 Annual report · Delaware Pooled Trust
(continues) 145
Other Portfolio information
(Unaudited)
Delaware Pooled® Trust
Tax Information
The information set forth below is for each Portfolio’s fiscal year as required by federal laws. Shareholders, however, must report distributions on a calendar year basis for income tax purposes, which may include distributions for portions of two fiscal years of a fund. Accordingly, the information needed by shareholders for income tax purposes will be sent to them in January of each year. Please consult your tax advisor for proper treatment of this information. All designations are based on financial information available as of the date of this annual report and, accordingly are subject to change. For any and all items requiring designation, it is the intention of each Portfolio to designate the maximum amount permitted under the Internal Revenue Code and the regulations thereunder.
For the fiscal year ended October 31, 2012, each Portfolio designates distributions paid during the year as follows:
| | (A) | | (B) | | | | | | | | | | | |
| | Long-Term | | Ordinary | | | | | | | | | | | |
| | Capital Gains | | Income | | Total | | (C) |
| | Distributions | | Distributions* | | Distribution | | Qualifying |
| | (Tax Basis) | | (Tax Basis) | | (Tax Basis) | | Dividends1 |
| The Large-Cap Value Equity Portfolio | | | — | | | | | 100.00 | % | | | | | 100.00 | % | | | | 100.00 | % | |
| The Select 20 Portfolio | | | — | | | | | 100.00 | % | | | | | 100.00 | % | | | | 36.57 | % | |
| The Large-Cap Growth Equity Portfolio | | | — | | | | | 100.00 | % | | | | | 100.00 | % | | | | 100.00 | % | |
| The Focus Smid-Cap Growth Equity Portfolio | | | — | | | | | 100.00 | % | | | | | 100.00 | % | | | | 100.00 | % | |
| The Real Estate Investment Trust Portfolio II | | | — | | | | | 100.00 | % | | | | | 100.00 | % | | | | 0.64 | % | |
| The Core Focus Fixed Income Portfolio | | | — | | | | | 100.00 | % | | | | | 100.00 | % | | | | 0.02 | % | |
| The High-Yield Bond Portfolio | | | — | | | | | 100.00 | % | | | | | 100.00 | % | | | | 0.29 | % | |
| The Core Plus Fixed Income Portfolio | | | — | | | | | 100.00 | % | | | | | 100.00 | % | | | | — | | |
| International Equity Portfolio | | | — | | | | | 100.00 | % | | | | | 100.00 | % | | | | — | | |
| The Labor Select International Equity Portfolio | | | — | | | | | 100.00 | % | | | | | 100.00 | % | | | | — | | |
| The Emerging Markets Portfolio | | | 78.39 | % | | | | 21.61 | % | | | | | 100.00 | % | | | | 0.20 | % | |
| The Emerging Markets Portfolio II | | | 0.11 | % | | | | 99.89 | % | | | | | 100.00 | % | | | | 5.53 | % | |
(A) and (B) are based on a percentage of each Portfolio’s total distributions.
(C) is based on a percentage of each Portfolio’s ordinary income distributions.
1Qualifying dividends represent dividends which qualify for the corporate dividends received deduction.
*For the fiscal year ended October 31, 2012, certain dividends paid by the Portfolios may be subject to a maximum tax rate of 15%, as provided for by the Jobs and Growth Tax Relief Reconciliation Act of 2003 and as extended by the Tax Relief, Unemployment Insurance Reauthorization and Jobs Creation Act of 2010. The Portfolios intend to designate the following amounts to be taxed at a maximum rate of 15%. Complete information will be computed and reported in conjunction with your 2012 Form 1099-DIV.
| Maximum amount to be |
| Taxed at a maximum rate of 15% |
| The Large-Cap Value Equity Portfolio | | 100.00 | % | |
| The Select 20 Portfolio | | 36.57 | % | |
| The Large-Cap Growth Equity Portfolio | | 100.00 | % | |
| The Focus Smid-Cap Growth Equity Portfolio | | 100.00 | % | |
| The Real Estate Investment Trust Portfolio II | | 0.64 | % | |
| The Core Focus Fixed Income Portfolio | | 0.02 | % | |
| The High-Yield Bond Portfolio | | 0.29 | % | |
| The International Equity Portfolio | | 98.12 | % | |
| The Labor Select International Equity Portfolio | | 11.69 | % | |
| The Emerging Markets Portfolio | | 10.18 | % | |
| The Emerging Markets Portfolio II | | 19.48 | % | |
The International Equity Portfolio, The Labor Select International Equity Portfolio, The Emerging Markets Portfolio and The Emerging Markets Portfolio II intend to pass through foreign tax credits in the maximum amount of $609,758, $633,308, $1,085,528, and $25,897, respectively. The gross foreign source income earned during the fiscal year 2012 was $24,965,558, $24,475,310, $14,924,458, and $393,326, respectively. Complete information will be computed and reported in conjunction with your 2012 Form 1099-DIV.
2012 Annual report · Delaware Pooled Trust
146
Fund management
Robert Akester
Senior Portfolio Manager — Mondrian Investment Partners Ltd. — The Emerging Markets Portfolio
A graduate of University College, London, Mr. Akester joined Mondrian in 1996. Prior to joining Mondrian he was a Director of Hill Samuel Investment Management where he had responsibility for significant overseas clients and Far Eastern markets. He has 40 years of investment experience, including over 30 years of involvement in emerging markets. Mr. Akester is a Senior Portfolio Manager in the Emerging Markets Team.
Damon J. Andres, CFA
Vice President, Senior Portfolio Manager — The Real Estate Investment Trust Portfolio II
Damon J. Andres, who joined Delaware Investments in 1994 as an analyst, currently serves as a portfolio manager for the firm’s real estate securities and income solutions (RESIS) group. He also serves as a portfolio manager for the firm’s Dividend Income products. From 1991 to 1994, he performed investment-consulting services as a consulting associate with Cambridge Associates. Andres earned a bachelor’s degree in business administration with an emphasis in finance and accounting from the University of Richmond.
Kristen E. Bartholdson
Vice President, Senior Portfolio Manager — The Large-Cap Value Equity Portfolio
Kristen E. Bartholdson is a senior portfolio manager for the firm’s Large-Cap Value team. Prior to joining the firm in 2006 as an associate portfolio manager, she worked at Susquehanna International Group from 2004 to 2006, where she was an equity research salesperson. From 2000 to 2004 she worked in equity research at Credit Suisse, most recently as an associate analyst in investment strategy. Bartholdson earned her bachelor’s degree in economics from Princeton University.
Nigel Bliss
Senior Portfolio Manager — Mondrian Investment Partners Ltd. — The Labor Select International Equity Portfolio
Mr. Bliss has a BA (Hons) Degree in Geography from the University of Manchester. He holds the ASIP designation and is a member of the CFA Institute and the CFA Society of the UK. He commenced his career at Cazenove & Co. and moved to join Mondrian in 1995. Mr. Bliss is a Senior Portfolio Manager in the Non-US Equity Team. He has had significant experience analyzing securities in the Pacific Basin region and in the global materials, utilities, property, and industrials sectors. Mr. Bliss is a member of Mondrian’s Non-U.S. Equity Strategy Committee.
Christopher J. Bonavico, CFA
Vice President, Senior Portfolio Manager, Equity Analyst — The Large-Cap Growth Equity Portfolio, The Focus Smid-Cap Growth Equity Portfolio, and The Select 20 Portfolio
Christopher J. Bonavico joined Delaware Investments in April 2005 as a senior portfolio manager on the firm’s Focus Growth Equity team, which manages large-cap growth, smid-cap growth, all-cap growth, and global growth portfolios. Prior to joining the firm, he was a principal and portfolio manager at Transamerica Investment Management, where he managed sub-advised funds and institutional separate accounts. Before joining Transamerica in 1993, he was a research analyst for Salomon Brothers. Bonavico received his bachelor’s degree in economics from the University of Delaware.
2012 Annual report · Delaware Pooled Trust
(continues) 147
Other Portfolio information
(Unaudited)
Delaware Pooled® Trust
Kenneth F. Broad, CFA
Vice President, Senior Portfolio Manager, Equity Analyst — The Focus Smid-Cap Growth Equity Portfolio and The Select 20 Portfolio
Kenneth F. Broad joined Delaware Investments in April 2005 as a senior portfolio manager on the firm’s Focus Growth Equity team, which manages large-cap growth, smid-cap growth, all-cap growth, and global growth portfolios. Prior to joining the firm, he was a principal and portfolio manager at Transamerica Investment Management, where he also managed sub-advised funds and institutional separate accounts. Before joining Transamerica in 2000, he was a portfolio manager with The Franklin Templeton Group and was a consultant in the business valuation and merger and acquisition group at KPMG Peat Marwick. He received an MBA from the University of California at Los Angeles and his bachelor’s degree in economics from Colgate University.
Liu-Er Chen, CFA
Senior Vice President, Chief Investment Officer — Emerging Markets and Healthcare — The Emerging Markets Portfolio II
Liu-Er Chen heads the firm’s global Emerging Markets team, and he is also the portfolio manager for Delaware Healthcare Fund, which launched in September 2007. Prior to joining Delaware Investments in September 2006 in his current position, he spent nearly 11 years at Evergreen Investment Management Company, where he most recently worked as managing director and senior portfolio manager. He co-managed the Evergreen Emerging Markets Growth Fund from 1999 to 2001, and became the Fund’s sole manager in 2001. He was also the sole manager of the Evergreen Health Care Fund since its inception in 1999. Chen began his career at Evergreen in 1995 as an analyst covering Asian and global healthcare stocks, before being promoted to portfolio manager in 1998. Prior to his career in asset management, Chen worked for three years in sales, marketing, and business development for major American and European pharmaceutical and medical device companies. He is licensed to practice medicine in China and has experience in medical research at both the Chinese Academy of Sciences and Cornell Medical School. He holds an MBA with a concentration in management from Columbia Business School.
Ginny Chong, CFA
Senior Portfolio Manager — Mondrian Investment Partners Ltd. — The Emerging Markets Portfolio
Prior to joining Mondrian in 2000, Ms. Chong worked for PricewaterhouseCoopers in Vancouver, within the Corporate Finance and Investment Banking Division where she qualified as a Canadian Chartered Accountant. Ms. Chong has a degree in Commerce from the University of British Columbia, Vancouver. Ms. Chong is presently a Senior Portfolio Manager within the Emerging Markets Team. Ms. Chong is a CFA Charterholder and is a member of the CFA Institute and the CFA Society of the UK.
Thomas H. Chow, CFA
Senior Vice President, Senior Portfolio Manager — The Core Focus Fixed Income Portfolio and The Core Plus Fixed Income Portfolio
Thomas H. Chow is a member of the firm’s taxable fixed income portfolio management team, with primary responsibility for portfolio construction and strategic asset allocation in investment grade credit exposures. He is the lead portfolio manager for Delaware Corporate Bond Fund and Delaware Extended Duration Bond Fund, as well as several institutional mandates. His experience includes significant exposure to asset liability management strategies and credit risk opportunities. Prior to joining Delaware Investments in 2001 as a portfolio manager working on the Lincoln General Account, he was a trader of high grade and high yield securities, and was involved in the portfolio management of collateralized bond obligations (CBOs) and insurance portfolios at SunAmerica/AIG from 1997 to 2001. Before that, he was an analyst, trader, and portfolio manager at Conseco Capital Management from 1989 to 1997. Chow received a bachelor’s degree in business analysis from Indiana University, and he is a Fellow of Life Management Institute.
2012 Annual report · Delaware Pooled Trust
148
Elizabeth A. Desmond
Director, Chief Investment Officer — International Equities — Mondrian Investment Partners Ltd. — The International Equity Portfolio
Ms. Desmond is a graduate of Wellesley College and the Masters Program in East Asian Studies at Stanford University. After working for the Japanese government for two years, she began her investment career as a Pacific Basin investment manager with Shearson Lehman Global Asset Management. Prior to joining Mondrian in 1991, she was a Pacific Basin Equity Analyst and Senior Portfolio Manager at Hill Samuel Investment Advisers Ltd. Ms. Desmond is a CFA Charterholder, and a member of the CFA Institute and the CFA Society of the UK.
Chuck M. Devereux
Senior Vice President, Director of Credit Research — The High-Yield Portfolio and The Core Focus Fixed Income Portfolio
Chuck M. Devereux is the head of the firm’s taxable credit research department. In addition, he serves as a consultant for the team responsible for portfolio management of some of the firm’s fixed income products. Prior to April 2007, he was a senior vice president and co-head of the firm’s private placements group, which has responsibility for managing a portfolio of approximately $8 billion of privately placed securities. Prior to joining Delaware Investments in 2001, Devereux was employed by Valuemetrics/VM Equity Partners, a financial advisory and investment banking firm, where he participated in financial advisory and capital-raising efforts for privately held, middle-market companies. These efforts included placements of traditional corporate debt and equity as well as mezzanine and venture-capital financings. Prior to Valuemetrics/VM Equity Partners, he was a trust officer in the privately held asset division of the Northern Trust Corporation for three years. Devereux earned an MBA with a concentration in finance from DePaul University and a bachelor’s degree in economics from St. Joseph’s College.
Roger A. Early, CPA, CFA, CFP
Senior Vice President, Co-Chief Investment Officer — Total Return Fixed Income Strategy — The Core Focus Fixed Income Portfolio and The Core Plus Fixed Income Portfolio
Roger A. Early rejoined Delaware Investments in March 2007 as a member of the firm’s taxable fixed income portfolio management team, with primary responsibility for portfolio construction and strategic asset allocation. During his previous time at the firm, from 1994 to 2001, he was a senior portfolio manager in the same area, and he left Delaware Investments as head of its U.S. investment grade fixed income group. In recent years, Early was a senior portfolio manager at Chartwell Investment Partners and Rittenhouse Financial and was the chief investment officer for fixed income at Turner Investments. Prior to joining Delaware Investments in 1994, he worked for more than 10 years at Federated Investors where he managed more than $25 billion in mutual fund and institutional portfolios in the short-term and investment grade markets. He left the firm as head of institutional fixed income management. Earlier in his career, he held management positions with the Federal Reserve Bank, PNC Financial, Touche Ross, and Rockwell International. Early earned his bachelor’s degree in economics from The Wharton School of the University of Pennsylvania and an MBA with concentrations in finance and accounting from the University of Pittsburgh. He is a member of the CFA Society of Philadelphia.
Christopher M. Ericksen, CFA
Vice President, Portfolio Manager, Equity Analyst — The Large-Cap Growth Equity Portfolio
Christopher M. Ericksen joined Delaware Investments in April 2005 as a portfolio manager on the firm’s Focus Growth Equity team, which manages large-cap growth, smid-cap growth, all-cap growth, and global growth portfolios. Prior to joining the firm, he was a portfolio manager at Transamerica Investment Management, where he also managed institutional separate accounts. Before joining Transamerica in 2004, he was a vice president at Goldman Sachs. During his 10 years there, he worked in investment banking as well as investment management. Ericksen received his bachelor’s degree from Carnegie Mellon University, with majors in industrial management, economics, and political science.
2012 Annual report · Delaware Pooled Trust
(continues) 149
Other Portfolio information
(Unaudited)
Delaware Pooled® Trust
Clive A. Gillmore
Chief Executive Officer, Chief Investment Officer — Global Equities — Mondrian Investment Partners Ltd. — The International Equity Portfolio, The Labor Select International Equity Portfolio, and The Emerging Markets Portfolio
Mr. Gillmore is a graduate of the University of Warwick and has completed the Investment Management Program at the London Business School. In 1990, Mr. Gillmore joined Mondrian Investment Partners’ predecessor organization as a founding member, having previously worked as a Senior Portfolio Manager for Hill Samuel Investment Advisers Ltd., and a Portfolio Manager at Legal and General Investment Management. He has more than 20 years of experience analyzing equity markets and securities around the world and has managed client portfolios with a wide range of mandates. Mr. Gillmore is CEO of Mondrian, CIO of Global Equities and he is a member of Mondrian’s Equity Strategy Committee and Chairman of the Emerging Markets Strategy Committee (where his research specialization lies).
Paul Grillo, CFA
Senior Vice President, Co-Chief Investment Officer — Total Return Fixed Income Strategy — The Core Focus Fixed Income Portfolio and The Core Plus Fixed Income Portfolio
Paul Grillo is a member of the firm’s taxable fixed income portfolio management team with primary responsibility for portfolio construction and strategic asset allocation. He is also a member of the firm’s asset allocation committee, which is responsible for building and managing multi-asset class portfolios. He joined Delaware Investments in 1992 as a mortgage-backed and asset-backed securities analyst, assuming portfolio management responsibilities in the mid-1990s. Grillo serves as co-lead portfolio manager for the firm’s Diversified Income products and has been influential in the growth and distribution of the firm’s multisector strategies. Prior to joining Delaware Investments, Grillo was a mortgage strategist and trader at Dreyfus Corporation. He also worked as a mortgage strategist and portfolio manager at Chemical Investment Group and as a financial analyst at Chemical Bank. Grillo holds a bachelor’s degree in business management from North Carolina State University and an MBA with a concentration in finance from Pace University.
Nikhil G. Lalvani, CFA
Vice President, Senior Portfolio Manager — The Large-Cap Value Equity Portfolio
Nikhil G. Lalvani is a senior portfolio manager for the firm’s Large-Cap Value team. At Delaware Investments, Lalvani has worked as both a fundamental and quantitative analyst. Prior to joining the firm in 1997 as an account analyst, he was a research associate with Bloomberg. Lalvani holds a bachelor’s degree in finance from The Pennsylvania State University. He is a member of the CFA Institute and the CFA Society of Philadelphia.
Anthony A. Lombardi, CFA
Vice President, Senior Portfolio Manager — The Large-Cap Value Equity Portfolio
Anthony A. Lombardi is a senior portfolio manager for the firm’s Large-Cap Value team. Prior to joining the firm in 2004 in his current role, Lombardi was a director at Merrill Lynch Investment Managers. He joined Merrill Lynch Investment Managers’ Capital Management Group in 1998 and last worked as a director and portfolio manager for the U.S. Active Large-Cap Value team, managing mutual funds and separate accounts for institutions and private clients. From 1990 to 1997, he worked at Dean Witter Reynolds as a sell-side equity research analyst, last serving as a vice president. He began his career as an investment analyst with Crossland Savings. Lombardi graduated from Hofstra University, receiving a bachelor’s degree in finance and an MBA with a concentration in finance. He is a member of the New York Society of Security Analysts and the CFA Institute.
2012 Annual report · Delaware Pooled Trust
150
Kevin P. Loome, CFA
Senior Vice President, Senior Portfolio Manager, Head of High Yield Investments — The High-Yield Bond Portfolio and The Core Plus Fixed Income Portfolio
Kevin P. Loome is head of the High Yield fixed income team, responsible for portfolio construction and strategic asset allocation of all high yield fixed income assets. Prior to joining Delaware Investments in August 2007 in his current position, Loome spent 11 years at T. Rowe Price, starting as an analyst and leaving the firm as a portfolio manager. He began his career with Morgan Stanley as a corporate finance analyst in the New York and London offices. Loome received his bachelor’s degree in commerce from the University of Virginia and earned an MBA from the Tuck School of Business at Dartmouth.
Nigel G. May
Deputy Chief Executive Officer — Mondrian Investment Partners Ltd. — The International Equity Portfolio
Mr. May is a graduate of Sidney Sussex College, Cambridge University, where he completed his Masters in Engineering. He joined Mondrian in 1991. Having led the European Team’s research effort since 1995, he is now on the investment committee for several of Mondrian’s investment products. Mr. May was formerly a Senior Portfolio Manager and analyst with Hill Samuel Investment Advisers Ltd., having joined the Hill Samuel Investment Group in 1986. Mr. May holds the ASIP designation and is a member of the CFA Institute and the CFA Society of the UK.
Andrew Miller, CFA
Senior Portfolio Manager — Mondrian Investment Partners Ltd. — The Emerging Markets Portfolio
Mr. Miller is a graduate of the University of Birmingham. Prior to joining Mondrian in 2000, he worked in the Investment Management department of PricewaterhouseCoopers, where he was responsible for the analysis and audit of various investment vehicles. Mr. Miller is presently a Senior Portfolio Manager within the Emerging Markets Team. Mr. Miller holds the ASIP designation and is a member of the CFA Institute and the CFA Society of the UK.
D. Tysen Nutt Jr.
Senior Vice President, Senior Portfolio Manager, Team Leader — The Large-Cap Value Equity Portfolio
D. Tysen Nutt Jr. is senior portfolio manager and team leader for the firm’s Large-Cap Value team. Before joining Delaware Investments in 2004 as senior vice president and senior portfolio manager, Nutt led the U.S. Active Large-Cap Value team within Merrill Lynch Investment Managers, where he managed mutual funds and separate accounts for institutions and private clients. He departed Merrill Lynch Investment Managers as a managing director. Prior to joining Merrill Lynch Investment Managers in 1994, Nutt was with Van Deventer & Hoch where he managed large-cap value portfolios for institutions and private clients. He began his investment career at Dean Witter Reynolds, where he eventually became vice president, investments. Nutt earned his bachelor’s degree from Dartmouth College, and he is a member of the New York Society of Security Analysts and the CFA Institute.
Melissa J. A. Platt, CFA
Portfolio Manager — Mondrian Investment Partners Ltd. — The International Equity Portfolio and The Labor Select International Equity Portfolio
Ms. Platt is an Economics and Finance graduate of Massey University, New Zealand. She started her career as a consultant at KPMG Corporate Finance. She then moved to FundSource Research for three years as an Investment Analyst and later as Research Manager. Ms. Platt joined Mondrian in 2004 and is a Portfolio Manager in the Non-US Equity Team. Ms. Platt is a CFA Charterholder, a member of the CFA Institute and a member of the CFA Society of the UK.
2012 Annual report · Delaware Pooled Trust
(continues) 151
Other Portfolio information
(Unaudited)
Delaware Pooled® Trust
Daniel J. Prislin, CFA
Vice President, Senior Portfolio Manager, Equity Analyst — The Large-Cap Growth Equity Portfolio and The Select 20 Portfolio
Daniel J. Prislin joined Delaware Investments in April 2005 as a senior portfolio manager on the firm’s Focus Growth Equity team, which manages large-cap growth, smid-cap growth, all-cap growth, and global growth portfolios. Prior to joining the firm, he was a principal and portfolio manager at Transamerica Investment Management, where he also managed sub-advised funds and institutional separate accounts. Prior to joining Transamerica in 1998, he was a portfolio manager with The Franklin Templeton Group. Prislin received an MBA and bachelor’s degree in business administration from the University of California at Berkeley.
Bilgin Soylu, CFA
Portfolio Manager — Mondrian Investment Partners Ltd. — The Labor Select International Equity Portfolio
Dr. Soylu holds a Science/Engineering PhD from Cambridge University. Following nine years in scientific research and project management at Cambridge University and having gained an MBA, he moved from the academic world to join a consultancy specialising in Telecommunications. Dr. Soylu’s most recent position before joining Mondrian in 2000 was as senior telecoms/ technology analyst for Yapi Kredi Bank, the largest private bank in Turkey. Dr. Soylu is a Portfolio Manager in the Non-US Equity Team. Dr. Soylu is a member of the CFA Institute and a member of the CFA Society of the UK.
Jeffrey S. Van Harte, CFA
Senior Vice President, Chief Investment Officer — Focus Growth Equity — The Large-Cap Growth Equity Portfolio and The Select 20 Portfolio
Jeffrey S. Van Harte is the chief investment officer for the Focus Growth Equity team, which manages large-cap growth, smid-cap growth, all-cap growth, and global growth portfolios. Prior to joining Delaware Investments in April 2005 in his current position, he was a principal and executive vice president at Transamerica Investment Management. Van Harte has been managing portfolios and separate accounts for more than 20 years. Before becoming a portfolio manager, Van Harte was a securities analyst and trader for Transamerica Investment Services, which he joined in 1980. Van Harte received his bachelor’s degree in finance from California State University at Fullerton.
Robert A. Vogel Jr., CFA
Vice President, Senior Portfolio Manager — The Large-Cap Value Equity Portfolio
Robert A. Vogel Jr. is a senior portfolio manager for the firm’s Large-Cap Value team. Prior to joining Delaware Investments in 2004 as vice president and senior portfolio manager, he worked at Merrill Lynch Investment Managers for more than seven years, where he rose to the position of director and portfolio manager within the U.S. Active Large-Cap Value team. He began his career in 1992 as a financial consultant at Merrill Lynch. Vogel graduated from Loyola University Maryland, earning both bachelor’s and master’s degrees in finance. He also earned an MBA with a concentration in finance from The Wharton School of the University of Pennsylvania. Vogel is a member of the New York Society of Security Analysts, the CFA Institute, and the CFA Society of Philadelphia.
2012 Annual report · Delaware Pooled Trust
152
Babak “Bob” Zenouzi
Senior Vice President, Chief Investment Officer — Real Estate Securities and Income Solutions (RESIS) — The Real Estate Investment Trust Portfolio II
Bob Zenouzi is the lead manager for the real estate securities and income solutions (RESIS) group at Delaware Investments, which includes the team, its process, and its institutional and retail products, which he created during his prior time with the firm. He also focuses on opportunities in Japan, Singapore, and Malaysia for the firm’s global REIT product. Additionally, he serves as lead portfolio manager for the firm’s Dividend Income products, which he helped to create in the 1990s. He is also a member of the firm’s asset allocation committee, which is responsible for building and managing multi-asset class portfolios. He rejoined Delaware Investments in May 2006 as senior portfolio manager and head of real estate securities. In his first term with the firm, he spent seven years as an analyst and portfolio manager, leaving in 1999 to work at Chartwell Investment Partners, where from 1999 to 2006 he was a partner and senior portfolio manager on Chartwell’s Small-Cap Value portfolio. He began his career with The Boston Company, where he held several positions in accounting and financial analysis. Zenouzi earned a master’s degree in finance from Boston College and a bachelor’s degree from Babson College. He is a member of the National Association of Real Estate Investment Trusts and the Urban Land Institute.
2012 Annual report · Delaware Pooled Trust
153
Board of trustees/directors
and officers addendum
Delaware Investments® Family of Funds
A mutual fund is governed by a Board of Trustees/Directors (“Trustees”), which has oversight responsibility for the management of a fund’s business affairs. Trustees establish procedures and oversee and review the performance of the investment manager, the distributor, and others who perform services for the fund. The independent fund trustees, in particular, are advocates for shareholder interests. Each trustee has served in that capacity since he or she was elected to or appointed to the Board of Trustees, and will continue to serve until his or her retirement or the election of a new trustee in his or her place. The following is a list of the Trustees and Officers with certain background and related information.
| | | | Number of | |
| | | | Portfolios in Fund | Other |
| Name, | | | | Complex Overseen | Directorships |
| Address, | Position(s) | Length of | Principal Occupation(s) | by Trustee | Held by |
| and Birth Date | Held with Fund(s) | Time Served | During Past 5 Years | or Officer | Trustee or Officer |
| Interested Trustees | | | | | |
| Patrick P. Coyne1 | Chairman, | Chairman and Trustee | Patrick P. Coyne has served in | 71 | Director and Audit |
| 2005 Market Street | President, | since August 16, 2006 | various executive capacities | | Committee Member |
| Philadelphia, PA 19103 | Chief Executive | | at different times at | | Kaydon Corp. |
| Officer, and | President and | Delaware Investments.2 | | |
| April 1963 | Trustee | Chief Executive Officer | | | Board of Governors Member |
| | since August 1, 2006 | | | Investment Company |
| | | | | Institute (ICI) |
| Independent Trustees | | | | | |
| Thomas L. Bennett | Trustee | Since March 2005 | Private Investor | 71 | Director |
| 2005 Market Street | | | (March 2004–Present) | | Bryn Mawr Bank Corp. (BMTC) |
| Philadelphia, PA 19103 | | | | | (2007–2011) |
| | | | | | |
| October 1947 | | | | | |
| John A. Fry | Trustee | Since January 2001 | President | 71 | Board of Governors Member — |
| 2005 Market Street | | | Drexel University | | NASDAQ OMX PHLX LLC |
| Philadelphia, PA 19103 | | | (August 2010–Present) | | |
| | | | | Director and Audit |
| May 1960 | | | President | | Committee Member |
| | | Franklin & Marshall College | | Community Health Systems |
| | | (July 2002–July 2010) | | |
| | | | | Director — Ecore |
| | | | | International |
| | | | | (2009–2010) |
| |
| | | | | Director — Allied |
| | | | | Barton Securities Holdings |
| | | | | (2005–2008) |
| Anthony D. Knerr | Trustee | Since April 1990 | Managing Director | 71 | None |
| 2005 Market Street | | | Anthony Knerr & Associates | | |
| Philadelphia, PA 19103 | | | (Strategic Consulting) | | |
| | | (1990–Present) | | |
| December 1938 | | | | | |
| Lucinda S. Landreth | Trustee | Since March 2005 | Private Investor | 71 | None |
| 2005 Market Street | | | (2004–Present) | | |
| Philadelphia, PA 19103 | | | | | |
| |
| June 1947 | | | | | |
2012 Annual report · Delaware Pooled Trust
154
| | | | Number of | |
| | | | Portfolios in Fund | Other |
| Name, | | | | Complex Overseen | Directorships |
| Address, | Position(s) | Length of | Principal Occupation(s) | by Trustee | Held by |
| and Birth Date | Held with Fund(s) | Time Served | During Past 5 Years | or Officer | Trustee or Officer |
| Independent Trustees (continued) | | | | |
| Frances A. Sevilla-Sacasa | Trustee | Since September 2011 | Chief Executive Officer — | 71 | Trust Manager — Camden |
| 2005 Market Street | | | Banco Itaú Europa | | Property Trust |
| Philadelphia, PA 19103 | | | International | | (since August 2011) |
| | | (since April 2012) | | |
| January 1956 | | | | | |
| | | Executive Advisor to Dean | | |
| | | (August 2011–March 2012) | | |
| | | and Interim Dean | | |
| | | (January 2011–July 2011) — | | |
| | | University of Miami School of | | |
| | | Business Administration | | |
| |
| | | President — U.S. Trust, | | |
| | | Bank of America Private | | |
| | | Wealth Management | | |
| | | (Private Banking) | | |
| | | (July 2007–December 2008) | | |
| Janet L. Yeomans | Trustee | Since April 1999 | Vice President and Treasurer | 71 | Director, Audit |
| 2005 Market Street | | | (January 2006–July 2012) | | Committee Member |
| Philadelphia, PA 19103 | | | Vice President — Mergers & | | and Investment |
| | | Acquisitions | | Committee Member |
| July 1948 | | | (January 2003–January 2006), | | Okabena Company |
| | | and Vice President | | |
| | | and Treasurer | | Chair — 3M Investment |
| | | (July 1995–January 2003) | | Management Company |
| | | 3M Corporation | | (January 2005–July 2012) |
| J. Richard Zecher | Trustee | Since March 2005 | Founder | 71 | Director and Compensation |
| 2005 Market Street | | | Investor Analytics | | Committee Member |
| Philadelphia, PA 19103 | | | (Risk Management) | | Investor Analytics |
| | | (May 1999–Present) | | |
| July 1940 | | | | | Director |
| | | Founder | | Oxigene, Inc. |
| | | P/E Investments | | (2003–2008) |
| | | (Hedge Fund) | | |
| | | (September 1996–Present) | | |
| Officers | | | | | |
| David F. Connor | Vice President, | Vice President since | David F. Connor has served as | 71 | None3 |
| 2005 Market Street | Deputy General | September 2000 | Vice President and Deputy | | |
| Philadelphia, | Counsel, and Secretary | and Secretary | General Counsel of | | |
| PA 19103 | | since October 2005 | Delaware Investments | | |
| | | since 2000. | | |
| December 1963 | | | | | |
| Daniel V. Geatens | Vice President | Treasurer | Daniel V. Geatens has served | 71 | None3 |
| 2005 Market Street | and Treasurer | since October 2007 | in various capacities at | | |
| Philadelphia, PA 19103 | | | different times at | | |
| | | Delaware Investments. | | |
| October 1972 | | | | | |
2012 Annual report · Delaware Pooled Trust
(continues) 155
| | | | Number of | |
| | | | Portfolios in Fund | Other |
| Name, | | | | Complex Overseen | Directorships |
| Address, | Position(s) | Length of | Principal Occupation(s) | by Trustee | Held by |
| and Birth Date | Held with Fund(s) | Time Served | During Past 5 Years | or Officer | Trustee or Officer |
| Officers (continued) | | | | | |
| David P. O’Connor | Executive Vice | Executive Vice | David P. O’Connor has served in | 71 | None3 |
| 2005 Market Street | President, | President | various executive and legal | | |
| Philadelphia, PA 19103 | General Counsel and | since February 2012; | capacities at different times | | |
| Chief Legal Officer | Senior Vice President | at Delaware Investments. | | |
| February 1966 | | October 2005– | | | |
| | February 2012; | | | |
| | General Counsel and | | | |
| | Chief Legal Officer | | | |
| | since October 2005 | | | |
| |
| Richard Salus | Senior Vice President | Chief Financial | Richard Salus has served in | 71 | None3 |
| 2005 Market Street | and Chief | Officer since | various executive capacities | | |
| Philadelphia, PA 19103 | Financial Officer | November 2006 | at different times at | | |
| | | Delaware Investments. | | |
| October 1963 | | | | | |
| 1 Patrick P. Coyne is considered to be an “Interested Trustee” because he is an executive officer of the Fund’s(s’) investment advisor. |
| 2 Delaware Investments is the marketing name for Delaware Management Holdings, Inc. and its subsidiaries, including the Fund’s(s’) investment advisor, principal underwriter, and its transfer agent. |
| 3 David F. Connor, Daniel V. Geatens, David P. O’Connor, and Richard Salus serve in similar capacities for the six portfolios of the Optimum Fund Trust, which have the same investment advisor, principal underwriter, and transfer agent as the registrant. |
The Statement of Additional Information for the Fund(s) includes additional information about the Trustees and Officers and is available, without charge, upon request by calling 800 523-1918.
2012 Annual report · Delaware Pooled Trust
156
Portfolio managers
Robert Akester
Senior Portfolio Manager
Mondrian Investment Partners Limited Damon J. Andres
Vice President and Senior Portfolio
Manager Kristen E. Bartholdson
Vice President and Senior Portfolio
Manager Nigel Bliss
Senior Portfolio Manager
Mondrian Investment Partners Limited Christopher J. Bonavico
Vice President, Senior Portfolio Manager,
and Equity Analyst Kenneth F. Broad
Vice President, Senior Portfolio Manager,
and Equity Analyst Liu-Er Chen
Senior Vice President and
Chief Investment Officer — Emerging
Markets and Healthcare Ginny Chong
Senior Portfolio Manager
Mondrian Investment Partners Limited Thomas H. Chow
Senior Vice President and Senior Portfolio
Manager Elizabeth A. Desmond
Director and Chief Investment Officer —
International Equities
Mondrian Investment Partners Limited | Chuck M. Devereux
Senior Vice President and Director of
Credit ResearchRoger A. Early
Senior Vice President and
Co-Chief Investment Officer —
Total Return Fixed Income StrategyChristopher M. Ericksen
Vice President, Portfolio Manager, and
Equity Analyst Clive A. Gillmore
Chief Executive Officer and Chief
Investment Officer — Global Equities
Mondrian Investment Partners Limited
Paul Grillo
Senior Vice President and
Co-Chief Investment Officer —
Total Return Fixed Income Strategy
Nikhil G. Lalvani
Vice President and Senior Portfolio
Manager
Anthony A. Lombardi
Vice President and Senior Portfolio
Manager
Kevin P. Loome
Senior Vice President, Senior Portfolio
Manager, and Head of High Yield
Investments Nigel G. May
Deputy Chief Executive Officer
Mondrian Investment Partners Limited | Andrew Miller
Senior Portfolio Manager
Mondrian Investment Partners Limited
D. Tysen Nutt Jr.
Senior Vice President, Senior Portfolio
Manager, and Team Leader — Large-Cap
Value Focus Equity
Melissa J.A. Platt
Portfolio Manager
Mondrian Investment Partners Limited
Daniel J. Prislin
Vice President, Senior Portfolio Manager,
and Equity Analyst
Bilgin Soylu
Portfolio Manager
Mondrian Investment Partners Limited
Jeffrey S. Van Harte
Senior Vice President and Chief
Investment Officer — Focus Growth Equity
Robert A. Vogel Jr.
Vice President and Senior Portfolio
Manager
Babak “Bob” Zenouzi
Senior Vice President and
Chief Investment Officer — Real Estate
Securities and Income Solutions (RESIS) |
2012 Annual report · Delaware Pooled Trust
157

Annual report Delaware REIT Fund October 31, 2012 Alternative / specialty mutual fund |
Carefully consider the Fund’s investment objectives, risk factors, charges, and expenses before investing. This and other information can be found in the Fund’s prospectus and, if available, its summary prospectus, which may be obtained by visiting delawareinvestments.com or calling 800 523-1918. Investors should read the prospectus and, if available, the summary prospectus carefully before investing. |
You can obtain shareholder reports and prospectuses online instead of in the mail.
Visit delawareinvestments.com/edelivery. |
Experience Delaware Investments
Delaware Investments is committed to the pursuit of consistently superior asset management and unparalleled client service. We believe in our investment processes, which seek to deliver consistent results, and in convenient services that help add value for our clients.
If you are interested in learning more about creating an investment plan, contact your financial advisor.
You can learn more about Delaware Investments or obtain a prospectus for Delaware REIT Fund at delawareinvestments.com.
| Manage your investments online |
- 24-hour access to your account information
- Obtain share prices
- Check your account balance and recent transactions
- Request statements or literature
- Make purchases and redemptions
|
Delaware Management Holdings, Inc. and its subsidiaries (collectively known by the marketing name of Delaware Investments) are wholly owned subsidiaries of Macquarie Group Limited, a global provider of banking, financial, advisory, investment and funds management services.
Investments in Delaware REIT Fund are not and will not be deposits with or liabilities of Macquarie Bank Limited ABN 46 008 583 542 and its holding companies, including their subsidiaries or related companies (Macquarie Group), and are subject to investment risk, including possible delays in repayment and loss of income and capital invested. No Macquarie Group company guarantees or will guarantee the performance of the Fund, the repayment of capital from the Fund, or any particular rate of return.
| Table of contents | |
| Portfolio management review | 1 |
| Performance summary | 4 |
| Disclosure of Fund expenses | 8 |
| Security type/sector allocation and | |
| top 10 equity holdings | 10 |
| Statement of net assets | 12 |
| Statement of operations | 17 |
| Statements of changes in net assets | 18 |
| Financial highlights | 20 |
| Notes to financial statements | 30 |
| Report of independent registered | |
| public accounting firm | 41 |
| Other Fund information | 42 |
| Board of trustees/directors and | |
| officers addendum | 46 |
| About the organization | 56 |
Unless otherwise noted, views expressed herein are current as of Oct. 31, 2012, and subject to change.
Funds are not FDIC insured and are not guaranteed. It is possible to lose the principal amount invested.
Mutual fund advisory services provided by Delaware Management Company, a series of Delaware Management Business Trust, which is a registered investment advisor. Delaware Investments, a member of Macquarie Group, refers to Delaware Management Holdings, Inc. and its subsidiaries, including the Fund’s distributor, Delaware Distributors, L.P. Macquarie Group refers to Macquarie Group Limited and its subsidiaries and affiliates worldwide.
© 2012 Delaware Management Holdings, Inc.
All third-party marks cited are the property of their respective owners.
Portfolio management review | |
| Delaware REIT Fund | November 6, 2012 |
| Performance preview (for the year ended October 31, 2012) | | | | |
| Delaware REIT Fund (Class A shares) | | 1-year return | | +13.38% |
| FTSE NAREIT Equity REITs Index (benchmark) | | 1-year return | | +14.94% |
Past performance does not guarantee future results.
For complete, annualized performance for Delaware REIT Fund, please see the table on page 4.
The performance of Class A shares excludes the applicable sales charge and reflects the reinvestment of all distributions.
Index performance returns do not reflect any management fees, transaction costs, or expenses. Indices are unmanaged and one cannot invest directly in an index.
At the beginning of the Fund’s fiscal year, in November 2011, real estate investment trust (REIT) prices overall were well below the highs they achieved several months earlier. However, REITs were on the ascent through nearly the entire remainder of the Fund’s fiscal year, with only a few exceptions, and they generated strong gains overall.
REIT prices generally rose in tandem with increased optimism about global economic conditions, fueled by the aggressive actions taken by central banks around the world to boost economic performance by lowering the cost of credit. As leveraged investments, REITs benefit directly when financing is readily available and relatively inexpensive. Accordingly, as credit became more accessible throughout the Fund’s fiscal year, REITs generally responded well.
In this favorable environment, each REIT sector enjoyed positive absolute returns. Malls and shopping center companies were the two strongest-performing sectors in the FTSE NAREIT Equity REITs Index during the fiscal year, bolstered by growing strength in consumer spending and tight supplies relative to demand, which resulted in rising rents and strong tenant occupancy levels. In contrast, apartment REITs generated only sluggish gains, in part because the sector had peaked in the previous year, but also because other areas of the market that had previously underperformed began to draw more investor attention.
Fund performance
For its fiscal year ended Oct. 31, 2012, Delaware REIT Fund (Class A shares) returned +13.38% at net asset value and +6.89% at maximum offer price (both returns assume reinvestment of all distributions). In comparison, the Fund’s benchmark, the FTSE NAREIT Equity REITs Index, rose 14.94% during the same time period. For complete, annualized performance of Delaware REIT Fund, please see the table on page 4.
Hurt by modest small-cap exposure
On an absolute basis, the Fund provided solid returns to shareholders during its fiscal year. Fund performance was hampered, however, by holdings that included Strategic Hotels & Resorts, an owner of luxury hotel properties. Though the company continued to generate compelling growth and an improving balance sheet, its stock price fell slightly during the fiscal year — even as the overall market generated a double-digit gain — as many investors appeared unwilling to pay a premium for the company’s growth prospects. That said, we believe the stock
1
Portfolio management review
Delaware REIT Fund
continued to offer investors relatively good value at the end of the Fund’s fiscal year, and it therefore remained in the Fund’s portfolio. Another lackluster performer during the fiscal year was BRE Properties, an apartment owner and operator focused on the California market, whose stock price fluctuated widely and finished the period down modestly.
On a relative basis, the Fund’s results were also dampened by its exposure to smaller-cap real estate securities, which was more limited than the benchmark’s allocation. A number of these smaller-cap stocks with heightened growth potential benefited amid the highly favorable market conditions for REITs. The Fund, for example, lacked any exposure to healthcare property company Sabra Health Care REIT and regional mall operator Pennsylvania Real Estate Investment Trust, two benchmark constituents whose shares were up sharply.
Effective stock picking among mall operators, office REITs
The negative results mentioned earlier were offset somewhat by positive factors that included the Fund’s exposure to General Growth Properties and CBL & Associates Properties, two high-quality regional mall operators with a higher degree of leverage than some of their peers. The added level of debt on their balance sheets, made possible by lower capital costs, we believe helped boost their performance relative to less-leveraged mall companies. The Fund’s position in National Retail Properties, which develops and leases properties to retail tenants, also added to performance. This REIT, whose shares were up more than 20% during the Fund’s fiscal year, enjoyed good competitive positioning and was able to capitalize effectively on the relatively low cost of financing.
We again concentrated on what we viewed as the high-quality, attractively valued REITs that we always seek to emphasize for the Fund, while selling stocks whose prices we believed had become too expensive relative to the underlying companies’ growth prospects. While our basic strategy remained the same, we positioned the Fund’s portfolio somewhat more defensively than usual, with a smaller emphasis on REITs in the more economically sensitive sectors, such as hotel and industrial REITs, and a greater focus on REITs with, in our view, solid balance sheets and lower levels of debt. |
2
The Fund’s position in self-storage operator Extra Space Storage also proved helpful. As one of the leading companies in its industry, it continued to gain market share, while tight supply within the industry helped the company maintain pricing power. The Fund’s holdings in Kilroy Realty also had a positive effect on performance versus the index. This company’s presence in the San Francisco market, coupled with its strong balance sheet, enabled it to take advantage of constructive market conditions, which in turn supported its stock price.
The Fund also benefited from maintaining relatively limited exposure (compared with the benchmark) to suburban office REITs, a category that did not perform well.
Maintaining our approach
We did not make significant changes to our overall management approach during the Fund’s fiscal year. We again concentrated on what we viewed as the high-quality, attractively valued REITs that we always seek to emphasize within the Fund, while selling stocks whose prices we believed had become too expensive relative to the underlying companies’ growth prospects. While our basic strategy remained the same, we positioned the Fund’s portfolio somewhat more defensively than usual, with a smaller emphasis on REITs in the more economically sensitive sectors, such as hotel and industrial REITs, and a greater focus on REITs with, in our view, solid balance sheets and lower levels of debt. This was the positioning we adopted throughout the Fund’s fiscal year, and one that we continued maintaining as the period came to a close.
3
Performance summary | |
| Delaware REIT Fund | October 31, 2012 |
The performance data quoted represent past performance; past performance does not guarantee future results. Investment return and principal value will fluctuate so your shares, when redeemed, may be worth more or less than their original cost. Please obtain the performance data current for the most recent month end by calling 800 523-1918 or visiting our website at delawareinvestments.com/performance. Current performance may be lower or higher than the performance data quoted.
| Fund performance1,2 | | Average annual total returns through October 31, 2012 |
| | | | | | | | | Lifetime |
| | | | | | | | | (if less than |
| | 1 year | | 5 years | | 10 years | | 10 years) |
| Class A (Est. Dec. 6, 1995) | | | | | | | | | |
| Excluding sales charge | | +13.38% | | +1.45% | | +10.70 | % | | n/a |
| Including sales charge | | +6.89% | | +0.26% | | +10.05 | % | | n/a |
| Class B (Est. Nov. 11, 1997) | | | | | | | | | |
| Excluding sales charge | | +12.57% | | +0.70% | | +10.03 | % | | n/a |
| Including sales charge | | +8.57% | | +0.38% | | +10.03 | % | | n/a |
| Class C (Est. Nov. 11, 1997) | | | | | | | | | |
| Excluding sales charge | | +12.57% | | +0.69% | | +9.87 | % | | n/a |
| Including sales charge | | +11.57% | | +0.69% | | +9.87 | % | | n/a |
| Class R (Est. June 2, 2003) | | | | | | | | | |
| Excluding sales charge | | +13.09% | | +1.20% | | n/a | | | +9.42% |
| Including sales charge | | +13.09% | | +1.20% | | n/a | | | +9.42% |
| Institutional Class (Est. Nov. 11, 1997) | | | | | | | | | |
| Excluding sales charge | | +13.72% | | +1.71% | | +10.97 | % | | n/a |
| Including sales charge | | +13.72% | | +1.71% | | +10.97 | % | | n/a |
1 Returns reflect the reinvestment of all distributions and are presented both with and without the applicable sales charges described below. Returns do not reflect the deduction of taxes the shareholder would pay on Fund distributions or redemptions of Fund shares.
Expense limitations were in effect for certain classes during some or all of the periods shown in the “Fund performance” chart. The current expenses for each class are listed on the “Fund expense ratios” table on page 5. Performance would have been lower had expense limitations not been in effect.
Class A shares are sold with a maximum front-end sales charge of 5.75%, and have an annual distribution and service fee of 0.30% of average daily net assets. This fee has been contractually limited to 0.25% of average daily net assets from Feb. 28, 2012, through Feb. 28, 2013. Performance for Class A shares, excluding sales charges, assumes that no front-end sales charge applied.
Class B shares may be purchased only through dividend reinvestment and certain permitted exchanges as described in the prospectus. Please see the prospectus for additional
4
information on Class B shares. Class B shares have a contingent deferred sales charge that declines from 4.00% to zero depending on the period of time the shares are held. They are also subject to an annual distribution and service fee of 1.00% of average daily net assets. Class B shares will automatically convert to Class A shares on a quarterly basis approximately eight years after purchase. Ten-year and lifetime performance figures for Class B shares reflect conversion to Class A shares after approximately eight years.
Class C shares are sold with a contingent deferred sales charge of 1.00% if redeemed during the first 12 months. They are also subject to an annual distribution and service fee of 1.00% of average daily net assets.
Performance for Class B and C shares, excluding sales charges, assumes either that contingent deferred sales charges did not apply or that the investment was not redeemed.
Class R shares are available only for certain retirement plan products. They are sold without a sales charge and have an annual distribution and service fee of 0.60% of average daily net assets, which has been limited contractually to 0.50% from Feb. 28, 2012, through Feb. 28, 2013.
Institutional Class shares are available without sales or asset-based distribution charges only to certain eligible institutional accounts.
The “Fund performance” table and the “Performance of a $10,000 investment” graph do not reflect the deduction of taxes the shareholder would pay on Fund distributions or redemptions of Fund shares.
Narrowly focused investments may exhibit higher volatility than investments in multiple industry sectors.
REIT investments are subject to many of the risks associated with direct real estate ownership, including changes in economic conditions, credit risk, and interest rate fluctuations. A REIT fund’s tax status as a regulated investment company could be jeopardized if it holds real estate directly, as a result of defaults, or receives rental income from real estate holdings.
“Nondiversified” Funds may allocate more of their net assets to investments in single securities than “diversified” Funds. Resulting adverse effects may subject these Funds to greater risks and volatility.
2 The Fund’s expense ratios, as described in the most recent prospectus, are disclosed in the following “Fund expense ratios” table. Delaware Investments has agreed to reimburse certain expenses and/or waive certain fees in order to prevent total fund operating expenses (excluding certain fees and expenses) from exceeding 1.25% of the Fund’s average daily net assets from Feb. 28, 2012, through Feb. 28, 2013. Please see the most recent prospectus and any applicable supplement(s) for additional information on these fee waivers and/or reimbursements.
| Fund expense ratios | | Class A | | Class B | | Class C | | Class R | | Institutional Class |
| Total annual operating expenses | | 1.57% | | 2.27% | | 2.27% | | 1.87% | | 1.27% |
| (without fee waivers) | | | | | | | | | | |
| Net expenses | | 1.50% | | 2.25% | | 2.25% | | 1.75% | | 1.25% |
| (including fee waivers, if any) | | | | | | | | | | |
| Type of waiver | | Contractual | | Contractual | | Contractual | | Contractual | | Contractual |
5
Performance summary
Delaware REIT Fund
Performance of a $10,000 investment1
Average annual total returns from Oct. 31, 2002, through Oct. 31, 2012
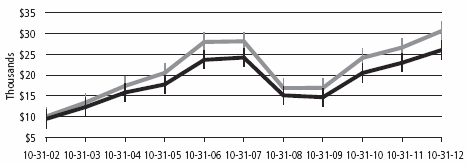
| For period beginning Oct. 31, 2002, through Oct. 31, 2012 | Starting value | Ending value |
| FTSE NAREIT Equity REITs Index | $10,000 | $30,640 |
| Delaware REIT Fund — Class A shares | $9,425 | $26,051 |
1 The “Performance of a $10,000 investment” graph assumes $10,000 invested in Class A shares of the Fund on Oct. 31, 2002, and includes the effect of a 5.75% front-end sales charge and the reinvestment of all distributions. The graph does not reflect the deduction of taxes the shareholders would pay on Fund distributions or redemptions of Fund shares. Expense limitations were in effect for some or all of the periods shown. Performance would have been lower had expense limitations not been in effect. Current expenses are listed in the “Fund expense ratios” table on page 5. Please note additional details on pages 4 through 6.
The chart also assumes $10,000 invested in the FTSE NAREIT Equity REITs Index as of Oct. 31, 2002. The FTSE NAREIT Equity REITs Index measures the performance of all publicly traded equity real estate investment trusts (REITs) traded on U.S. exchanges, excluding timber REITs.
Index performance returns do not reflect any management fees, transaction costs, or expenses. Indices are unmanaged and one cannot invest directly in an index. Past performance is not a guarantee of future results.
Performance of other Fund classes will vary due to different charges and expenses.
| | | Nasdaq symbols | | CUSIPs | |
| Class A | | | DPREX | | | 246248868 | |
| Class B | | | DPRBX | | | 246248819 | |
| Class C | | | DPRCX | | | 246248793 | |
| Class R | | | DPRRX | | | 246248561 | |
| Institutional Class | | | DPRSX | | | 246248777 | |
6
Disclosure of Fund expenses
For the six-month period from May 1, 2012 to October 31, 2012 (Unaudited)
As a shareholder of the Fund, you incur two types of costs: (1) transaction costs, including sales charges (loads) on purchase payments, reinvested dividends, or other distributions; redemption fees; and exchange fees; and (2) ongoing costs, including management fees; distribution and/or service (12b-1) fees; and other Fund expenses. This example is intended to help you understand your ongoing costs (in dollars) of investing in the Fund and to compare these costs with the ongoing costs of investing in other mutual funds.
The example is based on an investment of $1,000 invested at the beginning of the period and held for the entire six-month period from May 1, 2012 to October 31, 2012.
Actual expenses
The first section of the table shown, “Actual Fund return,” provides information about actual account values and actual expenses. You may use the information in this section of the table, together with the amount you invested, to estimate the expenses that you paid over the period. Simply divide your account value by $1,000 (for example, an $8,600 account value divided by $1,000 = 8.6), then multiply the result by the number in the first section under the heading entitled “Expenses Paid During Period” to estimate the expenses you paid on your account during this period.
Hypothetical example for comparison purposes
The second section of the table shown, “Hypothetical 5% return,” provides information about hypothetical account values and hypothetical expenses based on the Fund’s actual expense ratio and an assumed rate of return of 5% per year before expenses, which is not the Fund’s actual return. The hypothetical account values and expenses may not be used to estimate the actual ending account balance or expenses you paid for the period. You may use this information to compare the ongoing costs of investing in the Fund and other funds. To do so, compare this 5% hypothetical example with the 5% hypothetical examples that appear in the shareholder reports of the other funds.
Please note that the expenses shown in the table are meant to highlight your ongoing costs only and do not reflect any transactional costs, such as sales charges (loads), redemption fees, or exchange fees. Therefore, the second section of the table is useful in comparing ongoing costs only, and will not help you determine the relative total costs of owning different funds. In addition, if these transactional costs were included, your costs would have been higher. The Fund’s expenses shown in the table reflect fee waivers in effect. The expenses shown in the table assume reinvestment of all dividends and distributions.
8
Delaware REIT Fund
Expense analysis of an investment of $1,000
| Beginning | | Ending | | | | | | | Expenses |
| Account Value | | Account Value | | Annualized | | Paid During Period |
| 5/1/12 | | 10/31/12 | | Expense Ratio | | 5/1/12 to 10/31/12* |
| Actual Fund return† | | | | | | | | | | | | | | | | | | | |
| Class A | | $ | 1,000.00 | | | | $ | 991.50 | | | | 1.30 | % | | | | $ | 6.51 | |
| Class B | | | 1,000.00 | | | | | 988.50 | | | | 2.05 | % | | | | | 10.25 | |
| Class C | | | 1,000.00 | | | | | 987.80 | | | | 2.05 | % | | | | | 10.24 | |
| Class R | | | 1,000.00 | | | | | 991.00 | | | | 1.55 | % | | | | | 7.76 | |
| Institutional Class | | | 1,000.00 | | | | | 993.60 | | | | 1.05 | % | | | | | 5.26 | |
| Hypothetical 5% return (5% return before expenses) | | | | | | | | | | | |
| Class A | | $ | 1,000.00 | | | | $ | 1,018.60 | | | | 1.30 | % | | | | $ | 6.60 | |
| Class B | | | 1,000.00 | | | | | 1,014.83 | | | | 2.05 | % | | | | | 10.38 | |
| Class C | | | 1,000.00 | | | | | 1,014.83 | | | | 2.05 | % | | | | | 10.38 | |
| Class R | | | 1,000.00 | | | | | 1,017.34 | | | | 1.55 | % | | | | | 7.86 | |
| Institutional Class | | | 1,000.00 | | | | | 1,019.86 | | | | 1.05 | % | | | | | 5.33 | |
*“Expenses Paid During Period” are equal to the Fund’s annualized expense ratio, multiplied by the average account value over the period, multiplied by 184/366 (to reflect the one-half year period).
†Because actual returns reflect only the most recent six month period, the returns shown may differ significantly from fiscal year returns.
9
Security type/sector allocation and
top 10 equity holdings | |
| Delaware REIT Fund | As of October 31, 2012 (Unaudited) |
Sector designations may be different than the sector designations presented in other Fund materials. The sector designations may represent the investment manager’s internal sector classifications, which may result in the sector designations for one fund being different than another fund’s sector designations.
| Security type/sector | Percentage of net assets |
| Common Stock | 97.37 | % |
| Diversified REITs | 3.48 | % |
| Healthcare REITs | 13.40 | % |
| Hotel REITs | 4.20 | % |
| Industrial REITs | 6.74 | % |
| Mall REITs | 19.65 | % |
| Manufactured Housing REIT | 1.01 | % |
| Multifamily REITs | 16.25 | % |
| Office REITs | 9.96 | % |
| Office/Industrial REITs | 4.40 | % |
| Self-Storage REITs | 5.34 | % |
| Shopping Center REITs | 8.96 | % |
| Single Tenant REIT | 1.96 | % |
| Specialty REITs | 2.02 | % |
| Short-Term Investments | 3.15 | % |
| Securities Lending Collateral | 1.75 | % |
| Total Value of Securities | 102.27 | % |
| Obligation to Return Securities Lending Collateral | (2.02 | %) |
| Other Liabilities Net of Receivables and Other Assets | (0.25 | %) |
| Total Net Assets | 100.00 | % |
10
Holdings are for informational purposes only and are subject to change at any time. They are not a recommendation to buy, sell, or hold any security.
| Top 10 equity holdings | Percentage of net assets |
| Simon Property Group | 12.61 | % |
| Boston Properties | 4.86 | % |
| Public Storage | 4.39 | % |
| Ventas | 4.22 | % |
| ProLogis | 4.16 | % |
| HCP | 4.10 | % |
| Equity Residential | 4.00 | % |
| Health Care REIT | 3.13 | % |
| Macerich | 3.10 | % |
| AvalonBay Communities | 2.91 | % |
11
| Statement of net assets | |
| Delaware REIT Fund | | | | October 31, 2012 |
| | | Number of shares | | Value |
| Common Stock – 97.37% | | | | |
| Diversified REITs – 3.48% | | | | |
| Lexington Realty Trust | 238,061 | | $ | 2,259,199 |
| Vornado Realty Trust | 65,432 | | | 5,248,301 |
| | | | | 7,507,500 |
| Healthcare REITs – 13.40% | | | | |
| HCP | 199,430 | | | 8,834,749 |
| Health Care REIT | 113,541 | | | 6,747,742 |
| Healthcare Realty Trust | 138,578 | | | 3,255,197 |
| Senior Housing Properties Trust | 44,300 | | | 973,714 |
| Ventas | 143,777 | | | 9,096,770 |
| | | | | 28,908,172 |
| Hotel REITs – 4.20% | | | | |
| Host Hotels & Resorts | 362,485 | | | 5,241,533 |
| | Starwood Hotels & Resorts Worldwide | 17,155 | | | 889,487 |
| † | Strategic Hotels & Resorts | 263,900 | | | 1,448,811 |
| Summit Hotel Properties | 92,800 | | | 766,528 |
| † | Sunstone Hotel Investors | 72,600 | | | 717,288 |
| | | | | 9,063,647 |
| Industrial REITs – 6.74% | | | | |
| DCT Industrial Trust | 231,200 | | | 1,491,240 |
| EastGroup Properties | 40,100 | | | 2,087,606 |
| † | First Industrial Realty Trust | 147,700 | | | 1,971,795 |
| ProLogis | 261,966 | | | 8,982,814 |
| | | | | 14,533,455 |
| Mall REITs – 19.65% | | | | |
| CBL & Associates Properties | 94,056 | | | 2,104,033 |
| General Growth Properties | 221,811 | | | 4,360,804 |
| Macerich | 117,251 | | | 6,683,307 |
| Simon Property Group | 178,758 | | | 27,208,754 |
| Taubman Centers | 25,800 | | | 2,026,590 |
| | | | | 42,383,488 |
| Manufactured Housing REIT – 1.01% | | | | |
| Equity Lifestyle Properties | 32,418 | | | 2,182,704 |
| | | | | 2,182,704 |
| Multifamily REITs – 16.25% | | | | |
| American Campus Communities | 25,500 | | | 1,155,405 |
| Apartment Investment & Management | 110,900 | | | 2,959,921 |
| AvalonBay Communities | 46,351 | | | 6,283,342 |
12
| | | Number of shares | | Value |
| Common Stock (continued) | | | | |
| Multifamily REITs (continued) | | | | |
| | BRE Properties | 25,929 | | $ | 1,253,667 |
| Camden Property Trust | 80,686 | | | 5,295,422 |
| Colonial Properties Trust | 118,572 | | | 2,564,712 |
| Education Realty Trust | 187,300 | | | 1,972,269 |
| Equity Residential | 150,123 | | | 8,618,561 |
| Essex Property Trust | 23,727 | | | 3,559,050 |
| UDR | 57,548 | | | 1,396,690 |
| | | | | 35,059,039 |
| Office REITs – 9.96% | | | | |
| Boston Properties | 98,674 | | | 10,489,046 |
| Corporate Office Properties Trust | 122,304 | | | 3,051,485 |
| Douglas Emmett | 41,300 | | | 968,485 |
| Kilroy Realty | 52,075 | | | 2,312,651 |
| Parkway Properties | 79,611 | | | 1,096,243 |
| SL Green Realty | 47,562 | | | 3,581,419 |
| | | | | 21,499,329 |
| Office/Industrial REITs – 4.40% | | | | |
| Digital Realty Trust | 26,626 | | | 1,635,635 |
| Duke Realty | 80,200 | | | 1,161,296 |
| Liberty Property Trust | 120,250 | | | 4,223,180 |
| PS Business Parks | 38,429 | | | 2,464,452 |
| | | | | 9,484,563 |
| Self-Storage REITs – 5.34% | | | | |
| Extra Space Storage | 59,394 | | | 2,048,499 |
| Public Storage | 68,266 | | | 9,463,716 |
| | | | | 11,512,215 |
| Shopping Center REITs – 8.96% | | | | |
| DDR | 218,375 | | | 3,354,240 |
| Federal Realty Investment Trust | 34,176 | | | 3,685,198 |
| Kimco Realty | 191,979 | | | 3,747,430 |
| Ramco-Gershenson Properties Trust | 145,700 | | | 1,888,272 |
| Regency Centers | 85,231 | | | 4,092,793 |
| Tanger Factory Outlet Centers | 81,300 | | | 2,558,511 |
| | | | | 19,326,444 |
| Single Tenant REIT – 1.96% | | | | |
| * | National Retail Properties | 133,675 | | | 4,234,824 |
| | | | | 4,234,824 |
13
Statement of net assets
Delaware REIT Fund
| | | Number of shares | | Value |
| Common Stock (continued) | | | | | |
| Specialty REITs – 2.02% | | | | | |
| American Tower | | 35,400 | | $ | 2,665,266 |
| Rayonier | | 34,457 | | | 1,688,738 |
| | | | | | 4,354,004 |
| Total Common Stock (cost $189,743,894) | | | | | 210,049,384 |
| |
| | Principal amount | | | |
| Short-Term Investments – 3.15% | | | | | |
| ≠Discount Note – 0.15% | | | | | |
| Federal Home Loan Bank 0.095% 11/28/12 | $ | 327,726 | | | 327,709 |
| | | | | | 327,709 |
| Repurchase Agreements – 2.40% | | | | | |
| Bank of America 0.24%, dated 10/31/12, to be | | | | | |
| repurchased on 11/1/12, repurchase price | | | | | |
| $2,004,864 (collateralized by U.S. government | | | | | |
| obligations 0.00%-1.25% 1/10/13–8/31/16; | | | | | |
| market value $2,044,947) | | 2,004,850 | | | 2,004,850 |
| BNP Paribas 0.28%, dated 10/31/12, to be | | | | | |
| repurchased on 11/1/12, repurchase price | | | | | |
| $3,169,174 (collateralized by U.S. government | | | | | |
| obligations 0.00%-2.00% 1/24/13–4/15/16; | | | | | |
| market value $3,232,533) | | 3,169,150 | | | 3,169,150 |
| | | | | | 5,174,000 |
| ≠U.S. Treasury Obligation – 0.60% | | | | | |
| U.S. Treasury Bill 0.05% 11/15/12 | | 1,286,063 | | | 1,286,035 |
| | | | | | 1,286,035 |
| Total Short-Term Investments (cost $6,787,720) | | | | | 6,787,744 |
| |
| Total Value of Securities Before Securities Lending | | | | | |
| Collateral – 100.52% (cost $196,531,614) | | | | | 216,837,128 |
| |
| | Number of shares | | | |
| **Securities Lending Collateral – 1.75% | | | | | |
| Investment Companies | | | | | |
| Delaware Investments Collateral Fund No.1 | | 3,771,191 | | | 3,771,191 |
| †@Mellon GSL Reinvestment Trust II | | 580,111 | | | 0 |
| Total Securities Lending Collateral | | | | | |
| (cost $4,351,302) | | | | | 3,771,191 |
14
| | | | | |
| Total Value of Securities – 102.27% | | | |
| | (cost $200,882,916) | $ | 220,608,319 | © |
| **Obligation to Return Securities | | | |
| Lending Collateral – (2.02%) | | (4,351,302 | ) |
| Other Liabilities Net of Receivables | | | |
| and Other Assets – (0.25%) | | (540,014 | ) |
| Net Assets Applicable to 16,771,306 | | | |
| Shares Outstanding – 100.00% | $ | 215,717,003 | |
| |
| Net Asset Value – Delaware REIT Fund | | | |
| Class A ($83,114,361 / 6,467,481 Shares) | | | $12.85 | |
| Net Asset Value – Delaware REIT Fund | | | |
| Class B ($1,857,053 / 144,746 Shares) | | | $12.83 | |
| Net Asset Value – Delaware REIT Fund | | | |
| Class C ($20,197,510 / 1,573,647 Shares) | | | $12.83 | |
| Net Asset Value – Delaware REIT Fund | | | |
| Class R ($9,446,214 / 735,065 Shares) | | | $12.85 | |
| Net Asset Value – Delaware REIT Fund | | | |
| Institutional Class ($101,101,865 / 7,850,367 Shares) | | | $12.88 | |
| |
| Components of Net Assets at October 31, 2012: | | | |
| Shares of beneficial interest (unlimited authorization – no par) | $ | 214,619,517 | |
| Accumulated net realized loss on investments | | (18,627,917 | ) |
| Net unrealized appreciation of investments | | 19,725,403 | |
| Total net assets | $ | 215,717,003 | |
| † | Non income producing security. |
| * | Fully or partially on loan. |
| ≠ | The rate shown is the effective yield at time of purchase. |
| ** | See Note 8 in “Notes to financial statements” for additional information on securities lending collateral. |
| @ | Illiquid security. At October 31, 2012, the aggregate value of illiquid securities was $0, which represented 0.00% of the Fund’s net assets. See Note 9 in “Notes to financial statements.” |
| © | Includes $4,234,824 of securities loaned. |
15
Statement of net assets
Delaware REIT Fund
| | | |
| Net Asset Value and Offering Price Per Share – | | |
| Delaware REIT Fund | | |
| Net asset value Class A (A) | $ | 12.85 |
| Sales charge (5.75% of offering price) (B) | | 0.78 |
| Offering price | $ | 13.63 |
| (A) | | Net asset value per share, as illustrated, is the amount which would be paid upon redemption or repurchase of shares. |
| (B) | | See the current prospectus for purchases of $50,000 or more. |
REIT — Real Estate Investment Trust
See accompanying notes, which are an integral part of the financial statements.
16
| Statement of operations | |
| Delaware REIT Fund | October 31, 2012 |
| Investment Income: | | | | | | |
| Dividends | $ | 4,732,301 | | | | |
| Securities lending income | | 21,665 | | | | |
| Interest | | 7,802 | | $ | 4,761,768 | |
| |
| Expenses: | | | | | | |
| Management fees | | 1,571,873 | | | | |
| Distribution expenses – Class A | | 241,298 | | | | |
| Distribution expenses – Class B | | 28,251 | | | | |
| Distribution expenses – Class C | | 193,925 | | | | |
| Distribution expenses – Class R | | 48,019 | | | | |
| Dividend disbursing and transfer agent fees and expenses | | 306,912 | | | | |
| Reports and statements to shareholders | | 87,238 | | | | |
| Accounting and administration expenses | | 81,936 | | | | |
| Registration fees | | 77,172 | | | | |
| Legal fees | | 18,616 | | | | |
| Audit and tax | | 14,502 | | | | |
| Dues and services | | 11,863 | | | | |
| Trustees’ fees | | 9,854 | | | | |
| Custodian fees | | 5,339 | | | | |
| Insurance fees | | 3,616 | | | | |
| Pricing fees | | 2,804 | | | | |
| Consulting fees | | 1,893 | | | | |
| Trustees’ expenses | | 609 | | | 2,705,720 | |
| Less waived distribution expenses – Class A | | | | | (40,216 | ) |
| Less waived distribution expenses – Class R | | | | | (8,003 | ) |
| Less expense paid indirectly | | | | | (885 | ) |
| Total operating expenses | | | | | 2,656,616 | |
| Net Investment Income | | | | | 2,105,152 | |
| |
| Net Realized and Unrealized Gain: | | | | | | |
| Net realized gain on investments | | | | | 22,457,772 | |
| Net change in unrealized appreciation (depreciation) | | | | | | |
| of investments | | | | | 1,321,901 | |
| Net Realized and Unrealized Gain | | | | | 23,779,673 | |
| |
| Net Increase in Net Assets Resulting from Operations | | | | $ | 25,884,825 | |
See accompanying notes, which are an integral part of the financial statements.
17
Statements of changes in net assets
Delaware REIT Fund
| Year Ended |
| 10/31/12 | | 10/31/11 |
| Increase (Decrease) in Net Assets from Operations: | | | | | | | |
| Net investment income | $ | 2,105,152 | | | $ | 1,922,930 | |
| Net realized gain | | 22,457,772 | | | | 29,456,388 | |
| Net change in unrealized appreciation (depreciation) | | 1,321,901 | | | | (7,594,181 | ) |
| Net increase in net assets resulting from operations | | 25,884,825 | | | | 23,785,137 | |
| |
| Dividends and Distributions to shareholders from: | | | | | | | |
| Net investment income: | | | | | | | |
| Class A | | (1,381,831 | ) | | | (1,196,436 | ) |
| Class B | | (24,529 | ) | | | (39,797 | ) |
| Class C | | (191,245 | ) | | | (155,030 | ) |
| Class R | | (118,605 | ) | | | (80,792 | ) |
| Institutional Class | | (1,932,049 | ) | | | (1,838,764 | ) |
| | | (3,648,259 | ) | | | (3,310,819 | ) |
| |
| Capital Share Transactions: | | | | | | | |
| Proceeds from shares sold: | | | | | | | |
| Class A | | 15,743,995 | | | | 14,141,867 | |
| Class B | | 5,255 | | | | 27,380 | |
| Class C | | 2,930,059 | | | | 2,174,858 | |
| Class R | | 4,787,812 | | | | 2,194,345 | |
| Institutional Class | | 24,594,775 | | | | 26,944,199 | |
| |
| Net asset value of shares issued upon reinvestment | | | | | | | |
| of dividends and distributions: | | | | | | | |
| Class A | | 1,278,549 | | | | 1,089,522 | |
| Class B | | 22,014 | | | | 36,674 | |
| Class C | | 182,212 | | | | 144,152 | |
| Class R | | 118,570 | | | | 80,705 | |
| Institutional Class | | 1,917,914 | | | | 1,790,713 | |
| | | 51,581,155 | | | | 48,624,415 | |
18
| Year Ended |
| 10/31/12 | | 10/31/11 |
| Capital Share Transactions (continued): | | | | | | | |
| Cost of shares redeemed: | | | | | | | |
| Class A | $ | (17,567,192 | ) | | $ | (30,207,746 | ) |
| Class B | | (2,386,962 | ) | | | (4,132,128 | ) |
| Class C | | (3,322,904 | ) | | | (4,520,039 | ) |
| Class R | | (2,591,194 | ) | | | (2,170,126 | ) |
| Institutional Class | | (33,959,968 | ) | | | (37,016,402 | ) |
| | | (59,828,220 | ) | | | (78,046,441 | ) |
| Decrease in net assets derived from capital share transactions | | (8,247,065 | ) | | | (29,422,026 | ) |
| Net Increase (Decrease) in Net Assets | | 13,989,501 | | | | (8,947,708 | ) |
| |
| Net Assets: | | | | | | | |
| Beginning of year | | 201,727,502 | | | | 210,675,210 | |
| End of year (there was no undistributed net investment | | | | | | | |
| income at either year end) | $ | 215,717,003 | | | $ | 201,727,502 | |
See accompanying notes, which are an integral part of the financial statements.
19
Financial highlights
Delaware REIT Fund Class A
Selected data for each share of the Fund outstanding throughout each period were as follows:
| Net asset value, beginning of period |
| |
| Income (loss) from investment operations: |
| Net investment income1 |
| Net realized and unrealized gain (loss) |
| Total from investment operations |
| |
| Less dividends and distributions from: |
| Net investment income |
| Net realized gain |
| Return of capital |
| Total dividends and distributions |
| |
| Net asset value, end of period |
| |
| Total return2 |
| |
| Ratios and supplemental data: |
| Net assets, end of period (000 omitted) |
| Ratio of expenses to average net assets |
| Ratio of expenses to average net assets |
| prior to fees waived |
| Ratio of net investment income to average net assets |
| Ratio of net investment income to average net assets |
| prior to fees waived |
| Portfolio turnover |
1 The average shares outstanding method has been applied for per share information. |
2 Total investment return is based on the change in net asset value of a share during the period and assumes reinvestment of dividends and distributions at net asset value and does not reflect the impact of a sales charge. Total investment return during all of the periods shown reflects waivers by the manager and/or distributor. Performance would have been lower had the waivers not been in effect. |
See accompanying notes, which are an integral part of the financial statements.
20
| Year Ended |
| | 10/31/12 | | | 10/31/11 | | | 10/31/10 | | | 10/31/09 | | | 10/31/08 | | |
| | $11.530 | | | $10.460 | | | $7.630 | | | $8.200 | | | $17.690 | | |
| | |
| | |
| | 0.122 | | | 0.098 | | | 0.131 | | | 0.221 | | | 0.225 | | |
| | 1.412 | | | 1.145 | | | 2.886 | | | (0.509 | ) | | (5.793 | ) | |
| | 1.534 | | | 1.243 | | | 3.017 | | | (0.288 | ) | | (5.568 | ) | |
| | |
| | |
| | (0.214 | ) | | (0.173 | ) | | (0.187 | ) | | (0.224 | ) | | (0.339 | ) | |
| | — | | | — | | | — | | | — | | | (3.583 | ) | |
| | — | | | — | | | — | | | (0.058 | ) | | — | | |
| | (0.214 | ) | | (0.173 | ) | | (0.187 | ) | | (0.282 | ) | | (3.922 | ) | |
| | |
| | $12.850 | | | $11.530 | | | $10.460 | | | $7.630 | | | $8.200 | | |
| | |
| | 13.38% | | | 12.01% | | | 39.84% | | | (2.97% | ) | | (37.85% | ) | |
| | |
| | |
| | $83,114 | | | $75,149 | | | $82,646 | | | $64,237 | | | $73,445 | | |
| | 1.30% | | | 1.51% | | | 1.53% | | | 1.48% | | | 1.48% | | |
| | |
| | 1.35% | | | 1.57% | | | 1.62% | | | 1.88% | | | 1.59% | | |
| | 0.98% | | | 0.89% | | | 1.42% | | | 3.38% | | | 1.82% | | |
| | |
| | 0.93% | | | 0.83% | | | 1.33% | | | 2.98% | | | 1.71% | | |
| | 87% | | | 129% | | | 175% | | | 174% | | | 115% | | |
21
Financial highlights
Delaware REIT Fund Class B
Selected data for each share of the Fund outstanding throughout each period were as follows:
| Net asset value, beginning of period |
| |
| Income (loss) from investment operations: |
| Net investment income1 |
| Net realized and unrealized gain (loss) |
| Total from investment operations |
| |
| Less dividends and distributions from: |
| Net investment income |
| Net realized gain |
| Return of capital |
| Total dividends and distributions |
| |
| Net asset value, end of period |
| |
| Total return2 |
| |
| Ratios and supplemental data: |
| Net assets, end of period (000 omitted) |
| Ratio of expenses to average net assets |
| Ratio of expenses to average net assets |
| prior to fees waived |
| Ratio of net investment income to average net assets |
| Ratio of net investment income to average net assets |
| prior to fees waived |
| Portfolio turnover |
1 The average shares outstanding method has been applied for per share information. |
2 Total investment return is based on the change in net asset value of a share during the period and assumes reinvestment of dividends and distributions at net asset value and does not reflect the impact of a sales charge. Total investment return during some of the periods shown reflects a waiver by the manager. Performance would have been lower had the waiver not been in effect. |
See accompanying notes, which are an integral part of the financial statements.
22
| Year Ended |
| | 10/31/12 | | 10/31/11 | | 10/31/10 | | 10/31/09 | | 10/31/08 | |
| | $11.510 | | | $10.450 | | | $7.620 | | | $8.190 | | | $17.680 | | |
| | |
| | |
| | 0.028 | | | 0.015 | | | 0.061 | | | 0.173 | | | 0.138 | | |
| | 1.415 | | | 1.136 | | | 2.888 | | | (0.511 | ) | | (5.793 | ) | |
| | 1.443 | | | 1.151 | | | 2.949 | | | (0.338 | ) | | (5.655 | ) | |
| | |
| | |
| | (0.123 | ) | | (0.091 | ) | | (0.119 | ) | | (0.174 | ) | | (0.252 | ) | |
| | — | | | — | | | — | | | — | | | (3.583 | ) | |
| | — | | | — | | | — | | | (0.058 | ) | | — | | |
| | (0.123 | ) | | (0.091 | ) | | (0.119 | ) | | (0.232 | ) | | (3.835 | ) | |
| | |
| | $12.830 | | | $11.510 | | | $10.450 | | | $7.620 | | | $8.190 | | |
| | |
| | 12.57% | | | 11.08% | | | 38.88% | | | (3.73% | ) | | (38.28% | ) | |
| | |
| | |
| | $1,857 | | | $3,863 | | | $7,393 | | | $10,985 | | | $17,831 | | |
| | 2.05% | | | 2.26% | | | 2.28% | | | 2.23% | | | 2.23% | | |
| | |
| | 2.05% | | | 2.27% | | | 2.32% | | | 2.58% | | | 2.29% | | |
| | 0.23% | | | 0.14% | | | 0.67% | | | 2.63% | | | 1.07% | | |
| | |
| | 0.23% | | | 0.13% | | | 0.63% | | | 2.28% | | | 1.01% | | |
| | 87% | | | 129% | | | 175% | | | 174% | | | 115% | | |
23
Financial highlights
Delaware REIT Fund Class C
Selected data for each share of the Fund outstanding throughout each period were as follows:
| Net asset value, beginning of period |
| |
| Income (loss) from investment operations: |
| Net investment income1 |
| Net realized and unrealized gain (loss) |
| Total from investment operations |
| |
| Less dividends and distributions from: |
| Net investment income |
| Net realized gain |
| Return of capital |
| Total dividends and distributions |
| |
| Net asset value, end of period |
| |
| Total return2 |
| |
| Ratios and supplemental data: |
| Net assets, end of period (000 omitted) |
| Ratio of expenses to average net assets |
| Ratio of expenses to average net assets |
| prior to fees waived |
| Ratio of net investment income to average net assets |
| Ratio of net investment income to average net assets |
| prior to fees waived |
| Portfolio turnover |
1 The average shares outstanding method has been applied for per share information. |
2 Total investment return is based on the change in net asset value of a share during the period and assumes reinvestment of dividends and distributions at net asset value and does not reflect the impact of a sales charge. Total investment return during some of the periods shown reflects a waiver by the manager. Performance would have been lower had the waiver not been in effect. |
See accompanying notes, which are an integral part of the financial statements.
24
| Year Ended |
| | 10/31/12 | | 10/31/11 | | 10/31/10 | | 10/31/09 | | 10/31/08 | |
| | $11.510 | | | $10.450 | | | $7.620 | | | $8.190 | | | $17.680 | | |
| | |
| | |
| | 0.028 | | | 0.015 | | | 0.062 | | | 0.173 | | | 0.136 | | |
| | 1.415 | | | 1.136 | | | 2.887 | | | (0.511 | ) | | (5.791 | ) | |
| | 1.443 | | | 1.151 | | | 2.949 | | | (0.338 | ) | | (5.655 | ) | |
| | |
| | |
| | (0.123 | ) | | (0.091 | ) | | (0.119 | ) | | (0.174 | ) | | (0.252 | ) | |
| | — | | | — | | | — | | | — | | | (3.583 | ) | |
| | — | | | — | | | — | | | (0.058 | ) | | — | | |
| | (0.123 | ) | | (0.091 | ) | | (0.119 | ) | | (0.232 | ) | | (3.835 | ) | |
| | |
| | $12.830 | | | $11.510 | | | $10.450 | | | $7.620 | | | $8.190 | | |
| | |
| | 12.57% | | | 11.08% | | | 38.88% | | | (3.73% | ) | | (38.33% | ) | |
| | |
| | |
| | $20,198 | | | $18,345 | | | $18,713 | | | $16,314 | | | $22,695 | | |
| | 2.05% | | | 2.26% | | | 2.28% | | | 2.23% | | | 2.23% | | |
| | |
| | 2.05% | | | 2.27% | | | 2.32% | | | 2.58% | | | 2.29% | | |
| | 0.23% | | | 0.14% | | | 0.67% | | | 2.63% | | | 1.07% | | |
| | |
| | 0.23% | | | 0.13% | | | 0.63% | | | 2.28% | | | 1.01% | | |
| | 87% | | | 129% | | | 175% | | | 174% | | | 115% | | |
25
Financial highlights
Delaware REIT Fund Class R
Selected data for each share of the Fund outstanding throughout each period were as follows:
| Net asset value, beginning of period |
| |
| Income (loss) from investment operations: |
| Net investment income1 |
| Net realized and unrealized gain (loss) |
| Total from investment operations |
| |
| Less dividends and distributions from: |
| Net investment income |
| Net realized gain |
| Return of capital |
| Total dividends and distributions |
| |
| Net asset value, end of period |
| |
| Total return2 |
| |
| Ratios and supplemental data: |
| Net assets, end of period (000 omitted) |
| Ratio of expenses to average net assets |
| Ratio of expenses to average net assets |
| prior to fees waived |
| Ratio of net investment income to average net assets |
| Ratio of net investment income to average net assets |
| prior to fees waived |
| Portfolio turnover |
1 The average shares outstanding method has been applied for per share information. |
2 Total investment return is based on the change in net asset value of a share during the period and assumes reinvestment of dividends and distributions at net asset value. Total investment return during all of the periods shown reflects waivers by the manager and/or distributor. Performance would have been lower had the waivers not been in effect. |
See accompanying notes, which are an integral part of the financial statements.
26
| Year Ended |
| | 10/31/12 | | 10/31/11 | | 10/31/10 | | 10/31/09 | | 10/31/08 | |
| | $11.530 | | | $10.460 | | | $7.630 | | | $8.200 | | | $17.690 | | |
| | |
| | |
| | 0.091 | | | 0.071 | | | 0.109 | | | 0.205 | | | 0.191 | | |
| | 1.412 | | | 1.145 | | | 2.885 | | | (0.509 | ) | | (5.789 | ) | |
| | 1.503 | | | 1.216 | | | 2.994 | | | (0.304 | ) | | (5.598 | ) | |
| | |
| | |
| | (0.183 | ) | | (0.146 | ) | | (0.164 | ) | | (0.208 | ) | | (0.309 | ) | |
| | — | | | — | | | — | | | — | | | (3.583 | ) | |
| | — | | | — | | | — | | | (0.058 | ) | | — | | |
| | (0.183 | ) | | (0.146 | ) | | (0.164 | ) | | (0.266 | ) | | (3.892 | ) | |
| | |
| | $12.850 | | | $11.530 | | | $10.460 | | | $7.630 | | | $8.200 | | |
| | |
| | 13.09% | | | 11.73% | | | 39.50% | | | (3.21% | ) | | (38.00% | ) | |
| | |
| | |
| | $9,446 | | | $6,368 | | | $5,680 | | | $3,596 | | | $3,395 | | |
| | 1.55% | | | 1.76% | | | 1.78% | | | 1.73% | | | 1.73% | | |
| | |
| | 1.65% | | | 1.87% | | | 1.92% | | | 2.18% | | | 1.89% | | |
| | 0.73% | | | 0.64% | | | 1.17% | | | 3.13% | | | 1.57% | | |
| | |
| | 0.63% | | | 0.53% | | | 1.03% | | | 2.68% | | | 1.41% | | |
| | 87% | | | 129% | | | 175% | | | 174% | | | 115% | | |
27
Financial highlights
Delaware REIT Fund Institutional Class
Selected data for each share of the Fund outstanding throughout each period were as follows:
| Net asset value, beginning of period |
| |
| Income (loss) from investment operations: |
| Net investment income1 |
| Net realized and unrealized gain (loss) |
| Total from investment operations |
| |
| Less dividends and distributions from: |
| Net investment income |
| Net realized gain |
| Return of capital |
| Total dividends and distributions |
| |
| Net asset value, end of period |
| |
| Total return2 |
| |
| Ratios and supplemental data: |
| Net assets, end of period (000 omitted) |
| Ratio of expenses to average net assets |
| Ratio of expenses to average net assets |
| prior to fees waived |
| Ratio of net investment income to average net assets |
| Ratio of net investment income to average net assets |
| prior to fees waived |
| Portfolio turnover |
1 The average shares outstanding method has been applied for per share information. |
2 Total investment return is based on the change in net asset value of a share during the period and assumes reinvestment of dividends and distributions at net asset value. Total investment return during some of the periods shown reflects a waiver by the manager. Performance would have been lower had the waiver not been in effect. |
See accompanying notes, which are an integral part of the financial statements.
28
| Year Ended |
| | 10/31/12 | | 10/31/11 | | 10/31/10 | | 10/31/09 | | 10/31/08 | |
| | $11.550 | | | $10.480 | | | $7.640 | | | $8.220 | | | $17.710 | | |
| | |
| | |
| | 0.153 | | | 0.127 | | | 0.155 | | | 0.238 | | | 0.247 | | |
| | 1.422 | | | 1.144 | | | 2.893 | | | (0.520 | ) | | (5.784 | ) | |
| | 1.575 | | | 1.271 | | | 3.048 | | | (0.282 | ) | | (5.537 | ) | |
| | |
| | |
| | (0.245 | ) | | (0.201 | ) | | (0.208 | ) | | (0.240 | ) | | (0.370 | ) | |
| | — | | | — | | | — | | | — | | | (3.583 | ) | |
| | — | | | — | | | — | | | (0.058 | ) | | — | | |
| | (0.245 | ) | | (0.201 | ) | | (0.208 | ) | | (0.298 | ) | | (3.953 | ) | |
| | |
| | $12.880 | | | $11.550 | | | $10.480 | | | $7.640 | | | $8.220 | | |
| | |
| | 13.72% | | | 12.27% | | | 40.23% | | | (2.72% | ) | | (37.66% | ) | |
| | |
| | |
| | $101,102 | | | $98,003 | | | $96,243 | | | $99,334 | | | $87,430 | | |
| | 1.05% | | | 1.26% | | | 1.28% | | | 1.23% | | | 1.23% | | |
| | |
| | 1.05% | | | 1.27% | | | 1.32% | | | 1.58% | | | 1.29% | | |
| | 1.23% | | | 1.14% | | | 1.67% | | | 3.63% | | | 2.07% | | |
| | |
| | 1.23% | | | 1.13% | | | 1.63% | | | 3.28% | | | 2.01% | | |
| | 87% | | | 129% | | | 175% | | | 174% | | | 115% | | |
29
Notes to financial statements
| Delaware REIT Fund | October 31, 2012 |
The Real Estate Investment Trust Portfolio (Delaware REIT Fund or Fund) is a series of Delaware Pooled® Trust (Trust), which is organized as a Delaware statutory trust. The Trust is an open-end investment company. The Fund is considered non-diversified under the Investment Company Act of 1940, as amended, and offers Class A, Class B, Class C, Class R and Institutional Class shares. Class A shares are sold with a maximum front-end sales charge of up to 5.75%. Class A share purchases of $1,000,000 or more will incur a contingent deferred sales charge (CDSC) of 1% if redeemed during the first year and 0.50% during the second year, provided that Delaware Distributors, L.P. (DDLP) paid a financial advisor a commission on the purchase of those shares. Class B shares may be purchased only through dividend reinvestment and certain permitted exchanges. Prior to June 1, 2007, Class B shares were sold with a CDSC that declined from 4% to zero depending upon the period of time the shares were held. Class B shares will automatically convert to Class A shares on a quarterly basis approximately eight years after purchase. Class C shares are sold with a CDSC of 1%, if redeemed during the first twelve months. Class R and Institutional Class shares are not subject to a sales charge and are offered for sale exclusively to certain eligible investors. This report contains information relating only to the Delaware REIT Fund. All other Delaware Pooled Trust portfolios are included in a separate report.
The investment objectives of the Fund are to seek maximum long-term total return, with capital appreciation as a secondary objective. It seeks to achieve its objectives by investing primarily in securities of companies principally engaged in the real estate industry.
1. Significant Accounting Policies
The following accounting policies are in accordance with U.S. generally accepted accounting principles (U.S. GAAP) and are consistently followed by the Fund.
Security Valuation — Equity securities, except those traded on the Nasdaq Stock Market, Inc. (Nasdaq), are valued at the last quoted sales price as of the time of the regular close of the New York Stock Exchange (NYSE) on the valuation date. Securities traded on the Nasdaq are valued in accordance with the Nasdaq Official Closing Price, which may not be the last sales price. If on a particular day an equity security does not trade, then the mean between the bid and ask prices will be used, which approximates fair value. U.S. government and agency securities are valued at the mean between the bid and ask prices, which approximates fair value. Investment company securities are valued at net asset value per share, as reported by the underlying investment company. Generally, other securities and assets for which market quotations are not readily available are valued at fair value as determined in good faith under the direction of the Fund’s Board of Trustees (Board). In determining whether market quotations are readily available or fair valuation will be used, various factors will be taken into consideration, such as market closures or suspension of trading in a security. The Fund may use fair value pricing more frequently for securities traded primarily in non-U.S. markets because, among other things, most foreign markets close well before the Fund values its securities, generally as of 4:00 p.m. Eastern time. The earlier close of these foreign markets gives rise to the possibility that significant events, including broad market moves, government actions or pronouncements, aftermarket
30
trading, or news events may have occurred in the interim. To account for this, the Fund may frequently value foreign securities using fair value prices based on third-party vendor modeling tools (international fair value pricing).
Federal Income Taxes — No provision for federal income taxes has been made as the Fund intends to continue to qualify for federal income tax purposes as a regulated investment company under Subchapter M of the Internal Revenue Code of 1986, as amended, and make the requisite distributions to shareholders. The Fund evaluates tax positions taken or expected to be taken in the course of preparing the Fund’s tax returns to determine whether the tax positions are “more-likely-than-not” of being sustained by the applicable tax authority. Tax positions not deemed to meet the more-likely-than-not threshold are recorded as a tax benefit or expense in the current year. Management has analyzed the Fund’s tax positions taken for all open federal income tax years (October 31, 2009–October 31, 2012), and has concluded that no provision for federal income tax is required in the Fund’s financial statements.
Class Accounting — Investment income, common expenses and realized and unrealized gain (loss) on investments are allocated to the various classes of the Fund on the basis of daily net assets of each class. Distribution expenses relating to a specific class are charged directly to that class.
Repurchase Agreements — The Fund may purchase certain U.S. government securities subject to the counterparty’s agreement to repurchase them at an agreed upon date and price. The counterparty will be required on a daily basis to maintain the value of the collateral subject to the agreement at not less than the repurchase price (including accrued interest). The agreements are conditioned upon the collateral being deposited under the Federal Reserve book-entry system with the Fund’s custodian or a third-party sub-custodian. In the event of default or bankruptcy by the other party to the agreement, retention of the collateral may be subject to legal proceedings. All open repurchase agreements as of the date of this report were entered into on October 31, 2012.
Use of Estimates — The preparation of financial statements in conformity with U.S. GAAP requires management to make estimates and assumptions that affect the fair value of investments, the reported amounts of assets and liabilities and disclosure of contingent assets and liabilities at the date of the financial statements and the reported amounts of revenues and expenses during the reporting period. Actual results could differ from those estimates and the differences could be material.
Other — Expenses directly attributable to the Fund are charged directly to the Fund. Other expenses common to various funds within the Delaware Investments® Family of Funds are generally allocated amongst such funds on the basis of average net assets. Management fees and some other expenses are paid monthly. Security transactions are recorded on the date the securities are purchased or sold (trade date) for financial reporting purposes. Costs used in calculating realized gains and losses on the sale of investment securities are those of the specific securities sold. Dividend income is recorded on the ex-dividend date and interest income is recorded on the accrual basis. Distributions received from investments in Real Estate Investment Trusts (REITs) are recorded as dividend income on the ex-dividend date, subject to reclassification
31
Notes to financial statements
Delaware REIT Fund
1. Significant Accounting Policies (continued)
upon notice of the character of such distributions by the issuer. The financial statements reflect an estimate of the reclassification of the distribution character. The Fund declares and pays dividends from net investment income quarterly and distributions from net realized gain on investments, if any, annually. The Fund may distribute income dividends and capital gains more frequently, if necessary for tax purposes. Dividends and distributions, if any, are recorded on the ex-dividend date.
Subject to seeking best execution, the Fund may direct certain security trades to brokers who have agreed to rebate a portion of the related brokerage commission to the Fund in cash. Such commission rebates are included in realized gain on investments in the accompanying financial statements and totaled $168 for the year ended October 31, 2012. In general, best execution refers to many factors, including the price paid or received for a security, the commission charged, the promptness and reliability of execution, the confidentiality and placement accorded the order, and other factors affecting the overall benefit obtained by the Fund on the transaction.
The Fund may receive earnings credits from its custodian when positive cash balances are maintained, which are used to offset custody fees. There were no earnings credits for the year ended October 31, 2012.
The Fund receives earnings credits from its transfer agent when positive cash balances are maintained, which are used to offset transfer agent fees. The expense paid under this arrangement is included in dividend disbursing and transfer agent fees and expenses on the statement of operations with the corresponding expense offset shown as “expense paid indirectly.” For the year ended October 31, 2012, the Fund earned $885 under this agreement.
| 2. | Investment Management, Administration Agreements and Other Transactions with Affiliates |
In accordance with the terms of its investment management agreement, the Fund pays Delaware Management Company (DMC), a series of Delaware Management Business Trust and the investment manager, an annual fee which is calculated daily at the rate of 0.75% on the first $500 million of average daily net assets of the Fund, 0.70% on the next $500 million, 0.65% on the next $1.5 billion and 0.60% on average daily net assets in excess of $2.5 billion.
Effective February 28, 2012, DMC has contractually agreed to waive that portion, if any, of its management fee and reimburse the Fund to the extent necessary to ensure that total annual operating expenses (excluding any 12b-1 plan fees and certain other expenses) do not exceed 1.25% of average daily net assets of the Fund through February 28, 2013. Prior to February 28, 2012, DMC had contractually agreed to waive expenses to the extent necessary to ensure that total annual operating expenses did not exceed 1.30% of average daily net assets of the Fund. This waiver and reimbursement may be terminated only by agreement of the Fund. This waiver and reimbursement apply only to expenses paid directly by the Fund.
32
Delaware Service Company, Inc. (DSC), an affiliate of DMC, provides fund accounting and financial administration oversight services to the Fund. For these services, the Fund pays DSC fees based on the aggregate daily net assets of the Delaware Investments® Family of Funds at the following annual rate: 0.0050% of the first $30 billion; 0.0045% of the next $10 billion; 0.0040% of the next $10 billion; and 0.0025% of aggregate average daily net assets in excess of $50 billion. The fees payable to DSC under the service agreement described above are allocated among all Funds in the Delaware Investments Family of Funds on a relative net asset value basis. For the year ended October 31, 2012, the Fund was charged $ 10,279 for these services.
DSC is also the transfer agent and dividend disbursing agent of the Fund. The Fund pays DSC a monthly asset-based fee for these services. Pursuant to a sub-transfer agency agreement between DSC and BNY Mellon Investment Servicing (US) Inc. (BNYMIS), BNYMIS provides certain sub-transfer agency services to the Fund. Sub-transfer agency fees are passed on to and paid directly by the Fund.
Pursuant to a distribution agreement and distribution plan, the Fund pays DDLP, the distributor and an affiliate of DMC, an annual distribution and service fee not to exceed 0.30% of the average daily net assets of the Class A shares, 1.00% of the average daily net assets of the Class B and Class C shares and 0.60% of the average daily net assets of the Class R shares. Institutional Class shares pay no distribution and service expenses. DDLP has contracted to limit the Class A and Class R shares’ 12b-1 fees through February 28, 2013 to 0.25% and 0.50%, of the average daily net assets, respectively.
At October 31, 2012, the Fund had liabilities payable to affiliates as follows:
| Investment management fees payable to DMC | | $137,581 |
| Dividend disbursing, transfer agent and fund accounting | | |
| oversight fees and other expenses payable to DSC | | 5,017 |
| Distribution fees payable to DDLP | | 40,579 |
| Other expenses payable to DMC and affiliates* | | 8,799 |
*DMC, as part of its administrative services, pays operating expenses on behalf of the Fund and is reimbursed on a periodic basis. Expenses include items such as printing of shareholder reports, fees for audit, legal and tax services, registration fees and trustees’ fees.
As provided in the investment management agreement, the Fund bears the cost of certain legal and tax services, including internal legal and tax services provided to the Fund by DMC and/or its affiliates’ employees. For the year ended October 31, 2012, the Fund was charged 5,627 for internal legal and tax services provided by DMC and/or its affiliates’ employees.
For the year ended October 31, 2012, DDLP earned $23,454 for commissions on sales of the Fund’s Class A shares. For the year ended October 31, 2012, DDLP received gross CDSC commissions of $0, $734 and $ 208 on redemptions of the Fund’s Class A, Class B and Class C shares, respectively, and these commissions were entirely used to offset up-front commissions previously paid by DDLP to broker/dealers on sales of those shares.
33
Notes to financial statements
Delaware REIT Fund
2. Investment Management, Administration Agreements and Other Transactions with Affiliates (continued)
Trustees’ fees include expenses accrued by the Fund for each Trustee’s retainer and meeting fees. Certain officers of DMC, DSC and DDLP are officers and/or Trustees of the Trust. These officers and Trustees are paid no compensation by the Fund.
3. Investments
For the year ended October 31, 2012, the Fund made purchases of $177,053,778 and sales of $182,644,434 of investment securities other than short-term investments.
At October 31, 2012, the cost of investments for federal income tax purposes was $ 207,966,510. At October 31, 2012, the net unrealized appreciation was $ 12,641,809, of which $22,379,810 related to unrealized appreciation of investments and $ 9,738,001 related to unrealized depreciation of investments.
U.S. GAAP defines fair value as the price that the Fund would receive to sell an asset or pay to transfer a liability in an orderly transaction between market participants at the measurement date under current market conditions. A three level hierarchy for fair value measurements has been established based upon the transparency of inputs to the valuation of an asset or liability. Inputs may be observable or unobservable and refer broadly to the assumptions that market participants would use in pricing the asset or liability. Observable inputs reflect the assumptions market participants would use in pricing the asset or liability based on market data obtained from sources independent of the reporting entity. Unobservable inputs reflect the reporting entity’s own assumptions about the assumptions that market participants would use in pricing the asset or liability developed based on the best information available under the circumstances. The Fund’s investment in its entirety is assigned a level based upon the observability of the inputs which are significant to the overall valuation. The three level hierarchy of inputs is summarized below.
| Level 1 – | inputs are quoted prices in active markets for identical investments (e.g., equity securities, open-end investment companies, futures contracts, exchange-traded options contracts) |
| | |
| Level 2 – | other observable inputs (including, but not limited to: quoted prices for similar assets or liabilities in markets that are active, quoted prices for identical or similar assets or liabilities in markets that are not active, inputs other than quoted prices that are observable for the assets or liabilities (such as interest rates, yield curves, volatilities, prepayment speeds, loss severities, credit risks and default rates) or other market-corroborated inputs) (e.g., debt securities, government securities, swap contracts, foreign currency exchange contracts, foreign securities utilizing international fair value pricing, broker-quoted securities, fair valued securities) |
| |
| Level 3 – | inputs are significant unobservable inputs (including the Fund’s own assumptions used to determine the fair value of investments) (e.g., broker-quoted securities, fair valued securities) |
34
Level 3 investments are valued using significant unobservable inputs. The Fund may also use an income-based valuation approach in which the anticipated future cash flows of the investment are discounted to calculate fair value. Discounts may also be applied due to the nature or duration of any restrictions on the disposition of the investments. Valuations may also be based upon current market prices of securities that are comparable in coupon, rating, maturity and industry. The derived value of a Level 3 investment may not represent the value which is received upon disposition and this could impact the results of operations.
The following table summarizes the valuation of the Fund’s investments by fair value hierarchy levels as of October 31, 2012:
| Level 1 | | Level 2 | | Level 3 | | Total |
| Common Stock | $ | 210,049,384 | | $ | — | | $ | — | | | $ | 210,049,384 |
| Short-Term Investments | | — | | | 6,787,744 | | | — | | | | 6,787,744 |
| Securities Lending Collateral | | — | | | 3,771,191 | | | — | | | | 3,771,191 |
| Total | $ | 210,049,384 | | $ | 10,558,935 | | $ | — | | | $ | 220,608,319 |
The securities deemed worthless on the statement of net assets have been included as level 3 securities within the fair value hierarchy.
A reconciliation of Level 3 investments is presented when the Fund has a significant amount of Level 3 investments at the beginning, interim or end of the period in relation to net assets.
During the year ended October 31, 2012, there were no transfers between Level 1 investments, Level 2 investments or Level 3 investments that had a material impact to the Fund. The Fund’s policy is to recognize transfers between levels at the beginning of the reporting period.
Management has determined not to provide additional disclosure under ASU No. 2011-04 since the Level 3 investments are not considered material to the Fund’s net assets at the end of the period.
4. Dividend and Distribution Information
Income and long-term capital gain distributions are determined in accordance with federal income tax regulations, which may differ from U.S. GAAP. Additionally, distributions from net short-term gains on sales of investment securities are treated as ordinary income for federal income tax purposes. The tax character of dividends and distributions paid during the years ended October 31, 2012 and 2011 was as follows:
| | Year Ended |
| | 10/31/12 | | 10/31/11 |
| Ordinary income | | $3,648,259 | | $3,310,819 |
35
Notes to financial statements
Delaware REIT Fund
5. Components of Net Assets on a Tax Basis
As of October 31, 2012, the components of net assets on a tax basis were as follows:
| Shares of beneficial interest | $ | 214,619,517 | |
| Capital loss carryforwards | | (11,544,323 | ) |
| Unrealized appreciation | | 12,641,809 | |
| Net assets | $ | 215,717,003 | |
The differences between book basis and tax basis components of net assets are primarily attributable to tax deferral of losses on wash sales.
For financial reporting purposes, capital accounts are adjusted to reflect the tax character of permanent book/tax differences. Reclassifications are primarily due to the excess distribution. Results of operations and net assets were not affected by these reclassifications. For the year ended October 31, 2012, the Fund recorded the following reclassifications.
| Distributions in excess of net investment income | $ | 1,543,107 | |
| Paid-in capital | | (1,543,107 | ) |
For federal income tax purposes, capital loss carryforwards may be carried forward and applied against future capital gains. $17,696,540 was utilized in October 31, 2012. Capital loss carryforwards remaining at October 31, 2012 will expire as follows: $11,544,323 expires in 2017.
On December 22, 2010, the Regulated Investment Company Modernization Act of 2010 (the Act) was enacted, which changed various technical rules governing the tax treatment of regulated investment companies. The changes were generally effective for taxable years beginning after the date of enactment. Under the Act, the Fund is permitted to carry forward capital losses incurred in taxable years beginning after the date of enactment for an unlimited period. However, any losses incurred during those future taxable years will be required to be utilized prior to the losses incurred in pre-enactment taxable years, which carry an expiration date. As a result of this ordering rule, pre-enactment capital loss carryforwards may be more likely to expire unused. Additionally, post-enactment capital loss carryforwards will retain their character as either short-term or long-term capital losses rather than being considered all short-term as permitted under previous regulation.
36
6. Capital Shares
Transactions in capital shares were as follows:
| Year Ended |
| 10/31/12 | | 10/31/11 |
| Shares sold: | | | | | |
| Class A | 1,256,635 | | | 1,285,369 | |
| Class B | 369 | | | 2,476 | |
| Class C | 233,353 | | | 199,439 | |
| Class R | 382,481 | | | 198,344 | |
| Institutional Class | 1,957,566 | | | 2,456,013 | |
| |
| Shares issued upon reinvestment of dividends and distributions: | | | | | |
| Class A | 102,650 | | | 100,989 | |
| Class B | 1,787 | | | 3,390 | |
| Class C | 14,616 | | | 13,353 | |
| Class R | 9,479 | | | 7,472 | |
| Institutional Class | 153,938 | | | 165,325 | |
| | 4,112,874 | | | 4,432,170 | |
| Shares redeemed: | | | | | |
| Class A | (1,411,771 | ) | | (2,766,428 | ) |
| Class B | (193,029 | ) | | (377,998 | ) |
| Class C | (267,649 | ) | | (410,170 | ) |
| Class R | (209,439 | ) | | (196,257 | ) |
| Institutional Class | (2,746,081 | ) | | (3,316,116 | ) |
| | (4,827,969 | ) | | (7,066,969 | ) |
| Net decrease | (715,095 | ) | | (2,634,799 | ) |
For the years ended October 31, 2012 and 2011, 102,624 Class B shares were converted to 102,353 Class A shares valued at $1,254,931 and 199,570 Class B shares were converted to 199,021 Class A shares valued at $2,174,143, respectively. The respective amounts are included in Class B redemptions and Class A subscriptions in the table above and the statements of changes in net assets.
37
Notes to financial statements
Delaware REIT Fund
7. Line of Credit
The Fund, along with certain other funds in the Delaware Investments® Family of Funds (Participants), was a participant in a $100,000,000 revolving line of credit to be used for temporary or emergency purposes as an additional source of liquidity to fund redemptions of investor shares. Under the agreement, the Participants were charged an annual commitment fee, which was allocated across the Participants on the basis of each Participant’s allocation of the entire facility. The Participants were permitted to borrow up to a maximum of one third of their net assets under the agreement. Each Participant was individually, and not jointly, liable for its particular advances, if any, under the line of credit. The line of credit under the agreement expired on November 15, 2011.
On November 15, 2011, the Fund, along with the other Participants, entered into an amendment to the agreement for a $125,000,000 revolving line of credit. The line of credit available under the agreement is to be used as described above and operates in substantially the same manner as the original agreement. The agreement expired on November 13, 2012.
On November 13, 2012, the Fund, along with the other Participants, entered into an amendment to the agreement for a $125,000,000 revolving line of credit. The agreement is to be used as described above and operates in substantially the same manner as the original agreement. The line of credit available under the agreement expires on November 12, 2013. The Fund had no amounts outstanding as of October 31, 2012 or at any time during the year then ended.
8. Securities Lending
The Fund, along with other funds in the Delaware Investments Family of Funds, may lend its securities pursuant to a security lending agreement (Lending Agreement) with The Bank of New York Mellon (BNY Mellon). At the time a security is loaned, the borrower must post collateral equal to the required percentage of the market value of the loaned security, including any accrued interest. The required percentage is: (i) 102% with respect to U.S. securities and foreign securities that are denominated and payable in U.S. dollars; and (ii) 105% with respect to foreign securities. With respect to each loan, if on any business day the aggregate market value of securities collateral plus cash collateral held is less than the aggregate market value of the securities which are the subject of such loan, the borrower will be notified to provide additional collateral by the end of the following business day which, together with the collateral already held, will be not less than the applicable initial collateral requirements for such security loan. If the aggregate market value of securities collateral and cash collateral held with respect to a security loan exceeds the applicable initial collateral requirement, upon the request of the borrower BNY Mellon must return enough collateral to the borrower by the end of the following business day to reduce the value of the remaining collateral to the applicable initial collateral requirement for such security loan. As a result of the foregoing, the value of the collateral held with respect to a loaned security may be temporarily more or less than the value of the security on loan.
38
Cash collateral received is generally invested in the Delaware Investments Collateral Fund No. 1 (Collective Trust) established by BNY Mellon for the purpose of investment on behalf of funds managed by DMC that participate in BNY Mellon’s securities lending program. The Collective Trust may invest in U.S. government securities and high quality corporate debt, asset-backed and other money market securities and in repurchase agreements collateralized by such securities, provided that the Collective Trust will generally have a dollar-weighted average portfolio maturity of 60 days or less. In October 2008, BNY Mellon transferred certain distressed securities from the Fund’s previous collateral investment pool into the Mellon GSL Reinvestment Trust II. The Fund can also accept U.S. government securities and letters of credit (non-cash collateral) in connection with securities loans. In the event of default or bankruptcy by the lending agent, realization and/or retention of the collateral may be subject to legal proceedings. In the event the borrower fails to return loaned securities and the collateral received is insufficient to cover the value of the loaned securities and provided such collateral shortfall is not the result of investment losses, the lending agent has agreed to pay the amount of the shortfall to the Fund, or at the discretion of the lending agent, replace the loaned securities. The Fund continues to record dividends or interest, as applicable, on the securities loaned and is subject to changes in value of the securities loaned that may occur during the term of the loan. The Fund has the right under the Lending Agreement to recover the securities from the borrower on demand. With respect to security loans collateralized by non-cash collateral, the Fund receives loan premiums paid by the borrower. With respect to security loans collateralized by cash collateral, the earnings from the collateral investments are shared among the Fund, the security lending agent and the borrower. The Fund records security lending income net of allocations to the security lending agent and the borrower.
The Collective Trust used for the investment of cash collateral received from borrowers of securities seeks to maintain a net asset value per unit of $1.00, but there can be no assurance that it will always be able to do so. The Fund may incur investment losses as a result of investing securities lending collateral in the Collective Trust or another collateral investment pool. This could occur if an investment in a collateral investment pool defaulted or if it were necessary to liquidate assets in the collateral investment pool to meet returns on outstanding security loans at a time when the collateral investment pool’s net asset value per unit was less than $1.00. Under those circumstances, the Fund may not receive an amount from the collateral investment pool that is equal in amount to the collateral the Fund would be required to return to the borrower of the securities and the Fund would be required to make up for this shortfall.
At October 31, 2012, the value of securities on loan was $4,234,824, for which cash collateral was received and invested in accordance with the Lending Agreement. At October 31, 2012, the value of invested collateral was $3,771,191. These investments are presented on the statement of net assets under the caption “Securities Lending Collateral.”
39
Notes to financial statements
Delaware REIT Fund
9. Credit and Market Risk
The Fund concentrates its investments in the real estate industry and is subject to the risks associated with that industry. If the Fund holds real estate directly as a result of defaults or receives rental income directly from real estate holdings, its tax status as a regulated investment company may be jeopardized. The Fund is also affected by interest rate changes, particularly if the REITs it holds use floating rate debt to finance their ongoing operations. Its investments may also tend to fluctuate more in value than a portfolio that invests in a broader range of industries.
The Fund may invest up to 15% of its net assets in illiquid securities, which may include securities with contractual restrictions on resale, securities exempt from registration under Rule 144A of the Securities Act of 1933, as amended, and other securities which may not be readily marketable. The relative illiquidity of these securities may impair the Fund from disposing of them in a timely manner and at a fair price when it is necessary or desirable to do so. While maintaining oversight, the Fund’s Board has delegated to DMC the day-to-day functions of determining whether individual securities are liquid for purposes of the Fund’s limitation on investments in illiquid securities. Securities eligible for resale pursuant to Rule 144A, which are determined to be liquid, are not subject to the Fund’s 15% limit on investments in illiquid securities. As of October 31, 2012, there were no Rule 144A securities. Illiquid securities have been identified on the statement of net assets.
10. Contractual Obligations
The Fund enters into contracts in the normal course of business that contain a variety of indemnifications. The Fund’s maximum exposure under these arrangements is unknown. However, the Fund has not had prior claims or losses pursuant to these contracts. Management has reviewed the Fund’s existing contracts and expects the risk of loss to be remote.
11. Subsequent Events
Except as described in Note 7, management has determined that no material events or transactions occurred subsequent to October 31, 2012 that would require recognition or disclosure in the Fund’s financial statements.
40
Report of independent
registered public accounting firm
To the Board of Trustees of Delaware Pooled® Trust
and the Shareholders of The Real Estate Investment Trust Portfolio:
In our opinion, the accompanying statement of net assets and the related statements of operations and of changes in net assets and the financial highlights present fairly, in all material respects, the financial position of The Real Estate Investment Trust Portfolio (one of the series constituting Delaware Pooled Trust, hereafter referred to as the “Fund”) at October 31, 2012, the results of its operations for the year then ended, the changes in its net assets for each of the two years in the period then ended and the financial highlights for each of the three years in the period then ended, in conformity with accounting principles generally accepted in the United States of America. These financial statements and financial highlights (hereafter referred to as “financial statements”) are the responsibility of the Fund’s management; our responsibility is to express an opinion on these financial statements based on our audits. We conducted our audits of these financial statements in accordance with the standards of the Public Company Accounting Oversight Board (United States). Those standards require that we plan and perform the audit to obtain reasonable assurance about whether the financial statements are free of material misstatement. An audit includes examining, on a test basis, evidence supporting the amounts and disclosures in the financial statements, assessing the accounting principles used and significant estimates made by management, and evaluating the overall financial statement presentation. We believe that our audits, which included confirmation of securities at October 31, 2012 by correspondence with the custodian and brokers, provide a reasonable basis for our opinion. The financial highlights for each of the two years in the period ended October 31, 2009 were audited by other independent accountants whose report dated December 22, 2009 expressed an unqualified opinion on those statements.
PricewaterhouseCoopers LLP
Philadelphia, Pennsylvania
December 14, 2012
41
Other Fund information
(Unaudited)
Delaware REIT Fund
Board Consideration of Delaware REIT Fund investment advisory agreement
At a meeting held on August 21–23, 2012 (the “Annual Meeting”), the Board of Trustees (the “Board”), including a majority of disinterested or independent Trustees, approved the renewal of the Investment Advisory Agreement for Delaware REIT Fund (the “Fund”). In making its decision, the Board considered information furnished at regular quarterly Board meetings, including reports detailing Fund performance, investment strategies and expenses, as well as information prepared specifically in connection with the renewal of the investment advisory and sub-advisory contracts. Information furnished specifically in connection with the renewal of the Investment Advisory Agreement with Delaware Management Company (“DMC”) included materials provided by DMC and its affiliates (“Delaware Investments”) concerning, among other things, the nature, extent and quality of services provided to the Fund, the costs of such services to the Fund, economies of scale and the financial condition and profitability of Delaware Investments. In addition, in connection with the Annual Meeting, reports were provided in May 2012 and included independent historical and comparative reports provided by Lipper, Inc., an independent statistical compilation organization (“Lipper”). The Lipper reports compared the Fund’s investment performance and expenses with those of other comparable mutual funds. The Independent Trustees reviewed and discussed the Lipper reports with independent legal counsel to the Independent Trustees. The Board requested and received information regarding DMC’s policy with respect to advisory fee levels and its breakpoint philosophy; the structure of portfolio manager compensation; the investment manager’s profitability; comparative client fee information; and any constraints or limitations on the availability of securities in certain investment styles, which had in the past year inhibited, or which were likely in the future to inhibit, DMC’s ability to invest fully in accordance with Fund policies.
In considering information relating to the approval of the Fund’s advisory agreement, the Independent Trustees received assistance and advice from and met separately with independent legal counsel to the Independent Trustees. Although the Board gave attention to all information furnished, the following discussion identifies, under separate headings, the primary factors taken into account by the Board during its contract renewal considerations.
Nature, Extent and Quality of Service. The Board considered the services provided by Delaware Investments to the Fund and its shareholders. In reviewing the nature, extent and quality of services, the Board considered reports furnished to it throughout the year, which covered matters such as the relative performance of the Fund, compliance of portfolio managers with the investment policies, strategies and restrictions for the Fund, compliance by DMC and Delaware Distributors, L.P. (together, “Management”) personnel with the Code of Ethics adopted throughout the Delaware Investments® Family of Funds complex and adherence to fair value pricing procedures as established by the Board. The Board was pleased with the current staffing of the Fund’s investment advisor and the emphasis placed on research in the investment process. The Board recognized DMC’s receipt of several industry distinctions. The Board gave favorable consideration to DMC’s efforts to control expenditures while maintaining service levels committed to fund matters. The Board noted that in July 2011 Management implemented measures to reduce
42
overall costs and improve transfer agent and shareholder servicing functions through outsourcing. The Board noted the benefits provided to Fund shareholders through each shareholder’s ability to exchange an investment in one Delaware Investments® fund for the same class of shares in another Delaware Investments fund without a sales charge, to reinvest Fund dividends into additional shares of the Fund or into additional shares of other Delaware Investments funds and the privilege to combine holdings in other Delaware Investments funds to obtain a reduced sales charge. The Board was satisfied with the nature, extent and quality of the overall services provided by Delaware Investments.
Investment Performance. The Board placed significant emphasis on the investment performance of the Fund in view of the importance of investment performance to shareholders. Although the Board gave appropriate consideration to performance reports and discussions with portfolio managers at Investment Committee meetings throughout the year, the Board gave particular weight to the Lipper reports furnished for the Annual Meeting. The Lipper reports prepared for the Fund showed the investment performance of its Class A shares in comparison to a group of similar funds as selected by Lipper (the “Performance Universe”). A fund with the best performance ranked first, and a fund with the poorest performance ranked last. The highest/best performing 25% of funds in the Performance Universe make up the first quartile; the next 25%, the second quartile; the next 25%, the third quartile; and the poorest/worst performing 25% of funds in the Performance Universe make up the fourth quartile. Comparative annualized performance for the Fund was shown for the past one-, three-, five- and ten-year periods, as applicable, ended March 31, 2012. The Board’s objective is that the Fund’s performance for the periods considered be at or above the median of its Performance Universe. The following paragraph summarizes the performance results for the Fund and the Board’s view of such performance.
The Performance Universe for the Fund consisted of the Fund and all retail and institutional real estate funds as selected by Lipper. The Lipper report comparison showed that the Fund’s total return for the one-year period was in the first quartile of its Performance Universe. The report further showed that the Fund’s total return for the three- and ten-year periods was in the third quartile and the Fund’s total return for the five-year period was in the second quartile. The Board determined that the Fund’s performance results were mixed. Observing that the Fund’s one- and five-year performance was above median, the Board was satisfied with performance.
Comparative Expenses. The Board considered expense comparison data for the Delaware Investments Family of Funds. Management provided the Board with information on pricing levels and fee structures for the Fund as of its most recently completed fiscal year. The Board also focused on the comparative analysis of effective management fees and total expense ratios of the Fund versus effective management fees and expense ratios of a group of similar funds as selected by Lipper (the “Expense Group”). In reviewing comparative costs, the Fund’s contractual management fee and the actual management fee incurred by the Fund were compared with the contractual management fees (assuming all funds in the Expense Group were similar in size to the Fund) and actual management fees (as reported by each fund) within the Expense Group, taking
43
Other Fund information
(Unaudited)
Delaware REIT Fund
Board Consideration of Delaware REIT Fund investment advisory agreement (continued)
into account any applicable breakpoints and fee waivers. The Fund’s total expenses were also compared with those of its Expense Group. The Lipper total expenses, for comparative consistency, were shown by Lipper for Class A shares and comparative total expenses including 12b-1 and non 12b-1 service fees. The Board considered fees paid to Delaware Investments for non-management services. The Board’s objective is to limit the Fund’s total expense ratio to be competitive with that of the Expense Group. The following paragraph summarizes the expense results for the Fund and the Board’s view of such expenses.
The expense comparisons for the Fund showed that its actual management fee was in the quartile with the second lowest expenses of its Expense Group and its total expenses were in the quartile with the second highest expenses of its Expense Group. The Board gave favorable consideration to the Fund’s management fee, but noted that the Fund’s total expenses were not in line with the Board’s objective. In evaluating the total expenses, the Board considered fee waivers in place through February 2013 and various initiatives implemented by Management, such as the outsourcing of certain transfer agency services, creating an opportunity for a reduction in expenses. The Board was satisfied with Management’s efforts to improve the Fund’s total expense ratio and bring it in line with the Board’s objective.
Management Profitability. The Board considered the level of profits realized by Delaware Investments in connection with the operation of the Fund. In this respect, the Board reviewed the Investment Management Profitability Analysis that addressed the overall profitability of Delaware Investments’ business in providing management and other services to each of the individual funds and the Delaware Investments® Family of Funds as a whole. Specific attention was given to the methodology followed in allocating costs for the purpose of determining profitability. Management stated that the level of profits of Delaware Investments, to a certain extent, reflect recent operational cost savings and efficiencies initiated by Delaware Investments. The Board considered Delaware Investments’ efforts to improve services provided to fund shareholders and to meet additional regulatory and compliance requirements resulting from recent industry-wide Securities and Exchange Commission initiatives. The Board also considered the extent to which Delaware Investments might derive ancillary benefits from fund operations, including the potential for procuring additional business as a result of the prestige and visibility associated with its role as service provider to the Delaware Investments Family of Funds and the benefits from allocation of fund brokerage to improve trading efficiencies. The Board found that the management fees were reasonable in light of the services rendered and the level of profitability of Delaware Investments.
Economies of Scale. The Trustees considered whether economies of scale are realized by Delaware Investments as the Fund’s assets increase and the extent to which any economies of scale are reflected in the level of management fees charged. The Trustees reviewed the standardized advisory fee pricing and structure, approved by the Board and shareholders, which includes breakpoints. Breakpoints in the advisory fee occur when the advisory fee rate is reduced on assets
44
in excess of specified levels. Breakpoints result in a lower advisory fee than would otherwise be the case on all assets when the asset levels specified are exceeded. The Board noted that the fee under the Fund’s management contract fell within the standard structure. Although the Fund has not reached a size at which it can take advantage of breakpoints, the Board recognized that the fee was structured so that when the Fund grows, economies of scale may be shared.
Tax Information
The information set forth below is for the Fund’s fiscal year as required by federal income tax laws. Shareholders, however, must report distributions on a calendar year basis for income tax purposes, which may include distributions for portions of two fiscal years of a fund. Accordingly, the information needed by shareholders for income tax purposes will be sent to them in January of each year. Please consult your tax advisor for proper treatment of this information.
All designations are based on financial information available as of the date of this annual report and, accordingly are subject to change. For any and all items requiring designation, it is the intention of the Fund to designate the maximum amount permitted under the Internal Revenue Code and the regulations thereunder.
For the fiscal year ended October 31, 2012, the Fund designates distributions paid during the year as follows:
| (A) | Ordinary Income Distributions* (Tax Basis) | 100% |
| (B) | Qualifying Dividends1 | 0.53% |
(A) and (B) are based on a percentage of the Fund’s total distributions. |
1Qualifying dividends represent dividends which quality for the corporate dividends received deduction. |
*For the fiscal year ended October 31, 2012, certain dividends paid by the Fund may be subject to a maximum tax rate of 15%, as provided for by the Jobs and Growth Tax Relief Reconciliation Act of 2003 and as extended by the Tax Relief, Unemployment Insurance Reauthorization and Jobs Creation Act of 2010. The Fund intends to designate up to 0.53% to be taxed at a maximum rate of 15%. Complete information will be computed and reported in conjunction with your 2012 Form 1099-DIV. |
For the fiscal year ended October 31, 2012, certain interest income paid by the Fund, determined to be Qualified Interest Income and Short-Term Capital Gains, may be subject to relief from U.S. withholding for foreign shareholders, as provided by the American Jobs Creation Act of 2004 and as extended by the Tax Relief, Unemployment Insurance Reauthorization and Jobs Creation Act of 2010. For the fiscal year ended October 31, 2012, the Fund designated maximum distributions of Qualified Short-Term Capital Gain of 0.10%.
45
Board of trustees/directors and officers addendum
Delaware Investments® Family of Funds
A mutual fund is governed by a Board of Trustees/Directors (“Trustees”), which has oversight responsibility for the management of a fund’s business affairs. Trustees establish procedures and oversee and review the performance of the investment manager, the distributor, and others who perform services for the fund. The independent fund trustees, in particular, are advocates
| Name, Address, | | Position(s) | | Length of |
| and Birth Date | | Held with Fund(s) | | Time Served |
| Interested Trustees | | | | |
| Patrick P. Coyne1 | | Chairman, President, | | Chairman and Trustee |
| 2005 Market Street | | Chief Executive Officer, | | since August 16, 2006 |
| Philadelphia, PA 19103 | | and Trustee | | |
| April 1963 | | | | President and |
| | | | Chief Executive Officer |
| | | | since August 1, 2006 |
| | | | |
| | | | |
| | | | |
| | | | |
| | | | |
| | | | |
| | | | |
| | | | |
| | | | |
| | | | |
| | | | |
| | | | |
| | | | |
| | | | |
1 Patrick P. Coyne is considered to be an “Interested Trustee” because he is an executive officer of the Fund’s(s’) investment advisor.
46
for shareholder interests. Each trustee has served in that capacity since he or she was elected to or appointed to the Board of Trustees, and will continue to serve until his or her retirement or the election of a new trustee in his or her place. The following is a list of the Trustees and Officers with certain background and related information.
| | Number of Portfolios in | | |
| Principal Occupation(s) | | Fund Complex Overseen | | Other Directorships |
| During Past 5 Years | | by Trustee or Officer | | Held by Trustee or Officer |
| |
| Patrick P. Coyne has served in | | 71 | | Director and Audit |
| various executive capacities | | | | Committee Member |
| at different times at | | | | Kaydon Corp. |
| Delaware Investments.2 | | | | |
| | | | | Board of Governors Member |
| | | | | Investment Company |
| | | | | Institute (ICI) |
| | | | | |
| | | | | |
| | | | | |
| | | | | |
| | | | | |
| | | | | |
| | | | | |
| | | | | |
| | | | | |
| | | | | |
| | | | | |
| | | | | |
| | | | | |
2 Delaware Investments is the marketing name for Delaware Management Holdings, Inc. and its subsidiaries, including the Fund’s(s’) investment advisor, principal underwriter, and its transfer agent.
47
Board of trustees/directors and officers addendum
Delaware Investments® Family of Funds
| Name, Address, | | Position(s) | | Length of |
| and Birth Date | | Held with Fund(s) | | Time Served |
| Independent Trustees | | | | |
| Thomas L. Bennett | | Trustee | | Since March 2005 |
| 2005 Market Street | | | | |
| Philadelphia, PA 19103 | | | | |
| October 1947 | | | | |
| John A. Fry | | Trustee | | Since January 2001 |
| 2005 Market Street | | | | |
| Philadelphia, PA 19103 | | | | |
| May 1960 | | | | |
| |
| |
| |
| |
| |
| |
| |
| |
| |
| |
| Anthony D. Knerr | | Trustee | | Since April 1990 |
| 2005 Market Street | | | | |
| Philadelphia, PA 19103 | | | | |
| December 1938 | | | | |
| Lucinda S. Landreth | | Trustee | | Since March 2005 |
| 2005 Market Street | | | | |
| Philadelphia, PA 19103 | | | | |
| June 1947 | | | | |
48
| Number of Portfolios in | |
| Principal Occupation(s) | Fund Complex Overseen | Other Directorships |
| During Past 5 Years | by Trustee or Officer | Held by Trustee or Officer |
| |
| Private Investor | 71 | Director |
| (March 2004–Present) | | Bryn Mawr Bank Corp. (BMTC) |
| | | (2007–2011) |
| |
| President | 71 | Board of Governors Member — |
| Drexel University | | NASDAQ OMX PHLX LLC |
| (August 2010–Present) | | |
| | | Director and Audit |
| President | | Committee Member |
| Franklin & Marshall College | | Community Health Systems |
| (July 2002–July 2010) | | |
| | | Director — Ecore |
| | | International |
| | | (2009–2010) |
| |
| | | Director — Allied |
| | | Barton Securities Holdings |
| | | (2005–2008) |
| Managing Director | 71 | None |
| Anthony Knerr & Associates | | |
| (Strategic Consulting) | | |
| (1990–Present) | | |
| Private Investor | 71 | None |
| (2004–Present) | | |
| | | |
| | | |
49
Board of trustees/directors and officers addendum
Delaware Investments® Family of Funds
| Name, Address, | | Position(s) | | Length of |
| and Birth Date | | Held with Fund(s) | | Time Served |
| Independent Trustees (continued) |
| Frances A. Sevilla-Sacasa | | Trustee | | Since September 2011 |
| 2005 Market Street | | | | |
| Philadelphia, PA 19103 | | | | |
| January 1956 | | | | |
| | | | | |
| | | | | |
| | | | | |
| | | | | |
| | | | | |
| | | | | |
| | | | | |
| | | | | |
| | | | | |
| | | | | |
| | | | | |
| | | | | |
| | | | | |
50
| Number of Portfolios in | |
| Principal Occupation(s) | Fund Complex Overseen | Other Directorships |
| During Past 5 Years | by Trustee or Officer | Held by Trustee or Officer |
| |
| Chief Executive Officer — | 71 | Trust Manager — Camden |
| Banco Itaú Europa | | Property Trust |
| International | | (since August 2011) |
| (since April 2012) | | |
| |
| Executive Advisor to Dean | | |
| (August 2011–March 2012) | | |
| and Interim Dean | | |
| (January 2011–July 2011) — | | |
| University of Miami School of | | |
| Business Administration | | |
| |
| President — U.S. Trust, | | |
| Bank of America Private | | |
| Wealth Management | | |
| (Private Banking) | | |
| (July 2007–December 2008) | | |
51
Board of trustees/directors and officers addendum
Delaware Investments® Family of Funds
| Name, Address, | | Position(s) | | Length of |
| and Birth Date | | Held with Fund(s) | | Time Served |
| Independent Trustees (continued) | | | | |
| Janet L. Yeomans | | Trustee | | Since April 1999 |
| 2005 Market Street | | | | |
| Philadelphia, PA 19103 | | | | |
| July 1948 | | | | |
| |
| |
| |
| |
| |
| |
| J. Richard Zecher | | Trustee | | Since March 2005 |
| 2005 Market Street | | | | |
| Philadelphia, PA 19103 | | | | |
| July 1940 | | | | |
| | | | | |
| | | | | |
| | | | | |
| | | | | |
| | | | | |
52
| | Number of Portfolios in | | |
| Principal Occupation(s) | | Fund Complex Overseen | | Other Directorships |
| During Past 5 Years | | by Trustee or Officer | | Held by Trustee or Officer |
| |
| Vice President and Treasurer | | 71 | | Director, Audit |
| (January 2006–July 2012) | | | | Committee Member and |
| Vice President — Mergers & Acquisitions | | | | Investment Committee |
| (January 2003–January 2006), and | | | | Member |
| Vice President and Treasurer | | | | Okabena Company |
| (July 1995–January 2003) | | | | |
| 3M Corporation | | | | Chair — 3M |
| | | | | Investment Management |
| | | | | Company |
| | | | | (January 2005–July 2012) |
| Founder | | 71 | | Director and Compensation |
| Investor Analytics | | | | Committee Member |
| (Risk Management) | | | | Investor Analytics |
| (May 1999–Present) | | | | |
| | | | Director |
| Founder | | | | Oxigene, Inc. |
| P/E Investments | | | | (2003–2008) |
| (Hedge Fund) | | | | |
| (September 1996–Present) | | | | |
53
Board of trustees/directors and officers addendum
Delaware Investments® Family of Funds
| Name, Address, | | Position(s) | | Length of |
| and Birth Date | | Held with Fund(s) | | Time Served |
| Officers |
| David F. Connor | | Vice President, | | Vice President since |
| 2005 Market Street | | Deputy General | | September 2000 |
| Philadelphia, PA 19103 | | Counsel, and Secretary | | and Secretary since |
| December 1963 | | | | October 2005 |
| |
| Daniel V. Geatens | | Vice President | | Treasurer |
| 2005 Market Street | | and Treasurer | | since October 2007 |
| Philadelphia, PA 19103 | | | | |
| October 1972 | | | | |
| David P. O’Connor | | Executive Vice President, | | Executive Vice President |
| 2005 Market Street | | General Counsel | | since February 2012; |
| Philadelphia, PA 19103 | | and Chief Legal Officer | | Senior Vice President |
| February 1966 | | | | October 2005– |
| | | | | February 2012; |
| | | | | General Counsel and |
| | | | | Chief Legal Officer |
| | | | | since October 2005 |
| Richard Salus | | Senior Vice President | | Chief Financial Officer |
| 2005 Market Street | | and Chief Financial Officer | | since November 2006 |
| Philadelphia, PA 19103 | | | | |
| October 1963 | | | | |
The Statement of Additional Information for the Fund(s) includes additional information about the Trustees and Officers and is available, without charge, upon request by calling 800 523-1918.
54
| | Number of Portfolios in | | |
| Principal Occupation(s) | | Fund Complex Overseen | | Other Directorships |
| During Past 5 Years | | by Trustee or Officer | | Held by Trustee or Officer |
| |
| David F. Connor has served as | | 71 | | None3 |
| Vice President and Deputy | | | | |
| General Counsel of | | | | |
| Delaware Investments | | | | |
| since 2000. | | | | |
| Daniel V. Geatens has served | | 71 | | None3 |
| in various capacities at | | | | |
| different times at | | | | |
| Delaware Investments. | | | | |
| David P. O’Connor has served in | | 71 | | None3 |
| various executive and legal | | | | |
| capacities at different times | | | | |
| at Delaware Investments. | | | | |
| |
| |
| |
| |
| Richard Salus has served in | | 71 | | None3 |
| various executive capacities | | | | |
| at different times at | | | | |
| Delaware Investments. | | | | |
3 David F. Connor, Daniel V. Geatens, David P. O’Connor, and Richard Salus serve in similar capacities for the six portfolios of the Optimum Fund Trust, which have the same investment advisor, principal underwriter, and transfer agent as the registrant.
55
About the organization
Board of trustees |
Patrick P. Coyne
Chairman, President, and
Chief Executive Officer
Delaware Investments®
Family of Funds
Philadelphia, PA Thomas L. Bennett
Private Investor
Rosemont, PA | John A. Fry
President
Drexel University
Philadelphia, PA Anthony D. Knerr
Founder and Managing
Director
Anthony Knerr &
Associates
New York, NY | Lucinda S. Landreth
Former Chief Investment
Officer
Assurant, Inc.
Philadelphia, PA Frances A.
Sevilla-Sacasa
Chief Executive Officer
Banco Itaú Europa
International
Miami, FL | Janet L. Yeomans
Former Vice President and
Treasurer
3M Corporation
St. Paul, MN J. Richard Zecher
Founder
Investor Analytics
Scottsdale, AZ |
| | | | |
Affiliated officers |
David F. Connor
Vice President, Deputy
General Counsel, and
Secretary
Delaware Investments
Family of Funds
Philadelphia, PA | Daniel V. Geatens
Vice President and
Treasurer
Delaware Investments
Family of Funds
Philadelphia, PA | David P. O’Connor
Executive Vice President,
General Counsel,
and Chief Legal Officer
Delaware Investments
Family of Funds
Philadelphia, PA | Richard Salus
Senior Vice President and
Chief Financial Officer
Delaware Investments
Family of Funds
Philadelphia, PA |
This annual report is for the information of Delaware REIT Fund shareholders, but it may be used with prospective investors when preceded or accompanied by the Delaware Investments Fund fact sheet for the most recently completed calendar quarter. These documents are available at delawareinvestments.com.
Delaware Investments is the marketing name of Delaware Management Holdings, Inc. and its subsidiaries.The Fund files its complete schedule of portfolio holdings with the Securities and Exchange Commission (SEC) for the first and third quarters of each fiscal year on Form N-Q. The Fund’s Forms N-Q, as well as a description of the policies and procedures that the Fund uses to determine how to vote proxies (if any) relating to portfolio securities are available without charge (i) upon request, by calling 800 523-1918; and (ii) on the SEC’s website at sec.gov. In addition, a description of the policies and procedures that the Fund uses to determine how to vote proxies (if any) relating to portfolio securities and the Fund’s Schedule of Investments are available without charge on the Fund’s website at delawareinvestments.com. The Fund’s Forms N-Q may be reviewed and copied at the SEC’s Public Reference Room in Washington, D.C.; information on the operation of the Public Reference Room may be obtained by calling 800 SEC-0330.
Information (if any) regarding how the Fund voted proxies relating to portfolio securities during the most recently disclosed 12-month period ended June 30 is available without charge (i) through the Fund’s website at delawareinvestments.com; and (ii) on the SEC’s website at sec.gov.
56
Item 2. Code of Ethics
The registrant has adopted a code of ethics that applies to the registrant’s principal executive officer, principal financial officer, principal accounting officer or controller, or persons performing similar functions, regardless of whether these individuals are employed by the registrant or a third party. A copy of the registrant’s Code of Business Ethics has been posted on the Delaware Investments Internet Web site at www.delawareinvestments.com. Any amendments to the Code of Business Ethics, and information on any waiver from its provisions granted by the registrant, will also be posted on this Web site within five business days of such amendment or waiver and will remain on the Web site for at least 12 months.
Item 3. Audit Committee Financial Expert
The registrant’s Board of Trustees/Directors has determined that certain members of the registrant’s Audit Committee are audit committee financial experts, as defined below. For purposes of this item, an “audit committee financial expert” is a person who has the following attributes:
a. An understanding of generally accepted accounting principles and financial statements;
b. The ability to assess the general application of such principles in connection with the accounting for estimates, accruals, and reserves;
c. Experience preparing, auditing, analyzing, or evaluating financial statements that present a breadth and level of complexity of accounting issues that are generally comparable to the breadth and complexity of issues that can reasonably be expected to be raised by the registrant’s financial statements, or experience actively supervising one or more persons engaged in such activities;
d. An understanding of internal controls and procedures for financial reporting; and
e. An understanding of audit committee functions.
An “audit committee financial expert” shall have acquired such attributes through:
a. Education and experience as a principal financial officer, principal accounting officer, controller, public accountant, or auditor or experience in one or more positions that involve the performance of similar functions;
b. Experience actively supervising a principal financial officer, principal accounting officer, controller, public accountant, auditor, or person performing similar functions;
c. Experience overseeing or assessing the performance of companies or public accountants with respect to the preparation, auditing, or evaluation of financial statements; or
d. Other relevant experience.
The registrant’s Board of Trustees/Directors has also determined that each member of the registrant’s Audit Committee is independent. In order to be “independent” for purposes of this item, the Audit Committee member may not: (i) other than in his or her capacity as a member of the Board of Trustees/Directors or any committee thereof, accept directly or indirectly any consulting, advisory or other compensatory fee from the issuer; or (ii) be an “interested person” of the registrant as defined in Section 2(a)(19) of the Investment Company Act of 1940.
The names of the audit committee financial experts on the registrant’s Audit Committee are set forth below:
Thomas L. Bennett1
John A. Fry
Frances A. Sevilla-Sacasa
Janet L. Yeomans
Item 4. Principal Accountant Fees and Services
(a) Audit fees.
The aggregate fees billed for services provided to the registrant by its independent auditors for the audit of the registrant’s annual financial statements and for services normally provided by the independent auditors in connection with statutory and regulatory filings or engagements were $192,880 for the fiscal year ended October 31, 2012.
____________________
1 The instructions to Form N-CSR require disclosure on the relevant experience of persons who qualify as audit committee financial experts based on “other relevant experience.” The Board of Trustees/Directors has determined that Mr. Bennett qualifies as an audit committee financial expert by virtue of: his education and Chartered Financial Analyst designation; his experience as a credit analyst, portfolio manager and the manager of other credit analysts and portfolio managers; and his prior service on the audit committees of public companies.
The aggregate fees billed for services provided to the registrant by its independent auditors for the audit of the registrant’s annual financial statements and for services normally provided by the independent auditors in connection with statutory and regulatory filings or engagements were $222,300 for the fiscal year ended October 31, 2011.
(b) Audit-related fees.
The aggregate fees billed by the registrant’s independent auditors for services relating to the performance of the audit of the registrant’s financial statements and not reported under paragraph (a) of this Item were $0 for the fiscal year ended October 31, 2012.
The aggregate fees billed by the registrant’s independent auditors for services relating to the performance of the audit of the financial statements of the registrant’s investment adviser and other service providers under common control with the adviser and that relate directly to the operations or financial reporting of the registrant were $685,000 for the registrant’s fiscal year ended October 31, 2012. The percentage of these fees relating to services approved by the registrant’s Audit Committee pursuant to the de minimis exception from the pre-approval requirement in Rule 2-01(c)(7)(i)(C) of Regulation S-X was 0%. These audit-related services were as follows: year end audit procedures; group reporting and subsidiary statutory audits.
The aggregate fees billed by the registrant’s independent auditors for services relating to the performance of the audit of the registrant’s financial statements and not reported under paragraph (a) of this Item were $0 for the fiscal year ended October 31, 2011.
The aggregate fees billed by the registrant’s independent auditors for services relating to the performance of the audit of the financial statements of the registrant’s investment adviser and other service providers under common control with the adviser and that relate directly to the operations or financial reporting of the registrant were $593,000 for the registrant’s fiscal year ended October 31, 2011. The percentage of these fees relating to services approved by the registrant’s Audit Committee pursuant to the de minimis exception from the pre-approval requirement in Rule 2-01(c)(7)(i)(C) of Regulation S-X was 0%. These audit-related services were as follows: year end audit procedures; reporting up and subsidiary statutory audits.
(c) Tax fees.
The aggregate fees billed by the registrant’s independent auditors for tax-related services provided to the registrant were $33,990 for the fiscal year ended October 31, 2012. The percentage of these fees relating to services approved by the registrant’s Audit Committee pursuant to the de minimis exception from the pre-approval requirement in Rule 2-01(c)(7)(i)(C) of Regulation S-X was 0%. These tax-related services were as follows: review of income tax returns and review of annual excise distribution calculations.
The aggregate fees billed by the registrant’s independent auditors for tax-related services provided to the registrant’s investment adviser and other service providers under common control with the adviser and that relate directly to the operations or financial reporting of the registrant were $0 for the registrant’s fiscal year ended October 31, 2012.
The aggregate fees billed by the registrant’s independent auditors for tax-related services provided to the registrant were $40,950 for the fiscal year ended October 31, 2011. The percentage of these fees relating to services approved by the registrant’s Audit Committee pursuant to the de minimis exception from the pre-approval requirement in Rule 2-01(c)(7)(i)(C) of Regulation S-X was 0%. These tax-related services were as follows: review of income tax returns and review of annual excise distribution calculations.
The aggregate fees billed by the registrant’s independent auditors for tax-related services provided to the registrant’s investment adviser and other service providers under common control with the adviser and that relate directly to the operations or financial reporting of the registrant were $0 for the registrant’s fiscal year ended October 31, 2011.
(d) All other fees.
The aggregate fees billed for all services provided by the independent auditors to the registrant other than those set forth in paragraphs (a), (b) and (c) of this Item were $0 for the fiscal year ended October 31, 2012.
The aggregate fees billed for all services other than those set forth in paragraphs (b) and (c) of this Item provided by the registrant’s independent auditors to the registrant’s adviser and other service providers under common control with the adviser and that relate directly to the operations or financial reporting of the registrant were $0 for the registrant’s fiscal year ended October 31, 2012. The percentage of these fees relating to services approved by the registrant’s Audit Committee pursuant to the de minimis exception from the pre-approval requirement in Rule 2-01(c)(7)(i)(C) of Regulation S-X was 0%.
The aggregate fees billed for all services provided by the independent auditors to the registrant other than those set forth in paragraphs (a), (b) and (c) of this Item were $0 for the fiscal year ended October 31, 2011.
The aggregate fees billed for all services other than those set forth in paragraphs (b) and (c) of this Item provided by the registrant’s independent auditors to the registrant’s adviser and other service providers under common control with the adviser and that relate directly to the operations or financial reporting of the registrant were $25,000 for the registrant’s fiscal year ended October 31, 2011. The percentage of these fees relating to services approved by the registrant’s Audit Committee pursuant to the de minimis exception from the pre-approval requirement in Rule 2-01(c)(7)(i)(C) of Regulation S-X was 0%. These other services were as follows: attest examination of management's assertion to the controls in place at the transfer agent to be in compliance with Rule 17ad-13(a)(3) of the Securities Exchange Act of 1934.
(e) The registrant’s Audit Committee has established pre-approval policies and procedures as permitted by Rule 2-01(c)(7)(i)(B) of Regulation S-X (the “Pre-Approval Policy”) with respect to services provided by the registrant’s independent auditors. Pursuant to the Pre-Approval Policy, the Audit Committee has pre-approved the services set forth in the table below with respect to the registrant up to the specified fee limits. Certain fee limits are based on aggregate fees to the registrant and other registrants within the Delaware Investments Family of Funds.
| Service | Range of Fees |
| Audit Services | |
| Statutory audits or financial audits for new Funds | up to $25,000 per Fund |
| Services associated with SEC registration statements (e.g., Form N-1A, Form N-14, etc.), periodic reports and other documents filed with the SEC or other documents issued in connection with securities offerings (e.g., comfort letters for closed-end Fund offerings, consents), and assistance in responding to SEC comment letters | up to $10,000 per Fund |
| Consultations by Fund management as to the accounting or disclosure treatment of transactions or events and/or the actual or potential impact of final or proposed rules, standards or interpretations by the SEC, FASB, or other regulatory or standard-setting bodies (Note: Under SEC rules, some consultations may be considered “audit-related services” rather than “audit services”) | up to $25,000 in the aggregate |
| Audit-Related Services | |
| Consultations by Fund management as to the accounting or disclosure treatment of transactions or events and/or the actual or potential impact of final or proposed rules, standards or interpretations by the SEC, FASB, or other regulatory or standard-setting bodies (Note: Under SEC rules, some consultations may be considered “audit services” rather than “audit-related services”) | up to $25,000 in the aggregate |
| Tax Services | |
| U.S. federal, state and local and international tax planning and advice (e.g., consulting on statutory, regulatory or administrative developments, evaluation of Funds’ tax compliance function, etc.) | up to $25,000 in the aggregate |
| U.S. federal, state and local tax compliance (e.g., excise distribution reviews, etc.) | up to $5,000 per Fund |
| Review of federal, state, local and international income, franchise and other tax returns | up to $5,000 per Fund |
Under the Pre-Approval Policy, the Audit Committee has also pre-approved the services set forth in the table below with respect to the registrant’s investment adviser and other entities controlling, controlled by or under common control with the investment adviser that provide ongoing services to the registrant (the “Control Affiliates”) up to the specified fee limit. This fee limit is based on aggregate fees to the investment adviser and its Control Affiliates.
| Service | Range of Fees |
| Non-Audit Services | |
| Services associated with periodic reports and other documents filed with the SEC and assistance in responding to SEC comment letters | up to $10,000 in the aggregate |
The Pre-Approval Policy requires the registrant’s independent auditors to report to the Audit Committee at each of its regular meetings regarding all services initiated since the last such report was rendered, including those services authorized by the Pre-Approval Policy.
(f) Not applicable.
(g) The aggregate non-audit fees billed by the registrant’s independent auditors for services rendered to the registrant and to its investment adviser and other service providers under common control with the adviser were $10,867,923 and $5,228,766 for the registrant’s fiscal years ended October 31, 2012 and October 31, 2011, respectively.
(h) In connection with its selection of the independent auditors, the registrant’s Audit Committee has considered the independent auditors’ provision of non-audit services to the registrant’s investment adviser and other service providers under common control with the adviser that were not required to be pre-approved pursuant to Rule 2-01(c)(7)(ii) of Regulation S-X. The Audit Committee has determined that the independent auditors’ provision of these services is compatible with maintaining the auditors’ independence.
Item 5. Audit Committee of Listed Registrants
Not applicable.
Item 6. Investments
(a) Included as part of report to shareholders filed under Item 1 of this Form N-CSR.
(b) Divestment of securities in accordance with Section 13(c) of the Investment Company Act of 1940.
Not applicable.
Item 7. Disclosure of Proxy Voting Policies and Procedures for Closed-End Management Investment Companies
Not applicable.
Item 8. Portfolio Managers of Closed-End Management Investment Companies
Not applicable.
Item 9. Purchases of Equity Securities by Closed-End Management Investment Company and Affiliated Purchasers
Not applicable.
Item 10. Submission of Matters to a Vote of Security Holders
Not applicable.
Item 11. Controls and Procedures
The registrant’s principal executive officer and principal financial officer have evaluated the registrant’s disclosure controls and procedures within 90 days of the filing of this report and have concluded that they are effective in providing reasonable assurance that the information required to be disclosed by the registrant in its reports or statements filed under the Securities Exchange Act of 1934 is recorded, processed, summarized and reported within the time periods specified in the rules and forms of the Securities and Exchange Commission.
There were no significant changes in the registrant’s internal control over financial reporting that occurred during the second fiscal quarter of the period covered by the report to stockholders included herein (i.e., the registrant’s fourth fiscal quarter) that have materially affected, or are reasonably likely to materially affect, the registrant’s internal control over financial reporting.
Item 12. Exhibits
(a) (1) Code of Ethics
Not applicable.
(2) Certifications of Principal Executive Officer and Principal Financial Officer pursuant to Rule 30a-2 under the Investment Company Act of 1940 are attached hereto as Exhibit 99.CERT.
(3) Written solicitations to purchase securities pursuant to Rule 23c-1 under the Securities Exchange Act of 1934.
Not applicable.
(b) Certifications pursuant to Section 906 of the Sarbanes-Oxley Act of 2002 are furnished herewith as Exhibit 99.906CERT.
SIGNATURES
Pursuant to the requirements of the Securities Exchange Act of 1934 and the Investment Company Act of 1940, the registrant has duly caused this report to be signed on its behalf, by the undersigned, thereunto duly authorized.
Name of Registrant: DELAWARE POOLED® TRUST
| /s/ PATRICK P. COYNE |
| By: | Patrick P. Coyne |
| Title: | Chief Executive Officer |
| Date: | January 7, 2013 |
Pursuant to the requirements of the Securities Exchange Act of 1934 and the Investment Company Act of 1940, this report has been signed below by the following persons on behalf of the registrant and in the capacities and on the dates indicated.
| /s/ PATRICK P. COYNE |
| By: | Patrick P. Coyne |
| Title: | Chief Executive Officer |
| Date: | January 7, 2013 |
| |
| /s/ RICHARD SALUS |
| By: | Richard Salus |
| Title: | Chief Financial Officer |
| Date: | January 7, 2013 |