Item 1. Reports to Stockholders

| | |
| Annual report | | |
| |
| October 31, 2015 | | |
| |
| U.S. equities | | U.S. fixed income |
The Large-Cap Value Equity Portfolio | | The High-Yield Bond Portfolio |
The Select 20 Portfolio | | The Core Plus Fixed Income Portfolio |
The Large-Cap Growth Equity Portfolio | | |
The Focus Smid-Cap Growth Equity Portfolio | | |
| | International equities |
| | The International Equity Portfolio |
| | The Labor Select International Equity Portfolio |
| | The Emerging Markets Portfolio |
| | The Emerging Markets Portfolio II |

This page intentionally left blank.
Delaware Pooled® Trust
Delaware Pooled Trust, based in Philadelphia, is a registered investment company that offers no-load, open-end equity and fixed income mutual funds to institutional and high net worth individual investors.
Delaware Management Company, a series of Delaware Management Business Trust (DMBT), serves as investment advisor for the Portfolios. Mondrian Investment Partners Limited serves as investment sub-advisor for The International Equity Portfolio,* The Labor Select International Equity Portfolio, and The Emerging Markets Portfolio.* Jackson Square Partners, LLC, serves as investment sub-advisor for The Select 20 Portfolio, The Large-Cap Growth Equity Portfolio, and The Focus-Smid Cap Growth Equity Portfolio.
The performance quoted in this report represents past performance and does not guarantee future results. Investment return and principal value of an investment will fluctuate so that shares, when redeemed, may be worth more or less than their original cost. Current performance may be lower or higher than the performance quoted. Performance data current to the most recent month end may be obtained by calling 800 231-8002 or visiting delawareinvestments.com/dpt/performance. Carefully consider the Portfolios’ investment objectives, risk factors, charges, and expenses before investing. This and other information can be found in the Portfolios’ prospectus and, if available, their summary prospectuses, which may be obtained by visiting delawareinvestments.com or calling 800 231-8002. Investors should read the prospectus and, if available, the summary prospectus carefully before investing. Performance includes reinvestment of all distributions.
Portfolios are not FDIC insured and are not guaranteed. It is possible to lose the principal amount invested. Mutual fund advisory services are provided by Delaware Management Company, a series of DMBT, which is a registered investment advisor.
Delaware Investments, a member of Macquarie Group, refers to Delaware Management Holdings, Inc. and its subsidiaries, including the Portfolios’ distributor, Delaware Distributors, L.P. Macquarie Group refers to Macquarie Group Limited and its subsidiaries and affiliates worldwide.
Neither Delaware Investments nor its affiliates noted in this document are authorized deposit-taking institutions for the purposes of the Banking Act 1959 (Commonwealth of Australia). The obligations of these entities do not represent deposits or other liabilities of Macquarie Bank Limited (MBL). MBL does not guarantee or otherwise provide assurance in respect of these entities, unless noted otherwise.
*Closed to new investors.
©2015 Delaware Management Holdings, Inc.
All third-party marks cited are the property of their respective owners.
Portfolio objectives and strategies
The Large-Cap Value Equity Portfolio seeks long-term capital appreciation. The Portfolio invests primarily in securities of large-capitalization companies that we believe have long-term capital appreciation potential. The Portfolio currently defines large-capitalization stocks as those with market capitalizations of $5 billion or greater at the time of purchase. Typically, we seek to select securities that we believe are undervalued in relation to their intrinsic value as indicated by multiple factors.
The Select 20 Portfolio seeks long-term capital appreciation. The Portfolio seeks to achieve its objective by investing in a portfolio of twenty (20) securities, primarily common stocks of companies that the Portfolio’s sub-advisor, Jackson Square Partners, LLC believes have long-term capital appreciation potential and are expected to grow faster than the U.S. economy.
The Large-Cap Growth Equity Portfolio seeks capital appreciation. The Portfolio invests primarily in common stocks of growth-oriented companies that the Portfolio’s sub-advisor, Jackson Square Partners, LLC (“JSP”), believes have long-term capital appreciation potential and expects to grow faster than the U.S. economy. For purposes of the Portfolio, JSP generally considers large-capitalization companies to be those that, at the time of purchase, have total market capitalizations within the range of market capitalizations of companies in the Russell 1000® Growth Index.
The Focus Smid-Cap Growth Equity Portfolio seeks long-term capital appreciation. The Portfolio invests primarily in common stocks of growth-oriented companies that the Portfolio’s sub-advisor, Jackson Square Partners, LLC believes have long-term capital appreciation potential and expects to grow faster than the U.S. economy. For purposes of this Portfolio, small-market capitalization companies are those companies whose market capitalization is similar to the market capitalization of companies in the Russell 2000® Growth Index, and mid-market capitalization companies are those companies whose market capitalization is similar to the market capitalization of companies in the Russell Midcap® Growth Index. The two indices listed above are for purposes of determining range and not for targeting portfolio management.
The High-Yield Bond Portfolio seeks high total return. The Portfolio will primarily invest its assets at the time of purchase in: (1) corporate bonds rated BB or lower by Standard & Poor’s (S&P) or similarly rated by another nationally recognized statistical rating organization; (2) securities issued or guaranteed by the U.S. government, its agencies, or instrumentalities; or (3) commercial paper of companies rated A-1 or A-2 by S&P, rated P-1 or P-2 by Moody’s Investors Service, Inc. (Moody’s), or unrated but considered to be of comparable quality.
The Core Plus Fixed Income Portfolio seeks maximum long-term total return, consistent with reasonable risk. The Portfolio allocates its investments principally among three sectors of the fixed income securities markets: U.S. investment grade sector, U.S. high yield sector, and international sector.
The International Equity Portfolio seeks maximum long-term total return. The Portfolio invests primarily in equity securities of companies that are organized, have a majority of their assets, or derive most of their operating income outside the United States, and that, in the opinion of Mondrian Investment Partners Limited, the Portfolio’s sub-advisor, are undervalued at the time of purchase based on the sub-advisor’s fundamental analysis. Investments will be made mainly in marketable securities of companies in developed countries. The International Equity Portfolio is presently closed to new investors.
The Labor Select International Equity Portfolio seeks maximum long-term total return. The Portfolio invests primarily in equity securities of companies that are organized, have a majority of their assets, or derive most of their operating income outside of the United States, and that, in the opinion of Mondrian Investment Partners Limited (“Mondrian”), the Portfolio’s sub-advisor, are undervalued at the time of purchase based on the rigorous fundamental analysis that the sub-advisor employs. In addition to following these quantitative guidelines, Mondrian will select securities of issuers that present certain characteristics that are compatible or operate in accordance with certain investment policies or restrictions followed by organized labor.
The Emerging Markets Portfolio seeks long-term capital appreciation. The Portfolio generally invests in equity securities of companies that are organized in, have a majority of their assets in, or derive a majority of their operating income from emerging countries. The Emerging Markets Portfolio is presently closed to new investors.
The Emerging Markets Portfolio II seeks long-term capital appreciation. The Portfolio invests primarily in a broad range of equity securities of companies located in emerging market countries. The Portfolio may invest in companies of any size. The portfolio manager believes that although market price and intrinsic business value are positively correlated in the long run, short-term divergences can emerge. The Portfolio seeks to take advantage of these divergences through a fundamental, bottom-up approach. The Portfolio invests in securities of companies with sustainable franchises when they are trading at a discount to the portfolio manager’s intrinsic value estimate for that security.
2
Carefully consider the Portfolios’ investment objectives, risk factors, charges, and expenses before investing. This and other information can be found in the Portfolios’ prospectus and, if available, its summary prospectus, which may be obtained by visiting delawareinvestments.com or calling 800 231-8002. Investors should read the applicable prospectus and, if available, the applicable summary prospectus carefully before investing.
The Portfolios of Delaware Pooled® Trust (DPT) are designed exclusively for institutional investors and high net worth individuals.
International investments entail risks not ordinarily associated with U.S. investments including fluctuation in currency values, differences in accounting principles, or economic or political instability in other nations. Investing in emerging markets can be riskier than investing in established foreign markets due to increased volatility and lower trading volume.
Narrowly focused investments may exhibit higher volatility than investments in multiple industry sectors.
The Portfolios’ share prices and yields will fluctuate in response to movements in stock prices.
Fixed income securities and bond funds can lose value, and investors can lose principal, as interest rates rise. They also may be affected by economic conditions that hinder an issuer’s ability to make interest and principal payments on its debt.
The Portfolios may also be subject to prepayment risk, the risk that the principal of a fixed income security that is held by the Portfolios may be prepaid prior to maturity, potentially forcing the Portfolios to reinvest that money at a lower interest rate.
Securities in the lowest of the rating categories considered to be investment grade (that is, Baa or BBB) have some speculative characteristics.
High yielding, noninvestment grade bonds (junk bonds) involve higher risk than investment grade bonds.
The high yield secondary market is particularly susceptible to liquidity problems when institutional investors, such as mutual funds and certain other financial institutions, temporarily stop buying bonds for regulatory, financial, or other reasons. In addition, a less liquid secondary market makes it more difficult for a Portfolio to obtain precise valuations of the high yield securities in its portfolio.
Certain Portfolios expect to hold a concentrated portfolio of a limited number of securities; those Portfolios’ risk is increased because each investment has a greater effect on that Portfolio’s overall performance.
The Select 20 Portfolio is considered “nondiversified” as defined in the Investment Company Act of 1940. “Nondiversified” Portfolios may allocate more of their net assets to investments in single securities than “diversified” Portfolios. Resulting adverse effects may subject this Portfolio to greater risks and volatility.
3
Portfolio management review
Delaware Pooled® Trust — The Large-Cap Value Equity Portfolio
October 31, 2015
For the fiscal year ended Oct. 31, 2015, Delaware Pooled Trust — The Large-Cap Value Equity Portfolio, returned +3.18% at net asset value (NAV) with all distributions reinvested. This result outpaced the Portfolio’s benchmark, the Russell 1000® Value Index, which returned +0.53% for the same period. Complete annualized performance for The Large-Cap Value Equity Portfolio is shown on the table on page 6.
Stock prices failed to gather much momentum over the Portfolio’s fiscal year, reflecting the U.S. economy’s slow but steady growth. The country’s gross domestic product (GDP) — a measure of economic activity — rose 2.1% in the fourth quarter of 2014, followed by a slight gain of 0.6% in the first three months of 2015. Growth picked up in the second quarter of 2015, with GDP expanding 3.9% before falling back to 1.5% in the subsequent quarter.
Relative to the benchmark, the Portfolio benefited from its defensive positioning. In other words, we emphasized stocks with what we viewed as having stronger business fundamentals, many of which were in traditionally defensive sectors, such as consumer staples, which tend to maintain more price stability in a down market. Our security selection was especially favorable in this group. Also, when we did invest in more typically economically sensitive sectors, we tended to focus on companies that in our opinion had more conservative characteristics.
Within consumer staples, the Portfolio benefited the most from food products companies Kraft Heinz and Mondelez International. We originally invested in Kraft Foods, the predecessor of Kraft Heinz, for what we viewed as its strong collection of brands and reasonably valued stock. We were also attracted to the company’s solid dividend and potential to further improve its financial strength. Heinz appeared to notice these characteristics as well, agreeing to merge with Kraft in March 2015, a move that resulted in a sharply higher share price.
Meanwhile, shares of Mondelez — which was spun off from Kraft several years ago — benefited from the company’s success in managing expenses and expanding its business footprint. Its stock was up by roughly one-third for the fiscal year, while Kraft Heinz saw its shares gain close to three-quarters of its value overall.
Stock selection in industrials also contributed to the Portfolio’s outperformance, especially its position in defense contractor Northrop Grumman. The company produced strong financial results despite cutbacks in U.S. military spending that seemed to concern many investors. Late in the fiscal year, Northrop Grumman further benefited from news that the company won a significant contract to build the U.S. Air Force’s next-generation Long Range Strike Bomber (LRS-B); the stock went up 10% on the news.
Other notable relative contributors included Broadcom, a maker of semiconductors for communications applications, and Lowe’s, a retailer of home improvement products. Shares of Broadcom gained
sharply after the company agreed to be acquired by Avago at a significant premium. This put the company’s stock near our price target, and we ultimately sold the Portfolio’s position. Meanwhile, Lowe’s continued to benefit from the steady recovery in the housing market, and from the company’s efforts to improve its merchandising, which helped lift its sales and earnings.
On the negative side, security selection was poor in the energy sector, where continued weakness in commodity prices hampered most companies. By far, the Portfolio’s largest detractor in the group was Marathon Oil, whose relatively high exposure to U.S. shale markets was a significant negative, as was its elevated debt level and smaller size relative to other large-cap operators. A position in Halliburton hurt performance, as reduced energy exploration activity across the industry cut into the company’s revenues and earnings. Weak market prices of crude oil and natural gas also hurt two other Portfolio holdings, Chevron and ConocoPhillips. We continue to closely monitor the Portfolio’s energy stocks for signs of lasting financial stress. It’s possible that a bottoming process in oil prices is starting to take shape and our longer term view on global oil demand remains positive.
Elsewhere, a stake in Xerox, a provider of document management and other business services, produced disappointing results. The company continued to face various business challenges that led to narrower profit margins, lower earnings, and reduced revenues. Despite recent execution challenges, Xerox has the potential to benefit from its transformation to a services-oriented business model, in our view.
We made relatively few changes to the Portfolio during the fiscal year. With the sale of Broadcom in June, we used the proceeds to establish a new position in pharmacy benefits manager Express Scripts Holding, which we viewed as a high-quality growth opportunity with an unusually attractive valuation. Another meaningful purchase was of CA, which we acquired in March 2015. The company’s recent business challenges left its stock with what we saw as a favorable risk-reward tradeoff.
We sold the Portfolio’s holding in Baxter International, which spun off its global pharmaceutical business, Baxalta. The new company will build on its strengths in hematology and immunology. With the proceeds of the sale, we added to our stake in Baxalta, which we think has an attractive valuation relative to its growth potential.
At fiscal year end, it remained difficult for us to identify attractive new purchase candidates in light of relatively high valuations. At the end of the period, we were closing in on a few favorable opportunities in the consumer discretionary sector, and we were also considering some longer-range ideas in the consumer staples, financials, and industrials sectors. We are also taking a fresh look at
the Portfolio’s exposure to the energy sector and where energy prices might be going in the next three to five years.
That said, we do not anticipate large adjustments to the Portfolio anytime soon. Regardless of market conditions, our approach remains consistent. We will continue to look for companies available for purchase at what we view as attractive valuations because of temporary fundamental challenges and negative investor sentiment, adhering to our process of searching for what we believe are favorable relative values in the marketplace.
The views expressed are current as of the date of this report and subject to change.
5
Performance summary
Delaware Pooled® Trust — The Large-Cap Value Equity Portfolio
The performance data quoted represent past performance; past performance does not guarantee future results. Investment return and principal value will fluctuate so your shares, when redeemed, may be worth more or less than their original cost. Current performance may be lower or higher than the performance data quoted. Please obtain the performance data for the most recent month end by calling 800 231-8002 or visiting our website at delawareinvestments.com.
Carefully consider the Portfolio’s investment objectives, risk factors, charges, and expenses before investing. This and other information can be found in the Portfolio’s prospectus and, if available, its summary prospectus, which may be obtained by visiting delawareinvestments.com or calling 800 231-8002. Investors should read the prospectus and, if available, the summary prospectus carefully before investing.
| | | | | | | | | | |
| Portfolio and benchmark performance | | | | | | | | | | |
| Average annual total returns | | | | | | | | | | |
| Periods ended Oct. 31, 2015 | | 1 year | | 3 years | | 5 years | | 10 years | | Lifetime |
| | | | | |
| | | | | | | | | | |
The Large-Cap Value Equity Portfolio | | +3.18% | | +15.97% | | +15.59% | | +8.27% | | +9.96% |
Russell 1000 Value Index | | +0.53% | | +14.52% | | +13.26% | | +6.75% | | +9.95% |
| | |
| |
| Portfolio profile | | |
| Oct. 31, 2015 | | |
| | |
Total net assets | | Number of holdings |
$214.7 million | | 33 |
| | |
Inception date | | |
Feb. 3, 1992 | | |
Growth of $1,000,000
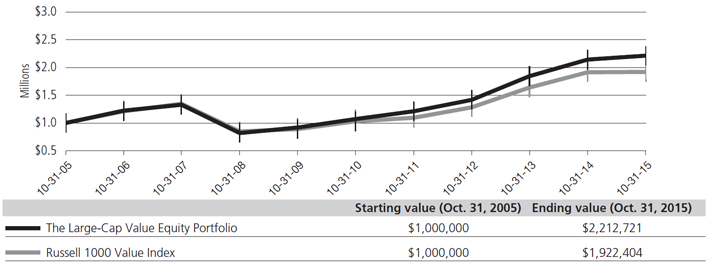
The performance graph assumes $1 million invested on Oct. 31, 2005, and includes reinvestment of all distributions. The performance graph does not reflect the deduction of taxes the shareholder would pay on Portfolio distributions or redemptions of Portfolio shares.
Total return assumes reinvestment of dividends and capital gains, but does not reflect reductions for taxes. Returns and share values will fluctuate so that shares, when redeemed, may be worth more or less than their original cost.
The most recent prospectus disclosed the Portfolio’s total operating expenses as 0.68%. Management has contractually agreed to reimburse certain expenses and/or waive its management fees from Nov. 1, 2014, through Oct. 31, 2015,* in order to prevent total annual Portfolio
operating expenses (with certain exclusions) from exceeding, in an aggregate amount, 0.70% of the Portfolio’s average daily net assets, as described in the most recent prospectus.
Expense limitations were in effect during the period shown. Performance would have been lower had the expense limitations not been in effect.
The Russell 1000 Value Index measures the performance of the large-cap value segment of the U.S. equity universe. It includes those Russell 1000 companies with lower price-to-book ratios and lower forecasted growth values.
Russell Investment Group is the source and owner of the trademarks, service marks, and copyrights related to the Russell Indexes. Russell® is a trademark of Russell Investment Group.
Index performance returns do not reflect any management fees, transaction costs, or expenses. Indices are unmanaged and one cannot invest directly in an index.
Investing involves risk, including the possible loss of principal.
Past performance is not a guarantee of future results.
* The contractual waiver period is from Feb. 27, 2014 through Feb. 29, 2016.
7
Portfolio management review
Delaware Pooled® Trust — The Select 20 Portfolio
October 31, 2015
For the fiscal year ended Oct. 31, 2015, Delaware Pooled Trust — The Select 20 Portfolio, returned +10.60% at net asset value (NAV) with all distributions reinvested. This result outpaced the Portfolio’s benchmark, the Russell 3000® Growth Index, which returned +8.72% for the same period. Complete annualized performance for The Select 20 Portfolio is shown in the table on page 10.
The U.S. economy hit several rough patches in late summer and early fall as a China-led global slowdown rocked the financial world. An eleventh-hour rebound in October helped domestic stocks climb back to pre-correction levels, enabling the broad-based stock market, as measured by the S&P 500® Index, to gain a moderate 5.20% during the 12-month period.
Oil prices were a recurring theme as the price per barrel fell precipitously throughout the fiscal year, eventually bottoming out at a six-year low. Despite a drop in consumption brought on primarily by the slowdown in China, major oil producers like the Organization of the Petroleum-Exporting Countries (OPEC) maintained production levels in an effort to remain competitive with U.S. shale oil producers. The resulting dramatic supply-demand imbalance led many U.S. producers to cut back or close rigs late in the period. (Source: Bloomberg.)
The once reliable Chinese growth engine sputtered amid a combination of excess manufacturing capacity and a slowing growth rate. In mid-August, the Chinese government surprised investors by devaluing its currency by roughly 2% relative to the U.S. dollar. As the cost of Chinese goods fell in foreign markets, fears about the stability of other Asian nations resulted in emerging markets being among the weakest performers during the period.
The European Union (EU) continued to struggle with the management of Greece’s ongoing debt crisis. The EU also shared concerns about the Chinese economy, volatility amid faltering energy stocks, and apprehension about a potential rate increase by the U.S. Federal Reserve. The European Central Bank advised that it would continue its easing of monetary policy. All of these factors led to dramatic market swings that left international equity market performance, as measured by the MSCI EAFE Index, essentially flat for the fiscal year.
U.S. investors spent a majority of the year trying to predict when the Fed would reverse its seven-year-old, zero interest-rate policy. Though the Fed hinted throughout the year that a rate hike was just around the corner, uncertain economic data repeatedly pushed the Fed off that path. An October delay in the rate hike led to a widespread market rally, with U.S. equities — in particular large-cap growth equities — posting outsized gains for the month.
At fiscal year end, despite recent market gains, uncertainty remained about China’s economic future, the long-term trajectory of oil prices, and the timeline for Fed rate hikes.
The Portfolio’s strong relative performance in the healthcare and financial services sectors was partially offset by weak relative performance in the technology and consumer discretionary sectors.
Electronic Arts, a global interactive entertainment software company, was a contributor to performance during the period. The company reported relatively strong financial results driven in part by several individual game titles, cost controls, and growth in digital game sales. Additionally, we believe the company had a particularly strong showing at this year’s Electronic Entertainment Expo (E3) after its upcoming game Star Wars Battlefront received an overall positive initial response. We believe the company should continue to benefit from upcoming and established game franchises and its growth within the digital-downloads and mobile-phone gaming channels, which we think will be increasingly important for the company’s growth going forward.
Visa was also a contributor to performance during the period. The company continued to report strong financial results and had several positive developments during the period. The market reacted favorably to the proposed acquisition between Visa and Visa Europe (the latter is a former subsidiary of Visa that has been an independent entity since 2007). Additionally, Visa invested in an online digital-payment company, Stripe, giving Visa immediate access to the digital-payment space. While there are some concerns over disintermediating technologies, such as alternative mobile-payment services, we believe Visa has attempted to take aggressive initiatives through technology upgrades and strategic partnerships. We continue to believe the company is well positioned to benefit from the secular global trend of payment transactions moving from paper-based currency to electronic transactions.
Qualcomm was a detractor from performance during the period. The stock experienced weakness over concerns related to fears of increased competition and more pricing pressure than expected. We believe these issues are transitory and do not threaten our long-term thesis on the company. A positive development was a settlement of the antimonopoly suit with the Chinese government that had added to downward pressure on the stock. We believe that Qualcomm continues to benefit from its unique intellectual property and patent position in the semiconductor industry as well as its technology applications targeted at the explosive growth and proliferation of wireless devices. Further, we believe that new management at the company appears more willing than its predecessors to consider meaningful capital allocation actions that could potentially create significant value for shareholders.
VeriFone Systems was also a detractor from performance during the period. Investors may have become concerned about future financial guidance and the impact of global currency fluctuations, given that more than half of the company’s revenues are generated outside the United States. The company also faces increased
competition within the digital-payment space. Despite these concerns, we believe the company’s capital investment in next-generation products should help create a more complete and integrated product offering suite to clients and consumers. We believe this technology will allow the company to effectively compete with existing technology offered by Square and Apple Pay. We continue to believe the company is well positioned to benefit from the secular trend to electronic forms of payments.
Regardless of the economic outcome, we remain consistent in our long-term investment philosophy: We want to own what we view as strong secular-growth companies with solid business models and competitive positions that we believe can grow market share and have the potential to deliver shareholder value in a variety of market environments.
The views expressed are current as of the date of this report and subject to change.
9
Performance summary
Delaware Pooled® Trust — The Select 20 Portfolio
The performance data quoted represent past performance; past performance does not guarantee future results. Investment return and principal value will fluctuate so your shares, when redeemed, may be worth more or less than their original cost. Current performance may be lower or higher than the performance data quoted. Please obtain the performance data for the most recent month end by calling 800 231-8002 or visiting our website at delawareinvestments.com.
Carefully consider the Portfolio’s investment objectives, risk factors, charges, and expenses before investing. This and other information can be found in the Portfolio’s prospectus and, if available, its summary prospectus, which may be obtained by visiting delawareinvestments.com or calling 800 231-8002. Investors should read the prospectus and, if available, the summary prospectus carefully before investing.
Portfolio and benchmark performance
| | | | | | | | | | |
| Average annual total returns | | | | | | | | | | |
| Periods ended Oct. 31, 2015 | | 1 year | | 3 years | | 5 years | | 10 years | | Lifetime |
| | | | | |
| | | | | | | | | | |
The Select 20 Portfolio | | +10.60% | | +15.76% | | +15.90% | | +8.51% | | +2.59% |
Russell 3000 Growth Index | | +8.72% | | +17.79% | | +15.16% | | +9.06% | | +2.22% |
| | |
| |
| Portfolio profile | | |
| Oct. 31, 2015 | | |
| | |
Total net assets | | Number of holdings |
$93.6 million | | 21 |
| | |
Inception date | | |
March 31, 2000 | | |
Growth of $1,000,000
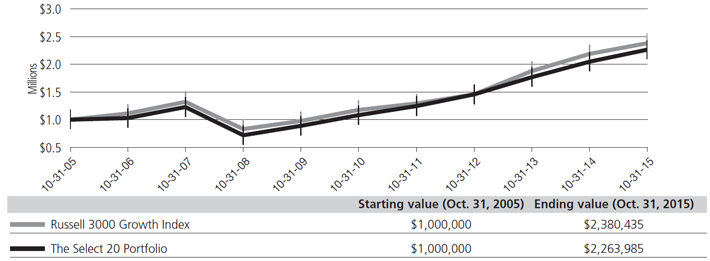
The performance graph assumes $1 million invested on Oct. 31, 2005, and includes reinvestment of all distributions. The performance graph does not reflect the deduction of taxes the shareholder would pay on Portfolio distributions or redemptions of Portfolio shares.
Total return assumes reinvestment of dividends and capital gains, but does not reflect reductions for taxes. Returns and share values will fluctuate so that shares, when redeemed, may be worth more or less than their original cost.
The most recent prospectus disclosed the Portfolio’s total operating expenses as 0.87%. Management has contractually agreed to reimburse certain expenses and/or waive its management fees from Nov. 1, 2014, through Oct. 31, 2015,* in order to prevent total annual Portfolio
operating expenses (with certain exceptions) from exceeding, in an aggregate amount, 0.89% of the Portfolio’s average daily net assets, as described in the most recent prospectus.
Expense limitations were in effect during the period shown. Performance would have been lower had the expense limitations not been in effect.
The Russell 3000 Growth Index measures the performance of the broad growth segment of the U.S. equity universe. It includes those Russell 3000 companies with higher price-to-book ratios and higher forecasted growth values.
The S&P 500 Index, mentioned on page 8, measures the performance of 500 mostly large-cap stocks weighted by market value, and is often used to represent performance of the U.S. stock market.
The MSCI EAFE (Europe, Australasia, Far East) Index, mentioned on page 8, is a free float-adjusted market capitalization weighted index designed to measure equity market performance of developed markets, excluding the United States and Canada. Index “net” return approximates the minimum possible dividend reinvestment, after deduction of withholding tax at the highest possible rate.
Russell Investment Group is the source and owner of the trademarks, service marks, and copyrights related to the Russell Indexes. Russell® is a trademark of Russell Investment Group.
Index performance returns do not reflect any management fees, transaction costs, or expenses. Indices are unmanaged and one cannot invest directly in an index.
Investing involves risk, including the possible loss of principal.
Past performance is not a guarantee of future results.
Because the Portfolio expects to hold a concentrated portfolio of a limited number of securities, the Portfolio’s risk is increased because each investment has a greater effect on the Portfolio’s overall performance.
Investments in small and/or medium-sized companies typically exhibit greater risk and higher volatility than larger, more established companies.
“Nondiversified” Portfolios may allocate more of their net assets to investments in single securities than “diversified” Portfolios. Resulting adverse effects may subject these Portfolios to greater risks and volatility.
On Feb. 28, 2008, the Portfolio changed its investment strategy to limit its investments to no less than 15 securities and no more than 25 securities. The performance prior to Feb. 28, 2008 is that of the Portfolio’s predecessor, The All-Cap Growth Equity Portfolio.
* The contractual waiver period is from Feb. 27, 2014 through Feb. 29, 2016.
11
Portfolio management review
Delaware Pooled® Trust — The Large-Cap Growth Equity Portfolio
October 31, 2015
For the fiscal year ended Oct. 31, 2015, Delaware Pooled Trust — The Large-Cap Growth Equity Portfolio, returned +8.06% at net asset value (NAV) with all distributions reinvested. For the same period, the Portfolio’s benchmark, the Russell 1000® Growth Index, returned +9.18%. Complete annualized performance for The Large-Cap Growth Equity Portfolio is shown on the table on page 14.
The U.S. economy hit several rough patches in late summer and early fall as a China-led global slowdown rocked the financial world. An eleventh-hour rebound in October helped domestic stocks climb back to pre-correction levels, enabling the broad-based stock market, as measured by the S&P 500® Index, to gain a moderate 5.20% during the 12-month period.
Oil prices were a recurring theme as the price per barrel fell precipitously throughout the fiscal year, eventually bottoming out at a six-year low. Despite a demand in consumption brought on primarily by the slowdown in China, major oil producers like the Organization of the Petroleum-Exporting Countries (OPEC) maintained production levels in an effort to remain competitive with U.S. shale oil producers. The resulting supply-demand imbalance led many U.S. producers to cut back or close rigs late in the period. (Source: Bloomberg.)
The once reliable Chinese growth engine sputtered amid a combination of excess manufacturing capacity and a slowing growth rate. In mid-August, the Chinese government surprised investors by devaluing its currency by roughly 2% relative to the U.S. dollar. As the cost of Chinese goods fell in foreign markets, fears about the stability of other Asian nations resulted in emerging markets’ being among the weakest performers during the period.
The European Union (EU) continued to struggle with the management of Greece’s ongoing debt crisis. The EU also shared concerns about the Chinese economy, volatility amid faltering energy stocks, and apprehension about a potential rate increase by the U.S. Federal Reserve. The European Central Bank advised that it would continue its easing of monetary policy. All of these factors led to dramatic market swings that left international equity market performance, as measured by the MSCI EAFE Index, essentially flat for the fiscal year.
U.S. investors spent most of the year trying to predict when the Fed would reverse its seven-year-old, zero interest-rate policy. Though the Fed hinted throughout the year that a rate hike was just around the corner, uncertain economic data repeatedly pushed it off that path. An October delay in the rate hike led to a widespread market rally, with U.S. equities — in particular large-cap growth equities — posting outsized gains for the month.
At fiscal year end, despite recent market gains, uncertainty remained about China’s economic future, the long-term trajectory of oil prices, and the timeline for Fed rate hikes.
The Portfolio’s strong relative performance in the financial services and producer durables sectors was unable to overcome weak relative performance in the consumer discretionary and technology sectors.
Equinix was a contributor to performance during the period. The company reported relatively strong financial results and received a favorable real estate investment trust (REIT) status ruling from the Internal Revenue Service. Additionally, the company is pursuing several strategic acquisitions that should further strengthen its global presence. The company continues to benefit from significant opportunities associated with cloud computing and its disruption of the information technology supply chain. Increased globalization and the robust need for a secure and accessible network to meet the needs of a dispersed user base are creating significant demand. We believe the company’s innovative product offerings make it well positioned in a technology-spending environment that is focused on addressing the needs of enterprises struggling to maintain the highest level of network performance and quality of service for global users.
Electronic Arts, a global interactive entertainment software company, was also a contributor to performance during the period. The company reported relatively strong financial results driven in part by several individual game titles, cost controls, and growth in digital-game sales. Additionally, we believe the company had a particularly strong showing at this year’s Electronic Entertainment Expo (E3) after its upcoming game Star Wars Battlefront received an overall positive initial response. We believe the company should continue to benefit from upcoming and established game franchises and its growth within the digital-downloads and mobile-phone gaming channels, which we think will be increasingly important for the company’s growth going forward.
Valeant Pharmaceuticals International was a detractor from performance during the period. The company was hit hard by allegations of wrongdoing at its specialty pharmacy partner, Philidor. Investors’ lack of familiarity with this relationship left the stock vulnerable when questions were raised, and a short-seller’s analogy to Enron put incremental pressure on the stock and raised investor scrutiny. Our best assessment at this point is that Philidor is a relatively small part of Valeant’s total business. Further, third-quarter cash generation was positive and would indicate the company is what we thought it was: a cash-generating business with solid medium-term growth prospects. It is now trading at a very high free-cash-flow yield on our 2016 projections, despite our having applied a very substantial haircut to those projections. We also note that the shareholder base and board include large owners with an interest in reaching an economic outcome we believe could be beneficial. Considering both risk and reward, as well as the remaining unknowns, we have maintained exposure to the stock in the midrange of our portfolio weights.
Qualcomm was also a detractor from performance during the period. The stock experienced weakness over concerns related to fears of increased competition and more pricing pressure than expected. We believe these issues are transitory and do not threaten our long-term thesis on the company. A positive development was a settlement of the antimonopoly suit with the Chinese government that had added to downward pressure on the stock. We believe that Qualcomm continues to benefit from its unique intellectual property and patent position in the semiconductor industry as well as its technology applications targeted at the explosive growth and proliferation of wireless devices. Further, we believe that new management at the company appears more willing than its predecessors to consider meaningful capital allocation actions that could potentially create significant value for shareholders.
Regardless of the economic outcome, we remain consistent in our long-term investment philosophy: We want to own what we view as strong secular-growth companies with solid business models and competitive positions that we believe can grow market share and have the potential to deliver shareholder value in a variety of market environments.
The views expressed are current as of the date of this report and subject to change.
13
Performance summary
Delaware Pooled® Trust — The Large-Cap Growth Equity Portfolio
The performance data quoted represent past performance; past performance does not guarantee future results. Investment return and principal value will fluctuate so your shares, when redeemed, may be worth more or less than their original cost. Current performance may be lower or higher than the performance data quoted. Please obtain the performance data for the most recent month end by calling 800 231-8002 or visiting our website at delawareinvestments.com.
Carefully consider the Portfolio’s investment objectives, risk factors, charges, and expenses before investing. This and other information can be found in the Portfolio’s prospectus and, if available, its summary prospectus, which may be obtained by visiting delawareinvestments.com or calling 800 231-8002. Investors should read the prospectus and, if available, the summary prospectus carefully before investing.
| | | | | | | | |
| Portfolio and benchmark performance | | | | | | | | |
| Average annual total returns | | | | | | | | |
| Periods ended Oct. 31, 2015 | | 1 year | | 3 years | | 5 years | | Lifetime |
| | | | |
| | | | | | | | |
The Large-Cap Growth Equity Portfolio | | +8.06% | | +17.40% | | +15.98% | | +8.38% |
Russell 1000 Growth Index | | +9.18% | | +17.94% | | +15.30% | | +9.09% |
| | | | |
| | |
| Portfolio profile | | | | |
| Oct. 31, 2015 | | | | |
| | | | |
Total net assets | | | | Number of holdings |
$313.5 million | | | | 30 |
| | | | |
Inception date | | | | |
Nov. 1, 2005 | | | | |
Growth of $1,000,000
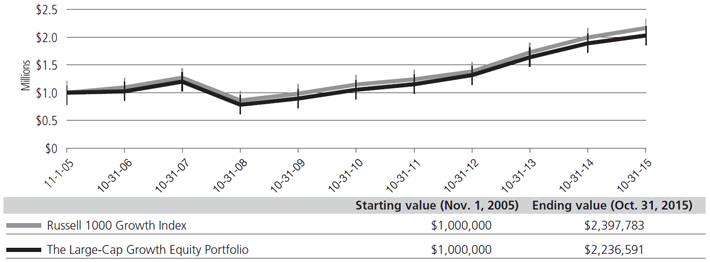
The performance graph assumes $1 million invested on Nov. 1, 2005, and includes reinvestment of all distributions. The performance graph does not reflect the deduction of taxes the shareholder would pay on Portfolio distributions or redemptions of Portfolio shares.
Total return assumes reinvestment of dividends and capital gains, but does not reflect reductions for taxes. Returns and share values will fluctuate so that shares, when redeemed, may be worth more or less than their original cost.
The most recent prospectus disclosed the Portfolio’s total operating expenses as 0.64%. Management has contractually agreed to reimburse certain expenses and/or waive its management fees from Nov. 1, 2014, through Oct. 31, 2015,* in order to prevent total annual Portfolio
operating expenses (with certain exceptions) from exceeding, in an aggregate amount, 0.65% of the Portfolio’s average daily net assets, as described in the most recent prospectus.
Expense limitations were in effect during the period shown. Performance would have been lower had the expense limitations not been in effect.
The Russell 1000 Growth Index measures the performance of the large-cap growth segment of the U.S. equity universe. It includes those Russell 1000 companies with higher price-to-book ratios and higher forecasted growth values.
The S&P 500 Index, mentioned on page 12, measures the performance of 500 mostly large-cap stocks weighted by market value, and is often used to represent performance of the U.S. stock market.
The MSCI EAFE (Europe, Australasia, Far East) Index, mentioned on page 12, is a free float-adjusted market capitalization weighted index designed to measure equity market performance of developed markets, excluding the United States and Canada. Index “net” return approximates the minimum possible dividend reinvestment, after deduction of withholding tax at the highest possible rate.
Russell Investment Group is the source and owner of the trademarks, service marks, and copyrights related to the Russell Indexes. Russell® is a trademark of Russell Investment Group.
Index performance returns do not reflect any management fees, transaction costs, or expenses. Indices are unmanaged and one cannot invest directly in an index.
Investing involves risk, including the possible loss of principal.
Past performance is not a guarantee of future results.
Because the Portfolio expects to hold a concentrated portfolio of a limited number of securities, the Portfolio’s risk is increased because each investment has a greater effect on the Portfolio’s overall performance.
*The contractual waiver period is from Feb. 27, 2014 through Feb. 29, 2016.
15
Portfolio management review
Delaware Pooled® Trust — The Focus Smid-Cap Growth Equity Portfolio
October 31, 2015
For the fiscal year ended Oct. 31, 2015, Delaware Pooled Trust — The Focus Smid-Cap Growth Equity Portfolio, returned +8.30% at net asset value (NAV) with all distributions reinvested. This result outpaced the Portfolio’s benchmark, the Russell 2500™ Growth Index, which returned +4.17% for the same period. Complete annualized performance for The Focus Smid-Cap Growth Equity Portfolio is shown in the table on page 18.
The U.S. economy hit several rough patches during the fiscal year, most notably in late summer and early fall as a China-led global slowdown rocked the financial world. An eleventh-hour rebound in October helped domestic stocks climb back to pre-correction levels, enabling the broad-based stock market, as measured by the S&P 500® Index, to gain a moderate 5.20% during the 12-month period.
Oil prices were a recurring theme as the price per barrel fell precipitously throughout the period, eventually bottoming out at a six-year low. Despite a drop in consumption brought on primarily by the slowdown in China, major oil producers like the Organization of the Petroleum-Exporting Countries (OPEC) maintained production levels in an effort to remain competitive with U.S. shale oil producers. The resulting supply-demand imbalance led many U.S. producers to cut back or close rigs late in the period. (Source: Bloomberg.)
The once reliable Chinese growth engine sputtered amid a combination of excess manufacturing capacity and a slowing growth rate. In mid-August, the Chinese government surprised investors by devaluing its currency by roughly 2% relative to the U.S. dollar. As the cost of Chinese goods fell in foreign markets, fears about the stability of other Asian nations resulted in emerging markets’ being among the weakest performers during the period.
The European Union (EU) continued to struggle with the management of Greece’s ongoing debt crisis. The EU also shared concerns about the Chinese economy, volatility amid faltering energy stocks, and apprehension about a potential rate increase by the U.S. Federal Reserve. The European Central Bank advised that it would continue its easing of monetary policy. All of these factors led to dramatic market swings that left international equity market performance, as measured by the MSCI EAFE Index, essentially flat for the fiscal year.
Within the United States, investors spent a majority of the year trying to predict when the Federal Reserve would reverse its seven-year-old, zero interest-rate policy. Though the Fed hinted throughout the year that a rate hike was just around the corner, uncertain economic data repeatedly pushed it off that path. An October delay in the rate hike led to a widespread market rally, with U.S. equities — in particular large-cap growth equities — posting outsized gains for the month.
At fiscal year end, despite recent market gains, uncertainty remained about China’s economic future, the long-term trajectory of oil prices, and the timeline for Fed rate hikes.
The Portfolio’s strong relative performance in the financial services and utilities sectors was partially offset by weak relative performance in the consumer discretionary sector.
Abiomed was a contributor to performance during the period. The company continued to experience strong growth in its Impella (heart pump) product line and also received positive regulatory approval for several new heart-pump devices. Additionally, the U.S. Department of Justice announced it had closed an investigation into the company’s marketing and labeling practices associated with its Impella 2.5 device without taking any enforcement action. We believe these developments should further enhance the company’s ability to increase shareholder value.
Heartland Payment Systems was also a contributor to performance during the period. There has been some concern over the past few years about the effect of the company’s acquisition strategy and heavy capital investment on financials over the near-to-intermediate term. However, we feel we are already seeing some benefits as evidenced by the company’s strong organic growth rates in both card and non-card business segments and its margin expansion. Overall, we believe the company is well-positioned to benefit from the secular global trend of payment transactions moving from paper-based currency to electronic transactions.
Shutterstock, a provider of digital image and sound licensing services, was a detractor from performance during the period. The stock experienced weakness amid increasing concerns that Adobe, among other competitors, is aggressively pursuing the space. We continue to believe that Shutterstock provides an attractive alternative to traditional licensed digital image and sound providers by providing a pure-pricing model and relatively transparent terms at a significantly lower cost compared to existing companies. Image and sound licensing has historically been very expensive, often with excessively complex terms. Therefore we feel Shutterstock should be able to gain considerable market share. Despite Shutterstock’s being a new entrant to the market, we believe recent acquisitions should help the company further strengthen its competitive position.
Sally Beauty Holdings was also a detractor from performance during the period. Relatively new management has introduced several marketing initiatives and promotional activity that have hurt margins, but we anticipate promotional spending will drive increased growth over the intermediate to long term. We continue to believe that this beauty-supply retailer is a relatively steady growth business due to aging demographics and the relatively low level of discretionary income required of its target customer base.
16
Regardless of the economic outcome, we remain consistent in our long-term investment philosophy: We want to own what we view as strong secular-growth companies with solid business models and competitive positions that we believe can grow market share and have the potential to deliver shareholder value in a variety of market environments.
The views expressed are current as of the date of this report and subject to change.
17
Performance summary
Delaware Pooled® Trust — The Focus Smid-Cap Growth Equity Portfolio
The performance data quoted represent past performance; past performance does not guarantee future results. Investment return and principal value will fluctuate so your shares, when redeemed, may be worth more or less than their original cost. Current performance may be lower or higher than the performance data quoted. Please obtain the performance data for the most recent month end by calling 800 231-8002 or visiting our website at delawareinvestments.com.
Carefully consider the Portfolio’s investment objectives, risk factors, charges, and expenses before investing. This and other information can be found in the Portfolio’s prospectus and, if available, its summary prospectus, which may be obtained by visiting delawareinvestments.com or calling 800 231-8002. Investors should read the prospectus and, if available, the summary prospectus carefully before investing.
| | | | | | | | | | | | | | | | | | | | |
| Portfolio and benchmark performance | | | | | | | | | | | | | | | | | | | | |
Average annual total returns | | | | | | | | | | | | | | | | | | | | |
Periods ended Oct. 31, 2015 | | 1 year | | | 3 years | | | 5 years | | | 10 years | | | Lifetime | |
The Focus Smid-Cap Growth Equity Portfolio | | | +8.30% | | | | +15.70% | | | | +14.53% | | | | +11.34% | | | | +10.42% | |
Russell 2500 Growth Index | | | +4.17% | | | | +16.48% | | | | +14.25% | | | | +9.29% | | | | +9.16% | |
Portfolio profile | | | | | | | | | | | | | | | | | | | | |
Oct. 31, 2015 | | | | | | | | | | | | | | | | | | | | |
Total net assets | | | | | | | Number of holdings | | | | | |
$51.4 million | | | | | | | 41 | | | | | | | | | | | | | |
Inception date | | | | | | | | | | | | | | | | | | | | |
Dec. 1, 2003 | | | | | | | | | | | | | | | | | | | | |
Growth of $1,000,000
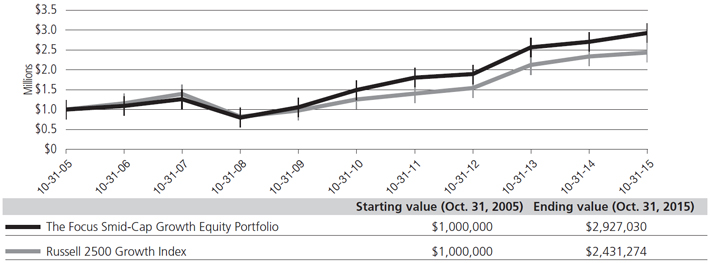
The performance graph assumes $1 million invested on Oct. 31, 2005, and includes reinvestment of all distributions. The performance graph does not reflect the deduction of taxes the shareholder would pay on Portfolio distributions or redemptions of Portfolio shares.
Total return assumes reinvestment of dividends and capital gains, but does not reflect reductions for taxes. Returns and share values will fluctuate so that shares, when redeemed, may be worth more or less than their original cost.
The most recent prospectus disclosed the Portfolio’s total operating expenses as 0.91%. Management has contractually agreed to reimburse certain expenses and/or waive its management fees from Nov. 1, 2014, through Oct. 31, 2015,* in order to prevent total annual Portfolio
18
operating expenses (with certain exclusions) from exceeding, in an aggregate amount, 0.92% of the Portfolio’s average daily net assets, as described in the most recent prospectus.
Expense limitations were in effect during the period shown. Performance would have been lower had the expense limitations not been in effect.
The Russell 2500 Growth Index measures the performance of the small- to mid-cap growth segment of the U.S. equity universe. It includes those Russell 2500 companies with higher price-to-book ratios and higher forecasted growth values.
The S&P 500 Index, mentioned on page 16, measures the performance of 500 mostly large-cap stocks weighted by market value, and is often used to represent performance of the U.S. stock market.
The MSCI EAFE (Europe, Australasia, Far East) Index, mentioned on page 16, is a free float-adjusted market capitalization weighted index designed to measure equity market performance of developed markets, excluding the United States and Canada. Index “net” return approximates the minimum possible dividend reinvestment, after deduction of withholding tax at the highest possible rate.
Russell Investment Group is the source and owner of the trademarks, service marks, and copyrights related to the Russell Indexes. Russell® is a trademark of Russell Investment Group.
Index performance returns do not reflect any management fees, transaction costs, or expenses. Indices are unmanaged and one cannot invest directly in an index.
Past performance is not a guarantee of future results.
Because the Portfolio expects to hold a concentrated portfolio of a limited number of securities, the Portfolio’s risk is increased because each investment has a greater effect on the Portfolio’s overall performance.
Investments in small and/or medium-sized companies typically exhibit greater risk and higher volatility than larger, more established companies.
*The contractual waiver period is from Feb. 27, 2014 through Feb. 29, 2016.
Portfolio management review
Delaware Pooled® Trust — The High-Yield Bond Portfolio
October 31, 2015
For the fiscal year ended Oct. 31, 2015, Delaware Pooled Trust — The High-Yield Bond Portfolio returned -3.41% at net asset value (NAV) with all distributions reinvested. For the same period, the Portfolio’s benchmark, the BofA Merrill Lynch U.S. High Yield Constrained Index, returned -2.03%. Complete annualized performance for The High-Yield Bond Portfolio is shown in the table on page 22.
Despite stable benchmark interest rates, modest economic growth, and clear signs of recovery in the U.S. labor market, high yield bonds experienced a volatile 12 months through Oct. 31, 2015, ending in negative territory for the year. The main culprit was the 50% drop in oil prices during the Portfolio’s fiscal year. That triggered rising defaults and a subsequent selloff in the energy sector, which accounts for 20% of the $1.5 trillion high yield market (source: JPMorgan Chase). The result was an asset class sharply bifurcated along mostly cyclical lines: The energy, metals-and-mining, and basic industry groups underperformed, while more stable, higher-quality sectors like cable, healthcare, and food and beverages outperformed the benchmark.
Throughout the fiscal period, the story in high yield revolved around energy. Though oil prices still hovered near $100 a barrel during the summer of 2014, an economic slowdown in China — combined with geopolitical instability in Europe and an unwillingness among the Organization of the Petroleum Exporting Countries (OPEC) members to cut production — caused prices to drop to around $50 a barrel by December 2014, and to the mid-$40 range at the end of October 2015. At that level, many energy companies are unprofitable, and those with the highest amounts of leverage are most at risk. So, while defaults within all nonenergy sectors of the high yield market were just 2.2% for the 12 months ended Oct. 31, 2015, the default rate within the energy and metals-and-mining groups rose to nearly 5% over the same period, a 13-year high for the sector.
With the plunge in energy debt prices making for unnerving headlines — and dragging the Portfolio’s benchmark lower as well — selling pressure spiked in October and December 2014. This increased selling exposed liquidity shortfalls in the high yield market, as financial regulations (Dodd-Frank) have reduced the incentive for dealers to hold as much inventory of certain securities as they did previously. Though bargain hunters eventually stepped in to support bond prices, weakness reappeared late in the Portfolio’s fiscal year, as another Greece-related crisis in the euro zone compounded unresolved concerns over Chinese economic growth and overcapacity in the energy sector.
As the fiscal year began, the Portfolio’s weighting in the energy sector was roughly in line with the benchmark. Within a few months, we reduced this to an underweight position. Still, two of the Portfolio’s three weakest- performing individual issues over the fiscal
period were from the energy group. Though we sold the Portfolio’s entire position in exploration and development company MidStates Petroleum, it nonetheless cost the Portfolio 0.26 percentage points of relative performance. When an attempted asset sale failed to close, MidStates Petroleum bonds reacted negatively and we exited the position given concerns about tighter liquidity.
Similarly, holdings in Halcon Resources cost the Portfolio 0.21 percentage points in return relative to the benchmark before we closed the position. Halcon, an independent exploration and production company, suffered a steep drop in earnings as the prices of oil and natural gas plunged. The Portfolio’s largest performance shortfall resulted from its position in Intelsat, the largest global communications satellite operator. Intelsat has experienced a difficult pricing environment and declining government revenues at the same time that it needs to refinance large near-term maturities. Against the backdrop of a volatile high yield market, the Portfolio’s position in Intelsat negatively affected performance by 0.77 percentage points.
On the positive side, the Portfolio’s holdings in the 7.5% bonds of Gray Television, an operator of 50 local-market TV stations, contributed 0.11 percentage points to performance as a result of strong operating metrics during the year.
Similarly, the Portfolio’s position in Landry’s added 0.09 percentage points of relative return. Investors were attracted to Landry’s high coupon and terms, a 9.375% issue that was callable in September 2015 (but is still outstanding). The Portfolio’s position in the 6% bonds of MGM Resorts International, a casino operator, contributed 0.08 percentage points of outperformance as a result of good operating performance and investor demand for higher-quality high yield issues during times of market stress. Notably, each outperforming security in the Portfolio had similar characteristics: above-average coupons, acceptable performance, and operations outside the energy and metals-and-mining industries.
The Portfolio had minimal exposure to derivatives, briefly holding futures contracts and credit default swaps in amounts equal to about 2% of the notional value of assets. Neither position had a material effect (that is, greater than 0.50 percentage points) on total Portfolio performance, and there were no derivative positions outstanding as of the end of the fiscal year.
Portfolio holdings reflect our view that the U.S. Federal Reserve may soon raise short-term interest rates off the zero-to-0.25% floor, where they have languished since the days of the financial crisis in December 2008. Though high yield bonds generally are considered less interest rate sensitive than other fixed income market sectors, the group’s response to rate changes varies. For example, in our view, the lower-rated credit tiers often are the least vulnerable to rate hikes if, as now, the rationale for tightening monetary policy is accelerating economic growth and not accelerating inflation.
20
Accordingly, we have overweighted CCC-rated credits, maintained a market weighting to BB-rated bonds, and underweighted the B-rated segment. With regard to industry groups, the Portfolio ended the fiscal year with a significant underweight to the energy sector, given the murky (and largely unfavorable) outlook for oil and gas prices. In general, the Portfolio is also overweight higher-coupon securities in sectors that we view as more stable and lower risk than the benchmark. As always, we maintain a broadly diversified approach to investing in the sector, with the average position size of the Portfolio’s approximately 200 holdings being just 0.50% of Portfolio net assets at the end of the fiscal year.
The views expressed are current as of the date of this report and subject to change.
Performance summary
Delaware Pooled® Trust — The High-Yield Bond Portfolio
The performance data quoted represent past performance; past performance does not guarantee future results. Investment return and principal value will fluctuate so your shares, when redeemed, may be worth more or less than their original cost. Current performance may be lower or higher than the performance data quoted. Please obtain the performance data for the most recent month end by calling 800 231-8002 or visiting our website at delawareinvestments.com.
Carefully consider the Portfolio’s investment objectives, risk factors, charges, and expenses before investing. This and other information can be found in the Portfolio’s prospectus and, if available, its summary prospectus, which may be obtained by visiting delawareinvestments.com or calling 800 231-8002. Investors should read the prospectus and, if available, the summary prospectus carefully before investing.
| | | | | | | | | | | | | | | | | | | | |
| Portfolio and benchmark performance | | | | | | | | | | | | | | | | | | | | |
| Average annual total returns | | | | | | | | | | | | | | | | | | | | |
Periods ended Oct. 31, 2015 | | 1 year | | | 3 years | | | 5 years | | | 10 years | | | Lifetime | |
The High-Yield Bond Portfolio | | | –3.41% | | | | +3.87% | | | | +6.19% | | | | +7.84% | | | | +7.70% | |
BofA Merrill Lynch U.S. High Yield Constrained Index | | | –2.03% | | | | +4.11% | | | | +6.00% | | | | +7.52% | | | | +6.83% | |
Portfolio profile | | | | | | | | | | | | | | | | | | | | |
Oct. 31, 2015 | | | | | | | | | | | | | | | | | | | | |
Total net assets | | | | | | | Number of holdings | | | | | |
$206.1 million | | | | | | | 260 | | | | | | | | | | | | | |
Inception date | | | | | | | | | | | | | | | | | | | | |
Dec. 2, 1996 | | | | | | | | | | | | | | | | | | | | |
Growth of $1,000,000
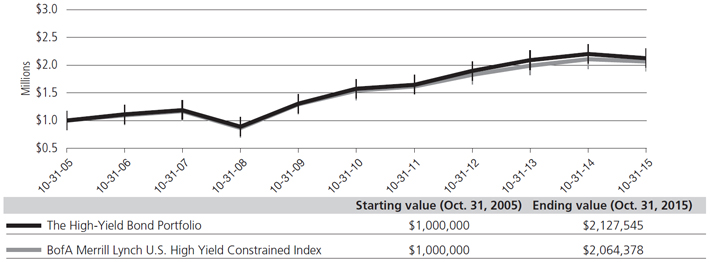
The performance graph assumes $1 million invested on Oct. 31, 2005, and includes reinvestment of all distributions. The performance graph does not reflect the deduction of taxes the shareholder would pay on Portfolio distributions or redemptions of Portfolio shares.
Total return assumes reinvestment of dividends and capital gains, but does not reflect reductions for taxes. Returns and share values will fluctuate so that shares, when redeemed, may be worth more or less than their original cost.
The most recent prospectus disclosed the Portfolio’s total operating expenses as 0.57%. Management has contractually agreed to reimburse certain expenses and/or waive its management fees from Nov. 1, 2014, through Oct. 31, 2015,* in order to prevent total annual Portfolio
22
operating expenses (with certain exceptions) from exceeding, in an aggregate amount, 0.59% of the Portfolio’s average daily net assets, as described in the most recent prospectus.
Expense limitations were in effect during the period shown. Performance would have been lower had the expense limitations not been in effect.
The BofA Merrill Lynch U.S. High Yield Constrained Index tracks the performance of U.S. dollar–denominated high yield corporate debt publicly issued in the U.S. domestic market, but caps individual issuer exposure at 2% of the benchmark. Qualifying securities must have, among other things, a below-investment-grade rating (based on an average of Moody’s, Standard & Poor’s, and Fitch), an investment grade issuing country (based on an average of Moody’s, Standard & Poor’s, and Fitch foreign currency long-term sovereign debt ratings), and maturities of one year or more.
Index performance returns do not reflect any management fees, transaction costs, or expenses. Indices are unmanaged and one cannot invest directly in an index.
Investing involves risk, including the possible loss of principal.
Past performance is not a guarantee of future results.
Fixed income securities and bond funds can lose value, and investors can lose principal, as interest rates rise. They also may be affected by economic conditions that hinder an issuer’s ability to make interest and principal payments on its debt.
The Portfolio may also be subject to prepayment risk, the risk that the principal of a fixed income security that is held by the Portfolio may be prepaid prior to maturity, potentially forcing the Portfolio to reinvest that money at a lower interest rate.
The Portfolio may be invested in foreign corporate bonds, which have special risks not ordinarily associated with domestic investments, such as currency fluctuations, economic and political change, and different accounting standards.
High yielding, noninvestment grade bonds (junk bonds) involve higher risk than investment grade bonds.
The high yield secondary market is particularly susceptible to liquidity problems when institutional investors, such as mutual funds and certain other financial institutions, temporarily stop buying bonds for regulatory, financial, or other reasons. In addition, a less liquid secondary market makes it more difficult for the Portfolio to obtain precise valuations of the high yield securities in its portfolio.
The Portfolio may experience portfolio turnover in excess of 100%, which could result in higher transaction costs and tax liability.
Per Standard & Poor’s credit rating agency, bonds rated below AAA, including A, are more susceptible to the adverse effects of changes in circumstances and economic conditions than those in higher-rated categories, but the obligor’s capacity to meet its financial commitment on the obligation is still strong. Bonds rated BBB exhibit adequate protection parameters, although adverse economic conditions or changing circumstances are more likely to lead to a weakened capacity of the obligor to meet its financial commitments. Bonds rated BB, B, and CCC are regarded as having significant speculative characteristics with BB indicating the least degree of speculation.
Investing in emerging markets can be riskier than investing in established foreign markets due to increased volatility and lower trading volume.
*The contractual waiver period is from Feb. 27, 2014 through Feb. 29, 2016.
23
Portfolio management review
Delaware Pooled® Trust — The Core Plus Fixed Income Portfolio
October 31, 2015
For the fiscal year ended Oct. 31, 2015, Delaware Pooled Trust — The Core Plus Fixed Income Portfolio returned +1.29% at net asset value (NAV) with all distributions reinvested. The Portfolio’s benchmark, the Barclays U.S. Aggregate Index, returned +1.96% for the same period. Complete annualized performance for The Core Plus Fixed Income Portfolio is shown in the table on page 25.
A key development during the fiscal year was the divergence in central bank policies. As the European Central Bank launched its quantitative easing program, the U.S. Federal Reserve signaled a potential rate hike. This had a profound effect on the market, particularly in currencies, driving the U.S. dollar higher relative to many other currencies. That contributed to deterioration in emerging-market economies and held back revenue growth for U.S.-based multinational companies.
The strong U.S. dollar cut significantly into global sales and net earnings of many U.S. corporations. Not only did it make U.S. exports more expensive for consumers in other countries, but currency conversions into U.S. dollars became highly unfavorable for many large U.S. companies. This, in turn, affected investment-grade corporate credit, leading us to reduce the Portfolio’s credit overweight during the fiscal year.
Slowdowns in global growth and global trade were among the macroeconomic factors affecting the markets. Of particular concern were continued indications of slowing Chinese growth and the collapse in commodity prices. China’s decelerating economic growth rate is expected to keep commodity prices under pressure, while weighing on many emerging-market nations and Asian countries that have grown dependent on Chinese demand. (Source: Bloomberg.)
The Portfolio’s overweight to investment grade corporate credit was a key contributor to performance versus the Barclays U.S. Aggregate Index. As the fiscal year progressed, however, we reduced that position. The Portfolio’s below-investment-grade holdings detracted from performance along with its overall exposure to high yield credit and emerging markets. Security selection within commodities was also negative. Disappointing holdings included FMG Resources, a metals and mining company, and Pacific Exploration and Production.
Security selection within industrials was a slight negative, hurt by energy holdings. In particular, the Portfolio’s exposure to mid-stream assets, such as pipeline companies, was costly. Enbridge Energy Partners and Williams Partners were weak performers. During the fiscal year, we moved to a slightly more conservative position, including an allocation to electric utilities, and the Portfolio benefited from owning National Rural Utilities bonds also.
Generally, security selection in investment grade corporate credit was positive for performance. The Portfolio’s holdings largely did well. Financials, utilities, and noncorporates outperformed their benchmark
sectors and the benchmark overall. The Portfolio’s holdings in industrials outperformed the benchmark.
The Portfolio’s performance was hurt by its significant underweight to U.S. Treasurys, as they outperformed credit and both high yield and emerging market bonds. The Portfolio’s overweight to asset-backed securities (ABS) detracted from performance. Security selection was weak, and the Portfolio trailed the benchmark’s ABS component. However, the Portfolio’s exposure to commercial mortgage-backed securities (CMBS) was positive, helped by security selection and asset allocation. Our primary focus was on seasoned multifamily- and conduit-loan securitizations.
The Portfolio’s strongest-performing sector was financials. Wells Fargo and Bank of America were among the better individual contributors. Because the Portfolio had minimal exposure to asset managers that had negative absolute returns, they had little effect on overall performance.
The Portfolio had a slight underweight to mortgage-backed securities (MBS), with minimal effect. The Portfolio held a barbell position — that is, combining long-term bonds and short-term bonds in an attempt to seek better risk-adjusted returns in the process — in MBS, balanced between current coupons and seasoned high-coupon securities. An out-of-benchmark position in municipals, one of the strongest-performing asset classes, was beneficial. These included Golden State Tobacco Securitization bonds and City of New York general obligation bonds.
In assessing market risks, credit risk remains paramount. In 2015, we’ve seen a significant rise in security-specific risk, and we believe this should continue. Furthermore, fundamentals have also been under pressure. Issuers have taken advantage of relaxed underwriting standards, leading to an abundance of new issuance, particularly in investment grade corporate credit. We have also seen a significant rise in debt-financed share buybacks and debt-financed mergers and acquisitions, which can be detrimental to bond investors because they increase the companies’ leverage profile.
We believe that slower global growth may continue to weigh on commodities; accordingly, we have taken steps designed to reduce the Portfolio’s exposure to these issuers in both high yield and investment grade corporate credit, while allocating more to U.S. Treasurys and structured product, primarily MBS.
The Portfolio used derivatives during the fiscal year, but they did not have a material effect on performance (that is, more than 50 basis points). The Portfolio used U.S. Treasury futures, euro-bond futures, and credit derivatives. The credit protection hedges had minimal effect on performance and exposure to U.S. Treasury futures was positive, helping to manage duration risk. Overall, derivatives contributed fewer than 20 basis points to Portfolio performance.
|
| The views expressed are current as of the date of this report and subject to change. |
24
Performance summary
Delaware Pooled® Trust — The Core Plus Fixed Income Portfolio
The performance data quoted represent past performance; past performance does not guarantee future results. Investment return and principal value will fluctuate so your shares, when redeemed, may be worth more or less than their original cost. Current performance may be lower or higher than the performance data quoted. Please obtain the performance data for the most recent month end by calling 800 231-8002 or visiting our website at delawareinvestments.com.
Carefully consider the Portfolio’s investment objectives, risk factors, charges, and expenses before investing. This and other information can be found in the Portfolio’s prospectus and, if available, its summary prospectus, which may be obtained by visiting delawareinvestments.com or calling 800 231-8002. Investors should read the prospectus and, if available, the summary prospectus carefully before investing.
| | | | | | | | | | | | | | | | | | | | |
| Portfolio and benchmark performance | | | | | | | | | | | | | | | | | | | | |
| Average annual total returns | | | | | | | | | | | | | | | | | | | | |
Periods ended Oct. 31, 2015 | | | 1 year | | | | 3 years | | | | 5 years | | | | 10 years | | | | Lifetime | |
The Core Plus Fixed Income Portfolio | | | +1.29% | | | | +1.89% | | | | +3.66% | | | | +5.83% | | | | +6.01% | |
Barclays U.S. Aggregate Index | | | +1.96% | | | | +1.65% | | | | +3.03% | | | | +4.72% | | | | +4.75% | |
Portfolio profile | | | | | | | | | | | | | | | | | | | | |
Oct. 31, 2015 | | | | | | | | | | | | | | | | | | | | |
Total net assets | | | | | | | Number of holdings | | | | | |
$128.1 million | | | | | | | 744 | | | | | | | | | | | | | |
Inception date | | | | | | | | | | | | | | | | | | | | |
June 28, 2002 | | | | | | | | | | | | | | | | | | | | |
Growth of $1,000,000
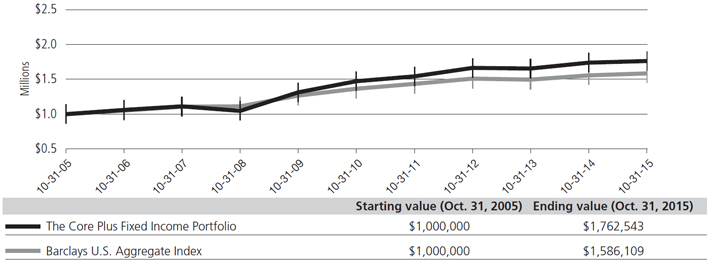
The performance graph assumes $1 million invested on Oct. 31, 2005, and includes reinvestment of all distributions. The performance graph does not reflect the deduction of taxes the shareholder would pay on Portfolio distributions or redemptions of Portfolio shares.
Total return assumes reinvestment of dividends and capital gains, but does not reflect reductions for taxes. Returns and share values will fluctuate so that shares, when redeemed, may be worth more or less than their original cost.
The most recent prospectus disclosed the Portfolio’s total operating expenses as 0.65%. Management has contractually agreed to reimburse certain expenses and/or waive its management fees from Nov. 1, 2014, through Oct. 31, 2015,* in order to prevent total annual Portfolio
Performance summary
Delaware Pooled® Trust — The Core Plus Fixed Income Portfolio
operating expenses (with certain exclusions) from exceeding, in an aggregate amount, 0.45% of the Portfolio’s average daily net assets, as described in the most recent prospectus.
Expense limitations were in effect during the period shown. Performance would have been lower had the expense limitations not been in effect.
The Barclays U.S. Aggregate Index measures the performance of publicly issued investment grade (Baa3/BBB- or better) corporate, U.S. government, mortgage- and asset-backed securities with at least one year to maturity and at least $250 million par amount outstanding.
Index performance returns do not reflect any management fees, transaction costs, or expenses. Indices are unmanaged and one cannot invest directly in an index.
Investing involves risk, including the possible loss of principal.
Past performance is not a guarantee of future results.
Fixed income securities and bond funds can lose value, and investors can lose principal, as interest rates rise. They also may be affected by economic conditions that hinder an issuer’s ability to make interest and principal payments on its debt.
The Portfolio may also be subject to prepayment risk, the risk that the principal of a fixed income security that is held by the Portfolio may be prepaid prior to maturity, potentially forcing the Portfolio to reinvest that money at a lower interest rate.
Interest payments on inflation-indexed debt securities will vary as the principal and/or interest is adjusted for inflation.
High yielding, noninvestment grade bonds (junk bonds) involve higher risk than investment grade bonds. The high yield secondary market is particularly susceptible to liquidity problems when institutional investors, such as mutual funds and certain other financial institutions, temporarily stop buying bonds for regulatory, financial, or other reasons. In addition, a less liquid secondary market makes it more difficult for the Portfolio to obtain precise valuations of the high yield securities in its portfolio.
International investments entail risks not ordinarily associated with U.S. investments including fluctuation in currency values, differences in accounting principles, or economic or political instability in other nations. Investing in emerging markets can be riskier than investing in established foreign markets due to increased volatility and lower trading volume.
Because the Portfolio may invest in bank loans and other direct indebtedness, it is subject to the risk that the Portfolio will not receive payment of principal, interest, and other amounts due in connection with these investments, which primarily depend on the financial condition of the borrower and the lending institution.
The Portfolio may experience portfolio turnover in excess of 100%, which could result in higher transaction costs and tax liability.
Per Standard & Poor’s credit rating agency, bonds rated below AAA, including A, are more susceptible to the adverse effects of changes in circumstances and economic conditions than those in higher-rated categories, but the obligor’s capacity to meet its financial commitment on the obligation is still strong. Bonds rated BBB exhibit adequate protection parameters, although adverse economic conditions or changing circumstances are more likely to lead to a weakened capacity of the obligor to meet its financial commitments. Bonds rated BB, B, and CCC are regarded as having significant speculative characteristics with BB indicating the least degree of speculation.
*The contractual waiver period is from Feb. 27, 2014 through Feb. 29, 2016.
26
Portfolio management review
Delaware Pooled® Trust — The International Equity Portfolio
October 31, 2015
For the fiscal year ended Oct. 31, 2015, Delaware Pooled Trust — The International Equity Portfolio returned -1.39% at net asset value (NAV) with all distributions reinvested. The Portfolio’s benchmark, the MSCI EAFE Index, returned +0.37% (gross) and -0.07% (net) for the same period. Complete annualized performance for The International Equity Portfolio is shown in the table on page 29.
The strong U.S. dollar hampered absolute performance as the MSCI EAFE Index return in local currencies was 9.1%.
The highlights of the Portfolio’s investment strategy include: a strong value stock orientation; overweight positions in selected European markets; an overweight position in the telecommunications, energy, and healthcare sectors; and underweight positions in financials, materials, and industrial sectors. Given our value style, it’s worth noting that the MSCI EAFE Value Index returned -4.2% (net) for the 12 months ended Oct. 31, 2015.
Much of the volatility during the Portfolio’s fiscal year resulted from diverging central bank policies, which had the net effect of weakening most international currencies. In the first half of 2015, equity markets performed relatively well — mainly due to improving economic data in Europe. However, elevated concerns over Greece pulled equity markets down in the final days of June. Markets also weakened significantly when the Chinese government unexpectedly devalued the renminbi on what was dubbed as “Black Monday,” Aug. 24. The implications reverberated across asset classes, and there was worldwide indiscriminate selling in equities. Markets finally recovered some poise in October to finish flat for the year.
Currency allocation decisions were unusually important during the fiscal year. The Swiss franc was one of the stronger performers, falling only 2.4%. Elsewhere, the British pound depreciated 3.5%, the Japanese yen declined 7.1%, the euro depreciated 11.8%, and the Australian dollar fell 18.8%. Overall, the Portfolio’s currency allocation strategies added value on a relative basis. The Portfolio’s overweight position in the Swiss franc and underweight position in the weak Australian dollar supported returns. Additionally, during the fiscal year we took profits and closed our defensive hedge out of the Australian dollar, as our analysis based on our purchasing power parity models indicated that the currency was no longer significantly overvalued.
A review of the relative strength of sectors over the last 12 months illustrates that consumer stocks that were beneficiaries of lower oil and other commodity prices produced the highest relative returns. The consumer staples sector achieved a 9.6% return, and the consumer discretionary sector gained 8.9%. The traditionally defensive healthcare and telecommunication sectors, and the services sector, also fared well on a relative basis (they were only down 5.4% and 4.8%, respectively). Meanwhile, intensified concerns about global economic growth weighed on returns of cyclically sensitive sectors. The industrial sector gained only 1.5% while the financial
sector climbed 3.8%, held back by the weak returns from Australian banks. Not surprisingly, plummeting oil and commodities prices had a negative effect on companies in the utilities, materials, and energy sectors, which were down 4.8%, 12.5%, and 21.3%, respectively.
In this environment, our bottom-up (stock by stock) selection discipline led to country and sector weightings that added to relative investment performance. Specifically, the Portfolio benefited from absolute and relative returns in Japan, the Netherlands, and Australia. Also, an overweight position in the telecommunication services sector and underweight position in the materials sector added to Portfolio returns. However, this was somewhat offset by the effect of stock selection in France and the industrial sector, and the Portfolio’s overweight exposure to the energy sector.
Again, it’s not surprising to us that the Portfolio’s energy- and power-related holdings were the largest detractors from relative investment returns. Vallourec, the French manufacturer of premium seamless fuel pipes, fell 76% after the oil price plummeted, reflecting a subdued outlook for oil demand and supply. Vallourec faces significant short-term challenges due to the decline in oil and gas drilling activity on the back of the weak oil price. At the current share price, we believe the stock is materially undervalued; therefore, we continue to hold the position.
RWE, the German utility, declined 64%, due to weak power prices, uncertainty about power generation taxes, and concerns that provisions for the decommissioning of nuclear power plants could be meaningfully insufficient. Its share price has been under pressure due to falling power prices in Germany. RWE has three valuable divisions: German and Czech electricity distribution, electric and gas supply operations in various European countries, and renewable power generation. We believe the stock is materially undervalued; for this reason, we continue to hold the position.
Also, Amec Foster Wheeler, the U.K. engineering services firm, fell 31% as the weak oil and gas environment put pressure on profit margins. The company’s share price has been weak for two reasons. First, its revenues are sensitive to capital expenditure by oil & gas companies, which have come under some pressure due to the lower oil price. Second, the company’s balance sheet became more stretched following the acquisition of Foster Wheeler in late 2014 —this led to the company’s recent decision to cut its dividend. We continue to like Amec Foster Wheeler’s business model and the relative resilience of earnings, and we believe the dividend now looks more sustainable.
On the positive side, the Portfolio benefited from the strong returns of Dutch food retailer Koninklijke Ahold. Its share price rose 40%, supported by resilient financial results, a dividend increase and share repurchase program, and favorable reaction to the announcement of a merger with Belgium-based Delhaize. Tokio Marine Holdings, the non-life insurer in Japan, presents a similar story. Here again,
Portfolio management review
Delaware Pooled® Trust — The International Equity Portfolio
strong operational results, a share buyback program, and positive merger news drove the share price up 34%. Also, Deutsche Telekom, the German telecommunications operator, gained 37%, driven by substantial operating performance in its U.S. business, compounded by a strong U.S. dollar.
For the last few years, the markets have gyrated between fear and euphoria as investors struggle to understand an economic outlook characterized by too much leverage and slow economic growth. Volatility is the inevitable result, particularly since policy decisions cannot create real economic growth on their own. The Portfolio remains positioned, in our view, to navigate this environment with the goal of achieving long-term, stable real returns while potentially offering protection on the downside.
The views expressed are current as of the date of this report and subject to change.
28
Performance summary
Delaware Pooled® Trust — The International Equity Portfolio
The performance data quoted represent past performance; past performance does not guarantee future results. Investment return and principal value will fluctuate so your shares, when redeemed, may be worth more or less than their original cost. Current performance may be lower or higher than the performance data quoted. Please obtain the performance data for the most recent month end by calling 800 231-8002 or visiting our website at delawareinvestments.com.
Carefully consider the Portfolio’s investment objectives, risk factors, charges, and expenses before investing. This and other information can be found in the Portfolio’s prospectus and, if available, its summary prospectus, which may be obtained by visiting delawareinvestments.com or calling 800 231-8002. Investors should read the prospectus and, if available, the summary prospectus carefully before investing.
| | | | | | | | | | |
| Portfolio and benchmark performance | | | | | | | | | | |
| Average annual total returns | | | | | | | | | | |
| Periods ended Oct. 31, 2015 | | 1 year | | 3 years | | 5 years | | 10 years | | Lifetime |
| | | | | |
| | | | | | | | | | |
The International Equity Portfolio | | –1.39% | | +7.62% | | +4.79% | | +4.32% | | +7.60% |
MSCI EAFE Index (gross) | | +0.37% | | +8.48% | | +5.28% | | +4.53% | | +5.80% |
MSCI EAFE Index (net) | | –0.07% | | +8.02% | | +4.81% | | +4.05% | | +5.40% |
| | |
| |
| Portfolio profile | | |
| Oct. 31, 2015 | | |
| | |
Total net assets | | Number of holdings |
$358.4 million | | 56 |
| | |
Inception date | | |
Feb. 4, 1992 | | |
Growth of $1,000,000
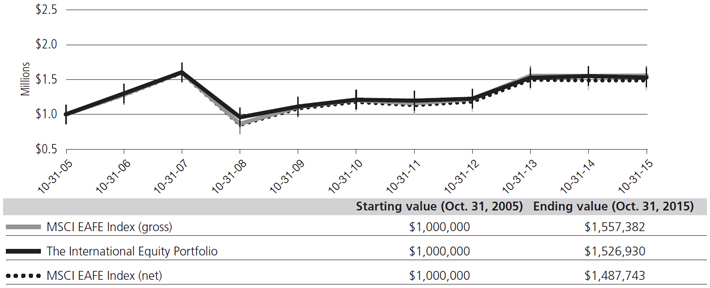
The performance graph assumes $1 million invested on Oct. 31, 2005, and includes reinvestment of all distributions. The performance graph does not reflect the deduction of taxes the shareholder would pay on Portfolio distributions or redemptions of Portfolio shares.
Total return assumes reinvestment of dividends and capital gains, but does not reflect reductions for taxes. Returns and share values will fluctuate so that shares, when redeemed, may be worth more or less than their original cost.
Performance summary
Delaware Pooled® Trust — The International Equity Portfolio
The most recent prospectus disclosed the Portfolio’s total operating expenses as 0.86%.
The MSCI EAFE (Europe, Australasia, Far East) Index is a free float-adjusted market capitalization weighted index designed to measure equity market performance of developed markets, excluding the United States and Canada. Index “gross” return approximates the maximum possible dividend reinvestment. Index “net” return approximates the minimum possible dividend reinvestment, after deduction of withholding tax at the highest possible rate.
The MSCI EAFE Value Index, mentioned on page 27, is a subset of the MSCI EAFE Index, which measures equity market performance across developed market countries in Europe, Australasia, and the Far East. The MSCI EAFE Value Index consists of those securities classified by MSCI as most representing the value style.
Index performance returns do not reflect any management fees, transaction costs, or expenses. Indices are unmanaged and one cannot invest directly in an index.
Investing involves risk, including the possible loss of principal.
Past performance is not a guarantee of future results.
International investments entail risks not ordinarily associated with U.S. investments including fluctuation in currency values, differences in accounting principles, or economic or political instability in other nations.
Investing in emerging markets can be riskier than investing in established foreign markets due to increased volatility and lower trading volume.
If and when the Portfolio invests in forward foreign currency contracts or uses other investments to hedge against currency risks, the Portfolio will be subject to special risks, including counterparty risk.
From time to time, the Portfolio may invest up to 30% of its net assets in securities of issuers in the commercial banking industry; to the extent that the Portfolio invests 30% of its net assets in such securities, it may be slightly more sensitive to movement in the commercial banking industry.
The Portfolio is presently closed to new investors.
30
Portfolio management review
Delaware Pooled® Trust — The Labor Select International Equity Portfolio
October 31, 2015
For the fiscal year ended Oct. 31, 2015, Delaware Pooled Trust — The Labor Select International Equity Portfolio returned -0.98% at net asset value (NAV) with all distributions reinvested. The Portfolio’s benchmark, the MSCI EAFE Index, returned +0.37% (gross) and -0.07% (net) for the same period. Complete annualized performance for The Labor Select International Equity Portfolio is shown in the table on page 33.
The strong U.S. dollar hampered absolute performance as the MSCI EAFE Index return in local currencies was 9.1%.
The highlights of the Portfolio’s investment strategy include: a strong value stock orientation; overweight positions in selected European markets; an overweight position in the telecommunications, energy, and healthcare sectors; and underweight positions in financials, materials and industrial sectors. Given our value style, it’s worth noting that the MSCI EAFE Value Index returned -4.2% for the 12 months ended Oct. 31, 2015.
Much of the volatility during the Portfolio’s fiscal year resulted from diverging central bank policies, which had the net effect of weakening most international currencies. In the first half of 2015, equity markets performed relatively well — mainly due to improving economic data in Europe. However, elevated concerns over Greece pulled equity markets down in the final days of June. Markets also weakened significantly when the Chinese government unexpectedly devalued the renminbi on what was dubbed as “Black Monday,” Aug. 24. The implications reverberated across asset classes, and there was worldwide indiscriminate selling in equities. Markets finally recovered some poise in October to finish flat for the year.
Currency allocation decisions were unusually important during the fiscal year. The Swiss franc was one of the stronger performers, falling only 2.4%. Elsewhere, the British pound depreciated 3.5%, the Japanese yen declined 7.1%, the euro depreciated 11.8%, and the Australian dollar fell 18.8%. Overall, the Portfolio’s currency allocation strategies added value on a relative basis. The Portfolio’s overweight position in the Swiss franc and underweight position in the weak Australian dollar supported returns. Additionally, during the fiscal year we took profits and closed our defensive hedge out of the Australian dollar, as our analysis based on our purchasing power parity models indicated that the currency was no longer significantly overvalued.
A review of the relative strength of sectors over the last 12 months illustrates that consumer stocks that were beneficiaries of lower oil and other commodity prices produced the highest relative returns. The consumer staples sector achieved a 9.6% return, and the consumer discretionary sector gained 8.9%. The traditionally defensive healthcare and telecommunication sectors, and the services sector, also fared well on a relative basis (they were only down 5.4% and 4.8%, respectively). Meanwhile, intensified concerns about
global economic growth weighed on returns of cyclically sensitive sectors. The industrial sector gained only 1.5% while the financial sector climbed 3.8%, held back by the weak returns from Australian banks. Not surprisingly, plummeting oil and commodities prices had a negative effect on companies in the utilities, materials, and energy sectors, which were down 4.8%, 12.5% and 21.3%, respectively.
In this environment, our bottom-up (stock by stock) selection discipline led to country and sector weightings that added to relative investment performance. Specifically, the Portfolio benefited from absolute and relative returns in Japan, the Netherlands, and Australia. Also, an overweight position in the telecommunication services sector and underweight position in the materials sector added to Portfolio returns. However, this was somewhat offset by the effect of stock selection in France and the industrial sector, and the Portfolio’s overweight exposure to the energy sector.
Again, it’s not surprising to us that the Portfolio’s energy- and power-related holdings were the largest detractors from relative investment returns. Vallourec, the French manufacturer of premium seamless fuel pipes, fell 76% after the oil price plummeted, reflecting a subdued outlook for oil demand and supply. Vallourec faces significant short-term challenges due to the decline in oil and gas drilling activity on the back of the weak oil price. At the current share price, we believe the stock is materially undervalued; therefore, we continue to hold the position.
RWE, the German utility, declined 64%, due to weak power prices, uncertainty about power generation taxes, and concerns that provisions for the decommissioning of nuclear power plants could be meaningfully insufficient. Its share price has been under pressure due to falling power prices in Germany. RWE has three valuable divisions: German and Czech electricity distribution, electric and gas supply operations in various European countries, and renewable power generation. We believe the stock is materially undervalued; for this reason, we continue to hold the position.
Also, Amec Foster Wheeler, the U.K. engineering services firm, fell 31% as the weak oil and gas environment put pressure on profit margins. The company’s share price has been weak for two reasons. First, its revenues are sensitive to capital expenditure by oil & gas companies, which have come under some pressure due to the lower oil price. Second, the company’s balance sheet became more stretched following the acquisition of Foster Wheeler in late 2014 —this led to the company’s recent decision to cut its dividend. We continue to like Amec Foster Wheeler’s business model and the relative resilience of earnings, and we believe the dividend now looks more sustainable.
On the positive side, the Portfolio benefited from the strong returns of Dutch food retailer Koninklijke Ahold. Its share price rose 40%, supported by resilient financial results, a dividend increase and share repurchase program, and favorable reaction to the announcement of
Portfolio management review
Delaware Pooled® Trust — The Labor Select International Equity Portfolio
a merger with Belgium-based Delhaize. Tokio Marine Holdings, the non-life insurer in Japan, presents a similar story. Here again, strong operational results, a share buyback program, and positive merger news drove the share price up 33.7%. Also, the German telecommunications operator Telefonica Deutschland Holding was up 38%, based on early synergistic results from the company’s acquisition of KPN’s German business, E-Plus.
For the last few years, the markets have gyrated between fear and euphoria as investors struggle to understand an economic outlook characterized by too much leverage and slow economic growth. Volatility is the inevitable result, particularly since policy decisions cannot create real economic growth on their own. The Portfolio remains positioned, in our view, to navigate this environment with the goal of achieving long-term, stable real returns while potentially offering protection on the downside.
The views expressed are current as of the date of this report and subject to change.
32
Performance summary
Delaware Pooled® Trust — The Labor Select International Equity Portfolio
The performance data quoted represent past performance; past performance does not guarantee future results. Investment return and principal value will fluctuate so your shares, when redeemed, may be worth more or less than their original cost. Current performance may be lower or higher than the performance data quoted. Please obtain the performance data for the most recent month end by calling 800 231-8002 or visiting our website at delawareinvestments.com.
Carefully consider the Portfolio’s investment objectives, risk factors, charges, and expenses before investing. This and other information can be found in the Portfolio’s prospectus and, if available, its summary prospectus, which may be obtained by visiting delawareinvestments.com or calling 800 231-8002. Investors should read the prospectus and, if available, the summary prospectus carefully before investing.
| | | | | | | | | | |
| Portfolio and benchmark performance | | | | | | | | | | |
| Average annual total returns | | | | | | | | | | |
| Periods ended Oct. 31, 2015 | | 1 year | | 3 years | | 5 years | | 10 years | | Lifetime |
| | | | | |
| | | | | | | | | | |
The Labor Select International Equity Portfolio | | –0.98% | | +7.13% | | +4.34% | | +4.09% | | +7.25% |
MSCI EAFE Index (gross) | | +0.37% | | +8.48% | | +5.28% | | +4.53% | | +5.80% |
MSCI EAFE Index (net) | | –0.07% | | +8.02% | | +4.81% | | +4.05% | | +5.40% |
| | |
| |
| Portfolio profile | | |
| Oct. 31, 2015 | | |
| | |
Total net assets | | Number of holdings |
$360.7 million | | 54 |
| | |
Inception date | | |
Dec. 19, 1995 | | |
Growth of $1,000,000
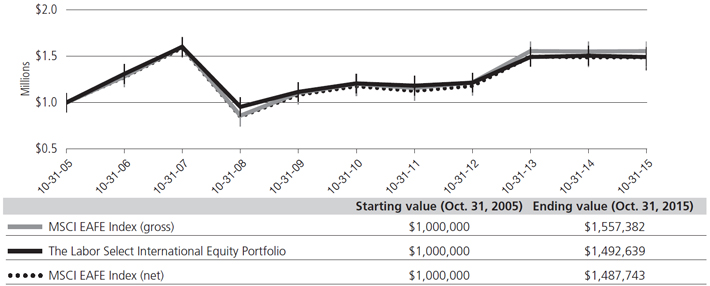
The performance graph assumes $1 million invested on Oct. 31, 2005, and includes reinvestment of all distributions. The performance graph does not reflect the deduction of taxes the shareholder would pay on Portfolio distributions or redemptions of Portfolio shares.
Total return assumes reinvestment of dividends and capital gains, but does not reflect reductions for taxes. Returns and share values will fluctuate so that shares, when redeemed, may be worth more or less than their original cost.
Performance summary
Delaware Pooled® Trust — The Labor Select International Equity Portfolio
The most recent prospectus disclosed the Portfolio’s total operating expenses as 0.86%.
The MSCI EAFE (Europe, Australasia, Far East) Index is a free float-adjusted market capitalization weighted index designed to measure equity market performance of developed markets, excluding the United States and Canada. Index “gross” return approximates the maximum possible dividend reinvestment. Index “net” return approximates the minimum possible dividend reinvestment, after deduction of withholding tax at the highest possible rate.
The MSCI EAFE Value Index, mentioned on page 31, is a subset of the MSCI EAFE Index, which measures equity market performance across developed market countries in Europe, Australasia, and the Far East. The MSCI EAFE Value Index consists of those securities classified by MSCI as most representing the value style.
Index performance returns do not reflect any management fees, transaction costs, or expenses. Indices are unmanaged and one cannot invest directly in an index.
Investing involves risk, including the possible loss of principal.
Past performance is not a guarantee of future results.
International investments entail risks not ordinarily associated with U.S. investments including fluctuation in currency values, differences in accounting principles, or economic or political instability in other nations.
Investing in emerging markets can be riskier than investing in established foreign markets due to increased volatility and lower trading volume.
If and when the Portfolio invests in forward foreign currency contracts or uses other investments to hedge against currency risks, the Portfolio will be subject to special risks, including counterparty risk.
From time to time, the Portfolio may invest up to 30% of its net assets in securities of issuers in the commercial banking industry; to the extent that the Portfolio invests 30% of its net assets in such securities, it may be slightly more sensitive to movement in the commercial banking industry.
34
Portfolio management review
Delaware Pooled® Trust — The Emerging Markets Portfolio
October 31, 2015
Delaware Pooled Trust — The Emerging Markets Portfolio returned -17.11% at net asset value (NAV) with all distributions reinvested for the fiscal year ended Oct. 31, 2015. The Portfolio’s benchmark, the MSCI Emerging Markets Index, returned -14.22% (gross) and -14.53% (net). Complete annualized performance for The Emerging Markets Portfolio is shown in the table on page 36.
We saw a highly volatile environment for emerging market economies during the fiscal year. The effects of a strong U.S. dollar can hardly be overstated. For the majority of the countries in this asset class, weak currencies pummeled weak markets. In local currency terms, the return on this asset class for the fiscal year was essentially flat; however, translating these returns into dollars seemed to stifle performance.
The most obvious exception was China. The MSCI China Index is made up of companies listed on the Hong Kong exchange. These stocks didn’t suffer from the U.S. dollar’s strength given the peg of the Hong Kong dollar. Although China was one of the strongest-performing markets in the MSCI Emerging Markets Index, its return for the period (-9.4%), was less of a standout when compared with other countries’ returns in their local currencies. Markets that outperformed in their local currencies but experienced a severe U.S. dollar handicap included India (-3.8%), Korea (-1.5%), Taiwan (-7.8%), Mexico (-7.2%), Turkey (-23.3%), and South Africa (-10.6%) (returns are shown in U.S. dollars).
The slowing Chinese economy led to very weak commodity prices during the Portfolio’s fiscal year. Asian markets, in general, have benefited. Economies with a greater dependence on commodity exports, including Brazil, down 36.2% (the Brazilian real was down 30.8%), and Malaysia, down 21.7% (the ringgit fell 18.6%), fared comparatively worse.
In terms of country weightings, a significant factor in the Portfolio’s underperformance relative to its benchmark was an underweight positioning in China. Chinese financial companies, which make up approximately 9-10% of the benchmark, were particularly strong performers. The Portfolio held no exposure to Chinese financials during the fiscal year, due to our assessment of stocks’ valuations and risk exposures. Other country weightings that hurt relative performance were the Portfolio’s underweight in Korea and overweight in Malaysia.
India was a significant beneficiary of falling oil prices, which has helped ease both inflation and its current account deficit. The Portfolio’s overweight in India contributed to relative performance, as did the Portfolio’s overweight in Middle East markets, whose returns were shored up by their pegs to the U.S. dollar.
The sectors hit hardest during the fiscal year included energy (-9.1%) and materials (-15.3%). The Portfolio was underweighted both
sectors, particularly materials, which helped relative performance. Emerging market sectors that outperformed the benchmark included consumer staples, consumer discretionary, information technology, and healthcare. The Portfolio’s overweights in the consumer sectors also contributed to returns. The Portfolio’s underweight in information technology — notably Chinese companies — detracted from benchmark-relative performance. We continue to find little value in this Chinese sector.
Two Brazilian holdings were among the largest drags on the Portfolio’s returns for the fiscal year. Iron ore company Vale was down approximately 55%. Vale struggled with falling ore prices as continued weakness in China coincided with increased iron ore supply; we were slightly overweight in this holding. Toll road operator CCR was down 56%. The company has shown sensitivity to rising interest rates on the back of imported inflation fueled by Brazil’s weak currency.
Another disappointment was Perusahaan Gas Negara Persero, the Indonesian natural gas transporter and distributor. The stock fell 50% as lower gas distribution volumes and a slowing Indonesian economy affected the company. AMMB Holdings, one of the Portfolio’s Malaysian bank holdings, declined 39% during the fiscal year. This was partly due to Malaysia’s currency woes. In addition, AMMB Holdings was associated with the political scandal involving Prime Minister Najib Razak, who was accused of embezzling state funds.
We still hold all the above stocks. We believe the precipitous falls create long-term value opportunities today.
A strong absolute and relative performer for the Portfolio was Mexican airport operator Grupo Aeroportuario del Pacifico (GAP). The stock gained 40% as rising passenger traffic supported healthy earnings. Solid operational results boosted China toll road operator Jiangsu Expressway, gaining approximately 25%. Another holding that contributed to both relative and absolute performance was Tupras Turkiye Petrol Rafinerileri, a Turkish oil refiner. It returned 22% on the back of improving gross refining margins. Finally, Qatar Electricity & Water, up 17.9%, turned in a solid operational performance. Qatar’s peg to the U.S. dollar also contributed to the stock’s returns.
Although value has underperformed growth during the fiscal year, we, as value managers, consider this an opportunity. Valuations are currently discounted to levels not seen in many years, particularly when viewed against those of developed markets. Many of the attributes of emerging markets that have the potential to drive long-term growth — including rising productivity, low labor costs, and a growing middle class — remain in place, in our view.
|
| The views expressed are current as of the date of this report and subject to change. |
Performance summary
Delaware Pooled® Trust — The Emerging Markets Portfolio
The performance data quoted represent past performance; past performance does not guarantee future results. Investment return and principal value will fluctuate so your shares, when redeemed, may be worth more or less than their original cost. Current performance may be lower or higher than the performance data quoted. Please obtain the performance data for the most recent month end by calling 800 231-8002 or visiting our website at delawareinvestments.com.
Carefully consider the Portfolio’s investment objectives, risk factors, charges, and expenses before investing. This and other information can be found in the Portfolio’s prospectus and, if available, its summary prospectus, which may be obtained by visiting delawareinvestments.com or calling 800 231-8002. Investors should read the prospectus and, if available, the summary prospectus carefully before investing.
| | | | | | | | | | |
| Portfolio and benchmark performance | | | | | | | | | | |
| Average annual total returns | | | | | | | | | | |
| Periods ended Oct. 31, 2015 | | 1 year | | 3 years | | 5 years | | 10 years | | Lifetime |
| | | | | |
| | | | | | | | | | |
The Emerging Markets Portfolio | | –17.11% | | –4.43% | | –2.26% | | +5.37% | | +7.24% |
MSCI Emerging Markets Index (gross) | | –14.22% | | –2.53% | | –2.47% | | +6.04% | | +5.44% |
MSCI Emerging Markets Index (net) | | –14.53% | | –2.87% | | –2.80% | | +5.70% | | +5.16% |
| | |
| |
| Portfolio profile | | |
| Oct. 31, 2015 | | |
| | |
Total net assets | | Number of holdings |
$172.7 million | | 88 |
| | |
Inception date | | |
April 16, 1997 | | |
Growth of $1,000,000
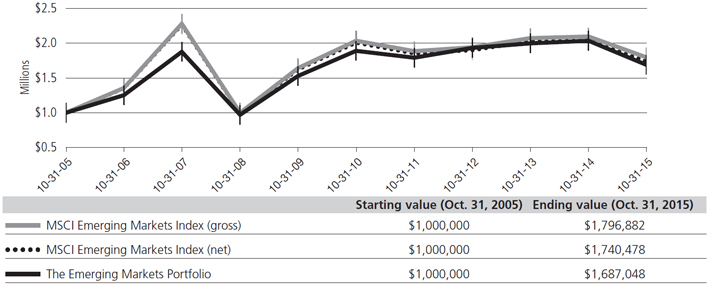
The performance graph assumes $1 million invested on Oct. 31, 2005, and includes reinvestment of all distributions. The performance graph does not reflect the deduction of taxes the shareholder would pay on Portfolio distributions or redemptions of Portfolio shares.
Total return assumes reinvestment of dividends and capital gains, but does not reflect reductions for taxes. Returns and share values will fluctuate so that shares, when redeemed, may be worth more or less than their original cost.
The most recent prospectus disclosed the Portfolio’s total operating expenses as 1.16%. The purchase reimbursement fee (0.55%) and redemption reimbursement fee (0.55%) are paid to the Portfolio. The fees are designed to reflect an approximation of the brokerage and other transaction costs associated with the investment of an investor’s purchase amount or the disposition of assets to meet redemptions, and to limit the extent to which the Portfolio (and, indirectly, the Portfolio’s existing shareholders) would have to bear such costs. In lieu of the reimbursement fees, investors in The Emerging Markets Portfolio may be permitted to utilize alternative purchase and redemption methods designed to accomplish the same economic effect as the reimbursement fees. Reimbursement fees applicable to purchases and redemptions of shares of the Portfolio are not reflected in the “Growth of $1,000,000” graph.
Expense limitations were in effect during the period shown. Performance would have been lower had the expense limitations not been in effect.
The MSCI Emerging Markets Index measures equity market performance across emerging market countries worldwide. Index “gross” return approximates the maximum possible dividend reinvestment. Index “net” return approximates the minimum possible dividend reinvestment, after deduction of withholding tax at the highest possible rate.
The MSCI China Index, mentioned on page 35, captures large-cap and mid-cap representation across China H shares, B shares, Red chips, and P chips. With 143 constituents, the index covers about 85% of the China equity universe.
Index performance returns do not reflect any management fees, transaction costs, or expenses. Indices are unmanaged and one cannot invest directly in an index.
Investing involves risk, including the possible loss of principal.
Past performance is not a guarantee of future results.
International investments entail risks not ordinarily associated with U.S. investments including fluctuation in currency values, differences in accounting principles, or economic or political instability in other nations.
Investing in emerging markets can be riskier than investing in established foreign markets due to increased volatility and lower trading volume.
If and when the Portfolio invests in forward foreign currency contracts or uses other investments to hedge against currency risks, the Portfolio will be subject to special risks, including counterparty risk.
Fixed income securities and bond funds can lose value, and investors can lose principal, as interest rates rise. They also may be affected by economic conditions that hinder an issuer’s ability to make interest and principal payments on its debt.
The Portfolio may also be subject to prepayment risk, the risk that the principal of a fixed income security that is held by the Portfolio may be prepaid prior to maturity, potentially forcing the Portfolio to reinvest that money at a lower interest rate.
High yielding, noninvestment grade bonds (junk bonds) involve higher risk than investment grade bonds.
The Portfolio is presently closed to new investors.
37
Portfolio management review
Delaware Pooled® Trust — The Emerging Markets Portfolio II
October 31, 2015
For the fiscal year ended Oct. 31, 2015, Delaware Pooled Trust — The Emerging Markets Portfolio II returned -21.84% at net asset value (NAV) with all distributions reinvested. This result lagged the Portfolio’s benchmark, the MSCI Emerging Markets Index, which returned -14.22% (gross) and -14.53% (net) for the same period. Complete annualized performance for The Emerging Markets Portfolio II is shown in the table on page 39.
Emerging market equities fell sharply during the Portfolio’s fiscal year. Concerns about an overheated domestic Chinese equity market, lackluster economic growth across most emerging countries, and lack of progress in debt negotiations between Greece and its creditors contributed to declines in many emerging markets countries. In addition, slowing economic growth in China and the timing of interest rate increases in the United States contributed to heightened investor risk aversion, market volatility, and fund outflows.
During the fiscal year, Israel contributed the most to performance due to the Portfolio’s overweight position in Teva Pharmaceutical. Shares rose after the company announced a deal to buy the generics business Allergan. In Korea, shares of Lotte Chilsung Beverage benefited from the company’s market share gains in beer. The Portfolio’s position in Samsung Electronics outperformed in anticipation of increased capital returns to shareholders and relatively stable performance in its semiconductor business. Shares of KT&G also performed well as cigarette demand has been resilient, while the dividend remains attractive to us. In addition, the Portfolio’s underweight positions in Malaysia, Greece, Poland, and the United Arab Emirates contributed to relative performance as all of these markets underperformed.
In contrast, Brazil detracted the most from performance. Shares of consumer companies Hypermarcas and B2W Cia Digital and telecommunication operators Tim Participacoes and Telefonica Brasil declined as general economic weakness negatively affected consumers’ purchasing power. In addition, currency depreciation eroded revenue and profits in U.S. dollar terms. The slowdown in business travel and the weaker currency significantly affected airline Gol Linhas Aereas Inteligentes S.A. However, we believe that long-term competitiveness and franchise sustainability remain intact for all these companies and that they may be well-positioned for structural growth when the economy recovers.
Elsewhere, in China an underweight position in Tencent Holdings was unfavorable to the Portfolio’s performance in terms of asset allocation. In addition, a large overweight position in Baidu detracted from performance due to downward pressure on short-term earnings as the company has invested more heavily in future
growth initiatives. The Portfolio’s position in PetroChina also detracted from performance as shares declined in sympathy with oil prices. We believe that the company remains well-positioned for long-term growth in gas consumption. Finally, the Portfolio’s underweight position in the financial sector hurt relative performance as the sector rallied on speculation about further policy stimuli to boost the economy.
In Mexico, underperformance primarily stemmed from the Portfolio’s investment in Cemex. Shares declined amid concerns about the company’s U.S. dollar-denominated debt. We believe the stock is undervalued compared to its assets. Additionally, in our view Cemex should see improving operations in Mexico and the U.S. due to greater pricing power in both countries.
Shares of Empresas ICA also declined due to disappointing earnings coupled with slow progress in reducing its debt through asset divestiture. ICA is one of the largest construction groups in Mexico, and we believe the company remains attractive if infrastructure construction needs in Mexico continue to be strong. A position in Grupo Televisa also detracted from Portfolio performance as recent advertising revenue has come in weaker than expected, raising questions about whether this is a cyclical or structural downturn. In addition, the correction in U.S. media stocks seems to have cast a cloud over the company’s proposed initial public offering of Univision. We believe, however, that Grupo Televisa’s ecosystem remains robust and that the company is well-positioned to benefit from long-term growth in consumption and income.
Among sectors, consumer staples contributed the most to performance due to the Portfolio’s positions in Lotte Chilsung and KT&G. On the negative side, the consumer discretionary sector detracted the most from performance due to B2W in Brazil and an underweight position in Naspers in South Africa.
Our investment approach remains centered on identifying individual companies that we believe possess sustainable franchises and favorable long-term growth prospects, trading at what we believe to be significant discounts to their intrinsic value. We are particularly focused on companies that we think should benefit from long-term changes in how people in emerging markets live and work; sectors we currently favor include technology and telecommunications. In the short-term, global growth concerns are eclipsing fundamental valuation merits, in our opinion. However, we remain patient with our investments and continue to believe that companies with what we view as sound fundamentals have the potential to outperform over the long-term.
|
| The views expressed are current as of the date of this report and subject to change. |
Performance summary
Delaware Pooled® Trust — The Emerging Markets Portfolio II
The performance data quoted represent past performance; past performance does not guarantee future results. Investment return and principal value will fluctuate so your shares, when redeemed, may be worth more or less than their original cost. Current performance may be lower or higher than the performance data quoted. Please obtain the performance data for the most recent month end by calling 800 231-8002 or visiting our website at delawareinvestments.com.
Carefully consider the Portfolio’s investment objectives, risk factors, charges, and expenses before investing. This and other information can be found in the Portfolio’s prospectus and, if available, its summary prospectus, which may be obtained by visiting delawareinvestments.com or calling 800 231-8002. Investors should read the prospectus and, if available, the summary prospectus carefully before investing.
| | | | | | | | |
| Portfolio and benchmark performance | | | | | | | | |
| Average annual total returns | | | | | | | | |
| Periods ended Oct. 31, 2015 | | 1 year | | 3 years | | 5 years | | Lifetime |
| | | | |
| | | | | | | | |
The Emerging Markets Portfolio II | | –21.84% | | –1.25% | | –2.78% | | –0.24% |
MSCI Emerging Markets Index (gross) | | –14.22% | | –2.53% | | –2.47% | | +5.44% |
MSCI Emerging Markets Index (net) | | –14.53% | | –2.87% | | –2.80% | | +5.16% |
| | |
| |
| Portfolio profile | | |
| Oct. 31, 2015 | | |
| | |
Total net assets | | Number of holdings |
$33.3 million | | 117 |
| | |
Inception date | | |
June 23, 2010 | | |
Growth of $1,000,000
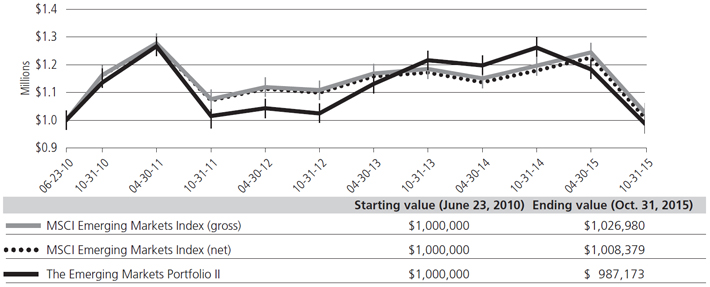
The performance graph assumes $1 million invested on June 23, 2010, and includes reinvestment of all distributions. The performance graph does not reflect the deduction of taxes the shareholder would pay on Portfolio distributions or redemptions of Portfolio shares.
Total return assumes reinvestment of dividends and capital gains, but does not reflect reductions for taxes. Returns and share values will fluctuate so that shares, when redeemed, may be worth more or less than their original cost.
Performance summary
Delaware Pooled® Trust — The Emerging Markets Portfolio II
The most recent prospectus disclosed the Portfolio’s total operating expenses as 1.32%. Management has contractually agreed to reimburse certain expenses and/or waive its management fees from Nov. 1, 2014, through Oct. 31, 2015,* in order to prevent total annual Portfolio operating expenses (with certain exclusions) from exceeding, in an aggregate amount, 1.20% of the Portfolio’s average daily net assets, as described in the most recent prospectus.
Expense limitations were in effect during the period shown. Performance would have been lower had the expense limitations not been in effect.
The MSCI Emerging Markets Index measures equity market performance across emerging market countries worldwide. Index “gross” return approximates the maximum possible dividend reinvestment. Index “net” return approximates the minimum possible dividend reinvestment, after deduction of withholding tax at the highest possible rate.
Index performance returns do not reflect any management fees, transaction costs, or expenses. Indices are unmanaged and one cannot invest directly in an index.
Investing involves risk, including the possible loss of principal.
Past performance is not a guarantee of future results.
International investments entail risks not ordinarily associated with U.S. investments including fluctuation in currency values, differences in accounting principles, or economic or political instability in other nations.
Investing in emerging markets can be riskier than investing in established foreign markets due to increased volatility and lower trading volume.
If and when the Portfolio invests in forward foreign currency contracts or uses other investments to hedge against currency risks, the Portfolio will be subject to special risks, including counterparty risk.
The Portfolio may invest in derivatives, which may involve additional expenses and are subject to risk, including the risk that an underlying security or securities index moves in the opposite direction from what the portfolio manager anticipated. A derivative transaction depends upon the counterparties’ ability to fulfill their contractual obligations.
*The contractual waiver period is from Feb. 27, 2014 through Feb. 29, 2016.
40
Disclosure of Portfolio expenses
For the six-month period from May 1, 2015 to October 31, 2015 (Unaudited)
As a shareholder of a Portfolio, you incur two types of costs: (1) transaction costs, including reimbursement fees on The Emerging Markets Portfolio; and (2) ongoing costs, including management fees and other Portfolio expenses. The following examples are intended to help you understand your ongoing costs (in dollars) of investing in a Portfolio and to compare these costs with the ongoing costs of investing in other mutual funds.
The examples are based on an investment of $1,000 invested at the beginning of the period and held for the entire six-month period from May 1, 2015 to Oct. 31, 2015.
Actual Expenses
The first section of the table shown, “Actual Portfolio return,” provides information about actual account values and actual expenses. You may use the information in this table, together with the amount you invested, to estimate the expenses that you paid over the period. Simply divide your account value by $1,000 (for example, an $8,600 account value divided by $1,000 = 8.6), then multiply the result by the number in the first section under the heading entitled “Expenses Paid During Period” to estimate the expenses you paid on your account during the period.
Hypothetical Example for Comparison Purposes
The second section of the table shown, “Hypothetical 5% return,” provides information about hypothetical account values and hypothetical expenses based on a Portfolio’s actual expense ratio and an assumed rate of return of 5% per year before expenses, which is not the Portfolio’s actual return. The hypothetical account values and expenses may not be used to estimate the actual ending account balance or expenses you paid for the period. You may use this information to compare the ongoing costs of investing in the Portfolio and other funds. To do so, compare this 5% hypothetical example with the 5% hypothetical examples that appear in the shareholder reports of other funds.
Please note that the expenses shown in the table are meant to highlight your ongoing costs only and do not reflect any transactional costs. Therefore, the second section of the table is useful in comparing ongoing costs only, and will not help you determine the relative total costs of owning different funds. In addition, if these transactional costs were included, your costs would have been higher. Certain of the Portfolios’ actual expenses shown in the table reflect fee waivers in effect. The expenses shown in the table assume reinvestment of all dividends and distributions.
In each case, “Expenses Paid During Period” are equal to the relevant Portfolio’s annualized expense ratio, multiplied by the average account value over the period, multiplied by 184/365 (to reflect the one-half year period).
Delaware Pooled® Trust
Expense Analysis of an Investment of $1,000
| | | | | | | | | | | | | | | | |
| | | Beginning
Account
Value
5/1/15 | | | Ending
Account
Value
10/31/15 | | | Annualized
Expense
Ratio | | | Expenses Paid During Period
5/1/15 to 10/31/15 | |
Actual Portfolio return† | |
The Large-Cap Value Equity Portfolio | | $ | 1,000.00 | | | $ | 978.50 | | | | 0.63% | | | | $3.14 | |
The Select 20 Portfolio | | | 1,000.00 | | | | 1,044.30 | | | | 0.87% | | | | 4.48 | |
The Large-Cap Growth Equity Portfolio | | | 1,000.00 | | | | 1,010.80 | | | | 0.62% | | | | 3.14 | |
The Focus Smid-Cap Growth Equity Portfolio | | | 1,000.00 | | | | 984.00 | | | | 0.90% | | | | 4.50 | |
The High-Yield Bond Portfolio | | | 1,000.00 | | | | 960.50 | | | | 0.54% | | | | 2.67 | |
The Core Plus Fixed Income Portfolio | | | 1,000.00 | | | | 992.30 | | | | 0.43% | | | | 2.16 | |
The International Equity Portfolio | | | 1,000.00 | | | | 928.30 | | | | 0.88% | | | | 4.28 | |
The Labor Select International Equity Portfolio | | | 1,000.00 | | | | 933.60 | | | | 0.86% | | | | 4.19 | |
The Emerging Markets Portfolio | | | 1,000.00 | | | | 851.80 | | | | 1.18% | | | | 5.51 | |
The Emerging Markets Portfolio II | | | 1,000.00 | | | | 833.70 | | | | 1.20% | | | | 5.55 | |
Disclosure of Portfolio expenses
| | | | | | | | |
| | | Beginning
Account
Value
5/1/15 | | Ending
Account
Value
10/31/15 | | Annualized
Expense
Ratio | | Expenses Paid During Period 5/1/15 to 10/31/15 |
Hypothetical 5% return (5% return before expenses) |
The Large-Cap Value Equity Portfolio | | $1,000.00 | | $1,022.03 | | 0.63% | | $3.21 |
The Select 20 Portfolio | | 1,000.00 | | 1,020.82 | | 0.87% | | 4.43 |
The Large-Cap Growth Equity Portfolio | | 1,000.00 | | 1,022.08 | | 0.62% | | 3.16 |
The Focus Smid-Cap Growth Equity Portfolio | | 1,000.00 | | 1,020.67 | | 0.90% | | 4.58 |
The High-Yield Bond Portfolio | | 1,000.00 | | 1,022.48 | | 0.54% | | 2.75 |
The Core Plus Fixed Income Portfolio | | 1,000.00 | | 1,023.04 | | 0.43% | | 2.19 |
The International Equity Portfolio | | 1,000.00 | | 1,020.77 | | 0.88% | | 4.48 |
The Labor Select International Equity Portfolio | | 1,000.00 | | 1,020.87 | | 0.86% | | 4.38 |
The Emerging Markets Portfolio | | 1,000.00 | | 1,019.26 | | 1.18% | | 6.01 |
The Emerging Markets Portfolio II | | 1,000.00 | | 1,019.16 | | 1.20% | | 6.11 |
†Because actual returns reflect only the most recent six-month period, the returns shown may differ significantly from fiscal year returns.
42
Security type / sector allocations
and top 10 equity holdings
Delaware Pooled® Trust — The Large-Cap Value Equity Portfolio
As of October 31, 2015 (Unaudited)
Sector designations may be different than the sector designations presented in other Portfolio materials. The sector designations may represent the investment manager’s internal sector classifications, which may result in the sector designations for one portfolio being different than another portfolio’s sector designations.
| | | | |
| Security type / sector | | Percentage
of net assets | |
Common Stock | | | 98.85% | |
Consumer Discretionary | | | 6.36% | |
Consumer Staples | | | 11.90% | |
Energy | | | 13.03% | |
Financials | | | 12.09% | |
Healthcare | | | 21.68% | |
Industrials | | | 9.36% | |
Information Technology | | | 12.23% | |
Materials | | | 3.34% | |
Telecommunications | | | 6.06% | |
Utilities | | | 2.80% | |
Short-Term Investments | | | 1.00% | |
Total Value of Securities | | | 99.85% | |
Receivables and Other Assets Net of Liabilities | | | 0.15% | |
Total Net Assets | | | 100.00% | |
Holdings are for informational purposes only and are subject to change at any time. They are not a recommendation to buy, sell, or hold any security.
| | |
| Top 10 equity holdings | | Percentage
of net assets |
Intel | | 3.35% |
duPont (E.I.) deNemours | | 3.34% |
Cisco Systems | | 3.22% |
Johnson & Johnson | | 3.20% |
Merck | | 3.19% |
Lowe’s | | 3.19% |
Quest Diagnostics | | 3.18% |
Johnson Controls | | 3.17% |
Northrop Grumman | | 3.17% |
Kraft Heinz | | 3.14% |
Security type / sector allocations
and top 10 equity holdings
Delaware Pooled® Trust — The Select 20 Portfolio
As of October 31, 2015 (Unaudited)
Sector designations may be different than the sector designations presented in other Portfolio materials. The sector designations may represent the investment manager’s or sub-advisor’s internal sector classifications, which may result in the sector designations for one portfolio being different than another portfolio’s sector designations.
| | | | |
| Security type / sector | | Percentage
of net assets | |
Common Stock✧ | | | 97.99% | |
Consumer Discretionary | | | 20.63% | |
Consumer Staples | | | 3.07% | |
Financials | | | 21.46% | |
Healthcare | | | 13.32% | |
Information Technology* | | | 29.70% | |
Office REIT | | | 4.73% | |
Producer Durables | | | 5.08% | |
Short-Term Investments | | | 2.09% | |
Total Value of Securities | | | 100.08% | |
Liabilities Net of Receivables and Other Assets | | | (0.08% | ) |
Total Net Assets | | | 100.00% | |
|
✧ Narrow industries are utilized for compliance purposes for diversification whereas broad sectors are used for financial reporting. |
| * | To monitor compliance with the Portfolio’s concentration guidelines as described in the Portfolio’s Prospectus and Statement of Additional Information, the Information Technology sector (as disclosed herein for financial reporting purposes) is divided into various sub-categories or “industries,” in this case, computers, internet, semiconductors, and software. As of Oct. 31, 2015, such amounts, as a percentage of total net assets, were 4.18%, 6.54%, 6.67%, and 12.30%, respectively. The percentage in any such single industry will comply with the Portfolio’s concentration policy even if the percentage in the “Information Technology sector” for financial reporting purposes may exceed 25%. |
Holdings are for informational purposes only and are subject to change at any time. They are not a recommendation to buy, sell, or hold any security.
| | |
| Top 10 equity holdings | | Percentage
of net assets |
Visa Class A | | 7.92% |
Microsoft | | 6.74% |
QUALCOMM | | 6.67% |
Celgene | | 5.89% |
Electronic Arts | | 5.57% |
Liberty Interactive QVC Group Class A | | 5.19% |
Intercontinental Exchange | | 5.15% |
Zebra Technologies | | 5.08% |
Crown Castle International | | 4.88% |
Allergan | | 4.81% |
44
Delaware Pooled® Trust — The Large-Cap Growth Equity Portfolio
As of October 31, 2015 (Unaudited)
Sector designations may be different than the sector designations presented in other Portfolio materials. The sector designations may represent the investment manager’s or sub-advisor’s internal sector classifications, which may result in the sector designations for one portfolio being different than another portfolio’s sector designations.
| | | | |
| Security type / sector | | Percentage
of net assets | |
Common Stock✧ | | | 97.70% | |
Consumer Discretionary | | | 17.66% | |
Consumer Staples | | | 4.40% | |
Financials | | | 21.23% | |
Healthcare | | | 22.22% | |
Information Technology* | | | 32.19% | |
Short-Term Investments | | | 1.50% | |
Total Value of Securities | | | 99.20% | |
Receivables and Other Assets Net of Liabilities | | | 0.80% | |
Total Net Assets | | | 100.00% | |
|
✧ Narrow industries are utilized for compliance purposes for diversification whereas broad sectors are used for financial reporting. |
* To monitor compliance with the Portfolio’s concentration guidelines as described in the Portfolio’s Prospectus and Statement of Additional Information, the Information Technology sector (as disclosed herein for financial reporting purposes) is divided into various sub-categories or “industries,” in this case, internet, semiconductors, and software. As of Oct. 31, 2015, such amounts, as a percentage of total net assets, were 16.56%, 5.73%, and 9.90%, respectively. The percentage in any such single industry will comply with the Portfolio’s concentration policy even if the percentage in the “Information Technology sector” for financial reporting purposes may exceed 25%.
Holdings are for informational purposes only and are subject to change at any time. They are not a recommendation to buy, sell, or hold any security.
| | |
| Top 10 equity holdings | | Percentage
of net assets |
Celgene | | 5.79% |
Visa Class A | | 5.76% |
QUALCOMM | | 5.74% |
Allergan | | 4.93% |
MasterCard Class A | | 4.45% |
Walgreens Boots Alliance | | 4.40% |
Equinix | | 4.31% |
Crown Castle International | | 4.21% |
Liberty Interactive QVC Group Class A | | 4.15% |
Microsoft | | 4.11% |
Security type / sector allocations
and top 10 equity holdings
Delaware Pooled® Trust — The Focus Smid-Cap Growth Equity Portfolio
As of October 31, 2015 (Unaudited)
Sector designations may be different than the sector designations presented in other Portfolio materials. The sector designations may represent the investment manager’s or sub-advisor’s internal sector classifications, which may result in the sector designations for one portfolio being different than another portfolio’s sector designations.
| | | | |
| Security type / sector | | Percentage
of net assets | |
Common Stock | | | 97.40% | |
Consumer Discretionary | | | 21.23% | |
Energy | | | 3.73% | |
Financials | | | 17.37% | |
Healthcare | | | 10.48% | |
Information Technology | | | 19.06% | |
Office REITs | | | 5.19% | |
Producer Durables | | | 14.56% | |
Utilities | | | 5.78% | |
Short-Term Investments | | | 1.93% | |
Total Value of Securities | | | 99.33% | |
Receivables and Other Assets Net of Liabilities | | | 0.67% | |
Total Net Assets | | | 100.00% | |
Holdings are for informational purposes only and are subject to change at any time. They are not a recommendation to buy, sell, or hold any security.
| | |
| Top 10 equity holdings | | Percentage
of net assets |
Heartland Payment Systems | | 6.25% |
j2 Global | | 5.79% |
MSCI Class A | | 5.47% |
Blackbaud | | 5.30% |
Graco | | 5.20% |
Equity Commonwealth | | 5.19% |
Zebra Technologies | | 5.11% |
Sally Beauty Holdings | | 4.68% |
Bio-Techne | | 4.60% |
DineEquity | | 4.37% |
46
Security type / sector allocations
Delaware Pooled® Trust — The High-Yield Bond Portfolio
As of October 31, 2015 (Unaudited)
Sector designations may be different than the sector designations presented in other Portfolio materials. The sector designations may represent the investment manager’s internal sector classifications, which may result in the sector designations for one portfolio being different than another portfolio’s sector designations.
| | | | |
| Security type / sector | | Percentage
of net assets | |
Convertible Bond | | | 0.08% | |
Corporate Bonds | | | 85.87% | |
Automobiles | | | 0.88% | |
Banking | | | 3.28% | |
Basic Industry | | | 8.20% | |
Capital Goods | | | 5.06% | |
Consumer Cyclical | | | 4.84% | |
Consumer Non-Cyclical | | | 5.87% | |
Energy | | | 8.08% | |
Financials | | | 1.61% | |
Healthcare | | | 10.63% | |
Insurance | | | 1.37% | |
Media | | | 9.97% | |
Services | | | 7.10% | |
Technology & Electronics | | | 5.87% | |
Telecommunications | | | 9.92% | |
Utilities | | | 3.19% | |
Municipal Bond | | | 0.27% | |
Senior Secured Loans | | | 6.61% | |
Common Stock | | | 0.00% | |
Preferred Stock | | | 1.03% | |
Short-Term Investments | | | 6.51% | |
Total Value of Securities | | | 100.37% | |
Liabilities Net of Receivables and Other Assets | | | (0.37% | ) |
Total Net Assets | | | 100.00% | |
Security type / sector allocations
Delaware Pooled® Trust — The Core Plus Fixed Income Portfolio
As of October 31, 2015 (Unaudited)
Sector designations may be different than the sector designations presented in other Portfolio materials. The sector designations may represent the investment manager’s internal sector classifications, which may result in the sector designations for one portfolio being different than another portfolio’s sector designations.
| | | | |
| Security type / sector | | Percentage
of net assets | |
Agency Asset-Backed Security | | | 0.11% | |
Agency Collateralized Mortgage Obligations | | | 1.78% | |
Agency Mortgage-Backed Securities | | | 28.96% | |
Collateralized Debt Obligations | | | 1.35% | |
Commercial Mortgage-Backed Securities | | | 5.67% | |
Convertible Bonds | | | 0.11% | |
Corporate Bonds | | | 31.17% | |
Banking | | | 4.75% | |
Basic Industry | | | 1.70% | |
Brokerage | | | 0.18% | |
Capital Goods | | | 1.28% | |
Communications | | | 4.22% | |
Consumer Cyclical | | | 2.54% | |
Consumer Non-Cyclical | | | 2.94% | |
Electric | | | 5.81% | |
Energy | | | 2.69% | |
Finance Companies | | | 0.69% | |
Insurance | | | 1.16% | |
REITs | | | 0.94% | |
Services | | | 0.26% | |
Technology | | | 1.09% | |
Transportation | | | 0.87% | |
Utilities | | | 0.05% | |
| | | | |
| Security type / sector | | Percentage
of net assets | |
Municipal Bonds | | | 0.84% | |
Non-Agency Asset-Backed Securities | | | 7.71% | |
Non-Agency Collateralized Mortgage Obligations | | | 0.93% | |
Senior Secured Loans | | | 4.84% | |
Sovereign Bonds | | | 0.80% | |
Supranational Banks | | | 0.10% | |
U.S. Treasury Obligations | | | 13.44% | |
Convertible Preferred Stock | | | 0.01% | |
Preferred Stock | | | 0.21% | |
Short-Term Investments | | | 13.74% | |
Total Value of Securities | | | 111.77% | |
Liabilities Net of Receivables and Other Assets | | | (11.77% | ) |
Total Net Assets | | | 100.00% | |
48
Security type / country and sector allocations
Delaware Pooled® Trust — The International Equity Portfolio
As of October 31, 2015 (Unaudited)
Sector designations may be different than the sector designations presented in other Portfolio materials. The sector designations may represent the investment manager’s or sub-advisor’s internal sector classifications, which may result in the sector designations for one portfolio being different than another portfolio’s sector designations.
| | | | |
| Security type / country | | Percentage
of net assets | |
| |
Common Stock | | | 99.41% | |
Australia | | | 1.25% | |
China | | | 1.58% | |
Denmark | | | 0.72% | |
France | | | 6.84% | |
Germany | | | 9.99% | |
Israel | | | 0.54% | |
Italy | | | 2.46% | |
Japan | | | 17.50% | |
Netherlands | | | 4.79% | |
Norway | | | 0.30% | |
Singapore | | | 5.81% | |
Spain | | | 6.48% | |
Sweden | | | 3.74% | |
Switzerland | | | 13.19% | |
Taiwan | | | 1.02% | |
United Kingdom | | | 23.20% | |
| |
Rights | | | 0.01% | |
| |
Short-Term Investments | | | 0.37% | |
| |
Total Value of Securities | | | 99.79% | |
| |
Receivables and Other Assets Net of Liabilities | | | 0.21% | |
| |
Total Net Assets | | | 100.00% | |
| |
| | | | |
| Common stock by sector | | Percentage
of net assets | |
| |
Consumer Discretionary | | | 7.59% | |
Consumer Staples | | | 14.53% | |
Energy | | | 11.03% | |
Financials | | | 11.42% | |
Healthcare | | | 12.45% | |
Industrials | | | 9.49% | |
Information Technology | | | 9.17% | |
Materials | | | 2.72% | |
Telecommunication Services | | | 13.00% | |
Utilities | | | 8.01% | |
| |
Total | | | 99.41% | |
| |
Security type / country and sector allocations
Delaware Pooled® Trust — The Labor Select International Equity Portfolio
As of October 31, 2015 (Unaudited)
Sector designations may be different than the sector designations presented in other Portfolio materials. The sector designations may represent the investment manager’s or sub-advisor’s internal sector classifications, which may result in the sector designations for one portfolio being different than another portfolio’s sector designations.
| | | | |
| Security type / country | | Percentage
of net assets | |
| |
Common Stock | | | 98.87% | |
Australia | | | 1.24% | |
Denmark | | | 0.75% | |
France | | | 6.95% | |
Germany | | | 10.83% | |
Israel | | | 0.71% | |
Japan | | | 18.68% | |
Netherlands | | | 5.55% | |
Norway | | | 0.35% | |
Singapore | | | 5.62% | |
Spain | | | 6.68% | |
Sweden | | | 3.70% | |
Switzerland | | | 12.92% | |
United Kingdom | | | 24.89% | |
| |
Rights | | | 0.01% | |
| |
Short-Term Investments | | | 0.79% | |
| |
Total Value of Securities | | | 99.67% | |
| |
Receivables and Other Assets Net of Liabilities | | | 0.33% | |
| |
Total Net Assets | | | 100.00% | |
| |
| | | | |
| Common stock by sector | | Percentage
of net assets | |
| |
Consumer Discretionary | | | 7.49% | |
Consumer Staples | | | 15.25% | |
Energy | | | 11.01% | |
Financials | | | 11.40% | |
Healthcare | | | 12.74% | |
Industrials | | | 8.62% | |
Information Technology | | | 8.40% | |
Materials | | | 2.68% | |
Telecommunication Services | | | 13.15% | |
Utilities | | | 8.13% | |
| |
Total | | | 98.87% | |
| |
50
Delaware Pooled® Trust — The Emerging Markets Portfolio
As of October 31, 2015 (Unaudited)
Sector designations may be different than the sector designations presented in other Portfolio materials. The sector designations may represent the investment manager’s or sub-advisor’s internal sector classifications, which may result in the sector designations for one portfolio being different than another portfolio’s sector designations.
| | | | |
| Security type / country | | Percentage
of net assets | |
| |
Common Stock | | | 97.26% | |
Brazil | | | 4.64% | |
Chile | | | 2.35% | |
China | | | 18.51% | |
Colombia | | | 0.31% | |
India | | | 10.35% | |
Indonesia | | | 3.66% | |
Kazakhstan | | | 0.41% | |
Malaysia | | | 5.68% | |
Mexico | | | 6.82% | |
Peru | | | 1.31% | |
Philippines | | | 1.82% | |
Qatar | | | 2.82% | |
Republic of Korea | | | 7.80% | |
Romania | | | 0.48% | |
Russia | | | 1.52% | |
South Africa | | | 4.01% | |
Taiwan | | | 14.27% | |
Thailand | | | 1.42% | |
Turkey | | | 2.34% | |
United Arab Emirates | | | 1.45% | |
United Kingdom | | | 3.57% | |
United States | | | 1.72% | |
| |
Preferred Stock | | | 1.53% | |
Brazil | | | 0.85% | |
Republic of Korea | | | 0.68% | |
| |
Short-Term Investments | | | 0.45% | |
| |
Total Value of Securities | | | 99.24% | |
| |
Receivables and Other Assets Net of Liabilities | | | 0.76% | |
| |
Total Net Assets | | | 100.00% | |
| |
| | | | |
| Common and preferred stock by sector | | Percentage
of net assets | |
| |
Consumer Discretionary | | | 13.53% | |
Consumer Staples | | | 11.07% | |
Energy | | | 5.20% | |
Financials | | | 22.35% | |
Healthcare | | | 1.52% | |
Industrials | | | 8.82% | |
Information Technology | | | 14.09% | |
Materials | | | 2.55% | |
Telecommunication Services | | | 10.72% | |
Utilities | | | 8.94% | |
| |
Total | | | 98.79% | |
| |
Security type / country and sector allocations
Delaware Pooled® Trust — The Emerging Markets Portfolio II
As of October 31, 2015 (Unaudited)
Sector designations may be different than the sector designations presented in other Portfolio materials. The sector designations may represent the investment manager’s internal sector classifications, which may result in the sector designations for one portfolio being different than another portfolio’s sector designations.
| | | | |
| Security type / country | | Percentage
of net assets | |
| |
Common Stock | | | 97.45% | |
Argentina | | | 1.37% | |
Bahrain | | | 0.03% | |
Brazil | | | 11.17% | |
Chile | | | 0.83% | |
China/Hong Kong | | | 20.27% | |
Colombia | | | 0.64% | |
India | | | 8.89% | |
Indonesia | | | 0.91% | |
Malaysia | | | 0.31% | |
Mexico | | | 6.83% | |
Netherlands | | | 0.52% | |
Peru | | | 0.22% | |
Poland | | | 0.75% | |
Republic of Korea | | | 25.91% | |
Russia | | | 4.19% | |
South Africa | | | 1.19% | |
Taiwan | | | 7.20% | |
Thailand | | | 1.24% | |
Turkey | | | 1.68% | |
United Kingdom | | | 0.10% | |
United States | | | 3.20% | |
| |
Preferred Stock | | | 1.15% | |
Republic of Korea | | | 1.15% | |
| |
Short-Term Investments | | | 1.24% | |
| |
Total Value of Securities | | | 99.84% | |
| |
Receivables and Other Assets Net of Liabilities | | | 0.16% | |
| |
Total Net Assets | | | 100.00% | |
| |
| | | | |
| Common and preferred stock by sector | | Percentage
of net assets | |
| |
Consumer Discretionary | | | 7.10% | |
Consumer Staples | | | 13.45% | |
Energy | | | 14.34% | |
Financials | | | 10.49% | |
Industrials | | | 2.77% | |
Information Technology | | | 28.47% | |
Materials | | | 7.36% | |
Telecommunication Services | | | 14.54% | |
Utilities | | | 0.08% | |
| |
Total | | | 98.60% | |
| |
52
Schedules of investments
Delaware Pooled® Trust — The Large-Cap Value Equity Portfolio
October 31, 2015
| | | | | | | | |
| | | Number of
shares | | | Value (U.S. $) | |
| |
Common Stock – 98.85% | | | | | | | | |
| |
Consumer Discretionary – 6.36% | | | | | |
Johnson Controls | | | 150,600 | | | $ | 6,804,108 | |
Lowe’s | | | 92,700 | | | | 6,844,041 | |
| | | | | | | | |
| | | | | | | 13,648,149 | |
| | | | | | | | |
Consumer Staples – 11.90% | | | | | |
Archer-Daniels-Midland | | | 136,100 | | | | 6,214,326 | |
CVS Health | | | 60,900 | | | | 6,015,702 | |
Kraft Heinz | | | 86,433 | | | | 6,739,181 | |
Mondelez International | | | 142,500 | | | | 6,577,800 | |
| | | | | | | | |
| | | | | | | 25,547,009 | |
| | | | | | | | |
Energy – 13.03% | | | | | | | | |
Chevron | | | 65,300 | | | | 5,934,464 | |
ConocoPhillips | | | 105,600 | | | | 5,633,760 | |
Halliburton | | | 145,100 | | | | 5,568,938 | |
Marathon Oil | | | 247,400 | | | | 4,547,212 | |
Occidental Petroleum | | | 84,300 | | | | 6,283,722 | |
| | | | | | | | |
| | | | | | | 27,968,096 | |
| | | | | | | | |
Financials – 12.09% | | | | | | | | |
Allstate | | | 103,600 | | | | 6,410,768 | |
Bank of New York Mellon | | | 158,700 | | | | 6,609,855 | |
BB&T | | | 174,900 | | | | 6,497,535 | |
Marsh & McLennan | | | 115,700 | | | | 6,449,118 | |
| | | | | | | | |
| | | | | | | 25,967,276 | |
| | | | | | | | |
Healthcare – 21.68% | | | | | | | | |
Baxalta | | | 192,800 | | | | 6,643,888 | |
Cardinal Health | | | 79,000 | | | | 6,493,800 | |
Express Scripts Holding † | | | 74,110 | | | | 6,401,622 | |
Johnson & Johnson | | | 68,100 | | | | 6,880,143 | |
Merck | | | 125,500 | | | | 6,859,830 | |
Pfizer | | | 190,711 | | | | 6,449,846 | |
Quest Diagnostics | | | 100,500 | | | | 6,828,975 | |
| | | | | | | | |
| | | | | | | 46,558,104 | |
| | | | | | | | |
Industrials – 9.36% | | | | | | | | |
Northrop Grumman | | | 36,200 | | | | 6,796,550 | |
Raytheon | | | 57,300 | | | | 6,727,020 | |
Waste Management | | | 122,100 | | | | 6,564,096 | |
| | | | | | | | |
| | | | | | | 20,087,666 | |
| | | | | | | | |
Information Technology – 12.23% | | | | | |
CA | | | 226,836 | | | | 6,285,625 | |
Cisco Systems | | | 239,500 | | | | 6,909,575 | |
Intel | | | 212,300 | | | | 7,188,478 | |
Xerox | | | 626,000 | | | | 5,878,140 | |
| | | | | | | | |
| | | | | | | 26,261,818 | |
| | | | | | | | |
| | | | | | | | |
| | | Number of
shares | | | Value (U.S. $) | |
| |
Common Stock (continued) | | | | | |
| |
Materials – 3.34% | | | | | | | | |
duPont (E.I.) deNemours | | | 113,100 | | | $ | 7,170,540 | |
| | | | | | | | |
| | | | | | | 7,170,540 | |
| | | | | | | | |
Telecommunications – 6.06% | |
AT&T | | | 190,800 | | | | 6,393,708 | |
Verizon Communications | | | 141,400 | | | | 6,628,832 | |
| | | | | | | | |
| | | | | | | 13,022,540 | |
| | | | | | | | |
Utilities – 2.80% | | | | | | | | |
Edison International | | | 99,500 | | | | 6,021,740 | |
| | | | | | | | |
| | | | | | | 6,021,740 | |
| | | | | | | | |
Total Common Stock (cost $206,754,347) | | | | 212,252,938 | |
| | | | | | | | |
| | | Principal
amount° | | | | |
| |
Short-Term Investments – 1.00% | | | | | |
| |
Discount Notes – 0.63%≠ | | | | | | | | |
Federal Home Loan Bank | | | | | | | | |
0.105% 11/3/15 | | | 178,126 | | | | 178,126 | |
0.12% 1/4/16 | | | 189,859 | | | | 189,833 | |
0.12% 1/25/16 | | | 88,674 | | | | 88,657 | |
0.14% 2/18/16 | | | 160,165 | | | | 160,112 | |
0.155% 2/3/16 | | | 125,363 | | | | 125,328 | |
0.17% 1/21/16 | | | 111,644 | | | | 111,624 | |
0.18% 2/26/16 | | | 108,634 | | | | 108,596 | |
0.18% 3/7/16 | | | 99,416 | | | | 99,355 | |
0.185% 1/19/16 | | | 60,667 | | | | 60,656 | |
0.19% 3/22/16 | | | 131,998 | | | | 131,908 | |
0.195% 12/2/15 | | | 85,925 | | | | 85,923 | |
0.295% 3/2/16 | | | 29,363 | | | | 29,346 | |
| | | | | | | | |
| | | | | | | 1,369,464 | |
| | | | | | | | |
Repurchase Agreements – 0.37% | |
Bank of America Merrill Lynch 0.04%, dated 10/30/15, to be repurchased on 11/2/15, repurchase price $133,011 (collateralized by U.S. government obligations 3.625% 8/15/43; market value $135,671) | | | 133,011 | | | | 133,011 | |
Schedules of investments
Delaware Pooled® Trust — The Large-Cap Value Equity Portfolio
| | | | | | | | |
| | | Principal
amount° | | | Value (U.S. $) | |
| |
Short-Term Investments (continued) | | | | | |
| |
Repurchase Agreements (continued) | | | | | |
Bank of Montreal
0.05%, dated 10/30/15, to be repurchased on 11/2/15, repurchase price $66,506 (collateralized by U.S. government obligations 2.00%–4.50% 8/15/25–8/15/45; market value $67,835) | | | 66,505 | | | $ | 66,505 | |
BNP Paribas
0.06%, dated 10/30/15, to be repurchased on 11/2/15, repurchase price $591,839 (collateralized by U.S. government obligations 0.00%–8.50% 2/29/16–11/15/44; market value $603,673) | | | 591,836 | | | | 591,836 | |
| | | | | | | | |
| | | | | | | 791,352 | |
| | | | | | | | |
| |
Total Short-Term Investments
(cost $2,160,665) | | | | 2,160,816 | |
| | | | | | | | |
Total Value of
Securities – 99.85% | | | | | | | | |
(cost $208,915,012) | | | | | | $ | 214,413,754 | |
| | | | | | | | |
| ≠ | The rate shown is the effective yield at the time of purchase. |
| ° | Principal amount shown is stated in U.S. dollars unless noted that the security is denominated in another currency. |
| † | Non-income-producing security. |
See accompanying notes, which are an integral part of the financial statements.
54
Delaware Pooled® Trust — The Select 20 Portfolio
October 31, 2015
| | | | | | | | |
| | | Number of
shares | | | Value (U.S. $) | |
| |
Common Stock – 97.99%² | |
| |
Consumer Discretionary – 20.63% | |
Discovery Communications Class A † | | | 96,904 | | | $ | 2,852,854 | |
eBay † | | | 132,535 | | | | 3,697,727 | |
L Brands | | | 42,905 | | | | 4,118,022 | |
Liberty Interactive QVC Group Class A † | | | 177,476 | | | | 4,857,518 | |
TripAdvisor † | | | 45,250 | | | | 3,791,045 | |
| | | | | | | | |
| | | | | | | 19,317,166 | |
| | | | | | | | |
Consumer Staples – 3.07% | |
Walgreens Boots Alliance | | | 33,915 | | | | 2,871,922 | |
| | | | | | | | |
| | | | | | | 2,871,922 | |
| | | | | | | | |
Financials – 21.46% | |
Crown Castle International | | | 53,490 | | | | 4,571,255 | |
Intercontinental Exchange | | | 19,095 | | | | 4,819,578 | |
PayPal Holdings † | | | 91,296 | | | | 3,287,569 | |
Visa Class A | | | 95,592 | | | | 7,416,027 | |
| | | | | | | | |
| | | | | | | 20,094,429 | |
| | | | | | | | |
Healthcare – 13.32% | |
Allergan † | | | 14,608 | | | | 4,506,130 | |
Biogen † | | | 8,424 | | | | 2,447,256 | |
Celgene † | | | 44,915 | | | | 5,511,520 | |
| | | | | | | | |
| | | | | | | 12,464,906 | |
| | | | | | | | |
Information Technology – 29.70% | |
Alphabet Class A † | | | 4,225 | | | | 3,115,473 | |
Alphabet Class C † | | | 4,231 | | | | 3,007,437 | |
Electronic Arts † | | | 72,300 | | | | 5,210,661 | |
Microsoft | | | 119,805 | | | | 6,306,535 | |
QUALCOMM | | | 105,165 | | | | 6,248,904 | |
VeriFone Systems † | | | 129,925 | | | | 3,915,939 | |
| | | | | | | | |
| | | | | | | 27,804,949 | |
| | | | | | | | |
Office REIT – 4.73% | |
Equity Commonwealth | | | 154,180 | | | | 4,426,508 | |
| | | | | | | | |
| | | | | | | 4,426,508 | |
| | | | | | | | |
Producer Durables – 5.08% | |
Zebra Technologies † | | | 61,881 | | | | 4,758,649 | |
| | | | | | | | |
| | | | | | | 4,758,649 | |
| | | | | | | | |
| |
Total Common Stock (cost $66,362,295) | | | | 91,738,529 | |
| | | | | | | | |
| | | | | | | | |
| | | Principal
amount° | | | Value (U.S. $) | |
| |
Short-Term Investments – 2.09% | |
| |
Discount Notes – 1.92%≠ | |
Federal Home Loan Bank | | | | | | | | |
0.12% 1/4/16 | | | 429,870 | | | $ | 429,810 | |
0.12% 1/25/16 | | | 17,634 | | | | 17,631 | |
0.155% 2/3/16 | | | 283,841 | | | | 283,761 | |
0.17% 1/21/16 | | | 321,867 | | | | 321,809 | |
0.18% 2/26/16 | | | 250,233 | | | | 250,145 | |
0.18% 3/7/16 | | | 225,092 | | | | 224,954 | |
0.185% 1/19/16 | | | 166,745 | | | | 166,716 | |
0.19% 3/22/16 | | | 24,055 | | | | 24,038 | |
0.295% 3/2/16 | | | 80,704 | | | | 80,657 | |
| | | | | | | | |
| | | | | | | 1,799,521 | |
| | | | | | | | |
Repurchase Agreements – 0.17% | | | | | |
Bank of America Merrill Lynch 0.04%, dated 10/30/15, to be repurchased on 11/2/15, repurchase price $26,451 (collateralized by U.S. government obligations 3.625% 8/15/43; market value $26,980) | | | 26,451 | | | | 26,451 | |
Bank of Montreal
0.05%, dated 10/30/15, to be repurchased on 11/2/15, repurchase price $13,226 (collateralized by U.S. government obligations 2.00%–4.50% 8/15/25–8/15/45; market value $13,490) | | | 13,225 | | | | 13,225 | |
BNP Paribas
0.06%, dated 10/30/15, to be repurchased on 11/2/15, repurchase price $117,695 (collateralized by U.S. government obligations 0.00%–8.50% 2/29/16–11/15/44; market value $120,049) | | | 117,695 | | | | 117,695 | |
| | | | | | | | |
| | | | | | | 157,371 | |
| | | | | | | | |
| |
Total Short-Term Investments (cost $1,956,622) | | | | 1,956,892 | |
| | | | | | | | |
| | |
Total Value of
Securities – 100.08% | | | | | | | | |
(cost $68,318,917) | | | | | | | $93,695,421 | |
| | | | | | | | |
Schedules of investments
Delaware Pooled® Trust — The Select 20 Portfolio
| ² | Narrow industries are utilized for compliance purposes for diversification whereas broad sectors are used for financial reporting. |
| ≠ | The rate shown is the effective yield at the time of purchase. |
| ° | Principal amount shown is stated in U.S. dollars unless noted that the security is denominated in another currency. |
| † | Non-income-producing security. |
REIT – Real Estate Investment Trust
See accompanying notes, which are an integral part of the financial statements.
56
Delaware Pooled® Trust — The Large-Cap Growth Equity Portfolio
October 31, 2015
| | | | | | | | |
| | | Number of
shares | | | Value (U.S. $) | |
| |
Common Stock – 97.70%² | |
| |
Consumer Discretionary – 17.66% | |
Discovery Communications Class A † | | | 80,566 | | | $ | 2,371,863 | |
Discovery Communications Class C † | | | 144,461 | | | | 3,975,567 | |
eBay † | | | 372,857 | | | | 10,402,710 | |
L Brands | | | 105,022 | | | | 10,080,012 | |
Liberty Interactive QVC Group Class A † | | | 475,324 | | | | 13,009,618 | |
NIKE Class B | | | 65,188 | | | | 8,541,584 | |
TripAdvisor † | | | 83,250 | | | | 6,974,685 | |
| | | | | | | | |
| | | | | | | 55,356,039 | |
| | | | | | | | |
Consumer Staples – 4.40% | |
Walgreens Boots Alliance | | | 162,969 | | | | 13,800,215 | |
| | | | | | | | |
| | | | | | | 13,800,215 | |
| | | | | | | | |
Financials – 21.23% | |
Crown Castle International | | | 154,616 | | | | 13,213,483 | |
Intercontinental Exchange | | | 40,109 | | | | 10,123,512 | |
MasterCard Class A | | | 140,949 | | | | 13,952,541 | |
PayPal Holdings † | | | 311,257 | | | | 11,208,365 | |
Visa Class A | | | 232,609 | | | | 18,045,806 | |
| | | | | | | | |
| | | | | | | 66,543,707 | |
| | | | | | | | |
Healthcare – 22.22% | |
Allergan † | | | 50,101 | | | | 15,454,655 | |
Biogen † | | | 36,806 | | | | 10,692,511 | |
Celgene † | | | 147,891 | | | | 18,147,705 | |
DENTSPLY International | | | 57,293 | | | | 3,486,279 | |
Novo Nordisk ADR | | | 185,020 | | | | 9,839,364 | |
Sirona Dental Systems † | | | 31,364 | | | | 3,422,753 | |
Valeant Pharmaceuticals International † | | | 91,823 | | | | 8,610,243 | |
| | | | | | | | |
| | | | | | | 69,653,510 | |
| | | | | | | | |
Information Technology – 32.19% | |
Alphabet Class A † | | | 15,142 | | | | 11,165,559 | |
Alphabet Class C † | | | 12,189 | | | | 8,664,063 | |
Baidu ADR † | | | 49,329 | | | | 9,247,708 | |
Electronic Arts † | | | 168,350 | | | | 12,132,985 | |
Equinix | | | 45,558 | | | | 13,516,147 | |
Facebook Class A † | | | 78,592 | | | | 8,014,026 | |
Intuit | | | 61,912 | | | | 6,032,086 | |
Microsoft | | | 244,553 | | | | 12,873,270 | |
QUALCOMM | | | 302,611 | | | | 17,981,146 | |
| | | | | | | | |
| | | Number of
shares | | | Value (U.S. $) | |
| |
Common Stock² (continued) | |
| |
Information Technology (continued) | |
Yelp † | | | 58,821 | | | $ | 1,308,767 | |
| | | | | | | | |
| | | | | | | 100,935,757 | |
| | | | | | | | |
| |
Total Common Stock (cost $244,806,736) | | | | 306,289,228 | |
| | | | | | | | |
| | |
| | | Principal
amount° | | | | |
| |
Short-Term Investments – 1.50% | |
| |
Discount Notes – 1.50%≠ | |
Federal Home Loan Bank | | | | | | | | |
0.107% 11/3/15 | | | 24,977 | | | | 24,977 | |
0.12% 1/4/16 | | | 1,206,555 | | | | 1,206,386 | |
0.14% 2/18/16 | | | 364,766 | | | | 364,645 | |
0.155% 2/3/16 | | | 796,684 | | | | 796,457 | |
0.17% 1/21/16 | | | 522,984 | | | | 522,891 | |
0.18% 2/26/16 | | | 938,940 | | | | 938,608 | |
0.18% 3/7/16 | | | 631,787 | | | | 631,400 | |
0.185% 1/19/16 | | | 74,667 | | | | 74,654 | |
0.195% 12/2/15 | | | 105,754 | | | | 105,751 | |
0.295% 3/2/16 | | | 36,139 | | | | 36,118 | |
| | | | | | | | |
| | | | | | | 4,701,887 | |
| | | | | | | | |
| |
Total Short-Term Investments (cost $4,701,283) | | | | 4,701,887 | |
| | | | | | | | |
| | |
Total Value of
Securities – 99.20% | | | | | | | | |
(cost $249,508,019) | | | | | | | $310,991,115 | |
| | | | | | | | |
| ² | Narrow industries are utilized for compliance purposes for diversification whereas broad sectors are used for financial reporting. |
| ≠ | The rate shown is the effective yield at the time of purchase. |
| ° | Principal amount shown is stated in U.S. dollars unless noted that the security is denominated in another currency. |
| † | Non-income-producing security. |
ADR – American Depositary Receipt
See accompanying notes, which are an integral part of the financial statements.
Schedules of investments
Delaware Pooled® Trust — The Focus Smid-Cap Growth Equity Portfolio
October 31, 2015
| | | | | | | | |
| | | Number of
shares | | | Value (U.S. $) | |
| |
Common Stock – 97.40% | |
| |
Consumer Discretionary – 21.23% | |
DineEquity | | | 26,916 | | | $ | 2,246,140 | |
Dunkin’ Brands Group | | | 40,517 | | | | 1,677,809 | |
Liberty TripAdvisor Holdings Class A † | | | 22,967 | | | | 716,341 | |
Outfront Media | | | 84,198 | | | | 1,987,915 | |
Pandora Media † | | | 60,417 | | | | 695,400 | |
Quotient Technology † | | | 62,003 | | | | 343,497 | |
Sally Beauty Holdings † | | | 102,306 | | | | 2,405,214 | |
Shutterstock † | | | 29,746 | | | | 847,166 | |
| | | | | | | | |
| | | | | | | 10,919,482 | |
| | | | | | | | |
Energy – 3.73% | | | | | | | | |
Core Laboratories (Netherlands) | | | 16,491 | | | | 1,918,398 | |
| | | | | | | | |
| | | | | | | 1,918,398 | |
| | | | | | | | |
Financials – 17.37% | | | | | | | | |
Affiliated Managers Group † | | | 8,716 | | | | 1,571,146 | |
Heartland Payment Systems | | | 43,458 | | | | 3,215,892 | |
LendingClub † | | | 55,184 | | | | 782,509 | |
MSCI Class A | | | 42,005 | | | | 2,814,335 | |
WisdomTree Investments | | | 28,691 | | | | 551,728 | |
| | | | | | | | |
| | | | | | | 8,935,610 | |
| | | | | | | | |
Healthcare – 10.48% | | | | | | | | |
ABIOMED † | | | 24,376 | | | | 1,795,536 | |
athenahealth † | | | 8,070 | | | | 1,230,271 | |
Bio-Techne | | | 26,839 | | | | 2,367,200 | |
| | | | | | | | |
| | | | | | | 5,393,007 | |
| | | | | | | | |
Information Technology – 19.06% | |
Arista Networks † | | | 12,701 | | | | 819,341 | |
Blackbaud | | | 43,506 | | | | 2,727,391 | |
Ellie Mae † | | | 11,342 | | | | 827,739 | |
Logitech International Class R | | | 116,308 | | | | 1,711,796 | |
NIC | | | 68,811 | | | | 1,305,345 | |
VeriFone Systems † | | | 68,880 | | | | 2,076,043 | |
Yelp † | | | 15,102 | | | | 336,019 | |
| | | | | | | | |
| | | | | | | 9,803,674 | |
| | | | | | | | |
Office REITs – 5.19% | | | | | | | | |
Equity Commonwealth | | | 93,075 | | | | 2,672,183 | |
| | | | | | | | |
| | | | | | | 2,672,183 | |
| | | | | | | | |
Producer Durables – 14.56% | |
Expeditors International of Washington | | | 43,858 | | | | 2,183,690 | |
| | | | | | | | |
| | | Number of
shares | | | Value (U.S. $) | |
| |
Common Stock (continued) | | | | | |
| |
Producer Durables (continued) | | | | | |
Graco | | | 36,460 | | | $ | 2,676,164 | |
Zebra Technologies † | | | 34,185 | | | | 2,628,827 | |
| | | | | | | | |
| | | | | | | 7,488,681 | |
| | | | | | | | |
Utilities – 5.78% | | | | | | | | |
j2 Global | | | 38,375 | | | | 2,975,981 | |
| | | | | | | | |
| | | | | | | 2,975,981 | �� |
| | | | | | | | |
Total Common Stock (cost $38,479,449) | | | | 50,107,016 | |
| | | | | | | | |
| | |
| | | Principal
amount° | | | | |
| |
Short-Term Investments – 1.93% | | | | | |
| |
Discount Notes – 1.61%≠ | | | | | | | | |
Federal Home Loan Bank | | | | | | | | |
0.104% 11/3/15 | | | 81,308 | | | | 81,308 | |
0.12% 1/4/16 | | | 46,171 | | | | 46,165 | |
0.12% 1/25/16 | | | 18,440 | | | | 18,437 | |
0.14% 2/18/16 | | | 53,716 | | | | 53,699 | |
0.155% 2/3/16 | | | 30,487 | | | | 30,478 | |
0.17% 1/21/16 | | | 53,842 | | | | 53,833 | |
0.18% 2/26/16 | | | 280,344 | | | | 280,245 | |
0.18% 3/7/16 | | | 24,177 | | | | 24,162 | |
0.185% 1/19/16 | | | 71,840 | | | | 71,828 | |
0.19% 3/22/16 | | | 29,373 | | | | 29,353 | |
0.195% 12/2/15 | | | 101,750 | | | | 101,747 | |
0.295% 3/2/16 | | | 34,771 | | | | 34,750 | |
| | | | | | | | |
| | | | | | | 826,005 | |
| | | | | | | | |
Repurchase Agreements – 0.32% | | | | | |
Bank of America Merrill Lynch 0.04%, dated 10/30/15, to be repurchased on 11/2/15, repurchase price $27,660 (collateralized by U.S. government obligations 3.625% 8/15/43; market value $28,213) | | | 27,660 | | | | 27,660 | |
Bank of Montreal 0.05%, dated 10/30/15, to be repurchased on 11/2/15, repurchase price $13,830 (collateralized by U.S. government obligations 2.00%–4.50% 8/15/25–8/15/45; market value $14,107) | | | 13,830 | | | | 13,830 | |
58
| | | | | | | | |
| | | Principal
amount° | | | Value
(U.S. $) | |
| |
Short-Term Investments (continued) | |
| |
Repurchase Agreements (continued) | |
BNP Paribas 0.06%, dated 10/30/15, to be repurchased on 11/2/15, repurchase price $123,075 (collateralized by U.S. government obligations 0.00%–8.50% 2/29/16–11/15/44; market value $125,536) | | | 123,075 | | | $ | 123,075 | |
| | | | | | | | |
| | | | | | | 164,565 | |
| | | | | | | | |
| |
Total Short-Term Investments (cost $990,431) | | | | 990,570 | |
| | | | | | | | |
| | |
Total Value of Securities – 99.33% | | | | | | | | |
(cost $39,469,880) | | | | | | | $51,097,586 | |
| | | | | | | | |
| ≠ | The rate shown is the effective yield at the time of purchase. |
| ° | Principal amount shown is stated in U.S. dollars unless noted that the security is denominated in another currency. |
| † | Non-income-producing security. |
REIT – Real Estate Investment Trust
See accompanying notes, which are an integral part of the financial statements.
59
Schedules of investments
Delaware Pooled® Trust — The High-Yield Bond Portfolio
October 31, 2015
| | | | | | | | |
| | | Principal
amount° | | | Value (U.S. $) | |
| |
Convertible Bond – 0.08% | | | | | | | | |
| |
Clearwire Communications 144A 8.25% exercise price $7.08, expiration date 11/30/40 # | | | 153,000 | | | $ | 157,973 | |
| | | | | | | | |
Total Convertible Bond (cost $156,251) | | | | 157,973 | |
| | | | | | | | |
|
| |
Corporate Bonds – 85.87% | | | | | | | | |
| |
Automobiles – 0.88% | | | | | | | | |
Gates Global 144A 6.00% 7/15/22 # | | | 880,000 | | | | 710,600 | |
International Automotive Components Group 144A 9.125% 6/1/18 # | | | 721,000 | | | | 731,815 | |
Meritor 6.75% 6/15/21 | | | 375,000 | | | | 372,187 | |
| | | | | | | | |
| | | | | | | 1,814,602 | |
| | | | | | | | |
Banking – 3.28% | | | | | | | | |
Credit Suisse Group 144A 7.50% 12/29/49 #● | | | 1,260,000 | | | | 1,332,884 | |
ING Groep 6.50% 12/29/49 ● | | | 785,000 | | | | 758,997 | |
JPMorgan Chase 6.75% 1/29/49 ● | | | 1,045,000 | | | | 1,135,131 | |
Lloyds Banking Group 7.50% 4/30/49 ● | | | 895,000 | | | | 953,175 | |
Popular 7.00% 7/1/19 | | | 993,000 | | | | 971,899 | |
Royal Bank of Scotland Group 8.00% 12/29/49 ● | | | 1,010,000 | | | | 1,057,975 | |
Societe Generale 144A 8.00% 9/29/49 #● | | | 540,000 | | | | 546,498 | |
| | | | | | | | |
| | | | | | | 6,756,559 | |
| | | | | | | | |
Basic Industry – 8.20% | | | | | | | | |
AK Steel | | | | | | | | |
7.625% 5/15/20 @ | | | 722,000 | | | | 379,050 | |
7.625% 10/1/21 | | | 410,000 | | | | 196,800 | |
ArcelorMittal | | | | | | | | |
5.125% 6/1/20 | | | 225,000 | | | | 216,774 | |
6.125% 6/1/25 | | | 255,000 | | | | 220,493 | |
6.25% 3/1/21 | | | 225,000 | | | | 213,609 | |
Berry Plastics 144A 6.00% 10/15/22 # | | | 755,000 | | | | 792,750 | |
BHP Billiton Finance USA 144A 6.25% 10/19/75 #● | | | 805,000 | | | | 824,119 | |
Blue Cube Spinco 144A 10.00% 10/15/25 # | | | 375,000 | | | | 408,750 | |
Builders FirstSource | | | | | | | | |
144A 7.625% 6/1/21 # | | | 758,000 | | | | 811,060 | |
144A 10.75% 8/15/23 # | | | 985,000 | | | | 1,021,937 | |
| | | | | | | | |
| | | Principal
amount° | | | Value (U.S. $) | |
| |
Corporate Bonds (continued) | |
| |
Basic Industry (continued) | |
Cemex 144A 7.25% 1/15/21 # | | | 1,020,000 | | | $ | 1,048,050 | |
Chemours | | | | | | | | |
144A 6.625% 5/15/23 # | | | 325,000 | | | | 243,344 | |
144A 7.00% 5/15/25 # | | | 755,000 | | | | 564,363 | |
CPG Merger Sub 144A 8.00% 10/1/21 # | | | 600,000 | | | | 613,500 | |
FMG Resources August 2006 144A 9.75% 3/1/22 # | | | 520,000 | | | | 518,700 | |
Hexion | | | | | | | | |
6.625% 4/15/20 | | | 625,000 | | | | 532,813 | |
10.00% 4/15/20 | | | 380,000 | | | | 361,950 | |
Joseph T Ryerson & Son | | | | | | | | |
9.00% 10/15/17 | | | 582,000 | | | | 509,250 | |
11.25% 10/15/18 @ | | | 204,000 | | | | 178,500 | |
Kissner Milling 144A 7.25% 6/1/19 # | | | 365,000 | | | | 371,844 | |
Lundin Mining 144A 7.875% 11/1/22 # | | | 1,075,000 | | | | 1,080,160 | |
NCI Building Systems 144A 8.25% 1/15/23 # | | | 405,000 | | | | 431,325 | |
New Gold | | | | | | | | |
144A 6.25% 11/15/22 # | | | 605,000 | | | | 521,813 | |
144A 7.00% 4/15/20 # | | | 370,000 | | | | 346,413 | |
Norbord 144A 6.25% 4/15/23 # | | | 305,000 | | | | 308,050 | |
Rayonier AM Products 144A 5.50% 6/1/24 # | | | 1,125,000 | | | | 894,375 | |
Steel Dynamics 5.50% 10/1/24 | | | 870,000 | | | | 861,300 | |
Summit Materials 6.125% 7/15/23 | | | 400,000 | | | | 400,000 | |
TPC Group 144A 8.75% 12/15/20 # | | | 1,745,000 | | | | 1,435,437 | |
Tronox Finance 144A 7.50% 3/15/22 # | | | 535,000 | | | | 379,850 | |
Wise Metals Intermediate Holdings 144A PIK 9.75% 6/15/19 #T | | | 237,000 | | | | 221,299 | |
| | | | | | | | |
| | | | | | | 16,907,678 | |
| | | | | | | | |
Capital Goods – 5.06% | | | | | | | | |
Accudyne Industries Borrower 144A 7.75% 12/15/20 # | | | 265,000 | | | | 231,213 | |
Ardagh Packaging Finance 144A 6.00% 6/30/21 # | | | 840,000 | | | | 827,400 | |
BWAY Holding 144A 9.125% 8/15/21 # | | | 1,330,000 | | | | 1,300,075 | |
Gardner Denver 144A 6.875% 8/15/21 # | | | 2,309,000 | | | | 2,008,830 | |
60
| | | | | | | | |
| | | Principal
amount° | | | Value (U.S. $) | |
| |
Corporate Bonds (continued) | |
| |
Capital Goods (continued) | |
KLX 144A 5.875% 12/1/22 # | | | 1,065,000 | | | $ | 1,092,290 | |
Milacron 144A 7.75% 2/15/21 # | | | 235,000 | | | | 242,050 | |
Plastipak Holdings 144A 6.50% 10/1/21 # | | | 1,250,000 | | | | 1,243,750 | |
Reynolds Group Issuer 8.25% 2/15/21 | | | 635,000 | | | | 662,781 | |
Signode Industrial Group 144A 6.375% 5/1/22 # | | | 1,080,000 | | | | 1,017,900 | |
StandardAero Aviation Holdings 144A 10.00% 7/15/23 # | | | 990,000 | | | | 1,004,850 | |
TransDigm | | | | | | | | |
6.00% 7/15/22 | | | 225,000 | | | | 228,375 | |
6.50% 7/15/24 | | | 565,000 | | | | 577,713 | |
| | | | | | | | |
| | | | | | | 10,437,227 | |
| | | | | | | | |
Consumer Cyclical – 4.84% | |
American Tire Distributors 144A 10.25% 3/1/22 # | | | 1,020,000 | | | | 1,035,300 | |
Beacon Roofing Supply 144A 6.375% 10/1/23 # | | | 395,000 | | | | 417,713 | |
Boyd Gaming 6.875% 5/15/23 | | | 1,015,000 | | | | 1,080,975 | |
Caesars Growth Properties Holdings 9.375% 5/1/22 | | | 440,000 | | | | 366,300 | |
Caleres 144A 6.25% 8/15/23 # | | | 580,000 | | | | 588,700 | |
L Brands 144A 6.875% 11/1/35 # | | | 1,030,000 | | | | 1,073,775 | |
Midas Intermediate Holdco II 144A 7.875% 10/1/22 # | | | 450,000 | | | | 445,500 | |
Mohegan Tribal Gaming Authority 144A 9.75% 9/1/21 # | | | 435,000 | | | | 450,225 | |
Neiman Marcus Group 144A PIK 8.75% 10/15/21 #T | | | 1,470,000 | | | | 1,534,239 | |
Party City Holdings 144A 6.125% 8/15/23 # | | | 270,000 | | | | 279,450 | |
PF Chang’s China Bistro 144A 10.25% 6/30/20 # | | | 429,000 | | | | 401,115 | |
Rite Aid 144A 6.125% 4/1/23 # | | | 1,125,000 | | | | 1,216,406 | |
Tempur Sealy International 144A 5.625% 10/15/23 # | | | 310,000 | | | | 326,275 | |
Wynn Las Vegas 144A 5.50% 3/1/25 # | | | 800,000 | | | | 753,840 | |
| | | | | | | | |
| | | | | | | 9,969,813 | |
| | | | | | | | |
| | | | | | | | |
| | | Principal
amount° | | | Value (U.S. $) | |
| |
Corporate Bonds (continued) | |
| |
Consumer Non-Cyclical – 5.87% | |
Avis Budget Car Rental 144A 5.25% 3/15/25 # | | | 1,115,000 | | | $ | 1,115,000 | |
Cott Beverages | | | | | | | | |
5.375% 7/1/22 | | | 255,000 | | | | 254,363 | |
6.75% 1/1/20 | | | 365,000 | | | | 387,813 | |
ExamWorks Group 5.625% 4/15/23 | | | 1,125,000 | | | | 1,174,219 | |
JBS Investments | | | | | | | | |
144A 7.25% 4/3/24 # | | | 230,000 | | | | 237,475 | |
144A 7.75% 10/28/20 # | | | 579,000 | | | | 619,819 | |
JBS USA 144A 5.75% 6/15/25 # | | | 2,120,000 | | | | 2,061,700 | |
Kronos Acquisition Holdings 144A 9.00% 8/15/23 # | | | 1,140,000 | | | | 1,091,550 | |
Post Holdings | | | | | | | | |
7.375% 2/15/22 | | | 695,000 | | | | 734,858 | |
144A 7.75% 3/15/24 # | | | 750,000 | | | | 800,625 | |
Prestige Brands 144A 5.375% 12/15/21 # | | | 450,000 | | | | 452,250 | |
Spectrum Brands | | | | | | | | |
144A 6.125% 12/15/24 # | | | 925,000 | | | | 1,001,313 | |
6.625% 11/15/22 | | | 416,000 | | | | 456,560 | |
SUPERVALU 7.75% 11/15/22 | | | 1,290,000 | | | | 1,275,423 | |
Visant 10.00% 10/1/17 | | | 425,000 | | | | 438,813 | |
| | | | | | | | |
| | | | | | | 12,101,781 | |
| | | | | | | | |
Energy – 8.08% | |
Baytex Energy 144A 5.625% 6/1/24 # | | | 565,000 | | | | 468,950 | |
California Resources | | | | | | | | |
5.50% 9/15/21 | | | 750,000 | | | | 519,375 | |
6.00% 11/15/24 | | | 140,000 | | | | 95,725 | |
Calumet Specialty Products Partners 7.625% 1/15/22 | | | 1,135,000 | | | | 1,100,950 | |
Chesapeake Energy | | | | | | | | |
4.875% 4/15/22 | | | 890,000 | | | | 556,250 | |
5.75% 3/15/23 | | | 425,000 | | | | 269,875 | |
6.125% 2/15/21 | | | 290,000 | | | | 191,371 | |
6.50% 8/15/17 | | | 205,000 | | | | 189,369 | |
Comstock Resources 144A 10.00% 3/15/20 # | | | 1,005,000 | | | | 660,787 | |
CSI Compressco 7.25% 8/15/22 | | | 675,000 | | | | 563,625 | |
Energy Transfer Equity 5.875% 1/15/24 | | | 745,000 | | | | 725,462 | |
EP Energy 6.375% 6/15/23 | | | 700,000 | | | | 533,750 | |
Exterran Partners 6.00% 4/1/21 | | | 390,000 | | | | 339,300 | |
Schedules of investments
Delaware Pooled® Trust — The High-Yield Bond Portfolio
| | | | | | | | |
| | | Principal
amount° | | | Value (U.S. $) | |
| |
Corporate Bonds (continued) | |
| |
Energy (continued) | |
Genesis Energy | | | | | | | | |
5.75% 2/15/21 | | | 665,000 | | | $ | 625,100 | |
6.00% 5/15/23 | | | 395,000 | | | | 361,425 | |
6.75% 8/1/22 | | | 315,000 | | | | 308,700 | |
Halcon Resources 144A 8.625% 2/1/20 # | | | 1,150,000 | | | | 996,187 | |
Laredo Petroleum | | | | | | | | |
5.625% 1/15/22 | | | 375,000 | | | | 354,375 | |
7.375% 5/1/22 | | | 521,000 | | | | 517,093 | |
MarkWest Energy Partners | | | | | | | | |
4.875% 12/1/24 | | | 430,000 | | | | 407,963 | |
5.50% 2/15/23 | | | 530,000 | | | | 524,700 | |
Murphy Oil USA 6.00% 8/15/23 | | | 990,000 | | | | 1,049,400 | |
Northern Oil & Gas 8.00% 6/1/20 | | | 720,000 | | | | 599,040 | |
NuStar Logistics 6.75% 2/1/21 | | | 890,000 | | | | 927,635 | |
Oasis Petroleum 6.875% 3/15/22 | | | 1,075,000 | | | | 921,813 | |
PDC Energy 7.75% 10/15/22 | | | 535,000 | | | | 540,350 | |
Pioneer Energy Services 6.125% 3/15/22 | | | 910,000 | | | | 527,800 | |
Rose Rock Midstream 144A 5.625% 11/15/23 # | | | 300,000 | | | | 256,500 | |
Targa Resources Partners 144A 6.75% 3/15/24 # | | | 1,050,000 | | | | 1,034,250 | |
Transocean | | | | | | | | |
4.30% 10/15/22 | | | 235,000 | | | | 154,775 | |
6.875% 12/15/21 | | | 405,000 | | | | 321,469 | |
| | | | | | | | |
| | | | | | | 16,643,364 | |
| | | | | | | | |
Financials – 1.61% | | | | | | | | |
Communications Sales & Leasing | | | | | | | | |
144A 6.00% 4/15/23 # | | | 485,000 | | | | 472,875 | |
8.25% 10/15/23 | | | 335,000 | | | | 311,383 | |
ESH Hospitality 144A 5.25% 5/1/25 # | | | 460,000 | | | | 464,002 | |
Infinity Acquisition 144A 7.25% 8/1/22 # | | | 490,000 | | | | 441,000 | |
Iron Mountain 144A 6.00% 10/1/20 # | | | 445,000 | | | | 472,813 | |
James Hardie International Finance 144A 5.875% 2/15/23 # | | | 1,115,000 | | | | 1,159,600 | |
| | | | | | | | |
| | | | | | | 3,321,673 | |
| | | | | | | | |
| | | | | | | | |
| | | Principal
amount° | | | Value (U.S. $) | |
| |
Corporate Bonds (continued) | |
| |
Healthcare – 10.63% | |
Community Health Systems 6.875% 2/1/22 | | | 2,915,000 | | | $ | 2,951,437 | |
DaVita HealthCare Partners | | | | | | | | |
5.00% 5/1/25 | | | 1,265,000 | | | | 1,258,925 | |
5.125% 7/15/24 | | | 1,065,000 | | | | 1,082,972 | |
HCA 5.375% 2/1/25 | | | 3,050,000 | | | | 3,141,500 | |
HealthSouth | | | | | | | | |
5.75% 11/1/24 | | | 365,000 | | | | 366,825 | |
144A 5.75% 11/1/24 # | | | 500,000 | | | | 502,500 | |
144A 5.75% 9/15/25 # | | | 470,000 | | | | 470,294 | |
Hill-Rom Holdings 144A 5.75% 9/1/23 # | | | 525,000 | | | | 538,125 | |
IASIS Healthcare 8.375% 5/15/19 | | | 1,895,000 | | | | 1,942,375 | |
Immucor 11.125% 8/15/19 | | | 2,467,000 | | | | 2,541,010 | |
Kinetic Concepts | | | | | | | | |
10.50% 11/1/18 | | | 283,000 | | | | 299,527 | |
12.50% 11/1/19 | | | 900,000 | | | | 957,375 | |
Mallinckrodt International Finance | | | | | | | | |
4.75% 4/15/23 | | | 80,000 | | | | 70,000 | |
144A 5.50% 4/15/25 # | | | 540,000 | | | | 493,932 | |
144A 5.625% 10/15/23 # | | | 505,000 | | | | 479,119 | |
Sterigenics-Nordion Holdings 144A 6.50% 5/15/23 # | | | 875,000 | | | | 882,656 | |
Tenet Healthcare | | | | | | | | |
6.75% 6/15/23 | | | 410,000 | | | | 408,975 | |
8.125% 4/1/22 | | | 1,685,000 | | | | 1,790,313 | |
Valeant Pharmaceuticals International | | | | | | | | |
144A 5.875% 5/15/23 # | | | 180,000 | | | | 152,437 | |
144A 6.125% 4/15/25 # | | | 1,320,000 | | | | 1,117,050 | |
144A 6.75% 8/15/18 # | | | 480,000 | | | | 465,648 | |
| | | | | | | | |
| | | | | | | 21,912,995 | |
| | | | | | | | |
Insurance – 1.37% | | | | | | | | |
HUB International 144A 7.875% 10/1/21 # | | | 1,185,000 | | | | 1,185,000 | |
USI 144A 7.75% 1/15/21 # | | | 1,035,000 | | | | 1,038,881 | |
XLIT 6.50% 10/29/49 ● | | | 750,000 | | | | 600,150 | |
| | | | | | | | |
| | | | | | | 2,824,031 | |
| | | | | | | | |
Media – 9.97% | | | | | | | | |
Altice 144A 7.75% 5/15/22 # | | | 765,000 | | | | 738,225 | |
Altice US Finance 144A 7.75% 7/15/25 # | | | 875,000 | | | | 844,375 | |
CCO Holdings 144A 5.375% 5/1/25 # | | | 950,000 | | | | 942,875 | |
62
| | | | | | | | |
| | | Principal
amount° | | | Value (U.S. $) | |
| |
Corporate Bonds (continued) | |
| |
Media (continued) | |
CCO Safari II 144A 4.908% 7/23/25 # | | | 400,000 | | | $ | 407,205 | |
Clear Channel Worldwide Holdings 7.625% 3/15/20 | | | 690,000 | | | | 718,463 | |
Columbus International 144A 7.375% 3/30/21 # | | | 495,000 | | | | 516,656 | |
CSC Holdings 5.25% 6/1/24 | | | 886,000 | | | | 781,443 | |
DISH DBS 5.875% 11/15/24 | | | 770,000 | | | | 738,430 | |
Gray Television 7.50% 10/1/20 | | | 2,564,000 | | | | 2,685,662 | |
Midcontinent Communications & Midcontinent Finance 144A 6.875% 8/15/23 # | | | 270,000 | | | | 277,763 | |
Neptune Finco | | | | | | | | |
144A 6.625% 10/15/25 # | | | 490,000 | | | | 516,950 | |
144A 10.125% 1/15/23 # | | | 390,000 | | | | 413,400 | |
144A 10.875% 10/15/25 # | | | 330,000 | | | | 353,100 | |
Nexstar Broadcasting 144A 6.125% 2/15/22 # | | | 110,000 | | | | 110,275 | |
Numericable-SFR 144A 6.00% 5/15/22 # | | | 1,050,000 | | | | 1,055,250 | |
RCN Telecom Services 144A 8.50% 8/15/20 # | | | 715,000 | | | | 754,325 | |
Sinclair Television Group 144A 5.625% 8/1/24 # | | | 1,515,000 | | | | 1,490,381 | |
Sirius XM Radio 144A 5.375% 4/15/25 # | | | 830,000 | | | | 851,787 | |
Tribune Media 144A 5.875% 7/15/22 # | | | 1,030,000 | | | | 1,060,900 | |
Univision Communications 144A 8.50% 5/15/21 # | | | 1,115,000 | | | | 1,169,356 | |
VTR Finance 144A 6.875% 1/15/24 # | | | 1,995,000 | | | | 1,935,150 | |
WideOpenWest Finance | | | | | | | | |
10.25% 7/15/19 | | | 1,780,000 | | | | 1,784,450 | |
13.375% 10/15/19 @ | | | 400,000 | | | | 409,000 | |
| | | | | | | | |
| | | | | | | 20,555,421 | |
| | | | | | | | |
Services – 7.10% | |
AECOM 144A 5.875% 10/15/24 # | | | 485,000 | | | | 502,581 | |
Air Medical Merger Sub 144A 6.375% 5/15/23 # | | | 1,745,000 | | | | 1,596,675 | |
Algeco Scotsman Global Finance | | | | | | | | |
144A 8.50% 10/15/18 # | | | 1,110,000 | | | | 974,025 | |
144A 10.75% 10/15/19 # | | | 260,000 | | | | 144,300 | |
| | | | | | | | |
| | | Principal
amount° | | | Value (U.S. $) | |
| |
Corporate Bonds (continued) | |
| |
Services (continued) | |
Blue Coat Holdings 144A 8.375% 6/1/23 # | | | 850,000 | | | $ | 884,000 | |
BlueLine Rental Finance 144A 7.00% 2/1/19 # | | | 610,000 | | | | 618,387 | |
Covanta Holding 5.875% 3/1/24 | | | 325,000 | | | | 324,187 | |
GEO Group | | | | | | | | |
5.125% 4/1/23 | | | 265,000 | | | | 261,025 | |
5.875% 10/15/24 | | | 435,000 | | | | 441,525 | |
Mattamy Group 144A 6.50% 11/15/20 # | | | 1,375,000 | | | | 1,360,390 | |
MGM Resorts International 6.00% 3/15/23 | | | 1,760,000 | | | | 1,790,800 | |
Navios South American Logistics 144A 7.25% 5/1/22 # | | | 1,145,000 | | | | 967,525 | |
OPE KAG Finance Sub 144A 7.875% 7/31/23 # | | | 680,000 | | | | 708,900 | |
Pinnacle Entertainment 7.75% 4/1/22 | | | 210,000 | | | | 233,625 | |
United Rentals North America | | | | | | | | |
5.50% 7/15/25 | | | 1,050,000 | | | | 1,051,313 | |
5.75% 11/15/24 | | | 1,645,000 | | | | 1,677,900 | |
Univar USA 144A 6.75% 7/15/23 # | | | 345,000 | | | | 342,413 | |
Vander Intermediate Holding II 144A PIK 9.75% 2/1/19 #T | | | 335,000 | | | | 291,450 | |
XPO Logistics 144A 6.50% 6/15/22 # | | | 510,000 | | | | 457,087 | |
| | | | | | | | |
| | | | | | | 14,628,108 | |
| | | | | | | | |
Technology & Electronics – 5.87% | |
CommScope 144A 5.50% 6/15/24 # | | | 1,025,000 | | | | 1,018,594 | |
CommScope Technologies Finance 144A 6.00% 6/15/25 # | | | 690,000 | | | | 702,075 | |
Emdeon 144A 6.00% 2/15/21 # | | | 715,000 | | | | 703,381 | |
Entegris 144A 6.00% 4/1/22 # | | | 755,000 | | | | 780,481 | |
First Data | | | | | | | | |
144A 5.375% 8/15/23 # | | | 715,000 | | | | 729,300 | |
144A 7.00% 12/1/23 # | | | 2,730,000 | | | | 2,784,600 | |
11.25% 1/15/21 | | | 805,000 | | | | 891,699 | |
11.75% 8/15/21 | | | 2,260,000 | | | | 2,582,050 | |
Schedules of investments
Delaware Pooled® Trust — The High-Yield Bond Portfolio
| | | | | | | | |
| | | Principal
amount° | | | Value (U.S. $) | |
| |
Corporate Bonds (continued) | |
| |
Technology & Electronics (continued) | |
Infor US | | | | | | | | |
144A 5.75% 8/15/20 # | | | 340,000 | | | $ | 347,650 | |
144A 6.50% 5/15/22 # | | | 1,060,000 | | | | 1,007,000 | |
Micron Technology | | | | | | | | |
144A 5.25% 1/15/24 # | | | 415,000 | | | | 398,400 | |
144A 5.625% 1/15/26 # | | | 165,000 | | | | 155,513 | |
| | | | | | | | |
| | | | | | | 12,100,743 | |
| | | | | | | | |
Telecommunications – 9.92% | |
CenturyLink 6.75% 12/1/23 | | | 1,085,000 | | | | 1,080,823 | |
Cogent Communications Finance 144A 5.625% 4/15/21 # | | | 860,000 | | | | 817,000 | |
Cogent Communications Group 144A 5.375% 3/1/22 # | | | 230,000 | | | | 227,700 | |
Digicel 144A 6.75% 3/1/23 # | | | 200,000 | | | | 181,000 | |
Digicel Group 144A 8.25% 9/30/20 # | | | 2,715,000 | | | | 2,416,350 | |
Frontier Communications | | | | | | | | |
144A 10.50% 9/15/22 # | | | 640,000 | | | | 665,600 | |
144A 11.00% 9/15/25 # | | | 870,000 | | | | 914,039 | |
Hughes Satellite Systems 7.625% 6/15/21 | | | 439,000 | | | | 480,156 | |
Intelsat Jackson Holdings | | | | | | | | |
7.25% 4/1/19 | | | 80,000 | | | | 75,400 | |
7.50% 4/1/21 | | | 200,000 | | | | 181,500 | |
Intelsat Luxembourg | | | | | | | | |
7.75% 6/1/21 | | | 1,710,000 | | | | 1,017,450 | |
8.125% 6/1/23 @ | | | 1,915,000 | | | | 1,144,213 | |
Level 3 Communications 5.75% 12/1/22 | | | 1,020,000 | | | | 1,048,050 | |
Level 3 Financing 144A 5.375% 5/1/25 # | | | 1,345,000 | | | | 1,353,406 | |
Sable International Finance 144A 6.875% 8/1/22 # | | | 790,000 | | | | 807,775 | |
Sprint | | | | | | | | |
7.125% 6/15/24 | | | 2,120,000 | | | | 1,866,925 | |
7.25% 9/15/21 | | | 980,000 | | | | 902,825 | |
7.875% 9/15/23 | | | 1,010,000 | | | | 936,775 | |
Sprint Capital 6.90% 5/1/19 | | | 280,000 | | | | 269,500 | |
T-Mobile USA | | | | | | | | |
6.00% 3/1/23 | | | 645,000 | | | | 644,597 | |
6.375% 3/1/25 | | | 470,000 | | | | 473,525 | |
West 144A 5.375% 7/15/22 # | | | 395,000 | | | | 377,719 | |
Wind Acquisition Finance 144A 7.375% 4/23/21 # | | | 970,000 | | | | 979,700 | |
| | | | | | | | |
| | | Principal
amount° | | | Value (U.S. $) | |
| |
Corporate Bonds (continued) | |
| |
Telecommunications (continued) | |
Zayo Group 144A 6.00% 4/1/23 # | | | 1,555,000 | | | $ | 1,589,210 | |
| | | | | | | | |
| | | | | | | 20,451,238 | |
| | | | | | | | |
Utilities – 3.19% | |
AES 5.50% 4/15/25 | | | 720,000 | | | | 673,200 | |
AES Gener 144A 8.375% 12/18/73 #● | | | 400,000 | | | | 416,000 | |
Calpine | | | | | | | | |
5.375% 1/15/23 | | | 885,000 | | | | 850,706 | |
5.50% 2/1/24 | | | 385,000 | | | | 367,675 | |
DPL 6.75% 10/1/19 | | | 555,000 | | | | 571,650 | |
Dynegy | | | | | | | | |
5.875% 6/1/23 | | | 395,000 | | | | 371,300 | |
7.375% 11/1/22 | | | 340,000 | | | | 342,550 | |
7.625% 11/1/24 | | | 1,110,000 | | | | 1,118,325 | |
Enel 144A 8.75% 9/24/73 #● | | | 820,000 | | | | 947,100 | |
GenOn Energy | | | | | | | | |
7.875% 6/15/17 | | | 420,000 | | | | 391,650 | |
9.875% 10/15/20 | | | 630,000 | | | | 525,263 | |
| | | | | | | | |
| | | | | | | 6,575,419 | |
| | | | | | | | |
| |
Total Corporate Bonds (cost $184,390,762) | | | | 177,000,652 | |
| | | | | | | | |
|
| |
Municipal Bond – 0.27% | |
| |
City of Chicago, Illinois (Taxable Build America Bond) Series B 7.75% 1/1/42 | | | 550,000 | | | | 567,028 | |
| | | | | | | | |
| |
Total Municipal Bond (cost $541,457) | | | | 567,028 | |
| | | | | | | | |
|
| |
Senior Secured Loans – 6.61%« | |
| |
21st Century Oncology Tranche B 1st Lien 6.50% 4/30/22 @ | | | 374,063 | | | | 359,100 | |
Accudyne Industries (Hamilton Sundstrand Industrial) 1st Lien 4.00% 12/13/19 @ | | | 660,000 | | | | 608,300 | |
Applied Systems 2nd Lien 7.50% 1/23/22 @ | | | 983,640 | | | | 967,246 | |
Atkore International 2nd Lien 7.75% 10/9/21 @ | | | 475,000 | | | | 419,187 | |
Avaya 1st Lien 4.823% 10/26/17 @ | | | 880,043 | | | | 726,035 | |
BJ’s Wholesale Club 2nd Lien 8.50% 3/31/20 @ | | | 1,385,000 | | | | 1,353,145 | |
64
| | | | | | | | |
| | | Principal
amount° | | | Value (U.S. $) | |
| |
Senior Secured Loans« (continued) | |
| |
Drillship Ocean Ventures Tranche B 1st Lien 5.50% 7/25/21 @ | | | 531,463 | | | $ | 345,894 | |
Flint Group 2nd Lien 8.25% 9/7/22 @ | | | 700,000 | | | | 690,667 | |
FMG Resources August 2006 1st Lien 3.75% 6/30/19 @ | | | 958,575 | | | | 814,549 | |
Green Energy Partners (Panda Stonewall) Tranche B 1st Lien 6.50% 11/13/21 @ | | | 179,000 | | | | 174,525 | |
iHeartCommunications Tranche D 1st Lien 6.938% 1/30/19 @ | | | 3,600,000 | | | | 3,025,285 | |
KIK Custom Products 1st Lien 6.00% 8/26/22 @ | | | 455,000 | | | | 445,758 | |
Marina District Finance Tranche B 1st Lien 6.50% 8/15/18 @ | | | 902,557 | | | | 905,750 | |
Mauser Holding 2nd Lien 8.75% 7/31/22 @ | | | 363,000 | | | | 343,943 | |
Moxie Patriot Tranche B1 1st Lien 6.75% 12/19/20 @ | | | 236,000 | | | | 225,380 | |
Pabst Blue Ribbon 1st Lien 5.75% 11/13/21 @ | | | 280,000 | | | | 280,467 | |
Pabst Blue Ribbon 2nd Lien 9.25% 11/13/22 @ | | | 185,000 | | | | 181,994 | |
Panda Liberty Tranche B 1st Lien 7.50% 8/21/20 @ | | | 276,000 | | | | 264,960 | |
Penney (J.C.) 1st Lien 6.00% 5/22/18 @ | | | 962,538 | | | | 960,733 | |
Rite Aid 2nd Lien 5.75% 8/21/20 @ | | | 295,000 | | | | 297,950 | |
Solenis International 2nd Lien 7.75% 7/31/22 @ | | | 250,000 | | | | 235,833 | |
| | | | | | | | |
| |
Total Senior Secured Loans (cost $14,035,925) | | | | 13,626,701 | |
| | | | | | | | |
| | |
| | | Number of
shares | | | | |
| |
Common Stock – 0.00% | |
| |
Century Communications =† | | | 60,000 | | | | 0 | |
| | | | | | | | |
| | |
Total Common Stock (cost $1,816) | | | | | | | 0 | |
| | | | | | | | |
|
| |
Preferred Stock – 1.03% | |
| |
Ally Financial | | | | | | | | |
144A 7.00% # | | | 951 | | | | 973,972 | |
8.50% ● | | | 2,085 | | | | 53,585 | |
Bank of America 6.50% ● | | | 870,000 | | | | 910,246 | |
| | | | | | | | |
| | | Number of
shares | | | Value (U.S. $) | |
| |
Preferred Stock (continued) | |
| |
GMAC Capital Trust I 8.125% ● | | | 7,000 | | | $ | 180,810 | |
| | | | | | | | |
| |
Total Preferred Stock (cost $2,058,090) | | | | 2,118,613 | |
| | | | | | | | |
| | |
| | | Principal
amount° | | | | |
| |
Short-Term Investments – 6.51% | |
| |
Discount Notes – 2.32%≠ | |
Federal Home Loan Bank | | | | | | | | |
0.185% 1/19/16 | | | 1,977,481 | | | | 1,977,138 | |
0.195% 12/2/15 | | | 2,800,785 | | | | 2,800,715 | |
| | | | | | | | |
| | |
| | | | | | | 4,777,853 | |
| | | | | | | | |
Repurchase Agreements – 4.19% | |
Bank of America Merrill Lynch 0.04%, dated 10/30/15, to be repurchased on 11/2/15, repurchase price $1,453,144 (collateralized by U.S. government obligations 3.625% 8/15/43; market value $1,482,202) | | | 1,453,139 | | | | 1,453,139 | |
Bank of Montreal
0.05%, dated 10/30/15, to be repurchased on 11/2/15, repurchase price $726,573 (collateralized by U.S. government obligations 2.00%–4.50% 8/15/25–8/15/45; market value $741,101) | | | 726,570 | | | | 726,570 | |
BNP Paribas
0.06%, dated 10/30/15, to be repurchased on 11/2/15, repurchase price $6,465,844 (collateralized by U.S. government obligations 0.00%–8.50% 2/29/16–11/15/44; market value $6,595,129) | | | 6,465,812 | | | | 6,465,812 | |
| | | | | | | | |
| | |
| | | | | | | 8,645,521 | |
| | | | | | | | |
| |
Total Short-Term Investments (cost $13,422,513) | | | | 13,423,374 | |
| | | | | | | | |
| |
Total Value of Securities – 100.37% (cost $214,606,814) | | | $ | 206,894,341 | |
| | | | | | | | |
Schedules of investments
Delaware Pooled® Trust — The High-Yield Bond Portfolio
| # | Security exempt from registration under Rule 144A of the Securities Act of 1933, as amended. At Oct. 31, 2015, the aggregate value of Rule 144A securities was $98,519,414, which represents 47.80% of the Portfolio’s net assets. See Note 11 in “Notes to financial statements.” |
| @ | Illiquid security. At Oct. 31, 2015, the aggregate value of illiquid securities was $15,737,464, which represents 7.63% of the Portfolio’s net assets. See Note 11 in “Notes to financial statements.” |
| T | 100% of the income received was in the form of cash. |
| = | Security is being fair valued in accordance with the Portfolio’s fair valuation policy. At Oct. 31, 2015, the aggregate value of fair valued securities was $0, which represents 0.00% of the Portfolio’s net assets. See Note 1 in “Notes to financial statements.” |
| ≠ | The rate shown is the effective yield at the time of purchase. |
| ° | Principal amount shown is stated in U.S. dollars unless noted that the security is denominated in another currency. |
| † | Non-income-producing security. |
| ● | Variable rate security. The rate shown is the rate as of Oct. 31, 2015. Interest rates reset periodically. |
| « | Senior secured loans generally pay interest at rates which are periodically redetermined by reference to a base lending rate plus a premium. These base lending rates are generally: (i) the prime rate offered by one or more U.S. banks, (ii) the lending rate offered by one or more European banks such as the London Interbank Offered Rate (LIBOR), and (iii) the certificate of deposit rate. Senior secured loans may be subject to restrictions on resale. Stated rate in effect at Oct. 31, 2015. |
PIK – Payment-in-kind
See accompanying notes, which are an integral part of the financial statements.
66
Delaware Pooled® Trust — The Core Plus Fixed Income Portfolio
October 31, 2015
| | | | | | | | |
| | | Principal
amount° | | | Value
(U.S. $) | |
| |
Agency Asset-Backed Security – 0.11% | |
| |
Fannie Mae Grantor Trust | |
Series 2003-T4 2A5 5.112% 9/26/33 f | | | 126,825 | | | $ | 138,366 | |
| | | | | | | | |
Total Agency Asset-Backed Security (cost $125,799) | | | | 138,366 | |
| | | | | | | | |
|
| |
Agency Collateralized Mortgage Obligations – 1.78% | |
| |
Fannie Mae REMICs | | | | | | | | |
Series 2002-90 A1 6.50% 6/25/42 | | | 14,086 | | | | 16,059 | |
Series 2002-90 A2 6.50% 11/25/42 | | | 32,333 | | | | 36,553 | |
Series 2004-W11 1A2 6.50% 5/25/44 | | | 25,165 | | | | 29,640 | |
Series 2005-70 PA 5.50% 8/25/35 | | | 11,246 | | | | 12,675 | |
Series 2008-15 SB 6.403% 8/25/36 ●S | | | 29,382 | | | | 5,840 | |
Series 2010-129 SM 5.803% 11/25/40 ●S | | | 194,563 | | | | 31,409 | |
Series 2011-15 SA 6.863% 3/25/41 ●S | | | 186,171 | | | | 42,652 | |
Series 2011-118 DC 4.00% 11/25/41 | | | 445,716 | | | | 464,163 | |
Series 2012-122 SD 5.903% 11/25/42 ●S | | | 81,571 | | | | 19,601 | |
Series 2013-38 AI 3.00% 4/25/33 S | | | 155,832 | | | | 22,403 | |
Series 2013-43 IX 4.00% 5/25/43 S | | | 673,716 | | | | 163,852 | |
Series 2013-44 DI 3.00% 5/25/33 S | | | 204,072 | | | | 29,257 | |
Series 2014-68 BS 5.953% 11/25/44 ●S | | | 251,538 | | | | 53,265 | |
Series 2014-90 SA 5.953% 1/25/45 ●S | | | 709,954 | | | | 158,962 | |
Series 2015-27 SA 6.253% 5/25/45 ●S | | | 95,664 | | | | 23,248 | |
Series 2015-44 Z 3.00% 9/25/43 | | | 187,867 | | | | 178,176 | |
Freddie Mac REMICs | | | | | | | | |
Series 1730 Z 7.00% 5/15/24 | | | 48,965 | | | | 55,287 | |
Series 2326 ZQ 6.50% 6/15/31 | | | 42,693 | | | | 48,385 | |
Series 3123 HT 5.00% 3/15/26 | | | 138,750 | | | | 150,371 | |
Series 3656 PM 5.00% 4/15/40 | | | 91,649 | | | | 100,808 | |
| | | | | | | | |
| | | Principal
amount° | | | Value
(U.S. $) | |
| |
Agency Collateralized Mortgage Obligations (continued) | |
| |
Freddie Mac REMICs | | | | | | | | |
Series 4120 IK 3.00% 10/15/32 S | | | 376,165 | | | $ | 51,500 | |
Series 4146 IA 3.50% 12/15/32 S | | | 198,780 | | | | 31,787 | |
Series 4159 KS 5.954% 1/15/43 ●S | | | 169,749 | | | | 41,443 | |
Series 4185 LI 3.00% 3/15/33 S | | | 77,921 | | | | 10,986 | |
Series 4191 CI 3.00% 4/15/33 S | | | 80,804 | | | | 10,845 | |
Series 4435 DY 3.00% 2/15/35 | | | 157,000 | | | | 154,764 | |
GNMA | | | | | | | | |
Series 2010-113 KE 4.50% 9/20/40 | | | 125,000 | | | | 138,353 | |
Series 2015-133 AL 3.00% 5/20/45 | | | 208,000 | | | | 199,845 | |
| | | | | | | | |
Total Agency Collateralized Mortgage Obligations (cost $2,252,353) | | | | 2,282,129 | |
| | | | | | | | |
|
| |
Agency Mortgage-Backed Securities – 28.96% | |
| |
Fannie Mae | | | | | | | | |
6.50% 8/1/17 | | | 2,857 | | | | 2,926 | |
Fannie Mae ARM | | | | | | | | |
2.094% 3/1/38 ● | | | 39,121 | | | | 41,258 | |
2.283% 8/1/34 ● | | | 35,733 | | | | 37,768 | |
2.352% 4/1/36 ● | | | 28,480 | | | | 30,364 | |
2.415% 5/1/43 ● | | | 28,825 | | | | 29,319 | |
2.553% 6/1/43 ● | | | 9,607 | | | | 9,816 | |
2.913% 7/1/45 ● | | | 35,692 | | | | 36,536 | |
3.082% 4/1/44 ● | | | 138,003 | | | | 142,861 | |
3.184% 4/1/44 ● | | | 58,601 | | | | 60,710 | |
3.26% 3/1/44 ● | | | 55,400 | | | | 57,575 | |
3.282% 9/1/43 ● | | | 27,492 | | | | 28,547 | |
Fannie Mae Relocation 30 yr | | | | | | | | |
5.00% 11/1/33 | | | 1,354 | | | | 1,478 | |
5.00% 1/1/34 | | | 2,221 | | | | 2,424 | |
5.00% 11/1/34 | | | 3,889 | | | | 4,243 | |
5.00% 10/1/35 | | | 9,527 | | | | 10,397 | |
5.00% 1/1/36 | | | 12,126 | | | | 13,224 | |
Fannie Mae S.F. 15 yr | | | | | | | | |
2.50% 10/1/27 | | | 57,800 | | | | 59,307 | |
2.50% 12/1/27 | | | 50,186 | | | | 51,496 | |
2.50% 4/1/28 | | | 26,522 | | | | 27,214 | |
2.50% 9/1/28 | | | 72,866 | | | | 74,855 | |
3.00% 9/1/30 | | | 110,757 | | | | 115,376 | |
3.50% 4/1/26 | | | 279,391 | | | | 296,689 | |
3.50% 6/1/26 | | | 709,265 | | | | 750,037 | |
Schedules of investments
Delaware Pooled® Trust — The Core Plus Fixed Income Portfolio
| | | | | | | | |
| | | Principal
amount° | | | Value (U.S. $) | |
| |
Agency Mortgage-Backed Securities (continued) | |
| |
Fannie Mae S.F. 15 yr | | | | | | | | |
3.50% 7/1/26 | | | 20,593 | | | $ | 21,811 | |
3.50% 11/1/26 | | | 33,949 | | | | 35,961 | |
3.50% 8/1/29 | | | 142,115 | | | | 150,129 | |
3.50% 4/1/30 | | | 68,673 | | | | 73,014 | |
4.00% 4/1/24 | | | 12,639 | | | | 13,397 | |
4.00% 5/1/24 | | | 55,643 | | | | 58,969 | |
4.00% 5/1/25 | | | 18,311 | | | | 19,460 | |
4.00% 11/1/25 | | | 66,488 | | | | 70,654 | |
4.00% 12/1/26 | | | 29,479 | | | | 31,254 | |
4.00% 1/1/27 | | | 324,150 | | | | 344,503 | |
4.00% 5/1/27 | | | 65,993 | | | | 70,139 | |
4.00% 8/1/27 | | | 38,948 | | | | 41,376 | |
4.50% 1/1/20 | | | 4,888 | | | | 5,129 | |
5.00% 12/1/20 | | | 3,328 | | | | 3,551 | |
5.00% 6/1/23 | | | 6,389 | | | | 6,847 | |
5.50% 5/1/20 | | | 151 | | | | 157 | |
5.50% 6/1/23 | | | 40,217 | | | | 44,118 | |
6.00% 8/1/22 | | | 23,573 | | | | 25,863 | |
Fannie Mae S.F. 15 yr TBA | | | | | | | | |
2.50% 1/1/31 | | | 379,000 | | | | 384,197 | |
3.00% 1/1/31 | | | 244,000 | | | | 252,819 | |
Fannie Mae S.F. 20 yr | | | | | | | | |
3.00% 2/1/33 | | | 4,677 | | | | 4,840 | |
3.00% 8/1/33 | | | 13,186 | | | | 13,661 | |
3.00% 8/1/34 | | | 31,382 | | | | 32,506 | |
3.50% 9/1/33 | | | 19,483 | | | | 20,588 | |
4.00% 1/1/31 | | | 8,819 | | | | 9,485 | |
4.00% 2/1/31 | | | 24,702 | | | | 26,566 | |
Fannie Mae S.F. 30 yr | | | | | | | | |
3.00% 7/1/42 | | | 27,895 | | | | 28,300 | |
3.00% 10/1/42 | | | 439,176 | | | | 445,300 | |
3.00% 12/1/42 | | | 65,077 | | | | 65,989 | |
3.00% 1/1/43 | | | 182,980 | | | | 185,451 | |
3.00% 2/1/43 | | | 20,942 | | | | 21,228 | |
3.00% 5/1/43 | | | 51,912 | | | | 52,607 | |
3.50% 1/1/43 | | | 332,972 | | | | 347,362 | |
3.50% 8/1/45 | | | 2,134,231 | | | | 2,223,852 | |
4.00% 8/1/43 | | | 15,084 | | | | 16,148 | |
4.50% 7/1/36 | | | 8,779 | | | | 9,544 | |
4.50% 11/1/40 | | | 19,611 | | | | 21,307 | |
4.50% 3/1/41 | | | 22,996 | | | | 24,974 | |
4.50% 4/1/41 | | | 74,521 | | | | 80,987 | |
4.50% 7/1/41 | | | 35,816 | | | | 38,919 | |
4.50% 8/1/41 | | | 43,001 | | | | 47,535 | |
4.50% 1/1/42 | | | 1,164,195 | | | | 1,265,371 | |
4.50% 9/1/42 | | | 733,227 | | | | 798,850 | |
4.50% 11/1/43 | | | 117,492 | | | | 127,924 | |
4.50% 5/1/44 | | | 579,369 | | | | 631,090 | |
| | | | | | | | |
| | | Principal
amount° | | | Value (U.S. $) | |
| |
Agency Mortgage-Backed Securities (continued) | |
| |
Fannie Mae S.F. 30 yr | | | | | | | | |
4.50% 6/1/44 | | | 80,517 | | | $ | 87,438 | |
4.50% 9/1/44 | | | 2,945,125 | | | | 3,209,205 | |
4.50% 10/1/44 | | | 377,663 | | | | 411,542 | |
4.50% 2/1/45 | | | 963,718 | | | | 1,049,711 | |
5.00% 3/1/34 | | | 4,128 | | | | 4,570 | |
5.00% 2/1/35 | | | 45,232 | | | | 50,076 | |
5.00% 3/1/35 | | | 7,268 | | | | 8,019 | |
5.00% 6/1/35 | | | 6,398 | | | | 7,116 | |
5.00% 8/1/35 | | | 83,026 | | | | 91,396 | |
5.00% 10/1/35 | | | 30,936 | | | | 34,099 | |
5.00% 11/1/35 | | | 18,826 | | | | 20,746 | |
5.00% 4/1/37 | | | 8,921 | | | | 9,834 | |
5.00% 8/1/37 | | | 2,444 | | | | 2,693 | |
5.00% 2/1/38 | | | 8,437 | | | | 9,294 | |
5.50% 12/1/32 | | | 1,836 | | | | 2,068 | |
5.50% 9/1/33 | | | 199,898 | | | | 224,655 | |
5.50% 4/1/34 | | | 6,499 | | | | 7,314 | |
5.50% 5/1/34 | | | 147,933 | | | | 166,713 | |
5.50% 11/1/34 | | | 6,330 | | | | 7,142 | |
5.50% 12/1/34 | | | 245,944 | | | | 277,546 | |
5.50% 3/1/35 | | | 160,677 | | | | 181,583 | |
5.50% 5/1/35 | | | 11,164 | | | | 12,600 | |
5.50% 6/1/35 | | | 6,545 | | | | 7,307 | |
5.50% 12/1/35 | | | 6,819 | | | | 7,655 | |
5.50% 1/1/36 | | | 63,329 | | | | 71,461 | |
5.50% 4/1/36 | | | 159,879 | | | | 179,752 | |
5.50% 5/1/36 | | | 3,099 | | | | 3,484 | |
5.50% 7/1/36 | | | 2,661 | | | | 3,000 | |
5.50% 11/1/36 | | | 12,063 | | | | 13,512 | |
5.50% 1/1/37 | | | 50,495 | | | | 56,603 | |
5.50% 2/1/37 | | | 23,579 | | | | 26,399 | |
5.50% 4/1/37 | | | 99,368 | | | | 111,437 | |
5.50% 8/1/37 | | | 384,128 | | | | 433,399 | |
5.50% 9/1/37 | | | 68,244 | | | | 76,478 | |
5.50% 1/1/38 | | | 743,978 | | | | 837,523 | |
5.50% 2/1/38 | | | 125,067 | | | | 139,998 | |
5.50% 4/1/38 | | | 161,877 | | | | 181,262 | |
5.50% 6/1/38 | | | 104,438 | | | | 116,955 | |
5.50% 9/1/38 | | | 110,630 | | | | 124,580 | |
5.50% 1/1/39 | | | 49,256 | | | | 55,100 | |
5.50% 2/1/39 | | | 172,711 | | | | 194,609 | |
5.50% 10/1/39 | | | 77,471 | | | | 86,746 | |
5.50% 11/1/39 | | | 55,334 | | | | 61,828 | |
5.50% 12/1/39 | | | 136,952 | | | | 154,181 | |
5.50% 7/1/40 | | | 89,387 | | | | 100,725 | |
5.50% 9/1/41 | | | 457,702 | | | | 512,519 | |
6.00% 4/1/35 | | | 524,376 | | | | 598,891 | |
6.00% 7/1/35 | | | 55,557 | | | | 63,209 | |
68
| | | | | | | | |
| | | Principal amount° | | | Value (U.S. $) | |
| |
Agency Mortgage-Backed Securities (continued) | |
| |
Fannie Mae S.F. 30 yr | | | | | | | | |
6.00% 6/1/36 | | | 3,048 | | | $ | 3,458 | |
6.00% 7/1/36 | | | 3,243 | | | | 3,672 | |
6.00% 12/1/36 | | | 3,383 | | | | 3,853 | |
6.00% 2/1/37 | | | 10,624 | | | | 12,056 | |
6.00% 6/1/37 | | | 1,898 | | | | 2,166 | |
6.00% 7/1/37 | | | 1,875 | | | | 2,123 | |
6.00% 8/1/37 | | | 21,831 | | | | 24,792 | |
6.00% 9/1/37 | | | 3,516 | | | | 3,989 | |
6.00% 11/1/37 | | | 3,980 | | | | 4,506 | |
6.00% 5/1/38 | | | 87,658 | | | | 99,400 | |
6.00% 7/1/38 | | | 1,240 | | | | 1,404 | |
6.00% 9/1/38 | | | 9,588 | | | | 10,882 | |
6.00% 10/1/38 | | | 37,753 | | | | 42,832 | |
6.00% 11/1/38 | | | 8,244 | | | | 9,379 | |
6.00% 1/1/39 | | | 16,056 | | | | 18,211 | |
6.00% 2/1/39 | | | 21,188 | | | | 24,105 | |
6.00% 9/1/39 | | | 135,645 | | | | 153,886 | |
6.00% 3/1/40 | | | 14,871 | | | | 16,888 | |
6.00% 4/1/40 | | | 31,794 | | | | 36,066 | |
6.00% 9/1/40 | | | 13,094 | | | | 14,857 | |
6.00% 11/1/40 | | | 5,569 | | | | 6,371 | |
6.00% 5/1/41 | | | 204,090 | | | | 231,679 | |
7.00% 12/1/33 | | | 7,653 | | | | 9,273 | |
7.00% 5/1/35 | | | 455 | | | | 516 | |
7.00% 6/1/35 | | | 2,265 | | | | 2,352 | |
7.00% 12/1/37 | | | 8,308 | | | | 9,001 | |
7.50% 6/1/31 | | | 1,178 | | | | 1,424 | |
7.50% 6/1/34 | | | 10,191 | | | | 11,909 | |
Fannie Mae S.F. 30 yr TBA | | | | | | | | |
3.00% 12/1/45 | | | 7,526,000 | | | | 7,588,560 | |
3.00% 1/1/46 | | | 3,498,000 | | | | 3,518,605 | |
4.50% 12/1/43 | | | 167,000 | | | | 180,754 | |
4.50% 1/1/46 | | | 2,080,000 | | | | 2,248,691 | |
Freddie Mac ARM | | | | | | | | |
2.513% 4/1/34 ● | | | 1,933 | | | | 2,052 | |
2.519% 1/1/44 ● | | | 108,933 | | | | 111,872 | |
2.958% 10/1/45 ● | | | 76,000 | | | | 77,739 | |
Freddie Mac Relocation 30 yr | | | | | | | | |
5.00% 9/1/33 | | | 1,763 | | | | 1,916 | |
Freddie Mac S.F. 15 yr | | | | | | | | |
3.50% 11/1/25 | | | 12,330 | | | | 13,030 | |
3.50% 6/1/26 | | | 14,164 | | | | 14,966 | |
3.50% 1/1/27 | | | 11,693 | | | | 12,354 | |
4.00% 12/1/24 | | | 10,836 | | | | 11,546 | |
4.00% 5/1/25 | | | 5,442 | | | | 5,802 | |
4.00% 8/1/25 | | | 14,114 | | | | 15,047 | |
4.00% 4/1/26 | | | 15,822 | | | | 16,688 | |
4.00% 1/1/29 | | | 173,632 | | | | 181,526 | |
| | | | | | | | |
| | | Principal amount° | | | Value (U.S. $) | |
| |
Agency Mortgage-Backed Securities (continued) | |
| |
Freddie Mac S.F. 15 yr | | | | | | | | |
4.50% 8/1/24 | | | 30,326 | | | $ | 32,813 | |
4.50% 9/1/26 | | | 31,782 | | | | 34,367 | |
Freddie Mac S.F. 20 yr | | | | | | | | |
3.50% 1/1/34 | | | 46,329 | | | | 48,554 | |
Freddie Mac S.F. 30 yr | | | | | | | | |
3.00% 10/1/42 | | | 28,571 | | | | 28,899 | |
3.00% 11/1/42 | | | 25,045 | | | | 25,388 | |
3.50% 8/1/45 | | | 390,751 | | | | 407,020 | |
4.50% 10/1/39 | | | 26,189 | | | | 28,428 | |
4.50% 4/1/41 | | | 165,151 | | | | 179,285 | |
4.50% 3/1/42 | | | 95,795 | | | | 104,363 | |
5.50% 3/1/34 | | | 43,677 | | | | 48,722 | |
5.50% 12/1/34 | | | 3,544 | | | | 3,956 | |
5.50% 9/1/35 | | | 60,849 | | | | 67,746 | |
5.50% 11/1/35 | | | 6,795 | | | | 7,569 | |
5.50% 6/1/36 | | | 2,199 | | | | 2,442 | |
5.50% 11/1/36 | | | 4,682 | | | | 5,199 | |
5.50% 12/1/36 | | | 1,132 | | | | 1,260 | |
5.50% 9/1/37 | | | 7,467 | | | | 8,328 | |
5.50% 4/1/38 | | | 351,459 | | | | 391,972 | |
5.50% 6/1/38 | | | 2,667 | | | | 2,967 | |
5.50% 7/1/38 | | | 26,899 | | | | 29,970 | |
5.50% 8/1/38 | | | 16,932 | | | | 18,858 | |
5.50% 6/1/39 | | | 27,361 | | | | 30,456 | |
5.50% 3/1/40 | | | 12,900 | | | | 14,386 | |
5.50% 8/1/40 | | | 40,735 | | | | 45,369 | |
5.50% 1/1/41 | | | 13,009 | | | | 14,515 | |
5.50% 6/1/41 | | | 231,242 | | | | 257,862 | |
6.00% 2/1/36 | | | 7,909 | | | | 9,044 | |
6.00% 1/1/38 | | | 4,859 | | | | 5,503 | |
6.00% 6/1/38 | | | 13,396 | | | | 15,167 | |
6.00% 8/1/38 | | | 19,197 | | | | 21,983 | |
6.00% 5/1/40 | | | 43,015 | | | | 49,087 | |
6.00% 7/1/40 | | | 44,881 | | | | 50,638 | |
7.00% 11/1/33 | | | 1,102 | | | | 1,313 | |
GNMA I S.F. 30 yr | | | | | | | | |
5.00% 6/15/40 | | | 7,363 | | | | 8,150 | |
7.00% 12/15/34 | | | 138,567 | | | | 165,819 | |
7.50% 12/15/31 | | | 325 | | | | 401 | |
7.50% 2/15/32 | | | 318 | | | | 391 | |
| | | | | | | | |
Total Agency Mortgage-Backed Securities (cost $36,935,082) | | | | 37,102,513 | |
| | | | | | | | |
| | | | | | | | |
| |
Collateralized Debt Obligations – 1.35% | |
| |
Avery Point III CLO | | | | | | | | |
Series 2013-3A A 144A 1.715% 1/18/25 #● | | | 250,000 | | | | 245,650 | |
Schedules of investments
Delaware Pooled® Trust — The Core Plus Fixed Income Portfolio
| | | | | | | | |
| | | Principal amount° | | | Value (U.S. $) | |
| |
Collateralized Debt Obligations (continued) | |
| |
Benefit Street Partners CLO IV | | | | | | | | |
Series 2014-IVA A1A 144A 1.807% 7/20/26 #● | | | 500,000 | | | $ | 495,450 | |
Cent CLO 21 | | | | | | | | |
Series 2014-21A A1B 144A 1.713% 7/27/26 #● | | | 250,000 | | | | 246,425 | |
Magnetite IX | | | | | | | | |
Series 2014-9A A1 144A 1.74% 7/25/26 #● | | | 505,000 | | | | 499,092 | |
Neuberger Berman CLO XIX | | | | | | | | |
Series 2015-19A A1 144A 1.718% 7/15/27 #● | | | 250,000 | | | | 246,300 | |
| | | | | | | | |
Total Collateralized Debt Obligations (cost $1,753,535) | | | | 1,732,917 | |
| | | | | | | | |
|
| |
Commercial Mortgage-Backed Securities – 5.67% | |
| |
Banc of America Commercial Mortgage Trust | | | | | | | | |
Series 2006-1 AM 5.421% 9/10/45 ● | | | 550,000 | | | | 550,761 | |
Series 2007-4 AM 5.809% 2/10/51 ● | | | 60,000 | | | | 63,711 | |
Bear Stearns Commercial Mortgage Securities Trust | | | | | | | | |
Series 2007-PWR18 A4 5.70% 6/11/50 | | | 55,000 | | | | 57,841 | |
CD Commercial Mortgage Trust | | | | | | | | |
Series 2005-CD1 AJ 5.255% 7/15/44 ● | | | 13,912 | | | | 13,906 | |
Series 2005-CD1 C 5.255% 7/15/44 ● | | | 20,000 | | | | 19,988 | |
CFCRE Commercial Mortgage Trust | | | | | | | | |
Series 2011-C1 A2 144A 3.759% 4/15/44 # | | | 33,600 | | | | 33,802 | |
Citigroup Commercial Mortgage Trust | | | | | | | | |
Series 2007-C6 AM 5.711% 12/10/49 ● | | | 60,000 | | | | 62,384 | |
Series 2014-GC25 A4 3.635% 10/10/47 | | | 100,000 | | | | 103,506 | |
Series 2015-GC27 A5 3.137% 2/10/48 | | | 45,000 | | | | 44,679 | |
COMM Mortgage Trust | | | | | | | | |
Series 2014-CR19 A5 3.796% 8/10/47 | | | 80,000 | | | | 84,001 | |
Series 2014-CR20 A4 3.59% 11/10/47 | | | 57,000 | | | | 58,932 | |
| | | | | | | | |
| | | Principal amount° | | | Value (U.S. $) | |
| |
Commercial Mortgage-Backed Securities (continued) | |
| |
COMM Mortgage Trust | | | | | | | | |
Series 2014-CR20 AM 3.938% 11/10/47 | | | 350,000 | | | $ | 366,530 | |
Series 2014-CR21 A3 3.528% 12/10/47 | | | 30,000 | | | | 30,861 | |
Series 2015-3BP A 144A 3.178% 2/10/35 # | | | 130,000 | | | | 129,748 | |
Commercial Mortgage Trust | | | | | | | | |
Series 2007-GG9 AM 5.475% 3/10/39 | | | 75,000 | | | | 77,595 | |
DBUBS Mortgage Trust | | | | | | | | |
Series 2011-LC1A A3 144A 5.002% 11/10/46 # | | | 105,000 | | | | 117,795 | |
Series 2011-LC1A C 144A 5.607% 11/10/46 #● | | | 135,000 | | | | 150,633 | |
Freddie Mac Multifamily Structured Pass Through Certificates | | | | | | | | |
Series K038 A2 3.389% 3/25/24 ¿ | | | 100,000 | | | | 105,691 | |
FREMF Mortgage Trust | | | | | | | | |
Series 2011-K10 B 144A 4.63% 11/25/49 #● | | | 180,000 | | | | 191,509 | |
Series 2011-K13 B 144A 4.60% 1/25/48 #● | | | 100,000 | | | | 107,207 | |
Series 2011-K15 B 144A 4.948% 8/25/44 #● | | | 55,000 | | | | 60,606 | |
Series 2012-K18 B 144A 4.265% 1/25/45 #● | | | 50,000 | | | | 53,240 | |
Series 2012-K19 B 144A 4.036% 5/25/45 #● | | | 15,000 | | | | 15,889 | |
Series 2012-K22 B 144A 3.687% 8/25/45 #● | | | 60,000 | | | | 61,017 | |
Series 2012-K22 C 144A 3.687% 8/25/45 #● | | | 115,000 | | | | 115,756 | |
Series 2012-K707 B 144A 3.883% 1/25/47 #● | | | 35,000 | | | | 36,044 | |
Series 2012-K708 B 144A 3.754% 2/25/45 #● | | | 145,000 | | | | 150,522 | |
Series 2012-K708 C 144A 3.754% 2/25/45 #● | | | 25,000 | | | | 25,481 | |
Series 2012-K711 B 144A 3.562% 8/25/45 #● | | | 10,000 | | | | 10,297 | |
Series 2013-K26 C 144A 3.599% 12/25/45 #● | | | 40,000 | | | | 38,898 | |
Series 2013-K30 C 144A 3.556% 6/25/45 #● | | | 75,000 | | | | 73,565 | |
Series 2013-K31 C 144A 3.627% 7/25/46 #● | | | 228,000 | | | | 225,981 | |
Series 2013-K33 B 144A 3.503% 8/25/46 #● | | | 45,000 | | | | 43,995 | |
70
| | | | | | | | |
| | | Principal
amount° | | | Value
(U.S. $) | |
| |
Commercial Mortgage-Backed Securities (continued) | |
| |
FREMF Mortgage Trust | | | | | | | | |
Series 2013-K33 C 144A 3.503% 8/25/46 #● | | | 25,000 | | | $ | 23,960 | |
Series 2013-K712 B 144A 3.371% 5/25/45 #● | | | 190,000 | | | | 194,521 | |
Series 2013-K712 C 144A 3.371% 5/25/45 #● | | | 250,000 | | | | 249,418 | |
Series 2013-K713 B 144A 3.165% 4/25/46 #● | | | 110,000 | | | | 111,674 | |
Series 2013-K713 C 144A 3.165% 4/25/46 #● | | | 135,000 | | | | 134,042 | |
Series 2014-K716 C 144A 3.954% 8/25/47 #● | | | 55,000 | | | | 56,125 | |
Series 2015-K47 B 144A 3.60% 6/25/48 #● | | | 20,000 | | | | 17,996 | |
GRACE Mortgage Trust | | | | | | | | |
Series 2014-GRCE A 144A 3.369% 6/10/28 # | | | 900,000 | | | | 934,986 | |
GS Mortgage Securities Trust | | | | | | | | |
Series 2006-GG6 A4 5.553% 4/10/38 ● | | | 1,262 | | | | 1,261 | |
Series 2010-C1 A2 144A 4.592% 8/10/43 # | | | 200,000 | | | | 217,884 | |
Series 2010-C1 C 144A 5.635% 8/10/43 #● | | | 100,000 | | | | 110,143 | |
Series 2015-GC32 A4 3.764% 7/10/48 | | | 55,000 | | | | 57,424 | |
Hilton USA Trust | | | | | | | | |
Series 2013-HLT BFX 144A 3.367% 11/5/30 # | | | 100,000 | | | | 100,137 | |
Houston Galleria Mall Trust | | | | | | | | |
Series 2015-HGLR A1A2 144A 3.087% 3/5/37 # | | | 165,000 | | | | 160,491 | |
JPMBB Commercial Mortgage Securities Trust | | | | | | | | |
Series 2014-C18 A1 1.254% 2/15/47 | | | 51,769 | | | | 51,668 | |
Series 2014-C22 B 4.561% 9/15/47 ● | | | 30,000 | | | | 30,973 | |
JPMorgan Chase Commercial Mortgage Securities Trust | | | | | | | | |
Series 2005-CB11 E 5.507% 8/12/37 ● | | | 20,000 | | | | 21,737 | |
Series 2005-LDP4 AJ 5.04% 10/15/42 ● | | | 16,005 | | | | 16,001 | |
Series 2005-LDP5 D 5.546% 12/15/44 ● | | | 40,000 | | | | 39,908 | |
Series 2006-LDP8 AM 5.44% 5/15/45 | | | 320,000 | | | | 327,836 | |
| | | | | | | | |
| | | Principal
amount° | | | Value
(U.S. $) | |
| |
Commercial Mortgage-Backed Securities (continued) | |
| |
LB-UBS Commercial Mortgage Trust | | | | | | | | |
Series 2004-C1 A4 4.568% 1/15/31 | | | 2,247 | | | $ | 2,261 | |
Series 2006-C6 AJ 5.452% 9/15/39 ● | | | 85,000 | | | | 87,508 | |
Series 2006-C6 AM 5.413% 9/15/39 | | | 145,000 | | | | 149,496 | |
Morgan Stanley Bank of America Merrill Lynch Trust | | | | | | | | |
Series 2014-C19 AS 3.832% 12/15/47 | | | 30,000 | | | | 30,769 | |
Series 2015-C22 A3 3.046% 4/15/48 | | | 55,000 | | | | 53,824 | |
Series 2015-C23 A4 3.719% 7/15/50 | | | 220,000 | | | | 228,641 | |
Series 2015-C26 A5 3.531% 11/15/48 | | | 135,000 | | | | 139,046 | |
Morgan Stanley Capital I Trust | | | | | | | | |
Series 2005-HQ7 AJ 5.239% 11/14/42 ● | | | 16,086 | | | | 16,086 | |
Series 2006-HQ10 B 5.448% 11/12/41 ● | | | 100,000 | | | | 95,455 | |
Series 2006-T21 AM 5.204% 10/12/52 ● | | | 35,624 | | | | 35,618 | |
Series 2006-TOP23 A4 5.843% 8/12/41 ● | | | 60,816 | | | | 61,835 | |
TimberStar Trust I | | | | | | | | |
Series 2006-1A A 144A 5.668% 10/15/36 # | | | 25,000 | | | | 25,841 | |
Wells Fargo Commercial Mortgage Trust | | | | | | | | |
Series 2012-LC5 A3 2.918% 10/15/45 | | | 60,000 | | | | 60,685 | |
Series 2015-NXS3 A4 3.617% 9/15/57 | | | 90,000 | | | | 92,620 | |
WFRBS Commercial Mortgage Trust | | | | | | | | |
Series 2014-C23 A5 3.917% 10/15/57 | | | 35,000 | | | | 37,022 | |
| | | | | | | | |
| |
Total Commercial Mortgage-Backed Securities (cost $7,320,214) | | | | 7,257,263 | |
| | | | | | | | |
|
| |
Convertible Bonds – 0.11% | |
| |
Alaska Communications Systems Group 6.25%exercise price $10.28,expiration date 4/27/18 @ | | | 7,000 | | | | 7,048 | |
Schedules of investments
Delaware Pooled® Trust — The Core Plus Fixed Income Portfolio
| | | | | | | | |
| | | Principal amount° | | | Value (U.S. $) | |
| |
Convertible Bonds (continued) | | | | | | | | |
| |
Ares Capital 5.75% exercise price $18.36, expiration date 2/1/16 | | | 7,000 | | | $ | 7,061 | |
BGC Partners 4.50% exercise price $9.84, expiration date 7/13/16 | | | 10,000 | | | | 10,531 | |
Blucora 4.25% exercise price $21.66, expiration date 3/29/19 | | | 3,000 | | | | 2,723 | |
Chesapeake Energy 2.50% exercise price $47.55, expiration date 5/15/37 | | | 3,000 | | | | 2,580 | |
Ciena 144A 3.75% exercise price $20.17, expiration date 10/15/18 # | | | 7,000 | | | | 9,651 | |
General Cable 4.50% exercise price $33.77, expiration date 11/15/29 @f | | | 12,000 | | | | 8,243 | |
Gilead Sciences 1.625% exercise price $22.53, expiration date 4/29/16 | | | 4,000 | | | | 19,108 | |
Helix Energy Solutions Group 3.25% exercise price $25.02, expiration date 3/12/32 | | | 6,000 | | | | 5,003 | |
Hologic 2.00% exercise price $31.17, expiration date 2/27/42 f | | | 7,000 | | | | 9,428 | |
Jefferies Group 3.875% exercise price $44.69, expiration date 10/31/29 | | | 8,000 | | | | 8,210 | |
Meritor 4.00% exercise price $26.73, expiration date 2/12/27 f | | | 14,000 | | | | 13,834 | |
Nuance Communications 2.75% exercise price $32.30, expiration date 11/1/31 | | | 9,000 | | | | 9,056 | |
NuVasive 2.75% exercise price $42.13, expiration date 6/30/17 | | | 16,000 | | | | 20,170 | |
Titan Machinery 3.75% exercise price $43.17, expiration date 4/30/19 @ | | | 7,000 | | | | 5,316 | |
Vector Group 2.50% exercise price $15.98, expiration date 1/14/19 ● | | | 2,000 | | | | 3,137 | |
| | | | | | | | |
Total Convertible Bonds (cost $125,342) | | | | 141,099 | |
| | | | | | | | |
| | | | | | | | |
| | | Principal
amount° | | | Value (U.S. $) | |
| |
Corporate Bonds – 31.17% | | | | | |
| |
Banking – 4.75% | |
Banco Bilbao Vizcaya Argentaria Colombia 144A 4.875% 4/21/25 # | | | 150,000 | | | $ | 147,000 | |
Bank of America | | | | | | | | |
3.875% 8/1/25 | | | 40,000 | | | | 40,779 | |
3.95% 4/21/25 | | | 525,000 | | | | 517,596 | |
Bank of New York Mellon 2.15% 2/24/20 | | | 25,000 | | | | 25,020 | |
BB&T 5.25% 11/1/19 | | | 312,000 | | | | 343,487 | |
BBVA Bancomer 144A 7.25% 4/22/20 # | | | 100,000 | | | | 111,508 | |
Citigroup 4.45% 9/29/27 | | | 90,000 | | | | 90,125 | |
City National 5.25% 9/15/20 | | | 70,000 | | | | 78,900 | |
Compass Bank 3.875% 4/10/25 | | | 250,000 | | | | 233,258 | |
Credit Suisse Group 144A 6.25% 12/29/49 #● | | | 200,000 | | | | 199,071 | |
Fifth Third Bancorp 2.875% 7/27/20 | | | 50,000 | | | | 50,395 | |
Finnvera 144A 2.375% 6/4/25 # | | | 200,000 | | | | 196,803 | |
Goldman Sachs Group 5.20% 12/17/19 | | NZD | 40,000 | | | | 28,253 | |
HSBC USA 2.75% 8/7/20 | | | 100,000 | | | | 100,773 | �� |
JPMorgan Chase 4.25% 10/1/27 | | | 280,000 | | | | 281,679 | |
KeyBank | | | | | | | | |
3.30% 6/1/25 | | | 250,000 | | | | 248,499 | |
5.45% 3/3/16 | | | 250,000 | | | | 253,693 | |
Morgan Stanley 3.95% 4/23/27 | | | 20,000 | | | | 19,498 | |
MUFG Americas Holdings 3.00% 2/10/25 | | | 175,000 | | | | 167,357 | |
Nordea Bank 144A 6.125% 12/29/49 #● | | | 200,000 | | | | 198,250 | |
PNC Bank | | | | | | | | |
2.30% 6/1/20 | | | 250,000 | | | | 249,295 | |
2.60% 7/21/20 | | | 250,000 | | | | 252,897 | |
6.875% 4/1/18 | | | 250,000 | | | | 277,455 | |
Santander Holdings USA 3.45% 8/27/18 | | | 45,000 | | | | 46,273 | |
Santander UK Group Holdings 144A 4.75% 9/15/25 # | | | 400,000 | | | | 400,165 | |
State Street | | | | | | | | |
2.55% 8/18/20 | | | 120,000 | | | | 121,317 | |
3.10% 5/15/23 | | | 65,000 | | | | 64,066 | |
3.55% 8/18/25 | | | 135,000 | | | | 138,775 | |
72
| | | | | | | | |
| | | Principal
amount° | | | Value (U.S. $) | |
| |
Corporate Bonds (continued) | |
| |
Banking (continued) | | | | | | | | |
SunTrust Banks 2.35% 11/1/18 | | | 75,000 | | | $ | 75,485 | |
SVB Financial Group 3.50% 1/29/25 | | | 120,000 | | | | 116,447 | |
UBS Group Funding Jersey 144A 4.125% 9/24/25 # | | | 200,000 | | | | 201,289 | |
US Bancorp 3.60% 9/11/24 @ | | | 40,000 | | | | 40,880 | |
US Bank 2.80% 1/27/25 | | | 250,000 | | | | 243,684 | |
USB Capital IX 3.50% 10/29/49 @● | | | 355,000 | | | | 282,584 | |
Wells Fargo 4.30% 7/22/27 | | | 175,000 | | | | 180,839 | |
Zions Bancorporation 4.50% 6/13/23 | | | 55,000 | | | | 56,848 | |
| | | | | | | | |
| | | | | | | 6,080,243 | |
| | | | | | | | |
Basic Industry – 1.70% | | | | | | | | |
ArcelorMittal 10.60% 6/1/19 | | | 90,000 | | | | 99,900 | |
BHP Billiton Finance USA 144A 6.25% 10/19/75 #● | | | 200,000 | | | | 204,750 | |
CF Industries | | | | | | | | |
5.375% 3/15/44 | | | 95,000 | | | | 94,151 | |
7.125% 5/1/20 | | | 125,000 | | | | 145,799 | |
Dow Chemical 8.55% 5/15/19 | | | 209,000 | | | | 251,552 | |
Georgia-Pacific 144A 2.539% 11/15/19 # | | | 15,000 | | | | 15,065 | |
8.00% 1/15/24 | | | 150,000 | | | | 192,542 | |
Gerdau Holdings 144A 7.00% 1/20/20 # | | | 100,000 | | | | 99,985 | |
Grace (W.R.) 144A 5.125% 10/1/21 # | | | 55,000 | | | | 57,337 | |
International Paper 3.80% 1/15/26 | | | 255,000 | | | | 254,990 | |
LyondellBasell Industries 4.625% 2/26/55 | | | 70,000 | | | | 60,831 | |
Methanex 4.25% 12/1/24 | | | 175,000 | | | | 166,417 | |
NOVA Chemicals 144A 5.00% 5/1/25 # | | | 55,000 | | | | 55,138 | |
OCP 144A 4.50% 10/22/25 # | | | 200,000 | | | | 192,321 | |
PPG Industries 2.30% 11/15/19 | | | 290,000 | | | | 289,603 | |
| | | | | | | | |
| | | | | | | 2,180,381 | |
| | | | | | | | |
Brokerage – 0.18% | | | | | | | | |
Jefferies Group | | | | | | | | |
5.125% 1/20/23 | | | 35,000 | | | | 35,080 | |
| | | | | | | | |
| | | Principal
amount° | | | Value (U.S. $) | |
| |
Corporate Bonds (continued) | |
| |
Brokerage (continued) | | | | | | | | |
Jefferies Group | | | | | | | | |
6.45% 6/8/27 | | | 30,000 | | | $ | 31,413 | |
6.50% 1/20/43 | | | 15,000 | | | | 14,727 | |
Lazard Group | | | | | | | | |
3.75% 2/13/25 | | | 125,000 | | | | 117,190 | |
6.85% 6/15/17 | | | 34,000 | | | | 36,457 | |
| | | | | | | | |
| | | | | | | 234,867 | |
| | | | | | | | |
Capital Goods – 1.28% | | | | | | | | |
AECOM 144A 5.875% 10/15/24 # | | | 240,000 | | | | 248,700 | |
Algeco Scotsman Global Finance 144A 8.50% 10/15/18 # | | | 265,000 | | | | 232,537 | |
Cemex Finance 144A 9.375% 10/12/22 # | | | 200,000 | | | | 218,500 | |
Crane | | | | | | | | |
2.75% 12/15/18 | | | 20,000 | | | | 20,182 | |
4.45% 12/15/23 | | | 95,000 | | | | 98,912 | |
Embraer Netherlands Finance 5.05% 6/15/25 | | | 45,000 | | | | 43,200 | |
Fortune Brands Home & Security 3.00% 6/15/20 | | | 70,000 | | | | 70,378 | |
Masco 4.45% 4/1/25 | | | 70,000 | | | | 70,350 | |
Parker-Hannifin 3.30% 11/21/24 | | | 10,000 | | | | 10,186 | |
Rolls-Royce 144A 3.625% 10/14/25 # | | | 400,000 | | | | 405,936 | |
Trinity Industries 4.55% 10/1/24 @ | | | 80,000 | | | | 76,184 | |
Union Andina de Cementos 144A 5.875% 10/30/21 # | | | 150,000 | | | | 150,563 | |
| | | | | | | | |
| | | | | | | 1,645,628 | |
| | | | | | | | |
Communications – 4.22% | | | | | | | | |
21st Century Fox America | | | | | | | | |
144A 3.70% 10/15/25 # | | | 105,000 | | | | 105,228 | |
144A 4.95% 10/15/45 # | | | 95,000 | | | | 97,584 | |
American Tower | | | | | | | | |
2.80% 6/1/20 | | | 70,000 | | | | 69,749 | |
4.00% 6/1/25 | | | 85,000 | | | | 84,164 | |
American Tower Trust I 144A 3.07% 3/15/23 # | | | 65,000 | | | | 63,625 | |
AT&T | | | | | | | | |
4.50% 5/15/35 | | | 80,000 | | | | 75,065 | |
4.75% 5/15/46 | | | 175,000 | | | | 161,297 | |
CBS 4.00% 1/15/26 | | | 70,000 | | | | 69,962 | |
CC Holdings GS V 3.849% 4/15/23 | | | 65,000 | | | | 64,385 | |
Schedules of investments
Delaware Pooled® Trust — The Core Plus Fixed Income Portfolio
| | | | | | | | |
| | | Principal
amount° | | | Value (U.S. $) | |
| |
Corporate Bonds (continued) | | | | | |
| |
Communications (continued) | | | | | |
CCO Safari II 144A 4.908% 7/23/25 # | | | 245,000 | | | $ | 249,413 | |
Columbus International 144A 7.375% 3/30/21 # | | | 200,000 | | | | 208,750 | |
Crown Castle Towers 144A 4.883% 8/15/20 # | | | 275,000 | | | | 297,816 | |
CSC Holdings 5.25% 6/1/24 | | | 470,000 | | | | 414,535 | |
Digicel Group 144A 8.25% 9/30/20 # | | | 375,000 | | | | 333,750 | |
DISH DBS 5.00% 3/15/23 | | | 295,000 | | | | 273,613 | |
Frontier Communications | | | | | | | | |
144A 10.50% 9/15/22 # | | | 80,000 | | | | 83,200 | |
144A 11.00% 9/15/25 # | | | 175,000 | | | | 183,859 | |
GTP Acquisition Partners I 144A 2.35% 6/15/20 # | | | 100,000 | | | | 98,971 | |
Intelsat Luxembourg 8.125% 6/1/23 @ | | | 445,000 | | | | 265,887 | |
Millicom International Cellular 144A 6.00% 3/15/25 # | | | 200,000 | | | | 165,500 | |
MTS International Funding 144A 8.625% 6/22/20 # | | | 100,000 | | | | 111,276 | |
Myriad International Holdings 144A 5.50% 7/21/25 # | | | 200,000 | | | | 196,497 | |
SBA Tower Trust | | | | | | | | |
144A 2.24% 4/16/18 # | | | 45,000 | | | | 44,617 | |
144A 2.898% 10/15/19 # | | | 60,000 | | | | 59,653 | |
Scripps Networks Interactive 3.95% 6/15/25 | | | 70,000 | | | | 67,125 | |
SES 144A 3.60% 4/4/23 # | | | 165,000 | | | | 164,834 | |
SES GLOBAL Americas Holdings 144A 5.30% 3/25/44 # | | | 120,000 | | | | 117,762 | |
Sky 144A 3.75% 9/16/24 # | | | 200,000 | | | | 199,699 | |
Sprint 7.125% 6/15/24 | | | 605,000 | | | | 532,778 | |
Telefonica Emisiones 6.421% 6/20/16 | | | 50,000 | | | | 51,628 | |
Time Warner 4.85% 7/15/45 | | | 75,000 | | | | 74,813 | |
Time Warner Cable 5.50% 9/1/41 | | | 75,000 | | | | 69,062 | |
Verizon Communications | | | | | | | | |
4.40% 11/1/34 | | | 90,000 | | | | 84,860 | |
4.862% 8/21/46 | | | 245,000 | | | | 235,454 | |
WPP Finance 2010 5.625% 11/15/43 | | | 30,000 | | | | 31,181 | |
| | | | | | | | |
| | |
| | | | | | | 5,407,592 | |
| | | | | | | | |
| | | | | | | | |
| | | Principal
amount° | | | Value (U.S. $) | |
| |
Corporate Bonds (continued) | | | | | |
| |
Consumer Cyclical – 2.54% | |
AutoNation | | | | | | | | |
3.35% 1/15/21 | | | 25,000 | | | $ | 25,271 | |
4.50% 10/1/25 | | | 65,000 | | | | 66,698 | |
CDK Global 4.50% 10/15/24 | | | 80,000 | | | | 78,954 | |
CVS Health 144A 5.00% 12/1/24 # | | | 375,000 | | | | 417,283 | |
Daimler Finance North America 144A 3.30% 5/19/25 # | | | 150,000 | | | | 148,258 | |
Ford Motor Credit 2.24% 6/15/18 | | | 465,000 | | | | 463,764 | |
General Motors Financial | | | | | |
3.20% 7/13/20 | | | 55,000 | | | | 54,623 | |
3.45% 4/10/22 | | | 95,000 | | | | 92,902 | |
4.00% 1/15/25 | | | 95,000 | | | | 93,322 | |
4.30% 7/13/25 | | | 120,000 | | | | 122,358 | |
4.375% 9/25/21 | | | 65,000 | | | | 67,524 | |
Harman International Industries 4.15% 5/15/25 | | | 185,000 | | | | 181,058 | |
Hyundai Capital America 144A 2.55% 2/6/19 # | | | 75,000 | | | | 74,680 | |
INVISTA Finance 144A 4.25% 10/15/19 # | | | 80,000 | | | | 78,600 | |
Lowe’s 3.375% 9/15/25 | | | 105,000 | | | | 106,761 | |
Marriott International 3.375% 10/15/20 | | | 50,000 | | | | 51,625 | |
MGM Resorts International 6.00% 3/15/23 | | | 280,000 | | | | 284,900 | |
QVC | | | | | | | | |
4.375% 3/15/23 | | | 210,000 | | | | 202,831 | |
5.45% 8/15/34 | | | 110,000 | | | | 98,303 | |
Signet UK Finance 4.70% 6/15/24 | | | 105,000 | | | | 105,501 | |
Starwood Hotels & Resorts Worldwide | | | | | | | | |
3.75% 3/15/25 @ | | | 290,000 | | | | 284,011 | |
4.50% 10/1/34 @ | | | 20,000 | | | | 18,293 | |
Toyota Motor Credit 2.80% 7/13/22 | | | 140,000 | | | | 140,318 | |
| | | | | | | | |
| | |
| | | | | | | 3,257,838 | |
| | | | | | | | |
Consumer Non-Cyclical – 2.94% | | | | | |
Becton Dickinson 6.375% 8/1/19 | | | 120,000 | | | | 136,376 | |
Boston Scientific | | | | | | | | |
2.65% 10/1/18 | | | 55,000 | | | | 55,624 | |
6.00% 1/15/20 | | | 85,000 | | | | 95,293 | |
74
| | | | | | | | |
| | | Principal
amount° | | | Value
(U.S. $) | |
| |
Corporate Bonds (continued) | | | | | |
| |
Consumer Non-Cyclical (continued) | | | | | |
Campbell Soup
3.30% 3/19/25 | | | 140,000 | | | $ | 137,500 | |
Celgene 3.25% 8/15/22 | | | 425,000 | | | | 425,044 | |
Community Health Systems
6.875% 2/1/22 | | | 600,000 | | | | 607,500 | |
EMD Finance 144A
2.95% 3/19/22 # | | | 70,000 | | | | 68,947 | |
Express Scripts Holding | | | | | | | | |
2.25% 6/15/19 | | | 60,000 | | | | 60,047 | |
3.50% 6/15/24 | | | 50,000 | | | | 49,471 | |
JB 144A 3.75% 5/13/25 # | | | 150,000 | | | | 146,603 | |
JBS Investments 144A
7.75% 10/28/20 # | | | 200,000 | | | | 214,100 | |
JBS USA 144A
5.75% 6/15/25 # | | | 345,000 | | | | 335,513 | |
PepsiCo 4.45% 4/14/46 | | | 95,000 | | | | 97,499 | |
Perrigo Finance
3.50% 12/15/21 | | | 400,000 | | | | 391,911 | |
Reynolds American | | | | | | | | |
2.30% 6/12/18 | | | 125,000 | | | | 126,889 | |
4.00% 6/12/22 | | | 15,000 | | | | 15,746 | |
5.85% 8/15/45 | | | 40,000 | | | | 44,537 | |
St. Jude Medical
2.80% 9/15/20 | | | 75,000 | | | | 75,525 | |
Stryker 3.375% 11/1/25 | | | 65,000 | | | | 65,053 | |
Sysco 2.60% 10/1/20 | | | 105,000 | | | | 106,147 | |
Zimmer Biomet Holdings
4.625% 11/30/19 | | | 120,000 | | | | 129,625 | |
Zoetis 3.25% 2/1/23 | | | 395,000 | | | | 378,342 | |
| | | | | | | | |
| | |
| | | | | | | 3,763,292 | |
| | | | | | | | |
Electric – 5.81% | | | | | | | | |
AES 5.50% 4/15/25 | | | 110,000 | | | | 102,850 | |
AES Gener 144A
5.25% 8/15/21 # | | | 200,000 | | | | 212,644 | |
Ameren Illinois | | | | | | | | |
3.25% 3/1/25 | | | 300,000 | | | | 305,631 | |
9.75% 11/15/18 | | | 295,000 | | | | 361,205 | |
American Transmission Systems 144A 5.25% 1/15/22 # | | | 50,000 | | | | 55,096 | |
Appalachian Power
4.45% 6/1/45 | | | 75,000 | | | | 73,216 | |
Berkshire Hathaway Energy
3.75% 11/15/23 | | | 345,000 | | | | 357,806 | |
CenterPoint Energy
5.95% 2/1/17 | | | 5,000 | | | | 5,263 | |
Cleveland Electric Illuminating
5.50% 8/15/24 | | | 75,000 | | | | 85,613 | |
| | | | | | | | |
| | | Principal
amount° | | | Value
(U.S. $) | |
| |
Corporate Bonds (continued) | | | | | |
| |
Electric (continued) | | | | | |
CMS Energy 6.25% 2/1/20 | | | 35,000 | | | $ | 40,098 | |
ComEd Financing III
6.35% 3/15/33 @ | | | 60,000 | | | | 62,792 | |
Dominion Resources
1.90% 6/15/18 | | | 205,000 | | | | 205,217 | |
DTE Energy 144A
3.30% 6/15/22 # | | | 115,000 | | | | 116,826 | |
Dynegy 7.625% 11/1/24 | | | 300,000 | | | | 302,250 | |
Electricite de France | | | | | | | | |
144A 3.625% 10/13/25 # | | | 100,000 | | | | 99,822 | |
144A 4.60% 1/27/20 # | | | 45,000 | | | | 48,981 | |
144A 4.95% 10/13/45 # | | | 130,000 | | | | 129,288 | |
144A 5.25% 1/29/49 #● | | | 100,000 | | | | 99,875 | |
Enel 144A
8.75% 9/24/73 #● | | | 200,000 | | | | 231,000 | |
Entergy 4.00% 7/15/22 | | | 45,000 | | | | 46,314 | |
Entergy Louisiana
4.05% 9/1/23 | | | 315,000 | | | | 330,376 | |
Exelon 3.95% 6/15/25 | | | 220,000 | | | | 222,518 | |
Great Plains Energy
4.85% 6/1/21 | | | 35,000 | | | | 38,102 | |
Indiana Michigan Power
3.20% 3/15/23 | | | 10,000 | | | | 9,958 | |
Integrys Holding 6.11% 12/1/66 @● | | | 90,000 | | | | 75,730 | |
Interstate Power & Light
3.40% 8/15/25 | | | 85,000 | | | | 85,993 | |
IPALCO Enterprises | | | | | | | | |
144A 3.45% 7/15/20 # | | | 115,000 | | | | 114,137 | |
5.00% 5/1/18 | | | 35,000 | | | | 37,100 | |
ITC Holdings 3.65% 6/15/24 | | | 75,000 | | | | 75,451 | |
Kansas City Power & Light
3.65% 8/15/25 | | | 220,000 | | | | 223,743 | |
LG&E & KU Energy
4.375% 10/1/21 | | | 165,000 | | | | 178,771 | |
Louisville Gas & Electric | | | | | | | | |
3.30% 10/1/25 | | | 15,000 | | | | 15,307 | |
4.375% 10/1/45 | | | 5,000 | | | | 5,194 | |
Metropolitan Edison 144A
4.00% 4/15/25 # | | | 110,000 | | | | 110,647 | |
MidAmerican Energy
4.25% 5/1/46 | | | 145,000 | | | | 147,192 | |
National Rural Utilities
Cooperative Finance | | | | | |
2.85% 1/27/25 | | | 430,000 | | | | 415,006 | |
4.75% 4/30/43 ● | | | 70,000 | | | | 69,790 | |
NextEra Energy Capital
Holdings 3.625% 6/15/23 | | | 440,000 | | | | 441,771 | |
NV Energy 6.25% 11/15/20 | | | 75,000 | | | | 86,811 | |
Schedules of investments
Delaware Pooled® Trust — The Core Plus Fixed Income Portfolio
| | | | | | | | |
| | | Principal
amount° | | | Value
(U.S. $) | |
| |
Corporate Bonds (continued) | |
| |
Electric (continued) | | | | | | | | |
Pennsylvania Electric
5.20% 4/1/20 | | | 140,000 | | | $ | 151,871 | |
Public Service of
New Hampshire
3.50% 11/1/23 | | | 45,000 | | | | 46,840 | |
Public Service of
Oklahoma 5.15% 12/1/19 | | | 325,000 | | | | 359,244 | |
Puget Energy 6.00% 9/1/21 | | | 30,000 | | | | 34,477 | |
SCANA 4.125% 2/1/22 | | | 95,000 | | | | 94,632 | |
Southern 2.75% 6/15/20 | | | 500,000 | | | | 497,804 | |
Trans-Allegheny Interstate Line 144A 3.85% 6/1/25 # | | | 285,000 | | | | 286,358 | |
WEC Energy Group
3.55% 6/15/25 | | | 110,000 | | | | 112,162 | |
Xcel Energy 3.30% 6/1/25 | | | 230,000 | | | | 228,028 | |
| | | | | | | | |
| | |
| | | | | | | 7,436,800 | |
| | | | | | | | |
Energy – 2.69% | | | | | | | | |
CNOOC Finance 2015
Australia 2.625% 5/5/20 | | | 200,000 | | | | 197,380 | |
Continental Resources
4.50% 4/15/23 | | | 195,000 | | | | 172,550 | |
Dominion Gas Holdings | | | | | | | | |
3.60% 12/15/24 | | | 110,000 | | | | 108,730 | |
4.60% 12/15/44 | | | 160,000 | | | | 151,525 | |
Ecopetrol 5.375% 6/26/26 | | | 80,000 | | | | 74,750 | |
Enbridge Energy Partners
8.05% 10/1/37 ● | | | 100,000 | | | | 91,250 | |
Energy Transfer Partners
9.70% 3/15/19 | | | 59,000 | | | | 69,900 | |
Ensco 4.70% 3/15/21 | | | 85,000 | | | | 76,577 | |
Enterprise Products Operating | | | | | | | | |
4.05% 2/15/22 | | | 120,000 | | | | 122,823 | |
7.034% 1/15/68 ● | | | 120,000 | | | | 127,050 | |
Gulfstream Natural Gas
System 144A
4.60% 9/15/25 # | | | 90,000 | | | | 89,726 | |
Kinder Morgan Energy Partners 9.00% 2/1/19 | | | 115,000 | | | | 132,891 | |
Newfield Exploration
5.625% 7/1/24 | | | 50,000 | | | | 49,750 | |
Noble Energy
5.05% 11/15/44 | | | 65,000 | | | | 59,688 | |
Petroleos Mexicanos 144A
4.25% 1/15/25 # | | | 30,000 | | | | 28,620 | |
Petronas Global Sukuk 144A
2.707% 3/18/20 # | | | 200,000 | | | | 199,133 | |
Plains All American Pipeline
8.75% 5/1/19 | | | 100,000 | | | | 118,612 | |
| | | | | | | | |
| | | Principal
amount° | | | Value (U.S. $) | |
| |
Corporate Bonds (continued) | |
| |
Energy (continued) | | | | | | | | |
Pride International
6.875% 8/15/20 | | | 180,000 | | | $ | 177,460 | |
QEP Resources
5.375% 10/1/22 | | | 405,000 | | | | 366,525 | |
Regency Energy Partners
5.875% 3/1/22 | | | 300,000 | | | | 308,481 | |
Talisman Energy
5.50% 5/15/42 | | | 150,000 | | | | 109,822 | |
Williams Partners
4.00% 9/15/25 | | | 290,000 | | | | 247,281 | |
Woodside Finance | | | | | | | | |
144A 3.65% 3/5/25 # | | | 100,000 | | | | 91,257 | |
144A 8.75% 3/1/19 # | | | 140,000 | | | | 163,805 | |
YPF | | | | | | | | |
144A 8.75% 4/4/24 # | | | 75,000 | | | | 76,384 | |
144A 8.875% 12/19/18 # | | | 30,000 | | | | 31,125 | |
| | | | | | | | |
| | |
| | | | | | | 3,443,095 | |
| | | | | | | | |
Finance Companies – 0.69% | | | | | | | | |
Affiliated Managers Group
3.50% 8/1/25 | | | 105,000 | | | | 100,997 | |
Aviation Capital Group | | | | | | | | |
144A 2.875% 9/17/18 # | | | 15,000 | | | | 15,007 | |
144A 4.875% 10/1/25 # | | | 95,000 | | | | 95,375 | |
144A 6.75% 4/6/21 # | | | 65,000 | | | | 73,694 | |
General Electric Capital | | | | | | | | |
2.10% 12/11/19 | | | 130,000 | | | | 130,396 | |
5.55% 5/4/20 | | | 10,000 | | | | 11,418 | |
6.00% 8/7/19 | | | 90,000 | | | | 103,263 | |
7.125% 12/29/49 ● | | | 100,000 | | | | 117,625 | |
Peachtree Corners Funding
Trust 144A
3.976% 2/15/25 # | | | 235,000 | | | | 236,967 | |
| | | | | | | | |
| | |
| | | | | | | 884,742 | |
| | | | | | | | |
Insurance – 1.16% | | | | | | | | |
ACE INA Holdings | | | | | | | | |
2.875% 11/3/22 | | | 60,000 | | | | 60,135 | |
3.35% 5/3/26 | | | 90,000 | | | | 90,421 | |
4.35% 11/3/45 | | | 80,000 | | | | 81,187 | |
Berkshire Hathaway Finance
2.90% 10/15/20 | | | 65,000 | | | | 67,641 | |
Five Corners Funding
Trust 144A
4.419% 11/15/23 # | | | 100,000 | | | | 105,741 | |
Highmark | | | | | | | | |
144A 4.75% 5/15/21 # | | | 40,000 | | | | 41,197 | |
144A 6.125% 5/15/41 # | | | 15,000 | | | | 15,107 | |
76
| | | | | | | | |
| | | Principal
amount° | | | Value
(U.S. $) | |
| |
Corporate Bonds (continued) | |
| |
Insurance (continued) | | | | | | | | |
Liberty Mutual Group 144A 4.95% 5/1/22 # | | | 25,000 | | | $ | 26,980 | |
Prudential Financial 5.375% 5/15/45 ● | | | 85,000 | | | | 85,531 | |
TIAA Asset Management Finance | | | | | | | | |
144A 2.95% 11/1/19 # | | | 90,000 | | | | 91,212 | |
144A 4.125% 11/1/24 # | | | 460,000 | | | | 469,216 | |
Voya Financial 5.65% 5/15/53 ● | | | 45,000 | | | | 45,787 | |
XLIT | | | | | | | | |
4.45% 3/31/25 | | | 125,000 | | | | 125,216 | |
5.50% 3/31/45 | | | 145,000 | | | | 139,582 | |
6.50% 10/29/49 ● | | | 45,000 | | | | 36,009 | |
| | | | | | | | |
| | |
| | | | | | | 1,480,962 | |
| | | | | | | | |
REITs – 0.94% | | | | | | | | |
Carey (W.P.) 4.60% 4/1/24 | | | 55,000 | | | | 55,637 | |
CBL & Associates | | | | | | | | |
4.60% 10/15/24 | | | 115,000 | | | | 109,290 | |
5.25% 12/1/23 | | | 15,000 | | | | 15,387 | |
Corporate Office Properties | | | | | | | | |
3.60% 5/15/23 | | | 45,000 | | | | 41,711 | |
5.25% 2/15/24 | | | 55,000 | | | | 56,171 | |
DDR | | | | | | | | |
7.875% 9/1/20 | | | 165,000 | | | | 200,212 | |
9.625% 3/15/16 | | | 105,000 | | | | 108,155 | |
Education Realty Operating Partnership 4.60% 12/1/24 | | | 110,000 | | | | 109,825 | |
Hospitality Properties Trust 4.50% 3/15/25 | | | 65,000 | | | | 63,314 | |
Host Hotels & Resorts 3.75% 10/15/23 | | | 135,000 | | | | 130,699 | |
Kimco Realty 3.40% 11/1/22 | | | 25,000 | | | | 25,053 | |
Omega Healthcare Investors 144A 5.25% 1/15/26 # | | | 80,000 | | | | 82,724 | |
Regency Centers 5.875% 6/15/17 | | | 93,000 | | | | 98,812 | |
UDR 4.00% 10/1/25 | | | 40,000 | | | | 40,741 | |
Ventas Realty 4.125% 1/15/26 | | | 65,000 | | | | 65,169 | |
| | | | | | | | |
| | |
| | | | | | | 1,202,900 | |
| | | | | | | | |
Services – 0.26% | | | | | | | | |
United Rentals North America 5.75% 11/15/24 | | | 325,000 | | | | 331,500 | |
| | | | | | | | |
| | |
| | | | | | | 331,500 | |
| | | | | | | | |
| | | | | | | | |
| | | Principal
amount° | | | Value
(U.S. $) | |
| |
Corporate Bonds (continued) | |
| |
Technology – 1.09% | | | | | | | | |
Apple 3.45% 2/9/45 | | | 170,000 | | | $ | 147,031 | |
Baidu 2.75% 6/9/19 | | | 200,000 | | | | 199,934 | |
Cisco Systems 1.65% 6/15/18 | | | 145,000 | | | | 146,227 | |
Flextronics International 144A 4.75% 6/15/25 # | | | 130,000 | | | | 127,075 | |
Microsoft | | | | | | | | |
4.20% 11/3/35 | | | 50,000 | | | | 50,366 | |
4.45% 11/3/45 | | | 40,000 | | | | 40,657 | |
Motorola Solutions 4.00% 9/1/24 | | | 105,000 | | | | 92,826 | |
Oracle | | | | | | | | |
3.25% 5/15/30 | | | 115,000 | | | | 107,991 | |
4.30% 7/8/34 | | | 30,000 | | | | 29,945 | |
QUALCOMM | | | | | | | | |
3.00% 5/20/22 | | | 90,000 | | | | 88,952 | |
3.45% 5/20/25 | | | 85,000 | | | | 81,729 | |
Seagate HDD Cayman 4.75% 1/1/25 | | | 85,000 | | | | 76,479 | |
144A 4.875% 6/1/27 # | | | 10,000 | | | | 8,711 | |
Tencent Holdings 144A 3.375% 5/2/19 # | | | 200,000 | | | | 204,444 | |
| | | | | | | | |
| | |
| | | | | | | 1,402,367 | |
| | | | | | | | |
Transportation – 0.87% | | | | | | | | |
Air Canada 2015-1 Class A Pass Through Trust 144A 3.60% 3/15/27 #¿ | | | 65,000 | | | | 62,806 | |
American Airlines 2014-1 Class A Pass Through Trust 3.70% 10/1/26 ¿ | | | 32,964 | | | | 33,335 | |
American Airlines 2015-1 Class A Pass Through Trust 3.375% 5/1/27 ¿ | | | 100,000 | | | | 97,675 | |
American Airlines 2015-2 Class AA Pass Through Trust 3.60% 9/22/27 ¿ | | | 35,000 | | | | 35,499 | |
Brambles USA | | | | | | | | |
144A 4.125% 10/23/25 # | | | 5,000 | | | | 5,020 | |
144A 5.35% 4/1/20 # | | | 120,000 | | | | 131,631 | |
Burlington Northern Santa Fe 3.65% 9/1/25 | | | 70,000 | | | | 71,513 | |
CSX 3.35% 11/1/25 | | | 110,000 | | | | 110,147 | |
FedEx 4.75% 11/15/45 | | | 70,000 | | | | 69,330 | |
HPHT Finance 15 144A 2.875% 3/17/20 # | | | 200,000 | | | | 200,420 | |
United Airlines 2014-1 Class A Pass Through Trust 4.00% 4/11/26 ¿ | | | 29,108 | | | | 29,727 | |
Schedules of investments
Delaware Pooled® Trust — The Core Plus Fixed Income Portfolio
| | | | | | | | |
| | | Principal
amount° | | | Value (U.S. $) | |
| |
Corporate Bonds (continued) | |
| |
Transportation (continued) | | | | | | | | |
United Airlines 2014-2 Class A Pass Through Trust 3.75% 9/3/26 ¿ | | | 70,000 | | | $ | 70,613 | |
United Parcel Service 5.125% 4/1/19 | | | 175,000 | | | | 195,306 | |
| | | | | | | | |
| | |
| | | | | | | 1,113,022 | |
| | | | | | | | |
Utilities – 0.05% | | | | | | | | |
American Water Capital | | | | | | | | |
3.40% 3/1/25 | | | 30,000 | | | | 30,730 | |
4.30% 9/1/45 | | | 35,000 | | | | 36,082 | |
| | | | | | | | |
| | |
| | | | | | | 66,812 | |
| | | | | | | | |
| |
Total Corporate Bonds (cost $40,473,191) | | | | 39,932,041 | |
| | | | | | | | |
|
| |
Municipal Bonds – 0.84% | |
| |
Atlanta, Georgia Water & Wastewater Revenue 5.00% 11/1/40 | | | 65,000 | | | | 73,780 | |
California State Various Purpose 5.00% 3/1/45 | | | 110,000 | | | | 124,443 | |
Chicago, Illinois (Taxable Build America Bond) Series B 7.75% 1/1/42 | | | 155,000 | | | | 159,799 | |
Golden State, California Tobacco Securitization (Asset-Backed Senior Notes) Series A-1 5.125% 6/1/47 | | | 25,000 | | | | 21,233 | |
(Asset-Backed Senior Notes) Series A-1 5.75% 6/1/47 | | | 25,000 | | | | 23,059 | |
(Enhanced Asset-Backed) Series A 5.00% 6/1/40 | | | 195,000 | | | | 217,296 | |
Maryland State Local Facilities 2nd Loan Series A 5.00% 8/1/21 | | | 30,000 | | | | 36,029 | |
New Jersey State Transportation Trust Fund (Transportation Program) Series AA 5.00% 6/15/44 | | | 40,000 | | | | 40,631 | |
New York City, New York Series I 5.00% 8/1/22 | | | 20,000 | | | | 24,017 | |
New York City, New York Water & Sewer System Series EE 5.00% 6/15/45 | | | 95,000 | | | | 106,768 | |
| | | | | | | | |
| | | Principal
amount° | | | Value (U.S. $) | |
| |
Municipal Bonds (continued) | |
| |
New York State Thruway Authority Revenue Series A 5.00% 5/1/19 | | | 30,000 | | | $ | 33,938 | |
Texas Private Activity Bond Surface Transportation Revenue Bond (Senior Lien NTC Mobility Partners Segments 3) 6.75% 6/30/43 (AMT) | | | 20,000 | | | | 24,327 | |
Texas State Transportation Commission (Senior Lien Mobility Fund) Series A 5.00% 10/1/44 | | | 165,000 | | | | 188,021 | |
| | | | | | | | |
| |
Total Municipal Bonds (cost $1,060,954) | | | | 1,073,341 | |
| | | | | | | | |
|
| |
Non-Agency Asset-Backed Securities – 7.71% | |
| |
AEP Texas Central Transition Funding II | | | | | | | | |
Series 2006-A A4 5.17% 1/1/18 | | | 87,013 | | | | 91,047 | |
Ally Master Owner Trust | | | | | | | | |
Series 2012-5 A 1.54% 9/15/19 | | | 325,000 | | | | 324,883 | |
Series 2014-4 A2 1.43% 6/17/19 | | | 185,000 | | | | 184,780 | |
American Express Credit Account Master Trust | | | | | | | | |
Series 2014-1 A 0.566% 12/15/21 ● | | | 300,000 | | | | 298,668 | |
Series 2014-3 A 1.49% 4/15/20 | | | 100,000 | | | | 100,500 | |
American Express Credit Account Secured Note Trust | | | | | | | | |
Series 2012-4 A 0.436% 5/15/20 ● | | | 360,000 | | | | 358,713 | |
ARI Fleet Lease Trust | | | | | | | | |
Series 2015-A A2 144A 1.11% 11/15/18 # | | | 100,000 | | | | 99,794 | |
Avis Budget Rental Car Funding AESOP | | | | | | | | |
Series 2011-3A A 144A 3.41% 11/20/17 # | | | 100,000 | | | | 102,021 | |
Series 2013-1A A 144A 1.92% 9/20/19 # | | | 100,000 | | | | 99,433 | |
Bank of America Credit Card Trust | | | | | | | | |
Series 2014-A3 A 0.486% 1/15/20 ● | | | 135,000 | | | | 134,707 | |
Series 2015-A1 A 0.526% 6/15/20 ● | | | 360,000 | | | | 359,865 | |
78
| | | | | | | | |
| | | Principal
amount° | | | Value (U.S. $) | |
| |
Non-Agency Asset-Backed Securities (continued) | |
| |
Cabela’s Credit Card Master Note Trust | | | | | | | | |
Series 2012-2A A1 144A 1.45% 6/15/20 # | | | 115,000 | | | $ | 115,102 | |
California Republic Auto Receivables Trust | | | | | | | | |
Series 2013-1 A2 144A 1.41% 9/17/18 # | | | 28,529 | | | | 28,601 | |
Capital One Multi-Asset Execution Trust | | | | | | | | |
Series 2007-A1 A1 0.246% 11/15/19 ● | | | 100,000 | | | | 99,660 | |
Series 2007-A2 A2 0.276% 12/16/19 ● | | | 100,000 | | | | 99,553 | |
Series 2007-A5 A5 0.236% 7/15/20 ● | | | 155,000 | | | | 153,760 | |
Series 2014-A4 A 0.567% 6/15/22 ● | | | 80,000 | | | | 79,098 | |
Series 2015-A7 A7 1.45% 8/16/21 | | | 90,000 | | | | 89,636 | |
Chase Issuance Trust | | | | | | | | |
Series 2013-A6 A6 0.616% 7/15/20 ● | | | 200,000 | | | | 199,906 | |
Series 2014-A5 A5 0.566% 4/15/21 ● | | | 115,000 | | | | 114,471 | |
Citibank Credit Card Issuance Trust | | | | | | | | |
Series 2013-A4 A4 0.617% 7/24/20 ● | | | 350,000 | | | | 349,590 | |
Series 2014-A9 A9 0.445% 11/23/18 ● | | | 280,000 | | | | 279,842 | |
Citicorp Residential Mortgage Trust | | | | | | | | |
Series 2006-3 A5 5.948% 11/25/36 f | | | 300,000 | | | | 298,348 | |
Dell Equipment Finance Trust | | | | | | | | |
Series 2014-1 A3 144A 0.94% 6/22/20 # | | | 100,000 | | | | 99,971 | |
Discover Card Execution Note Trust | | | | | | | | |
Series 2013-A1 A1 0.496% 8/17/20 ● | | | 200,000 | | | | 199,546 | |
Series 2014-A1 A1 0.626% 7/15/21 ● | | | 200,000 | | | | 199,682 | |
Series 2015-A1 A1 0.546% 8/17/20 ● | | | 450,000 | | | | 448,544 | |
Series 2015-A2 A 1.90% 10/17/22 | | | 100,000 | | | | 99,907 | |
Series 2015-A3 A 1.45% 3/15/21 | | | 115,000 | | | | 114,702 | |
| | | | | | | | |
| | | Principal
amount° | | | Value (U.S. $) | |
| |
Non-Agency Asset-Backed Securities (continued) | |
| |
FirstKey Lending Trust | | | | | | | | |
Series 2015-SFR1 A 144A 2.553% 3/9/47 # | | | 98,805 | | | $ | 97,122 | |
Ford Credit Auto Lease Trust | | | | | | | | |
Series 2015-A A3 1.13% 6/15/18 | | | 80,000 | | | | 79,837 | |
Ford Credit Auto Owner Trust | | | | | | | | |
Series 2014-2 A 144A 2.31% 4/15/26 # | | | 155,000 | | | | 156,213 | |
GE Dealer Floorplan Master Note Trust | | | | | | | | |
Series 2014-2 A 0.644% 10/20/19 ● | | | 825,000 | | | | 819,276 | |
Golden Credit Card Trust | | | | | | | | |
Series 2014-2A A 144A 0.646% 3/15/21 #● | | | 450,000 | | | | 447,734 | |
GreatAmerica Leasing Receivables | | | | | | | | |
Series 2014-1 A3 144A 0.89% 7/15/17 # | | | 100,000 | | | | 99,772 | |
HOA Funding | | | | | | | | |
Series 2014-1A A2 144A 4.846% 8/20/44 # | | | 49,000 | | | | 47,202 | |
Honda Auto Receivables Owner Trust | | | | | | | | |
Series 2015-3 A3 1.27% 4/18/19 | | | 100,000 | | | | 100,070 | |
Hyundai Auto Lease Securitization Trust | | | | | | | | |
Series 2014-A A4 144A 1.01% 9/15/17 # | | | 100,000 | | | | 99,976 | |
Hyundai Auto Receivables Trust | | | | | | | | |
Series 2015-C A2B 0.566% 11/15/18 ● | | | 145,000 | | | | 144,981 | |
Mid-State Trust XI | | | | | | | | |
Series 11 A1 4.864% 7/15/38 | | | 10,722 | | | | 11,365 | |
MMAF Equipment Finance | | | | | | | | |
Series 2014-AA A4 144A 1.59% 2/8/22 # | | | 100,000 | | | | 99,994 | |
NextGear Floorplan Master Owner Trust | | | | | | | | |
Series 2014-1A A 144A 1.92% 10/15/19 # | | | 115,000 | | | | 114,562 | |
Nissan Auto Lease Trust | | | | | | | | |
Series 2014-A A4 1.04% 10/15/19 | | | 145,000 | | | | 144,952 | |
Nissan Auto Receivables Owner Trust | | | | | | | | |
Series 2015-C A2B 0.544% 11/15/18 ● | | | 90,000 | | | | 90,003 | |
Schedules of investments
Delaware Pooled® Trust — The Core Plus Fixed Income Portfolio
| | | | | | | | |
| | | Principal
amount° | | | Value
(U.S. $) | |
| |
Non-Agency Asset-Backed Securities (continued) | |
| |
Penarth Master Issuer | | | | | | | | |
Series 2015-1A A1 144A
0.597% 3/18/19 #● | | | 150,000 | | | $ | 149,616 | |
Series 2015-2A A1 144A
0.597% 5/18/19 #● | | | 200,000 | | | | 199,436 | |
PFS Financing | | | | | | | | |
Series 2015-AA A 144A
0.816% 4/15/20 #● | | | 100,000 | | | | 99,472 | |
Porsche Innovative Lease
Owner Trust
| | | | | | | | |
Series 2015-1 A3 144A
1.19% 7/23/18 # | | | 100,000 | | | | 99,738 | |
Progress Residential Trust
| | | | | | | | |
Series 2015-SFR2 A 144A
2.74% 6/12/32 # | | | 100,000 | | | | 98,433 | |
Synchrony Credit Card Master Note Trust | | | | | | | | |
Series 2012-6 A 1.36% 8/17/20 | | | 100,000 | | | | 99,833 | |
Series 2015-2 A 1.60% 4/15/21 | | | 140,000 | | | | 139,954 | |
Trade MAPS 1 | | | | | | | | |
Series 2013-1A A 144A 0.895% 12/10/18 #● | | | 250,000 | | | | 249,383 | |
Series 2013-1A B 144A 1.445% 12/10/18 #● | | | 250,000 | | | | 249,372 | |
Volkswagen Auto Lease Trust | | | | | | | | |
Series 2015-A A3
1.25% 12/20/17 | | | 85,000 | | | | 84,729 | |
Volkswagen Credit Auto Master Trust
| | | | | | | | |
Series 2014-1A A2 144A
1.40% 7/22/19 # | | | 270,000 | | | | 267,984 | |
Volvo Financial Equipment | | | | | | | | |
Series 2014-1A A3 144A 0.82% 4/16/18 # | | | 50,000 | | | | 49,928 | |
Series 2014-1A B 144A 1.66% 11/16/20 # | | | 100,000 | | | | 100,258 | |
Wheels
| | | | | | | | |
Series 2014-1A A2 144A
0.84% 3/20/23 # | | | 132,231 | | | | 131,803 | |
World Financial Network
Credit Card Master Trust
| | | | | | | | |
Series 2015-A A
0.676% 2/15/22 ● | | | 75,000 | | | | 74,730 | |
| | | | | | | | |
Total Non-Agency Asset-Backed Securities (cost $9,877,544) | | | | 9,872,058 | |
| | | | | | | | |
| | | | | | | | |
| | | Principal
amount° | | | Value (U.S. $) | |
| |
Non-Agency Collateralized Mortgage Obligations – 0.93% | |
| |
JPMorgan Mortgage Trust | | | | | |
Series 2014-2 B1 144A 3.427% 6/25/29 #● | | | 90,284 | | | $ | 91,206 | |
Series 2014-2 B2 144A 3.427% 6/25/29 #● | | | 90,284 | | | | 89,795 | |
Series 2014-IVR6 2A4 144A 2.50% 7/25/44 #● | | | 100,000 | | | | 100,809 | |
Series 2015-4 B1 144A 3.637% 6/25/45 #● | | | 99,464 | | | | 96,730 | |
Series 2015-4 B2 144A 3.637% 6/25/45 #● | | | 99,464 | | | | 94,657 | |
JPMorgan Trust | | | | | | | | |
Series 2015-1 B1 144A 2.664% 12/25/44 #● | | | 99,442 | | | | 98,368 | |
Series 2015-6 B1 144A 3.657% 10/25/45 #● | | | 100,000 | | | | 99,945 | |
Series 2015-6 B2 144A 3.657% 10/25/45 #● | | | 100,000 | | | | 97,945 | |
Sequoia Mortgage Trust | | | | | | | | |
Series 2013-11 B1 144A 3.689% 9/25/43 #● | | | 95,379 | | | | 94,924 | |
Series 2014-2 A4 144A 3.50% 7/25/44 #● | | | 73,320 | | | | 74,322 | |
Series 2015-1 B2 144A 3.898% 1/25/45 #● | | | 44,257 | | | | 44,642 | |
Towd Point Mortgage Trust
| | | | | | | | |
Series 2015-5 A1B 144A
2.75% 5/25/55 #● | | | 105,000 | | | | 105,000 | |
WinWater Mortgage Loan Trust
| | | | | | | | |
Series 2015-3 B1 144A
3.907% 3/20/45 #● | | | 98,871 | | | | 99,468 | |
| | | | | | | | |
| |
Total Non-Agency Collateralized Mortgage Obligations (cost $1,182,097) | | | | 1,187,811 | |
| | | | | | | | |
|
| |
Senior Secured Loans – 4.84%« | | | | | |
| |
Activision Blizzard Tranche B
1st Lien
3.25% 10/11/20 @ | | | 115,863 | | | | 116,341 | |
Aramark Tranche E
3.25% 9/7/19 @ | | | 64,339 | | | | 64,419 | |
BJ’s Wholesale Club 2nd Lien
8.50% 3/31/20 @ | | | 105,000 | | | | 102,585 | |
BJ’s Wholesale Club Tranche B
1st Lien 4.50% 9/26/19 @ | | | 147,317 | | | | 146,018 | |
Calpine Construction Finance
Tranche B 1st Lien
3.00% 5/3/20 @ | | | 146,625 | | | | 143,143 | |
80
| | | | | | | | |
| | | Principal
amount° | | | Value (U.S. $) | |
| |
Senior Secured Loans« (continued) | |
| |
Communications Sales &
Leasing Tranche B 1st Lien
5.00% 10/24/22 @ | | | 119,700 | | | $ | 113,216 | |
DaVita Healthcare Partners
Tranche B 1st Lien
3.50% 6/24/21 @ | | | 380,188 | | | | 381,001 | |
DPx Holdings 1st Lien
4.25% 3/11/21 @ | | | 518,438 | | | | 508,976 | |
Emdeon 1st Lien
3.75% 11/2/18 @ | | | 105,144 | | | | 104,662 | |
Energy Transfer Equity 1st Lien
3.25% 12/2/19 @ | | | 125,000 | | | | 119,688 | |
FCA Tranche B 1st Lien
3.50% 5/24/17 @ | | | 190,736 | | | | 190,636 | |
First Data Tranche B 1st Lien
4.197% 3/24/21 @ | | | 84,068 | | | | 84,263 | |
HCA Tranche B4 1st Lien
3.077% 5/1/18 @ | | | 490,000 | | | | 490,679 | |
HCA Tranche B5 1st Lien
2.938% 3/31/17 @ | | | 123,480 | | | | 123,600 | |
Hilton Worldwide Finance Tranche B2
3.50% 10/25/20 @ | | | 251,462 | | | | 252,265 | |
Houghton International 1st Lien
4.25% 12/20/19 @ | | | 189,638 | | | | 189,717 | |
Houghton International 2nd Lien
9.75% 12/21/20 @ | | | 125,000 | | | | 124,063 | |
IASIS Healthcare Tranche B 1st Lien
4.50% 5/3/18 @ | | | 28,954 | | | | 29,047 | |
Immucor Tranche B2 1st Lien
5.00% 8/19/18 @ | | | 183,536 | | | | 180,095 | |
Intelsat Jackson Holdings Tranche B2
3.75% 6/30/19 @ | | | 343,958 | | | | 334,016 | |
Kinetic Concepts Tranche E1 1st Lien
4.50% 5/4/18 @ | | | 197,985 | | | | 198,232 | |
Landry’s Tranche B 1st Lien
4.00% 4/24/18 @ | | | 158,770 | | | | 159,141 | |
Level 3 Financing Tranche B 1st Lien
4.00% 1/15/20 @ | | | 250,000 | | | | 250,938 | |
Neiman Marcus Group 1st Lien
4.25% 10/25/20 @ | | | 173,674 | | | | 169,727 | |
Numericable US 1st Lien
4.50% 5/21/20 @ | | | 151,658 | | | | 150,141 | |
Numericable US Tranche B2 1st Lien
4.50% 5/21/20 @ | | | 131,205 | | | | 129,739 | |
Rite Aid 2nd Lien
4.875% 6/21/21 @ | | | 400,000 | | | | 401,438 | |
| | | | | | | | |
| | | Principal
amount° | | | Value (U.S. $) | |
| |
Senior Secured Loans« (continued) | |
| |
Scientific Games International 1st Lien
6.00% 10/18/20 @ | | | 191,588 | | | $ | 187,696 | |
Sensus USA 4.50% 5/9/17 @ | | | 197,661 | | | | 197,167 | |
Smart & Final Stores Tranche B 1st Lien
4.00% 11/15/19 @ | | | 200,637 | | | | 200,135 | |
Univision Communications Tranche C4 1st Lien
4.00% 3/1/20 @ | | | 160,726 | | | | 159,744 | |
USI Insurance Services Tranche B 1st Lien
4.25% 12/27/19 @ | | | 48,632 | | | | 48,207 | |
Valeant Pharmaceuticals International Tranche BE 1st Lien
3.75% 8/5/20 @ | | | 159,961 | | | | 149,084 | |
| | | | | | | | |
| |
Total Senior Secured Loans (cost $6,254,421) | | | | 6,199,819 | |
| | | | | | | | |
|
| |
Sovereign Bonds – 0.80%D | |
| |
Australia – 0.02% | | | | | | | | |
Australia Government Bond
3.25% 4/21/25 | | AUD | 34,000 | | | | 25,532 | |
| | | | | | | | |
| | |
| | | | | | | 25,532 | |
| | | | | | | | |
Dominican Republic – 0.08% | | | | | | | | |
Dominican Republic International Bond 144A
5.50% 1/27/25 # | | | 100,000 | | | | 99,250 | |
| | | | | | | | |
| | |
| | | | | | | 99,250 | |
| | | | | | | | |
Germany – 0.03% | | | | | | | | |
Bundesrepublik Deutschland
0.50% 2/15/25 | | EUR | 33,000 | | | | 36,403 | |
| | | | | | | | |
| | |
| | | | | | | 36,403 | |
| | | | | | | | |
Indonesia – 0.15% | | | | | | | | |
Indonesia Government International Bond 144A
5.125% 1/15/45 # | | | 200,000 | | | | 188,299 | |
| | | | | | | | |
| | |
| | | | | | | 188,299 | |
| | | | | | | | |
Italy – 0.11% | | | | | | | | |
Italy Buoni Poliennali Del Tesoro
1.35% 4/15/22 | | EUR | 122,000 | | | | 137,250 | |
| | | | | | | | |
| | |
| | | | | | | 137,250 | |
| | | | | | | | |
Schedules of investments
Delaware Pooled® Trust — The Core Plus Fixed Income Portfolio
| | | | | | | | |
| | | Principal Amount° | | | Value (U.S. $) | |
| |
Sovereign BondsD (continued) | |
| |
Kazakhstan – 0.15% | | | | | | | | |
Kazakhstan Government International Bond 144A
5.125% 7/21/25 # | | | 200,000 | | | $ | 199,605 | |
| | | | | | | | |
| | |
| | | | | | | 199,605 | |
| | | | | | | | |
Mexico – 0.05% | | | | | | | | |
Mexican Bonos 10.00% 12/5/24 | | | MXN 882,000 | | | | 68,445 | |
| | | | | | | | |
| | |
| | | | | | | 68,445 | |
| | | | | | | | |
Peru – 0.04% | | | | | | | | |
Peruvian Government International Bond 4.125% 8/25/27 | | | 47,000 | | | | 47,470 | |
| | | | | | | | |
| | |
| | | | | | | 47,470 | |
| | | | | | | | |
Poland – 0.03% | | | | | | | | |
Poland Government Bond 3.25% 7/25/25 | | | PLN 138,000 | | | | 37,511 | |
| | | | | | | | |
| | |
| | | | | | | 37,511 | |
| | | | | | | | |
South Africa – 0.04% | | | | | | | | |
South Africa Government Bonds 8.00% 1/31/30 | | | ZAR 798,000 | | | | 54,336 | |
| | | | | | | | |
| | |
| | | | | | | 54,336 | |
| | | | | | | | |
United Kingdom – 0.06% | | | | | | | | |
United Kingdom Gilt 3.25% 1/22/44 | | | GBP 42,900 | | | | 74,441 | |
| | | | | | | | |
| | |
| | | | | | | 74,441 | |
| | | | | | | | |
Uruguay – 0.04% | | | | | | | | |
Uruguay Government International Bond 4.375% 10/27/27 | | | 57,000 | | | | 56,858 | |
| | | | | | | | |
| | |
| | | | | | | 56,858 | |
| | | | | | | | |
| |
Total Sovereign Bonds (cost $1,045,965) | | | | 1,025,400 | |
| | | | | | | | |
|
| |
Supranational Banks – 0.10% | |
| |
European Bank for Reconstruction & Development 7.375% 4/15/19 | | | IDR360,000,000 | | | | 23,815 | |
Inter-American Development Bank 6.00% 9/5/17 | | | INR 3,900,000 | | | | 59,128 | |
International Bank for Reconstruction & Development 4.625% 10/6/21 | | | NZD 40,000 | | | | 28,749 | |
| | | | | | | | |
| | | Principal Amount° | | | Value (U.S. $) | |
| |
Supranational Banks (continued) | |
| |
International Finance 3.625% 5/20/20 | | | NZD 20,000 | | | $ | 13,741 | |
| | | | | | | | |
| |
Total Supranational Banks (cost $138,955) | | | | 125,433 | |
| | | | | | | | |
|
| |
U.S. Treasury Obligations – 13.44% | |
| |
U.S. Treasury Bonds | | | | | | | | |
2.875% 8/15/45 | | | 2,895,000 | | | | 2,861,131 | |
U.S. Treasury Notes | | | | | | | | |
1.375% 9/30/20 | | | 4,470,000 | | | | 4,439,997 | |
1.375% 10/31/20 | | | 3,765,000 | | | | 3,737,828 | |
2.00% 8/15/25 ¥ | | | 6,255,000 | | | | 6,172,659 | |
| | | | | | | | |
Total U.S. Treasury Obligations
(cost $17,364,842) | | | | 17,211,615 | |
| | | | | | | | |
| | |
| | | Number of shares | | | | |
| |
Convertible Preferred Stock – 0.01% | |
| |
Bank of America 7.25% exercise price $50.00, expiration date 12/31/49 | | | 1 | | | | 1,094 | |
Chesapeake Energy 5.75% exercise price $26.10, expiration date 12/31/49 | | | 4 | | | | 1,800 | |
Dominion Resources 6.125% exercise price $64.91, expiration date 4/1/16 | | | 60 | | | | 3,349 | |
Intelsat 5.75% exercise price $22.05, expiration date 5/1/16 @ | | | 120 | | | | 2,286 | |
Wells Fargo 7.50% exercise price $156.71, expiration date 12/31/49 | | | 7 | | | | 8,295 | |
| | | | | | | | |
| |
Total Convertible Preferred Stock
(cost $25,038) | | | | 16,824 | |
| | | | | | | | |
|
| |
Preferred Stock – 0.21% | |
| |
Bank of America 6.10% ● | | | 70,000 | | | | 70,875 | |
Integrys Energy Group 6.00% @● | | | 1,950 | | | | 49,786 | |
National Retail Properties 5.70% | | | 1,225 | | | | 30,821 | |
PNC Preferred Funding Trust II 1.56% #● | | | 100,000 | | | | 92,625 | |
Public Storage 5.20% | | | 1,200 | | | | 29,652 | |
| | | | | | | | |
| |
Total Preferred Stock (cost $275,875) | | | | 273,759 | |
| | | | | | | | |
82
| | | | | | | | |
| | | Principal amount° | | | Value (U.S. $) | |
| |
Short-Term Investments – 13.74% | |
| |
Repurchase Agreements – 13.74% | | | | | |
Bank of America Merrill Lynch
0.04%, dated 10/30/15, to be repurchased on 11/2/15, repurchase price $2,958,737 (collateralized by U.S. government obligations 3.625% 8/15/43; market value $3,017,902) | | | 2,958,727 | | | $ | 2,958,727 | |
Bank of Montreal
0.05%, dated 10/30/15, to be repurchased on 11/2/15, repurchase price $1,479,370 (collateralized by U.S. government obligations 2.00%–4.50% 8/15/25–8/15/45; market value $1,508,951) | | | 1,479,364 | | | | 1,479,364 | |
BNP Paribas
0.06%, dated 10/30/15, to be repurchased on 11/2/15, repurchase price $13,165,062 (collateralized by U.S. government obligations 0.00%–8.50% 2/29/16–11/15/44; market value $13,428,297) | | | 13,164,996 | | | | 13,164,996 | |
| | | | | | | | |
| | |
Total Short-Term Investments
(cost $17,603,087) | | | | | | | 17,603,087 | |
| | | | | | | | |
Total Value of
Securities – 111.77% (cost $143,814,294) | | | | | | $ | 143,175,475 | |
| | | | | | | | |
| # | Security exempt from registration under Rule 144A of the Securities Act of 1933, as amended. At Oct. 31, 2015, the aggregate value of Rule 144A securities was $22,671,268, which represents 17.70% of the Portfolio’s net assets. See Note 11 in “Notes to financial statements.” |
| @ | Illiquid security. At Oct. 31, 2015, the aggregate value of illiquid securities was $7,378,859, which represents 5.76% of the Portfolio’s net assets. See Note 11 in “Notes to financial statements.” |
| ¿ | Pass Through Agreement. Security represents the contractual right to receive a proportionate amount of underlying payments due to the counterparty pursuant to various agreements related to the rescheduling of obligations and the exchange of certain notes. |
| ° | Principal amount shown is stated in U.S. dollars unless noted that the security is denominated in another currency. |
| ● | Variable rate security. The rate shown is the rate as of Oct. 31, 2015. Interest rates reset periodically. |
| ¥ | Fully or partially pledged as collateral for futures contracts. |
| D | Securities have been classified by country of origin. |
| ∑ | Interest only security. An interest only security is the interest only portion of a fixed income security which is separated and sold individually from the principal portion of the security. |
| « | Senior secured loans generally pay interest at rates which are periodically redetermined by reference to a base lending rate plus a premium. These base lending rates are generally: (i) the prime rate offered by one or more U.S. banks, (ii) the lending rate offered by one or more European banks such as the London Interbank Offered Rate (LIBOR), and (iii) the certificate of deposit rate. Senior secured loans may be subject to restrictions on resale. Stated rate in effect at Oct. 31, 2015. |
| f | Step coupon bond. Coupon increases or decreases periodically based on a predetermined schedule. Stated rate in effect at Oct. 31, 2015. |
The following foreign currency exchange contracts, futures contracts, and swap contracts were outstanding at Oct. 31, 2015:1
Foreign Currency Exchange Contracts
| | | | | | | | | | | | | | |
Counterparty | | Contracts to
Receive (Deliver) | | | In
Exchange
For | | | Settlement
Date | | Unrealized
Appreciation
(Depreciation) | |
TD | | EUR | (89,619 | ) | | USD | 98,692 | | | 11/23/15 | | $ | 132 | |
TD | | IDR | (356,278,690 | ) | | USD | 26,235 | | | 11/23/15 | | | 432 | |
| | | | | | | | | | | | | | |
| | | | | | | | | | | | $ | 564 | |
| | | | | | | | | | | | | | |
Futures Contracts
| | | | | | | | | | | | | | | | | | |
Contracts to Buy (Sell) | | Notional
Cost
(Proceeds) | | | Notional
Value | | | Expiration
Date | | | Unrealized
Appreciation
(Depreciation) | |
| (1) | | E-mini S&P 500 Index | | $ | (97,502 | ) | | $ | (103,685 | ) | | | 12/21/15 | | | $ | (6,183 | ) |
| 27 | | Euro-Bund | | | 4,558,239 | | | | 4,666,803 | | | | 12/8/15 | | | | 108,564 | |
| 21 | | U.S. Treasury Long Bonds | | | 3,289,598 | | | | 3,285,187 | | | | 12/22/15 | | | | (4,411 | ) |
| (1) | | U.S. Treasury 5 yr Notes | | | (119,845 | ) | | | (119,773 | ) | | | 1/2/16 | | | | 72 | |
| (4) | | U.S. Treasury 10 yr Notes | | | (515,426 | ) | | | (510,750 | ) | | | 12/22/15 | | | | 4,676 | |
| | | | | | | | | | | | | | | | | | |
| | | | | |
| | | | $ | 7,115,064 | | | | | | | | | | | $ | 102,718 | |
| | | | | | | | | | | | | | | | | | |
Schedules of investments
Delaware Pooled® Trust — The Core Plus Fixed Income Portfolio
Swap Contracts
CDS Contracts2
| | | | | | | | | | | | | | | | |
Counterparty | | Swap Referenced Obligation | | Notional
Value3 | | | Annual
Protection
Payments | | | Termination
Date | | Unrealized
Appreciation
(Depreciation)4 | |
| | Protection Purchased: | | | | | | | | | | | | | | |
ICE | | CITI - CDX.NA.HY.24 | | | 321,750 | | | | 5.00% | | | 6/20/20 | | $ | (607 | ) |
ICE | | MSC - iTraxx Europe Crossover Series 24 Version 1 | | | EUR 360,000 | | | | 5.00% | | | 12/20/20 | | | (2,101 | ) |
JPMC | | CDX.EM.24 | | | 623,280 | | | | 1.00% | | | 12/20/20 | | | (2,435 | ) |
JPMC | | People’s Republic of China | | | 128,000 | | | | 1.00% | | | 9/20/20 | | | (226 | ) |
| | | | | | | | | | | | | | | | |
| | | | | |
| | | | | | | | | | | | | | $ | (5,369 | ) |
| | | | | | | | | | | | | | | | |
The use of foreign currency exchange contracts, futures contracts, and swap contracts involves elements of market risk and risks in excess of the amounts disclosed in the financial statements. The foreign currency exchange contracts and notional values presented above represent the Portfolio’s total exposure in such contracts, whereas only the net unrealized appreciation (depreciation) is reflected in the Portfolio’s net assets.
1See Note 8 in “Notes to financial statements.”
2A CDS contract is a risk-transfer instrument through which one party (purchaser of protection) transfers to another party (seller of protection) the financial risk of a credit event (as defined in the CDS agreement), as it relates to a particular reference security or basket of securities (such as an index). Periodic payments (receipts) on such contracts are accrued daily and recorded as unrealized losses (gains) on swap contracts. Upon payment (receipt), such amounts are recorded as realized losses (gains) on swap contracts. Upfront payments made or received in connection with CDS contracts are amortized over the expected life of the CDS contracts as unrealized losses (gains) on swap contracts. The change in value of CDS contracts is recorded as unrealized appreciation or depreciation daily. A realized gain or loss is recorded upon a credit event (as defined in the CDS agreement) or the maturity or termination of the agreement.
3Notional value shown is stated in U.S. Dollars unless noted that the swap is denominated in another currency.
4Unrealized appreciation (depreciation) does not include periodic interest payments on swap contracts accrued daily in the amount of $(7,110).
Summary of abbreviations:
AMT – Subject to Alternative Minimum Tax
ARM – Adjustable Rate Mortgage
AUD – Australian Dollar
CDS – Credit Default Swap
CDX.EM – Credit Default Swap Emerging Markets Index
CDX.NA.HY – Credit Default Swap Index North America High Yield
CITI – Citigroup Global Markets
CLO – Collateralized Loan Obligation
DB – Deutsche Bank
EUR – European Monetary Unit
GBP – British Pound Sterling
GE – General Electric
GNMA – Government National Mortgage Association
GS – Goldman Sachs
HSBC – Hong Kong Shanghai Bank
ICE – IntercontinentalExchange, Inc.
IDR – Indonesian Rupiah
INR – Indian Rupee
JPMBB – JPMorgan Barclays Bank
JPMC – JPMorgan Chase Bank
LB – Lehman Brothers
MSC – Morgan Stanley Capital
MXN – Mexican Peso
NZD – New Zealand Dollar
PLN – Polish Zloty
RBS – Royal Bank of Scotland
REIT – Real Estate Investment Trust
REMIC – Real Estate Mortgage Investment Conduit
S.F. – Single Family
TBA – To be announced
TD – Toronto Dominion Bank
UBS – Union Bank of Switzerland
USD – U.S. Dollar
WF – Wells Fargo
yr – Year
ZAR – South African Rand
See accompanying notes, which are an integral part of the financial statements.
84
Delaware Pooled® Trust — The International Equity Portfolio
October 31, 2015
| | | | | | | | |
| | | Number of shares | | | Value (U.S. $) | |
| |
Common Stock – 99.41%D | |
| |
Australia – 1.25% | | | | | | | | |
QBE Insurance Group | | | 474,378 | | | $ | 4,480,624 | |
| | | | | | | | |
| | | | | | | 4,480,624 | |
| | | | | | | | |
China – 1.58% | | | | | | | | |
China Mobile | | | 472,000 | | | | 5,651,345 | |
| | | | | | | | |
| | | | | | | 5,651,345 | |
| | | | | | | | |
Denmark – 0.72% | | | | | | | | |
ISS | | | 73,062 | | | | 2,570,910 | |
| | | | | | | | |
| | | | | | | 2,570,910 | |
| | | | | | | | |
France – 6.84% | | | | | | | | |
Cie de Saint-Gobain | | | 180,443 | | | | 7,574,456 | |
GDF Suez VVPR Strip =† | | | 162,519 | | | | 0 | |
Sanofi | | | 116,481 | | | | 11,762,774 | |
Societe Generale | | | 85,871 | | | | 3,994,524 | |
Vallourec | | | 105,083 | | | | 1,166,888 | |
| | | | | | | | |
| | | | | | | 24,498,642 | |
| | | | | | | | |
Germany – 9.99% | | | | | | | | |
Allianz | | | 33,659 | | | | 5,896,968 | |
Daimler | | | 71,489 | | | | 6,206,930 | |
Deutsche Telekom | | | 544,012 | | | | 10,170,928 | |
RWE | | | 403,277 | | | | 5,611,011 | |
SAP | | | 100,306 | | | | 7,927,029 | |
| | | | | | | | |
| | | | | | | 35,812,866 | |
| | | | | | | | |
Israel – 0.54% | | | | | | | | |
Teva Pharmaceutical Industries ADR | | | 32,479 | | | | 1,922,432 | |
| | | | | | | | |
| | | | | | | 1,922,432 | |
| | | | | | | | |
Italy – 2.46% | | | | | | | | |
Eni | | | 539,260 | | | | 8,810,337 | |
| | | | | | | | |
| | | | | | | 8,810,337 | |
| | | | | | | | |
Japan – 17.50% | | | | | | | | |
Canon | | | 316,300 | | | | 9,540,371 | |
Honda Motor | | | 326,000 | | | | 10,924,296 | |
Hoya | | | 87,000 | | | | 3,625,481 | |
Kao | | | 81,300 | | | | 4,203,105 | |
Kirin Holdings | | | 613,400 | | | | 8,747,609 | |
Makita | | | 2,800 | | | | 154,756 | |
NTT DOCOMO | | | 146,300 | | | | 2,857,990 | |
Takeda Pharmaceutical | | | 223,400 | | | | 10,977,478 | |
Tokio Marine Holdings | | | 203,552 | | | | 7,914,037 | |
Tokyo Electron | | | 62,200 | | | | 3,764,574 | |
| | | | | | | | |
| | | | | | | 62,709,697 | |
| | | | | | | | |
| | | | | | | | |
| | | Number of shares | | | Value (U.S. $) | |
| |
Common StockD (continued) | |
| |
Netherlands – 4.79% | | | | | | | | |
Koninklijke Ahold | | | 474,284 | | | $ | 9,657,283 | |
Royal Dutch Shell Class A | | | 286,694 | | | | 7,511,352 | |
| | | | | | | | |
| | | | | | | 17,168,635 | |
| | | | | | | | |
Norway – 0.30% | | | | | | | | |
Orkla | | | 87,037 | | | | 739,962 | |
Telenor | | | 18,302 | | | | 345,223 | |
| | | | | | | | |
| | | | | | | 1,085,185 | |
| | | | | | | | |
Singapore – 5.81% | | | | | | | | |
Jardine Matheson Holdings | | | 60,015 | | | | 3,276,219 | |
Sembcorp Industries | | | 1,315,900 | | | | 3,362,302 | |
Singapore Telecommunications | | | 2,346,702 | | | | 6,666,101 | |
United Overseas Bank | | | 518,142 | | | | 7,518,255 | |
| | | | | | | | |
| | | | | | | 20,822,877 | |
| | | | | | | | |
Spain – 6.48% | | | | | | | | |
Banco Santander | | | 434,653 | | | | 2,437,184 | |
Iberdrola | | | 1,609,750 | | | | 11,498,648 | |
Telefonica | | | 703,631 | | | | 9,306,493 | |
| | | | | | | | |
| | | | | | | 23,242,325 | |
| | | | | | | | |
Sweden – 3.74% | | | | | | | | |
Ericsson Class B | | | 446,463 | | | | 4,354,857 | |
TeliaSonera | | | 1,770,241 | | | | 9,059,302 | |
| | | | | | | | |
| | | | | | | 13,414,159 | |
| | | | | | | | |
Switzerland – 13.19% | | | | | | | | |
ABB † | | | 572,680 | | | | 10,809,436 | |
Nestle | | | 131,702 | | | | 10,071,486 | |
Novartis | | | 87,591 | | | | 7,960,805 | |
Syngenta | | | 28,941 | | | | 9,742,631 | |
Zurich Insurance Group † | | | 32,911 | | | | 8,698,811 | |
| | | | | | | | |
| | | | | | | 47,283,169 | |
| | | | | | | | |
Taiwan – 1.02% | | | | | | | | |
Taiwan Semiconductor Manufacturing ADR | | | 166,032 | | | | 3,646,063 | |
| | | | | | | | |
| | | | | | | 3,646,063 | |
| | | | | | | | |
United Kingdom – 23.20% | | | | | | | | |
Amec Foster Wheeler | | | 524,140 | | | | 5,744,236 | |
BG Group | | | 526,496 | | | | 8,318,294 | |
BP | | | 1,532,775 | | | | 9,129,161 | |
G4S | | | 2,049,113 | | | | 7,665,686 | |
GlaxoSmithKline | | | 554,165 | | | | 12,001,368 | |
Kingfisher | | | 649,718 | | | | 3,536,209 | |
National Grid | | | 814,871 | | | | 11,615,877 | |
Schedules of investments
Delaware Pooled® Trust — The International Equity Portfolio
| | | | | | | | |
| | | Number of shares | | | Value (U.S. $) | |
| |
Common StockD (continued) | |
| |
United Kingdom (continued) | |
Pearson | | | 297,237 | | | $ | 3,947,058 | |
Tesco † | | | 2,593,432 | | | | 7,327,447 | |
Unilever | | | 254,411 | | | | 11,344,874 | |
Vodafone Group | | | 767,372 | | | | 2,534,207 | |
| | | | | | | | |
| | | | | | | 83,164,417 | |
| | | | | | | | |
Total Common Stock
(cost $349,485,541) | | | | | | | 356,283,683 | |
| | | | | | | | |
|
| |
Rights – 0.01% | | | | | | | | |
| |
Banco Santander exercise price EUR 0.05, expiration date 11/3/15 † | | | 434,653 | | | | 23,894 | |
| | | | | | | | |
Total Rights (cost $24,614) | | | | 23,894 | |
| | | | | | | | |
| | | Principal
amount° | | | | |
| |
Short-Term Investments – 0.37% | |
| |
Discount Notes – 0.37%≠ | | | | | | | | |
Federal Home Loan Bank | | | | | | | | |
0.105% 11/3/15 | | | 63,314 | | | | 63,314 | |
0.12% 1/4/16 | | | 421,644 | | | | 421,585 | |
0.14% 2/18/16 | | | 117,979 | | | | 117,940 | |
0.155% 2/3/16 | | | 278,410 | | | | 278,331 | |
0.18% 3/7/16 | | | 220,785 | | | | 220,650 | |
0.185% 1/19/16 | | | 77,718 | | | | 77,705 | |
0.195% 12/2/15 | | | 110,076 | | | | 110,073 | |
0.295% 3/2/16 | | | 37,616 | | | | 37,594 | |
| | | | | | | | |
| |
Total Short-Term Investments
(cost $1,327,061) | | | | 1,327,192 | |
| | | | | | | | |
| | |
Total Value of
Securities – 99.79% (cost $350,837,216) | | | | | | $ | 357,634,769 | |
| | | | | | | | |
| = | Security is being fair valued in accordance with the Portfolio’s fair valuation policy. At Oct. 31, 2015, the aggregate value of fair valued securities was $0, which represents 0.00% of the Portfolio’s net assets. See Note 1 in “Notes to financial statements.” |
| ≠ | The rate shown is the effective yield at the time of purchase. |
| ° | Principal amount shown is stated in U.S. dollars unless noted that the security is denominated in another currency. |
| † | Non-income-producing security. |
| D | Securities have been classified by country of origin. Aggregate classification by business sectors has been presented on page 49 in “Security type / country and sector allocations.” |
The following foreign currency exchange contracts were outstanding at Oct. 31, 2015:1
Foreign Currency Exchange Contracts
| | | | | | | | | | | | | | |
Counterparty | | Contracts to
Receive
(Deliver) | | | In Exchange
For | | | Settlement
Date | | Unrealized
Appreciation
(Depreciation) | |
BNYM | | GBP | 139,173 | | | USD | (213,563 | ) | | 11/2/15 | | $ | 955 | |
NT | | SGD | 139,973 | | | USD | (100,012 | ) | | 11/4/15 | | | (127 | ) |
| | | | | | | | | | | | | | |
| | | | | | | | | | | | $ | 828 | |
| | | | | | | | | | | | | | |
The use of foreign currency exchange contracts involves elements of market risk and risks in excess of the amounts disclosed in the financial statements. The foreign currency exchange contracts presented above represent the Portfolio’s total exposure in such contracts, whereas only the net unrealized appreciation (depreciation) is reflected in the Portfolio’s net assets.
1See Note 8 in “Notes to financial statements.”
Summary of abbreviations:
ADR – American Depositary Receipt
BNYM – BNY Mellon
EUR – euro
GBP – British Pound Sterling
NT – Northern Trust
SGD – Singapore Dollar
USD – U.S. Dollar
VVPR Strip – Dividend Coupon
See accompanying notes, which are an integral part of the financial statements.
86
Delaware Pooled® Trust — The Labor Select International Equity Portfolio
October 31, 2015
| | | | | | | | |
| | | Number of shares | | | Value (U.S. $) | |
| |
Common Stock – 98.87%D | |
| |
Australia – 1.24% | | | | | | | | |
QBE Insurance Group | | | 473,390 | | | $ | 4,471,292 | |
| | | | | | | | |
| | | | | | | 4,471,292 | |
| | | | | | | | |
Denmark – 0.75% | | | | | | | | |
ISS | | | 77,453 | | | | 2,725,421 | |
| | | | | | | | |
| | | | | | | 2,725,421 | |
| | | | | | | | |
France – 6.95% | | | | | | | | |
Cie de Saint-Gobain | | | 187,041 | | | | 7,851,420 | |
GDF Suez VVPR Strip =† | | | 101,871 | | | | 0 | |
Sanofi | | | 115,824 | | | | 11,696,427 | |
Societe Generale | | | 90,357 | | | | 4,203,203 | |
Vallourec | | | 118,755 | | | | 1,318,708 | |
| | | | | | | | |
| | | | | | | 25,069,758 | |
| | | | | | | | |
Germany – 10.83% | | | | | | | | |
Allianz | | | 32,881 | | | | 5,760,664 | |
Daimler | | | 70,511 | | | | 6,122,017 | |
RWE | | | 451,867 | | | | 6,287,069 | |
SAP | | | 109,077 | | | | 8,620,188 | |
Telefonica Deutschland Holding | | | 1,903,260 | | | | 12,253,910 | |
| | | | | | | | |
| | | | | | | 39,043,848 | |
| | | | | | | | |
Israel – 0.71% | | | | | | | | |
Teva Pharmaceutical Industries ADR | | | 43,000 | | | | 2,545,170 | |
| | | | | | | | |
| | | | | | | 2,545,170 | |
| | | | | | | | |
Japan – 18.68% | | | | | | | | |
Canon | | | 314,300 | | | | 9,480,046 | |
Honda Motor | | | 318,600 | | | | 10,676,321 | |
Hoya | | | 99,500 | | | | 4,146,383 | |
Kao | | | 94,000 | | | | 4,859,679 | |
Kirin Holdings | | | 666,800 | | | | 9,509,138 | |
Makita | | | 3,200 | | | | 176,864 | |
NTT DOCOMO | | | 176,300 | | | | 3,444,044 | |
Seven & i Holdings | | | 19,900 | | | | 908,758 | |
Takeda Pharmaceutical | | | 243,900 | | | | 11,984,811 | |
Tokio Marine Holdings | | | 219,700 | | | | 8,541,866 | |
Tokyo Electron | | | 60,200 | | | | 3,643,527 | |
| | | | | | | | |
| | | | | | | 67,371,437 | |
| | | | | | | | |
Netherlands – 5.55% | | | | | | | | |
Koninklijke Ahold | | | 467,426 | | | | 9,517,641 | |
Royal Dutch Shell Class A | | | 401,196 | | | | 10,511,292 | |
| | | | | | | | |
| | | | | | | 20,028,933 | |
| | | | | | | | |
Norway – 0.35% | | | | | | | | |
Orkla | | | 106,422 | | | | 904,768 | |
| | | | | | | | |
| | | Number of shares | | | Value (U.S. $) | |
| |
Common StockD (continued) | |
| |
Norway (continued) | |
Telenor | | | 19,660 | | | $ | 370,839 | |
| | | | | | | | |
| | | | | | | 1,275,607 | |
| | | | | | | | |
Singapore – 5.62% | | | | | | | | |
Sembcorp Industries | | | 1,328,100 | | | | 3,393,475 | |
Singapore Telecommunications | | | 3,366,900 | | | | 9,564,101 | |
United Overseas Bank | | | 503,819 | | | | 7,310,428 | |
| | | | | | | | |
| | | | | | | 20,268,004 | |
| | | | | | | | |
Spain – 6.68% | | | | | | | | |
Banco Santander | | | 417,384 | | | | 2,340,354 | |
Iberdrola | | | 1,596,415 | | | | 11,403,395 | |
Telefonica | | | 781,679 | | | | 10,338,786 | |
| | | | | | | | |
| | | | | | | 24,082,535 | |
| | | | | | | | |
Sweden – 3.70% | | | | | | | | |
Ericsson Class B | | | 452,570 | | | | 4,414,426 | |
TeliaSonera | | | 1,745,370 | | | | 8,932,023 | |
| | | | | | | | |
| | | | | | | 13,346,449 | |
| | | | | | | | |
Switzerland – 12.92% | | | | | | | | |
ABB † | | | 570,150 | | | | 10,761,682 | |
Nestle | | | 127,624 | | | | 9,759,634 | |
Novartis | | | 87,193 | | | | 7,924,632 | |
Syngenta | | | 28,697 | | | | 9,660,491 | |
Zurich Insurance Group † | | | 32,089 | | | | 8,481,545 | |
| | | | | | | | |
| | | | | | | 46,587,984 | |
| | | | | | | | |
United Kingdom – 24.89% | |
Amec Foster Wheeler | | | 496,322 | | | | 5,439,368 | |
BG Group | | | 741,489 | | | | 11,715,044 | |
BP | | | 2,024,311 | | | | 12,056,734 | |
G4S | | | 2,025,643 | | | | 7,577,885 | |
GlaxoSmithKline | | | 545,409 | | | | 11,811,742 | |
Kingfisher | | | 646,845 | | | | 3,520,572 | |
National Grid | | | 815,327 | | | | 11,622,378 | |
Pearson | | | 297,404 | | | | 3,949,276 | |
Sainsbury (J.) | | | 479,960 | | | | 1,970,855 | |
Tesco † | | | 2,125,991 | | | | 6,006,745 | |
Unilever | | | 259,148 | | | | 11,556,109 | |
Vodafone Group | | | 768,075 | | | | 2,536,529 | |
| | | | | | | | |
| | | | | | | 89,763,237 | |
| | | | | | | | |
Total Common Stock
(cost $354,911,310) | | | | | | | 356,579,675 | |
| | | | | | | | |
Schedules of investments
Delaware Pooled® Trust — The Labor Select International Equity Portfolio
| | | | | | | | |
| | | Number of shares | | | Value (U.S. $) | |
| |
Right – 0.01% | | | | | | | | |
| |
Banco Santander exercise price EUR 0.05, expiration date 11/3/15 † | | | 417,384 | | | $ | 22,945 | |
| | | | | | | | |
Total Right (cost $23,636) | | | | | | | 22,945 | |
| | | | | | | | |
| | |
| | | Principal
amount° | | | | |
| |
Short-Term Investments – 0.79% | |
| |
Repurchase Agreements – 0.79% | |
Bank of America Merrill Lynch | | | | | | | | |
0.04%, dated 10/30/15, to be repurchased on 11/2/15, repurchase price $478,084 (collateralized by U.S. government obligations 3.625% 8/15/43; market value $487,644) | | | 478,082 | | | | 478,082 | |
Bank of Montreal | | | | | | | | |
0.05%, dated 10/30/15, to be repurchased on 11/2/15, repurchase price $239,042 (collateralized by U.S. government obligations 2.00%–4.50% 8/15/25–8/15/45; market value $243,822) | | | 239,041 | | | | 239,041 | |
BNP Paribas | | | | | | | | |
0.06%, dated 10/30/15, to be repurchased on 11/2/15, repurchase price $2,127,259 (collateralized by U.S. government obligations 0.00%–8.50% 2/29/16–11/15/44; market value $2,169,793) | | | 2,127,248 | | | | 2,127,248 | |
| | | | | | | | |
| |
Total Short-Term Investments
(cost $2,844,371) | | | | 2,844,371 | |
| | | | | | | | |
| | |
Total Value of
Securities – 99.67% (cost $357,779,317) | | | | | | $ | 359,446,991 | |
| | | | | | | | |
| = | Security is being fair valued in accordance with the Portfolio’s fair valuation policy. At Oct. 31, 2015, the aggregate value of fair valued securities was $0, which represents 0.00% of the Portfolio’s net assets. See Note 1 in “Notes to financial statements.” |
| ° | Principal amount shown is stated in U.S. dollars unless noted that the security is denominated in another currency. |
| † | Non-income-producing security. |
| D | Securities have been classified by country of origin. Aggregate classification by business sectors has been presented on page 50 in “Security type / country and sector allocations.” |
The following foreign currency exchange contracts were outstanding at Oct. 31, 2015:1
Foreign Currency Exchange Contracts
| | | | | | | | | | | | | | |
Counterparty | | Contracts to
Receive
(Deliver) | | | In Exchange
For | | | Settlement
Date | | Unrealized
Appreciation
(Depreciation) | |
BNYM | | GBP | 210,375 | | | USD | (322,903 | ) | | 11/2/15 | | $ | 1,364 | |
NT | | SGD | 139,952 | | | USD | (99,623 | ) | | 11/3/15 | | | 250 | |
| | | | | | | | | | | | | | |
| | | | | | | | | | | | $ | 1,614 | |
| | | | | | | | | | | | | | |
The use of foreign currency exchange contracts involves elements of market risk and risks in excess of the amount disclosed in the financial statements. The foreign currency exchange contracts presented above represent the Portfolio’s total exposure in such contracts, whereas only the net unrealized appreciation (depreciation) is reflected in the Portfolio’s net assets.
1See Note 8 in “Notes to financial statements.”
Summary of abbreviations:
ADR – American Depositary Receipt
BNYM – BNY Mellon
EUR – euro
GBP – British Pound Sterling
NT – Northern Trust
SGD – Singapore Dollar
USD – U.S. Dollar
VVPR Strip – Dividend Coupon
See accompanying notes, which are an integral part of the financial statements.
88
Delaware Pooled® Trust — The Emerging Markets Portfolio
October 31, 2015
| | | | | | | | |
| | | Number of shares | | | Value (U.S. $) | |
| |
Common Stock – 97.26%D | |
| |
Brazil – 4.64% | | | | | | | | |
Ambev ADR | | | 325,200 | | | $ | 1,583,724 | |
CCR | | | 801,100 | | | | 2,518,144 | |
Cielo | | | 137,869 | | | | 1,309,054 | |
CPFL Energia † | | | 247,366 | | | | 993,762 | |
EcoRodovias Infraestrutura e Logistica | | | 268,700 | | | | 414,644 | |
Transmissora Alianca de Energia Eletrica | | | 182,400 | | | | 941,389 | |
Vale ADR | | | 57,400 | | | | 250,264 | |
| | | | | | | | |
| | | | | | | 8,010,981 | |
| | | | | | | | |
Chile – 2.35% | | | | | | | | |
Banco Santander Chile ADR | | | 49,970 | | | | 948,930 | |
Cia Cervecerias Unidas | | | 129,627 | | | | 1,554,831 | |
Enersis ADR | | | 117,600 | | | | 1,558,200 | |
| | | | | | | | |
| | | | | | | 4,061,961 | |
| | | | | | | | |
China – 18.51%n | | | | | | | | |
Beijing Enterprises Holdings | | | 366,999 | | | | 2,327,289 | |
Belle International Holdings | | | 2,770,515 | | | | 2,695,217 | |
China BlueChemical Class H | | | 3,363,000 | | | | 1,006,646 | |
China Mobile | | | 380,000 | | | | 4,549,812 | |
China Resources Power Holdings | | | 1,770,000 | | | | 4,023,843 | |
Golden Eagle Retail Group | | | 1,485,000 | | | | 1,910,220 | |
Hengan International Group | | | 328,000 | | | | 3,552,683 | |
Huabao International Holdings | | | 3,986,000 | | | | 1,671,408 | |
Jiangsu Expressway Class H | | | 2,500,000 | | | | 3,393,264 | |
Mindray Medical International ADR | | | 109,179 | | | | 2,618,112 | |
Sands China | | | 566,800 | | | | 2,058,591 | |
Want Want China Holdings | | | 2,304,000 | | | | 1,920,334 | |
WH Group 144A #† | | | 420,500 | | | | 232,748 | |
| | | | | | | | |
| | | | | | | 31,960,167 | |
| | | | | | | | |
Colombia – 0.31% | | | | | | | | |
Bancolombia ADR | | | 15,600 | | | | 540,072 | |
| | | | | | | | |
| | | | | | | 540,072 | |
| | | | | | | | |
India – 10.35% | | | | | | | | |
Axis Bank | | | 285,341 | | | | 2,074,547 | |
Bajaj Auto | | | 103,529 | | | | 4,038,116 | |
Cairn India | | | 956,966 | | | | 2,245,028 | |
Housing Development Finance | | | 186,213 | | | | 3,579,261 | |
Indiabulls Housing Finance | | | 12,567 | | | | 138,483 | |
Infosys | | | 122,511 | | | | 2,127,370 | |
Infosys ADR | | | 77,000 | | | | 1,398,320 | |
| | | | | | | | |
| | | Number of shares | | | Value (U.S. $) | |
| |
Common StockD (continued) | |
| |
India (continued) | | | | | | | | |
Larsen & Toubro | | | 73,895 | | | $ | 1,594,282 | |
Rural Electrification | | | 178,952 | | | | 683,095 | |
| | | | | | | | |
| | | | | | | 17,878,502 | |
| | | | | | | | |
Indonesia – 3.66% | | | | | | | | |
Bank Mandiri Persero | | | 3,428,100 | | | | 2,178,957 | |
Bank Rakyat Indonesia Persero | | | 3,570,800 | | | | 2,745,766 | |
Perusahaan Gas Negara Persero | | | 6,369,800 | | | | 1,396,121 | |
| | | | | | | | |
| | | | | | | 6,320,844 | |
| | | | | | | | |
Kazakhstan – 0.41% | | | | | | | | |
KazMunaiGas Exploration Production GDR | | | 99,921 | | | | 699,447 | |
| | | | | | | | |
| | | | | | | 699,447 | |
| | | | | | | | |
Malaysia – 5.68% | | | | | | | | |
AMMB Holdings | | | 1,587,200 | | | | 1,766,019 | |
Genting Malaysia | | | 1,780,200 | | | | 1,781,858 | |
Malayan Banking | | | 1,377,888 | | | | 2,649,291 | |
Tenaga Nasional | | | 1,223,600 | | | | 3,605,860 | |
| | | | | | | | |
| | | | | | | 9,803,028 | |
| | | | | | | | |
Mexico – 6.82% | | | | | | | | |
Arca Continental | | | 157,200 | | | | 1,003,586 | |
Fibra Uno Administracion | | | 2,017,700 | | | | 4,421,948 | |
Gentera | | | 720,400 | | | | 1,322,507 | |
Grupo Aeroportuario del Pacifico ADR | | | 14,200 | | | | 1,293,194 | |
Grupo Financiero Santander Mexico Class B ADR | | | 239,114 | | | | 2,187,893 | |
Kimberly-Clark de Mexico Class A | | | 644,100 | | | | 1,540,596 | |
| | | | | | | | |
| | | | | | | 11,769,724 | |
| | | | | | | | |
Peru – 1.31% | | | | | | | | |
Credicorp | | | 20,028 | | | | 2,266,769 | |
| | | | | | | | |
| | | | | | | 2,266,769 | |
| | | | | | | | |
Philippines – 1.82% | | | | | | | | |
Philippine Long Distance Telephone ADR | | | 66,400 | | | | 3,148,688 | |
| | | | | | | | |
| | | | | | | 3,148,688 | |
| | | | | | | | |
Qatar – 2.82% | | | | | | | | |
Qatar Electricity & Water | | | 49,874 | | | | 2,912,770 | |
Qatar National Bank | | | 39,049 | | | | 1,957,679 | |
| | | | | | | | |
| | | | | | | 4,870,449 | |
| | | | | | | | |
Schedules of investments
Delaware Pooled® Trust — The Emerging Markets Portfolio
| | | | | | | | |
| | | Number of shares | | | Value (U.S. $) | |
| |
Common StockD (continued) | |
| |
Republic of Korea – 7.80% | | | | | | | | |
Hyundai Mobis | | | 23,184 | | | $ | 4,873,276 | |
Kangwon Land | | | 26,957 | | | | 998,696 | |
Samsung Electronics | | | 3,743 | | | | 4,497,750 | |
SK Telecom | | | 14,708 | | | | 3,104,503 | |
| | | | | | | | |
| | | | | | | 13,474,225 | |
| | | | | | | | |
Romania – 0.48% | | | | | | | | |
Societatea Nationala de Gaze Naturale GDR | | | 111,708 | | | | 832,225 | |
| | | | | | | | |
| | | | | | | 832,225 | |
| | | | | | | | |
Russia – 1.52% | | | | | | | | |
Gazprom ADR | | | 624,024 | | | | 2,627,141 | |
| | | | | | | | |
| | | | | | | 2,627,141 | |
| | | | | | | | |
South Africa – 4.01% | | | | | | | | |
Bidvest Group | | | 60,929 | | | | 1,559,740 | |
Growthpoint Properties | | | 846,138 | | | | 1,552,339 | |
MTN Group | | | 121,741 | | | | 1,389,213 | |
Redefine Properties | | | 1,849,818 | | | | 1,546,364 | |
Truworths International | | | 127,877 | | | | 866,939 | |
| | | | | | | | |
| | | | | | | 6,914,595 | |
| | | | | | | | |
Taiwan – 14.27% | | | | | | | | |
Asustek Computer | | | 275,000 | | | | 2,464,962 | |
CTBC Financial Holding | | | 2,307,339 | | | | 1,268,628 | |
MediaTek | | | 378,000 | | | | 2,963,222 | |
Mega Financial Holding | | | 3,107,000 | | | | 2,268,163 | |
Novatek Microelectronics | | | 501,000 | | | | 1,712,952 | |
Quanta Computer | | | 894,000 | | | | 1,528,323 | |
Taiwan Mobile | | | 1,255,000 | | | | 3,962,344 | |
Taiwan Semiconductor Manufacturing | | | 1,506,588 | | | | 6,334,491 | |
Teco Electric and Machinery | | | 2,442,000 | | | | 2,136,233 | |
| | | | | | | | |
| | | | | | | 24,639,318 | |
| | | | | | | | |
Thailand – 1.42% | | | | | | | | |
PTT Foreign | | | 114,400 | | | | 882,716 | |
Thai Union Group Pcl Class F | | | 3,164,800 | | | | 1,571,744 | |
| | | | | | | | |
| | | | | | | 2,454,460 | |
| | | | | | | | |
Turkey – 2.34% | | | | | | | | |
Tupras Turkiye Petrol Rafinerileri † | | | 64,148 | | | | 1,694,156 | |
Turk Telekomunikasyon | | | 1,089,582 | | | | 2,350,661 | |
| | | | | | | | |
| | | | | | | 4,044,817 | |
| | | | | | | | |
United Arab Emirates – 1.45% | |
First Gulf Bank | | | 744,730 | | | | 2,504,061 | |
| | | | | | | | |
| | | | | | | 2,504,061 | |
| | | | | | | | |
| | | | | | | | |
| | | Number of shares | | | Value (U.S. $) | |
| |
Common StockD (continued) | |
| |
United Kingdom – 3.57% | |
SABMiller | | | 19,488 | | | $ | 1,196,437 | |
Unilever | | | 111,254 | | | | 4,961,116 | |
| | | | | | | | |
| | | | | | | 6,157,553 | |
| | | | | | | | |
United States – 1.72% | | | | | | | | |
Yum! Brands | | | 41,756 | | | | 2,960,918 | |
| | | | | | | | |
| | | | | | | 2,960,918 | |
| | | | | | | | |
Total Common Stock
(cost $201,661,586) | | | | 167,939,945 | |
| | | | | | | | |
|
| |
Preferred Stock – 1.53%D | |
| |
Brazil – 0.85% | | | | | | | | |
Vale ADR 12.45% | | | 409,900 | | | | 1,475,640 | |
| | | | | | | | |
| | | | | | | 1,475,640 | |
| | | | | | | | |
Republic of Korea – 0.68% | | | | | | | | |
Hyundai Motor 0.82% | | | 11,742 | | | | 1,172,380 | |
| | | | | | | | |
| | | | | | | 1,172,380 | |
| | | | | | | | |
Total Preferred Stock
(cost $5,891,360) | | | | 2,648,020 | |
| | | | | | | | |
| | |
| | | Principal
amount° | | | | |
| |
Short-Term Investments – 0.45% | |
| |
Discount Notes – 0.29%≠ | | | | | | | | |
Federal Home Loan Bank | | | | | | | | |
0.103% 11/3/15 | | | 13,495 | | | | 13,495 | |
0.12% 1/4/16 | | | 171,948 | | | | 171,924 | |
0.12% 1/25/16 | | | 30,330 | | | | 30,325 | |
0.14% 2/18/16 | | | 28,546 | | | | 28,536 | |
0.155% 2/3/16 | | | 113,537 | | | | 113,504 | |
0.18% 2/26/16 | | | 54,711 | | | | 54,692 | |
0.18% 3/7/16 | | | 90,037 | | | | 89,982 | |
| | | | | | | | |
| | | | | | | 502,458 | |
| | | | | | | | |
Repurchase Agreements – 0.16% | |
Bank of America Merrill Lynch | | | | | | | | |
0.04%, dated 10/30/15, to be repurchased on 11/2/15, repurchase price $45,496 (collateralized by U.S. government obligations 3.625% 8/15/43; market value $46,405) | | | 45,495 | | | | 45,495 | |
90
| | | | | | | | |
| | | Principal
amount° | | | Value (U.S. $) | |
| |
Short-Term Investments (continued) | |
| |
Repurchase Agreements (continued) | |
Bank of Montreal | | | | | | | | |
0.05%, dated 10/30/15, to be repurchased on 11/2/15, repurchase price $22,748 (collateralized by U.S. government obligations 2.00%–4.50% 8/15/25–8/15/45; market value $23,203) | | | 22,748 | | | $ | 22,748 | |
BNP Paribas | | | | | | | | |
0.06%, dated 10/30/15, to be repurchased on 11/2/15, repurchase price $202,436 (collateralized by U.S. government obligations 0.00%–8.50% 2/29/16–11/15/44; market value $206,483) | | | 202,435 | | | | 202,435 | |
| | | | | | | | |
| | | | | | | 270,678 | |
| | | | | | | | |
| |
Total Short-Term Investments
(cost $773,090) | | | | 773,136 | |
| | | | | | | | |
Total Value of | | | | | | | | |
Securities – 99.24%
(cost $208,326,036) | | | $ | 171,361,101 | |
| | | | | | | | |
| # | Security exempt from registration under Rule 144A of the Securities Act of 1933, as amended. At Oct. 31, 2015, the aggregate value of Rule 144A securities was $232,748, which represents 0.13% of the Portfolio’s net assets. See Note 11 in “Notes to financial statements.” |
| ≠ | The rate shown is the effective yield at the time of purchase. |
| n | Securities listed and traded on the Hong Kong Stock Exchange. |
| ° | Principal amount shown is stated in U.S. dollars unless noted that the security is denominated in another currency. |
| † | Non-income-producing security. |
| D | Securities have been classified by country of origin. Aggregate classification by business sectors has been presented on page 51 in “Security type / country and sector allocations.” |
The following foreign currency exchange contracts were outstanding at Oct. 31, 2015:1
Foreign Currency Exchange Contracts
| | | | | | | | | | | | | | |
Counterparty | | Contracts to
Receive (Deliver) | | | In Exchange
For | | | Settlement
Date | | Unrealized
Appreciation
(Depreciation) | |
BCLY | | ZAR | (2,169,135 | ) | | USD | 157,450 | | | 11/2/15 | | $ | 671 | |
BNYM | | BRL | (308,376 | ) | | USD | 79,923 | | | 11/3/15 | | | 56 | |
BNYM | | INR | (10,070,963 | ) | | USD | 153,755 | | | 11/2/15 | | | (178 | ) |
BNYM | | KRW | 232,497,340 | | | USD | (203,514 | ) | | 11/3/15 | | | 87 | |
BNYM | | MYR | (403,614 | ) | | USD | 93,788 | | | 11/2/15 | | | (141 | ) |
BNYM | | THB | 2,852,388 | | | USD | (80,255 | ) | | 11/4/15 | | | (252 | ) |
| | | | | | | | | | | | | | |
| | | | | | | | | | | | $ | 243 | |
| | | | | | | | | | | | | | |
The use of foreign currency exchange contracts involves elements of market risk and risks in excess of the amounts disclosed in the financial statements. The foreign currency exchange contracts presented above represent the Portfolio’s total exposure in such contracts, whereas only the net unrealized appreciation (depreciation) is reflected in the Portfolio’s net assets.
1See Note 8 in “Notes to financial statements.”
Summary of abbreviations:
ADR – American Depositary Receipt
BCLY – Barclays Bank
BNYM – BNY Mellon
BRL – Brazilian Real
GDR – Global Depositary Receipt
INR – Indian Rupee
KRW – South Korean Won
MYR – Malaysian Ringgit
THB – Thailand Baht
USD – U.S. Dollar
ZAR – South African Rand
See accompanying notes, which are an integral part of the financial statements.
91
Schedules of investments
Delaware Pooled® Trust — The Emerging Markets Portfolio II
October 31, 2015
| | | | | | | | |
| | | Number of shares | | | Value (U.S. $) | |
| |
Common Stock – 97.45%D | |
| |
Argentina – 1.37% | | | | | | | | |
Cresud ADR † | | | 8,192 | | | $ | 104,694 | |
IRSA Inversiones y Representaciones ADR † | | | 4,000 | | | | 71,960 | |
MercadoLibre | | | 1,100 | | | | 108,207 | |
YPF ADR | | | 8,000 | | | | 170,880 | |
| | | | | | | | |
| | | | | | | 455,741 | |
| | | | | | | | |
Bahrain – 0.03% | | | | | | | | |
Aluminum Bahrain GDR 144A # | | | 1,800 | | | | 10,500 | |
| | | | | | | | |
| | | | | | | 10,500 | |
| | | | | | | | |
Brazil – 11.17% | | | | | | | | |
B2W Cia Digital † | | | 94,335 | | | | 356,715 | |
Banco Bradesco ADR | | | 8,847 | | | | 48,128 | |
Banco Santander Brasil ADR | | | 48,000 | | | | 171,360 | |
Braskem ADR | | | 12,800 | | | | 142,720 | |
BRF ADR | | | 16,900 | | | | 259,077 | |
Centrais Eletricas Brasileiras ADR † | | | 21,300 | | | | 26,838 | |
Cia Hering | | | 51,400 | | | | 201,961 | |
Cyrela Brazil Realty | | | 15,780 | | | | 36,670 | |
Fibria Celulose ADR | | | 40,300 | | | | 544,856 | |
Gerdau | | | 11,700 | | | | 12,441 | |
Gerdau ADR | | | 13,000 | | | | 18,070 | |
Gol Linhas Aereas Inteligentes ADR | | | 45,200 | | | | 40,156 | |
Hypermarcas † | | | 78,500 | | | | 356,286 | |
Itau Unibanco Holding ADR | | | 66,550 | | | | 455,867 | |
Petroleo Brasileiro ADR † | | | 53,200 | | | | 259,616 | |
Rumo Logistica Operadora Multimodal † | | | 10,486 | | | | 19,962 | |
Santos Brasil Participacoes | | | 5,900 | | | | 21,866 | |
Telefonica Brasil ADR | | | 6,055 | | | | 62,730 | |
Tim Participacoes ADR | | | 53,200 | | | | 591,052 | |
Vale ADR | | | 21,600 | | | | 94,176 | |
| | | | | | | | |
| | | | | | | 3,720,547 | |
| | | | | | | | |
Chile – 0.83% | | | | | | | | |
Latam Airlines Group ADR † | | | 3,603 | | | | 19,853 | |
Sociedad Quimica y Minera de Chile ADR | | | 13,300 | | | | 257,754 | |
| | | | | | | | |
| | | | | | | 277,607 | |
| | | | | | | | |
China/Hong Kong – 20.27% | |
Baidu ADR † | | | 10,150 | | | | 1,902,821 | |
China Mengniu Dairy | | | 134,000 | | | | 260,370 | |
China Mobile | | | 50,000 | | | | 598,659 | |
China Mobile ADR | | | 7,200 | | | | 434,232 | |
China Petroleum & Chemical | | | 94,000 | | | | 67,310 | |
| | | | | | | | |
| | | Number of shares | | | Value (U.S. $) | |
| |
Common StockD (continued) | |
| |
China/Hong Kong (continued) | |
China Petroleum & Chemical ADR | | | 3,770 | | | $ | 271,742 | |
China Unicom Hong Kong ADR | | | 17,100 | | | | 209,988 | |
CNOOC ADR | | | 1,600 | | | | 181,888 | |
PetroChina ADR | | | 1,700 | | | | 133,671 | |
PetroChina Class H | | | 280,000 | | | | 218,924 | |
Qunar Cayman Islands ADR † | | | 2,900 | | | | 140,766 | |
SINA † | | | 6,200 | | | | 295,368 | |
Sohu.com † | | | 16,000 | | | | 808,320 | |
Tencent Holdings | | | 27,100 | | | | 512,584 | |
Tianjin Development Holdings | | | 190,000 | | | | 123,551 | |
Tingyi Cayman Islands Holding | | | 42,000 | | | | 72,180 | |
Tsingtao Brewery | | | 24,000 | | | | 115,035 | |
Uni-President China Holdings | | | 492,000 | | | | 404,358 | |
| | | | | | | | |
| | | | | | | 6,751,767 | |
| | | | | | | | |
Colombia – 0.64% | | | | | | | | |
Bolsa de Valores de Colombia | | | 10,000 | | | | 57 | |
Cemex Latam Holdings † | | | 61,058 | | | | 212,449 | |
| | | | | | | | |
| | | | | | | 212,506 | |
| | | | | | | | |
India – 8.89% | | | | | | | | |
Cairn India | | | 74,000 | | | | 173,603 | |
ICICI Bank ADR | | | 13,000 | | | | 112,060 | |
Reliance Communications † | | | 90,082 | | | | 103,737 | |
Reliance Industries | | | 30,356 | | | | 439,962 | |
Reliance Industries GDR 144A # | | | 55,000 | | | | 1,578,500 | |
Steel Authority of India | | | 49,589 | | | | 40,459 | |
Tata Chemicals | | | 62,463 | | | | 390,177 | |
Ultratech Cement | | | 2,784 | | | | 122,880 | |
| | | | | | | | |
| | | | | | | 2,961,378 | |
| | | | | | | | |
Indonesia – 0.91% | | | | | | | | |
Global Mediacom | | | 2,369,600 | | | | 150,616 | |
Tambang Batubara Bukit Asam Persero | | | 118,500 | | | | 63,200 | |
United Tractors | | | 67,106 | | | | 88,739 | |
| | | | | | | | |
| | | | | | | 302,555 | |
| | | | | | | | |
| | | | | | | | |
| | | Number of shares | | | Value (U.S. $) | |
| |
Common StockD (continued) | |
| |
Malaysia – 0.31% | | | | | | | | |
UEM Sunrise | | | 356,100 | | | $ | 103,614 | |
| | | | | | | | |
| | | | | | | 103,614 | |
| | | | | | | | |
Mexico – 6.83% | | | | | | | | |
America Movil Class L ADR | | | 11,000 | | | | 195,910 | |
Cemex ADR † | | | 70,311 | | | | 443,662 | |
Empresas ICA ADR † | | | 27,200 | | | | 41,888 | |
Fomento Economico Mexicano ADR | | | 2,500 | | | | 247,725 | |
Grupo Financiero Banorte Class O | | | 24,300 | | | | 130,021 | |
Grupo Financiero Santander Mexico Class B ADR | | | 19,400 | | | | 177,510 | |
Grupo Televisa ADR | | | 30,000 | | | | 874,200 | |
Wal-Mart de Mexico Class V | | | 61,629 | | | | 163,144 | |
| | | | | | | | |
| | | | | | | 2,274,060 | |
| | | | | | | | |
Netherlands – 0.52% | | | | | | | | |
Yandex Class A † | | | 10,800 | | | | 173,880 | |
| | | | | | | | |
| | | | | | | 173,880 | |
| | | | | | | | |
Peru – 0.22% | | | | | | | | |
Cia de Minas Buenaventura ADR | | | 11,500 | | | | 73,715 | |
| | | | | | | | |
| | | | | | | 73,715 | |
| | | | | | | | |
Poland – 0.75% | | | | | | | | |
Jastrzebska Spolka Weglowa † | | | 2,926 | | | | 10,014 | |
Polski Koncern Naftowy Orlen | | | 8,460 | | | | 137,365 | |
Powszechna Kasa Oszczednosci Bank Polski † | | | 13,921 | | | | 103,133 | |
| | | | | | | | |
| | | | | | | 250,512 | |
| | | | | | | | |
Republic of Korea – 25.91% | |
Hitejinro Holdings | | | 20,000 | | | | 239,102 | |
KB Financial Group ADR | | | 28,000 | | | | 882,840 | |
KCC | | | 1,455 | | | | 520,567 | |
KT ADR † | | | 28,300 | | | | 371,296 | |
KT&G | | | 5,530 | | | | 552,143 | |
LG Display ADR | | | 17,800 | | | | 169,100 | |
LG Electronics | | | 5,107 | | | | 219,618 | |
LG Uplus | | | 28,207 | | | | 270,516 | |
Lotte Chilsung Beverage | | | 425 | | | | 831,188 | |
Lotte Confectionery | | | 257 | | | | 447,702 | |
Samsung Electronics | | | 2,017 | | | | 2,423,495 | |
Samsung Life Insurance | | | 4,270 | | | | 407,639 | |
SK Telecom ADR | | | 55,000 | | | | 1,295,800 | |
| | | | | | | | |
| | | | | | | 8,631,006 | |
| | | | | | | | |
| | | | | | | | |
| | | Number of shares | | | Value (U.S. $) | |
| |
Common StockD (continued) | |
| |
Russia – 4.19% | | | | | | | | |
Etalon Group GDR 144A #= | | | 4,800 | | | $ | 9,264 | |
Gazprom ADR | | | 50,000 | | | | 210,500 | |
Lukoil (London International Exchange) ADR | | | 3,600 | | | | 130,680 | |
Lukoil ADR | | | 3,400 | | | | 123,250 | |
MegaFon GDR | | | 14,100 | | | | 182,595 | |
Mobile TeleSystems ADR | | | 19,400 | | | | 136,382 | |
Moscow Exchange = | | | 70,000 | | | | 98,513 | |
Rosneft GDR | | | 52,800 | | | | 211,200 | |
Sberbank of Russia = | | | 141,095 | | | | 200,091 | |
VTB Bank | | | 16,155,925 | | | | 18,310 | |
VTB Bank GDR | | | 33,800 | | | | 74,292 | |
| | | | | | | | |
| | | | | | | 1,395,077 | |
| | | | | | | | |
South Africa – 1.19% | | | | | | | | |
Anglo American Platinum † | | | 1,687 | | | | 29,609 | |
Impala Platinum Holdings † | | | 4,413 | | | | 12,069 | |
Sasol ADR | | | 5,200 | | | | 167,232 | |
Vodacom Group | | | 17,262 | | | | 186,982 | |
| | | | | | | | |
| | | | | | | 395,892 | |
| | | | | | | | |
Taiwan – 7.20% | | | | | | | | |
Hon Hai Precision Industry | | | 218,824 | | | | 583,711 | |
MediaTek | | | 68,000 | | | | 533,066 | |
Mitac Holdings | | | 472,000 | | | | 369,284 | |
Taiwan Semiconductor Manufacturing | | | 95,000 | | | | 399,430 | |
Taiwan Semiconductor Manufacturing ADR | | | 12,800 | | | | 281,088 | |
United Microelectronics | | | 634,000 | | | | 232,392 | |
| | | | | | | | |
| | | | | | | 2,398,971 | |
| | | | | | | | |
Thailand – 1.24% | | | | | | | | |
Bangkok Bank | | | 37,099 | | | | 174,357 | |
PTT Exploration & Production Foreign Share | | | 14,571 | | | | 29,845 | |
PTT Foreign | | | 27,160 | | | | 209,568 | |
| | | | | | | | |
| | | | | | | 413,770 | |
| | | | | | | | |
Turkey – 1.68% | | | | | | | | |
Akbank | | | 58,758 | | | | 150,948 | |
Anadolu Efes Biracilik Ve Malt Sanayii | | | 19,910 | | | | 157,065 | |
Turkcell Iletisim Hizmetleri ADR | | | 20,600 | | | | 204,146 | |
Turkiye Sise ve Cam Fabrikalari | | | 41,358 | | | | 47,379 | |
| | | | | | | | |
| | | | | | | 559,538 | |
| | | | | | | | |
Schedules of investments
Delaware Pooled® Trust – The Emerging Markets Portfolio II
| | | | | | | | |
| | | Number of shares | | | Value (U.S. $) | |
| |
Common StockD (continued) | |
| |
United Kingdom – 0.10% | | | | | |
Anglo American ADR | | | 8,400 | | | $ | 35,196 | |
| | | | | | | | |
| | | | | | | 35,196 | |
| | | | | | | | |
United States – 3.20% | | | | | |
Archer-Daniels-Midland | | | 8,200 | | | | 374,412 | |
Yahoo † | | | 19,400 | | | | 691,028 | |
| | | | | | | | |
| | | | | | | 1,065,440 | |
| | | | | | | | |
Total Common Stock
(cost $38,841,316) | | | | 32,463,272 | |
| | | | | | | | |
|
| |
Preferred Stock – 1.15%D | | | | | |
| |
Republic of Korea – 1.15% | | | | | |
LG Electronics 1.67% | | | 17,861 | | | | 384,042 | |
| | | | | | | | |
Total Preferred Stock
(cost $307,186) | | | | 384,042 | |
| | | | | | | | |
| | |
| | | Principal
amount° | | | | |
| |
Short-Term Investments – 1.24% | | | | | |
| |
Repurchase Agreements – 1.24% | | | | | |
Bank of America Merrill Lynch | | | | | |
0.04%, dated 10/30/15, to be repurchased on 11/2/15, repurchase price $69,680 (collateralized by U.S. government obligations 3.625% 8/15/43; market value $71,073) | | | 69,679 | | | | 69,679 | |
Bank of Montreal | | | | | |
0.05%, dated 10/30/15, to be repurchased on 11/2/15, repurchase price $34,840 (collateralized by U.S. government obligations 2.00%–4.50% 8/15/25–8/15/45; market value $35,537) | | | 34,840 | | | | 34,840 | |
| | | | | | | | |
| | | Principal amount° | | | Value (U.S. $) | |
| |
Short-Term Investments (continued) | |
| |
Repurchase Agreements (continued) | |
BNP Paribas | | | | | | | | |
0.06%, dated 10/30/15, to be repurchased on 11/2/15, repurchase price $310,043 (collateralized by U.S. government obligations 0.00%–8.50% 2/29/16–11/15/44; market value $316,243) | | | 310,042 | | | $ | 310,042 | |
| | | | | | | | |
| |
Total Short-Term Investments
(cost $414,561) | | | | 414,561 | |
| | | | | | | | |
| |
Total Value of
Securities – 99.84% (cost $39,563,063) | | | $ | 33,261,875 | |
| | | | | | | | |
| # | Security exempt from registration under Rule 144A of the Securities Act of 1933, as amended. At Oct. 31, 2015, the aggregate value of Rule 144A securities was $1,598,264, which represents 4.80% of the Portfolio’s net assets. See Note 11 in “Notes to financial statements.” |
| = | Security is being fair valued in accordance with the Portfolio’s fair valuation policy. At Oct. 31, 2015, the aggregate value of fair valued securities was $307,868, which represents 0.92% of the Portfolio’s net assets. See Note 1 in “Notes to financial statements.” |
| ° | Principal amount shown is stated in U.S. dollars unless noted that the security is denominated in another currency. |
| † | Non-income-producing security. |
| D | Securities have been classified by country of origin. Aggregate classification by business sectors has been presented on page 52 in “Security type / country and sector allocations.” |
Summary of abbreviations:
ADR – American Depositary Receipt
GDR – Global Depositary Receipt
See accompanying notes, which are an integral part of the financial statements.
94
This page intentionally left blank.
Statements of assets and liabilities
Delaware Pooled® Trust
October 31, 2015
| | | | | | | | | | | | |
| | | The
Large-Cap
Value Equity
Portfolio | | | The
Select 20
Portfolio | | | The
Large-Cap
Growth Equity
Portfolio | |
Assets: | | | | | | | | | | | | |
Investments, at value1 | | $ | 212,252,938 | | | $ | 91,738,529 | | | $ | 306,289,228 | |
Short-term investments, at value2 | | | 1,369,464 | | | | 1,799,521 | | | | 4,701,887 | |
Repurchase agreements, at value3 | | | 791,352 | | | | 157,371 | | | | — | |
Cash | | | 92,707 | | | | 916 | | | | — | |
Dividends and interest receivable | | | 400,442 | | | | — | | | | 608,849 | |
Receivable for securities sold | | | — | | | | — | | | | 2,643,533 | |
| | | | | | | | | | | | |
Total assets | | | 214,906,903 | | | | 93,696,337 | | | | 314,243,497 | |
| | | | | | | | | | | | |
Liabilities: | | | | | | | | | | | | |
Cash overdraft | | | — | | | | — | | | | 302,810 | |
Payable for securities purchased | | | 45,783 | | | | — | | | | 240,584 | |
Investment management fees payable | | | 98,943 | | | | 57,544 | | | | 141,978 | |
Other accrued expenses | | | 32,063 | | | | 12,547 | | | | 41,988 | |
Other affiliates payable | | | 3,519 | | | | 1,502 | | | | 4,820 | |
Trustees’ fees and expenses payable | | | 512 | | | | 217 | | | | 734 | |
| | | | | | | | | | | | |
Total liabilities | | | 180,820 | | | | 71,810 | | | | 732,914 | |
| | | | | | | | | | | | |
Total Net Assets | | $ | 214,726,083 | | | $ | 93,624,527 | | | $ | 313,510,583 | |
| | | | | | | | | | | | |
| | | |
Net Assets Consist of: | | | | | | | | | | | | |
Paid-in capital | | $ | 189,511,798 | | | $ | 52,266,185 | | | $ | 207,893,792 | |
Undistributed (distribution in excess of) net investment income | | | 3,667,861 | | | | — | | | | 1,707,689 | |
Accumulated net realized gain on investments | | | 16,047,682 | | | | 15,981,838 | | | | 42,426,006 | |
Net unrealized appreciation of investments | | | 5,498,742 | | | | 25,376,504 | | | | 61,483,096 | |
| | | | | | | | | | | | |
Total Net Assets | | $ | 214,726,083 | | | $ | 93,624,527 | | | $ | 313,510,583 | |
| | | | | | | | | | | | |
| | | |
Net Asset Value | | | | | | | | | | | | |
| | | |
Portfolio Class | | | | | | | | | | | | |
Net assets | | $ | 214,726,083 | | | $ | 93,624,527 | | | $ | 313,510,583 | |
Shares of beneficial interest outstanding, unlimited authorization, no par | | | 7,864,331 | | | | 10,463,756 | | | | 18,668,742 | |
Net asset value per share | | $ | 27.30 | | | $ | 8.95 | | | $ | 16.79 | |
| | | |
1Investments, at cost | | $ | 206,754,347 | | | $ | 66,362,295 | | | $ | 244,806,736 | |
2Short-term investments, at cost | | | 1,369,313 | | | | 1,799,251 | | | | 4,701,283 | |
3Repurchase agreements, at cost | | | 791,352 | | | | 157,371 | | | | — | |
See accompanying notes, which are an integral part of the financial statements.
96
| | | | | | | | | | |
| | | The
Focus Smid-Cap
Growth Equity
Portfolio | | The
High-Yield
Bond
Portfolio |
Assets: | | | | | | | | | | |
Investments, at value1 | | | $ | 50,107,016 | | | | $ | 193,470,967 | |
Short-term investments, at value2 | | | | 826,005 | | | | | 4,777,853 | |
Repurchase agreements, at value3 | | | | 164,565 | | | | | 8,645,521 | |
Foreign currencies, at value4 | | | | 55,399 | | | | | — | |
Cash | | | | 206 | | | | | 791,396 | |
Receivable for securities sold | | | | 298,423 | | | | | 4,566,453 | |
Dividends and interest receivable | | | | 35,700 | | | | | 3,373,285 | |
Other assets5 | | | | — | | | | | 48,975 | |
| | | | | | | | | | |
Total assets | | | | 51,487,314 | | | | | 215,674,450 | |
| | | | | | | | | | |
Liabilities: | | | | | | | | | | |
Payable for securities purchased | | | | — | | | | | 9,270,403 | |
Investment management fees payable | | | | 32,744 | | | | | 78,147 | |
Other accrued expenses | | | | 10,898 | | | | | 29,928 | |
Other affiliates payable | | | | 842 | | | | | 3,322 | |
Trustees’ fees and expenses payable | | | | 120 | | | | | 514 | |
Bond proceeds payable5 | | | | — | | | | | 163,250 | |
| | | | | | | | | | |
Total liabilities | | | | 44,604 | | | | | 9,545,564 | |
| | | | | | | | | | |
Total Net Assets | | | $ | 51,442,710 | | | | $ | 206,128,886 | |
| | | | | | | | | | |
| | |
Net Assets Consist of: | | | | | | | | | | |
Paid-in capital | | | $ | 37,279,693 | | | | $ | 213,086,358 | |
Undistributed net investment income | | | | 21,146 | | | | | 9,244,849 | |
Accumulated net realized gain (loss) on investments | | | | 2,515,250 | | | | | (8,489,848 | ) |
Net unrealized appreciation (depreciation) of investments | | | | 11,627,706 | | | | | (7,712,473 | ) |
Net unrealized depreciation of foreign currencies | | | | (1,085 | ) | | | | — | |
| | | | | | | | | | |
Total Net Assets | | | $ | 51,442,710 | | | | $ | 206,128,886 | |
| | | | | | | | | | |
| | |
Net Asset Value | | | | | | | | | | |
| | |
Portfolio Class | | | | | | | | | | |
Net assets | | | $ | 51,442,710 | | | | $ | 206,128,886 | |
Shares of beneficial interest outstanding, unlimited authorization, no par | | | | 2,789,739 | | | | | 26,494,568 | |
Net asset value per share | | | $ | 18.44 | | | | $ | 7.78 | |
| | |
1Investments, at cost | | | $ | 38,479,449 | | | | $ | 201,184,301 | |
2Short-term investments, at cost | | | | 825,866 | | | | | 4,776,992 | |
3Repurchase agreements, at cost | | | | 164,565 | | | | | 8,645,521 | |
4Foreign currencies, at cost | | | | 56,143 | | | | | — | |
5See Note 15 in “Notes to Financial Statements.” | | | | | | | | | | |
See accompanying notes, which are an integral part of the financial statements.
Statements of assets and liabilities
Delaware Pooled® Trust
| | | | | | | | | | | | |
| | | The
Core Plus
Fixed Income
Portfolio | | | The
International
Equity
Portfolio | | | The
Labor Select
International
Equity
Portfolio | |
Assets: | | | | | | | | | | | | |
Investments, at value1 | | $ | 125,572,388 | | | $ | 356,307,577 | | | $ | 356,602,620 | |
Short-term investments, at value2 | | | — | | | | 1,327,192 | | | | — | |
Repurchase agreements, at value3 | | | 17,603,087 | | | | — | | | | 2,844,371 | |
Cash | | | 2,134,786 | | | | — | | | | 319,233 | |
Variation margin due from brokers on centrally cleared credit default swap contracts | | | 82,763 | | | | — | | | | — | |
Foreign currencies, at value4 | | | 8,333 | | | | 68,714 | | | | 770 | |
Receivable for securities sold | | | 18,272,405 | | | | — | | | | — | |
Dividends and interest receivable | | | 711,067 | | | | 1,200,876 | | | | 1,614,356 | |
Receivable for fund shares sold | | | — | | | | 382,579 | | | | — | |
Unrealized appreciation on foreign currency exchange contracts | | | 564 | | | | 955 | | | | 1,614 | |
Upfront payments paid on credit default swap contracts | | | 13,768 | | | | — | | | | — | |
Other assets5 | | | 75,182 | | | | — | | | | — | |
| | | | | | | | | | | | |
Total assets | | | 164,474,343 | | | | 359,287,893 | | | | 361,382,964 | |
| | | | | | | | | | | | |
Liabilities: | | | | | | | | | | | | |
Cash overdraft | | | — | | | | 75,814 | | | | — | |
Payable for securities purchased | | | 36,060,574 | | | | 321,431 | | | | 424,161 | |
Swap interest payable | | | 4,942 | | | | — | | | | — | |
Variation margin due to broker on futures contracts | | | 1,141 | | | | — | | | | — | |
Payable for fund shares redeemed | | | — | | | | 197,959 | | | | — | |
Other accrued expenses | | | 33,871 | | | | 78,566 | | | | 74,636 | |
Investment management fees payable | | | 21,801 | | | | 226,467 | | | | 227,191 | |
Other affiliates payable | | | 2,137 | | | | 5,806 | | | | 5,954 | |
Trustees’ fees and expenses payable | | | 327 | | | | 786 | | | | 859 | |
Unrealized depreciation on credit default swap contracts | | | 5,369 | | | | — | | | | — | |
Unrealized depreciation on foreign currency exchange contracts | | | — | | | | 127 | | | | — | |
Bond proceeds payable5 | | | 250,607 | | | | — | | | | — | |
| | | | | | | | | | | | |
Total liabilities | | | 36,380,769 | | | | 906,956 | | | | 732,801 | |
| | | | | | | | | | | | |
Total Net Assets | | $ | 128,093,574 | | | $ | 358,380,937 | | | $ | 360,650,163 | |
| | | | | | | | | | | | |
98
| | | | | | | | | | | | |
| | | The
Core Plus
Fixed Income
Portfolio | | | The
International
Equity
Portfolio | | | The
Labor Select
International
Equity
Portfolio | |
Net Assets Consist of: | | | | | | | | | | | | |
Paid-in capital | | $ | 126,522,335 | | | $ | 471,863,727 | | | $ | 409,056,230 | |
Undistributed net investment income | | | 2,382,671 | | | | 8,220,825 | | | | 8,304,431 | |
Accumulated net realized loss on investments | | | (262,749 | ) | | | (128,445,079 | ) | | | (58,275,803 | ) |
Net unrealized appreciation (depreciation) of investments | | | (638,819 | ) | | | 6,797,553 | | | | 1,667,674 | |
Net unrealized depreciation of foreign currencies | | | (668 | ) | | | (56,917 | ) | | | (103,983 | ) |
Net unrealized appreciation of foreign currency exchange contracts | | | 564 | | | | 828 | | | | 1,614 | |
Net unrealized appreciation of futures contracts | | | 102,718 | | | | — | | | | — | |
Net unrealized depreciation of swap contracts | | | (12,478 | ) | | | — | | | | — | |
| | | | | | | | | | | | |
Total Net Assets | | $ | 128,093,574 | | | $ | 358,380,937 | | | $ | 360,650,163 | |
| | | | | | | | | | | | |
| | | |
Net Asset Value | | | | | | | | | | | | |
| | | |
Portfolio Class | | | | | | | | | | | | |
Net assets | | $ | 128,093,574 | | | $ | 358,380,937 | | | $ | 360,650,163 | |
Shares of beneficial interest outstanding, unlimited authorization, no par | | | 12,450,834 | | | | 25,167,620 | | | | 26,147,484 | |
Net asset value per share | | $ | 10.29 | | | $ | 14.24 | | | $ | 13.79 | |
1Investments, at cost | | $ | 126,211,207 | | | $ | 349,510,155 | | | $ | 354,934,946 | |
2Short-term investments, at cost | | | — | | | | 1,327,061 | | | | — | |
3Repurchase agreements, at cost | | | 17,603,087 | | | | — | | | | 2,844,371 | |
4Foreign currencies, at cost | | | 8,865 | | | | 69,399 | | | | 765 | |
5See Note 15 in “Notes to Financial Statements.” | | | | | | | | | | | | |
See accompanying notes, which are an integral part of the financial statements.
Statements of assets and liabilities
Delaware Pooled® Trust
| | | | | | | | |
| | | The
Emerging
Markets
Portfolio | | | The
Emerging
Markets
Portfolio II | |
Assets: | | | | | | | | |
Investments, at value1 | | $ | 170,587,965 | | | $ | 32,847,314 | |
Short-term investments, at value2 | | | 502,458 | | | | — | |
Repurchase agreements, at value3 | | | 270,678 | | | | 414,561 | |
Foreign currencies, at value4 | | | 1,423,940 | | | | 30,090 | |
Cash | | | — | | | | 48,448 | |
Receivable for securities sold | | | 589,762 | | | | — | |
Dividends and interest receivable | | | 257,674 | | | | 11,967 | |
Receivable for fund shares sold | | | 1,274 | | | | — | |
Unrealized appreciation on foreign currency exchange contracts | | | 814 | | | | — | |
| | | | | | | | |
Total assets | | | 173,634,565 | | | | 33,352,380 | |
| | | | | | | | |
Liabilities: | | | | | | | | |
Cash overdraft | | | 143,683 | | | | — | |
Payable for securities purchased | | | 545,413 | | | | — | |
Payable for fund shares redeemed | | | 1,274 | | | | — | |
Investment management fees payable | | | 148,666 | | | | 22,471 | |
Other accrued expenses | | | 85,194 | | | | 11,646 | |
Other affiliates payable | | | 3,101 | | | | 563 | |
Trustees’ fees and expenses payable | | | 427 | | | | 78 | |
Unrealized depreciation on foreign currency exchange contracts | | | 571 | | | | — | |
Other liabilities | | | 32,114 | | | | 3,605 | |
| | | | | | | | |
Total liabilities | | | 960,443 | | | | 38,363 | |
| | | | | | | | |
Total Net Assets | | $ | 172,674,122 | | | $ | 33,314,017 | |
| | | | | | | | |
| | |
Net Assets Consist of: | | | | | | | | |
Paid-in capital | | $ | 225,904,525 | | | $ | 38,998,264 | |
Undistributed (distribution in excess of) net investment income | | | 3,851,084 | | | | (436,088 | ) |
Accumulated net realized gain (loss) on investments | | | (20,078,590 | ) | | | 1,056,786 | |
Net unrealized depreciation of investments | | | (36,964,935 | ) | | | (6,301,188 | ) |
Net unrealized depreciation of foreign currencies | | | (38,205 | ) | | | (3,757 | ) |
Net unrealized appreciation of foreign currency exchange contracts | | | 243 | | | | — | |
| | | | | | | | |
Total Net Assets | | $ | 172,674,122 | | | $ | 33,314,017 | |
| | | | | | | | |
| | |
Net Asset Value | | | | | | | | |
| | |
Portfolio Class | | | | | | | | |
Net assets | | $ | 172,674,122 | | | $ | 33,314,017 | |
Shares of beneficial interest outstanding, unlimited authorization, no par | | | 23,121,815 | | | | 4,517,188 | |
Net asset value per share | | $ | 7.47 | | | $ | 7.37 | |
1Investments, at cost | | $ | 207,552,946 | | | $ | 39,148,502 | |
2Short-term investments, at cost | | | 502,412 | | | | — | |
3Repurchase agreements, at cost | | | 270,678 | | | | 414,561 | |
4Foreign currencies, at cost | | | 1,430,087 | | | | 30,115 | |
See accompanying notes, which are an integral part of the financial statements.
100
Statements of operations
Delaware Pooled® Trust
Year ended October 31, 2015
| | | | | | | | | | | | |
| | | The
Large-Cap
Value Equity
Portfolio | | | The
Select 20
Portfolio | | | The
Large-Cap
Growth Equity
Portfolio | |
Investment Income: | | | | | | | | | | | | |
Dividends | | $ | 5,461,742 | | | $ | 813,013 | | | $ | 3,924,687 | |
Interest | | | 3,236 | | | | 3,620 | | | | 4,443 | |
Foreign tax withheld | | | — | | | | — | | | | (18,154 | ) |
| | | | | | | | | | | | |
| | | 5,464,978 | | | | 816,633 | | | | 3,910,976 | |
| | | | | | | | | | | | |
Expenses: | | | | | | | | | | | | |
Management fees | | | 1,168,342 | | | | 689,108 | | | | 1,639,947 | |
Accounting and administration expenses | | | 67,721 | | | | 29,320 | | | | 95,133 | |
Audit and tax | | | 32,872 | | | | 32,873 | | | | 32,886 | |
Legal fees | | | 26,077 | | | | 13,349 | | | | 32,742 | |
Dividend disbursing and transfer agent fees and expenses | | | 22,708 | | | | 9,956 | | | | 32,006 | |
Reports and statements to shareholders | | | 18,205 | | | | 7,915 | | | | 19,541 | |
Registration fees | | | 18,127 | | | | 17,427 | | | | 20,309 | |
Custodian fees | | | 10,672 | | | | 5,656 | | | | 20,060 | |
Trustees’ fees and expenses | | | 9,738 | | | | 4,286 | | | | 13,702 | |
Other | | | 7,984 | | | | 7,235 | | | | 11,055 | |
| | | | | | | | | | | | |
| | | 1,382,446 | | | | 817,125 | | | | 1,917,381 | |
Less expenses waived | | | — | | | | (3,669 | ) | | | — | |
Less expense paid indirectly | | | (1 | ) | | | (1 | ) | | | (1 | ) |
| | | | | | | | | | | | |
Total operating expenses | | | 1,382,445 | | | | 813,455 | | | | 1,917,380 | |
| | | | | | | | | | | | |
Net Investment Income | | | 4,082,533 | | | | 3,178 | | | | 1,993,596 | |
| | | | | | | | | | | | |
Net Realized and Unrealized Gain (Loss) | | | | | | | | | | | | |
Net realized gain (loss) on: | | | | | | | | | | | | |
Investments | | | 16,063,958 | | | | 16,710,086 | | | | 43,076,271 | |
Foreign currencies | | | — | | | | — | | | | (790 | ) |
| | | | | | | | | | | | |
Net realized gain | | | 16,063,958 | | | | 16,710,086 | | | | 43,075,481 | |
| | | | | | | | | | | | |
Net change in unrealized appreciation (depreciation) of investments | | | (14,827,414 | ) | | | (7,406,451 | ) | | | (22,341,614 | ) |
| | | | | | | | | | | | |
| | | |
Net Realized and Unrealized Gain | | | 1,236,544 | | | | 9,303,635 | | | | 20,733,867 | |
| | | | | | | | | | | | |
Net Increase in Net Assets Resulting from Operations | | $ | 5,319,077 | | | $ | 9,306,813 | | | $ | 22,727,463 | |
| | | | | | | | | | | | |
See accompanying notes, which are an integral part of the financial statements.
Statements of operations
Delaware Pooled® Trust
| | | | | | | | | | |
| | | The
Focus Smid-Cap
Growth Equity
Portfolio | | The
High-Yield
Bond
Portfolio |
Investment Income: | | | | | | | | | | |
Dividends | | | $ | 644,501 | | | | $ | 121,041 | |
Interest | | | | 1,599 | | | | | 11,560,610 | |
Foreign tax withheld | | | | (21,587 | ) | | | | — | |
| | | | | | | | | | |
| | | | 624,513 | | | | | 11,681,651 | |
| | | | | | | | | | |
| | |
Expenses: | | | | | | | | | | |
Management fees | | | | 360,302 | | | | | 790,583 | |
Audit and tax | | | | 32,906 | | | | | 40,639 | |
Accounting and administration expenses | | | | 15,328 | | | | | 56,069 | |
Legal fees | | | | 8,565 | | | | | 19,962 | |
Reports and statements to shareholders | | | | 5,431 | | | | | 13,214 | |
Dividend disbursing and transfer agent fees and expenses | | | | 5,285 | | | | | 18,840 | |
Registration fees | | | | 5,198 | | | | | 12,473 | |
Custodian fees | | | | 4,812 | | | | | 11,115 | |
Trustees’ fees and expenses | | | | 2,210 | | | | | 7,999 | |
Other | | | | 4,154 | | | | | 18,027 | |
| | | | | | | | | | |
| | | | 444,191 | | | | | 988,921 | |
Less expenses waived | | | | (1,049 | ) | | | | — | |
Less expense paid indirectly | | | | (1 | ) | | | | (1 | ) |
| | | | | | | | | | |
Total operating expenses | | | | 443,141 | | | | | 988,920 | |
| | | | | | | | | | |
Net Investment Income | | | | 181,372 | | | | | 10,692,731 | |
| | | | | | | | | | |
| | |
Net Realized and Unrealized Gain (Loss) | | | | | | | | | | |
Net realized gain (loss) on: | | | | | | | | | | |
Investments1 | | | | 3,130,016 | | | | | (8,277,336 | ) |
Foreign currencies | | | | (671 | ) | | | | 116 | |
Foreign currency exchange contracts | | | | (277 | ) | | | | — | |
Futures contracts | | | | — | | | | | (19,406 | ) |
Swap contracts | | | | — | | | | | (116,497 | ) |
| | | | | | | | | | |
Net realized gain (loss) | | | | 3,129,068 | | | | | (8,413,123 | ) |
| | | | | | | | | | |
Net change in unrealized appreciation (depreciation) of: | | | | | | | | | | |
Investments | | | | 409,668 | | | | | (8,404,557 | ) |
Foreign currencies | | | | (1,085 | ) | | | | — | |
Futures contracts | | | | — | | | | | 15,984 | |
Swap contracts | | | | — | | | | | 106,230 | |
| | | | | | | | | | |
Net change in unrealized appreciation (depreciation) | | | | 408,583 | | | | | (8,282,343 | ) |
| | | | | | | | | | |
Net Realized and Unrealized Gain (Loss) | | | | 3,537,651 | | | | | (16,695,466 | ) |
| | | | | | | | | | |
Net Increase (Decrease) in Net Assets Resulting from Operations | | | $ | 3,719,023 | | | | $ | (6,002,735 | ) |
| | | | | | | | | | |
1Includes $114,275 loss contingencies on General Motors term loan litigation for
The High-Yield Bond Portfolio. See Note 15 in “Notes to financial statements.” | | | | | | | | | | |
See accompanying notes, which are an integral part of the financial statements.
102
| | | | | | | | | | | | |
| | | The
Core Plus
Fixed Income
Portfolio | | | The
International
Equity
Portfolio | | | The
Labor Select
International
Equity
Portfolio | |
Investment Income: | | | | | | | | | | | | |
Dividends | | $ | 10,502 | | | $ | 14,169,074 | | | $ | 13,942,962 | |
Interest | | | 3,305,424 | | | | 2,207 | | | | 2,260 | |
Foreign tax withheld | | | — | | | | (1,014,981 | ) | | | (896,044 | ) |
| | | | | | | | | | | | |
| | | 3,315,926 | | | | 13,156,300 | | | | 13,049,178 | |
| | | | | | | | | | | | |
Expenses: | | | | | | | | | | | | |
Management fees | | | 511,878 | | | | 2,888,486 | | | | 2,798,499 | |
Audit and tax | | | 42,712 | | | | 61,883 | | | | 70,332 | |
Accounting and administration expenses | | | 37,990 | | | | 122,921 | | | | 119,035 | |
Custodian fees | | | 24,430 | | | | 104,402 | | | | 99,378 | |
Registration fees | | | 18,029 | | | | 18,205 | | | | 14,449 | |
Legal fees | | | 13,357 | | | | 46,236 | | | | 39,334 | |
Dividend disbursing and transfer agent fees and expenses | | | 12,746 | | | | 69,290 | | | | 58,222 | |
Reports and statements to shareholders | | | 9,974 | | | | 27,550 | | | | 19,627 | |
Trustees’ fees and expenses | | | 5,307 | | | | 18,229 | | | | 17,434 | |
Other | | | 45,391 | | | | 18,726 | | | | 17,070 | |
| | | | | | | | | | | | |
| | | 721,814 | | | | 3,375,928 | | | | 3,253,380 | |
Less expenses waived | | | (183,937 | ) | | | — | | | | — | |
Less expense paid indirectly | | | — | | | | (1 | ) | | | (2 | ) |
| | | | | | | | | | | | |
Total operating expenses | | | 537,877 | | | | 3,375,927 | | | | 3,253,378 | |
| | | | | | | | | | | | |
Net Investment Income | | | 2,778,049 | | | | 9,780,373 | | | | 9,795,800 | |
| | | | | | | | | | | | |
| | | |
Net Realized and Unrealized Gain (Loss) | | | | | | | | | | | | |
Net realized gain (loss) on: | | | | | | | | | | | | |
Investments1,2 | | | 578,193 | | | | 21,797,313 | | | | 11,110,502 | |
Redemptions in kind* | | | — | | | | 5,334,630 | | | | — | |
Foreign currencies | | | (166,053 | ) | | | (322,981 | ) | | | (92,538 | ) |
Foreign currency exchange contracts | | | 1,425 | | | | 683,851 | | | | 395,776 | |
Futures contracts | | | 142,574 | | | | — | | | | — | |
Swap contracts | | | 3,390 | | | | — | | | | — | |
| | | | | | | | | | | | |
Net realized gain | | | 559,529 | | | | 27,492,813 | | | | 11,413,740 | |
| | | | | | | | | | | | |
Net change in unrealized appreciation (depreciation) of: | | | | | | | | | | | | |
Investments | | | (1,944,101 | ) | | | (36,720,278 | ) | | | (24,557,772 | ) |
Foreign currencies | | | 4,410 | | | | (10,420 | ) | | | 7,942 | |
Foreign currency exchange contracts | | | 1,674 | | | | (77,176 | ) | | | (62,058 | ) |
Futures contracts | | | 122,177 | | | | — | | | | — | |
Swap contracts | | | (10,969 | ) | | | — | | | | — | |
| | | | | | | | | | | | |
Net change in unrealized appreciation (depreciation) | | | (1,826,809 | ) | | | (36,807,874 | ) | | | (24,611,888 | ) |
| | | | | | | | | | | | |
Net Realized and Unrealized Loss | | | (1,267,280 | ) | | | (9,315,061 | ) | | | (13,198,148 | ) |
| | | | | | | | | | | | |
Net Increase (Decrease) in Net Assets Resulting from Operations | | $ | 1,510,769 | | | $ | 465,312 | | | $ | (3,402,348 | ) |
| | | | | | | | | | | | |
1Includes $268 capital gain taxes paid for The Core Plus Fixed Income Portfolio. 2Includes $175,425 loss contingencies on General Motors term loan litigation for The Core Plus Fixed Income Portfolio. See Note 15 in “Notes to financial statements.” *See Note 13 in “Notes to financial statements.” | | | | | | | | | | | | |
See accompanying notes, which are an integral part of the financial statements.
Statements of operations
Delaware Pooled® Trust
| | | | | | | | |
| | | The
Emerging
Markets
Portfolio | | | The
Emerging
Markets
Portfolio II | |
Investment Income: | | | | | | | | |
Dividends | | $ | 8,328,212 | | | $ | 689,471 | |
Interest | | | 3,072 | | | | 232 | |
Foreign tax withheld | | | (816,795 | ) | | | (85,132 | ) |
| | | | | | | | |
| | | 7,514,489 | | | | 604,571 | |
| | | | | | | | |
Expenses: | | | | | | | | |
Management fees | | | 2,432,693 | | | | 369,657 | |
Custodian fees | | | 199,173 | | | | 23,109 | |
Accounting and administration expenses | | | 77,614 | | | | 11,794 | |
Audit and tax | | | 70,954 | | | | 49,045 | |
Legal fees | | | 32,237 | | | | 5,463 | |
Dividend disbursing and transfer agent fees and expenses | | | 25,903 | | | | 4,122 | |
Reports and statements to shareholders | | | 16,397 | | | | 5,605 | |
Registration fees | | | 15,570 | | | | 18,894 | |
Trustees’ fees and expenses | | | 11,892 | | | | 1,765 | |
Other | | | 15,840 | | | | 10,103 | |
| | | | | | | | |
| | | 2,898,273 | | | | 499,557 | |
Less expenses waived | | | — | | | | (53,605 | ) |
Less expense paid indirectly | | | (1 | ) | | | (1 | ) |
| | | | | | | | |
Total operating expenses | | | 2,898,272 | | | | 445,951 | |
| | | | | | | | |
Net Investment Income | | | 4,616,217 | | | | 158,620 | |
| | | | | | | | |
| | |
Net Realized and Unrealized Gain (Loss) | | | | | | | | |
Net realized gain (loss) on: | | | | | | | | |
Investments1 | | | (18,029,675 | ) | | | 1,062,169 | |
Foreign currencies | | | (264,584 | ) | | | 2,859 | |
Foreign currency exchange contracts | | | (174,171 | ) | | | (5,216 | ) |
| | | | | | | | |
Net realized gain (loss) | | | (18,468,430 | ) | | | 1,059,812 | |
| | | | | | | | |
Net change in unrealized appreciation (depreciation) of: | | | | | | | | |
Investments2 | | | (35,337,220 | ) | | | (10,508,484 | ) |
Foreign currencies | | | 466,200 | | | | 3,845 | |
Foreign currency exchange contracts | | | 16,679 | | | | 662 | |
| | | | | | | | |
Net change in unrealized appreciation (depreciation) | | | (34,854,341 | ) | | | (10,503,977 | ) |
| | | | | | | | |
Net Realized and Unrealized Loss | | | (53,322,771 | ) | | | (9,444,165 | ) |
| | | | | | | | |
Net Decrease in Net Assets Resulting from Operations | | $ | (48,706,554 | ) | | $ | (9,285,545 | ) |
| | | | | | | | |
| | |
| 1Includes $115,807 capital gain taxes paid for The Emerging Markets Portfolio. | | | | | | | | |
| 2Includes $32,114 and $3,605 capital gain taxes accrued for The Emerging Markets Portfolio and The Emerging Markets Portfolio II, respectively. | | | | | | | | |
See accompanying notes, which are an integral part of the financial statements.
104
Statements of changes in net assets
Delaware Pooled® Trust
| | | | | | | | | | | | | | | | | | | | | | | | |
| | | The
Large-Cap
Value Equity
Portfolio | | | The
Select 20
Portfolio | | | The
Large-Cap
Growth Equity
Portfolio | |
| | | Year ended | | | Year ended | | | Year ended | |
| | | 10/31/15 | | | 10/31/14 | | | 10/31/15 | | | 10/31/14 | | | 10/31/15 | | | 10/31/14 | |
Increase (Decrease) in Net Assets from Operations: | | | | | | | | | | | | | | | | | | | | | | | | |
Net investment income | | $ | 4,082,533 | | | $ | 2,022,798 | | | $ | 3,178 | | | $ | 74,497 | | | $ | 1,993,596 | | | $ | 1,809,579 | |
Net realized gain | | | 16,063,958 | | | | 4,047,355 | | | | 16,710,086 | | | | 25,918,447 | | | | 43,075,481 | | | | 24,177,529 | |
Net change in unrealized appreciation (depreciation) | | | (14,827,414 | ) | | | 9,729,583 | | | | (7,406,451 | ) | | | (7,284,821 | ) | | | (22,341,614 | ) | | | 16,123,166 | |
| | | | | | | | | | | | | | | | | | | | | | | | |
Net increase in net assets resulting from operations | | | 5,319,077 | | | | 15,799,736 | | | | 9,306,813 | | | | 18,708,123 | | | | 22,727,463 | | | | 42,110,274 | |
| | | | | | | | | | | | | | | | | | | | | | | | |
| | | | | | |
Dividends and Distributions to Shareholders from: | | | | | | | | | | | | | | | | | | | | | | | | |
Net investment income | | | (2,147,479 | ) | | | (1,238,119 | ) | | | (106,287 | ) | | | (98,955 | ) | | | (1,786,278 | ) | | | (852,040 | ) |
Net realized gain | | | (3,785,813 | ) | | | (451,277 | ) | | | (25,051,110 | ) | | | (2,407,909 | ) | | | (23,432,720 | ) | | | — | |
| | | | | | | | | | | | | | | | | | | | | | | | |
| | | (5,933,292 | ) | | | (1,689,396 | ) | | | (25,157,397 | ) | | | (2,506,864 | ) | | | (25,218,998 | ) | | | (852,040 | ) |
| | | | | | | | | | | | | | | | | | | | | | | | |
| | | | | | |
Capital Share Transactions: | | | | | | | | | | | | | | | | | | | | | | | | |
Proceeds from shares sold | | | 99,370,183 | | | | 45,461,313 | | | | 50,003 | | | | 3,175,400 | | | | 61,465,582 | | | | 20,129,000 | |
Net asset value of shares issued upon reinvestment of dividends and distributions | | | 4,983,737 | | | | 1,235,465 | | | | 22,904,367 | | | | 1,848,361 | | | | 23,511,377 | | | | 737,927 | |
| | | | | | | | | | | | | | | | | | | | | | | | |
| | | 104,353,920 | | | | 46,696,778 | | | | 22,954,370 | | | | 5,023,761 | | | | 84,976,959 | | | | 20,866,927 | |
| | | | | | | | | | | | | | | | | | | | | | | | |
Cost of shares redeemed | | | (28,810,964 | ) | | | (10,246,939 | ) | | | (3,833,016 | ) | | | (118,953,511 | ) | | | (46,296,415 | ) | | | (39,761,752 | ) |
| | | | | | | | | | | | | | | | | | | | | | | | |
Increase (decrease) in net assets derived from capital share transactions | | | 75,542,956 | | | | 36,449,839 | | | | 19,121,354 | | | | (113,929,750 | ) | | | 38,680,544 | | | | (18,894,825 | ) |
| | | | | | | | | | | | | | | | | | | | | | | | |
| | | | | | |
Net Increase (Decrease) in Net Assets | | | 74,928,741 | | | | 50,560,179 | | | | 3,270,770 | | | | (97,728,491 | ) | | | 36,189,009 | | | | 22,363,409 | |
| | | | | | |
Net Assets: | | | | | | | | | | | | | | | | | | | | | | | | |
Beginning of year | | | 139,797,342 | | | | 89,237,163 | | | | 90,353,757 | | | | 188,082,248 | | | | 277,321,574 | | | | 254,958,165 | |
| | | | | | | | | | | | | | | | | | | | | | | | |
End of year | | $ | 214,726,083 | | | $ | 139,797,342 | | | $ | 93,624,527 | | | $ | 90,353,757 | | | $ | 313,510,583 | | | $ | 277,321,574 | |
| | | | | | | | | | | | | | | | | | | | | | | | |
Undistributed net investment income | | $ | 3,667,861 | | | $ | 1,732,807 | | | $ | — | | | $ | 45,929 | | | $ | 1,707,689 | | | $ | 1,501,161 | |
| | | | | | | | | | | | | | | | | | | | | | | | |
See accompanying notes, which are an integral part of the financial statements.
Statements of changes in net assets
Delaware Pooled® Trust
| | | | | | | | | | | | | | | | |
| | | The
Focus Smid-Cap
Growth Equity
Portfolio | | | The
High-Yield
Bond
Portfolio | |
| | | Year ended | | | Year ended | |
| | | 10/31/15 | | | 10/31/14 | | | 10/31/15 | | | 10/31/14 | |
Increase (Decrease) in Net Assets from Operations: | | | | | | | | | | | | | | | | |
Net investment income (loss) | | $ | 181,372 | | | $ | (25,459 | ) | | $ | 10,692,731 | | | $ | 8,039,565 | |
Net realized gain (loss) | | | 3,129,068 | | | | 10,168,546 | | | | (8,413,123 | ) | | | 3,683,284 | |
Net change in unrealized appreciation (depreciation) | | | 408,583 | | | | (6,816,587 | ) | | | (8,282,343 | ) | | | (4,834,052 | ) |
| | | | | | | | | | | | | | | | |
Net increase (decrease) in net assets resulting from operations | | | 3,719,023 | | | | 3,326,500 | | | | (6,002,735 | ) | | | 6,888,797 | |
| | | | | | | | | | | | | | | | |
| | | | |
Dividends and Distributions to Shareholders from: | | | | | | | | | | | | | | | | |
Net investment income | | | (159,278 | ) | | | (48,668 | ) | | | (8,232,022 | ) | | | (8,364,409 | ) |
Net realized gain | | | (9,985,516 | ) | | | — | | | | (2,140,715 | ) | | | — | |
| | | | | | | | | | | | | | | | |
| | | (10,144,794 | ) | | | (48,668 | ) | | | (10,372,737 | ) | | | (8,364,409 | ) |
| | | | | | | | | | | | | | | | |
| | | | |
Capital Share Transactions: | | | | | | | | | | | | | | | | |
Proceeds from shares sold | | | 5,418,599 | | | | 9,804,200 | | | | 91,186,357 | | | | 9,021,353 | |
Net asset value of shares issued upon reinvestment of dividends and distributions | | | 9,933,771 | | | | 44,060 | | | | 8,892,572 | | | | 6,925,632 | |
| | | | | | | | | | | | | | | | |
| | | 15,352,370 | | | | 9,848,260 | | | | 100,078,929 | | | | 15,946,985 | |
| | | | | | | | | | | | | | | | |
Cost of shares redeemed | | | (765,000 | ) | | | (59,279,351 | ) | | | (20,757,038 | ) | | | (6,599,065 | ) |
| | | | | | | | | | | | | | | | |
Increase (decrease) in net assets derived from capital share transactions | | | 14,587,370 | | | | (49,431,091 | ) | | | 79,321,891 | | | | 9,347,920 | |
| | | | | | | | | | | | | | | | |
| | | | |
Net Increase (Decrease) in Net Assets | | | 8,161,599 | | | | (46,153,259 | ) | | | 62,946,419 | | | | 7,872,308 | |
| | | | |
Net Assets: | | | | | | | | | | | | | | | | |
Beginning of year | | | 43,281,111 | | | | 89,434,370 | | | | 143,182,467 | | | | 135,310,159 | |
| | | | | | | | | | | | | | | | |
End of year | | $ | 51,442,710 | | | $ | 43,281,111 | | | $ | 206,128,886 | | | $ | 143,182,467 | |
| | | | | | | | | | | | | | | | |
Undistributed net investment income | | $ | 21,146 | | | $ | — | | | $ | 9,244,849 | | | $ | 6,861,293 | |
| | | | | | | | | | | | | | | | |
See accompanying notes, which are an integral part of the financial statements.
106
| | | | | | | | | | | | | | | | | | | | | | | | |
| | | The
Core Plus
Fixed Income
Portfolio | | | The
International
Equity
Portfolio | | | The
Labor Select
International Equity
Portfolio | |
| | | Year ended | | | Year ended | | | Year ended | |
| | | 10/31/15 | | | 10/31/14 | | | 10/31/15 | | | 10/31/14 | | | 10/31/15 | | | 10/31/14 | |
Increase (Decrease) in Net Assets from Operations: | | | | | | | | | | | | | | | | | | | | | | | | |
Net investment income | | $ | 2,778,049 | | | $ | 2,071,245 | | | $ | 9,780,373 | | | $ | 19,459,695 | | | $ | 9,795,800 | | | $ | 20,527,088 | |
Net realized gain | | | 559,529 | | | | 1,261,684 | | | | 27,492,813 | | | | 33,733,574 | | | | 11,413,740 | | | | 32,115,674 | |
Net change in unrealized appreciation (depreciation) | | | (1,826,809 | ) | | | 252,088 | | | | (36,807,874 | ) | | | (44,297,323 | ) | | | (24,611,888 | ) | | | (43,121,023 | ) |
| | | | | | | | | | | | | | | | | | | | | | | | |
Net increase (decrease) in net assets resulting from operations | | | 1,510,769 | | | | 3,585,017 | | | | 465,312 | | | | 8,895,946 | | | | (3,402,348 | ) | | | 9,521,739 | |
| | | | | | | | | | | | | | | | | | | | | | | | |
| | | | | | |
Dividends and Distributions to Shareholders from: | | | | | | | | | | | | | | | | | | | | | | | | |
Net investment income | | | (2,287,390 | ) | | | (1,349,489 | ) | | | (19,976,817 | ) | | | (13,166,001 | ) | | | (20,172,329 | ) | | | (15,240,625 | ) |
| | | | | | | | | | | | | | | | | | | | | | | | |
| | | (2,287,390 | ) | | | (1,349,489 | ) | | | (19,976,817 | ) | | | (13,166,001 | ) | | | (20,172,329 | ) | | | (15,240,625 | ) |
| | | | | | | | | | | | | | | | | | | | | | | | |
| | | | | | |
Capital Share Transactions: | | | | | | | | | | | | | | | | | | | | | | | | |
Proceeds from shares sold | | | 56,670,000 | | | | 18,225,000 | | | | 71,665,939 | | | | 31,493,180 | | | | 13,897,051 | | | | 27,424,401 | |
Net asset value of shares issued upon reinvestment of dividends and distributions | | | 2,094,599 | | | | 1,349,489 | | | | 13,785,666 | | | | 9,565,196 | | | | 20,125,060 | | | | 15,214,036 | |
| | | | | | | | | | | | | | | | | | | | | | | | |
| | | 58,764,599 | | | | 19,574,489 | | | | 85,451,605 | | | | 41,058,376 | | | | 34,022,111 | | | | 42,638,437 | |
| | | | | | | | | | | | | | | | | | | | | | | | |
Cost of shares redeemed | | | (6,930,000 | ) | | | (1,415,000 | ) | | | (154,086,264 | ) | | | (81,944,610 | ) | | | (23,294,454 | ) | | | (169,524,361 | ) |
| | | | | | | | | | | | | | | | | | | | | | | | |
Increase (decrease) in net assets derived from capital share transactions | | | 51,834,599 | | | | 18,159,489 | | | | (68,634,659 | ) | | | (40,886,234 | ) | | | 10,727,657 | | | | (126,885,924 | ) |
| | | | | | | | | | | | | | | | | | | | | | | | |
Net Increase (Decrease) in Net Assets | | | 51,057,978 | | | | 20,395,017 | | | | (88,146,164 | ) | | | (45,156,289 | ) | | | (12,847,020 | ) | | | (132,604,810 | ) |
| | | | | | |
Net Assets: | | | | | | | | | | | | | | | | | | | | | | | | |
Beginning of year | | | 77,035,596 | | | | 56,640,579 | | | | 446,527,101 | | | | 491,683,390 | | | | 373,497,183 | | | | 506,101,993 | |
| | | | | | | | | | | | | | | | | | | | | | | | |
End of year | | $ | 128,093,574 | | | $ | 77,035,596 | | | $ | 358,380,937 | | | $ | 446,527,101 | | | $ | 360,650,163 | | | $ | 373,497,183 | |
| | | | | | | | | | | | | | | | | | | | | | | | |
Undistributed net investment income | | $ | 2,382,671 | | | $ | 1,820,073 | | | $ | 8,220,825 | | | $ | 18,056,399 | | | $ | 8,304,431 | | | $ | 18,377,722 | |
| | | | | | | | | | | | | | | | | | | | | | | | |
See accompanying notes, which are an integral part of the financial statements.
Statements of changes in net assets
Delaware Pooled® Trust
| | | | | | | | | | | | | | | | |
| | | The
Emerging
Markets
Portfolio | | | The
Emerging
Markets
Portfolio II | |
| | | Year ended | | | Year ended | |
| | | 10/31/15 | | | 10/31/14 | | | 10/31/15 | | | 10/31/14 | |
Increase (Decrease) in Net Assets from Operations: | | | | | | | | | | | | | | | | |
Net investment income | | $ | 4,616,217 | | | $ | 7,430,003 | | | $ | 158,620 | | | $ | 276,216 | |
Net realized gain (loss) | | | (18,468,430 | ) | | | 12,505,005 | | | | 1,059,812 | | | | 1,116,607 | |
Net change in unrealized appreciation (depreciation) | | | (34,854,341 | ) | | | (13,240,417 | ) | | | (10,503,977 | ) | | | 251,401 | |
| | | | | | | | | | | | | | | | |
Net increase (decrease) in net assets resulting from operations | | | (48,706,554 | ) | | | 6,694,591 | | | | (9,285,545 | ) | | | 1,644,224 | |
| | | | | | | | | | | | | | | | |
| | | | |
Dividends and Distributions to Shareholders from: | | | | | | | | | | | | | | | | |
Net investment income | | | (6,578,952 | ) | | | (5,872,140 | ) | | | (597,941 | ) | | | (402,381 | ) |
Net realized gain | | | (14,021,206 | ) | | | (11,018,509 | ) | | | (1,135,659 | ) | | | (161,827 | ) |
| | | | | | | | | | | | | | | | |
| | | (20,600,158 | ) | | | (16,890,649 | ) | | | (1,733,600 | ) | | | (564,208 | ) |
| | | | | | | | | | | | | | | | |
| | | | |
Capital Share Transactions: | | | | | | | | | | | | | | | | |
Proceeds from shares sold | | | 22,120,839 | | | | 31,579,483 | | | | 135,001 | | | | 1,570,049 | |
Purchase reimbursement fees | | | 118,421 | | | | 171,224 | | | | — | | | | — | |
Net asset value of shares issued upon reinvestment of dividends and distributions | | | 17,047,447 | | | | 14,226,136 | | | | 1,733,600 | | | | 564,207 | |
| | | | | | | | | | | | | | | | |
| | | 39,286,707 | | | | 45,976,843 | | | | 1,868,601 | | | | 2,134,256 | |
| | | | | | | | | | | | | | | | |
Cost of shares redeemed | | | (108,099,812 | ) | | | (59,835,193 | ) | | | (50,000 | ) | | | (2,923,000 | ) |
Redemption reimbursement fees | | | 583,024 | | | | 381,420 | | | | — | | | | — | |
| | | | | | | | | | | | | | | | |
| | | (107,516,788 | ) | | | (59,453,773 | ) | | | (50,000 | ) | | | (2,923,000 | ) |
| | | | | | | | | | | | | | | | |
Increase (decrease) in net assets derived from capital share transactions | | | (68,230,081 | ) | | | (13,476,930 | ) | | | 1,818,601 | | | | (788,744 | ) |
| | | | | | | | | | | | | | | | |
| | | | |
Net Increase (Decrease) in Net Assets | | | (137,536,793 | ) | | | (23,672,988 | ) | | | (9,200,544 | ) | | | 291,272 | |
| | | | |
Net Assets: | | | | | | | | | | | | | | | | |
Beginning of year | | | 310,210,915 | | | | 333,883,903 | | | | 42,514,561 | | | | 42,223,289 | |
| | | | | | | | | | | | | | | | |
End of year | | $ | 172,674,122 | | | $ | 310,210,915 | | | $ | 33,314,017 | | | $ | 42,514,561 | |
| | | | | | | | | | | | | | | | |
Undistributed (distribution in excess of) net investment income | | $ | 3,851,084 | | | $ | 6,278,692 | | | $ | (436,088 | ) | | $ | 5,590 | |
| | | | | | | | | | | | | | | | |
See accompanying notes, which are an integral part of the financial statements.
108
Financial highlights
Delaware Pooled® Trust — The Large-Cap Value Equity Portfolio
Selected data for each share of the Portfolio outstanding throughout each period were as follows:
| | | | | | | | | | | | | | | | | | | | | | | | | | | | | | |
| | | Year ended |
| | | 10/31/15 | | | | | 10/31/14 | | | | | 10/31/13 | | | | | 10/31/12 | | | | | 10/31/11 | | | |
Net asset value, beginning of period | | $ | 27.610 | | | | | $ | 24.190 | | | | | $ | 18.970 | | | | | $ | 16.570 | | | | | $ | 15.130 | | | |
| | | | | | | | | | |
Income from investment operations: | | | | | | | | | | | | | | | | | | | | | | | | | | | | | | |
Net investment income1 | | | 0.525 | | | | | | 0.473 | | | | | | 0.440 | | | | | | 0.394 | | | | | | 0.346 | | | |
Net realized and unrealized gain | | | 0.342 | | | | | | 3.385 | | | | | | 5.170 | | | | | | 2.379 | | | | | | 1.579 | | | |
| | | | | | | | | | | | | | | | | | | | | | | | | | | | | | |
Total from investment operations | | | 0.867 | | | | | | 3.858 | | | | | | 5.610 | | | | | | 2.773 | | | | | | 1.925 | | | |
| | | | | | | | | | | | | | | | | | | | | | | | | | | | | | |
| | | | | | | | | | |
Less dividends and distributions from: | | | | | | | | | | | | | | | | | | | | | | | | | | | | | | |
Net investment income | | | (0.426 | ) | | | | | (0.321 | ) | | | | | (0.390 | ) | | | | | (0.373 | ) | | | | | (0.485 | ) | | |
Net realized gain | | | (0.751 | ) | | | | | (0.117 | ) | | | | | — | | | | | | — | | | | | | — | | | |
| | | | | | | | | | | | | | | | | | | | | | | | | | | | | | |
Total dividends and distributions | | | (1.177 | ) | | | | | (0.438 | ) | | | | | (0.390 | ) | | | | | (0.373 | ) | | | | | (0.485 | ) | | |
| | | | | | | | | | | | | | | | | | | | | | | | | | | | | | |
| | | | | | | | | | |
Net asset value, end of period | | $ | 27.300 | | | | | $ | 27.610 | | | | | $ | 24.190 | | | | | $ | 18.970 | | | | | $ | 16.570 | | | |
| | | | | | | | | | | | | | | | | | | | | | | | | | | | | | |
| | | | | | | | | | |
Total return2 | | | 3.18% | | | | | | 16.19% | | | | | | 30.09% | | | | | | 17.12% | | | | | | 12.98% | | | |
| | | | | | | | | | |
Ratios and supplemental data: | | | | | | | | | | | | | | | | | | | | | | | | | | | | | | |
Net assets, end of period (000 omitted) | | $ | 214,726 | | | | | $ | 139,797 | | | | | $ | 89,237 | | | | | $ | 8,417 | | | | | $ | 6,641 | | | |
Ratio of expenses to average net assets | | | 0.65% | | | | | | 0.68% | | | | | | 0.70% | | | | | | 0.70% | | | | | | 0.70% | | | |
Ratio of expenses to average net assets prior to fees waived | | | 0.65% | | | | | | 0.68% | | | | | | 0.72% | | | | | | 1.09% | | | | | | 1.24% | | | |
Ratio of net investment income to average net assets | | | 1.92% | | | | | | 1.83% | | | | | | 1.97% | | | | | | 2.21% | | | | | | 2.15% | | | |
Ratio of net investment income to average net assets prior to fees waived | | | 1.92% | | | | | | 1.83% | | | | | | 1.95% | | | | | | 1.82% | | | | | | 1.61% | | | |
Portfolio turnover | | | 31% | | | | | | 19% | | | | | | 9% | | | | | | 14% | | | | | | 133% | | | |
| 1 | The average shares outstanding method has been applied for per share information. |
| 2 | Total investment return is based on the change in net asset value of a share during the period and assumes reinvestment of dividends and distributions at net asset value. Total investment return during some of the periods shown reflects a waiver by the manager. Performance would have been lower had the waiver not been in effect. |
See accompanying notes, which are an integral part of the financial statements.
Financial highlights
Delaware Pooled® Trust — The Select 20 Portfolio
Selected data for each share of the Portfolio outstanding throughout each period were as follows:
| | | | | | | | | | | | | | | | | | | | | | | | | | | | | | |
| | | Year ended |
| | | 10/31/15 | | | | | 10/31/14 | | | | | 10/31/13 | | | | | 10/31/12 | | | | | 10/31/11 | | | |
Net asset value, beginning of period | | $ | 11.050 | | | | | $ | 9.680 | | | | | $ | 8.140 | | | | | $ | 6.960 | | | | | $ | 6.040 | | | |
| | | | | | | | | | |
Income (loss) from investment operations: | | | | | | | | | | | | | | | | | | | | | | | | | | | | | | |
Net investment income (loss)1 | | | — | 2 | | | | | 0.006 | | | | | | 0.017 | | | | | | (0.002 | ) | | | | | 0.003 | | | |
Net realized and unrealized gain | | | 0.977 | | | | | | 1.516 | | | | | | 1.667 | | | | | | 1.184 | | | | | | 0.917 | | | |
| | | | | | | | | | | | | | | | | | | | | | | | | | | | | | |
Total from investment operations | | | 0.977 | | | | | | 1.522 | | | | | | 1.684 | | | | | | 1.182 | | | | | | 0.920 | | | |
| | | | | | | | | | | | | | | | | | | | | | | | | | | | | | |
| | | | | | | | | | |
Less dividends and distributions from: | | | | | | | | | | | | | | | | | | | | | | | | | | | | | | |
Net investment income | | | (0.013 | ) | | | | | (0.006 | ) | | | | | (0.016 | ) | | | | | (0.002 | ) | | | | | — | | | |
Net realized gain | | | (3.064 | ) | | | | | (0.146 | ) | | | | | (0.128 | ) | | | | | — | | | | | | — | | | |
| | | | | | | | | | | | | | | | | | | | | | | | | | | | | | |
Total dividends and distributions | | | (3.077 | ) | | | | | (0.152 | ) | | | | | (0.144 | ) | | | | | (0.002 | ) | | | | | — | | | |
| | | | | | | | | | | | | | | | | | | | | | | | | | | | | | |
| | | | | | | | | | |
Net asset value, end of period | | $ | 8.950 | | | | | $ | 11.050 | | | | | $ | 9.680 | | | | | $ | 8.140 | | | | | $ | 6.960 | | | |
| | | | | | | | | | | | | | | | | | | | | | | | | | | | | | |
| | | | | | | | | | |
Total return3 | | | 10.60% | | | | | | 15.92% | | | | | | 21.00% | | | | | | 16.99% | | | | | | 15.23% | | | |
| | | | | | | | | | |
Ratios and supplemental data: | | | | | | | | | | | | | | | | | | | | | | | | | | | | | | |
Net assets, end of period (000 omitted) | | $ | 93,625 | | | | | $ | 90,354 | | | | | $ | 188,082 | | | | | $ | 124,511 | | | | | $ | 45,978 | | | |
Ratio of expenses to average net assets | | | 0.89% | | | | | | 0.87% | | | | | | 0.85% | | | | | | 0.86% | | | | | | 0.89% | | | |
Ratio of expenses to average net assets prior to fees waived | | | 0.89% | | | | | | 0.87% | | | | | | 0.85% | | | | | | 0.87% | | | | | | 1.02% | | | |
Ratio of net investment income (loss) to average net assets | | | 0.00% | | | | | | 0.06% | | | | | | 0.20% | | | | | | (0.02% | ) | | | | | 0.04% | | | |
Ratio of net investment income (loss) to average net assets prior to fees waived | | | 0.00% | | | | | | 0.06% | | | | | | 0.20% | | | | | | (0.03% | ) | | | | | (0.09% | ) | | |
Portfolio turnover | | | 31% | | | | | | 21% | | | | | | 46% | | | | | | 42% | | | | | | 26% | | | |
| | | | | | | | | | | | | | | | | | | | | | | | | | | | | | | |
| 1 | The average shares outstanding method has been applied for per share information. |
| 2 | Amount is less than 0.001 per share. |
| 3 | Total investment return is based on the change in net asset value of a share during the period and assumes reinvestment of dividends and distributions at net asset value. Total investment return during some of the periods shown reflects a waiver by the manager. Performance would have been lower had the waiver not been in effect. |
See accompanying notes, which are an integral part of the financial statements.
110
Delaware Pooled® Trust — The Large-Cap Growth Equity Portfolio
Selected data for each share of the Portfolio outstanding throughout each period were as follows:
| | | | | | | | | | | | | | | | | | | | | | | | | | | | | | |
| | | Year ended |
| | | 10/31/15 | | | | | 10/31/14 | | | | | 10/31/13 | | | | | 10/31/12 | | | | | 10/31/11 | | | |
Net asset value, beginning of period | | $ | 17.040 | | | | | $ | 14.600 | | | | | $ | 11.470 | | | | | $ | 9.880 | | | | | $ | 8.900 | | | |
| | | | | | | | | | |
Income from investment operations: | | | | | | | | | | | | | | | | | | | | | | | | | | | | | | |
Net investment income1 | | | 0.111 | | | | | | 0.109 | | | | | | 0.062 | | | | | | 0.027 | | | | | | 0.053 | | | |
Net realized and unrealized gain | | | 1.192 | | | | | | 2.381 | | | | | | 3.121 | | | | | | 1.589 | | | | | | 0.962 | | | |
| | | | | | | | | | | | | | | | | | | | | | | | | | | | | | |
Total from investment operations | | | 1.303 | | | | | | 2.490 | | | | | | 3.183 | | | | | | 1.616 | | | | | | 1.015 | | | |
| | | | | | | | | | | | | | | | | | | | | | | | | | | | | | |
| | | | | | | | | | |
Less dividends and distributions from: | | | | | | | | | | | | | | | | | | | | | | | | | | | | | | |
Net investment income | | | (0.110 | ) | | | | | (0.050 | ) | | | | | (0.053 | ) | | | | | (0.026 | ) | | | | | (0.035 | ) | | |
Net realized gain | | | (1.443 | ) | | | | | — | | | | | | — | | | | | | — | | | | | | — | | | |
| | | | | | | | | | | | | | | | | | | | | | | | | | | | | | |
Total dividends and distributions | | | (1.553 | ) | | | | | (0.050 | ) | | | | | (0.053 | ) | | | | | (0.026 | ) | | | | | (0.035 | ) | | |
| | | | | | | | | | | | | | | | | | | | | | | | | | | | | | |
| | | | | | | | | | |
Net asset value, end of period | | $ | 16.790 | | | | | $ | 17.040 | | | | | $ | 14.600 | | | | | $ | 11.470 | | | | | $ | 9.880 | | | |
| | | | | | | | | | | | | | | | | | | | | | | | | | | | | | |
| | | | | | | | | | |
Total return2 | | | 8.06% | | | | | | 17.10% | | | | | | 27.86% | | | | | | 16.40% | | | | | | 11.43% | | | |
| | | | | | | | | | |
Ratios and supplemental data: | | | | | | | | | | | | | | | | | | | | | | | | | | | | | | |
Net assets, end of period (000 omitted) | | $ | 313,511 | | | | | $ | 277,322 | | | | | $ | 254,958 | | | | | $ | 216,467 | | | | | $ | 170,531 | | | |
Ratio of expenses to average net assets | | | 0.64% | | | | | | 0.64% | | | | | | 0.65% | | | | | | 0.65% | | | | | | 0.64% | | | |
Ratio of net investment income to average net assets | | | 0.67% | | | | | | 0.69% | | | | | | 0.48% | | | | | | 0.25% | | | | | | 0.55% | | | |
Portfolio turnover | | | 49% | | | | | | 30% | | | | | | 38% | | | | | | 40%3 | | | | | | 19% | | | |
| | | | | | | | | | | | | | | | | | | | | | | | | | | | | | | |
| 1 | The average shares outstanding method has been applied for per share information. |
| 2 | Total investment return is based on the change in net asset value of a share during the period and assumes reinvestment of dividends and distributions at net asset value. |
| 3 | Excludes the value of Portfolio securities received or delivered as a result of in-kind purchases or redemptions of the Portfolio’s capital shares. |
See accompanying notes, which are an integral part of the financial statements.
Financial highlights
Delaware Pooled® Trust — The Focus Smid-Cap Growth Equity Portfolio
Selected data for each share of the Portfolio outstanding throughout each period were as follows:
| | | | | | | | | | | | | | | | | | | | | | | | | | | | | | |
| | | Year ended |
| | | 10/31/15 | | | | | 10/31/14 | | | | | 10/31/13 | | | | | 10/31/12 | | | | | 10/31/11 | | | |
Net asset value, beginning of period | | $ | 21.850 | | | | | $ | 20.720 | | | | | $ | 15.500 | | | | | $ | 14.810 | | | | | $ | 12.290 | | | |
| | | | | | | | | | |
Income (loss) from investment operations: | | | | | | | | | | | | | | | | | | | | | | | | | | | | | | |
Net investment income (loss)1 | | | 0.072 | | | | | | (0.010 | ) | | | | | (0.005 | ) | | | | | (0.022 | ) | | | | | 0.079 | | | |
Net realized and unrealized gain | | | 1.486 | | | | | | 1.152 | | | | | | 5.446 | | | | | | 0.723 | | | | | | 2.547 | | | |
| | | | | | | | | | | | | | | | | | | | | | | | | | | | | | |
Total from investment operations | | | 1.558 | | | | | | 1.142 | | | | | | 5.441 | | | | | | 0.701 | | | | | | 2.626 | | | |
| | | | | | | | | | | | | | | | | | | | | | | | | | | | | | |
| | | | | | | | | | |
Less dividends and distributions from: | | | | | | | | | | | | | | | | | | | | | | | | | | | | | | |
Net investment income | | | (0.078 | ) | | | | | (0.012 | ) | | | | | — | | | | | | (0.011 | ) | | | | | (0.106 | ) | | |
Net realized gain | | | (4.890 | ) | | | | | — | | | | | | (0.221 | ) | | | | | — | | | | | | — | | | |
| | | | | | | | | | | | | | | | | | | | | | | | | | | | | | |
Total dividends and distributions | | | (4.968 | ) | | | | | (0.012 | ) | | | | | (0.221 | ) | | | | | (0.011 | ) | | | | | (0.106 | ) | | |
| | | | | | | | | | | | | | | | | | | | | | | | | | | | | | |
| | | | | | | | | | |
Net asset value, end of period | | $ | 18.440 | | | | | $ | 21.850 | | | | | $ | 20.720 | | | | | $ | 15.500 | | | | | $ | 14.810 | | | |
| | | | | | | | | | | | | | | | | | | | | | | | | | | | | | |
| | | | | | | | | | |
Total return2 | | | 8.30% | | | | | | 5.51% | | | | | | 35.56% | | | | | | 4.74% | | | | | | 21.44% | | | |
| | | | | | | | | | |
Ratios and supplemental data: | | | | | | | | | | | | | | | | | | | | | | | | | | | | | | |
Net assets, end of period (000 omitted) | | $ | 51,443 | | | | | $ | 43,281 | | | | | $ | 89,434 | | | | | $ | 17,853 | | | | | $ | 16,721 | | | |
Ratio of expenses to average net assets | | | 0.92% | | | | | | 0.90% | | | | | | 0.89% | | | | | | 0.92% | | | | | | 0.92% | | | |
Ratio of expenses to average net assets prior to fees waived | | | 0.92% | | | | | | 0.91% | | | | | | 0.89% | | | | | | 0.94% | | | | | | 1.05% | | | |
Ratio of net investment income (loss) to average net assets | | | 0.38% | | | | | | (0.05% | ) | | | | | (0.03% | ) | | | | | (0.14% | ) | | | | | 0.54% | | | |
Ratio of net investment income (loss) to average net assets prior to fees waived | | | 0.38% | | | | | | (0.06% | ) | | | | | (0.03% | ) | | | | | (0.16% | ) | | | | | 0.41% | | | |
Portfolio turnover | | | 21% | | | | | | 40% | | | | | | 26% | | | | | | 44% | | | | | | 16% | | | |
| | | | | | | | | | | | | | | | | | | | | | | | | | | | | | | |
| 1 | The average shares outstanding method has been applied for per share information. |
| 2 | Total investment return is based on the change in net asset value of a share during the period and assumes reinvestment of dividends and distributions at net asset value. Total investment return during all of the periods shown reflects a waiver by the manager. Performance would have been lower had the waiver not been in effect. |
See accompanying notes, which are an integral part of the financial statements.
112
Delaware Pooled® Trust — The High-Yield Bond Portfolio
Selected data for each share of the Portfolio outstanding throughout each period were as follows:
| | | | | | | | | | | | | | | | | | | | | | | | | | | | | | |
| | | Year ended |
| | | 10/31/15 | | | | | 10/31/14 | | | | | 10/31/13 | | | | | 10/31/12 | | | | | 10/31/11 | | | |
Net asset value, beginning of period | | $ | 8.610 | | | | | $ | 8.720 | | | | | $ | 8.350 | | | | | $ | 7.830 | | | | | $ | 8.110 | | | |
| | | | | | | | | | |
Income (loss) from investment operations: | | | | | | | | | | | | | | | | | | | | | | | | | | | | | | |
Net investment income1 | | | 0.485 | | | | | | 0.496 | | | | | | 0.529 | | | | | | 0.592 | | | | | | 0.613 | | | |
Net realized and unrealized gain (loss) | | | (0.782 | ) | | | | | (0.063 | ) | | | | | 0.291 | | | | | | 0.511 | | | | | | (0.274 | ) | | |
| | | | | | | | | | | | | | | | | | | | | | | | | | | | | | |
Total from investment operations | | | (0.297 | ) | | | | | 0.433 | | | | | | 0.820 | | | | | | 1.103 | | | | | | 0.339 | | | |
| | | | | | | | | | | | | | | | | | | | | | | | | | | | | | |
| | | | | | | | | | |
Less dividends and distributions from: | | | | | | | | | | | | | | | | | | | | | | | | | | | | | | |
Net investment income | | | (0.423 | ) | | | | | (0.543 | ) | | | | | (0.450 | ) | | | | | (0.583 | ) | | | | | (0.619 | ) | | |
Net realized gain | | | (0.110 | ) | | | | | — | | | | | | — | | | | | | — | | | | | | — | | | |
| | | | | | | | | | | | | | | | | | | | | | | | | | | | | | |
Total dividends and distributions | | | (0.533 | ) | | | | | (0.543 | ) | | | | | (0.450 | ) | | | | | (0.583 | ) | | | | | (0.619 | ) | | |
| | | | | | | | | | | | | | | | | | | | | | | | | | | | | | |
| | | | | | | | | | |
Net asset value, end of period | | $ | 7.780 | | | | | $ | 8.610 | | | | | $ | 8.720 | | | | | $ | 8.350 | | | | | $ | 7.830 | | | |
| | | | | | | | | | | | | | | | | | | | | | | | | | | | | | |
| | | | | | | | | | |
Total return2 | | | (3.41% | ) | | | | | 5.23% | | | | | | 10.24% | | | | | | 15.31% | | | | | | 4.52% | | | |
| | | | | | | | | | |
Ratios and supplemental data: | | | | | | | | | | | | | | | | | | | | | | | | | | | | | | |
Net assets, end of period (000 omitted) | | $ | 206,129 | | | | | $ | 143,182 | | | | | $ | 135,310 | | | | | $ | 113,048 | | | | | $ | 57,840 | | | |
Ratio of expenses to average net assets | | | 0.56% | | | | | | 0.57% | | | | | | 0.57% | | | | | | 0.58% | | | | | | 0.59% | | | |
Ratio of expenses to average net assets prior to fees waived | | | 0.56% | | | | | | 0.57% | | | | | | 0.57% | | | | | | 0.58% | | | | | | 0.60% | | | |
Ratio of net investment income to average net assets | | | 6.09% | | | | | | 5.76% | | | | | | 6.29% | | | | | | 7.53% | | | | | | 7.82% | | | |
Ratio of net investment income to average net assets prior to fees waived | | | 6.09% | | | | | | 5.76% | | | | | | 6.29% | | | | | | 7.53% | | | | | | 7.81% | | | |
Portfolio turnover | | | 84% | | | | | | 101% | | | | | | 90% | | | | | | 68% | | | | | | 77% | | | |
| | | | | | | | | | | | | | | | | | | | | | | | | | | | | | | |
| 1 | The average shares outstanding method has been applied for per share information. |
| 2 | Total investment return is based on the change in net asset value of a share during the period and assumes reinvestment of dividends and distributions at net asset value. Total investment return during some of the periods shown reflects a waiver by the manager. Performance would have been lower had the waiver not been in effect. |
See accompanying notes, which are an integral part of the financial statements.
Financial highlights
Delaware Pooled® Trust — The Core Plus Fixed Income Portfolio
Selected data for each share of the Portfolio outstanding throughout each period were as follows:
| | | | | | | | | | | | | | | | | | | | | | | | | | | | | | |
| | | Year ended |
| | | 10/31/15 | | | | | 10/31/14 | | | | | 10/31/13 | | | | | 10/31/12 | | | | | 10/31/11 | | | |
Net asset value, beginning of period | | $ | 10.370 | | | | | $ | 10.100 | | | | | $ | 10.540 | | | | | $ | 10.050 | | | | | $ | 10.130 | | | |
| | | | | | | | | | |
Income (loss) from investment operations: | | | | | | | | | | | | | | | | | | | | | | | | | | | | | | |
Net investment income1 | | | 0.240 | | | | | | 0.294 | | | | | | 0.289 | | | | | | 0.320 | | | | | | 0.369 | | | |
Net realized and unrealized gain (loss) | | | (0.109 | ) | | | | | 0.201 | | | | | | (0.346 | ) | | | | | 0.460 | | | | | | 0.081 | | | |
| | | | | | | | | | | | | | | | | | | | | | | | | | | | | | |
Total from investment operations | | | 0.131 | | | | | | 0.495 | | | | | | (0.057 | ) | | | | | 0.780 | | | | | | 0.450 | | | |
| | | | | | | | | | | | | | | | | | | | | | | | | | | | | | |
| | | | | | | | | | |
Less dividends and distributions from: | | | | | | | | | | | | | | | | | | | | | | | | | | | | | | |
Net investment income | | | (0.211 | ) | | | | | (0.225 | ) | | | | | (0.383 | ) | | | | | (0.290 | ) | | | | | (0.530 | ) | | |
| | | | | | | | | | | | | | | | | | | | | | | | | | | | | | |
Total dividends and distributions | | | (0.211 | ) | | | | | (0.225 | ) | | | | | (0.383 | ) | | | | | (0.290 | ) | | | | | (0.530 | ) | | |
| | | | | | | | | | | | | | | | | | | | | | | | | | | | | | |
| | | | | | | | | | |
Net asset value, end of period | | $ | 10.290 | | | | | $ | 10.370 | | | | | $ | 10.100 | | | | | $ | 10.540 | | | | | $ | 10.050 | | | |
| | | | | | | | | | | | | | | | | | | | | | | | | | | | | | |
| | | | | | | | | | |
Total return2 | | | 1.29% | | | | | | 5.02% | | | | | | (0.55% | ) | | | | | 7.95% | | | | | | 4.80% | | | |
| | | | | | | | | | |
Ratios and supplemental data: | | | | | | | | | | | | | | | | | | | | | | | | | | | | | | |
Net assets, end of period (000 omitted) | | $ | 128,094 | | | | | $ | 77,036 | | | | | $ | 56,641 | | | | | $ | 60,313 | | | | | $ | 53,851 | | | |
Ratio of expenses to average net assets | | | 0.45% | | | | | | 0.45% | | | | | | 0.45% | | | | | | 0.45% | | | | | | 0.45% | | | |
Ratio of expenses to average net assets prior to fees waived | | | 0.61% | | | | | | 0.65% | | | | | | 0.70% | | | | | | 0.62% | | | | | | 0.64% | | | |
Ratio of net investment income to average net assets | | | 2.33% | | | | | | 2.90% | | | | | | 2.84% | | | | | | 3.14% | | | | | | 3.77% | | | |
Ratio of net investment income to average net assets prior to fees waived | | | 2.17% | | | | | | 2.70% | | | | | | 2.59% | | | | | | 2.97% | | | | | | 3.58% | | | |
Portfolio turnover | | | 436% | | | | | | 339% | | | | | | 358% | | | | | | 327% | | | | | | 273% | | | |
| | | | | | | | | | | | | | | | | | | | | | | | | | | | | | | |
| 1 | The average shares outstanding method has been applied for per share information. |
| 2 | Total investment return is based on the change in net asset value of a share during the period and assumes reinvestment of dividends and distributions at net asset value. Total investment return during all of the periods shown reflects a waiver by the manager. Performance would have been lower had the waiver not been in effect. |
See accompanying notes, which are an integral part of the financial statements.
114
Delaware Pooled® Trust — The International Equity Portfolio
Selected data for each share of the Portfolio outstanding throughout each period were as follows:
| | | | | | | | | | | | | | | | | | | | | | | | | | | | | | |
| | | Year ended |
| | | 10/31/15 | | | | | 10/31/14 | | | | | 10/31/13 | | | | | 10/31/12 | | | | | 10/31/11 | | | |
Net asset value, beginning of period | | $ | 15.120 | | | | | $ | 15.340 | | | | | $ | 12.840 | | | | | $ | 13.120 | | | | | $ | 13.680 | | | |
| | | | | | | | | | |
Income (loss) from investment operations: | | | | | | | | | | | | | | | | | | | | | | | | | | | | | | |
Net investment income1 | | | 0.375 | | | | | | 0.629 | | | | | | 0.337 | | | | | | 0.441 | | | | | | 0.471 | | | |
Net realized and unrealized gain (loss) | | | (0.577 | ) | | | | | (0.429 | ) | | | | | 2.700 | | | | | | (0.183 | ) | | | | | (0.596 | ) | | |
| | | | | | | | | | | | | | | | | | | | | | | | | | | | | | |
Total from investment operations | | | (0.202 | ) | | | | | 0.200 | | | | | | 3.037 | | | | | | 0.258 | | | | | | (0.125 | ) | | |
| | | | | | | | | | | | | | | | | | | | | | | | | | | | | | |
| | | | | | | | | | |
Less dividends and distributions from: | | | | | | | | | | | | | | | | | | | | | | | | | | | | | | |
Net investment income | | | (0.678 | ) | | | | | (0.420 | ) | | | | | (0.537 | ) | | | | | (0.538 | ) | | | | | (0.435 | ) | | |
| | | | | | | | | | | | | | | | | | | | | | | | | | | | | | |
Total dividends and distributions | | | (0.678 | ) | | | | | (0.420 | ) | | | | | (0.537 | ) | | | | | (0.538 | ) | | | | | (0.435 | ) | | |
| | | | | | | | | | | | | | | | | | | | | | | | | | | | | | |
| | | | | | | | | | |
Net asset value, end of period | | $ | 14.240 | | | | | $ | 15.120 | | | | | $ | 15.340 | | | | | $ | 12.840 | | | | | $ | 13.120 | | | |
| | | | | | | | | | | | | | | | | | | | | | | | | | | | | | |
| | | | | | | | | | |
Total return2 | | | (1.39% | ) | | | | | 1.46% | | | | | | 24.59% | | | | | | 2.26% | | | | | | (0.88% | ) | | |
| | | | | | | | | | |
Ratios and supplemental data: | | | | | | | | | | | | | | | | | | | | | | | | | | | | | | |
Net assets, end of period (000 omitted) | | $ | 358,381 | | | | | $ | 446,527 | | | | | $ | 491,683 | | | | | $ | 467,827 | | | | | $ | 589,109 | | | |
Ratio of expenses to average net assets | | | 0.88% | | | | | | 0.86% | | | | | | 0.88% | | | | | | 0.85% | | | | | | 0.77% | | | |
Ratio of net investment income to average net assets | | | 2.54% | | | | | | 4.04% | | | | | | 2.48% | | | | | | 3.56% | | | | | | 3.48% | | | |
Portfolio turnover | | | 28%3 | | | | | | 21% | | | | | | 20% | | | | | | 16%3 | | | | | | 22% | | | |
| | | | | | | | | | | | | | | | | | | | | | | | | | | | | | | |
| 1 | The average shares outstanding method has been applied for per share information. |
| 2 | Total investment return is based on the change in net asset value of a share during the period and assumes reinvestment of dividends and distributions at net asset value. |
| 3 | Excludes the value of Portfolio securities received or delivered as a result of in-kind purchases or redemptions of the Portfolio’s capital shares. |
See accompanying notes, which are an integral part of the financial statements.
Financial highlights
Delaware Pooled® Trust — The Labor Select International Equity Portfolio
Selected data for each share of the Portfolio outstanding throughout each period were as follows:
| | | | | | | | | | | | | | | | | | | | | | | | | | | | | | |
| | | Year ended |
| | | 10/31/15 | | | | | 10/31/14 | | | | | 10/31/13 | | | | | 10/31/12 | | | | | 10/31/11 | | | |
Net asset value, beginning of period | | $ | 14.740 | | | | | $ | 15.070 | | | | | $ | 12.650 | | | | | $ | 12.920 | | | | | $ | 13.570 | | | |
| | | | | | | | | | |
Income (loss) from investment operations: | | | | | | | | | | | | | | | | | | | | | | | | | | | | | | |
Net investment income1 | | | 0.374 | | | | | | 0.693 | | | | | | 0.324 | | | | | | 0.441 | | | | | | 0.451 | | | |
Net realized and unrealized gain (loss) | | | (0.524 | ) | | | | | (0.573 | ) | | | | | 2.516 | | | | | | (0.176 | ) | | | | | (0.695 | ) | | |
| | | | | | | | | | | | | | | | | | | | | | | | | | | | | | |
Total from investment operations | | | (0.150 | ) | | | | | 0.120 | | | | | | 2.840 | | | | | | 0.265 | | | | | | (0.244 | ) | | |
| | | | | | | | | | | | | | | | | | | | | | | | | | | | | | |
| | | | | | | | | | |
Less dividends and distributions from: | | | | | | | | | | | | | | | | | | | | | | | | | | | | | | |
Net investment income | | | (0.800 | ) | | | | | (0.450 | ) | | | | | (0.420 | ) | | | | | (0.535 | ) | | | | | (0.406 | ) | | |
| | | | | | | | | | | | | | | | | | | | | | | | | | | | | | |
Total dividends and distributions | | | (0.800 | ) | | | | | (0.450 | ) | | | | | (0.420 | ) | | | | | (0.535 | ) | | | | | (0.406 | ) | | |
| | | | | | | | | | | | | | | | | | | | | | | | | | | | | | |
| | | | | | | | | | |
Net asset value, end of period | | $ | 13.790 | | | | | $ | 14.740 | | | | | $ | 15.070 | | | | | $ | 12.650 | | | | | $ | 12.920 | | | |
| | | | | | | | | | | | | | | | | | | | | | | | | | | | | | |
| | | | | | | | | | |
Total return2 | | | (0.98% | ) | | | | | 0.86% | | | | | | 23.11% | | | | | | 2.40% | | | | | | (1.79% | ) | | |
| | | | | | | | | | |
Ratios and supplemental data: | | | | | | | | | | | | | | | | | | | | | | | | | | | | | | |
Net assets, end of period (000 omitted) | | $ | 360,650 | | | | | $ | 373,497 | | | | | $ | 506,102 | | | | | $ | 509,527 | | | | | $ | 572,642 | | | |
Ratio of expenses to average net assets | | | 0.87% | | | | | | 0.86% | | | | | | 0.88% | | | | | | 0.87% | | | | | | 0.85% | | | |
Ratio of net investment income to average net assets | | | 2.63% | | | | | | 4.54% | | | | | | 2.43% | | | | | | 3.59% | | | | | | 3.37% | | | |
Portfolio turnover | | | 20% | | | | | | 23% | | | | | | 16% | | | | | | 17% | | | | | | 20% | | | |
| | | | | | | | | | | | | | | | | | | | | | | | | | | | | | | |
| 1 | The average shares outstanding method has been applied for per share information. |
| 2 | Total investment return is based on the change in net asset value of a share during the period and assumes reinvestment of dividends and distributions at net asset value. |
See accompanying notes, which are an integral part of the financial statements.
116
Delaware Pooled® Trust — The Emerging Markets Portfolio
Selected data for each share of the Portfolio outstanding throughout each period were as follows:
| | | | | | | | | | | | | | | | | | | | | | | | | | | | | | |
| | | Year ended |
| | | 10/31/15 | | | | | 10/31/14 | | | | | 10/31/13 | | | | | 10/31/12 | | | | | 10/31/11 | | | |
Net asset value, beginning of period | | $ | 9.750 | | | | | $ | 10.110 | | | | | $ | 10.160 | | | | | $ | 10.510 | | | | | $ | 11.420 | | | |
| | | | | | | | | | |
Income (loss) from investment operations: | | | | | | | | | | | | | | | | | | | | | | | | | | | | | | |
Net investment income1 | | | 0.159 | | | | | | 0.216 | | | | | | 0.175 | | | | | | 0.177 | | | | | | 0.266 | | | |
Net realized and unrealized gain (loss) | | | (1.771 | ) | | | | | (0.080 | ) | | | | | 0.158 | | | | | | 0.467 | | | | | | (0.873 | ) | | |
| | | | | | | | | | | | | | | | | | | | | | | | | | | | | | |
Total from investment operations | | | (1.612 | ) | | | | | 0.136 | | | | | | 0.333 | | | | | | 0.644 | | | | | | (0.607 | ) | | |
| | | | | | | | | | | | | | | | | | | | | | | | | | | | | | |
| | | | | | | | | | |
Less dividends and distributions from: | | | | | | | | | | | | | | | | | | | | | | | | | | | | | | |
Net investment income | | | (0.221 | ) | | | | | (0.178 | ) | | | | | (0.239 | ) | | | | | (0.220 | ) | | | | | (0.330 | ) | | |
Net realized gain | | | (0.471 | ) | | | | | (0.334 | ) | | | | | (0.164 | ) | | | | | (0.798 | ) | | | | | — | | | |
| | | | | | | | | | | | | | | | | | | | | | | | | | | | | | |
Total dividends and distributions | | | (0.692 | ) | | | | | (0.512 | ) | | | | | (0.403 | ) | | | | | (1.018 | ) | | | | | (0.330 | ) | | |
| | | | | | | | | | | | | | | | | | | | | | | | | | | | | | |
| | | | | | | | | | |
Reimbursement fees: | | | | | | | | | | | | | | | | | | | | | | | | | | | | | | |
Purchase reimbursement fees1,2 | | | 0.004 | | | | | | 0.005 | | | | | | 0.014 | | | | | | 0.006 | | | | | | 0.005 | | | |
Redemption reimbursement fees1,2 | | | 0.020 | | | | | | 0.011 | | | | | | 0.006 | | | | | | 0.018 | | | | | | 0.022 | | | |
| | | | | | | | | | | | | | | | | | | | | | | | | | | | | | |
| | | 0.024 | | | | | | 0.016 | | | | | | 0.020 | | | | | | 0.024 | | | | | | 0.027 | | | |
| | | | | | | | | | | | | | | | | | | | | | | | | | | | | | |
| | | | | | | | | | |
Net asset value, end of period | | $ | 7.470 | | | | | $ | 9.750 | | | | | $ | 10.110 | | | | | $ | 10.160 | | | | | $ | 10.510 | | | |
| | | | | | | | | | | | | | | | | | | | | | | | | | | | | | |
| | | | | | | | | | |
Total return3 | | | (17.11% | ) | | | | | 1.89% | | | | | | 3.36% | | | | | | 7.81% | | | | | | (5.22% | ) | | |
| | | | | | | | | | |
Ratios and supplemental data: | | | | | | | | | | | | | | | | | | | | | | | | | | | | | | |
Net assets, end of period (000 omitted) | | $ | 172,674 | | | | | $ | 310,211 | | | | | $ | 333,884 | | | | | $ | 316,809 | | | | | $ | 531,527 | | | |
Ratio of expenses to average net assets | | | 1.19% | | | | | | 1.16% | | | | | | 1.20% | | | | | | 1.20% | | | | | | 1.14% | | | |
Ratio of net investment income to average net assets | | | 1.90% | | | | | | 2.25% | | | | | | 1.72% | | | | | | 1.80% | | | | | | 2.41% | | | |
Portfolio turnover | | | 27% | | | | | | 30% | | | | | | 40%4 | | | | | | 38%4 | | | | | | 39% | | | |
| | | | | | | | | | | | | | | | | | | | | | | | | | | | | | | |
| 1 | The average shares outstanding method has been applied for per share information. |
| 2 | The Portfolio charges a 0.55% purchase reimbursement fee and a 0.55% redemption reimbursement fee, which are retained by the Portfolio. |
| 3 | Total investment return is based on the change in net asset value of a share during the period and assumes reinvestment of dividends and distributions at net asset value. Total investment return does not reflect the purchase reimbursement fee and redemption reimbursement fee. |
| 4 | Excludes the value of Portfolio securities received or delivered as a result of in-kind purchases or redemptions of the Portfolio’s capital shares. |
See accompanying notes, which are an integral part of the financial statements.
Financial highlights
Delaware Pooled® Trust — The Emerging Markets Portfolio II
Selected data for each share of the Portfolio outstanding throughout each period were as follows:
| | | | | | | | | | | | | | | | | | | | | | | | | | | | | | |
| | | Year ended | | 6/23/101 to | | | |
| | | 10/31/15 | | | | | 10/31/14 | | | | | 10/31/13 | | | | | 10/31/12 | | | | | 10/31/10 | | | |
| | | | | | | | | | | | | | | | | | | | | | | | | | | | | | | |
Net asset value, beginning of period | | $ | 9.880 | | | | | $ | 9.650 | | | | | $ | 8.170 | | | | | $ | 8.550 | | | | | $ | 9.660 | | | |
| | | | | | | | | | |
Income (loss) from investment operations: | | | | | | | | | | | | | | | | | | | | | | | | | | | | | | |
Net investment income2 | | | 0.035 | | | | | | 0.062 | | | | | | 0.075 | | | | | | 0.070 | | | | | | 0.089 | | | |
Net realized and unrealized gain (loss) | | | (2.142 | ) | | | | | 0.297 | | | | | | 1.446 | | | | | | (0.028 | ) | | | | | (1.099 | ) | | |
| | | | | | | | | | | | | | | | | | | | | | | | | | | | | | |
Total from investment operations | | | (2.107 | ) | | | | | 0.359 | | | | | | 1.521 | | | | | | 0.042 | | | | | | (1.010 | ) | | |
| | | | | | | | | | | | | | | | | | | | | | | | | | | | | | |
| | | | | | | | | | |
Less dividends and distributions from: | | | | | | | | | | | | | | | | | | | | | | | | | | | | | | |
Net investment income | | | (0.139 | ) | | | | | (0.092 | ) | | | | | (0.041 | ) | | | | | (0.128 | ) | | | | | (0.026 | ) | | |
Net realized gain | | | (0.264 | ) | | | | | (0.037 | ) | | | | | — | | | | | | (0.294 | ) | | | | | (0.074 | ) | | |
| | | | | | | | | | | | | | | | | | | | | | | | | | | | | | |
Total dividends and distributions | | | (0.403 | ) | | | | | (0.129 | ) | | | | | (0.041 | ) | | | | | (0.422 | ) | | | | | (0.100 | ) | | |
| | | | | | | | | | | | | | | | | | | | | | | | | | | | | | |
| | | | | | | | | | |
Net asset value, end of period | | $ | 7.370 | | | | | $ | 9.880 | | | | | $ | 9.650 | | | | | $ | 8.170 | | | | | $ | 8.550 | | | |
| | | | | | | | | | | | | | | | | | | | | | | | | | | | | | |
| | | | | | | | | | |
Total return3 | | | (21.84% | ) | | | | | 3.80% | | | | | | 18.68% | | | | | | 0.89% | | | | | | (10.58% | ) | | |
| | | | | | | | | | |
Ratios and supplemental data: | | | | | | | | | | | | | | | | | | | | | | | | | | | | | | |
Net assets, end of period (000 omitted) | | $ | 33,314 | | | | | $ | 42,515 | | | | | $ | 42,223 | | | | | $ | 29,686 | | | | | $ | 15,339 | | | |
Ratio of expenses to average net assets | | | 1.21% | | | | | | 1.20% | | | | | | 1.20% | | | | | | 1.20% | | | | | | 1.25% | | | |
Ratio of expenses to average net assets prior to fees waived | | | 1.35% | | | | | | 1.32% | | | | | | 1.36% | | | | | | 1.41% | | | | | | 1.64% | �� | | |
Ratio of net investment income to average net assets | | | 0.43% | | | | | | 0.64% | | | | | | 0.85% | | | | | | 0.87% | | | | | | 0.94% | | | |
Ratio of net investment income to average net assets prior to fees waived | | | 0.29% | | | | | | 0.52% | | | | | | 0.69% | | | | | | 0.66% | | | | | | 0.55% | | | |
Portfolio turnover | | | 8% | | | | | | 11% | | | | | | 11% | | | | | | 12% | | | | | | 23% | | | |
| | | | | | | | | | | | | | | | | | | | | | | | | | | | | | | |
| 1 | Date of commencement of operations; ratios have been annualized and total return and portfolio turnover have not been annualized. |
| 2 | The average shares outstanding method has been applied for per share information. |
| 3 | Total investment return is based on the change in net asset value of a share during the period and assumes reinvestment of dividends and distributions at net asset value. Total investment return during all of the periods shown reflects a waiver by the manager. Performance would have been lower had the waiver not been in effect. |
See accompanying notes, which are an integral part of the financial statements.
118
Notes to financial statements
Delaware Pooled® Trust
October 31, 2015
Delaware Pooled Trust (Trust) is organized as a Delaware statutory trust and offers 11 separate Portfolios. These financial statements and the related notes pertain to The Large-Cap Value Equity Portfolio, The Select 20 Portfolio, The Large-Cap Growth Equity Portfolio, The Focus Smid-Cap Growth Equity Portfolio, The High-Yield Bond Portfolio, The Core Plus Fixed Income Portfolio, The International Equity Portfolio, The Labor Select International Equity Portfolio, The Emerging Markets Portfolio, and The Emerging Markets Portfolio II (each, a Portfolio, or collectively, Portfolios). The Real Estate Investment Trust Portfolio is included in a separate report. The Trust is an open-end investment company. Each Portfolio is considered diversified under the Investment Company Act of 1940, as amended, except for The Select 20 Portfolio which is non-diversified. Each Portfolio offers one class of shares.
The investment objective of The Large-Cap Value Equity Portfolio is to seek long-term capital appreciation.
The investment objective of The Select 20 Portfolio is to seek long-term capital appreciation.
The investment objective of The Large-Cap Growth Equity Portfolio is to seek capital appreciation.
The investment objective of The Focus Smid-Cap Growth Equity Portfolio is to seek long-term capital appreciation.
The investment objective of The High-Yield Bond Portfolio is to seek high total return.
The investment objective of The Core Plus Fixed Income Portfolio is to seek maximum long-term total return, consistent with reasonable risk.
The investment objective of The International Equity Portfolio is to seek maximum long-term total return.
The investment objective of The Labor Select International Equity Portfolio is to seek maximum long-term total return.
The investment objective of The Emerging Markets Portfolio is to seek long-term capital appreciation.
The investment objective of The Emerging Markets Portfolio II is to seek long-term capital appreciation.
1. Significant Accounting Policies
The following accounting policies are in accordance with U.S. generally accepted accounting principles (U.S. GAAP) and are consistently followed by the Portfolios.
Security Valuation — Equity securities, except those traded on The Nasdaq Stock Market LLC (Nasdaq), are valued at the last quoted sales price as of the time of the regular close of the New York Stock Exchange on the valuation date. Equity securities traded on the Nasdaq are valued in accordance with the Nasdaq Official Closing Price, which may not be the last sales price. If, on a particular day, an equity security does not trade, the mean between the bid and ask prices will be used, which approximates fair value. Securities listed on a foreign exchange are normally valued at the last quoted sales price on the valuation date. Debt securities, credit default swap (CDS) contracts, and interest rate swap contracts are valued based upon valuations provided by an independent pricing service or broker/counterparty and reviewed by management. To the extent current market prices are not available, the pricing service may take into account developments related to the specific security, as well as transactions in comparable securities. U.S. government and agency securities are valued at the mean between the bid and ask prices, which approximates fair value. Valuations for fixed income securities utilize matrix systems, which reflect such factors as security prices, yields, maturities, and ratings, and are supplemented by dealer and exchange quotations. For asset-backed securities, collateralized mortgage obligations, commercial mortgage securities, and U.S. government agency mortgage securities, pricing vendors utilize matrix pricing which considers prepayment speed; attributes of the collateral; yield or price of bonds of comparable quality, coupon, maturity, and type as well as broker/dealer-supplied prices. Swap prices are derived using daily swap curves and models that incorporate a number of market data factors, such as discounted cash flows, trades, and values of the underlying reference instruments. Foreign currency exchange contracts and foreign cross currency exchange contracts are valued at the mean between the bid and ask prices, which approximates fair value. Interpolated values are derived when the settlement date of the contract is an interim date for which quotations are not available. Futures contracts and options on futures contracts are valued at the daily quoted settlement prices. Exchange-traded options are valued at the last reported sale price or, if no sales are reported, at the mean between the last reported bid and ask prices, which approximates fair value. Generally, other securities and assets for which market quotations are not readily available are valued at fair value as determined in good faith under the direction of the Trust’s Board of Trustees (Board). In determining whether market quotations are readily available or fair valuation will be used, various factors will be taken into consideration, such as market closures or suspension of trading in a security. The Portfolios may use fair value pricing more frequently for securities traded primarily in non-U.S. markets because, among other things, most foreign markets close well before the Portfolios value their securities, generally as of 4:00 p.m. Eastern time. The earlier close of these foreign markets gives rise to the possibility that significant
Notes to financial statements
Delaware Pooled® Trust
1. Significant Accounting Policies (continued)
events, including broad market moves, government actions or pronouncements, aftermarket trading, or news events may have occurred in the interim. Whenever such a significant event occurs, the Portfolios may value foreign securities using fair value prices based on third-party vendor modeling tools (international fair value pricing).
Federal and Foreign Income Taxes — No provision for federal income taxes has been made as each Portfolio intends to continue to qualify for federal income tax purposes as a regulated investment company under Subchapter M of the Internal Revenue Code of 1986, as amended, and make the requisite distributions to shareholders. The Portfolios evaluate tax positions taken or expected to be taken in the course of preparing each Portfolio’s tax returns to determine whether the tax positions are “more-likely-than-not” of being sustained by the applicable tax authority. Tax positions not deemed to meet the “more-likely-than-not” threshold are recorded as a tax benefit or expense in the current year. Management has analyzed each Portfolio’s tax positions taken for all open federal income tax years (Oct. 31, 2012–Oct. 31, 2015), and has concluded that no provision for federal income tax is required in any Portfolio’s financial statements. In regard to foreign taxes only, each Portfolio has open tax years in certain foreign countries in which it invests that may date back to the inception of each Portfolio.
Repurchase Agreements — Each Portfolio may purchase certain U.S. government securities subject to the counterparty’s agreement to repurchase them at an agreed upon date and price. The counterparty will be required on a daily basis to maintain the value of the collateral subject to the agreement at not less than the repurchase price (including accrued interest). The agreements are conditioned upon the collateral being deposited under the Federal Reserve book-entry system with each Portfolio’s custodian or a third-party sub-custodian. In the event of default or bankruptcy by the other party to the agreement, retention of the collateral may be subject to legal proceedings. All open repurchase agreements as of the date of this report were entered into on Oct. 30, 2015 and will mature on the next business day.
To Be Announced Trades (TBA) — Certain Portfolios may contract to purchase or sell securities for a fixed price at a transaction date beyond the customary settlement period (examples: when issued, delayed delivery, forward commitment, or TBA transactions) consistent with each Portfolio’s ability to manage their investment portfolio and meet redemption requests. These transactions involve a commitment by each Portfolio to purchase or deliver securities for a predetermined price or yield with payment and delivery taking place more than three days in the future, or after a period longer than the customary settlement period for that type of security. No interest will be earned by each Portfolio on such purchases until the securities are delivered or the transaction is completed; however, the market value may change prior to delivery.
Foreign Currency Transactions — Transactions denominated in foreign currencies are recorded at the prevailing exchange rates on the valuation date in accordance with each Portfolio’s prospectus. The value of all assets and liabilities denominated in foreign currencies is translated daily into U.S. dollars at the exchange rate of such currencies against the U.S. dollar. Transaction gains or losses resulting from changes in exchange rates during the reporting period or upon settlement of the foreign currency transaction are reported in operations for the current period. Each Portfolio generally bifurcates that portion of realized gains and losses on investments in debt securities which is due to changes in foreign exchange rates from that which is due to changes in market prices of debt securities. That portion of gains (losses) is included in the “Statements of operations” under “Net realized gain (loss) on foreign currencies.” For foreign equity securities, these changes are included in the “Statements of operations” under “Net realized and unrealized gain (loss) on investments.” Each Portfolio reports certain foreign currency related transactions as components of realized gains (losses) for financial reporting purposes, whereas such components are treated as ordinary income (loss) for federal income tax purposes.
Use of Estimates — Each Portfolio is an investment company, whose financial statements are prepared in conformity with U.S. GAAP. Therefore, each Portfolio follows the accounting and reporting guidelines for investment companies. The preparation of financial statements in conformity with U.S. GAAP requires management to make estimates and assumptions that affect the fair value of investments, the reported amounts of assets and liabilities and disclosure of contingent assets and liabilities at the date of the financial statements, and the reported amounts of revenues and expenses during the reporting period. Actual results could differ from those estimates and the differences could be material.
Reimbursement Fees — The Emerging Markets Portfolio may charge a 0.55% purchase reimbursement fee and a 0.55% redemption reimbursement fee. These fees are designed to reflect an approximation of the brokerage and other transaction costs associated with the investment of an investor’s purchase amount or the disposition of assets to meet redemptions, and to limit the extent to which the Portfolio (and, indirectly, the Portfolio’s existing shareholders) would have to bear such costs. These fees are accounted for as an addition to paid-in capital for the Portfolio in the “Statements of changes in net assets.”
120
Other — Expenses directly attributable to each Portfolio are charged directly to the Portfolio. Other expenses common to various funds within the Delaware Investments® Family of Funds are generally allocated among such funds on the basis of average net assets. Management fees and some other expenses are paid monthly. Security transactions are recorded on the date the securities are purchased or sold (trade date) for financial reporting purposes. Costs used in calculating realized gains and losses on the sale of investment securities are those of the specific securities sold. Interest income is recorded on the accrual basis. Discounts and premiums on debt securities are accreted or amortized to interest income, respectively, over the lives of the respective securities using the effective interest method. Dividend income is recorded on the ex-dividend date. Realized gains (losses) on paydowns of asset- and mortgage-backed securities are classified as interest income. Distributions received from investments in Real Estate Investment Trusts (REITs) are recorded as dividend income on the ex-dividend date, subject to reclassification upon notice of the character of such distributions by the issuer. Foreign dividends are also recorded on the ex-dividend date or as soon after the ex-dividend date that a Portfolio is aware of such dividends, net of all tax withholdings, a portion of which may be reclaimable. Withholding taxes and reclaims on foreign dividends and interest have been recorded in accordance with each Portfolio’s understanding of the applicable country’s tax rules and rates. Each Portfolio may pay foreign capital gains taxes on certain foreign securities held, which are reported as components of realized losses for financial reporting purposes, whereas such components are treated as ordinary loss for federal income tax purposes.
Each Portfolio declares and pays dividends from net investment income and distributions from net realized gain on investments, if any, annually. Each Portfolio may distribute more frequently, if necessary for tax purposes. Dividends and distributions, if any, are recorded on the ex-dividend date.
Subject to seeking best execution, each Portfolio may direct certain security trades to brokers who have agreed to rebate a portion of the related brokerage commission to each Portfolio in cash. In general, best execution refers to many factors, including the price paid or received for a security, the commission charged, the promptness and reliability of execution, the confidentiality and placement accorded the order, and other factors affecting the overall benefit obtained by the Portfolio on the transaction. Such commission rebates are included in realized gain on investments in the accompanying financial statements. The total commission rebates for the year ended Oct. 31, 2015 are as follows:
| | |
| | | Commission Rebates |
The Large-Cap Value Equity Portfolio | | $115 |
The Large-Cap Growth Equity Portfolio | | 948 |
Each Portfolio may receive earnings credits from its custodian when positive cash balances are maintained, which may be used to offset custody fees. There were no such earnings credits for the year ended Oct. 31, 2015.
Each Portfolio receives earnings credits from its transfer agent when positive cash balances are maintained, which may be used to offset transfer agent fees. If the amount earned is greater than one dollar, the expense paid under this arrangement is included on the “Statements of operations” under “Dividend disbursing and transfer agent fees and expenses” with the corresponding expense offset shown under “Less expense paid indirectly.” For the year ended Oct. 31, 2015, earnings credits are as follows:
| | |
| | | Earnings Credits |
The Large-Cap Value Equity Portfolio | | $ 1 |
The Select 20 Portfolio | | 1 |
The Large-Cap Growth Equity Portfolio | | 1 |
The Focus Smid-Cap Growth Equity Portfolio | | 1 |
The High-Yield Bond Portfolio | | 1 |
The Core Plus Fixed Income Portfolio | | — |
The International Equity Portfolio | | 1 |
The Labor Select International Equity Portfolio | | 2 |
The Emerging Markets Portfolio | | 1 |
The Emerging Markets Portfolio II | | 1 |
Notes to financial statements
Delaware Pooled® Trust
2. Investment Management, Administration Agreements, and Other Transactions with Affiliates
In accordance with the terms of the investment management agreements, Delaware Management Company (DMC), a series of Delaware Management Business Trust and the investment manager of the Portfolios, will receive an annual fee, which is calculated daily based on the average daily net assets of each Portfolio.
DMC has contractually agreed to waive that portion, if any, of its management fees and reimburse each Portfolio (except for The International Equity Portfolio, The Labor Select International Equity Portfolio, and The Emerging Markets Portfolio) to the extent necessary to ensure that annual operating expenses, (excluding any 12b-1 fees, taxes, interest, short sale dividend and interest expenses, acquired fund fees and expenses, brokerage fees, certain insurance costs, and nonroutine expenses or costs, including, but not limited to, those relating to reorganizations, litigation, conducting shareholder meetings and liquidations) do not exceed specified percentages of average daily net assets of each Portfolio from Nov. 1, 2014 through Oct. 31, 2015.* For purposes of these waivers and reimbursements, nonroutine expenses may also include such additional costs and expenses as may be agreed upon from time to time by the Portfolios’ Board and DMC. These expense waivers and reimbursements apply only to expenses paid directly by the Portfolios and may only be terminated by agreement of DMC and the Portfolios.
The management fee rates and the operating expense limitation rates in effect for the year ended Oct. 31, 2015, are as follows:
| | | | | | |
| | | Management
fee as a percentage
of average daily
net assets (per annum) | | | | Contractual
operating expense
limitation as
a percentage
of average daily
net assets (per annum)† |
The Large-Cap Value Equity Portfolio | | 0.55% | | | | 0.70% |
The Select 20 Portfolio | | 0.75% | | | | 0.89% |
The Large-Cap Growth Equity Portfolio | | 0.55% | | | | 0.65% |
The Focus Smid-Cap Growth Equity Portfolio | | 0.75% | | | | 0.92% |
The High-Yield Bond Portfolio | | 0.45% | | | | 0.59% |
The Core Plus Fixed Income Portfolio | | 0.43% | | | | 0.45% |
The International Equity Portfolio | | 0.75% | | | | N/A |
The Labor Select International Equity Portfolio | | 0.75% | | | | N/A |
The Emerging Markets Portfolio | | 1.00% | | | | N/A |
The Emerging Markets Portfolio II | | 1.00% | | | | 1.20% |
| † | These operating expense limitations exclude certain expenses, such as 12b-1 fees, taxes, interest, short sale dividend and interest expenses, acquired fund fees and expenses, brokerage fees, certain insurance costs, and nonroutine expenses or costs, including, but not limited to, those relating to reorganizations, litigation, conducting shareholder meetings, and liquidations. In some instances, a Portfolio’s annual operating expenses may be lower than the contracted operating expense limitations. |
Mondrian Investment Partners Limited (Mondrian) furnishes investment sub-advisory services to The International Equity Portfolio, The Labor Select International Equity Portfolio, and The Emerging Markets Portfolio. For these services, DMC, not the Portfolios, pays Mondrian the following percentages of the Portfolios’ average daily net assets:
| | |
| | | Sub-advisory fee as a
percentage of average daily
net assets (per annum) |
The International Equity Portfolio | | 0.36% |
The Labor Select International Equity Portfolio | | 0.30% |
The Emerging Markets Portfolio | | 0.75% |
122
Jackson Square Partners, LLC (JSP), a related party of DMC, furnishes investment sub-advisory services to The Select 20 Portfolio, The Large-Cap Growth Equity Portfolio, and The Focus Smid-Cap Growth Equity Portfolio. For these services, DMC, not the Portfolios, pays JSP the following percentages of the Portfolio’s average daily net assets:
| | |
| | | Sub-advisory fee as a
percentage of average daily
net assets (per annum) |
The Select 20 Portfolio | | 0.375% |
The Large-Cap Growth Equity Portfolio | | 0.275% |
The Focus Smid-Cap Growth Equity Portfolio | | 0.375% |
Delaware Investments Fund Services Company (DIFSC), an affiliate of DMC, provides fund accounting and financial administration oversight services to each Portfolio. For these services, DIFSC’s fees are calculated based on the aggregate daily net assets of the Delaware Investments® Family of Funds at the following annual rate: 0.0050% of the first $30 billion; 0.0045% of the next $10 billion; 0.0040% of the next $10 billion; and 0.0025% of aggregate average daily net assets in excess of $50 billion. The fees payable to DIFSC under the service agreement described above are allocated among all retail funds in the Delaware Investments Family of Funds on a relative net asset value basis. These amounts are included on the “Statements of operations” under “Accounting and administrative expenses.” For the year ended Oct. 31, 2015, each Portfolio was charged for these services as follows:
| | | | |
The Large-Cap Value Equity Portfolio | | | $10,043 | |
The Select 20 Portfolio | | | 4,345 | |
The Large-Cap Growth Equity Portfolio | | | 14,100 | |
The Focus Smid-Cap Growth Equity Portfolio | | | 2,272 | |
The High-Yield Bond Portfolio | | | 8,308 | |
The Core Plus Fixed Income Portfolio | | | 5,630 | |
The International Equity Portfolio | | | 18,214 | |
The Labor Select International Equity Portfolio | | | 17,644 | |
The Emerging Markets Portfolio | | | 11,503 | |
The Emerging Markets Portfolio II | | | 1,748 | |
DIFSC is also the transfer agent and dividend disbursing agent of each Portfolio. For these services, each Portfolio pays DIFSC fees at the annual rate of 0.0075% of each Portfolio’s average daily net assets. These amounts are included on the “Statements of operations” under “Dividend disbursing and transfer agent fees and expenses.” For the year ended Oct. 31, 2015, each Portfolio was charged the following amounts for these services:
| | | | |
The Large-Cap Value Equity Portfolio | | | $15,932 | |
The Select 20 Portfolio | | | 6,891 | |
The Large-Cap Growth Equity Portfolio | | | 22,363 | |
The Focus Smid-Cap Growth Equity Portfolio | | | 3,603 | |
The High-Yield Bond Portfolio | | | 13,176 | |
The Core Plus Fixed Income Portfolio | | | 8,928 | |
The International Equity Portfolio | | | 28,885 | |
The Labor Select International Equity Portfolio | | | 27,985 | |
The Emerging Markets Portfolio | | | 18,245 | |
The Emerging Markets Portfolio II | | | 2,772 | |
Pursuant to a sub-transfer agency agreement between DIFSC and BNY Mellon Investment Servicing (US) Inc. (BNYMIS), BNYMIS provides certain sub-transfer agency services to each Portfolio. Sub-transfer agency fees are passed on to and paid directly by each Portfolio.
Notes to financial statements
Delaware Pooled® Trust
2. Investment Management, Administration Agreements, and Other Transactions with Affiliates (continued)
As provided in the investment management agreement, each Portfolio bears a portion of the cost of resources shared with DMC, including the cost of internal personnel of DMC and/or its affiliates that provide legal, tax, and regulatory reporting services to the Portfolios. These amounts are included on the “Statements of operations” under “Legal fees.” For the year ended Oct. 31, 2015, each Portfolio was charged for internal legal, tax, and regulatory reporting services provided by DMC and/or its affiliates’ employees as follows:
| | | | |
The Large-Cap Value Equity Portfolio | | | $ 8,492 | |
The Select 20 Portfolio | | | 6,744 | |
The Large-Cap Growth Equity Portfolio | | | 11,782 | |
The Focus Smid-Cap Growth Equity Portfolio | | | 1,899 | |
The High-Yield Bond Portfolio | | | 6,843 | |
The Core Plus Fixed Income Portfolio | | | 4,616 | |
The International Equity Portfolio | | | 15,693 | |
The Labor Select International Equity Portfolio | | | 14,929 | |
The Emerging Markets Portfolio | | | 10,142 | |
The Emerging Markets Portfolio II | | | 2,074 | |
Trustees’ fees include expenses accrued by each Portfolio for each Trustee’s retainer and meeting fees. Certain officers of DMC, DIFSC, and DDLP are officers and/or Trustees of the Trust. These officers and Trustees are paid no compensation by the Portfolios.
* The contractual waiver period is Feb. 27, 2014 through Feb. 29, 2016.
3. Investments
For the year ended Oct. 31, 2015, each Portfolio made purchases and sales of investment securities other than short-term investments as follows:
| | | | | | | | | | | | | | | | |
| | | Purchases
other than
U.S. government
securities | | | Purchases of
U.S. government
securities | | | Sales
other than
U.S. government
securities | | | Sales of
U.S. government
securities | |
The Large-Cap Value Equity Portfolio | | $ | 136,185,711 | | | $ | — | | | $ | 64,105,804 | | | $ | — | |
The Select 20 Portfolio | | | 27,288,255 | | | | — | | | | 34,100,015 | | | | — | |
The Large-Cap Growth Equity Portfolio | | | 150,734,984 | | | | — | | | | 141,740,567 | | | | — | |
The Focus Smid-Cap Growth Equity Portfolio | | | 14,472,653 | | | | — | | | | 9,375,600 | | | | — | |
The High-Yield Bond Portfolio | | | 212,695,575 | | | | — | | | | 137,762,181 | | | | — | |
The Core Plus Fixed Income Portfolio | | | 387,429,133 | | | | 161,123,794 | | | | 347,666,442 | | | | 149,312,498 | |
The International Equity Portfolio | | | 104,756,813 | | | | — | | | | 181,891,140 | | | | — | |
The Labor Select International Equity Portfolio | | | 74,923,928 | | | | — | | | | 75,452,271 | | | | — | |
The Emerging Markets Portfolio | | | 64,038,944 | | | | — | | | | 144,482,160 | | | | — | |
The Emerging Markets Portfolio II | | | 3,016,257 | | | | — | | | | 3,175,769 | | | | — | |
124
At Oct. 31, 2015, the cost of investments and unrealized appreciation (depreciation) for federal income tax purposes for each Portfolio were as follows:
| | | | | | | | | | | | | | | | | | | | | | |
| | | Cost of
investments | | | | | Aggregate
unrealized
appreciation
of investments | | | | | Aggregate
unrealized
depreciation
of investments | | | | | Net unrealized
appreciation
(depreciation)
of investments | |
The Large-Cap Value Equity Portfolio | | $ | 209,031,757 | | | | | $ | 16,515,506 | | | | | $ | (11,133,509) | | | | | $ | 5,381,997 | |
The Select 20 Portfolio | | | 68,893,322 | | | | | | 25,989,361 | | | | | | (1,187,262) | | | | | | 24,802,099 | |
The Large-Cap Growth Equity Portfolio | | | 250,474,284 | | | | | | 75,773,302 | | | | | | (15,256,471) | | | | | | 60,516,831 | |
The Focus Smid-Cap Growth Equity Portfolio | | | 39,924,635 | | | | | | 14,541,138 | | | | | | (3,368,187) | | | | | | 11,172,951 | |
The High-Yield Bond Portfolio | | | 214,793,750 | | | | | | 2,057,225 | | | | | | (9,956,634) | | | | | | (7,899,409) | |
The Core Plus Fixed Income Portfolio | | | 143,851,536 | | | | | | 1,002,041 | | | | | | (1,678,102) | | | | | | (676,061) | |
The International Equity Portfolio | | | 354,142,640 | | | | | | 58,783,208 | | | | | | (55,291,079) | | | | | | 3,492,129 | |
The Labor Select International Equity Portfolio | | | 360,631,088 | | | | | | 63,754,705 | | | | | | (64,938,802) | | | | | | (1,184,097) | |
The Emerging Markets Portfolio | | | 212,393,966 | | | | | | 14,094,600 | | | | | | (55,127,465) | | | | | | (41,032,865) | |
The Emerging Markets Portfolio II | | | 40,166,851 | | | | | | 4,503,606 | | | | | | (11,408,582) | | | | | | (6,904,976) | |
U. S. GAAP defines fair value as the price that each Portfolio would receive to sell an asset or pay to transfer a liability in an orderly transaction between market participants at the measurement date under current market conditions. A three-level hierarchy for fair value measurements has been established based upon the transparency of inputs to the valuation of an asset or liability. Inputs may be observable or unobservable and refer broadly to the assumptions that market participants would use in pricing the asset or liability. Observable inputs reflect the assumptions market participants would use in pricing the asset or liability based on market data obtained from sources independent of the reporting entity. Unobservable inputs reflect the reporting entity’s own assumptions about the assumptions that market participants would use in pricing the asset or liability based on the best information available under the circumstances. Each Portfolio’s investment in its entirety is assigned a level based upon the observability of the inputs which are significant to the overall valuation. The three-level hierarchy of inputs is summarized below.
| | | | |
| Level 1 | | – | | Inputs are quoted prices in active markets for identical investments. (Examples: equity securities, open-end investment companies, futures contracts, exchange-traded options contracts) |
| | |
| Level 2 | | – | | Other observable inputs, including, but not limited to: quoted prices for similar assets or liabilities in markets that are active, quoted prices for identical or similar assets or liabilities in markets that are not active, inputs other than quoted prices that are observable for the assets or liabilities (such as interest rates, yield curves, volatilities, prepayment speeds, loss severities, credit risks, and default rates), or other market-corroborated inputs. (Examples: debt securities, government securities, swap contracts, foreign currency exchange contracts, foreign securities utilizing international fair value pricing, broker-quoted securities, fair valued securities) |
| | |
| Level 3 | | – | | Significant unobservable inputs, including each Portfolio’s own assumptions used to determine the fair value of investments. (Examples: broker-quoted securities, fair valued securities) |
Notes to financial statements
Delaware Pooled® Trust
3. Investments (continued)
Level 3 investments are valued using significant unobservable inputs. Each Portfolio may also use an income-based valuation approach in which the anticipated future cash flows of the investment are discounted to calculate fair value. Discounts may also be applied due to the nature or duration of any restrictions on the disposition of the investments. Valuations may also be based upon current market prices of securities that are comparable in coupon, rating, maturity, and industry. The derived value of a Level 3 investment may not represent the value which is received upon disposition and this could impact the results of operations.
The following table summarizes the valuation of The Large-Cap Value Equity Portfolio’s investments by fair value hierarchy levels as of Oct. 31, 2015:
| | | | | | | | | | | | | | | | |
Securities | | Level 1 | | | | | Level 2 | | | | | Total | |
Common Stock | | $ | 212,252,938 | | | | | $ | — | | | | | $ | 212,252,938 | |
Short-Term Investments | | | — | | | | | | 2,160,816 | | | | | | 2,160,816 | |
| | | | | | | | | | | | | | | | |
Total Value of Securities | | $ | 212,252,938 | | | | | $ | 2,160,816 | | | | | $ | 214,413,754 | |
| | | | | | | | | | | | | | | | |
The following table summarizes the valuation of The Select 20 Portfolio’s investments by fair value hierarchy levels as of Oct. 31, 2015:
| | | | | | | | | | | | | | | | |
Securities | | Level 1 | | | | | Level 2 | | | | | Total | |
Common Stock | | $ | 91,738,529 | | | | | $ | — | | | | | $ | 91,738,529 | |
Short-Term Investments | | | — | | | | | | 1,956,892 | | | | | | 1,956,892 | |
| | | | | | | | | | | | | | | | |
Total Value of Securities | | $ | 91,738,529 | | | | | $ | 1,956,892 | | | | | $ | 93,695,421 | |
| | | | | | | | | | | | | | | | |
The following table summarizes the valuation of The Large-Cap Growth Equity Portfolio’s investments by fair value hierarchy levels as of Oct. 31, 2015:
| | | | | | | | | | | | | | | | |
Securities | | Level 1 | | | | | Level 2 | | | | | Total | |
Common Stock | | $ | 306,289,228 | | | | | $ | — | | | | | $ | 306,289,228 | |
Short-Term Investments | | | — | | | | | | 4,701,887 | | | | | | 4,701,887 | |
| | | | | | | | | | | | | | | | |
Total Value of Securities | | $ | 306,289,228 | | | | | $ | 4,701,887 | | | | | $ | 310,991,115 | |
| | | | | | | | | | | | | | | | |
The following table summarizes the valuation of The Focus Smid-Cap Growth Equity Portfolio’s investments by fair value hierarchy levels as of Oct. 31, 2015:
| | | | | | | | | | | | | | | | |
Securities | | Level 1 | | | | | Level 2 | | | | | Total | |
Common Stock | | $ | 50,107,016 | | | | | $ | — | | | | | $ | 50,107,016 | |
Short-Term Investments | | | — | | | | | | 990,570 | | | | | | 990,570 | |
| | | | | | | | | | | | | | | | |
Total Value of Securities | | $ | 50,107,016 | | | | | $ | 990,570 | | | | | $ | 51,097,586 | |
| | | | | | | | | | | | | | | | |
The following table summarizes the valuation of The High-Yield Bond Portfolio’s investments by fair value hierarchy levels as of Oct. 31, 2015:
| | | | | | | | | | | | | | | | | | | | |
Securities | | Level 1 | | | | | Level 2 | | | | | Level 3 | | | | Total | |
Corporate Debt | | | $ — | | | | | | $177,158,625 | | | | | $— | | | | | $177,158,625 | |
Senior Secured Loans | | | — | | | | | | 13,626,701 | | | | | — | | | | | 13,626,701 | |
Municipal Bonds | | | — | | | | | | 567,028 | | | | | — | | | | | 567,028 | |
Common Stock | | | — | | | | | | — | | | | | — | | | | | — | |
Preferred Stock1 | | | 234,395 | | | | | | 1,884,218 | | | | | — | | | | | 2,118,613 | |
Short-Term Investments | | | — | | | | | | 13,423,374 | | | | | — | | | | | 13,423,374 | |
Total Value of Securities | | | $234,395 | | | | | | $206,659,946 | | | | | $— | | | | | $206,894,341 | |
1Security type is valued across multiple levels. The amounts attributed to Level 1 investments and Level 2 investments represent 11.06% and 88.94%, respectively, of the total market value of this security type. Level 1 investments represent exchange traded investments and Level 2 investments represent investments with observable inputs.
126
The following table summarizes the valuation of The Core Plus Fixed Income Portfolio’s investments by fair value hierarchy levels as of Oct. 31, 2015:
| | | | | | | | | | | | | | | | | | | | |
| Securities | | Level 1 | | Level 2 | | Level 3 | | Total |
Agency, Asset-Backed & Mortgage-Backed Securities1 | | | $ | — | | | | $ | 57,735,140 | | | | $ | 105,000 | | | | $ | 57,840,140 | |
Corporate Debt | | | | — | | | | | 41,806,057 | | | | | — | | | | | 41,806,057 | |
Foreign Debt | | | | — | | | | | 1,150,833 | | | | | — | | | | | 1,150,833 | |
Senior Secured Loans | | | | — | | | | | 6,199,819 | | | | | — | | | | | 6,199,819 | |
Municipal Bonds | | | | — | | | | | 1,073,341 | | | | | — | | | | | 1,073,341 | |
Convertible Preferred Stock1 | | | | 13,930 | | | | | 2,894 | | | | | — | | | | | 16,824 | |
Preferred Stock1 | | | | 110,259 | | | | | 163,500 | | | | | — | | | | | 273,759 | |
U.S. Treasury Obligations | | | | — | | | | | 17,211,615 | | | | | — | | | | | 17,211,615 | |
Short-Term Investments | | | | — | | | | | 17,603,087 | | | | | — | | | | | 17,603,087 | |
| | | | | | | | | | | | | | | | | | | | |
Total Value of Securities | | | $ | 124,189 | | | | $ | 142,946,286 | | | | $ | 105,000 | | | | $ | 143,175,475 | |
| | | | | | | | | | | | | | | | | | | | |
Foreign Currency Exchange Contracts | | | $ | — | | | | $ | 564 | | | | $ | — | | | | $ | 564 | |
Futures Contracts | | | | 102,718 | | | | | — | | | | | — | | | | | 102,718 | |
Swap Contracts | | | | — | | | | | (5,369 | ) | | | | — | | | | | (5,369 | ) |
1Security type is valued across multiple levels. Level 1 investments represent exchange-traded investments, Level 2 investments represent investments with observable inputs or matrix-priced investments, and Level 3 investments represent investments without observable inputs. The amounts attributed to Level 1 investments, Level 2 investments, and Level 3 investments represent the following percentages of the total market value of these security types:
| | | | | | | | | | | | | | | | |
| | | Level 1 | | | Level 2 | | | Level 3 | | | Total | |
Agency, Asset-Backed & Mortgage-Backed Securities | | | — | | | | 99.82 | % | | | 0.18% | | | | 100.00% | |
Convertible Preferred Stock | | | 82.80 | % | | | 17.20 | % | | | — | | | | 100.00% | |
Preferred Stock | | | 40.28 | % | | | 59.72 | % | | | — | | | | 100.00% | |
The following table summarizes the valuation of The International Equity Portfolio’s investments by fair value hierarchy levels as of Oct. 31, 2015:
| | | | | | | | | | | | | | | | | | | | |
| Securities | | Level 1 | | Level 2 | | Level 3 | | Total |
Common Stock | | | $ | 356,283,683 | | | | $ | — | | | | | $— | | | | $ | 356,283,683 | |
Right | | | | 23,894 | | | | | — | | | | | — | | | | | 23,894 | |
Short-Term Investments | | | | — | | | | | 1,327,192 | | | | | — | | | | | 1,327,192 | |
| | | | | | | | | | | | | | | | | | | | |
Total Value of Securities | | | $ | 356,307,577 | | | | $ | 1,327,192 | | | | | $— | | | | $ | 357,634,769 | |
| | | | | | | | | | | | | | | | | | | | |
Foreign Currency Exchange Contracts | | | $ | — | | | | $ | 828 | | | | | $— | | | | $ | 828 | |
The following table summarizes the valuation of The Labor Select International Equity Portfolio’s investments by fair value hierarchy levels as of Oct. 31, 2015:
| | | | | | | | | | | | | | | | | | | | |
| Securities | | Level 1 | | Level 2 | | Level 3 | | Total |
Common Stock | | | $ | 356,579,675 | | | | $ | — | | | | | $— | | | | $ | 356,579,675 | |
Right | | | | 22,945 | | | | | — | | | | | — | | | | | 22,945 | |
Short-Term Investments | | | | — | | | | | 2,844,371 | | | | | — | | | | | 2,844,371 | |
| | | | | | | | | | | | | | | | | | | | |
Total Value of Securities | | | $ | 356,602,620 | | | | $ | 2,844,371 | | | | | $— | | | | $ | 359,446,991 | |
| | | | | | | | | | | | | | | | | | | | |
Foreign Currency Exchange Contracts | | | $ | — | | | | $ | 1,614 | | | | | $— | | | | $ | 1,614 | |
Notes to financial statements
Delaware Pooled® Trust
3. Investments (continued)
The following table summarizes the valuation of The Emerging Markets Portfolio’s investments by fair value hierarchy levels as of Oct. 31, 2015:
| | | | | | | | | | | | | | | |
| Securities | | Level 1 | | Level 2 | | Total |
Common Stock | | | $ | 167,939,945 | | | | $ | — | | | | $ | 167,939,945 | |
Preferred Stock | | | | 2,648,020 | | | | | — | | | | | 2,648,020 | |
Short-Term Investments | | | | — | | | | | 773,136 | | | | | 773,136 | |
| | | | | | | | | | | | | | | |
Total Value of Securities | | | $ | 170,587,965 | | | | $ | 773,136 | | | | $ | 171,361,101 | |
| | | | | | | | | | | | | | | |
Foreign Currency Exchange Contracts | | | $ | — | | | | $ | 243 | | | | $ | 243 | |
The following table summarizes the valuation of The Emerging Markets Portfolio II’s investments by fair value hierarchy levels as of Oct. 31, 2015:
| | | | | | | | | | | | | | | |
| Securities | | Level 1 | | Level 2 | | Total |
Common Stock | | | | | | | | | | | | | | | |
Argentina | | | $ | 455,741 | | | | $ | — | | | | $ | 455,741 | |
Bahrain | | | | — | | | | | 10,500 | | | | | 10,500 | |
Brazil | | | | 3,720,547 | | | | | — | | | | | 3,720,547 | |
Chile | | | | 277,607 | | | | | — | | | | | 277,607 | |
China/Hong Kong | | | | 6,751,767 | | | | | — | | | | | 6,751,767 | |
Colombia | | | | 212,506 | | | | | — | | | | | 212,506 | |
India | | | | 2,961,378 | | | | | — | | | | | 2,961,378 | |
Indonesia | | | | 302,555 | | | | | — | | | | | 302,555 | |
Malaysia | | | | 103,614 | | | | | — | | | | | 103,614 | |
Mexico | | | | 2,274,060 | | | | | — | | | | | 2,274,060 | |
Netherlands | | | | 173,880 | | | | | — | | | | | 173,880 | |
Peru | | | | 73,715 | | | | | — | | | | | 73,715 | |
Poland | | | | 250,512 | | | | | — | | | | | 250,512 | |
Republic of Korea | | | | 8,631,006 | | | | | — | | | | | 8,631,006 | |
Russia | | | | 1,087,209 | | | | | 307,868 | | | | | 1,395,077 | |
South Africa | | | | 395,892 | | | | | — | | | | | 395,892 | |
Taiwan | | | | 2,398,971 | | | | | — | | | | | 2,398,971 | |
Thailand | | | | 413,770 | | | | | — | | | | | 413,770 | |
Turkey | | | | 559,538 | | | | | — | | | | | 559,538 | |
United Kingdom | | | | 35,196 | | | | | — | | | | | 35,196 | |
United States | | | | 1,065,440 | | | | | — | | | | | 1,065,440 | |
Preferred Stock | | | | 384,042 | | | | | — | | | | | 384,042 | |
Short-Term Investments | | | | — | | | | | 414,561 | | | | | 414,561 | |
| | | | | | | | | | | | | | | |
Total Value of Securities | | | $ | 32,528,946 | | | | $ | 732,929 | | | | $ | 33,261,875 | |
| | | | | | | | | | | | | | | |
The securities that have been deemed worthless on the “Schedules of investments” are considered to be Level 3 securities in these tables.
128
During the year ended Oct. 31, 2015, there were no transfers between Level 1 investments, Level 2 investments, or Level 3 investments that had a significant impact to each Portfolio. This does not include transfers between Level 1 investments and Level 2 investments due to each Portfolio utilizing international fair value pricing during the period. In accordance with the fair valuation procedures described in Note 1, international fair value pricing of securities in each Portfolio occurs when market volatility exceeds an established rolling threshold. If the threshold is exceeded on a given date, then prices of international securities (those that traded on exchanges that close at a different time than the time that each Portfolio’s net asset value is determined) are established using a separate pricing feed from a third party vendor designed to establish a price for each such security as of the time that each Portfolio’s net asset value is determined. Further, international fair value pricing uses other observable market-based inputs in place of the closing exchange price due to the events occurring after the close of the exchange or market on which the investment is principally traded, causing a change in classification between levels. Each Portfolio’s policy is to recognize transfers at the beginning of the reporting period.
A reconciliation of Level 3 investments is presented when a Portfolio has a significant amount of Level 3 investments at the beginning, interim, or end of the period in relation to net assets. Management has determined not to provide additional disclosure on Level 3 inputs since the Level 3 investments are not considered significant to each Portfolio’s net assets at the end of the period.
4. Dividend and Distribution Information
Income and long-term capital gain distributions are determined in accordance with federal income tax regulations, which may differ from U.S. GAAP. Additionally, distributions from net gains on foreign currency transactions and net short-term gains on sales of investment securities are treated as ordinary income for federal income tax purposes. The tax character of dividends and distributions paid during the years ended Oct. 31, 2015 and 2014 was as follows:
| | | | | | | | | | | | |
| | | Ordinary
income | | | Long-term
capital gain | | | Total | |
Year ended Oct. 31, 2015: | | | | | | | | | | | | |
The Large-Cap Value Equity Portfolio | | $ | 2,308,514 | | | $ | 3,624,778 | | | $ | 5,933,292 | |
The Select 20 Portfolio | | | 2,167,483 | | | | 22,989,914 | | | | 25,157,397 | |
The Large-Cap Growth Equity Portfolio | | | 1,786,278 | | | | 23,432,720 | | | | 25,218,998 | |
The Focus Smid-Cap Growth Equity Portfolio | | | 3,001,781 | | | | 7,143,013 | | | | 10,144,794 | |
The High-Yield Bond Portfolio | | | 8,241,464 | | | | 2,131,273 | | | | 10,372,737 | |
The Core Plus Fixed Income Portfolio | | | 2,287,390 | | | | — | | | | 2,287,390 | |
The International Equity Portfolio | | | 19,976,817 | | | | — | | | | 19,976,817 | |
The Labor Select International Equity Portfolio | | | 20,172,329 | | | | — | | | | 20,172,329 | |
The Emerging Markets Portfolio | | | 7,350,324 | | | | 13,249,834 | | | | 20,600,158 | |
The Emerging Markets Portfolio II | | | 649,479 | | | | 1,084,121 | | | | 1,733,600 | |
Notes to financial statements
Delaware Pooled® Trust
4. Dividend and Distribution Information (continued)
| | | | | | | | | | | | |
| | | Ordinary
income | | | Long-term
capital gain | | | Total | |
Year ended Oct. 31, 2014: | | | | | | | | | | | | |
The Large-Cap Value Equity Portfolio | | $ | 1,238,119 | | | $ | 451,277 | | | $ | 1,689,396 | |
The Select 20 Portfolio | | | 98,955 | | | | 2,407,909 | | | | 2,506,864 | |
The Large-Cap Growth Equity Portfolio | | | 852,040 | | | | — | | | | 852,040 | |
The Focus Smid-Cap Growth Equity Portfolio | | | 48,668 | | | | — | | | | 48,668 | |
The High-Yield Bond Portfolio | | | 8,364,409 | | | | — | | | | 8,364,409 | |
The Core Plus Fixed Income Portfolio | | | 1,349,489 | | | | — | | | | 1,349,489 | |
The International Equity Portfolio | | | 13,166,001 | | | | — | | | | 13,166,001 | |
The Labor Select International Equity Portfolio | | | 15,240,625 | | | | — | | | | 15,240,625 | |
The Emerging Markets Portfolio | | | 7,191,722 | | | | 9,698,927 | | | | 16,890,649 | |
The Emerging Markets Portfolio II | | | 402,381 | | | | 161,827 | | | | 564,208 | |
5. Components of Net Assets on a Tax Basis
As of Oct. 31, 2015, the components of net assets on a tax basis were as follows:
| | | | | | | | | | | | | | | | |
| | | The
Large-Cap
Value Equity
Portfolio | | | The
Select 20
Portfolio | | | The
Large-Cap
Growth Equity
Portfolio | | | The
Focus Smid-Cap
Growth Equity
Portfolio | |
Shares of beneficial interest | | $ | 189,511,798 | | | $ | 52,266,185 | | | $ | 207,893,792 | | | | $37,279,693 | |
Undistributed ordinary income | | | 5,224,804 | | | | — | | | | 1,707,689 | | | | 303,294 | |
Undistributed long-term capital gain | | | 14,607,484 | | | | 16,556,243 | | | | 43,392,271 | | | | 2,687,857 | |
Unrealized appreciation of investments, foreign currencies, and derivatives | | | 5,381,997 | | | | 24,802,099 | | | | 60,516,831 | | | | 11,171,866 | |
| | | | | | | | | | | | | | | | |
Net assets | | $ | 214,726,083 | | | $ | 93,624,527 | | | $ | 313,510,583 | | | | $51,442,710 | |
| | | | | | | | | | | | | | | | |
| | | | | | | | | | | | |
| | | |
| | | The
High-Yield
Bond
Portfolio | | | The
Core Plus
Fixed Income
Portfolio | | | The
International
Equity
Portfolio | |
Shares of beneficial interest | | $ | 213,086,358 | | | $ | 126,522,335 | | | $ | 471,863,727 | |
Undistributed ordinary income | | | 9,246,881 | | | | 2,423,184 | | | | 8,220,825 | |
Other temporary differences | | | (114,275 | ) | | | (224 | ) | | | — | |
Capital loss carryforwards | | | (8,190,669 | ) | | | — | | | | (125,139,655 | ) |
Unrealized appreciation (depreciation) of investments, foreign currencies, and derivatives | | | (7,899,409 | ) | | | (851,721 | ) | | | 3,436,040 | |
| | | | | | | | | | | | |
Net assets | | $ | 206,128,886 | | | $ | 128,093,574 | | | $ | 358,380,937 | |
| | | | | | | | | | | | |
| | | | | | | | | | | | |
| | | |
| | | Labor Select
International
Equity
Portfolio | | | The
Emerging
Markets
Portfolio | | | The
Emerging
Markets
Portfolio II | |
Shares of beneficial interest | | | $409,056,230 | | | | $225,904,525 | | | | $38,998,264 | |
Undistributed ordinary income | | | 8,304,431 | | | | 3,872,681 | | | | 372,823 | |
Undistributed long-term capital gain | | | — | | | | — | | | | 851,663 | |
Capital loss carryforwards | | | (55,424,032 | ) | | | (16,032,380 | ) | | | — | |
Unrealized depreciation of investments, foreign currencies, and derivatives | | | (1,286,466 | ) | | | (41,070,704 | ) | | | (6,908,733 | ) |
Net assets | | | $360,650,163 | | | | $172,674,122 | | | | $33,314,017 | |
130
The differences between book basis and tax basis components of net assets are primarily attributable to tax deferral of losses on wash sales, mark-to-market on futures contracts, mark-to-market on foreign currency exchange contracts, tax deferral of losses on straddles, tax treatment of passive foreign investment companies, contingent payment debt instruments, tax treatment of trust preferred securities, tax treatment of market discount and premium on debt instruments, and CDS contracts.
For financial reporting purposes, capital accounts are adjusted to reflect the tax character of permanent book/tax differences. Reclassifications are primarily due to tax treatment of net operating losses, gain (loss) on foreign currency transactions, dividends and distributions, market discount and premium on certain debt instruments, contingent payment debt instruments, CDS contracts, tax treatment of foreign capital gains taxes, passive foreign investment companies, and paydown gains (losses) on mortgage- and asset-backed securities. Results of operations and net assets were not affected by these reclassifications. For the year ended Oct. 31, 2015, the following Portfolios recorded the following reclassifications.
| | | | | | | | | | | | | | | |
| | | Undistributed
(distributions in excess of)
net investment income (loss) | | Accumulated
net realized
gain (loss) | | Paid-in
Capital |
The Select 20 Portfolio | | | $ | 57,180 | | | | $ | (57,180 | ) | | | $ | — | |
The Large-Cap Growth Equity Portfolio | | | | (790 | ) | | | | 790 | | | | | — | |
The Focus Smid-Cap Growth Equity Portfolio | | | | (948 | ) | | | | 948 | | | | | — | |
The High-Yield Bond Portfolio | | | | (77,153 | ) | | | | 77,153 | | | | | — | |
The Core Plus Fixed Income Portfolio | | | | 71,939 | | | | | (71,939 | ) | | | | — | |
The International Equity Portfolio | | | | 360,870 | | | | | (5,695,500 | ) | | | | 5,334,630 | |
The Labor Select International Equity Portfolio | | | | 303,238 | | | | | (303,238 | ) | | | | — | |
The Emerging Markets Portfolio | | | | (464,873 | ) | | | | 464,873 | | | | | — | |
The Emerging Markets Portfolio II | | | | (2,357 | ) | | | | 2,357 | | | | | — | |
For federal income tax purposes, capital loss carryforwards may be carried forward and applied against future gains.
In 2015, the following Portfolios utilized capital loss carryforwards as follows:
| | | | |
| | | Capital loss
carryforwards
utilized | |
The Core Plus Fixed Income Portfolio | | | $ 648,084 | |
The International Equity Portfolio | | | 20,403,410 | |
The Labor Select International Equity Portfolio | | | 10,198,398 | |
Capital loss carryforwards remaining at Oct. 31, 2015 for the following Portfolios will expire as follows:
| | | | | | | | | | | | |
| | | Year of expiration | |
| | | 2017 | | | 2018 | | | Total | |
The International Equity Portfolio | | $ | 111,280,174 | | | $ | 13,859,481 | | | $ | 125,139,655 | |
The Labor Select International Equity Portfolio | | | 36,948,230 | | | | 18,475,802 | | | | 55,424,032 | |
On Dec. 22, 2010, the Regulated Investment Company Modernization Act of 2010 (Act) was enacted, which changed various technical rules governing the tax treatment of regulated investment companies. The changes were generally effective for taxable years beginning after the date of enactment. Under the Act, the Portfolios are permitted to carry forward capital losses incurred in taxable years beginning after the date of enactment for an unlimited period. Additionally, post-enactment capital loss carryforwards will retain their character as either short-term or long-term capital losses rather than being considered all short-term as permitted under previous regulation.
Losses incurred that will be carried forward under the Act are as follows:
| | | | | | | | | | |
| | | Loss carryforward character |
| | | Short-term | | Long-term |
The High-Yield Bond Portfolio | | | $ | 5,249,182 | | | | $ | 2,941,487 | |
The Emerging Markets Portfolio | | | | 651,778 | | | | | 15,380,602 | |
Notes to financial statements
Delaware Pooled® Trust
6. Capital Shares
Transactions in capital shares were as follows:
| | | | | | | | | | | | | | | | | | | | |
| | | Shares
sold | | Shares issued
upon reinvestment
of dividends
and distributions | | Shares
redeemed | | Net
increase
(decrease) |
Year ended Oct. 31, 2015: | | | | | | | | | | | | | | | | | | | | |
The Large-Cap Value Equity Portfolio | | | | 3,651,046 | | | | | 184,378 | | | | | (1,035,167 | ) | | | | 2,800,257 | |
The Select 20 Portfolio | | | | 5,862 | | | | | 2,720,234 | | | | | (442,683 | ) | | | | 2,283,413 | |
The Large-Cap Growth Equity Portfolio | | | | 3,695,155 | | | | | 1,463,971 | | | | | (2,760,683 | ) | | | | 2,398,443 | |
The Focus Smid-Cap Growth Equity Portfolio | | | | 283,996 | | | | | 566,349 | | | | | (41,426 | ) | | | | 808,919 | |
The High-Yield Bond Portfolio | | | | 11,339,586 | | | | | 1,150,398 | | | | | (2,620,835 | ) | | | | 9,869,149 | |
The Core Plus Fixed Income Portfolio | | | | 5,484,439 | | | | | 206,364 | | | | | (671,662 | ) | | | | 5,019,141 | |
The International Equity Portfolio | | | | 5,191,868 | | | | | 970,821 | | | | | (10,517,899 | ) | | | | (4,355,210 | ) |
The Labor Select International Equity Portfolio | | | | 970,304 | | | | | 1,470,056 | | | | | (1,626,774 | ) | | | | 813,586 | |
The Emerging Markets Portfolio | | | | 2,510,338 | | | | | 2,046,512 | | | | | (13,238,050 | ) | | | | (8,681,200 | ) |
The Emerging Markets Portfolio II | | | | 15,625 | | | | | 205,647 | | | | | (5,821 | ) | | | | 215,451 | |
| | | | |
Year ended Oct. 31, 2014: | | | | | | | | | | | | | | | | | | | | |
The Large-Cap Value Equity Portfolio | | | | 1,729,199 | | | | | 50,863 | | | | | (404,716 | ) | | | | 1,375,346 | |
The Select 20 Portfolio | | | | 318,550 | | | | | 188,416 | | | | | (11,749,979 | ) | | | | (11,243,013 | ) |
The Large-Cap Growth Equity Portfolio | | | | 1,282,232 | | | | | 48,484 | | | | | (2,518,987 | ) | | | | (1,188,271 | ) |
The Focus Smid-Cap Growth Equity Portfolio | | | | 465,364 | | | | | 2,054 | | | | | (2,803,693 | ) | | | | (2,336,275 | ) |
The High-Yield Bond Portfolio | | | | 1,042,416 | | | | | 838,454 | | | | | (769,914 | ) | | | | 1,110,956 | |
The Core Plus Fixed Income Portfolio | | | | 1,827,309 | | | | | 137,283 | | | | | (140,461 | ) | | | | 1,824,131 | |
The International Equity Portfolio | | | | 2,003,255 | | | | | 652,915 | | | | | (5,191,846 | ) | | | | (2,535,676 | ) |
The Labor Select International Equity Portfolio | | | | 1,775,454 | | | | | 1,055,797 | | | | | (11,084,045 | ) | | | | (8,252,794 | ) |
The Emerging Markets Portfolio | | | | 3,293,614 | | | | | 1,541,293 | | | | | (6,054,513 | ) | | | | (1,219,606 | ) |
The Emerging Markets Portfolio II | | | | 162,328 | | | | | 60,407 | | | | | (294,701 | ) | | | | (71,966 | ) |
7. Line of Credit
Each Portfolio, along with certain other funds in the Delaware Investments® Family of Funds (Participants), was a participant in a $225,000,000 revolving line of credit to be used for temporary or emergency purposes as an additional source of liquidity to fund redemptions of investor shares. Under the agreement, the Participants were charged an annual commitment fee of 0.08%, which was allocated across the Participants on the basis of each Participant’s allocation of the entire facility. The Participants were permitted to borrow up to a maximum of one third of their net assets under the agreement. Each Participant was individually, and not jointly, liable for its particular advances, if any, under the line of credit. The line of credit available under the agreement expired on Nov. 10, 2014.
On Nov. 10, 2014, each Portfolio, along with the other Participants, entered into an amendment to the agreement for a $275,000,000 revolving line of credit. The line of credit was to be used as described above and operated in substantially the same manner as the agreement described above. The line of credit available under the agreement expired on Nov. 9, 2015.
Each Portfolio had no amounts outstanding as of Oct. 31, 2015 or at any time during the year then ended.
8. Derivatives
U.S. GAAP requires disclosures that enable investors to understand: (1) how and why an entity uses derivatives; (2) how they are accounted for; and (3) how they affect an entity’s results of operations and financial position.
Foreign Currency Exchange Contracts — Each Portfolio may enter into foreign currency exchange contracts and foreign cross currency exchange contracts as a way of managing foreign exchange rate risk. Each Portfolio may enter into these contracts to fix the U.S. dollar value of a security that it has agreed to buy or sell for the period between the date the trade was entered into and the date the security is delivered and paid for. Each Portfolio may also use these contracts to hedge the U.S. dollar value of securities it already owns that are denominated in foreign
132
currencies. In addition, each Portfolio may enter into these contracts to facilitate or expedite the settlement of portfolio transactions. The change in value is recorded as an unrealized gain or loss. When the contract is closed, a realized gain or loss is recorded equal to the difference between the value of the contract at the time it was opened and the value at the time it was closed.
The use of foreign currency exchange contracts and foreign cross currency exchange contracts does not eliminate fluctuations in the underlying prices of the securities, but does establish a rate of exchange that can be achieved in the future. Although foreign currency exchange contracts and foreign cross currency exchange contracts limit the risk of loss due to an unfavorable change in the value of the hedged currency, they also limit any potential gain that might result should the value of the currency change favorably. In addition, each Portfolio could be exposed to risks if the counterparties to the contracts are unable to meet the terms of their contracts. Each Portfolio’s maximum risk of loss from counterparty credit risk is the value of its currency exchanged with the counterparty. The risk is generally mitigated by having a netting arrangement between each Portfolio and the counterparty and by the posting of collateral by the counterparty to the Portfolio to cover each Portfolio’s exposure to the counterparty.
The Focus Smid-Cap Growth Equity Portfolio, The Core Plus Fixed Income Portfolio, The International Equity Portfolio, and The Labor Select International Equity Portfolio entered into foreign currency exchange contracts and foreign cross currency exchange contracts in order to hedge the U.S. dollar value of securities they already own that are denominated in foreign currencies. The International Equity Portfolio, The Labor Select International Equity Portfolio, The Emerging Markets Portfolio, and The Emerging Markets Portfolio II entered into foreign currency exchange contracts and foreign cross currency exchange contracts to facilitate or expedite the settlement of portfolio transactions.
Futures Contracts — A futures contract is an agreement in which the writer (or seller) of the contract agrees to deliver to the buyer an amount of cash or securities equal to a specific dollar amount times the difference between the value of a specific security or index at the close of the last trading day of the contract and the price at which the agreement is made. The Select 20, The Large-Cap Growth Equity, The Focus Smid-Cap Growth Equity, The High-Yield Bond, The Core Plus Fixed Income, The Emerging Markets, and The Emerging Markets II Portfolios may use futures in the normal course of pursuing their respective investment objectives. Each Portfolio may invest in futures contracts to hedge its existing portfolio securities against fluctuations in value caused by changes in interest rates or market conditions. Upon entering into a futures contract, a Portfolio deposits cash or pledges U.S. government securities to a broker, equal to the minimum “initial margin” requirements of the exchange on which the contract is traded. Subsequent payments are received from the broker or paid to the broker each day, based on the daily fluctuation in the market value of the contract. These receipts or payments are known as “variation margin” and are recorded daily by each Portfolio as unrealized gains or losses until the contracts are closed. When the contracts are closed, the Portfolio records a realized gain or loss equal to the difference between the value of the contract at the time it was opened and the value at the time it was closed. Risks of entering into futures contracts include potential imperfect correlation between the futures contracts and the underlying securities and the possibility of an illiquid secondary market for these instruments. When investing in futures, there is reduced counterparty credit risk to each Portfolio because futures are exchange-traded and the exchange’s clearinghouse, as counterparty to all exchange-traded futures, guarantees against default. The Core Plus Fixed Income Portfolio posted securities with a value of $192,433 as collateral for futures contracts.
The High-Yield Bond Portfolio and The Core Plus Fixed Income Portfolio entered into futures contracts in order to hedge the Portfolios’ existing portfolio securities against fluctuations in value caused by changes in interest rates or market conditions.
Options Contracts — Each Portfolio may enter into options contracts in the normal course of pursuing its respective investment objective. Each Portfolio may buy or write options contracts for any number of reasons, including without limitation: to manage each Portfolio’s exposure to changes in securities prices caused by interest rates or market conditions and foreign currencies; as an efficient means of adjusting each Portfolio’s overall exposure to certain markets; to protect the value of portfolio securities; and as a cash management tool. Each Portfolio may buy or write call or put options on securities, financial indices, futures, swaps, and foreign currencies. When each Portfolio buys an option, a premium is paid and an asset is recorded and adjusted on a daily basis to reflect the current market value of the option purchased. When each Portfolio writes an option, a premium is received and a liability is recorded and adjusted on a daily basis to reflect the current market value of the option written. Premiums received from writing options that expire unexercised are treated by each Portfolio on the expiration date as realized gains. The difference between the premium received and the amount paid on effecting a closing purchase transaction, including brokerage commissions, is treated as realized gain or loss. If a call option is exercised, the premium is added to the proceeds from the sale of the underlying security in determining whether each Portfolio has a realized gain or loss. If a put option is exercised, the premium reduces the cost basis of the securities purchased by each Portfolio. Each Portfolio, as writer of an option, bears the market risk of an unfavorable change in the price of the security underlying the written option. When writing options, each Portfolio is subject to minimal counterparty risk because the counterparty is only obligated to pay premiums and does not bear the market risk of an unfavorable market change.
Notes to financial statements
Delaware Pooled® Trust
8. Derivatives (continued)
The Core Plus Fixed Income Portfolio purchased option contracts in order to manage the Portfolio’s exposure to changes in securities prices caused by interest rates or market conditions.
There were no transactions in options written during the year ended Oct. 31, 2015.
Swap Contracts — The High-Yield Bond Portfolio and The Core Plus Fixed Income Portfolio may enter into credit default swap (CDS) contracts in accordance with their investment objectives. The Core Plus Fixed Income Portfolio may enter into interest rate swap contracts in accordance with its investment objective. The Portfolio may use interest rate swaps to adjust the Portfolio’s sensitivity to interest rates or to hedge against changes in interest rates. The Portfolios may enter into CDS contracts in order to hedge against a credit event, to enhance total return, or to gain exposure to certain securities or markets. The Portfolios will not be permitted to enter into any swap transactions unless, at the time of entering into such transactions, the unsecured long-term debt of the actual counterparty, combined with any credit enhancements, is rated at least BBB- by Standard & Poor’s Financial Services LLC (S&P) or Baa3 by Moody’s Investors Service, Inc. (Moody’s) or is determined to be of equivalent quality by DMC.
Credit Default Swaps — A CDS contract is a risk-transfer instrument through which one party (purchaser of protection) transfers to another party (seller of protection) the financial risk of a credit event (as defined in the CDS agreement), as it relates to a particular reference security or basket of securities (such as an index). In exchange for the protection offered by the seller of protection, the purchaser of protection agrees to pay the seller of protection a periodic amount at a stated rate that is applied to the notional amount of the CDS contract. In addition, an upfront payment may be made or received by a Portfolio in connection with an unwinding or assignment of a CDS contract. Upon the occurrence of a credit event, the seller of protection would pay the par (or other agreed- upon) value of the reference security (or basket of securities) to the counterparty. Credit events generally include, among others, bankruptcy, failure to pay, and obligation default.
During the year ended Oct. 31, 2015, the Portfolios entered into CDS contracts as purchasers of protection. Periodic payments (receipts) on such contracts are accrued daily and recorded as unrealized losses (gains) on swap contracts. Upon payment (receipt), such amounts are recorded as realized losses (gains) on swap contracts. Upfront payments made or received in connection with CDS contracts are amortized over the expected life of the CDS contracts as unrealized losses (gains) on swap contracts. The change in value of CDS contracts is recorded daily as unrealized appreciation or depreciation. A realized gain or loss is recorded upon a credit event (as defined in the CDS agreement) or the maturity or termination of the agreement. Initial margin and variation margin are posted to central counterparties for centrally cleared CDS basket trades as determined by the applicable central counterparty. During the year ended Oct. 31, 2015, the Portfolios did not enter into any CDS contracts as a seller of protection.
CDS contracts may involve greater risks than if a Portfolio had invested in the reference obligation directly. CDS contracts are subject to general market risk, liquidity risk, counterparty risk, and credit risk. A Portfolio’s maximum risk of loss from counterparty credit risk, either as the seller of protection or the buyer of protection, is the fair value of the contract. This risk is mitigated by (1) for bilateral swap contracts, having netting arrangements between each Portfolio and the counterparty and by the posting of collateral by the counterparty to each Portfolio to cover the Portfolios’ exposure to the counterparty or (2) for cleared swaps, trading these instruments through a central counterparty.
The High-Yield Bond Portfolio entered into CDS contracts in order to gain exposure to certain securities or markets. The Core Plus Fixed Income Portfolio entered into CDS contracts in order to hedge against credit events.
134
Swaps Generally — The value of open swaps may differ from that which would be realized in the event a Portfolio terminated its position in the contract on a given day. Risks of entering into these contracts include the potential inability of the counterparty to meet the terms of the contracts. This type of risk is generally limited to the amount of favorable movement in the value of the underlying security, instrument, or basket of instruments, if any, at the day of default. Risks also arise from potential losses from adverse market movements and such losses could exceed the unrealized amounts shown on the “Schedules of investments.”
At Oct. 31, 2015, The Core Plus Fixed Income Portfolio posted $82,763 in cash collateral for centrally cleared swap contracts, which is presented as “Variation margin due from brokers on centrally cleared credit default swap contracts” on the “Statements of assets and liabilities.”
Fair values of derivative instruments as of Oct. 31, 2015 were as follows:
| | | | | | | | | | |
| | | The Core Plus Fixed Income Portfolio |
| | | Asset Derivatives
Fair Value |
| Statements of Assets and Liabilities Location | | Currency
Contracts | | Equity
Contracts | | Interest rate
Contracts | | Credit
Contracts | | Total |
| Unrealized appreciation on foreign currency exchange contracts | | $564 | | $— | | $ — | | $— | | $ 564 |
| Variation margin due from broker on futures contracts* | | — | | — | | 113,312 | | — | | 113,312 |
Total | | $564 | | $— | | $113,312 | | $— | | $113,876 |
| |
| | | Liability Derivatives
Fair Value |
| Statements of Assets and Liabilities Location | | Currency
Contracts | | Equity
Contracts | | Interest rate
Contracts | | Credit
Contracts | | Total |
| Variation margin due to broker on futures contracts* | | $— | | $(6,183) | | $(4,411) | | $ — | | $(10,594) |
| Unrealized depreciation on swap contracts | | — | | — | | — | | (5,369) | | (5,369) |
Total | | $— | | $(6,183) | | $(4,411) | | $(5,369) | | $(15,963) |
| * | Includes cumulative appreciation (depreciation) of futures contracts from the date the contracts are opened through Oct. 31, 2015. Only current day variation margin is reported on the “Statements of assets and liabilities.” |
Notes to financial statements
Delaware Pooled® Trust
8. Derivatives (continued)
The effect of derivative instruments on the “Statements of operations” for the year ended Oct. 31, 2015 was as follows:
| | | | | | | | | | | | | | | | | | | | |
| | | | | The High-Yield Bond Portfolio
Net Realized Loss on: |
| | | | | Futures
Contracts | | Swap
Contracts | | Total |
Interest rate contracts | | | | | | | | | $(19,406) | | | | | $ — | | | | | $ (19,406) | |
Credit contracts | | | | | | | | | — | | | | | (116,497) | | | | | (116,497) | |
Total | | | | | | | | | $(19,406) | | | | | $(116,497) | | | | | $(135,903) | |
| | |
| | | | | Net Change in Unrealized Appreciation
(Depreciation) of: |
| | | | | Futures
Contracts | | Swaps
Contracts | | Total |
Interest rate contracts | | | | | | | | | $15,984 | | | | | $ — | | | | | $ 15,984 | |
Credit contracts | | | | | | | | | — | | | | | 106,230 | | | | | 106,230 | |
Total | | | | | | | | | $15,984 | | | | | $106,230 | | | | | $122,214 | |
| |
| | | The Core Plus Fixed Income Portfolio
Net Realized Gain (Loss) on: |
| | | | |
| | | Foreign
Currency
Exchange
Contracts | | Futures
Contracts | | Swap
Contracts | | Total |
Forward currency exchange contracts | | | | $1,425 | | | | | $ — | | | | | $ — | | | | | $ 1,425 | |
Interest rate contracts | | | | — | | | | | 142,574 | | | | | — | | | | | 142,574 | |
Credit contracts | | | | — | | | | | — | | | | | 3,390 | | | | | 3,390 | |
Total | | | | $1,425 | | | | | $142,574 | | | | | $3,390 | | | | | $147,389 | |
| |
| | | Net Change in Unrealized Appreciation (Depreciation) of: |
| | | | |
| | | Foreign
Currency
Exchange
Contracts | | Futures
Contracts | | Swaps
Contracts | | Total |
Forward currency exchange contracts | | | | $1,674 | | | | | $ — | | | | | $ — | | | | | $ 1,674 | |
Interest rate contracts | | | | — | | | | | 122,177 | | | | | — | | | | | 122,177 | |
Credit contracts | | | | — | | | | | — | | | | | (10,969) | | | | | (10,969) | |
Total | | | | $1,674 | | | | | $122,177 | | | | | $(10,969) | | | | | $112,882 | |
At Oct. 31, 2015, The Focus Smid-Cap Growth Equity Portfolio, The International Equity Portfolio, The Labor Select International Equity Portfolio, The Emerging Markets Portfolio, and The Emerging Markets Portfolio II had foreign currency risk, which is disclosed on the “Statements of assets and liabilities” and “Statements of operations.”
136
Derivatives Generally. The tables below summarize the average balance of derivative holdings by each Portfolio during the year ended Oct. 31, 2015.
| | | | | | | | | | | | | | | | | | | | |
| | | The Focus Smid-Cap Growth Equity Portfolio |
| | | Long Derivative Volume | | Short Derivative Volume |
Foreign currency exchange contracts (average cost) | | | | USD | | | | | 906 | | | | | USD | | | | | 155 | |
| |
| | | The High-Yield Bond Portfolio |
| | | Long Derivative Volume | | Short Derivative Volume |
Futures contracts (average notional value) | | | | USD | | | | | — | | | | | USD | | | | | 204,868 | |
CDS contracts (average notional value)* | | | | | | | | | 126,454 | | | | | | | | | | — | |
| |
| | | The Core Plus Fixed Income Portfolio |
| | | Long Derivative Volume | | Short Derivative Volume |
Foreign currency exchange contracts (average cost) | | | | USD | | | | | 8,527 | | | | | USD | | | | | 203,800 | |
Futures contracts (average notional value) | | | | | | | | | 7,053,461 | | | | | | | | | | 4,621,077 | |
CDS contracts (average notional value)* | | | | | | | | | 504,097 | | | | | | | | | | — | |
| | | | EUR | | | | | 185,797 | | | | | | | | | | — | |
| |
| | | The International Equity Portfolio |
| | | Long Derivative Volume | | Short Derivative Volume |
Foreign currency exchange contracts (average cost) | | | | USD | | | | | 142,658 | | | | | USD | | | | | 1,091,851 | |
| |
| | | The Labor Select International Equity Portfolio |
| | | Long Derivative Volume | | Short Derivative Volume |
Foreign currency exchange contracts (average cost) | | | | USD | | | | | 79,742 | | | | | USD | | | | | 851,405 | |
| |
| | | The Emerging Markets Portfolio |
| | | Long Derivative Volume | | Short Derivative Volume |
Foreign currency exchange contracts (average cost) | | | | USD | | | | | 176,543 | | | | | USD | | | | | 369,398 | |
| |
| | | The Emerging Markets Portfolio II |
| | | Long Derivative Volume | | Short Derivative Volume |
Foreign currency exchange contracts (average cost) | | | | USD | | | | | 6,055 | | | | | USD | | | | | 5,102 | |
*Long represents buying protection and short represents selling protection.
9. Offsetting
In December 2011, the Financial Accounting Standards Board (FASB) issued guidance that expanded disclosure requirements on the offsetting of certain assets and liabilities. The disclosures are required for investments and derivative financial instruments subject to master netting or similar agreements which are eligible for offset on the “Statements of assets and liabilities” and require an entity to disclose both gross and net information about such investments and transactions in the financial statements. In January 2013, the FASB issued guidance that clarified which investments and transactions are subject to the offsetting disclosure requirements. The scope of the disclosure requirements for offsetting is limited to derivative instruments, repurchase agreements and reverse repurchase agreements, and securities borrowing. The guidance is effective for financial statements with fiscal years beginning on or after Jan. 1, 2013, and interim periods within those fiscal years.
In order to better define its contractual rights and to secure rights that will help each Portfolio mitigate its counterparty risk, the Portfolios entered into an International Swaps and Derivatives Association, Inc. Master Agreement (ISDA Master Agreement) or a similar agreement with certain of their derivative contract counterparties. An ISDA Master Agreement is a bilateral agreement between each Portfolio and a counterparty that governs certain over-the-counter (OTC) derivatives and foreign exchange contracts and typically contains, among other things, collateral posting items and netting provisions in the event of a default and/or termination event. Under an ISDA Master Agreement, each Portfolio may, under certain circumstances, offset with the counterparty certain derivative financial instruments’ payables and/or receivables with collateral held and/or posted and create one single net payment. The provisions of the ISDA Master Agreement typically permit a single net payment in the event of default (close-out), including the bankruptcy or insolvency of the counterparty. However, bankruptcy or insolvency laws of a particular jurisdiction may impose restrictions on or prohibitions against the right of offset in bankruptcy, insolvency, or other events.
Notes to financial statements
Delaware Pooled® Trust
9. Offsetting (continued)
For financial reporting purposes, the Portfolios do not offset derivative assets and derivative liabilities that are subject to netting arrangements on the “Statements of assets and liabilities.”
At Oct. 31, 2015, the Portfolios had the following assets and liabilities subject to offsetting provisions:
Offsetting of Financial Assets and Liabilities and Derivative Assets and Liabilities
| | | | | | | | | | | | | | | | | | | | | | | | | |
| The Large-Cap Value Equity Portfolio | | |
Master Repurchase Agreements Counterparty | | Repurchase
Agreements | | Fair Value of
Non-Cash
Collateral Received | | Cash
Collateral
Received | | Net
Collateral
Received | | Net Exposure(a) |
Bank of America Merrill Lynch | | | $ | 133,011 | | | | $ | (133,011 | ) | | | $ | — | | | | $ | (133,011 | ) | | | $ | — | |
Bank of Montreal | | | | 66,505 | | | | | (66,505 | ) | | | | — | | | | | (66,505 | ) | | | | — | |
BNP Paribas | | | | 591,836 | | | | | (591,836 | ) | | | | — | | | | | (591,836 | ) | | | | — | |
| | | | | | | | | | | | | | | | | | | | | | | | | |
Total | | | $ | 791,352 | | | | $ | (791,352 | ) | | | $ | — | | | | | (791,352 | ) | | | $ | — | |
| | | | | | | | | | | | | | | | | | | | | | | | | |
| |
| The Select 20 Portfolio | | |
Master Repurchase Agreements Counterparty | | Repurchase
Agreements | | Fair Value of
Non-Cash
Collateral Received | | Cash
Collateral
Received | | Net
Collateral
Received | | Net Exposure(a) |
Bank of America Merrill Lynch | | | $ | 26,451 | | | | $ | (26,451 | ) | | | $ | — | | | | $ | (26,451 | ) | | | $ | — | |
Bank of Montreal | | | | 13,225 | | | | | (13,225 | ) | | | | — | | | | | (13,225 | ) | | | | — | |
BNP Paribas | | | | 117,695 | | | | | (117,695 | ) | | | | — | | | | | (117,695 | ) | | | | — | |
| | | | | | | | | | | | | | | | | | | | | | | | | |
Total | | | $ | 157,371 | | | | $ | (157,371 | ) | | | $ | — | | | | $ | (157,371 | ) | | | $ | — | |
| | | | | | | | | | | | | | | | | | | | | | | | | |
| |
| The Focus Smid-Cap Growth Equity Portfolio | | |
Master Repurchase Agreements Counterparty | | Repurchase
Agreements | | Fair Value of
Non-Cash
Collateral Received | | Cash
Collateral
Received | | Net
Collateral
Received | | Net Exposure(a) |
Bank of America Merrill Lynch | | | $ | 27,660 | | | | $ | (27,660 | ) | | | $ | — | | | | $ | (27,660 | ) | | | $ | — | |
Bank of Montreal | | | | 13,830 | | | | | (13,830 | ) | | | | — | | | | | (13,830 | ) | | | | — | |
BNP Paribas | | | | 123,075 | | | | | (123,075 | ) | | | | — | | | | | (123,075 | ) | | | | — | |
| | | | | | | | | | | | | | | | | | | | | | | | | |
Total | | | $ | 164,565 | | | | $ | (164,565 | ) | | | $ | — | | | | $ | (164,565 | ) | | | $ | — | |
| | | | | | | | | | | | | | | | | | | | | | | | | |
138
| | | | | | | | | | | | | | | | | | | | | | | | | |
| The High-Yield Bond Portfolio | | |
Master Repurchase Agreements Counterparty | | Repurchase
Agreements | | Fair Value of
Non-Cash
Collateral Received | | Cash
Collateral
Received | | Net
Collateral
Received | | Net Exposure(a) |
Bank of America Merrill Lynch | | | $ | 1,453,139 | | | | $ | (1,453,139 | ) | | | $ | — | | | | $ | (1,453,139 | ) | | | $ | — | |
Bank of Montreal | | | | 726,570 | | | | | (726,570 | ) | | | | — | | | | | (726,570 | ) | | | | — | |
BNP Paribas | | | | 6,465,812 | | | | | (6,465,812 | ) | | | | — | | | | | (6,465,812 | ) | | | | — | |
| | | | | | | | | | | | | | | | | | | | | | | | | |
Total | | | $ | 8,645,521 | | | | $ | (8,645,521 | ) | | | $ | — | | | | $ | (8,645,521 | ) | | | $ | — | |
| | | | | | | | | | | | | | | | | | | | | | | | | |
| | | | | | | | | | | | | | | |
| | | The Core Plus Fixed Income Portfolio | | |
| Counterparty | | Gross Value of
Derivative Asset | | Gross Value of
Derivative Liability | | Net Position |
JPMorgan Chase Bank | | | $ | — | | | | $ | (2,661 | ) | | | $ | (2,661 | ) |
Toronto Dominion Bank | | | | 564 | | | | | — | | | | | 564 | |
| | | | | | | | | | | | | | | |
Total | | | $ | 564 | | | | $ | (2,661 | ) | | | $ | (2,097 | ) |
| | | | | | | | | | | | | | | |
| | | | | | | | | | | | | | | | | | | | | | | | | | | | | | |
| Counterparty | | Net Position | | Fair Value of
Non-Cash
Collateral Received | | Cash
Collateral
Received | | Fair Value of
Non-Cash
Collateral Pledged | | Cash
Collateral
Pledged | | Net Exposure(a) |
JPMorgan Chase Bank | | | $ | (2,661 | ) | | | $ | — | | | | $ | — | | | | $ | — | | | | $ | — | | | | $ | (2,661 | ) |
Toronto Dominion Bank | | | | 564 | | | | | — | | | | | — | | | | | — | | | | | — | | | | | 564 | |
| | | | | | | | | | | | | | | | | | | | | | | | | | | | | | |
Total | | | $ | (2,097 | ) | | | $ | — | | | | $ | — | | | | $ | — | | | | $ | — | | | | $ | (2,097 | ) |
| | | | | | | | | | | | | | | | | | | | | | | | | | | | | | |
| | | | | | | | | | | | | | | | | | | | | | | | | |
| The Core Plus Fixed Income Portfolio | | |
Master Repurchase Agreements
Counterparty | | Repurchase
Agreements | | Fair Value of
Non-Cash
Collateral Received | | Cash
Collateral
Received | | Net
Collateral
Received | | Net Exposure(a) |
Bank of America Merrill Lynch | | | $ | 2,958,727 | | | | $ | (2,958,727 | ) | | | $ | — | | | | $ | (2,958,727 | ) | | | $ | — | |
Bank of Montreal | | | | 1,479,364 | | | | | (1,479,364 | ) | | | | — | | | | | (1,479,364 | ) | | | | — | |
BNP Paribas | | | | 13,164,996 | | | | | (13,164,996 | ) | | | | — | | | | | (13,164,996 | ) | | | | — | |
| | | | | | | | | | | | | | | | | | | | | | | | | |
Total | | | $ | 17,603,087 | | | | $ | (17,603,087 | ) | | | $ | — | | | | $ | (17,603,087 | ) | | | $ | — | |
| | | | | | | | | | | | | | | | | | | | | | | | | |
Notes to financial statements
Delaware Pooled® Trust
9. Offsetting (continued)
| | | | | | | | | | | | | | | |
| | | The International Equity Portfolio | | |
| Counterparty | | Gross Value of
Derivative Asset | | Gross Value of
Derivative Liability | | Net Position |
BNY Mellon | | | | $955 | | | | | $ — | | | | | $955 | |
Northern Trust | | | | — | | | | | (127 | ) | | | | (127 | ) |
Total | | | | $955 | | | | | $(127 | ) | | | | $828 | |
| | | | | | | | | | | | | | | | | | | | | | | | | | | | | | |
| Counterparty | | Net Position | | Fair Value of
Non-Cash
Collateral Received | | Cash
Collateral
Received | | Fair Value of
Non-Cash
Collateral Pledged | | Cash
Collateral
Pledged | | Net Exposure(a) |
BNY Mellon | | | | $955 | | | | | $— | | | | | $— | | | | | $— | | | | | $— | | | | | $955 | |
Northern Trust | | | | (127 | ) | | | | — | | | | | — | | | | | — | | | | | — | | | | | (127 | ) |
Total | | | | $828 | | | | | $— | | | | | $— | | | | | $— | | | | | $— | | | | | $828 | |
| | | | | | | | | | | | | | | |
| | | The Labor Select International Equity Portfolio | | |
| Counterparty | | Gross Value of
Derivative Asset | | Gross Value of
Derivative Liability | | Net Position |
BNY Mellon | | | | $1,364 | | | | | $— | | | | | $1,364 | |
Northern Trust | | | | 250 | | | | | — | | | | | 250 | |
Total | | | | $1,614 | | | | | $— | | | | | $1,614 | |
| | | | | | | | | | | | | | | | | | | | | | | | | | | | | | |
| Counterparty | | Net Position | | Fair Value of
Non-Cash
Collateral Received | | Cash
Collateral
Received | | Fair Value of
Non-Cash
Collateral Pledged | | Cash
Collateral
Pledged | | Net Exposure(a) |
BNY Mellon | | | | $1,364 | | | | | $— | | | | | $— | | | | | $— | | | | | $— | | | | | $1,364 | |
Northern Trust | | | | 250 | | | | | — | | | | | — | | | | | — | | | | | — | | | | | 250 | |
Total | | | | $1,614 | | | | | $— | | | | | $— | | | | | $— | | | | | $— | | | | | $1,614 | |
| | | | | | | | | | | | | | | | | | | | | | | | | |
| The Labor Select International Equity Portfolio | | |
| Master Repurchase Agreements Counterparty | | Repurchase
Agreements | | Fair Value of
Non-Cash
Collateral Received | | Cash
Collateral
Received | | Net
Collateral
Received | | Net Exposure(a) |
Bank of America Merrill Lynch | | | | $ 478,082 | | | | | $ (478,082 | ) | | | | $— | | | | | $ (478,082 | ) | | | | $— | |
Bank of Montreal | | | | 239,041 | | | | | (239,041 | ) | | | | — | | | | | (239,041 | ) | | | | — | |
BNP Paribas | | | | 2,127,248 | | | | | (2,127,248 | ) | | | | — | | | | | (2,127,248 | ) | | | | — | |
Total | | | | $2,844,371 | | | | | $(2,844,371 | ) | | | | $— | | | | | $(2,844,371 | ) | | | | $— | |
140
| | | | | | | | | | | | | | | |
| | | The Emerging Markets Portfolio | | |
| Counterparty | | Gross Value of
Derivative Asset | | Gross Value of
Derivative Liability | | Net Position |
Barclays Bank | | | $ | 671 | | | | $ | — | | | | $ | 671 | |
BNY Mellon | | | | 143 | | | | | (571 | ) | | | | (428 | ) |
| | | | | | | | | | | | | | | |
Total | | | $ | 814 | | | | $ | (571 | ) | | | $ | 243 | |
| | | | | | | | | | | | | | | |
| | | | | | | | | | | | | | | | | | | | | | | | | | | | | | |
| Counterparty | | Net Position | | Fair Value of
Non-Cash
Collateral Received | | Cash
Collateral
Received | | Fair Value of
Non-Cash
Collateral Pledged | | Cash
Collateral
Pledged | | Net Exposure(a) |
Barclays Bank | | | $ | 671 | | | | $ | — | | | | $ | — | | | | $ | — | | | | $ | — | | | | $ | 671 | |
BNY Mellon | | | | (428 | ) | | | | — | | | | | — | | | | | — | | | | | — | | | | | (428 | ) |
| | | | | | | | | | | | | | | | | | | | | | | | | | | | | | |
Total | | | $ | 243 | | | | $ | — | | | | $ | — | | | | $ | — | | | | $ | — | | | | $ | 243 | |
| | | | | | | | | | | | | | | | | | | | | | | | | | | | | | |
| | | | | | | | | | | | | | | | | | | | | | | | | |
| The Emerging Markets Portfolio | | |
Master Repurchase Agreements
Counterparty | | Repurchase
Agreements | | Fair Value of
Non-Cash
Collateral Received | | Cash
Collateral
Received | | Net
Collateral
Received | | Net Exposure(a) |
Bank of America Merrill Lynch | | | $ | 45,495 | | | | $ | (45,495 | ) | | | $ | — | | | | $ | (45,495 | ) | | | $ | — | |
Bank of Montreal | | | | 22,748 | | | | | (22,748 | ) | | | | — | | | | | (22,748 | ) | | | | — | |
BNP Paribas | | | | 202,435 | | | | | (202,435 | ) | | | | — | | | | | (202,435 | ) | | | | — | |
| | | | | | | | | | | | | | | | | | | | | | | | | |
Total | | | $ | 270,678 | | | | $ | (270,678 | ) | | | $ | — | | | | $ | (270,678 | ) | | | $ | — | |
| | | | | | | | | | | | | | | | | | | | | | | | | |
| | | | | | | | | | | | | | | | | | | | | | | | | |
| The Emerging Markets Portfolio II | | |
Master Repurchase Agreements
Counterparty | | Repurchase
Agreements | | Fair Value of
Non-Cash
Collateral
Received | | Cash
Collateral
Received | | Net Collateral
Received | | Net
Exposure(a) |
Bank of America Merrill Lynch | | | $ | 69,679 | | | | $ | (69,679 | ) | | | $ | — | | | | $ | (69,679 | ) | | | $ | — | |
Bank of Montreal | | | | 34,840 | | | | | (34,840 | ) | | | | — | | | | | (34,840 | ) | | | | — | |
BNP Paribas | | | | 310,042 | | | | | (310,042 | ) | | | | — | | | | | (310,042 | ) | | | | — | |
| | | | | | | | | | | | | | | | | | | | | | | | | |
Total | | | $ | 414,561 | | | | $ | (414,561 | ) | | | $ | — | | | | $ | (414,561 | ) | | | $ | — | |
| | | | | | | | | | | | | | | | | | | | | | | | | |
(a)Net exposure represents the receivable (payable) that would be due from (to) the counterparty in the event of default.
10. Securities Lending
Each Portfolio, along with other funds in the Delaware Investments® Family of Funds, may lend its securities pursuant to a security lending agreement (Lending Agreement) with The Bank of New York Mellon (BNY Mellon). At the time a security is loaned, the borrower must post collateral equal to the required percentage of the market value of the loaned security, including any accrued interest. The required percentage is: (1) 102% with respect to U.S. securities and foreign securities that are denominated and payable in U.S. dollars; and (2) 105% with respect to foreign securities. With respect to each loan, if on any business day the aggregate market value of securities collateral plus cash collateral held is less than the aggregate market value of the securities which are the subject of such loan, the borrower will be notified to provide additional collateral by the end of the following business day which, together with the collateral already held, will be not less than the applicable initial collateral requirements for such security loan. If the aggregate market value of securities collateral and cash collateral held with respect to a security loan exceeds the applicable initial collateral requirement, upon the request of the borrower, BNY Mellon must return enough collateral to the borrower by the end of the following business day to reduce the value of the remaining collateral to the applicable initial collateral requirement for such security loan. As a result of the foregoing, the value of the collateral held with respect to a loaned security on any particular day may be more or less than the value of the security on loan.
Notes to financial statements
Delaware Pooled® Trust
10. Securities Lending (continued)
Cash collateral received is generally invested in the Delaware Investments Collateral Fund No. 1 (Collective Trust) established by BNY Mellon for the purpose of investment on behalf of funds managed by DMC that participate in BNY Mellon’s securities lending program. The Collective Trust may invest in U.S. government securities and high-quality corporate debt, asset-backed and other money market securities, and in repurchase agreements collateralized by such securities, provided that the Collective Trust will generally have a dollar-weighted average portfolio maturity of 60 days or less. Each Portfolio can also accept U.S. government securities and letters of credit (non-cash collateral) in connection with securities loans. In the event of default or bankruptcy by the lending agent, realization and/or retention of the collateral may be subject to legal proceedings. In the event the borrower fails to return loaned securities and the collateral received is insufficient to cover the value of the loaned securities and provided such collateral shortfall is not the result of investment losses, the lending agent has agreed to pay the amount of the shortfall to each Portfolio or, at the discretion of the lending agent, replace the loaned securities. Each Portfolio continues to record dividends or interest, as applicable, on the securities loaned and is subject to changes in value of the securities loaned that may occur during the term of the loan. Each Portfolio has the right under the Lending Agreement to recover the securities from the borrower on demand. With respect to security loans collateralized by non-cash collateral, each Portfolio receives loan premiums paid by the borrower. With respect to security loans collateralized by cash collateral, the earnings from the collateral investments are shared among each Portfolio, the security lending agent, and the borrower. Each Portfolio records security lending income net of allocations to the security lending agent and the borrower.
The Collective Trust used for the investment of cash collateral received from borrowers of securities seeks to maintain a net asset value per unit of $1.00, but there can be no assurance that it will always be able to do so. Each Portfolio may incur investment losses as a result of investing securities lending collateral in the Collective Trust. This could occur if an investment in the Collateral Trust defaulted or if it were necessary to liquidate assets in the Collateral Trust to meet returns on outstanding security loans at a time when the Collateral Trust’s net asset value per unit was less than $1.00. Under those circumstances, each Portfolio may not receive an amount from the Collateral Trust that is equal in amount to the collateral each Portfolio would be required to return to the borrower of the securities and each Portfolio would be required to make up for this shortfall.
During the year ended Oct. 31, 2015, none of the Portfolios had securities out on loan.
11. Credit and Market Risk
Some countries in which The International Equity, The Labor Select International Equity, The Emerging Markets, and The Emerging Markets II Portfolios invest require governmental approval for the repatriation of investment income, capital, or the proceeds of sales of securities by foreign investors. In addition, if there is deterioration in a country’s balance of payments or for other reasons, a country may impose temporary restrictions on foreign capital remittances abroad.
The securities exchanges of certain foreign markets are substantially smaller, less liquid and more volatile than the major securities markets in the United States. Consequently, acquisition and disposition of securities by each Portfolio may be inhibited. In addition, a significant portion of the aggregate market value of securities listed on the major securities exchanges in emerging markets is held by a smaller number of investors. This may limit the number of shares available for acquisition or disposition by each Portfolio.
The High-Yield Bond Portfolio invests a portion of its assets in high yield fixed income securities which are securities rated lower than BBB-by S&P and lower than Baa3 by Moody’s, or similarly rated by another nationally recognized statistical rating organization. The Core Plus Fixed Income Portfolio invests a portion of its assets in high yield fixed income securities which are securities rated BB or lower by S&P and Ba or lower by Moody’s, or similarly rated by another nationally recognized statistical rating organization. Investments in these higher yielding securities are generally accompanied by a greater degree of credit risk than higher rated securities. Additionally, lower rated securities may be more susceptible to adverse economic and competitive industry conditions than investment grade securities.
The High-Yield Bond Portfolio and The Core Plus Fixed Income Portfolio invest in bank loans and other securities that may subject them to direct indebtedness risk, the risk that each Portfolio will not receive payment of principal, interest and other amounts due in connection with these investments and will depend primarily on the financial condition of the borrower. Loans that are fully secured offer each Portfolio more protection than unsecured loans in the event of nonpayment of scheduled interest or principal, although there is no assurance that the liquidation of collateral from a secured loan would satisfy the corporate borrower’s obligation, or that the collateral can be liquidated. Some loans or claims may be in default at the time of purchase. Certain of the loans and the other direct indebtedness acquired by each Portfolio may involve revolving credit facilities or other standby financing commitments that obligate each Portfolio to pay additional cash on a certain date or on demand. These commitments may require each Portfolio to increase its investment in a company at a time when each Portfolio might not
142
otherwise decide to do so (including at a time when the company’s financial condition makes it unlikely that such amounts will be repaid). To the extent that each Portfolio is committed to advance additional funds, it will at all times hold and maintain cash or other high grade debt obligations in an amount sufficient to meet such commitments.
As each Portfolio may be required to rely upon another lending institution to collect and pass on to each Portfolio amounts payable with respect to the loan and to enforce each Portfolio’s rights under the loan and other direct indebtedness, an insolvency, bankruptcy, or reorganization of the lending institution may delay or prevent each Portfolio from receiving such amounts. The highly leveraged nature of many loans may make them especially vulnerable to adverse changes in economic or market conditions. Investments in such loans and other direct indebtedness may involve additional risk to each Portfolio.
The Core Plus Fixed Income Portfolio invests in fixed income securities whose value is derived from an underlying pool of mortgages or consumer loans. The value of these securities is sensitive to changes in economic conditions, including delinquencies and/or defaults, and may be adversely affected by shifts in the market’s perception of the issuers and changes in interest rates. Investors receive principal and interest payments as the underlying mortgages and consumer loans are paid back. Some of these securities are collateralized mortgage obligations (CMOs). CMOs are debt securities issued by U.S. government agencies or by financial institutions and other mortgage lenders, which are collateralized by a pool of mortgages held under an indenture. Prepayment of mortgages may shorten the stated maturity of the obligations and can result in a loss of premium, if any has been paid. Certain of these securities may be stripped (securities which provide only the principal or interest feature of the underlying security). The yield to maturity on an interest-only CMO is extremely sensitive not only to changes in prevailing interest rates, but also to the rate of principal payments (including prepayments) on the related underlying mortgage assets. A rapid rate of principal payments may have a material adverse effect on the Portfolio’s yield to maturity. If the underlying mortgage assets experience greater than anticipated prepayments of principal, the Portfolio may fail to fully recoup its initial investment in these securities even if the securities are rated in the highest rating categories.
The High-Yield Bond Portfolio and The Core Plus Fixed Income Portfolio invest in certain obligations that may have liquidity protection designed to ensure that the receipt of payments due on the underlying security is timely. Such protection may be provided through guarantees, insurance policies or letters of credit obtained by the issuer or sponsor through third parties, through various means of structuring the transaction or through a combination of such approaches. Each Portfolio will not pay any additional fees for such credit support, although the existence of credit support may increase the price of a security.
The Select 20 and The Focus Smid-Cap Growth Equity Portfolios invest a significant portion of their assets in small- and mid-sized companies and may be subject to certain risks associated with ownership of securities of such companies. Investments in small- or mid-sized companies may be more volatile than investments in larger companies for a number of reasons, which include more limited financial resources or a dependence on narrow product lines.
Because The Large-Cap Value Equity, The Select 20, The Large-Cap Growth Equity, and The Focus Smid-Cap Growth Equity Portfolios expect to hold a concentrated portfolio of a limited number of securities, the Portfolios’ risk is increased because each investment has a greater effect on the Portfolio’s overall performance.
The International Equity Portfolio may invest up to 10% its net assets in illiquid securities, which may include securities with contractual restrictions on resale, securities exempt from registration under Rule 144A promulgated under the Securities Act of 1933, as amended, and other securities, which may not be readily marketable. The Large-Cap Value Equity, The Select 20, The Large-Cap Growth Equity, The Focus Smid-Cap Growth Equity, The High-Yield Bond, The Core Plus Fixed Income, The Labor Select International Equity, The Emerging Markets, and The Emerging Markets II Portfolios may invest up to 15% of each Portfolio’s net assets in such securities. The relative illiquidity of these securities may impair each Portfolio from disposing of them in a timely manner and at a fair price when it is necessary or desirable to do so. While maintaining oversight, the Portfolios’ Board has delegated to DMC the day-to-day functions of determining whether individual securities are liquid for purposes of each Portfolio’s limitation on investments in illiquid securities. Securities eligible for resale pursuant to Rule 144A, which are determined to be liquid, are not subject to the Portfolios’ limit on investments in illiquid securities. Rule 144A and illiquid securities have been identified on the “Schedules of investments.”
12. Contractual Obligations
Each Portfolio enters into contracts in the normal course of business that contain a variety of indemnifications. Each Portfolio’s maximum exposure under these arrangements is unknown. However, the Portfolios have not had prior claims or losses pursuant to these contracts. Management has reviewed each Portfolio’s existing contracts and expects the risk of loss to be remote.
Notes to financial statements
Delaware Pooled® Trust
13. In-Kind Redemption
During the year ended Oct. 31, 2015, The International Equity Portfolio satisfied withdrawal requests with transfers of securities of $67,371,660, resulting in net realized gains of $5,334,630.
14. Recent Accounting Pronouncements
In June 2014, the FASB issued guidance to improve the financial reporting of reverse repurchase agreements and other similar transactions. The guidance includes expanded disclosure requirements for entities that enter into reverse repurchase agreements and similar transactions accounted for as secured borrowings. The guidance is effective for financial statements with fiscal years beginning on or after Dec. 15, 2014 and interim periods within those fiscal years. Management has determined that this pronouncement has no impact to the Funds’ financial statements.
In May 2015, the FASB issued Accounting Standards Update (“ASU”) No. 2015-07 regarding “Disclosures for Investments in Certain Entities That Calculate Net Asset Value per Share”. The amendments in this update are effective for the Portfolios for fiscal years beginning after Dec. 15, 2015, and interim periods within those fiscal years. ASU No. 2015-07 will eliminate the requirement to categorize investments in the fair value hierarchy if their fair value is measured at net asset value (“NAV”) per share (or its equivalent) using the practical expedient in the FASB’s fair value measurement guidance. Management is evaluating the impact, if any, of this guidance on the Portfolios’ financial statement disclosures.
15. General Motors Term Loan Litigation
The High Yield Bond Portfolio and The Core Plus Fixed Income Portfolio received notice of a litigation proceeding related to a General Motors Corporation (G.M.) term loan participation previously held by the Portfolios in 2009. We believe the matter subject to the litigation notice will likely lead to a recovery from the Portfolios of certain amounts received by the Portfolios because a U.S. Court of Appeals has ruled that the Portfolios and similarly situated investors were unsecured creditors rather than secured lenders of G. M. as a result of an erroneous UCC filing made by a third party. The Portfolios received the full principal on the loans in 2009 after the G.M. bankruptcy. However, based upon the court ruling the estate is seeking to recover such amounts arguing that, as unsecured creditors, the Portfolios should not have received payment in full. Based upon currently available information related to the litigation and the Portfolios’ potential exposure, the Portfolios recorded assets of $48,975 and $75,182, respectively, and liabilities of $163,250 and $250,607, respectively, that resulted in a decrease in the Portfolios’ net asset value to reflect this likely recovery.
16. Subsequent Events
On Nov. 9, 2015, each Portfolio, along with the other Participants, entered into an amendment to the agreement for a $155,000,000 revolving line of credit to be used as described in Note 7 and to be operated in substantially the same manner as the agreement described in Note 7, with the exception of the annual commitment fee. Under the amendment to the agreement, the Participants are charged an annual commitment fee of 0.10%, which is allocated across the Participants on the basis of each Participant’s allocation of the entire facility. The line of credit available under the agreement expires on Nov. 7, 2016.
On Nov. 18, 2015, the Board of Trustees of the Trust approved the submission of an Agreement and Plan of Reorganization to shareholders of The International Equity Portfolio, proposing to merge The International Equity Portfolio into the Mondrian International Equity Fund series of Gallery Trust (the “Reorganization”). The Reorganization is subject to the approval of the shareholders of The International Equity Portfolio and is intended to be a tax-free transaction. On the date of the Reorganization, The International Equity Portfolio will exchange all of its assets at net asset value for shares of the Mondrian International Equity Fund. Shareholders of The International Equity Portfolio will receive shares of the Mondrian International Equity Fund with a value equal to the net asset value of their ownership interests in the Portfolio at the date of the Reorganization. More information about the proposed Reorganization will be provided to shareholders in the proxy materials. If approved by shareholders of The International Equity Portfolio, the Reorganization is expected to occur in the first quarter of 2016.
Management has determined that no other material events or transactions occurred subsequent to Oct. 31, 2015 that would require recognition or disclosure in each Portfolio’s financial statements.
144
Report of independent
registered public accounting firm
To the Board of Trustees of Delaware Pooled® Trust and the Shareholders of The Large-Cap Value Equity Portfolio, The Select 20 Portfolio, The Large-Cap Growth Equity Portfolio, The Focus Smid-Cap Growth Equity Portfolio, The High-Yield Bond Portfolio, The Core Plus Fixed Income Portfolio, The International Equity Portfolio, The Labor Select International Equity Portfolio, The Emerging Markets Portfolio and The Emerging Markets Portfolio II:
In our opinion, the accompanying statements of assets and liabilities, including the schedules of investments, and the related statements of operations and of changes in net assets and the financial highlights present fairly, in all material respects, the financial position of The Large-Cap Value Equity Portfolio, The Select 20 Portfolio, The Large-Cap Growth Equity Portfolio, The Focus Smid-Cap Growth Equity Portfolio, The High-Yield Bond Portfolio, The Core Plus Fixed Income Portfolio, The International Equity Portfolio, The Labor Select International Equity Portfolio, The Emerging Markets Portfolio and The Emerging Markets Portfolio II (ten of the series constituting Delaware Pooled Trust, hereafter collectively referred to as the “Funds”) at October 31, 2015, the results of each of their operations for the year then ended, the changes in each of their net assets for each of the two years in the period then ended and the financial highlights for each of the periods indicated, in conformity with accounting principles generally accepted in the United States of America. These financial statements and financial highlights (hereafter referred to as “financial statements”) are the responsibility of the Funds’ management. Our responsibility is to express an opinion on these financial statements based on our audits. We conducted our audits of these financial statements in accordance with the standards of the Public Company Accounting Oversight Board (United States). Those standards require that we plan and perform the audit to obtain reasonable assurance about whether the financial statements are free of material misstatement. An audit includes examining, on a test basis, evidence supporting the amounts and disclosures in the financial statements, assessing the accounting principles used and significant estimates made by management, and evaluating the overall financial statement presentation. We believe that our audits, which included confirmation of securities at October 31, 2015 by correspondence with the custodian and brokers, and the application of alternative auditing procedures where confirmations of securities purchased had not been received, provide a reasonable basis for our opinion.
PricewaterhouseCoopers LLP
Philadelphia, Pennsylvania
December 18, 2015
145
Other Portfolio information
(Unaudited)
Delaware Pooled® Trust
Tax Information
The information set forth below is for each Portfolio’s fiscal year as required by federal laws. Shareholders, however, must report distributions on a calendar year basis for income tax purposes, which may include distributions for portions of two fiscal years of a fund. Accordingly, the information needed by shareholders for income tax purposes will be sent to them in January of each year. Please consult your tax advisor for proper treatment of this information.
All disclosures are based on financial information available as of the date of this annual report and, accordingly are subject to change. For any and all items requiring reporting, it is the intention of each Portfolio to report the maximum amount permitted under the Internal Revenue Code and the regulations thereunder.
For the fiscal year ended Oct. 31, 2015, each Portfolio reports distributions paid during the year as follows:
| | | | | | | | | | | | | | | | |
| | | (A)
Long-Term
Capital Gains
Distributions
(Tax Basis) | | | (B)
Ordinary Income
Distributions*
(Tax Basis) | | | Total
Distribution
(Tax Basis) | | | (C)
Qualifying
Dividends1 | |
The Large-Cap Value Equity Portfolio | | | 61.09% | | | | 38.91% | | | | 100.00% | | | | 99.58% | |
The Select 20 Portfolio | | | 91.38% | | | | 8.62% | | | | 100.00% | | | | 48.41% | |
The Large-Cap Growth Equity Portfolio | | | 92.92% | | | | 7.08% | | | | 100.00% | | | | 100.00% | |
The Focus Smid-Cap Growth Equity Portfolio | | | 70.41% | | | | 29.59% | | | | 100.00% | | | | 20.04% | |
The High-Yield Bond Portfolio | | | 20.55% | | | | 79.45% | | | | 100.00% | | | | 2.20% | |
The Core Plus Fixed Income Portfolio | | | — | | | | 100.00% | | | | 100.00% | | | | 0.50% | |
The International Equity Portfolio | | | — | | | | 100.00% | | | | 100.00% | | | | — | |
The Labor Select International Equity Portfolio | | | — | | | | 100.00% | | | | 100.00% | | | | — | |
The Emerging Markets Portfolio | | | 64.32% | | | | 35.68% | | | | 100.00% | | | | 2.32% | |
The Emerging Markets Portfolio II | | | 62.54% | | | | 37.46% | | | | 100.00% | | | | 2.21% | |
(A) and (B) are based on a percentage of each Portfolio’s total distributions.
(C) is based on a percentage of each Portfolio’s ordinary income distributions.
1Qualifying dividends represent dividends which qualify for the corporate dividends received deduction.
*For the fiscal year ended Oct. 31, 2015, certain dividends paid by the Portfolios may be subject to a maximum tax rate of 20%, as provided for by the Jobs and Growth Tax Relief Reconciliation Act of 2003 and as extended by the Tax Relief, Unemployment Insurance Reauthorization and Jobs Creation Act of 2010, and made permanent by the American Taxpayer Relief Act of 2012. The Portfolios intend to report the following percentages to be taxed at a maximum rate of 20%. Complete information will be computed and reported in conjunction with your 2015 Form 1099-DIV, as applicable.
| | |
| | | Maximum amount to be
Taxed at a maximum rate of 20% |
The Large-Cap Value Equity Portfolio | | 99.58% |
The Select 20 Portfolio | | 48.38% |
The Large-Cap Growth Equity Portfolio | | 100.00% |
The Focus Smid-Cap Growth Equity Portfolio | | 22.55% |
The High-Yield Bond Portfolio | | 2.30% |
The Core Plus Fixed Income Portfolio | | 0.51% |
The International Equity Portfolio | | 94.30% |
The Labor Select International Equity Portfolio | | 90.62% |
The Emerging Markets Portfolio | | 95.04% |
The Emerging Markets Portfolio II | | 99.83% |
The International Equity Portfolio, The Labor Select International Equity Portfolio, The Emerging Markets Portfolio and The Emerging Markets Portfolio II intend to pass through foreign tax credits in the maximum amount of $778,595, $708,880, $405,873, and $56,703, respectively. The gross foreign source income earned during the fiscal year 2015 was $14,169,074, $13,942,962, $8,214,643, and $677,655, respectively. Complete information will be computed and reported in conjunction with your 2015 Form 1099-DIV.
146
For the fiscal year ended Oct. 31, 2015, certain interest income paid by the Portfolios, determined to be Qualified Interest Income and Qualified Short-Term Capital Gain may be subject to relief from U.S. withholding for foreign shareholders, as provided by the American Jobs Creation Act of 2004 and as extended by the Tax Relief, Unemployment Insurance Reauthorization, and Job Creations Act of 2010, and by the American Taxpayer Relief Act of 2012. For the fiscal year ended Oct. 31, 2015, the following Portfolio has reported maximum distributions of Qualified Interest Income and Qualified Short-Term Capital Gain as follows:
| | | | | | |
| | | Qualified Interest Income | | | | Qualified
Short-Term Capital Gain |
The Large-Cap Value Equity Portfolio | | $264 | | | | $161,035 |
Board Consideration of Investment Advisory Agreements
At a meeting held on Aug. 18–20, 2015 (the “Annual Meeting”), the Board of Trustees (collectively referred to here as the “Board”), including a majority of disinterested or independent Trustees, approved the renewal of the Investment Advisory Agreements and Sub-Advisory Agreements, as applicable, for each of the series of Delaware Pooled® Trust (each, a “Portfolio” and together, the “Portfolios”). In making its decision, the Board considered information furnished at regular quarterly Board meetings, including reports detailing Portfolio performance, investment strategies and expenses, as well as information prepared specifically in connection with the renewal of the investment advisory and sub-advisory contracts. Information furnished specifically in connection with the renewal of the Investment Management Agreements with Delaware Management Company (“DMC”) and Sub-Advisory Agreements with Mondrian Investment Partners Limited (“Mondrian”) and Jackson Square Partners, LLC (“JSP”) included materials provided by DMC and its affiliates (“Delaware Investments”), Mondrian and JSP, as applicable, concerning, among other things, the nature, extent, and quality of services provided to the Portfolios; the costs of such services to the Portfolios; economies of scale; and the investment manager’s financial condition and profitability. In addition, in connection with the Annual Meeting, reports were provided to the Trustees in May 2015 and included reports provided by Lipper, Inc., an independent statistical compilation organization (“Lipper”). The Lipper reports compared each Portfolio’s investment performance and expenses with those of other comparable mutual funds. The Independent Trustees reviewed and discussed the Lipper reports with independent legal counsel to the Independent Trustees. In addition to the information noted above, the Board also requested and received information regarding DMC’s, Mondrian’s or JSP’s, as applicable, policy with respect to advisory fee levels and its breakpoint philosophy; the structure of portfolio manager compensation; comparative client fee information; and any constraints or limitations on the availability of securities for certain investment styles, which had in the past year inhibited, or which were likely in the future to inhibit, the investment manager’s ability to invest fully in accordance with Portfolio policies.
In considering information relating to the approval of each Portfolio’s advisory and sub-advisory agreement, as applicable, the Independent Trustees received assistance and advice from and met separately with independent legal counsel to the Independent Trustees. They also engaged a consultant to assist them in analyzing portions of the data received. The Independent Trustees reviewed and discussed with such consultant two reports prepared by the consultant with respect to such data. Although the Board gave attention to all information furnished, the following discussion identifies, under separate headings, the primary factors taken into account by the Board during its contract renewal considerations.
Nature, extent, and quality of service. The Board considered the services provided by DMC to the Portfolios and their shareholders. In reviewing the nature, extent, and quality of services, the Board considered reports furnished to it throughout the year, which covered matters such as the relative performance of the Portfolio; compliance of portfolio managers with the investment policies, strategies, and restrictions for the Portfolios; compliance by DMC and Delaware Distributors, L.P. (together, “Management”) personnel with the Code of Ethics adopted throughout the Delaware Investments® Family of Funds complex; and adherence to fair value pricing procedures as established by the Board. The Board was pleased with the current staffing of the Portfolios’ investment adviser and the emphasis placed on research in the investment process. The Board recognized DMC’s receipt of several industry distinctions during the past several years. The Board gave favorable consideration to DMC’s efforts to control expenditures while maintaining service levels committed to Portfolio matters. The Board noted that in November 2013, Management negotiated a substantial reduction in fees for fund accounting services provided to the Portfolios. The Board once again noted the benefits provided to Portfolio shareholders through each shareholder’s ability to exchange investments between Portfolios or the institutional class shares of other Delaware Investments funds and to reinvest Portfolio dividends into additional shares of the Portfolio or into additional shares of other Delaware Investments funds. The Board was satisfied with the nature, extent, and quality of the overall services provided by DMC.
Other Portfolio information
(Unaudited)
Delaware Pooled® Trust
Board Consideration of Investment Advisory Agreements (continued)
Nature, extent, and quality of service. The Board considered the services provided by Mondrian to The Emerging Markets Portfolio, The International Equity Portfolio, and The Labor Select International Equity Portfolio and their shareholders, as applicable. In reviewing the nature, extent, and quality of services, the Board considered reports furnished to it throughout the year at regular Board Meetings covering matters such as relative performance of the Portfolios; compliance of portfolio managers with the investment policies, strategies, and restrictions for the Portfolios, the compliance of Mondrian personnel with its Code of Ethics; and adherence to fair value pricing procedures as established by the Board. The Board was pleased with the current staffing of Mondrian and the emphasis placed on research in the investment process. The Board was satisfied with the nature, extent, and quality of the overall services proposed to be provided by Mondrian.
Nature, extent, and quality of service. The Board considered the services provided by JSP to The Large-Cap Growth Equity Portfolio, The Focus Smid-Cap Growth Equity Portfolio, and The Select 20 Portfolio and their shareholders. In reviewing the nature, extent, and quality of services, the Board took account of reports furnished to it throughout the year at regular Board Meetings covering matters such as relative performance of the Portfolios; compliance of portfolio managers with the investment policies, strategies, and restrictions for the Portfolio; the compliance of JSP personnel with its Code of Ethics; and adherence to fair value pricing procedures as established by the Board. The Board was pleased with the current staffing of JSP and the emphasis placed on research in the investment process. The Board was satisfied with the nature, extent, and quality of the overall services provided by JSP.
Investment performance. The Board placed significant emphasis on the investment performance of the Portfolios in view of the importance of investment performance to shareholders. Although the Board gave appropriate consideration to performance reports and discussions with portfolio managers at Board meetings throughout the year, the Board gave particular weight to the Lipper reports furnished for the Annual Meeting. The Lipper reports prepared for each Portfolio showed the investment performance of its shares in comparison to a group of similar funds as selected by Lipper (the “Performance Universe”). A fund with the best performance ranked first, and a fund with the poorest performance ranked last. The highest/best performing 25% of funds in the Performance Universe make up the first quartile; the next 25%, the second quartile; the next 25%, the third quartile; and the poorest/worst performing 25% of funds in the Performance Universe make up the fourth quartile. Comparative annualized performance for the Portfolios was shown for the past 1-, 3-, 5-, and 10-year periods, to the extent applicable, ended March 31, 2015. The Board’s objective is that each Portfolio’s performance for the periods considered be at or above the median of its Performance Universe.
The Core Plus Fixed Income Portfolio – The Performance Universe for the Portfolio consisted of the Portfolio and all retail and institutional core plus bond funds as selected by Lipper. The Lipper report comparison showed that the Portfolio’s total return for the 1-, 3-, and 5-year periods was in the second quartile of its Performance Universe. The report further showed that the Portfolio’s total return for the 10-year period was in the first quartile of its Performance Universe. The Board was satisfied with performance.
The Emerging Markets Portfolio – The Performance Universe for the Portfolio consisted of the Portfolio and all retail and institutional emerging markets funds as selected by Lipper. The Lipper report comparison showed that the Portfolio’s total return for the 1- and 3-year periods was in the third quartile of its Performance Universe. The report further showed that the Portfolio’s total return for the 5- and 10-year periods was in the second quartile of its Performance Universe. The Board observed that the Portfolio’s performance results were mixed, but tended toward median, which was acceptable to the Board.
The Emerging Markets Portfolio II – The Performance Universe for the Portfolio consisted of the Portfolio and all retail and institutional emerging markets funds as selected by Lipper. The Lipper report comparison showed that the Portfolio’s total return for the 1-year period was in the fourth quartile of its Performance Universe. The report further showed that the Portfolio’s total return for the 3-year period was in the second quartile of its Performance Universe. The Board observed that the Portfolio’s 1-year performance was not in line with the Board’s objective. In evaluating the Portfolio’s performance, the Board considered the Portfolio’s intermediate term performance results, which were acceptable. Overall, the Board was satisfied with performance.
The Focus Smid-Cap Growth Equity Portfolio – The Performance Universe for the Portfolio consisted of the Portfolio and all retail and institutional mid-cap growth funds as selected by Lipper. The Lipper report comparison showed that the Portfolio’s total return for the 1-year period was in the second quartile of its Performance Universe. The report further showed that the Portfolio’s total return for the 3-year period was in the fourth quartile of its Performance Universe, and the Portfolio’s total return for the 5- and 10-year periods was in the first quartile of its Performance Universe. The Board was satisfied with performance.
148
The High-Yield Bond Portfolio – The Performance Universe for the Portfolio consisted of the Portfolio and all retail and institutional high yield funds as selected by Lipper. The Lipper report comparison showed that the Portfolio’s total return for the 1-year period was in the third quartile of its Performance Universe. The report further showed that the Portfolio’s total return for the 3-, 5-, and 10-year periods was in the first quartile of its Performance Universe. The Board was satisfied with performance.
The International Equity Portfolio – The Performance Universe for the Portfolio consisted of the Portfolio and all retail and institutional international large-cap value funds as selected by Lipper. The Lipper report comparison showed that the Portfolio’s total return for the 1-, 3-, and 5-year periods was in the first quartile of its Performance Universe. The report further showed that the Portfolio’s total return for 10-year period was in the second quartile of its Performance Universe. The Board was satisfied with performance.
The Labor Select International Equity Portfolio – The Performance Universe for the Portfolio consisted of the Portfolio and all retail and institutional international large-cap value funds as selected by Lipper. The Lipper report comparison showed that the Portfolio’s total return for the 1-, 3-, and 10-year periods was in the second quartile of its Performance Universe. The report further showed that the Portfolio’s total return for the 5-year period was in the first quartile of its Performance Universe. The Board was satisfied with performance.
The Large-Cap Growth Equity Portfolio – The Performance Universe for the Portfolio consisted of the Portfolio and all retail and institutional large-cap growth funds as selected by Lipper. The Lipper report comparison showed that the Portfolio’s total return for the 1- and 3-year periods was in the second quartile of its Performance Universe. The report further showed that the Portfolio’s total return for the 5-year period was in the first quartile of its Performance Universe. The Board was satisfied with performance.
The Large-Cap Value Equity Portfolio – The Performance Universe for the Portfolio consisted of the Portfolio and all retail and institutional large-cap value funds as selected by Lipper. The Lipper report comparison showed that the Portfolio’s total return for the 1-, 3-, 5-, and 10-year periods was in the first quartile of its Performance Universe. The Board was very satisfied with performance.
The Select 20 Portfolio – The Performance Universe for the Portfolio consisted of the Portfolio and all retail and institutional multi-cap growth funds as selected by Lipper. The Lipper report comparison showed that the Portfolio’s total return for the 1- and 10-year periods was in the second quartile of its Performance Universe. The report further showed that the Portfolio’s total return for the 3- and 5-year periods was in the fourth quartile and first quartile, respectively, of its Performance Universe. The Board was satisfied with performance.
Comparative expenses. The Board considered expense comparison data for the Delaware Investments® Family of Funds. Management provided the Board with information on pricing levels and fee structures for the Portfolios as of its most recent fiscal year end. The Board also focused on the comparative analysis of effective management fees and total expense ratios of each Portfolio versus effective management fees and expense ratios of a group of similar funds as selected by Lipper (the “Expense Group”). In reviewing comparative costs, each Portfolio’s contractual management fee and the actual management fee incurred by the Portfolio were compared with the contractual management fees (assuming all funds in the Expense Group were similar in size to the Portfolio) and actual management fees (as reported by each fund) within the Expense Group, taking into account any applicable breakpoints and fee waivers. Each Portfolio’s total expenses were also compared with those of its Expense Group. The Board considered fees paid to DMC for non-management services. The Board’s objective is to limit each Portfolio’s total expense ratio to be competitive with that of the Expense Group.
The Core Plus Fixed Income Portfolio – The expense comparisons for the Portfolio showed that its actual management fee and total expenses were in the quartile with the lowest expenses of its Expense Group. The Board was satisfied with the management fee and total expenses of the Portfolio in comparison to those of its Expense Group.
The Emerging Markets Portfolio – The expense comparisons for the Portfolio showed that its actual management fee was in the quartile with the second lowest expenses of its Expense Group and its total expenses were in the quartile with the lowest expenses of its Expense Group. The Board was satisfied with the management fee and total expenses of the Portfolio in comparison to those of its Expense Group.
The Emerging Markets Portfolio II – The expense comparisons for the Portfolio showed that its actual management fee was in the quartile with the second highest expenses of its Expense Group and its total expenses were in the quartile with the lowest expenses of its Expense Group. The Board was satisfied with the total expenses of the Portfolio in comparison to those of its Expense Group.
The Focus Smid-Cap Growth Equity Portfolio – The expense comparisons for the Portfolio showed that its actual management fee was in the quartile with the second highest expenses of its Expense Group and its total expenses were in the quartile with the lowest expenses of its Expense Group. The Board was satisfied with the total expenses of the Portfolio in comparison to those of its Expense Group.
Other Portfolio information
(Unaudited)
Delaware Pooled® Trust
Board Consideration of Investment Advisory Agreements (continued)
The High-Yield Bond Portfolio – The expense comparisons for the Portfolio showed that its actual management fee and total expenses were in the quartile with the lowest expenses of its Expense Group. The Board was satisfied with the management fee and total expenses of the Portfolio in comparison to those of its Expense Group.
The International Equity Portfolio – The expense comparisons for the Portfolio showed that its actual management fee was in the quartile with the second lowest expenses of its Expense Group and its total expenses were in the quartile with the lowest expenses of its Expense Group. The Board was satisfied with the management fee and total expenses of the Portfolio in comparison to those of its Expense Group.
The Labor Select International Equity Portfolio – The expense comparisons for the Portfolio showed that its actual management fee was in the quartile with the second lowest expenses of its Expense Group and its total expenses were in the quartile with the lowest expenses of its Expense Group. The Board was satisfied with the management fee and total expenses of the Portfolio in comparison to those of its Expense Group.
The Large-Cap Growth Equity Portfolio – The expense comparisons for the Portfolio showed that its actual management fee and total expenses were both in the quartile with the lowest expenses of its Expense Group. The Board was satisfied with the management fee and total expenses of the Portfolio in comparison to those of its Expense Group.
The Large-Cap Value Equity Portfolio – The expense comparisons for the Portfolio showed that its actual management fee and total expenses were both in the quartile with the lowest expenses of its Expense Group. The Board was satisfied with the management fee and total expenses of the Portfolio in comparison to those of its Expense Group.
The Select 20 Portfolio – The expense comparisons for the Portfolio showed that its actual management fee was in the quartile with the second lowest expenses of its Expense Group and its total expenses were in the quartile with the lowest expenses of its Expense Group. The Board was satisfied with the total expenses of the Portfolio in comparison to those of its Expense Group.
Management profitability. The Board considered the level of profits, if any, realized by DMC in connection with the operation of the Portfolios. In this respect, the Board reviewed the Investment Management Profitability Analysis that addressed the overall profitability of DMC’s business in providing management and other services to each of the individual funds and the Delaware Investments® Family of Funds as a whole. Specific attention was given to the methodology followed in allocating costs for the purpose of determining profitability. Management stated that the level of profits of DMC, to a certain extent, reflects recent operational cost savings and efficiencies initiated by DMC. The Board considered DMC’s efforts to improve services provided to fund shareholders and to meet additional regulatory and compliance requirements resulting from recent industry-wide Securities and Exchange Commission initiatives. The Board also considered the extent to which DMC might derive ancillary benefits from fund operations, including the potential for procuring additional business as a result of the prestige and visibility associated with its role as service provider to the Delaware Investments Family of Funds and the benefits from allocation of fund brokerage to improve trading efficiencies. The Board found that the management fees were reasonable in light of the services rendered and the profitability of DMC.
Management profitability. Trustees were also given available information on profits being realized by Mondrian in relation to the services being provided to The Emerging Markets Portfolio, The International Equity Portfolio, and The Labor Select International Equity Portfolio and in relation to Mondrian’s overall investment advisory business, but believed such information to be of limited relevance because the sub-advisory fees are paid by DMC out of its management fee, and changes in the level of sub-advisory fees have no impact on Portfolio expenses. The Board was also provided information on potential fall-out benefits derived or to be derived by Mondrian in connection with its relationship to the Portfolios, such as reputational enhancement, soft dollar arrangements, or commissions paid to affiliated broker-dealers, as applicable.
Management profitability. Trustees were also given available information on profits being realized by JSP in relation to the services being provided to The Large-Cap Growth Equity Portfolio, The Focus Smid-Cap Growth Equity Portfolio, and The Select 20 Portfolio and in relation to JSP’s overall investment advisory business, but believed such information to be of limited relevance because the sub-advisory fees are paid by DMC out of its management fee, and changes in the level of sub-advisory fees have no impact on Portfolio expenses. The Board was also provided information on potential fall-out benefits derived or to be derived by JSP in connection with its relationship to the Portfolios, such as reputational enhancement, soft dollar arrangements, or commissions paid to affiliated broker/dealers, as applicable.
Economies of scale. The Trustees considered whether economies of scale are realized by DMC as each Portfolio’s assets increase and the extent to which any economies of scale are reflected in the level of management fees charged. The Trustees reviewed the standardized advisory
150
fee pricing and structure approved by the Board and shareholders which does not includes breakpoints. Breakpoints in the advisory fee occur when the advisory fee rate is reduced on assets in excess of specified levels. Breakpoints result in a lower advisory fee than would otherwise be the case in the absence of breakpoints, when the asset levels specified in the breakpoints are exceeded. Benchmarking analysis indicated that less than one quarter of competing funds in the institutional market employ breakpoints. Management believed, and the Board agreed, that the Portfolios were priced with relatively low management fees to reflect potential economies of scale at all asset levels. The Board noted that the fee under the management contract for The Core Plus Fixed Income Portfolio did not fall within the standardized fee pricing structure. With respect to The Core Plus Fixed Income Portfolio, Management explained that the portfolio management fee was priced slightly lower than the standard fee rate for special domestic funds.
Other Portfolio information
(Unaudited)
Delaware Pooled® Trust
Fund management
Kristen E. Bartholdson
Vice President, Senior Portfolio Manager — The Large-Cap Value Equity Portfolio
Kristen E. Bartholdson is a senior portfolio manager for the firm’s Large-Cap Value team. Prior to joining the firm in 2006 as an associate portfolio manager, she worked at Susquehanna International Group from 2004 to 2006, where she was an equity research salesperson. From 2000 to 2004 she worked in equity research at Credit Suisse, most recently as an associate analyst in investment strategy. Bartholdson earned her bachelor’s degree in economics from Princeton University.
Nigel Bliss
Senior Portfolio Manager – Mondrian Investment Partners Ltd. — The International Equity Portfolio and The Labor Select International Equity Portfolio
Nigel Bliss has a BA (Hons) Degree in Geography from the University of Manchester. He holds the ASIP designation and is a member of the CFA Institute and the CFA Society of the UK. He commenced his career at Cazenove & Co. and moved to join Mondrian in 1995. Bliss is a senior portfolio manager in the Non-US Equity Team. He has had significant experience analyzing securities in the Pacific Basin region and in the global materials, utilities, property, and industrials sectors. In recent years Bliss has taken responsibility for leading coverage of securities listed in the UK and Scandinavian markets whilst still maintaining his sector specialization. Bliss is a member of Mondrian’s Non-US Equity Strategy Committee.
Christopher J. Bonavico, CFA
Portfolio Manager, Equity Analyst – Jackson Square Partners, LLC — The Large-Cap Growth Equity Portfolio, The Focus Smid-Cap Growth Equity Portfolio, and The Select 20 Portfolio
Christopher J. Bonavico became a member of Jackson Square Partners (JSP), at its inception in May 2014 as a portfolio manager and equity analyst. Jackson Square Partners manages large-cap growth, smid-cap growth, all-cap growth, and global growth portfolios. Prior to joining JSP, he was a portfolio manager and equity analyst on the Delaware Investments Focus Growth Equity team from April 2005 to April 2014. The Focus Growth Equity team managed large-cap growth, smid-cap growth, all-cap growth, and global growth portfolios. Prior to joining Delaware Investments, he was a principal and portfolio manager at Transamerica Investment Management, where he managed sub-advised funds and institutional separate accounts. Before joining Transamerica in 1993, he was a research analyst for Salomon Brothers. Bonavico received his bachelor’s degree in economics from the University of Delaware.
Kenneth F. Broad, CFA
Portfolio Manager, Equity Analyst – Jackson Square Partners, LLC — The Focus Smid-Cap Growth Equity Portfolio and The Select 20 Portfolio
Kenneth F. Broad became a member of Jackson Square Partners (JSP), at its inception in May 2014 as a portfolio manager and equity analyst. Jackson Square Partners manages large-cap growth, smid-cap growth, all-cap growth, and global growth portfolios. Prior to joining JSP, he was a portfolio manager and equity analyst on the Delaware Investments Focus Growth Equity team from April 2005 to April 2014. The Focus Growth Equity team managed large-cap growth, smid-cap growth, all-cap growth, and global growth portfolios. Prior to joining Delaware Investments, he was a principal and portfolio manager at Transamerica Investment Management, where he managed sub-advised funds and institutional separate accounts. Before joining Transamerica in 2000, he was a portfolio manager with The Franklin Templeton Group and was a consultant in the business valuation and merger and acquisition group at KPMG Peat Marwick. He received an MBA from the University of California at Los Angeles and his bachelor’s degree in economics from Colgate University.
Adam H. Brown, CFA
Senior Vice President, Senior Portfolio Manager — The High-Yield Bond Portfolio and The Core Plus Fixed Income Portfolio
Adam H. Brown is a senior portfolio manager on the firm’s taxable fixed income team. He manages the bank loan portfolios, and he is a co-portfolio manager for the high yield, fixed rate multisector, and core plus strategies. Brown joined Delaware Investments in April 2011 as part of the firm’s integration of Macquarie Four Corners Capital Management, where he worked since 2002. At Four Corners, he was a co-portfolio manager on four collateralized loan obligations (CLOs) and a senior research analyst supporting noninvestment grade portfolios. Before that, Brown was with the predecessor of Wells Fargo Securities, where he worked in the leveraged finance group arranging senior secured bank loans and high yield bond financings for financial sponsors and corporate issuers. He earned a bachelor’s degree in accounting from the University of Florida and an MBA from the A.B. Freeman School of Business at Tulane University.
152
Liu-Er Chen, CFA
Senior Vice President, Chief Investment Officer – Emerging Markets and Healthcare — The Emerging Markets Portfolio II
Liu-Er Chen heads the firm’s global Emerging Markets team, and he is also the portfolio manager for Delaware Healthcare Fund, which launched in September 2007. Prior to joining Delaware Investments in September 2006 in his current position, he spent nearly 11 years at Evergreen Investment Management Company, where he most recently worked as managing director and senior portfolio manager. He co-managed the Evergreen Emerging Markets Growth Fund from 1999 to 2001, and became the Fund’s sole manager in 2001. He was also the sole manager of the Evergreen Health Care Fund since its inception in 1999. Chen began his career at Evergreen in 1995 as an analyst covering Asian and global healthcare stocks, before being promoted to portfolio manager in 1998. Prior to his career in asset management, Chen worked for three years in sales, marketing, and business development for major American and European pharmaceutical and medical device companies. He received his medical education in China and he has experience in medical research at both the Chinese Academy of Sciences and Cornell Medical School. He holds an MBA with a concentration in management from Columbia Business School.
Ginny Chong, CFA
Senior Portfolio Manager – Mondrian Investment Partners Ltd. — The Emerging Markets Portfolio
Prior to joining Mondrian in 2000, Ginny Chong worked for PricewaterhouseCoopers in Vancouver, within the Corporate Finance and Investment Banking Division where she qualified as a Canadian Chartered Accountant. Chong has a degree in Commerce from the University of British Columbia, Vancouver. Chong is presently a senior portfolio manager within the Emerging Markets Team. Chong is a CFA Charterholder and is a member of the CFA Institute and the CFA Society of the U.K.
Craig C. Dembek, CFA
Senior Vice President, Co-Head of Credit Research, Senior Research Analyst — The High-Yield Bond Portfolio and The Core Plus Fixed Income Portfolio
Craig C. Dembek is co-head of credit research and senior research analyst on the firm’s taxable fixed income team with primary responsibility for banks, brokers, insurance companies, and real estate investment trusts (REITs), as well as oversight for other sectors. He rejoined the firm in March 2007. During his previous time at Delaware Investments, from April 1999 to January 2001, he was a senior investment grade credit analyst. Most recently, he spent four years at Chartwell Investment Partners as a senior fixed income analyst and Turner Investment Partners as a senior fixed income analyst and portfolio manager. Dembek also spent two years at Stein, Roe & Farnham as a senior fixed income analyst. Earlier in his career, he worked for two years as a lead bank analyst at the Federal Reserve Bank of Boston. Dembek earned a bachelor’s degree in finance from Michigan State University and an MBA with a concentration in finance from the University of Vermont.
Elizabeth A. Desmond
Director, Chief Investment Officer – International Equities – Mondrian Investment Partners Ltd. — The International Equity Portfolio and The Labor Select International Equity Portfolio
Elizabeth A. Desmond is a graduate of Wellesley College and the Masters Program in East Asian Studies at Stanford University. After working for the Japanese government for two years, she began her investment career as a Pacific Basin investment manager with Shearson Lehman Global Asset Management. Prior to joining Mondrian in 1991, she was a Pacific Basin Equity Analyst and senior portfolio manager at Hill Samuel Investment Advisers Ltd. Desmond is a CFA Charterholder, and a member of the CFA Institute and the CFA Society of the U.K.
Roger A. Early, CPA, CFA
Managing Director, Head of Fixed Income Investments, Executive Vice President, Co-Chief Investment Officer – Total Return Fixed Income Strategy — The Core Plus Fixed Income Portfolio
Roger A. Early rejoined Delaware Investments in March 2007 as a member of the firm’s taxable fixed income portfolio management team, with primary responsibility for portfolio construction and strategic asset allocation. He became head of fixed income investments in February 2015. During his previous time at the firm, from 1994 to 2001, he was a senior portfolio manager in the same area, and he left Delaware Investments as head of its U.S. investment grade fixed income group. In recent years, Early was a senior portfolio manager at Chartwell Investment Partners and Rittenhouse Financial and was the chief investment officer for fixed income at Turner Investments. Prior to joining Delaware Investments in 1994, he worked for more than 10 years at Federated Investors where he managed more than $25 billion in mutual fund and institutional portfolios in the short-term and investment grade markets. He left the firm as head of institutional fixed income management. Earlier in his career, he held management positions with the Federal Reserve Bank, PNC Financial, Touche Ross, and Rockwell International. Early earned his
Other Portfolio information
(Unaudited)
Delaware Pooled® Trust
Fund management (continued)
bachelor’s degree in economics from The Wharton School of the University of Pennsylvania and an MBA with concentrations in finance and accounting from the University of Pittsburgh. He is a member of the CFA Society of Philadelphia.
Christopher M. Ericksen, CFA
Portfolio Manager, Equity Analyst – Jackson Square Partners, LLC — The Large-Cap Growth Equity Portfolio
Christopher M. Ericksen became a member of Jackson Square Partners (JSP), at its inception in May 2014 as a portfolio manager and equity analyst. Jackson Square Partners manages large-cap growth, smid-cap growth, all-cap growth, and global growth portfolios. Prior to joining JSP, he was a portfolio manager and equity analyst on the Delaware Investments Focus Growth Equity team from April 2005 to April 2014. The Focus Growth team managed large-cap growth, smid-cap growth, all-cap growth, and global growth portfolios. Prior to joining Delaware Investments, he was a portfolio manager at Transamerica Investment Management, where he also managed institutional separate accounts. Before joining Transamerica in 2004, he was a vice president at Goldman Sachs. During his 10 years there, he worked in investment banking as well as investment management. Ericksen received his bachelor’s degree from Carnegie Mellon University, with majors in industrial management, economics, and political science.
Paul Grillo, CFA
Senior Vice President, Co-Chief Investment Officer – Total Return Fixed Income Strategy — The Core Plus Fixed Income Portfolio
Paul Grillo is a member of the firm’s taxable fixed income portfolio management team with primary responsibility for portfolio construction and strategic asset allocation. He is also a member of the firm’s asset allocation committee, which is responsible for building and managing multi-asset class portfolios. He joined Delaware Investments in 1992 as a mortgage-backed and asset-backed securities analyst, assuming portfolio management responsibilities in the mid-1990s. Grillo serves as lead portfolio manager for the firm’s Diversified Income products and has been influential in the growth and distribution of the firm’s multisector strategies. Prior to joining Delaware Investments, Grillo was a mortgage strategist and trader at Dreyfus Corporation. He also worked as a mortgage strategist and portfolio manager at Chemical Investment Group and as a financial analyst at Chemical Bank. Grillo holds a bachelor’s degree in business management from North Carolina State University and an MBA with a concentration in finance from Pace University.
Gregory J.P. Halton, CFA
Senior Portfolio Manager – Mondrian Investment Partners Ltd. — The Emerging Markets Portfolio
Having graduated from St Catherine’s College, Oxford in 2000 with a MEng (Hons) in Engineering Science, Gregory J.P. Halton worked in the global equity division of Deutsche Asset Management before joining Mondrian in 2004. Halton is a senior portfolio manager within the Emerging Markets Team. Halton is a CFA Charterholder and is a member of the CFA Institute and the CFA Society of the U.K.
J. David Hillmeyer, CFA
Senior Vice President, Senior Portfolio Manager — The Core Plus Fixed Income Portfolio
J. David Hillmeyer is a member of the firm’s taxable fixed income portfolio management team. He is responsible for portfolio construction and asset allocation of the diversified floating rate strategy and serves as co-portfolio manager for fixed rate multisector, core plus, and investment grade corporate bond strategies. Prior to joining Delaware Investments in August 2007 as a vice president and corporate bond trader, he worked for more than 11 years in various roles at Hartford Investment Management Company, including senior corporate bond trader, high yield portfolio manager / trader, and quantitative analyst. He began his career as an investment advisor in January 1989 at Shawmut Bank, leaving the firm as an investment officer in November 1995. Hillmeyer earned his bachelor’s degree from Colorado State University, and he is a member of the CFA Society of Philadelphia and the Philadelphia Council for Business Economics.
Nikhil G. Lalvani, CFA
Vice President, Senior Portfolio Manager — The Large-Cap Value Equity Portfolio
Nikhil G. Lalvani is a senior portfolio manager for the firm’s Large-Cap Value team. At Delaware Investments, Lalvani has worked as both a fundamental and quantitative analyst. Prior to joining the firm in 1997 as an account analyst, he was a research associate with Bloomberg. Lalvani holds a bachelor’s degree in finance from The Pennsylvania State University. He is a member of the CFA Institute and the CFA Society of Philadelphia.
154
Anthony A. Lombardi, CFA
Vice President, Senior Portfolio Manager — The Large-Cap Value Equity Portfolio
Anthony A. Lombardi is a senior portfolio manager for the firm’s Large-Cap Value team. Prior to joining the firm in 2004 in his current role, Lombardi was a director at Merrill Lynch Investment Managers. He joined Merrill Lynch Investment Managers’ Capital Management Group in 1998 and last worked as a director and portfolio manager for the U.S. Active Large-Cap Value team, managing mutual funds and separate accounts for institutions and private clients. From 1990 to 1997, he worked at Dean Witter Reynolds as a sell-side equity research analyst, last serving as a vice president. He began his career as an investment analyst with Crossland Savings. Lombardi graduated from Hofstra University, receiving a bachelor’s degree in finance and an MBA in finance with a concentration in portfolio management. He is a member of the New York Society of Security Analysts and the CFA Institute.
Paul A. Matlack, CFA
Senior Vice President, Senior Portfolio Manager, Fixed Income Strategist — The High-Yield Bond Portfolio and
The Core Plus Fixed Income Portfolio
Paul A. Matlack is a strategist and senior portfolio manager for the firm’s fixed income team. Matlack rejoined the firm in May 2010. During his previous time at Delaware Investments, from September 1989 to October 2000, he was senior credit analyst, senior portfolio manager, and left the firm as co-head of the high yield group. Most recently, he worked at Chartwell Investment Partners from September 2003 to April 2010 as senior portfolio manager in fixed income, where he managed core, core plus, and high yield strategies. Prior to that, Matlack held senior roles at Turner Investment Partners, PNC Bank, and Mellon Bank. He earned a bachelor’s degree in international relations from the University of Pennsylvania and an MBA with a concentration in finance from George Washington University.
John P. McCarthy, CFA
Senior Vice President, Co-Head of Credit Research, Senior Research Analyst — The High-Yield Bond Portfolio and
The Core Plus Fixed Income Portfolio
John P. McCarthy is co-head of credit research and senior research analyst on the firm’s taxable fixed income team, responsible for steel, metals, and mining. He rejoined Delaware Investments in March 2007 after he worked in the firm’s fixed income area from 1990 to 2000 as a senior high yield analyst and high yield trader, and from 2001 to 2002 as a municipal bond trader. Most recently, he was a senior high yield analyst/ trader at Chartwell Investment Partners. McCarthy earned a bachelor’s degree in business administration from Babson College, and he is a member of the CFA Society of Philadelphia.
Andrew Miller
Chief Investment Officer – Emerging Market Equities – Mondrian Investment Partners Ltd. — The Emerging Markets Portfolio
Andrew Miller is a graduate of the University of Birmingham. Prior to joining Mondrian in 2000, he worked in the Investment Management department of PricewaterhouseCoopers, where he was responsible for the analysis and audit of various investment vehicles. Miller is presently Chief Investment Officer within the Emerging Markets Team. Miller holds the ASIP designation and is a member of the CFA Institute and the CFA Society of the U.K.
D. Tysen Nutt Jr.
Senior Vice President, Senior Portfolio Manager, Team Leader — The Large-Cap Value Equity Portfolio
D. Tysen Nutt Jr. is senior portfolio manager and team leader for the firm’s Large-Cap Value team. Before joining Delaware Investments in 2004 as senior vice president and senior portfolio manager, Nutt led the U.S. Active Large-Cap Value team within Merrill Lynch Investment Managers, where he managed mutual funds and separate accounts for institutions and private clients. He departed Merrill Lynch Investment Managers as a managing director. Prior to joining Merrill Lynch Investment Managers in 1994, Nutt was with Van Deventer & Hoch where he managed large-cap value portfolios for institutions and private clients. He began his investment career at Dean Witter Reynolds, where he eventually became vice president, investments. Nutt earned his bachelor’s degree from Dartmouth College, and he is a member of the New York Society of Security Analysts and the CFA Institute.
Other Portfolio information
(Unaudited)
Delaware Pooled® Trust
Fund management (continued)
Melissa J. A. Platt, CFA
Portfolio Manager – Mondrian Investment Partners Ltd. — The International Equity Portfolio and The Labor Select International Equity Portfolio
Melissa J.A. Platt is an Economics and Finance graduate of Massey University, New Zealand. She started her career as a consultant at KPMG Corporate Finance. She then moved to FundSource Research for 3 years as an investment analyst and later as research manager. Platt joined Mondrian in 2004 and is a portfolio manager in the Non-US Equity Team. Platt is a CFA Charterholder, a member of the CFA Institute and a member of the CFA Society of the U.K.
Andrew R. Porter, CFA
Senior Portfolio Manager – Mondrian Investment Partners Ltd. — The International Equity Portfolio and The Labor Select International Equity Portfolio
Andrew R. Porter studied at Magdalen College, Oxford University graduating with a first class degree in Chemistry. He also has an MSc in Economics from the University of London. Porter started his career as a consultant and trainee chartered accountant at Deloitte and Touche. Prior to joining Mondrian in 2003, Porter worked at Frank Russell, part of the team managing the multi-manager funds in the Asia Pacific region. Porter is a CFA Charterholder, a member of the CFA Institute and a member of the CFA Society of the U.K. Porter is a member of Mondrian’s Non-U.S. Equity Strategy Committee.
Daniel J. Prislin, CFA
Portfolio Manager, Equity Analyst – Jackson Square Partners, LLC — The Large-Cap Growth Equity Portfolio and The Select 20 Portfolio
Daniel J. Prislin became a member of Jackson Square Partners (JSP), at its inception in May 2014 as a portfolio manager and equity analyst. Jackson Square Partners manages large-cap growth, smid-cap growth, all-cap growth, and global growth portfolios. Prior to joining JSP, he was a portfolio manager and equity analyst on the Delaware Investments Focus Growth Equity team from April 2005 to April 2014. The Focus Growth Equity team managed large-cap growth, smid-cap growth, all-cap growth, and global growth portfolios. Prior to joining Delaware Investments, he was a principal and portfolio manager at Transamerica Investment Management, where he also managed sub-advised funds and institutional separate accounts. Prior to joining Transamerica in 1998, he was a portfolio manager with The Franklin Templeton Group. Prislin received an MBA and bachelor’s degree in business administration from the University of California at Berkeley.
Christopher M. Testa, CFA
Senior Vice President, Senior Portfolio Manager — The High-Yield Bond Portfolio and The Core Plus Fixed Income Portfolio
Christopher M. Testa joined Delaware Investments in January 2014 as a senior portfolio manager in the firm’s corporate credit portfolio management group. He primarily manages high yield assets. Prior to joining the firm, Testa worked as a portfolio manager who focused on high yield credit at S. Goldman Asset Management from 2009 to 2012 and Princeton Advisory Group from 2012 to 2013. Previously, he served as head of U.S. credit at Drake Management, and prior to that he was head of credit research and a high yield portfolio manager at Goldman Sachs Asset Management. Testa has more than 20 years of experience analyzing and investing in high yield and distressed credit. He earned his bachelor’s degree in economics, with a minor in government, from Hamilton College, and an MBA in finance with a concentration in investments from The Wharton School of the University of Pennsylvania.
Jeffrey S. Van Harte, CFA
Chairman, Chief Investment Officer – Jackson Square Partners, LLC — The Large-Cap Growth Equity Portfolio and The Select 20 Portfolio
Jeffrey S. Van Harte became a member of Jackson Square Partners (JSP), at its inception in May 2014 as chairman and chief investment officer. Jackson Square Partners manages large-cap growth, smid-cap growth, all-cap growth, and global growth portfolios. Prior to joining JSP, he was the chief investment officer of the Delaware Investments Focus Growth Equity team from April 2005 to April 2014. The Focus Growth Equity team managed large-cap growth, smid-cap growth, all-cap growth, and global growth portfolios. Prior to Delaware Investments, he was a principal and executive vice president at Transamerica Investment Management. Van Harte has been managing portfolios and separate accounts for 30 years. Before becoming a portfolio manager, Van Harte was a securities analyst and trader for Transamerica Investment Services, which he joined in 1980. Van Harte received his bachelor’s degree in finance from California State University at Fullerton.
156
Robert A. Vogel Jr., CFA
Vice President, Senior Portfolio Manager — The Large-Cap Value Equity Portfolio
Robert A. Vogel Jr. is a senior portfolio manager for the firm’s Large-Cap Value team. Prior to joining Delaware Investments in 2004 as vice president and senior portfolio manager, he worked at Merrill Lynch Investment Managers for more than seven years, where he rose to the position of director and portfolio manager within the U.S. Active Large-Cap Value team. He began his career in 1992 as a financial consultant at Merrill Lynch. Vogel graduated from Loyola University Maryland, earning both bachelor’s and master’s degrees in finance. He also earned an MBA with a concentration in finance from The Wharton School of the University of Pennsylvania. Vogel is a member of the New York Society of Security Analysts, the CFA Institute, and the CFA Society of Philadelphia.
157
Board of trustees / directors and officers addendum
Delaware Investments® Family of Funds
A mutual fund is governed by a Board of Trustees / Directors (“Trustees”), which has oversight responsibility for the management of a fund’s business affairs. Trustees establish procedures and oversee and review the performance of the investment manager, the distributor, and others who perform services for the fund. The independent fund trustees, in particular, are advocates for shareholder interests. Each trustee has served in that capacity since he or she was elected to or appointed to the Board of Trustees, and will continue to serve until his or her retirement or the election of a new trustee in his or her place. The following is a list of the Trustees and Officers with certain background and related information.
| | | | | | | | | | |
Name, Address, and Birth Date | | Position(s) Held with Fund(s) | | Length of Time Served | | Principal Occupation(s) During the Past Five Years | | Number of Portfolios in Fund Complex Overseen by Trustee or Officer | | Other Directorships Held by Trustee or Officer |
|
Interested Trustee | | | | | | | | | | |
|
Shawn K. Lytle1 2005 Market Street Philadelphia, PA 19103 February 1970 | | President, Chief Executive Officer, and Trustee | | Trustee since September 1, 2015 | | Shawn K. Lytle has served as President of Delaware Investments2 since June 2015 and was the Regional Head of Americas | | 64 | | Trustee — UBS Relationship Funds, SMA Relationship Trust, (May 2010–April 2015) and UBS Funds |
| | | | President and Chief Executive Officer since Aug. 20, 2015 | | for UBS Global Asset Management from 2010 through 2015. | | | | |
|
Independent Trustees | | | | | | | | | | |
|
Thomas L. Bennett 2005 Market Street Philadelphia, PA 19103 October 1947 | | Chairman and Trustee | | Trustee since March 2005 | | Private Investor (March 2004–Present) | | 64 | | Director — Bryn Mawr Bank Corp. (BMTC) (2007–2011) |
| | | | Chairman since March 1, 2015 | | | | | | |
| | | | | | | | | | | |
Ann D. Borowiec 2005 Market Street Philadelphia, PA 19103 November 1958 | | Trustee | | Since January 2013 | | Chief Executive Officer Private Wealth Management (2011–2013) and Market Manager, New Jersey Private Bank (2005–2011) — J.P. Morgan Chase & Co. | | 64 | | None |
Joseph W. Chow 2005 Market Street Philadelphia, PA 19103 January 1953 | | Trustee | | Since January 2013 | | Executive Vice President (Emerging Economies Strategies, Risk and Corporate Administration) State Street Corporation (July 2004–March 2011) | | 64 | | Director and Audit Committee Member – Hercules Technology Growth Capital, Inc. (2004–2014) |
| | | | | | | | | | | |
John A. Fry 2005 Market Street Philadelphia, PA 19103 | | Trustee | | Since January 2001 | | President — Drexel University (August 2010–Present) | | 64 | | Director — Hershey Trust Company |
May 1960 | | | | | | | | | | Director, Audit |
| | | | | | President — Franklin & Marshall College (July 2002–July 2010) | | | | Committee, and Governance Committee Member — Community Health Systems |
| | | | | | | | | | |
| | | | | | | | | | Director — |
| | | | | | | | | | | Drexel Morgan & Co. |
158
| | | | | | | | | | |
Name, Address, and Birth Date | | Position(s) Held with Fund(s) | | Length of Time Served | | Principal Occupation(s) During the Past Five Years | | Number of Portfolios in Fund Complex Overseen by Trustee or Officer | | Other Directorships Held by Trustee or Officer |
|
| Independent Trustees (continued) | | | | | | |
|
Lucinda S. Landreth 2005 Market Street Philadelphia, PA 19103 June 1947 | | Trustee | | Since March 2005 | | Private Investor (2004–Present) | | 64 | | None |
Frances A. Sevilla-Sacasa 2005 Market Street Philadelphia, PA 19103 January 1956 | | Trustee | | Since September 2011 | | Chief Executive Officer — Banco Itaú International (April 2012–Present) | | 64 | | Trust Manager and Audit Committee Member — Camden Property Trust |
| | | | | |
| | | | | | Executive Advisor to Dean (August 2011–March 2012) and Interim Dean (January 2011–July 2011) — University of Miami School of Business Administration | | | | |
| | | | | |
| | | | | | | President — U.S. Trust, Bank of America Private Wealth Management (Private Banking) (July 2007-December 2008) | | | | |
Thomas K. Whitford 2005 Market Street Philadelphia, PA 19103 March 1956 | | Trustee | | Since January 2013 | | Vice Chairman (2010–April 2013) Chief Administrative Officer (2008–2010) and Executive Vice President and Chief Administrative Officer (2007–2009) — PNC Financial Services Group | | 64 | | Director — HSBC Finance Corporation and HSBC North America Holdings Inc. Director — HSBC Bank |
Janet L. Yeomans 2005 Market Street Philadelphia, PA 19103 July 1948 | | Trustee | | Since April 1999 | | Vice President and Treasurer (January 2006–July 2012) Vice President — Mergers & Acquisitions (January 2003–January 2006), and Vice President and Treasurer (July 1995–January 2003) 3M Corporation | | 64 | | Director, Audit and Compliance Committee Chair, Investment Committee Member, and Governance Committee Member — Okabena Company |
| | | | | |
| | | | | | | | | | | Chair — 3M Investment Management Company (2005–2012) |
Board of trustees / directors and officers addendum
Delaware Investments® Family of Funds
| | | | | | | | | | |
Name, Address, and Birth Date | | Position(s) Held with Fund(s) | | Length of Time Served | | Principal Occupation(s) During the Past Five Years | | Number of Portfolios in Fund Complex Overseen by Trustee or Officer | | Other Directorships Held by Trustee or Officer |
|
Officers | | | | | | | | | | |
|
David F. Connor 2005 Market Street Philadelphia, PA 19103 December 1963 | | Senior Vice President, General Counsel, and Secretary | | Senior Vice President, since May 2013; General Counsel since May 2015; Secretary since October 2005 | | David F. Connor has served as Senior Vice President of the Fund(s) and the investment advisor since 2013, General Counsel of the Fund(s) and the investment advisor since 2015, Secretary of the Fund(s) and the investment advisor since 2005. | | 64 | | None3 |
Daniel V. Geatens 2005 Market Street Philadelphia, PA 19103 October 1972 | | Vice President and Treasurer | | Treasurer since October 2007 | | Daniel V. Geatens has served as Vice President and Treasurer of the Fund(s) since 2007 and Vice President and Director of Financial Administration of the investment advisor since 2010. | | 64 | | None3 |
Richard Salus 2005 Market Street Philadelphia, PA 19103 October 1963 | | Senior Vice President and Chief Financial Officer | | Chief Financial Officer since November 2006 | | Richard Salus has served as Senior Vice President and Chief Financial Officer of the Fund(s) and the investment advisor since 2006. | | 64 | | None3 |
| 1 | Shawn K. Lytle is considered to be an “Interested Trustee” because he is an executive officer of the Fund’s(s’) investment advisor. |
| 2 | Delaware Investments is the marketing name for Delaware Management Holdings, Inc. and its subsidiaries, including the Fund’s(s’) investment advisor, principal underwriter, and its transfer agent. |
| 3 | David F. Connor, Daniel V. Geatens, and Richard Salus serve in similar capacities for the six portfolios of the Optimum Fund Trust, which have the same investment advisor, principal underwriter, and transfer agent as the registrant. |
The Statement of Additional Information for the Fund(s) includes additional information about the Trustees and Officers and is available, without charge, upon request by calling 800 523-1918.
160
Portfolio managers
| | | | |
Kristen E. Bartholdson Vice President and Senior Portfolio Manager Nigel Bliss Senior Portfolio Manager Mondrian Investment Partners Limited Christopher J. Bonavico Portfolio Manager, Equity Analyst — Jackson Square Partners, LLC Kenneth F. Broad Portfolio Manager, Equity Analyst — Jackson Square Partners, LLC Adam H. Brown Senior Vice President and Senior Portfolio Manager Liu-Er Chen Senior Vice President and Chief Investment Officer — Emerging Markets and Healthcare Ginny Chong Senior Portfolio Manager Mondrian Investment Partners Limited Craig C. Dembek Senior Vice President, Co-Head of Credit Research and Senior Research Analyst Elizabeth A. Desmond Director and Chief Investment Officer — International Equities Mondrian Investment Partners Limited Roger A. Early Managing Director, Head of Fixed Income Investments, Executive Vice President, and Co-Chief Investment Officer — Total Return Fixed Income Strategy Christopher M. Ericksen Portfolio Manager, Equity Analyst — Jackson Square Partners, LLC | | Paul Grillo Senior Vice President and Co-Chief Investment Officer — Total Return Fixed Income Strategy Gregory J.P. Halton Senior Portfolio Manager Mondrian Investment Partners Limited J. David Hillmeyer Senior Vice President and Senior Portfolio Manager Nikhil G. Lalvani Vice President and Senior Portfolio Manager Anthony A. Lombardi Vice President and Senior Portfolio Manager Paul A. Matlack Senior Vice President, Senior Portfolio Manager, and Fixed Income Strategist John P. McCarthy Senior Vice President, Co-Head of Credit Research, and Senior Research Analyst Andrew Miller Chief Investment Officer — Emerging Market Equities Mondrian Investment Partners Limited D. Tysen Nutt Jr. Senior Vice President, Senior Portfolio Manager, and Team Leader — Large-Cap Value Focus Equity Melissa J.A. Platt Portfolio Manager Mondrian Investment Partners Limited Andrew R. Porter Senior Portfolio Manager Mondrian Investment Partners Limited | | Daniel J. Prislin Portfolio Manager, Equity Analyst — Jackson Square Partners, LLC Christopher M. Testa Senior Vice President and Senior Portfolio Manager Jeffrey S. Van Harte Chairman, Chief Investment Officer — Jackson Square Partners, LLC Robert A. Vogel Jr. Vice President and Senior Portfolio Manager |
161
Custodian
The Bank of New York Mellon
One Wall Street
New York, NY 10286
Independent registered public accounting firm
PricewaterhouseCoopers LLP
Two Commerce Square, Suite 1700
2001 Market Street
Philadelphia, PA 19103-7042
Investment advisor
Delaware Management Company, a series of Delaware Management Business Trust
2005 Market Street
Philadelphia, PA 19103
Investment sub-advisors for certain Portfolios
Mondrian Investment Partners Limited
Fifth Floor
10 Gresham Street
London EC2V 7JD
United Kingdom
Jackson Square Partners, LLC
101 California Street
Suite 3750
San Francisco, CA 94111
Delaware Investments, a member of Macquarie Group, refers to DMHI and its subsidiaries. Macquarie Group refers to Macquarie Group Limited and its subsidiaries and affiliates worldwide.
The Portfolios are distributed by Delaware Distributors, L.P., an affiliate of DMBT, DMHI, and Macquarie Group Limited.
Each Portfolio files its complete schedule of portfolio holdings with the Securities and Exchange Commission for the first and third quarters of each fiscal year on Form N-Q. Each Portfolio’s Forms N-Q, as well as a description of the policies and procedures that the Portfolios use to determine how to vote proxies (if any) relating to portfolio securities and the Schedules of Investments included in the Portfolios’ most recent Forms N-Q are available without charge (i) upon request, by calling 800 231-8002; (ii) on the Portfolios’ website at delawareinvestments.com; and (iii) on the Commission’s website at sec.gov. Each Portfolio’s Forms N-Q may be reviewed and copied at the Commission’s Public Reference Room in Washington, D.C.; information on the operation of the Public Reference Room may be obtained by calling 800 SEC-0330.
Information (if any) regarding how each Portfolio voted proxies relating to portfolio securities during the most recently disclosed 12-month period ended June 30 is available without charge (i) through the Portfolios’ website at delawareinvestments.com; and (ii) on the Commission’s website at sec.gov.
This report was prepared for investors in the Delaware Pooled ® Trust Portfolios. It may be distributed to others only if preceded or accompanied by a current Delaware Pooled Trust prospectus, which contains details about charges, expenses, investment objectives, and operating policies of the Portfolios. All Delaware Pooled Trust Portfolios are offered by prospectus only. The return and principal value of an investment in a Portfolio will fluctuate so that shares, when redeemed, may be worth more or less than their original cost.
Carefully consider the Portfolios’ investment objectives, risk factors, charges, and expenses before investing. This and other information can be found in the Portfolios’ prospectus and, if available, their summary prospectuses, which may be obtained by visiting delawareinvestments.com or calling 800 231-8002. Investors should read the prospectus and, if available, the summary prospectus carefully before investing.
| | |
(15601) AR-DPT 20696 [12/15} | | 2005 Market Street Philadelphia, PA 19103 Telephone 800 231-8002 Fax 215 255-1162 Printed in the USA |