Item 1. Reports to Stockholders

| | |
| Annual report | | |
| |
| October 31, 2016 | | |
| |
| U.S. equities | | |
The Large-Cap Value Equity Portfolio | | |
| |
| U.S. fixed income | | |
The High-Yield Bond Portfolio | | |
The Core Plus Fixed Income Portfolio | | |
| |
| International equities | | |
The Labor Select International Equity Portfolio | | |
The Emerging Markets Portfolio | | |
The Emerging Markets Portfolio II | | |
| | |
| | |

This page intentionally left blank.
Delaware Pooled® Trust
Delaware Pooled Trust, based in Philadelphia, is a registered investment company that offers no-load, open-end equity and fixed income mutual funds to institutional and high net worth individual investors.
Delaware Management Company, a series of Delaware Management Business Trust (DMBT), serves as investment advisor for the Portfolios. Mondrian Investment Partners Limited serves as investment sub-advisor for The Labor Select International Equity Portfolio and The Emerging Markets Portfolio.*
The performance quoted in this report represents past performance and does not guarantee future results. Investment return and principal value of an investment will fluctuate so that shares, when redeemed, may be worth more or less than their original cost. Current performance may be lower or higher than the performance quoted. Performance data current to the most recent month end may be obtained by calling 800 231-8002 or visiting delawareinvestments.com/dpt/performance. Carefully consider the Portfolios’ investment objectives, risk factors, charges, and expenses before investing. This and other information can be found in the Portfolios’ prospectus which may be obtained by visiting delawareinvestments.com/dpt/literature or calling 800 231-8002. Investors should read the prospectus carefully before investing. Performance includes reinvestment of all distributions.
The portfolios are not FDIC insured and are not guaranteed. It is possible to lose the principal amount invested. Mutual fund advisory services are provided by Delaware Management Company, a series of DMBT, which is a registered investment advisor.
Delaware Investments, a member of Macquarie Group, refers to Delaware Management Holdings, Inc. and its subsidiaries, including the Portfolios’ distributor, Delaware Distributors, L.P. Macquarie Group refers to Macquarie Group Limited and its subsidiaries and affiliates worldwide.
Neither Delaware Investments nor its affiliates referred to in this document are authorized deposit-taking institutions for the purposes of the Banking Act 1959 (Commonwealth of Australia). The obligations of these entities do not represent deposits or other liabilities of Macquarie Bank Limited (MBL), a subsidiary of Macquarie Group Limited and an affiliate of Delaware Investments. MBL does not guarantee or otherwise provide assurance in respect of the obligations of these entities, unless noted otherwise. The Portfolios are governed by U.S laws and regulations.
*Closed to new investors.
©2016 Delaware Management Holdings, Inc.
All third-party marks cited are the property of their respective owners.
Portfolio objectives and strategies
The Large-Cap Value Equity Portfolio seeks long-term capital appreciation. The Portfolio invests primarily in securities of large-capitalization companies that we believe have long-term capital appreciation potential. The Portfolio currently defines large-capitalization stocks as those with market capitalizations of $5 billion or greater at the time of purchase. Typically, we seek to select securities that we believe are undervalued in relation to their intrinsic value as indicated by multiple factors.
The High-Yield Bond Portfolio seeks high total return. The Portfolio will primarily invest its assets at the time of purchase in: (1) corporate bonds rated BB or lower by Standard & Poor’s (S&P) or similarly rated by another nationally recognized statistical rating organization; (2) securities issued or guaranteed by the U.S. government, its agencies, or instrumentalities; or (3) commercial paper of companies rated A-1 or A-2 by S&P, rated P-1 or P-2 by Moody’s Investors Service, Inc. (Moody’s), or unrated but considered to be of comparable quality.
The Core Plus Fixed Income Portfolio seeks maximum long-term total return, consistent with reasonable risk. The Portfolio allocates its investments principally among three sectors of the fixed income securities markets: U.S. investment grade sector, U.S. high yield sector, and international sector.
The Labor Select International Equity Portfolio seeks maximum long-term total return. The Portfolio invests primarily in equity securities of companies that are organized, have a majority of their assets, or derive most of their operating income outside of the United States, and that, in the opinion of Mondrian Investment Partners Limited (“Mondrian”), the Portfolio’s sub-advisor, are undervalued at the time of purchase based on the rigorous fundamental analysis that the sub-advisor employs. In addition to following these quantitative guidelines, Mondrian will select securities of issuers that present certain characteristics that are compatible or operate in accordance with certain investment policies or restrictions followed by organized labor.
The Emerging Markets Portfolio seeks long-term capital appreciation. The Portfolio generally invests in equity securities of companies that are organized in, have a majority of their assets in, or derive a majority of their operating income from emerging countries. The Emerging Markets Portfolio is presently closed to new investors.
The Emerging Markets Portfolio II seeks long-term capital appreciation. The Portfolio invests primarily in a broad range of equity securities of companies located in emerging market countries. The Portfolio may invest in companies of any size. The portfolio manager believes that although market price and intrinsic business value are positively correlated in the long run, short-term divergences can emerge. The Portfolio seeks to take advantage of these divergences through a fundamental, bottom-up approach. The Portfolio invests in securities of companies with sustainable franchises when they are trading at a discount to the portfolio manager’s intrinsic value estimate for that security.
Carefully consider the Portfolios’ investment objectives, risk factors, charges, and expenses before investing. This and other information can be found in the Portfolios’ prospectus which may be obtained by visiting delawareinvestments.com/dpt/literature or calling 800 231-8002. Investors should read the applicable prospectus carefully before investing.
The Portfolios of Delaware Pooled ® Trust (DPT) are designed exclusively for institutional investors and high net worth individuals.
International investments entail risks not ordinarily associated with U.S. investments including fluctuation in currency values, differences in accounting principles, or economic or political instability in other nations. Investing in emerging markets can be riskier than investing in established foreign markets due to increased volatility and lower trading volume.
The Portfolios’ share prices and yields will fluctuate in response to movements in stock prices.
Fixed income securities and bond funds can lose value, and investors can lose principal, as interest rates rise. They also may be affected by economic conditions that hinder an issuer ’s ability to make interest and principal payments on its debt.
The Portfolios may also be subject to prepayment risk, the risk that the principal of a fixed income security that is held by the Portfolios may be prepaid prior to maturity, potentially forcing the Portfolios to reinvest that money at a lower interest rate.
2
Securities in the lowest of the rating categories considered to be investment grade (that is, Baa or BBB) have some speculative characteristics.
High yielding, non-investment-grade bonds (junk bonds) involve higher risk than investment grade bonds.
The high yield secondary market is particularly susceptible to liquidity problems when institutional investors, such as mutual funds and certain other financial institutions, temporarily stop buying bonds for regulatory, financial, or other reasons. In addition, a less liquid secondary market makes it more difficult for a Portfolio to obtain precise valuations of the high yield securities in its portfolio.
3
Portfolio management review
Delaware Pooled® Trust — The Large-Cap Value Equity Portfolio
October 31, 2016
For the fiscal year ended Oct. 31, 2016, Delaware Pooled Trust — The Large-Cap Value Equity Portfolio added +7.15% at net asset value (NAV) with all distributions reinvested. This result outpaced the Portfolio’s benchmark, the Russell 1000® Value Index, which returned +6.37% during the same period. Complete annualized performance for The Large-Cap Value Equity Portfolio is shown on the table on page 5.
The economy in the United States continued its slow but steady growth throughout the fiscal year. The country’s gross domestic product (GDP) — a measure of national economic output — expanded at an average pace of 1.5% for the four quarters leading up to September 2016. Against this sluggish backdrop, the U.S. Federal Reserve increased interest rates by 0.25 percentage points in December 2015, but opted not to follow up with additional rate hikes for the remainder of the fiscal year. (Source: Bloomberg.)
Throughout the fiscal period, stock prices were highly volatile, as investors faced questions about the Fed’s pace of rate changes, sluggish corporate profits, the Brexit vote in the United Kingdom, and uncertainty surrounding the U.S. presidential election, among other concerns. Nevertheless, the equity market finished the Portfolio’s fiscal year in positive territory, largely on the strength of a rally between February and July 2016.
A significant underweight and security selection in the financials sector, especially an investment in insurance broker Marsh & McLennan Companies, helped the Portfolio’s performance the most.
Stock picking in the industrials category also contributed to performance, especially the Portfolio’s investments in Waste Management (the country’s largest solid-waste disposal business) and defense contractor Northrop Grumman. Waste Management has been able to maintain pricing power while simultaneously improving collection volumes — a situation that has allowed the company to produce favorable revenue and earnings growth. Northrop Grumman benefited from its ability to produce better-than-expected revenue growth, especially in its aerospace business. Investments in biopharmaceuticals manufacturer Baxalta and clinical laboratory-services provider Quest Diagnostics helped the Portfolio in the healthcare sector. Baxalta’s shares performed well on news of the company’s potential acquisition by Ireland-based Shire, a transaction ultimately announced in January 2016. We sold the Portfolio’s position in Baxalta when the transaction closed in June, as our own internal investment guidelines require us to invest exclusively in U.S. companies. Shares of Quest Diagnostics gained during the fiscal year, as investors became steadily more optimistic about the longer-term prospects of this medical-testing company. Some of the Portfolio’s healthcare investments did not meet our expectations. Express Scripts, a pharmacy benefits manager (PBM), found itself in a protracted contract dispute with Anthem, its largest
The views expressed are current as of the date of this report and subject to change.
customer. Despite its short-term difficulties, we see good upside potential with Express Scripts over the longer term. A related detractor was CVS Health, which combines a chain of retail pharmacies with a PBM division. Although CVS encountered some financial challenges during the fiscal period owing to lower levels of drug price inflation and higher expenses, we believe it is well positioned for the long term.
In energy, the Portfolio benefited most by its investment in oil and gas services company Halliburton, which we believe is well positioned to capitalize on a potential rebound in demand for its services. In contrast, the Portfolio’s position in Marathon Oil detracted from results, as declining oil prices hurt the energy exploration and production firm for much of the fiscal year. No matter what is happening in the market and economy, our approach remains the same — we try to look past short-term concerns about companies and focus on their long-term potential. Throughout the fiscal period, we maintained the Portfolio’s generally defensive positioning and continued to emphasize what we believe are reasonably valued, higher-quality stocks. In our opinion, this approach was well suited to the current environment of sluggish economic growth and uncertainty on the part of investors, especially leading up to the November U.S. presidential election.
Valuations strike us as high across the market. As it has become more difficult to find stocks that are undervalued on an absolute basis, our investment focus has shifted to stocks that we believe provide good relative value — that is, better value than other available alternatives in the Portfolio’s investment universe, in our opinion.
During the fiscal year, we made modest changes to the Portfolio, selling only two holdings — Baxalta and Johnson Controls, both of which were acquired by offshore firms. With the proceeds of the Baxalta sale, we established a new position in Abbott Laboratories, a medical-products company that we liked for what we viewed as its strong competitive position and attractive relative valuation.
At fiscal year end, we were researching our options for a new consumer discretionary position to replace the Portfolio’s previous position in Johnson Controls. We also had equity research projects underway in the information technology sector, a sector in which we believed were finding decent relative value, and in real estate investment trusts (REITs). In late August REITs became the 11th sector in the S&P 500® Index, and one in which we have been exploring opportunities because of our investment process mandate to have exposure to all S&P 500 Index economic sectors.
We continue to emphasize what we view as higher-quality, attractively valued stocks with the potential to offer a good risk-reward trade-off for our shareholders. We remain grateful for our shareholders’ confidence.
Performance summary
Delaware Pooled® Trust — The Large-Cap Value Equity Portfolio
The performance data quoted represent past performance; past performance does not guarantee future results. Investment return and principal value will fluctuate so your shares, when redeemed, may be worth more or less than their original cost. Current performance may be lower or higher than the performance data quoted. Please obtain the performance data for the most recent month end by calling 800 231-8002 or visiting our website at delawareinvestments.com/dpt/performance.
Carefully consider the Portfolio’s investment objectives, risk factors, charges, and expenses before investing. This and other information can be found in the Portfolio’s prospectus which may be obtained by visiting delawareinvestments.com/dpt/literature or calling 800 231-8002. Investors should read the prospectus carefully before investing.
| | | | | | | | | | | | | | | | | | | | |
| Portfolio and benchmark performance | | | | | | | | | | | | | | | | | | | | |
| Average annual total returns | | | | | | | | | | | | | | | | | | | | |
| Periods ended Oct. 31, 2016 | | 1 year | | | 3 years | | | 5 years | | | 10 years | | | Lifetime | |
| | | | | |
| | | | | | | | | | | | | | | | | | | | |
The Large-Cap Value Equity Portfolio | | | +7.15% | | | | +8.71% | | | | +14.38% | | | | +6.81% | | | | +9.84% | |
Russell 1000 Value Index | | | +6.37% | | | | +7.59% | | | | +13.31% | | | | +5.35% | | | | +9.80% | |
| | |
| |
| Portfolio profile | | |
| Oct. 31, 2016 | | |
| | |
Total net assets | | Number of holdings |
$217.1 million | | 32 |
| | |
Inception date | | |
Feb. 3, 1992 | | |
Growth of $1,000,000
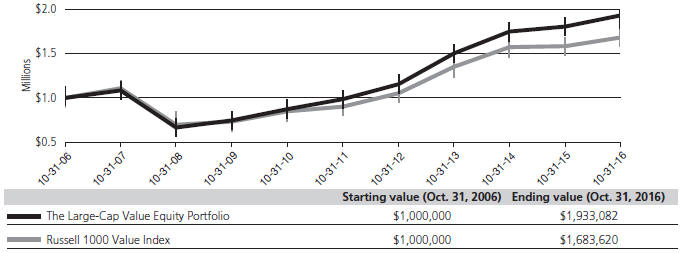
The performance graph assumes $1 million invested on Oct. 31, 2006, and includes reinvestment of all distributions. The performance graph does not reflect the deduction of taxes the shareholder would pay on Portfolio distributions or redemptions of Portfolio shares.
Total return assumes reinvestment of dividends and capital gains, but does not reflect reductions for taxes. Returns and share values will fluctuate so that shares, when redeemed, may be worth more or less than their original cost.
Performance summary
Delaware Pooled® Trust — The Large-Cap Value Equity Portfolio
The most recent prospectus disclosed the Portfolio’s total operating expenses as 0.65%. Management has contractually agreed to reimburse certain expenses and/or waive its management fees from Nov. 1, 2015, through Oct. 31, 2016,* in order to prevent total annual Portfolio operating expenses (with certain exclusions) from exceeding, in an aggregate amount, 0.70% of the Portfolio’s average daily net assets, as described in the most recent prospectus.
Expense limitations were in effect during the period shown. Performance would have been lower had the expense limitations not been in effect.
The Russell 1000 Value Index measures the performance of the large-cap value segment of the U.S. equity universe. It includes those Russell 1000 companies with lower price-to-book ratios and lower forecasted growth values.
The S&P 500 Index, mentioned on page 4, measures the performance of 500 mostly large-cap stocks weighted by market value, and is often used to represent performance of the U.S. stock market.
Russell Investment Group is the source and owner of the trademarks, service marks, and copyrights related to the Russell Indexes. Russell® is a trademark of Russell Investment Group.
Index performance returns do not reflect any management fees, transaction costs, or expenses. Indices are unmanaged and one cannot invest directly in an index.
Investing involves risk, including the possible loss of principal.
Past performance is not a guarantee of future results.
* The contractual waiver period is from Feb. 27, 2015 through Feb. 28, 2017.
6
Portfolio management review
Delaware Pooled® Trust — The High-Yield Bond Portfolio
October 31, 2016
For the fiscal year ended Oct. 31, 2016, Delaware Pooled Trust — The High-Yield Bond Portfolio returned +6.63% at net asset value (NAV) with all distributions reinvested. For the same period, the Portfolio’s benchmark, the BofA Merrill Lynch U.S. High Yield Constrained Index, returned +10.18%. Complete annualized performance for The High-Yield Bond Portfolio is shown in the table on page 9.
A rebound in commodity prices and the U.S. Federal Reserve’s assurances of continued monetary accommodation sparked a rally in high yield bond prices over the last three quarters of the Portfolio’s fiscal year ended Oct. 31, 2016. However, conditions were anything but accommodative in the first quarter of the fiscal year, as a steep fall in commodity prices — especially oil — magnified the effect of the Fed’s first interest rate hike since the global financial crisis. As such, the high yield market took on bipolar characteristics, with negative returns from November 2015 through January 2016 and solidly positive returns from February through October 2016. As a result, credit spreads finished inside their historical averages and nearly 1% tighter than where they were at the start of the fiscal year.
Importantly, the recovery in oil prices that began in February 2016 — coupled with a global search for yield — reopened capital markets to energy companies. This backdrop allowed many distressed businesses to extend maturity profiles by accessing both debt and equity markets, despite an oil price environment that, in our view, was not supportive of business models and balance sheets. Given the weak pricing environment, defaults among high yield energy companies climbed to the low double digits, versus low single digits for the rest of the high yield sector. Nevertheless, it was the meaningful recovery in oil prices that allowed the energy sector to return 12.3% for the fiscal year.
More broadly, domestic high yield bonds benefited from a global search for income. Almost three-quarters of developed-market debt now trades at a negative yield, and global central banks gave no indication that a new monetary tightening cycle was close at hand. In that environment, most industry groups performed relatively well, with gaming, consumer products, chemicals, and technology all outperforming the BofA Merrill Lynch U.S. High Yield Constrained Index. Excluding the still-depressed commodity group, high yield bonds generally finished the fiscal year at prices that we believe to be slightly overvalued given their underlying fundamentals. Any mild overvaluation, however, is likely to be expected given the continued low level of global interest rates.
Shifting currents within the high yield market created significant managerial challenges for the Portfolio. As the fiscal year began, we trimmed exposure to the energy sector; at one point, the Portfolio’s allocation to the group fell to just 3% of assets. Though we subsequently increased the Portfolio’s energy holdings, we finished the period about 3 percentage points below the sector’s 13%
weighting in the benchmark index. With the short- to medium-term outlook for energy prices likely to remain cloudy, we took what we considered to be a cautious approach, preferring companies that we view as having favorable cost structures, manageable free cash flows, diversified assets, geographic exposure, and the ability to withstand a $40-a-barrel oil price for a long time.
Elsewhere, we added marginally to the Portfolio’s metals and mining allocation as the recovery in commodity prices gained traction. We also added so-called “fallen angels,” whose credit ratings had dropped below investment grade after the plunge in oil prices. Finally, we increased the Portfolio’s weighting to holdings that fit our up-in-quality criteria.
Among individual holdings, the Portfolio’s overweight position in Builders FirstSource contributed to relative performance. The company owns and operates 55 distribution centers and manufacturing facilities for building materials throughout the United States. While Builders FirstSource benefited from a healthy environment for residential home construction, the company also exhibited many of the characteristics we prefer in a high yield credit, including strong free cash flow, a U.S.-centric clientele, and a plan for shedding debt. The Portfolio’s position in Builders FirstSource — which grew to about 0.80% of assets by the end of the fiscal year — contributed 0.10 percentage points to the Portfolio’s total return during the fiscal year.
AK Steel, which operates steelmaking plants in Ohio, Kentucky, Indiana, Michigan, and Pennsylvania, also contributed to the Portfolio’s results. After several difficult years — during which the Portfolio continued to hold the bonds — the company recovered strongly in 2016 following several favorable trade rulings that seemed to boost the price of its key commodity. AK Steel also benefited from continued strength in the U.S. auto industry.
Another basic materials company, Australia-based FMG Resources, contributed to the Portfolio’s performance. FMG Resources gained from a recovery in iron ore prices, positive free cash flow, a reduction in debt, and a favorable cost structure. As a result, we added to the Portfolio’s position in FMG Resources during the fiscal year.
Most of the Portfolio’s underperforming positions suffered from weak free cash flows and overleveraged balance sheets, exacerbated by a difficult business environment. Among the primary detractors from relative performance was Immucor, whose products are designed to support immune system health. Given the near-term challenges posed by, in our view, an overlevered balance sheet, we reduced the Portfolio’s holdings with an emphasis on the secured part of the company’s capital structure.
The global networking company Intelsat also detracted from relative performance. Intelsat operates a fleet of nearly 50 satellites, but the company suffered from liquidity issues that called into serious
Portfolio management review
Delaware Pooled® Trust — The High-Yield Bond Portfolio
question its ability to refund maturing bonds at par. Consequently, we exited the Portfolio’s position during the fiscal period.
The Portfolio’s Neiman Marcus bonds likewise reduced returns. The luxury products retailer suffered a 5% drop in same-store sales despite generally robust consumer spending. Revenues from the Dallas-based company’s eight Texas stores were particularly hurt by the decline in oil prices. Neiman Marcus announced stronger earnings toward the end of the fiscal year, however, and the Portfolio retains a decreased position.
We believe the Portfolio may be positioned to benefit from a bottom-up, bond-by-bond approach that, if accurate, would play to our
strength as fundamental credit analysts. However, given the resilience of the U.S. economy (compared to much of the developed world) we continue to favor companies with a domestic focus. As noted earlier, the Portfolio continues to be overweight businesses that we view as having healthy free cash flows, a disciplined strategy of capital allocation, and a commitment to deleveraging. We are generally satisfied with the Portfolio’s current yield profile, though we may look to add income to the portfolio if opportunities present themselves.
The views expressed are current as of the date of this report and subject to change.
8
Performance summary
Delaware Pooled® Trust — The High-Yield Bond Portfolio
The performance data quoted represent past performance; past performance does not guarantee future results. Investment return and principal value will fluctuate so your shares, when redeemed, may be worth more or less than their original cost. Current performance may be lower or higher than the performance data quoted. Please obtain the performance data for the most recent month end by calling 800 231-8002 or visiting our website at delawareinvestments.com/dpt/performance.
Carefully consider the Portfolio’s investment objectives, risk factors, charges, and expenses before investing. This and other information can be found in the Portfolio’s prospectus which may be obtained by visiting delawareinvestments.com/dpt/literature or calling 800 231-8002. Investors should read the prospectus carefully before investing.
| | | | | | | | | | | | | | | | | | | | | | | | | | | | | | | | | | | | |
| Portfolio and benchmark performance | | | | | | | | | | | | | | | | | | | | | | | | | | | | | | | | | | | | |
| Average annual total returns | | | | | | | | | | | | | | | | | | | | | | | | | | | | | | | | | | | | |
| Periods ended Oct. 31, 2016 | | 1 year | | | | | | 3 years | | | | | | 5 years | | | | | | 10 years | | | | | | Lifetime | |
| | | | | | | | | |
| | | | | | | | | | | | | | | | | | | | | | | | | | | | | | | | | | | | |
The High-Yield Bond Portfolio | | | +6.63% | | | | | | | | +2.72% | | | | | | | | +6.62% | | | | | | | | +7.38% | | | | | | | | +7.65% | |
| BofA Merrill Lynch U.S. High Yield Constrained Index | | | +10.18% | | | | | | | | +4.54% | | | | | | | | +7.07% | | | | | | | | +7.56% | | | | | | | | +7.00% | |
| | |
| |
| Portfolio profile | | |
| Oct. 31, 2016 | | |
| | |
Total net assets | | Number of holdings |
$242.3 million | | 231 |
| | |
Inception date | | |
Dec. 2, 1996 | | |
Growth of $1,000,000
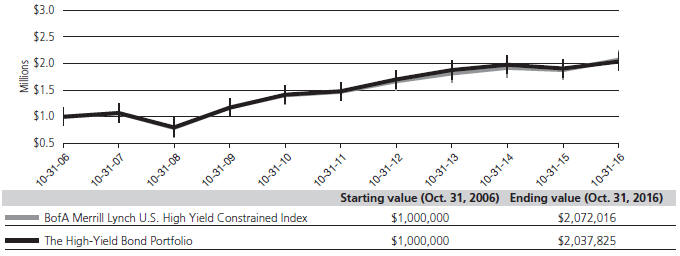
The performance graph assumes $1 million invested on Oct. 31, 2006, and includes reinvestment of all distributions. The performance graph does not reflect the deduction of taxes the shareholder would pay on Portfolio distributions or redemptions of Portfolio shares.
Total return assumes reinvestment of dividends and capital gains, but does not reflect reductions for taxes. Returns and share values will fluctuate so that shares, when redeemed, may be worth more or less than their original cost.
Performance summary
Delaware Pooled® Trust — The High-Yield Bond Portfolio
The most recent prospectus disclosed the Portfolio’s total operating expenses as 0.56%. Management has contractually agreed to reimburse certain expenses and/or waive its management fees from Nov. 1, 2015, through Oct. 31, 2016,* in order to prevent total annual Portfolio operating expenses (with certain exceptions) from exceeding, in an aggregate amount, 0.59% of the Portfolio’s average daily net assets, as described in the most recent prospectus.
Expense limitations were in effect during the period shown. Performance would have been lower had the expense limitations not been in effect.
The BofA Merrill Lynch U.S. High Yield Constrained Index tracks the performance of U.S. dollar-denominated high yield corporate debt publicly issued in the U.S. domestic market, but caps individual issuer exposure at 2% of the benchmark. Qualifying securities must have, among other things, a below-investment-grade rating (based on an average of Moody’s, Standard & Poor’s, and Fitch), an investment grade issuing country (based on an average of Moody’s, Standard & Poor’s, and Fitch foreign currency long-term sovereign debt ratings), and maturities of one year or more.
Index performance returns do not reflect any management fees, transaction costs, or expenses. Indices are unmanaged and one cannot invest directly in an index.
Investing involves risk, including the possible loss of principal.
Past performance is not a guarantee of future results.
Fixed income securities and bond funds can lose value, and investors can lose principal, as interest rates rise. They also may be affected by economic conditions that hinder an issuer’s ability to make interest and principal payments on its debt.
The Portfolio may also be subject to prepayment risk, the risk that the principal of a fixed income security that is held by the Portfolio may be prepaid prior to maturity, potentially forcing the Portfolio to reinvest that money at a lower interest rate.
The Portfolio may be invested in foreign corporate bonds, which have special risks not ordinarily associated with domestic investments, such as currency fluctuations, economic and political change, and different accounting standards.
High yielding, noninvestment grade bonds (junk bonds) involve higher risk than investment grade bonds.
The high yield secondary market is particularly susceptible to liquidity problems when institutional investors, such as mutual funds and certain other financial institutions, temporarily stop buying bonds for regulatory, financial, or other reasons. In addition, a less liquid secondary market makes it more difficult for the Portfolio to obtain precise valuations of the high yield securities in its portfolio.
The Portfolio may experience portfolio turnover in excess of 100%, which could result in higher transaction costs and tax liability.
Per Standard & Poor’s credit rating agency, bonds rated below AAA, including A, are more susceptible to the adverse effects of changes in circumstances and economic conditions than those in higher-rated categories, but the obligor’s capacity to meet its financial commitment on the obligation is still strong. Bonds rated BBB exhibit adequate protection parameters, although adverse economic conditions or changing circumstances are more likely to lead to a weakened capacity of the obligor to meet its financial commitments. Bonds rated BB, B, and CCC are regarded as having significant speculative characteristics with BB indicating the least degree of speculation.
Investing in emerging markets can be riskier than investing in established foreign markets due to increased volatility and lower trading volume.
* The contractual waiver period is from Feb. 27, 2015 through Feb. 28, 2017.
10
Portfolio management review
Delaware Pooled® Trust — The Core Plus Fixed Income Portfolio
October 31, 2016
For the fiscal year ended Oct. 31, 2016, Delaware Pooled Trust — The Core Plus Fixed Income Portfolio returned +3.63% at net asset value (NAV) with all distributions reinvested. The Portfolio’s benchmark, the Bloomberg Barclays U.S. Aggregate Index, formerly known as the Barclays U.S. Aggregate Index, returned +4.37% for the same period. Complete annualized performance for The Core Plus Fixed Income Portfolio is shown in the table on page 13.
The Portfolio’s fiscal year began with slow global growth and somewhat challenged earnings for companies in the United States. Commodity prices, particularly oil, were in a prolonged slump, and the U.S. dollar rallied. In December 2015, the U.S. Federal Reserve raised the federal funds rate for the first time in nine years, signaling a shift to tighter monetary policy.
Market volatility picked up significantly in January and February 2016 as financial conditions deteriorated in an already slow-growth environment, prompting action by central banks. The European Central Bank injected more stimulus by expanding its quantitative easing program and beginning the purchase of corporate bonds, a significant development. At the same time, the Fed announced that it would go slowly on additional rate hikes, an important dovish signal. The Bank of Japan also added more monetary stimulus. These concerted central bank actions caused a market reversal: Oil prices rose and energy securities rallied, particularly in fixed income. Additionally, yield spreads began to decline significantly.
The summer began with Brexit, the United Kingdom’s vote to leave the European Union. Although the result was shocking, its effect was tempered as the Bank of England quickly injected more liquidity into the U.K. financial markets, seemingly easing investor anxiety. The Portfolio’s fiscal year ended with a high degree of uncertainty in the run-up to the U.S. presidential election.
The Portfolio’s performance was hurt by a defensive position in a rapidly changing market that benefited from central bank stimulus in the winter. Underweights relative to the benchmark index in both the energy and metals-and-mining sectors were primary detractors as the two sectors rallied in the winter and spring.
The Portfolio had responded to deteriorating market conditions and rising risks before the fiscal year began by moving Portfolio assets from the corporate sector — including investment grade bonds — to more defensive agency mortgage-backed securities (MBS). We also increased the Portfolio’s exposure to Treasurys, attempting to take some risk off the table as risk premiums widened early in the fiscal period. This limited gains in the Portfolio, as it missed the strong rally that resulted from central bank stimuli in February and March. As the markets rebounded, we added back corporate exposure, but we did so conservatively.
We looked for bonds issued by companies that we viewed as having good balance sheet management and resilient product lineups that
could withstand what we saw as a continued slow-growth, earnings-and-revenue-challenged environment. This included relatively defensive energy investments, as we focused on companies with less exposure to petroleum price volatility.
Among these were some midstream holdings — pipeline companies — that had been sensitive to oil prices in 2015. Although some of these companies had been downgraded, in our view they were generally in better financial shape, with less leverage, than oil service companies that had made heavy capital expenditures in an effort to capture the significant buildup in shale and offshore platform exploration. After oil prices stabilized, these companies began to look more attractive to us. In an environment of lower oil prices, the market gave them the latitude to be somewhat more flexible in their capital-market activities. Holdings included independent energy producers with more stable balance sheets, such as ConocoPhillips, Anadarko Petroleum, and Noble Energy. Elsewhere in the energy sector, we couldn’t keep up with credit markets and energy markets that were significantly rallying, which led to most of the underperformance.
Also detracting were bonds issued by Sprint Communications in the telecommunications sector, Community Health Systems within healthcare, and high yield bonds issued by Dynegy, an electricity provider utility, and QEP Resources, an independent natural gas and oil exploration firm.
Exposure to asset-backed securities (ABS) and collateralized loan obligations (CLOs) detracted somewhat from the Portfolio’s performance as they missed the full benefit of the bond rally earlier this year. The Portfolio’s returns also were held back somewhat by a lack of exposure to the robust high yield bond market.
On the positive side, the Portfolio benefited from its exposure to finance companies — money-center banks, regional banks, and foreign banks, including large Swiss banks, and major U.K. mortgage providers. The Portfolio also benefited from corporate bonds issued by food and beverage and communications firms related to mergers and acquisitions.
Performance was boosted by an overweight to commercial mortgage-backed securities (CMBS), particularly more defensive investments, including Freddie Mac multifamily securitizations. Individual contributors also included bonds issued by Fannie Mae and Bank of America, and by 30-year interest rate swaps. The Portfolio’s overweight to utilities was beneficial, compounded by outperformance versus the Portfolio’s benchmark, the Bloomberg Barclays U.S. Aggregate Index. Additionally, the Portfolio gained overall from its allocation to emerging market bonds, which rallied and are not included in the benchmark index.
Throughout the Portfolio’s fiscal year, corporate fundamentals declined as companies became more levered, balance sheets
Portfolio management review
Delaware Pooled® Trust — The Core Plus Fixed Income Portfolio
weakened somewhat, and earnings growth receded. However, there was a slight uptick in earnings in the third quarter of 2016, partly due to the weakening U.S. dollar. During the previous fiscal year, the U.S. dollar had rallied, placing a financial strain on U.S. firms with overseas earnings.
The Portfolio’s use of derivatives had no material effect on its performance. We used derivatives for a variety of hedging purposes. We employed them either to increase or decrease interest rate sensitivity, to make adjustments in yield curve exposure, or to try to capture the effect of collapsing swap rates, and we recently used credit default swap indices to dial back credit risk. We also used currency futures to reduce currency exposure when it seemed warranted.
The election of Donald Trump shortly after the end of the fiscal period underscores the uncertainties and global risks associated with a series of anti-establishment election results, beginning with the U.K. Brexit vote in June, and that could continue next year with national elections in Italy, France, and Germany. The Portfolio is positioned for a possible change in the interest rate environment, with exposure to risk reduced through interest rate futures. In our view, uncertainty regarding trade pacts and potential renewed strengthening of the U.S. dollar could negatively impact emerging market bonds.
The views expressed are current as of the date of this report and subject to change.
12
Performance summary
Delaware Pooled® Trust — The Core Plus Fixed Income Portfolio
The performance data quoted represent past performance; past performance does not guarantee future results. Investment return and principal value will fluctuate so your shares, when redeemed, may be worth more or less than their original cost. Current performance may be lower or higher than the performance data quoted. Please obtain the performance data for the most recent month end by calling 800 231-8002 or visiting our website at delawareinvestments.com/dpt/performance.
Carefully consider the Portfolio’s investment objectives, risk factors, charges, and expenses before investing. This and other information can be found in the Portfolio’s prospectus which may be obtained by visiting delawareinvestments.com/dpt/literature or calling 800 231-8002. Investors should read the prospectus carefully before investing.
| | | | | | | | | | | | | | | | | | | | | | | | | | | | | | | | | | | | |
| Portfolio and benchmark performance | | | | | | | | | | | | | | | | | | | | | | | | | | | | | | | | | | | | |
| Average annual total returns | | | | | | | | | | | | | | | | | | | | | | | | | | | | | | | | | | | | |
| Periods ended Oct. 31, 2016 | | 1 year | | | | | | 3 years | | | | | | 5 years | | | | | | 10 years | | | | | | Lifetime | |
| | | | | | | | | |
| | | | | | | | | | | | | | | | | | | | | | | | | | | | | | | | | | | | |
The Core Plus Fixed Income Portfolio | | | +3.63% | | | | | | | | +3.30% | | | | | | | | +3.43% | | | | | | | | +5.57% | | | | | | | | +5.84% | |
Bloomberg Barclays U.S. Aggregate Index* | | | +4.37% | | | | | | | | +3.48% | | | | | | | | +2.90% | | | | | | | | +4.64% | | | | | | | | +4.73% | |
*Formerly known as the Barclays U.S. Aggregate Index. | | | | | | | | | | | | | | | | | | | | | | | | | | | | | | | | | | | | |
| | |
| |
| Portfolio profile | | |
| Oct. 31, 2016 | | |
| | |
Total net assets | | Number of holdings |
$133.2 million | | 744 |
| | |
Inception date | | |
June 28, 2002 | | |
Growth of $1,000,000
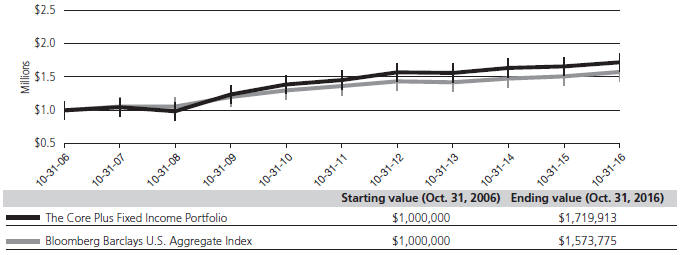
The performance graph assumes $1 million invested on Oct. 31, 2006, and includes reinvestment of all distributions. The performance graph does not reflect the deduction of taxes the shareholder would pay on Portfolio distributions or redemptions of Portfolio shares.
Total return assumes reinvestment of dividends and capital gains, but does not reflect reductions for taxes. Returns and share values will fluctuate so that shares, when redeemed, may be worth more or less than their original cost.
Performance summary
Delaware Pooled® Trust — The Core Plus Fixed Income Portfolio
The most recent prospectus disclosed the Portfolio’s total operating expenses as 0.60%. Management has contractually agreed to reimburse certain expenses and/or waive its management fees from Nov. 1, 2015, through Oct. 31, 2016,* in order to prevent total annual Portfolio operating expenses (with certain exclusions) from exceeding, in an aggregate amount, 0.45% of the Portfolio’s average daily net assets, as described in the most recent prospectus.
Expense limitations were in effect during the period shown. Performance would have been lower had the expense limitations not been in effect.
The Bloomberg Barclays U.S. Aggregate Index (formerly known as the Barclays U.S. Aggregate Index) measures the performance of publicly issued investment grade (Baa3/BBB- or better) corporate, U.S. government, mortgage- and asset-backed securities with at least one year to maturity and at least $250 million par amount outstanding.
Index performance returns do not reflect any management fees, transaction costs, or expenses. Indices are unmanaged and one cannot invest directly in an index.
Investing involves risk, including the possible loss of principal.
Past performance is not a guarantee of future results.
Fixed income securities and bond funds can lose value, and investors can lose principal, as interest rates rise. They also may be affected by economic conditions that hinder an issuer’s ability to make interest and principal payments on its debt.
The Portfolio may also be subject to prepayment risk, the risk that the principal of a fixed income security that is held by the Portfolio may be prepaid prior to maturity, potentially forcing the Portfolio to reinvest that money at a lower interest rate.
Interest payments on inflation-indexed debt securities will vary as the principal and/or interest is adjusted for inflation.
High yielding, non-investment grade bonds (junk bonds) involve higher risk than investment grade bonds. The high yield secondary market is particularly susceptible to liquidity problems when institutional investors, such as mutual funds and certain other financial institutions, temporarily stop buying bonds for regulatory, financial, or other reasons. In addition, a less liquid secondary market makes it more difficult for the Portfolio to obtain precise valuations of the high yield securities in its portfolio.
International investments entail risks not ordinarily associated with U.S. investments including fluctuation in currency values, differences in accounting principles, or economic or political instability in other nations. Investing in emerging markets can be riskier than investing in established foreign markets due to increased volatility and lower trading volume.
Because the Portfolio may invest in bank loans and other direct indebtedness, it is subject to the risk that the Portfolio will not receive payment of principal, interest, and other amounts due in connection with these investments, which primarily depend on the financial condition of the borrower and the lending institution.
The Portfolio may experience portfolio turnover in excess of 100%, which could result in higher transaction costs and tax liability.
Per Standard & Poor’s credit rating agency, bonds rated below AAA, including A, are more susceptible to the adverse effects of changes in circumstances and economic conditions than those in higher-rated categories, but the obligor’s capacity to meet its financial commitment on the obligation is still strong. Bonds rated BBB exhibit adequate protection parameters, although adverse economic conditions or changing circumstances are more likely to lead to a weakened capacity of the obligor to meet its financial commitments. Bonds rated BB, B, and CCC are regarded as having significant speculative characteristics with BB indicating the least degree of speculation.
Investments in mortgage-backed securities (MBS) may involve risks. MBS represent an ownership interest in a pool of mortgage loans. The individual mortgage loans are packaged or “pooled” together for sale to investors. These mortgage loans may have either fixed or adjustable interest rates.
Investments in collateralized loan obligations (CLOs) may involve risks. CLOs are securities backed by a pool of debt, often low-rated corporate loans. Investors receive scheduled debt payments from the underlying loans but assume most of the risk in the event that borrowers default.
*The contractual waiver period is from Feb. 27, 2015 through Feb. 28, 2017.
14
Portfolio management review
Delaware Pooled® Trust — The Labor Select International Equity Portfolio
October 31, 2016
For the fiscal year ended Oct. 31, 2016, Delaware Pooled Trust — The Labor Select International Equity Portfolio returned -4.24% at net asset value (NAV) with all distributions reinvested. The Portfolio’s benchmark, the MSCI EAFE Index, returned -2.74% (gross) and -3.23% (net) for the same period. Complete annualized performance for The Labor Select International Equity Portfolio is shown in the table on page 17.
Over the course of the 12-month fiscal period, central bank policies and investor sentiment toward the United Kingdom’s Brexit referendum seemed to strongly affect the markets in the Portfolio’s asset class. Returns in Europe lagged those in the Asia Pacific region. The performance of local currencies relative to the U.S. dollar varied widely. In fact, the Portfolio’s underperformance relative to its benchmark index was entirely due to currency movements, though currency effects held back U.S. dollar returns for the benchmark index as well.
After a partial recovery in non-commodity-linked sectors in late 2015, markets again weakened in early 2016, driven by further Chinese renminbi devaluation and the Bank of Japan’s (BOJ’s) surprise decision to introduce negative interest rates. The unexpected results of the June 2016 Brexit referendum triggered a fall in international equities. Euro-zone markets and the financial sector registered the most significant losses, as many investors worried about potential economic and political repercussions. By the close of the fiscal period, supportive central banks and increasing expectations for additional stimulus appeared to help international equities shrug off Brexit concerns. The third quarter of 2016 saw particularly strong gains, led by cyclically sensitive sectors.
Among the larger European markets, the Dutch market registered the most modest decline, down just 0.2% in U.S. dollar terms. Next in terms of limited losses was the export-oriented German market (-2.9%), which was helped by improved Chinese and euro-zone data. Other major European markets, including France (-5.0%), Spain (-9.1%), the U.K. (-10.2%), and Italy (-23.2%), experienced greater declines. In the case of the U.K., strong local returns were not enough to offset the British pound’s depreciation. Brexit particularly hit stocks in the financial and consumer discretionary sectors; however, the large number of internationally diversified companies in the U.K. portion of the benchmark index mitigated its effect on the broader U.K. equity market.
Most Asia Pacific markets in the benchmark index generated strong returns for the fiscal period in U.S. dollar terms. Australia, supported by a recovery in commodity prices, generated the highest return among major markets, up 12.6%. The materials sector, in fact, generated the highest returns over the fiscal period. Improved expectations for Chinese growth supported the Hong Kong market, which gained 8.5%. The Japanese market rose 3.2%, as yen appreciation more than offset local market declines. Conversely, the
markets in Singapore fell 3.8% when growth estimates were again revised downward.
As stated previously, currency effects were responsible for the Portfolio’s relative performance. Most prominently, the British pound ended the fiscal period 21% weaker. This was largely seen as a response to Brexit. The Portfolio’s overweight position in the pound hurt its relative performance while its underweight position in the strong Japanese yen also detracted from performance. The yen was up 14.8% for the fiscal period, as many investors sought safe havens, and the BOJ, after moving to negative interest rates in January 2016, refrained from further increasing the scale of its quantitative easing.
In contrast, our country, sector, and stock selection all outperformed the Portfolio’s benchmark index. In terms of country allocation results, the positive effect of the Portfolio’s underweight position in Japan and its overweight position in the U.K. more than offset the negative effects of an underweight position in Australia. In local currency terms, Japan was down 10.1%, while the U.K. and Australia were up 13.5% and 5.5%, respectively.
Returns from holdings in Switzerland, Japan, and the U.K. drove the Portfolio’s strong relative stock selection. An underweight position in financials (by 7.4 percentage points) and an overweight position in the energy sector (by 4.5 percentage points) drove the Portfolio’s relative outperformance at the sector level. Strong stock selection within sectors also added to relative returns, led by the Portfolio’s stocks in the utilities and consumer staples sectors.
In terms of individual holdings, among the Portfolio’s biggest disappointments was its position in U.K. retail bank Lloyds Banking Group. The stock fell more than 35% over the 12-month period, primarily due to concerns regarding the outlook for the U.K. economy and housing market following the Brexit result. We acquired the position in Lloyds Banking Group when we bought into the share price weakness, starting in late 2015. We also held Pearson, a U.K. media and education company, in the Portfolio during the fiscal period. The stock decreased more than 25% due to continued weakness in the U.S. higher education market. Finally, Sanofi, the French healthcare company, declined more than 20% as a result of continued competition and pricing pressure on diabetes drug Lantus® in the United States. We continue to hold all three stocks in the Portfolio and, in fact, we added to the positions during the fiscal period as we believe that the market reaction to the events described above was excessive.
Stocks that delivered strong positive returns for the Portfolio included Syngenta, the Swiss agrichemicals company, which rose more than 20%, aided by ChemChina’s bid to acquire it. The Portfolio’s position in Japanese brewer Kirin Holdings also gained more than 20%. Kirin Holdings’ strong financial results indicated to us that its strategy to regain share in the Japanese market was succeeding. Tokyo
Portfolio management review
Delaware Pooled® Trust — The Labor Select International Equity Portfolio
Electron, the Japanese manufacturer of semiconductor production equipment, increased more than 50% during the fiscal year. The company benefited from a strong order environment, improving margins and shareholder returns, and rising semiconductor capital expenditure in China.
The highlights of the Portfolio’s investment strategy during the period include a strong value stock orientation, overweight positions in selected European markets, an overweight position in the telecommunications and energy sectors, and underweight positions in the financials, materials, and industrial sectors.
The views expressed are current as of the date of this report and subject to change.
16
Performance summary
Delaware Pooled® Trust — The Labor Select International Equity Portfolio
The performance data quoted represent past performance; past performance does not guarantee future results. Investment return and principal value will fluctuate so your shares, when redeemed, may be worth more or less than their original cost. Current performance may be lower or higher than the performance data quoted. Please obtain the performance data for the most recent month end by calling 800 231-8002 or visiting our website at delawareinvestments.com/dpt/performance.
Carefully consider the Portfolio’s investment objectives, risk factors, charges, and expenses before investing. This and other information can be found in the Portfolio’s prospectus which may be obtained by visiting delawareinvestments.com/dpt/literature or calling 800 231-8002. Investors should read the prospectus carefully before investing.
| | | | | | | | | | | | | | | | | | | | | | | | | | | | | | | | | | | | |
| Portfolio and benchmark performance | | | | | | | | | | | | | | | | | | | | | | | | | | | | | | | | | | | | |
| Average annual total returns | | | | | | | | | | | | | | | | | | | | | | | | | | | | | | | | | | | | |
| Periods ended Oct. 31, 2016 | | 1 year | | | | | | 3 years | | | | | | 5 years | | | | | | 10 years | | | | | | Lifetime | |
| | | | | | | | | |
| | | | | | | | | | | | | | | | | | | | | | | | | | | | | | | | | | | | |
The Labor Select International Equity Portfolio | | | –4.24% | | | | | | | | –1.47% | | | | | | | | +3.81% | | | | | | | | +0.88% | | | | | | | | +6.66% | |
MSCI EAFE Index (gross) | | | –2.74% | | | | | | | | –0.86% | | | | | | | | +5.48% | | | | | | | | +1.70% | | | | | | | | +4.82% | |
MSCI EAFE Index (net) | | | –3.23% | | | | | | | | –1.31% | | | | | | | | +4.99% | | | | | | | | +1.22% | | | | | | | | +4.40% | |
| | |
| |
| Portfolio profile | | |
| Oct. 31, 2016 | | |
| | |
Total net assets | | Number of holdings |
$394.8 million | | 50 |
| | |
Inception date | | |
Dec. 19, 1995 | | |
Growth of $1,000,000
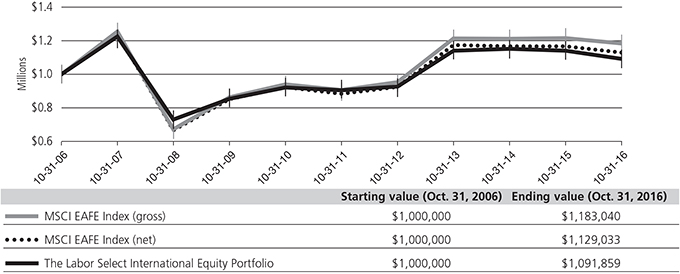
The performance graph assumes $1 million invested on Oct. 31, 2006, and includes reinvestment of all distributions. The performance graph does not reflect the deduction of taxes the shareholder would pay on Portfolio distributions or redemptions of Portfolio shares.
Total return assumes reinvestment of dividends and capital gains, but does not reflect reductions for taxes. Returns and share values will fluctuate so that shares, when redeemed, may be worth more or less than their original cost.
Performance summary
Delaware Pooled® Trust — The Labor Select International Equity Portfolio
The most recent prospectus disclosed the Portfolio’s total operating expenses as 0.87%.
The MSCI EAFE (Europe, Australasia, Far East) Index is a free float-adjusted market capitalization weighted index designed to measure equity market performance of developed markets, excluding the United States and Canada. Index “gross” return approximates the maximum possible dividend reinvestment. Index “net” return approximates the minimum possible dividend reinvestment, after deduction of withholding tax at the highest possible rate.
Index performance returns do not reflect any management fees, transaction costs, or expenses. Indices are unmanaged and one cannot invest directly in an index.
Investing involves risk, including the possible loss of principal.
Past performance is not a guarantee of future results.
International investments entail risks not ordinarily associated with U.S. investments including fluctuation in currency values, differences in accounting principles, or economic or political instability in other nations.
Investing in emerging markets can be riskier than investing in established foreign markets due to increased volatility and lower trading volume.
If and when the Portfolio invests in forward foreign currency contracts or uses other investments to hedge against currency risks, the Portfolio will be subject to special risks, including counterparty risk.
From time to time, the Portfolio may invest up to 30% of its net assets in securities of issuers in the commercial banking industry; to the extent that the Portfolio invests 30% of its net assets in such securities, it may be slightly more sensitive to movement in the commercial banking industry.
18
Portfolio management review
Delaware Pooled® Trust — The Emerging Markets Portfolio
October 31, 2016
Delaware Pooled Trust — The Emerging Markets Portfolio returned +6.75% at net asset value (NAV) with all distributions reinvested for the fiscal year ended Oct. 31, 2016. The Portfolio’s benchmark, the MSCI Emerging Markets Index, returned +9.67% (gross) and +9.27% (net). Complete annualized performance for The Emerging Markets Portfolio is shown in the table on page 21.
Emerging markets outperformed developed markets for the Portfolio’s fiscal year — a long time coming. In our view, three key drivers of this asset class’s positive performance stood out. The first was the rally in commodity markets that began in January 2016. Most of the stronger-performing markets for the fiscal year all had some direct link to commodities. These included commodity exporter Peru, up 31%. Indonesia, a big coal producer, was up 32%. Commodity-rich Russia was up 19%, followed by Chile, up 14%.
Second, the information technology (IT) sector has continued to find favor with investors. During the Portfolio’s fiscal year, this sector as a whole rose approximately 20% for the emerging market asset class, principally due to performance gains of Internet-related businesses. This was led by the three largest Chinese Internet stocks — Tencent, Alibaba, and Baidu. Additionally, Taiwan’s outperformance for the period (+18%), for example, was related to its economy’s strong emphasis on IT-related industries.
Finally, Brazil was up 71% for the fiscal year, riding the wave of a huge reversal in investor sentiment along with a strong recovery of its currency, which rose approximately 25%. Brazil benefited from the new government put into place this year. President Dilma Rousseff was impeached during the fiscal year, and investors seemed hopeful that the necessary reforms would commence. As a commodity producer, Brazil was also helped by the upswing in commodity prices.
Conversely, many of the smallest European markets turned in the weakest performances, including Greece (-42%), Poland (-12%), and the Czech Republic (-5%). Turkey was down 6%. Of the major emerging markets, the weakest was Mexico (-5%), despite its strength as an oil exporter. Mexico’s currency, which depreciated 12.1%, was undermined by uncertainties over the outcome of the U.S. presidential election. In terms of sectors, most of the underperformers were industries that historically have been considered defensive, including telecommunications, the consumer sectors, healthcare, utilities, and real estate. The exception, of course, were commodities, which significantly outperformed.
The Portfolio’s underperformance with respect to its benchmark index was largely due to the Portfolio’s underweighting and more defensive positioning in Brazil, as well as the Portfolio’s underweight to the commodities sector, particularly materials. Avoiding growth-oriented IT stocks that we viewed as overvalued also detracted from the Portfolio’s performance. The most notable example was our lack of a position in Chinese Internet company Tencent, which gained 40% for the fiscal period. Tencent takes up more than 3.5% of the benchmark
index; not holding this company cost the Portfolio about 80 basis points in relative performance.
In terms of contributors, our stock selection in India, stock selection and positioning in Korea, and avoidance of exposure to poorly performing European countries including Greece, Poland, and the Czech Republic, all helped the Portfolio’s performance. India was up just 4% for the fiscal period, but the Portfolio’s holdings in oil and gas explorer Cairn India (+44%) and housing finance company Indiabulls Housing Finance (+15%), were strong outperformers. Korea slightly underperformed the Portfolio’s benchmark index; the Portfolio’s underweight there aided performance, as did the Portfolio’s large positions in Samsung Electronics (+19%) and Hyundai Mobis (+14%). Stock selection in the healthcare sector also added value for the Portfolio.
We can’t neglect to mention China, given that it takes up more than 25% of the benchmark index. China’s unremarkable performance numbers for the fiscal period (+1.5%) masked the disparities between the big gains posted by many Internet-related companies and the less attractive returns that were often seen in other Chinese sectors.
In terms of individual detractors, several consumer-related Chinese stocks were among the Portfolio’s biggest disappointments. These companies struggled under the competitive pressures that resulted from China’s lower-growth environment: shoe manufacturer Belle International Holdings (-38%), snack foods producer Want Want China Holdings (-27%), and consumer products company Hengan International Group (-26%). We continue to hold all three names; we reduced Hengan International Group and Want Want China Holdings in light of concerns regarding margin sustainability, and we added to Belle International Holdings, due to the company’s deep value proposition that we believe still exists.
Another Chinese holding that detracted from the Portfolio’s performance was utility company China Resources Power Holdings. The company declined 25%, as it was negatively affected by rising coal prices, which saw some recovery in China toward the second half of the fiscal period. And finally, Philippines-based telecommunications company PLDT produced weak numbers, declining 33%. Competitive pressure in the Philippines dragged on the company’s profitability and top line growth. We added to China Resources Power Holdings during the Portfolio’s fiscal year given the particularly cheap multiples and progressive dividend policy. The company’s stock starts on a dividend yield of almost 7%. We are currently reviewing PLDT, which we still held in the Portfolio as of the end of the fiscal year.
Contributors to performance included the Portfolio’s large holding in Taiwan Semiconductor Manufacturing. The company rose 42% during the fiscal year. WH Group — a Chinese stock that we began buying late in 2015 — contributed to the Portfolio’s
Portfolio management review
Delaware Pooled® Trust — The Emerging Markets Portfolio
performance. WH Group is the largest pork-producing company in the world. The company’s free cash flow generation has been relatively strong and it has paid down a lot of debt, while also increasing dividends. The Portfolio’s position in WH Group rose 53% by the end of the fiscal period.
Although we didn’t fully participate in the Brazilian rally, the Portfolio held several strong performers there. These included credit card processing company Cielo, up 29%, and brewer Ambev, up 20%. CCR, the toll road operator, rose 74%.
At fiscal year end, the Portfolio was defensively positioned, being underweight the more cyclical sectors such as materials and information technology, while being overweight more stable areas
such as consumer, telecommunications, and utility. We remain underweight China, with no exposure to the high growth Internet companies such as Tencent and Alibaba, and overweight selective areas such as India, Malaysia, the Middle East, and Mexico. We continue to tilt the Portfolio more toward what we view as value names that have underperformed, especially where fundamentals have not deteriorated anywhere near what the price moves would suggest. We remain disciplined in our approach with a commitment to finding what we see as undervalued companies using the dividend discount model approach. We remain confident that after an underwhelming period for the product, there is potential for our value names to be more in favor.
The views expressed are current as of the date of this report and subject to change.
20
Performance summary
Delaware Pooled® Trust — The Emerging Markets Portfolio
The performance data quoted represent past performance; past performance does not guarantee future results. Investment return and principal value will fluctuate so your shares, when redeemed, may be worth more or less than their original cost. Current performance may be lower or higher than the performance data quoted. Please obtain the performance data for the most recent month end by calling 800 231-8002 or visiting our website at delawareinvestments.com/dpt/performance.
Carefully consider the Portfolio’s investment objectives, risk factors, charges, and expenses before investing. This and other information can be found in the Portfolio’s prospectus which may be obtained by visiting delawareinvestments.com/dpt/literature or calling 800 231-8002. Investors should read the prospectus carefully before investing.
Portfolio and benchmark performance
| | | | | | | | | | |
| Average annual total returns | | | | | | | | | | |
| Periods ended Oct. 31, 2016 | | 1 year | | 3 years | | 5 years | | 10 years | | Lifetime |
| | | | | |
| | | | | | | | | | |
The Emerging Markets Portfolio | | +6.75% | | –3.39% | | +0.09% | | +3.71% | | +7.22% |
MSCI Emerging Markets Index (gross) | | +9.67% | | –1.70% | | +0.90% | | +3.82% | | +5.65% |
MSCI Emerging Markets Index (net) | | +9.27% | | –2.05% | | +0.55% | | +3.49% | | +5.37% |
| | |
| |
| Portfolio profile | | |
| Oct. 31, 2016 | | |
| | |
Total net assets | | Number of holdings |
$133.8 million | | 88 |
| | |
Inception date | | |
April 16, 1997 | | |
Growth of $1,000,000
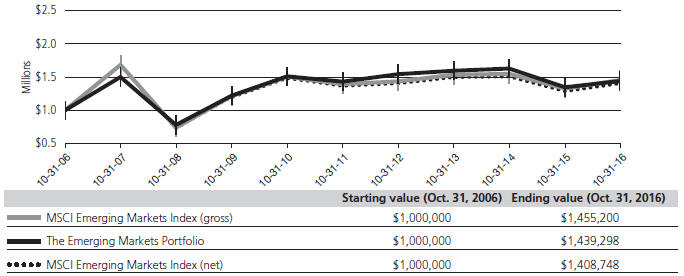
The performance graph assumes $1 million invested on Oct. 31, 2006, and includes reinvestment of all distributions. The performance graph does not reflect the deduction of taxes the shareholder would pay on Portfolio distributions or redemptions of Portfolio shares.
Total return assumes reinvestment of dividends and capital gains, but does not reflect reductions for taxes. Returns and share values will fluctuate so that shares, when redeemed, may be worth more or less than their original cost.
Performance summary
Delaware Pooled® Trust — The Emerging Markets Portfolio
The most recent prospectus disclosed the Portfolio’s total operating expenses as 1.19%. The purchase reimbursement fee (0.55%) and redemption reimbursement fee (0.55%) are paid to the Portfolio. These fees are designed to reflect an approximation of the brokerage and other transaction costs associated with the investment of an investor’s purchase amount or the disposition of assets to meet redemptions, and to limit the extent to which the Portfolio (and, indirectly, the Portfolio’s existing shareholders) would have to bear such costs. In lieu of the reimbursement fees, investors in The Emerging Markets Portfolio may be permitted to utilize alternative purchase and redemption methods designed to accomplish the same economic effect as the reimbursement fees. Reimbursement fees applicable to purchases and redemptions of shares of the Portfolio are not reflected in the “Growth of $1,000,000” graph.
Expense limitations were in effect during the period shown. Performance would have been lower had the expense limitations not been in effect.
The MSCI Emerging Markets Index measures equity market performance across emerging market countries worldwide. Index “gross” return approximates the maximum possible dividend reinvestment. Index “net” return approximates the minimum possible dividend reinvestment, after deduction of withholding tax at the highest possible rate.
Index performance returns do not reflect any management fees, transaction costs, or expenses. Indices are unmanaged and one cannot invest directly in an index.
Investing involves risk, including the possible loss of principal.
Past performance is not a guarantee of future results.
International investments entail risks not ordinarily associated with U.S. investments including fluctuation in currency values, differences in accounting principles, or economic or political instability in other nations.
Investing in emerging markets can be riskier than investing in established foreign markets due to increased volatility and lower trading volume.
If and when the Portfolio invests in forward foreign currency contracts or uses other investments to hedge against currency risks, the Portfolio will be subject to special risks, including counterparty risk.
Fixed income securities and bond funds can lose value, and investors can lose principal, as interest rates rise. They also may be affected by economic conditions that hinder an issuer’s ability to make interest and principal payments on its debt.
The Portfolio may also be subject to prepayment risk, the risk that the principal of a fixed income security that is held by the Portfolio may be prepaid prior to maturity, potentially forcing the Portfolio to reinvest that money at a lower interest rate.
High yielding, non-investment-grade bonds (junk bonds) involve higher risk than investment grade bonds.
The Portfolio is presently closed to new investors.
22
Portfolio management review
Delaware Pooled® Trust — The Emerging Markets Portfolio II
October 31, 2016
For the fiscal year ended Oct. 31, 2016, Delaware Pooled Trust — The Emerging Markets Portfolio II returned +13.62% at net asset value (NAV) with all distributions reinvested. This result outpaced the Portfolio’s benchmark, the MSCI Emerging Markets Index, which returned +9.67% (gross) and +9.27% (net) for the same period. Complete annualized performance for The Emerging Markets Portfolio II is shown in the table on page 24.
Emerging market equities rose sharply during the Portfolio’s fiscal year. Positive drivers of performance included the impeachment of Brazil’s president Dilma Rousseff, a continued rebound in commodity prices, and expectations that the U.S. Federal Reserve will increase interest rates at a more moderate pace.
Among countries, the Portfolio’s overweight positioning in Brazil contributed the most to relative performance. Shares of Petrobras rose as the company executed on its plan to reduce debt through asset sales. Hypermarcas and Itau Unibanco Holding also outperformed, buoyed by some signs of stabilization in the economy.
SINA was the largest contributor to performance in China. SINA operates an online portal and owns a majority stake in Weibo, a leading Internet social media platform. Shares of Weibo rose as the company appeared to show progress in generating advertising revenue on its platform — this in turn boosted SINA’s valuation. In addition, SINA distributed a small portion of its Weibo holdings to shareholders, which investors seemed to view favorably from a corporate governance perspective.
The Portfolio’s positions in Sohu.com and Baidu detracted from this outperformance. Shares of Sohu.com declined after the company indicated weakness in its gaming and brand advertising businesses. We believe that Sohu’s search business remains a key growth driver and that the stock is significantly undervalued. Shares of Baidu also underperformed following the government’s investigation into healthcare-related advertising on Baidu’s search results. The company subsequently lowered its second quarter guidance as it began working to address these concerns.
On the negative side, the Portfolio’s overweight in Turkey was unfavorable when the failed coup attempt against President Erdogan prompted a broad selloff in equities and currency depreciation. Shares of Akbank, a bellwether for the economy, declined during the fiscal year. In our view, Akbank is a particularly well run private bank, and we believe one of the best capitalized and most conservatively provisioned in Turkey. We believe profit growth should improve substantially — regulatory headwinds will likely subside and the bank should be in a position to benefit from secular growth and to take market share as the sector becomes more capital constrained.
Shares of Anadolu Efes Biracilik Ve Malt Sanayii fell due to negative sentiment and lira weakness related to the failed coup attempt. However, in our opinion, its beer business continues to have strong pricing power in Turkey, potential growth opportunity, and likely participation in consolidation in the Russian market. Furthermore, we believe its soft drink business has a strong position in Turkey, Central Asia, Southeast Asia, and the Middle East, as well as strong secular growth opportunities.
Shares of mobile operator Turkcell Iletisim Hizmetleri also underperformed due to intense competition and rising capital spending. Turkcell is the leading mobile telecommunications operator in Turkey, as well as a provider of fiber broadband access. There are high barriers to entry in this sector, and increasing competitive rationality and strong data demand should lead to double-digit revenue growth for the company. Elsewhere, the Portfolio’s underweight positioning in Indonesia was unfavorable in terms of asset allocation.
The financials sector added the most to the Portfolio’s relative performance due to positive stock selection. The Portfolio’s positions in Itau Unibanco Holding and Banco Santander Brasil and the Portfolio’s underweight positioning in Chinese financials were the main contributors to performance.
In contrast, the consumer staples sector detracted the most from performance. Shares of Lotte Chilsung Beverage in Korea were pressured by an ongoing investigation into alleged misuse of funds by Lotte Group’s senior management. We will continue to monitor these developments, but we do not believe that they materially alter the underlying businesses. Shares of Uni-President China Holdings also detracted from the Portfolio’s performance as industry growth remained lackluster in both noodles and beverages. Uni-President China remains a leader in instant noodles and beverages in China and we believe that the company has competitive brands and should continue to gain market share.
Despite a challenging macroeconomic backdrop, we believe there are pockets of opportunities for long-term stock appreciation driven by structural demographic shifts, technology adoption, implementation of government policy, improvement in corporate governance, and industry consolidation. Our investment approach remains centered on identifying individual companies that we believe possess sustainable franchises and favorable long-term growth prospects and that trade at significant discounts to their intrinsic value. We are particularly focused on companies that we think should benefit from long-term changes in how people in emerging markets live and work. Sectors we currently favor include technology and telecommunication.
|
| The views expressed are current as of the date of this report and subject to change. |
23
Performance summary
Delaware Pooled® Trust — The Emerging Markets Portfolio II
The performance data quoted represent past performance; past performance does not guarantee future results. Investment return and principal value will fluctuate so your shares, when redeemed, may be worth more or less than their original cost. Current performance may be lower or higher than the performance data quoted. Please obtain the performance data for the most recent month end by calling 800 231-8002 or visiting our website at delawareinvestments.com/dpt/performance.
Carefully consider the Portfolio’s investment objectives, risk factors, charges, and expenses before investing. This and other information can be found in the Portfolio’s prospectus which may be obtained by visiting delawareinvestments.com/dpt/literature or calling 800 231-8002. Investors should read the prospectus carefully before investing.
| | | | | | | | | | | | | | | | |
| Portfolio and benchmark performance | | | | | | | | | | | | | | | | |
| Average annual total returns | | | | | | | | | | | | | | | | |
| Periods ended Oct. 31, 2016 | | 1 year | | | 3 years | | | 5 years | | | Lifetime | |
| | | | |
| | | | | | | | | | | | | | | | |
The Emerging Markets Portfolio II | | | +13.62% | | | | –2.68% | | | | +1.99% | | | | +1.82% | |
MSCI Emerging Markets Index (gross) | | | +9.67% | | | | –1.70% | | | | +0.90% | | | | +2.61% | |
MSCI Emerging Markets Index (net) | | | +9.27% | | | | –2.05% | | | | +0.55% | | | | +2.25% | |
| | |
| |
| Portfolio profile | | |
| Oct. 31, 2016 | | |
| | |
Total net assets | | Number of holdings |
$37.2 million | | 96 |
| | |
Inception date | | |
June 23, 2010 | | |
Growth of $1,000,000
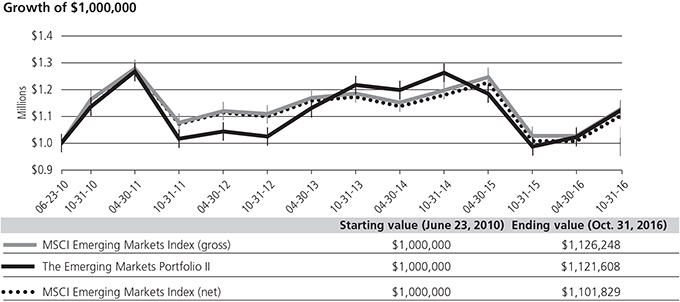
The performance graph assumes $1 million invested on June 23, 2010, and includes reinvestment of all distributions. The performance graph does not reflect the deduction of taxes the shareholder would pay on Portfolio distributions or redemptions of Portfolio shares.
Total return assumes reinvestment of dividends and capital gains, but does not reflect reductions for taxes. Returns and share values will fluctuate so that shares, when redeemed, may be worth more or less than their original cost.
24
The most recent prospectus disclosed the Portfolio’s total operating expenses as 1.35%. Management has contractually agreed to reimburse certain expenses and/or waive its management fees from Nov. 1, 2015, through Oct. 31, 2016,* in order to prevent total annual Portfolio operating expenses (with certain exclusions) from exceeding, in an aggregate amount, 1.20% of the Portfolio’s average daily net assets, as described in the most recent prospectus.
Expense limitations were in effect during the period shown. Performance would have been lower had the expense limitations not been in effect.
The MSCI Emerging Markets Index measures equity market performance across emerging market countries worldwide. Index “gross” return approximates the maximum possible dividend reinvestment. Index “net” return approximates the minimum possible dividend reinvestment, after deduction of withholding tax at the highest possible rate.
Index performance returns do not reflect any management fees, transaction costs, or expenses. Indices are unmanaged and one cannot invest directly in an index.
Investing involves risk, including the possible loss of principal.
Past performance is not a guarantee of future results.
International investments entail risks not ordinarily associated with U.S. investments including fluctuation in currency values, differences in accounting principles, or economic or political instability in other nations.
Investing in emerging markets can be riskier than investing in established foreign markets due to increased volatility and lower trading volume.
If and when the Portfolio invests in forward foreign currency contracts or uses other investments to hedge against currency risks, the Portfolio will be subject to special risks, including counterparty risk.
The Portfolio may invest in derivatives, which may involve additional expenses and are subject to risk, including the risk that an underlying security or securities index moves in the opposite direction from what the portfolio manager anticipated. A derivative transaction depends upon the counterparties’ ability to fulfill their contractual obligations.
*The contractual waiver period is from Feb. 27, 2015 through Feb. 28, 2017.
25
Disclosure of Portfolio expenses
For the six-month period from May 1, 2016 to October 31, 2016 (Unaudited)
As a shareholder of a Portfolio, you incur two types of costs: (1) transaction costs, including reimbursement fees on The Emerging Markets Portfolio; and (2) ongoing costs, including management fees and other Portfolio expenses. The following examples are intended to help you understand your ongoing costs (in dollars) of investing in a Portfolio and to compare these costs with the ongoing costs of investing in other mutual funds.
The examples are based on an investment of $1,000 invested at the beginning of the period and held for the entire six-month period from May 1, 2016 to Oct. 31, 2016.
Actual Expenses
The first section of the table shown, “Actual Portfolio return,” provides information about actual account values and actual expenses. You may use the information in this table, together with the amount you invested, to estimate the expenses that you paid over the period. Simply divide your account value by $1,000 (for example, an $8,600 account value divided by $1,000 = 8.6), then multiply the result by the number in the first section under the heading entitled “Expenses Paid During Period” to estimate the expenses you paid on your account during the period.
Hypothetical Example for Comparison Purposes
The second section of the table shown, “Hypothetical 5% return,” provides information about hypothetical account values and hypothetical expenses based on a Portfolio’s actual expense ratio and an assumed rate of return of 5% per year before expenses, which is not the Portfolio’s actual return. The hypothetical account values and expenses may not be used to estimate the actual ending account balance or expenses you paid for the period. You may use this information to compare the ongoing costs of investing in the Portfolio and other funds. To do so, compare this 5% hypothetical example with the 5% hypothetical examples that appear in the shareholder reports of other funds.
Please note that the expenses shown in the table are meant to highlight your ongoing costs only and do not reflect any transactional costs. Therefore, the second section of the table is useful in comparing ongoing costs only, and will not help you determine the relative total costs of owning different funds. In addition, if these transactional costs were included, your costs would have been higher. Certain of the Portfolios’ actual expenses shown in the table reflect fee waivers in effect. The expenses shown in the table assume reinvestment of all dividends and distributions.
In each case, “Expenses Paid During Period” are equal to the relevant Portfolio’s annualized expense ratio, multiplied by the average account value over the period, multiplied by 184/366 (to reflect the one-half year period).
Delaware Pooled® Trust
Expense Analysis of an Investment of $1,000
| | | | | | | | | | | | | | | | |
| | | Beginning
Account
Value
5/1/16 | | | Ending
Account
Value
10/31/16 | | | Annualized Expense
Ratio | | | Expenses
Paid
During
Period
5/1/16 to
10/31/16 | |
Actual Portfolio return† | |
The Large-Cap Value Equity Portfolio | | $ | 1,000.00 | | | $ | 1,035.30 | | | | 0.65% | | | | $3.33 | |
The High-Yield Bond Portfolio | | | 1,000.00 | | | | 1,063.40 | | | | 0.55% | | | | 2.85 | |
The Core Plus Fixed Income Portfolio | | | 1,000.00 | | | | 1,017.60 | | | | 0.45% | | | | 2.28 | |
The Labor Select International Equity Portfolio | | | 1,000.00 | | | | 993.80 | | | | 0.86% | | | | 4.31 | |
The Emerging Markets Portfolio | | | 1,000.00 | | | | 1,047.20 | | | | 1.19% | | | | 6.12 | |
The Emerging Markets Portfolio II | | | 1,000.00 | | | | 1,097.30 | | | | 1.20% | | | | 6.33 | |
Hypothetical 5% return (5% return before expenses) | |
The Large-Cap Value Equity Portfolio | | $ | 1,000.00 | | | $ | 1,021.87 | | | | 0.65% | | | $ | 3.30 | |
The High-Yield Bond Portfolio | | | 1,000.00 | | | | 1,022.37 | | | | 0.55% | | | | 2.80 | |
The Core Plus Fixed Income Portfolio | | | 1,000.00 | | | | 1,022.87 | | | | 0.45% | | | | 2.29 | |
The Labor Select International Equity Portfolio | | | 1,000.00 | | | | 1,020.81 | | | | 0.86% | | | | 4.37 | |
The Emerging Markets Portfolio | | | 1,000.00 | | | | 1,019.15 | | | | 1.19% | | | | 6.04 | |
The Emerging Markets Portfolio II | | | 1,000.00 | | | | 1,019.10 | | | | 1.20% | | | | 6.09 | |
†Because actual returns reflect only the most recent six-month period, the returns shown may differ significantly from fiscal year returns.
26
Security type / sector allocations
and top 10 equity holdings
Delaware Pooled® Trust — The Large-Cap Value Equity Portfolio
As of October 31, 2016 (Unaudited)
Sector designations may be different than the sector designations presented in other Portfolio materials. The sector designations may represent the investment manager’s internal sector classifications, which may result in the sector designations for one portfolio being different than another portfolio’s sector designations.
| | | | |
| Security type / sector | | Percentage of net assets | |
Common Stock | | | 95.71% | |
Consumer Discretionary | | | 2.64% | |
Consumer Staples | | | 12.22% | |
Energy | | | 13.67% | |
Financials | | | 13.08% | |
Healthcare | | | 20.44% | |
Industrials | | | 9.52% | |
Information Technology | | | 12.23% | |
Materials | | | 3.39% | |
Telecommunications | | | 5.43% | |
Utilities | | | 3.09% | |
Short-Term Investments | | | 4.13% | |
Total Value of Securities | | | 99.84% | |
Receivables and Other Assets Net of Liabilities | | | 0.16% | |
Total Net Assets | | | 100.00% | |
Holdings are for informational purposes only and are subject to change at any time. They are not a recommendation to buy, sell, or hold any security.
| | |
| Top 10 equity holdings | | Percentage
of net assets |
Bank of New York Mellon | | 3.54% |
BB&T | | 3.50% |
EI du Pont de Nemours & Co. | | 3.39% |
Cisco Systems | | 3.30% |
Intel | | 3.28% |
Northrop Grumman | | 3.25% |
ConocoPhillips | | 3.23% |
Halliburton | | 3.22% |
Archer-Daniels-Midland | | 3.15% |
Waste Management | | 3.15% |
Security type / sector allocations
Delaware Pooled® Trust — The High-Yield Bond Portfolio
As of October 31, 2016 (Unaudited)
Sector designations may be different than the sector designations presented in other Portfolio materials. The sector designations may represent the investment manager’s internal sector classifications, which may result in the sector designations for one portfolio being different than another portfolio’s sector designations.
| | | | |
| Security type / sector | | Percentage
of net assets | |
Convertible Bond | | | 0.20% | |
Corporate Bonds | | | 87.47% | |
Automobile | | | 0.55% | |
Banking | | | 3.45% | |
Basic Industry | | | 10.54% | |
Capital Goods | | | 6.05% | |
Consumer Cyclical | | | 6.10% | |
Consumer Non-Cyclical | | | 7.02% | |
Energy | | | 11.16% | |
Financials | | | 3.09% | |
Healthcare | | | 6.70% | |
Insurance | | | 1.78% | |
Media | | | 10.79% | |
Services | | | 4.52% | |
Technology & Electronics | | | 5.24% | |
Telecommunications | | | 6.69% | |
Utilities | | | 3.79% | |
Senior Secured Loans | | | 5.06% | |
Common Stock | | | 0.00% | |
Preferred Stock | | | 1.16% | |
Short-Term Investments | | | 6.42% | |
Total Value of Securities | | | 100.31% | |
Liabilities Net of Receivables and Other Assets | | | (0.31%) | |
Total Net Assets | | | 100.00% | |
28
Delaware Pooled® Trust — The Core Plus Fixed Income Portfolio
As of October 31, 2016 (Unaudited)
Sector designations may be different than the sector designations presented in other Portfolio materials. The sector designations may represent the investment manager’s internal sector classifications, which may result in the sector designations for one portfolio being different than another portfolio’s sector designations.
| | | | |
| Security type / sector | | Percentage of net assets | |
Agency Asset-Backed Security | | | 0.10% | |
Agency Collateralized Mortgage Obligations | | | 2.99% | |
Agency Commercial Mortgage-Backed Securities | | | 1.64% | |
Agency Mortgage-Backed Securities | | | 23.29% | |
Collateralized Debt Obligations | | | 2.21% | |
Convertible Bonds | | | 0.05% | |
Corporate Bonds | | | 45.96% | |
Banking | | | 10.28% | |
Basic Industry | | | 2.08% | |
Brokerage | | | 0.28% | |
Capital Goods | | | 2.31% | |
Communications | | | 3.81% | |
Consumer Cyclical | | | 3.57% | |
Consumer Non-Cyclical | | | 5.93% | |
Electric | | | 6.88% | |
Energy | | | 3.18% | |
Finance Companies | | | 1.35% | |
Insurance | | | 0.99% | |
Natural Gas | | | 0.26% | |
REITs | | | 1.77% | |
Services | | | 0.25% | |
Technology | | | 1.22% | |
Transportation | | | 1.80% | |
| | | | |
| Security type / sector | | Percentage of net assets | |
Municipal Bonds | | | 1.30% | |
Non-Agency Asset-Backed Securities | | | 4.76% | |
Non-Agency Collateralized Mortgage Obligations | | | 1.36% | |
Non-Agency Commercial Mortgage-Backed Securities | | | 5.00% | |
Regional Bonds | | | 0.73% | |
Senior Secured Loans | | | 3.60% | |
Sovereign Bonds | | | 0.45% | |
Supranational Bank | | | 0.19% | |
U.S. Treasury Obligations | | | 2.95% | |
Convertible Preferred Stock | | | 0.01% | |
Preferred Stock | | | 0.36% | |
Options Purchased | | | 0.02% | |
Short-Term Investments | | | 10.69% | |
Total Value of Securities | | | 107.66% | |
Liabilities Net of Receivables and Other Assets | | | (7.66% | ) |
Total Net Assets | | | 100.00% | |
Security type / country and sector allocations
Delaware Pooled® Trust — The Labor Select International Equity Portfolio
As of October 31, 2016 (Unaudited)
Sector designations may be different than the sector designations presented in other Portfolio materials. The sector designations may represent the investment manager’s or sub-advisor’s internal sector classifications, which may result in the sector designations for one portfolio being different than another portfolio’s sector designations.
| | | | |
| Security type / country | | Percentage
of net assets | |
| |
Common Stock | | | 98.55% | |
Australia | | | 1.34% | |
Denmark | | | 0.94% | |
France | | | 7.00% | |
Germany | | | 9.12% | |
Italy | | | 4.13% | |
Japan | | | 18.87% | |
Netherlands | | | 2.38% | |
Singapore | | | 6.96% | |
Spain | | | 5.73% | |
Sweden | | | 3.81% | |
Switzerland | | | 12.60% | |
United Kingdom | | | 25.67% | |
| |
Right | | | 0.01% | |
| |
Short-Term Investments | | | 0.75% | |
| |
Total Value of Securities | | | 99.31% | |
| |
Receivables and Other Assets Net of Liabilities | | | 0.69% | |
| |
Total Net Assets | | | 100.00% | |
| |
| | | | |
| Common stock by sector | | Percentage
of net assets | |
| |
Consumer Discretionary | | | 10.28% | |
Consumer Staples | | | 12.58% | |
Energy | | | 9.88% | |
Financials | | | 15.50% | |
Healthcare | | | 11.25% | |
Industrials | | | 9.47% | |
Information Technology | | | 8.65% | |
Materials | | | 2.95% | |
Real Estate | | | 0.90% | |
Telecommunication Services | | | 10.34% | |
Utilities | | | 6.75% | |
| |
Total | | | 98.55% | |
| |
30
Delaware Pooled® Trust — The Emerging Markets Portfolio
As of October 31, 2016 (Unaudited)
Sector designations may be different than the sector designations presented in other Portfolio materials. The sector designations may represent the investment manager’s or sub-advisor’s internal sector classifications, which may result in the sector designations for one portfolio being different than another portfolio’s sector designations.
| | | | |
| Security type / country | | Percentage of net assets | |
Common Stock | | | 96.18% | |
Brazil | | | 4.26% | |
Chile | | | 1.44% | |
China | | | 16.43% | |
India | | | 12.39% | |
Indonesia | | | 2.62% | |
Kazakhstan | | | 0.35% | |
Malaysia | | | 5.17% | |
Mexico | | | 5.30% | |
Peru | | | 1.79% | |
Philippines | | | 1.44% | |
Qatar | | | 2.63% | |
Republic of Korea | | | 9.03% | |
Romania | | | 0.33% | |
Russia | | | 2.87% | |
South Africa | | | 7.04% | |
Taiwan | | | 14.13% | |
Thailand | | | 2.82% | |
Turkey | | | 1.74% | |
United Arab Emirates | | | 1.47% | |
United Kingdom | | | 1.57% | |
United States | | | 1.36% | |
Preferred Stock | | | 2.44% | |
Short-Term Investments | | | 1.36% | |
Total Value of Securities | | | 99.98% | |
Receivables and Other Assets Net of Liabilities | | | 0.02% | |
Total Net Assets | | | 100.00% | |
| | | | |
| Common and preferred stock by sector | | Percentage
of net assets | |
Consumer Discretionary | | | 14.09% | |
Consumer Staples | | | 10.00% | |
Energy | | | 6.82% | |
Financials | | | 23.12% | |
Healthcare | | | 1.66% | |
Industrials | | | 8.29% | |
Information Technology | | | 15.99% | |
Materials | | | 2.25% | |
Telecommunication Service | | | 11.51% | |
Utilities | | | 4.89% | |
Total | | | 98.62% | |
Security type / country and sector allocations
Delaware Pooled® Trust — The Emerging Markets Portfolio II
As of October 31, 2016 (Unaudited)
Sector designations may be different than the sector designations presented in other Portfolio materials. The sector designations may represent the investment manager’s internal sector classifications, which may result in the sector designations for one portfolio being different than another portfolio’s sector designations.
| | | | |
| Security type / country | | Percentage of net assets | |
Common Stock | | | 100.80% | |
Argentina | | | 0.68% | |
Bahrain | | | 0.02% | |
Brazil | | | 17.74% | |
Chile | | | 1.14% | |
China/Hong Kong | | | 23.48% | |
Colombia | | | 0.61% | |
India | | | 9.80% | |
Indonesia | | | 1.68% | |
Malaysia | | | 0.25% | |
Mexico | | | 5.78% | |
Netherlands | | | 1.18% | |
Peru | | | 0.41% | |
Poland | | | 0.15% | |
Republic of Korea | | | 19.96% | |
Russia | | | 4.28% | |
South Africa | | | 1.09% | |
Taiwan | | | 6.49% | |
Thailand | | | 1.18% | |
Turkey | | | 2.71% | |
United States | | | 2.17% | |
Exchange-Traded Fund | | | 0.50% | |
Preferred Stock | | | 1.00% | |
Short-Term Investments | | | 0.70% | |
Total Value of Securities | | | 103.00% | |
Liabilities Net of Receivables and Other Assets | | | (3.00% | ) |
Total Net Assets | | | 100.00% | |
| | | | |
| Common and preferred stock by sector | | Percentage
of net assets | |
Consumer Discretionary | | | 10.27% | |
Consumer Staples | | | 13.68% | |
Energy | | | 12.84% | |
Financials | | | 11.97% | |
Industrials | | | 2.42% | |
Information Technology* | | | 31.52% | |
Materials | | | 6.67% | |
Telecommunication Services | | | 12.01% | |
Utilities | | | 0.42% | |
Total | | | 101.80% | |
| * | To monitor compliance with the Portfolio’s concentration guidelines as described in the Portfolio’s Prospectus and Statement of Additional Information, the Information Technology sector (as disclosed herein for financial reporting purposes) is subdivided into a variety of “industries” (in accordance with the requirements of the Investment Company Act of 1940 as amended). The Information Technology sector consisted of electronics, internet, and semiconductors. As of Oct. 31, 2016, such amounts, as a percentage of total net assets, were 1.31%, 18.29%, and 11.92%, respectively. The percentage in any such single industry will comply with the Portfolio’s concentration policy even if the percentages in the Information Technology sector for financial reporting purposes may exceed 25%. |
32
Schedules of investments
Delaware Pooled® Trust — The Large-Cap Value Equity Portfolio
October 31, 2016
| | | | | | | | |
| | | Number of
shares | | | Value (U.S. $) | |
| |
Common Stock – 95.71% | | | | | |
| |
Consumer Discretionary – 2.64% | | | | | |
Lowe’s | | | 86,000 | | | $ | 5,731,900 | |
| | | | | | | | |
| | |
| | | | | | | 5,731,900 | |
| | | | | | | | |
Consumer Staples – 12.22% | | | | | |
Archer-Daniels-Midland | | | 156,900 | | | | 6,836,133 | |
CVS Health | | | 74,800 | | | | 6,290,680 | |
Kraft Heinz | | | 75,733 | | | | 6,736,450 | |
Mondelez International | | | 148,200 | | | | 6,660,108 | |
| | | | | | | | |
| | |
| | | | | | | 26,523,371 | |
| | | | | | | | |
Energy – 13.67% | | | | | | | | |
Chevron | | | 65,200 | | | | 6,829,700 | |
ConocoPhillips | | | 161,600 | | | | 7,021,520 | |
Halliburton | | | 151,800 | | | | 6,982,800 | |
Marathon Oil | | | 175,000 | | | | 2,306,500 | |
Occidental Petroleum | | | 89,800 | | | | 6,547,318 | |
| | | | | | | | |
| | |
| | | | | | | 29,687,838 | |
| | | | | | | | |
Financials – 13.08% | | | | | | | | |
Allstate | | | 98,100 | | | | 6,660,990 | |
Bank of New York Mellon | | | 177,600 | | | | 7,684,752 | |
BB&T | | | 194,100 | | | | 7,608,720 | |
Marsh & McLennan | | | 101,800 | | | | 6,453,102 | |
| | | | | | | | |
| | |
| | | | | | | 28,407,564 | |
| | | | | | | | |
Healthcare – 20.44% | | | | | | | | |
Abbott Laboratories | | | 160,100 | | | | 6,282,324 | |
Cardinal Health | | | 85,400 | | | | 5,866,126 | |
Express Scripts Holding † | | | 92,610 | | | | 6,241,914 | |
Johnson & Johnson | | | 55,600 | | | | 6,449,044 | |
Merck & Co. | | | 115,400 | | | | 6,776,288 | |
Pfizer | | | 189,211 | | | | 5,999,881 | |
Quest Diagnostics | | | 83,100 | | | | 6,767,664 | |
| | | | | | | | |
| | |
| | | | | | | 44,383,241 | |
| | | | | | | | |
Industrials – 9.52% | | | | | | | | |
Northrop Grumman | | | 30,800 | | | | 7,053,200 | |
Raytheon | | | 49,600 | | | | 6,775,856 | |
Waste Management | | | 104,100 | | | | 6,835,206 | |
| | | | | | | | |
| | |
| | | | | | | 20,664,262 | |
| | | | | | | | |
Information Technology – 12.23% | | | | | |
CA @ | | | 203,936 | | | | 6,268,993 | |
Cisco Systems | | | 233,600 | | | | 7,166,848 | |
Intel | | | 204,100 | | | | 7,116,967 | |
Xerox | | | 615,100 | | | | 6,009,527 | |
| | | | | | | | |
| | |
| | | | | | | 26,562,335 | |
| | | | | | | | |
| | | | | | | | |
| | | Number of shares | | | Value (U.S. $) | |
| |
Common Stock (continued) | | | | | |
| |
Materials – 3.39% | | | | | | | | |
EI du Pont de Nemours & Co. | | | 106,900 | | | $ | 7,353,651 | |
| | | | | | | | |
| | |
| | | | | | | 7,353,651 | |
| | | | | | | | |
Telecommunications – 5.43% | | | | | |
AT&T | | | 160,400 | | | | 5,901,116 | |
Verizon Communications | | | 122,300 | | | | 5,882,630 | |
| | | | | | | | |
| | |
| | | | | | | 11,783,746 | |
| | | | | | | | |
Utilities – 3.09% | | | | | | | | |
Edison International | | | 91,400 | | | | 6,716,072 | |
| | | | | | | | |
| | |
| | | | | | | 6,716,072 | |
| | | | | | | | |
| |
Total Common Stock
(cost $198,674,675) | | | | 207,813,980 | |
| | | | | | | | |
| | |
| | | Principal
amount° | | | | |
| |
Short-Term Investments – 4.13% | | | | | |
| |
Discount Notes – 1.69%≠ | | | | | |
Federal Home Loan Bank | | | | | |
0.285% 11/10/16 | | | 539,475 | | | | 539,449 | |
0.285% 12/21/16 | | | 1,870,582 | | | | 1,870,062 | |
0.30% 11/3/16 | | | 410,474 | | | | 410,470 | |
0.31% 1/25/17 | | | 690,305 | | | | 689,799 | |
0.315% 11/1/16 | | | 161,692 | | | | 161,692 | |
| | | | | | | | |
| | | | | | | 3,671,472 | |
| | | | | | | | |
Repurchase Agreements – 1.56% | | | | | |
Bank of America Merrill Lynch
0.25%, dated 10/31/16, to be repurchased on 11/1/16, repurchase price $930,582 (collateralized by U.S. government obligations 2.25% 11/15/24; market value $949,188) | | | 930,576 | | | | 930,576 | |
Bank of Montreal
0.27%, dated 10/31/16, to be repurchased on 11/1/16, repurchase price $310,194 (collateralized by U.S. government obligations 0.125%–3.875% 11/30/17–2/15/45; market value $316,396) | | | 310,192 | | | | 310,192 | |
Schedules of investments
Delaware Pooled® Trust — The Large-Cap Value Equity Portfolio
| | | | | | | | |
| | | Principal
amount° | | | Value (U.S. $) | |
| |
Short-Term Investments (continued) | | | | | |
| |
Repurchase Agreements (continued) | | | | | |
BNP Paribas
0.32%, dated 10/31/16, to be repurchased on 11/1/16, repurchase price $2,150,251 (collateralized by U.S. government obligations 0.00%–4.75% 4/30/17–2/15/45; market value $2,193,237) | | | 2,150,232 | | | $ | 2,150,232 | |
| | | | | | | | |
| | |
| | | | | | | 3,391,000 | |
| | | | | | | | |
U.S. Treasury Obligation – 0.88%≠ | | | | | |
U.S. Treasury Bill
0.228% 11/3/16 | | | 1,911,667 | | | | 1,911,655 | |
| | | | | | | | |
| | |
| | | | | | | 1,911,655 | |
| | | | | | | | |
Total Short-Term Investments
(cost $8,973,877) | | | | 8,974,127 | |
| | | | | | | | |
Total Value of
Securities – 99.84%
(cost $207,648,552) | | | | | | $ | 216,788,107 | |
| | | | | | | | |
| @ | Illiquid security. At Oct. 31, 2016, the aggregate value of illiquid securities was $6,268,993, which represents 2.89% of the Portfolio’s net assets. See Note 11 in “Notes to financial statements.” |
| ≠ | The rate shown is the effective yield at the time of purchase. |
| ° | Principal amount shown is stated in U.S. dollars unless noted that the security is denominated in another currency. |
| † | Non-income-producing security. |
See accompanying notes, which are an integral part of the financial statements.
34
Delaware Pooled® Trust — The High-Yield Bond Portfolio
October 31, 2016
| | | | | | | | |
| | | Principal amount° | | | Value (U.S. $) | |
| |
Convertible Bond – 0.20% | | | | | | | | |
| |
Clearwire Communications 144A 8.25% exercise price $7.08, maturity date 12/1/40 # | | | 456,000 | | | $ | 478,800 | |
| | | | | | | | |
| | |
Total Convertible Bond
(cost $464,523) | | | | | | | 478,800 | |
| | | | | | | | |
|
| |
Corporate Bonds – 87.47% | | | | | | | | |
| |
Automobile – 0.55% | | | | | | | | |
Gates Global 144A
6.00% 7/15/22 # | | | 615,000 | | | | 584,250 | |
Group 1 Automotive 144A 5.25% 12/15/23 # | | | 740,000 | | | | 740,000 | |
| | | | | | | | |
| | |
| | | | | | | 1,324,250 | |
| | | | | | | | |
Banking – 3.45% | | | | | | | | |
Credit Suisse Group 144A 6.25% 12/29/49 #● | | | 1,300,000 | | | | 1,257,750 | |
JPMorgan Chase & Co.
6.75% 8/29/49 ● | | | 2,045,000 | | | | 2,272,506 | |
Lloyds Banking Group
7.50% 4/30/49 ● | | | 1,215,000 | | | | 1,254,488 | |
Popular 7.00% 7/1/19 | | | 1,638,000 | | | | 1,705,568 | |
Royal Bank of Scotland Group 8.625% 12/29/49 ● | | | 725,000 | | | | 723,187 | |
UBS Group 6.875% 12/29/49 ● | | | 1,145,000 | | | | 1,136,186 | |
| | | | | | | | |
| | |
| | | | | | | 8,349,685 | |
| | | | | | | | |
Basic Industry – 10.54% | | | | | | | | |
Aercap Global Aviation Trust 144A 6.50% 6/15/45 #● | | | 945,000 | | | | 978,075 | |
AK Steel 7.625% 5/15/20 | | | 722,000 | | | | 729,220 | |
Alcoa Nederland Holding | | | | | | | | |
144A 6.75% 9/30/24 # | | | 620,000 | | | | 643,250 | |
144A 7.00% 9/30/26 # | | | 510,000 | | | | 526,473 | |
Ball 5.25% 7/1/25 | | | 560,000 | | | | 597,520 | |
BMC East 144A
5.50% 10/1/24 # | | | 730,000 | | | | 742,775 | |
Boise Cascade 144A
5.625% 9/1/24 # | | | 1,215,000 | | | | 1,234,744 | |
Builders FirstSource | | | | | | | | |
144A 5.625% 9/1/24 # | | | 600,000 | | | | 608,250 | |
144A 10.75% 8/15/23 # | | | 1,580,000 | | | | 1,824,900 | |
Cemex 144A 7.75% 4/16/26 # | | | 200,000 | | | | 224,620 | |
Cemex Finance 144A
6.00% 4/1/24 # | | | 785,000 | | | | 814,438 | |
| | | | | | | | |
| | | Principal amount° | | | Value (U.S. $) | |
| |
Corporate Bonds (continued) | | | | | | | | |
| |
Basic Industry (continued) | | | | | | | | |
Chemours | | | | | | | | |
6.625% 5/15/23 | | | 325,000 | | | $ | 316,875 | |
7.00% 5/15/25 | | | 430,000 | | | | 420,325 | |
FMG Resources August 2006 | | | | | | | | |
144A 6.875% 4/1/22 # | | | 1,870,000 | | | | 1,935,824 | |
144A 9.75% 3/1/22 # | | | 215,000 | | | | 250,475 | |
Freeport-McMoRan
4.55% 11/14/24 | | | 780,000 | | | | 719,550 | |
James Hardie International Finance 144A
5.875% 2/15/23 # | | | 1,115,000 | | | | 1,181,900 | |
Joseph T Ryerson & Son 144A 11.00% 5/15/22 # | | | 470,000 | | | | 514,650 | |
Kraton Polymers 144A
10.50% 4/15/23 # | | | 1,105,000 | | | | 1,243,125 | |
NCI Building Systems 144A 8.25% 1/15/23 # | | | 975,000 | | | | 1,071,281 | |
New Gold | | | | | | | | |
144A 6.25% 11/15/22 # | | | 527,000 | | | | 534,905 | |
144A 7.00% 4/15/20 # | | | 370,000 | | | | 382,950 | |
NOVA Chemicals 144A
5.00% 5/1/25 # | | | 810,000 | | | | 815,063 | |
PQ 144A 6.75% 11/15/22 # | | | 1,145,000 | | | | 1,238,031 | |
Rayonier AM Products 144A 5.50% 6/1/24 # | | | 735,000 | | | | 678,037 | |
Steel Dynamics 5.50% 10/1/24 | | | 685,000 | | | | 724,387 | |
Summit Materials | | | | | | | | |
6.125% 7/15/23 | | | 1,150,000 | | | | 1,184,500 | |
144A 8.50% 4/15/22 # | | | 400,000 | | | | 442,000 | |
U.S. Concrete 6.375% 6/1/24 | | | 1,150,000 | | | | 1,198,875 | |
Zekelman Industries 144A 9.875% 6/15/23 # | | | 1,670,000 | | | | 1,761,850 | |
| | | | | | | | |
| | |
| | | | | | | 25,538,868 | |
| | | | | | | | |
Capital Goods – 6.05% | | | | | | | | |
Ardagh Packaging Finance 144A 7.25% 5/15/24 # | | | 1,115,000 | | | | 1,181,900 | |
BWAY Holding 144A
9.125% 8/15/21 # | | | 1,477,000 | | | | 1,550,850 | |
Gardner Denver 144A
6.875% 8/15/21 # | | | 2,024,000 | | | | 1,993,640 | |
KLX 144A 5.875% 12/1/22 # | | | 1,100,000 | | | | 1,124,970 | |
Novelis | | | | | | | | |
144A 5.875% 9/30/26 # | | | 200,000 | | | | 203,000 | |
144A 6.25% 8/15/24 # | | | 1,490,000 | | | | 1,553,325 | |
Plastipak Holdings 144A
6.50% 10/1/21 # | | | 1,175,000 | | | | 1,222,000 | |
Schedules of investments
Delaware Pooled® Trust — The High-Yield Bond Portfolio
| | | | | | | | |
| | | Principal amount° | | | Value (U.S. $) | |
| |
Corporate Bonds (continued) | | | | | |
| |
Capital Goods (continued) | | | | | |
Reynolds Group Issuer
8.25% 2/15/21 | | | 1,495,000 | | | $ | 1,563,023 | |
Signode Industrial Group 144A
6.375% 5/1/22 # | | | 1,080,000 | | | | 1,096,200 | |
StandardAero Aviation Holdings 144A
10.00% 7/15/23 # | | | 1,190,000 | | | | 1,267,350 | |
TransDigm 144A
6.375% 6/15/26 # | | | 1,860,000 | | | | 1,911,336 | |
| | | | | | | | |
| | |
| | | | | | | 14,667,594 | |
| | | | | | | | |
Consumer Cyclical – 6.10% | | | | | |
American Builders & Contractors Supply
144A 5.75% 12/15/23 # | | | 630,000 | | | | 658,350 | |
American Tire Distributors 144A 10.25% 3/1/22 # | | | 1,310,000 | | | | 1,210,938 | |
Beacon Roofing Supply
6.375% 10/1/23 | | | 835,000 | | | | 897,625 | |
Boyd Gaming 144A
6.375% 4/1/26 # | | | 1,925,000 | | | | 2,069,375 | |
Golden Nugget Escrow 144A 8.50% 12/1/21 # | | | 345,000 | | | | 363,975 | |
HD Supply 144A
5.75% 4/15/24 # | | | 590,000 | | | | 620,975 | |
JC Penney
8.125% 10/1/19 | | | 1,120,000 | | | | 1,225,000 | |
L Brands | | | | | | | | |
6.75% 7/1/36 | | | 570,000 | | | | 607,905 | |
6.875% 11/1/35 | | | 1,310,000 | | | | 1,395,150 | |
M/I Homes
6.75% 1/15/21 | | | 1,165,000 | | | | 1,231,987 | |
MGM Resorts International 4.625% 9/1/26 | | | 440,000 | | | | 425,700 | |
Mohegan Tribal Gaming Authority 144A
7.875% 10/15/24 # | | | 1,740,000 | | | | 1,770,450 | |
Neiman Marcus Group
144A 8.00% 10/15/21 # | | | 645,000 | | | | 535,350 | |
Penske Automotive Group
5.50% 5/15/26 | | | 1,105,000 | | | | 1,099,475 | |
Scientific Games International
10.00% 12/1/22 | | | 720,000 | | | | 669,600 | |
| | | | | | | | |
| | |
| | | | | | | 14,781,855 | |
| | | | | | | | |
Consumer Non-Cyclical – 7.02% | | | | | |
Albertsons | | | | | | | | |
144A 5.75% 3/15/25 # | | | 715,000 | | | | 707,628 | |
144A 6.625% 6/15/24 # | | | 1,115,000 | | | | 1,159,600 | |
Dean Foods 144A
6.50% 3/15/23 # | | | 855,000 | | | | 912,713 | |
| | | | | | | | |
| | | Principal amount° | | | Value (U.S. $) | |
| |
Corporate Bonds (continued) | | | | | |
| |
Consumer Non-Cyclical (continued) | | | | | |
Herc Rentals | | | | | | | | |
144A 7.50% 6/1/22 # | | | 320,000 | | | $ | 320,800 | |
144A 7.75% 6/1/24 # | | | 855,000 | | | | 861,413 | |
JBS USA 144A
5.75% 6/15/25 # | | | 1,230,000 | | | | 1,211,550 | |
Kronos Acquisition Holdings 144A
9.00% 8/15/23 # | | | 1,925,000 | | | | 1,982,750 | |
Live Nation Entertainment 144A 4.875% 11/1/24 # | | | 1,162,000 | | | | 1,162,000 | |
NBTY 144A
7.625% 5/15/21 # | | | 1,715,000 | | | | 1,680,700 | |
NES Rentals Holdings 144A 7.875% 5/1/18 # | | | 680,000 | | | | 669,800 | |
Post Holdings 144A
7.75% 3/15/24 # | | | 950,000 | | | | 1,054,690 | |
Prestige Brands 144A
5.375% 12/15/21 # | | | 210,000 | | | | 218,925 | |
Prime Security Services Borrower 144A
9.25% 5/15/23 # | | | 2,345,000 | | | | 2,497,425 | |
Revlon Consumer Products 144A
6.25% 8/1/24 # | | | 640,000 | | | | 660,800 | |
Team Health 144A
7.25% 12/15/23 # | | | 810,000 | | | | 918,337 | |
US Foods 144A
5.875% 6/15/24 # | | | 955,000 | | | | 997,975 | |
| | | | | | | | |
| | |
| | | | | | | 17,017,106 | |
| | | | | | | | |
Energy – 11.16% | | | | | | | | |
Antero Resources
5.625% 6/1/23 | | | 1,766,000 | | | | 1,810,150 | |
Baytex Energy 144A
5.625% 6/1/24 # | | | 985,000 | | | | 797,850 | |
Cheniere Corpus Christi Holdings 144A
7.00% 6/30/24 # | | | 545,000 | | | | 580,425 | |
Energy Transfer Equity
7.50% 10/15/20 | | | 705,000 | | | | 771,975 | |
Freeport-McMoran Oil & Gas | | | | | |
6.50% 11/15/20 | | | 1,340,000 | | | | 1,375,175 | |
6.875% 2/15/23 | | | 850,000 | | | | 886,125 | |
Genesis Energy | | | | | | | | |
5.75% 2/15/21 | | | 665,000 | | | | 666,663 | |
6.00% 5/15/23 | | | 475,000 | | | | 478,563 | |
6.75% 8/1/22 | | | 710,000 | | | | 733,075 | |
Gulfport Energy 144A 6.00% 10/15/24 # | | | 1,230,000 | | | | 1,254,600 | |
Hilcorp Energy I | | | | | | | | |
144A 5.00% 12/1/24 # | | | 595,000 | | | | 583,100 | |
144A 5.75% 10/1/25 # | | | 554,000 | | | | 558,155 | |
36
| | | | | | | | |
| | | Principal amount° | | | Value (U.S. $) | |
| |
Corporate Bonds (continued) | | | | | |
| |
Energy (continued) | | | | | | | | |
Holly Energy Partners 144A 6.00% 8/1/24 # | | | 640,000 | | | $ | 668,800 | |
Laredo Petroleum
6.25% 3/15/23 | | | 1,980,000 | | | | 1,999,800 | |
Murphy Oil
6.875% 8/15/24 | | | 1,590,000 | | | | 1,679,377 | |
Murphy Oil USA
6.00% 8/15/23 | | | 990,000 | | | | 1,046,925 | |
Noble Holding International
5.25% 3/16/18 | | | 600,000 | | | | 597,378 | |
NuStar Logistics
6.75% 2/1/21 | | | 1,075,000 | | | | 1,174,437 | |
Oasis Petroleum
6.875% 3/15/22 | | | 1,235,000 | | | | 1,228,825 | |
QEP Resources
5.25% 5/1/23 | | | 1,195,000 | | | | 1,180,063 | |
Sabine Pass Liquefaction 144A
5.00% 3/15/27 # | | | 545,000 | | | | 555,900 | |
Southwestern Energy
6.70% 1/23/25 | | | 1,215,000 | | | | 1,163,362 | |
Targa Resources Partners | | | | | | | | |
144A 5.375% 2/1/27 # | | | 1,220,000 | | | | 1,223,050 | |
6.75% 3/15/24 | | | 1,075,000 | | | | 1,155,625 | |
Tesoro Logistics
6.375% 5/1/24 | | | 870,000 | | | | 941,775 | |
Transocean
5.55% 10/15/22 | | | 1,530,000 | | | | 1,315,800 | |
WPX Energy
7.50% 8/1/20 | | | 575,000 | | | | 608,781 | |
| | | | | | | | |
| | |
| | | | | | | 27,035,754 | |
| | | | | | | | |
Financials – 3.09% | | | | | | | | |
Ally Financial
5.75% 11/20/25 | | | 1,660,000 | | | | 1,705,650 | |
Communications Sales & Leasing | | | | | | | | |
144A 6.00% 4/15/23 # | | | 485,000 | | | | 504,400 | |
8.25% 10/15/23 | | | 520,000 | | | | 551,200 | |
Double Eagle Acquisition Sub 144A
7.50% 10/1/24 # | | | 650,000 | | | | 671,125 | |
E*TRADE Financial
5.875% 12/29/49 ● | | | 1,135,000 | | | | 1,178,981 | |
ESH Hospitality 144A
5.25% 5/1/25 # | | | 1,690,000 | | | | 1,677,325 | |
Iron Mountain US Holdings 144A
5.375% 6/1/26 # | | | 1,190,000 | | | | 1,207,850 | |
| | | | | | | | |
| | |
| | | | | | | 7,496,531 | |
| | | | | | | | |
Healthcare – 6.70% | | | | | | | | |
DaVita | | | | | | | | |
5.00% 5/1/25 | | | 1,265,000 | | | | 1,223,888 | |
5.125% 7/15/24 | | | 475,000 | | | | 465,500 | |
| | | | | | | | |
| | | Principal amount° | | | Value (U.S. $) | |
| |
Corporate Bonds (continued) | | | | | |
| |
Healthcare (continued) | | | | | | | | |
HCA | | | | | | | | |
5.375% 2/1/25 | | | 2,250,000 | | | $ | 2,299,387 | |
7.58% 9/15/25 | | | 500,000 | | | | 560,000 | |
HealthSouth | | | | | | | | |
5.75% 11/1/24 | | | 1,115,000 | | | | 1,155,419 | |
5.75% 9/15/25 | | | 680,000 | | | | 707,200 | |
Hill-Rom Holdings 144A 5.75% 9/1/23 # | | | 1,205,000 | | | | 1,271,275 | |
IASIS Healthcare
8.375% 5/15/19 | | | 1,585,000 | | | | 1,517,637 | |
Immucor
11.125% 8/15/19 | | | 245,000 | | | | 231,525 | |
Mallinckrodt International Finance | | | | | | | | |
4.75% 4/15/23 | | | 650,000 | | | | 569,563 | |
144A 5.50% 4/15/25 # | | | 340,000 | | | | 316,200 | |
144A 5.625% 10/15/23 # | | | 505,000 | | | | 477,225 | |
MPH Acquisition Holdings 144A
7.125% 6/1/24 # | | | 1,625,000 | | | | 1,742,650 | |
Tenet Healthcare
8.125% 4/1/22 | | | 1,650,000 | | | | 1,621,125 | |
Valeant Pharmaceuticals International | | | | | | | | |
144A 5.375% 3/15/20 # | | | 705,000 | | | | 613,350 | |
144A 6.125% 4/15/25 # | | | 515,000 | | | | 408,137 | |
144A 6.75% 8/15/18 # | | | 1,065,000 | | | | 1,044,765 | |
| | | | | | | | |
| | |
| | | | | | | 16,224,846 | |
| | | | | | | | |
Insurance – 1.78% | | | | | | | | |
HUB International | | | | | | | | |
144A 7.875% 10/1/21 # | | | 1,835,000 | | | | 1,880,324 | |
144A 9.25% 2/15/21 # | | | 325,000 | | | | 338,000 | |
USI 144A 7.75% 1/15/21 # | | | 1,235,000 | | | | 1,253,525 | |
XLIT 6.50% 12/29/49 ● | | | 1,090,000 | | | | 838,619 | |
| | | | | | | | |
| | |
| | | | | | | 4,310,468 | |
| | | | | | | | |
Media – 10.79% | | | | | | | | |
Altice Luxembourg 144A
7.75% 5/15/22 # | | | 965,000 | | | | 1,010,234 | |
CCO Holdings | | | | | | | | |
144A 5.375% 5/1/25 # | | | 950,000 | | | | 978,500 | |
144A 5.50% 5/1/26 # | | | 115,000 | | | | 118,091 | |
144A 5.75% 2/15/26 # | | | 1,235,000 | | | | 1,289,803 | |
Cequel Communications Holdings I 144A
7.75% 7/15/25 # | | | 1,055,000 | | | | 1,134,125 | |
Columbus Cable Barbados 144A 7.375% 3/30/21 # | | | 495,000 | | | | 531,506 | |
Schedules of investments
Delaware Pooled® Trust — The High-Yield Bond Portfolio
| | | | | | | | |
| | | Principal amount° | | | Value (U.S. $) | |
| |
Corporate Bonds (continued) | | | | | | | | |
| |
Media (continued) | | | | | | | | |
CSC Holdings | | | | | | | | |
144A 5.50% 4/15/27 # | | | 720,000 | | | $ | 732,150 | |
144A 10.875% 10/15/25 # | | | 1,490,000 | | | | 1,717,225 | |
DISH DBS | | | | | | | | |
5.875% 11/15/24 | | | 316,000 | | | | 319,357 | |
7.75% 7/1/26 | | | 1,307,000 | | | | 1,438,523 | |
Gray Television 144A
5.875% 7/15/26 # | | | 1,755,000 | | | | 1,750,613 | |
Lamar Media
5.75% 2/1/26 | | | 1,040,000 | | | | 1,117,376 | |
Midcontinent Communications & Midcontinent Finance 144A 6.875% 8/15/23 # | | | 680,000 | | | | 727,600 | |
Nexstar Escrow 144A
5.625% 8/1/24 # | | | 1,675,000 | | | | 1,666,625 | |
RCN Telecom Services 144A 8.50% 8/15/20 # | | | 715,000 | | | | 762,816 | |
SFR Group 144A
7.375% 5/1/26 # | | | 2,640,000 | | | | 2,669,700 | |
Sinclair Television Group 144A 5.125% 2/15/27 # | | | 1,255,000 | | | | 1,204,800 | |
Sirius XM Radio 144A
5.375% 4/15/25 # | | | 1,080,000 | | | | 1,104,192 | |
Tribune Media 5.875% 7/15/22 | | | 1,210,000 | | | | 1,216,050 | |
Unitymedia 144A 6.125% 1/15/25 # | | | 1,135,000 | | | | 1,188,913 | |
VTR Finance 144A
6.875% 1/15/24 # | | | 1,570,000 | | | | 1,646,538 | |
WideOpenWest Finance 10.25% 7/15/19 | | | 1,310,000 | | | | 1,378,775 | |
Ziggo Bond Finance 144A 6.00% 1/15/27 # | | | 440,000 | | | | 433,125 | |
| | | | | | | | |
| | |
| | | | | | | 26,136,637 | |
| | | | | | | | |
Services – 4.52% | | | | | | | | |
Advanced Disposal Services 144A 5.625% 11/15/24 # | | | 1,230,000 | | | | 1,239,225 | |
Air Medical Merger Sub 144A 6.375% 5/15/23 # | | | 1,760,000 | | | | 1,685,200 | |
Brinker International 144A 5.00% 10/1/24 # | | | 1,135,000 | | | | 1,157,700 | |
GEO Group | | | | | | | | |
5.125% 4/1/23 | | | 265,000 | | | | 232,206 | |
5.875% 10/15/24 | | | 610,000 | | | | 532,225 | |
6.00% 4/15/26 | | | 805,000 | | | | 698,337 | |
GFL Environmental 144A 9.875% 2/1/21 # | | | 740,000 | | | | 814,000 | |
| | | | | | | | |
| | | Principal amount° | | | Value (U.S. $) | |
| |
Corporate Bonds (continued) | | | | | | | | |
| |
Services (continued) | | | | | | | | |
Landry’s 144A
6.75% 10/15/24 # | | | 810,000 | | | $ | 828,225 | |
United Rentals North America | | | | | | | | |
5.50% 7/15/25 | | | 545,000 | | | | 553,856 | |
5.50% 5/15/27 | | | 1,242,000 | | | | 1,237,343 | |
Vander Intermediate Holding II 144A PIK 10.50%
2/1/19 # | | | 352,587 | | | | 187,753 | |
XPO Logistics | | | | | | | | |
144A 6.125% 9/1/23 # | | | 755,000 | | | | 778,594 | |
144A 6.50% 6/15/22 # | | | 960,000 | | | | 1,000,800 | |
| | | | | | | | |
| | |
| | | | | | | 10,945,464 | |
| | | | | | | | |
Technology & Electronics – 5.24% | | | | | |
CommScope 144A
5.50% 6/15/24 # | | | 430,000 | | | | 452,037 | |
CommScope Technologies Finance 144A
6.00% 6/15/25 # | | | 690,000 | | | | 727,950 | |
Diamond 1 Finance 144A 8.10% 7/15/36 # | | | 875,000 | | | | 1,047,284 | |
Entegris 144A 6.00% 4/1/22 # | | | 1,005,000 | | | | 1,043,944 | |
First Data 144A
7.00% 12/1/23 # | | | 2,875,000 | | | | 3,018,750 | |
Infor Software Parent 144A PIK 7.125% 5/1/21 #T | | | 810,000 | | | | 824,175 | |
Infor US 6.50% 5/15/22 | | | 1,030,000 | | | | 1,069,912 | |
Micron Technology 144A
7.50% 9/15/23 # | | | 530,000 | | | | 586,313 | |
Microsemi 144A
9.125% 4/15/23 # | | | 1,240,000 | | | | 1,435,300 | |
Sensata Technologies UK Financing 144A
6.25% 2/15/26 # | | | 1,140,000 | | | | 1,239,750 | |
Solera 144A 10.50% 3/1/24 # | | | 725,000 | | | | 814,045 | |
Western Digital 144A
10.50% 4/1/24 # | | | 390,000 | | | | 451,425 | |
| | | | | | | | |
| | |
| | | | | | | 12,710,885 | |
| | | | | | | | |
Telecommunications – 6.69% | | | | | |
CenturyLink | | | | | | | | |
6.75% 12/1/23 | | | 1,140,000 | | | | 1,175,625 | |
7.50% 4/1/24 | | | 290,000 | | | | 302,687 | |
Cogent Communications Finance 144A
5.625% 4/15/21 # | | | 860,000 | | | | 866,450 | |
38
| | | | | | | | |
| | | Principal amount° | | | Value (U.S. $) | |
| |
Corporate Bonds (continued) | |
| |
Telecommunications (continued) | | | | | |
Cogent Communications Group 144A
5.375% 3/1/22 # | | | 340,000 | | | $ | 351,050 | |
Digicel 144A
6.00% 4/15/21 # | | | 1,355,000 | | | | 1,219,093 | |
Frontier Communications | | | | | | | | |
10.50% 9/15/22 | | | 1,060,000 | | | | 1,106,375 | |
11.00% 9/15/25 | | | 35,000 | | | | 35,968 | |
Level 3 Financing 5.375% 5/1/25 | | | 1,070,000 | | | | 1,088,725 | |
Sable International Finance 144A
6.875% 8/1/22 # | | | 585,000 | | | | 608,400 | |
Sprint | | | | | | | | |
7.125% 6/15/24 | | | 1,655,000 | | | | 1,559,837 | |
7.875% 9/15/23 | | | 430,000 | | | | 426,775 | |
Sprint Communications | | | | | | | | |
144A 7.00% 3/1/20 # | | | 535,000 | | | | 583,150 | |
7.00% 8/15/20 | | | 865,000 | | | | 901,763 | |
T-Mobile USA | | | | | | | | |
6.00% 3/1/23 | | | 645,000 | | | | 680,475 | |
6.00% 4/15/24 | | | 245,000 | | | | 261,231 | |
6.375% 3/1/25 | | | 790,000 | | | | 848,760 | |
6.50% 1/15/26 | | | 693,000 | | | | 761,399 | |
Virgin Media Secured Finance 144A
5.25% 1/15/26 # | | | 1,215,000 | | | | 1,208,561 | |
Wind Acquisition Finance 144A 7.375% 4/23/21 # | | | 970,000 | | | | 999,100 | |
Zayo Group
6.375% 5/15/25 | | | 1,150,000 | | | | 1,215,056 | |
| | | | | | | | |
| | |
| | | | | | | 16,200,480 | |
| | | | | | | | |
Utilities – 3.79% | | | | | | | | |
AES | | | | | | | | |
5.50% 4/15/25 | | | 1,055,000 | | | | 1,070,825 | |
6.00% 5/15/26 | | | 60,000 | | | | 61,875 | |
AmeriGas Partners 5.875% 8/20/26 | | | 1,730,000 | | | | 1,820,825 | |
Calpine | | | | | | | | |
5.50% 2/1/24 | | | 385,000 | | | | 377,300 | |
5.75% 1/15/25 | | | 1,570,000 | | | | 1,532,713 | |
| | | | | | | | |
| | | Principal amount° | | | Value (U.S. $) | |
| |
Corporate Bonds (continued) | |
| |
Utilities (continued) | |
Dynegy | | | | | | | | |
7.625% 11/1/24 | | | 1,500,000 | | | $ | 1,443,750 | |
144A 8.00% 1/15/25 # | | | 955,000 | | | | 923,963 | |
Emera 6.75% 6/15/76 ● | | | 1,115,000 | | | | 1,234,325 | |
Enel 144A
8.75% 9/24/73 #● | | | 620,000 | | | | 725,090 | |
| | | | | | | | |
| | |
| | | | | | | 9,190,666 | |
| | | | | | | | |
| |
Total Corporate Bonds
(cost $205,847,332) | | | | 211,931,089 | |
| | | | | | | | |
|
| |
Senior Secured Loans – 5.06%« | | | | | |
| |
Accudyne Industries Borrower 1st Lien 4.00% 12/13/19 | | | 921,934 | | | | 852,597 | |
Amaya Holdings 1st Lien 5.00% 8/1/21 | | | 1,151,256 | | | | 1,152,245 | |
Applied Systems 2nd Lien 7.50% 1/23/22 @ | | | 2,304,892 | | | | 2,322,658 | |
BJ’s Wholesale Club 2nd Lien 8.50% 3/31/20 | | | 1,221,155 | | | | 1,228,482 | |
Blue Ribbon 1st Lien 5.00% 11/13/21 | | | 518,996 | | | | 522,888 | |
Flint Group 2nd Lien 8.25% 9/7/22 @ | | | 700,000 | | | | 670,250 | |
FMG Resources August 2006 1st Lien
3.75% 6/30/19 | | | 133,751 | | | | 133,814 | |
Frank Russell Tranche B 1st Lien 6.75% 6/1/23 | | | 657,353 | | | | 659,818 | |
Immucor Tranche B2 1st Lien 5.00% 8/17/18 | | | 935,142 | | | | 916,732 | |
KIK Custom Products 1st Lien 6.00% 8/26/22 @ | | | 733,307 | | | | 733,307 | |
Kronos 2nd Lien
9.25% 10/20/24 | | | 1,230,000 | | | | 1,271,032 | |
Mohegan Tribal Gaming Authority Tranche B 1st Lien
5.50% 10/13/23 | | | 714,330 | | | | 713,735 | |
Neiman Marcus Group 1st Lien
4.25% 10/25/20 | | | 158,773 | | | | 146,359 | |
Solera Tranche B 1st Lien 5.75% 3/3/23 | | | 398,000 | | | | 402,892 | |
Schedules of investments
Delaware Pooled® Trust — The High-Yield Bond Portfolio
| | | | | | | | |
| | | Principal amount° | | | Value (U.S. $) | |
| |
Senior Secured Loans« (continued) | | | | | |
| |
Windstream Services Tranche B6 1st Lien 4.75% 3/30/21 | | | 546,255 | | | $ | 548,901 | |
| | | | | | | | |
| |
Total Senior Secured Loans
(cost $11,988,234) | | | | 12,275,710 | |
| | | | | | | | |
| | |
| | | Number of shares | | | | |
| |
Common Stock – 0.00% | | | | | |
| |
Century Communications @=† | | | 60,000 | | | | 0 | |
| | | | | | | | |
Total Common Stock (cost $1,816) | | | | 0 | |
| | | | | | | | |
|
| |
Preferred Stock –1.16% | | | | | |
| |
Bank of America 6.50% ● | | | 1,335,000 | | | | 1,450,144 | |
GMAC Capital Trust I
6.602% ● | | | 7,000 | | | | 178,710 | |
Morgan Stanley 5.55% ● | | | 1,150,000 | | | | 1,178,750 | |
| | | | | | | | |
| |
Total Preferred Stock
(cost $2,716,481) | | | | 2,807,604 | |
| | | | | | | | |
| | |
| | | Principal amount° | | | | |
| |
Short-Term Investments – 6.42% | | | | | |
| |
Repurchase Agreements – 6.42% | | | | | |
Bank of America Merrill Lynch 0.25%, dated 10/31/16, to be repurchased on 11/1/16, repurchase price $4,269,537 (collateralized by U.S. government obligations 2.25% 11/15/24; market value $4,354,899) | | | 4,269,508 | | | | 4,269,508 | |
Bank of Montreal 0.27%, dated 10/31/16, to be repurchased on 11/1/16, repurchase price $1,423,180 (collateralized by U.S. government obligations 0.125%–3.875% 11/30/17–2/15/45; market value $1,451,634) | | | 1,423,169 | | | | 1,423,169 | |
| | | | | | | | |
| | | Principal amount° | | | Value (U.S. $) | |
| |
Short-Term Investments (continued) | | | | | |
| |
Repurchase Agreements (continued) | | | | | |
BNP Paribas 0.32%, dated 10/31/16, to be repurchased on 11/1/16, repurchase price $9,865,411 (collateralized by U.S. government obligations 0.00%–4.75% 4/30/17–2/15/45; market value $10,062,632) | | | 9,865,323 | | | $ | 9,865,323 | |
| | | | | | | | |
| | |
| | | | | | | 15,558,000 | |
| | | | | | | | |
| |
Total Short-Term Investments
(cost $15,558,000) | | | | 15,558,000 | |
| | | | | | | | |
| |
Total Value of Securities – 100.31%
(cost $236,576,386) | | | $ | 243,051,203 | |
| | | | | | | | |
| # | Security exempt from registration under Rule 144A of the Securities Act of 1933, as amended. At Oct. 31, 2016, the aggregate value of Rule 144A securities was $127,171,420, which represents 52.49% of the Portfolio’s net assets. See Note 11 in “Notes to financial statements.” |
| @ | Illiquid security. At Oct. 31, 2016, the aggregate value of illiquid securities was $3,726,215, which represents 1.54% of the Portfolio’s net assets. See Note 11 in “Notes to financial statements.” |
| 100% of the income received was in the form of additional par. |
| T | 100% of the income received was in the form of cash. |
| = | Security is being fair valued in accordance with the Portfolio’s fair valuation policy. At Oct. 31, 2016, the aggregate value of fair valued securities was $0, which represents 0.00% of the Portfolio’s net assets. See Note 1 in “Notes to financial statements.” |
| « | Senior secured loans generally pay interest at rates which are periodically reset by reference to a base lending rate plus a premium. These base lending rates are generally: (i) the prime rate offered by one or more U.S. banks, (ii) the lending rate offered by one or more European banks such as the London Interbank Offered Rate (LIBOR), and (iii) the certificate of deposit rate. Senior secured loans may be subject to restrictions on resale. Stated rate in effect at Oct. 31, 2016. |
| ° | Principal amount shown is stated in U.S. dollars unless noted that the security is denominated in another currency. |
| † | Non-income-producing security. |
| ● | Variable rate security. Each rate shown is as of Oct. 31, 2016. Interest rates reset periodically. |
40
Unfunded Commitments
The Portfolio may invest in floating rate loans. In connection with these investments, the Portfolio may also enter into unfunded corporate loan commitments (commitments). Commitments may obligate the Portfolio to furnish temporary financing to a borrower until permanent financing can be arranged. In connection with these commitments, the Portfolio earns a commitment fee, typically set as a percentage of the commitment amount. The following unfunded loan commitment was outstanding at Oct. 31, 2016:
| | |
Borrower | | Unfunded Loan Commitment |
Grande Communications Networks | | $1,230,000 |
PIK – Payment-in-kind
See accompanying notes, which are an integral part of the financial statements.
Schedules of investments
Delaware Pooled® Trust — The Core Plus Fixed Income Portfolio
October 31, 2016
| | | | | | | | |
| | | Principal amount° | | | Value (U.S. $) | |
| |
Agency Asset-Backed Security – 0.10% | | | | | |
| |
Fannie Mae Grantor Trust Series 2003-T4 2A5 4.992%
9/26/33 f | | | 118,296 | | | $ | 132,556 | |
| | | | | | | | |
Total Agency Asset-Backed Security
(cost $117,339) | | | | 132,556 | |
| | | | | | | | |
|
| |
Agency Collateralized Mortgage Obligations – 2.99% | |
| |
Fannie Mae REMICs | | | | | | | | |
Series 2002-90 A1 6.50% 6/25/42 | | | 12,352 | | | | 14,639 | |
Series 2002-90 A2 6.50% 11/25/42 | | | 26,862 | | | | 30,347 | |
Series 2004-W11 1A2 6.50% 5/25/44 | | | 22,665 | | | | 26,981 | |
Series 2005-70 PA 5.50% 8/25/35 | | | 8,751 | | | | 9,913 | |
Series 2008-15 SB
6.066% 8/25/36 ∑● | | | 24,035 | | | | 4,941 | |
Series 2010-129 SM
5.466% 11/25/40 ∑● | | | 151,281 | | | | 26,820 | |
Series 2011-118 DC
4.00% 11/25/41 | | | 330,819 | | | | 347,222 | |
Series 2012-122 SD
5.566% 11/25/42 ∑● | | | 194,225 | | | | 42,057 | |
Series 2013-7 EI
3.00% 10/25/40 ∑ | | | 122,413 | | | | 14,075 | |
Series 2013-38 AI
3.00% 4/25/33 ∑ | | | 131,555 | | | | 16,620 | |
Series 2013-43 IX
4.00% 5/25/43 ∑ | | | 595,177 | | | | 127,409 | |
Series 2013-44 DI
3.00% 5/25/33 ∑ | | | 175,820 | | | | 25,774 | |
Series 2013-55 AI 3.00% 6/25/33 ∑ | | | 261,364 | | | | 34,070 | |
Series 2014-68 BS
5.616% 11/25/44 ∑● | | | 210,844 | | | | 44,096 | |
Series 2014-90 SA
5.616% 1/25/45 ∑● | | | 586,638 | | | | 120,733 | |
Series 2015-27 SA
5.916% 5/25/45 ∑● | | | 81,038 | | | | 19,206 | |
Series 2015-44 Z
3.00% 9/25/43 | | | 193,581 | | | | 193,156 | |
Series 2015-95 SH
5.466% 1/25/46 ∑● | | | 197,914 | | | | 50,017 | |
Series 2016-55 SK
5.466% 8/25/46 ∑● | | | 156,954 | | | | 42,711 | |
Series 2016-62 SA
5.466% 9/25/46 ∑● | | | 312,779 | | | | 86,217 | |
Series 2016-74 GS
5.466% 10/25/46 ∑● | | | 99,363 | | | | 28,082 | |
| | | | | | | | |
| | | Principal amount° | | | Value (U.S. $) | |
| |
Agency Collateralized Mortgage Obligations (continued) | |
| |
Freddie Mac REMICs | | | | | | | | |
Series 1730 Z
7.00% 5/15/24 | | | 37,986 | | | $ | 42,550 | |
Series 2326 ZQ
6.50% 6/15/31 | | | 33,025 | | | | 37,850 | |
Series 3123 HT
5.00% 3/15/26 | | | 105,252 | | | | 114,678 | |
Series 3656 PM
5.00% 4/15/40 | | | 71,326 | | | | 79,118 | |
Series 4109 AI
3.00% 7/15/31 ∑ | | | 411,009 | | | | 44,827 | |
Series 4120 IK
3.00% 10/15/32 ∑ | | | 316,857 | | | | 40,930 | |
Series 4146 IA
3.50% 12/15/32 ∑ | | | 167,734 | | | | 24,221 | |
Series 4159 KS
5.615% 1/15/43 ∑● | | | 146,479 | | | | 39,100 | |
Series 4181 DI
2.50% 3/15/33 ∑ | | | 101,789 | | | | 11,388 | |
Series 4184 GS 5.585% 3/15/43 ∑● | | | 176,039 | | | | 40,655 | |
Series 4185 LI
3.00% 3/15/33 ∑ | | | 67,074 | | | | 9,699 | |
Series 4191 CI
3.00% 4/15/33 ∑ | | | 70,229 | | | | 8,747 | |
Series 4435 DY
3.00% 2/15/35 | | | 157,000 | | | | 161,764 | |
Series 4592 WT
5.50% 6/15/46 | | | 357,470 | | | | 400,607 | |
Series 4594 SG 5.465% 6/15/46 ∑● | | | 458,814 | | | | 123,242 | |
Series 4623 LZ 2.50% 10/15/46 | | | 66,000 | | | | 61,174 | |
Series 4623 MW
2.50% 10/15/46 | | | 80,000 | | | | 77,200 | |
Freddie Mac Strips | | | | | | | | |
Series 267 S5
5.465% 8/15/42 ∑● | | | 218,586 | | | | 42,676 | |
Series 299 S1
5.465% 1/15/43 ∑● | | | 165,372 | | | | 35,559 | |
Series 326 S2
5.415% 3/15/44 ∑● | | | 117,801 | | | | 26,293 | |
Freddie Mac Structured Agency Credit Risk Debt Notes | | | | | | | | |
Series 2015-HQA2 M2
3.334% 5/25/28 ● | | | 250,000 | | | | 256,315 | |
Series 2016-DNA1 M2 3.434% 7/25/28 ● | | | 250,000 | | | | 257,369 | |
42
| | | | | | | | |
| | | Principal amount° | | | Value (U.S. $) | |
| |
Agency Collateralized Mortgage Obligations (continued) | |
| |
GNMA | | | | | | | | |
Series 2010-113 KE
4.50% 9/20/40 | | | 125,000 | | | $ | 138,995 | |
Series 2012-136 MX 2.00% 11/20/42 | | | 30,000 | | | | 27,494 | |
Series 2013-113 AZ 3.00% 8/20/43 | | | 204,512 | | | | 198,996 | |
Series 2013-113 LY 3.00% 5/20/43 | | | 22,000 | | | | 22,709 | |
Series 2015-64 GZ 2.00% 5/20/45 | | | 79,211 | | | | 67,284 | |
Series 2015-133 AL 3.00% 5/20/45 | | | 208,000 | | | | 207,297 | |
Series 2016-111 PB 2.50% 8/20/46 | | | 74,000 | | | | 70,526 | |
Series 2016-134 MW 3.00% 10/20/46 | | | 13,000 | | | | 13,130 | |
| | | | | | | | |
Total Agency Collateralized Mortgage Obligations
(cost $4,076,350) | | | | 3,987,479 | |
| | | | | | | | |
|
| |
Agency Commercial Mortgage-Backed
Securities –1.64% | |
| |
Freddie Mac Multifamily Structured Pass-Through Certificates | | | | | | | | |
Series K041 A2 3.171% 10/25/24 ◆ | | | 240,000 | | | | 257,346 | |
Series K055 A2 2.673% 3/25/26 ◆ | | | 255,000 | | | | 262,264 | |
Series K056 A2 2.525% 5/25/26 ◆ | | | 85,000 | | | | 86,347 | |
Series K057 A2 2.57% 7/25/26 ◆ | | | 70,000 | | | | 71,292 | |
Series K716 A2 3.13% 6/25/21 ◆ | | | 100,000 | | | | 106,492 | |
Series K719 A1 2.53% 12/25/21 ◆ | | | 58,371 | | | | 60,464 | |
Series K722 A1 2.183% 5/25/22 ◆ | | | 89,535 | | | | 90,953 | |
Series KS03 A4 3.161% 5/25/25 ◆● | | | 120,000 | | | | 127,040 | |
FREMF Mortgage Trust | | | | | | | | |
Series 2010-K7 B 144A 5.444% 4/25/20 #● | | | 95,000 | | | | 104,988 | |
Series 2011-K10 B 144A 4.631% 11/25/49 #● | | | 90,000 | | | | 97,363 | |
Series 2011-K14 B 144A 5.167% 2/25/47 #● | | | 50,000 | | | | 55,643 | |
Series 2011-K15 B 144A 4.948% 8/25/44 #● | | | 55,000 | | | | 60,438 | |
| | | | | | | | |
| | | Principal amount° | | | Value (U.S. $) | |
| |
Agency Commercial Mortgage-Backed Securities (continued) | |
| |
FREMF Mortgage Trust | | | | | | | | |
Series 2012-K18 B 144A 4.255% 1/25/45 #● | | | 50,000 | | | $ | 54,032 | |
Series 2012-K22 B 144A 3.686% 8/25/45 #● | | | 60,000 | | | | 63,338 | |
Series 2012-K708 B 144A 3.751% 2/25/45 #● | | | 110,000 | | | | 113,177 | |
Series 2012-K708 C 144A 3.751% 2/25/45 #● | | | 25,000 | | | | 24,980 | |
Series 2013-K33 B 144A 3.502% 8/25/46 #● | | | 45,000 | | | | 45,906 | |
Series 2013-K35 C 144A 3.942% 8/25/23 #● | | | 20,000 | | | | 19,424 | |
Series 2013-K712 B 144A 3.369% 5/25/45 #● | | | 60,000 | | | | 61,460 | |
Series 2013-K712 C 144A 3.369% 5/25/45 #● | | | 250,000 | | | | 253,406 | |
Series 2013-K713 B
144A 3.165% 4/25/46 #● | | | 35,000 | | | | 35,814 | |
Series 2013-K713 C 144A 3.165% 4/25/46 #● | | | 135,000 | | | | 134,332 | |
| | | | | | | | |
Total Agency Commercial Mortgage-Backed Securities
(cost $2,181,308) | | | | | | | 2,186,499 | |
| | | | | | | | |
|
| |
Agency Mortgage-Backed Securities – 23.29% | |
| |
Fannie Mae ARM | | | | | | | | |
2.415% 5/1/43 ● | | | 26,325 | | | | 27,038 | |
2.419% 3/1/38 ● | | | 32,100 | | | | 33,739 | |
2.553% 6/1/43 ● | | | 9,574 | | | | 9,823 | |
2.812% 8/1/34 ● | | | 31,853 | | | | 33,405 | |
2.913% 7/1/45 ● | | | 34,820 | | | | 36,032 | |
2.951% 12/1/45 ● | | | 45,074 | | | | 46,875 | |
2.965% 4/1/46 ● | | | 24,800 | | | | 25,749 | |
3.07% 4/1/44 ● | | | 107,400 | | | | 111,442 | |
3.203% 4/1/44 ● | | | 36,153 | | | | 37,566 | |
3.239% 3/1/44 ● | | | 47,275 | | | | 49,509 | |
3.275% 9/1/43 ● | | | 22,828 | | | | 23,796 | |
Fannie Mae S.F. 30 yr | | | | | | | | |
3.00% 12/1/46 | | | 9,851,000 | | | | 10,122,287 | |
4.50% 11/1/39 | | | 63,256 | | | | 70,400 | |
4.50% 1/1/40 | | | 949,287 | | | | 1,051,723 | |
4.50% 6/1/40 | | | 67,673 | | | | 75,110 | |
4.50% 8/1/40 | | | 20,184 | | | | 22,209 | |
4.50% 7/1/41 | | | 172,895 | | | | 191,251 | |
4.50% 8/1/41 | | | 84,258 | | | | 93,565 | |
4.50% 1/1/42 | | | 27,219 | | | | 30,156 | |
4.50% 8/1/42 | | | 449,225 | | | | 495,199 | |
4.50% 10/1/43 | | | 468,415 | | | | 518,686 | |
Schedules of investments
Delaware Pooled® Trust — The Core Plus Fixed Income Portfolio
| | | | | | | | |
| | | Principal amount° | | | Value (U.S. $) | |
| |
Agency Mortgage-Backed Securities (continued) | |
| |
Fannie Mae S.F. 30 yr | | | | | | | | |
4.50% 10/1/44 | | | 59,234 | | | $ | 65,356 | |
4.50% 2/1/46 | | | 4,130,468 | | | | 4,530,845 | |
4.50% 3/1/46 | | | 33,013 | | | | 36,409 | |
4.50% 7/1/46 | | | 95,742 | | | | 104,788 | |
5.50% 12/1/32 | | | 1,430 | | | | 1,626 | |
5.50% 6/1/33 | | | 16,094 | | | | 18,281 | |
5.50% 9/1/33 | | | 147,393 | | | | 166,683 | |
5.50% 4/1/34 | | | 5,256 | | | | 5,977 | |
5.50% 5/1/34 | | | 117,657 | | | | 133,846 | |
5.50% 7/1/34 | | | 3,738 | | | | 4,257 | |
5.50% 9/1/34 | | | 60,544 | | | | 68,939 | |
5.50% 11/1/34 | | | 4,928 | | | | 5,614 | |
5.50% 12/1/34 | | | 202,960 | | | | 230,925 | |
5.50% 3/1/35 | | | 11,994 | | | | 13,627 | |
5.50% 5/1/35 | | | 51,878 | | | | 59,033 | |
5.50% 6/1/35 | | | 4,901 | | | | 5,580 | |
5.50% 12/1/35 | | | 5,156 | | | | 5,839 | |
5.50% 1/1/36 | | | 49,272 | | | | 56,127 | |
5.50% 4/1/36 | | | 152,642 | | | | 173,180 | |
5.50% 5/1/36 | | | 2,373 | | | | 2,697 | |
5.50% 7/1/36 | | | 2,056 | | | | 2,338 | |
5.50% 9/1/36 | | | 133,266 | | | | 151,549 | |
5.50% 11/1/36 | | | 8,827 | | | | 9,997 | |
5.50% 1/1/37 | | | 36,254 | | | | 41,006 | |
5.50% 2/1/37 | | | 17,903 | | | | 20,273 | |
5.50% 4/1/37 | | | 72,726 | | | | 82,374 | |
5.50% 8/1/37 | | | 569,045 | | | | 647,214 | |
5.50% 9/1/37 | | | 50,274 | | | | 56,840 | |
5.50% 1/1/38 | | | 476 | | | | 538 | |
5.50% 2/1/38 | | | 20,838 | | | | 23,652 | |
5.50% 6/1/38 | | | 85,634 | | | | 96,849 | |
5.50% 7/1/38 | | | 18,719 | | | | 21,145 | |
5.50% 9/1/38 | | | 85,683 | | | | 97,232 | |
5.50% 1/1/39 | | | 199,360 | | | | 226,746 | |
5.50% 2/1/39 | | | 133,012 | | | | 151,197 | |
5.50% 6/1/39 | | | 52,758 | | | | 59,814 | |
5.50% 10/1/39 | | | 57,633 | | | | 65,200 | |
5.50% 12/1/39 | | | 107,690 | | | | 122,529 | |
5.50% 3/1/40 | | | 317,346 | | | | 360,983 | |
5.50% 7/1/40 | | | 67,159 | | | | 76,321 | |
5.50% 3/1/41 | | | 232,053 | | | | 263,990 | |
5.50% 6/1/41 | | | 137,511 | | | | 156,450 | |
5.50% 9/1/41 | | | 485,123 | | | | 549,916 | |
6.00% 4/1/35 | | | 419,259 | | | | 485,963 | |
6.00% 7/1/35 | | | 40,306 | | | | 46,455 | |
6.00% 6/1/36 | | | 2,357 | | | | 2,707 | |
6.00% 7/1/36 | | | 3,140 | | | | 3,594 | |
6.00% 9/1/36 | | | 21,494 | | | | 25,254 | |
| | | | | | | | |
| | | Principal amount° | | | Value (U.S. $) | |
| |
Agency Mortgage-Backed Securities (continued) | |
| |
Fannie Mae S.F. 30 yr | | | | | | | | |
6.00% 12/1/36 | | | 2,600 | | | $ | 3,006 | |
6.00% 2/1/37 | | | 8,068 | | | | 9,259 | |
6.00% 6/1/37 | | | 1,433 | | | | 1,662 | |
6.00% 7/1/37 | | | 1,308 | | | | 1,506 | |
6.00% 8/1/37 | | | 9,787 | | | | 11,203 | |
6.00% 9/1/37 | | | 2,691 | | | | 3,088 | |
6.00% 11/1/37 | | | 439 | | | | 503 | |
6.00% 5/1/38 | | | 85,491 | | | | 98,106 | |
6.00% 9/1/38 | | | 7,853 | | | | 9,014 | |
6.00% 10/1/38 | | | 3,534 | | | | 4,055 | |
6.00% 11/1/38 | | | 6,271 | | | | 7,262 | |
6.00% 1/1/39 | | | 11,339 | | | | 12,979 | |
6.00% 9/1/39 | | | 99,214 | | | | 113,677 | |
6.00% 10/1/39 | | | 177,271 | | | | 206,537 | |
6.00% 3/1/40 | | | 11,330 | | | | 12,996 | |
6.00% 4/1/40 | | | 23,626 | | | | 27,087 | |
6.00% 9/1/40 | | | 9,748 | | | | 11,177 | |
6.00% 10/1/40 | | | 235,950 | | | | 270,493 | |
6.00% 11/1/40 | | | 4,290 | | | | 5,001 | |
6.00% 5/1/41 | | | 192,921 | | | | 221,564 | |
6.00% 7/1/41 | | | 317,457 | | | | 365,040 | |
6.50% 5/1/40 | | | 37,048 | | | | 43,408 | |
7.00% 12/1/37 | | | 8,157 | | | | 8,767 | |
7.50% 6/1/31 | | | 972 | | | | 1,172 | |
7.50% 6/1/34 | | | 9,814 | | | | 11,408 | |
Freddie Mac ARM | | | | | | | | |
2.553% 10/1/46● | | | 60,000 | | | | 61,690 | |
2.82% 9/1/45● | | | 249,767 | | | | 257,970 | |
2.938% 10/1/45● | | | 66,340 | | | | 68,870 | |
2.946% 11/1/44● | | | 21,917 | | | | 22,651 | |
2.982% 11/1/45● | | | 51,094 | | | | 53,077 | |
3.11% 3/1/46● | | | 96,935 | | | | 100,837 | |
Freddie Mac S.F. 30 yr | | | | | | | | |
4.50% 4/1/39 | | | 10,658 | | | | 11,740 | |
4.50% 5/1/40 | | | 392,683 | | | | 437,580 | |
4.50% 3/1/42 | | | 79,005 | | | | 87,053 | |
4.50% 7/1/42 | | | 106,825 | | | | 117,406 | |
4.50% 12/1/43 | | | 76,435 | | | | 84,443 | |
4.50% 8/1/44 | | | 160,245 | | | | 176,614 | |
4.50% 7/1/45 | | | 408,411 | | | | 448,292 | |
5.50% 3/1/34 | | | 3,088 | | | | 3,520 | |
5.50% 12/1/34 | | | 2,800 | | | | 3,198 | |
5.50% 11/1/35 | | | 5,209 | | | | 5,935 | |
5.50% 6/1/36 | | | 1,689 | | | | 1,920 | |
5.50% 11/1/36 | | | 3,365 | | | | 3,827 | |
5.50% 12/1/36 | | | 841 | | | | 955 | |
5.50% 9/1/37 | | | 5,535 | | | | 6,283 | |
5.50% 4/1/38 | | | 262,617 | | | | 298,145 | |
44
| | | | | | | | |
| | | Principal amount° | | | Value (U.S. $) | |
| |
Agency Mortgage-Backed Securities (continued) | |
| |
Freddie Mac S.F. 30 yr | | | | | | | | |
5.50% 6/1/38 | | | 2,222 | | | $ | 2,523 | |
5.50% 7/1/38 | | | 20,221 | | | | 22,985 | |
5.50% 6/1/39 | | | 19,847 | | | | 22,483 | |
5.50% 3/1/40 | | | 9,775 | | | | 11,112 | |
5.50% 8/1/40 | | | 30,037 | | | | 34,073 | |
5.50% 1/1/41 | | | 9,417 | | | | 10,683 | |
5.50% 6/1/41 | | | 327,727 | | | | 370,994 | |
6.00% 2/1/36 | | | 6,021 | | | | 6,950 | |
6.00% 9/1/37 | | | 14,737 | | | | 16,923 | |
6.00% 1/1/38 | | | 3,725 | | | | 4,271 | |
6.00% 6/1/38 | | | 9,868 | | | | 11,340 | |
6.00% 8/1/38 | | | 14,503 | | | | 16,886 | |
6.00% 5/1/40 | | | 81,007 | | | | 92,896 | |
6.00% 7/1/40 | | | 76,576 | | | | 87,835 | |
7.00% 11/1/33 | | | 926 | | | | 1,120 | |
GNMA I S.F. 30 yr | | | | | | | | |
5.00% 3/15/40 | | | 276,082 | | | | 307,670 | |
7.00% 12/15/34 | | | 116,454 | | | | 139,873 | |
GNMA II S.F. 30 yr | | | | | | | | |
5.50% 5/20/37 | | | 32,611 | | | | 36,490 | |
5.50% 4/20/40 | | | 30,658 | | | | 33,850 | |
6.00% 2/20/39 | | | 51,781 | | | | 59,000 | |
6.00% 4/20/46 | | | 51,856 | | | | 58,298 | |
Mega Pool | | | | | | | | |
4.50% 10/1/46 = | | | 3,017,000 | | | | 3,336,142 | |
| | | | | | | | |
| |
Total Agency Mortgage-Backed Securities
(cost $30,871,639) | | | | 31,039,688 | |
| | | | | | | | |
|
| |
Collateralized Debt Obligations – 2.21% | |
| |
Anchorage Capital CLO VI Series 2015-6A A1 144A 2.42% 4/15/27 #● | | | 250,000 | | | | 249,688 | |
Avery Point III CLO Series 2013-3A A 144A 2.282% 1/18/25 #● | | | 250,000 | | | | 249,942 | |
Benefit Street Partners CLO IV Series 2014-IVA A1A 144A 2.371% 7/20/26 #● | | | 500,000 | | | | 500,361 | |
BlueMountain CLO Series 2015-2A A1 144A 2.312% 7/18/27 #● | | | 250,000 | | | | 250,463 | |
Cedar Funding VI CLO 144A 2.344% 10/20/28 #● | | | 250,000 | | | | 249,875 | |
Cent CLO 21 Series 2014-21A A1B 144A 2.276% 7/27/26 #● | | | 250,000 | | | | 249,874 | |
| | | | | | | | |
| | | Principal amount° | | | Value (U.S. $) | |
| |
Collateralized Debt Obligations (continued) | |
| |
Magnetite IX Series 2014-9A A1 144A 2.302% 7/25/26 #● | | | 505,000 | | | $ | 505,233 | |
Neuberger Berman CLO XIX Series 2015-19A A1
144A 2.30% 7/15/27 #● | | | 250,000 | | | | 249,874 | |
Shackleton CLO
Series 2014-5A A
144A 2.288% 5/7/26 #● | | | 250,000 | | | | 249,729 | |
Venture XXIV CLO
Series 2016-24A A1D 144A 2.24% 10/20/28 #● | | | 195,000 | | | | 194,610 | |
| | | | | | | | |
| | |
Total Collateralized Debt Obligations (cost $2,946,429) | | | | | | | 2,949,649 | |
| | | | | | | | |
|
| |
Convertible Bonds – 0.05% | | | | | | | | |
| |
Alaska Communications Systems Group 6.25% exercise price $10.28,maturity date 5/1/18 @ | | | 7,000 | | | | 6,913 | |
Blucora 4.25% exercise price $21.66, maturity date 4/1/19 | | | 3,000 | | | | 2,953 | |
Ciena 144A 3.75% exercise price $20.17, maturity date 10/15/18 # | | | 7,000 | | | | 8,347 | |
General Cable 4.50% exercise price $31.96, maturity date 11/15/29 @f | | | 12,000 | | | | 7,777 | |
Hologic 2.00% exercise price $31.18, maturity date 3/1/42 f | | | 7,000 | | | | 8,952 | |
Jefferies Group 3.875%exercise price $44.04,maturity date 11/1/29 | | | 8,000 | | | | 8,140 | |
Meritor 4.00% exercise price $26.73, maturity date 2/15/27 f | | | 14,000 | | | | 14,105 | |
Nuance Communications 2.75% exercise price $32.30, maturity date 11/1/31 | | | 9,000 | | | | 9,045 | |
Vector Group 2.50% exercise price $15.22, maturity date 1/15/19 ● | | | 2,000 | | | | 2,861 | |
| | | | | | | | |
| |
Total Convertible Bonds (cost $67,293) | | | | 69,093 | |
| | | | | | | | |
Schedules of investments
Delaware Pooled® Trust — The Core Plus Fixed Income Portfolio
| | | | | | | | |
| | | Principal amount° | | | Value (U.S. $) | |
| |
Corporate Bonds — 45.96% | | | | | |
| |
Banking – 10.28% | | | | | | | | |
Banco Nacional de Comercio Exterior 144A 3.80% 8/11/26 #● | | | 200,000 | | | $ | 198,500 | |
Banco Nacional de Costa Rica 144A 5.875% 4/25/21 # | | | 200,000 | | | | 207,980 | |
Bank of America | | | | | | | | |
3.248% 10/21/27 | | | 60,000 | | | | 60,149 | |
3.50% 4/19/26 | | | 20,000 | | | | 20,570 | |
4.45% 3/3/26 | | | 785,000 | | | | 839,569 | |
Bank of New York Mellon | | | | | | | | |
2.15% 2/24/20 | | | 25,000 | | | | 25,304 | |
2.20% 8/16/23 | | | 125,000 | | | | 123,305 | |
2.50% 4/15/21 | | | 270,000 | | | | 275,466 | |
2.80% 5/4/26 | | | 70,000 | | | | 70,701 | |
3.00% 10/30/28 | | | 50,000 | | | | 49,959 | |
4.625% 12/29/49 ● | | | 150,000 | | | | 146,820 | |
Barclays 3.20% 8/10/21 | | | 235,000 | | | | 236,817 | |
BB&T 2.05% 5/10/21 | | | 670,000 | | | | 672,825 | |
Capital One 2.25% 9/13/21 | | | 250,000 | | | | 248,890 | |
Citigroup 3.20% 10/21/26 | | | 165,000 | | | | 164,963 | |
Citizens Bank 2.55% 5/13/21 | | | 250,000 | | | | 253,431 | |
Citizens Financial Group
4.30% 12/3/25 | | | 115,000 | | | | 120,156 | |
Compass Bank 3.875% 4/10/25 | | | 250,000 | | | | 243,267 | |
Cooperatieve Rabobank
3.75% 7/21/26 | | | 250,000 | | | | 251,608 | |
Credit Suisse Group 144A 6.25% 12/29/49 #● | | | 400,000 | | | | 387,000 | |
Credit Suisse Group Funding Guernsey 144A
4.55% 4/17/26 # | | | 610,000 | | | | 641,010 | |
Fifth Third Bancorp
2.875% 7/27/20 | | | 50,000 | | | | 51,769 | |
Fifth Third Bank 3.85% 3/15/26 | | | 450,000 | | | | 473,885 | |
Goldman Sachs Group 5.15% 5/22/45 | | | 330,000 | | | | 357,917 | |
HSBC Holdings 2.65% 1/5/22 | | | 200,000 | | | | 199,138 | |
Huntington Bancshares
2.30% 1/14/22 | | | 160,000 | | | | 158,800 | |
JPMorgan Chase & Co.
4.25% 10/1/27 | | | 715,000 | | | | 762,138 | |
KeyBank 3.40% 5/20/26 | | | 550,000 | | | | 558,928 | |
KeyCorp 5.00% 12/29/49 ● | | | 250,000 | | | | 246,063 | |
| | | | | | | | |
| | | Principal amount° | | | Value (U.S. $) | |
| |
Corporate Bonds (continued) | |
| |
Banking (continued) | | | | | | | | |
Morgan Stanley | | | | | | | | |
3.125% 7/27/26 | | | 250,000 | | | $ | 249,327 | |
3.95% 4/23/27 | | | 530,000 | | | | 546,424 | |
Nationwide Building Society 144A 4.00% 9/14/26 # | | | 250,000 | | | | 247,116 | |
PNC Bank | | | | | | | | |
2.30% 6/1/20 | | | 250,000 | | | | 253,930 | |
2.45% 11/5/20 | | | 250,000 | | | | 254,854 | |
6.875% 4/1/18 | | | 250,000 | | | | 268,185 | |
PNC Financial Services Group 5.00% 12/29/49 ● | | | 160,000 | | | | 160,163 | |
Royal Bank of Scotland Group | | | | | | | | |
3.875% 9/12/23 | | | 200,000 | | | | 196,104 | |
8.625% 12/29/49 ● | | | 200,000 | | | | 199,500 | |
State Street | | | | | | | | |
2.55% 8/18/20 | | | 120,000 | | | | 123,679 | |
3.10% 5/15/23 | | | 65,000 | | | | 66,864 | |
3.55% 8/18/25 | | | 130,000 | | | | 140,012 | |
SunTrust Bank
3.30% 5/15/26 | | | 200,000 | | | | 201,957 | |
SunTrust Banks
2.35% 11/1/18 | | | 75,000 | | | | 76,123 | |
SVB Financial Group
3.50% 1/29/25 | | | 120,000 | | | | 119,915 | |
Swedbank 144A
2.65% 3/10/21 # | | | 200,000 | | | | 205,361 | |
Toronto-Dominion Bank | | | | | | | | |
2.125% 4/7/21 | | | 110,000 | | | | 110,839 | |
2.50% 12/14/20 | | | 95,000 | | | | 97,260 | |
3.625% 9/15/31 ● | | | 165,000 | | | | 165,102 | |
UBS Group Funding Jersey | | | | | | | | |
144A 2.65% 2/1/22 # | | | 400,000 | | | | 398,342 | |
144A 4.125% 4/15/26 # | | | 345,000 | | | | 360,930 | |
US Bancorp | | | | | | | | |
2.375% 7/22/26 | | | 315,000 | | | | 306,877 | |
3.10% 4/27/26 | | | 140,000 | | | | 142,952 | |
3.60% 9/11/24 | | | 40,000 | | | | 42,465 | |
USB Capital IX
3.50% 10/29/49 ● | | | 355,000 | | | | 305,744 | |
Wells Fargo & Co.
3.00% 10/23/26 | | | 140,000 | | | | 139,217 | |
Woori Bank 144A
4.75% 4/30/24 # | | | 200,000 | | | | 212,254 | |
Zions Bancorporation
4.50% 6/13/23 | | | 55,000 | | | | 57,242 | |
| | | | | | | | |
| | |
| | | | | | | 13,695,666 | |
| | | | | | | | |
46
| | | | | | | | |
| | | Principal
amount° | | | Value (U.S. $) | |
| |
Corporate Bonds (continued) | | | | | |
| |
Basic Industry – 2.08% | | | | | | | | |
Dow Chemical
8.55% 5/15/19 | | | 209,000 | | | $ | 243,666 | |
Eastman Chemical
4.65% 10/15/44 | | | 275,000 | | | | 279,618 | |
Georgia-Pacific | | | | | | | | |
144A 2.539% 11/15/19 # | | | 15,000 | | | | 15,311 | |
8.00% 1/15/24 | | | 310,000 | | | | 408,281 | |
International Paper | | | | | | | | |
4.40% 8/15/47 | | | 270,000 | | | | 265,172 | |
5.15% 5/15/46 | | | 145,000 | | | | 157,371 | |
INVISTA Finance 144A 4.25% 10/15/19 # | | | 80,000 | | | | 80,591 | |
NOVA Chemicals 144A
5.00% 5/1/25 # | | | 55,000 | | | | 55,344 | |
OCP 144A 4.50% 10/22/25 # | | | 200,000 | | | | 202,152 | |
Rio Tinto Finance USA 3.75% 6/15/25 | | | 185,000 | | | | 197,388 | |
Steel Dynamics
5.50% 10/1/24 | | | 355,000 | | | | 375,413 | |
Suzano Austria 144A
5.75% 7/14/26 # | | | 300,000 | | | | 297,390 | |
Vale Overseas
5.875% 6/10/21 | | | 130,000 | | | | 138,938 | |
WR Grace & Co-Conn
144A 5.125% 10/1/21 # | | | 55,000 | | | | 58,713 | |
| | | | | | | | |
| | |
| | | | | | | 2,775,348 | |
| | | | | | | | |
Brokerage – 0.28% | | | | | | | | |
E*TRADE Financial
5.875% 12/29/49 ● | | | 160,000 | | | | 166,200 | |
Jefferies Group | | | | | | | | |
6.45% 6/8/27 | | | 30,000 | | | | 33,537 | |
6.50% 1/20/43 | | | 15,000 | | | | 15,583 | |
Lazard Group | | | | | | | | |
3.75% 2/13/25 | | | 125,000 | | | | 127,215 | |
6.85% 6/15/17 | | | 34,000 | | | | 34,983 | |
| | | | | | | | |
| | |
| | | | | | | 377,518 | |
| | | | | | | | |
Capital Goods – 2.31% | | | | | | | | |
Ball 5.00% 3/15/22 | | | 320,000 | | | | 345,600 | |
CCL Industries 144A
3.25% 10/1/26 # | | | 95,000 | | | | 93,691 | |
Cemex 144A
7.75% 4/16/26 # | | | 200,000 | | | | 224,620 | |
Crane | | | | | | | | |
2.75% 12/15/18 | | | 20,000 | | | | 20,406 | |
4.45% 12/15/23 | | | 95,000 | | | | 100,828 | |
Crown Americas 144A 4.25% 9/30/26 # | | | 200,000 | | | | 196,500 | |
| | | | | | | | |
| | | Principal amount° | | | Value (U.S. $) | |
| |
Corporate Bonds (continued) | | | | | |
| |
Capital Goods (continued) | | | | | | | | |
Fortive 144A
3.15% 6/15/26 # | | | 140,000 | | | $ | 141,942 | |
Fortune Brands Home & Security 3.00% 6/15/20 | | | 70,000 | | | | 72,057 | |
General Electric | | | | | | | | |
2.10% 12/11/19 | | | 130,000 | | | | 132,612 | |
5.55% 5/4/20 | | | 10,000 | | | | 11,281 | |
6.00% 8/7/19 | | | 90,000 | | | | 101,096 | |
LafargeHolcim Finance US 144A 3.50% 9/22/26 # | | | 400,000 | | | | 404,172 | |
Lennox International
3.00% 11/15/23 | | | 100,000 | | | | 99,999 | |
Masco 3.50% 4/1/21 | | | 395,000 | | | | 406,455 | |
Parker-Hannifin
3.30% 11/21/24 | | | 10,000 | | | | 10,557 | |
Siemens Financierings-maatschappij 144A
2.35% 10/15/26 # | | | 330,000 | | | | 319,396 | |
St. Marys Cement 144A
5.75% 1/28/27 # | | | 200,000 | | | | 202,680 | |
United Technologies
3.75% 11/1/46 | | | 125,000 | | | | 124,318 | |
Waste Management
2.40% 5/15/23 | | | 70,000 | | | | 70,313 | |
| | | | | | | | |
| | |
| | | | | | | 3,078,523 | |
| | | | | | | | |
Communications – 3.81% | | | | | | | | |
21st Century Fox America 4.95% 10/15/45 | | | 175,000 | | | | 192,869 | |
Activision Blizzard 144A 3.40% 9/15/26 # | | | 175,000 | | | | 173,812 | |
AT&T | | | | | | | | |
4.35% 6/15/45 | | | 155,000 | | | | 142,751 | |
144A 4.50% 3/9/48 # | | | 270,000 | | | | 254,261 | |
CC Holdings GS V
3.849% 4/15/23 | | | 65,000 | | | | 68,602 | |
Charter Communications Operating 144A
4.908% 7/23/25 # | | | 280,000 | | | | 302,521 | |
Columbus Cable Barbados 144A 7.375% 3/30/21 # | | | 200,000 | | | | 214,750 | |
Crown Castle International 5.25% 1/15/23 | | | 150,000 | | | | 168,174 | |
Crown Castle Towers 144A 4.883% 8/15/20 # | | | 275,000 | | | | 299,154 | |
CSC Holdings 144A
5.50% 4/15/27 # | | | 200,000 | | | | 203,375 | |
Schedules of investments
Delaware Pooled® Trust — The Core Plus Fixed Income Portfolio
| | | | | | | | |
| | | Principal
amount° | | | Value (U.S. $) | |
| |
Corporate Bonds (continued) | | | | | |
| |
Communications (continued) | | | | | |
Deutsche Telekom
International Finance 144A
2.485% 9/19/23 # | | | 505,000 | | | $ | 500,783 | |
DISH DBS
7.75% 7/1/26 | | | 265,000 | | | | 291,667 | |
Frontier Communications 10.50% 9/15/22 | | | 80,000 | | | | 83,500 | |
GTP Acquisition Partners I 144A 2.35% 6/15/20 # | | | 100,000 | | | | 99,733 | |
Millicom International Cellular 144A
6.00% 3/15/25 # | | | 200,000 | | | | 202,640 | |
SBA Tower Trust | | | | | | | | |
144A 2.24% 4/16/18 # | | | 45,000 | | | | 45,115 | |
144A 2.898% 10/15/19 # | | | 60,000 | | | | 61,027 | |
Sky 144A
3.75% 9/16/24 # | | | 345,000 | | | | 354,524 | |
Sprint Communications 144A
7.00% 3/1/20 # | | | 270,000 | | | | 294,300 | |
Time Warner Cable
7.30% 7/1/38 | | | 305,000 | | | | 385,987 | |
Verizon Communications | | | | | | | | |
4.125% 8/15/46 | | | 415,000 | | | | 397,850 | |
4.522% 9/15/48 | | | 130,000 | | | | 129,819 | |
4.862% 8/21/46 | | | 60,000 | | | | 63,807 | |
Viacom 3.45% 10/4/26 | | | 95,000 | | | | 94,553 | |
WPP Finance 2010 | | | | | | | | |
5.625% 11/15/43 | | | 50,000 | | | | 58,200 | |
| | | | | | | | |
| | |
| | | | | | | 5,083,774 | |
| | | | | | | | |
Consumer Cyclical – 3.57% | | | | | |
Adient Global Holdings 144A 4.875% 8/15/26 # | | | 200,000 | | | | 197,220 | |
CVS Health
5.00% 12/1/24 | | | 375,000 | | | | 428,573 | |
Daimler Finance North America 144A 2.20% 10/30/21 # | | | 150,000 | | | | 150,307 | |
144A 3.30% 5/19/25 # | | | 150,000 | | | | 155,352 | |
Ford Motor Credit
2.24% 6/15/18 | | | 465,000 | | | | 467,906 | |
General Motors Financial | | | | | | | | |
3.45% 4/10/22 | | | 30,000 | | | | 30,371 | |
3.70% 5/9/23 | | | 105,000 | | | | 106,523 | |
4.00% 10/6/26 | | | 285,000 | | | | 284,737 | |
5.25% 3/1/26 | | | 185,000 | | | | 201,846 | |
Goodyear Tire & Rubber 5.00% 5/31/26 | | | 330,000 | | | | 333,713 | |
Hyundai Capital America | | | | | | | | |
144A 2.55% 2/6/19 # | | | 75,000 | | | | 76,164 | |
144A 2.75% 9/27/26 # | | | 115,000 | | | | 111,248 | |
144A 3.00% 3/18/21 # | | | 120,000 | | | | 123,625 | |
| | | | | | | | |
| | | Principal
amount° | | | Value (U.S. $) | |
| |
Corporate Bonds (continued) | | | | | |
| |
Consumer Cyclical (continued) | | | | | |
JD.com
3.125% 4/29/21 | | | 200,000 | | | $ | 199,921 | |
Lowe’s | | | | | | | | |
3.375% 9/15/25 | | | 105,000 | | | | 112,025 | |
3.70% 4/15/46 | | | 150,000 | | | | 148,278 | |
Marriott International 3.125% 6/15/26 | | | 165,000 | | | | 165,299 | |
MGM Growth Properties Operating Partnership 144A 4.50% 9/1/26 # | | | 250,000 | | | | 246,875 | |
Starbucks
2.45% 6/15/26 | | | 80,000 | | | | 80,185 | |
Starwood Hotels & Resorts Worldwide | | | | | | | | |
3.75% 3/15/25 | | | 145,000 | | | | 149,724 | |
4.50% 10/1/34 | | | 20,000 | | | | 20,392 | |
Target 3.625% 4/15/46 | | | 225,000 | | | | 222,242 | |
Toyota Motor Credit 2.80% 7/13/22 | | | 140,000 | | | | 145,876 | |
Walgreens Boots Alliance | | | | | | | | |
3.10% 6/1/23 | | | 350,000 | | | | 354,672 | |
3.45% 6/1/26 | | | 195,000 | | | | 199,161 | |
4.80% 11/18/44 | | | 40,000 | | | | 42,997 | |
| | | | | | | | |
| | |
| | | | | | | 4,755,232 | |
| | | | | | | | |
Consumer Non-Cyclical – 5.93% | | | | | |
AbbVie | | | | | | | | |
3.20% 5/14/26 | | | 190,000 | | | | 187,224 | |
4.45% 5/14/46 | | | 70,000 | | | | 69,359 | |
Altria Group
3.875% 9/16/46 | | | 260,000 | | | | 257,093 | |
Anheuser-Busch InBev Finance
3.65% 2/1/26 | | | 740,000 | | | | 779,571 | |
Aramark Services 144A
4.75% 6/1/26 # | | | 230,000 | | | | 230,575 | |
Becle 144A
3.75% 5/13/25 # | | | 150,000 | | | | 152,805 | |
Becton Dickinson & Co.
6.375% 8/1/19 | | | 120,000 | | | | 134,638 | |
Biogen | | | | | | | | |
4.05% 9/15/25 | | | 50,000 | | | | 53,378 | |
5.20% 9/15/45 | | | 125,000 | | | | 141,506 | |
BRF 144A
4.35% 9/29/26 # | | | 200,000 | | | | 194,400 | |
Celgene 3.25% 8/15/22 | | | 425,000 | | | | 441,957 | |
Gilead Sciences | | | | | | | | |
2.95% 3/1/27 | | | 115,000 | | | | 113,856 | |
4.15% 3/1/47 | | | 290,000 | | | | 288,606 | |
Gruma 144A
4.875% 12/1/24 # | | | 200,000 | | | | 217,500 | |
JBS USA 144A
5.75% 6/15/25 # | | | 90,000 | | | | 88,650 | |
48
| | | | | | | | |
| | | Principal
amount° | | | Value
(U.S. $) | |
| |
Corporate Bonds (continued) | | | | | |
| |
Consumer Non-Cyclical (continued) | |
Kraft Heinz Foods
3.00% 6/1/26 | | | 245,000 | | | $ | 242,746 | |
Molson Coors Brewing | | | | | | | | |
3.00% 7/15/26 | | | 110,000 | | | | 109,268 | |
4.20% 7/15/46 | | | 115,000 | | | | 115,456 | |
Mylan 144A
3.95% 6/15/26 # | | | 390,000 | | | | 389,766 | |
New York & Presbyterian Hospital
4.063% 8/1/56 | | | 130,000 | | | | 133,629 | |
PepsiCo
2.375% 10/6/26 | | | 190,000 | | | | 186,533 | |
Pernod Ricard | | | | | | | | |
144A 3.25% 6/8/26 # | | | 165,000 | | | | 166,069 | |
144A 4.45% 1/15/22 # | | | 300,000 | | | | 328,826 | |
Reynolds American | | | | | | | | |
4.00% 6/12/22 | | | 25,000 | | | | 26,924 | |
4.45% 6/12/25 | | | 170,000 | | | | 186,936 | |
Shire Acquisitions Investments Ireland | | | | | | | | |
2.40% 9/23/21 | | | 160,000 | | | | 158,941 | |
2.875% 9/23/23 | | | 150,000 | | | | 147,749 | |
3.20% 9/23/26 | | | 90,000 | | | | 88,563 | |
Sigma Alimentos 144A
4.125% 5/2/26 # | | | 200,000 | | | | 201,700 | |
St. Jude Medical
2.80% 9/15/20 | | | 75,000 | | | | 76,730 | |
Sysco 3.30% 7/15/26 | | | 400,000 | | | | 408,646 | |
Tempur Sealy International
5.50% 6/15/26 | | | 335,000 | | | | 345,888 | |
Teva Pharmaceutical Finance Netherlands III | | | | | | | | |
2.20% 7/21/21 | | | 10,000 | | | | 9,890 | |
2.80% 7/21/23 | | | 545,000 | | | | 537,117 | |
Thermo Fisher Scientific
3.00% 4/15/23 | | | 545,000 | | | | 553,979 | |
Zimmer Biomet Holdings | | | | | | | | |
4.45% 8/15/45 | | | 10,000 | | | | 9,898 | |
4.625% 11/30/19 | | | 120,000 | | | | 129,491 | |
| | | | | | | | |
| | |
| | | | | | | 7,905,863 | |
| | | | | | | | |
Electric – 6.88% | | | | | | | | |
AES 5.50% 4/15/25 | | | 110,000 | | | | 111,650 | |
AES Gener 144A | | | | | | | | |
5.25% 8/15/21 # | | | 200,000 | | | | 212,536 | |
Ameren 3.65% 2/15/26 | | | 300,000 | | | | 315,586 | |
Ameren Illinois
9.75% 11/15/18 | | | 295,000 | | | | 343,117 | |
American Transmission Systems 144A
5.25% 1/15/22 # | | | 50,000 | | | | 57,086 | |
| | | | | | | | |
| | | Principal
amount° | | | Value
(U.S. $) | |
| |
Corporate Bonds (continued) | | | | | |
| |
Electric (continued) | | | | | |
Appalachian Power
4.45% 6/1/45 | | | 75,000 | | | $ | 81,137 | |
Berkshire Hathaway Energy
3.75% 11/15/23 | | | 345,000 | | | | 373,251 | |
Black Hills | | | | | | | | |
3.15% 1/15/27 | | | 70,000 | | | | 70,236 | |
3.95% 1/15/26 | | | 45,000 | | | | 47,863 | |
CenterPoint Energy 5.95% 2/1/17 | | | 5,000 | | | | 5,053 | |
Cleveland Electric Illuminating
5.50% 8/15/24 | | | 75,000 | | | | 88,047 | |
CMS Energy
6.25% 2/1/20 | | | 120,000 | | | | 136,026 | |
ComEd Financing III 6.35% 3/15/33 @ | | | 60,000 | | | | 62,354 | |
Commonwealth Edison | | | | | | | | |
3.65% 6/15/46 | | | 20,000 | | | | 20,009 | |
4.35% 11/15/45 | | | 135,000 | | | | 149,654 | |
Consumers Energy | | | | | | | | |
3.25% 8/15/46 | | | 195,000 | | | | 186,781 | |
4.10% 11/15/45 | | | 40,000 | | | | 43,743 | |
Dominion Resources | | | | | | | | |
2.85% 8/15/26 | | | 30,000 | | | | 29,606 | |
3.90% 10/1/25 | | | 240,000 | | | | 256,342 | |
DTE Energy | | | | | | | | |
2.85% 10/1/26 | | | 140,000 | | | | 137,667 | |
3.30% 6/15/22 | | | 115,000 | | | | 120,888 | |
Duke Energy | | | | | | | | |
2.65% 9/1/26 | | | 30,000 | | | | 29,253 | |
4.80% 12/15/45 | | | 90,000 | | | | 101,244 | |
Duke Energy Carolinas
3.875% 3/15/46 | | | 80,000 | | | | 82,941 | |
Emera 6.75% 6/15/76 ● | | | 215,000 | | | | 238,009 | |
Emera US Finance 144A
4.75% 6/15/46 # | | | 285,000 | | | | 304,092 | |
Enel 144A
8.75% 9/24/73 #● | | | 200,000 | | | | 233,900 | |
Enel Finance International 144A
6.00% 10/7/39 # | | | 100,000 | | | | 119,636 | |
Enersis Americas
4.00% 10/25/26 | | | 30,000 | | | | 29,995 | |
Entergy | | | | | | | | |
2.95% 9/1/26 | | | 40,000 | | | | 39,647 | |
4.00% 7/15/22 | | | 40,000 | | | | 43,068 | |
Entergy Louisiana | | | | | | | | |
4.05% 9/1/23 | | | 315,000 | | | | 342,662 | |
4.95% 1/15/45 | | | 10,000 | | | | 10,657 | |
Schedules of investments
Delaware Pooled® Trust — The Core Plus Fixed Income Portfolio
| | | | | | | | |
| | | Principal amount° | | | Value (U.S. $) | |
| |
Corporate Bonds (continued) | | | | | |
| |
Electric (continued) | | | | | |
Entergy Mississippi
2.85% 6/1/28 | | | 115,000 | | | $ | 114,978 | |
Exelon 3.95% 6/15/25 | | | 220,000 | | | | 234,986 | |
Fortis 144A
3.055% 10/4/26 # | | | 280,000 | | | | 276,116 | |
Great Plains Energy
4.85% 6/1/21 | | | 35,000 | | | | 38,233 | |
Indiana Michigan Power | | | | | | | | |
3.20% 3/15/23 | | | 10,000 | | | | 10,355 | |
4.55% 3/15/46 | | | 45,000 | | | | 48,936 | |
IPALCO Enterprises | | | | | | | | |
3.45% 7/15/20 | | | 115,000 | | | | 118,450 | |
5.00% 5/1/18 | | | 35,000 | | | | 36,750 | |
ITC Holdings
3.25% 6/30/26 | | | 50,000 | | | | 50,512 | |
Kansas City Power & Light
3.65% 8/15/25 | | | 220,000 | | | | 228,351 | |
LG&E & KU Energy
4.375% 10/1/21 | | | 165,000 | | | | 180,560 | |
Louisville Gas & Electric | | | | | | | | |
3.30% 10/1/25 | | | 15,000 | | | | 15,863 | |
4.375% 10/1/45 | | | 40,000 | | | | 44,297 | |
Massachusetts Electric 144A
4.004% 8/15/46 # | | | 295,000 | | | | 300,178 | |
Metropolitan Edison 144A
4.00% 4/15/25 # | | | 110,000 | | | | 115,145 | |
MidAmerican Energy
4.25% 5/1/46 | | | 115,000 | | | | 127,584 | |
National Rural Utilities Cooperative Finance | | | | | | | | |
2.85% 1/27/25 | | | 430,000 | | | | 440,221 | |
4.75% 4/30/43 ● | | | 70,000 | | | | 71,657 | |
5.25% 4/20/46 ● | | | 60,000 | | | | 64,249 | |
NextEra Energy Capital Holdings
3.625% 6/15/23 | | | 145,000 | | | | 152,127 | |
NV Energy
6.25% 11/15/20 | | | 75,000 | | | | 87,226 | |
Pennsylvania Electric
5.20% 4/1/20 | | | 140,000 | | | | 150,450 | |
Public Service of New Hampshire
3.50% 11/1/23 | | | 45,000 | | | | 47,723 | |
Public Service of Oklahoma
5.15% 12/1/19 | | | 325,000 | | | | 354,853 | |
SCANA 4.125% 2/1/22 | | | 95,000 | | | | 98,787 | |
South Carolina Electric & Gas
4.10% 6/15/46 | | | 115,000 | | | | 119,963 | |
Southern | | | | | | | | |
2.75% 6/15/20 | | | 180,000 | | | | 185,002 | |
3.25% 7/1/26 | | | 175,000 | | | | 179,715 | |
4.40% 7/1/46 | | | 145,000 | | | | 153,779 | |
| | | | | | | | |
| | | Principal
amount° | | | Value (U.S. $) | |
| |
Corporate Bonds (continued) | | | | | |
| |
Electric (continued) | | | | | |
Trans-Allegheny Interstate Line 144A
3.85% 6/1/25 # | | | 285,000 | | | $ | 301,405 | |
Wisconsin Electric Power
4.30% 12/15/45 | | | 140,000 | | | | 154,639 | |
Xcel Energy
3.30% 6/1/25 | | | 230,000 | | | | 239,951 | |
| | | | | | | | |
| | |
| | | | | | | 9,166,777 | |
| | | | | | | | |
Energy – 3.18% | | | | | | | | |
Anadarko Petroleum
6.60% 3/15/46 | | | 135,000 | | | | 167,470 | |
BP Capital Markets
3.017% 1/16/27 | | | 125,000 | | | | 125,507 | |
Buckeye Partners
3.95% 12/1/26 | | | 115,000 | | | | 115,096 | |
CNOOC Finance 2015 Australia
2.625% 5/5/20 | | | 200,000 | | | | 203,461 | |
Colorado Interstate Gas 144A
4.15% 8/15/26 # | | | 145,000 | | | | 144,199 | |
ConocoPhillips
4.95% 3/15/26 | | | 315,000 | | | | 354,021 | |
Dominion Gas Holdings
4.60% 12/15/44 | | | 95,000 | | | | 100,142 | |
Empresa Nacional del Petroleo 144A
4.75% 12/6/21 # | | | 170,000 | | | | 182,992 | |
Energy Transfer Partners | | | | | | | | |
4.75% 1/15/26 | | | 35,000 | | | | 36,139 | |
6.125% 12/15/45 | | | 230,000 | | | | 240,613 | |
9.70% 3/15/19 | | | 59,000 | | | | 68,366 | |
EnLink Midstream Partners
4.85% 7/15/26 | | | 70,000 | | | | 71,438 | |
Enterprise Products Operating
7.034% 1/15/68 ● | | | 30,000 | | | | 31,673 | |
Newfield Exploration
5.75% 1/30/22 | | | 385,000 | | | | 403,288 | |
Noble Energy
5.05% 11/15/44 | | | 65,000 | | | | 65,832 | |
Pertamina Persero 144A
4.875% 5/3/22 # | | | 200,000 | | | | 213,922 | |
Petrobras Global Finance
8.375% 5/23/21 | | | 55,000 | | | | 60,984 | |
Petroleos Mexicanos | | | | | | | | |
6.625% 6/15/35 | | | 20,000 | | | | 20,230 | |
144A 6.75% 9/21/47 # | | | 85,000 | | | | 84,469 | |
Petronas Global Sukuk 144A
2.707% 3/18/20 # | | | 200,000 | | | | 203,518 | |
Plains All American Pipeline | | | | | | | | |
4.65% 10/15/25 | | | 55,000 | | | | 58,406 | |
8.75% 5/1/19 | | | 100,000 | | | | 115,625 | |
50
| | | | | | | | |
| | | Principal
amount° | | | Value (U.S. $) | |
| |
Corporate Bonds (continued) | | | | | |
| |
Energy (continued) | | | | | | | | |
Regency Energy Partners | | | | | | | | |
5.00% 10/1/22 | | | 70,000 | | | $ | 75,206 | |
5.875% 3/1/22 | | | 100,000 | | | | 112,121 | |
Shell International Finance | | | | | | | | |
2.875% 5/10/26 | | | 95,000 | | | | 95,295 | |
3.75% 9/12/46 | | | 50,000 | | | | 47,725 | |
4.00% 5/10/46 | | | 225,000 | | | | 223,559 | |
Tengizchevroil Finance Co. International 144A
4.00% 8/15/26 # | | | 200,000 | | | | 193,385 | |
Transcanada Trust 5.875% 8/15/76 ● | | | 100,000 | | | | 107,250 | |
Woodside Finance | | | | | | | | |
144A 3.65% 3/5/25 # | | | 65,000 | | | | 65,281 | |
144A 3.70% 9/15/26 # | | | 85,000 | | | | 84,917 | |
144A 8.75% 3/1/19 # | | | 140,000 | | | | 159,197 | |
| | | | | | | | |
| | |
| | | | | | | 4,231,327 | |
| | | | | | | | |
Finance Companies – 1.35% | | | | | |
AerCap Global Aviation
Trust 144A
6.50% 6/15/45 #● | | | 200,000 | | | | 207,000 | |
AerCap Ireland Capital
3.95% 2/1/22 | | | 450,000 | | | | 459,774 | |
Affiliated Managers Group
3.50% 8/1/25 | | | 105,000 | | | | 103,556 | |
Air Lease
3.00% 9/15/23 | | | 140,000 | | | | 138,937 | |
Aviation Capital Group | | | | | | | | |
144A 2.875% 9/17/18 # | | | 15,000 | | | | 15,282 | |
144A 4.875% 10/1/25 # | | | 185,000 | | | | 204,194 | |
144A 6.75% 4/6/21 # | | | 35,000 | | | | 41,573 | |
Equate Petrochemical 144A
3.00% 3/3/22 # | | | 200,000 | | | | 197,182 | |
Peachtree Corners Funding Trust 144A
3.976% 2/15/25 # | | | 235,000 | | | | 236,264 | |
SMBC Aviation Capital
Finance 144A
2.65% 7/15/21 # | | | 200,000 | | | | 198,452 | |
| | | | | | | | |
| | |
| | | | | | | 1,802,214 | |
| | | | | | | | |
Insurance – 0.99% | | | | | | | | |
Berkshire Hathaway
2.75% 3/15/23 | | | 80,000 | | | | 82,445 | |
Berkshire Hathaway Finance
2.90% 10/15/20 | | | 65,000 | | | | 67,714 | |
Five Corners Funding Trust
4.419% 11/15/23 | | | 100,000 | | | | 108,556 | |
| | | | | | | | |
| | | Principal
amount° | | | Value (U.S. $) | |
| |
Corporate Bonds (continued) | | | | | |
| |
Insurance (continued) | | | | | | | | |
Highmark 144A
6.125% 5/15/41 #@ | | | 15,000 | | | $ | 14,711 | |
Liberty Mutual Group 144A
4.95% 5/1/22 # | | | 25,000 | | | | 28,057 | |
Principal Life Global Funding II 144A 3.00% 4/18/26 # | | | 105,000 | | | | 106,166 | |
Prudential Financial
5.375% 5/15/45 ● | | | 85,000 | | | | 88,570 | |
TIAA Asset Management Finance | | | | | | | | |
144A 2.95% 11/1/19 # | | | 90,000 | | | | 92,633 | |
144A 4.125% 11/1/24 # | | | 460,000 | | | | 477,963 | |
XLIT | | | | | | | | |
4.45% 3/31/25 | | | 85,000 | | | | 86,532 | |
5.50% 3/31/45 | | | 135,000 | | | | 130,943 | |
6.50% 12/29/49 ● | | | 45,000 | | | | 34,622 | |
| | | | | | | | |
| | |
| | | | | | | 1,318,912 | |
| | | | | | | | |
Natural Gas – 0.26% | | | | | | | | |
KeySpan Gas East 144A
2.742% 8/15/26 # | | | 155,000 | | | | 154,615 | |
Southern Co. Gas Capital | | | | | | | | |
3.25% 6/15/26 | | | 95,000 | | | | 97,448 | |
3.95% 10/1/46 | | | 90,000 | | | | 89,617 | |
| | | | | | | | |
| | |
| | | | | | | 341,680 | |
| | | | | | | | |
REITs – 1.77% | | | | | | | | |
Alexandria Real Estate Equities
3.95% 1/15/27 | | | 45,000 | | | | 47,046 | |
American Tower | | | | | | | | |
2.80% 6/1/20 | | | 70,000 | | | | 71,538 | |
3.30% 2/15/21 | | | 145,000 | | | | 150,759 | |
4.00% 6/1/25 | | | 220,000 | | | | 231,584 | |
4.40% 2/15/26 | | | 95,000 | | | | 102,462 | |
American Tower Trust I 144A
3.07% 3/15/23 # | | | 65,000 | | | | 67,632 | |
AvalonBay Communities
2.95% 5/11/26 | | | 195,000 | | | | 194,235 | |
Corporate Office Properties | | | | | | | | |
3.60% 5/15/23 | | | 45,000 | | | | 44,634 | |
5.25% 2/15/24 | | | 55,000 | | | | 59,320 | |
CubeSmart
3.125% 9/1/26 | | | 135,000 | | | | 132,891 | |
DDR 7.875% 9/1/20 | | | 165,000 | | | | 196,847 | |
Education Realty Operating
Partnership
4.60% 12/1/24 | | | 110,000 | | | | 113,843 | |
Hospitality Properties Trust
4.50% 3/15/25 | | | 65,000 | | | | 65,866 | |
Schedules of investments
Delaware Pooled® Trust — The Core Plus Fixed Income Portfolio
| | | | | | | | |
| | | Principal
amount° | | | Value (U.S. $) | |
| |
Corporate Bonds (continued) | | | | | |
| |
REITs (continued) | | | | | |
Host Hotels & Resorts
3.75% 10/15/23 | | | 135,000 | | | $ | 136,123 | |
Kite Realty Group
4.00% 10/1/26 | | | 45,000 | | | | 44,782 | |
PLA Administradora
Industrial 144A
5.25% 11/10/22 # | | | 200,000 | | | | 208,500 | |
Sovran Acquisition
3.50% 7/1/26 | | | 100,000 | | | | 100,482 | |
Trust F 144A
5.25% 1/30/26 # | | | 200,000 | | | | 207,500 | |
UDR | | | | | | | | |
2.95% 9/1/26 | | | 80,000 | | | | 79,012 | |
4.00% 10/1/25 | | | 40,000 | | | | 42,844 | |
WP Carey
4.60% 4/1/24 | | | 55,000 | | | | 57,377 | |
| | | | | | | | |
| | |
| | | | | | | 2,355,277 | |
| | | | | | | | |
Services – 0.25% | | | | | | | | |
United Rentals North America
5.75% 11/15/24 | | | 325,000 | | | | 338,814 | |
| | | | | | | | |
| | |
| | | | | | | 338,814 | |
| | | | | | | | |
Technology – 1.22% | | | | | | | | |
Apple 3.85% 8/4/46 | | | 150,000 | | | | 146,451 | |
CDK Global
4.50% 10/15/24 | | | 80,000 | | | | 80,809 | |
Cisco Systems
1.85% 9/20/21 | | | 135,000 | | | | 134,853 | |
Diamond 1 Finance 144A
6.02% 6/15/26 # | | | 245,000 | | | | 267,546 | |
Fidelity National Information Services | | | | | | | | |
3.00% 8/15/26 | | | 45,000 | | | | 44,075 | |
5.00% 10/15/25 | | | 255,000 | | | | 287,499 | |
NXP 144A
4.625% 6/1/23 # | | | 335,000 | | | | 367,663 | |
Oracle 4.00% 7/15/46 | | | 85,000 | | | | 84,157 | |
Tencent Holdings 144A
3.375% 5/2/19 # | | | 200,000 | | | | 207,014 | |
| | | | | | | | |
| | |
| | | | | | | 1,620,067 | |
| | | | | | | | |
Transportation – 1.80% | | | | | | | | |
Air Canada 2015-1 Class A Pass Through Trust 144A
3.60% 3/15/27 # ◆ | | | 62,416 | | | | 64,678 | |
American Airlines 2014-1 Class A Pass Through
Trust 3.70% 10/1/26 ◆ | | | 30,989 | | | | 32,231 | |
American Airlines 2015-1 Class A Pass Through Trust
3.375% 5/1/27 ◆ | | | 95,451 | | | | 97,479 | |
| | | | | | | | |
| | | Principal
amount° | | | Value (U.S. $) | |
| |
Corporate Bonds (continued) | | | | | |
| |
Transportation (continued) | | | | | |
American Airlines 2015-2 Class AA Pass Through
Trust 3.60% 9/22/27 ◆ | | | 34,172 | | | $ | 36,222 | |
American Airlines 2016-1 Class AA Pass Through
Trust 3.575% 1/15/28 ◆ | | | 64,841 | | | | 68,086 | |
Burlington Northern Santa Fe
4.70% 9/1/45 | | | 550,000 | | | | 630,667 | |
CSX 3.80% 11/1/46 | | | 305,000 | | | | 296,183 | |
ERAC USA Finance | | | | | | | | |
144A 3.30% 12/1/26 # | | | 235,000 | | | | 239,133 | |
144A 4.20% 11/1/46 # | | | 55,000 | | | | 53,535 | |
Penske Truck Leasing 144A
3.30% 4/1/21 # | | | 410,000 | | | | 425,126 | |
Transurban Finance 144A
3.375% 3/22/27 # | | | 60,000 | | | | 59,659 | |
United Airlines 2014-1 Class A Pass Through Trust
4.00% 4/11/26 ◆ | | | 27,456 | | | | 29,206 | |
United Airlines 2014-2 Class A Pass Through Trust
3.75% 9/3/26 ◆ | | | 65,963 | | | | 69,384 | |
United Airlines 2016-1 Class AA Pass Through Trust
3.10% 7/7/28 ◆ | | | 105,000 | | | | 107,811 | |
United Parcel Service
5.125% 4/1/19 | | | 175,000 | | | | 190,906 | |
| | | | | | | | |
| | |
| | | | | | | 2,400,306 | |
| | | | | | | | |
| |
Total Corporate Bonds
(cost $60,172,439) | | | | 61,247,298 | |
| | | | | | | | |
| | | | | |
| |
Municipal Bonds – 1.30% | |
| |
Bay Area Toll Authority
(Build America Bonds)
Series S-3 6.907%
10/1/50 | | | 175,000 | | | | 267,829 | |
California State
(Build America Bonds)
7.55% 4/1/39 | | | 140,000 | | | | 217,309 | |
(Various Purpose Group) Series B 5.00% 9/1/26 | | | 95,000 | | | | 120,972 | |
Commonwealth of
Massachusetts | | | | | | | | |
Series B 5.00% 7/1/26 | | | 35,000 | | | | 44,664 | |
Series C 5.00% 10/1/25 | | | 85,000 | | | | 107,454 | |
Series D 5.00% 4/1/26 | | | 35,000 | | | | 44,514 | |
Dallas, Texas Area Rapid Transit
Series A 5.00% 12/1/46 | | | 140,000 | | | | 164,058 | |
52
| | | | | | | | |
| | | Principal amount° | | | Value (U.S. $) | |
| |
Municipal Bonds (continued) | | | | | |
| |
New Jersey Turnpike Authority | | | | | | | | |
Series E 5.00% 1/1/45 | | | 140,000 | | | $ | 161,787 | |
(Build America Bonds) Series A 7.102% 1/1/41 | | | 95,000 | | | | 140,228 | |
Series F 7.414% 1/1/40 | | | 45,000 | | | | 68,463 | |
New York City, New York | | | | | | | | |
Series C 5.00% 8/1/26 | | | 65,000 | | | | 81,975 | |
Series C 5.00% 8/1/27 | | | 35,000 | | | | 43,689 | |
South Carolina Public Service Authority Series D 4.77% 12/1/45 | | | 55,000 | | | | 60,719 | |
Texas Water Development Board | | | | | | | | |
5.00% 10/15/46 | | | 125,000 | | | | 148,988 | |
Series A 5.00% 10/15/45 | | | 45,000 | | | | 53,618 | |
| | | | | | | | |
Total Municipal Bonds
(cost $1,739,364) | | | | | | | 1,726,267 | |
| | | | | | | | |
| | | | | | | |
| |
Non-Agency Asset-Backed Securities – 4.76% | |
| |
AEP Texas Central Transition Funding II Series 2006-A A4
5.17% 1/1/18 | | | 52,899 | | | | 54,201 | |
Ally Master Owner Trust | | | | | | | | |
Series 2012-5 A
1.54% 9/15/19 | | | 110,000 | | | | 110,348 | |
Series 2014-4 A2
1.43% 6/17/19 | | | 185,000 | | | | 185,304 | |
American Express Credit Account Master Trust
Series 2014-3 A
1.49% 4/15/20 | | | 100,000 | | | | 100,377 | |
ARI Fleet Lease Trust
Series 2015-A A2 144A
1.11% 11/15/18 # | | | 55,949 | | | | 55,863 | |
Avis Budget Rental Car
Funding AESOP
Series 2013-1A A 144A
1.92% 9/20/19 # | | | 100,000 | | | | 99,855 | |
Bank of America Credit Card Trust
Series 2016-A1 A
0.925% 10/15/21 ● | | | 130,000 | | | | 130,389 | |
California Republic Auto
Receivables Trust
Series 2013-1 A2 144A
1.41% 9/17/18 # | | | 6,972 | | | | 6,978 | |
| | | | | | | | |
| | | Principal amount° | | | Value (U.S. $) | |
| |
Non-Agency Asset-Backed Securities (continued) | |
| |
Capital One Multi-Asset Execution Trust | | | | | | | | |
Series 2007-A2 A2 0.615% 12/16/19 ● | | | 100,000 | | | $ | 100,000 | |
Series 2014-A4 A 0.895% 6/15/22 ● | | | 80,000 | | | | 79,960 | |
Chase Issuance Trust | | | | | | | | |
Series 2007-C1 C1 0.995% 4/15/19 ● | | | 100,000 | | | | 99,972 | |
Series 2013-A6 A6 0.955% 7/15/20 ● | | | 200,000 | | | | 200,853 | |
Citibank Credit Card Issuance Trust
Series 2014-A9 A9
0.796% 11/23/18 ● | | | 100,000 | | | | 100,008 | |
CNH Equipment Trust
Series 2016-B A2B
0.935% 10/15/19 ● | | | 25,000 | | | | 25,034 | |
Discover Card Execution Note Trust | | | | | | | | |
Series 2013-A1 A1 0.835% 8/17/20 ● | | | 200,000 | | | | 200,379 | |
Series 2014-A1 A1 0.965% 7/15/21 ● | | | 200,000 | | | | 200,754 | |
Series 2016-A2 A2 1.075% 9/15/21 ● | | | 100,000 | | | | 100,715 | |
Ford Credit Auto Lease Trust
Series 2015-A A3
1.13% 6/15/18 | | | 80,000 | | | | 80,027 | |
Ford Credit Auto Owner Trust | | | | | | | | |
Series 2016-2 A 144A 2.03% 12/15/27 # | | | 245,000 | | | | 246,077 | |
Series 2016-B A2B 0.845% 3/15/19 ● | | | 110,000 | | | | 110,119 | |
Golden Credit Card Trust | | | | | | | | |
Series 2014-2A A 144A 0.985% 3/15/21 #● | | | 450,000 | | | | 450,314 | |
GreatAmerica Leasing Receivables
Series 2014-1 A3 144A
0.89% 7/15/17 # | | | 14,966 | | | | 14,964 | |
HOA Funding
Series 2014-1A A2 144A
4.846% 8/20/44 # | | | 48,000 | | | | 43,338 | |
Honda Auto Receivables Owner Trust
Series 2015-3 A3
1.27% 4/18/19 | | | 100,000 | | | | 100,175 | |
Schedules of investments
Delaware Pooled® Trust — The Core Plus Fixed Income Portfolio
| | | | | | | | |
| | | Principal amount° | | | Value (U.S. $) | |
| |
Non-Agency Asset-Backed Securities (continued) | |
| |
Hyundai Auto Receivables Trust
Series 2015-C A2B
0.905% 11/15/18 ● | | | 84,333 | | | $ | 84,376 | |
Mercedes-Benz Auto Lease Trust
Series 2016-A A2B
1.095% 7/16/18 ● | | | 76,936 | | | | 77,044 | |
Mercedes-Benz Master Owner Trust
Series 2016-AA A 144A
1.115% 5/15/20 #● | | | 100,000 | | | | 100,399 | |
Navistar Financial Dealer Note
Master Owner Trust II
Series 2016-1 A 144A
2.146% 9/27/21 #● | | | 65,000 | | | | 65,369 | |
NextGear Floorplan Master
Owner Trust
Series 2014-1A A 144A
1.92% 10/15/19 # | | | 115,000 | | | | 114,867 | |
Nissan Auto Lease Trust | | | | | | | | |
Series 2015-B A2B 1.065% 12/15/17 ● | | | 59,677 | | | | 59,760 | |
Series 2016-A A2B 0.915% 8/15/18 ● | | | 80,000 | | | | 80,102 | |
Penarth Master Issuer | | | | | | | | |
Series 2015-1A A1 144A 0.936% 3/18/19 #● | | | 150,000 | | | | 149,892 | |
Series 2015-2A A1 144A 0.936% 5/18/19 #● | | | 200,000 | | | | 199,935 | |
PFS Financing
Series 2015-AA A 144A
1.155% 4/15/20 #● | | | 100,000 | | | | 99,901 | |
Porsche Innovative Lease
Owner Trust
Series 2015-1 A3 144A
1.19% 7/23/18 # | | | 100,000 | | | | 100,046 | |
Synchrony Credit Card Master
Note Trust
Series 2012-6 A
1.36% 8/17/20 | | | 100,000 | | | | 100,154 | |
Toyota Auto Receivables
Owner Trust
Series 2016-B A2B
0.785% 10/15/18 ● | | | 80,000 | | | | 80,068 | |
Trade MAPS 1 | | | | | | | | |
Series 2013-1A A 144A 1.23% 12/10/18 #● | | | 250,000 | | | | 249,770 | |
Series 2013-1A B 144A 1.78% 12/10/18 #● | | | 250,000 | | | | 249,554 | |
| | | | | | | | |
| | | Principal amount° | | | Value
(U.S. $) | |
| |
Non-Agency Asset-Backed Securities (continued) | |
| |
Verizon Owner Trust
Series 2016-1A A 144A
1.42% 1/20/21 # | | | 320,000 | | | $ | 320,378 | |
Volkswagen Credit Auto
Master Trust
Series 2014-1A A2 144A
1.40% 7/22/19 # | | | 270,000 | | | | 269,784 | |
Volvo Financial Equipment | | | | | | | | |
Series 2014-1A A3 144A 0.82% 4/16/18 # | | | 17,581 | | | | 17,567 | |
Series 2014-1A B 144A 1.66% 11/16/20 # | | | 100,000 | | | | 100,027 | |
Wells Fargo Dealer Floorplan
Master Note Trust
Series 2014-2 A
0.976% 10/20/19 ● | | | 825,000 | | | | 825,448 | |
Wheels
Series 2014-1A A2 144A
0.84% 3/20/23 # | | | 31,857 | | | | 31,820 | |
World Financial Network Credit Card Master Trust
Series 2015-A A
1.015% 2/15/22 ● | | | 75,000 | | | | 75,158 | |
| | | | | | | | |
| |
Total Non-Agency Asset-Backed Securities
(cost $6,346,693) | | | | 6,347,423 | |
| | | | | | | | |
| | | | | | | |
| |
Non-Agency Collateralized Mortgage
Obligations – 1.36% | |
| |
Amherst Pierpont Securities
Series AM-9241 S
5.47% 5/15/46 =S | | | 100,000 | | | | 21,484 | |
Citicorp Residential Mortgage Trust
Series 2006-3 A5
5.875% 11/25/36 f | | | 300,000 | | | | 307,808 | |
JPMorgan Mortgage Trust | | | | | | | | |
Series 2014-2 B1 144A 3.432% 6/25/29 #● | | | 82,614 | | | | 81,642 | |
Series 2014-2 B2 144A 3.432% 6/25/29 #● | | | 82,614 | | | | 79,568 | |
Series 2014-IVR6 2A4 144A 2.50% 7/25/44 #● | | | 100,000 | | | | 100,986 | |
Series 2015-1 B1 144A 2.659% 12/25/44 #● | | | 197,313 | | | | 195,236 | |
Series 2015-4 B1 144A 3.631% 6/25/45 #● | | | 97,250 | | | | 94,690 | |
Series 2015-4 B2 144A 3.631% 6/25/45 #● | | | 97,250 | | | | 92,815 | |
Series 2015-5 B2 144A 2.894% 5/25/45 #● | | | 98,329 | | | | 92,381 | |
54
| | | | | | | | |
| | | Principal
amount° | | | Value (U.S. $) | |
| |
Non-Agency Collateralized Mortgage Obligations (continued) | |
| |
JPMorgan Mortgage Trust | | | | | | | | |
Series 2015-6 B1 144A 3.639% 10/25/45 #● | | | 97,403 | | | $ | 97,398 | |
Series 2015-6 B2 144A 3.639% 10/25/45 #● | | | 97,403 | | | | 95,637 | |
New Residential Mortgage Loan Trust
Series 2015-2A A1 144A
3.75% 8/25/55 #● | | | 88,402 | | | | 91,718 | |
Sequoia Mortgage Trust | | | | | | | | |
Series 2013-11 B1 144A 3.666% 9/25/43 #● | | | 93,065 | | | | 93,411 | |
Series 2014-2 A4 144A 3.50% 7/25/44 #● | | | 50,648 | | | | 51,803 | |
Series 2015-1 B2 144A 3.879% 1/25/45 #● | | | 43,216 | | | | 42,667 | |
Towd Point Mortgage Trust | | | | | | | | |
Series 2015-5 A1B 144A 2.75% 5/25/55 #● | | | 86,656 | | | | 87,803 | |
Series 2015-6 A1B 144A 2.75% 4/25/55 #● | | | 89,660 | | | | 90,936 | |
WinWater Mortgage Loan Trust
Series 2015-3 B1 144A
3.908% 3/20/45 #● | | | 96,851 | | | | 98,514 | |
| | | | | | | | |
Total Non-Agency Collateralized Mortgage Obligations
(cost $1,771,292) | | | | 1,816,497 | |
| | | | | | | | |
| | | | | | | |
| |
Non-Agency Commercial Mortgage-Backed Securities – 5.00% | |
| |
Banc of America Commercial Mortgage Trust
Series 2007-4 AM
5.813% 2/10/51 ● | | | 60,000 | | | | 61,660 | |
Bear Stearns Commercial Mortgage Securities Trust
Series 2007-PWR18 A4
5.70% 6/11/50 | | | 47,649 | | | | 48,963 | |
Citigroup Commercial | | | | | | | | |
Mortgage Trust | | | | | | | | |
Series 2007-C6 AM 5.711% 12/10/49 ● | | | 60,000 | | | | 60,868 | |
Series 2014-GC25 A4 3.635% 10/10/47 | | | 100,000 | | | | 107,115 | |
Series 2015-GC27 A5 3.137% 2/10/48 | | | 150,000 | | | | 155,254 | |
Series 2016-P3 A4 3.329% 4/15/49 | | | 110,000 | | | | 115,384 | |
Series 2016-P5 A4 2.941% 10/10/49 | | | 95,000 | | | | 96,221 | |
| | | | | | | | |
| | | Principal
amount° | | | Value (U.S. $) | |
| |
Non-Agency Commercial Mortgage-Backed Securities (continued) | |
COMM Mortgage Trust | | | | | | | | |
Series 2013-CR6 AM 144A 3.147% 3/10/46 # | | | 105,000 | | | $ | 107,927 | |
Series 2014-CR19 A5 3.796% 8/10/47 | | | 80,000 | | | | 86,561 | |
Series 2014-CR20 AM 3.938% 11/10/47 | | | 350,000 | | | | 374,068 | |
Series 2015-3BP A 144A 3.178% 2/10/35 # | | | 130,000 | | | | 134,833 | |
Series 2015-CR23 A4 3.497% 5/10/48 | | | 55,000 | | | | 58,229 | |
Commercial Mortgage Trust
Series 2007-GG9 AM
5.475% 3/10/39 | | | 75,000 | | | | 75,259 | |
DB-JPM | | | | | | | | |
Series 2016-C1 A4 3.276% 5/10/49 | | | 195,000 | | | | 203,955 | |
Series 2016-C1 B 4.195% 5/10/49 ● | | | 25,000 | | | | 26,932 | |
Series 2016-C3 A5 2.89% 9/10/49 | | | 230,000 | | | | 233,002 | |
DB-UBS Mortgage Trust | | | | | | | | |
Series 2011-LC1A A3 144A 5.002% 11/10/46 # | | | 105,000 | | | | 115,550 | |
Series 2011-LC1A C 144A 5.697% 11/10/46 #● | | | 135,000 | | | | 152,298 | |
GRACE Mortgage Trust
Series 2014-GRCE A 144A
3.369% 6/10/28 # | | | 750,000 | | | | 793,550 | |
GS Mortgage Securities Trust | | | | | | | | |
Series 2010-C1 C 144A 5.635% 8/10/43 #● | | | 100,000 | | | | 108,513 | |
Series 2014-GC24 A5 3.931% 9/10/47 | | | 465,000 | | | | 507,606 | |
Series 2015-GC32 A4 3.764% 7/10/48 | | | 75,000 | | | | 81,327 | |
Hilton USA Trust
Series 2013-HLT BFX 144A
3.367% 11/5/30 # | | | 215,000 | | | | 215,114 | |
JPM-BB Commercial Mortgage Securities Trust
Series 2015-C33 A4
3.77% 12/15/48 | | | 255,000 | | | | 275,345 | |
JPM-DB Commercial Mortgage Securities Trust
Series 2016-C2 A4
3.144% 6/15/49 | | | 205,000 | | | | 212,098 | |
Schedules of investments
Delaware Pooled® Trust — The Core Plus Fixed Income Portfolio
| | | | | | | | |
| | | Principal
amount° | | | Value
(U.S. $) | |
| |
Non-Agency Commercial Mortgage-Backed Securities (continued) | |
| |
JPMorgan Chase Commercial | | | | | | | | |
Mortgage Securities | | | | | | | | |
Series 2016-WIKI A 144A 2.798% 10/5/31 # | | | 55,000 | | | $ | 56,340 | |
Series 2016-WIKI B 144A 3.201% 10/5/31 # | | | 85,000 | | | | 87,077 | |
JPMorgan Chase Commercial Mortgage Securities Trust | | | | | | | | |
Series 2005-CB11 E 5.508% 8/12/37 ● | | | 20,000 | | | | 21,362 | |
Series 2005-LDP5 D 5.551% 12/15/44 ● | | | 40,000 | | | | 39,887 | |
Series 2013-LC11 B 3.499% 4/15/46 | | | 95,000 | | | | 98,204 | |
Series 2015-JP1 A5 3.914% 1/15/49 | | | 170,000 | | | | 186,250 | |
Series 2016-JP2 A4 2.822% 8/15/49 | | | 125,000 | | | | 125,884 | |
LB-UBS Commercial Mortgage Trust | | | | | | | | |
Series 2004-C1 A4 4.568% 1/15/31 | | | 1,809 | | | | 1,809 | |
Series 2006-C6 AJ 5.452% 9/15/39 ● | | | 75,554 | | | | 70,260 | |
Morgan Stanley BAML Trust | | | | | | | | |
Series 2014-C17 A5 3.741% 8/15/47 | | | 100,000 | | | | 107,917 | |
Series 2015-C23 A4 3.719% 7/15/50 | | | 300,000 | | | | 323,296 | |
Series 2015-C26 A5 3.531% 10/15/48 | | | 135,000 | | | | 143,728 | |
Series 2016-C29 A4 3.325% 5/15/49 | | | 95,000 | | | | 99,147 | |
Morgan Stanley Capital I Trust
Series 2006-HQ10 B
5.448% 11/12/41 ● | | | 100,000 | | | | 99,907 | |
Wells Fargo Commercial
Mortgage Trust | | | | | | | | |
Series 2012-LC5 A3 2.918% 10/15/45 | | | 75,000 | | | | 78,216 | |
Series 2012-LC5 B 4.142% 10/15/45 | | | 100,000 | | | | 106,075 | |
Series 2014-LC18 A5 3.405% 12/15/47 | | | 35,000 | | | | 36,865 | |
Series 2015-NXS3 A4 3.617% 9/15/57 | | | 90,000 | | | | 96,132 | |
Series 2016-BNK1 A3 2.652% 8/15/49 | | | 155,000 | | | | 154,491 | |
Series 2016-BNK1 B 2.967% 8/15/49 | | | 30,000 | | | | 29,781 | |
| | | | | | | | |
| | | Principal
amount° | | | Value (U.S. $) | |
| |
Non-Agency Commercial Mortgage-Backed Securities (continued) | |
| |
WF-RBS Commercial Mortgage Trust
Series 2012-C10 A3 2.875% 12/15/45 | | | 275,000 | | | $ | 285,381 | |
| | | | | | | | |
| |
Total Non-Agency Commercial Mortgage-Backed Securities
(cost $6,580,627) | | | | 6,655,641 | |
| | | | | | | | |
| | | | | | | |
| |
Regional Bonds – 0.73%D | | | | | |
| |
Canada – 0.27% | | | | | | | | |
Province of British Columbia Canada
2.25% 6/2/26 | | | 245,000 | | | | 245,980 | |
Province of Manitoba Canada 2.125% 6/22/26 | | | 115,000 | | | | 113,097 | |
| | | | | | | | |
| | |
| | | | | | | 359,077 | |
| | | | | | | | |
Japan – 0.46% | | | | | | | | |
Japan Finance Organization for Municipalities | | | | | | | | |
144A 2.125% 4/13/21 # | | | 206,000 | | | | 207,130 | |
144A 2.125% 10/25/23 # | | | 212,000 | | | | 209,775 | |
Japan International Cooperation Agency | | | | | | | | |
2.125% 10/20/26 | | | 200,000 | | | | 197,102 | |
| | | | | | | | |
| | |
| | | | | | | 614,007 | |
| | | | | | | | |
| |
Total Regional Bonds
(cost $973,819) | | | | 973,084 | |
| | | | | | | | |
| | | | | | | |
| |
Senior Secured Loans – 3.60%« | | | | | |
| |
Air Medical Group Holdings Tranche B 1st Lien
4.25% 4/28/22 | | | 348,237 | | | | 346,539 | |
Aramark Services Tranche E 1st Lien 3.338% 9/7/19 | | | 45,368 | | | | 45,673 | |
Avago Technologies Cayman Finance Tranche B3 1st Lien
3.535% 2/1/23 | | | 87,714 | | | | 88,728 | |
Builders FirstSource Tranche B 1st Lien
4.75% 7/31/22 | | | 374,063 | | | | 376,354 | |
Calpine Construction Finance Tranche B 1st Lien
3.09% 5/3/20 | | | 145,125 | | | | 144,536 | |
Community Health Systems Tranche H 1st Lien
4.00% 1/27/21 | | | 170,686 | | | | 162,216 | |
DaVita Tranche B 1st Lien
3.50% 6/24/21 | | | 376,338 | | | | 377,372 | |
FCA Tranche B 1st Lien
3.50% 5/24/17 | | | 111,448 | | | | 111,705 | |
56
| | | | | | | | | | |
| | | Principal amount° | | | Value (U.S. $) | |
| |
Senior Secured Loans« (continued) | |
| |
First Data Tranche B 1st Lien
3.524% 3/24/21 | | | 336,050 | | | $ | 338,290 | |
HCA Tranche B6 1st Lien
3.784% 3/17/23 | | | 94,028 | | | | 95,078 | |
Houghton International 1st Lien
4.25% 12/20/19 | | | 187,688 | | | | 187,101 | |
IASIS Healthcare Tranche B 1st Lien
4.50% 5/3/18 | | | 22,672 | | | | 22,581 | |
Keurig Green Mountain Tranche B 1st Lien
5.25% 3/3/23 | | | 313,632 | | | | 318,337 | |
Kinetic Concepts Tranche F1
1st Lien 5.00% 11/4/20 | | | 195,992 | | | | 197,442 | |
Level 3 Financing Tranche B
1st Lien 4.00% 1/15/20 | | | 250,000 | | | | 251,562 | |
MGM Growth Properties Operating Partnership Tranche B 1st Lien
4.00% 4/25/23 | | | 348,250 | | | | 349,828 | |
NBTY Tranche B 1st Lien
5.00% 5/5/23 | | | 224,438 | | | | 225,307 | |
SFR Group Tranche B 1st Lien
5.137% 1/15/24 | | | 348,250 | | | | 350,862 | |
Solera Tranche B 1st Lien
5.75% 3/3/23 | | | 134,325 | | | | 135,976 | |
T-Mobile USA Tranche B 1st
Lien 3.50% 11/9/22 | | | 338,296 | | | | 341,226 | |
Univision Communications Tranche C4 1st Lien
4.00% 3/1/20 | | | 328,576 | | | | 329,466 | |
| | | | | | | | | | |
| |
Total Senior Secured Loans
(cost $4,773,364) | | | | 4,796,179 | |
| | | | | | | | | | |
| | | | | | | | | |
| | | | | | | | | |
| |
Sovereign Bonds – 0.45%D | | | | | |
| |
Hungary – 0.22% | | | | | |
Hungary Government International Bond
5.75% 11/22/23 | | | 250,000 | | | | 292,094 | |
| | | | | | | | | | |
| | |
| | | | | | | 292,094 | |
| | | | | | | | | | |
Mexico – 0.12% | | | | | | | | |
Mexican Bonos
8.50% 5/31/29 | | MXN | | | 2,642,000 | | | | 163,682 | |
| | | | | | | | | | |
| | | |
| | | | | | | | | 163,682 | |
| | | | | | | | | | |
| | | | | | | | | | |
| | | Principal Amount° | | | Value (U.S. $) | |
| |
Sovereign BondsD (continued) | | | | | |
| |
South Africa – 0.11% | | | | | | | | |
Republic of South Africa Government Bond
8.00% 1/31/30 | | ZAR | | | 2,042,000 | | | $ | 138,720 | |
| | | | | | | | | | |
| | |
| | | | | | | 138,720 | |
| | | | | | | | | | |
Total Sovereign Bonds
(cost $604,993) | | | | 594,496 | |
| | | | | | | | | | |
| | | | | | | | | |
| | | | | | | | | |
| |
Supranational Bank – 0.19%« | | | | | |
| |
International Bank for Reconstruction & Development
3.50% 1/22/21 | | NZD | | | 345,000 | | | | 253,634 | |
| | | | | | | | | | |
Total Supranational Bank
(cost $261,386) | | | | 253,634 | |
| | | | | | | | | | |
| | | | | | | | | |
| |
U.S. Treasury Obligations – 2.95% | | | | | |
| |
U.S. Treasury Bond
2.50% 5/15/46 ¥ | | | 1,415,000 | | | | 1,389,133 | |
U.S. Treasury Notes | | | | | | | | |
1.125% 9/30/21 | | | 920,000 | | | | 911,339 | |
1.50% 8/15/26 | | | 1,685,000 | | | | 1,634,780 | |
| | | | | | | | | | |
| |
Total U.S. Treasury Obligations
(cost $4,042,145) | | | | 3,935,252 | |
| | | | | | | | | | |
| | |
| | | Number
of shares | | | | |
| |
Convertible Preferred Stock – 0.01% | |
| |
Bank of America 7.25% exercise price $50.00, expiration date 12/31/49 | | | 1 | | | | 1,231 | |
Wells Fargo & Co. 7.50% exercise price $156.71, expiration date 12/31/49 | | | 7 | | | | 9,135 | |
| | | | | | | | | | |
| |
Total Convertible Preferred Stock
(cost $10,171) | | | | 10,366 | |
| | | | | | | | | | |
| | | | | | | | | |
| |
Preferred Stock – 0.36% | | | | | |
| |
General Electric 5.00% ● | | | 308,000 | | | | 326,680 | |
Integrys Holdings 6.00% ● | | | 1,950 | | | | 53,143 | |
PNC Preferred Funding Trust II 144A 2.073% #● | | | 100,000 | | | | 97,500 | |
| | | | | | | | | | |
| |
Total Preferred Stock
(cost $454,325) | | | | 477,323 | |
| | | | | | | | | | |
Schedules of investments
Delaware Pooled® Trust — The Core Plus Fixed Income Portfolio
| | | | | | | | |
| | | Number of Contracts | | | Value (U.S.$) | |
| |
| Options Purchased – 0.02% | |
| |
Futures Call Option – 0.01% | |
U.S. Treasury 10 yr Notes exercise price $130.5, expiration date 11/25/16 | | | 34 | | | $ | 9,563 | |
Futures Put Option – 0.01% | | | | | | | | |
U.S. Treasury 10 yr Notes exercise price $129.5 expiration date 11/25/16 | | | 34 | | | | 19,656 | |
| | | | | | | | |
Total Options Purchased
(cost $27,286) | | | | 29,219 | |
| | | | | | | | |
| | |
| | | Principal amount° | | | | |
| |
Short-Term Investments – 10.69% | |
| |
Repurchase Agreements – 10.69% | |
Bank of America Merrill Lynch
0.25%, dated 10/31/16, to be repurchased on 11/1/16, repurchase price $3,909,489 (collateralized by U.S. government obligations 2.25% 11/15/24; market value $3,987,652) | | | 3,909,462 | | | | 3,909,462 | |
Bank of Montreal
0.27%, dated 10/31/16, to be repurchased on 11/1/16, repurchase price $1,303,164 (collateralized by U.S. government obligations 0.125%–3.875% 11/30/17–2/15/45; market value $1,329,218) | | | 1,303,154 | | | | 1,303,154 | |
BNP Paribas
0.32%, dated 10/31/16, to be repurchased on 11/1/16, repurchase price $9,033,465 (collateralized by U.S. government obligations 0.00%–4.75% 4/30/17–2/15/45; market value $9,214,054) | | | 9,033,384 | | | | 9,033,384 | |
| | | | | | | | |
| | |
Total Short-Term Investments
(cost $14,246,000) | | | | | | | 14,246,000 | |
| | | | | | | | |
| | | | | | | | |
| | | | | | Value (U.S. $) | |
| |
| | | | | | | | | |
| |
Total Value of
Securities – 107.66%
(cost $142,264,262) | | | | | | $ | 143,473,643 | |
| | | | | | | | |
| # | Security exempt from registration under Rule 144A of the Securities Act of 1933, as amended. At Oct. 31, 2016, the aggregate value of Rule 144A securities was $29,423,931, which represents 22.08% of the Portfolio’s net assets. See Note 11 in “Notes to financial statements.” |
| @ | Illiquid security. At Oct. 31, 2016, the aggregate value of illiquid securities was $91,755, which represents 0.07% of the Portfolio’s net assets. See Note 11 in “Notes to financial statements.” |
| ◆ | Pass Through Agreement. Security represents the contractual right to receive a proportionate amount of underlying payments due to the counterparty pursuant to various agreements related to the rescheduling of obligations and the exchange of certain notes. |
| = | Security is being fair valued in accordance with the Portfolio’s fair valuation policy. At Oct. 31, 2016, the aggregate value of fair valued securities was $3,357,626, which represents 2.52% of the Portfolio’s net assets. See Note 1 in “Notes to financial statements.” |
| « | Senior secured loans generally pay interest at rates which are periodically reset by reference to a base lending rate plus a premium. These base lending rates are generally: (i) the prime rate offered by one or more U.S. banks, (ii) the lending rate offered by one or more European banks such as the London Interbank Offered Rate (LIBOR), and (iii) the certificate of deposit rate. Senior secured loans may be subject to restrictions on resale. Stated rate in effect at Oct. 31, 2016. |
| ° | Principal amount shown is stated in U.S. dollars unless noted that the security is denominated in another currency. |
| D | Securities have been classified by country of origin. |
| ∑ | Interest only security. An interest only security is the interest only portion of a fixed income security, which is separated and sold individually from the principal portion of the security. |
| ● | Variable rate security. Each rate shown is as of Oct. 31, 2016. Interest rates reset periodically. |
| f | Step coupon bond. Coupon increases or decreases periodically based on a predetermined schedule. Stated rate in effect at Oct. 31, 2016. |
| ¥ | Fully or partially pledged as collateral for futures contracts. |
58
The following foreign currency exchange contracts, futures contracts and swap contracts were outstanding at Oct. 31, 2016:1
Foreign Currency Exchange Contracts
| | | | | | | | | | | | | | | | | | | | | | | | |
Counterparty | | Contracts to
Receive (Deliver) | | | In Exchange For | | | Settlement
Date | | | Unrealized
Appreciation
(Depreciation) | |
BCLY | | | COP | | | | 198,203,237 | | | | USD | | | | (67,149) | | | | 12/9/16 | | | $ | (1,646) | |
TD | | | INR | | | | 13,814,903 | | | | USD | | | | (206,361) | | | | 12/9/16 | | | | (391) | |
TD | | | ZAR | | | | (786,000) | | | | USD | | | | 55,987 | | | | 12/9/16 | | | | (1,844) | |
| | | | | | | | | | | | | | | | | | | | | | | | |
| | | | | | | | | | | | | | | | | | | | | | $ | (3,881) | |
| | | | | | | | | | | | | | | | | | | | | | | | |
Futures Contracts
| | | | | | | | | | | | | | | | | | |
Contracts to Buy (Sell) | | Notional
Cost
(Proceeds) | | | Notional
Value | | | Expiration
Date | | | Unrealized
Appreciation
(Depreciation) | |
| (1) | | E-mini S&P 500 Index | | $ | (106,740) | | | $ | (106,005) | | | | 12/19/16 | | | $ | 735 | |
| | U.S. Treasury 10 yr | | | | | | | | | | | | | | | | |
| (42) | | Notes | | | (5,468,792) | | | | (5,444,250) | | | | 12/21/16 | | | | 24,542 | |
| | U.S. Treasury Long | | | | | | | | | | | | | | | | |
| (21) | | Bonds | | | (3,414,781) | | | | (3,417,094) | | | | 12/21/16 | | | | (2,313) | |
| | | | | | | | | | | | | | | | | | |
| | | | $ | (8,990,313) | | | | | | | | | | | $ | 22,964 | |
| | | | | | | | | | | | | | | | | | |
Swap Contracts
Credit Default Swap (CDS) Contracts2
| | | | | | | | | | | | | | | | | | | | | | |
Counterparty | | Swap Referenced Obligation | | Notional
Value3 | | | Annual Protection
Payments | | | Termination
Date | | | Upfront
Payments
Paid
(Received) | | | Unrealized
Appreciation
(Depreciation)4 | |
| | | | | | |
| | Protection Purchased: | | | | | | | | | | | | | | | | | | | | |
CITI | | ICE - CDX.NA.HY.275 | | | 330,000 | | | | 5.00% | | | | 12/20/21 | | | $ | (12,846 | ) | | | $1,534 | |
The use of foreign currency exchange contracts, futures contracts, and swap contracts involves elements of market risk and risks in excess of the amounts disclosed in the financial statements. The foreign currency exchange contracts and notional values presented above represent the Portfolio’s total exposure in such contracts, whereas only the net unrealized appreciation (depreciation) is reflected in the Portfolio’s net assets.
1See Note 8 in “Notes to financial statements.”
2A CDS contract is a risk-transfer instrument through which one party (purchaser of protection) transfers to another party (seller of protection) the financial risk of a credit event (as defined in the CDS agreement), as it relates to a particular reference security or basket of securities (such as an index). Periodic payments (receipts) on such contracts are accrued daily and recorded as unrealized losses (gains) on swap contracts. Upon payment (receipt), such amounts are recorded as realized losses (gains) on swap contracts. Upfront
payments made or received in connection with CDS contracts are amortized over the expected life of the CDS contracts as unrealized losses (gains) on swap contracts. The change in value of CDS contracts is recorded daily as unrealized appreciation or depreciation. A realized gain or loss is recorded upon a credit event (as defined in the CDS agreement) or the maturity or termination of the agreement.
3Notional value shown is stated in U.S. Dollars unless noted that the swap is denominated in another currency.
4Unrealized appreciation (depreciation) does not include periodic interest payments (receipts) on swap contracts accrued daily in the amount of ($826).
5Markit’s CDX.NA.HY Index, is composed of one hundred (100) of the most liquid North American entities with high yield credit ratings that trade in the CDS market.
Schedules of investments
Delaware Pooled® Trust — The Core Plus Fixed Income Portfolio
Summary of abbreviations:
ARM – Adjustable Rate Mortgage
BCLY – Barclays Bank
COP – Colomblan Peso
CDS – Credit Default Swap
CDX.NA.HY – Credit Default Swap Index North America High Yield
CITI – Citigroup Global Markets
CLO – Collateralized Loan Obligation
DB – Deutsche Bank
GNMA – Government National Mortgage Association
GS – Goldman Sachs
ICE – Intercontinental Exchange, Inc.
INR – Indian Rupee
JPM – JPMorgan
LB – Lehman Brothers
MXN – Mexican Peso
NZD – New Zealand Dollar
RBS – Royal Bank of Scotland
REIT – Real Estate Investment Trust
REMIC – Real Estate Mortgage Investment Conduit
S.F. – Single Family
TD – Toronto Dominion Bank
UBS – Union Bank of Switzerland
USD – U.S. Dollar
WF – Wells Fargo
yr – Year
ZAR – South African Rand
See accompanying notes, which are an integral part
of the financial statements.
60
Delaware Pooled® Trust — The Labor Select International Equity Portfolio
October 31, 2016
| | | | | | | | |
| | | Number of
shares | | | Value (U.S. $) | |
| |
Common Stock – 98.55%D | |
| |
Australia – 1.34% | |
QBE Insurance Group | | | 697,008 | | | $ | 5,296,838 | |
| | | | | | | | |
| | |
| | | | | | | 5,296,838 | |
| | | | | | | | |
Denmark – 0.94% | |
ISS | | | 93,846 | | | | 3,689,686 | |
| | | | | | | | |
| | |
| | | | | | | 3,689,686 | |
| | | | | | | | |
France – 7.00% | |
Cie de Saint-Gobain | | | 213,076 | | | | 9,460,254 | |
GDF Suez VVPR Strip @=† | | | 101,871 | | | | 0 | |
Sanofi | | | 166,142 | | | | 12,941,854 | |
Societe Generale | | | 133,933 | | | | 5,228,207 | |
| | | | | | | | |
| | |
| | | | | | | 27,630,315 | |
| | | | | | | | |
Germany – 9.12% | |
Allianz | | | 59,376 | | | | 9,255,561 | |
Daimler | | | 107,966 | | | | 7,693,112 | |
SAP | | | 127,268 | | | | 11,210,206 | |
Telefonica Deutschland Holding | | | 2,027,399 | | | | 7,858,513 | |
| | | | | | | | |
| | |
| | | | | | | 36,017,392 | |
| | | | | | | | |
Italy – 4.13% | |
Enel | | | 1,723,395 | | | | 7,416,079 | |
Eni | | | 612,174 | | | | 8,877,305 | |
| | | | | | | | |
| | |
| | | | | | | 16,293,384 | |
| | | | | | | | |
Japan – 18.87% | |
Canon | | | 336,600 | | | | 9,683,629 | |
Honda Motor | | | 448,500 | | | | 13,446,018 | |
Hoya | | | 93,400 | | | | 3,905,397 | |
Kirin Holdings | | | 736,100 | | | | 12,687,144 | |
Mitsubishi Electric | | | 493,000 | | | | 6,687,256 | |
NTT DOCOMO | | | 91,200 | | | | 2,296,306 | |
Sumitomo Electric Industries | | | 58,100 | | | | 861,223 | |
Takeda Pharmaceutical | | | 265,400 | | | | 11,894,536 | |
Tokio Marine Holdings | | | 218,100 | | | | 8,628,749 | |
Tokyo Electron | | | 48,700 | | | | 4,406,080 | |
| | | | | | | | |
| | |
| | | | | | | 74,496,338 | |
| | | | | | | | |
Netherlands – 2.38% | |
Koninklijke Ahold Delhaize | | | 411,703 | | | | 9,398,237 | |
| | | | | | | | |
| | |
| | | | | | | 9,398,237 | |
| | | | | | | | |
Singapore – 6.96% | |
Ascendas Real Estate Investment Trust | | | 2,091,700 | | | | 3,563,219 | |
Sembcorp Industries | | | 1,153,900 | | | | 2,098,377 | |
Singapore Telecommunications | | | 4,088,600 | | | | 11,402,529 | |
| | | | | | | | |
| | | Number of
shares | | | Value (U.S. $) | |
| |
Common StockD (continued) | |
| |
Singapore (continued) | | | | | | | | |
United Overseas Bank | | | 772,942 | | | $ | 10,433,675 | |
| | | | | | | | |
| | |
| | | | | | | 27,497,800 | |
| | | | | | | | |
Spain – 5.73% | |
Banco Santander | | | 489,971 | | | | 2,408,025 | |
Iberdrola | | | 1,624,923 | | | | 11,075,364 | |
Telefonica | | | 899,919 | | | | 9,147,825 | |
| | | | | | | | |
| | |
| | | | | | | 22,631,214 | |
| | | | | | | | |
Sweden – 3.81% | |
Telefonaktiebolaget LM
Ericsson Class B | | | 1,023,818 | | | | 4,955,778 | |
Telia | | | 2,527,326 | | | | 10,101,302 | |
| | | | | | | | |
| | |
| | | | | | | 15,057,080 | |
| | | | | | | | |
Switzerland – 12.60% | |
ABB † | | | 589,340 | | | | 12,149,498 | |
Nestle | | | 112,788 | | | | 8,177,999 | |
Novartis | | | 99,082 | | | | 7,049,035 | |
Syngenta | | | 29,117 | | | | 11,640,327 | |
Zurich Insurance Group † | | | 41,076 | | | | 10,746,881 | |
| | | | | | | | |
| | |
| | | | | | | 49,763,740 | |
| | | | | | | | |
United Kingdom – 25.67% | |
Amec Foster Wheeler | | | 556,350 | | | | 3,045,309 | |
BP | | | 2,322,248 | | | | 13,748,841 | |
G4S | | | 2,593,935 | | | | 6,984,948 | |
GlaxoSmithKline | | | 631,881 | | | | 12,517,841 | |
J Sainsbury | | | 457,883 | | | | 1,406,166 | |
Kingfisher | | | 2,177,531 | | | | 9,629,721 | |
Lloyds Banking Group | | | 13,123,381 | | | | 9,197,684 | |
National Grid | | | 626,187 | | | | 8,162,723 | |
Pearson | | | 568,859 | | | | 5,274,347 | |
Royal Dutch Shell Class B | | | 515,856 | | | | 13,354,274 | |
Tesco † | | | 3,961,871 | | | | 10,219,963 | |
Unilever | | | 186,354 | | | | 7,796,366 | |
| | | | | | | | |
| | |
| | | | | | | 101,338,183 | |
| | | | | | | | |
| | |
Total Common Stock
(cost $412,323,497) | | | | | | | 389,110,207 | |
| | | | | | | | |
| | | | | | | | |
| |
Right – 0.01% | |
| |
Banco Santander † | | | 489,971 | | | | 27,431 | |
| | | | | | | | |
Total Right (cost $25,341) | | | | 27,431 | |
| | | | | | | | |
Schedules of investments
Delaware Pooled® Trust — The Labor Select International Equity Portfolio
| | | | | | | | |
| | | Principal
amount° | | | Value (U.S. $) | |
| |
Short-Term Investments – 0.75% | |
| |
Discount Notes – 0.33%≠ | |
Federal Home Loan Bank | | | | | | | | |
0.279% 12/21/16 | | | 312,197 | | | $ | 312,110 | |
0.285% 11/10/16 | | | 164,448 | | | | 164,441 | |
0.30% 11/3/16 | | | 130,017 | | | | 130,016 | |
0.31% 1/25/17 | | | 215,417 | | | | 215,260 | |
0.315% 11/1/16 | | | 482,238 | | | | 482,237 | |
| | | | | | | | |
| | |
| | | | | | | 1,304,064 | |
| | | | | | | | |
Repurchase Agreements – 0.29% | |
Bank of America Merrill Lynch
0.25%, dated 10/31/16, to be repurchased on 11/1/16, repurchase price $311,475 (collateralized by U.S. government obligations
2.25% 11/15/24;market value $317,702) | | | 311,473 | | | | 311,473 | |
Bank of Montreal
0.27%, dated 10/31/16, to be repurchased on 11/1/16, repurchase price $103,825 (collateralized by U.S. government obligations
0.125%–3.875%
11/30/17–2/15/45; market value $105,901) | | | 103,824 | | | | 103,824 | |
BNP Paribas
0.32%, dated 10/31/16, to be repurchased on 11/1/16, repurchase price $719,710 (collateralized by U.S. government obligations
0.00%–4.75% 4/30/17–2/15/45; market value $734,097) | | | 719,703 | | | | 719,703 | |
| | | | | | | | |
| | |
| | | | | | | 1,135,000 | |
| | | | | | | | |
U.S. Treasury Obligation – 0.13% | |
U.S. Treasury Bill | | | | | | | | |
0.253% 11/3/16 | | | 538,283 | | | | 538,280 | |
| | | | | | | | |
| | |
| | | | | | | 538,280 | |
| | | | | | | | |
Total Short-Term Investments
(cost $2,977,301) | | | | 2,977,344 | |
| | | | | | | | |
| |
Total Value of Securities – 99.31%
(cost $415,326,139) | | | $ | 392,114,982 | |
| | | | | | | | |
| @ | Illiquid security. At Oct. 31, 2016, the aggregate value of illiquid securities was $0, which represents 0.00% of the Portfolio’s net assets. See Note 11 in “Notes to financial statements.” |
| = | Security is being fair valued in accordance with the Portfolio’s fair valuation policy. At Oct. 31, 2016,the aggregate value of fair valued securities was $0, which represents 0.00% of the Portfolio’s net assets. See Note 1 in “Notes to financial statements.” |
| ≠ | The rate shown is the effective yield at the time of purchase. |
| ° | Principal amount shown is stated in U.S. dollars unless noted that the security is denominated in another currency. |
| D | Securities have been classified by country of origin. Aggregate classification by business sectors has been presented on page 30 in “Security type / country and sector allocations.” |
| † | Non-income-producing security. |
The following foreign currency exchange contracts were outstanding at Oct. 31, 2016:1
Foreign Currency Exchange Contracts
| | | | | | | | | | | | | | | | | | | | | | | | |
Counterparty | | Contracts to
Receive (Deliver) | | | In Exchange
For | | | Settlement
Date | | | Unrealized
Appreciation
(Depreciation) | |
BNYM | | | CHF | | | | (89,056 | ) | | | USD | | | | 89,986 | | | | 11/1/16 | | | $ | (15 | ) |
BNYM | | | EUR | | | | (124,234 | ) | | | USD | | | | 135,956 | | | | 11/1/16 | | | | (427 | ) |
BNYM | | | GBP | | | | 150,118 | | | | USD | | | | (182,523 | ) | | | 11/1/16 | | | | 1,225 | |
DB | | | JPY | | | | (36,740,149 | ) | | | USD | | | | 350,841 | | | | 11/1/16 | | | | 490 | |
NT | | | JPY | | | | (75,308,900 | ) | | | USD | | | | 714,926 | | | | 11/2/16 | | | | (3,237 | ) |
| | | | | | | | | | | | | | | | | | | | | | | | |
| | | | | | | | | | | | | | | | | | | | | | $ | (1,964 | ) |
| | | | | | | | | | | | | | | | | | | | | | | | |
The use of foreign currency exchange contracts involves elements of market risk and risks in excess of these amounts disclosed in the financial statements. The foreign currency exchange contracts presented above represent the Portfolio’s total exposure in such contracts, whereas only the net unrealized appreciation (depreciation) is reflected in the Portfolio’s net assets.
1See Note 8 in “Notes to financial statements.”
Summary of abbreviations:
BNYM – BNY Mellon
CHF – Swiss Franc
DB – Deutsche Bank
EUR – European Monetary Unit
GBP – British Pound Sterling
JPY – Japanese Yen
NT – Northern Trust
USD – U.S. Dollar
VVPR Strip – Dividend Coupon
See accompanying notes, which are an integral part of the financial statements.
62
Delaware Pooled® Trust — The Emerging Markets Portfolio
October 31, 2016
| | | | | | | | |
| | | Number of
shares | | | Value (U.S. $) | |
| |
Common Stock – 96.18%D | | | | | |
| |
Brazil – 4.26% | |
Ambev ADR | | | 229,900 | | | $ | 1,356,410 | |
CCR | | | 365,800 | | | | 1,991,731 | |
Cielo | | | 231,302 | | | | 2,351,425 | |
| | | | | | | | |
| | |
| | | | | | | 5,699,566 | |
| | | | | | | | |
Chile – 1.44% | |
Banco Santander Chile ADR | | | 34,770 | | | | 794,495 | |
Cia Cervecerias Unidas | | | 105,683 | | | | 1,135,135 | |
| | | | | | | | |
| | |
| | | | | | | 1,929,630 | |
| | | | | | | | |
China – 16.43%∎ | |
Beijing Enterprises Holdings | | | 395,999 | | | | 1,981,131 | |
Belle International Holdings | | | 3,058,515 | | | | 1,853,514 | |
China BlueChemical Class H | | | 2,409,000 | | | | 465,924 | |
China Mobile | | | 356,000 | | | | 4,078,447 | |
China Resources Power Holdings | | | 1,402,038 | | | | 2,382,663 | |
CSPC Pharmaceutical Group | | | 386,000 | | | | 400,157 | |
Golden Eagle Retail Group | | | 860,000 | | | | 1,195,376 | |
Hengan International Group | | | 165,500 | | | | 1,317,718 | |
Jiangsu Expressway Class H | | | 1,466,000 | | | | 1,996,114 | |
Sands China | | | 424,000 | | | | 1,845,130 | |
Want Want China Holdings | | | 1,254,000 | | | | 764,797 | |
WH Group # | | | 4,569,000 | | | | 3,705,606 | |
| | | | | | | | |
| | |
| | | | | | | 21,986,577 | |
| | | | | | | | |
India – 12.39% | |
Axis Bank | | | 168,702 | | | | 1,234,064 | |
Bajaj Auto | | | 75,411 | | | | 3,199,462 | |
Cairn India | | | 673,819 | | | | 2,276,423 | |
HCL Technologies | | | 184,156 | | | | 2,117,869 | |
Housing Development Finance | | | 100,928 | | | | 2,084,359 | |
Indiabulls Housing Finance | | | 121,294 | | | | 1,540,447 | |
Infosys | | | 72,398 | | | | 1,085,427 | |
Larsen & Toubro | | | 84,674 | | | | 1,872,456 | |
Reliance Industries | | | 74,274 | | | | 1,168,924 | |
| | | | | | | | |
| | |
| | | | | | | 16,579,431 | |
| | | | | | | | |
Indonesia – 2.62% | |
Bank Mandiri Persero | | | 1,649,100 | | | | 1,450,293 | |
Bank Rakyat Indonesia Persero | | | 2,192,900 | | | | 2,050,382 | |
| | | | | | | | |
| | |
| | | | | | | 3,500,675 | |
| | | | | | | | |
Kazakhstan – 0.35% | |
KazMunaiGas Exploration Production GDR † | | | 61,570 | | | | 464,854 | |
| | | | | | | | |
| | |
| | | | | | | 464,854 | |
| | | | | | | | |
| | | | | | | | |
| | | Number of
shares | | | Value (U.S. $) | |
| |
Common StockD (continued) | | | | | |
| |
Malaysia – 5.17% | |
AMMB Holdings | | | 1,396,800 | | | $ | 1,398,465 | |
Genting Malaysia | | | 1,433,400 | | | | 1,626,456 | |
Malayan Banking | | | 936,520 | | | | 1,763,649 | |
Tenaga Nasional | | | 621,400 | | | | 2,124,166 | |
| | | | | | | | |
| | |
| | | | | | | 6,912,736 | |
| | | | | | | | |
Mexico – 5.30% | |
Arca Continental | | | 91,331 | | | | 567,575 | |
Fibra Uno Administracion | | | 1,753,700 | | | | 3,337,420 | |
Gentera | | | 500,700 | | | | 987,572 | |
Grupo Aeroportuario del Pacifico ADR | | | 6,100 | | | | 589,443 | |
Grupo Financiero Santander Mexico Class B ADR | | | 110,514 | | | | 1,000,152 | |
Kimberly-Clark de Mexico Class A | | | 281,100 | | | | 605,746 | |
| | | | | | | | |
| | |
| | | | | | | 7,087,908 | |
| | | | | | | | |
Peru – 1.79% | |
Credicorp | | | 16,129 | | | | 2,398,060 | |
| | | | | | | | |
| | |
| | | | | | | 2,398,060 | |
| | | | | | | | |
Philippines – 1.44% | |
PLDT ADR | | | 60,700 | | | | 1,930,260 | |
| | | | | | | | |
| | |
| | | | | | | 1,930,260 | |
| | | | | | | | |
Qatar – 2.63% | |
Qatar Electricity & Water | | | 35,253 | | | | 2,032,961 | |
Qatar National Bank | | | 33,986 | | | | 1,493,254 | |
| | | | | | | | |
| | |
| | | | | | | 3,526,215 | |
| | | | | | | | |
Republic of Korea – 9.03% | |
Hyundai Mobis | | | 14,323 | | | | 3,429,759 | |
Kangwon Land | | | 18,950 | | | | 628,492 | |
Samsung Electronics | | | 3,200 | | | | 4,583,615 | |
SK Telecom | | | 17,649 | | | | 3,447,281 | |
| | | | | | | | |
| | |
| | | | | | | 12,089,147 | |
| | | | | | | | |
Romania – 0.33% | |
Societatea Nationala de Gaze Naturale GDR | | | 79,612 | | | | 439,458 | |
| | | | | | | | |
| | |
| | | | | | | 439,458 | |
| | | | | | | | |
Russia – 2.87% | |
Gazprom ADR | | | 547,606 | | | | 2,365,658 | |
LUKOIL ADR | | | 30,240 | | | | 1,474,200 | |
| | | | | | | | |
| | |
| | | | | | | 3,839,858 | |
| | | | | | | | |
South Africa – 7.04% | |
Bidvest Group | | | 88,668 | | | | 1,100,874 | |
Schedules of investments
Delaware Pooled® Trust — The Emerging Markets Portfolio
| | | | | | | | |
| | | Number of
shares | | | Value (U.S. $) | |
| |
Common StockD (continued) | |
| |
South Africa (continued) | |
Cie Financiere Richemont NVDR | | | 199,743 | | | $ | 1,287,006 | |
Growthpoint Properties | | | 674,571 | | | | 1,257,715 | |
MTN Group | | | 164,093 | | | | 1,416,186 | |
Redefine Properties | | | 1,498,179 | | | | 1,286,653 | |
Woolworths Holdings | | | 531,042 | | | | 3,076,274 | |
| | | | | | | | |
| | |
| | | | | | | 9,424,708 | |
| | | | | | | | |
Taiwan – 14.13% | |
Asustek Computer | | | 200,000 | | | | 1,752,357 | |
CTBC Financial Holding | | | 2,453,046 | | | | 1,321,454 | |
MediaTek | | | 272,000 | | | | 2,068,605 | |
Mega Financial Holding | | | 2,367,245 | | | | 1,620,296 | |
Novatek Microelectronics | | | 353,000 | | | | 1,325,533 | |
Quanta Computer | | | 629,000 | | | | 1,275,640 | |
Taiwan Mobile | | | 896,000 | | | | 3,137,384 | |
Taiwan Semiconductor Manufacturing | | | 810,588 | | | | 4,841,823 | |
Teco Electric and Machinery | | | 1,761,000 | | | | 1,565,271 | |
| | | | | | | | |
| | |
| | | | | | | 18,908,363 | |
| | | | | | | | |
Thailand – 2.82% | |
Kasikornbank NVDR | | | 395,800 | | | | 1,945,213 | |
Thai Union Group Class F | | | 2,949,300 | | | | 1,828,697 | |
| | | | | | | | |
| | |
| | | | | | | 3,773,910 | |
| | | | | | | | |
Turkey – 1.74% | |
Tupras Turkiye Petrol Rafinerileri | | | 45,793 | | | | 933,101 | |
Turk Telekomunikasyon | | | 751,760 | | | | 1,389,696 | |
| | | | | | | | |
| | |
| | | | | | | 2,322,797 | |
| | | | | | | | |
United Arab Emirates – 1.47% | |
First Gulf Bank | | | 629,481 | | | | 1,970,904 | |
| | | | | | | | |
| | |
| | | | | | | 1,970,904 | |
| | | | | | | | |
United Kingdom – 1.57% | |
Unilever | | | 50,293 | | | | 2,104,074 | |
| | | | | | | | |
| | |
| | | | | | | 2,104,074 | |
| | | | | | | | |
United States – 1.36% | |
Abbott Laboratories | | | 46,483 | | | | 1,823,992 | |
| | | | | | | | |
| | |
| | | | | | | 1,823,992 | |
| | | | | | | | |
Total Common Stock
(cost $139,339,827) | | | | | | | 128,713,123 | |
| | | | | | | | |
| | | | | | | | |
| | | Number of
shares | | | Value (U.S. $) | |
| |
Preferred Stock – 2.44%D | | | | | |
| |
Brazil – 1.91% | | | | | | | | |
Suzano Papel e Celulose 2.66% | | | 723,200 | | | $ | 2,548,872 | |
| | | | | | | | |
| | |
| | | | | | | 2,548,872 | |
| | | | | | | | |
Republic of Korea – 0.53% | |
Hyundai Motor 2.03% | | | 8,139 | | | | 714,852 | |
| | | | | | | | |
| | |
| | | | | | | 714,852 | |
| | | | | | | | |
Total Preferred Stock
(cost $3,115,581) | | | | 3,263,724 | |
| | | | | | | | |
| | |
| | | Principal
amount° | | | | |
| |
Short-Term Investments – 1.36% | | | | | |
| |
Discount Notes – 0.52%≠ | | | | | |
Federal Home Loan Bank | | | | | | | | |
0.285% 11/10/16 | | | 66,443 | | | | 66,440 | |
0.288% 12/21/16 | | | 405,611 | | | | 405,498 | |
0.299% 11/3/16 | | | 110,664 | | | | 110,663 | |
0.31% 1/25/17 | | | 81,796 | | | | 81,736 | |
0.315% 11/1/16 | | | 26,908 | | | | 26,908 | |
| | | | | | | | |
| | |
| | | | | | | 691,245 | |
| | | | | | | | |
Repurchase Agreements – 0.39% | |
Bank of America Merrill Lynch 0.25%, dated 10/31/16, to be repurchased on 11/1/16, repurchase price $144,623 (collateralized by U.S. government obligations
2.25% 11/15/24; market value $147,515) | | | 144,622 | | | | 144,622 | |
Bank of Montreal 0.27%, dated 10/31/16, to be repurchased on 11/1/16, repurchase price $48,208 (collateralized by U.S. government obligations 0.125%–3.875% 11/30/17–2/15/45; market value $49,172) | | | 48,207 | | | | 48,207 | |
64
| | | | | | | | |
| | | Principal
amount° | | | Value (U.S. $) | |
| |
Short-Term Investments (continued) | |
| |
Repurchase Agreements (continued) | |
BNP Paribas
0.32%, dated 10/31/16, to be repurchased on 11/1/16, repurchase price $334,174 (collateralized by U.S. government obligations 0.00%–4.75% 4/30/17–2/15/45; market value $340,854) | | | 334,171 | | | $ | 334,171 | |
| | | | | | | | |
| | |
| | | | | | | 527,000 | |
| | | | | | | | |
U.S. Treasury Obligation – 0.45%≠ | |
U.S. Treasury Bill | | | | | | | | |
0.226% 11/3/16 | | | 602,942 | | | | 602,938 | |
| | | | | | | | |
| | |
| | | | | | | 602,938 | |
| | | | | | | | |
| |
Total Short-Term Investments
(cost $1,821,128) | | | | 1,821,183 | |
| | | | | | | | |
| |
Total Value of
Securities – 99.98%
(cost $144,276,536) | | | $ | 133,798,030 | |
| | | | | | | | |
| # | Security exempt from registration under Rule 144A of the Securities Act of 1933, as amended. At Oct. 31, 2016, the aggregate value of Rule 144A securities was $3,705,606, which represents 2.77% of the Portfolio’s net assets. See Note 11 in “Notes to financial statements.” |
| ≠ | The rate shown is the effective yield at the time of purchase. |
| ∎ | Securities listed and traded on the Hong Kong Stock Exchange. |
| ° | Principal amount shown is stated in U.S. dollars unless noted that the security is denominated in another currency. |
| D | Securities have been classified by country of origin. Aggregate classification by business sectors has been presented on page 31 in “Security type / country and sector allocations.” |
| † | Non-income-producing security. |
The following foreign currency exchange contracts were outstanding at Oct. 31, 2016:1
Foreign Currency Exchange Contracts
| | | | | | | | | | | | | | |
Counterparty | | Contracts to
Receive (Deliver) | | In Exchange For | | Settlement Date | | Unrealized
Appreciation
(Depreciation) | |
| BNYM | | HKD | | 3,479,562 | | USD | | (448,749) | | 11/1/16 | | $ | (94 | ) |
| BNYM | | MXN | | 1,509,424 | | USD | | (80,245) | | 11/1/16 | | | (394 | ) |
| | | | | | | | | | | | | | |
| | | | | | | | | | | | $ | (488 | ) |
| | | | | | | | | | | | | | |
The use of foreign currency exchange contracts involves elements of market risk and risks in excess of the amounts disclosed in the financial statements. The foreign currency exchange contracts presented above represent the Portfolio’s total exposure in such contracts, whereas only the net unrealized appreciation (depreciation) is reflected in the Portfolio’s net assets.
1See Note 8 in “Notes to financial statements.”
Summary of abbreviations:
ADR – American Depositary Receipt
BNYM – BNY Mellon
GDR – Global Depositary Receipt
HKD – Hong Kong Dollar
MXN – Mexican Peso
NVDR – Non-Voting Depositary Receipt
USD – U.S. Dollar
See accompanying notes, which are an integral part of the financial statements.
Schedules of investments
Delaware Pooled® Trust — The Emerging Markets Portfolio II
October 31, 2016
| | | | | | | | |
| | | Number of shares | | | Value (U.S. $) | |
| |
Common Stock – 100.80%D | | | | | |
| |
Argentina – 0.68% | | | | | | | | |
Cresud ADR @† | | | 8,192 | | | $ | 143,360 | |
IRSA Inversiones y Representaciones ADR @† | | | 5,900 | | | | 110,566 | |
| | | | | | | | |
| | |
| | | | | | | 253,926 | |
| | | | | | | | |
Bahrain – 0.02% | | | | | | | | |
Aluminum Bahrain GDR 144A #@ | | | 1,800 | | | | 7,161 | |
| | | | | | | | |
| | |
| | | | | | | 7,161 | |
| | | | | | | | |
Brazil – 17.74% | | | | | | | | |
B2W Cia Digital @† | | | 172,824 | | | | 844,087 | |
Banco Bradesco ADR | | | 41,731 | | | | 434,420 | |
Braskem ADR | | | 12,800 | | | | 227,200 | |
BRF ADR | | | 19,400 | | | | 324,368 | |
Centrais Eletricas Brasileiras ADR † | | | 21,300 | | | | 157,407 | |
Cia Brasileira de Distribuicao ADR | | | 26,500 | | | | 504,825 | |
Cia Hering | | | 51,400 | | | | 314,004 | |
Cyrela Brazil Realty | | | 15,780 | | | | 53,094 | |
Fibria Celulose ADR | | | 40,300 | | | | 321,594 | |
Gerdau @ | | | 11,700 | | | | 29,323 | |
Gerdau ADR | | | 13,000 | | | | 44,590 | |
Hypermarcas | | | 56,300 | | | | 471,460 | |
Itau Unibanco Holding ADR | | | 73,205 | | | | 873,336 | |
Petroleo Brasileiro ADR † | | | 53,200 | | | | 620,844 | |
Santos Brasil Participacoes | | | 29,500 | | | | 28,372 | |
Telefonica Brasil ADR | | | 32,155 | | | | 463,032 | |
TIM Participacoes ADR | | | 53,200 | | | | 736,820 | |
Vale ADR | | | 21,600 | | | | 149,472 | |
| | | | | | | | |
| | |
| | | | | | | 6,598,248 | |
| | | | | | | | |
Chile – 1.14% | | | | | | | | |
Latam Airlines Group ADR † | | | 3,603 | | | | 34,553 | |
Sociedad Quimica y Minera de Chile ADR | | | 13,300 | | | | 389,158 | |
| | | | | | | | |
| | |
| | | | | | | 423,711 | |
| | | | | | | | |
China/Hong Kong – 23.48% | |
Alibaba Group Holding ADR † | | | 7,100 | | | | 721,999 | |
Baidu ADR † | | | 8,450 | | | | 1,494,467 | |
China Mengniu Dairy | | | 191,000 | | | | 362,025 | |
China Mobile | | | 24,500 | | | | 280,680 | |
China Mobile ADR | | | 7,200 | | | | 413,496 | |
China Petroleum & Chemical | | | 94,000 | | | | 68,480 | |
China Petroleum & Chemical ADR | | | 3,770 | | | | 273,023 | |
Ctrip.com International ADR † | | | 19,800 | | | | 874,170 | |
SINA † | | | 18,700 | | | | 1,349,018 | |
| | | | | | | | |
| | | Number of shares | | | Value (U.S. $) | |
| |
Common StockD (continued) | | | | | |
| |
China/Hong Kong (continued) | | | | | |
Sohu.com @† | | | 20,300 | | | $ | 759,829 | |
Tencent Holdings | | | 51,800 | | | | 1,374,556 | |
Tianjin Development Holdings @ | | | 190,000 | | | | 91,380 | |
Tingyi Cayman Islands Holding | | | 164,000 | | | | 176,993 | |
Uni-President China | | | | | | | | |
Holdings @ | | | 492,000 | | | | 333,052 | |
Weibo ADR † | | | 1,870 | | | | 86,039 | |
ZTO Express Cayman ADR † | | | 4,400 | | | | 74,492 | |
| | | | | | | | |
| | |
| | | | | | | 8,733,699 | |
| | | | | | | | |
Colombia – 0.61% | | | | | | | | |
Cemex Latam Holdings † | | | 61,058 | | | | 227,030 | |
| | | | | | | | |
| | |
| | | | | | | 227,030 | |
| | | | | | | | |
India – 9.80% | | | | | | | | |
Cairn India | | | 74,000 | | | | 250,001 | |
ICICI Bank ADR | | | 70,000 | | | | 580,300 | |
Reliance Communications † | | | 90,082 | | | | 62,954 | |
Reliance Industries | | | 30,356 | | | | 477,742 | |
Reliance Industries GDR
144A # | | | 55,000 | | | | 1,743,500 | |
Tata Chemicals | | | 45,026 | | | | 365,651 | |
UltraTech Cement | | | 2,784 | | | | 165,388 | |
| | | | | | | | |
| | |
| | | | | | | 3,645,536 | |
| | | | | | | | |
Indonesia – 1.68% | | | | | | | | |
Astra International | | | 401,900 | | | | 253,344 | |
Global Mediacom | | | 2,369,600 | | | | 154,365 | |
Tambang Batubara Bukit Asam Persero | | | 118,500 | | | | 108,074 | |
United Tractors | | | 67,106 | | | | 111,218 | |
| | | | | | | | |
| | |
| | | | | | | 627,001 | |
| | | | | | | | |
Malaysia – 0.25% | | | | | | | | |
UEM Sunrise | | | 356,100 | | | | 95,073 | |
| | | | | | | | |
| | |
| | | | | | | 95,073 | |
| | | | | | | | |
Mexico – 5.78% | | | | | | | | |
America Movil Class L ADR | | | 12,084 | | | | 158,784 | |
Cemex ADR † | | | 39,891 | | | | 346,254 | |
Fomento Economico Mexicano ADR | | | 4,800 | | | | 459,216 | |
Grupo Financiero Banorte Class O | | | 24,300 | | | | 143,350 | |
Grupo Financiero Santander Mexico Class B ADR | | | 19,400 | | | | 175,570 | |
66
| | | | | | | | |
| | | Number of shares | | | Value (U.S. $) | |
| |
Common StockD (continued) | |
| |
Mexico (continued) | | | | | | | | |
Grupo Televisa ADR | | | 30,000 | | | $ | 735,900 | |
Wal-Mart de Mexico Class V | | | 61,629 | | | | 130,360 | |
| | | | | | | | |
| | |
| | | | | | | 2,149,434 | |
| | | | | | | | |
Netherlands – 1.18% | | | | | | | | |
VimpelCom ADR | | | 67,300 | | | | 224,782 | |
Yandex Class A † | | | 10,800 | | | | 212,652 | |
| | | | | | | | |
| | |
| | | | | | | 437,434 | |
| | | | | | | | |
Peru – 0.41% | | | | | | | | |
Cia de Minas Buenaventura ADR † | | | 11,500 | | | | 152,835 | |
| | | | | | | | |
| | |
| | | | | | | 152,835 | |
| | | | | | | | |
Poland – 0.15% | | | | | | | | |
Jastrzebska Spolka Weglowa † | | | 2,926 | | | | 54,220 | |
| | | | | | | | |
| | |
| | | | | | | 54,220 | |
| | | | | | | | |
Republic of Korea – 19.96% | |
Hitejinro Holdings | | | 20,000 | | | | 208,870 | |
KB Financial Group ADR | | | 9,600 | | | | 355,008 | |
KCC | | | 1,455 | | | | 514,352 | |
LG Uplus | | | 28,207 | | | | 290,883 | |
Lotte Chilsung Beverage @ | | | 369 | | | | 496,622 | |
Lotte Confectionery @ | | | 2,570 | | | | 431,234 | |
Samsung Biologics =† | | | 8,500 | | | | 1,010,269 | |
Samsung Electronics | | | 1,749 | | | | 2,505,147 | |
Samsung Life Insurance | | | 4,270 | | | | 412,353 | |
SK Telecom ADR | | | 55,000 | | | | 1,201,750 | |
| | | | | | | | |
| | |
| | | | | | | 7,426,488 | |
| | | | | | | | |
Russia – 4.28% | | | | | | | | |
Etalon Group GDR 144A #@= | | | 4,800 | | | | 13,680 | |
Gazprom ADR | | | 50,000 | | | | 216,000 | |
LUKOIL ADR | | | 3,400 | | | | 165,274 | |
LUKOIL(London International Exchange) ADR | | | 6,083 | | | | 296,546 | |
MegaFon GDR | | | 14,100 | | | | 134,373 | |
Mobile TeleSystems ADR | | | 19,400 | | | | 149,574 | |
Rosneft GDR | | | 52,800 | | | | 287,760 | |
Sberbank of Russia = | | | 141,095 | | | | 327,893 | |
| | | | | | | | |
| | |
| | | | | | | 1,591,100 | |
| | | | | | | | |
South Africa – 1.09% | | | | | | | | |
Vodacom Group | | | 17,262 | | | | 186,206 | |
Woolworths Holdings | | | 37,735 | | | | 218,595 | |
| | | | | | | | |
| | |
| | | | | | | 404,801 | |
| | | | | | | | |
| | | | | | | | |
| | | Number of shares | | | Value (U.S. $) | |
| |
Common StockD (continued) | |
| |
Taiwan – 6.49% | | | | | | | | |
Hon Hai Precision Industry | | | 180,206 | | | $ | 487,098 | |
MediaTek | | | 80,000 | | | | 608,413 | |
Taiwan Semiconductor Manufacturing | | | 95,000 | | | | 567,456 | |
Taiwan Semiconductor | | | | | | | | |
Manufacturing ADR | | | 24,200 | | | | 752,620 | |
| | | | | | | | |
| | |
| | | | | | | 2,415,587 | |
| | | | | | | | |
Thailand – 1.18% | | | | | | | | |
Bangkok Bank | | | 37,099 | | | | 169,078 | |
PTT Foreign | | | 27,160 | | | | 268,515 | |
| | | | | | | | |
| | |
| | | | | | | 437,593 | |
| | | | | | | | |
Turkey – 2.71% | | | | | | | | |
Akbank | | | 231,744 | | | | 619,382 | |
Anadolu Efes Biracilik Ve Malt Sanayii | | | 29,112 | | | | 177,913 | |
Turkcell Iletisim Hizmetleri ADR † | | | 20,600 | | | | 165,212 | |
Turkiye Sise ve Cam Fabrikalari | | | 44,622 | | | | 46,868 | |
| | | | | | | | |
| | |
| | | | | | | 1,009,375 | |
| | | | | | | | |
United States – 2.17% | | | | | | | | |
Yahoo † | | | 19,400 | | | | 806,070 | |
| | | | | | | | |
| | |
| | | | | | | 806,070 | |
| | | | | | | | |
Total Common Stock
(cost $37,466,189) | | | | 37,496,322 | |
| | | | | | | | |
|
| |
Exchange-Traded Fund – 0.50%D | |
| |
United States – 0.50% | | | | | | | | |
iShares MSCI Turkey | | | 5,000 | | | | 186,800 | |
| | | | | | | | |
Total Exchange-Traded Fund
(cost $184,363) | | | | 186,800 | |
| | | | | | | | |
|
| |
Preferred Stock – 1.00%D | |
| |
Republic of Korea – 1.00% | |
LG Electronics 1.90% | | | 17,861 | | | | 370,722 | |
| | | | | | | | |
| |
Total Preferred Stock
(cost $307,186) | | | | 370,722 | |
| | | | | | | | |
Schedules of investments
Delaware Pooled® Trust — The Emerging Markets Portfolio II
| | | | | | | | |
| | | Principal
amount° | | | Value (U.S. $) | |
| |
Short-Term Investments – 0.70% | |
| |
Repurchase Agreements – 0.70% | |
Bank of America Merrill Lynch 0.25%, dated 10/31/16, to be repurchased on 11/1/16, repurchase price $71,351 (collateralized by U.S. government obligations 2.25% 11/15/24; market value $72,778) | | | 71,351 | | | $ | 71,351 | |
Bank of Montreal
0.27%, dated 10/31/16, to be repurchased on 11/1/16, repurchase price $23,784 (collateralized by U.S. government obligations 0.125%–3.875% 11/30/17–2/15/45; market value $24,259) | | | 23,783 | | | | 23,783 | |
BNP Paribas
0.32%, dated 10/31/16, to be repurchased on 11/1/16, repurchase price $164,867 (collateralized by U.S. government obligations 0.00%–4.75% 4/30/17–2/15/45; market value $168,163) | | | 164,866 | | | | 164,866 | |
| | | | | | | | |
| |
Total Short-Term Investments
(cost $260,000) | | | | 260,000 | |
| | | | | | | | |
| | |
Total Value of
Securities – 103.00% (cost $38,217,738) | | | | | | $ | 38,313,844 | |
| | | | | | | | |
| # | Security exempt from registration under Rule 144A of the Securities Act of 1933, as amended. At Oct. 31, 2016, the aggregate value of Rule 144A securities was $1,764,341, which represents 4.74% of the Portfolio’s net assets. See Note 11 in “Notes to financial statements.” |
| @ | Illiquid security. At Oct. 31, 2016, the aggregate value of illiquid securities was $3,260,294, which represents 8.76% of the Portfolio’s net assets. See Note 11 in “Notes to financial statements.” |
| = | Security is being fair valued in accordance with the Portfolio’s fair valuation policy. At Oct. 31, 2016, the aggregate value of fair valued securities was $1,351,977, which represents 3.63% of the Portfolio’s net assets. See Note 1 in “Notes to financial statements.” |
| ° | Principal amount shown is stated in U.S. dollars unless noted that the security is denominated in another currency. |
| D | Securities have been classified by country of origin. Aggregate classification by business sectors has been presented on page 32 in “Security type / country and sector allocations.” |
| † | Non-income-producing security. |
The following foreign currency exchange contracts were outstanding at Oct. 31, 2016:1
Foreign Currency Exchange Contracts
| | | | | | | | | | | | | | |
Counterparty | | Contracts to
Receive (Deliver) | | | In Exchange For | | | Settlement
Date | | Unrealized
Appreciation
(Depreciation) | |
BNYM | | | KRW 1,167,560,000 | | | | USD (1,018,740 | ) | | 11/7/16 | | $ | 1,721 | |
The use of foreign currency exchange contracts involves elements of market risk and risks in excess of the amounts disclosed in the financial statements. The foreign currency exchange contracts presented above represents the Portfolio’s total exposure in such contracts, whereas only the net unrealized appreciation (depreciation) is reflected in the Portfolio’s net assets.
1See Note 8 in “Notes to financial statements.”
Summary of abbreviations:
ADR – American Depositary Receipt
BNYM – Bank of New York Mellon
GDR – Global Depositary Receipt
KRW – South Korean Won
USD – U.S. Dollar
See accompanying notes, which are an integral part of the financial statements.
68
This page intentionally left blank.
Statements of assets and liabilities
Delaware Pooled® Trust
October 31, 2016
| | | | | | | | | | | | |
| | | The
Large-Cap
Value Equity
Portfolio | | | The
High-Yield
Bond
Portfolio | | | The
Core Plus
Fixed Income
Portfolio | |
Assets: | | | | | | | | | | | | |
Investments, at value1 | | $ | 207,813,980 | | | $ | 227,493,203 | | | $ | 129,227,643 | |
Short-term investments, at value2 | | | 5,583,127 | | | | — | | | | — | |
Repurchase agreements, at value3 | | | 3,391,000 | | | | 15,558,000 | | | | 14,246,000 | |
Cash | | | 84,405 | | | | — | | | | 350,836 | |
Cash collateral due from brokers | | | — | | | | — | | | | 25,354 | |
Foreign currencies, at value4 | | | — | | | | — | | | | 34,773 | |
Dividends and interest receivable | | | 396,252 | | | | 3,746,731 | | | | 815,637 | |
Receivable for fund shares sold | | | — | | | | 127,500 | | | | — | |
Receivable for securities sold | | | — | | | | 2,673,311 | | | | 13,571,297 | |
Variation margin due from brokers for centrally cleared credit default swap contracts | | | — | | | | — | | | | 347 | |
Unrealized appreciation on credit default swap contracts | | | — | | | | — | | | | 1,187 | |
Other assets5 | | | — | | | | 48,975 | | | | 75,182 | |
| | | | | | | | | | | | |
Total assets | | | 217,268,764 | | | | 249,647,720 | | | | 158,348,256 | |
| | | | | | | | | | | | |
Liabilities: | | | | | | | | | | | | |
Cash overdraft | | | — | | | | 182,036 | | | | — | |
Variation margin due to brokers futures contracts | | | — | | | | — | | | | 14,252 | |
Payable for securities purchased | | | — | | | | 6,862,658 | | | | 24,709,828 | |
Investment management fees payable to affiliates | | | 102,096 | | | | 92,575 | | | | 31,373 | |
Other accrued expenses | | | 29,739 | | | | 37,858 | | | | 50,732 | |
Audit and tax fees payable | | | 5,157 | | | | 5,558 | | | | 5,558 | |
Dividend disbursing and transfer agent fees and expenses payable to affiliates | | | 1,392 | | | | 1,543 | | | | 842 | |
Accounting and administrative fees payable to affiliates | | | 874 | | | | 969 | | | | 528 | |
Legal fees payable to affiliates | | | 855 | | | | 930 | | | | 512 | |
Trustees’ fees and expenses payable | | | 635 | | | | 691 | | | | 379 | |
Reports and statements to shareholders expenses payable to affiliates | | | 92 | | | | 103 | | | | 57 | |
Unrealized depreciation on foreign currency exchange contracts | | | — | | | | — | | | | 3,881 | |
Upfront payments received on credit default swap contracts | | | — | | | | — | | | | 12,846 | |
Swap payments payable | | | — | | | | — | | | | 1,943 | |
Bond Proceeds payable5 | | | — | | | | 163,250 | | | | 250,607 | |
| | | | | | | | | | | | |
Total liabilities | | | 140,840 | | | | 7,348,171 | | | | 25,083,338 | |
| | | | | | | | | | | | |
Total Net Assets | | $ | 217,127,924 | | | $ | 242,299,549 | | | $ | 133,264,918 | |
| | | | | | | | | | | | |
| | | |
Net Assets Consist of: | | | | | | | | | | | | |
Paid-in capital | | $ | 197,534,136 | | | $ | 245,767,919 | | | $ | 129,802,035 | |
Undistributed net investment income | | | 3,455,541 | | | | 11,266,540 | | | | 2,761,071 | |
Accumulated net realized gain (loss) on investments | | | 6,998,692 | | | | (21,209,727 | ) | | | (529,184 | ) |
Net unrealized appreciation of investments | | | 9,139,555 | | | | 6,474,817 | | | | 1,207,448 | |
Net unrealized appreciation of foreign currencies | | | — | | | | — | | | | 1,824 | |
Net unrealized depreciation of foreign currency exchange contracts | | | — | | | | — | | | | (3,881 | ) |
Net unrealized appreciation of future contracts | | | — | | | | — | | | | 22,964 | |
Net unrealized appreciation of options purchased | | | — | | | | — | | | | 1,933 | |
Net unrealized appreciation of swap contracts | | | — | | | | — | | | | 708 | |
| | | | | | | �� | | | | | |
Total Net Assets | | $ | 217,127,924 | | | $ | 242,299,549 | | | $ | 133,264,918 | |
| | | | | | | | | | | | |
70
| | | | | | | | | | | | |
| | | The
Large-Cap
Value Equity
Portfolio | | | The
High-Yield
Bond
Portfolio | | | The
Core Plus
Fixed Income
Portfolio | |
Net Asset Value | | | | | | | | | | | | |
| | | |
Portfolio Class | | | | | | | | | | | | |
Net assets | | $ | 217,127,924 | | | $ | 242,299,549 | | | $ | 133,264,918 | |
Shares of beneficial interest outstanding, unlimited authorization, no par | | | 8,226,552 | | | | 30,738,492 | | | | 12,786,048 | |
Net asset value per share | | $ | 26.39 | | | $ | 7.88 | | | $ | 10.42 | |
| | | |
1Investments, at cost | | $ | 198,674,675 | | | $ | 221,018,386 | | | $ | 128,018,262 | |
2 Short-term investments, at cost | | | 5,582,877 | | | | — | | | | — | |
3 Repurchase agreements, at cost | | | 3,391,000 | | | | 15,558,000 | | | | 14,246,000 | |
4 Foreign currencies, at cost | | | — | | | | — | | | | 33,397 | |
5 See Note 13 in “Notes to financial statements.” | | | | | | | | | | | | |
See accompanying notes, which are an integral part of the financial statements.
Statements of assets and liabilities
Delaware Pooled® Trust
| | | | | | | | | | | | |
| | | The
Labor Select
International
Equity
Portfolio | | | The
Emerging
Markets
Portfolio | | | The
Emerging
Markets
Portfolio II | |
Assets: | | | | | | | | | | | | |
Investments, at value1 | | $ | 389,137,638 | | | $ | 131,976,847 | | | $ | 38,053,844 | |
Short-term investments, at value2 | | | 1,842,344 | | | | 1,294,183 | | | | — | |
Repurchase agreements, at value3 | | | 1,135,000 | | | | 527,000 | | | | 260,000 | |
Foreign currencies, at value4 | | | 293,806 | | | | 344,737 | | | | 8,095 | |
Cash | | | — | | | | — | | | | 1,887 | |
Receivable for securities sold | | | 1,389,251 | | | | 906,032 | | | | — | |
Foreign tax reclaims receivable | | | 1,297,421 | | | | 4,127 | | | | 1,203 | |
Dividends and interest receivable | | | 712,176 | | | | 49,632 | | | | 39,266 | |
Receivable for fund shares sold | | | 201 | | | | — | | | | — | |
Unrealized appreciation on foreign currency exchange contracts | | | 1,715 | | | | — | | | | 1,721 | |
| | | | | | | | | | | | |
Total assets | | | 395,809,552 | | | | 135,102,558 | | | | 38,366,016 | |
| | | | | | | | | | | | |
Liabilities: | | | | | | | | | | | | |
Cash overdraft | | | 186,702 | | | | 1,365 | | | | — | |
Payable for securities purchased | | | 422,974 | | | | 986,575 | | | | 1,106,172 | |
Investment management fees payable to affiliates | | | 253,622 | | | | 113,997 | | | | 27,720 | |
Other accrued expenses | | | 98,842 | | | | 85,304 | | | | 15,113 | |
Audit and tax fees payable | | | 6,760 | | | | 6,760 | | | | 6,760 | |
Dividend disbursing and transfer agent fees and expenses payable to affiliates | | | 2,536 | | | | 855 | | | | 239 | |
Accounting and administration fees payable to affiliates | | | 1,592 | | | | 537 | | | | 150 | |
Legal fees payable to affiliates | | | 1,563 | | | | 517 | | | | 147 | |
Trustees’ fees and expenses payable | | | 1,162 | | | | 386 | | | | 107 | |
Reports and statements to shareholders expenses payable to affiliates | | | 167 | | | | 57 | | | | 15 | |
Unrealized depreciation on foreign currency exchange contracts | | | 3,679 | | | | 488 | | | | — | |
Deferred capital gains tax | | | — | | | | 78,086 | | | | 12,041 | |
| | | | | | | | | | | | |
Total liabilities | | | 979,599 | | | | 1,274,927 | | | | 1,168,464 | |
| | | | | | | | | | | | |
Total Net Assets | | $ | 394,829,953 | | | $ | 133,827,631 | | | $ | 37,197,552 | |
| | | | | | | | | | | | |
| | | |
Net Assets Consist of: | | | | | | | | | | | | |
Paid-in capital | | $ | 468,431,909 | | | $ | 183,689,083 | | | $ | 39,776,213 | |
Undistributed (distributions in excess of) net investment income | | | 11,001,243 | | | | 3,978,087 | | | | (431,929 | ) |
Accumulated net realized loss on investments | | | (61,284,620 | ) | | | (43,278,841 | ) | | | (2,232,025 | ) |
Net unrealized appreciation (depreciation) of investments | | | (23,211,157 | ) | | | (10,478,506 | ) | | | 96,106 | |
Net unrealized depreciation of foreign currencies | | | (105,458 | ) | | | (81,704 | ) | | | (12,534 | ) |
Net unrealized appreciation (depreciation) of foreign currency exchange contracts | | | (1,964 | ) | | | (488 | ) | | | 1,721 | |
| | | | | | | | | | | | |
Total Net Assets | | $ | 394,829,953 | | | $ | 133,827,631 | | | $ | 37,197,552 | |
| | | | | | | | | | | | |
| | | |
Net Asset Value | | | | | | | | | | | | |
| | | |
Portfolio Class | | | | | | | | | | | | |
Net assets | | $ | 394,829,953 | | | $ | 133,827,631 | | | $ | 37,197,552 | |
Shares of beneficial interest outstanding, unlimited authorization, no par | | | 30,771,646 | | | | 17,233,687 | | | | 4,645,515 | |
Net asset value per share | | $ | 12.83 | | | $ | 7.77 | | | $ | 8.01 | |
1Investments, at cost | | $ | 412,348,838 | | | $ | 142,455,408 | | | $ | 37,957,738 | |
2 Short-term investments, at cost | | | 1,842,301 | | | | 1,294,128 | | | | — | |
3 Repurchase agreements, at cost | | | 1,135,000 | | | | 527,000 | | | | 260,000 | |
4 Foreign currencies, at cost | | | 292,512 | | | | 348,678 | | | | 7,960 | |
See accompanying notes, which are an integral part of the financial statements. | |
72
This page intentionally left blank.
Statements of operations
Delaware Pooled® Trust
Year ended October 31, 2016
| | | | | | | | | | | | |
| | | The
Large-Cap
Value Equity
Portfolio | | | The
High-Yield
Bond
Portfolio | | | The
Core Plus
Fixed Income
Portfolio | |
Investment Income: | | | | | | | | | | | | |
Dividends | | $ | 5,591,792 | | | $ | 20,352 | | | $ | 4,347 | |
Interest | | | 12,966 | | | | 15,093,538 | | | | 3,405,872 | |
| | | | | | | | | | | | |
| | | 5,604,758 | | | | 15,113,890 | | | | 3,410,219 | |
| | | | | | | | | | | | |
Expenses: | | | | | | | | | | | | |
Management fees | | | 1,180,904 | | | | 1,021,923 | | | | 570,128 | |
Accounting and administration expenses | | | 69,135 | | | | 73,188 | | | | 42,717 | |
Audit and tax fees | | | 33,757 | | | | 41,799 | | | | 43,913 | |
Dividend disbursing and transfer agent fees and expenses | | | 23,841 | | | | 25,146 | | | | 14,742 | |
Legal fees | | | 21,183 | | | | 21,766 | | | | 13,744 | |
Registration fees | | | 20,446 | | | | 15,022 | | | | 20,032 | |
Trustees’ fees and expenses | | | 10,630 | | | | 11,022 | | | | 6,552 | |
Custodian fees | | | 8,647 | | | | 15,082 | | | | 24,133 | |
Reports and statements to shareholders expenses | | | 7,622 | | | | 8,921 | | | | 8,753 | |
Other | | | 9,492 | | | | 21,249 | | | | 49,749 | |
| | | | | | | | | | | | |
| | | 1,385,657 | | | | 1,255,118 | | | | 794,463 | |
Less expenses waived | | | — | | | | — | | | | (197,676 | ) |
Less expense paid indirectly | | | (2 | ) | | | (2 | ) | | | — | |
| | | | | | | | | | | | |
Total operating expenses | | | 1,385,655 | | | | 1,255,116 | | | | 596,787 | |
| | | | | | | | | | | | |
Net Investment Income | | | 4,219,103 | | | | 13,858,774 | | | | 2,813,432 | |
| | | | | | | | | | | | |
| | | |
Net Realized and Unrealized Gain (Loss) | | | | | | | | | | | | |
Net realized gain (loss) on: | | | | | | | | | | | | |
Investments | | | 7,118,226 | | | | (12,974,478 | ) | | | 539,497 | |
Foreign currencies | | | — | | | | — | | | | (60,877 | ) |
Foreign currency exchange contracts | | | — | | | | — | | | | 13,331 | |
Futures contracts | | | — | | | | — | | | | (288,805 | ) |
Options purchased | | | — | | | | — | | | | (2,416 | ) |
Options written | | | — | | | | — | | | | (40,581 | ) |
Swap contracts | | | — | | | | (87,721 | ) | | | 125,977 | |
| | | | | | | | | | | | |
Net realized gain (loss) | | | 7,118,226 | | | | (13,062,199 | ) | | | 286,126 | |
| | | | | | | | | | | | |
Net change in unrealized appreciation (depreciation) of: | | | | | | | | | | | | |
Investments | | | 3,640,813 | | | | 14,187,290 | | | | 1,846,267 | |
Foreign currencies | | | — | | | | — | | | | 2,492 | |
Foreign currency exchange contracts | | | — | | | | — | | | | (4,445 | ) |
Futures contracts | | | — | | | | — | | | | (79,754 | ) |
Options purchased | | | — | | | | — | | | | 1,933 | |
Swap contracts | | | — | | | | — | | | | 13,186 | |
| | | | | | | | | | | | |
Net change in unrealized appreciation (depreciation) | | | 3,640,813 | | | | 14,187,290 | | | | 1,779,679 | |
| | | | | | | | | | | | |
Net Realized and Unrealized Gain | | | 10,759,039 | | | | 1,125,091 | | | | 2,065,805 | |
| | | | | | | | | | | | |
Net Increase in Net Assets Resulting from Operations | | $ | 14,978,142 | | | $ | 14,983,865 | | | $ | 4,879,237 | |
| | | | | | | | | | | | |
See accompanying notes, which are an integral part of the financial statements.
74
| | | | | | | | | | | | |
| | | The
Labor Select
International
Equity
Portfolio | | | The
Emerging
Markets
Portfolio | | | The
Emerging
Markets
Portfolio II | |
Investment Income: | | | | | | | | | | | | |
Dividends | | $ | 16,618,297 | | | $ | 5,999,609 | | | $ | 817,539 | |
Interest | | | 12,556 | | | | 3,538 | | | | 485 | |
Foreign tax withheld | | | (999,674 | ) | | | (517,758 | ) | | | (82,358 | ) |
| | | | | | | | | | | | |
| | | 15,631,179 | | | | 5,485,389 | | | | 735,666 | |
| | | | | | | | | | | | |
Expenses: | | | | | | | | | | | | |
Management fees | | | 2,761,596 | | | | 1,480,363 | | | | 338,718 | |
Accounting and administration expenses | | | 118,477 | | | | 47,729 | | | | 10,900 | |
Custodian fees | | | 83,050 | | | | 103,914 | | | | 14,321 | |
Dividend disbursing and transfer agent fees and expenses | | | 50,877 | | | | 16,400 | | | | 3,941 | |
Audit and tax fees | | | 38,657 | | | | 58,813 | | | | 46,758 | |
Legal fees | | | 34,514 | | | | 14,968 | | | | 5,530 | |
Trustees’ fees and expenses | | | 18,164 | | | | 7,527 | | | | 1,664 | |
Registration fees | | | 16,822 | | | | 13,447 | | | | 20,141 | |
Reports and statements to shareholders expenses | | | 13,599 | | | | 7,507 | | | | 1,956 | |
Other | | | 17,836 | | | | 14,740 | | | | 10,887 | |
| | | | | | | | | | | | |
| | | 3,153,592 | | | | 1,765,408 | | | | 454,816 | |
Less expenses waived | | | — | | | | — | | | | (48,321 | ) |
Less expense paid indirectly | | | (4 | ) | | | (2 | ) | | | (2 | ) |
| | | | | | | | | | | | |
Total operating expenses | | | 3,153,588 | | | | 1,765,406 | | | | 406,493 | |
| | | | | | | | | | | | |
Net Investment Income | | | 12,477,591 | | | | 3,719,983 | | | | 329,173 | |
| | | | | | | | | | | | |
| | | |
Net Realized and Unrealized Gain (Loss) | | | | | | | | | | | | |
Net realized gain (loss) on: | | | | | | | | | | | | |
Investments | | | (3,008,817 | ) | | | (23,186,049 | ) | | | (2,203,186 | ) |
Foreign currencies | | | (190,434 | ) | | | (117,166 | ) | | | (270 | ) |
Foreign currency exchange contracts | | | (4,833 | ) | | | 609,280 | | | | 5,531 | |
| | | | | | | | | | | | |
Net realized loss on investments | | | (3,204,084 | ) | | | (22,693,935 | ) | | | (2,197,925 | ) |
| | | | | | | | | | | | |
Net change in unrealized appreciation (depreciation) of: | | | | | | | | | | | | |
Investments1 | | | (24,878,831 | ) | | | 26,486,429 | | | | 6,397,294 | |
Foreign currencies | | | (1,475 | ) | | | (43,499 | ) | | | (8,777 | ) |
Foreign currency exchange contracts | | | (3,578 | ) | | | (731 | ) | | | 1,721 | |
| | | | | | | | | | | | |
Net change in unrealized appreciation (depreciation) | | | (24,883,884 | ) | | | 26,442,199 | | | | 6,390,238 | |
| | | | | | | | | | | | |
Net Realized and Unrealized Gain (Loss) | | | (28,087,968 | ) | | | 3,748,264 | | | | 4,192,313 | |
| | | | | | | | | | | | |
Net Increase (Decrease) in Net Assets Resulting from Operations | | $ | (15,610,377 | ) | | $ | 7,468,247 | | | $ | 4,521,486 | |
| | | | | | | | | | | | |
1Includes $78,086 and $12,041 capital gains tax accrued for The Emerging Markets
Portfolio and The Emerging Markets Portfolio II, respectively.
See accompanying notes, which are an integral part of the financial statements.
Statements of changes in net assets
Delaware Pooled® Trust
| | | | | | | | | | | | | | | | | | | | | | | | |
| | | The
Large-Cap
Value Equity
Portfolio | | | The
High-Yield
Bond
Portfolio | | | The
Core Plus
Fixed Income
Portfolio | |
| | | Year ended | | | Year ended | | | Year ended | |
| | | 10/31/16 | | | 10/31/15 | | | 10/31/16 | | | 10/31/15 | | | 10/31/16 | | | 10/31/15 | |
| | | | | | |
Increase (Decrease) in Net Assets from Operations: | | | | | | | | | | | | | | | | | | | | | | | | |
Net investment income | | $ | 4,219,103 | | | $ | 4,082,533 | | | $ | 13,858,774 | | | $ | 10,692,731 | | | $ | 2,813,432 | | | $ | 2,778,049 | |
Net realized gain (loss) | | | 7,118,226 | | | | 16,063,958 | | | | (13,062,199 | ) | | | (8,413,123 | ) | | | 286,126 | | | | 559,529 | |
Net change in unrealized appreciation (depreciation) | | | 3,640,813 | | | | (14,827,414 | ) | | | 14,187,290 | | | | (8,282,343 | ) | | | 1,779,679 | | | | (1,826,809 | ) |
| | | | | | | | | | | | | | | | | | | | | | | | |
Net increase (decrease) in net assets resulting from operations | | | 14,978,142 | | | | 5,319,077 | | | | 14,983,865 | | | | (6,002,735 | ) | | | 4,879,237 | | | | 1,510,769 | |
| | | | | | | | | | | | | | | | | | | | | | | | |
| | | | | | |
Dividends and Distributions to Shareholders from: | | | | | | | | | | | | | | | | | | | | | | | | |
Net investment income | | | (4,431,423 | ) | | | (2,147,479 | ) | | | (11,494,763 | ) | | | (8,232,022 | ) | | | (2,936,304 | ) | | | (2,287,390 | ) |
Net realized gain | | | (16,167,216 | ) | | | (3,785,813 | ) | | | — | | | | (2,140,715 | ) | | | (51,289 | ) | | | — | |
| | | | | | | | | | | | | | | | | | | | | | | | |
| | | (20,598,639 | ) | | | (5,933,292 | ) | | | (11,494,763 | ) | | | (10,372,737 | ) | | | (2,987,593 | ) | | | (2,287,390 | ) |
| | | | | | | | | | | | | | | | | | | | | | | | |
| | | | | | |
Capital Share Transactions: | | | | | | | | | | | | | | | | | | | | | | | | |
Proceeds from shares sold | | | 13,423,545 | | | | 99,370,183 | | | | 48,508,401 | | | | 91,186,357 | | | | 11,230,000 | | | | 56,670,000 | |
Net asset value of shares issued upon reinvestment of dividends and distributions | | | 18,387,342 | | | | 4,983,737 | | | | 10,852,540 | | | | 8,892,572 | | | | 2,774,700 | | | | 2,094,599 | |
| | | | | | | | | | | | | | | | | | | | | | | | |
| | | 31,810,887 | | | | 104,353,920 | | | | 59,360,941 | | | | 100,078,929 | | | | 14,004,700 | | | | 58,764,599 | |
| | | | | | | | | | | | | | | | | | | | | | | | |
Cost of shares redeemed | | | (23,788,549 | ) | | | (28,810,964 | ) | | | (26,679,380 | ) | | | (20,757,038 | ) | | | (10,725,000 | ) | | | (6,930,000 | ) |
| | | | | | | | | | | | | | | | | | | | | | | | |
Increase in net assets derived from capital share transactions | | | 8,022,338 | | | | 75,542,956 | | | | 32,681,561 | | | | 79,321,891 | | | | 3,279,700 | | | | 51,834,599 | |
| | | | | | | | | | | | | | | | | | | | | | | | |
| | | | | | |
Net Increase in Net Assets | | | 2,401,841 | | | | 74,928,741 | | | | 36,170,663 | | | | 62,946,419 | | | | 5,171,344 | | | | 51,057,978 | |
| | | | | | |
Net Assets: | | | | | | | | | | | | | | | | | | | | | | | | |
Beginning of year | | | 214,726,083 | | | | 139,797,342 | | | | 206,128,886 | | | | 143,182,467 | | | | 128,093,574 | | | | 77,035,596 | |
| | | | | | | | | | | | | | | | | | | | | | | | |
End of year | | $ | 217,127,924 | | | $ | 214,726,083 | | | $ | 242,299,549 | | | $ | 206,128,886 | | | $ | 133,264,918 | | | $ | 128,093,574 | |
| | | | | | | | | | | | | | | | | | | | | | | | |
Undistributed net investment income | | $ | 3,455,541 | | | $ | 3,667,861 | | | $ | 11,266,540 | | | $ | 9,244,849 | | | $ | 2,761,071 | | | $ | 2,382,671 | |
| | | | | | | | | | | | | | | | | | | | | | | | |
See accompanying notes, which are an integral part of the financial statements.
76
| | | | | | | | | | | | | | | | | | | | | | | | |
| | | The
Labor Select
International Equity
Portfolio | | | The
Emerging
Markets
Portfolio | | | The
Emerging
Markets
Portfolio II | |
| | | Year ended | | | Year ended | | | Year ended | |
| | | 10/31/16 | | | 10/31/15 | | | 10/31/16 | | | 10/31/15 | | | 10/31/16 | | | 10/31/15 | |
| | | | | | |
Increase (Decrease) in Net Assets from Operations: | | | | | | | | | | | | | | | | | | | | | | | | |
Net investment income | | $ | 12,477,591 | | | $ | 9,795,800 | | | $ | 3,719,983 | | | $ | 4,616,217 | | | $ | 329,173 | | | $ | 158,620 | |
Net realized gain (loss) | | | (3,204,084 | ) | | | 11,413,740 | | | | (22,693,935 | ) | | | (18,468,430 | ) | | | (2,197,925 | ) | | | 1,059,812 | |
Net change in unrealized appreciation (depreciation) | | | (24,883,884 | ) | | | (24,611,888 | ) | | | 26,442,199 | | | | (34,854,341 | ) | | | 6,390,238 | | | | (10,503,977 | ) |
| | | | | | | | | | | | | | | | | | | | | | | | |
Net increase (decrease) in net assets resulting from operations | | | (15,610,377 | ) | | | (3,402,348 | ) | | | 7,468,247 | | | | (48,706,554 | ) | | | 4,521,486 | | | | (9,285,545 | ) |
| | | | | | | | | | | | | | | | | | | | | | | | |
| | | | | | |
Dividends and Distributions to Shareholders from: | | | | | | | | | | | | | | | | | | | | | | | | |
Net investment income | | | (9,585,512 | ) | | | (20,172,329 | ) | | | (4,099,296 | ) | | | (6,578,952 | ) | | | (347,034 | ) | | | (597,941 | ) |
Net realized gain | | | — | | | | — | | | | — | | | | (14,021,206 | ) | | | (1,068,866 | ) | | | (1,135,659 | ) |
| | | | | | | | | | | | | | | | | | | | | | | | |
| | | (9,585,512 | ) | | | (20,172,329 | ) | | | (4,099,296 | ) | | | (20,600,158 | ) | | | (1,415,900 | ) | | | (1,733,600 | ) |
| | | | | | | | | | | | | | | | | | | | | | | | |
| | | | | | |
Capital Share Transactions: | | | | | | | | | | | | | | | | | | | | | | | | |
Proceeds from shares sold | | | 79,256,887 | | | | 13,897,051 | | | | 8,001,148 | | | | 22,120,839 | | | | 860,050 | | | | 135,001 | |
Purchase reimbursement fees | | | — | | | | — | | | | 42,620 | | | | 118,421 | | | | — | | | | — | |
Net asset value of shares issued upon reinvestment of dividends and distributions | | | 9,563,827 | | | | 20,125,060 | | | | 3,027,278 | | | | 17,047,447 | | | | 1,415,899 | | | | 1,733,600 | |
| | | | | | | | | | | | | | | | | | | | | | | | |
| | | 88,820,714 | | | | 34,022,111 | | | | 11,071,046 | | | | 39,286,707 | | | | 2,275,949 | | | | 1,868,601 | |
| | | | | | | | | | | | | | | | | | | | | | | | |
Cost of shares redeemed | | | (29,445,035 | ) | | | (23,294,454 | ) | | | (53,579,564 | ) | | | (108,099,812 | ) | | | (1,498,000 | ) | | | (50,000 | ) |
Redemption reimbursement fees | | | — | | | | — | | | | 293,076 | | | | 583,024 | | | | — | | | | — | |
| | | | | | | | | | | | | | | | | | | | | | | | |
| | | (29,445,035 | ) | | | (23,294,454 | ) | | | (53,286,488 | ) | | | (107,516,788 | ) | | | (1,498,000 | ) | | | (50,000 | ) |
| | | | | | | | | | | | | | | | | | | | | | | | |
Increase (decrease) in net assets derived from capital share transactions | | | 59,375,679 | | | | 10,727,657 | | | | (42,215,442 | ) | | | (68,230,081 | ) | | | 777,949 | | | | 1,818,601 | |
| | | | | | | | | | | | | | | | | | | | | | | | |
| | | | | | |
Net Increase (Decrease) in Net Assets | | | 34,179,790 | | | | (12,847,020 | ) | | | (38,846,491 | ) | | | (137,536,793 | ) | | | 3,883,535 | | | | (9,200,544 | ) |
| | | | | | |
Net Assets: | | | | | | | | | | | | | | | | | | | | | | | | |
Beginning of year | | | 360,650,163 | | | | 373,497,183 | | | | 172,674,122 | | | | 310,210,915 | | | | 33,314,017 | | | | 42,514,561 | |
| | | | | | | | | | | | | | | | | | | | | | | | |
End of year | | $ | 394,829,953 | | | $ | 360,650,163 | | | $ | 133,827,631 | | | $ | 172,674,122 | | | $ | 37,197,552 | | | $ | 33,314,017 | |
| | | | | | | | | | | | | | | | | | | | | | | | |
Undistributed (distributions in excess of) net investment income | | $ | 11,001,243 | | | $ | 8,304,431 | | | $ | 3,978,087 | | | $ | 3,851,084 | | | $ | (431,929 | ) | | $ | (436,088 | ) |
| | | | | | | | | | | | | | | | | | | | | | | | |
See accompanying notes, which are an integral part of the financial statements.
Financial highlights
Delaware Pooled® Trust — The Large-Cap Value Equity Portfolio
Selected data for each share of the Portfolio outstanding throughout each period were as follows:
| | | | | | | | | | | | | | | | | | | | |
| | | Year ended | |
| | | 10/31/16 | | | 10/31/15 | | | 10/31/14 | | | 10/31/13 | | | 10/31/12 | |
Net asset value, beginning of period | | $ | 27.300 | | | $ | 27.610 | | | $ | 24.190 | | | $ | 18.970 | | | $ | 16.570 | |
| | | | | |
Income from investment operations: | | | | | | | | | | | | | | | | | | | | |
Net investment income1 | | | 0.505 | | | | 0.525 | | | | 0.473 | | | | 0.440 | | | | 0.394 | |
Net realized and unrealized gain | | | 1.202 | | | | 0.342 | | | | 3.385 | | | | 5.170 | | | | 2.379 | |
| | | | | | | | | | | | | | | | | | | | |
Total from investment operations | | | 1.707 | | | | 0.867 | | | | 3.858 | | | | 5.610 | | | | 2.773 | |
| | | | | | | | | | | | | | | | | | | | |
| | | | | |
Less dividends and distributions from: | | | | | | | | | | | | | | | | | | | | |
Net investment income | | | (0.563) | | | | (0.426) | | | | (0.321) | | | | (0.390) | | | | (0.373) | |
Net realized gain | | | (2.054) | | | | (0.751) | | | | (0.117) | | | | — | | | | — | |
| | | | | | | | | | | | | | | | | | | | |
Total dividends and distributions | | | (2.617) | | | | (1.177) | | | | (0.438) | | | | (0.390) | | | | (0.373) | |
| | | | | | | | | | | | | | | | | | | | |
| | | | | |
Net asset value, end of period | | $ | 26.390 | | | $ | 27.300 | | | $ | 27.610 | | | $ | 24.190 | | | $ | 18.970 | |
| | | | | | | | | | | | | | | | | | | | |
| | | | | |
Total return2 | | | 7.15% | | | | 3.18% | | | | 16.19% | | | | 30.09% | | | | 17.12% | |
| | | | | |
Ratios and supplemental data: | | | | | | | | | | | | | | | | | | | | |
Net assets, end of period (000 omitted) | | $ | 217,128 | | | $ | 214,726 | | | $ | 139,797 | | | $ | 89,237 | | | $ | 8,417 | |
Ratio of expenses to average net assets | | | 0.65% | | | | 0.65% | | | | 0.68% | | | | 0.70% | | | | 0.70% | |
Ratio of expenses to average net assets prior to fees waived | | | 0.65% | | | | 0.65% | | | | 0.68% | | | | 0.72% | | | | 1.09% | |
Ratio of net investment income to average net assets | | | 1.97% | | | | 1.92% | | | | 1.83% | | | | 1.97% | | | | 2.21% | |
Ratio of net investment income to average net assets prior to fees waived | | | 1.97% | | | | 1.92% | | | | 1.83% | | | | 1.95% | | | | 1.82% | |
Portfolio turnover | | | 13% | | | | 31% | | | | 19% | | | | 9% | | | | 14% | |
| 1 | The average shares outstanding method has been applied for per share information. |
| 2 | Total investment return is based on the change in net asset value of a share during the period and assumes reinvestment of dividends and distributions at net asset value. Total investment return during some of the periods shown reflects a waiver by the manager. Performance would have been lower had the waiver not been in effect. |
See accompanying notes, which are an integral part of the financial statements.
78
Delaware Pooled® Trust — The High-Yield Bond Portfolio
Selected data for each share of the Portfolio outstanding throughout each period were as follows:
| | | | | | | | | | | | | | | | | | | | |
| | | Year ended | |
| | | 10/31/16 | | | 10/31/15 | | | 10/31/14 | | | 10/31/13 | | | 10/31/12 | |
Net asset value, beginning of period | | $ | 7.780 | | | $ | 8.610 | | | $ | 8.720 | | | $ | 8.350 | | | $ | 7.830 | |
| | | | | |
Income (loss) from investment operations: | | | | | | | | | | | | | | | | | | | | |
Net investment income1 | | | 0.454 | | | | 0.485 | | | | 0.496 | | | | 0.529 | | | | 0.592 | |
Net realized and unrealized gain (loss) | | | 0.016 | | | | (0.782 | ) | | | (0.063 | ) | | | 0.291 | | | | 0.511 | |
| | | | | | | | | | | | | | | | | | | | |
Total from investment operations | | | 0.470 | | | | (0.297 | ) | | | 0.433 | | | | 0.820 | | | | 1.103 | |
| | | | | | | | | | | | | | | | | | | | |
| | | | | |
Less dividends and distributions from: | | | | | | | | | | | | | | | | | | | | |
Net investment income | | | (0.370 | ) | | | (0.423 | ) | | | (0.543 | ) | | | (0.450 | ) | | | (0.583 | ) |
Net realized gain | | | — | | | | (0.110 | ) | | | — | | | | — | | | | — | |
| | | | | | | | | | | | | | | | | | | | |
Total dividends and distributions | | | (0.370 | ) | | | (0.533 | ) | | | (0.543 | ) | | | (0.450 | ) | | | (0.583 | ) |
| | | | | | | | | | | | | | | | | | | | |
| | | | | |
Net asset value, end of period | | $ | 7.880 | | | $ | 7.780 | | | $ | 8.610 | | | $ | 8.720 | | | $ | 8.350 | |
| | | | | | | | | | | | | | | | | | | | |
| | | | | |
Total return2 | | | 6.63% | | | | (3.41% | ) | | | 5.23% | | | | 10.24% | | | | 15.31% | |
| | | | | |
Ratios and supplemental data: | | | | | | | | | | | | | | | | | | | | |
Net assets, end of period (000 omitted) | | $ | 242,300 | | | $ | 206,129 | | | $ | 143,182 | | | $ | 135,310 | | | $ | 113,048 | |
Ratio of expenses to average net assets | | | 0.55% | | | | 0.56% | | | | 0.57% | | | | 0.57% | | | | 0.58% | |
Ratio of net investment income to average net assets | | | 6.10% | | | | 6.09% | | | | 5.76% | | | | 6.29% | | | | 7.53% | |
Portfolio turnover | | | 119% | | | | 84% | | | | 101% | | | | 90% | | | | 68% | |
| 1 | The average shares outstanding method has been applied for per share information. |
| 2 | Total investment return is based on the change in net asset value of a share during the period and assumes reinvestment of dividends and distributions at net asset value. |
See accompanying notes, which are an integral part of the financial statements.
Financial highlights
Delaware Pooled® Trust — The Core Plus Fixed Income Portfolio
Selected data for each share of the Portfolio outstanding throughout each period were as follows:
| | | | | | | | | | | | | | | | | | | | |
| | | Year ended | |
| | | 10/31/16 | | | 10/31/15 | | | 10/31/14 | | | 10/31/13 | | | 10/31/12 | |
Net asset value, beginning of period | | $ | 10.290 | | | $ | 10.370 | | | $ | 10.100 | | | $ | 10.540 | | | $ | 10.050 | |
| | | | | |
Income (loss) from investment operations: | | | | | | | | | | | | | | | | | | | | |
Net investment income1 | | | 0.218 | | | | 0.240 | | | | 0.294 | | | | 0.289 | | | | 0.320 | |
Net realized and unrealized gain (loss) | | | 0.145 | | | | (0.109 | ) | | | 0.201 | | | | (0.346 | ) | | | 0.460 | |
| | | | | | | | | | | | | | | | | | | | |
Total from investment operations | | | 0.363 | | | | 0.131 | | | | 0.495 | | | | (0.057 | ) | | | 0.780 | |
| | | | | | | | | | | | | | | | | | | | |
| | | | | |
Less dividends and distributions from: | | | | | | | | | | | | | | | | | | | | |
Net investment income | | | (0.229 | ) | | | (0.211 | ) | | | (0.225 | ) | | | (0.383 | ) | | | (0.290 | ) |
Net realized gain | | | (0.004 | ) | | | — | | | | — | | | | — | | | | — | |
| | | | | | | | | | | | | | | | | | | | |
Total dividends and distributions | | | (0.233 | ) | | | (0.211 | ) | | | (0.225 | ) | | | (0.383 | ) | | | (0.290 | ) |
| | | | | | | | | | | | | | | | | | | | |
| | | | | |
Net asset value, end of period | | $ | 10.420 | | | $ | 10.290 | | | $ | 10.370 | | | $ | 10.100 | | | $ | 10.540 | |
| | | | | | | | | | | | | | | | | | | | |
| | | | | |
Total return2 | | | 3.63% | | | | 1.29% | | | | 5.02% | | | | (0.55% | ) | | | 7.95% | |
| | | | | |
Ratios and supplemental data: | | | | | | | | | | | | | | | | | | | | |
Net assets, end of period (000 omitted) | | $ | 133,265 | | | $ | 128,094 | | | $ | 77,036 | | | $ | 56,641 | | | $ | 60,313 | |
Ratio of expenses to average net assets | | | 0.45% | | | | 0.45% | | | | 0.45% | | | | 0.45% | | | | 0.45% | |
Ratio of expenses to average net assets prior to fees waived | | | 0.60% | | | | 0.61% | | | | 0.65% | | | | 0.70% | | | | 0.62% | |
Ratio of net investment income to average net assets | | | 2.12% | | | | 2.33% | | | | 2.90% | | | | 2.84% | | | | 3.14% | |
Ratio of net investment income to average net assets prior to fees waived | | | 1.97% | | | | 2.17% | | | | 2.70% | | | | 2.59% | | | | 2.97% | |
Portfolio turnover | | | 310% | | | | 436% | | | | 339% | | | | 358% | | | | 327% | |
| 1 | The average shares outstanding method has been applied for per share information. |
| 2 | Total investment return is based on the change in net asset value of a share during the period and assumes reinvestment of dividends and distributions at net asset value. Total investment return during all of the periods shown reflects a waiver by the manager. Performance would have been lower had the waiver not been in effect. |
See accompanying notes, which are an integral part of the financial statements.
80
Delaware Pooled® Trust — The Labor Select International Equity Portfolio
Selected data for each share of the Portfolio outstanding throughout each period were as follows:
| | | | | | | | | | | | | | | | | | | | |
| | | Year ended | |
| | | 10/31/16 | | | 10/31/15 | | | 10/31/14 | | | 10/31/13 | | | 10/31/12 | |
Net asset value, beginning of period | | $ | 13.790 | | | $ | 14.740 | | | $ | 15.070 | | | $ | 12.650 | | | $ | 12.920 | |
| | | | | |
Income (loss) from investment operations: | | | | | | | | | | | | | | | | | | | | |
Net investment income1 | | | 0.433 | | | | 0.374 | | | | 0.693 | | | | 0.324 | | | | 0.441 | |
Net realized and unrealized gain (loss) | | | (1.026 | ) | | | (0.524 | ) | | | (0.573 | ) | | | 2.516 | | | | (0.176 | ) |
| | | | | | | | | | | | | | | | | | | | |
Total from investment operations | | | (0.593 | ) | | | (0.150 | ) | | | 0.120 | | �� | | 2.840 | | | | 0.265 | |
| | | | | | | | | | | | | | | | | | | | |
| | | | | |
Less dividends and distributions from: | | | | | | | | | | | | | | | | | | | | |
Net investment income | | | (0.367 | ) | | | (0.800 | ) | | | (0.450 | ) | | | (0.420 | ) | | | (0.535 | ) |
| | | | | | | | | | | | | | | | | | | | |
Total dividends and distributions | | | (0.367 | ) | | | (0.800 | ) | | | (0.450 | ) | | | (0.420 | ) | | | (0.535 | ) |
| | | | | | | | | | | | | | | | | | | | |
| | | | | |
Net asset value, end of period | | $ | 12.830 | | | $ | 13.790 | | | $ | 14.740 | | | $ | 15.070 | | | $ | 12.650 | |
| | | | | | | | | | | | | | | | | | | | |
| | | | | |
Total return2 | | | (4.24% | ) | | | (0.98% | ) | | | 0.86% | | | | 23.11% | | | | 2.40% | |
| | | | | |
Ratios and supplemental data: | | | | | | | | | | | | | | | | | | | | |
Net assets, end of period (000 omitted) | | $ | 394,830 | | | $ | 360,650 | | | $ | 373,497 | | | $ | 506,102 | | | $ | 509,527 | |
Ratio of expenses to average net assets | | | 0.86% | | | | 0.87% | | | | 0.86% | | | | 0.88% | | | | 0.87% | |
Ratio of net investment income to average net assets | | | 3.39% | | | | 2.63% | | | | 4.54% | | | | 2.43% | | | | 3.59% | |
Portfolio turnover | | | 22% | | | | 20% | | | | 23% | | | | 16% | | | | 17% | |
| 1 | The average shares outstanding method has been applied for per share information. |
| 2 | Total investment return is based on the change in net asset value of a share during the period and assumes reinvestment of dividends and distributions at net asset value. |
See accompanying notes, which are an integral part of the financial statements.
Financial highlights
Delaware Pooled® Trust — The Emerging Markets Portfolio
Selected data for each share of the Portfolio outstanding throughout each period were as follows:
| | | | | | | | | | | | | | | | | | | | |
| | | Year ended | |
| | | 10/31/16 | | | 10/31/15 | | | 10/31/14 | | | 10/31/13 | | | 10/31/12 | |
Net asset value, beginning of period | | $ | 7.470 | | | $ | 9.750 | | | $ | 10.110 | | | $ | 10.160 | | | $ | 10.510 | |
| | | | | |
Income (loss) from investment operations: | | | | | | | | | | | | | | | | | | | | |
Net investment income1 | | | 0.182 | | | | 0.159 | | | | 0.216 | | | | 0.175 | | | | 0.177 | |
Net realized and unrealized gain (loss) | | | 0.282 | | | | (1.771 | ) | | | (0.080 | ) | | | 0.158 | | | | 0.467 | |
| | | | | | | | | | | | | | | | | | | | |
Total from investment operations | | | 0.464 | | | | (1.612 | ) | | | 0.136 | | | | 0.333 | | | | 0.644 | |
| | | | | | | | | | | | | | | | | | | | |
| | | | | |
Less dividends and distributions from: | | | | | | | | | | | | | | | | | | | | |
Net investment income | | | (0.180 | ) | | | (0.221 | ) | | | (0.178 | ) | | | (0.239 | ) | | | (0.220 | ) |
Net realized gain | | | — | | | | (0.471 | ) | | | (0.334 | ) | | | (0.164 | ) | | | (0.798 | ) |
| | | | | | | | | | | | | | | | | | | | |
Total dividends and distributions | | | (0.180 | ) | | | (0.692 | ) | | | (0.512 | ) | | | (0.403 | ) | | | (1.018 | ) |
| | | | | | | | | | | | | | | | | | | | |
| | | | | |
Reimbursement fees: | | | | | | | | | | | | | | | | | | | | |
Purchase reimbursement fees1,2 | | | 0.002 | | | | 0.004 | | | | 0.005 | | | | 0.014 | | | | 0.006 | |
Redemption reimbursement fees1,2 | | | 0.014 | | | | 0.020 | | | | 0.011 | | | | 0.006 | | | | 0.018 | |
| | | | | | | | | | | | | | | | | | | | |
| | | 0.016 | | | | 0.024 | | | | 0.016 | | | | 0.020 | | | | 0.024 | |
| | | | | | | | | | | | | | | | | | | | |
| | | | | |
Net asset value, end of period | | $ | 7.770 | | | $ | 7.470 | | | $ | 9.750 | | | $ | 10.110 | | | $ | 10.160 | |
| | | | | | | | | | | | | | | | | | | | |
| | | | | |
Total return3 | | | 6.75% | | | | (17.11% | ) | | | 1.89% | | | | 3.36% | | | | 7.81% | |
| | | | | |
Ratios and supplemental data: | | | | | | | | | | | | | | | | | | | | |
Net assets, end of period (000 omitted) | | $ | 133,828 | | | $ | 172,674 | | | $ | 310,211 | | | $ | 333,884 | | | $ | 316,809 | |
Ratio of expenses to average net assets | | | 1.19% | | | | 1.19% | | | | 1.16% | | | | 1.20% | | | | 1.20% | |
Ratio of net investment income to average net assets | | | 2.51% | | | | 1.90% | | | | 2.25% | | | | 1.72% | | | | 1.80% | |
Portfolio turnover | | | 28% | | | | 27% | | | | 30% | | | | 40% | 4 | | | 38% | 4 |
| |
| 1 | The average shares outstanding method has been applied for per share information. |
| 2 | The Portfolio charges a 0.55% purchase reimbursement fee and a 0.55% redemption reimbursement fee, which are retained by the Portfolio. |
| 3 | Total investment return is based on the change in net asset value of a share during the period and assumes reinvestment of dividends and distributions at net asset value. Total investment return does not reflect the purchase reimbursement fee and redemption reimbursement fee. |
| 4 | Excludes the value of Portfolio securities received or delivered as a result of in-kind purchases or redemptions of the Portfolio’s capital shares. |
See accompanying notes, which are an integral part of the financial statements.
82
Delaware Pooled® Trust — The Emerging Markets Portfolio II
Selected data for each share of the Portfolio outstanding throughout each period were as follows:
| | | | | | | | | | | | | | | | | | | | |
| | | Year ended | |
| | | 10/31/16 | | | 10/31/15 | | | 10/31/14 | | | 10/31/13 | | | 10/31/12 | |
Net asset value, beginning of period | | $ | 7.370 | | | $ | 9.880 | | | $ | 9.650 | | | $ | 8.170 | | | $ | 8.550 | |
| | | | | |
Income (loss) from investment operations: | | | | | | | | | | | | | | | | | | | | |
Net investment income1 | | | 0.069 | | | | 0.035 | | | | 0.062 | | | | 0.075 | | | | 0.070 | |
Net realized and unrealized gain (loss) | | | 0.877 | | | | (2.142 | ) | | | 0.297 | | | | 1.446 | | | | (0.028 | ) |
| | | | | | | | | | | | | | | | | | | | |
Total from investment operations | | | 0.946 | | | | (2.107 | ) | | | 0.359 | | | | 1.521 | | | | 0.042 | |
| | | | | | | | | | | | | | | | | | | | |
| | | | | |
Less dividends and distributions from: | | | | | | | | | | | | | | | | | | | | |
Net investment income | | | (0.075 | ) | | | (0.139 | ) | | | (0.092 | ) | | | (0.041 | ) | | | (0.128 | ) |
Net realized gain | | | (0.231 | ) | | | (0.264 | ) | | | (0.037 | ) | | | — | | | | (0.294 | ) |
| | | | | | | | | | | | | | | | | | | | |
Total dividends and distributions | | | (0.306 | ) | | | (0.403 | ) | | | (0.129 | ) | | | (0.041 | ) | | | (0.422 | ) |
| | | | | | | | | | | | | | | | | | | | |
| | | | | |
Net asset value, end of period | | $ | 8.010 | | | $ | 7.370 | | | $ | 9.880 | | | $ | 9.650 | | | $ | 8.170 | |
| | | | | | | | | | | | | | | | | | | | |
| | | | | |
Total return2 | | | 13.62% | | | | (21.84% | ) | | | 3.80% | | | | 18.68% | | | | 0.89% | |
| | | | | |
Ratios and supplemental data: | | | | | | | | | | | | | | | | | | | | |
Net assets, end of period (000 omitted) | | $ | 37,198 | | | $ | 33,314 | | | $ | 42,515 | | | $ | 42,223 | | | $ | 29,686 | |
Ratio of expenses to average net assets | | | 1.20% | | | | 1.21% | | | | 1.20% | | | | 1.20% | | | | 1.20% | |
Ratio of expenses to average net assets prior to fees waived | | | 1.34% | | | | 1.35% | | | | 1.32% | | | | 1.36% | | | | 1.41% | |
Ratio of net investment income to average net assets | | | 0.97% | | | | 0.43% | | | | 0.64% | | | | 0.85% | | | | 0.87% | |
Ratio of net investment income to average net assets prior to fees waived | | | 0.83% | | | | 0.29% | | | | 0.52% | | | | 0.69% | | | | 0.66% | |
Portfolio turnover | | | 20% | | | | 8% | | | | 11% | | | | 11% | | | | 12% | |
| 1 | The average shares outstanding method has been applied for per share information. |
| 2 | Total investment return is based on the change in net asset value of a share during the period and assumes reinvestment of dividends and distributions at net asset value. Total investment return during all of the periods shown reflects a waiver by the manager. Performance would have been lower had the waiver not been in effect. |
See accompanying notes, which are an integral part of the financial statements.
Notes to financial statements
Delaware Pooled® Trust
October 31, 2016
Delaware Pooled Trust (Trust) is organized as a Delaware statutory trust and offers seven separate Portfolios. These financial statements and the related notes pertain to The Large-Cap Value Equity Portfolio, The High-Yield Bond Portfolio, The Core Plus Fixed Income Portfolio, The Labor Select International Equity Portfolio, The Emerging Markets Portfolio, and The Emerging Markets Portfolio II (each, a Portfolio, and collectively, the Portfolios).The Real Estate Investment Trust Portfolio is included in a separate report. The Trust is an open-end investment company. Each Portfolio is considered diversified under the Investment Company Act of 1940,as amended. Each Portfolio offers one class of shares.
The investment objective of The Large-Cap Value Equity Portfolio is to seek long-term capital appreciation.
The investment objective of The High-Yield Bond Portfolio is to seek high total return.
The investment objective of The Core Plus Fixed Income Portfolio is to seek maximum long-term total return, consistent with reasonable risk.
The investment objective of The Labor Select International Equity Portfolio is to seek maximum long-term total return.
The investment objective of The Emerging Markets Portfolio is to seek long-term capital appreciation.
The investment objective of The Emerging Markets Portfolio II is to seek long-term capital appreciation.
1. Significant Accounting Policies
The following accounting policies are in accordance with U.S. generally accepted accounting principles (U.S.GAAP) and are consistently followed by the Portfolios.
Security Valuation — Equity securities and exchange-traded Funds (ETFs), except those traded on the Nasdaq Stock Market LLC (Nasdaq), are valued at the last quoted sales price as of the time of the regular close of the New York Stock Exchange on the valuation date. Equity securities and ETFs traded on the Nasdaq are valued in accordance with the Nasdaq Official Closing Price, which may not be the last sales price. If, on a particular day, an equity security or ETF does not trade, the mean between the bid and ask prices will be used, which approximates fair value. Securities listed on a foreign exchange are normally valued at the last quoted sales price on the valuation date. Debt securities, credit default swap (CDS) contracts, and interest rate swap contracts are valued based upon valuations provided by an independent pricing service or broker/counterparty and reviewed by management. To the extent current market prices are not available, the pricing service may take into account developments related to the specific security, as well as transactions in comparable securities. U.S. government and agency securities are valued at the mean between the bid and ask prices, which approximates fair value. Valuations for fixed income securities utilize matrix systems, which reflect such factors as security prices, yields, maturities, and ratings, and are supplemented by dealer and exchange quotations. For asset-backed securities, collateralized mortgage obligations, commercial mortgage securities, and U.S. government agency mortgage securities, pricing vendors utilize matrix pricing which considers prepayment speed; attributes of the collateral; yield or price of bonds of comparable quality, coupon, maturity, and type as well as broker/dealer-supplied prices. Swap prices are derived using daily swap curves and models that incorporate a number of market data factors, such as discounted cash flows, trades, and values of the underlying reference instruments. Foreign currency exchange contracts and foreign cross currency exchange contracts are valued at the mean between the bid and ask prices, which approximates fair value. Interpolated values are derived when the settlement date of the contract is an interim date for which quotations are not available. Futures contracts and options on futures contracts are valued at the daily quoted settlement prices. Exchange-traded options are valued at the last reported sale price or, if no sales are reported, at the mean between the last reported bid and ask prices, which approximates fair value. Generally, other securities and assets for which market quotations are not readily available are valued at fair value as determined in good faith under the direction of the Trust’s Board of Trustees (Board). In determining whether market quotations are readily available or fair valuation will be used, various factors will be taken into consideration, such as market closures or suspension of trading in a security. The Portfolios may use fair value pricing more frequently for securities traded primarily in non-U.S. markets because, among other things, most foreign markets close well before the Portfolios value their securities, generally as of 4:00 p.m. Eastern time. The earlier close of these foreign markets gives rise to the possibility that significant events, including broad market moves, government actions or pronouncements, aftermarket trading, or news events may have occurred in the interim. Whenever such a significant event occurs, the Portfolios may value foreign securities using fair value prices based on third-party vendor modeling tools (international fair value pricing).
84
Federal and Foreign Income Taxes — No provision for federal income taxes has been made as each Portfolio intends to continue to qualify for federal income tax purposes as a regulated investment company under Subchapter M of the Internal Revenue Code of 1986, as amended, and make the requisite distributions to shareholders. The Portfolios evaluate tax positions taken or expected to be taken in the course of preparing each Portfolio’s tax returns to determine whether the tax positions are “more-likely-than-not” of being sustained by the applicable tax authority. Tax positions not deemed to meet the “more-likely-than-not” threshold are recorded as a tax benefit or expense in the current year. Management has analyzed each Portfolio’s tax positions taken for all open federal income tax years (Oct. 31, 2013–Oct. 31, 2016), and has concluded that no provision for federal income tax is required in any Portfolio’s financial statements. In regard to foreign taxes only, each Portfolio has open tax years in certain foreign countries in which it invests that may date back to the inception of each Portfolio.
Repurchase Agreements — Each Portfolio may purchase certain U.S. government securities subject to the counterparty’s agreement to repurchase them at an agreed upon date and price. The counterparty will be required on a daily basis to maintain the value of the collateral subject to the agreement at not less than the repurchase price (including accrued interest). The agreements are conditioned upon the collateral being deposited under the Federal Reserve book-entry system with each Portfolio’s custodian or a third-party sub-custodian. In the event of default or bankruptcy by the other party to the agreement, retention of the collateral may be subject to legal proceedings. All open repurchase agreements as of the date of this report were entered into on Oct. 31, 2016, and matured on the next business day.
To Be Announced Trades (TBA) — Certain Portfolios may contract to purchase or sell securities for a fixed price at a transaction date beyond the customary settlement period (examples: when issued, delayed delivery, forward commitment, or TBA transactions) consistent with each Portfolio’s ability to manage their investment portfolio and meet redemption requests. These transactions involve a commitment by each Portfolio to purchase or deliver securities for a predetermined price or yield with payment and delivery taking place more than three days in the future, or after a period longer than the customary settlement period for that type of security. No interest will be earned by each Portfolio on such purchases until the securities are delivered or the transaction is completed; however, the market value may change prior to delivery.
Foreign Currency Transactions — Transactions denominated in foreign currencies are recorded at the prevailing exchange rates on the valuation date in accordance with each Portfolio’s prospectus. The value of all assets and liabilities denominated in foreign currencies is translated daily into U.S. dollars at the exchange rate of such currencies against the U.S. dollar. Transaction gains or losses resulting from changes in exchange rates during the reporting period or upon settlement of the foreign currency transaction are reported in operations for the current period. Each Portfolio generally bifurcates that portion of realized gains and losses on investments in debt securities which is due to changes in foreign exchange rates from that which is due to changes in market prices of debt securities. That portion of gains (losses), which is due to changes in foreign exchange rates, is included in the “Statements of operations” under “Net realized gain (loss) on foreign currencies.” For foreign equity securities, these changes are included in the “Statements of operations” under “Net realized and unrealized gain (loss) on investments.” Each Portfolio reports certain foreign currency related transactions as components of realized gains (losses) for financial reporting purposes, whereas such components are treated as ordinary income (loss) for federal income tax purposes.
Use of Estimates — Each Portfolio is an investment company, whose financial statements are prepared in conformity with U.S. GAAP. Therefore, each Portfolio follows the accounting and reporting guidelines for investment companies. The preparation of financial statements in conformity with U.S. GAAP requires management to make estimates and assumptions that affect the fair value of investments, the reported amounts of assets and liabilities and disclosure of contingent assets and liabilities at the date of the financial statements, and the reported amounts of revenues and expenses during the reporting period. Actual results could differ from those estimates and the differences could be material.
Reimbursement Fees — The Emerging Markets Portfolio may charge a 0.55% purchase reimbursement fee and a 0.55% redemption reimbursement fee. These fees are designed to reflect an approximation of the brokerage and other transaction costs associated with the investment of an investor’s purchase amount or the disposition of assets to meet redemptions, and to limit the extent to which the Portfolio (and, indirectly, the Portfolio’s existing shareholders) would have to bear such costs. These fees are accounted for as an addition to paid-in capital for the Portfolio in the “Statements of changes in net assets.”
Notes to financial statements
Delaware Pooled® Trust
1. Significant Accounting Policies (continued)
Other — Expenses directly attributable to each Portfolio are charged directly to the Portfolio. Other expenses common to various funds within the Delaware Investments® Family of Funds are generally allocated among such funds on the basis of average net assets. Management fees and some other expenses are paid monthly. Security transactions are recorded on the date the securities are purchased or sold (trade date) for financial reporting purposes. Costs used in calculating realized gains and losses on the sale of investment securities are those of the specific securities sold. Interest income is recorded on the accrual basis. Discounts and premiums on debt securities are accreted or amortized to interest income, respectively, over the lives of the respective securities using the effective interest method. Dividend income is recorded on the ex-dividend date. Realized gains (losses) on paydowns of asset- and mortgage-backed securities are classified as interest income. Distributions received from investments in Real Estate Investment Trusts (REITs) are recorded as dividend income on the ex-dividend date, subject to reclassification upon notice of the character of such distributions by the issuer. Foreign dividends are also recorded on the ex-dividend date or as soon after the ex-dividend date that a Portfolio is aware of such dividends, net of all tax withholdings, a portion of which may be reclaimable. Withholding taxes and reclaims on foreign dividends and interest have been recorded in accordance with each Portfolio’s understanding of the applicable country’s tax rules and rates. Each Portfolio may pay foreign capital gains taxes on certain foreign securities held, which are reported as components of realized losses for financial reporting purposes, whereas such components are treated as ordinary loss for federal income tax purposes.
Each Portfolio declares and pays dividends from net investment income and distributions from net realized gain on investments, if any, annually. Each Portfolio may distribute more frequently, if necessary for tax purposes. Dividends and distributions, if any, are recorded on the ex-dividend date.
Subject to seeking best execution, each Portfolio may direct certain security trades to brokers who have agreed to rebate a portion of the related brokerage commission to each Portfolio in cash. In general, best execution refers to many factors, including the price paid or received for a security, the commission charged, the promptness and reliability of execution, the confidentiality and placement accorded the order, and other factors affecting the overall benefit obtained by the Portfolio on the transaction. Such commission rebates are included in realized gain on investments in the accompanying financial statements. There were no commission rebates for the year ended Oct. 31, 2016.
Each Portfolio may receive earnings credits from its custodian when positive cash balances are maintained, which may be used to offset custody fees. There were no such earnings credits for the year ended Oct. 31, 2016.
Each Portfolio receives earnings credits from its transfer agent when positive cash balances are maintained, which may be used to offset transfer agent fees. If the amount earned is greater than one dollar, the expense paid under this arrangement is included on the “Statements of operations” under “Dividend disbursing and transfer agent fees and expenses” with the corresponding expense offset shown under “Less expense paid indirectly.” For the year ended Oct. 31, 2016, earnings credits are as follows:
| | |
| | | Earnings Credits |
The Large-Cap Value Equity Portfolio | | $ 2 |
The High-Yield Bond Portfolio | | 2 |
The Core Plus Fixed Income Portfolio | | — |
The Labor Select International Equity Portfolio | | 4 |
The Emerging Markets Portfolio | | 2 |
The Emerging Markets Portfolio II | | 2 |
86
2. Investment Management, Administration Agreements, and Other Transactions with Affiliates
In accordance with the terms of the investment management agreements, Delaware Management Company (DMC), a series of Delaware Management Business Trust and the investment manager of the Portfolios, will receive an annual fee, which is calculated daily based on the average daily net assets of each Portfolio.
DMC has contractually agreed to waive that portion, if any, of its management fees and/or pay/reimburse each Portfolio (except for The Labor Select International Equity Portfolio and The Emerging Markets Portfolio) to the extent necessary to ensure that annual operating expenses, (excluding any 12b-1 fees, taxes, interest, short sale dividend and interest expenses, acquired fund fees and expenses, brokerage fees, certain insurance costs, and nonroutine expenses or costs, including, but not limited to, those relating to reorganizations, litigation, conducting shareholder meetings, and liquidations) do not exceed specified percentages of average daily net assets of each Portfolio from Nov. 1, 2015 through Oct. 31, 2016.* For purposes of these waivers and reimbursements, nonroutine expenses may also include such additional costs and expenses as may be agreed upon from time to time by the Portfolios’ Board and DMC. These expense waivers and reimbursements apply only to expenses paid directly by the Portfolios and may only be terminated by agreement of DMC and the Portfolios.
The management fee rates and the operating expense limitation rates in effect for the year ended Oct. 31, 2016, are as follows:
| | | | | | |
| | | Management
fee as a percentage
of average daily
net assets (per annum) | | | | Contractual
operating expense
limitation as
a percentage
of average daily
net assets (per annum)† |
The Large-Cap Value Equity Portfolio | | 0.55% | | | | 0.70% |
The High-Yield Bond Portfolio | | 0.45% | | | | 0.59% |
The Core Plus Fixed Income Portfolio | | 0.43% | | | | 0.45% |
The Labor Select International Equity Portfolio | | 0.75% | | | | N/A |
The Emerging Markets Portfolio | | 1.00% | | | | N/A |
The Emerging Markets Portfolio II | | 1.00% | | | | 1.20% |
| † | These operating expense limitations exclude certain expenses, such as 12b-1 fees, taxes, interest, short sale dividend and interest expenses, acquired fund fees and expenses, brokerage fees, certain insurance costs, and nonroutine expenses or costs, including, but not limited to, those relating to reorganizations, litigation, conducting shareholder meetings, and liquidations. In some instances, a Portfolio’s annual operating expenses may be lower than the contracted operating expense limitations. |
Mondrian Investment Partners Limited (Mondrian) furnishes investment sub-advisory services to The Labor Select International Equity Portfolio and The Emerging Markets Portfolio. For these services, DMC, not the Portfolios, pays Mondrian the following percentages of the Portfolios’ average daily net assets:
| | |
| | | Sub-advisory fee as a
percentage of average daily
net assets (per annum) |
The Labor Select International Equity Portfolio | | 0.30% |
The Emerging Markets Portfolio | | 0.75% |
Notes to financial statements
Delaware Pooled® Trust
2. Investment Management, Administration Agreements, and Other Transactions with Affiliates (continued)
Delaware Investments Fund Services Company (DIFSC), an affiliate of DMC, provides fund accounting and financial administration oversight services to each Portfolio. For these services, DIFSC’s fees are calculated based on the aggregate daily net assets of the Delaware Investments® Family of Funds at the following annual rate: 0.0050% of the first $30 billion; 0.0045% of the next $10 billion; 0.0040% of the next $10 billion; and 0.0025% of aggregate average daily net assets in excess of $50 billion. The fees payable to DIFSC under the service agreement described above are allocated among all funds in the Delaware Investments Family of Funds on a relative net asset value (NAV) basis. These amounts are included on the “Statements of operations” under “Accounting and administrative expenses.” For the year ended Oct. 31, 2016, each Portfolio was charged for these services as follows:
| | | | |
The Large-Cap Value Equity Portfolio | | $ | 10,177 | |
The High-Yield Bond Portfolio | | | 10,818 | |
The Core Plus Fixed Income Portfolio | | | 6,286 | |
The Labor Select International Equity Portfolio | | | 17,450 | |
The Emerging Markets Portfolio | | | 7,020 | |
The Emerging Markets Portfolio II | | | 1,605 | |
DIFSC is also the transfer agent and dividend disbursing agent of each Portfolio. For these services, each Portfolio pays DIFSC fees at the annual rate of 0.0075% of each Portfolio’s average daily net assets. These amounts are included on the “Statements of operations” under “Dividend disbursing and transfer agent fees and expenses.” For the year ended Oct. 31, 2016, each Portfolio was charged the following amounts for these services:
| | | | |
The Large-Cap Value Equity Portfolio | | $ | 16,103 | |
The High-Yield Bond Portfolio | | | 17,032 | |
The Core Plus Fixed Income Portfolio | | | 9,944 | |
The Labor Select International Equity Portfolio | | | 27,616 | |
The Emerging Markets Portfolio | | | 11,103 | |
The Emerging Markets Portfolio II | | | 2,540 | |
Pursuant to a sub-transfer agency agreement between DIFSC and BNY Mellon Investment Servicing (US) Inc. (BNYMIS), BNYMIS provides certain sub-transfer agency services to each Portfolio. Sub-transfer agency fees are paid by each Portfolio and are also included on the “Statement of operations” under “Dividend disbursing and transfer agent fees and expenses.”
As provided in the investment management agreement, each Portfolio bears a portion of the cost of certain resources shared with DMC, including the cost of internal personnel of DMC and/or its affiliates that provide legal, tax, and regulatory reporting services to the Portfolios. These amounts are included on the “Statements of operations” under “Legal fees.” For the year ended Oct. 31, 2016, each Portfolio was charged for internal legal, tax, and regulatory reporting services provided by DMC and/or its affiliates’ employees as follows:
| | | | |
The Large-Cap Value Equity Portfolio | | $ | 9,314 | |
The High-Yield Bond Portfolio | | | 8,389 | |
The Core Plus Fixed Income Portfolio | | | 4,900 | |
The Labor Select International Equity Portfolio | | | 13,539 | |
The Emerging Markets Portfolio | | | 5,562 | |
The Emerging Markets Portfolio II | | | 1,247 | |
Trustees’ fees include expenses accrued by each Portfolio for each Trustee’s retainer and meeting fees. Certain officers of DMC, DIFSC, and DDLP are officers and/or Trustees of the Trust. These officers and Trustees are paid no compensation by the Portfolios.
88
Cross trades for the year ended Oct. 31, 2016, were executed by the Portfolios pursuant to procedures adopted by the Board designed to ensure compliance with Rule 17a-7 under the 1940 Act. Cross trading is the buying or selling of portfolio securities between funds of investment companies, or between a fund of an investment company and another entity, that are or could be considered affiliates by virtue of having a common investment advisor (or affiliated investment advisors), common directors/trustees and/or common officers. At their regularly scheduled meetings, the Board reviews such transactions for compliance with the procedures adopted by the Board. Pursuant to these procedures, for the year ended Oct. 31, 2016, the Portfolios engaged in securities purchases and securities sales, which resulted in net realized gains (losses) as follows:
| | | | | | | | | | |
| | | Purchases | | | Sales | | | Net realized gain (loss) |
The High-Yield Bond Portfolio | | $ | 9,939,339 | | | $ | 9,382,398 | | | $(4,423) |
The Labor Select International Equity Portfolio | | | — | | | | 9,255,735 | | | 282 |
*The contractual waiver period is Feb. 27, 2015 through Feb. 28, 2017.
3. Investments
For the year ended Oct. 31, 2016, each Portfolio made purchases and sales of investment securities other than short-term investments as follows:
| | | | | | | | | | | | | | | | | | | | |
| | | Purchases | | | | Sales | | |
| | | other than | | Purchases of | | other than | | Sales of |
| | | U.S. government | | U.S. government | | U.S. government | | U.S. government |
| | | securities | | securities | | securities | | securities |
The Large-Cap Value Equity Portfolio | | | | $ 26,563,027 | | | | | $ — | | | | | $ 41,715,031 | | | | | $ — | |
The High-Yield Bond Portfolio | | | | 287,735,006 | | | | | — | | | | | 255,390,864 | | | | | — | |
The Core Plus Fixed Income Portfolio | | | | 291,150,513 | | | | | 111,615,903 | | | | | 275,190,790 | | | | | 125,483,271 | |
The Labor Select International Equity Portfolio | | | | 141,203,548 | | | | | — | | | | | 81,325,700 | | | | | — | |
The Emerging Markets Portfolio | | | | 41,497,506 | | | | | — | | | | | 84,484,259 | | | | | — | |
The Emerging Markets Portfolio II | | | | 7,636,671 | | | | | — | | | | | 6,723,677 | | | | | — | |
At Oct. 31, 2016, the cost and unrealized appreciation (depreciation) of investments for federal income tax purposes for each Portfolio were as follows:
| | | | | | | | | | | | | | | | | | | | |
| | | | | Aggregate | | Aggregate | | Net unrealized |
| | | | | unrealized | | unrealized | | appreciation |
| | | Cost of | | appreciation | | depreciation | | (depreciation) |
| | | investments | | of investments | | of investments | | of investments |
The Large-Cap Value Equity Portfolio | | | $ | 207,957,431 | | | | $ | 20,447,553 | | | | $ | (11,616,877 | ) | | | $ | 8,830,676 | |
The High-Yield Bond Portfolio | | | | 236,545,052 | | | | | 7,850,756 | | | | | (1,344,605 | ) | | | | 6,506,151 | |
The Core Plus Fixed Income Portfolio | | | | 142,300,031 | | | | | 1,998,726 | | | | | (825,114 | ) | | | | 1,173,612 | |
The Labor Select International Equity Portfolio | | | | 419,615,722 | | | | | 50,118,339 | | | | | (77,619,079 | ) | | | | (27,500,740 | ) |
The Emerging Markets Portfolio | | | | 148,807,101 | | | | | 12,859,100 | | | | | (27,868,171 | ) | | | | (15,009,071 | ) |
The Emerging Markets Portfolio II | | | | 38,972,251 | | | | | 6,015,705 | | | | | (6,674,112 | ) | | | | (658,407 | ) |
U.S.GAAP defines fair value as the price that each Portfolio would receive to sell an asset or pay to transfer a liability in an orderly transaction between market participants at the measurement date under current market conditions. A three-level hierarchy for fair value measurements has been established based upon the transparency of inputs to the valuation of an asset or liability. Inputs may be observable or unobservable and refer broadly to the assumptions that market participants would use in pricing the asset or liability. Observable inputs reflect the assumptions market participants would use in pricing the asset or liability based on market data obtained from sources independent of the reporting entity. Unobservable inputs reflect the reporting entity’s own assumptions about the assumptions that market participants would use in pricing the asset or liability based on the best information available under the circumstances. Each Portfolio’s investment in its entirety is assigned a level based upon the observability of the inputs which are significant to the overall valuation. The three-level hierarchy of inputs is summarized below.
Notes to financial statements
Delaware Pooled® Trust
3. Investments (continued)
| | |
| Level 1 – | | Inputs are quoted prices in active markets for identical investments. (Examples: equity securities, open-end investment companies, futures contracts, exchange-traded options contracts) |
| |
| Level 2 – | | Other observable inputs, including, but not limited to: quoted prices for similar assets or liabilities in markets that are active, quoted prices for identical or similar assets or liabilities in markets that are not active, inputs other than quoted prices that are observable for the assets or liabilities (such as interest rates, yield curves, volatilities, prepayment speeds, loss severities, credit risks, and default rates), or other market-corroborated inputs. (Examples: debt securities, government securities, swap contracts, foreign currency exchange contracts, foreign securities utilizing international fair value pricing, broker-quoted securities, fair valued securities) |
| |
| Level 3 – | | Significant unobservable inputs, including each Portfolio’s own assumptions used to determine the fair value of investments. (Examples: broker-quoted securities, fair valued securities) |
Level 3 investments are valued using significant unobservable inputs. Each Portfolio may also use an income-based valuation approach in which the anticipated future cash flows of the investment are discounted to calculate fair value. Discounts may also be applied due to the nature or duration of any restrictions on the disposition of the investments. Valuations may also be based upon current market prices of securities that are comparable in coupon, rating, maturity, and industry. The derived value of a Level 3 investment may not represent the value which is received upon disposition and this could impact the results of operations.
The following table summarizes the valuation of The Large-Cap Value Equity Portfolio’s investments by fair value hierarchy levels as of Oct. 31, 2016:
| | | | | | | | | | | | |
Securities | | Level 1 | | | Level 2 | | | Total | |
Common Stock | | $ | 207,813,980 | | | $ | — | | | $ | 207,813,980 | |
Short-Term Investments | | | — | | | | 8,974,127 | | | | 8,974,127 | |
| | | | | | | | | | | | |
Total Value of Securities | | $ | 207,813,980 | | | $ | 8,974,127 | | | $ | 216,788,107 | |
| | | | | | | | | | | | |
The following table summarizes the valuation of The High-Yield Bond Portfolio’s investments by fair value hierarchy levels as of Oct. 31, 2016:
| | | | | | | | | | | | | | | | | | | | |
| Securities | | Level 1 | | Level 2 | | Level 3 | | Total |
Corporate Debt | | | $ | — | | | | $ | 212,409,889 | | | | | $— | | | | $ | 212,409,889 | |
Senior Secured Loans | | | | — | | | | | 12,275,710 | | | | | — | | | | | 12,275,710 | |
Common Stock | | | | — | | | | | — | | | | | — | | | | | — | |
Preferred Stock1 | | | | 178,710 | | | | | 2,628,894 | | | | | — | | | | | 2,807,604 | |
Short-Term Investments | | | | — | | | | | 15,558,000 | | | | | — | | | | | 15,558,000 | |
| | | | | | | | | | | | | | | | | | | | |
| | | | |
Total Value of Securities | | | $ | 178,710 | | | | $ | 242,872,493 | | | | | $— | | | | $ | 243,051,203 | |
| | | | | | | | | | | | | | | | | | | | |
1Security type is valued across multiple levels. Level 1 investments represent exchange-traded investments, Level 2 investments represent investments with observable inputs or matrix-priced investments, and Level 3 investments represent investments without observable inputs. The amounts attributed to Level 1 investments, Level 2 investments, and Level 3 investments represent the following percentages of the total market value of these security types:
| | | | | | | | | | | | |
| | | Level 1 | | | Level 2 | | | Total | |
Preferred Stock | | | 6.37% | | | | 93.63% | | | | 100.00% | |
90
The following table summarizes the valuation of The Core Plus Fixed Income Portfolio’s investments by fair value hierarchy levels as of Oct. 31, 2016:
| | | | | | | | | | | | | | | | | | | | |
| Securities | | Level 1 | | Level 2 | | Level 3 | | Total |
Agency, Asset-Backed & Mortgage-Backed Securities1 | | | $ | — | | | | $ | 54,955,574 | | | | $ | 159,858 | | | | $ | 55,115,432 | |
Corporate Debt | | | | — | | | | | 61,316,391 | | | | | — | | | | | 61,316,391 | |
Foreign Debt | | | | — | | | | | 1,821,214 | | | | | — | | | | | 1,821,214 | |
Senior Secured Loans | | | | — | | | | | 4,796,179 | | | | | — | | | | | 4,796,179 | |
Municipal Bonds | | | | — | | | | | 1,726,267 | | | | | — | | | | | 1,726,267 | |
Convertible Preferred Stock | | | | 10,366 | | | | | — | | | | | — | | | | | 10,366 | |
Preferred Stock | | | | — | | | | | 477,323 | | | | | — | | | | | 477,323 | |
U.S. Treasury Obligations | | | | — | | | | | 3,935,252 | | | | | — | | | | | 3,935,252 | |
Short-Term Investments | | | | — | | | | | 14,246,000 | | | | | — | | | | | 14,246,000 | |
Option Purchased | | | | 29,219 | | | | | — | | | | | — | | | | | 29,219 | |
| | | | | | | | | | | | | | | | | | | | |
Total Value of Securities | | | $ | 39,585 | | | | $ | 143,274,200 | | | | $ | 159,858 | | | | $ | 143,473,643 | |
| | | | | | | | | | | | | | | | | | | | |
Foreign Currency Exchange Contracts | | | $ | — | | | | $ | (3,881 | ) | | | $ | — | | | | $ | (3,881 | ) |
Futures Contracts | | | | 22,964 | | | | | — | | | | | — | | | | | 22,964 | |
Swap Contracts | | | | — | | | | | 1,534 | | | | | — | | | | | 1,534 | |
1Security type is valued across multiple levels. Level 1 investments represent exchange-traded investments, Level 2 investments represent investments with observable inputs or matrix-priced investments, and Level 3 investments represent investments without observable inputs. The amounts attributed to Level 1 investments, Level 2 investments, and Level 3 investments represent the following percentages of the total market value of these security types:
| | | | | | | | | | | | | | | | | | | | |
| | | Level 1 | | Level 2 | | Level 3 | | Total |
Agency, Asset-Backed & Mortgage-Backed Securities | | | | — | | | | | 99.71 | % | | | | 0.29 | % | | | | 100.00 | % |
The following table summarizes the valuation of The Labor Select International Equity Portfolio’s investments by fair value hierarchy levels as of Oct. 31, 2016:
| | | | | | | | | | | | | | | | | | | | |
| Securities | | Level 1 | | Level 2 | | Level 3 | | Total |
Common Stock | | | $ | 389,110,207 | | | | $ | — | | | | $ | — | | | | $ | 389,110,207 | |
Right | | | | 27,431 | | | | | — | | | | | — | | | | | 27,431 | |
Short-Term Investments | | | | — | | | | | 2,977,344 | | | | | — | | | | | 2,977,344 | |
| | | | | | | | | | | | | | | | | | | | |
Total Value of Securities | | | $ | 389,137,638 | | | | $ | 2,977,344 | | | | $ | — | | | | $ | 392,114,982 | |
| | | | | | | | | | | | | | | | | | | | |
Foreign Currency Exchange Contracts | | | $ | — | | | | $ | (1,964 | ) | | | $ | — | | | | $ | (1,964 | ) |
Notes to financial statements
Delaware Pooled® Trust
3. Investments (continued)
The following table summarizes the valuation of The Emerging Markets Portfolio’s investments by fair value hierarchy levels as of Oct. 31, 2016:
| | | | | | | | | | | | | | | |
| Securities | | Level 1 | | Level 2 | | Total |
Common Stock | | | | | | | | | | | | | | | |
Brazil | | | $ | 5,699,566 | | | | $ | — | | | | $ | 5,699,566 | |
Chile | | | | 1,929,630 | | | | | — | | | | | 1,929,630 | |
China | | | | 21,986,577 | | | | | — | | | | | 21,986,577 | |
India | | | | — | | | | | 16,579,431 | | | | | 16,579,431 | |
Indonesia | | | | 3,500,675 | | | | | — | | | | | 3,500,675 | |
Kazakhstan | | | | 464,854 | | | | | — | | | | | 464,854 | |
Malaysia | | | | 6,912,736 | | | | | — | | | | | 6,912,736 | |
Mexico | | | | 7,087,908 | | | | | — | | | | | 7,087,908 | |
Peru | | | | 2,398,060 | | | | | — | | | | | 2,398,060 | |
Philippines | | | | 1,930,260 | | | | | — | | | | | 1,930,260 | |
Qatar | | | | 3,526,215 | | | | | — | | | | | 3,526,215 | |
Republic of Korea | | | | 12,089,147 | | | | | — | | | | | 12,089,147 | |
Romania | | | | 439,458 | | | | | — | | | | | 439,458 | |
Russia | | | | 3,839,858 | | | | | — | | | | | 3,839,858 | |
South Africa | | | | 9,424,708 | | | | | — | | | | | 9,424,708 | |
Taiwan | | | | 18,908,363 | | | | | — | | | | | 18,908,363 | |
Thailand | | | | 3,773,910 | | | | | — | | | | | 3,773,910 | |
Turkey | | | | 2,322,797 | | | | | — | | | | | 2,322,797 | |
United Arab Emirates | | | | 1,970,904 | | | | | — | | | | | 1,970,904 | |
United Kingdom | | | | 2,104,074 | | | | | — | | | | | 2,104,074 | |
United States | | | | 1,823,992 | | | | | — | | | | | 1,823,992 | |
Preferred Stock | | | | 3,263,724 | | | | | — | | | | | 3,263,724 | |
Short-Term Investments | | | | — | | | | | 1,821,183 | | | | | 1,821,183 | |
| | | | | | | | | | | | | | | |
Total Value of Securities | | | $ | 115,397,416 | | | | $ | 18,400,614 | | | | $ | 133,798,030 | |
| | | | | | | | | | | | | | | |
Foreign Currency Exchange Contract | | | $ | — | | | | $ | (488 | ) | | | $ | (488 | ) |
92
The following table summarizes the valuation of The Emerging Markets Portfolio II’s investments by fair value hierarchy levels as of Oct. 31, 2016:
| | | | | | | | | | | | | | | |
| Securities | | Level 1 | | Level 2 | | Total |
Common Stock | | | | | | | | | | | | | | | |
Argentina | | | $ | 253,926 | | | | $ | — | | | | $ | 253,926 | |
Bahrain | | | | — | | | | | 7,161 | | | | | 7,161 | |
Brazil | | | | 6,598,248 | | | | | — | | | | | 6,598,248 | |
Chile | | | | 423,711 | | | | | — | | | | | 423,711 | |
China/Hong Kong | | | | 8,733,699 | | | | | — | | | | | 8,733,699 | |
Colombia | | | | 227,030 | | | | | — | | | | | 227,030 | |
India | | | | 2,323,800 | | | | | 1,321,736 | | | | | 3,645,536 | |
Indonesia | | | | 627,001 | | | | | — | | | | | 627,001 | |
Malaysia | | | | 95,073 | | | | | — | | | | | 95,073 | |
Mexico | | | | 2,149,434 | | | | | — | | | | | 2,149,434 | |
Netherlands | | | | 437,434 | | | | | — | | | | | 437,434 | |
Peru | | | | 152,835 | | | | | — | | | | | 152,835 | |
Poland | | | | 54,220 | | | | | — | | | | | 54,220 | |
Republic of Korea | | | | 6,416,219 | | | | | 1,010,269 | | | | | 7,426,488 | |
Russia | | | | 1,249,527 | | | | | 341,573 | | | | | 1,591,100 | |
South Africa | | | | 404,801 | | | | | — | | | | | 404,801 | |
Taiwan | | | | 2,415,587 | | | | | — | | | | | 2,415,587 | |
Thailand | | | | 437,593 | | | | | — | | | | | 437,593 | |
Turkey | | | | 1,009,375 | | | | | — | | | | | 1,009,375 | |
United States | | | | 806,070 | | | | | — | | | | | 806,070 | |
Exchanged-Traded Fund | | | | 186,800 | | | | | — | | | | | 186,800 | |
Preferred Stock | | | | 370,722 | | | | | — | | | | | 370,722 | |
Short-Term Investments | | | | — | | | | | 260,000 | | | | | 260,000 | |
| | | | | | | | | | | | | | | |
Total Value of Securities | | | $ | 35,373,105 | | | | $ | 2,940,739 | | | | $ | 38,313,844 | |
| | | | | | | | | | | | | | | |
Foreign Currency Exchange Contract | | | $ | — | | | | $ | 1,721 | | | | $ | 1,721 | |
The securities that have been valued at zero on the “Schedules of investments” are considered to be Level 3 securities in these tables.
As a result of utilizing international fair value pricing at Oct. 31, 2016, a portion of the common stock of The Emerging Markets Portfolio and The Emerging Markets Portfolio II was categorized as Level 2.
During the year ended Oct. 31, 2016, there were no transfers between Level 1 investments, Level 2 investments, or Level 3 investments that had a significant impact to each Portfolio. This does not include transfers between Level 1 investments and Level 2 investments due to each Portfolio utilizing international fair value pricing during the period. In accordance with the fair valuation procedures described in Note 1, international fair value pricing of securities in each Portfolio occurs when market volatility exceeds an established rolling threshold. If the threshold is exceeded on a given date, then prices of international securities (those that traded on exchanges that close at a different time than the time that each Portfolio’s NAV is determined) are established using a separate pricing feed from a third party vendor designed to establish a price for each such security as of the time that each Portfolio’s NAV is determined. Further, international fair value pricing uses other observable market-based inputs in place of the closing exchange price due to the events occurring after the close of the exchange or market on which the investment is principally traded, causing a change in classification between levels. Each Portfolio’s policy is to recognize transfers at the beginning of the reporting period.
A reconciliation of Level 3 investments is presented when a Portfolio has a significant amount of Level 3 investments at the beginning, interim, or end of the period in relation to the Portfolio’s net assets. Management has determined not to provide a reconciliation of Level 3 investments as they were not considered significant to each Portfolio’s net assets at the beginning, interim, or end of the year. Management has determined not to provide additional disclosure on Level 3 inputs for all Portfolios, since the Level 3 investments are not considered significant to each Portfolio’s net assets at the end of the year.
Notes to financial statements
Delaware Pooled® Trust
4. Dividend and Distribution Information
Income and long-term capital gain distributions are determined in accordance with federal income tax regulations, which may differ from U.S. GAAP. Additionally, distributions from net gains on foreign currency transactions and net short-term gains on sales of investment securities are treated as ordinary income for federal income tax purposes. The tax character of dividends and distributions paid during the years ended Oct. 31, 2016 and 2015 was as follows:
| | | | | | | | | | | | | | | |
| | | Ordinary
income | | Long-term
capital gain | | Total |
Year ended Oct. 31, 2016: | | | | | | | | | | | | | | | |
The Large-Cap Value Equity Portfolio | | | $ | 5,989,899 | | | | $ | 14,608,740 | | | | $ | 20,598,639 | |
The High-Yield Bond Portfolio | | | | 11,494,763 | | | | | — | | | | | 11,494,763 | |
The Core Plus Fixed Income Portfolio | | | | 2,987,593 | | | | | — | | | | | 2,987,593 | |
The Labor Select International Equity Portfolio | | | | 9,585,512 | | | | | — | | | | | 9,585,512 | |
The Emerging Markets Portfolio | | | | 4,099,296 | | | | | — | | | | | 4,099,296 | |
The Emerging Markets Portfolio II | | | | 564,237 | | | | | 851,663 | | | | | 1,415,900 | |
| | | |
| | | Ordinary
income | | Long-term
capital gain | | Total |
Year ended Oct. 31, 2015: | | | | | | | | | | | | | | | |
The Large-Cap Value Equity Portfolio | | | $ | 2,308,514 | | | | $ | 3,624,778 | | | | $ | 5,933,292 | |
The High-Yield Bond Portfolio | | | | 8,241,464 | | | | | 2,131,273 | | | | | 10,372,737 | |
The Core Plus Fixed Income Portfolio | | | | 2,287,390 | | | | | — | | | | | 2,287,390 | |
The Labor Select International Equity Portfolio | | | | 20,172,329 | | | | | — | | | | | 20,172,329 | |
The Emerging Markets Portfolio | | | | 7,350,324 | | | | | 13,249,834 | | | | | 20,600,158 | |
The Emerging Markets Portfolio II | | | | 649,479 | | | | | 1,084,121 | | | | | 1,733,600 | |
5. Components of Net Assets on a Tax Basis
As of Oct. 31, 2016,the components of net assets on a tax basis were as follows:
| | | | | | | | | | | | | | | |
| | | The
Large-Cap
Value Equity
Portfolio | | The
High-Yield
Bond
Portfolio | | The
Core Plus
Fixed Income
Portfolio |
Shares of beneficial interest | | | $ | 197,534,136 | | | | $ | 245,767,919 | | | | $ | 129,802,035 | |
Undistributed ordinary income | | | | 4,948,270 | | | | | 11,267,958 | | | | | 2,768,541 | |
Undistributed long-term capital gain | | | | 5,814,842 | | | | | — | | | | | — | |
Capital loss carryforwards | | | | — | | | | | (21,128,204 | ) | | | | (303,736 | ) |
Unrealized appreciation of investments, foreign currencies, and derivatives | | | | 8,830,676 | | | | | 6,506,151 | | | | | 998,078 | |
Other temporary differences | | | | — | | | | | (114,275 | ) | | | | — | |
| | | | | | | | | | | | | | | |
Net assets | | | $ | 217,127,924 | | | | $ | 242,299,549 | | | | $ | 133,264,918 | |
| | | | | | | | | | | | | | | |
| | | |
| | | The Labor Select
International
Equity
Portfolio | | The
Emerging
Markets
Portfolio | | The
Emerging
Markets
Portfolio II |
Shares of beneficial interest | | | $ | 468,431,909 | | | | $ | 183,689,083 | | | | $ | 39,776,213 | |
Undistributed ordinary income | | | | 11,016,480 | | | | | 4,295,986 | | | | | 321,142 | |
Capital loss carryforwards | | | | (57,013,021 | ) | | | | (39,066,175 | ) | | | | (2,228,862 | ) |
Unrealized depreciation of investments, foreign currencies, and derivatives | | | | (27,605,415 | ) | | | | (15,091,263 | ) | | | | (670,941 | ) |
| | | | | | | | | | | | | | | |
Net assets | | | $ | 394,829,953 | | | | $ | 133,827,631 | | | | $ | 37,197,552 | |
| | | | | | | | | | | | | | | |
The differences between book basis and tax basis components of net assets are primarily attributable to tax deferral of losses on wash sales, mark-to-market on futures contracts, mark-to-market on foreign currency exchange contracts, tax deferral of losses on straddles, tax treatment
94
of passive foreign investment companies, contingent payment debt instruments, tax treatment of trust preferred securities, tax treatment of market discount and premium on debt instruments, CDS contracts, and troubled debt.
For financial reporting purposes, capital accounts are adjusted to reflect the tax character of permanent book/tax differences. Reclassifications are primarily due to tax treatment of gain (loss) on foreign currency transactions, dividends and distributions, market discount and premium on certain debt instruments, contingent payment debt instruments, CDS contracts, passive foreign investment companies, and paydown gains (losses) on mortgage- and asset-backed securities. Results of operations and net assets were not affected by these reclassifications. For the year ended Oct. 31, 2016, the following Portfolios recorded the following reclassifications:
| | | | | | | | |
| | | Undistributed
(distributions in excess of)
net investment income (loss) | | | Accumulated
net realized
gain (loss) | |
The High-Yield Bond Portfolio | | | $(342,320) | | | | $342,320 | |
The Core Plus Fixed Income Portfolio | | | 501,272 | | | | (501,272) | |
The Labor Select International Equity Portfolio | | | (195,267) | | | | 195,267 | |
The Emerging Markets Portfolio | | | 506,316 | | | | (506,316) | |
The Emerging Markets Portfolio II | | | 22,020 | | | | (22,020) | |
For federal income tax purposes, capital loss carryforwards may be carried forward and applied against future gains.
Capital loss carryforwards remaining at Oct. 31, 2016 for the following Portfolio will expire as follows:
| | | | | | | | | | | | | | | |
| | | | | Year of expiration | | |
| | | 2017 | | 2018 | | Total |
The Labor Select International Equity Portfolio | | | | $36,948,230 | | | | | $18,475,802 | | | | | $55,424,032 | |
On Dec. 22, 2010, the Regulated Investment Company Modernization Act of 2010 (Act) was enacted, which changed various technical rules governing the tax treatment of regulated investment companies. The changes were generally effective for taxable years beginning after the date of enactment. Under the Act, the Portfolios are permitted to carry forward capital losses incurred in taxable years beginning after the date of enactment for an unlimited period. However, any losses incurred during those future taxable years will be required to be utilized prior to the losses incurred in pre-enactment taxable years, which carry an expiration date. As a result of this ordering rule, pre- enactment capital loss carryforwards may be more likely to expire unused. Additionally, post-enactment capital loss carryforwards will retain their character as either short-term or long-term capital losses rather than being considered all short-term as permitted under previous regulation.
Losses incurred that will be carried forward under the Act are as follows:
| | | | | | | | |
| | | Loss carryforward character | |
| | | Short-term | | | Long-term | |
The High-Yield Bond Portfolio | | $ | 9,849,081 | | | $ | 11,279,123 | |
The Core Plus Fixed Income Portfolio | | | — | | | | 303,736 | |
The Labor Select International Equity Portfolio | | | — | | | | 1,588,989 | |
The Emerging Markets Portfolio | | | 2,159,848 | | | | 36,906,327 | |
The Emerging Markets Portfolio II | | | 2,546 | | | | 2,226,316 | |
Notes to financial statements
Delaware Pooled® Trust
6. Capital Shares
Transactions in capital shares were as follows:
| | | | | | | | | | | | | | | | | | | | |
| | | Shares
sold | | Shares issued
upon reinvestment
of dividends
and distributions | | Shares
redeemed | | Net
increase
(decrease) |
Year ended Oct. 31, 2016: | | | | | | | | | | | | | | | | | | | | |
The Large-Cap Value Equity Portfolio | | | | 507,123 | | | | | 762,327 | | | | | (907,229 | ) | | | | 362,221 | |
The High-Yield Bond Portfolio | | | | 6,419,614 | | | | | 1,548,151 | | | | | (3,723,841 | ) | | | | 4,243,924 | |
The Core Plus Fixed Income Portfolio | | | | 1,090,234 | | | | | 278,305 | | | | | (1,033,325 | ) | | | | 335,214 | |
The Labor Select International Equity Portfolio | | | | 6,162,848 | | | | | 762,058 | | | | | (2,300,744 | ) | | | | 4,624,162 | |
The Emerging Markets Portfolio | | | | 1,052,933 | | | | | 441,294 | | | | | (7,382,355 | ) | | | | (5,888,128 | ) |
The Emerging Markets Portfolio II | | | | 116,582 | | | | | 210,074 | | | | | (198,329 | ) | | | | 128,327 | |
| | | | |
Year ended Oct. 31, 2015: | | | | | | | | | | | | | | | | | | | | |
The Large-Cap Value Equity Portfolio | | | | 3,651,046 | | | | | 184,378 | | | | | (1,035,167 | ) | | | | 2,800,257 | |
The High-Yield Bond Portfolio | | | | 11,339,586 | | | | | 1,150,398 | | | | | (2,620,835 | ) | | | | 9,869,149 | |
The Core Plus Fixed Income Portfolio | | | | 5,484,439 | | | | | 206,364 | | | | | (671,662 | ) | | | | 5,019,141 | |
The Labor Select International Equity Portfolio | | | | 970,304 | | | | | 1,470,056 | | | | | (1,626,774 | ) | | | | 813,586 | |
The Emerging Markets Portfolio | | | | 2,510,338 | | | | | 2,046,512 | | | | | (13,238,050 | ) | | | | (8,681,200 | ) |
The Emerging Markets Portfolio II | | | | 15,625 | | | | | 205,647 | | | | | (5,821 | ) | | | | 215,451 | |
7. Line of Credit
Each Portfolio, along with certain other funds in the Delaware Investments® Family of Funds (Participants), was a participant in a $275,000,000 revolving line of credit intended to be used for temporary or emergency purposes as an additional source of liquidity to fund redemptions of investor shares. Under the agreement, the Participants were charged an annual commitment fee of 0.08%, which was allocated across the Participants on the basis of relative net assets of each Participant’s allocation of the entire facility. The Participants were permitted to borrow up to a maximum of one-third of their net assets under the agreement. Each Participant was individually, and not jointly, liable for its particular advances, if any, under the line of credit. The line of credit available under the agreement expired on Nov. 9, 2015.
On Nov. 9, 2015, each Portfolio, along with the other Participants, entered into an amendment to the agreement for a $155,000,000 revolving line of credit. The line of credit was to be used as described above and operated in substantially the same manner as the original agreement, with the exception of the annual commitment fee. Under the amendment to the agreement, the Participants were charged an annual commitment fee of 0.10%, which was allocated across the Participants on the basis of relative net assets of each Participant’s allocation of the entire facility. The line of credit available under the agreement expired on Nov. 7, 2016.
Each Portfolio had no amount outstanding as of Oct. 31, 2016 or at any time during the year then ended.
96
8. Derivatives
U.S. GAAP requires disclosures that enable investors to understand: (1) how and why an entity uses derivatives; (2) how they are accounted for; and (3) how they affect an entity’s results of operations and financial position.
Foreign Currency Exchange Contracts — Each Portfolio may enter into foreign currency exchange contracts and foreign cross currency exchange contracts as a way of managing foreign exchange rate risk. Each Portfolio may enter into these contracts to fix the U.S. dollar value of a security that it has agreed to buy or sell for the period between the date the trade was entered into and the date the security is delivered and paid for. Each Portfolio may also use these contracts to hedge the U.S. dollar value of securities it already owns that are denominated in foreign currencies. In addition, each Portfolio may enter into these contracts to facilitate or expedite the settlement of portfolio transactions. The change in value is recorded as an unrealized gain or loss. When the contract is closed, a realized gain or loss is recorded equal to the difference between the value of the contract at the time it was opened and the value at the time it was closed.
The use of foreign currency exchange contracts and foreign cross currency exchange contracts does not eliminate fluctuations in the underlying prices of the securities, but does establish a rate of exchange that can be achieved in the future. Although foreign currency exchange contracts and foreign cross currency exchange contracts limit the risk of loss due to an unfavorable change in the value of the hedged currency, they also limit any potential gain that might result should the value of the currency change favorably. In addition, each Portfolio could be exposed to risks if the counterparties to the contracts are unable to meet the terms of their contracts. Each Portfolio’s maximum risk of loss from counterparty credit risk is the value of its currency exchanged with the counterparty. The risk is generally mitigated by having a netting arrangement between each Portfolio and the counterparty and by the posting of collateral by the counterparty to the Portfolio to cover each Portfolio’s exposure to the counterparty.
The Core Plus Fixed Income Portfolio, The Labor Select International Equity Portfolio, and The Emerging Markets Portfolio entered into foreign currency exchange contracts and foreign cross currency exchange contracts in order to hedge the U.S. dollar value of securities they already own that are denominated in foreign currencies. The Emerging Markets Portfolio II entered into foreign currency exchange contracts and foreign cross currency exchange contracts to facilitate or expedite the settlement of portfolio transactions.
Futures Contracts — A futures contract is an agreement in which the writer (or seller) of the contract agrees to deliver to the buyer an amount of cash or securities equal to a specific dollar amount times the difference between the value of a specific security or index at the close of the last trading day of the contract and the price at which the agreement is made. The High-Yield Bond, The Core Plus Fixed Income, The Emerging Markets, and The Emerging Markets II Portfolios may use futures in the normal course of pursuing their respective investment objectives. Each Portfolio may invest in futures contracts to hedge its existing portfolio securities against fluctuations in value caused by changes in interest rates or market conditions. Upon entering into a futures contract, a Portfolio deposits cash or pledges U.S. government securities to a broker, equal to the minimum “initial margin” requirements of the exchange on which the contract is traded. Subsequent payments are received from the broker or paid to the broker each day, based on the daily fluctuation in the market value of the contract. These receipts or payments are known as “variation margin” and are recorded daily by each Portfolio as unrealized gains or losses until the contracts are closed. When the contracts are closed, the Portfolio records a realized gain or loss equal to the difference between the value of the contract at the time it was opened and the value at the time it was closed. Risks of entering into futures contracts include potential imperfect correlation between the futures contracts and the underlying securities and the possibility of an illiquid secondary market for these instruments. When investing in futures, there is reduced counterparty credit risk to each Portfolio because futures are exchange-traded and the exchange’s clearinghouse, as counterparty to all exchange-traded futures, guarantees against default. The Core Plus Fixed Income Portfolio posted securities with a value of $147,258 as collateral for futures contracts.
The Core Plus Fixed Income Portfolio entered into futures contracts in order to hedge the Portfolio’s existing portfolio securities against fluctuations in value caused by changes in interest rates or market conditions.
Options Contracts — Each Portfolio may enter into options contracts in the normal course of pursuing its respective investment objective. Each Portfolio may buy or write options contracts for any number of reasons, including without limitation: to manage each Portfolio’s exposure to changes in securities prices caused by interest rates or market conditions and foreign currencies; as an efficient means of adjusting each Portfolio’s overall exposure to certain markets; to protect the value of portfolio securities; and as a cash management tool. Each Portfolio may buy or write call or put options on securities, financial indices, futures, swaps, and foreign currencies. When each Portfolio buys an option, a premium is paid and an asset is recorded and adjusted on a daily basis to reflect the current market value of the option purchased. When each Portfolio writes an option, a premium is received and a liability is recorded and adjusted on a daily basis to reflect the current market value of the option written. Premiums received from writing options that expire unexercised are treated by each Portfolio on the expiration date as
Notes to financial statements
Delaware Pooled® Trust
8. Derivatives (continued)
realized gains. The difference between the premium received and the amount paid on effecting a closing purchase transaction, including brokerage commissions, is treated as realized gain or loss. If a call option is exercised, the premium is added to the proceeds from the sale of the underlying security in determining whether each Portfolio has a realized gain or loss. If a put option is exercised, the premium reduces the cost basis of the securities purchased by each Portfolio. Each Portfolio, as writer of an option, bears the market risk of an unfavorable change in the price of the security underlying the written option. When writing options, each Portfolio is subject to minimal counterparty risk because the counterparty is only obligated to pay premiums and does not bear the market risk of an unfavorable market change. Transactions in options written during the year ended Oct. 31, 2016 for The Core Plus Fixed Income Portfolio were as follows:
| | | | | | | | | | |
| | | Number of
Contracts | | Premiums |
Options outstanding, Oct. 31, 2015 | | | | — | | | | $ | — | |
Options written | | | | 34 | | | | | 29,219 | |
Options terminated in closing purchase transactions | | | | (34 | ) | | | | (29,219 | ) |
| | | | | | | | | | |
Options outstanding, Oct. 31, 2016 | | | | — | | | | | — | |
| | | | | | | | | | |
The Core Plus Fixed Income Portfolio purchased option contracts in order to manage the Portfolio’s exposure to changes in securities prices caused by interest rates or market conditions.
Swap Contracts — The High-Yield Bond Portfolio and The Core Plus Fixed Income Portfolio may enter into credit default swap (CDS) contracts in accordance with their investment objectives. The Core Plus Fixed Income Portfolio may enter into interest rate swap contracts in accordance with its investment objective. The Portfolio may use interest rate swaps to adjust the Portfolio’s sensitivity to interest rates or to hedge against changes in interest rates. The Portfolios may enter into CDS contracts in order to hedge against a credit event, to enhance total return, or to gain exposure to certain securities or markets. The Portfolios will not be permitted to enter into any swap transactions unless, at the time of entering into such transactions, the unsecured long-term debt of the actual counterparty, combined with any credit enhancements, is rated at least BBB- by Standard & Poor’s Financial Services LLC (S&P) or Baa3 by Moody’s Investors Service, Inc. (Moody’s) or is determined to be of equivalent quality by DMC.
Interest Rate Swaps. An interest rate swap contract is an exchange of interest rates between counterparties. In one instance, an interest rate swap involves payments received by the Portfolio from another party based on a variable or floating interest rate, in return for making payments based on a fixed interest rate. An interest rate swap can also work in reverse with the Portfolio receiving payments based on a fixed interest rate and making payments based on a variable or floating interest rate. Interest rate swaps may be used to adjust the Portfolio’s sensitivity to interest rates or to hedge against changes in interest rates. Periodic payments on such contracts are accrued daily and recorded as unrealized appreciation (depreciation) on swap contracts. Upon periodic payment (receipt) or termination of the contract, such amounts are recorded as realized gains or losses on swap contracts. A Portfolio’s maximum risk of loss from counterparty credit risk is the discounted net value of the cash flows to be received from/paid to the counterparty over the interest rate swap contract’s remaining life, to the extent that the amount is positive. This risk is mitigated by (1) for bilateral swap contracts, having netting arrangements between each Portfolio and the counterparty and by the posting of collateral by the counterparty to each Portfolio to cover the Portfolios’ exposure to the counterparty or (2) for cleared swaps, trading these instruments through a central counterparty. There were no interest rate swaps outstanding at Oct. 31, 2016.
The Core Plus Fixed Income Portfolio entered into interest rate swap contracts in order to manage the Portfolio’s sensitivity to interest rates or to hedge against changes in interest rates.
Credit Default Swaps. A CDS contract is a risk-transfer instrument through which one party (purchaser of protection) transfers to another party (seller of protection) the financial risk of a credit event (as defined in the CDS agreement), as it relates to a particular reference security or basket of securities (such as an index). In exchange for the protection offered by the seller of protection, the purchaser of protection agrees to pay the seller of protection a periodic amount at a stated rate that is applied to the notional amount of the CDS contract. In addition, an upfront payment may be made or received by a Portfolio in connection with an unwinding or assignment of a CDS contract. Upon the occurrence of a credit event, the seller of protection would pay the par (or other agreed- upon) value of the reference security (or basket of securities) to the counterparty. Credit events generally include, among others, bankruptcy, failure to pay, and obligation default.
During the year ended Oct. 31, 2016, certain of the Portfolios entered into CDS contracts as purchasers and sellers of protection. Periodic payments (receipts) on such contracts are accrued daily and recorded as unrealized losses (gains) on swap contracts. Upon payment (receipt), such amounts are recorded as realized losses (gains) on swap contracts. Upfront payments made or received in connection with CDS contracts
98
are amortized over the expected life of the CDS contracts as unrealized losses (gains) on swap contracts. The change in value of CDS contracts is recorded daily as unrealized appreciation or depreciation. A realized gain or loss is recorded upon a credit event (as defined in the CDS agreement) or the maturity or termination of the agreement. Initial margin and variation margin are posted to central counterparties for centrally cleared CDS basket trades as determined by the applicable central counterparty.
CDS contracts may involve greater risks than if a Portfolio had invested in the reference obligation directly. CDS contracts are subject to general market risk, liquidity risk, counterparty risk, and credit risk. A Portfolio’s maximum risk of loss from counterparty credit risk, either as the seller of protection or the buyer of protection, is the fair value of the contract. This risk is mitigated by (1) for bilateral swap contracts, having netting arrangements between each Portfolio and the counterparty and by the posting of collateral by the counterparty to each Portfolio to cover the Portfolios’ exposure to the counterparty or (2) for cleared swaps, trading these instruments through a central counterparty.
The High-Yield Bond Portfolio and The Core Plus Fixed Income Portfolio entered into CDS contracts in order to hedge against credit events.
Swaps Generally. The value of open swaps may differ from that which would be realized in the event a Portfolio terminated its position in the contract on a given day. Risks of entering into these contracts include the potential inability of the counterparty to meet the terms of the contracts. This type of risk is generally limited to the amount of favorable movement in the value of the underlying security, instrument, or basket of instruments, if any, at the day of default. Risks also arise from potential losses from adverse market movements and such losses could exceed the unrealized amounts shown on the “Schedules of investments.”
At Oct. 31, 2016, The Core Plus Fixed Income Portfolio posted $25,354 in cash collateral for centrally cleared credit default swap contracts, which is presented as “Variation margin due from brokers on centrally cleared credit default swap contracts” on the “Statements of assets and liabilities.”
Fair values of derivative instruments as of Oct. 31, 2016 were as follows:
| | | | | | | | | | | | | | | | | | | | |
| | | | | The Core Plus Fixed Income Portfolio Asset Derivatives |
Statements of Assets and Liabilities Location | | | | Interest rate
Contracts | | Fair Value
Credit
Contracts | | Total |
Variation margin due from broker on futures contracts* | | | | | | | | $ | 25,277 | | | | $ | — | | | | $ | 25,277 | |
Unrealized appreciation on swap contracts | | | | | | | | | — | | | | | 1,534 | | | | | 1,534 | |
| | | | | | | | | | | | | | | | | | | | |
Total | | | | | | | | $ | 25,277 | | | | $ | 1,534 | | | | $ | 26,811 | |
| | | | | | | | | | | | | | | | | | | | |
| | | |
| | | | | Liability Derivatives | | |
| | | | | Fair Value | | |
Statements of Assets and Liabilities Location | | Equity
Contracts | | Interest rate
Contracts | | Credit
Contracts | | Total |
Unrealized depreciation on foreign currency exchange contracts | | | $ | (3,881 | ) | | | $ | — | | | | $ | — | | | | $ | (3,881 | ) |
Variation margin due to broker on futures contracts* | | | | — | | | | | (2,313 | ) | | | | — | | | | | (2,313 | ) |
Unrealized depreciation on swap contracts | | | | — | | | | | — | | | | | — | | | | | — | |
| | | | | | | | | | | | | | | | | | | | |
Total | | | $ | (3,881 | ) | | | $ | (2,313 | ) | | | $ | — | | | | $ | (6,194 | ) |
| | | | | | | | | | | | | | | | | | | | |
*Includes cumulative appreciation (depreciation) of futures contracts from the date the contracts are opened through Oct. 31, 2016. Only current day variation margin is reported on the “Statements of assets and liabilities.”
Notes to financial statements
Delaware Pooled® Trust
8. Derivatives (continued)
The effect of derivative instruments on the “Statements of operations” for the year ended Oct. 31, 2016 was as follows:
| | | | | | | | | | | | | | | | | | | | | | | | | | | | | | |
| | | The Core Plus Fixed Income Portfolio |
| | | Net Realized Gain (Loss) on: |
| | | Options
Purchased | | Options
Written | | Foreign
Currency
Exchange
Contracts | | Futures
Contracts | | Swap
Contracts | | Total |
Forward currency exchange contracts | | | $ | — | | | | $ | — | | | | $ | 13,331 | | | | $ | — | | | | $ | — | | | | $ | 13,331 | |
Equity contracts | | | | — | | | | | — | | | | | — | | | | | 56,496 | | | | | | | | | | 56,496 | |
Interest rate contracts | | | | (2,416 | ) | | | | (40,581 | ) | | | | — | | | | | 232,309 | | | | | 219,911 | | | | | 409,223 | |
Credit contracts | | | | — | | | | | — | | | | | — | | | | | — | | | | | (93,934 | ) | | | | (93,934 | ) |
| | | | | | | | | | | | | | | | | | | | | | | | | | | | | | |
Total | | | $ | (2,416 | ) | | | $ | (40,581 | ) | | | $ | 13,331 | | | | $ | 288,805 | | | | $ | 125,977 | | | | $ | 385,116 | |
| | | | | | | | | | | | | | | | | | | | | | | | | | | | | | |
| | |
| | | | | The Core Plus Fixed Income Portfolio |
| | | | | Net Change in Unrealized Appreciation (Depreciation) of: |
| | | | | Foreign
Currency
Exchange
Contracts | | Futures
Contracts | | Options
Purchased | | Swaps
Contracts | | Total |
Forward currency exchange contracts | | | | | | | | $ | (4,445 | ) | | | $ | — | | | | $ | — | | | | $ | — | | | | $ | (4,445 | ) |
Equity contracts | | | | | | | | | — | | | | | 2,476 | | | | | — | | | | | — | | | | | 2,476 | |
Interest rate contracts | | | | | | | | | — | | | | | (82,230 | ) | | | | 1,933 | | | | | 141,448 | | | | | 61,151 | |
Credit contracts | | | | | | | | | — | | | | | — | | | | | — | | | | | (128,262 | ) | | | | (128,262 | ) |
| | | | | | | | | | | | | | | | | | | | | | | | | | | | | | |
Total | | | | | | | | $ | (4,445 | ) | | | $ | (79,754 | ) | | | $ | 1,933 | | | | $ | 13,186 | | | | $ | (69,080 | ) |
| | | | | | | | | | | | | | | | | | | | | | | | | | | | | | |
At Oct. 31, 2016, The Labor Select International Equity Portfolio, The Emerging Markets Portfolio, and The Emerging Markets Portfolio II had foreign currency risk, which is disclosed on the “Statements of assets and liabilities” and “Statements of operations.” At Oct. 31, 2016, The High-Yield Bond Portfolio had credit risk, which is disclosed on the “Statements of operations.”
100
Derivatives Generally. The tables below summarize the average balance of derivative holdings by each Portfolio during the year ended Oct. 31, 2016.
| | | | | | | | | | | | | | | | | | | | |
| | | The High-Yield Bond Portfolio |
| | | Long Derivative Volume | | Short Derivative Volume |
CDS contracts (average notional value)* | | | | USD | | | | | — | | | | | USD | | | | | 216,071 | |
| |
| | | The Core Plus Fixed Income Portfolio |
| | | Long Derivative Volume | | Short Derivative Volume |
Foreign currency exchange contracts (average cost) | | | | USD | | | | | 119,930 | | | | | USD | | | | | 19,192 | |
Futures contracts (average notional value) | | | | | | | | | 5,082,527 | | | | | | | | | | 4,087,627 | |
Options contracts (average notional value) | | | | | | | | | 3,573 | | | | | | | | | | 77 | |
CDS contracts (average notional value)* | | | | | | | | | 1,173,920 | | | | | | | | | | 221,964 | |
| | | | EUR | | | | | 218,571 | | | | | | | | | | — | |
Interest rate contracts (average notional value)** | | | | USD | | | | | 1,058,333 | | | | | | | | | | — | |
| |
| | | The Labor Select International Equity Portfolio |
| | | Long Derivative Volume | | Short Derivative Volume |
Foreign currency exchange contracts (average cost) | | | | USD | | | | | 259,620 | | | | | USD | | | | | 108,717 | |
| |
| | | The Emerging Markets Portfolio |
| | | Long Derivative Volume | | Short Derivative Volume |
Foreign currency exchange contracts (average cost) | | | | USD | | | | | 104,046 | | | | | USD | | | | | 70,199 | |
| |
| | | The Emerging Markets Portfolio II |
| | | Long Derivative Volume | | Short Derivative Volume |
Foreign currency exchange contracts (average cost) | | | | USD | | | | | 13,573 | | | | | USD | | | | | 5,452 | |
*Long represents buying protection and short represents selling protection.
**Long represents receiving fixed interest payments and short represents paying fixed interest payments.
9. Offsetting
In December 2011, the Financial Accounting Standards Board (FASB) issued guidance that expanded disclosure requirements on the offsetting of certain assets and liabilities. The disclosures are required for investments and derivative financial instruments subject to master netting or similar agreements which are eligible for offset on the “Statements of assets and liabilities” and require an entity to disclose both gross and net information about such investments and transactions in the financial statements. In January 2013, the FASB issued guidance that clarified which investments and transactions are subject to the offsetting disclosure requirements. The scope of the disclosure requirements for offsetting is limited to derivative instruments, repurchase agreements and reverse repurchase agreements, and securities borrowing.
In order to better define its contractual rights and to secure rights that will help each Portfolio mitigate its counterparty risk, the Portfolios entered into an International Swaps and Derivatives Association, Inc. Master Agreement (ISDA Master Agreement) or a similar agreement with certain of their derivative contract counterparties. An ISDA Master Agreement is a bilateral agreement between each Portfolio and a counterparty that governs certain over-the-counter (OTC) derivatives and foreign exchange contracts and typically contains, among other things, collateral posting items and netting provisions in the event of a default and/or termination event. Under an ISDA Master Agreement, each Portfolio may, under certain circumstances, offset with the counterparty certain derivative financial instruments’ payables and/or receivables with collateral held and/or posted and create one single net payment. The provisions of the ISDA Master Agreement typically permit a single net payment in the event of default (close-out), including the bankruptcy or insolvency of the counterparty. However, bankruptcy or insolvency laws of a particular jurisdiction may impose restrictions on or prohibitions against the right of offset in bankruptcy, insolvency, or other events.
For financial reporting purposes, the Portfolios do not offset derivative assets and derivative liabilities that are subject to netting arrangements on the “Statements of assets and liabilities.”
Notes to financial statements
Delaware Pooled® Trust
9. Offsetting (continued)
At Oct. 31, 2016, the Portfolios had the following assets and liabilities subject to offsetting provisions:
Offsetting of Financial Assets and Liabilities and Derivative Assets and Liabilities
| | | | | | | | | | | | | | | | | | | | | | | | | |
| The Large-Cap Value Equity Portfolio | | |
Master Repurchase Agreements Counterparty | | Repurchase
Agreements | | Fair Value of
Non-Cash
Collateral Received(a) | | Cash
Collateral
Received | | Net
Collateral
Received | | Net Exposure(b) |
Bank of America Merrill Lynch | | | $ | 930,576 | | | | $ | (930,576 | ) | | | $ | — | | | | $ | (930,576 | ) | | | | $— | |
Bank of Montreal | | | | 310,192 | | | | | (310,192 | ) | | | | — | | | | | (310,192 | ) | | | | — | |
BNP Paribas | | | | 2,150,232 | | | | | (2,150,232 | ) | | | | — | | | | | (2,150,232 | ) | | | | — | |
| | | | | | | | | | | | | | | | | | | | | | | | | |
Total | | | $ | 3,391,000 | | | | $ | (3,391,000 | ) | | | $ | — | | | | | (3,391,000 | ) | | | | $— | |
| | | | | | | | | | | | | | | | | | | | | | | | | |
| |
| The High-Yield Bond Portfolio | | |
Master Repurchase Agreements Counterparty | | Repurchase
Agreements | | Fair Value of
Non-Cash
Collateral Received(a) | | Cash
Collateral
Received | | Net
Collateral
Received | | Net Exposure(b) |
Bank of America Merrill Lynch | | | $ | 4,269,508 | | | | $ | (4,269,508 | ) | | | $ | — | | | | $ | (4,269,508 | ) | | | | $— | |
Bank of Montreal | | | | 1,423,169 | | | | | (1,423,169 | ) | | | | — | | | | | (1,423,169 | ) | | | | — | |
BNP Paribas | | | | 9,865,323 | | | | | (9,865,323 | ) | | | | — | | | | | (9,865,323 | ) | | | | — | |
| | | | | | | | | | | | | | | | | | | | | | | | | |
Total | | | $ | 15,558,000 | | | | $ | (15,558,000 | ) | | | $ | — | | | | $ | (15,558,000 | ) | | | | $— | |
| | | | | | | | | | | | | | | | | | | | | | | | | |
| | | | | | | | | | | | | | | |
| | | The Core Plus Fixed Income Portfolio | | |
| Counterparty | | Gross Value of
Derivative Asset | | Gross Value of
Derivative Liability | | Net Position |
Barclays Bank | | | $ | — | | | | $ | (1,646 | ) | | | | $(1,646) | |
Toronto Dominion Bank | | | | | | | | | (2,235 | ) | | | | (2,235) | |
| | | | | | | | | | | | | | | |
Total | | | $ | — | | | | $ | (3,881 | ) | | | | $(3,881) | |
| | | | | | | | | | | | | | | |
| | | | | | | | | | | | | | | | | | | | | | | | | | | | | | |
| Counterparty | | Net Position | | Fair Value of
Non-Cash
Collateral Received | | Cash
Collateral
Received | | Fair Value of
Non-Cash
Collateral Pledged | | Cash
Collateral
Pledged | | Net Exposure(b) |
Barclays Bank | | | | $(1,646) | | | | $ | — | | | | $ | — | | | | $ | — | | | | $ | — | | | | | $(1,646) | |
Toronto Dominion Bank | | | | (2,235) | | | | | — | | | | | — | | | | | — | | | | | — | | | | | (2,235) | |
| | | | | | | | | | | | | | | | | | | | | | | | | | | | | | |
Total | | | | $(3,881) | | | | $ | — | | | | $ | — | | | | $ | — | | | | $ | — | | | | | $(3,881) | |
| | | | | | | | | | | | | | | | | | | | | | | | | | | | | | |
| | | | | | | | | | | | | | | | | | | | | | | | | |
| The Core Plus Fixed Income Portfolio |
Master Repurchase Agreements
Counterparty | | Repurchase
Agreements | | Fair Value of
Non-Cash
Collateral Received(a) | | Cash
Collateral
Received | | Net
Collateral
Received | | Net Exposure(b) |
Bank of America Merrill Lynch | | | $ | 3,909,462 | | | | $ | (3,909,462 | ) | | | $ | — | | | | $ | (3,909,462 | ) | | | | $— | |
Bank of Montreal | | | | 1,303,154 | | | | | (1,303,154 | ) | | | | — | | | | | (1,303,154 | ) | | | | — | |
BNP Paribas | | | | 9,033,384 | | | | | (9,033,384 | ) | | | | — | | | | | (9,033,384 | ) | | | | — | |
| | | | | | | | | | | | | | | | | | | | | | | | | |
Total | | | $ | 14,246,000 | | | | $ | (14,246,000 | ) | | | $ | — | | | | $ | (14,246,000 | ) | | | | $— | |
| | | | | | | | | | | | | | | | | | | | | | | | | |
102
| | | | | | | | | | | | | | | |
| | | The Labor Select International Equity Portfolio | | |
| Counterparty | | Gross Value of
Derivative Asset | | Gross Value of
Derivative Liability | | Net Position |
BNY Mellon | | | | $1,225 | | | | | $ (442 | ) | | | | $ 783 | |
Deutsche Bank | | | | 490 | | | | | – | | | | | 490 | |
Northern Trust | | | | — | | | | | (3,237 | ) | | | | (3,237 | ) |
Total | | | | $1,715 | | | | | $(3,679 | ) | | | | $(1,964 | ) |
| | | | | | | | | | | | | | | | | | | | | | | | | | | | | | |
| Counterparty | | Net Position | | Fair Value of
Non-Cash
Collateral Received | | Cash
Collateral
Received | | Fair Value of
Non-Cash
Collateral Pledged | | Cash
Collateral
Pledged | | Net Exposure(b) |
BNY Mellon | | | $ | 783 | | | | $ | — | | | | $ | — | | | | $ | — | | | | $ | — | | | | $ | 783 | |
Deutsche Bank | | | | 490 | | | | | — | | | | | — | | | | | — | | | | | — | | | | | 490 | |
Northern Trust | | | | (3,237 | ) | | | | — | | | | | — | | | | | — | | | | | — | | | | | (3,237 | ) |
| | | | | | | | | | | | | | | | | | | | | | | | | | | | | | |
Total | | | $ | (1,964 | ) | | | $ | — | | | | $ | — | | | | $ | — | | | | $ | — | | | | $ | (1,964 | ) |
| | | | | | | | | | | | | | | | | | | | | | | | | | | | | | |
| | | | | | | | | | | | | | | | | | | | | | | | | |
| The Labor Select International Equity Portfolio | | |
Master Repurchase Agreements
Counterparty | | Repurchase
Agreements | | Fair Value of
Non-Cash
Collateral Received(a) | | Cash
Collateral
Received | | Net
Collateral
Received | | Net Exposure(b) |
Bank of America Merrill Lynch | | | $ | 311,473 | | | | $ | (311,473 | ) | | | $ | — | | | | $ | (311,473 | ) | | | $ | — | |
Bank of Montreal | | | | 103,824 | | | | | (103,824 | ) | | | | — | | | | | (103,824 | ) | | | | — | |
BNP Paribas | | | | 719,703 | | | | | (719,703 | ) | | | | — | | | | | (719,703 | ) | | | | — | |
| | | | | | | | | | | | | | | | | | | | | | | | | |
Total | | | $ | 1,135,000 | | | | $ | (1,135,000 | ) | | | $ | — | | | | $ | (1,135,000 | ) | | | $ | — | |
| | | | | | | | | | | | | | | | | | | | | | | | | |
| | | | | | | | | | | | | | | |
| | | The Emerging Markets Portfolio | | |
| Counterparty | | Gross Value of
Derivative Asset | | Gross Value of
Derivative Liability | | Net Position |
BNY Mellon | | | | $— | | | | | $(488 | ) | | | | $(488) | |
| | | | | | | | | | | | | | | | | | | | | | | | | | | | | | |
| Counterparty | | Net Position | | Fair Value of
Non-Cash
Collateral Received | | Cash
Collateral
Received | | Fair Value of
Non-Cash
Collateral Pledged | | Cash
Collateral
Pledged | | Net Exposure(b) |
BNY Mellon | | | | $(488 | ) | | | $ | — | | | | $ | — | | | | $ | — | | | | $ | — | | | | | $(488) | |
| | | | | | | | | | | | | | | | | | | | | | | | | |
| | | The Emerging Markets Portfolio | | | | |
Master Repurchase Agreements Counterparty | | Repurchase
Agreements | | Fair Value of
Non-Cash
Collateral Received(a) | | Cash
Collateral
Received | | Net
Collateral
Received | | Net Exposure(b) |
Bank of America Merrill Lynch | | | $ | 144,622 | | | | $ | (144,622 | ) | | | $ | — | | | | $ | (144,622 | ) | | | $ | — | |
Bank of Montreal | | | | 48,207 | | | | | (48,207 | ) | | | | — | | | | | (48,207 | ) | | | | — | |
BNP Paribas | | | | 334,171 | | | | | (334,171 | ) | | | | — | | | | | (334,171 | ) | | | | — | |
| | | | | | | | | | | | | | | | | | | | | | | | | |
Total | | | $ | 527,000 | | | | $ | (527,000 | ) | | | $ | — | | | | $ | (527,000 | ) | | | $ | — | |
| | | | | | | | | | | | | | | | | | | | | | | | | |
Notes to financial statements
Delaware Pooled® Trust
9. Offsetting (continued)
| | | | | | | | | | | | | | | |
| | | The Emerging Markets Portfolio II | | |
| Counterparty | | Gross Value of
Derivative Asset | | Gross Value of
Derivative Liability | | Net Position |
BNY Mellon | | | | $1,721 | | | | | $— | | | | | $1,721 | |
| | | | | | | | | | | | | | | | | | | | | | | | | | | | | | |
| Counterparty | | Net Position | | Fair Value of
Non-Cash
Collateral Received | | Cash
Collateral
Received | | Fair Value of
Non-Cash
Collateral Pledged | | Cash
Collateral
Pledged | | Net Exposure(b) |
BNY Mellon | | | | $1,721 | | | | | $— | | | | | $— | | | | | $— | | | | | $— | | | | | $1,721 | |
| | | | | | | | | | | | | | | | | | | | | | | | | |
| | | The Emerging Markets Portfolio II | | | | |
Master Repurchase Agreements
Counterparty | | Repurchase
Agreements | | Fair Value of
Non-Cash
Collateral
Received(a) | | Cash
Collateral
Received | | Net Collateral
Received | | Net
Exposure(b) |
Bank of America Merrill Lynch | | | $ | 71,351 | | | | $ | (71,351 | ) | | | $ | — | | | | $ | (71,351 | ) | | | | $— | |
Bank of Montreal | | | | 23,783 | | | | | (23,783 | ) | | | | — | | | | | (23,783 | ) | | | | — | |
BNP Paribas | | | | 164,866 | | | | | (164,866 | ) | | | | — | | | | | (164,866 | ) | | | | — | |
| | | | | | | | | | | | | | | | | | | | | | | | | |
Total | | | $ | 260,000 | | | | $ | (260,000 | ) | | | $ | — | | | | $ | (260,000 | ) | | | | $— | |
| | | | | | | | | | | | | | | | | | | | | | | | | |
(a)The value of the related collateral received exceeded the value of the repurchase agreements as of Oct. 31, 2016.
(b)Net exposure represents the receivable (payable) that would be due from (to) the counterparty in the event of default.
10. Securities Lending
Each Portfolio, along with other funds in the Delaware Investments® Family of Funds, may lend its securities pursuant to a security lending agreement (Lending Agreement) with The Bank of New York Mellon (BNY Mellon). At the time a security is loaned, the borrower must post collateral equal to the required percentage of the market value of the loaned security, including any accrued interest. The required percentage is: (1) 102% with respect to U.S. securities and foreign securities that are denominated and payable in U.S. dollars; and (2) 105% with respect to foreign securities. With respect to each loan, if on any business day the aggregate market value of securities collateral plus cash collateral held is less than the aggregate market value of the securities which are the subject of such loan, the borrower will be notified to provide additional collateral by the end of the following business day which, together with the collateral already held, will be not less than the applicable initial collateral requirements for such security loan. If the aggregate market value of securities collateral and cash collateral held with respect to a security loan exceeds the applicable initial collateral requirement, upon the request of the borrower, BNY Mellon must return enough collateral to the borrower by the end of the following business day to reduce the value of the remaining collateral to the applicable initial collateral requirement for such security loan. As a result of the foregoing, the value of the collateral held with respect to a loaned security on any particular day may be more or less than the value of the security on loan.
Prior to Dec. 29, 2015, cash collateral received was generally invested in the Delaware Investments Collateral Fund No. 1 (Collective Trust), a pooled account established by BNY Mellon for the use of funds managed by DMC that participate in BNY Mellon’s securities lending program. The Collective Trust sought to maintain a NAV per unit of $1.00.
On Dec. 29, 2015, the assets in the Collective Trust were transferred to a series of individual separate accounts, each corresponding to a Portfolio. The investment guidelines permit each separate account to hold certain securities that would be considered eligible securities for a money market fund. Cash collateral received is generally invested in government securities; certain obligations issued by government sponsored enterprises; repurchase agreements collateralized by U.S. Treasury securities; obligations issued by the central government of any Organization for Economic Cooperation and Development (OECD) country or its agencies, instrumentalities or establishments; obligations of supranational organizations, commercial paper, notes, bonds and other debt obligations; certificates of deposit, time deposits and other bank obligations; and asset-backed securities.
104
In the event of default or bankruptcy by the lending agent, realization and/or retention of the collateral may be subject to legal proceedings. In the event the borrower fails to return loaned securities and the collateral received is insufficient to cover the value of the loaned securities and provided such collateral shortfall is not the result of investment losses, the lending agent has agreed to pay the amount of the shortfall to each Portfolio or, at the discretion of the lending agent, replace the loaned securities. Each Portfolio continues to record dividends or interest, as applicable, on the securities loaned and are subject to changes in value of the securities loaned that may occur during the term of the loan. Each Portfolio has the right under the Lending Agreement to recover the securities from the borrower on demand. With respect to security loans collateralized by non-cash collateral, each Portfolio receives loan premiums paid by the borrower. With respect to security loans collateralized by cash collateral, the earnings from the collateral investments are shared among each Portfolio, the security lending agent, and the borrower. Each Portfolio records security lending income net of allocations to the security lending agent and the borrower.
Each Portfolio may incur investment losses as a result of investing securities lending collateral. This could occur if an investment in the collateral investment account defaulted or became impaired. Under those circumstances, the value of a Portfolio’s cash collateral account may be less than the amount the Portfolio would be required to return to the borrowers of the securities and the Portfolio would be required to make up for this shortfall.
During the year ended Oct. 31, 2016, none of the Portfolios had securities out on loan.
11. Credit and Market Risk
Some countries in which The Labor Select International Equity, The Emerging Markets, and The Emerging Markets II Portfolios invest require governmental approval for the repatriation of investment income, capital, or the proceeds of sales of securities by foreign investors. In addition, if there is deterioration in a country’s balance of payments or for other reasons, a country may impose temporary restrictions on foreign capital remittances abroad.
The securities exchanges of certain foreign markets are substantially smaller, less liquid and more volatile than the major securities markets in the United States. Consequently, acquisition and disposition of securities by each Portfolio may be inhibited. In addition, a significant portion of the aggregate market value of securities listed on the major securities exchanges in emerging markets is held by a smaller number of investors. This may limit the number of shares available for acquisition or disposition by each Portfolio.
The High-Yield Bond Portfolio invests a portion of its assets in high yield fixed income securities which are securities rated lower than BBB-by S&P and lower than Baa3 by Moody’s, or similarly rated by another nationally recognized statistical rating organization. The Core Plus Fixed Income Portfolio invests a portion of its assets in high yield fixed income securities which are securities rated BB or lower by S&P and Ba or lower by Moody’s, or similarly rated by another nationally recognized statistical rating organization. Investments in these higher yielding securities are generally accompanied by a greater degree of credit risk than higher rated securities. Additionally, lower rated securities may be more susceptible to adverse economic and competitive industry conditions than investment grade securities.
The High-Yield Bond Portfolio and The Core Plus Fixed Income Portfolio invest in bank loans and other securities that may subject them to direct indebtedness risk, the risk that each Portfolio will not receive payment of principal, interest and other amounts due in connection with these investments and will depend primarily on the financial condition of the borrower. Loans that are fully secured offer each Portfolio more protection than unsecured loans in the event of nonpayment of scheduled interest or principal, although there is no assurance that the liquidation of collateral from a secured loan would satisfy the corporate borrower’s obligation, or that the collateral can be liquidated. Some loans or claims may be in default at the time of purchase. Certain of the loans and the other direct indebtedness acquired by each Portfolio may involve revolving credit facilities or other standby financing commitments that obligate each Portfolio to pay additional cash on a certain date or on demand. These commitments may require each Portfolio to increase its investment in a company at a time when each Portfolio might not otherwise decide to do so (including at a time when the company’s financial condition makes it unlikely that such amounts will be repaid). To the extent that each Portfolio is committed to advance additional funds, it will at all times hold and maintain cash or other high grade debt obligations in an amount sufficient to meet such commitments.
As each Portfolio may be required to rely upon another lending institution to collect and pass on to each Portfolio amounts payable with respect to the loan and to enforce each Portfolio’s rights under the loan and other direct indebtedness, an insolvency, bankruptcy, or reorganization of the lending institution may delay or prevent each Portfolio from receiving such amounts. The highly leveraged nature of many loans may make them especially vulnerable to adverse changes in economic or market conditions. Investments in such loans and other direct indebtedness may involve additional risk to each Portfolio.
Notes to financial statements
Delaware Pooled® Trust
11. Credit and Market Risk (continued)
The Core Plus Fixed Income Portfolio invests in fixed income securities whose value is derived from an underlying pool of mortgages or consumer loans. The value of these securities is sensitive to changes in economic conditions, including delinquencies and/or defaults, and may be adversely affected by shifts in the market’s perception of the issuers and changes in interest rates. Investors receive principal and interest payments as the underlying mortgages and consumer loans are paid back. Some of these securities are collateralized mortgage obligations (CMOs). CMOs are debt securities issued by U.S. government agencies or by financial institutions and other mortgage lenders, which are collateralized by a pool of mortgages held under an indenture. Prepayment of mortgages may shorten the stated maturity of the obligations and can result in a loss of premium, if any has been paid. Certain of these securities may be stripped (securities which provide only the principal or interest feature of the underlying security). The yield to maturity on an interest-only CMO is extremely sensitive not only to changes in prevailing interest rates, but also to the rate of principal payments (including prepayments) on the related underlying mortgage assets. A rapid rate of principal payments may have a material adverse effect on the Portfolio’s yield to maturity. If the underlying mortgage assets experience greater than anticipated prepayments of principal, the Portfolio may fail to fully recoup its initial investment in these securities even if the securities are rated in the highest rating categories.
The High-Yield Bond Portfolio and The Core Plus Fixed Income Portfolio invest in certain obligations that may have liquidity protection designed to ensure that the receipt of payments due on the underlying security is timely. Such protection may be provided through guarantees, insurance policies or letters of credit obtained by the issuer or sponsor through third parties, through various means of structuring the transaction or through a combination of such approaches. Each Portfolio will not pay any additional fees for such credit support, although the existence of credit support may increase the price of a security.
Because The Large-Cap Value Equity Portfolio expects to hold a concentrated portfolio of a limited number of securities, the Portfolio’s risk is increased because each investment has a greater effect on the Portfolio’s overall performance.
Each Portfolio may invest up to 15% of its net assets in illiquid securities, which may include securities with contractual restrictions on resale, securities exempt from registration under Rule 144A promulgated under the Securities Act of 1933, as amended, and other securities, which may not be readily marketable. The relative illiquidity of these securities may impair each Portfolio from disposing of them in a timely manner and at a fair price when it is necessary or desirable to do so. While maintaining oversight, the Portfolios’ Board has delegated to DMC the day-to-day functions of determining whether individual securities are liquid for purposes of each Portfolio’s limitation on investments in illiquid securities. Securities eligible for resale pursuant to Rule 144A, which are determined to be liquid, are not subject to the Portfolios’ limit on investments in illiquid securities. Rule 144A and illiquid securities have been identified on the “Schedules of investments.” When monitoring compliance with the Portfolios’ illiquid limit, certain holdings that are common to multiple clients of the investment manager may be aggregated and considered illiquid in the aggregate solely for monitoring purposes. For purposes of determining illiquidity for financial reporting purposes, only the holdings of each Portfolio will be considered.
12. Contractual Obligations
Each Portfolio enters into contracts in the normal course of business that contain a variety of indemnifications. Each Portfolio’s maximum exposure under these arrangements is unknown. However, the Portfolios have not had prior claims or losses pursuant to these contracts. Management has reviewed each Portfolio’s existing contracts and expects the risk of loss to be remote.
13. General Motors Term Loan Litigation
The High-Yield Bond Portfolio and The Core Plus Fixed Income Portfolio received notice of a litigation proceeding related to a General Motors Corporation (G.M.) term loan participation previously held by the Portfolios in 2009. We believe the matter subject to the litigation notice will likely lead to a recovery from the Portfolios of certain amounts received by the Portfolios because a U.S. Court of Appeals has ruled that the Portfolios and similarly situated investors were unsecured creditors rather than secured lenders of G.M. as a result of an erroneous UCC filing made by a third party. The Portfolios received the full principal on the loans in 2009 after the G.M. bankruptcy. However, based upon the court ruling the estate is seeking to recover such amounts arguing that, as unsecured creditors, the Portfolios should not have received payment in full. Based upon currently available information related to the litigation and the Portfolios’ potential exposure, the Portfolios recorded assets of $48,975 and $75,182, respectively, and liabilities of $163,250 and $250,607, respectively, that resulted in a decrease in the Portfolios’ NAV to reflect this likely recovery.
106
14. Subsequent Events
On Nov. 7, 2016, each Portfolio, along with the other Participants, entered into an amendment to the agreement for a $155,000,000 revolving line of credit. The line of credit is to be used as described in Note 7 and operates in substantially the same manner as the original agreement, with the exception of the annual commitment fee. Under the amendment to the agreement, the Participants are charged an annual commitment fee of 0.15%, which is allocated across the Participants on the basis of relative net assets of each Participant’s allocation of the entire facility. The line of credit available under the agreement expires on Nov. 6, 2017.
Management has determined that no other material events or transactions occurred subsequent to Oct. 31, 2016 that would require recognition or disclosure in the Portfolios’ financial statements.
Report of independent
registered public accounting firm
To the Board of Trustees of Delaware Pooled® Trust and the Shareholders of the Funds, as defined:
In our opinion, the accompanying statements of assets and liabilities, including the schedules of investments, and the related statements of operations and of changes in net assets and the financial highlights present fairly, in all material respects, the financial position of The Large-Cap Value Equity Portfolio, The High-Yield Bond Portfolio, The Core Plus Fixed Income Portfolio, The Labor Select International Equity Portfolio, The Emerging Markets Portfolio and The Emerging Markets Portfolio II (six of the series constituting Delaware Pooled Trust, hereafter collectively referred to as the “Funds”) as of October 31, 2016, the results of each of their operations for the year then ended, the changes in each of their net assets for each of the two years in the period then ended and the financial highlights for each of the five years in the period then ended, in conformity with accounting principles generally accepted in the United States of America. These financial statements and financial highlights (hereafter referred to as “financial statements”) are the responsibility of the Funds’ management. Our responsibility is to express an opinion on these financial statements based on our audits. We conducted our audits of these financial statements in accordance with the standards of the Public Company Accounting Oversight Board (United States). Those standards require that we plan and perform the audit to obtain reasonable assurance about whether the financial statements are free of material misstatement. An audit includes examining, on a test basis, evidence supporting the amounts and disclosures in the financial statements, assessing the accounting principles used and significant estimates made by management, and evaluating the overall financial statement presentation. We believe that our audits, which included confirmation of securities as of October 31, 2016 by correspondence with the custodian and brokers, provide a reasonable basis for our opinion.
PricewaterhouseCoopers LLP
Philadelphia, Pennsylvania
December 21, 2016
108
Other Portfolio information
(Unaudited)
Delaware Pooled® Trust
Tax Information
The information set forth below is for each Portfolio’s fiscal year as required by federal laws. Shareholders, however, must report distributions on a calendar year basis for income tax purposes, which may include distributions for portions of two fiscal years of a fund. Accordingly, the information needed by shareholders for income tax purposes will be sent to them in January of each year. Please consult your tax advisor for proper treatment of this information.
All disclosures are based on financial information available as of the date of this annual report and, accordingly are subject to change. For any and all items requiring reporting, it is the intention of each Portfolio to report the maximum amount permitted under the Internal Revenue Code and the regulations thereunder.
For the fiscal year ended Oct. 31, 2016, each Portfolio reports distributions paid during the year as follows:
| | | | | | | | | | | | | | | | |
| | | (A)
Long-Term
Capital Gains
Distributions
(Tax Basis) | | | (B)
Ordinary Income
Distributions*
(Tax Basis) | | | Total
Distribution
(Tax Basis) | | | (C)
Qualifying
Dividends1 | |
The Large-Cap Value Equity Portfolio | | | 70.92% | | | | 29.08% | | | | 100.00% | | | | 97.81% | |
The High-Yield Bond Portfolio | | | — | | | | 100.00% | | | | 100.00% | | | | 0.82% | |
The Core Plus Fixed Income Portfolio | | | — | | | | 100.00% | | | | 100.00% | | | | 0.21% | |
The Labor Select International Equity Portfolio | | | — | | | | 100.00% | | | | 100.00% | | | | — | |
The Emerging Markets Portfolio | | | — | | | | 100.00% | | | | 100.00% | | | | 2.65% | |
The Emerging Markets Portfolio II | | | 60.15% | | | | 39.85% | | | | 100.00% | | | | 2.62% | |
(A) and (B) are based on a percentage of each Portfolio’s total distributions.
(C) is based on a percentage of each Portfolio’s ordinary income distributions.
1Qualifying dividends represent dividends which qualify for the corporate dividends received deduction.
*For the fiscal year ended Oct. 31, 2016, certain dividends paid by the Portfolios may be subject to a maximum tax rate of 20%. The Portfolios intend to report the following percentages to be taxed at a maximum rate of 20%. Complete information will be computed and reported in conjunction with your 2016 Form 1099-DIV, as applicable.
| | |
| | | Maximum amount to be
Taxed at a maximum rate of 20% |
The Large-Cap Value Equity Portfolio | | 97.80% |
The High-Yield Bond Portfolio | | 0.82% |
The Core Plus Fixed Income Portfolio | | 0.23% |
The Labor Select International Equity Portfolio | | 100.00% |
The Emerging Markets Portfolio | | 90.76% |
The Emerging Markets Portfolio II | | 100.00% |
The Labor Select International Equity Portfolio, The Emerging Markets Portfolio and The Emerging Markets Portfolio II intend to pass through foreign tax credits in the maximum amount of $850,894, $298,174, and $59,530, respectively. The gross foreign source income earned during the fiscal year 2016 was $16,618,297, $5,815,539, and $808,427, respectively. Complete information will be computed and reported in conjunction with your 2016 Form 1099-DIV.
For the fiscal year ended Oct. 31, 2016, certain interest income paid by the Portfolios, determined to be Qualified Interest Income and Short-Term Capital Gains, may be subject to relief from U.S. withholding for foreign shareholders, as provided by the American Jobs Creation Act of 2004, and by the Tax Relief Unemployment Insurance Reauthorization and Job Creations Act of 2010, and as extended by the American Taxpayer Relief Act of 2012. For the fiscal year ended Oct. 31, 2016, the following Portfolio has reported maximum distributions of Qualified Interest Income and Short-Term Capital Gain as follows:
| | | | | | |
| | | Qualified Interest Income | | | | Short-Term Capital Gain |
The Large-Cap Value Equity Portfolio | | $1,889 | | | | $1,558,476 |
Other Portfolio information
(Unaudited)
Delaware Pooled® Trust
Board Consideration of Investment Advisory Agreements
At a meeting of the Board of Trustees held on May 17–19, 2016 (the “May Meeting”), the Board of Trustees, including a majority of disinterested or independent Trustees, (the “Board”) approved new sub-advisory agreements with Jackson Square Partners (“JSP”) for The Select 20 Portfolio and The Focus Smid-Cap Growth Portfolio (each, a “Portfolio” and together, the “Portfolios”1). In reaching the decision to approve the sub-advisory agreements with JSP, the Board considered and reviewed information provided by JSP, including its personnel, operations, and financial condition. The Board also reviewed material furnished by Delaware Management Company (“DMC”), including: a memorandum from DMC reviewing the terms of the sub-advisory agreements, the proposed sub-advisory fees, and the various services proposed to be provided by JSP; information concerning JSP’s organizational structure and the experience of its investment management personnel; copies of JSP’s Form ADV, compliance policies and procedures, and its Code of Ethics; and a copy of the proposed JSP sub-advisory agreements.
In considering such information and materials, the Independent Trustees received assistance and advice from and met separately with independent legal counsel. The materials prepared by Management specifically in connection with the approval of the sub-advisory agreement were provided to the Independent Trustees in advance of the May Meeting. Although attention was given to all information furnished, the following discussion addressed some primary factors relevant to the Board’s decision. This discussion of the information and factors considered by the Board is not intended to be exhaustive, but rather summarizes certain factors considered by the Board.
Nature, Extent and Quality of Service. The Board considered the services provided by JSP to the Portfolios and their shareholders. In reviewing the nature, extent, and quality of services, the Board took account of reports furnished to it throughout the year at regular Board Meetings covering matters such as relative performance of the Portfolios; compliance of portfolio managers with the investment policies, strategies, and restrictions for the Portfolios; the compliance of JSP personnel with its Code of Ethics; and adherence to fair value pricing procedures as established by the Board. The Board was pleased with the current staffing of JSP and the emphasis placed on research in the investment process. The Board was satisfied with the nature, extent, and quality of the overall services provided by JSP.
Investment Performance. The Board placed significant emphasis on the investment performance of the Portfolios in view of the importance of investment performance to shareholders. Although the Board gave appropriate consideration to performance reports and discussions with portfolio managers at Investment Committee meetings, the Board gave particular weight to the Broadridge Financial Solutions (“Broadridge”) reports furnished for the May Meeting. The Broadridge reports prepared for each Portfolio showed the investment performance of its Class A shares in comparison to a group of similar funds as selected by Broadridge (the “Performance Universe”). A fund with the best performance ranked first, and a fund with the poorest performance ranked last. The highest/best performing 25% of funds in the Performance Universe make up the first quartile; the next 25%, the second quartile; the next 25%, the third quartile; and the poorest/worst performing 25% of funds in the Performance Universe make up the fourth quartile. Comparative annualized performance for each Portfolio was shown for the past 1-, 3-, 5-, and 10-year periods, to the extent applicable, ended Jan. 31, 2016. The Board’s objective is that each Portfolio’s performance for the periods considered be at or above the median of its Performance Universe.
The Focus Smid-Cap Growth Equity Portfolio — The Performance Universe for the Portfolio consisted of the Portfolio and all retail and institutional mid-cap growth funds as selected by Broadridge. The Broadridge report comparison showed that the Portfolio’s total return for the 1-, 3-, 5-, and 10-year periods was in the first quartile of its Performance Universe. The Board was satisfied with performance.
The Select 20 Portfolio — The Performance Universe for the Portfolio consisted of the Portfolio and all retail and institutional multi-cap growth funds as selected by Broadridge. The Broadridge report comparison showed that the Portfolio’s total return for the 1- and 5-year periods was in the first quartile of its Performance Universe. The report further showed that the Portfolio’s total return for the 3- and 10-year periods was in the second quartile of its Performance Universe. The Board was satisfied with performance.
1 Subsequent to the Board’s approval of the Portfolios’ new sub-advisory agreements with JSP and the renewal of the Portfolios’ investment advisory agreements, shareholders of each Portfolio approved the reorganization of The Large-Cap Growth Equity Portfolio, The Focus Smid-Cap Growth Equity Portfolio, and The Select 20 Portfolio with and into Jackson Square Large-Cap Growth Fund, Jackson Square SMID-Cap Growth Fund, and Jackson Square Select 20 Growth Fund, respectively. The reorganizations occurred on Sept. 19, 2016.
110
Comparative Expenses. The Board considered expense comparison data for the Delaware Investments® Family of Funds. Management provided the Board with information on pricing levels and fee structures for each Portfolio as of its most recently completed fiscal year. The Board also focused on the comparative analysis of effective management fees and total expense ratios of each Portfolio versus effective management fees and expense ratios of a group of similar funds as selected by Broadridge (the “Expense Group”). In reviewing comparative costs, each Portfolio’s contractual management fee and the actual management fee incurred by the Portfolio were compared with the contractual management fees (assuming all funds in the Expense Group were similar in size to the Series) and actual management fees (as reported by each fund) within the Expense Group, taking into account any applicable breakpoints and fee waivers. The Portfolio’s total expenses were also compared with those of its Expense Group. The Lipper total expenses, for comparative consistency, were shown by Broadridge for Class A shares and comparative total expenses including 12b-1 and non-12b-1 service fees. The Board considered fees paid to DMC for non-management services. The Board’s objective is to limit each Portfolio’s total expense ratio to be competitive with that of the Expense Group.
The Focus Smid-Cap Growth Equity Portfolio — The expense comparisons for the Portfolio showed that its actual management fee was in the quartile with the second lowest expenses of its Expense Group and its total expenses were in the quartile with the lowest expenses of its Expense Group. The Board was satisfied with the total expenses of the Portfolio in comparison to those of its Expense Group.
The Select 20 Portfolio — The expense comparisons for the Portfolio showed that its actual management fee was in the quartile with the second highest expenses of its Expense Group and its total expenses were in the quartile with the second lowest expenses of its Expense Group. The Board was satisfied with the total expenses of the Portfolio in comparison to those of its Expense Group.
Management Profitability. Trustees were also given available information on profits being realized in relation to the services being provided to the Portfolios or in relation to JSP’s overall investment advisory business, but believed such information to be of limited relevance because the sub-advisory fees are paid by DMC out of its management fee, and changes in the level of sub-advisory fees have no impact on Portfolio expenses. The Board was also provided information on potential fall-out benefits derived or to be derived by JSP in connection with its relationship to the Portfolios, such as reputational enhancement, soft dollar arrangements or commissions paid to affiliated broker/dealers, as applicable.
At a meeting held on Aug. 16–18, 2016 (the “Annual Meeting”), the Board, including a majority of disinterested or independent Trustees, approved the renewal of the Investment Advisory Agreements for each of the series of Delaware Pooled Trust. In making its decision, the Board considered information furnished at regular quarterly Board meetings, including reports detailing Portfolio performance, investment strategies, and expenses, as well as information prepared specifically in connection with the renewal of the investment advisory and sub-advisory contracts. Information furnished specifically in connection with the renewal of the Investment Management Agreement with DMC, and Sub-Advisory Agreements with Mondrian Investment Partners Limited (“Mondrian”) and JSP included materials provided by DMC and its affiliates (“Delaware Investments”), Mondrian and JSP, as applicable, concerning, among other things, the nature, extent, and quality of services provided to the Portfolios; the costs of such services to the Portfolios; economies of scale; and the investment manager’s financial condition and profitability. In addition, in connection with the Annual Meeting, reports were provided to the Trustees in May 2016 and included reports provided by Broadridge. The Broadridge reports compared the Portfolio’s investment performance and expenses with those of other comparable mutual funds. The Independent Trustees reviewed and discussed the Broadridge reports with independent legal counsel to the Independent Trustees. In addition to the information noted above, the Board also requested and received information regarding DMC’s policy with respect to advisory fee levels and its breakpoint philosophy; the structure of portfolio manager compensation; comparative client fee information; and any constraints or limitations on the availability of securities for certain investment styles, which had in the past year inhibited, or which were likely in the future to inhibit, the investment manager’s ability to invest fully in accordance with Portfolio policies.
In considering information relating to the approval of each Portfolio’s advisory agreement and sub-advisory agreement, as applicable, the Independent Trustees received assistance and advice from and met separately with independent legal counsel to the Independent Trustees. Although the Board gave attention to all information furnished, the following discussion identifies, under separate headings, the primary factors taken into account by the Board during its contract renewal considerations.
Other Portfolio information
(Unaudited)
Delaware Pooled® Trust
Board Consideration of Investment Advisory Agreements (continued)
Nature, Extent and Quality of Service. The Board considered the services provided by DMC to the Portfolios and their shareholders. In reviewing the nature, extent, and quality of services, the Board considered reports furnished to it throughout the year, which covered matters such as the relative performance of the Portfolio; compliance of portfolio managers with the investment policies, strategies, and restrictions for the Portfolios; compliance by DMC and Delaware Distributors, L.P. (together, “Management”) personnel with the Code of Ethics adopted throughout the Delaware Investments® Family of Funds complex; and adherence to fair value pricing procedures as established by the Board. The Board was pleased with the current staffing of the Portfolios’ investment advisor and the emphasis placed on research in the investment process. The Board recognized DMC’s receipt of several industry distinctions during the past several years. The Board gave favorable consideration to DMC’s efforts to control expenditures while maintaining service levels committed to Portfolio matters. The Board also noted the benefits provided to Portfolio shareholders through each shareholder’s ability to exchange investments between Portfolios or the institutional class shares of other Delaware Investments funds and to reinvest Portfolio dividends into additional shares of the Portfolio or into additional shares of other Delaware Investments funds. The Board was satisfied with the nature, extent and quality of the overall services provided by DMC.
Nature, Extent and Quality of Service. The Board considered the services provided by Mondrian to The Emerging Markets Portfolio and The Labor Select International Equity Portfolio and their shareholders, as applicable. In reviewing the nature, extent, and quality of services, the Board considered reports furnished to it throughout the year at regular Board Meetings covering matters such as relative performance of the Portfolios; compliance of portfolio managers with the investment policies, strategies, and restrictions for the portfolios; the compliance of Mondrian personnel with its Code of Ethics; and adherence to fair value pricing procedures as established by the Board. The Board was pleased with the current staffing of Mondrian and the emphasis placed on research in the investment process. The Board was satisfied with the nature, extent, and quality of the overall services proposed to be provided by Mondrian.
Nature, Extent and Quality of Service. The Board considered the services provided by JSP to The Large Cap Growth Equity Portfolio and its shareholders, as applicable. In reviewing the nature, extent, and quality of services, the Board considered reports furnished to it throughout the year at regular Board Meetings covering matters such as relative performance of the Portfolio; compliance of portfolio managers with the investment policies, strategies, and restrictions for the Portfolio; the compliance of JSP personnel with its Code of Ethics; and adherence to fair value pricing procedures as established by the Board. The Board was pleased with the current staffing of JSP and the emphasis placed on research in the investment process. The Board was satisfied with the nature, extent, and quality of the overall services provided by JSP.
Investment Performance. The Board placed significant emphasis on the investment performance of the Portfolios in view of the importance of investment performance to shareholders. Although the Board gave appropriate consideration to performance reports and discussions with portfolio managers at Board meetings throughout the year, the Board gave particular weight to the Broadridge reports furnished for the Annual Meeting. The Broadridge reports prepared for each Portfolio showed the investment performance of its shares in comparison to the Performance Universe. A fund with the best performance ranked first, and a fund with the poorest performance ranked last. The highest/best performing 25% of funds in the Performance Universe make up the first quartile; the next 25%, the second quartile; the next 25%, the third quartile; and the poorest/worst performing 25% of funds in the Performance Universe make up the fourth quartile. Comparative annualized performance for the Portfolios was shown for the past 1-, 3-, 5-, and 10-year periods, to the extent applicable, ended Jan. 31, 2016. The Board’s objective is that each Portfolio’s performance for the periods considered be at or above the median of its Performance Universe.
The Core Plus Fixed Income Portfolio — The Performance Universe for the Portfolio consisted of the Portfolio and all retail and institutional core plus bond funds as selected by Broadridge. The Broadridge report comparison showed that the Portfolio’s total return for the 1-, 3-, and 5-year periods was in the second quartile of its Performance Universe. The report further showed that the Portfolio’s total return for the 10-year period was in the first quartile of its Performance Universe. The Board was satisfied with performance.
The Emerging Markets Portfolio — The Performance Universe for the Portfolio consisted of the Portfolio and all retail and institutional emerging markets funds as selected by Broadridge. The Broadridge report comparison showed that the Portfolio’s total return for the 1- and 3-year periods was in the third quartile of its Performance Universe. The report further showed that the Portfolio’s total return for the 5- and 10-year periods was in the second quartile of its Performance Universe. The Board observed that the Portfolio’s performance results were mixed, but tended toward median, which was acceptable to the Board.
112
The Emerging Markets Portfolio II — The Performance Universe for the Portfolio consisted of the Portfolio and all retail and institutional emerging markets funds as selected by Broadridge. The Broadridge report comparison showed that the Portfolio’s total return for the 1-year period was in the fourth quartile of its Performance Universe. The report further showed that the Portfolio’s total return for the 3- and 5-year periods was in the second quartile and third quartile, respectively, of its Performance Universe. The Board observed that the Portfolio’s short-term performance was not in line with the Board’s objective. In evaluating the Portfolio’s performance, the Board considered the Portfolio’s intermediate term performance results, which were acceptable. Overall, the Board was satisfied with performance.
The Focus Smid-Cap Growth Equity Portfolio — The Performance Universe for the Portfolio consisted of the Portfolio and all retail and institutional mid-cap growth funds as selected by Broadridge. The Broadridge report comparison showed that the Portfolio’s total return for the 1-, 3-, 5-, and 10-year periods was in the first quartile of its Performance Universe. The Board was satisfied with performance.
The High-Yield Bond Portfolio — The Performance Universe for the Portfolio consisted of the Portfolio and all retail and institutional high yield funds as selected by Broadridge. The Broadridge report comparison showed that the Portfolio’s total return for the 1-year period was in the third quartile of its Performance Universe. The report further showed that the Portfolio’s total return for the 3-year period was in the second quartile of its Performance Universes and the Portfolio’s total return for the 5- and 10-year periods was in the first quartile of its Performance Universe. The Board was satisfied with performance.
The Labor Select International Equity Portfolio — The Performance Universe for the Portfolio consisted of the Portfolio and all retail and institutional international large-cap value funds as selected by Broadridge. The Broadridge report comparison showed that the Portfolio’s total return for the 1-year period was in the third quartile of its Performance Universe. The report further showed that the Portfolio’s total return for the 3- and 5-year periods was in the first quartile of its Performance Universe and the Portfolio’s total return for the 10-year period was in the second quartile of the Performance Universe. The Board was satisfied with performance.
The Large-Cap Growth Equity Portfolio — The Performance Universe for the Portfolio consisted of the Portfolio and all retail and institutional large-cap growth funds as selected by Broadridge. The Broadridge report comparison showed that the Portfolio’s total return for the 1- and 5-year periods was in the first quartile of its Performance Universe. The report further showed that the Portfolio’s total return for the 3- and 10-year periods was in the second quartile of its Performance Universe. The Board was satisfied with performance.
The Large-Cap Value Equity Portfolio — The Performance Universe for the Portfolio consisted of the Portfolio and all retail and institutional large-cap value funds as selected by Broadridge. The Broadridge report comparison showed that the Portfolio’s total return for the 1-, 3-, 5-, and 10-year periods was in the first quartile of its Performance Universe. The Board was satisfied with performance.
The Select 20 Portfolio — The Performance Universe for the Portfolio consisted of the Portfolio and all retail and institutional multi-cap growth funds as selected by Broadridge. The Broadridge report comparison showed that the Portfolio’s total return for the 1- and 5-year periods was in the first quartile of its Performance Universe. The report further showed that the Portfolio’s total return for the 3- and 10-year periods was in the second quartile of its Performance Universe. The Board was satisfied with performance.
Comparative Expenses. The Board considered expense comparison data for the Delaware Investments® Family of Funds. Management provided the Board with information on pricing levels and fee structures for the Portfolios as of its most recent fiscal year end. The Board also focused on the comparative analysis of effective management fees and total expense ratios of each Portfolio versus effective management fees and expense ratios of the Expense Group. In reviewing comparative costs, each Portfolio’s contractual management fee and the actual management fee incurred by the Portfolio were compared with the contractual management fees (assuming all funds in the Expense Group were similar in size to the Portfolio) and actual management fees (as reported by each fund) within the Expense Group, taking into account any applicable breakpoints and fee waivers. Each Portfolio’s total expenses were also compared with those of its Expense Group. The Board’s objective is to limit each Portfolio’s total expense ratio to be competitive with that of the Expense Group.
The Core Plus Fixed Income Portfolio — The expense comparisons for the Portfolio showed that its actual management fee was in the quartile with the second lowest expenses of its Expense Group and its total expenses were in the quartile with the lowest expenses of its Expense Group. The Board was satisfied with the management fee and total expenses of the Portfolio in comparison to those of its Expense Group.
The Emerging Markets Portfolio — The expense comparisons for the Portfolio showed that its actual management fee was in the quartile with the second lowest expenses of its Expense Group and its total expenses were in the quartile with the lowest expenses of its Expense Group. The Board was satisfied with the management fee and total expenses of the Portfolio in comparison to those of its Expense Group.
Other Portfolio information
(Unaudited)
Delaware Pooled® Trust
Board Consideration of Investment Advisory Agreements (continued)
The Emerging Markets Portfolio II — The expense comparisons for the Portfolio showed that its actual management fee was in the quartile with the second highest expenses of its Expense Group and its total expenses were in the quartile with the lowest expenses of its Expense Group. The Board was satisfied with the total expenses of the Portfolio in comparison to those of its Expense Group.
The Focus Smid-Cap Growth Equity Portfolio — The expense comparisons for the Portfolio showed that its actual management fee was in the quartile with the second lowest expenses of its Expense Group and its total expenses were in the quartile with the lowest expenses of its Expense Group. The Board was satisfied with the total expenses of the Portfolio in comparison to those of its Expense Group.
The High-Yield Bond Portfolio — The expense comparisons for the Portfolio showed that its actual management fee and total expenses were in the quartile with the lowest expenses of its Expense Group. The Board was satisfied with the management fee and total expenses of the Portfolio in comparison to those of its Expense Group.
The Labor Select International Equity Portfolio — The expense comparisons for the Portfolio showed that its actual management fee was in the quartile with the second highest expenses of its Expense Group and its total expenses were in the quartile with the lowest expenses of its Expense Group. The Board was satisfied with the total expenses of the Portfolio in comparison to those of its Expense Group.
The Large-Cap Growth Equity Portfolio — The expense comparisons for the Portfolio showed that its actual management fee and total expenses were in the quartile with the lowest expenses of its Expense Group. The Board was satisfied with the management fee and total expenses of the Portfolio in comparison to those of its Expense Group.
The Large-Cap Value Equity Portfolio — The expense comparisons for the Portfolio showed that its actual management fee and total expenses were in the quartile with the lowest expenses of its Expense Group. The Board was satisfied with the management fee and total expenses of the Portfolio in comparison to those of its Expense Group.
The Select 20 Portfolio — The expense comparisons for the Portfolio showed that its actual management fee was in the quartile with the second highest expenses of its Expense Group and its total expenses were in the quartile with the second lowest expenses of its Expense Group. The Board was satisfied with the total expenses of the Portfolio in comparison to those of its Expense Group.
Management Profitability. The Board considered the level of profits, if any, realized by DMC in connection with the operation of the Portfolios. In this respect, the Board reviewed the Investment Management Profitability Analysis that addressed the overall profitability of DMC’s business in providing management and other services to each of the individual funds and the Delaware Investments® Family of Funds as a whole. Specific attention was given to the methodology followed in allocating costs for the purpose of determining profitability. Management stated that the level of profits of DMC, to a certain extent, reflects recent operational cost savings and efficiencies initiated by DMC. The Board considered DMC’s efforts to improve services provided to fund shareholders and to meet additional regulatory and compliance requirements resulting from recent industry-wide Securities and Exchange Commission initiatives. The Board also considered the extent to which DMC might derive ancillary benefits from fund operations, including the potential for procuring additional business as a result of the prestige and visibility associated with its role as service provider to the Delaware Investments Family of Funds and the benefits from allocation of fund brokerage to improve trading efficiencies. The Board found that the management fees were reasonable in light of the services rendered and the profitability of DMC.
Management Profitability. Trustees were also given available information on profits being realized by Mondrian in relation to the services being provided to The Emerging Markets Portfolio and The Labor Select International Equity Portfolio and in relation to Mondrian’s overall investment advisory business, but believed such information to be of limited relevance because the sub-advisory fees are paid by DMC out of its management fee, and changes in the level of sub-advisory fees have no impact on Portfolio expenses. The Board was also provided information on potential fall-out benefits derived or to be derived by Mondrian in connection with its relationship to the Portfolio, such as reputational enhancement, soft dollar arrangements or commissions paid to affiliated broker/dealers, as applicable.
Management Profitability. Trustees were also given available information on profits being realized by JSP in relation to the services being provided to The Large Cap Growth Equity Portfolio and in relation to JSP’s overall investment advisory business, but believed such information to be of limited relevance because the sub-advisory fees are paid by DMC out of its management fee, and changes in the level of sub-advisory fees have no impact on Portfolio expenses. The Board was also provided information on potential fall-out benefits derived or to be derived by JSP in connection with its relationship to the Portfolio, such as reputational enhancement, soft dollar arrangements or commissions paid to affiliated broker/dealers, as applicable.
114
Economies of Scale. The Trustees considered whether economies of scale are realized by DMC as each Portfolio’s assets increase and the extent to which any economies of scale are reflected in the level of management fees charged. The Trustees reviewed the standardized advisory fee pricing and structure approved by the Board and shareholders which does not includes breakpoints. Breakpoints in the advisory fee occur when the advisory fee rate is reduced on assets in excess of specified levels. Breakpoints result in a lower advisory fee, than would otherwise be the case in the absence of breakpoints, when the asset levels specified in the breakpoints are exceeded. Benchmarking analysis indicated that less than one quarter of competing funds in the institutional market employ breakpoints. Management believed, and the Board agreed, that the Portfolios were priced with relatively low management fees to reflect potential economies of scale at all asset levels. The Board noted that the fee under the management contract for The Core Plus Fixed Income Portfolio did not fall within the standardized fee pricing structure. With respect to The Core Plus Fixed Income Portfolio, Management explained that the portfolio management fee was priced slightly lower than the standard fee rate for special domestic funds.
Other Portfolio information
(Unaudited)
Delaware Pooled® Trust
Fund management
Kristen E. Bartholdson
Vice President, Senior Portfolio Manager — The Large-Cap Value Equity Portfolio
Kristen E. Bartholdson is a senior portfolio manager for the firm’s Large-Cap Value team. Prior to joining the firm in 2006 as an associate portfolio manager, she worked at Susquehanna International Group from 2004 to 2006, where she was an equity research salesperson. From 2000 to 2004, she worked in equity research at Credit Suisse, most recently as an associate analyst in investment strategy. Bartholdson earned her bachelor’s degree in economics from Princeton University.
Nigel A. Bliss
Senior Portfolio Manager — Mondrian Investment Partners Ltd. — The Labor Select International Equity Portfolio
Nigel Bliss has a BA (Hons) Degree in Geography from the University of Manchester. He holds the ASIP designation and is a member of the CFA Institute and the CFA Society of the U.K. He commenced his career at Cazenove & Co. and moved to join Mondrian in 1995. Bliss is a senior portfolio manager in the Non-U.S. Equity Team. He has had significant experience analyzing securities in the Pacific Basin region and in the global materials, utilities, property and industrials sectors. In recent years Bliss has taken responsibility for leading coverage of securities listed in the U.K. and Scandinavian markets while still maintaining his sector specialization. Bliss is a member of Mondrian’s Non-U.S. Equity Strategy Committee.
Adam H. Brown, CFA
Senior Vice President, Senior Portfolio Manager — The High-Yield Bond Portfolio and The Core Plus Fixed Income Portfolio
Adam H. Brown is a senior portfolio manager on the firm’s taxable fixed income team. He manages the bank loan portfolios and is a co-portfolio manager for the high yield, fixed rate multisector, and core plus strategies. Brown joined Delaware Investments in April 2011 as part of the firm’s integration of Macquarie Four Corners Capital Management, where he worked since 2002. At Four Corners, he was a co-portfolio manager on four collateralized loan obligations (CLOs) and a senior research analyst supporting noninvestment grade portfolios. Before that, Brown was with the predecessor of Wells Fargo Securities, where he worked in the leveraged finance group arranging senior secured bank loans and high yield bond financings for financial sponsors and corporate issuers. He earned a bachelor’s degree in accounting from the University of Florida and an MBA from the A.B. Freeman School of Business at Tulane University.
Liu-Er Chen, CFA
Senior Vice President, Chief Investment Officer — Emerging Markets and Healthcare — The Emerging Markets Portfolio II
Liu-Er Chen heads the firm’s global Emerging Markets team, and he is also the portfolio manager for Delaware Healthcare Fund, which launched in September 2007. Prior to joining Delaware Investments in September 2006 in his current position, he spent nearly 11 years at Evergreen Investment Management Company, where he most recently worked as managing director and senior portfolio manager. He co-managed the Evergreen Emerging Markets Growth Fund from 1999 to 2001, and became the Fund’s sole manager in 2001. He was also the sole manager of the Evergreen Health Care Fund since its inception in 1999. Chen began his career at Evergreen in 1995 as an analyst covering Asian and global healthcare stocks, before being promoted to portfolio manager in 1998. Prior to his career in asset management, Chen worked for three years in sales, marketing, and business development for major American and European pharmaceutical and medical device companies. He received his medical education in China and he has experience in medical research at both the Chinese Academy of Sciences and Cornell Medical School. He holds an MBA with a concentration in management from Columbia Business School.
116
Ginny Chong, CFA
Senior Portfolio Manager — Mondrian Investment Partners Ltd. — The Emerging Markets Portfolio
Prior to joining Mondrian in 2000, Ginny Chong worked for PricewaterhouseCoopers in Vancouver, within the Corporate Finance and Investment Banking Division where she qualified as a Canadian Chartered Accountant. Chong has a degree in Commerce from the University of British Columbia, Vancouver. Chong is presently a senior portfolio manager within the Emerging Markets Team. Chong is a CFA Charterholder and is a member of the CFA Institute and the CFA Society of the U.K.
Craig C. Dembek, CFA
Senior Vice President, Co-Head of Credit Research, Senior Research Analyst — The High-Yield Bond Portfolio and The Core Plus Fixed Income Portfolio
Craig C. Dembek is co-head of credit research and senior research analyst on the firm’s taxable fixed income team with primary responsibility for banks, brokers, insurance companies, and real estate investment trusts (REITs), as well as oversight for other sectors. He rejoined the firm in March 2007. During his previous time at Delaware Investments, from April 1999 to January 2001, he was a senior investment grade credit analyst. Most recently, he spent four years at Chartwell Investment Partners as a senior fixed income analyst and Turner Investment Partners as a senior fixed income analyst and portfolio manager. Dembek also spent two years at Stein, Roe & Farnham as a senior fixed income analyst. Earlier in his career, he worked for two years as a lead bank analyst at the Federal Reserve Bank of Boston. Dembek earned a bachelor’s degree in finance from Michigan State University and an MBA with a concentration in finance from the University of Vermont.
Elizabeth A. Desmond, CFA
Director, Chief Investment Officer — International Equities — Mondrian Investment Partners Ltd. — The Labor Select International Equity Portfolio
Elizabeth A. Desmond is a graduate of Wellesley College and the Masters Program in East Asian Studies at Stanford University. After working for the Japanese government for two years, she began her investment career as a Pacific Basin investment manager with Shearson Lehman Global Asset Management. Prior to joining Mondrian in 1991, she was a Pacific Basin Equity Analyst and senior portfolio manager at Hill Samuel Investment Advisers Ltd. Desmond is a CFA Charterholder, and a member of the CFA Institute and the CFA Society of the U.K.
Roger A. Early, CPA, CFA
Executive Director, Head of Fixed Income Investments, Executive Vice President, Co-Chief Investment Officer — Total Return Fixed Income Strategy — The Core Plus Fixed Income Portfolio
Roger A. Early rejoined Delaware Investments in March 2007 as a member of the firm’s taxable fixed income portfolio management team, with primary responsibility for portfolio construction and strategic asset allocation. He became head of fixed income investments in February 2015. During his previous time at the firm, from 1994 to 2001, he was a senior portfolio manager in the same area, and he left Delaware Investments as head of its U.S. investment grade fixed income group. In recent years, Early was a senior portfolio manager at Chartwell Investment Partners and Rittenhouse Financial and was the chief investment officer for fixed income at Turner Investments. Prior to joining Delaware Investments in 1994, he worked for more than 10 years at Federated Investors where he managed more than $25 billion in mutual fund and institutional portfolios in the short-term and investment grade markets. He left the firm as head of institutional fixed income management. Earlier in his career, he held management positions with the Federal Reserve Bank, PNC Financial, Touche Ross, and Rockwell International. Early earned his bachelor’s degree in economics from The Wharton School of the University of Pennsylvania and an MBA with concentrations in finance and accounting from the University of Pittsburgh. He is a member of the CFA Society of Philadelphia.
Other Portfolio information
(Unaudited)
Delaware Pooled® Trust
Fund management (continued)
Paul Grillo, CFA
Senior Vice President, Co-Chief Investment Officer — Total Return Fixed Income Strategy — The Core Plus Fixed Income Portfolio
Paul Grillo is a member of the firm’s taxable fixed income portfolio management team with primary responsibility for portfolio construction and strategic asset allocation. He is also a member of the firm’s asset allocation committee, which is responsible for building and managing multi-asset class portfolios. He joined Delaware Investments in 1992 as a mortgage-backed and asset-backed securities analyst, assuming portfolio management responsibilities in the mid–1990s. Grillo serves as lead portfolio manager for the firm’s Diversified Income products and has been influential in the growth and distribution of the firm’s multisector strategies. Prior to joining Delaware Investments, Grillo was a mortgage strategist and trader at Dreyfus Corporation. He also worked as a mortgage strategist and portfolio manager at Chemical Investment Group and as a financial analyst at Chemical Bank. Grillo holds a bachelor’s degree in business management from North Carolina State University and an MBA with a concentration in finance from Pace University.
Gregory Halton, CFA
Senior Portfolio Manager — Mondrian Investment Partners Ltd. — The Emerging Markets Portfolio
Having graduated from St Catherine’s College, Oxford in 2000 with a MEng (Hons) in Engineering Science, Gregory J.P. Halton worked in the global equity division of Deutsche Asset Management before joining Mondrian in 2004. Halton is a senior portfolio manager within the Emerging Markets Team. Halton is a CFA Charterholder and is a member of the CFA Institute and the CFA Society of the U.K.
J. David Hillmeyer, CFA
Senior Vice President, Senior Portfolio Manager — The Core Plus Fixed Income Portfolio
J. David Hillmeyer is a member of the firm’s taxable fixed income portfolio management team. He is responsible for portfolio construction and asset allocation of the diversified floating rate strategy and serves as co-portfolio manager for the fixed rate multisector, core plus, and investment grade corporate bond strategies. Prior to joining Delaware Investments in August 2007 as a vice president and corporate bond trader, he worked for more than 11 years in various roles at Hartford Investment Management Company, including senior corporate bond trader, high yield portfolio manager / trader, and quantitative analyst. He began his career as an investment advisor in January 1989 at Shawmut Bank, leaving the firm as an investment officer in November 1995. Hillmeyer earned his bachelor’s degree from Colorado State University, and he is a member of the CFA Society of Philadelphia and the Philadelphia Council for Business Economics.
Nikhil G. Lalvani, CFA
Vice President, Senior Portfolio Manager — The Large-Cap Value Equity Portfolio
Nikhil G. Lalvani is a senior portfolio manager for the firm’s Large-Cap Value team. At Delaware Investments, Lalvani has worked as both a fundamental and quantitative analyst. Prior to joining the firm in 1997 as an account analyst, he was a research associate with Bloomberg. Lalvani holds a bachelor’s degree in finance from The Pennsylvania State University. He is a member of the CFA Institute and the CFA Society of Philadelphia.
Paul A. Matlack, CFA
Senior Vice President, Senior Portfolio Manager, Fixed Income Strategist — The High-Yield Bond Portfolio and The Core Plus Fixed Income Portfolio
Paul A. Matlack is a strategist and senior portfolio manager for the firm’s fixed income team. Matlack rejoined the firm in May 2010. During his previous time at Delaware Investments, from September 1989 to October 2000, he was senior credit analyst, senior portfolio manager, and left the firm as co-head of the high yield group. Most recently, he worked at Chartwell Investment Partners from September 2003 to April 2010 as senior portfolio manager in fixed income, where he managed core, core plus, and high yield strategies. Prior to that, Matlack held senior roles at Turner Investment Partners, PNC Bank, and Mellon Bank. He earned a bachelor’s degree in international relations from the University of Pennsylvania and an MBA with a concentration in finance from George Washington University.
118
John P. McCarthy, CFA
Senior Vice President, Senior Portfolio Manager, Co-Head of Credit Research — The High-Yield Bond Portfolio and The Core Plus Fixed Income Portfolio
John P. McCarthy is a senior portfolio manager for the firm’s high yield strategies, a role he assumed in July 2016. He is also co-head of credit research on the firm’s taxable fixed income team. McCarthy rejoined Delaware Investments in March 2007 as a senior research analyst, after he worked in the firm’s fixed income area from 1990 to 2000 as a senior high yield analyst and high yield trader, and from 2001 to 2002 as a municipal bond trader. Prior to rejoining Delaware Investments, he was a senior high yield analyst/trader at Chartwell Investment Partners. McCarthy earned a bachelor’s degree in business administration from Babson College, and he is a member of the CFA Society of Philadelphia.
Andrew Miller
Chief Investment Officer, Emerging Market Equities — Mondrian Investment Partners Ltd. — The Emerging Markets Portfolio
Andrew Miller is a graduate of the University of Birmingham. Prior to joining Mondrian in 2000, he worked in the Investment Management department of PricewaterhouseCoopers, where he was responsible for the analysis and audit of various investment vehicles. Miller is presently Chief Investment Officer within the Emerging Markets Team. Miller holds the ASIP designation and is a member of the CFA Institute and the CFA Society of the U.K.
D. Tysen Nutt Jr.
Senior Vice President, Senior Portfolio Manager, Team Leader — The Large-Cap Value Equity Portfolio
D. Tysen Nutt Jr. is senior portfolio manager and team leader for the firm’s Large-Cap Value team. Before joining Delaware Investments in 2004 as senior vice president and senior portfolio manager, Nutt led the U.S. Active Large-Cap Value team within Merrill Lynch Investment Managers, where he managed mutual funds and separate accounts for institutions and private clients. He departed Merrill Lynch Investment Managers as a managing director. Prior to joining Merrill Lynch Investment Managers in 1994, Nutt was with Van Deventer & Hoch where he managed large-cap value portfolios for institutions and private clients. He began his investment career at Dean Witter Reynolds, where he eventually became vice president, investments. Nutt earned his bachelor’s degree from Dartmouth College, and he is a member of the New York Society of Security Analysts and the CFA Institute.
Melissa J. A. Platt, CFA
Portfolio Manager — Mondrian Investment Partners Ltd. — The Labor Select International Equity Portfolio
Melissa J.A. Platt is an Economics and Finance graduate of Massey University, New Zealand. She started her career as a consultant at KPMG Corporate Finance. She then moved to FundSource Research for 3 years as an Investment Analyst and later as Research Manager. Platt joined Mondrian in 2004 and is a portfolio manager in the Non-U.S. Equity Team. Platt is a CFA Charterholder, a member of the CFA Institute and a member of the CFA Society of the U.K.
Robert A. Vogel Jr., CFA
Vice President, Senior Portfolio Manager — The Large-Cap Value Equity Portfolio
Robert A. Vogel Jr. is a senior portfolio manager for the firm’s Large-Cap Value team. Prior to joining Delaware Investments in 2004 as vice president and senior portfolio manager, he worked at Merrill Lynch Investment Managers for more than seven years, where he rose to the position of director and portfolio manager within the U.S. Active Large-Cap Value team. He began his career in 1992 as a financial consultant at Merrill Lynch. Vogel graduated from Loyola University Maryland, earning both bachelor’s and master’s degrees in finance. He also earned an MBA with a concentration in finance from The Wharton School of the University of Pennsylvania. Vogel is a member of the New York Society of Security Analysts, the CFA Institute, and the CFA Society of Philadelphia.
Board of trustees / directors and officers addendum
Delaware Investments® Family of Funds
A mutual fund is governed by a Board of Trustees / Directors (“Trustees”), which has oversight responsibility for the management of a fund’s business affairs. Trustees establish procedures and oversee and review the performance of the investment manager, the distributor, and others who perform services for the fund. The independent fund trustees, in particular, are advocates for shareholder interests. Each trustee has served in that capacity since he or she was elected to or appointed to the Board of Trustees, and will continue to serve until his or her retirement or the election of a new trustee in his or her place. The following is a list of the Trustees and Officers with certain background and related information.
| | | | | | | | | | |
Name, Address, and Birth Date | | Position(s) Held with Fund(s) | | Length of Time Served | | Principal Occupation(s) During the Past Five Years | | Number of Portfolios in Fund
Complex Overseen by Trustee or Officer | | Other Directorships Held by Trustee or Officer |
|
Interested Trustee | | | | | | | | | | |
|
Shawn K. Lytle1,3 2005 Market Street Philadelphia, PA 19103 February 1970 | | President, Chief Executive Officer, and Trustee | | Trustee since September 2015 | | Shawn K. Lytle has served as President of Delaware Investments2 since June 2015 and was the Regional Head of Americas | | 62 | | Trustee — UBS Relationship Funds, SMA Relationship Trust, and UBS Funds (May 2010–April 2015) |
| | | | President and Chief Executive Officer since August 2015 | | for UBS Global Asset Management from 2010 through 2015. | | | |
|
Independent Trustees | | | | | | | | | | |
|
Thomas L. Bennett 2005 Market Street Philadelphia, PA 19103 October 1947 | | Chairman and Trustee | | Trustee since March 2005 | | Private Investor (March 2004–Present) | | 62 | | Director — Bryn Mawr Bank Corp. (BMTC) (2007–2011) |
| | | | Chairman since March 2015 | | | | | | |
| | | | | | | | | | | |
Ann D. Borowiec 2005 Market Street Philadelphia, PA 19103 November 1958 | | Trustee | | Since March 2015 | | Chief Executive Officer Private Wealth Management (2011–2013) and Market Manager, New Jersey Private Bank
(2005–2011) — J.P. Morgan Chase & Co. | | 62 | | None |
Joseph W. Chow 2005 Market Street Philadelphia, PA 19103 January 1953 | | Trustee | | Since January 2013 | | Executive Vice President (Emerging Economies Strategies, Risks and Corporate Administration) State Street Corporation (July 2004–March 2011) | | 62 | | Director and Audit Committee Member – Hercules Technology Growth Capital, Inc. (2004–2014) |
| | | | | |
| | | | | | | | | | | |
John A. Fry 2005 Market Street Philadelphia, PA 19103 May 1960 | | Trustee | | Since January 2001 | | President — Drexel University (August 2010–Present) | | 62 | | Director, Audit and Governance Committee Member — Community Health |
| | | | | | | | | | Systems |
| | | | | | President — Franklin & Marshall College (July 2002–July 2010) | | | | Director — Drexel Morgan & Co. |
| | | | | | | | | | |
| | | | | | | | | | | Director, Audit Committee Member — vTv Therapeutics LLC |
120
| | | | | | | | | | |
Name, Address, and Birth Date | | Position(s) Held with Fund(s) | | Length of Time Served | | Principal Occupation(s) During the Past Five Years | | Number of Portfolios in Fund
Complex Overseen by Trustee or Officer | | Other Directorships Held by Trustee or Officer |
|
| Independent Trustees (continued) | | | | | | |
|
Lucinda S. Landreth 2005 Market Street Philadelphia, PA 19103 June 1947 | | Trustee | | Since March 2005 | | Private Investor (2004–Present) | | 62 | | None |
Frances A. Sevilla-Sacasa 2005 Market Street Philadelphia, PA 19103 January 1956 | | Trustee | | Since September 2011 | | Chief Executive Officer — Banco Itaú International (April 2012–Present) | | 62 | | Trust Manager and Audit Committee Member — Camden Property Trust |
| | | | | |
| | | | | | Executive Advisor to Dean (August 2011–March 2012) and Interim Dean (January 2011–July 2011) — University of Miami School of Business Administration | | | | |
| | | | | |
| | | | | | | President — U.S. Trust, Bank of America Private Wealth Management (Private Banking) (July 2007-December 2008) | | | | |
Thomas K. Whitford 2005 Market Street Philadelphia, PA 19103 March 1956 | | Trustee | | Since January 2013 | | Vice Chairman (2010–April 2013) and Chief Administrative Officer (2008–2010) — PNC Financial Services Group | | 62 | | Director — HSBC Finance Corporation and HSBC North America Holdings Inc. Director — HSBC Bank |
Janet L. Yeomans 2005 Market Street Philadelphia, PA 19103 July 1948 | | Trustee | | Since April 1999 | | Vice President and Treasurer (January 2006–July 2012), Vice President — Mergers & Acquisitions (January 2003–January 2006), and Vice President and Treasurer (July 1995–January 2003) — 3M Company | | 62 | | Director, Personnel and Compensation Committee Chair, Audit Committee Member and Governance Committee Member — Okabena Company |
| | | | | |
| | | | | | | | | | | |
Board of trustees / directors and officers addendum
Delaware Investments® Family of Funds
| | | | | | | | | | |
Name, Address, and Birth Date | | Position(s) Held with Fund(s) | | Length of Time Served | | Principal Occupation(s) During the Past Five Years | | Number of Portfolios in Fund Complex Overseen by Trustee or Officer | | Other Directorships Held by Trustee or Officer |
|
Officers | | | | | | | | | | |
|
David F. Connor 2005 Market Street Philadelphia, PA 19103 December 1963 | | Senior Vice President, General Counsel, and Secretary | | Senior Vice President, since May 2013; General Counsel since May 2015; Secretary since October 2005 | | David F. Connor has served in various capacities at different times at Delaware Investments. | | 62 | | None3 |
Daniel V. Geatens 2005 Market Street Philadelphia, PA 19103 October 1972 | | Vice President and Treasurer | | Treasurer since October 2007 | | Daniel V. Geatens has served in various capacities at different times at Delaware Investments. | | 62 | | None3 |
Richard Salus 2005 Market Street Philadelphia, PA 19103 October 1963 | | Senior Vice President and Chief Financial Officer | | Chief Financial Officer since November 2006 | | Richard Salus has served in various capacities at different times at Delaware Investments. | | 62 | | None3 |
| 1 | Shawn K. Lytle is considered to be an “Interested Trustee” because he is an executive officer of the Fund’s(s’) investment advisor. |
| 2 | Delaware Investments is the marketing name for Delaware Management Holdings, Inc. and its subsidiaries, including the Fund’s(s’) investment advisor, principal underwriter, and its transfer agent. |
| 3 | Shawn K. Lytle, David F. Connor, Daniel V. Geatens, and Richard Salus serve in similar capacities for the six portfolios of the Optimum Fund Trust, which have the same investment advisor, principal underwriter, and transfer agent as the registrant. |
The Statement of Additional Information for the Fund(s) includes additional information about the Trustees and Officers and is available, without charge, upon request by calling 800 523-1918.
122
Portfolio managers
| | | | |
Kristen E. Bartholdson Vice President and Senior Portfolio Manager Nigel Bliss Senior Portfolio Manager Mondrian Investment Partners Limited Adam H. Brown Senior Vice President and Senior Portfolio Manager Liu-Er Chen Senior Vice President and Chief Investment Officer — Emerging Markets and Healthcare Ginny Chong Senior Portfolio Manager Mondrian Investment Partners Limited Craig C. Dembek Senior Vice President, Co-Head of Credit Research, and Senior Research Analyst Elizabeth A. Desmond Director and Chief Investment Officer — International Equities Mondrian Investment Partners Limited Roger A. Early Executive Director, Head of Fixed Income Investments, Executive Vice President, and Co-Chief Investment Officer — Total Return Fixed Income Strategy Paul Grillo Senior Vice President and Co-Chief Investment Officer — Total Return Fixed Income Strategy Gregory J.P. Halton Senior Portfolio Manager Mondrian Investment Partners Limited J. David Hillmeyer Senior Vice President and Senior Portfolio Manager Nikhil G. Lalvani Vice President and Senior Portfolio Manager | | Paul A. Matlack Senior Vice President, Senior Portfolio Manager, and Fixed Income Strategist John P. McCarthy Senior Vice President, Senior Portfolio Manager, and Co-Head of Credit Research Andrew Miller Chief Investment Officer — Emerging Market Equities Mondrian Investment Partners Limited D. Tysen Nutt Jr. Senior Vice President, Senior Portfolio Manager, and Team Leader — Large-Cap Value Focus Equity Melissa J.A. Platt Portfolio Manager Mondrian Investment Partners Limited Robert A. Vogel Jr. Vice President and Senior Portfolio Manager | | |
123
This page intentionally left blank.
This page intentionally left blank.
Custodian
The Bank of New York Mellon
One Wall Street
New York, NY 10286
Independent registered public accounting firm
PricewaterhouseCoopers LLP
Two Commerce Square, Suite 1700
2001 Market Street
Philadelphia, PA 19103-7042
Investment advisor
Delaware Management Company, a series of Delaware Management Business Trust
2005 Market Street
Philadelphia, PA 19103
Investment sub-advisor for certain Portfolios
Mondrian Investment Partners Limited
Fifth Floor
10 Gresham Street
London EC2V 7JD
United Kingdom
Delaware Investments, a member of Macquarie Group, refers to DMHI and its subsidiaries. Macquarie Group refers to Macquarie Group Limited and its subsidiaries and affiliates worldwide.
The Portfolios are distributed by Delaware Distributors, L.P., an affiliate of DMBT, DMHI, and Macquarie Group Limited.
Each Portfolio files its complete schedule of portfolio holdings with the Securities and Exchange Commission for the first and third quarters of each fiscal year on Form N-Q. Each Portfolio’s Forms N-Q, as well as a description of the policies and procedures that the Portfolios use to determine how to vote proxies (if any) relating to portfolio securities and the Schedules of Investments included in the Portfolios’ most recent Forms N-Q are available without charge (i) upon request, by calling 800 231-8002; (ii) on the Portfolios’ website at delawareinvestments.com/dpt/literature; and (iii) on the Commission’s website at sec.gov. Each Portfolio’s Forms N-Q may be reviewed and copied at the Commission’s Public Reference Room in Washington, D.C.; information on the operation of the Public Reference Room may be obtained by calling 800 SEC-0330.
Information (if any) regarding how each Portfolio voted proxies relating to portfolio securities during the most recently disclosed 12-month period ended June 30 is available without charge (i) through the Portfolios’ website at delawareinvestments.com/proxy; and (ii) on the Commission’s website at sec.gov.
This report was prepared for investors in the Delaware Pooled ® Trust Portfolios. It may be distributed to others only if preceded or accompanied by a current Delaware Pooled Trust prospectus, which contains details about charges, expenses, investment objectives, and operating policies of the Portfolios. All Delaware Pooled Trust Portfolios are offered by prospectus only. The return and principal value of an investment in a Portfolio will fluctuate so that shares, when redeemed, may be worth more or less than their original cost.
Carefully consider the Portfolios’ investment objectives, risk factors, charges, and expenses before investing. This and other information can be found in the Portfolios’ prospectus which may be obtained by visiting delawareinvestments.com/dpt/literature or calling 800 231-8002. Investors should read the prospectus carefully before investing.
| | |

(18135) AR-DPT 21320 [12/16] | | 2005 Market Street Philadelphia, PA 19103 Telephone 800 231-8002 Fax 215 255-1162 Printed in the USA |

Annual report
Alternative / specialty mutual fund
Delaware REIT Fund
October 31, 2016
Carefully consider the Fund’s investment objectives, risk factors, charges, and expenses before investing. This and other information can be found in the Fund’s prospectus and its summary prospectus, which may be obtained by visiting delawareinvestments.com/literature or calling 800 523-1918. Investors should read the prospectus and the summary prospectus carefully before investing.
You can obtain shareholder reports and prospectuses online instead of in the mail.
Visit delawareinvestments.com/edelivery.
Experience Delaware Investments
Delaware Investments is committed to the pursuit of consistently superior asset management and unparalleled client service. We believe in our investment processes, which seek to deliver consistent results, and in convenient services that help add value for our clients.
If you are interested in learning more about creating an investment plan, contact your financial advisor.
You can learn more about Delaware Investments or obtain a prospectus for Delaware REIT Fund at delawareinvestments.com/literature.
Manage your investments online
| • | | 24-hour access to your account information |
| • | | Check your account balance and recent transactions |
| • | | Request statements or literature |
| • | | Make purchases and redemptions |
Delaware Management Holdings, Inc. and its subsidiaries (collectively known by the marketing name of Delaware Investments) are wholly owned subsidiaries of Macquarie Group Limited, a global provider of banking, financial, advisory, investment, and funds management services.
Neither Delaware Investments nor its affiliates referred to in this document are authorized deposit-taking institutions for the purpose of the Banking Act 1959 (Commonwealth of Australia). The obligations of these entities do not represent deposits or other liabilities of Macquarie Bank Limited (MBL), a subsidiary of Macquarie Group Limited and an affiliate of Delaware Investments. MBL does not guarantee or otherwise provide assurance in respect of the obligations of these entities, unless noted otherwise. The Fund is governed by U.S. laws and regulations.
Table of contents
Unless otherwise noted, views expressed herein are current as of Oct. 31, 2016, and subject to change for events occurring after such date.
The Fund is not FDIC insured and is not guaranteed. It is possible to lose the principal amount invested.
Mutual fund advisory services provided by Delaware Management Company, a series of Delaware Management Business Trust, which is a registered investment advisor. Delaware Investments, a member of Macquarie Group, refers to Delaware Management Holdings, Inc. and its subsidiaries, including the Funds’ distributor, Delaware Distributors, L.P. Macquarie Group refers to Macquarie Group Limited and its subsidiaries and affiliates worldwide.
© 2016 Delaware Management Holdings, Inc.
All third-party marks cited are the property of their respective owners.
Portfolio management review
| | | | |
Delaware REIT Fund | | | November 8, 2016 | |
| | | | | | | | |
Performance preview (for the year ended October 31, 2016) | | | | | | | | |
Delaware REIT Fund (Institutional Class shares) | | | 1-year return | | | | +4.60% | |
Delaware REIT Fund (Class A shares) | | | 1-year return | | | | +4.24% | |
FTSE NAREIT Equity REITs Index (benchmark) | | | 1-year return | | | | +6.81% | |
Past performance does not guarantee future results.
For complete, annualized performance for Delaware REIT Fund, please see the table on page 4.
Institutional Class shares are available without sales or asset-based distribution charges only to certain eligible accounts. The performance of Class A shares excludes the applicable sales charge. Both Institutional Class shares and Class A shares reflect the reinvestment of all distributions.
Please see page 6 for a description of the index. Index performance returns do not reflect any management fees, transaction costs, or expenses. Indices are unmanaged and one cannot invest directly in an index.
| | |
For the Fund’s fiscal year ended Oct. 31, 2016, market conditions were highly volatile for investors in real estate investment trusts (REITs). In our view, that volatility was driven by investors’ changing expectations about the direction of interest rates. The fiscal period began with the REIT market under pressure, reflecting the growing consensus that the U.S. Federal Reserve would finally raise its target short-term interest rate. The Fed did so in December 2015, increasing the federal funds rate by 0.25 percentage points. It was the central bank’s first such rate hike in nine years. Early in 2016, however, as financial markets struggled and U.S. economic growth remained sluggish, the Fed opted to delay the additional rate increases that investors had widely anticipated. With higher rates seemingly off the table for a while, REITs and other equities rallied from mid-February 2016 through the end of July. As the fiscal year progressed and the U.S. economy continued to produce solid if unspectacular growth, investors once again began to anticipate higher rates later in 2016. That expectation put pressure on REIT valuations for the rest of the Fund’s fiscal year. In subsequent months, REITs corrected sharply but still finished the fiscal year comfortably in positive territory. | | In our opinion, REIT market performance was aided by: ● An indication that the Fed would delay a possible additional interest rate hike ● Low rates, which allowed companies to shore up their balance sheets ● Higher demand for specialized warehouse and distribution facilities to provide for e-commerce. |
1
Portfolio management review
Delaware REIT Fund
| | |
This market volatility came despite the generally favorable credit backdrop for REITs, as low interest rates allowed many companies that might otherwise have struggled to improve their balance sheets. In addition, most property types continued to benefit from a favorable supply-demand environment, with apartments in certain U.S. coastal markets a notable exception to this trend. During the fiscal year, REIT sectors characterized by shorter-duration leases, such as lodging, encountered some difficulty in conjunction with slowing corporate profits. Mall REITs also struggled amid more difficult business conditions for retailers. On the positive side, industrial REITs performed particularly well, as increased reliance on e-commerce has boosted demand for specialized warehouse and distribution facilities. Within the Fund For the fiscal year ended Oct. 31, 2016, Delaware REIT Fund Institutional Class shares returned +4.60%. The Fund’s Class A shares returned +4.24% at net asset value and -1.76% at maximum offer price. These figures reflect all distributions reinvested. During the same period, the Fund’s benchmark, the FTSE NAREIT Equity REITs Index, returned +6.81%. For complete, annualized performance of Delaware REIT Fund, please see the table on page 4. Relative to the benchmark, the Fund was hampered by stock selection among apartment REITs. In particular, our overweighting in Equity Residential weighed on results, as this apartment owner’s negative return fell well short of the sector’s overall performance. We emphasized this stock partly because we were optimistic about steps the company’s management had taken; however, Equity Residential was hurt by weakness in certain U.S. coastal markets, as increased apartment supply slowed the growth of rental income. We continued to hold the stock because we believed it was selling below the underlying real estate value and that the management team could close the gap via additional property sales or an outright sale of the company if the discount to net asset value persists. | | Another weak-performing sector was freestanding retail, where a lack of exposure to Realty Income, the largest stock in the category, held back Fund performance. We chose instead to hold other freestanding REITs that we liked for their diversified property portfolios. Although our investment in these other names did add value, their collective contribution failed to compensate for the negative effect of not holding Realty Income. Stock selection among lodging REITs also weighed on the Fund’s relative performance. A significant overweighting in Host Hotels & Resorts was a particular detractor, as this stock lagged both the market and the overall lodging sector. In addition, within regional malls, relative overweightings in Simon Property Group and General Growth Properties hurt results. Both stocks were weak performers throughout the fiscal year, reflecting the ongoing struggles of retailers around the country. That said, at period end, we continued to see Simon Property Group and General Growth Properties as high-quality companies and good long-term investments. As discussed earlier, industrial REITs enjoyed especially strong results during the fiscal year. Accordingly, the Fund’s overweight in two such names, Duke Realty and First Industrial Realty Trust, added to the Fund’s relative performance, as the stocks gained more than 30% and 25%, respectively. Among healthcare REITs, Alexandria Real Estate Equities added value. This owner and operator of laboratory space for pharmaceutical and biotechnology companies saw its shares rise more than 20%. In addition, the Fund benefited from not holding benchmark component HCP, whose properties include medical office buildings and senior housing facilities. We avoided this stock in part because of the company’s exposure to the skilled nursing care business — whose |
2
| | |
fundamentals we questioned in light of uncertainty surrounding Medicare reimbursement rates – and because of concerns about HCP’s management. HCP shares declined close to 2% for the fiscal year, significantly trailing the results of the average healthcare REIT in the benchmark index. The Fund’s underweight on average in Public Storage also contributed to relative performance. Along with other self-storage REITs, shares of Public Storage struggled amid slowing cash flow growth and high equity valuations. Sticking to our approach During the fiscal year, we followed the same management strategy that we follow in all market environments. We emphasized those areas of the REIT market that we thought would benefit from a strong fundamental backdrop and where we saw attractive valuations. We likewise kept our focus on real estate companies with the potential to continue growing their cash flow and prudently raising capital. | | We maintained the Fund’s underweight in the healthcare sector, given our persistent concerns about the senior housing industry. As the period progressed, we also became more cautious about self-storage, given increased supply weighing on industry fundamentals. Meanwhile, we continued to overweight the industrial sector, drawn by its potential to benefit from continued strong demand for warehouse and distribution facilities. At fiscal year end, we sought out selective opportunities in the lodging and retail categories. In both sectors, various REITs have struggled, providing what we saw as good opportunities to invest in stocks we liked at more favorable prices. The inclusion of real estate as the 11th sector in the S&P 500® Index should help broaden awareness of real estate securities over time. In light of that and recent market volatility, we encourage investors to continue to view the real estate asset class as a potential long-term investment. |
3
Performance summary
| | |
| Delaware REIT Fund | | October 31, 2016 |
The performance data quoted represent past performance; past performance does not guarantee future results. Investment return and principal value will fluctuate so your shares, when redeemed, may be worth more or less than their original cost. Please obtain the performance data current for the most recent month end by calling 800 523-1918 or visiting our website at delawareinvestments.com/performance. Current performance may be lower or higher than the performance data quoted.
| | | | | | | | | | | | | | | | |
| Fund and benchmark performance1,2 | | Average annual total returns through October 31, 2016 | |
| | | | |
| | | 1 year | | | 5 years | | | 10 years | | | Lifetime | |
Class A (Est. Dec. 6, 1995) | | | | | | | | | | | | | | | | |
Excluding sales charge | | | +4.24% | | | | +10.21% | | | | +4.66% | | | | +11.24% | |
Including sales charge | | | -1.76% | | | | +8.92% | | | | +4.04% | | | | +10.93% | |
Class C (Est. Nov. 11, 1997) | | | | | | | | | | | | | | | | |
Excluding sales charge | | | +3.53% | | | | +9.41% | | | | +3.88% | | | | +8.08% | |
Including sales charge | | | +2.62% | | | | +9.41% | | | | +3.88% | | | | +8.08% | |
Class R (Est. June 2, 2003) | | | | | | | | | | | | | | | | |
Excluding sales charge | | | +4.00% | | | | +9.93% | | | | +4.40% | | | | +9.35% | |
Including sales charge | | | +4.00% | | | | +9.93% | | | | +4.40% | | | | +9.35% | |
Institutional Class (Est. Nov. 11, 1997) | | | | | | | | | | | | | | | | |
Excluding sales charge | | | +4.60% | | | | +10.50% | | | | +4.93% | | | | +9.16% | |
Including sales charge | | | +4.60% | | | | +10.50% | | | | +4.93% | | | | +9.16% | |
Class R6 (Est. Aug. 31, 2016) | | | | | | | | | | | | | | | | |
Excluding sales charge | | | n/a | | | | n/a | | | | n/a | | | | -6.79%* | |
Including sales charge | | | n/a | | | | n/a | | | | n/a | | | | -6.79%* | |
FTSE NAREIT Equity REITs Index | | | +6.81% | | | | +11.52% | | | | +5.09% | | | | +9.16%** | |
*Returns are as of the Fund’s Class R6 inception date. Returns for less than one year are not annualized. The benchmark lifetime return since the Class R6 inception date was -7.32%.
**The benchmark lifetime return is for Institutional Class share comparison only and is calculated using the last business day in the month of the Fund’s Institutional Class inception date.
1Returns reflect the reinvestment of all distributions and are presented both with and without the applicable sales charges described below. Returns do not reflect the deduction of taxes the shareholder would pay on Fund distributions or redemptions of Fund shares.
Expense limitations were in effect for certain classes during some or all of the periods shown in the “Fund and benchmark performance” table. Expenses for each class are listed on the “Fund expense ratios” table on page 5. Performance would have been lower had expense limitations not been in effect.
Institutional Class shares are available without sales or asset-based distribution charges only to certain eligible accounts.
Class A shares are sold with a maximum front-end sales charge of 5.75%, and have an annual distribution and service fee of 0.25% of average daily net assets. Performance for Class A shares, excluding sales charges, assumes that no front-end sales charge applied.
4
Class C shares are sold with a contingent deferred sales charge of 1.00% if redeemed during the first 12 months. They are also subject to an annual distribution and service fee of 1.00% of average daily net assets. Performance for Class C shares, excluding sales charges, assumes either that contingent deferred sales charges did not apply or that the investment was not redeemed.
Class R shares are available only for certain retirement plan products. They are sold without a sales charge and have an annual distribution and service fee of 0.50% of average daily net assets.
Class R6 shares are available only to certain investors.
Narrowly focused investments may exhibit higher volatility than investments in multiple industry sectors.
REIT investments are subject to many of the risks associated with direct real estate ownership, including changes in economic conditions, credit risk, and interest rate fluctuations.
A REIT fund’s tax status as a regulated investment company could be jeopardized if it holds real estate directly, as a result of defaults, or receives rental income from real estate holdings.
2 The Fund’s expense ratios, as described in the most recent prospectus, are disclosed in the following “Fund expense ratios” table.
| | | | | | | | | | | | |
| Fund expense ratios | | Class A | | Class C | | Class R | | Institutional
Class | | Class R6 | | |
Total annual operating expenses | | 1.32% | | 2.07% | | 1.57% | | 1.07% | | 0.94% | | |
(without fee waivers) | | | | | | | | | | | | |
Net expenses | | 1.32% | | 2.07% | | 1.57% | | 1.07% | | 0.94% | | |
(including fee waivers, if any) | | | | | | | | | | | | |
Type of waiver | | n/a | | n/a | | n/a | | n/a | | n/a | | |
5
Performance summary
Delaware REIT Fund
Performance of a $10,000 investment1
Average annual total returns from Oct. 31, 2006, through Oct. 31, 2016
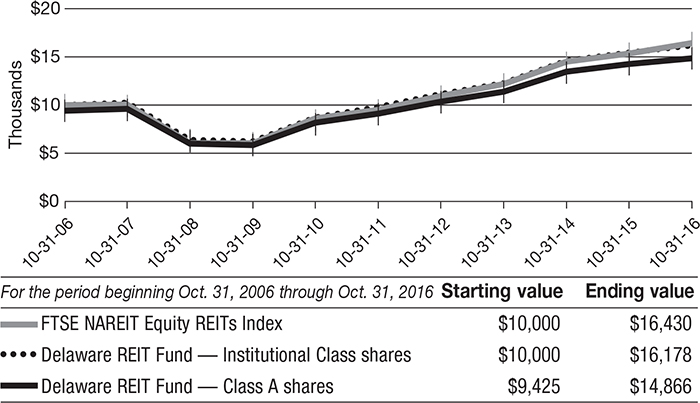
1 The “Performance of a $10,000 investment” graph assumes $10,000 invested in Institutional Class and Class A shares of the Fund on Oct. 31, 2006, and includes the effect of a 5.75% front-end sales charge (for Class A shares) and the reinvestment of all distributions. The graph does not reflect the deduction of taxes the shareholders would pay on Fund distributions or redemptions of Fund shares. Expense limitations were in effect for some or all of the periods shown. Performance would have been lower had expense limitations not been in effect. Expenses are listed in the “Fund expense ratios” table on page 5. Please note additional details on pages 4 through 7.
The graph also assumes $10,000 invested in the FTSE NAREIT Equity REITs Index as of Oct. 31, 2006. The FTSE NAREIT Equity REITs
Index measures the performance of all publicly traded equity real estate investment trusts (REITs) traded on U.S. exchanges, excluding timber and infrastructure REITs.
The S&P 500 Index, mentioned on page 3, measures the performance of 500 mostly large-cap stocks weighted by market value, and is often used to represent performance of the U.S. stock market.
Index performance returns do not reflect any management fees, transaction costs, or expenses. Indices are unmanaged and one cannot invest directly in an index. Past performance is not a guarantee of future results.
Performance of other Fund classes will vary due to different charges and expenses.
6
| | | | | | | | | | |
| | | Nasdaq symbols | | CUSIPs | | | | | |
| Class A | | DPREX | | 246248868 | | | | | | |
| Class C | | DPRCX | | 246248793 | | | | | | |
| Class R | | DPRRX | | 246248561 | | | | | | |
| Institutional Class | | DPRSX | | 246248777 | | | | | | |
| Class R6 | | DPRDX | | 246248454 | | | | | | |
7
Disclosure of Fund expenses
For the six-month period from May 1, 2016 to October 31, 2016 (Unaudited)
As a shareholder of the Fund, you incur two types of costs: (1) transaction costs, including sales charges (loads) on purchase payments, reinvested dividends, or other distributions; redemption fees; and exchange fees; and (2) ongoing costs, including management fees; distribution and/or service (12b-1) fees; and other Fund expenses. This example is intended to help you understand your ongoing costs (in dollars) of investing in the Fund and to compare these costs with the ongoing costs of investing in other mutual funds.
The example is based on an investment of $1,000 invested at the beginning of the period and held for the entire six-month period from May 1, 2016 to Oct. 31, 2016.
Actual expenses
The first section of the table shown, “Actual Fund return,” provides information about actual account values and actual expenses. You may use the information in this section of the table, together with the amount you invested, to estimate the expenses that you paid over the period. Simply divide your account value by $1,000 (for example, an $8,600 account value divided by $1,000 = 8.6), then multiply the result by the number in the first section under the heading entitled “Expenses Paid During Period” to estimate the expenses you paid on your account during this period.
Hypothetical example for comparison purposes
The second section of the table shown, “Hypothetical 5% return,” provides information about hypothetical account values and hypothetical expenses based on the Fund’s actual expense ratio and an assumed rate of return of 5% per year before expenses, which is not the Fund’s actual return. The hypothetical account values and expenses may not be used to estimate the actual ending account balance or expenses you paid for the period. You may use this information to compare the ongoing costs of investing in the Fund and other funds. To do so, compare this 5% hypothetical example with the 5% hypothetical examples that appear in the shareholder reports of the other funds.
Please note that the expenses shown in the table are meant to highlight your ongoing costs only and do not reflect any transactional costs, such as sales charges (loads), redemption fees, or exchange fees. Therefore, the second section of the table is useful in comparing ongoing costs only, and will not help you determine the relative total costs of owning different funds. In addition, if these transactional costs were included, your costs would have been higher. The expenses shown in the table assume reinvestment of all dividends and distributions.
8
Delaware REIT Fund
Expense analysis of an investment of $1,000
| | | | | | | | | | |
| | | Beginning Account Value 5/1/16 | | Ending Account Value 10/31/16 | | | Annualized Expense Ratio | | Expenses Paid During Period
5/1/16 to 10/31/16* |
Actual Fund return† | | | | | | | | |
| Class A | | $1,000.00 | | | $1,013.40 | | | 1.32% | | $6.68 |
| Class C | | 1,000.00 | | | 1,009.80 | | | 2.07% | | 10.46 |
| Class R | | 1,000.00 | | | 1,011.50 | | | 1.57% | | 7.94 |
| Institutional Class | | 1,000.00 | | | 1,014.70 | | | 1.07% | | 5.42 |
| Class R6** | | 1,000.00 | | | 932.10 | | | 0.93% | | 1.52 |
Hypothetical 5% return (5% return before expenses) | | | | | |
Class A | | $1,000.00 | | | $1,018.50 | | | 1.32% | | $6.70 |
| Class C | | 1,000.00 | | | 1,014.73 | | | 2.07% | | 10.48 |
| Class R | | 1,000.00 | | | 1,017.24 | | | 1.57% | | 7.96 |
| Institutional Class | | 1,000.00 | | | 1,019.76 | | | 1.07% | | 5.43 |
| Class R6** | | 1,000.00 | | | 1,020.46 | | | 0.93% | | 4.72 |
| * | “Expenses Paid During Period” are equal to the Fund’s annualized expense ratio, multiplied by the average account value over the period, multiplied by 184/366 (to reflect the one-half year period). |
| † | Because actual returns reflect only the most recent six-month period, the returns shown may differ significantly from fiscal year returns. |
| ** | The Class R6 shares commenced operations on Aug. 31, 2016. The ending account value for “Actual Fund return” uses the performance since inception and is not annualized and the expenses paid during the period for “Actual Fund return” are equal to the Class R6 annualized expense ratio, multiplied by the average account value over the period, multiplied by 62/366 (to reflect the actual days since inception). |
9
Security type / sector allocation and top 10 equity holdings
| | |
Delaware REIT Fund | | As of October 31, 2016 (Unaudited) |
Sector designations may be different than the sector designations presented in other Fund materials. The sector designations may represent the investment manager’s internal sector classifications.
| | | | |
| Security type / sector | | Percentage of net assets | | |
Convertible Bond | | 0.69% | | |
Common Stocks | | 96.86% | | |
Diversified REITs | | 6.87% | | |
Healthcare REITs | | 9.66% | | |
Hotel REITs | | 3.70% | | |
Industrial REITs | | 9.67% | | |
Information Technology REITs | | 5.73% | | |
Mall REITs | | 12.07% | | |
Manufactured Housing REIT | | 1.06% | | |
Mixed REIT | | 1.20% | | |
Multifamily REITs | | 14.75% | | |
Office REITs | | 11.08% | | |
Self-Storage REITs | | 4.24% | | |
Shopping Center REITs | | 11.05% | | |
Single Tenant REITs | | 5.78% | | |
Short-Term Investments | | 3.26% | | |
Total Value of Securities | | 100.81% | | |
Liabilities Net of Receivables and Other Assets | | (0.81%) | | |
Total Net Assets | | 100.00% | | |
Holdings are for informational purposes only and are subject to change at any time. They are not a recommendation to buy, sell, or hold any security.
| | | | |
| Top 10 equity holdings | | Percentage of net assets | | |
Simon Property Group | | 8.60% | | |
Equinix | | 4.34% | | |
Prologis | | 4.27% | | |
Equity Residential | | 3.99% | | |
AvalonBay Communities | | 3.55% | | |
Vornado Realty Trust | | 3.07% | | |
Alexandria Real Estate Equities | | 2.60% | | |
Public Storage | | 2.57% | | |
Host Hotels & Resorts | | 2.52% | | |
Apartment Investment & Management | | 2.47% | | |
10
| | |
| Schedule of investments | | |
Delaware REIT Fund | | October 31, 2016 |
| | | | | | | | |
| | | Principal amount° | | | Value (U.S. $) | |
Convertible Bond – 0.69% | | | | | | | | |
VEREIT 3.75% exercise price $14.99, maturity date 12/15/20 | | | 1,069,000 | | | $ | 1,089,717 | |
| | | | | | | | |
Total Convertible Bond (cost $1,001,177) | | | | | | | 1,089,717 | |
| | | | | | | | |
| Number of shares | | | | | |
��Common Stock – 96.86% | | | | | | | | |
Diversified REITs – 6.87% | | | | | | | | |
Digital Realty Trust | | | 27,900 | | | | 2,606,697 | |
Gramercy Property Trust | | | 112,300 | | | | 1,035,406 | |
Vornado Realty Trust | | | 52,232 | | | | 4,846,085 | |
Washington Real Estate Investment Trust | | | 80,651 | | | | 2,372,752 | |
| | | | | | | | |
| | | | | | | 10,860,940 | |
| | | | | | | | |
Healthcare REITs – 9.66% | | | | | | | | |
Alexandria Real Estate Equities | | | 38,076 | | | | 4,104,974 | |
Care Capital Properties | | | 29,749 | | | | 790,431 | |
Healthcare Realty Trust | | | 69,600 | | | | 2,219,544 | |
National Health Investors | | | 20,900 | | | | 1,583,384 | |
Ventas | | | 52,977 | | | | 3,589,192 | |
Welltower | | | 43,525 | | | | 2,982,768 | |
| | | | | | | | |
| | | | | | | 15,270,293 | |
| | | | | | | | |
Hotel REITs – 3.70% | | | | | | | | |
Host Hotels & Resorts | | | 256,864 | | | | 3,976,255 | |
Sunstone Hotel Investors | | | 148,243 | | | | 1,861,932 | |
| | | | | | | | |
| | | | | | | 5,838,187 | |
| | | | | | | | |
Industrial REITs – 9.67% | | | | | | | | |
DCT Industrial Trust | | | 38,351 | | | | 1,792,909 | |
Duke Realty | | | 117,700 | | | | 3,077,855 | |
First Industrial Realty Trust | | | 138,600 | | | | 3,660,426 | |
Prologis | | | 129,509 | | | | 6,755,190 | |
| | | | | | | | |
| | | | | | | 15,286,380 | |
| | | | | | | | |
Information Technology REITs – 5.73% | | | | | | | | |
Crown Castle International | | | 24,100 | | | | 2,192,859 | |
Equinix | | | 19,200 | | | | 6,859,776 | |
| | | | | | | | |
| | | | | | | 9,052,635 | |
| | | | | | | | |
Mall REITs – 12.07% | | | | | | | | |
General Growth Properties | | | 143,423 | | | | 3,578,404 | |
Simon Property Group | | | 73,058 | | | | 13,585,866 | |
Taubman Centers | | | 26,400 | | | | 1,912,944 | |
| | | | | | | | |
| | | | | | | 19,077,214 | |
| | | | | | | | |
Manufactured Housing REIT – 1.06% | | | | | | | | |
Equity LifeStyle Properties | | | 22,036 | | | | 1,671,210 | |
| | | | | | | | |
| | | | | | | 1,671,210 | |
| | | | | | | | |
11
Schedule of investments
Delaware REIT Fund
| | | | | | | | |
| | | Number of shares | | | Value (U.S. $) | |
Common Stock (continued) | | | | | | | | |
Mixed REIT – 1.20% | | | | | | | | |
Liberty Property Trust | | | 46,900 | | | $ | 1,896,167 | |
| | | | | | | | |
| | | | | | | 1,896,167 | |
| | | | | | | | |
Multifamily REITs – 14.75% | | | | | | | | |
American Campus Communities | | | 40,495 | | | | 2,110,195 | |
Apartment Investment & Management | | | 88,500 | | | | 3,900,195 | |
AvalonBay Communities | | | 32,751 | | | | 5,606,316 | |
Equity Residential | | | 102,123 | | | | 6,306,095 | |
Essex Property Trust | | | 8,627 | | | | 1,846,954 | |
UDR | | | 101,200 | | | | 3,538,964 | |
| | | | | | | | |
| | | | | | | 23,308,719 | |
| | | | | | | | |
Office REITs – 11.08% | | | | | | | | |
Boston Properties | | | 17,674 | | | | 2,129,363 | |
Brandywine Realty Trust | | | 120,208 | | | | 1,863,224 | |
Empire State Realty Trust | | | 111,400 | | | | 2,180,098 | |
Equity Commonwealth † | | | 56,700 | | | | 1,712,907 | |
Hudson Pacific Properties | | | 86,200 | | | | 2,898,044 | |
Kilroy Realty | | | 46,800 | | | | 3,361,644 | |
Mack-Cali Realty | | | 94,800 | | | | 2,434,464 | |
SL Green Realty | | | 9,430 | | | | 926,215 | |
| | | | | | | | |
| | | | | | | 17,505,959 | |
| | | | | | | | |
Self-Storage REITs – 4.24% | | | | | | | | |
CubeSmart | | | 68,821 | | | | 1,794,164 | |
Extra Space Storage | | | 11,600 | | | | 848,540 | |
Public Storage | | | 19,002 | | | | 4,061,107 | |
| | | | | | | | |
| | | | | | | 6,703,811 | |
| | | | | | | | |
Shopping Center REITs – 11.05% | | | | | | | | |
Brixmor Property Group | | | 91,000 | | | | 2,313,220 | |
DDR | | | 139,375 | | | | 2,131,044 | |
Equity One | | | 106,600 | | | | 3,038,100 | |
Federal Realty Investment Trust | | | 14,200 | | | | 2,062,266 | |
Kimco Realty | | | 72,179 | | | | 1,920,683 | |
Regency Centers | | | 28,219 | | | | 2,033,743 | |
Retail Properties of America | | | 100,900 | | | | 1,571,013 | |
Urban Edge Properties | | | 92,800 | | | | 2,395,168 | |
| | | | | | | | |
| | | | | | | 17,465,237 | |
| | | | | | | | |
Single Tenant REITs – 5.78% | | | | | | | | |
National Retail Properties | | | 53,200 | | | | 2,426,984 | |
Spirit Realty Capital | | | 310,432 | | | | 3,697,245 | |
STORE Capital | | | 110,200 | | | | 3,007,358 | |
| | | | | | | | |
| | | | | | | 9,131,587 | |
| | | | | | | | |
Total Common Stock (cost $152,665,880) | | | | | | | 153,068,339 | |
| | | | | | | | |
12
| | | | | | | | |
| | | Principal amount° | | | Value (U.S. $) | |
Short-Term Investments – 3.26% | | | | | | | | |
Discount Notes – 1.25%≠ | | | | | | | | |
Federal Home Loan Bank | | | | | | | | |
0.285% 11/10/16 | | | 60,373 | | | $ | 60,371 | |
0.285% 12/21/16 | | | 1,197,705 | | | | 1,197,372 | |
0.30% 11/3/16 | | | 304,568 | | | | 304,564 | |
0.31% 1/25/17 | | | 238,965 | | | | 238,790 | |
0.32% 11/1/16 | | | 172,060 | | | | 172,060 | |
| | | | | | | | |
| | | | | | | 1,973,157 | |
| | | | | | | | |
Repurchase Agreements – 1.46% | | | | | | | | |
Bank of America Merrill Lynch | | | | | | | | |
0.25%, dated 10/31/16, to be repurchased on 11/1/16, repurchase price $632,280 (collateralized by U.S. government obligations 2.25% 11/15/24; market value $644,921) | | | 632,275 | | | | 632,275 | |
Bank of Montreal | | | | | | | | |
0.27%, dated 10/31/16, to be repurchased on 11/1/16, repurchase price $210,760 (collateralized by U.S. government obligations 0.125%–3.875% 11/30/17–2/15/45; market value $214,974) | | | 210,759 | | | | 210,759 | |
BNP Paribas | | | | | | | | |
0.32%, dated 10/31/16, to be repurchased on 11/1/16, repurchase price $1,460,979 (collateralized by U.S. government obligations 0.00%–4.75% 4/30/17–2/15/45; market value $1,490,185) | | | 1,460,966 | | | | 1,460,966 | |
| | | | | | | | |
| | | | | | | 2,304,000 | |
| | | | | | | | |
U.S. Treasury Obligation – 0.55%≠ | | | | | | | | |
U.S. Treasury Bill 0.231% 11/3/16 | | | 867,293 | | | | 867,288 | |
| | | | | | | | |
| | | | | | | 867,288 | |
| | | | | | | | |
Total Short-Term Investments (cost $5,144,294) | | | | | | | 5,144,445 | |
| | | | | | | | |
Total Value of Securities – 100.81% (cost $158,811,351) | | | | | | $ | 159,302,501 | |
| | | | | | | | |
| ≠ | The rate shown is the effective yield at the time of purchase. |
| ° | Principal amount shown is stated in U.S. dollars unless noted that the security is denominated in another currency. |
| † | Non-income-producing security. |
| REIT | – Real Estate Investment Trust |
See accompanying notes, which are an integral part of the financial statements.
13
| | | | |
| Statement of assets and liabilities | | | |
| Delaware REIT Fund | | | October 31, 2016 | |
| | | | | | | | |
Assets: | | | | | | | | |
Investments, at value1 | | $ | 154,158,056 | | | | | |
Short-term investments, at value2 | | | 5,144,445 | | | | | |
Cash | | | 85,345 | | | | | |
Receivable for securities sold | | | 2,426,915 | | | | | |
Receivable for fund shares sold | | | 276,958 | | | | | |
Dividends and interest receivable | | | 39,449 | | | | | |
| | | | | | | | |
Total assets | | | 162,131,168 | | | | | |
| | | | | | | | |
Liabilities: | | | | | | | | |
Payable for securities purchased | | | 3,677,805 | | | | | |
Payable for fund shares redeemed | | | 199,537 | | | | | |
Investment management fees payable to affiliates | | | 101,825 | | | | | |
Other accrued expenses | | | 78,562 | | | | | |
Distribution fees payable to affiliates | | | 41,637 | | | | | |
Trustees’ fees and expenses payable | | | 480 | | | | | |
Audit and tax fees payable | | | 5,158 | | | | | |
Dividend disbursing and transfer agent fees and expense payable to affiliates | | | 2,746 | | | | | |
Accounting and administration expenses payable to affiliates | | | 639 | | | | | |
Legal fees payable to affiliates | | | 227 | | | | | |
Reports and statements to shareholders expenses payable to affiliates | | | 67 | | | | | |
| | | | | | | | |
Total liabilities | | | 4,108,683 | | | | | |
| | | | | | | | |
Total Net Assets | | $ | 158,022,485 | | | | | |
| | | | | | | | |
| | |
Net Assets Consist of: | | | | | | | | |
Paid-in capital | | $ | 129,712,672 | | | | | |
Accumulated net realized gain on investments | | | 27,818,663 | | | | | |
Net unrealized appreciation of investments | | | 491,150 | | | | | |
| | | | | | | | |
Total Net Assets | | $ | 158,022,485 | | | | | |
| | | | | | | | |
14
| | | | |
Net Asset Value | | | | |
Class A: | | | | |
Net assets | | $ | 86,129,416 | |
Shares of beneficial interest outstanding, unlimited authorization, no par | | | 6,030,935 | |
Net asset value per share | | $ | 14.28 | |
Sales charge | | | 5.75 | % |
Offering price per share, equal to net asset value per share / (1 – sales charge) | | $ | 15.15 | |
| |
Class C: | | | | |
Net assets | | $ | 20,598,510 | |
Shares of beneficial interest outstanding, unlimited authorization, no par | | | 1,446,678 | |
Net asset value per share | | $ | 14.24 | |
| |
Class R: | | | | |
Net assets | | $ | 12,573,037 | |
Shares of beneficial interest outstanding, unlimited authorization, no par | | | 880,855 | |
Net asset value per share | | $ | 14.27 | |
| |
Institutional Class: | | | | |
Net assets | | $ | 38,719,659 | |
Shares of beneficial interest outstanding, unlimited authorization, no par | | | 2,702,761 | |
Net asset value per share | | $ | 14.33 | |
| |
Class R6: | | | | |
Net assets | | $ | 1,863 | |
Shares of beneficial interest outstanding, unlimited authorization, no par | | | 130 | |
Net asset value per share | | $ | 14.33 | |
| |
| | | | |
1 Investments, at cost | | $ | 153,667,057 | |
2 Short-term investments, at cost | | | 5,144,294 | |
See accompanying notes, which are an integral part of the financial statements.
15
| | | | |
| Statement of operations | | | |
| Delaware REIT Fund | | | Year ended October 31, 2016 | |
| | | | |
Investment Income: | | | | |
Dividends | | $ | 4,807,832 | |
Interest | | | 68,820 | |
| | | | |
| | | 4,876,652 | |
| | | | |
Expenses: | | | | |
Management fees | | | 1,427,217 | |
Distribution expenses — Class A | | | 225,801 | |
Distribution expenses — Class C | | | 215,236 | |
Distribution expenses — Class R | | | 58,647 | |
Dividend disbursing and transfer agent fees and expenses | | | 346,547 | |
Reports and statements to shareholders expenses | | | 72,481 | |
Registration fees | | | 63,391 | |
Accounting and administration expenses | | | 61,447 | |
Audit and tax fees | | | 37,605 | |
Legal fees | | | 17,397 | |
Custodian fees | | | 12,038 | |
Trustees’ fees and expenses | | | 9,912 | |
Other | | | 16,994 | |
| | | | |
| | | 2,564,713 | |
Less expense paid indirectly | | | (351 | ) |
| | | | |
Total operating expenses | | | 2,564,362 | |
| | | | |
Net Investment Income | | | 2,312,290 | |
| | | | |
| |
Net Realized and Unrealized Gain (Loss): | | | | |
Net realized gain on: | | | | |
Investments | | | 31,394,178 | |
Options written | | | 60,962 | |
| | | | |
Net realized gain | | | 31,455,140 | |
| | | | |
Net change in unrealized appreciation (depreciation) of investments | | | (23,750,706 | ) |
| | | | |
Net Realized and Unrealized Gain | | | 7,704,434 | |
| | | | |
Net Increase in Net Assets Resulting from Operations | | $ | 10,016,724 | |
| | | | |
See accompanying notes, which are an integral part of the financial statements.
16
This page intentionally left blank.
Statements of changes in net assets
Delaware REIT Fund
| | | | | | | | |
| | | Year ended | |
| | | 10/31/16 | | | 10/31/15 | |
Increase (Decrease) in Net Assets from Operations: | | | | | | | | |
Net investment income | | $ | 2,312,290 | | | $ | 2,061,974 | |
Net realized gain | | | 31,455,140 | | | | 26,090,366 | |
Net change in unrealized appreciation (depreciation) | | | (23,750,706 | ) | | | (14,219,970 | ) |
| | | | | | | | |
Net increase in net assets resulting from operations | | | 10,016,724 | | | | 13,932,370 | |
| | | | | | | | |
| | |
Dividends and Distributions to Shareholders from: | | | | | | | | |
Net investment income: | | | | | | | | |
Class A | | | (1,482,721 | ) | | | (1,470,382 | ) |
Class C | | | (206,654 | ) | | | (195,910 | ) |
Class R | | | (164,189 | ) | | | (170,764 | ) |
Institutional Class | | | (1,343,228 | ) | | | (1,977,470 | ) |
Class R6 | | | (7 | ) | | | — | |
| | |
Net realized gain: | | | | | | | | |
Class A | | | (9,285,426 | ) | | | (4,518,655 | ) |
Class C | | | (2,233,077 | ) | | | (1,061,514 | ) |
Class R | | | (1,164,924 | ) | | | (591,895 | ) |
Institutional Class | | | (10,700,738 | ) | | | (5,235,326 | ) |
| | | | | | | | |
| | | (26,580,964 | ) | | | (15,221,916 | ) |
| | | | | | | | |
| | |
Capital Share Transactions: | | | | | | | | |
Proceeds from shares sold: | | | | | | | | |
Class A | | | 13,067,194 | | | | 14,840,517 | |
Class C | | | 2,140,853 | | | | 3,083,052 | |
Class R | | | 4,398,497 | | | | 4,803,315 | |
Institutional Class | | | 8,840,154 | | | | 14,933,229 | |
Class R6 | | | 2,000 | | | | — | |
| | |
Net asset value of shares issued upon reinvestment of dividends and distributions: | | | | | | | | |
Class A | | | 10,527,452 | | | | 5,805,743 | |
Class C | | | 2,383,275 | | | | 1,227,010 | |
Class R | | | 1,328,789 | | | | 760,013 | |
Institutional Class | | | 11,979,432 | | | | 7,173,432 | |
Class R6 | | | 7 | | | | — | |
| | | | | | | | |
| | | 54,667,653 | | | | 52,626,311 | |
| | | | | | | | |
18
| | | | | | | | |
| | | Year ended | |
| | | 10/31/16 | | | 10/31/15 | |
Capital Share Transactions (continued): | | | | | | | | |
Cost of shares redeemed: | | | | | | | | |
Class A | | $ | (21,287,891 | ) | | $ | (28,050,468 | ) |
Class C | | | (4,306,650 | ) | | | (5,229,447 | ) |
Class R | | | (4,268,959 | ) | | | (5,961,227 | ) |
Institutional Class | | | (84,169,618 | ) | | | (32,554,747 | ) |
| | | | | | | | |
| | | (114,033,118 | ) | | | (71,795,889 | ) |
| | | | | | | | |
Decrease in net assets derived from capital share transactions | | | (59,365,465 | ) | | | (19,169,578 | ) |
| | | | | | | | |
Net Decrease in Net Assets | | | (75,929,705 | ) | | | (20,459,124 | ) |
| | |
Net Assets: | | | | | | | | |
Beginning of year | | | 233,952,190 | | | | 254,411,314 | |
| | | | | | | | |
End of year (there was no undistributed net investment income at either year end) | | $ | 158,022,485 | | | $ | 233,952,190 | |
| | | | | | | | |
See accompanying notes, which are an integral part of the financial statements.
19
Financial highlights
Delaware REIT Fund Class A
Selected data for each share of the Fund outstanding throughout each period were as follows:
|
Net asset value, beginning of period |
|
Income from investment operations: |
Net investment income1 |
Net realized and unrealized gain |
Total from investment operations |
|
Less dividends and distributions from: |
Net investment income |
Net realized gain |
Total dividends and distributions |
|
Net asset value, end of period |
|
Total return2 |
|
Ratios and supplemental data: |
Net assets, end of period (000 omitted) |
Ratio of expenses to average net assets |
Ratio of expenses to average net assets prior to fees waived |
Ratio of net investment income to average net assets |
Ratio of net investment income to average net assets prior to fees waived |
Portfolio turnover |
| 1 | The average shares outstanding method has been applied for per share information. |
| 2 | Total investment return is based on the change in net asset value of a share during the period and assumes reinvestment of dividends and distributions at net asset value and does not reflect the impact of a sales charge. Total investment return during some of the periods shown reflects a waiver by the distributor. Performance would have been lower had the waiver not been in effect. |
See accompanying notes, which are an integral part of the financial statements.
20
| | | | | | | | | | | | | | | | | | | | | | |
| | | | Year ended | |
| | | | | | |
| | | | 10/31/16 | | | 10/31/15 | | | 10/31/14 | | | 10/31/13 | | | 10/31/12 | |
| | |
| | | | | $15.540 | | | $ | 15.610 | | | $ | 13.870 | | | $ | 12.850 | | | $ | 11.530 | |
| | | | | |
| | | | | 0.181 | | | | 0.125 | | | | 0.125 | | | | 0.153 | | | | 0.122 | |
| | | | | 0.407 | | | | 0.758 | | | | 2.308 | | | | 1.100 | | | | 1.412 | |
| | | | | | | | | | | | | | | | | | | | | | |
| | | | | 0.588 | | | | 0.883 | | | | 2.433 | | | | 1.253 | | | | 1.534 | |
| | | | | | | | | | | | | | | | | | | | | | |
| | | | | |
| | | | | (0.243 | ) | | | (0.238 | ) | | | (0.254 | ) | | | (0.233 | ) | | | (0.214 | ) |
| | | | | (1.605 | ) | | | (0.715 | ) | | | (0.439 | ) | | | — | | | | — | |
| | | | | | | | | | | | | | | | | | | | | | |
| | | | | (1.848 | ) | | | (0.953 | ) | | | (0.693 | ) | | | (0.233 | ) | | | (0.214 | ) |
| | | | | | | | | | | | | | | | | | | | | | |
| | | | | |
| | | | | $14.280 | | | $ | 15.540 | | | $ | 15.610 | | | $ | 13.870 | | | $ | 12.850 | |
| | | | | | | | | | | | | | | | | | | | | | |
| | | | | |
| | | | | 4.24% | | | | 5.70% | | | | 18.53% | | | | 9.82% | | | | 13.38% | |
| | | | | |
| | | | | $86,129 | | | $ | 90,899 | | | $ | 98,986 | | | $ | 91,593 | | | $ | 83,114 | |
| | | | | 1.33% | | | | 1.37% | | | | 1.34% | | | | 1.31% | | | | 1.30% | |
| | | | | |
| | | | | 1.33% | | | | 1.37% | | | | 1.34% | | | | 1.36% | | | | 1.35% | |
| | | | | 1.24% | | | | 0.81% | | | | 0.89% | | | | 1.11% | | | | 0.98% | |
| | | | | |
| | | | | 1.24% | | | | 0.81% | | | | 0.89% | | | | 1.06% | | | | 0.93% | |
| | | | | 111% | | | | 67% | | | | 83% | | | | 101% | | | | 87% | |
| | |
21
Financial highlights
Delaware REIT Fund Class C
Selected data for each share of the Fund outstanding throughout each period were as follows:
|
Net asset value, beginning of period |
|
Income from investment operations: |
Net investment income1 |
Net realized and unrealized gain |
Total from investment operations |
|
Less dividends and distributions from: |
Net investment income |
Net realized gain |
Total dividends and distributions |
|
Net asset value, end of period |
|
Total return2 |
|
Ratios and supplemental data: |
Net assets, end of period (000 omitted) |
Ratio of expenses to average net assets |
Ratio of net investment income to average net assets |
Portfolio turnover |
| 1 | The average shares outstanding method has been applied for per share information. |
| 2 | Total investment return is based on the change in net asset value of a share during the period and assumes reinvestment of dividends and distributions at net asset value and does not reflect the impact of a sales charge. |
See accompanying notes, which are an integral part of the financial statements.
22
| | | | | | | | | | | | | | | | | | | | | | |
| | | | Year ended | |
| | | | | | |
| | | | 10/31/16 | | | 10/31/15 | | | 10/31/14 | | | 10/31/13 | | | 10/31/12 | |
| | |
| | | | | $15.500 | | | $ | 15.590 | | | $ | 13.860 | | | $ | 12.830 | | | $ | 11.510 | |
| | | | | |
| | | | | 0.071 | | | | 0.008 | | | | 0.019 | | | | 0.050 | | | | 0.028 | |
| | | | | 0.416 | | | | 0.750 | | | | 2.299 | | | | 1.111 | | | | 1.415 | |
| | | | | | | | | | | | | | | | | | | | | | |
| | | | | 0.487 | | | | 0.758 | | | | 2.318 | | | | 1.161 | | | | 1.443 | |
| | | | | | | | | | | | | | | | | | | | | | |
| | | | | |
| | | | | (0.142 | ) | | | (0.133 | ) | | | (0.149 | ) | | | (0.131 | ) | | | (0.123 | ) |
| | | | | (1.605 | ) | | | (0.715 | ) | | | (0.439 | ) | | | — | | | | — | |
| | | | | | | | | | | | | | | | | | | | | | |
| | | | | (1.747 | ) | | | (0.848 | ) | | | (0.588 | ) | | | (0.131 | ) | | | (0.123 | ) |
| | | | | | | | | | | | | | | | | | | | | | |
| | | | | |
| | | | | $14.240 | | | $ | 15.500 | | | $ | 15.590 | | | $ | 13.860 | | | $ | 12.830 | |
| | | | | | | | | | | | | | | | | | | | | | |
| | | | | |
| | | | | 3.53% | | | | 4.86% | | | | 17.68% | | | | 9.00% | | | | 12.57% | |
| | | | | |
| | | | | $20,598 | | | $ | 22,085 | | | $ | 23,171 | | | $ | 21,083 | | | $ | 20,198 | |
| | | | | 2.08% | | | | 2.12% | | | | 2.09% | | | | 2.06% | | | | 2.05% | |
| | | | | 0.49% | | | | 0.06% | | | | 0.14% | | | | 0.36% | | | | 0.23% | |
| | | | | 111% | | | | 67% | | | | 83% | | | | 101% | | | | 87% | |
| | |
23
Financial highlights
Delaware REIT Fund Class R
Selected data for each share of the Fund outstanding throughout each period were as follows:
|
Net asset value, beginning of period |
|
Income from investment operations: |
Net investment income1 |
Net realized and unrealized gain |
Total from investment operations |
|
Less dividends and distributions from: |
Net investment income |
Net realized gain |
Total dividends and distributions |
|
Net asset value, end of period |
|
Total return2 |
|
Ratios and supplemental data: |
Net assets, end of period (000 omitted) |
Ratio of expenses to average net assets |
Ratio of expenses to average net assets prior to fees waived |
Ratio of net investment income to average net assets |
Ratio of net investment income to average net assets prior to fees waived |
Portfolio turnover |
| 1 | The average shares outstanding method has been applied for per share information. |
| 2 | Total investment return is based on the change in net asset value of a share during the period and assumes reinvestment of dividends and distributions at net asset value. Total investment return during some of the periods shown reflects a waiver by the distributor. Performance would have been lower had the waiver not been in effect. |
See accompanying notes, which are an integral part of the financial statements.
24
| | | | | | | | | | | | | | | | | | | | | | |
| | | | Year ended | |
| | | | | | |
| | | | 10/31/16 | | | 10/31/15 | | | 10/31/14 | | | 10/31/13 | | | 10/31/12 | |
| | |
| | | | | $15.530 | | | $ | 15.610 | | | $ | 13.870 | | | $ | 12.850 | | | $ | 11.530 | |
| | | | | |
| | | | | 0.145 | | | | 0.086 | | | | 0.091 | | | | 0.119 | | | | 0.091 | |
| | | | | 0.409 | | | | 0.753 | | | | 2.307 | | | | 1.100 | | | | 1.412 | |
| | | | | | | | | | | | | | | | | | | | | | |
| | | | | 0.554 | | | | 0.839 | | | | 2.398 | | | | 1.219 | | | | 1.503 | |
| | | | | | | | | | | | | | | | | | | | | | |
| | | | | |
| | | | | (0.209 | ) | | | (0.204 | ) | | | (0.219 | ) | | | (0.199 | ) | | | (0.183 | ) |
| | | | | (1.605 | ) | | | (0.715 | ) | | | (0.439 | ) | | | — | | | | — | |
| | | | | | | | | | | | | | | | | | | | | | |
| | | | | (1.814 | ) | | | (0.919 | ) | | | (0.658 | ) | | | (0.199 | ) | | | (0.183 | ) |
| | | | | | | | | | | | | | | | | | | | | | |
| | | | | |
| | | | | $14.270 | | | $ | 15.530 | | | $ | 15.610 | | | $ | 13.870 | | | $ | 12.850 | |
| | | | | | | | | | | | | | | | | | | | | | |
| | | | | |
| | | | | 4.00% | | | | 5.40% | | | | 18.24% | | | | 9.54% | | | | 13.09% | |
| | | | | |
| | | | | $12,573 | | | $ | 12,025 | | | $ | 12,614 | | | $ | 10,503 | | | $ | 9,446 | |
| | | | | 1.58% | | | | 1.62% | | | | 1.59% | | | | 1.56% | | | | 1.55% | |
| | | | | |
| | | | | 1.58% | | | | 1.62% | | | | 1.59% | | | | 1.65% | | | | 1.65% | |
| | | | | 0.99% | | | | 0.56% | | | | 0.64% | | | | 0.86% | | | | 0.73% | |
| | | | | |
| | | | | 0.99% | | | | 0.56% | | | | 0.64% | | | | 0.77% | | | | 0.63% | |
| | | | | 111% | | | | 67% | | | | 83% | | | | 101% | | | | 87% | |
| | |
25
Financial highlights
Delaware REIT Fund Institutional Class
Selected data for each share of the Fund outstanding throughout each period were as follows:
|
Net asset value, beginning of period |
|
Income from investment operations: |
Net investment income1 |
Net realized and unrealized gain |
Total from investment operations |
|
Less dividends and distributions from: |
Net investment income |
Net realized gain |
Total dividends and distributions |
|
Net asset value, end of period |
|
Total return2 |
|
Ratios and supplemental data: |
Net assets, end of period (000 omitted) |
Ratio of expenses to average net assets |
Ratio of net investment income to average net assets |
Portfolio turnover |
| 1 | The average shares outstanding method has been applied for per share information. |
| 2 | Total investment return is based on the change in net asset value of a share during the period and assumes reinvestment of dividends and distributions at net asset value. |
See accompanying notes, which are an integral part of the financial statements.
26
| | | | | | | | | | | | | | | | | | | | | | |
| | | | Year ended | |
| | | | | | |
| | | | 10/31/16 | | | 10/31/15 | | | 10/31/14 | | | 10/31/13 | | | 10/31/12 | |
| | |
| | | | | $15.570 | | | $ | 15.640 | | | $ | 13.900 | | | $ | 12.880 | | | $ | 11.550 | |
| | | | | |
| | | | | 0.212 | | | | 0.164 | | | | 0.161 | | | | 0.188 | | | | 0.153 | |
| | | | | 0.429 | | | | 0.755 | | | | 2.308 | | | | 1.099 | | | | 1.422 | |
| | | | | | | | | | | | | | | | | | | | | | |
| | | | | 0.641 | | | | 0.919 | | | | 2.469 | | | | 1.287 | | | | 1.575 | |
| | | | | | | | | | | | | | | | | | | | | | |
| | | | | |
| | | | | (0.276 | ) | | | (0.274 | ) | | | (0.290 | ) | | | (0.267 | ) | | | (0.245 | ) |
| | | | | (1.605 | ) | | | (0.715 | ) | | | (0.439 | ) | | | — | | | | — | |
| | | | | | | | | | | | | | | | | | | | | | |
| | | | | (1.881 | ) | | | (0.989 | ) | | | (0.729 | ) | | | (0.267 | ) | | | (0.245 | ) |
| | | | | | | | | | | | | | | | | | | | | | |
| | | | | |
| | | | | $14.330 | | | $ | 15.570 | | | $ | 15.640 | | | $ | 13.900 | | | $ | 12.880 | |
| | | | | | | | | | | | | | | | | | | | | | |
| | | | | |
| | | | | 4.60% | | | | 5.94% | | | | 18.80% | | | | 10.07% | | | | 13.72% | |
| | | | | |
| | | | | $38,720 | | | $ | 108,943 | | | $ | 119,640 | | | $ | 106,221 | | | $ | 101,102 | |
| | | | | 1.08% | | | | 1.12% | | | | 1.09% | | | | 1.06% | | | | 1.05% | |
| | | | | 1.49% | | | | 1.06% | | | | 1.14% | | | | 1.36% | | | | 1.23% | |
| | | | | 111% | | | | 67% | | | | 83% | | | | 101% | | | | 87% | |
| | |
27
Financial highlights
Delaware REIT Fund Class R6
Selected data for each share of the Fund outstanding throughout the period were as follows:
| | | | |
| | | 8/31/161 to 10/31/16 | |
| |
Net asset value, beginning of period | | $ | 15.430 | |
| |
Income (loss) from investment operations: | | | | |
Net investment income2 | | | 0.292 | |
Net realized and unrealized gain (loss) | | | (1.336 | ) |
| | | | |
Total from investment operations | | | (1.044 | ) |
| | | | |
| |
Less dividends and distributions from: | | | | |
Net investment income | | | (0.056 | ) |
| | | | |
Total dividends and distributions | | | (0.056 | ) |
| | | | |
| |
Net asset value, end of period | | $ | 14.330 | |
| | | | |
| |
Total return3 | | | (6.79% | ) |
| |
Ratios and supplemental data: | | | | |
Net assets, end of period (000 omitted) | | $ | 2 | |
Ratio of expenses to average net assets | | | 0.93% | |
Ratio of net investment income to average net assets | | | 1.97% | |
Portfolio turnover | | | 111% | 4 |
| |
| 1 | Date of commencement of operations; ratios have been annualized and total return has not been annualized. |
| 2 | The average shares outstanding method has been applied for per share information. |
| 3 | Total investment return is based on the change in net asset value of a share during the period and assumes reinvestment of dividends and distributions at net asset value. |
| 4 | Portfolio turnover is representative of the Fund for the entire year ended Oct. 31, 2016. |
See accompanying notes, which are an integral part of the financial statements.
28
Notes to financial statements
| | |
| Delaware REIT Fund | | October 31, 2016 |
The Real Estate Investment Trust Portfolio (Delaware REIT Fund or Fund) is a series of Delaware Pooled® Trust (Trust), which is organized as a Delaware statutory trust. The Trust is an open-end investment company. The Fund is considered diversified under the Investment Company Act of 1940 (1940 Act), as amended, and offers Class A, Class C, Class R, Institutional Class, and Class R6 shares. Class A shares are sold with a maximum front-end sales charge of 5.75%. Class A share purchases of $1,000,000 or more will incur a contingent deferred sales charge (CDSC) instead of a front-end sales charge of 1.00% if redeemed during the first year and 0.50% during the second year, provided that Delaware Distributors, L.P. (DDLP) paid a financial advisor a commission on the purchase of those shares. Class C shares are sold with a CDSC of 1.00%, if redeemed during the first 12 months. Class R, Institutional Class, and Class R6 shares are not subject to a sales charge and are offered for sale exclusively to certain eligible investors. In addition, Class R6 shares do not pay any service fees, sub-accounting fees, and/or sub-transfer agency fees. Class R6 commenced operations on Aug. 31, 2016. This report contains information relating only to Delaware REIT Fund. All other Delaware Pooled Trust Portfolios are included in a separate report.
The investment objectives of the Fund are to seek maximum long-term total return, with capital appreciation as a secondary objective. It seeks to achieve its objectives by investing primarily in securities of companies principally engaged in the real estate industry.
1. Significant Accounting Policies
The following accounting policies are in accordance with U.S. generally accepted accounting principles (U.S. GAAP) and are consistently followed by the Fund.
Security Valuation – Equity securities, except those traded on the Nasdaq Stock Market LLC (Nasdaq), are valued at the last quoted sales price as of the time of the regular close of the New York Stock Exchange on the valuation date. Equity securities traded on the Nasdaq are valued in accordance with the Nasdaq Official Closing Price, which may not be the last sales price. If, on a particular day, an equity security does not trade, the mean between the bid and ask prices will be used, which approximates fair value. U.S. government and agency securities are valued at the mean between the bid and ask prices, which approximates fair value. Exchange-traded options are valued at the last reported sale price or, if no sales are reported, at the mean between the last reported bid and ask prices, which approximates fair value. Generally, other securities and assets for which market quotations are not readily available are valued at fair value as determined in good faith under the direction of the Trust’s Board of Trustees (Board). In determining whether market quotations are readily available or fair valuation will be used, various factors will be taken into consideration, such as market closures or suspension of trading in a security.
Federal Income Taxes – No provision for federal income taxes has been made as the Fund intends to continue to qualify for federal income tax purposes as a regulated investment company under Subchapter M of the Internal Revenue Code of 1986, as amended, and make the requisite distributions to shareholders. The Fund evaluates tax positions taken or expected to be taken in the course of preparing the Fund’s tax returns to determine whether the tax positions are “more-likely-than-not” of being sustained by the applicable tax authority. Tax positions not deemed to meet the “more-likely-than-not” threshold are recorded as a tax benefit or expense in the current year. Management has analyzed the Fund’s tax positions taken for all open federal income tax years (Oct. 31, 2013–Oct. 31, 2016), and has concluded that no provision for federal income tax is required in the Fund’s financial statements.
29
Notes to financial statements
Delaware REIT Fund
1. Significant Accounting Policies (continued)
Class Accounting – Investment income, common expenses, and realized and unrealized gain (loss) on investments are allocated to the various classes of the Fund on the basis of daily net assets of each class. Distribution expenses relating to a specific class are charged directly to that class. Class R6 shares will not be allocated any expenses related to service fees, sub-accounting fees, and/or sub-transfer agency fees paid to brokers, dealers, or other financial intermediaries.
Repurchase Agreements – The Fund may purchase certain U.S. government securities subject to the counterparty’s agreement to repurchase them at an agreed upon date and price. The counterparty will be required on a daily basis to maintain the value of the collateral subject to the agreement at not less than the repurchase price (including accrued interest). The agreements are conditioned upon the collateral being deposited under the Federal Reserve book-entry system with the Fund’s custodian or a third-party sub-custodian. In the event of default or bankruptcy by the other party to the agreement, retention of the collateral may be subject to legal proceedings. All open repurchase agreements as of the date of this report were entered into on Oct 31, 2016, and matured on the next business day.
Use of Estimates – The Fund is an investment company, whose financial statements are prepared in conformity with U.S. GAAP. Therefore, the Fund follows the accounting and reporting guidelines for investment companies. The preparation of financial statements in conformity with U.S. GAAP requires management to make estimates and assumptions that affect the fair value of investments, the reported amounts of assets and liabilities and disclosure of contingent assets and liabilities at the date of the financial statements, and the reported amounts of revenues and expenses during the reporting period. Actual results could differ from those estimates and the differences could be material.
Other – Expenses directly attributable to the Fund are charged directly to the Fund. Other expenses common to various funds within the Delaware Investments® Family of Funds are generally allocated among such funds on the basis of average net assets. Management fees and some other expenses are paid monthly. Security transactions are recorded on the date the securities are purchased or sold (trade date) for financial reporting purposes. Costs used in calculating realized gains and losses on the sale of investment securities are those of the specific securities sold. Dividend income is recorded on the ex-dividend date and interest income is recorded on the accrual basis. Discounts and premiums on debt securities are accreted or amortized to interest income, respectively, over the lives of the respective securities using the effective interest method. Distributions received from investments in real estate investment trusts (REITs) are recorded as dividend income on the ex-dividend date, subject to reclassification upon notice of the character of such distributions by the issuer. The Fund declares and pays dividends from net investment income quarterly and net realized gain on investments, if any, annually. The Fund may distribute more frequently, if necessary for tax purposes. Dividends and distributions, if any, are recorded on the ex-dividend date.
Subject to seeking best execution, the Fund may direct certain security trades to brokers who have agreed to rebate a portion of the related brokerage commission to the Fund in cash. In general, best execution refers to many factors, including the price paid or received for a security, the commission charged, the promptness and reliability of execution, the confidentiality and placement accorded the order, and other factors affecting the overall benefit obtained by the Fund on the transaction. There were no commission rebates for the year ended Oct. 31, 2016.
30
The Fund may receive earnings credits from its custodian when positive cash balances are maintained, which may be used to offset custody fees. There were no such earnings credits for the year ended Oct. 31, 2016.
The Fund receives earnings credits from its transfer agent when positive cash balances are maintained, which may be used to offset transfer agent fees. If the amount earned is greater than $1.00 dollar, the expense paid under this arrangement is included on the “Statement of operations” under “Dividend disbursing and transfer agent fees and expenses” with the corresponding expense offset shown under “Less expense paid indirectly.” For the year ended Oct. 31, 2016, the Fund earned $351 under this agreement.
2. Investment Management, Administration Agreements, and Other Transactions with Affiliates
In accordance with the terms of its investment management agreement, the Fund pays Delaware Management Company (DMC), a series of Delaware Management Business Trust and the investment manager, an annual fee which is calculated daily at the rate of 0.75% on the first $500 million of the average daily net assets of the Fund; 0.70% on the next $500 million; 0.65% on the next $1.5 billion; and 0.60% on average daily net assets in excess of $2.5 billion.
Delaware Investments Fund Services Company (DIFSC), an affiliate of DMC, provides fund accounting and financial administration oversight services to the Fund. For these services, DIFSC’s fees are calculated based on the aggregate daily net assets of the Delaware Investments® Family of Funds at the following annual rate: 0.0050% of the first $30 billion; 0.0045% of the next $10 billion; 0.0040% of the next $10 billion; and 0.0025% of aggregate average daily net assets in excess of $50 billion. The fees payable to DIFSC under the service agreement described above are allocated among all funds in the Delaware Investments Family of Funds on a relative net asset value (NAV) basis. For the year ended Oct. 31, 2016, the Fund was charged $9,028 for these services. This amount is included on the “Statement of operations” under “Accounting and administration expenses.”
DIFSC is also the transfer agent and dividend disbursing agent of the Fund. For these services, DIFSC’s fees are calculated based on the aggregate daily net assets of the retail funds within the Delaware Investments Family of Funds at the following annual rate: 0.025% of the first $20 billion; 0.020% of the next $5 billion; 0.015% of the next $5 billion; and 0.013% of average daily net assets in excess of $30 billion. The fees payable to DIFSC under the service agreement described above are allocated among all retail funds in the Delaware Investments Family of Funds on a relative NAV basis. For the year ended Oct. 31, 2016, the Fund was charged $39,407 for these services. This amount is included on the “Statement of operations” under “Dividend disbursing and transfer agent fees and expenses.” Pursuant to a sub-transfer agency agreement between DIFSC and BNY Mellon Investment Servicing (US) Inc. (BNYMIS), BNYMIS provides certain sub-transfer agency services to the Fund. Sub-transfer agency fees are paid by the Fund and are also included on the “Statement of operations” under “Dividend disbursing and transfer agent fees and expenses.”
31
Notes to financial statements
Delaware REIT Fund
2. Investment Management, Administration Agreements, and Other Transactions with Affiliates (continued)
Pursuant to a distribution agreement and distribution plan, the Fund pays DDLP, the distributor and an affiliate of DMC, an annual distribution and service fee of 0.25% of the average daily net assets of the Class A shares, 1.00% of the average daily net assets of the Class C shares, and 0.50% of the average daily net assets of the Class R shares. Institutional Class and Class R6 shares pay no distribution and service fee.
As provided in the investment management agreement, the Fund bears a portion of the cost of certain resources shared with DMC, including the cost of internal personnel of DMC and/or its affiliates that provide legal, tax, and regulatory reporting services to the Fund. For the year ended Oct. 31, 2016, the Fund was charged $4,156 for internal legal, tax, and regulatory reporting services provided by DMC and/or its affiliates’ employees. This amount is included on the “Statement of operations” under “Legal fees.”
For the year ended Oct. 31, 2016, DDLP earned $13,996 for commissions on sales of the Fund’s Class A shares. For the year ended Oct. 31, 2016, DDLP received gross CDSC commissions of $92 and $751 on redemptions of the Fund’s Class A and Class C shares, respectively, and these commissions were entirely used to offset upfront commissions previously paid by DDLP to broker/dealers on sales of those shares.
Trustees’ fees include expenses accrued by the Fund for each Trustee’s retainer and meeting fees. Certain officers of DMC, DIFSC, and DDLP are officers and/or Trustees of the Trust. These officers and Trustees are paid no compensation by the Fund.
Cross trades for the year ended Oct. 31, 2016 were executed by the Fund pursuant to procedures adopted by the Board designed to ensure compliance with Rule 17a-7 under the 1940 Act. Cross trading is the buying or selling of portfolio securities between funds of investment companies, or between a fund of an investment company and another entity, that are or could be considered affiliates by virtue of having a common investment advisor (or affiliated investment advisors), common directors/trustees and/or common officers. At its regularly scheduled meetings, the Board reviews such transactions for compliance with the procedures adopted by the Board. Pursuant to these procedures, for the year ended Oct. 31, 2016, the Fund engaged in securities sales of $33,921, which resulted in net realized gain of $1,115.
3. Investments
For the year ended Oct. 31, 2016, the Fund made purchases and sales of investment securities other than short-term investments as follows:
| | | | |
Purchases | | $ | 206,455,034 | |
Sales | | | 284,387,273 | |
32
At Oct. 31, 2016, the cost and unrealized appreciation (depreciation) of investments for federal income tax purposes were as follows:
| | | | |
Cost of investments | | $ | 161,016,055 | |
| | | | |
Aggregate unrealized appreciation of investments | | $ | 5,464,093 | |
Aggregate unrealized depreciation of investments | | | (7,177,647 | ) |
| | | | |
Net unrealized depreciation of investments | | $ | (1,713,554 | ) |
| | | | |
U.S. GAAP defines fair value as the price that the Fund would receive to sell an asset or pay to transfer a liability in an orderly transaction between market participants at the measurement date under current market conditions. A three-level hierarchy for fair value measurements has been established based upon the transparency of inputs to the valuation of an asset or liability. Inputs may be observable or unobservable and refer broadly to the assumptions that market participants would use in pricing the asset or liability. Observable inputs reflect the assumptions market participants would use in pricing the asset or liability based on market data obtained from sources independent of the reporting entity. Unobservable inputs reflect the reporting entity’s own assumptions about the assumptions that market participants would use in pricing the asset or liability based on the best information available under the circumstances. The Fund’s investment in its entirety is assigned a level based upon the observability of the inputs which are significant to the overall valuation. The three-level hierarchy of inputs is summarized below.
| | |
| Level 1 – | | Inputs are quoted prices in active markets for identical investments. (Examples: equity securities, open-end investment companies, futures contracts, exchange-traded options contracts) |
| |
| Level 2 – | | Other observable inputs, including, but not limited to: quoted prices for similar assets or liabilities in markets that are active, quoted prices for identical or similar assets or liabilities in markets that are not active, inputs other than quoted prices that are observable for the assets or liabilities (such as interest rates, yield curves, volatilities, prepayment speeds, loss severities, credit risks, and default rates) or other market-corroborated inputs. (Examples: debt securities, government securities, swap contracts, foreign currency exchange contracts, foreign securities utilizing international fair value pricing, broker-quoted securities, fair valued securities) |
| |
| Level 3 – | | Significant unobservable inputs, including the Fund’s own assumptions used to determine the fair value of investments. (Examples: broker-quoted securities, fair valued securities) |
Level 3 investments are valued using significant unobservable inputs. The Fund may also use an income-based valuation approach in which the anticipated future cash flows of the investment are discounted to calculate fair value. Discounts may also be applied due to the nature or duration of any restrictions on the disposition of the investments. Valuations may also be based upon current market prices of securities that are comparable in coupon, rating, maturity, and industry. The derived value of a Level 3 investment may not represent the value which is received upon disposition and this could impact the results of operations.
33
Notes to financial statements
Delaware REIT Fund
3. Investments (continued)
The following table summarizes the valuation of the Fund’s investments by fair value hierarchy levels as of Oct. 31, 2016:
| | | | | | | | | | | | |
Securities | | Level 1 | | | Level 2 | | | Total | |
Convertible Bond | | $ | — | | | $ | 1,089,717 | | | $ | 1,089,717 | |
Common Stock | | | 153,068,339 | | | | — | | | | 153,068,339 | |
Short-Term Investments | | | — | | | | 5,144,445 | | | | 5,144,445 | |
| | | | | | | | | | | | |
Total Value of Securities | | $ | 153,068,339 | | | $ | 6,234,162 | | | $ | 159,302,501 | |
| | | | | | | | | | | | |
During the year ended Oct. 31, 2016, there were no transfers between Level 1 investments, Level 2 investments, or Level 3 investments that had a significant impact to the Fund. The Fund’s policy is to recognize transfers between levels at the beginning of the reporting period.
A reconciliation of Level 3 investments is presented when the Fund has a significant amount of Level 3 investments at the beginning, interim, or end of the period in relation to net assets. During the year ended Oct. 31, 2016, there were no Level 3 investments.
4. Dividends and Distribution Information
Income and long-term capital gain distributions are determined in accordance with federal income tax regulations, which may differ from U.S. GAAP. Additionally, distributions from net short-term gains on sales of investment securities are treated as ordinary income for federal income tax purposes. The tax character of dividends and distributions paid during the years ended Oct. 31, 2016 and 2015 was as follows:
| | | | | | | | |
| | | Year ended | |
| | | 10/31/16 | | | 10/31/15 | |
Ordinary income | | $ | 5,116,145 | | | $ | 4,046,794 | |
Long-term capital gains | | | 21,464,819 | | | | 11,175,122 | |
| | | | | | | | |
Total | | $ | 26,580,964 | | | $ | 15,221,916 | |
| | | | | | | | |
5. Components of Net Assets on a Tax Basis
As of Oct. 31, 2016, the components of net assets on a tax basis were as follows:
| | | | |
Shares of beneficial interest | | $ | 129,712,672 | |
Undistributed ordinary income* | | | 4,648,460 | |
Undistributed long-term capital gains* | | | 25,374,907 | |
Unrealized depreciation of investments | | | (1,713,554 | ) |
| | | | |
Net assets | | $ | 158,022,485 | |
| | | | |
*The undistributed earnings for the Fund are estimated pending final notification of the tax character of distributions received from investments in REITs.
The differences between book basis and tax basis components of net assets are primarily attributable to tax deferral of losses on wash sales.
34
For financial reporting purposes, capital accounts are adjusted to reflect the tax character of permanent book/tax differences. Reclassifications are primarily due to dividends and distributions and tax treatment of REIT adjustments. Results of operations and net assets were not affected by these reclassifications. For the year ended Oct. 31, 2016, the Fund recorded the following reclassifications:
| | | | |
Undistributed net investment income | | $ | 884,509 | |
Accumulated net realized gain | | | (884,509 | ) |
6. Capital Shares
Transactions in capital shares were as follows:
| | | | | | | | |
| | | Year ended | |
| | | 10/31/16 | | | | 10/31/15 | |
Shares sold: | | | | | | | | |
Class A | | | 887,763 | | | | 945,659 | |
Class C | | | 146,310 | | | | 197,810 | |
Class R | | | 302,408 | | | | 304,959 | |
Institutional Class | | | 612,347 | | | | 968,761 | |
Class R6 | | | 130 | | | | — | |
| | |
Shares issued upon reinvestment of dividends and distributions: | | | | | | | | |
Class A | | | 756,495 | | | | 372,567 | |
Class C | | | 171,981 | | | | 78,713 | |
Class R | | | 95,543 | | | | 48,764 | |
Institutional Class | | | 860,490 | | | | 459,797 | |
| | | | | | | | |
| | | 3,833,467 | | | | 3,377,030 | |
| | | | | | | | |
| | |
Shares redeemed: | | | | | | | | |
Class A | | | (1,464,442 | ) | | | (1,808,907 | ) |
Class C | | | (296,138 | ) | | | (338,364 | ) |
Class R | | | (291,402 | ) | | | (387,568 | ) |
Institutional Class | | | (5,765,168 | ) | | | (2,081,667 | ) |
| | | | | | | | |
| | | (7,817,150 | ) | | | (4,616,506 | ) |
| | | | | | | | |
Net decrease | | | (3,983,683 | ) | | | (1,239,476 | ) |
| | | | | | | | |
35
Notes to financial statements
Delaware REIT Fund
6. Capital Shares (continued)
Certain shareholders may exchange shares of one class for another class in the same Fund. For the years ended Oct. 31, 2016 and 2015, the Fund had the following exchange transactions. These exchange transactions are included as subscriptions and redemptions in the table on the previous page and the “Statements of changes in net assets.”
| | | | | | | | |
| | | | | Year ended | | | |
| | | | | 10/31/16 | | | |
| Exchange Redemptions | | Exchange Subscriptions | | | |
| | | | | Institutional | | | |
Class A Shares | | Class C Shares | | Class Shares | | Value | |
8,159 | | 1,279 | | 9,410 | | | $146,266 | |
| | | | | Year ended | | | |
| | | | | 10/31/15 | | | |
| Exchange Redemptions | | Exchange Subscriptions | | | |
| | | Institutional | | | |
Class A
Shares | | Class C
Shares | | Class Shares | | Value | |
1,038 | | 578 | | 1,611 | | | $25,773 | |
7. Line of Credit
The Fund, along with certain other funds in the Delaware Investments® Family of Funds (Participants), was a participant in a $275,000,000 revolving line of credit intended to be used for temporary or emergency purposes as an additional source of liquidity to fund redemptions of investor shares. Under the agreement, the Participants were charged an annual commitment fee of 0.08%, which was allocated across the Participants on the basis of relative net assets of each Participant’s allocation of the entire facility. The Participants were permitted to borrow up to a maximum of one third of their net assets under the agreement. Each Participant was individually, and not jointly, liable for its particular advances, if any, under the line of credit. The line of credit available under the agreement expired on Nov. 9, 2015.
On Nov. 9, 2015, the Fund, along with the other Participants, entered into an amendment to the agreement for a $155,000,000 revolving line of credit. The line of credit was to be used as described above and operated in substantially the same manner as the original agreement, with the exception of the annual commitment fee. Under the amendment to the agreement, the Participants were charged an annual commitment fee of 0.10%, which was allocated across the Participants on the basis of relative net assets of each Participant’s allocation of the entire facility. The line of credit available under the agreement expired on Nov. 7, 2016.
The Fund had no amount outstanding as of Oct. 31, 2016, or at any time during the year then ended.
36
8. Derivatives
U.S. GAAP requires disclosures that enable investors to understand: (1) how and why an entity uses derivatives; (2) how they are accounted for; and (3) how they affect an entity’s results of operations and financial position.
Options Contracts – The Fund may enter into options contracts in the normal course of
pursuing its investment objective. The Fund may buy or write options contracts for any number of reasons, including without limitation: to manage the Fund’s exposure to changes in securities prices caused by interest rates or market conditions and foreign currencies; as an efficient means of adjusting the Fund’s overall exposure to certain markets; to protect the value of portfolio securities; and as a cash management tool. The Fund may buy or write call or put options on securities, futures, swaps, swaptions, financial indices, and foreign currencies. When the Fund buys an option, a premium is paid and an asset is recorded and adjusted on a daily basis to reflect the current market value of the option purchased. When the Fund writes an option, a premium is received and a liability is recorded and adjusted on a daily basis to reflect the current market value of the option written. Premiums received from writing options that expire unexercised are treated by the Fund on the expiration date as realized gains. The difference between the premium received and the amount paid on effecting a closing purchase transaction, including brokerage commissions, is treated as realized gain or loss. If a call option is exercised, the premium is added to the proceeds from the sale of the underlying security in determining whether the Fund has a realized gain or loss. If a put option is exercised, the premium reduces the cost basis of the securities purchased by the Fund. The Fund, as writer of an option, bears the market risk of an unfavorable change in the price of the security underlying the written option. When writing options, the Fund is subject to minimal counterparty risk because the counterparty is only obligated to pay premiums and does not bear the market risk of an unfavorable market change.
Transactions in options written for the year ended Oct. 31, 2016 were as follows:
| | | | | | | | |
| | | Number of | | | | |
| | | Contracts | | | Premiums | |
Options outstanding Oct. 31, 2015 | | | — | | | $ | — | |
Options written | | | 310 | | | | 60,962 | |
Options expired | | | (310) | | | | (60,962) | |
| | | | | | | | |
Options outstanding Oct. 31, 2016 | | | — | | | $ | — | |
| | | | | | | | |
During the year ended Oct. 31, 2016, the Fund used options contracts to protect the value of portfolio securities.
Derivatives generally. The table below summarizes the average balance of derivative holdings by the Fund during the year ended Oct. 31, 2016:
| | | | | | | | |
| | | Long Derivative | | | Short Derivative | |
| | | Volume | | | Volume | |
Options contracts (average notional value) | | | $— | | | | $1,658 | |
37
Notes to financial statements
Delaware REIT Fund
9. Offsetting
In December 2011, the Financial Accounting Standards Board (FASB) issued guidance that expanded disclosure requirements on the offsetting of certain assets and liabilities. The disclosures are required for investments and derivative financial instruments subject to master netting or similar agreements which are eligible for offset on the “Statement of assets and liabilities” and require an entity to disclose both gross and net information about such investments and transactions in the financial statements. In January 2013, the FASB issued guidance that clarified which investments and transactions are subject to the offsetting disclosure requirements. The scope of the disclosure requirements for offsetting is limited to derivative instruments, repurchase agreements and reverse repurchase agreements, and securities borrowing.
In order to better define its contractual rights and to secure rights that will help the Fund mitigate its counterparty risk, the Fund entered into an International Swaps and Derivatives Association, Inc. Master Agreement (ISDA Master Agreement) or similar agreement with certain of its derivative contract counterparties. An ISDA Master Agreement is a bilateral agreement between the Fund and a counterparty that governs certain over-the-counter (OTC) derivatives and foreign exchange contracts and typically contains, among other things, collateral posting items and netting provisions in the event of a default and/or termination event. Under an ISDA Master Agreement, the Fund may, under certain circumstances, offset with the counterparty certain derivative financial instruments’ payables and/or receivables with collateral held and/or posted and create one single net payment. The provisions of the ISDA Master Agreement typically permit a single net payment in the event of default (close-out), including the bankruptcy or insolvency of the counterparty. However, bankruptcy or insolvency laws of a particular jurisdiction may impose restrictions on or prohibitions against the right of offset in bankruptcy, insolvency, or other events.
For financial reporting purposes, the Fund does not offset derivative assets and derivative liabilities that are subject to netting arrangements on the “Statement of assets and liabilities.”
At Oct. 31, 2016, the Fund had the following assets and liabilities subject to offsetting provisions:
Master Repurchase Agreements
| | | | | | | | | | | | | | | | | | | | | | | | | |
| Counterparty | | Repurchase Agreements | | Fair Value of Non-Cash Collateral Received(a) | | Cash Collateral
Received | | Net Collateral
Received | | Net Exposure(b) |
Bank of America | | | | | | | | | | | | | | | | | | | | | | | | | |
Merrill Lynch | | | $ | 632,275 | | | | $ | (632,275 | ) | | | $ | — | | | | $ | (632,275 | ) | | | $ | — | |
Bank of Montreal | | | | 210,759 | | | | | (210,759 | ) | | | | — | | | | | (210,759 | ) | | | | — | |
BNP Paribas | | | | 1,460,966 | | | | | (1,460,966 | ) | | | | — | | | | | (1,460,966 | ) | | | | — | |
| | | | | | | | | | | | | | | | | | | | | | | | | |
Total | | | $ | 2,304,000 | | | | $ | (2,304,000 | ) | | | $ | — | | | | $ | (2,304,000 | ) | | | $ | — | |
| | | | | | | | | | | | | | | | | | | | | | | | | |
(a)The value of the related collateral received exceeded the value of the repurchase agreements as of Oct. 31, 2016.
(b)Net exposure represents the receivable (payable) that would be due from (to) the counterparty in the event of default.
10. Securities Lending
The Fund, along with other funds in the Delaware Investments® Family of Funds, may lend its securities pursuant to a security lending agreement (Lending Agreement) with The Bank of New York Mellon (BNY Mellon). At the time a security is loaned, the borrower must post collateral equal to the required percentage of the market value of the loaned security, including any accrued interest. The required
38
percentage is: (1) 102% with respect to U.S. securities and foreign securities that are denominated and payable in U.S. dollars; and (2) 105% with respect to foreign securities. With respect to each loan, if on any business day the aggregate market value of securities collateral plus cash collateral held is less than the aggregate market value of the securities which are the subject of such loan, the borrower will be notified to provide additional collateral by the end of the following business day which, together with the collateral already held, will be not less than the applicable initial collateral requirements for such security loan. If the aggregate market value of securities collateral and cash collateral held with respect to a security loan exceeds the applicable initial collateral requirement, upon request of the borrower, BNY Mellon must return enough collateral to the borrower by the end of the following business day to reduce the value of the remaining collateral to the applicable initial collateral requirement for such security loan. As a result of the foregoing, the value of the collateral held with respect to a loaned security on any particular day may be more or less than the value of the security on loan.
Prior to Dec. 29, 2015, cash collateral received was generally invested in the Delaware Investments Collateral Fund No. 1 (Collective Trust), a pooled account established by BNY Mellon for the use of funds managed by DMC that participate in BNY Mellon’s securities lending program. The Collective Trust sought to maintain a NAV per unit of $1.00.
On Dec. 29, 2015, the assets in the Collective Trust were transferred to a series of individual separate accounts, each corresponding to a Fund. The investment guidelines permit each separate account to hold certain securities that would be considered eligible securities for a money market fund. Cash collateral received is generally invested in government securities; certain obligations issued by government sponsored enterprises; repurchase agreements collateralized by U.S. Treasury securities; obligations issued by the central government of any Organization for Economic Cooperation and Development (OECD) country or its agencies, instrumentalities or establishments; obligations of supranational organizations, commercial paper, notes, bonds and other debt obligations; certificates of deposit, time deposits and other bank obligations; and asset-backed securities.
In the event of default or bankruptcy by the lending agent, realization and/or retention of the collateral may be subject to legal proceedings. In the event the borrower fails to return loaned securities and the collateral received is insufficient to cover the value of the loaned securities and provided such collateral shortfall is not the result of investment losses, the lending agent has agreed to pay the amount of the shortfall to the Fund or, at the discretion of the lending agent, replace the loaned securities. The Fund continues to record dividends or interest, as applicable, on the securities loaned and is subject to changes in value of the securities loaned that may occur during the term of the loan. The Fund has the right under the Lending Agreement to recover the securities from the borrower on demand. With respect to security loans collateralized by non-cash collateral, the Fund receives loan premiums paid by the borrower. With respect to security loans collateralized by cash collateral, the earnings from the collateral investments are shared among the Fund, the security lending agent, and the borrower. The Fund records security lending income net of allocations to the security lending agent and the borrower.
The Fund may incur investment losses as a result of investing securities lending collateral. This could occur if an investment in the collateral investment account defaulted or became impaired. Under those circumstances, the value of the Fund’s cash collateral account may be less than the amount the Fund would be required to return to the borrowers of the securities and the Fund would be required to make up for this shortfall.
39
Notes to financial statements
Delaware REIT Fund
10. Securities Lending (continued)
During the year ended Oct. 31, 2016, the Fund had no securities on loan.
11. Credit and Market Risk
The Fund concentrates its investments in the real estate industry and is subject to the risks associated with that industry. If the Fund holds real estate directly as a result of defaults or receives rental income directly from real estate holdings, its tax status as a regulated investment company may be jeopardized. The Fund is also affected by interest rate changes, particularly if the REITs it holds use floating rate debt to finance their ongoing operations. Its investments may also tend to fluctuate more widely than that of a fund that invests in a broad range of industries.
The Fund may invest up to 15% of its net assets in illiquid securities, which may include securities with contractual restrictions on resale, securities exempt from registration under Rule 144A promulgated under the Securities Act of 1933, as amended, and other securities which may not be readily marketable. The relative illiquidity of these securities may impair the Fund from disposing of them in a timely manner and at a fair price when it is necessary or desirable to do so. While maintaining oversight, the Fund’s Board has delegated to DMC the day-to-day functions of determining whether individual securities are liquid for purposes of the Fund’s limitation on investments in illiquid securities. Securities eligible for resale pursuant to Rule 144A, which are determined to be liquid, are not subject to the Fund’s 15% limit on investments in illiquid securities. As of Oct. 31, 2016, there were no Rule 144A securities held by the Fund and no securities have been determined to be illiquid under the Fund’s Liquidity Procedures. When monitoring compliance with the Fund’s illiquid limit, certain holdings that are common to multiple clients of the investment manager may be aggregated and considered illiquid in the aggregate solely for monitoring purposes. For purposes of determining illiquidity for financial reporting purposes, only the holdings of this Fund will be considered.
12. Contractual Obligations
The Fund enters into contracts in the normal course of business that contain a variety of indemnifications. The Fund’s maximum exposure under these arrangements is unknown. However, the Fund has not had prior claims or losses pursuant to these contracts. Management has reviewed the Fund’s existing contracts and expects the risk of loss to be remote.
13. Subsequent Events
On Nov. 7, 2016, the Fund, along with the other Participants, entered into an amendment to the agreement for a $155,000,000 revolving line of credit. The line of credit is to be used as described in Note 7 and operates in substantially the same manner as the original agreement, with the exception of the annual commitment fee. Under the amendment to the agreement, the Participants are charged an annual commitment fee of 0.15%, which is allocated across the Participants on the basis of relative net assets of each Participant’s allocation of the entire facility. The line of credit available under the agreement expires on Nov. 6, 2017.
40
Management has determined that no other material events or transactions occurred subsequent to Oct. 31, 2016 that would require recognition or disclosure in the Fund’s financial statements.
41
Report of independent
registered public accounting firm
To the Board of Trustees of Delaware Pooled® Trust
and the Shareholders of The Real Estate Investment Trust Portfolio:
In our opinion, the accompanying statement of assets and liabilities, including the schedule of investments, and the related statements of operations and of changes in net assets and the financial highlights present fairly, in all material respects, the financial position of The Real Estate Investment Trust Portfolio (one of the series constituting Delaware Pooled Trust, hereafter referred to as the “Fund”) as of October 31, 2016, the results of its operations for the year then ended, the changes in its net assets for each of the two years in the period then ended and the financial highlights for each of the periods indicated, in conformity with accounting principles generally accepted in the United States of America. These financial statements and financial highlights (hereafter referred to as “financial statements”) are the responsibility of the Fund’s management. Our responsibility is to express an opinion on these financial statements based on our audits. We conducted our audits of these financial statements in accordance with the standards of the Public Company Accounting Oversight Board (United States). Those standards require that we plan and perform the audit to obtain reasonable assurance about whether the financial statements are free of material misstatement. An audit includes examining, on a test basis, evidence supporting the amounts and disclosures in the financial statements, assessing the accounting principles used and significant estimates made by management, and evaluating the overall financial statement presentation. We believe that our audits, which included confirmation of securities as of October 31, 2016 by correspondence with the custodian and brokers, provide a reasonable basis for our opinion.
PricewaterhouseCoopers LLP
Philadelphia, Pennsylvania
December 21, 2016
42
Other Fund information (Unaudited)
Delaware REIT Fund
Tax Information
The information set forth below is for the Fund’s fiscal year as required by federal income tax laws. Shareholders, however, must report distributions on a calendar year basis for income tax purposes, which may include distributions for portions of two fiscal years of the Fund. Accordingly, the information needed by shareholders for income tax purposes will be sent to them in January of each year. Please consult your tax advisor for proper treatment of this information.
All disclosures are based on financial information available as of the date of this annual report and, accordingly are subject to change. For any and all items requiring reporting, it is the intention of the Fund to report the maximum amount permitted under the Internal Revenue Code and the regulations thereunder.
For the fiscal year ended Oct. 31, 2016, the Fund reports distributions paid during the year as follows:
| | | | |
(A) Long-Term Capital Gains Distributions (Tax Basis) | | | 80.75 | % |
(B) Ordinary Income Distributions (Tax Basis) | | | 19.25 | % |
Total Distributions. | | | 100.00 | % |
(A) and (B) are based on a percentage of the Fund’s total distributions.
Board consideration of Delaware REIT Fund investment advisory agreement
At a meeting held on Aug. 16–18, 2016 (the “Annual Meeting”), the Board of Trustees (the “Board”), including a majority of disinterested or independent Trustees, approved the renewal of the Investment Advisory Agreement for Delaware REIT Fund (the “Fund”). In making its decision, the Board considered information furnished at regular quarterly Board meetings, including reports detailing Fund performance, investment strategies, and expenses, as well as information prepared specifically in connection with the renewal of the investment advisory and sub-advisory contracts. Information furnished specifically in connection with the renewal of the Investment Management Agreement with Delaware Management Company (“DMC”) included materials provided by DMC and its affiliates (“Delaware Investments”) concerning, among other things, the nature, extent, and quality of services provided to the Fund; the costs of such services to the Fund; economies of scale; and the investment manager’s financial condition and profitability. In addition, in connection with the Annual Meeting, reports were provided to the Trustees in May 2016 and included reports provided by Broadridge Financial Solutions (“Broadridge”). The Broadridge reports compared the Fund’s investment performance and expenses with those of other comparable mutual funds. The Independent Trustees reviewed and discussed the Broadridge reports with independent legal counsel to the Independent Trustees. In addition to the information noted above, the Board also requested and received information regarding DMC’s policy with respect to advisory fee levels and its breakpoint philosophy; the structure of portfolio manager compensation; comparative client fee information; and any constraints or limitations on the availability of securities for certain investment styles, which had in the past year inhibited, or which were likely in the future to inhibit, the investment manager’s ability to invest fully in accordance with Fund policies.
In considering information relating to the approval of the Fund’s advisory agreement, the Independent Trustees received assistance and advice from and met separately with independent legal counsel to the Independent Trustees. Although the Board gave attention to all information furnished, the following discussion identifies, under separate headings, the primary factors taken into account by the Board during its contract renewal considerations.
43
Other Fund information (Unaudited)
Delaware REIT Fund
Board consideration of Delaware REIT Fund investment advisory agreement (continued)
Nature, extent, and quality of service. The Board considered the services provided by DMC to the Fund and its shareholders. In reviewing the nature, extent, and quality of services, the Board considered reports furnished to it throughout the year, which covered matters such as the relative performance of the Fund; compliance of portfolio managers with the investment policies, strategies, and restrictions for the Fund; compliance by DMC and Delaware Distributors, L.P. (together, “Management”) personnel with the Code of Ethics adopted throughout the Delaware Investments® Family of Funds complex; and adherence to fair value pricing procedures as established by the Board. The Board was pleased with the current staffing of the Fund’s investment advisor and the emphasis placed on research in the investment process. The Board recognized DMC’s receipt of several industry distinctions during the past several years. The Board gave favorable consideration to DMC’s efforts to control expenditures while maintaining service levels committed to Fund matters. The Board also noted the benefits provided to Fund shareholders through each shareholder’s ability to exchange an investment in one Delaware Investments fund for the same class of shares in another Delaware Investments fund without a sales charge, to reinvest Fund dividends into additional shares of the Fund or into additional shares of other Delaware Investments funds, and the privilege to combine holdings in other Delaware Investments funds to obtain a reduced sales charge. The Board was satisfied with the nature, extent, and quality of the overall services provided by DMC.
Investment performance. The Board placed significant emphasis on the investment performance of the Fund in view of the importance of investment performance to shareholders. Although the Board gave appropriate consideration to performance reports and discussions with portfolio managers at Investment Committee meetings throughout the year, the Board gave particular weight to the Broadridge reports furnished for the Annual Meeting. The Broadridge reports prepared for the Fund showed the investment performance of its Class A shares in comparison to a group of similar funds as selected by Broadridge (the “Performance Universe”). A fund with the best performance ranked first, and a fund with the poorest performance ranked last. The highest/best performing 25% of funds in the Performance Universe make up the first quartile; the next 25%, the second quartile; the next 25%, the third quartile; and the poorest/ worst performing 25% of funds in the Performance Universe make up the fourth quartile. Comparative annualized performance for the Fund was shown for the past 1-, 3-, 5-, and 10-year periods, to the extent applicable, ended Jan. 31, 2016. The Board’s objective is that the Fund’s performance for the periods considered be at or above the median of its Performance Universe.
The Performance Universe for the Fund consisted of the Fund and all retail and institutional real estate funds as selected by Broadridge. The Broadridge report comparison showed that the Fund’s total return for the 1-, 3-, 5-, and 10-year periods was in the second quartile of its Performance Universe. The Board was satisfied with performance.
Comparative expenses. The Board considered expense comparison data for the Delaware Investments Family of Funds. Management provided the Board with information on pricing levels and fee structures for the Fund as of its most recently completed fiscal year. The Board also focused on the comparative analysis of effective management fees and total expense ratios of the Fund versus effective management
44
fees and expense ratios of a group of similar funds as selected by Broadridge (the “Expense Group”). In reviewing comparative costs, the Fund’s contractual management fee and the actual management fee incurred by the Fund were compared with the contractual management fees (assuming all funds in the Expense Group were similar in size to the Fund) and actual management fees (as reported by each fund) within the Expense Group, taking into account any applicable breakpoints and fee waivers. The Fund’s total expenses were also compared with those of its Expense Group. The Broadridge total expenses, for comparative consistency, were shown by Broadridge for Class A shares and comparative total expenses including 12b-1 and non-12b-1 service fees. The Board’s objective is to limit the Fund’s total expense ratio to be competitive with that of the Expense Group.
The expense comparisons for the Fund showed that its actual management fee was in the quartile with the lowest expenses in its Expense Group and its total expenses were in the quartile with the second lowest expenses of its Expense Group. The Board was satisfied with the management fee and total expenses of the Fund in comparison to those of its Expense Group as shown in the Broadridge report.
Management profitability. The Board considered the level of profits realized by DMC in connection with the operation of the Fund. In this respect, the Board reviewed the Investment Management Profitability Analysis that addressed the overall profitability of DMC’s business in providing management and other services to each of the individual funds and the Delaware Investments® Family of Funds as a whole. Specific attention was given to the methodology followed in allocating costs for the purpose of determining profitability. Management stated that the level of profits of DMC, to a certain extent, reflects recent operational cost savings and efficiencies initiated by DMC. The Board considered DMC’s efforts to improve services provided to fund shareholders and to meet additional regulatory and compliance requirements resulting from recent industry-wide Securities and Exchange Commission initiatives. The Board also considered the extent to which DMC might derive ancillary benefits from fund operations, including the potential for procuring additional business as a result of the prestige and visibility associated with its role as service provider to the Delaware Investments Family of Funds and the benefits from allocation of fund brokerage to improve trading efficiencies. The Board found that the management fees were reasonable in light of the services rendered and the level of profitability of DMC.
Economies of scale. The Trustees considered whether economies of scale are realized by DMC as the Fund’s assets increase and the extent to which any economies of scale are reflected in the level of management fees charged. The Trustees reviewed the standardized advisory fee pricing and structure, approved by the Board and shareholders, which includes breakpoints, and which applies to most funds in the Delaware Investments Family of Funds complex. Breakpoints in the advisory fee occur when the advisory fee rate is reduced on assets in excess of specified levels. Breakpoints result in a lower advisory fee than would otherwise be the case in the absence of breakpoints, when the asset levels specified in the breakpoints are exceeded. The Board noted that the fee under the Fund’s management contract fell within the standardized fee pricing structure. Although, as of May 31, 2016, the Fund has not reached a size at which it can take advantage of any breakpoints in the applicable fee schedule, the Board recognized that the fee was structured so that if the Fund grows, economies of scale may be shared.
45
Board of trustees / directors and officers addendum
Delaware Investments® Family of Funds
A mutual fund is governed by a Board of Trustees/Directors (“Trustees”), which has oversight responsibility for the management of a fund’s business affairs. Trustees establish procedures and oversee and review the performance of the investment manager, the distributor, and others who perform services for the fund. The independent fund trustees, in particular, are advocates
| | | | | | |
Name, Address, and Birth Date | | Position(s) Held with Fund(s) | | Length of Time Served | |
Interested Trustee | | | | | | |
Shawn K. Lytle1, 3 2005 Market Street Philadelphia, PA 19103 February 1970 | | President, Chief Executive Officer, and Trustee | |
| Trustee since
September 2015 President and
Chief Executive Officer
since August 2015 |
|
Independent Trustees | | | | | | |
Thomas L. Bennett 2005 Market Street Philadelphia, PA 19103 October 1947 | | Chairman and Trustee | |
| Trustee since
March 2005 Chairman since March 2015 |
|
Ann D. Borowiec 2005 Market Street Philadelphia, PA 19103 November 1958 | | Trustee | | | Since March 2015 | |
Joseph W. Chow 2005 Market Street Philadelphia, PA 19103 January 1953 | | Trustee | | | Since January 2013 | |
| 1 | Shawn K. Lytle is considered to be an “Interested Trustee” because he is an executive officer of the Fund’s(s’) investment advisor. |
46
for shareholder interests. Each trustee has served in that capacity since he or she was elected to or appointed to the Board of Trustees, and will continue to serve until his or her retirement or the election of a new trustee in his or her place. The following is a list of the Trustees and Officers with certain background and related information.
| | | | |
Principal Occupation(s) During the Past Five Years | | Number of Portfolios in
Fund Complex Overseen
by Trustee or Officer | | Other Directorships
Held by Trustee or Officer |
| | | | |
Shawn K. Lytle has served as President of Delaware Investments2 since June 2015 and was the Regional Head of Americas for UBS Global Asset Management from 2010 through 2015. | | 62 | | Trustee — UBS
Relationship Funds, SMA Relationship Trust, and UBS Funds (May 2010–April 2015) |
| | | | |
Private Investor (March 2004–Present) | | 62 | | Director —
Bryn Mawr Bank Corp. (BMTC)(2007–2011) |
Chief Executive Officer Private Wealth Management (2011–2013) and Market Manager, New Jersey Private Bank (2005–2011) — J.P. Morgan Chase & Co. | | 62 | | None |
Executive Vice President (Emerging Economies Strategies, Risks, and Corporate Administration) State Street Corporation (July 2004–March 2011) | | 62 | | Director and Audit Committee
Member — Hercules
Technology GrowthCapital, Inc. (2004–2014) |
| 2 | Delaware Investments is the marketing name for Delaware Management Holdings, Inc. and its subsidiaries, including the Fund’s(s’) investment advisor, principal underwriter, and its transfer agent. |
47
Board of trustees / directors and officers addendum
Delaware Investments® Family of Funds
| | | | |
Name, Address, and Birth Date | | Position(s) Held with Fund(s) | | Length of Time Served |
Independent Trustees (continued) | | |
John A. Fry 2005 Market Street Philadelphia, PA 19103 May 1960 | | Trustee | | Since January 2001 |
Lucinda S. Landreth 2005 Market Street Philadelphia, PA 19103 June 1947 | | Trustee | | Since March 2005 |
Frances A. Sevilla-Sacasa 2005 Market Street Philadelphia, PA 19103 January 1956 | | Trustee | | Since September 2011 |
48
| | | | |
Principal Occupation(s) During the Past Five Years | | Number of Portfolios in Fund Complex Overseen by Trustee or Officer | | Other Directorships
Held by Trustee or Officer |
| | | | |
President — Drexel University (August 2010–Present) President — Franklin & Marshall College (July 2002–July 2010) | | 62 | | Director, Audit
and Governance Committee
Member — Community Health Systems Director — Drexel Morgan & Co. Director, Audit Committee Member — vTv Therapeutics LLC |
Private Investor (2004–Present) | | 62 | | None |
Chief Executive Officer — Banco Itaú International (April 2012–Present) Executive Advisor to Dean (August 2011–March 2012) and Interim Dean (January 2011–July 2011) — University of Miami School of Business Administration President — U.S. Trust, Bank of America Private Wealth Management (Private Banking) (July 2007–December 2008) | | 62 | | Trust Manager and
Audit Committee Member — Camden Property Trust |
49
Board of trustees / directors and officers addendum
Delaware Investments® Family of Funds
| | | | |
Name, Address, and Birth Date | | Position(s) Held with Fund(s) | | Length of
Time Served |
Independent Trustees (continued) | | |
Thomas K. Whitford 2005 Market Street Philadelphia, PA 19103 March 1956 | | Trustee | | Since January 2013 |
Janet L. Yeomans 2005 Market Street Philadelphia, PA 19103 July 1948 | | Trustee | | Since April 1999 |
50
| | | | |
Principal Occupation(s)
During the Past Five Years | | Number of Portfolios in Fund Complex Overseen by Trustee or Officer | | Other Directorships
Held by Trustee or Officer |
| | | | |
Vice Chairman (2010–April 2013) and Chief Administrative Officer (2008–2010) — PNC Financial Services Group | | 62 | | Director — HSBC Finance
Corporation and HSBCNorth America Holdings Inc. Director — HSBC Bank |
Vice President and Treasurer (January 2006–July 2012), Vice President — Mergers & Acquisitions (January 2003–January 2006), and Vice President and Treasurer (July 1995–January 2003) — 3M Company | | 62 | | Director, Personnel and
Compensation CommitteeChair, Audit Committee Member and Governance
Committee Member — Okabena Company |
51
Board of trustees / directors and officers addendum
Delaware Investments® Family of Funds
| | | | | | |
| Name, Address, | | Position(s) | | | Length of | |
| and Birth Date | | Held with Fund(s) | | | Time Served | |
Officers | | | | | | |
David F. Connor 2005 Market Street Philadelphia, PA 19103 December 1963 | | Senior Vice President, General Counsel, and Secretary | |
| Senior Vice President
since May 2013; General Counsel since May 2015; Secretary since October 2005 |
|
Daniel V. Geatens 2005 Market Street Philadelphia, PA 19103 October 1972 | | Vice President and Treasurer | | | Treasurer since October 2007 | |
Richard Salus 2005 Market Street Philadelphia, PA 19103 October 1963 | | Senior Vice President and Chief Financial Officer | |
| Chief Financial Officer
since November 2006 |
|
The Statement of Additional Information for the Fund(s) includes additional information about the Trustees and Officers and is available, without charge, upon request by calling 800 523-1918.
52
| | | | |
| | | Number of Portfolios in | | |
| Principal Occupation(s) | | Fund Complex Overseen | | Other Directorships |
| During the Past Five Years | | by Trustee or Officer | | Held by Trustee or Officer |
| | | | |
David F. Connor has served in various capacities at different times at Delaware Investments. | | 62 | | None3 |
Daniel V. Geatens has served in various capacities at different times at Delaware Investments. | | 62 | | None3 |
Richard Salus has served in various capacities at different times at Delaware Investments. | | 62 | | None3 |
| 3 | Shawn K. Lytle, David F. Connor, Daniel V. Geatens, and Richard Salus serve in similar capacities for the six portfolios of the Optimum Fund Trust, which have the same investment advisor, principal underwriter, and transfer agent as the registrant. |
53
About the organization
| | | | | | | | | | |
| Board of trustees | | | | | | | | |
| | | |
Shawn K. Lytle | | Ann D. Borowiec | | | John A. Fry | | | | Frances A. | |
President and | | Former Chief Executive | | | President | | | | Sevilla-Sacasa | |
Chief Executive Officer | | Officer | | | Drexel University | | | | Chief Executive Officer | |
Delaware Investments® | | Private Wealth Management | | | Philadelphia, PA | | | | Banco Itaú | |
Family of Funds | | J.P. Morgan Chase & Co. | | | | | | | International | |
Philadelphia, PA | | New York, NY | | | Lucinda S. Landreth | | | | Miami, FL | |
| | | | | Former Chief Investment | | | | | |
Thomas L. Bennett | | Joseph W. Chow | | | Officer | | | | Thomas K. Whitford | |
Chairman of the Board | | Former Executive Vice | | | Assurant, Inc. | | | | Former Vice Chairman | |
Delaware Investments | | President | | | New York, NY | | | | PNC Financial Services Group | |
Family of Funds | | State Street Corporation | | | | | | | Pittsburgh, PA | |
Private Investor | | Boston, MA | | | | | | | | |
Rosemont, PA | | | | | | | | | Janet L. Yeomans | |
| | | | | | | | | Former Vice President and | |
| | | | | | | | | Treasurer | |
| | | | | | | | | 3M Company | |
| | | | | | | | | St. Paul, MN | |
| | | | | | | | |
| Affiliated officers | | | | | | | | |
| | | | |
David F. Connor | | Daniel V. Geatens | | Richard Salus | | | | |
Senior Vice President, | | Vice President and | | Senior Vice President and | | | | |
General Counsel, | | Treasurer | | Chief Financial Officer | | | | |
and Secretary | | Delaware Investments | | Delaware Investments | | | | |
Delaware Investments | | Family of Funds | | Family of Funds | | | | |
Family of Funds | | Philadelphia, PA | | Philadelphia, PA | | | | |
Philadelphia, PA | | | | | | | | |
This annual report is for the information of Delaware REIT Fund shareholders, but it may be used with prospective investors when preceded or accompanied by the Delaware Investments Fund fact sheet for the most recently completed calendar quarter. These documents are available at delawareinvestments.com/literature.
Delaware Investments is the marketing name of Delaware Management Holdings, Inc. and its subsidiaries.
The Fund files its complete schedule of portfolio holdings with the Securities and Exchange Commission (SEC) for the first and third quarters of each fiscal year on Form N-Q. The Fund’s Forms N-Q, as well as a description of the policies and procedures that the Fund uses to determine how to vote proxies (if any) relating to portfolio securities are available without charge (i) upon request, by calling 800 523-1918; and (ii) on the SEC’s website at sec.gov. In addition, a description of the policies and procedures that the Fund uses to determine how to vote proxies (if any) relating to portfolio securities and the Schedules of Investments included in the Fund’s most recent Form N-Q are available without charge on the Fund’s website at delawareinvestments.com/literature. The Fund’s Forms N-Q may be reviewed and copied at the SEC’s Public Reference Room in Washington, D.C.; information on the operation of the Public Reference Room may be obtained by calling 800 SEC- 0330.
Information (if any) regarding how the Fund voted proxies relating to portfolio securities during the most recently disclosed 12-month period ended June 30 is available without charge (i) through the Fund’s website at delawareinvestments.com/proxy; and (ii) on the SEC’s website at sec.gov.
54
Item 2. Code of Ethics
The registrant has adopted a code of ethics that applies to the registrant’s principal executive officer, principal financial officer, principal accounting officer or controller, or persons performing similar functions, regardless of whether these individuals are employed by the registrant or a third party. A copy of the registrant’s Code of Business Ethics has been posted on the Delaware Investments Internet Web site at www.delawareinvestments.com. Any amendments to the Code of Business Ethics, and information on any waiver from its provisions granted by the registrant, will also be posted on this Web site within five business days of such amendment or waiver and will remain on the Web site for at least 12 months.
Item 3. Audit Committee Financial Expert
The registrant’s Board of Trustees/Directors has determined that certain members of the registrant’s Audit Committee are audit committee financial experts, as defined below. For purposes of this item, an “audit committee financial expert” is a person who has the following attributes:
a. An understanding of generally accepted accounting principles and financial statements;
b. The ability to assess the general application of such principles in connection with the accounting for estimates, accruals, and reserves;
c. Experience preparing, auditing, analyzing, or evaluating financial statements that present a breadth and level of complexity of accounting issues that are generally comparable to the breadth and complexity of issues that can reasonably be expected to be raised by the registrant’s financial statements, or experience actively supervising one or more persons engaged in such activities;
d. An understanding of internal controls and procedures for financial reporting; and
e. An understanding of audit committee functions.
An “audit committee financial expert” shall have acquired such attributes through:
a. Education and experience as a principal financial officer, principal accounting officer, controller, public accountant, or auditor or experience in one or more positions that involve the performance of similar functions;
b. Experience actively supervising a principal financial officer, principal accounting officer, controller, public accountant, auditor, or person performing similar functions;
c. Experience overseeing or assessing the performance of companies or public accountants with respect to the preparation, auditing, or evaluation of financial statements; or
d. Other relevant experience.
The registrant’s Board of Trustees/Directors has also determined that each member of the registrant’s Audit Committee is independent. In order to be “independent” for purposes of this item, the Audit Committee member may not: (i) other than in his or her capacity as a member of the Board of Trustees/Directors or any committee thereof, accept directly or indirectly any consulting, advisory or other compensatory fee from the issuer; or (ii) be an “interested person” of the registrant as defined in Section 2(a)(19) of the Investment Company Act of 1940.
The names of the audit committee financial experts on the registrant’s Audit Committee are set forth below:
Ann D. Borowiec
Joseph W. Chow
Lucinda S. Landreth1
Thomas K. Whitford
Item 4. Principal Accountant Fees and Services
(a) Audit fees.
PricewaterhouseCoopers LLP (“PwC”), the Independent Accountant to the series portfolios of Delaware Pooled Trust (“Funds”), has advised the Audit Committee of the Board of Trustees of the Funds (“Audit Committee”) that, as of the date of the filing of this Annual Report on Form N-CSR, it is in discussions with the staff of the Securities and Exchange Commission (“SEC Staff”), or the SEC, regarding the interpretation and application of Rule 2-01(c)(1)(ii)(A) of Regulation S-X, or the Loan Rule.
The Loan Rule prohibits accounting firms, such as PwC, from having certain financial relationships with their audit clients and affiliated entities. Specifically, the Loan Rule provides, in relevant part, that an accounting firm generally would not be independent if it receives a loan from a lender that is a “record or beneficial owner of more than ten percent of the audit client’s equity securities.” Under the SEC Staff’s interpretation of the Loan Rule, based on information provided to us by PwC, some of PwC’s relationships with its lenders who also own shares of one or more funds within the Delaware Investments Family of Funds investment company complex implicate the Loan Rule, calling into question PwC’s independence with respect to the Funds. PwC believes that, in light of the facts of these lending relationships, its ability to exercise objective judgment with respect to the audit of the Funds has not been impaired.
The Audit Committee has considered the lending relationships described by PwC and has concluded that (1) the lending relationships did not affect PwC’s application of objective judgment in conducting its audits and issuing reports on the Funds’ financial statements; and (2) a reasonable investor with knowledge of the lending relationships described by PwC would reach the same conclusion. In making this determination, the Audit Committee considered, among other things, PwC’s description of the relevant lending relationships and PwC’s representation that its objectivity was not impaired in conducting its audit of the Funds’ financial statements. In connection with this determination, PwC advised the Audit Committee that it believes PwC is independent and it continues to have discussions with the SEC Staff.
____________________
1 The instructions to Form N-CSR require disclosure on the relevant experience of persons who qualify as audit committee financial experts based on “other relevant experience.” The Board of Trustees/Directors has determined that Ms. Landreth qualifies as an audit committee financial expert by virtue of her experience as a financial analyst, her Chartered Financial Analyst (CFA) designation, and her service as an audit committee chairperson for a non-profit organization.
If the SEC were ultimately to determine that PwC was not independent with respect to the Funds for certain time periods, the Funds’ filings with the SEC that contain the Funds’ financial statements for such periods would be non-compliant with the applicable securities laws. If the SEC determines that PwC was not independent, among other things, the Funds could be required to have independent audits conducted on the Funds’ previously audited financial statements by another registered public accounting firm for the affected periods. The time involved to conduct such independent audits may impair the Funds’ ability to issue shares. Any of the foregoing possible outcomes potentially could have a material adverse effect on the Funds.
The aggregate fees billed for services provided to the registrant by its independent auditors for the audit of the registrant’s annual financial statements and for services normally provided by the independent auditors in connection with statutory and regulatory filings or engagements were $226,010 for the fiscal year ended October 31, 2016.
The aggregate fees billed for services provided to the registrant by its independent auditors for the audit of the registrant’s annual financial statements and for services normally provided by the independent auditors in connection with statutory and regulatory filings or engagements were $329,550 for the fiscal year ended October 31, 2015.
(b) Audit-related fees.
The aggregate fees billed by the registrant’s independent auditors for services relating to the performance of the audit of the registrant’s financial statements and not reported under paragraph (a) of this Item were $0 for the fiscal year ended October 31, 2016.
The aggregate fees billed by the registrant’s independent auditors for services relating to the performance of the audit of the financial statements of the registrant’s investment adviser and other service providers under common control with the adviser and that relate directly to the operations or financial reporting of the registrant were $667,000 for the registrant’s fiscal year ended October 31, 2016. The percentage of these fees relating to services approved by the registrant’s Audit Committee pursuant to the de minimis exception from the pre-approval requirement in Rule 2-01(c)(7)(i)(C) of Regulation S-X was 0%. These audit-related services were as follows: year end audit procedures; group reporting and subsidiary statutory audits.
The aggregate fees billed by the registrant’s independent auditors for services relating to the performance of the audit of the registrant’s financial statements and not reported under paragraph (a) of this Item were $0 for the fiscal year ended October 31, 2015.
The aggregate fees billed by the registrant’s independent auditors for services relating to the performance of the audit of the financial statements of the registrant’s investment adviser and other service providers under common control with the adviser and that relate directly to the operations or financial reporting of the registrant were $612,000 for the registrant’s fiscal year ended October 31, 2015. The percentage of these fees relating to services approved by the registrant’s Audit Committee pursuant to the de minimis exception from the pre-approval requirement in Rule 2-01(c)(7)(i)(C) of Regulation S-X was 0%. These audit-related services were as follows: year end audit procedures; group reporting and subsidiary statutory audits.
(c) Tax fees.
The aggregate fees billed by the registrant’s independent auditors for tax-related services provided to the registrant were $63,944 for the fiscal year ended October 31, 2016. The percentage of these fees relating to services approved by the registrant’s Audit Committee pursuant to the de minimis exception from the pre-approval requirement in Rule 2-01(c)(7)(i)(C) of Regulation S-X was 0%. These tax-related services were as follows: review of income tax returns and review of annual excise distribution calculations.
The aggregate fees billed by the registrant’s independent auditors for tax-related services provided to the registrant’s investment adviser and other service providers under common control with the adviser and that relate directly to the operations or financial reporting of the registrant were $0 for the registrant’s fiscal year ended October 31, 2016.
The aggregate fees billed by the registrant’s independent auditors for tax-related services provided to the registrant were $63,944 for the fiscal year ended October 31, 2015. The percentage of these fees relating to services approved by the registrant’s Audit Committee pursuant to the de minimis exception from the pre-approval requirement in Rule 2-01(c)(7)(i)(C) of Regulation S-X was 0%. These tax-related services were as follows: review of income tax returns and review of annual excise distribution calculations.
The aggregate fees billed by the registrant’s independent auditors for tax-related services provided to the registrant’s investment adviser and other service providers under common control with the adviser and that relate directly to the operations or financial reporting of the registrant were $0 for the registrant’s fiscal year ended October 31, 2015.
(d) All other fees.
The aggregate fees billed for all services provided by the independent auditors to the registrant other than those set forth in paragraphs (a), (b) and (c) of this Item were $0 for the fiscal year ended October 31, 2016.
The aggregate fees billed for all services other than those set forth in paragraphs (b) and (c) of this Item provided by the registrant’s independent auditors to the registrant’s adviser and other service providers under common control with the adviser and that relate directly to the operations or financial reporting of the registrant were $0 for the registrant’s fiscal year ended October 31, 2016. The percentage of these fees relating to services approved by the registrant’s Audit Committee pursuant to the de minimis exception from the pre-approval requirement in Rule 2-01(c)(7)(i)(C) of Regulation S-X was 0%.
The aggregate fees billed for all services provided by the independent auditors to the registrant other than those set forth in paragraphs (a), (b) and (c) of this Item were $0 for the fiscal year ended October 31, 2015.
The aggregate fees billed for all services other than those set forth in paragraphs (b) and (c) of this Item provided by the registrant’s independent auditors to the registrant’s adviser and other service providers under common control with the adviser and that relate directly to the operations or financial reporting of the registrant were $0 for the registrant’s fiscal year ended October 31, 2015. The percentage of these fees relating to services approved by the registrant’s Audit Committee pursuant to the de minimis exception from the pre-approval requirement in Rule 2-01(c)(7)(i)(C) of Regulation S-X was 0%.
(e) The registrant’s Audit Committee has established pre-approval policies and procedures as permitted by Rule 2-01(c)(7)(i)(B) of Regulation S-X (the “Pre-Approval Policy”) with respect to services provided by the registrant’s independent auditors. Pursuant to the Pre Approval Policy, the Audit Committee has pre-approved the services set forth in the table below with respect to the registrant up to the specified fee limits. Certain fee limits are based on aggregate fees to the registrant and other registrants within the Delaware Investments Family of Funds.
| Service | Range of Fees |
Audit Services | |
Statutory audits or financial audits for new Funds | up to $40,000 per Fund |
Services associated with SEC registration statements (e.g., Form N-1A, Form N-14, etc.), periodic reports and other documents filed with the SEC or other documents issued in connection with securities offerings (e.g., comfort letters for closed-end Fund offerings, consents), and assistance in responding to SEC comment letters | up to $10,000 per Fund |
Consultations by Fund management as to the accounting or disclosure treatment of transactions or events and/or the actual or potential impact of final or proposed rules, standards or interpretations by the SEC, FASB, or other regulatory or standard-setting bodies (Note: Under SEC rules, some consultations may be considered “audit-related services” rather than “audit services”) | up to $25,000 in the aggregate |
Audit-Related Services | |
Consultations by Fund management as to the accounting or disclosure treatment of transactions or events and /or the actual or potential impact of final or proposed rules, standards or interpretations by the SEC, FASB, or other regulatory or standard-setting bodies (Note: Under SEC rules, some consultations may be considered “audit services” rather than “audit-related services”) | up to $25,000 in the aggregate |
Tax Services | |
U.S. federal, state and local and international tax planning and advice (e.g., consulting on statutory, regulatory or administrative developments, evaluation of Funds’ tax compliance function, etc.) | up to $25,000 in the aggregate |
U.S. federal, state and local tax compliance (e.g., excise distribution reviews, etc.) | up to $5,000 per Fund |
Review of federal, state, local and international income, franchise and other tax returns | up to $5,000 per Fund |
Under the Pre-Approval Policy, the Audit Committee has also pre-approved the services set forth in the table below with respect to the registrant’s investment adviser and other entities controlling, controlled by or under common control with the investment adviser that provide ongoing services to the registrant (the “Control Affiliates”) up to the specified fee limit. This fee limit is based on aggregate fees to the investment adviser and its Control Affiliates.
| Service | Range of Fees |
Non-Audit Services | |
Services associated with periodic reports and other documents filed with the SEC and assistance in responding to SEC comment letters | up to $10,000 in the aggregate |
The Pre-Approval Policy requires the registrant’s independent auditors to report to the Audit Committee at each of its regular meetings regarding all services initiated since the last such report was rendered, including those services authorized by the Pre-Approval Policy.
(f) Not applicable.
(g) The aggregate non-audit fees billed by the registrant’s independent auditors for services rendered to the registrant and to its investment adviser and other service providers under common control with the adviser were $8,665,000 and $11,111,212 for the registrant’s fiscal years ended October 31, 2016 and October 31, 2015, respectively.
(h) In connection with its selection of the independent auditors, the registrant’s Audit Committee has considered the independent auditors’ provision of non-audit services to the registrant’s investment adviser and other service providers under common control with the adviser that were not required to be pre-approved pursuant to Rule 2-01(c)(7)(ii) of Regulation S-X. The Audit Committee has determined that the independent auditors’ provision of these services is compatible with maintaining the auditors’ independence.
Item 5. Audit Committee of Listed Registrants
Not applicable.
Item 6. Investments
(a) Included as part of report to shareholders filed under Item 1 of this Form N-CSR.
(b) Divestment of securities in accordance with Section 13(c) of the Investment Company Act of 1940.
Not applicable.
Item 7. Disclosure of Proxy Voting Policies and Procedures for Closed-End Management Investment Companies
Not applicable.
Item 8. Portfolio Managers of Closed-End Management Investment Companies
Not applicable.
Item 9. Purchases of Equity Securities by Closed-End Management Investment Company and Affiliated Purchasers
Not applicable.
Item 10. Submission of Matters to a Vote of Security Holders
Not applicable.
Item 11. Controls and Procedures
The registrant’s principal executive officer and principal financial officer have evaluated the registrant’s disclosure controls and procedures within 90 days of the filing of this report and have concluded that they are effective in providing reasonable assurance that the information required to be disclosed by the registrant in its reports or statements filed under the Securities Exchange Act of 1934 is recorded, processed, summarized and reported within the time periods specified in the rules and forms of the Securities and Exchange Commission.
There were no significant changes in the registrant’s internal control over financial reporting that occurred during the second fiscal quarter of the period covered by the report to stockholders included herein (i.e., the registrant’s fourth fiscal quarter) that have materially affected, or are reasonably likely to materially affect, the registrant’s internal control over financial reporting.
Item 12. Exhibits
| (a) | (1) Code of Ethics |
| |
Not applicable. |
| |
| (2) Certifications of Principal Executive Officer and Principal Financial Officer pursuant to Rule 30a-2 under the Investment Company Act of 1940 are attached hereto as Exhibit 99.CERT. |
| |
| (3) Written solicitations to purchase securities pursuant to Rule 23c-1 under the Securities Exchange Act of 1934. |
| |
Not applicable. |
| |
| (b) | Certifications pursuant to Section 906 of the Sarbanes-Oxley Act of 2002 are furnished herewith as Exhibit 99.906CERT. |
SIGNATURES
Pursuant to the requirements of the Securities Exchange Act of 1934 and the Investment Company Act of 1940, the registrant has duly caused this report to be signed on its behalf, by the undersigned, thereunto duly authorized.
DELAWARE POOLED® TRUST
| /s/ SHAWN K. LYTLE |
| By: | Shawn K. Lytle |
| Title: | President and Chief Executive Officer |
| Date: | January 5, 2017 |
Pursuant to the requirements of the Securities Exchange Act of 1934 and the Investment Company Act of 1940, this report has been signed below by the following persons on behalf of the registrant and in the capacities and on the dates indicated.
| /s/ SHAWN K. LYTLE |
| By: | Shawn K. Lytle |
| Title: | President and Chief Executive Officer |
| Date: | January 5, 2017 |
| |
| |
| /s/ RICHARD SALUS |
| By: | Richard Salus |
| Title: | Chief Financial Officer |
| Date: | January 5, 2017 |