Item 1. Reports to Stockholders

Macquarie Institutional Portfolios (registered as Delaware Pooled® Trust)
|
US equities |
Macquarie Large Cap Value Portfolio (formerly, The Large-Cap Value Equity Portfolio) |
|
US fixed income |
Macquarie Core Plus Bond Portfolio (formerly, The Core Plus Fixed Income Portfolio) |
Macquarie High Yield Bond Portfolio (formerly, The High-Yield Bond Portfolio) |
|
International equities |
Macquarie Emerging Markets Portfolio (formerly, The Emerging Markets Portfolio) |
Macquarie Emerging Markets Portfolio II (formerly, The Emerging Markets Portfolio II) |
Macquarie Labor Select International Equity Portfolio (formerly, The Labor Select International Equity Portfolio) |
October 31, 2017

This page intentionally left blank.
Table of contents
Macquarie Institutional Portfolios
Macquarie Institutional Portfolios (registered as Delaware Pooled® Trust) are designed exclusively for institutional investors and high net worth individuals.
Delaware Management Company, a series of Macquarie Investment Management Business Trust (MIMBT), serves as investment advisor for the Portfolios. Mondrian Investment Partners Limited serves as investment sub-advisor for Macquarie Emerging Markets Portfolio* and Macquarie Labor Select International Equity Portfolio.
The performance quoted in this report represents past performance and does not guarantee future results. Investment return and principal value of an investment will fluctuate so that shares, when redeemed, may be worth more or less than their original cost. Current performance may be lower or higher than the performance quoted. Performance data current to the most recent month end may be obtained by calling 800 231-8002 or visiting macquarie.com/investment-management/institutional. Carefully consider the Portfolios’ investment objectives, risk factors, charges, and expenses before investing. This and other information can be found in the Portfolios’ prospectus which may be obtained by visiting macquarie.com/investment-management/institutional or calling 800 231-8002. Investors should read the prospectus carefully before investing. Performance includes reinvestment of all distributions.
The Portfolios are not FDIC insured and are not guaranteed. It is possible to lose the principal amount invested. Mutual fund advisory services are provided by Delaware Management Company, a series of MIMBT, which is a registered investment advisor.
The Portfolios are distributed by Delaware Distributors, L.P., an affiliate of MIMBT, Macquarie Management Holdings, Inc., and Macquarie Group Limited. Macquarie Investment Management, a member of Macquarie Group, refers to the companies comprising the asset management division of Macquarie Group Limited and its subsidiaries and affiliates worldwide.
Other than Macquarie Bank Limited (MBL), none of the entities noted are authorized deposit-taking institutions for the purposes of the Banking Act 1959 (Commonwealth of Australia). The obligations of these entities do not represent deposits or other liabilities of MBL. MBL does not guarantee or otherwise provide assurance in respect of the obligations of these entities, unless noted otherwise.
*Closed to new investors.
©2017 Macquarie Management Holdings, Inc.
All third-party marks cited are the property of their respective owners.
1
Portfolio objectives and strategies
Macquarie Large Cap Value Portfolio seeks long-term capital appreciation. The Portfolio invests primarily in securities of large-capitalization companies that we believe have long-term capital appreciation potential. The Portfolio currently defines large-capitalization stocks as those with market capitalizations of $5 billion or greater at the time of purchase. Typically, we seek to select securities that we believe are undervalued in relation to their intrinsic value as indicated by multiple factors.
Macquarie Core Plus Bond Portfolio seeks maximum long-term total return, consistent with reasonable risk. The Portfolio allocates its investments principally among three sectors of the fixed income securities markets: US investment grade sector, US high yield sector, and international sector.
Macquarie High Yield Bond Portfolio seeks high total return. The Portfolio will primarily invest its assets at the time of purchase in: (1) corporate bonds rated BB or lower by Standard & Poor’s (S&P) or similarly rated by another nationally recognized statistical rating organization; (2) securities issued or guaranteed by the US government, its agencies, or instrumentalities; or (3) commercial paper of companies rated A-1 or A-2 by S&P, rated P-1 or P-2 by Moody’s Investors Service, Inc. (Moody’s), or unrated but considered to be of comparable quality.
Macquarie Emerging Markets Portfolio seeks long-term capital appreciation. The Portfolio generally invests in equity securities of companies that are organized in, have a majority of their assets in, or derive a majority of their operating income from emerging countries. Macquarie Emerging Markets Portfolio is presently closed to new investors.
Macquarie Emerging Markets Portfolio II seeks long-term capital appreciation. The Portfolio invests primarily in a broad range of equity securities of companies located in emerging market countries. The Portfolio may invest in companies of any size. The portfolio manager believes that although market price and intrinsic business value are positively correlated in the long run, short-term divergences can emerge. The Portfolio seeks to take advantage of these divergences through a fundamental, bottom-up approach. The Portfolio invests in securities of companies with sustainable franchises when they are trading at a discount to the portfolio manager’s intrinsic value estimate for that security.
Macquarie Labor Select International Equity Portfolio seeks maximum long-term total return. The Portfolio invests primarily in equity securities of companies that are organized, have a majority of their assets, or derive most of their operating income outside of the United States, and that, in the opinion of Mondrian Investment Partners Limited (“Mondrian”), the Portfolio’s sub-advisor, are undervalued at the time of purchase based on the rigorous fundamental analysis that the sub-advisor employs. In addition to following these quantitative guidelines, Mondrian will select securities of issuers that present certain characteristics that are compatible or operate in accordance with certain investment policies or restrictions followed by organized labor.
Carefully consider the Portfolios’ investment objectives, risk factors, charges, and expenses before investing. This and other information can be found in the Portfolios’ prospectus, which may be obtained by visiting macquarie.com/investment-management/institutional or calling 800 231-8002. Investors should read the applicable prospectus carefully before investing.
Macquarie Institutional Portfolios are designed exclusively for institutional investors and high net worth individuals.
International investments entail risks not ordinarily associated with US investments including fluctuation in currency values, differences in accounting principles, or economic or political instability in other nations. Investing in emerging markets can be riskier than investing in established foreign markets due to increased volatility and lower trading volume.
The Portfolios’ share prices and yields will fluctuate in response to movements in stock prices.
Fixed income securities and bond funds can lose value, and investors can lose principal, as interest rates rise. They also may be affected by economic conditions that hinder an issuer’s ability to make interest and principal payments on its debt.
2
The Portfolios may also be subject to prepayment risk, the risk that the principal of a bond that is held by a portfolio will be prepaid prior to maturity, at the time when interest rates are lower than what the bond was paying. A portfolio may then have to reinvest that money at a lower interest rate.
Securities in the lowest of the rating categories considered to be investment grade (that is, Baa or BBB) have some speculative characteristics.
High yielding, non-investment-grade bonds (junk bonds) involve higher risk than investment grade bonds.
The high yield secondary market is particularly susceptible to liquidity problems when institutional investors, such as mutual funds and certain other financial institutions, temporarily stop buying bonds for regulatory, financial, or other reasons. In addition, a less liquid secondary market makes it more difficult for the Portfolio to obtain precise valuations of the high yield securities in its portfolio.
If and when the Portfolio invests in forward foreign currency contracts or uses other investments to hedge against currency risks, the Portfolio will be subject to special risks, including counterparty risk.
The Portfolios may invest in derivatives, which may involve additional expenses and are subject to risk, including the risk that an underlying security or securities index moves in the opposite direction from what the portfolio manager anticipated. A derivative transaction depends upon the counterparties’ ability to fulfill their contractual obligations.
Interest payments on inflation-indexed debt securities will vary as the principal and/or interest is adjusted for inflation.
3
Portfolio management review
Macquarie Institutional Portfolios — Macquarie Large Cap Value Portfolio
October 31, 2017
For the fiscal year ended Oct. 31, 2017, Macquarie Large Cap Value Portfolio (formerly, The Large-Cap Value Equity Portfolio) gained +13.83% at net asset value (NAV) with all distributions reinvested. This result trailed the Portfolio’s benchmark, the Russell 1000® Value Index, which returned +17.78% for the same period. Complete annualized performance for Macquarie Large Cap Value Portfolio is shown on the table on page 6.
Stock prices rose during the fiscal year in almost uninterrupted fashion and were especially strong early in the weeks after the November 2016 presidential election. With the victory of Donald Trump came Republican control in Washington, D.C. and, investors believed, greater likelihood of growth-oriented economic policies such as regulatory reform, tax reduction, and more infrastructure spending. Investors’ optimism cooled over time, however, even as stocks continued to gain ground on improving economic conditions and solid employment data.
A substantial underweighting in the financials sector hampered the Portfolio’s performance for the fiscal year. This category was by far the strongest-performing sector in the benchmark due to optimism about potential regulatory changes and higher interest rates, with both likely to drive future profitability for banks and other financial companies. With valuations in the financials sector relatively high, we found better opportunity elsewhere in the market.
That said, one of the Portfolio’s strongest contributors to relative performance, Allstate, came from the financials sector. We liked this insurance provider partly for its sound business fundamentals and underwriting practices, and its strong financial results helped drive the stock higher during the fiscal year.
Stock selection in the consumer staples sector also hurt performance. In this group, notable detractors included agricultural commodity company Archer-Daniels-Midland, packaged-foods manufacturer Mondelez International, and especially CVS Health, which combines a chain of retail pharmacies with a pharmacy benefits management (PBM) business. Increased competition was partly responsible for the decline in CVS’ stock during the 12-month period. At fiscal year end, however, we continued to have confidence in this company, reflecting our ongoing optimism about the long-term potential for its PBM business.
Another PBM holding in the Portfolio, Express Scripts Holding, also detracted from performance during the fiscal year. Express Scripts had been involved in a contract dispute with Anthem, the company’s largest customer, and concern that Express Scripts would have trouble replacing the loss of Anthem’s business weighed on its shares. At the end of the fiscal year, we continued to see potential here, however, and believed that Express Scripts’ present difficulties were more than priced into its current valuation.
Abbott Laboratories was one of the Portfolio’s strongest contributors for the fiscal year. This medical device and healthcare products company fared well, as the firm has come to market with various new products and has executed its business well.
Stock selection in consumer discretionary and industrials was a source of strength. The Portfolio’s position in discount retailer Dollar Tree led the way. We added this name in August 2017, as it met our criteria for a fairly defensive consumer discretionary stock. In our view, Dollar Tree is more insulated from online competition than many other retailers. The company’s shares rose sharply shortly after we established the Portfolio’s position as Dollar Tree reported stronger-than-expected second-quarter financial results.
In industrials, the Portfolio benefited most from a position in Raytheon. This defense contractor continued to produce strong sales and earnings throughout the fiscal period. The company has also benefited from the expectation that geopolitical instability could boost military spending.
Throughout the fiscal year, we maintained our value-oriented approach to managing the Portfolio. In all market conditions, we try to look past the market’s short-term concerns about companies and focus on their long-term revenue and earnings growth potential.
During the fiscal period, our approach continued to be generally defensive, reflecting historically high stock valuations, and we emphasized high-quality stocks that struck us as attractively valued relative to other available opportunities. This approach included the Portfolio’s largest overweighting, in the traditionally defensive healthcare sector. One exception to our defensive approach came in the energy sector, however, where we remained overweight. In our view, the sector offers attractive relative value and we think the imbalance between supply and demand in the global oil market should continue to improve.
During the fiscal year, two stocks were sold from the Portfolio and three were added. On the sale side, we eliminated the Portfolio’s stake in print technology company Xerox, as the company prepared to split itself into two smaller firms that did not meet our criteria. Late in the fiscal period, we also sold the Portfolio’s stake in packaged foods company Kraft Heinz, which had performed well and approached our price target.
We used the proceeds of this latter sale to purchase Dollar Tree. Another purchase involved apartment real estate investment trust (REIT) Equity Residential. This acquisition enabled us to gain exposure to the real estate sector — a new category added to the benchmark shortly before the fiscal year — with a name we believed offered good value compared with other REITs. We also added a new position in enterprise software company Oracle. The company had been slow to embrace the transition to cloud computing, which had caused its shares to lag. We believed that market concerns about
4
Oracle’s competitive position were overdone and that the stock had an attractive risk-reward profile.
Although high valuations have tempered our performance expectations for the US equity market, our long-term outlook for
stocks — especially those value-oriented, higher-quality stocks that we seek to emphasize in the Portfolio — remains positive.
The views expressed are current as of the date of this report and are subject to change.
5
Performance summary
Macquarie Institutional Portfolios — Macquarie Large Cap Value Portfolio
The performance quoted represents past performance and does not guarantee future results. Investment return and principal value of an investment will fluctuate so that shares, when redeemed, may be worth more or less than their original cost. Current performance may be lower or higher than the performance quoted. Performance data current to the most recent month end may be obtained by calling 800 231-8002 or visiting macquarie.com/investment-management/mip.
Carefully consider the Portfolio’s investment objectives, risk factors, charges, and expenses before investing. This and other information can be found in the Portfolio’s prospectus and, if available, its summary prospectus, which may be obtained by visiting macquarie.com/investment-management/mip or calling 800 231-8002. Investors should read the prospectus and, if available, the summary prospectus carefully before investing.
Portfolio and benchmark performance
Average annual total returns
| | | | | | | | | | |
Periods ended Oct. 31, 2017 | | 1 year | | 3 years | | 5 years | | 10 years | | Lifetime |
Macquarie Large Cap Value Portfolio | | +13.83% | | +7.97% | | +13.73% | | +7.33% | | +9.99% |
Russell 1000 Value Index | | +17.78% | | +7.99% | | +13.48% | | +5.99% | | +10.10% |
Portfolio profile
Oct. 31, 2017
| | | | | | |
Total net assets | | Number of holdings | | | | |
$168.9 million | | 33 | | | | |
Inception date | | | | | | |
Feb. 3, 1992 | | | | | | |
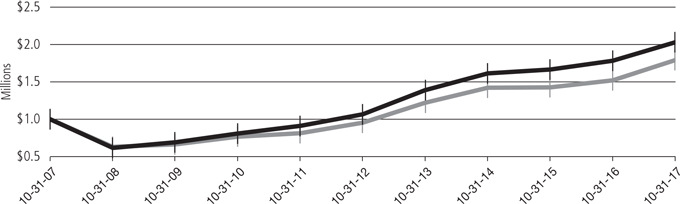
Growth of $1,000,000
| | | | | | |
| | | | Starting value (Oct. 31, 2007) | | Ending value (Oct. 31, 2017) |

| | Macquarie Large Cap Value Portfolio | | $1,000,000 | | $2,028,193 |

| | Russell 1000 Value Index | | $1,000,000 | | $1,789,148 |
The performance graph assumes $1 million invested on Oct. 31, 2007, and includes reinvestment of all distributions. The performance graph does not reflect the deduction of taxes the shareholder would pay on Portfolio distributions or redemptions of Portfolio shares.
Total return assumes reinvestment of dividends and capital gains, but does not reflect reductions for taxes. Returns and share values will fluctuate so that shares, when redeemed, may be worth more or less than their original cost.
6
The most recent prospectus disclosed the Portfolio’s total operating expenses as 0.65%. Management has contractually agreed to reimburse certain expenses and/or waive its management fees from Nov. 1, 2016, through Oct. 31, 2017,* in order to prevent total annual Portfolio operating expenses (with certain exclusions) from exceeding, in an aggregate amount, 0.70% of the Portfolio’s average daily net assets, as described in the most recent prospectus. Please see the “Financial highlights” section in this report for the most recent expense ratios.
Expense limitations were in effect during the period shown. Performance would have been lower had the expense limitations not been in effect.
The Russell 1000 Value Index measures the performance of the large-cap value segment of the US equity universe. It includes those Russell 1000 companies with lower price-to-book ratios and lower forecasted growth values.
Russell Investment Group is the source and owner of the trademarks, service marks, and copyrights related to the Russell Indexes. Russell® is a trademark of Russell Investment Group.
Index performance returns do not reflect any management fees, transaction costs, or expenses. Indices are unmanaged and one cannot invest directly in an index.
Investing involves risk, including the possible loss of principal.
Past performance is not a guarantee of future results.
* The aggregate contractual waiver period covering this report is from Feb. 26, 2016 through Feb. 28, 2018.
7
Portfolio management review
Macquarie Institutional Portfolios — Macquarie Core Plus Bond Portfolio
October 31, 2017
For the fiscal year ended Oct. 31, 2017, Macquarie Core Plus Bond Portfolio (formerly, The Core Plus Fixed Income Portfolio) returned +2.60% at net asset value (NAV) with all distributions reinvested. The Portfolio’s benchmark, the Bloomberg Barclays US Aggregate Index, returned +0.90% for the same period. Complete annualized performance for Macquarie Core Plus Bond Portfolio is shown in the table on page 10.
As the fiscal year began, the global economy picked up momentum following a brief period of economic and financial weakness. Earlier in 2016, slow-growing economies led the Bank of Japan (BOJ) and the European Central Bank (ECB) to initiate new stimulus policies, igniting rallies in numerous fixed income sectors. The BOJ pegged its 10-year government bond at a 0% yield and maintained shorter-term rates in negative yield territory, while the ECB extended its monthly asset purchases to $60 billion and began to include corporate bond purchases.
These major central bank moves and the pause in the US Federal Reserve’s move toward rate normalization in 2016 enhanced market liquidity, broadly boosting fixed income performance.
Additionally, early in the Portfolio’s fiscal year, the surprise election of Donald Trump as US president had a twofold effect on investors as they anticipated a more favorable operating environment for businesses and better returns from stocks. Additionally, Trump’s early tough talk on trade had a negative effect on emerging market fixed income securities and currencies, creating a buying opportunity.
Fixed income market yield premiums compressed throughout the fiscal year, despite a series of legislative disappointments, as investors found favor with the administration’s effort to reduce the regulatory burden on businesses. Meanwhile, the economic and financial market environments continued to improve. The euro zone entered a slow but steady period of growth while the US economy strengthened as unemployment continued to decline. China’s rate of growth stabilized, and other emerging market countries, which had suffered from a downturn in commodity prices, rallied back strongly. Early in 2017, for example, Brazil rebounded from a two-year recession.
The tightening of yield spreads boosted prices in most non-Treasury fixed income sectors. High yield spreads compressed significantly during the fiscal year, and investment grade corporate bonds, emerging market bonds, agency mortgage-backed securities (MBS), and commercial mortgage-backed securities (CMBS) benefited to varying degrees. High yield bonds also gained from a clearing-out process prompted by a modest spike in credit defaults before the fiscal period. This removed some market participants with weaker balance sheets and reinforced better behavior among companies that had taken on leverage or were considering doing so. As the fiscal year unfolded, companies reduced their leverage, improved their interest rate coverage ratios, and had better balance-sheet liquidity, resulting in lower default rates.
Holdings in high yield bonds, emerging markets, bank and finance bonds, and hybrid-type vehicles including convertible bonds and preferred stocks aided the Portfolio’s relative performance. A barbell strategy among agency MBS — focused on the short and long ends of the yield curve — also contributed.
Among high yield bonds, the Portfolio’s relatively defensive position helped during the fiscal year as intermediate quality and some lower-beta (less volatile) energy holdings performed well, including pipeline investments and independent energy producers.
In emerging market bonds, US dollar-denominated government bonds performed well early in the fiscal year, with yields decreasing as a result of improving economic fundamentals and a healthier market environment. Later in the period, the combination of some disappointments regarding the Trump administration’s legislative agenda and firming economic growth in non-US markets sparked a rally in both emerging market and developed market currencies relative to the US dollar. The Portfolio’s local-currency emerging market investments did well in Latin America, Asia, and Eastern Europe. We invested in Argentina for the first time in years, encouraged by its new president’s attractive economic policies. Uruguayan and Turkish government issues also contributed among emerging market bonds.
Domestically, with the Portfolio’s bank and finance investments, we went lower in the capital structure to find additional yield and greater potential return. This included extensive exposure to subordinate debt, including alternative tier 1 capital investments, which performed particularly well. The banking sector recovered strongly from the global financial crisis, thanks in part to regulators forcing banks to add capital and bolster their balance sheets. The result during the Portfolio’s fiscal year was a sound return on investments that were lower in capital structure. Individual contributors included hybrid securities issued by Royal Bank of Scotland Group, Credit Suisse Group, and UBS Group.
Among agency collateralized mortgage obligations (CMOs), we combined short-term interest-only investments on the short end of the barbell with long average life sequential-pay investments on the long end. With the yield curve flattening and short-term rates rising as a result of the Fed’s rate hikes, this barbell approach outperformed a typical plain-vanilla agency MBS investment.
On the negative side, the Portfolio’s US Treasury investments detracted from absolute returns. However, the Portfolio’s underweight exposure in Treasurys aided relative performance. Cross-country hedging was a more significant relative detractor from returns. Because we had anticipated that European rates would rise as a result of the region’s economic upswing, we used an interest rate swap in which the Portfolio paid 30-year bond rates and
8
received the London interbank offered rate (LIBOR). However, while the swap spreads widened, the yield curve flattened, hurting that trade.
Individual detractors from performance included Fannie Mae fixed-rate agency MBS, 30-year interest rate swaps, and a short position on 10-year German bund futures. Also, late in the period, South African bonds detracted from performance as a result of political volatility.
Overall, as of fiscal year end, we believed a number of sectors were fully priced and could be subject to corrections in the event of disappointing performance. The yield curve has flattened in response to the Fed’s slow and steady interest rate increases. With a rise in inflation, the curve could steepen again and compress fixed income prices across multiple sectors. Accordingly, as central bank
stimulus is gradually withdrawn, we anticipate a shift toward capital preservation.
The Portfolio used interest rate swaps — specifically interest rate futures — to adjust yield curve and duration levels. We used currency forwards to hedge currency exposure, primarily to help reduce it. The use of both derivatives, though intended to hedge risks, detracted from overall returns.
We also bought options on spot currency to help hedge long positions, used credit default swaps to lower credit exposure at times, and bought E-mini S&P 500 futures (these are one-fifth the size of the standard S&P 500 futures contracts) to hedge volatility and credit exposure. None of these derivative products or strategies had a material effect on the Portfolio’s returns.
The views expressed are current as of the date of this report and are subject to change.
9
Performance summary
Macquarie Institutional Portfolios — Macquarie Core Plus Bond Portfolio
The performance quoted represents past performance and does not guarantee future results. Investment return and principal value of an investment will fluctuate so that shares, when redeemed, may be worth more or less than their original cost. Current performance may be lower or higher than the performance quoted. Performance data current to the most recent month end may be obtained by calling 800 231-8002 or visiting macquarie.com/investment-management/mip.
Carefully consider the Portfolio’s investment objectives, risk factors, charges, and expenses before investing. This and other information can be found in the Portfolio’s prospectus and, if available, its summary prospectus, which may be obtained by visiting macquarie.com/investment-management/mip or calling 800 231-8002. Investors should read the prospectus and, if available, the summary prospectus carefully before investing.
| | | | | | | | | | |
Portfolio and benchmark performance |
Average annual total returns |
Periods ended Oct. 31, 2017 | | 1 year | | 3 years | | 5 years | | 10 years | | Lifetime |
Macquarie Core Plus Bond Portfolio | | +2.60% | | +2.50% | | +2.38% | | +5.36% | | +5.63% |
Bloomberg Barclays US Aggregate Index | | +0.90% | | +2.40% | | +2.04% | | +4.19% | | +4.47% |
Portfolio profile
Oct. 31, 2017
| | | | |
Total net assets | | Number of holdings | | |
$168.2 million | | 916 | | |
Inception date | | | | |
June 28, 2002 | | | | |
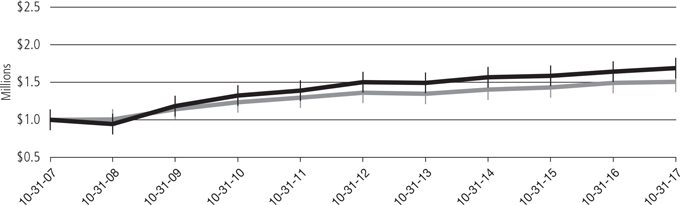
Growth of $1,000,000
| | | | | | |
| | | | Starting value (Oct. 31, 2007) | | Ending value (Oct. 31, 2017) |

| | Macquarie Core Plus Bond Portfolio | | $1,000,000 | | $1,685,994 |

| | Bloomberg Barclays US Aggregate Index | | $1,000,000 | | $1,506,972 |
The performance graph assumes $1 million invested on Oct. 31, 2007, and includes reinvestment of all distributions. The performance graph does not reflect the deduction of taxes the shareholder would pay on Portfolio distributions or redemptions of Portfolio shares.
Total return assumes reinvestment of dividends and capital gains, but does not reflect reductions for taxes. Returns and share values will fluctuate so that shares, when redeemed, may be worth more or less than their original cost.
10
The most recent prospectus disclosed the Portfolio’s total operating expenses as 0.60%. Management has contractually agreed to reimburse certain expenses and/or waive its management fees from Nov. 1, 2016, through Oct. 31, 2017,* in order to prevent total annual Portfolio operating expenses (with certain exclusions) from exceeding, in an aggregate amount, 0.45% of the Portfolio’s average daily net assets, as described in the most recent prospectus. Please see the “Financial highlights” section in this report for the most recent expense ratios.
Expense limitations were in effect during the period shown. Performance would have been lower had the expense limitations not been in effect.
The Bloomberg Barclays US Aggregate Index measures the performance of publicly issued investment grade (Baa3/BBB- or better) corporate, US government, mortgage- and asset-backed securities with at least one year to maturity and at least $250 million par amount outstanding.
Index performance returns do not reflect any management fees, transaction costs, or expenses. Indices are unmanaged and one cannot invest directly in an index.
Investing involves risk, including the possible loss of principal.
Past performance is not a guarantee of future results.
Fixed income securities and bond funds can lose value, and investors can lose principal, as interest rates rise. They also may be affected by economic conditions that hinder an issuer’s ability to make interest and principal payments on its debt.
The Portfolio may also be subject to prepayment risk, the risk that the principal of a bond that is held by the Portfolio will be prepaid prior to maturity, at the time when interest rates are lower than what the bond was paying. The Portfolio may then have to reinvest that money at a lower interest rate.
Interest payments on inflation-indexed debt securities will vary as the principal and/or interest is adjusted for inflation.
High yielding, non-investment grade bonds (junk bonds) involve higher risk than investment grade bonds. The high yield secondary market is particularly susceptible to liquidity problems when institutional investors, such as mutual funds and certain other financial institutions, temporarily stop buying bonds for regulatory, financial, or other reasons. In addition, a less liquid secondary market makes it more difficult for the Portfolio to obtain precise valuations of the high yield securities in its portfolio.
International investments entail risks not ordinarily associated with US investments including fluctuation in currency values, differences in accounting principles, or economic or political instability in other nations.
Investing in emerging markets can be riskier than investing in established foreign markets due to increased volatility and lower trading volume.
Because the Portfolio may invest in bank loans and other direct indebtedness, it is subject to the risk that the Portfolio will not receive payment of principal, interest, and other amounts due in connection with these investments, which primarily depend on the financial condition of the borrower and the lending institution.
The Portfolio may experience portfolio turnover in excess of 100%, which could result in higher transaction costs and tax liability.
This document may mention bond ratings published by nationally recognized statistical rating organizations (NRSROs) Standard & Poor’s, Moody’s Investors Service, and Fitch, Inc. For securities rated by an NRSRO other than S&P, the rating is converted to the equivalent S&P credit rating. Bonds rated AAA are rated as having the highest quality and are generally considered to have the lowest degree of investment risk. Bonds rated AA are considered to be of high quality, but with a slightly higher degree of risk than bonds rated AAA. Bonds rated A are considered to have many favorable investment qualities, though they are somewhat more susceptible to adverse economic conditions. Bonds rated BBB are believed to be of medium-grade quality and generally riskier over the long term. Bonds rated BB, B, and CCC are regarded as having significant speculative characteristics, with BB indicating the least degree of speculation of the three.
Investments in mortgage-backed securities (MBS) may involve risks. MBS represent an ownership interest in a pool of mortgage loans. The individual mortgage loans are packaged or “pooled” together for sale to investors. These mortgage loans may have either fixed or adjustable interest rates.
*The aggregate contractual waiver period covering this report is from Feb. 26, 2016 through Feb. 28, 2018.
11
Portfolio management review
Macquarie Institutional Portfolios — Macquarie High Yield Bond Portfolio
October 31, 2017
For the fiscal year ended Oct. 31, 2017, Macquarie High Yield Bond Portfolio (formerly, The High-Yield Bond Portfolio) returned +8.88% at net asset value (NAV) with all distributions reinvested. For the same period, the Portfolio’s benchmark, the BofA Merrill Lynch US High Yield Constrained Index, returned +9.14%. Complete annualized performance for Macquarie High Yield Bond Portfolio is shown in the table on page 14.
High yield bonds posted strong returns during the Portfolio’s fiscal year ended Oct. 31, 2017, as slow-but-steady economic growth and continued low benchmark interest rates provided investors with the confidence and incentive to move down the credit spectrum in search of yield. Notably, a portion of the demand for high yield debt originated from nontraditional buyers in Europe and Asia, where rates remained lower and economic growth was even more modest. Overall, high yield credit spreads tightened from 491 basis points at the start of the Portfolio’s fiscal year to 351 basis points as the period ended (source: Bloomberg).
Spreads tightened in January and February 2017, which seemed to indicate an optimistic outlook on corporate earnings and the potential for pro-growth fiscal policies. However, in March, spreads widened as increased energy supply and weakness in prices destabilized a key sector of the high yield market. Nonetheless, this period of spread widening was offset by the US presidential election results, which many investors believed enhanced the possibility of a major boost in infrastructure spending. Though expectations for a robust round of fiscal stimuli that would include corporate tax cuts were subsequently scaled back, business-friendly policies in Congress and the White House appeared likely to provide much-needed support to a high yield market that had become expensive — although not appearing to approach price inflation — by historical standards.
Sectors that typically benefit from faster economic growth, lower taxes, and targeted federal spending outperformed during the fiscal year. These included areas related to infrastructure spending such as basic industry, capital goods, commodities, and paper & packaging. Buyers were not indiscriminate, however, as weaker businesses were weeded out and replaced by sturdier names. Meanwhile, healthcare underperformed as a result of uncertainty about the fate of the Affordable Care Act and the legislation that might replace it, and headlines about high prescription drug prices. Retail also lagged, reflecting the ongoing move from brick-and-mortar stores to online shopping. Similarly, traditional wireline providers struggled amid the shift to wireless communications.
The Portfolio’s strongest sector contributors during the fiscal year were basic industry and capital goods; the largest detractors were energy and financials. On the individual securities level, our bottom-up (bond-by-bond) approach to portfolio construction identified several issues that offered nearly the same yield as similar bonds
ranking lower on the credit spectrum. A series of incremental moves into those positions improved the Portfolio’s credit profile without sacrificing income.
Among individual holdings, Scientific Games International contributed significantly to the Portfolio’s relative performance. In conducting our due diligence, we became convinced that the company — which provides a wide array of interactive technology products to the global lottery and regulated gaming industries — was committed to deleveraging its balance sheet and improving the pace of its sales growth. Scientific Games International was the Portfolio’s strongest performer during the fiscal year, and while maintaining a position in the security, we sold off a portion of the position in order to take some profits.
Prime Security Services Borrower added to the Portfolio’s performance during the fiscal year. The California-based company provides armed and unarmed security services to homes, businesses, events, individuals, and airports. In the past, we have found various aspects of the security business appealing, particularly its potential to generate recurrent free cash flow.
In the case of Prime Security Services Borrower, management indicated a willingness to pull back on capital spending plans and use the savings to pay down debt. As the fiscal year ended, the Portfolio continued to hold the bonds in anticipation of additional deleveraging that could result in a credit upgrade.
The Portfolio’s position in unsecured, longer-dated Sprint bonds also contributed to relative outperformance on the basis of stronger-than-expected earnings and ongoing rumors about merger and acquisition activity. Though the company’s management is actively attempting to partner with another communications business — either through an acquisition or as an acquisition target itself — we prefer to view Sprint as a stand-alone company that could remain independent indefinitely. The Portfolio continues to hold Sprint debt as we monitor the company’s attempt to find an alternative to its stalled merger negotiations with T-Mobile US.
Consumer products company Revlon detracted from the Portfolio’s relative performance. Management reported poor operating results and compounded the earnings undershoot by failing to provide investors with clear guidance for subsequent quarters. Revlon was also slow to establish an outlet for selling its products on Amazon, an oversight that exacerbated the general softness playing out in the retail sector. Given the lack of clarity, in our view, regarding the company’s prospects, we exited the position in the Portfolio during the fiscal year.
Uniti Group bonds also underperformed due to credit deterioration at its main tenant, Windstream, from which it derives 70% of its revenue. As Windstream has come under financial pressure, questions surrounding its ability to make lease payments to Uniti Group have
12
emerged, resulting in weakness within the Uniti bond complex. Based on this fundamental shift in risk profile for Uniti Group, we exited the Portfolio’s position during the fiscal year.
Another detractor from relative performance was the Portfolio’s position in Staples. The broader retail sector has come under pressure and has weighed heavily on most names within the space, including Staples, despite its business-to-business profile. Headlines surrounding Amazon’s intentions to offer prime membership to its business customers has further added to the pressure on Staples bonds despite little evidence that this offering will affect Staples’ current business with larger enterprise customers. However, given the broader pressure within retail, we reduced the Portfolio’s position in Staples and maintain our current position predicated on our view of solid credit metrics, reasonable free cash flow profile, and likely deleveraging of its balance sheet moving forward.
Despite a mild slip late in the Portfolio’s fiscal year, high yield fundamentals remained solid and should remain well supported. Given the current level of valuations, however, we are likely to continue to migrate the Portfolio toward what we view as higher-quality names. Specifically, we remain open to building larger positions when we believe a management team is committed to using free cash flow to deleverage its balance sheet. More broadly, we are inclined to view episodes of spread widening as buying opportunities within a generally favorable macroeconomic backdrop for high yield bonds. We believe that elevated valuations within the high yield market should play to our strength as bottom-up bond pickers and our emphasis on uncovering relative value through meticulous credit analysis.
The views expressed are current as of the date of this report and are subject to change.
13
Performance summary
Macquarie Institutional Portfolios — Macquarie High Yield Bond Portfolio
The performance quoted represents past performance and does not guarantee future results. Investment return and principal value of an investment will fluctuate so that shares, when redeemed, may be worth more or less than their original cost. Current performance may be lower or higher than the performance quoted. Performance data current to the most recent month end may be obtained by calling 800 231-8002 or visiting macquarie.com/investment-management/mip.
Carefully consider the Portfolio’s investment objectives, risk factors, charges, and expenses before investing. This and other information can be found in the Portfolio’s prospectus and, if available, its summary prospectus, which may be obtained by visiting macquarie.com/investment-management/mip or calling 800 231-8002. Investors should read the prospectus and, if available, the summary prospectus carefully before investing.
Portfolio and benchmark performance
Average annual total returns
| | | | | | | | | | | | | | | | | | | | |
Periods ended Oct. 31, 2017 | | | 1 year | | | | 3 years | | | | 5 years | | | | 10 years | | | | Lifetime | |
Macquarie High Yield Bond Portfolio | | | +8.88% | | | | +3.89% | | | | +5.40% | | | | +7.58% | | | | +7.70% | |
BofA Merrill Lynch US High Yield Constrained Index | | | +9.14% | | | | +5.62% | | | | +6.30% | | | | +7.77% | | | | +7.10% | |
Portfolio profile
Oct. 31, 2017
| | | | |
Total net assets | | Number of holdings | | |
$113.3 million | | 218 | | |
| | | | |
Inception date | | | | |
Dec. 2, 1996 | | | | |
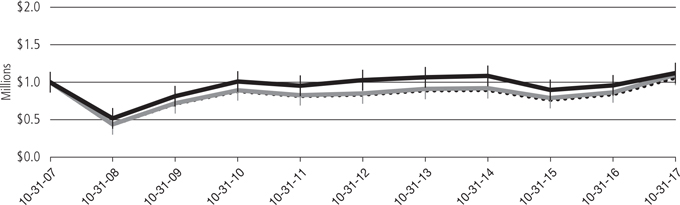
Growth of $1,000,000
| | | | | | |
| | | | Starting value (Oct. 31, 2007) | | Ending value (Oct. 31, 2017) |
| | BofA Merrill Lynch US High Yield Constrained Index | | $1,000,000 | | $2,114,219 |
| | Macquarie High Yield Bond Portfolio | | $1,000,000 | | $2,075,566 |
The performance graph assumes $1 million invested on Oct. 31, 2007, and includes reinvestment of all distributions. The performance graph does not reflect the deduction of taxes the shareholder would pay on Portfolio distributions or redemptions of Portfolio shares.
Total return assumes reinvestment of dividends and capital gains, but does not reflect reductions for taxes. Returns and share values will fluctuate so that shares, when redeemed, may be worth more or less than their original cost.
14
The most recent prospectus disclosed the Portfolio’s total operating expenses as 0.55%. Management has contractually agreed to reimburse certain expenses and/or waive its management fees from Nov. 1, 2016, through Oct. 31, 2017,* in order to prevent total annual Portfolio operating expenses (with certain exceptions) from exceeding, in an aggregate amount, 0.59% of the Portfolio’s average daily net assets, as described in the most recent prospectus. Please see the “Financial highlights” section in this report for the most recent expense ratios.
Expense limitations were in effect during the period shown. Performance would have been lower had the expense limitations not been in effect.
The BofA Merrill Lynch US High Yield Constrained Index tracks the performance of US dollar-denominated high yield corporate debt publicly issued in the US domestic market, but caps individual issuer exposure at 2% of the benchmark. Qualifying securities must have, among other things, a below-investment-grade rating (based on an average of Moody’s, Standard & Poor’s, and Fitch), an investment grade issuing country (based on an average of Moody’s, Standard & Poor’s, and Fitch foreign currency long-term sovereign debt ratings), and maturities of one year or more.
Index performance returns do not reflect any management fees, transaction costs, or expenses. Indices are unmanaged and one cannot invest directly in an index.
Investing involves risk, including the possible loss of principal.
Past performance is not a guarantee of future results.
Fixed income securities and bond funds can lose value, and investors can lose principal, as interest rates rise. They also may be affected by economic conditions that hinder an issuer’s ability to make interest and principal payments on its debt.
The Portfolio may also be subject to prepayment risk, the risk that the principal of a bond that is held by the Portfolio will be prepaid prior to maturity, at the time when interest rates are lower than what the bond was paying. The Portfolio may then have to reinvest that money at a lower interest rate.
The Portfolio may be invested in foreign corporate bonds, which have special risks not ordinarily associated with domestic investments, such as currency fluctuations, economic and political change, and different accounting standards.
High yielding, noninvestment grade bonds (junk bonds) involve higher risk than investment grade bonds.
The high yield secondary market is particularly susceptible to liquidity problems when institutional investors, such as mutual funds and certain other financial institutions, temporarily stop buying bonds for regulatory, financial, or other reasons. In addition, a less liquid secondary market makes it more difficult for the Portfolio to obtain precise valuations of the high yield securities in its portfolio.
The Portfolio may experience portfolio turnover in excess of 100%, which could result in higher transaction costs and tax liability.
This document may mention bond ratings published by nationally recognized statistical rating organizations (NRSROs) Standard & Poor’s, Moody’s Investors Service, and Fitch, Inc. For securities rated by an NRSRO other than S&P, the rating is converted to the equivalent S&P credit rating. Bonds rated AAA are rated as having the highest quality and are generally considered to have the lowest degree of investment risk. Bonds rated AA are considered to be of high quality, but with a slightly higher degree of risk than bonds rated AAA. Bonds rated A are considered to have many favorable investment qualities, though they are somewhat more susceptible to adverse economic conditions. Bonds rated BBB are believed to be of medium-grade quality and generally riskier over the long term. Bonds rated BB, B, and CCC are regarded as having significant speculative characteristics, with BB indicating the least degree of speculation of the three.
International investments entail risks not ordinarily associated with US investments including fluctuation in currency values, differences in accounting principles, or economic or political instability in other nations. Investing in emerging markets can be riskier than investing in established foreign markets due to increased volatility and lower trading volume.
*The aggregate contractual waiver period covering this report is from Feb. 26, 2016 through Feb. 28, 2018.
15
Portfolio management review
Macquarie Institutional Portfolios — Macquarie Emerging Markets Portfolio
October 31, 2017
For the fiscal year ended Oct. 31, 2017, Macquarie Emerging Markets Portfolio (formerly, The Emerging Markets Portfolio) returned +16.88% at net asset value (NAV) with all distributions reinvested. The Portfolio’s benchmark, the MSCI Emerging Markets Index, returned +26.91% (gross) and +26.45% (net) for the same period. Complete annualized performance for Macquarie Emerging Markets Portfolio is shown in the table on page 18.
The fiscal-year surge in emerging markets — which began in early 2017 — was largely due to strong performances in Asia, particularly China (+41%) and South Korea (+41%). Asian emerging markets were up 32%. As investors’ confidence in global growth prospects strengthened, these economies (which now make up more than 70% of the MSCI Emerging Markets Index) were the obvious beneficiaries. In most Asian countries, economic and political stability — with the key exception of saber rattling on the Korean peninsula — seemed to help boost returns. Benchmark-dominant China, with an almost 30% weighting, has been resilient and stable over the past 12 months, in general. Prior concerns about a slowing economy and a so-called “hard landing” proved to be exaggerated, and China’s economy grew 6.8% in the third quarter of 2017.
(Source: MSCI, Bloomberg.)
The laggards among emerging market countries included Mexico (+2%), Indonesia (+6%), Malaysia (+6%), and Brazil (+10%). India’s gain of 23% for the fiscal year, though strong, still underperformed.
Technology-related Asian growth stocks were among the strongest performers for the fiscal year, with China’s three Internet goliaths driving up the benchmark’s performance. Baidu (+38%), Alibaba (+82%), and Tencent (+69%) — the so-called BATs — make up more than 10% of the MSCI Emerging Markets Index, with weightings of 1.3%, 4.0%, and 4.9%, respectively. Given our value-based methodology, we declined to hold any Chinese growth-oriented technology stocks throughout the fiscal year, including the three BAT stocks. This was a significant driver of the Portfolio’s benchmark-relative underperformance for the fiscal year. The lofty valuations of these companies led us to question whether the assumed future growth built into their prices could be sustained over the long term. The BATs traded at price-to-earnings ratios of approximately 50 at the end of the fiscal period.
Similarly, we selectively underweighted information technology stocks in other markets. This sector was up 52% for the fiscal year. South Korean technology stocks performed relatively well, which also hurt the Portfolio’s relative performance. Samsung Electronics, which makes up about 5.3% of the benchmark, was up about 75% during the fiscal year. The Portfolio’s approximate one-percentage-point underweight in Samsung Electronics detracted on a relative basis. In fact, growth, as measured by the MSCI Emerging Markets Growth Index, was up 32% over the fiscal year versus a 21% rise in
the MSCI Emerging Markets Value Index during the same period (both based on net returns).
Other than information technology, just two other sectors outperformed over the fiscal year: materials (up 28%) and real estate (up 35%). Chinese property stocks drove the real estate sector’s rise. Many of the more stable and defensive sectors underperformed by a large margin, including consumer staples (+6%), telecommunication services (+7%), utilities (+8%), and healthcare (+11%). Energy rose 21%.
As we adhered to our value discipline, investors’ willingness to pay high premiums for growth stocks kept the benchmark’s advances out of the Portfolio’s reach for most of the fiscal period. Yet our methodology helped the Portfolio achieve strong gains in overlooked companies where valuations remained attractive to us. Our stock selection in energy was a strong contributor to the Portfolio’s absolute returns, as was stock selection in India, which was the strongest-performing area of the Portfolio. Indian holdings that did well included energy company Reliance Industries, up 85%; diversified commodity company Vedanta, up 79%; and Indiabulls Housing Finance, up 56%.
Individual holdings that detracted from the Portfolio’s performance included South African retailer Woolworths Holdings, which was down 27% over the fiscal year. The company’s stock took a hit as the restructuring benefits it hoped to achieve after its acquisition of an Australian department store operator were not yet realized. We still have confidence that its management could achieve most, if not all, of the benefits it is aiming for. The Portfolio’s holding in Fibra Uno Administracion, the Mexican real estate investment trust (REIT), declined 11% during the 12-month period. Fibra Uno Administracion contended with the dual headwinds of general concerns about Mexican growth and a rise in Mexican interest rates. Finally, Cielo, the Brazilian credit card processor, was down 17% due to concerns about the sustainability of its growth, and potential regulatory changes affecting the company’s profitability. We added to the Portfolio’s positions in all three stocks during the fiscal year.
The Portfolio’s positioning in Brazil helped both its absolute and relative performance. Though Brazil ended the fiscal period with a 10% gain, its market had a weak showing during the first six months of 2017. The Portfolio was underweight in Brazil compared to the benchmark during this time, but we added to the Portfolio’s positioning, including a number of new stocks, in the second half of the year; Brazil’s performance subsequently rose. One Brazilian highlight for the Portfolio was Suzano Papel e Celulose, a pulp and paper producer that gained 78% during the fiscal year, following a recovery in pulp prices.
The Portfolio ended the fiscal period overweight in India, where we continue to see attractive long-term growth prospects. In a market that can be quite expensive, we uncovered a number of value
16
opportunities, particularly in commodities, financials, and software. At the end of the fiscal period, the Portfolio remained overweight in Brazil, where we took advantage of volatility by investing in what we viewed as attractively priced companies. And we maintained the Portfolio’s underweight positioning in China, avoiding what we consider to be inflated valuations in the growth-oriented technology sector.
The Portfolio utilized foreign currency exchange contracts to facilitate the purchase and sale of equities traded on international exchanges. The effect of these contracts on performance was immaterial.
The views expressed are current as of the date of this report and are subject to change.
17
Performance summary
Macquarie Institutional Portfolios — Macquarie Emerging Markets Portfolio
The performance quoted represents past performance and does not guarantee future results. Investment return and principal value of an investment will fluctuate so that shares, when redeemed, may be worth more or less than their original cost. Current performance may be lower or higher than the performance quoted. Performance data current to the most recent month end may be obtained by calling 800 231-8002 or visiting macquarie.com/investment-management/mip.
Carefully consider the Portfolio’s investment objectives, risk factors, charges, and expenses before investing. This and other information can be found in the Portfolio’s prospectus and, if available, its summary prospectus, which may be obtained by visiting macquarie.com/investment-management/mip or calling 800 231-8002. Investors should read the prospectus and, if available, the summary prospectus carefully before investing.
Portfolio and benchmark performance
Average annual total returns
| | | | | | | | | | | | | | | | | | | | |
Periods ended Oct. 31, 2017 | | | 1 year | | | | 3 years | | | | 5 years | | | | 10 years | | | | Lifetime | |
Macquarie Emerging Markets Portfolio | | | +16.88% | | | | +1.13% | | | | +1.72% | | | | +1.15% | | | | +7.67% | |
MSCI Emerging Markets Index (gross) | | | +26.91% | | | | +6.08% | | | | +5.21% | | | | +0.93% | | | | +6.60% | |
MSCI Emerging Markets Index (net) | | | +26.45% | | | | +5.70% | | | | +4.83% | | | | +0.60% | | | | +6.30% | |
Portfolio profile
Oct. 31, 2017
| | | | |
| Total net assets | | Number of holdings | | |
| $136.7 million | | 74 | | |
| | | | |
| Inception date | | | | |
| April 16, 1997 | | | | |
Growth of $1,000,000
| | | | |
| | Starting value (Oct. 31, 2007) | | Ending value (Oct. 31, 2017) |
 Macquarie Emerging Markets Portfolio Macquarie Emerging Markets Portfolio
| | $1,000,000 | | $1,121,683 |
 MSCI Emerging Markets Index (gross) MSCI Emerging Markets Index (gross)
| | $1,000,000 | | $1,097,106 |
 MSCI Emerging Markets Index (net) MSCI Emerging Markets Index (net)
| | $1,000,000 | | $1,061,262 |
The performance graph assumes $1 million invested on Oct. 31, 2007, and includes reinvestment of all distributions. The performance graph does not reflect the deduction of taxes the shareholder would pay on Portfolio distributions or redemptions of Portfolio shares.
Total return assumes reinvestment of dividends and capital gains, but does not reflect reductions for taxes. Returns and share values will fluctuate so that shares, when redeemed, may be worth more or less than their original cost.
18
The most recent prospectus disclosed the Portfolio’s total operating expenses as 1.19%. Please see the “Financial highlights” section in this report for the most recent expense ratios. The purchase reimbursement fee (0.55%) and redemption reimbursement fee (0.55%) are paid to the Portfolio. These fees are designed to reflect an approximation of the brokerage and other transaction costs associated with the investment of an investor’s purchase amount or the disposition of assets to meet redemptions, and to limit the extent to which the Portfolio (and, indirectly, the Portfolio’s existing shareholders) would have to bear such costs. In lieu of the reimbursement fees, investors in Macquarie Emerging Markets Portfolio may be permitted to utilize alternative purchase and redemption methods designed to accomplish the same economic effect as the reimbursement fees. Reimbursement fees applicable to purchases and redemptions of shares of the Portfolio are not reflected in the “Growth of $1,000,000” graph.
Expense limitations were in effect during the period shown. Performance would have been lower had the expense limitations not been in effect.
The MSCI Emerging Markets Index measures equity market performance across emerging market countries worldwide. Index “gross” return approximates the maximum possible dividend reinvestment. Index “net” return approximates the minimum possible dividend reinvestment, after deduction of withholding tax at the highest possible rate.
The MSCI Emerging Markets Growth Index, mentioned on page 16, includes large- and mid-cap securities exhibiting overall growth style characteristics across 24 emerging market countries. The growth investment style characteristics for index construction are defined using five variables: long-term forward earnings per share (EPS) growth rate, short-term forward EPS growth rate, current internal growth rate, long-term historical EPS growth trend, and long-term historical sales per share growth trend.
The MSCI Emerging Markets Value Index, mentioned on page 16, includes large- and mid-cap securities exhibiting overall value style characteristics across 24 emerging market countries. The value investment style characteristics for index construction are defined using three variables: book value to price, 12-month forward earnings to price, and dividend yield.
Index performance returns do not reflect any management fees, transaction costs, or expenses. Indices are unmanaged and one cannot invest directly in an index.
Investing involves risk, including the possible loss of principal.
Past performance is not a guarantee of future results.
International investments entail risks not ordinarily associated with US investments including fluctuation in currency values, differences in accounting principles, or economic or political instability in other nations.
Investing in emerging markets can be riskier than investing in established foreign markets due to increased volatility and lower trading volume.
If and when the Portfolio invests in forward foreign currency contracts or uses other investments to hedge against currency risks, the Portfolio will be subject to special risks, including counterparty risk.
Fixed income securities and bond funds can lose value, and investors can lose principal, as interest rates rise. They also may be affected by economic conditions that hinder an issuer’s ability to make interest and principal payments on its debt.
The Portfolio may also be subject to prepayment risk, the risk that the principal of a bond that is held by the Portfolio will be prepaid prior to maturity, at the time when interest rates are lower than what the bond was paying. The Portfolio may then have to reinvest that money at a lower interest rate.
High yielding, non-investment-grade bonds (junk bonds) involve higher risk than investment grade bonds.
The Portfolio is presently closed to new investors.
19
Portfolio management review
Macquarie Institutional Portfolios — Macquarie Emerging Markets Portfolio II
October 31, 2017
For the fiscal year ended Oct. 31, 2017, Macquarie Emerging Markets Portfolio II (formerly, The Emerging Markets Portfolio II) returned +35.74% at net asset value (NAV) with all distributions reinvested. This result outpaced the Portfolio’s benchmark, the MSCI Emerging Markets Index, which returned +26.91% (gross) and +26.45% (net) for the same period. Complete annualized performance for Macquarie Emerging Markets Portfolio II is shown in the table on page 22.
The MSCI Emerging Markets Index rose sharply during the fiscal year, outpacing developed market equities (as measured by the MSCI EAFE Index). Emerging markets fell in November of 2016, following the US presidential election that resulted in a surprise victory for Donald Trump and triggered a rise in US bond yields and an appreciation of the US dollar. These, in turn, negatively affected emerging market equities and currencies. By early 2017, however, concerns surrounding the Trump administration’s policy agenda seemed to subside. Fund flows into emerging markets were generally robust, supported by stabilizing economic data, rising earnings expectations, and modest US dollar weakness.
India was the primary driver of the Portfolio’s outperformance during the fiscal year, due to favorable stock selection. Shares of Reliance Industries rose as its core refining and petrochemicals businesses performed relatively well, while its mobile telecommunications business continued to gain subscriber market share. We believe that Reliance Industries is among the most cost-competitive refiners and petrochemicals manufacturers globally. We expect the company’s earnings to grow through capacity expansion in these businesses; additionally, we hold a favorable view toward the company’s ventures in telecommunications and retail.
The Portfolio’s holdings in South Korea also contributed to the Portfolio’s performance due to positive asset allocation and favorable stock selection. Most notably, Samsung Biologics rose in anticipation of the stock’s inclusion in the KOSPI 200 Index, as well as optimism toward the company’s biosimilar pipeline. Shares of Samsung Electronics outperformed due to strength in the memory business while shares of LG Electronics rose due to optimism surrounding its auto components business.
In China, favorable stock selection in the technology sector contributed to the Portfolio’s performance, as several Chinese Internet stocks performed well. Strong user growth in Weibo also resulted in SINA posting strong financial results (SINA is Weibo’s controlling shareholder.) Weibo continues to demonstrate the social media platform’s monetization potential. Shares of Sohu.com rose in light of improved performance in its gaming and search businesses. Over the long term, we believe that these companies remain well positioned to potentially benefit from rising consumption and Internet engagement in China.
In Taiwan, the Portfolio’s underweight allocation, along with positive stock selection, contributed to performance. MediaTek outperformed as it has developed lower-cost smartphone chips that are expected to bolster profit margins. Shares of FIT Hon Teng, a recently listed company, rose in sympathy with positive sentiment in the communications sector.
Mexico was the main detractor from the Portfolio’s performance. In particular, shares of Grupo Televisa declined — Mexico’s core advertising market continued to be weak as consumption trends remained lackluster. We continue to hold the long-term view that the stock is undervalued compared to its assets, especially its Univision stake in the US and cable business in Mexico. Shares of Fomento Economico Mexicano also declined in sympathy with Mexico as a whole, which underperformed the MSCI Emerging Markets Index due to continued uncertainty around North American Free Trade Agreement (NAFTA) negotiations and a sluggish consumer environment. We believe Fomento Economico Mexicano is one of the strongest franchises in Mexico’s consumer sector and trades at a discount to fair value.
In Turkey, asset allocation and stock selection also detracted from relative performance as the Portfolio’s overweight position in Akbank was flat in US dollar terms during the fiscal year. Akbank is a well-run private bank and one of the most capitalized and most conservatively provisioned in Turkey, in our view. We believe the stock is well-positioned for growth as the economy recovers. In South Korea, shares of KCC detracted from the Portfolio’s relative performance as sales in the core paints business have been subdued due to softness in the shipbuilding and auto sectors. We continue to hold the stock due to inexpensive valuations. In addition, with the Lotte Group in the shadows of the political rift between South Korea and China, shares of Lotte Chilsung Beverage remained under pressure. Despite these concerns, we consider Lotte Group’s decision to restructure ownership as a positive step toward improving corporate transparency.
Technology, led by SINA and Samsung Electronics, was the largest contributor among sectors to the Portfolio’s performance. In contrast, the consumer staples sector detracted the most from the Portfolio’s relative performance.
Considering the varied macroeconomic backdrop that we see across emerging markets, we believe there are selective opportunities for long-term stock appreciation driven by structural demographic shifts, technology adoption, implementation of government policy, improvement in corporate governance, and industry consolidation. Our investment approach remains centered on identifying individual companies that we believe possess sustainable franchises and favorable long-term growth prospects and that trade at significant discounts to their intrinsic value. We are particularly focused on companies that we expect to benefit from long-term changes in how
20
people in emerging markets live and work. Sectors we currently favor include technology, telecommunications, and consumer staples.
The Portfolio utilized foreign currency exchange contracts to facilitate the purchase and sale of equities traded on international exchanges. The effect of these contracts on performance was immaterial.
The views expressed are current as of the date of this report and are subject to change.
21
Performance summary
Macquarie Institutional Portfolios — Macquarie Emerging Markets Portfolio II
The performance quoted represents past performance and does not guarantee future results. Investment return and principal value of an investment will fluctuate so that shares, when redeemed, may be worth more or less than their original cost. Current performance may be lower or higher than the performance quoted. Performance data current to the most recent month end may be obtained by calling 800 231-8002 or visiting macquarie.com/investment-management/mip.
Carefully consider the Portfolio’s investment objectives, risk factors, charges, and expenses before investing. This and other information can be found in the Portfolio’s prospectus and, if available, its summary prospectus, which may be obtained by visiting macquarie.com/investment-management/mip or calling 800 231-8002. Investors should read the prospectus and, if available, the summary prospectus carefully before investing.
Portfolio and benchmark performance
Average annual total returns
| | | | | | | | | | | | | | | | |
Periods ended Oct. 31, 2017 | | | 1 year | | | | 3 years | | | | 5 years | | | | Lifetime | |
Macquarie Emerging Markets Portfolio II | | | +35.74 | % | | | +6.43 | % | | | +8.23 | % | | | +5.88 | % |
MSCI Emerging Markets Index (gross) | | | +26.91 | % | | | +6.08 | % | | | +5.21 | % | | | +5.63 | % |
MSCI Emerging Markets Index (net) | | | +26.45 | % | | | +5.70 | % | | | +4.83 | % | | | +5.26 | % |
Portfolio profile
Oct. 31, 2017
| | | | |
| Total net assets | | Number of holdings | | |
| $46.0 million | | 98 | | |
| | | | |
| Inception date | | | | |
| June 23, 2010 | | | | |
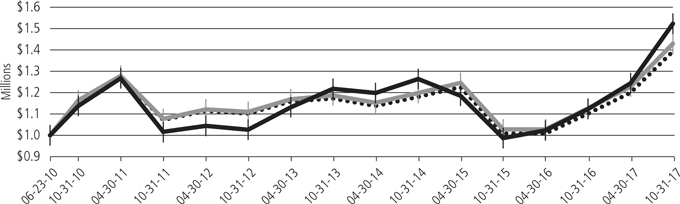
Growth of $1,000,000
| | | | |
| | Starting value (June 23, 2010) | | Ending value (Oct. 31, 2017) |
 Macquarie Emerging Markets Portfolio II Macquarie Emerging Markets Portfolio II
| | $1,000,000 | | $1,522,447 |
 MSCI Emerging Markets Index (gross) MSCI Emerging Markets Index (gross)
| | $1,000,000 | | $1,429,299 |
 MSCI Emerging Markets Index (net) MSCI Emerging Markets Index (net)
| | $1,000,000 | | $1,393,272 |
The performance graph assumes $1 million invested on June 23, 2010, and includes reinvestment of all distributions. The performance graph does not reflect the deduction of taxes the shareholder would pay on Portfolio distributions or redemptions of Portfolio shares.
Total return assumes reinvestment of dividends and capital gains, but does not reflect reductions for taxes. Returns and share values will fluctuate so that shares, when redeemed, may be worth more or less than their original cost.
22
The most recent prospectus disclosed the Portfolio’s total operating expenses as 1.34%. Management has contractually agreed to reimburse certain expenses and/or waive its management fees from Nov. 1, 2016, through Oct. 31, 2017,* in order to prevent total annual Portfolio operating expenses (with certain exclusions) from exceeding, in an aggregate amount, 1.20% of the Portfolio’s average daily net assets, as described in the most recent prospectus. Please see the “Financial highlights” section in this report for the most recent expense ratios.
Expense limitations were in effect during the period shown. Performance would have been lower had the expense limitations not been in effect.
The MSCI Emerging Markets Index measures equity market performance across emerging market countries worldwide. Index “gross” return approximates the maximum possible dividend reinvestment. Index “net” return approximates the minimum possible dividend reinvestment, after deduction of withholding tax at the highest possible rate.
The KOSPI 200 Index, mentioned on page 20, is a capitalization-weighted index of 200 Korean stocks which make up 93% of the total market value of the Korea Stock Exchange.
The MSCI EAFE (Europe, Australasia, Far East) Index, mentioned on page 20, is a free float-adjusted market capitalization weighted index designed to measure equity market performance of developed markets, excluding the United States and Canada.
Index performance returns do not reflect any management fees, transaction costs, or expenses. Indices are unmanaged and one cannot invest directly in an index.
Investing involves risk, including the possible loss of principal.
Past performance is not a guarantee of future results.
International investments entail risks not ordinarily associated with US investments including fluctuation in currency values, differences in accounting principles, or economic or political instability in other nations.
Investing in emerging markets can be riskier than investing in established foreign markets due to increased volatility and lower trading volume.
If and when the Portfolio invests in forward foreign currency contracts or uses other investments to hedge against currency risks, the Portfolio will be subject to special risks, including counterparty risk.
*The aggregate contractual waiver period covering this report is from Feb. 26, 2016 through Feb. 28, 2018.
23
Portfolio management review
Macquarie Institutional Portfolios — Macquarie Labor Select International Equity Portfolio
October 31, 2017
For the fiscal year ended Oct. 31, 2017, Macquarie Labor Select International Equity Portfolio (formerly, The Labor Select International Equity Portfolio) returned +22.13% at net asset value (NAV) with all distributions reinvested. The Portfolio’s benchmark, the MSCI EAFE Index, returned +24.01% (gross) and +23.44% (net) for the same period. Complete annualized performance for Macquarie Labor Select International Equity Portfolio is shown in the table on page 26.
International equity markets turned in a rousing performance over the 12-month period. The MSCI EAFE Index achieved strong results across Europe and the Asia-Pacific region. Cyclical stocks — which we avoided because of their extended valuations — led the rally during the fiscal year. As a result, the Portfolio lagged the benchmark, returning a still-robust 22.1% in US dollar terms. The Portfolio is designed to generate long-term alpha (that is, excess returns) through downside protection and capital preservation in weak markets, while capturing most of the upside in strong markets. As such, lagging the benchmark during such a strong bull market was not unexpected.
A quick review of the fiscal year’s headlines does little to explain the markets’ strength. Investors generally like certainty, yet somehow they seemed to shrug off uncertainties related to the implementation of Brexit, the Catalonian independence movement, and the surprising victory of Donald Trump in the US presidential election. Central banks worldwide, with the exception of the Bank of Japan, wound down monetary stimulus programs, signaling the advent of higher rates. North Korea continued launching missiles that were capable of delivering nuclear warheads at greater distances.
However, when we dig a little deeper, a more encouraging story takes shape. Familiar leaders were re-elected in Germany (Angela Merkel), Japan (Shinzo Abe), and the Netherlands (Mark Rutte). Although the election of Emmanuel Macron brought a new party into power in France, the policies of En Marche are generally pro-business and not out of the mainstream.
Exporters, in particular, caught a friendly tailwind, as solid performance in the world’s two largest economies — China and the United States — boosted demand to unexpected levels. In China, continued stimulus stoked strong gross domestic product (GDP) growth. Concerns that the US market had peaked proved to be off the mark, as its economy turned in its strongest performance since 2015. Demand from China and the US was robust, which has generally helped companies both in international developed markets and in emerging markets.
In addition, since the beginning of 2017, currency trends reversed and most currencies appreciated relative to the US dollar. The British pound and the euro rose 8.8% and 6.3%, respectively, but the Japanese yen depreciated 7.5% on expectations of monetary policy divergence. Overall, this helped investment results for US-based
investors, as strong local market returns in international equities were augmented by the currency translation.
All of the major European markets did well, led by Italy (+41.2%), France (+33.4%), Germany (+30.0%), and Spain (+28.0%). The UK equity market lagged the benchmark due to political uncertainty, yet still returned +21.6%. Weakness in Switzerland’s healthcare and consumer staples sectors held back Swiss equities (+20.3%).
The Asia-Pacific region wasn’t quite as strong across the board. Strength in the financial and real estate sectors and a recovery in surrounding emerging markets drove Singapore’s returns (+29.9%). Robust Macau gambling revenue helped Hong Kong’s return of +18.1%. Mounting geopolitical tensions over North Korea and a weak yen held back Japan’s returns (+17.8%). The Australian equity market generated the weakest returns among all major markets, but still increased 17.2%. A new bank levy weighed on both the financial and real estate sectors as its property market slowed.
Source: MSCI, Bloomberg.
The Portfolio’s defensive investment strategy is based on a strong value stock orientation. During the fiscal year, our fundamental analysis led us to diverge from market weightings in select European markets — these decisions detracted slightly from the Portfolio’s relative returns. The Portfolio benefited from an underweight position in the weak Australian equity market and an overweight in the strong Italian equity market. However, these were more than offset by the Portfolio’s overweight in the weak UK equity market and underweight in Japan.
As mentioned above, currency was an absolute positive for US investors in international equities. Currency allocation within the Portfolio also added to relative returns. The Portfolio’s underweight position in the weak yen and overweight position in the British pound were the chief sources of outperformance.
At the sector level, the Portfolio held overweight positions in telecommunications and energy, and underweight positions in financials and materials. Overall, sector allocations held back the Portfolio’s relative performance.
The telecommunications sector generated the weakest returns for the Portfolio. Increased competitive pressures and unfavorable regulatory regimes, as well as currency weakness from Japanese stocks, weighed on returns. Although this sector gained 8.4%, the Portfolio’s overweight detracted from relative performance. We also overweighted the energy sector, which worked out better for the Portfolio. Energy-related equities gained 26.5%, supported by a rise in the price of oil as higher demand growth and an agreement between the Organization of the Petroleum Exporting Countries (OPEC) and Russia to curb supply led to signs of a rebalancing of supply and demand.
24
Underweights in financials and materials detracted from the Portfolio’s relative returns versus the benchmark. Financials rose 29.2% as the sector benefited from generally robust economic data, steepening yield curves, and a growing consensus that delaying the so-called Basel IV rules would not materially affect capital requirements. The materials sector also generated strong returns, up 31.0%. The Chinese credit stimulus (which began in 2016) and a rise in expectations for US infrastructure spending following Trump’s victory led to gains in bulk commodities and metals.
The Portfolio’s holding in Koninklijke Ahold Delhaize held back returns. The Netherlands-based food retailer declined 15.3% when concerns over increased competition in the US food retail market were heightened by Amazon’s acquisition of Whole Foods. Another food retailer, UK-based Tesco, fell 5.9% despite strong operational performance, as pockets of high-profile shareholder opposition to Booker Group’s acquisition of Tesco emerged. Fears that a decline in discretionary income for UK consumers could hold back spending also weighed on the share price. Kingfisher decreased 2.8% due to market skepticism over its strategic plan to improve profitability by centralizing sourcing and its supply chain. The decline occurred despite full-year results indicating that the UK home improvement
company is on track to execute its strategy. The Portfolio continues to hold all three stocks and we added to the positions during the fiscal period, as we believe that the market overreacted to these events.
Holdings that delivered strong positive returns for the Portfolio included Enel, Allianz, and Kirin Holdings. The Portfolio gained significantly when Enel, the Italian utility, rose 48.7%. Cost savings from the company’s restructuring efforts in Latin America increased returns in Argentina, and robust Italian earnings contributed to Enel’s solid financial performance. Allianz, the German insurer, increased 54.0%. All of its segments performed relatively well, capital remained strong, and guidance for full-year 2017 operating profit was near the top of its target range. Finally, Kirin, the Japanese brewer, rose 40.7% on signs of easing competition in the domestic beer market.
The highlights of the Portfolio’s investment strategy include a strong value stock orientation, overweight positions in selected European markets, overweight positions in the telecommunications and energy sectors, and underweight positions in the financials and materials sectors.
The views expressed are current as of the date of this report and are subject to change.
25
Performance summary
Macquarie Institutional Portfolios — Macquarie Labor Select International Equity Portfolio
The performance quoted represents past performance and does not guarantee future results. Investment return and principal value of an investment will fluctuate so that shares, when redeemed, may be worth more or less than their original cost. Current performance may be lower or higher than the performance quoted. Performance data current to the most recent month end may be obtained by calling 800 231-8002 or visiting macquarie.com/investment-management/mip.
Carefully consider the Portfolio’s investment objectives, risk factors, charges, and expenses before investing. This and other information can be found in the Portfolio’s prospectus and, if available, its summary prospectus, which may be obtained by visiting macquarie.com/investment-management/mip or calling 800 231-8002. Investors should read the prospectus and, if available, the summary prospectus carefully before investing.
| | | | | | | | | | | | | | | | | | | | |
Portfolio and benchmark performance | | | | | | | | | | | | | | | | | | | | |
Average annual total returns | | | | | | | | | | | | | | | | | | | | |
Periods ended Oct. 31, 2017 | | | 1 year | | | | 3 years | | | | 5 years | | | | 10 years | | | | Lifetime | |
Macquarie Labor Select International Equity Portfolio | | | +22.13% | | | | +5.01% | | | | +7.54% | | | | +0.86% | | | | +7.33% | |
MSCI EAFE Index (gross) | | | +24.01% | | | | +6.58% | | | | +9.01% | | | | +1.58% | | | | +5.63% | |
MSCI EAFE Index (net) | | | +23.44% | | | | +6.08% | | | | +8.53% | | | | +1.10% | | | | +5.21% | |
| | | | | |
Portfolio profile | | | | | | | | | | | | | | | | | | | | |
Oct. 31, 2017 | | | | | | | | | | | | | | | | | | | | |
Total net assets | | | | | | | Number of holdings | |
$490.3 million | | | | | | | 56 | | | | | | | | | | | | | |
Inception date | | | | | | | | | | | | |
Dec. 19, 1995 | | | | | | | | | | | | | | | | | | | | |
Growth of $1,000,000
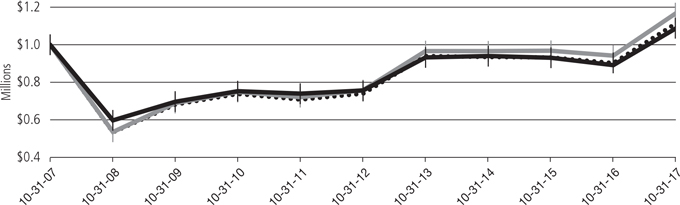
| | | | | | |
| | | | Starting value (Oct. 31, 2007) | | Ending value (Oct. 31, 2017) |

| | MSCI EAFE Index (gross) | | $1,000,000 | | $1,169,618 |

| | MSCI EAFE Index (net) | | $1,000,000 | | $1,115,702 |

| | Macquarie Labor Select International Equity Portfolio | | $1,000,000 | | $1,089,184 |
The performance graph assumes $1 million invested on Oct. 31, 2007, and includes reinvestment of all distributions. The performance graph does not reflect the deduction of taxes the shareholder would pay on Portfolio distributions or redemptions of Portfolio shares.
Total return assumes reinvestment of dividends and capital gains, but does not reflect reductions for taxes. Returns and share values will fluctuate so that shares, when redeemed, may be worth more or less than their original cost.
26
The most recent prospectus disclosed the Portfolio’s total operating expenses as 0.86%. Please see the “Financial highlights” section in this report for the most recent expense ratios.
The MSCI EAFE (Europe, Australasia, Far East) Index is a free float-adjusted market capitalization weighted index designed to measure equity market performance of developed markets, excluding the United States and Canada. Index “gross” return approximates the maximum possible dividend reinvestment. Index “net” return approximates the minimum possible dividend reinvestment, after deduction of withholding tax at the highest possible rate.
Index performance returns do not reflect any management fees, transaction costs, or expenses. Indices are unmanaged and one cannot invest directly in an index.
Investing involves risk, including the possible loss of principal.
Past performance is not a guarantee of future results.
International investments entail risks not ordinarily associated with US investments including fluctuation in currency values, differences in accounting principles, or economic or political instability in other nations.
Investing in emerging markets can be riskier than investing in established foreign markets due to increased volatility and lower trading volume.
If and when the Portfolio invests in forward foreign currency contracts or uses other investments to hedge against currency risks, the Portfolio will be subject to special risks, including counterparty risk.
From time to time, the Portfolio may invest up to 30% of its net assets in securities of issuers in the commercial banking industry; to the extent that the Portfolio invests 30% of its net assets in such securities, it may be slightly more sensitive to movement in the commercial banking industry.
Disclosure of Portfolio expenses
For the six-month period from May 1, 2017 to October 31, 2017 (Unaudited)
As a shareholder of a Portfolio, you incur two types of costs: (1) transaction costs, including reimbursement fees on Macquarie Emerging Markets Portfolio; and (2) ongoing costs, including management fees and other Portfolio expenses. The following examples are intended to help you understand your ongoing costs (in dollars) of investing in a Portfolio and to compare these costs with the ongoing costs of investing in other mutual funds.
The examples are based on an investment of $1,000 invested at the beginning of the period and held for the entire six-month period from May 1, 2017 to Oct. 31, 2017.
Actual Expenses
The first section of the table shown, “Actual Portfolio return,” provides information about actual account values and actual expenses. You may use the information in this table, together with the amount you invested, to estimate the expenses that you paid over the period. Simply divide your account value by $1,000 (for example, an $8,600 account value divided by $1,000 = 8.6), then multiply the result by the number in the first section under the heading entitled “Expenses Paid During Period” to estimate the expenses you paid on your account during the period.
Hypothetical Example for Comparison Purposes
The second section of the table shown, “Hypothetical 5% return,” provides information about hypothetical account values and hypothetical expenses based on a Portfolio’s actual expense ratio and an assumed rate of return of 5% per year before expenses, which is not the Portfolio’s actual return. The hypothetical account values and expenses may not be used to estimate the actual ending account balance or expenses you paid for the period. You may use this information to compare the ongoing costs of investing in the Portfolio and other funds. To do so, compare this 5% hypothetical example with the 5% hypothetical examples that appear in the shareholder reports of other funds.
Please note that the expenses shown in the table are meant to highlight your ongoing costs only and do not reflect any transactional costs. Therefore, the second section of the table is useful in comparing ongoing costs only, and will not help you determine the relative total costs of owning different funds. In addition, if these transactional costs were included, your costs would have been higher. Certain of the Portfolios’ actual expenses shown in the table reflect fee waivers in effect. The expenses shown in the table assume reinvestment of all dividends and distributions.
In each case, “Expenses Paid During Period” are equal to the relevant Portfolio’s annualized expense ratio, multiplied by the average account value over the period, multiplied by 184/365 (to reflect the one-half year period).
Macquarie Institutional Portfolios
Expense Analysis of an Investment of $1,000
| | | | | | | | | | | | | | | | |
| | | Beginning
Account
Value
5/1/17 | | | Ending
Account
Value
10/31/17 | | | Annualized
Expense
Ratio | | | Expenses
Paid
During
Period
5/1/17 to
10/31/17 | |
Actual Portfolio return† | | | | | |
Macquarie | | | | | | | | | | | | | | | | |
Large Cap Value Portfolio | | $ | 1,000.00 | | | $ | 1,049.30 | | | | 0.67 | % | | $ | 3.46 | |
Macquarie | | | | | | | | | | | | | | | | |
Core Plus Bond Portfolio | | | 1,000.00 | | | | 1,021.60 | | | | 0.45 | % | | | 2.29 | |
Macquarie | | | | | | | | | | | | | | | | |
High Yield Bond Portfolio | | | 1,000.00 | | | | 1,035.90 | | | | 0.59 | % | | | 3.03 | |
Macquarie | | | | | | | | | | | | | | | | |
Emerging Markets Portfolio | | | 1,000.00 | | | | 1,073.50 | | | | 1.24 | % | | | 6.48 | |
Macquarie | | | | | | | | | | | | | | | | |
Emerging Markets Portfolio II | | | 1,000.00 | | | | 1,224.60 | | | | 1.20 | % | | | 6.73 | |
Macquarie | | | | | | | | | | | | | | | | |
Labor Select International Equity Portfolio | | | 1,000.00 | | | | 1,092.70 | | | | 0.87 | % | | | 4.59 | |
| |
Hypothetical 5% return (5% return before expenses) | | | | | |
Macquarie | | | | | | | | | | | | | | | | |
Large Cap Value Portfolio | | $ | 1,000.00 | | | $ | 1,021.83 | | | | 0.67 | % | | $ | 3.41 | |
Macquarie | | | | | | | | | | | | | | | | |
Core Plus Bond Portfolio | | | 1,000.00 | | | | 1,022.94 | | | | 0.45 | % | | | 2.29 | |
Macquarie | | | | | | | | | | | | | | | | |
High Yield Bond Portfolio | | | 1,000.00 | | | | 1,022.23 | | | | 0.59 | % | | | 3.01 | |
Macquarie | | | | | | | | | | | | | | | | |
Emerging Markets Portfolio | | | 1,000.00 | | | | 1,018.95 | | | | 1.24 | % | | | 6.31 | |
Macquarie | | | | | | | | | | | | | | | | |
Emerging Markets Portfolio II | | | 1,000.00 | | | | 1,019.16 | | | | 1.20 | % | | | 6.11 | |
Macquarie | | | | | | | | | | | | | | | | |
Labor Select International Equity Portfolio | | | 1,000.00 | | | | 1,020.82 | | | | 0.87 | % | | | 4.43 | |
†Because actual returns reflect only the most recent six-month period, the returns shown may differ significantly from fiscal year returns.
28
Security type / sector allocations
and top 10 equity holdings
Macquarie Institutional Portfolios — Macquarie Large Cap Value Portfolio
As of October 31, 2017 (Unaudited)
Sector designations may be different than the sector designations presented in other Portfolio materials. The sector designations may represent the investment manager’s internal sector classifications, which may result in the sector designations for one portfolio being different than another portfolio’s sector designations.
| | |
| Security type / sector | | Percentage
of net assets |
Common Stock | | 98.80% |
Consumer Discretionary | | 5.99% |
Consumer Staples | | 8.89% |
Energy | | 15.40% |
Financials | | 12.03% |
Healthcare | | 20.11% |
Industrials | | 9.12% |
Information Technology | | 12.43% |
Materials | | 2.98% |
Real Estate | | 3.16% |
Telecommunications | | 5.70% |
Utilities | | 2.99% |
Short-Term Investments | | 5.87% |
Total Value of Securities | | 104.67% |
Liabilities Net of Receivables and Other Assets | | (4.67%) |
Total Net Assets | | 100.00% |
Holdings are for informational purposes only and are subject to change at any time. They are not a recommendation to buy, sell, or hold any security.
| | |
| Top 10 equity holdings | | Percentage
of net assets |
Intel | | 3.31% |
Marathon Oil | | 3.22% |
Mondelez International | | 3.16% |
Equity Residential | | 3.16% |
Chevron | | 3.11% |
Oracle | | 3.09% |
Raytheon | | 3.08% |
Halliburton | | 3.07% |
Pfizer | | 3.06% |
BB&T | | 3.05% |
Security type / sector allocations
Macquarie Institutional Portfolios — Macquarie Core Plus Bond Portfolio
As of October 31, 2017 (Unaudited)
Sector designations may be different than the sector designations presented in other Portfolio materials. The sector designations may represent the investment manager’s internal sector classifications, which may result in the sector designations for one portfolio being different than another portfolio’s sector designations.
| | |
| Security type / sector | | Percentage
of net assets |
Agency Asset-Backed Security | | 0.07% |
Agency Collateralized Mortgage Obligations | | 5.88% |
Agency Commercial Mortgage-Backed Securities | | 1.15% |
Agency Mortgage-Backed Securities | | 10.82% |
Collateralized Debt Obligations | | 2.36% |
Convertible Bonds | | 0.62% |
Corporate Bonds | | 49.93% |
Banking | | 11.04% |
Basic Industry | | 4.46% |
Brokerage | | 0.57% |
Capital Goods | | 3.07% |
Communications | | 5.20% |
Consumer Cyclical | | 3.83% |
Consumer Non-Cyclical | | 4.55% |
Electric | | 5.52% |
Energy | | 5.77% |
Finance Companies | | 0.91% |
Insurance | | 1.49% |
REITs | | 1.24% |
Technology | | 1.39% |
Transportation | | 0.89% |
| | |
| Security type / sector | | Percentage
of net assets |
Loan Agreements | | 3.06% |
Municipal Bonds | | 0.61% |
Non-Agency Asset-Backed Securities | | 2.71% |
Non-Agency Collateralized Mortgage Obligations | | 1.33% |
Non-Agency Commercial Mortgage-Backed Securities | | 5.93% |
Regional Bonds | | 0.38% |
Sovereign Bonds | | 3.93% |
Supranational Banks | | 0.32% |
US Treasury Obligations | | 3.86% |
Convertible Preferred Stock | | 0.16% |
Preferred Stock | | 0.37% |
Options Purchased | | 0.01% |
Short-Term Investments | | 6.61% |
Total Value of Securities | | 100.11% |
Liabilities Net of Receivables and Other Assets | | (0.11%) |
Total Net Assets | | 100.00% |
30
Macquarie Institutional Portfolios — Macquarie High Yield Bond Portfolio
As of October 31, 2017 (Unaudited)
Sector designations may be different than the sector designations presented in other Portfolio materials. The sector designations may represent the investment manager’s internal sector classifications, which may result in the sector designations for one portfolio being different than another portfolio’s sector designations.
| | |
| Security type / sector | | Percentage
of net assets |
Corporate Bonds | | 90.04% |
Automotive | | 0.66% |
Banking | | 3.13% |
Basic Industry | | 14.97% |
Capital Goods | | 3.01% |
Consumer Cyclical | | 7.71% |
Consumer Non-Cyclical | | 2.29% |
Energy | | 14.81% |
Financial Services | | 1.93% |
Healthcare | | 6.94% |
Insurance | | 2.24% |
Media | | 9.60% |
Services | | 8.40% |
Technology & Electronics | | 4.20% |
Telecommunications | | 5.96% |
Transportation | | 0.97% |
Utilities | | 3.22% |
Municipal Bond | | 0.27% |
Loan Agreements | | 2.97% |
Common Stock | | 0.00% |
Preferred Stock | | 0.96% |
Short-Term Investments | | 3.91% |
Total Value of Securities | | 98.15% |
Receivables and Other Assets Net of Liabilities | | 1.85% |
Total Net Assets | | 100.00% |
Security type / country and sector allocations
Macquarie Institutional Portfolios — Macquarie Emerging Markets Portfolio
As of October 31, 2017 (Unaudited)
Sector designations may be different than the sector designations presented in other Portfolio materials. The sector designations may represent the investment manager’s or sub-advisor’s internal sector classifications, which may result in the sector designations for one portfolio being different than another portfolio’s sector designations.
| | | | |
| Security type / country | | Percentage
of net assets | |
Common Stock | | | 95.66% | |
Brazil | | | 7.85% | |
China/Hong Kong | | | 19.28% | |
India | | | 13.56% | |
Indonesia | | | 1.41% | |
Kazakhstan | | | 0.41% | |
Malaysia | | | 4.97% | |
Mexico | | | 3.10% | |
Peru | | | 1.22% | |
Philippines | | | 1.17% | |
Qatar | | | 1.66% | |
Republic of Korea | | | 13.51% | |
Romania | | | 0.38% | |
Russia | | | 3.96% | |
South Africa | | | 6.03% | |
Taiwan | | | 10.34% | |
Thailand | | | 2.50% | |
Turkey | | | 2.86% | |
United Arab Emirates | | | 1.45% | |
Preferred Stock | | | 3.02% | |
Short-Term Investments | | | 1.50% | |
Total Value of Securities | | | 100.18% | |
Liabilities Net of Receivables and Other Assets | | | (0.18% | ) |
Total Net Assets | | | 100.00% | |
| | | | |
| Common and preferred stock by sector | | Percentage
of net assets | |
Consumer Discretionary | | | 11.48% | |
Consumer Staples | | | 4.94% | |
Energy | | | 5.66% | |
Financials | | | 26.10% | |
Healthcare | | | 1.08% | |
Industrials | | | 7.48% | |
Information Technology | | | 17.74% | |
Materials | | | 7.92% | |
Real Estate | | | 3.30% | |
Telecommunication Services | | | 6.66% | |
Utilities | | | 6.32% | |
Total | | | 98.68% | |
32
Macquarie Institutional Portfolios — Macquarie Emerging Markets Portfolio II
As of October 31, 2017 (Unaudited)
Sector designations may be different than the sector designations presented in other Portfolio materials. The sector designations may represent the investment manager’s internal sector classifications, which may result in the sector designations for one portfolio being different than another portfolio’s sector designations.
| | | | |
| Security type / country | | Percentage
of net assets | |
Common Stock | | | 98.10% | |
Argentina | | | 1.43% | |
Bahrain | | | 0.03% | |
Brazil | | | 14.72% | |
Canada | | | 0.76% | |
Chile | | | 0.47% | |
China/Hong Kong | | | 25.44% | |
Colombia | | | 0.47% | |
India | | | 10.57% | |
Indonesia | | | 1.35% | |
Malaysia | | | 0.20% | |
Mexico | | | 5.50% | |
Netherlands | | | 1.07% | |
Peru | | | 0.56% | |
Republic of Korea | | | 18.32% | |
Russia | | | 4.61% | |
Taiwan | | | 7.22% | |
Thailand | | | 1.21% | |
Turkey | | | 2.57% | |
United States | | | 1.60% | |
Exchange-Traded Fund | | | 0.46% | |
Preferred Stock | | | 1.64% | |
Rights | | | 0.00% | |
Total Value of Securities | | | 100.20% | |
Liabilities Net of Receivables and Other Assets | | | (0.20% | ) |
Total Net Assets | | | 100.00% | |
| | | | |
Common stock, preferred stock,
and rights by sector | | Percentage
of net assets | |
Consumer Discretionary | | | 9.30% | |
Consumer Staples | | | 9.00% | |
Energy | | | 13.92% | |
Financials | | | 12.58% | |
Healthcare | | | 0.57% | |
Industrials | | | 1.29% | |
Information Technology* | | | 38.28% | |
Materials | | | 4.42% | |
Telecommunication Services | | | 10.07% | |
Utilities | | | 0.31% | |
Total | | | 99.74% | |
| * | To monitor compliance with the Portfolio’s concentration guidelines as described in the Portfolio’s Prospectus and Statement of Additional Information, the Information Technology sector (as disclosed herein for financial reporting purposes) is subdivided into a variety of “industries” (in accordance with the requirements of the Investment Company Act of 1940 as amended). The Information Technology sector consisted of electronics, Internet, communications, and semiconductors. As of Oct. 31, 2017, such amounts, as a percentage of total net assets, were 1.45%, 21.19%, 1.60%, and 14.04%, respectively. The percentage in any such single industry will comply with the Portfolio’s concentration policy even if the percentages in the Information Technology sector for financial reporting purposes may exceed 25%. |
Security type / country and sector allocations
Macquarie Institutional Portfolios — Macquarie Labor Select International Equity Portfolio
As of October 31, 2017 (Unaudited)
Sector designations may be different than the sector designations presented in other Portfolio materials. The sector designations may represent the investment manager’s or sub-advisor’s internal sector classifications, which may result in the sector designations for one portfolio being different than another portfolio’s sector designations.
| | | | |
| Security type / country | | Percentage
of net assets | |
Common Stock | | | 98.86% | |
Australia | | | 1.39% | |
China/Hong Kong | | | 2.82% | |
Denmark | | | 1.16% | |
France | | | 6.63% | |
Germany | | | 12.85% | |
Italy | | | 5.82% | |
Japan | | | 18.03% | |
Netherlands | | | 2.53% | |
Singapore | | | 6.40% | |
Spain | | | 5.48% | |
Sweden | | | 4.44% | |
Switzerland | | | 7.48% | |
United Kingdom | | | 23.83% | |
Preferred Stock | | | 0.12% | |
Rights | | | 0.01% | |
Short-Term Investments | | | 0.45% | |
Total Value of Securities | | | 99.44% | |
Receivables and Other Assets Net of Liabilities | | | 0.56% | |
Total Net Assets | | | 100.00% | |
| | | | |
Common stock, preferred stock, and
rights by sector | | Percentage
of net assets | |
Consumer Discretionary | | | 14.56% | |
Consumer Staples | | | 8.51% | |
Energy | | | 10.84% | |
Financials | | | 16.03% | |
Healthcare | | | 10.98% | |
Industrials | | | 12.36% | |
Information Technology | | | 6.09% | |
Materials | | | 1.32% | |
Real Estate | | | 1.21% | |
Telecommunication Services | | | 10.00% | |
Utilities | | | 7.09% | |
Total | | | 98.99% | |
34
Schedules of investments
Macquarie Investment Portfolios — Macquarie Large Cap Value Portfolio
October 31, 2017
| | | | | | | | |
| | | Number of
shares | | | Value
(US $) | |
Common Stock – 98.80% | | | | | |
Consumer Discretionary – 5.99% | | | | | | | | |
Dollar Tree † | | | 56,200 | | | $ | 5,128,250 | |
Lowe’s | | | 62,400 | | | | 4,988,880 | |
| | | | | | | | |
| | | | | | | 10,117,130 | |
| | | | | | | | |
Consumer Staples – 8.89% | | | | | | | | |
Archer-Daniels-Midland | | | 124,000 | | | | 5,067,880 | |
CVS Health | | | 67,100 | | | | 4,598,363 | |
Mondelez International | | | 128,900 | | | | 5,340,327 | |
| | | | | | | | |
| | | | | | | 15,006,570 | |
| | | | | | | | |
Energy – 15.40% | | | | | | | | |
Chevron | | | 45,300 | | | | 5,249,817 | |
ConocoPhillips | | | 98,900 | | | | 5,058,735 | |
Halliburton | | | 121,300 | | | | 5,184,362 | |
Marathon Oil | | | 382,300 | | | | 5,436,306 | |
Occidental Petroleum | | | 78,700 | | | | 5,081,659 | |
| | | | | | | | |
| | | | | | | 26,010,879 | |
| | | | | | | | |
Financials – 12.03% | | | | | | | | |
Allstate | | | 54,200 | | | | 5,087,212 | |
Bank of New York Mellon | | | 97,400 | | | | 5,011,230 | |
BB&T | | | 104,600 | | | | 5,150,504 | |
Marsh & McLennan | | | 62,500 | | | | 5,058,125 | |
| | | | | | | | |
| | | | | | | 20,307,071 | |
| | | | | | | | |
Healthcare – 20.11% | | | | | | | | |
Abbott Laboratories | | | 91,700 | | | | 4,972,891 | |
Cardinal Health | | | 77,700 | | | | 4,809,630 | |
Express Scripts Holding † | | | 83,410 | | | | 5,112,199 | |
Johnson & Johnson | | | 35,900 | | | | 5,004,819 | |
Merck & Co. | | | 79,200 | | | | 4,363,128 | |
Pfizer | | | 147,211 | | | | 5,161,218 | |
Quest Diagnostics | | | 48,300 | | | | 4,529,574 | |
| | | | | | | | |
| | | | | | | 33,953,459 | |
| | | | | | | | |
Industrials – 9.12% | | | | | | | | |
Northrop Grumman | | | 17,100 | | | | 5,053,563 | |
Raytheon | | | 28,900 | | | | 5,207,780 | |
Waste Management | | | 62,600 | | | | 5,143,842 | |
| | | | | | | | |
| | | | | | | 15,405,185 | |
| | | | | | | | |
Information Technology – 12.43% | | | | | | | | |
CA | | | 157,936 | | | | 5,113,968 | |
Cisco Systems | | | 148,500 | | | | 5,071,275 | |
Intel | | | 123,000 | | | | 5,595,270 | |
Oracle | | | 102,500 | | | | 5,217,250 | |
| | | | | | | | |
| | | | | | | 20,997,763 | |
| | | | | | | | |
| | | | | | | | |
| | | Number of
shares | | | Value
(US $) | |
Common Stock (continued) | | | | | | | | |
Materials – 2.98% | | | | | | | | |
DowDuPont | | | 69,614 | | | $ | 5,033,788 | |
| | | | | | | | |
| | | | | | | 5,033,788 | |
| | | | | | | | |
Real Estate – 3.16% | | | | | | | | |
Equity Residential | | | 79,250 | | | | 5,330,355 | |
| | | | | | | | |
| | | | | | | 5,330,355 | |
| | | | | | | | |
Telecommunications – 5.70% | | | | | | | | |
AT&T | | | 138,000 | | | | 4,643,700 | |
Verizon Communications | | | 104,100 | | | | 4,983,267 | |
| | | | | | | | |
| | | | | | | 9,626,967 | |
| | | | | | | | |
Utilities – 2.99% | | | | | | | | |
Edison International | | | 63,200 | | | | 5,052,840 | |
| | | | | | | | |
| | | | | | | 5,052,840 | |
| | | | | | | | |
Total Common Stock
(cost $149,503,459) | | | | | | | 166,842,007 | |
| | | | | | | | |
| | |
| | | Principal
amount° | | | | |
Short-Term Investments – 5.87% | | | | | | | | |
Discount Notes – 2.94%≠ | | | | | | | | |
Federal Home Loan Bank
0.85% 11/1/17 | | | 639,971 | | | | 639,971 | |
0.90% 11/6/17 | | | 1,759,776 | | | | 1,759,532 | |
0.96% 11/3/17 | | | 734,045 | | | | 734,004 | |
0.97% 11/15/17 | | | 965,849 | | | | 965,473 | |
1.005% 11/9/17 | | | 424,663 | | | | 424,568 | |
1.005% 11/13/17 | | | 438,037 | | | | 437,891 | |
| | | | | | | | |
| | | | | | | 4,961,439 | |
| | | | | | | | |
Repurchase Agreements – 2.93% | | | | | | | | |
Bank of America Merrill Lynch
0.97%, dated 10/31/17, to be repurchased on 11/1/17, repurchase price $1,293,590 (collateralized by US government obligations 0.00%–9.00% 11/24/17–5/15/47; market value $1,319,428) | | | 1,293,556 | | | | 1,293,556 | |
Schedules of investments
Macquarie Investment Portfolios — Macquarie Large Cap Value Portfolio
| | | | | | | | |
| | | Principal
amount° | | | Value
(US $) | |
Short-Term Investments (continued) | | | | | |
Repurchase Agreements (continued) | | | | | |
BNP Paribas
1.00%, dated 10/31/17, to be repurchased on 11/1/17, repurchase price $3,654,021 (collateralized by US government obligations 0.00%–5.00% 2/15/18–2/15/46; market value $3,726,998) | | | 3,653,919 | | | $ | 3,653,919 | |
| | | | | | | | |
| | | | | | | 4,947,475 | |
| | | | | | | | |
Total Short-Term Investments
(cost $9,908,951) | | | | 9,908,914 | |
| | | | | | | | |
Total Value of
Securities – 104.67% | | | | | |
(cost $159,412,410) | | | | | | $ | 176,750,921 | |
| | | | | | | | |
| ≠ | The rate shown is the effective yield at the time of purchase. |
| ° | Principal amount shown is stated in US dollars unless noted that the security is denominated in another currency. |
| † | Non-income producing security. |
See accompanying notes, which are an integral part of the financial statements.
36
Macquarie Institutional Portfolios — Macquarie Core Plus Bond Portfolio
October 31, 2017
| | | | | | | | |
| | | Principal
amount° | | | Value
(US $) | |
Agency Asset-Backed Security – 0.07% | | | | | |
Fannie Mae Grantor Trust | | | | | | | | |
Series 2003-T4 2A5 4.757% 9/26/33 f | | | 101,590 | | | $ | 111,784 | |
| | | | | | | | |
Total Agency Asset-Backed Security
(cost $100,769) | | | | 111,784 | |
| | | | | | | | |
| | | | | | | |
Agency Collateralized Mortgage Obligations – 6.20% | | | | | |
Fannie Mae Connecticut Avenue Securities | | | | | | | | |
Series 2017-C01 1M1 2.538% (LIBOR01M + 1.30%) 7/25/29 ● | | | 76,233 | | | | 76,967 | |
Series 2017-C04 2M2 4.088% (LIBOR01M + 2.85%) 11/25/29 ● | | | 95,000 | | | | 97,079 | |
Series 2017-C05 1M2 3.438% (LIBOR01M + 2.20%) 1/25/30 ● | | | 105,000 | | | | 104,199 | |
Fannie Mae REMIC Trust | | | | | | | | |
Series 2004-W11 1A2 6.50% 5/25/44 | | | 19,978 | | | | 22,885 | |
Fannie Mae REMICs | | | | | | | | |
Series 2002-90 A1 6.50% 6/25/42 | | | 10,957 | | | | 12,622 | |
Series 2002-90 A2 6.50% 11/25/42 | | | 24,333 | | | | 27,728 | |
Series 2005-70 PA 5.50% 8/25/35 | | | 7,066 | | | | 7,925 | |
Series 2008-15 SB 5.362% (6.60% minus LIBOR01M, Cap 6.60%, Floor 0.00%) 8/25/36 S● | | | 19,701 | | | | 3,674 | |
Series 2010-129 SM 4.762% (6.00% minus LIBOR01M, Cap 6.00%, Floor 0.00%) 11/25/40 S● | | | 122,999 | | | | 18,544 | |
Series 2011-118 DC 4.00% 11/25/41 | | | 259,542 | | | | 269,883 | |
Series 2012-122 SD 4.862% (6.10% minus LIBOR01M, Cap 6.10%, Floor 0.00%) 11/25/42 S● | | | 162,330 | | | | 31,446 | |
Series 2012-132 AI 3.00% 12/25/27 S | | | 262,645 | | | | 24,519 | |
Series 2012-137 AI 3.00% 12/25/27 S | | | 427,698 | | | | 40,623 | |
Series 2012-139 NS 5.462% (6.70% minus LIBOR01M, Cap 6.70%, Floor 0.00%) 12/25/42 S● | | | 76,376 | | | | 17,877 | |
| | | | | | | | |
| | | Principal
amount° | | | Value
(US $) | |
Agency Collateralized Mortgage Obligations (continued) | | | | | |
Fannie Mae REMICs | | | | | | | | |
Series 2013-2 CS 4.912% (6.15% minus LIBOR01M, Cap 6.15%, Floor 0.00%) 2/25/43 S● | | | 220,347 | | | $ | 42,040 | |
Series 2013-7 EI 3.00% 10/25/40 S | | | 101,569 | | | | 13,390 | |
Series 2013-26 ID 3.00% 4/25/33 S | | | 57,732 | | | | 8,368 | |
Series 2013-38 AI 3.00% 4/25/33 S | | | 54,629 | | | | 7,212 | |
Series 2013-43 IX 4.00% 5/25/43 S | | | 516,434 | | | | 123,448 | |
Series 2013-44 DI 3.00% 5/25/33 S | | | 149,881 | | | | 21,817 | |
Series 2013-55 AI 3.00% 6/25/33 S | | | 225,867 | | | | 33,160 | |
Series 2013-59 PY 2.50% 6/25/43 | | | 15,000 | | | | 13,818 | |
Series 2013-103 SK 4.682% (5.92% minus LIBOR01M, Cap 5.92%, Floor 0.00%) 10/25/43 S● | | | 267,820 | | | | 59,057 | |
Series 2014-68 BS 4.912% (6.15% minus LIBOR01M, Cap 6.15%, Floor 0.00%) 11/25/44 S● | | | 174,853 | | | | 34,559 | |
Series 2014-90 SA 4.912% (6.15% minus LIBOR01M, Cap 6.15%, Floor 0.00%) 1/25/45 S● | | | 476,152 | | | | 92,795 | |
Series 2015-27 SA 5.212% (6.45% minus LIBOR01M, Cap 6.45%, Floor 0.00%) 5/25/45 S● | | | 66,777 | | | | 14,121 | |
Series 2015-40 GZ 3.50% 5/25/45 | | | 62,023 | | | | 60,801 | |
Series 2015-44 Z 3.00% 9/25/43 | | | 199,469 | | | | 194,075 | |
Series 2015-89 AZ 3.50% 12/25/45 | | | 20,316 | | | | 19,775 | |
Series 2015-95 SH 4.762% (6.00% minus LIBOR01M, Cap 6.00%, Floor 0.00%) 1/25/46 S● | | | 174,960 | | | | 38,905 | |
Series 2016-33 DI 3.50% 6/25/36 S | | | 320,684 | | | | 48,004 | |
Series 2016-40 ZC 3.00% 7/25/46 | | | 50,997 | | | | 47,244 | |
Series 2016-50 IB 3.00% 2/25/46 S | | | 92,621 | | | | 13,945 | |
Schedules of investments
Macquarie Institutional Portfolios — Macquarie Core Plus Bond Portfolio
| | | | | | | | |
| | | Principal
amount° | | | Value
(US $) | |
Agency Collateralized Mortgage Obligations (continued) | | | | | |
Fannie Mae REMICs | | | | | | | | |
Series 2016-51 LI 3.00% 8/25/46 S | | | 457,382 | | | $ | 72,937 | |
Series 2016-55 SK 4.762% (6.00% minus LIBOR01M, Cap 6.00%, Floor 0.00%) 8/25/46 S● | | | 140,783 | | | | 31,502 | |
Series 2016-62 SA 4.762% (6.00% minus LIBOR01M, Cap 6.00%, Floor 0.00%) 9/25/46 S● | | | 286,029 | | | | 66,911 | |
Series 2016-74 GS 4.762% (6.00% minus LIBOR01M, Cap 6.00%, Floor 0.00%) 10/25/46 S● | | | 91,921 | | | | 22,564 | |
Series 2016-79 JS 4.812% (6.05% minus LIBOR01M, Cap 6.05%, Floor 0.00%) 11/25/46 S● | | | 302,488 | | | | 65,074 | |
Series 2016-85 SA 4.762% (6.00% minus LIBOR01M, Cap 6.00%, Floor 0.00%) 11/25/46 S● | | | 317,027 | | | | 75,023 | |
Series 2016-99 DI 3.50% 1/25/46 S | | | 95,160 | | | | 16,048 | |
Series 2016-105 SA 4.762% (6.00% minus LIBOR01M, Cap 6.00%, Floor 0.00%) 1/25/47 S● | | | 211,990 | | | | 46,728 | |
Series 2017-8 BZ 3.00% 2/25/47 | | | 153,409 | | | | 142,109 | |
Series 2017-8 SG 4.762% (6.00% minus LIBOR01M, Cap 6.00%, Floor 0.00%) 2/25/47 S● | | | 266,734 | | | | 59,137 | |
Series 2017-11 EI 3.00% 3/25/42 S | | | 258,261 | | | | 38,084 | |
Series 2017-12 JI 3.50% 5/25/40 S | | | 89,452 | | | | 12,996 | |
Series 2017-16 SM 4.812% (6.05% minus LIBOR01M, Cap 6.05%, Floor 0.00%) 3/25/47 S● | | | 329,412 | | | | 70,746 | |
Series 2017-16 YT 3.00% 7/25/46 | | | 41,000 | | | | 40,463 | |
Series 2017-26 VZ 3.00% 4/25/47 | | | 145,521 | | | | 133,388 | |
Series 2017-40 GZ 3.50% 5/25/47 | | | 48,846 | | | | 49,902 | |
Series 2017-46 VG 3.50% 4/25/38 | | | 31,000 | | | | 31,843 | |
| | | | | | | | |
| | | Principal
amount° | | | Value
(US $) | |
Agency Collateralized Mortgage Obligations (continued) | | | | | |
Fannie Mae REMICs | | | | | | | | |
Series 2017-61 SB 4.912% (6.15% minus LIBOR01M, Cap 6.15%, Floor 0.00%) 8/25/47 S● | | | 474,202 | | | $ | 109,031 | |
Series 2017-61 TB 3.00% 8/25/44 | | | 45,000 | | | | 43,935 | |
Series 2017-69 SG 4.912% (6.15% minus LIBOR01M, Cap 6.15%, Floor 0.00%) 9/25/47 S● | | | 238,089 | | | | 51,899 | |
Freddie Mac REMICs | | | | | | | | |
Series 1730 Z 7.00% 5/15/24 | | | 29,841 | | | | 32,826 | |
Series 2326 ZQ 6.50% 6/15/31 | | | 26,735 | | | | 30,052 | |
Series 3123 HT 5.00% 3/15/26 | | | 78,760 | | | | 83,892 | |
Series 3656 PM 5.00% 4/15/40 | | | 55,097 | | | | 60,278 | |
Series 4050 EI 4.00% 2/15/39 S | | | 181,813 | | | | 20,504 | |
Series 4109 AI 3.00% 7/15/31 S | | | 335,421 | | | | 39,185 | |
Series 4120 IK 3.00% 10/15/32 S | | | 266,730 | | | | 36,958 | |
Series 4135 AI 3.50% 11/15/42 S | | | 4,508,070 | | | | 935,847 | |
Series 4146 IA 3.50% 12/15/32 S | | | 137,442 | | | | 21,895 | |
Series 4159 KS 4.911% (6.15% minus LIBOR01M, Cap 6.15%, Floor 0.00%) 1/15/43 S● | | | 124,194 | | | | 27,245 | |
Series 4161 IM 3.50% 2/15/43 S | | | 64,002 | | | | 14,277 | |
Series 4181 DI 2.50% 3/15/33 S | | | 88,904 | | | | 11,275 | |
Series 4184 GS 4.881% (6.12% minus LIBOR01M, Cap 6.12%, Floor 0.00%) 3/15/43 S● | | | 151,302 | | | | 32,615 | |
Series 4185 LI 3.00% 3/15/33 S | | | 58,289 | | | | 8,466 | |
Series 4191 CI 3.00% 4/15/33 S | | | 60,702 | | | | 8,836 | |
Series 4435 DY 3.00% 2/15/35 | | | 157,000 | | | | 157,233 | |
Series 4457 KZ 3.00% 4/15/45 | | | 129,334 | | | | 122,834 | |
38
| | | | | | | | |
| | | Principal
amount° | | | Value
(US $) | |
Agency Collateralized Mortgage Obligations (continued) | | | | | |
Freddie Mac REMICs | | | | | | | | |
Series 4464 DA 2.50% 1/15/43 | | | 28,717 | | | $ | 27,242 | |
Series 4494 SA 4.941% (6.18% minus LIBOR01M, Cap 6.18%, Floor 0.00%) 7/15/45 S● | | | 71,840 | | | | 14,863 | |
Series 4543 HI 3.00% 4/15/44 S | | | 83,912 | | | | 13,391 | |
Series 4581 LI 3.00% 5/15/36 S | | | 79,029 | | | | 11,207 | |
Series 4592 WT 5.50% 6/15/46 | | | 268,686 | | | | 298,405 | |
Series 4594 SG 4.761% (6.00% minus LIBOR01M, Cap 6.00%, Floor 0.00%) 6/15/46 S● | | | 420,395 | | | | 95,172 | |
Series 4614 HB 2.50% 9/15/46 | | | 78,000 | | | | 70,604 | |
Series 4618 SA 4.761% (6.00% minus LIBOR01M, Cap 6.00%, Floor 0.00%) 9/15/46 S● | | | 96,576 | | | | 23,097 | |
Series 4623 LZ 2.50% 10/15/46 | | | 67,669 | | | | 59,078 | |
Series 4623 MS 4.761% (6.00% minus LIBOR01M, Cap 6.00%, Floor 0.00%) 10/15/46 S● | | | 93,369 | | | | 22,625 | |
Series 4623 MW 2.50% 10/15/46 | | | 80,000 | | | | 73,151 | |
Series 4625 BI 3.50% 6/15/46 S | | | 303,961 | | | | 63,738 | |
Series 4625 PZ 3.00% 6/15/46 | | | 40,186 | | | | 38,000 | |
Series 4631 GS 4.761% (6.00% minus LIBOR01M, Cap 6.00%, Floor 0.00%) 11/15/46 S● | | | 321,064 | | | | 68,703 | |
Series 4631 LJ 3.00% 3/15/41 | | | 26,000 | | | | 25,992 | |
Series 4636 NZ 3.00% 12/15/46 | | | 89,200 | | | | 84,759 | |
Series 4640 LB 3.00% 9/15/43 | | | 295,000 | | | | 292,948 | |
Series 4648 MZ 3.00% 6/15/46 | | | 15,341 | | | | 14,470 | |
Series 4648 SA 4.761% (6.00% minus LIBOR01M, Cap 6.00%, Floor 0.00%) 1/15/47 S● | | | 231,868 | | | | 50,143 | |
| | | | | | | | |
| | | Principal
amount° | | | Value
(US $) | |
Agency Collateralized Mortgage Obligations (continued) | | | | | |
Freddie Mac REMICs | | | | | | | | |
Series 4650 JE 3.00% 7/15/46 | | | 16,000 | | | $ | 15,400 | |
Series 4655 WI 3.50% 8/15/43 S | | | 96,508 | | | | 16,532 | |
Series 4657 PS 4.761% (6.00% minus LIBOR01M, Cap 6.00%, Floor 0.00%) 2/15/47 S● | | | 187,271 | | | | 39,620 | |
Series 4663 AI 3.00% 3/15/42 S | | | 166,675 | | | | 22,873 | |
Series 4663 HZ 3.50% 3/15/47 | | | 1,038,967 | | | | 1,021,477 | |
Series 4673 WI 3.50% 9/15/43 S | | | 757,666 | | | | 104,895 | |
Series 4676 KZ 2.50% 7/15/45 | | | 50,628 | | | | 44,678 | |
Series 4700 WI 3.50% 1/15/44 S | | | 147,211 | | | | 22,072 | |
Series 4703 CI 3.50% 7/15/42 S | | | 269,262 | | | | 35,678 | |
Freddie Mac Strips | | | | | | | | |
Series 267 S5 4.761% (6.00% minus LIBOR01M, Cap 6.00%, Floor 0.00%) 8/15/42 S● | | | 183,235 | | | | 34,570 | |
Series 299 S1 4.761% (6.00% minus LIBOR01M, Cap 6.00%, Floor 0.00%) 1/15/43 S● | | | 142,164 | | | | 26,673 | |
Series 326 S2 4.711% (5.95% minus LIBOR01M, Cap 5.95%, Floor 0.00%) 3/15/44 S● | | | 167,944 | | | | 33,033 | |
Series 350 S5 1.697% 9/15/40 S● | | | 161,820 | | | | 8,624 | |
Freddie Mac Structured | | | | | | | | |
Agency Credit Risk Debt Notes | | | | | | | | |
Series 2017-DNA1 M2 4.488% (LIBOR01M + 3.25%) 7/25/29 ● | | | 250,000 | | | | 262,972 | |
Series 2017-DNA3 M2 3.738% (LIBOR01M + 2.50%) 3/25/30 ● | | | 250,000 | | | | 252,239 | |
Series 2017-HQA3 M2 3.588% (LIBOR01M + 2.35%) 4/25/30 ● | | | 250,000 | | | | 249,862 | |
GNMA | | | | | | | | |
Series 2010-113 KE 4.50% 9/20/40 | | | 125,000 | | | | 135,782 | |
Schedules of investments
Macquarie Institutional Portfolios — Macquarie Core Plus Bond Portfolio
| | | | | | | | |
| | | Principal
amount° | | | Value
(US $) | |
Agency Collateralized Mortgage Obligations (continued) | | | | | |
GNMA | | | | | | | | |
Series 2012-136 MX 2.00% 11/20/42 | | | 30,000 | | | $ | 26,344 | |
Series 2013-113 AZ 3.00% 8/20/43 | | | 210,733 | | | | 204,674 | |
Series 2013-113 LY 3.00% 5/20/43 | | | 22,000 | | | | 21,853 | |
Series 2015-64 GZ 2.00% 5/20/45 | | | 80,810 | | | | 67,556 | |
Series 2015-74 CI 3.00% 10/16/39 S | | | 167,632 | | | | 22,147 | |
Series 2015-133 AL 3.00% 5/20/45 | | | 208,000 | | | | 208,791 | |
Series 2015-142 AI 4.00% 2/20/44 S | | | 56,555 | | | | 7,395 | |
Series 2016-89 QS 4.811% (6.05% minus LIBOR01M, Cap 6.05%, Floor 0.00%) 7/20/46 S● | | | 155,237 | | | | 37,139 | |
Series 2016-108 SK 4.811% (6.05% minus LIBOR01M, Cap 6.05%, Floor 0.00%) 8/20/46 S● | | | 241,814 | | | | 54,490 | |
Series 2016-111 PB 2.50% 8/20/46 | | | 74,000 | | | | 67,505 | |
Series 2016-115 SA 4.861% (6.10% minus LIBOR01M, Cap 6.10%, Floor 0.00%) 8/20/46 S● | | | 480,724 | | | | 108,952 | |
Series 2016-116 GI 3.50% 11/20/44 S | | | 297,361 | | | | 52,757 | |
Series 2016-118 DI 3.50% 3/20/43 S | | | 340,308 | | | | 53,189 | |
Series 2016-120 AS 4.861% (6.10% minus LIBOR01M, Cap 6.10%, Floor 0.00%) 9/20/46 S● | | | 257,953 | | | | 61,242 | |
Series 2016-120 NS 4.861% (6.10% minus LIBOR01M, Cap 6.10%, Floor 0.00%) 9/20/46 S● | | | 349,395 | | | | 83,288 | |
Series 2016-121 JS 4.861% (6.10% minus LIBOR01M, Cap 6.10%, Floor 0.00%) 9/20/46 S● | | | 249,835 | | | | 60,438 | |
Series 2016-134 MW 3.00% 10/20/46 | | | 13,000 | | | | 13,227 | |
Series 2016-149 GI 4.00% 11/20/46 S | | | 95,318 | | | | 21,122 | |
Series 2016-156 PB 2.00% 11/20/46 | | | 47,000 | | | | 38,683 | |
| | | | | | | | |
| | | Principal
amount° | | | Value
(US $) | |
Agency Collateralized Mortgage Obligations (continued) | | | | | |
GNMA | | | | | | | | |
Series 2016-160 GI 3.50% 11/20/46 S | | | 206,420 | | | $ | 47,716 | |
Series 2016-163 MI 3.50% 11/20/46 S | | | 165,094 | | | | 19,570 | |
Series 2016-163 XI 3.00% 10/20/46 S | | | 238,346 | | | | 33,351 | |
Series 2017-10 KZ 3.00% 1/20/47 | | | 15,341 | | | | 14,199 | |
Series 2017-25 CZ 3.50% 2/20/47 | | | 65,509 | | | | 65,532 | |
Series 2017-56 QS 4.911% (6.15% minus LIBOR01M, Cap 6.15%, Floor 0.00%) 4/20/47 S● | | | 292,801 | | | | 60,973 | |
Series 2017-68 SB 4.911% (6.15% minus LIBOR01M, Cap 6.15%, Floor 0.00%) 5/20/47 S● | | | 229,005 | | | | 43,642 | |
Series 2017-80 AS 4.961% (6.20% minus LIBOR01M, Cap 6.20%, Floor 0.00%) 5/20/47 S● | | | 327,905 | | | | 72,075 | |
Series 2017-91 SM 4.961% (6.20% minus LIBOR01M, Cap 6.20%, Floor 0.00%) 6/20/47 S● | | | 193,866 | | | | 44,069 | |
Series 2017-101 AI 4.00% 7/20/47 S | | | 138,550 | | | | 28,198 | |
Series 2017-101 KS 4.961% (6.20% minus LIBOR01M, Cap 6.20%, Floor 0.00%) 7/20/47 S● | | | 222,846 | | | | 48,549 | |
Series 2017-101 SK 4.961% (6.20% minus LIBOR01M, Cap 6.20%, Floor 0.00%) 7/20/47 S● | | | 564,968 | | | | 123,003 | |
Series 2017-101 TI 4.00% 3/20/44 S | | | 212,397 | | | | 34,199 | |
Series 2017-117 SD 4.961% (6.20% minus LIBOR01M, Cap 6.20%, Floor 0.00%) 8/20/47 S● | | | 189,429 | | | | 42,109 | |
Series 2017-120 QS 4.961% (6.20% minus LIBOR01M, Cap 6.20%, Floor 0.00%) 8/20/47 S● | | | 263,908 | | | | 56,213 | |
Series 2017-130 YJ 2.50% 8/20/47 | | | 40,000 | | | | 36,120 | |
40
| | | | | | | | |
| | | Principal
amount° | | | Value
(US $) | |
Agency Collateralized Mortgage Obligations (continued) | | | | | |
GNMA | | | | | | | | |
Series 2017-134 ES 4.961% (6.20% minus LIBOR01M, Cap 6.20%, Floor 0.00%) 9/20/47 S● | | | 354,481 | | | $ | 75,860 | |
Series 2017-137 CZ 3.00% 9/20/47 | | | 201,503 | | | | 185,581 | |
Series 2017-141 JS 4.961% (6.20% minus LIBOR01M, Cap 6.20%, Floor 0.00%) 9/20/47 S● | | | 219,683 | | | | 46,379 | |
| | | | | | | | |
Total Agency Collateralized Mortgage Obligations (cost $10,547,182) | | | | 10,429,741 | |
| | | | | | | | |
| | | | | | | |
Agency Commercial Mortgage-Backed Securities – 1.15% | | | | | |
Freddie Mac Multifamily Structured Pass Through Certificates | | | | | | | | |
Series K057 A2 2.57% 7/25/26 ◆ | | | 240,000 | | | | 236,655 | |
Series KS03 A4
3.161% 5/25/25 ◆● | | | 130,000 | | | | 133,598 | |
FREMF Mortgage Trust | | | | | | | | |
Series 2010-K7 B 144A 5.685% 4/25/20 #● | | | 95,000 | | | | 101,180 | |
Series 2011-K12 B 144A 4.344% 1/25/46 #● | | | 95,000 | | | | 99,655 | |
Series 2011-K14 B 144A 5.167% 2/25/47 #● | | | 50,000 | | | | 53,952 | |
Series 2011-K15 B 144A 4.948% 8/25/44 #● | | | 150,000 | | | | 161,160 | |
Series 2011-K704 B 144A 4.536% 10/25/30 #● | | | 85,000 | | | | 86,251 | |
Series 2012-K22 B 144A 3.686% 8/25/45 #● | | | 60,000 | | | | 61,778 | |
Series 2012-K708 B 144A 3.751% 2/25/45 #● | | | 470,533 | | | | 477,738 | |
Series 2013-K32 B 144A 3.537% 10/25/46 #● | | | 95,000 | | | | 97,526 | |
Series 2013-K33 B 144A 3.501% 8/25/46 #● | | | 115,000 | | | | 116,686 | |
Series 2013-K712 B 144A 3.365% 5/25/45 #● | | | 140,000 | | | | 142,009 | |
Series 2013-K713 B 144A 3.165% 4/25/46 #● | | | 35,000 | | | | 35,392 | |
Series 2013-K713 C 144A 3.165% 4/25/46 #● | | | 135,000 | | | | 135,205 | |
| | | | | | | | |
Total Agency Commercial Mortgage-Backed Securities (cost $1,944,515) | | | | 1,938,785 | |
| | | | | | | | |
| | | | | | | | |
| | | Principal
amount° | | | Value
(US $) | |
Agency Mortgage-Backed Securities – 10.82% | | | | | |
Fannie Mae 3.00% 10/1/47 | | | 732,962 | | | $ | 730,009 | |
3.00% 2/1/57 | | | 268,504 | | | | 266,105 | |
Fannie Mae ARM 2.529%(LIBOR12M + 1.608%) 12/1/46 ● | | | 173,708 | | | | 173,894 | |
2.912%(LIBOR12M + 1.60%) 7/1/45 ● | | | 27,319 | | | | 27,774 | |
2.958%(LIBOR12M + 1.609%) 4/1/46 ● | | | 20,748 | | | | 21,120 | |
2.959%(LIBOR12M + 1.556%) 12/1/45 ● | | | 38,766 | | | | 39,616 | |
3.047%(LIBOR12M + 1.559%) 4/1/44 ● | | | 82,497 | | | | 84,354 | |
3.108%(LIBOR12M + 1.481%) 3/1/38 ● | | | 24,333 | | | | 25,322 | |
3.20%(LIBOR12M + 1.547%) 4/1/44 ● | | | 31,596 | | | | 32,437 | |
3.206%(LIBOR12M + 1.525%) 3/1/44 ● | | | 40,622 | | | | 41,748 | |
3.268%(LIBOR12M + 1.56%) 9/1/43 ● | | | 19,633 | | | | 20,161 | |
3.283%(LIBOR12M + 1.518%) 8/1/34 ● | | | 18,119 | | | | 18,891 | |
Fannie Mae FHAVA 4.50% 7/1/40 | | | 65,265 | | | | 70,247 | |
Fannie Mae S.F. 30 yr 4.50% 11/1/39 | | | 52,075 | | | | 56,643 | |
4.50% 6/1/40 | | | 58,498 | | | | 63,440 | |
4.50% 8/1/40 | | | 16,278 | | | | 17,578 | |
4.50% 8/1/41 | | | 71,498 | | | | 77,827 | |
4.50% 10/1/43 | | | 1,585,000 | | | | 1,717,909 | |
4.50% 10/1/44 | | | 46,145 | | | | 49,970 | |
4.50% 3/1/46 | | | 166,949 | | | | 178,812 | |
4.50% 5/1/46 | | | 702,672 | | | | 758,382 | |
4.50% 7/1/46 | | | 285,347 | | | | 307,521 | |
5.00% 12/1/35 | | | 246,126 | | | | 272,649 | |
5.00% 1/1/40 | | | 763,375 | | | | 846,155 | |
5.50% 8/1/37 | | | 208,804 | | | | 233,411 | |
5.50% 2/1/38 | | | 70,239 | | | | 77,725 | |
5.50% 3/1/39 | | | 77,663 | | | | 87,446 | |
5.50% 6/1/39 | | | 40,137 | | | | 44,692 | |
5.50% 6/1/41 | | | 108,100 | | | | 120,902 | |
5.50% 9/1/41 | | | 75,568 | | | | 85,183 | |
5.50% 5/1/44 | | | 2,520,557 | | | | 2,815,805 | |
6.00% 9/1/36 | | | 17,996 | | | | 20,653 | |
6.00% 12/1/36 | | | 1,946 | | | | 2,199 | |
6.00% 6/1/37 | | | 1,113 | | | | 1,263 | |
6.00% 7/1/37 | | | 880 | | | | 995 | |
6.00% 10/1/38 | | | 17,973 | | | | 20,383 | |
Schedules of investments
Macquarie Institutional Portfolios — Macquarie Core Plus Bond Portfolio
| | | | | | | | |
| | | Principal
amount° | | | Value (US $) | |
Agency Mortgage-Backed Securities (continued) | | | | | |
Fannie Mae S.F. 30 yr | | | | | | | | |
6.00% 11/1/38 | | | 4,693 | | | $ | 5,322 | |
6.00% 10/1/39 | | | 139,690 | | | | 159,067 | |
6.00% 11/1/40 | | | 3,312 | | | | 3,768 | |
6.00% 7/1/41 | | | 47,321 | | | | 53,812 | |
6.50% 5/1/40 | | | 27,609 | | | | 30,980 | |
7.00% 12/1/37 | | | 7,995 | | | | 8,479 | |
7.50% 6/1/31 | | | 785 | | | | 931 | |
7.50% 6/1/34 | | | 9,452 | | | | 10,689 | |
Fannie Mae S.F. 30 yr TBA | | | | | | | | |
3.00% 12/1/47 | | | 2,937,000 | | | | 2,933,673 | |
6.00% 11/1/47 | | | 619,000 | | | | 702,066 | |
Freddie Mac ARM | | | | | | | | |
2.558%(LIBOR12M + 1.63%) 10/1/46 ● | | | 56,796 | | | | 56,936 | |
2.74%(LIBOR12M + 1.629%) 2/1/47 ● | | | 32,444 | | | | 32,667 | |
2.921%(LIBOR12M + 1.63%) 10/1/45 ● | | | 58,269 | | | | 59,267 | |
2.924%(LIBOR12M + 1.612%) 11/1/44 ● | | | 16,527 | | | | 16,917 | |
2.969%(LIBOR12M + 1.62%) 11/1/45 ● | | | 47,295 | | | | 48,202 | |
3.111%(LIBOR12M + 1.62%) 3/1/46 ● | | | 85,401 | | | | 87,388 | |
Freddie Mac S.F. 30 yr | | | | | | | | |
4.50% 4/1/39 | | | 8,531 | | | | 9,184 | |
4.50% 5/1/40 | | | 318,345 | | | | 345,180 | |
4.50% 3/1/42 | | | 64,222 | | | | 69,231 | |
4.50% 7/1/42 | | | 84,675 | | | | 91,249 | |
4.50% 8/1/42 | | | 2,113,754 | | | | 2,282,865 | |
4.50% 12/1/43 | | | 61,910 | | | | 66,698 | |
4.50% 8/1/44 | | | 120,758 | | | | 129,644 | |
4.50% 7/1/45 | | | 320,267 | | | | 343,761 | |
5.00% 6/1/36 | | | 83,573 | | | | 91,192 | |
5.00% 5/1/41 | | | 66,121 | | | | 72,676 | |
5.00% 4/1/44 | | | 78,397 | | | | 86,110 | |
5.50% 3/1/34 | | | 2,511 | | | | 2,798 | |
5.50% 12/1/34 | | | 2,193 | | | | 2,448 | |
5.50% 11/1/35 | | | 4,045 | | | | 4,516 | |
5.50% 12/1/35 | | | 2,226 | | | | 2,491 | |
5.50% 11/1/36 | | | 2,738 | | | | 3,052 | |
5.50% 9/1/37 | | | 4,233 | | | | 4,703 | |
5.50% 1/1/39 | | | 17,471 | | | | 19,412 | |
5.50% 6/1/41 | | | 190,605 | | | | 212,037 | |
6.00% 2/1/36 | | | 4,649 | | | | 5,264 | |
6.00% 1/1/38 | | | 2,668 | | | | 3,005 | |
6.00% 8/1/38 | | | 10,851 | | | | 12,348 | |
6.00% 5/1/40 | | | 25,921 | | | | 29,385 | |
| | | | | | | | |
| | | Principal
amount° | | | Value (US $) | |
Agency Mortgage-Backed Securities (continued) | |
Freddie Mac S.F. 30 yr | | | | | | | | |
6.00% 7/1/40 | | | 25,364 | | | $ | 28,723 | |
7.00% 11/1/33 | | | 750 | | | | 858 | |
GNMA I S.F. 30 yr | | | | | | | | |
5.50% 2/15/41 | | | 36,341 | | | | 40,372 | |
7.00% 12/15/34 | | | 97,226 | | | | 113,101 | |
GNMA II S.F. 30 yr | | | | | | | | |
5.00% 9/20/46 | | | 90,724 | | | | 98,435 | |
5.50% 5/20/37 | | | 27,853 | | | | 30,841 | |
5.50% 4/20/40 | | | 20,909 | | | | 22,727 | |
6.00% 2/20/39 | | | 27,662 | | | | 30,717 | |
6.00% 10/20/39 | | | 111,031 | | | | 123,345 | |
6.00% 2/20/40 | | | 109,507 | | | | 122,046 | |
6.00% 4/20/46 | | | 34,749 | | | | 38,744 | |
6.50% 10/20/39 | | | 43,205 | | | | 48,175 | |
| | | | | | | | |
Total Agency Mortgage-Backed Securities
(cost $18,268,160) | | | | 18,206,718 | |
| | | | | | | | |
| | | | | | | | |
Collateralized Debt Obligations – 2.36% | |
Ammc CLO 21 | | | | | | | | |
Series 2017-21A A 144A 2.637% (LIBOR03M + 1.25%) 11/2/30 #● | | | 250,000 | | | | 251,145 | |
Apex Credit CLO 2017 | | | | | | | | |
Series 2017-1A A1 144A 2.835% (LIBOR03M + 1.47%) 4/24/29 #● | | | 295,000 | | | | 296,556 | |
Benefit Street Partners CLO IV | | | | | | | | |
Series 2014-IVA A1R 144A 2.853% (LIBOR03M + 1.49%) 1/20/29 #● | | | 500,000 | | | | 508,177 | |
BlueMountain CLO | | | | | | | | |
Series 2015-2A A1 144A 2.784% (LIBOR03M + 1.43%) 7/18/27 #● | | | 250,000 | | | | 250,670 | |
Cedar Funding VI CLO | | | | | | | | |
Series 2016-6A A1 144A 2.777% (LIBOR03M + 1.47%) 10/20/28 #● | | | 250,000 | | | | 253,365 | |
GoldenTree Loan Management US CLO 1 | | | | | | | | |
Series 2017-1A A 144A 2.583% (LIBOR03M + 1.22%) 4/20/29 #● | | | 250,000 | | | | 252,897 | |
MP CLO IV | | | | | | | | |
Series 2013-2A ARR 144A 2.647% (LIBOR03M + 1.28%) 7/25/29 #● | | | 250,000 | | | | 250,427 | |
42
| | | | | | | | |
| | | Principal
amount° | | | Value
(US $) | |
Collateralized Debt Obligations (continued) | |
Northwoods Capital XV | | | | | | | | |
Series 2017-15A A 144A 2.555% (LIBOR03M + 1.30%) 6/20/29 #● | | | 250,000 | | | $ | 251,654 | |
Oaktree CLO | | | | | | | | |
Series 2014-1A A1R 144A 2.599% (LIBOR03M + 1.29%) 5/13/29 #● | | | 350,000 | | | | 353,757 | |
OCP CLO | | | | | | | | |
Series 2017-13A A1A 144A 2.561% (LIBOR03M + 1.26%) 7/15/30 #● | | | 250,000 | | | | 251,500 | |
Octagon Investment Partners XV | | | | | | | | |
Series 2013-1A A1AR 144A 2.516% (LIBOR03M + 1.21%) 7/19/30 #● | | | 250,000 | | | | 251,948 | |
TIAA CLO II | | | | | | | | |
Series 2017-1A A 144A 2.643% (LIBOR03M + 1.28%) 4/20/29 #● | | | 250,000 | | | | 251,373 | |
Venture CDO | | | | | | | | |
Series 2016-25A A1 144A 2.853% (LIBOR03M + 1.49%) 4/20/29 #● | | | 100,000 | | | | 100,444 | |
Venture XXIV CLO | | | | | | | | |
Series 2016-24A A1D 144A 2.783% (LIBOR03M + 1.42%) 10/20/28 #● | | | 195,000 | | | | 197,712 | |
Venture XXVIII CLO | | | | | | | | |
Series 2017-28A A2 144A 2.716% (LIBOR03M + 1.11%) 7/20/30 #● | | | 250,000 | | | | 249,586 | |
| | | | | | | | |
Total Collateralized Debt Obligations (cost $3,935,880) | | | | | | | 3,971,211 | |
| | | | | | | | |
| | | | | | | | |
Convertible Bonds – 0.62% | | | | | | | | |
BioMarin Pharmaceutical 1.50% exercise price $94.15, maturity date 10/15/20 | | | 60,000 | | | | 68,363 | |
Blackhawk Network Holdings 1.50% exercise price $49.83, maturity date 1/15/22 | | | 30,000 | | | | 30,131 | |
Blackstone Mortgage Trust 5.25% exercise price $27.67, maturity date 12/1/18 | | | 40,000 | | | | 46,475 | |
| | | | | | | | |
| | | Principal
amount° | | | Value
(US $) | |
Convertible Bonds (continued) | | | | | | | | |
Cemex 3.72% exercise price $11.01, maturity date 3/15/20 | | | 30,000 | | | $ | 32,006 | |
Ciena 3.75% exercise price $20.17, maturity date 10/15/18 | | | 7,000 | | | | 8,295 | |
DISH Network 3.375% exercise price $65.18, maturity date 8/15/26 | | | 100,000 | | | | 108,063 | |
GAIN Capital Holdings 144A 5.00% exercise price $8.19, maturity date 8/15/22 # | | | 58,000 | | | | 64,924 | |
General Cable 4.50% exercise price $30.70, maturity date 11/15/29 f | | | 12,000 | | | | 11,573 | |
Hologic 2.00% exercise price $31.18, maturity date 3/1/42 f | | | 27,000 | | | | 33,615 | |
Insulet 1.25% exercise price $58.37, maturity date 9/15/21 | | | 60,000 | | | | 71,475 | |
Kaman 144A 3.25% exercise price $65.26, maturity date 5/1/24 # | | | 21,000 | | | | 22,798 | |
Liberty Interactive 144A 1.75% exercise price $341.10, maturity date 9/30/46 # | | | 80,000 | | | | 90,750 | |
Medicines 2.75% exercise price $48.97, maturity date 7/15/23 | | | 70,000 | | | | 65,931 | |
Microchip Technology 144A 1.625% exercise price $99.68, maturity date 2/15/27 # | | | 40,000 | | | | 50,575 | |
Neurocrine Biosciences 144A 2.25% exercise price $75.92, maturity date 5/15/24 # | | | 30,000 | | | | 34,444 | |
Nuance Communications 2.75% exercise price $32.30, maturity date 11/1/31 | | | 9,000 | | | | 9,023 | |
Pacira Pharmaceuticals 144A 2.375% exercise price $66.89, maturity date 4/1/22 # | | | 40,000 | | | | 37,225 | |
PDC Energy 1.125% exercise price $85.39, maturity date 9/15/21 | | | 50,000 | | | | 49,063 | |
Schedules of investments
Macquarie Institutional Portfolios — Macquarie Core Plus Bond Portfolio
| | | | | | | | |
| | | Principal
amount° | | | Value
(US $) | |
Convertible Bonds (continued) | | | | | |
Priceline Group 0.35% exercise price $1,315.10, maturity date 6/15/20 | | | 50,000 | | | $ | 74,500 | |
RPM International 2.25% exercise price $52.36, maturity date 12/15/20 | | | 25,000 | | | | 29,188 | |
Vector Group 2.50% exercise price $14.50, maturity date 1/15/19 ● | | | 20,000 | | | | 29,338 | |
Verint Systems 1.50% exercise price $64.46, maturity date 6/1/21 | | | 70,000 | | | | 68,906 | |
| | | | | | | | |
Total Convertible Bonds
(cost $1,044,182) | | | | 1,036,661 | |
| | | | | | | | |
| | | | | | | | |
Corporate Bonds – 49.93% | | | | | |
Banking – 11.04% | | | | | | | | |
Akbank Turk 144A 7.20% 3/16/27 #µ | | | 200,000 | | | | 207,086 | |
Ally Financial
5.75% 11/20/25 | | | 585,000 | | | | 648,619 | |
Banco Do Brasil 144A 4.625% 1/15/25 # | | | 200,000 | | | | 199,900 | |
Banco Nacional de Costa Rica 144A
5.875% 4/25/21 # | | | 200,000 | | | | 208,900 | |
Banco Santander
3.80% 2/23/28 | | | 200,000 | | | | 200,117 | |
Bancolombia
4.875% 10/18/27 µ | | | 200,000 | | | | 200,150 | |
Banistmo 144A
3.65% 9/19/22 # | | | 200,000 | | | | 200,380 | |
Bank of America
3.593% 7/21/28 µ | | | 350,000 | | | | 354,107 | |
4.183% 11/25/27 | | | 485,000 | | | | 506,654 | |
4.443% 1/20/48 µ | | | 250,000 | | | | 271,584 | |
Bank of New York Mellon 2.50% 4/15/21 | | | 110,000 | | | | 111,075 | |
3.30% 8/23/29 | | | 540,000 | | | | 538,852 | |
4.625%µy | | | 200,000 | | | | 206,250 | |
Barclays 8.25%µy | | | 400,000 | | | | 425,834 | |
BOC Aviation 144A 2.375% 9/15/21 # | | | 200,000 | | | | 196,364 | |
Branch Banking & Trust 2.85% 4/1/21 | | | 500,000 | | | | 509,550 | |
Citigroup
2.414% (LIBOR03M + 1.10%) 5/17/24 ● | | | 95,000 | | | | 95,977 | |
3.52% 10/27/28 µ | | | 20,000 | | | | 20,006 | |
Citizens Bank 2.55% 5/13/21 | | | 250,000 | | | | 251,201 | |
| | | | | | | | |
| | | Principal
amount° | | | Value
(US $) | |
Corporate Bonds (continued) | | | | | |
Banking (continued) | | | | | | | | |
Citizens Financial Group 4.30% 12/3/25 | | | 115,000 | | | $ | 120,451 | |
Compass Bank 2.875% 6/29/22 | | | 250,000 | | | | 248,462 | |
3.875% 4/10/25 | | | 250,000 | | | | 250,677 | |
Cooperatieve Rabobank 3.75% 7/21/26 | | | 250,000 | | | | 254,955 | |
Credit Suisse Group 144A 4.282% 1/9/28 # | | | 410,000 | | | | 427,884 | |
144A 6.25%#µy | | | 200,000 | | | | 219,250 | |
Credit Suisse Group Funding Guernsey 4.55% 4/17/26 | | | 360,000 | | | | 387,630 | |
Development Bank of Japan 144A 2.625% 9/1/27 # | | | 200,000 | | | | 197,347 | |
Fifth Third Bancorp 2.60% 6/15/22 | | | 50,000 | | | | 49,858 | |
Fifth Third Bank 3.85% 3/15/26 | | | 250,000 | | | | 258,421 | |
Goldman Sachs Group 3.272% 9/29/25 µ | | | 150,000 | | | | 149,691 | |
3.691% 6/5/28 µ | | | 515,000 | | | | 520,265 | |
5.15% 5/22/45 | | | 160,000 | | | | 182,550 | |
Huntington Bancshares 2.30% 1/14/22 | | | 160,000 | | | | 158,125 | |
Huntington National Bank 2.50% 8/7/22 | | | 250,000 | | | | 248,474 | |
JPMorgan Chase & Co.
3.54% 5/1/28 µ | | | 125,000 | | | | 126,594 | |
3.882% 7/24/38 µ | | | 170,000 | | | | 171,914 | |
4.032% 7/24/48 µ | | | 140,000 | | | | 143,128 | |
4.25% 10/1/27 | | | 25,000 | | | | 26,514 | |
6.75%µy | | | 205,000 | | | | 235,237 | |
KeyBank
2.30% 9/14/22 | | | 250,000 | | | | 247,759 | |
2.40% 6/9/22 | | | 250,000 | | | | 248,907 | |
3.40% 5/20/26 | | | 300,000 | | | | 299,330 | |
Landwirtschaftliche Rentenbank 5.375% 4/23/24 | | NZD | 38,000 | | | | 29,072 | |
Lloyds Banking Group 3.574% 11/7/28 µ | | | 395,000 | | | | 395,000 | |
Manufacturers & Traders Trust 2.50% 5/18/22 | | | 250,000 | | | | 250,425 | |
Morgan Stanley
3.591% 7/22/28 µ | | | 325,000 | | | | 327,892 | |
3.95% 4/23/27 | | | 105,000 | | | | 107,250 | |
4.375% 1/22/47 | | | 325,000 | | | | 346,782 | |
5.00% 11/24/25 | | | 360,000 | | | | 394,857 | |
44
| | | | | | | | |
| | | Principal
amount° | | | Value
(US $) | |
Corporate Bonds (continued) | | | | | |
Banking (continued) | | | | | | | | |
Nationwide Building | | | | | | | | |
Society 144A
4.125% 10/18/32 #µ | | | 500,000 | | | $ | 500,945 | |
Northern Trust
3.375% 5/8/32 µ | | | 55,000 | | | | 54,829 | |
PNC Bank
3.10% 10/25/27 | | | 500,000 | | | | 499,104 | |
6.875% 4/1/18 | | | 250,000 | | | | 255,432 | |
PNC Financial Services Group
5.00%µy | | | 160,000 | | | | 170,000 | |
Popular
7.00% 7/1/19 | | | 315,000 | | | | 322,875 | |
Regions Financial
2.75% 8/14/22 | | | 75,000 | | | | 75,199 | |
Royal Bank of Scotland Group
8.625%µy | | | 400,000 | | | | 453,960 | |
Santander UK 144A
5.00% 11/7/23 # | | | 200,000 | | | | 216,553 | |
Santander UK Group Holdings
3.823% 11/3/28 µ | | | 255,000 | | | | 257,213 | |
State Street
3.10% 5/15/23 | | | 65,000 | | | | 66,267 | |
3.30% 12/16/24 | | | 105,000 | | | | 109,066 | |
SunTrust Bank
2.45% 8/1/22 | | | 115,000 | | | | 114,608 | |
2.70% 1/27/22 | | | 55,000 | | | | 55,375 | |
3.30% 5/15/26 | | | 200,000 | | | | 198,334 | |
5.05%µy | | | 45,000 | | | | 46,260 | |
SVB Financial Group
3.50% 1/29/25 | | | 120,000 | | | | 120,838 | |
Toronto-Dominion Bank
2.50% 12/14/20 | | | 95,000 | | | | 95,998 | |
UBS Group 6.875%µy | | | 330,000 | | | | 371,144 | |
UBS Group Funding | | | | | | | | |
Switzerland
144A 2.859% 8/15/23 #µ | | | 200,000 | | | | 199,888 | |
144A 3.491% 5/23/23 # | | | 200,000 | | | | 205,164 | |
US Bancorp
2.375% 7/22/26 | | | 315,000 | | | | 299,482 | |
2.625% 1/24/22 | | | 40,000 | | | | 40,515 | |
3.10% 4/27/26 | | | 140,000 | | | | 139,604 | |
3.15% 4/27/27 | | | 410,000 | | | | 412,088 | |
3.60% 9/11/24 | | | 40,000 | | | | 41,629 | |
USB Capital IX 3.50% | | | | | | | | |
(LIBOR03M + 1.02%)y● | | | 355,000 | | | | 319,230 | |
Wells Fargo & Co.
4.75% 12/7/46 | | | 125,000 | | | | 136,621 | |
Wells Fargo Capital X
5.95% 12/15/36 | | | 55,000 | | | | 62,150 | |
| | | | | | | | |
| | | Principal
amount° | | | Value
(US $) | |
Corporate Bonds (continued) | | | | | |
Banking (continued) | | | | | | | | |
Westpac Banking
4.322% 11/23/31 µ | | | 40,000 | | | $ | 41,529 | |
5.00%µy | | | 50,000 | | | | 50,294 | |
Woori Bank 144A
4.75% 4/30/24 # | | | 200,000 | | | | 210,127 | |
Zions Bancorporation
4.50% 6/13/23 | | | 55,000 | | | | 58,291 | |
| | | | | | | | |
| | | | | | | 18,577,919 | |
| | | | | | | | |
Basic Industry – 4.46% | | | | | | | | |
Anglo American Capital 144A
4.875% 5/14/25 # | | | 600,000 | | | | 641,625 | |
Barrick North America Finance
5.75% 5/1/43 | | | 180,000 | | | | 224,390 | |
Beacon Escrow 144A
4.875% 11/1/25 # | | | 500,000 | | | | 509,375 | |
BHP Billiton Finance | | | | | | | | |
USA 144A
6.25% 10/19/75 #µ | | | 400,000 | | | | 439,200 | |
Boise Cascade 144A
5.625% 9/1/24 # | | | 500,000 | | | | 522,500 | |
Braskem Netherlands | | | | | | | | |
Finance 144A
4.50% 1/10/28 # | | | 200,000 | | | | 199,130 | |
Chemours
5.375% 5/15/27 | | | 220,000 | | | | 235,400 | |
CK Hutchison International
17 144A
2.875% 4/5/22 # | | | 200,000 | | | | 201,034 | |
Dow Chemical
8.55% 5/15/19 | | | 549,000 | | | | 603,009 | |
Equate Petrochemical 144A
3.00% 3/3/22 # | | | 200,000 | | | | 198,300 | |
Freeport-McMoRan
4.55% 11/14/24 | | | 375,000 | | | | 375,937 | |
Georgia-Pacific 144A
2.539% 11/15/19 # | | | 15,000 | | | | 15,159 | |
8.00% 1/15/24 | | | 310,000 | | | | 398,869 | |
Hudbay Minerals 144A
7.625% 1/15/25 # | | | 155,000 | | | | 171,663 | |
International Paper
4.35% 8/15/48 | | | 50,000 | | | | 51,601 | |
4.40% 8/15/47 | | | 65,000 | | | | 67,428 | |
Joseph T Ryerson & Son 144A
11.00% 5/15/22 # | | | 310,000 | | | | 349,525 | |
Mexichem 144A
5.50% 1/15/48 # | | | 200,000 | | | | 194,640 | |
Mosaic 5.625% 11/15/43 | | | 160,000 | | | | 168,384 | |
NOVA Chemicals
144A 5.00% 5/1/25 # | | | 55,000 | | | | 55,825 | |
144A 5.25% 6/1/27 # | | | 305,000 | | | | 311,100 | |
OCP 144A 4.50% 10/22/25 # | | | 200,000 | | | | 200,307 | |
Schedules of investments
Macquarie Institutional Portfolios — Macquarie Core Plus Bond Portfolio
| | | | | | | | |
| | | Principal
amount° | | | Value
(US $) | |
Corporate Bonds (continued) | | | | | | | | |
Basic Industry (continued) | | | | | | | | |
Olin 5.125% 9/15/27 | | | 345,000 | | | $ | 363,544 | |
Phosagro OAO via Phosagro | | | | | | | | |
Bond Funding DAC
144A 3.95% 11/3/21 # | | | 200,000 | | | | 202,540 | |
Steel Dynamics
5.50% 10/1/24 | | | 355,000 | | | | 381,085 | |
Vedanta Resources 144A
6.375% 7/30/22 # | | | 200,000 | | | | 209,740 | |
WestRock
144A 3.00% 9/15/24 # | | | 75,000 | | | | 74,837 | |
144A 3.375% 9/15/27 # | | | 70,000 | | | | 69,792 | |
WR Grace & Co.-Conn 144A
5.625% 10/1/24 # | | | 63,000 | | | | 69,143 | |
| | | | | | | | |
| | | | | | | 7,505,082 | |
| | | | | | | | |
Brokerage – 0.57% | | | | | | | | |
Charles Schwab 5.00%µy | | | 65,000 | | | | 65,813 | |
E*TRADE Financial
3.80% 8/24/27 | | | 300,000 | | | | 302,531 | |
5.875%µy | | | 160,000 | | | | 171,200 | |
Intercontinental Exchange
3.10% 9/15/27 | | | 100,000 | | | | 99,559 | |
Jefferies Group
4.85% 1/15/27 | | | 65,000 | | | | 69,202 | |
6.45% 6/8/27 | | | 30,000 | | | | 35,150 | |
6.50% 1/20/43 | | | 65,000 | | | | 74,751 | |
Lazard Group
3.625% 3/1/27 | | | 10,000 | | | | 9,993 | |
3.75% 2/13/25 | | | 125,000 | | | | 127,777 | |
| | | | | | | | |
| | | | | | | 955,976 | |
| | | | | | | | |
Capital Goods – 3.07% | | | | | | | | |
3M 2.875% 10/15/27 | | | 155,000 | | | | 155,171 | |
Allegion US Holding
3.20% 10/1/24 | | | 80,000 | | | | 80,365 | |
3.55% 10/1/27 | | | 432,000 | | | | 432,212 | |
Ardagh Packaging | | | | | | | | |
Finance 144A
6.00% 2/15/25 # | | | 345,000 | | | | 366,994 | |
Ball 5.25% 7/1/25 | | | 330,000 | | | | 363,825 | |
Boral Finance 144A
3.75% 5/1/28 # | | | 65,000 | | | | 65,612 | |
CCL Industries 144A
3.25% 10/1/26 # | | | 95,000 | | | | 91,061 | |
Crane
2.75% 12/15/18 | | | 20,000 | | | | 20,162 | |
4.45% 12/15/23 | | | 95,000 | | | | 99,538 | |
Eaton 3.103% 9/15/27 | | | 235,000 | | | | 231,886 | |
| | | | | | | | |
| | | Principal
amount° | | | Value
(US $) | |
Corporate Bonds (continued) | | | | | | | | |
Capital Goods (continued) | | | | | | | | |
General Electric
2.10% 12/11/19 | | | 130,000 | | | $ | 130,837 | |
5.55% 5/4/20 | | | 10,000 | | | | 10,878 | |
6.00% 8/7/19 | | | 90,000 | | | | 96,531 | |
LafargeHolcim Finance US 144A 3.50% 9/22/26 # | | | 400,000 | | | | 398,966 | |
Lennox International
3.00% 11/15/23 | | | 100,000 | | | | 100,204 | |
Northrop Grumman
3.25% 1/15/28 | | | 110,000 | | | | 110,926 | |
4.03% 10/15/47 | | | 130,000 | | | | 134,003 | |
Parker-Hannifin
3.30% 11/21/24 | | | 10,000 | | | | 10,290 | |
Rockwell Collins
3.20% 3/15/24 | | | 95,000 | | | | 96,987 | |
3.50% 3/15/27 | | | 250,000 | | | | 257,087 | |
Siemens Financierings-maatschappij 144A
3.125% 3/16/24 # | | | 545,000 | | | | 557,705 | |
Standard Industries 144A
5.00% 2/15/27 # | | | 400,000 | | | | 417,880 | |
Tyco Electronics Group
3.125% 8/15/27 | | | 70,000 | | | | 69,664 | |
United Rentals North America
5.875% 9/15/26 | | | 400,000 | | | | 437,750 | |
United Technologies
2.80% 5/4/24 | | | 150,000 | | | | 149,950 | |
3.75% 11/1/46 | | | 125,000 | | | | 122,110 | |
Waste Management
3.15% 11/15/27 | | | 165,000 | | | | 165,346 | |
| | | | | | | | |
| | | | | | | 5,173,940 | |
| | | | | | | | |
Communications – 5.20% | | | | | | | | |
AMC Networks
4.75% 8/1/25 | | | 225,000 | | | | 225,281 | |
AT&T
3.90% 8/14/27 | | | 130,000 | | | | 129,667 | |
4.25% 3/1/27 | | | 155,000 | | | | 159,234 | |
4.90% 8/14/37 | | | 370,000 | | | | 370,982 | |
5.15% 2/14/50 | | | 95,000 | | | | 94,039 | |
5.25% 3/1/37 | | | 45,000 | | | | 47,217 | |
CC Holdings GS V
3.849% 4/15/23 | | | 65,000 | | | | 67,590 | |
Cincinnati Bell 144A
7.00% 7/15/24 # | | | 84,000 | | | | 84,000 | |
Comcast 3.15% 2/15/28 | | | 430,000 | | | | 426,657 | |
Crown Castle International
3.65% 9/1/27 | | | 270,000 | | | | 269,968 | |
5.25% 1/15/23 | | | 150,000 | | | | 165,898 | |
46
| | | | | | | | |
| | | Principal
amount° | | | Value
(US $) | |
Corporate Bonds (continued) | | | | | | | | |
Communications (continued) | | | | | | | | |
Crown Castle Towers 144A
4.883% 8/15/20 # | | | 275,000 | | | $ | 290,525 | |
CSC Holdings 144A
5.50% 4/15/27 # | | | 200,000 | | | | 206,500 | |
Deutsche Telekom | | | | | | | | |
International Finance 144A
2.485% 9/19/23 # | | | 505,000 | | | | 492,045 | |
Discovery Communications
3.95% 3/20/28 | | | 350,000 | | | | 347,842 | |
5.20% 9/20/47 | | | 195,000 | | | | 199,383 | |
DISH DBS 7.75% 7/1/26 | | | 145,000 | | | | 159,137 | |
GTP Acquisition Partners I
144A 2.35% 6/15/20 # | | | 100,000 | | | | 99,716 | |
Level 3 Financing
5.375% 5/1/25 | | | 485,000 | | | | 508,037 | |
Midcontinent | | | | | | | | |
Communications 144A
6.875% 8/15/23 # | | | 155,000 | | | | 167,013 | |
Myriad International | | | | | | | | |
Holdings 144A
4.85% 7/6/27 # | | | 200,000 | | | | 205,795 | |
Nielsen Luxembourg 144A
5.00% 2/1/25 # | | | 345,000 | | | | 357,937 | |
SBA Tower Trust
144A 2.24% 4/10/18 # | | | 45,000 | | | | 45,011 | |
144A 2.898% 10/8/19 # | | | 60,000 | | | | 60,457 | |
Sirius XM Radio
144A 5.00% 8/1/27 # | | | 35,000 | | | | 35,481 | |
144A 5.375% 4/15/25 # | | | 330,000 | | | | 348,563 | |
Sprint 7.875% 9/15/23 | | | 443,000 | | | | 496,160 | |
Telecom Italia 144A
5.303% 5/30/24 # | | | 200,000 | | | | 216,250 | |
Time Warner Cable
7.30% 7/1/38 | | | 360,000 | | | | 452,156 | |
Time Warner Entertainment
8.375% 3/15/23 | | | 185,000 | | | | 229,872 | |
Unitymedia 144A
6.125% 1/15/25 # | | | 200,000 | | | | 214,080 | |
VEON Holdings 144A
4.95% 6/16/24 # | | | 200,000 | | | | 205,152 | |
Verizon Communications
4.50% 8/10/33 | | | 260,000 | | | | 268,566 | |
5.25% 3/16/37 | | | 110,000 | | | | 120,120 | |
Virgin Media Secured | | | | | | | | |
Finance 144A
5.50% 8/15/26 # | | | 400,000 | | | | 419,500 | |
Wind Acquisition | | | | | | | | |
Finance 144A
7.375% 4/23/21 # | | | 200,000 | | | | 208,260 | |
| | | | | | | | |
| | | Principal
amount° | | | Value
(US $) | |
Corporate Bonds (continued) | | | | | | | | |
Communications (continued) | | | | | | | | |
Zayo Group 144A
5.75% 1/15/27 # | | | 345,000 | | | $ | 364,406 | |
| | | | | | | | |
| | | | | | | 8,758,497 | |
| | | | | | | | |
Consumer Cyclical – 3.83% | | | | | | | | |
Atento Luxco 1 144A
6.125% 8/10/22 # | | | 75,000 | | | | 78,795 | |
Boyd Gaming
6.375% 4/1/26 | | | 320,000 | | | | 352,000 | |
Cencosud 144A
6.625% 2/12/45 # | | | 200,000 | | | | 218,739 | |
CVS Health
5.00% 12/1/24 | | | 375,000 | | | | 411,474 | |
Dollar General
3.875% 4/15/27 | | | 255,000 | | | | 266,444 | |
Ford Motor Credit
2.24% 6/15/18 | | | 465,000 | | | | 466,239 | |
General Motors
6.75% 4/1/46 | | | 40,000 | | | | 49,090 | |
General Motors Financial
5.25% 3/1/26 | | | 265,000 | | | | 289,958 | |
GLP Capital
5.375% 4/15/26 | | | 250,000 | | | | 271,250 | |
Goodyear Tire & Rubber
5.00% 5/31/26 | | | 330,000 | | | | 339,487 | |
Hyundai Capital America
144A 2.55% 2/6/19 # | | | 75,000 | | | | 75,152 | |
144A 3.00% 3/18/21 # | | | 120,000 | | | | 120,215 | |
JD.com
3.125% 4/29/21 | | | 200,000 | | | | 200,955 | |
Lear
3.80% 9/15/27 | | | 115,000 | | | | 115,609 | |
Lennar
4.50% 4/30/24 | | | 500,000 | | | | 516,250 | |
4.875% 12/15/23 | | | 165,000 | | | | 175,106 | |
Live Nation | | | | | | | | |
Entertainment 144A
4.875% 11/1/24 # | | | 195,000 | | | | 202,248 | |
Lowe’s
3.70% 4/15/46 | | | 150,000 | | | | 146,696 | |
4.05% 5/3/47 | | | 25,000 | | | | 25,830 | |
Marriott International
4.50% 10/1/34 | | | 20,000 | | | | 21,162 | |
MGM Growth Properties | | | | | | | | |
Operating Partnership
4.50% 9/1/26 | | | 250,000 | | | | 252,187 | |
Murphy Oil USA
6.00% 8/15/23 | | | 190,000 | | | | 200,213 | |
Penn National Gaming 144A
5.625% 1/15/27 # | | | 400,000 | | | | 415,000 | |
Penske Automotive Group
5.50% 5/15/26 | | | 350,000 | | | | 360,937 | |
PulteGroup
5.00% 1/15/27 | | | 170,000 | | | | 179,775 | |
Schedules of investments
Macquarie Institutional Portfolios — Macquarie Core Plus Bond Portfolio
| | | | | | | | |
| | | Principal
amount° | | | Value
(US $) | |
Corporate Bonds (continued) | | | | | | | | |
Consumer Cyclical (continued) | | | | | | | | |
Scientific Games International
10.00% 12/1/22 | | | 350,000 | | | $ | 388,063 | |
Tapestry 4.125% 7/15/27 | | | 115,000 | | | | 116,010 | |
Toyota Motor Credit
2.80% 7/13/22 | | | 140,000 | | | | 142,792 | |
Wyndham Worldwide
4.15% 4/1/24 | | | 40,000 | | | | 40,595 | |
| | | | | | | | |
| | | | | | | 6,438,271 | |
| | | | | | | | |
Consumer Non-Cyclical – 4.55% | | | | | |
Abbott Laboratories
2.80% 9/15/20 | | | 75,000 | | | | 76,198 | |
4.90% 11/30/46 | | | 220,000 | | | | 247,453 | |
Anheuser-Busch InBev | | | | | | | | |
Finance
3.65% 2/1/26 | | | 815,000 | | | | 842,301 | |
BAT Capital
144A 3.557% 8/15/27 # | | | 185,000 | | | | 185,818 | |
144A 4.39% 8/15/37 # | | | 180,000 | | | | 186,603 | |
Becle 144A
3.75% 5/13/25 # | | | 150,000 | | | | 150,808 | |
Becton Dickinson & Co.
3.363% 6/6/24 | | | 225,000 | | | | 227,175 | |
3.70% 6/6/27 | | | 75,000 | | | | 75,588 | |
Biogen 5.20% 9/15/45 | | | 285,000 | | | | 328,581 | |
Celgene 3.25% 8/15/22 | | | 425,000 | | | | 434,606 | |
DaVita 5.00% 5/1/25 | | | 190,000 | | | | 187,625 | |
ESAL 144A 6.25% 2/5/23 # | | | 200,000 | | | | 193,500 | |
HCA 5.375% 2/1/25 | | | 595,000 | | | | 613,409 | |
HealthSouth 5.75% 11/1/24 | | | 210,000 | | | | 215,381 | |
Kroger 2.65% 10/15/26 | | | 100,000 | | | | 92,761 | |
Marfrig Holdings | | | | | | | | |
Europe 144A
8.00% 6/8/23 # | | | 200,000 | | | | 209,750 | |
McCormick & Co.
2.70% 8/15/22 | | | 70,000 | | | | 70,344 | |
Molson Coors Brewing
3.00% 7/15/26 | | | 310,000 | | | | 302,455 | |
4.20% 7/15/46 | | | 115,000 | | | | 113,882 | |
Mylan 3.95% 6/15/26 | | | 90,000 | | | | 90,051 | |
New York & Presbyterian | | | | | | | | |
Hospital 4.063% 8/1/56 | | | 130,000 | | | | 131,417 | |
Pernod Ricard
144A 4.45% 1/15/22 # | | | 295,000 | | | | 317,145 | |
Pfizer 3.00% 12/15/26 | | | 160,000 | | | | 161,624 | |
Scotts Miracle-Gro
5.25% 12/15/26 | | | 195,000 | | | | 208,670 | |
Shire Acquisitions Investments | | | | | | | | |
Ireland
2.40% 9/23/21 | | | 160,000 | | | | 159,049 | |
2.875% 9/23/23 | | | 300,000 | | | | 297,313 | |
| | | | | | | | |
| | | Principal
amount° | | | Value
(US $) | |
Corporate Bonds (continued) | | | | | | | | |
Consumer Non-Cyclical (continued) | | | | | | | | |
Tempur Sealy International
5.50% 6/15/26 | | | 335,000 | | | $ | 345,888 | |
Tenet Healthcare 144A
5.125% 5/1/25 # | | | 380,000 | | | | 371,450 | |
Thermo Fisher Scientific
3.00% 4/15/23 | | | 545,000 | | | | 552,192 | |
Zimmer Biomet Holdings
4.625% 11/30/19 | | | 120,000 | | | | 125,744 | |
Zoetis 3.00% 9/12/27 | | | 140,000 | | | | 137,340 | |
| | | | | | | | |
| | | | | | | 7,652,121 | |
| | | | | | | | |
Electric – 5.52% | | | | | | | | |
AES 5.50% 4/15/25 | | | 110,000 | | | | 116,875 | |
AES Andres 144A
7.95% 5/11/26 # | | | 200,000 | | | | 217,500 | |
AES Gener
144A 5.25% 8/15/21 # | | | 200,000 | | | | 212,540 | |
144A 8.375% 12/18/73 #µ | | | 200,000 | | | | 212,340 | |
Ameren Illinois
9.75% 11/15/18 | | | 295,000 | | | | 318,048 | |
American Transmission | | | | | | | | |
Systems 144A 5.25% 1/15/22 # | | | 50,000 | | | | 54,675 | |
Berkshire Hathaway Energy
3.75% 11/15/23 | | | 195,000 | | | | 205,442 | |
Calpine
144A 5.25% 6/1/26 # | | | 125,000 | | | | 125,781 | |
5.50% 2/1/24 | | | 240,000 | | | | 230,626 | |
Cerro del Aguila
144A 4.125% 8/16/27 # | | | 200,000 | | | | 200,000 | |
Cleveland Electric Illuminating
144A 3.50% 4/1/28 # | | | 185,000 | | | | 185,838 | |
5.50% 8/15/24 | | | 75,000 | | | | 86,053 | |
CMS Energy 6.25% 2/1/20 | | | 120,000 | | | | 130,364 | |
ComEd Financing III
6.35% 3/15/33 | | | 60,000 | | | | 65,850 | |
Consumers Energy
3.25% 8/15/46 | | | 105,000 | | | | 96,446 | |
Dominion Energy
3.625% 12/1/24 | | | 305,000 | | | | 316,076 | |
DTE Electric 3.75% 8/15/47 | | | 55,000 | | | | 55,766 | |
DTE Energy
2.85% 10/1/26 | | | 190,000 | | | | 183,558 | |
3.30% 6/15/22 | | | 115,000 | | | | 117,964 | |
Duke Energy 2.65% 9/1/26 | | | 230,000 | | | | 221,139 | |
Dynegy 7.375% 11/1/22 | | | 350,000 | | | | 375,813 | |
Emera 6.75% 6/15/76 µ | | | 215,000 | | | | 246,981 | |
48
| | | | | | | | |
| | | Principal
amount° | | | Value
(US $) | |
Corporate Bonds (continued) | | | | | | | | |
Electric (continued) | | | | | | | | |
Emera US Finance
3.55% 6/15/26 | | | 165,000 | | | $ | 166,856 | |
4.75% 6/15/46 | | | 190,000 | | | | 206,320 | |
Enel 144A 8.75% 9/24/73 #µ | | | 200,000 | | | | 247,500 | |
Enel Americas 4.00%
10/25/26 | | | 75,000 | | | | 76,687 | |
Enel Finance International
144A 3.50% 4/6/28 # | | | 200,000 | | | | 196,940 | |
144A 3.625% 5/25/27 # | | | 200,000 | | | | 200,252 | |
Entergy
2.95% 9/1/26 | | | 40,000 | | | | 38,888 | |
Entergy Louisiana
4.05% 9/1/23 | | | 315,000 | | | | 337,035 | |
4.95% 1/15/45 | | | 10,000 | | | | 10,456 | |
Entergy Mississippi
2.85% 6/1/28 | | | 115,000 | | | | 111,681 | |
Exelon
3.497% 6/1/22 | | | 180,000 | | | | 185,416 | |
3.95% 6/15/25 | | | 150,000 | | | | 157,190 | |
Fortis 3.055% 10/4/26 | | | 480,000 | | | | 466,917 | |
Great Plains Energy
4.85% 6/1/21 | | | 35,000 | | | | 37,212 | |
Indiana Michigan Power
3.20% 3/15/23 | | | 10,000 | | | | 10,238 | |
4.55% 3/15/46 | | | 245,000 | | | | 273,214 | |
IPALCO Enterprises
3.45% 7/15/20 | | | 115,000 | | | | 117,156 | |
Kansas City Power & Light
3.65% 8/15/25 | | | 220,000 | | | | 226,421 | |
LG&E & KU Energy
4.375% 10/1/21 | | | 165,000 | | | | 175,241 | |
Metropolitan Edison 144A
4.00% 4/15/25 # | | | 110,000 | | | | 113,239 | |
MidAmerican Energy
4.25% 5/1/46 | | | 115,000 | | | | 125,736 | |
National Rural Utilities Cooperative Finance
2.85% 1/27/25 | | | 430,000 | | | | 428,875 | |
4.75% 4/30/43 µ | | | 70,000 | | | | 73,958 | |
5.25% 4/20/46 µ | | | 60,000 | | | | 64,883 | |
New York State Electric & Gas
144A 3.25% 12/1/26 # | | | 145,000 | | | | 146,642 | |
NextEra Energy Capital Holdings
3.55% 5/1/27 | | | 40,000 | | | | 41,357 | |
3.625% 6/15/23 | | | 145,000 | | | | 150,831 | |
NV Energy 6.25% 11/15/20 | | | 75,000 | | | | 83,432 | |
Pennsylvania Electric
5.20% 4/1/20 | | | 15,000 | | | | 15,972 | |
| | | | | | | | |
| | | Principal
amount° | | | Value
(US $) | |
Corporate Bonds (continued) | | | | | | | | |
Electric (continued) | | | | | | | | |
Public Service Co. of | | | | | | | | |
New Hampshire
3.50% 11/1/23 | | | 45,000 | | | $ | 47,102 | |
Public Service Co. of | | | | | | | | |
Oklahoma 5.15% 12/1/19 | | | 100,000 | | | | 105,933 | |
Southern
2.75% 6/15/20 | | | 125,000 | | | | 126,902 | |
3.25% 7/1/26 | | | 320,000 | | | | 318,795 | |
Trans-Allegheny Interstate | | | | | | | | |
Line 144A 3.85% 6/1/25 # | | | 70,000 | | | | 73,290 | |
Wisconsin Electric Power
4.30% 12/15/45 | | | 140,000 | | | | 149,223 | |
| | | | | | | | |
| | | | | | | 9,283,465 | |
| | | | | | | | |
Energy – 5.77% | | | | | | | | |
Abu Dhabi Crude Oil Pipeline
144A 3.65% 11/2/29 # | | | 200,000 | | | | 201,000 | |
144A 4.60% 11/2/47 # | | | 200,000 | | | | 204,681 | |
AmeriGas Partners
5.50% 5/20/25 | | | 325,000 | | | | 333,937 | |
Anadarko Petroleum
6.60% 3/15/46 | | | 225,000 | | | | 285,292 | |
Antero Resources
5.00% 3/1/25 | | | 355,000 | | | | 362,100 | |
Boston Gas 144A
3.15% 8/1/27 # | | | 60,000 | | | | 60,027 | |
Cheniere Corpus Christi | | | | | | | | |
Holdings
5.875% 3/31/25 | | | 160,000 | | | | 173,800 | |
Diamondback Energy
4.75% 11/1/24 | | | 275,000 | | | | 281,187 | |
Energy Transfer
6.125% 12/15/45 | | | 330,000 | | | | 361,947 | |
9.70% 3/15/19 | | | 59,000 | | | | 64,798 | |
EnLink Midstream Partners
6.00%µy | | | 70,000 | | | | 70,683 | |
Enterprise Products Operating 7.034% 1/15/68 µ | | | 30,000 | | | | 30,150 | |
Gazprom OAO Via Gaz | | | | | | | | |
Capital 144A
4.95% 3/23/27 # | | | 200,000 | | | | 205,297 | |
Gulfport Energy
6.00% 10/15/24 | | | 170,000 | | | | 170,850 | |
Hilcorp Energy I 144A
5.00% 12/1/24 # | | | 500,000 | | | | 500,000 | |
KazMunayGas National 144A
4.75% 4/19/27 # | | | 200,000 | | | | 204,824 | |
Magellan Midstream Partners
4.20% 10/3/47 | | | 120,000 | | | | 118,869 | |
Marathon Oil
4.40% 7/15/27 | | | 165,000 | | | | 169,705 | |
MPLX
4.875% 12/1/24 | | | 255,000 | | | | 277,717 | |
Schedules of investments
Macquarie Institutional Portfolios — Macquarie Core Plus Bond Portfolio
| | | | | | | | |
| | | Principal
amount° | | | Value
(US $) | |
Corporate Bonds (continued) | | | | | | | | |
Energy (continued) | | | | | | | | |
Murphy Oil 6.875% 8/15/24 | | | 385,000 | | | $ | 414,837 | |
Nabors Industries
5.50% 1/15/23 | | | 287,000 | | | | 276,237 | |
Newfield Exploration
5.75% 1/30/22 | | | 385,000 | | | | 415,800 | |
Noble Energy
3.85% 1/15/28 | | | 120,000 | | | | 120,696 | |
4.95% 8/15/47 | | | 25,000 | | | | 26,181 | |
5.05% 11/15/44 | | | 360,000 | | | | 379,584 | |
ONEOK
4.95% 7/13/47 | | | 105,000 | | | | 107,738 | |
7.50% 9/1/23 | | | 220,000 | | | | 263,934 | |
Pertamina Persero 144A
4.875% 5/3/22 # | | | 200,000 | | | | 215,336 | |
Perusahaan Gas Negara | | | | | | | | |
Persero 144A
5.125% 5/16/24 # | | | 200,000 | | | | 217,438 | |
Perusahaan Listrik | | | | | | | | |
Negara 144A
4.125% 5/15/27 # | | | 200,000 | | | | 200,847 | |
Petrobras Global Finance
144A 5.299% 1/27/25 # | | | 31,000 | | | | 31,140 | |
6.75% 1/27/41 | | | 175,000 | | | | 176,750 | |
7.375% 1/17/27 | | | 80,000 | | | | 88,960 | |
Petroleos Mexicanos 144A
6.75% 9/21/47 # | | | 130,000 | | | | 134,316 | |
6.75% 9/21/47 | | | 25,000 | | | | 25,830 | |
Plains All American Pipeline
3.85% 10/15/23 | | | 145,000 | | | | 145,865 | |
6.125%µy | | | 120,000 | | | | 122,616 | |
8.75% 5/1/19 | | | 100,000 | | | | 108,873 | |
Sabine Pass Liquefaction
5.75% 5/15/24 | | | 100,000 | | | | 112,158 | |
5.875% 6/30/26 | | | 440,000 | | | | 498,574 | |
Southern Gas Corridor 144A
6.875% 3/24/26 # | | | 200,000 | | | | 226,484 | |
Southwestern Energy
6.70% 1/23/25 | | | 250,000 | | | | 256,250 | |
Sunoco Logistics Partners | | | | | | | | |
Operations
5.40% 10/1/47 | | | 65,000 | | | | 66,100 | |
Tengizchevroil Finance Co. | | | | | | | | |
International 144A
4.00% 8/15/26 # | | | 200,000 | | | | 197,181 | |
Transcanada Trust
5.30% 3/15/77 µ | | | 105,000 | | | | 109,418 | |
5.875% 8/15/76 µ | | | 90,000 | | | | 98,550 | |
Transocean Proteus 144A
6.25% 12/1/24 # | | | 237,500 | | | | 250,266 | |
| | | | | | | | |
| | | Principal
amount° | | | Value
(US $) | |
Corporate Bonds (continued) | | | | | | | | |
Energy (continued) | | | | | | | | |
Woodside Finance
144A 3.65% 3/5/25 # | | | 65,000 | | | $ | 65,701 | |
144A 3.70% 3/15/28 # | | | 5,000 | | | | 5,006 | |
144A 8.75% 3/1/19 # | | | 140,000 | | | | 152,021 | |
YPF 144A 25.458% | | | | | | | | |
(BADLARPP + 4.00%) 7/7/20 #● | | | 125,000 | | | | 121,719 | |
| | | | | | | | |
| | | | | | | 9,709,270 | |
| | | | | | | | |
Finance Companies – 0.91% | | | | | | | | |
AerCap Global Aviation | | | | | | | | |
Trust 144A
6.50% 6/15/45 #µ | | | 200,000 | | | | 219,000 | |
AerCap Ireland Capital
3.65% 7/21/27 | | | 300,000 | | | | 300,366 | |
Air Lease
3.00% 9/15/23 | | | 140,000 | | | | 141,171 | |
3.625% 4/1/27 | | | 130,000 | | | | 130,950 | |
Aviation Capital Group
144A 2.875% 1/20/22 # | | | 170,000 | | | | 170,771 | |
144A 4.875% 10/1/25 # | | | 185,000 | | | | 203,033 | |
International Lease Finance
8.625% 1/15/22 | | | 300,000 | | | | 367,022 | |
| | | | | | | | |
| | | | | | | 1,532,313 | |
| | | | | | | | |
Insurance – 1.49% | | | | | | | | |
Allstate 3.28% 12/15/26 | | | 460,000 | | | | 470,187 | |
Berkshire Hathaway
2.75% 3/15/23 | | | 80,000 | | | | 81,162 | |
Berkshire Hathaway Finance
2.90% 10/15/20 | | | 65,000 | | | | 66,935 | |
Cigna
3.05% 10/15/27 | | | 360,000 | | | | 351,758 | |
Liberty Mutual Group 144A
4.95% 5/1/22 # | | | 25,000 | | | | 27,328 | |
Metropolitan Life Global | | | | | | | | |
Funding I 144A
3.45% 12/18/26 # | | | 390,000 | | | | 400,867 | |
Nuveen Finance
144A 2.95% 11/1/19 # | | | 90,000 | | | | 91,427 | |
144A 4.125% 11/1/24 # | | | 460,000 | | | | 487,201 | |
Progressive 4.125% 4/15/47 | | | 135,000 | | | | 142,840 | |
Prudential Financial
5.375% 5/15/45 µ | | | 85,000 | | | | 91,656 | |
UnitedHealth Group
3.75% 10/15/47 | | | 115,000 | | | | 112,959 | |
XLIT
3.817% (LIBOR03M + 2.458%)y● | | | 45,000 | | | | 40,669 | |
50
| | | | | | | | |
| | | Principal
amount° | | | Value
(US $) | |
Corporate Bonds (continued) | | | | | | | | |
Insurance (continued) | | | | | | | | |
XLIT
5.50% 3/31/45 | | | 130,000 | | | $ | 137,593 | |
| | | | | | | | |
| | | | | | | 2,502,582 | |
| | | | | | | | |
REITs – 1.24% | | | | | | | | |
American Tower
4.00% 6/1/25 | | | 125,000 | | | | 130,034 | |
4.40% 2/15/26 | | | 70,000 | | | | 74,306 | |
American Tower Trust I 144A
3.07% 3/15/23 # | | | 120,000 | | | | 121,852 | |
Corporate Office Properties
3.60% 5/15/23 | | | 45,000 | | | | 45,444 | |
5.25% 2/15/24 | | | 55,000 | | | | 59,721 | |
CubeSmart 3.125% 9/1/26 | | | 135,000 | | | | 129,557 | |
CyrusOne 144A
5.00% 3/15/24 # | | | 75,000 | | | | 78,844 | |
Education Realty Operating | | | | | | | | |
Partnership
4.60% 12/1/24 | | | 110,000 | | | | 114,737 | |
Goodman US Finance | | | | | | | | |
Three 144A
3.70% 3/15/28 # | | | 355,000 | | | | 354,275 | |
Hospitality Properties Trust
4.50% 3/15/25 | | | 65,000 | | | | 67,749 | |
Host Hotels & Resorts
3.75% 10/15/23 | | | 135,000 | | | | 138,938 | |
3.875% 4/1/24 | | | 65,000 | | | | 66,787 | |
Hudson Pacific Properties
3.95% 11/1/27 | | | 85,000 | | | | 85,241 | |
LifeStorage 3.50% 7/1/26 | | | 100,000 | | | | 96,704 | |
Physicians Realty
4.30% 3/15/27 | | | 60,000 | | | | 61,438 | |
Regency Centers
3.60% 2/1/27 | | | 140,000 | | | | 140,374 | |
Trust F/1401 144A
5.25% 1/30/26 # | | | 200,000 | | | | 214,260 | |
UDR 4.00% 10/1/25 | | | 40,000 | | | | 41,766 | |
WP Carey 4.60% 4/1/24 | | | 55,000 | | | | 57,575 | |
| | | | | | | | |
| | | | | | | 2,079,602 | |
| | | | | | | | |
Technology – 1.39% | | | | | | | | |
Broadcom 144A
3.50% 1/15/28 # | | | 180,000 | | | | 179,406 | |
CDK Global 5.00% 10/15/24 | | | 110,000 | | | | 117,997 | |
CDW Finance 5.00% 9/1/25 | | | 420,000 | | | | 441,525 | |
CommScope | | | | | | | | |
Technologies 144A
5.00% 3/15/27 # | | | 345,000 | | | | 336,806 | |
Dell International 144A
6.02% 6/15/26 # | | | 95,000 | | | | 106,225 | |
| | | | | | | | |
| | | Principal
amount° | | | Value
(US $) | |
Corporate Bonds (continued) | | | | | | | | |
Technology (continued) | | | | | | | | |
Equinix 5.375% 5/15/27 | | | 375,000 | | | $ | 402,656 | |
Microsoft 4.25% 2/6/47 | | | 160,000 | | | | 177,040 | |
NXP 144A 4.625% 6/1/23 # | | | 335,000 | | | | 361,800 | |
Symantec 144A
5.00% 4/15/25 # | | | 200,000 | | | | 209,500 | |
| | | | | | | | |
| | | | | | | 2,332,955 | |
| | | | | | | | |
Transportation – 0.89% | | | | | | | | |
Air Canada 2015-1 Class A Pass Through Trust 144A
3.60% 3/15/27 #◆ | | | 59,280 | | | | 60,803 | |
American Airlines 2014-1 Class A Pass Through Trust
3.70% 10/1/26 ◆ | | | 29,075 | | | | 29,903 | |
American Airlines 2015-1 Class A Pass Through Trust
3.375% 5/1/27 ◆ | | | 90,392 | | | | 91,580 | |
American Airlines 2015-2 Class AA Pass Through Trust 3.60% 9/22/27 ◆ | | | 32,514 | | | | 33,732 | |
American Airlines 2016-1 Class AA Pass Through Trust 3.575% 1/15/28 ◆ | | | 61,854 | | | | 63,836 | |
Avis Budget Car Rental 144A
6.375% 4/1/24 # | | | 140,000 | | | | 145,950 | |
Penske Truck Leasing
144A 2.70% 3/14/23 # | | | 120,000 | | | | 118,729 | |
144A 3.30% 4/1/21 # | | | 410,000 | | | | 420,884 | |
144A 4.20% 4/1/27 # | | | 150,000 | | | | 157,411 | |
United Airlines 2014-1 Class A Pass Through Trust
4.00% 4/11/26 ◆ | | | 25,809 | | | | 27,176 | |
United Airlines 2014-2 Class A Pass Through Trust
3.75% 9/3/26 ◆ | | | 61,971 | | | | 64,217 | |
United Airlines 2016-1 Class AA Pass Through Trust
3.10% 7/7/28 ◆ | | | 105,000 | | | | 105,706 | |
United Parcel Service
5.125% 4/1/19 | | | 175,000 | | | | 183,122 | |
| | | | | | | | |
| | | | | | | 1,503,049 | |
| | | | | | | | |
Total Corporate Bonds (cost $82,282,947) | | | | 84,005,042 | |
| | | | | | | | |
| | | | | | | | |
Loan Agreements – 3.06% | | | | | | | | |
Albertsons Tranche B 1st Lien
3.50% (LIBOR03M +
2.75%) 8/25/21 ● | | | 94,900 | | | | 92,231 | |
Schedules of investments
Macquarie Institutional Portfolios — Macquarie Core Plus Bond Portfolio
| | | | | | | | |
| | | Principal
amount° | | | Value
(US $) | |
Loan Agreements (continued) | | | | | | | | |
American Airlines Tranche B
1st Lien 3.25% (LIBOR03M + 2.50%) 12/14/23 ● | | | 155,000 | | | $ | 155,474 | |
AssuredPartners Tranche B 1st Lien 3.50% (LIBOR03M + 3.50%) 10/22/24 ● | | | 125,000 | | | | 126,003 | |
Beacon Roofing Supply Tranche B 1st Lien 2.25% (LIBOR03M + 2.25%)
1/2/25 ● | | | 50,000 | | | | 50,354 | |
Blue Ribbon Tranche 1st Lien 5.00% (LIBOR03M + 4.00%) 11/13/21 ● | | | 103,903 | | | | 103,319 | |
Builders FirstSource 1st Lien 4.00% (LIBOR03M + 3.00%) 2/29/24 ● | | | 250,829 | | | | 252,083 | |
Change Healthcare Holdings Tranche B 1st Lien 3.75% (LIBOR03M + 2.75%)
3/1/24 ● | | | 348,250 | | | | 350,523 | |
DaVita Tranche B 1st Lien 3.50% (LIBOR03M + 2.75%) 6/24/21 ● | | | 137,956 | | | | 139,298 | |
Energy Transfer Equity 2.00% (LIBOR03M + 2.00%)
2/2/24 ● | | | 125,000 | | | | 124,932 | |
First Data 1st Lien 2.50% (LIBOR03M + 2.50%)
4/26/24 ● | | | 104,133 | | | | 104,773 | |
First Eagle Holdings Tranche B 1st Lien 3.75% (LIBOR03M + 3.00%) 12/1/22 ● | | | 55,344 | | | | 55,871 | |
Flying Fortress Holdings Tranche B 1st Lien 2.00% (LIBOR03M + 2.00%)
11/2/22 ● | | | 150,000 | | | | 151,031 | |
Gates Global Tranche B 1st Lien 4.25% (LIBOR03M + 3.25%) 3/31/24 ● | | | 90,115 | | | | 90,750 | |
HVSC Merger Sub 2nd Lien 9.25% (LIBOR03M + 8.25%) 10/20/25 ● | | | 110,000 | | | | 110,000 | |
HVSC Merger Sub Tranche B 1st Lien 5.00% (LIBOR03M + 4.00%) 10/20/24 ● | | | 90,000 | | | | 90,984 | |
INC Research Holdings Tranche B 1st Lien 2.25% (LIBOR03M + 2.25%)
6/26/24 ● | | | 167,344 | | | | 168,407 | |
| | | | | | | | |
| | | Principal
amount° | | | Value
(US $) | |
Loan Agreements (continued) | | | | | | | | |
INEOS US Finance Tranche B 1st Lien
2.00% (LIBOR03M + 2.00%) 3/31/24 ● | | | 125,000 | | | $ | 125,365 | |
2.75% (LIBOR03M + 2.75%) 3/31/24 ● | | | 158,676 | | | | 159,370 | |
JC Penney Tranche B 1st Lien 5.25% (LIBOR03M + 4.25%) 6/23/23 ● | | | 124,370 | | | | 114,757 | |
On Semiconductor Tranche B 1st Lien 2.25% (LIBOR03M + 2.25%) 3/31/23 ● | | | 105,942 | | | | 106,532 | |
Penn National Gaming Tranche B 1st Lien 3.25% (LIBOR03M + 2.50%) 1/19/24 ● | | | 338,300 | | | | 340,444 | |
PharMerica Tranche B 1st Lien 4.50% (LIBOR03M + 3.50%) 9/26/24 ● | | | 115,000 | | | | 115,791 | |
PharMerica Tranche B 2nd Lien 8.75% (LIBOR03M + 7.75%) 9/26/25 ● | | | 45,000 | | | | 45,281 | |
PQ Tranche B 1st Lien 3.25% (LIBOR03M + 3.25%)
11/4/22 ● | | | 182,802 | | | | 185,103 | |
Radiate Holdco 1st Lien 3.75% (LIBOR03M + 3.00%) 2/1/24 ● | | | 203,975 | | | | 202,206 | |
Ring Container Technologies Group 1st Lien 2.75% (LIBOR03M + 2.75%)
9/29/24 ● | | | 75,000 | | | | 75,164 | |
Scientific Games International Tranche B4 1st Lien 3.25% (LIBOR03M + 3.25%)
8/14/24 ● | | | 100,000 | | | | 101,281 | |
SFR Group Tranche B 1st Lien 2.75% (LIBOR03M + 2.75%) 7/18/25 ● | | | 149,250 | | | | 149,320 | |
Sinclair Television Group Tranche B2 1st Lien 2.25% (LIBOR03M + 2.25%) 1/3/24 ● | | | 148,100 | | | | 148,655 | |
Sprint Communications Tranche B 1st Lien 3.25% (LIBOR03M + 2.50%) 2/2/24 ● | | | 44,688 | | | | 44,871 | |
Staples 1st Lien 5.00% (LIBOR03M + 4.00%) 9/12/24 ● | | | 70,000 | | | | 66,206 | |
52
| | | | | | | | |
| | | Principal
amount° | | | Value
(US $) | |
Loan Agreements (continued) | |
Stars Group Holdings Tranche B 1st Lien 4.50% (LIBOR03M + 3.50%) 8/1/21 ● | | | 113,760 | | | $ | 114,642 | |
Tennessee Merger Sub Tranche B 1st Lien 3.75% (LIBOR03M + 2.75%) 2/6/24 ● | | | 19,676 | | | | 19,512 | |
Uniti Group 1st Lien 4.00% (LIBOR03M + 3.00%) 10/24/22 ● | | | 29,863 | | | | 28,715 | |
Unitymedia Finance 2.25% (LIBOR03M + 2.25%) 1/15/26 ● | | | 40,000 | | | | 39,946 | |
Univision Communications Tranche C 1st Lien 3.75% (LIBOR03M + 2.75%) 3/15/24 ● | | | 130,883 | | | | 130,422 | |
UPC Financing Partnership Tranche AR 1st Lien 2.50% (LIBOR03M + 2.50%) 1/15/26 ● | | | 50,000 | | | | 50,225 | |
USI Tranche B 1st Lien 3.00% (LIBOR03M + 3.00%) 5/16/24 ● | | | 230,000 | | | | 230,546 | |
Valeant Pharmaceuticals International Tranche B-F1 5.50% (LIBOR03M + 4.75%) 4/1/22 ● | | | 375,000 | | | | 382,688 | |
| | | | | | | | |
Total Loan Agreements
(cost $5,145,817) | | | | | | | 5,143,075 | |
| | | | | | | | |
| | | | | | | | |
Municipal Bonds – 0.61% | |
Bay Area, California Toll Authority
(Build America Bonds) Series S-3 6.907% 10/1/50 | | | 175,000 | | | | 267,209 | |
Buckeye, Ohio Tobacco Settlement Financing Authority (Asset-Backed Senior Turbo) Series A-2 5.875% 6/1/47 | | | 50,000 | | | | 47,000 | |
California State
(Build America Bonds)
7.55% 4/1/39 | | | 140,000 | | | | 216,370 | |
Commonwealth of Massachusetts Series C 5.00% 10/1/25 | | | 20,000 | | | | 24,552 | |
| | | | | | | | |
| | | Principal
amount° | | | Value
(US $) | |
Municipal Bonds (continued) | |
New Jersey Turnpike Authority (Build America Bonds) | | | | | | | | |
Series A 7.102% 1/1/41 | | | 95,000 | | | $ | 140,468 | |
Series F 7.414% 1/1/40 | | | 45,000 | | | | 68,634 | |
South Carolina Public Service Authority | | | | | | | | |
Series D 4.77% 12/1/45 | | | 55,000 | | | | 57,184 | |
Texas Water Development Board
5.00% 10/15/46 | | | 125,000 | | | | 145,459 | |
Series A 5.00% 10/15/45 | | | 45,000 | | | | 52,083 | |
| | | | | | | | |
Total Municipal Bonds
(cost $1,031,367) | | | | | | | 1,018,959 | |
| | | | | | | | |
| | | | | | | | |
Non-Agency Asset-Backed Securities – 2.71% | |
AEP Texas Central Transition Funding II Series 2006-A A4
5.17% 1/1/18 | | | 16,010 | | | | 16,103 | |
American Express Credit Account Master Trust Series 2017-5 A 1.619% (LIBOR01M + 0.38%) 2/18/25 ● | | | 100,000 | | | | 100,552 | |
ARI Fleet Lease Trust | | | | | | | | |
Series 2015-A A2 144A 1.11% 11/15/18 # | | | 7,920 | | | | 7,915 | |
Atrium XIII
144A 0.00% (LIBOR03M + 1.18%) 11/21/30 #● | | | 250,000 | | | | 250,000 | |
Avis Budget Rental Car Funding AESOP | | | | | | | | |
Series 2013-1A A 144A 1.92% 9/20/19 # | | | 100,000 | | | | 99,830 | |
Bank of America Credit Card Trust | | | | | | | | |
Series 2016-A1 A 1.629% (LIBOR01M + 0.39%) 10/15/21 ● | | | 130,000 | | | | 130,597 | |
Series 2017-A1 A1
1.95% 8/15/22 | | | 200,000 | | | | 200,079 | |
Barclays Dryrock Issuance Trust | | | | | | | | |
Series 2017-1 A 1.569% (LIBOR01M + 0.33%) 3/15/23 ● | | | 100,000 | | | | 100,298 | |
Capital One Multi-Asset Execution Trust | | | | | | | | |
Series 2014-A4 A4 1.599% (LIBOR01M + 0.36%) 6/15/22 ● | | | 80,000 | | | | 80,388 | |
Schedules of investments
Macquarie Institutional Portfolios — Macquarie Core Plus Bond Portfolio
| | | | | | | | |
| | | Principal
amount° | | | Value
(US $) | |
Non-Agency Asset-Backed Securities (continued) | | | | | |
Chase Issuance Trust | | | | | | | | |
Series 2013-A6 A6 1.659% (LIBOR01M + 0.42%) 7/15/20 ● | | | 200,000 | | | $ | 200,530 | |
Citibank Credit Card Issuance Trust | | | | | | | | |
Series 2017-A5 A5 1.859% (LIBOR01M + 0.62%) 4/22/26 ● | | | 100,000 | | | | 101,118 | |
Series 2017-A7 A7 1.605% (LIBOR01M + 0.37%) 8/8/24 ● | | | 100,000 | | | | 100,439 | |
Citicorp Residential Mortgage Trust | | | | | | | | |
Series 2006-3 A5
5.482% 11/25/36 f | | | 300,000 | | | | 313,686 | |
CNH Equipment Trust | | | | | | | | |
Series 2016-B A2B 1.639% (LIBOR01M + 0.40%) 10/15/19 ● | | | 10,232 | | | | 10,239 | |
Discover Card Execution Note Trust | | | | | | | | |
Series 2014-A1 A1 1.669% (LIBOR01M + 0.43%) 7/15/21 ● | | | 200,000 | | | | 200,900 | |
Series 2016-A2 A2 1.779% (LIBOR01M + 0.54%) 9/15/21 ● | | | 100,000 | | | | 100,607 | |
Series 2017-A3 A3 1.469% (LIBOR01M + 0.23%) 10/17/22 ● | | | 150,000 | | | | 150,329 | |
Series 2017-A5 A5 1.839% (LIBOR01M + 0.60%) 12/15/26 ● | | | 165,000 | | | | 166,671 | |
Series 2017-A7 A7 1.592% (LIBOR01M + 0.36%) 4/15/25 ● | | | 105,000 | | | | 105,250 | |
Ford Credit Auto Owner Trust | | | | | | | | |
Series 2016-B A2B 1.549% (LIBOR01M + 0.31%) 3/15/19 ● | | | 23,204 | | | | 23,211 | |
Ford Credit Floorplan Master Owner Trust | | | | | | | | |
Series 2017-1 A2 1.659% (LIBOR01M + 0.42%) 5/15/22 ● | | | 60,000 | | | | 60,303 | |
Golden Credit Card Trust | | | | | | | | |
Series 2014-2A A 144A
1.689% (LIBOR01M + 0.45%) 3/15/21 #● | | | 450,000 | | | | 451,729 | |
| | | | | | | | |
| | | Principal
amount° | | | Value
(US $) | |
Non-Agency Asset-Backed Securities (continued) | | | | | |
HOA Funding | | | | | | | | |
Series 2014-1A A2 144A 4.846% 8/20/44 # | | | 47,000 | | | $ | 45,474 | |
Hyundai Auto Lease Securitization Trust | | | | | | | | |
Series 2016-C A3 144A 1.49% 2/18/20 # | | | 100,000 | | | | 99,802 | |
Mercedes-Benz Auto Lease Trust | | | | | | | | |
Series 2016-A A2B 1.799% (LIBOR01M + 0.56%) 7/16/18 ● | | | 3,887 | | | | 3,888 | |
Mercedes-Benz Master Owner Trust | | | | | | | | |
Series 2016-AA A 144A 1.819% (LIBOR01M + 0.58%) 5/15/20 #● | | | 100,000 | | | | 100,252 | |
Navistar Financial Dealer Note Master Owner Trust II | | | | | | | | |
Series 2016-1 A 144A 2.588% (LIBOR01M + 1.35%) 9/27/21 #● | | | 65,000 | | | | 65,460 | |
New Residential Mortgage Loan Trust | | | | | | | | |
Series 2017-6A A1 144A 4.00% 8/27/57 #● | | | 98,331 | | | | 102,063 | |
Nissan Auto Lease Trust | | | | | | | | |
Series 2016-A A2B 1.619% (LIBOR01M + 0.38%) 8/15/18 ● | | | 17,827 | | | | 17,832 | |
Series 2016-B A3 1.50% 7/15/19 | | | 100,000 | | | | 99,817 | |
PFS Financing | | | | | | | | |
Series 2017-C A 144A 1.708% (LIBOR01M + 0.47%) 10/15/21 #● | | | 115,000 | | | | 115,000 | |
Towd Point Mortgage Trust | | | | | | | | |
Series 2015-4 A2 144A 3.75% 4/25/55 #● | | | 110,000 | | | | 114,172 | |
Series 2015-5 A1B 144A 2.75% 5/25/55 #● | | | 64,838 | | | | 65,077 | |
Series 2015-6 A1B 144A 2.75% 4/25/55 #● | | | 70,287 | | | | 70,529 | |
Series 2017-1 A1 144A 2.75% 10/25/56 #● | | | 85,432 | | | | 85,717 | |
Series 2017-2 A1 144A 2.75% 4/25/57 #● | | | 91,178 | | | | 91,637 | |
Toyota Auto Receivables Owner Trust | | | | | | | | |
Series 2016-B A2B 1.489% (LIBOR01M + 0.25%) 10/15/18 ● | | | 10,144 | | | | 10,145 | |
54
| | | | | | | | |
| | | Principal
amount° | | | Value
(US $) | |
Non-Agency Asset-Backed Securities (continued) | |
Toyota Auto Receivables Owner Trust | | | | | | | | |
Series 2017-B A2B
1.299% (LIBOR01M + 0.06%) 1/15/20 ● | | | 235,000 | | | $ | 234,963 | |
Verizon Owner Trust | | | | | | | | |
Series 2016-2A A 144A
1.68% 5/20/21 # | | | 100,000 | | | | 99,617 | |
Volvo Financial Equipment | | | | | | | | |
Series 2014-1A B 144A
1.66% 11/16/20 # | | | 100,000 | | | | 99,971 | |
World Financial Network Credit Card Master Trust | | | | | | | | |
Series 2015-A A 1.719% (LIBOR01M + 0.48%) 2/15/22 ● | | | 75,000 | | | | 75,127 | |
| | | | | | | | |
Total Non-Agency Asset-Backed Securities
(cost $4,517,138) | | | | 4,567,317 | |
| | | | | | | | |
| | | | | | | | |
Non-Agency Collateralized Mortgage Obligations –1.01% | |
JPMorgan Mortgage Trust | | | | | | | | |
Series 2014-2 B1 144A
3.426% 6/25/29 #● | | | 74,532 | | | | 75,579 | |
Series 2014-2 B2 144A
3.426% 6/25/29 #● | | | 74,532 | | | | 75,272 | |
Series 2014-IVR6 2A4
144A 2.50% 7/25/44 #● | | | 100,000 | | | | 100,022 | |
Series 2015-1 B1 144A
2.609% 12/25/44 #● | | | 195,669 | | | | 194,569 | |
Series 2015-4 B1 144A
3.627% 6/25/45 #● | | | 94,915 | | | | 93,114 | |
Series 2015-4 B2 144A
3.627% 6/25/45 #● | | | 94,915 | | | | 92,065 | |
Series 2015-5 B2 144A
2.871% 5/25/45 #● | | | 96,884 | | | | 95,080 | |
Series 2015-6 B1 144A
3.62% 10/25/45 #● | | | 94,661 | | | | 93,436 | |
Series 2015-6 B2 144A
3.62% 10/25/45 #● | | | 94,661 | | | | 92,474 | |
Series 2016-4 B1 144A
3.901% 10/25/46 #● | | | 97,684 | | | | 99,470 | |
Series 2016-4 B2 144A
3.901% 10/25/46 #● | | | 97,684 | | | | 100,200 | |
Series 2017-1 B2 144A
3.561% 1/25/47 #● | | | 103,525 | | | | 103,626 | |
Series 2017-2 A3 144A
3.50% 5/25/47 #● | | | 52,118 | | | | 52,879 | |
| | | | | | | | |
| | | Principal
amount° | | | Value
(US $) | |
Non-Agency Collateralized Mortgage Obligations (continued) | |
New Residential Mortgage Loan Trust | | | | | | | | |
Series 2016-4A A1 144A
3.75% 11/25/56 #● | | | 80,311 | | | $ | 82,522 | |
Series 2017-1A A1 144A
4.00% 2/25/57 #● | | | 84,282 | | | | 87,286 | |
Series 2017-2A A3 144A
4.00% 3/25/57 #● | | | 85,742 | | | | 88,817 | |
Sequoia Mortgage Trust | | | | | | | | |
Series 2014-2 A4 144A
3.50% 7/25/44 #● | | | 35,908 | | | | 36,478 | |
Series 2015-1 B2 144A 3.874% 1/25/45 #● | | | 42,113 | | | | 42,323 | |
Series 2017-4 A1 144A
3.50% 7/25/47 #● | | | 93,594 | | | | 95,251 | |
| | | | | | | | |
Total Non-Agency Collateralized Mortgage Obligations (cost $1,680,016) | | | | 1,700,463 | |
| | | | | | | | |
| | | | | | | | |
Non-Agency Commercial Mortgage-Backed Securities – 5.93% | |
Banc of America Commercial Mortgage Trust | | | | | | | | |
Series 2017-BNK3 AS
3.748% 2/15/50 | | | 225,000 | | | | 231,889 | |
Series 2017-BNK3 C
4.352% 2/15/50 ● | | | 50,000 | | | | 51,143 | |
BANK | | | | | | | | |
Series 2017-BNK4 XA
1.458% 5/15/50 ● | | | 602,680 | | | | 59,280 | |
Series 2017-BNK5 A5
3.39% 6/15/60 | | | 225,000 | | | | 231,396 | |
Series 2017-BNK5 B
3.896% 6/15/60 ● | | | 95,000 | | | | 96,631 | |
Series 2017-BNK7 A5
3.435% 9/15/60 | | | 110,000 | | | | 113,615 | |
Series 2017-BNK8 A4
3.488% 11/15/50 | | | 85,000 | | | | 87,862 | |
CD Mortgage Trust | | | | | | | | |
Series 2016-CD2 A4
3.526% 11/10/49 ● | | | 80,000 | | | | 83,126 | |
CFCRE Commercial Mortgage Trust | | | | | | | | |
Series 2016-C7 A3
3.839% 12/10/54 | | | 185,000 | | | | 194,860 | |
Series 2017-C8 A4
3.572% 6/15/50 | | | 70,000 | | | | 72,169 | |
Citigroup Commercial Mortgage Trust | | | | | | | | |
Series 2014-GC25 A4
3.635% 10/10/47 | | | 120,000 | | | | 125,639 | |
Schedules of investments
Macquarie Institutional Portfolios — Macquarie Core Plus Bond Portfolio
| | | | | | | | |
| | | Principal
amount° | | | Value
(US $) | |
Non-Agency Commercial Mortgage-Backed Securities (continued) | |
Citigroup Commercial Mortgage Trust | | | | | | | | |
Series 2015-GC27 A5
3.137% 2/10/48 | | | 150,000 | | | $ | 151,899 | |
Series 2016-P3 A4
3.329% 4/15/49 | | | 490,000 | | | | 502,067 | |
Series 2017-C4 A4
3.471% 10/12/50 | | | 170,000 | | | | 175,434 | |
COMM Mortgage Trust | | | | | | | | |
Series 2013-CR6 AM 144A 3.147% 3/10/46 # | | | 105,000 | | | | 106,233 | |
Series 2013-WWP A2 144A 3.424% 3/10/31 # | | | 100,000 | | | | 104,140 | |
Series 2014-CR19 A5
3.796% 8/10/47 | | | 80,000 | | | | 84,319 | |
Series 2014-CR20 AM
3.938% 11/10/47 | | | 350,000 | | | | 367,357 | |
Series 2015-3BP A 144A
3.178% 2/10/35 # | | | 130,000 | | | | 131,615 | |
Series 2015-CR23 A4
3.497% 5/10/48 | | | 115,000 | | | | 119,367 | |
Commercial Mortgage Pass Through Certificates | | | | | | | | |
Series 2016-CR28 A4
3.762% 2/10/49 ◆ | | | 115,000 | | | | 121,448 | |
DB-JPM | | | | | | | | |
Series 2016-C1 A4
3.276% 5/10/49 | | | 295,000 | | | | 301,262 | |
Series 2016-C1 B
4.195% 5/10/49 ● | | | 25,000 | | | | 26,026 | |
Series 2016-C3 A5
2.89% 9/10/49 | | | 140,000 | | | | 138,886 | |
DB-UBS Mortgage Trust | | | | | | | | |
Series 2011-LC1A C 144A 5.685% 11/10/46 #● | | | 135,000 | | | | 146,285 | |
GRACE Mortgage Trust | | | | | | | | |
Series 2014-GRCE A 144A 3.369% 6/10/28 # | | | 850,000 | | | | 876,837 | |
Series 2014-GRCE B 144A 3.52% 6/10/28 # | | | 200,000 | | | | 204,515 | |
GS Mortgage Securities Trust | | | | | | | | |
Series 2010-C1 C 144A
5.635% 8/10/43 #● | | | 100,000 | | | | 105,095 | |
Series 2014-GC24 A5
3.931% 9/10/47 | | | 215,000 | | | | 229,903 | |
Series 2015-GC32 A4
3.764% 7/10/48 | | | 75,000 | | | | 79,237 | |
Series 2017-GS5 A4
3.674% 3/10/50 | | | 175,000 | | | | 183,785 | |
| | | | | | | | |
| | | Principal
amount° | | | Value
(US $) | |
Non-Agency Commercial Mortgage-Backed Securities (continued) | |
GS Mortgage Securities Trust | | | | | | | | |
Series 2017-GS5 XA
0.825% 3/10/50 S● | | | 4,244,642 | | | $ | 273,450 | |
Series 2017-GS6 A3
3.433% 5/10/50 | | | 115,000 | | | | 118,077 | |
Series 2017-GS6 XA
1.052% 5/10/50 S● | | | 3,386,859 | | | | 277,704 | |
JPM-BB Commercial Mortgage Securities Trust | | | | | | | | |
Series 2015-C31 A3
3.801% 8/15/48 | | | 100,000 | | | | 104,965 | |
Series 2015-C33 A4
3.77% 12/15/48 | | | 255,000 | | | | 268,164 | |
JPM-DB Commercial Mortgage Securities Trust | | | | | | | | |
Series 2016-C2 A4
3.144% 6/15/49 | | | 405,000 | | | | 409,449 | |
Series 2016-C4 A3
3.141% 12/15/49 | | | 140,000 | | | | 141,430 | |
Series 2017-C7 A5
3.409% 10/15/50 | | | 230,000 | | | | 235,505 | |
JPMorgan Chase Commercial Mortgage Securities Trust | | | | | | | | |
Series 2005-CB11 E
5.525% 8/12/37 ● | | | 20,000 | | | | 20,581 | |
Series 2013-LC11 B
3.499% 4/15/46 | | | 150,000 | | | | 150,344 | |
Series 2015-JP1 A5
3.914% 1/15/49 | | | 170,000 | | | | 180,784 | |
Series 2016-JP2 A4
2.822% 8/15/49 | | | 230,000 | | | | 226,595 | |
Series 2016-JP2 AS
3.056% 8/15/49 | | | 180,000 | | | | 176,047 | |
Series 2016-WIKI A 144A 2.798% 10/5/31 # | | | 105,000 | | | | 105,958 | |
Series 2016-WIKI B 144A 3.201% 10/5/31 # | | | 85,000 | | | | 86,072 | |
LB-UBS Commercial Mortgage Trust | | | | | | | | |
Series 2006-C6 AJ
5.452% 9/15/39 ● | | | 65,462 | | | | 52,283 | |
Morgan Stanley BAML Trust | | | | | | | | |
Series 2014-C17 A5
3.741% 8/15/47 | | | 100,000 | | | | 105,571 | |
Series 2015-C23 A4
3.719% 7/15/50 | | | 300,000 | | | | 315,373 | |
Series 2015-C26 A5
3.531% 10/15/48 | | | 120,000 | | | | 124,668 | |
Series 2016-C29 A4
3.325% 5/15/49 | | | 95,000 | | | | 97,102 | |
56
| | | | | | | | |
| | | Principal
amount° | | | Value
(US $) | |
Non-Agency Commercial Mortgage-Backed Securities (continued) | | | | | |
Morgan Stanley Capital I Trust | | | | | | | | |
Series 2006-HQ10 B 5.448% 11/12/41 ● | | | 100,000 | | | $ | 94,974 | |
Wells Fargo Commercial Mortgage Trust | | | | | | | | |
Series 2012-LC5 B 4.142% 10/15/45 | | | 100,000 | | | | 103,488 | |
Series 2014-LC18 A5 3.405% 12/15/47 | | | 35,000 | | | | 36,138 | |
Series 2015-C30 XA 0.963% 9/15/58 S● | | | 1,920,536 | | | | 109,900 | |
Series 2015-NXS3 A4 3.617% 9/15/57 | | | 80,000 | | | | 83,589 | |
Series 2016-BNK1 A3 2.652% 8/15/49 | | | 155,000 | | | | 151,017 | |
Series 2016-BNK1 B 2.967% 8/15/49 | | | 30,000 | | | | 28,643 | |
Series 2017-C38 A5 3.453% 7/15/50 | | | 140,000 | | | | 144,586 | |
WF-RBS Commercial Mortgage Trust | | | | | | | | |
Series 2012-C10 A3 2.875% 12/15/45 | | | 240,000 | | | | 243,309 | |
| | | | | | | | |
Total Non-Agency Commercial Mortgage-Backed Securities
(cost $10,008,775) | | | | 9,969,086 | |
| | | | | | | | |
| | | | | | | | |
Regional Bonds – 0.38%D | | | | | |
Argentina – 0.19% | | | | | |
Provincia De Buenos Aires 144A 7.875% 6/15/27 # | | | 150,000 | | | | 166,650 | |
Provincia de Cordoba 144A 7.125% 6/10/21 # | | | 150,000 | | | | 162,209 | |
| | | | | | | | |
| | | | | | | 328,859 | |
| | | | | | | | |
Canada – 0.19% | | | | | | | | |
Province of Quebec Canada 2.75% 4/12/27 | | | 315,000 | | | | 314,603 | |
| | | | | | | | |
| | | | | | | 314,603 | |
| | | | | | | | |
Total Regional Bonds (cost $620,230) | | | | 643,462 | |
| | | | | | | | |
| | | | | | | | |
Sovereign Bonds – 3.93%D | | | | | |
Argentina – 0.41% | | | | | |
Argentine Bonos del Tesoro 15.50% 10/17/26 | | ARS | 3,608,000 | | | | 216,082 | |
16.00% 10/17/23 | | ARS | 3,174,000 | | | | 184,247 | |
22.75% 3/5/18 | | ARS | 1,400,000 | | | | 81,467 | |
| | | | | | | | |
| | | Principal
amount° | | | Value
(US $) | |
Sovereign BondsD (continued) | | | | | |
Argentina (continued) | |
Argentine Republic Government International Bond 5.625% 1/26/22 | | | 205,000 | | | $ | 215,763 | |
| | | | | | | | |
| | | | | | | 697,559 | |
| | | | | | | | |
Brazil – 0.17% | | | | | | | | |
Brazil Notas do Tesouro Nacional Series F 10.00% 1/1/25 | | BRL | 926,000 | | | | 286,620 | |
| | | | | | | | |
| | | | | | | 286,620 | |
| | | | | | | | |
Colombia – 0.17% | |
Colombian TES Series B 7.00% 6/30/32 | | COP | 860,000,000 | | | | 284,245 | |
| | | | | | | | |
| | | | | | | 284,245 | |
| | | | | | | | |
Ecuador – 0.12% | |
Ecuador Government International Bond 144A 8.875% 10/23/27 # | | | 200,000 | | | | 203,984 | |
| | | | | | | | |
| | | | | | | 203,984 | |
| | | | | | | | |
Egypt – 0.13% | |
Egypt Government International Bond 144A 8.50% 1/31/47 # | | | 200,000 | | | | 226,627 | |
| | | | | | | | |
| | | | | | | 226,627 | |
| | | | | | | | |
Indonesia – 0.45% | | | | | |
Indonesia Treasury Bond 7.50% 8/15/32 | | IDR | 10,026,000,000 | | | | 754,768 | |
| | | | | | | | |
| | | | | | | 754,768 | |
| | | | | | | | |
Ivory Coast – 0.24% | |
Ivory Coast Government International Bond 144A 6.125% 6/15/33 # | | | 400,000 | | | | 395,936 | |
| | | | | | | | |
| | | | | | | 395,936 | |
| | | | | | | | |
Malaysia – 0.31% | |
Malaysia Government Bond 3.844% 4/15/33 | | MYR | 2,376,000 | | | | 522,618 | |
| | | | | | | | |
| | | | | | | 522,618 | |
| | | | | | | | |
Mexico – 0.32% | | | | | | | | |
Mexican Bonos 5.75% 3/5/26 | | MXN | 2,863,000 | | | | 135,760 | |
6.50% 6/9/22 | | MXN | 6,084,000 | | | | 310,735 | |
10.00% 12/5/24 | | MXN | 1,534,000 | | | | 92,878 | |
| | | | | | | | |
| | | | | | | 539,373 | |
| | | | | | | | |
Schedules of investments
Macquarie Institutional Portfolios — Macquarie Core Plus Bond Portfolio
| | | | | | | | |
| | | Principal
amount° | | | Value
(US $) | |
Sovereign BondsD (continued) | | | | | |
Mongolia – 0.12% | | | | | | | | |
Mongolia Government International Bond 144A 5.625% 5/1/23 # | | | 200,000 | | | $ | 200,811 | |
| | | | | | | | |
| | | | | | | 200,811 | |
| | | | | | | | |
Nigeria – 0.13% | | | | | | | | |
Nigeria Government International Bond 144A 7.875% 2/16/32 # | | | 200,000 | | | | 220,178 | |
| | | | | | | | |
| | | | | | | 220,178 | |
| | | | | | | | |
Saudi Arabia – 0.17% | | | | | | | | |
Saudi Government International Bond 144A 2.875% 3/4/23 # | | | 285,000 | | | | 284,131 | |
| | | | | | | | |
| | | | | | | 284,131 | |
| | | | | | | | |
South Africa – 0.31% | |
Republic of South Africa Government Bond 8.00% 1/31/30 | | ZAR | 538,000 | | | | 33,701 | |
8.75% 1/31/44 | | ZAR | 8,056,000 | | | | 495,778 | |
| | | | | | | | |
| | | | | | | 529,479 | |
| | | | | | | | |
Turkey – 0.60% | | | | | | | | |
Turkey Government Bond 11.10% 5/15/19 | | TRY | 2,799,000 | | | | 725,510 | |
Turkey Government International Bond 5.75% 5/11/47 | | | 300,000 | | | | 286,575 | |
| | | | | | | | |
| | | | | | | 1,012,085 | |
| | | | | | | | |
Ukraine – 0.12% | | | | | | | | |
Ukraine Government International Bond 144A 7.375% 9/25/32 # | | | 200,000 | | | | 197,569 | |
| | | | | | | | |
| | | | | | | 197,569 | |
| | | | | | | | |
Uruguay – 0.16% | | | | | | | | |
Uruguay Government International Bond | | | | | | | | |
144A 8.50% 3/15/28 # | | UYU | 4,227,000 | | | | 147,213 | |
144A 9.875% 6/20/22 # | | UYU | 3,157,000 | | | | 115,525 | |
| | | | | | | | |
| | | | | | | 262,738 | |
| | | | | | | | |
Total Sovereign Bonds (cost $6,856,809) | | | | 6,618,721 | |
| | | | | | | | |
| | | | | | | | |
Supranational Banks – 0.32% | |
Banque Ouest Africaine de Developpement 144A 5.00% 7/27/27 # | | | 200,000 | | | | 208,561 | |
| | | | | | | | |
| | | Principal
amount° | | | Value
(US $) | |
Supranational Banks (continued) | | | | | |
Inter-American Development Bank 6.25% 6/15/21 | | IDR | 4,400,000,000 | | | $ | 324,091 | |
| | | | | | | | |
Total Supranational Banks (cost $527,990) | | | | 532,652 | |
| | | | | | | | |
| | | | | | | | |
US Treasury Obligations – 3.86% | |
US Treasury Bonds 2.75% 8/15/47 | | | 3,435,000 | | | | 3,346,576 | |
US Treasury Notes 1.375% 9/15/20 | | | 195,000 | | | | 193,157 | |
1.875% 9/30/22 | | | 1,375,000 | | | | 1,365,977 | |
2.00% 10/31/22 | | | 25,000 | | | | 24,983 | |
2.25% 8/15/27 | | | 1,580,000 | | | | 1,562,688 | |
| | | | | | | | |
Total US Treasury Obligations
(cost $6,553,401) | | | | 6,493,381 | |
| | | | | | | | |
| | |
| | | Number of
shares | | | | |
Convertible Preferred Stock – 0.16% | |
AMG Capital Trust II 5.15% exercise price $200.00, maturity date 10/15/37 | | | 500 | | | | 30,375 | |
Bank of America 7.25% exercise price $50.00y | | | 1 | | | | 1,297 | |
Becton Dickinson 6.125% exercise price $211.80, maturity date 5/1/20 | | | 1,300 | | | | 73,801 | |
DTE Energy 6.50% exercise price $116.31, maturity date 10/1/19 | | | 1,000 | | | | 54,930 | |
Kinder Morgan 9.75% exercise price $32.38, maturity date 10/26/18 | | | 700 | | | | 26,320 | |
NextEra Energy 6.123% exercise price $159.55, maturity date 9/1/19 | | | 800 | | | | 45,920 | |
6.371% exercise price $114.03, maturity date 9/1/18 | | | 300 | | | | 20,949 | |
Wells Fargo & Co. 7.50% exercise price $156.71y | | | 7 | | | | 9,170 | |
| | | | | | | | |
Total Convertible Preferred Stock (cost $262,617) | | | | 262,762 | |
| | | | | |
| | | | | | | | |
Preferred Stock – 0.37% | |
Bank of America 6.50%µy | | | 185,000 | | | | 211,825 | |
General Electric 5.00%µy | | | 308,000 | | | | 320,991 | |
58
| | | | | | | | |
| | | Number of
shares | | | Value
(US $) | |
Preferred Stock (continued) | |
Integrys Holdings 6.00%, maturity date 8/1/73 µ | | | 1,950 | | | $ | 55,209 | |
Morgan Stanley 5.55%µy | | | 40,000 | | | | 42,050 | |
| | | | | | | | |
Total Preferred Stock (cost $600,845) | | | | | | | 630,075 | |
| | | | | | | | |
| | |
| | | Number of
contracts | | | | |
Options Purchased – 0.01% | |
Currency Call Option – 0.00% | |
USD vs KRW strike price KRW 1,130, expiration date 1/31/18, notional amount $ 51,551 (CITI) | | | 142,000 | | | | 1,823 | |
| | | | | | | | |
| | | | | | | 1,823 | |
| | | | | | | | |
Currency Put Options – 0.01% | |
USD vs CNH strike price CNH 6.70, expiration date 1/19/18, notional amount $ 120,089 (BNP) | | | 338,000 | | | | 2,420 | |
USD vs KRW strike price KRW 1,140, expiration date 1/22/18, notional amount $ 82,344 (BAML) | | | 280,000 | | | | 2,621 | |
USD vs MXN strike price MXN 19.50, expiration date 1/17/18, notional amount $ 104,939 (BNP) | | | 245,000 | | | | 4,914 | |
USD vs SGD strike price SGD 1.37, expiration date 1/19/18, notional amount $ 165,206 (BNP) | | | 397,000 | | | | 2,779 | |
| | | | | | | | |
| | | | | | | 12,734 | |
| | | | | | | | |
Total Options Purchased (premium paid $16,164) | | | | 14,557 | |
| | | | | | | | |
| | |
| | | Principal
amount° | | | | |
Short-Term Investments – 6.61% | |
Discount Note – 0.78%≠ | | | | | | | | |
Federal Home Loan Bank 0.85% 11/1/17 | | | 1,310,831 | | | | 1,310,831 | |
| | | | | | | | |
| | | | | | | 1,310,831 | |
| | | | | | | | |
| | | | | | | | |
| | | Principal
amount° | | | Value
(US $) | |
Short-Term Investments (continued) | |
Repurchase Agreements – 5.83% | |
Bank of America Merrill Lynch 0.97%, dated 10/31/17, to be repurchased on 11/1/17, repurchase price $2,566,970 (collateralized by US government obligations 0.00%–9.00% 11/24/17–5/15/47; market value $2,618,242) | | | 2,566,901 | | | $ | 2,566,901 | |
BNP Paribas 1.00%, dated 10/31/17, to be repurchased on 11/1/17, repurchase price $7,250,953 (collateralized by US government obligations 0.00%–5.00% 2/15/18–2/15/46; market value $7,395,767) | | | 7,250,752 | | | | 7,250,752 | |
| | | | | | | | |
| | | | | | | 9,817,653 | |
| | | | | | | | |
Total Short-Term Investments (cost $11,128,484) | | | | 11,128,484 | |
| | | | | | | | |
Total Value of Securities – 100.11% (cost $167,073,288) | | | $ | 168,422,936 | |
| | | | | | | | |
| # | Security exempt from registration under Rule 144A of the Securities Act of 1933, as amended. At Oct. 31, 2017, the aggregate value of Rule 144A securities was $40,216,858, which represents 23.90% of the Portfolio’s net assets. See Note 11 in “Notes to financial statements.” |
| ◆ | Pass Through Agreement. Security represents the contractual right to receive a proportionate amount of underlying payments due to the counterparty pursuant to various agreements related to the rescheduling of obligations and the exchange of certain notes. |
| ≠ | The rate shown is the effective yield at the time of purchase. |
| ° | Principal amount shown is stated in US dollars unless noted that the security is denominated in another currency. |
| D | Securities have been classified by country of origin. |
| µ | Fixed to variable rate investment. The rate shown reflects the fixed rate in effect at Oct. 31, 2017. Rate will reset at a future date. |
| S | Interest only security. An interest only security is the interest only portion of a fixed income security, which is separated and sold individually from the principal portion of the security. |
| y | No contractual maturity date. |
| ● | Variable rate investment. Interest rates reset periodically. Interest rate shown reflects the rate in effect at Oct. 31, 2017. For securities based on a published reference rate and spread, the reference rate |
Schedules of investments
Macquarie Institutional Portfolios — Macquarie Core Plus Bond Portfolio
and spread are indicated in their description above. Certain variable rate securities are not based on a published reference rate and spread but are determined by the issuer or agent and are based on current market conditions. These securities do not indicate a reference rate and spread in their description above.
| f | Step coupon bond. Coupon increases or decreases periodically based on a predetermined schedule. Stated rate in effect at Oct. 31, 2017. |
The following foreign currency exchange contracts, futures contracts, and swap contracts were outstanding at Oct. 31, 2017:1
Foreign Currency Exchange Contracts
| | | | | | | | | | | | | | | | | | | | | | | | | | | | |
Counterparty | | Contracts to
Receive (Deliver) | | | In Exchange For | | | Settlement
Date | | | Unrealized
Appreciation | | | Unrealized
Depreciation | |
| | | | | |
BAML | | | CAD | | | | 456,715 | | | | USD | | | | (364,149 | ) | | | 11/17/17 | | | $ | — | | | $ | (10,083 | ) |
BAML | | | EUR | | | | 5,081 | | | | USD | | | | (5,973 | ) | | | 11/17/17 | | | | — | | | | (49 | ) |
BAML | | | JPY | | | | (33,213,513 | ) | | | USD | | | | 290,557 | | | | 11/17/17 | | | | — | | | | (1,758 | ) |
BAML | | | KRW | | | | (382,506,386 | ) | | | USD | | | | 333,600 | | | | 11/17/17 | | | | — | | | | (8,532 | ) |
BAML | | | NZD | | | | 382,318 | | | | USD | | | | (271,006 | ) | | | 11/17/17 | | | | — | | | | (9,472 | ) |
BNP | | | AUD | | | | 267,622 | | | | USD | | | | (207,639 | ) | | | 11/17/17 | | | | — | | | | (2,852 | ) |
BNP | | | COP | | | | 878,158,596 | | | | USD | | | | (293,557 | ) | | | 11/17/17 | | | | — | | | | (5,366 | ) |
CITI | | | AUD | | | | 302,850 | | | | USD | | | | (231,528 | ) | | | 11/17/17 | | | | 216 | | | | — | |
CITI | | | GBP | | | | (302,850 | ) | | | USD | | | | 401,404 | | | | 11/17/17 | | | | — | | | | (1,022 | ) |
CITI | | | NZD | | | | 302,850 | | | | USD | | | | (207,034 | ) | | | 11/17/17 | | | | 138 | | | | — | |
TD | | | AUD | | | | 454,954 | | | | USD | | | | (353,098 | ) | | | 11/17/17 | | | | — | | | | (4,962 | ) |
TD | | | COP | | | | 296,512,311 | | | | USD | | | | (100,257 | ) | | | 11/17/17 | | | | — | | | | (2,949 | ) |
TD | | | JPY | | | | 14,313,555 | | | | USD | | | | (127,200 | ) | | | 11/17/17 | | | | — | | | | (1,226 | ) |
| | | | | | | | | | | | | | | | | | | | | | | | | | | | |
Total Foreign Currency Exchange Contracts | | | | | | | | | | | | | | | $ | 354 | | | $ | (48,271 | ) |
| | | | | | | | | | | | | | | | | | | | | | | | | | | | |
Futures Contracts
| | | | | | | | | | | | | | | | | | | | | | |
Contracts to Buy (Sell) | | Notional
Amount | | | Notional Cost
(Proceeds) | | | Expiration
Date | | | Value/
Unrealized
Appreciation | | | Value/
Unrealized
Depreciation | |
(11) | | Long Gilt | | $ | (1,816,417 | ) | | $ | (1,814,623 | ) | | | 12/28/17 | | | $ | — | | | $ | (1,794 | ) |
(61) | | US Treasury 5 yr Notes | | | (7,148,438 | ) | | | (7,160,765 | ) | | | 1/2/18 | | | | 12,327 | | | | — | |
(12) | | US Treasury 10 yr
Notes | | | (1,499,250 | ) | | | (1,491,852 | ) | | | 12/20/17 | | | | — | | | | (7,398 | ) |
7 | | US Treasury Long
Bonds | | | 1,067,281 | | | | 1,088,525 | | | | 12/20/17 | | | | — | | | | (21,244 | ) |
| | | | | | | | | | | | | | | | | | | | | | |
Total Futures Contracts | | | | | | $ | (9,378,715 | ) | | | | | | $ | 12,327 | | | $ | (30,436 | ) |
| | | | | | | | | | | | | | | | | | | | | | |
60
Swap Contracts
Credit Default Swap (CDS) Contracts2
| | | | | | | | | | | | | | | | | | | | |
Counterparty/ Reference Obligation/ Termination Date/ Payment Frequency | | Notional
Amount3 | | | Annual
Protection
Payments | | | Value | | | Upfront
Payments
Paid
(Received) | | | Unrealized
Depreciation4 | |
Over-The-Counter/Protection Sold/Moody’s Ratings: | | | | | | | | | | | | | | | | | | | | |
MSC-CMBX.NA.BBB-.65 5/11/63- Monthly | | | (85,000 | ) | | | 3.00 | % | | $ | (14,221 | ) | | $ | (9,012 | ) | | $ | (5,209 | ) |
MSC-CMBX.NA.BBB-.65 5/11/63- Monthly | | | (85,000 | ) | | | 3.00 | % | | | (14,220 | ) | | | (9,579 | ) | | | (4,641 | ) |
MSC-CMBX.NA.BBB-.65 5/11/63- Monthly | | | (95,000 | ) | | | 3.00 | % | | | (15,894 | ) | | | (12,102 | ) | | | (3,792 | ) |
MSC-CMBX.NA.BBB-.65 5/11/63- Monthly | | | (175,000 | ) | | | 3.00 | % | | | (29,279 | ) | | | (20,601 | ) | | | (8,678 | ) |
MSC-CMBX.NA.BBB5 5/11/63- Monthly | | | (175,000 | ) | | | 3.00 | % | | | (29,279 | ) | | | (18,839 | ) | | | (10,440 | ) |
| | | | | | | | | | | | | | | | | | | | |
Total CDS Contracts | | | | | | | | | | $ | (102,893 | ) | | $ | (70,133 | ) | | $ | (32,760 | ) |
| | | | | | | | | | | | | | | | | | | | |
IRS Contracts6
| | | | | | | | | | | | | | | | |
Reference Obligation/ Termination Date/ Payment Frequency (Fixed Rate / Floating Rate) | | Notional
Amount3 | | | Fixed / Floating
Interest Rate Paid
(Received) | | | Value | | | Unrealized
Depreciation4 | |
Centrally Cleared: | | | | | | | | | | | | | | | | |
30 yr IRS 12/21/46-(Semiannually/ Quarterly) - | | | 260,000 | | | | 2.767%/(1.326%) | | | $ | (7,771 | ) | | $ | (7,771 | ) |
30 yr IRS 1/27/47-(Semiannually/ Quarterly) - | | | 70,000 | | | | 2.661%/(1.374%) | | | | (1,091 | ) | | | (1,091 | ) |
30 yr IRS 1/30/47-(Semiannually/ Quarterly) - | | | 110,000 | | | | 2.687%/(1.311%) | | | | (2,319 | ) | | | (2,319 | ) |
| | | | | | | | | | | | | | | | |
Total IRS Contracts | | | | | | | | | | $ | (11,181 | ) | | $ | (11,181 | ) |
| | | | | | | | | | | | | | | | |
The use of foreign currency exchange contracts, futures contracts, and swap contracts involves elements of market risk and risks in excess of the amounts disclosed in the financial statements. The foreign currency exchange contracts and notional values presented above represent the Portfolio’s total exposure in such contracts, whereas only the net unrealized appreciation (depreciation) is reflected in the Portfolio’s net assets.
1See Note 8 in “Notes to financial statements.“
2A CDS contract is a risk-transfer instrument through which one party (purchaser of protection) transfers to another party (seller of protection) the financial risk of a credit event (as defined in the CDS agreement), as it relates to a particular reference security or basket of securities (such
as an index). Periodic payments (receipts) on such contracts are accrued daily and recorded as unrealized losses (gains) on swap contracts. Upon payment (receipt), such amounts are recorded as realized losses (gains) on swap contracts. Upfront payments made or received in connection with CDS contracts are amortized over the expected life of the CDS contracts as unrealized losses (gains) on swap contracts. The change in value of CDS contracts is recorded daily as unrealized appreciation or depreciation. A realized gain or loss is recorded upon a credit event (as defined in the CDS agreement) or the maturity or termination of the agreement.
3Notional value/amount shown is stated in US Dollars unless noted that the swap is denominated in another currency.
Schedules of investments
Macquarie Institutional Portfolios – Macquarie Core Plus Bond Portfolio
4Unrealized appreciation (depreciation) does not include periodic interest payments (receipts) on swap contracts accrued daily in the amount of $(2,582).
5Markit’s CMBX Index or the CMBX.NA Index is a synthetic tradable index referencing a basket of 25 commercial mortgage-backed securities in North America. Credit-quality rating are measured on a scale that ranges from AAA (highest) to BB (lowest).
US Agency and US Agency mortgage-backed securities appear under US Government.
6An interest rate swap agreement is an exchange of interest rates between counterparties. Periodic payments (receipt) on such contracts are accrued daily and recorded as unrealized appreciation (depreciation) on swap contracts. Upon periodic payment (receipt) or termination of the contract, such amounts are recorded as realized gains (losses) on swap contracts.
Summary of abbreviations:
ARM – Adjustable Rate Mortgage
ARS – Argentine Peso
AUD – Australian Dollar
BADLARPP – Argentina Term Deposit Rate
BAML – Bank of America Merrill Lynch
BNP – Banque Paribas
BRL – Brazilian Real
CAD – Canadian Dollar
CDO – Collateralized Debt Obligation
CDS – Credit Default Swap
CITI – Citigroup Global Markets
CLO – Collateralized Loan Obligation
CNH – Chinese Offshore Renminbi
COP – Colombian Peso
DB – Deutsche Bank
EUR – European Monetary Unit
GBP – British Pound Sterling
Summary of abbreviations: (continued)
GNMA – Government National Mortgage Association
GS – Goldman Sachs
ICE – Intercontinental Exchange, Inc.
IDR – Indonesian Rupiah
JPM – JPMorgan
JPY – Japanese Yen
KRW – Korean Won
LB – Lehman Brothers
LIBOR – London Interbank Offered Rate
LIBOR01M – ICE LIBOR USD 1 Month
LIBOR03M – ICE LIBOR USD 3 Month
LIBOR12M – ICE LIBOR USD 12 Month
MSC – Morgan Stanley Capital
MXN – Mexican Peso
MYR – Malaysian Ringgit
NZD – New Zealand Dollar
RBS – Royal Bank of Scotland
REIT – Real Estate Investment Trust
REMIC – Real Estate Mortgage Investment Conduit
SGD – Singapore Dollar
S.F. – Single Family
TBA – To be announced
TD – Toronto Dominion Bank
TRY – Turkish Lira
UBS – Union Bank of Switzerland
USD – US Dollar
UYU – Uruguayan Peso
WF – Wells Fargo
yr – Year
ZAR – South African Rand
See accompanying notes. which are an integral part of the financial statements.
62
Macquarie Institutional Portfolios — Macquarie High Yield Bond Portfolio
October 31, 2017
| | | | | | | | |
| | | Principal
amount° | | | Value
(US $) | |
Corporate Bonds – 90.04% | | | | | | | | |
Automotive – 0.66% | | | | | | | | |
Allison Transmission 144A
4.75% 10/1/27 # | | | 420,000 | | | $ | 425,250 | |
American Tire Distributors 144A 10.25% 3/1/22 # | | | 305,000 | | | | 319,487 | |
| | | | | | | | |
| | | | | | | 744,737 | |
| | | | | | | | |
Banking – 3.13% | | | | | | | | |
Ally Financial
5.75% 11/20/25 | | | 760,000 | | | | 842,650 | |
Credit Suisse Group 144A
6.25%#µy | | | 655,000 | | | | 718,044 | |
Lloyds Banking Group
7.50%µy | | | 250,000 | | | | 285,938 | |
Popular 7.00% 7/1/19 | | | 498,000 | | | | 510,450 | |
Royal Bank of Scotland Group
8.625%µy | | | 405,000 | | | | 459,635 | |
UBS Group 6.875%µy | | | 650,000 | | | | 731,041 | |
| | | | | | | | |
| | | | | | | 3,547,758 | |
| | | | | | | | |
Basic Industry – 14.97% | | | | | | | | |
AK Steel 6.375% 10/15/25 | | | 590,000 | | | | 582,625 | |
Allegheny Technologies
7.875% 8/15/23 | | | 365,000 | | | | 400,587 | |
Beacon Escrow 144A
4.875% 11/1/25 # | | | 565,000 | | | | 575,594 | |
BMC East 144A
5.50% 10/1/24 # | | | 330,000 | | | | 346,500 | |
Boise Cascade 144A
5.625% 9/1/24 # | | | 555,000 | | | | 579,975 | |
Builders FirstSource
144A 5.625% 9/1/24 # | | | 270,000 | | | | 286,200 | |
144A 10.75% 8/15/23 # | | | 485,000 | | | | 552,900 | |
Cemex 144A
7.75% 4/16/26 # | | | 445,000 | | | | 505,119 | |
Chemours
5.375% 5/15/27 | | | 300,000 | | | | 321,000 | |
7.00% 5/15/25 | | | 230,000 | | | | 257,600 | |
Coeur Mining
5.875% 6/1/24 | | | 370,000 | | | | 371,387 | |
FMG Resources 144A
5.125% 5/15/24 # | | | 500,000 | | | | 516,250 | |
Freeport-McMoRan
6.875% 2/15/23 | | | 915,000 | | | | 1,005,466 | |
Hudbay Minerals
144A 7.25% 1/15/23 # | | | 60,000 | | | | 64,950 | |
144A 7.625% 1/15/25 # | | | 450,000 | | | | 498,375 | |
Joseph T Ryerson & Son
144A 11.00% 5/15/22 # | | | 660,000 | | | | 744,150 | |
Koppers 144A
6.00% 2/15/25 # | | | 565,000 | | | | 607,375 | |
| | | | | | | | |
| | | Principal
amount° | | | Value
(US $) | |
Corporate Bonds (continued) | | | | | |
Basic Industry (continued) | | | | | | | | |
Kraton Polymers
144A 7.00% 4/15/25 # | | | 485,000 | | | $ | 526,225 | |
144A 10.50% 4/15/23 # | | | 215,000 | | | | 245,100 | |
NCI Building Systems
144A 8.25% 1/15/23 # | | | 445,000 | | | | 478,097 | |
New Gold
144A 6.25% 11/15/22 # | | | 257,000 | | | | 265,995 | |
144A 6.375% 5/15/25 # | | | 455,000 | | | | 484,575 | |
NOVA Chemicals 144A
5.25% 6/1/27 # | | | 540,000 | | | | 550,800 | |
Novelis 144A
6.25% 8/15/24 # | | | 690,000 | | | | 729,675 | |
Olin 5.125% 9/15/27 | | | 555,000 | | | | 584,831 | |
Steel Dynamics
5.00% 12/15/26 | | | 1,350,000 | | | | 1,431,000 | |
Summit Materials 144A
5.125% 6/1/25 # | | | 290,000 | | | | 294,350 | |
6.125% 7/15/23 | | | 360,000 | | | | 375,300 | |
Tronox Finance 144A
5.75% 10/1/25 # | | | 545,000 | | | | 570,887 | |
US Concrete 6.375% 6/1/24 | | | 660,000 | | | | 712,800 | |
Valvoline 144A
4.375% 8/15/25 # | | | 390,000 | | | | 394,388 | |
Zekelman Industries 144A
9.875% 6/15/23 # | | | 970,000 | | | | 1,098,525 | |
| | | | | | | | |
| | | | | | | 16,958,601 | |
| | | | | | | | |
Capital Goods – 3.01% | | | | | | | | |
Ardagh Packaging Finance 144A 6.00% 2/15/25 # | | | 295,000 | | | | 313,806 | |
BWAY Holding
144A 5.50% 4/15/24 # | | | 465,000 | | | | 485,344 | |
144A 7.25% 4/15/25 # | | | 390,000 | | | | 405,600 | |
Flex Acquisition 144A
6.875% 1/15/25 # | | | 600,000 | | | | 621,375 | |
Plastipak Holdings 144A
6.25% 10/15/25 # | | | 200,000 | | | | 204,750 | |
StandardAero Aviation Holdings 144A
10.00% 7/15/23 # | | | 495,000 | | | | 549,450 | |
TransDigm 6.375% 6/15/26 | | | 425,000 | | | | 434,563 | |
Trident Merger Sub 144A
6.625% 11/1/25 # | | | 390,000 | | | | 388,908 | |
| | | | | | | | |
| | | | | | | 3,403,796 | |
| | | | | | | | |
Consumer Cyclical – 7.71% | | | | | | | | |
AMC Entertainment Holdings
6.125% 5/15/27 | | | 560,000 | | | | 557,200 | |
Boyd Gaming
6.375% 4/1/26 | | | 650,000 | | | | 715,000 | |
Schedules of investments
Macquarie Institutional Portfolios — Macquarie High Yield Bond Portfolio
| | | | | | | | |
| | | Principal
amount° | | | Value
(US $) | |
Corporate Bonds (continued) | | | | | | | | |
Consumer Cyclical (continued) | | | | | | | | |
JC Penney 8.125% 10/1/19 | | | 214,000 | | | $ | 214,000 | |
Lithia Motors 144A
5.25% 8/1/25 # | | | 270,000 | | | | 283,837 | |
Live Nation Entertainment
144A 4.875% 11/1/24 # | | | 382,000 | | | | 396,199 | |
M/I Homes 5.625% 8/1/25 | | | 470,000 | | | | 479,987 | |
MGM Resorts International
4.625% 9/1/26 | | | 595,000 | | | | 597,975 | |
Mohegan Gaming & Entertainment 144A
7.875% 10/15/24 # | | | 800,000 | | | | 855,000 | |
New Red Finance
144A 5.00% 10/15/25 # | | | 350,000 | | | | 357,000 | |
144A 5.00% 10/15/25 # | | | 205,000 | | | | 209,100 | |
Penn National Gaming 144A
5.625% 1/15/27 # | | | 535,000 | | | | 555,063 | |
Penske Automotive Group
5.50% 5/15/26 | | | 505,000 | | | | 520,781 | |
PetSmart 144A
5.875% 6/1/25 # | | | 455,000 | | | | 398,125 | |
Scientific Games International
144A 5.00% 10/15/25 # | | | 255,000 | | | | 259,463 | |
10.00% 12/1/22 | | | 815,000 | | | | 903,631 | |
Staples 144A
8.50% 9/15/25 # | | | 590,000 | | | | 522,150 | |
Station Casinos 144A
5.00% 10/1/25 # | | | 325,000 | | | | 326,219 | |
Tempur Sealy International
5.50% 6/15/26 | | | 560,000 | | | | 578,200 | |
| | | | | | | | |
| | | | | | | 8,728,930 | |
| | | | | | | | |
Consumer Non-Cyclical – 2.29% | | | | | |
Albertsons 6.625% 6/15/24 | | | 560,000 | | | | 529,200 | |
Cott Holdings 144A
5.50% 4/1/25 # | | | 535,000 | | | | 553,056 | |
Dean Foods 144A
6.50% 3/15/23 # | | | 385,000 | | | | 386,925 | |
JBS USA LUX 144A
5.75% 6/15/25 # | | | 570,000 | | | | 555,750 | |
Post Holdings
144A 5.00% 8/15/26 # | | | 285,000 | | | | 287,137 | |
144A 5.75% 3/1/27 # | | | 272,000 | | | | 283,900 | |
| | | | | | | | |
| | | | | | | 2,595,968 | |
| | | | | | | | |
Energy – 14.81% | | | | | | | | |
Alta Mesa Holdings 144A
7.875% 12/15/24 # | | | 530,000 | | | | 577,700 | |
AmeriGas Partners
5.875% 8/20/26 | | | 535,000 | | | | 559,075 | |
| | | | | | | | |
| | | Principal
amount° | | | Value
(US $) | |
Corporate Bonds (continued) | | | | | | | | |
Energy (continued) | | | | | | | | |
Antero Resources
5.00% 3/1/25 | | | 415,000 | | | $ | 423,300 | |
5.625% 6/1/23 | | | 131,000 | | | | 137,877 | |
Cheniere Corpus Christi Holdings
144A 5.125% 6/30/27 # | | | 110,000 | | | | 113,713 | |
5.875% 3/31/25 | | | 260,000 | | | | 282,425 | |
7.00% 6/30/24 | | | 375,000 | | | | 429,844 | |
Cheniere Energy Partners
144A 5.25% 10/1/25 # | | | 410,000 | | | | 423,325 | |
Chesapeake Energy
144A 8.00% 12/15/22 # | | | 150,000 | | | | 161,953 | |
144A 8.00% 1/15/25 # | | | 210,000 | | | | 210,525 | |
144A 8.00% 1/15/25 # | | | 130,000 | | | | 128,700 | |
Crestwood Midstream Partners 5.75% 4/1/25 | | | 535,000 | | | | 551,050 | |
Diamond Offshore Drilling
7.875% 8/15/25 | | | 270,000 | | | | 289,913 | |
Energy Transfer Equity
4.25% 3/15/23 | | | 260,000 | | | | 265,203 | |
Genesis Energy
6.50% 10/1/25 | | | 845,000 | | | | 859,787 | |
Gulfport Energy
144A 6.375% 1/15/26 # | | | 520,000 | | | | 526,175 | |
6.625% 5/1/23 | | | 190,000 | | | | 195,700 | |
Halcon Resources 144A
6.75% 2/15/25 # | | | 142,000 | | | | 146,260 | |
Hilcorp Energy I
144A 5.00% 12/1/24 # | | | 265,000 | | | | 265,000 | |
144A 5.75% 10/1/25 # | | | 254,000 | | | | 261,303 | |
Laredo Petroleum
6.25% 3/15/23 | | | 580,000 | | | | 604,650 | |
Murphy Oil
5.75% 8/15/25 | | | 245,000 | | | | 253,575 | |
6.875% 8/15/24 | | | 980,000 | | | | 1,055,950 | |
Murphy Oil USA
5.625% 5/1/27 | | | 625,000 | | | | 664,844 | |
Newfield Exploration
5.375% 1/1/26 | | | 545,000 | | | | 581,787 | |
NuStar Logistics
5.625% 4/28/27 | | | 606,000 | | | | 640,845 | |
Oasis Petroleum
6.50% 11/1/21 | | | 145,000 | | | | 148,263 | |
6.875% 3/15/22 | | | 530,000 | | | | 547,225 | |
Precision Drilling
6.50% 12/15/21 | | | 375,000 | | | | 380,625 | |
6.625% 11/15/20 | | | 298,955 | | | | 302,692 | |
7.75% 12/15/23 | | | 430,000 | | | | 442,900 | |
64
| | | | | | | | |
| | | Principal
amount° | | | Value
(US $) | |
Corporate Bonds (continued) | | | | | |
Energy (continued) | | | | | | | | |
QEP Resources
6.875% 3/1/21 | | | 785,000 | | | $ | 837,987 | |
SESI 7.125% 12/15/21 | | | 245,000 | | | | 251,737 | |
Southwestern Energy
4.10% 3/15/22 | | | 340,000 | | | | 335,750 | |
6.70% 1/23/25 | | | 615,000 | | | | 630,375 | |
Summit Midstream Holdings
5.75% 4/15/25 | | | 365,000 | | | | 374,125 | |
Targa Resources Partners
5.375% 2/1/27 | | | 540,000 | | | | 561,600 | |
Transocean 144A
9.00% 7/15/23 # | | | 490,000 | | | | 534,100 | |
Transocean Proteus 144A
6.25% 12/1/24 # | | | 242,250 | | | | 255,271 | |
WildHorse Resource Development 144A
6.875% 2/1/25 # | | | 565,000 | | | | 562,175 | |
| | | | | | | | |
| | | | | | | 16,775,304 | |
| | | | | | | | |
Financial Services – 1.93% | | | | | | | | |
AerCap Global Aviation Trust
144A 6.50% 6/15/45 #µ | | | 705,000 | | | | 771,975 | |
E*TRADE Financial
5.875%µy | | | 570,000 | | | | 609,900 | |
NFP 144A
6.875% 7/15/25 # | | | 770,000 | | | | 802,725 | |
| | | | | | | | |
| | | | | | | 2,184,600 | |
| | | | | | | | |
Healthcare – 6.94% | | | | | | | | |
Air Medical Group Holdings
144A 6.375% 5/15/23 # | | | 810,000 | | | | 785,700 | |
Change Healthcare Holdings
144A 5.75% 3/1/25 # | | | 575,000 | | | | 590,094 | |
DaVita 5.00% 5/1/25 | | | 580,000 | | | | 572,750 | |
HCA
5.375% 2/1/25 | | | 945,000 | | | | 974,238 | |
5.875% 2/15/26 | | | 350,000 | | | | 368,813 | |
7.58% 9/15/25 | | | 230,000 | | | | 263,925 | |
HealthSouth
5.75% 11/1/24 | | | 320,000 | | | | 328,200 | |
5.75% 9/15/25 | | | 720,000 | | | | 746,100 | |
Hill-Rom Holdings
144A 5.00% 2/15/25 # | | | 210,000 | | | | 215,775 | |
144A 5.75% 9/1/23 # | | | 330,000 | | | | 348,975 | |
inVentiv Group Holdings
144A 7.50% 10/1/24 # | | | 148,000 | | | | 163,910 | |
Mallinckrodt International Finance
144A 5.50% 4/15/25 # | | | 120,000 | | | | 108,300 | |
144A 5.625% 10/15/23 # | | | 235,000 | | | | 220,606 | |
| | | | | | | | |
| | | Principal
amount° | | | Value
(US $) | |
Corporate Bonds (continued) | | | | | | | | |
Healthcare (continued) | | | | | | | | |
MPH Acquisition Holdings
144A 7.125% 6/1/24 # | | | 820,000 | | | $ | 884,575 | |
SP Finco 144A
6.75% 7/1/25 # | | | 280,000 | | | | 256,200 | |
Surgery Center Holdings
144A 8.875% 4/15/21 # | | | 280,000 | | | | 287,000 | |
Tenet Healthcare
144A 5.125% 5/1/25 # | | | 455,000 | | | | 444,763 | |
8.125% 4/1/22 | | | 300,000 | | | | 301,500 | |
| | | | | | | | |
| | | | | | | 7,861,424 | |
| | | | | | | | |
Insurance – 2.24% | | | | | | | | |
AssuredPartners 144A
7.00% 8/15/25 # | | | 660,000 | | | | 689,700 | |
HUB International 144A
7.875% 10/1/21 # | | | 845,000 | | | | 880,558 | |
USIS Merger Sub 144A
6.875% 5/1/25 # | | | 935,000 | | | | 972,400 | |
| | | | | | | | |
| | | | | | | 2,542,658 | |
| | | | | | | | |
Media – 9.60% | | | | | | | | |
Altice Luxembourg 144A
7.75% 5/15/22 # | | | 785,000 | | | | 832,100 | |
CCO Holdings
144A 5.50% 5/1/26 # | | | 55,000 | | | | 56,513 | |
144A 5.75% 2/15/26 # | | | 565,000 | | | | 592,035 | |
144A 5.875% 5/1/27 # | | | 655,000 | | | | 687,553 | |
Cequel Communications Holdings I 144A
7.75% 7/15/25 # | | | 360,000 | | | | 395,100 | |
CSC Holdings 144A
10.875% 10/15/25 # | | | 460,000 | | | | 564,650 | |
DISH DBS 7.75% 7/1/26 | | | 257,000 | | | | 282,057 | |
Gray Television 144A
5.875% 7/15/26 # | | | 780,000 | | | | 801,450 | |
Lamar Media 5.75% 2/1/26 | | | 365,000 | | | | 395,113 | |
Midcontinent Communications 144A
6.875% 8/15/23 # | | | 255,000 | | | | 274,763 | |
Nexstar Broadcasting 144A
5.625% 8/1/24 # | | | 520,000 | | | | 534,950 | |
Nielsen Luxembourg 144A
5.00% 2/1/25 # | | | 300,000 | | | | 311,250 | |
Radiate Holdco 144A
6.625% 2/15/25 # | | | 540,000 | | | | 531,900 | |
SFR Group 144A
7.375% 5/1/26 # | | | 810,000 | | | | 873,787 | |
Sinclair Television Group
144A 5.125% 2/15/27 # | | | 585,000 | | | | 559,406 | |
Schedules of investments
Macquarie Institutional Portfolios — Macquarie High Yield Bond Portfolio
| | | | | | | | |
| | | Principal
amount° | | | Value
(US $) | |
Corporate Bonds (continued) | | | | | |
Media (continued) | | | | | | | | |
Sirius XM Radio
144A 5.00% 8/1/27 # | | | 275,000 | | | $ | 278,781 | |
144A 5.375% 4/15/25 # | | | 500,000 | | | | 528,125 | |
Tribune Media
5.875% 7/15/22 | | | 475,000 | | | | 495,187 | |
UPC Holding 144A
5.50% 1/15/28 # | | | 640,000 | | | | 638,400 | |
Virgin Media Secured Finance
144A 5.25% 1/15/26 # | | | 225,000 | | | | 234,326 | |
VTR Finance 144A
6.875% 1/15/24 # | | | 945,000 | | | | 1,004,299 | |
| | | | | | | | |
| | | | | | | 10,871,745 | |
| | | | | | | | |
Services – 8.40% | | | | | | | | |
Advanced Disposal Services
144A 5.625% 11/15/24 # | | | 570,000 | | | | 594,225 | |
Ashtead Capital 144A
4.375% 8/15/27 # | | | 685,000 | | | | 696,131 | |
Avis Budget Car Rental 144A
6.375% 4/1/24 # | | | 415,000 | | | | 432,637 | |
Cardtronics 144A
5.50% 5/1/25 # | | | 280,000 | | | | 279,300 | |
Covanta Holding
5.875% 7/1/25 | | | 580,000 | | | | 575,650 | |
ESH Hospitality 144A
5.25% 5/1/25 # | | | 780,000 | | | | 808,275 | |
GEO Group
5.875% 10/15/24 | | | 280,000 | | | | 294,084 | |
6.00% 4/15/26 | | | 375,000 | | | | 393,750 | |
H&E Equipment Services
144A 5.625% 9/1/25 # | | | 470,000 | | | | 497,613 | |
Herc Rentals 144A
7.75% 6/1/24 # | | | 597,000 | | | | 658,193 | |
Iron Mountain 144A
4.875% 9/15/27 # | | | 480,000 | | | | 490,800 | |
Iron Mountain US Holdings
144A 5.375% 6/1/26 # | | | 500,000 | | | | 525,000 | |
KAR Auction Services 144A
5.125% 6/1/25 # | | | 260,000 | | | | 269,750 | |
Prime Security Services Borrower 144A
9.25% 5/15/23 # | | | 1,280,000 | | | | 1,421,696 | |
Team Health Holdings 144A
6.375% 2/1/25 # | | | 410,000 | | | | 379,250 | |
TMS International 144A
7.25% 8/15/25 # | | | 360,000 | | | | 376,200 | |
United Rentals North America
5.50% 5/15/27 | | | 767,000 | | | | 822,607 | |
| | | | | | | | |
| | | | | | | 9,515,161 | |
| | | | | | | | |
| | | | | | | | |
| | | Principal
amount° | | | Value
(US $) | |
Corporate Bonds (continued) | | | | | |
Technology & Electronics – 4.20% | | | | | | | | |
CDK Global 5.00% 10/15/24 | | | 520,000 | | | $ | 557,804 | |
CDW 5.00% 9/1/25 | | | 275,000 | | | | 289,094 | |
CommScope Technologies
144A 5.00% 3/15/27 # | | | 555,000 | | | | 541,819 | |
144A 6.00% 6/15/25 # | | | 230,000 | | | | 243,800 | |
Entegris 144A
6.00% 4/1/22 # | | | 605,000 | | | | 632,981 | |
Genesys Telecommunications Laboratories 144A
10.00% 11/30/24 # | | | 500,000 | | | | 565,625 | |
Infor US 6.50% 5/15/22 | | | 470,000 | | | | 493,406 | |
Sensata Technologies UK Financing 144A
6.25% 2/15/26 # | | | 550,000 | | | | 606,375 | |
Solera 144A
10.50% 3/1/24 # | | | 445,000 | | | | 509,525 | |
TTM Technologies 144A
5.625% 10/1/25 # | | | 305,000 | | | | 311,863 | |
| | | | | | | | |
| | | | | | | 4,752,292 | |
| | | | | | | | |
Telecommunications – 5.96% | | | | | | | | |
CenturyLink 6.75% 12/1/23 | | | 530,000 | | | | 553,320 | |
Cincinnati Bell 144A
7.00% 7/15/24 # | | | 280,000 | | | | 280,000 | |
CyrusOne 144A
5.375% 3/15/27 # | | | 545,000 | | | | 583,831 | |
Level 3 Financing
5.375% 5/1/25 | | | 490,000 | | | | 513,275 | |
Sprint
7.125% 6/15/24 | | | 875,000 | | | | 948,010 | |
7.875% 9/15/23 | | | 200,000 | | | | 224,000 | |
Sprint Capital
6.875% 11/15/28 | | | 460,000 | | | | 491,913 | |
T-Mobile USA
6.375% 3/1/25 | | | 360,000 | | | | 389,700 | |
6.50% 1/15/26 | | | 187,000 | | | | 207,359 | |
Wind Acquisition Finance
144A 7.375% 4/23/21 # | | | 910,000 | | | | 947,583 | |
Wind Tre 144A
5.00% 1/20/26 # | | | 565,000 | | | | 569,375 | |
Zayo Group
144A 5.75% 1/15/27 # | | | 235,000 | | | | 248,219 | |
6.375% 5/15/25 | | | 740,000 | | | | 799,281 | |
| | | | | | | | |
| | | | | | | 6,755,866 | |
| | | | | | | | |
Transportation – 0.97% | | | | | | | | |
DAE Funding
144A 4.50% 8/1/22 # | | | 205,000 | | | | 208,331 | |
144A 5.00% 8/1/24 # | | | 185,000 | | | | 189,394 | |
66
| | | | | | | | |
| | | Principal
amount° | | | Value
(US $) | |
Corporate Bonds (continued) | | | | | |
Transportation (continued) | | | | | | | | |
XPO Logistics 144A
6.125% 9/1/23 # | | | 665,000 | | | $ | 702,406 | |
| | | | | | | | |
| | | | | | | 1,100,131 | |
| | | | | | | | |
Utilities – 3.22% | | | | | | | | |
AES
5.125% 9/1/27 | | | 275,000 | | | | 282,975 | |
5.50% 4/15/25 | | | 265,000 | | | | 281,563 | |
Calpine 5.75% 1/15/25 | | | 1,215,000 | | | | 1,159,566 | |
Dynegy
7.375% 11/1/22 | | | 280,000 | | | | 300,650 | |
144A 8.00% 1/15/25 # | | | 495,000 | | | | 543,881 | |
144A 8.125% 1/30/26 # | | | 280,000 | | | | 311,150 | |
Enel 144A
8.75% 9/24/73 #µ | | | 620,000 | | | | 767,250 | |
| | | | | | | | |
| | | | | | | 3,647,035 | |
| | | | | | | | |
Total Corporate Bonds (cost $98,630,426) | | | | | | | 101,986,006 | |
| | | | | | | | |
| | | | | | | |
Municipal Bond – 0.27% | | | | | | | | |
Buckeye, Ohio Tobacco Settlement Financing Authority (Asset-Backed Senior Turbo) Series A-2 5.875% 6/1/47 | | | 325,000 | | | | 305,500 | |
| | | | | | | | |
Total Municipal Bond (cost $312,862) | | | | | | | 305,500 | |
| | | | | | | | |
| | | | | | | |
Loan Agreements – 2.97% | | | | | | | | |
Applied Systems 2nd Lien 8.00% (LIBOR03M + 7.00%) 9/19/25 ● | | | 565,000 | | | | 583,245 | |
CH Hold 2nd Lien 8.25% (LIBOR03M + 7.25%) 2/1/25 ● | | | 295,000 | | | | 302,652 | |
Cyxtera DC Holdings 2nd Lien 8.25% (LIBOR03M + 7.25%) 5/1/25 ● | | | 335,000 | | | | 340,304 | |
Kronos 2nd Lien 9.25% (LIBOR03M + 8.25%) 11/1/24 ● | | | 525,000 | | | | 542,719 | |
Russell Investments US Institutional Holdco Tranche B 1st Lien 5.25% (LIBOR03M + 4.25%) 6/1/23 ● | | | 650,763 | | | | 659,575 | |
| | | | | | | | |
| | | Principal
amount° | | | Value
(US $) | |
Loan Agreements (continued) | | | | | |
Summit Midstream Partners Holdings Tranche B 1st Lien 7.00% (LIBOR03M + 6.00%) 5/21/22 ● | | | 334,163 | | | $ | 340,846 | |
Windstream Services Tranche B6 1st Lien 4.75% (LIBOR03M + 4.00%) 3/30/21 ● | | | 638,388 | | | | 599,885 | |
| | | | | | | | |
Total Loan Agreements (cost $3,115,344) | | | | | | | 3,369,226 | |
| | | | | | | | |
| | | Number
of shares | | | | |
Common Stock – 0.00% | | | | | | | | |
Century Communications =† | | | 60,000 | | | | 0 | |
| | | | | | | | |
Total Common Stock (cost $1,816) | | | | | | | 0 | |
| | | | | | | | |
| | | | | | | |
Preferred Stock – 0.96% | | | | | | | | |
Bank of America 6.50% µ | | | 785,000 | | | | 898,825 | |
GMAC Capital Trust I 7.10% (LIBOR03M + 5.785%) ● | | | 7,000 | | | | 183,820 | |
| | | | | | | | |
Total Preferred Stock (cost $988,711) | | | | | | | 1,082,645 | |
| | | | | | | | |
| | | Principal amount° | | | | |
Short-Term Investments – 3.91% | | | | | | | | |
Discount Note – 0.46%≠ | | | | | | | | |
Federal Home Loan Bank
0.85% 11/1/17 | | | 522,035 | | | | 522,035 | |
| | | | | | | | |
| | | | | | | 522,035 | |
| | | | | | | | |
Repurchase Agreements – 3.45% | | | | | | | | |
Bank of America Merrill Lynch 0.97%, dated 10/31/17, to be repurchased on 11/1/17, repurchase price $1,022,290 (collateralized by US government obligations 0.00%–9.00% 11/24/17–5/15/47; market value $1,042,708) | | | 1,022,262 | | | | 1,022,262 | |
Schedules of investments
Macquarie Institutional Portfolios — Macquarie High Yield Bond Portfolio
| | | | | | | | |
| | | Principal
amount° | | | Value
(US $) | |
Short-Term Investments (continued) | |
Repurchase Agreements (continued) | | | | | | | | |
BNP Paribas 1.00%, dated 10/31/17, to be repurchased on 11/1/17, repurchase price $2,887,674 (collateralized by US government obligations 0.00%–5.00% 2/15/18–2/15/46; market value $2,945,346) | | | 2,887,594 | | | $ | 2,887,594 | |
| | | | | | | | |
| | | | | | | 3,909,856 | |
| | | | | | | | |
Total Short-Term Investments (cost $4,431,891) | | | | | | | 4,431,891 | |
| | | | | | | | |
Total Value of Securities – 98.15% | | | | | |
(cost $107,481,050) | | | | | | $ | 111,175,268 | |
| | | | | | | | |
| | # | Security exempt from registration under Rule 144A of the Securities Act of 1933, as amended. At Oct. 31, 2017, the aggregate value of Rule 144A securities was $60,058,265, which represents 53.02% of the Portfolio’s net assets. See Note 11 in “Notes to financial statements.” |
| | = | The value of this security was determined using significant unobservable inputs and is reported as a Level 3 security in the disclosure table located in Note 3 in “Notes to financial statements.” |
| | ≠ | The rate shown is the effective yield at the time of purchase. |
| | ° | Principal amount shown is stated in US dollars unless noted that the security is denominated in another currency. |
| | µ | Fixed to variable rate investment. The rate shown reflects the fixed rate in effect at Oct. 31, 2017. Rate will reset at a future date. |
| | y | No contractual maturity date. |
| | † | Non-income producing security. |
| | ● | Variable rate investment. Interest rates reset periodically. Interest rate shown reflects the rate in effect at Oct. 31, 2017. For securities based on a published reference rate and spread, the reference rate and spread are indicated in their description above. Certain variable rate securities are not based on a published reference rate and spread but are determined by the issuer or agent and are based on current market conditions. These securities do not indicate a reference rate and spread in their description above. |
Summary of abbreviations:
ICE – Intercontinental Exchange
LIBOR – London Interbank Offered Rate
LIBOR03M – ICE LIBOR USD 3Month
USD – US Dollar
See accompanying notes, which are an integral part of the financial statements.
68
Macquarie Institutional Portfolios — Macquarie Emerging Markets Portfolio
October 31, 2017
| | | | | | | | |
| | | Number of
shares | | | Value
(US $) | |
Common Stock – 95.66%D | |
Brazil – 7.85% | | | | | | | | |
Ambev ADR | | | 214,689 | | | $ | 1,358,981 | |
CCR | | | 380,305 | | | | 2,111,191 | |
Cielo | | | 372,482 | | | | 2,543,713 | |
Embraer ADR | | | 139,347 | | | | 2,667,103 | |
Hypermarcas | | | 62,100 | | | | 651,316 | |
Itau Unibanco Holding ADR | | | 109,200 | | | | 1,398,852 | |
| | | | | | | | |
| | | | | | | 10,731,156 | |
| | | | | | | | |
China/Hong Kong – 19.28% | | | | | | | | |
China BlueChemical | | | 1,987,000 | | | | 593,446 | |
China Construction Bank | | | 5,824,000 | | | | 5,195,867 | |
China Mobile | | | 362,500 | | | | 3,640,613 | |
China Resources Power Holdings | | | 1,382,038 | | | | 2,657,288 | |
China State Construction International Holdings | | | 1,294,000 | | | | 1,817,910 | |
CSPC Pharmaceutical Group | | | 476,000 | | | | 827,359 | |
Dongfeng Motor Group Class H | | | 2,154,000 | | | | 2,954,316 | |
Golden Eagle Retail Group | | | 434,000 | | | | 525,713 | |
Jiangsu Expressway | | | 862,000 | | | | 1,321,496 | |
Sands China | | | 391,200 | | | | 1,842,823 | |
Tongda Group Holdings | | | 4,840,000 | | | | 1,371,087 | |
WH Group 144A # | | | 3,554,000 | | | | 3,598,918 | |
| | | | | | | | |
| | | | | | | 26,346,836 | |
| | | | | | | | |
India – 13.56% | | | | | | | | |
Bajaj Auto | | | 63,157 | | | | 3,175,926 | |
HCL Technologies | | | 184,663 | | | | 2,439,888 | |
Housing Development Finance | | | 58,318 | | | | 1,537,289 | |
Indiabulls Housing Finance | | | 158,417 | | | | 3,042,687 | |
Infosys | | | 65,026 | | | | 925,476 | |
Infosys ADR | | | 53,142 | | | | 789,159 | |
Larsen & Toubro | | | 68,595 | | | | 1,294,458 | |
Power Grid Corp of India | | | 438,512 | | | | 1,434,259 | |
Reliance Industries | | | 85,889 | | | | 1,247,601 | |
Vedanta | | | 517,651 | | | | 2,652,141 | |
| | | | | | | | |
| | | | | | | 18,538,884 | |
| | | | | | | | |
Indonesia – 1.41% | | | | | | | | |
Bank Rakyat Indonesia | | | | | | | | |
Persero | | | 1,679,600 | | | | 1,931,927 | |
| | | | | | | | |
| | | | | | | 1,931,927 | |
| | | | | | | | |
Kazakhstan – 0.41% | | | | | | | | |
KazMunaiGas Exploration Production GDR | | | 54,151 | | | | 555,048 | |
| | | | | | | | |
| | | | | | | 555,048 | |
| | | | | | | | |
| | | | | | | | |
| | | Number of
shares | | | Value
(US $) | |
Common StockD (continued) | |
Malaysia – 4.97% | | | | | | | | |
AMMB Holdings | | | 1,205,200 | | | $ | 1,218,438 | |
Genting Malaysia | | | 1,600,200 | | | | 1,901,265 | |
Malayan Banking | | | 1,060,699 | | | | 2,317,578 | |
Tenaga Nasional | | | 382,500 | | | | 1,355,262 | |
| | | | | | | | |
| | | | | | | 6,792,543 | |
| | | | | | | | |
Mexico – 3.10% | | | | | | | | |
Fibra Uno Administracion | | | 1,914,488 | | | | 3,003,784 | |
Grupo Financiero Santander Mexico Class B ADR | | | 67,857 | | | | 571,356 | |
Wal-Mart de Mexico | | | 293,522 | | | | 657,111 | |
| | | | | | | | |
| | | | | | | 4,232,251 | |
| | | | | | | | |
Peru – 1.22% | | | | | | | | |
Credicorp | | | 7,936 | | | | 1,662,116 | |
| | | | | | | | |
| | | | | | | 1,662,116 | |
| | | | | | | | |
Philippines – 1.17% | | | | | | | | |
PLDT ADR | | | 48,168 | | | | 1,592,434 | |
| | | | | | | | |
| | | | | | | 1,592,434 | |
| | | | | | | | |
Qatar – 1.66% | | | | | | | | |
Qatar Electricity & Water | | | 25,666 | | | | 1,289,908 | |
Qatar National Bank | | | 29,452 | | | | 982,744 | |
| | | | | | | | |
| | | | | | | 2,272,652 | |
| | | | | | | | |
Republic of Korea – 13.51% | | | | | | | | |
Hyundai Mobis | | | 5,072 | | | | 1,206,487 | |
Kangwon Land | | | 40,110 | | | | 1,227,985 | |
Korea Electric Power | | | 54,522 | | | | 1,907,674 | |
Korea Zinc | | | 2,413 | | | | 1,102,741 | |
Samsung Electronics | | | 2,398 | | | | 5,894,669 | |
Samsung SDI | | | 7,367 | | | | 1,354,578 | |
Shinhan Financial Group Co. | | | 70,154 | | | | 3,143,420 | |
SK Telecom | | | 11,150 | | | | 2,627,393 | |
| | | | | | | | |
| | | | | | | 18,464,947 | |
| | | | | | | | |
Romania – 0.38% | | | | | | | | |
Societatea Nationala de Gaze Naturale ROMGAZ GDR † | | | 65,088 | | | | 521,355 | |
| | | | | | | | |
| | | | | | | 521,355 | |
| | | | | | | | |
Schedules of investments
Macquarie Institutional Portfolios — Macquarie Emerging Markets Portfolio
| | | | | | | | |
| | | Number of
shares | | | Value
(US $) | |
Common StockD (continued) | | | | | | | | |
Russia – 3.96% | | | | | | | | |
Gazprom PJSC ADR | | | 916,431 | | | $ | 3,935,613 | |
LUKOIL PJSC ADR | | | 27,914 | | | | 1,482,233 | |
| | | | | | | | |
| | | | | | | 5,417,846 | |
| | | | | | | | |
South Africa – 6.03% | | | | | | | | |
Barclays Africa Group | | | 174,651 | | | | 1,731,100 | |
Growthpoint Properties | | | 550,072 | | | | 953,568 | |
Redefine Properties | | | 735,091 | | | | 551,627 | |
Sasol | | | 73,328 | | | | 2,145,423 | |
Woolworths Holdings | | | 717,267 | | | | 2,858,668 | |
| | | | | | | | |
| | | | | | | 8,240,386 | |
| | | | | | | | |
Taiwan – 10.34% | | | | | | | | |
Asustek Computer | | | 170,000 | | | | 1,471,178 | |
CTBC Financial Holding | | | 2,107,046 | | | | 1,348,364 | |
Mega Financial Holding | | | 2,049,245 | | | | 1,610,342 | |
Novatek Microelectronics | | | 311,000 | | | | 1,149,770 | |
Quanta Computer | | | 433,000 | | | | 1,019,347 | |
Taiwan Mobile | | | 350,000 | | | | 1,247,534 | |
Taiwan Semiconductor Manufacturing | | | 655,588 | | | | 5,282,179 | |
Teco Electric & Machinery | | | 1,080,000 | | | | 1,008,041 | |
| | | | | | | | |
| | | | | | | 14,136,755 | |
| | | | | | | | |
Thailand – 2.50% | | | | | | | | |
Kasikornbank NVDR | | | 344,400 | | | | 2,280,795 | |
Thai Union Group Foreign | | | 2,055,800 | | | | 1,132,485 | |
| | | | | | | | |
| | | | | | | 3,413,280 | |
| | | | | | | | |
Turkey – 2.86% | | | | | | | | |
Eregli Demir ve Celik | | | | | | | | |
Fabrikalari TAS | | | 565,190 | | | | 1,325,985 | |
Turkiye Garanti Bankasi | | | 483,143 | | | | 1,328,355 | |
Turkiye Halk Bankasi | | | 430,575 | | | | 1,255,331 | |
| | | | | | | | |
| | | | | | | 3,909,671 | |
| | | | | | | | |
United Arab Emirates – 1.45% | | | | | |
First Abu Dhabi Bank | | | 703,755 | | | | 1,983,272 | |
| | | | | | | | |
| | | | | | | 1,983,272 | |
| | | | | | | | |
Total Common Stock
(cost $122,328,519) | | | | | | | 130,743,359 | |
| | | | | | | | |
| | | | | | | |
Preferred Stock – 3.02%D | | | | | |
Brazil – 2.74% | | | | | | | | |
Itausa – Investimentos Itau 5.52% | | | 350,900 | | | | 1,131,659 | |
Suzano Papel e Celulose Class A 1.64% | | | 423,200 | | | | 2,620,986 | |
| | | | | | | | |
| | | | | | | 3,752,645 | |
| | | | | | | | |
| | | | | | | | |
| | | Number of
shares | | | Value
(US $) | |
Preferred StockD (continued) | | | | | |
India – 0.28% | | | | | | | | |
Vedanta 7.50% | | | 2,364,248 | | | $ | 377,791 | |
| | | | | | | | |
| | | | | | | 377,791 | |
| | | | | | | | |
Total Preferred Stock (cost $2,565,536) | | | | | | | 4,130,436 | |
| | | | | | | | |
| | |
| | | Principal amount° | | | | |
Short-Term Investments – 1.50% | | | | | |
Discount Notes – 0.95%≠ | | | | | | | | |
Federal Home Loan Bank
0.00% 11/1/17 | | | 96,314 | | | | 96,313 | |
0.90% 11/6/17 | | | 264,841 | | | | 264,804 | |
0.96% 11/3/17 | | | 110,471 | | | | 110,465 | |
0.97% 11/15/17 | | | 145,357 | | | | 145,301 | |
1.005% 11/9/17 | | | 519,033 | | | | 518,917 | |
1.005% 11/13/17 | | | 166,257 | | | | 166,202 | |
| | | | | | | | |
| | | | | | | 1,302,002 | |
| | | | | | | | |
Repurchase Agreements – 0.55% | | | | | |
Bank of America Merrill Lynch 0.97%, dated 10/31/17, to be repurchased on 11/1/17, repurchase price $194,681 (collateralized by US government obligations 0.00%–9.00% 11/24/17–5/15/47; market value $198,570) | | | 194,676 | | | | 194,676 | |
BNP Paribas
1.00%, dated 10/31/17, to be repurchased on 11/1/17, repurchase price $549,918 (collateralized by US government obligations 0.00%–5.00% 2/15/18–2/15/46; market value $560,901) | | | 549,903 | | | | 549,903 | |
| | | | | | | | |
| | | | | | | 744,579 | |
| | | | | | | | |
Total Short-Term Investments
(cost $2,046,586) | | | | | | | 2,046,581 | |
| | | | | | | | |
Total Value of
Securities – 100.18% | | | | | | | | |
(cost $126,940,641) | | | | | | $ | 136,920,376 | |
| | | | | | | | |
70
| | # | Security exempt from registration under Rule 144A of the Securities Act of 1933, as amended. At Oct. 31, 2017, the aggregate value of Rule 144A securities was $3,598,918, which represents 2.63% of the Portfolio’s net assets. See Note 11 in “Notes to financial statements.” |
| | ≠ | The rate shown is the effective yield at the time of purchase. |
| | ° | Principal amount shown is stated in US dollars unless noted that the security is denominated in another currency. |
| | D | Securities have been classified by country of origin. Aggregate classification by business sector has been presented on page 31 in “Security type / country and sector allocations.” |
| | † | Non-income producing security. |
The following foreign currency exchange contracts were outstanding at Oct. 31, 2017:1
Foreign Currency Exchange Contracts
| | | | | | | | | | | | | | | | | | | | | | | | |
Counterparty | | Contracts to
Receive
(Deliver) | | | In Exchange
For | | | Settlement
Date | | | Unrealized
Appreciation | |
BNYM | | | KRW | | | | 90,521,732 | | | | USD | | | | (80,819 | ) | | | 11/1/17 | | | $ | 2 | |
JPMC | | | TRY | | | | (1,180,133 | ) | | | USD | | | | 312,379 | | | | 11/1/17 | | | | 1,380 | |
| | | | | | | | | | | | | | | | | | | | | | | | |
Total Foreign Currency Exchange Contracts | | | $ | 1,382 | |
| | | | | | | | | | | | | | | | | | | | | | | | |
The use of foreign currency exchange contracts involves elements of market risk and risks in excess of the amounts disclosed in the financial statements. The foreign currency exchange contracts presented above represent the Portfolio’s total exposure in such contracts, whereas only the net unrealized appreciation (depreciation) is reflected in the Portfolio’s net assets.
1See Note 8 in “Notes to financial statements.”
Summary of abbreviations:
ADR – American Depositary Receipt
BNYM – BNY Mellon
GDR – Global Depositary Receipt
JPMC – JPMorgan Chase
KRW – South Korean Won
NVDR – Non-Voting Depositary Receipt
TRY – Turkish Lira
USD – US Dollar
See accompanying notes, which are an integral part of the financial statements.
Schedules of investments
Macquarie Institutional Portfolios — Macquarie Emerging Markets Portfolio II
October 31, 2017
| | | | | | | | |
| | | Number of
shares | | | Value
(US $) | |
Common Stock – 98.10%D | | | | | |
Argentina – 1.43% | | | | | | | | |
Cresud ADR † | | | 12,255 | | | $ | 265,688 | |
IRSA Inversiones y Representaciones ADR † | | | 9,200 | | | | 267,904 | |
IRSA Propiedades Comerciales ADR | | | 2,254 | | | | 126,224 | |
| | | | | | | | |
| | | | | | | 659,816 | |
| | | | | | | | |
Bahrain – 0.03% | | | | | | | | |
Aluminum Bahrain GDR 144A # | | | 1,800 | | | | 13,241 | |
| | | | | | | | |
| | | | | | | 13,241 | |
| | | | | | | | |
Brazil – 14.72% | | | | | | | | |
Atacadao Distribuicao Comercio e Industria † | | | 37,800 | | | | 190,312 | |
B2W Cia Digital † | | | 228,885 | | | | 1,479,815 | |
Banco Bradesco ADR | | | 45,904 | | | | 485,205 | |
Banco Santander Brasil ADR | | | 17,000 | | | | 147,730 | |
BRF ADR † | | | 26,500 | | | | 356,955 | |
Centrais Eletricas Brasileiras ADR † | | | 21,300 | | | | 142,923 | |
Cia Brasileira de Distribuicao ADR † | | | 19,200 | | | | 446,016 | |
Cia Hering | | | 51,400 | | | | 458,802 | |
Cyrela Brazil Realty SA Empreendimentos e participacoes | | | 15,780 | | | | 61,744 | |
Gerdau ADR | | | 13,000 | | | | 43,030 | |
Hypermarcas | | | 25,100 | | | | 263,253 | |
Itau Unibanco Holding ADR | | | 57,005 | | | | 730,234 | |
JBS | | | 31,100 | | | | 71,492 | |
Petroleo Brasileiro
ADR † | | | 53,200 | | | | 566,580 | |
Rumo † | | | 4,700 | | | | 18,204 | |
Santos Brasil Participacoes † | | | 29,500 | | | | 31,562 | |
Telefonica Brasil ADR | | | 32,155 | | | | 495,187 | |
TIM Participacoes ADR | | | 35,600 | | | | 656,464 | |
Vale ADR | | | 13,300 | | | | 130,207 | |
| | | | | | | | |
| | | | | | | 6,775,715 | |
| | | | | | | | |
Canada – 0.76% | | | | | | | | |
Potash Corp of Saskatchewan | | | 18,000 | | | | 350,460 | |
| | | | | | | | |
| | | | | | | 350,460 | |
| | | | | | | | |
Chile – 0.47% | | | | | | | | |
Sociedad Quimica y Minera de Chile ADR | | | 3,600 | | | | 215,064 | |
| | | | | | | | |
| | | | | | | 215,064 | |
| | | | | | | | |
| | | | | | | | |
| | | Number of
shares | | | Value
(US $) | |
Common StockD (continued) | | | | | | | | |
China/Hong Kong – 25.44% | | | | | | | | |
Alibaba Group Holding ADR † | | | 11,500 | | | $ | 2,126,235 | |
Baidu ADR † | | | 3,350 | | | | 817,199 | |
China Mengniu Dairy † | | | 148,000 | | | | 409,773 | |
China Mobile ADR | | | 7,200 | | | | 363,240 | |
China Petroleum & Chemical | | | 94,000 | | | | 69,042 | |
China Petroleum & Chemical ADR | | | 3,770 | | | | 277,623 | |
Ctrip.com International ADR † | | | 7,700 | | | | 368,753 | |
Ping An Insurance Group of China | | | 36,500 | | | | 320,487 | |
SINA † | | | 18,700 | | | | 2,013,055 | |
Sohu.com † | | | 20,300 | | | | 1,161,769 | |
Tencent Holdings | | | 51,800 | | | | 2,322,614 | |
Tianjin Development Holdings | | | 190,000 | | | | 97,418 | |
Tingyi Cayman Islands Holding | | | 224,000 | | | | 353,167 | |
Uni-President China Holdings | | | 492,000 | | | | 411,188 | |
Weibo ADR † | | | 5,670 | | | | 525,326 | |
ZhongAn Online P&C Insurance Class H 144A #† | | | 7,600 | | | | 76,668 | |
| | | | | | | | |
| | | | | | | 11,713,557 | |
| | | | | | | | |
Colombia – 0.47% | | | | | | | | |
CEMEX Latam Holdings † | | | 61,058 | | | | 216,369 | |
| | | | | | | | |
| | | | | | | 216,369 | |
| | | | | | | | |
India – 10.57% | | | | | | | | |
ICICI Bank ADR | | | 53,000 | | | | 484,950 | |
Reliance Industries | | | 60,712 | | | | 881,886 | |
Reliance Industries GDR 144A # | | | 102,314 | | | | 2,936,412 | |
Tata Chemicals | | | 33,278 | | | | 376,547 | |
UltraTech Cement | | | 2,784 | | | | 189,166 | |
| | | | | | | | |
| | | | | | | 4,868,961 | |
| | | | | | | | |
Indonesia – 1.35% | | | | | | | | |
Astra International | | | 709,200 | | | | 418,330 | |
Global Mediacom | | | 2,369,600 | | | | 102,210 | |
Tambang Batubara Bukit Asam Persero | | | 118,500 | | | | 100,261 | |
United Tractors | | | 13 | | | | 33 | |
| | | | | | | | |
| | | | | | | 620,834 | |
| | | | | | | | |
Malaysia – 0.20% | | | | | | | | |
UEM Sunrise † | | | 356,100 | | | | 93,367 | |
| | | | | | | | |
| | | | | | | 93,367 | |
| | | | | | | | |
72
| | | | | | | | |
| | | Number of
shares | | | Value
(US $) | |
Common StockD (continued) | | | | | |
Mexico – 5.50% | | | | | | | | |
America Movil Class L ADR | | | 12,230 | | | $ | 209,378 | |
Cemex ADR † | | | 24,986 | | | | 202,637 | |
Coca-Cola Femsa ADR | | | 11,700 | | | | 800,748 | |
Fomento Economico Mexicano ADR | | | 4,800 | | | | 421,200 | |
Grupo Financiero Banorte | | | 24,300 | | | | 143,987 | |
Grupo Financiero Santander Mexico Class B ADR | | | 37,700 | | | | 317,434 | |
Grupo Televisa ADR | | | 20,000 | | | | 437,800 | |
| | | | | | | | |
| | | | | | | 2,533,184 | |
| | | | | | | | |
Netherlands – 1.07% | | | | | | | | |
VEON ADR | | | 32,141 | | | | 125,671 | |
Yandex Class A † | | | 10,800 | | | | 365,364 | |
| | | | | | | | |
| | | | | | | 491,035 | |
| | | | | | | | |
Peru – 0.56% | | | | | | | | |
Cia de Minas Buenaventura ADR | | | 18,800 | | | | 259,252 | |
| | | | | | | | |
| | | | | | | 259,252 | |
| | | | | | | | |
Republic of Korea – 18.32% | | | | | | | | |
Hitejinro Holdings | | | 20,000 | | | | 193,690 | |
Hyundai Motor | | | 1,668 | | | | 239,700 | |
KB Financial Group ADR | | | 9,600 | | | | 504,096 | |
LG Uplus | | | 28,207 | | | | 323,524 | |
Lotte | | | 5,824 | | | | 387,268 | |
Lotte Chilsung Beverage | | | 181 | | | | 223,316 | |
Lotte Confectionery † | | | 592 | | | | 98,325 | |
NAVER | | | 289 | | | | 230,612 | |
Samsung Electronics | | | 1,312 | | | | 3,225,106 | |
Samsung Life Insurance | | | 4,270 | | | | 514,527 | |
SK Hynix | | | 8,000 | | | | 586,959 | |
SK Telecom | | | 2,000 | | | | 471,281 | |
SK Telecom ADR | | | 55,000 | | | | 1,437,700 | |
| | | | | | | | |
| | | | | | | 8,436,104 | |
| | | | | | | | |
Russia – 4.61% | | | | | | | | |
Etalon Group
GDR 144A #= | | | 4,800 | | | | 19,440 | |
Gazprom PJSC ADR | | | 103,216 | | | | 443,261 | |
LUKOIL (London International Exchange) ADR | | | 6,083 | | | | 323,007 | |
LUKOIL ADR | | | 3,400 | | | | 180,302 | |
Mail.Ru Group GDR † | | | 5,990 | | | | 194,675 | |
Mobile TeleSystems ADR | | | 19,400 | | | | 205,834 | |
Rosneft Oil GDR | | | 52,800 | | | | 289,344 | |
Sberbank of Russia PJSC | | | 141,095 | | | | 467,582 | |
| | | | | | | | |
| | | | | | | 2,123,445 | |
| | | | | | | | |
| | | | | | | | |
| | | Number of
shares | | | Value
(US $) | |
Common StockD (continued) | | | | | |
Taiwan – 7.22% | | | | | | | | |
Hon Hai Precision Industry | | | 180,206 | | | $ | 669,211 | |
MediaTek | | | 98,000 | | | | 1,112,916 | |
Taiwan Semiconductor Manufacturing | | | 95,000 | | | | 765,431 | |
Taiwan Semiconductor Manufacturing ADR | | | 18,300 | | | | 774,639 | |
| | | | | | | | |
| | | | | | | 3,322,197 | |
| | | | | | | | |
Thailand – 1.21% | | | | | | | | |
Bangkok Bank | | | 37,099 | | | | 215,536 | |
PTT Foreign | | | 27,160 | | | | 343,384 | |
| | | | | | | | |
| | | | | | | 558,920 | |
| | | | | | | | |
Turkey – 2.57% | | | | | | | | |
Akbank Turk | | | 231,744 | | | | 611,500 | |
Anadolu Efes Biracilik Ve Malt Sanayii | | | 29,112 | | | | 168,523 | |
Turkcell Iletisim Hizmetleri | | | 41,325 | | | | 154,361 | |
Turkcell Iletisim Hizmetleri ADR | | | 20,600 | | | | 193,434 | |
Turkiye Sise ve Cam Fabrikalari | | | 48,975 | | | | 57,450 | |
| | | | | | | | |
| | | | | | | 1,185,268 | |
| | | | | | | | |
United States – 1.60% | | | | | | | | |
Altaba † | | | 10,500 | | | | 736,260 | |
| | | | | | | | |
| | | | | | | 736,260 | |
| | | | | | | | |
Total Common Stock
(cost $34,747,476) | | | | | | | 45,173,049 | |
| | | | | | | | |
Exchange-Traded Fund – 0.46%D | | | | | |
United States – 0.46% | | | | | | | | |
iShares MSCI Turkey | | | 5,000 | | | | 209,100 | |
| | | | | | | | |
Total Exchange-Traded Fund
(cost $184,363) | | | | | | | 209,100 | |
| | | | | | | | |
Preferred Stock – 1.64%D | | | | | |
Brazil – 0.09% | | | | | | | | |
Gerdau 0.37% | | | 11,700 | | | | 39,163 | |
| | | | | | | | |
| | | | | | | 39,163 | |
| | | | | | | | |
Republic of Korea – 1.55% | | | | | |
LG Electronics 1.02% | | | 17,861 | | | | 715,811 | |
| | | | | | | | |
| | | | | | | 715,811 | |
| | | | | | | | |
Total Preferred Stock
(cost $419,154) | | | | | | | 754,974 | |
| | | | | | | | |
Schedules of investments
Macquarie Institutional Portfolios – Macquarie Emerging Markets Portfolio II
| | | | | | | | |
| | | Number of
shares | | | Value
(US $) | |
Rights – 0.00%D | | | | | | | | |
China/Hong Kong – 0.00% | | | | | |
Tencent Holdings exercise price HKD 55.00, expiration date 11/8/17 =† | | | 41 | | | $ | 0 | |
| | | | | | | | |
Total Rights (cost $0) | | | | | | | 0 | |
| | | | | | | | |
Total Value of
Securities – 100.20% | | | | | | | | |
(cost $35,350,993) | | | | | | $ | 46,137,123 | |
| | | | | | | | |
| | # | Security exempt from registration under Rule 144A of the Securities Act of 1933, as amended. At Oct. 31, 2017, the aggregate value of Rule 144A securities was $3,045,761, which represents 6.61% |
| | of the Portfolio’s net assets. See Note 11 in “Notes to financial statements.” |
| | = | The value of this security was determined using significant unobservable inputs and is reported as a Level 3 security in the disclosure table located in Note 3 in “Notes to financial statements.” |
| | D | Securities have been classified by country of origin. Aggregate classification by business sector has been presented on page 32 in “Security type / country and sector allocations.” |
| | † | Non-income producing security. |
Summary of abbreviations:
ADR – American Depositary Receipt
GDR – Global Depositary Receipt
HKD – Hong Kong Dollar
See accompanying notes, which are an integral part of the financial statements.
74
Macquarie Institutional Portfolios — Macquarie Labor Select International Equity Portfolio
October 31, 2017
| | | | | | | | |
| | | Number of
shares | | | Value
(US $) | |
Common Stock – 98.86%D | | | | | | | | |
Australia – 1.39% | | | | | | | | |
QBE Insurance Group | | | 835,860 | | | $ | 6,832,268 | |
| | | | | | | | |
| | | | | | | 6,832,268 | |
| | | | | | | | |
China/Hong Kong – 2.82% | | | | | | | | |
CK Hutchison Holdings | | | 729,000 | | | | 9,255,704 | |
WH Group 144A # | | | 4,512,500 | | | | 4,569,533 | |
| | | | | | | | |
| | | | | | | 13,825,237 | |
| | | | | | | | |
Denmark – 1.16% | | | | | | | | |
ISS | | | 134,844 | | | | 5,707,638 | |
| | | | | | | | |
| | | | | | | 5,707,638 | |
| | | | | | | | |
France – 6.63% | | | | | | | | |
Cie de Saint-Gobain | | | 166,342 | | | | 9,757,929 | |
Sanofi | | | 166,101 | | | | 15,728,213 | |
Societe Generale | | | 125,547 | | | | 6,990,436 | |
| | | | | | | | |
| | | | | | | 32,476,578 | |
| | | | | | | | |
Germany – 12.85% | | | | | | | | |
Allianz | | | 55,266 | | | | 12,902,341 | |
Bayerische Motoren Werke | | | 45,829 | | | | 4,700,238 | |
Daimler | | | 159,202 | | | | 13,291,170 | |
Evonik Industries | | | 178,115 | | | | 6,479,099 | |
SAP | | | 107,660 | | | | 12,301,514 | |
Telefonica Deutschland Holding | | | 2,610,688 | | | | 13,316,762 | |
| | | | | | | | |
| | | | | | | 62,991,124 | |
| | | | | | | | |
Italy – 5.82% | | | | | | | | |
Enel | | | 2,381,949 | | | | 14,774,816 | |
Eni | | | 842,379 | | | | 13,776,682 | |
| | | | | | | | |
| | | | | | | 28,551,498 | |
| | | | | | | | |
Japan – 18.03% | | | | | | | | |
Canon | | | 199,500 | | | | 7,444,514 | |
FUJIFILM Holdings | | | 77,600 | | | | 3,157,096 | |
Honda Motor | | | 470,800 | | | | 14,587,119 | |
Isuzu Motors | | | 230,800 | | | | 3,346,148 | |
Kirin Holdings | | | 500,200 | | | | 11,897,374 | |
Kyushu Railway | | | 130,800 | | | | 4,170,001 | |
Mitsubishi Electric | | | 483,200 | | | | 8,208,089 | |
Otsuka Holdings | | | 29,600 | | | | 1,231,847 | |
Santen Pharmaceutical | | | 6,800 | | | | 107,587 | |
Sekisui Chemical | | | 244,000 | | | | 4,884,077 | |
Sumitomo Electric Industries | | | 340,700 | | | | 5,757,487 | |
Takeda Pharmaceutical | | | 260,300 | | | | 14,639,800 | |
Tokio Marine Holdings | | | 209,900 | | | | 8,962,354 | |
| | | | | | | | |
| | | | | | | 88,393,493 | |
| | | | | | | | |
| | | | | | | | |
| | | Number of
shares | | | Value
(US $) | |
Common StockD (continued) | | | | | |
Netherlands – 2.53% | | | | | | | | |
Koninklijke Ahold Delhaize | | | 609,773 | | | $ | 11,474,801 | |
Royal Dutch Shell Class A | | | 29,501 | | | | 926,844 | |
| | | | | | | | |
| | | | | | | 12,401,645 | |
| | | | | | | | |
Singapore – 6.40% | | | | | | | | |
Ascendas Real Estate | | | | | | | | |
Investment Trust | | | 2,944,900 | | | | 5,919,614 | |
Singapore Telecommunications | | | 3,956,100 | | | | 10,883,556 | |
United Overseas Bank | | | 807,609 | | | | 14,586,849 | |
| | | | | | | | |
| | | | | | | 31,390,019 | |
| | | | | | | | |
Spain – 5.48% | | | | | | | | |
Banco Santander | | | 564,017 | | | | 3,825,683 | |
Iberdrola | | | 1,609,584 | | | | 13,008,222 | |
Telefonica | | | 955,083 | | | | 10,019,431 | |
| | | | | | | | |
| | | | | | | 26,853,336 | |
| | | | | | | | |
Sweden – 4.44% | | | | | | | | |
Telefonaktiebolaget LM | | | | | | | | |
Ericsson Class B | | | 1,106,220 | | | | 6,963,716 | |
Telia | | | 3,201,741 | | | | 14,819,954 | |
| | | | | | | | |
| | | | | | | 21,783,670 | |
| | | | | | | | |
Switzerland – 7.48% | | | | | | | | |
ABB | | | 528,346 | | | | 13,811,721 | |
Novartis | | | 133,575 | | | | 11,005,729 | |
Zurich Insurance Group | | | 38,773 | | | | 11,834,189 | |
| | | | | | | | |
| | | | | | | 36,651,639 | |
| | | | | | | | |
United Kingdom – 23.83% | | | | | | | | |
BP | | | 2,305,745 | | | | 15,624,238 | |
G4S | | | 2,602,115 | | | | 9,711,357 | |
GlaxoSmithKline | | | 616,052 | | | | 11,107,194 | |
J Sainsbury | | | 457,883 | | | | 1,474,733 | |
John Wood Group | | | 747,698 | | | | 7,065,587 | |
Kingfisher | | | 2,621,346 | | | | 10,883,296 | |
Lloyds Banking Group | | | 13,917,765 | | | | 12,623,324 | |
National Grid | | | 578,303 | | | | 6,958,743 | |
Next | | | 122,406 | | | | 8,000,243 | |
Pearson | | | 294,784 | | | | 2,754,325 | |
Royal Dutch Shell Class B | | | 489,426 | | | | 15,740,504 | |
Tesco | | | 5,105,531 | | | | 12,300,573 | |
WPP | | | 144,560 | | | | 2,561,245 | |
| | | | | | | | |
| | | | | | | 116,805,362 | |
| | | | | | | | |
Total Common Stock
(cost $444,086,562) | | | | | | | 484,663,507 | |
| | | | | | | | |
Schedules of investments
Macquarie Institutional Portfolios – Macquarie Labor Select International Equity Portfolio
| | | | | | | | |
| | | Number of
shares | | | Value
(US $) | |
Preferred Stock – 0.12% | | | | | | | | |
Bayerische Motoren Werke 4.59% | | | 6,993 | | | $ | 613,584 | |
| | | | | | | | |
Total Preferred Stock (cost $505,658) | | | | | | | 613,584 | |
| | | | | | | | |
| | | | | | | |
Rights – 0.01% | | | | | | | | |
Banco Santander
exercise price EUR 0.04 expiration date 11/1/17 † | | | 563,882 | | | | 26,930 | |
| | | | | | | | |
Total Rights (cost $25,880) | | | | | | | 26,930 | |
| | | | | | | | |
| | |
| | | Principal amount° | | | | |
Short-Term Investments – 0.45% | |
Discount Notes – 0.41%≠ | | | | | | | | |
Federal Home Loan Bank
0.855% 11/1/17 | | | 26,531 | | | | 26,531 | |
0.901% 11/6/17 | | | 72,955 | | | | 72,945 | |
0.958% 11/3/17 | | | 30,431 | | | | 30,430 | |
0.97% 11/15/17 | | | 40,041 | | | | 40,026 | |
1.005% 11/9/17 | | | 1,256,135 | | | | 1,255,856 | |
1.005% 11/13/17 | | | 590,693 | | | | 590,497 | |
| | | | | | | | |
| | | | | | | 2,016,285 | |
| | | | | | | | |
Repurchase Agreements – 0.04% | |
Bank of America Merrill Lynch 0.97%, dated 10/31/17, to be repurchased on 11/1/17, repurchase price $53,629 (collateralized by US government obligations 0.00%–9.00% 11/24/17–5/15/47; market value $54,700) | | | 53,627 | | | | 53,627 | |
BNP Paribas 1.00%, dated 10/31/17, to be repurchased on 11/1/17, repurchase price $151,485 (collateralized by US government obligations 0.00%–5.00% 2/15/18–2/15/46; market value $154,511) | | | 151,481 | | | | 151,481 | |
| | | | | | | | |
| | | | | | | 205,108 | |
| | | | | | | | |
Total Short-Term Investments
(cost $2,221,392) | | | | | | | 2,221,393 | |
| | | | | | | | |
| | | | |
Total Value of
Securities – 99.44% | | | | |
(cost $446,839,492) | | $ | 487,525,414 | |
| | | | |
| | # | Security exempt from registration under Rule 144A of the Securities Act of 1933, as amended. At Oct. 31, 2017, the aggregate value of Rule 144A securities was $4,569,533, which represents 0.93% of the Portfolio’s net assets. See Note 11 in “Notes to financial statements.” |
| | ≠ | The rate shown is the effective yield at the time of purchase. |
| | ° | Principal amount shown is stated in US dollars unless noted that the security is denominated in another currency. |
| | D | Securities have been classified by country of origin. Aggregate classification by business sector has been presented on page 33 in “Security type / country and sector allocations.” |
| | † | Non-income producing security. |
The following foreign currency exchange contracts were outstanding at Oct. 31, 2017:1
Foreign Currency Exchange Contracts
| | | | | | | | | | | | | | | | | | | | | | | | |
Counterparty | | Contracts
to Receive
(Deliver) | | | In
Exchange For | | | Settlement
Date | | | Unrealized
Depreciation | |
BNYM | | | JPY | | | | 51,595,445 | | | | USD | | | | (454,285 | ) | | | 11/2/17 | | | $ | (483 | ) |
BNYM | | | JPY | | | | 55,265,363 | | | | USD | | | | (487,804 | ) | | | 11/6/17 | | | | (1,645 | ) |
DB | | | JPY | | | | (70,547,252 | ) | | | USD | | | | 618,770 | | | | 11/1/17 | | | | (1,696 | ) |
| | | | | | | | | | | | | | | | | | | | | | | | |
Total Foreign Currency Exchange Contracts | | | | $(3,824 | ) |
| | | | | | | | | | | | | | | | | | | | | | | | |
The use of foreign currency exchange contracts involves elements of market risk and risks in excess of these amounts disclosed in the financial statements. The foreign currency exchange contracts presented above represents the Portfolio’s total exposure in such contracts, whereas only the net unrealized appreciation (depreciation) is reflected in the Portfolio’s net assets.
1See Note 8 in “Notes to financial statements.”
Summary of abbreviations:
BNYM – BNY Mellon
DB – Deutsche Bank
JPY – Japanese Yen
USD – US Dollar
See accompanying notes, which are an integral part of the financial statements.
76
This page intentionally left blank.
Statements of assets and liabilities
Macquarie Institutional Portfolios
October 31, 2017
| | | | | | | | | | | | |
| | | Macquarie
Large Cap
Value
Portfolio | | | Macquarie
Core Plus
Bond
Portfolio | | | Macquarie
High Yield
Bond
Portfolio | |
Assets: | | | | | | | | | | | | |
Investments, at value1 | | $ | 166,842,007 | | | $ | 157,294,452 | | | $ | 106,743,377 | |
Short-term investments, at value2 | | | 4,961,439 | | | | 1,310,831 | | | | 522,035 | |
Repurchase agreements, at value3 | | | 4,947,475 | | | | 9,817,653 | | | | 3,909,856 | |
Cash | | | — | | | | 3,411,079 | | | | 1,439,498 | |
Cash collateral due from brokers | | | — | | | | 236,988 | | | | — | |
Foreign currencies, at value4 | | | — | | | | 105,451 | | | | — | |
Dividends and interest receivable | | | 326,575 | | | | 1,336,490 | | | | 1,678,961 | |
Swap payments receivable | | | — | | | | 898 | | | | — | |
Receivable for fund shares sold | | | — | | | | — | | | | 90,950 | |
Receivable for securities sold | | | — | | | | 7,912,987 | | | | 365,775 | |
Variation margin due from brokers for futures contracts | | | — | | | | 6,746 | | | | — | |
Unrealized appreciation on foreign currency exchange contracts | | | — | | | | 354 | | | | — | |
Other assets5 | | | — | | | | 75,182 | | | | 48,975 | |
| | | | | | | | | | | | |
Total assets | | | 177,077,496 | | | | 181,509,111 | | | | 114,799,427 | |
| | | | | | | | | | | | |
Liabilities: | | | | | | | | | | | | |
Cash due to custodian | | | 858,515 | | | | — | | | | — | |
Payable for fund shares redeemed | | | 7,200,000 | | | | — | | | | — | |
Variation margin due to brokers on centrally cleared interest rate swap contracts | | | — | | | | 532 | | | | — | |
Payable for securities purchased | | | — | | | | 12,721,287 | | | | 1,255,032 | |
Investment management fees payable to affiliates | | | 83,092 | | | | 29,296 | | | | 36,983 | |
Audit and tax fees payable | | | 28,600 | | | | 37,826 | | | | 36,050 | |
Administration fees payable | | | 20,576 | | | | — | | | | 16,184 | |
Other accrued expenses | | | 12,683 | | | | 59,459 | | | | 13,082 | |
Custody fees payable | | | 2,935 | | | | — | | | | 3,237 | |
Dividend disbursing and transfer agent fees and expenses payable to affiliates | | | 1,133 | | | | 1,054 | | | | 722 | |
Accounting and administration fees payable to affiliates | | | 914 | | | | 874 | | | | 705 | |
Legal fees payable to affiliates | | | 733 | | | | 644 | | | | 469 | |
Trustees’ fees and expenses payable | | | 442 | | | | 388 | | | | 281 | |
Reports and statements to shareholders expenses payable to affiliates | | | 120 | | | | 120 | | | | 80 | |
Unrealized depreciation on credit default swap contracts | | | — | | | | 32,760 | | | | — | |
Unrealized depreciation on foreign currency exchange contracts | | | — | | | | 48,271 | | | | — | |
Upfront payments received on credit default swap contracts | | | — | | | | 70,133 | | | | — | |
Unrealized depreciation on interest rate swap contracts | | | — | | | | 10,649 | | | | — | |
Swap payments payable | | | — | | | | 3,494 | | | | — | |
Contingent liabilities5 | | | — | | | | 250,607 | | | | 163,250 | |
| | | | | | | | | | | | |
Total liabilities | | | 8,209,743 | | | | 13,267,394 | | | | 1,526,075 | |
| | | | | | | | | | | | |
Total Net Assets | | $ | 168,867,753 | | | $ | 168,241,717 | | | $ | 113,273,352 | |
| | | | | | | | | | | | |
78
| | | | | | | | | | | | |
| | | Macquarie
Large Cap
Value
Portfolio | | | Macquarie
Core Plus
Bond
Portfolio | | | Macquarie
High Yield
Bond
Portfolio | |
Net Assets Consist of: | | | | | | | | | | | | |
Paid-in capital | | $ | 134,473,306 | | | $ | 164,231,969 | | | $ | 117,384,938 | |
Undistributed net investment income | | | 2,754,476 | | | | 4,188,427 | | | | 6,944,390 | |
Accumulated net realized gain (loss) on investments | | | 14,301,460 | | | | (1,405,083 | ) | | | (14,750,194 | ) |
Net unrealized appreciation of investments | | | 17,338,511 | | | | 1,351,255 | | | | 3,694,218 | |
Net unrealized depreciation of foreign currencies | | | — | | | | (10,695 | ) | | | — | |
Net unrealized depreciation of foreign currency exchange contracts | | | — | | | | (47,917 | ) | | | — | |
Net unrealized depreciation of future contracts | | | — | | | | (18,109 | ) | | | — | |
Net unrealized depreciation of options purchased | | | — | | | | (1,607 | ) | | | — | |
Net unrealized depreciation of swap contracts | | | — | | | | (46,523 | ) | | | — | |
| | | | | | | | | | | | |
Total Net Assets | | $ | 168,867,753 | | | $ | 168,241,717 | | | $ | 113,273,352 | |
| | | | | | | | | | | | |
| | | |
Net Asset Value | | | | | | | | | | | | |
| | | |
Portfolio Class | | | | | | | | | | | | |
Net assets | | $ | 168,867,753 | | | $ | 168,241,717 | | | $ | 113,273,352 | |
Shares of beneficial interest outstanding, unlimited authorization, no par | | | 5,916,171 | | | | 16,161,356 | | | | 14,003,799 | |
Net asset value per share | | $ | 28.54 | | | $ | 10.41 | | | $ | 8.09 | |
| | | |
| | | | | | | | | | | | |
1Investments, at cost | | $ | 149,503,459 | | | $ | 155,944,804 | | | $ | 103,049,159 | |
2Short-term investments, at cost | | | 4,961,476 | | | | 1,310,831 | | | | 522,035 | |
3Repurchase agreements, at cost | | | 4,947,475 | | | | 9,817,653 | | | | 3,909,856 | |
4Foreign currencies, at cost | | | — | | | | 110,772 | | | | — | |
5See Note 14 in “Notes to financial statements.” | | | | | | | | | | | | |
See accompanying notes, which are an integral part of the financial statements.
Statements of assets and liabilities
Macquarie Institutional Portfolios
| | | | | | | | | | | | |
| | | Macquarie
Emerging
Markets
Portfolio | | | Macquarie
Emerging
Markets
Portfolio II | | | Macquarie
Labor Select
International
Equity
Portfolio | |
Assets: | | | | | | | | | | | | |
Investments, at value1 | | $ | 134,873,795 | | | $ | 46,137,123 | | | $ | 485,304,021 | |
Short-term investments, at value2 | | | 1,302,002 | | | | — | | | | 2,016,285 | |
Repurchase agreements, at value3 | | | 744,579 | | | | — | | | | 205,108 | |
Foreign currencies, at value4 | | | 106,663 | | | | 85,111 | | | | 117,789 | |
Cash | | | — | | | | — | | | | 289,763 | |
Receivable for securities sold | | | 311,089 | | | | 223,224 | | | | 1,627,668 | |
Dividends and interest receivable | | | 81,831 | | | | 34,909 | | | | 865,639 | |
Foreign tax reclaims receivable | | | 8,397 | | | | 765 | | | | 1,823,548 | |
Receivable for fund shares sold | | | — | | | | — | | | | 2,196 | |
Unrealized appreciation on foreign currency exchange contracts | | | 1,382 | | | | — | | | | — | |
| | | | | | | | | | | | |
Total assets | | | 137,429,738 | | | | 46,481,132 | | | | 492,252,017 | |
| | | | | | | | | | | | |
Liabilities: | | | | | | | | | | | | |
Cash due to custodian | | | 199,573 | | | | 320,763 | | | | — | |
Payable for securities purchased | | | 80,798 | | | | 2,377 | | | | 1,498,393 | |
Payable for fund shares redeemed | | | 2,500 | | | | — | | | | 1,936 | |
Investment management fees payable to affiliates | | | 116,106 | | | | 27,319 | | | | 312,614 | |
Custody fees payable | | | 47,246 | | | | 7,095 | | | | 59,732 | |
Audit and tax fees payable | | | 30,780 | | | | 30,569 | | | | 30,780 | |
Other accrued expenses | | | 28,289 | | | | 4,378 | | | | 20,693 | |
Legal fees payable to affiliates | | | 1,946 | | | | 559 | | | | 2,417 | |
Dividend disbursing and transfer agent fees and expenses payable to affiliates | | | 871 | | | | 294 | | | | 3,126 | |
Accounting and administration fees payable to affiliates | | | 781 | | | | 489 | | | | 1,924 | |
Trustees’ fees and expenses payable | | | 332 | | | | 111 | | | | 1,231 | |
Reports and statements to shareholders expenses payable to affiliates | | | 97 | | | | 33 | | | | 348 | |
Administration fees payable | | | — | | | | 11,520 | | | | 42,260 | |
Unrealized depreciation on foreign currency exchange contracts | | | — | | | | — | | | | 3,824 | |
Deferred capital gains tax payable | | | 242,440 | | | | 29,367 | | | | — | |
| | | | | | | | | | | | |
Total liabilities | | | 751,759 | | | | 434,874 | | | | 1,979,278 | |
| | | | | | | | | | | | |
Total Net Assets | | $ | 136,677,979 | | | $ | 46,046,258 | | | $ | 490,272,739 | |
| | | | | | | | | | | | |
80
| | | | | | | | | | | | |
| | | Macquarie
Emerging
Markets
Portfolio | | | Macquarie
Emerging
Markets
Portfolio II | | | Macquarie
Labor Select
International
Equity
Portfolio | |
Net Assets Consist of: | | | | | | | | | | | | |
Paid-in capital | | $ | 169,920,655 | | | $ | 36,111,391 | | | $ | 460,176,900 | |
Undistributed (distributions in excess of) net investment income | | | 2,851,320 | | | | (211,411 | ) | | | 12,218,187 | |
Accumulated net realized loss on investments | | | (45,835,535 | ) | | | (611,296 | ) | | | (22,769,744 | ) |
Net unrealized appreciation of investments5 | | | 9,737,295 | | | | 10,756,763 | | | | 40,685,922 | |
Net unrealized appreciation (depreciation) of foreign currencies | | | 2,862 | | | | 811 | | | | (34,702 | ) |
Net unrealized appreciation (depreciation) of foreign currency exchange contracts | | | 1,382 | | | | — | | | | (3,824 | ) |
| | | | | | | | | | | | |
Total Net Assets | | $ | 136,677,979 | | | $ | 46,046,258 | | | $ | 490,272,739 | |
| | | | | | | | | | | | |
| | | |
Net Asset Value | | | | | | | | | | | | |
| | | |
Portfolio Class | | | | | | | | | | | | |
Net assets | | $ | 136,677,979 | | | $ | 46,046,258 | | | $ | 490,272,739 | |
Shares of beneficial interest outstanding, unlimited authorization, no par | | | 15,605,154 | | | | 4,285,897 | | | | 32,227,875 | |
Net asset value per share | | $ | 8.76 | | | $ | 10.74 | | | $ | 15.21 | |
1Investments, at cost | | $ | 124,894,055 | | | $ | 35,350,993 | | | $ | 444,618,100 | |
2Short-term investments, at cost | | | 1,302,007 | | | | — | | | | 2,016,284 | |
3Repurchase agreements, at cost | | | 744,579 | | | | — | | | | 205,108 | |
4Foreign currencies, at cost | | | 107,355 | | | | 84,178 | | | | 120,842 | |
5Includes deferred capital gains tax payable | | | 242,440 | | | | 29,367 | | | | — | |
See accompanying notes, which are an integral part of the financial statements.
Statements of operations
Macquarie Institutional Portfolios
Year ended October 31, 2017
| | | | | | | | | | | | |
| | | Macquarie
Large Cap
Value
Portfolio | | | Macquarie
Core Plus
Bond
Portfolio | | | Macquarie
High Yield
Bond
Portfolio | |
Investment Income: | | | | | | | | | | | | |
Dividends | | $ | 4,735,338 | | | $ | 3,517 | | | $ | 12,013 | |
Interest | | | 21,512 | | | | 5,161,486 | | | | 9,837,843 | |
Foreign tax withheld | | | — | | | | (733 | ) | | | — | |
| | | | | | | | | | | | |
| | | 4,756,850 | | | | 5,164,270 | | | | 9,849,856 | |
| | | | | | | | | | | | |
Expenses: | | | | | | | | | | | | |
Management fees | | | 1,090,252 | | | | 628,699 | | | | 720,415 | |
Accounting and administration expenses | | | 63,111 | | | | 47,716 | | | | 54,001 | |
Legal fees | | | 34,324 | | | | 24,524 | | | | 30,551 | |
Audit and tax fees | | | 33,922 | | | | 43,681 | | | | 41,994 | |
Dividend disbursing and transfer agent fees and expenses | | | 24,217 | | | | 17,838 | | | | 19,748 | |
Registration fees | | | 23,504 | | | | 24,409 | | | | 18,862 | |
Reports and statements to shareholders expenses | | | 14,453 | | | | 9,234 | | | | 11,534 | |
Custodian fees | | | 10,512 | | | | 23,257 | | | | 11,584 | |
Trustees’ fees and expenses | | | 9,731 | | | | 6,869 | | | | 8,481 | |
Other | | | 9,312 | | | | 57,029 | | | | 18,347 | |
| | | | | | | | | | | | |
| | | 1,313,338 | | | | 883,256 | | | | 935,517 | |
Less expenses waived | | | — | | | | (225,132 | ) | | | (20,918 | ) |
Less expense paid indirectly | | | (88 | ) | | | (767 | ) | | | (415 | ) |
| | | | | | | | | | | | |
Total operating expenses | | | 1,313,250 | | | | 657,357 | | | | 914,184 | |
| | | | | | | | | | | | |
Net Investment Income | | | 3,443,600 | | | | 4,506,913 | | | | 8,935,672 | |
| | | | | | | | | | | | |
| | | |
Net Realized and Unrealized Gain (Loss) | | | | | | | | | | | | |
Net realized gain (loss) on: | | | | | | | | | | | | |
Investments | | | 14,613,043 | | | | (255,287 | ) | | | 6,778,229 | |
Foreign currencies | | | — | | | | (13,116 | ) | | | — | |
Foreign currency exchange contracts | | | — | | | | (24,395 | ) | | | — | |
Futures contracts | | | — | | | | (194,791 | ) | | | — | |
Options purchased | | | — | | | | (10,444 | ) | | | — | |
Options written | | | — | | | | 42,703 | | | | — | |
Swap contracts | | | — | | | | (86,251 | ) | | | — | |
| | | | | | | | | | | | |
Net realized gain (loss) | | | 14,613,043 | | | | (541,581 | ) | | | 6,778,229 | |
| | | | | | | | | | | | |
Net change in unrealized appreciation (depreciation) of: | | | | | | | | | | | | |
Investments | | | 8,198,956 | | | | 143,807 | | | | (2,780,599 | ) |
Foreign currencies | | | — | | | | (12,519 | ) | | | — | |
Foreign currency exchange contracts | | | — | | | | (44,036 | ) | | | — | |
Futures contracts | | | — | | | | (41,073 | ) | | | — | |
Options purchased | | | — | | | | (3,540 | ) | | | — | |
Swap contracts | | | — | | | | (47,231 | ) | | | — | |
| | | | | | | | | | | | |
Net change in unrealized appreciation (depreciation) | | | 8,198,956 | | | | (4,592 | ) | | | (2,780,599 | ) |
| | | | | | | | | | | | |
Net Realized and Unrealized Gain (Loss) | | | 22,811,999 | | | | (546,173 | ) | | | 3,997,630 | |
| | | | | | | | | | | | |
Net Increase in Net Assets Resulting from Operations | | $ | 26,255,599 | | | $ | 3,960,740 | | | $ | 12,933,302 | |
| | | | | | | | | | | | |
See accompanying notes, which are an integral part of the financial statements.
82
| | | | | | | | | | | | |
| | | Macquarie
Emerging
Markets
Portfolio | | | Macquarie
Emerging
Markets
Portfolio II | | | Macquarie
Labor Select
International
Equity Portfolio | |
Investment Income: | | | | | | | | | | | | |
Dividends | | | $ 5,230,384 | | | | $ 1,128,873 | | | | $ 18,817,082 | |
Interest | | | 4,832 | | | | 996 | | | | 18,092 | |
Foreign tax withheld | | | (546,601 | ) | | | (96,812 | ) | | | (1,296,090 | ) |
| | | | | | | | | | | | |
| | | 4,688,615 | | | | 1,033,057 | | | | 17,539,084 | |
| | | | | | | | | | | | |
Expenses: | | | | | | | | | | | | |
Management fees | | | 1,354,772 | | | | 406,612 | | | | 3,445,499 | |
Custodian fees | | | 101,570 | | | | 15,150 | | | | 138,448 | |
Audit and tax fees | | | 66,339 | | | | 41,239 | | | | 40,739 | |
Accounting and administration expenses | | | 45,340 | | | | 19,772 | | | | 130,856 | |
Legal fees | | | 21,900 | | | | 6,903 | | | | 73,004 | |
Registration fees | | | 21,501 | | | | 25,830 | | | | 20,712 | |
Dividend disbursing and transfer agent fees and expenses | | | 16,546 | | | | 5,177 | | | | 47,718 | |
Reports and statements to shareholders expenses | | | 9,573 | | | | 4,862 | | | | 25,868 | |
Trustees’ fees and expenses | | | 6,436 | | | | 1,900 | | | | 21,420 | |
Other | | | 14,879 | | | | 10,479 | | | | 19,255 | |
| | | | | | | | | | | | |
| | | 1,658,856 | | | | 537,924 | | | | 3,963,519 | |
Less expenses waived | | | — | | | | (50,362 | ) | | | — | |
Less expense paid indirectly | | | (291 | ) | | | (9 | ) | | | (421 | ) |
| | | | | | | | | | | | |
Total operating expenses | | | 1,658,565 | | | | 487,553 | | | | 3,963,098 | |
| | | | | | | | | | | | |
Net Investment Income | | | 3,030,050 | | | | 545,504 | | | | 13,575,986 | |
| | | | | | | | | | | | |
| | | |
Net Realized and Unrealized Gain (Loss) | | | | | | | | | | | | |
Net realized gain (loss) on: | | | | | | | | | | | | |
Investments1 | | | (2,195,870 | ) | | | 1,716,025 | | | | 15,259,451 | |
Foreign currencies | | | 6,065 | | | | 3,745 | | | | (58,067 | ) |
Foreign currency exchange contracts | | | 35,440 | | | | (4,314 | ) | | | 8,657 | |
| | | | | | | | | | | | |
Net realized gain (loss) | | | (2,154,365 | ) | | | 1,715,456 | | | | 15,210,041 | |
| | | | | | | | | | | | |
Net change in unrealized appreciation (depreciation) of: | | | | | | | | | | | | |
Investments2 | | | 20,293,887 | | | | 10,672,698 | | | | 63,897,079 | |
Foreign currencies | | | 6,480 | | | | 1,304 | | | | 70,756 | |
Foreign currency exchange contracts | | | 1,870 | | | | (1,721 | ) | | | (1,860 | ) |
| | | | | | | | | | | | |
Net change in unrealized appreciation (depreciation) | | | 20,302,237 | | | | 10,672,281 | | | | 63,965,975 | |
| | | | | | | | | | | | |
Net Realized and Unrealized Gain | | | 18,147,872 | | | | 12,387,737 | | | | 79,176,016 | |
| | | | | | | | | | | | |
Net Increase in Net Assets Resulting from Operations | | | $21,177,922 | | | | $12,933,241 | | | | $92,752,002 | |
| | | | | | | | | | | | |
1Includes $28,098 capital gains taxes paid for Macquarie Emerging Markets Portfolio.
2Includes $164,354 and $17,326 capital gains tax accrued for Macquarie Emerging Markets Portfolio and Macquarie Emerging Markets Portfolio II, respectively.
See accompanying notes, which are an integral part of the financial statements.
83
Statements of changes in net assets
Macquarie Institutional Portfolios
| | | | | | | | | | | | | | | | | | | | | | | | |
| | | Macquarie
Large Cap
Value
Portfolio
| | | Macquarie
Core Plus
Bond
Portfolio
| | | Macquarie
High Yield
Bond
Portfolio
| |
| | | Year ended | | | Year ended | | | Year ended | |
| | | 10/31/17 | | | 10/31/16 | | | 10/31/17 | | | 10/31/16 | | | 10/31/17 | | | 10/31/16 | |
Increase (Decrease) in Net Assets
from Operations: | | | | | | | | | | | | | | | | | | | | | | | | |
Net investment income | | $ | 3,443,600 | | | $ | 4,219,103 | | | $ | 4,506,913 | | | $ | 2,813,432 | | | $ | 8,935,672 | | | $ | 13,858,774 | |
Net realized gain (loss) | | | 14,613,043 | | | | 7,118,226 | | | | (541,581 | ) | | | 286,126 | | | | 6,778,229 | | | | (13,062,199 | ) |
Net change in unrealized appreciation (depreciation) | | | 8,198,956 | | | | 3,640,813 | | | | (4,592 | ) | | | 1,779,679 | | | | (2,780,599 | ) | | | 14,187,290 | |
| | | | | | | | | | | | | | | | | | | | | | | | |
Net increase in net assets resulting from operations | | | 26,255,599 | | | | 14,978,142 | | | | 3,960,740 | | | | 4,879,237 | | | | 12,933,302 | | | | 14,983,865 | |
| | | | | | | | | | | | | | | | | | | | | | | | |
| | | | | | |
Dividends and Distributions to Shareholders from: | | | | | | | | | | | | | | | | | | | | | | | | |
Net investment income | | | (4,144,665 | ) | | | (4,431,423 | ) | | | (3,413,875 | ) | | | (2,936,304 | ) | | | (13,576,518 | ) | | | (11,494,763 | ) |
Net realized gain | | | (7,310,275 | ) | | | (16,167,216 | ) | | | — | | | | (51,289 | ) | | | — | | | | — | |
| | | | | | | | | | | | | | | | | | | | | | | | |
| | | (11,454,940 | ) | | | (20,598,639 | ) | | | (3,413,875 | ) | | | (2,987,593 | ) | | | (13,576,518 | ) | | | (11,494,763 | ) |
| | | | | | | | | | | | | | | | | | | | | | | | |
| | | | | | |
Capital Share Transactions: | | | | | | | | | | | | | | | | | | | | | | | | |
Proceeds from shares sold | | | 17,904,730 | | | | 13,423,545 | | | | 46,514,968 | | | | 11,230,000 | | | | 12,229,617 | | | | 48,508,401 | |
Net asset value of shares issued upon reinvestment of dividends and distributions | | | 9,619,602 | | | | 18,387,342 | | | | 3,169,915 | | | | 2,774,700 | | | | 13,425,532 | | | | 10,852,540 | |
| | | | | | | | | | | | | | | | | | | | | | | | |
| | | 27,524,332 | | | | 31,810,887 | | | | 49,684,883 | | | | 14,004,700 | | | | 25,655,149 | | | | 59,360,941 | |
| | | | | | | | | | | | | | | | | | | | | | | | |
Cost of shares redeemed | | | (90,585,162 | ) | | | (23,788,549 | ) | | | (15,254,949 | ) | | | (10,725,000 | ) | | | (154,038,130 | ) | | | (26,679,380 | ) |
| | | | | | | | | | | | | | | | | | | | | | | | |
Increase (decrease) in net assets derived from capital share transactions | | | (63,060,830 | ) | | | 8,022,338 | | | | 34,429,934 | | | | 3,279,700 | | | | (128,382,981 | ) | | | 32,681,561 | |
| | | | | | | | | | | | | | | | | | | | | | | | |
| | | | | | |
Net Increase (Decrease) in Net Assets | | | (48,260,171 | ) | | | 2,401,841 | | | | 34,976,799 | | | | 5,171,344 | | | | (129,026,197 | ) | | | 36,170,663 | |
| | | | | | |
Net Assets: | | | | | | | | | | | | | | | | | | | | | | | | |
Beginning of year | | | 217,127,924 | | | | 214,726,083 | | | | 133,264,918 | | | | 128,093,574 | | | | 242,299,549 | | | | 206,128,886 | |
| | | | | | | | | | | | | | | | | | | | | | | | |
End of year | | $ | 168,867,753 | | | $ | 217,127,924 | | | $ | 168,241,717 | | | $ | 133,264,918 | | | $ | 113,273,352 | | | $ | 242,299,549 | |
| | | | | | | | | | | | | | | | | | | | | | | | |
Undistributed net investment income | | $ | 2,754,476 | | | $ | 3,455,541 | | | $ | 4,188,427 | | | $ | 2,761,071 | | | $ | 6,944,390 | | | $ | 11,266,540 | |
| | | | | | | | | | | | | | | | | | | | | | | | |
See accompanying notes, which are an integral part of the financial statements.
84
| | | | | | | | | | | | | | | | | | | | | | | | |
| | | Macquarie
Emerging
Markets
Portfolio | | | Macquarie
Emerging
Markets
Portfolio II | | | Macquarie
Labor Select
International Equity
Portfolio | |
| | | Year ended | | | Year ended | | | Year ended | |
| | | 10/31/17 | | | 10/31/16 | | | 10/31/17 | | | 10/31/16 | | | 10/31/17 | | | 10/31/16 | |
Increase (Decrease) in Net Assets
from Operations: | | | | | | | | | | | | | | | | | | | | | | | | |
Net investment income | | $ | 3,030,050 | | | $ | 3,719,983 | | | $ | 545,504 | | | $ | 329,173 | | | $ | 13,575,986 | | | $ | 12,477,591 | |
Net realized gain (loss) | | | (2,154,365 | ) | | | (22,693,935 | ) | | | 1,715,456 | | | | (2,197,925 | ) | | | 15,210,041 | | | | (3,204,084 | ) |
Net change in
unrealized
appreciation (depreciation) | | | 20,302,237 | | | | 26,442,199 | | | | 10,672,281 | | | | 6,390,238 | | | | 63,965,975 | | | | (24,883,884 | ) |
| | | | | | | | | | | | | | | | | | | | | | | | |
Net increase (decrease) in net assets resulting from operations | | | 21,177,922 | | | | 7,468,247 | | | | 12,933,241 | | | | 4,521,486 | | | | 92,752,002 | | | | (15,610,377 | ) |
| | | | | | | | | | | | | | | | | | | | | | | | |
| | | | | | |
Dividends and Distributions to Shareholders from: | | | | | | | | | | | | | | | | | | | | | | | | |
Net investment income | | | (4,559,146 | ) | | | (4,099,296 | ) | | | (419,713 | ) | | | (347,034 | ) | | | (12,309,632 | ) | | | (9,585,512 | ) |
Net realized gain | | | — | | | | — | | | | — | | | | (1,068,866 | ) | | | — | | | | — | |
| | | | | | | | | | | | | | | | | | | | | | | | |
| | | (4,559,146 | ) | | | (4,099,296 | ) | | | (419,713 | ) | | | (1,415,900 | ) | | | (12,309,632 | ) | | | (9,585,512 | ) |
| | | | | | | | | | | | | | | | | | | | | | | | |
| | | | | | |
Capital Share Transactions: | | | | | | | | | | | | | | | | | | | | | | | | |
Proceeds from shares
sold | | | 14,846,158 | | | | 8,001,148 | | | | 100,000 | | | | 860,050 | | | | 38,212,375 | | | | 79,256,887 | |
Purchase reimbursement fees | | | 81,116 | | | | 42,620 | | | | — | | | | — | | | | — | | | | — | |
Net asset value of
shares issued upon reinvestment of dividends and distributions | | | 3,181,049 | | | | 3,027,278 | | | | 419,713 | | | | 1,415,899 | | | | 12,038,422 | | | | 9,563,827 | |
| | | | | | | | | | | | | | | | | | | | | | | | |
| | | 18,108,323 | | | | 11,071,046 | | | | 519,713 | | | | 2,275,949 | | | | 50,250,797 | | | | 88,820,714 | |
| | | | | | | | | | | | | | | | | | | | | | | | |
Cost of shares redeemed | | | (32,052,050 | ) | | | (53,579,564 | ) | | | (4,184,535 | ) | | | (1,498,000 | ) | | | (35,250,381 | ) | | | (29,445,035 | ) |
Redemption reimbursement fees | | | 175,299 | | | | 293,076 | | | | — | | | | — | | | | — | | | | — | |
| | | | | | | | | | | | | | | | | | | | | | | | |
| | | (31,876,751 | ) | | | (53,286,488 | ) | | | (4,184,535 | ) | | | (1,498,000 | ) | | | (35,250,381 | ) | | | (29,445,035 | ) |
| | | | | | | | | | | | | | | | | | | | | | | | |
Increase (decrease) in net assets derived from capital share transactions | | | (13,768,428 | ) | | | (42,215,442 | ) | | | (3,664,822 | ) | | | 777,949 | | | | 15,000,416 | | | | 59,375,679 | |
| | | | | | | | | | | | | | | | | | | | | | | | |
| | | | | | |
Net Increase (Decrease) in Net Assets | | | 2,850,348 | | | | (38,846,491 | ) | | | 8,848,706 | | | | 3,883,535 | | | | 95,442,786 | | | | 34,179,790 | |
| | | | | | |
Net Assets: | | | | | | | | | | | | | | | | | | | | | | | | |
Beginning of year | | | 133,827,631 | | | | 172,674,122 | | | | 37,197,552 | | | | 33,314,017 | | | | 394,829,953 | | | | 360,650,163 | |
| | | | | | | | | | | | | | | | | | | | | | | | |
End of year | | $ | 136,677,979 | | | $ | 133,827,631 | | | $ | 46,046,258 | | | $ | 37,197,552 | | | $ | 490,272,739 | | | $ | 394,829,953 | |
| | | | | | | | | | | | | | | | | | | | | | | | |
Undistributed (distributions in excess of) net investment income | | $ | 2,851,320 | | | $ | 3,978,087 | | | $ | (211,411 | ) | | $ | (431,929 | ) | | $ | 12,218,187 | | | $ | 11,001,243 | |
| | | | | | | | | | | | | | | | | | | | | | | | |
See accompanying notes, which are an integral part of the financial statements.
85
Financial highlights
Macquarie Institutional Portfolios — Macquarie Large Cap Value Portfolio
Selected data for each share of the Portfolio outstanding throughout each period were as follows:
| | | | | | | | | | | | | | | | | | | | |
| | | Year ended | |
| | | 10/31/17 | | | 10/31/16 | | | 10/31/15 | | | 10/31/14 | | | 10/31/13 | |
Net asset value, beginning of period | | $ | 26.39 | | | $ | 27.30 | | | $ | 27.61 | | | $ | 24.19 | | | $ | 18.97 | |
| | | | | |
Income from investment operations: | | | | | | | | | | | | | | | | | | | | |
Net investment income1 | | | 0.47 | | | | 0.51 | | | | 0.53 | | | | 0.47 | | | | 0.44 | |
Net realized and unrealized gain | | | 3.09 | | | | 1.19 | | | | 0.34 | | | | 3.39 | | | | 5.17 | |
| | | | | | | | | | | | | | | | | | | | |
Total from investment operations | | | 3.56 | | | | 1.70 | | | | 0.87 | | | | 3.86 | | | | 5.61 | |
| | | | | | | | | | | | | | | | | | | | |
| | | | | |
Less dividends and distributions from: | | | | | | | | | | | | | | | | | | | | |
Net investment income | | | (0.51 | ) | | | (0.56 | ) | | | (0.43 | ) | | | (0.32 | ) | | | (0.39 | ) |
Net realized gain | | | (0.90 | ) | | | (2.05 | ) | | | (0.75 | ) | | | (0.12 | ) | | | — | |
| | | | | | | | | | | | | | | | | | | | |
Total dividends and distributions | | | (1.41 | ) | | | (2.61 | ) | | | (1.18 | ) | | | (0.44 | ) | | | (0.39 | ) |
| | | | | | | | | | | | | | | | | | | | |
| | | | | |
Net asset value, end of period | | $ | 28.54 | | | $ | 26.39 | | | $ | 27.30 | | | $ | 27.61 | | | $ | 24.19 | |
| | | | | | | | | | | | | | | | | | | | |
| | | | | |
Total return2 | | | 13.83% | | | | 7.15% | | | | 3.18% | | | | 16.19% | | | | 30.09% | |
| | | | | |
Ratios and supplemental data: | | | | | | | | | | | | | | | | | | | | |
Net assets, end of period (000 omitted) | | $ | 168,868 | | | $ | 217,128 | | | $ | 214,726 | | | $ | 139,797 | | | $ | 89,237 | |
Ratio of expenses to average net assets | | | 0.66% | | | | 0.65% | | | | 0.65% | | | | 0.68% | | | | 0.70% | |
Ratio of expenses to average net assets prior to fees waived3 | | | 0.66% | | | | 0.65% | | | | 0.65% | | | | 0.68% | | | | 0.72% | |
Ratio of net investment income to average net assets | | | 1.74% | | | | 1.97% | | | | 1.92% | | | | 1.83% | | | | 1.97% | |
Ratio of net investment income to average net assets prior to fees waived3 | | | 1.74% | | | | 1.97% | | | | 1.92% | | | | 1.83% | | | | 1.95% | |
Portfolio turnover | | | 23% | | | | 13% | | | | 31% | | | | 19% | | | | 9% | |
| 1 | The average shares outstanding method has been applied for per share information. |
| 2 | Total investment return is based on the change in net asset value of a share during the period and assumes reinvestment of dividends and distributions at net asset value. Total investment return during some of the periods shown reflects a waiver by the manager. Performance would have been lower had the waiver not been in effect. |
| 3 | Expenses paid indirectly were not material and had no impact on the ratios disclosed. Expenses paid indirectly for the year ended Oct. 31, 2017 are reflected on the “Statements of operations.” |
See accompanying notes, which are an integral part of the financial statements.
86
Macquarie Institutional Portfolios — Macquarie Core Plus Bond Portfolio
Selected data for each share of the Portfolio outstanding throughout each period were as follows:
| | | | | | | | | | | | | | | | | | | | |
| | | Year ended | |
| | | | 10/31/17 | | | | 10/31/16 | | | | 10/31/15 | | | | 10/31/14 | | | | 10/31/13 | |
Net asset value, beginning of period | | | $ 10.42 | | | | $ 10.29 | | | | $ 10.37 | | | | $ 10.10 | | | | $ 10.54 | |
| | | | | |
Income (loss) from investment operations: | | | | | | | | | | | | | | | | | | | | |
Net investment income1 | | | 0.32 | | | | 0.22 | | | | 0.24 | | | | 0.29 | | | | 0.29 | |
Net realized and unrealized gain (loss) | | | (0.06 | ) | | | 0.14 | | | | (0.11 | ) | | | 0.21 | | | | (0.35 | ) |
| | | | | | | | | | | | | | | | | | | | |
Total from investment operations | | | 0.26 | | | | 0.36 | | | | 0.13 | | | | 0.50 | | | | (0.06 | ) |
| | | | | | | | | | | | | | | | | | | | |
| | | | | |
Less dividends and distributions from: | | | | | | | | | | | | | | | | | | | | |
Net investment income | | | (0.27 | ) | | | (0.23 | ) | | | (0.21 | ) | | | (0.23 | ) | | | (0.38 | ) |
Net realized gain | | | — | | | | — | 2 | | | — | | | | — | | | | — | |
| | | | | | | | | | | | | | | | | | | | |
Total dividends and distributions | | | (0.27 | ) | | | (0.23 | ) | | | (0.21 | ) | | | (0.23 | ) | | | (0.38 | ) |
| | | | | | | | | | | | | | | | | | | | |
| | | | | |
Net asset value, end of period | | | $ 10.41 | | | | $ 10.42 | | | | $ 10.29 | | | | $ 10.37 | | | | $ 10.10 | |
| | | | | | | | | | | | | | | | | | | | |
| | | | | |
Total return3 | | | 2.60% | | | | 3.63% | | | | 1.29% | | | | 5.02% | | | | (0.55% | ) |
| | | | | |
Ratios and supplemental data: | | | | | | | | | | | | | | | | | | | | |
Net assets, end of period (000 omitted) | | | $168,242 | | | | $133,265 | | | | $128,094 | | | | $77,036 | | | | $56,641 | |
Ratio of expenses to average net assets | | | 0.45% | | | | 0.45% | | | | 0.45% | | | | 0.45% | | | | 0.45% | |
Ratio of expenses to average net assets prior to fees waived4 | | | 0.60% | | | | 0.60% | | | | 0.61% | | | | 0.65% | | | | 0.70% | |
Ratio of net investment income to average net assets | | | 3.08% | | | | 2.12% | | | | 2.33% | | | | 2.90% | | | | 2.84% | |
Ratio of net investment income to average net assets prior to fees waived4 | | | 2.93% | | | | 1.97% | | | | 2.17% | | | | 2.70% | | | | 2.59% | |
Portfolio turnover | | | 162% | | | | 310% | | | | 436% | | | | 339% | | | | 358% | |
| 1 | The average shares outstanding method has been applied for per share information. |
| 2 | For the year ended Oct. 31, 2016, net realized gain distributions of $51,289 was made by the Portfolio, which calculated to a de minimis amount of $(0.004) per share. |
| 3 | Total investment return is based on the change in net asset value of a share during the period and assumes reinvestment of dividends and distributions at net asset value. Total investment return during all of the periods shown reflects a waiver by the manager. Performance would have been lower had the waiver not been in effect. |
| 4 | Expenses paid indirectly were not material and had no impact on the ratios disclosed. Expenses paid indirectly for the year ended Oct. 31, 2017 are reflected on the “Statements of operations.” |
See accompanying notes, which are an integral part of the financial statements.
Financial highlights
Macquarie Institutional Portfolios — Macquarie High Yield Bond Portfolio
Selected data for each share of the Portfolio outstanding throughout each period were as follows:
| | | | | | | | | | | | | | | | | | | | |
| | | Year ended | |
| | | 10/31/17 | | | 10/31/16 | | | 10/31/15 | | | 10/31/14 | | | 10/31/13 | |
Net asset value, beginning of period | | $ | 7.88 | | | $ | 7.78 | | | $ | 8.61 | | | $ | 8.72 | | | $ | 8.35 | |
| | | | | |
Income (loss) from investment operations: | | | | | | | | | | | | | | | | | | | | |
Net investment income1 | | | 0.43 | | | | 0.45 | | | | 0.49 | | | | 0.50 | | | | 0.53 | |
Net realized and unrealized gain (loss) | | | 0.23 | | | | 0.02 | | | | (0.79 | ) | | | (0.07 | ) | | | 0.29 | |
| | | | | | | | | | | | | | | | | | | | |
Total from investment operations | | | 0.66 | | | | 0.47 | | | | (0.30 | ) | | | 0.43 | | | | 0.82 | |
| | | | | | | | | | | | | | | | | | | | |
| | | | | |
Less dividends and distributions from: | | | | | | | | | | | | | | | | | | | | |
Net investment income | | | (0.45 | ) | | | (0.37 | ) | | | (0.42 | ) | | | (0.54 | ) | | | (0.45 | ) |
Net realized gain | | | — | | | | — | | | | (0.11 | ) | | | — | | | | — | |
| | | | | | | | | | | | | | | | | | | | |
Total dividends and distributions | | | (0.45 | ) | | | (0.37 | ) | | | (0.53 | ) | | | (0.54 | ) | | | (0.45 | ) |
| | | | | | | | | | | | | | | | | | | | |
| | | | | |
Net asset value, end of period | | $ | 8.09 | | | $ | 7.88 | | | $ | 7.78 | | | $ | 8.61 | | | $ | 8.72 | |
| | | | | | | | | | | | | | | | | | | | |
| | | | | |
Total return2 | | | 8.88% | | | | 6.63% | | | | (3.41%) | | | | 5.23% | | | | 10.24% | |
| | | | | |
Ratios and supplemental data: | | | | | | | | | | | | | | | | | | | | |
Net assets, end of period (000 omitted) | | $ | 113,273 | | | $ | 242,300 | | | $ | 206,129 | | | $ | 143,182 | | | $ | 135,310 | |
Ratio of expenses to average net assets | | | 0.57% | | | | 0.55% | | | | 0.56% | | | | 0.57% | | | | 0.57% | |
Ratio of expenses to average net assets prior to fees waived3 | | | 0.58% | | | | 0.55% | | | | 0.56% | | | | 0.57% | | | | 0.57% | |
Ratio of net investment income to average net assets | | | 5.58% | | | | 6.10% | | | | 6.09% | | | | 5.76% | | | | 6.29% | |
Ratio of net investment income to average net assets prior to fees waived3 | | | 5.57% | | | | 6.10% | | | | 6.09% | | | | 5.76% | | | | 6.29% | |
Portfolio turnover | | | 99% | | | | 119% | | | | 84% | | | | 101% | | | | 90% | |
| 1 | The average shares outstanding method has been applied for per share information. |
| 2 | Total investment return is based on the change in net asset value of a share during the period and assumes reinvestment of dividends and distributions at net asset value. Total investment return during some of the periods shown reflects a waiver by the manager. Performance would have been lower had the waiver not been in effect. |
| 3 | Expenses paid indirectly were not material and had no impact on the ratios disclosed. Expenses paid indirectly for the year ended Oct. 31, 2017 are reflected on the “Statements of operations.” |
See accompanying notes, which are an integral part of the financial statements.
88
Macquarie Institutional Portfolios — Macquarie Emerging Markets Portfolio
Selected data for each share of the Portfolio outstanding throughout each period were as follows:
| | | | | | | | | | | | | | | | | | | | |
| | | Year ended | |
| | | 10/31/17 | | | 10/31/16 | | | 10/31/15 | | | 10/31/14 | | | 10/31/13 | |
Net asset value, beginning of period | | | $7.77 | | | | $7.47 | | | | $9.75 | | | | $10.11 | | | | $10.16 | |
| | | | | |
Income (loss) from investment operations: | | | | | | | | | | | | | | | | | | | | |
Net investment income1 | | | 0.18 | | | | 0.18 | | | | 0.16 | | | | 0.22 | | | | 0.18 | |
Net realized and unrealized gain (loss) | | | 1.05 | | | | 0.29 | | | | (1.77 | ) | | | (0.09 | ) | | | 0.15 | |
Total from investment operations | | | 1.23 | | | | 0.47 | | | | (1.61 | ) | | | 0.13 | | | | 0.33 | |
| | | | | |
Less dividends and distributions from: | | | | | | | | | | | | | | | | | | | | |
Net investment income | | | (0.26 | ) | | | (0.18 | ) | | | (0.22 | ) | | | (0.18 | ) | | | (0.24 | ) |
Net realized gain | | | — | | | | — | | | | (0.47 | ) | | | (0.33 | ) | | | (0.16 | ) |
| | | | | | | | | | | | | | | | | | | | |
Total dividends and distributions | | | (0.26 | ) | | | (0.18 | ) | | | (0.69 | ) | | | (0.51 | ) | | | (0.40 | ) |
| | | | | | | | | | | | | | | | | | | | |
| | | | | |
Reimbursement fees: | | | | | | | | | | | | | | | | | | | | |
Purchase reimbursement fees1,2 | | | 0.01 | | | | — | 3 | | | — | 4 | | | 0.01 | | | | 0.01 | |
Redemption reimbursement fees1,2 | | | 0.01 | | | | 0.01 | | | | 0.02 | | | | 0.01 | | | | 0.01 | |
| | | | | | | | | | | | | | | | | | | | |
| | | 0.02 | | | | 0.01 | | | | 0.02 | | | | 0.02 | | | | 0.02 | |
| | | | | | | | | | | | | | | | | | | | |
| | | | | |
Net asset value, end of period | | | $8.76 | | | | $7.77 | | | | $7.47 | | | | $9.75 | | | | $10.11 | |
| | | | | | | | | | | | | | | | | | | | |
| | | | | |
Total return5 | | | 16.88% | | | | 6.75% | | | | (17.11%) | | | | 1.89% | | | | 3.36% | |
| | | | | |
Ratios and supplemental data: | | | | | | | | | | | | | | | | | | | | |
Net assets, end of period (000 omitted) | | | $136,678 | | | | $133,828 | | | | $172,674 | | | | $310,211 | | | | $333,884 | |
Ratio of expenses to average net assets6 | | | 1.22% | | | | 1.19% | | | | 1.19% | | | | 1.16% | | | | 1.20% | |
Ratio of net investment income to average net assets6 | | | 2.24% | | | | 2.51% | | | | 1.90% | | | | 2.25% | | | | 1.72% | |
Portfolio turnover | | | 45% | | | | 28% | | | | 27% | | | | 30% | | | | 40% | 7 |
| 1 | The average shares outstanding method has been applied for per share information. |
| 2 | The Portfolio charges a 0.55% purchase reimbursement fee and a 0.55% redemption reimbursement fee, which are retained by the Portfolio. |
| 3 | For the year ended Oct. 31, 2016, purchase reimbursement fees of $42,620 were earned by the Portfolio, which calculated to a de minimis amount of $0.002 per share. |
| 4 | For the year ended Oct. 31, 2015, purchase reimbursement fees of $118,421 were earned by the Portfolio, which calculated to a de minimis amount of $0.004 per share. |
| 5 | Total investment return is based on the change in net asset value of a share during the period and assumes reinvestment of dividends and distributions at net asset value. Total investment return does not reflect the purchase reimbursement fee and redemption reimbursement fee. |
| 6 | Expenses paid indirectly were not material and had no impact on the ratios disclosed. Expenses paid indirectly for the year ended Oct. 31, 2017 are reflected on the “Statements of operations.” |
| 7 | Excludes the value of Portfolio securities received or delivered as a result of in-kind purchases or redemptions of the Portfolio’s capital shares. |
See accompanying notes, which are an integral part of the financial statements.
Financial highlights
Macquarie Institutional Portfolios — Macquarie Emerging Markets Portfolio II
Selected data for each share of the Portfolio outstanding throughout each period were as follows:
| | | | | | | | | | | | | | | | | | | | |
| | | Year ended | |
| | | 10/31/17 | | | 10/31/16 | | | 10/31/15 | | | 10/31/14 | | | 10/31/13 | |
Net asset value, beginning of period | | $ | 8.01 | | | $ | 7.37 | | | $ | 9.88 | | | $ | 9.65 | | | $ | 8.17 | |
| | | | | |
Income (loss) from investment operations: | | | | | | | | | | | | | | | | | | | | |
Net investment income1 | | | 0.12 | | | | 0.07 | | | | 0.04 | | | | 0.06 | | | | 0.08 | |
Net realized and unrealized gain (loss) | | | 2.70 | | | | 0.88 | | | | (2.15 | ) | | | 0.30 | | | | 1.44 | |
| | | | | | | | | | | | | | | | | | | | |
Total from investment operations | | | 2.82 | | | | 0.95 | | | | (2.11 | ) | | | 0.36 | | | | 1.52 | |
| | | | | | | | | | | | | | | | | | | | |
| | | | | |
Less dividends and distributions from: | | | | | | | | | | | | | | | | | | | | |
Net investment income | | | (0.09 | ) | | | (0.08 | ) | | | (0.14 | ) | | | (0.09 | ) | | | (0.04 | ) |
Net realized gain | | | — | | | | (0.23 | ) | | | (0.26 | ) | | | (0.04 | ) | | | — | |
| | | | | | | | | | | | | | | | | | | | |
Total dividends and distributions | | | (0.09 | ) | | | (0.31 | ) | | | (0.40 | ) | | | (0.13 | ) | | | (0.04 | ) |
| | | | | | | | | | | | | | | | | | | | |
| | | | | |
Net asset value, end of period | | | | | | | | | | | | | | | | | | | | |
| | | $10.74 | | | $8.01 | | | $7.37 | | | $9.88 | | | $9.65 | |
| | | | | | | | | | | | | | | | | | | | |
Total return2 | | | 35.74% | | | | 13.62% | | | | (21.84% | ) | | | 3.80% | | | | 18.68% | |
| | | | | |
Ratios and supplemental data: | | | | | | | | | | | | | | | | | | | | |
Net assets, end of period (000 omitted) | | $ | 46,046 | | | $ | 37,198 | | | $ | 33,314 | | | $ | 42,515 | | | $ | 42,223 | |
Ratio of expenses to average net assets | | | 1.20% | | | | 1.20% | | | | 1.21% | | | | 1.20% | | | | 1.20% | |
Ratio of expenses to average net assets prior to fees waived3 | | | 1.32% | | | | 1.34% | | | | 1.35% | | | | 1.32% | | | | 1.36% | |
Ratio of net investment income to average net assets | | | 1.34% | | | | 0.97% | | | | 0.43% | | | | 0.64% | | | | 0.85% | |
Ratio of net investment income to average net assets prior to fees waived3 | | | 1.22% | | | | 0.83% | | | | 0.29% | | | | 0.52% | | | | 0.69% | |
Portfolio turnover | | | 14% | | | | 20% | | | | 8% | | | | 11% | | | | 11% | |
| 1 | The average shares outstanding method has been applied for per share information. |
| 2 | Total investment return is based on the change in net asset value of a share during the period and assumes reinvestment of dividends and distributions at net asset value. Total investment return during all of the periods shown reflects a waiver by the manager. Performance would have been lower had the waiver not been in effect. |
| 3 | Expenses paid indirectly were not material and had no impact on the ratios disclosed. Expenses paid indirectly for the year ended Oct. 31, 2017 are reflected on the “Statements of operations.” |
See accompanying notes, which are an integral part of the financial statements.
90
Macquarie Institutional Portfolios — Macquarie Labor Select International Equity Portfolio
Selected data for each share of the Portfolio outstanding throughout each period were as follows:
| | | | | | | | | | | | | | | | | | | | |
| | | Year ended | |
| | | 10/31/17 | | | 10/31/16 | | | 10/31/15 | | | 10/31/14 | | | 10/31/13 | |
Net asset value, beginning of period | | $ | 12.83 | | | $ | 13.79 | | | $ | 14.74 | | | $ | 15.07 | | | $ | 12.65 | |
| | | | | |
Income (loss) from investment operations: | | | | | | | | | | | | | | | | | | | | |
Net investment income1 | | | 0.41 | | | | 0.43 | | | | 0.37 | | | | 0.69 | | | | 0.32 | |
Net realized and unrealized gain (loss) | | | 2.35 | | | | (1.02 | ) | | | (0.52 | ) | | | (0.57 | ) | | | 2.52 | |
| | | | | | | | | | | | | | | | | | | | |
Total from investment operations | | | 2.76 | | | | (0.59 | ) | | | (0.15 | ) | | | 0.12 | | | | 2.84 | |
| | | | | | | | | | | | | | | | | | | | |
| | | | | |
Less dividends and distributions from: | | | | | | | | | | | | | | | | | | | | |
Net investment income | | | (0.38 | ) | | | (0.37 | ) | | | (0.80 | ) | | | (0.45 | ) | | | (0.42 | ) |
| | | | | | | | | | | | | | | | | | | | |
Total dividends and distributions | | | (0.38 | ) | | | (0.37 | ) | | | (0.80 | ) | | | (0.45 | ) | | | (0.42 | ) |
| | | | | | | | | | | | | | | | | | | | |
| | | | | |
Net asset value, end of period | | $ | 15.21 | | | $ | 12.83 | | | $ | 13.79 | | | $ | 14.74 | | | $ | 15.07 | |
| | | | | | | | | | | | | | | | | | | | |
| | | | | |
Total return2 | | | 22.13% | | | | (4.24%) | | | | (0.98%) | | | | 0.86% | | | | 23.11% | |
| | | | | |
Ratios and supplemental data: | | | | | | | | | | | | | | | | | | | | |
Net assets, end of period (000 omitted) | | $ | 490,273 | | | $ | 394,830 | | | $ | 360,650 | | | $ | 373,497 | | | $ | 506,102 | |
Ratio of expenses to average net assets3 | | | 0.86% | | | | 0.86% | | | | 0.87% | | | | 0.86% | | | | 0.88% | |
Ratio of net investment income to average net assets3 | | | 2.96% | | | | 3.39% | | | | 2.63% | | | | 4.54% | | | | 2.43% | |
Portfolio turnover | | | 21% | | | | 22% | | | | 20% | | | | 23% | | | | 16% | |
| 1 | The average shares outstanding method has been applied for per share information. |
| 2 | Total investment return is based on the change in net asset value of a share during the period and assumes reinvestment of dividends and distributions at net asset value. |
| 3 | Expenses paid indirectly were not material and had no impact on the ratios disclosed. Expenses paid indirectly for the year ended Oct. 31, 2017 are reflected on the “Statements of operations.” |
See accompanying notes, which are an integral part of the financial statements.
91
Notes to financial statements
Macquarie Institutional Portfolios
October 31, 2017
Macquarie Institutional Portfolios (registered as Delaware Pooled® Trust (Trust)) is organized as a Delaware statutory trust and offers seven separate Portfolios. These financial statements and the related notes pertain to Macquarie Large Cap Value Portfolio (formerly, The Large-Cap Value Equity Portfolio) Macquarie Core Plus Bond Portfolio (formerly, The Core Plus Fixed Income Portfolio), Macquarie High Yield Bond Portfolio (formerly, The High-Yield Bond Portfolio), Macquarie Emerging Markets Portfolio (formerly, The Emerging Markets Portfolio), Macquarie Emerging Markets Portfolio II (formerly, The Emerging Markets Portfolio II), and Macquarie Labor Select International Equity Portfolio (formerly, The Labor Select International Equity Portfolio), (each, a Portfolio, and collectively, the Portfolios). Delaware REIT Fund is included in a separate report. The Trust is an open-end investment company. Each Portfolio is considered diversified under the Investment Company Act of 1940, as amended. Each Portfolio offers one class of shares.
The investment objective of Macquarie Large Cap Value Portfolio is to seek long-term capital appreciation.
The investment objective of Macquarie Core Plus Bond Portfolio is to seek maximum long-term total return, consistent with reasonable risk.
The investment objective of Macquarie High Yield Bond Portfolio is to seek high total return.
The investment objective of Macquarie Emerging Markets Portfolio is to seek long-term capital appreciation.
The investment objective of Macquarie Emerging Markets Portfolio II is to seek long-term capital appreciation.
The investment objective of Macquarie Labor Select International Equity Portfolio is to seek maximum long-term total return.
1. Significant Accounting Policies
The following accounting policies are in accordance with US generally accepted accounting principles (US GAAP) and are consistently followed by the Portfolios.
Security Valuation — Equity securities and exchange-traded funds (ETFs), except those traded on the Nasdaq Stock Market LLC (Nasdaq), are valued at the last quoted sales price as of the time of the regular close of the New York Stock Exchange on the valuation date. Equity securities and ETFs traded on the Nasdaq are valued in accordance with the Nasdaq Official Closing Price, which may not be the last sales price. If, on a particular day, an equity security or ETF does not trade, the mean between the bid and ask prices will be used, which approximates fair value. Equity securities listed on a foreign exchange are normally valued at the last quoted sales price on the valuation date. Debt securities, credit default swap (CDS) contracts, and interest rate swap contracts are valued based upon valuations provided by an independent pricing service or broker/counterparty and reviewed by management. To the extent current market prices are not available, the pricing service may take into account developments related to the specific security, as well as transactions in comparable securities. US government and agency securities are valued at the mean between the bid and ask prices, which approximates fair value. Valuations for fixed income securities utilize matrix systems, which reflect such factors as security prices, yields, maturities, and ratings, and are supplemented by dealer and exchange quotations. For asset-backed securities, collateralized mortgage obligations, commercial mortgage securities, and US government agency mortgage securities, pricing vendors utilize matrix pricing which considers prepayment speed; attributes of the collateral; yield or price of bonds of comparable quality, coupon, maturity, and type as well as broker/dealer-supplied prices. Swap prices are derived using daily swap curves and models that incorporate a number of market data factors, such as discounted cash flows, trades, and values of the underlying reference instruments. Foreign currency exchange contracts and foreign cross currency exchange contracts are valued at the mean between the bid and ask prices, which approximates fair value. Interpolated values are derived when the settlement date of the contract is an interim date for which quotations are not available. Futures contracts and options on futures contracts are valued at the daily quoted settlement prices. Exchange-traded options are valued at the last reported sale price or, if no sales are reported, at the mean between the last reported bid and ask prices, which approximates fair value. Generally, other securities and assets for which market quotations are not readily available are valued at fair value as determined in good faith under the direction of the Trust’s Board of Trustees (Board). In determining whether market quotations are readily available or fair valuation will be used, various factors will be taken into consideration, such as market closures or suspension of trading in a security. The Portfolios may use fair value pricing more frequently for securities traded primarily in non-US markets because, among other things, most foreign markets close well before the Portfolios value their securities, generally as of 4:00pm Eastern time. The earlier close of these foreign markets gives rise to the possibility that significant events, including broad market moves, government actions or pronouncements, aftermarket trading, or news events may have occurred in the interim. Whenever such a significant event occurs, the Portfolios may value foreign securities using fair value prices based on third-party vendor modeling tools (international fair value pricing). The foregoing valuation policies apply to restricted and unrestricted securities.
92
Federal and Foreign Income Taxes — No provision for federal income taxes has been made as each Portfolio intends to continue to qualify for federal income tax purposes as a regulated investment company under Subchapter M of the Internal Revenue Code of 1986, as amended, and make the requisite distributions to shareholders. The Portfolios evaluate tax positions taken or expected to be taken in the course of preparing each Portfolio’s tax returns to determine whether the tax positions are “more-likely-than-not” of being sustained by the applicable tax authority. Tax positions not deemed to meet the “more-likely-than-not” threshold are recorded as a tax benefit or expense in the current year. Management has analyzed each Portfolio’s tax positions taken or to be taken on the Portfolios’ federal income tax returns through the year ended Oct. 31, 2017 and for all open tax years (years ended Oct. 31, 2014–Oct 31, 2016), and has concluded that no provision for federal income tax is required in any Portfolio’s financial statements. In regard to foreign taxes only, each Portfolio has open tax years in certain foreign countries in which it invests that may date back to the inception of each Portfolio. If applicable, each Portfolio recognizes interest accrued on unrecognized tax benefits in interest expense and penalties in other expenses on the “Statements of operations.” During the year ended Oct. 31, 2017, the Portfolios did not incur any interest or tax penalties.
Repurchase Agreements — Each Portfolio may purchase certain US government securities subject to the counterparty’s agreement to repurchase them at an agreed upon date and price. The counterparty will be required on a daily basis to maintain the value of the collateral subject to the agreement at not less than the repurchase price (including accrued interest). The agreements are conditioned upon the collateral being deposited under the Federal Reserve book-entry system with each Portfolio’s custodian or a third-party sub-custodian. In the event of default or bankruptcy by the other party to the agreement, retention of the collateral may be subject to legal proceedings. All open repurchase agreements as of the date of this report were entered into on Oct. 31, 2017, and matured on the next business day.
To Be Announced Trades (TBA) — Certain Portfolios may contract to purchase or sell securities for a fixed price at a transaction date beyond the customary settlement period (examples: when issued, delayed delivery, forward commitment, or TBA transactions) consistent with each Portfolio’s ability to manage its investment portfolio and meet redemption requests. These transactions involve a commitment by each Portfolio to purchase or deliver securities for a predetermined price or yield with payment and delivery taking place more than three days in the future, or after a period longer than the customary settlement period for that type of security. No interest will be earned by each Portfolio on such purchases until the securities are delivered or the transaction is completed; however, the market value may change prior to delivery.
Foreign Currency Transactions — Transactions denominated in foreign currencies are recorded at the prevailing exchange rates on the valuation date in accordance with each Portfolio’s prospectus. The value of all assets and liabilities denominated in foreign currencies is translated daily into US dollars at the exchange rate of such currencies against the US dollar. Transaction gains or losses resulting from changes in exchange rates during the reporting period or upon settlement of the foreign currency transaction are reported in operations for the current period. Each Portfolio generally bifurcates that portion of realized gains and losses on investments in debt securities which is due to changes in foreign exchange rates from that which is due to changes in market prices of debt securities. That portion of gains (losses), which is due to changes in foreign exchange rates, is included in the “Statements of operations” under “Net realized gain (loss) on foreign currencies.” For foreign equity securities, these changes are included in the “Statements of operations” under “Net realized and unrealized gain (loss) on investments.” Each Portfolio reports certain foreign currency related transactions as components of realized gains (losses) for financial reporting purposes, whereas such components are treated as ordinary income (loss) for federal income tax purposes.
Use of Estimates — Each Portfolio is an investment company, whose financial statements are prepared in conformity with US GAAP. Therefore, each Portfolio follows the accounting and reporting guidelines for investment companies. The preparation of financial statements in conformity with US GAAP requires management to make estimates and assumptions that affect the fair value of investments, the reported amounts of assets and liabilities and disclosure of contingent assets and liabilities at the date of the financial statements, and the reported amounts of revenues and expenses during the reporting period. Actual results could differ from those estimates and the differences could be material.
Reimbursement Fees — Macquarie Emerging Markets Portfolio may charge a 0.55% purchase reimbursement fee and a 0.55% redemption reimbursement fee. These fees are designed to reflect an approximation of the brokerage and other transaction costs associated with the investment of an investor’s purchase amount or the disposition of assets to meet redemptions, and to limit the extent to which the Portfolio (and, indirectly, the Portfolio’s existing shareholders) would have to bear such costs. These fees are accounted for as an addition to paid-in capital for the Portfolio in the “Statements of changes in net assets.”
Other — Expenses directly attributable to each Portfolio are charged directly to the Portfolio. Other expenses common to various funds within Delaware FundsSM by Macquarie (Delaware Funds) are generally allocated among such funds on the basis of average net assets. Management fees and certain other expenses are paid monthly. Security transactions are recorded on the date the securities are purchased or sold (trade
Notes to financial statements
Macquarie Institutional Portfolios
1. Significant Accounting Policies (continued)
date) for financial reporting purposes. Costs used in calculating realized gains and losses on the sale of investment securities are those of the specific securities sold. Dividend income is recorded on the ex-dividend date and interest income is recorded on the accrual basis. Discounts and premiums on debt securities are accreted or amortized to interest income, respectively, over the lives of the respective securities using the effective interest method. Realized gains (losses) on paydowns of asset- and mortgage-backed securities are classified as interest income. Distributions received from investments in Real Estate Investment Trusts (REITs) are recorded as dividend income on the ex-dividend date, subject to reclassification upon notice of the character of such distributions by the issuer. Foreign dividends are also recorded on the ex-dividend date or as soon after the ex-dividend date that a Portfolio is aware of such dividends, net of all tax withholdings, a portion of which may be reclaimable. Withholding taxes and reclaims on foreign dividends and interest have been recorded in accordance with each Portfolio’s understanding of the applicable country’s tax rules and rates. Each Portfolio may pay foreign capital gains taxes on certain foreign securities held, which are reported as components of realized losses for financial reporting purposes, whereas such components are treated as ordinary loss for federal income tax purposes. The Portfolios will accrue such taxes as applicable based upon current interpretations of the tax rules and regulations that exist in the markets in which they invest.
Each Portfolio declares and pays dividends from net investment income and distributions from net realized gain on investments, if any, annually. Each Portfolio may distribute more frequently, if necessary for tax purposes. Dividends and distributions, if any, are recorded on the ex-dividend date.
Subject to seeking best execution, each Portfolio may direct certain security trades to brokers who have agreed to rebate a portion of the related brokerage commission to each Portfolio in cash. In general, best execution refers to many factors, including the price paid or received for a security, the commission charged, the promptness and reliability of execution, the confidentiality and placement accorded the order, and other factors affecting the overall benefit obtained by the Portfolio on the transaction. Such commission rebates are included in realized gain on investments in the accompanying financial statements. There were no commission rebates for the year ended Oct. 31, 2017.
Each Portfolio receives earnings credits from its custodian when positive cash balances are maintained, which may be used to offset custody fees. The expense paid under this arrangement is included on the “Statements of operations” under “Custodian fees” with the corresponding offset included in “Less expenses paid indirectly.” For the year ended Oct. 31, 2017, custody credits are as follows:
| | | | | |
| | | Custody Credits |
Macquarie Large Cap Value Portfolio | | | $ | 86 | |
Macquarie Core Plus Bond Portfolio | | | | 766 | |
Macquarie High Yield Bond Portfolio | | | | 413 | |
Macquarie Emerging Markets Portfolio | | | | 289 | |
Macquarie Emerging Markets Portfolio II | | | | 7 | |
Macquarie Labor Select International Equity Portfolio | | | | 418 | |
Each Portfolio receives earnings credits from its transfer agent when positive cash balances are maintained, which may be used to offset transfer agent fees. If the amount earned is greater than $1, the expense paid under this arrangement is included on the “Statements of operations” under “Dividend disbursing and transfer agent fees and expenses” with the corresponding expense offset shown under “Less expense paid indirectly.” For the year ended Oct. 31, 2017, earnings credits are as follows:
| | | | | |
| | | Earnings Credits |
Macquarie Large Cap Value Portfolio | | | | $2 | |
Macquarie Core Plus Bond Portfolio | | | | 1 | |
Macquarie High Yield Bond Portfolio | | | | 2 | |
Macquarie Emerging Markets Portfolio | | | | 2 | |
Macquarie Emerging Markets Portfolio II | | | | 2 | |
Macquarie Labor Select International Equity Portfolio | | | | 3 | |
2. Investment Management, Administration Agreements, and Other Transactions with Affiliates
In accordance with the terms of the investment management agreements, Delaware Management Company (DMC), a series of Macquarie Investment Management Business Trust (formerly, Delaware Management Business Trust) and the investment manager of the Portfolios, will receive an annual fee, which is calculated daily and paid monthly based on the average daily net assets of each Portfolio.
94
DMC has contractually agreed to waive that portion, if any, of its management fees and/or pay/reimburse each Portfolio (except for Macquarie Labor Select International Equity Portfolio and Macquarie Emerging Markets Portfolio) to the extent necessary to ensure that annual operating expenses, (excluding any 12b-1 fees, taxes, interest, short sale dividend and interest expenses, acquired fund fees and expenses, brokerage fees, certain insurance costs, and nonroutine expenses or costs, including, but not limited to, those relating to reorganizations, litigation, conducting shareholder meetings, and liquidations) do not exceed specified percentages of average daily net assets of each Portfolio from Nov. 1, 2016 through Oct. 31, 2017.* For purposes of these waivers and reimbursements, nonroutine expenses may also include such additional costs and expenses as may be agreed upon from time to time by the Portfolios’ Board and DMC. These expense waivers and reimbursements apply only to expenses paid directly by the Portfolios and may only be terminated by agreement of DMC and the Portfolios.
The management fee rates and the operating expense limitation rates in effect for the year ended Oct. 31, 2017, are as follows:
| | | | |
| | | Management
fee as a percentage
of average daily
net assets (per annum) | | Contractual
operating expense
limitation as
a percentage
of average daily
net assets (per annum)† |
Macquarie Large Cap Value Portfolio | | 0.55% | | 0.70% |
Macquarie Core Plus Bond Portfolio | | 0.43% | | 0.45% |
Macquarie High Yield Bond Portfolio | | 0.45% | | 0.59% |
Macquarie Emerging Markets Portfolio | | 1.00% | | N/A |
Macquarie Emerging Markets Portfolio II | | 1.00% | | 1.20% |
Macquarie Labor Select International Equity Portfolio | | 0.75% | | N/A |
| † | These operating expense limitations exclude certain expenses, such as 12b-1 fees, taxes, interest, short sale dividend and interest expenses, acquired fund fees and expenses, brokerage fees, certain insurance costs, and nonroutine expenses or costs, including, but not limited to, those relating to reorganizations, litigation, conducting shareholder meetings, and liquidations. In some instances, a Portfolio’s annual operating expenses may be lower than the contracted operating expense limitations. |
Mondrian Investment Partners Limited (Mondrian) furnishes investment sub-advisory services to Macquarie Emerging Markets Portfolio and Macquarie Labor Select International Equity Portfolio. For these services, DMC, not the Portfolios, pays Mondrian the following percentages of the Portfolios’ average daily net assets:
| | |
| | | Sub-advisory fee as a
percentage of average daily
net assets (per annum) |
Macquarie Emerging Markets Portfolio | | 0.75% |
Macquarie Labor Select International Equity Portfolio | | 0.30% |
Delaware Investments Fund Services Company (DIFSC), an affiliate of DMC, provides fund accounting and financial administration oversight services to each Portfolio. For these services, DIFSC’s fees were calculated daily and paid monthly based on the aggregate daily net assets of the Delaware Funds from Nov. 1, 2016 through Aug. 31, 2017 at the following annual rate: 0.0050% of the first $30 billion; 0.0045% of the next $10 billion; 0.0040% of the next $10 billion; and 0.0025% of aggregate average daily net assets in excess of $50 billion. The fees payable to DIFSC under the service agreement described above were allocated among all funds in the Delaware Funds on a relative net asset value (NAV) basis. Effective Sept. 1, 2017, each Portfolio entered into an amendment to the DIFSC agreement. Under the amendment to the DIFSC agreement, DIFSC’s fees are calculated daily and paid monthly based on the aggregate daily net assets of the Delaware Funds at the following annual rate: 0.00475% of the first $35 billion; 0.0040% of the next $10 billion; and 0.0025% of aggregate average daily net assets in excess of $45 billion (Total Fee). Each Fund in the Delaware Funds pays a minimum of $4,000, which, in aggregate, is subtracted from the Total Fee. Each Fund in the Delaware Funds then pays its relative portion of the remainder of the Total Fee on a relative NAV basis. These amounts are included on the “Statements of operations” under “Accounting and administrative expenses.”
Notes to financial statements
Macquarie Institutional Portfolios
2. Investment Management, Administration Agreements, and Other Transactions with Affiliates (continued)
For the year ended Oct. 31, 2017, each Portfolio was charged for these services as follows:
| | | | |
Macquarie Large Cap Value Portfolio | | $ | 9,629 | |
Macquarie Core Plus Bond Portfolio | | | 7,231 | |
Macquarie High Yield Bond Portfolio | | | 7,958 | |
Macquarie Emerging Markets Portfolio | | | 6,768 | |
Macquarie Emerging Markets Portfolio II | | | 2,491 | |
Macquarie Labor Select International Equity Portfolio | | | 21,308 | |
DIFSC is also the transfer agent and dividend disbursing agent of each Portfolio. For these services, DIFSC’s fees are calculated daily and paid monthly at the annual rate of 0.0075% of each Portfolio’s average daily net assets. These amounts are included on the “Statements of operations” under “Dividend disbursing and transfer agent fees and expenses.” For the year ended Oct. 31, 2017, each Portfolio was charged the following amounts for these services:
| | | | |
Macquarie Large Cap Value Portfolio | | $ | 14,867 | |
Macquarie Core Plus Bond Portfolio | | | 10,966 | |
Macquarie High Yield Bond Portfolio | | | 12,007 | |
Macquarie Emerging Markets Portfolio | | | 10,161 | |
Macquarie Emerging Markets Portfolio II | | | 3,050 | |
Macquarie Labor Select International Equity Portfolio | | | 34,455 | |
Pursuant to a sub-transfer agency agreement between DIFSC and BNY Mellon Investment Servicing (US) Inc. (BNYMIS), BNYMIS provides certain sub-transfer agency services to each Portfolio. Sub-transfer agency fees are paid by each Portfolio and are also included on the “Statements of operations” under “Dividend disbursing and transfer agent fees and expenses.”
As provided in the investment management agreement, each Portfolio bears a portion of the cost of certain resources shared with DMC, including the cost of internal personnel of DMC and/or its affiliates that provide legal, tax, and regulatory reporting services to the Portfolios. These amounts are included on the “Statements of operations” under “Legal fees.” For the year ended Oct. 31, 2017, each Portfolio was charged for internal legal, tax, and regulatory reporting services provided by DMC and/or its affiliates’ employees as follows:
| | | | |
Macquarie Large Cap Value Portfolio | | $ | 11,382 | |
Macquarie Core Plus Bond Portfolio | | | 7,856 | |
Macquarie High Yield Bond Portfolio | | | 9,664 | |
Macquarie Emerging Markets Portfolio | | | 8,323 | |
Macquarie Emerging Markets Portfolio II | | | 3,251 | |
Macquarie Labor Select International Equity Portfolio | | | 25,667 | |
Trustees’ fees include expenses accrued by each Portfolio for each Trustee’s retainer and meeting fees. Certain officers of DMC, DIFSC, and DDLP are officers and/or Trustees of the Trust. These officers and Trustees are paid no compensation by the Portfolios.
Cross trades for the year ended Oct. 31, 2017, were executed by the Portfolios pursuant to procedures adopted by the Board designed to ensure compliance with Rule 17a-7 under the 1940 Act. Cross trading is the buying or selling of portfolio securities between funds of investment companies, or between a fund of an investment company and another entity, that are or could be considered affiliates by virtue of having a common investment advisor (or affiliated investment advisors), common directors/trustees and/or common officers. At their regularly scheduled meetings, the Board reviews such transactions for compliance with the procedures adopted by the Board. Pursuant to these procedures, for the year ended Oct. 31, 2017, the Portfolios engaged in securities purchases and securities sales, which resulted in net realized gains (losses) as follows:
| | | | | | | | | | | | | | | |
| | | Purchases | | Sales | | Net realized gain (loss) |
Macquarie Large Cap Value Portfolio | | | $ | — | | | | $ | 222,555 | | | | $ | 8 | |
Macquarie Core Plus Bond Portfolio | | | | 378,946 | | | | | — | | | | | — | |
Macquarie High Yield Bond Portfolio | | | | 2,899,761 | | | | | 112,522,121 | | | | | 2,726,220 | |
Macquarie Emerging Markets Portfolio | | | | — | | | | | 1,430,307 | | | | | 50 | |
Macquarie Labor Select International Equity Portfolio | | | | — | | | | | 1,145,309 | | | | | (42 | ) |
| * | The aggregate contractual waiver period covering this report is from Feb. 26, 2016 through Feb. 28, 2018. |
96
3. Investments
For the year ended Oct. 31, 2017, each Portfolio made purchases and sales of investment securities other than short-term investments as follows:
| | | | | | | | | | | | | | | | | | | | |
| | | Purchases
other than
US government
securities | | Purchases of
US government
securities | | Sales
other than
US government
securities | | Sales of
US government
securities |
Macquarie Large Cap Value Portfolio | | | $ | 43,973,399 | | | | $ | — | | | | $ | 107,484,773 | | | | $ | — | |
Macquarie Core Plus Bond Portfolio | | | | 197,991,266 | | | | | 61,558,380 | | | | | 171,441,213 | | | | | 58,821,132 | |
Macquarie High Yield Bond Portfolio | | | | 152,038,271 | | | | | — | | | | | 278,737,928 | | | | | — | |
Macquarie Emerging Markets Portfolio | | | | 60,524,797 | | | | | — | | | | | 75,908,788 | | | | | — | |
Macquarie Emerging Markets Portfolio II | | | | 5,670,878 | | | | | — | | | | | 10,337,355 | | | | | — | |
Macquarie Labor Select International Equity Portfolio | | | | 108,884,425 | | | | | — | | | | | 92,509,787 | | | | | — | |
The tax cost of investments includes adjustments to net unrealized appreciation (depreciation which may not necessarily be final tax cost basis adjustments, but approximate the tax basis unrealized gains and losses that may be realized and distributed to shareholders. At Oct. 31, 2017, the cost and unrealized appreciation (depreciation) of investments and derivatives for federal income tax purposes for each Portfolio were as follows:
| | | | | | | | | | | | | | | | | | | | |
| | | Cost of
investments
and derivatives | | Aggregate
unrealized
appreciation
of investments
and derivatives | | Aggregate
unrealized
depreciation
of investments
and derivatives | | Net unrealized
appreciation
of investments
and derivatives |
Macquarie Large Cap Value Portfolio | | | $ | 161,126,925 | | | | $ | 24,772,193 | | | | $ | (9,148,197 | ) | | | $ | 15,623,996 | |
Macquarie Core Plus Bond Portfolio | | | | 167,037,734 | | | | | 2,651,905 | | | | | (1,376,670 | ) | | | | 1,275,235 | |
Macquarie High Yield Bond Portfolio | | | | 107,628,573 | | | | | 4,087,545 | | | | | (540,850 | ) | | | | 3,546,695 | |
Macquarie Emerging Markets Portfolio | | | | 133,150,466 | | | | | 18,980,483 | | | | | (15,209,191 | ) | | | | 3,771,292 | |
Macquarie Emerging Markets Portfolio II | | | | 36,617,140 | | | | | 13,951,060 | | | | | (4,431,077 | ) | | | | 9,519,983 | |
Macquarie Labor Select International Equity Portfolio | | | | 452,013,132 | | | | | 84,843,877 | | | | | (49,335,419 | ) | | | | 35,508,458 | |
US GAAP defines fair value as the price that each Portfolio would receive to sell an asset or pay to transfer a liability in an orderly transaction between market participants at the measurement date under current market conditions. A three-level hierarchy for fair value measurements has been established based upon the transparency of inputs to the valuation of an asset or liability. Inputs may be observable or unobservable and refer broadly to the assumptions that market participants would use in pricing the asset or liability. Observable inputs reflect the assumptions market participants would use in pricing the asset or liability based on market data obtained from sources independent of the reporting entity. Unobservable inputs reflect the reporting entity’s own assumptions about the assumptions that market participants would use in pricing the asset or liability based on the best information available under the circumstances. Each Portfolio’s investment in its entirety is assigned a level based upon the observability of the inputs which are significant to the overall valuation. The three-level hierarchy of inputs is summarized below and on the next page.
| | | | |
| Level 1 | | – | | Inputs are quoted prices in active markets for identical investments. (Examples: equity securities, open-end investment companies, futures contracts, exchange-traded options contracts) |
| | |
| Level 2 | | – | | Other observable inputs, including, but not limited to: quoted prices for similar assets or liabilities in markets that are active, quoted prices for identical or similar assets or liabilities in markets that are not active, inputs other than quoted prices that are observable for the assets or liabilities (such as interest rates, yield curves, volatilities, prepayment speeds, loss severities, credit risks, and default rates), or other market-corroborated inputs. (Examples: debt securities, government securities, swap contracts, foreign currency exchange contracts, foreign securities utilizing international fair value pricing, broker-quoted securities, fair valued securities) |
| | |
| Level 3 | | – | | Significant unobservable inputs, including each Portfolio’s own assumptions used to determine the fair value of investments. (Examples: broker-quoted securities, fair valued securities) |
Level 3 investments are valued using significant unobservable inputs. Each Portfolio may also use an income-based valuation approach in which the anticipated future cash flows of the investment are discounted to calculate fair value. Discounts may also be applied due to the nature or
Notes to financial statements
Macquarie Institutional Portfolios
3. Investments (continued)
duration of any restrictions on the disposition of the investments. Valuations may also be based upon current market prices of securities that are comparable in coupon, rating, maturity, and industry. The derived value of a Level 3 investment may not represent the value which is received upon disposition and this could impact the results of operations.
The following table summarizes the valuation of Macquarie Large Cap Value Portfolio’s investments by fair value hierarchy levels as of Oct. 31, 2017:
| | | | | | | | | | | | | | | |
Securities | | Level 1 | | Level 2 | | Total |
Assets: | | | | | | | | | | | | | | | |
Common Stock | | | $ | 166,842,007 | | | | $ | — | | | | $ | 166,842,007 | |
Short-Term Investments | | | | — | | | | | 9,908,914 | | | | | 9,908,914 | |
| | | | | | | | | | | | | | | |
Total Value of Securities | | | $ | 166,842,007 | | | | $ | 9,908,914 | | | | $ | 176,750,921 | |
| | | | | | | | | | | | | | | |
The following table summarizes the valuation of Macquarie Core Plus Bond Portfolio’s investments by fair value hierarchy levels as of Oct. 31, 2017:
| | | | | | | | | | | | | | | |
Securities: | | Level 1 | | Level 2 | | Total |
Assets: | | | | | | | | | | | | | | | |
Agency, Asset- & Mortgage-Backed Securities | | | $ | — | | | | $ | 50,895,105 | | | | $ | 50,895,105 | |
Corporate Debt | | | | — | | | | | 85,041,703 | | | | | 85,041,703 | |
Municipal Bonds | | | | — | | | | | 1,018,959 | | | | | 1,018,959 | |
Foreign Debt | | | | — | | | | | 7,794,835 | | | | | 7,794,835 | |
Loan Agreements | | | | — | | | | | 5,143,075 | | | | | 5,143,075 | |
US Treasury Obligations | | | | — | | | | | 6,493,381 | | | | | 6,493,381 | |
Convertible Preferred Stock1 | | | | 36,787 | | | | | 225,975 | | | | | 262,762 | |
Preferred Stock | | | | — | | | | | 630,075 | | | | | 630,075 | |
Options Purchased | | | | — | | | | | 14,557 | | | | | 14,557 | |
Short-Term Investments | | | | — | | | | | 11,128,484 | | | | | 11,128,484 | |
| | | | | | | | | | | | | | | |
Total Value of Securities | | | $ | 36,787 | | | | $ | 168,386,149 | | | | $ | 168,422,936 | |
| | | | | | | | | | | | | | | |
| | | |
Derivatives*: | | | | | | |
Assets: | | | | | | | | | | | | | | | |
Foreign Currency Exchange | | | | | | | | | | | | | | | |
Contracts | | | | — | | | | | 354 | | | | | 354 | |
Futures Contracts | | | | 12,327 | | | | | — | | | | | 12,327 | |
Liabilities: | | | | | | | | | | | | | | | |
Foreign Currency Exchange | | | | | | | | | | | | | | | |
Contracts | | | | — | | | | | (48,271 | ) | | | | (48,271 | ) |
Futures Contracts | | | | (30,436 | ) | | | | — | | | | | (30,436 | ) |
Swap Contracts | | | | — | | | | | (43,941 | ) | | | | (43,941 | ) |
*Foreign Currency Exchange Contracts, Futures Contracts, and Swap Contracts are valued at the unrealized appreciation (depreciation) on the instrument at the year end.
1Security type is valued across multiple levels. Level 1 investments represent exchange-traded investments and Level 2 investments represent investments with observable inputs or matrix-priced investments. The amounts attributed to Level 1 investments and Level 2 investments represent the following percentages of the total market value of these security types:
| | | | | | | | | | | | | | | | | | | | | | | | | | | | | | | | | | | |
| | | Level 1 | | | | Level 2 | | | | Level 3 | | | | Total |
Convertible Preferred Stock | | 14.00% | | | | 86.00% | | | | — | | | | 100.00% |
98
The following table summarizes the valuation of Macquarie High Yield Bond Portfolio’s investments by fair value hierarchy levels as of Oct. 31, 2017:
| | | | | | | | | | | | | | | | | | | | |
Securities | | Level 1 | | Level 2 | | Level 3 | | Total |
Assets: | | | | | | | | | | | | | | | | | | | | |
Corporate Debt | | | $ | — | | | | $ | 101,986,006 | | | | $ | — | | | | $ | 101,986,006 | |
Loan Agreements | | | | — | | | | | 3,369,226 | | | | | — | | | | | 3,369,226 | |
Municipal Bond | | | | — | | | | | 305,500 | | | | | — | | | | | 305,500 | |
Common Stock | | | | — | | | | | — | | | | | — | | | | | — | |
Preferred Stock1 | | | | 183,820 | | | | | 898,825 | | | | | — | | | | | 1,082,645 | |
Short-Term Investments | | | | — | | | | | 4,431,891 | | | | | — | | | | | 4,431,891 | |
| | | | | | | | | | | | | | | | | | | | |
Total Value of Securities | | | $ | 183,820 | | | | $ | 110,991,448 | | | | $ | — | | | | $ | 111,175,268 | |
| | | | | | | | | | | | | | | | | | | | |
1Security type is valued across multiple levels. Level 1 investments represent exchange-traded investments, Level 2 investments represent investments with observable inputs or matrix-priced investments, and Level 3 investments represent investments without observable inputs. The amounts attributed to Level 1 investments, Level 2 investments, and Level 3 investments represent the following percentages of the total market value of these security types:
| | | | | | | | | | | | | | | | | | | | |
| | | Level 1 | | Level 2 | | Level 3 | | Total |
Preferred Stock | | | | 16.98 | % | | | | 83.02 | % | | | | — | | | | | 100.00 | % |
The following table summarizes the valuation of Macquarie Emerging Markets Portfolio’s investments by fair value hierarchy levels as of Oct. 31, 2017:
| | | | | | | | | | | | | | | |
Securities | | Level 1 | | Level 2 | | Total |
Assets: | | | | | | | | | | | | | | | |
Common Stock | | | $ | 130,743,359 | | | | $ | — | | | | $ | 130,743,359 | |
Preferred Stock | | | | 4,130,436 | | | | | — | | | | | 4,130,436 | |
Short-Term Investments | | | | — | | | | | 2,046,581 | | | | | 2,046,581 | |
| | | | | | | | | | | | | | | |
Total Value of Securities | | | $ | 134,873,795 | | | | $ | 2,046,581 | | | | $ | 136,920,376 | |
| | | | | | | | | | | | | | | |
Derivatives*: | | | | | | |
Assets: | | | | | | | | | | | | | | | |
Foreign Currency Exchange Contract | | | $ | — | | | | $ | 1,382 | | | | $ | 1,382 | |
*Foreign Currency Exchange Contracts are valued at the unrealized appreciation (depreciation) on the instrument at the year end.
Notes to financial statements
Macquarie Institutional Portfolios
3. Investments (continued)
The following table summarizes the valuation of Macquarie Emerging Markets Portfolio II’s investments by fair value hierarchy levels as of Oct. 31, 2017:
| | | | | | | | | | | | | | | |
Securities | | Level 1 | | Level 2 | | Total |
Assets: | | | | | | | | | | | | | | | |
Common Stock | | | | | | | | | | | | | | | |
Argentina | | | $ | 659,816 | | | | $ | — | | | | $ | 659,816 | |
Bahrain | | | | 13,241 | | | | | — | | | | | 13,241 | |
Brazil | | | | 6,775,715 | | | | | — | | | | | 6,775,715 | |
Canada | | | | 350,460 | | | | | — | | | | | 350,460 | |
Chile | | | | 215,064 | | | | | — | | | | | 215,064 | |
China/Hong Kong | | | | 11,713,557 | | | | | — | | | | | 11,713,557 | |
Colombia | | | | 216,369 | | | | | — | | | | | 216,369 | |
India | | | | 4,868,961 | | | | | — | | | | | 4,868,961 | |
Indonesia | | | | 620,834 | | | | | — | | | | | 620,834 | |
Malaysia | | | | 93,367 | | | | | — | | | | | 93,367 | |
Mexico | | | | 2,533,184 | | | | | — | | | | | 2,533,184 | |
Netherlands | | | | 491,035 | | | | | — | | | | | 491,035 | |
Peru | | | | 259,252 | | | | | — | | | | | 259,252 | |
Republic of Korea | | | | 8,436,104 | | | | | — | | | | | 8,436,104 | |
Russia | | | | 1,636,423 | | | | | 487,022 | | | | | 2,123,445 | |
Taiwan | | | | 3,322,197 | | | | | — | | | | | 3,322,197 | |
Thailand | | | | 558,920 | | | | | — | | | | | 558,920 | |
Turkey | | | | 1,185,268 | | | | | — | | | | | 1,185,268 | |
United States | | | | 736,260 | | | | | — | | | | | 736,260 | |
Exchanged-Traded Fund | | | | 209,100 | | | | | — | | | | | 209,100 | |
Preferred Stock | | | | 754,974 | | | | | — | | | | | 754,974 | |
Rights | | | | — | | | | | — | | | | | — | |
| | | | | | | | | | | | | | | |
Total Value of Securities | | | $ | 45,650,101 | | | | $ | 487,022 | | | | $ | 46,137,123 | |
| | | | | | | | | | | | | | | |
100
The following table summarizes the valuation of Macquarie Labor Select International Equity Portfolio’s investments by fair value hierarchy levels as of Oct. 31, 2017:
| | | | | | | | | | | | | | | |
Securities | | Level 1 | | Level 2 | | Total |
Assets: | | | | | | | | | | | | | | | |
Common Stock | | | | | | | | | | | | | | | |
Australia | | | $ | 6,832,268 | | | | $ | — | | | | $ | 6,832,268 | |
China/Hong Kong | | | | 13,825,237 | | | | | — | | | | | 13,825,237 | |
Denmark | | | | 5,707,638 | | | | | — | | | | | 5,707,638 | |
France | | | | 32,476,578 | | | | | — | | | | | 32,476,578 | |
Germany | | | | — | | | | | 62,991,124 | | | | | 62,991,124 | |
Italy | | | | 28,551,498 | | | | | — | | | | | 28,551,498 | |
Japan | | | | 88,393,493 | | | | | — | | | | | 88,393,493 | |
Netherlands | | | | 12,401,645 | | | | | — | | | | | 12,401,645 | |
Singapore | | | | 31,390,019 | | | | | — | | | | | 31,390,019 | |
Spain | | | | 26,853,336 | | | | | — | | | | | 26,853,336 | |
Sweden | | | | 21,783,670 | | | | | — | | | | | 21,783,670 | |
Switzerland | | | | 36,651,639 | | | | | — | | | | | 36,651,639 | |
United Kingdom | | | | 116,805,362 | | | | | — | | | | | 116,805,362 | |
Preferred Stock | | | | — | | | | | 613,584 | | | | | 613,584 | |
Rights | | | | — | | | | | 26,930 | | | | | 26,930 | |
Short-Term Investments | | | | — | | | | | 2,221,393 | | | | | 2,221,393 | |
| | | | | | | | | | | | | | | |
Total Value of Securities | | | $ | 421,672,383 | | | | $ | 65,853,031 | | | | $ | 487,525,414 | |
| | | | | | | | | | | | | | | |
| | | |
Derivatives*: | | | | | | |
Liabilities: | | | | | | | | | | | | | | | |
Foreign Currency Exchange Contracts | | | | — | | | | | (3,824 | ) | | | | (3,824 | ) |
*Foreign Currency Exchange Contracts are valued at the unrealized appreciation (depreciation) on the instrument at the year end.
The securities that have been valued at zero on the “Schedules of investments” are considered to be Level 3 securities in these tables.
As a result of utilizing international fair value pricing at Oct. 31, 2017, a portion of the common stock of Macquarie Emerging Markets Portfolio II and Macquarie Labor Select International Equity Portfolio was categorized as Level 2.
During the year ended Oct. 31, 2017, there were no transfers between Level 1 investments, Level 2 investments, or Level 3 investments that had a significant impact to each Portfolio. This does not include transfers between Level 1 investments and Level 2 investments due to each Portfolio utilizing international fair value pricing during the period. In accordance with the fair valuation procedures described in Note 1, international fair value pricing of securities in each Portfolio occurs when market volatility exceeds an established rolling threshold. If the threshold is exceeded on a given date, then prices of international securities (those that traded on exchanges that close at a different time than the time that each Portfolio’s NAV is determined) are established using a separate pricing feed from a third party vendor designed to establish a price for each such security as of the time that each Portfolio’s NAV is determined. Further, international fair value pricing uses other observable market-based inputs in place of the closing exchange price due to the events occurring after the close of the exchange or market on which the investment is principally traded, causing a change in classification between levels. Each Portfolio’s policy is to recognize transfers between levels based on fair value at the beginning of the reporting period.
A reconciliation of Level 3 investments is presented when a Portfolio has a significant amount of Level 3 investments at the beginning, interim, or end of the period in relation to the Portfolio’s net assets. Management has determined not to provide a reconciliation of Level 3 investments as they were not considered significant to each Portfolio’s net assets at the beginning, interim, or end of the period. Management has determined not to provide additional disclosure on Level 3 inputs since the Level 3 investments are not considered significant to each Portfolio’s net assets at the end of the period.
Notes to financial statements
Macquarie Institutional Portfolios
4. Dividend and Distribution Information
Income and long-term capital gain distributions are determined in accordance with federal income tax regulations, which may differ from US GAAP. Additionally, distributions from net gains on foreign currency transactions and net short-term gains on sales of investment securities are treated as ordinary income for federal income tax purposes. The tax character of dividends and distributions paid during the years ended Oct. 31, 2017 and 2016 was as follows:
| | | | | | | | | | | | | | | |
| | | Ordinary
income | | Long-term
capital gain | | Total |
Year ended Oct. 31, 2017: | | | | | | | | | | | | | | | |
Macquarie Large Cap Value Portfolio | | | $ | 5,637,723 | | | | $ | 5,817,217 | | | | $ | 11,454,940 | |
Macquarie Core Plus Bond Portfolio | | | | 3,413,875 | | | | | — | | | | | 3,413,875 | |
Macquarie High Yield Bond Portfolio | | | | 13,576,518 | | | | | — | | | | | 13,576,518 | |
Macquarie Emerging Markets Portfolio | | | | 4,559,146 | | | | | — | | | | | 4,559,146 | |
Macquarie Emerging Markets Portfolio II | | | | 419,713 | | | | | — | | | | | 419,713 | |
Macquarie Labor Select International Equity Portfolio | | | | 12,309,632 | | | | | — | | | | | 12,309,632 | |
| | | |
| | | Ordinary
income | | Long-term
capital gain | | Total |
Year ended Oct. 31, 2016: | | | | | | | | | | | | | | | |
Macquarie Large Cap Value Portfolio | | | $ | 5,989,899 | | | | $ | 14,608,740 | | | | $ | 20,598,639 | |
Macquarie Core Plus Bond Portfolio | | | | 2,987,593 | | | | | — | | | | | 2,987,593 | |
Macquarie High Yield Bond Portfolio | | | | 11,494,763 | | | | | — | | | | | 11,494,763 | |
Macquarie Emerging Markets Portfolio | | | | 4,099,296 | | | | | — | | | | | 4,099,296 | |
Macquarie Emerging Markets Portfolio II | | | | 564,237 | | | | | 851,663 | | | | | 1,415,900 | |
Macquarie Labor Select International Equity Portfolio | | | | 9,585,512 | | | | | — | | | | | 9,585,512 | |
5. Components of Net Assets on a Tax Basis
As of Oct. 31, 2017, the components of net assets on a tax basis were as follows:
| | | | | | | | | | | | | | | |
| | | |
| | | Macquarie
Large Cap
Value
Portfolio | | Macquarie
Core Plus
Bond Portfolio | | Macquarie
High Yield
Bond Portfolio |
Shares of beneficial interest | | | $ | 134,473,306 | | | | $ | 164,231,969 | | | | $ | 117,384,938 | |
Undistributed ordinary income | | | | 3,470,628 | | | | | 4,119,459 | | | | | 6,947,190 | |
Undistributed long-term capital gain | | | | 15,299,823 | | | | | — | | | | | — | |
Capital loss carryforwards | | | | — | | | | | (1,209,521 | ) | | | | (14,491,196 | ) |
Unrealized appreciation of investments, foreign currencies, and derivatives | | | | 15,623,996 | | | | | 1,275,235 | | | | | 3,546,695 | |
Other temporary differences | | | | — | | | | | (175,425 | ) | | | | (114,275 | ) |
| | | | | | | | | | | | | | | |
Net assets | | | $ | 168,867,753 | | | | $ | 168,241,717 | | | | $ | 113,273,352 | |
| | | | | | | | | | | | | | | |
| | | |
| | | Macquarie
Emerging
Markets
Portfolio | | Macquarie
Emerging
Markets
Portfolio II | | Macquarie
Labor Select
International
Equity
Portfolio |
Shares of beneficial interest | | | $ | 169,920,655 | | | | $ | 36,111,391 | | | | $ | 460,176,900 | |
Undistributed ordinary income | | | | 4,933,363 | | | | | 1,016,055 | | | | | 13,063,183 | |
Capital loss carryforwards | | | | (41,947,331 | ) | | | | (601,171 | ) | | | | (18,475,802 | ) |
Unrealized depreciation of investments, foreign currencies, and derivatives | | | | 3,771,292 | | | | | 9,519,983 | | | | | 35,508,458 | |
| | | | | | | | | | | | | | | |
Net assets | | | $ | 136,677,979 | | | | $ | 46,046,258 | | | | $ | 490,272,739 | |
| | | | | | | | | | | | | | | |
The differences between book basis and tax basis components of net assets are primarily attributable to tax deferral of losses on wash sales, mark-to-market on futures contracts, mark-to-market on foreign currency exchange contracts, tax deferral of losses on straddles, tax treatment
102
of passive foreign investment companies, contingent payment debt instruments, tax treatment of trust preferred securities, tax treatment of market discount and premium on debt instruments, CDS contracts, deemed dividend income, and troubled debt.
For financial reporting purposes, capital accounts are adjusted to reflect the tax character of permanent book/tax differences. Reclassifications are primarily due to tax treatment of net operating losses, gain (loss) on foreign currency transactions, dividends and distributions, market discount and premium on certain debt instruments, contingent payment debt instruments, CDS contracts, tax treatment of foreign capital gains taxes, passive foreign investment companies, expired capital loss carryforwards, deemed dividend income, and paydown gains (losses) on mortgage- and asset-backed securities. Results of operations and net assets were not affected by these reclassifications. For the year ended Oct. 31, 2017, the following Portfolios recorded the following reclassifications:
| | | | | | | | | | | | | | | |
| | | Undistributed
(distributions in excess of)
net investment income (loss) | | Accumulated
net realized
gain (loss) | | Paid-in
Capital |
Macquarie Core Plus Bond Portfolio | | | $ | 334,318 | | | | $ | (334,318 | ) | | | $ | — | |
Macquarie High Yield Bond Portfolio | | | | 318,696 | | | | | (318,696 | ) | | | | — | |
Macquarie Emerging Markets Portfolio | | | | 402,329 | | | | | (402,329 | ) | | | | — | |
Macquarie Emerging Markets Portfolio II | | | | 94,727 | | | | | (94,727 | ) | | | | — | |
Macquarie Labor Select International Equity Portfolio | | | | (49,410 | ) | | | | 23,304,835 | | | | | (23,255,425 | ) |
For federal income tax purposes, capital loss carryforwards may be carried forward and applied against future gain.
In 2017, the following Portfolios utilized capital loss carryforwards as follows:
| | | | |
Macquarie High Yield Bond Portfolio | | $ | 6,637,008 | |
Macquarie Emerging Markets Portfolio II | | | 1,627,691 | |
Macquarie Labor Select International Equity Portfolio | | | 15,281,794 | |
Under the Regulated Investment Company Modernization Act of 2010 (Act), net capital losses recognized for tax years beginning after Dec. 22, 2010 may be carried forward indefinitely, and their character is retained as short-term and/or long-term losses. Previously, net capital losses were carried forward for eight years and treated as short-term losses. As a transition rule, the Act requires that post-enactment net capital losses be used before pre-enactment net capital losses. Capital loss carryforwards available to offset future realized capital gains for the Portfolios are as follows:
| | | | | | | | | | | | | | | | | | | | |
| | | Pre-enactment capital loss
Expiration date | | No expiration
Post-enactment capital loss character | | |
| | | 2018 | | Short-term | | Long-term | | Total |
Macquarie Core Plus Bond Portfolio | | | $ | — | | | | $ | 1,209,521 | | | | $ | — | | | | $ | 1,209,521 | |
Macquarie High Yield Bond Portfolio | | | | — | | | | | 5,775,827 | | | | | 8,715,369 | | | | | 14,491,196 | |
Macquarie Emerging Markets Portfolio | | | | — | | | | | — | | | | | 41,947,331 | | | | | 41,947,331 | |
Macquarie Emerging Markets Portfolio II | | | | — | | | | | — | | | | | 601,171 | | | | | 601,171 | |
Macquarie Labor Select International Equity Portfolio | | | | 18,475,802 | | | | | — | | | | | — | | | | | 18,475,802 | |
Notes to financial statements
Macquarie Institutional Portfolios
6. Capital Shares
Transactions in capital shares were as follows:
| | | | | | | | | | | | | | | | | | | | |
| | | Shares
sold | | Shares issued
upon reinvestment
of dividends
and distributions | | Shares
redeemed | | Net
increase
(decrease) |
Year ended Oct. 31, 2017: | | | | | | | | | | | | | | | | | | | | |
Macquarie Large Cap Value Portfolio | | | | 650,421 | | | | | 359,881 | | | | | (3,320,683 | ) | | | | (2,310,381 | ) |
Macquarie Core Plus Bond Portfolio | | | | 4,527,737 | | | | | 320,194 | | | | | (1,472,623 | ) | | | | 3,375,308 | |
Macquarie High Yield Bond Portfolio | | | | 1,571,066 | | | | | 1,792,461 | | | | | (20,098,220 | ) | | | | (16,734,693 | ) |
Macquarie Emerging Markets Portfolio | | | | 1,926,721 | | | | | 446,150 | | | | | (4,001,404 | ) | | | | (1,628,533 | ) |
Macquarie Emerging Markets Portfolio II | | | | 10,989 | | | | | 56,949 | | | | | (427,556 | ) | | | | (359,618 | ) |
Macquarie Labor Select International Equity Portfolio | | | | 2,907,378 | | | | | 956,189 | | | | | (2,407,338 | ) | | | | 1,456,229 | |
| | | | |
Year ended Oct. 31, 2016: | | | | | | | | | | | | | | | | | | | | |
Macquarie Large Cap Value Portfolio | | | | 507,123 | | | | | 762,327 | | | | | (907,229 | ) | | | | 362,221 | |
Macquarie Core Plus Bond Portfolio | | | | 1,090,234 | | | | | 278,305 | | | | | (1,033,325 | ) | | | | 335,214 | |
Macquarie High Yield Bond Portfolio | | | | 6,419,614 | | | | | 1,548,151 | | | | | (3,723,841 | ) | | | | 4,243,924 | |
Macquarie Emerging Markets Portfolio | | | | 1,052,933 | | | | | 441,294 | | | | | (7,382,355 | ) | | | | (5,888,128 | ) |
Macquarie Emerging Markets Portfolio II | | | | 116,582 | | | | | 210,074 | | | | | (198,329 | ) | | | | 128,327 | |
Macquarie Labor Select International Equity Portfolio | | | | 6,162,848 | | | | | 762,058 | | | | | (2,300,744 | ) | | | | 4,624,162 | |
7. Line of Credit
Each Portfolio, along with certain other funds in the Delaware Funds (Participants), was a participant in a $155,000,000 revolving line of credit intended to be used for temporary or emergency purposes as an additional source of liquidity to fund redemptions of investor shares. Under the agreement, the Participants were charged an annual commitment fee of 0.10%, which was generally allocated across the Participants based on a weighted average of the respective net assets of each participant. The Participants were permitted to borrow up to a maximum of one-third of their net assets under the agreement. Each Participant was individually, and not jointly, liable for its particular advances, if any, under the line of credit. The line of credit available under the agreement expired on Nov. 7, 2016.
On Nov. 7, 2016, each Portfolio, along with the other Participants, entered into an amendment to the agreement for a $155,000,000 revolving line of credit. The line of credit was to be used as described above and operated in substantially the same manner as the original agreement, with the exception of the annual commitment fee. Under the amendment to the agreement, the Participants were charged an annual commitment fee of 0.15%, which was generally allocated across the Participants based on a weighted average of the respective net assets of each participant. The line of credit available under the agreement expired on Nov. 6, 2017.
Each Portfolio had no amounts outstanding as of Oct. 31, 2017, or at any time during the year then ended.
8. Derivatives
US GAAP requires disclosures that enable investors to understand: (1) how and why an entity uses derivatives; (2) how they are accounted for; and (3) how they affect an entity’s results of operations and financial position.
Foreign Currency Exchange Contracts — Each Portfolio may enter into foreign currency exchange contracts and foreign cross currency exchange contracts as a way of managing foreign exchange rate risk. Each Portfolio may enter into these contracts to fix the US dollar value of a security that it has agreed to buy or sell for the period between the date the trade was entered into and the date the security is delivered and paid for. Each Portfolio may also use these contracts to hedge the US dollar value of securities it already owns that are denominated in foreign currencies. In addition, each Portfolio may enter into these contracts to facilitate or expedite the settlement of portfolio transactions. The change in value is recorded as an unrealized gain or loss. When the contract is closed, a realized gain or loss is recorded equal to the difference between the value of the contract at the time it was opened and the value at the time it was closed.
The use of foreign currency exchange contracts and foreign cross currency exchange contracts does not eliminate fluctuations in the underlying prices of the securities, but does establish a rate of exchange that can be achieved in the future. Although foreign currency exchange contracts
104
and foreign cross currency exchange contracts limit the risk of loss due to an unfavorable change in the value of the hedged currency, they also limit any potential gain that might result should the value of the currency change favorably. In addition, each Portfolio could be exposed to risks if the counterparties to the contracts are unable to meet the terms of their contracts. Each Portfolio’s maximum risk of loss from counterparty credit risk is the value of its currency exchanged with the counterparty. The risk is generally mitigated by having a netting arrangement between each Portfolio and the counterparty and by the posting of collateral by the counterparty to the Portfolio to cover each Portfolio’s exposure to the counterparty.
Macquarie Core Plus Bond Portfolio used foreign currency exchange contracts and foreign cross currency exchange contracts in order to hedge the US dollar value of securities they already own that are denominated in foreign currencies. Macquarie Emerging Markets Portfolio, Macquarie Emerging Markets Portfolio II, and Macquarie Labor Select International Equity Portfolio entered into foreign currency exchange contracts and foreign cross currency exchange contracts to facilitate or expedite the settlement of portfolio transactions.
Futures Contracts — A futures contract is an agreement in which the writer (or seller) of the contract agrees to deliver to the buyer an amount of cash or securities equal to a specific dollar amount times the difference between the value of a specific security or index at the close of the last trading day of the contract and the price at which the agreement is made. Macquarie Core Plus Bond, Macquarie High Yield Bond, Macquarie Emerging Markets, and Macquarie Emerging Markets II Portfolios may use futures contracts in the normal course of pursuing their respective investment objectives. Each Portfolio may invest in futures contracts to hedge its existing portfolio securities against fluctuations in value caused by changes in interest rates or market conditions. Upon entering into a futures contract, a Portfolio deposits cash or pledges US government securities to a broker, equal to the minimum “initial margin” requirements of the exchange on which the contract is traded. Subsequent payments are received from the broker or paid to the broker each day, based on the daily fluctuation in the market value of the contract. These receipts or payments are known as “variation margin” and are recorded daily by each Portfolio as unrealized gains or losses until the contracts are closed. When the contracts are closed, the Portfolio records a realized gain or loss equal to the difference between the value of the contract at the time it was opened and the value at the time it was closed. Risks of entering into futures contracts include potential imperfect correlation between the futures contracts and the underlying securities and the possibility of an illiquid secondary market for these instruments. When investing in futures, there is reduced counterparty credit risk to each Portfolio because futures are exchange-traded and the exchange’s clearinghouse, as counterparty to all exchange-traded futures, guarantees against default. Macquarie Core Plus Bond Portfolio posted $70,000 cash collateral for futures contracts which is included in “Cash collateral due from brokers” on the “Statements of assets and liabilities.”
Macquarie Core Plus Bond Portfolio used futures contracts in order to hedge the Portfolio’s existing portfolio securities against fluctuations in value caused by changes in interest rates or market conditions.
Options Contracts — Each Portfolio may enter into options contracts in the normal course of pursuing its respective investment objective. Each Portfolio may buy or write options contracts for any number of reasons, including without limitation: to manage each Portfolio’s exposure to changes in securities prices caused by interest rates or market conditions and foreign currencies; as an efficient means of adjusting each Portfolio’s overall exposure to certain markets; to protect the value of portfolio securities; and as a cash management tool. Each Portfolio may buy or write call or put options on securities, financial indices, futures, swaps, and foreign currencies. When each Portfolio buys an option, a premium is paid and an asset is recorded and adjusted on a daily basis to reflect the current market value of the option purchased. When each Portfolio writes an option, a premium is received and a liability is recorded and adjusted on a daily basis to reflect the current market value of the option written. Premiums received from writing options that expire unexercised are treated by each Portfolio on the expiration date as realized gains. The difference between the premium received and the amount paid on effecting a closing purchase transaction, including brokerage commissions, is treated as realized gain or loss. If a call option is exercised, the premium is added to the proceeds from the sale of the underlying security in determining whether each Portfolio has a realized gain or loss. If a put option is exercised, the premium reduces the cost basis of the securities purchased by each Portfolio. Each Portfolio, as writer of an option, bears the market risk of an unfavorable change in the price of the security underlying the written option. When writing options, each Portfolio is subject to minimal counterparty risk because the counterparty is only obligated to pay premiums and does not bear the market risk of an unfavorable market change.
Macquarie Core Plus Bond Portfolio used option contracts in order to manage the Portfolio’s exposure to changes in securities prices caused by interest rates or market conditions and to manage the Portfolio’s exposure to changes in foreign currencies.
Swap Contracts — Macquarie Core Plus Bond Portfolio and Macquarie High Yield Bond Portfolio may enter into credit default swap (CDS) contracts in accordance with their investment objectives. Macquarie Core Plus Bond Portfolio may enter into interest rate swap contracts in accordance with its investment objective. The Portfolio may use interest rate swaps to adjust the Portfolio’s sensitivity to interest rates or to
Notes to financial statements
Macquarie Institutional Portfolios
8. Derivatives (continued)
hedge against changes in interest rates. The Portfolios may enter into CDS contracts in order to hedge against a credit event, to enhance total return, or to gain exposure to certain securities or markets. The Portfolios will not be permitted to enter into any swap transactions unless, at the time of entering into such transactions, the unsecured long-term debt of the actual counterparty, combined with any credit enhancements, is rated at least BBB- by Standard & Poor’s Financial Services LLC (S&P) or Baa3 by Moody’s Investors Service, Inc. (Moody’s) or is determined to be of equivalent quality by DMC.
Interest Rate Swaps. An interest rate swap contract is an exchange of interest rates between counterparties. In one instance, an interest rate swap involves payments received by the Portfolio from another party based on a variable or floating interest rate, in return for making payments based on a fixed interest rate. An interest rate swap can also work in reverse with the Portfolio receiving payments based on a fixed interest rate and making payments based on a variable or floating interest rate. Interest rate swaps may be used to adjust the Portfolio’s sensitivity to interest rates or to hedge against changes in interest rates. Periodic payments on such contracts are accrued daily and recorded as unrealized appreciation (depreciation) on swap contracts. Upon periodic payment (receipt) or termination of the contract, such amounts are recorded as realized gains or losses on swap contracts. The Portfolio’s maximum risk of loss from counterparty credit risk is the discounted net value of the cash flows to be received from/paid to the counterparty over the interest rate swap contract’s remaining life, to the extent that the amount is positive. This risk is mitigated by (1) for bilateral swap contracts, having netting arrangements between the Portfolio and the counterparty and by the posting of collateral by the counterparty to the Portfolio to cover the Portfolio’s exposure to the counterparty or (2) for cleared swaps, trading these instruments through a central counterparty.
Macquarie Core Plus Bond Portfolio used interest rate swap contracts in order to manage the Portfolio’s sensitivity to interest rates or to hedge against changes in interest rates.
Credit Default Swaps. A CDS contract is a risk-transfer instrument through which one party (purchaser of protection) transfers to another party (seller of protection) the financial risk of a credit event (as defined in the CDS agreement), as it relates to a particular reference security or basket of securities (such as an index). In exchange for the protection offered by the seller of protection, the purchaser of protection agrees to pay the seller of protection a periodic amount at a stated rate that is applied to the notional amount of the CDS contract. In addition, an upfront payment may be made or received by a Portfolio in connection with an unwinding or assignment of a CDS contract. Upon the occurrence of a credit event, the seller of protection would pay the par (or other agreed- upon) value of the reference security (or basket of securities) to the counterparty. Credit events generally include, among others, bankruptcy, failure to pay, and obligation default.
During the year ended Oct. 31, 2017, certain of the Portfolios entered into CDS contracts as purchasers and sellers of protection. Periodic payments (receipts) on such contracts are accrued daily and recorded as unrealized losses (gains) on swap contracts. Upon payment (receipt), such amounts are recorded as realized losses (gains) on swap contracts. Upfront payments made or received in connection with CDS contracts are amortized over the expected life of the CDS contracts as unrealized losses (gains) on swap contracts. The change in value of CDS contracts is recorded daily as unrealized appreciation or depreciation. A realized gain or loss is recorded upon a credit event (as defined in the CDS agreement) or the maturity or termination of the agreement. Initial margin and variation margin are posted to central counterparties for centrally cleared CDS basket trades as determined by the applicable central counterparty.
As disclosed in the footnotes to the “Schedules of investments,” at Oct. 31, 2017, the notional value of the protection sold was USD 615,000, which reflects the maximum potential amount Macquarie Core Plus Bond Portfolio would have been required to make as a seller of credit protection if a credit event had occurred. In addition to serving as the source of the current value of the securities, the quoted market prices and resulting market values for credit default swap agreements on securities and credit indices serve as an indicator of the current status of the payment/performance risk and represent the likelihood of an expected liability (or profit) for the credit derivative if the swap agreement had been closed/sold as of the period end. Increasing market values, in absolute terms when compared to the notional amount of the swap, represent a deterioration of the reference entity’s credit soundness and a greater likelihood of risk of default or other credit event occurring as defined under the terms of the agreement. At Oct. 31, 2017, there were no recourse provisions with third parties to recover any amounts paid under the credit derivative agreement (including any purchased credit protection) nor was any collateral held by the Portfolio or other third parties which the Portfolio can obtain upon occurrence of a credit event. At Oct. 31, 2017, net unrealized depreciation of the protection sold was $32,760.
CDS contracts may involve greater risks than if a Portfolio had invested in the reference obligation directly. CDS contracts are subject to general market risk, liquidity risk, counterparty risk, and credit risk. Each Portfolio’s maximum risk of loss from counterparty credit risk, either as the seller of protection or the buyer of protection, is the fair value of the contract. This risk is mitigated by (1) for bilateral swap contracts,
106
having netting arrangements between each Portfolio and the counterparty and by the posting of collateral by the counterparty to each Portfolio to cover the Portfolios’ exposure to the counterparty or (2) for cleared swaps, trading these instruments through a central counterparty.
Macquarie Core Plus Bond Portfolio used CDS contracts in order to hedge against credit events and to gain exposure to certain securities or markets.
Swaps Generally. The value of open swaps may differ from that which would be realized in the event a Portfolio terminated its position in the contract on a given day. Risks of entering into these contracts include the potential inability of the counterparty to meet the terms of the contracts. This type of risk is generally limited to the amount of favorable movement in the value of the underlying security, instrument, or basket of instruments, if any, at the day of default. Risks also arise from potential losses from adverse market movements and such losses could exceed the unrealized amounts shown on the “Schedules of investments.”
At Oct. 31, 2017, Macquarie Core Plus Bond Portfolio posted $110,000 cash collateral for credit default swap contracts, and $56,988 cash collateral for centrally cleared interest rate swap contracts, which are included in “Cash collateral due from brokers” on the “Statements of assets and liabilities.”
Fair values of derivative instruments as of Oct. 31, 2017 were as follows:
| | | | | | | | | | | | | | | | | | | | |
| | | | | Macquarie Core Plus Bond Portfolio |
| | | | | | | Asset Derivatives
Fair Value | | |
| Statements of Assets and Liabilities Location | | | | Currency
Contracts | | Interest rate
Contracts | | Total |
Unrealized appreciation on foreign currency exchange contracts | | | | | | | | $ | 354 | | | | $ | — | | | | $ | 354 | |
Variation margin due from brokers on futures contracts* | | | | | | | | | — | | | | | 12,327 | | | | | 12,327 | |
| | | | | | | | | | | | | | | | | | | | |
Total | | | | | | | | $ | 354 | | | | $ | 12,327 | | | | $ | 12,681 | |
| | | | | | | | | | | | | | | | | | | | |
| |
| | | Liability Derivatives
Fair Value |
| Statements of Assets and Liabilities Location | | Currency
Contracts | | Interest rate
Contracts | | Credit
Contracts | | Total |
Unrealized depreciation on foreign currency exchange contracts | | | $ | 48,271 | | | | $ | — | | | | $ | — | | | | $ | 48,271 | |
Variation margin due to brokers on futures contracts* | | | | — | | | | | 30,436 | | | | | — | | | | | 30,436 | |
Variation margin due to brokers on centrally cleared interest rate swap contracts | | | | — | | | | | 532 | | | | | — | | | | | 532 | |
Unrealized depreciation on credit default swap contracts | | | | — | | | | | — | | | | | 32,760 | | | | | 32,760 | |
Unrealized depreciation on interest rate swap contracts | | | | — | | | | | 10,649 | | | | | — | | | | | 10,649 | |
| | | | | | | | | | | | | | | | | | | | |
Total | | | $ | 48,271 | | | | $ | 41,617 | | | | $ | 32,760 | | | | $ | 122,648 | |
| | | | | | | | | | | | | | | | | | | | |
* Includes cumulative appreciation (depreciation) of futures contracts from the date the contracts are opened through Oct. 31, 2017. Only current day variation margin is reported on the “Statements of assets and liabilities.”
Notes to financial statements
Macquarie Institutional Portfolios
8. Derivatives (continued)
The effect of derivative instruments on the “Statements of operations” for the year ended Oct. 31, 2017 was as follows:
| | | | | | | | | | | | | | | | | | | | | | | | | | | | | | |
| | | Macquarie Core Plus Bond Portfolio
Net Realized Gain (Loss) on: |
| | | Options
Purchased | | Options
Written | | Foreign
Currency
Exchange
Contracts | | Futures
Contracts | | Swap
Contracts | | Total |
Forward currency exchange contracts | | | $ | (4,862 | ) | | | $ | — | | | | $ | (24,395 | ) | | | $ | — | | | | $ | — | | | | $ | (29,257 | ) |
Equity contracts | | | | — | | | | | — | | | | | — | | | | | (14,041 | ) | | | | — | | | | | (14,041 | ) |
Interest rate contracts | | | | (5,582 | ) | | | | 42,703 | | | | | — | | | | | (180,750 | ) | | | | 13,203 | | | | | (130,426 | ) |
Credit contracts | | | | — | | | | | — | | | | | — | | | | | — | | | | | (99,454 | ) | | | | (99,454 | ) |
| | | | | | | | | | | | | | | | | | | | | | | | | | | | | | |
Total | | | $ | (10,444 | ) | | | $ | 42,703 | | | | $ | (24,395 | ) | | | $ | (194,791 | ) | | | $ | (86,251 | ) | | | $ | (273,178 | ) |
| | | | | | | | | | | | | | | | | | | | | | | | | | | | | | |
| | | | | | | | | | | | | | | | | | | | | | | | | |
| | | Macquarie Core Plus Bond Portfolio
Net Change in Unrealized Appreciation (Depreciation) of: |
| | | Foreign
Currency
Exchange
Contracts | | Futures
Contracts | | Options
Purchased | | Swaps
Contracts | | Total |
Forward currency exchange contracts | | | $ | (44,036 | ) | | | $ | — | | | | $ | (1,607 | ) | | | $ | — | | | | $ | (45,643 | ) |
Equity contracts | | | | — | | | | | (2,529 | ) | | | | — | | | | | — | | | | | (2,529 | ) |
Interest rate contracts | | | | — | | | | | (38,544 | ) | | | | (1,933 | ) | | | | (11,181 | ) | | | | (51,658 | ) |
Credit contracts | | | | — | | | | | — | | | | | — | | | | | (36,050 | ) | | | | (36,050 | ) |
| | | | | | | | | | | | | | | | | | | | | | | | | |
Total | | | $ | (44,036 | ) | | | $ | (41,073 | ) | | | $ | (3,540 | ) | | | $ | (47,231 | ) | | | $ | (135,880 | ) |
| | | | | | | | | | | | | | | | | | | | | | | | | |
At Oct. 31, 2017, Macquarie Emerging Markets Portfolio, Macquarie Emerging Markets Portfolio II, and Macquarie Labor Select International Equity Portfolio had foreign currency risk, which is disclosed on the “Statements of assets and liabilities” and/or “Statements of operations.”
Derivatives Generally. The tables below summarize the average balance of derivative holdings by each Portfolio during the year ended Oct. 31, 2017.
| | | | | | | | | | |
| | | Macquarie Core Plus Bond Portfolio |
| | | Long Derivative Volume | | Short Derivative Volume |
Foreign currency exchange contracts (average cost) | | | USD | 1,052,500 | | | | USD | 228,249 | |
Futures contracts (average notional value) | | | | 6,131,301 | | | | | 6,414,662 | |
Options contracts (average notional value) | | | | 4,609 | | | | | 9,185 | |
CDS contracts (average notional value)* | | | | 676,257 | | | | | 275,595 | |
Interest rate contracts (average notional value)** | | | | — | | | | | 676,250 | |
| |
| | | Macquarie Emerging Markets Portfolio |
| | | Long Derivative Volume | | Short Derivative Volume |
Foreign currency exchange contracts (average cost) | | | USD | 79,402 | | | | USD | 60,083 | |
| |
| | | Macquarie Emerging Markets Portfolio II |
| | | Long Derivative Volume | | Short Derivative Volume |
Foreign currency exchange contracts (average cost) | | | USD | 20,013 | | | | USD | 5,171 | |
| |
| | | Macquarie Labor Select International Equity Portfolio |
| | | Long Derivative Volume | | Short Derivative Volume |
Foreign currency exchange contracts (average cost) | | | USD | 150,008 | | | | USD | 63,102 | |
*Long represents buying protection and short represents selling protection.
**Long represents receiving fixed interest payments and short represents paying fixed interest payments.
108
9. Offsetting
Each Portfolio entered into an International Swaps and Derivatives Association, Inc. Master Agreement (ISDA Master Agreement) or a similar agreement with certain of their derivative contract counterparties in order to better define its contractual rights and to secure rights that will help each Portfolio mitigate its counterparty risk, An ISDA Master Agreement is a bilateral agreement between each Portfolio and a counterparty that governs certain over-the-counter (OTC) derivatives and foreign exchange contracts and typically contains, among other things, collateral posting items and netting provisions in the event of a default and/or termination event. Under an ISDA Master Agreement, each Portfolio may, under certain circumstances, offset with the counterparty certain derivative financial instruments’ payables and/or receivables with collateral held and/or posted and create one single net payment. The provisions of the ISDA Master Agreement typically permit a single net payment in the event of default (close-out), including the bankruptcy or insolvency of the counterparty. However, bankruptcy or insolvency laws of a particular jurisdiction may impose restrictions on or prohibitions against the right of offset in bankruptcy, insolvency, or other events.
For financial reporting purposes, the Portfolios do not offset derivative assets and derivative liabilities that are subject to netting arrangements on the “Statements of assets and liabilities.”
At Oct. 31, 2017, the Portfolios had the following assets and liabilities subject to offsetting provisions:
Offsetting of Financial Assets and Liabilities and Derivative Assets and Liabilities
| | | | | | | | | | | | | | | | | | | | | | | | | |
| | | Macquarie Large Cap Value Portfolio | | | | | | |
Master Repurchase
Agreements Counterparty | | Repurchase
Agreements | | Fair Value of
Non-Cash
Collateral Received(a) | | Cash
Collateral
Received | | Net
Collateral
Received | | Net Exposure(b) |
Bank of America Merrill Lynch | | | $ | 1,293,556 | | | | $ | (1,293,556 | ) | | | $ | — | | | | $ | (1,293,556 | ) | | | $ | — | |
BNP Paribas | | | | 3,653,919 | | | | | (3,653,919 | ) | | | | — | | | | | (3,653,919 | ) | | | | — | |
| | | | | | | | | | | | | | | | | | | | | | | | | |
Total | | | $ | 4,947,475 | | | | $ | (4,947,475 | ) | | | $ | — | | | | | (4,947,475 | ) | | | $ | — | |
| | | | | | | | | | | | | | | | | | | | | | | | | |
| | | | | | | | | | | | | | | | | | | | | | | | | |
| | | Macquarie Core Plus Bond Portfolio | | | | |
Counterparty | | Gross Value of
Derivative Asset | | | | Gross Value of
Derivative Liability | | | | Net Position |
Bank of America Merrill Lynch | | | $ | — | | | | | | | | | $ | (31,481 | ) | | | | | | | | $ | (31,481 | ) |
BNP Paribas | | | | 663 | | | | | | | | | | (8,901 | ) | | | | | | | | | (8,238 | ) |
Citibank | | | | 354 | | | | | | | | | | (1,022 | ) | | | | | | | | | (668 | ) |
Morgan Stanley Capital | | | | — | | | | | | | | | | (32,760 | ) | | | | | | | | | (32,760 | ) |
Toronto Dominion Bank | | | | — | | | | | | | | | | (9,137 | ) | | | | | | | | | (9,137 | ) |
| | | | | | | | | | | | | | | | | | | | | | | | | |
Total | | | $ | 1,017 | | | | | | | | | $ | (83,301 | ) | | | | | | | | $ | (82,284 | ) |
| | | | | | | | | | | | | | | | | | | | | | | | | |
| | | | | | | | | | | | | | | | | | | | | | | | | | | | | | |
Counterparty | | Net Position | | Fair Value of
Non-Cash
Collateral Received | | Cash
Collateral
Received | | Fair Value of
Non-Cash
Collateral
Pledged | | Cash
Collateral
Pledged | | Net Exposure(b) |
Bank of America Merrill Lynch | | | $ | (31,481 | ) | | | $ | — | | | | $ | — | | | | $ | — | | | | $ | — | | | | $ | (31,481 | ) |
BNP Paribas | | | | (8,238 | ) | | | | — | | | | | — | | | | | — | | | | | — | | | | | (8,238 | ) |
Citibank | | | | (668 | ) | | | | — | | | | | — | | | | | — | | | | | — | | | | | (668 | ) |
Morgan Stanley Capital | | | | (32,760 | ) | | | | — | | | | | — | | | | | — | | | | | 32,760 | | | | | — | |
Toronto Dominion Bank | | | | (9,137 | ) | | | | — | | | | | — | | | | | — | | | | | — | | | | | (9,137 | ) |
| | | | | | | | | | | | | | | | | | | | | | | | | | | | | | |
Total | | | $ | (82,284 | ) | | | $ | — | | | | $ | — | | | | $ | — | | | | $ | 32,760 | | | | $ | (49,524 | ) |
| | | | | | | | | | | | | | | | | | | | | | | | | | | | | | |
Notes to financial statements
Macquarie Institutional Portfolios
9. Offsetting (continued)
| | | | | | | | | | | | | | | | | | | | | | | | | |
| | | Macquarie Core Plus Bond Portfolio |
Master Repurchase
Agreements Counterparty | | Repurchase
Agreements | | Fair Value of
Non-Cash
Collateral Received(a) | | Cash
Collateral
Received | | Net
Collateral
Received | | Net Exposure(b) |
Bank of America Merrill Lynch | | | $ | 2,566,901 | | | | $ | (2,566,901 | ) | | | $ | — | | | | $ | (2,566,901 | ) | | | $ | — | |
BNP Paribas | | | | 7,250,752 | | | | | (7,250,752 | ) | | | | — | | | | | (7,250,752 | ) | | | | — | |
| | | | | | | | | | | | | | | | | | | | | | | | | |
Total | | | $ | 9,817,653 | | | | $ | (9,817,653 | ) | | | $ | — | | | | $ | (9,817,653 | ) | | | $ | — | |
| | | | | | | | | | | | | | | | | | | | | | | | | |
| |
| | | Macquarie High Yield Bond Portfolio |
Master Repurchase
Agreements Counterparty | | Repurchase
Agreements | | Fair Value of
Non-Cash
Collateral Received(a) | | Cash
Collateral
Received | | Net
Collateral
Received | | Net Exposure(b) |
Bank of America Merrill Lynch | | | $ | 1,022,262 | | | | $ | (1,022,262 | ) | | | $ | — | | | | $ | (1,022,262 | ) | | | $ | — | |
BNP Paribas | | | | 2,887,594 | | | | | (2,887,594 | ) | | | | — | | | | | (2,887,594 | ) | | | | — | |
| | | | | | | | | | | | | | | | | | | | | | | | | |
Total | | | $ | 3,909,856 | | | | $ | (3,909,856 | ) | | | $ | — | | | | $ | (3,909,856 | ) | | | $ | — | |
| | | | | | | | | | | | | | | | | | | | | | | | | |
| | | | | | | | | | | | | | | |
| | | Macquarie Emerging Markets Portfolio |
Counterparty | | Gross Value of
Derivative Asset | | Gross Value of
Derivative Liability | | Net Position |
BNY Mellon | | | $ | 2 | | | | $ | — | | | | $ | 2 | |
JPMorgan Chase | | | | 1,380 | | | | | — | | | | | 1,380 | |
| | | | | | | | | | | | | | | |
Total | | | $ | 1,382 | | | | $ | — | | | | $ | 1,382 | |
| | | | | | | | | | | | | | | |
| | | | | | | | | | | | | | | | | | | | | | | | | | | | | | |
Counterparty | | Net Position | | Fair Value of
Non-Cash
Collateral Received | | Cash
Collateral
Received | | Fair Value of
Non-Cash
Collateral Pledged | | Cash
Collateral
Pledged | | Net Exposure(b) |
BNY Mellon | | | $ | 2 | | | | $ | — | | | | $ | — | | | | $ | — | | | | $ | — | | | | $ | 2 | |
JPMorgan Chase | | | | 1,380 | | | | | — | | | | | — | | | | | — | | | | | — | | | | | 1,380 | |
| | | | | | | | | | | | | | | | | | | | | | | | | | | | | | |
Total | | | $ | 1,382 | | | | $ | — | | | | $ | — | | | | $ | — | | | | $ | — | | | | $ | 1,382 | |
| | | | | | | | | | | | | | | | | | | | | | | | | | | | | | |
| | | | | | | | | | | | | | | | | | | | | | | | | |
| | | Macquarie Emerging Markets Portfolio |
Master Repurchase
Agreements Counterparty | | Repurchase
Agreements | | Fair Value of
Non-Cash
Collateral Received(a) | | Cash
Collateral
Received | | Net
Collateral
Received | | Net Exposure(b) |
Bank of America Merrill Lynch | | | $ | 194,676 | | | | $ | (194,676 | ) | | | $ | — | | | | $ | (194,676 | ) | | | $ | — | |
BNP Paribas | | | | 549,903 | | | | | (549,903 | ) | | | | — | | | | | (549,903 | ) | | | | — | |
| | | | | | | | | | | | | | | | | | | | | | | | | |
Total | | | $ | 744,579 | | | | $ | (744,579 | ) | | | $ | — | | | | $ | (744,579 | ) | | | $ | — | |
| | | | | | | | | | | | | | | | | | | | | | | | | |
110
| | | | | | | | | | | | | | | |
| | | Macquarie Labor Select International Equity Portfolio |
Counterparty | | Gross Value of
Derivative Asset | | Gross Value of
Derivative Liability | | Net Position |
BNY Mellon | | | $ | — | | | | $ | (2,128 | ) | | | $ | (2,128 | ) |
Deutsche Bank | | | | — | | | | | (1,696 | ) | | | | (1,696 | ) |
| | | | | | | | | | | | | | | |
Total | | | $ | — | | | | $ | (3,824 | ) | | | $ | (3,824 | ) |
| | | | | | | | | | | | | | | |
| | | | | | | | | | | | | | | | | | | | | | | | | | | | | | |
Counterparty | | Net Position | | Fair Value of
Non-Cash
Collateral Received | | Cash
Collateral
Received | | Fair Value of
Non-Cash
Collateral Pledged | | Cash
Collateral
Pledged | | Net Exposure(b) |
BNY Mellon | | | $ | (2,128 | ) | | | $ | — | | | | $ | — | | | | $ | — | | | | $ | — | | | | $ | (2,128 | ) |
Deutsche Bank | | | | (1,696 | ) | | | | — | | | | | — | | | | | — | | | | | — | | | | | (1,696 | ) |
| | | | | | | | | | | | | | | | | | | | | | | | | | | | | | |
Total | | | $ | (3,824 | ) | | | $ | — | | | | $ | — | | | | $ | — | | | | $ | — | | | | $ | (3,824 | ) |
| | | | | | | | | | | | | | | | | | | | | | | | | | | | | | |
| | | | | | | | | | | | | | | | | | | | | | | | | |
| | | Macquarie Labor Select International Equity Portfolio |
Master Repurchase
Agreements Counterparty | | Repurchase
Agreements | | Fair Value of
Non-Cash
Collateral Received(a) | | Cash
Collateral
Received | | Net
Collateral
Received | | Net Exposure(b) |
Bank of America Merrill Lynch | | | $ | 53,627 | | | | $ | (53,627 | ) | | | $ | — | | | | $ | (53,627 | ) | | | $ | — | |
BNP Paribas | | | | 151,481 | | | | | (151,481 | ) | | | | — | | | | | (151,481 | ) | | | | — | |
| | | | | | | | | | | | | | | | | | | | | | | | | |
Total | | | $ | 205,108 | | | | $ | (205,108 | ) | | | $ | — | | | | $ | (205,108 | ) | | | $ | — | |
| | | | | | | | | | | | | | | | | | | | | | | | | |
(a)The value of the related collateral received exceeded the value of the net position and repurchase agreements as of Oct. 31, 2017.
(b)Net exposure represents the receivable (payable) that would be due from (to) the counterparty in the event of default.
10. Securities Lending
Each Portfolio, along with other funds in the Delaware Funds, may lend its securities pursuant to a security lending agreement (Lending Agreement) with The Bank of New York Mellon (BNY Mellon). At the time a security is loaned, the borrower must post collateral equal to the required percentage of the market value of the loaned security, including any accrued interest. The required percentage is: (1) 102% with respect to US securities and foreign securities that are denominated and payable in US dollars; and (2) 105% with respect to foreign securities. With respect to each loan, if on any business day the aggregate market value of securities collateral plus cash collateral held is less than the aggregate market value of the securities which are the subject of such loan, the borrower will be notified to provide additional collateral by the end of the following business day which, together with the collateral already held, will be not less than the applicable initial collateral requirements for such security loan. If the aggregate market value of securities collateral and cash collateral held with respect to a security loan exceeds the applicable initial collateral requirement, upon the request of the borrower, BNY Mellon must return enough collateral to the borrower by the end of the following business day to reduce the value of the remaining collateral to the applicable initial collateral requirement for such security loan. As a result of the foregoing, the value of the collateral held with respect to a loaned security on any particular day may be more or less than the value of the security on loan.
Cash collateral received by each Portfolio of the Trust is generally invested in a series of individual separate accounts, each corresponding to a Portfolio. The investment guidelines permit each separate account to hold certain securities that would be considered eligible securities for a money market fund. Cash collateral received is generally invested in government securities; certain obligations issued by government sponsored enterprises; repurchase agreements collateralized by US Treasury securities; obligations issued by the central government of any Organization for Economic Cooperation and Development (OECD) country or its agencies, instrumentalities or establishments; obligations of supranational organizations, commercial paper, notes, bonds, and other debt obligations; certificates of deposit, time deposits and other bank obligations; and asset-backed securities. A Portfolio can also accept US government securities and letters of credit (non-cash collateral) in connection with securities loans.
In the event of default or bankruptcy by the lending agent, realization and/or retention of the collateral may be subject to legal proceedings. In the event the borrower fails to return loaned securities and the collateral received is insufficient to cover the value of the loaned securities and provided such collateral shortfall is not the result of investment losses, the lending agent has agreed to pay the amount of the shortfall
Notes to financial statements
Macquarie Institutional Portfolios
10. Securities Lending (continued)
to each Portfolio or, at the discretion of the lending agent, replace the loaned securities. Each Portfolio continues to record dividends or interest, as applicable, on the securities loaned and are subject to changes in value of the securities loaned that may occur during the term of the loan. Each Portfolio has the right under the Lending Agreement to recover the securities from the borrower on demand. With respect to security loans collateralized by non-cash collateral, each Portfolio receives loan premiums paid by the borrower. With respect to security loans collateralized by cash collateral, the earnings from the collateral investments are shared among each Portfolio, the security lending agent, and the borrower. Each Portfolio records security lending income net of allocations to the security lending agent and the borrower.
Each Portfolio may incur investment losses as a result of investing securities lending collateral. This could occur if an investment in the collateral investment account defaulted or became impaired. Under those circumstances, the value of the Portfolio’s cash collateral account may be less than the amount the Portfolio would be required to return to the borrowers of the securities and the Portfolio would be required to make up for this shortfall.
During the year ended Oct. 31, 2017, none of the Portfolios had securities out on loan.
11. Credit and Market Risk
Some countries in which Macquarie Emerging Markets, Macquarie Emerging Markets II, and Macquarie Labor Select International Equity Portfolios invest require governmental approval for the repatriation of investment income, capital, or the proceeds of sales of securities by foreign investors. In addition, if there is deterioration in a country’s balance of payments or for other reasons, a country may impose temporary restrictions on foreign capital remittances abroad.
The securities exchanges of certain foreign markets are substantially smaller, less liquid and more volatile than the major securities markets in the United States. Consequently, acquisition and disposition of securities by each Portfolio may be inhibited. In addition, a significant portion of the aggregate market value of securities listed on the major securities exchanges in emerging markets is held by a smaller number of investors. This may limit the number of shares available for acquisition or disposition by each Portfolio.
Macquarie Core Plus Bond Portfolio invests a portion of its assets in high yield fixed income securities which are securities rated BB or lower by S&P and Ba or lower by Moody’s, or similarly rated by another nationally recognized statistical rating organization. Macquarie High Yield Bond Portfolio invests a portion of its assets in high yield fixed income securities which are securities rated lower than BBB- by S&P and lower than Baa3 by Moody’s, or similarly rated by another nationally recognized statistical rating organization. Investments in these higher yielding securities are generally accompanied by a greater degree of credit risk than higher rated securities. Additionally, lower rated securities may be more susceptible to adverse economic and competitive industry conditions than investment grade securities.
Macquarie Core Plus Bond Portfolio and Macquarie High Yield Bond Portfolio invest in bank loans and other securities that may subject them to direct indebtedness risk, the risk that each Portfolio will not receive payment of principal, interest and other amounts due in connection with these investments and will depend primarily on the financial condition of the borrower. Loans that are fully secured offer each Portfolio more protection than unsecured loans in the event of nonpayment of scheduled interest or principal, although there is no assurance that the liquidation of collateral from a secured loan would satisfy the corporate borrower’s obligation, or that the collateral can be liquidated. Some loans or claims may be in default at the time of purchase. Certain of the loans and the other direct indebtedness acquired by each Portfolio may involve revolving credit facilities or other standby financing commitments that obligate each Portfolio to pay additional cash on a certain date or on demand. These commitments may require each Portfolio to increase its investment in a company at a time when each Portfolio might not otherwise decide to do so (including at a time when the company’s financial condition makes it unlikely that such amounts will be repaid). To the extent that each Portfolio is committed to advance additional funds, it will at all times hold and maintain cash or other high grade debt obligations in an amount sufficient to meet such commitments. When a loan agreement is purchased the Fund may pay an assignment fee. On an ongoing basis, the Fund may receive a commitment fee based on the undrawn portion of the underlying line of credit portion of a loan agreement. Prepayment penalty fees are received upon the prepayment of a loan agreement by a borrower. Prepayment penalty, facility, commitment, consent and amendment fees are recorded to income as earned or paid.
As each Portfolio may be required to rely upon another lending institution to collect and pass on to each Portfolio amounts payable with respect to the loan and to enforce each Portfolio’s rights under the loan and other direct indebtedness, an insolvency, bankruptcy, or reorganization of the lending institution may delay or prevent each Portfolio from receiving such amounts. The highly leveraged nature of many loans may make
112
them especially vulnerable to adverse changes in economic or market conditions. Investments in such loans and other direct indebtedness may involve additional risk to each Portfolio.
Macquarie Core Plus Bond Portfolio invests in fixed income securities whose value is derived from an underlying pool of mortgages or consumer loans. The value of these securities is sensitive to changes in economic conditions, including delinquencies and/or defaults, and may be adversely affected by shifts in the market’s perception of the issuers and changes in interest rates. Investors receive principal and interest payments as the underlying mortgages and consumer loans are paid back. Some of these securities are collateralized mortgage obligations (CMOs). CMOs are debt securities issued by US government agencies or by financial institutions and other mortgage lenders, which are collateralized by a pool of mortgages held under an indenture. Prepayment of mortgages may shorten the stated maturity of the obligations and can result in a loss of premium, if any has been paid. Certain of these securities may be stripped (securities which provide only the principal or interest feature of the underlying security). The yield to maturity on an interest-only CMO is extremely sensitive not only to changes in prevailing interest rates, but also to the rate of principal payments (including prepayments) on the related underlying mortgage assets. A rapid rate of principal payments may have a material adverse effect on the Portfolio’s yield to maturity. If the underlying mortgage assets experience greater than anticipated prepayments of principal, the Portfolio may fail to fully recoup its initial investment in these securities even if the securities are rated in the highest rating categories.
Macquarie Core Plus Bond Portfolio and Macquarie High Yield Bond Portfolio invest in certain obligations that may have liquidity protection designed to ensure that the receipt of payments due on the underlying security is timely. Such protection may be provided through guarantees, insurance policies or letters of credit obtained by the issuer or sponsor through third parties, through various means of structuring the transaction or through a combination of such approaches. Each Portfolio will not pay any additional fees for such credit support, although the existence of credit support may increase the price of a security.
Because Macquarie Large Cap Value Portfolio expects to hold a concentrated portfolio of a limited number of securities, the Portfolio’s risk is increased because each investment has a greater effect on the Portfolio’s overall performance.
Each Portfolio may invest up to 15% of its net assets in illiquid securities, which may include securities with contractual restrictions on resale, securities exempt from registration under Rule 144A promulgated under the Securities Act of 1933, as amended, and other securities, which may not be readily marketable. The relative illiquidity of these securities may impair each Portfolio from disposing of them in a timely manner and at a fair price when it is necessary or desirable to do so. While maintaining oversight, the Portfolios’ Board has delegated to DMC the day-to-day functions of determining whether individual securities are liquid for purposes of each Portfolio’s limitation on investments in illiquid securities. Securities eligible for resale pursuant to Rule 144A, which are determined to be liquid, are not subject to the Portfolios’ limit on investments in illiquid securities. As of Oct. 31, 2017, Rule 144A securities have been identified on the “Schedules of investments.”
12. Contractual Obligations
Each Portfolio enters into contracts in the normal course of business that contain a variety of indemnifications. Each Portfolio’s maximum exposure under these arrangements is unknown. However, the Portfolios have not had prior claims or losses pursuant to these contracts. Management has reviewed each Portfolio’s existing contracts and expects the risk of loss to be remote.
13. Recent Accounting Pronouncements
In October 2016, the Securities and Exchange Commission released its Final Rule on Investment Company Reporting Modernization (Rule). The Rule contains amendments to Regulation S-X which impact financial statement presentation, particularly the presentation of derivative investments. The financial statements presented are in compliance with the most recent Regulation S-X amendments.
14. General Motors Term Loan Litigation
Macquarie Core Plus Bond Portfolio and Macquarie High Yield Bond Portfolio received notice of a litigation proceeding related to a General Motors Corporation (G.M.) term loan participation previously held by the Portfolios in 2009. We believe the matter subject to the litigation notice will likely lead to a recovery from the Portfolios of certain amounts received by the Portfolios because a US Court of Appeals has ruled that the Portfolios and similarly situated investors were unsecured creditors rather than secured lenders of G.M. as a result of an erroneous UCC filing made by a third party. The Portfolios received the full principal on the loans in 2009 after the G.M. bankruptcy. However, based upon the court ruling the estate is seeking to recover such amounts arguing that, as unsecured creditors, the Portfolios should not have received payment in full. Based upon currently available information related to the litigation and the Portfolios’ potential exposure, the Portfolios
Notes to financial statements
Macquarie Institutional Portfolios
14. General Motors Term Loan Litigation (continued)
recorded assets of $75,182 and $48,975, respectively, and liabilities of $250,607 and $163,250, respectively, that resulted in a decrease in the Portfolios’ NAV to reflect this likely recovery.
15. Subsequent Events
On Nov. 6, 2017, each Portfolio, along with the other Participants, entered into an amendment to the agreement for a $155,000,000 revolving line of credit. The line of credit is to be used as described in Note 7 and operates in substantially the same manner as the original agreement, with the exception of the annual commitment fee. Under the amendment to the agreement, the Participants are charged an annual commitment fee of 0.15%, which is generally allocated across the Participants based on a weighted average of the respective net assets of each participant. The line of credit available under the agreement expires on Nov. 5, 2018.
Effective Nov. 1, 2017. Macquarie Emerging Markets Portfolio’s reimbursement fees of 0.55% will be reduced to 0.40% for purchases and 0.45% for redemptions.
Management has determined that no other material events or transactions occurred subsequent to Oct. 31, 2017 that would require recognition or disclosure in each Portfolio’s financial statements.
114
Report of independent
registered public accounting firm
To the Board of Trustees of Delaware Pooled® Trust and the Shareholders of the Funds, as defined
In our opinion, the accompanying statements of assets and liabilities, including the schedules of investments, and the related statements of operations and of changes in net assets and the financial highlights present fairly, in all material respects, the financial position of Macquarie Large Cap Value Portfolio, Macquarie Core Plus Bond Portfolio, Macquarie High Yield Bond Portfolio, Macquarie Emerging Markets Portfolio, Macquarie Emerging Markets Portfolio II, and Macquarie Labor Select International Equity Portfolio (six of the series constituting Delaware Pooled Trust, hereafter collectively referred to as the “Funds”) as of October 31, 2017, the results of each of their operations for the year then ended, the changes in each of their net assets for each of the two years in the period then ended and the financial highlights for each of the five years in the period then ended, in conformity with accounting principles generally accepted in the United States of America. These financial statements and financial highlights (hereafter referred to as “financial statements”) are the responsibility of the Funds’ management. Our responsibility is to express an opinion on these financial statements based on our audits. We conducted our audits of these financial statements in accordance with the standards of the Public Company Accounting Oversight Board (United States). Those standards require that we plan and perform the audit to obtain reasonable assurance about whether the financial statements are free of material misstatement. An audit includes examining, on a test basis, evidence supporting the amounts and disclosures in the financial statements, assessing the accounting principles used and significant estimates made by management, and evaluating the overall financial statement presentation. We believe that our audits, which included confirmation of securities as of October 31, 2017 by correspondence with the custodian and brokers, provide a reasonable basis for our opinion.
PricewaterhouseCoopers LLP
Philadelphia, Pennsylvania
December 19, 2017
115
Other Portfolio information
(Unaudited)
Macquarie Institutional Portfolios
Tax Information
The information set forth below is for each Portfolio’s fiscal year as required by federal laws. Shareholders, however, must report distributions on a calendar year basis for income tax purposes, which may include distributions for portions of two fiscal years of a fund. Accordingly, the information needed by shareholders for income tax purposes will be sent to them in January of each year. Please consult your tax advisor for proper treatment of this information.
All disclosures are based on financial information available as of the date of this annual report and, accordingly are subject to change. For any and all items requiring reporting, it is the intention of each Portfolio to report the maximum amount permitted under the Internal Revenue Code and the regulations thereunder.
For the fiscal year ended Oct. 31, 2017, each Portfolio reports distributions paid during the year as follows:
| | | | | | | | | | | | | | | | |
| | | (A)
Long-Term
Capital Gains
Distributions
(Tax Basis) | | | (B)
Ordinary Income
Distributions*
(Tax Basis) | | | Total
Distribution
(Tax Basis) | | | (C)
Qualifying
Dividends1 | |
Macquarie Large Cap Value Portfolio | | | 50.78 | % | | | 49.22 | % | | | 100.00 | % | | | 98.83 | % |
Macquarie Core Plus Bond Portfolio | | | — | | | | 100.00 | % | | | 100.00 | % | | | 0.09 | % |
Macquarie High Yield Bond Portfolio | | | — | | | | 100.00 | % | | | 100.00 | % | | | — | |
Macquarie Emerging Markets Portfolio | | | — | | | | 100.00 | % | | | 100.00 | % | | | 1.92 | % |
Macquarie Emerging Markets Portfolio II | | | — | | | | 100.00 | % | | | 100.00 | % | | | 0.92 | % |
Macquarie Labor Select International Equity Portfolio | | | — | | | | 100.00 | % | | | 100.00 | % | | | — | |
(A) and (B) are based on a percentage of each Portfolio’s total distributions.
(C) is based on a percentage of each Portfolio’s ordinary income distributions.
1Qualifying dividends represent dividends which qualify for the corporate dividends received deduction.
*For the fiscal year ended Oct. 31, 2017, certain dividends paid by the Portfolios may be subject to a maximum tax rate of 20%. The Portfolios intend to report the following percentages to be taxed at a maximum rate of 20%. Complete information will be computed and reported in conjunction with your 2017 Form 1099-DIV, as applicable.
| | |
| | | Maximum amount to be
Taxed at a maximum rate of 20% |
Macquarie Large Cap Value Portfolio | | 98.77% |
Macquarie Core Plus Bond Portfolio | | — |
Macquarie High Yield Bond Portfolio | | — |
Macquarie Emerging Markets Portfolio | | 56.49% |
Macquarie Emerging Markets Portfolio II | | 89.25% |
Macquarie Labor Select International Equity Portfolio | | 100.00% |
Macquarie Emerging Markets Portfolio, Macquarie Emerging Markets Portfolio II and Macquarie Labor Select International Equity Portfolio intend to pass through foreign tax credits in the maximum amount of $370,849, $69,082, and $1,097,540, respectively. The gross foreign source income earned during the fiscal year 2017 was $5,219,576, $1,123,713, and $18,817,083, respectively. Complete information will be computed and reported in conjunction with your 2017 Form 1099-DIV.
For the fiscal year ended Oct. 31, 2017, certain interest income paid by the Portfolios, determined to be Qualified Interest Income and Short-Term Capital Gains, may be subject to relief from US withholding for foreign shareholders, as provided by the American Jobs Creation Act of 2004, and by the Tax Relief Unemployment Insurance Reauthorization and Job Creations Act of 2010, and as extended by the American Taxpayer Relief Act of 2012. For the fiscal year ended Oct. 31, 2017, the following Portfolio has reported maximum distributions of Qualified Interest Income and Short-Term Capital Gain as follows:
| | | | |
| | | Qualified Interest Income | | Short-Term Capital Gain |
Macquarie Large Cap Value Portfolio | | $16,351 | | $716,481 |
116
Board consideration of Macquarie Investment Portfolios investment advisory and sub-advisory agreements
At a meeting held on Aug. 16-17, 2017 (the “Annual Meeting”), the Board of Trustees (the “Board”), including a majority of disinterested or independent Trustees, approved the renewal of the Investment Advisory Agreements for each of the series of Macquarie Investment Portfolios (each, a “Portfolio” and together, the “Portfolios”). In making its decision, the Board considered information furnished at regular quarterly Board meetings, including reports detailing Fund performance, investment strategies, and expenses, as well as information prepared specifically in connection with the renewal of the investment advisory and sub-advisory contracts. Information furnished specifically in connection with the renewal of the Investment Advisory Agreement with Delaware Management Company (“DMC”), a series of Macquarie Investment Management Business Trust (formerly, Delaware Management Business Trust), and Sub-Advisory Agreement with Mondrian Investment Partners Limited (“Mondrian”) included materials provided by DMC and its affiliates and Mondrian, as applicable, concerning, among other things, the nature, extent, and quality of services provided to the Portfolios; the costs of such services to the Portfolios; economies of scale; and the investment manager’s financial condition and profitability. In addition, in connection with the Annual Meeting, reports were provided to the Trustees in May 2017 and included reports provided by Broadridge Financial Solutions (formerly Lipper) (“Broadridge” or “Lipper”). The Broadridge reports compared each Portfolio’s investment performance and expenses with those of other comparable mutual funds. The Independent Trustees reviewed and discussed the Broadridge reports with independent legal counsel to the Independent Trustees. In addition to the information noted above, the Board also requested and received information regarding DMC’s or JSP’s, as applicable, policy with respect to advisory fee levels and its breakpoint philosophy; the structure of portfolio manager compensation; comparative client fee information; and any constraints or limitations on the availability of securities for certain investment styles, which had in the past year inhibited, or which were likely in the future to inhibit, the investment manager’s ability to invest fully in accordance with Portfolio policies.
In considering information relating to the approval of each Portfolio’s advisory and sub-advisory agreements, as applicable, the Independent Trustees received assistance and advice from and met separately with independent legal counsel to the Independent Trustees and also from an experienced and knowledgeable fund consultant, JDL Consultants, LLC (“JDL”). Although the Board gave attention to all information furnished, the following discussion identifies, under separate headings, the primary factors taken into account by the Board during its contract renewal considerations.
Nature, extent, and quality of service. The Board considered the services provided by DMC to the Portfolios and their shareholders. In reviewing the nature, extent, and quality of services, the Board considered reports furnished to it throughout the year, which covered matters such as the relative performance of the Portfolio; compliance of portfolio managers with the investment policies, strategies, and restrictions for the Portfolios; compliance by DMC and Delaware Distributors, L.P. (together, “Management”) personnel with the Code of Ethics adopted throughout the Delaware FundsSM by Macquarie (“Delaware Funds”); and adherence to fair value pricing procedures as established by the Board. The Board was pleased with the current staffing of the Portfolios’ investment advisor and the emphasis placed on research in the investment process. The Board recognized DMC’s receipt of several industry distinctions during the past several years. The Board gave favorable consideration to DMC’s efforts to control expenditures while maintaining service levels committed to Portfolio matters. The Board also noted the benefits provided to Portfolio shareholders through each shareholder’s ability to exchange investments between Portfolios or the Institutional Class shares of other Delaware Funds and to reinvest Portfolio dividends into additional shares of the Portfolio or into additional shares of other Delaware Funds. The Board was satisfied with the nature, extent, and quality of the overall services provided by DMC.
Nature, extent, and quality of service. The Board considered the services provided by Mondrian to Macquarie Emerging Markets Portfolio and Macquarie Labor Select International Equity Portfolio and their shareholders, as applicable. In reviewing the nature, extent, and quality of services, the Board considered reports furnished to it throughout the year at regular Board Meetings covering matters such as relative performance of the Portfolios; compliance of portfolio managers with the investment policies, strategies, and restrictions for the Portfolios; the compliance of Mondrian personnel with its Code of Ethics; and adherence to fair value pricing procedures as established by the Board. The Board was pleased with the current staffing of Mondrian and the emphasis placed on research in the investment process. The Board was satisfied with the nature, extent, and quality of the overall services provided by Mondrian.
Investment performance. The Board placed significant emphasis on the investment performance of the Portfolios in view of the importance of investment performance to shareholders. Although the Board considered performance reports and discussions with portfolio managers at Board meetings throughout the year, the Board gave particular weight to the Broadridge reports furnished for the Annual Meeting. The Broadridge reports prepared for each Portfolio showed the investment performance of its shares in comparison to a group of similar funds as selected by Broadridge (the “Performance Universe”). A fund with the best performance ranked first, and a fund with the poorest performance ranked last. The highest/best performing 25% of funds in the Performance Universe make up the first quartile; the next 25%, the second quartile; the next 25%, the third quartile; and the poorest/worst performing 25% of funds in the Performance Universe make up the fourth
Other Portfolio information
(Unaudited)
Macquarie Institutional Portfolios
Board consideration of Macquarie Investment Portfolios investment advisory and sub-advisory agreements (continued)
quartile. Comparative annualized performance for the Portfolios was shown for the past 1-, 3-, 5-, and 10-year periods, to the extent applicable, ended Jan. 31, 2017. The Board’s objective is that each Portfolio’s performance for the 1-, 3-, and 5-year periods be at or above the median of its Performance Universe.
Macquarie Core Plus Bond Portfolio — The Performance Universe for the Portfolio consisted of the Portfolio and all retail and institutional core plus bond funds as selected by Broadridge. The Broadridge report comparison showed that the Portfolio’s total return for the 1-year period was in the fourth quartile of its Performance Universes. The report further showed that the Portfolio’s total return for the 3- and 5-year periods was in the third quartile of its Performance Universe. The Board observed that the Portfolio’s performance was not in line with the Board’s objective. In evaluating the Portfolio’s performance, the Board considered the numerous investment and performance reports delivered by Management personnel to the Board’s Investments Committee. The Board was satisfied that Management was taking action to improve Portfolio performance and to meet the Board’s performance objective.
Macquarie Emerging Markets Portfolio — The Performance Universe for the Portfolio consisted of the Portfolio and all retail and institutional emerging markets funds as selected by Broadridge. The Broadridge report comparison showed that the Portfolio’s total return for the 1-, 3-, and 5-year periods was in the third quartile of its Performance Universe. The Board observed that the Portfolio’s performance was not in line with the Board’s objective. In evaluating the Portfolio’s performance, the Board considered the numerous investment and performance reports delivered by Management personnel to the Board’s Investments Committee. The Board was satisfied that Management was taking action to improve Portfolio performance and to meet the Board’s performance objective.
Macquarie Emerging Markets Portfolio II — The Performance Universe for the Portfolio consisted of the Portfolio and all retail and institutional emerging markets funds as selected by Broadridge. The Broadridge report comparison showed that the Portfolio’s total return for the 1-year period was in the first quartile of its Performance Universe. The report further showed that the Portfolio’s total return for the 3-year period was in the third quartile of its Performance Universe and its total return for the 5-year periods was in the second quartile of its Performance Universe. The Board was satisfied with performance.
Macquarie High Yield Bond Portfolio — The Performance Universe for the Portfolio consisted of the Portfolio and all retail and institutional high yield funds as selected by Broadridge. The Broadridge report comparison showed that the Portfolio’s total return for the 1- and 3-year period was in the third quartile of its Performance Universe. The report further showed that the Portfolio’s total return for the 5-year period was in the second quartile of its Performance Universes. The Board was satisfied with performance.
Macquarie Labor Select International Equity Portfolio — The Performance Universe for the Portfolio consisted of the Portfolio and all retail and institutional international large-cap value funds as selected by Broadridge. The Broadridge report comparison showed that the Portfolio’s total return for the 1-year period was in the fourth quartile of its Performance Universe. The report further showed that the Portfolio’s total return for the 3-year period was in the first quartile of its Performance Universe and the Portfolio’s total return for the 5-year period was in the third quartile of its Performance Universe. The Board observed that the Portfolio’s short-term performance was not in line with the Board’s objective. In evaluating the Portfolio’s performance, the Board considered the Portfolio’s longer-term performance results, which were strong. The Board was satisfied with performance.
Macquarie Large-Cap Value Portfolio — The Performance Universe for the Portfolio consisted of the Portfolio and all retail and institutional large-cap value funds as selected by Broadridge. The Broadridge report comparison showed that the Portfolio’s total return for the 1-year period was in the fourth quartile of its Performance Universe. The report further showed that the Portfolio’s total return for the 3- and 5-year periods was in the first quartile of its Performance Universe. The Board observed that the Portfolio’s short-term performance was not in line with the Board’s objective. In evaluating the Portfolio’s performance, the Board considered the Portfolio’s longer-term performance results, which were strong. The Board was satisfied with performance.
Comparative expenses. The Board considered expense data for the Delaware Funds. Management provided the Board with information on pricing levels and fee structures for the Portfolios as of its most recent fiscal year end. The Board also focused on the comparative analysis of effective management fees and total expense ratios of each Portfolio versus effective management fees and expense ratios of a group of similar funds as selected by Broadridge (the “Expense Group”). In reviewing comparative costs, each Portfolio’s contractual management fee and the actual management fee incurred by the Portfolio were compared with the contractual management fees (assuming all funds in the Expense Group were similar in size to the Portfolio) and actual management fees (as reported by each fund) within the Expense Group, taking into
118
account any applicable breakpoints and fee waivers. Each Portfolio’s total expenses were also compared with those of its Expense Group. The Board’s objective is to limit each Portfolio’s total expense ratio to be competitive with that of the Expense Group.
Macquarie Core Plus Bond Portfolio — The expense comparisons for the Portfolio showed that its actual management fee was in the quartile with the second lowest expenses of its Expense Group and its total expenses were in the quartile with the lowest expenses of its Expense Group. The Board was satisfied with the management fee and total expenses of the Portfolio in comparison to those of its Expense Group.
Macquarie Emerging Markets Portfolio — The expense comparisons for the Portfolio showed that its actual management fee was in the quartile with the second lowest expenses of its Expense Group and its total expenses were in the quartile with the lowest expenses of its Expense Group. The Board was satisfied with the management fee and total expenses of the Portfolio in comparison to those of its Expense Group.
Macquarie Emerging Markets Portfolio II — The expense comparisons for the Portfolio showed that its actual management fee was in the quartile with the highest expenses of its Expense Group and its total expenses were in the quartile with the lowest expenses of its Expense Group. The Board was satisfied with the total expenses of the Portfolio in comparison to those of its Expense Group.
Macquarie High Yield Bond Portfolio – The expense comparisons for the Portfolio showed that its actual management fee and total expenses were in the quartile with the lowest expenses of its Expense Group. The Board was satisfied with the management fee and total expenses of the Portfolio in comparison to those of its Expense Group.
Macquarie Labor Select International Equity Portfolio — The expense comparisons for the Portfolio showed that its actual management fee was in the quartile with the second highest expenses of its Expense Group and its total expenses were in the quartile with the lowest expenses of its Expense Group. The Board was satisfied with the total expenses of the Portfolio in comparison to those of its Expense Group.
Macquarie Large Cap Value Equity Portfolio — The expense comparisons for the Portfolio showed that its actual management fee and total expenses were in the quartile with the lowest expenses of its Expense Group. The Board was satisfied with the management fee and total expenses of the Portfolio in comparison to those of its Expense Group.
Management profitability. The Board considered the level of profits, if any, realized by DMC in connection with the operation of the Portfolios. In this respect, the Board reviewed the Investment Management Profitability Analysis that addressed the overall profitability of DMC’s business in providing management and other services to each of the individual funds and the Delaware Funds as a whole. Specific attention was given to the methodology used by DMC in allocating costs for the purpose of determining profitability. Management stated that the level of profits of DMC, to a certain extent, reflects recent operational cost savings and efficiencies initiated by DMC. The Board considered DMC’s efforts to improve services provided to fund shareholders and to meet additional regulatory and compliance requirements resulting from recent industry-wide Securities and Exchange Commission initiatives. The Board also considered the extent to which DMC might derive ancillary benefits from fund operations, including the potential for procuring additional business as a result of the prestige and visibility associated with its role as service provider to the Delaware Funds and the benefits from allocation of fund brokerage to improve trading efficiencies. Finally, the Board also reviewed a report prepared by JDL regarding DMC profitability in the context of sub-advised funds and met with JDL personnel to discuss DMC’s profitability in such context. The Board found that the management fees were reasonable in light of the services rendered and the profitability of DMC.
Management profitability. Trustees were also given available information on profits being realized by Mondrian in relation to the services being provided to Macquarie Emerging Markets Portfolio and Macquarie Labor Select International Equity Portfolio and in relation to Mondrian’s overall investment advisory business, but believed such information to be of limited relevance because the sub-advisory fees are paid by DMC out of its management fee, and changes in the level of sub-advisory fees have no effect on Portfolio expenses. The Board was also provided information on potential fall-out benefits derived or to be derived by Mondrian in connection with its relationship to the Portfolios, such as reputational enhancement, soft dollar arrangements or commissions paid to affiliated broker/dealers, as applicable.
Economies of scale. The Trustees considered whether economies of scale are realized by DMC as each Portfolio’s assets increase and the extent to which any economies of scale are reflected in the level of management fees charged. The Trustees reviewed the standardized advisory fee pricing and structure approved by the Board and shareholders which does not includes breakpoints. Breakpoints in the advisory fee occur when the advisory fee rate is reduced on assets in excess of specified levels. Breakpoints result in a lower advisory fee, than would otherwise be the case in the absence of breakpoints, when the asset levels specified in the breakpoints are exceeded. Benchmarking analysis indicated that less than one quarter of competing funds in the institutional market employ breakpoints. Management believed, and the Board agreed, that the Portfolios were priced with relatively low management fees to reflect potential economies of scale at all asset levels. The Board noted that the
Other Portfolio information
(Unaudited)
Macquarie Institutional Portfolios
Board consideration of Macquarie Investment Portfolios investment advisory and sub-advisory agreements (continued)
fee under the management contract for Macquarie Core Plus Bond Portfolio did not fall within the standardized fee pricing structure. With respect to Macquarie Core Plus Bond Portfolio, Management explained that the portfolio management fee was priced slightly lower than the standard fee rate for special domestic funds.
120
Fund management
Kristen E. Bartholdson
Vice President, Senior Portfolio Manager — Macquarie Large Cap Value Portfolio
Kristen E. Bartholdson is a senior portfolio manager for the firm’s Large-Cap Value team. Prior to joining Macquarie Investment Management (MIM), which includes the former Delaware Investments, in 2006 as an associate portfolio manager, she worked at Susquehanna International Group from 2004 to 2006, where she was an equity research salesperson. From 2000 to 2004, she worked in equity research at Credit Suisse, most recently as an associate analyst in investment strategy. Bartholdson earned her bachelor’s degree in economics from Princeton University.
Nigel A. Bliss
Senior Portfolio Manager — Mondrian Investment Partners Ltd. — Macquarie Labor Select International Equity Portfolio
Nigel Bliss is a graduate of the University of Manchester, holds the ASIP designation, and is a member of the CFA Institute and the CFA Society of the UK. He commenced his career at Cazenove & Co. in 1993 and moved to join Mondrian in 1995. Bliss is a senior portfolio manager in the Non-US Equity Team and a member of Mondrian’s Non-US Equity Strategy Committee. He has had significant experience analyzing securities in the Pacific Basin region and in the global materials, utilities, property, and industrials sectors. In recent years, Bliss has taken responsibility for leading coverage of securities listed in the UK and Scandinavian markets while still maintaining his sector specialization.
Adam H. Brown, CFA
Senior Vice President, Senior Portfolio Manager, Co-Head of High Yield — Macquarie Investment Management, Americas — Macquarie Core Plus Bond Portfolio and Macquarie High Yield Bond Portfolio
Adam H. Brown is a senior portfolio manager on the firm’s taxable fixed income team. He manages the bank loan portfolios and is a co-portfolio manager for the high yield, fixed rate multisector, and core plus strategies. Brown joined Macquarie Investment Management (MIM), which includes the former Delaware Investments, in April 2011 as part of the firm’s integration of Macquarie Four Corners Capital Management, where he had worked since 2002. At Four Corners, he was a co-portfolio manager on four collateralized loan obligations (CLOs) and a senior research analyst supporting noninvestment grade portfolios. Before that, Brown was with the predecessor of Wells Fargo Securities, where he worked in the leveraged finance group arranging senior secured bank loans and high yield bond financings for financial sponsors and corporate issuers. He earned a bachelor’s degree in accounting from the University of Florida and an MBA from the A.B. Freeman School of Business at Tulane University.
Liu-Er Chen, CFA
Senior Vice President, Chief Investment Officer — Emerging Markets and Healthcare — Macquarie Emerging Markets Portfolio II
Liu-Er Chen heads the firm’s global Emerging Markets team, and he is also the portfolio manager for Delaware Healthcare Fund, which launched in September 2007. Prior to joining Macquarie Investment Management (MIM), which includes the former Delaware Investments, in September 2006 in his current position, he spent nearly 11 years at Evergreen Investment Management Company, where he most recently worked as managing director and senior portfolio manager. He co-managed the Evergreen Emerging Markets Growth Fund from 1999 to 2001, and became the Fund’s sole manager in 2001. He was also the sole manager of the Evergreen Health Care Fund since its inception in 1999. Chen began his career at Evergreen in 1995 as an analyst covering Asian and global healthcare stocks, before being promoted to portfolio manager in 1998. Prior to his career in asset management, Chen worked for three years in sales, marketing, and business development for major American and European pharmaceutical and medical device companies. He received his medical education in China, and he has experience in medical research at both the Chinese Academy of Sciences and Cornell Medical School. He holds an MBA with a concentration in management from Columbia Business School.
Other Portfolio information
(Unaudited)
Macquarie Institutional Portfolios
Fund management (continued)
Ginny Chong, CFA
Senior Portfolio Manager — Mondrian Investment Partners Ltd. — Macquarie Emerging Markets Portfolio
Prior to joining Mondrian in 2000, Ginny Chong worked for PricewaterhouseCoopers in Vancouver, within the Corporate Finance and Investment Banking Division where she qualified as a Canadian Chartered Accountant. Chong has a degree in Commerce from the University of British Columbia, Vancouver. Chong is presently a senior portfolio manager within the Emerging Markets Team. Chong is a CFA Charterholder and is a member of the CFA Institute and the CFA Society of the UK.
Craig C. Dembek, CFA
Senior Vice President, Head of Credit Research — Macquarie Investment Management, Americas — Macquarie Core Plus Bond Portfolio and Macquarie High Yield Bond Portfolio
Craig C. Dembek is head of credit research and a senior research analyst on the firm’s taxable fixed income team with primary responsibility for banks, brokers, insurance companies, and real estate investment trusts (REITs). He rejoined Macquarie Investment Management (MIM), which includes the former Delaware Investments, in March 2007. During his previous time at the firm, from April 1999 to January 2001, he was a senior investment grade credit analyst. Most recently, he spent four years at Chartwell Investment Partners as a senior fixed income analyst and Turner Investment Partners as a senior fixed income analyst and portfolio manager. Dembek also spent two years at Stein, Roe & Farnham as a senior fixed income analyst. Earlier in his career, he worked for two years as a lead bank analyst at the Federal Reserve Bank of Boston. Dembek earned a bachelor’s degree in finance from Michigan State University and an MBA with a concentration in finance from the University of Vermont.
Elizabeth A. Desmond, CFA
Director, Chief Investment Officer — International Equities — Mondrian Investment Partners Ltd. — Macquarie Labor Select International Equity Portfolio
Elizabeth A. Desmond holds a bachelor’s degree from Wellesley College and a master’s degree in East Asian Studies from Stanford University. After working for the Japanese government for two years, she began her investment career as a Pacific Basin investment manager with Shearson Lehman Global Asset Management. In 1991, Desmond joined Mondrian Investment Partners’ predecessor organization as a founding member after previously working as a Pacific Basin equity analyst and senior portfolio manager at Hill Samuel Investment Advisers Ltd. She is a director and leads the International Equity investment team. In addition, she chairs the International Equity Strategy Committee. Desmond is a CFA Charterholder, and a member of the CFA Institute and the CFA Society of the UK. She sits on the CFA UK’s Advisory Council.
Roger A. Early, CPA, CFA
Executive Director, Global Co-Head of Fixed Income — Macquarie Investment Management — Macquarie Core Plus Bond Portfolio
Roger A. Early is global co-head of the firm’s fixed income team. He rejoined Macquarie Investment Management (MIM), which includes the former Delaware Investments, in March 2007 as a member of the firm’s taxable fixed income portfolio management team, with primary responsibility for portfolio construction and strategic asset allocation. He became head of fixed income investments in the Americas in February 2015. During his previous time at the firm, from 1994 to 2001, he was a senior portfolio manager in the same area, and he left the firm as head of its US investment grade fixed income group. In recent years, Early was a senior portfolio manager at Chartwell Investment Partners and Rittenhouse Financial and was the chief investment officer for fixed income at Turner Investments. Prior to joining the firm in 1994, he worked for more than 10 years at Federated Investors where he managed more than $25 billion in mutual fund and institutional portfolios in the short-term and investment grade markets. He left the firm as head of institutional fixed income management. Earlier in his career, he held management positions with the Federal Reserve Bank, PNC Financial, Touche Ross, and Rockwell International. Early earned his bachelor’s degree in economics from The Wharton School of the University of Pennsylvania and an MBA with concentrations in finance and accounting from the University of Pittsburgh. He is a member of the CFA Society of Philadelphia.
122
Paul Grillo, CFA
Senior Vice President, Chief Investment Officer of Total Return Strategies — Macquarie Core Plus Bond Portfolio
Paul Grillo is a member of the firm’s taxable fixed income portfolio management team with primary responsibility for portfolio construction and strategic asset allocation. He is also a member of the firm’s asset allocation committee, which is responsible for building and managing multi-asset class portfolios. He joined Macquarie Investment Management (MIM), which includes the former Delaware Investments, in 1992 as a mortgage-backed and asset-backed securities analyst, assuming portfolio management responsibilities in the mid-1990s. Grillo serves as lead portfolio manager for the firm’s Diversified Income products and has been influential in the growth and distribution of the firm’s multisector strategies. Prior to joining the firm, Grillo was a mortgage strategist and trader at Dreyfus Corporation. He also worked as a mortgage strategist and portfolio manager at Chemical Investment Group and as a financial analyst at Chemical Bank. Grillo holds a bachelor’s degree in business management from North Carolina State University and an MBA with a concentration in finance from Pace University.
Gregory J.P. Halton, CFA
Senior Portfolio Manager — Mondrian Investment Partners Ltd. — Macquarie Emerging Markets Portfolio
Having graduated from St Catherine’s College, Oxford in 2000 with a MEng (Hons) in Engineering Science, Gregory J.P. Halton worked in the global equity division of Deutsche Asset Management before joining Mondrian in 2004. Halton is a senior portfolio manager within the Emerging Markets Team. Halton is a CFA Charterholder and is a member of the CFA Institute and the CFA Society of the UK.
J. David Hillmeyer, CFA
Senior Vice President, Senior Portfolio Manager — Macquarie Core Plus Bond Portfolio
J. David Hillmeyer is a member of the firm’s taxable fixed income portfolio management team. He is co-portfolio manager for the fixed rate diversified multisector, core plus, and investment grade corporate bond strategies. Prior to joining Macquarie Investment Management (MIM), which includes the former Delaware Investments, in August 2007 as a vice president and corporate bond trader, he worked for more than 11 years in various roles at Hartford Investment Management Company, including senior corporate bond trader, high yield portfolio manager / trader, and quantitative analyst. He began his career as an investment advisor in January 1989 at Shawmut Bank, leaving the firm as an investment officer in November 1995. Hillmeyer earned his bachelor’s degree from Colorado State University, and he is a member of the CFA Society of Philadelphia and the Philadelphia Council for Business Economics.
Nikhil G. Lalvani, CFA
Vice President, Senior Portfolio Manager — Macquarie Large Cap Value Portfolio
Nikhil G. Lalvani is a senior portfolio manager for the firm’s Large-Cap Value team. At Macquarie Investment Management (MIM), which includes the former Delaware Investments, Lalvani has worked as both a fundamental and quantitative analyst. Prior to joining the firm in 1997 as an account analyst, he was a research associate with Bloomberg. Lalvani holds a bachelor’s degree in finance from The Pennsylvania State University. He is a member of the CFA Institute and the CFA Society of Philadelphia.
Paul A. Matlack, CFA
Senior Vice President, Senior Portfolio Manager, Fixed Income Strategist — Macquarie Core Plus Bond Portfolio and Macquarie High Yield Bond Portfolio
Paul A. Matlack is a strategist and senior portfolio manager for the firm’s fixed income team. Matlack rejoined the firm in May 2010. During his previous time at Macquarie Investment Management (MIM), which includes the former Delaware Investments, from September 1989 to October 2000, he was senior credit analyst, senior portfolio manager, and left the firm as co-head of the high yield group. Most recently, he worked at Chartwell Investment Partners from September 2003 to April 2010 as senior portfolio manager in fixed income, where he managed core, core plus, and high yield strategies. Prior to that, Matlack held senior roles at Turner Investment Partners, PNC Bank, and Mellon Bank. He earned a bachelor’s degree in international relations from the University of Pennsylvania and an MBA with a concentration in finance from George Washington University.
Other Portfolio information
(Unaudited)
Macquarie Institutional Portfolios
Fund management (continued)
John P. McCarthy, CFA
Senior Vice President, Senior Portfolio Manager, Co-Head of High Yield — Macquarie Investment Management, Americas — Macquarie Core Plus Bond Portfolio and Macquarie High Yield Bond Portfolio
John P. McCarthy is a senior portfolio manager and co-head for the firm’s high yield strategies, a role he assumed in July 2016. From December 2012 to June 2016, he was co-head of credit research on the firm’s taxable fixed income team. McCarthy rejoined Macquarie Investment Management (MIM), which includes the former Delaware Investments, in March 2007 as a senior research analyst, after he worked in the firm’s fixed income area from 1990 to 2000 as a senior high yield analyst and high yield trader, and from 2001 to 2002 as a municipal bond trader. Prior to rejoining Delaware Investments, he was a senior high yield analyst/trader at Chartwell Investment Partners. McCarthy earned a bachelor’s degree in business administration from Babson College, and he is a member of the CFA Society of Philadelphia.
Andrew Miller
Chief Investment Officer, Emerging Market Equities — Mondrian Investment Partners Ltd. — Macquarie Emerging Markets Portfolio
Andrew Miller has a BA (Hons) degree in History from the University of Birmingham. Prior to joining Mondrian in 2000, he worked in the Investment Management department of PricewaterhouseCoopers, where he was responsible for the analysis and audit of various investment vehicles. While at Mondrian, Miller has specialized in Emerging Markets and he is now the Chief Investment Officer for this product. He holds the ASIP designation and is a member of the CFA Institute and the CFA Society of the UK.
D. Tysen Nutt Jr.
Senior Vice President, Senior Portfolio Manager, Team Leader — Large-Cap Value Equity — Macquarie Large Cap Value Portfolio
D. Tysen Nutt Jr. is currently senior portfolio manager and team leader for the firm’s Large-Cap Value team. Before joining Macquarie Investment Management (MIM), which includes the former Delaware Investments, in 2004 as senior vice president and senior portfolio manager, Nutt led the US Active Large-Cap Value team within Merrill Lynch Investment Managers, where he managed mutual funds and separate accounts for institutions and private clients. He departed Merrill Lynch Investment Managers as a managing director. Prior to joining Merrill Lynch Investment Managers in 1994, Nutt was with Van Deventer & Hoch where he managed large-cap value portfolios for institutions and private clients. He began his investment career at Dean Witter Reynolds, where he eventually became vice president, investments. Nutt earned his bachelor’s degree from Dartmouth College, and he is a member of the CFA Society New York and the CFA Institute.
Melissa J. A. Platt, CFA
Portfolio Manager — Mondrian Investment Partners Ltd. — Macquarie Labor Select International Equity Portfolio
Melissa J. A. Platt holds a Bachelor of Business Studies (Honours) in Financial Economics and a Bachelor of Applied Economics from Massey University in New Zealand. She started her business career as a consultant at KPMG Corporate Finance and then moved to FundSource Research for three years, where she worked as an investment analyst and later as research manager. Platt joined Mondrian in 2004 and is a portfolio manager in the International Equity Team. She is a CFA Charterholder and a member of the CFA Institute and the CFA Society of the UK.
Robert A. Vogel Jr., CFA
Vice President, Senior Portfolio Manager — Macquarie Large Cap Value Portfolio
Robert A. Vogel Jr. is a senior portfolio manager for the firm’s Large-Cap Value team. Prior to joining Macquarie Investment Management (MIM), which includes the former Delaware Investments, in 2004 as vice president and senior portfolio manager, he worked at Merrill Lynch Investment Managers for more than seven years, where he rose to the position of director and portfolio manager within the US Active Large-Cap Value team. He began his career in 1992 as a financial consultant at Merrill Lynch. Vogel graduated from Loyola University Maryland, earning both bachelor’s and master’s degrees in finance. He also earned an MBA with a concentration in finance from The Wharton School of the University of Pennsylvania. Vogel is a member of the CFA Society New York, the CFA Institute, and the CFA Society of Philadelphia.
124
Board of trustees / directors and officers addendum
Delaware FundsSM by Macquarie
A mutual fund is governed by a Board of Trustees / Directors (“Trustees”), which has oversight responsibility for the management of a fund’s business affairs. Trustees establish procedures and oversee and review the performance of the investment manager, the distributor, and others who perform services for the fund. The independent fund trustees, in particular, are advocates for shareholder interests. Each trustee has served in that capacity since he or she was elected to or appointed to the Board of Trustees, and will continue to serve until his or her retirement or the election of a new trustee in his or her place. The following is a list of the Trustees and Officers with certain background and related information.
| | | | | | | | | | |
Name,
Address,
and Birth Date | | Position(s)
Held with
Fund(s) | | Length of Time
Served | | Principal
Occupation(s)
During the
Past Five Years | | Number of
Portfolios in Fund
Complex Overseen
by Trustee
or Officer | | Other
Directorships
Held by
Trustee
or Officer |
Interested Trustee |
Shawn K. Lytle1,2 2005 Market Street Philadelphia, PA 19103 February 1970 | | President, Chief Executive Officer, and Trustee | | Trustee since September 2015 President and Chief Executive Officer since August 2015 | | Shawn K. Lytle has served as President of Macquarie Investment Management3 since June 2015 and was the Regional Head of Americas for UBS Global Asset Management from 2010 through 2015. | | 60 | | Trustee — UBS Relationship Funds, SMA Relationship Trust, and UBS Funds (May 2010–April 2015) |
Independent Trustees |
Thomas L. Bennett 2005 Market Street Philadelphia, PA 19103 October 1947 | | Chairman and Trustee | | Trustee since March 2005 Chairman since March 2015 | | Private Investor (March 2004–Present) | | 60 | | None |
Ann D. Borowiec 2005 Market Street Philadelphia, PA 19103 November 1958 | | Trustee | | Since March 2015 | | Chief Executive Officer, Private Wealth Management (2011–2013) and Market Manager, New Jersey Private Bank (2005–2011) — J.P. Morgan Chase & Co. | | 60 | | Director — Banco Santander International Director — Santander Bank, N.A. |
Joseph W. Chow 2005 Market Street Philadelphia, PA 19103 January 1953 | | Trustee | | Since January 2013 | | Executive Vice President (Emerging Economies Strategies, Risks, and Corporate Administration) State Street Corporation (July 2004–March 2011) | | 60 | | Director and Audit Committee Member — Hercules Technology Growth Capital, Inc. (2004–2014) |
John A. Fry
2005 Market Street Philadelphia, PA 19103 May 1960 | | Trustee | | Since January 2001 | | President — Drexel University (August 2010–Present) President — Franklin & Marshall College (July 2002–July 2010) | | 60 | | Director, Audit Committee, and Governance Committee Member — Community Health Systems Director — Drexel Morgan & Co. Director, Audit Committee Member — vTv Therapeutics LLC Director — FS Credit Real Estate Income Trust, Inc. |
Board of trustees / directors and officers addendum
Delaware FundsSM by Macquarie
| | | | | | | | | | |
Name,
Address,
and Birth Date | | Position(s)
Held with
Fund(s) | | Length of Time
Served | | Principal
Occupation(s)
During the
Past Five Years | | Number of
Portfolios in Fund
Complex Overseen
by Trustee or
Officer | | Other
Directorships
Held by
Trustee
or Officer |
Independent Trustees (continued) |
Lucinda S. Landreth 2005 Market Street Philadelphia, PA 19103 June 1947 | | Trustee | | Since March 2005 | | Private Investor (2004–Present) | | 60 | | None |
Frances A. Sevilla-Sacasa 2005 Market Street Philadelphia, PA 19103 January 1956 | | Trustee | | Since September 2011 | | Chief Executive Officer — Banco Itaú International (April 2012–December 2016) Executive Advisor to Dean (August 2011–March 2012) and Interim Dean (January 2011–July 2011) — University of Miami School of Business Administration President — U.S. Trust, Bank of America Private Wealth Management (Private Banking) (July 2007-December 2008) | | 60 | | Trust Manager and Audit Committee Chair — Camden Property Trust |
Thomas K. Whitford 2005 Market Street Philadelphia, PA 19103 March 1956 | | Trustee | | Since January 2013 | | Vice Chairman (2010–April 2013) — PNC Financial Services Group | | 60 | | Director — HSBC Finance Corporation and HSBC North America Holdings Inc. Director — HSBC USA Bank Inc. |
Janet L. Yeomans 2005 Market Street Philadelphia, PA 19103 July 1948 | | Trustee | | Since April 1999 | | Vice President and Treasurer (January 2006–July 2012), Vice President — Mergers & Acquisitions (January 2003–January 2006), and Vice President and Treasurer (July 1995–January 2003) — 3M Company | | 60 | | Director (2009-2017); Personnel and Compensation Committee Chair; Member of Nominating, Investments, and Audit Committees for various periods throughout directorship — Okabena Company |
126
| | | | | | | | | | |
Name,
Address,
and Birth Date | | Position(s)
Held with
Fund(s) | | Length of Time Served | | Principal
Occupation(s)
During the
Past Five Years | | Number of
Portfolios in Fund
Complex Overseen
by Trustee
or Officer | | Other
Directorships
Held by
Trustee
or Officer |
Officers |
David F. Connor 2005 Market Street Philadelphia, PA 19103 December 1963 | | Senior Vice President, General Counsel, and Secretary | | Senior Vice President, since May 2013; General Counsel since May 2015; Secretary since October 2005 | | David F. Connor has served in various capacities at different times at Macquarie Investment Management. | | 60 | | None2 |
Daniel V. Geatens 2005 Market Street Philadelphia, PA 19103 October 1972 | | Vice President and Treasurer | | Treasurer since October 2007 | | Daniel V. Geatens has served in various capacities at different times at Macquarie Investment Management. | | 60 | | None2 |
Richard Salus
2005 Market Street Philadelphia, PA 19103 October 1963 | | Senior Vice President and Chief Financial Officer | | Chief Financial Officer since November 2006 | | Richard Salus has served in various capacities at different times at Macquarie Investment Management. | | 60 | | None2 |
| 1 | Shawn K. Lytle is considered to be an “Interested Trustee” because he is an executive officer of the Fund’s(s’) investment advisor. |
| 2 | Shawn K. Lytle, David F. Connor, Daniel V. Geatens, and Richard Salus serve in similar capacities for the six portfolios of the Optimum Fund Trust, which have the same investment advisor, principal underwriter, and transfer agent as the registrant. Mr. Geatens also serves as the CFO and Treasurer for Macquarie Global Infrastructure Total Return Fund Inc., which shares an affiliated investment manager. |
| 3 | Macquarie Investment Management (formerly known as Delaware Investments) is the marketing name for Macquarie Management Holdings, Inc. (formerly known as Delaware Management Holdings, Inc.) and its subsidiaries, including the Fund’s(s’) investment advisor, principal underwriter, and its transfer agent. |
The Statement of Additional Information for the Fund(s) includes additional information about the Trustees and Officers and is available, without charge, upon request by calling 800 523-1918.
Portfolio managers
Kristen E. Bartholdson
Vice President and Senior
Portfolio Manager
Nigel Bliss
Senior Portfolio Manager
Mondrian Investment Partners Limited
Adam H. Brown
Senior Vice President, Senior Portfolio
Manager, Co-Head of High Yield —
Macquarie Investment Management, Americas
Liu-Er Chen
Senior Vice President and
Chief Investment Officer —
Emerging Markets and Healthcare
Ginny Chong
Senior Portfolio Manager
Mondrian Investment Partners Limited
Craig C. Dembek
Senior Vice President, Head of Credit Research —
Macquarie Investment Management, Americas
Elizabeth A. Desmond
Director and Chief Investment
Officer — International Equities
Mondrian Investment Partners Limited
Roger A. Early
Executive Director,
Global Co-Head of Fixed Income —
Macquarie Investment Management
Paul Grillo
Senior Vice President and
Chief Investment Officer —
Total Return Strategies
Gregory J.P. Halton
Senior Portfolio Manager
Mondrian Investment Partners Limited
J. David Hillmeyer
Senior Vice President and Senior
Portfolio Manager
Nikhil G. Lalvani
Vice President and Senior
Portfolio Manager
Paul A. Matlack
Senior Vice President, Senior
Portfolio Manager, and Fixed Income
Strategist
John P. McCarthy
Senior Vice President, Senior Portfolio
Manager, Co-Head of High Yield —
Macquarie Investment Management, Americas
Andrew Miller
Chief Investment Officer —
Emerging Market Equities
Mondrian Investment Partners Limited
D. Tysen Nutt Jr.
Senior Vice President, Senior Portfolio
Manager, and Team Leader —
Large-Cap Value Equity
Melissa J. A. Platt
Portfolio Manager
Mondrian Investment Partners Limited
Robert A. Vogel Jr.
Vice President and Senior
Portfolio Manager
128
This page intentionally left blank.
Custodian
The Bank of New York Mellon
One Wall Street
New York, NY 10286
Independent registered public accounting firm
PricewaterhouseCoopers LLP
Two Commerce Square, Suite 1700
2001 Market Street
Philadelphia, PA 19103-7042
Investment advisor
Delaware Management Company, a series of Macquarie Investment Management Business Trust
2005 Market Street
Philadelphia, PA 19103
Investment sub-advisor for certain Portfolios
Mondrian Investment Partners Limited
Fifth Floor
10 Gresham Street
London EC2V 7JD
United Kingdom
Macquarie Investment Management, a member of Macquarie Group, refers to the companies comprising the asset management division of Macquarie Group Limited and its subsidiaries and affiliates worldwide.
The Portfolios are distributed by Delaware Distributors, L.P., an affiliate of MIMBT, Macquarie Management Holdings, Inc., and Macquarie Group Limited.
Each Portfolio files its complete schedule of portfolio holdings with the Securities and Exchange Commission for the first and third quarters of each fiscal year on Form N-Q. Each Portfolio’s Forms N-Q, as well as a description of the policies and procedures that the Portfolios use to determine how to vote proxies (if any) relating to portfolio securities and the Schedules of Investments included in the Portfolios’ most recent Forms N-Q are available without charge (i) upon request, by calling 800 231-8002; (ii) on the Portfolios’ website at macquarie.com/investment-management/institutional; and (iii) on the Commission’s website at sec.gov. Each Portfolio’s Forms N-Q may be reviewed and copied at the Commission’s Public Reference Room in Washington, D.C.; information on the operation of the Public Reference Room may be obtained by calling 800 SEC-0330.
Information (if any) regarding how each Portfolio voted proxies relating to portfolio securities during the most recently disclosed 12-month period ended June 30 is available without charge (i) through the Portfolios’ website at delawarefunds.com/proxy; and (ii) on the Commission’s website at sec.gov.
This report was prepared for investors in the Macquarie Institutional Portfolios. It may be distributed to others only if preceded or accompanied by a current Macquarie Institutional Portfolios prospectus, which contains details about charges, expenses, investment objectives, and operating policies of the Portfolios. All Macquarie Institutional Portfolios are offered by prospectus only. The return and principal value of an investment in a Portfolio will fluctuate so that shares, when redeemed, may be worth more or less than their original cost.
Carefully consider the Portfolios’ investment objectives, risk factors, charges, and expenses before investing. This and other information can be found in the Portfolios’ prospectus which may be obtained by visiting macquarie.com/investment-management/institutional or calling 800 231-8002. Investors should read the prospectus carefully before investing.
| | |

(315667) AR-DPT 21678 [12/17] | | 2005 Market Street Philadelphia, PA 19103 Telephone 800 231-8002 Fax 215 255-1162 Printed in the USA |
Alternative / specialty mutual fund
Delaware REIT Fund
October 31, 2017
Carefully consider the Fund’s investment objectives, risk factors, charges, and expenses before investing. This and other information can be found in the Fund’s prospectus and its summary prospectus, which may be obtained by visiting delawarefunds.com/literature or calling 800 523-1918. Investors should read the prospectus and the summary prospectus carefully before investing.
You can obtain shareholder reports and prospectuses online instead of in the mail.
Visit delawarefunds.com/edelivery.

Experience Delaware FundsSM by Macquarie
Macquarie Investment Management (MIM) is a global asset manager with offices throughout the United States, Europe, Asia, and Australia. We are active managers who prioritize autonomy and accountability at the investment team level in pursuit of opportunities that matter for our clients. Delaware Funds is one of the longest-standing mutual fund families, with more than 75 years in existence.
If you are interested in learning more about creating an investment plan, contact your financial advisor.
You can learn more about Delaware Funds or obtain a prospectus for Delaware REIT Fund at delawarefunds.com/literature.
Manage your account online
| • | | Check your account balance and transactions |
| • | | View statements and tax forms |
| • | | Make purchases and redemptions |
Visit delawarefunds.com/account-access.
MIM is the marketing name for the registered investment advisers including Macquarie Investment Management Business Trust (MIMBT) (formerly, Delaware Management Business Trust), Macquarie Funds Management Hong Kong Limited, Macquarie Investment Management Austria Kapitalanlage AG, Macquarie Investment Management Global Limited, Macquarie Bank International Limited, Macquarie Investment Management Europe Limited, Macquarie Investment Management Limited, and Macquarie Capital Investment Management, Inc.
The Fund is distributed by Delaware Distributors, L.P., an affiliate of MIMBT and Macquarie Group Limited. MIM, a member of Macquarie Group, refers to the companies comprising the asset management division of Macquarie Group Limited and its subsidiaries and affiliates worldwide.
Other than Macquarie Bank Limited (MBL), none of the entities noted are authorized deposit-taking institutions for the purposes of the Banking Act 1959 (Commonwealth of Australia). The obligations of these entities do not represent deposits or other liabilities of MBL. MBL does not guarantee or otherwise provide assurance in respect of the obligations of these entities, unless noted otherwise. The Fund is governed by US laws and regulations.
Unless otherwise noted, views expressed herein are current as of Oct. 31, 2017, and subject to change for events occurring after such date.
The Fund is not FDIC insured and is not guaranteed. It is possible to lose the principal amount invested.
Advisory services provided by Delaware Management Company, a series of MIMBT, a US registered investment advisor.
All third-party marks cited are the property of their respective owners.
© 2017 Macquarie Management Holdings, Inc. (formerly, Delaware Management Holdings, Inc.)
| | | | |
| Portfolio management review | | | | |
| Delaware REIT Fund | | | November 7, 2017 | |
| | | | | | |
| Performance preview (for the year ended October 31, 2017) |
Delaware REIT Fund (Institutional Class shares) | | | 1-year return | | | +1.14% |
Delaware REIT Fund (Class A shares) | | | 1-year return | | | +0.90% |
FTSE NAREIT Equity REITs Index (benchmark) | | | 1-year return | | | +5.67% |
Past performance does not guarantee future results.
For complete, annualized performance for Delaware REIT Fund, please see the table on page 4.
Institutional Class shares are not subject to a sales charge and are offered for sale exclusively to certain eligible investors. In addition, Institutional Class shares pay no distribution and service fee.
The performance of Class A shares excludes the applicable sales charge. Both Institutional Class shares and Class A shares reflect the reinvestment of all distributions.
Please see page 6 for a description of the index. Index performance returns do not reflect any management fees, transaction costs, or expenses. Indices are unmanaged and one cannot invest directly in an index.
As the Fund’s fiscal year began, equity investors were increasingly optimistic. A strengthening global economy, coupled with the market’s expectation for growth-oriented US government policies after Republicans’ electoral victories in November 2016, led to an especially favorable environment for cyclical growth stocks.
In this environment, value- and yield-oriented investments were left behind after leading the way for several years. Real estate investment trusts (REITs) were at a relative performance disadvantage throughout most of the 12-month period ended Oct. 31, 2017.
A series of interest rate increases from the US Federal Reserve, which sought to limit potential inflation amid improving economic and employment data, provided a further headwind for REITs. US gross domestic product (GDP) – a measure of the country’s economic output – grew by an annualized 3.1% in the second quarter of 2017 and an estimated 3.0% in the third quarter. It was the first time since mid-2014 that US GDP expanded at an annual pace of 3% or more in consecutive quarters. Meanwhile, the US unemployment rate hit 4.1% in October 2017, a 17-year low. (Source: Bloomberg.)
Against this strong economic backdrop, the Fed opted to raise its benchmark short-term interest rate by 0.25 percentage points three times during
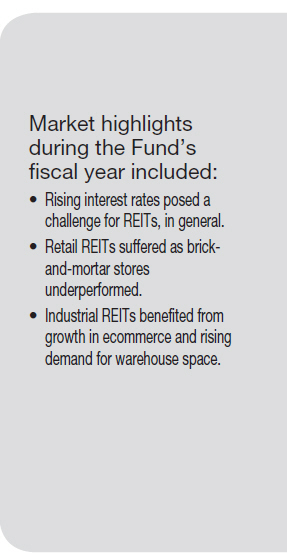
1
| | | | |
| Portfolio management review | | | | |
| Delaware REIT Fund | | | | |
the fiscal year. At period end, the federal funds rate stood at 1.25%, up from 0.50% in November 2016.
For the Fund’s fiscal year, the US REIT market, as measured by the FTSE NAREIT Equity REITs Index, gained 5.67%, well behind the broader equity market, with the S&P 500® Index gaining 23.63% for the same period.
Within real estate securities, investors encountered a significant performance dichotomy. Retail REITs, for example, significantly underperformed, reflecting growth in ecommerce and a corresponding decline in sales at physical stores. During the Fund’s fiscal year, shopping center and mall REIT stocks declined more than 16% and close to 19%, respectively.
In contrast, industrial REITs gained 25%, benefiting from increased demand for warehouse space that was necessary to accommodate a growing economy and an increased emphasis on ecommerce. Data center REITs also performed quite well. These operators of specialized facilities for data storage and processing have benefited from the massive growth in cloud computing.
Fund performance
For the fiscal year ended Oct. 31, 2017, Delaware REIT Fund underperformed its benchmark, the FTSE NAREIT Equity REITs Index. The Fund’s Institutional Class shares returned +1.14%. The Fund’s Class A shares returned +0.90% at net asset value and -4.90% at maximum offer price (these figures reflect all distributions reinvested). During the same period, the benchmark returned +5.67%. For complete, annualized performance of Delaware REIT Fund, please see the table on page 4.
Individual detractors
The Fund’s largest individual detractor relative to the benchmark, by far, was Brookdale Senior Living, which operates senior care facilities. The company’s shares fell more than 15% for the
fiscal year, as the senior housing industry has been in a cyclical downturn due to excess supply. Brookdale Senior Living also struggled due to management missteps. Despite these recent concerns, we remained optimistic about the stock and added to the Fund’s position on weakness as the period progressed. In our view, Brookdale Senior Living is well positioned to take advantage of the favorable demographics of an aging population, which could translate into heightened demand for assisted-living space over time. As long-term, value-oriented investors, we are willing to look past a company’s short-term difficulties when we believe the stock’s longer-term potential remains solid. This was the thesis behind our original investment in Brookdale Senior Living, and our view remained intact throughout the fiscal year.
In the retail area, positions in GGP, an owner and operator of regional malls, and Brixmor Property Group, a shopping center REIT, hampered the Fund’s performance. The stocks declined more than 15% and 25%, respectively, for the fiscal year, in a difficult environment for retail property owners.
Positions in several freestanding retail operators, especially Store Capital and Spirit Realty Capital – whose notable declines largely reflected investors’ pessimism about the retail industry – also hurt the Fund’s performance. We ultimately sold the Fund’s stake in Store Capital and reduced its exposure to Spirit Realty Capital, as we found what we believed were more attractive investment opportunities elsewhere.
Individual contributors
The Fund benefited from a few of its industrial REIT holdings, especially Prologis and DCT Industrial Trust, which each gained more than 25% due to favorable growth trends for owners of warehouse properties.
Tempering this favorable result, however, was the Fund’s significant underweighting and ultimate
2
sale of a third strong-performing industrial REIT, Duke Realty. Although our exiting the Duke Realty position was, in retrospect, premature given the stock’s subsequent strong performance (it ultimately gained 12% for the 12-month period), we saw greater growth opportunities in Prologis and DCT and were comfortable with the trade-off.
Other notable relative contributors included Equinix, an operator of data centers that benefited from the continued dramatic growth of cloud computing and rising infrastructure-related demand, and Crown Castle International, an owner of cellular towers that we think has been well situated to take advantage of growing demand in its industry.
Maintaining a consistent approach
We continued to pursue our consistent management strategy: Regardless of underlying economic or market conditions, we emphasize areas of the REIT market that, in our opinion, have the potential to benefit from a strong fundamental backdrop for commercial real estate, and that offer what we see as attractively valued securities. We also emphasize companies that in our view can continue to grow their cash flow and prudently raise capital.
During the fiscal period, the Fund was modestly overweight in both the regional mall and shopping center categories. As we discussed earlier, retail REITs struggled amid increasingly difficult business conditions for brick-and-mortar retailers. Although we acknowledge that the business environment has become more challenging for retailers and the REITs that lease them space, we also believe that various high-quality retail REITs have been overly penalized. In our opinion, the market is not adequately distinguishing between stronger and weaker companies, and a number of stocks in the category have become attractively valued. By focusing on higher-quality, attractively valued REIT operators, we saw the potential to add long-term value for our shareholders, despite short-term uncertainty.
The Fund also remained overweight in the industrial sector, reflecting what we saw as the category’s ability to benefit from further strong demand for warehouse and distribution facilities in light of increased ecommerce activity – a trend we believe is likely to persist. Even as valuations in this category do strike us as relatively high, the attractive growth potential provides us with what we see as good reason to emphasize certain high-quality names in the sector.
3
| | | | |
| Performance summary | | | | |
| Delaware REIT Fund | | | October 31, 2017 | |
The performance quoted represents past performance and does not guarantee future results. Investment return and principal value of an investment will fluctuate so that shares, when redeemed, may be worth more or less than their original cost. Current performance may be lower or higher than the performance quoted. Performance data current to the most recent month end may be obtained by calling 800 523-1918 or visiting delawarefunds.com/performance.
| | | | | | | | | | | | | | | | |
Fund and benchmark performance1,2 | | | Average annual total returns through October 31, 2017 | |
| | | | 1 year | | | | 5 years | | | | 10 years | | | | Lifetime | |
Class A (Est. Dec. 6, 1995) | | | | | | | | | | | | | | | | |
Excluding sales charge | | | +0.90% | | | | +7.67% | | | | +4.52% | | | | +10.75% | |
Including sales charge | | | -4.90% | | | | +6.41% | | | | +3.90% | | | | +10.45% | |
Class C (Est. Nov. 11, 1997) | | | | | | | | | | | | | | | | |
Excluding sales charge | | | +0.13% | | | | +6.87% | | | | +3.73% | | | | +7.67% | |
Including sales charge | | | -0.67% | | | | +6.87% | | | | +3.73% | | | | +7.67% | |
Class R (Est. June 2, 2003) | | | | | | | | | | | | | | | | |
Excluding sales charge | | | +0.66% | | | | +7.40% | | | | +4.26% | | | | +8.72% | |
Including sales charge | | | +0.66% | | | | +7.40% | | | | +4.26% | | | | +8.72% | |
Institutional Class (Est. Nov. 11, 1997) | | | | | | | | | | | | | | | | |
Excluding sales charge | | | +1.14% | | | | +7.94% | | | | +4.78% | | | | +8.75% | |
Including sales charge | | | +1.14% | | | | +7.94% | | | | +4.78% | | | | +8.75% | |
Class R6 (Est. Aug. 31, 2016) | | | | | | | | | | | | | | | | |
Excluding sales charge | | | +1.28% | | | | n/a | | | | n/a | | | | -4.81% | |
Including sales charge | | | +1.28% | | | | n/a | | | | n/a | | | | -4.81% | |
FTSE NAREIT Equity REITs Index | | | +5.67% | | | | +9.66% | | | | +5.61% | | | | +8.98%* | |
*The benchmark lifetime return is for Institutional Class share comparison only and is calculated using the last business day in the month of the Fund’s Institutional Class inception date.
1Returns reflect the reinvestment of all distributions and are presented both with and without the applicable sales charges described below. Returns do not reflect the deduction of taxes the shareholder would pay on Fund distributions or redemptions of Fund shares.
Expense limitations were in effect for certain classes during some or all of the periods shown in the “Fund and benchmark performance” table. Expenses for each class are listed on the “Fund expense ratios” table on page 5. Performance would have been lower had expense limitations not been in effect.
Institutional Class shares are not subject to a sales charge and are offered for sale exclusively to
certain eligible investors. In addition, Institutional Class shares pay no distribution and service fee.
Class A shares are sold with a maximum front-end sales charge of 5.75%, and have an annual distribution and service fee of 0.25% of average daily net assets. Performance for Class A shares, excluding sales charges, assumes that no front-end sales charge applied.
Class C shares are sold with a contingent deferred sales charge of 1.00% if redeemed during the first 12 months. They are also subject to an annual distribution and service fee of 1.00% of average daily net assets. Performance for Class C shares, excluding sales charges, assumes either that contingent deferred sales charges did not apply or that the investment was not redeemed.
4
Class R shares are available only for certain retirement plan products. They are sold without a sales charge and have an annual distribution and service fee of 0.50% of average daily net assets.
Class R6 shares are available only to certain investors. In addition, Class R6 shares do not pay any service fees, sub-accounting fees, and/or sub-transfer agency fees to any brokers, dealers, or other financial intermediaries. Class R6 shares pay no distribution and service fee.
Narrowly focused investments may exhibit higher volatility than investments in multiple industry sectors.
REIT investments are subject to many of the risks associated with direct real estate ownership, including changes in economic conditions, credit risk, and interest rate fluctuations.
A REIT fund’s tax status as a regulated investment company could be jeopardized if it holds real estate directly, as a result of defaults, or receives rental income from real estate holdings.
2 The Fund’s expense ratios, as described in the most recent prospectus, are disclosed in the following “Fund expense ratios” table. Please see the “Financial highlights” section in this report for the most recent expense ratios.
| | | | | | | | | | |
| Fund expense ratios | | Class A | | Class C | | Class R | | Institutional
Class | | Class R6 |
Total annual operating expenses | | 1.33% | | 2.08% | | 1.58% | | 1.08% | | 0.93% |
(without fee waivers) | | | | | | | | | | |
Net expenses | | 1.33% | | 2.08% | | 1.58% | | 1.08% | | 0.93% |
(including fee waivers, if any) | | | | | | | | | | |
Type of waiver | | n/a | | n/a | | n/a | | n/a | | n/a |
5
| | | | |
| Performance summary | | | | |
| Delaware REIT Fund | | | | |
Performance of a $10,000 investment1
Average annual total returns from Oct. 31, 2007, through Oct. 31, 2017
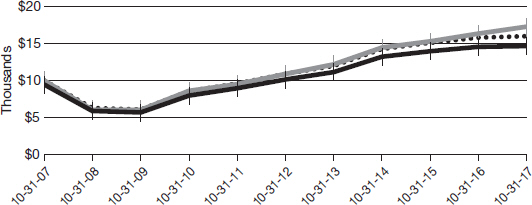
| | | | | | | | | | |
| For the period beginning Oct. 31, 2007 through Oct. 31, 2017 | | | Starting value | | | Ending value |
 | | FTSE NAREIT Equity REITs Index | | | $10,000 | | | $17,264 |
 | | Delaware REIT Fund — Institutional Class shares | | | $10,000 | | | $15,954 |
 | | Delaware REIT Fund — Class A shares | | | $9,425 | | | $14,659 |
1 The “Performance of a $10,000 investment” graph assumes $10,000 invested in Institutional Class and Class A shares of the Fund on Oct. 31, 2007, and includes the effect of a 5.75% front-end sales charge (for Class A shares) and the reinvestment of all distributions. The graph does not reflect the deduction of taxes the shareholders would pay on Fund distributions or redemptions of Fund shares. Expense limitations were in effect for some or all of the periods shown. Performance would have been lower had expense limitations not been in effect. Expenses are listed in the “Fund expense ratios” table on page 5. Please note additional details on pages 4 through 7.
The graph also assumes $10,000 invested in the FTSE NAREIT Equity REITs Index as of Oct. 31, 2007. The FTSE NAREIT Equity REITs
Index measures the performance of all publicly traded equity real estate investment trusts (REITs) traded on US exchanges, excluding timber and infrastructure REITs.
The S&P 500 Index, mentioned on page 2, measures the performance of 500 mostly large-cap stocks weighted by market value, and is often used to represent performance of the US stock market.
Index performance returns do not reflect any management fees, transaction costs, or expenses. Indices are unmanaged and one cannot invest directly in an index. Past performance is not a guarantee of future results.
Performance of other Fund classes will vary due to different charges and expenses.
6
| | | | | | |
| | | Nasdaq symbols | | CUSIPs | | |
Class A | | DPREX | | 246248868 | | |
Class C | | DPRCX | | 246248793 | | |
Class R | | DPRRX | | 246248561 | | |
Institutional Class | | DPRSX | | 246248777 | | |
Class R6 | | DPRDX | | 246248454 | | |
7
| | | | |
| Disclosure of Fund expenses | | | | |
| For the six-month period from May 1, 2017 to October 31, 2017 (Unaudited) | | | | |
As a shareholder of the Fund, you incur two types of costs: (1) transaction costs, including sales charges (loads) on purchase payments, reinvested dividends, or other distributions; redemption fees; and exchange fees; and (2) ongoing costs, including management fees; distribution and/or service (12b-1) fees; and other Fund expenses. This example is intended to help you understand your ongoing costs (in dollars) of investing in the Fund and to compare these costs with the ongoing costs of investing in other mutual funds.
The example is based on an investment of $1,000 invested at the beginning of the period and held for the entire six-month period from May 1, 2017 to Oct. 31, 2017.
Actual expenses
The first section of the table shown, “Actual Fund return,” provides information about actual account values and actual expenses. You may use the information in this section of the table, together with the amount you invested, to estimate the expenses that you paid over the period. Simply divide your account value by $1,000 (for example, an $8,600 account value divided by $1,000 = 8.6), then multiply the result by the number in the first section under the heading entitled “Expenses Paid During Period” to estimate the expenses you paid on your account during this period.
Hypothetical example for comparison purposes
The second section of the table shown, “Hypothetical 5% return,” provides information about hypothetical account values and hypothetical expenses based on the Fund’s actual expense ratio and an assumed rate of return of 5% per year before expenses, which is not the Fund’s actual return. The hypothetical account values and expenses may not be used to estimate the actual ending account balance or expenses you paid for the period. You may use this information to compare the ongoing costs of investing in the Fund and other funds. To do so, compare this 5% hypothetical example with the 5% hypothetical examples that appear in the shareholder reports of the other funds.
Please note that the expenses shown in the table are meant to highlight your ongoing costs only and do not reflect any transactional costs, such as sales charges (loads), redemption fees, or exchange fees. Therefore, the second section of the table is useful in comparing ongoing costs only, and will not help you determine the relative total costs of owning different funds. In addition, if these transactional costs were included, your costs would have been higher. The expenses shown in the table assume reinvestment of all dividends and distributions.
8
| | | | |
| Delaware REIT Fund | | | | |
| Expense analysis of an investment of $1,000 | | | | |
| | | | | | | | | | | | | | | | | | | | |
| | Beginning
Account Value
5/1/17 | | Ending
Account Value
10/31/17 | | Annualized
Expense Ratio | | Expenses
Paid During Period
5/1/17 to 10/31/17* |
Actual Fund return† | | | | | | | | | | | | | | | | | | | | |
Class A | | | | $1,000.00 | | | | | $995.80 | | | | | 1.43 | % | | | | $7.19 | |
Class C | | | | 1,000.00 | | | | | 992.00 | | | | | 2.18 | % | | | | 10.95 | |
Class R | | | | 1,000.00 | | | | | 994.50 | | | | | 1.68 | % | | | | 8.45 | |
Institutional Class | | | | 1,000.00 | | | | | 997.00 | | | | | 1.18 | % | | | | 5.94 | |
Class R6 | | | | 1,000.00 | | | | | 997.90 | | | | | 1.05 | % | | | | 5.29 | |
Hypothetical 5% return (5% return before expenses) | | | | | | |
Class A | | | | $1,000.00 | | | | | $1,018.00 | | | | | 1.43 | % | | | | $7.27 | |
Class C | | | | 1,000.00 | | | | | 1,014.22 | | | | | 2.18 | % | | | | 11.07 | |
Class R | | | | 1,000.00 | | | | | 1,016.74 | | | | | 1.68 | % | | | | 8.54 | |
Institutional Class | | | | 1,000.00 | | | | | 1,019.26 | | | | | 1.18 | % | | | | 6.01 | |
Class R6 | | | | 1,000.00 | | | | | 1,019.91 | | | | | 1.05 | % | | | | 5.35 | |
| * | “Expenses Paid During Period” are equal to the Fund’s annualized expense ratio, multiplied by the average account value over the period, multiplied by 184/365 (to reflect the one-half year period). |
| † | Because actual returns reflect only the most recent six-month period, the returns shown may differ significantly from fiscal year returns. |
9
| | |
| Security type / sector allocation and top 10 equity holdings |
| Delaware REIT Fund | | As of October 31, 2017 (Unaudited) |
Sector designations may be different than the sector designations presented in other Fund materials. The sector designations may represent the investment manager’s internal sector classifications.
| | | | | |
| Security type / sector | | Percentage of net assets |
Common Stocks | | | | 95.91 | % |
Diversified REITs | | | | 4.19 | % |
Healthcare | | | | 3.65 | % |
Healthcare REITs | | | | 6.11 | % |
Hotel REITs | | | | 6.37 | % |
Industrial REITs | | | | 8.95 | % |
Information Technology REITs | | | | 9.38 | % |
Mall REITs | | | | 8.97 | % |
Manufactured Housing REIT | | | | 1.57 | % |
Mixed REIT | | | | 0.81 | % |
Multifamily REITs | | | | 17.54 | % |
Office REITs | | | | 9.69 | % |
Self-Storage REITs | | | | 4.54 | % |
Shopping Center REITs | | | | 9.97 | % |
Single Tenant REITs | | | | 2.19 | % |
Specialty REITs | | | | 1.98 | % |
Short-Term Investments | | | | 2.95 | % |
Total Value of Securities | | | | 98.86 | % |
Receivables and Other Assets Net of Liabilities | | | | 1.14 | % |
Total Net Assets | | | | 100.00 | % |
Holdings are for informational purposes only and are subject to change at any time. They are not a recommendation to buy, sell, or hold any security.
| | | | | |
| Top 10 equity holdings | | Percentage of net assets |
Simon Property Group | | | | 6.72 | % |
Equinix | | | | 6.00 | % |
Prologis | | | | 5.92 | % |
AvalonBay Communities | | | | 5.08 | % |
Boston Properties | | | | 4.13 | % |
UDR | | | | 3.99 | % |
Equity Residential | | | | 3.68 | % |
Brookdale Senior Living | | | | 3.65 | % |
DCT Industrial Trust | | | | 3.02 | % |
Regency Centers | | | | 2.67 | % |
10
| | | | |
| Schedule of investments | | | | |
| Delaware REIT Fund | | | October 31, 2017 | |
| | | | | | | | |
| | Number of shares | | | Value (US $) | |
Common Stock – 95.91% | | | | | | | | |
Diversified REITs – 4.19% | | | | | | | | |
Forest City Realty Trust | | | 46,500 | | | $ | 1,145,295 | |
Gramercy Property Trust | | | 14,200 | | | | 421,740 | |
Vornado Realty Trust | | | 30,532 | | | | 2,285,625 | |
Washington Real Estate Investment Trust | | | 43,100 | | | | 1,387,389 | |
| | | | | | | | |
| | | | | | | 5,240,049 | |
| | | | | | | | |
Healthcare – 3.65% | | | | | | | | |
Brookdale Senior Living † | | | 456,100 | | | | 4,574,683 | |
| | | | | | | | |
| | | | | | | 4,574,683 | |
| | | | | | | | |
Healthcare REITs – 6.11% | | | | | | | | |
HCP | | | 83,800 | | | | 2,165,392 | |
Healthcare Realty Trust | | | 47,000 | | | | 1,515,280 | |
Sabra Health Care REIT | | | 33,900 | | | | 675,288 | |
Welltower | | | 49,125 | | | | 3,289,410 | |
| | | | | | | | |
| | | | | | | 7,645,370 | |
| | | | | | | | |
Hotel REITs – 6.37% | | | | | | | | |
Host Hotels & Resorts | | | 129,364 | | | | 2,530,360 | |
MGM Growth Properties | | | 70,600 | | | | 2,083,406 | |
Park Hotels & Resorts | | | 48,700 | | | | 1,402,073 | |
Sunstone Hotel Investors | | | 120,343 | | | | 1,963,998 | |
| | | | | | | | |
| | | | | | | 7,979,837 | |
| | | | | | | | |
Industrial REITs – 8.95% | | | | | | | | |
DCT Industrial Trust | | | 65,251 | | | | 3,785,863 | |
Prologis | | | 114,809 | | | | 7,414,365 | |
| | | | | | | | |
| | | | | | | 11,200,228 | |
| | | | | | | | |
Information Technology REITs – 9.38% | | | | | | | | |
CoreSite Realty | | | 8,200 | | | | 908,150 | |
Crown Castle International | | | 31,000 | | | | 3,319,480 | |
Equinix | | | 16,200 | | | | 7,508,700 | |
| | | | | | | | |
| | | | | | | 11,736,330 | |
| | | | | | | | |
Mall REITs – 8.97% | | | | | | | | |
GGP | | | 144,823 | | | | 2,818,256 | |
Simon Property Group | | | 54,158 | | | | 8,412,362 | |
| | | | | | | | |
| | | | | | | 11,230,618 | |
| | | | | | | | |
Manufactured Housing REIT – 1.57% | | | | | | | | |
Equity LifeStyle Properties | | | 22,136 | | | | 1,958,593 | |
| | | | | | | | |
| | | | | | | 1,958,593 | |
| | | | | | | | |
Mixed REIT – 0.81% | | | | | | | | |
Liberty Property Trust | | | 23,700 | | | | 1,016,256 | |
| | | | | | | | |
| | | | | | | 1,016,256 | |
| | | | | | | | |
Multifamily REITs – 17.54% | | | | | | | | |
American Homes 4 Rent | | | 37,200 | | | | 791,616 | |
11
| | | | |
| Schedule of investments | | | | |
| Delaware REIT Fund | | | | |
| | | | | | | | |
| | Number of shares | | | Value (US $) | |
Common Stock (continued) | | | | | | | | |
Multifamily REITs (continued) | | | | | | | | |
AvalonBay Communities | | | 35,051 | | | $ | 6,355,798 | |
Camden Property Trust | | | 21,400 | | | | 1,952,536 | |
Equity Residential | | | 68,423 | | | | 4,602,131 | |
Essex Property Trust | | | 12,427 | | | | 3,261,218 | |
UDR | | | 128,800 | | | | 4,996,152 | |
| | | | | | | | |
| | | | | | | 21,959,451 | |
| | | | | | | | |
Office REITs – 9.69% | | | | | | | | |
Boston Properties | | | 42,674 | | | | 5,171,235 | |
Brandywine Realty Trust | | | 132,000 | | | | 2,308,680 | |
Columbia Property Trust | | | 81,000 | | | | 1,788,480 | |
Empire State Realty Trust | | | 75,700 | | | | 1,517,785 | |
Equity Commonwealth † | | | 18,200 | | | | 546,910 | |
Kilroy Realty | | | 11,200 | | | | 797,776 | |
| | | | | | | | |
| | | | | | | 12,130,866 | |
| | | | | | | | |
Self-Storage REITs – 4.54% | | | | | | | | |
CubeSmart | | | 41,000 | | | | 1,116,020 | |
Extra Space Storage | | | 25,800 | | | | 2,105,022 | |
Public Storage | | | 11,902 | | | | 2,466,689 | |
| | | | | | | | |
| | | | | | | 5,687,731 | |
| | | | | | | | |
Shopping Center REITs – 9.97% | | | | | | | | |
Brixmor Property Group | | | 144,100 | | | | 2,517,427 | |
Kimco Realty | | | 102,300 | | | | 1,857,768 | |
Regency Centers | | | 54,225 | | | | 3,337,549 | |
Retail Properties of America | | | 76,600 | | | | 936,052 | |
Urban Edge Properties | | | 58,685 | | | | 1,376,750 | |
Weingarten Realty Investors | | | 80,800 | | | | 2,460,360 | |
| | | | | | | | |
| | | | | | | 12,485,906 | |
| | | | | | | | |
Single Tenant REITs – 2.19% | | | | | | | | |
Realty Income | | | 18,300 | | | | 982,161 | |
Spirit Realty Capital | | | 48,600 | | | | 403,866 | |
VEREIT | | | 172,000 | | | | 1,357,080 | |
| | | | | | | | |
| | | | | | | 2,743,107 | |
| | | | | | | | |
Specialty REITs – 1.98% | | | | | | | | |
CoreCivic | | | 18,000 | | | | 443,880 | |
Invitation Homes | | | 90,200 | | | | 2,035,814 | |
| | | | | | | | |
| | | | | | | 2,479,694 | |
| | | | | | | | |
| | |
Total Common Stock (cost $120,856,481) | | | | | | | 120,068,719 | |
| | | | | | | | |
12
| | | | | | | | |
| | Principal amount° | | | Value (US $) | |
Short-Term Investments – 2.95% | | | | | | | | |
Discount Notes – 2.72%≠ | | | | | | | | |
Federal Home Loan Bank
0.85% 11/1/17 | | | 36,343 | | | $ | 36,343 | |
0.90% 11/6/17 | | | 99,936 | | | | 99,922 | |
0.959% 11/3/17 | | | 41,686 | | | | 41,683 | |
0.97% 11/15/17 | | | 54,850 | | | | 54,828 | |
1.005% 11/9/17 | | | 2,821,522 | | | | 2,820,896 | |
1.005% 11/13/17 | | | 356,902 | | | | 356,783 | |
| | | | | | | | |
| | | | | | | 3,410,455 | |
| | | | | | | | |
Repurchase Agreements – 0.23% | | | | | | | | |
Bank of America Merrill Lynch
0.97%, dated 10/31/17, to be repurchased on 11/1/17, repurchase price $73,462 (collateralized by US government obligations 0.00%–9.00% 11/24/17–5/15/47; market value $74,929) | | | 73,460 | | | | 73,460 | |
BNP Paribas
1.00%, dated 10/31/17, to be repurchased on 11/1/17, repurchase price $207,508 (collateralized by US government obligations 0.00%–5.00% 2/15/18–2/15/46; market value $211,652) | | | 207,502 | | | | 207,502 | |
| | | | | | | | |
| | | | | | | 280,962 | |
| | | | | | | | |
Total Short-Term Investments (cost $3,691,414) | | | | | | | 3,691,417 | |
| | | | | | | | |
Total Value of Securities – 98.86%
(cost $124,547,895) | | | | | | $ | 123,760,136 | |
| | | | | | | | |
| ≠ | The rate shown is the effective yield at the time of purchase. |
| ° | Principal amount shown is stated in US dollars unless noted that the security is denominated in another currency. |
| † | Non-income producing security. |
REIT – Real Estate Investment Trust
See accompanying notes, which are an integral part of the financial statements.
13
| | | | |
| Statement of assets and liabilities | | | | |
| Delaware REIT Fund | | | October 31, 2017 | |
| | | | |
Assets: | | | | |
Investments, at value1 | | $ | 120,068,719 | |
Short-term investments, at value2 | | | 3,691,417 | |
Cash | | | 54,056 | |
Receivable for securities sold | | | 2,521,472 | |
Dividends and interest receivable | | | 19,659 | |
Receivable for fund shares sold | | | 12,533 | |
| | | | |
Total assets | | | 126,367,856 | |
| | | | |
Liabilities: | | | | |
Payable for securities purchased | | | 860,764 | |
Payable for fund shares redeemed | | | 82,335 | |
Investment management fees payable to affiliates | | | 81,563 | |
Other accrued expenses | | | 74,427 | |
Audit and tax fees payable | | | 30,780 | |
Distribution fees payable to affiliates | | | 29,484 | |
Administration fees payable | | | 17,804 | |
Custodian fees payable | | | 4,053 | |
Dividend disbursing and transfer agent fees and expense payable to affiliates | | | 2,142 | |
Accounting and administration expenses payable to affiliates | | | 753 | |
Trustees’ fees and expenses payable | | | 319 | |
Legal fees payable to affiliates | | | 186 | |
Reports and statements to shareholders expenses payable to affiliates | | | 89 | |
| | | | |
Total liabilities | | | 1,184,699 | |
| | | | |
Total Net Assets | | $ | 125,183,157 | |
| | | | |
| |
Net Assets Consist of: | | | | |
Paid-in capital | | $ | 127,753,048 | |
Accumulated net realized loss on investments | | | (1,782,132 | ) |
Net unrealized depreciation of investments | | | (787,759 | ) |
| | | | |
Total Net Assets | | $ | 125,183,157 | |
| | | | |
14
| | | | |
Net Asset Value | | | | |
Class A: | | | | |
Net assets | | $ | 65,823,679 | |
Shares of beneficial interest outstanding, unlimited authorization, no par | | | 5,795,464 | |
Net asset value per share | | $ | 11.36 | |
Sales charge | | | 5.75 | % |
Offering price per share, equal to net asset value per share / (1 – sales charge) | | $ | 12.05 | |
| |
Class C: | | | | |
Net assets | | $ | 13,331,453 | |
Shares of beneficial interest outstanding, unlimited authorization, no par | | | 1,178,958 | |
Net asset value per share | | $ | 11.31 | |
| |
Class R: | | | | |
Net assets | | $ | 7,884,835 | |
Shares of beneficial interest outstanding, unlimited authorization, no par | | | 694,835 | |
Net asset value per share | | $ | 11.35 | |
| |
Institutional Class: | | | | |
Net assets | | $ | 16,988,108 | |
Shares of beneficial interest outstanding, unlimited authorization, no par | | | 1,489,487 | |
Net asset value per share | | $ | 11.41 | |
| |
Class R6: | | | | |
Net assets | | $ | 21,155,082 | |
Shares of beneficial interest outstanding, unlimited authorization, no par | | | 1,854,571 | |
Net asset value per share | | $ | 11.41 | |
| |
| | | | |
1Investments, at cost | | $ | 120,856,481 | |
2Short-term investments, at cost | | | 3,691,414 | |
See accompanying notes, which are an integral part of the financial statements.
15
| | | | |
| Statement of operations | | | | |
| Delaware REIT Fund | |
| Year ended October 31, 2017
|
|
| | | | |
Investment Income: | | | | |
Dividends | | $ | 3,013,901 | |
Interest | | | 27,302 | |
| | | | |
| | | 3,041,203 | |
| | | | |
Expenses: | | | | |
Management fees | | | 1,063,169 | |
Distribution expenses – Class A | | | 189,748 | |
Distribution expenses – Class C | | | 168,724 | |
Distribution expenses – Class R | | | 48,109 | |
Dividend disbursing and transfer agent fees and expenses | | | 254,088 | |
Registration fees | | | 114,021 | |
Reports and statements to shareholders expenses | | | 57,479 | |
Accounting and administration expenses | | | 47,429 | |
Audit and tax fees | | | 44,435 | |
Legal fees | | | 42,215 | |
Custodian fees | | | 15,794 | |
Trustees’ fees and expenses | | | 6,948 | |
Other | | | 17,167 | |
| | | | |
| | | 2,069,326 | |
Less expense paid indirectly | | | (419 | ) |
| | | | |
Total operating expenses | | | 2,068,907 | |
| | | | |
Net Investment Income | | | 972,296 | |
| | | | |
| |
Net Realized and Unrealized Gain (Loss): | | | | |
Net realized gain on investments | | | 1,904,993 | |
Net change in unrealized appreciation (depreciation) of investments | | | (1,278,909 | ) |
| | | | |
Net Realized and Unrealized Gain | | | 626,084 | |
| | | | |
Net Increase in Net Assets Resulting from Operations | | $ | 1,598,380 | |
| | | | |
See accompanying notes, which are an integral part of the financial statements.
16
This page intentionally left blank.
| | | | |
| Statements of changes in net assets | | | | |
| Delaware REIT Fund | | | | |
| | | | | | | | |
| | | Year ended | |
| | | 10/31/17 | | | 10/31/16 | |
Increase (Decrease) in Net Assets from Operations: | | | | | | | | |
Net investment income | | $ | 972,296 | | | $ | 2,312,290 | |
Net realized gain | | | 1,904,993 | | | | 31,455,140 | |
Net change in unrealized appreciation (depreciation) | | | (1,278,909 | ) | | | (23,750,706 | ) |
| | | | | | | | |
Net increase in net assets resulting from operations | | | 1,598,380 | | | | 10,016,724 | |
| | | | | | | | |
| | |
Dividends and Distributions to Shareholders from: | | | | | | | | |
Net investment income: | | | | | | | | |
Class A | | | (1,318,781 | ) | | | (1,482,721 | ) |
Class C | | | (180,219 | ) | | | (206,654 | ) |
Class R | | | (143,795 | ) | | | (164,189 | ) |
Institutional Class | | | (445,133 | ) | | | (1,343,228 | ) |
Class R6 | | | (361,062 | ) | | | (7 | ) |
| | |
Net realized gain: | | | | | | | | |
Class A | | | (16,360,369 | ) | | | (9,285,426 | ) |
Class C | | | (3,921,243 | ) | | | (2,233,077 | ) |
Class R | | | (2,223,195 | ) | | | (1,164,924 | ) |
Institutional Class | | | (7,523,920 | ) | | | (10,700,738 | ) |
Class R6 | | | (367 | ) | | | — | |
| | | | | | | | |
| | | (32,478,084 | ) | | | (26,580,964 | ) |
| | | | | | | | |
| | |
Capital Share Transactions: | | | | | | | | |
Proceeds from shares sold: | | | | | | | | |
Class A | | | 7,431,644 | | | | 13,067,194 | |
Class C | | | 624,277 | | | | 2,140,853 | |
Class R | | | 1,779,605 | | | | 4,398,497 | |
Institutional Class | | | 6,981,497 | | | | 8,840,154 | |
Class R6 | | | 22,982,791 | | | | 2,000 | |
| | |
Net asset value of shares issued upon reinvestment of dividends and distributions: | | | | | | | | |
Class A | | | 17,259,738 | | | | 10,527,452 | |
Class C | | | 4,042,772 | | | | 2,383,275 | |
Class R | | | 2,366,985 | | | | 1,328,789 | |
Institutional Class | | | 7,893,996 | | | | 11,979,432 | |
Class R6 | | | 361,429 | | | | 7 | |
| | | | | | | | |
| | | 71,724,734 | | | | 54,667,653 | |
| | | | | | | | |
18
| | | | | | | | |
| | | Year ended | |
| | | 10/31/17 | | | 10/31/16 | |
Capital Share Transactions (continued): | | | | | | | | |
Cost of shares redeemed: | | | | | | | | |
Class A | | $ | (28,241,800 | ) | | $ | (21,287,891 | ) |
Class C | | | (7,957,171 | ) | | | (4,306,650 | ) |
Class R | | | (6,571,414 | ) | | | (4,268,959 | ) |
Institutional Class | | | (28,968,149 | ) | | | (84,169,618 | ) |
Class R6 | | | (1,945,824 | ) | | | — | |
| | | | | | | | |
| | | (73,684,358 | ) | | | (114,033,118 | ) |
| | | | | | | | |
Decrease in net assets derived from capital share transactions | | | (1,959,624 | ) | | | (59,365,465 | ) |
| | | | | | | | |
Net Decrease in Net Assets | | | (32,839,328 | ) | | | (75,929,705 | ) |
| | |
Net Assets: | | | | | | | | |
Beginning of year | | | 158,022,485 | | | | 233,952,190 | |
| | | | | | | | |
End of year (there was no undistributed net investment income at either year end) | | $ | 125,183,157 | | | $ | 158,022,485 | |
| | | | | | | | |
See accompanying notes, which are an integral part of the financial statements.
19
| | | | |
| Financial highlights | | | | |
| Delaware REIT Fund Class A | | | | |
Selected data for each share of the Fund outstanding throughout each period were as follows:
|
Net asset value, beginning of period |
|
Income from investment operations: |
Net investment income1 |
Net realized and unrealized gain |
Total from investment operations |
|
Less dividends and distributions from: |
Net investment income |
Net realized gain |
Total dividends and distributions |
|
Net asset value, end of period |
|
Total return2 |
|
Ratios and supplemental data: |
Net assets, end of period (000 omitted) |
Ratio of expenses to average net assets |
Ratio of expenses to average net assets prior to fees waived3 |
Ratio of net investment income to average net assets |
Ratio of net investment income to average net assets prior to fees waived3 |
Portfolio turnover |
| 1 | The average shares outstanding method has been applied for per share information. |
| 2 | Total investment return is based on the change in net asset value of a share during the period and assumes reinvestment of dividends and distributions at net asset value and does not reflect the impact of a sales charge. Total investment return during some of the periods shown reflects a waiver by the distributor. Performance would have been lower had the waiver not been in effect. |
| 3 | Expenses paid indirectly were not material and had no impact on the ratios disclosed. Expenses paid indirectly for the year ended Oct. 31, 2017 are reflected on the “Statement of operations.” |
See accompanying notes, which are an integral part of the financial statements.
20
| | | | | | | | | | | | | | | | | | | | |
| | | Year ended | |
| | | 10/31/17 | | | 10/31/16 | | | 10/31/15 | | | 10/31/14 | | | 10/31/13 | |
| | $ | 14.28 | | | $ | 15.54 | | | $ | 15.61 | | | $ | 13.87 | | | $ | 12.85 | |
| | | | | |
| | | 0.08 | | | | 0.18 | | | | 0.13 | | | | 0.13 | | | | 0.15 | |
| | | 0.03 | | | | 0.41 | | | | 0.76 | | | | 2.30 | | | | 1.10 | |
| | | | | | | | | | | | | | | | | | | | |
| | | 0.11 | | | | 0.59 | | | | 0.89 | | | | 2.43 | | | | 1.25 | |
| | | | | | | | | | | | | | | | | | | | |
| | | | | |
| | | (0.21 | ) | | | (0.24 | ) | | | (0.24 | ) | | | (0.25 | ) | | | (0.23 | ) |
| | | (2.82 | ) | | | (1.61 | ) | | | (0.72 | ) | | | (0.44 | ) | | | — | |
| | | | | | | | | | | | | | | | | | | | |
| | | (3.03 | ) | | | (1.85 | ) | | | (0.96 | ) | | | (0.69 | ) | | | (0.23 | ) |
| | | | | | | | | | | | | | | | | | | | |
| | | | | |
| | $ | 11.36 | | | $ | 14.28 | | | $ | 15.54 | | | $ | 15.61 | | | $ | 13.87 | |
| | | | | | | | | | | | | | | | | | | | |
| | | | | |
| | | 0.90% | | | | 4.24% | | | | 5.70% | | | | 18.53% | | | | 9.82% | |
| | | | | |
| | $ | 65,824 | | | $ | 86,129 | | | $ | 90,899 | | | $ | 98,986 | | | $ | 91,593 | |
| | | 1.44% | | | | 1.33% | | | | 1.37% | | | | 1.34% | | | | 1.31% | |
| | | | | |
| | | 1.44% | | | | 1.33% | | | | 1.37% | | | | 1.34% | | | | 1.36% | |
| | | 0.71% | | | | 1.24% | | | | 0.81% | | | | 0.89% | | | | 1.11% | |
| | | | | |
| | | 0.71% | | | | 1.24% | | | | 0.81% | | | | 0.89% | | | | 1.06% | |
| | | | 145% | | | | 111% | | | | 67% | | | | 83% | | | | 101% | |
21
| | | | |
| Financial highlights | | | | |
| Delaware REIT Fund Class C | | | | |
Selected data for each share of the Fund outstanding throughout each period were as follows:
|
Net asset value, beginning of period |
|
Income from investment operations: |
Net investment income1 |
Net realized and unrealized gain |
Total from investment operations |
|
Less dividends and distributions from: |
Net investment income |
Net realized gain |
Total dividends and distributions |
|
Net asset value, end of period |
|
Total return3 |
|
Ratios and supplemental data: |
Net assets, end of period (000 omitted) |
Ratio of expenses to average net assets4 |
Ratio of net investment income (loss) to average net assets4 |
Portfolio turnover |
| 1 | The average shares outstanding method has been applied for per share information. |
| 2 | Amount is less than $(0.005) per share. |
| 3 | Total investment return is based on the change in net asset value of a share during the period and assumes reinvestment of dividends and distributions at net asset value and does not reflect the impact of a sales charge. |
| 4 | Expenses paid indirectly were not material and had no impact on the ratios disclosed. Expenses paid indirectly for the year ended Oct. 31, 2017 are reflected on the “Statement of operations.” |
See accompanying notes, which are an integral part of the financial statements.
22
| | | | | | | | | | | | | | | | | | | | |
| | | Year ended | |
| | | 10/31/17 | | | 10/31/16 | | | 10/31/15 | | | 10/31/14 | | | 10/31/13 | |
| | $ | 14.24 | | | $ | 15.50 | | | $ | 15.59 | | | $ | 13.86 | | | $ | 12.83 | |
| | | | | |
| | | — | 2 | | | 0.07 | | | | 0.01 | | | | 0.02 | | | | 0.05 | |
| | | 0.02 | | | | 0.42 | | | | 0.75 | | | | 2.30 | | | | 1.11 | |
| | | | | | | | | | | | | | | | | | | | |
| | | 0.02 | | | | 0.49 | | | | 0.76 | | | | 2.32 | | | | 1.16 | |
| | | | | | | | | | | | | | | | | | | | |
| | | | | |
| | | (0.13 | ) | | | (0.14 | ) | | | (0.13 | ) | | | (0.15 | ) | | | (0.13 | ) |
| | | (2.82 | ) | | | (1.61 | ) | | | (0.72 | ) | | | (0.44 | ) | | | — | |
| | | | | | | | | | | | | | | | | | | | |
| | | (2.95 | ) | | | (1.75 | ) | | | (0.85 | ) | | | (0.59 | ) | | | (0.13 | ) |
| | | | | | | | | | | | | | | | | | | | |
| | | | | |
| | $ | 11.31 | | | $ | 14.24 | | | $ | 15.50 | | | $ | 15.59 | | | $ | 13.86 | |
| | | | | | | | | | | | | | | | | | | | |
| | | | | |
| | | 0.13% | | | | 3.53% | | | | 4.86% | | | | 17.68% | | | | 9.00% | |
| | | | | |
| | $ | 13,331 | | | $ | 20,598 | | | $ | 22,085 | | | $ | 23,171 | | | $ | 21,083 | |
| | | 2.19% | | | | 2.08% | | | | 2.12% | | | | 2.09% | | | | 2.06% | |
| | | (0.04% | ) | | | 0.49% | | | | 0.06% | | | | 0.14% | | | | 0.36% | |
| | | | 145% | | | | 111% | | | | 67% | | | | 83% | | | | 101% | |
23
| | | | |
| Financial highlights | | | | |
| Delaware REIT Fund Class R | | | | |
Selected data for each share of the Fund outstanding throughout each period were as follows:
|
Net asset value, beginning of period |
|
Income from investment operations: |
Net investment income1 |
Net realized and unrealized gain |
Total from investment operations |
|
Less dividends and distributions from: |
Net investment income |
Net realized gain |
Total dividends and distributions |
|
Net asset value, end of period |
|
Total return2 |
|
Ratios and supplemental data: |
Net assets, end of period (000 omitted) |
Ratio of expenses to average net assets |
Ratio of expenses to average net assets prior to fees waived3 |
Ratio of net investment income to average net assets |
Ratio of net investment income to average net assets prior to fees waived3 |
Portfolio turnover |
| 1 | The average shares outstanding method has been applied for per share information. |
| 2 | Total investment return is based on the change in net asset value of a share during the period and assumes reinvestment of dividends and distributions at net asset value. Total investment return during some of the periods shown reflects a waiver by the distributor. Performance would have been lower had the waiver not been in effect. |
| 3 | Expenses paid indirectly were not material and had no impact on the ratios disclosed. Expenses paid indirectly for the year ended Oct. 31, 2017 are reflected on the “Statement of operations.” |
See accompanying notes, which are an integral part of the financial statements.
24
| | | | | | | | | | | | | | | | | | | | |
| | | Year ended | |
| | | 10/31/17 | | | 10/31/16 | | | 10/31/15 | | | 10/31/14 | | | 10/31/13 | |
| | $ | 14.27 | | | $ | 15.53 | | | $ | 15.61 | | | $ | 13.87 | | | $ | 12.85 | |
| | | | | |
| | | 0.05 | | | | 0.15 | | | | 0.09 | | | | 0.09 | | | | 0.12 | |
| | | 0.04 | | | | 0.41 | | | | 0.75 | | | | 2.31 | | | | 1.10 | |
| | | | | | | | | | | | | | | | | | | | |
| | | 0.09 | | | | 0.56 | | | | 0.84 | | | | 2.40 | | | | 1.22 | |
| | | | | | | | | | | | | | | | | | | | |
| | | | | |
| | | (0.19 | ) | | | (0.21 | ) | | | (0.20 | ) | | | (0.22 | ) | | | (0.20 | ) |
| | | (2.82 | ) | | | (1.61 | ) | | | (0.72 | ) | | | (0.44 | ) | | | — | |
| | | | | | | | | | | | | | | | | | | | |
| | | (3.01 | ) | | | (1.82 | ) | | | (0.92 | ) | | | (0.66 | ) | | | (0.20 | ) |
| | | | | | | | | | | | | | | | | | | | |
| | | | | |
| | $ | 11.35 | | | $ | 14.27 | | | $ | 15.53 | | | $ | 15.61 | | | $ | 13.87 | |
| | | | | | | | | | | | | | | | | | | | |
| | | | | |
| | | 0.66% | | | | 4.00% | | | | 5.40% | | | | 18.24% | | | | 9.54% | |
| | | | | |
| | $ | 7,885 | | | $ | 12,573 | | | $ | 12,025 | | | $ | 12,614 | | | $ | 10,503 | |
| | | 1.69% | | | | 1.58% | | | | 1.62% | | | | 1.59% | | | | 1.56% | |
| | | | | |
| | | 1.69% | | | | 1.58% | | | | 1.62% | | | | 1.59% | | | | 1.65% | |
| | | 0.46% | | | | 0.99% | | | | 0.56% | | | | 0.64% | | | | 0.86% | |
| | | | | |
| | | 0.46% | | | | 0.99% | | | | 0.56% | | | | 0.64% | | | | 0.77% | |
| | | | 145% | | | | 111% | | | | 67% | | | | 83% | | | | 101% | |
25
| | | | |
| Financial highlights | | | | |
| Delaware REIT Fund Institutional Class | | | | |
Selected data for each share of the Fund outstanding throughout each period were as follows:
|
Net asset value, beginning of period |
|
Income from investment operations: |
Net investment income1 |
Net realized and unrealized gain |
Total from investment operations |
|
Less dividends and distributions from: |
Net investment income |
Net realized gain |
Total dividends and distributions |
|
Net asset value, end of period |
|
Total return2 |
|
Ratios and supplemental data: |
Net assets, end of period (000 omitted) |
Ratio of expenses to average net assets3 |
Ratio of net investment income to average net assets3 |
Portfolio turnover |
| 1 | The average shares outstanding method has been applied for per share information. |
| 2 | Total investment return is based on the change in net asset value of a share during the period and assumes reinvestment of dividends and distributions at net asset value. |
| 3 | Expenses paid indirectly were not material and had no impact on the ratios disclosed. Expenses paid indirectly for the year ended Oct. 31, 2017 are reflected on the “Statement of operations.” |
See accompanying notes, which are an integral part of the financial statements.
26
| | | | | | | | | | | | | | | | | | |
| Year ended | |
| | 10/31/17 | | | | 10/31/16 | | | | 10/31/15 | | | | 10/31/14 | | | | 10/31/13 | |
| $ | 14.33 | | | $ | 15.57 | | | $ | 15.64 | | | $ | 13.90 | | | $ | 12.88 | |
| | | | |
| | 0.12 | | | | 0.21 | | | | 0.16 | | | | 0.16 | | | | 0.19 | |
| | 0.02 | | | | 0.44 | | | | 0.76 | | | | 2.31 | | | | 1.10 | |
| | | | | | | | | | | | | | | | | | |
| | 0.14 | | | | 0.65 | | | | 0.92 | | | | 2.47 | | | | 1.29 | |
| | | | | | | | | | | | | | | | | | |
| | | | |
| | (0.24 | ) | | | (0.28 | ) | | | (0.27 | ) | | | (0.29 | ) | | | (0.27 | ) |
| | (2.82 | ) | | | (1.61 | ) | | | (0.72 | ) | | | (0.44 | ) | | | — | |
| | | | | | | | | | | | | | | | | | |
| | (3.06 | ) | | | (1.89 | ) | | | (0.99 | ) | | | (0.73 | ) | | | (0.27 | ) |
| | | | | | | | | | | | | | | | | | |
| | | | |
| $ | 11.41 | | | $ | 14.33 | | | $ | 15.57 | | | $ | 15.64 | | | $ | 13.90 | |
| | | | | | | | | | | | | | | | | | |
| | | | |
| | 1.14% | | | | 4.60% | | | | 5.94% | | | | 18.80% | | | | 10.07% | |
| | | | |
| $ | 16,988 | | | $ | 38,720 | | | $ | 108,943 | | | $ | 119,640 | | | $ | 106,221 | |
| | 1.19% | | | | 1.08% | | | | 1.12% | | | | 1.09% | | | | 1.06% | |
| | 0.96% | | | | 1.49% | | | | 1.06% | | | | 1.14% | | | | 1.36% | |
| | 145% | | | | 111% | | | | 67% | | | | 83% | | | | 101% | |
27
| | | | |
| Financial highlights | | | | |
| Delaware REIT Fund Class R6 | | | | |
Selected data for each share of the Fund outstanding throughout each period were as follows:
| | | | | | | | |
| | | Year ended
10/31/17 | | | 8/31/161
to
10/31/16 | |
| | |
Net asset value, beginning of period | | $ | 14.33 | | | $ | 15.43 | |
| | |
Income (loss) from investment operations: | | | | | | | | |
Net investment income2 | | | 0.13 | | | | 0.29 | |
Net realized and unrealized gain (loss) | | | 0.03 | | | | (1.33 | ) |
| | | | | | | | |
Total from investment operations | | | 0.16 | | | | (1.04 | ) |
| | | | | | | | |
| | |
Less dividends and distributions from: | | | | | | | | |
Net investment income | | | (0.26 | ) | | | (0.06 | ) |
Net realized gain | | | (2.82 | ) | | | — | |
| | | | | | | | |
Total dividends and distributions | | | (3.08 | ) | | | (0.06 | ) |
| | | | | | | | |
| | |
Net asset value, end of period | | $ | 11.41 | | | $ | 14.33 | |
| | | | | | | | |
| | |
Total return3 | | | 1.28% | | | | (6.79% | ) |
| | |
Ratios and supplemental data: | | | | | | | | |
Net assets, end of period (000 omitted) | | $ | 21,155 | | | $ | 2 | |
Ratio of expenses to average net assets4 | | | 1.04% | | | | 0.93% | |
Ratio of net investment income to average net assets4 | | | 1.11% | | | | 1.97% | |
Portfolio turnover | | | 145% | | | | 111% | 5 |
| 1 | Date of commencement of operations; ratios have been annualized and total return has not been annualized. |
| 2 | The average shares outstanding method has been applied for per share information. |
| 3 | Total investment return is based on the change in net asset value of a share during the period and assumes reinvestment of dividends and distributions at net asset value. |
| 4 | Expenses paid indirectly were not material and had no impact on the ratios disclosed. Expenses paid indirectly for the year ended Oct. 31, 2017 are reflected on the “Statement of operations.” |
| 5 | Portfolio turnover is representative of the Fund for the entire year ended Oct. 31, 2016. |
See accompanying notes, which are an integral part of the financial statements.
28
| | | | |
| Notes to financial statements | | | | |
| Delaware REIT Fund | | | October 31, 2017 | |
Delaware REIT Fund (Fund) is a series of Delaware Pooled® Trust (Trust), which is organized as a Delaware statutory trust. The Trust is an open-end investment company. The Fund is considered diversified under the Investment Company Act of 1940, as amended, (1940 Act), and offers Class A, Class C, Class R, Institutional Class, and Class R6 shares. Class A shares are sold with a maximum front-end sales charge of 5.75%. Class A share purchases of $1,000,000 or more will incur a contingent deferred sales charge (CDSC) instead of a front-end sales charge of 1.00% if redeemed during the first year, and 0.50% during the second year, provided that Delaware Distributors, L.P. (DDLP) paid a financial advisor a commission on the purchase of those shares. Class C shares are sold with a CDSC of 1.00%, if redeemed during the first 12 months. Class R, Institutional Class, and Class R6 shares are not subject to a sales charge and are offered for sale exclusively to certain eligible investors. In addition, Class R6 shares do not pay any service fees, sub-accounting fees, and/or sub-transfer agency fees to any brokers, dealers, or other financial intermediaries. This report contains information relating only to Delaware REIT Fund. All other series of Delaware Pooled Trust, Macquarie Institutional Portfolios, are included in a separate report.
The investment objectives of the Fund are to seek maximum long-term total return, with capital appreciation as a secondary objective. It seeks to achieve its objectives by investing primarily in securities of companies principally engaged in the real estate industry.
1. Significant Accounting Policies
The following accounting policies are in accordance with US generally accepted accounting principles (US GAAP) and are consistently followed by the Fund.
Security Valuation – Equity securities, except those traded on the Nasdaq Stock Market LLC (Nasdaq), are valued at the last quoted sales price as of the time of the regular close of the New York Stock Exchange on the valuation date. Equity securities traded on the Nasdaq are valued in accordance with the Nasdaq Official Closing Price, which may not be the last sales price. If, on a particular day, an equity security does not trade, the mean between the bid and ask prices will be used, which approximates fair value. US government and agency securities are valued at the mean between the bid and ask prices, which approximates fair value. Generally, other securities and assets for which market quotations are not readily available are valued at fair value as determined in good faith under the direction of the Trust’s Board of Trustees (Board). In determining whether market quotations are readily available or fair valuation will be used, various factors will be taken into consideration, such as market closures or suspension of trading in a security. The foregoing valuation policies apply to restricted and unrestricted securities.
Federal Income Taxes – No provision for federal income taxes has been made as the Fund intends to continue to qualify for federal income tax purposes as a regulated investment company under Subchapter M of the Internal Revenue Code of 1986, as amended, and make the requisite distributions to shareholders. The Fund evaluates tax positions taken or expected to be taken in the course of preparing the Fund’s tax returns to determine whether the tax positions are “more-likely-than-not” of being sustained by the applicable tax authority. Tax positions not deemed to meet the “more-likely-than-not” threshold are recorded as a tax benefit or expense in the current year. Management has analyzed the Fund’s tax positions taken or to be taken on the Fund’s federal income tax returns through the year ended Oct. 31, 2017 and for all open federal income tax years (years ended Oct. 31, 2014–
29
| | | | |
| Notes to financial statements | | | | |
| Delaware REIT Fund | | | | |
1. Significant Accounting Policies (continued)
Oct. 31, 2016), and has concluded that no provision for federal income tax is required in the Fund’s financial statements. If applicable, the Fund recognizes interest accrued on unrecognized tax benefits in interest expense and penalties in other expenses on the “Statement of operations.” During the year ended Oct. 31, 2017, the Fund did not incur any interest or tax penalties.
Class Accounting – Investment income, common expenses, and realized and unrealized gain (loss) on investments are allocated to the various classes of the Fund on the basis of daily net assets of each class. Distribution expenses relating to a specific class are charged directly to that class. Class R6 shares will not be allocated any expenses related to service fees, sub-accounting fees, and/or sub-transfer agency fees paid to brokers, dealers, or other financial intermediaries.
Repurchase Agreements – The Fund may purchase certain US government securities subject to the counterparty’s agreement to repurchase them at an agreed upon date and price. The counterparty will be required on a daily basis to maintain the value of the collateral subject to the agreement at not less than the repurchase price (including accrued interest). The agreements are conditioned upon the collateral being deposited under the Federal Reserve book-entry system with the Fund’s custodian or a third-party sub-custodian. In the event of default or bankruptcy by the other party to the agreement, retention of the collateral may be subject to legal proceedings. All open repurchase agreements as of the date of this report were entered into on Oct. 31, 2017 and matured on the next business day.
Use of Estimates – The Fund is an investment company, whose financial statements are prepared in conformity with US GAAP. Therefore, the Fund follows the accounting and reporting guidelines for investment companies. The preparation of financial statements in conformity with US GAAP requires management to make estimates and assumptions that affect the fair value of investments, the reported amounts of assets and liabilities and disclosure of contingent assets and liabilities at the date of the financial statements, and the reported amounts of revenues and expenses during the reporting period. Actual results could differ from those estimates and the differences could be material.
Other – Expenses directly attributable to the Fund are charged directly to the Fund. Other expenses common to various funds within the Delaware FundsSM by Macquarie (Delaware Funds) are generally allocated among such funds on the basis of average net assets. Management fees and certain other expenses are paid monthly. Security transactions are recorded on the date the securities are purchased or sold (trade date) for financial reporting purposes. Costs used in calculating realized gains and losses on the sale of investment securities are those of the specific securities sold. Dividend income is recorded on the ex-dividend date and interest income is recorded on the accrual basis. Discounts and premiums on debt securities are accreted or amortized to interest income, respectively, over the lives of the respective securities using the effective interest method. Distributions received from investments in real estate investment trusts (REITs) are recorded as dividend income on the ex-dividend date, subject to reclassification upon notice of the character of such distributions by the issuer. The financial statements reflect an estimate of the reclassification of the distribution character. The Fund declares and pays dividends from net investment income quarterly and net realized gain on investments, if any, annually. The Fund may distribute more frequently, if necessary for tax purposes. Dividends and distributions, if any, are recorded on the ex-dividend date.
30
Subject to seeking best execution, the Fund may direct certain security trades to brokers who have agreed to rebate a portion of the related brokerage commission to the Fund in cash. In general, best execution refers to many factors, including the price paid or received for a security, the commission charged, the promptness and reliability of execution, the confidentiality and placement accorded the order, and other factors affecting the overall benefit obtained by the Fund on the transaction. There were no commission rebates for the year ended Oct. 31, 2017.
The Fund may receive earnings credits from its custodian when positive cash balances are maintained, which may be used to offset custody fees. The expense paid under this arrangement is on the “Statement of operations” under “Custodian fees” with the corresponding expense offset shown under “Less expense paid indirectly.” For the year ended Oct. 31, 2017, the Fund earned $87 under this agreement.
The Fund receives earnings credits from its transfer agent when positive cash balances are maintained, which may be used to offset transfer agent fees. If the amount earned is greater than $1, the expense paid under this arrangement is included on the “Statement of operations” under “Dividend disbursing and transfer agent fees and expenses” with the corresponding expense offset shown under “Less expense paid indirectly.” For the year ended Oct. 31, 2017, the Fund earned $332 under this agreement.
2. Investment Management, Administration Agreements, and Other Transactions with Affiliates
In accordance with the terms of its investment management agreement, the Fund pays Delaware Management Company (DMC), a series of Macquarie Investment Management Business Trust (formerly, Delaware Management Business Trust) and the investment manager, an annual fee which is calculated daily and paid monthly at the rate of 0.75% on the first $500 million of the average daily net assets of the Fund; 0.70% on the next $500 million; 0.65% on the next $1.5 billion; and 0.60% on average daily net assets in excess of $2.5 billion.
Delaware Investments Fund Services Company (DIFSC), an affiliate of DMC, provides fund accounting and financial administration oversight services to the Fund. For these services, DIFSC’s fees were calculated daily and paid monthly based on the aggregate daily net assets of the Delaware Funds from Nov. 1, 2016 through Aug. 31, 2017 at the following annual rate: 0.0050% of the first $30 billion; 0.0045% of the next $10 billion; 0.0040% of the next $10 billion; and 0.0025% of aggregate average daily net assets in excess of $50 billion. The fees payable to DIFSC under the service agreement described above were allocated among all funds in the Delaware Funds on a relative net asset value (NAV) basis. Effective Sept. 1, 2017, the Fund entered into an amendment to the DIFSC agreement. Under the amendment to the DIFSC agreement, DIFSC’s fees are calculated daily and paid monthly based on the aggregate daily net assets of the Delaware Funds at the following annual rate: 0.00475% of the first $35 billion; 0.0040% of the next $10 billion; and 0.0025% of aggregate average daily net assets in excess of $45 billion (Total Fee). Each Fund in the Delaware Funds pays a minimum of $4,000, which, in aggregate, is subtracted from the Total Fee. Each Fund in the Delaware Funds then pays its relative portion of the remainder of the Total Fee on a relative NAV basis. For the year ended Oct. 31, 2017, the Fund was charged $7,072 for these services. This amount is included on the “Statement of operations” under “Accounting and administration expenses.”
31
| | | | |
| Notes to financial statements | | | | |
| Delaware REIT Fund | | | | |
2. Investment Management, Administration Agreements, and Other Transactions with Affiliates (continued)
DIFSC is also the transfer agent and dividend disbursing agent of the Fund. For these services, DIFSC’s fees are calculated daily and paid monthly based on the aggregate daily net assets of the retail funds within the Delaware Funds at the following annual rate: 0.025% of the first $20 billion; 0.020% of the next $5 billion; 0.015% of the next $5 billion; and 0.013% of average daily net assets in excess of $30 billion. The fees payable to DIFSC under the service agreement described above were allocated among all retail funds in the Delaware Funds on a relative NAV basis. For the year ended Oct. 31, 2017, the Fund was charged $28,226 for these services. This amount is included on the “Statement of operations” under “Dividend disbursing and transfer agent fees and expenses.” Pursuant to a sub-transfer agency agreement between DIFSC and BNY Mellon Investment Servicing (US) Inc. (BNYMIS), BNYMIS provides certain sub-transfer agency services to the Fund. Sub-transfer agency fees are paid by the Fund and are also included on the “Statement of operations” under “Dividend disbursing and transfer agent fees and expenses.”
Pursuant to a distribution agreement and distribution plan, the Fund pays DDLP, the distributor and an affiliate of DMC, an annual distribution and service (12b-1) fee of 0.25% of the average daily net assets of the Class A shares, 1.00% of the average daily net assets of the Class C shares, and 0.50% of the average daily net assets of the Class R shares. The fees are calculated daily and paid monthly. Institutional Class and Class R6 shares pay no 12b-1 fees.
As provided in the investment management agreement, the Fund bears a portion of the cost of certain resources shared with DMC, including the cost of internal personnel of DMC and/or its affiliates that provide legal, tax, and regulatory reporting services to the Fund. For the year ended Oct. 31, 2017, the Fund was charged $2,956 for internal legal, tax, and regulatory reporting services provided by DMC and/or its affiliates’ employees. This amount is included on the “Statement of operations” under “Legal fees.”
For the year ended Oct. 31, 2017, DDLP earned $5,863 for commissions on sales of the Fund’s Class A shares. For the year ended Oct. 31, 2017, DDLP received gross CDSC commissions of $491 and $1,480 on redemptions of the Fund’s Class A and Class C shares, respectively, and these commissions were entirely used to offset upfront commissions previously paid by DDLP to broker/dealers on sales of those shares.
Trustees’ fees include expenses accrued by the Fund for each Trustee’s retainer and meeting fees. Certain officers of DMC, DIFSC, and DDLP are officers and/or Trustees of the Trust. These officers and Trustees are paid no compensation by the Fund.
Cross trades for the year ended Oct. 31, 2017 were executed by the Fund pursuant to procedures adopted by the Board designed to ensure compliance with Rule 17a-7 under the 1940 Act. Cross trading is the buying or selling of portfolio securities between funds of investment companies, or between a fund of an investment company and another entity, that are or could be considered affiliates by virtue of having a common investment advisor (or affiliated investment advisors), common directors/trustees and/or common officers. At its regularly scheduled meetings, the Board reviews such transactions for compliance with the procedures adopted by the Board. Pursuant to these procedures, for the year
32
ended Oct. 31, 2017, the Fund engaged in securities sales of $4,487,215 which resulted in net realized loss of $40. There were no securities purchases under Rule 17a-7 for the year ended Oct. 31, 2017.
3. Investments
For the year ended Oct. 31, 2017, the Fund made purchases and sales of investment securities other than short-term investments as follows:
| | | | |
Purchases | | $ | 201,458,208 | |
Sales | | | 234,139,288 | |
Tax cost of investments includes adjustments to net unrealized appreciation (depreciation) which may not necessarily be final tax cost basis adjustments, but approximate the tax basis unrealized gains and losses that may be realized and distributed to shareholders. At Oct. 31, 2017, the cost and unrealized appreciation (depreciation) of investments for federal income tax purposes were as follows:
| | | | |
Cost of investments | | $ | 129,067,186 | |
| | | | |
Aggregate unrealized appreciation of investments | | $ | 4,268,848 | |
Aggregate unrealized depreciation of investments | | | (9,575,898 | ) |
| | | | |
Net unrealized depreciation of investments | | $ | (5,307,050 | ) |
| | | | |
US GAAP defines fair value as the price that the Fund would receive to sell an asset or pay to transfer a liability in an orderly transaction between market participants at the measurement date under current market conditions. A three-level hierarchy for fair value measurements has been established based upon the transparency of inputs to the valuation of an asset or liability. Inputs may be observable or unobservable and refer broadly to the assumptions that market participants would use in pricing the asset or liability. Observable inputs reflect the assumptions market participants would use in pricing the asset or liability based on market data obtained from sources independent of the reporting entity. Unobservable inputs reflect the reporting entity’s own assumptions about the assumptions that market participants would use in pricing the asset or liability based on the best information available under the circumstances. The Fund’s investment in its entirety is assigned a level based upon the observability of the inputs which are significant to the overall valuation. The three-level hierarchy of inputs is summarized below.
| | |
Level 1 – | | Inputs are quoted prices in active markets for identical investments. (Examples: equity securities, open-end investment companies, futures contracts, exchange-traded options contracts) |
| |
Level 2 – | | Other observable inputs, including, but not limited to: quoted prices for similar assets or liabilities in markets that are active, quoted prices for identical or similar assets or liabilities in markets that are not active, inputs other than quoted prices that are observable for the assets or liabilities (such as interest rates, yield curves, volatilities, prepayment speeds, loss severities, credit risks, and default rates) or other market-corroborated inputs. (Examples: debt securities, government securities, swap contracts, foreign currency exchange contracts, foreign securities utilizing international fair value pricing, broker-quoted securities, fair valued securities) |
33
| | | | |
| Notes to financial statements | | | | |
| Delaware REIT Fund | | | | |
3. Investments (continued)
| | |
Level 3 – | | Significant unobservable inputs, including the Fund’s own assumptions used to determine the fair value of investments. (Examples: broker-quoted securities, fair valued securities) |
Level 3 investments are valued using significant unobservable inputs. The Fund may also use an income-based valuation approach in which the anticipated future cash flows of the investment are discounted to calculate fair value. Discounts may also be applied due to the nature or duration of any restrictions on the disposition of the investments. Valuations may also be based upon current market prices of securities that are comparable in coupon, rating, maturity, and industry. The derived value of a Level 3 investment may not represent the value which is received upon disposition and this could impact the results of operations.
The following table summarizes the valuation of the Fund’s investments by fair value hierarchy levels as of Oct. 31, 2017:
| | | | | | | | | | | | |
Securities | | Level 1 | | | Level 2 | | | Total | |
Assets: | | | | | | | | | | | | |
Common Stock | | $ | 120,068,719 | | | $ | — | | | $ | 120,068,719 | |
Short-Term Investments | | | — | | | | 3,691,417 | | | | 3,691,417 | |
| | | | | | | | | | | | |
Total Value of Securities | | $ | 120,068,719 | | | $ | 3,691,417 | | | $ | 123,760,136 | |
| | | | | | | | | | | | |
During the year ended Oct. 31, 2017, there were no transfers between Level 1 investments, Level 2 investments, or Level 3 investments that had a significant impact to the Fund. The Fund’s policy is to recognize transfers between levels based on fair value at the beginning of the reporting period.
A reconciliation of Level 3 investments is presented when the Fund has a significant amount of Level 3 investments at the beginning, interim, or end of the period in relation to net assets. During the year ended Oct. 31, 2017, there were no Level 3 investments.
4. Dividend and Distribution Information
Income and long-term capital gain distributions are determined in accordance with federal income tax regulations, which may differ from US GAAP. Additionally, distributions from net short-term gains on sales of investment securities are treated as ordinary income for federal income tax purposes. The tax character of dividends and distributions paid during the years ended Oct. 31, 2017 and 2016 was as follows:
| | | | | | | | |
| | | Year ended | |
| | | 10/31/17 | | | 10/31/16 | |
Ordinary income | | $ | 5,649,568 | | | $ | 5,116,145 | |
Long-term capital gains | | | 26,828,516 | | | | 21,464,819 | |
| | | | | | | | |
Total | | $ | 32,478,084 | | | $ | 26,580,964 | |
| | | | | | | | |
34
5. Components of Net Assets on a Tax Basis
As of Oct. 31, 2017, the components of net assets on a tax basis were as follows:
| | | | |
Shares of beneficial interest | | $ | 127,753,048 | |
Undistributed long-term capital gains* | | | 2,737,159 | |
Unrealized depreciation of investments | | | (5,307,050 | ) |
| | | | |
Net assets | | $ | 125,183,157 | |
| | | | |
*The undistributed earnings for the Fund are estimated pending final notification of the tax character of distributions received from investments in REITs.
The differences between book basis and tax basis components of net assets are primarily attributable to tax deferral of losses on wash sales.
For financial reporting purposes, capital accounts are adjusted to reflect the tax character of permanent book/tax differences. Reclassifications are primarily due to dividends and distributions and tax treatment of REIT adjustments. Results of operations and net assets were not affected by these reclassifications. For the year ended Oct. 31, 2017, the Fund recorded the following reclassifications:
| | | | |
Undistributed net investment income | | $ | 1,476,694 | |
Accumulated net realized loss | | | (1,476,694 | ) |
35
| | | | |
| Notes to financial statements | | | | |
| Delaware REIT Fund | | | | |
| | | | | | | | |
| 6. Capital Shares | | | | | | | | |
| | |
Transactions in capital shares were as follows: | | | | | | | | |
| |
| | | Year ended | |
| | | 10/31/17 | | | 10/31/16 | |
Shares sold: | | | | | | | | |
Class A | | | 618,178 | | | | 887,763 | |
Class C | | | 47,829 | | | | 146,310 | |
Class R | | | 146,394 | | | | 302,408 | |
Institutional Class | | | 575,078 | | | | 612,347 | |
Class R6 | | | 1,989,717 | | | | 130 | |
| | |
Shares issued upon reinvestment of dividends and distributions: | | | | | | | | |
Class A | | | 1,505,601 | | | | 756,495 | |
Class C | | | 353,945 | | | | 171,981 | |
Class R | | | 206,667 | | | | 95,543 | |
Institutional Class | | | 686,283 | | | | 860,490 | |
Class R6 | | | 31,242 | | | | — | |
| | | | | | | | |
| | | 6,160,934 | | | | 3,833,467 | |
| | | | | | | | |
| | |
Shares redeemed: | | | | | | | | |
Class A | | | (2,359,250 | ) | | | (1,464,442 | ) |
Class C | | | (669,494 | ) | | | (296,138 | ) |
Class R | | | (539,081 | ) | | | (291,402 | ) |
Institutional Class | | | (2,474,635 | ) | | | (5,765,168 | ) |
Class R6 | | | (166,518 | ) | | | — | |
| | | | | | | | |
| | | (6,208,978 | ) | | | (7,817,150 | ) |
| | | | | | | | |
Net decrease | | | (48,044 | ) | | | (3,983,683 | ) |
| | | | | | | | |
Certain shareholders may exchange shares of one class for shares of another class in the same Fund. For the years ended Oct. 31, 2017 and 2016, the Fund had the following exchange transactions. These exchange transactions are included as subscriptions and redemptions in the table above and on the “Statements of changes in net assets.”
| | | | | | | | | | | | | | | | | | | | | | |
| | | | Exchange Redemptions | | | Exchange Subscriptions | | | | |
| Year ended | | | Class A Shares | | | Class C Shares | | | Class A Shares | | | Institutional Class Shares | | | Value | |
| | 10/31/17 | | | | 85,007 | | | | 4,747 | | | | 2,884 | | | | 86,481 | | | $ | 1,049,065 | |
| | 10/31/16 | | | | 8,159 | | | | 1,279 | | | | — | | | | 9,410 | | | | 146,266 | |
7. Line of Credit
The Fund, along with certain other funds in the Delaware Funds (Participants), was a participant in a $155,000,000 revolving line of credit to be used for temporary or emergency purposes as an additional source of liquidity to fund redemptions of investor shares. Under the agreement, the Participants were charged an annual commitment fee of 0.10%, which was generally allocated across the Participants
36
based on a weighted average of the respective net assets of each Participant. The Participants were permitted to borrow up to a maximum of one-third of their net assets under the agreement. Each Participant was individually, and not jointly, liable for its particular advances, if any, under the line of credit. The line of credit available under the agreement expired on Nov. 7, 2016.
On Nov. 7, 2016, the Fund, along with the other Participants, entered into an amendment to the agreement for a $155,000,000 revolving line of credit. The line of credit was to be used as described above and operated in substantially the same manner as the original agreement, with the exception of the annual commitment fee. Under the amendment to the agreement, the Participants were charged an annual commitment fee of 0.15%, which was generally allocated across the Participants based on a weighted average of the respective net assets of each Participant. The line of credit available under the agreement expired on Nov. 6, 2017.
The Fund had no amounts outstanding as of Oct. 31, 2017, or at any time during the year then ended.
8. Offsetting
The Fund entered into an International Swaps and Derivatives Association, Inc. Master Agreement (ISDA Master Agreement) or a similar agreement with certain of its derivative contract counterparties in order to better define its contractual rights and to secure rights that will help the Fund mitigate its counterparty risk. An ISDA Master Agreement is a bilateral agreement between the Fund and a counterparty that governs over-the-counter (OTC) derivatives and foreign exchange contracts and typically contains, among other things, collateral posting items and netting provisions in the event of a default and/or termination event. Under an ISDA Master Agreement, the Fund may, under certain circumstances, offset with the counterparty certain derivative financial instruments’ payables and/or receivables with collateral held and/or posted and create one single net payment. The provisions of the ISDA Master Agreement typically permit a single net payment in the event of default (close-out), including the bankruptcy or insolvency of the counterparty. However, bankruptcy or insolvency laws of a particular jurisdiction may impose restrictions on or prohibitions against the right of offset in bankruptcy, insolvency, or other events.
For financial reporting purposes, the Fund does not offset derivative assets and derivative liabilities that are subject to netting arrangements on the “Statement of assets and liabilities.”
At Oct. 31, 2017, the Fund had the following assets and liabilities subject to offsetting provisions:
Master Repurchase Agreements
| | | | | | | | | | | | | | | | | | | | | | | | | |
Counterparty | | Repurchase
Agreements | | Fair Value of
Non-Cash
Collateral Received(a) | | Cash Collateral Received | | Net Collateral Received | | Net Exposure(b) |
Bank of America Merrill Lynch | | | $ | 73,460 | | | | $ | (73,460 | ) | | | $ | — | | | | $ | (73,460 | ) | | | $ | — | |
BNP Paribas | | | | 207,502 | | | | | (207,502 | ) | | | | — | | | | | (207,502 | ) | | | | — | |
| | | | | | | | | | | | | | | | | | | | | | | | | |
Total | | | $ | 280,962 | | | | $ | (280,962 | ) | | | $ | — | | | | $ | (280,962 | ) | | | $ | — | |
| | | | | | | | | | | | | | | | | | | | | | | | | |
(a) The value of the related collateral received exceeded the value of the repurchase agreements as of Oct. 31, 2017.
(b) Net exposure represents the receivable (payable) that would be due from (to) the counterparty in the event of default.
37
| | | | |
| Notes to financial statements | | | | |
| Delaware REIT Fund | | | | |
9. Securities Lending
The Fund, along with other funds in the Delaware Funds, may lend its securities pursuant to a security lending agreement (Lending Agreement) with The Bank of New York Mellon (BNY Mellon). At the time a security is loaned, the borrower must post collateral equal to the required percentage of the market value of the loaned security, including any accrued interest. The required percentage is: (1) 102% with respect to US securities and foreign securities that are denominated and payable in US dollars; and (2) 105% with respect to foreign securities. With respect to each loan, if on any business day the aggregate market value of securities collateral plus cash collateral held is less than the aggregate market value of the securities which are the subject of such loan, the borrower will be notified to provide additional collateral by the end of the following business day which, together with the collateral already held, will be not less than the applicable initial collateral requirements for such security loan. If the aggregate market value of securities collateral and cash collateral held with respect to a security loan exceeds the applicable initial collateral requirement, upon request of the borrower, BNY Mellon must return enough collateral to the borrower by the end of the following business day to reduce the value of the remaining collateral to the applicable initial collateral requirement for such security loan. As a result of the foregoing, the value of the collateral held with respect to a loaned security on any particular day may be more or less than the value of the security on loan.
Cash collateral received by each fund of the Trust is generally invested in a series of individual separate accounts, each corresponding to a fund. The investment guidelines permit each separate account to hold certain securities that would be considered eligible securities for a money market fund. Cash collateral received is generally invested in government securities; certain obligations issued by government sponsored enterprises; repurchase agreements collateralized by US Treasury securities; obligations issued by the central government of any Organization for Economic Cooperation and Development (OECD) country or its agencies, instrumentalities or establishments; obligations of supranational organizations, commercial paper, notes, bonds and other debt obligations; certificates of deposit, time deposits, and other bank obligations; and asset-backed securities. A Fund can also accept US government securities and letters of credit (non-cash collateral) in connection with securities loans.
In the event of default or bankruptcy by the lending agent, realization and/or retention of the collateral may be subject to legal proceedings. In the event the borrower fails to return loaned securities and the collateral received is insufficient to cover the value of the loaned securities and provided such collateral shortfall is not the result of investment losses, the lending agent has agreed to pay the amount of the shortfall to the Fund or, at the discretion of the lending agent, replace the loaned securities. The Fund continues to record dividends or interest, as applicable, on the securities loaned and is subject to changes in value of the securities loaned that may occur during the term of the loan. The Fund has the right under the Lending Agreement to recover the securities from the borrower on demand. With respect to security loans collateralized by non-cash collateral, the Fund receives loan premiums paid by the borrower. With respect to security loans collateralized by cash collateral, the earnings from the collateral investments are shared among the Fund, the security lending agent, and the borrower. The Fund records security lending income net of allocations to the security lending agent and the borrower.
The Fund may incur investment losses as a result of investing securities lending collateral. This could occur if an investment in the collateral investment account defaulted or became impaired. Under those circumstances, the value of the Fund’s cash collateral account may be less than the amount the Fund
38
would be required to return to the borrowers of the securities and the Fund would be required to make up for this shortfall.
During the year ended Oct. 31, 2017, the Fund had no securities out on loan.
10. Credit and Market Risk
The Fund concentrates its investments in the real estate industry and is subject to the risks associated with that industry. If the Fund holds real estate directly as a result of defaults or receives rental income directly from real estate holdings, its tax status as a regulated investment company may be jeopardized. The Fund is also affected by interest rate changes, particularly if the REITs it holds use floating rate debt to finance their ongoing operations. Its investments may also tend to fluctuate more widely than that of a fund that invests in a broad range of industries.
The Fund may invest up to 15% of its net assets in illiquid securities, which may include securities with contractual restrictions on resale, securities exempt from registration under Rule 144A promulgated under the Securities Act of 1933, as amended, and other securities which may not be readily marketable. The relative illiquidity of these securities may impair the Fund from disposing of them in a timely manner and at a fair price when it is necessary or desirable to do so. While maintaining oversight, the Fund’s Board has delegated to DMC the day-to-day functions of determining whether individual securities are liquid for purposes of the Fund’s limitation on investments in illiquid securities. Securities eligible for resale pursuant to Rule 144A, which are determined to be liquid, are not subject to the Fund’s 15% limit on investments in illiquid securities. As of Oct. 31, 2017, there were no Rule 144A securities held by the Fund.
11. Contractual Obligations
The Fund enters into contracts in the normal course of business that contain a variety of indemnifications. The Fund’s maximum exposure under these arrangements is unknown. However, the Fund has not had prior claims or losses pursuant to these contracts. Management has reviewed the Fund’s existing contracts and expects the risk of loss to be remote.
12. Recent Accounting Pronouncements
In October 2016, the Securities and Exchange Commission released its Final Rule on Investment Company Reporting Modernization (Rule). The Rule contains amendments to Regulation S-X which impact financial statement presentation, particularly the presentation of derivative investments. The financial statements presented are in compliance with the most recent Regulation S-X amendments.
13. Subsequent Events
On Nov. 6, 2017, the Fund, along with the other Participants, entered into an amendment to the agreement for a $155,000,000 revolving line of credit to be used as described in Note 7 and to be operated in substantially the same manner as the agreement described in Note 7. Under the amendment to the agreement, the Participants are charged an annual commitment fee of 0.15%, which is generally allocated across the Participants based on a weighted average of the respective net assets of each Participant. The line of credit available under the agreement expires on Nov. 5, 2018.
39
| | | | |
| Notes to financial statements | | | | |
| Delaware REIT Fund | | | | |
13. Subsequent Events (continued)
Management has determined that no other material events or transactions occurred subsequent to Oct. 31, 2017 that would require recognition or disclosure in the Fund’s financial statements.
40
| | | | |
Report of independent registered public accounting firm | | | | |
To the Board of Trustees of Delaware Pooled® Trust and the Shareholders of Delaware REIT Fund
In our opinion, the accompanying statement of assets and liabilities, including the schedule of investments, and the related statements of operations and of changes in net assets and the financial highlights present fairly, in all material respects, the financial position of Delaware REIT Fund (one of the series constituting Delaware Pooled Trust, hereafter referred to as the “Fund”) as of October 31, 2017, the results of its operations for the year then ended, the changes in its net assets for each of the two years in the period then ended and the financial highlights for each of the periods indicated, in conformity with accounting principles generally accepted in the United States of America. These financial statements and financial highlights (hereafter referred to as “financial statements”) are the responsibility of the Fund’s management. Our responsibility is to express an opinion on these financial statements based on our audits. We conducted our audits of these financial statements in accordance with the standards of the Public Company Accounting Oversight Board (United States). Those standards require that we plan and perform the audit to obtain reasonable assurance about whether the financial statements are free of material misstatement. An audit includes examining, on a test basis, evidence supporting the amounts and disclosures in the financial statements, assessing the accounting principles used and significant estimates made by management, and evaluating the overall financial statement presentation. We believe that our audits, which included confirmation of securities as of October 31, 2017 by correspondence with the custodian and brokers, provide a reasonable basis for our opinion.
PricewaterhouseCoopers LLP
Philadelphia, Pennsylvania
December 19, 2017
41
| | | | |
| Other Fund information (Unaudited) | | | | |
| Delaware REIT Fund | | | | |
Tax Information
The information set forth below is for the Fund’s fiscal year as required by federal income tax laws. Shareholders, however, must report distributions on a calendar year basis for income tax purposes, which may include distributions for portions of two fiscal years of the Fund. Accordingly, the information needed by shareholders for income tax purposes will be sent to them in January of each year. Please consult your tax advisor for proper treatment of this information.
All disclosures are based on financial information available as of the date of this annual report and, accordingly are subject to change. For any and all items requiring reporting, it is the intention of the Fund to report the maximum amount permitted under the Internal Revenue Code and the regulations thereunder.
For the fiscal year ended Oct. 31, 2017, the Fund reports distributions paid during the year as follows:
| | | | |
(A) Long-Term Capital Gains Distributions (Tax Basis) | | | 82.60 | % |
(B) Ordinary Income Distributions (Tax Basis) | | | 17.40 | % |
Total Distributions. | | | 100.00 | % |
(A) and (B) are based on a percentage of the Fund’s total distributions.
Board consideration of Delaware REIT Fund investment advisory agreement
At a meeting held on Aug. 16-17, 2017 (the “Annual Meeting”), the Board of Trustees (the “Board”), including a majority of disinterested or independent Trustees, approved the renewal of the Investment Advisory Agreement for Delaware REIT Fund (the “Fund”). In making its decision, the Board considered information furnished at regular quarterly Board meetings, including reports detailing Fund performance, investment strategies, and expenses, as well as information prepared specifically in connection with the renewal of the Investment Advisory Agreement. Information furnished specifically in connection with the renewal of the Investment Advisory Agreement with Delaware Management Company (“DMC”), a series of Macquarie Investment Management Business Trust (formerly, Delaware Management Business Trust), included materials provided by DMC and its affiliates concerning, among other things, the nature, extent, and quality of services provided to the Fund; the costs of such services to the Fund; economies of scale; and the investment manager’s financial condition and profitability. In addition, in connection with the Annual Meeting, reports were provided to the Trustees in May 2017 and included reports provided by Broadridge Financial Solutions (formerly Lipper) (“Broadridge” or “Lipper”). The Broadridge reports compared the Fund’s investment performance and expenses with those of other comparable mutual funds. The Independent Trustees reviewed and discussed the Broadridge reports with independent legal counsel to the Independent Trustees. In addition to the information noted above, the Board also requested and received information regarding DMC’s policy with respect to advisory fee levels and its breakpoint philosophy; the structure of portfolio manager compensation; comparative client fee information; and any constraints or limitations on the availability of securities for certain investment styles, which had in the past year inhibited, or which were likely in the future to inhibit, the investment manager’s ability to invest fully in accordance with Fund policies.
In considering information relating to the approval of the Fund’s advisory agreement, the Independent Trustees received assistance and advice from and met separately with independent legal counsel to the
42
Independent Trustees and also from an experienced and knowledgeable fund consultant, JDL Consultants, LLC (“JDL”). Although the Board gave attention to all information furnished, the following discussion identifies, under separate headings, the primary factors taken into account by the Board during its contract renewal considerations.
Nature, extent, and quality of service. The Board considered the services provided by DMC to the Fund and its shareholders. In reviewing the nature, extent, and quality of services, the Board considered reports furnished to it throughout the year, which covered matters such as the relative performance of the Fund; compliance of portfolio managers with the investment policies, strategies, and restrictions for the Fund; compliance by DMC and Delaware Distributors, L.P. (together, “Management”) personnel with the Code of Ethics adopted throughout the Delaware FundsSM by Macquarie (“Delaware Funds”); and adherence to fair value pricing procedures as established by the Board. The Board was pleased with the current staffing of the Fund’s investment advisor and the emphasis placed on research in the investment process. The Board recognized DMC’s receipt of certain industry distinctions during the past several years. The Board gave favorable consideration to DMC’s efforts to control expenditures while maintaining service levels committed to Fund matters. The Board also noted the benefits provided to Fund shareholders through each shareholder’s ability to exchange an investment in one Delaware Fund for the same class of shares in another Delaware Fund without a sales charge, to reinvest Fund dividends into additional shares of the Fund or into additional shares of other Delaware Funds and the privilege to combine holdings in other Delaware Funds to obtain a reduced sales charge. The Board was satisfied with the nature, extent, and quality of the overall services provided by DMC.
Investment performance. The Board placed significant emphasis on the investment performance of the Fund in view of the importance of investment performance to shareholders. Although the Board considered performance reports and discussions with portfolio managers at Investments Committee meetings throughout the year, the Board gave particular weight to the Broadridge reports furnished for the Annual Meeting. The Broadridge reports prepared for the Fund showed the investment performance of its Class A shares in comparison to a group of similar funds as selected by Broadridge (the “Performance Universe”). A fund with the best performance ranked first, and a fund with the poorest performance ranked last. The highest/best performing 25% of funds in the Performance Universe make up the first quartile; the next 25%, the second quartile; the next 25%, the third quartile; and the poorest/ worst performing 25% of funds in the Performance Universe make up the fourth quartile. Comparative annualized performance for the Fund was shown for the past 1-, 3-, 5-, and 10-year periods, to the extent applicable, ended Jan. 31, 2017. The Board’s objective is that the Fund’s performance for the 1-, 3-, and 5-year periods considered be at or above the median of its Performance Universe.
The Performance Universe for the Fund consisted of the Fund and all retail and institutional real estate funds as selected by Broadridge. The Broadridge report comparison showed that the Fund’s total return for the 1-, 3-, and 5-year periods was in the third quartile of its Performance Universe. The Board observed that the Fund’s performance results were not in line with the Board’s objective. In evaluating the Fund’s performance, the Board considered the numerous investment performance reports delivered by Management personnel to the Board’s Investments Committee. The Board was satisfied that Management was taking action to improve Fund performance and to meet the Board’s performance objective.
43
| | | | |
| Other Fund information (Unaudited) | | | | |
| Delaware REIT Fund | | | | |
Board consideration of Delaware REIT Fund investment advisory agreement (continued)
Comparative expenses. The Board considered expense data for the Delaware Funds. Management provided the Board with information on pricing levels and fee structures for the Fund as of its most recently completed fiscal year. The Board also focused on the comparative analysis of effective management fees and total expense ratios of the Fund versus effective management fees and total expense ratios of a group of similar funds as selected by Broadridge (the “Expense Group”). In reviewing comparative costs, the Fund’s contractual management fee and the actual management fee incurred by the Fund were compared with the contractual management fees (assuming all funds in the Expense Group were similar in size to the Fund) and actual management fees (as reported by each fund) within the Expense Group, taking into account any applicable breakpoints and fee waivers. The Fund’s total expenses were also compared with those of its Expense Group. The Broadridge total expenses, for comparative consistency, were shown by Broadridge for Class A shares and comparative total expenses including 12b-1 and non-12b-1 service fees. The Board’s objective is to limit the Fund’s total expense ratio to be competitive with that of the Expense Group.
The expense comparisons for the Fund showed that its actual management fee was in the quartile with the second lowest expenses in its Expense Group and its total expenses were in the quartile with the second highest expenses of its Expense Group. The Board gave favorable consideration to the Fund’s management fee, but noted that the Fund’s total expenses were not in line with the Board’s objective. In evaluating the total expenses, the Board considered various initiatives implemented by Management, such as the negotiation of lower fees for fund accounting, fund accounting oversight and custody services, which had created an opportunity for a further reduction in expenses. The Board encouraged Management to continue its efforts to improve the Fund’s total expense ratio and to bring it in line with the Board’s objective.
Management profitability. The Board considered the level of profits realized by DMC in connection with the operation of the Fund. In this respect, the Board reviewed the Investment Management Profitability Analysis that addressed the overall profitability of DMC’s business in providing management and other services to each of the individual funds and the Delaware Funds as a whole. Specific attention was given to the methodology used by DMC in allocating costs for the purpose of determining profitability. Management stated that the level of profits of DMC, to a certain extent, reflects recent operational cost savings and efficiencies initiated by DMC. The Board considered DMC’s efforts to improve services provided to fund shareholders and to meet additional regulatory and compliance requirements resulting from recent industry-wide Securities and Exchange Commission initiatives. The Board also considered the extent to which DMC might derive ancillary benefits from fund operations, including the potential for procuring additional business as a result of the prestige and visibility associated with its role as service provider to the Delaware Funds and the benefits from allocation of fund brokerage to improve trading efficiencies. Finally, the Board also reviewed a report prepared by JDL regarding DMC profitability in the context of subadvised funds and met with JDL personnel to discuss DMC’s profitability in such context. The Board found that the management fees were reasonable in light of the services rendered and the level of profitability of DMC.
Economies of scale. The Trustees considered whether economies of scale are realized by DMC as the Fund’s assets increase and the extent to which any economies of scale are reflected in the level of management fees charged. The Trustees reviewed the standardized advisory fee pricing and structure,
44
approved by the Board and shareholders, which includes breakpoints, and which applies to most funds in the Delaware Funds complex. Breakpoints in the advisory fee occur when the advisory fee rate is reduced on assets in excess of specified levels. Breakpoints result in a lower advisory fee than would otherwise be the case in the absence of breakpoints, when the asset levels specified in the breakpoints are exceeded. The Board noted that the fee under the Fund’s management contract fell within the standardized fee pricing structure. Although, as of Feb. 28, 2017, the Fund has not reached a size at which it can take advantage of any breakpoints in the applicable fee schedule, the Board recognized that the fee was structured so that if the Fund grows, economies of scale may be shared.
45
| | | | |
| Board of trustees / directors and officers addendum | | | | |
| Delaware FundsSM by Macquarie | | | | |
A mutual fund is governed by a Board of Trustees/Directors (“Trustees”), which has oversight responsibility for the management of a fund’s business affairs. Trustees establish procedures and oversee and review the performance of the investment manager, the distributor, and others who perform services for the fund. The independent fund trustees, in particular, are advocates
| | | | |
Name, Address, and Birth Date | | Position(s) Held with Fund(s) | | Length of Time Served |
Interested Trustee | | | | |
| | |
Shawn K. Lytle1, 2 2005 Market Street Philadelphia, PA 19103 February 1970 | | President, Chief Executive Officer, and Trustee | | Trustee since September 2015 |
| | | | President and Chief Executive Officer since August 2015 |
| | | | |
Independent Trustees | | | | |
| | |
Thomas L. Bennett 2005 Market Street Philadelphia, PA 19103 October 1947 | | Chairman and Trustee | | Trustee since March 2005 |
| | | | Chairman since March 2015 |
Ann D. Borowiec 2005 Market Street Philadelphia, PA 19103 November 1958 | | Trustee | | Since March 2015 |
| | |
Joseph W. Chow 2005 Market Street Philadelphia, PA 19103 January 1953 | | Trustee | | Since January 2013 |
| 1 | Shawn K. Lytle is considered to be an “Interested Trustee” because he is an executive officer of the Fund’s(s’) investment advisor. |
| 2 | Shawn K. Lytle, David F. Connor, Daniel V. Geatens, and Richard Salus serve in similar capacities for the six portfolios of the Optimum Fund Trust, which have the same investment advisor, principal underwriter, and transfer agent as the registrant. Mr. Geatens also serves as the CFO and Treasurer for Macquarie Global Infrastructure Total Return Fund Inc., which shares an affiliated investment manager. |
46
for shareholder interests. Each trustee has served in that capacity since he or she was elected to or appointed to the Board of Trustees, and will continue to serve until his or her retirement or the election of a new trustee in his or her place. The following is a list of the Trustees and Officers with certain background and related information.
| | | | |
Principal Occupation(s) During the Past Five Years | | Number of Portfolios in Fund Complex Overseen by Trustee or Officer | | Other Directorships Held by Trustee or Officer |
| | |
| | | | |
Shawn K. Lytle has served as President of Macquarie Investment Management3 since June 2015 and was the Regional Head of Americas for UBS Global Asset Management from 2010 through 2015. | | 60 | | Trustee — UBS Relationship Funds, SMA Relationship Trust, and UBS Funds (May 2010–April 2015) |
| | |
| | | | |
Private Investor (March 2004–Present) | | 60 | | None |
Chief Executive Officer, Private Wealth Management (2011–2013) and Market Manager, New Jersey Private Bank (2005–2011) — J.P. Morgan Chase & Co. | | 60 | | Director — Banco Santander International Director — Santander Bank, N.A. |
Executive Vice President (Emerging Economies Strategies, Risks, and Corporate Administration) State Street Corporation (July 2004–March 2011) | | 60 | | Director and Audit Committee Member — Hercules Technology Growth Capital, Inc. (2004–2014) |
| 3 | Macquarie Investment Management (formerly known as Delaware Investments) is the marketing name for Macquarie Management Holdings, Inc. (formerly known as Delaware Management Holdings, Inc.) and its subsidiaries, including the Fund’s(s’) investment advisor, principal underwriter, and its transfer agent. |
47
| | | | |
| Board of trustees / directors and officers addendum | | | | |
| Delaware FundsSM by Macquarie | | | | |
| | | | |
| | | | |
| Name, Address, | | Position(s) | | Length of |
| and Birth Date | | Held with Fund(s) | | Time Served |
Independent Trustees (continued) | | | | |
| John A. Fry | | Trustee | | Since January 2001 |
| 2005 Market Street | | | | |
Philadelphia, PA 19103 May 1960 | | | | |
| | | |
| Lucinda S. Landreth | | Trustee | | Since March 2005 |
| 2005 Market Street | | | | |
| Philadelphia, PA 19103 | | | | |
| June 1947 | | | | |
| Frances A. Sevilla-Sacasa | | Trustee | | Since September 2011 |
| 2005 Market Street | | | | |
| Philadelphia, PA 19103 | | | | |
January 1956 | | | | |
48
| | | | |
| | | Number of Portfolios in | | |
| Principal Occupation(s) | | Fund Complex Overseen | | Other Directorships |
| During the Past Five Years | | by Trustee or Officer | | Held by Trustee or Officer |
| | |
| | | | | |
| President — | | 60 | | Director, Audit Committee, |
| Drexel University | | | | and Governance Committee |
| (August 2010–Present) | | | | Member — Community |
| | | | Health Systems |
| President — | | | | |
| Franklin & Marshall College | | | | Director — Drexel |
| (July 2002–July 2010) | | | | Morgan & Co. |
| | |
| | | | Director, Audit Committee |
| | | | Member — vTv |
| | | | Therapeutics LLC |
| | |
| | | | Director — FS Credit Real |
| | | | Estate Income Trust, Inc. |
| Private Investor | | 60 | | None |
(2004–Present) | | | | |
| Chief Executive Officer — | | 60 | | Trust Manager and |
| Banco Itaú | | | | Audit Committee |
| International | | | | Chair — Camden |
| (April 2012–December 2016) | | | | Property Trust |
| | |
| Executive Advisor to Dean | | | | |
| (August 2011–March 2012) | | | | |
| and Interim Dean | | | | |
| (January 2011–July 2011) — | | | | |
| University of Miami School of | | | | |
| Business Administration | | | | |
| | |
| President — U.S. Trust, | | | | |
| Bank of America Private | | | | |
| Wealth Management | | | | |
| (Private Banking) | | | | |
(July 2007–December 2008) | | | | |
49
| | | | |
| Board of trustees / directors and officers addendum | | | | |
| Delaware FundsSM by Macquarie | | | | |
| | | | |
Name, Address, and Birth Date | | Position(s) Held with Fund(s) | | Length of Time Served |
Independent Trustees (continued) | | |
Thomas K. Whitford 2005 Market Street Philadelphia, PA 19103 March 1956 | | Trustee | | Since January 2013 |
Janet L. Yeomans 2005 Market Street Philadelphia, PA 19103 July 1948 | | Trustee | | Since April 1999 |
Officers | | | | |
David F. Connor 2005 Market Street Philadelphia, PA 19103 December 1963 | | Senior Vice President, General Counsel, and Secretary | | Senior Vice President since May 2013; General Counsel since May 2015; Secretary since October 2005 |
Daniel V. Geatens 2005 Market Street Philadelphia, PA 19103 October 1972 | | Vice President and Treasurer | | Treasurer since October 2007 |
Richard Salus 2005 Market Street Philadelphia, PA 19103 October 1963 | | Senior Vice President and Chief Financial Officer | | Chief Financial Officer since November 2006 |
The Statement of Additional Information for the Fund(s) includes additional information about the Trustees and Officers and is available, without charge, upon request by calling 800 523-1918.
50
| | | | |
Principal Occupation(s) During the Past Five Years | | Number of Portfolios in Fund Complex Overseen by Trustee or Officer | | Other Directorships Held by Trustee or Officer |
| | |
| | | | | |
Vice Chairman (2010–April 2013) — PNC Financial Services Group | | 60 | | Director — HSBC Finance Corporation and HSBC North America Holdings Inc. |
| | |
| | | | Director — |
| | | | | HSBC USA Inc. |
| Vice President and Treasurer | | 60 | | Director (2009–2017); |
| (January 2006–July 2012), | | | | Personnel and Compensation |
| Vice President — | | | | Committee Chair; Member of |
| Mergers & Acquisitions | | | | Nominating, Investments, and |
| (January 2003–January 2006), | | | | Audit Committees for various |
| and Vice President | | | | periods throughout |
| and Treasurer | | | | directorship — |
| (July 1995–January 2003) — | | | | Okabena Company |
3M Company | | | | |
| | |
| | | | | |
| David F. Connor has served | | 60 | | None2 |
in various capacities at different times at | | | | |
| Macquarie Investment | | | | |
Management. | | | | |
| Daniel V. Geatens has served | | 60 | | None2 |
in various capacities at different times at | | | | |
| Macquarie Investment | | | | |
Management. | | | | |
| Richard Salus has served | | 60 | | None2 |
in various executive capacities at different times at | | | | |
| Macquarie Investment | | | | |
Management. | | | | |
51
| | | | | | |
| Board of trustees | | | | | | |
Shawn K. Lytle President and Chief Executive Officer Delaware FundsSM by Macquarie Philadelphia, PA Thomas L. Bennett Chairman of the Board Delaware Funds by Macquarie Private Investor Rosemont, PA | | Ann D. Borowiec Former Chief Executive Officer Private Wealth Management J.P. Morgan Chase & Co. New York, NY Joseph W. Chow Former Executive Vice President State Street Corporation Boston, MA | | John A. Fry President Drexel University Philadelphia, PA Lucinda S. Landreth Former Chief Investment Officer Assurant, Inc. New York, NY | | Frances A. Sevilla-Sacasa Former Chief Executive Officer Banco Itaú International Miami, FL Thomas K. Whitford Former Vice Chairman PNC Financial Services Group Pittsburgh, PA Janet L. Yeomans Former Vice President and Treasurer 3M Company St. Paul, MN |
| Affiliated officers | | | | | | |
| | | |
David F. Connor | | Daniel V. Geatens | | Richard Salus | | |
| Senior Vice President, | | Vice President and | | Senior Vice President and | | |
| General Counsel, | | Treasurer | | Chief Financial Officer | | |
| and Secretary | | Delaware Funds | | Delaware Funds | | |
| Delaware Funds | | by Macquarie | | by Macquarie | | |
| by Macquarie | | Philadelphia, PA | | Philadelphia, PA | | |
| Philadelphia, PA | | | | | | |
This annual report is for the information of Delaware REIT Fund shareholders, but it may be used with prospective investors when preceded or accompanied by the Delaware Fund fact sheet for the most recently completed calendar quarter. These documents are available at delawarefunds.com/literature.
The Fund files its complete schedule of portfolio holdings with the Securities and Exchange Commission (SEC) for the first and third quarters of each fiscal year on Form N-Q. The Fund’s Forms N-Q, as well as a description of the policies and procedures that the Fund uses to determine how to vote proxies (if any) relating to portfolio securities are available without charge (i) upon request, by calling 800 523-1918; and (ii) on the SEC’s website at sec.gov. In addition, a description of the policies and procedures that the Fund uses to determine how to vote proxies (if any) relating to portfolio securities and the Schedule of Investments included in the Fund’s most recent Form N-Q are available without charge on the Fund’s website at delawarefunds.com/literature. The Fund’s Forms N-Q may be reviewed and copied at the SEC’s Public Reference Room in Washington, D.C.; information on the operation of the Public Reference Room may be obtained by calling 800 SEC-0330.
Information (if any) regarding how the Fund voted proxies relating to portfolio securities during the most recently disclosed 12-month period ended June 30 is available without charge (i) through the Fund’s website at delawarefunds.com/proxy; and (ii) on the SEC’s website at sec.gov.
52
Item 2. Code of Ethics
Item 3. Audit Committee Financial Expert
The registrant’s Board of Trustees/Directors has determined that certain members of the registrant’s Audit Committee are audit committee financial experts, as defined below. For purposes of this item, an “audit committee financial expert” is a person who has the following attributes:
a. An understanding of generally accepted accounting principles and financial statements;
b. The ability to assess the general application of such principles in connection with the accounting for estimates, accruals, and reserves;
c. Experience preparing, auditing, analyzing, or evaluating financial statements that present a breadth and level of complexity of accounting issues that are generally comparable to the breadth and complexity of issues that can reasonably be expected to be raised by the registrant’s financial statements, or experience actively supervising one or more persons engaged in such activities;
d. An understanding of internal controls and procedures for financial reporting; and
e. An understanding of audit committee functions.
An “audit committee financial expert” shall have acquired such attributes through:
a. Education and experience as a principal financial officer, principal accounting officer, controller, public accountant, or auditor or experience in one or more positions that involve the performance of similar functions;
b. Experience actively supervising a principal financial officer, principal accounting officer, controller, public accountant, auditor, or person performing similar functions;
c. Experience overseeing or assessing the performance of companies or public accountants with respect to the preparation, auditing, or evaluation of financial statements; or
d. Other relevant experience.
The registrant’s Board of Trustees/Directors has also determined that each member of the registrant’s Audit Committee is independent. In order to be “independent” for purposes of this item, the Audit Committee member may not: (i) other than in his or her capacity as a member of the Board of Trustees/Directors or any committee thereof, accept directly or indirectly any consulting, advisory or other compensatory fee from the issuer; or (ii) be an “interested person” of the registrant as defined in Section 2(a)(19) of the Investment Company Act of 1940.
The names of the audit committee financial experts on the registrant’s Audit Committee are set forth below:
Joseph W. Chow
John A. Fry
Lucinda S. Landreth
Thomas K. Whitford
Item 4. Principal Accountant Fees and Services
The aggregate fees billed for services provided to the registrant by its independent auditors for the audit of the registrant’s annual financial statements and for services normally provided by the independent auditors in connection with statutory and regulatory filings or engagements were $226,010 for the fiscal year ended October 31, 2017.
The aggregate fees billed for services provided to the registrant by its independent auditors for the audit of the registrant’s annual financial statements and for services normally provided by the independent auditors in connection with statutory and regulatory filings or engagements were $226,010 for the fiscal year ended October 31, 2016.
The aggregate fees billed by the registrant’s independent auditors for services relating to the performance of the audit of the registrant’s financial statements and not reported under paragraph (a) of this Item were $0 for the fiscal year ended October 31, 2017.
The aggregate fees billed by the registrant’s independent auditors for services relating to the performance of the audit of the registrant’s financial statements and not reported under paragraph (a) of this Item were $0 for the fiscal year ended October 31, 2016.
The aggregate fees billed by the registrant’s independent auditors for tax-related services provided to the registrant’s investment adviser and other service providers under common control with the adviser and that relate directly to the operations or financial reporting of the registrant were $0 for the registrant’s fiscal year ended October 31, 2017.
The aggregate fees billed by the registrant’s independent auditors for tax-related services provided to the registrant’s investment adviser and other service providers under common control with the adviser and that relate directly to the operations or financial reporting of the registrant were $0 for the registrant’s fiscal year ended October 31, 2016.
The aggregate fees billed for all services provided by the independent auditors to the registrant other than those set forth in paragraphs (a), (b) and (c) of this Item were $0 for the fiscal year ended October 31, 2017.
The aggregate fees billed for all services provided by the independent auditors to the registrant other than those set forth in paragraphs (a), (b) and (c) of this Item were $0 for the fiscal year ended October 31, 2016.
Under the Pre-Approval Policy, the Audit Committee has also pre-approved the services set forth in the table below with respect to the registrant’s investment adviser and other entities controlling, controlled by or under common control with the investment adviser that provide ongoing services to the registrant (the “Control Affiliates”) up to the specified fee limit. This fee limit is based on aggregate fees to the investment adviser and its Control Affiliates.
The Pre-Approval Policy requires the registrant’s independent auditors to report to the Audit Committee at each of its regular meetings regarding all services initiated since the last such report was rendered, including those services authorized by the Pre-Approval Policy.
(f) Not applicable.
(g) The aggregate non-audit fees billed by the registrant’s independent auditors for services rendered to the registrant and to its investment adviser and other service providers under common control with the adviser were $11,180,000 and $8,665,000 for the registrant’s fiscal years ended October 31, 2017 and October 31, 2016, respectively.
(h) In connection with its selection of the independent auditors, the registrant’s Audit Committee has considered the independent auditors’ provision of non-audit services to the registrant’s investment adviser and other service providers under common control with the adviser that were not required to be pre-approved pursuant to Rule 2-01(c)(7)(ii) of Regulation S-X. The Audit Committee has determined that the independent auditors’ provision of these services is compatible with maintaining the auditors’ independence.
Item 5. Audit Committee of Listed Registrants
Not applicable.
Item 6. Investments
(a) Included as part of report to shareholders filed under Item 1 of this Form N-CSR.
(b) Divestment of securities in accordance with Section 13(c) of the Investment Company Act of 1940.
Not applicable.
Item 7. Disclosure of Proxy Voting Policies and Procedures for Closed-End Management Investment Companies
Not applicable.
Item 8. Portfolio Managers of Closed-End Management Investment Companies
Not applicable.
Item 9. Purchases of Equity Securities by Closed-End Management Investment Company and Affiliated Purchasers
Not applicable.
Item 10. Submission of Matters to a Vote of Security Holders
Not applicable.
Item 11. Controls and Procedures
The registrant’s principal executive officer and principal financial officer have evaluated the registrant’s disclosure controls and procedures within 90 days of the filing of this report and have concluded that they are effective in providing reasonable assurance that the information required to be disclosed by the registrant in its reports or statements filed under the Securities Exchange Act of 1934 is recorded, processed, summarized and reported within the time periods specified in the rules and forms of the Securities and Exchange Commission.
There were no significant changes in the registrant’s internal control over financial reporting that occurred during the second fiscal quarter of the period covered by the report to stockholders included herein (i.e., the registrant’s fourth fiscal quarter) that have materially affected, or are reasonably likely to materially affect, the registrant’s internal control over financial reporting.
Item 12. Exhibits
Not applicable.
(2) Certifications of Principal Executive Officer and Principal Financial Officer pursuant to Rule 30a-2 under the Investment Company Act of 1940 are attached hereto as Exhibit 99.CERT.
(3) Written solicitations to purchase securities pursuant to Rule 23c-1 under the Securities Exchange Act of 1934.
Not applicable.
(b) Certifications pursuant to Section 906 of the Sarbanes-Oxley Act of 2002 are furnished herewith as Exhibit 99.906CERT.
Pursuant to the requirements of the Securities Exchange Act of 1934 and the Investment Company Act of 1940, the registrant has duly caused this report to be signed on its behalf, by the undersigned, thereunto duly authorized.
Pursuant to the requirements of the Securities Exchange Act of 1934 and the Investment Company Act of 1940, this report has been signed below by the following persons on behalf of the registrant and in the capacities and on the dates indicated.