Item 1. Reports to Stockholders

Macquarie Institutional Portfolios (registered as Delaware Pooled® Trust)
| | |
US equities | | |
Macquarie Large Cap Value Portfolio | | |
| |
US fixed income | | |
Macquarie Core Plus Bond Portfolio | | |
Macquarie High Yield Bond Portfolio | | |
| |
International equities | | |
Macquarie Emerging Markets Portfolio | | |
Macquarie Emerging Markets Portfolio II | | |
Macquarie Labor Select International Equity Portfolio | | |
October 31, 2018

This page intentionally left blank.
Macquarie Institutional Portfolios
Macquarie Institutional Portfolios (registered as Delaware Pooled® Trust) are designed exclusively for institutional investors and high net worth individuals.
Delaware Management Company, a series of Macquarie Investment Management Business Trust (MIMBT), serves as investment advisor for the Portfolios. Mondrian Investment Partners Limited serves as investment sub-advisor for Macquarie Emerging Markets Portfolio* and Macquarie Labor Select International Equity Portfolio.
The performance quoted represents past performance and does not guarantee future results. Investment return and principal value of an investment will fluctuate so that shares, when redeemed, may be worth more or less than their original cost. Current performance may be lower or higher than the performance quoted. Performance data current to the most recent month end may be obtained by calling 800 231-8002 or visiting macquarie.com/investment-management/institutional. Carefully consider the Portfolios’ investment objectives, risk factors, charges, and expenses before investing. This and other information can be found in the Portfolios’ prospectus which may be obtained by visiting macquarie.com/investment-management/institutional or calling 800 231-8002. Investors should read the prospectus carefully before investing. Performance includes reinvestment of all distributions.
The Portfolios are not FDIC insured and are not guaranteed. It is possible to lose the principal amount invested. Mutual fund advisory services are provided by Delaware Management Company, a series of MIMBT, which is a registered investment advisor.
The Portfolios are distributed by Delaware Distributors, L.P. (DDLP), an affiliate of MIMBT, Macquarie Management Holdings, Inc., and Macquarie Group Limited. Macquarie Investment Management (MIM) is the marketing name for certain companies comprising the asset management division of Macquarie Group Limited and its subsidiaries and affiliates worldwide. Institutional investment management is provided by Macquarie Investment Management Advisers (MIMA), a series of MIMBT. MIMBT is a US registered investment advisor, and may not be able to provide investment advisory services to certain clients in certain jurisdictions.
Other than Macquarie Bank Limited (MBL), none of the entities noted are authorized deposit-taking institutions for the purposes of the Banking Act 1959 (Commonwealth of Australia). The obligations of these entities do not represent deposits or other liabilities of MBL. MBL does not guarantee or otherwise provide assurance in respect of the obligations of these entities, unless noted otherwise. The Portfolios are governed by US laws and regulations.
*Closed to new investors.
©2018 Macquarie Management Holdings, Inc.
All third-party marks cited are the property of their respective owners.
1
Portfolio objectives and strategies
Macquarie Large Cap Value Portfolio seeks long-term capital appreciation. The Portfolio invests primarily in securities of large-capitalization companies that we believe have long-term capital appreciation potential. The Portfolio currently defines large-capitalization stocks as those with market capitalizations of $5 billion or greater at the time of purchase. Typically, we seek to select securities that we believe are undervalued in relation to their intrinsic value as indicated by multiple factors.
Macquarie Core Plus Bond Portfolio seeks maximum long-term total return, consistent with reasonable risk. The Portfolio allocates its investments principally among three sectors of the fixed income securities markets: US investment grade sector, US high yield sector, and international sector.
Macquarie High Yield Bond Portfolio seeks high total return. The Portfolio will primarily invest its assets at the time of purchase in: (1) corporate bonds rated BB or lower by Standard & Poor’s (S&P) or similarly rated by another nationally recognized statistical rating organization; (2) securities issued or guaranteed by the US government, its agencies, or instrumentalities; or (3) commercial paper of companies rated A-1 or A-2 by S&P, rated P-1 or P-2 by Moody’s Investors Service, Inc. (Moody’s), or unrated but considered to be of comparable quality.
Macquarie Emerging Markets Portfolio seeks long-term capital appreciation. The Portfolio generally invests in equity securities of companies that are organized in, have a majority of their assets in, or derive a majority of their operating income from emerging countries. Macquarie Emerging Markets Portfolio is presently closed to new investors.
Macquarie Emerging Markets Portfolio II seeks long-term capital appreciation. The Portfolio invests primarily in a broad range of equity securities of companies located in emerging market countries. The Portfolio may invest in companies of any size. The portfolio manager believes that although market price and intrinsic business value are positively correlated in the long run, short-term divergences can emerge. The Portfolio seeks to take advantage of these divergences through a fundamental, bottom-up approach. The Portfolio invests in securities of companies with sustainable franchises when they are trading at a discount to the portfolio manager’s intrinsic value estimate for that security.
Macquarie Labor Select International Equity Portfolio seeks maximum long-term total return. The Portfolio invests primarily in equity securities of companies that are organized, have a majority of their assets, or derive most of their operating income outside of the United States, and that, in the opinion of Mondrian Investment Partners Limited (“Mondrian”), the Portfolio’s sub-advisor, are undervalued at the time of purchase based on the rigorous fundamental analysis that the sub-advisor employs. In addition to following these quantitative guidelines, Mondrian will select securities of issuers that present certain characteristics that are compatible or operate in accordance with certain investment policies or restrictions followed by organized labor.
Carefully consider the Portfolios’ investment objectives, risk factors, charges, and expenses before investing. This and other information can be found in the Portfolios’ prospectus, which may be obtained by visiting macquarie.com/investment-management/institutional or calling 800 231-8002. Investors should read the applicable prospectus carefully before investing.
Macquarie Institutional Portfolios are designed exclusively for institutional investors and high net worth individuals.
International investments entail risks not ordinarily associated with US investments including fluctuation in currency values, differences in accounting principles, or economic or political instability in other nations. Investing in emerging markets can be riskier than investing in established foreign markets due to increased volatility and lower trading volume.
The Portfolios’ share prices and yields will fluctuate in response to movements in stock prices.
Fixed income securities and bond funds can lose value, and investors can lose principal, as interest rates rise. They also may be affected by economic conditions that hinder an issuer’s ability to make interest and principal payments on its debt.
2
The Portfolios may also be subject to prepayment risk, the risk that the principal of a bond that is held by a portfolio will be prepaid prior to maturity, at the time when interest rates are lower than what the bond was paying. A portfolio may then have to reinvest that money at a lower interest rate.
Securities in the lowest of the rating categories considered to be investment grade (that is, Baa or BBB) have some speculative characteristics.
High yielding, non-investment-grade bonds (junk bonds) involve higher risk than investment grade bonds.
The high yield secondary market is particularly susceptible to liquidity problems when institutional investors, such as mutual funds and certain other financial institutions, temporarily stop buying bonds for regulatory, financial, or other reasons. In addition, a less liquid secondary market makes it more difficult for the Portfolio to obtain precise valuations of the high yield securities in its portfolio.
If and when a Portfolio invests in forward foreign currency contracts or uses other investments to hedge against currency risks, the Portfolio will be subject to special risks, including counterparty risk.
The Portfolios may invest in derivatives, which may involve additional expenses and are subject to risk, including the risk that an underlying security or securities index moves in the opposite direction from what the portfolio manager anticipated. A derivative transaction depends upon the counterparties’ ability to fulfill their contractual obligations.
Interest payments on inflation-indexed debt securities will vary as the principal and/or interest is adjusted for inflation.
3
Portfolio management review
Macquarie Institutional Portfolios — Macquarie Large Cap Value Portfolio
October 31, 2018
For the fiscal year ended Oct. 31, 2018, Macquarie Large Cap Value Portfolio gained +9.00% at net asset value (NAV) with all distributions reinvested. This result was ahead of the Portfolio’s benchmark, the Russell 1000® Value Index, which returned +3.03% for the same period. Complete annualized performance for Macquarie Large Cap Value Portfolio is shown on the table on page 6.
US stock prices moved higher during the Portfolio’s fiscal year, accompanied by an increase in volatility. There were three corrective phases in the broad-market S&P 500® Index, between -7% and -10% each, during the period. While it’s difficult, in our view, to pinpoint the reasons — perhaps volatility had simply been too low for too long — several developments appeared to put investors on edge, including rising interest rates, a more restrictive global-trade environment, concerns about rising deficits and debt, waning Federal Reserve stimulus, and the potential for higher inflation.
Early in the Portfolio’s fiscal year, Congressional Republicans passed their tax bill, which was signed into law in late December 2017. The market’s reaction was generally positive as investors appeared to discount a boost in corporate earnings resulting from a lower tax rate. The Federal Open Market Committee (FOMC) implemented four quarter-point rate increases during the period, three of which occurred under its new chair, Jerome Powell. These increases lifted the federal funds rate target range to between 2.00% and 2.25%. The economy appeared to be on solid footing throughout the fiscal year as evidenced by higher real gross domestic product (GDP – a measure of goods and services a nation produces) growth, robust consumer sentiment, very low unemployment, a surge in corporate earnings, and rising business investment.
Stock selection and an overweight allocation in the healthcare sector made strong contributions to relative performance. Pharmacy benefit manager Express Scripts Holding Co. led performance in the sector and in the Portfolio. Investors have generally reacted positively to the pending acquisition of Express Scripts by Cigna Corp., which seeks to expand its customer base, provide a wider array of services, and position itself to further deliver on cost containment.
Another healthcare stock, pharmaceutical and medical-products distributor Cardinal Health Inc., was a notable detractor. Several developments have pressured the company’s shares including weak performance in its Cordis medical-device unit, higher-than-expected deflation in generic drug pricing, and investors’ concerns about increasing competition in the pharmaceutical supply chain.
Stock selection in the energy and information technology sectors also contributed to performance during the fiscal year. The Portfolio’s position in exploration and production company ConocoPhillips led the way. The company continues to benefit from prior moves it made to strengthen its finances and improve efficiency. ConocoPhillips has focused its production in several US shale basins and has seen
improvement in revenues and earnings as oil prices have risen and break-even costs have come down.
In information technology, the Portfolio benefited most from a position in CA Inc., a provider of IT management software and solutions. In July, the company agreed to be acquired by semiconductor developer Broadcom in an all-cash deal worth $18.9 billion — a premium to CA’s share price at that time. The deal closed shortly after the end of the Portfolio’s fiscal year.
Halliburton Co., a provider of energy services, was a significant detractor from the Portfolio’s performance. As the largest provider of pressure-pumping services in the United States, the company’s stock has been hurt by ongoing constraints on takeaway capacity in the Permian Basin, as well as by slowing activity in another shale basin. Near term, we think the company’s margins will likely remain under pressure as Halliburton absorbs higher costs.
Stock selection in the materials sector hurt relative performance the most. The Portfolio’s one holding in the sector, diversified chemical manufacturer DowDuPont Inc., was weakest among all Portfolio holdings for the fiscal year. The company has faced higher cost pressures, mostly from rising input prices, as well as foreign-exchange headwinds. Since approximately two-thirds of DowDuPont’s revenue comes from outside the US, we believe rising trade tensions and potential tariffs have likely weighed on its shares as well.
During the fiscal year, there was one full position sale and purchase in the Portfolio. We exited the Portfolio’s position in integrated oil company Chevron Corp., reducing our target weight in the energy sector to 12%. A longtime Portfolio holding that had been a solid performer, Chevron’s shares were near their all-time high reached in 2014 before the oil market correction, and within 10% of our price target. We used the proceeds of this sale to purchase American International Group Inc. (AIG), a leading global multiline insurer that we found attractively valued. AIG has significantly changed since it nearly went bankrupt during the global financial crisis. More recently, AIG has faced new challenges owing to poor underwriting in its core property and casualty business. This led to significant reserve charges and turnover in senior and mid-level management. Consequently, financial and share-price performance was weak relative to peers. Valuation looked attractive to us and a new, highly regarded management team took steps to improve balance-sheet strength and underwriting discipline. In our view, AIG offers attractive upside potential if it can deliver on its business turnaround. The purchase raised the Portfolio’s target weight in the financial sector to 15%.
Throughout the fiscal year, we maintained our value-oriented approach to managing the Portfolio. In all market conditions, we try to look past the market’s short-term concerns about companies and focus on their long-term revenue, earnings, and cash-flow potential.
4
Although high valuations have tempered our performance expectations for the US equity market, our long-term outlook for
stocks — especially those value-oriented, higher-quality stocks that we seek to emphasize in the Portfolio — remains positive.
The views expressed are current as of the date of this report and are subject to change.
5
Performance summary
Macquarie Institutional Portfolios — Macquarie Large Cap Value Portfolio
The performance quoted represents past performance and does not guarantee future results. Investment return and principal value of an investment will fluctuate so that shares, when redeemed, may be worth more or less than their original cost. Current performance may be lower or higher than the performance quoted. Performance data current to the most recent month end may be obtained by calling 800 231-8002 or visiting macquarie.com/investment-management/mip.
Carefully consider the Portfolio’s investment objectives, risk factors, charges, and expenses before investing. This and other information can be found in the Portfolio’s prospectus and, if available, its summary prospectus, which may be obtained by visiting macquarie.com/investment-management/mip or calling 800 231-8002. Investors should read the prospectus and, if available, the summary prospectus carefully before investing.
Portfolio and benchmark performance
Average annual total returns
| | | | | | | | | | |
Periods ended Oct. 31, 2018 | | 1 year | | 3 years | | 5 years | | 10 years | | Lifetime |
Macquarie Large Cap Value Portfolio | | +9.00% | | +9.95% | | +9.77% | | +13.64% | | +9.96% |
Russell 1000 Value Index | | +3.03% | | +8.88% | | +8.61% | | +11.30% | | +9.83% |
Portfolio profile
Oct. 31, 2018
| | | | | | |
Total net assets | | Number of holdings | | | | |
$106.8 million | | 33 | | | | |
Inception date | | | | | | |
Feb. 3, 1992 | | | | | | |
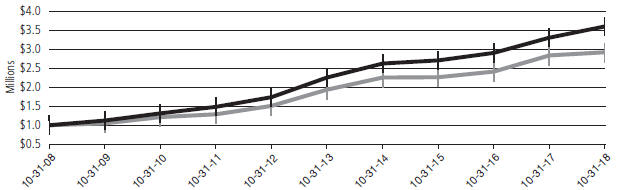
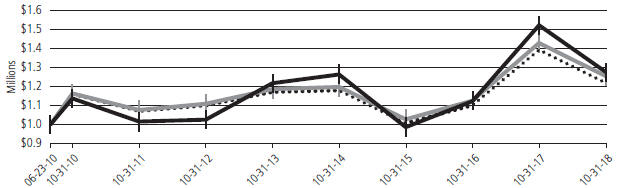
Growth of $1,000,000
| | | | | | |
| | | | Starting value (Oct. 31, 2008) | | Ending value (Oct. 31, 2018) |
| | | |

| | Macquarie Large Cap Value Portfolio | | $1,000,000 | | $3,593,140 |
| | | |

| | Russell 1000 Value Index | | $1,000,000 | | $2,916,960 |
The performance graph assumes $1 million invested on Oct. 31, 2008, and includes reinvestment of all distributions. The performance graph does not reflect the deduction of taxes the shareholder would pay on Portfolio distributions or redemptions of Portfolio shares.
Total return assumes reinvestment of dividends and capital gains, but does not reflect reductions for taxes. Returns and share values will fluctuate so that shares, when redeemed, may be worth more or less than their original cost.
6
The most recent prospectus disclosed the Portfolio’s total operating expenses as 0.66%. Management has contractually agreed to reimburse certain expenses and/or waive its management fees from Nov. 1, 2017 through Oct. 31, 2018,* in order to prevent total annual Portfolio operating expenses (with certain exclusions) from exceeding, in an aggregate amount, 0.70% of the Portfolio’s average daily net assets, as described in the most recent prospectus.
Expense limitations were in effect during the period shown. Performance would have been lower had the expense limitations not been in effect.
The Russell 1000 Value Index measures the performance of the large-cap value segment of the US equity universe. It includes those Russell 1000 companies with lower price-to-book ratios and lower forecasted growth values.
The S&P 500 Index, mentioned on page 4, measures the performance of 500 mostly large-cap stocks weighted by market value, and is often used to represent performance of the US stock market.
Frank Russell Company (“Russell”) is the source and owner of the trademarks, service marks, and copyrights related to the Russell Indexes. Russell® is a trademark of the Frank Russell Company.
Index performance returns do not reflect any management fees, transaction costs, or expenses. Indices are unmanaged and one cannot invest directly in an index.
Investing involves risk, including the possible loss of principal.
Past performance is not a guarantee of future results.
* The aggregate contractual waiver period covering this report is from Feb. 28, 2017 through Feb. 28, 2019.
7
Portfolio management review
Macquarie Institutional Portfolios — Macquarie Core Plus Bond Portfolio
October 31, 2018
For the fiscal year ended Oct. 31, 2018, Macquarie Core Plus Bond Portfolio returned -2.29% at net asset value (NAV) with all distributions reinvested. The Portfolio’s benchmark, the Bloomberg Barclays US Aggregate Index, returned -2.05% for the same period. Complete annualized performance for Macquarie Core Plus Bond Portfolio is shown in the table on page 10.
As the Portfolio’s fiscal year began, the US Federal Reserve announced it would begin tapering reinvestment of its large-scale asset purchases and let its balance sheet gradually shrink, effectively ending the monetary-policy stimulus that had been in place over the past decade. Additionally, the Fed’s short-term interest rate hikes continued, causing the yield curve to flatten as short-term yields rose faster than longer-term yields.
At the same time that the Fed began withdrawing monetary stimulus, business received a boost in confidence and profits from government deregulation and the accommodative fiscal policy that resulted from passage of the tax reform bill in December 2017.
In spring 2018, trade tensions flared with the Trump administration’s implementation of tariffs on steel and aluminum. China responded in kind, leading many investors to fear a potential trade war. Closer to home, the administration’s threat to withdraw from the North American Free Trade Agreement (NAFTA) led to a reworking of that agreement with Mexico and Canada, though it has not yet been ratified.
During the fiscal period, the pace of US economic growth diverged from that of other economies. As the US economy rebounded, thanks in part to the federal tax cuts and deregulation, Europe began to encounter new issues and emerging markets felt pressure on their US dollar-denominated debt as the dollar strengthened. The London interbank offered rate (LIBOR) rose in the second quarter of 2018 in part because of US tax reform and the repatriation of overseas assets by some US-based firms. The US-China trade war intensified, and Italy’s political uncertainty weighed on financial markets as well. Driven by these factors and concerns about rising interest rates, US stock volatility increased in the spring and summer.
Among emerging markets, Turkey and Argentina were particularly concerning. Turkey’s president threatened the independence of the country’s central bank, and the weakening condition of the country’s fiscal accounts raised investors’ anxiety. Argentina’s inflation rose significantly, and the country’s fiscal account deteriorated.
Emerging markets exposure detracted from Portfolio performance as currencies deteriorated and yield premiums widened, causing debt securities issued by emerging market countries to underperform. Argentina and Turkey had a large negative impact among emerging market bonds, as US dollar-denominated and local sovereign bonds detracted along with some bank issues in both countries. Similarly, a
small exposure to developed market local currency bonds hurt performance because of the stronger US dollar.
Investment grade financial bonds, which averaged about 10% of the Portfolio, were adversely affected by increases in the federal funds rate and LIBOR. Meanwhile, yield spreads rose on bank securities, particularly in the first quarter of 2018. More generally, investment grade and high yield bonds posed a challenge as credit spreads widened through the period. Within high yield, American Tire Distributors Inc. detracted from returns after two major customers, tire manufacturers Goodyear and Bridgestone, stopped using the company as a distributor. We exited the Portfolio’s position in American Tire during the fiscal year.
In retrospect, we underestimated both the extent to which economic growth divergence between the US and other economies would lead to significant monetary policy divergence and the challenges posed by a stronger US dollar. In response, we reduced risk by decreasing the Portfolio’s exposure to emerging market local currency bonds and, to a certain extent, emerging market US dollar-denominated bonds. We also gradually reduced the Portfolio’s exposure to investment grade corporate bonds and traditional high yield bonds, redeploying assets in US Treasury securities.
Entering the fourth calendar quarter of 2018, we began to unwind an investment in collateralized mortgage obligations (CMOs) that we had held in the Portfolio for a few years but felt was no longer attractive in a more volatile environment. We used these assets to add slightly to the Portfolio’s high-quality asset-backed securities (ABS), and we plan to purchase fixed-rate agency mortgage-backed securities (MBS).
On the positive side, the Portfolio’s performance relative to its benchmark was helped to some extent by exposure to sectors that benefited from rising rates. Premium agency mortgage-backed coupons performed well. Similarly, exposure to high-quality collateralized loan obligations (CLOs) contributed to performance as they reset, capturing higher yields. Exposure to bank loans was also positive, as the credit environment was somewhat benign and coupons reset quarterly.
Fannie Mae and Freddie Mac 4.5% pass-through bonds performed well along with bonds issued by financial firms Royal Bank of Scotland Group PLC, Credit Suisse Group AG, and aircraft leasing firm AerCap Global Aviation Trust, as finance spreads widened, creating expanded profit opportunities. Elsewhere, Energy Transfer Partners LP, a master limited partnership that owns and operates a large diversified portfolio of US energy assets, had strong performance and added to returns.
Along with adding high-quality securities, including ABS and Treasury securities, we used derivatives to help manage risk exposure. Because we expect more volatility as the Fed continues to increase rates,
8
we’ve added additional derivative protection. Further, we believe 2019 could see monetary policy divergence between the Fed and other major central banks come back in line if the Fed pauses its rate hikes and dials back its monetary tightening pressure.
At various volatile periods during the fiscal year we used derivatives, specifically credit default swaps, to reduce credit exposure and to hedge the Portfolio’s small exposure to convertible bonds. The use of credit default swaps had an immaterial effect on the Portfolio’s returns during the fiscal period.
We also used forward currency hedges to add liquidity and to reduce local currency exposure in developed and emerging markets. Because the Portfolio’s natural duration (interest rate sensitivity) was reduced through exposure to less interest rate sensitive areas such as CLOs and bank loans, we used interest rate futures to add interest rate exposure. However, our bias was to be short, by up to a year, of the benchmark’s interest rate sensitivity measure. The short position contributed modestly to the Portfolio’s returns as interest rates rose during the fiscal year.
The views expressed are current as of the date of this report and are subject to change.
9
Performance summary
Macquarie Institutional Portfolios — Macquarie Core Plus Bond Portfolio
The performance quoted represents past performance and does not guarantee future results. Investment return and principal value of an investment will fluctuate so that shares, when redeemed, may be worth more or less than their original cost. Current performance may be lower or higher than the performance quoted. Performance data current to the most recent month end may be obtained by calling 800 231-8002 or visiting macquarie.com/investment-management/mip.
Carefully consider the Portfolio’s investment objectives, risk factors, charges, and expenses before investing. This and other information can be found in the Portfolio’s prospectus and, if available, its summary prospectus, which may be obtained by visiting macquarie.com/investment-management/mip or calling 800 231-8002. Investors should read the prospectus and, if available, the summary prospectus carefully before investing.
| | | | | | | | | | |
Portfolio and benchmark performance |
Average annual total returns |
Periods ended Oct. 31, 2018 | | 1 year | | 3 years | | 5 years | | 10 years | | Lifetime |
Macquarie Core Plus Bond Portfolio | | –2.29% | | +1.28% | | +2.02% | | +5.75% | | +5.13% |
Bloomberg Barclays US Aggregate Index | | –2.05% | | –1.04% | | +1.83% | | +3.94% | | +4.03% |
Portfolio profile
Oct. 31, 2018
| | | | |
Total net assets | | Number of holdings | | |
$220 million | | 970 | | |
Inception date | | | | |
June 28, 2002 | | | | |
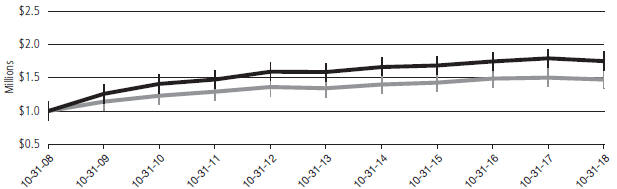
Growth of $1,000,000
| | | | | | |
| | | | Starting value (Oct. 31, 2008) | | Ending value (Oct. 31, 2018) |
| | | |
 | | Macquarie Core Plus Bond Portfolio | | $1,000,000 | | $1,749,149 |
| | | |
 | | Bloomberg Barclays US Aggregate Index | | $1,000,000 | | $1,471,502 |
The performance graph assumes $1 million invested on Oct. 31, 2008 and includes reinvestment of all distributions. The performance graph does not reflect the deduction of taxes the shareholder would pay on Portfolio distributions or redemptions of Portfolio shares.
Total return assumes reinvestment of dividends and capital gains but does not reflect reductions for taxes. Returns and share values will fluctuate so that shares, when redeemed, may be worth more or less than their original cost.
10
The most recent prospectus disclosed the Portfolio’s total operating expenses as 0.60%. Management has contractually agreed to reimburse certain expenses and/or waive its management fees from Nov. 1, 2017 through Oct. 31, 2018,* in order to prevent total annual Portfolio operating expenses (with certain exclusions) from exceeding, in an aggregate amount, 0.45% of the Portfolio’s average daily net assets, as described in the most recent prospectus.
Expense limitations were in effect during the period shown. Performance would have been lower had the expense limitations not been in effect.
The Bloomberg Barclays US Aggregate Index measures the performance of publicly issued investment grade (Baa3/BBB- or better) corporate, US government, mortgage- and asset-backed securities with at least one year to maturity and at least $250 million par amount outstanding.
Index performance returns do not reflect any management fees, transaction costs, or expenses. Indices are unmanaged and one cannot invest directly in an index.
Investing involves risk, including the possible loss of principal.
Past performance is not a guarantee of future results.
Fixed income securities and bond funds can lose value, and investors can lose principal, as interest rates rise. They also may be affected by economic conditions that hinder an issuer’s ability to make interest and principal payments on its debt.
The Portfolio may also be subject to prepayment risk, the risk that the principal of a bond that is held by the Portfolio will be prepaid prior to maturity, at the time when interest rates are lower than what the bond was paying. The Portfolio may then have to reinvest that money at a lower interest rate.
Interest payments on inflation-indexed debt securities will vary as the principal and/or interest is adjusted for inflation.
High yielding, non-investment-grade bonds (junk bonds) involve higher risk than investment grade bonds. The high yield secondary market is particularly susceptible to liquidity problems when institutional investors, such as mutual funds and certain other financial institutions, temporarily stop buying bonds for regulatory, financial, or other reasons. In addition, a less liquid secondary market makes it more difficult for the Portfolio to obtain precise valuations of the high yield securities in its portfolio.
International investments entail risks not ordinarily associated with US investments including fluctuation in currency values, differences in accounting principles, or economic or political instability in other nations.
Investing in emerging markets can be riskier than investing in established foreign markets due to increased volatility and lower trading volume.
Because the Portfolio may invest in bank loans and other direct indebtedness, it is subject to the risk that the Portfolio will not receive payment of principal, interest, and other amounts due in connection with these investments, which primarily depend on the financial condition of the borrower and the lending institution.
The Portfolio may invest in derivatives, which may involve additional expenses and are subject to risk, including the risk that an underlying security or securities index moves in the opposite direction from what the portfolio manager anticipated. A derivatives transaction depends upon the counterparties’ ability to fulfill their contractual obligations.
If and when the Portfolio invests in forward foreign currency contracts or uses other investments to hedge against currency risks, the Portfolio will be subject to special risks, including counterparty risk.
The Portfolio may experience portfolio turnover in excess of 100%, which could result in higher transaction costs and tax liability.
*The aggregate contractual waiver period covering this report is from Feb. 28, 2017 through Feb. 28, 2019.
Performance summary
Macquarie Institutional Portfolios — Macquarie Core Plus Bond Portfolio
This document may mention bond ratings published by nationally recognized statistical rating organizations (NRSROs) Standard & Poor’s, Moody’s Investors Service, and Fitch, Inc. For securities rated by an NRSRO other than S&P, the rating is converted to the equivalent S&P credit rating. Bonds rated AAA are rated as having the highest quality and are generally considered to have the lowest degree of investment risk. Bonds rated AA are considered to be of high quality, but with a slightly higher degree of risk than bonds rated AAA. Bonds rated A are considered to have many favorable investment qualities, though they are somewhat more susceptible to adverse economic conditions. Bonds rated BBB are believed to be of medium-grade quality and generally riskier over the long term. Bonds rated BB, B, and CCC are regarded as having significant speculative characteristics, with BB indicating the least degree of speculation of the three.
Investments in mortgage-backed securities (MBS) may involve risks. MBS represent an ownership interest in a pool of mortgage loans. The individual mortgage loans are packaged or “pooled” together for sale to investors. These mortgage loans may have either fixed or adjustable interest rates.
Investments in collateralized loan obligations (CLOs) may involve risks. CLOs are securities backed by a pool of debt, often low-rated corporate loans. Investors receive scheduled debt payments from the underlying loans but assume most of the risk in the event that borrowers default.
Investments in collateralized mortgage obligations (CMOs) may involve risks. CMOs are debt securities issued by US government agencies or by financial institutions and other mortgage lenders, which are collateralized by a pool of mortgages held under an indenture. Prepayment of mortgages may shorten the stated maturity of the obligations and can result in a loss of premium, if any has been paid.
12
Portfolio management review
Macquarie Institutional Portfolios — Macquarie High Yield Bond Portfolio
October 31, 2018
For the fiscal year ended Oct. 31, 2018, Macquarie High Yield Bond Portfolio returned -0.77% at net asset value (NAV) with all distributions reinvested. For the same period, the Portfolio’s benchmark, the ICE BofAML US High Yield Constrained Index, returned +0.86%. Complete annualized performance for Macquarie High Yield Bond Portfolio is shown in the table on page 15.
High yield bonds posted modest gains during the Portfolio’s fiscal year ended Oct. 31, 2018, as the sector’s income component offset the effects of rising interest rates across the fixed income yield curve. There were, however, divergent forces working at the credit and sector levels. Lower-rated bonds briefly lost value in late 2017 amid concerns that the tax bill (then debated in Congress) would limit the deductibility of interest. When that fear subsided, CCC-rated bonds subsequently outperformed, especially as sharply rising Treasury yields in early 2018 caused investors to reduce exposure to longer-duration, higher-rated bonds. Over the Portfolio’s fiscal year, credit spreads widened slightly, while default rates remained low by historical standards.
Industries’ initial reactions to the Trump administration’s trade policy drove sector returns. Companies that make steel benefited from the imposition of tariffs on metal imports from Canada, Mexico, and the European Union, with the price of steel rising by more than one-third over the first six months of 2018. Conversely, rising raw material prices curtailed second-quarter earnings of companies that use steel — a group that includes homebuilders, automobiles, manufacturers, and a wide array of basic industries.
A steep rise in transportation costs also sliced into the bottom lines of energy-intensive industries.
Overall, however, US corporations operated in one of the most favorable earnings environments in several decades, with lower tax rates, reduced regulation, and increased consumer and government spending augmenting a late-cycle economic expansion. Unit labor costs remained notably restrained despite an unemployment rate below 4% and the fastest pace of economic growth since 2014.
From a valuation perspective, high yield spreads finished the Portfolio’s fiscal year at the lower end of historical ranges, the result of the strong fundamental backdrop discussed above and solid technical conditions. Light new-issue supply activity was a large contributor to the solid technical picture, as cash received from interest payments and principal repayments outweighed both the retail outflows from the market and the reduced volume of new-issue supply brought to market during the fiscal period.
During the fiscal year, the Portfolio’s positioning in the automotive, pharmaceuticals, support services, and chemicals sectors detracted from the Portfolio’s performance. In contrast, the Portfolio’s positioning in the software services, health facilities, insurance
brokerage, and wireline telecommunications sectors contributed to performance.
Source: Bloomberg.
American Tire Distributors Inc. detracted from the Portfolio’s relative performance during the fiscal year. The company suffered a negative credit event when Goodyear and Bridgestone — its two largest customers, representing about one-quarter of annual revenue — formed a joint venture to in-source distribution of their manufactured tires. Bonds issued by American Tire Distributors traded down sharply on the news, and we subsequently sold the Portfolio’s position because of the company’s deteriorating long-term outlook.
Alta Mesa Holdings LP, an oil and natural gas exploration and production company, also detracted from performance. The company’s weaker-than-expected third-quarter earnings results, combined with a precipitous 11% drop in oil prices in October, resulted in weakness in the company’s equity and bond prices. We remain positive on the longer-term fundamentals of the company and maintain our position in the bonds.
Finally, Tronox Inc., a titanium dioxide producer, detracted from returns for the year. In 2017, the company announced the acquisition of Cristal USA Inc. with the intention of selling certain Cristal assets in order to both alleviate any antitrust concerns surrounding the transaction and enhance the combined company’s credit profile moving forward. In August 2018, the Federal Trade Commission (FTC) filed an injunction to block the acquisition. As a result, Tronox’s bonds sold off, detracting from overall Portfolio performance. It is our view that the transactions will ultimately be completed, and we maintain the Portfolio’s position in the bonds.
A bank loan issued to Applied Systems Inc., a provider of software to the property and casualty insurance market, was the Portfolio’s strongest contributor. Applied Systems reported positive earnings during the fiscal year. In our view, the company has used its favorable free-cash-flow profile and stable margins to reduce outstanding debt while continuing to build upon an already-dominant market share within its industry.
Tenet Healthcare Corp., a US-based owner and operator of hospitals and related healthcare facilities, also contributed to performance for the year. Investors’ outlook for hospitals improved throughout the year as the likelihood of a repeal of the Affordable Care Act diminished. Additionally, Tenet’s strong earnings, supported by a cost-savings plan and deleveraging of its balance sheet, led to strong performance for the company’s bond complex. We maintain the Portfolio’s position in Tenet’s bonds.
Finally, a position in Surgery Center Holdings Inc. contributed to the Portfolio’s returns for the year. The hospital services company brought in a new management team early in the year and implemented operational efficiency plans to enhance revenues and
Portfolio management review
Macquarie Institutional Portfolios — Macquarie High Yield Bond Portfolio
improve operating margins. The improving operating trends throughout the year resulted in solid bond performance. We currently maintain the Portfolio’s position in the company’s bonds.
Although the economic backdrop for high yield bonds remains generally supportive, we are cognizant of various risk factors, including the continuation of the Federal Reserve’s monetary tightening cycle, stretched valuations, volatility in domestic equity markets, and the unforeseen consequences of an escalating trade war on the global economy. With those risks in mind, we moved the Portfolio’s duration component to neutral and, with regard to credit quality, maintain an overweight allocation to what we view as our highest conviction names. At the sector level, we have reduced exposure to sectors, such as builders, building materials, and
packaging. Meanwhile, we have retained an overweight allocation to banking and insurance brokers.
Given the strength of domestic economic activity, we believe that the US credit cycle has further to run, thus potentially lending support to lower-tier credits. Conversely, the likely rise in benchmark and market interest rates could pressure longer-duration, higher-quality issues. As such, we think achieving a proper balance between credit and duration risk remains the primary challenge in managing the Portfolio. In this environment, credit selection could remain paramount, in which case we believe our bottom-up (bond by bond) approach to managing and constructing high yield portfolios may prove advantageous.
The views expressed are current as of the date of this report and are subject to change.
14
Performance summary
Macquarie Institutional Portfolios — Macquarie High Yield Bond Portfolio
The performance quoted represents past performance and does not guarantee future results. Investment return and principal value of an investment will fluctuate so that shares, when redeemed, may be worth more or less than their original cost. Current performance may be lower or higher than the performance quoted. Performance data current to the most recent month end may be obtained by calling 800 231-8002 or visiting macquarie.com/investment-management/mip.
Carefully consider the Portfolio’s investment objectives, risk factors, charges, and expenses before investing. This and other information can be found in the Portfolio’s prospectus and, if available, its summary prospectus, which may be obtained by visiting macquarie.com/investment-management/mip or calling 800 231-8002. Investors should read the prospectus and, if available, the summary prospectus carefully before investing.
Portfolio and benchmark performance
Average annual total returns
| | | | | | | | | | | | | | | | | | | | |
Periods ended Oct. 31, 2018 | | | 1 year | | | | 3 years | | | | 5 years | | | | 10 years | | | | Lifetime | |
Macquarie High Yield Bond Portfolio | | | –0.77% | | | | +4.83% | | | | +3.21% | | | | +10.65% | | | | +7.30% | |
ICE BofAML US High Yield Constrained Index* | | | +0.86% | | | | +6.65% | | | | +4.69% | | | | +11.20% | | | | +6.81% | |
*Formerly known as the BofA Merrill Lynch US High Yield Constrained Index.
Portfolio profile
Oct. 31, 2018
| | | | |
Total net assets | | Number of holdings | | |
$77.7 million | | 157 | | |
| | | | |
Inception date | | | | |
Dec. 2, 1996 | | | | |
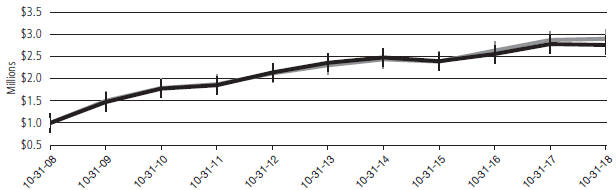
Growth of $1,000,000
| | | | | | |
| | | | Starting value (Oct. 31, 2008) | | Ending value (Oct. 31, 2018) |
| | | |
| | ICE BofAML US High Yield Constrained Index | | $1,000,000 | | $2,890,470 |
| | | |
| | Macquarie High Yield Bond Portfolio | | $1,000,000 | | $2,752,196 |
The performance graph assumes $1 million invested on Oct. 31, 2008, and includes reinvestment of all distributions. The performance graph does not reflect the deduction of taxes the shareholder would pay on Portfolio distributions or redemptions of Portfolio shares.
Total return assumes reinvestment of dividends and capital gains, but does not reflect reductions for taxes. Returns and share values will fluctuate so that shares, when redeemed, may be worth more or less than their original cost.
Performance summary
Macquarie Institutional Portfolios — Macquarie High Yield Bond Portfolio
The most recent prospectus disclosed the Portfolio’s total operating expenses as 0.58%. Management has contractually agreed to reimburse certain expenses and/or waive its management fees from Nov. 1, 2017 through Oct. 31, 2018,* in order to prevent total annual Portfolio operating expenses (with certain exceptions) from exceeding, in an aggregate amount, 0.59% of the Portfolio’s average daily net assets, as described in the most recent prospectus.
Expense limitations were in effect during the period shown. Performance would have been lower had the expense limitations not been in effect.
The ICE BofAML US High Yield Constrained Index (formerly known as the BofA Merrill Lynch US High Yield Constrained Index) tracks the performance of US dollar-denominated high yield corporate debt publicly issued in the US domestic market, but caps individual issuer exposure at 2% of the benchmark. Qualifying securities must have, among other things, a below-investment-grade rating (based on an average of Moody’s, Standard & Poor’s, and Fitch), an investment grade issuing country (based on an average of Moody’s, Standard & Poor’s, and Fitch foreign currency long-term sovereign debt ratings), and maturities of one year or more.
Index performance returns do not reflect any management fees, transaction costs, or expenses. Indices are unmanaged and one cannot invest directly in an index.
Investing involves risk, including the possible loss of principal.
Past performance is not a guarantee of future results.
Fixed income securities and bond funds can lose value, and investors can lose principal, as interest rates rise. They also may be affected by economic conditions that hinder an issuer’s ability to make interest and principal payments on its debt.
The Portfolio may also be subject to prepayment risk, the risk that the principal of a bond that is held by the Portfolio will be prepaid prior to maturity, at the time when interest rates are lower than what the bond was paying. The Portfolio may then have to reinvest that money at a lower interest rate.
The Portfolio may be invested in foreign corporate bonds, which have special risks not ordinarily associated with domestic investments, such as currency fluctuations, economic and political change, and different accounting standards.
High yielding, non-investment-grade bonds (junk bonds) involve higher risk than investment grade bonds. The high yield secondary market is particularly susceptible to liquidity problems when institutional investors, such as mutual funds and certain other financial institutions, temporarily stop buying bonds for regulatory, financial, or other reasons. In addition, a less liquid secondary market makes it more difficult for the Portfolio to obtain precise valuations of the high yield securities in its portfolio.
The Portfolio may experience portfolio turnover in excess of 100%, which could result in higher transaction costs and tax liability.
This document may mention bond ratings published by nationally recognized statistical rating organizations (NRSROs) Standard & Poor’s, Moody’s Investors Service, and Fitch, Inc. For securities rated by an NRSRO other than S&P, the rating is converted to the equivalent S&P credit rating. Bonds rated AAA are rated as having the highest quality and are generally considered to have the lowest degree of investment risk. Bonds rated AA are considered to be of high quality, but with a slightly higher degree of risk than bonds rated AAA. Bonds rated A are considered to have many favorable investment qualities, though they are somewhat more susceptible to adverse economic conditions. Bonds rated BBB are believed to be of medium-grade quality and generally riskier over the long term. Bonds rated BB, B, and CCC are regarded as having significant speculative characteristics, with BB indicating the least degree of speculation of the three.
International investments entail risks not ordinarily associated with US investments including fluctuation in currency values, differences in accounting principles, or economic or political instability in other nations. Investing in emerging markets can be riskier than investing in established foreign markets due to increased volatility and lower trading volume.
*The aggregate contractual waiver period covering this report is from Feb. 28, 2017 through Feb. 28, 2019.
16
Portfolio management review
Macquarie Institutional Portfolios — Macquarie Emerging Markets Portfolio
October 31, 2018
For the fiscal year ended Oct. 31, 2018, Macquarie Emerging Markets Portfolio returned -10.28% at net asset value (NAV) with all distributions reinvested, outperforming its benchmark, the MSCI Emerging Markets Index. The index returned -12.19% (gross) and -12.52% (net) for the same period. Complete annualized performance for Macquarie Emerging Markets Portfolio is shown in the table on page 19.
Weakness in emerging markets — a dramatic reversal from the previous fiscal year’s robust performance — was largely due to three key factors:
First, US-China trade protectionism and imposed tariffs weighed heavily on these markets. China saw a decline of 16.7% for the 12-month period as the trade and tariff wars seemed to dampen investor confidence in Chinese economic growth and spread across the asset class.
A second factor was the reversal of the dominant Chinese Internet-related companies that had seen significant growth in recent years. Tencent (-24%), Alibaba (-23%), and Baidu (-22%) make up a large part of the benchmark index and clearly dragged down the index’s performance. South African-listed Naspers (-28%), which owns a big stake in Tencent, also declined sharply during the Portfolio’s fiscal year.
Third, concerns over rising US interest rates weighed on stocks in all markets, particularly emerging markets. Finally, some fairly consequential elections in Brazil, Malaysia, Mexico, Turkey, and South Africa affected emerging markets. Results in these elections weighed on investor sentiment and contributed to market volatility.
Value style investing, as measured by the MSCI Emerging Markets Value Index, outperformed growth style investing, as measured by the MSCI Emerging Markets Growth Index, by a significant margin (-8.3% versus -16.7%, respectively). This after a long period in which growth had outperformed. This outcome clearly benefited the Portfolio’s positioning, as value stocks, particularly within the energy sector, performed well. Overall, the recovery in oil prices helped energy stocks. The energy sector gained 14.5%. The strongest-performing emerging markets, in fact, all have a strong commodity focus. Brazil was up 5% and Russia rose 10.7%. Qatar also gained during the period. Countries with strong technology-linked markets, notably China and South Korea (-20%), fared poorly during the fiscal year.
The Portfolio’s outperformance largely can be attributed to the Portfolio’s positioning from a country perspective. We were overweight in commodity-linked areas including Brazil, Russia, and the Middle East, and underweight in China, South Korea, and South Africa. From a sector perspective, we benefited more from our stock selection within sectors than our allocation to specific sectors. The one exception was the Portfolio’s overall information technology (IT)
positioning: Both the Portfolio’s IT underweight and our stock selection within IT were significant positives in terms of relative performance. On the negative side, the Portfolio was underweighted in the energy sector, whose upsurge hurt both relative and absolute performance. In addition, the Portfolio’s overweight in Turkey also hurt performance.
Turning to specific stocks, all of the Portfolio’s energy-related holdings performed well. Two Middle Eastern banks held in the Portfolio, with their obvious linkage to the energy markets, were standouts during the fiscal year. Qatar National Bank QPSC was up 61% and First Abu Dhabi Bank PJSC was up 44%. Within Russia, LUKOIL PJSC was up 34%, and Gazprom PJSC rose by 12%.
The strongest-performing stock in the Portfolio over the 12-month period was Brazilian pulp and paper company Suzano Papel e Celulose S.A., which rose 82%. Suzano has done well for several reasons. Pulp prices have been quite strong. In addition, as an exporter, Suzano benefited from a weakening Brazilian real. What was possibly most relevant though was its announced takeover of Brazilian pulp and paper company Fibria, as this merger is projected to potentially yield significant benefits.
The Portfolio’s holdings in Turkey, particularly Turkish banks, hurt performance during the 12-month period. Turkey’s rising political tensions with the United States and weak currency, along with investors’ increasing concerns over its economic policies, all dragged its market down. The Portfolio’s two Turkish banks, Turkiye Halk Bankasi AS and Turkiye Garanti Bankasi AS, fell 60% and 54%, respectively. Given the deeply discounted valuation of these banks and the Turkish lira, we continue to hold these positions in the Portfolio.
Two holdings in India also saw significant declines. Vedanta Ltd.,a diversified mining company, was down more than 40%. Although materials in general did well for the fiscal period, deterioration in prices in some of Vedanta’s key platforms, such as zinc, punished the stock. We increased the Portfolio’s position in Vedanta on this weakness, as we believe it has strong and well-supported long-term fundamentals. Indiabulls Housing Finance Ltd. was down 37%. Indiabulls’ weakness occurred mostly toward the end of the 12-month period, driven by concerns about liquidity in the Indian market and its ability to access financing. Currency weakness compounded the drop in price. We added to the Portfolio’s position in Indiabulls during the fiscal period, believing that concerns over tight liquidity may be exaggerated.
Another disappointing holding for the Portfolio during the fiscal year was China-headquartered WH Group Ltd., which declined 36%. The company comprises about half US-based Smithfield, and half a Chinese pork company. WH Group was in the firing zone of the trade wars, and its stock was weakened by pork prices and domestic
Portfolio management review
Macquarie Institutional Portfolios — Macquarie Emerging Markets Portfolio
Chinese concerns. We added to the Portfolio’s holding considerably during the fiscal period, believing that the selloff was overdone. About 80% of WH Group’s profits come from packaged meats, a highly stable business where profits grew for the fiscal year.
Asia was the weakest region during the fiscal year and we took advantage of that weakness to increase the Portfolio’s overall weighting in the region. In particular, we added to holdings in both China and South Korea. The Portfolio ended the fiscal period still underweight in China — but that underweight narrowed — and with a slight overweight in South Korea. In adding to holdings in China, we identified situations where we believed either that a stock was sold down in excess of the impact of the trade war, as with WH Group, or that a company still had attractive business prospects regardless of protectionist posturing.
For much of 2017, volatility in this asset class had diminished to unprecedentedly low levels. Because we had expected volatility to increase, it was not a huge surprise to us to see a return to more historical norms over the past fiscal year. Our strong value orientation continued to lead us to invest in companies with more defensive attributes that have the potential to make them less vulnerable to volatility-inducing trade wars, political uncertainties, and domestic economic changes. Our objective is a portfolio that seeks to protect capital and outperform in volatile markets, and we were gratified to see the Portfolio outperform its benchmark for the fiscal period.
The Portfolio utilized foreign currency exchange contracts to facilitate the purchase and sale of equities traded on international exchanges. The effect of these contracts on performance was immaterial.
The views expressed are current as of the date of this report and are subject to change.
18
Performance summary
Macquarie Institutional Portfolios — Macquarie Emerging Markets Portfolio
The performance quoted represents past performance and does not guarantee future results. Investment return and principal value of an investment will fluctuate so that shares, when redeemed, may be worth more or less than their original cost. Current performance may be lower or higher than the performance quoted. Performance data current to the most recent month end may be obtained by calling 800 231-8002 or visiting macquarie.com/investment-management/mip.
Carefully consider the Portfolio’s investment objectives, risk factors, charges, and expenses before investing. This and other information can be found in the Portfolio’s prospectus and, if available, its summary prospectus, which may be obtained by visiting macquarie.com/investment-management/mip or calling 800 231-8002. Investors should read the prospectus and, if available, the summary prospectus carefully before investing.
Portfolio and benchmark performance
Average annual total returns
| | | | | | | | | | | | | | | | | | | | |
Periods ended Oct. 31, 2018 | | | 1 year | | | | 3 years | | | | 5 years | | | | 10 years | | | | Lifetime | |
Macquarie Emerging Markets Portfolio | | | –10.28% | | | | +3.83% | | | | –1.11% | | | | +6.86% | | | | +6.76% | |
MSCI Emerging Markets Index (net) | | | –12.52% | | | | +6.52% | | | | +0.78% | | | | +7.84% | | | | +5.35% | |
MSCI Emerging Markets Index (gross) | | | –12.19% | | | | +6.92% | | | | +1.15% | | | | +8.20% | | | | +5.64% | |
Portfolio profile
Oct. 31, 2018
| | | | |
| Total net assets | | Number of holdings | | |
| $79.5 million | | 59 | | |
| | | | |
| Inception date | | | | |
| April 16, 1997 | | | | |
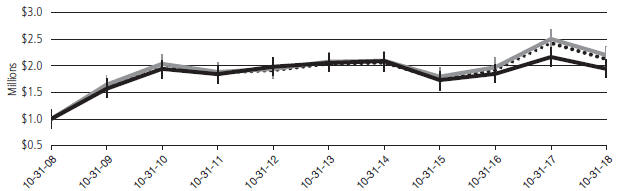
Growth of $1,000,000
| | | | |
| | Starting value (Oct. 31, 2008) | | Ending value (Oct. 31, 2018) |
| | |
 MSCI Emerging Markets Index (gross) MSCI Emerging Markets Index (gross)
| | $1,000,000 | | $2,200,231 |
| | |
 MSCI Emerging Markets Index (net) MSCI Emerging Markets Index (net)
| | $1,000,000 | | $2,127,101 |
| | | |
 Macquarie Emerging Markets Portfolio Macquarie Emerging Markets Portfolio
| | $1,000,000 | | $1,941,500 |
The performance graph assumes $1 million invested on Oct. 31, 2008, and includes reinvestment of all distributions. The performance graph does not reflect the deduction of taxes the shareholder would pay on Portfolio distributions or redemptions of Portfolio shares.
Total return assumes reinvestment of dividends and capital gains, but does not reflect reductions for taxes. Returns and share values will fluctuate so that shares, when redeemed, may be worth more or less than their original cost.
Performance summary
Macquarie Institutional Portfolios — Macquarie Emerging Markets Portfolio
The most recent prospectus disclosed the Portfolio’s total operating expenses as 1.22%. The purchase reimbursement fee (0.40%) and redemption reimbursement fee (0.45%) are paid to the Portfolio. These fees are designed to reflect an approximation of the brokerage and other transaction costs associated with the investment of an investor’s purchase amount or the disposition of assets to meet redemptions, and to limit the extent to which the Portfolio (and, indirectly, the Portfolio’s existing shareholders) would have to bear such costs. In lieu of the reimbursement fees, investors in Macquarie Emerging Markets Portfolio may be permitted to utilize alternative purchase and redemption methods designed to accomplish the same economic effect as the reimbursement fees. Reimbursement fees applicable to purchases and redemptions of shares of the Portfolio are not reflected in the “Growth of $1,000,000” graph.
Expense limitations were in effect during the period shown. Performance would have been lower had the expense limitations not been in effect.
The MSCI Emerging Markets Index measures equity market performance across emerging market countries worldwide. Index “gross” return approximates the maximum possible dividend reinvestment. Index “net” return approximates the minimum possible dividend reinvestment, after deduction of withholding tax at the highest possible rate.
The MSCI Emerging Markets Growth Index, mentioned on page 17, includes large- and mid-cap securities exhibiting overall growth style characteristics across 24 emerging market countries. The growth investment style characteristics for index construction are defined using five variables: long-term forward earnings per share (EPS) growth rate, short-term forward EPS growth rate, current internal growth rate, long-term historical EPS growth trend, and long-term historical sales per share growth trend.
The MSCI Emerging Markets Value Index, mentioned on page 17, includes large- and mid-cap securities exhibiting overall value style characteristics across 24 emerging market countries. The value investment style characteristics for index construction are defined using three variables: book value to price, 12-month forward earnings to price, and dividend yield.
Index performance returns do not reflect any management fees, transaction costs, or expenses. Indices are unmanaged and one cannot invest directly in an index.
Investing involves risk, including the possible loss of principal.
Past performance is not a guarantee of future results.
International investments entail risks not ordinarily associated with US investments including fluctuation in currency values, differences in accounting principles, or economic or political instability in other nations. Investing in emerging markets can be riskier than investing in established foreign markets due to increased volatility and lower trading volume.
If and when the Portfolio invests in forward foreign currency contracts or uses other investments to hedge against currency risks, the Portfolio will be subject to special risks, including counterparty risk.
Fixed income securities and bond funds can lose value, and investors can lose principal, as interest rates rise. They also may be affected by economic conditions that hinder an issuer’s ability to make interest and principal payments on its debt.
The Portfolio may also be subject to prepayment risk, the risk that the principal of a bond that is held by the Portfolio will be prepaid prior to maturity, at the time when interest rates are lower than what the bond was paying. The Portfolio may then have to reinvest that money at a lower interest rate.
High yielding, non-investment-grade bonds (junk bonds) involve higher risk than investment grade bonds.
The Portfolio is presently closed to new investors.
20
Portfolio management review
Macquarie Institutional Portfolios — Macquarie Emerging Markets Portfolio II
October 31, 2018
For the fiscal year ended Oct. 31, 2018, Macquarie Emerging Markets Portfolio II returned -16.13% at net asset value (NAV) with all distributions reinvested. This result lagged the Portfolio’s benchmark, the MSCI Emerging Markets Index, which returned -12.19% (gross) and -12.52% (net) for the same period. Complete annualized performance for Macquarie Emerging Markets Portfolio II is shown in the table on page 23.
The MSCI Emerging Markets Index fell during the 12-month period ended Oct. 31, 2018. Concerns related to US interest rate tightening and a rising US dollar led to depreciation in emerging market currencies and rate hikes in some countries. This, in turn, raised concerns about economic growth and higher inflation. Additionally, persistent rhetoric about tariffs and trade ratcheted up, especially between the United States and China. Country-specific concerns were also present, particularly related to Turkey, South Africa, and China. Investors also focused on the elections in Brazil and Mexico. Sector performance varied widely. Energy delivered the strongest performance on the back of oil prices. In contrast, the technology sector declined due to concerns about both the peaking of the semiconductor cycle and the Chinese Internet sector.
Among countries, the Portfolio’s holdings in Brazil contributed the most to relative performance during the fiscal year, due to the Portfolio’s overweight allocation. Shares of B2W Cia Digital gained on optimism about the shift in its sales strategy. We continue to believe that the company appears well positioned for structural growth in Brazil’s ecommerce industry, which is still in its early stages of development. Shares of Petroleo Brasileiro S.A. (Petrobras) also performed well during the fiscal year, as the company showed progress on both divestiture and operations. Shares of Itau Unibanco Holding S.A. outperformed due to expectations for accelerating growth in Brazil. This outperformance was somewhat mitigated by the Portfolio’s position in BRF S.A., whose shares were hit hard due to news that it is under investigation for forging records. This will likely impact short-term results; however, we believe that BRF’s brand and operations appear largely intact and, in our view, are likely to recover.
In Russia, rising energy prices drove performance of LUKOIL PJSC, Rosneft Oil Co. PJSC, and Gazprom PJSC. Shares of Yandex NV also performed well after reporting strong earnings results and guidance earlier in 2018, particularly in its fast-growing taxi business. Finally, the Portfolio’s lack of a position in Magnit PJSC was positive in terms of asset allocation.
In South Korea, shares of telecommunications operator SK Telecom Co. Ltd. rose during the Portfolio’s fiscal year, supported by a stable operating environment and inexpensive valuations. We remain optimistic about the company’s long-term growth opportunities in 5G wireless networking.
Elsewhere, in India, favorable stock selection contributed to the Portfolio’s relative performance as shares of Reliance Industries Ltd. outperformed. The company reported strong financial results driven by both its refining and petrochemicals business, in addition to its telecommunications business. Furthermore, Reliance Industries has increasingly focused on strengthening its media and retail businesses. Finally, the Portfolio’s underweight positioning in South Africa contributed to relative performance as currency depreciation weighed on the equity market during the fiscal year.
On the negative side, the Portfolio’s holdings in China detracted the most from relative performance during the fiscal year due to unfavorable stock selection and unfavorable asset allocation. Concern about slower economic growth, exacerbated by rising trade tensions, weighed on advertising-driven stocks such as SINA Corp. China and Weibo Corp. and consumer staples stocks such as Tsingtao Brewery Co. Ltd. In addition, tightening government regulations in the gaming sector adversely affected sentiment for stocks such as Sohu.com Ltd. Shares of JD.com Inc. declined during the fiscal year following allegations of misconduct by the chairman and CEO. Despite these concerns, we retain our optimistic view about long-term consumption growth and Internet engagement in China, and we continue to view these companies as well positioned to potentially capture value from these trends. The Portfolio’s position in Uni-President China Holdings Ltd. was a bright spot, however, as business fundamentals in both instant noodles and beverages seemed to stabilize. The company continued to benefit as consumption-upgrades trended higher.
In Taiwan, MediaTek Inc. underperformed on concern about Chinese smartphone demand. Despite this underperformance, MediaTek has strong technology capabilities in mobile basebands, chipsets, and Wi-Fi. As mobile technology penetrates more deeply into everyday products, we believe there may be attractive structural growth opportunities for MediaTek.
The Portfolio’s overweight allocation to Argentina and Turkey detracted from performance as those currencies came under pressure due to greater reliance on external funding, higher inflation, and rising US interest rates. Despite higher macroeconomic volatility, we believe the Portfolio’s holdings are appropriately positioned to weather economic stress and remain invested. The primary detractors during the fiscal year were IRSA Inversiones y Representaciones S.A. in Argentina and Akbank T.A.S. in Turkey. Among sectors, energy contributed the most to performance due to the Portfolio’s positions in Reliance Industries in India and Lukoil in Russia. The consumer discretionary sector also outperformed during the fiscal year due to the Portfolio’s position in B2W. In contrast, the technology sector detracted most from relative performance due to the Portfolio’s positions in SINA and Sohu.com.
21
Portfolio management review
Macquarie Institutional Portfolios — Macquarie Emerging Markets Portfolio II
Considering the varied macroeconomic backdrop that we see across emerging markets, we believe there are selective opportunities for long-term stock appreciation driven by structural demographic shifts, technology adoption, implementation of government policy, improvement in corporate governance, and industry consolidation. We have found that in markets where price action is heavily macro driven, investors can often misprice individual companies significantly. Our investment approach remains centered on identifying individual companies that we believe possess sustainable franchises and favorable long-term growth prospects and that trade at significant discounts to their intrinsic value. We are particularly
focused on companies that we expect to benefit from long-term changes in how people in emerging markets live and work. Among countries, we currently hold overweight positions in Brazil, Russia, South Korea, and India. Conversely, we are currently underweight South Africa and Taiwan. Sectors we currently favor include technology, telecommunications, and consumer staples. We have an underweight allocation to financials.
The Portfolio utilized foreign currency exchange contracts to facilitate the purchase and sale of equities traded on international exchanges. The effect of these contracts on performance was immaterial.
The views expressed are current as of the date of this report and are subject to change.
22
Performance summary
Macquarie Institutional Portfolios — Macquarie Emerging Markets Portfolio II
The performance quoted represents past performance and does not guarantee future results. Investment return and principal value of an investment will fluctuate so that shares, when redeemed, may be worth more or less than their original cost. Current performance may be lower or higher than the performance quoted. Performance data current to the most recent month end may be obtained by calling 800 231-8002 or visiting macquarie.com/investment-management/mip.
Carefully consider the Portfolio’s investment objectives, risk factors, charges, and expenses before investing. This and other information can be found in the Portfolio’s prospectus and, if available, its summary prospectus, which may be obtained by visiting macquarie.com/investment-management/mip or calling 800 231-8002. Investors should read the prospectus and, if available, the summary prospectus carefully before investing.
Portfolio and benchmark performance
Average annual total returns
| | | | | | | | |
Periods ended Oct. 31, 2018 | | 1 year | | 3 years | | 5 years | | Lifetime |
Macquarie Emerging Markets Portfolio II | | –16.13% | | +8.96% | | +0.97% | | +2.97% |
MSCI Emerging Markets Index (net) | | –12.52% | | +6.52% | | +0.78% | | +2.95% |
MSCI Emerging Markets Index (gross) | | –12.19% | | +6.92% | | +1.15% | | +3.31% |
Portfolio profile
Oct. 31, 2018
| | | | |
| Total net assets | | Number of holdings | | |
| $27.2 million | | 71 | | |
| | | | |
| Inception date | | | | |
| June 23, 2010 | | | | |
Growth of $1,000,000
| | | | |
| | Starting value (June 23, 2010) | | Ending value (Oct. 31, 2018) |
| | |
 Macquarie Emerging Markets Portfolio II Macquarie Emerging Markets Portfolio II
| | $1,000,000 | | $1,276,875 |
| | |
 MSCI Emerging Markets Index (gross) MSCI Emerging Markets Index (gross)
| | $1,000,000 | | $1,255,105 |
| | | |
 MSCI Emerging Markets Index (net) MSCI Emerging Markets Index (net)
| | $1,000,000 | | $1,218,885 |
The performance graph assumes $1 million invested on June 23, 2010, and includes reinvestment of all distributions. The performance graph does not reflect the deduction of taxes the shareholder would pay on Portfolio distributions or redemptions of Portfolio shares.
Total return assumes reinvestment of dividends and capital gains, but does not reflect reductions for taxes. Returns and share values will fluctuate so that shares, when redeemed, may be worth more or less than their original cost.
23
Performance summary
Macquarie Institutional Portfolios — Macquarie Emerging Markets Portfolio II
The most recent prospectus disclosed the Portfolio’s total operating expenses as 1.32%. Management has contractually agreed to reimburse certain expenses and/or waive its management fees from Nov. 1, 2017 through Oct. 31, 2018,* in order to prevent total annual Portfolio operating expenses (with certain exclusions) from exceeding, in an aggregate amount, 1.20% of the Portfolio’s average daily net assets, as described in the most recent prospectus. Please see the “Financial highlights” section in this report for the most recent expense ratios.
Expense limitations were in effect during the period shown. Performance would have been lower had the expense limitations not been in effect.
The MSCI Emerging Markets Index measures equity market performance across emerging market countries worldwide. Index “gross” return approximates the maximum possible dividend reinvestment. Index “net” return approximates the minimum possible dividend reinvestment, after deduction of withholding tax at the highest possible rate.
Index performance returns do not reflect any management fees, transaction costs, or expenses. Indices are unmanaged and one cannot invest directly in an index.
Investing involves risk, including the possible loss of principal.
Past performance is not a guarantee of future results.
International investments entail risks not ordinarily associated with US investments including fluctuation in currency values, differences in accounting principles, or economic or political instability in other nations. Investing in emerging markets can be riskier than investing in established foreign markets due to increased volatility and lower trading volume.
If and when the Portfolio invests in forward foreign currency contracts or uses other investments to hedge against currency risks, the Portfolio will be subject to special risks, including counterparty risk.
*The aggregate contractual waiver period covering this report is from Feb. 28, 2017 through Feb. 28, 2019.
24
Portfolio management review
Macquarie Institutional Portfolios — Macquarie Labor Select International Equity Portfolio
October 31, 2018
For the fiscal year ended Oct. 31, 2018, Macquarie Labor Select International Equity Portfolio returned -7.02% at net asset value (NAV) with all distributions reinvested. The Portfolio’s benchmark, the MSCI EAFE Index, returned -6.85% (net) and -6.39% (gross) for the same period. Complete annualized performance for Macquarie Labor Select International Equity Portfolio is shown in the table on page 27.
International equity markets posted negative returns over the 12-month period ended Oct. 31, 2018 — all due to significant market declines in October.
Markets were generally robust for most of the year, despite intensifying political and economic tensions. However, beginning in February 2018, a sharp, broad selloff saw volatility return. The period was also characterized by a shift in the relative returns of value and growth investment styles, with value stocks leading the market late in the fiscal period after growth had outperformed for several years. The broad MSCI EAFE Index declined 6.9% (net), while the MSCI EAFE Growth Index fell 6.0% (net) and the MSCI EAFE Value Index declined 7.7% (net) — all in US dollar terms. (Sources: MSCI, Bloomberg.)
The Portfolio’s long-term strategy of seeking to generate alpha (active return on an investment) through downside protection and capital preservation in weak markets worked as expected during the fiscal year: At the beginning of the fiscal period, we captured most but not all the market’s upside performance and we protected capital during October’s large market decline. As such, the Portfolio outperformed the MSCI EAFE Value Index and performed in line with the MSCI EAFE Index over the full 12-month period.
Except for the energy and healthcare sectors, all sectors declined over the 12-month period. Sector-weight decisions within the Portfolio added to relative returns during the fiscal year. The Portfolio benefited from an overweight position in the strong energy sector and an underweight in the weak financials sector. Returns for energy stocks were supported by the price of oil, which rose due to the risk of supply disruptions as Venezuela production declined and the United States announced sanctions on Iran. Financial stocks came under pressure from heightened capital market volatility; the Portfolio’s underweight position in financials contributed to relative returns. However, these gains were partially offset by an overweight position in the telecommunication services sector where competitive and regulatory pressures depressed revenue growth.
Overall, country allocation weighed on the Portfolio’s relative returns. During the fiscal period, Asia Pacific markets outperformed those in Europe. Japan posted relatively strong returns, supported by Prime Minister Abe’s convincing victory that gave his Liberal Democratic Party (LDP) a renewed mandate to pursue reflationary policies. The Australian equity market, supported by strong results from the companies in the healthcare and materials sector, fared relatively well. The surprise in Australia was its new prime minister, its seventh
prime minister in the past 10 years. Although the Portfolio’s underweight position in the strong Australian equity market weighed on relative returns, its exposure to the UK equity market added to relative returns as did its lack of exposure to the Belgian market.
Political concerns influenced equity market returns in southern Europe, particularly in Spain and Italy, where the Portfolio’s overweight positioning weighed on relative returns. Interestingly, the UK equity market exceeded index returns despite its own political concerns. The main driver was an outsized weighting in energy stocks, which rallied on higher oil prices. This tempered the weaker performance of the more domestically exposed stocks that are more affected by Brexit-related uncertainty. The Portfolio’s overweight position in the UK equity market added to relative investment returns. We continue to believe that the UK market remains attractively valued.
Individual security selection is the key component of the Portfolio’s investment discipline. During the fiscal period, security selection contributed to relative performance. Positive stock selection in Europe was somewhat offset by returns from holdings in Japan and Hong Kong. Stock selection in Italy benefited from avoiding exposure to financial stocks. The Portfolio’s holdings in Sweden, the Netherlands, and the United Kingdom were also supportive, while positions in France held back relative returns.
Among the Portfolio’s standout performers, UK food retailer Tesco PLC advanced 14.9% over the 12-month period. Tesco’s share price rose following notable progress with the integration of a recently acquired food wholesaler, Booker. The firm, despite headwinds in Thailand, has also made progress with its long-term profit-margin objectives.
Another food retailer, Dutch-listed Koninklijke Ahold Delhaize NV rose on strong underlying results, and the appearance of beneficial merger synergies that ran ahead of expectations. Koninklijke Ahold Delhaize was up 25.9%.
Eni SpA, the Italian energy group, benefited from the rise in oil prices. The firm also lowered break-even levels through strict capital discipline, which drove strong cash flow generation. Eni rose 14.4% over the 12-month period.
Holdings that detracted from the Portfolio’s performance include French building materials manufacturer Cie de Saint-Gobain, which declined 33.8% during the fiscal year. Despite robust results for the first six months of 2018, the share price declined on news of a reorganization and potential divestment of the company. Despite a challenging backdrop, Cie de Saint-Gobain is still expected to grow operating profits in 2018. The company also raised the dividend. We believe the share price reaction has been overdone and we have been adding to the Portfolio’s position.
Portfolio management review
Macquarie Institutional Portfolios — Macquarie Labor Select International Equity Portfolio
The Portfolio’s position in Japan-based Takeda Pharmaceutical Co. Ltd. also posted disappointing returns following its ambitious bid to acquire UK-listed Shire. Concerns centered on the scale of the transaction, as the additional financial leverage could pose increased risk to Takeda’s operations. However, we believe that the valuation is attractive following recent share price weakness. Takeda fell 25.5% during the 12-month period.
Finally, Hong Kong packaged meats manufacturer WH Group Ltd. declined 28.4% on the back of trade tariffs and incidents of the swine flu in China. WH Group is a diversified, branded low-cost producer with synergy benefits across the whole group and continues to be undervalued compared with global peers, in our view. We believe the share price reaction has been overdone and have been adding to the Portfolio’s position.
Currency allocation policy had no impact on the Portfolio’s relative returns during the fiscal year. The Japanese yen, which slightly rose against the US dollar, was the only major currency to appreciate versus the US dollar. All other major international equity currencies fell during the fiscal period, as investors sought safe havens. Thus, the Portfolio’s underweight of the Japanese yen weighed on relative returns. This was more than offset, however, by the positive effect of the Portfolio’s underweight to the weak Australian dollar.
To summarize: The highlights of the Portfolio’s investment strategy included a strong value stock orientation, overweight positions in selected European markets, overweight positions in the telecommunications, energy, and utilities sectors, and underweight positions in the materials and consumer staples sectors.
The Portfolio utilized foreign currency exchange contracts to facilitate the purchase and sale of equities traded on international exchanges. The effect of these contracts on performance was immaterial.
The views expressed are current as of the date of this report and are subject to change.
26
Performance summary
Macquarie Institutional Portfolios — Macquarie Labor Select International Equity Portfolio
The performance quoted represents past performance and does not guarantee future results. Investment return and principal value of an investment will fluctuate so that shares, when redeemed, may be worth more or less than their original cost. Current performance may be lower or higher than the performance quoted. Performance data current to the most recent month end may be obtained by calling 800 231-8002 or visiting macquarie.com/investment-management/mip.
Carefully consider the Portfolio’s investment objectives, risk factors, charges, and expenses before investing. This and other information can be found in the Portfolio’s prospectus and, if available, its summary prospectus, which may be obtained by visiting macquarie.com/investment-management/mip or calling 800 231-8002. Investors should read the prospectus and, if available, the summary prospectus carefully before investing.
Portfolio and benchmark performance
Average annual total returns
| | | | | | | | | | |
Periods ended Oct. 31, 2018 | | 1 year | | 3 years | | 5 years | | 10 years | | Lifetime |
Macquarie Labor Select International Equity Portfolio | | –7.02% | | +2.83% | | +1.66% | | +5.42% | | +6.66% |
MSCI EAFE Index (net) | | –6.85% | | +3.62% | | +2.02% | | +6.89% | | +4.65% |
MSCI EAFE Index (gross) | | –6.39% | | +4.13% | | +2.50% | | +7.39% | | +5.07% |
Portfolio profile
Oct. 31, 2018
| | | | |
| Total net assets | | Number of holdings | | |
| $405.9 million | | 52 | | |
| | | | |
| Inception date | | | | |
| Dec. 19, 1995 | | | | |
Growth of $1,000,000
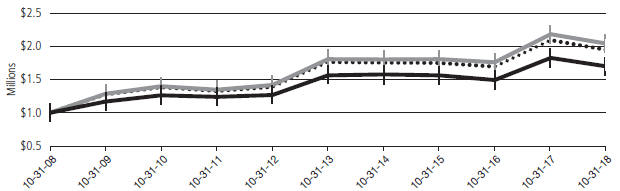
| | | | |
| | Starting value (Oct. 31, 2008) | | Ending value (Oct. 31, 2018) |
| | |
MSCI EAFE Index (gross) | | $1,000,000 | | $2,040,132 |
| | |
MSCI EAFE Index (net) | | $1,000,000 | | $1,947,275 |
| | | |
Macquarie Labor Select International Equity Portfolio | | $1,000,000 | | $1,695,564 |
The performance graph assumes $1 million invested on Oct. 31, 2008, and includes reinvestment of all distributions. The performance graph does not reflect the deduction of taxes the shareholder would pay on Portfolio distributions or redemptions of Portfolio shares.
Total return assumes reinvestment of dividends and capital gains, but does not reflect reductions for taxes. Returns and share values will fluctuate so that shares, when redeemed, may be worth more or less than their original cost.
Performance summary
Macquarie Institutional Portfolios — Macquarie Labor Select International Equity Portfolio
The most recent prospectus disclosed the Portfolio’s total operating expenses as 0.86%.
The MSCI EAFE (Europe, Australasia, Far East) Index is a free float-adjusted market capitalization weighted index designed to measure equity market performance of developed markets, excluding the United States and Canada. Index “gross” return approximates the maximum possible dividend reinvestment. Index “net” return approximates the minimum possible dividend reinvestment, after deduction of withholding tax at the highest possible rate.
The MSCI EAFE Growth Index, mentioned on page 25, is a subset of the MSCI EAFE Index, which measures equity market performance across developed market countries in Europe, Australasia, and the Far East. The MSCI EAFE Growth Index consists of those securities classified by MSCI as most representing the growth style.
The MSCI EAFE Value Index, mentioned on page 25, is a subset of the MSCI EAFE Index, which measures equity market performance across developed market countries in Europe, Australasia, and the Far East. The MSCI EAFE Value Index consists of those securities classified by MSCI as most representing the value style.
Index performance returns do not reflect any management fees, transaction costs, or expenses. Indices are unmanaged and one cannot invest directly in an index.
Investing involves risk, including the possible loss of principal.
Past performance is not a guarantee of future results.
International investments entail risks not ordinarily associated with US investments including fluctuation in currency values, differences in accounting principles, or economic or political instability in other nations.
Investing in emerging markets can be riskier than investing in established foreign markets due to increased volatility and lower trading volume.
If and when the Portfolio invests in forward foreign currency contracts or uses other investments to hedge against currency risks, the Portfolio will be subject to special risks, including counterparty risk.
From time to time, the Portfolio may invest up to 30% of its net assets in securities of issuers in the commercial banking industry; to the extent that the Portfolio invests 30% of its net assets in such securities, it may be slightly more sensitive to movement in the commercial banking industry.
28
Disclosure of Portfolio expenses
For the six-month period from May 1, 2018 to October 31, 2018 (Unaudited)
As a shareholder of a Portfolio, you incur two types of costs: (1) transaction costs, including reimbursement fees on Macquarie Emerging Markets Portfolio; and (2) ongoing costs, including management fees and other Portfolio expenses. The following examples are intended to help you understand your ongoing costs (in dollars) of investing in a Portfolio and to compare these costs with the ongoing costs of investing in other mutual funds.
The examples are based on an investment of $1,000 invested at the beginning of the period and held for the entire six-month period from May 1, 2018 to Oct. 31, 2018.
Actual Expenses
The first section of the table shown, “Actual Portfolio return,” provides information about actual account values and actual expenses. You may use the information in this table, together with the amount you invested, to estimate the expenses that you paid over the period. Simply divide your account value by $1,000 (for example, an $8,600 account value divided by $1,000 = 8.6), then multiply the result by the number in the first section under the heading entitled “Expenses Paid During Period” to estimate the expenses you paid on your account during the period.
Hypothetical Example for Comparison Purposes
The second section of the table shown, “Hypothetical 5% return,” provides information about hypothetical account values and hypothetical expenses based on a Portfolio’s actual expense ratio and an assumed rate of return of 5% per year before expenses, which is not the Portfolio’s actual return. The hypothetical account values and expenses may not be used to estimate the actual ending account balance or expenses you paid for the period. You may use this information to compare the ongoing costs of investing in the Portfolio and other funds. To do so, compare this 5% hypothetical example with the 5% hypothetical examples that appear in the shareholder reports of other funds.
Please note that the expenses shown in the table are meant to highlight your ongoing costs only and do not reflect any transactional costs. Therefore, the second section of the table is useful in comparing ongoing costs only, and will not help you determine the relative total costs of owning different funds. In addition, if these transactional costs were included, your costs would have been higher. Certain of the Portfolios’ actual expenses shown in the table reflect fee waivers in effect. The Portfolios’ expenses shown in the table assume reinvestment of all dividends and distributions.
In each case, “Expenses Paid During Period” are equal to the relevant Portfolio’s annualized expense ratio, multiplied by the average account value over the period, multiplied by 184/365 (to reflect the one-half year period).
Macquarie Institutional Portfolios
Expense Analysis of an Investment of $1,000
| | | | | | | | |
| | | Beginning
Account
Value
5/1/18 | | Ending
Account
Value
10/31/18 | | Annualized
Expense
Ratio | | Expenses
Paid
During
Period
5/1/18 to
10/31/18 |
Actual Portfolio return† |
Macquarie Large Cap Value Portfolio | | $1,000.00 | | $1,014.30 | | 0.70% | | $3.55 |
Macquarie Core Plus Bond Portfolio | | 1,000.00 | | 989.00 | | 0.45% | | 2.26 |
Macquarie High Yield Bond Portfolio | | 1,000.00 | | 1,005.40 | | 0.59% | | 2.98 |
Macquarie Emerging Markets Portfolio | | 1,000.00 | | 857.10 | | 1.28% | | 5.99 |
Macquarie Emerging Markets Portfolio II | | 1,000.00 | | 838.60 | | 1.20% | | 5.56 |
Macquarie Labor Select International Equity Portfolio | | 1,000.00 | | 902.20 | | 0.87% | | 4.17 |
|
Hypothetical 5% return (5% return before expenses) |
Macquarie Large Cap Value Portfolio | | $1,000.00 | | $1,021.68 | | 0.70% | | $3.57 |
Macquarie Core Plus Bond Portfolio | | 1,000.00 | | 1,022.94 | | 0.45% | | 2.29 |
Macquarie High Yield Bond Portfolio | | 1,000.00 | | 1,022.23 | | 0.59% | | 3.01 |
Macquarie Emerging Markets Portfolio | | 1,000.00 | | 1,018.75 | | 1.28% | | 6.51 |
Macquarie Emerging Markets Portfolio II | | 1,000.00 | | 1,019.16 | | 1.20% | | 6.11 |
Macquarie Labor Select International Equity Portfolio | | 1,000.00 | | 1,020.82 | | 0.87% | | 4.43 |
| † | Because actual returns reflect only the most recent six-month period, the returns shown may differ significantly from fiscal year returns. |
29
Security type / sector allocations
and top 10 equity holdings
Macquarie Institutional Portfolios — Macquarie Large Cap Value Portfolio
As of October 31, 2018 (Unaudited)
Sector designations may be different than the sector designations presented in other Portfolio materials. The sector designations may represent the investment manager’s internal sector classifications, which may result in the sector designations for one portfolio being different than another portfolio’s sector designations.
| | | | |
| Security type / sector | | Percentage
of net assets | |
Common Stock | | | 98.78% | |
Communication Services | | | 5.82% | |
Consumer Discretionary | | | 5.87% | |
Consumer Staples | | | 6.02% | |
Energy | | | 11.54% | |
Financials | | | 15.35% | |
Healthcare | | | 24.41% | |
Industrials | | | 8.32% | |
Information Technology | | | 12.64% | |
Materials | | | 2.76% | |
Real Estate | | | 3.09% | |
Utilities | | | 2.96% | |
Short-Term Investments | | | 1.07% | |
Total Value of Securities | | | 99.85% | |
Receivables and Other Assets Net of Liabilities | | | 0.15% | |
Total Net Assets | | | 100.00% | |
Holdings are for informational purposes only and are subject to change at any time. They are not a recommendation to buy, sell, or hold any security.
| | | | |
| Top 10 equity holdings | | Percentage
of net assets | |
Marsh & McLennan | | | 3.38% | |
BB&T | | | 3.29% | |
Abbott Laboratories | | | 3.25% | |
Oracle | | | 3.22% | |
Cisco Systems | | | 3.22% | |
Intel | | | 3.19% | |
CVS Health | | | 3.10% | |
Equity Residential | | | 3.09% | |
Bank of New York Mellon | | | 3.08% | |
Express Scripts Holding | | | 3.08% | |
30
Security type / sector allocations
Macquarie Institutional Portfolios — Macquarie Core Plus Bond Portfolio
As of October 31, 2018 (Unaudited)
Sector designations may be different than the sector designations presented in other Portfolio materials. The sector designations may represent the investment manager’s internal sector classifications, which may result in the sector designations for one portfolio being different than another portfolio’s sector designations.
| | | | |
| Security type / sector | | Percentage
of net assets | |
Agency Asset-Backed Security | | | 0.04% | |
Agency Collateralized Mortgage Obligations | | | 5.12% | |
Agency Commercial Mortgage-Backed Securities | | | 2.19% | |
Agency Mortgage-Backed Securities | | | 10.45% | |
Collateralized Debt Obligations | | | 5.32% | |
Convertible Bonds | | | 3.70% | |
Corporate Bonds | | | 37.03% | |
Banking | | | 7.55% | |
Basic Industry | | | 3.09% | |
Brokerage | | | 0.75% | |
Capital Goods | | | 1.97% | |
Communications | | | 4.04% | |
Consumer Cyclical | | | 1.86% | |
Consumer Non-Cyclical | | | 4.21% | |
Electric | | | 4.09% | |
Energy | | | 3.99% | |
Finance Companies | | | 0.85% | |
Insurance | | | 1.30% | |
REITs | | | 0.47% | |
Technology | | | 1.77% | |
Transportation | | | 0.77% | |
Utilities | | | 0.32% | |
| | | | |
| Security type / sector | | Percentage
of net assets | |
Loan Agreements | | | 8.29% | |
Municipal Bonds | | | 0.12% | |
Non-Agency Asset-Backed Securities | | | 4.82% | |
Non-Agency Collateralized Mortgage Obligations | | | 1.48% | |
Non-Agency Commercial Mortgage-Backed Securities | | | 5.79% | |
Regional Bond | | | 0.06% | |
Sovereign Bonds | | | 1.25% | |
Supranational Banks | | | 0.18% | |
US Treasury Obligations | | | 12.56% | |
Convertible Preferred Stock | | | 0.34% | |
Preferred Stock | | | 0.11% | |
Short-Term Investments | | | 1.58% | |
Total Value of Securities | | | 100.43% | |
Liabilities Net of Receivables and Other Assets | | | (0.43%) | |
Total Net Assets | | | 100.00% | |
Security type / sector allocations
Macquarie Institutional Portfolios — Macquarie High Yield Bond Portfolio
As of October 31, 2018 (Unaudited)
Sector designations may be different than the sector designations presented in other Portfolio materials. The sector designations may represent the investment manager’s internal sector classifications, which may result in the sector designations for one portfolio being different than another portfolio’s sector designations.
| | | | |
| Security type / sector | | Percentage
of net assets | |
Corporate Bonds | | | 89.82% | |
Banking | | | 4.91% | |
Basic Industry | | | 12.80% | |
Capital Goods | | | 4.29% | |
Consumer Cyclical | | | 5.17% | |
Consumer Non-Cyclical | | | 3.37% | |
Energy | | | 16.82% | |
Healthcare | | | 11.05% | |
Insurance | | | 4.98% | |
Media | | | 8.50% | |
Services | | | 6.34% | |
Technology & Electronics | | | 4.35% | |
Telecommunications | | | 5.25% | |
Utilities | | | 1.99% | |
Loan Agreements | | | 6.39% | |
Common Stock | | | 0.00% | |
Short-Term Investments | | | 2.38% | |
Total Value of Securities | | | 98.59% | |
Receivables and Other Assets Net of Liabilities | | | 1.41% | |
Total Net Assets | | | 100.00% | |
32
Security type / country and sector allocations
Macquarie Institutional Portfolios — Macquarie Emerging Markets Portfolio
As of October 31, 2018 (Unaudited)
Sector designations may be different than the sector designations presented in other Portfolio materials. The sector designations may represent the investment manager’s or sub-advisor’s internal sector classifications, which may result in the sector designations for one portfolio being different than another portfolio’s sector designations.
| | | | |
| Security type / country | | Percentage
of net assets | |
Common Stock | | | 95.79% | |
Brazil | | | 10.59% | |
China/Hong Kong | | | 25.54% | |
India | | | 13.73% | |
Indonesia | | | 1.36% | |
Malaysia | | | 3.55% | |
Mexico | | | 1.62% | |
Peru | | | 1.11% | |
Philippines | | | 1.02% | |
Qatar | | | 1.12% | |
Republic of Korea | | | 14.71% | |
Romania | | | 0.32% | |
Russia | | | 4.80% | |
South Africa | | | 0.90% | |
Taiwan | | | 9.13% | |
Thailand | | | 1.88% | |
Turkey | | | 1.57% | |
United Arab Emirates | | | 1.27% | |
United Kingdom | | | 1.57% | |
Preferred Stock | | | 3.03% | |
Short-Term Investments | | | 0.67% | |
Total Value of Securities | | | 99.49% | |
Receivables and Other Assets Net of Liabilities | | | 0.51% | |
Total Net Assets | | | 100.00% | |
| | | | |
Common stock and preferred stock by
sector | | Percentage
of net assets | |
Consumer Discretionary | | | 9.91% | |
Consumer Staples | | | 5.41% | |
Energy | | | 3.79% | |
Financials | | | 29.56% | |
Healthcare | | | 5.24% | |
Industrials | | | 7.07% | |
Information Technology | | | 15.33% | |
Materials | | | 13.08% | |
Real Estate | | | 1.62% | |
Telecommunication Services | | | 5.14% | |
Utilities | | | 2.67% | |
Total | | | 98.82% | |
To monitor compliance with the Portfolio’s concentration guidelines as described in the Portfolio’s Prospectus and Statement of Additional Information, the Financials sector (as disclosed herein for financial reporting purposes) is subdivided into a variety of “industries” (in accordance with the requirements of the Investment Company Act of 1940 as amended). The Financials sector consisted of banks, diversified financial services, holding companies -diversified, and insurance. As of Oct. 31, 2018, such amounts, as a percentage of total net assets were 13.92%, 9.15%, 1.52%, and 4.97%, respectively. The percentage in any such single industry will comply with the Portfolio’s concentration policy even if the percentage in the Financials sector for financial reporting purposes may exceed 25%.
Security type / country and sector allocations
Macquarie Institutional Portfolios — Macquarie Emerging Markets Portfolio II
As of October 31, 2018 (Unaudited)
Sector designations may be different than the sector designations presented in other Portfolio materials. The sector designations may represent the investment manager’s internal sector classifications, which may result in the sector designations for one portfolio being different than another portfolio’s sector designations.
| | | | |
| Security type / country | | Percentage
of net assets | |
Common Stock | | | 98.40% | |
Argentina | | | 0.39% | |
Bahrain | | | 0.05% | |
Brazil | | | 13.49% | |
China/Hong Kong | | | 30.46% | |
India | | | 10.24% | |
Indonesia | | | 1.12% | |
Malaysia | | | 0.19% | |
Mexico | | | 4.97% | |
Netherlands | | | 0.29% | |
Peru | | | 0.83% | |
Republic of Korea | | | 16.29% | |
Russia | | | 7.43% | |
Taiwan | | | 8.91% | |
Thailand | | | 0.61% | |
Turkey | | | 1.65% | |
United States | | | 1.48% | |
Preferred Stock | | | 0.86% | |
Total Value of Securities | | | 99.26% | |
Receivables and Other Assets Net of Liabilities | | | 0.74% | |
Total Net Assets | | | 100.00% | |
| | | | |
Common stock and preferred stock by sector | | Percentage
of net assets | |
Consumer Discretionary | | | 16.13% | |
Consumer Staples | | | 9.21% | |
Energy | | | 18.34% | |
Financials | | | 7.93% | |
Healthcare | | | 0.65% | |
Industrials | | | 0.39% | |
Information Technology | | | 31.97% | |
Materials | | | 3.26% | |
Telecommunication Services | | | 11.38% | |
Total | | | 99.26% | |
To monitor compliance with the Portfolio’s concentration guidelines as described in the Portfolio’s Prospectus and Statement of Additional Information, the Information Technology sector (as disclosed herein for financial reporting purposes) is subdivided into a variety of “industries” (in accordance with the requirements of the Investment Company Act of 1940 as amended). The Information Technology sector consisted of electronics, Internet, and semiconductors. As of Oct. 31, 2018, such amounts, as a percentage of total net assets, were 1.74%, 12.58%, and 17.65%, respectively. The percentage in any such single industry will comply with the Portfolio’s concentration policy even if the percentages in the Information Technology sector for financial reporting purposes may exceed 25%.
34
Macquarie Institutional Portfolios — Macquarie Labor Select International Equity Portfolio
As of October 31, 2018 (Unaudited)
Sector designations may be different than the sector designations presented in other Portfolio materials. The sector designations may represent the investment manager’s or sub-advisor’s internal sector classifications, which may result in the sector designations for one portfolio being different than another portfolio’s sector designations.
| | | | |
| Security type / country | | Percentage
of net assets | |
Common Stock | | | 98.60% | |
Australia | | | 1.50% | |
China/Hong Kong | | | 4.47% | |
Denmark | | | 2.05% | |
France | | | 6.10% | |
Germany | | | 9.00% | |
Italy | | | 6.25% | |
Japan | | | 18.98% | |
Netherlands | | | 2.15% | |
Singapore | | | 6.19% | |
Spain | | | 7.11% | |
Sweden | | | 3.19% | |
Switzerland | | | 6.69% | |
United Kingdom | | | 24.92% | |
Preferred Stock | | | 0.13% | |
Rights | | | 0.02% | |
Short-Term Investments | | | 0.82% | |
Total Value of Securities | | | 99.57% | |
Receivables and Other Assets Net of Liabilities | | | 0.43% | |
Total Net Assets | | | 100.00% | |
| | | | |
Common stock, preferred stock and right by sector | | Percentage
of net assets | |
Consumer Discretionary | | | 13.55% | |
Consumer Staples | | | 6.50% | |
Energy | | | 10.94% | |
Financials | | | 17.69% | |
Healthcare | | | 11.45% | |
Industrials | | | 15.15% | |
Information Technology | | | 2.84% | |
Materials | | | 1.23% | |
Real Estate | | | 1.09% | |
Telecommunication Services | | | 9.44% | |
Utilities | | | 8.87% | |
Total | | | 98.75% | |
35
Schedules of investments
Macquarie Institutional Portfolios — Macquarie Large Cap Value Portfolio
October 31, 2018
| | | | | | | | |
| | | Number of
shares | | | Value (US $) | |
Common Stock – 98.78% | | | | | | | | |
Communication Services – 5.82% | | | | | |
AT&T | | | 97,800 | | | $ | 3,000,504 | |
Verizon Communications | | | 56,300 | | | | 3,214,167 | |
| | | | | | | | |
| | |
| | | | | | | 6,214,671 | |
| | | | | | | | |
Consumer Discretionary – 5.87% | | | | | |
Dollar Tree † | | | 38,700 | | | | 3,262,410 | |
Lowe’s | | | 31,600 | | | | 3,008,952 | |
| | | | | | | | |
| | |
| | | | | | | 6,271,362 | |
| | | | | | | | |
Consumer Staples – 6.02% | | | | | | | | |
Archer-Daniels-Midland | | | 66,800 | | | | 3,156,300 | |
Mondelez International Class A | | | 77,900 | | | | 3,270,242 | |
| | | | | | | | |
| | |
| | | | | | | 6,426,542 | |
| | | | | | | | |
Energy – 11.54% | | | | | | | | |
ConocoPhillips | | | 46,600 | | | | 3,257,340 | |
Halliburton | | | 88,000 | | | | 3,051,840 | |
Marathon Oil | | | 158,600 | | | | 3,011,814 | |
Occidental Petroleum | | | 44,800 | | | | 3,004,736 | |
| | | | | | | | |
| | |
| | | | | | | 12,325,730 | |
| | | | | | | | |
Financials – 15.35% | | | | | | | | |
Allstate | | | 33,600 | | | | 3,216,192 | |
American International
Group | | | 66,900 | | | | 2,762,301 | |
Bank of New York Mellon | | | 69,600 | | | | 3,294,168 | |
BB&T | | | 71,600 | | | | 3,519,856 | |
Marsh & McLennan | | | 42,600 | | | | 3,610,350 | |
| | | | | | | | |
| | |
| | | | | | | 16,402,867 | |
| | | | | | | | |
Healthcare – 24.41% | | | | | | | | |
Abbott Laboratories | | | 50,400 | | | | 3,474,576 | |
Cardinal Health | | | 62,500 | | | | 3,162,500 | |
CVS Health | | | 45,700 | | | | 3,308,223 | |
Express Scripts Holding † | | | 33,910 | | | | 3,288,253 | |
Johnson & Johnson | | | 23,200 | | | | 3,247,768 | |
Merck & Co. | | | 44,600 | | | | 3,283,006 | |
Pfizer | | | 72,811 | | | | 3,135,241 | |
Quest Diagnostics | | | 33,800 | | | | 3,180,918 | |
| | | | | | | | |
| | |
| | | | | | | 26,080,485 | |
| | | | | | | | |
Industrials – 8.32% | | | | | | | | |
Northrop Grumman | | | 10,400 | | | | 2,724,280 | |
Raytheon | | | 16,600 | | | | 2,905,664 | |
Waste Management | | | 36,400 | | | | 3,256,708 | |
| | | | | | | | |
| | |
| | | | | | | 8,886,652 | |
| | | | | | | | |
Information Technology – 12.64% | | | | | |
CA | | | 72,736 | | | | 3,226,569 | |
| | | | | | | | |
| | | Number of
shares | | | Value (US $) | |
Common Stock (continued) | | | | | |
Information Technology (continued) | | | | | |
Cisco Systems | | | 75,100 | | | $ | 3,435,825 | |
Intel | | | 72,700 | | | | 3,408,176 | |
Oracle | | | 70,400 | | | | 3,438,336 | |
| | | | | | | | |
| | |
| | | | | | | 13,508,906 | |
| | | | | | | | |
Materials – 2.76% | | | | | | | | |
DowDuPont | | | 54,614 | | | | 2,944,787 | |
| | | | | | | | |
| | |
| | | | | | | 2,944,787 | |
| | | | | | | | |
Real Estate – 3.09% | | | | | | | | |
Equity Residential | | | 50,750 | | | | 3,296,720 | |
| | | | | | | | |
| | |
| | | | | | | 3,296,720 | |
| | | | | | | | |
Utilities – 2.96% | | | | | | | | |
Edison International | | | 45,600 | | | | 3,164,184 | |
| | | | | | | | |
| | |
| | | | | | | 3,164,184 | |
| | | | | | | | |
| |
Total Common Stock (cost $90,753,718) | | | | 105,522,906 | |
| | | | | | | | |
| | |
| | | Principal
amount° | | | | |
Short-Term Investments – 1.07% | |
Discount Note – 0.16%≠ | | | | | | | | |
Federal Home Loan Bank 2.00% 11/1/18 | | | 174,070 | | | | 174,070 | |
| | | | | | | | |
| | |
| | | | | | | 174,070 | |
| | | | | | | | |
Repurchase Agreements – 0.91% | |
Bank of America Merrill Lynch
2.12%, dated 10/31/18, to be repurchased on 11/1/18, repurchase price $133,908 (collateralized by US government obligations 0.00% 5/15/19–8/15/31; market value $136,578) | | | 133,900 | | | | 133,900 | |
Bank of Montreal
2.10%, dated 10/31/18, to be repurchased on 11/1/18, repurchase price $368,247 (collateralized by US government obligations 0.00%–3.75% 11/1/18–2/15/47; market value $375,590) | | | 368,226 | | | | 368,226 | |
36
| | | | | | | | |
| | | Principal
amount° | | | Value (US $) | |
Short-Term Investments (continued) | | | | | |
Repurchase Agreements (continued) | | | | | |
BNP Paribas
2.17%, dated 10/31/18, to be repurchased on 11/1/18, repurchase price $472,844 (collateralized by US government obligations 0.00%–8.00% 2/28/19–8/15/46; market value $482,271) | | | 472,815 | | | $ | 472,815 | |
| | | | | | | | |
| | |
| | | | | | | 974,941 | |
| | | | | | | | |
Total Short-Term Investments
(cost $1,149,011) | | | | | | | 1,149,011 | |
| | | | | | | | |
| | |
Total Value of
Securities – 99.85%
(cost $91,902,729) | | | | | | $ | 106,671,917 | |
| | | | | | | | |
| ≠ | The rate shown is the effective yield at the time of purchase. |
| ° | Principal amount shown is stated in USD unless noted that the security is denominated in another currency. |
| † | Non-income producing security. |
USD – US Dollar
See accompanying notes, which are an integral part of the financial statements.
Schedules of investments
Macquarie Institutional Portfolios — Macquarie Core Plus Bond Portfolio
October 31, 2018
| | | | | | | | |
| | | Principal
amount° | | | Value (US $) | |
Agency Asset-Backed Security – 0.04% | | | | | |
Fannie Mae Grantor Trust | | | | | | | | |
Series 2003-T4 2A5
4.678% 9/26/33 ● | | | 80,480 | | | $ | 86,565 | |
| | | | | | | | |
| |
Total Agency Asset-Backed Security
(cost $79,829) | | | | 86,565 | |
| | | | | | | | |
| | | | | | | | | |
Agency Collateralized Mortgage Obligations – 5.12% | |
Fannie Mae Connecticut Avenue Securities | | | | | | | | |
Series 2017-C01 1M1 3.581% (LIBOR01M + 1.30%) 7/25/29 ● | | | 44,782 | | | | 45,061 | |
Series 2017-C04 2M2 5.131% (LIBOR01M + 2.85%) 11/25/29 ● | | | 370,000 | | | | 388,099 | |
Series 2018-C01 1M2 4.531% (LIBOR01M + 2.25%, Floor 2.25%) 7/25/30 ● | | | 135,000 | | | | 136,156 | |
Series 2018-C02 2M2 4.481% (LIBOR01M + 2.20%, Floor 2.20%) 8/25/30 ● | | | 120,000 | | | | 120,419 | |
Series 2018-C03 1M2 4.431% (LIBOR01M + 2.15%, Floor 2.15%) 10/25/30 ● | | | 130,000 | | | | 129,746 | |
Series 2018-C05 1M2 4.631% (LIBOR01M + 2.35%, Floor 2.35%) 1/25/31 ● | | | 125,000 | | | | 125,620 | |
Fannie Mae REMIC Trust | | | | | | | | |
Series 2004-W11 1A2
6.50% 5/25/44 | | | 17,806 | | | | 19,518 | |
Fannie Mae REMICs | | | | | | | | |
Series 2008-15 SB
4.319% (6.60% minus LIBOR01M, Cap 6.60%) 8/25/36 S● | | | 16,358 | | | | 2,454 | |
Series 2011-118 DC
4.00% 11/25/41 | | | 223,550 | | | | 223,582 | |
Series 2012-44 IK
3.50% 12/25/31 S | | | 34,458 | | | | 3,597 | |
Series 2012-128 IC
3.00% 11/25/32 S | | | 362,193 | | | | 46,187 | |
Series 2012-128 IY
3.00% 11/25/32 S | | | 344,511 | | | | 46,881 | |
Series 2012-132 AI
3.00% 12/25/27 S | | | 210,928 | | | | 17,639 | |
Series 2012-137 AI
3.00% 12/25/27 S | | | 341,302 | | | | 29,852 | |
| | | | | | | | |
| | | Principal amount° | | | Value (US $) | |
Agency Collateralized Mortgage Obligations (continued) | |
Fannie Mae REMICs | | | | | | | | |
Series 2012-139 NS
4.419% (6.70% minus LIBOR01M, Cap 6.70%) 12/25/42 S● | | | 143,144 | | | $ | 28,024 | |
Series 2012-144 PI
3.50% 6/25/42 S | | | 67,805 | | | | 8,952 | |
Series 2012-146 IO
3.50% 1/25/43 S | | | 316,316 | | | | 63,645 | |
Series 2012-149 IC
3.50% 1/25/28 S | | | 222,640 | | | | 23,175 | |
Series 2013-1 YI
3.00% 2/25/33 S | | | 287,401 | | | | 37,449 | |
Series 2013-7 EI
3.00% 10/25/40 S | | | 83,410 | | | | 11,153 | |
Series 2013-26 ID
3.00% 4/25/33 S | | | 50,020 | | | | 6,971 | |
Series 2013-35 IB
3.00% 4/25/33 S | | | 207,109 | | | | 26,777 | |
Series 2013-35 IG
3.00% 4/25/28 S | | | 154,981 | | | | 13,725 | |
Series 2013-38 AI
3.00% 4/25/33 S | | | 48,091 | | | | 6,195 | |
Series 2013-43 IX
4.00% 5/25/43 S | | | 445,921 | | | | 109,509 | |
Series 2013-44 DI
3.00% 5/25/33 S | | | 129,883 | | | | 18,243 | |
Series 2013-55 AI
3.00% 6/25/33 S | | | 194,555 | | | | 26,155 | |
Series 2013-67 AI
3.00% 7/25/28 S | | | 286,212 | | | | 24,658 | |
Series 2013-103 SK
3.639% (5.92% minus LIBOR01M, Cap 5.92%) 10/25/43 S● | | | 237,498 | | | | 40,703 | |
Series 2014-76 IO
3.50% 11/25/39 S | | | 350,887 | | | | 32,980 | |
Series 2015-27 SA
4.169% (6.45% minus LIBOR01M, Cap 6.45%) 5/25/45 S● | | | 55,591 | | | | 10,096 | |
Series 2015-57 LI
3.50% 8/25/35 S | | | 310,414 | | | | 49,099 | |
Series 2015-89 AZ
3.50% 12/25/45 | | | 21,039 | | | | 19,139 | |
Series 2015-95 SH
3.719% (6.00% minus LIBOR01M, Cap 6.00%) 1/25/46 S● | | | 151,338 | | | | 25,482 | |
Series 2016-20 DI
3.50% 4/25/31 S | | | 1,461,083 | | | | 191,289 | |
38
| | | | | | | | |
| | | Principal
amount° | | | Value (US $) | |
Agency Collateralized Mortgage Obligations (continued) | |
Fannie Mae REMICs | | | | | | | | |
Series 2016-33 DI
3.50% 6/25/36 S | | | 268,984 | | | $ | 40,782 | |
Series 2016-50 IB
3.00% 2/25/46 S | | | 85,030 | | | | 13,087 | |
Series 2016-51 LI
3.00% 8/25/46 S | | | 405,761 | | | | 64,093 | |
Series 2016-55 SK
3.719% (6.00% minus LIBOR01M, Cap 6.00%) 8/25/46 S● | | | 122,013 | | | | 22,145 | |
Series 2016-62 SA
3.719% (6.00% minus LIBOR01M, Cap 6.00%) 9/25/46 S● | | | 337,149 | | | | 62,293 | |
Series 2016-74 GS
3.719% (6.00% minus LIBOR01M, Cap 6.00%) 10/25/46 S● | | | 81,021 | | | | 15,260 | |
Series 2016-85 SA
3.719% (6.00% minus LIBOR01M, Cap 6.00%) 11/25/46 S● | | | 283,215 | | | | 52,635 | |
Series 2016-99 DI
3.50% 1/25/46 S | | | 85,839 | | | | 16,463 | |
Series 2016-105 SA
3.719% (6.00% minus LIBOR01M, Cap 6.00%) 1/25/47 S● | | | 179,211 | | | | 28,384 | |
Series 2017-8 SG
3.719% (6.00% minus LIBOR01M, Cap 6.00%) 2/25/47 S● | | | 235,749 | | | | 43,129 | |
Series 2017-11 EI
3.00% 3/25/42 S | | | 236,262 | | | | 35,468 | |
Series 2017-12 JI
3.50% 5/25/40 S | | | 73,055 | | | | 10,686 | |
Series 2017-15 NZ
3.50% 3/25/47 | | | 31,799 | | | | 29,549 | |
Series 2017-16 SM
3.769% (6.05% minus LIBOR01M, Cap 6.05%) 3/25/47 S● | | | 289,158 | | | | 53,018 | |
Series 2017-40 GZ
3.50% 5/25/47 | | | 50,583 | | | | 46,647 | |
Series 2017-46 VG
3.50% 4/25/38 | | | 31,000 | | | | 29,992 | |
Series 2017-61 TB
3.00% 8/25/44 | | | 45,000 | | | | 40,715 | |
Series 2017-88 EI
3.00% 11/25/47 S | | | 228,911 | | | | 44,768 | |
| | | | | | | | |
| | | Principal amount° | | | Value (US $) | |
Agency Collateralized Mortgage Obligations
(continued) | |
Fannie Mae REMICs | | | | | | | | |
Series 2017-88 IE
3.00% 11/25/47 S | | | 194,791 | | | $ | 37,387 | |
Series 2017-99 IE
3.00% 12/25/47 S | | | 280,562 | | | | 56,959 | |
Series 2018-15 GZ
3.00% 3/25/48 | | | 27,545 | | | | 24,610 | |
Freddie Mac REMICs | | | | | | | | |
Series 4050 EI
4.00% 2/15/39 S | | | 132,526 | | | | 12,740 | |
Series 4109 AI
3.00% 7/15/31 S | | | 278,901 | | | | 33,725 | |
Series 4120 IK
3.00% 10/15/32 S | | | 231,296 | | | | 32,578 | |
Series 4120 MI
3.00% 10/15/32 S | | | 74,806 | | | | 10,902 | |
Series 4121 AI
3.50% 10/15/42 S | | | 290,044 | | | | 57,689 | |
Series 4135 AI
3.50% 11/15/42 S | | | 3,879,837 | | | | 821,601 | |
Series 4139 IP
3.50% 4/15/42 S | | | 66,993 | | | | 8,650 | |
Series 4145 LI
3.00% 12/15/27 S | | | 575,411 | | | | 51,884 | |
Series 4146 AI 3.00% 12/15/27 S | | | 138,841 | | | | 11,198 | |
Series 4146 IA
3.50% 12/15/32 S | | | 116,143 | | | | 18,073 | |
Series 4150 IO
3.50% 1/15/43 S | | | 329,129 | | | | 68,393 | |
Series 4150 UI
3.50% 8/15/32 S | | | 137,252 | | | | 15,082 | |
Series 4159 KS
3.871% (6.15% minus LIBOR01M, Cap 6.15%) 1/15/43 S● | | | 107,621 | | | | 19,682 | |
Series 4161 IM
3.50% 2/15/43 S | | | 56,593 | | | | 12,828 | |
Series 4181 DI
2.50% 3/15/33 S | | | 77,019 | | | | 9,275 | |
Series 4184 GS
3.841% (6.12% minus LIBOR01M, Cap 6.12%) 3/15/43 S● | | | 130,764 | | | | 23,855 | |
Series 4185 LI
3.00% 3/15/33 S | | | 52,237 | | | | 7,451 | |
Series 4186 IB
3.00% 3/15/33 S | | | 168,341 | | | | 21,753 | |
Series 4186 JI
3.00% 3/15/33 S | | | 234,576 | | | | 27,433 | |
Schedules of investments
Macquarie Institutional Portfolios — Macquarie Core Plus Bond Portfolio
| | | | | | | | |
| | | Principal
amount° | | | Value (US $) | |
Agency Collateralized Mortgage Obligations
(continued) | |
Freddie Mac REMICs | | | | | | | | |
Series 4188 JI
3.00% 4/15/33 S | | | 239,570 | | | $ | 27,230 | |
Series 4191 CI
3.00% 4/15/33 S | | | 52,474 | | | | 7,279 | |
Series 4218 AI
3.00% 6/15/33 S | | | 197,432 | | | | 26,399 | |
Series 4494 SA
3.901% (6.18% minus LIBOR01M, Cap 6.18%) 7/15/45 S● | | | 61,082 | | | | 10,886 | |
Series 4531 PZ
3.50% 11/15/45 | | | 14,395 | | | | 12,952 | |
Series 4543 HI
3.00% 4/15/44 S | | | 73,976 | | | | 11,708 | |
Series 4580 MI
3.50% 2/15/43 S | | | 73,531 | | | | 11,530 | |
Series 4581 LI
3.00% 5/15/36 S | | | 68,161 | | | | 9,333 | |
Series 4592 WT
5.50% 6/15/46 | | | 216,872 | | | | 233,916 | |
Series 4594 SG
3.721% (6.00% minus LIBOR01M, Cap 6.00%) 6/15/46 S● | | | 366,522 | | | | 67,559 | |
Series 4618 SA
3.721% (6.00% minus LIBOR01M, Cap 6.00%) 9/15/46 S● | | | 85,816 | | | | 14,837 | |
Series 4623 MS
3.721% (6.00% minus LIBOR01M, Cap 6.00%) 10/15/46 S● | | | 84,214 | | | | 15,460 | |
Series 4625 BI
3.50% 6/15/46 S | | | 263,848 | | | | 57,091 | |
Series 4625 PZ
3.00% 6/15/46 | | | 53,088 | | | | 45,799 | |
Series 4627 PI
3.50% 5/15/44 S | | | 315,862 | | | | 46,555 | |
Series 4631 GS
3.721% (6.00% minus LIBOR01M, Cap 6.00%) 11/15/46 S● | | | 271,774 | | | | 44,732 | |
Series 4648 MZ
3.00% 6/15/46 | | | 27,400 | | | | 24,012 | |
Series 4648 SA
3.721% (6.00% minus LIBOR01M, Cap
6.00%) 1/15/47 S● | | | 201,633 | | | | 39,756 | |
Series 4655 WI
3.50% 8/15/43 S | | | 163,019 | | | | 25,510 | |
Series 4657 JZ
3.50% 2/15/47 | | | 10,600 | | | | 9,164 | |
| | | | | | | | |
| | | Principal amount° | | | Value (US $) | |
Agency Collateralized Mortgage Obligations
(continued) | |
Freddie Mac REMICs | | | | | | | | |
Series 4657 PS
3.721% (6.00% minus LIBOR01M, Cap 6.00%) 2/15/47 S● | | | 161,511 | | | $ | 30,056 | |
Series 4663 AI
3.00% 3/15/42 S | | | 149,322 | | | | 21,289 | |
Series 4663 HZ
3.50% 3/15/47 | | | 1,075,920 | | | | 995,086 | |
Series 4667 LI
3.50% 10/15/43 S | | | 79,938 | | | | 14,020 | |
Series 4673 WI
3.50% 9/15/43 S | | | 655,916 | | | | 106,975 | |
Series 4676 KZ
2.50% 7/15/45 | | | 51,909 | | | | 41,632 | |
Series 4700 WI
3.50% 1/15/44 S | | | 132,597 | | | | 20,896 | |
Series 4703 CI
3.50% 7/15/42 S | | | 239,192 | | | | 34,217 | |
Freddie Mac Strips | | | | | | | | |
Series 267 S5
3.721% (6.00% minus LIBOR01M, Cap 6.00%) 8/15/42 S● | | | 151,952 | | | | 23,647 | |
Series 299 S1
3.721% (6.00% minus LIBOR01M, Cap 6.00%) 1/15/43 S● | | | 123,358 | | | | 19,781 | |
Series 304 C31
3.00% 12/15/27 S | | | 247,559 | | | | 21,576 | |
Series 304 C38
3.50% 12/15/27 S | | | 129,618 | | | | 11,493 | |
Freddie Mac Structured Agency Credit Risk Debt Notes | | | | | | | | |
Series 2017-DNA1 M2 5.531% (LIBOR01M + 3.25%, Floor 3.25%) 7/25/29 ● | | | 250,000 | | | | 272,323 | |
Series 2017-DNA3 M2 4.781% (LIBOR01M + 2.50%) 3/25/30 ● | | | 500,000 | | | | 518,275 | |
Series 2017-HQA3 M2 4.631% (LIBOR01M + 2.35%) 4/25/30 ● | | | 500,000 | | | | 510,591 | |
Series 2018-DNA1 M2 4.081% (LIBOR01M + 1.80%) 7/25/30 ● | | | 200,000 | | | | 196,752 | |
Series 2018-HQA1 M2 4.581% (LIBOR01M + 2.30%) 9/25/30 ● | | | 185,000 | | | | 184,906 | |
40
| | | | | | | | |
| | | Principal amount° | | | Value (US $) | |
Agency Collateralized Mortgage Obligations
(continued) | |
GNMA | | | | | | | | |
Series 2011-157 SG
4.32% (6.60% minus LIBOR01M, Cap 6.60%) 12/20/41 S● | | | 216,693 | | | $ | 40,997 | |
Series 2012-108 KI
4.00% 8/16/42 S | | | 446,296 | | | | 86,801 | |
Series 2012-136 MX
2.00% 11/20/42 | | | 30,000 | | | | 24,780 | |
Series 2013-113 LY
3.00% 5/20/43 | | | 22,000 | | | | 20,092 | |
Series 2015-74 CI
3.00% 10/16/39 S | | | 142,027 | | | | 17,057 | |
Series 2015-111 IH
3.50% 8/20/45 S | | | 281,820 | | | | 35,725 | |
Series 2015-142 AI
4.00% 2/20/44 S | | | 42,449 | | | | 5,509 | |
Series 2016-75 JI
3.00% 9/20/43 S | | | 755,112 | | | | 112,410 | |
Series 2016-89 QS
3.77% (6.05% minus LIBOR01M, Cap 6.05%) 7/20/46 S● | | | 136,342 | | | | 26,553 | |
Series 2016-108 SK
3.77% (6.05% minus LIBOR01M, Cap 6.05%) 8/20/46 S● | | | 223,917 | | | | 40,988 | |
Series 2016-115 SA
3.82% (6.10% minus LIBOR01M, Cap 6.10%) 8/20/46 S● | | | 432,137 | | | | 76,612 | |
Series 2016-116 GI
3.50% 11/20/44 S | | | 264,366 | | | | 40,842 | |
Series 2016-118 DI
3.50% 3/20/43 S | | | 296,250 | | | | 41,786 | |
Series 2016-120 NS
3.82% (6.10% minus LIBOR01M, Cap 6.10%) 9/20/46 S● | | | 318,918 | | | | 59,388 | |
Series 2016-121 JS
3.82% (6.10% minus LIBOR01M, Cap 6.10%) 9/20/46 S● | | | 230,039 | | | | 42,470 | |
Series 2016-149 GI
4.00% 11/20/46 S | | | 86,136 | | | | 17,515 | |
Series 2016-156 PB
2.00% 11/20/46 | | | 47,000 | | | | 35,764 | |
Series 2016-160 GI
3.50% 11/20/46 S | | | 185,359 | | | | 43,583 | |
Series 2016-160 IE
3.00% 6/20/46 S | | | 796,547 | | | | 137,527 | |
Series 2016-161 MI
3.00% 3/20/46 S | | | 128,656 | | | | 20,415 | |
Series 2016-161 PI
3.50% 6/20/46 S | | | 1,519,797 | | | | 268,342 | |
Series 2016-163 MI
3.50% 11/20/46 S | | | 132,906 | | | | 17,297 | |
| | | | | | | | |
| | | Principal amount° | | | Value (US $) | |
Agency Collateralized Mortgage Obligations
(continued) | |
GNMA | | | | | | | | |
Series 2016-163 XI
3.00% 10/20/46 S | | | 205,231 | | | $ | 29,932 | |
Series 2016-171 IO
3.00% 7/20/44 S | | | 433,645 | | | | 59,671 | |
Series 2016-171 IP
3.00% 3/20/46 S | | | 89,019 | | | | 13,570 | |
Series 2016-172 IO
3.00% 4/20/46 S | | | 153,394 | | | | 24,794 | |
Series 2017-10 KZ
3.00% 1/20/47 | | | 27,400 | | | | 23,995 | |
Series 2017-11 IM
3.00% 5/20/42 S | | | 681,891 | | | | 88,298 | |
Series 2017-56 JZ
3.00% 4/20/47 | | | 3,138 | | | | 2,715 | |
Series 2017-56 QS
3.87% (6.15% minus LIBOR01M, Cap 6.15%) 4/20/47 S● | | | 263,430 | | | | 45,212 | |
Series 2017-68 SB
3.87% (6.15% minus LIBOR01M, Cap 6.15%) 5/20/47 S● | | | 203,609 | | | | 32,909 | |
Series 2017-80 AS
3.92% (6.20% minus LIBOR01M, Cap 6.20%) 5/20/47 S● | | | 295,375 | | | | 52,100 | |
Series 2017-91 SM
3.92% (6.20% minus LIBOR01M, Cap 6.20%) 6/20/47 S● | | | 181,979 | | | | 29,892 | |
Series 2017-101 AI
4.00% 7/20/47 S | | | 127,424 | | | | 23,649 | |
Series 2017-101 KS
3.92% (6.20% minus LIBOR01M, Cap 6.20%) 7/20/47 S● | | | 203,767 | | | | 35,762 | |
Series 2017-101 TI
4.00% 3/20/44 S | | | 187,843 | | | | 29,615 | |
Series 2017-117 SD
3.92% (6.20% minus LIBOR01M, Cap 6.20%) 8/20/47 S● | | | 176,412 | | | | 28,417 | |
Series 2017-130 YJ
2.50% 8/20/47 | | | 40,000 | | | | 34,622 | |
Series 2017-134 ES
3.92% (6.20% minus LIBOR01M, Cap 6.20%) 9/20/47 S● | | | 334,942 | | | | 54,215 | |
Series 2017-134 SD
3.92% (6.20% minus LIBOR01M, Cap
6.20%) 9/20/47 S● | | | 2,928,561 | | | | 540,207 | |
Series 2017-137 IO
3.00% 6/20/45 S | | | 364,799 | | | | 64,290 | |
Series 2017-141 IA
3.00% 3/20/46 S | | | 1,376,112 | | | | 219,126 | |
Schedules of investments
Macquarie Institutional Portfolios — Macquarie Core Plus Bond Portfolio
| | | | | | | | |
| | | Principal amount° | | | Value (US $) | |
Agency Collateralized Mortgage Obligations (continued) | |
GNMA | | | | | | | | |
Series 2017-141 JS 3.92% (6.20% minus LIBOR01M, Cap 6.20%) 9/20/47 S● | | | 205,891 | | | $ | 36,021 | |
Series 2017-144 EI
3.00% 12/20/44 S | | | 333,975 | | | | 55,279 | |
Series 2017-174 HI 3.00% 7/20/45 S | | | 304,029 | | | | 54,398 | |
Series 2018-1 ST 3.92% (6.20% minus LIBOR01M, Cap 6.20%) 1/20/48 S● | | | 612,150 | | | | 114,012 | |
Series 2018-11 AI
3.00% 1/20/46 S | | | 200,056 | | | | 37,037 | |
Series 2018-13 PZ
3.00% 1/20/48 | | | 56,250 | | | | 50,104 | |
Series 2018-14 ZE
3.50% 1/20/48 | | | 30,797 | | | | 28,335 | |
Series 2018-24 HZ
3.00% 2/20/48 | | | 26,525 | | | | 22,423 | |
Series 2018-34 TY
3.50% 3/20/48 | | | 45,000 | | | | 42,176 | |
Series 2018-37 SA 3.92% (6.20% minus LIBOR01M, Cap 6.20%) 3/20/48 S● | | | 209,912 | | | | 37,548 | |
Series 2018-46 AS 3.92% (6.20% minus LIBOR01M, Cap 6.20%) 3/20/48 S● | | | 732,002 | | | | 137,992 | |
Series 2018-63 BZ
3.00% 4/20/48 = | | | 112,675 | | | | 96,911 | |
| | | | | | | | |
| |
Total Agency Collateralized Mortgage Obligations (cost $11,317,349) | | | | 11,263,995 | |
| | | | | | | | |
| | | | | | | | | |
Agency Commercial Mortgage-Backed Securities – 2.19% | |
Freddie Mac Multifamily Structured Pass Through Certificates | | | | | | | | |
Series K058 A2 2.653% 8/25/26 ◆ | | | 1,095,000 | | | | 1,023,775 | |
Series K061 A2 3.347% 11/25/26 ◆● | | | 275,000 | | | | 270,111 | |
FREMF Mortgage Trust | | | | | | | | |
Series 2010-K7 B 144A 5.50% 4/25/20 #● | | | 95,000 | | | | 97,430 | |
Series 2010-K8 B 144A 5.278% 9/25/43 #● | | | 1,000,000 | | | | 1,025,265 | |
Series 2011-K11 B 144A 4.416% 12/25/48 #● | | | 730,000 | | | | 744,570 | |
Series 2011-K14 B 144A 5.18% 2/25/47 #● | | | 50,000 | | | | 52,007 | |
| | | | | | | | |
| | | Principal
amount° | | | Value (US $) | |
Agency Commercial Mortgage-Backed Securities (continued) | |
FREMF Mortgage Trust | | | | | | | | |
Series 2011-K15 B 144A 4.948% 8/25/44 #● | | | 150,000 | | | $ | 155,402 | |
Series 2012-K22 B 144A 3.686% 8/25/45 #● | | | 60,000 | | | | 59,812 | |
Series 2013-K25 C 144A 3.619% 11/25/45 #● | | | 280,000 | | | | 274,172 | |
Series 2013-K28 C 144A 3.49% 6/25/46 #● | | | 30,000 | | | | 29,323 | |
Series 2013-K33 B 144A 3.50% 8/25/46 #● | | | 115,000 | | | | 113,524 | |
Series 2013-K33 C 144A 3.50% 8/25/46 #● | | | 20,000 | | | | 19,466 | |
Series 2013-K712 B 144A 3.358% 5/25/45 #● | | | 140,000 | | | | 139,771 | |
Series 2013-K713 B 144A 3.154% 4/25/46 #● | | | 35,000 | | | | 34,856 | |
Series 2013-K713 C 144A 3.154% 4/25/46 #● | | | 135,000 | | | | 134,362 | |
Series 2014-K717 B 144A 3.629% 11/25/47 #● | | | 90,000 | | | | 89,847 | |
Series 2014-K717 C 144A 3.629% 11/25/47 #● | | | 40,000 | | | | 39,489 | |
Series 2016-K53 B 144A 4.019% 3/25/49 #● | | | 15,000 | | | | 14,689 | |
Series 2016-K722 B 144A 3.835% 7/25/49 #● | | | 370,000 | | | | 367,849 | |
Series 2016-K723 B 144A 3.58% 11/25/23 #● | | | 65,000 | | | | 63,104 | |
Series 2017-K71 B 144A 3.753% 11/25/50 #● | | | 80,000 | | | | 75,822 | |
| | | | | | | | |
| |
Total Agency Commercial Mortgage-Backed Securities (cost $4,914,754) | | | | 4,824,646 | |
| | | | | | | | |
| | | | | | | | | |
Agency Mortgage-Backed Securities – 10.45% | |
Fannie Mae | | | | | | | | |
3.00% 10/1/47 | | | 704,183 | | | | 661,503 | |
3.00% 2/1/57 | | | 242,978 | | | | 227,693 | |
Fannie Mae ARM | | | | | | | | |
4.203%(LIBOR12M + 1.525%, Cap 9.533%) 8/1/34 ● | | | 15,585 | | | | 16,211 | |
Fannie Mae FHAVA | | | | | | | | |
4.50% 7/1/40 | | | 53,753 | | | | 55,543 | |
Fannie Mae S.F. 30 yr | | | | | | | | |
4.50% 11/1/39 | | | 47,147 | | | | 48,823 | |
4.50% 6/1/40 | | | 52,472 | | | | 54,190 | |
4.50% 8/1/40 | | | 13,169 | | | | 13,566 | |
4.50% 8/1/41 | | | 60,429 | | | | 62,604 | |
42
| | | | | | | | |
| | | Principal
amount° | | | Value (US $) | |
Agency Mortgage-Backed Securities (continued) | |
Fannie Mae S.F. 30 yr | | | | | | | | |
4.50% 10/1/43 | | | 1,333,710 | | | $ | 1,381,586 | |
4.50% 10/1/44 | | | 28,605 | | | | 29,515 | |
4.50% 3/1/46 | | | 20,881 | | | | 21,545 | |
4.50% 5/1/46 | | | 575,502 | | | | 591,709 | |
4.50% 7/1/46 | | | 228,477 | | | | 234,614 | |
4.50% 8/1/47 | | | 1,302,199 | | | | 1,335,635 | |
4.50% 8/1/48 | | | 1,396,687 | | | | 1,431,415 | |
5.00% 1/1/40 | | | 635,960 | | | | 673,298 | |
5.00% 6/1/44 | | | 158,308 | | | | 167,701 | |
5.00% 7/1/47 | | | 252,457 | | | | 267,726 | |
5.00% 9/1/48 | | | 950,924 | | | | 995,057 | |
5.50% 5/1/44 | | | 2,832,618 | | | | 3,042,108 | |
5.50% 8/1/48 | | | 186,608 | | | | 201,240 | |
6.00% 6/1/41 | | | 450,716 | | | | 491,664 | |
6.00% 7/1/41 | | | 1,527,001 | | | | 1,667,479 | |
6.00% 1/1/42 | | | 378,000 | | | | 416,269 | |
Fannie Mae S.F. 30 yr TBA | | | | | | | | |
3.50% 12/1/48 | | | 1,770,000 | | | | 1,721,087 | |
Freddie Mac S.F. 30 yr | | | | | | | | |
4.50% 4/1/39 | | | 7,149 | | | | 7,363 | |
4.50% 5/1/40 | | | 273,073 | | | | 282,311 | |
4.50% 3/1/42 | | | 53,197 | | | | 55,124 | |
4.50% 7/1/42 | | | 69,054 | | | | 71,557 | |
4.50% 8/1/42 | | | 1,772,459 | | | | 1,828,455 | |
4.50% 12/1/43 | | | 47,102 | | | | 48,717 | |
4.50% 8/1/44 | | | 86,927 | | | | 89,610 | |
4.50% 11/1/45 | | | 321,494 | | | | 331,163 | |
4.50% 8/1/48 | | | 1,765,752 | | | | 1,819,459 | |
5.50% 6/1/41 | | | 447,945 | | | | 484,928 | |
6.00% 7/1/40 | | | 1,156,747 | | | | 1,271,961 | |
GNMA I S.F. 30 yr | | | | | | | | |
5.50% 2/15/41 | | | 28,970 | | | | 30,890 | |
GNMA II S.F. 30 yr | | | | | | | | |
5.00% 9/20/46 | | | 67,930 | | | | 71,648 | |
5.00% 7/20/48 | | | 270,924 | | | | 282,742 | |
5.00% 9/20/48 | | | 273,525 | | | | 285,128 | |
5.50% 5/20/37 | | | 16,124 | | | | 16,954 | |
6.00% 2/20/39 | | | 17,854 | | | | 18,903 | |
6.00% 10/20/39 | | | 76,891 | | | | 81,450 | |
6.00% 2/20/40 | | | 79,617 | | | | 84,577 | |
6.00% 4/20/46 | | | 23,950 | | | | 25,464 | |
| | | | | | | | |
| |
Total Agency Mortgage-Backed Securities (cost $23,627,902) | | | | 22,998,185 | |
| | | | | | | | |
| | | | | | | | |
| | | Principal
amount° | | | Value (US $) | |
Collateralized Debt Obligations – 5.32% | |
AMMC CLO 21 | | | | | | | | |
Series 2017-21A A
144A 3.809% (LIBOR03M + 1.25%) 11/2/30 #● | | | 250,000 | | | $ | 250,996 | |
AMMC CLO 22 | | | | | | | | |
Series 2018-22A A
144A 3.52% (LIBOR03M + 1.03%, Floor 1.03%) 4/25/31 #● | | | 250,000 | | | | 248,593 | |
Apex Credit CLO 2017 | | | | | | | | |
Series 2017-1A A1
144A 3.957% (LIBOR03M + 1.47%, Floor 1.47%) 4/24/29 #● | | | 295,000 | | | | 295,594 | |
Apex Credit CLO 2018 | | | | | | | | |
Series 2018-1A A2
144A 3.52% (LIBOR03M + 1.03%) 4/25/31 #● | | | 1,800,000 | | | | 1,789,848 | |
Atlas Senior Loan Fund X | | | | | | | | |
Series 2018-10A A
144A 3.526% (LIBOR03M + 1.09%) 1/15/31 #● | | | 350,000 | | | | 348,249 | |
Battalion CLO XII | | | | | | | | |
Series 2018-12A A1
144A 3.40% (LIBOR03M + 1.07%, Floor 1.07%) 5/17/31 #● | | | 700,000 | | | | 696,681 | |
Benefit Street Partners
CLO IV | | | | | | | | |
Series 2014-IVA A1R
144A 3.959% (LIBOR03M + 1.49%) 1/20/29 #● | | | 500,000 | | | | 501,111 | |
CFIP CLO | | | | | | | | |
Series 2017-1A A
144A 3.665% (LIBOR03M + 1.22%) 1/18/30 #● | | | 500,000 | | | | 500,105 | |
ECP CLO | | | | | | | | |
Series 2015-7A A1R
144A 3.609% (LIBOR03M + 1.14%) 4/22/30 #● | | | 700,000 | | | | 696,377 | |
Galaxy XXI CLO | | | | | | | | |
Series 2015-21A AR
144A 3.489% (LIBOR03M + 1.02%) 4/20/31 #● | | | 250,000 | | | | 248,571 | |
GoldenTree Loan Management US CLO 1 | | | | | | | | |
Series 2017-1A A
144A 3.689% (LIBOR03M + 1.22%) 4/20/29 #● | | | 250,000 | | | | 250,190 | |
Schedules of investments
Macquarie Institutional Portfolios — Macquarie Core Plus Bond Portfolio
| | | | | | | | |
| | | Principal
amount° | | | Value (US $) | |
Collateralized Debt Obligations (continued) | |
Mariner CLO 5 | | | | | | | | |
Series 2018-5A A
144A 3.60% (LIBOR03M + 1.11%, Floor 1.11%)
4/25/31 #● | | | 400,000 | | | $ | 398,576 | |
Midocean Credit CLO IX | | | | | | | | |
Series 2018-9A A1
144A 3.397% (LIBOR03M + 1.15%, Floor 1.15%)
7/20/31 #● | | | 250,000 | | | | 250,261 | |
Midocean Credit CLO VIII | | | | | | | | |
Series 2018-8A A1
144A 3.472% (LIBOR03M + 1.15%) 2/20/31 #● | | | 250,000 | | | | 249,872 | |
MP CLO IV | | | | | | | | |
Series 2013-2A ARR
144A 3.77% (LIBOR03M + 1.28%) 7/25/29 #● | | | 250,000 | | | | 250,000 | |
Northwoods Capital XV | | | | | | | | |
Series 2017-15A A
144A 3.638% (LIBOR03M + 1.30%) 6/20/29 #● | | | 250,000 | | | | 250,500 | |
Northwoods Capital XVII | | | | | | | | |
Series 2018-17A A
144A 3.529% (LIBOR03M + 1.06%, Floor 1.06%) 4/22/31 #● | | | 400,000 | | | | 397,000 | |
Oaktree CLO | | | | | | | | |
Series 2014-1A A1R
144A 3.628% (LIBOR03M + 1.29%) 5/13/29 #● | | | 350,000 | | | | 350,909 | |
OCP CLO | | | | | | | | |
Series 2017-13A A1A
144A 3.696% (LIBOR03M + 1.26%) 7/15/30 #● | | | 250,000 | | | | 250,375 | |
Octagon Investment Partners XV CLO | | | | | | | | |
Series 2013-1A A1AR
144A 3.66% (LIBOR03M + 1.21%) 7/19/30 #● | | | 250,000 | | | | 250,173 | |
OZLM XVIII | | | | | | | | |
Series 2018-18A A
144A 3.456% (LIBOR03M + 1.02%, Floor 1.02%)
4/15/31 #● | | | 350,000 | | | | 347,474 | |
Saranac CLO VII | | | | | | | | |
Series 2014-2A A1AR
144A 3.552% (LIBOR03M + 1.23%) 11/20/29 #● | | | 250,000 | | | | 250,384 | |
| | | | | | | | |
| | | Principal
amount° | | | Value (US $) | |
Collateralized Debt Obligations (continued) | |
Shackleton CLO | | | | | | | | |
Series 2013-3A AR
144A 3.556% (LIBOR03M + 1.12%, Floor 1.12%)
7/15/30 #● | | | 250,000 | | | $ | 249,294 | |
Sounds Point CLO IV-R | | | | | | | | |
Series 2013-3RA A
144A 3.595% (LIBOR03M + 1.15%, Floor 1.15%)
4/18/31 #● | | | 700,000 | | | | 700,044 | |
Steele Creek CLO | | | | | | | | |
Series 2017-1A A
144A 3.686% (LIBOR03M + 1.25%) 1/15/30 #● | | | 250,000 | | | | 250,613 | |
TIAA CLO II | | | | | | | | |
Series 2017-1A A
144A 3.749% (LIBOR03M + 1.28%) 4/20/29 #● | | | 250,000 | | | | 250,295 | |
Venture 31 CLO | | | | | | | | |
Series 2018-31A A1
144A 3.499% (LIBOR03M + 1.03%, Floor 1.03%)
4/20/31 #● | | | 400,000 | | | | 397,314 | |
Venture CDO | | | | | | | | |
Series 2016-25A A1
144A 3.959% (LIBOR03M + 1.49%) 4/20/29 #● | | | 100,000 | | | | 100,179 | |
Venture XXII CLO | | | | | | | | |
Series 2015-22A AR
144A 3.516% (LIBOR03M + 1.08%) 1/15/31 #● | | | 250,000 | | | | 249,724 | |
Venture XXIV CLO | | | | | | | | |
Series 2016-24A A1D
144A 3.889% (LIBOR03M + 1.42%) 10/20/28 #● | | | 195,000 | | | | 195,438 | |
Venture XXVIII CLO | | | | | | | | |
Series 2017-28A A2
144A 3.579% (LIBOR03M + 1.11%) 7/20/30 #● | | | 250,000 | | | | 249,638 | |
| | | | | | | | |
| |
Total Collateralized Debt Obligations (cost $11,736,309) | | | | 11,714,378 | |
| | | | | | | | |
| | | | | | | | | |
Convertible Bonds – 3.70% | |
Aerojet Rocketdyne Holdings 2.25% exercise price $26.00, maturity date 12/15/23 | | | 400,000 | | | | 588,708 | |
BioMarin Pharmaceutical 1.50% exercise price $94.15, maturity date 10/15/20 | | | 520,000 | | | | 614,298 | |
44
| | | | | | | | |
| | | Principal
amount° | | | Value (US $) | |
Convertible Bonds (continued) | | | | | |
Blackstone Mortgage Trust 4.375% exercise price $35.67, maturity date 5/5/22 | | | 410,000 | | | $ | 405,460 | |
Blackstone Mortgage Trust 4.75% exercise price $36.23, maturity date 3/15/23 | | | 190,000 | | | | 187,668 | |
Booking Holdings 0.35% exercise price $1,315.10, maturity date 6/15/20 | | | 200,000 | | | | 289,284 | |
Cemex 3.72% exercise price $11.01, maturity date 3/15/20 | | | 700,000 | | | | 689,417 | |
DISH Network 3.375% exercise price $65.18, maturity date 8/15/26 | | | 450,000 | | | | 402,053 | |
Empire State Realty OP 144A 2.625% exercise price $19.25, maturity date 8/15/19 # | | | 400,000 | | | | 398,563 | |
GAIN Capital Holdings 5.00% exercise price $8.20, maturity date 8/15/22 | | | 58,000 | | | | 66,644 | |
GCI Liberty 144A 1.75% exercise price $370.52, maturity date 9/30/46 # | | | 80,000 | | | | 86,491 | |
Insulet 1.25% exercise price $58.37, maturity date 9/15/21 | | | 175,000 | | | | 272,483 | |
Insulet 144A 1.375% exercise price $93.18, maturity date 11/15/24 # | | | 250,000 | | | | 282,809 | |
Liberty Media 2.25% exercise price $35.14, maturity date 9/30/46 | | | 1,000,000 | | | | 523,307 | |
Medicines 2.75% exercise price $48.97, maturity date 7/15/23 | | | 540,000 | | | | 458,199 | |
Microchip Technology 1.625% exercise price $98.03, maturity date 2/15/27 | | | 540,000 | | | | 513,156 | |
Neurocrine Biosciences 2.25% exercise price $75.92, maturity date 5/15/24 | | | 190,000 | | | | 293,253 | |
Palo Alto Networks 144A 0.75% exercise price $266.35, maturity date 7/1/23 # | | | 463,000 | | | | 452,107 | |
| | | | | | | | |
| | | Principal
amount° | | | Value (US $) | |
Convertible Bonds (continued) | | | | | |
Paratek Pharmaceuticals 144A 4.75% exercise price $15.90, maturity date
5/1/24 # | | | 500,000 | | | $ | 431,450 | |
RPM International 2.25% exercise price $52.03, maturity date 12/15/20 | | | 25,000 | | | | 28,889 | |
Synaptics 0.50% exercise price $73.02, maturity date 6/15/22 | | | 500,000 | | | | 447,500 | |
Team 5.00% exercise price $21.70, maturity date 8/1/23 | | | 300,000 | | | | 352,016 | |
Vector Group 2.50% exercise price $13.81, maturity date 1/15/19 ● | | | 285,000 | | | | 298,797 | |
Verint Systems 1.50% exercise price $64.46, maturity date 6/1/21 | | | 70,000 | | | | 69,806 | |
| | | | | | | | |
| |
Total Convertible Bonds
(cost $8,355,977) | | | | 8,152,358 | |
| | | | | | | | |
| | | | | | | | | |
Corporate Bonds – 37.03% | | | | | |
Banking – 7.55% | | | | | | | | |
Akbank T.A.S. 144A
7.20% 3/16/27 #µ | | | 200,000 | | | | 170,340 | |
Banco Santander
3.848% 4/12/23 | | | 400,000 | | | | 387,516 | |
Banco Santander Mexico 144A
4.125% 11/9/22 # | | | 150,000 | | | | 147,113 | |
Bank of America | | | | | | | | |
3.864% 7/23/24 µ | | | 95,000 | | | | 94,379 | |
4.271% 7/23/29 µ | | | 540,000 | | | | 533,206 | |
5.625% 7/1/20 | | | 120,000 | | | | 124,559 | |
Bank of Montreal
3.803% 12/15/32 µ | | | 160,000 | | | | 146,851 | |
Bank of New York Mellon
2.95% 1/29/23 | | | 115,000 | | | | 111,904 | |
Barclays | | | | | | | | |
7.75%µy | | | 200,000 | | | | 200,040 | |
8.25%µy | | | 400,000 | | | | 402,358 | |
BOC Aviation 144A
2.375% 9/15/21 # | | | 200,000 | | | | 190,950 | |
Branch Banking & Trust
2.85% 4/1/21 | | | 500,000 | | | | 494,152 | |
Citibank 3.40% 7/23/21 | | | 250,000 | | | | 249,041 | |
Citigroup 3.412% (LIBOR03M + 1.10%) 5/17/24 ● | | | 95,000 | | | | 95,628 | |
Schedules of investments
Macquarie Institutional Portfolios — Macquarie Core Plus Bond Portfolio
| | | | | | | | |
| | | Principal
amount° | | | Value (US $) | |
Corporate Bonds (continued) | | | | | |
Banking (continued) | | | | | | | | |
Citizens Bank
2.55% 5/13/21 | | | 250,000 | | | $ | 243,424 | |
Citizens Financial Group
4.30% 12/3/25 | | | 115,000 | | | | 112,828 | |
Compass Bank
2.875% 6/29/22 | | | 250,000 | | | | 239,780 | |
3.875% 4/10/25 | | | 250,000 | | | | 237,732 | |
Credit Suisse Group
144A 3.869% 1/12/29 #µ | | | 705,000 | | | | 654,419 | |
144A 6.25%#µy | | | 200,000 | | | | 195,131 | |
144A 7.25%#µy | | | 200,000 | | | | 198,250 | |
DBS Group Holdings 144A 4.52% 12/11/28 #µ | | | 275,000 | | | | 278,378 | |
Fifth Third Bancorp
2.60% 6/15/22 | | | 50,000 | | | | 48,106 | |
3.95% 3/14/28 | | | 210,000 | | | | 204,750 | |
Fifth Third Bank
2.30% 3/15/19 | | | 330,000 | | | | 329,457 | |
3.85% 3/15/26 | | | 250,000 | | | | 242,811 | |
Goldman Sachs Group
4.223% 5/1/29 µ | | | 190,000 | | | | 184,642 | |
5.15% 5/22/45 | | | 170,000 | | | | 166,798 | |
6.00% 6/15/20 | | | 650,000 | | | | 676,682 | |
HSBC Holdings
4.292% 9/12/26 µ | | | 400,000 | | | | 394,928 | |
6.50%µy | | | 215,000 | | | | 202,100 | |
Huntington Bancshares
2.30% 1/14/22 | | | 160,000 | | | | 153,031 | |
Huntington National Bank
2.50% 8/7/22 | | | 250,000 | | | | 239,229 | |
JPMorgan Chase & Co.
3.797% 7/23/24 µ | | | 230,000 | | | | 228,721 | |
4.203% 7/23/29 µ | | | 185,000 | | | | 182,438 | |
6.75%µy | | | 205,000 | | | | 218,889 | |
KeyBank 3.40% 5/20/26 | | | 300,000 | | | | 282,262 | |
Lloyds Banking Group
7.50%µy | | | 200,000 | | | | 202,250 | |
Morgan Stanley
3.772% 1/24/29 µ | | | 290,000 | | | | 275,166 | |
5.00% 11/24/25 | | | 440,000 | | | | 451,188 | |
5.50% 1/26/20 | | | 335,000 | | | | 343,928 | |
Nationwide Building Society 144A 4.125% 10/18/32 #µ | | | 250,000 | | | | 223,076 | |
PNC Bank
2.70% 11/1/22 | | | 250,000 | | | | 240,208 | |
4.05% 7/26/28 | | | 500,000 | | | | 491,220 | |
PNC Financial Services Group 5.00%µy | | | 160,000 | | | | 155,120 | |
| | | | | | | | |
| | | Principal
amount° | | | Value (US $) | |
Corporate Bonds (continued) | | | | | |
Banking (continued) | | | | | | | | |
Regions Financial
2.75% 8/14/22 | | | 75,000 | | | $ | 72,181 | |
3.80% 8/14/23 | | | 175,000 | | | | 173,407 | |
Royal Bank of Scotland Group 8.625%µy | | | 400,000 | | | | 421,500 | |
Santander UK 144A
5.00% 11/7/23 # | | | 870,000 | | | | 873,328 | |
State Street
3.10% 5/15/23 | | | 65,000 | | | | 63,353 | |
3.30% 12/16/24 | | | 105,000 | | | | 102,002 | |
SunTrust Bank
2.45% 8/1/22 | | | 115,000 | | | | 110,251 | |
3.00% 2/2/23 | | | 225,000 | | | | 218,871 | |
3.30% 5/15/26 | | | 200,000 | | | | 187,452 | |
SunTrust Banks
2.70% 1/27/22 | | | 55,000 | | | | 53,289 | |
4.00% 5/1/25 | | | 200,000 | | | | 198,607 | |
SVB Financial Group
3.50% 1/29/25 | | | 120,000 | | | | 115,284 | |
Turkiye Garanti Bankasi 144A 5.25% 9/13/22 # | | | 200,000 | | | | 185,370 | |
UBS Group Funding Switzerland 6.875%µy | | | 330,000 | | | | 326,700 | |
US Bancorp
2.375% 7/22/26 | | | 465,000 | | | | 417,716 | |
3.10% 4/27/26 | | | 140,000 | | | | 130,742 | |
3.15% 4/27/27 | | | 390,000 | | | | 368,076 | |
3.60% 9/11/24 | | | 40,000 | | | | 39,360 | |
US Bank 3.40% 7/24/23 | | | 250,000 | | | | 247,868 | |
USB Capital IX 3.50% (LIBOR03M +
1.02%)y● | | | 355,000 | | | | 309,294 | |
Wells Fargo Capital X
5.95% 12/15/36 | | | 55,000 | | | | 57,750 | |
Westpac Banking 5.00%µy | | | 50,000 | | | | 43,786 | |
Woori Bank 144A
4.75% 4/30/24 # | | | 200,000 | | | | 200,248 | |
Zions Bancorp 4.50% 6/13/23 | | | 55,000 | | | | 55,318 | |
| | | | | | | | |
| | |
| | | | | | | 16,616,732 | |
| | | | | | | | |
Basic Industry – 3.09% | | | | | | | | |
Anglo American Capital
144A 4.75% 4/10/27 # | | | 440,000 | | | | 424,277 | |
144A 4.875% 5/14/25 # | | | 400,000 | | | | 394,799 | |
BHP Billiton Finance USA
144A 6.25% 10/19/75 #µ | | | 400,000 | | | | 417,700 | |
46
| | | | | | | | |
| | | Principal
amount° | | | Value (US $) | |
Corporate Bonds (continued) | | | | | |
Basic Industry (continued) | | | | | | | | |
Braskem Netherlands Finance 144A 4.50% 1/10/28 # | | | 200,000 | | | $ | 185,000 | |
CK Hutchison International 17 144A 2.875% 4/5/22 # | | | 200,000 | | | | 194,057 | |
CSN Resources 144A 7.625% 2/13/23 # | | | 200,000 | | | | 185,502 | |
Cydsa 144A 6.25% 10/4/27 # | | | 200,000 | | | | 186,902 | |
Dow Chemical 8.55% 5/15/19 | | | 549,000 | | | | 564,725 | |
Equate Petrochemical 144A 3.00% 3/3/22 # | | | 200,000 | | | | 191,797 | |
Freeport-McMoRan
4.55% 11/14/24 | | | 85,000 | | | | 78,944 | |
Georgia-Pacific 8.00% 1/15/24 | | | 310,000 | | | | 368,885 | |
Hudbay Minerals 144A 7.625% 1/15/25 # | | | 155,000 | | | | 156,163 | |
Israel Chemicals 144A 6.375% 5/31/38 # | | | 425,000 | | | | 422,769 | |
Joseph T Ryerson & Son 144A 11.00% 5/15/22 # | | | 310,000 | | | | 332,475 | |
Mexichem 144A
5.50% 1/15/48 # | | | 200,000 | | | | 176,402 | |
NOVA Chemicals 144A 5.25% 6/1/27 # | | | 305,000 | | | | 276,025 | |
Novolipetsk Steel Via Steel Funding DAC 144A 4.00% 9/21/24 # | | | 295,000 | | | | 272,801 | |
OCP 144A 4.50% 10/22/25 # | | | 200,000 | | | | 189,685 | |
Olin 5.125% 9/15/27 | | | 245,000 | | | | 229,381 | |
Petkim Petrokimya Holding 144A 5.875% 1/26/23 # | | | 200,000 | | | | 183,875 | |
Phosagro OAO Via Phosagro Bond Funding DAC 144A 3.95% 11/3/21 # | | | 200,000 | | | | 194,096 | |
SASOL Financing USA 5.875% 3/27/24 | | | 200,000 | | | | 201,727 | |
Suzano Austria 144A
6.00% 1/15/29 # | | | 200,000 | | | | 204,000 | |
Syngenta Finance
144A 3.933% 4/23/21 # | | | 375,000 | | | | 373,332 | |
144A 4.441% 4/24/23 # | | | 200,000 | | | | 197,014 | |
Vedanta Resources 144A 7.125% 5/31/23 # | | | 200,000 | | | | 188,500 | |
| | | | | | | | |
| | |
| | | | | | | 6,790,833 | |
| | | | | | | | |
| | | | | | | | |
| | | Principal
amount° | | | Value (US $) | |
Corporate Bonds (continued) | | | | | |
Brokerage – 0.75% | | | | | | | | |
Charles Schwab
3.20% 1/25/28 | | | 75,000 | | | $ | 70,337 | |
3.25% 5/21/21 | | | 100,000 | | | | 99,702 | |
3.85% 5/21/25 | | | 105,000 | | | | 105,115 | |
5.00%µy | | | 65,000 | | | | 61,831 | |
E*TRADE Financial 3.80% 8/24/27 | | | 205,000 | | | | 192,023 | |
5.875%µy | | | 160,000 | | | | 159,600 | |
Intercontinental Exchange 3.45% 9/21/23 | | | 55,000 | | | | 54,663 | |
3.75% 9/21/28 | | | 60,000 | | | | 58,658 | |
4.25% 9/21/48 | | | 60,000 | | | | 56,041 | |
Jefferies Group
4.15% 1/23/30 | | | 135,000 | | | | 118,058 | |
6.45% 6/8/27 | | | 30,000 | | | | 31,875 | |
6.50% 1/20/43 | | | 110,000 | | | | 110,378 | |
Lazard Group
3.625% 3/1/27 | | | 10,000 | | | | 9,196 | |
3.75% 2/13/25 | | | 125,000 | | | | 119,697 | |
4.50% 9/19/28 | | | 205,000 | | | | 199,823 | |
NFP 144A 6.875% 7/15/25 # | | | 200,000 | | | | 194,500 | |
| | | | | | | | |
| | |
| | | | | | | 1,641,497 | |
| | | | | | | | |
Capital Goods – 1.97% | | | | | | | | |
Allegion US Holding 3.55% 10/1/27 | | | 432,000 | | | | 391,743 | |
Ardagh Packaging Finance 144A 6.00% 2/15/25 # | | | 345,000 | | | | 324,300 | |
Boise Cascade 144A
5.625% 9/1/24 # | | | 245,000 | | | | 241,325 | |
CCL Industries 144A
3.25% 10/1/26 # | | | 95,000 | | | | 86,416 | |
Crane 4.45% 12/15/23 | | | 95,000 | | | | 97,092 | |
General Electric
2.10% 12/11/19 | | | 130,000 | | | | 127,825 | |
5.55% 5/4/20 | | | 10,000 | | | | 10,270 | |
6.00% 8/7/19 | | | 90,000 | | | | 91,804 | |
Grupo Cementos de Chihuahua 144A 5.25% 6/23/24 # | | | 200,000 | | | | 197,500 | |
Harris 4.40% 6/15/28 | | | 140,000 | | | | 140,361 | |
L3 Technologies
3.85% 6/15/23 | | | 105,000 | | | | 104,797 | |
4.40% 6/15/28 | | | 200,000 | | | | 200,130 | |
Martin Marietta Materials
4.25% 12/15/47 | | | 320,000 | | | | 257,838 | |
Northrop Grumman
2.55% 10/15/22 | | | 460,000 | | | | 442,669 | |
Schedules of investments
Macquarie Institutional Portfolios — Macquarie Core Plus Bond Portfolio
| | | | | | | | |
| | | Principal
amount° | | | Value (US $) | |
Corporate Bonds (continued) | | | | | | | | |
Capital Goods (continued) | | | | | | | | |
Northrop Grumman 3.25% 8/1/23 | | | 25,000 | | | $ | 24,491 | |
Nvent Finance 4.55% 4/15/28 | | | 775,000 | | | | 750,419 | |
Parker-Hannifin 3.30% 11/21/24 | | | 10,000 | | | | 9,800 | |
Standard Industries 144A 5.00% 2/15/27 # | | | 400,000 | | | | 366,000 | |
United Rentals North America 5.875% 9/15/26 | | | 115,000 | | | | 113,131 | |
United Technologies 3.65% 8/16/23 | | | 50,000 | | | | 49,493 | |
4.125% 11/16/28 | | | 310,000 | | | | 305,682 | |
| | | | | | | | |
| | |
| | | | | | | 4,333,086 | |
| | | | | | | | |
Communications – 4.04% | | | | | | | | |
AMC Networks
4.75% 8/1/25 | | | 225,000 | | | | 209,723 | |
American Tower Trust I 144A
3.07% 3/15/23 # | | | 120,000 | | | | 116,415 | |
AT&T
3.514% (LIBOR03M +
1.18%) 6/12/24 ● | | | 130,000 | | | | 130,459 | |
144A 4.30% 2/15/30 # | | | 90,000 | | | | 84,762 | |
4.50% 3/9/48 | | | 115,000 | | | | 96,188 | |
5.25% 3/1/37 | | | 345,000 | | | | 330,959 | |
CCO Holdings 144A 5.125% 5/1/27 # | | | 500,000 | | | | 471,875 | |
Charter Communications Operating 5.375% 4/1/38 | | | 105,000 | | | | 96,638 | |
Comcast
3.70% 4/15/24 | | | 435,000 | | | | 433,828 | |
4.15% 10/15/28 | | | 215,000 | | | | 213,508 | |
4.70% 10/15/48 | | | 305,000 | | | | 296,379 | |
Crown Castle International 3.80% 2/15/28 | | | 495,000 | | | | 461,827 | |
5.25% 1/15/23 | | | 150,000 | | | | 156,587 | |
Crown Castle Towers 144A 4.241% 7/15/28 # | | | 250,000 | | | | 250,020 | |
CSC Holdings 144A 5.50% 4/15/27 # | | | 200,000 | | | | 192,500 | |
Deutsche Telekom International Finance 144A 2.82% 1/19/22 # | | | 175,000 | | | | 170,308 | |
Discovery Communications 5.20% 9/20/47 | | | 335,000 | | | | 310,513 | |
GTP Acquisition Partners I 144A 2.35% 6/15/20 # | | | 100,000 | | | | 97,816 | |
| | | | | | | | |
| | | Principal
amount° | | | Value (US $) | |
Corporate Bonds (continued) | | | | | | | | |
Communications (continued) | | | | | | | | |
Level 3 Financing 5.375% 5/1/25 | | | 370,000 | | | $ | 362,138 | |
Myriad International Holdings 144A 4.85% 7/6/27 # | | | 200,000 | | | | 193,880 | |
SBA Tower Trust 144A 2.898% 10/15/19 # | | | 60,000 | | | | 59,665 | |
Sirius XM Radio 144A 5.375% 4/15/25 # | | | 125,000 | | | | 124,141 | |
Sprint 7.875% 9/15/23 | | | 223,000 | | | | 238,610 | |
Sprint Spectrum 144A 4.738% 3/20/25 # | | | 220,000 | | | | 220,275 | |
Telecom Italia 144A 5.303% 5/30/24 # | | | 200,000 | | | | 189,250 | |
Telefonica Emisiones 4.895% 3/6/48 | | | 310,000 | | | | 277,026 | |
TELUS 4.60% 11/16/48 | | | 355,000 | | | | 341,057 | |
Time Warner Cable 7.30% 7/1/38 | | | 360,000 | | | | 398,103 | |
Time Warner Entertainment 8.375% 3/15/23 | | | 185,000 | | | | 213,432 | |
VEON Holdings 144A 4.95% 6/16/24 # | | | 200,000 | | | | 189,852 | |
Verizon Communications 4.50% 8/10/33 | | | 610,000 | | | | 594,096 | |
Viacom 4.375% 3/15/43 | | | 360,000 | | | | 295,662 | |
Virgin Media Secured Finance 144A 5.50% 8/15/26 # | | | 200,000 | | | | 189,000 | |
Vodafone Group 3.75% 1/16/24 | | | 440,000 | | | | 430,651 | |
Warner Media 4.85% 7/15/45 | | | 245,000 | | | | 218,663 | |
Zayo Group 144A 5.75% 1/15/27 # | | | 240,000 | | | | 235,848 | |
| | | | | | | | |
| | |
| | | | | | | 8,891,654 | |
| | | | | | | | |
Consumer Cyclical – 1.86% | | | | | | | | |
Atento Luxco 1 144A 6.125% 8/10/22 # | | | 75,000 | | | | 73,875 | |
Best Buy 4.45% 10/1/28 | | | 335,000 | | | | 322,596 | |
Boyd Gaming 6.375% 4/1/26 | | | 230,000 | | | | 228,850 | |
Dollar Tree
3.70% 5/15/23 | | | 270,000 | | | | 263,394 | |
4.00% 5/15/25 | | | 190,000 | | | | 182,832 | |
Ford Motor Credit 4.14% 2/15/23 | | | 420,000 | | | | 408,041 | |
General Motors
6.75% 4/1/46 | | | 40,000 | | | | 40,822 | |
48
| | | | | | | | |
| | | Principal
amount° | | | Value (US $) | |
Corporate Bonds (continued) | | | | | |
Consumer Cyclical (continued) | | | | | | | | |
General Motors Financial
4.35% 4/9/25 | | | 445,000 | | | $ | 429,267 | |
5.25% 3/1/26 | | | 70,000 | | | | 70,001 | |
GLP Capital
5.30% 1/15/29 | | | 105,000 | | | | 103,556 | |
5.375% 4/15/26 | | | 180,000 | | | | 179,325 | |
Hyundai Capital America 144A 2.55% 2/6/19 # | | | 75,000 | | | | 74,887 | |
JD.com 3.125% 4/29/21 | | | 200,000 | | | | 192,878 | |
Lowe’s 4.05% 5/3/47 | | | 25,000 | | | | 22,703 | |
Marriott International
4.50% 10/1/34 | | | 20,000 | | | | 19,398 | |
Penn National Gaming 144A
5.625% 1/15/27 # | | | 305,000 | | | | 284,413 | |
Penske Automotive Group
5.50% 5/15/26 | | | 245,000 | | | | 233,975 | |
Royal Caribbean Cruises
3.70% 3/15/28 | | | 380,000 | | | | 349,393 | |
Sands China 144A
4.60% 8/8/23 # | | | 200,000 | | | | 197,759 | |
Scientific Games International
10.00% 12/1/22 | | | 255,000 | | | | 267,431 | |
Toyota Motor Credit
2.80% 7/13/22 | | | 140,000 | | | | 136,803 | |
| | | | | | | | |
| | |
| | | | | | | 4,082,199 | |
| | | | | | | | |
Consumer Non-Cyclical – 4.21% | | | | | | | | |
Abbott Laboratories
2.80% 9/15/20 | | | 875,000 | | | | 867,923 | |
AbbVie 4.25% 11/14/28 | | | 325,000 | | | | 313,962 | |
Anheuser-Busch InBev Finance 3.65% 2/1/26 | | | 385,000 | | | | 365,739 | |
AstraZeneca
3.50% 8/17/23 | | | 115,000 | | | | 113,287 | |
4.00% 1/17/29 | | | 385,000 | | | | 371,282 | |
BAT Capital
144A 2.297% 8/14/20 # | | | 15,000 | | | | 14,684 | |
144A 3.222% 8/15/24 # | | | 375,000 | | | | 354,368 | |
Bayer US Finance II
144A 4.25% 12/15/25 # | | | 200,000 | | | | 196,660 | |
144A 4.375% 12/15/28 # | | | 405,000 | | | | 392,996 | |
Becton Dickinson and Co.
3.363% 6/6/24 | | | 305,000 | | | | 291,825 | |
Bunge Finance
4.35% 3/15/24 | | | 270,000 | | | | 265,314 | |
Campbell Soup
3.65% 3/15/23 | | | 560,000 | | | | 543,473 | |
| | | | | | | | |
| | | Principal
amount° | | | Value (US $) | |
Corporate Bonds (continued) | | | | | |
Consumer Non-Cyclical (continued) | | | | | |
Conagra Brands
4.30% 5/1/24 | | | 180,000 | | | $ | 180,495 | |
4.60% 11/1/25 | | | 100,000 | | | | 100,226 | |
5.30% 11/1/38 | | | 125,000 | | | | 121,430 | |
CVS Health
4.30% 3/25/28 | | | 1,235,000 | | | | 1,206,965 | |
5.00% 12/1/24 | | | 375,000 | | | | 388,664 | |
DaVita 5.00% 5/1/25 | | | 125,000 | | | | 118,125 | |
Encompass Health
5.75% 11/1/24 | | | 100,000 | | | | 100,125 | |
ESAL 144A 6.25% 2/5/23 # | | | 200,000 | | | | 197,500 | |
General Mills
3.70% 10/17/23 | | | 210,000 | | | | 207,121 | |
HCA 5.375% 2/1/25 | | | 465,000 | | | | 469,069 | |
Marfrig Holdings Europe 144A 8.00% 6/8/23 # | | | 200,000 | | | | 203,000 | |
MHP 144A 6.95% 4/3/26 # | | | 200,000 | | | | 185,224 | |
Mylan 144A
4.55% 4/15/28 # | | | 180,000 | | | | 166,894 | |
Nestle Holdings 144A
4.00% 9/24/48 # | | | 345,000 | | | | 323,275 | |
New York & Presbyterian Hospital 4.063% 8/1/56 | | | 130,000 | | | | 120,855 | |
Pernod Ricard 144A
4.45% 1/15/22 # | | | 255,000 | | | | 259,969 | |
Rede D’or Finance 144A
4.95% 1/17/28 # | | | 200,000 | | | | 177,852 | |
Tenet Healthcare
5.125% 5/1/25 | | | 130,000 | | | | 125,450 | |
Teva Pharmaceutical Finance Netherlands III 6.00% 4/15/24 | | | 200,000 | | | | 199,263 | |
Thermo Fisher Scientific
3.00% 4/15/23 | | | 210,000 | | | | 202,617 | |
Zimmer Biomet Holdings
4.625% 11/30/19 | | | 120,000 | | | | 121,478 | |
| | | | | | | | |
| | |
| | | | | | | 9,267,110 | |
| | | | | | | | |
Electric – 4.09% | | | | | | | | |
AES 5.50% 4/15/25 | | | 110,000 | | | | 110,825 | |
AES Andres 144A
7.95% 5/11/26 # | | | 200,000 | | | | 205,750 | |
AES Gener
144A 5.25% 8/15/21 # | | | 97,000 | | | | 99,564 | |
144A 8.375% 12/18/73 #µ | | | 200,000 | | | | 203,168 | |
Ameren Illinois
9.75% 11/15/18 | | | 295,000 | | | | 295,745 | |
Schedules of investments
Macquarie Institutional Portfolios — Macquarie Core Plus Bond Portfolio
| | | | | | | | |
| | | Principal
amount° | | | Value (US $) | |
Corporate Bonds (continued) | | | | | |
Electric (continued) | | | | | | | | |
American Transmission Systems 144A 5.25% 1/15/22 # | | | 50,000 | | | $ | 52,297 | |
Atlantic City Electric
4.00% 10/15/28 | | | 210,000 | | | | 211,052 | |
Ausgrid Finance
144A 3.85% 5/1/23 # | | | 245,000 | | | | 242,936 | |
144A 4.35% 8/1/28 # | | | 170,000 | | | | 167,257 | |
Avangrid 3.15% 12/1/24 | | | 100,000 | | | | 94,698 | |
Berkshire Hathaway Energy
3.75% 11/15/23 | | | 195,000 | | | | 196,230 | |
Calpine 5.50% 2/1/24 | | | 240,000 | | | | 218,700 | |
CenterPoint Energy
3.85% 2/1/24 | | | 150,000 | | | | 150,075 | |
4.25% 11/1/28 | | | 175,000 | | | | 173,660 | |
6.125%µy | | | 205,000 | | | | 207,306 | |
Cleveland Electric Illuminating
144A 3.50% 4/1/28 # | | | 175,000 | | | | 163,891 | |
5.50% 8/15/24 | | | 270,000 | | | | 292,174 | |
ComEd Financing III
6.35% 3/15/33 | | | 60,000 | | | | 63,000 | |
Consumers Energy
3.80% 11/15/28 | | | 90,000 | | | | 89,662 | |
4.35% 4/15/49 | | | 85,000 | | | | 84,648 | |
Dominion Energy
3.625% 12/1/24 | | | 305,000 | | | | 299,304 | |
DTE Energy
3.30% 6/15/22 | | | 115,000 | | | | 113,293 | |
Electricite de France 144A
4.50% 9/21/28 # | | | 260,000 | | | | 251,704 | |
Emera 6.75% 6/15/76 µ | | | 215,000 | | | | 225,213 | |
Enel 144A 8.75% 9/24/73 #µ | | | 200,000 | | | | 216,500 | |
Enel Finance International 144A 4.625% 9/14/25 # | | | 560,000 | | | | 530,206 | |
Entergy Louisiana
4.00% 3/15/33 | | | 85,000 | | | | 83,930 | |
4.05% 9/1/23 | | | 315,000 | | | | 321,098 | |
4.95% 1/15/45 | | | 10,000 | | | | 9,783 | |
Entergy Mississippi
2.85% 6/1/28 | | | 115,000 | | | | 104,846 | |
Evergy 4.85% 6/1/21 | | | 35,000 | | | | 35,742 | |
Exelon
3.497% 6/1/22 | | | 180,000 | | | | 175,701 | |
3.95% 6/15/25 | | | 150,000 | | | | 147,862 | |
Interstate Power & Light
4.10% 9/26/28 | | | 195,000 | | | | 194,294 | |
Israel Electric 144A
5.00% 11/12/24 # | | | 200,000 | | | | 202,500 | |
| | | | | | | | |
| | | Principal
amount° | | | Value (US $) | |
Corporate Bonds (continued) | | | | | |
Electric (continued) | | | | | | | | |
Kansas City Power & Light
3.65% 8/15/25 | | | 220,000 | | | $ | 215,839 | |
LG&E & KU Energy
4.375% 10/1/21 | | | 165,000 | | | | 168,036 | |
Mississippi Power
3.95% 3/30/28 | | | 205,000 | | | | 199,063 | |
National Rural Utilities Cooperative Finance 2.85% 1/27/25 | | | 430,000 | | | | 407,230 | |
4.75% 4/30/43 µ | | | 70,000 | | | | 69,841 | |
5.25% 4/20/46 µ | | | 60,000 | | | | 60,358 | |
Nevada Power
2.75% 4/15/20 | | | 225,000 | | | | 223,994 | |
New York State Electric & Gas 144A 3.25% 12/1/26 # | | | 145,000 | | | | 137,886 | |
NV Energy 6.25% 11/15/20 | | | 75,000 | | | | 79,018 | |
Oglethorpe Power 144A
5.05% 10/1/48 # | | | 255,000 | | | | 251,354 | |
Pennsylvania Electric
5.20% 4/1/20 | | | 15,000 | | | | 15,352 | |
PSEG Power 3.85% 6/1/23 | | | 225,000 | | | | 223,639 | |
Public Service Co. of Oklahoma 5.15% 12/1/19 | | | 100,000 | | | | 102,191 | |
Southwestern Electric Power
4.10% 9/15/28 | | | 540,000 | | | | 534,498 | |
Trans-Allegheny Interstate | | | | | | | | |
Line 144A 3.85% 6/1/25 # | | | 70,000 | | | | 68,701 | |
| | | | | | | | |
| | |
| | | | | | | 8,991,614 | |
| | | | | | | | |
Energy – 3.99% | | | | | | | | |
Abu Dhabi Crude Oil Pipeline 144A 4.60% 11/2/47 # | | | 200,000 | | | | 189,798 | |
Anadarko Petroleum
6.60% 3/15/46 | | | 70,000 | | | | 77,649 | |
Andeavor Logistics
4.25% 12/1/27 | | | 315,000 | | | | 300,396 | |
BP Capital Markets America
3.796% 9/21/25 | | | 410,000 | | | | 402,242 | |
Cheniere Corpus Christi Holdings 5.875% 3/31/25 | | | 160,000 | | | | 164,800 | |
Enbridge
6.00% 1/15/77 µ | | | 505,000 | | | | 474,652 | |
6.25% 3/1/78 µ | | | 90,000 | | | | 84,528 | |
Enbridge Energy Partners
4.375% 10/15/20 | | | 45,000 | | | | 45,620 | |
5.20% 3/15/20 | | | 25,000 | | | | 25,539 | |
5.50% 9/15/40 | | | 75,000 | | | | 76,989 | |
50
| | | | | | | | |
| | | Principal
amount° | | | Value (US $) | |
Corporate Bonds (continued) | | | | | |
Energy (continued) | | | | | | | | |
Energy Transfer Operating
6.625%µy | | | 230,000 | | | $ | 213,469 | |
9.70% 3/15/19 | | | 59,000 | | | | 60,394 | |
Enterprise Products Operating
4.80% 2/1/49 | | | 75,000 | | | | 72,409 | |
Gazprom OAO Via Gaz Capital 144A
4.95% 3/23/27 # | | | 200,000 | | | | 191,397 | |
Geopark 144A
6.50% 9/21/24 # | | | 200,000 | | | | 199,750 | |
KazMunayGas National 144A
6.375% 10/24/48 # | | | 200,000 | | | | 203,639 | |
Kinder Morgan
5.20% 3/1/48 | | | 455,000 | | | | 440,965 | |
Marathon Oil
4.40% 7/15/27 | | | 145,000 | | | | 141,569 | |
5.20% 6/1/45 | | | 200,000 | | | | 196,918 | |
MPLX 4.875% 12/1/24 | | | 255,000 | | | | 261,469 | |
Murphy Oil 6.875% 8/15/24 | | | 185,000 | | | | 193,691 | |
Newfield Exploration
5.75% 1/30/22 | | | 335,000 | | | | 347,144 | |
Noble Energy
3.85% 1/15/28 | | | 240,000 | | | | 220,500 | |
4.95% 8/15/47 | | | 70,000 | | | | 63,735 | |
5.05% 11/15/44 | | | 65,000 | | | | 59,811 | |
ONEOK 7.50% 9/1/23 | | | 220,000 | | | | 248,986 | |
Pertamina Persero 144A
4.875% 5/3/22 # | | | 200,000 | | | | 203,299 | |
Perusahaan Listrik Negara 144A 4.125% 5/15/27 # | | | 200,000 | | | | 180,506 | |
Petrobras Global Finance
7.375% 1/17/27 | | | 180,000 | | | | 187,173 | |
Petroleos Mexicanos
6.75% 9/21/47 | | | 155,000 | | | | 133,905 | |
Sabine Pass Liquefaction
5.625% 3/1/25 | | | 370,000 | | | | 386,800 | |
5.75% 5/15/24 | | | 100,000 | | | | 106,032 | |
5.875% 6/30/26 | | | 460,000 | | | | 489,116 | |
Southwestern Energy
6.20% 1/23/25 | | | 250,000 | | | | 244,063 | |
Sunoco Logistics Partners Operations 4.25% 4/1/24 | | | 230,000 | | | | 227,089 | |
Tecpetrol 144A
4.875% 12/12/22 # | | | 255,000 | | | | 233,328 | |
TransCanada PipeLines
5.10% 3/15/49 | | | 135,000 | | | | 135,630 | |
Transcanada Trust
5.875% 8/15/76 µ | | | 90,000 | | | | 88,821 | |
| | | | | | | | |
| | | Principal
amount° | | | Value (US $) | |
Corporate Bonds (continued) | | | | | |
Energy (continued) | | | | | | | | |
Transcontinental Gas Pipe Line 4.00% 3/15/28 | | | 90,000 | | | $ | 86,652 | |
4.60% 3/15/48 | | | 85,000 | | | | 78,568 | |
Transocean Proteus 144A
6.25% 12/1/24 # | | | 212,500 | | | | 212,500 | |
Tullow Oil 144A
7.00% 3/1/25 # | | | 200,000 | | | | 196,270 | |
Williams
3.75% 6/15/27 | | | 155,000 | | | | 144,597 | |
4.55% 6/24/24 | | | 140,000 | | | | 141,094 | |
4.85% 3/1/48 | | | 220,000 | | | | 201,631 | |
YPF
144A 7.00% 12/15/47 # | | | 125,000 | | | | 95,400 | |
144A 47.833% (BADLARPP + 4.00%) 7/7/20 #● | | | 125,000 | | | | 54,688 | |
| | | | | | | | |
| | |
| | | | | | | 8,785,221 | |
| | | | | | | | |
Finance Companies – 0.85% | | | | | | | | |
AerCap Ireland Capital
3.65% 7/21/27 | | | 700,000 | | | | 629,295 | |
Air Lease
3.00% 9/15/23 | | | 355,000 | | | | 334,774 | |
3.625% 4/1/27 | | | 130,000 | | | | 118,513 | |
Aviation Capital Group
144A 3.50% 11/1/27 # | | | 110,000 | | | | 99,061 | |
144A 4.875% 10/1/25 # | | | 185,000 | | | | 186,566 | |
GE Capital International Funding Co. Unlimited 4.418% 11/15/35 | | | 200,000 | | | | 173,102 | |
International Lease Finance
8.625% 1/15/22 | | | 300,000 | | | | 340,146 | |
| | | | | | | | |
| | |
| | | | | | | 1,881,457 | |
| | | | | | | | |
Insurance – 1.30% | | | | | | | | |
Acrisure 144A
7.00% 11/15/25 # | | | 73,000 | | | | 65,517 | |
AssuredPartners 144A
7.00% 8/15/25 # | | | 112,000 | | | | 110,740 | |
AXA Equitable Holdings
144A 4.35% 4/20/28 # | | | 95,000 | | | | 91,227 | |
144A 5.00% 4/20/48 # | | | 160,000 | | | | 143,076 | |
Berkshire Hathaway Finance
2.90% 10/15/20 | | | 65,000 | | | | 64,807 | |
Halfmoon Parent
144A 3.326% (LIBOR03M + 0.89%) 7/15/23 #● | | | 185,000 | | | | 184,972 | |
144A 4.125% 11/15/25 # | | | 335,000 | | | | 331,663 | |
144A 4.375% 10/15/28 # | | | 245,000 | | | | 239,730 | |
Schedules of investments
Macquarie Institutional Portfolios — Macquarie Core Plus Bond Portfolio
| | | | | | | | |
| | | Principal
amount° | | | Value (US $) | |
Corporate Bonds (continued) | | | | | |
Insurance (continued) | | | | | | | | |
Liberty Mutual Group 144A
4.95% 5/1/22 # | | | 25,000 | | | $ | 25,759 | |
Nuveen Finance
144A 2.95% 11/1/19 # | | | 90,000 | | | | 89,846 | |
144A 4.125% 11/1/24 # | | | 460,000 | | | | 460,913 | |
Progressive 4.00% 3/1/29 | | | 205,000 | | | | 204,042 | |
Prudential Financial
5.375% 5/15/45 µ | | | 85,000 | | | | 83,300 | |
USIS Merger Sub 144A
6.875% 5/1/25 # | | | 190,000 | | | | 185,725 | |
Voya Financial 144A
4.70% 1/23/48 #µ | | | 205,000 | | | | 176,813 | |
Willis North America
3.60% 5/15/24 | | | 55,000 | | | | 52,985 | |
4.50% 9/15/28 | | | 180,000 | | | | 178,523 | |
XLIT
4.894% (LIBOR03M +
2.458%)y● | | | 45,000 | | | | 44,218 | |
5.50% 3/31/45 | | | 130,000 | | | | 133,401 | |
| | | | | | | | |
| | |
| | | | | | | 2,867,257 | |
| | | | | | | | |
REITs – 0.47% | | | | | | | | |
Corporate Office Properties
3.60% 5/15/23 | | | 45,000 | | | | 43,414 | |
5.25% 2/15/24 | | | 55,000 | | | | 56,538 | |
CubeSmart 3.125% 9/1/26 | | | 135,000 | | | | 121,974 | |
ESH Hospitality 144A
5.25% 5/1/25 # | | | 250,000 | | | | 237,188 | |
Hospitality Properties Trust
4.50% 3/15/25 | | | 65,000 | | | | 62,809 | |
Host Hotels & Resorts
3.75% 10/15/23 | | | 135,000 | | | | 131,447 | |
3.875% 4/1/24 | | | 65,000 | | | | 63,445 | |
Kilroy Realty
3.45% 12/15/24 | | | 135,000 | | | | 128,449 | |
LifeStorage 3.50% 7/1/26 | | | 100,000 | | | | 92,121 | |
UDR 4.00% 10/1/25 | | | 40,000 | | | | 39,556 | |
WP Carey 4.60% 4/1/24 | | | 55,000 | | | | 55,362 | |
| | | | | | | | |
| | |
| | | | | | | 1,032,303 | |
| | | | | | | | |
Technology – 1.77% | | | | | | | | |
Baidu 4.375% 3/29/28 | | | 200,000 | | | | 194,522 | |
Broadcom 3.50% 1/15/28 | | | 240,000 | | | | 211,695 | |
CDK Global 5.00% 10/15/24 | | | 110,000 | | | | 108,867 | |
CDW Finance 5.00% 9/1/25 | | | 355,000 | | | | 347,456 | |
CommScope Technologies 144A 5.00% 3/15/27 # | | | 255,000 | | | | 229,500 | |
| | | | | | | | |
| | | Principal
amount° | | | Value (US $) | |
Corporate Bonds (continued) | | | | | |
Technology (continued) | | | | | | | | |
Corning
4.375% 11/15/57 | | | 105,000 | | | $ | 85,684 | |
5.35% 11/15/48 | | | 105,000 | | | | 105,171 | |
Dell International 144A
6.02% 6/15/26 # | | | 485,000 | | | | 503,659 | |
Equinix 5.375% 5/15/27 | | | 280,000 | | | | 277,900 | |
Fiserv
3.80% 10/1/23 | | | 80,000 | | | | 80,044 | |
4.20% 10/1/28 | | | 155,000 | | | | 153,751 | |
Marvell Technology Group
4.875% 6/22/28 | | | 340,000 | | | | 334,186 | |
MSCI 144A
5.375% 5/15/27 # | | | 465,000 | | | | 461,513 | |
NXP 144A 4.625% 6/1/23 # | | | 335,000 | | | | 332,906 | |
Oracle 2.40% 9/15/23 | | | 305,000 | | | | 288,515 | |
Tencent Holdings 144A
3.925% 1/19/38 # | | | 200,000 | | | | 174,109 | |
| | | | | | | | |
| | |
| | | | | | | 3,889,478 | |
| | | | | | | | |
Transportation – 0.77% | | | | | | | | |
Adani Abbot Point Terminal 144A 4.45% 12/15/22 # | | | 340,000 | | | | 299,068 | |
Avis Budget Car Rental 144A
6.375% 4/1/24 # | | | 140,000 | | | | 134,225 | |
Burlington Northern Santa Fe
4.15% 12/15/48 | | | 155,000 | | | | 146,647 | |
FedEx 4.05% 2/15/48 | | | 70,000 | | | | 59,340 | |
Norfolk Southern
3.80% 8/1/28 | | | 190,000 | | | | 185,080 | |
Penske Truck Leasing
144A 3.30% 4/1/21 # | | | 410,000 | | | | 405,291 | |
144A 4.20% 4/1/27 # | | | 35,000 | | | | 34,040 | |
Union Pacific 3.50% 6/8/23 | | | 175,000 | | | | 174,349 | |
United Airlines 2014-1 Class A Pass Through Trust 4.00% 4/11/26 ¨ | | | 24,167 | | | | 24,184 | |
United Airlines 2014-2 Class A Pass Through Trust 3.75% 9/3/26 ¨ | | | 58,054 | | | | 57,694 | |
United Parcel Service
5.125% 4/1/19 | | | 175,000 | | | | 176,698 | |
| | | | | | | | |
| | |
| | | | | | | 1,696,616 | |
| | | | | | | | |
Utilities – 0.32% | | | | | | | | |
Aegea Finance 144A
5.75% 10/10/24 # | | | 200,000 | | | | 193,500 | |
KazTransGas JSC 144A
4.375% 9/26/27 # | | | 200,000 | | | | 189,326 | |
NiSource 144A 5.65%#µy | | | 200,000 | | | | 196,290 | |
52
| | | | | | | | |
| | | Principal
amount° | | | Value (US $) | |
Corporate Bonds (continued) | | | | | |
Utilities (continued) | | | | | | | | |
Sempra Energy
3.80% 2/1/38 | | | 145,000 | | | $ | 126,699 | |
| | | | | | | | |
| | |
| | | | | | | 705,815 | |
| | | | | | | | |
| |
Total Corporate Bonds
(cost $84,255,925) | | | | 81,472,872 | |
| | | | | | | | |
| | | | | | | | | |
Loan Agreements – 8.29% | | | | | |
Acrisure Tranche B 1st Lien
6.552% (LIBOR01M +
4.25%) 11/22/23 ● | | | 158,797 | | | | 159,551 | |
Air Medical Group Holdings Tranche B 1st Lien 5.534% (LIBOR01M + 3.25%) 4/28/22 ● | | | 255 | | | | 248 | |
Albertson’s Tranche B4 1st Lien 5.052% (LIBOR01M + 2.75%) 8/25/21 ● | | | 148,183 | | | | 148,137 | |
Alpha 3 Tranche B1 1st Lien 5.386% (LIBOR03M + 3.00%) 1/31/24 ● | | | 49,108 | | | | 49,190 | |
Altice France Tranche B11 1st Lien 5.052% (LIBOR01M + 2.75%) 7/31/25 ● | | | 117,826 | | | | 114,733 | |
Altice France Tranche B13 1st Lien 6.28% (LIBOR01M + 4.00%) 1/31/26 ● | | | 35,000 | | | | 34,580 | |
American Airlines Tranche B 1st Lien 4.28% (LIBOR01M + 2.00%) 12/14/23 ● | | | 403,450 | | | | 401,275 | |
Applied Systems 2nd Lien 9.386% (LIBOR03M + 7.00%) 9/19/25 ● | | | 225,000 | | | | 230,288 | |
Aramark Services Tranche B3 1st Lien 4.052% (LIBOR01M + 1.75%) 3/11/25 ● | | | 69,950 | | | | 70,081 | |
AssuredPartners Tranche B 1st Lien 5.552% (LIBOR01M + 3.25%) 10/22/24 ● | | | 113,750 | | | | 113,589 | |
Avis Budget Car Rental Tranche B 1st Lien 4.31% (LIBOR01M + 2.00%) 2/13/25 ● | | | 119,100 | | | | 118,875 | |
Bausch Health Tranche B 1st Lien 5.274% (LIBOR01M + 3.00%) 6/1/25 ● | | | 208,989 | | | | 209,497 | |
Blue Ribbon 1st Lien 6.265% (LIBOR03M + 3.00%) 11/13/21 ● | | | 151,832 | | | | 142,532 | |
| | | | | | | | |
| | | Principal
amount° | | | Value (US $) | |
Loan Agreements (continued) | | | | | |
Boxer Parent Tranche B 1st Lien 6.648% (LIBOR03M + 4.25%) 10/2/25 ● | | | 148,000 | | | $ | 148,648 | |
Builders FirstSource 1st Lien 5.386% (LIBOR03M + 3.00%) 2/29/24 ● | | | 173,480 | | | | 172,143 | |
BWAY Holding Tranche B 1st Lien 5.658% (LIBOR03M + 3.25%) 4/3/24 ● | | | 248,116 | | | | 247,030 | |
Change Healthcare Holdings Tranche B 1st Lien 5.173% (LIBOR01M + 2.75%) 3/1/24 ● | | | 30,561 | | | | 30,563 | |
Charter Communications Operating Tranche B 1st Lien 4.31% (LIBOR01M + 2.00%) 4/30/25 ● | | | 119,100 | | | | 119,249 | |
Chemours Tranche B2 1st Lien 4.05% (LIBOR01M + 1.75%) 4/3/25 ● | | | 171,667 | | | | 170,916 | |
CityCenter Holdings Tranche B 1st Lien 4.552% (LIBOR01M + 2.25%) 4/18/24 ● | | | 243,241 | | | | 243,051 | |
Community Health Systems Tranche H 1st Lien 5.563% (LIBOR03M + 3.25%)
1/27/21 ● | | | 119,306 | | | | 117,118 | |
Core & Main Tranche B 1st Lien 5.317% (LIBOR03M + 3.00%) 8/1/24 ● | | | 143,910 | | | | 144,030 | |
CPM Holdings 1st Lien
0.00% 10/24/25 ● X | | | 50,000 | | | | 50,375 | |
CPM Holdings 2nd Lien
5.646% (LIBOR03M +
3.25%) 10/24/26 ● | | | 25,000 | | | | 25,094 | |
CROWN Americas Tranche B
1st Lien 4.283% (LIBOR01M + 2.00%) 4/3/25 ● | | | 477,011 | | | | 478,651 | |
CSC Holdings Tranche B 1st
Lien 4.78% (LIBOR01M + 2.50%) 1/25/26 ● | | | 64,675 | | | | 64,885 | |
Dakota Holdings Tranche B 1st
Lien 5.552% (LIBOR01M + 3.25%) 2/13/25 ● | | | 85,570 | | | | 85,616 | |
DaVita Tranche B 1st Lien
5.052% (LIBOR01M +
2.75%) 6/24/21 ● | | | 136,530 | | | | 136,988 | |
Schedules of investments
Macquarie Institutional Portfolios — Macquarie Core Plus Bond Portfolio
| | | | | | | | |
| | | Principal
amount° | | | Value (US $) | |
Loan Agreements (continued) | | | | | | | | |
Delek US Holdings Tranche B 1st Lien 4.552% (LIBOR01M + 2.25%) 3/30/25 ● | | | 84,575 | | | $ | 84,663 | |
Digicel International Finance Tranche B 1st Lien 5.57% (LIBOR03M + 3.25%) 5/10/24 ● | | | 58,849 | | | | 56,495 | |
DTZ US Borrower Tranche B 1st Lien 5.552% (LIBOR01M + 3.25%) 8/21/25 ● | | | 65,000 | | | | 65,075 | |
Energy Transfer Tranche B 1st Lien 4.302% (LIBOR01M + 2.00%) 2/2/24 ● | | | 400,000 | | | | 400,475 | |
Envision Healthcare Tranche B 1st Lien 6.052% (LIBOR01M + 3.75%) 10/11/25 ● | | | 300,000 | | | | 294,396 | |
ESH Hospitality Tranche B 1st Lien 4.302% (LIBOR01M + 2.00%) 8/30/23 ● | | | 248,128 | | | | 248,303 | |
ExamWorks Group Tranche B 1st Lien 5.552% (LIBOR01M + 3.25%) 7/27/23 ● | | | 162,180 | | | | 162,957 | |
First Data 1st Lien 4.287% (LIBOR01M + 2.00%) 4/26/24 ● | | | 504,133 | | | | 503,583 | |
Flying Fortress Holdings Tranche B 1st Lien 4.136% (LIBOR03M + 1.75%) 10/30/22 ● | | | 150,000 | | | | 150,670 | |
Frontier Communications Tranche A-DD 1st Lien 5.06% (LIBOR01M + 2.75%) 3/31/21 ● | | | 48,611 | | | | 47,335 | |
Frontier Communications Tranche B1 1st Lien 6.06% (LIBOR01M + 3.75%) 6/15/24 ● | | | 109,246 | | | | 105,969 | |
Gardner Denver Tranche B1 1st Lien 5.052% (LIBOR01M + 2.75%) 7/30/24 ● | | | 224,007 | | | | 224,867 | |
Gates Global Tranche B2 1st Lien 5.052% (LIBOR01M + 2.75%) 3/31/24 ● | | | 89,214 | | | | 89,469 | |
GEO Group Tranche B 1st Lien 4.31% (LIBOR01M + 2.00%) 3/23/24 ● | | | 49,747 | | | | 49,639 | |
| | | | | | | | |
| | | Principal
amount° | | | Value (US $) | |
Loan Agreements (continued) | | | | | | | | |
GIP III Stetson I Tranche B 1st Lien 6.695% (LIBOR03M + 4.25%) 7/18/25 ● | | | 77,000 | | | $ | 77,337 | |
Gray Television Tranche B2 1st Lien 4.515% (LIBOR01M + 2.25%) 2/7/24 ● | | | 107,721 | | | | 107,900 | |
Greeneden US Holdings II Tranche B3 1st Lien 5.802% (LIBOR01M + 3.50%) 12/1/23 ● | | | 248,125 | | | | 248,962 | |
Greenhill & Co. Tranche B 1st Lien 6.048% (LIBOR02M + 3.75%) 10/12/22 ● | | | 45,810 | | | | 46,096 | |
GVC Holdings Tranche B2 1st Lien 4.802% (LIBOR01M + 2.50%) 3/16/24 ● | | | 137,310 | | | | 137,567 | |
HCA Tranche B10 1st Lien 4.302% (LIBOR01M + 2.00%) 3/13/25 ● | | | 358,200 | | | | 360,314 | |
Heartland Dental 1st Lien 6.052% (LIBOR01M + 3.75%) 4/30/25 ● | | | 111,026 | | | | 110,795 | |
Hilton Worldwide Finance Tranche B2 1st Lien 4.031% (LIBOR01M + 1.75%) 10/25/23 ● | | | 73,969 | | | | 74,113 | |
Hoya Midco Tranche B 1st Lien 5.802% (LIBOR01M + 3.50%) 6/30/24 ● | | | 173,681 | | | | 173,138 | |
HUB International Tranche B 1st Lien 5.49% (LIBOR03M + 3.00%) 4/25/25 ● | | | 199,500 | | | | 199,286 | |
Hyperion Insurance Group Tranche B 1st Lien 5.813% (LIBOR01M + 3.50%) 12/20/24 ● | | | 204,859 | | | | 206,182 | |
INEOS US Finance Tranche B 1st Lien 4.302% (LIBOR01M + 2.00%) 3/31/24 ● | | | 392,038 | | | | 392,283 | |
IQVIA Tranche B3 1st Lien 4.136% (LIBOR03M + 1.75%) 6/11/25 ● | | | 144,638 | | | | 144,421 | |
Iron Mountain Tranche B 1st Lien 4.052% (LIBOR01M + 1.75%) 1/2/26 ● | | | 248,750 | | | | 245,848 | |
JBS USA Tranche B 1st Lien 4.844% (LIBOR03M + 2.50%) 10/30/22 ● | | | 146,452 | | | | 146,624 | |
Kronos 2nd Lien 10.593% (LIBOR03M + 8.25%) 11/1/24 ● | | | 38,000 | | | | 38,586 | |
54
| | | | | | | | |
| | | Principal
amount° | | | Value (US $) | |
Loan Agreements (continued) | | | | | | | | |
Lucid Energy Group II Borrower 1st Lien 5.28% (LIBOR01M + 3.00%) 2/18/25 ● | | | 124,200 | | | $ | 122,079 | |
LUX HOLDCO III 1st Lien 5.302% (LIBOR01M + 3.00%) 3/28/25 ● | | | 45,770 | | | | 46,027 | |
MGM Growth Properties Operating Partnership Tranche B 1st Lien 4.302% (LIBOR01M + 2.00%) 3/25/25 ● | | | 143,893 | | | | 143,623 | |
Microchip Technology 1st Lien 4.31% (LIBOR01M + 2.00%) 5/29/25 ● | | | 212,518 | | | | 211,934 | |
MPH Acquisition Holdings Tranche B 1st Lien 5.136% (LIBOR03M + 2.75%) 6/7/23 ● | | | 243,748 | | | | 243,539 | |
NCI Building Systems Tranche B 1st Lien 4.302% (LIBOR01M + 2.00%) 2/8/25 ● | | | 497,500 | | | | 497,293 | |
NFP Tranche B 1st Lien 5.302% (LIBOR01M + 3.00%) 1/8/24 ● | | | 129,015 | | | | 128,789 | |
Nielsen Finance Tranche B4 1st Lien 4.281% (LIBOR01M + 2.00%) 10/4/23 ● | | | 22,194 | | | | 22,111 | |
Northriver Midstream Finance Tranche B 1st Lien 5.646% (LIBOR03M + 3.25%) 10/1/25 ● | | | 25,000 | | | | 25,166 | |
OCI Partners 1st Lien 6.386% (LIBOR03M + 4.00%) 3/13/25 ● | | | 44,775 | | | | 45,055 | |
ON Semiconductor Tranche B 1st Lien 4.052% (LIBOR01M + 1.75%) 3/31/23 ● | | | 74,909 | | | | 74,881 | |
Penn National Gaming Tranche B 1st Lien 4.581% (LIBOR02M + 2.25%) 10/15/25 ● | | | 200,000 | | | | 200,828 | |
Pisces Midco Tranche B 1st Lien 6.175% (LIBOR03M + 3.75%) 4/12/25 ● | | | 68,828 | | | | 68,670 | |
PQ Tranche B 1st Lien 5.027% (LIBOR03M + 2.50%) 2/8/25 ● | | | 174,496 | | | | 174,569 | |
| | | | | | | | |
| | | Principal
amount° | | | Value (US $) | |
Loan Agreements (continued) | | | | | | | | |
Prestige Brands Tranche B5 1st Lien 4.302% (LIBOR01M + 2.00%) 1/26/24 ● | | | 100,677 | | | $ | 100,902 | |
Radiate Holdco Tranche B 1st Lien 5.302% (LIBOR01M + 3.00%) 2/1/24 ● | | | 112,570 | | | | 112,001 | |
Refinitiv US Holdings Tranche B 1st Lien 6.052% (LIBOR01M + 3.75%) 10/1/25 ● | | | 169,000 | | | | 167,733 | |
Russell Investments US Institutional Holdco Tranche B 1st Lien 5.552% (LIBOR01M + 3.25%)
6/1/23 ● | | | 380,783 | | | | 382,965 | |
Sable International Finance Tranche B4 1st Lien 5.547% (LIBOR01M + 3.25%) 1/31/26 ● | | | 350,000 | | | | 350,462 | |
SBA Senior Finance II Tranche B 1st Lien 4.31% (LIBOR01M + 2.00%) 4/11/25 ● | | | 184,538 | | | | 184,384 | |
Scientific Games International Tranche B5 1st Lien 5.046% (LIBOR02M + 2.75%) 8/14/24 ● | | | 285,034 | | | | 282,778 | |
Sigma US Tranche B2 1st Lien 5.398% (LIBOR03M + 3.00%) 7/2/25 ● | | | 107,000 | | | | 106,816 | |
Sinclair Television Group Tranche B2 1st Lien 4.56% (LIBOR01M + 2.25%) 1/3/24 ● | | | 146,608 | | | | 146,699 | |
Solenis International 1st Lien 6.311% (LIBOR03M + 4.00%) 12/26/23 ● | | | 75,810 | | | | 75,984 | |
Specialty Building Products Holdings 1st Lien 0.00% 10/1/25 ● X | | | 146,000 | | | | 145,787 | |
Sprint Communications Tranche B 1st Lien 4.813% (LIBOR01M + 2.50%) 2/2/24 ● | | | 495,850 | | | | 495,536 | |
SS&C European Holdings Tranche B4 1st Lien 4.552% (LIBOR01M + 2.25%) 4/16/25 ● | | | 51,455 | | | | 51,266 | |
Schedules of investments
Macquarie Institutional Portfolios — Macquarie Core Plus Bond Portfolio
| | | | | | | | |
| | | Principal
amount° | | | Value (US $) | |
Loan Agreements (continued) | | | | | | | | |
SS&C Technologies Tranche B3 1st Lien 4.552% (LIBOR01M + 2.25%) 4/16/25 ● | | | 132,753 | | | $ | 132,265 | |
SS&C Technologies Tranche B5 1st Lien 4.552% (LIBOR01M + 2.25%) 4/16/25 ● | | | 69,000 | | | | 68,853 | |
StandardAero Aviation Holdings 1st Lien 6.05% (LIBOR01M + 3.75%) 7/7/22 ● | | | 89,017 | | | | 89,510 | |
Staples 1st Lien 6.343% (LIBOR03M + 4.00%) 9/12/24 ● | | | 58,627 | | | | 58,517 | |
Stars Group Holdings Tranche B 1st Lien 5.886% (LIBOR03M + 3.50%) 7/10/25 ● | | | 239,400 | | | | 240,447 | |
Summit Materials Tranche B 1st Lien 4.302% (LIBOR01M + 2.00%) 11/10/24 ● | | | 99,250 | | | | 98,924 | |
Summit Midstream Partners Holdings Tranche B 1st Lien 8.302% (LIBOR01M + 6.00%) 5/21/22 ● | | | 120,725 | | | | 121,479 | |
Surgery Center Holdings 1st Lien 5.57% (LIBOR03M + 3.25%) 8/31/24 ● | | | 223,308 | | | | 223,169 | |
Syneos Health Tranche B 1st Lien 4.302% (LIBOR01M + 2.00%) 8/1/24 ● | | | 132,919 | | | | 132,883 | |
Telenet Financing USD Tranche AN 1st Lien 4.53% (LIBOR01M + 2.25%) 8/15/26 ● | | | 120,000 | | | | 119,675 | |
Tenneco Tranche B 1st Lien 5.052% (LIBOR01M + 2.75%) 10/1/25 ● | | | 66,000 | | | | 65,897 | |
TerraForm Power Operating Tranche B 1st Lien 4.302% (LIBOR01M + 2.00%) 11/8/22 ● | | | 143,913 | | | | 143,913 | |
Titan Acquisition Tranche B 1st Lien 5.302% (LIBOR01M + 3.00%) 3/28/25 ● | | | 112,435 | | | | 106,157 | |
TMS International Tranche B2 1st Lien 5.187% (LIBOR03M + 2.75%) 8/14/24 ● | | | 52,216 | | | | 52,216 | |
| | | | | | | | |
| | | Principal
amount° | | | Value (US $) | |
Loan Agreements (continued) | | | | | | | | |
TransDigm Tranche F 1st Lien 4.802% (LIBOR01M + 2.50%) 6/9/23 ● | | | 297,752 | | | $ | 296,771 | |
Trident TPI Holdings 1st Lien 5.552% (LIBOR01M + 3.25%) 10/5/24 ● | | | 61,216 | | | | 60,834 | |
Tronox Blocked Borrower Tranche B 1st Lien 5.302% (LIBOR01M + 3.00%) 9/22/24 ● | | | 27,005 | | | | 26,988 | |
Tronox Finance Tranche B 1st Lien 5.302% (LIBOR01M + 3.00%) 9/22/24 ● | | | 62,320 | | | | 62,281 | |
Unitymedia Finance Tranche D 1st Lien 4.53% (LIBOR01M + 2.25%) 1/15/26 ● | | | 40,000 | | | | 39,979 | |
Unitymedia Finance Tranche E 1st Lien 4.28% (LIBOR01M + 2.00%) 6/1/23 ● | | | 275,000 | | | | 274,951 | |
Univision Communications Tranche C5 1st Lien 5.052% (LIBOR01M + 2.75%) 3/15/24 ● | | | 64,645 | | | | 62,126 | |
UPC Financing Partnership Tranche AR 1st Lien 4.78% (LIBOR01M + 2.50%) 1/15/26 ● | | | 41,646 | | | | 41,535 | |
USI Tranche B 1st Lien 5.386% (LIBOR03M + 3.00%) 5/16/24 ● | | | 329,268 | | | | 327,787 | |
USIC Holdings 1st Lien 5.552% (LIBOR01M + 3.25%) 12/9/23 ● | | | 211,147 | | | | 212,159 | |
Utz Quality Foods 1st Lien 5.802% (LIBOR01M + 3.50%) 11/21/24 ● | | | 43,590 | | | | 43,808 | |
Vantage Specialty Chemicals 2nd Lien 10.777% (LIBOR03M + 8.25%) 10/26/25 ● | | | 10,000 | | | | 10,033 | |
Vantage Specialty Chemicals Tranche B 1st Lien 5.806% (LIBOR01M + 3.50%) 10/28/24 ● | | | 89,325 | | | | 89,688 | |
Virgin Media Bristol Tranche K 1st Lien 4.78% (LIBOR01M + 2.50%) 1/15/26 ● | | | 60,000 | | | | 60,032 | |
Vistra Operations Tranche B3 1st Lien 4.293% (LIBOR01M + 2.00%) 12/1/25 ● | | | 324,188 | | | | 323,580 | |
56
| | | | | | | | |
| | | Principal
amount° | | | Value (US $) | |
Loan Agreements (continued) | | | | | |
Visual Comfort Group 1st Lien 0.00% 2/28/24 ● X | | | 130,000 | | | $ | 130,975 | |
Wyndham Hotels & Resorts Tranche B 1st Lien 4.052% (LIBOR01M + 1.75%) 5/30/25 ● | | | 75,000 | | | | 75,066 | |
Wynn Resorts Tranche B 1st Lien 0.00% 10/22/24 ● X | | | 85,000 | | | | 84,934 | |
XPO Logistics Tranche B 1st Lien 4.509% (LIBOR03M + 2.00%) 2/24/25 ● | | | 210,000 | | | | 210,758 | |
Zayo Group Tranche B2 1st Lien 4.552% (LIBOR01M + 2.25%) 1/19/24 ● | | | 156,000 | | | | 156,414 | |
Zekelman Industries 1st Lien 4.623% (LIBOR03M + 2.25%) 6/14/21 ● | | | 168,712 | | | | 168,686 | |
| | | | | | | | |
| |
Total Loan Agreements
(cost $18,309,786) | | | | 18,241,448 | |
| | | | | | | | |
| | | | | | | | | |
Municipal Bonds – 0.12% | | | | | |
Buckeye, Ohio Tobacco Settlement Financing Authority (Asset-Backed Senior Turbo) Series A-2 5.875% 6/1/47 | | | 25,000 | | | | 24,374 | |
California State (Build America Bonds)
7.55% 4/1/39 | | | 75,000 | | | | 106,758 | |
Commonwealth of Massachusetts | | | | | | | | |
Series C 5.00% 10/1/25 | | | 10,000 | | | | 11,558 | |
South Carolina Public Service Authority | | | | | | | | |
Series D 4.77% 12/1/45 | | | 30,000 | | | | 29,478 | |
Texas Water Development Board | | | | | | | | |
Series A 5.00% 10/15/45 | | | 20,000 | | | | 21,953 | |
Series B 5.00% 10/15/46 | | | 55,000 | | | | 60,563 | |
| | | | | | | | |
| |
Total Municipal Bonds
(cost $270,735) | | | | 254,684 | |
| | | | | | | | |
| | | | | | | | | |
Non-Agency Asset-Backed Securities – 4.82% | |
American Express Credit Account Master Trust | | | | | | | | |
Series 2017-2 A 2.73% (LIBOR01M + 0.45%) 9/16/24 ● | | | 340,000 | | | | 342,613 | |
| | | | | | | | |
| | | Principal
amount° | | | Value (US $) | |
Non-Agency Asset-Backed Securities (continued) | |
American Express Credit Account Master Trust | | | | | | | | |
Series 2017-5 A 2.66% (LIBOR01M + 0.38%) 2/18/25 ● | | | 355,000 | | | $ | 356,562 | |
Series 2018-3 A 2.60% (LIBOR01M + 0.32%) 10/15/25 ● | | | 165,000 | | | | 165,045 | |
Series 2018-9 A 2.66% (LIBOR01M + 0.38%) 4/15/26 ● | | | 100,000 | | | | 100,090 | |
Atrium Xiii | | | | | | | | |
Series 13A A1 144A 3.657% (LIBOR03M + 1.18%) 11/21/30 #● | | | 250,000 | | | | 250,213 | |
Bank of America Credit Card Trust | | | | | | | | |
Series 2016-A1 A 2.67% (LIBOR01M + 0.39%) 10/15/21 ● | | | 130,000 | | | | 130,204 | |
Series 2017-A1 A1 1.95% 8/15/22 | | | 200,000 | | | | 197,037 | |
Barclays Dryrock Issuance Trust | | | | | | | | |
Series 2017-1 A 2.61% (LIBOR01M + 0.33%, Floor 0.33%) 3/15/23 ● | | | 100,000 | | | | 100,168 | |
Chase Issuance Trust | | | | | | | | |
Series 2017-A2 A 2.68% (LIBOR01M + 0.40%) 3/15/24 ● | | | 320,000 | | | | 322,096 | |
Series 2018-A1 A1 2.48% (LIBOR01M + 0.20%) 4/17/23 ● | | | 530,000 | | | | 530,717 | |
Citibank Credit Card Issuance Trust | | | | | | | | |
Series 2017-A5 A5 2.90% (LIBOR01M + 0.62%, Floor 0.62%) 4/22/26 ● | | | 100,000 | | | | 100,880 | |
Series 2017-A7 A7 2.647% (LIBOR01M + 0.37%) 8/8/24 ● | | | 100,000 | | | | 100,094 | |
Series 2018-A2 A2 2.61% (LIBOR01M + 0.33%) 1/20/25 ● | | | 465,000 | | | | 464,620 | |
Citicorp Residential Mortgage Trust | | | | | | | | |
Series 2006-3 A5 5.287% 11/25/36 ● | | | 300,000 | | | | 307,864 | |
CNH Equipment Trust | | | | | | | | |
Series 2017-A A3 2.07% 5/16/22 | | | 440,000 | | | | 435,250 | |
Schedules of investments
Macquarie Institutional Portfolios — Macquarie Core Plus Bond Portfolio
| | | | | | | | |
| | | Principal
amount° | | | Value (US $) | |
Non-Agency Asset-Backed Securities (continued) | |
Discover Card Execution Note Trust | | | | | | | | |
Series 2014-A1 A1 2.71% (LIBOR01M + 0.43%, Floor 0.43%) 7/15/21 ● | | | 200,000 | | | $ | 200,144 | |
Series 2017-A3 A3 2.51% (LIBOR01M + 0.23%) 10/17/22 ● | | | 150,000 | | | | 150,153 | |
Series 2017-A7 A7 2.64% (LIBOR01M + 0.36%) 4/15/25 ● | | | 105,000 | | | | 105,295 | |
Series 2018-A2 A2 2.61% (LIBOR01M + 0.33%) 8/15/25 ● | | | 305,000 | | | | 304,988 | |
Series 2018-A6 A6 2.664% (LIBOR01M + 0.39%) 3/15/26 ● | | | 400,000 | | | | 400,027 | |
Ford Credit Auto Owner Trust | | | | | | | | |
Series 2018-1 A 144A 3.19% 7/15/31 # | | | 160,000 | | | | 154,712 | |
Ford Credit Floorplan Master Owner Trust | | | | | | | | |
Series 2017-1 A2 2.70% (LIBOR01M + 0.42%) 5/15/22 ● | | | 60,000 | | | | 60,220 | |
GMF Floorplan Owner Revolving Trust | | | | | | | | |
Series 2017-1 A1 144A 2.22% 1/18/22 # | | | 100,000 | | | | 99,059 | |
Golden Credit Card Trust | | | | | | | | |
Series 2014-2A A 144A 2.73% (LIBOR01M + 0.45%) 3/15/21 #● | | | 130,000 | | | | 130,127 | |
HOA Funding | | | | | | | | |
Series 2014-1A A2 144A 4.846% 8/20/44 # | | | 46,000 | | | | 45,291 | |
Hyundai Auto Lease Securitization Trust | | | | | | | | |
Series 2016-C A3 144A 1.49% 2/18/20 # | | | 39,122 | | | | 39,068 | |
Series 2018-A A2B 144A 2.48% (LIBOR01M + 0.20%) 8/17/20 #● | | | 247,401 | | | | 247,542 | |
Series 2018-A A3 144A 2.81% 4/15/21 # | | | 100,000 | | | | 99,530 | |
Mercedes-Benz Master Owner Trust | | | | | | | | |
Series 2017-BA A 144A 2.70% (LIBOR01M + 0.42%) 5/16/22 #● | | | 500,000 | | | | 501,424 | |
| | | | | | | | |
| | | Principal
amount° | | | Value (US $) | |
Non-Agency Asset-Backed Securities (continued) | |
Mercedes-Benz Master Owner Trust | | | | | | | | |
Series 2018-BA A 144A 2.62% (LIBOR01M + 0.34%) 5/15/23 #● | | | 100,000 | | | $ | 100,179 | |
Navistar Financial Dealer Note Master Owner Trust II | | | | | | | | |
Series 2018-1 A 144A 2.911% (LIBOR01M + 0.63%, Floor 0.63%) 9/25/23 #● | | | 55,000 | | | | 55,042 | |
New Residential Mortgage Loan Trust | | | | | | | | |
Series 2018-RPL1 A1 144A 3.50% 12/25/57 #● | | | 95,372 | | | | 93,522 | |
Nissan Master Owner Trust Receivables | | | | | | | | |
Series 2017-C A 2.60% (LIBOR01M + 0.32%) 10/17/22 ● | | | 265,000 | | | | 265,344 | |
Penarth Master Issuer | | | | | | | | |
Series 2018-2A A1 144A 2.742% (LIBOR01M + 0.45%) 9/18/22 #=● | | | 355,000 | | | | 354,969 | |
PFS Financing | | | | | | | | |
Series 2018-A A 144A 2.68% (LIBOR01M + 0.40%) 2/15/22 #● | | | 100,000 | | | | 100,013 | |
Series 2018-E A 144A 2.73% (LIBOR01M + 0.45%) 10/17/22 #=● | | | 505,000 | | | | 504,950 | |
Tesla Auto Lease Trust | | | | | | | | |
Series 2018-A B 144A 2.75% 2/20/20 # | | | 675,000 | | | | 671,640 | |
Towd Point Mortgage Trust | | | | | | | | |
Series 2015-5 A1B 144A 2.75% 5/25/55 #● | | | 47,841 | | | | 47,010 | |
Series 2015-6 A1B 144A 2.75% 4/25/55 #● | | | 54,546 | | | | 53,357 | |
Series 2017-1 A1 144A 2.75% 10/25/56 #● | | | 67,366 | | | | 65,705 | |
Series 2017-2 A1 144A 2.75% 4/25/57 #● | | | 69,549 | | | | 68,035 | |
Series 2018-1 A1 144A 3.00% 1/25/58 #● | | | 88,665 | | | | 86,541 | |
Toyota Auto Receivables Owner Trust | | | | | | | | |
Series 2017-B A2B 2.34% (LIBOR01M + 0.06%, Floor 0.06%) 1/15/20 ● | | | 58,175 | | | | 58,169 | |
58
| | | | | | | | |
| | | Principal
amount° | | | Value
(US $) | |
Non-Agency Asset-Backed Securities (continued) | |
Toyota Auto Receivables Owner Trust | | | | | | | | |
Series 2018-C A2B 2.40% (LIBOR01M + 0.12%) 8/16/21 ● | | | 500,000 | | | $ | 500,000 | |
Verizon Owner Trust | | | | | | | | |
Series 2016-2A A 144A 1.68% 5/20/21 # | | | 100,000 | | | | 99,350 | |
Series 2017-3A A1B 144A 2.55% (LIBOR01M + 0.27%) 4/20/22 #● | | | 275,000 | | | | 275,138 | |
Series 2018-1A A1B 144A 2.54% (LIBOR01M + 0.26%) 9/20/22 #● | | | 225,000 | | | | 225,248 | |
Volkswagen Auto Loan Enhanced Trust | | | | | | | | |
Series 2018-1 A2B 2.46% (LIBOR01M + 0.18%) 7/20/21 ● | | | 200,000 | | | | 200,064 | |
Volvo Financial Equipment Master Owner Trust | | | | | | | | |
Series 2017-A A 144A 2.78% (LIBOR01M + 0.50%) 11/15/22 #● | | | 255,000 | | | | 255,732 | |
Wendys Funding | | | | | | | | |
Series 2018-1A A2I 144A 3.573% 3/15/48 # | | | 79,400 | | | | 76,226 | |
| | | | | | | | |
| |
Total Non-Agency Asset-Backed Securities
(cost $10,587,145) | | | | 10,597,267 | |
| | | | | | | | |
| | | | | | | | | |
Non-Agency Collateralized Mortgage Obligations – 1.48% | |
Flagstar Mortgage Trust | | | | | | | | |
Series 2018-1 A5 144A 3.50% 3/25/48 #● | | | 108,715 | | | | 106,260 | |
Series 2018-5 A7 144A 4.00% 9/25/48 #● | | | 103,391 | | | | 103,336 | |
Galton Funding Mortgage Trust | | | | | | | | |
Series 2018-1 A43 144A 3.50% 11/25/57 #● | | | 84,579 | | | | 83,857 | |
Holmes Master Issuer | | | | | | | | |
Series 2018-2A A2 144A 2.856% (LIBOR03M + 0.42%) 10/15/54 #● | | | 200,000 | | | | 199,981 | |
JPMorgan Mortgage Trust | | | | | | | | |
Series 2014-2 B1 144A 3.419% 6/25/29 #● | | | 66,295 | | | | 64,710 | |
Series 2014-2 B2 144A 3.419% 6/25/29 #● | | | 66,295 | | | | 64,319 | |
| | | | | | | | |
| | | Principal
amount° | | | Value
(US $) | |
Non-Agency Collateralized Mortgage Obligations (continued) | |
JPMorgan Mortgage Trust | | | | | | | | |
Series 2014-IVR6 2A4 144A 2.50% 7/25/44 #● | | | 100,000 | | | $ | 100,139 | |
Series 2015-4 B1 144A 3.624% 6/25/45 #● | | | 92,427 | | | | 89,056 | |
Series 2015-4 B2 144A 3.624% 6/25/45 #● | | | 92,427 | | | | 87,915 | |
Series 2015-5 B2 144A 3.086% 5/25/45 #● | | | 95,314 | | | | 93,977 | |
Series 2015-6 B1 144A 3.616% 10/25/45 #● | | | 91,771 | | | | 89,144 | |
Series 2015-6 B2 144A 3.616% 10/25/45 #● | | | 91,771 | | | | 88,507 | |
Series 2016-4 B1 144A 3.90% 10/25/46 #● | | | 95,023 | | | | 92,679 | |
Series 2016-4 B2 144A 3.90% 10/25/46 #● | | | 95,023 | | | | 92,160 | |
Series 2017-1 B2 144A 3.551% 1/25/47 #● | | | 101,209 | | | | 95,555 | |
Series 2017-2 A3 144A 3.50% 5/25/47 #● | | | 47,180 | | | | 45,304 | |
Series 2018-3 A5 144A 3.50% 9/25/48 #● | | | 259,017 | | | | 253,402 | |
Series 2018-4 A15 144A 3.50% 10/25/48 #=● | | | 167,715 | | | | 165,890 | |
Series 2018-6 1A4 144A 3.50% 12/25/48 #● | | | 109,724 | | | | 108,637 | |
Series 2018-7FRB A2 144A 2.966% (LIBOR01M + 0.75%) 4/25/46 #=● | | | 123,608 | | | | 123,811 | |
Sequoia Mortgage Trust | | | | | | | | |
Series 2014-2 A4 144A 3.50% 7/25/44 #● | | | 29,706 | | | | 28,822 | |
Series 2015-1 B2 144A 3.875% 1/25/45 #● | | | 40,946 | | | | 40,408 | |
Series 2015-2 B2 144A 3.743% 5/25/45 #● | | | 342,906 | | | | 333,446 | |
Series 2017-4 A1 144A 3.50% 7/25/47 #● | | | 85,060 | | | | 81,784 | |
Series 2017-5 B1 144A 3.879% 8/25/47 #● | | | 247,812 | | | | 240,943 | |
Series 2018-5 A4 144A 3.50% 5/25/48 #=● | | | 138,240 | | | | 135,332 | |
Series 2018-8 A4 144A 4.00% 11/25/48 #● | | | 240,000 | | | | 239,968 | |
| | | | | | | | |
| |
Total Non-Agency Collateralized Mortgage Obligations
(cost $3,306,222) | | | | 3,249,342 | |
| | | | | | | | |
Schedules of investments
Macquarie Institutional Portfolios — Macquarie Core Plus Bond Portfolio
| | | | | | | | |
| | | Principal
amount° | | | Value (US $) | |
Non-Agency Commercial Mortgage-Backed Securities – 5.79% | |
Banc of America Commercial Mortgage Trust | | | | | | | | |
Series 2017-BNK3 C 4.352% 2/15/50 ● | | | 50,000 | | | $ | 48,583 | |
BANK | | | | | | | | |
Series 2017-BNK4 XA 1.445% 5/15/50 ● | | | 597,797 | | | | 51,162 | |
Series 2017-BNK5 A5 3.39% 6/15/60 | | | 225,000 | | | | 214,875 | |
Series 2017-BNK5 B 3.896% 6/15/60 ● | | | 95,000 | | | | 92,690 | |
Series 2017-BNK7 A5 3.435% 9/15/60 | | | 110,000 | | | | 105,259 | |
Series 2017-BNK8 A4 3.488% 11/15/50 | | | 85,000 | | | | 81,544 | |
BENCHMARK Mortgage Trust | | | | | | | | |
Series 2018-B6 A4 4.261% 10/10/51 | | | 80,000 | | | | 81,292 | |
CD Mortgage Trust | | | | | | | | |
Series 2016-CD2 A3 3.248% 11/10/49 | | | 1,350,000 | | | | 1,290,492 | |
CFCRE Commercial Mortgage Trust | | | | | | | | |
Series 2016-C7 A3 3.839% 12/10/54 | | | 185,000 | | | | 183,325 | |
Citigroup Commercial Mortgage Trust | | | | | | | | |
Series 2014-GC25 A4 3.635% 10/10/47 | | | 120,000 | | | | 119,141 | |
Series 2016-P3 A4 3.329% 4/15/49 | | | 308,000 | | | | 296,648 | |
Series 2017-C4 A4 3.471% 10/12/50 | | | 120,000 | | | | 114,986 | |
Series 2018-C5 A4 4.228% 6/10/51 | | | 700,000 | | | | 708,980 | |
COMM Mortgage Trust | | | | | | | | |
Series 2013-CR6 AM 144A 3.147% 3/10/46 # | | | 105,000 | | | | 102,508 | |
Series 2013-WWP A2 144A 3.424% 3/10/31 # | | | 100,000 | | | | 100,075 | |
Series 2014-CR19 A5 3.796% 8/10/47 | | | 80,000 | | | | 80,185 | |
Series 2014-CR20 AM 3.938% 11/10/47 | | | 350,000 | | | | 348,488 | |
Series 2015-3BP A 144A 3.178% 2/10/35 # | | | 130,000 | | | | 125,253 | |
Series 2015-CR23 A4 3.497% 5/10/48 | | | 115,000 | | | | 112,784 | |
| | | | | | | | |
| | | Principal amount° | | | Value (US $) | |
Non-Agency Commercial Mortgage-Backed Securities (continued) | |
Commercial Mortgage Pass Through Certificates | | | | | | | | |
Series 2016-CR28 A4 3.762% 2/10/49 ◆ | | | 480,000 | | | $ | 474,602 | |
DB-JPM | | | | | | | | |
Series 2016-C1 A4 3.276% 5/10/49 | | | 295,000 | | | | 283,098 | |
Series 2016-C1 B 4.195% 5/10/49 ● | | | 25,000 | | | | 24,873 | |
Series 2016-C3 A5 2.89% 8/10/49 | | | 140,000 | | | | 130,334 | |
GRACE Mortgage Trust | | | | | | | | |
Series 2014-GRCE A 144A 3.369% 6/10/28 # | | | 250,000 | | | | 249,568 | |
Series 2014-GRCE B 144A 3.52% 6/10/28 # | | | 200,000 | | | | 199,321 | |
GS Mortgage Securities Trust | | | | | | | | |
Series 2010-C1 C 144A 5.635% 8/10/43 #● | | | 100,000 | | | | 102,195 | |
Series 2014-GC24 A5 3.931% 9/10/47 | | | 215,000 | | | | 216,773 | |
Series 2015-GC32 A4 3.764% 7/10/48 | | | 75,000 | | | | 74,661 | |
Series 2017-GS5 A4 3.674% 3/10/50 | | | 175,000 | | | | 171,358 | |
Series 2017-GS5 XA 0.821% 3/10/50 ● | | | 4,232,844 | | | | 237,402 | |
Series 2017-GS6 A3 3.433% 5/10/50 | | | 115,000 | | | | 110,320 | |
Series 2017-GS6 XA 1.048% 5/10/50 ● | | | 3,378,325 | | | | 244,949 | |
Series 2018-GS9 A4 3.992% 3/10/51 ● | | | 130,000 | | | | 129,333 | |
Series 2018-GS9 B 4.321% 3/10/51 ● | | | 125,000 | | | | 124,459 | |
JPM-BB Commercial Mortgage Securities Trust | | | | | | | | |
Series 2015-C27 XA 1.324% 2/15/48 ● | | | 2,892,343 | | | | 145,725 | |
Series 2015-C31 A3 3.801% 8/15/48 | | | 350,000 | | | | 348,154 | |
Series 2015-C33 A4 3.77% 12/15/48 | | | 255,000 | | | | 252,755 | |
JPM-DB Commercial Mortgage Securities Trust | | | | | | | | |
Series 2016-C2 A4 3.144% 6/15/49 | | | 405,000 | | | | 384,380 | |
Series 2016-C4 A3 3.141% 12/15/49 | | | 1,490,000 | | | | 1,406,955 | |
60
| | | | | | | | |
| | | Principal amount° | | | Value (US $) | |
Non-Agency Commercial Mortgage-Backed Securities (continued) | |
JPM-DB Commercial Mortgage Securities Trust | | | | | | | | |
Series 2017-C7 A5 3.409% 10/15/50 | | | 290,000 | | | $ | 276,768 | |
JPMorgan Chase Commercial Mortgage Securities Trust | | | | | | | | |
Series 2005-CB11 E 5.565% 8/12/37 ● | | | 20,000 | | | | 20,499 | |
Series 2013-LC11 B 3.499% 4/15/46 | | | 150,000 | | | | 146,045 | |
Series 2015-JP1 A5 3.914% 1/15/49 | | | 170,000 | | | | 169,888 | |
Series 2016-JP2 AS 3.056% 8/15/49 | | | 180,000 | | | | 167,298 | |
Series 2016-WIKI A 144A 2.798% 10/5/31 # | | | 105,000 | | | | 102,531 | |
Series 2016-WIKI B 144A 3.201% 10/5/31 # | | | 85,000 | | | | 83,259 | |
LB-UBS Commercial Mortgage Trust | | | | | | | | |
Series 2006-C6 AJ 5.452% 9/15/39 ● | | | 42,750 | | | | 29,498 | |
Morgan Stanley BAML Trust | | | | | | | | |
Series 2014-C17 A5 3.741% 8/15/47 | | | 100,000 | | | | 99,905 | |
Series 2015-C26 A5 3.531% 10/15/48 | | | 120,000 | | | | 117,346 | |
Series 2016-C29 A4 3.325% 5/15/49 | | | 95,000 | | | | 91,347 | |
Morgan Stanley Capital I Trust | | | | | | | | |
Series 2006-HQ10 B 5.448% 11/12/41 ● | | | 100,000 | | | | 94,476 | |
Series 2016-BNK2 A4 3.049% 11/15/49 | | | 120,000 | | | | 112,609 | |
Series 2018-L1 A4 4.407% 10/15/51 | | | 105,000 | | | | 108,462 | |
UBS Commercial Mortgage Trust | | | | | | | | |
Series 2018-C9 A4 4.117% 3/15/51 ● | | | 225,000 | | | | 225,322 | |
UBS-Barclays Commercial Mortgage Trust | | | | | | | | |
Series 2013-C5 B 144A 3.649% 3/10/46 #● | | | 150,000 | | | | 147,541 | |
Wells Fargo Commercial Mortgage Trust | | | | | | | | |
Series 2012-LC5 B 4.142% 10/15/45 | | | 100,000 | | | | 100,768 | |
Series 2014-LC18 A5 3.405% 12/15/47 | | | 385,000 | | | | 375,848 | |
| | | | | | | | |
| | | Principal amount° | | | Value (US $) | |
Non-Agency Commercial Mortgage-Backed Securities (continued) | |
Wells Fargo Commercial Mortgage Trust | | | | | | | | |
Series 2015-C30 XA 0.932% 9/15/58 ● | | | 1,888,261 | | | $ | 94,204 | |
Series 2015-NXS3 A4 3.617% 9/15/57 | | | 80,000 | | | | 78,736 | |
Series 2016-BNK1 A3 2.652% 8/15/49 | | | 155,000 | | | | 142,100 | |
Series 2016-BNK1 B 2.967% 8/15/49 | | | 30,000 | | | | 27,257 | |
Series 2017-C38 A5 3.453% 7/15/50 | | | 140,000 | | | | 134,383 | |
WF-RBS Commercial Mortgage Trust | | | | | | | | |
Series 2012-C10 A3 2.875% 12/15/45 | | | 240,000 | | | | 233,432 | |
| | | | | | | | |
| |
Total Non-Agency Commercial
Mortgage-Backed Securities
(cost $13,334,372) | | | | 12,749,007 | |
| | | | | | | | |
| | | | | | | | |
Regional Bond – 0.06%D | | | | | |
Argentina – 0.06% | | | | | | | | |
Provincia de Cordoba 144A 7.45% 9/1/24 # | | | 150,000 | | | | 126,002 | |
| | | | | | | | |
| |
Total Regional Bond
(cost $156,362) | | | | 126,002 | |
| | | | | | | | |
| | | | | | | | |
Sovereign Bonds – 1.25%D | | | | | |
Argentina – 0.21% | | | | | | | | |
Argentine Bonos del Tesoro 16.00% 10/17/23 | | | ARS 2,137,000 | | | | 53,871 | |
Argentine Republic Government International Bond 5.625% 1/26/22 | | | 205,000 | | | | 185,269 | |
6.875% 1/11/48 | | | 295,000 | | | | 219,037 | |
| | | | | | | | |
| | |
| | | | | | | 458,177 | |
| | | | | | | | |
Brazil – 0.28% | | | | | | | | |
Brazil Notas do Tesouro Nacional Series F
10.00% 1/1/27 | | | BRL 2,278,000 | | | | 613,606 | |
| | | | | | | | |
| | |
| | | | | | | 613,606 | |
| | | | | | | | |
Colombia – 0.19% | | | | | | | | |
Colombian TES Series B
7.00% 6/30/32 | | | COP 1,411,000,000 | | | | 420,358 | |
| | | | | | | | |
| | |
| | | | | | | 420,358 | |
| | | | | | | | |
Schedules of investments
Macquarie Institutional Portfolios — Macquarie Core Plus Bond Portfolio
| | | | | | | | |
| | | Principal
amount° | | | Value (US $) | |
Sovereign BondsD (continued) | | | | | |
Egypt – 0.17% | | | | | | | | |
Egypt Government International Bond
144A 5.577% 2/21/23 # | | | 200,000 | | | $ | 191,501 | |
144A 7.903% 2/21/48 # | | | 200,000 | | | | 179,564 | |
| | | | | | | | |
| | |
| | | | | | | 371,065 | |
| | | | | | | | |
Ivory Coast – 0.08% | | | | | | | | |
Ivory Coast Government International Bond
144A 6.125% 6/15/33 # | | | 200,000 | | | | 173,918 | |
| | | | | | | | |
| | |
| | | | | | | 173,918 | |
| | | | | | | | |
Nigeria – 0.09% | | | | | | | | |
Nigeria Government International Bond
144A 7.875% 2/16/32 # | | | 200,000 | | | | 193,166 | |
| | | | | | | | |
| | |
| | | | | | | 193,166 | |
| | | | | | | | |
Senegal – 0.07% | | | | | | | | |
Senegal Government International Bond
144A 6.75% 3/13/48 # | | | 200,000 | | | | 165,550 | |
| | | | | | | | |
| | |
| | | | | | | 165,550 | |
| | | | | | | | |
South Africa – 0.08% | | | | | | | | |
Republic of South Africa Government International Bond 5.875% 6/22/30 | | | 200,000 | | | | 188,754 | |
| | | | | | | | |
| | |
| | | | | | | 188,754 | |
| | | | | | | | |
Ukraine – 0.08% | | | | | | | | |
Ukraine Government International Bond
144A 7.375% 9/25/32 # | | | 200,000 | | | | 167,226 | |
| | | | | | | | |
| | |
| | | | | | | 167,226 | |
| | | | | | | | |
| |
Total Sovereign Bonds
(cost $3,060,169) | | | | 2,751,820 | |
| | | | | | | | |
| | | | | | | | |
Supranational Banks – 0.18% | | | | | | | | |
Arab Petroleum Investments
144A 4.125% 9/18/23 # | | | 200,000 | | | | 200,391 | |
Banque Ouest Africaine de Developpement
144A 5.00% 7/27/27 # | | | 200,000 | | | | 190,800 | |
| | | | | | | | |
| |
Total Supranational Banks
(cost $395,808) | | | | 391,191 | |
| | | | | | | | |
| | | | | | | | |
| | | Principal amount° | | | Value
(US $) | |
US Treasury Obligations – 12.56% | | | | | |
US Treasury Bond 3.00% 8/15/48 | | | 1,245,000 | | | $ | 1,154,738 | |
US Treasury Notes 2.875% 9/30/23 | | | 6,580,000 | | | | 6,547,999 | |
2.875% 10/31/23 | | | 8,100,000 | | | | 8,060,607 | |
2.875% 5/15/28 ¥ | | | 2,815,000 | | | | 2,752,927 | |
2.875% 8/15/28 | | | 9,340,000 | | | | 9,126,202 | |
| | | | | | | | |
| |
Total US Treasury Obligations
(cost $27,744,872) | | | | 27,642,473 | |
| | | | | | | | |
| | |
| | | Number of
shares | | | | |
Convertible Preferred Stock – 0.34% | | | | | |
A Schulman 6.00% exercise price $52.33 y | | | 200 | | | | 206,500 | |
AMG Capital Trust II 5.15% exercise price $198.02, maturity date 10/15/37 | | | 500 | | | | 26,576 | |
Bank of America 7.25% exercise price $50.00 y | | | 151 | | | | 191,966 | |
Crown Castle International 6.875% exercise price $114.88, maturity date 8/1/20 | | | 250 | | | | 261,250 | |
DTE Energy 6.50% exercise price $116.31, maturity date 10/1/19 | | | 1,000 | | | | 53,330 | |
Wells Fargo & Co. 7.50% exercise price $156.71 y | | | 7 | | | | 8,904 | |
| | | | | | | | |
| |
Total Convertible Preferred Stock
(cost $770,040) | | | | 748,526 | |
| | | | | | | | |
| | | | | | | | |
Preferred Stock – 0.11% | | | | | | | | |
Bank of America 6.50%µy | | | 185,000 | | | | 196,415 | |
Morgan Stanley 5.55%µy | | | 40,000 | | | | 40,450 | |
| | | | | | | | |
| |
Total Preferred Stock
(cost $240,588) | | | | 236,865 | |
| | | | | | | | |
62
| | | | | | | | |
| | | Principal
amount° | | | Value (US $) | |
Short-Term Investments – 1.58% | | | | | |
Discount Note – 0.24%≠ | | | | | | | | |
Federal Home Loan Bank
2.00% 11/1/18 | | | 528,574 | | | $ | 528,574 | |
| | | | | | | | |
| | |
| | | | | | | 528,574 | |
| | | | | | | | |
Repurchase Agreements – 1.34% | | | | | |
Bank of America Merrill Lynch
2.12%, dated 10/31/18, to be repurchased on 11/1/18, repurchase price $406,619 (collateralized by US government obligations 0.00% 5/15/19–8/15/31; market value $414,727) | | | 406,595 | | | | 406,595 | |
Bank of Montreal
2.10%, dated 10/31/18, to be repurchased on 11/1/18, repurchase price $1,118,202 (collateralized by US government obligations 0.00%–3.75% 11/1/18–2/15/47; market value $1,140,499) | | | 1,118,136 | | | | 1,118,136 | |
BNP Paribas
2.17%, dated 10/31/18, to be repurchased on 11/1/18, repurchase price $1,435,814 (collateralized by US government obligations 0.00%–8.00% 2/28/19–8/15/46; market value $1,464,442) | | | 1,435,728 | | | | 1,435,728 | |
| | | | | | | | |
| | |
| | | | | | | 2,960,459 | |
| | | | | | | | |
| |
Total Short-Term Investments
(cost $3,489,033) | | | | 3,489,033 | |
| | | | | | | | |
| | |
Total Value of
Securities – 100.43%
(cost $225,953,177) | | | | | | $ | 220,990,657 | |
| | | | | | | | |
| | # | Security exempt from registration under Rule 144A of the Securities Act of 1933, as amended. At Oct. 31, 2018, the aggregate value of Rule 144A securities was $54,145,182, which represents 24.61% of the Portfolio’s net assets. See Note 11 in “Notes to financial statements.” |
| | ¨ | Pass Through Agreement. Security represents the contractual right to receive a proportionate amount of underlying payments due to the counterparty pursuant to various agreements related to the rescheduling of obligations and the exchange of certain notes. |
| | = | The value of this security was determined using significant unobservable inputs and is reported as a Level 3 security in the disclosure table located in Note 3 in “Notes to financial statements.” |
| | ≠ | The rate shown is the effective yield at the time of purchase. |
| | ° | Principal amount shown is stated in USD unless noted that the security is denominated in another currency. |
| | D | Securities have been classified by country of origin. |
| | µ | Fixed to variable rate investment. The rate shown reflects the fixed rate in effect at Oct. 31, 2018. Rate will reset at a future date. |
| | S | Interest only security. An interest only security is the interest only portion of a fixed income security, which is separated and sold individually from the principal portion of the security. |
| | y | No contractual maturity date. |
| | ● | Variable rate investment. Rates reset periodically. Rate shown reflects the rate in effect at Oct. 31, 2018. For securities based on a published reference rate and spread, the reference rate and spread are indicated in their description above. The reference rate descriptions (i.e. LIBOR03M, LIBOR06M, etc.) used in this report are identical for different securities, but the underlying reference rates may differ due to the timing of the reset period. Certain variable rate securities are not based on a published reference rate and spread but are determined by the issuer or agent and are based on current market conditions, or for mortgage-backed securities, are impacted by the individual mortgages which are paying off over time. These securities do not indicate a reference rate and spread in their description above. |
| | X | This loan will settle after Oct. 31, 2018, at which time the interest rate, based on the LIBOR and the agreed upon spread on trade date, will be reflected. |
| | ¥ | Fully or partially pledged as collateral for futures contracts. |
Unfunded Loan Commitments1
The Portfolio may invest in floating rate loans. In connection with these investments, the Portfolio may also enter into unfunded corporate loan commitments (commitments). Commitments may obligate the Series to furnish temporary financing to a borrower until permanent financing can be arranged. In connection with these commitments, the Portfolio earns a commitment fee, typically set as a percentage of the commitment amount. The following unfunded loan commitment was outstanding at Oct. 31, 2018:
| | | | | | |
Borrower | | Principal Amount | | Cost | | Value |
Heartland Dental Tranche DD 1st Lien 3.75% 4/30/25 | | $16,696 | | $16,696 | | $16,661 |
Schedules of investments
Macquarie Institutional Portfolios — Macquarie Core Plus Bond Portfolio
The following foreign currency exchange contracts, futures contracts, and swap contracts were outstanding at Oct. 31, 2018:2
Foreign Currency Exchange Contracts
| | | | | | | | | | | | | | | | | | | | | | | | | | |
Counterparty | | Contracts to
Receive (Deliver) | | | In Exchange For | | | Settlement
Date | | | Unrealized
Appreciation | | | Unrealized
Depreciation | |
BAML | | AUD | | | 852,592 | | | | USD | | | | (604,164) | | | | 1/11/19 | | | $ | 128 | | | $ | — | |
BAML | | CAD | | | 533,023 | | | | USD | | | | (407,550) | | | | 1/11/19 | | | | — | | | | (2,022 | ) |
BAML | | EUR | | | 208,401 | | | | USD | | | | (238,798) | | | | 1/11/19 | | | | — | | | | (1,108 | ) |
BAML | | NZD | | | 522,026 | | | | USD | | | | (341,231) | | | | 1/11/19 | | | | — | | | | (294 | ) |
BNP | | AUD | | | (153,446) | | | | USD | | | | 108,816 | | | | 1/11/19 | | | | 58 | | | | — | |
HSBC | | GBP | | | (280,900) | | | | USD | | | | 361,236 | | | | 1/11/19 | | | | 755 | | | | — | |
| | | | | | | | | | | | | | | | | | | | | | | | | | |
Total Foreign Currency Exchange Contracts | | | | | | | | | | | | | | | $ | 941 | | | $ | (3,424 | ) |
| | | | | | | | | | | | | | | | | | | | | | | | | | |
Futures Contracts
| | | | | | | | | | | | | | | | | | | | | | | | |
| Contracts to Buy (Sell) | | Notional
Amount | | | Notional
Cost
(Proceeds) | | | Expiration
Date | | | Value/
Unrealized
Appreciation | | | Value/
Unrealized
Depreciation | | | Variation Margin
Due from
(Due to) Brokers |
| (23) | | E-mini S&P 500 Index | | $ | (3,117,765 | ) | | $ | (3,164,159 | ) | | | 12/24/18 | | | $ | 46,394 | | | $ | — | | | $ (27,325) |
| 47 | | US Treasury 5 yr Notes | | | 5,281,992 | | | | 5,283,226 | | | | 1/2/19 | | | | — | | | | (1,234 | ) | | (10,281) |
| 385 | | US Treasury 10 yr Notes | | | 45,598,437 | | | | 45,444,261 | | | | 12/20/18 | | | | 154,176 | | | | — | | | (132,705) |
| | | | | | | | | | | | | | | | | | | | | | | | |
Total Futures Contracts | | | | | | $ | 47,563,328 | | | | | | | $ | 200,570 | | | $ | (1,234 | ) | | $(170,311) |
| | | | | | | | | | | | | | | | | | | | | | | | |
Swap Contracts
CDS Contracts3
| | | | | | | | | | | | | | | | | | | | | | | | |
Counterparty/ Reference Obligation/ Termination Date/ Payment Frequency | | Notional
Amount4 | | | Annual Protection
Payments | | | Value | | | Upfront
Payments
Paid
(Received) | | | Unrealized
Depreciation5 | | | Variation Margin
Due from
(Due to) Brokers | |
Over-The-Counter: | | | | | | | | | | | | | | | | | | | | | | | | |
Protection Sold/Moody’s Ratings: | | | | | | | | | | | | | | | | | |
MSC-CMBX.NA.BBB-.66 5/11/63-Monthly | | | 890,000 | | | | 3.00% | | | $ | (123,868) | | | $ | (105,709 | ) | | $ | (18,159 | ) | | $ | — | |
The use of foreign currency exchange contracts, futures contracts, and swap contracts involves elements of market risk and risks in excess of the amounts disclosed in the financial statements. The foreign currency exchange contracts and notional amounts presented above represent the Portfolio’s total exposure in such contracts, whereas only the net unrealized appreciation (depreciation) is reflected in the Portfolio’s net assets.
1See Note 11 in “Notes to financial statements.“
2See Note 8 in “Notes to financial statements.”
3A CDS contract is a risk-transfer instrument through which one party (purchaser of protection) transfers to another party (seller of protection) the financial risk of a credit event (as defined in the CDS agreement), as it relates to a particular reference security or basket of securities (such as an index). Periodic payments (receipts) on such
contracts are accrued daily and recorded as unrealized losses (gains) on swap contracts. Upon payment (receipt), such amounts are recorded as realized losses (gains) on swap contracts. Upfront payments made or received in connection with CDS contracts are amortized over the expected life of the CDS contracts as unrealized losses (gains) on swap contracts. The change in value of CDS contracts is recorded daily as unrealized appreciation or depreciation. A realized gain or loss is recorded upon a credit event (as defined in the CDS agreement) or the maturity or termination of the agreement.
4Notional amount shown is stated in US Dollars unless noted that the swap is denominated in another currency.
5Unrealized appreciation (depreciation) does not include periodic interest payments (receipts) on swap contracts accrued daily in the amount of $490.
64
6Markit’s CMBX.NA Index is a synthetic tradable index referencing a basket of 25 commercial mortgage-backed securities in North America. Credit-quality ratings are measured on a scale that ranges from AAA (highest) to BB (lowest). US Agency and US Agency mortgage-backed securities appear under US Government.
Summary of abbreviations:
ARM – Adjustable Rate Mortgage
ARS – Argentine Peso
AUD – Australian Dollar
BADLARPP – Argentina Term Deposit Rate
BAML – Bank of America Merrill Lynch
BNP – Banque Paribas
BRL – Brazilian Real
CAD – Canadian Dollar
CDO – Collateralized Debt Obligation
CDS – Credit Default Swap
CLO – Collateralized Loan Obligation
CMBX.NA – Commercial Mortgage-Backed Securities Index North America
COP – Colombian Peso
DB – Deutsche Bank
EUR – European Monetary Unit
FHAVA – Federal Housing Administration & Veterans Administration
Summary of abbreviations: (continued)
FREMF – Freddie Mac Multifamily
GBP – British Pound Sterling
GNMA – Government National Mortgage Association
GS – Goldman Sachs
HSBC – Hong Kong Shanghai Bank
ICE – Intercontinental Exchange, Inc.
JPM – JPMorgan
LB – Lehman Brothers
LIBOR – London Interbank Offered Rate
LIBOR01M – ICE LIBOR USD 1 Month
LIBOR02M – ICE LIBOR USD 2 Month
LIBOR03M – ICE LIBOR USD 3 Month
LIBOR06M – ICE LIBOR USD 6 Month
LIBOR12M – ICE LIBOR USD 12 Month
MSC – Morgan Stanley Capital
NZD – New Zealand Dollar
RBS – Royal Bank of Scotland
REIT – Real Estate Investment Trust
REMIC – Real Estate Mortgage Investment Conduit
S.F. – Single Family
TBA – To be announced
UBS – Union Bank of Switzerland
USD – US Dollar
WF – Wells Fargo
yr – Year
See accompanying notes, which are an integral part of the financial statements.
65
Schedules of investments
Macquarie Institutional Portfolios — Macquarie High Yield Bond Portfolio
October 31, 2018
| | | | | | | | |
| | | Principal
amount° | | | Value (US $) | |
Corporate Bonds – 89.82% | | | | | | | | |
Banking – 4.91% | | | | | | | | |
Barclays 7.75%µy | | | 610,000 | | | $ | 610,122 | |
Credit Suisse Group | | | | | | | | |
144A 6.25%#µy | | | 455,000 | | | | 443,923 | |
144A 7.50%#µy | | | 200,000 | | | | 204,000 | |
HSBC Holdings 6.50%µy | | | 625,000 | | | | 587,500 | |
Lloyds Banking Group
7.50%µy | | | 345,000 | | | | 348,881 | |
Popular 6.125% 9/14/23 | | | 590,000 | | | | 598,437 | |
Royal Bank of Scotland Group 8.625%µy | | | 405,000 | | | | 426,769 | |
UBS Group Funding Switzerland 6.875%µy | | | 600,000 | | | | 594,000 | |
| | | | | | | | |
| | |
| | | | | | | 3,813,632 | |
| | | | | | | | |
Basic Industry – 12.80% | | | | | | | | |
BMC East
144A 5.50% 10/1/24 # | | | 290,000 | | | | 272,600 | |
Boise Cascade
144A 5.625% 9/1/24 # | | | 550,000 | | | | 541,750 | |
Cleveland-Cliffs
5.75% 3/1/25 | | | 570,000 | | | | 540,787 | |
First Quantum Minerals
144A 6.875% 3/1/26 # | | | 235,000 | | | | 203,863 | |
144A 7.25% 5/15/22 # | | | 280,000 | | | | 267,400 | |
144A 7.25% 4/1/23 # | | | 390,000 | | | | 361,725 | |
Freeport-McMoRan 6.875% 2/15/23 | | | 305,000 | | | | 320,250 | |
Hudbay Minerals | | | | | | | | |
144A 7.25% 1/15/23 # | | | 50,000 | | | | 50,000 | |
144A 7.625% 1/15/25 # | | | 520,000 | | | | 523,900 | |
IAMGOLD
144A 7.00% 4/15/25 # | | | 320,000 | | | | 318,800 | |
Joseph T Ryerson & Son
144A 11.00% 5/15/22 # | | | 540,000 | | | | 579,150 | |
New Enterprise Stone & Lime
144A 10.125% 4/1/22 # | | | 520,000 | | | | 546,000 | |
NOVA Chemicals
144A 5.25% 6/1/27 # | | | 695,000 | | | | 628,975 | |
Novelis
144A 6.25% 8/15/24 # | | | 410,000 | | | | 406,925 | |
Schweitzer-Mauduit International
144A 6.875% 10/1/26 # | | | 370,000 | | | | 375,550 | |
Standard Industries
144A 6.00% 10/15/25 # | | | 955,000 | | | | 943,063 | |
Starfruit Finco
144A 8.00% 10/1/26 # | | | 585,000 | | | | 568,913 | |
Steel Dynamics
5.00% 12/15/26 | | | 547,000 | | | | 536,060 | |
| | | | | | | | |
| | | Principal
amount° | | | Value (US $) | |
Corporate Bonds (continued) | | | | | | | | |
Basic Industry (continued) | | | | | | | | |
Tronox
144A 6.50% 4/15/26 # | | | 280,000 | | | $ | 256,900 | |
Tronox Finance
144A 5.75% 10/1/25 # | | | 710,000 | | | | 624,800 | |
William Lyon Homes
6.00% 9/1/23 | | | 445,000 | | | | 408,287 | |
Zekelman Industries
144A 9.875% 6/15/23 # | | | 630,000 | | | | 674,100 | |
| | | | | | | | |
| | |
| | | | | | | 9,949,798 | |
| | | | | | | | |
Capital Goods – 4.29% | | | | | | | | |
Anixter
144A 6.00% 12/1/25 # | | | 390,000 | | | | 391,950 | |
Ardagh Packaging Finance
144A 6.00% 2/15/25 # | | | 360,000 | | | | 338,400 | |
Bombardier | | | | | | | | |
144A 6.00% 10/15/22 # | | | 195,000 | | | | 192,319 | |
144A 7.50% 3/15/25 # | | | 385,000 | | | | 386,809 | |
BWAY Holding
144A 7.25% 4/15/25 # | | | 365,000 | | | | 346,750 | |
BWX Technologies
144A 5.375% 7/15/26 # | | | 215,000 | | | | 216,075 | |
EnPro Industries
144A 5.75% 10/15/26 # | | | 415,000 | | | | 410,975 | |
Intertape Polymer Group
144A 7.00% 10/15/26 # | | | 375,000 | | | | 375,937 | |
Titan International
6.50% 11/30/23 | | | 125,000 | | | | 116,875 | |
TransDigm
6.375% 6/15/26 | | | 565,000 | | | | 555,113 | |
| | | | | | | | |
| | |
| | | | | | | 3,331,203 | |
| | | | | | | | |
Consumer Cyclical – 5.17% | | | | | | | | |
AMC Entertainment Holdings
6.125% 5/15/27 | | | 715,000 | | | | 660,481 | |
Boyd Gaming
6.00% 8/15/26 | | | 580,000 | | | | 562,600 | |
Golden Nugget
144A 8.75% 10/1/25 # | | | 701,000 | | | | 722,030 | |
M/I Homes
5.625% 8/1/25 | | | 410,000 | | | | 379,250 | |
MGM Resorts International
5.75% 6/15/25 | | | 385,000 | | | | 377,300 | |
Penske Automotive Group
5.50% 5/15/26 | | | 350,000 | | | | 334,250 | |
Scientific Games International
10.00% 12/1/22 | | | 940,000 | | | | 985,825 | |
| | | | | | | | |
| | |
| | | | | | | 4,021,736 | |
| | | | | | | | |
Consumer Non-Cyclical – 3.37% | | | | | | | | |
Dean Foods
144A 6.50% 3/15/23 # | | | 335,000 | | | | 309,456 | |
66
| | | | | | | | |
| | | Principal
amount° | | | Value (US $) | |
Corporate Bonds (continued) | | | | | | | | |
Consumer Non-Cyclical (continued) | | | | | |
JBS USA
144A 5.75% 6/15/25 # | | | 330,000 | | | $ | 320,513 | |
144A 6.75% 2/15/28 # | | | 380,000 | | | | 370,975 | |
Minerva Luxembourg
144A 6.50% 9/20/26 # | | | 285,000 | | | | 264,337 | |
Pilgrim’s Pride
144A 5.75% 3/15/25 # | | | 390,000 | | | | 365,625 | |
Prestige Brands
144A 6.375% 3/1/24 # | | | 380,000 | | | | 377,150 | |
Sigma Holdco
144A 7.875% 5/15/26 # | | | 660,000 | | | | 610,500 | |
| | | | | | | | |
| | |
| | | | | | | 2,618,556 | |
| | | | | | | | |
Energy – 16.82% | | | | | | | | |
Alta Mesa Holdings 7.875% 12/15/24 | | | 880,000 | | | | 792,000 | |
AmeriGas Partners | | | | | | | | |
5.625% 5/20/24 | | | 250,000 | | | | 241,250 | |
5.875% 8/20/26 | | | 415,000 | | | | 394,250 | |
Cheniere Corpus Christi
Holdings 7.00% 6/30/24 | | | 410,000 | | | | 444,337 | |
Cheniere Energy Partners
5.25% 10/1/25 | | | 555,000 | | | | 545,981 | |
Chesapeake Energy
7.00% 10/1/24 | | | 170,000 | | | | 166,387 | |
8.00% 1/15/25 | | | 410,000 | | | | 416,919 | |
Crestwood Midstream Partners
5.75% 4/1/25 | | | 465,000 | | | | 466,163 | |
DCP Midstream Operating
5.375% 7/15/25 | | | 315,000 | | | | 320,607 | |
Diamond Offshore Drilling
7.875% 8/15/25 | | | 610,000 | | | | 602,375 | |
Ensco
7.75% 2/1/26 | | | 690,000 | | | | 646,013 | |
Genesis Energy
6.50% 10/1/25 | | | 680,000 | | | | 630,700 | |
Gulfport Energy
6.375% 5/15/25 | | | 230,000 | | | | 219,363 | |
6.375% 1/15/26 | | | 445,000 | | | | 416,075 | |
Laredo Petroleum
6.25% 3/15/23 | | | 750,000 | | | | 740,625 | |
Murphy Oil
6.875% 8/15/24 | | | 910,000 | | | | 952,752 | |
Murphy Oil USA
5.625% 5/1/27 | | | 545,000 | | | | 533,419 | |
Nine Energy Service
144A 8.75% 11/1/23 # | | | 220,000 | | | | 224,125 | |
Oasis Petroleum
144A 6.25% 5/1/26 # | | | 435,000 | | | | 427,931 | |
Precision Drilling
144A 7.125% 1/15/26 # | | | 720,000 | | | | 716,400 | |
| | | | | | | | |
| | | Principal
amount° | | | Value (US $) | |
Corporate Bonds (continued) | | | | | | | | |
Energy (continued) | | | | | | | | |
Southwestern Energy
7.75% 10/1/27 | | | 745,000 | | | $ | 763,625 | |
Summit Midstream Holdings
5.75% 4/15/25 | | | 325,000 | | | | 312,813 | |
Targa Resources Partners
5.375% 2/1/27 | | | 470,000 | | | | 459,425 | |
144A 5.875% 4/15/26 # | | | 395,000 | | | | 399,197 | |
Transocean
144A 9.00% 7/15/23 # | | | 520,000 | | | | 546,650 | |
Whiting Petroleum
6.625% 1/15/26 | | | 695,000 | | | | 698,475 | |
| | | | | | | | |
| | |
| | | | | | | 13,077,857 | |
| | | | | | | | |
Healthcare – 11.05% | | | | | | | | |
Air Medical Group Holdings
144A 6.375% 5/15/23 # | | | 437,000 | | | | 394,939 | |
Bausch Health
144A 5.50% 11/1/25 # | | | 390,000 | | | | 383,663 | |
Charles River Laboratories
International
144A 5.50% 4/1/26 # | | | 865,000 | | | | 865,000 | |
Community Health Systems
6.25% 3/31/23 | | | 418,000 | | | | 386,002 | |
Encompass Health
5.75% 11/1/24 | | | 260,000 | | | | 260,325 | |
5.75% 9/15/25 | | | 530,000 | | | | 527,350 | |
Hadrian Merger
144A 8.50% 5/1/26 # | | | 405,000 | | | | 386,775 | |
HCA
5.375% 2/1/25 | | | 340,000 | | | | 342,975 | |
5.875% 2/15/26 | | | 580,000 | | | | 594,500 | |
7.58% 9/15/25 | | | 230,000 | | | | 253,575 | |
Hill-Rom Holdings
144A 5.00% 2/15/25 # | | | 180,000 | | | | 174,600 | |
144A 5.75% 9/1/23 # | | | 290,000 | | | | 294,713 | |
MPH Acquisition Holdings
144A 7.125% 6/1/24 # | | | 530,000 | | | | 539,709 | |
Polaris Intermediate 144A PIK
8.50% 12/1/22 #T | | | 230,000 | | | | 236,613 | |
Surgery Center Holdings
144A 6.75% 7/1/25 # | | | 340,000 | | | | 320,450 | |
144A 8.875% 4/15/21 # | | | 645,000 | | | | 665,963 | |
Tenet Healthcare
5.125% 5/1/25 | | | 80,000 | | | | 77,200 | |
8.125% 4/1/22 | | | 770,000 | | | | 804,650 | |
Teva Pharmaceutical Finance
Netherlands III
6.00% 4/15/24 | | | 655,000 | | | | 652,587 | |
Schedules of investments
Macquarie Institutional Portfolios — Macquarie High Yield Bond Portfolio
| | | | | | | | |
| | | Principal
amount° | | | Value (US $) | |
Corporate Bonds (continued) | | | | | | | | |
Healthcare (continued) | | | | | | | | |
WellCare Health Plans
144A 5.375% 8/15/26 # | | | 430,000 | | | $ | 430,000 | |
| | | | | | | | |
| | |
| | | | | | | 8,591,589 | |
| | | | | | | | |
Insurance – 4.98% | | | | | | | | |
Acrisure
144A 7.00% 11/15/25 # | | | 415,000 | | | | 372,463 | |
AssuredPartners
144A 7.00% 8/15/25 # | | | 780,000 | | | | 771,225 | |
HUB International
144A 7.00% 5/1/26 # | | | 1,045,000 | | | | 1,022,533 | |
NFP 144A 6.875% 7/15/25 # | | | 760,000 | | | | 739,100 | |
USIS Merger Sub
144A 6.875% 5/1/25 # | | | 985,000 | | | | 962,837 | |
| | | | | | | | |
| | |
| | | | | | | 3,868,158 | |
| | | | | | | | |
Media – 8.50% | | | | | | | | |
Altice Luxembourg
144A 7.75% 5/15/22 # | | | 840,000 | | | | 780,150 | |
CCO Holdings
144A 5.50% 5/1/26 # | | | 45,000 | | | | 43,931 | |
144A 5.75% 2/15/26 # | | | 830,000 | | | | 823,775 | |
144A 5.875% 5/1/27 # | | | 575,000 | | | | 566,375 | |
Cequel Communications Holdings I
144A 7.50% 4/1/28 # | | | 225,000 | | | | 234,049 | |
144A 7.75% 7/15/25 # | | | 360,000 | | | | 381,600 | |
CSC Holdings
6.75% 11/15/21 | | | 585,000 | | | | 614,045 | |
144A 10.875% 10/15/25 # | | | 260,000 | | | | 300,625 | |
Gray Television
144A 5.875% 7/15/26 # | | | 410,000 | | | | 394,498 | |
Radiate Holdco
144A 6.625% 2/15/25 # | | | 440,000 | | | | 412,500 | |
Sirius XM Radio
144A 5.375% 4/15/25 # | | | 895,000 | | | | 888,847 | |
Virgin Media Secured Finance
144A 5.25% 1/15/26 # | | | 875,000 | | | | 819,219 | |
VTR Finance
144A 6.875% 1/15/24 # | | | 345,000 | | | | 350,606 | |
| | | | | | | | |
| | |
| | | | | | | 6,610,220 | |
| | | | | | | | |
Services – 6.34% | | | | | | | | |
Advanced Disposal Services
144A 5.625% 11/15/24 # | | | 380,000 | | | | 371,450 | |
Ashtead Capital
144A 5.25% 8/1/26 # | | | 340,000 | | | | 335,444 | |
Avis Budget Car Rental
144A 6.375% 4/1/24 # | | | 545,000 | | | | 522,519 | |
| | | | | | | | |
| | | Principal
amount° | | | Value (US $) | |
Corporate Bonds (continued) | | | | | | | | |
Services (continued) | | | | | | | | |
Covanta Holding
5.875% 7/1/25 | | | 470,000 | | | $ | 457,075 | |
ESH Hospitality
144A 5.25% 5/1/25 # | | | 495,000 | | | | 469,631 | |
GEO Group
5.875% 10/15/24 | | | 55,000 | | | | 51,277 | |
6.00% 4/15/26 | | | 305,000 | | | | 280,219 | |
Iron Mountain US Holdings
144A 5.375% 6/1/26 # | | | 440,000 | | | | 407,000 | |
Prime Security Services
Borrower
144A 9.25% 5/15/23 # | | | 496,000 | | | | 525,363 | |
TMS International
144A 7.25% 8/15/25 # | | | 300,000 | | | | 299,250 | |
United Rentals North America
5.50% 5/15/27 | | | 217,000 | | | | 206,693 | |
5.875% 9/15/26 | | | 340,000 | | | | 334,475 | |
6.50% 12/15/26 | | | 260,000 | | | | 263,575 | |
WeWork 144A
7.875% 5/1/25 # | | | 440,000 | | | | 405,900 | |
| | | | | | | | |
| | |
| | | | | | | 4,929,871 | |
| | | | | | | | |
Technology & Electronics – 4.35% | | | | | |
CDK Global
5.875% 6/15/26 | | | 1,125,000 | | | | 1,134,843 | |
CommScope Technologies
144A 5.00% 3/15/27 # | | | 885,000 | | | | 796,500 | |
144A 6.00% 6/15/25 # | | | 235,000 | | | | 229,713 | |
Genesys Telecommunications
Laboratories
144A 10.00% 11/30/24 # | | | 415,000 | | | | 451,313 | |
Infor Software Parent
144A PIK 7.125% 5/1/21 #T | | | 195,000 | | | | 196,950 | |
RP Crown Parent
144A 7.375% 10/15/24 # | | | 558,000 | | | | 573,345 | |
| | | | | | | | |
| | |
| | | | | | | 3,382,664 | |
| | | | | | | | |
Telecommunications – 5.25% | | | | | | | | |
C&W Senior Financing
144A 7.50% 10/15/26 # | | | 430,000 | | | | 432,150 | |
Level 3 Financing
5.375% 5/1/25 | | | 1,057,000 | | | | 1,034,539 | |
Sprint
7.125% 6/15/24 | | | 305,000 | | | | 312,625 | |
7.625% 3/1/26 | | | 190,000 | | | | 197,244 | |
7.875% 9/15/23 | | | 560,000 | | | | 599,200 | |
T-Mobile USA
6.50% 1/15/26 | | | 742,000 | | | | 784,665 | |
68
| | | | | | | | |
| | | Principal
amount° | | | Value (US $) | |
Corporate Bonds (continued) | | | | | | | | |
Telecommunications (continued) | | | | | | | | |
Zayo Group 6.375% 5/15/25 | | | 705,000 | | | $ | 723,506 | |
| | | | | | | | |
| | |
| | | | | | | 4,083,929 | |
| | | | | | | | |
Utilities – 1.99% | | | | | | | | |
Calpine
5.75% 1/15/25 | | | 865,000 | | | | 776,165 | |
144A 5.875% 1/15/24 # | | | 415,000 | | | | 416,037 | |
Vistra Operations
144A 5.50% 9/1/26 # | | | 355,000 | | | | 350,119 | |
| | | | | | | | |
| | |
| | | | | | | 1,542,321 | |
| | | | | | | | |
| |
Total Corporate Bonds
(cost $71,973,925) | | | | 69,821,534 | |
| | | | | | | | |
| | | | | | | | | |
Loan Agreements – 6.39% | | | | | | | | |
AI Ladder Luxembourg Subco Tranche B 1st Lien 7.02% (LIBOR06M + 4.50%) 7/2/25 ● | | | 378,000 | | | | 380,363 | |
Applied Systems 2nd Lien 9.386% (LIBOR03M + 7.00%) 9/19/25 ● | | | 885,000 | | | | 905,797 | |
Blue Ribbon 1st Lien 6.265% (LIBOR03M + 3.00%) 11/13/21 ● | | | 307,026 | | | | 288,220 | |
CH Hold 2nd Lien 9.552% (LIBOR01M + 7.25%) 2/1/25 ● | | | 295,000 | | | | 297,950 | |
Community Health Systems Tranche H 1st Lien 5.563% (LIBOR03M + 3.25%) 1/27/21 ● | | | 200,000 | | | | 196,333 | |
Frontier Communications Tranche B1 1st Lien 6.06% (LIBOR01M + 3.75%) 6/15/24 ● | | | 595,123 | | | | 577,269 | |
Kronos 2nd Lien 10.593% (LIBOR03M + 8.25%) 11/1/24 ● | | | 380,000 | | | | 385,858 | |
Solenis International Tranche B 2nd Lien 10.811% (LIBOR03M + 8.50%) 6/18/24 ● | | | 395,000 | | | | 389,075 | |
Summit Midstream Partners Holdings Tranche B 1st Lien 8.302% (LIBOR01M + 6.00%) 5/21/22 ● | | | 265,767 | | | | 267,428 | |
Utz Quality Foods 1st Lien 5.802% (LIBOR01M + 3.50%) 11/21/24 ● | | | 203,088 | | | | 204,104 | |
| | | | | | | | |
| | | Principal
amount° | | | Value (US $) | |
Loan Agreements (continued) | | | | | | | | |
Vantage Specialty Chemicals 2nd Lien 10.777% (LIBOR03M + 8.25%) 10/26/25 ● | | | 275,000 | | | $ | 275,916 | |
Vantage Specialty Chemicals Tranche B 1st Lien 5.806% (LIBOR01M + 3.50%) 10/28/24 ● | | | 277,900 | | | | 279,029 | |
Verscend Holding Tranche B 1st Lien 6.802% (LIBOR01M + 4.50%) 8/27/25 ● | | | 430,000 | | | | 433,494 | |
Visual Comfort Group 2nd Lien 9.242% (LIBOR01M + 8.00%) 2/28/25 ● | | | 83,143 | | | | 84,078 | |
| | | | | | | | |
Total Loan Agreements
(cost $4,985,203) | | | | | | | 4,964,914 | |
| | | | | | | | |
| | |
| | | Number
of shares | | | | |
Common Stock – 0.00% | | | | | | | | |
Century Communications =† | | | 60,000 | | | | 0 | |
| | | | | | | | |
Total Common Stock (cost $1,816) | | | | | | | 0 | |
| | | | | | | | |
| | |
| | | Principal
amount° | | | | |
Short-Term Investments – 2.38% | | | | | | | | |
Discount Note – 0.36%≠ | | | | | | | | |
Federal Home Loan Bank 2.00% 11/1/18 | | | 280,572 | | | | 280,572 | |
| | | | | | | | |
| | | | | | | 280,572 | |
| | | | | | | | |
Repurchase Agreements – 2.02% | | | | | | | | |
Bank of America Merrill Lynch 2.12%, dated 10/31/18, to be repurchased on 11/1/18, repurchase price $215,838 (collateralized by US government obligations 0.00% 5/15/19–8/15/31; market value $220,142) | | | 215,825 | | | | 215,825 | |
Bank of Montreal 2.10%, dated 10/31/18, to be repurchased on 11/1/18, repurchase price $593,554 (collateralized by US government obligations 0.00%–3.75% 11/1/18–2/15/47; market value $605,390) | | | 593,519 | | | | 593,519 | |
Schedules of investments
Macquarie Institutional Portfolios — Macquarie High Yield Bond Portfolio
| | | | | | | | |
| | | Principal
amount° | | | Value (US $) | |
Short-Term Investments (continued) | | | | | |
Repurchase Agreements (continued) | | | | | |
BNP Paribas 2.17%, dated 10/31/18, to be repurchased on 11/1/18, repurchase price $762,146 (collateralized by US government obligations 0.00%–8.00% 2/28/19–8/15/46; market value $777,342) | | | 762,101 | | | $ | 762,101 | |
| | | | | | | | |
| | | | | | | 1,571,445 | |
| | | | | | | | |
Total Short-Term Investments
(cost $1,852,016) | | | | | | | 1,852,017 | |
| | | | | | | | |
Total Value of
Securities – 98.59%
(cost $78,812,960) | | | | | | $ | 76,638,465 | |
| | | | | | | | |
| | # | Security exempt from registration under Rule 144A of the Securities Act of 1933, as amended. At Oct. 31, 2018, the aggregate value of Rule 144A securities was $38,445,883, which represents 49.46% of the Portfolio’s net assets. See Note 11 in “Notes to financial statements.” |
| | T | PIK. 100% of the income received was in the form of cash. |
| | = | The value of this security was determined using significant unobservable inputs and is reported as a Level 3 security in the disclosure table located in Note 3 in “Notes to financial statements.” |
| | ≠ | The rate shown is the effective yield at the time of purchase. |
| | ° | Principal amount shown is stated in USD unless noted that the security is denominated in another currency. |
| | µ | Fixed to variable rate investment. The rate shown reflects the fixed rate in effect at Oct. 31, 2018. Rate will reset at a future date. |
| | y | No contractual maturity date. |
| | † | Non-income producing security. |
| | ● | Variable rate investment. Rates reset periodically. Rate shown reflects the rate in effect at Oct. 31, 2018. For securities based on a published reference rate and spread, the reference rate and spread are indicated in their description above. The reference rate descriptions (i.e. LIBOR03M, LIBOR06M, etc.) used in this report are identical for different securities, but the underlying reference rates may differ due to the timing of the reset period. Certain variable rate securities are not based on a published reference rate and spread but are determined by the issuer or agent and are based on current market conditions, or for mortgage-backed securities, are impacted by the individual mortgages which are paying off over time. These securities do not indicate a reference rate and spread in their description above. |
Summary of abbreviations:
ICE – Intercontinental Exchange
LIBOR – London Interbank Offered Rate
LIBOR01M – ICE LIBOR USD 1Month
LIBOR03M – ICE LIBOR USD 3Month
LIBOR06M – ICE LIBOR USD 6Month
PIK – Pay-in-kind
USD – US Dollar
See accompanying notes, which are an integral part of the financial statements.
70
Macquarie Institutional Portfolios — Macquarie Emerging Markets Portfolio
October 31, 2018
| | | | | | | | |
| | | Number of
shares | | | Value (US $) | |
Common Stock – 95.79%D | |
Brazil – 10.59% | | | | | | | | |
CCR | | | 351,805 | | | $ | 1,027,575 | |
Embraer ADR | | | 117,478 | | | | 2,616,235 | |
Hypera | | | 222,800 | | | | 1,770,307 | |
Kroton Educacional | | | 351,400 | | | | 1,076,437 | |
Suzano Papel E Celulose | | | 190,800 | | | | 1,927,739 | |
| | | | | | | | |
| | |
| | | | | | | 8,418,293 | |
| | | | | | | | |
China/Hong Kong – 25.54% | | | | | |
Brilliance China Automotive Holdings | | | 542,000 | | | | 475,460 | |
China Construction Bank Class H | | | 3,721,000 | | | | 2,952,789 | |
China Medical System Holdings | | | 888,000 | | | | 1,060,666 | |
China Mobile | | | 245,500 | | | | 2,299,814 | |
China Resources Power Holdings | | | 654,038 | | | | 1,150,745 | |
China State Construction International Holdings | | | 1,150,000 | | | | 822,377 | |
Dongfeng Motor Group Class H | | | 812,000 | | | | 802,347 | |
Hengan International Group | | | 78,000 | | | | 620,051 | |
Jiangsu Expressway Class H | | | 556,000 | | | | 745,866 | |
Ping An Insurance Group Co. of China Class H | | | 417,500 | | | | 3,947,058 | |
Sands China | | | 512,400 | | | | 2,026,289 | |
Tongda Group Holdings | | | 3,540,000 | | | | 457,884 | |
WH Group 144A # | | | 4,174,500 | | | | 2,931,604 | |
| | | | | | | | |
| | |
| | | | | | | 20,292,950 | |
| | | | | | | | |
India – 13.73% | | | | | | | | |
Bajaj Auto | | | 38,962 | | | | 1,366,305 | |
HCL Technologies | | | 108,445 | | | | 1,550,336 | |
Housing Development Finance | | | 37,643 | | | | 900,554 | |
Indiabulls Housing Finance | | | 246,559 | | | | 2,780,951 | |
Larsen & Toubro | | | 23,111 | | | | 406,133 | |
Lupin | | | 111,226 | | | | 1,333,052 | |
Power Grid Corp of India | | | 217,222 | | | | 546,024 | |
Vedanta | | | 709,817 | | | | 2,030,903 | |
| | | | | | | | |
| | |
| | | | | | | 10,914,258 | |
| | | | | | | | |
Indonesia – 1.36% | | | | | | | | |
Bank Rakyat Indonesia Persero | | | 5,202,700 | | | | 1,079,811 | |
| | | | | | | | |
| | |
| | | | | | | 1,079,811 | |
| | | | | | | | |
| | | | | | | | |
| | | Number of
shares | | | Value (US $) | |
Common StockD (continued) | |
Malaysia – 3.55% | | | | | | | | |
AMMB Holdings | | | 759,200 | | | $ | 690,042 | |
Genting Malaysia | | | 1,250,000 | | | | 1,342,580 | |
Malayan Banking | | | 348,112 | | | | 790,125 | |
| | | | | | | | |
| | |
| | | | | | | 2,822,747 | |
| | | | | | | | |
Mexico – 1.62% | | | | | | | | |
Fibra Uno Administracion | | | 1,202,893 | | | | 1,287,973 | |
| | | | | | | | |
| | |
| | | | | | | 1,287,973 | |
| | | | | | | | |
Peru – 1.11% | | | | | | | | |
Credicorp | | | 3,892 | | | | 878,463 | |
| | | | | | | | |
| | |
| | | | | | | 878,463 | |
| | | | | | | | |
Philippines – 1.02% | | | | | | | | |
PLDT | | | 31,369 | | | | 809,542 | |
| | | | | | | | |
| | |
| | | | | | | 809,542 | |
| | | | | | | | |
Qatar – 1.12% | | | | | | | | |
Qatar Electricity & Water | | | 8,229 | | | | 424,500 | |
Qatar National Bank | | | 8,662 | | | | 463,648 | |
| | | | | | | | |
| | |
| | | | | | | 888,148 | |
| | | | | | | | |
Republic of Korea – 14.71% | | | | | |
Kangwon Land | | | 30,868 | | | | 781,640 | |
Korea Zinc | | | 3,520 | | | | 1,173,988 | |
LG Chem | | | 7,356 | | | | 2,247,816 | |
Samsung Electronics | | | 99,623 | | | | 3,729,466 | |
Samsung SDI | | | 3,816 | | | | 793,591 | |
Shinhan Financial Group | | | 53,344 | | | | 1,986,842 | |
SK Telecom | | | 4,158 | | | | 976,966 | |
| | | | | | | | |
| | |
| | | | | | | 11,690,309 | |
| | | | | | | | |
Romania – 0.32% | | | | | | | | |
Societatea Nationala de Gaze Naturale ROMGAZ GDR ³ | | | 31,690 | | | | 255,052 | |
| | | | | | | | |
| | |
| | | | | | | 255,052 | |
| | | | | | | | |
Russia – 4.80% | | | | | | | | |
Gazprom PJSC ADR | | | 373,006 | | | | 1,763,754 | |
LUKOIL PJSC ADR | | | 13,353 | | | | 995,586 | |
MMC Norilsk Nickel PJSC ADR | | | 63,775 | | | | 1,055,875 | |
| | | | | | | | |
| | |
| | | | | | | 3,815,215 | |
| | | | | | | | |
South Africa – 0.90% | | | | | | | | |
Sasol | | | 21,864 | | | | 714,515 | |
| | | | | | | | |
| | |
| | | | | | | 714,515 | |
| | | | | | | | |
Schedules of investments
Macquarie Institutional Portfolios — Macquarie Emerging Markets Portfolio
| | | | | | | | |
| | | Number of
shares | | | Value (US $) | |
Common StockD (continued) | | | | | |
Taiwan – 9.13% | | | | | | | | |
ASE Technology Holding † | | | 742,000 | | | $ | 1,496,558 | |
CTBC Financial Holding | | | 1,184,046 | | | | 792,874 | |
Mega Financial Holding | | | 955,245 | | | | 808,895 | |
Taiwan Semiconductor Manufacturing | | | 553,588 | | | | 4,155,997 | |
| | | | | | | | |
| | |
| | | | | | | 7,254,324 | |
| | | | | | | | |
Thailand – 1.88% | | | | | | | | |
Kasikornbank NVDR | | | 124,700 | | | | 750,652 | |
Thai Union Group Foreign | | | 1,489,900 | | | | 746,074 | |
| | | | | | | | |
| | |
| | | | | | | 1,496,726 | |
| | | | | | | | |
Turkey – 1.57% | | | | | | | | |
Turkiye Garanti Bankasi | | | 463,520 | | | | 583,070 | |
Turkiye Halk Bankasi | | | 599,562 | | | | 663,044 | |
| | | | | | | | |
| | |
| | | | | | | 1,246,114 | |
| | | | | | | | |
United Arab Emirates – 1.27% | | | | | |
First Abu Dhabi Bank | | | 267,898 | | | | 1,008,540 | |
| | | | | | | | |
| | |
| | | | | | | 1,008,540 | |
| | | | | | | | |
United Kingdom – 1.57% | | | | | | | | |
Anglo American | | | 58,364 | | | | 1,245,685 | |
| | | | | | | | |
| | |
| | | | | | | 1,245,685 | |
| | | | | | | | |
| | |
Total Common Stock
(cost $82,052,079) | | | | | | | 76,118,665 | |
| | | | | | | | |
| | | | | | | | | |
Preferred Stock – 3.03%D | | | | | |
Brazil – 3.03% | | | | | | | | |
Itau Unibanco Holding ADR 6.67% | | | 91,117 | | | | 1,200,011 | |
Itausa - Investimentos Itau 4.81% | | | 402,188 | | | | 1,210,400 | |
| | | | | | | | |
| | |
Total Preferred Stock
(cost $2,295,041) | | | | | | | 2,410,411 | |
| | | | | | | | |
| | |
| | | Principal
amount° | | | | |
Short-Term Investments – 0.67% | |
Discount Note – 0.10% ≠ | | | | | | | | |
Federal Home Loan Bank 1.999% 11/1/18 | | | 80,142 | | | | 80,142 | |
| | | | | | | | |
| | |
| | | | | | | 80,142 | |
| | | | | | | | |
| | | | | | | | |
| | | Principal
amount° | | | Value (US $) | |
Short-Term Investments (continued) | | | | | |
Repurchase Agreements – 0.57% | | | | | |
Bank of America Merrill Lynch 2.12%, dated 10/31/18, to be repurchased on 11/1/18, repurchase price $61,651 (collateralized by US government obligations 0.00% 5/15/19–8/15/31; market value $62,881) | | | 61,648 | | | $ | 61,648 | |
Bank of Montreal 2.10%, dated 10/31/18, to be repurchased on 11/1/18, repurchase price $169,541 (collateralized by US government obligations 0.00%–3.75% 11/1/18–2/15/47; market value $172,922) | | | 169,531 | | | | 169,531 | |
BNP Paribas
2.17%, dated 10/31/18, to be repurchased on 11/1/18, repurchase price $217,697 (collateralized by US government obligations 0.00%–8.00% 2/28/19–8/15/46; market value $222,038) | | | 217,684 | | | | 217,684 | |
| | | | | | | | |
| | |
| | | | | | | 448,863 | |
| | | | | | | | |
| |
Total Short-Term Investments
(cost $529,005) | | | | 529,005 | |
| | | | | | | | |
| | |
Total Value of Securities – 99.49%
(cost $84,876,125) | | | | | | $ | 79,058,081 | |
| | | | | | | | |
| | # | Security exempt from registration under Rule 144A of the Securities Act of 1933, as amended. At Oct. 31, 2018, the aggregate value of Rule 144A securities was $2,931,604, which represents 3.69% of the Portfolio’s net assets. See Note 11 in “Notes to financial statements.” |
| | ≠ | The rate shown is the effective yield at the time of purchase. |
| | ³ | Security was purchased pursuant to Regulation S under the Securities Act of 1933, which exempts from registration securities offered and sold outside of the United States. Such securities cannot be sold by the issuer in the United States without either an effective |
72
| | registration statement filed pursuant to the Securities Act of 1933, or pursuant to an exemption from registration. At October 31, 2018, the aggregate value of Regulation S securities was $255,052 which represents 0.32% of the Portfolio’s net assets. |
| | ° | Principal amount shown is stated in USD unless noted that the security is denominated in another currency. |
| | D | Securities have been classified by country of origin. Aggregate classification by business sector has been presented on page 32 in “Security type / country and sector allocations.” |
| | † | Non-income producing security. |
The following foreign currency exchange contracts were outstanding at Oct. 31, 2018:1
Foreign Currency Exchange Contracts
| | | | | | | | | | | | | | | | | | | | | | |
Counterparty | | Contracts to
Receive (Deliver) | | | In Exchange For | | | Settlement
Date | | Unrealized
Appreciation | | | Unrealized
Depreciation | |
BNYM | | HKD | | | 1,047,625 | | | USD | | | (133,522 | ) | | 11/1/18 | | $ | 76 | | | $ | — | |
BNYM | | HKD | | | 1,427,719 | | | USD | | | (181,988 | ) | | 11/2/18 | | | 89 | | | | — | |
BNYM | | KRW | | | (85,370,582 | ) | | USD | | | 74,799 | | | 11/1/18 | | | — | | | | (99 | ) |
| | | | | | | | | | | | | | | | | | | | | | |
Total Foreign Currency Exchange Contracts | | | | | | | | | | | $ | 165 | | | $ | (99 | ) |
| | | | | | | | | | | | | | | | | | | | | | |
The use of foreign currency exchange contracts involves elements of market risk and risks in excess of the amounts disclosed in the financial statements. The foreign currency exchange contracts presented above represent the Portfolio’s total exposure in such contracts, whereas only the net unrealized appreciation (depreciation) is reflected in the Portfolio’s net assets.
1See Note 8 in “Notes to financial statements.”
Summary of abbreviations:
ADR – American Depositary Receipt
BNYM – BNY Mellon
GDR – Global Depositary Receipt
HKD – Hong Kong Dollar
KRW – South Korean Won
NVDR – Non-Voting Depositary Receipt
USD – US Dollar
See accompanying notes, which are an integral part of the financial statements.
Schedules of investments
Macquarie Institutional Portfolios — Macquarie Emerging Markets Portfolio II
October 31, 2018
| | | | | | | | |
| | | Number of
shares | | | Value (US $) | |
Common Stock – 98.40%D | | | | | |
Argentina – 0.39%
| | | | | | | | |
IRSA Inversiones y Representaciones ADR | | | 8,000 | | | $ | 106,960 | |
| | | | | | | | |
| | |
| | | | | | | 106,960 | |
| | | | | | | | |
Bahrain – 0.05% | | | | | | | | |
Aluminum Bahrain GDR 144A # | | | 1,800 | | | | 13,850 | |
| | | | | | | | |
| | |
| | | | | | | 13,850 | |
| | | | | | | | |
Brazil – 13.49% | | | | | | | | |
B2W Cia Digital † | | | 142,200 | | | | 1,317,495 | |
Banco Bradesco ADR | | | 29,494 | | | | 270,460 | |
BRF ADR † | | | 37,400 | | | | 221,408 | |
Cia Brasileira de Distribuicao ADR | | | 13,900 | | | | 290,649 | |
Gerdau ADR | | | 11,300 | | | | 49,155 | |
Itau Unibanco Holding ADR | | | 38,805 | | | | 511,062 | |
Petroleo Brasileiro ADR | | | 30,700 | | | | 498,875 | |
Rumo † | | | 4,100 | | | | 18,288 | |
Telefonica Brasil ADR | | | 27,855 | | | | 323,118 | |
Vale ADR | | | 11,500 | | | | 173,650 | |
| | | | | | | | |
| | |
| | | | | | | 3,674,160 | |
| | | | | | | | |
China/Hong Kong – 30.46% | | | | | |
Alibaba Group Holding ADR † | | | 9,600 | | | | 1,365,888 | |
Baidu ADR † | | | 2,350 | | | | 446,641 | |
BeiGene † | | | 9,300 | | | | 80,643 | |
China Mengniu Dairy † | | | 123,000 | | | | 363,942 | |
China Mobile ADR | | | 16,200 | | | | 754,110 | |
China Petroleum & Chemical Class H | | | 82,000 | | | | 66,795 | |
China Petroleum & Chemical ADR | | | 3,170 | | | | 255,692 | |
CNOOC ADR | | | 1,000 | | | | 169,250 | |
Ctrip.com International ADR † | | | 6,700 | | | | 222,976 | |
Genscript Biotech † | | | 62,000 | | | | 95,847 | |
JD.com ADR † | | | 6,900 | | | | 162,288 | |
PetroChina ADR | | | 2,200 | | | | 159,808 | |
Ping An Insurance Group of China Class H | | | 31,500 | | | | 297,802 | |
SINA † | | | 13,300 | | | | 842,023 | |
Sohu.com ADR † | | | 16,800 | | | | 303,576 | |
Tencent Holdings | | | 43,000 | | | | 1,473,148 | |
Tianjin Development Holdings | | | 164,000 | | | | 52,164 | |
Tingyi Cayman Islands Holding | | | 186,000 | | | | 275,587 | |
Tsingtao Brewery Class H | | | 82,000 | | | | 324,268 | |
| | | | | | | | |
| | | Number of
shares | | | Value (US $) | |
Common StockD (continued) | | | | | |
China/Hong Kong (continued) | | | | | |
Uni-President China Holdings | | | 405,000 | | | $ | 394,000 | |
Weibo ADR † | | | 3,170 | | | | 187,062 | |
| | | | | | | | |
| | |
| | | | | | | 8,293,510 | |
| | | | | | | | |
India – 10.24% | | | | | | | | |
Reliance Industries GDR 144A # | | | 81,397 | | | | 2,323,421 | |
Tata Chemicals | | | 28,827 | | | | 267,486 | |
Tata Motors ADR † | | | 6,900 | | | | 84,249 | |
UltraTech Cement | | | 2,412 | | | | 114,134 | |
| | | | | | | | |
| | |
| | | | | | | 2,789,290 | |
| | | | | | | | |
Indonesia – 1.12% | | | | | | | | |
Astra International | | | 587,700 | | | | 305,701 | |
| | | | | | | | |
| | |
| | | | | | | 305,701 | |
| | | | | | | | |
Malaysia – 0.19% | | | | | | | | |
UEM Sunrise | | | 308,500 | | | | 50,599 | |
| | | | | | | | |
| | |
| | | | | | | 50,599 | |
| | | | | | | | |
Mexico – 4.97% | | | | | | | | |
America Movil ADR Class L | | | 9,400 | | | | 135,266 | |
Banco Santander Mexico SA Institucion de Banca Multiple Grupo Financiero Santand ADR | | | 32,700 | | | | 205,356 | |
Coca-Cola Femsa ADR | | | 9,700 | | | | 552,803 | |
Grupo Financiero Banorte | | | 21,000 | | | | 115,776 | |
Grupo Televisa ADR | | | 23,900 | | | | 343,682 | |
| | | | | | | | |
| | |
| | | | | | | 1,352,883 | |
| | | | | | | | |
Netherlands – 0.29% | | | | | | | | |
VEON ADR | | | 27,841 | | | | 78,233 | |
| | | | | | | | |
| | |
| | | | | | | 78,233 | |
| | | | | | | | |
Peru – 0.83% | | | | | | | | |
Cia de Minas Buenaventura ADR | | | 16,300 | | | | 225,592 | |
| | | | | | | | |
| | |
| | | | | | | 225,592 | |
| | | | | | | | |
Republic of Korea – 16.29% | | | | | |
Samsung Electronics | | | 54,399 | | | | 2,036,470 | |
SK Hynix | | | 13,578 | | | | 817,740 | |
SK Telecom | | | 1,705 | | | | 400,608 | |
SK Telecom ADR | | | 45,600 | | | | 1,181,496 | |
| | | | | | | | |
| | |
| | | | | | | 4,436,314 | |
| | | | | | | | |
Russia – 7.43% | | | | | | | | |
Etalon Group GDR 144A #= | | | 4,800 | | | | 11,064 | |
74
| | | | | | | | |
| | | Number of
shares | | | Value (US $) | |
Common StockD (continued) | | | | | |
Russia (continued) | | | | | | | | |
Gazprom PJSC ADR | | | 89,409 | | | $ | 422,769 | |
LUKOIL (London International Exchange) ADR | | | 5,269 | | | | 392,851 | |
LUKOIL ADR | | | 2,900 | | | | 216,456 | |
Mobile TeleSystems ADR | | | 16,800 | | | | 134,568 | |
Rosneft Oil GDR | | | 45,738 | | | | 320,453 | |
Sberbank of Russia PJSC | | | 122,221 | | | | 352,152 | |
Yandex Class A † | | | 5,700 | | | | 171,741 | |
| | | | | | | | |
| | |
| | | | | | | 2,022,054 | |
| | | | | | | | |
Taiwan – 8.91% | | | | | | | | |
Hon Hai Precision Industry † | | | 186,564 | | | | 474,908 | |
MediaTek | | | 81,000 | | | | 598,318 | |
Taiwan Semiconductor Manufacturing | | | 78,000 | | | | 585,576 | |
Taiwan Semiconductor Manufacturing ADR | | | 15,200 | | | | 579,120 | |
United Microelectronics ADR | | | 100,000 | | | | 188,000 | |
| | | | | | | | |
| | |
| | | | | | | 2,425,922 | |
| | | | | | | | |
Thailand – 0.61% | | | | | | | | |
PTT PCL | | | 111,300 | | | | 167,034 | |
| | | | | | | | |
| | |
| | | | | | | 167,034 | |
| | | | | | | | |
Turkey – 1.65% | | | | | | | | |
Akbank T.A.S. | | | 200,745 | | | | 237,398 | |
Anadolu Efes Biracilik Ve Malt Sanayii | | | 25,218 | | | | 84,788 | |
Turkcell Iletisim Hizmetleri ADR | | | 17,800 | | | | 91,848 | |
Turkiye Sise ve Cam Fabrikalari | | | 42,425 | | | | 35,930 | |
| | | | | | | | |
| | |
| | | | | | | 449,964 | |
| | | | | | | | |
| | | | | | | | |
| | | Number of
shares | | | Value (US $) | |
Common StockD (continued) | | | | | |
United States – 1.48% | | | | | | | | |
Altaba † | | | 6,700 | | | $ | 402,450 | |
| | | | | | | | |
| | |
| | | | | | | 402,450 | |
| | | | | | | | |
Total Common Stock
(cost $23,775,644) | | | | | | | 26,794,516 | |
| | | | | | | | |
| | | | | | | | | |
Preferred Stock – 0.86%D | | | | | |
Brazil – 0.16% | | | | | | | | |
Gerdau 1.64% | | | 10,100 | | | | 43,885 | |
| | | | | | | | |
| | |
| | | | | | | 43,885 | |
| | | | | | | | |
Republic of Korea – 0.70% | | | | | |
| | |
LG Electronics 1.64% | | | 8,325 | | | | 188,968 | |
| | | | | | | | |
| | |
| | | | | | | 188,968 | |
| | | | | | | | |
| |
Total Preferred Stock
(cost $239,399) | | | | 232,853 | |
| | | | | |
| |
Total Value of
Securities – 99.26%
(cost $24,015,043) | | | $ | 27,027,369 | |
| | | | | | | | |
| # | Security exempt from registration under Rule 144A of the Securities Act of 1933, as amended. At Oct. 31, 2018, the aggregate value of Rule 144A securities was $2,348,335, which represents 8.62% of the Portfolio’s net assets. See Note 11 in “Notes to financial statements.” |
| = | The value of this security was determined using significant unobservable inputs and is reported as a Level 3 security in the disclosure table located in Note 3 in “Notes to financial statements.” |
| D | Securities have been classified by country of origin. Aggregate classification by business sector has been presented on page 33 in “Security type / country and sector allocations.” |
| † | Non-income producing security. |
Summary of abbreviations:
ADR – American Depositary Receipt
GDR – Global Depositary Receipt
See accompanying notes, which are an integral part of the financial statements.
Schedules of investments
Macquarie Institutional Portfolios – Macquarie Labor Select International Equity Portfolio
October 31, 2018
| | | | | | | | |
| | | Number of
shares | | | Value (US $) | |
Common Stock – 98.60%D | | | | | |
Australia – 1.50% | | | | | | | | |
QBE Insurance Group | | | 759,697 | | | $ | 6,103,947 | |
| | | | | | | | |
| | |
| | | | | | | 6,103,947 | |
| | | | | | | | |
China/Hong Kong – 4.47% | | | | | | | | |
CK Hutchison Holdings | | | 1,221,000 | | | | 12,298,063 | |
WH Group | | | 8,334,500 | | | | 5,853,025 | |
| | | | | | | | |
| | |
| | | | | | | 18,151,088 | |
| | | | | | | | |
Denmark – 2.05% | | | | | | | | |
ISS | | | 253,475 | | | | 8,324,418 | |
| | | | | | | | |
| | |
| | | | | | | 8,324,418 | |
| | | | | | | | |
France – 6.10% | | | | | | | | |
Cie de Saint-Gobain | | | 199,851 | | | | 7,528,672 | |
Sanofi | | | 146,264 | | | | 13,070,235 | |
Societe Generale | | | 113,583 | | | | 4,163,697 | |
| | | | | | | | |
| | |
| | | | | | | 24,762,604 | |
| | | | | | | | |
Germany – 9.00% | | | | | | | | |
Allianz | | | 48,303 | | | | 10,062,479 | |
Bayerische Motoren Werke | | | 43,311 | | | | 3,729,544 | |
Daimler | | | 156,672 | | | | 9,280,717 | |
Evonik Industries | | | 161,885 | | | | 5,008,039 | |
Telefonica Deutschland Holding | | | 2,169,704 | | | | 8,434,561 | |
| | | | | | | | |
| | |
| | | | | | | 36,515,340 | |
| | | | | | | | |
Italy – 6.25% | | | | | | | | |
Enel | | | 2,584,947 | | | | 12,674,164 | |
Eni | | | 715,535 | | | | 12,707,724 | |
| | | | | | | | |
| | |
| | | | | | | 25,381,888 | |
| | | | | | | | |
Japan – 18.98% | | | | | | | | |
Coca-Cola Bottlers Japan Holdings | | | 79,700 | | | | 2,085,844 | |
FUJIFILM Holdings | | | 201,000 | | | | 8,693,327 | |
Fujitsu | | | 46,500 | | | | 2,828,986 | |
Honda Motor | | | 407,100 | | | | 11,620,886 | |
Isuzu Motors | | | 223,200 | | | | 2,926,275 | |
Kyushu Railway | | | 138,300 | | | | 4,247,196 | |
Mitsubishi Electric | | | 445,200 | | | | 5,635,984 | |
Otsuka Holdings | | | 48,500 | | | | 2,319,657 | |
Secom | | | 62,400 | | | | 5,108,787 | |
Sekisui Chemical | | | 360,200 | | | | 5,664,474 | |
Sumitomo Electric Industries | | | 465,800 | | | | 6,352,390 | |
Takeda Pharmaceutical | | | 253,500 | | | | 10,509,996 | |
Tokio Marine Holdings | | | 192,100 | | | | 9,050,242 | |
| | | | | | | | |
| | |
| | | | | | | 77,044,044 | |
| | | | | | | | |
| | | | | | | | |
| | | Number of
shares | | | Value (US $) | |
Common StockD (continued) | | | | | |
Netherlands – 2.15% | | | | | | | | |
Koninklijke Ahold Delhaize | | | 381,504 | | | $ | 8,732,822 | |
| | | | | | | | |
| | |
| | | | | | | 8,732,822 | |
| | | | | | | | |
Singapore – 6.19% | | | | | | | | |
Ascendas Real Estate Investment Trust | | | 2,435,300 | | | | 4,434,417 | |
Singapore Telecommunications | | | 3,595,600 | | | | 8,213,068 | |
United Overseas Bank | | | 706,709 | | | | 12,494,967 | |
| | | | | | | | |
| | |
| | | | | | | 25,142,452 | |
| | | | | | | | |
Spain – 7.11% | | | | | | | | |
Banco Santander | | | 1,901,676 | | | | 9,048,092 | |
Iberdrola | | | 1,563,207 | | | | 11,060,976 | |
Telefonica | | | 1,064,688 | | | | 8,733,701 | |
| | | | | | | | |
| | |
| | | | | | | 28,842,769 | |
| | | | | | | | |
Sweden – 3.19% | | | | | | | | |
Telia | | | 2,872,262 | | | | 12,929,468 | |
| | | | | | | | |
| | |
| | | | | | | 12,929,468 | |
| | | | | | | | |
Switzerland – 6.69% | | | | | | | | |
ABB | | | 436,896 | | | | 8,791,021 | |
Novartis | | | 110,010 | | | | 9,633,836 | |
Zurich Insurance Group | | | 28,184 | | | | 8,750,608 | |
| | | | | | | | |
| | |
| | | | | | | 27,175,465 | |
| | | | | | | | |
United Kingdom – 24.92% | | | | | | | | |
BP | | | 1,450,534 | | | | 10,478,252 | |
G4S | | | 2,546,924 | | | | 6,989,665 | |
GlaxoSmithKline | | | 565,854 | | | | 10,959,326 | |
John Wood Group | | | 947,116 | | | | 8,632,248 | |
Kingfisher | | | 2,429,676 | | | | 7,889,558 | |
Lloyds Banking Group | | | 16,511,388 | | | | 12,049,016 | |
National Grid | | | 418,085 | | | | 4,416,669 | |
Royal Dutch Shell Class B | | | 385,741 | | | | 12,580,143 | |
SSE | | | 538,771 | | | | 7,852,815 | |
Tesco | | | 3,569,388 | | | | 9,720,960 | |
Travis Perkins | | | 181,558 | | | | 2,564,272 | |
WPP | | | 619,919 | | | | 7,014,837 | |
| | | | | | | | |
| | |
| | | | | | | 101,147,761 | |
| | | | | | | | |
Total Common Stock
(cost $419,047,576) | | | | | | | 400,254,066 | |
| | | | | | | | |
| | | | | | | | | |
Preferred Stock – 0.13% | | | | | |
Bayerische Motoren Werke 5.92% | | | 6,993 | | | | 526,689 | |
| | | | | | | | |
| |
Total Preferred Stock (cost $505,658) | | | | 526,689 | |
| | | | | | | | |
76
| | | | | | | | |
| | | Number of
shares | | | Value
(US $) | |
Rights – 0.02% | | | | | |
Banco Santander
exercise price EUR 0.03 expiration date 11/02/18 † | | | 1,901,676 | | | $ | 73,880 | |
| | | | | | | | |
Total Rights (cost $74,394) | | | | 73,880 | |
| | | | | | | | |
| | | | | | | | |
| | | Principal
amount° | | | | |
Short-Term Investments – 0.82% | | | | | |
Discount Note – 0.13%≠ | | | | | | | | |
Federal Home Loan Bank
2.00% 11/1/18 | | | 502,819 | | | | 502,819 | |
| | | | | | | | |
| | | | | | | 502,819 | |
| | | | | | | | |
Repurchase Agreements – 0.69% | | | | | |
Bank of America Merrill Lynch 2.12%, dated 10/31/18, to be repurchased on 11/1/18, repurchase price $386,807 (collateralized by US government obligations 0.00% 5/15/19–8/15/31; market value $394,520) | | | 386,784 | | | | 386,784 | |
Bank of Montreal 2.10%, dated 10/31/18, to be repurchased on 11/1/18, repurchase price $1,063,718 (collateralized by US government obligations 0.00%–3.75% 11/1/18–2/15/47; market value $1,084,929) | | | 1,063,656 | | | | 1,063,656 | |
| | | | | | | | |
| | | Principal
amount° | | | | |
Short-Term Investments (continued) | | | | | |
Repurchase Agreements (continued) | | | | | |
BNP Paribas 2.17%, dated 10/31/18, to be repurchased on 11/1/18, repurchase price $1,365,855 (collateralized by US government obligations 0.00%–8.00% 2/28/19–8/15/46; market value $1,393,088) | | | 1,365,772 | | | | 1,365,772 | |
| | | | | | | | |
| | | | | | | 2,816,212 | |
| | | | | | | | |
Total Short-Term Investments
(cost $3,319,031) | | | | 3,319,031 | |
| | | | | | | | |
Total Value of Securities – 99.57% | | | | | |
(cost $422,946,659) | | | | | | $ | 404,173,666 | |
| | | | | | | | |
| ≠ | The rate shown is the effective yield at the time of purchase. |
| ° | Principal amount shown is stated in USD unless noted that the security is denominated in another currency. |
| D | Securities have been classified by country of origin. Aggregate classification by business sector has been presented on page 34 in “Security type / country and sector allocations.” |
| † | Non-income producing security. |
The following foreign currency exchange contracts were outstanding at Oct. 31, 2018:1
Foreign Currency Exchange Contracts
| | | | | | | | | | | | | | | | | | | | | | |
Counterparty | | Contracts to Receive (Deliver) | | | In Exchange For | | | Settlement
Date | | Unrealized
Appreciation | | | Unrealized
Depreciation | |
BNYM | | JPY | | | 28,901,722 | | | USD | | | (257,117 | ) | | 11/1/18 | | $ | — | | | $ | (959 | ) |
BNYM | | JPY | | | 33,545,262 | | | USD | | | (297,142 | ) | | 11/2/18 | | | 193 | | | | — | |
| | | | | | | | | | | | | | | | | | | | | | |
Total Foreign Currency Exchange Contracts | | | | | | | | | | | $ | 193 | | | $ | (959 | ) |
| | | | | | | | | | | | | | | | | | | | | | |
The use of foreign currency exchange contracts involves elements of market risk and risks in excess of the amounts disclosed in the financial statements. The foreign currency exchange contracts presented above represent the Portfolio’s total exposure in such contracts, whereas only the net unrealized appreciation (depreciation) is reflected in the Portfolio’s net assets.
1See Note 8 in “Notes to financial statements.”
Summary of abbreviations:
BNYM – BNY Mellon
EUR – Euro
JPY – Japanese Yen
USD – US Dollar
See accompanying notes, which are an integral part of the financial statements.
Statements of assets and liabilities
Macquarie Institutional Portfolios
October 31, 2018
| | | | | | | | | | | | |
| | | Macquarie
Large Cap
Value
Portfolio | | | Macquarie
Core Plus
Bond
Portfolio | | | Macquarie
High Yield
Bond
Portfolio | |
Assets: | | | | | | | | | | | | |
Investments, at value1 | | $ | 106,671,917 | | | $ | 220,990,657 | | | $ | 76,638,465 | |
Cash | | | 33,539 | | | | 145,935 | | | | 21,249 | |
Cash collateral due from brokers | | | — | | | | 110,029 | | | | — | |
Foreign currencies, at value2 | | | — | | | | 30,361 | | | | — | |
Dividends and interest receivable | | | 214,204 | | | | 1,559,108 | | | | 1,224,648 | |
Swap payments receivable | | | — | | | | 520 | | | | — | |
Receivable for securities sold | | | — | | | | 348,342 | | | | 418,031 | |
Unrealized appreciation on foreign currency exchange contracts | | | — | | | | 941 | | | | — | |
Other assets3 | | | — | | | | 75,182 | | | | 48,975 | |
| | | | | | | | | | | | |
Total assets | | | 106,919,660 | | | | 223,261,075 | | | | 78,351,368 | |
| | | | | | | | | | | | |
Liabilities: | | | | | | | | | | | | |
Variation margin due to brokers futures contracts | | | — | | | | 170,311 | | | | — | |
Payable for securities purchased | | | — | | | | 2,523,775 | | | | 390,000 | |
Investment management fees payable to affiliates | | | 56,358 | | | | 63,981 | | | | 34,915 | |
Other accrued expenses | | | 17,804 | | | | 68,693 | | | | 14,147 | |
Administration fees payable | | | 10,279 | | | | — | | | | 9,335 | |
Custody fees payable | | | 1,383 | | | | — | | | | 1,993 | |
Legal fees payable to affiliates | | | 1,111 | | | | 2,092 | | | | 730 | |
Dividend disbursing and transfer agent fees and expenses payable to affiliates | | | 729 | | | | 1,413 | | | | 499 | |
Accounting and administration fees payable to affiliates | | | 707 | | | | 1,052 | | | | 591 | |
Trustees’ fees and expenses payable | | | 197 | | | | 531 | | | | 185 | |
Reports and statements to shareholders expenses payable to affiliates | | | 85 | | | | 174 | | | | 62 | |
Unrealized depreciation on credit default swap contracts | | | — | | | | 18,159 | | | | — | |
Unrealized depreciation on foreign currency exchange contracts | | | — | | | | 3,424 | | | | — | |
Upfront payments received on credit default swap contracts | | | — | | | | 105,709 | | | | — | |
Contingent liabilities3 | | | — | | | | 250,607 | | | | 163,250 | |
| | | | | | | | | | | | |
Total liabilities | | | 88,653 | | | | 3,209,921 | | | | 615,707 | |
| | | | | | | | | | | | |
Total Net Assets | | $ | 106,831,007 | | | $ | 220,051,154 | | | $ | 77,735,661 | |
| | | | | | | | | | | | |
78
| | | | | | | | | | | | |
| | | Macquarie
Large Cap
Value
Portfolio | | | Macquarie
Core Plus
Bond
Portfolio | | | Macquarie
High Yield
Bond
Portfolio | |
Net Assets Consist of: | | | | | | | | | | | | |
Paid-in capital | | $ | 78,476,057 | | | $ | 226,109,680 | | | $ | 90,803,517 | |
Total distributable earnings (loss) | | | 28,354,950 | | | | (6,058,526 | ) | | | (13,067,856 | ) |
| | | | | | | | | | | | |
Total Net Assets | | $ | 106,831,007 | | | $ | 220,051,154 | | | $ | 77,735,661 | |
| | | | | | | | | | | | |
| | | |
Net Asset Value | | | | | | | | | | | | |
| | | |
Portfolio Class | | | | | | | | | | | | |
Net assets | | $ | 106,831,007 | | | $ | 220,051,154 | | | $ | 77,735,661 | |
Shares of beneficial interest outstanding, unlimited authorization, no par | | | 3,951,955 | | | | 22,291,943 | | | | 10,418,552 | |
Net asset value per share | | $ | 27.03 | | | $ | 9.87 | | | $ | 7.46 | |
| | | |
| | | | | | | | | | | | |
1Investments, at cost | | $ | 91,902,729 | | | $ | 225,953,177 | | | $ | 78,812,960 | |
2Foreign currencies, at cost | | | — | | | | 32,481 | | | | — | |
3See Note 14 in “Notes to financial statements.” | | | | | | | | | | | | |
See accompanying notes, which are an integral part of the financial statements.
Statements of assets and liabilities
Macquarie Institutional Portfolios
| | | | | | | | | | | | |
| | | Macquarie
Emerging
Markets
Portfolio | | | Macquarie
Emerging
Markets
Portfolio II | | | Macquarie
Labor Select
International
Equity
Portfolio | |
Assets: | | | | | | | | | | | | |
Investments, at value1 | | $ | 79,058,081 | | | $ | 27,027,369 | | | $ | 404,173,666 | |
Foreign currencies, at value2 | | | 683,143 | | | | 189,852 | | | | 260,353 | |
Cash | | | 47,662 | | | | — | | | | 1,334 | |
Receivable for securities sold | | | 182,816 | | | | 444,246 | | | | 703,774 | |
Dividends and interest receivable | | | 101,728 | | | | 53,382 | | | | 1,137,523 | |
Foreign tax reclaims receivable | | | 1,125 | | | | 1,572 | | | | 2,194,906 | |
Unrealized appreciation on foreign currency exchange contracts | | | 165 | | | | — | | | | 193 | |
| | | | | | | | | | | | |
Total assets | | | 80,074,720 | | | | 27,716,421 | | | | 408,471,749 | |
| | | | | | | | | | | | |
Liabilities: | | | | | | | | | | | | |
Cash due to custodian | | | — | | | | 108,591 | | | | — | |
Payable for securities purchased | | | 467,003 | | | | 338,223 | | | | 668,066 | |
Payable for fund shares redeemed | | | — | | | | — | | | | 1,500,500 | |
Investment management fees payable to affiliates | | | 70,492 | | | | 18,596 | | | | 265,557 | |
Custody fees payable | | | 45,275 | | | | 7,153 | | | | 46,944 | |
Other accrued expenses | | | 26,648 | | | | 5,724 | | | | 38,821 | |
Legal fees payable to affiliates | | | 807 | | | | 272 | | | | 4,028 | |
Accounting and administration fees payable to affiliates | | | 606 | | | | 429 | | | | 1,678 | |
Dividend disbursing and transfer agent fees and expenses payable to affiliates | | | 529 | | | | 177 | | | | 2,656 | |
Trustees’ fees and expenses payable | | | 205 | | | | 69 | | | | 1,022 | |
Reports and statements to shareholders expenses payable to affiliates | | | 63 | | | | 22 | | | | 323 | |
Administration fees payable | | | — | | | | 8,170 | | | | 18,002 | |
Unrealized depreciation on foreign currency exchange contracts | | | 99 | | | | — | | | | 959 | |
| | | | | | | | | | | | |
Total liabilities | | | 611,727 | | | | 487,426 | | | | 2,548,556 | |
| | | | | | | | | | | | |
Total Net Assets | | $ | 79,462,993 | | | $ | 27,228,995 | | | $ | 405,923,193 | |
| | | | | | | | | | | | |
80
| | | | | | | | | | | | |
| | | Macquarie
Emerging
Markets
Portfolio | | | Macquarie
Emerging
Markets
Portfolio II | | | Macquarie
Labor Select
International
Equity
Portfolio | |
Net Assets Consist of: | | | | | | | | | | | | |
Paid-in capital | | $ | 127,235,747 | | | $ | 23,779,616 | | | $ | 417,167,743 | |
Total distributable earnings (loss) | | | (47,772,754 | ) | | | 3,449,379 | | | | (11,244,550 | ) |
| | | | | | | | | | | | |
Total Net Assets | | $ | 79,462,993 | | | $ | 27,228,995 | | | $ | 405,923,193 | |
| | | | | | | | | | | | |
| | | |
Net Asset Value | | | | | | | | | | | | |
| | | |
Portfolio Class | | | | | | | | | | | | |
Net assets | | $ | 79,462,993 | | | $ | 27,228,995 | | | $ | 405,923,193 | |
Shares of beneficial interest outstanding, unlimited authorization, no par | | | 10,514,416 | | | | 3,101,319 | | | | 29,541,502 | |
Net asset value per share | | $ | 7.56 | | | $ | 8.78 | | | $ | 13.74 | |
1Investments, at cost | | $ | 84,876,125 | | | $ | 24,015,043 | | | $ | 422,946,659 | |
2Foreign currencies, at cost | | | 691,370 | | | | 192,569 | | | | 260,080 | |
See accompanying notes, which are an integral part of the financial statements.
Statements of operations
Macquarie Institutional Portfolios
Year ended October 31, 2018
| | | | | | | | | | | | |
| | | Macquarie
Large Cap
Value
Portfolio | | | Macquarie
Core Plus
Bond
Portfolio | | | Macquarie
High Yield
Bond
Portfolio | |
Investment Income: | | | | | | | | | | | | |
Dividends | | $ | 3,052,914 | | | $ | 60,911 | | | $ | 15,676 | |
Interest | | | 22,768 | | | | 7,935,810 | | | | 5,864,115 | |
Foreign tax withheld | | | — | | | | (8,097 | ) | | | — | |
| | | | | | | | | | | | |
| | | 3,075,682 | | | | 7,988,624 | | | | 5,879,791 | |
| | | | | | | | | | | | |
Expenses: | | | | | | | | | | | | |
Management fees | | | 711,126 | | | | 936,296 | | | | 434,890 | |
Accounting and administration expenses | | | 55,352 | | | | 71,037 | | | | 49,549 | |
Legal fees | | | 44,217 | | | | 36,692 | | | | 18,710 | |
Audit and tax fees | | | 34,170 | | | | 45,624 | | | | 42,910 | |
Dividend disbursing and transfer agent fees and expenses | | | 15,799 | | | | 26,564 | | | | 11,796 | |
Registration fees | | | 9,593 | | | | 16,613 | | | | 7,135 | |
Reports and statements to shareholders expenses | | | 8,389 | | | | 12,192 | | | | 2,658 | |
Custodian fees | | | 7,519 | | | | 24,783 | | | | 7,145 | |
Trustees’ fees and expenses | | | 6,234 | | | | 10,046 | | | | 4,733 | |
Other | | | 8,336 | | | | 90,902 | | | | 19,082 | |
| | | | | | | | | | | | |
| | | 900,735 | | | | 1,270,749 | | | | 598,608 | |
Less expenses waived | | | — | | | | (288,990 | ) | | | (26,558 | ) |
Less expenses paid indirectly | | | (64 | ) | | | (2,518 | ) | | | (702 | ) |
| | | | | | | | | | | | |
Total operating expenses | | | 900,671 | | | | 979,241 | | | | 571,348 | |
| | | | | | | | | | | | |
Net Investment Income | | | 2,175,011 | | | | 7,009,383 | | | | 5,308,443 | |
| | | | | | | | | | | | |
| | | |
Net Realized and Unrealized Gain (Loss) | | | | | | | | | | | | |
Net realized gain (loss) on: | | | | | | | | | | | | |
Investments | | | 13,590,238 | | | | (4,054,979 | ) | | | (442,627 | ) |
Foreign currencies | | | — | | | | (1,409,877 | ) | | | — | |
Foreign currency exchange contracts | | | — | | | | (127,522 | ) | | | — | |
Futures contracts | | | — | | | | (266,976 | ) | | | — | |
Options purchased | | | — | | | | 18,056 | | | | — | |
Swap contracts | | | — | | | | (194,641 | ) | | | — | |
| | | | | | | | | | | | |
Net realized gain (loss) | | | 13,590,238 | | | | (6,035,939 | ) | | | (442,627 | ) |
| | | | | | | | | | | | |
Net change in unrealized appreciation (depreciation) of: | | | | | | | | | | | | |
Investments | | | (2,569,323 | ) | | | (6,313,775 | ) | | | (5,868,713 | ) |
Foreign currencies | | | — | | | | 8,858 | | | | — | |
Foreign currency exchange contracts | | | — | | | | 45,434 | | | | — | |
Futures contracts | | | — | | | | 217,445 | | | | — | |
Options purchased | | | — | | | | 1,607 | | | | — | |
Swap contracts | | | — | | | | 28,854 | | | | — | |
| | | | | | | | | | | | |
Net change in unrealized appreciation (depreciation) | | | (2,569,323 | ) | | | (6,011,577 | ) | | | (5,868,713 | ) |
| | | | | | | | | | | | |
Net Realized and Unrealized Gain (Loss) | | | 11,020,915 | | | | (12,047,516 | ) | | | (6,311,340 | ) |
| | | | | | | | | | | | |
Net Increase (Decrease) in Net Assets Resulting from Operations | | $ | 13,195,926 | | | $ | (5,038,133 | ) | | $ | (1,002,897 | ) |
| | | | | | | | | | | | |
See accompanying notes, which are an integral part of the financial statements.
82
| | | | | | | | | | | | |
| | | Macquarie
Emerging
Markets
Portfolio | | | Macquarie
Emerging
Markets
Portfolio II | | | Macquarie
Labor Select
International
Equity
Portfolio | |
Investment Income: | | | | | | | | | | | | |
Dividends | | $ | 4,542,527 | | | $ | 859,134 | | | $ | 18,940,487 | |
Interest | | | 27,285 | | | | 2,174 | | | | 51,657 | |
Foreign tax withheld | | | (420,751 | ) | | | (106,705 | ) | | | (1,408,517 | ) |
| | | | | | | | | | | | |
| | | 4,149,061 | | | | 754,603 | | | | 17,583,627 | |
| | | | | | | | | | | | |
Expenses: | | | | | | | | | | | | |
Management fees | | | 1,161,699 | | | | 376,779 | | | | 3,445,682 | |
Custodian fees | | | 100,685 | | | | 20,497 | | | | 114,567 | |
Audit and tax fees | | | 65,400 | | | | 50,126 | | | | 90,827 | |
Accounting and administration expenses | | | 53,635 | | | | 39,046 | | | | 114,754 | |
Legal fees | | | 22,702 | | | | 9,941 | | | | 80,184 | |
Dividend disbursing and transfer agent fees and expenses | | | 14,216 | | | | 4,765 | | | | 55,878 | |
Registration fees | | | 11,625 | | | | 19,805 | | | | 8,934 | |
Reports and statements to shareholders expenses | | | 7,735 | | | | 2,073 | | | | 23,202 | |
Trustees’ fees and expenses | | | 5,652 | | | | 1,826 | | | | 21,668 | |
Other | | | 17,585 | | | | 12,052 | | | | 24,600 | |
| | | | | | | | | | | | |
| | | 1,460,934 | | | | 536,910 | | | | 3,980,296 | |
Less expenses waived | | | — | | | | (83,783 | ) | | | — | |
Less expenses paid indirectly | | | (241 | ) | | | (3 | ) | | | (1,206 | ) |
| | | | | | | | | | | | |
Total operating expenses | | | 1,460,693 | | | | 453,124 | | | | 3,979,090 | |
| | | | | | | | | | | | |
Net Investment Income | | | 2,688,368 | | | | 301,479 | | | | 13,604,537 | |
| | | | | | | | | | | | |
| | | |
Net Realized and Unrealized Gain (Loss) | | | | | | | | | | | | |
Net realized gain (loss) on: | | | | | | | | | | | | |
Investments1 | | | 3,760,923 | | | | 2,118,400 | | | | 14,639,309 | |
Foreign currencies | | | (52,746 | ) | | | (11,341 | ) | | | (30,834 | ) |
Foreign currency exchange contracts | | | (69,869 | ) | | | (6,542 | ) | | | (79,059 | ) |
| | | | | | | | | | | | |
Net realized gain | | | 3,638,308 | | | | 2,100,517 | | | | 14,529,416 | |
| | | | | | | | | | | | |
Net change in unrealized appreciation (depreciation) of: | | | | | | | | | | | | |
Investments2 | | | (15,555,339 | ) | | | (7,744,437 | ) | | | (59,458,915 | ) |
Foreign currencies | | | 701 | | | | (3,975 | ) | | | (36,663 | ) |
Foreign currency exchange contracts | | | (1,316 | ) | | | — | | | | 3,058 | |
| | | | | | | | | | | | |
Net change in unrealized appreciation (depreciation) | | | (15,555,954 | ) | | | (7,748,412 | ) | | | (59,492,520 | ) |
| | | | | | | | | | | | |
Net Realized and Unrealized Loss | | | (11,917,646 | ) | | | (5,647,895 | ) | | | (44,963,104 | ) |
| | | | | | | | | | | | |
Net Decrease in Net Assets Resulting from Operations | | $ | (9,229,278 | ) | | $ | (5,346,416 | ) | | $ | (31,358,567 | ) |
| | | | | | | | | | | | |
1Includes $76,749 capital gains taxes paid for Macquarie Emerging Markets Portfolio II.
2Includes increase of $242,440 and decrease of $47,382 capital gains tax accrued for Macquarie
Emerging Markets Portfolio and Macquarie Emerging Markets Portfolio II, respectively.
See accompanying notes, which are an integral part of the financial statements.
83
Statements of changes in net assets
Macquarie Institutional Portfolios
| | | | | | | | | | | | | | | | | | | | | | | | |
| | | Macquarie
Large Cap
Value
Portfolio | | | Macquarie
Core Plus
Bond
Portfolio | | | Macquarie
High Yield
Bond Portfolio | |
| | | Year ended | | | Year ended | | | Year ended | |
| | | 10/31/18 | | | 10/31/17 | | | 10/31/18 | | | 10/31/17 | | | 10/31/18 | | | 10/31/17 | |
Increase (Decrease) in Net Assets from Operations: | | | | | | | | | | | | | | | | | | | | | | | | |
Net investment income | | $ | 2,175,011 | | | $ | 3,443,600 | | | $ | 7,009,383 | | | $ | 4,506,913 | | | $ | 5,308,443 | | | $ | 8,935,672 | |
Net realized gain (loss) | | | 13,590,238 | | | | 14,613,043 | | | | (6,035,939 | ) | | | (541,581 | ) | | | (442,627 | ) | | | 6,778,229 | |
Net change in unrealized appreciation (depreciation) | | | (2,569,323 | ) | | | 8,198,956 | | | | (6,011,577 | ) | | | (4,592 | ) | | | (5,868,713 | ) | | | (2,780,599 | ) |
| | | | | | | | | | | | | | | | | | | | | | | | |
Net increase (decrease) in net assets resulting from operations | | | 13,195,926 | | | | 26,255,599 | | | | (5,038,133 | ) | | | 3,960,740 | | | | (1,002,897 | ) | | | 12,933,302 | |
| | | | | | | | | | | | | | | | | | | | | | | | |
| | | | | | |
Dividends and Distributions to Shareholders from: | | | | | | | | | | | | | | | | | | | | | | | | |
Distributable earnings* | | | (19,235,423 | ) | | | (11,454,940 | ) | | | (5,030,141 | ) | | | (3,413,875 | ) | | | (7,953,373 | ) | | | (13,576,518 | ) |
| | | | | | | | | | | | | | | | | | | | | | | | |
| | | (19,235,423 | ) | | | (11,454,940 | ) | | | (5,030,141 | ) | | | (3,413,875 | ) | | | (7,953,373 | ) | | | (13,576,518 | ) |
| | | | | | | | | | | | | | | | | | | | | | | | |
| | | | | | |
Capital Share Transactions: | | | | | | | | | | | | | | | | | | | | | | | | |
Proceeds from shares sold | | | 11,054,529 | | | | 17,904,730 | | | | 91,751,003 | | | | 46,514,968 | | | | 3,925,944 | | | | 12,229,617 | |
Net asset value of shares issued upon reinvestment of dividends and distributions | | | 17,071,425 | | | | 9,619,602 | | | | 4,763,506 | | | | 3,169,915 | | | | 7,626,256 | | | | 13,425,532 | |
| | | | | | | | | | | | | | | | | | | | | | | | |
| | | 28,125,954 | | | | 27,524,332 | | | | 96,514,509 | | | | 49,684,883 | | | | 11,552,200 | | | | 25,655,149 | |
| | | | | | | | | | | | | | | | | | | | | | | | |
Cost of shares redeemed | | | (84,123,203 | ) | | | (90,585,162 | ) | | | (34,636,798 | ) | | | (15,254,949 | ) | | | (38,133,621 | ) | | | (154,038,130 | ) |
| | | | | | | | | | | | | | | | | | | | | | | | |
Increase (decrease) in net assets derived from capital share transactions | | | (55,997,249 | ) | | | (63,060,830 | ) | | | 61,877,711 | | | | 34,429,934 | | | | (26,581,421 | ) | | | (128,382,981 | ) |
| | | | | | | | | | | | | | | | | | | | | | | | |
| | | | | | |
Net Increase (Decrease) in Net Assets | | | (62,036,746 | ) | | | (48,260,171 | ) | | | 51,809,437 | | | | 34,976,799 | | | | (35,537,691 | ) | | | (129,026,197 | ) |
| | | | | | |
Net Assets: | | | | | | | | | | | | | | | | | | | | | | | | |
Beginning of year | | | 168,867,753 | | | | 217,127,924 | | | | 168,241,717 | | | | 133,264,918 | | | | 113,273,352 | | | | 242,299,549 | |
| | | | | | | | | | | | | | | | | | | | | | | | |
End of year1 | | $ | 106,831,007 | | | $ | 168,867,753 | | | $ | 220,051,154 | | | $ | 168,241,717 | | | $ | 77,735,661 | | | $ | 113,273,352 | |
| | | | | | | | | | | | | | | | | | | | | | | | |
*For the year ended Oct. 31, 2018, the Portfolios have adopted amendments to Regulation S-X (see Note 13 in “Notes to financial statements”). For the year ended Oct. 31, 2017, the dividends and distributions to shareholders were as follows:
| | | | | | | | | | | | | | | | | | | | |
| | | Macquarie
Large Cap
Value
Portfolio | | | | | | Macquarie
Core Plus
Bond
Portfolio | | | | | | Macquarie
High Yield
Bond
Portfolio | |
| Dividends from net investment income | | $ | 4,144,665 | | | | | | | $ | 3,413,875 | | | | | | | $ | 13,576,518 | |
| Dividends from net realized gain | | | 7,310,275 | | | | | | | | — | | | | | | | | — | |
1Net Assets – End of year includes undistributed net investment income of $2,754,476, $4,188,427 and $6,944,390 in 2017 for Macquarie Large Cap Value Portfolio, Macquarie Core Plus Bond Portfolio and Macquarie High Yield Bond Portfolio, respectively. The Securities and Exchange Commission eliminated the requirement to disclose undistributed net investment income in 2018.
See accompanying notes, which are an integral part of the financial statements.
84
| | | | | | | | | | | | | | | | | | | | | | | | |
| | | Macquarie
Emerging
Markets
Portfolio | | | Macquarie
Emerging
Markets
Portfolio II | | | Macquarie
Labor Select
International Equity
Portfolio | |
| | | Year ended | | | Year ended | | | Year ended | |
| | | 10/31/18 | | | 10/31/17 | | | 10/31/18 | | | 10/31/17 | | | 10/31/18 | | | 10/31/17 | |
Increase (Decrease) in Net Assets from Operations: | | | | | | | | | | | | | | | | | | | | | | | | |
Net investment income | | $ | 2,688,368 | | | $ | 3,030,050 | | | $ | 301,479 | | | $ | 545,504 | | | $ | 13,604,537 | | | $ | 13,575,986 | |
Net realized gain (loss) | | | 3,638,308 | | | | (2,154,365 | ) | | | 2,100,517 | | | | 1,715,456 | | | | 14,529,416 | | | | 15,210,041 | |
Net change in unrealized appreciation (depreciation) | | | (15,555,954 | ) | | | 20,302,237 | | | | (7,748,412 | ) | | | 10,672,281 | | | | (59,492,520 | ) | | | 63,965,975 | |
| | | | | | | | | | | | | | | | | | | | | | | | |
Net increase (decrease) in net assets resulting from operations | | | (9,229,278 | ) | | | 21,177,922 | | | | (5,346,416 | ) | | | 12,933,241 | | | | (31,358,567 | ) | | | 92,752,002 | |
| | | | | | | | | | | | | | | | | | | | | | | | |
| | | | | | |
Dividends and Distributions to Shareholders from: | | | | | | | | | | | | | | | | | | | | | | | | |
Distributable earnings* | | | (5,300,800 | ) | | | (4,559,146 | ) | | | (1,139,072 | ) | | | (419,713 | ) | | | (14,155,472 | ) | | | (12,309,632 | ) |
| | | | | | | | | | | | | | | | | | | | | | | | |
| | | (5,300,800 | ) | | | (4,559,146 | ) | | | (1,139,072 | ) | | | (419,713 | ) | | | (14,155,472 | ) | | | (12,309,632 | ) |
| | | | | | | | | | | | | | | | | | | | | | | | |
| | | | | | |
Capital Share Transactions: | | | | | | | | | | | | | | | | | | | | | | | | |
Proceeds from shares sold | | | 1,466,788 | | | | 14,846,158 | | | | 336,000 | | | | 100,000 | | | | 19,589,321 | | | | 38,212,375 | |
Purchase reimbursement fees | | | 5,924 | | | | 81,116 | | | | — | | | | — | | | | — | | | | — | |
Net asset value of shares issued upon reinvestment of dividends and distributions | | | 4,187,088 | | | | 3,181,049 | | | | 1,139,071 | | | | 419,713 | | | | 14,139,472 | | | | 12,038,422 | |
| | | | | | | | | | | | | | | | | | | | | | | | |
| | | 5,659,800 | | | | 18,108,323 | | | | 1,475,071 | | | | 519,713 | | | | 33,728,793 | | | | 50,250,797 | |
| | | | | | | | | | | | | | | | | | | | | | | | |
Cost of shares redeemed | | | (48,563,251 | ) | | | (32,052,050 | ) | | | (13,806,846 | ) | | | (4,184,535 | ) | | | (72,564,300 | ) | | | (35,250,381 | ) |
Redemption reimbursement fees | | | 218,543 | | | | 175,299 | | | | — | | | | — | | | | — | | | | — | |
| | | | | | | | | | | | | | | | | | | | | | | | |
| | | (48,344,708 | ) | | | (31,876,751 | ) | | | (13,806,846 | ) | | | (4,184,535 | ) | | | (72,564,300 | ) | | | (35,250,381 | ) |
| | | | | | | | | | | | | | | | | | | | | | | | |
Increase (decrease) in net assets derived from capital share transactions | | | (42,684,908 | ) | | | (13,768,428 | ) | | | (12,331,775 | ) | | | (3,664,822 | ) | | | (38,835,507 | ) | | | 15,000,416 | |
| | | | | | | | | | | | | | | | | | | | | | | | |
| | | | | | |
Net Increase (Decrease) in Net Assets | | | (57,214,986 | ) | | | 2,850,348 | | | | (18,817,263 | ) | | | 8,848,706 | | | | (84,349,546 | ) | | | 95,442,786 | |
| | | | | | |
Net Assets: | | | | | | | | | | | | | | | | | | | | | | | | |
Beginning of year | | | 136,677,979 | | | | 133,827,631 | | | | 46,046,258 | | | | 37,197,552 | | | | 490,272,739 | | | | 394,829,953 | |
| | | | | | | | | | | | | | | | | | | | | | | | |
End of year1 | | $ | 79,462,993 | | | $ | 136,677,979 | | | $ | 27,228,995 | | | $ | 46,046,258 | | | $ | 405,923,193 | | | $ | 490,272,739 | |
| | | | | | | | | | | | | | | | | | | | | | | | |
*For the year ended Oct. 31, 2018, the Portfolios have adopted amendments to Regulation S-X (see Note 13 in “Notes to financial statements”). For the year ended Oct. 31, 2017, the dividends and distributions to shareholders were as follows:
| | | | | | |
| | | Macquarie Emerging | | Macquarie Emerging | | Macquarie Labor Select |
| | | Markets Portfolio | | Markets Portfolio II | | International Equity Portfolio |
| Dividends from net investment income | | $ 4,559,146 | | $ 419,713 | | $ 12,309,632 |
1Net Assets – End of year includes undistributed (distributions in excess of) net investment income of $2,851,320, $(211,411) and $12,218,187 in 2017 for Macquarie Emerging Markets Portfolio, Macquarie Emerging Markets Portfolio II and Macquarie Labor Select International Equity Portfolio, respectively. The Securities and Exchange Commission eliminated the requirement to disclose undistributed (distributions in excess of) net investment income in 2018.
See accompanying notes, which are an integral part of the financial statements.
85
Financial highlights
Macquarie Institutional Portfolios — Macquarie Large Cap Value Portfolio
Selected data for each share of the Portfolio outstanding throughout each period were as follows:
| | | | | | | | | | | | | | | | | | | | |
| | | Year ended | |
| | | 10/31/18 | | | 10/31/17 | | | 10/31/16 | | | 10/31/15 | | | 10/31/14 | |
Net asset value, beginning of period | | $ | 28.54 | | | $ | 26.39 | | | $ | 27.30 | | | $ | 27.61 | | | $ | 24.19 | |
| | | | | |
Income from investment operations: | | | | | | | | | | | | | | | | | | | | |
Net investment income1 | | | 0.46 | | | | 0.47 | | | | 0.51 | | | | 0.53 | | | | 0.47 | |
Net realized and unrealized gain | | | 1.97 | | | | 3.09 | | | | 1.19 | | | | 0.34 | | | | 3.39 | |
| | | | | | | | | | | | | | | | | | | | |
Total from investment operations | | | 2.43 | | | | 3.56 | | | | 1.70 | | | | 0.87 | | | | 3.86 | |
| | | | | | | | | | | | | | | | | | | | |
| | | | | |
Less dividends and distributions from: | | | | | | | | | | | | | | | | | | | | |
Net investment income | | | (0.66 | ) | | | (0.51 | ) | | | (0.56 | ) | | | (0.43 | ) | | | (0.32 | ) |
Net realized gain | | | (3.28 | ) | | | (0.90 | ) | | | (2.05 | ) | | | (0.75 | ) | | | (0.12 | ) |
| | | | | | | | | | | | | | | | | | | | |
Total dividends and distributions | | | (3.94 | ) | | | (1.41 | ) | | | (2.61 | ) | | | (1.18 | ) | | | (0.44 | ) |
| | | | | | | | | | | | | | | | | | | | |
| | | | | |
Net asset value, end of period | | $ | 27.03 | | | $ | 28.54 | | | $ | 26.39 | | | $ | 27.30 | | | $ | 27.61 | |
| | | | | | | | | | | | | | | | | | | | |
| | | | | |
Total return2 | | | 9.00% | | | | 13.83% | | | | 7.15% | | | | 3.18% | | | | 16.19% | |
| | | | | |
Ratios and supplemental data: | | | | | | | | | | | | | | | | | | | | |
Net assets, end of period (000 omitted) | | $ | 106,831 | | | $ | 168,868 | | | $ | 217,128 | | | $ | 214,726 | | | $ | 139,797 | |
Ratio of expenses to average net assets | | | 0.70% | | | | 0.66% | | | | 0.65% | | | | 0.65% | | | | 0.68% | |
Ratio of net investment income to average net assets | | | 1.68% | | | | 1.74% | | | | 1.97% | | | | 1.92% | | | | 1.83% | |
Portfolio turnover | | | 16% | | | | 23% | | | | 13% | | | | 31% | | | | 19% | |
| 1 | The average shares outstanding method has been applied for per share information. |
| 2 | Total investment return is based on the change in net asset value of a share during the period and assumes reinvestment of dividends and distributions at net asset value. |
See accompanying notes, which are an integral part of the financial statements.
86
Macquarie Institutional Portfolios — Macquarie Core Plus Bond Portfolio
Selected data for each share of the Portfolio outstanding throughout each period were as follows:
| | | | | | | | | | | | | | | | | | | | |
| | | Year ended | |
| | | 10/31/18 | | | 10/31/17 | | | 10/31/16 | | | 10/31/15 | | | 10/31/14 | |
Net asset value, beginning of period | | $ | 10.41 | | | $ | 10.42 | | | $ | 10.29 | | | $ | 10.37 | | | $ | 10.10 | |
| | | | | |
Income (loss) from investment operations: | | | | | | | | | | | | | | | | | | | | |
Net investment income1 | | | 0.32 | | | | 0.32 | | | | 0.22 | | | | 0.24 | | | | 0.29 | |
Net realized and unrealized gain (loss) | | | (0.55 | ) | | | (0.06 | ) | | | 0.14 | | | | (0.11 | ) | | | 0.21 | |
| | | | | | | | | | | | | | | | | | | | |
Total from investment operations | | | (0.23 | ) | | | 0.26 | | | | 0.36 | | | | 0.13 | | | | 0.50 | |
| | | | | | | | | | | | | | | | | | | | |
| | | | | |
Less dividends and distributions from: | | | | | | | | | | | | | | | | | | | | |
Net investment income | | | (0.31 | ) | | | (0.27 | ) | | | (0.23 | ) | | | (0.21 | ) | | | (0.23 | ) |
Net realized gain | | | — | | | | — | | | | — | 2 | | | — | | | | — | |
| | | | | | | | | | | | | | | | | | | | |
Total dividends and distributions | | | (0.31 | ) | | | (0.27 | ) | | | (0.23 | ) | | | (0.21 | ) | | | (0.23 | ) |
| | | | | | | | | | | | | | | | | | | | |
| | | | | |
Net asset value, end of period | | $ | 9.87 | | | $ | 10.41 | | | $ | 10.42 | | | $ | 10.29 | | | $ | 10.37 | |
| | | | | | | | | | | | | | | | | | | | |
| | | | | |
Total return3 | | | (2.29% | ) | | | 2.60% | | | | 3.63% | | | | 1.29% | | | | 5.02% | |
| | | | | |
Ratios and supplemental data: | | | | | | | | | | | | | | | | | | | | |
Net assets, end of period (000 omitted) | | $ | 220,051 | | | $ | 168,242 | | | $ | 133,265 | | | $ | 128,094 | | | $ | 77,036 | |
Ratio of expenses to average net assets | | | 0.45% | | | | 0.45% | | | | 0.45% | | | | 0.45% | | | | 0.45% | |
Ratio of expenses to average net assets prior to fees waived | | | 0.58% | | | | 0.60% | | | | 0.60% | | | | 0.61% | | | | 0.65% | |
Ratio of net investment income to average net assets | | | 3.22% | | | | 3.08% | | | | 2.12% | | | | 2.33% | | | | 2.90% | |
Ratio of net investment income to average net assets prior to fees waived | | | 3.09% | | | | 2.93% | | | | 1.97% | | | | 2.17% | | | | 2.70% | |
Portfolio turnover | | | 171% | | | | 162% | | | | 310% | | | | 436% | | | | 339% | |
| 1 | The average shares outstanding method has been applied for per share information. |
| 2 | For the year ended Oct. 31, 2016, net realized gain distributions of $51,289 was made by the Portfolio, which calculated to a de minimis amount of $(0.004) per share. |
| 3 | Total investment return is based on the change in net asset value of a share during the period and assumes reinvestment of dividends and distributions at net asset value. Total investment return during all of the periods shown reflects a waiver by the manager. Performance would have been lower had the waiver not been in effect. |
See accompanying notes, which are an integral part of the financial statements.
Financial highlights
Macquarie Institutional Portfolios — Macquarie High Yield Bond Portfolio
Selected data for each share of the Portfolio outstanding throughout each period were as follows:
| | | | | | | | | | | | | | | | | | | | |
| | | Year ended | |
| | | 10/31/18 | | | 10/31/17 | | | 10/31/16 | | | 10/31/15 | | | 10/31/14 | |
Net asset value, beginning of period | | $ | 8.09 | | | $ | 7.88 | | | $ | 7.78 | | | $ | 8.61 | | | $ | 8.72 | |
| | | | | |
Income (loss) from investment operations: | | | | | | | | | | | | | | | | | | | | |
Net investment income1 | | | 0.42 | | | | 0.43 | | | | 0.45 | | | | 0.49 | | | | 0.50 | |
Net realized and unrealized gain (loss) | | | (0.48 | ) | | | 0.23 | | | | 0.02 | | | | (0.79 | ) | | | (0.07 | ) |
| | | | | | | | | | | | | | | | | | | | |
Total from investment operations | | | (0.06 | ) | | | 0.66 | | | | 0.47 | | | | (0.30 | ) | | | 0.43 | |
| | | | | | | | | | | | | | | | | | | | |
| | | | | |
Less dividends and distributions from: | | | | | | | | | | | | | | | | | | | | |
Net investment income | | | (0.57 | ) | | | (0.45 | ) | | | (0.37 | ) | | | (0.42 | ) | | | (0.54 | ) |
Net realized gain | | | — | | | | — | | | | — | | | | (0.11 | ) | | | — | |
| | | | | | | | | | | | | | | | | | | | |
Total dividends and distributions | | | (0.57 | ) | | | (0.45 | ) | | | (0.37 | ) | | | (0.53 | ) | | | (0.54 | ) |
| | | | | | | | | | | | | | | | | | | | |
| | | | | |
Net asset value, end of period | | $ | 7.46 | | | $ | 8.09 | | | $ | 7.88 | | | $ | 7.78 | | | $ | 8.61 | |
| | | | | | | | | | | | | | | | | | | | |
| | | | | |
Total return2 | | | (0.77% | ) | | | 8.88% | | | | 6.63% | | | | (3.41% | ) | | | 5.23% | |
| | | | | |
Ratios and supplemental data: | | | | | | | | | | | | | | | | | | | | |
Net assets, end of period (000 omitted) | | $ | 77,736 | | | $ | 113,273 | | | $ | 242,300 | | | $ | 206,129 | | | $ | 143,182 | |
Ratio of expenses to average net assets | | | 0.59% | | | | 0.57% | | | | 0.55% | | | | 0.56% | | | | 0.57% | |
Ratio of expenses to average net assets prior to fees waived | | | 0.62% | | | | 0.58% | | | | 0.55% | | | | 0.56% | | | | 0.57% | |
Ratio of net investment income to average net assets | | | 5.49% | | | | 5.58% | | | | 6.10% | | | | 6.09% | | | | 5.76% | |
Ratio of net investment income to average net assets prior to fees waived | | | 5.46% | | | | 5.57% | | | | 6.10% | | | | 6.09% | | | | 5.76% | |
Portfolio turnover | | | 112% | | | | 99% | | | | 119% | | | | 84% | | | | 101% | |
| 1 | The average shares outstanding method has been applied for per share information. |
| 2 | Total investment return is based on the change in net asset value of a share during the period and assumes reinvestment of dividends and distributions at net asset value. Total investment return during some of the periods shown reflects a waiver by the manager. Performance would have been lower had the waiver not been in effect. |
See accompanying notes, which are an integral part of the financial statements.
88
Macquarie Institutional Portfolios — Macquarie Emerging Markets Portfolio
Selected data for each share of the Portfolio outstanding throughout each period were as follows:
| | | | | | | | | | | | | | | | | | | | |
| | | Year ended | |
| | | 10/31/18 | | | 10/31/17 | | | 10/31/16 | | | 10/31/15 | | | 10/31/14 | |
Net asset value, beginning of period | | $ | 8.76 | | | $ | 7.77 | | | $ | 7.47 | | | $ | 9.75 | | | $ | 10.11 | |
| | | | | |
Income (loss) from investment operations: | | | | | | | | | | | | | | | | | | | | |
Net investment income1 | | | 0.20 | | | | 0.18 | | | | 0.18 | | | | 0.16 | | | | 0.22 | |
Net realized and unrealized gain (loss) | | | (1.08 | ) | | | 1.05 | | | | 0.29 | | | | (1.77 | ) | | | (0.09 | ) |
| | | | | | | | | | | | | | | | | | | | |
Total from investment operations | | | (0.88 | ) | | | 1.23 | | | | 0.47 | | | | (1.61 | ) | | | 0.13 | |
| | | | | | | | | | | | | | | | | | | | |
| | | | | |
Less dividends and distributions from: | | | | | | | | | | | | | | | | | | | | |
Net investment income | | | (0.34 | ) | | | (0.26 | ) | | | (0.18 | ) | | | (0.22 | ) | | | (0.18 | ) |
Net realized gain | | | — | | | | — | | | | — | | | | (0.47 | ) | | | (0.33 | ) |
| | | | | | | | | | | | | | | | | | | | |
Total dividends and distributions | | | (0.34 | ) | | | (0.26 | ) | | | (0.18 | ) | | | (0.69 | ) | | | (0.51 | ) |
| | | | | | | | | | | | | | | | | | | | |
| | | | | |
Reimbursement fees: | | | | | | | | | | | | | | | | | | | | |
Purchase reimbursement fees1,2 | | | — | 3 | | | 0.01 | | | | — | 4 | | | — | 5 | | | 0.01 | |
Redemption reimbursement fees1,2 | | | 0.02 | | | | 0.01 | | | | 0.01 | | | | 0.02 | | | | 0.01 | |
| | | | | | | | | | | | | | | | | | | | |
| | | 0.02 | | | | 0.02 | | | | 0.01 | | | | 0.02 | | | | 0.02 | |
| | | | | | | | | | | | | | | | | | | | |
| | | | | |
Net asset value, end of period | | $ | 7.56 | | | $ | 8.76 | | | $ | 7.77 | | | $ | 7.47 | | | $ | 9.75 | |
| | | | | | | | | | | | | | | | | | | | |
| | | | | |
Total return6 | | | (10.28% | ) | | | 16.88% | | | | 6.75% | | | | (17.11% | ) | | | 1.89% | |
| | | | | |
Ratios and supplemental data: | | | | | | | | | | | | | | | | | | | | |
Net assets, end of period (000 omitted) | | $ | 79,463 | | | $ | 136,678 | | | $ | 133,828 | | | $
|
172,674 |
| | $ | 310,211 | |
Ratio of expenses to average net assets | | | 1.26% | | | | 1.22% | | | | 1.19% | | | | 1.19% | | | | 1.16% | |
Ratio of net investment income to average net assets | | | 2.31% | | | | 2.24% | | | | 2.51% | | | | 1.90% | | | | 2.25% | |
Portfolio turnover | | | 40% | | | | 45% | | | | 28% | | | | 27% | | | | 30% | |
| 1 | The average shares outstanding method has been applied for per share information. |
| 2 | The Portfolio charges a 0.55% purchase reimbursement fee and a 0.55% redemption reimbursement fee, which are retained by the Portfolio. |
| 3 | For the year ended Oct. 31, 2018, purchase reimbursement fees of $5,924 were earned by the Portfolio, which calculated to a de minimis amount of $0.0004 per share. |
| 4 | For the year ended Oct. 31, 2016, purchase reimbursement fees of $42,620 were earned by the Portfolio, which calculated to a de minimis amount of $0.002 per share. |
| 5 | For the year ended Oct. 31, 2015, purchase reimbursement fees of $118,421 were earned by the Portfolio, which calculated to a de minimis amount of $0.004 per share. |
| 6 | Total investment return is based on the change in net asset value of a share during the period and assumes reinvestment of dividends and distributions at net asset value. Total investment return does not reflect the purchase reimbursement fee and redemption reimbursement fee. |
See accompanying notes, which are an integral part of the financial statements.
Financial highlights
Macquarie Institutional Portfolios — Macquarie Emerging Markets Portfolio II
Selected data for each share of the Portfolio outstanding throughout each period were as follows:
| | | | | | | | | | | | | | | | | | | | |
| | | Year ended | |
| | | | 10/31/18 | | | | 10/31/17 | | | | 10/31/16 | | | | 10/31/15 | | | | 10/31/14 | |
Net asset value, beginning of period | | $ | 10.74 | | | $ | 8.01 | | | $ | 7.37 | | | $ | 9.88 | | | $ | 9.65 | |
| | | | | |
Income (loss) from investment operations: | | | | | | | | | | | | | | | | | | | | |
Net investment income1 | | | 0.08 | | | | 0.12 | | | | 0.07 | | | | 0.04 | | | | 0.06 | |
Net realized and unrealized gain (loss) | | | (1.77 | ) | | | 2.70 | | | | 0.88 | | | | (2.15 | ) | | | 0.30 | |
| | | | | | | | | | | | | | | | | | | | |
Total from investment operations | | | (1.69 | ) | | | 2.82 | | | | 0.95 | | | | (2.11 | ) | | | 0.36 | |
| | | | | | | | | | | | | | | | | | | | |
| | | | | |
Less dividends and distributions from: | | | | | | | | | | | | | | | | | | | | |
Net investment income | | | (0.27 | ) | | | (0.09 | ) | | | (0.08 | ) | | | (0.14 | ) | | | (0.09 | ) |
Net realized gain | | | — | | | | — | | | | (0.23 | ) | | | (0.26 | ) | | | (0.04 | ) |
| | | | | | | | | | | | | | | | | | | | |
Total dividends and distributions | | | (0.27 | ) | | | (0.09 | ) | | | (0.31 | ) | | | (0.40 | ) | | | (0.13 | ) |
| | | | | | | | | | | | | | | | | | | | |
| | | | | |
Net asset value, end of period | | $ | 8.78 | | | $ | 10.74 | | | $ | 8.01 | | | $ | 7.37 | | | $ | 9.88 | |
| | | | | | | | | | | | | | | | | | | | |
| | | | | |
Total return2 | | | (16.13% | ) | | | 35.74% | | | | 13.62% | | | | (21.84% | ) | | | 3.80% | |
| | | | | |
Ratios and supplemental data: | | | | | | | | | | | | | | | | | | | | |
Net assets, end of period (000 omitted) | | $ | 27,229 | | | $ | 46,046 | | | $ | 37,198 | | | $ | 33,314 | | | $ | 42,515 | |
Ratio of expenses to average net assets | | | 1.20% | | | | 1.20% | | | | 1.20% | | | | 1.21% | �� | | | 1.20% | |
Ratio of expenses to average net assets prior to fees waived | | | 1.42% | | | | 1.32% | | | | 1.34% | | | | 1.35% | | | | 1.32% | |
Ratio of net investment income to average net assets | | | 0.80% | | | | 1.34% | | | | 0.97% | | | | 0.43% | | | | 0.64% | |
Ratio of net investment income to average net assets prior to fees waived | | | 0.58% | | | | 1.22% | | | | 0.83% | | | | 0.29% | | | | 0.52% | |
Portfolio turnover | | | 12% | | | | 14% | | | | 20% | | | | 8% | | | | 11% | |
| 1 | The average shares outstanding method has been applied for per share information. |
| 2 | Total investment return is based on the change in net asset value of a share during the period and assumes reinvestment of dividends and distributions at net asset value. Total investment return during all of the periods shown reflects a waiver by the manager. Performance would have been lower had the waiver not been in effect. |
See accompanying notes, which are an integral part of the financial statements.
90
Macquarie Institutional Portfolios — Macquarie Labor Select International Equity Portfolio
Selected data for each share of the Portfolio outstanding throughout each period were as follows:
| | | | | | | | | | | | | | | | | | | | |
| | | Year ended | |
| | | 10/31/18 | | | 10/31/17 | | | 10/31/16 | | | 10/31/15 | | | 10/31/14 | |
Net asset value, beginning of period | | $ | 15.21 | | | $ | 12.83 | | | $ | 13.79 | | | $ | 14.74 | | | $ | 15.07 | |
| | | | | |
Income (loss) from investment operations: | | | | | | | | | | | | | | | | | | | | |
Net investment income1 | | | 0.44 | | | | 0.41 | | | | 0.43 | | | | 0.37 | | | | 0.69 | |
Net realized and unrealized gain (loss) | | | (1.47 | ) | | | 2.35 | | | | (1.02 | ) | | | (0.52 | ) | | | (0.57 | ) |
| | | | | | | | | | | | | | | | | | | | |
Total from investment operations | | | (1.03 | ) | | | 2.76 | | | | (0.59 | ) | | | (0.15 | ) | | | 0.12 | |
| | | | | | | | | | | | | | | | | | | | |
| | | | | |
Less dividends and distributions from: | | | | | | | | | | | | | | | | | | | | |
Net investment income | | | (0.44 | ) | | | (0.38 | ) | | | (0.37 | ) | | | (0.80 | ) | | | (0.45 | ) |
| | | | | | | | | | | | | | | | | | | | |
Total dividends and distributions | | | (0.44 | ) | | | (0.38 | ) | | | (0.37 | ) | | | (0.80 | ) | | | (0.45 | ) |
| | | | | | | | | | | | | | | | | | | | |
| | | | | |
Net asset value, end of period | | $ | 13.74 | | | $ | 15.21 | | | $ | 12.83 | | | $ | 13.79 | | | $ | 14.74 | |
| | | | | | | | | | | | | | | | | | | | |
| | | | | |
Total return2 | | | (7.02% | ) | | | 22.13% | | | | (4.24% | ) | | | (0.98% | ) | | | 0.86% | |
| | | | | |
Ratios and supplemental data: | | | | | | | | | | | | | | | | | | | | |
Net assets, end of period (000 omitted) | | $ | 405,923 | | | $ | 490,273 | | | $ | 394,830 | | | $ | 360,650 | | | $ | 373,497 | |
Ratio of expenses to average net assets | | | 0.87% | | | | 0.86% | | | | 0.86% | | | | 0.87% | | | | 0.86% | |
Ratio of net investment income to average net assets | | | 2.96% | | | | 2.96% | | | | 3.39% | | | | 2.63% | | | | 4.54% | |
Portfolio turnover | | | 20% | | | | 21% | | | | 22% | | | | 20% | | | | 23% | |
| 1 | The average shares outstanding method has been applied for per share information. |
| 2 | Total investment return is based on the change in net asset value of a share during the period and assumes reinvestment of dividends and distributions at net asset value. |
See accompanying notes, which are an integral part of the financial statements.
91
This page intentionally left blank.
Notes to financial statements
Macquarie Institutional Portfolios
October 31, 2018
Macquarie Institutional Portfolios (registered as Delaware Pooled® Trust (Trust)) is organized as a Delaware statutory trust and offers seven separate Portfolios. These financial statements and the related notes pertain to Macquarie Large Cap Value Portfolio, Macquarie Core Plus Bond Portfolio, Macquarie High Yield Bond Portfolio, Macquarie Emerging Markets Portfolio, Macquarie Emerging Markets Portfolio II, and Macquarie Labor Select International Equity Portfolio, (each, a Portfolio, and collectively, the Portfolios). Delaware REIT Fund is included in a separate report. The Trust is an open-end investment company. Each Portfolio is considered diversified under the Investment Company Act of 1940, as amended. Each Portfolio offers one class of shares.
The investment objective of Macquarie Large Cap Value Portfolio is to seek long-term capital appreciation.
The investment objective of Macquarie Core Plus Bond Portfolio is to seek maximum long-term total return, consistent with reasonable risk.
The investment objective of Macquarie High Yield Bond Portfolio is to seek high total return.
The investment objective of Macquarie Emerging Markets Portfolio is to seek long-term capital appreciation.
The investment objective of Macquarie Emerging Markets Portfolio II is to seek long-term capital appreciation.
The investment objective of Macquarie Labor Select International Equity Portfolio is to seek maximum long-term total return.
1. Significant Accounting Policies
Each Portfolio is an investment company and follows accounting and reporting guidance under Financial Accounting Standards Board (FASB) Accounting Standards Codification Topic 946, Financial Services – Investment Companies. The following accounting policies are in accordance with US generally accepted accounting principles (US GAAP) and are consistently followed by the Portfolios.
Security Valuation — Equity securities and exchange-traded funds (ETFs), except those traded on the Nasdaq Stock Market LLC (Nasdaq), are valued at the last quoted sales price as of the time of the regular close of the New York Stock Exchange on the valuation date. Equity securities and ETFs traded on the Nasdaq are valued in accordance with the Nasdaq Official Closing Price, which may not be the last sales price. If, on a particular day, an equity security or ETF does not trade, the mean between the bid and ask prices will be used, which approximates fair value. Equity securities listed on a foreign exchange are normally valued at the last quoted sales price on the valuation date. US government and agency securities are valued at the mean between the bid and ask prices, which approximates fair value. Other debt securities, credit default swap (CDS) contracts, and interest rate swap contracts are valued based upon valuations provided by an independent pricing service or broker/counterparty and reviewed by management. To the extent current market prices are not available, the pricing service may take into account developments related to the specific security, as well as transactions in comparable securities. Valuations for fixed income securities utilize matrix systems, which reflect such factors as security prices, yields, maturities, and ratings, and are supplemented by dealer and exchange quotations. For asset-backed securities, collateralized mortgage obligations, commercial mortgage securities, and US government agency mortgage securities, pricing vendors utilize matrix pricing which considers prepayment speed, attributes of the collateral, yield or price of bonds of comparable quality, coupon, maturity, and type as well as broker/dealer-supplied prices. Swap prices are derived using daily swap curves and models that incorporate a number of market data factors, such as discounted cash flows, trades, and values of the underlying reference instruments. Foreign currency exchange contracts and foreign cross currency exchange contracts are valued at the mean between the bid and ask prices, which approximates fair value. Interpolated values are derived when the settlement date of the contract is an interim date for which quotations are not available. Futures contracts and options on futures contracts are valued at the daily quoted settlement prices. Exchange-traded options are valued at the last reported sale price or, if no sales are reported, at the mean between the last reported bid and ask prices, which approximates fair value. Generally, other securities and assets for which market quotations are not readily available are valued at fair value as determined in good faith under the direction of the Trust’s Board of Trustees (Board). In determining whether market quotations are readily available or fair valuation will be used, various factors will be taken into consideration, such as market closures or suspension of trading in a security. The Portfolios may use fair value pricing more frequently for securities traded primarily in non-US markets because, among other things, most foreign markets close well before the Portfolios value their securities, generally as of 4:00pm Eastern time. The earlier close of these foreign markets gives rise to the possibility that significant events, including broad market moves, government actions or pronouncements, aftermarket trading, or news events may have occurred in the interim. Whenever such a significant event occurs, the Portfolios may value foreign securities using fair value prices based on third-party vendor modeling tools (international fair value pricing). Restricted securities are valued at fair value using methods approved by the Board.
Federal and Foreign Income Taxes — No provision for federal income taxes has been made as each Portfolio intends to continue to qualify for federal income tax purposes as a regulated investment company under Subchapter M of the Internal Revenue Code of 1986, as amended,
Notes to financial statements
Macquarie Institutional Portfolios
1. Significant Accounting Policies (continued)
and make the requisite distributions to shareholders. The Portfolios evaluate tax positions taken or expected to be taken in the course of preparing each Portfolio’s tax returns to determine whether the tax positions are “more-likely-than-not” of being sustained by the applicable tax authority. Tax positions not deemed to meet the “more-likely-than-not” threshold are recorded as a tax benefit or expense in the current year. Management has analyzed each Portfolio’s tax positions taken or expected to be taken on the Portfolios’ federal income tax returns through the year ended Oct. 31, 2018 and for all open tax years (years ended Oct. 31, 2015–Oct 31, 2017), and has concluded that no provision for federal income tax is required in any Portfolio’s financial statements. In regard to foreign taxes only, each Portfolio has open tax years in certain foreign countries in which it invests that may date back to the inception of each Portfolio. If applicable, each Portfolio recognizes interest accrued on unrecognized tax benefits in interest expense and penalties in other expenses on the “Statements of operations.” During the year ended Oct. 31, 2018, the Portfolios did not incur any interest or tax penalties.
Repurchase Agreements — Each Portfolio may purchase certain US government securities subject to the counterparty’s agreement to repurchase them at an agreed upon date and price. The counterparty will be required on a daily basis to maintain the value of the collateral subject to the agreement at not less than the repurchase price (including accrued interest). The agreements are conditioned upon the collateral being deposited under the Federal Reserve book-entry system with each Portfolio’s custodian or a third-party sub-custodian. In the event of default or bankruptcy by the other party to the agreement, retention of the collateral may be subject to legal proceedings. All open repurchase agreements as of the date of this report were entered into on Oct. 31, 2018, and matured on the next business day.
To Be Announced Trades (TBA) — Certain Portfolios may contract to purchase or sell securities for a fixed price at a transaction date beyond the customary settlement period (examples: when issued, delayed delivery, forward commitment, or TBA transactions) consistent with each Portfolio’s ability to manage its investment portfolio and meet redemption requests. These transactions involve a commitment by each Portfolio to purchase or sell securities for a predetermined price or yield with payment and delivery taking place more than three days in the future, or after a period longer than the customary settlement period for that type of security. No interest will be earned by each Portfolio on such purchases until the securities are delivered or the transaction is completed; however, the market value may change prior to delivery.
Foreign Currency Transactions — Transactions denominated in foreign currencies are recorded at the prevailing exchange rates on the valuation date in accordance with each Portfolio’s prospectus. The value of all assets and liabilities denominated in foreign currencies is translated daily into US dollars at the exchange rate of such currencies against the US dollar. Transaction gains or losses resulting from changes in exchange rates during the reporting period or upon settlement of the foreign currency transaction are reported in operations for the current period. Each Portfolio generally bifurcates that portion of realized gains and losses on investments in debt securities which is due to changes in foreign exchange rates from that which is due to changes in market prices of debt securities. That portion of gains (losses), which is due to changes in foreign exchange rates, is included on the “Statements of operations” under “Net realized gain (loss) on foreign currencies.” For foreign equity securities, these changes are included on the “Statements of operations” under “Net realized and unrealized gain (loss) on investments.” Each Portfolio reports certain foreign currency related transactions as components of realized gains (losses) for financial reporting purposes, whereas such components are treated as ordinary income (loss) for federal income tax purposes.
Use of Estimates — The preparation of financial statements in conformity with US GAAP requires management to make estimates and assumptions that affect the fair value of investments, the reported amounts of assets and liabilities and disclosure of contingent assets and liabilities at the date of the financial statements, and the reported amounts of revenues and expenses during the reporting period. Actual results could differ from those estimates and the differences could be material.
Reimbursement Fees — Macquarie Emerging Markets Portfolio may charge a 0.40% purchase reimbursement fee and a 0.45% redemption reimbursement fee. These fees are designed to reflect an approximation of the brokerage and other transaction costs associated with the investment of an investor’s purchase amount or the disposition of assets to meet redemptions, and to limit the extent to which the Portfolio (and, indirectly, the Portfolio’s existing shareholders) would have to bear such costs. These fees are accounted for as an addition to paid-in capital for the Portfolio in the “Statements of changes in net assets.”
Other — Expenses directly attributable to a Portfolio are charged directly to that Portfolio. Other expenses common to various funds within Delaware Funds® by Macquarie (Delaware Funds) are generally allocated among such funds on the basis of average net assets. Management fees and certain other expenses are paid monthly. Security transactions are recorded on the date the securities are purchased or sold (trade date) for financial reporting purposes. Costs used in calculating realized gains and losses on the sale of investment securities are those of the specific securities sold. Dividend income is recorded on the ex-dividend date and interest income is recorded on the accrual basis. Discounts and premiums on debt securities are accreted or amortized to interest income, respectively, over the lives of the respective securities using the
94
effective interest method. Realized gains (losses) on paydowns of asset- and mortgage-backed securities are classified as interest income. Distributions received from investments in real estate investment trusts (REITs) are recorded as dividend income on the ex-dividend date, subject to reclassification upon notice of the character of such distributions by the issuer. Foreign dividends are also recorded on the ex-dividend date or as soon after the ex-dividend date that a Portfolio is aware of such dividends, net of all tax withholdings, a portion of which may be reclaimable. Withholding taxes and reclaims on foreign dividends and interest have been recorded in accordance with each Portfolio’s understanding of the applicable country’s tax rules and rates. Each Portfolio may pay foreign capital gains taxes on certain foreign securities held, which are reported as components of realized losses for financial reporting purposes, whereas such components are treated as ordinary loss for federal income tax purposes. The Portfolios will accrue such taxes as applicable based upon current interpretations of the tax rules and regulations that exist in the markets in which they invest.
Each Portfolio declares and pays dividends from net investment income and distributions from net realized gain on investments, if any, annually. Each Portfolio may distribute more frequently, if necessary for tax purposes. Dividends and distributions, if any, are recorded on the ex-dividend date.
Subject to seeking best execution, each Portfolio may direct certain security trades to brokers who have agreed to rebate a portion of the related brokerage commission to each Portfolio in cash. In general, best execution refers to many factors, including the price paid or received for a security, the commission charged, the promptness and reliability of execution, the confidentiality and placement accorded the order, and other factors affecting the overall benefit obtained by the Portfolio on the transaction. Such commission rebates are included in realized gain on investments in the accompanying financial statements. There were no commission rebates for the year ended Oct. 31, 2018.
Each Portfolio receives earnings credits from its custodian when positive cash balances are maintained, which may be used to offset custody fees. The expense paid under this arrangement is included on the “Statements of operations” under “Custodian fees” with the corresponding expense offset included in “Less expenses paid indirectly.” For the year ended Oct. 31, 2018, custody credits are as follows:
| | | | | |
| | | Custody Credits |
Macquarie Large Cap Value Portfolio | | | $ | 62 | |
Macquarie Core Plus Bond Portfolio | | | | 2,517 | |
Macquarie High Yield Bond Portfolio | | | | 700 | |
Macquarie Emerging Markets Portfolio | | | | 240 | |
Macquarie Emerging Markets Portfolio II | | | | 1 | |
Macquarie Labor Select International Equity Portfolio | | | | 1,203 | |
Each Portfolio receives earnings credits from its transfer agent when positive cash balances are maintained, which may be used to offset transfer agent fees. If the amount earned is greater than $1, the expense paid under this arrangement is included on the “Statements of operations” under “Dividend disbursing and transfer agent fees and expenses” with the corresponding expense offset included under “Less expense paid indirectly.” For the year ended Oct. 31, 2018, earnings credits are as follows:
| | | | | |
| | | Earnings Credits |
Macquarie Large Cap Value Portfolio | | | $ | 2 | |
Macquarie Core Plus Bond Portfolio | | | | 1 | |
Macquarie High Yield Bond Portfolio | | | | 2 | |
Macquarie Emerging Markets Portfolio | | | | 1 | |
Macquarie Emerging Markets Portfolio II | | | | 2 | |
Macquarie Labor Select International Equity Portfolio | | | | 3 | |
2. Investment Management, Administration Agreements, and Other Transactions with Affiliates
In accordance with the terms of the respective investment management agreements, Delaware Management Company (DMC), a series of Macquarie Investment Management Business Trust and the investment manager of the Portfolios, will receive an annual fee, which is calculated daily and paid monthly based on the average daily net assets of each Portfolio.
DMC has contractually agreed to waive that portion, if any, of its management fees and/or pay/reimburse each Portfolio (except for Macquarie Labor Select International Equity Portfolio and Macquarie Emerging Markets Portfolio) to the extent necessary to ensure that annual operating expenses (excluding any distribution and service (12b-1) fees, taxes, interest, acquired fund fees and expenses, short sale, dividend and interest expenses, brokerage fees, certain insurance costs, and nonroutine expenses or costs, including, but not limited to, those relating to reorganizations, litigation, conducting shareholder meetings, and liquidations) do not exceed specified percentages of average daily net assets
Notes to financial statements
Macquarie Institutional Portfolios
2. Investment Management, Administration Agreements, and Other Transactions with Affiliates (continued)
of each Portfolio from Nov. 1, 2017 through Oct. 31, 2018.* For purposes of these waivers and reimbursements, nonroutine expenses may also include such additional costs and expenses as may be agreed upon from time to time by the Portfolios’ Board and DMC. These expense waivers and reimbursements apply only to expenses paid directly by the Portfolios and may only be terminated by agreement of DMC and the Portfolios. The waivers and reimbursements are accrued daily and received monthly.
The management fee rates and the operating expense limitation rates in effect for the year ended Oct. 31, 2018, are as follows:
| | | | | | | | | | |
| | | Management fee as a percentage of average daily
net assets (per annum) | | Contractual operating expense
limitation as a percentage of average daily
net assets (per annum)† |
Macquarie Large Cap Value Portfolio | | | | 0.55 | % | | | | 0.70 | % |
Macquarie Core Plus Bond Portfolio | | | | 0.43 | % | | | | 0.45 | % |
Macquarie High Yield Bond Portfolio | | | | 0.45 | % | | | | 0.59 | % |
Macquarie Emerging Markets Portfolio | | | | 1.00 | % | | | | N/A | |
Macquarie Emerging Markets Portfolio II | | | | 1.00 | % | | | | 1.20 | % |
Macquarie Labor Select International Equity Portfolio | | | | 0.75 | % | | | | N/A | |
| † | These operating expense limitations exclude certain expenses, such as 12b-1 fees, taxes, interest, short sale dividend and interest expenses, acquired fund fees and expenses, brokerage fees, certain insurance costs, and nonroutine expenses or costs, including, but not limited to, those relating to reorganizations, litigation, conducting shareholder meetings, and liquidations. In some instances, a Portfolio’s annual operating expenses may be lower than the contracted operating expense limitations. |
Mondrian Investment Partners Limited (Mondrian) furnishes investment sub-advisory services to Macquarie Emerging Markets Portfolio and Macquarie Labor Select International Equity Portfolio. For these services, DMC, not the Portfolios, pays Mondrian the following percentages of the Portfolios’ average daily net assets:
| | | | | |
| | | Sub-advisory fee as a
percentage of average daily
net assets (per annum) |
Macquarie Emerging Markets Portfolio | | | | 0.75 | % |
Macquarie Labor Select International Equity Portfolio | | | | 0.30 | % |
Delaware Investments Fund Services Company (DIFSC), an affiliate of DMC, provides fund accounting and financial administration oversight services to each Portfolio. For these services DIFSC’s fees are calculated daily and paid monthly based on the aggregate daily net assets of all funds within the Delaware Funds at the following annual rate: 0.00475% of the first $35 billion; 0.0040% of the next $10 billion; and 0.0025% of aggregate average daily net assets in excess of $45 billion (Total Fee). Each Fund in the Delaware Funds pays a minimum of $4,000, which, in aggregate, is subtracted from the Total Fee. Each Fund in the Delaware Funds then pays its relative portion of the remainder of the Total Fee on a relative net asset value (NAV) basis. These amounts are included on the “Statements of operations” under “Accounting and administrative expenses.”
For the year ended Oct. 31, 2018, each Portfolio was charged for these services as follows:
| | | | |
Macquarie Large Cap Value Portfolio | | $ | 8,879 | |
Macquarie Core Plus Bond Portfolio | | | 12,211 | |
Macquarie High Yield Bond Portfolio | | | 7,648 | |
Macquarie Emerging Markets Portfolio | | | 8,385 | |
Macquarie Emerging Markets Portfolio II | | | 5,422 | |
Macquarie Labor Select International Equity Portfolio | | | 21,333 | |
96
DIFSC is also the transfer agent and dividend disbursing agent of each Portfolio. For these services, DIFSC’s fees are calculated daily and paid monthly at the annual rate of 0.0075% of each Portfolio’s average daily net assets. These amounts are included on the “Statements of operations” under “Dividend disbursing and transfer agent fees and expenses.” For the year ended Oct. 31, 2018, each Portfolio was charged for these services as follows:
| | | | |
Macquarie Large Cap Value Portfolio | | $ | 9,697 | |
Macquarie Core Plus Bond Portfolio | | | 16,331 | |
Macquarie High Yield Bond Portfolio | | | 7,248 | |
Macquarie Emerging Markets Portfolio | | | 8,713 | |
Macquarie Emerging Markets Portfolio II | | | 2,826 | |
Macquarie Labor Select International Equity Portfolio | | | 34,457 | |
Pursuant to a sub-transfer agency agreement between DIFSC and BNY Mellon Investment Servicing (US) Inc. (BNYMIS), BNYMIS provides certain sub-transfer agency services to each Portfolio. Sub-transfer agency fees are paid by each Portfolio and are also included on the “Statements of operations” under “Dividend disbursing and transfer agent fees and expenses.”
As provided in the investment management agreement, each Portfolio bears a portion of the cost of certain resources shared with DMC, including the cost of internal personnel of DMC and/or its affiliates that provide legal, tax, and regulatory reporting services to the Portfolios. These amounts are included on the “Statements of operations” under “Legal fees.” For the year ended Oct. 31, 2018, each Portfolio was charged for internal legal, tax, and regulatory reporting services provided by DMC and/or its affiliates’ employees as follows:
| | | | |
Macquarie Large Cap Value Portfolio | | $ | 28,737 | |
Macquarie Core Plus Bond Portfolio | | | 18,850 | |
Macquarie High Yield Bond Portfolio | | | 8,087 | |
Macquarie Emerging Markets Portfolio | | | 14,218 | |
Macquarie Emerging Markets Portfolio II | | | 5,695 | |
Macquarie Labor Select International Equity Portfolio | | | 39,954 | |
Trustees’ fees include expenses accrued by each Portfolio for each Trustee’s retainer and meeting fees. Certain officers of DMC, DIFSC, and DDLP are officers and/or Trustees of the Trust. These officers and Trustees are paid no compensation by the Portfolios.
Cross trades for the year ended Oct. 31, 2018, were executed by Macquarie High Yield Bond Portfolio pursuant to procedures adopted by the Board designed to ensure compliance with Rule 17a-7 under the 1940 Act. Cross trading is the buying or selling of portfolio securities between funds of investment companies, or between a fund of an investment company and another entity, that are or could be considered affiliates by virtue of having a common investment advisor (or affiliated investment advisors), common directors/trustees and/or common officers. At their regularly scheduled meetings, the Board reviews such transactions for compliance with the procedures adopted by the Board. Pursuant to these procedures, for the year ended Oct. 31, 2018, Macquarie High Yield Bond Portfolio engaged in Rule 17a-7 securities purchases of $2,571,806 and Rule 17a-7 securities sales of $9,327,507, which resulted in net realized gains of $1,617.
| * | The aggregate contractual waiver period covering this report is from Feb. 28, 2017 through Feb. 28, 2019. |
3. Investments
For the year ended Oct. 31, 2018, each Portfolio made purchases and sales of investment securities other than short-term investments as follows:
| | | | | | | | | | | | | | | | |
| | | Purchases
other than
US government
securities | | | Purchases of
US government
securities | | | Sales
other than
US government
securities | | | Sales of
US government
securities | |
Macquarie Large Cap Value Portfolio | | $ | 19,919,257 | | | $ | — | | | $ | 92,183,765 | | | $ | — | |
Macquarie Core Plus Bond Portfolio | | | 196,558,827 | | | | 236,484,525 | | | | 155,075,227 | | | | 204,611,627 | |
Macquarie High Yield Bond Portfolio | | | 101,958,507 | | | | — | | | | 127,625,039 | | | | — | |
Macquarie Emerging Markets Portfolio | | | 45,764,242 | | | | — | | | | 90,223,264 | | | | — | |
Macquarie Emerging Markets Portfolio II | | | 4,417,027 | | | | — | | | | 17,948,116 | | | | — | |
Macquarie Labor Select International Equity Portfolio | | | 90,474,102 | | | | — | | | | 130,083,518 | | | | — | |
Notes to financial statements
Macquarie Institutional Portfolios
3. Investments (continued)
The tax cost of investments includes adjustments to net unrealized appreciation (depreciation) which may not necessarily be final tax cost basis adjustments, but approximate the tax basis unrealized gains and losses that may be realized and distributed to shareholders. At Oct. 31, 2018, the cost and unrealized appreciation (depreciation) of investments and derivatives for federal income tax purposes for each Portfolio were as follows:
| | | | | | | | | | | | | | | | |
| | | Cost of
investments
and derivatives | | | Aggregate
unrealized
appreciation of investments
and derivatives | | | Aggregate
unrealized
depreciation of investments
and derivatives | | | Net unrealized
appreciation of investments
and derivatives | |
Macquarie Large Cap Value Portfolio | | $ | 93,680,930 | | | $ | 18,365,758 | | | $ | (5,374,771 | ) | | $ | 12,990,987 | |
Macquarie Core Plus Bond Portfolio | | | 226,384,706 | | | | 1,121,604 | | | | (6,336,959 | ) | | | (5,215,355 | ) |
Macquarie High Yield Bond Portfolio | | | 79,138,565 | | | | 153,312 | | | | (2,653,412 | ) | | | (2,500,100 | ) |
Macquarie Emerging Markets Portfolio | | | 88,243,961 | | | | 7,249,063 | | | | (16,434,877 | ) | | | (9,185,814 | ) |
Macquarie Emerging Markets Portfolio II | | | 24,919,887 | | | | 6,482,003 | | | | (4,374,521 | ) | | | 2,107,482 | |
Macquarie Labor Select International Equity Portfolio | | | 427,349,552 | | | | 34,759,937 | | | | (57,936,589 | ) | | | (23,176,652 | ) |
US GAAP defines fair value as the price that each Portfolio would receive to sell an asset or pay to transfer a liability in an orderly transaction between market participants at the measurement date under current market conditions. A three-level hierarchy for fair value measurements has been established based upon the transparency of inputs to the valuation of an asset or liability. Inputs may be observable or unobservable and refer broadly to the assumptions that market participants would use in pricing the asset or liability. Observable inputs reflect the assumptions market participants would use in pricing the asset or liability based on market data obtained from sources independent of the reporting entity. Unobservable inputs reflect the reporting entity’s own assumptions about the assumptions that market participants would use in pricing the asset or liability based on the best information available under the circumstances. Each Portfolio’s investment in its entirety is assigned a level based upon the observability of the inputs which are significant to the overall valuation. The three-level hierarchy of inputs is summarized below.
| | | | |
| Level 1 | | – | | Inputs are quoted prices in active markets for identical investments. (Examples: equity securities, open-end investment companies, futures contracts, exchange-traded options contracts) |
| | |
| Level 2 | | – | | Other observable inputs, including, but not limited to: quoted prices for similar assets or liabilities in markets that are active, quoted prices for identical or similar assets or liabilities in markets that are not active, inputs other than quoted prices that are observable for the assets or liabilities (such as interest rates, yield curves, volatilities, prepayment speeds, loss severities, credit risks, and default rates), or other market-corroborated inputs. (Examples: debt securities, government securities, swap contracts, foreign currency exchange contracts, foreign securities utilizing international fair value pricing, broker-quoted securities, fair valued securities) |
| | |
| Level 3 | | – | | Significant unobservable inputs, including each Portfolio’s own assumptions used to determine the fair value of investments. (Examples: broker-quoted securities, fair valued securities) |
Level 3 investments are valued using significant unobservable inputs. Each Portfolio may also use an income-based valuation approach in which the anticipated future cash flows of the investment are discounted to calculate fair value. Discounts may also be applied due to the nature or duration of any restrictions on the disposition of the investments. Valuations may also be based upon current market prices of securities that are comparable in coupon, rating, maturity, and industry. The derived value of a Level 3 investment may not represent the value which is received upon disposition and this could impact the results of operations.
98
The following table summarizes the valuation of Macquarie Large Cap Value Portfolio’s investments by fair value hierarchy levels as of Oct. 31, 2018:
| | | | | | | | | | | | |
| | | Level 1 | | | Level 2 | | | Total | |
Securities | | | | | | | | | | | | |
Assets: | | | | | | | | | | | | |
Common Stock | | $ | 105,522,906 | | | $ | — | | | $ | 105,522,906 | |
Short-Term Investments | | | — | | | | 1,149,011 | | | | 1,149,011 | |
| | | | | | | | | | | | |
Total Value of Securities | | $ | 105,522,906 | | | $ | 1,149,011 | | | $ | 106,671,917 | |
| | | | | | | | | | | | |
The following table summarizes the valuation of Macquarie Core Plus Bond Portfolio’s investments by fair value hierarchy levels as of Oct. 31, 2018:
| | | | | | | | | | | | | | | | |
| | | Level 1 | | | Level 2 | | | Level 3 | | | Total | |
Securities | | | | | | | | | | | | | | | | |
Assets: | | | | | | | | | | | | | | | | |
Agency, Asset- &
Mortgage-Backed Securities1 | | $ | — | | | $ | 76,978,435 | | | $ | 504,950 | | | $ | 77,483,385 | |
Corporate Debt | | | — | | | | 89,625,230 | | | | — | | | | 89,625,230 | |
Municipal Bonds | | | — | | | | 254,684 | | | | — | | | | 254,684 | |
Foreign Debt | | | — | | | | 3,269,013 | | | | — | | | | 3,269,013 | |
Loan Agreements | | | — | | | | 18,241,448 | | | | — | | | | 18,241,448 | |
US Treasury Obligations | | | — | | | | 27,642,473 | | | | — | | | | 27,642,473 | |
Convertible Preferred Stock | | | — | | | | 748,526 | | | | — | | | | 748,526 | |
Preferred Stock | | | — | | | | 236,865 | | | | — | | | | 236,865 | |
Short-Term Investments | | | — | | | | 3,489,033 | | | | — | | | | 3,489,033 | |
| | | | | | | | | | | | | | | | |
Total Value of Securities | | $ | — | | | $ | 220,485,707 | | | $ | 504,950 | | | $ | 220,990,657 | |
| | | | | | | | | | | | | | | | |
| | | | |
Derivatives2 | | | | | | | | | | | | | | | | |
Assets: | | | | | | | | | | | | | | | | |
Foreign Currency Exchange Contracts | | $ | — | | | $ | 941 | | | $ | — | | | $ | 941 | |
Futures Contracts | | | 200,570 | | | | — | | | | — | | | | 200,570 | |
Liabilities: | | | | | | | | | | | | | | | | |
Foreign Currency Exchange Contracts | | $ | — | | | $ | (3,424 | ) | | $ | — | | | $ | (3,424 | ) |
Futures Contracts | | | (1,234 | ) | | | — | | | | — | | | | (1,234 | ) |
Swap Contracts | | | — | | | | (18,159 | ) | | | — | | | | (18,159 | ) |
1Security type is valued across multiple levels. Level 2 investments represent investments with observable inputs or matrix-priced investments and Level 3 investments represent investments without observable inputs. The amounts attributed to Level 2 investments and Level 3 investments represent the following percentages of the total market value of these security types:
| | | | | | | | | | | | |
| | | Level 2 | | | Level 3 | | | Total | |
Agency, Asset-Backed &
Mortgage-Backed Securities | | | 98.89 | % | | | 1.11 | % | | | 100.00 | % |
2 Foreign Currency Exchange Contracts, Futures Contracts, and Swap Contracts are valued at the unrealized appreciation (depreciation) on the instrument at the year end.
Notes to financial statements
Macquarie Institutional Portfolios
3. Investments (continued)
The following table summarizes the valuation of Macquarie High Yield Bond Portfolio’s investments by fair value hierarchy levels as of Oct. 31, 2018:
| | | | | | | | | | | | | | | |
| | | Level 2 | | Level 3 | | Total |
Securities | | | | | | | | | | | | | | | |
Assets: | | | | | | | | | | | | | | | |
Corporate Debt | | | $ | 69,821,534 | | | | $ | — | | | | $ | 69,821,534 | |
Loan Agreements | | | | 4,964,914 | | | | | — | | | | | 4,964,914 | |
Common Stock | | | | — | | | | | — | | | | | — | |
Short-Term Investments | | | | 1,852,017 | | | | | — | | | | | 1,852,017 | |
| | | | | | | | | | | | | | | |
Total Value of Securities | | | $ | 76,638,465 | | | | $ | — | | | | $ | 76,638,465 | |
| | | | | | | | | | | | | | | |
The security that has been valued at zero on the “Schedules of investments” is considered to be Level 3 investment in this table.
100
The following table summarizes the valuation of Macquarie Emerging Markets Portfolio’s investments by fair value hierarchy levels as of Oct. 31, 2018:
| | | | | | | | | | | | |
| | | Level 1 | | | Level 2 | | | Total | |
Securities | | | | | | | | | | | | |
Assets: | | | | | | | | | | | | |
Common Stock | | | | | | | | | | | | |
Brazil | | $ | 8,418,293 | | | $ | — | | | $ | 8,418,293 | |
China/Hong Kong | | | — | | | | 20,292,950 | | | | 20,292,950 | |
India | | | — | | | | 10,914,258 | | | | 10,914,258 | |
Indonesia | | | — | | | | 1,079,811 | | | | 1,079,811 | |
Malaysia | | | — | | | | 2,822,747 | | | | 2,822,747 | |
Mexico | | | 1,287,973 | | | | — | | | | 1,287,973 | |
Peru | | | 878,463 | | | | — | | | | 878,463 | |
Philippines | | | — | | | | 809,542 | | | | 809,542 | |
Qatar | | | — | | | | 888,148 | | | | 888,148 | |
Republic of Korea | | | — | | | | 11,690,309 | | | | 11,690,309 | |
Romania | | | — | | | | 255,052 | | | | 255,052 | |
Russia | | | — | | | | 3,815,215 | | | | 3,815,215 | |
South Africa | | | — | | | | 714,515 | | | | 714,515 | |
Taiwan | | | — | | | | 7,254,324 | | | | 7,254,324 | |
Thailand | | | 746,074 | | | | 750,652 | | | | 1,496,726 | |
Turkey | | | — | | | | 1,246,114 | | | | 1,246,114 | |
United Arab Emirates | | | — | | | | 1,008,540 | | | | 1,008,540 | |
United Kingdom | | | — | | | | 1,245,685 | | | | 1,245,685 | |
Preferred Stock | | | 2,410,411 | | | | — | | | | 2,410,411 | |
Short-Term Investments | | | — | | | | 529,005 | | | | 529,005 | |
| | | | | | | | | | | | |
Total Value of Securities | | $ | 13,741,214 | | | $ | 65,316,867 | | | $ | 79,058,081 | |
| | | | | | | | | | | | |
| | | |
Derivatives1 | | | | | | | | | | | | |
Assets: | | | | | | | | | | | | |
Foreign Currency Exchange Contract | | | $— | | | | $165 | | | | $165 | |
Liabilities: | | | | | | | | | | | | |
Foreign Currency Exchange Contract | | | $— | | | | $(99) | | | | $(99) | |
1Foreign Currency Exchange Contracts are valued at the unrealized appreciation (depreciation) on the instrument at the year end.
Notes to financial statements
Macquarie Institutional Portfolios
3. Investments (continued)
The following table summarizes the valuation of Macquarie Emerging Markets Portfolio II’s investments by fair value hierarchy levels as of Oct. 31, 2018:
| | | | | | | | | | | | |
| | | Level 1 | | | Level 2 | | | Total | |
Securities | | | | | | | | | | | | |
Assets: | | | | | | | | | | | | |
Common Stock | | | | | | | | | | | | |
Argentina | | $ | 106,960 | | | $ | — | | | $ | 106,960 | |
Bahrain | | | 13,850 | | | | — | | | | 13,850 | |
Brazil | | | 3,674,160 | | | | — | | | | 3,674,160 | |
China/Hong Kong | | | 4,949,957 | | | | 3,343,553 | | | | 8,293,510 | |
India | | | 84,249 | | | | 2,705,041 | | | | 2,789,290 | |
Indonesia | | | — | | | | 305,701 | | | | 305,701 | |
Malaysia | | | — | | | | 50,599 | | | | 50,599 | |
Mexico | | | 1,352,883 | | | | — | | | | 1,352,883 | |
Netherlands | | | 78,233 | | | | — | | | | 78,233 | |
Peru | | | 225,592 | | | | — | | | | 225,592 | |
Republic of Korea | | | 1,181,496 | | | | 3,254,818 | | | | 4,436,314 | |
Russia | | | 522,765 | | | | 1,499,289 | | | | 2,022,054 | |
Taiwan | | | 767,120 | | | | 1,658,802 | | | | 2,425,922 | |
Thailand | | | 167,034 | | | | — | | | | 167,034 | |
Turkey | | | 91,848 | | | | 358,116 | | | | 449,964 | |
United States | | | 402,450 | | | | — | | | | 402,450 | |
Preferred Stock | | | 43,885 | | | | 188,968 | | | | 232,853 | |
| | | | | | | | | | | | |
Total Value of Securities | | $ | 13,662,482 | | | $ | 13,364,887 | | | $ | 27,027,369 | |
| | | | | | | | | | | | |
1Foreign Currency Exchange Contracts are valued at the unrealized appreciation (depreciation) on the instrument at the year end.
102
The following table summarizes the valuation of Macquarie Labor Select International Equity Portfolio’s investments by fair value hierarchy levels as of Oct. 31, 2018:
| | | | | | | | | | | | |
| | | Level 1 | | | Level 2 | | | Total | |
Securities | | | | | | | | | | | | |
Assets: | | | | | | | | | | | | |
Common Stock | | $ | — | | | $ | 400,254,066 | | | $ | 400,254,066 | |
Preferred Stock | | | — | | | | 526,689 | | | | 526,689 | |
Rights | | | 73,880 | | | | — | | | | 73,880 | |
Short-Term Investments | | | — | | | | 3,319,031 | | | | 3,319,031 | |
| | | | | | | | | | | | |
Total Value of Securities | | $ | 73,880 | | | $ | 404,099,786 | | | $ | 404,173,666 | |
| | | | | | | | | | | | |
Derivatives1 | | | | | | | | | | | | |
Assets: | | | | | | | | | | | | |
Foreign Currency Exchange Contracts | | $ | — | | | $ | 193 | | | $ | 193 | |
Liabilities: | | | | | | | | | | | | |
Foreign Currency Exchange Contracts | | | — | | | $ | (959 | ) | | | (959 | ) |
1Foreign Currency Exchange Contracts are valued at the unrealized appreciation (depreciation) on the instrument at the year end.
The securities that have been valued at zero on the “Schedules of investments” are considered to be Level 3 securities in these tables.
As a result of utilizing international fair value pricing at Oct. 31, 2018, a majority of the common stock of Macquarie Emerging Markets Portfolio, a portion of the common stock of Macquarie Emerging Markets Portfolio II and all of the common stock of Macquarie Labor Select International Equity Portfolio was categorized as Level 2.
During the year ended Oct. 31, 2018, there were no transfers between Level 1 investments, Level 2 investments, or Level 3 investments that had a significant impact to each Portfolio. This does not include transfers between Level 1 investments and Level 2 investments due to each Portfolio utilizing international fair value pricing during the year. In accordance with the fair valuation procedures described in Note 1, international fair value pricing of securities in each Portfolio occurs when market volatility exceeds an established rolling threshold. If the threshold is exceeded on a given date, then prices of international securities (those that traded on exchanges that close at a different time than the time that each Portfolio’s NAV is determined) are established using a separate pricing feed from a third party vendor designed to establish a price for each such security as of the time that each Portfolio’s NAV is determined. Further, international fair value pricing uses other observable market-based inputs in place of the closing exchange price due to the events occurring after the close of the exchange or market on which the investment is principally traded, causing a change in classification between levels. Each Portfolio’s policy is to recognize transfers between levels based on fair value at the beginning of the reporting period.
A reconciliation of Level 3 investments is presented when a Portfolio has a significant amount of Level 3 investments at the beginning, interim, or end of the period in relation to the Portfolio’s net assets. Management has determined not to provide a reconciliation of Level 3 investments as they were not considered significant to each Portfolio’s net assets at the beginning, interim, or end of the period. Management has determined not to provide additional disclosure on Level 3 inputs since the Level 3 investments were not considered significant to each Portfolio’s net assets at the end of the period.
Notes to financial statements
Macquarie Institutional Portfolios
4. Dividend and Distribution Information
Income and long-term capital gain distributions are determined in accordance with federal income tax regulations, which may differ from US GAAP. Additionally, distributions from net gains on foreign currency transactions and net short-term gains on sales of investment securities are treated as ordinary income for federal income tax purposes. The tax character of dividends and distributions paid during the years ended Oct. 31, 2018 and 2017 was as follows:
| | | | | | | | | | | | |
| | | Ordinary
income | | | Long-term
capital gain | | | Total | |
Year ended Oct. 31, 2018: | | | | | | | | | | | | |
Macquarie Large Cap Value Portfolio | | $ | 3,934,074 | | | $ | 15,301,349 | | | $ | 19,235,423 | |
Macquarie Core Plus Bond Portfolio | | | 5,030,141 | | | | — | | | | 5,030,141 | |
Macquarie High Yield Bond Portfolio | | | 7,953,373 | | | | — | | | | 7,953,373 | |
Macquarie Emerging Markets Portfolio | | | 5,300,800 | | | | — | | | | 5,300,800 | |
Macquarie Emerging Markets Portfolio II | | | 1,139,072 | | | | — | | | | 1,139,072 | |
Macquarie Labor Select International Equity Portfolio | | | 14,155,472 | | | | — | | | | 14,155,472 | |
| | | Ordinary
income | | | Long-term
capital gain | | | Total | |
Year ended Oct. 31, 2017: | | | | | | | | | | | | |
Macquarie Large Cap Value Portfolio | | $ | 5,637,723 | | | $ | 5,817,217 | | | $ | 11,454,940 | |
Macquarie Core Plus Bond Portfolio | | | 3,413,875 | | | | — | | | | 3,413,875 | |
Macquarie High Yield Bond Portfolio | | | 13,576,518 | | | | — | | | | 13,576,518 | |
Macquarie Emerging Markets Portfolio | | | 4,559,146 | | | | — | | | | 4,559,146 | |
Macquarie Emerging Markets Portfolio II | | | 419,713 | | | | — | | | | 419,713 | |
Macquarie Labor Select International Equity Portfolio | | | 12,309,632 | | | | — | | | | 12,309,632 | |
5. Components of Net Assets on a Tax Basis
As of Oct. 31, 2018, the components of net assets on a tax basis were as follows:
| | | | | | | | | | | | |
| | | Macquarie
Large Cap
Value
Portfolio | | | Macquarie
Core Plus
Bond
Portfolio | | | Macquarie
High Yield
Bond
Portfolio | |
Shares of beneficial interest | | $ | 78,476,057 | | | $ | 226,109,680 | | | $ | 90,803,517 | |
Undistributed ordinary income | | | 2,688,223 | | | | 4,943,897 | | | | 4,574,641 | |
Undistributed long-term capital gain | | | 12,675,740 | | | | — | | | | — | |
Capital loss carryforwards | | | — | | | | (5,611,643 | ) | | | (15,028,122 | ) |
Unrealized appreciation (depreciation) of investments, foreign currencies, and derivatives | | | 12,990,987 | | | | (5,215,355 | ) | | | (2,500,100 | ) |
Other temporary differences | | | — | | | | (175,425 | ) | | | (114,275 | ) |
| | | | | | | | | | | | |
Net assets | | $ | 106,831,007 | | | $ | 220,051,154 | | | $ | 77,735,661 | |
| | | | | | | | | | | | |
| | | Macquarie
Emerging
Markets
Portfolio | | | Macquarie
Emerging
Markets
Portfolio II | | | Macquarie
Labor Select
International
Equity
Portfolio | |
Shares of beneficial interest | | $ | 127,235,747 | | | $ | 23,779,616 | | | $ | 417,167,743 | |
Undistributed ordinary income | | | 1,436,470 | | | | 83,830 | | | | 11,932,102 | |
Undistributed long-term capital gain | | | — | | | | 1,258,067 | | | | — | |
Capital loss carryforwards* | | | (40,023,410 | ) | | | — | | | | — | |
Unrealized appreciation (depreciation) of investments, foreign currencies, and derivatives | | | (9,185,814 | ) | | | 2,107,482 | | | | (23,176,652 | ) |
| | | | | | | | | | | | |
Net assets | | $ | 79,462,993 | | | $ | 27,228,995 | | | $ | 405,923,193 | |
| | | | | | | | | | | | |
*For Macquarie Emerging Markets Portfolio, the amount of this loss which can be utilized is subject to an annual limitation in accordance with the Internal Revenue Code, as a result of changes in the Fund’s ownership during the year.
104
The differences between book basis and tax basis components of net assets are primarily attributable to tax deferral of losses on wash sales, mark-to-market on futures contracts, mark-to-market on foreign currency exchange contracts, tax treatment of passive foreign investment companies, contingent payment debt instruments, tax treatment of market discount and premium on debt instruments, CDS contracts, deemed dividend income, and troubled debt.
For financial reporting purposes, capital accounts are adjusted to reflect the tax character of permanent book/tax differences. Reclassifications are primarily due to expired capital loss carryforwards. Results of operations and net assets were not affected by these reclassifications. For the year ended Oct. 31, 2018, the following Portfolios recorded the following reclassifications:
| | | | | | | | |
| | | Distributable
earnings | | | Paid-in
Capital | |
Macquarie Labor Select International Equity Portfolio | | | 4,173,650 | | | | (4,173,650 | ) |
For federal income tax purposes, capital loss carryforwards may be carried forward and applied against future gain.
In 2018, the following Portfolios utilized capital loss carryforwards as follows:
| | | | |
Macquarie Emerging Markets Portfolio | | | 1,923,921 | |
Macquarie Emerging Markets Portfolio II | | | 601,171 | |
Macquarie Labor Select International Equity Portfolio | | | 14,302,152 | |
At Oct. 31, 2018, capital loss carryforwards available to offset future realized capital gains for the Portfolios are as follows:
| | | | | | | | | | | | |
| | | Short-term | | | Long-term | | | Total | |
Macquarie Core Plus Bond Portfolio | | $ | 4,615,953 | | | $ | 995,690 | | | $ | 5,611,643 | |
Macquarie High Yield Bond Portfolio | | | 6,792,273 | | | | 8,235,849 | | | | 15,028,122 | |
Macquarie Emerging Markets Portfolio | | | — | | | | 40,023,410 | | | | 40,023,410 | |
Notes to financial statements
Macquarie Institutional Portfolios
6. Capital Shares
Transactions in capital shares were as follows:
| | | | | | | | | | | | | | | | | | | | |
| | | Shares
sold | | Shares issued
upon reinvestment
of dividends
and distributions | | Shares
redeemed | | Net
increase
(decrease) |
Year ended Oct. 31, 2018: | | | | | | | | | | | | | | | | | | | | |
Macquarie Large Cap Value Portfolio | | | | 401,878 | | | | | 654,077 | | | | | (3,020,171 | ) | | | | (1,964,216 | ) |
Macquarie Core Plus Bond Portfolio | | | | 9,137,115 | | | | | 470,702 | | | | | (3,477,230 | ) | | | | 6,130,587 | |
Macquarie High Yield Bond Portfolio | | | | 518,733 | | | | | 1,015,480 | | | | | (5,119,460 | ) | | | | (3,585,247 | ) |
Macquarie Emerging Markets Portfolio | | | | 164,712 | | | | | 489,718 | | | | | (5,745,168 | ) | | | | (5,090,738 | ) |
Macquarie Emerging Markets Portfolio II | | | | 35,606 | | | | | 111,021 | | | | | (1,331,205 | ) | | | | (1,184,578 | ) |
Macquarie Labor Select International Equity Portfolio | | | | 1,312,591 | | | | | 950,233 | | | | | (4,949,197 | ) | | | | (2,686,373 | ) |
| | | | |
Year ended Oct. 31, 2017: | | | | | | | | | | | | | | | | | | | | |
Macquarie Large Cap Value Portfolio | | | | 650,421 | | | | | 359,881 | | | | | (3,320,683 | ) | | | | (2,310,381 | ) |
Macquarie Core Plus Bond Portfolio | | | | 4,527,737 | | | | | 320,194 | | | | | (1,472,623 | ) | | | | 3,375,308 | |
Macquarie High Yield Bond Portfolio | | | | 1,571,066 | | | | | 1,792,461 | | | | | (20,098,220 | ) | | | | (16,734,693 | ) |
Macquarie Emerging Markets Portfolio | | | | 1,926,721 | | | | | 446,150 | | | | | (4,001,404 | ) | | | | (1,628,533 | ) |
Macquarie Emerging Markets Portfolio II | | | | 10,989 | | | | | 56,949 | | | | | (427,556 | ) | | | | (359,618 | ) |
Macquarie Labor Select International Equity Portfolio | | | | 2,907,378 | | | | | 956,189 | | | | | (2,407,338 | ) | | | | 1,456,229 | |
7. Line of Credit
Each Portfolio, along with certain other funds in the Delaware Funds (Participants), was a participant in a $155,000,000 revolving line of credit intended to be used for temporary or emergency purposes as an additional source of liquidity to fund redemptions of investor shares. Under the agreement, the Participants were charged an annual commitment fee of 0.15%, which was allocated across the Participants based on a weighted average of the respective net assets of each Participant. The Participants were permitted to borrow up to a maximum of one-third of their net assets under the agreement. Each Participant was individually, and not jointly, liable for its particular advances, if any, under the line of credit. The line of credit available under the agreement expired on Nov. 6, 2017.
On Nov. 6, 2017, each Portfolio, along with the other Participants, entered into an amendment to the agreement for a $130,000,000 revolving line of credit. The revolving line of credit available was reduced from $155,000,000 on Sept. 6, 2018. The line of credit is to be used as described above and operates in substantially the same manner as the original agreement. The line of credit available under the agreement expired on Nov. 5, 2018.
Each Portfolio had no amounts outstanding as of Oct. 31, 2018, or at any time during the year then ended.
8. Derivatives
US GAAP requires disclosures that enable investors to understand: (1) how and why an entity uses derivatives; (2) how they are accounted for; and (3) how they affect an entity’s results of operations and financial position.
Foreign Currency Exchange Contracts — Each Portfolio may enter into foreign currency exchange contracts and foreign cross currency exchange contracts as a way of managing foreign exchange rate risk. Each Portfolio may enter into these contracts to fix the US dollar value of a security that it has agreed to buy or sell for the period between the date the trade was entered into and the date the security is delivered and paid for. Each Portfolio may also enter into these contracts to hedge the US dollar value of securities it already owns that are denominated in foreign currencies. In addition, each Portfolio may enter into these contracts to facilitate or expedite the settlement of portfolio transactions. The change in value is recorded as an unrealized gain or loss. When the contract is closed, a realized gain or loss is recorded equal to the difference between the value of the contract at the time it was opened and the value at the time it was closed.
The use of foreign currency exchange contracts and foreign cross currency exchange contracts does not eliminate fluctuations in the underlying prices of the securities, but does establish a rate of exchange that can be achieved in the future. Although foreign currency exchange contracts and foreign cross currency exchange contracts limit the risk of loss due to an unfavorable change in the value of the hedged currency, they also
106
limit any potential gain that might result should the value of the currency change favorably. In addition, each Portfolio could be exposed to risks if the counterparties to the contracts are unable to meet the terms of their contracts. Each Portfolio’s maximum risk of loss from counterparty credit risk is the value of its currency exchanged with the counterparty. The risk is generally mitigated by having a netting arrangement between each Portfolio and the counterparty and by the posting of collateral by the counterparty to the Portfolio to cover each Portfolio’s exposure to the counterparty.
Macquarie Core Plus Bond Portfolio used foreign currency exchange contracts and foreign cross currency exchange contracts in order to hedge the US dollar value of securities it already owns that are denominated in foreign currencies. Macquarie Emerging Markets Portfolio, Macquarie Emerging Markets Portfolio II, and Macquarie Labor Select International Equity Portfolio entered into foreign currency exchange contracts and foreign cross currency exchange contracts to facilitate or expedite the settlement of portfolio transactions.
Futures Contracts — A futures contract is an agreement in which the writer (or seller) of the contract agrees to deliver to the buyer an amount of cash or securities equal to a specific dollar amount times the difference between the value of a specific security or index at the close of the last trading day of the contract and the price at which the agreement is made. Macquarie Core Plus Bond, Macquarie High Yield Bond, Macquarie Emerging Markets, and Macquarie Emerging Markets II Portfolios may use futures contracts in the normal course of pursuing their respective investment objectives. Each Portfolio may invest in futures contracts to hedge its existing portfolio securities against fluctuations in value caused by changes in interest rates or market conditions. Upon entering into a futures contract, a Portfolio deposits cash or pledges US government securities to a broker, equal to the minimum “initial margin” requirements of the exchange on which the contract is traded. Subsequent payments are received from the broker or paid to the broker each day, based on the daily fluctuation in the market value of the contract. These receipts or payments are known as “variation margin” and are recorded daily by each Portfolio as unrealized gains or losses until the contracts are closed. When the contracts are closed, the Portfolio records a realized gain or loss equal to the difference between the value of the contract at the time it was opened and the value at the time it was closed. Risks of entering into futures contracts include potential imperfect correlation between the futures contracts and the underlying securities and the possibility of an illiquid secondary market for these instruments. When investing in futures, there is reduced counterparty credit risk to each Portfolio because futures are exchange-traded and the exchange’s clearinghouse, as counterparty to all exchange-traded futures, guarantees against default. Macquarie Core Plus Bond Portfolio posted securities collateral valued at $609,261 as margin for open futures contracts. Securities collateral are presented on the “Schedule of investments.”
Macquarie Core Plus Bond Portfolio used futures contracts in order to hedge the Portfolio’s existing portfolio securities against fluctuations in value caused by changes in interest rates or market conditions.
Options Contracts — Each Portfolio may enter into options contracts in the normal course of pursuing its respective investment objective. Each Portfolio may buy or write options contracts for any number of reasons, including without limitation: to manage each Portfolio’s exposure to changes in securities prices caused by interest rates or market conditions and foreign currencies; as an efficient means of adjusting each Portfolio’s overall exposure to certain markets; to protect the value of portfolio securities; and as a cash management tool. Each Portfolio may buy or write call or put options on securities, financial indices, futures, swaps, and foreign currencies. When each Portfolio buys an option, a premium is paid and an asset is recorded and adjusted on a daily basis to reflect the current market value of the option purchased. When each Portfolio writes an option, a premium is received and a liability is recorded and adjusted on a daily basis to reflect the current market value of the option written. Premiums received from writing options that expire unexercised are treated by each Portfolio on the expiration date as realized gains. The difference between the premium received and the amount paid on effecting a closing purchase transaction, including brokerage commissions, is treated as realized gain or loss. If a call option is exercised, the premium is added to the proceeds from the sale of the underlying security in determining whether each Portfolio has a realized gain or loss. If a put option is exercised, the premium reduces the cost basis of the securities purchased by each Portfolio. Each Portfolio, as writer of an option, bears the market risk of an unfavorable change in the price of the security underlying the written option. When writing options, each Portfolio is subject to minimal counterparty risk because the counterparty is only obligated to pay premiums and does not bear the market risk of an unfavorable market change.
Macquarie Core Plus Bond Portfolio used option contracts in order to manage the Portfolio’s exposure to changes in securities prices caused by interest rates or market conditions.
Swap Contracts — Macquarie Core Plus Bond Portfolio and Macquarie High Yield Bond Portfolio may enter into credit default swap (CDS) contracts in accordance with their investment objectives. Macquarie Core Plus Bond Portfolio may enter into interest rate swap contracts in accordance with its investment objective. The Portfolio may use interest rate swaps to adjust the Portfolio’s sensitivity to interest rates or to hedge against changes in interest rates. The Portfolios may enter into CDS contracts in order to hedge against a credit event, to enhance total
Notes to financial statements
Macquarie Institutional Portfolios
8. Derivatives (continued)
return, or to gain exposure to certain securities or markets. The Portfolios will not be permitted to enter into any swap transactions unless, at the time of entering into such transactions, the unsecured long-term debt of the actual counterparty, combined with any credit enhancements, is rated at least BBB- by Standard & Poor’s Financial Services LLC (S&P) or Baa3 by Moody’s Investors Service, Inc. (Moody’s) or is determined to be of equivalent quality by DMC.
Interest Rate Swaps. An interest rate swap contract is an exchange of interest rates between counterparties. In one instance, an interest rate swap involves payments received by the Portfolio from another party based on a variable or floating interest rate, in return for making payments based on a fixed interest rate. An interest rate swap can also work in reverse with the Portfolio receiving payments based on a fixed interest rate and making payments based on a variable or floating interest rate. Interest rate swaps may be used to adjust the Portfolio’s sensitivity to interest rates or to hedge against changes in interest rates. Periodic payments on such contracts are accrued daily and recorded as unrealized appreciation (depreciation) on swap contracts. Upon periodic payment (receipt) or termination of the contract, such amounts are recorded as realized gains or losses on swap contracts. The Portfolio’s maximum risk of loss from counterparty credit risk is the discounted net value of the cash flows to be received from/paid to the counterparty over the interest rate swap contract’s remaining life, to the extent that the amount is positive. This risk is mitigated by (1) for bilateral swap contracts, having netting arrangements between the Portfolio and the counterparty and by the posting of collateral by the counterparty to the Portfolio to cover the Portfolio’s exposure to the counterparty or (2) for cleared swaps, trading these instruments through a central counterparty.
Macquarie Core Plus Bond Portfolio used interest rate swap contracts in order to manage the Portfolio’s sensitivity to interest rates or to hedge against changes in interest rates.
Credit Default Swaps. A CDS contract is a risk-transfer instrument through which one party (purchaser of protection) transfers to another party (seller of protection) the financial risk of a credit event (as defined in the CDS agreement), as it relates to a particular reference security or basket of securities (such as an index). In exchange for the protection offered by the seller of protection, the purchaser of protection agrees to pay the seller of protection a periodic amount at a stated rate that is applied to the notional amount of the CDS contract. In addition, an upfront payment may be made or received by a Portfolio in connection with an unwinding or assignment of a CDS contract. Upon the occurrence of a credit event, the seller of protection would pay the par (or other agreed-upon) value of the reference security (or basket of securities) to the counterparty. Credit events generally include, among others, bankruptcy, failure to pay, and obligation default.
During the year ended Oct. 31, 2018, certain of the Portfolios entered into CDS contracts as purchasers and sellers of protection. Periodic payments (receipts) on such contracts are accrued daily and recorded as unrealized losses (gains) on swap contracts. Upon payment (receipt), such amounts are recorded as realized losses (gains) on swap contracts. Upfront payments made or received in connection with CDS contracts are amortized over the expected life of the CDS contracts as unrealized losses (gains) on swap contracts. The change in value of CDS contracts is recorded daily as unrealized appreciation or depreciation. A realized gain or loss is recorded upon a credit event (as defined in the CDS agreement) or the maturity or termination of the agreement. Initial margin and variation margin are posted to central counterparties for centrally cleared CDS basket trades as determined by the applicable central counterparty.
As disclosed in the footnotes to the “Schedules of investments,” at Oct. 31, 2018, the notional value of the protection sold was USD 890,000, which reflects the maximum potential amount Macquarie Core Plus Bond Portfolio would have been required to make as a seller of credit protection if a credit event had occurred. In addition to serving as the source of the current value of the securities, the quoted market prices and resulting market values for credit default swap agreements on securities and credit indices serve as an indicator of the current status of the payment/performance risk and represent the likelihood of an expected liability (or profit) for the credit derivative if the swap agreement had been closed/sold as of the year end. Increasing market values, in absolute terms when compared to the notional amount of the swap, represent a deterioration of the reference entity’s credit soundness and a greater likelihood of risk of default or other credit event occurring as defined under the terms of the agreement. At Oct. 31, 2018, there were no recourse provisions with third parties to recover any amounts paid under the credit derivative agreement (including any purchased credit protection) nor was any collateral held by the Portfolio or other third parties which the Portfolio can obtain upon occurrence of a credit event. At Oct. 31, 2018, net unrealized depreciation of the protection sold was $18,159.
CDS contracts may involve greater risks than if a Portfolio had invested in the reference obligation directly. CDS contracts are subject to general market risk, liquidity risk, counterparty risk, and credit risk. Each Portfolio’s maximum risk of loss from counterparty credit risk, either as the seller of protection or the buyer of protection, is the fair value of the contract. This risk is mitigated by (1) for bilateral swap contracts,
108
having netting arrangements between each Portfolio and the counterparty and by the posting of collateral by the counterparty to each Portfolio to cover the Portfolios’ exposure to the counterparty or (2) for cleared swaps, trading these instruments through a central counterparty.
Macquarie Core Plus Bond Portfolio used CDS contracts in order to hedge against credit events and to gain exposure to certain securities or markets.
Swaps Generally. For centrally cleared swaps, payments are received from the broker or paid to the broker each day, based on the daily fluctuation in the market value of the contract. These receipts or payments are known as “variation margin” and are recorded by the Portfolio as unrealized gains or losses until the contracts are closed. When the contracts are closed the Portfolio records a realized gain or loss equal to the difference between the value of the contract at the time it was opened and the value at the time it was closed. The value of open swaps may differ from that which would be realized in the event a Portfolio terminated its position in the contract on a given day. Risks of entering into these contracts include the potential inability of the counterparty to meet the terms of the contracts. This type of risk is generally limited to the amount of favorable movement in the value of the underlying security, instrument, or basket of instruments, if any, at the day of default. Risks also arise from potential losses from adverse market movements and such losses could exceed the unrealized amounts shown on the “Schedules of investments.”
At Oct. 31, 2018, Macquarie Core Plus Bond Portfolio posted $110,000 cash collateral for credit default swap contracts, and $29 cash collateral for centrally cleared interest rate swap contracts, which are included in “Cash collateral due from brokers” on the “Statements of assets and liabilities.”
Fair values of derivative instruments as of Oct. 31, 2018 were as follows:
| | | | | | | | | | | | | | | | | | | | |
| | | Macquarie Core Plus Bond Portfolio Asset Derivatives Fair Value |
Statements of Assets and Liabilities
Location | | Currency
Contracts | | Equity
Contracts | | Interest rate
Contracts | | Total |
Unrealized appreciation on foreign currency exchange contracts | | | $ | 941 | | | | $ | — | | | | $ | — | | | | $ | 941 | |
Variation margin due to brokers on futures contracts* | | | | — | | | | | 46,394 | | | | | 154,176 | | | | | 200,570 | |
| | | | | | | | | | | | | | | | | | | | |
Total | | | $ | 941 | | | | $ | 46,394 | | | | $ | 154,176 | | | | $ | 201,511 | |
| | | | | | | | | | | | | | | | | | | | |
| |
| | | Liability Derivatives Fair Value |
Statements of Assets and Liabilities
Location | | Currency
Contracts | | Interest rate
Contracts | | Credit
Contracts | | Total |
Unrealized depreciation on foreign currency exchange contracts | | | $ | 3,424 | | | | $ | — | | | | $ | — | | | | $ | 3,424 | |
Variation margin due to brokers on futures contracts* | | | | — | | | | | 1,234 | | | | | — | | | | | 1,234 | |
Unrealized depreciation on credit default swap contracts | | | | — | | | | | — | | | | | 18,159 | | | | | 18,159 | |
| | | | | | | | | | | | | | | | | | | | |
Total | | | $ | 3,424 | | | | $ | 1,234 | | | | $ | 18,159 | | | | $ | 22,817 | |
| | | | | | | | | | | | | | | | | | | | |
*Includes cumulative appreciation (depreciation) of futures contracts from the date the contracts are opened through Oct. 31, 2018. Only current day variation margin is reported on the “Statements of assets and liabilities.”
Notes to financial statements
Macquarie Institutional Portfolios
8. Derivatives (continued)
The effect of derivative instruments on the “Statements of operations” for the year ended Oct. 31, 2018 was as follows:
| | | | | | | | | | | | | | | | | | | | | | | | | |
| | | Macquarie Core Plus Bond Portfolio
Net Realized Gain (Loss) on: |
| | | Foreign
Currency
Exchange
Contracts | | Futures
Contracts | | Options
Purchased | | Swap
Contracts | | Total |
Forward currency exchange contracts | | | $ | (127,522 | ) | | | $ | — | | | | | (20,365 | ) | | | $ | — | | | | $ | (147,887 | ) |
Equity contracts | | | | — | | | | | 188,245 | | | | | — | | | | | — | | | | | 188,245 | |
Interest rate contracts | | | | — | | | | | (455,221 | ) | | | | 38,421 | | | | | 15,832 | | | | | (400,968 | ) |
Credit contracts | | | | — | | | | | — | | | | | — | | | | | (210,473 | ) | | | | (210,473 | ) |
| | | | | | | | | | | | | | | | | | | | | | | | | |
Total | | | $ | (127,522 | ) | | | $ | (266,976 | ) | | | $ | 18,056 | | | | $ | (194,641 | ) | | | $ | (571,083 | ) |
| | | | | | | | | | | | | | | | | | | | | | | | | |
| |
| | | Macquarie Core Plus Bond Portfolio Net Change in Unrealized Appreciation (Depreciation) of: |
| | | Foreign
Currency
Exchange
Contracts | | Futures
Contracts | | Options
Purchased | | Swaps
Contracts | | Total |
Forward currency exchange contracts | | | $ | 45,434 | | | | $ | — | | | | $ | 1,607 | | | | $ | — | | | | $ | 47,041 | |
Equity contracts | | | | — | | | | | 46,394 | | | | | — | | | | | — | | | | | 46,394 | |
Interest rate contracts | | | | — | | | | | 171,051 | | | | | — | | | | | 11,181 | | | | | 182,232 | |
Credit contracts | | | | — | | | | | — | | | | | — | | | | | 17,673 | | | | | 17,673 | |
| | | | | | | | | | | | | | | | | | | | | | | | | |
Total | | | $ | 45,434 | | | | $ | 217,445 | | | | $ | 1,607 | | | | $ | 28,854 | | | | $ | 293,340 | |
| | | | | | | | | | | | | | | | | | | | | | | | | |
At Oct. 31, 2018, Macquarie Emerging Markets Portfolio, Macquarie Emerging Markets Portfolio II, and Macquarie Labor Select International Equity Portfolio had foreign currency risk, which is disclosed on the “Statements of assets and liabilities” and/or “Statements of operations.”
Derivatives Generally. The tables below summarize the average balance of derivative holdings by each Portfolio during the year ended Oct. 31, 2018.
| | | | | | | | | | | | | | | | |
| | | Macquarie Core Plus Bond Portfolio | |
| | | Long Derivative Volume | | | Short Derivative Volume | |
Foreign currency exchange contracts (average cost) | | | USD | | | | 1,443,047 | | | | USD | | | | 1,508,380 | |
Futures contracts (average notional value) | | | | | | | 17,768,343 | | | | | | | | 11,980,705 | |
Options contracts (average notional value) | | | | | | | 6,855 | | | | | | | | — | |
CDS contracts (average notional value)* | | | | | | | 2,518,413 | | | | | | | | 843,075 | |
CDS contracts (average notional value)* | | | EUR | | | | 54,563 | | | | | | | | — | |
Interest rate contracts (average notional value)** | | | USD | | | | — | | | | | | | | 274,127 | |
| |
| | | Macquarie Emerging Markets Portfolio | |
| | | Long Derivative Volume | | | Short Derivative Volume | |
Foreign currency exchange contracts (average cost) | | | USD | | | | 63,538 | | | | USD | | | | 80,732 | |
| |
| | | Macquarie Emerging Markets Portfolio II | |
| | | Long Derivative Volume | | | Short Derivative Volume | |
Foreign currency exchange contracts (average cost) | | | USD | | | | 6,984 | | | | USD | | | | 5,725 | |
| |
| | | Macquarie Labor Select International Equity Portfolio | |
| | | Long Derivative Volume | | | Short Derivative Volume | |
Foreign currency exchange contracts (average cost) | | | USD | | | | 122,472 | | | | USD | | | | 56,628 | |
*Long represents buying protection and short represents selling protection.
**Long represents receiving fixed interest payments and short represents paying fixed interest payments.
9. Offsetting
Each Portfolio entered into an International Swaps and Derivatives Association, Inc. Master Agreement (ISDA Master Agreement) or a similar agreement with certain of their derivative contract counterparties in order to better define its contractual rights and to secure rights that will help each Portfolio mitigate its counterparty risk. An ISDA Master Agreement is a bilateral agreement between each Portfolio and a counterparty that governs certain over-the-counter (OTC) derivatives and foreign exchange contracts and typically contains, among other things, collateral posting items and netting provisions in the event of a default and/or termination event. Under an ISDA Master Agreement, each Portfolio may, under certain circumstances, offset with the counterparty certain derivative financial instruments’ payables and/or receivables with collateral held and/or posted and create one single net payment. The provisions of the ISDA Master Agreement typically permit a single net payment in the event of default (close-out), including the bankruptcy or insolvency of the counterparty. However, bankruptcy or insolvency laws of a particular jurisdiction may impose restrictions on or prohibitions against the right of offset in bankruptcy, insolvency, or other events.
For financial reporting purposes, the Portfolios do not offset derivative assets and derivative liabilities that are subject to netting arrangements on the “Statements of assets and liabilities.”
At Oct. 31, 2018, the Portfolios had the following assets and liabilities subject to offsetting provisions:
Offsetting of Financial Assets and Liabilities and Derivative Assets and Liabilities
| | | | | | | | | | | | | | | |
| | | Macquarie Core Plus Bond Portfolio | | |
Counterparty | | Gross Value of
Derivative Asset | | Gross Value of
Derivative Liability | | Net Position |
Bank of America Merrill Lynch | | | $ | 128 | | | | $ | (3,424 | ) | | | $ | (3,296 | ) |
BNP Paribas | | | | 58 | | | | | — | | | | | 58 | |
Hong Kong Shanghai Bank | | | | 755 | | | | | — | | | | | 755 | |
Morgan Stanley Capital | | | | — | | | | | (18,159 | ) | | | | (18,159 | ) |
| | | | | | | | | | | | | | | |
Total | | | $ | 941 | | | | $ | (21,583 | ) | | | $ | (20,642 | ) |
| | | | | | | | | | | | | | | |
Notes to financial statements
Macquarie Institutional Portfolios
9. Offsetting (continued)
| | | | | | | | | | | | | | | | | | | | | | | | | | | | | | |
Counterparty | | Net Position | | Fair Value of
Non-Cash
Collateral Received | | Cash
Collateral
Received | | Fair Value of
Non-Cash
Collateral Pledged | | Cash
Collateral
Pledged | | Net Exposure(b) |
Bank of America Merrill Lynch | | | $ | (3,296 | ) | | | $ | — | | | | $ | — | | | | $ | — | | | | $ | — | | | | $ | (3,296 | ) |
BNP Paribas | | | | 58 | | | | | — | | | | | — | | | | | — | | | | | — | | | | | 58 | |
Hong Kong Shanghai Bank | | | | 755 | | | | | — | | | | | — | | | | | — | | | | | — | | | | | 755 | |
Morgan Stanley Capital | | | | (18,159 | ) | | | | — | | | | | — | | | | | — | | | | | 18,159 | | | | | — | |
| | | | | | | | | | | | | | | | | | | | | | | | | | | | | | |
Total | | | $ | (20,642 | ) | | | $ | — | | | | $ | — | | | | $ | — | | | | $ | 18,159 | | | | $ | (2,483 | ) |
| | | | | | | | | | | | | | | | | | | | | | | | | | | | | | |
| | | | | | | | | | | | | | | | | | | | | | | | | |
| Macquarie Emerging Markets Portfolio |
Counterparty | | Gross Value of
Derivative Asset | | | | Gross Value of
Derivative Liability | | | | Net Position |
BNY Mellon | | | $ | 165 | | | | | | | | | $ | (99 | ) | | | | | | | | $ | 66 | |
| | | | | | | | | | | | | | | | | | | | | | | | | | | | | | |
Counterparty | | Net Position | | Fair Value of
Non-Cash
Collateral Received | | Cash
Collateral
Received | | Fair Value of
Non-Cash
Collateral Pledged | | Cash
Collateral
Pledged | | Net Exposure(b) |
BNY Mellon | | | $ | 66 | | | | $ | — | | | | $ | — | | | | $ | — | | | | $ | — | | | | $ | 66 | |
| | | | | | | | | | | | | | | | | | | | | | | | | |
| Macquarie Labor Select International Equity Portfolio |
Counterparty | | Gross Value of
Derivative Asset | | | | Gross Value of
Derivative Liability | | | | Net Position |
BNY Mellon | | | $ | 193 | | | | | | | | | $ | (959 | ) | | | | | | | | $ | (766 | ) |
| | | | | | | | | | | | | | | | | | | | | | | | | | | | | | |
Counterparty | | Net Position | | Fair Value of
Non-Cash
Collateral Received | | Cash
Collateral
Received | | Fair Value of
Non-Cash
Collateral Pledged | | Cash
Collateral
Pledged | | Net Exposure(b) |
BNY Mellon | | | | $(766) | | | | | $— | | | | | $— | | | | | $— | | | | | $— | | | | | $(766) | |
Master Repurchase Agreements
Repurchase agreements are entered into by each Portfolio under Master Repurchase Agreements (each, an MRA). The MRA permits each Portfolio, under certain circumstances including an event of default (such as bankruptcy or insolvency), to offset payables and/or receivables with collateral held by and/or posted to the counterparty. As a result, one single net payment is created. Bankruptcy or insolvency laws of a particular jurisdiction may impose restrictions on or prohibitions against such a right of offset in the event of the MRA counterparty’s bankruptcy or insolvency. Based on the terms of the MRA, each Portfolio receives securities as collateral with a market value in excess of the repurchase price at maturity. Upon a bankruptcy or insolvency of the MRA counterparty, each Portfolio would recognize a liability with respect
112
to such excess collateral. The liability reflects each Portfolio’s obligation under bankruptcy law to return the excess to the counterparty. As of Oct. 31, 2018, the following table is a summary of each Portfolio’s repurchase agreements by counterparty which are subject to offset under an MRA:
| | | | | | | | | | | | | | | | | | | | | | | | | |
|
| Macquarie Large Cap Value Portfolio |
Counterparty | | Repurchase
Agreements | | Fair Value of
Non-Cash
Collateral Received(a) | | Cash
Collateral
Received | | Net
Collateral
Received | | Net Exposure(b) |
Bank of America Merrill Lynch | | | $ | 133,900 | | | | $ | (133,900 | ) | | | $ | — | | | | $ | (133,900 | ) | | | $ | — | |
Bank of Montreal | | | | 368,226 | | | | | (368,226 | ) | | | | — | | | | | (368,226 | ) | | | | — | |
BNP Paribas | | | | 472,815 | | | | | (472,815 | ) | | | | — | | | | | (472,815 | ) | | | | — | |
| | | | | | | | | | | | | | | | | | | | | | | | | |
Total | | | $ | 974,941 | | | | $ | (974,941 | ) | | | $ | — | | | | $ | (974,941 | ) | | | $ | — | |
| | | | | | | | | | | | | | | | | | | | | | | | | |
| | | | | | | | | | | | | | | | | | | | | | | | | |
|
| Macquarie Core Plus Bond Portfolio |
Counterparty | | Repurchase
Agreements | | Fair Value of
Non-Cash
Collateral Received(a) | | Cash
Collateral
Received | | Net
Collateral
Received | | Net
Exposure(b) |
Bank of America Merrill Lynch | | | $ | 406,595 | | | | $ | (406,595 | ) | | | $ | — | | | | $ | (406,595 | ) | | | $ | — | |
Bank of Montreal | | | | 1,118,136 | | | | | (1,118,136 | ) | | | | — | | | | | (1,118,136 | ) | | | | — | |
BNP Paribas | | | | 1,435,728 | | | | | (1,435,728 | ) | | | | — | | | | | (1,435,728 | ) | | | | — | |
| | | | | | | | | | | | | | | | | | | | | | | | | |
Total | | | $ | 2,960,459 | | | | $ | (2,960,459 | ) | | | $ | — | | | | $ | (2,960,459 | ) | | | $ | — | |
| | | | | | | | | | | | | | | | | | | | | | | | | |
| | | | | | | | | | | | | | | | | | | | | | | | | |
|
| Macquarie High Yield Bond Portfolio |
Counterparty | | Repurchase
Agreements | | Fair Value of
Non-Cash
Collateral Received(a) | | Cash
Collateral
Received | | Net
Collateral
Received | | Net
Exposure(b) |
Bank of America Merrill Lynch | | | $ | 215,825 | | | | $ | (215,825 | ) | | | $ | — | | | | $ | (215,825 | ) | | | $ | — | |
Bank of Montreal | | | | 593,519 | | | | | (593,519 | ) | | | | — | | | | | (593,519 | ) | | | | — | |
BNP Paribas | | | | 762,101 | | | | | (762,101 | ) | | | | — | | | | | (762,101 | ) | | | | — | |
| | | | | | | | | | | | | | | | | | | | | | | | | |
Total | | | $ | 1,571,445 | | | | $ | (1,571,445 | ) | | | $ | — | | | | $ | (1,571,445 | ) | | | $ | — | |
| | | | | | | | | | | | | | | | | | | | | | | | | |
| | | | | | | | | | | | | | | | | | | | | | | | | |
|
| Macquarie Emerging Markets Portfolio |
Counterparty | | Repurchase
Agreements | | Fair Value of
Non-Cash
Collateral Received(a) | | Cash
Collateral
Received | | Net
Collateral
Received | | Net
Exposure(b) |
Bank of America Merrill Lynch | | | $ | 61,648 | | | | $ | (61,648 | ) | | | $ | — | | | | $ | (61,648 | ) | | | $ | — | |
Bank of Montreal | | | | 169,531 | | | | | (169,531 | ) | | | | — | | | | | (169,531 | ) | | | | — | |
BNP Paribas | | | | 217,684 | | | | | (217,684 | ) | | | | — | | | | | (217,684 | ) | | | | — | |
| | | | | | | | | | | | | | | | | | | | | | | | | |
Total | | | $ | 448,863 | | | | $ | (448,863 | ) | | | $ | — | | | | $ | (448,863 | ) | | | $ | — | |
| | | | | | | | | | | | | | | | | | | | | | | | | |
| | | | | | | | | | | | | | | | | | | | | | | | | |
|
| Macquarie Labor Select International Equity Portfolio |
Counterparty | | Repurchase
Agreements | | Fair Value of
Non-Cash
Collateral Received(a) | | Cash
Collateral
Received | | Net
Collateral
Received | | Net
Exposure(b) |
Bank of America Merrill Lynch | | | $ | 386,784 | | | | $ | (386,784 | ) | | | $ | — | | | | $ | (386,784 | ) | | | $ | — | |
Bank of Montreal | | | | 1,063,656 | | | | | (1,063,656 | ) | | | | — | | | | | (1,063,656 | ) | | | | — | |
BNP Paribas | | | | 1,365,772 | | | | | (1,365,772 | ) | | | | — | | | | | (1,365,772 | ) | | | | — | |
| | | | | | | | | | | | | | | | | | | | | | | | | |
Total | | | $ | 2,816,212 | | | | $ | (2,816,212 | ) | | | $ | — | | | | $ | (2,816,212 | ) | | | $ | — | |
| | | | | | | | | | | | | | | | | | | | | | | | | |
Notes to financial statements
Macquarie Institutional Portfolios
9. Offsetting (continued)
Master Securities Forward Transaction Agreements (MFA)
MFA govern certain forward settling transactions, such as TBA securities, delayed-delivery or sale-buyback transactions by and between the Portfolios and select counterparties. The MFA maintain provisions for, among other things, transaction initiation and confirmation, payment and transfer, events of default, termination, and maintenance of collateral. As of Oct. 31, 2018, the following table is a summary of Macquarie Core Plus Bond Portfolio’s TBA securities by counterparty which are subject to offsetting under MFA:
Macquarie Core Plus Bond Portfolio
| | | | | | | | | | | | | | | | | | | | |
Counterparty | | TBA at Value | | Cash
Collateral
Received | | Cash
Collateral
Pledged | | Net Exposure(b) |
Goldman Sachs | | | $ | 1,721,087 | | | $— | | $— | | $1,721,087 |
(a)The value of the related collateral received exceeded the value of the net position and repurchase agreements as of Oct. 31, 2018.
(b)Net exposure represents the receivable (payable) that would be due from (to) the counterparty in the event of default.
10. Securities Lending
Each Portfolio may lend its securities pursuant to a security lending agreement (Lending Agreement) with The Bank of New York Mellon (BNY Mellon). At the time a security is loaned, the borrower must post collateral equal to the required percentage of the market value of the loaned security, including any accrued interest. The required percentage is: (1) 102% with respect to US securities and foreign securities that are denominated and payable in US dollars; and (2) 105% with respect to foreign securities. With respect to each loan, if on any business day the aggregate market value of securities collateral plus cash collateral held is less than the aggregate market value of the securities which are the subject of such loan, the borrower will be notified to provide additional collateral by the end of the following business day which, together with the collateral already held, will be not less than the applicable initial collateral requirements for such security loan. If the aggregate market value of securities collateral and cash collateral held with respect to a security loan exceeds the applicable initial collateral requirement, upon the request of the borrower, BNY Mellon must return enough collateral to the borrower by the end of the following business day to reduce the value of the remaining collateral to the applicable initial collateral requirement for such security loan. As a result of the foregoing, the value of the collateral held with respect to a loaned security on any particular day may be more or less than the value of the security on loan. The collateral percentage with respect to the market value of the loaned securities is determined by the security lending agent.
Cash collateral received by each Portfolio of the Trust is generally invested in a series of individual separate accounts, each corresponding to a Portfolio. The investment guidelines permit each separate account to hold certain securities that would be considered eligible securities for a money market fund. Cash collateral received is generally invested in government securities; certain obligations issued by government sponsored enterprises; repurchase agreements collateralized by US Treasury securities; obligations issued by the central government of any Organization for Economic Cooperation and Development (OECD) country or its agencies, instrumentalities or establishments; obligations of supranational organizations, commercial paper, notes, bonds, and other debt obligations; certificates of deposit, time deposits and other bank obligations; and asset-backed securities. A Portfolio can also accept US government securities and letters of credit (non-cash collateral) in connection with securities loans.
In the event of default or bankruptcy by the lending agent, realization and/or retention of the collateral may be subject to legal proceedings. In the event the borrower fails to return loaned securities and the collateral received is insufficient to cover the value of the loaned securities and provided such collateral shortfall is not the result of investment losses, the lending agent has agreed to pay the amount of the shortfall to each Portfolio or, at the discretion of the lending agent, replace the loaned securities. Each Portfolio continues to record dividends or interest, as applicable, on the securities loaned and are subject to changes in value of the securities loaned that may occur during the term of the loan. Each Portfolio has the right under the Lending Agreement to recover the securities from the borrower on demand. With respect to security loans collateralized by non-cash collateral, each Portfolio receives loan premiums paid by the borrower. With respect to security loans collateralized by cash collateral, the earnings from the collateral investments are shared among each Portfolio, the security lending agent, and the borrower. Each Portfolio records security lending income net of allocations to the security lending agent and the borrower.
114
Each Portfolio may incur investment losses as a result of investing securities lending collateral. This could occur if an investment in the collateral investment account defaulted or became impaired. Under those circumstances, the value of the Portfolio’s cash collateral account may be less than the amount the Portfolio would be required to return to the borrowers of the securities and the Portfolio would be required to make up for this shortfall.
During the year ended Oct. 31, 2018, none of the Portfolios had securities out on loan.
11. Credit and Market Risk
Some countries in which Macquarie Emerging Markets, Macquarie Emerging Markets II, and Macquarie Labor Select International Equity Portfolios invest require governmental approval for the repatriation of investment income, capital, or the proceeds of sales of securities by foreign investors. In addition, if there is deterioration in a country’s balance of payments or for other reasons, a country may impose temporary restrictions on foreign capital remittances abroad.
The securities exchanges of certain foreign markets are substantially smaller, less liquid and more volatile than the major securities markets in the United States. Consequently, acquisition and disposition of securities by each Portfolio may be inhibited. In addition, a significant portion of the aggregate market value of securities listed on the major securities exchanges in emerging markets is held by a smaller number of investors. This may limit the number of shares available for acquisition or disposition by each Portfolio.
When interest rates rise, fixed income securities (i.e., debt obligations) generally will decline in value. These declines in value are greater for fixed income securities with longer maturities or durations.
Macquarie Core Plus Bond Portfolio invests a portion of its assets in high yield fixed income securities which are securities rated BB or lower by S&P and Ba or lower by Moody’s, or similarly rated by another nationally recognized statistical rating organization. Macquarie High Yield Bond Portfolio invests a portion of its assets in high yield fixed income securities which are securities rated lower than BBB- by S&P and lower than Baa3 by Moody’s, or similarly rated by another nationally recognized statistical rating organization. Investments in these higher yielding securities are generally accompanied by a greater degree of credit risk than higher rated securities. Additionally, lower rated securities may be more susceptible to adverse economic and competitive industry conditions than investment grade securities.
Macquarie Core Plus Bond Portfolio and Macquarie High Yield Bond Portfolio invest in bank loans and other securities that may subject them to direct indebtedness risk, the risk that each Portfolio will not receive payment of principal, interest and other amounts due in connection with these investments and will depend primarily on the financial condition of the borrower. Loans that are fully secured offer each Portfolio more protection than unsecured loans in the event of nonpayment of scheduled interest or principal, although there is no assurance that the liquidation of collateral from a secured loan would satisfy the corporate borrower’s obligation, or that the collateral can be liquidated. Some loans or claims may be in default at the time of purchase. Certain of the loans and the other direct indebtedness acquired by each Portfolio may involve revolving credit facilities or other standby financing commitments that obligate each Portfolio to pay additional cash on a certain date or on demand. These commitments may require each Portfolio to increase its investment in a company at a time when each Portfolio might not otherwise decide to do so (including at a time when the company’s financial condition makes it unlikely that such amounts will be repaid). To the extent that each Portfolio is committed to advance additional funds, it will at all times hold and maintain cash or other high grade debt obligations in an amount sufficient to meet such commitments. When a loan agreement is purchased the Fund may pay an assignment fee. On an ongoing basis, the Fund may receive a commitment fee based on the undrawn portion of the underlying line of credit portion of a loan agreement. Prepayment penalty fees are received upon the prepayment of a loan agreement by a borrower. Prepayment penalty, facility, commitment, consent and amendment fees are recorded to income as earned or paid.
As each Portfolio may be required to rely upon another lending institution to collect and pass on to each Portfolio amounts payable with respect to the loan and to enforce each Portfolio’s rights under the loan and other direct indebtedness, an insolvency, bankruptcy, or reorganization of the lending institution may delay or prevent each Portfolio from receiving such amounts. The highly leveraged nature of many loans may make them especially vulnerable to adverse changes in economic or market conditions. Investments in such loans and other direct indebtedness may involve additional risk to each Portfolio.
Macquarie Core Plus Bond Portfolio invests in fixed income securities whose value is derived from an underlying pool of mortgages or consumer loans. The value of these securities is sensitive to changes in economic conditions, including delinquencies and/or defaults, and may be adversely affected by shifts in the market’s perception of the issuers and changes in interest rates. Investors receive principal and interest payments as the underlying mortgages and consumer loans are paid back. Some of these securities are collateralized mortgage obligations (CMOs). CMOs are
Notes to financial statements
Macquarie Institutional Portfolios
11. Credit and Market Risk (continued)
debt securities issued by US government agencies or by financial institutions and other mortgage lenders, which are collateralized by a pool of mortgages held under an indenture. Prepayment of mortgages may shorten the stated maturity of the obligations and can result in a loss of premium, if any has been paid. Certain of these securities may be stripped (securities which provide only the principal or interest feature of the underlying security). The yield to maturity on an interest-only CMO is extremely sensitive not only to changes in prevailing interest rates, but also to the rate of principal payments (including prepayments) on the related underlying mortgage assets. A rapid rate of principal payments may have a material adverse effect on the Portfolio’s yield to maturity. If the underlying mortgage assets experience greater than anticipated prepayments of principal, the Portfolio may fail to fully recoup its initial investment in these securities even if the securities are rated in the highest rating categories.
Macquarie Core Plus Bond Portfolio and Macquarie High Yield Bond Portfolio invest in certain obligations that may have liquidity protection designed to ensure that the receipt of payments due on the underlying security is timely. Such protection may be provided through guarantees, insurance policies or letters of credit obtained by the issuer or sponsor through third parties, through various means of structuring the transaction or through a combination of such approaches. Each Portfolio will not pay any additional fees for such credit support, although the existence of credit support may increase the price of a security.
Because Macquarie Large Cap Value Portfolio expects to hold a concentrated portfolio of a limited number of securities, the Portfolio’s risk is increased because each investment has a greater effect on the Portfolio’s overall performance.
Each Portfolio may invest up to 15% of its net assets in illiquid securities, which may include securities with contractual restrictions on resale, securities exempt from registration under Rule 144A promulgated under the Securities Act of 1933, as amended, and other securities, which may not be readily marketable. The relative illiquidity of these securities may impair each Portfolio from disposing of them in a timely manner and at a fair price when it is necessary or desirable to do so. While maintaining oversight, the Portfolios’ Board has delegated to DMC, the day-to-day functions of determining whether individual securities are liquid for purposes of each Portfolio’s limitation on investments in illiquid securities. Securities eligible for resale pursuant to Rule 144A, which are determined to be liquid, are not subject to the Portfolios’ limit on investments in illiquid securities. Rule 144A securities have been identified on the “Schedules of investments.” Restricted securities are valued pursuant to the security valuation procedures described in Note 1.
12. Contractual Obligations
Each Portfolio enters into contracts in the normal course of business that contain a variety of indemnifications. Each Portfolio’s maximum exposure under these arrangements is unknown. However, the Portfolios have not had prior claims or losses pursuant to these contracts. Management has reviewed each Portfolio’s existing contracts and expects the risk of loss to be remote.
13. Recent Accounting Pronouncements
In March 2017, the FASB issued an Accounting Standards Update, ASU 2017-08, Receivables — Nonrefundable Fees and Other Costs (Subtopic 310-20), Premium Amortization on Purchased Callable Debt Securities which amends the amortization period for certain callable debt securities purchased at a premium, shortening such period to the earliest call date. ASU 2017-08 does not require any accounting change for debt securities held at a discount; the discount continues to be amortized to maturity. ASU 2017-08 is effective for fiscal and interim periods within those fiscal years, beginning after Dec. 15, 2018. At this time, management is evaluating the implications of changes on the financial statements.
In August 2018, the FASB issued an Accounting Standards Update, ASU 2018-13, which changes certain fair value measurement disclosure requirements. ASU 2018-13, in addition to other modifications and additions, removes the requirement to disclose the amount and reasons for transfers between Level 1 and Level 2 of the fair value hierarchy, the policy for the timing of transfers between levels and the valuation process for Level 3 fair value measurements. ASU 2018-13 is effective for fiscal years, and interim periods within those fiscal years, beginning after Dec. 15, 2019. At this time, management is evaluating the implications of these changes on the financial statements.
In August 2018, the Securities and Exchange Commission (SEC) adopted amendments to Regulation S-X to update and simplify the disclosure requirements for registered investment companies by eliminating requirements that are redundant or duplicative of US GAAP requirements or other SEC disclosure requirements. The new amendments require the presentation of the total, rather than the components, of distributable earnings on the “Statements of assets and liabilities” and the total, rather than the components, of dividends from net investment income and
116
distributions from net realized gains on the “Statements of changes in net assets.” The amendments also removed the requirement for the parenthetical disclosure of undistributed net investment income on the “Statements of changes in net assets” and certain tax adjustments that were reflected in the “Notes to financial statements.” All of these have been reflected in the Porfolios’ financial statements.
14. General Motors Term Loan Litigation
Macquarie Core Plus Bond Portfolio and Macquarie High Yield Bond Portfolio received notice of a litigation proceeding related to a General Motors Corporation (G.M.) term loan participation previously held by the Portfolios in 2009. Management believes the matter subject to the litigation notice will likely lead to a recovery from the Portfolios of certain amounts received by the Portfolios because a US Court of Appeals has ruled that the Portfolios and similarly situated investors were unsecured creditors rather than secured lenders of G.M. as a result of an erroneous UCC filing made by a third party. The Portfolios received the full principal on the loans in 2009 after the G.M. bankruptcy. However, based upon the court ruling the estate is seeking to recover such amounts arguing that, as unsecured creditors, the Portfolios should not have received payment in full. Based upon currently available information related to the litigation and the Portfolios’ potential exposure, the Portfolios recorded assets of $75,182 and $48,975, respectively, and contingent liabilities of $250,607 and $163,250, respectively, that resulted in a decrease in the Portfolios’ NAV to reflect this likely recovery.
15. Subsequent Events
On Nov. 5, 2018, each Portfolio, along with the other Participants, entered into an amendment to the agreement for a $190,000,000 revolving line of credit to be used as described in Note 7 and to be operated in substantially the same manner as the agreement described in Note 7. The revolving line of credit available was increased from $190,000,000 to $220,000,000 on Nov. 29, 2018. Under the amendment to the agreement, the Participants are charged an annual commitment fee of 0.15%, which is generally allocated across the Participants based on a weighted average of the respective net assets of each Participant. The line of credit available under the agreement expires on Nov. 4, 2019.
Management has determined that no other material events or transactions occurred subsequent to Oct. 31, 2018, that would require recognition or disclosure in each Portfolio’s financial statements.
117
Report of independent
registered public accounting firm
To the Board of Trustees of Delaware Pooled® Trust and Shareholders of Macquarie Large Cap Value Portfolio, Macquarie Core Plus Bond Portfolio, Macquarie High Yield Bond Portfolio, Macquarie Emerging Markets Portfolio, Macquarie Emerging Markets Portfolio II and Macquarie Labor Select International Equity Portfolio
Opinions on the Financial Statements
We have audited the accompanying statements of assets and liabilities, including the schedules of investments, of Macquarie Large Cap Value Portfolio, Macquarie Core Plus Bond Portfolio, Macquarie High Yield Bond Portfolio, Macquarie Emerging Markets Portfolio, Macquarie Emerging Markets Portfolio II and Macquarie Labor Select International Equity Portfolio (six of the series constituting Delaware Pooled® Trust, hereafter collectively referred to as the “Funds”) as of October 31, 2018, the related statements of operations for the year ended October 31, 2018, the statements of changes in net assets for each of the two years in the period ended October 31, 2018, including the related notes, and the financial highlights for each of the five years in the period ended October 31, 2018 (collectively referred to as the “financial statements”). In our opinion, the financial statements present fairly, in all material respects, the financial position of each of the Funds as of October 31, 2018, the results of each of their operations for the year then ended, the changes in each of their net assets for each of the two years in the period ended October 31, 2018 and each of the financial highlights for each of the five years in the period ended October 31, 2018 in conformity with accounting principles generally accepted in the United States of America.
Basis for Opinions
These financial statements are the responsibility of the Funds’ management. Our responsibility is to express an opinion on the Funds’ financial statements based on our audits. We are a public accounting firm registered with the Public Company Accounting Oversight Board (United States) (“PCAOB”) and are required to be independent with respect to the Funds in accordance with the U.S. federal securities laws and the applicable rules and regulations of the Securities and Exchange Commission and the PCAOB.
We conducted our audits of these financial statements in accordance with the standards of the PCAOB. Those standards require that we plan and perform the audit to obtain reasonable assurance about whether the financial statements are free of material misstatement, whether due to error or fraud.
Our audits included performing procedures to assess the risks of material misstatement of the financial statements, whether due to error or fraud, and performing procedures that respond to those risks. Such procedures included examining, on a test basis, evidence regarding the amounts and disclosures in the financial statements. Our audits also included evaluating the accounting principles used and significant estimates made by management, as well as evaluating the overall presentation of the financial statements. Our procedures included confirmation of securities owned as of October 31, 2018 by correspondence with the custodian and brokers; when replies were not received from brokers, we performed other auditing procedures. We believe that our audits provide a reasonable basis for our opinions.
/s/PricewaterhouseCoopers LLP
Philadelphia, Pennsylvania
December 20, 2018
We have served as the auditor of one or more investment companies in Delaware Funds® by Macquarie since 2010.
118
Other Portfolio information
(Unaudited)
Macquarie Institutional Portfolios
Tax Information
The information set forth below is for each Portfolio’s fiscal year as required by federal laws. Shareholders, however, must report distributions on a calendar year basis for income tax purposes, which may include distributions for portions of two fiscal years of a fund. Accordingly, the information needed by shareholders for income tax purposes will be sent to them in January of each year. Please consult your tax advisor for proper treatment of this information.
All disclosures are based on financial information available as of the date of this annual report and, accordingly, are subject to change. For any and all items requiring reporting, it is the intention of each Portfolio to report the maximum amount permitted under the Internal Revenue Code and the regulations thereunder.
For the fiscal year ended Oct. 31, 2018, each Portfolio reports distributions paid during the year as follows:
| | | | | | | | | | | | | | | | | | | | |
| | | (A)
Long-Term
Capital Gains
Distributions
(Tax Basis) | | (B)
Ordinary Income
Distributions*
(Tax Basis) | | Total
Distribution
(Tax Basis) | | (C)
Qualifying
Dividends1 |
Macquarie Large Cap Value Portfolio | | | | 79.55 | % | | | | 20.45 | % | | | | 100.00 | % | | | | 99.42 | % |
Macquarie Core Plus Bond Portfolio | | | | — | | | | | 100.00 | % | | | | 100.00 | % | | | | — | |
Macquarie High Yield Bond Portfolio | | | | — | | | | | 100.00 | % | | | | 100.00 | % | | | | — | |
Macquarie Emerging Markets Portfolio | | | | — | | | | | 100.00 | % | | | | 100.00 | % | | | | — | |
Macquarie Emerging Markets Portfolio II | | | | — | | | | | 100.00 | % | | | | 100.00 | % | | | | — | |
Macquarie Labor Select International Equity Portfolio | | | | — | | | | | 100.00 | % | | | | 100.00 | % | | | | — | |
(A) and (B) are based on a percentage of each Portfolio’s total distributions.
(C) is based on a percentage of each Portfolio’s ordinary income distributions.
1Qualifying dividends represent dividends which qualify for the corporate dividends received deduction.
*For the fiscal year ended Oct. 31, 2018, certain dividends paid by the Portfolios may be subject to a maximum tax rate of 20%. The Portfolios intend to report the following percentages to be taxed at a maximum rate of 20%. Complete information will be computed and reported in conjunction with your 2018 Form 1099-DIV, as applicable.
| | |
| | | Maximum percentage to be
taxed at a maximum rate of 20% |
Macquarie Large Cap Value Portfolio | | 99.41% |
Macquarie Core Plus Bond Portfolio | | — |
Macquarie High Yield Bond Portfolio | | — |
Macquarie Emerging Markets Portfolio | | 59.58% |
Macquarie Emerging Markets Portfolio II | | 59.18% |
Macquarie Labor Select International Equity Portfolio | | 100.00% |
Macquarie Emerging Markets Portfolio, Macquarie Emerging Markets Portfolio II and Macquarie Labor Select International Equity Portfolio intend to pass through foreign tax credits in the maximum amount of $290,964, $81,874, and $1,189,656, respectively. The gross foreign source income earned during the fiscal year 2018 was $4,542,527, $859,083, and $18,940,487, respectively. Complete information will be computed and reported in conjunction with your 2018 Form 1099-DIV.
For the fiscal year ended Oct. 31, 2018, certain interest income paid by the Portfolios, determined to be Qualified Interest Income and Short-Term Capital Gains, may be subject to relief from US withholding for foreign shareholders, as provided by the American Jobs Creation Act of 2004, and by the Tax Relief Unemployment Insurance Reauthorization and Job Creations Act of 2010, and as extended by the American Taxpayer Relief Act of 2012. For the fiscal year ended Oct. 31, 2018, the following Portfolio has reported maximum distributions of Qualified Interest Income and Short-Term Capital Gain as follows:
| | | | |
| | | Qualified Interest Income | | Short-Term Capital Gain |
Macquarie Large Cap Value Portfolio | | $17,708 | | $976,658 |
Other Portfolio information
(Unaudited)
Macquarie Institutional Portfolios
Board consideration of sub-advisory agreements for Macquarie Emerging Markets Portfolio II and Macquarie Large Cap Value Portfolio at a meeting held May 16-17, 2018
At a meeting held on May 16-17, 2018, the Board of Trustees of Delaware Pooled® Trust, including a majority of non-interested or independent Trustees (the “Independent Trustees”), approved a new Sub-Advisory Agreement between Delaware Management Company (“DMC” or “Management”) and each of Macquarie Investment Management Global Limited (“MIMGL”) and Macquarie Funds Management Hong Kong Limited (“MFMHK”) for Macquarie Emerging Markets Portfolio II and Macquarie Large Cap Value Portfolio (each, a “Portfolio” and together, the “Portfolios”). MIMGL and MFMHK may also be referenced as “sub-advisor(s)” below.
In reaching the decision to approve the Sub-Advisory Agreements, the Board considered and reviewed information about each of MIMGL and MFMHK, including their personnel, operations, and financial condition, which had been provided by MIMGL and MFMHK, respectively. The Board also reviewed material furnished by DMC, including: a memorandum from DMC reviewing the Sub-Advisory Agreements and the various services proposed to be rendered by MIMGL and MFMHK; information concerning MIMGL’s and MFMHK’s organizational structure and the experience of their key investment management personnel; copies of MIMGL’s and MFMHK’s Form ADV, financial statements, compliance policies and procedures, and Codes of Ethics; relevant performance information provided with respect to MIMGL and MFMHK; and a copy of the Sub-Advisory Agreements.
In considering such information and materials, the Independent Trustees received assistance and advice from and met separately with independent counsel. The materials prepared by Management in connection with the approval of the Sub-Advisory Agreements were sent to the Independent Trustees in advance of the meeting. While attention was given to all information furnished, the following discusses some primary factors relevant to the Board’s decision. This discussion of the information and factors considered by the Board (as well as the discussion above) is not intended to be exhaustive, but rather summarizes certain factors considered by the Board. In view of the wide variety of factors considered, the Board did not, unless otherwise noted, find it practicable to quantify or otherwise assign relative weights to the following factors. In addition, individual Trustees may have assigned different weights to various factors.
Nature, extent, and quality of services. The Board considered the nature, extent, and quality of services that MIMGL and MFMHK each would provide as a sub-advisor to the Portfolios. The Trustees considered the investment process to be employed by MIMGL and MFMHK in connection with DMC’s collaboration with MIMGL and MFMHK in managing the Portfolios, and the qualifications and experience of MIMGL and MFMHK’s equity teams with regard to implementing each Portfolio’s investment mandates. The Board considered MIMGL and MFMHK’s organization, personnel, and operations. The Trustees also considered Management’s review and recommendation process with respect to MIMGL and MFMHK, and Management’s favorable assessment as to the nature, quality, and extent of the sub-advisory services expected to be provided by MIMGL and MFMHK to the Portfolios. Based on their consideration and review of the foregoing factors, the Board concluded that the nature, quality, and extent of the sub-advisory services to be provided by MIMGL and MFMHK, as well as MIMGL and MFMHK’s ability to render such services based on their experience, organization and resources, were appropriate for the Portfolios, in light of each Portfolio’s investment objective, strategies, and policies. In discussing the nature of the services proposed to be provided by the sub-advisors, several Board members observed that, unlike traditional sub-advisors, who make the investment-related decisions with respect to the sub-advised portfolio, the relationship contemplated in this case is limited to access to the additional quantitative investment resources and related technology support of MIMGL and MFMHK.
Sub-advisory fees. The Board considered that DMC would not pay MIMGL and MFMHK fees in conjunction with the services that would be rendered to the sub-advised Portfolios. The Board concluded that, in light of the quality and extent of the services to be provided and the business relationships between the advisor and sub-advisors, the proposed fee arrangement was understandable and reasonable.
Investment performance. In evaluating performance, the Board considered that MIMGL and MFMHK would provide trade execution support, but that DMC’s portfolio managers for the Portfolios would retain portfolio management discretion over the Portfolio.
Economies of scale and fall-out benefits. The Board considered whether the proposed fee arrangement would reflect economies of scale for the benefit each Portfolio’s investors as assets in the Portfolio increased, as applicable.
Board consideration of advisory and sub-advisory agreements for each series of Macquarie Institutional Portfolios at a meeting held August 15-16, 2018
At a meeting held on Aug. 15-16, 2018 (the “Annual Meeting”), the Board of Trustees (the “Board”), including a majority of disinterested or independent Trustees, approved the renewal of the Investment Advisory Agreements and Investment Sub-Advisory Agreements, as applicable, for each of the series of Macquarie Institutional Portfolios (each, a “Portfolio” and together, the “Portfolios”). In making its decision, the Board
120
considered information furnished at regular quarterly Board meetings, including reports detailing Portfolio performance, investment strategies, and expenses, as well as information prepared specifically in connection with the renewal of the investment advisory and sub-advisory contracts. Information furnished specifically in connection with the renewal of the Investment Management Agreement with Delaware Management Company (“DMC”), a series of Macquarie Investment Management Business Trust (“MIMBT”), and Sub-Advisory Agreement with Mondrian Investment Partners Limited (“Mondrian”), included materials provided by DMC and its affiliates (collectively, “Macquarie Investment Management”) and Mondrian, as applicable, concerning, among other things, the nature, extent, and quality of services provided to the Portfolios; the costs of such services to the Portfolios; economies of scale; and the investment manager’s financial condition and profitability. In addition, in connection with the Annual Meeting, materials were provided to the Trustees in May 2018, including reports provided by Broadridge Financial Solutions (“Broadridge”). The Broadridge reports compared each Portfolio’s investment performance and expenses with those of other comparable mutual funds. The Independent Trustees reviewed and discussed the Broadridge reports with independent legal counsel to the Independent Trustees. In addition to the information noted above, the Board also requested and received information regarding DMC’s or Mondrian’s, as applicable, policy with respect to advisory fee levels and its breakpoint philosophy; the structure of portfolio manager compensation; comparative client fee information; and any constraints or limitations on the availability of securities for certain investment styles, which had in the past year inhibited, or which were likely in the future to inhibit, the investment manager’s ability to invest fully in accordance with Portfolio policies.
In considering information relating to the approval of each Portfolio’s advisory and sub-advisory agreements, as applicable, the Independent Trustees received assistance and advice from and met separately with independent legal counsel to the Independent Trustees and also from an experienced and knowledgeable independent fund consultant, JDL Consultants, LLC (“JDL”). Although the Board gave attention to all information furnished, the following discussion identifies, under separate headings, the primary factors taken into account by the Board during its contract renewal considerations.
Nature, extent, and quality of services. The Board considered the services provided by DMC to the Portfolios and their shareholders. In reviewing the nature, extent, and quality of services, the Board considered reports furnished to it throughout the year, which covered matters such as the relative performance of the Portfolios; compliance of portfolio managers with the investment policies, strategies, and restrictions for the Portfolios; compliance by DMC and Delaware Distributors, L.P. (together, “Management”) personnel with the Code of Ethics adopted throughout the Delaware Funds® by Macquarie (the “Delaware Funds”); and adherence to fair value pricing procedures as established by the Board. The Board was pleased with the current staffing of DMC and the emphasis placed on research in the investment process. The Board recognized DMC’s receipt of certain favorable industry distinctions during the past several years. The Board gave favorable consideration to DMC’s efforts to control expenses while maintaining service levels committed to Portfolio matters. The Board also noted the benefits provided to Portfolio shareholders through each shareholder’s ability to: (i) exchange investments between Portfolios or the institutional class shares of other Delaware Funds and (ii) reinvest Portfolio dividends into additional shares of the Portfolio or into additional shares of other Delaware Funds. The Board was satisfied with the nature, extent and quality of the overall services provided by DMC.
The Board considered the services provided by Mondrian to Macquarie Emerging Markets Portfolio and Macquarie Labor Select International Equity Portfolio and their shareholders, as applicable. In reviewing the nature, extent, and quality of services, the Board considered reports furnished to it throughout the year at regular Board meetings covering matters such as relative performance of the Portfolios; compliance of portfolio managers with the investment policies, strategies, and restrictions for the Portfolios; the compliance of Mondrian personnel with its Code of Ethics; and adherence to fair value pricing procedures as established by the Board. The Board was pleased with the current staffing of Mondrian and the emphasis placed on research in the investment process. The Board was satisfied with the nature, extent, and quality of the overall services provided by Mondrian.
Investment performance. The Board placed significant emphasis on the investment performance of the Portfolios in view of the importance of investment performance to shareholders. Although the Board considered performance reports and discussions with portfolio managers at Board meetings throughout the year, the Board gave particular weight to the Broadridge reports furnished for the 15(c) Meeting. The Broadridge reports prepared for each Portfolio showed the investment performance of its shares in comparison to a group of similar funds as selected by Broadridge (the “Performance Universe”). A fund with the best performance ranked first, and a fund with the poorest performance ranked last. The highest/best performing 25% of funds in the Performance Universe make up the first quartile; the next 25%, the second quartile; the next 25%, the third quartile; and the poorest/worst performing 25% of funds in the Performance Universe make up the fourth quartile. Comparative annualized performance for the Portfolios was shown for the past 1-, 3-, 5-, and 10-year periods, to the extent applicable, ended Jan. 31, 2018. The Board’s objective is that each Portfolio’s performance for the 1-, 3-, and 5-year periods be at or above the median of its Performance Universe.
Other Portfolio information
(Unaudited)
Macquarie Institutional Portfolios
Board consideration of advisory and sub-advisory agreements for each series of Macquarie Institutional Portfolios at a meeting held August 15-16, 2018 (continued)
Macquarie Core Plus Bond Portfolio — The Performance Universe for the Portfolio consisted of the Portfolio and all retail and institutional core plus bond funds as selected by Broadridge. The Broadridge report comparison showed that the Portfolio’s total return for the 1- and 10-year periods was in the first quartile of its Performance Universes. The report further showed that the Portfolio’s total return for the 3- and 5-year periods was in the third quartile and second quartile, respectively, of its Performance Universe. The Board was satisfied with performance.
Macquarie Emerging Markets Portfolio — The Performance Universe for the Portfolio consisted of the Portfolio and all retail and institutional emerging markets funds as selected by Broadridge. The Broadridge report comparison showed that the Portfolio’s total return for the 1-, 3-, and 5-year periods was in the fourth quartile of its Performance Universe. The report further showed that the Portfolio’s total return for the 10-year period was in the second quartile of its Performance Universe. The Board observed that the Portfolio’s performance was not in line with the Board’s objective. In evaluating the Portfolio’s performance, the Board considered the numerous investment and performance reports delivered by Management personnel to the Board’s Investments Committee. The Board was satisfied that Management was taking action to improve Portfolio performance and to meet the Board’s performance objective.
Macquarie Emerging Markets Portfolio II — The Performance Universe for the Portfolio consisted of the Portfolio and all retail and institutional emerging markets funds as selected by Broadridge. The Broadridge report comparison showed that the Portfolio’s total return for the 1-, 3-, and 5-year periods was in the first quartile of its Performance Universe. The report further showed that the Portfolio’s total return for the period since inception was in the second quartile of its Performance Universe. The Board was satisfied with performance.
Macquarie High Yield Bond Portfolio — The Performance Universe for the Portfolio consisted of the Portfolio and all retail and institutional high yield funds as selected by Broadridge. The Broadridge report comparison showed that the Portfolio’s total return for the 1- and 5-year period was in the second quartile of its Performance Universe. The report further showed that the Portfolio’s total return for the 3- and 10-year periods was in the third quartile and first quartile, respectively, of its Performance Universes. The Board was satisfied with performance.
Macquarie Labor Select International Equity Portfolio — The Performance Universe for the Portfolio consisted of the Portfolio and all retail and institutional international large-cap value funds as selected by Broadridge. The Broadridge report comparison showed that the Portfolio’s total return for the 1-year period was in the third quartile of its Performance Universe. The report further showed that the Portfolio’s total return for the 3-, 5-, and 10-year periods was in the fourth quartile, first quartile, and second quartile, respectively, of its Performance Universe. The Board observed that the Portfolio’s short-term performance was not in line with the Board’s objective. In evaluating the Portfolio’s performance, the Board considered the Portfolio’s longer-term performance results, which were strong. The Board was satisfied with performance.
Macquarie Large Cap Value Portfolio — The Performance Universe for the Portfolio consisted of the Portfolio and all retail and institutional large-cap value funds as selected by Broadridge. The Broadridge report comparison showed that the Portfolio’s total return for the 1- and 3-year periods was in the third quartile of its Performance Universe. The report further showed that the Portfolio’s total return for the 5- and 10-year periods was in the first quartile of its Performance Universe. The Board observed that the Portfolio’s short-term performance was not in line with the Board’s objective. In evaluating the Portfolio’s performance, the Board considered the Portfolio’s longer-term performance results, which were strong. The Board was satisfied with performance.
Comparative expenses. The Board considered expense data for the Delaware Funds. Management provided the Board with information on pricing levels and fee structures for each Portfolio as of its most recent fiscal year end. The Board also focused on the comparative analysis of effective management fees and total expense ratios of each Portfolio versus effective management fees and expense ratios of a group of similar funds as selected by Broadridge (the “Expense Group”). In reviewing comparative costs, each Portfolio’s contractual management fee and the actual management fee incurred by the Portfolio were compared with the contractual management fees (assuming all funds in the Expense Group were similar in size to the Portfolio) and actual management fees (as reported by each fund) within the Expense Group, taking into account any applicable breakpoints and fee waivers. Each Portfolio’s total expenses were also compared with those of its Expense Group. The Board’s objective is for each Portfolio’s total expense ratio to be competitive with those of the peer funds within its Expense Group.
Macquarie Core Plus Bond Portfolio — The expense comparisons for the Portfolio showed that its actual management fee was in the quartile with the second lowest expenses of its Expense Group and its total expenses were in the quartile with the lowest expenses of its Expense Group. The Board was satisfied with the management fee and total expenses of the Portfolio in comparison to those of its Expense Group.
122
Macquarie Emerging Markets Portfolio — The expense comparisons for the Portfolio showed that its actual management fee was in the quartile with the second highest expenses of its Expense Group and its total expenses were in the quartile with the second lowest expenses of its Expense Group. The Board was satisfied with the total expenses of the Portfolio in comparison to those of its Expense Group.
Macquarie Emerging Markets Portfolio II — The expense comparisons for the Portfolio showed that its actual management fee was in the quartile with the highest expenses of its Expense Group and its total expenses were in the quartile with the second lowest expenses of its Expense Group. The Board was satisfied with the total expenses of the Portfolio in comparison to those of its Expense Group.
Macquarie High Yield Bond Portfolio — The expense comparisons for the Portfolio showed that its actual management fee and total expenses were in the quartile with the lowest expenses of its Expense Group. The Board was satisfied with the management fee and total expenses of the Portfolio in comparison to those of its Expense Group.
Macquarie Labor Select International Equity Portfolio — The expense comparisons for the Portfolio showed that its actual management fee was in the quartile with the highest expenses of its Expense Group and its total expenses were in the quartile with the second lowest expenses of its Expense Group. The Board was satisfied with the total expenses of the Portfolio in comparison to those of its Expense Group.
Macquarie Large Cap Value Portfolio — The expense comparisons for the Portfolio showed that its actual management fee and total expenses were in the quartile with the lowest expenses of its Expense Group. The Board was satisfied with the management fee and total expenses of the Portfolio in comparison to those of its Expense Group.
Management profitability. The Board considered the level of profits, if any, realized by DMC in connection with the operation of the Portfolios. In this respect, the Board reviewed the Investment Management Profitability Analysis that addressed the overall profitability of DMC’s business in providing management and other services to each of the individual funds and the Delaware Funds as a whole. Specific attention was given to the methodology used by DMC in allocating costs for the purpose of determining profitability. Management stated that the level of profits of DMC, to a certain extent, reflects recent operational cost savings and efficiencies initiated by DMC. The Board considered DMC’s efforts to improve services provided to Portfolio shareholders and to meet additional regulatory and compliance requirements resulting from recent industry-wide Securities and Exchange Commission initiatives. The Board also considered the extent to which DMC might derive ancillary benefits from fund operations, including the potential for procuring additional business as a result of the prestige and visibility associated with its role as service provider to the Delaware Funds and the benefits from allocation of fund brokerage to improve trading efficiencies. As part of its work, the Board also reviewed a report prepared by JDL regarding MIMBT profitability as compared to certain peer fund complexes and the Independent Trustees met with JDL personnel to discuss DMC’s profitability in such context. The Board found that the management fees were reasonable in light of the services rendered and the profitability of DMC.
Management profitability. Trustees were also given available information on profits being realized by Mondrian in relation to the services being provided to Macquarie Emerging Markets Portfolio and Macquarie Labor Select International Equity Portfolio and in relation to Mondrian’s overall investment advisory business, but believed such information to be of limited relevance because the sub-advisory fees are paid by DMC out of its management fee, and changes in the level of sub-advisory fees have no impact on Portfolio expenses. The Board was also provided information on potential fall-out benefits derived or to be derived by Mondrian in connection with its relationship to the Portfolios, such as reputational enhancement, soft dollar arrangements or commissions paid to affiliated broker/dealers, as applicable.
Economies of scale. The Trustees considered whether economies of scale are realized by DMC as each Portfolio’s assets increase and the extent to which any economies of scale are reflected in the level of management fees charged. The Trustees reviewed the Portfolios’ advisory fee pricing and structure approved by the Board and shareholders which does not includes breakpoints. Breakpoints in the advisory fee occur when the advisory fee rate is reduced on assets in excess of specified levels. Breakpoints result in a lower advisory fee, than would otherwise be the case in the absence of breakpoints, when the asset levels specified in the breakpoints are exceeded. Benchmarking analysis indicated that less than one-quarter of competing funds in the institutional market employ breakpoints. Management believed, and the Board agreed, that the Portfolios were priced with relatively low management fees to reflect potential economies of scale at all asset levels. The Board noted that the fee under the management contract for Macquarie Core Plus Bond Portfolio did not fall within the standardized fee pricing structure. With respect to Macquarie Core Plus Bond Portfolio, Management explained that the portfolio management fee was priced slightly lower than the standard fee rate for special domestic funds.
Other Portfolio information
(Unaudited)
Macquarie Institutional Portfolios
Fund management
Kristen E. Bartholdson
Vice President, Senior Portfolio Manager — Macquarie Large Cap Value Portfolio
Kristen E. Bartholdson is a senior portfolio manager for the firm’s Large-Cap Value team. Prior to joining Macquarie Investment Management (MIM) in 2006 as an associate portfolio manager, she worked at Susquehanna International Group from 2004 to 2006, where she was an equity research salesperson. From 2000 to 2004, she worked in equity research at Credit Suisse, most recently as an associate analyst in investment strategy. Bartholdson earned her bachelor’s degree in economics from Princeton University.
Nigel A. Bliss
Senior Portfolio Manager — Mondrian Investment Partners Ltd. — Macquarie Labor Select International Equity Portfolio
Nigel Bliss is a graduate of the University of Manchester, holds the ASIP designation, and is a member of the CFA Institute and the CFA Society of the UK. He commenced his career at Cazenove & Co. in 1993 and moved to join Mondrian in 1995. Bliss is a senior portfolio manager in the Non-US Equity Team and a member of Mondrian’s Non-US Equity Strategy Committee. He has had significant experience analyzing securities in the Pacific Basin region and in the global materials, utilities, property, and industrials sectors. In recent years, Bliss has taken responsibility for leading coverage of securities listed in the UK and Scandinavian markets while still maintaining his sector specialization.
Adam H. Brown, CFA
Senior Vice President, Co-Head of High Yield, Senior Portfolio Manager — Macquarie High Yield Bond Portfolio and Macquarie Core Plus Bond Portfolio
Adam H. Brown is a senior portfolio manager and co-head of the firm’s high yield strategies. He manages the bank loan portfolios and is a co-portfolio manager for the high yield, fixed rate multisector, and core plus strategies. Brown joined Macquarie Investment Management (MIM) in April 2011 as part of the firm’s integration of Macquarie Four Corners Capital Management, where he had worked since 2002. At Four Corners, he was a co-portfolio manager on the firm’s collateralized loan obligations (CLOs) and a senior research analyst supporting noninvestment grade portfolios. Before that, Brown was with the predecessor of Wells Fargo Securities, where he worked in the leveraged finance group arranging senior secured bank loans and high yield bond financings for financial sponsors and corporate issuers. He earned a bachelor’s degree in accounting from the University of Florida and an MBA from the A.B. Freeman School of Business at Tulane University.
Liu-Er Chen, CFA
Senior Vice President, Chief Investment Officer — Emerging Markets and Healthcare — Macquarie Emerging Markets Portfolio II
Liu-Er Chen heads the firm’s global Emerging Markets team, and he is also the portfolio manager for Delaware Healthcare Fund, which launched in September 2007. Prior to joining Macquarie Investment Management (MIM) in September 2006 in his current position, he spent nearly 11 years at Evergreen Investment Management Company, where he most recently worked as managing director and senior portfolio manager. He co-managed the Evergreen Emerging Markets Growth Fund from 1999 to 2001, and became the Fund’s sole manager in 2001. He was also the sole manager of the Evergreen Health Care Fund since its inception in 1999. Chen began his career at Evergreen in 1995 as an analyst covering Asian and global healthcare stocks, before being promoted to portfolio manager in 1998. Prior to his career in asset management, Chen worked for three years in sales, marketing, and business development for major American and European pharmaceutical and medical device companies. He received his medical education in China, and he has experience in medical research at both the Chinese Academy of Sciences and Cornell Medical School. He holds an MBA with a concentration in management from Columbia Business School.
124
Ginny Chong, CFA
Senior Portfolio Manager — Mondrian Investment Partners Ltd. — Macquarie Emerging Markets Portfolio
Prior to joining Mondrian in 2000, Ginny Chong worked for PricewaterhouseCoopers in Vancouver, within the Corporate Finance and Investment Banking Division where she qualified as a Canadian Chartered Accountant. Chong has a degree in Commerce from the University of British Columbia, Vancouver. Chong is presently a senior portfolio manager within the Emerging Markets Team. Chong is a CFA Charterholder and is a member of the CFA Institute and the CFA Society of the UK.
Craig C. Dembek, CFA
Executive Director, Global Head of Credit Research — Macquarie High Yield Bond Portfolio and Macquarie Core Plus Bond Portfolio
Craig C. Dembek is global head of credit research and a senior research analyst on the firm’s taxable fixed income team with primary responsibility for banks, brokers, insurance companies, and real estate investment trusts (REITs). He rejoined Macquarie Investment Management (MIM) in March 2007. During his previous time at the firm, from April 1999 to January 2001, he was a senior investment grade credit analyst. Most recently, he spent four years at Chartwell Investment Partners as a senior fixed income analyst and Turner Investment Partners as a senior fixed income analyst and portfolio manager. Dembek also spent two years at Stein, Roe & Farnham as a senior fixed income analyst. Earlier in his career, he worked for two years as a lead bank analyst at the Federal Reserve Bank of Boston. Dembek earned a bachelor’s degree in finance from Michigan State University and an MBA with a concentration in finance from the University of Vermont.
Elizabeth A. Desmond, CFA
Deputy Chief Executive Officer and Chief Investment Officer — International Equities — Mondrian Investment Partners Ltd. — Macquarie Labor Select International Equity Portfolio
Elizabeth A. Desmond holds a BA from Wellesley College and an MA in East Asian Studies from Stanford University. After working for the Japanese government for two years, she began her investment career as a Pacific Basin investment manager with Shearson Lehman Global Asset Management. In 1991 Ms. Desmond joined Mondrian Investment Partners’ predecessor organization as a founding member after previously working as a Pacific Basin equity analyst and senior portfolio manager at Hill Samuel Investment Advisers Ltd. She is a Director and leads the International Equity investment team; in addition she chairs the International Equity Strategy Committee. Ms. Desmond is a CFA Charterholder, and a member of the CFA Institute and the CFA Society of the UK. She sits on the CFA UK’s Advisory Council.
Roger A. Early, CPA, CFA
Executive Director, Global Co-Head of Fixed Income — Macquarie Core Plus Bond Portfolio
Roger A. Early is global co-head of the firm’s fixed income team. He rejoined Macquarie Investment Management (MIM) in March 2007 as a member of the firm’s taxable fixed income portfolio management team, with primary responsibility for portfolio construction and strategic asset allocation. He became head of fixed income investments in the Americas in February 2015. During his previous time at the firm, from 1994 to 2001, he was a senior portfolio manager in the same area, and he left the firm as head of its US investment grade fixed income group. In recent years, Early was a senior portfolio manager at Chartwell Investment Partners and Rittenhouse Financial and was the chief investment officer for fixed income at Turner Investments. Prior to joining the firm in 1994, he worked for more than 10 years at Federated Investors where he managed more than $25 billion in mutual fund and institutional portfolios in the short-term and investment grade markets. He left the firm as head of institutional fixed income management. Earlier in his career, he held management positions with the Federal Reserve Bank, PNC Financial, Touche Ross, and Rockwell International. Early earned his bachelor’s degree in economics from The Wharton School of the University of Pennsylvania and an MBA with concentrations in finance and accounting from the University of Pittsburgh. He is a member of the CFA Society of Philadelphia.
Other Portfolio information
(Unaudited)
Macquarie Institutional Portfolios
Fund management (continued)
Paul Grillo, CFA
Senior Vice President, Chief Investment Officer — Diversified Income — Macquarie Core Plus Bond Portfolio
Paul Grillo is a member of the firm’s taxable fixed income portfolio management team with primary responsibility for portfolio construction and strategic asset allocation. He is also a member of the firm’s asset allocation committee, which is responsible for building and managing multi-asset class portfolios. He joined Macquarie Investment Management (MIM) in 1992 as a mortgage-backed and asset-backed securities analyst, assuming portfolio management responsibilities in the mid-1990s. Grillo serves as lead portfolio manager for the firm’s Diversified Income products and has been influential in the growth and distribution of the firm’s multisector strategies. Prior to joining the firm, Grillo was a mortgage strategist and trader at Dreyfus Corporation. He also worked as a mortgage strategist and portfolio manager at Chemical Investment Group and as a financial analyst at Chemical Bank. Grillo holds a bachelor’s degree in business management from North Carolina State University and an MBA with a concentration in finance from Pace University.
Gregory J.P. Halton, CFA
Senior Portfolio Manager — Mondrian Investment Partners Ltd. — Macquarie Emerging Markets Portfolio
Having graduated from St Catherine’s College, Oxford in 2000 with a MEng (Hons) in Engineering Science, Gregory J.P. Halton worked in the global equity division of Deutsche Asset Management before joining Mondrian in 2004. Halton is a senior portfolio manager within the Emerging Markets Team. Halton is a CFA Charterholder and is a member of the CFA Institute and the CFA Society of the UK.
J. David Hillmeyer, CFA
Executive Director, Head of Multisector/Global Fixed Income — Macquarie Investment Management, Americas — Macquarie Core Plus Bond Portfolio
J. David Hillmeyer is head of multisector/global fixed income in the Americas. He is co-portfolio manager for the fixed rate diversified multisector, core plus, and investment grade corporate bond strategies. Prior to joining Macquarie Investment Management (MIM) in August 2007 as a vice president and corporate bond trader, he worked for more than 11 years in various roles at Hartford Investment Management Company, including senior corporate bond trader, high yield portfolio manager / trader, and quantitative analyst. He began his career as an investment advisor in January 1989 at Shawmut Bank, leaving the firm as an investment officer in November 1995. Hillmeyer earned his bachelor’s degree from Colorado State University, and he is a member of the CFA Society of Philadelphia and the Philadelphia Council for Business Economics.
Nikhil G. Lalvani, CFA
Vice President, Senior Portfolio Manager, Team Leader — Large-Cap Value Equity — Macquarie Large Cap Value Portfolio
Nikhil G. Lalvani is a senior portfolio manager for the firm’s Large-Cap Value team and assumed the role of team leader in October 2018. At Macquarie Investment Management (MIM) Lalvani has worked as both a fundamental and quantitative analyst. Prior to joining the firm in 1997 as an account analyst, he was a research associate with Bloomberg. Lalvani holds a bachelor’s degree in finance from The Pennsylvania State University. He is a member of the CFA Institute and the CFA Society of Philadelphia.
Paul A. Matlack, CFA
Senior Vice President, Senior Portfolio Manager, Fixed Income Strategist — Macquarie Core Plus Bond Portfolio and Macquarie High Yield Bond Portfolio
Paul A. Matlack is a strategist and senior portfolio manager for the firm’s fixed income team. Matlack rejoined the firm in May 2010. During his previous time at Macquarie Investment Management (MIM) from September 1989 to October 2000, he was senior credit analyst, senior portfolio manager, and left the firm as co-head of the high yield group. Most recently, he worked at Chartwell Investment Partners from September 2003 to April 2010 as senior portfolio manager in fixed income, where he managed core, core plus, and high yield strategies. Prior to that, Matlack held senior roles at Turner Investment Partners, PNC Bank, and Mellon Bank. He earned a bachelor’s degree in international relations from the University of Pennsylvania and an MBA with a concentration in finance from George Washington University.
126
John P. McCarthy, CFA
Senior Vice President, Co-Head of High Yield, Senior Portfolio Manager — Macquarie High Yield Bond Portfolio and Macquarie Core Plus Bond Portfolio
John P. McCarthy is a senior portfolio manager and co-head for the firm’s high yield strategies, a role he assumed in July 2016. From December 2012 to June 2016, he was co-head of credit research on the firm’s taxable fixed income team. McCarthy rejoined Macquarie Investment Management (MIM) in March 2007 as a senior research analyst, after he worked in the firm’s fixed income area from 1990 to 2000 as a senior high yield analyst and high yield trader, and from 2001 to 2002 as a municipal bond trader. Prior to rejoining the firm, he was a senior high yield analyst/trader at Chartwell Investment Partners. McCarthy earned a bachelor’s degree in business administration from Babson College, and he is a member of the CFA Society of Philadelphia.
Andrew Miller
Chief Investment Officer, Emerging Market Equities — Mondrian Investment Partners Ltd. — Macquarie Emerging Markets Portfolio
Andrew Miller has a BA (Hons) degree in History from the University of Birmingham. Prior to joining Mondrian in 2000, he worked in the Investment Management department of PricewaterhouseCoopers, where he was responsible for the analysis and audit of various investment vehicles. While at Mondrian, Miller has specialized in Emerging Markets and he is now the Chief Investment Officer for this product. He holds the ASIP designation and is a member of the CFA Institute and the CFA Society of the UK.
D. Tysen Nutt Jr.
Senior Vice President, Senior Portfolio Manager — Macquarie Large Cap Value Portfolio
D. Tysen Nutt Jr. is a senior portfolio manager for the firm’s Large-Cap Value team. Before joining Macquarie Investment Management (MIM) in 2004 as senior vice president and senior portfolio manager, Nutt led the US Active Large-Cap Value team within Merrill Lynch Investment Managers, where he managed mutual funds and separate accounts for institutions and private clients. Nutt earned his bachelor’s degree from Dartmouth College, and he is a member of the CFA Society New York and the CFA Institute.
Melissa J. A. Platt, CFA
Portfolio Manager — Mondrian Investment Partners Ltd. — Macquarie Labor Select International Equity Portfolio
Melissa J. A. Platt holds a Bachelor of Business Studies (Honours) in Financial Economics and a Bachelor of Applied Economics from Massey University in New Zealand. She started her business career as a consultant at KPMG Corporate Finance and then moved to FundSource Research for three years, where she worked as an investment analyst and later as research manager. Platt joined Mondrian in 2004 and is a portfolio manager in the International Equity Team. She is a CFA Charterholder and a member of the CFA Institute and the CFA Society of the UK.
Robert A. Vogel Jr., CFA
Vice President, Senior Portfolio Manager — Macquarie Large Cap Value Portfolio
Robert A. Vogel Jr. is a senior portfolio manager for the firm’s Large-Cap Value team. Prior to joining Macquarie Investment Management (MIM) in 2004 as vice president and senior portfolio manager, he worked at Merrill Lynch Investment Managers for more than seven years, where he rose to the position of director and portfolio manager within the US Active Large-Cap Value team. He began his career in 1992 as a financial consultant at Merrill Lynch. Vogel graduated from Loyola University Maryland, earning both bachelor’s and master’s degrees in finance. He also earned an MBA with a concentration in finance from The Wharton School of the University of Pennsylvania. Vogel is a member of the CFA Society New York, the CFA Institute, and the CFA Society of Philadelphia.
This page intentionally left blank.
Board of trustees / directors and officers addendum
Delaware Funds® by Macquarie
A mutual fund is governed by a Board of Trustees / Directors (“Trustees”), which has oversight responsibility for the management of a fund’s business affairs. Trustees establish procedures and oversee and review the performance of the investment manager, the distributor, and others who perform services for the fund. The independent fund trustees, in particular, are advocates for shareholder interests. Each trustee has served in that capacity since he or she was elected to or appointed to the Board of Trustees, and will continue to serve until his or her retirement or the election of a new trustee in his or her place. The following is a list of the Trustees and Officers with certain background and related information.
| | | | | | | | | | |
Name,
Address,
and Birth Date | | Position(s) Held with Fund(s) | | Length of Time
Served | | Principal
Occupation(s)
During the
Past Five Years | | Number of
Portfolios in Fund
Complex Overseen
by Trustee or Officer | | Other
Directorships
Held by
Trustee
or Officer |
Interested Trustee |
Shawn K. Lytle1,2 2005 Market Street Philadelphia, PA 19103 February 1970 | | President, Chief Executive Officer, and Trustee | | Trustee since September 2015 President and Chief Executive Officer since August 2015 | | President — Macquarie Investment Management3 (June 2015-Present) Regional Head of Americas — UBS Global Asset Management (April 2010-May 2015) | | 59 | | Trustee — UBS Relationship Funds, SMA Relationship Trust, and UBS Funds (May 2010–April 2015) |
Independent Trustees |
Thomas L. Bennett 2005 Market Street Philadelphia, PA 19103 October 1947 | | Chair and Trustee | | Trustee since March 2005 Chair since March 2015 | | Private Investor (March 2004–Present) | | 59 | | None |
Ann D. Borowiec 2005 Market Street Philadelphia, PA 19103 November 1958 | | Trustee | | Since March 2015 | | Chief Executive Officer, Private Wealth Management (2011–2013) and Market Manager, New Jersey Private Bank (2005–2011) — J.P. Morgan Chase & Co. | | 59 | | Director — Banco Santander International (October 2016-Present) Director — Santander Bank, N.A. (December 2016-Present) |
Joseph W. Chow 2005 Market Street Philadelphia, PA 19103 January 1953 | | Trustee | | Since January 2013 | | Private Investor (April 2011-Present) | | 59 | | Director and Audit Committee Member — Hercules Technology Growth Capital, Inc. (July 2004–July 2014) |
John A. Fry 2005 Market Street Philadelphia, PA 19103 May 1960 | | Trustee | | Since January 2001 | | President — Drexel University (August 2010–Present) President — Franklin & Marshall College (July 2002–July 2010) | | 59 | | Director; Compensation Committee and Governance Committee Member — Community Health Systems Director — Drexel Morgan & Co. Director; Audit Committee Member — vTv Therapeutics LLC Director; Audit Committee Member — FS Credit Real Estate Income Trust, Inc. |
Board of trustees / directors and officers addendum
Delaware Funds® by Macquarie
| | | | | | | | | | |
Name, Address, and Birth Date | | Position(s)
Held with
Fund(s) | | Length of Time Served | | Principal Occupation(s) During the Past Five Years | | Number of
Portfolios in Fund
Complex Overseen
by Trustee
or Officer | | Other Directorships Held by Trustee or Officer |
Independent Trustees (continued) |
Lucinda S. Landreth 2005 Market Street Philadelphia, PA 19103 June 1947 | | Trustee | | Since March 2005 | | Private Investor (2004–Present) | | 59 | | None |
Frances A. Sevilla-Sacasa 2005 Market Street Philadelphia, PA 19103 January 1956 | | Trustee | | Since September 2011 | | Private Investor (January 2017-Present) Chief Executive Officer — Banco Itaú International (April 2012–December 2016) Executive Advisor to Dean (August 2011–March 2012) and Interim Dean (January 2011–July 2011) — University of Miami School of Business Administration President — U.S. Trust, Bank of America Private Wealth Management (Private Banking) (July 2007-December 2008) | | 59 | | Trust Manager and Audit Committee Chair — Camden Property Trust (August 2011-Present) Director — Carrizo Oil & Gas, Inc. (March 2018-Present) |
Thomas K. Whitford 2005 Market Street Philadelphia, PA 19103 March 1956 | | Trustee | | Since January 2013 | | Vice Chairman (2010–April 2013) — PNC Financial Services Group | | 59 | | Director — HSBC Finance Corporation and HSBC North America Holdings Inc. (December 2013-Present) Director — HSBC USA Bank, Inc. (July 2014-March 2017) |
Janet L. Yeomans 2005 Market Street Philadelphia, PA 19103 July 1948 | | Trustee | | Since April 1999 | | Vice President and Treasurer (January 2006–July 2012), Vice President — Mergers & Acquisitions (January 2003–January 2006), and Vice President and Treasurer (July 1995–January 2003) — 3M Company | | 59 | | Director (2009-2017); Personnel and Compensation Committee Chair; Member of Nominating, Investments, and Audit Committees for various periods throughout directorship — Okabena Company |
130
| | | | | | | | | | |
Name, Address, and Birth Date | | Position(s) Held with Fund(s) | | Length of Time Served | | Principal Occupation(s) During the Past Five Years | | Number of
Portfolios in Fund
Complex Overseen
by Trustee
or Officer | | Other Directorships Held by Trustee or Officer |
Officers |
David F. Connor 2005 Market Street Philadelphia, PA 19103 December 1963 | | Senior Vice President, General Counsel, and Secretary | | Senior Vice President, since May 2013; General Counsel since May 2015; Secretary since October 2005 | | David F. Connor has served in various capacities at different times at Macquarie Investment Management. | | 59 | | None2 |
Daniel V. Geatens 2005 Market Street Philadelphia, PA 19103 October 1972 | | Vice President and Treasurer | | Vice President and Treasurer since October 2007 | | Daniel V. Geatens has served in various capacities at different times at Macquarie Investment Management. | | 59 | | None2 |
Richard Salus 2005 Market Street Philadelphia, PA 19103 October 1963 | | Senior Vice President and Chief Financial Officer | | Senior Vice President and Chief Financial Officer since November 2006 | | Richard Salus has served in various capacities at different times at Macquarie Investment Management. | | 59 | | None2 |
| 1 | Shawn K. Lytle is considered to be an “Interested Trustee” because he is an executive officer of the Fund’s(s’) investment advisor. |
| 2 | Shawn K. Lytle, David F. Connor, Daniel V. Geatens, and Richard Salus serve in similar capacities for the six portfolios of the Optimum Fund Trust, which have the same investment advisor, principal underwriter, and transfer agent as the registrant. Mr. Geatens also serves as the Chief Financial Officer and Treasurer for Macquarie Global Infrastructure Total Return Fund Inc., which has an affiliated investment manager. |
| 3 | Macquarie Investment Management is the marketing name for Macquarie Management Holdings, Inc. and its subsidiaries, including the Fund’s(s’) investment manager, principal underwriter, and its transfer agent. |
The Statement of Additional Information for the Fund(s) includes additional information about the Trustees and Officers and is available, without charge, upon request by calling 800 523-1918.
Portfolio managers
Kristen E. Bartholdson
Vice President, Senior
Portfolio Manager
Nigel Bliss
Senior Portfolio Manager
Mondrian Investment Partners Limited
Adam H. Brown
Senior Vice President, Co-Head of High Yield,
Senior Portfolio Manager
Liu-Er Chen
Senior Vice President,
Chief Investment Officer —
Emerging Markets and Healthcare
Ginny Chong
Senior Portfolio Manager
Mondrian Investment Partners Limited
Craig C. Dembek
Senior Vice President, Global Head of Credit Research
Elizabeth A. Desmond
Deputy Chief Executive Officer, Chief Investment
Officer — International Equities
Mondrian Investment Partners Limited
Roger A. Early
Executive Director,
Global Co-Head of Fixed Income
Paul Grillo
Senior Vice President and
Chief Investment Officer —
Diversified Income
Gregory J.P. Halton
Senior Portfolio Manager
Mondrian Investment Partners Limited
J. David Hillmeyer
Executive Director, Head of
Multisector/Global Fixed Income
Nikhil G. Lalvani
Vice President, Senior Portfolio Manager,
Team Leader — Large-Cap Value Equity
Paul A. Matlack
Senior Vice President,
Senior Portfolio Manager,
Fixed Income Strategist
John P. McCarthy
Senior Vice President, Co-Head of High Yield,
Senior Portfolio Manager
Andrew Miller
Chief Investment Officer —
Emerging Market Equities
Mondrian Investment Partners Limited
D. Tysen Nutt Jr.
Senior Vice President,
Senior Portfolio Manager
Melissa J. A. Platt
Portfolio Manager
Mondrian Investment Partners Limited
Robert A. Vogel Jr.
Vice President, Senior Portfolio Manager
132
This page intentionally left blank.
Custodian
The Bank of New York Mellon
240 Greenwich Street
New York, NY 10286-0001
Independent registered public accounting firm
PricewaterhouseCoopers LLP
Two Commerce Square, Suite 1700
2001 Market Street
Philadelphia, PA 19103-7042
Investment advisor
Delaware Management Company, a series of Macquarie Investment Management Business Trust
2005 Market Street
Philadelphia, PA 19103-7094
Investment sub-advisor for certain Portfolios
Mondrian Investment Partners Limited
Fifth Floor
10 Gresham Street
London EC2V 7JD
United Kingdom
Macquarie Institutional Portfolios are designed exclusively for institutional investors and high net worth individuals. The Portfolios are distributed by Delaware Distributors, L.P. (DDLP), an affiliate of Macquarie Investment Management Business Trust (MIMBT), Macquarie Management Holdings, Inc., and Macquarie Group Limited. Macquarie Investment Management (MIM) is the marketing name for certain companies comprising the asset management division of Macquarie Group Limited and its subsidiaries and affiliates worldwide. Institutional investment management is provided by Macquarie Investment Management Advisers (MIMA), a series of MIMBT. MIMBT is a US registered investment advisor, and may not be able to provide investment advisory services to certain clients in certain jurisdictions.
Each Portfolio files its complete schedule of portfolio holdings with the Securities and Exchange Commission for the first and third quarters of each fiscal year on Form N-Q. Each Portfolio’s Forms N-Q, as well as a description of the policies and procedures that the Portfolios use to determine how to vote proxies (if any) relating to portfolio securities and the Schedules of Investments included in the Portfolios’ most recent Forms N-Q are available without charge (i) upon request, by calling 800 231-8002; (ii) on the Portfolios’ website at macquarie.com/investment-management/institutional; and (iii) on the Commission’s website at sec.gov. Each Portfolio’s Forms N-Q may be reviewed and copied at the Commission’s Public Reference Room in Washington, D.C.; information on the operation of the Public Reference Room may be obtained by calling 800 SEC-0330.
Information (if any) regarding how each Portfolio voted proxies relating to portfolio securities during the most recently disclosed 12-month period ended June 30 is available without charge (i) through the Portfolios’ website at delawarefunds.com/proxy; and (ii) on the Commission’s website at sec.gov.
This report was prepared for investors in the Macquarie Institutional Portfolios. It may be distributed to others only if preceded or accompanied by a current Macquarie Institutional Portfolios prospectus, which contains details about charges, expenses, investment objectives, and operating policies of the Portfolios. All Macquarie Institutional Portfolios are offered by prospectus only. The return and principal value of an investment in a Portfolio will fluctuate so that shares, when redeemed, may be worth more or less than their original cost.
Carefully consider the Portfolios’ investment objectives, risk factors, charges, and expenses before investing. This and other information can be found in the Portfolios’ prospectus, which may be obtained by visiting macquarie.com/investment-management/institutional or calling 800 231-8002. Investors should read the prospectus carefully before investing.
| | |

(682919) AR-DPT 22002 [12/18] | | 2005 Market Street Philadelphia, PA 19103-7094 Telephone 800 231-8002 Fax 215 255-1162 Printed in the USA |
Alternative / specialty mutual fund
Delaware REIT Fund
October 31, 2018
Carefully consider the Fund’s investment objectives, risk factors, charges, and expenses before investing. This and other information can be found in the Fund’s prospectus and its summary prospectus, which may be obtained by visiting delawarefunds.com/literature or calling 800 523-1918. Investors should read the prospectus and the summary prospectus carefully before investing.
You can obtain shareholder reports and prospectuses online instead of in the mail.
Visit delawarefunds.com/edelivery.

Experience Delaware Funds® by Macquarie
Macquarie Investment Management (MIM) is a global asset manager with offices throughout the United States, Europe, Asia, and Australia. We are active managers who prioritize autonomy and accountability at the investment team level in pursuit of opportunities that matter for our clients. Delaware Funds is one of the longest-standing mutual fund families, with more than 75 years in existence.
If you are interested in learning more about creating an investment plan, contact your financial advisor.
You can learn more about Delaware Funds or obtain a prospectus for Delaware REIT Fund at delawarefunds.com/literature.
Manage your account online
| • | | Check your account balance and transactions |
| • | | View statements and tax forms |
| • | | Make purchases and redemptions |
Visit delawarefunds.com/account-access.
Macquarie Asset Management (MAM) offers a diverse range of products including securities investment management, infrastructure and real asset management, and fund and equity-based structured products. MIM is the marketing name for certain companies comprising the asset management division of Macquarie Group. This includes the following registered investment advisers: Macquarie Investment Management Business Trust (MIMBT), Macquarie Funds Management Hong Kong Limited, Macquarie Investment Management Austria Kapitalanlage AG, Macquarie Investment Management Global Limited, Macquarie Investment Management Europe Limited, and Macquarie Capital Investment Management LLC.
The Fund is distributed by Delaware Distributors, L.P.
(DDLP), an affiliate of MIMBT and Macquarie Group Limited.
Other than Macquarie Bank Limited (MBL), none of the entities noted are authorized deposit-taking institutions for the purposes of the Banking Act 1959 (Commonwealth of Australia). The obligations of these entities do not represent deposits or other liabilities of MBL. MBL does not guarantee or otherwise provide assurance in respect of the obligations of these entities, unless noted otherwise. The Fund is governed by US laws and regulations.
Unless otherwise noted, views expressed herein are current as of Oct. 31, 2018, and subject to change for events occurring after such date.
The Fund is not FDIC insured and is not guaranteed. It is possible to lose the principal amount invested.
Advisory services provided by Delaware Management Company, a series of MIMBT, a US registered investment advisor.
All third-party marks cited are the property of their respective owners.
© 2018 Macquarie Management Holdings, Inc.
| | | | |
| Portfolio management review | | | | |
| Delaware REIT Fund | |
| November 13, 2018
|
|
| | | | | | | | |
| Performance preview (for the year ended October 31, 2018) | |
Delaware REIT Fund (Institutional Class shares) | | | 1-year return | | | | -0.08% | |
Delaware REIT Fund (Class A shares) | | | 1-year return | | | | -0.26% | |
FTSE NAREIT Equity REITs Index (benchmark) | | | 1-year return | | | | +1.26% | |
Past performance does not guarantee future results.
For complete, annualized performance for Delaware REIT Fund, please see the table on page 4.
Institutional Class shares are not subject to a sales charge and are offered for sale exclusively to certain eligible investors. In addition, Institutional Class shares pay no distribution and service fee.
The performance of Class A shares excludes the applicable sales charge. Both Institutional Class shares and Class A shares reflect the reinvestment of all distributions.
Please see page 6 for a description of the index. Index performance returns do not reflect any management fees, transaction costs, or expenses. Indices are unmanaged and one cannot invest directly in an index.
Investors in real estate investment trusts (REITs) encountered challenging market conditions for the fiscal year ended Oct. 31, 2018. During this period, the US REIT market, as measured by the FTSE NAREIT Equity REITs Index, returned +1.26%. That subdued return came with significant volatility, however, as two major market corrections — at the start and the end of the period — bookended a long upswing, as REITs bounced back from depressed levels and gained significant ground between February and August.
For the fiscal period, the FTSE NAREIT Equity REITs Index significantly trailed the broader equity market, as measured by the S&P 500® Index, which gained more than 7%, due largely to the resilience of growth-oriented and cyclically oriented investments.
Throughout the 12-month period, the US economy continued along its expansionary path. US gross domestic product (GDP) — a measure of the country’s economic
output — grew in all four quarters of the Fund’s fiscal year. The expansion was especially rapid in the second quarter (+4.2%) and third quarter (+3.5%) of 2018; this represented the country’s fastest half year of GDP growth since 2014. Meanwhile, the US unemployment rate continued to drop, hitting 3.7% in October 2018, a nearly 50-year low.
| | |
● The FTSE NAREIT Equity REITs Index significantly trailed the broader equity market due largely to the resilience of growth-oriented and cyclically oriented investments. ● Shares of manufactured homes and freestanding REITs performed relatively well as operators continued to grow their cash flow. ● Diversified REITs and the tech sector, including owners of data centers and wireless communications towers, saw weaker growth and share-price performance. | | |
1
| | | | |
| Portfolio management review | | | | |
| Delaware REIT Fund | | | | |
To combat potential inflation that can accelerate during periods of economic growth, the US Federal Reserve raised the federal funds rate by a quarter percentage point on four separate occasions during the fiscal year, ending in a target range of 2.00% to 2.25% as of Oct. 31, 2018, up from a range of 1.00% to 1.25% a year earlier.
Higher interest rates drove the REIT market’s struggles during the fiscal year, as REITs tend to rely on the availability of attractively priced capital to fund growth. Those real estate operators that saw the best share-price performance tended to be companies with relatively stable cash flows and the ability to generate good internal growth.
During the period, the gap between the strongest-and weakest-performing sectors generally reflected either the presence of cash flow growth or the difficulty of generating it. For example, the manufactured homes sector (+12%) and freestanding sector (+14%) tended to perform relatively well, as operators in these categories were able to continue to grow their cash flow. Other sectors, such as the diversified group (-15%), which consists of REITs that own properties across several categories, and the tech sector (-14%), which includes owners of data centers and wireless communications towers, saw weaker growth and share-price performance.
Within the Fund
For the fiscal year ended Oct. 31, 2018, Delaware REIT Fund Institutional Class shares returned -0.08%. The Fund’s Class A shares returned -0.26% at net asset value and -5.97% at maximum offer price. These figures reflect all distributions reinvested. For the same period, the Fund’s benchmark, the FTSE NAREIT Equity REITs Index, returned +1.26%. Complete annualized performance for Delaware REIT Fund is shown in the table on page 4.
Individual contributors and detractors
Relative to the benchmark, the Fund’s biggest performance challenge was security selection in the healthcare sector, especially with regard to the Fund’s large out-of-index position in Brookdale Senior Living Inc., an operator of senior care facilities. For this fiscal year, the company’s shares returned -11%, as an oversupply of senior housing facilities continued to hamper the group. At its current share price as of period end, we think Brookdale’s stock offers the most potential of any holding in the Fund. In our opinion, Brookdale’s shares are trading dramatically below the value of the real estate it owns.
Within the tech sector, where security selection was modestly negative overall, the Fund’s biggest relative detractors were Equinix Inc., a data center REIT, and SBA Communications Corp., an owner of wireless communications towers. SBA’s shares fell, likely due to concerns about the impact of a potential merger between two large wireless carriers, T-Mobile and Sprint, as the elimination of one competitor could lead to less capital spending in the industry. Meanwhile, Equinix struggled during the fiscal year as data center operators experienced slowing growth along with tighter availability of capital for companies in this industry. The negative effect from the Equinix position, however, was largely offset by the positive effect of our relative underweighting in industry leader Digital Realty Trust Inc., whose shares similarly declined during the fiscal year.
In the freestanding category, our security selection was positive on balance. The Fund benefited most from an overweight in STORE Capital Corp., a strong-performing triple-net REIT (meaning its tenants are responsible for paying ongoing expenses, such as real estate taxes and insurance). The company benefited from its ready access to attractively priced capital, which in turn enabled it to add to its external growth. In
2
contrast, the Fund’s underweight in another triple-net REIT, Realty Income Corp., which we sold during the fiscal year, detracted from Fund results considering the stock’s healthy gain for the full period.
In the regional malls sector, our security selection added value, largely due to the Fund’s position in
Simon Property Group Inc., whose shares gained 24%. The Fund’s overweight in this stock reflected our view that Simon Property Group is a best-in-class mall operator benefiting from outstanding properties, a strong management team, good corporate governance, smart capital allocation, and healthy free cash flow. Tempering this outperformance was our positioning in Macerich Co., another regional mall owner, whose shares in hindsight we bought and sold at inopportune times.
Elsewhere, in the industrial REIT sector, our security selection contributed to relative performance, largely due to an investment in DCT Industrial Trust Inc. This operator of warehouse and distribution facilities saw strong share-price performance, as the company was acquired by industry leader Prologis Inc., also a Fund holding, in a transaction that was announced in April and closed in August.
The Fund’s underweight allocation to the lagging diversified REIT sector contributed to relative performance. On an individual basis, the Fund benefited from not owning several weak-performing benchmark components during the period, notably Colony Capital Inc. and Brookfield Property REIT Inc., which suffered steep declines.
Seeking opportunities for growth
Our management strategy remained consistent with the Fund’s prospectus. We prioritize those
areas of the REIT market that, in our opinion, have the potential to benefit from a strong fundamental backdrop for commercial real estate, and that offer what we see as attractively valued securities available for investment. We also seek to invest in companies that, in our view, are able to grow their cash flow and prudently raise capital.
Throughout the fiscal year, our management approach focused on REIT investments in those market areas that have demonstrated stable to accelerating internal growth. We simultaneously sought to avoid companies experiencing dilution from equity sales or a slowdown in internal growth. We also selectively sought individual value opportunities, even as value investing has become more difficult in the current real estate environment of higher interest rates and capital costs.
In this environment, we continue to strive to own companies offering the opportunity for steady growth, which we currently find among owners of manufactured home communities, industrial properties, and data centers. Meanwhile, we have opportunistically added to what we view as deeper value areas, such as healthcare and retail.
As of fiscal year end, we plan to continue to invest in those areas of the REIT market where we see consistent growth potential. We also believe that if companies begin to act in more shareholder-friendly ways, the REIT asset class could be promising due to what we view as attractive valuations across multiple sectors.
3
| | | | |
| Performance summary | | | | |
| Delaware REIT Fund | | | October 31, 2018 | |
The performance quoted represents past performance and does not guarantee future results. Investment return and principal value of an investment will fluctuate so that shares, when redeemed, may be worth more or less than their original cost. Current performance may be lower or higher than the performance quoted. Performance data current to the most recent month end may be obtained by calling 800 523-1918 or visiting delawarefunds.com/performance.
| | | | | | | | |
Fund and benchmark performance1,2 | | Average annual total returns through October 31, 2018 |
| | | 1 year | | 5 years | | 10 years | | Lifetime |
Class A (Est. Dec. 6, 1995) | | | | | | | | |
Excluding sales charge | | -0.26% | | +5.62% | | +9.54% | | +10.24% |
Including sales charge | | -5.97% | | +4.37% | | +8.90% | | +9.96% |
Class C (Est. Nov. 11, 1997) | | | | | | | | |
Excluding sales charge | | -0.99% | | +4.84% | | +8.72% | | +7.24% |
Including sales charge | | -1.95% | | +4.84% | | +8.72% | | +7.24% |
Class R (Est. June 2, 2003) | | | | | | | | |
Excluding sales charge | | -0.54% | | +5.35% | | +9.26% | | +8.09% |
Including sales charge | | -0.54% | | +5.35% | | +9.26% | | +8.09% |
Institutional Class (Est. Nov. 11, 1997) | | | | | | | | |
Excluding sales charge | | -0.08% | | +5.87% | | +9.81% | | +8.31% |
Including sales charge | | -0.08% | | +5.87% | | +9.81% | | +8.31% |
Class R6 (Est. Aug. 31, 2016) | | | | | | | | |
Excluding sales charge | | +0.09% | | n/a | | n/a | | -2.58% |
Including sales charge | | +0.09% | | n/a | | n/a | | -2.58% |
FTSE NAREIT Equity REITs Index | | +1.26% | | +7.56% | | +11.28% | | +8.60%* |
*The benchmark lifetime return is for Institutional Class share comparison only and is calculated using the last business day in the month of the Fund’s Institutional Class inception date.
1Returns reflect the reinvestment of all distributions and are presented both with and without the applicable sales charges described below. Returns do not reflect the deduction of taxes the shareholder would pay on Fund distributions or redemptions of Fund shares.
Expense limitations were in effect for certain classes during some or all of the periods shown in the “Fund and benchmark performance” table. Expenses for each class are listed on the “Fund expense ratios” table on page 5. Performance would have been lower had expense limitations not been in effect.
Institutional Class shares are not subject to a sales charge and are offered for sale exclusively to
certain eligible investors. In addition, Institutional Class shares pay no distribution and service fee.
Class A shares are sold with a maximum front-end sales charge of 5.75%, and have an annual distribution and service fee of 0.25% of average daily net assets. Performance for Class A shares, excluding sales charges, assumes that no front-end sales charge applied.
Class C shares are sold with a contingent deferred sales charge of 1.00% if redeemed during the first 12 months. They are also subject to an annual distribution and service fee of 1.00% of average daily net assets. Performance for Class C shares, excluding sales charges, assumes either that
4
contingent deferred sales charges did not apply or that the investment was not redeemed.
Class R shares are available only for certain retirement plan products. They are sold without a sales charge and have an annual distribution and service fee of 0.50% of average daily net assets.
Class R6 shares are available only to certain investors. In addition, Class R6 shares do not pay any service fees, sub-accounting fees, and/or sub-transfer agency fees to any brokers, dealers, or other financial intermediaries. Class R6 shares pay no distribution and service fee.
Narrowly focused investments may exhibit higher volatility than investments in multiple industry sectors.
REIT investments are subject to many of the risks associated with direct real estate ownership, including changes in economic conditions, credit risk, and interest rate fluctuations.
A REIT fund’s tax status as a regulated investment company could be jeopardized if it holds real estate directly, as a result of defaults, or receives rental income from real estate holdings.
2The Fund’s expense ratios, as described in the most recent prospectus, are disclosed in the following “Fund expense ratios” table. Delaware Management Company has agreed to reimburse certain expenses and/or waive certain fees in order to prevent total annual fund operating expenses (excluding any 12b-1 fees, acquired fund fees and expenses, taxes, interest, short sale and dividend and interest expenses, brokerage fees, certain insurance costs, and nonroutine expenses or costs, including, but not limited to, those relating to reorganizations, litigation, conducting shareholder meetings, and liquidations (collectively, nonroutine expenses)) from exceeding 1.15% of the Fund’s average daily net assets for all share classes other than Class R6, and 1.00% of the Fund’s Class R6 shares’ average daily net assets, during the period from Feb. 28, 2018 to Oct. 31, 2018.* Please see the most recent prospectus and any applicable supplement(s) for additional information on these fee waivers and/or reimbursements. Please see the “Financial highlights” section in this report for the most recent expense ratios.
| | | | | | | | | | |
| Fund expense ratios | | Class A | | Class C | | Class R | | Institutional
Class | | Class R6 |
Total annual operating expenses | | 1.44% | | 2.19% | | 1.69% | | 1.19% | | 1.04% |
(without fee waivers) | | | | | | | | | | |
Net expenses | | 1.40% | | 2.15% | | 1.65% | | 1.15% | | 1.00% |
(including fee waivers, if any) | | | | | | | | | | |
Type of waiver | | Contractual | | Contractual | | Contractual | | Contractual | | Contractual |
*The aggregate contractual waiver period covering this report is from Feb. 28, 2018 through Feb. 28, 2019.
5
| | | | |
| Performance summary | | | | |
| Delaware REIT Fund | | | | |
Performance of a $10,000 investment1
Average annual total returns from Oct. 31, 2008 through Oct. 31, 2018
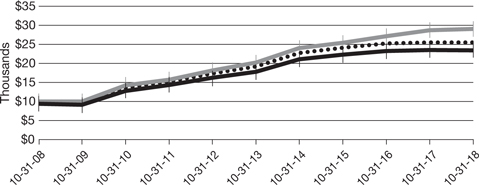
| | | | | | | | | | |
For the period beginning Oct. 31, 2008 through Oct. 31, 2018 | | | Starting value | | | | Ending value | |

| | FTSE NAREIT Equity REITs Index | | | $10,000 | | | | $ 29,112 | |

| | Delaware REIT Fund — Institutional Class shares | | | $10,000 | | | | $ 25,501 | |

| | Delaware REIT Fund — Class A shares | | | $9,425 | | | | $ 23,449 | |
1The “Performance of a $10,000 investment” graph assumes $10,000 invested in Institutional Class and Class A shares of the Fund on Oct. 31, 2008, and includes the effect of a 5.75% front-end sales charge (for Class A shares) and the reinvestment of all distributions. The graph does not reflect the deduction of taxes the shareholders would pay on Fund distributions or redemptions of Fund shares. Expense limitations were in effect for some or all of the periods shown. Performance would have been lower had expense limitations not been in effect. Expenses are listed in the “Fund expense ratios” table on page 5. Please note additional details on pages 4 through 7.
The graph also assumes $10,000 invested in the FTSE NAREIT Equity REITs Index as of Oct. 31, 2008. The FTSE NAREIT Equity REITs
Index measures the performance of all publicly traded equity real estate investment trusts (REITs) traded on US exchanges, excluding timber and infrastructure REITs.
The S&P 500 Index, mentioned on page 1, measures the performance of 500 mostly large-cap stocks weighted by market value, and is often used to represent performance of the US stock market.
Index performance returns do not reflect any management fees, transaction costs, or expenses. Indices are unmanaged and one cannot invest directly in an index. Past performance is not a guarantee of future results.
Performance of other Fund classes will vary due to different charges and expenses.
6
| | | | | | |
| | | Nasdaq symbols | | CUSIPs | | |
Class A | | DPREX | | 246248868 | | |
Class C | | DPRCX | | 246248793 | | |
Class R | | DPRRX | | 246248561 | | |
Institutional Class | | DPRSX | | 246248777 | | |
Class R6 | | DPRDX | | 246248454 | | |
7
| | | | |
| Disclosure of Fund expenses | | | | |
| For the six-month period from May 1, 2018 to October 31, 2018 (Unaudited) | | | | |
As a shareholder of the Fund, you incur two types of costs: (1) transaction costs, including sales charges (loads) on purchase payments, reinvested dividends, or other distributions; redemption fees; and exchange fees; and (2) ongoing costs, including management fees; distribution and/or service (12b-1) fees; and other Fund expenses. This example is intended to help you understand your ongoing costs (in dollars) of investing in the Fund and to compare these costs with the ongoing costs of investing in other mutual funds.
The example is based on an investment of $1,000 invested at the beginning of the period and held for the entire six-month period from May 1, 2018 to Oct. 31, 2018.
Actual expenses
The first section of the table shown, “Actual Fund return,” provides information about actual account values and actual expenses. You may use the information in this section of the table, together with the amount you invested, to estimate the expenses that you paid over the period. Simply divide your account value by $1,000 (for example, an $8,600 account value divided by $1,000 = 8.6), then multiply the result by the number in the first section under the heading entitled “Expenses Paid During Period” to estimate the expenses you paid on your account during this period.
Hypothetical example for comparison purposes
The second section of the table shown, “Hypothetical 5% return,” provides information about hypothetical account values and hypothetical expenses based on the Fund’s actual expense ratio and an assumed rate of return of 5% per year before expenses, which is not the Fund’s actual return. The hypothetical account values and expenses may not be used to estimate the actual ending account balance or expenses you paid for the period. You may use this information to compare the ongoing costs of investing in the Fund and other funds. To do so, compare this 5% hypothetical example with the 5% hypothetical examples that appear in the shareholder reports of the other funds.
Please note that the expenses shown in the table are meant to highlight your ongoing costs only and do not reflect any transactional costs, such as sales charges (loads), redemption fees, or exchange fees. Therefore, the second section of the table is useful in comparing ongoing costs only, and will not help you determine the relative total costs of owning different funds. In addition, if these transactional costs were included, your costs would have been higher. The Fund’s expenses shown in the table reflect fee waivers in effect. The Fund’s expenses shown in the table assume reinvestment of all dividends and distributions.
8
| | | | |
| Delaware REIT Fund | | | | |
| Expense analysis of an investment of $1,000 | | | | |
| | | | | | | | | | | | | | | | |
| | | Beginning
Account Value
5/1/18 | | | Ending
Account Value
10/31/18 | | | Annualized
Expense Ratio | | | Expenses
Paid During Period
5/1/18 to 10/31/18* | |
Actual Fund return† | | | | | | | | | | | | | | | | |
Class A | | | $1,000.00 | | | | $1,051.00 | | | | 1.37% | | | | $7.08 | |
Class C | | | 1,000.00 | | | | 1,047.10 | | | | 2.12% | | | | 10.94 | |
Class R | | | 1,000.00 | | | | 1,048.60 | | | | 1.62% | | | | 8.37 | |
Institutional Class | | | 1,000.00 | | | | 1,051.10 | | | | 1.12% | | | | 5.79 | |
Class R6 | | | 1,000.00 | | | | 1,051.90 | | | | 1.00% | | | | 5.17 | |
Hypothetical 5% return (5% return before expenses) | | | | | |
Class A | | | $1,000.00 | | | | $1,018.30 | | | | 1.37% | | | | $6.97 | |
Class C | | | 1,000.00 | | | | 1,014.52 | | | | 2.12% | | | | 10.76 | |
Class R | | | 1,000.00 | | | | 1,017.04 | | | | 1.62% | | | | 8.24 | |
Institutional Class | | | 1,000.00 | | | | 1,019.56 | | | | 1.12% | | | | 5.70 | |
Class R6 | | | 1,000.00 | | | | 1,020.16 | | | | 1.00% | | | | 5.09 | |
| * | “Expenses Paid During Period” are equal to the Fund’s annualized expense ratio, multiplied by the average account value over the period, multiplied by 184/365 (to reflect the one-half year period). |
| † | Because actual returns reflect only the most recent six-month period, the returns shown may differ significantly from fiscal year returns. |
9
| | | | |
| Security type / sector allocation and top 10 equity holdings | |
| Delaware REIT Fund | | | As of October 31, 2018 | (Unaudited) |
Sector designations may be different than the sector designations presented in other Fund materials. The sector designations may represent the investment manager’s internal sector classifications.
| | |
| Security type / sector | | Percentage of net assets |
Common Stocks | | 99.60% |
Diversified REITs | | 2.98% |
Healthcare REITs | | 14.14% |
Hotel REITs | | 6.98% |
Industrial REITs | | 9.95% |
Information Technology REITs | | 7.66% |
Mall REITs | | 9.21% |
Manufactured Housing REITs | | 4.11% |
Mixed REIT | | 1.25% |
Multifamily REITs | | 17.85% |
Office REITs | | 7.00% |
Self-Storage REITs | | 4.39% |
Shopping Center REITs | | 5.11% |
Single Tenant REITs | | 5.97% |
Specialty REITs | | 3.00% |
Short-Term Investments | | 0.58% |
Total Value of Securities | | 100.18% |
Liabilities Net of Receivables and Other Assets | | (0.18%) |
Total Net Assets | | 100.00% |
Holdings are for informational purposes only and are subject to change at any time. They are not a recommendation to buy, sell, or hold any security.
| | |
Top 10 equity holdings | | Percentage of net assets |
Simon Property Group | | 8.49% |
Brookdale Senior Living | | 5.63% |
Prologis | | 5.52% |
Welltower | | 4.54% |
AvalonBay Communities | | 4.50% |
Equity Residential | | 4.31% |
Equinix | | 4.17% |
Camden Property Trust | | 3.25% |
Duke Realty | | 3.10% |
STORE Capital | | 2.74% |
10
| | | | |
| Schedule of investments | | | | |
| Delaware REIT Fund | | | October 31, 2018 | |
| | | | | | | | |
| | | Number of shares | | | Value (US $) | |
Common Stock – 99.60% | | | | | | | | |
Diversified REITs – 2.98% | | | | | | | | |
Cousins Properties | | | 53,100 | | | $ | 441,261 | |
Vornado Realty Trust | | | 28,132 | | | | 1,915,226 | |
| | | | | | | | |
| | | | | | | 2,356,487 | |
| | | | | | | | |
Healthcare REITs – 14.14% | | | | | | | | |
Brookdale Senior Living † | | | 497,734 | | | | 4,444,765 | |
HCP | | | 37,300 | | | | 1,027,615 | |
Omega Healthcare Investors | | | 23,900 | | | | 797,065 | |
Sabra Health Care REIT | | | 60,500 | | | | 1,309,825 | |
Welltower | | | 54,300 | | | | 3,587,601 | |
| | | | | | | | |
| | | | | | | 11,166,871 | |
| | | | | | | | |
Hotel REITs – 6.98% | | | | | | | | |
Host Hotels & Resorts | | | 93,964 | | | | 1,795,652 | |
MGM Growth Properties Class A | | | 28,600 | | | | 809,094 | |
Park Hotels & Resorts | | | 44,500 | | | | 1,293,615 | |
RLJ Lodging Trust | | | 31,700 | | | | 616,248 | |
Sunstone Hotel Investors | | | 69,043 | | | | 999,052 | |
| | | | | | | | |
| | | | | | | 5,513,661 | |
| | | | | | | | |
Industrial REITs – 9.95% | | | | | | | | |
Duke Realty | | | 88,800 | | | | 2,448,216 | |
Prologis | | | 67,641 | | | | 4,360,815 | |
Rexford Industrial Realty | | | 33,100 | | | | 1,048,277 | |
| | | | | | | | |
| | | | | | | 7,857,308 | |
| | | | | | | | |
Information Technology REITs – 7.66% | | | | | | | | |
American Tower | | | 6,500 | | | | 1,012,765 | |
Digital Realty Trust | | | 10,300 | | | | 1,063,578 | |
Equinix | | | 8,700 | | | | 3,295,038 | |
SBA Communications † | | | 4,200 | | | | 681,114 | |
| | | | | | | | |
| | | | | | | 6,052,495 | |
| | | | | | | | |
Mall REITs – 9.21% | | | | | | | | |
Macerich | | | 11,000 | | | | 567,820 | |
Simon Property Group | | | 36,558 | | | | 6,709,124 | |
| | | | | | | | |
| | | | | | | 7,276,944 | |
| | | | | | | | |
Manufactured Housing REITs – 4.11% | | | | | | | | |
Equity LifeStyle Properties | | | 16,036 | | | | 1,518,449 | |
Sun Communities | | | 17,200 | | | | 1,728,084 | |
| | | | | | | | |
| | | | | | | 3,246,533 | |
| | | | | | | | |
11
| | | | |
| Schedule of investments | | | | |
| Delaware REIT Fund | | | | |
| | | | | | | | |
| | | Number of shares | | | Value (US $) | |
Common Stock (continued) | | | | | | | | |
Mixed REIT – 1.25% | | | | | | | | |
Liberty Property Trust | | | 23,600 | | | $ | 988,132 | |
| | | | | | | | |
| | | | | | | 988,132 | |
| | | | | | | | |
Multifamily REITs – 17.85% | | | | | | | | |
Apartment Investment & Management Class A | | | 37,300 | | | | 1,605,392 | |
AvalonBay Communities | | | 20,251 | | | | 3,551,620 | |
Camden Property Trust | | | 28,400 | | | | 2,563,668 | |
Equity Residential | | | 52,423 | | | | 3,405,398 | |
Essex Property Trust | | | 3,559 | | | | 892,526 | |
UDR | | | 53,000 | | | | 2,077,070 | |
| | | | | | | | |
| | | | | | | 14,095,674 | |
| | | | | | | | |
Office REITs – 7.00% | | | | | | | | |
Boston Properties | | | 12,574 | | | | 1,518,436 | |
Columbia Property Trust | | | 72,800 | | | | 1,634,360 | |
Empire State Realty Trust Class A | | | 24,900 | | | | 394,914 | |
Kilroy Realty | | | 13,400 | | | | 922,992 | |
SL Green Realty | | | 11,600 | | | | 1,058,616 | |
| | | | | | | | |
| | | | | | | 5,529,318 | |
| | | | | | | | |
Self-Storage REITs – 4.39% | | | | | | | | |
CubeSmart | | | 41,400 | | | | 1,199,772 | |
Extra Space Storage | | | 17,400 | | | | 1,567,044 | |
Public Storage | | | 3,402 | | | | 699,009 | |
| | | | | | | | |
| | | | | | | 3,465,825 | |
| | | | | | | | |
Shopping Center REITs – 5.11% | | | | | | | | |
Kimco Realty | | | 45,000 | | | | 724,050 | |
Regency Centers | | | 25,125 | | | | 1,591,920 | |
Retail Properties of America Class A | | | 42,700 | | | | 523,929 | |
SITE Centers | | | 59,500 | | | | 739,585 | |
Weingarten Realty Investors | | | 16,331 | | | | 459,228 | |
| | | | | | | | |
| | | | | | | 4,038,712 | |
| | | | | | | | |
Single Tenant REITs – 5.97% | | | | | | | | |
National Retail Properties | | | 34,693 | | | | 1,621,898 | |
Spirit Realty Capital | | | 118,300 | | | | 925,106 | |
STORE Capital | | | 74,600 | | | | 2,165,638 | |
| | | | | | | | |
| | | | | | | 4,712,642 | |
| | | | | | | | |
Specialty REITs – 3.00% | | | | | | | | |
GEO Group | | | 27,000 | | | | 596,970 | |
Invitation Homes | | | 81,000 | | | | 1,772,280 | |
| | | | | | | | |
| | | | | | | 2,369,250 | |
| | | | | | | | |
| | |
Total Common Stock (cost $78,043,434) | | | | | | | 78,669,852 | |
| | | | | | | | |
12
| | | | | | | | |
| | | Principal amount° | | | Value (US $) | |
Short-Term Investments – 0.58% | | | | | | | | |
Discount Note – 0.09%≠ | | | | | | | | |
Federal Home Loan Bank 1.999% 11/1/18 | | | 69,689 | | | $ | 69,689 | |
| | | | | | | | |
| | | | | | | 69,689 | |
| | | | | | | | |
Repurchase Agreements – 0.49% | | | | | | | | |
Bank of America Merrill Lynch
2.12%, dated 10/31/18, to be repurchased on 11/1/18, repurchase price $53,610 (collateralized by US government obligations 0.00% 5/15/19–8/15/31; market value $54,679) | | | 53,607 | | | | 53,607 | |
Bank of Montreal
2.10%, dated 10/31/18, to be repurchased on 11/1/18, repurchase price $147,427 (collateralized by US government obligations 0.00%–3.75%
11/1/18–2/15/47; market value $150,367) | | | 147,418 | | | | 147,418 | |
BNP Paribas
2.17%, dated 10/31/18, to be repurchased on 11/1/18, repurchase price $189,302 (collateralized by US government obligations 0.00%–8.00% 2/28/19–8/15/46; market value $193,077) | | | 189,291 | | | | 189,291 | |
| | | | | | | | |
| | | | | | | 390,316 | |
| | | | | | | | |
Total Short-Term Investments (cost $460,005) | | | | | | | 460,005 | |
| | | | | | | | |
Total Value of Securities – 100.18%
(cost $78,503,439) | | | | | | $ | 79,129,857 | |
| | | | | | | | |
| ≠ | The rate shown is the effective yield at the time of purchase. |
| ° | Principal amount shown is stated in USD unless noted that the security is denominated in another currency. |
| † | Non-income producing security. |
Summary of abbreviations:
REIT – Real Estate Investment Trust
USD – US Dollar
See accompanying notes, which are an integral part of the financial statements.
13
| | | | |
| Statement of assets and liabilities | | | | |
| Delaware REIT Fund | | | October 31, 2018 | |
| | | | |
Assets: | | | | |
Investments, at value1 | | $ | 79,129,857 | |
Cash | | | 30,396 | |
Dividends and interest receivable | | | 45,834 | |
Receivable for fund shares sold | | | 7,035 | |
| | | | |
Total assets | | | 79,213,122 | |
| | | | |
Liabilities: | | | | |
Payable for fund shares redeemed | | | 50,276 | |
Investment management fees payable to affiliates | | | 84,681 | |
Other accrued expenses | | | 57,980 | |
Distribution fees payable to affiliates | | | 17,351 | |
Administration fees payable | | | 9,451 | |
Custodian fees payable | | | 3,735 | |
Dividend disbursing and transfer agent fees and expense payable to affiliates | | | 674 | |
Accounting and administration expenses payable to affiliates | | | 597 | |
Trustees’ fees and expenses payable to affiliates | | | 202 | |
Legal fees payable to affiliates | | | 126 | |
Reports and statements to shareholders expenses payable to affiliates | | | 63 | |
| | | | |
Total liabilities | | | 225,136 | |
| | | | |
Total Net Assets | | $ | 78,987,986 | |
| | | | |
| |
Net Assets Consist of: | | | | |
Paid-in capital | | $ | 87,149,403 | |
Total distributable earnings (loss) | | | (8,161,417 | ) |
| | | | |
Total Net Assets | | $ | 78,987,986 | |
| | | | |
14
| | | | |
Net Asset Value | | | | |
Class A: | | | | |
Net assets | | $ | 50,627,156 | |
Shares of beneficial interest outstanding, unlimited authorization, no par | | | 4,658,211 | |
Net asset value per share | | $ | 10.87 | |
Sales charge | | | 5.75 | % |
Offering price per share, equal to net asset value per share / (1 – sales charge) | | $ | 11.53 | |
| |
Class C: | | | | |
Net assets | | $ | 4,809,556 | |
Shares of beneficial interest outstanding, unlimited authorization, no par | | | 443,407 | |
Net asset value per share | | $ | 10.85 | |
| |
Class R: | | | | |
Net assets | | $ | 4,933,904 | |
Shares of beneficial interest outstanding, unlimited authorization, no par | | | 454,242 | |
Net asset value per share | | $ | 10.86 | |
| |
Institutional Class: | | | | |
Net assets | | $ | 13,741,276 | |
Shares of beneficial interest outstanding, unlimited authorization, no par | | | 1,258,995 | |
Net asset value per share | | $ | 10.91 | |
| |
Class R6: | | | | |
Net assets | | $ | 4,876,094 | |
Shares of beneficial interest outstanding, unlimited authorization, no par | | | 447,739 | |
Net asset value per share | | $ | 10.89 | |
| |
| | | | |
1Investments, at cost | | $ | 78,503,439 | |
See accompanying notes, which are an integral part of the financial statements.
15
| | | | |
| Statement of operations | | | | |
| Delaware REIT Fund | | | Year ended October 31, 2018 | |
| | | | |
Investment Income: | | | | |
Dividends | | | $3,084,877 | |
Interest | | | 18,907 | |
| | | | |
| | | 3,103,784 | |
| | | | |
Expenses: | | | | |
Management fees | | | 739,568 | |
Distribution expenses — Class A | | | 143,093 | |
Distribution expenses — Class C | | | 93,209 | |
Distribution expenses — Class R | | | 31,917 | |
Dividend disbursing and transfer agent fees and expenses | | | 153,579 | |
Registration fees | | | 51,849 | |
Accounting and administration expenses | | | 49,892 | |
Reports and statements to shareholders expenses | | | 45,739 | |
Audit and tax fees | | | 36,410 | |
Legal fees | | | 20,693 | |
Custodian fees | | | 11,037 | |
Trustees’ fees and expenses | | | 4,775 | |
Other | | | 15,718 | |
| | | | |
| | | 1,397,479 | |
Less expenses waived | | | (21,513 | ) |
Less expenses paid indirectly | | | (334 | ) |
| | | | |
Total operating expenses | | | 1,375,632 | |
| | | | |
Net Investment Income | | | 1,728,152 | |
| | | | |
| |
Net Realized and Unrealized Gain (Loss): | | | | |
Net realized loss on investments | | | (4,660,347 | ) |
Net change in unrealized appreciation (depreciation) of investments | | | 1,414,177 | |
| | | | |
Net Realized and Unrealized Loss | | | (3,246,170 | ) |
| | | | |
Net Decrease in Net Assets Resulting from Operations | | | $(1,518,018 | ) |
| | | | |
See accompanying notes, which are an integral part of the financial statements.
16
This page intentionally left blank.
| | | | |
| Statements of changes in net assets | | | | |
| Delaware REIT Fund | | | | |
| | | | | | | | |
| | | Year ended | |
| | | 10/31/18 | | | 10/31/17 | |
Increase (Decrease) in Net Assets from Operations: | | | | | | | | |
Net investment income | | $ | 1,728,152 | | | $ | 972,296 | |
Net realized gain (loss) | | | (4,660,347 | ) | | | 1,904,993 | |
Net change in unrealized appreciation (depreciation) | | | 1,414,177 | | | | (1,278,909 | ) |
| | | | | | | | |
Net increase (decrease) in net assets resulting from operations | | | (1,518,018 | ) | | | 1,598,380 | |
| | | | | | | | |
| | |
Dividends and Distributions to Shareholders from: | | | | | | | | |
Distributable earnings*: | | | | | | | | |
Class A | | | (2,288,726 | ) | | | (17,679,150 | ) |
Class C | | | (318,021 | ) | | | (4,101,462 | ) |
Class R | | | (250,113 | ) | | | (2,366,990 | ) |
Institutional Class | | | (633,427 | ) | | | (7,969,053 | ) |
Class R6 | | | (583,221 | ) | | | (361,429 | ) |
| | |
Return of capital: | | | | | | | | |
Class A | | | (209,001 | ) | | | — | |
Class C | | | (19,894 | ) | | | — | |
Class R | | | (20,381 | ) | | | — | |
Institutional Class | | | (56,487 | ) | | | — | |
Class R6 | | | (20,089 | ) | | | — | |
| | | | | | | | |
| | | (4,399,360 | ) | | | (32,478,084 | ) |
| | | | | | | | |
| | |
Capital Share Transactions: | | | | | | | | |
Proceeds from shares sold: | | | | | | | | |
Class A | | | 8,318,136 | | | | 7,431,644 | |
Class C | | | 428,695 | | | | 624,277 | |
Class R | | | 1,440,311 | | | | 1,779,605 | |
Institutional Class | | | 5,556,687 | | | | 6,981,497 | |
Class R6 | | | 1,279,655 | | | | 22,982,791 | |
| | |
Net asset value of shares issued upon reinvestment of dividends and distributions: | | | | | | | | |
Class A | | | 2,442,673 | | | | 17,259,738 | |
Class C | | | 335,668 | | | | 4,042,772 | |
Class R | | | 270,493 | | | | 2,366,985 | |
Institutional Class | | | 674,532 | | | | 7,893,996 | |
Class R6 | | | 603,310 | | | | 361,429 | |
| | | | | | | | |
| | | 21,350,160 | | | | 71,724,734 | |
| | | | | | | | |
18
| | | | | | | | |
| | | Year ended | |
| | | 10/31/18 | | | 10/31/17 | |
Capital Share Transactions (continued): | | | | | | | | |
Cost of shares redeemed: | | | | | | | | |
Class A | | $ | (23,059,189 | ) | | $ | (28,241,800 | ) |
Class C | | | (8,777,823 | ) | | | (7,957,171 | ) |
Class R | | | (4,346,949 | ) | | | (6,571,414 | ) |
Institutional Class | | | (8,836,014 | ) | | | (28,968,149 | ) |
Class R6 | | | (16,607,978 | ) | | | (1,945,824 | ) |
| | | | | | | | |
| | | (61,627,953 | ) | | | (73,684,358 | ) |
| | | | | | | | |
Decrease in net assets derived from capital share transactions | | | (40,277,793 | ) | | | (1,959,624 | ) |
| | | | | | | | |
Net Decrease in Net Assets | | | (46,195,171 | ) | | | (32,839,328 | ) |
| | |
Net Assets: | | | | | | | | |
Beginning of year | | $ | 125,183,157 | | | $ | 158,022,485 | |
| | | | | | | | |
End of year1 | | $ | 78,987,986 | | | $ | 125,183,157 | |
| | | | | | | | |
| 1 | Net Assets - There was no undistributed net investment income for the year ended 10/31/17. The Securities and Exchange Commission eliminated the requirement to disclose undistributed (distributions in excess of) net investment income in 2018. |
| * | For the year ended Oct. 31, 2018, the Fund has adopted amendments to Regulation S-X (see Note 12 in “Notes to financial statements”). For the year ended Oct. 31, 2017, the dividends and distributions to shareholders were as follows: |
| | | | | | | | | | | | | | | | | | | | |
| | | | | | | | | | | | Institutional | | | | |
| | | Class A | | | Class C | | | Class R | | | Class | | | Class R6 | |
Dividends from net investment income | | | (1,318,781 | ) | | | (180,219 | ) | | | (143,795 | ) | | | (445,133 | ) | | | (361,062 | ) |
Distributions from net realized gains | | | (16,360,369 | ) | | | (3,921,243 | ) | | | (2,223,195 | ) | | | (7,523,920 | ) | | | (367 | ) |
See accompanying notes, which are an integral part of the financial statements.
19
| | | | |
| Financial highlights | | | | |
| Delaware REIT Fund Class A | | | | |
Selected data for each share of the Fund outstanding throughout each period were as follows:
|
Net asset value, beginning of period |
|
Income (loss) from investment operations: |
Net investment income1 |
Net realized and unrealized gain (loss) |
|
Total from investment operations |
|
Less dividends and distributions from: |
Net investment income |
Return of capital |
Net realized gain |
|
Total dividends and distributions |
|
|
Net asset value, end of period |
|
|
Total return2 |
|
Ratios and supplemental data: |
Net assets, end of period (000 omitted) |
Ratio of expenses to average net assets |
Ratio of expenses to average net assets prior to fees waived |
Ratio of net investment income to average net assets |
Ratio of net investment income to average net assets prior to fees waived |
Portfolio turnover |
| 1 | The average shares outstanding method has been applied for per share information. |
| 2 | Total investment return is based on the change in net asset value of a share during the period and assumes reinvestment of dividends and distributions at net asset value and does not reflect the impact of a sales charge. Total investment return during some of the periods shown reflects a waiver by the manager. Performance would have been lower had the waiver not been in effect. |
See accompanying notes, which are an integral part of the financial statements.
20
| | | | | | | | | | | | | | | | | | | | |
| | | Year ended | |
| | | | |
| | | 10/31/18 | | | 10/31/17 | | | 10/31/16 | | | 10/31/15 | | | 10/31/14 | |
| |
| | $ | 11.36 | | | $ | 14.28 | | | $ | 15.54 | | | $ | 15.61 | | | $ | 13.87 | |
| | | | | |
| | | | | | | | | | | | | | | | | | | | |
| | | 0.19 | | | | 0.08 | | | | 0.18 | | | | 0.13 | | | | 0.13 | |
| | | (0.21 | ) | | | 0.03 | | | | 0.41 | | | | 0.76 | | | | 2.30 | |
| | | | | | | | | | | | | | | | | | | | |
| | | (0.02 | ) | | | 0.11 | | | | 0.59 | | | | 0.89 | | | | 2.43 | |
| | | | | | | | | | | | | | | | | | | | |
| | | | | |
| | | | | | | | | | | | | | | | | | | | |
| | | (0.16 | ) | | | (0.21 | ) | | | (0.24 | ) | | | (0.24 | ) | | | (0.25 | ) |
| | | (0.05 | ) | | | — | | | | — | | | | — | | | | — | |
| | | (0.26 | ) | | | (2.82 | ) | | | (1.61 | ) | | | (0.72 | ) | | | (0.44 | ) |
| | | | | | | | | | | | | | | | | | | | |
| | | (0.47 | ) | | | (3.03 | ) | | | (1.85 | ) | | | (0.96 | ) | | | (0.69 | ) |
| | | | | | | | | | | | | | | | | | | | |
| | | | | |
| | $ | 10.87 | | | $ | 11.36 | | | $ | 14.28 | | | $ | 15.54 | | | $ | 15.61 | |
| | | | | | | | | | | | | | | | | | | | |
| | | | | |
| | | (0.26% | ) | | | 0.90% | | | | 4.24% | | | | 5.70% | | | | 18.53% | |
| | | | | |
| | | | | | | | | | | | | | | | | | | | |
| | $ | 50,627 | | | $ | 65,824 | | | $ | 86,129 | | | $ | 90,899 | | | $ | 98,986 | |
| | | 1.39% | | | | 1.44% | | | | 1.33% | | | | 1.37% | | | | 1.34% | |
| | | 1.41% | | | | 1.44% | | | | 1.33% | | | | 1.37% | | | | 1.34% | |
| | | 1.76% | | | | 0.71% | | | | 1.24% | | | | 0.81% | | | | 0.89% | |
| | | 1.74% | | | | 0.71% | | | | 1.24% | | | | 0.81% | | | | 0.89% | |
| | | 120% | | | | 145% | | | | 111% | | | | 67% | | | | 83% | |
| |
21
| | | | |
| Financial highlights | | | | |
| Delaware REIT Fund Class C | | | | |
Selected data for each share of the Fund outstanding throughout each period were as follows:
|
Net asset value, beginning of period |
|
Income (loss) from investment operations: |
Net investment income1 |
Net realized and unrealized gain (loss) |
|
Total from investment operations |
|
Less dividends and distributions from: |
Net investment income |
Return of capital |
Net realized gain |
|
Total dividends and distributions |
|
|
Net asset value, end of period |
|
|
Total return3 |
|
Ratios and supplemental data: |
Net assets, end of period (000 omitted) |
Ratio of expenses to average net assets |
Ratio of expenses to average net assets prior to fees waived |
Ratio of net investment income (loss) to average net assets |
Ratio of net investment income (loss) to average net assets prior to fees waived |
Portfolio turnover |
| 1 | The average shares outstanding method has been applied for per share information. |
| 2 | Amount is less than $(0.005) per share. |
| 3 | Total investment return is based on the change in net asset value of a share during the period and assumes reinvestment of dividends and distributions at net asset value and does not reflect the impact of a sales charge. Total investment return during some of the periods shown reflects a waiver by the manager. Performance would have been lower had the waiver not been in effect. |
See accompanying notes, which are an integral part of the financial statements.
22
| | | | | | | | | | | | | | | | | | | | | | |
| | | | Year ended | |
| | | | | | |
| | | | 10/31/18 | | | 10/31/17 | | | 10/31/16 | | | 10/31/15 | | | 10/31/14 | |
| | |
| | | | $ | 11.31 | | | $ | 14.24 | | | $ | 15.50 | | | $ | 15.59 | | | $ | 13.86 | |
| | | | | |
| | | | | | | | | | | | | | | | | | | | | | |
| | | | | 0.11 | | | | — | 2 | | | 0.07 | | | | 0.01 | | | | 0.02 | |
| | | | | (0.21 | ) | | | 0.02 | | | | 0.42 | | | | 0.75 | | | | 2.30 | |
| | | | | | | | | | | | | | | | | | | | | | |
| | | | | (0.10 | ) | | | 0.02 | | | | 0.49 | | | | 0.76 | | | | 2.32 | |
| | | | | | | | | | | | | | | | | | | | | | |
| | | | | |
| | | | | | | | | | | | | | | | | | | | | | |
| | | | | (0.05 | ) | | | (0.13 | ) | | | (0.14 | ) | | | (0.13 | ) | | | (0.15 | ) |
| | | | | (0.05 | ) | | | — | | | | — | | | | — | | | | — | |
| | | | | (0.26 | ) | | | (2.82 | ) | | | (1.61 | ) | | | (0.72 | ) | | | (0.44 | ) |
| | | | | | | | | | | | | | | | | | | | | | |
| | | | | (0.36 | ) | | | (2.95 | ) | | | (1.75 | ) | | | (0.85 | ) | | | (0.59 | ) |
| | | | | | | | | | | | | | | | | | | | | | |
| | | | | |
| | | | $ | 10.85 | | | $ | 11.31 | | | $ | 14.24 | | | $ | 15.50 | | | $ | 15.59 | |
| | | | | | | | | | | | | | | | | | | | | | |
| | | | | |
| | | | | (0.99% | ) | | | 0.13% | | | | 3.53% | | | | 4.86% | | | | 17.68% | |
| | | | | |
| | | | | | | | | | | | | | | | | | | | | | |
| | | | $ | 4,810 | | | $ | 13,331 | | | $ | 20,598 | | | $ | 22,085 | | | $ | 23,171 | |
| | | | | 2.14% | | | | 2.19% | | | | 2.08% | | | | 2.12% | | | | 2.09% | |
| | | | | 2.16% | | | | 2.19% | | | | 2.08% | | | | 2.12% | | | | 2.09% | |
| | | | | 1.01% | | | | (0.04% | ) | | | 0.49% | | | | 0.06% | | | | 0.14% | |
| | | | | 0.99% | | | | (0.04%) | | | | 0.49% | | | | 0.06% | | | | 0.14% | |
| | | | | 120% | | | | 145% | | | | 111% | | | | 67% | | | | 83% | |
| | |
23
| | | | |
| Financial highlights | | | | |
| Delaware REIT Fund Class R | | | | |
Selected data for each share of the Fund outstanding throughout each period were as follows:
|
Net asset value, beginning of period |
|
Income (loss) from investment operations: |
Net investment income1 |
Net realized and unrealized gain (loss) |
|
Total from investment operations |
|
Less dividends and distributions from: |
Net investment income |
Return of capital |
Net realized gain |
|
Total dividends and distributions |
|
|
Net asset value, end of period |
|
|
Total return2 |
|
Ratios and supplemental data: |
Net assets, end of period (000 omitted) |
Ratio of expenses to average net assets |
Ratio of expenses to average net assets prior to fees waived |
Ratio of net investment income to average net assets |
Ratio of net investment income to average net assets prior to fees waived |
Portfolio turnover |
| 1 | The average shares outstanding method has been applied for per share information. |
| 2 | Total investment return is based on the change in net asset value of a share during the period and assumes reinvestment of dividends and distributions at net asset value. Total investment return during some of the periods reflects a waiver by the manager. Performance would have been lower had the waiver not been in effect. |
See accompanying notes, which are an integral part of the financial statements.
24
| | | | | | | | | | | | | | | | | | | | |
| | | Year ended | |
| | | | |
| | | 10/31/18 | | | 10/31/17 | | | 10/31/16 | | | 10/31/15 | | | 10/31/14 | |
| |
| | $ | 11.35 | | | $ | 14.27 | | | $ | 15.53 | | | $ | 15.61 | | | $ | 13.87 | |
| | | | | |
| | | | | | | | | | | | | | | | | | | | |
| | | 0.17 | | | | 0.05 | | | | 0.15 | | | | 0.09 | | | | 0.09 | |
| | | (0.22 | ) | | | 0.04 | | | | 0.41 | | | | 0.75 | | | | 2.31 | |
| | | | | | | | | | | | | | | | | | | | |
| | | (0.05 | ) | | | 0.09 | | | | 0.56 | | | | 0.84 | | | | 2.40 | |
| | | | | | | | | | | | | | | | | | | | |
| | | | | |
| | | | | | | | | | | | | | | | | | | | |
| | | (0.13 | ) | | | (0.19 | ) | | | (0.21 | ) | | | (0.20 | ) | | | (0.22 | ) |
| | | (0.05 | ) | | | — | | | | — | | | | — | | | | — | |
| | | (0.26 | ) | | | (2.82 | ) | | | (1.61 | ) | | | (0.72 | ) | | | (0.44 | ) |
| | | | | | | | | | | | | | | | | | | | |
| | | (0.44 | ) | | | (3.01 | ) | | | (1.82 | ) | | | (0.92 | ) | | | (0.66 | ) |
| | | | | | | | | | | | | | | | | | | | |
| | | | | |
| | $ | 10.86 | | | $ | 11.35 | | | $ | 14.27 | | | $ | 15.53 | | | $ | 15.61 | |
| | | | | | | | | | | | | | | | | | | | |
| | | | | |
| | | (0.54% | ) | | | 0.66% | | | | 4.00% | | | | 5.40% | | | | 18.24% | |
| | | | | |
| | | | | | | | | | | | | | | | | | | | |
| | $ | 4,934 | | | $ | 7,885 | | | $ | 12,573 | | | $ | 12,025 | | | $ | 12,614 | |
| | | 1.64% | | | | 1.69% | | | | 1.58% | | | | 1.62% | | | | 1.59% | |
| | | 1.66% | | | | 1.69% | | | | 1.58% | | | | 1.62% | | | | 1.59% | |
| | | 1.51% | | | | 0.46% | | | | 0.99% | | | | 0.56% | | | | 0.64% | |
| | | 1.49% | | | | 0.46% | | | | 0.99% | | | | 0.56% | | | | 0.64% | |
| | | 120% | | | | 145% | | | | 111% | | | | 67% | | | | 83% | |
| |
25
| | | | |
| Financial highlights | | | | |
| Delaware REIT Fund Institutional Class | | | | |
Selected data for each share of the Fund outstanding throughout each period were as follows:
|
Net asset value, beginning of period |
|
Income (loss) from investment operations: |
Net investment income1 |
Net realized and unrealized gain (loss) |
|
Total from investment operations |
|
Less dividends and distributions from: |
Net investment income |
Return of capital |
Net realized gain |
|
Total dividends and distributions |
|
|
Net asset value, end of period |
|
|
Total return2 |
|
Ratios and supplemental data: |
Net assets, end of period (000 omitted) |
Ratio of expenses to average net assets |
Ratio of expenses to average net assets prior to fees waived |
Ratio of net investment income to average net assets |
Ratio of net investment income to average net assets prior to fees waived |
Portfolio turnover |
| 1 | The average shares outstanding method has been applied for per share information. |
| 2 | Total investment return is based on the change in net asset value of a share during the period and assumes reinvestment of dividends and distributions at net asset value. Total investment return during some of the periods shown reflects a waiver by the manager. Performance would have been lower had the waiver not been in effect. |
See accompanying notes, which are an integral part of the financial statements.
26
| | | | | | | | | | | | | | | | | | | | |
| | | Year ended | |
| | | | |
| | | 10/31/18 | | | 10/31/17 | | | 10/31/16 | | | 10/31/15 | | | 10/31/14 | |
| |
| | $ | 11.41 | | | $ | 14.33 | | | $ | 15.57 | | | $ | 15.64 | | | $ | 13.90 | |
| | | | | |
| | | | | | | | | | | | | | | | | | | | |
| | | 0.22 | | | | 0.12 | | | | 0.21 | | | | 0.16 | | | | 0.16 | |
| | | (0.22 | ) | | | 0.02 | | | | 0.44 | | | | 0.76 | | | | 2.31 | |
| | | | | | | | | | | | | | | | | | | | |
| | | — | | | | 0.14 | | | | 0.65 | | | | 0.92 | | | | 2.47 | |
| | | | | | | | | | | | | | | | | | | | |
| | | | | |
| | | | | | | | | | | | | | | | | | | | |
| | | (0.19 | ) | | | (0.24 | ) | | | (0.28 | ) | | | (0.27 | ) | | | (0.29 | ) |
| | | (0.05 | ) | | | — | | | | — | | | | — | | | | — | |
| | | (0.26 | ) | | | (2.82 | ) | | | (1.61 | ) | | | (0.72 | ) | | | (0.44 | ) |
| | | | | | | | | | | | | | | | | | | | |
| | | (0.50 | ) | | | (3.06 | ) | | | (1.89 | ) | | | (0.99 | ) | | | (0.73 | ) |
| | | | | | | | | | | | | | | | | | | | |
| | | | | |
| | $ | 10.91 | | | $ | 11.41 | | | $ | 14.33 | | | $ | 15.57 | | | $ | 15.64 | |
| | | | | | | | | | | | | | | | | | | | |
| | | | | |
| | | (0.08% | ) | | | 1.14% | | | | 4.60% | | | | 5.94% | | | | 18.80% | |
| | | | | |
| | | | | | | | | | | | | | | | | | | | |
| | $ | 13,741 | | | $ | 16,988 | | | $ | 38,720 | | | $ | 108,943 | | | $ | 119,640 | |
| | | 1.14% | | | | 1.19% | | | | 1.08% | | | | 1.12% | | | | 1.09% | |
| | | 1.16% | | | | 1.19% | | | | 1.08% | | | | 1.12% | | | | 1.09% | |
| | | 2.01% | | | | 0.96% | | | | 1.49% | | | | 1.06% | | | | 1.14% | |
| | | 1.99% | | | | 0.96% | | | | 1.49% | | | | 1.06% | | | | 1.14% | |
| | | 120% | | | | 145% | | | | 111% | | | | 67% | | | | 83% | |
| |
27
| | | | |
| Financial highlights | | | | |
| Delaware REIT Fund Class R6 | | | | |
Selected data for each share of the Fund outstanding throughout each period were as follows:
|
Net asset value, beginning of period |
|
Income (loss) from investment operations: |
Net investment income2 |
Net realized and unrealized gain (loss) |
|
Total from investment operations |
|
|
Less dividends and distributions from: |
Net investment income |
Return of capital |
Net realized gain |
|
Total dividends and distributions |
|
|
Net asset value, end of period |
|
|
Total return3 |
|
Ratios and supplemental data: |
Net assets, end of period (000 omitted) |
Ratio of expenses to average net assets |
Ratio of expenses to average net assets prior to fees waived |
Ratio of net investment income to average net assets |
Ratio of net investment income to average net assets prior to fees waived |
Portfolio turnover |
| 1 | Date of commencement of operations; ratios have been annualized and total return has not been annualized. |
| 2 | The average shares outstanding method has been applied for per share information. |
| 3 | Total investment return is based on the change in net asset value of a share during the period and assumes reinvestment of dividends and distributions at net asset value. Total investment return during some of the periods shown reflects a waiver by the manager. Performance would have been lower had the waiver not been in effect. |
| 4 | Portfolio turnover is representative of the Fund for the entire year ended Oct. 31, 2016. |
See accompanying notes, which are an integral part of the financial statements.
28
| | | | | | | | | | | | |
| | | Year ended | | |
| 8/31/161
to |
|
| | | 10/31/18 | | | 10/31/17 | | | 10/31/16 | |
| | $ | 11.41 | | | $ | 14.33 | | | $ | 15.43 | |
| | | |
| | | | | | | | | | | | |
| | | 0.24 | | | | 0.13 | | | | 0.29 | |
| | | (0.23 | ) | | | 0.03 | | | | (1.33 | ) |
| | | | | | | | | | | | |
| | | 0.01 | | | | 0.16 | | | | (1.04 | ) |
| | | | | | | | | | | | |
| | | |
| | | | | | | | | | | | |
| | | (0.22 | ) | | | (0.26 | ) | | | (0.06 | ) |
| | | (0.05 | ) | | | — | | | | — | |
| | | (0.26 | ) | | | (2.82 | ) | | | — | |
| | | | | | | | | | | | |
| | | (0.53 | ) | | | (3.08 | ) | | | (0.06 | ) |
| | | | | | | | | | | | |
| | | |
| | $ | 10.89 | | | $ | 11.41 | | | $ | 14.33 | |
| | | | | | | | | | | | |
| | | |
| | | 0.09% | | | | 1.28% | | | | (6.79% | ) |
| | | |
| | | | | | | | | | | | |
| | $ | 4,876 | | | $ | 21,155 | | | $ | 2 | |
| | | 1.01% | | | | 1.04% | | | | 0.93% | |
| | | 1.03% | | | | 1.04% | | | | 0.93% | |
| | | 2.14% | | | | 1.11% | | | | 1.97% | |
| | | 2.12% | | | | 1.11% | | | | 1.97% | |
| | | | 120% | | | | 145% | | | | 111% | 4 |
29
| | | | |
| Notes to financial statements | | | | |
| Delaware REIT Fund | |
| October 31, 2018
|
|
Delaware REIT Fund (Fund) is a series of Delaware Pooled® Trust (Trust), which is organized as a Delaware statutory trust. The Fund is an open-end investment company. The Fund is considered diversified under the Investment Company Act of 1940, as amended, and offers Class A, Class C, Class R, Institutional Class, and Class R6 shares. Class A shares are sold with a maximum front-end sales charge of 5.75%. Class A share purchases of $1,000,000 or more will incur a contingent deferred sales charge (CDSC) instead of a front-end sales charge of 1.00% if redeemed during the first year, and 0.50% during the second year, provided that Delaware Distributors, L.P. (DDLP) paid a financial advisor a commission on the purchase of those shares. Class C shares are sold with a CDSC of 1.00%, which will be incurred if redeemed during the first 12 months. Class R, Institutional Class, and Class R6 shares are not subject to a sales charge and are offered for sale exclusively to certain eligible investors. In addition, Class R6 shares do not pay any service fees, sub-accounting fees, and/or sub-transfer agency fees to any brokers, dealers, or other financial intermediaries. This report contains information relating only to Delaware REIT Fund. All other series of Delaware Pooled Trust, the Macquarie Institutional Portfolios, are included in a separate report.
The investment objectives of the Fund are to seek maximum long-term total return, with capital appreciation as a secondary objective. It seeks to achieve its objectives by investing primarily in securities of companies principally engaged in the real estate industry.
1. Significant Accounting Policies
The Fund is an investment company and follows accounting and reporting guidance under Financial Accounting Standards Board (FASB) Accounting Standards Codification Topic 946, Financial Services –Investment Companies. The following accounting policies are in accordance with US generally accepted accounting principles (US GAAP) and are consistently followed by the Fund.
Security Valuation – Equity securities, except those traded on the Nasdaq Stock Market LLC (Nasdaq), are valued at the last quoted sales price as of the time of the regular close of the New York Stock Exchange on the valuation date. Equity securities traded on the Nasdaq are valued in accordance with the Nasdaq Official Closing Price, which may not be the last sales price. If, on a particular day, an equity security does not trade, the mean between the bid and ask prices will be used, which approximates fair value. US government and agency securities are valued at the mean between the bid and ask prices, which approximates fair value. Generally, other securities and assets for which market quotations are not readily available are valued at fair value as determined in good faith under the direction of the Trust’s Board of Trustees (Board). In determining whether market quotations are readily available or fair valuation will be used, various factors will be taken into consideration, such as market closures or suspension of trading in a security. Restricted securities are valued at fair value using methods approved by the Board.
Federal Income Taxes – No provision for federal income taxes has been made as the Fund intends to continue to qualify for federal income tax purposes as a regulated investment company under Subchapter M of the Internal Revenue Code of 1986, as amended, and make the requisite distributions to shareholders. The Fund evaluates tax positions taken or expected to be taken in the course of preparing the Fund’s tax returns to determine whether the tax positions are “more-likely-than-not” of being sustained by the applicable tax authority. Tax positions not deemed to meet the “more-likely-than-not” threshold are recorded as a tax benefit or expense in the current year.
30
Management has analyzed the Fund’s tax positions taken or expected to be taken on the Fund’s federal income tax returns through the year ended Oct. 31, 2018 and for all open tax years (years ended Oct. 31, 2015–Oct. 31, 2017), and has concluded that no provision for federal income tax is required in the Fund’s financial statements. If applicable, the Fund recognizes interest accrued on unrecognized tax benefits in interest expense and penalties in other expenses on the “Statement of operations.” During the year ended Oct. 31, 2018, the Fund did not incur any interest or tax penalties.
Class Accounting – Investment income, common expenses, and realized and unrealized gain (loss) on investments are allocated to the various classes of the Fund on the basis of daily net assets of each class. Distribution expenses relating to a specific class are charged directly to that class. Class R6 shares will not be allocated any expenses related to service fees, sub-accounting fees, and/or sub-transfer agency fees paid to brokers, dealers, or other financial intermediaries.
Repurchase Agreements – The Fund may purchase certain US government securities subject to the counterparty’s agreement to repurchase them at an agreed upon date and price. The counterparty will be required on a daily basis to maintain the value of the collateral subject to the agreement at not less than the repurchase price (including accrued interest). The agreements are conditioned upon the collateral being deposited under the Federal Reserve book-entry system with the Fund’s custodian or a third-party sub-custodian. In the event of default or bankruptcy by the other party to the agreement, retention of the collateral may be subject to legal proceedings. All open repurchase agreements as of the date of this report were entered into on Oct. 31, 2018 and matured on the next business day.
Use of Estimates – The preparation of financial statements in conformity with US GAAP requires management to make estimates and assumptions that affect the fair value of investments, the reported amounts of assets and liabilities and disclosure of contingent assets and liabilities at the date of the financial statements, and the reported amounts of revenues and expenses during the reporting period. Actual results could differ from those estimates and the differences could be material.
Other – Expenses directly attributable to the Fund are charged directly to the Fund. Other expenses common to various funds within the Delaware Funds® by Macquarie (Delaware Funds) are generally allocated among such funds on the basis of average net assets. Management fees and certain other expenses are paid monthly. Security transactions are recorded on the date the securities are purchased or sold (trade date) for financial reporting purposes. Costs used in calculating realized gains and losses on the sale of investment securities are those of the specific securities sold. Dividend income is recorded on the ex-dividend date and interest income is recorded on the accrual basis. Discounts and premiums on debt securities are accreted or amortized to interest income, respectively, over the lives of the respective securities using the effective interest method. Distributions received from investments in real estate investment trusts (REITs) are recorded as dividend income on the ex-dividend date, subject to reclassification upon notice of the character of such distributions by the issuer. The financial statements reflect an estimate of the reclassification of the distribution character. The Fund declares and pays dividends from net investment income quarterly and net realized gain on investments, if any, annually. The Fund may distribute more frequently, if necessary for tax purposes. Dividends and distributions, if any, are recorded on the ex-dividend date.
The Fund receives earnings credits from its custodian when positive cash balances are maintained, which may be used to offset custody fees. The expense paid under this arrangement is included on the
31
| | | | |
| Notes to financial statements | | | | |
| Delaware REIT Fund | | | | |
1. Significant Accounting Policies (continued)
“Statement of operations” under “Custodian fees” with the corresponding expense offset included under “Less expenses paid indirectly.” For the year ended Oct. 31, 2018, the Fund earned $48 under this arrangement.
The Fund receives earnings credits from its transfer agent when positive cash balances are maintained, which may be used to offset transfer agent fees. If the amount earned is greater than $1, the expense paid under this arrangement is included on the “Statement of operations” under “Dividend disbursing and transfer agent fees and expenses” with the corresponding expense offset included under “Less expenses paid indirectly.” For the year ended Oct. 31, 2018, the Fund earned $286 under this arrangement.
2. Investment Management, Administration Agreements, and Other Transactions with Affiliates
In accordance with the terms of its investment management agreement, the Fund pays Delaware Management Company (DMC), a series of Macquarie Investment Management Business Trust and the investment manager, an annual fee which is calculated daily and paid monthly at the rate of 0.75% on the first $500 million of the average daily net assets of the Fund, 0.70% on the next $500 million, 0.65% on the next $1.5 billion, and 0.60% on average daily net assets in excess of $2.5 billion.
DMC has contractually agreed to waive that portion, if any, of its management fee and/or pay/reimburse the Fund to the extent necessary to ensure that total annual operating expenses (excluding any distribution and service (12b-1) fees, acquired fund fees and expenses, taxes, interest, short sale and dividend interest expenses, brokerage fees, certain insurance costs, and nonroutine expenses or costs, including, but not limited to, those relating to reorganizations, litigation, conducting shareholder meetings, and liquidations) do not exceed 1.15% of the Fund’s average daily net assets for all share classes other than Class R6 and 1.00% of the Fund’s average daily net assets of the Class R6 shares from Feb. 28, 2018 through Oct. 31, 2018.* These waivers and reimbursements may only be terminated by agreement of DMC and the Fund. The waivers and reimbursements are accrued daily and received monthly.
Delaware Investments Fund Services Company (DIFSC), an affiliate of DMC, provides fund accounting and financial administration oversight services to the Fund. For these services, DIFSC’s fees are calculated daily and paid monthly based on the aggregate daily net assets of all funds within the Delaware Funds at the following annual rate: 0.00475% of the first $35 billion; 0.0040% of the next $10 billion; and 0.0025% of aggregate average daily net assets in excess of $45 billion (Total Fee). Each Fund in the Delaware Funds pays a minimum of $4,000, which, in aggregate, is subtracted from the Total Fee. Each Fund then pays its portion of the remainder of the Total Fee on a relative net asset value (NAV) basis. For the year ended Oct. 31, 2018, the Fund was charged $7,722 for these services. This amount is included on the “Statement of operations” under “Accounting and administration expenses.”
32
DIFSC is also the transfer agent and dividend disbursing agent of the Fund. For these services, DIFSC’s fees were calculated daily and paid monthly based on the aggregate daily net assets of the retail funds within the Delaware Funds from Nov. 1, 2017 through June 30, 2018 at the following annual rate: 0.025% of the first $20 billion; 0.020% of the next $5 billion; 0.015% of the next $5 billion; and 0.013% of average daily net assets in excess of $30 billion. Effective July 1, 2018, the Fund as well as the other Delaware Funds entered into an amendment to the DIFSC agreement. Under the amendment to the DIFSC agreement, DIFSC’s fees are calculated daily and paid monthly based on the aggregate daily net assets of the retail funds within the Delaware Funds at the following annual rate: 0.014% of the first $20 billion; 0.011% of the next $5 billion; 0.007% of the next $5 billion; 0.005% of the next $20 billion; and 0.0025% of average daily net assets in excess of $50 billion. The fees payable to DIFSC under the transfer agent agreement described above are allocated among all retail funds in the Delaware Funds on a relative NAV basis. This amount is included on the “Statement of operations” under “Dividend disbursing and transfer agent fees and expenses.” For the year ended Oct. 31, 2018, the Fund was charged $16,389 for these services. Pursuant to a sub-transfer agency agreement between DIFSC and BNY Mellon Investment Servicing (US) Inc. (BNYMIS), BNYMIS provides certain sub-transfer agency services to the Fund. Sub-transfer agency fees are paid by the Fund and are also included on the “Statement of operations” under “Dividend disbursing and transfer agent fees and expenses.”
Pursuant to a distribution agreement and distribution plan, the Fund pays DDLP, the distributor and an affiliate of DMC, an annual 12b-1 fee of 0.25% of the average daily net assets of the Class A shares, 1.00% of the average daily net assets of the Class C shares, and 0.50% of the average daily net assets of the Class R shares. The fees are calculated daily and paid monthly. Institutional Class and Class R6 shares pay no 12b-1 fees.
As provided in the investment management agreement, the Fund bears a portion of the cost of certain resources shared with DMC, including the cost of internal personnel of DMC and/or its affiliates that provide legal, tax, and regulatory reporting services to the Fund. For the year ended Oct. 31, 2018, the Fund was charged $6,362 for internal legal, tax, and regulatory reporting services provided by DMC and/or its affiliates’ employees. This amount is included on the “Statement of operations” under “Legal fees.”
For the year ended Oct. 31, 2018, DDLP earned $3,395 for commissions on sales of the Fund’s Class A shares. For the year ended Oct. 31, 2018, DDLP received gross CDSC commissions of $7 and $308 on redemptions of the Fund’s Class A and Class C shares, respectively, and these commissions were entirely used to offset upfront commissions previously paid by DDLP to broker/dealers on sales of those shares.
Trustees’ fees include expenses accrued by the Fund for each Trustee’s retainer and meeting fees. Certain officers of DMC, DIFSC, and DDLP are officers and/or Trustees of the Trust. These officers and Trustees are paid no compensation by the Fund.
*The aggregate contractual waiver period covering this report is from Feb. 28, 2018 through Feb. 28, 2019.
33
| | | | |
| Notes to financial statements | | | | |
| Delaware REIT Fund | | | | |
3. Investments
For the year ended Oct. 31, 2018, the Fund made purchases and sales of investment securities other than short-term investments as follows:
| | | | |
Purchases | | $ | 118,392,142 | |
Sales | | | 155,813,868 | |
The tax cost of investments includes adjustments to net unrealized appreciation (depreciation) which may not necessarily be final tax cost basis adjustments, but approximate the tax basis unrealized gains and losses that may be realized and distributed to shareholders. At Oct. 31, 2018, the cost and unrealized appreciation (depreciation) of investments for federal income tax purposes for the Fund were as follows:
| | | | |
Cost of investments | | $ | 81,768,194 | |
| | | | |
Aggregate unrealized appreciation of investments | | $ | 2,968,218 | |
Aggregate unrealized depreciation of investments | | | (5,606,555 | ) |
| | | | |
Net unrealized depreciation of investments | | $ | (2,638,337 | ) |
| | | | |
US GAAP defines fair value as the price that the Fund would receive to sell an asset or pay to transfer a liability in an orderly transaction between market participants at the measurement date under current market conditions. A three-level hierarchy for fair value measurements has been established based upon the transparency of inputs to the valuation of an asset or liability. Inputs may be observable or unobservable and refer broadly to the assumptions that market participants would use in pricing the asset or liability. Observable inputs reflect the assumptions market participants would use in pricing the asset or liability based on market data obtained from sources independent of the reporting entity. Unobservable inputs reflect the reporting entity’s own assumptions about the assumptions that market participants would use in pricing the asset or liability based on the best information available under the circumstances. The Fund’s investment in its entirety is assigned a level based upon the observability of the inputs which are significant to the overall valuation. The three-level hierarchy of inputs is summarized below.
| | |
Level 1 – | | Inputs are quoted prices in active markets for identical investments. (Examples: equity securities, open-end investment companies, futures contracts, exchange-traded options contracts) |
| |
Level 2 – | | Other observable inputs, including, but not limited to: quoted prices for similar assets or liabilities in markets that are active, quoted prices for identical or similar assets or liabilities in markets that are not active, inputs other than quoted prices that are observable for the assets or liabilities (such as interest rates, yield curves, volatilities, prepayment speeds, loss severities, credit risks, and default rates) or other market-corroborated inputs. (Examples: debt securities, government securities, swap contracts, foreign currency exchange contracts, foreign securities utilizing international fair value pricing, broker-quoted securities, fair valued securities) |
| |
Level 3 – | | Significant unobservable inputs, including the Fund’s own assumptions used to determine the fair value of investments. (Examples: broker-quoted securities, fair valued securities) |
34
Level 3 investments are valued using significant unobservable inputs. The Fund may also use an income-based valuation approach in which the anticipated future cash flows of the investment are discounted to calculate fair value. Discounts may also be applied due to the nature or duration of any restrictions on the disposition of the investments. Valuations may also be based upon current market prices of securities that are comparable in coupon, rating, maturity, and industry. The derived value of a Level 3 investment may not represent the value which is received upon disposition and this could impact the results of operations.
The following table summarizes the valuation of the Fund’s investments by fair value hierarchy levels as of Oct. 31, 2018:
| | | | | | | | | | | | |
| | | Level 1 | | | Level 2 | | | Total | |
Securities | | | | | | | | | | | | |
Assets: | | | | | | | | | | | | |
Common Stock | | $ | 78,669,852 | | | $ | — | | | $ | 78,669,852 | |
Short-Term Investments | | | — | | | | 460,005 | | | | 460,005 | |
| | | | | | | | | | | | |
Total Value of Securities | | $ | 78,669,852 | | | $ | 460,005 | | | $ | 79,129,857 | |
| | | | | | | | | | | | |
During the year ended Oct. 31, 2018, there were no transfers between Level 1 investments, Level 2 investments, or Level 3 investments that had a significant impact to the Fund. The Fund’s policy is to recognize transfers between levels based on fair value at the beginning of the reporting period.
A reconciliation of Level 3 investments is presented when the Fund has a significant amount of Level 3 investments at the beginning, interim, or end of the period in relation to net assets. During the year ended Oct. 31, 2018, there were no Level 3 investments.
4. Dividend and Distribution Information
Income and long-term capital gain distributions are determined in accordance with federal income tax regulations, which may differ from US GAAP. Additionally, distributions from net short-term gains on sales of investment securities are treated as ordinary income for federal income tax purposes. The tax character of dividends and distributions paid during the years ended Oct. 31, 2018 and 2017 was as follows:
| | | | | | | | |
| | | Year ended | |
| | | 10/31/18 | | | 10/31/17 | |
Ordinary income | | $ | 1,570,203 | | | $ | 5,649,568 | |
Long-term capital gains | | | 2,503,305 | | | | 26,828,516 | |
Return of capital | | | 325,852 | | | | — | |
| | | | | | | | |
Total | | $ | 4,399,360 | | | $ | 32,478,084 | |
| | | | | | | | |
35
| | | | |
| Notes to financial statements | | | | |
| Delaware REIT Fund | | | | |
5. Components of Net Assets on a Tax Basis
As of Oct. 31, 2018, the components of net assets on a tax basis were as follows:
| | | | |
Shares of beneficial interest | | $ | 87,149,403 | |
Capital loss carryforwards | | | (5,523,080 | ) |
Unrealized depreciation of investments | | | (2,638,337 | ) |
| | | | |
Net assets | | $ | 78,987,986 | |
| | | | |
The differences between book basis and tax basis components of net assets are primarily attributable to tax deferral of losses on wash sales.
At Oct. 31, 2018, capital loss carryforwards available to offset future realized capital gains were as follows:
| | | | | | |
| | | | | Loss carryforward character | | |
| | | Short-term | | Long-term | | Total |
| | $2,095,451 | | $3,427,629 | | $5,523,080 |
6. Capital Shares
Transactions in capital shares were as follows:
| | | | | | | | |
| |
| | | Year ended | |
| | | 10/31/18 | | | 10/31/17 | |
Shares sold: | | | | | | | | |
Class A | | | 759,265 | | | | 618,178 | |
Class C | | | 38,919 | | | | 47,829 | |
Class R | | | 132,450 | | | | 146,394 | |
Institutional Class | | | 513,851 | | | | 575,078 | |
Class R6 | | | 115,352 | | | | 1,989,717 | |
| | |
Shares issued upon reinvestment of dividends and distributions: | | | | | | | | |
Class A | | | 220,247 | | | | 1,505,601 | |
Class C | | | 30,186 | | | | 353,945 | |
Class R | | | 24,369 | | | | 206,667 | |
Institutional Class | | | 60,750 | | | | 686,283 | |
Class R6 | | | 53,948 | | | | 31,242 | |
| | | | | | | | |
| | | 1,949,337 | | | | 6,160,934 | |
| | | | | | | | |
| | |
Shares redeemed: | | | | | | | | |
Class A | | | (2,116,765 | ) | | | (2,359,250 | ) |
Class C | | | (804,656 | ) | | | (669,494 | ) |
Class R | | | (397,412 | ) | | | (539,081 | ) |
Institutional Class | | | (805,093 | ) | | | (2,474,635 | ) |
Class R6 | | | (1,576,132 | ) | | | (166,518 | ) |
| | | | | | | | |
| | | (5,700,058 | ) | | | (6,208,978 | ) |
| | | | | | | | |
Net decrease | | | (3,750,721 | ) | | | (48,044 | ) |
| | | | | | | | |
36
Certain shareholders may exchange shares of one class for shares of another class in the same Fund. These exchange transactions are included as subscriptions and redemptions in the table above and on the “Statements of changes in net assets.” For the years ended Oct. 31, 2018 and 2017, the Fund had the following exchange transactions:
| | | | | | | | | | | | | | | | | | | | |
| | | Exchange Redemptions | | | Exchange Subscriptions | | | | |
| | | Class A
Shares | | | Class C
Shares | | | Class A
Shares | | | Institutional
Class Shares | | | Value | |
Year ended 10/31/18 | | | 8,761 | | | | 57,310 | | | | 57,000 | | | | 8,722 | | | $ | 721,029 | |
Year ended 10/31/17 | | | 85,007 | | | | 4,747 | | | | 2,884 | | | | 86,481 | | | | 1,049,065 | |
7. Line of Credit
The Fund, along with certain other funds in the Delaware Funds (Participants), was a participant in a $155,000,000 revolving line of credit intended to be used for temporary or emergency purposes as an additional source of liquidity to fund redemptions of investor shares. Under the agreement, the Participants were charged an annual commitment fee of 0.15%, which was allocated across the Participants based on a weighted average of the respective net assets of each Participant. The Participants were permitted to borrow up to a maximum of one-third of their net assets under the agreement. Each Participant was individually, and not jointly, liable for its particular advances, if any, under the line of credit. The line of credit available under the agreement expired on Nov. 6, 2017.
On Nov. 6, 2017, the Fund, along with the other Participants, entered into an amendment to the agreement for a $155,000,000 revolving line of credit. The revolving line of credit available was reduced from $155,000,000 to $130,000,000 on Sept. 6, 2018. The revolving line of credit was to be used as described above and operated in substantially the same manner as the original agreement. The line of credit available under the agreement expired on Nov. 5, 2018.
The Fund had no amounts outstanding as of Oct. 31, 2018, or at any time during the year then ended.
8. Offsetting
Master Repurchase Agreements
Repurchase agreements are entered into by the Fund under Master Repurchase Agreements (each, an MRA). The MRA permits the Fund, under certain circumstances including an event of default (such as bankruptcy or insolvency), to offset payables and/or receivables with collateral held by and/or posted to the counterparty. As a result, one single net payment is created. Bankruptcy or insolvency laws of a particular jurisdiction may impose restrictions on or prohibitions against such a right of offset in the event of the MRA counterparty’s bankruptcy or insolvency. Based on the terms of the MRA, the Fund receives securities as collateral with a market value in excess of the repurchase price at maturity. Upon a bankruptcy or insolvency of the MRA counterparty, the Fund would recognize a liability with respect to such excess collateral. The liability reflects the Fund’s obligation under bankruptcy law to return the excess to the counterparty. As of Oct. 31, 2018, the following table is a summary of the Fund’s repurchase agreements by counterparty which are subject to offset under an MRA:
37
| | | | |
| Notes to financial statements | | | | |
| Delaware REIT Fund | | | | |
8. Offsetting (continued)
| | | | | | | | | | | | | | | | | | | | | | | | | |
Counterparty | | Repurchase
Agreements | | Fair Value of
Non-Cash
Collateral Received(a) | | Cash Collateral Received | | Net Collateral Received | | Net Exposure(b) |
Bank of America Merrill Lynch | | | | $ 53,607 | | | | | $ (53,607 | ) | | | | $ — | | | | | $(53,607 | ) | | | | $ — | |
Bank of Montreal | | | | 147,418 | | | | | (147,418 | ) | | | | — | | | | | (147,418 | ) | | | | — | |
BNP Paribas | | | | 189,291 | | | | | (189,291 | ) | | | | — | | | | | (189,291 | ) | | | | — | |
| | | | | | | | | | | | | | | | | | | | | | | | | |
Total | | | | $390,316 | | | | | $(390,316 | ) | | | | $ — | | | | | $(390,316 | ) | | | | $ — | |
| | | | | | | | | | | | | | | | | | | | | | | | | |
(a)The value of the related collateral received exceeded the value of the repurchase agreements as of Oct. 31, 2018.
(b)Net exposure represents the receivable (payable) that would be due from (to) the counterparty in the event of default.
9. Securities Lending
The Fund, along with other funds in the Delaware Funds, may lend its securities pursuant to a security lending agreement (Lending Agreement) with The Bank of New York Mellon (BNY Mellon). At the time a security is loaned, the borrower must post collateral equal to the required percentage of the market value of the loaned security, including any accrued interest. The required percentage is: (1) 102% with respect to US securities and foreign securities that are denominated and payable in US dollars; and (2) 105% with respect to foreign securities. With respect to each loan, if on any business day the aggregate market value of securities collateral plus cash collateral held is less than the aggregate market value of the securities which are the subject of such loan, the borrower will be notified to provide additional collateral by the end of the following business day, which, together with the collateral already held, will be not less than the applicable initial collateral requirements for such security loan. If the aggregate market value of securities collateral and cash collateral held with respect to a security loan exceeds the applicable initial collateral requirement, upon request of the borrower, BNY Mellon must return enough collateral to the borrower by the end of the following business day to reduce the value of the remaining collateral to the applicable initial collateral requirement for such security loan. As a result of the foregoing, the value of the collateral held with respect to a loaned security on any particular day may be more or less than the value of the security on loan. The collateral percentage with respect to the market value of the loaned security is determined by the security lending agent.
Cash collateral received by each fund of the Trust is generally invested in a series of individual separate accounts, each corresponding to a fund. The investment guidelines permit each separate account to hold certain securities that would be considered eligible securities for a money market fund. Cash collateral received is generally invested in government securities; certain obligations issued by government sponsored enterprises; repurchase agreements collateralized by US Treasury securities; obligations issued by the central government of any Organization for Economic Cooperation and Development (OECD) country or its agencies, instrumentalities or establishments; obligations of supranational organizations; commercial paper, notes, bonds and other debt obligations; certificates of deposit, time deposits, and other bank obligations; and asset-backed securities. A fund can also accept US government securities and letters of credit (non-cash collateral) in connection with securities loans.
In the event of default or bankruptcy by the lending agent, realization and/or retention of the collateral may be subject to legal proceedings. In the event the borrower fails to return loaned securities and the
38
collateral received is insufficient to cover the value of the loaned securities and provided such collateral shortfall is not the result of investment losses, the lending agent has agreed to pay the amount of the shortfall to the Fund or, at the discretion of the lending agent, replace the loaned securities. The Fund continues to record dividends or interest, as applicable, on the securities loaned and is subject to changes in value of the securities loaned that may occur during the term of the loan. The Fund has the right under the Lending Agreement to recover the securities from the borrower on demand. With respect to security loans collateralized by non-cash collateral, the Fund receives loan premiums paid by the borrower. With respect to security loans collateralized by cash collateral, the earnings from the collateral investments are shared among the Fund, the security lending agent, and the borrower. The Fund records security lending income net of allocations to the security lending agent and the borrower.
The Fund may incur investment losses as a result of investing securities lending collateral. This could occur if an investment in the collateral investment account defaulted or became impaired. Under those circumstances, the value of a Fund’s cash collateral account may be less than the amount the Fund would be required to return to the borrowers of the securities and the Fund would be required to make up for this shortfall.
During the year ended Oct. 31, 2018, the Fund had no securities out on loan.
10. Credit and Market Risk
The Fund concentrates its investments in the real estate industry and is subject to the risks associated with that industry. If the Fund holds real estate directly as a result of defaults or receives rental income directly from real estate holdings, its tax status as a regulated investment company may be jeopardized. The Fund is also affected by interest rate changes, particularly if the REITs it holds use floating rate debt to finance their ongoing operations. Its investments may also tend to fluctuate more widely than that of a fund that invests in a broad range of industries.
The Fund may invest up to 15% of its net assets in illiquid securities, which may include securities with contractual restrictions on resale, securities exempt from registration under Rule 144A promulgated under the Securities Act of 1933, as amended, and other securities which may not be readily marketable. The relative illiquidity of these securities may impair the Fund from disposing of them in a timely manner and at a fair price when it is necessary or desirable to do so. While maintaining oversight, the Board has delegated to DMC the day-to-day functions of determining whether individual securities are liquid for purposes of the Fund’s limitation on investments in illiquid securities. Securities eligible for resale pursuant to Rule 144A, which are determined to be liquid, are not subject to the Fund’s 15% limit on investments in illiquid securities. As of Oct. 31, 2018, there were no Rule 144A securities held by the Fund. Restricted securities are valued pursuant to the security valuation procedures described in Note 1.
11. Contractual Obligations
The Fund enters into contracts in the normal course of business that contain a variety of indemnifications. The Fund’s maximum exposure under these arrangements is unknown. However, the Fund has not had prior claims or losses pursuant to these contracts. Management has reviewed the Fund’s existing contracts and expects the risk of loss to be remote.
39
| | | | |
| Notes to financial statements | | | | |
| Delaware REIT Fund | | | | |
12. Recent Accounting Pronouncements
In August 2018, the FASB issued an Accounting Standards Update, ASU 2018-13, which changes certain fair value measurement disclosure requirements. The ASU 2018-13, in addition to other modifications and additions, removes the requirement to disclose the amount and reasons for transfers between Level 1 and Level 2 of the fair value hierarchy, the policy for the timing of transfers between levels and the valuation process for Level 3 fair value measurements. The ASU 2018-13 is effective for fiscal years, and interim periods within those fiscal years, beginning after Dec. 15, 2019. At this time, management is evaluating the implications of these changes on the financial statements.
In August 2018, the Securities and Exchange Commission (SEC) adopted amendments to Regulation S-X to update and simplify the disclosure requirements for registered investment companies by eliminating requirements that are redundant or duplicative of US GAAP requirements or other SEC disclosure requirements. The new amendments require the presentation of the total, rather than the components, of distributable earnings on the “Statement of assets and liabilities” and the total, rather than the components, of dividends from net investment income and distributions from net realized gains on the “Statements of changes in net assets.” The amendments also removed the requirement for the parenthetical disclosure of undistributed net investment income on the “Statements of changes in net assets” and certain tax adjustments that were reflected in the “Notes to financial statements.” All of these have been reflected in the Fund’s financial statements.
13. Subsequent Events
On Nov. 5, 2018, the Fund, along with the other Participants, entered into an amendment to the agreement for a $190,000,000 revolving line of credit to be used as described in Note 7 and to be operated in substantially the same manner as the agreement described in Note 7. The revolving line of credit available was increased from $190,000,000 to $220,000,000 on Nov. 29, 2018. Under the amendment to the agreement, the Participants are charged an annual commitment fee of 0.15%, which is allocated across the Participants based on a weighted average of the respective net assets of each Participant. The line of credit available under the agreement expires on Nov. 4, 2019.
Management has determined that no other material events or transactions occurred subsequent to Oct. 31, 2018, that would require recognition or disclosure in the Fund’s financial statements.
40
| | | | |
Report of independent registered public accounting firm | | | | |
| To the Board of Trustees of Delaware Pooled® Trust and Shareholders of Delaware REIT Fund | | | | |
Opinion on the Financial Statements
We have audited the accompanying statement of assets and liabilities, including the schedule of investments, of Delaware REIT Fund (one of the series constituting Delaware Pooled® Trust, referred to hereafter as the “Fund”) as of October 31, 2018, the related statement of operations for the year ended October 31, 2018, the statements of changes in net assets for each of the two years in the period ended October 31, 2018, including the related notes, and the financial highlights for each of the periods indicated therein (collectively referred to as the “financial statements”). In our opinion, the financial statements present fairly, in all material respects, the financial position of the Fund as of October 31, 2018, the results of its operations for the year then ended, the changes in its net assets for each of the two years in the period ended October 31, 2018 and the financial highlights for each of the periods indicated therein in conformity with accounting principles generally accepted in the United States of America.
Basis for Opinion
These financial statements are the responsibility of the Fund’s management. Our responsibility is to express an opinion on the Fund’s financial statements based on our audits. We are a public accounting firm registered with the Public Company Accounting Oversight Board (United States) (“PCAOB”) and are required to be independent with respect to the Fund in accordance with the U.S. federal securities laws and the applicable rules and regulations of the Securities and Exchange Commission and the PCAOB.
We conducted our audits of these financial statements in accordance with the standards of the PCAOB. Those standards require that we plan and perform the audit to obtain reasonable assurance about whether the financial statements are free of material misstatement, whether due to error or fraud.
Our audits included performing procedures to assess the risks of material misstatement of the financial statements, whether due to error or fraud, and performing procedures that respond to those risks. Such procedures included examining, on a test basis, evidence regarding the amounts and disclosures in the financial statements. Our audits also included evaluating the accounting principles used and significant estimates made by management, as well as evaluating the overall presentation of the financial statements. Our procedures included confirmation of securities owned as of October 31, 2018 by correspondence with the custodian and brokers. We believe that our audits provide a reasonable basis for our opinion.
/s/PricewaterhouseCoopers LLP
Philadelphia, Pennsylvania
December 20, 2018
We have served as the auditor of one or more investment companies in Delaware Funds® by Macquarie since 2010.
41
| | | | |
| Other Fund information (Unaudited) | | | | |
| Delaware REIT Fund | | | | |
Tax Information
The information set forth below is for the Fund’s fiscal year as required by federal income tax laws. Shareholders, however, must report distributions on a calendar year basis for income tax purposes, which may include distributions for portions of two fiscal years of the Fund. Accordingly, the information needed by shareholders for income tax purposes will be sent to them in January of each year. Please consult your tax advisor for proper treatment of this information.
All disclosures are based on financial information available as of the date of this annual report and, accordingly, are subject to change. For any and all items requiring reporting, it is the intention of the Fund to report the maximum amount permitted under the Internal Revenue Code and the regulations thereunder.
For the fiscal year ended Oct. 31, 2018, the Fund reports distributions paid during the year as follows:
| | | | |
(A) Long-Term Capital Gains Distributions (Tax Basis) | | | 56.90 | % |
(B) Ordinary Income Distributions (Tax Basis) | | | 35.69 | % |
(C) Return of Capital (Tax Basis) | | | 7.41 | % |
Total Distributions | | | 100.00 | % |
(A), (B) and (C) are based on a percentage of the Fund’s total distributions.
Board consideration of sub-advisory agreements for Delaware REIT Fund at a meeting held May 16-17, 2018
At a meeting held on May 16-17, 2018, the Board of Trustees of Delaware Pooled® Trust, including a majority of non-interested or independent Trustees (the “Independent Trustees”), approved a new Sub-Advisory Agreement between Delaware Management Company (“DMC” or “Management”) and each of Macquarie Investment Management Global Limited (“MIMGL”) and Macquarie Funds Management Hong Kong Limited (“MFMHK”) for Delaware REIT Fund (the “Fund”). MIMGL and MFMHK may also be referenced as “sub-advisor(s)” below.
In reaching the decision to approve the Sub-Advisory Agreements, the Board considered and reviewed information about each of MIMGL and MFMHK, including their personnel, operations, and financial condition, which had been provided by MIMGL and MFMHK, respectively. The Board also reviewed material furnished by DMC, including: a memorandum from DMC reviewing the Sub-Advisory Agreements and the various services proposed to be rendered by MIMGL and MFMHK; information concerning MIMGL’s and MFMHK’s organizational structure and the experience of their key investment management personnel; copies of MIMGL’s and MFMHK’s Form ADV, financial statements, compliance policies and procedures, and Codes of Ethics; relevant performance information provided with respect to MIMGL and MFMHK; and a copy of the Sub-Advisory Agreements.
In considering such information and materials, the Independent Trustees received assistance and advice from and met separately with independent counsel. The materials prepared by Management in connection with the approval of the Sub-Advisory Agreements were sent to the Independent Trustees in advance of the meeting. While attention was given to all information furnished, the following discusses some primary factors relevant to the Board’s decision. This discussion of the information and factors
42
considered by the Board (as well as the discussion above) is not intended to be exhaustive, but rather summarizes certain factors considered by the Board. In view of the wide variety of factors considered, the Board did not, unless otherwise noted, find it practicable to quantify or otherwise assign relative weights to the following factors. In addition, individual Trustees may have assigned different weights to various factors.
Nature, extent, and quality of services. The Board considered the nature, extent, and quality of services that MIMGL and MFMHK each would provide as a sub-advisor to the Fund. The Trustees considered the investment process to be employed by MIMGL and MFMHK in connection with DMC’s collaboration with MIMGL and MFMHK in managing the Fund, and the qualifications and experience of MIMGL and MFMHK’s equity teams with regard to implementing the Fund’s investment mandates. The Board considered MIMGL and MFMHK’s organization, personnel, and operations. The Trustees also considered Management’s review and recommendation process with respect to MIMGL and MFMHK, and Management’s favorable assessment as to the nature, extent, and quality of the sub-advisory services expected to be provided by MIMGL and MFMHK to the Fund. Based on their consideration and review of the foregoing factors, the Board concluded that the nature, extent, and quality of the sub-advisory services to be provided by MIMGL and MFMHK, as well as MIMGL and MFMHK’s ability to render such services based on their experience, organization and resources, were appropriate for the Fund, in light of the Fund’s investment objective, strategies, and policies. In discussing the nature of the services proposed to be provided by the sub-advisors, several Board members observed that, unlike traditional sub-advisors, who make the investment-related decisions with respect to the sub-advised portfolio, the relationship contemplated in this case is limited to access to the additional quantitative investment resources and related technology support of MIMGL and MFMHK.
Sub-advisory fees. The Board considered that DMC would not pay MIMGL and MFMHK fees in conjunction with the services that would be rendered to the sub-advised Fund. The Board concluded that, in light of the quality and extent of the services to be provided and the business relationships between the advisor and sub-advisors, the proposed fee arrangement was understandable and reasonable.
Investment performance. In evaluating performance, the Board considered that MIMGL and MFMHK would provide trade execution support, but that DMC’s portfolio managers for the Fund would retain portfolio management discretion over the Fund.
Economies of scale and fall-out benefits. The Board considered whether the proposed fee arrangement would reflect economies of scale for the benefit of Fund investors as assets in the Fund increased, as applicable. The Board also considered that DMC and its affiliates may benefit by leveraging the global resources of its affiliates.
Board consideration of advisory agreement for Delaware REIT Fund at a meeting held August 15-16, 2018
At a meeting held on Aug. 15-16, 2018 (the “Annual Meeting”), the Board of Trustees (the “Board”), including a majority of disinterested or independent Trustees, approved the renewal of the Investment Advisory Agreement for Delaware REIT Fund (the “Fund”). In making its decision, the Board considered information furnished at regular quarterly Board meetings, including reports detailing Fund performance,
43
| | | | |
| Other Fund information (Unaudited) | | | | |
| Delaware REIT Fund | | | | |
Board consideration of advisory agreement for Delaware REIT Fund at a meeting held August 15-16, 2018 (continued)
investment strategies, and expenses, as well as information prepared specifically in connection with the renewal of the investment advisory contract. Information furnished specifically in connection with the renewal of the Investment Management Agreement with Delaware Management Company (“DMC”), a series of Macquarie Investment Management Business Trust (“MIMBT”), included materials provided by DMC and its affiliates (collectively, “Macquarie Investment Management”) concerning, among other things, the nature, extent, and quality of services provided to the Fund; the costs of such services to the Fund; economies of scale; and the investment manager’s financial condition and profitability. In addition, in connection with the Annual Meeting, materials were provided to the Trustees in May 2018, including reports provided by Broadridge Financial Solutions (“Broadridge”). The Broadridge reports compared the Fund’s investment performance and expenses with those of other comparable mutual funds. The Independent Trustees reviewed and discussed the Broadridge reports with independent legal counsel to the Independent Trustees. In addition to the information noted above, the Board also requested and received information regarding DMC’s policy with respect to advisory fee levels and its breakpoint philosophy; the structure of portfolio manager compensation; comparative client fee information; and any constraints or limitations on the availability of securities for certain investment styles, which had in the past year inhibited, or which were likely in the future to inhibit, the investment manager’s ability to invest fully in accordance with Fund policies.
In considering information relating to the approval of the Fund’s advisory agreement, the Independent Trustees received assistance and advice from and met separately with independent legal counsel to the Independent Trustees and also from an experienced and knowledgeable independent fund consultant, JDL Consultants, LLC (“JDL”). Although the Board gave attention to all information furnished, the following discussion identifies, under separate headings, the primary factors taken into account by the Board during its contract renewal considerations.
Nature, extent, and quality of services. The Board considered the services provided by DMC to the Fund and its shareholders. In reviewing the nature, extent, and quality of services, the Board considered reports furnished to it throughout the year, which covered matters such as the relative performance of the Fund; compliance of portfolio managers with the investment policies, strategies, and restrictions for the Fund; compliance by DMC and Delaware Distributors, L.P. (together, “Management”) personnel with the Code of Ethics adopted throughout the Delaware Funds® by Macquarie (“Delaware Funds”); and adherence to fair value pricing procedures as established by the Board. The Board was pleased with the current staffing of DMC and the emphasis placed on research in the investment process. The Board recognized DMC’s receipt of certain favorable industry distinctions during the past several years. The Board gave favorable consideration to DMC’s efforts to control expenses while maintaining service levels committed to Fund matters. The Board also noted the benefits provided to Fund shareholders (a) through each shareholder’s ability to: (i) exchange an investment in one Delaware Fund for the same class of shares in another Delaware Fund without a sales charge, or (ii) to reinvest Fund dividends into additional shares of the Fund or into additional shares of other Delaware Funds, and (b) the privilege to combine holdings in other Delaware Funds to obtain a reduced sales charge. The Board was satisfied with the nature, extent, and quality of the overall services provided by DMC.
44
Investment performance. The Board placed significant emphasis on the investment performance of the Fund in view of the importance of investment performance to shareholders. Although the Board considered performance reports and discussions with portfolio managers at Investment Committee meetings throughout the year, the Board gave particular weight to the Broadridge reports furnished for the Annual Meeting. The Broadridge reports prepared for the Fund showed the investment performance of its Class A shares in comparison to a group of similar funds as selected by Broadridge (the “Performance Universe”). A fund with the best performance ranked first, and a fund with the poorest performance ranked last. The highest/best performing 25% of funds in the Performance Universe make up the first quartile; the next 25%, the second quartile; the next 25%, the third quartile; and the poorest/worst performing 25% of funds in the Performance Universe make up the fourth quartile. Comparative annualized performance for the Fund was shown for the past 1-, 3-, 5-, and 10-year periods, to the extent applicable, ended Jan. 31, 2018. The Board’s objective is that the Fund’s performance for the 1-, 3-, and 5-year periods be at or above the median of its Performance Universe.
The Performance Universe for the Fund consisted of the Fund and all retail and institutional real estate funds as selected by Broadridge. The Broadridge report comparison showed that the Fund’s total return for the 1-, 3-, and 5-year periods was in the fourth quartile of its Performance Universe. The report further showed that the Fund’s total return for the 10-year period was in the third quartile of its Performance Universe. The Board observed that the Fund’s performance results were not in line with the Board’s objective. In evaluating the Fund’s performance, the Board considered the numerous investment and performance reports delivered by Management personnel to the Board’s Investments Committee. The Board believed that Management was taking action to improve Fund performance so as to meet the Board’s performance objective.
Comparative expenses. The Board considered expense data for the Delaware Funds. Management provided the Board with information on pricing levels and fee structures for the Fund as of its most recently completed fiscal year. The Board also focused on the comparative analysis of effective management fees and total expense ratios of the Fund versus effective management fees and total expense ratios of a group of similar funds as selected by Broadridge (the “Expense Group”). In reviewing comparative costs, the Fund’s contractual management fee and the actual management fee incurred by the Fund were compared with the contractual management fees (assuming all funds in the Expense Group were similar in size to the Fund) and actual management fees (as reported by each fund) within the Expense Group, taking into account any applicable breakpoints and fee waivers. The Fund’s total expenses were also compared with those of its Expense Group. The Broadridge total expenses, for comparative consistency, were shown by Broadridge for Class A shares and comparative total expenses including 12b-1 and non-12b-1 service fees. The Board’s objective is for each Fund’s total expense ratio to be competitive with those of the peer funds within its Expense Group.
The expense comparisons for the Fund showed that its actual management fee and total expenses were in the quartile with the second lowest expenses in its Expense Group. The Board was satisfied with the management fee and total expenses of the Fund in comparison to those of its Expense Group as shown in the Broadridge report.
Management profitability. The Board considered the level of profits realized by DMC in connection with the operation of the Fund. In this respect, the Board reviewed the Investment Management Profitability
45
| | | | |
| Other Fund information (Unaudited) | | | | |
| Delaware REIT Fund | | | | |
Board consideration of advisory agreement for Delaware REIT Fund at a meeting held August 15-16, 2018 (continued)
Analysis that addressed the overall profitability of DMC’s business in providing management and other services to each of the individual funds and the Delaware Funds as a whole. Specific attention was given to the methodology used by DMC in allocating costs for the purpose of determining profitability. Management stated that the level of profits of DMC, to a certain extent, reflects recent operational cost savings and efficiencies initiated by DMC. The Board considered DMC’s efforts to improve services provided to Fund shareholders and to meet additional regulatory and compliance requirements resulting from recent industry-wide Securities and Exchange Commission initiatives. The Board also considered the extent to which DMC might derive ancillary benefits from fund operations, including the potential for procuring additional business as a result of the prestige and visibility associated with its role as service provider to the Delaware Funds and the benefits from allocation of fund brokerage to improve trading efficiencies. As part of its work, the Board also reviewed a report prepared by JDL regarding MIMBT profitability as compared to certain peer fund complexes and the Independent Trustees met with JDL personnel to discuss DMC’s profitability in such context. The Board found that the management fees were reasonable in light of the services rendered and the level of profitability of DMC.
Economies of scale. The Trustees considered whether economies of scale are realized by DMC as the Fund’s assets increase and the extent to which any economies of scale are reflected in the level of management fees charged. The Trustees reviewed the Fund’s advisory fee pricing and structure, approved by the Board and shareholders, which includes breakpoints, and which applies to most funds in the Delaware Funds complex. Breakpoints in the advisory fee occur when the advisory fee rate is reduced on assets in excess of specified levels. Breakpoints result in a lower advisory fee than would otherwise be the case in the absence of breakpoints, when the asset levels specified in the breakpoints are exceeded. Although, as of March 31, 2018, the Fund had not reached a size at which it could take advantage of any breakpoints in the applicable fee schedule, the Board recognized that the fee was structured so that, if the Fund increases sufficiently in size, then economies of scale may be shared.
46
This page intentionally left blank.
| | | | |
| Board of trustees / directors and officers addendum | | | | |
| Delaware Funds® by Macquarie | | | | |
A mutual fund is governed by a Board of Trustees/Directors (“Trustees”), which has oversight responsibility for the management of a fund’s business affairs. Trustees establish procedures and oversee and review the performance of the investment manager, the distributor, and others who perform services for the fund. The independent fund trustees, in particular, are advocates
| | | | |
Name, Address,
and Birth Date | | Position(s)
Held with Fund(s) | | Length of
Time Served |
Interested Trustee | | | | |
| | |
Shawn K. Lytle1, 2 2005 Market Street Philadelphia, PA 19103 February 1970 | | President,
Chief Executive Officer,
and Trustee | | Trustee since
September 2015 President and
Chief Executive Officer
since August 2015 |
Independent Trustees | | | | |
| | |
Thomas L. Bennett 2005 Market Street Philadelphia, PA 19103 October 1947 | | Chair and Trustee | | Trustee since
March 2005 Chair since
March 2015 |
| | |
Ann D. Borowiec 2005 Market Street Philadelphia, PA 19103 November 1958 | | Trustee | | Since March 2015 |
| | |
Joseph W. Chow 2005 Market Street Philadelphia, PA 19103 January 1953 | | Trustee | | Since January 2013 |
| | | | | |
| 1 | Shawn K. Lytle is considered to be an “Interested Trustee” because he is an executive officer of the Fund’s(s’) investment advisor. |
| 2 | Shawn K. Lytle, David F. Connor, Daniel V. Geatens, and Richard Salus serve in similar capacities for the six portfolios of the Optimum Fund Trust, which have the same investment advisor, principal underwriter, and transfer agent as the registrant. Mr. Geatens also serves as the Chief Financial Officer and Treasurer for Macquarie Global Infrastructure Total Return Fund Inc., which has an affiliated investment manager. |
48
for shareholder interests. Each trustee has served in that capacity since he or she was elected to or appointed to the Board of Trustees, and will continue to serve until his or her retirement or the election of a new trustee in his or her place. The following is a list of the Trustees and Officers with certain background and related information.
| | | | |
Principal Occupation(s) During the Past Five Years | | Number of Portfolios in Fund Complex Overseen by Trustee or Officer | | Other Directorships Held by Trustee or Officer |
| | |
| | | | |
President — Macquarie
Investment Management3
(June 2015–Present) Regional Head of
Americas —UBS Global
Asset Management
(April 2010–May 2015) | | 59 | | Trustee — UBS
Relationship Funds,
SMA Relationship
Trust, and UBS Funds
(May 2010–April 2015) |
| | |
| | | | |
Private Investor
(March 2004–Present) | | 59 | | None |
Chief Executive Officer,
Private Wealth Management
(2011–2013) and
Market Manager,
New Jersey Private
Bank (2005–2011) —
J.P. Morgan Chase & Co. | | 59 | | Director —
Banco Santander International
(October 2016–Present) Director —
Santander Bank, N.A.
(December 2016–Present) |
Private Investor
(April 2011–Present) | | 59 | | Director and Audit Committee
Member — Hercules
Technology Growth
Capital, Inc.
(July 2004–July 2014) |
| 3 | Macquarie Investment Management is the marketing name for Macquarie Management Holdings, Inc. and its subsidiaries, including the Fund’s(s’) investment advisor, principal underwriter, and its transfer agent. |
49
| | | | |
| Board of trustees / directors and officers addendum | | | | |
| Delaware Funds® by Macquarie | | | | |
| | | | |
| Name, Address, | | Position(s) | | Length of |
| and Birth Date | | Held with Fund(s) | | Time Served |
Independent Trustees (continued) | | | | |
John A. Fry 2005 Market Street | | Trustee | | Since January 2001 |
Philadelphia, PA 19103 May 1960 | | | | |
| | | |
| Lucinda S. Landreth | | Trustee | | Since March 2005 |
| 2005 Market Street | | | | |
| Philadelphia, PA 19103 | | | | |
| June 1947 | | | | |
| | | |
| Frances A. Sevilla-Sacasa | | Trustee | | Since September 2011 |
| 2005 Market Street | | | | |
| Philadelphia, PA 19103 | | | | |
January 1956 | | | | |
50
| | | | |
| | | Number of Portfolios in | | |
| Principal Occupation(s) | | Fund Complex Overseen | | Other Directorships |
| During the Past Five Years | | by Trustee or Officer | | Held by Trustee or Officer |
| | |
| | | | |
| President — | | 59 | | Director; Compensation |
| Drexel University | | | | Committee and |
| (August 2010–Present) | | | | Governance Committee |
| | | | | Member — Community |
| | | | | Health Systems |
| | | | |
| | |
| President — | | | | Director — Drexel |
| Franklin & Marshall College | | | | Morgan & Co. |
| (July 2002–July 2010) | | | | |
| | |
| | | | Director; Audit Committee |
| | | | Member — vTv |
| | | | Therapeutics LLC |
| | | | |
| | |
| | | | Director; Audit Committee |
| | | | Member — FS Credit Real |
| | | | Estate Income Trust, Inc. |
| Private Investor | | 59 | | None |
(2004–Present) | | | | |
| Private Investor | | 59 | | Trust Manager and |
(January 2017–Present) Chief Executive Officer — Banco Itaú International (April 2012–December 2016) | | | | Audit Committee Chair — Camden Property Trust (August 2011–Present) Director — Carrizo Oil & Gas, Inc. (March 2018–Present) |
Executive Advisor to Dean (August 2011–March 2012) and Interim Dean (January 2011–July 2011) — University of Miami School of Business Administration | | |
| | |
President — U.S. Trust, Bank of America Private Wealth Management (Private Banking) (July 2007–December 2008) | | | | |
51
| | | | |
| Board of trustees / directors and officers addendum | | | | |
| Delaware Funds® by Macquarie | | | | |
| | | | |
Name, Address, and Birth Date | | Position(s) Held with Fund(s) | | Length of Time Served |
Independent Trustees (continued) | | |
Thomas K. Whitford
2005 Market Street Philadelphia, PA 19103 March 1956 | | Trustee | | Since January 2013 |
Janet L. Yeomans
2005 Market Street Philadelphia, PA 19103 July 1948 | | Trustee | | Since April 1999 |
Officers | | | | |
David F. Connor
2005 Market Street Philadelphia, PA 19103 December 1963 | | Senior Vice President, General Counsel, and Secretary | | Senior Vice President since May 2013; General Counsel since May 2015; Secretary since October 2005 |
Daniel V. Geatens 2005 Market Street Philadelphia, PA 19103 October 1972 | | Vice President and Treasurer | | Vice President and Treasurer since October 2007 |
Richard Salus 2005 Market Street Philadelphia, PA 19103 October 1963 | | Senior Vice President and Chief Financial Officer | | Senior Vice President and
Chief Financial Officer
since November 2006 |
The Statement of Additional Information for the Fund(s) includes additional information about the Trustees and Officers and is available, without charge, upon request by calling 800 523-1918.
52
| | | | |
Principal Occupation(s) During the Past Five Years | | Number of Portfolios in Fund Complex Overseen by Trustee or Officer | | Other Directorships Held by Trustee or Officer |
| | |
| | | | |
Vice Chairman (2010–April 2013) — PNC Financial Services Group | | 59 | | Director — HSBC Finance Corporation and HSBC North America Holdings Inc. (December 2013–Present) |
| | |
| | | | Director — |
| | | | | HSBC Bank USA Inc. (July 2014–March 2017) |
| Vice President and Treasurer | | 59 | | Director (2009–2017); |
| (January 2006–July 2012), | | | | Personnel and Compensation |
| Vice President — | | | | Committee Chair; Member of |
| Mergers & Acquisitions | | | | Nominating, Investments, and |
| (January 2003–January 2006), | | | | Audit Committees for various |
| and Vice President | | | | periods throughout |
| and Treasurer | | | | directorship — |
| (July 1995–January 2003) — | | | | Okabena Company |
3M Company | | | | |
| | |
| | | | |
| David F. Connor has served | | 59 | | None2 |
in various capacities at different times at | | | | |
| Macquarie Investment | | | | |
Management. | | | | |
| Daniel V. Geatens has served | | 59 | | None2 |
in various capacities at different times at | | | | |
| Macquarie Investment | | | | |
Management. | | | | |
| Richard Salus has served | | 59 | | None2 |
in various capacities at different times at | | | | |
| Macquarie Investment | | | | |
Management. | | | | |
53
| | | | | | |
| Board of trustees | | | | | | |
Shawn K. Lytle President and Chief Executive Officer Delaware Funds® by Macquarie Philadelphia, PA Thomas L. Bennett Chairman of the Board Delaware Funds by Macquarie Private Investor Rosemont, PA | | Ann D. Borowiec Former Chief Executive Officer Private Wealth Management J.P. Morgan Chase & Co. New York, NY Joseph W. Chow Former Executive Vice President State Street Corporation Boston, MA | | John A. Fry President Drexel University Philadelphia, PA Lucinda S. Landreth Former Chief Investment Officer Assurant, Inc. New York, NY | | Frances A. Sevilla-Sacasa Former Chief Executive Officer Banco Itaú International Miami, FL Thomas K. Whitford Former Vice Chairman PNC Financial Services Group Pittsburgh, PA Janet L. Yeomans Former Vice President and Treasurer 3M Company St. Paul, MN |
| Affiliated officers | | | | | | |
| | | |
David F. Connor | | Daniel V. Geatens | | Richard Salus | | |
| Senior Vice President, | | Vice President and | | Senior Vice President and | | |
| General Counsel, | | Treasurer | | Chief Financial Officer | | |
| and Secretary | | Delaware Funds | | Delaware Funds | | |
| Delaware Funds | | by Macquarie | | by Macquarie | | |
| by Macquarie | | Philadelphia, PA | | Philadelphia, PA | | |
| Philadelphia, PA | | | | | | |
This annual report is for the information of Delaware REIT Fund shareholders, but it may be used with prospective investors when preceded or accompanied by the Delaware Fund fact sheet for the most recently completed calendar quarter. These documents are available at delawarefunds.com/literature.
The Fund files its complete schedule of portfolio holdings with the Securities and Exchange Commission (SEC) for the first and third quarters of each fiscal year on Form N-Q. The Fund’s Forms N-Q, as well as a description of the policies and procedures that the Fund uses to determine how to vote proxies (if any) relating to portfolio securities are available without charge (i) upon request, by calling 800 523-1918; and (ii) on the SEC’s website at sec.gov. In addition, a description of the policies and procedures that the Fund uses to determine how to vote proxies (if any) relating to portfolio securities and the Schedule of Investments included in the Fund’s most recent Form N-Q are available without charge on the Fund’s website at delawarefunds.com/literature. The Fund’s Forms N-Q may be reviewed and copied at the SEC’s Public Reference Room in Washington, D.C.; information on the operation of the Public Reference Room may be obtained by calling 800 SEC-0330.
Information (if any) regarding how the Fund voted proxies relating to portfolio securities during the most recently disclosed 12-month period ended June 30 is available without charge (i) through the Fund’s website at delawarefunds.com/proxy; and (ii) on the SEC’s website at sec.gov.
54
Item 2. Code of Ethics
Item 3. Audit Committee Financial Expert
The registrant’s Board of Trustees has determined that certain members of the registrant’s Audit Committee are audit committee financial experts, as defined below. For purposes of this item, an “audit committee financial expert” is a person who has the following attributes:
a. An understanding of generally accepted accounting principles and financial statements;
b. The ability to assess the general application of such principles in connection with the accounting for estimates, accruals, and reserves;
c. Experience preparing, auditing, analyzing, or evaluating financial statements that present a breadth and level of complexity of accounting issues that are generally comparable to the breadth and complexity of issues that can reasonably be expected to be raised by the registrant’s financial statements, or experience actively supervising one or more persons engaged in such activities;
d. An understanding of internal controls and procedures for financial reporting; and
e. An understanding of audit committee functions.
An “audit committee financial expert” shall have acquired such attributes through:
a. Education and experience as a principal financial officer, principal accounting officer, controller, public accountant, or auditor or experience in one or more positions that involve the performance of similar functions;
b. Experience actively supervising a principal financial officer, principal accounting officer, controller, public accountant, auditor, or person performing similar functions;
c. Experience overseeing or assessing the performance of companies or public accountants with respect to the preparation, auditing, or evaluation of financial statements; or
d. Other relevant experience.
The registrant’s Board of Trustees has also determined that each member of the registrant’s Audit Committee is independent. In order to be “independent” for purposes of this item, the Audit Committee member may not: (i) other than in his or her capacity as a member of the Board of Trustees or any committee thereof, accept directly or indirectly any consulting, advisory or other compensatory fee from the issuer; or (ii) be an “interested person” of the registrant as defined in Section 2(a)(19) of the Investment Company Act of 1940.
The names of the audit committee financial experts on the registrant’s Audit Committee are set forth below:
Joseph W. Chow
John A. Fry
Lucinda S. Landreth
Thomas K. Whitford
Janet L. Yeomans
Item 4. Principal Accountant Fees and Services
The aggregate fees billed for services provided to the registrant by its independent auditors for the audit of the registrant’s annual financial statements and for services normally provided by the independent auditors in connection with statutory and regulatory filings or engagements were $232,490 for the fiscal year ended October 31, 2018.
The aggregate fees billed for services provided to the registrant by its independent auditors for the audit of the registrant’s annual financial statements and for services normally provided by the independent auditors in connection with statutory and regulatory filings or engagements were $226,010 for the fiscal year ended October 31, 2017.
The aggregate fees billed by the registrant’s independent auditors for services relating to the performance of the audit of the registrant’s financial statements and not reported under paragraph (a) of this Item were $0 for the fiscal year ended October 31, 2018.
The aggregate fees billed by the registrant’s independent auditors for services relating to the performance of the audit of the registrant’s financial statements and not reported under paragraph (a) of this Item were $0 for the fiscal year ended October 31, 2017.
The aggregate fees billed by the registrant’s independent auditors for tax-related services provided to the registrant’s investment adviser and other service providers under common control with the adviser and that relate directly to the operations or financial reporting of the registrant were $0 for the registrant’s fiscal year ended October 31, 2018.
The aggregate fees billed by the registrant’s independent auditors for tax-related services provided to the registrant’s investment adviser and other service providers under common control with the adviser and that relate directly to the operations or financial reporting of the registrant were $0 for the registrant’s fiscal year ended October 31, 2017.
The aggregate fees billed for all services provided by the independent auditors to the registrant other than those set forth in paragraphs (a), (b) and (c) of this Item were $0 for the fiscal year ended October 31, 2018.
The aggregate fees billed for all services provided by the independent auditors to the registrant other than those set forth in paragraphs (a), (b) and (c) of this Item were $0 for the fiscal year ended October 31, 2017.
Under the Pre-Approval Policy, the Audit Committee has also pre-approved the services set forth in the table below with respect to the registrant’s investment adviser and other entities controlling, controlled by or under common control with the investment adviser that provide ongoing services to the registrant (the “Control Affiliates”) up to the specified fee limit. This fee limit is based on aggregate fees to the investment adviser and its Control Affiliates.
The Pre-Approval Policy requires the registrant’s independent auditors to report to the Audit Committee at each of its regular meetings regarding all services initiated since the last such report was rendered, including those services authorized by the Pre-Approval Policy.
(f) Not applicable.
(g) The aggregate non-audit fees billed by the registrant’s independent auditors for services rendered to the registrant and to its investment adviser and other service providers under common control with the adviser were $11,748,000 and $11,180,000 for the registrant’s fiscal years ended October 31, 2018 and October 31, 2017, respectively.
(h) In connection with its selection of the independent auditors, the registrant’s Audit Committee has considered the independent auditors’ provision of non-audit services to the registrant’s investment adviser and other service providers under common control with the adviser that were not required to be pre-approved pursuant to Rule 2-01(c)(7)(ii) of Regulation S-X. The Audit Committee has determined that the independent auditors’ provision of these services is compatible with maintaining the auditors’ independence.
Item 5. Audit Committee of Listed Registrants
Not applicable.
Item 6. Investments
(a) Included as part of report to shareholders filed under Item 1 of this Form N-CSR.
(b) Divestment of securities in accordance with Section 13(c) of the Investment Company Act of 1940.
Not applicable.
Item 7. Disclosure of Proxy Voting Policies and Procedures for Closed-End Management Investment Companies
Not applicable.
Item 8. Portfolio Managers of Closed-End Management Investment Companies
Not applicable.
Item 9. Purchases of Equity Securities by Closed-End Management Investment Company and Affiliated Purchasers
Not applicable.
Item 10. Submission of Matters to a Vote of Security Holders
Not applicable.
Item 11. Controls and Procedures
The registrant’s principal executive officer and principal financial officer have evaluated the registrant’s disclosure controls and procedures within 90 days of the filing of this report and have concluded that they are effective in providing reasonable assurance that the information required to be disclosed by the registrant in its reports or statements filed under the Securities Exchange Act of 1934 is recorded, processed, summarized and reported within the time periods specified in the rules and forms of the Securities and Exchange Commission.
There were no significant changes in the registrant’s internal control over financial reporting that occurred during the second fiscal quarter of the period covered by the report to stockholders included herein (i.e., the registrant’s fourth fiscal quarter) that have materially affected, or are reasonably likely to materially affect, the registrant’s internal control over financial reporting.
Item 12. Disclosure of Securities Lending Activities for Closed-End Management Investment Companies
Not applicable.
Item 13. Exhibits
Pursuant to the requirements of the Securities Exchange Act of 1934 and the Investment Company Act of 1940, the registrant has duly caused this report to be signed on its behalf, by the undersigned, thereunto duly authorized.
Pursuant to the requirements of the Securities Exchange Act of 1934 and the Investment Company Act of 1940, this report has been signed below by the following persons on behalf of the registrant and in the capacities and on the dates indicated.