UNITED STATES SECURITIES AND EXCHANGE COMMISSION
Washington, D.C. 20549
FORM N-CSR
CERTIFIED SHAREHOLDER REPORT OF REGISTERED MANAGEMENT
INVESTMENT COMPANIES
| Investment Company Act file number: | | 811-06322
|
| Exact name of registrant as specified in charter: | | Delaware Pooled® Trust
|
| Address of principal executive offices: | | 610 Market Street |
| | Philadelphia, PA 19106
|
| Name and address of agent for service: | | David F. Connor, Esq. |
| | 610 Market Street |
| | Philadelphia, PA 19106
|
| Registrant’s telephone number, including area code: | | (800) 523-1918
|
| Date of fiscal year end: | | October 31
|
| Date of reporting period: | | October 31, 2021 |
Item 1. Reports to Stockholders
Table of Contents
 |  |
| | |
| Annual report |
Macquarie Institutional Portfolios (registered as Delaware Pooled® Trust)
Macquarie Emerging Markets Portfolio |
Macquarie Emerging Markets Portfolio II |
Macquarie Labor Select International Equity Portfolio |
October 31, 2021
Table of Contents
Table of contents
Macquarie Institutional Portfolios
Macquarie Institutional Portfolios (registered as Delaware Pooled® Trust) are designed exclusively for institutional investors and high net worth individuals. Delaware Management Company, a series of Macquarie Investment Management Business Trust (MIMBT), serves as investment advisor for the Portfolios. Mondrian Investment Partners Limited serves as investment sub-advisor for Macquarie Emerging Markets Portfolio* and Macquarie Labor Select International Equity Portfolio.
The performance quoted represents past performance and does not guarantee future results. Investment return and principal value of an investment will fluctuate so that shares, when redeemed, may be worth more or less than their original cost. Current performance may be lower or higher than the performance quoted. Performance data current to the most recent month end may be obtained by calling 800 231-8002 or visiting macquarieim.com/mipliterature. Carefully consider the Portfolios’ investment objectives, risk factors, charges, and expenses before investing. This and other information can be found in the Portfolios’ prospectus which may be obtained by visiting macquarieim.com/mipliterature or calling 800 231-8002. Investors should read the prospectus carefully before investing. Performance includes reinvestment of all distributions.
The Portfolios are not FDIC insured and are not guaranteed. It is possible to lose the principal amount invested. Mutual fund advisory services are provided by Delaware Management Company, a series of MIMBT, which is a registered investment advisor.
Macquarie Institutional Portfolios are designed exclusively for US institutional investors and high net worth individuals. Macquarie Institutional Portfolios are distributed in the United States by Delaware Distributors, L.P., an affiliate of MIMBT, Macquarie Management Holdings, Inc., and Macquarie Group Limited. Non-US investors cannot invest in Macquarie Institutional Portfolios. Macquarie Investment Management (MIM) is the marketing name for certain companies comprising the asset management division of Macquarie Group Limited and its subsidiaries and affiliates worldwide. Institutional investment management is provided by Macquarie Investment Management Advisers (MIMA), a series of Macquarie Investment Management Business Trust (MIMBT). MIMBT is a US registered investment advisor, and may not be able to provide investment advisory services to certain clients in certain jurisdictions.
Other than Macquarie Bank Limited (MBL), none of the entities noted are authorized deposit-taking institutions for the purposes of the Banking Act 1959 (Commonwealth of Australia). The obligations of these entities do not represent deposits or other liabilities of MBL. MBL does not guarantee or otherwise provide assurance in respect of the obligations of these entities, unless noted otherwise.
The Portfolios are governed by US laws and regulations.
*Closed to new investors.
©2021 Macquarie Management Holdings, Inc.
All third-party marks cited are the property of their respective owners.
Table of Contents
Portfolio management review (Unaudited)
Macquarie Institutional Portfolios — Macquarie Emerging Markets Portfolio
October 31, 2021
Investment objective
The Portfolio seeks long-term capital appreciation.
Macquarie Emerging Markets Portfolio gained 14.29% at net asset value (NAV) with all distributions reinvested for the fiscal year ended October 31, 2021. The Portfolio’s benchmark, the MSCI Emerging Markets Index, rose 17.33% (gross) and 16.96% (net) for the same period. Complete annualized performance for Macquarie Emerging Markets Portfolio is shown in the table on page 5.
This fiscal period presented emerging market investors with two widely dissimilar environments: China – and virtually everywhere else. China ended the period down 9%. In contrast, emerging markets excluding China were up 37%.
During the 12-month period, China’s markets were increasingly constrained by investor unease over both regulatory controls and the overall health of the Chinese economy. Initially, these markets were held back as authorities sought to more heavily regulate companies to help meet the government’s common prosperity goals, particularly in the consumer Internet and education sectors. This was compounded later in the fiscal period when one of China’s leading property companies, Evergrande, faced severe bond payment difficulties. Since property is a large portion of the Chinese economy – roughly 25% of gross domestic product (GDP) – investors worried about the potential for systemic risk.
Elsewhere, emerging markets benefited from the resurgence of economic activities and investor confidence following the easing of pandemic shutdowns. The Europe, Middle East, and Africa (EMEA) region gained 67%; Russia, the largest European market, was up 82%, profiting from oil’s ascendancy. Taiwan, South Korea, and India, the three largest emerging markets after China, gained 42%, 24%, and 50%, respectively.
The Portfolio’s underperformance relative to the benchmark was largely due to our top-down country positioning. The Portfolio’s overweight position in China – we held roughly 40% in Chinese stocks compared with the benchmark, which held approximately 35% – cost the Portfolio about 110 basis points for the 12-month period (one basis point is a hundredth of a percentage point). In addition, the global upsurge in energy prices buoyed Middle Eastern economies Saudi Arabia (+56%), the United Arab Emirates (+53%), Kuwait (+33%), and Qatar (+23%). Lack of exposure to Middle Eastern economies cost the Portfolio approximately 120 basis points in relative performance.
Where we added the most value to the Portfolio was in our stock selection, mostly in China, but also in Taiwan and South Korea. Our positioning in Asian companies added about 200 basis points.
Many sectors in emerging markets flourished during the fiscal year, including energy (+55%), materials (+44%), financials (+34%), information technology (IT) (+34%), and industrials (+29%). Consumer discretionary stocks fell 15%, real estate lost close to 11%, and communication services was down 1%. The leading sector for the Portfolio was IT, where we were overweight compared to the benchmark. This contributed approximately 160 basis points to relative performance. The sector that hurt the Portfolio’s performance the most was materials, where a slight underweight, along with exposure to the underperforming pulp and paper industry and gold stocks, hurt relative returns.
The strongest-performing stock for the Portfolio was Russian oil and gas conglomerate PJSC Lukoil Oil Co., which rose 107%, capitalizing on global energy demand.
Taiwanese stock ASE Technology Holding Co., which gained 63% for the Portfolio, was another strong contributor to performance. ASE is a leading packager and tester of chips. It benefited from heavy demand for semiconductors globally. ASE was one of several successful holdings that confirmed our overweight investment strategy in both the Taiwan market and the IT sector.
Despite China’s decline for the 12-month period, during the first half of the fiscal year the Chinese market was relatively robust, and we added value to the Portfolio through taking significant profits before the stock selloff occurred. China Merchants Bank Co. Ltd. was a case in point – we reduced the Portfolio’s position and took profits as we did with Baidu Inc., CSPC Pharmaceutical Group Ltd., and others. China Merchants, an outperformer in the strong financials sector, gained 66% for the Portfolio during the fiscal period.
The three holdings that most hurt the Portfolio’s performance were also Chinese stocks. Alibaba Group Holding Ltd. was down 45%; Ping An Insurance Group Co. of China Ltd. declined 28%; and Autohome Inc. was down 67% for the 12-month period.
Ping An, one of China’s largest life insurers, lost ground on concerns about the property sector and its negative effect on financials stocks. We believe the long-term investment case for Ping An remains solid, however. At period end, it traded below our worst-case valuations and offered a dividend yield of almost 5%.
Ecommerce platform Alibaba suffered from negative sentiment toward consumer discretionary stocks, as well as the confluence of negative effects on Chinese markets mentioned earlier.
Autohome’s decline was the Portfolio’s largest loss for the 12-month period. The leading online car portal in China, Autohome suffered from a host of factors. In addition to general worries over Chinese markets, the stock was punished by the chip shortage that held back auto manufacturers. These constraints in producing cars also led to
1
Table of Contents
Portfolio management review (Unaudited)
Macquarie Institutional Portfolios — Macquarie Emerging Markets Portfolio
reduced advertising spending. Another factor related to advertising spend: increasing competition. There has been an increase in competitive intensity in this industry. At period end, we viewed the stock as undervalued but still desirable, with roughly half of Autohome’s market cap in cash, the company still profitable, and its long-term business prospects attractive, in our view.
We added to all three underperforming Chinese companies in recent months, believing there’s a significant opportunity for these stocks to rally from here. We followed the same approach with other Chinese holdings that traded at unexpected lows and whose risks had been priced in. Our view is that, with regulatory changes, one must examine each company’s unique vulnerabilities and strengths to see the potential effects. In our opinion, many of the Chinese companies in the Portfolio that were sold down heavily in response to regulatory actions are more resilient than investors give them credit for. Likewise, we believe there will be a strong, growing Chinese market over the next five years.
The Portfolio utilized foreign currency exchange contracts to facilitate the purchase and sale of equities traded on international exchanges. The effect of these contracts on performance was immaterial.
2 The views expressed are current as of the date of this report and are subject to change.
Table of Contents
Portfolio management review (Unaudited)
Macquarie Institutional Portfolios — Macquarie Emerging Markets Portfolio II
October 31, 2021
Investment objective
The Portfolio seeks long-term capital appreciation.
For the fiscal year ended October 31, 2021, Macquarie Emerging Markets Portfolio II gained 16.50% at net asset value (NAV) with all distributions reinvested. This result lagged the Portfolio’s benchmark, the MSCI Emerging Markets Index, which advanced 17.33% (gross) and 16.96% (net) for the same period. Complete annualized performance for Macquarie Emerging Markets Portfolio II is shown in the table on page 8.
The MSCI Emerging Markets Index rose during the fiscal year ended October 31, 2021, but significantly lagged developed markets. Early in the 12-month period, markets rallied on the progress of COVID-19 vaccines, US dollar weakness, and fund inflows. The rally stalled, however, as investors wrestled with a host of issues including the pace of economic recovery, hints of earlier-than-expected interest rate hikes by the US Federal Reserve, supply chain disruptions, and COVID-19 variants. During the second half of the fiscal year, inflationary pressures globally appeared to ratchet up, prompting several central banks to tighten monetary policy. In addition, equities in China corrected sharply as policy makers announced measures to regulate business activities more tightly in sectors such as online gaming and for-profit education. Concerns about debt defaults in the property-development sector and weaker-than-expected macroeconomic data further weighed on investor sentiment. Among regions, Europe, the Middle East, and Africa (EMEA) outperformed significantly, while Asia lagged. Among sectors, energy, materials, technology, and financials outperformed, while consumer discretionary, real estate, and communication services lagged.
The technology sector contributed the most to the Portfolio’s relative performance due to favorable asset allocation and stock selection. End-demand for technology products appeared resilient, supporting the outlook for leading semiconductor companies. The energy sector also contributed to performance as companies producing oil and gas benefited from rising energy prices.
On the negative side, the financials and materials sectors detracted the most from relative performance. The Portfolio, compared to the benchmark, was underweight these sectors, both of which outperformed significantly as global economies began to recover from COVID-related slowdowns.
Among individual stocks, SK Telecom Co. Ltd. and MediaTek Inc. contributed the most to the Portfolio’s relative performance. Shares of SK Telecom in South Korea outperformed as the company announced plans to separate its telecommunications and non-telecommunications assets into two companies. Shares of MediaTek in Taiwan also outperformed, supported by strong demand for its 5G smartphone chips.
In contrast, Americanas S.A. (formerly B2W Companhia Digital) and JD.com detracted the most from the Portfolio’s relative performance. Shares of Americanas in Brazil underperformed as the company’s gross merchandise value (GMV) growth rate lagged peers, while investments in digital marketing and other growth initiatives weighed on margins. We believe that Brazilian ecommerce remains an attractive secular growth opportunity and that Americanas’ business strategy and assets position the company to benefit from this growth. Shares of JD.com in China underperformed as Chinese regulators raised concerns about anti-competitive business practices in the ecommerce sector. In our opinion, the ecommerce sector in China is very competitive and JD.com’s logistics infrastructure positions the company to gain market share. The Portfolio continued to hold both Americanas and JD.com at the end of the fiscal year.
We think that market volatility may persist in the near-term due to ongoing concerns about global supply chain challenges, rising interest rates, and geopolitical tension. Nonetheless, over the long term, we continue to expect some trends to persist including: greater technology adoption; industry consolidation; increasing consumer preference for high-quality, healthy, and premium products; accommodative monetary policy; and improvements in corporate governance. Our strategy remains centered on identifying individual companies that we believe possess sustainable franchises and favorable long-term growth prospects, and that trade at significant discounts to their intrinsic value. We are particularly focused on companies that we think could benefit from long-term changes in how people in emerging markets live and work.
Among countries, we currently hold overweight positions in South Korea, Russia, India, and Taiwan. Conversely, we are currently underweight China, South Africa, Saudi Arabia, and Southeast Asia. Sectors we currently favor include technology, energy, communication services, and consumer staples. The Portfolio is most underweight financials and materials.
The Portfolio utilized foreign currency exchange contracts to facilitate the purchase and sale of equities traded on international exchanges. The effect of these contracts on performance was immaterial.
The views expressed are current as of the date of this report and are subject to change. 3
Table of Contents
Portfolio management review (Unaudited)
Macquarie Institutional Portfolios — Macquarie Labor Select International Equity Portfolio
October 31, 2021
Investment objective
The Portfolio seeks maximum long-term total return.
For the fiscal year ended October 31, 2021, Macquarie Labor Select International Equity Portfolio advanced +37.68% at net asset value (NAV) and outperformed the Portfolio’s benchmark, the MSCI EAFE Index, which returned +34.80% (gross) and +34.18% (net). Complete annualized performance for Macquarie Labor Select International Equity Portfolio is shown in the table on page 10.
During the 12-month period ended October 31, 2021, international equity markets continued to rebound strongly from the sharp pandemic-induced decline in early 2020. Despite widespread shutdowns and ongoing geopolitical tensions, equities were supported by improving corporate earnings, continued economic stimulus, and the approval and distribution of multiple COVID vaccines, which enabled many economies to substantially re-open in 2021. Economically sensitive sectors outperformed, led by energy and financials, which were buoyed by an uptick in economic activity from the initial trough in the first half of 2020. The Portfolio, driven by robust stock selection, generated strong absolute returns that exceeded index returns.
The value segment of the MSCI EAFE Index returned 38% (net) and significantly outperformed the growth segment of the MSCI EAFE Index, which gained 30% (net), partially reversing some of the value-growth divergence that was seen in the months following the COVID-19 outbreak. In previous similar selloffs, markets have subsequently rewarded valuations once the focus returned to underlying fundamentals. This started to materialize during the fiscal year. However, valuation dispersions remain at historically extreme levels, providing what we view as attractive opportunities for patient stock-pickers who are focused on fundamental value.
Country allocation to the Netherlands and Hong Kong held back the Portfolio’s relative returns. The positive effect of its underweight position in the relatively weak Australian equity market was more than offset by its overweight position in the relatively weak Hong Kong market and its underweight position in the strong Dutch equity market. The Dutch market benefited from its high weighting to the strong information technology sector. The Hong Kong market generated the lowest returns for the Portfolio, as the region suffered from the Chinese government’s increasing regulatory crackdowns and fears of contagion from concerns over fallout from the Evergrande debt crisis.
In Europe, strong stock selection in the UK and Spain aided relative returns. After adding to the Portfolio’s positions during 2020, Banco Santander S.A. (+103.2%) and Lloyds Banking Group PLC (+95.2%) were bolstered by rising bond yields and a rebound in economic activity, which supported a fall in impairments. In the Asia-Pacific region, strong stock selection in Japan was driven by Fujifilm Holdings Corp. (+53.6%), the diversified imaging company, as it continued to benefit from its increased focus on healthcare. The market rewarded increased disclosures about, and investment in, its high-growth, high-margin biopharmaceutical manufacturing business.
The Portfolio’s weakest-performing stock during the fiscal year was the Japanese pharmaceutical company Takeda Pharmaceutical Co. Ltd. (-5.9%), which was down on higher-than-expected research and development (R&D) spending and on suspended trials of its narcolepsy drug. Returns from Hong Kong-based pork company WH Group Ltd. (+2.4%) and Japanese electronic equipment company Kyocera Corp. (+8.8%) were also relatively weak during the fiscal year. Plummeting pork prices in China alongside recent management issues held back WH Group. Kyocera, which was a defensive holding in the initial COVID selloff, lagged the strong market rebound with fiscal year 2021 guidance disappointing on higher-than-expected upfront investment. The company did, however, revise its dividend back up (to the fiscal year 2019 level) and reduce the number of its divisions to try to facilitate more dynamic decision making. In our opinion, there remains significant scope to unlock value through improved capital or operational efficiency and we continue to engage with the company on this. We continue to hold all three stocks in the Portfolio.
Overweight positions in the weak communication services and utilities sectors broadly offset the Portfolio’s overweight position in the strong energy sector and its underweight position in the relatively weak consumer staples sector. Energy was the standout performer, rising 80%, as gas prices rose sharply, and oil prices rallied back up to 2018 levels due to growing demand from COVID re-openings and continued crude oil supply discipline from OPEC+. Stock selection within sectors, led by strong stock selection in financials and communication services, added to the Portfolio’s relative returns.
The Portfolio’s underweight position in the strong Australian dollar and its overweight position in the weak Japanese yen more than offset the positive effect of its overweight position in the strong British pound. The British pound gained strength after a Brexit deal was eventually reached in December 2020.
The Portfolio utilized foreign currency exchange contracts to facilitate the purchase and sale of equities traded on international exchanges. The effect of these contracts on performance was immaterial.
4 The views expressed are current as of the date of this report and are subject to change.
Table of Contents
Performance summary (Unaudited)
Macquarie Institutional Portfolios — Macquarie Emerging Markets Portfolio
The performance quoted represents past performance and does not guarantee future results. Investment return and principal value of an investment will fluctuate so that shares, when redeemed, may be worth more or less than their original cost. Current performance may be lower or higher than the performance quoted. Performance data current to the most recent month end may be obtained by calling 800 231-8002 or visiting macquarieim.com/mipliterature.
Carefully consider the Portfolio’s investment objectives, risk factors, charges, and expenses before investing. This and other information can be found in the Portfolio’s prospectus and, if available, its summary prospectus, which may be obtained by visiting macquarieim.com/mipliterature or calling 800 231-8002. Investors should read the prospectus and, if available, the summary prospectus carefully before investing.
| Portfolio and benchmark performance | | Average annual total returns through October 31, 2021 |
| | 1 year | | 5 year | | 10 year | | Lifetime |
| Macquarie Emerging Markets Portfolio | | +14.29 | % | | +6.06 | % | | +3.04 | % | | | +6.98 | % | |
| MSCI Emerging Markets Index (net) | | +16.96 | % | | +9.39 | % | | +4.88 | % | | | +6.19 | %* | |
| MSCI Emerging Markets Index (gross) | | +17.33 | % | | +9.79 | % | | +5.25 | % | | | +6.49 | %* | |
| * | The benchmark lifetime return is calculated using the last business day in the month of the Portfolio’s inception date. |
Portfolio profile
October 31, 2021
| Total net assets | | Number of holdings |
| $69.3 million | | 46 |
| | | |
| Inception date | | |
| April 16, 1997 | | |
Growth of $1,000,000
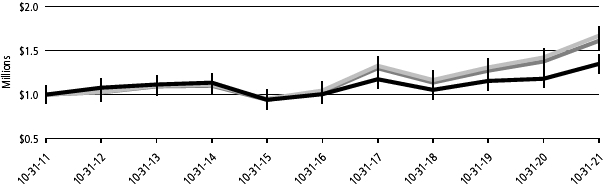
| For period beginning October 31, 2011 through October 31, 2021 | | Starting value | | Ending value |
 | MSCI Emerging Markets Index (gross) | | | $ | 1,000,000 | | | | $ | 1,667,908 | |
 | MSCI Emerging Markets Index (net) | | | $ | 1,000,000 | | | | $ | 1,609,939 | |
 | Macquarie Emerging Markets Portfolio | | | $ | 1,000,000 | | | | $ | 1,348,546 | |
The performance graph assumes $1 million invested on October 31, 2011 and includes reinvestment of all distributions. The performance graph does not reflect the deduction of taxes the shareholder would pay on Portfolio distributions or redemptions of Portfolio shares.
(continues) 5
Table of Contents
Performance summary (Unaudited)
Macquarie Institutional Portfolios — Macquarie Emerging Markets Portfolio
Total return assumes reinvestment of dividends and capital gains but does not reflect reductions for taxes. Returns and share values will fluctuate so that shares, when redeemed, may be worth more or less than their original cost.
The most recent prospectus disclosed the Portfolio’s total operating expenses as 1.28%. Management has contractually agreed to reimburse certain expenses and/or waive its management fees from February 26, 2021 through March 1, 2022,* in order to prevent total annual Portfolio operating expenses (with certain exclusions) from exceeding, in an aggregate amount, 1.26% of the Portfolio’s average daily net assets, as described in the most recent prospectus.
The purchase reimbursement fees (0.40%) and redemption reimbursement fees (0.45%) are paid to the Portfolio. These fees are designed to reflect an approximation of the brokerage and other transaction costs associated with the investment of an investor’s purchase amount or the disposition of assets to meet redemptions, and to limit the extent to which the Portfolio (and, indirectly, the Portfolio’s existing shareholders) would have to bear such costs. In lieu of the reimbursement fees, investors in Macquarie Emerging Markets Portfolio may be permitted to utilize alternative purchase and redemption methods designed to accomplish the same economic effect as the reimbursement fees. Reimbursement fees applicable to purchases and redemptions of shares of the Portfolio are not reflected in the “Growth of $1,000,000” graph.
Expense limitations were in effect during the period shown. Performance would have been lower had the expense limitations not been in effect.
The MSCI Emerging Markets Index represents large- and mid-cap stocks across emerging market countries worldwide. The index covers approximately 85% of the free float-adjusted market capitalization in each country. Index “net” return approximates the minimum possible dividend reinvestment, after deduction of withholding tax at the highest possible rate. Index “gross” return approximates the maximum possible dividend reinvestment.
Gross domestic product, mentioned on page 1, is a measure of all goods and services produced by a nation in a year. It is a measure of economic activity.
Index performance returns do not reflect any management fees, transaction costs, or expenses. Indices are unmanaged and one cannot invest directly in an index.
Investing involves risk, including the possible loss of principal.
Past performance is not a guarantee of future results.
International investments entail risks including fluctuation in currency values, differences in accounting principles, or economic or political instability. Investing in emerging markets can be riskier than investing in established foreign markets due to increased volatility, lower trading volume, and higher risk of market closures. In many emerging markets, there is substantially less publicly available information and the available information may be incomplete or misleading. Legal claims are generally more difficult to pursue.
If and when the Portfolio invests in forward foreign currency contracts or uses other investments to hedge against currency risks, the Portfolio will be subject to special risks, including counterparty risk.
Fixed income securities and bond funds can lose value, and investors can lose principal as interest rates rise. They also may be affected by economic conditions that hinder an issuer’s ability to make interest and principal payments on its debt. This includes prepayment risk, the risk that the principal of a bond that is held by a portfolio will be prepaid prior to maturity at the time when interest rates are lower than what the bond was paying. A portfolio may then have to reinvest that money at a lower interest rate.
High yielding, non-investment-grade bonds (junk bonds) involve higher risk than investment grade bonds. The high yield secondary market is particularly susceptible to liquidity problems when institutional investors, such as mutual funds and certain other financial institutions, temporarily stop buying bonds for regulatory, financial, or other reasons. In addition, a less liquid secondary market makes it more difficult for to obtain precise valuations of the high yield securities.
The Portfolio may invest in derivatives, which may involve additional expenses and are subject to risk, including the risk that an underlying security or securities index moves in the opposite direction from what the portfolio manager anticipated. A derivatives transaction depends upon the counterparties’ ability to fulfil their contractual obligations.
6
Table of Contents
To the extent the Portfolio focuses its investments in a particular country or geographic region, it may be more susceptible to economic, political, regulatory, or other events or conditions affecting issuers and countries within that country or geographic region. As a result, the Portfolio may be subject to greater price volatility and risk of loss than a portfolio holding more geographically diverse investments.
The Portfolio may be subject to the risk that securities cannot be readily sold within seven calendar days at approximately the price at which it has valued them.
The Portfolio is subject to the risk that the value of securities in a particular industry or sector (such as financials) will decline because of changing expectations for the performance of that industry or sector.
The disruptions caused by natural disasters, pandemics, or similar events could prevent the Portfolio from executing advantageous investment decisions in a timely manner and could negatively impact the Portfolio’s ability to achieve its investment objective and the value of the Portfolio’s investments.
The Portfolio is presently closed to new investors.
____________________
| * | The aggregate contractual waiver period covering this report is from February 28, 2020 through March 1, 2022. |
(continues) 7
Table of Contents
Performance summary (Unaudited)
Macquarie Institutional Portfolios — Macquarie Emerging Markets Portfolio II
The performance quoted represents past performance and does not guarantee future results. Investment return and principal value of an investment will fluctuate so that shares, when redeemed, may be worth more or less than their original cost. Current performance may be lower or higher than the performance quoted. Performance data current to the most recent month end may be obtained by calling 800 231-8002 or visiting macquarieim.com/mipliterature.
Carefully consider the Portfolio’s investment objectives, risk factors, charges, and expenses before investing. This and other information can be found in the Portfolio’s prospectus and, if available, its summary prospectus, which may be obtained by visiting macquarieim.com/mipliterature or calling 800 231-8002. Investors should read the prospectus and, if available, the summary prospectus carefully before investing.
| Portfolio and benchmark performance | | Average annual total returns through October 31, 2021 |
| | 1 year | | 5 year | | 10 year | | Lifetime |
| Macquarie Emerging Markets Portfolio II | | +16.50% | | +13.34% | | +7.52% | | +6.74% |
| MSCI Emerging Markets Index (net) | | +16.96% | | +9.39% | | +4.88% | | +5.35%* |
| MSCI Emerging Markets Index (gross) | | +17.33% | | +9.79% | | +5.25% | | +5.71%* |
| * | The benchmark lifetime return is calculated using the last business day in the month of the Portfolio’s inception date. |
| Portfolio profile | | |
| October 31, 2021 | | |
| | | |
| Total net assets | | Number of holdings |
| $22.3 million | | 87 |
| | | |
| Inception date | | |
| June 23, 2010 | | |
Growth of $1,000,000
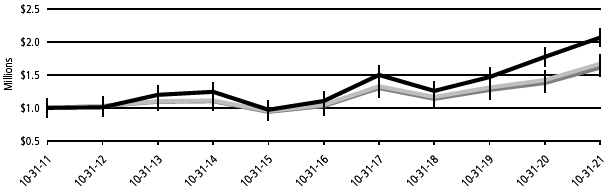
For period beginning October 31, 2011 through October 31, 2021 Starting value Ending value | | Starting value | | Ending value |
| Macquarie Emerging Markets Portfolio II | | $1,000,000 | | $2,064,170 |
| MSCI Emerging Markets Index (gross) | | $1,000,000 | | $1,667,908 |
| MSCI Emerging Markets Index (net) | | $1,000,000 | | $1,609,939 |
The performance graph assumes $1 million invested on October 31, 2011 and includes reinvestment of all distributions. The performance graph does not reflect the deduction of taxes the shareholder would pay on Portfolio distributions or redemptions of Portfolio shares.
8
Table of Contents
Total return assumes reinvestment of dividends and capital gains, but does not reflect reductions for taxes. Returns and share values will fluctuate so that shares, when redeemed, may be worth more or less than their original cost.
The most recent prospectus disclosed the Portfolio’s total operating expenses as 1.37%. Management has contractually agreed to reimburse certain expenses and/or waive its management fees from February 26, 2021 through March 1, 2022,* in order to prevent total annual Portfolio operating expenses (with certain exclusions) from exceeding, in an aggregate amount, 1.20% of the Portfolio’s average daily net assets, as described in the most recent prospectus.
Expense limitations were in effect during the period shown. Performance would have been lower had the expense limitations not been in effect.
The MSCI Emerging Markets Index represents large- and mid-cap stocks across emerging market countries worldwide. The index covers approximately 85% of the free float-adjusted market capitalization in each country. Index “net” return approximates the minimum possible dividend reinvestment, after deduction of withholding tax at the highest possible rate. Index “gross” return approximates the maximum possible dividend reinvestment.
Index performance returns do not reflect any management fees, transaction costs, or expenses. Indices are unmanaged and one cannot invest directly in an index.
Investing involves risk, including the possible loss of principal.
Past performance is not a guarantee of future results.
Investing in small and/or medium-sized companies typically exhibit greater risk and higher volatility than larger, more established companies.
International investments entail risks including fluctuation in currency values, differences in accounting principles, or economic or political instability. Investing in emerging markets can be riskier than investing in established foreign markets due to increased volatility, lower trading volume, and higher risk of market closures. In many emerging markets, there is substantially less publicly available information, and the available information may be incomplete or misleading. Legal claims are generally more difficult to pursue.
If and when the Portfolio invests in forward foreign currency contracts or uses other investments to hedge against currency risks, the Portfolio will be subject to special risks, including counterparty risk.
To the extent the Portfolio focuses its investments in a particular country or geographic region, it may be more susceptible to economic, political, regulatory, or other events or conditions affecting issuers and countries within that country or geographic region. As a result, the Portfolio may be subject to greater price volatility and risk of loss than a portfolio holding more geographically diverse investments.
The Portfolio may be subject to the risk that securities cannot be readily sold within seven calendar days at approximately the price at which it has valued them.
The Portfolio is subject to the risk that the value of securities in a particular industry or sector (such as financials) will decline because of changing expectations for the performance of that industry or sector.
The disruptions caused by natural disasters, pandemics, or similar events could prevent the Portfolio from executing advantageous investment decisions in a timely manner and could negatively impact the Portfolio’s ability to achieve its investment objective and the value of the Portfolio’s investments.
____________________
| * | The aggregate contractual waiver period covering this report is from February 28, 2020 through March 1, 2022. |
(continues) 9
Table of Contents
Performance summary (Unaudited)
Macquarie Institutional Portfolios — Macquarie Labor Select International Equity Portfolio
The performance quoted represents past performance and does not guarantee future results. Investment return and principal value of an investment will fluctuate so that shares, when redeemed, may be worth more or less than their original cost. Current performance may be lower or higher than the performance quoted. Performance data current to the most recent month end may be obtained by calling 800 231-8002 or visiting macquarieim.com/mipliterature.
Carefully consider the Portfolio’s investment objectives, risk factors, charges, and expenses before investing. This and other information can be found in the Portfolio’s prospectus and, if available, its summary prospectus, which may be obtained by visiting macquarieim.com/mipliterature or calling 800 231-8002. Investors should read the prospectus and, if available, the summary prospectus carefully before investing.
| Portfolio and benchmark performance | | Average annual total returns through October 31, 2021 |
| | 1 year | | 5 year | | 10 year | | Lifetime |
| Macquarie Labor Select International Equity Portfolio | | +37.68% | | +6.50% | | +5.15% | | +6.63% |
| MSCI EAFE Index (net) | | +34.18% | | +9.79% | | +7.37% | | +5.28%* |
| MSCI EAFE Index (gross) | | +34.80% | | +10.32% | | +7.87% | | +5.71%* |
| * | The benchmark lifetime return is calculated using the last business day in the month of the Portfolio’s inception date. |
| Portfolio profile | | |
| October 31, 2021 | | |
| | | |
| Total net assets | | Number of holdings |
| $174.1 million | | 46 |
| | | |
| Inception date | | |
| December 19, 1995 | | |
Growth of $1,000,000
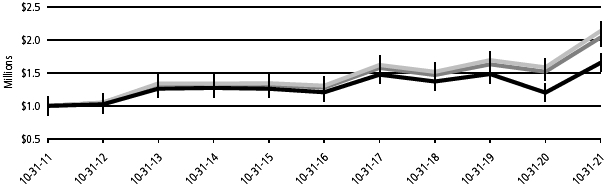
| For period beginning October 31, 2011 through October 31, 2021 | | Starting value | | Ending value |
| MSCI EAFE Index (gross) | | $1,000,000 | | $2,133,238 |
| MSCI EAFE Index (net) | | $1,000,000 | | $2,035,718 |
| Macquarie Labor Select International Equity Portfolio | | $1,000,000 | | $1,652,226 |
The performance graph assumes $1 million invested on October 31, 2011 and includes reinvestment of all distributions. The performance graph does not reflect the deduction of taxes the shareholder would pay on Portfolio distributions or redemptions of Portfolio shares.
10
Table of Contents
Total return assumes reinvestment of dividends and capital gains, but does not reflect reductions for taxes. Returns and share values will fluctuate so that shares, when redeemed, may be worth more or less than their original cost.
The most recent prospectus disclosed the Portfolio’s total operating expenses as 0.86%.
The MSCI EAFE (Europe, Australasia, Far East) Index represents large- and mid-cap stocks across 21 developed markets, excluding the United States and Canada. The index covers approximately 85% of the free float-adjusted market capitalization in each country. Index “net” return approximates the minimum possible dividend reinvestment, after deduction of withholding tax at the highest possible rate. Index “gross” return approximates the maximum possible dividend reinvestment.
Index performance returns do not reflect any management fees, transaction costs, or expenses. Indices are unmanaged and one cannot invest directly in an index.
Investing involves risk, including the possible loss of principal.
Past performance is not a guarantee of future results.
International investments entail risks including fluctuation in currency values, differences in accounting principles, or economic or political instability. Investing in emerging markets can be riskier than investing in established foreign markets due to increased volatility, lower trading volume, and higher risk of market closures. In many emerging markets, there is substantially less publicly available information, and the available information may be incomplete or misleading. Legal claims are generally more difficult to pursue.
If and when the Portfolio invests in forward foreign currency contracts or uses other investments to hedge against currency risks, the Portfolio will be subject to special risks, including counterparty risk.
From time to time, the Portfolio may invest up to 30% of its net assets in securities of issuers in the commercial banking industry; to the extent that the Portfolio invests 30% of its net assets in such securities, it may be slightly more sensitive to movement in the commercial banking industry.
To the extent the Portfolio focuses its investments in a particular country or geographic region, it may be more susceptible to economic, political, regulatory, or other events or conditions affecting issuers and countries within that country or geographic region. As a result, the Portfolio may be subject to greater price volatility and risk of loss than a portfolio holding more geographically diverse investments.
The Portfolio may be subject to the risk that securities cannot be readily sold within seven calendar days at approximately the price at which it has valued them.
The Portfolio is subject to the risk that the value of securities in a particular industry or sector (such as financials) will decline because of changing expectations for the performance of that industry or sector.
The disruptions caused by natural disasters, pandemics, or similar events could prevent the Portfolio from executing advantageous investment decisions in a timely manner and could negatively impact the Portfolio’s ability to achieve its investment objective and the value of the Portfolio’s investments.
(continues) 11
Table of Contents
Disclosure of Portfolio expenses
For the six-month period from May 1, 2021 to October 31, 2021 (Unaudited)
As a shareholder of a Portfolio, you incur two types of costs: (1) transaction costs, including reimbursement fees on Macquarie Emerging Markets Portfolio; and (2) ongoing costs, including management fees and other Portfolio expenses. The following examples are intended to help you understand your ongoing costs (in dollars) of investing in a Portfolio and to compare these costs with the ongoing costs of investing in other mutual funds.
The examples are based on an investment of $1,000 invested at the beginning of the period and held for the entire six-month period from May 1, 2021 to October 31, 2021.
Actual Expenses
The first section of the tables shown, “Actual Portfolio return,” provides information about actual account values and actual expenses. You may use the information in this table, together with the amount you invested, to estimate the expenses that you paid over the period. Simply divide your account value by $1,000 (for example, an $8,600 account value divided by $1,000 = 8.6), then multiply the result by the number in the first section under the heading entitled “Expenses Paid During Period” to estimate the expenses you paid on your account during this period.
Hypothetical Example for Comparison Purposes
The second section of the tables shown, “Hypothetical 5% return,” provides information about hypothetical account values and hypothetical expenses based on a Portfolio’s actual expense ratio and an assumed rate of return of 5% per year before expenses, which is not the Portfolio’s actual return. The hypothetical account values and expenses may not be used to estimate the actual ending account balance or expenses you paid for the period. You may use this information to compare the ongoing costs of investing in each Portfolio and other funds. To do so, compare this 5% hypothetical example with the 5% hypothetical examples that appear in the shareholder reports of the other funds.
Please note that the expenses shown in the tables are meant to highlight your ongoing costs only and do not reflect any transactional costs. Therefore, the second section of each table is useful in comparing ongoing costs only, and will not help you determine the relative total costs of owning different funds. In addition, if these transactional costs were included, your costs would have been higher. Certain of the Portfolios’ actual expenses shown in the table reflect fee waivers in effect and assume reinvestment of all dividends and distributions.
In each case, “Expenses Paid During Period” are equal to the relevant Portfolio’s annualized expense ratio, multiplied by the average account value over the period, multiplied by 184/365 (to reflect the one-half year period).
Macquarie Emerging Markets Portfolio
Expense analysis of an investment of $1,000
| | | | | | | | | Expenses |
| | | | | | | | | Paid |
| | Beginning | | Ending | | | | During |
| | Account | | Account | | Annualized | | Period |
| | Value | | Value | | Expense | | 5/1/21 to |
| | 5/1/21 | | 10/31/21 | | Ratio | | 10/31/21 |
| Actual Portfolio return† | | | | | | | | | |
| Portfolio Class | | $1,000.00 | | $ | 923.50 | | 1.24% | | $6.01 |
| Hypothetical 5% return (5% return before expenses) | | | | | | | | | |
| Portfolio Class | | $1,000.00 | | $ | 1,018.95 | | 1.24% | | $6.31 |
Macquarie Emerging Markets Portfolio II
Expense analysis of an investment of $1,000
| | | | | | | | | Expenses |
| | | | | | | | | Paid |
| | Beginning | | Ending | | | | During |
| | Account | | Account | | Annualized | | Period |
| | Value | | Value | | Expense | | 5/1/21 to |
| | 5/1/21 | | 10/31/21 | | Ratio | | 10/31/21 |
| Actual Portfolio return† | | | | | | | | | |
| Portfolio Class | | $1,000.00 | | $ | 933.90 | | 1.20% | | $5.85 |
| Hypothetical 5% return (5% return before expenses) | | | | | | | | | |
| Portfolio Class | | $1,000.00 | | $ | 1,019.16 | | 1.20% | | $6.11 |
Macquarie Labor Select International Equity Portfolio
Expense analysis of an investment of $1,000
| | | | | | | | Expenses |
| | | | | | | | Paid |
| | Beginning | | Ending | | | | During |
| | Account | | Account | | Annualized | | Period |
| | Value | | Value | | Expense | | 5/1/21 to |
| | 5/1/21 | | 10/31/21 | | Ratio | | 10/31/21 |
| Actual Portfolio return† | | | | | | | | |
| Portfolio Class | | $1,000.00 | | $1,037.20 | | 0.91% | | $4.67 |
| Hypothetical 5% return (5% return before expenses) | | | | | | | | |
| Portfolio Class | | $1,000.00 | | $1,020.62 | | 0.91% | | $4.63 |
| † | Because actual returns reflect only the most recent six-month period, the returns shown may differ significantly from fiscal year returns. |
In addition to the Portfolios’ expenses reflected above, each Portfolio also indirectly bears its portion of the fees and expenses of the investment companies (Underlying Funds) in which it invests. The tables above do not reflect the expenses of the Underlying Funds.
12
Table of Contents
Security type / country and sector allocations
Macquarie Institutional Portfolios — Macquarie Emerging Markets Portfolio
As of October 31, 2021 (Unaudited)
Sector designations may be different from the sector designations presented in other Portfolio materials. The sector designations may represent the investment manager’s or sub-advisor’s internal sector classifications, which may result in the sector designations for one Portfolio being different from another Portfolio’s sector designations.
| | Percentage |
| Security type / country | | of net assets |
| Common Stock by Country | | 95.35 | % |
| Austria | | 2.35 | % |
| Brazil | | 3.53 | % |
| Canada | | 1.36 | % |
| China | | 38.63 | % |
| Hong Kong | | 1.49 | % |
| India | | 9.38 | % |
| Indonesia | | 2.77 | % |
| Mexico | | 1.26 | % |
| Peru | | 2.55 | % |
| Republic of Korea | | 10.00 | % |
| Russia | | 3.01 | % |
| Taiwan | | 16.93 | % |
| United Kingdom | | 2.09 | % |
| Preferred Stock | | 3.65 | % |
| Short-Term Investments | | 1.25 | % |
| Total Value of Securities | | 100.25 | % |
| Liabilities Net of Receivables and Other | | | |
| Assets | | (0.25 | %) |
| Total Net Assets | | 100.00 | % |
| | Percentage |
| Common stock and preferred stock by sector | | of net assets |
| Communication Services | | 11.92 | % |
| Consumer Discretionary | | 10.62 | % |
| Consumer Staples | | 6.53 | % |
| Energy | | 5.33 | % |
| Financials | | 24.77 | % |
| Healthcare | | 4.59 | % |
| Information Technology* | | 27.14 | % |
| Materials | | 8.10 | % |
| Total | | 99.00 | % |
| * | To monitor compliance with the Portfolio’s concentration guidelines as described in the Portfolio’s Prospectus and Statement of Additional Information, the Information Technology sector (as disclosed herein for financial reporting purposes) is subdivided into a variety of “industries” (in accordance with the requirements of the Investment Company Act of 1940, as amended). The Information Technology sector consisted of Computers, Electrical Component and Equipment, Electronics, Energy-Alternate Sources, Semiconductors, and Software. As of October 31, 2021, such amounts, as a percentage of total net assets were 1.05%, 1.88%, 3.62%, 1.70%, 17.46%, and 1.43%, respectively. The percentage in any such single industry will comply with the Portfolio’s concentration policy even if the percentage in the Information Technology sector for financial reporting purposes may exceed 25%. |
13
Table of Contents
Security type / country and sector allocations
Macquarie Institutional Portfolios — Macquarie Emerging Markets Portfolio II
As of October 31, 2021 (Unaudited)
Sector designations may be different from the sector designations presented in other Portfolio materials. The sector designations may represent the investment manager’s internal sector classifications, which may result in the sector designations for one Portfolio being different from another Portfolio’s sector designations.
| | Percentage |
| Security type / country | | of net assets |
| Common Stock by Country | | 100.12 | % |
| Argentina | | 0.08 | % |
| Bahrain | | 0.03 | % |
| Brazil | | 4.08 | % |
| Chile | | 0.52 | % |
| China | | 28.83 | % |
| India | | 14.41 | % |
| Indonesia | | 2.51 | % |
| Malaysia | | 0.05 | % |
| Mexico | | 3.43 | % |
| Peru | | 0.30 | % |
| Republic of Korea | | 18.77 | % |
| Russia | | 7.17 | % |
| South Africa | | 0.24 | % |
| Taiwan | | 17.69 | % |
| Turkey | | 0.61 | % |
| United States | | 1.40 | % |
| Preferred Stock | | 0.08 | % |
| Warrants | | 0.00 | % |
| Short-Term Investments | | 0.03 | % |
| Total Value of Securities | | 100.23 | % |
| Liabilities Net of Receivables and Other | | | |
| Assets | | (0.23 | %) |
| Total Net Assets | | 100.00 | % |
| | Percentage |
| Common stock and preferred stock by sector | | of net assets |
| Communication Services | | 16.52 | % |
| Consumer Discretionary | | 12.83 | % |
| Consumer Staples | | 10.70 | % |
| Energy | | 15.11 | % |
| Financials | | 7.30 | % |
| Healthcare | | 0.54 | % |
| Industrials | | 0.18 | % |
| Information Technology* | | 34.22 | % |
| Materials | | 2.30 | % |
| Real Estate | | 0.16 | % |
| Utilities | | 0.34 | % |
| Total | | 100.20 | % |
| * | To monitor compliance with the Portfolio’s concentration guidelines as described in the Portfolio’s Prospectus and Statement of Additional Information, the Information Technology sector (as disclosed herein for financial reporting purposes) is subdivided into variety of “industries” (in accordance with the requirements of the Investment Company Act of 1940, as amended). The Information Technology sector consisted of Computers, Electronics, Electronic Components-Semiconductors, Internet, Retail, Semiconductor Components-Integrated Circuits, and Software. As of October 31, 2021, such amounts, as a percentage of total net assets were 1.22%, 1.86%, 18.87%, 0.59%, 0.01%, 10.23%, and 1.44%, respectively. The percentage in any such single industry will comply with the Portfolio’s concentration policy even if the percentage in the Information Technology sector for financial reporting purposes may exceed 25%. |
14
Table of Contents
Security type / country and sector allocations
Macquarie Institutional Portfolios — Macquarie Labor Select International Equity Portfolio
As of October 31, 2021 (Unaudited)
Sector designations may be different from the sector designations presented in other Portfolio materials. The sector designations may represent the investment manager’s or sub-advisor’s internal sector classifications, which may result in the sector designations for one Portfolio being different from another Portfolio’s sector designations.
| | Percentage |
| Security type / country | | of net assets |
| Common Stock by Country | | | 98.08% | |
| China/Hong Kong | | | 3.34% | |
| Denmark | | | 1.28% | |
| France | | | 8.37% | |
| Germany | | | 4.99% | |
| Italy | | | 7.27% | |
| Japan | | | 29.64% | |
| Singapore | | | 4.09% | |
| Spain | | | 4.74% | |
| Sweden | | | 3.34% | |
| Switzerland | | | 3.33% | |
| United Kingdom | | | 27.69% | |
| Short-Term Investments | | | 0.55% | |
| Total Value of Securities | | | 98.63% | |
| Receivables and Other Assets Net of | | | | |
| Liabilities | | | 1.37% | |
| Total Net Assets | | | 100.00% | |
| | Percentage |
| Common stock by sector | | of net assets |
| Communication Services | | | 8.59% | |
| Consumer Discretionary | | | 13.17% | |
| Consumer Staples | | | 6.70% | |
| Energy | | | 7.16% | |
| Financials | | | 16.43% | |
| Healthcare | | | 13.47% | |
| Industrials | | | 13.07% | |
| Information Technology | | | 6.70% | |
| Materials | | | 2.50% | |
| Utilities | | | 10.29% | |
| Total | | | 98.08% | |
15
Table of Contents
Schedules of investments
Macquarie Institutional Portfolios — Macquarie Emerging Markets Portfolio
October 31, 2021
| | | | | Number of | | | |
| | | | shares | | Value (US $) |
| Common Stock – 95.35%Δ | | | | | |
| Austria – 2.35% | | | | | |
| Mondi | | 65,243 | | $ | 1,629,512 |
| | | | | | | 1,629,512 |
| Brazil – 3.53% | | | | | |
| Hypera | | 203,000 | | | 1,007,842 |
| Itau Unibanco Holding ADR | | 113,137 | | | 460,468 |
| Suzano † | | 102,600 | | | 893,146 |
| XP Class A † | | 2,612 | | | 85,703 |
| | | | | | | 2,447,159 |
| Canada – 1.36% | | | | | |
| Barrick Gold | | 51,390 | | | 944,034 |
| | | | | | | 944,034 |
| China – 38.63% | | | | | |
| Alibaba Group Holding † | | 194,380 | | | 4,072,224 |
| Autohome ADR | | 40,371 | | | 1,588,599 |
| Baidu ADR † | | 16,954 | | | 2,750,617 |
| China Medical System Holdings | | 319,000 | | | 543,659 |
| China Merchants Bank Class H | | 255,000 | | | 2,148,352 |
| CSPC Pharmaceutical Group | | 1,564,960 | | | 1,637,269 |
| Gree Electric Appliances of | | | | | |
| | Zhuhai Class A | | 228,000 | | | 1,305,799 |
| Hengan International Group | | 149,500 | | | 781,078 |
| LONGi Green Energy Technology | | | | | |
| | Class A | | 77,128 | | | 1,177,416 |
| Midea Group Class A | | 172,819 | | | 1,857,197 |
| NetEase | | 69,662 | | | 1,376,139 |
| Ping An Insurance Group Co. of | | | | | |
| | China Class H | | 502,000 | | | 3,606,683 |
| Tencent Holdings | | 41,100 | | | 2,540,852 |
| Tingyi Cayman Islands Holding | | 674,000 | | | 1,261,287 |
| Yum China Holdings | | 2,279 | | | 130,085 |
| | | | | | | 26,777,256 |
| Hong Kong – 1.49% | | | | | |
| WH Group 144A # | | 1,475,820 | | | 1,035,663 |
| | | | | | | 1,035,663 |
| India – 9.38% | | | | | |
| HCL Technologies | | 65,081 | | | 994,059 |
| Housing Development Finance | | 64,349 | | | 2,444,585 |
| Infosys ADR | | 32,695 | | | 728,445 |
| Reliance Industries | | 68,888 | | | 2,333,257 |
| | | | | | | 6,500,346 |
| Indonesia – 2.77% | | | | | |
| Bank Rakyat Indonesia Persero | | 6,402,383 | | | 1,920,602 |
| | | | | | | 1,920,602 |
| Mexico – 1.26% | | | | | |
| Grupo Financiero Banorte | | | | | |
| | Class O | | 138,854 | | | 877,718 |
| | | | | | | 877,718 |
| Peru – 2.55% | | | | | |
| Credicorp | | 13,638 | | | 1,768,303 |
| | | | | | | 1,768,303 |
| Republic of Korea – 10.00% | | | | | |
| LG Chem | | 468 | | | 334,815 |
| Samsung Electronics | | 50,192 | | | 2,998,076 |
| Samsung Fire & Marine | | | | | |
| | Insurance | | 6,018 | | | 1,189,644 |
| Shinhan Financial Group | | 36,554 | | | 1,196,517 |
| SK Hynix | | 13,744 | | | 1,211,443 |
| | | | | | | 6,930,495 |
| Russia – 3.01% | | | | | |
| LUKOIL PJSC ADR (London | | | | | |
| | International Exchange) | | 13,283 | | | 1,354,866 |
| Polymetal International | | 39,324 | | | 729,218 |
| | | | | | | 2,084,084 |
| Taiwan – 16.93% | | | | | |
| Alchip Technologies | | 24,000 | | | 888,937 |
| ASE Technology Holding | | 166,000 | | | 595,746 |
| CTBC Financial Holding | | 1,037,046 | | | 865,184 |
| Delta Electronics | | 148,000 | | | 1,303,918 |
| Hon Hai Precision Industry | | 652,000 | | | 2,508,729 |
| Taiwan Semiconductor | | | | | |
| | Manufacturing | | 262,588 | | | 5,571,207 |
| | | | | | | | 11,733,721 |
| United Kingdom – 2.09% | | | | | |
| Unilever | | 27,114 | | | 1,451,531 |
| | | | | | | 1,451,531 |
| Total Common Stock | | | | | |
| | (cost $58,986,473) | | | | | 66,100,424 |
| | | | | | | | |
| Preferred Stock – 3.65%Δ | | | | | |
| Brazil – 0.87% | | | | | |
| Itausa 2.99% ** | | 329,888 | | | 600,880 |
| | | | | | | 600,880 |
| Republic of Korea – 2.78% | | | | | |
| LG Chem 2.66% ** | | 3,318 | | | 1,088,916 |
| Samsung Electronics 4.56% ** | | 15,351 | | | 840,755 |
| | | | | | 1,929,671 |
| Total Preferred Stock | | | | | |
| (cost $2,679,339) | | | | | 2,530,551 |
16
Table of Contents
| | | | | Number of | | | |
| | | | shares | | Value (US $) |
| Short-Term Investments – 1.25% | | | | | |
| Money Market Mutual Funds – 1.25% | | | | | |
| BlackRock FedFund – | | | | | |
| | Institutional Shares (seven-day | | | | | |
| | effective yield 0.03%) | | 216,066 | | $ | 216,066 |
| Fidelity Investments Money | | | | | |
| | Market Government Portfolio | | | | | |
| | – Class I (seven-day effective | | | | | |
| | yield 0.01%) | | 216,067 | | | 216,067 |
| GS Financial Square Government | | | | | |
| | Fund – Institutional Shares | | | | | |
| | (seven-day effective yield | | | | | |
| | 0.03%) | | 216,067 | | | 216,067 |
| Morgan Stanley Government | | | | | |
| | Portfolio – Institutional Share | | | | | |
| | Class (seven-day effective | | | | | |
| | yield 0.03%) | | 216,067 | | | 216,067 |
| Total Short-Term Investments | | | | | |
| (cost $864,267) | | | | | 864,267 |
| Total Value of | | | | | |
| Securities–100.25% | | | | | |
| (cost $62,530,079) | | | | $ | 69,495,242 |
| Δ | Securities have been classified by country of origin. Aggregate classification by business sector has been presented on page 13 in “Security type / country and sector allocations.” |
| † | Non-income producing security. |
| # | Security exempt from registration under Rule 144A of the Securities Act of 1933, as amended. At October 31, 2021, the aggregate value of Rule 144A securities was $1,035,663, which represents 1.49% of the Portfolio’s net assets. See Note 10 in “Notes to financial statements.” |
| ** | Perpetual security with no stated maturity date. |
Summary of abbreviations:
ADR – American Depositary Receipt
GS – Goldman Sachs
PJSC – Private Joint Stock Company
See accompanying notes, which are an integral part of the financial statements.
17
Table of Contents
Schedules of investments
Macquarie Institutional Portfolios — Macquarie Emerging Markets Portfolio II
October 31, 2021
| | | | | Number of | | | |
| | | | shares | | Value (US $) |
| Common Stock – 100.12%Δ | | | | | |
| Argentina – 0.08% | | | | | |
| IRSA Inversiones y | | | | | |
| | Representaciones ADR † | | 3,493 | | $ | 16,382 |
| IRSA Propiedades Comerciales | | | | | |
| | ADR | | 579 | | | 1,621 |
| | | | | | | 18,003 |
| Bahrain – 0.03% | | | | | |
| Aluminium Bahrain GDR 144A #, | | | | | |
| | † | | 691 | | | 6,736 |
| | | | | | | 6,736 |
| Brazil – 4.08% | | | | | |
| Americanas † | | 42,195 | | | 222,048 |
| Banco Bradesco ADR | | 28,682 | | | 100,387 |
| Banco Santander Brasil ADR | | 10,741 | | | 65,628 |
| BRF ADR † | | 20,063 | | | 82,860 |
| Getnet Adquirencia e Servicos | | | | | |
| | para Meios de Pagamento | | | | | |
| | ADR † | | 1,343 | | | 2,148 |
| Itau Unibanco Holding ADR | | 26,165 | | | 106,492 |
| Petroleo Brasileiro ADR | | 12,122 | | | 119,038 |
| Rumo † | | 1,573 | | | 4,415 |
| Telefonica Brasil ADR | | 8,845 | | | 71,025 |
| TIM ADR | | 6,138 | | | 60,521 |
| Vale ADR | | 4,239 | | | 53,962 |
| XP Class A † | | 604 | | | 19,820 |
| | | | | | | 908,344 |
| Chile – 0.52% | | | | | |
| Sociedad Quimica y Minera de | | | | | |
| | Chile ADR | | 2,110 | | | 115,818 |
| | | | | | | 115,818 |
| China – 28.83% | | | | | |
| Alibaba Group Holding † | | 4,500 | | | 94,274 |
| Alibaba Group Holding ADR † | | 4,590 | | | 757,075 |
| Anhui Conch Cement Class H | | 27,500 | | | 136,784 |
| Baidu ADR † | | 1,785 | | | 289,598 |
| BeiGene † | | 3,600 | | | 100,775 |
| China Petroleum & Chemical | | | | | |
| | ADR | | 1,715 | | | 83,486 |
| China Petroleum & Chemical | | | | | |
| | Class H | | 32,000 | | | 15,711 |
| DiDi Global ADR † | | 2,500 | | | 20,175 |
| Genor Biopharma Holdings 144A | | | | | |
| | #, † | | 12,500 | | | 16,226 |
| iQIYI ADR † | | 1,615 | | | 13,372 |
| JD.com ADR † | | 14,577 | | | 1,141,088 |
| Joinn Laboratories China Class H | | | | | |
| | 144A # | | 280 | | | 3,624 |
| Kunlun Energy | | 68,000 | | | 62,227 |
| Kweichow Moutai Class A | | 2,500 | | | 713,391 |
| Luzhou Laojiao Class A | | 4,200 | | | 150,265 |
| Ping An Insurance Group Co. of | | | | | |
| | China Class H | | 23,000 | | | 165,246 |
| Prosus † | | 2,283 | | | 201,130 |
| Sohu.com ADR † | | 6,444 | | | 130,555 |
| Tencent Holdings | | 18,200 | | | 1,125,146 |
| Tencent Music Entertainment | | | | | |
| | Group ADR † | | 4 | | | 31 |
| Tianjin Development Holdings | | 62,000 | | | 13,786 |
| Tingyi Cayman Islands Holding | | 58,000 | | | 108,538 |
| Trip.com Group ADR † | | 4,911 | | | 140,258 |
| Tsingtao Brewery Class H | | 24,000 | | | 208,676 |
| Uni-President China Holdings | | 107,000 | | | 91,316 |
| Weibo ADR † | | 1,715 | | | 77,141 |
| Wuliangye Yibin Class A | | 16,300 | | | 551,484 |
| Zhihu ADR † | | 500 | | | 4,130 |
| | | | | | | 6,415,508 |
| India – 14.41% | | | | | |
| HCL Technologies | | 21,000 | | | 320,758 |
| HDFC Bank | | 12,000 | | | 253,658 |
| Reliance Industries GDR 144A # | | 30,737 | | | 2,090,116 |
| Tata Chemicals | | 11,058 | | | 133,106 |
| Tata Consultancy Services | | 6,000 | | | 272,251 |
| Tata Consumer Products | | 12,607 | | | 136,287 |
| | | | | | | 3,206,176 |
| Indonesia – 2.51% | | | | | |
| Astra International | | 337,700 | | | 143,614 |
| Bank Central Asia | | 786,000 | | | 414,706 |
| | | | | | | 558,320 |
| Malaysia – 0.05% | | | | | |
| UEM Sunrise † | | 118,400 | | | 11,294 |
| | | | | | | 11,294 |
| Mexico – 3.43% | | | | | |
| America Movil ADR Class L | | 5,291 | | | 94,074 |
| Banco Santander Mexico ADR | | 16,863 | | | 108,766 |
| Becle | | 49,866 | | | 113,838 |
| Coca-Cola Femsa ADR | | 3,722 | | | 200,058 |
| Grupo Financiero Banorte | | | | | |
| | Class O | | 10,549 | | | 66,682 |
| Grupo Televisa ADR | | 17,723 | | | 179,357 |
| | | | | | | 762,775 |
| Peru – 0.30% | | | | | |
| Cia de Minas Buenaventura ADR | | | | | |
| | † | | 8,287 | | | 65,302 |
| | | | | | | 65,302 |
18
Table of Contents
| | | Number of | | | |
| | | | shares | | Value (US $) |
| Common StockΔ (continued) | | | | | |
| Republic of Korea – 18.77% | | | | | |
| Fila Holdings | | 3,123 | | $ | 99,151 |
| LG Uplus | | 6,905 | | | 84,795 |
| Samsung Electronics | | 24,291 | | | 1,450,953 |
| SK Hynix | | 13,489 | | | 1,188,967 |
| SK Telecom | | 1,780 | | | 462,516 |
| SK Telecom ADR | | 30,689 | | | 889,981 |
| | | | | | 4,176,363 |
| Russia – 7.17% | | | | | |
| Etalon Group GDR 144A # | | 4,800 | | | 7,546 |
| Gazprom PJSC ADR | | 44,140 | | | 432,837 |
| LUKOIL PJSC ADR (London | | | | | |
| International Exchange) | | 2,022 | | | 206,244 |
| Mail.Ru Group GDR † | | 2,072 | | | 42,393 |
| Rosneft Oil PJSC GDR | | 44,435 | | | 395,916 |
| Sberbank of Russia PJSC | | 52,760 | | | 265,007 |
| Yandex Class A † | | 2,962 | | | 245,372 |
| | | | | | 1,595,315 |
| South Africa – 0.24% | | | | | |
| Naspers Class N | | 318 | | | 53,922 |
| | | | | | 53,922 |
| Taiwan – 17.69% | | | | | |
| Hon Hai Precision Industry | | 107,564 | | | 413,879 |
| MediaTek | | 38,000 | | | 1,247,604 |
| Taiwan Semiconductor | | | | | |
| Manufacturing | | 64,000 | | | 1,357,858 |
| Taiwan Semiconductor | | | | | |
| Manufacturing ADR | | 5,831 | | | 662,985 |
| United Microelectronics ADR | | 24,806 | | | 254,757 |
| | | | | | 3,937,083 |
| Turkey – 0.61% | | | | | |
| Akbank TAS | | 100,106 | | | 61,017 |
| Anadolu Efes Biracilik Ve Malt | | | | | |
| Sanayii | | 9,675 | | | 22,341 |
| D-MARKET Elektronik Hizmetler | | | | | |
| ve Ticaret ADR † | | 500 | | | 2,275 |
| Turkcell Iletisim Hizmetleri ADR | | 9,092 | | | 36,095 |
| Turkiye Sise ve Cam Fabrikalari | | 16,275 | | | 14,660 |
| | | | | | 136,388 |
| United States – 1.40% | | | | | |
| Micron Technology | | 4,500 | | | 310,950 |
| | | | | | 310,950 |
| Total Common Stock | | | | | |
| (cost $15,211,052) | | | | | 22,278,297 |
| | | | | | | |
| Preferred Stock – 0.08%Δ | | | | | |
| Russia – 0.08% | | | | | |
| Transneft PJSC 6.18% ** | | 8 | | | 17,163 |
| Total Preferred Stock | | | | | |
| (cost $20,913) | | | | | 17,163 |
| | | | | | |
| Warrants – 0.00%Δ | | | | | |
| Argentina – 0.00% | | | | | |
| IRSA Inversiones y | | | | | |
| Representaciones exercise | | | | | |
| price $0.23, expiration date | | | | | |
| 3/5/26 | | 4,240 | | | 978 |
| Total Warrants | | | | | |
| (cost $0) | | | | | 978 |
| | | | | | |
| Short-Term Investments – 0.03% | | | | | |
| Money Market Mutual Funds – 0.03% | | | | |
| BlackRock FedFund – | | | | | |
| Institutional Shares (seven-day | | | | | |
| effective yield 0.03%) | | 1,860 | | | 1,860 |
| Fidelity Investments Money | | | | | |
| Market Government Portfolio | | | | | |
| – Class I (seven-day effective | | | | | |
| yield 0.01%) | | 1,860 | | | 1,860 |
| GS Financial Square Government | | | | | |
| Fund – Institutional Shares | | | | | |
| (seven-day effective yield | | | | | |
| 0.03%) | | 1,860 | | | 1,860 |
| Morgan Stanley Government | | | | | |
| Portfolio – Institutional Share | | | | | |
| Class (seven-day effective | | | | | |
| yield 0.03%) | | 1,859 | | | 1,859 |
| Total Short-Term Investments | | | | | |
| (cost $7,439) | | | | | 7,439 |
| Total Value of | | | | | |
| Securities–100.23% | | | | | |
| (cost $15,239,404) | | | | $ | 22,303,877 |
| Δ | Securities have been classified by country of origin. Aggregate classification by business sector has been presented on page 14 in “Security type / country and sector allocations.” |
| † | Non-income producing security. |
| # | Security exempt from registration under Rule 144A of the Securities Act of 1933, as amended. At October 31, 2021, the aggregate value of Rule 144A securities was $2,124,248, which represents 9.55% of the Portfolio’s net assets. See Note 10 in “Notes to financial statements.” |
| ** | Perpetual security with no stated maturity date. |
19
Table of Contents
Schedules of investments
Macquarie Institutional Portfolios — Macquarie Emerging Markets Portfolio II
Summary of abbreviations:
ADR – American Depositary Receipt
GDR – Global Depositary Receipt
GS – Goldman Sachs
PJSC – Private Joint Stock Company
See accompanying notes, which are an integral part of the financial statements.
20
Table of Contents
Macquarie Institutional Portfolios — Macquarie Labor Select International Equity Portfolio
October 31, 2021
| | | Number of | | | |
| | | | shares | | Value (US $) |
| Common Stock – 98.08%Δ | | | | | |
| China/Hong Kong – 3.34% | | | | | |
| Jardine Matheson Holdings | | 47,000 | | $ | 2,722,710 |
| WH Group 144A # | | 4,417,507 | | | 3,100,005 |
| | | | | | 5,822,715 |
| Denmark – 1.28% | | | | | |
| ISS † | | 111,582 | | | 2,221,236 |
| | | | | | 2,221,236 |
| France – 8.37% | | | | | |
| Bouygues | | 16,286 | | | 658,931 |
| Cie de Saint-Gobain | | 51,473 | | | 3,543,986 |
| Dassault Aviation | | 19,330 | | | 2,016,680 |
| Sanofi | | 57,696 | | | 5,764,585 |
| Societe Generale | | 77,746 | | | 2,591,528 |
| | | | | | 14,575,710 |
| Germany – 4.99% | | | | | |
| Allianz | | 18,649 | | | 4,336,441 |
| Evonik Industries | | 134,286 | | | 4,349,674 |
| | | | | | 8,686,115 |
| Italy – 7.27% | | | | | |
| Enel | | 683,662 | | | 5,718,707 |
| Eni | | 218,294 | | | 3,130,123 |
| Snam | | 673,787 | | | 3,814,262 |
| | | | | | 12,663,092 |
| Japan – 29.64% | | | | | |
| Coca-Cola Bottlers Japan | | | | | |
| Holdings | | 137,900 | | | 1,892,306 |
| Denso | | 58,000 | | | 4,184,549 |
| FUJIFILM Holdings | | 59,800 | | | 4,617,678 |
| Fujitsu | | 14,300 | | | 2,462,272 |
| Hitachi | | 28,700 | | | 1,650,360 |
| Honda Motor | | 183,200 | | | 5,383,082 |
| Kyocera | | 78,400 | | | 4,577,776 |
| Mitsubishi Electric | | 217,300 | | | 2,907,502 |
| Nippon Telegraph & Telephone | | 165,100 | | | 4,618,020 |
| Otsuka Holdings | | 60,000 | | | 2,365,782 |
| Sekisui Chemical | | 198,400 | | | 3,246,466 |
| Sony Group | | 53,500 | | | 6,167,932 |
| Takeda Pharmaceutical | | 158,000 | | | 4,440,219 |
| Tokio Marine Holdings | | 58,400 | | | 3,073,334 |
| | | | | | 51,587,278 |
| Singapore – 4.09% | | | | | |
| Singapore Telecommunications | | 832,700 | | | 1,543,752 |
| United Overseas Bank | | 280,709 | | | 5,568,384 |
| | | | | | 7,112,136 |
| Spain – 4.74% | | | | | |
| Banco Santander | | 1,573,840 | | | 5,961,130 |
| Red Electrica | | 110,199 | | | 2,294,295 |
| | | | | | 8,255,425 |
| Sweden – 3.34% | | | | | |
| Essity Class B | | 60,254 | | | 1,949,064 |
| Telia | | 981,102 | | | 3,860,776 |
| | | | | | 5,809,840 |
| Switzerland – 3.33% | | | | | |
| Novartis | | 54,907 | | | 4,536,004 |
| Zurich Insurance Group | | 2,850 | | | 1,263,450 |
| | | | | | 5,799,454 |
| United Kingdom – 27.69% | | | | | |
| BP | | 824,935 | | | 3,953,635 |
| CK Hutchison Holdings | | 820,500 | | | 5,520,619 |
| GlaxoSmithKline | | 306,824 | | | 6,334,672 |
| Kingfisher | | 786,493 | | | 3,605,789 |
| Lloyds Banking Group | | 8,446,006 | | | 5,804,820 |
| Royal Dutch Shell Class B | | 233,413 | | | 5,382,520 |
| SSE | | 271,089 | | | 6,097,366 |
| Tesco | | 1,277,906 | | | 4,720,222 |
| Travis Perkins | | 71,503 | | | 1,509,909 |
| Wickes Group | | 118,636 | | | 348,098 |
| WPP | | 340,427 | | | 4,919,813 |
| | | | | | 48,197,463 |
| Total Common Stock | | | | | |
| (cost $152,051,946) | | | | | 170,730,464 |
| |
| Short-Term Investments – 0.55% | | | | | |
| Money Market Mutual Funds – 0.55% | | | | |
| BlackRock FedFund – | | | | | |
| Institutional Shares (seven- | | | | | |
| day effective yield 0.03%) | | 239,378 | | | 239,378 |
| Fidelity Investments Money | | | | | |
| Market Government Portfolio | | | | | |
| – Class I (seven-day effective | | | | | |
| yield 0.01%) | | 239,379 | | | 239,379 |
| GS Financial Square | | | | | |
| Government Fund – | | | | | |
| Institutional Shares (seven- | | | | | |
| day effective yield 0.03%) | | 239,379 | | | 239,379 |
21
Table of Contents
Schedules of investments
Macquarie Institutional Portfolios — Macquarie Labor Select International Equity Portfolio
| | | Number of | | | |
| | | | shares | | Value (US $) |
| Short-Term Investments (continued) | | | |
| Money Market Mutual Funds (continued) | | | |
| Morgan Stanley Government | | | | | |
| Portfolio – Institutional | | | | | |
| Share Class (seven-day | | | | | |
| effective yield 0.03%) | | 239,379 | | $ | 239,379 |
| Total Short-Term Investments | | | | | |
| (cost $957,515) | | | | | 957,515 |
| Total Value of | | | | | |
| Securities–98.63% | | | | | |
| (cost $153,009,461) | | | | $ | 171,687,979 |
| Δ | Securities have been classified by country of origin. Aggregate classification by business sector has been presented on page 15 in “Security type / country and sector allocations.” |
| # | Security exempt from registration under Rule 144A of the Securities Act of 1933, as amended. At October 31, 2021, the aggregate value of Rule 144A securities was $3,100,005, which represents 1.78% of the Portfolio’s net assets. See Note 10 in “Notes to financial statements.” |
| † | Non-income producing security. |
Summary of abbreviations:
GS – Goldman Sachs
See accompanying notes, which are an integral part of the financial statements.
22
Table of Contents
Statements of assets and liabilities
Macquarie Institutional Portfolios
October 31, 2021 (Unaudited)
| | | | | | | | | | | Macquarie |
| | | Macquarie | | Macquarie | | Labor Select |
| | | Emerging | | Emerging | | International |
| | | Markets | | Markets | | Equity |
| | | | Portfolio | | Portfolio II | | Portfolio |
| Assets: | | | | | | | | | | | | |
| Investments, at value* | | $ | 69,495,242 | | | $ | 22,303,877 | | | $ | 171,687,979 | |
| Cash | | | 258 | | | | 57 | | | | 128,068 | |
| Foreign currencies, at valueΔ | | | 4,382 | | | | 14,915 | | | | 380,741 | |
| Dividends and interest receivable | | | 62,960 | | | | 28,226 | | | | 846,822 | |
| Foreign tax reclaims receivable | | | 2,847 | | | | 36 | | | | 1,678,781 | |
| Receivable for securities sold | | | — | | | | — | | | | 29,680 | |
| Total Assets | | | 69,565,689 | | | | 22,347,111 | | | | 174,752,071 | |
| Liabilities: | | | | | | | | | | | | |
| Capital gains tax payable | | | 67,932 | | | | 31,697 | | | | — | |
| Investment management fees payable to affiliates | | | 59,380 | | | | 20,913 | | | | 110,081 | |
| Payable for securities purchased | | | 52,663 | | | | — | | | | 454,695 | |
| Custody fees payable | | | 25,333 | | | | 12,403 | | | | 47,999 | |
| Accounting and administration fees payable to non-affiliates | | | 16,944 | | | | 15,366 | | | | 20,321 | |
| Audit and tax fees payable | | | 5,949 | | | | 5,949 | | | | 5,949 | |
| Payable for fund shares redeemed | | | 5,000 | | | | — | | | | 19,306 | |
| Reports and statements to shareholders expenses payable to non-affiliates | | | 4,765 | | | | 4,181 | | | | 9,481 | |
| Other accrued expenses | | | 4,100 | | | | 3,925 | | | | 9,260 | |
| Accounting and administration expenses payable to affiliates | | | 554 | | | | 409 | | | | 869 | |
| Dividend disbursing and transfer agent fees and expenses payable to affiliates | | | 445 | | | | 143 | | | | 1,101 | |
| Legal fees payable to affiliates | | | 207 | | | | 67 | | | | 517 | |
| Trustees’ fees and expenses payable to affiliates | | | 100 | | | | 32 | | | | 251 | |
| Reports and statements to shareholders expenses payable to affiliates | | | 92 | | | | 30 | | | | 230 | |
| Total Liabilities | | | 243,464 | | | | 95,115 | | | | 680,060 | |
| Total Net Assets | | $ | 69,322,225 | | | $ | 22,251,996 | | | $ | 174,072,011 | |
| | | | | | | | | | | | | |
| Net Assets Consist of: | | | | | | | | | | | | |
| Paid-in capital | | $ | 105,417,693 | | | $ | (3,610,281 | ) | | $ | 205,789,668 | |
| Total distributable earnings (loss) | | | (36,095,468 | ) | | | 25,862,277 | | | | (31,717,657 | ) |
| Total Net Assets | | $ | 69,322,225 | | | $ | 22,251,996 | | | $ | 174,072,011 | |
| | | | | | | | | | | | | |
| Portfolio Class: | | | | | | | | | | | | |
| Net assets | | $ | 69,322,225 | | | $ | 22,251,996 | | | $ | 174,072,011 | |
| Shares of beneficial interest outstanding, unlimited authorization, no par | | | 7,562,140 | | | | 1,751,131 | | | | 11,790,778 | |
| Net asset value per share | | $ | 9.17 | | | $ | 12.71 | | | $ | 14.76 | |
| ____________________ |
| * Investments, at cost | | $ | 62,530,079 | | | $ | 15,239,404 | | | $ | 153,009,461 | |
| Δ Foreign currencies, at cost | | | 4,521 | | | | 15,178 | | | | 382,307 | |
See accompanying notes, which are an integral part of the financial statements.
23
Table of Contents
Statements of operations
Macquarie Institutional Portfolios
Year ended October 31, 2021
| | | | | | | | | | | Macquarie |
| | | Macquarie | | Macquarie | | Labor Select |
| | | Emerging | | Emerging | | International |
| | | Markets | | Markets | | Equity |
| | | | Portfolio | | Portfolio II | | Portfolio |
| Investment Income: | | | | | | | | | | | | |
| Dividends | | $ | 1,737,149 | | | $ | 717,135 | | | $ | 8,120,142 | |
| Interest | | | 4,500 | | | | 11 | | | | 7,733 | |
| Foreign tax withheld | | | (201,187 | ) | | | (106,942 | ) | | | (550,154 | ) |
| | | | 1,540,462 | | | | 610,204 | | | | 7,577,721 | |
| | | | | | | | | | | | | |
| Expenses: | | | | | | | | | | | | |
| Management fees | | | 729,072 | | | | 344,546 | | | | 1,516,785 | |
| Accounting and administration expenses | | | 50,630 | | | | 44,450 | | | | 71,249 | |
| Audit and tax fees | | | 41,689 | | | | 39,519 | | | | 73,664 | |
| Custodian fees | | | 30,431 | | | | 19,951 | | | | 56,050 | |
| Registration fees | | | 15,278 | | | | 18,329 | | | | 13,503 | |
| Legal fees | | | 11,872 | | | | 5,290 | | | | 32,365 | |
| Dividend disbursing and transfer agent fees and expenses | | | 11,453 | | | | 5,304 | | | | 30,536 | |
| Reports and statements to shareholders expenses | | | 8,665 | | | | 7,139 | | | | 12,923 | |
| Trustees’ fees and expenses | | | 2,751 | | | | 1,517 | | | | 7,865 | |
| Other | | | 12,969 | | | | 14,418 | | | | 20,105 | |
| | | | 914,810 | | | | 500,463 | | | | 1,835,045 | |
| Less expenses waived | | | — | | | | (86,934 | ) | | | — | |
| Less expenses paid indirectly | | | (1 | ) | | | (1 | ) | | | (2 | ) |
| Total operating expenses | | | 914,809 | | | | 413,528 | | | | 1,835,043 | |
| Net Investment Income | | | 625,653 | | | | 196,676 | | | | 5,742,678 | |
| Net Realized and Unrealized Gain (Loss): | | | | | | | | | | | | |
| Net realized gain (loss) on: | | | | | | | | | | | | |
| Investments1 | | | 9,430,604 | | | | 19,661,440 | | | | 7,606,383 | |
| Foreign currencies | | | (20,171 | ) | | | 52,452 | | | | 6,075 | |
| Foreign currency exchange contracts | | | (19,327 | ) | | | (61,437 | ) | | | (44,450 | ) |
| Net realized gain | | | 9,391,106 | | | | 19,652,455 | | | | 7,568,008 | |
| | | | | | | | | | | | | |
| Net change in unrealized appreciation (depreciation) of: | | | | | | | | | | | | |
| Investments2 | | | (1,320,954 | ) | | | (6,699,766 | ) | | | 52,955,032 | |
| Foreign currencies | | | (32,698 | ) | | | (41 | ) | | | (78,672 | ) |
| Foreign currency exchange contracts | | | 21 | | | | 678 | | | | — | |
| Net change in unrealized appreciation (depreciation) | | | (1,353,631 | ) | | | (6,699,129 | ) | | | 52,876,360 | |
| Net Realized and Unrealized Gain | | | 8,037,475 | | | | 12,953,326 | | | | 60,444,368 | |
| Net Increase in Net Assets Resulting from Operations | | $ | 8,663,128 | | | $ | 13,150,002 | | | $ | 66,187,046 | |
| 1 | Includes $96 and $20,406 capital gains taxes paid for Macquarie Emerging Markets Portfolio and Macquarie Emerging Markets Portfolio II, respectively. |
| 2 | Includes increase of $67,932 and $31,697 capital gains tax accrued for Macquarie Emerging Markets Portfolio and Macquarie Emerging Markets Portfolio II, respectively. |
See accompanying notes, which are an integral part of the financial statements.
24
Table of Contents
Statements of changes in net assets
Macquarie Institutional Portfolios
| | | | | | | | | | | | | | | | | | Macquarie |
| | Macquarie | | Macquarie | | Labor Select |
| | Emerging | | Emerging | | International |
| | Markets | | Markets | | Equity |
| | Portfolio | | Portfolio II | | Portfolio |
| | Year ended | | Year ended | | Year ended |
| | 10/31/21 | | 10/31/20 | | 10/31/21 | | 10/31/20 | | 10/31/21 | | 10/31/20 |
| Increase (Decrease) in Net Assets from | | | | | | | | | | | | | | | | | | | | | | | | |
| Operations: | | | | | | | | | | | | | | | | | | | | | | | | |
| Net investment income | | $ | 625,653 | | | $ | 1,080,974 | | | $ | 196,676 | | | $ | 431,245 | | | $ | 5,742,678 | | | $ | 7,829,223 | |
| Net realized gain (loss) | | | 9,391,106 | | | | (6,096,422 | ) | | | 19,652,455 | | | | 2,070,903 | | | | 7,568,008 | | | | (59,157,139 | ) |
| Net change in unrealized appreciation | | | | | | | | | | | | | | | | | | | | | | | | |
| (depreciation) | | | (1,353,631 | ) | | | 4,786,256 | | | | (6,699,129 | ) | | | 6,216,733 | | | | 52,876,360 | | | | (27,339,418 | ) |
| Net increase (decrease) in net assets | | | | | | | | | | | | | | | | | | | | | | | | |
| resulting from operations | | | 8,663,128 | | | | (229,192 | ) | | | 13,150,002 | | | | 8,718,881 | | | | 66,187,046 | | | | (78,667,334 | ) |
| | | | | | | | | | | | | | | | | | | | | | | | | |
| Dividends and Distributions to | | | | | | | | | | | | | | | | | | | | | | | | |
| Shareholders from: | | | | | | | | | | | | | | | | | | | | | | | | |
| Distributable earnings | | | (814,896 | ) | | | (1,680,428 | ) | | | (2,533,750 | ) | | | (1,243,681 | ) | | | (7,466,559 | ) | | | (22,540,570 | ) |
| Total distributions to shareholders | | | (814,896 | ) | | | (1,680,428 | ) | | | (2,533,750 | ) | | | (1,243,681 | ) | | | (7,466,559 | ) | | | (22,540,570 | ) |
| Capital Share Transactions: | | | | | | | | | | | | | | | | | | | | | | | | |
| Proceeds from shares sold | | | — | | | | 6,031,060 | | | | — | | | | — | | | | 5,046,912 | | | | 12,297,533 | |
| Purchase reimbursement fees | | | — | | | | 24,027 | | | | — | | | | — | | | | — | | | | — | |
| Net asset value of shares issued upon | | | | | | | | | | | | | | | | | | | | | | | | |
| reinvestment of dividends and | | | | | | | | | | | | | | | | | | | | | | | | |
| distributions | | | 790,477 | | | | 1,612,658 | | | | 2,522,787 | | | | 1,233,499 | | | | 7,466,558 | | | | 22,540,569 | |
| | | 790,477 | | | | 7,667,745 | | | | 2,522,787 | | | | 1,233,499 | | | | 12,513,470 | | | | 34,838,102 | |
| Cost of shares redeemed | | | (13,477 | ) | | | (25,037,925 | ) | | | (41,413,226 | ) | | | (405,000 | ) | | | (82,442,449 | ) | | | (202,377,671 | ) |
| Redemption reimbursement fees | | | 38 | | | | 112,481 | | | | — | | | | — | | | | — | | | | — | |
| | | (13,439 | ) | | | (24,925,444 | ) | | | (41,413,226 | ) | | | (405,000 | ) | | | (82,442,449 | ) | | | (202,377,671 | ) |
| Increase (decrease) in net assets derived | | | | | | | | | | | | | | | | | | | | | | | | |
| from capital share transactions | | | 777,038 | | | | (17,257,699 | ) | | | (38,890,439 | ) | | | 828,499 | | | | (69,928,979 | ) | | | (167,539,569 | ) |
| Net Increase (Decrease) in Net Assets | | | 8,625,270 | | | | (19,167,319 | ) | | | (28,274,187 | ) | | | 8,303,699 | | | | (11,208,492 | ) | | | (268,747,473 | ) |
| | | | | | | | | | | | | | | | | | | | | | | | | |
| Net Assets: | | | | | | | | | | | | | | | | | | | | | | | | |
| Beginning of year | | | 60,696,955 | | | | 79,864,274 | | | | 50,526,183 | | | | 42,222,484 | | | | 185,280,503 | | | | 454,027,976 | |
| End of year | | $ | 69,322,225 | | | $ | 60,696,955 | | | $ | 22,251,996 | | | $ | 50,526,183 | | | $ | 174,072,011 | | | $ | 185,280,503 | |
See accompanying notes, which are an integral part of the financial statements.
25
Table of Contents
Financial highlights
Macquarie Institutional Portfolios — Macquarie Emerging Markets Portfolio
Selected data for each share of the Portfolio outstanding throughout each period were as follows:
| | Year ended |
| | 10/31/21 | | 10/31/20 | | 10/31/19 | | 10/31/18 | | 10/31/17 |
| Net asset value, beginning of period | | $ | 8.12 | | | $ | 8.11 | | | $ | 7.56 | | | $ | 8.76 | | | $ | 7.77 | |
| Income (loss) from investment operations | | | | | | | | | | | | | | | | | | | | |
| Net investment income1 | | | 0.08 | | | | 0.12 | | | | 0.17 | | | | 0.20 | | | | 0.18 | |
| Net realized and unrealized gain (loss) | | | 1.08 | | | | 0.05 | | | | 0.54 | | | | (1.08 | ) | | | 1.05 | |
| Total from investment operations | | | 1.16 | | | | 0.17 | | | | 0.71 | | | | (0.88 | ) | | | 1.23 | |
| Less dividends and distributions from: | | | | | | | | | | | | | | | | | | | | |
| Net investment income | | | (0.11 | ) | | | (0.17 | ) | | | (0.16 | ) | | | (0.34 | ) | | | (0.26 | ) |
| Total dividends and distributions | | | (0.11 | ) | | | (0.17 | ) | | | (0.16 | ) | | | (0.34 | ) | | | (0.26 | ) |
| Reimbursement fees | | | | | | | | | | | | | | | | | | | | |
| Purchase reimbursement fees1, 2 | | | — | | | | — | 3 | | | — | 4 | | | — | 5 | | | 0.01 | |
| Redemption reimbursement fees1, 2 | | | — | 6 | | | 0.01 | | | | — | 4 | | | 0.02 | | | | 0.01 | |
| Total reimbursement fees | | | — | | | | 0.01 | | | | — | | | | 0.02 | | | | 0.02 | |
| Net asset value, end of period | | $ | 9.17 | | | $ | 8.12 | | | $ | 8.11 | | | $ | 7.56 | | | $ | 8.76 | |
| Total return7 | | | 14.29% | | | | 2.16% | 8 | | | 9.62% | | | | (10.28% | ) | | | 16.88% | |
| Ratios and supplemental data: | | | | | | | | | | | | | | | | | | | | |
| Net assets, end of period (000 omitted) | | $ | 69,322 | | | $ | 60,697 | | | $ | 79,864 | | | $ | 79,463 | | | $ | 136,678 | |
| Ratio of expenses to average net assets9 | | | 1.25% | | | | 1.26% | | | | 1.30% | | | | 1.26% | | | | 1.22% | |
| Ratio of expenses to average net assets prior to fees waived9 | | | 1.25% | | | | 1.28% | | | | 1.30% | | | | 1.26% | | | | 1.22% | |
| Ratio of net investment income to average net assets | | | 0.86% | | | | 1.48% | | | | 2.19% | | | | 2.31% | | | | 2.24% | |
| Ratio of net investment income to average net assets prior to | | | | | | | | | | | | | | | | | | | | |
| fees waived | | | 0.86% | | | | 1.46% | | | | 2.19% | | | | 2.31% | | | | 2.24% | |
| Portfolio turnover | | | 42% | | | | 43% | | | | 33% | | | | 40% | | | | 45% | |
| 1 | Calculated using average shares outstanding. |
| 2 | Effective February 28, 2018, the Portfolio charges a 0.40% purchase reimbursement fee and a 0.45% redemption reimbursement fee, which are retained by the Portfolio. Previously, the Portfolio charged a 0.55% purchase reimbursement fee and a 0.55% redemption reimbursement fee. |
| 3 | For the year ended October 31, 2020, purchase reimbursement fees of $24,027 were earned by the Portfolio, which calculated to an amount of $0.003 per share. |
| 4 | For the year ended October 31, 2019, purchase and redemption fees of $732 and $31,858, respectively, were earned by the Portfolio, which calculated to amounts of $0.000 and $0.003 per share, respectively. |
| 5 | For the year ended October 31, 2018, purchase reimbursement fees of $5,924 were earned by the Portfolio, which calculated to an amount of $0.0004 per share. |
| 6 | For the year ended October 31, 2021, redemption reimbursement fees of $38 were earned by the Portfolio, which calculated to an amount of $0.000 per share. |
| 7 | Total return is based on the change in net asset value of a share during the period and assumes reinvestment of dividends and distributions at net asset value. Total return does not reflect the purchase reimbursement fee and redemption reimbursement fee. |
| 8 | Total return reflects a waiver by the manager. Performance would have been lower had the waiver not been in effect. |
| 9 | Expense ratios do not include expenses of the Underlying Funds in which the Portfolio invests. |
See accompanying notes, which are an integral part of the financial statements.
26
Table of Contents
Macquarie Institutional Portfolios — Macquarie Emerging Markets Portfolio II
Selected data for each share of the Portfolio outstanding throughout each period were as follows:
| | Year ended |
| | 10/31/21 | | 10/31/20 | | 10/31/19 | | 10/31/18 | | 10/31/17 |
| Net asset value, beginning of period | | $ | 11.41 | | | $ | 9.71 | | | $ | 8.78 | | | $ | 10.74 | | | $ | 8.01 | |
| | | | | | | | | | | | | | | | | | | | | |
| Income (loss) from investment operations | | | | | | | | | | | | | | | | | | | | |
| Net investment income1 | | | 0.08 | | | | 0.10 | | | | 0.09 | | | | 0.08 | | | | 0.12 | |
| Net realized and unrealized gain (loss) | | | 1.79 | | | | 1.89 | | | | 1.30 | | | | (1.77 | ) | | | 2.70 | |
| Total from investment operations | | | 1.87 | | | | 1.99 | | | | 1.39 | | | | (1.69 | ) | | | 2.82 | |
| | | | | | | | | | | | | | | | | | | | | |
| Less dividends and distributions from: | | | | | | | | | | | | | | | | | | | | |
| Net investment income | | | (0.09 | ) | | | (0.09 | ) | | | (0.05 | ) | | | (0.27 | ) | | | (0.09 | ) |
| Net realized gain | | | (0.48 | ) | | | (0.20 | ) | | | (0.41 | ) | | | — | | | | — | |
| Total dividends and distributions | | | (0.57 | ) | | | (0.29 | ) | | | (0.46 | ) | | | (0.27 | ) | | | (0.09 | ) |
| | | | | | | | | | | | | | | | | | | | | |
| Net asset value, end of period | | $ | 12.71 | | | $ | 11.41 | | | $ | 9.71 | | | $ | 8.78 | | | $ | 10.74 | |
| | | | | | | | | | | | | | | | | | | | | |
| Total return2 | | | 16.50% | | | | 20.79% | | | | 16.74% | | | | (16.13% | ) | | | 35.74% | |
| | | | | | | | | | | | | | | | | | | | | |
| Ratios and supplemental data: | | | | | | | | | | | | | | | | | | | | |
| Net assets, end of period (000 omitted) | | $ | 22,252 | | | $ | 50,526 | | | $ | 42,222 | | | $ | 27,229 | | | $ | 46,046 | |
| Ratio of expenses to average net assets3 | | | 1.20% | | | | 1.20% | | | | 1.20% | | | | 1.20% | | | | 1.20% | |
| Ratio of expenses to average net assets prior to fees waived3 | | | 1.45% | | | | 1.37% | | | | 1.42% | | | | 1.42% | | | | 1.32% | |
| Ratio of net investment income to average net assets | | | 0.57% | | | | 0.98% | | | | 1.03% | | | | 0.80% | | | | 1.34% | |
| Ratio of net investment income to average net assets prior to | | | | | | | | | | | | | | | | | | | | |
| fees waived | | | 0.32% | | | | 0.81% | | | | 0.81% | | | | 0.58% | | | | 1.22% | |
| Portfolio turnover | | | 12% | | | | 17% | | | | 9% | | | | 12% | | | | 14% | |
| 1 | Calculated using average shares outstanding. |
| 2 | Total return is based on the change in net asset value of a share during the period and assumes reinvestment of dividends and distributions at net asset value. Total return during all of the periods shown reflects a waiver by the manager. Performance would have been lower had the waiver not been in effect. |
| 3 | Expense ratios do not include expenses of the Underlying Funds in which the Portfolio invests. |
See accompanying notes, which are an integral part of the financial statements.
27
Table of Contents
Financial highlights
Macquarie Institutional Portfolios — Macquarie Labor Select International Equity Portfolio
Selected data for each share of the Portfolio outstanding throughout each period were as follows:
| | Year ended |
| | 10/31/21 | | 10/31/20 | | 10/31/19 | | 10/31/18 | | 10/31/17 |
| Net asset value, beginning of period | | $ | 11.09 | | | $ | 14.39 | | | $ | 13.74 | | | $ | 15.21 | | | $ | 12.83 | |
| | | | | | | | | | | | | | | | | | | | | |
| Income (loss) from investment operations | | | | | | | | | | | | | | | | | | | | |
| Net investment income1 | | | 0.40 | | | | 0.27 | | | | 0.47 | | | | 0.44 | | | | 0.41 | |
| Net realized and unrealized gain (loss) | | | 3.72 | | | | (2.84 | ) | | | 0.60 | | | | (1.47 | ) | | | 2.35 | |
| Total from investment operations | | | 4.12 | | | | (2.57 | ) | | | 1.07 | | | | (1.03 | ) | | | 2.76 | |
| | | | | | | | | | | | | | | | | | | | | |
| Less dividends and distributions from: | | | | | | | | | | | | | | | | | | | | |
| Net investment income | | | (0.45 | ) | | | (0.51 | ) | | | (0.42 | ) | | | (0.44 | ) | | | (0.38 | ) |
| Net realized gain | | | — | | | | (0.22 | ) | | | — | | | | — | | | | — | |
| Total dividends and distributions | | | (0.45 | ) | | | (0.73 | ) | | | (0.42 | ) | | | (0.44 | ) | | | (0.38 | ) |
| | | | | | | | | | | | | | | | | | | | | |
| Net asset value, end of period | | $ | 14.76 | | | $ | 11.09 | | | $ | 14.39 | | | $ | 13.74 | | | $ | 15.21 | |
| | | | | | | | | | | | | | | | | | | | | |
| Total return2 | | | 37.68% | | | | (19.01% | ) | | | 8.23% | | | | (7.02% | ) | | | 22.13% | |
| | | | | | | | | | | | | | | | | | | | | |
| Ratios and supplemental data: | | | | | | | | | | | | | | | | | | | | |
| Net assets, end of period (000 omitted) | | $ | 174,072 | | | $ | 185,281 | | | $ | 454,028 | | | $ | 405,923 | | | $ | 490,273 | |
| Ratio of expenses to average net assets3 | | | 0.91% | | | | 0.86% | | | | 0.86% | | | | 0.87% | | | | 0.86% | |
| Ratio of net investment income to average net assets | | | 2.84% | | | | 2.18% | | | | 3.44% | | | | 2.96% | | | | 2.96% | |
| Portfolio turnover | | | 15% | | | | 14% | | | | 16% | | | | 20% | | | | 21% | |
| 1 | Calculated using average shares outstanding. |
| 2 | Total return is based on the change in net asset value of a share during the period and assumes reinvestment of dividends and distributions at net asset value. |
| 3 | Expense ratios do not include expenses of the Underlying Funds in which the Portfolio invests. |
See accompanying notes, which are an integral part of the financial statements.
28
Table of Contents
Notes to financial statements
October 31, 2021
Macquarie Institutional Portfolios (registered as Delaware Pooled® Trust (Trust)) is organized as a Delaware statutory trust and offers four separate Portfolios. These financial statements and the related notes pertain to Macquarie Emerging Markets Portfolio, Macquarie Emerging Markets Portfolio II, and Macquarie Labor Select International Equity Portfolio (each, a Portfolio, and collectively, the Portfolios). Delaware Global Listed Real Assets Fund is included in a separate report. The Trust is an open-end investment company. Each Portfolio in this report is considered diversified under the Investment Company Act of 1940, as amended. Each Portfolio offers one class of shares.
1. Significant Accounting Policies
Each Portfolio follows accounting and reporting guidance under Financial Accounting Standards Board (FASB) Accounting Standards Codification Topic 946, Financial Services — Investment Companies. The following accounting policies are in accordance with US generally accepted accounting principles (US GAAP) and are consistently followed by the Portfolios.
Security Valuation — Equity securities, except those traded on the Nasdaq Stock Market LLC (Nasdaq), are valued at the last quoted sales price as of the time of the regular close of the New York Stock Exchange on the valuation date. Equity securities traded on the Nasdaq are valued in accordance with the Nasdaq Official Closing Price, which may not be the last sales price. If, on a particular day, an equity security does not trade, the mean between the bid and ask prices will be used, which approximates fair value. Equity securities listed on a foreign exchange are normally valued at the last quoted sales price on the valuation date. Open-end investment companies are valued at their published net asset value (NAV). Foreign currency exchange contracts and foreign cross currency exchange contracts are valued at the mean between the bid and ask prices, which approximates fair value. Interpolated values are derived when the settlement date of the contract is an interim date for which quotations are not available. Generally, other securities and assets for which market quotations are not readily available are valued at fair value as determined in good faith under the direction of the Trust’s Board of Trustees (Board). In determining whether market quotations are readily available or fair valuation will be used, various factors will be taken into consideration, such as market closures or suspension of trading in a security. The Portfolios may use fair value pricing more frequently for securities traded primarily in non-US markets because, among other things, most foreign markets close well before the Portfolios value their securities, generally as of 4:00pm Eastern time. The earlier close of these foreign markets gives rise to the possibility that significant events, including broad market moves, government actions or pronouncements, aftermarket trading, or news events may have occurred in the interim. Whenever such a significant event occurs, the Portfolios may value foreign securities using fair value prices based on third-party vendor modeling tools (international fair value pricing). Restricted securities are valued at fair value using methods approved by the Boards.
Federal and Foreign Income Taxes — No provision for federal income taxes has been made as each Portfolio intends to continue to qualify for federal income tax purposes as a regulated investment company under Subchapter M of the Internal Revenue Code of 1986, as amended, and make the requisite distributions to shareholders. The Portfolios evaluates tax positions taken or expected to be taken in the course of preparing each Portfolio’s tax returns to determine whether the tax positions are “more-likely-than-not” of being sustained by the applicable tax authority. Tax positions not deemed to meet the “more-likely-than-not” threshold are recorded as a tax benefit or expense in the current year. Management has analyzed each Portfolio’s tax positions taken or expected to be taken on the Portfolios’ federal income tax returns through the year ended October 31, 2021, and for all open tax years (years ended October 31, 2018–October 31, 2020), and has concluded that no provision for federal income tax is required in any Portfolio’s financial statements. In regard to foreign taxes only, each Portfolio has open tax years in certain foreign countries in which it invests that may date back to the inception of each Portfolio. If applicable, each Portfolio recognizes interest accrued on unrecognized tax benefits in interest expense and penalties in “Other” on the “Statements of operations.” During the year ended October 31, 2021, the Portfolios did not incur any interest or tax penalties.
Foreign Currency Transactions — Transactions denominated in foreign currencies are recorded at the prevailing exchange rates on the valuation date in accordance with each Portfolio’s prospectus. The value of all assets and liabilities denominated in foreign currencies is translated daily into US dollars at the exchange rate of such currencies against the US dollar. Transaction gains or losses resulting from changes in exchange rates during the reporting period or upon settlement of the foreign currency transaction are reported in operations for the current period. Each Portfolio generally bifurcates that portion of realized gains and losses on investments in debt securities which is due to changes in foreign exchange rates from that which is due to changes in market prices of debt securities. That portion of gains (losses), attributable to changes in foreign exchange rates, is included on the “Statements of operations” under “Net realized gain (loss) on foreign currencies.” For foreign equity securities, the realized gains and losses are included on the “Statements of operations” under “Net realized gain (loss) on investments.” Each Portfolio reports certain foreign currency related transactions as components of realized gains (losses) for financial reporting purposes, whereas such components are treated as ordinary income (loss) for federal income tax purposes.
(continues) 29
Table of Contents
Notes to financial statements
1. Significant Accounting Policies (continued)
Use of Estimates — The preparation of financial statements in conformity with US GAAP requires management to make estimates and assumptions that affect the fair value of investments, the reported amounts of assets and liabilities and disclosure of contingent assets and liabilities at the date of the financial statements, and the reported amounts of revenues and expenses during the reporting period. Actual results could differ from those estimates and the differences could be material.
Reimbursement Fees — Macquarie Emerging Markets Portfolio may charge a 0.40% purchase reimbursement fee and a 0.45% redemption reimbursement fee. These fees are designed to reflect an approximation of the brokerage and other transaction costs associated with the investment of an investor’s purchase amount or the disposition of assets to meet redemptions, and to limit the extent to which the Portfolio (and, indirectly, the Portfolio’s existing shareholders) would have to bear such costs. These fees are accounted for as an addition to paid-in capital for the Portfolio in the “Statements of changes in net assets.”
Other — Expenses directly attributable to a Portfolio are charged directly to that Portfolio. Other expenses common to various funds within Delaware Funds by Macquarie® (Delaware Funds) are generally allocated among such funds on the basis of average net assets. Management fees and certain other expenses are paid monthly. Security transactions are recorded on the date the securities are purchased or sold (trade date) for financial reporting purposes. Costs used in calculating realized gains and losses on the sale of investment securities are those of the specific securities sold. Dividend income is recorded on the ex-dividend date and interest income is recorded on the accrual basis. Discounts and premiums on debt securities are accreted or amortized to interest income, respectively, over the lives of the respective securities using the effective interest method. Premiums on callable debt securities are amortized to interest income to the earliest call date using the effective interest method. Realized gains (losses) on paydowns of asset- and mortgage-backed securities are classified as interest income. Distributions received from investments in real estate investment trusts (REITs) are recorded as dividend income on the ex-dividend date, subject to reclassification upon notice of the character of such distributions by the issuer, which are estimated. Foreign dividends are also recorded on the ex-dividend date or as soon after the ex-dividend date that a Portfolio is aware of such dividends, net of all tax withholdings, a portion of which may be reclaimable. Withholding taxes and reclaims on foreign dividends and interest have been recorded in accordance with each Portfolio’s understanding of the applicable country’s tax rules and rates. Each Portfolio may pay foreign capital gains taxes on certain foreign securities held, which are reported as components of realized losses for financial reporting purposes, whereas such components are treated as ordinary loss for federal income tax purposes. The Portfolios will accrue such taxes as applicable based upon current interpretations of the tax rules and regulations that exist in the markets in which they invest.
Each Portfolio declares and pays dividends from net investment income and distributions from net realized gain on investments, if any, annually. Each Portfolio may distribute more frequently, if necessary for tax purposes. Dividends and distributions, if any, are recorded on the ex-dividend date.
Each Portfolio receives earnings credits from its custodian when positive cash balances are maintained, which may be used to offset custody fees. The expenses paid under this arrangement are included on the “Statements of operations” under “Custodian fees” with the corresponding expenses offset included under “Less expenses paid indirectly.” There were no such earnings credits for the year ended October 31, 2021.
Each Portfolio receives earnings credits from its transfer agent when positive cash balances are maintained, which may be used to offset transfer agent fees. If the amount earned is greater than $1, the expenses paid under this arrangement are included on the “Statements of operations” under “Dividend disbursing and transfer agent fees and expenses” with the corresponding expenses offset included under “Less expenses paid indirectly.”
| | | | |
| Fund | | Earnings Credits |
| Macquarie Emerging Markets Portfolio | | | $1 | |
| Macquarie Emerging Markets Portfolio II | | | 1 | |
| Macquarie Labor Select International Equity Portfolio | | | 2 | |
2. Investment Management, Administration Agreements, and Other Transactions with Affiliates
In accordance with the terms of the respective investment management agreements, Delaware Management Company (DMC), a series of Macquarie Investment Management Business Trust and the investment manager of the Portfolios, will receive an annual fee, which is calculated daily and paid monthly based on the average daily net assets of each Portfolio.
30
Table of Contents
Effective February 26, 2021, DMC has contractually agreed to waive all or a portion, if any, of its management fees and/or pay/reimburse expenses for each Portfolio (except for Macquarie Labor Select International Equity Portfolio) (excluding any distribution and service (12b-1) fees, acquired fund fees and expenses, taxes, interest, short sale, dividend and interest expenses, brokerage fees, certain insurance costs, and nonroutine expenses or costs, including, but not limited to, those relating to reorganizations, litigation, conducting shareholder meetings, and liquidations), in order to prevent total annual portfolio operating expenses from exceeding specified percentages of average daily net assets of each Portfolio, from November 1, 2020 through October 31, 2021.* For purposes of these waivers and reimbursements, nonroutine expenses may also include such additional costs and expenses as may be agreed upon from time to time by the Portfolios’ Board and DMC. These expense waivers and reimbursements apply only to expenses paid directly by the Portfolios and may be terminated only by agreement of DMC and the Portfolios. The waivers and reimbursements are accrued daily and received monthly.
DMC may permit its affiliates, Macquarie Investment Management Global Limited (MIMGL) and Macquarie Funds Management Hong Kong Limited (together, the “Affiliated Sub-Advisors”), to execute equity security trades on behalf of the Manager for Macquarie Emerging Markets Portfolio II. The Manager may also seek quantitative support from MIMGL for the Portfolio. Although the Affiliated Sub-Advisors serve as sub-advisors, DMC has ultimate responsibility for all investment advisory services. For these services, DMC, not a Portfolio, may pay each Affiliated Sub-Advisor a portion of its investment management fee.
The management fee rates and the operating expense limitation rates in effect for the year ended October 31, 2021, are as follows:
| | | | Contractual |
| | | | operating expense |
| | | | limitation as |
| | Management fee | | a percentage |
| | as a percentage of | | of average |
| Fund | | average daily net assets (per annum) | | daily net assets (per annum) |
| Macquarie Emerging Markets Portfolio | | 1.00% | | 1.26% |
| Macquarie Emerging Markets Portfolio II | | 1.00% | | 1.20% |
| Macquarie Labor Select International Equity | | | | |
| Portfolio | | 0.75% | | N/A |
Mondrian Investment Partners Limited (Mondrian) furnishes investment sub-advisory services to Macquarie Emerging Markets Portfolio and Macquarie Labor Select International Equity Portfolio. For these services, DMC, not the Portfolios, pays Mondrian a portion of its investment management fee.
Delaware Investments Fund Services Company (DIFSC), an affiliate of DMC, provides fund accounting and financial administrative oversight services to each Portfolio. For these services, DIFSC’s fees are calculated daily and paid monthly, based on the aggregate daily net assets of all funds within the Delaware Funds at the following annual rates: 0.00475% of the first $35 billion; 0.0040% of the next $10 billion; and 0.0025% of aggregate average daily net assets in excess of $45 billion (Total Fee). Each fund in the Delaware Funds pays a minimum of $4,000, which, in aggregate, is subtracted from the Total Fee. Each fund then pays its portion of the remainder of the Total Fee on a relative NAV basis. These amounts are included on the “Statements of operations” under “Accounting and administration expenses.”
For the year ended October 31, 2021, each Portfolio was charged for these services as follows:
| Fund | | Fees |
| Macquarie Emerging Markets Portfolio | | $ | 6,507 |
| Macquarie Emerging Markets Portfolio II | | | 5,174 |
| Macquarie Labor Select International Equity Portfolio | | | 10,947 |
(continues) 31
Table of Contents
Notes to financial statements
2. Investment Management, Administration Agreements, and Other Transactions with Affiliates (continued)
DIFSC is also the transfer agent and dividend disbursing agent of each Portfolio. For these services, DIFSC’s fees are calculated daily and paid monthly, at the annual rate of 0.0075% of each Portfolio’s average daily net assets. These amounts are included on the “Statements of operations” under “Dividend disbursing and transfer agent fees and expenses.” For the year ended October 31, 2021, each Portfolio was charged for these services as follows:
| Fund | | Fees |
| Macquarie Emerging Markets Portfolio | | $ | 5,468 |
| Macquarie Emerging Markets Portfolio II | | | 2,584 |
| Macquarie Labor Select International Equity Portfolio | | | 15,168 |
Pursuant to a sub-transfer agency agreement between DIFSC and BNY Mellon Investment Servicing (US) Inc. (BNYMIS), BNYMIS provides certain sub-transfer agency services to each Portfolio. Sub-transfer agency fees are paid by each Portfolio and are also included on the “Statements of operations” under “Dividend disbursing and transfer agent fees and expenses.” These fees that are calculated daily and paid as invoices are received on a monthly or quarterly basis.
As provided in the investment management agreement, each Portfolio bears a portion of the cost of certain resources shared with DMC, including the cost of internal personnel of DMC and/or its affiliates that provide legal and regulatory reporting services to the Portfolios. These amounts are included on the “Statements of operations” under “Legal fees.” For the year ended October 31, 2021, each Portfolio was charged for internal legal and regulatory reporting services provided by DMC and/or its affiliates’ employees as follows:
| Fund | | Fees |
| Macquarie Emerging Markets Portfolio | | $ | 4,649 |
| Macquarie Emerging Markets Portfolio II | | | 2,514 |
| Macquarie Labor Select International Equity Portfolio | | | 12,853 |
Trustees’ fees include expenses accrued by each Portfolio for each Trustee’s retainer and meeting fees. Certain officers of DMC, DIFSC, and DDLP are officers and/or Trustees of the Trusts. These officers and Trustees are paid no compensation by the Portfolios.
In addition to the management fees and other expenses of a Portfolio, a Portfolio indirectly bears the investment management fees and other expenses of the investment companies (Underlying Funds) in which it invests. The amount of these fees and expenses incurred indirectly by a Portfolio will vary based upon the expense and fee levels of the Underlying Funds and the number of shares that are owned of the Underlying Funds at different times.
____________________
| * | The aggregate contractual waiver period covering this report is from February 28, 2020 through March 1, 2022 for Macquarie Emerging Markets Portfolio and Macquarie Emerging Markets Portfolio II. |
3. Investments
For the year ended October 31, 2021, each Portfolio made purchases and sales of investment securities other than short-term investments as follows:
| Fund | | Purchases
other than
US government
securities | | Sales
other than
US government
securities |
| Macquarie Emerging Markets Portfolio | | | $ | 29,920,534 | | | | $ | 29,627,181 | |
| Macquarie Emerging Markets Portfolio II | | | | 3,888,330 | | | | | 45,519,950 | |
| Macquarie Labor Select International Equity Portfolio | | | | 28,630,424 | | | | | 99,670,426 | |
32
Table of Contents
The tax cost of investments includes adjustments to net unrealized appreciation (depreciation) which may not necessarily be the final tax cost basis adjustments, but approximate the tax basis unrealized gains and losses that may be realized and distributed to shareholders. At October 31, 2021, the cost and unrealized appreciation (depreciation) of investments for federal income tax purpose for each Portfolio were as follows:
| Fund | | Cost of
investments
and derivatives | | Aggregate
unrealized
appreciation
of investments
and derivatives | | Aggregate
unrealized
depreciation
of investments
and derivatives | | Net unrealized
appreciation
of investments
and derivatives |
| Macquarie Emerging Markets Portfolio | | $ | 64,176,808 | | $ | 12,509,963 | | $ | (7,191,529 | ) | | $ | 5,318,434 |
| Macquarie Emerging Markets Portfolio II | | | 15,276,852 | | | 8,697,865 | | | (1,670,840 | ) | | | 7,027,025 |
| Macquarie Labor Select International Equity Portfolio | | | 158,552,868 | | | 30,023,986 | | | (16,888,875 | ) | | | 13,135,111 |
US GAAP defines fair value as the price that each Portfolio would receive to sell an asset or pay to transfer a liability in an orderly transaction between market participants at the measurement date under current market conditions. A three-level hierarchy for fair value measurements has been established based upon the transparency of inputs to the valuation of an asset or liability. Inputs may be observable or unobservable and refer broadly to the assumptions that market participants would use in pricing the asset or liability. Observable inputs reflect the assumptions market participants would use in pricing the asset or liability based on market data obtained from sources independent of the reporting entity. Unobservable inputs reflect the reporting entity’s own assumptions about the assumptions that market participants would use in pricing the asset or liability based on the best information available under the circumstances. Each Portfolio’s investment in its entirety is assigned a level based upon the observability of the inputs which are significant to the overall valuation. The three-level hierarchy of inputs is summarized as follows:
| Level 1 – | Inputs are quoted prices in active markets for identical investments. (Examples: equity securities, open-end investment companies, futures contracts, and exchange-traded options contracts) |
| | |
| Level 2 – | Other observable inputs, including, but not limited to: quoted prices for similar assets or liabilities in markets that are active, quoted prices for identical or similar assets or liabilities in markets that are not active, inputs other than quoted prices that are observable for the assets or liabilities (such as interest rates, yield curves, volatilities, prepayment speeds, loss severities, credit risks, and default rates) or other market-corroborated inputs. (Examples: debt securities, government securities, swap contracts, foreign currency exchange contracts, foreign securities utilizing international fair value pricing, broker-quoted securities, and fair valued securities) |
| | |
| Level 3 – | Significant unobservable inputs, including each Portfolio’s own assumptions used to determine the fair value of investments. (Examples: broker-quoted securities and fair valued securities) |
Level 3 investments are valued using significant unobservable inputs. Each Portfolio may also use an income-based valuation approach in which the anticipated future cash flows of the investment are discounted to calculate fair value. Discounts may also be applied due to the nature or duration of any restrictions on the disposition of the investments. Valuations may also be based upon current market prices of securities that are comparable in coupon, rating, maturity, and industry. The derived value of a Level 3 investment may not represent the value which is received upon disposition and this could impact the results of operations.
(continues) 33
Table of Contents
Notes to financial statements
3. Investments (continued)
| | Macquarie
Emerging
Markets
Portfolio |
| | Level 1 |
| Securities | | | | | |
| Assets: | | | | | |
| Common Stock | | | $ | 66,100,424 | |
| Preferred Stock | | | | 2,530,551 | |
| Short-Term Investments | | | | 864,267 | |
| Total Value of Securities | | | $ | 69,495,242 | |
| | Macquarie Emerging Markets Portfolio II |
| | Level 1 | | Level 2 | | Total |
| Securities | | | | | | | | | |
| Assets: | | | | | | | | | |
| Common Stock | | | | | | | | | |
| Argentina | | $ | 18,003 | | $ | — | | $ | 18,003 |
| Bahrain | | | 6,736 | | | — | | | 6,736 |
| Brazil | | | 908,344 | | | — | | | 908,344 |
| Chile | | | 115,818 | | | — | | | 115,818 |
| China | | | 6,415,508 | | | — | | | 6,415,508 |
| India | | | 3,206,176 | | | — | | | 3,206,176 |
| Indonesia | | | 558,320 | | | — | | | 558,320 |
| Malaysia | | | 11,294 | | | — | | | 11,294 |
| Mexico | | | 762,775 | | | — | | | 762,775 |
| Peru | | | 65,302 | | | — | | | 65,302 |
| Republic of Korea | | | 3,713,847 | | | 462,516 | | | 4,176,363 |
| Russia | | | 1,322,762 | | | 272,553 | | | 1,595,315 |
| South Africa | | | 53,922 | | | — | | | 53,922 |
| Taiwan | | | 3,937,083 | | | — | | | 3,937,083 |
| Turkey | | | 136,388 | | | — | | | 136,388 |
| United States | | | 310,950 | | | — | | | 310,950 |
| Preferred Stock | | | — | | | 17,163 | | | 17,163 |
| Warrants | | | 978 | | | — | | | 978 |
| Short-Term Investments | | | 7,439 | | | — | | | 7,439 |
| Total Value of Securities | | $ | 21,551,645 | | $ | 752,232 | | $ | 22,303,877 |
34
Table of Contents
| | Macquarie |
| | Labor Select |
| | International |
| | Equity Portfolio |
| | Level 1 |
| Securities | | | | | |
| Assets: | | | | | |
| Common Stock | | | $ | 170,730,464 | |
| Short-Term Investments | | | | 957,515 | |
| Total Value of Securities | | | $ | 171,687,979 | |
During the year ended October 31, 2021, there were no transfers into or out of Level 3 investments. Each Portfolio’s policy is to recognize transfers into or out of Level 3 investments based on fair value at the beginning of the reporting period.
A reconciliation of Level 3 investments is presented when a Portfolio has a significant amount of Level 3 investments at the beginning, interim, or end of the period in relation to each Portfolio’s net assets. During the year ended October 31, 2021, there were no Level 3 investments.
4. Dividend and Distribution Information
Income and long-term capital gain distributions are determined in accordance with federal income tax regulations, which may differ from US GAAP. Additionally, distributions from net gains on foreign currency transactions and net short-term gains on sales of investment securities are treated as ordinary income for federal income tax purposes. The tax character of dividends and distributions paid during the years ended October 31, 2021 and 2020 were as follows:
| | | | | Long-term | | | |
| | Ordinary | | capital | | | |
| | income | | gains | | Total |
| Year ended October 31, 2021: | | | | | | | | | |
| Macquarie Emerging Markets Portfolio | | $ | 814,896 | | $ | — | | $ | 814,896 |
| Macquarie Emerging Markets Portfolio II | | | 1,904,742 | | | 629,008 | | | 2,533,750 |
| Macquarie Labor Select International Equity Portfolio | | | 7,466,559 | | | — | | | 7,466,559 |
| | | | | | | | | | |
| Year ended October 31, 2020: | | | | | | | | | |
| Macquarie Emerging Markets Portfolio | | | 1,680,428 | | | — | | | 1,680,428 |
| Macquarie Emerging Markets Portfolio II | | | 413,111 | | | 830,570 | | | 1,243,681 |
| Macquarie Labor Select International Equity Portfolio | | | 15,845,402 | | | 6,695,168 | | | 22,540,570 |
5. Components of Net Assets on a Tax Basis
As of October 31, 2021, the components of net assets on a tax basis were as follows:
| | | | | | | | | | Macquarie |
| | Macquarie | | Macquarie | | Labor Select |
| | Emerging | | Emerging | | International |
| | Markets | | Markets | | Equity |
| | Portfolio | | Portfolio II | | Portfolio |
| Shares of beneficial interest | | $ | 105,417,693 | | | $ | (3,610,281 | ) | | $ | 205,789,668 | |
| Undistributed ordinary income | | | 1,431,976 | | | | 1,402,108 | | | | 5,682,722 | |
| Undistributed long-term capital gains | | | — | | | | 17,433,144 | | | | — | |
| Capital loss carryforwards | | | (42,845,878 | )* | | | — | | | | (50,535,490 | ) |
| Unrealized appreciation of investments, and foreign currencies | | | 5,318,434 | | | | 7,027,025 | | | | 13,135,111 | |
| Net assets | | $ | 69,322,225 | | | $ | 22,251,996 | | | $ | 174,072,011 | |
| * | A portion of the Portfolio’s capital loss carryforward is subject to limitation under the Internal Revenue Code and related regulations. |
(continues) 35
Table of Contents
Notes to financial statements
5. Components of Net Assets on a Tax Basis (continued)
The differences between book basis and tax basis components of net assets are primarily attributable to tax deferral of losses on wash sales, mark-to-market on foreign currency exchange contracts, and tax treatment of passive foreign investment companies.
For financial reporting purposes, capital accounts are adjusted to reflect the tax character of permanent book/tax differences. Reclassifications are primarily due to the tax treatment of passive foreign investment companies and capital gain tax reclass. Results of operations and net assets were not affected by these reclassifications. For the year ended October 31, 2021, the Portfolio’s had no reclassifications.
For federal income tax purposes, capital loss carryforwards may be carried forward and applied against future capital gains. At October 31, 2021, the Funds utilized the following capital loss carryforwards:
| Macquarie Emerging Markets Portfolio | | $ | 9,194,959 |
| Macquarie Emerging Markets Portfolio II | | | — |
| Macquarie Labor Select International Equity Portfolio | | | 6,769,602 |
At October 31, 2021, capital loss carryforwards available to offset future realized capital gains are as follows:
| | | | Loss carryforward character | | | |
| | | Short-term | | Long-term | | Total |
| Macquarie | | | | | | | | | | | |
| Emerging | | | | | | | | | | | |
| Markets | | | | | | | | | | | |
| Portfolio | | | $ | — | | | $ | 42,845,878 | | $ | 42,845,878 |
| Macquarie | | | | | | | | | | | |
| Labor Select | | | | | | | | | | | |
| International | | | | | | | | | | | |
| Equity | | | | | | | | | | | |
| Portfolio | | | | — | | | | 50,535,490 | | | 50,535,490 |
6. Capital Shares
Transactions in capital shares were as follows:
| | | | | | Shares issued | | | | | | | | |
| | | | | upon reinvestment | | Shares sold | | | | | Net |
| | | Shares | | of dividends | | and issued | | Shares | | increase |
| | | sold | | and distributions | | total | | redeemed | | (decrease) |
| Year ended October 31, 2021: | | | | | | | | | | | | |
| Macquarie Emerging Markets Portfolio | | — | | 87,442 | | 87,442 | | (1,409 | ) | | 86,033 | |
| Macquarie Emerging Markets Portfolio II | | — | | 202,308 | | 202,308 | | (2,880,810 | ) | | (2,678,502 | ) |
| Macquarie Labor Select International Equity Portfolio | | 352,321 | | 573,909 | | 926,230 | | (5,836,860 | ) | | (4,910,630 | ) |
Year ended October 31, 2020: | | | | | | | | | | | | |
| Macquarie Emerging Markets Portfolio | | 704,580 | | 191,300 | | 895,880 | | (3,261,751 | ) | | (2,365,871 | ) |
| Macquarie Emerging Markets Portfolio II | | — | | 120,577 | | 120,577 | | (39,481 | ) | | 81,096 | |
| Macquarie Labor Select International Equity Portfolio | | 991,507 | | 1,567,494 | | 2,559,001 | | (17,417,928) (14,858,927) | |
7. Line of Credit
Each Portfolio, along with certain other funds in the Delaware Funds (Participants), was a participant in a $275,000,000 revolving line of credit (Agreement) intended to be used for temporary or emergency purposes as an additional source of liquidity to fund redemptions of investor shares. Under the Agreement, the Participants were charged an annual commitment fee of 0.15%, which was allocated across the Participants based on a weighted average of the respective net assets of each Participant. The Participants were permitted to borrow up to a maximum of
36
Table of Contents
one-third of their net assets under the Agreement. Each Participant was individually, and not jointly, liable for its particular advances, if any, under the line of credit. The line of credit available under the Agreement expired on November 2, 2020.
On November 2, 2020, each Portfolio, along with the other Participants entered into an amendment to the Agreement for an amount of $225,000,000 to be used as described above. It operates in substantially the same manner as the original Agreement with the addition of an upfront fee of 0.05%, which was allocated across the Participants. The line of credit available under the Agreement expires on November 1, 2021.
The Portfolios had no amounts outstanding as of October 31, 2021, or at any time during the year then ended.
8. Derivatives
US GAAP requires disclosures that enable investors to understand: (1) how and why an entity uses derivatives; (2) how they are accounted for; and (3) how they affect an entity’s results of operations and financial position.
Foreign Currency Exchange Contracts — Each Portfolio may enter into foreign currency exchange contracts and foreign cross currency exchange contracts as a way of managing foreign exchange rate risk. Each Portfolio may enter into these contracts to fix the US dollar value of a security that it has agreed to buy or sell for the period between the date the trade was entered into and the date the security is delivered and paid for. Each Portfolio may also enter into these contracts to hedge the US dollar value of securities it already owns that are denominated in foreign currencies. In addition, each Portfolio may enter into these contracts to facilitate or expedite the settlement of portfolio transactions. The change in value is recorded as an unrealized gain or loss. When the contract is closed, a realized gain or loss is recorded equal to the difference between the value of the contract at the time it was opened and the value at the time it was closed.
The use of foreign currency exchange contracts and foreign cross currency exchange contracts does not eliminate fluctuations in the underlying prices of the securities, but does establish a rate of exchange that can be achieved in the future. Although foreign currency exchange contracts and foreign cross currency exchange contracts limit the risk of loss due to an unfavorable change in the value of the hedged currency, they also limit any potential gain that might result should the value of the currency change favorably. In addition, each Portfolio could be exposed to risks if the counterparties to the contracts are unable to meet the terms of their contracts. Each Portfolio’s maximum risk of loss from counterparty credit risk is the value of its currency exchanged with the counterparty. The risk is generally mitigated by having a netting arrangement between each Portfolio and the counterparty and by the posting of collateral by the counterparty to the Portfolio to cover each Portfolio’s exposure to the counterparty.
Macquarie Emerging Markets Portfolio, Macquarie Emerging Markets Portfolio II, and Macquarie Labor Select International Equity Portfolio entered into foreign currency exchange contracts and foreign cross currency exchange contracts to facilitate or expedite the settlement of portfolio transactions.
At October 31, 2021, Macquarie Emerging Markets Portfolio, Macquarie Emerging Markets Portfolio II, and Macquarie Labor Select International Equity Portfolio had foreign currency risk, which is disclosed on the “Statements of assets and liabilities” and/or “Statements of operations.”
The table below summarizes the average balance of derivative holdings by each Portfolio during the year ended October 31, 2021:
| | Long Derivative Volume | |
| | | | | | | | | | | | Macquarie |
| | Macquarie | | Macquarie | | Labor Select |
| | Emerging | | Emerging | | International |
| | Markets | | Markets | | Equity |
| | Portfolio | | Portfolio II | | Portfolio |
| Foreign currency exchange contracts (average notional value) | | | $ | 25,572 | | | | $ | 14,136 | | | | $ | 22,581 | |
(continues) 37
Table of Contents
Notes to financial statements
8. Derivatives (continued)
| | Short Derivative Volume |
| | | | | | | | | | | | Macquarie |
| | Macquarie | | Macquarie | | Labor Select |
| | Emerging | | Emerging | | International |
| | Markets | | Markets | | Equity |
| | Portfolio | | Portfolio II | | Portfolio |
| Foreign currency exchange contracts (average notional value) | | | $ | 18,771 | | | | $ | 37,919 | | | | $ | 191,228 | |
9. Securities Lending
Each Portfolio, along with other funds in the Delaware Funds, may lend its securities pursuant to a security lending agreement (Lending Agreement) with The Bank of New York Mellon (BNY Mellon). At the time a security is loaned, the borrower must post collateral equal to the required percentage of the market value of the loaned security, including any accrued interest. The required percentage is: (1) 102% with respect to US securities and foreign securities that are denominated and payable in US dollars; and (2) 105% with respect to foreign securities. With respect to each loan, if on any business day the aggregate market value of securities collateral plus cash collateral held is less than the aggregate market value of the securities which are the subject of such loan, the borrower will be notified to provide additional collateral by the end of the following business day, which, together with the collateral already held, will be not less than the applicable initial collateral requirements for such security loan. If the aggregate market value of securities collateral and cash collateral held with respect to a security loan exceeds the applicable initial collateral requirement, upon the request of the borrower, BNY Mellon must return enough collateral to the borrower by the end of the following business day to reduce the value of the remaining collateral to the applicable initial collateral requirement for such security loan. As a result of the foregoing, the value of the collateral held with respect to a loaned security on any particular day, may be more or less than the value of the security on loan. The collateral percentage with respect to the market value of the loaned security is determined by the security lending agent.
Cash collateral received by each Portfolio of the Trust is generally invested in a series of individual separate accounts, each corresponding to a Portfolio. The investment guidelines permit each separate account to hold certain securities that would be considered eligible securities for a money market fund. Cash collateral received is generally invested in government securities; certain obligations issued by government sponsored enterprises; repurchase agreements collateralized by US Treasury securities; obligations issued by the central government of any Organization for Economic Cooperation and Development (OECD) country or its agencies, instrumentalities or establishments; obligations of supranational organizations; commercial paper, notes, bonds, and other debt obligations; certificates of deposit, time deposits, and other bank obligations; and asset-backed securities. The Portfolio can also accept US government securities and letters of credit (non-cash collateral) in connection with securities loans.
In the event of default or bankruptcy by the lending agent, realization and/or retention of the collateral may be subject to legal proceedings. In the event the borrower fails to return loaned securities and the collateral received is insufficient to cover the value of the loaned securities and provided such collateral shortfall is not the result of investment losses, the lending agent has agreed to pay the amount of the shortfall to each Portfolio or, at the discretion of the lending agent, replace the loaned securities. Each Portfolio continues to record dividends or interest, as applicable, on the securities loaned and are subject to changes in value of the securities loaned that may occur during the term of the loan. Each Portfolio has the right under the Lending Agreement to recover the securities from the borrower on demand. With respect to security loans collateralized by non-cash collateral, each Portfolio receives loan premiums paid by the borrower. With respect to security loans collateralized by cash collateral, the earnings from the collateral investments are shared among each Portfolio, the security lending agent, and the borrower. Each Portfolio records security lending income net of allocations to the security lending agent and the borrower.
Each Portfolio may incur investment losses as a result of investing securities lending collateral. This could occur if an investment in the collateral investment account defaulted or became impaired. Under those circumstances, the value of the Portfolio’s cash collateral account may be less than the amount the Portfolio would be required to return to the borrowers of the securities and the Portfolio would be required to make up for this shortfall.
During the year ended October 31, 2021, the Portfolios had no securities out on loan.
38
Table of Contents
10. Credit and Market Risk
Beginning in January 2020, global financial markets have experienced and may continue to experience significant volatility resulting from the spread of a novel coronavirus known as COVID-19. The outbreak of COVID-19 has resulted in travel and border restrictions, quarantines, supply chain disruptions, lower consumer demand and general market uncertainty. The effects of COVID-19 have and may continue to adversely affect the global economy, the economies of certain nations, and individual issuers, all of which may negatively impact the Portfolios performance.
Investments in equity securities in general are subject to market risks that may cause their prices to fluctuate over time. Fluctuations in the value of equity securities in which the Portfolios invests will cause the NAV of the Funds to fluctuate.
Some countries in which Macquarie Emerging Markets, Macquarie Emerging Markets II, and Macquarie Labor Select International Equity Portfolios invest require governmental approval for the repatriation of investment income, capital, or the proceeds of sales of securities by foreign investors. In addition, if there is deterioration in a country’s balance of payments or for other reasons, a country may impose temporary restrictions on foreign capital remittances abroad.
Macquarie Emerging Markets Portfolio and Macquarie Emerging Markets Portfolio II invest a significant portion of their assets in the greater China region, which consists of Hong Kong, the People’s Republic of China, and Taiwan, among other countries. As a result, each Portfolio’s investments in the region are particularly susceptible to risks in that region. Adverse events in any one country within the region may impact the other countries in the region or Asia as a whole. As a result, adverse events in the region will generally have a greater effect on each Portfolio than if the Portfolio were more geographically diversified, which could result in greater volatility in each Portfolio’s net asset value and losses. Markets in the greater China region can experience significant volatility due to social, economic, regulatory, and political uncertainties.
The securities exchanges of certain foreign markets are substantially smaller, less liquid, and more volatile than the major securities markets in the United States. Consequently, acquisition and disposition of securities by each Portfolio may be inhibited. In addition, a significant portion of the aggregate market value of securities listed on the major securities exchanges in emerging markets is held by a smaller number of investors. This may limit the number of shares available for acquisition or disposition by each Portfolio.
Each Portfolio may invest up to 15% of its net assets in illiquid securities, which may include securities with contractual restrictions on resale, securities exempt from registration under Rule 144A promulgated under the Securities Act of 1933, as amended, and other securities which may not be readily marketable. The relative illiquidity of these securities may impair each Portfolio from disposing of them in a timely manner and at a fair price when it is necessary or desirable to do so. While maintaining oversight, the Portfolios’ Board has delegated to DMC, the day-to-day functions of determining whether individual securities are liquid for purposes of each Portfolio’s limitation on investments in illiquid securities. Securities eligible for resale pursuant to Rule 144A, which are determined to be liquid, are not subject to the Portfolios’ 15% limit on investments in illiquid securities. Rule 144A securities have been identified on the “Schedules of investments.”
11. Contractual Obligations
Each Portfolio enters into contracts in the normal course of business that contain a variety of indemnifications. Each Portfolio’s maximum exposure under these arrangements is unknown. However, each Portfolio has not had prior claims or losses pursuant to these contracts. Management has reviewed each Portfolio’s existing contracts and expects the risk of loss to be remote.
12. Recent Accounting Pronouncements
In March 2020, FASB issued an Accounting Standards Update (ASU), ASU 2020-04, Reference Rate Reform (Topic 848) – Facilitation of the Effects of Reference Rate Reform on Financial Reporting. The amendments in ASU 2020-04 provide optional temporary financial reporting relief from the effect of certain types of contract modifications due to the planned discontinuation of LIBOR and other interbank-offered based reference rates as of the end of 2021. ASU 2020-04 is effective for certain reference rate-related contract modifications that occur during the period March 12, 2020 through December 31, 2022. As of the financial reporting period, Management is evaluating the impact of applying this ASU.
(continues) 39
Table of Contents
Notes to financial statements
13. Subsequent Events
On November 1, 2021, the Portfolios, along with the other Participants, entered into an amendment to the agreement for a $355,000,000 revolving line of credit to be used as described in Note 7 and to be operated in substantially the same manner as the agreement described in Note 7. Under the amendment to the agreement, the Participants are charged an annual commitment fee of 0.15% with the addition of an upfront fee of 0.05%, which is allocated across the Participants based on a weighted average of the respective net assets of each Participant. The line of credit available under the agreement expires on October 31, 2022.
Management has determined that no other material events or transactions occurred subsequent to October 31, 2021, that would require recognition or disclosure in each Portfolio’s financial statements.
40
Table of Contents
Report of independent
registered public accounting firm
To the Board of Trustees of Delaware Pooled® Trust and Shareholders of Macquarie Emerging Markets Portfolio, Macquarie Emerging Markets Portfolio II and Macquarie Labor Select International Equity Portfolio
Opinions on the Financial Statements
We have audited the accompanying statements of assets and liabilities, including the schedules of investments, of Macquarie Emerging Markets Portfolio, Macquarie Emerging Markets Portfolio II and Macquarie Labor Select International Equity Portfolio (three of the series constituting Delaware Pooled® Trust, hereafter collectively referred to as the “Funds”) as of October 31, 2021, the related statements of operations for the year ended October 31, 2021, the statements of changes in net assets for each of the two years in the period ended October 31, 2021, including the related notes, and the financial highlights for each of the five years in the period ended October 31, 2021 (collectively referred to as the “financial statements”). In our opinion, the financial statements present fairly, in all material respects, the financial position of the Funds as of October 31, 2021, the results of each of their operations for the year then ended, the changes in each of their net assets for each of the two years in the period ended October 31, 2021 and each of the financial highlights for each of the five years in the period ended October 31, 2021 in conformity with accounting principles generally accepted in the United States of America.
Basis for Opinions
These financial statements are the responsibility of the Funds’ management. Our responsibility is to express an opinion on the Funds’ financial statements based on our audits. We are a public accounting firm registered with the Public Company Accounting Oversight Board (United States) (PCAOB) and are required to be independent with respect to the Funds in accordance with the U.S. federal securities laws and the applicable rules and regulations of the Securities and Exchange Commission and the PCAOB.
We conducted our audits of these financial statements in accordance with the standards of the PCAOB. Those standards require that we plan and perform the audit to obtain reasonable assurance about whether the financial statements are free of material misstatement, whether due to error or fraud.
Our audits included performing procedures to assess the risks of material misstatement of the financial statements, whether due to error or fraud, and performing procedures that respond to those risks. Such procedures included examining, on a test basis, evidence regarding the amounts and disclosures in the financial statements. Our audits also included evaluating the accounting principles used and significant estimates made by management, as well as evaluating the overall presentation of the financial statements. Our procedures included confirmation of securities owned as of October 31, 2021 by correspondence with the custodian, transfer agents and brokers; when replies were not received from brokers, we performed other auditing procedures. We believe that our audits provide a reasonable basis for our opinions.
/s/PricewaterhouseCoopers LLP
Philadelphia, Pennsylvania
December 20, 2021
We have served as the auditor of one or more investment companies in Delaware Funds® by Macquarie since 2010.
41
Table of Contents
Other Portfolio information
(Unaudited)
Macquarie Institutional Portfolios
Liquidity Risk Management Program
The Securities and Exchange Commission (the “SEC”) has adopted Rule 22e-4 under the Investment Company Act of 1940 (the “Liquidity Rule”), which requires all open-end funds (other than money market funds) to adopt and implement a program reasonably designed to assess and manage the fund’s “liquidity risk,” defined as the risk that the fund could not meet requests to redeem shares issued by the fund without significant dilution of remaining investors’ interests in the fund.
The Portfolios have adopted and implemented a liquidity risk management program in accordance with the Liquidity Rule (the “Program”). The Board has designated a member of the US Operational Risk Group of Macquarie Asset Management as the Program Administrator for each Portfolio in the Trust.
As required by the Liquidity Rule, the Program includes policies and procedures that provide for: (1) assessment, management, and review (no less frequently than annually) of each Portfolio’s liquidity risk; (2) classification of each of each Portfolio’s portfolio holdings into one of four liquidity categories (Highly Liquid, Moderately Liquid, Less Liquid, and Illiquid); (3) funds that do not primarily hold assets that are Highly Liquid, establishing and maintaining a minimum percentage of each of the Portfolio’s net assets in Highly Liquid investments (called a “Highly Liquid Investment Minimum” or “HLIM”); and (4) prohibiting each Portfolio’s acquisition of Illiquid investments if, immediately after the acquisition, each Portfolio would hold more than 15% of its net assets in Illiquid assets. The Program also requires reporting to the SEC (on a non-public basis) and to the Board if each Portfolio’s holdings of Illiquid assets exceed 15% of each Portfolio’s net assets. Portfolios with HLIMs must have procedures for addressing HLIM shortfalls, including reporting to the Board and, with respect to HLIM shortfalls lasting more than seven consecutive calendar days, reporting to the SEC (on a non-public basis).
In assessing and managing each Portfolio’s liquidity risk, the Program Administrator considers, as relevant, a variety of factors, including: (1) each Portfolio’s investment strategy and liquidity of portfolio investments during both normal and reasonably foreseeable stressed conditions; (2) short-term and long-term cash flow projections for the Portfolios during both normal and reasonably foreseeable stressed conditions; and (3) each Portfolio’s holdings of cash and cash equivalents and any borrowing arrangements. Classification of each Portfolio’s portfolio holdings in the four liquidity categories is based on the number of days it is reasonably expected to take to convert the investment to cash (for Highly Liquid and Moderately Liquid holdings) or to sell or dispose of the investment (for Less Liquid and Illiquid investments), in current market conditions without significantly changing the investment’s market value. Each Portfolio primarily holds assets that are classified as Highly Liquid, and therefore is not required to establish an HLIM.
At a meeting of the Board held on May 25-27, 2021, the Program Administrator provided a written report to the Board addressing the Program’s operation and assessing the adequacy and effectiveness of its implementation for the period from April 1, 2020 through March 31, 2021. The report concluded that the Program is appropriately designed and effectively implemented and that it meets the requirements of Rule 22e-4 and each Portfolio’s liquidity needs. Each Portfolio’s HLIM is set at an appropriate level and the Portfolios complied with their HLIM at all times during the reporting period.
42
Table of Contents
Tax information
The information set forth below is for each Portfolio’s fiscal year as required by federal laws. Shareholders, however, must report distributions on a calendar year basis for income tax purposes, which may include distributions for portions of two fiscal years of a fund. Accordingly, the information needed by shareholders for income tax purposes will be sent to them in January of each year. Please consult your tax advisor for proper treatment of this information.
All disclosures are based on financial information available as of the date of this annual report and, accordingly, are subject to change. For any and all items requiring reporting, it is the intention of each Portfolio to report the maximum amount permitted under the Internal Revenue Code and the regulations thereunder.
For the fiscal year ended October 31, 2021, each Portfolio reports distributions paid during the year as follows:
| | (A) | | | | | | | | | | |
| | Long-Term | | (B) | | | | | |
| | Capital Gains | | Ordinary Income | | Total |
| | Distributions | | Distributions | | Distributions |
| | (Tax Basis) | | (Tax Basis) | | (Tax Basis) |
| Macquarie Emerging Markets Portfolio | | | — | | | | | 100.00 | % | | | | 100.00 | % | |
| Macquarie Emerging Markets Portfolio II | | | 24.83 | % | | | | 75.17 | % | | | | 100.00 | % | |
| Macquarie Labor Select International Equity Portfolio | | | — | | | | | 100.00 | % | | | | 100.00 | % | |
____________________
(A) and (B) are based on a percentage of the Fund’s total distributions. |
For the fiscal year ended October 31, 2021, certain dividends paid by the Portfolios may be subject to a maximum tax rate of 20%. The Portfolios intend to report the following percentages to be taxed at a maximum rate of 20%. Complete information will be computed and reported in conjunction with your 2021 Form 1099-DIV, as applicable.
| | Maximum |
| | percentage to |
| | be |
| | taxed at a |
| | maximum rate |
| | of 20% |
| Macquarie Emerging Markets Portfolio | | | 97.59 | % | |
| Macquarie Emerging Markets Portfolio II | | | 27.45 | % | |
| Macquarie Labor Select International Equity Portfolio | | | 89.77 | % | |
Macquarie Emerging Markets Portfolio, Macquarie Emerging Markets Portfolio II, and Macquarie Labor Select International Equity Portfolio intend to pass through foreign tax credits in the maximum amount of $124,826, $102,475, and $365,979, respectively. The gross foreign source income earned during the fiscal year 2021 was $1,732,523, $703,973, and $7,900,743, respectively. Complete information will be computed and reported in conjunction with your 2021 Form 1099-DIV.
continues 43
Table of Contents
Other Portfolio information
(Unaudited)
Macquarie Institutional Portfolios
Board consideration of Investment Advisory and Sub-Advisory Agreements for each series of Macquarie Institutional Portfolios at a meeting held August 10-12, 2021
At a meeting held on August 10-12, 2021 (the “Annual Meeting”), the Board of Trustees (the “Board”), including a majority of disinterested or independent Trustees, approved the renewal of the Investment Advisory and Sub-Advisory Agreements, as applicable, for each of the series of Macquarie Institutional Portfolios (each, a “Portfolio” and together, the “Portfolios”). In making its decision, the Board considered information furnished at regular quarterly Board meetings, including reports detailing Portfolio performance, investment strategies, and expenses, as well as information prepared specifically in connection with the renewal of the investment advisory and sub-advisory contracts. Information furnished specifically in connection with the renewal of the Investment Management Agreement with Delaware Management Company (“DMC”), a series of Macquarie Investment Management Business Trust (“MIMBT”) and the Sub-Advisory Agreements with Mondrian Investment Partners Limited (“Mondrian”), Macquarie Funds Management Hong Kong Limited (“MFMHK”), Macquarie Investment Management Europe Limited (“MIMEL”), Macquarie Investment Management Global Limited (“MIMGL”), and Macquarie Investment Management Austria Kapitalanlage AG (“MIMAK”) (the “Sub-Advisers”), included materials provided by DMC and its affiliates (collectively, “Macquarie Investment Management”) concerning, among other things, the nature, extent, and quality of services provided to the Portfolios; the costs of such services to the Portfolios; economies of scale; and the investment manager’s financial condition and profitability. In addition, in connection with the Annual Meeting, materials were provided to the Trustees in May 2021, including reports provided by Broadridge Financial Solutions (“Broadridge”). The Broadridge reports compared each Portfolio’s investment performance and expenses with those of other comparable mutual funds. The Independent Trustees reviewed and discussed the Broadridge reports with independent legal counsel to the Independent Trustees. In addition to the information noted above, the Board also requested and received information regarding DMC’s policy with respect to advisory fee levels and its breakpoint philosophy; the structure of portfolio manager compensation; comparative client fee information; and any constraints or limitations on the availability of securities for certain investment styles, which had in the past year inhibited, or which were likely in the future to inhibit, the investment manager’s ability to invest fully in accordance with Portfolio policies.
In considering information relating to the approval of each Portfolio’s advisory and sub-advisory agreements, as applicable, the Independent Trustees received assistance and advice from and met separately with independent legal counsel to the Independent Trustees and also received assistance and advice from an experienced and knowledgeable independent fund consultant, JDL Consultants, LLC (“JDL”). Although the Board gave attention to all information furnished, the following discussion identifies, under separate headings, the primary factors taken into account by the Board during its contract renewal considerations.
Nature, extent, and quality of services. The Board considered the services provided by DMC to the Portfolios and their shareholders. In reviewing the nature, extent, and quality of services, the Board considered reports furnished to it throughout the year, which covered matters such as the relative performance of the Portfolios; compliance of portfolio managers with the investment policies, strategies, and restrictions for the Portfolios; compliance by DMC and Delaware Distributors, L.P. (together, “Management”) personnel with the Code of Ethics adopted throughout the Delaware Funds by Macquarie® (the “Delaware Funds”); and adherence to fair value pricing procedures as established by the Board. The Board was pleased with the current staffing of DMC and the emphasis placed on research in the investment process. The Board recognized DMC’s receipt of certain favorable industry distinctions during the past several years. The Board gave favorable consideration to DMC’s efforts to control expenses while maintaining service levels committed to Portfolio matters. The Board also noted the benefits provided to Portfolio shareholders through each shareholder’s ability to: (i) exchange investments between Portfolios or the institutional class shares of other Delaware Funds and (ii) reinvest Portfolio dividends into additional shares of the Portfolio or into additional shares of other Delaware Funds. The Board was satisfied with the nature, extent, and quality of the overall services provided by DMC.
Nature, extent, and quality of services. The Board considered the services provided by each Sub-Adviser to the Portfolios and their shareholders, as applicable. In reviewing the nature, extent, and quality of services, the Board considered reports furnished to it throughout the year at regular Board Meetings covering matters such as relative performance of the Portfolios; compliance of portfolio managers with the investment policies, strategies, and restrictions for the Portfolios; the compliance of Sub-Adviser personnel with its Code of Ethics and adherence to fair value pricing procedures as established by the Board. The Board was pleased with the current staffing of each Sub-Adviser and the emphasis placed on research in the investment process. The Board was satisfied with the nature, extent, and quality of the overall services provided by each Sub-Adviser.
Investment performance. The Board placed significant emphasis on the investment performance of the Portfolios in view of the importance of investment performance to shareholders.1 Although the Board considered performance reports and discussions with portfolio managers at
44
Table of Contents
Board meetings throughout the year, the Board gave particular weight to the Broadridge reports furnished for the Annual Meeting. The Broadridge reports prepared for each Portfolio showed the investment performance of its shares in comparison to a group of similar funds (the “Performance Universe”). A fund with the best performance ranked first, and a fund with the poorest performance ranked last. The highest/best performing 25% of funds in the Performance Universe make up the first quartile; the next 25%, the second quartile; the next 25%, the third quartile; and the poorest/worst performing 25% of funds in the Performance Universe make up the fourth quartile. Comparative annualized performance for the Portfolios was shown for the past 1-, 3-, 5- and 10-year periods, to the extent applicable, ended December 31, 2020. The Board’s objective is that each Portfolio’s performance for the 1-, 3-, and 5-year periods be at or above the median of its Performance Universe.
Macquarie Emerging Markets Portfolio – The Performance Universe for the Portfolio consisted of the Portfolio and all retail and institutional emerging markets funds as selected by Broadridge. The Broadridge report comparison showed that the Portfolio’s total return for the 1-, 3-, and 10-year periods was in the third quartile of its Performance Universe. The report further showed that the Portfolio’s total return for the 5-year period was in the fourth quartile of its Performance Universe. The Board observed that the Portfolio’s performance was not in line with the Board’s objective. In evaluating the Portfolio’s performance, the Board considered the performance attribution included in the Meeting materials, as well as the numerous investment and performance reports delivered by Management personnel to the Board’s Investments Committee. The Board was satisfied that Management was taking action to improve Portfolio performance and to meet the Board’s performance objective.
Macquarie Emerging Markets Portfolio II – The Performance Universe for the Portfolio consisted of the Portfolio and all retail and institutional emerging markets funds as selected by Broadridge. The Broadridge report comparison showed that the Portfolio’s total return for the 1-year, 3-year, 5-year, and 10-year periods was in the first quartile of its Performance Universe. The Board was satisfied with performance.
Macquarie Labor Select International Equity Portfolio – The Performance Universe for the Portfolio consisted of the Portfolio and all retail and institutional international large-cap value funds as selected by Broadridge. The Broadridge report comparison showed that the Portfolio’s total return for the 1-, 3-, and 5-year periods was in the fourth quartile of its Performance Universe. The report further showed that the Portfolio’s total return for the 10-year period was in the second quartile of its Performance Universe. The Board observed that the Portfolio’s performance was not in line with the Board’s objective. In evaluating the Portfolio’s performance, the Board considered the performance attribution included in the Meeting materials, as well as the numerous investment and performance reports delivered by Management personnel to the Board’s Investments Committee. The Board was satisfied that Management was taking action to improve Portfolio performance and to meet the Board’s performance objective.
Comparative expenses. The Board considered expense data for the Delaware Funds. Management provided the Board with information on pricing levels and fee structures for each Portfolio as of its most recent fiscal year end. The Board also focused on the comparative analysis of effective management fees and total expense ratios of each Portfolio versus effective management fees and expense ratios of a group of similar funds as selected by Broadridge (the “Expense Group”). In reviewing comparative costs, each Portfolio’s contractual management fee and the actual management fee incurred by the Portfolio were compared with the contractual management fees (assuming all funds in the Expense Group were similar in size to the Portfolio) and actual management fees (as reported by each fund) within the Expense Group, taking into account any applicable breakpoints and fee waivers. Each Portfolio’s total expenses were also compared with those of its Expense Group. The Board’s objective is for each Portfolio’s total expense ratio to be competitive with those of the peer funds within its Expense Group.2
Macquarie Emerging Markets Portfolio – The expense comparisons for the Portfolio showed that its actual management fee was in the quartile with the second highest expenses of its Expense Group and its total expenses were in the quartile with the highest expenses of its Expense Group. The Board noted that the Portfolio’s total expenses were not in line with the Board’s objective. In evaluating the total expenses, the Board considered fee waivers in place through February 2022 and various initiatives implemented by Management, such as the negotiation of lower fees for fund accounting, fund accounting oversight services, and custody, which had created an opportunity for a further reduction in expenses. The Board was satisfied with Management’s efforts to improve the Portfolio’s total expense ratio and to bring it in line with the Board’s objective.
Macquarie Emerging Markets Portfolio II – The expense comparisons for the Portfolio showed that its actual management fee was in the quartile with the second lowest expenses of its Expense Group and its total expenses were in the quartile with the second highest expenses of its Expense Group. The Board gave favorable consideration to the Portfolio’s management fee but noted that the Portfolio’s total expenses were not in line with the Board’s objective. In evaluating the total expenses, the Board considered fee waivers in place through February 2022 and various initiatives implemented by Management, such as the negotiation of lower fees for fund accounting, fund accounting oversight services,
continues 45
Table of Contents
Other Portfolio information
(Unaudited)
Macquarie Institutional Portfolios
Board consideration of Investment Advisory and Sub-Advisory Agreements for each series of Macquarie Institutional Portfolios at a meeting held August 10-12, 2021 (continued)
and custody, which had created an opportunity for a further reduction in expenses. The Board was satisfied with Management’s efforts to improve the Portfolio’s total expense ratio and to bring it in line with the Board’s objective.
Macquarie Labor Select International Equity Portfolio – The expense comparisons for the Portfolio showed that its actual management fee was in the quartile with the second highest expenses of its Expense Group and its total expenses were in the quartile with the second lowest expenses of its Expense Group. The Board was satisfied with the total expenses of the Portfolio in comparison to those of its Expense Group.
Management profitability. The Board considered the level of profits, if any, realized by DMC in connection with the operation of the Portfolios. In this respect, the Board reviewed the Investment Management Profitability Analysis that addressed the overall profitability of DMC’s business in providing management and other services to each of the individual funds and the Delaware Funds as a whole. Specific attention was given to the methodology used by DMC in allocating costs for the purpose of determining profitability. Management stated that the level of profits of DMC, to a certain extent, reflects recent operational cost savings and efficiencies initiated by DMC. The Board considered DMC’s efforts to improve services provided to Portfolio shareholders and to meet additional regulatory and compliance requirements resulting from recent industry-wide Securities and Exchange Commission initiatives. The Board also considered the extent to which DMC might derive ancillary benefits from fund operations, including the potential for procuring additional business as a result of the prestige and visibility associated with its role as service provider to the Delaware Funds and the benefits from allocation of fund brokerage to improve trading efficiencies. As part of its work, the Board also reviewed a report prepared by JDL regarding MIMBT profitability as compared to certain peer fund complexes and the Independent Trustees discussed with JDL personnel regarding DMC’s profitability in such context. The Board found that the management fees were reasonable in light of the services rendered and the profitability of DMC.
Management profitability. Trustees were also given available information on profits being realized by each Sub-Adviser in relation to the services being provided to the Portfolios, as applicable, and in relation to the Sub-Adviser’s overall investment advisory business, but believed such information to be of limited relevance because the sub-advisory fees are paid by DMC out of its management fee, and changes in the level of sub-advisory fees have no impact on Portfolio expenses. The Board was also provided information on potential fall-out benefits derived or to be derived by each Sub-Adviser in connection with its relationship to the Portfolios, such as reputational enhancement, soft-dollar arrangements, or commissions paid to affiliated broker/dealers, as applicable.
Economies of scale. The Trustees considered whether economies of scale are realized by DMC as each Portfolio’s assets increase and the extent to which any economies of scale are reflected in the level of management fees charged. The Trustees reviewed the Portfolios’ advisory fee pricing and structure approved by the Board and shareholders, which does not include breakpoints. Breakpoints in the advisory fee occur when the advisory fee rate is reduced on assets in excess of specified levels. Breakpoints result in a lower advisory fee, than would otherwise be the case in the absence of breakpoints, when the asset levels specified in the breakpoints are exceeded. Benchmarking analysis indicated that less than one quarter of competing funds in the institutional market employ breakpoints. Management believed, and the Board agreed, that the Portfolios were priced with relatively low management fees to reflect potential economies of scale at all asset levels.
____________________
| 1 | The Board also considered the performance of the Macquarie Large Cap Value Portfolio against the Broadridge report and was satisfied that Management was taking action to improve Portfolio performance and to meet the Board’s performance objective. The Portfolio was subsequently reorganized into Delaware Value® Fund, a series of Delaware Group Equity Funds II, prior to the end of its fiscal year. |
| 2 | The Board also considered the expense data of the Macquarie Large Cap Value Portfolio relative to its Expense Group and was satisfied with Management’s efforts to improve the Portfolio’s total expense ratio and to bring it in line with the Board’s objective. The Portfolio was subsequently reorganized into Delaware Value® Fund, a series of Delaware Group Equity Funds II, prior to the end of its fiscal year. |
46
Table of Contents
Portfolio manager bios
Macquarie Emerging Markets Portfolio
Ginny Chong, CFA
Senior Portfolio Manager – Mondrian Investment Partners Ltd.
Prior to joining Mondrian in 2000, Ginny Chong worked for PricewaterhouseCoopers in Vancouver, within the Corporate Finance and Investment Banking Division where she qualified as a Canadian Chartered Accountant. Ms. Chong has a degree in Commerce from the University of British Columbia, Vancouver. Ms. Chong is presently a senior portfolio manager within the Emerging Markets Team. Ms. Chong is a CFA Charterholder and is a member of the CFA Institute and the CFA Society of the UK.
Gregory Halton, CFA
Senior Portfolio Manager – Mondrian Investment Partners Ltd.
Gregory Halton graduated from the University of Oxford in 2000 with a MEng (Hons) in Engineering Science. He began his investment career in the global equity division of Deutsche Asset Management before joining Mondrian in 2004. He is presently a senior portfolio manager within the Emerging Markets Team. Mr. Halton is a CFA Charterholder and is a member of the CFA Institute and the CFA Society of the UK.
Andrew Miller
Chief Investment Officer, Emerging Market Equities – Mondrian Investment Partners Ltd.
Andrew Miller has a BA (Hons) degree in History from the University of Birmingham. Prior to joining Mondrian in 2000, he worked in the Investment Management department of PricewaterhouseCoopers, where he was responsible for the analysis and audit of various investment vehicles. Whilst at Mondrian, Mr. Miller has specialized in Emerging Markets and he is now the Chief Investment Officer for this product. Mr. Miller holds the ASIP designation and is a member of the CFA Institute and the CFA Society of the UK.
Macquarie Emerging Markets Portfolio II
Liu-Er Chen, CFA
Managing Director, Chief Investment Officer – Emerging Markets and Healthcare
Liu-Er Chen heads the firm’s global Emerging Markets team, and he is also the portfolio manager for Delaware Healthcare Fund, which launched in September 2007. Prior to joining Macquarie Asset Management (MAM) in September 2006 in his current position, he spent nearly 11 years at Evergreen Investment Management Company, where he most recently worked as managing director and senior portfolio manager. He co-managed the Evergreen Emerging Markets Growth Fund from 1999 to 2001, and became the Fund’s sole manager in 2001. He was also the sole manager of the Evergreen Health Care Fund since its inception in 1999. Chen began his career at Evergreen in 1995 as an analyst covering Asian and global healthcare stocks, before being promoted to portfolio manager in 1998. Prior to his career in asset management, Chen worked for three years in sales, marketing, and business development for major American and European pharmaceutical and medical device companies. He received his medical education in China, and he has experience in medical research at both the Chinese Academy of Sciences and Cornell Medical School. He holds an MBA with a concentration in management from Columbia Business School.
Macquarie Labor Select International Equity Portfolio
Nigel A. Bliss
Senior Portfolio Manager – Mondrian Investment Partners Ltd.
Nigel A. Bliss is a graduate of the University of Manchester, holds the ASIP designation and is a member of the CFA Institute and the CFA Society of the UK. He commenced his career at Cazenove & Co. in 1993 and moved to join Mondrian in 1995. Mr. Bliss is a senior portfolio manager in the Non-US Equity Team and a member of Mondrian’s Non-US Equity Strategy Committee. He has had significant experience analyzing securities in the Pacific Basin region and in the global materials, utilities, property and industrials sectors. In recent years Mr. Bliss has taken responsibility for leading coverage of securities listed in the Hong Kong and Scandinavian markets whilst still maintaining his sector specialization.
continues 47
Table of Contents
Other Portfolio information
(Unaudited)
Macquarie Institutional Portfolios
Portfolio manager bios (continued)
Elizabeth A. Desmond, CFA
Deputy Chief Executive Officer and Chief Investment Officer – International Equities – Mondrian Investment Partners Ltd.
Elizabeth A. Desmond holds a BA from Wellesley College and an MA in East Asian Studies from Stanford University. After working for the Japanese government for two years, she began her investment career as a Pacific Basin investment manager with Shearson Lehman Global Asset Management. In 1991 Ms. Desmond joined Mondrian Investment Partners’ predecessor organization as a founding member after previously working as a Pacific Basin equity analyst and senior portfolio manager at Hill Samuel Investment Advisers Ltd. She is a Director and leads the International Equity investment team; in addition she chairs the International Equity Strategy Committee. Ms. Desmond is a CFA Charterholder, and a member of the CFA Institute and the CFA Society of the UK. She sits on the CFA UK’s Advisory Council.
Zsolt Mester, CFA
Portfolio Manager – Mondrian Investment Partners Ltd.
Zsolt Mester holds a BSc (First Class) and an MSc (with Distinction) in Financial Economics from the University of London and an MPhil in Economics from the University of Oxford. After graduation, Mr. Mester worked for three years as an equity research analyst. He joined Mondrian in 2014 in the International Equities team. Mr. Mester is a CFA Charterholder and a member of the CFA Institute and the CFA Society of the UK.
48
Table of Contents
Board of trustees / directors and officers addendum
Delaware Funds by Macquarie®
A mutual fund is governed by a Board of Trustees/Directors (“Trustees”), which has oversight responsibility for the management of a fund’s business affairs. Trustees establish procedures and oversee and review the performance of the investment manager, the distributor, and others who perform services for the fund. The independent fund trustees, in particular, are advocates for shareholder interests. Each trustee has served in that capacity since he or she was elected to or appointed to the Board of Trustees, and will continue to serve until his or her retirement or the election of a new trustee in his or her place. The following is a list of the Trustees and Officers with certain background and related information.
| | | | | | | | Number of | | Other |
| | | | | | Principal | | Portfolios in Fund | | Directorships |
| Name, | | Position(s) | | | | Occupation(s) | | Complex Overseen | | Held by |
| Address, | | Held with | | Length of Time | | During the | | by Trustee | | Trustee |
| and Birth Date | | Fund(s) | | Served | | Past Five Years | | or Officer | | or Officer |
| Interested Trustee | | | | | | | | | | |
| | | | | | | | | | | |
| Shawn K. Lytle1 | | President, | | President and | | Global Head of Macquarie Investment | | 150 | | Trustee — UBS |
| 610 Market Street | | Chief Executive Officer, | | Chief Executive Officer | | Management2 | | | | Relationship Funds, SMA |
| Philadelphia, PA | | and Trustee | | since August 2015 | | (January 2019–Present) | | | | Relationship Trust, and |
| 19106-2354 | | | | Trustee since | | Head of Americas of | | | | UBS Funds |
| February 1970 | | | | September 2015 | | Macquarie Group | | | | (May 2010–April 2015) |
| | | | | | (December 2017–Present) | | | | |
| | | | | | Deputy Global Head of Macquarie Investment | | | | |
| | | | | | Management | | | | |
| | | | | | (2017–2019) | | | | |
| | | | | | Head of Macquarie Investment Management | | | | |
| | | | | | Americas | | | | |
| | | | | | (2015–2017) | | | | |
| Independent Trustees | | | | | | | | | | |
| | | | | | | | | | | |
| Jerome D. Abernathy | | Trustee | | Since January 2019 | | Managing Member, Stonebrook Capital | | 150 | | None |
| 610 Market Street | | | | | | Management, LLC (financial technology: macro | | | | |
| Philadelphia, PA | | | | | | factors and databases) | | | | |
| 19106-2354 | | | | | | (January 1993-Present) | | | | |
| July 1959 | | | | | | | | | | |
| | | | | | | | | | | |
| Thomas L. Bennett | | Chair and Trustee | | Trustee since March | | Private Investor | | 150 | | None |
| 610 Market Street | | | | 2005 | | (March 2004–Present) | | | | |
| Philadelphia, PA | | | | Chair since March 2015 | | | | | | |
| 19106-2354 | | | | | | | | | | |
| October 1947 | | | | | | | | | | |
| | | | | | | | | | | |
| Ann D. Borowiec | | Trustee | | Since March 2015 | | Chief Executive Officer, Private Wealth | | 150 | | Director — Banco |
| 610 Market Street | | | | | | Management (2011–2013) and Market | | | | Santander International |
| Philadelphia, PA | | | | | | Manager, New Jersey Private Bank (2005– | | | | (October 2016–December |
| 19106-2354 | | | | | | 2011) — J.P. Morgan Chase & Co. | | | | 2019) |
| November 1958 | | | | | | | | | | Director — Santander |
| | | | | | | | | | Bank, N.A. (December |
| | | | | | | | | | 2016–December 2019) |
| | | | | | | | | | | |
| Joseph W. Chow | | Trustee | | Since January 2013 | | Private Investor | | 150 | | Director and Audit |
| 610 Market Street | | | | | | (April 2011–Present) | | | | Committee Member — |
| Philadelphia, PA | | | | | | | | | | Hercules Technology |
| 19106-2354 | | | | | | | | | | Growth Capital, Inc. |
| January 1953 | | | | | | | | | | (July 2004–July 2014) |
49
Table of Contents
Board of trustees / directors and officers addendum
Delaware Funds by Macquarie®
| | | | | | | | Number of | | Other |
| | | | | | Principal | | Portfolios in Fund | | Directorships |
| Name, | | Position(s) | | | | Occupation(s) | | Complex Overseen | | Held by |
| Address, | | Held with | | Length of Time | | During the | | by Trustee | | Trustee |
| and Birth Date | | Fund(s) | | Served | | Past Five Years | | or Officer | | or Officer |
| | | | | | | | | | | |
| John A. Fry | | Trustee | | Since January 2001 | | President — Drexel University | | 150 | | Director; Compensation |
| 610 Market Street | | | | | | (August 2010–Present) | | | | Committee and |
| Philadelphia, PA | | | | | | President — Franklin & Marshall College | | | | Governance Committee |
| 19106-2354 | | | | | | (July 2002–June 2010) | | | | Member — Community |
| May 1960 | | | | | | | | | | Health Systems |
| | | | | | | | | | (May 2004–Present) |
| | | | | | | | | | Director — Drexel Morgan |
| | | | | | | | | | & Co. (2015–2019) |
| | | | | | | | | | Director, Audit and |
| | | | | | | | | | Compensation Committee |
| | | | | | | | | | Member — vTv |
| | | | | | | | | | Therapeutics Inc. |
| | | | | | | | | | (2017–Present) |
| | | | | | | | | | Director and Audit |
| | | | | | | | | | Committee Member — FS |
| | | | | | | | | | Credit Real Estate Income |
| | | | | | | | | | Trust, Inc. (2018–Present) |
| | | | | | | | | | Director — Federal |
| | | | | | | | | | Reserve |
| | | | | | | | | | Bank of Philadelphia |
| | | | | | | | | | (January 2020–Present) |
| | | | | | | | | | | |
| Frances A. | | Trustee | | Since September 2011 | | Private Investor | | 150 | | Trust Manager and Audit |
| Sevilla-Sacasa | | | | | | (January 2017–Present) | | | | Committee Chair — |
| 610 Market Street | | | | | | Chief Executive Officer — Banco Itaú | | | | Camden Property Trust |
| Philadelphia, PA | | | | | | International | | | | (August 2011–Present) |
| 19106-2354 | | | | | | (April 2012–December 2016) | | | | Director; Audit |
| January 1956 | | | | | | Executive Advisor to Dean (August 2011– | | | | and Compensation |
| | | | | | March 2012) and Interim Dean | | | | Committee Member — |
| | | | | | (January 2011–July 2011) — University of | | | | Callon Petroleum |
| | | | | | Miami School of Business Administration | | | | Company |
| | | | | | President — U.S. Trust, Bank of America | | | | (December 2019–Present) |
| | | | | | Private Wealth Management (Private Banking) | | | | Director — New Senior |
| | | | | | (July 2007-December 2008) | | | | Investment Group Inc. |
| | | | | | | | | | (January 2021–September |
| | | | | | | | | | 2021) |
| | | | | | | | | | Director; Audit Committee |
| | | | | | | | | | Member — Carrizo Oil & |
| | | | | | | | | | Gas, Inc. (March 2018– |
| | | | | | | | | | December 2019) |
| | | | | | | | | | | |
| Thomas K. Whitford | | Trustee | | Since January 2013 | | Vice Chairman — PNC Financial Services | | 150 | | Director — HSBC North |
| 610 Market Street | | | | | | Group | | | | America Holdings Inc. |
| Philadelphia, PA | | | | | | (2010–April 2013) | | | | (December 2013–Present) |
| 19106-2354 | | | | | | | | | | Director — HSBC USA Inc. |
| March 1956 | | | | | | | | | | (July 2014–Present) |
| | | | | | | | | | Director — HSBC Bank |
| | | | | | | | | | USA, National Association |
| | | | | | | | | | (July 2014–March 2017) |
| | | | | | | | | | Director — HSBC Finance |
| | | | | | | | | | Corporation |
| | | | | | | | | | (December 2013–April |
| | | | | | | | | | 2018) |
50
Table of Contents
| | | | | | | | Number of | | Other |
| | | | | | Principal | | Portfolios in Fund | | Directorships |
| Name, | | Position(s) | | | | Occupation(s) | | Complex Overseen | | Held by |
| Address, | | Held with | | Length of Time | | During the | | by Trustee | | Trustee |
| and Birth Date | | Fund(s) | | Served | | Past Five Years | | or Officer | | or Officer |
| | | | | | | | | | | |
| Christianna Wood | | Trustee | | Since January 2019 | | Chief Executive Officer and President — Gore | | 150 | | Director; Finance |
| 610 Market Street | | | | | | Creek Capital, Ltd. (August 2009–Present) | | | | Committee and Audit |
| Philadelphia, PA | | | | | | | | | | Committee Member — |
| 19106-2354 | | | | | | | | | | H&R Block Corporation |
| August 1959 | | | | | | | | | | (July 2008–Present) |
| | | | | | | | | | Director; Investments |
| | | | | | | | | | Committee, Capital and |
| | | | | | | | | | Finance Committee, and |
| | | | | | | | | | Audit Committee Member |
| | | | | | | | | | — Grange Insurance |
| | | | | | | | | | (2013–Present) |
| | | | | | | | | | Trustee; Chair of |
| | | | | | | | | | Nominating and |
| | | | | | | | | | Governance Committee |
| | | | | | | | | | and Audit Committee |
| | | | | | | | | | Member — |
| | | | | | | | | | The Merger Fund |
| | | | | | | | | | (2013–October 2021), |
| | | | | | | | | | The Merger Fund VL |
| | | | | | | | | | (2013–October 2021); |
| | | | | | | | | | WCM Alternatives: Event- |
| | | | | | | | | | Driven Fund (2013– |
| | | | | | | | | | October 2021), and WCM |
| | | | | | | | | | Alternatives: Credit Event |
| | | | | | | | | | Fund (December 2017– |
| | | | | | | | | | October 2021) |
| | | | | | | | | | Director; Chair of |
| | | | | | | | | | Governance Committee |
| | | | | | | | | | and Audit Committee |
| | | | | | | | | | Member — International |
| | | | | | | | | | Securities Exchange |
| | | | | | | | | | (2010–2016) |
| | | | | | | | | | | |
| Janet L. Yeomans | | Trustee | | Since April 1999 | | Vice President and Treasurer (January 2006– | | 150 | | Director; Personnel and |
| 610 Market Street | | | | | | July 2012), Vice President — Mergers & | | | | Compensation Committee |
| Philadelphia, PA | | | | | | Acquisitions | | | | Chair; Member of |
| 19106-2354 | | | | | | (January 2003–January 2006), and Vice | | | | Nominating, Investments, |
| July 1948 | | | | | | President and Treasurer | | | | and Audit Committees for |
| | | | | | (July 1995–January 2003) — 3M Company | | | | various periods |
| | | | | | | | | | throughout directorship |
| | | | | | | | | | — Okabena Company |
| | | | | | | | | | (2009–2017) |
| Officers | | | | | | | | | | |
| | | | | | | | | | | |
| David F. Connor | | Senior Vice President, | | Senior Vice President, | | David F. Connor has served in various | | 150 | | None3 |
| 610 Market Street | | General Counsel, and | | since May 2013; General | | capacities at different times at Macquarie | | | | |
| Philadelphia, PA | | Secretary | | Counsel since May 2015; | | Investment Management. | | | | |
| 19106-2354 | | | | Secretary since October | | | | | | |
| December 1963 | | | | 2005 | | | | | | |
| | | | | | | | | | |
| Daniel V. Geatens | | Senior Vice President and | | Senior Vice President and | | Daniel V. Geatens has served in various | | 150 | | None3 |
| 610 Market Street | | Treasurer | | Treasurer since October | | capacities at different times at Macquarie | | | | |
| Philadelphia, PA | | | | 2007 | | Investment Management. | | | | |
| 19106-2354 | | | | | | | | | | |
| October 1972 | | | | | | | | | | |
| | | | | | | | | | | |
| Richard Salus | | Senior Vice President and | | Senior Vice President and | | Richard Salus has served in various capacities | | 150 | | None |
| 610 Market Street | | Chief Financial Officer | | Chief Financial Officer | | at different times at Macquarie Investment | | | | |
| Philadelphia, PA | | | | since November 2006 | | Management. | | | | |
| 19106-2354 | | | | | | | | | | |
| October 1963 | | | | | | | | | | |
| 1 | Shawn K. Lytle is considered to be an “Interested Trustee” because he is an executive officer of the Fund’s(s’) investment advisor. |
51
Table of Contents
Board of trustees / directors and officers addendum
Delaware Funds by Macquarie®
| 2 | Macquarie Investment Management is the marketing name for Macquarie Management Holdings, Inc. and its subsidiaries, including the Fund’s(s’) investment advisor, principal underwriter, and its transfer agent. |
| 3 | David F. Connor serves as Senior Vice President and Secretary, and Daniel V. Geatens serves as Senior Vice President, Treasurer, and Chief Financial Officer, for the six portfolios of the Optimum Fund Trust, which have the same investment advisor, principal underwriter, and transfer agent as the registrant. Mr. Geatens also serves as the Chief Financial Officer and Treasurer for Macquarie Global Infrastructure Total Return Fund Inc. |
The Statement of Additional Information for the Fund(s) includes additional information about the Trustees and Officers and is available, without charge, upon request by calling 800 231-8002.
52
Table of Contents
Portfolio managers
Macquarie Emerging Markets Portfolio
Ginny Chong
Senior Portfolio Manager
Mondrian Investment Partners Limited
Gregory Halton
Senior Portfolio Manager
Mondrian Investment Partners Limited
Andrew Miller
Chief Investment Officer –
Emerging Market Equities
Mondrian Investment Partners Limited
Macquarie Emerging Markets Portfolio II
Liu-Er Chen
Managing Director,
Chief Investment Officer –
Emerging Markets and Healthcare
Macquarie Labor Select International Equity Portfolio
Nigel A. Bliss
Senior Portfolio Manager
Mondrian Investment Partners Limited
Elizabeth A. Desmond
Deputy Chief Executive Officer, Chief
Investment Officer – International Equities
Mondrian Investment Partners Limited
Zsolt Mester
Portfolio Manager
Mondrian Investment Partners Limited
53
Table of Contents
| | |
 |  |
| | |
| | |
| | |
| | |
| | |
| | |
| | |
| | |
| | |
| | |
| | Annual report |
| | |
Multi-asset mutual fund
Delaware Global Listed Real Assets Fund
October 31, 2021
Carefully consider the Fund’s investment objectives, risk factors, charges, and expenses before investing. This and other information can be found in the Fund’s prospectus and its summary prospectus, which may be obtained by visiting delawarefunds.com/literature or calling 800 523-1918. Investors should read the prospectus and the summary prospectus carefully before investing.
You can obtain shareholder reports and prospectuses online instead of in the mail.
Visit delawarefunds.com/edelivery.
Table of Contents
Experience Delaware Funds by Macquarie®
Macquarie Investment Management (MIM) is a global asset manager with offices in the United States, Europe, Asia, and Australia. As active managers, we prioritize autonomy and accountability at the investment team level in pursuit of opportunities that matter for clients. Delaware Funds is one of the longest-standing mutual fund families, with more than 80 years in existence.
If you are interested in learning more about creating an investment plan, contact your financial advisor.
You can learn more about Delaware Funds or obtain a prospectus for Delaware Global Listed Real Assets Fund at delawarefunds.com/literature.
Manage your account online
| ● | Check your account balance and transactions |
| ● | View statements and tax forms |
| ● | Make purchases and redemptions |
Visit delawarefunds.com/account-access.
Macquarie Asset Management (MAM) offers a diverse range of products including securities investment management, infrastructure and real asset management, and fund and equity-based structured products. MIM is the marketing name for certain companies comprising the asset management division of Macquarie Group. This includes the following investment advisers: Macquarie Investment Management Business Trust (MIMBT), Macquarie Funds Management Hong Kong Limited, Macquarie Investment Management Austria Kapitalanlage AG, Macquarie Investment Management Global Limited, Macquarie Investment Management Europe Limited, and Macquarie Investment Management Europe S.A.
The Fund is distributed by Delaware Distributors, L.P. (DDLP), an affiliate of MIMBT and Macquarie Group Limited.
Other than Macquarie Bank Limited (MBL), none of the entities noted are authorized deposit-taking institutions for the purposes of the Banking Act 1959 (Commonwealth of Australia). The obligations of these entities do not represent deposits or other liabilities of MBL. MBL does not guarantee or otherwise provide assurance in respect of the obligations of these entities, unless noted otherwise.
The Fund is governed by US laws and regulations.
Table of contents
Unless otherwise noted, views expressed herein are current as of October 31, 2021, and subject to change for events occurring after such date.
The Fund is not FDIC insured and is not guaranteed. It is possible to lose the principal amount invested.
Advisory services provided by Delaware Management Company, a series of MIMBT, a US registered investment advisor.
All third-party marks cited are the property of their respective owners.
© 2021 Macquarie Management Holdings, Inc.
Table of Contents
| Portfolio management review | |
| Delaware Global Listed Real Assets Fund | November 9, 2021 (Unaudited) |
| Performance preview (for the year ended October 31, 2021) | | | | |
| Delaware Global Listed Real Assets Fund (Institutional Class shares) | | 1-year return | | +30.62% |
| Delaware Global Listed Real Assets Fund (Class A shares) | | 1-year return | | +30.28% |
| Bloomberg Global Inflation-Linked Total Return Index Value Hedged USD | | | | |
| (primary benchmark) | | 1-year return | | +5.94% |
| Global Listed Real Assets Blended Benchmark* (secondary benchmark) | | 1-year return | | +26.11% |
Past performance does not guarantee future results.
For complete, annualized performance for Delaware Global Listed Real Assets Fund, please see the table on page 4. Institutional Class shares are not subject to a sales charge and are offered for sale exclusively to certain eligible investors. In addition, Institutional Class shares pay no distribution and service fee.
The performance of Class A shares excludes the applicable sales charge. The performance of both Institutional Class shares and Class A shares reflects the reinvestment of all distributions.
Please see page 8 for a description of the index. Index performance returns do not reflect any management fees, transaction costs, or expenses. Indices are unmanaged and one cannot invest directly in an index.
| * | The Global Listed Real Assets Blended Benchmark is computed using a combination of 20% S&P Global Natural Resources Index NR; 20% FTSE EPRA Nareit Developed Index NR; 20% S&P Global Infrastructure Index NR; and 40% Bloomberg Global Inflation-Linked Total Return Index Value Hedged USD. |
Investment objective
The Fund seeks total return, which is targeted to be in excess of inflation, through growth of capital and current income.
Market review
An environment where investors were willing to invest in higher-risk securities characterized the Fund’s fiscal year. Higher-risk assets continued to perform strongly on the back of the recovery story that followed the COVID-19-related crash. Although there were short setbacks – mainly due to further waves of COVID-19 variants – the Federal Reserve’s continued loose monetary policy, coupled with significantly expansive fiscal policy, led equities to new highs for most of the period. High yield corporates also recorded notably strong performances for the fiscal year, but, apart from gold, commodity prices developed even more strongly. In contrast, owing to rising yields, government bonds recorded losses, especially in the US and the UK, but also in the European Union.
The shift of power to Democrats in the White House and Congress made further stimulus packages possible in 2021. Rising demand led to supply bottlenecks and sharply rising energy prices. This price pressure contributed to the highest inflation rates in years and led to discussions about the central bank’s tapering its bond purchases. Accordingly, yields also rose significantly. In September, the Fed began to speak officially about the possibility of starting tapering policy in 2021.
Developments in China also caused a lot of turbulence over the summer, with tough government regulatory measures against its own technology sector, the collapse of the real estate giant Evergrande, and electricity shortages in the country that lead to power rationing.
After seven positive months, the US stock market recorded its first monthly loss in September in the face of various uncertainties, including the US debt ceiling debate. However, a government shutdown was avoided for the present, and, against the backdrop of strong third-quarter
1
Table of Contents
Portfolio management review
Delaware Global Listed Real Assets Fund
earnings results, equities reached new highs in October.
Source: Bloomberg.
Within the Fund
For the fiscal year ended October 31, 2021, Delaware Global Listed Real Assets Fund outperformed its primary benchmark, the Bloomberg Global Inflation-Linked Total Return Index, and its secondary benchmark, a blended benchmark consisting of 20% S&P Global Natural Resources Index (net return), 20% S&P Global Infrastructure Index (net return), 20% FTSE EPRA Nareit Developed Index (net return), and 40% Bloomberg Global Inflation-Linked Total Return Index Hedged USD. The Fund’s Institutional Class shares gained 30.62%. The Fund’s Class A shares rose 30.28% at net asset value and 22.76% at maximum offer price (both figures reflect all distributions reinvested). For the same period, the primary benchmark gained 5.94% and the secondary benchmark rose 26.11%. For complete, annualized performance of Delaware Global Listed Real Assets Fund, please see the table on page 4.
The Fund’s outperformance for the fiscal year mainly stemmed from equity exposure that was largely allocated to natural resources, infrastructure, and real estate. Natural resources equities strongly outperformed global equities for the 12-month period. Real estate outperformed broad equities, while infrastructure trailed, albeit at a high level of absolute performance. Since fixed income assets performed much more poorly than equities, the Fund’s underweight positioning in fixed income during the fiscal year contributed to its outperformance. Within fixed income, the allocation to public corporates and the corresponding underweight of inflation-linked bonds also benefited the Fund’s performance.
The Fund seeks diversification in terms of both geographies and asset classes within real assets.
Within the broader allocation between equities and fixed income, the Fund is neutral, with approximately 60% in equities and 40% in fixed income.
We periodically examine the contribution of derivatives to the Fund’s performance. Based on the available information, we believe the Fund’s combination of futures, options, swaps, and currency positions had only a limited effect on performance during the fiscal year.
At the end of the Fund’s fiscal year, we sought to continue to deliver the potential benefits of diversification while actively managing risk. With these two principles in mind, the Fund seeks to deliver returns that are derived from tactical asset allocation decisions as well as from active management of individual asset classes and investment styles. We manage the Fund based on the assumption that investors should keep a global perspective when evaluating potential investment opportunities, and, as a result, we continue to include investment possibilities around the globe within the Fund. Further, we believe that an investment in listed real assets offers exposure to asset class sectors that may not be available through traditional equity and fixed income exposure.
We think the growth outlook at fiscal year end is cautiously positive. Especially in the US, consumer demand is positive, the corporate earnings reporting season is going well, and the labor market is on a recovery path. Inflationary pressures are expected to remain for some time and will likely influence monetary policy, which has already begun to switch to a more restrictive stance. We believe current uncertainty factors include the latest COVID-19 wave – especially in Europe – and China’s economic weakness, which may affect the global economy.
In our view, a thoughtful active management approach is needed given this environment. We believe vigilant and continuous assessment of the
2
Table of Contents
current market environment offers potential opportunities to take advantage of market dislocations and achieve what we consider to be attractive risk-adjusted returns through an active focus on portfolio risk and diversification.
3
Table of Contents
| Performance summary |
| Delaware Global Listed Real Assets Fund | October 31, 2021 (Unaudited) |
The performance quoted represents past performance and does not guarantee future results. Investment return and principal value of an investment will fluctuate so that shares, when redeemed, may be worth more or less than their original cost. Current performance may be lower or higher than the performance quoted. Performance data current to the most recent month end may be obtained by calling 800 523-1918 or visiting delawarefunds.com/performance.
| Fund and benchmark performance1,2 | | Average annual total returns through October 31, 2021 |
| | | | 1 year | | 5 year | | 10 year | | Lifetime |
| Class A (Est. December 6, 1995) | | | | | | | | | | | | | | | | | | | | |
| Excluding sales charge | | | +30.28 | % | | | | +7.81 | % | | | | +9.00 | % | | | | +10.57 | % | |
| Including sales charge | | | +22.76 | % | | | | +6.54 | % | | | | +8.36 | % | | | | +10.32 | % | |
| Class C (Est. November 10, 1997) | | | | | | | | | | | | | | | | | | | | |
| Excluding sales charge | | | +29.31 | % | | | | +7.00 | % | | | | +8.20 | % | | | | +7.86 | % | |
| Including sales charge | | | +28.31 | % | | | | +7.00 | % | | | | +8.20 | % | | | | +7.86 | % | |
| Class R (Est. June 2, 2003) | | | | | | | | | | | | | | | | | | | | |
| Excluding sales charge | | | +30.02 | % | | | | +7.54 | % | | | | +8.73 | % | | | | +8.85 | % | |
| Including sales charge | | | +30.02 | % | | | | +7.54 | % | | | | +8.73 | % | | | | +8.85 | % | |
| Institutional Class (Est. November 10, 1997) | | | | | | | | | | | | | | | | | | | | |
| Excluding sales charge | | | +30.62 | % | | | | +8.08 | % | | | | +9.28 | % | | | | +8.94 | % | |
| Including sales charge | | | +30.62 | % | | | | +8.08 | % | | | | +9.28 | % | | | | +8.94 | % | |
| Class R6 (Est. August 31, 2016) | | | | | | | | | | | | | | | | | | | | |
| Excluding sales charge | | | +30.71 | % | | | | +8.20 | % | | | | — | | | | | +6.47 | % | |
| Including sales charge | | | +30.71 | % | | | | +8.20 | % | | | | — | | | | | +6.47 | % | |
| Bloomberg Global Inflation-Linked Total | | | | | | | | | | | | | | | | | | | | |
| Return Index Value Hedged USD | | | +5.94 | % | | | | +4.75 | % | | | | +4.91 | % | | | | +5.99 | %* | |
| Global Listed Real Assets Blended | | | | | | | | | | | | | | | | | | | | |
| Benchmark | | | +26.11 | % | | | | +7.09 | % | | | | +5.85 | % | | | | — | | |
| * | The benchmark lifetime return is for Institutional Class share comparison only and is calculated using the last business day in the month of the Fund's Institutional Class inception date. |
| 1 | Returns reflect the reinvestment of all distributions and are presented both with and without the applicable sales charges described below. Returns do not reflect the deduction of taxes the shareholder would pay on Fund distributions or redemptions of Fund shares. |
Expense limitations were in effect for certain classes during some or all of the periods shown in the “Fund and benchmark performance” table. Expenses for each class are listed in the “Fund expense ratios” table on page 7. Performance would have been lower had expense limitations not been in effect.
Institutional Class shares are not subject to a sales charge and are offered for sale exclusively to certain eligible investors. In addition, Institutional Class shares pay no distribution and service (12b-1) fee.
Class A shares are sold with a maximum front-end sales charge of 5.75%, and have an annual 12b-1
4
Table of Contents
fee of 0.25% of average daily net assets. Performance for Class A shares, excluding sales charges, assumes that no front-end sales charge applied.
Class C shares are sold with a contingent deferred sales charge (CDSC) of 1.00% if redeemed during the first 12 months. They are also subject to an annual 12b-1 fee of 1.00% of average daily net assets. Performance for Class C shares, excluding sales charges, assumes either that CDSCs did not apply or that the investment was not redeemed.
Class R shares are available only for certain retirement plan products. They are sold without a sales charge and have an annual 12b-1 fee of 0.50% of average daily net assets.
Class R6 shares are available only to certain investors. In addition, Class R6 shares do not pay any service fees, sub-accounting fees, and/or sub-transfer agency fees to any brokers, dealers, or other financial intermediaries. Class R6 shares pay no 12b-1 fee.
Prior to the close of business on August 19, 2019, the Fund invested primarily in securities principally engaged in the real estate industry. Since the close of business on August 19, 2019, the Fund has been repositioned to invest primarily in listed real assets securities (Repositioning). The historical returns prior to that time do not reflect the Repositioning.
Fixed income securities and bond funds can lose value, and investors can lose principal, as interest rates rise. They also may be affected by economic conditions that hinder an issuer’s ability to make interest and principal payments on its debt. The Fund may also be subject to prepayment risk, the risk that the principal of a bond that is held by a portfolio will be prepaid prior to maturity, at the time when interest rates are lower than what the bond was paying. A portfolio may then have to reinvest that money at a lower interest rate.
Investment strategies that hold securities issued by companies principally engaged in the infrastructure industry have greater exposure to the potential adverse economic, regulatory, political, and other changes affecting such entities.
International investments entail risks including fluctuation in currency values, differences in accounting principles, or economic or political instability. Investing in emerging markets can be riskier than investing in established foreign markets due to increased volatility, lower trading volume, and higher risk of market closures. In many emerging markets, there is substantially less publicly available information and the available information may be incomplete or misleading. Legal claims are generally more difficult to pursue.
If and when the Fund invests in forward foreign currency contracts or uses other investments to hedge against currency risks, the Fund will be subject to special risks, including counterparty risk.
The Fund may invest in derivatives, which may involve additional expenses and are subject to risk, including the risk that an underlying security or securities index moves in the opposite direction from what the portfolio manager anticipated. A derivatives transaction depends upon the counterparties’ ability to fulfill their contractual obligations.
High yielding, non-investment-grade bonds (junk bonds) involve higher risk than investment grade bonds.
Investments in small and/or medium-sized companies typically exhibit greater risk and higher volatility than larger, more established companies.
Exposure to the commodities markets may subject the investments to greater volatility than investments in traditional securities.
Investments related to gold and other precious metals are considered speculative and are
5
Table of Contents
Performance summary
Delaware Global Listed Real Assets Fund
affected by a variety of worldwide economic, financial and political factors.
Infrastructure companies are subject to risks including increased costs associated with capital construction programs and environmental regulations, surplus capacity, increased competition, availability of fuel at reasonable prices, energy conservation policies, difficulty in raising capital, and increased susceptibility to terrorist acts or political actions. Because the Fund invests significantly in Natural Resources Securities, there is the risk that the Fund will perform poorly during a downturn in the natural resource sector.
Leveraging risk is the risk that certain fund transactions may give rise to leverage, causing a fund to be more volatile than if it had not been leveraged.
Liquidity risk is the possibility that securities cannot be readily sold within seven days at approximately the price at which a fund has valued them.
The risk that the value of a fund’s shares will be affected by factors particular to Real Assets Securities and related industries or sectors (such as government regulation) and may fluctuate more widely than that of a fund that invests in a broad range of industries.
Investing in the real estate industry includes risks such as declines in real estate value, lack of availability of mortgage funds, overbuilding, extended vacancies, increases in property taxes, changes in zoning laws, costs from cleanup of environmental problems, uninsured damages, variations in rents, and changes in interest rates.
The disruptions caused by natural disasters, pandemics, or similar events could prevent the Fund from executing advantageous investment decisions in a timely manner and could negatively impact the Fund’s ability to achieve its investment objective and the value of the Fund’s investments.
6
Table of Contents
| 2 | The Fund’s expense ratios, as described in the most recent prospectus, are disclosed in the following “Fund expense ratios” table. Delaware Management Company has agreed to reimburse certain expenses and/or waive certain fees in order to prevent total annual fund operating expenses (excluding any 12b-1 fees, acquired fund fees and expenses, taxes, interest, short sale dividend and interest expenses, brokerage fees, certain insurance costs, and nonroutine expenses or costs, including, but not limited to, those relating to reorganizations, litigation, conducting shareholder meetings, and liquidations (collectively, nonroutine expenses)) from exceeding 1.08% of the Fund’s average daily net assets for all share classes other than Class R6 from February 26, 2021 through April 30, 2021 and 1.00% of the Fund’s Class R6 shares’ average daily net assets from November 1, 2020 to October 31, 2021.* From November 1, 2020 through February 25, 2021, the waiver was 1.15% for all share classes other than Class R6. Please see the most recent prospectus and any applicable supplement(s) for additional information on these fee waivers and/or reimbursements. Please see the “Financial highlights” section in this report for the most recent expense ratios. |
| | | | | | | | Institutional | | |
| Fund expense ratios | | Class A | | Class C | | Class R | | Class | | Class R6 |
| Total annual operating expenses | | | | | | | | | | |
| (without fee waivers) | | 1.53% | | 2.28% | | 1.78% | | 1.28% | | 1.20% |
| Net expenses (including fee | | | | | | | | | | |
| waivers, if any) | | 1.33% | | 2.08% | | 1.58% | | 1.08% | | 1.00% |
| Type of waiver | | Contractual | | Contractual | | Contractual | | Contractual | | Contractual |
| * | The aggregate contractual waiver period covering this report is from February 28, 2020 through March 1, 2022. |
7
Table of Contents
Performance summary
Delaware Global Listed Real Assets Fund
Performance of a $10,000 investment1
Average annual total returns from October 31, 2011 through October 31, 2021
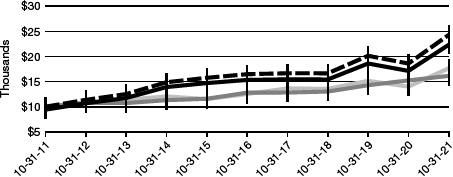
| For period beginning October 31, 2011 through October 31, 2021 | | Starting value | | Ending value |
 | Delaware Global Listed Real Assets Fund — Institutional Class shares | | | $10,000 | | | $24,295 |
 | Delaware Global Listed Real Assets Fund — Class A shares | | | $9,425 | | | $22,325 |
 | Global Listed Real Assets Blended Benchmark | | | $10,000 | | | $17,659 |
 | Bloomberg Global Inflation-Linked Total Return Index Value Hedged USD | | | $10,000 | | | $16,144 |
| 1 | The “Performance of a $10,000 investment” graph assumes $10,000 invested in Institutional Class and Class A shares of the Fund on October 31, 2011, and includes the effect of a 5.75% front-end sales charge (for Class A shares) and the reinvestment of all distributions. The graph does not reflect the deduction of taxes the shareholders would pay on Fund distributions or redemptions of Fund shares. Expense limitations were in effect for some or all of the periods shown. Performance would have been lower had expense limitations not been in effect. Expenses are listed in the “Fund expense ratios” table on page 7. Please note additional details on pages 4 through 9. |
The graph also assumes $10,000 invested in the Bloomberg Global Inflation-Linked Total Return Index Value Hedged USD and the Global Listed Real Assets Blended Benchmark as of October 31, 2011.
The Bloomberg Global Inflation Linked Total Return Index Hedged USD measures the performance of investment-grade, government inflation-linked debt from 12 different developed market countries. Investability is a key criterion for inclusion of markets in this index, and it is designed to include only those markets in which a global government linker fund is likely and able to invest. The index is hedged to the US dollar against foreign exchange risk by selling each foreign currency forward at the 1-month forward weight.
The Global Listed Real Assets Blended Benchmark is computed using a combination of 20% S&P Global Natural Resources Index (net return), 20% S&P Global Infrastructure Index (net
8
Table of Contents
return), 20% FTSE EPRA Nareit Developed Index (net return), and 40% Bloomberg Global Inflation-Linked Total Return Index Hedged USD.
| ● | The S&P Global Infrastructure Index is composed of 75 of the largest publicly listed companies in the global infrastructure industry. The index has balanced weights across three distinct infrastructure clusters: energy, transportation, and utilities. The “net total return” index reinvests regular cash dividends after the deduction of applicable withholding taxes. |
| ● | The S&P Global Natural Resources Index includes 90 of the largest publicly traded companies in natural resources and commodities businesses that meet specific investability requirements, offering investors diversified and investable equity exposure across three primary commodity-related sectors: agribusiness, energy, and metals and mining. The “net total return” index reinvests regular cash dividends after the deduction of applicable withholding taxes. |
| ● | The FTSE EPRA Nareit Developed Index tracks the performance of listed real estate companies and real estate investment trusts (REITs) worldwide, based in US dollars. The NR “net return” index reflects withholding taxes on foreign dividends, but no deduction for fees, expenses, or other taxes. |
Index performance returns do not reflect any management fees, transaction costs, or expenses. Indices are unmanaged and one cannot invest directly in an index. Past performance is not a guarantee of future results.
Performance of other Fund classes will vary due to different charges and expenses.
| | Nasdaq symbols | | CUSIPs |
| Class A | | DPREX | | 246248868 |
| Class C | | DPRCX | | 246248793 |
| Class R | | DPRRX | | 246248561 |
| Institutional Class | | DPRSX | | 246248777 |
| Class R6 | | DPRDX | | 246248454 |
9
Table of Contents
Disclosure of Fund expenses
For the six-month period from May 1, 2021 to October 31, 2021 (Unaudited)
As a shareholder of the Fund, you incur two types of costs: (1) transaction costs, including sales charges (loads) on purchase payments, reinvested dividends, or other distributions; redemption fees; and exchange fees; and (2) ongoing costs, including management fees; distribution and service (12b-1) fees; and other Fund expenses. This example is intended to help you understand your ongoing costs (in dollars) of investing in the Fund and to compare these costs with the ongoing costs of investing in other mutual funds.
The example is based on an investment of $1,000 invested at the beginning of the period and held for the entire six-month period from May 1, 2021 to October 31, 2021.
Actual expenses
The first section of the table shown, “Actual Fund return,” provides information about actual account values and actual expenses. You may use the information in this section of the table, together with the amount you invested, to estimate the expenses that you paid over the period. Simply divide your account value by $1,000 (for example, an $8,600 account value divided by $1,000 = 8.6), then multiply the result by the number in the first section under the heading entitled “Expenses Paid During Period” to estimate the expenses you paid on your account during this period.
Hypothetical example for comparison purposes
The second section of the table shown, “Hypothetical 5% return,” provides information about hypothetical account values and hypothetical expenses based on the Fund’s actual expense ratio and an assumed rate of return of 5% per year before expenses, which is not the Fund’s actual return. The hypothetical account values and expenses may not be used to estimate the actual ending account balance or expenses you paid for the period. You may use this information to compare the ongoing costs of investing in the Fund and other funds. To do so, compare this 5% hypothetical example with the 5% hypothetical examples that appear in the shareholder reports of the other funds.
Please note that the expenses shown in the table are meant to highlight your ongoing costs only and do not reflect any transactional costs, such as sales charges (loads), redemption fees, or exchange fees. Therefore, the second section of the table is useful in comparing ongoing costs only, and will not help you determine the relative total costs of owning different funds. In addition, if these transactional costs were included, your costs would have been higher. The Fund’s expenses shown in the table reflect fee waivers in effect and assume reinvestment of all dividends and distributions.
10
Table of Contents
Delaware Global Listed Real Assets Fund
Expense analysis of an investment of $1,000
| | Beginning | | Ending | | | | | | Expenses |
| | Account Value | | Account Value | | Annualized | | Paid During Period |
| | 5/1/21 | | 10/31/21 | | Expense Ratio | | 5/1/21 to 10/31/21* |
| Actual Fund return† | | | | | | | | | | | | | | | | | | | |
| Class A | | | $ | 1,000.00 | | | | $ | 1,065.90 | | | | 1.32% | | | | $ | 6.87 | |
| Class C | | | | 1,000.00 | | | | | 1,062.60 | | | | 2.07% | | | | | 10.76 | |
| Class R | | | | 1,000.00 | | | | | 1,065.50 | | | | 1.57% | | | | | 8.17 | |
| Institutional Class | | | | 1,000.00 | | | | | 1,067.70 | | | | 1.07% | | | | | 5.58 | |
| Class R6 | | | | 1,000.00 | | | | | 1,068.30 | | | | 1.00% | | | | | 5.21 | |
| Hypothetical 5% return (5% return before expenses) | | | | | | | | | | |
| Class A | | | $ | 1,000.00 | | | | $ | 1,018.55 | | | | 1.32% | | | | $ | 6.72 | |
| Class C | | | | 1,000.00 | | | | | 1,014.77 | | | | 2.07% | | | | | 10.51 | |
| Class R | | | | 1,000.00 | | | | | 1,017.29 | | | | 1.57% | | | | | 7.98 | |
| Institutional Class | | | | 1,000.00 | | | | | 1,019.81 | | | | 1.07% | | | | | 5.45 | |
| Class R6 | | | | 1,000.00 | | | | | 1,020.16 | | | | 1.00% | | | | | 5.09 | |
| * | “Expenses Paid During Period” are equal to the Fund’s annualized expense ratio, multiplied by the average account value over the period, multiplied by 184/365 (to reflect the one-half year period). |
| † | Because actual returns reflect only the most recent six-month period, the returns shown may differ significantly from fiscal year returns. |
In addition to the Fund’s expenses reflected above, the Fund also indirectly bears its portion of the fees and expenses of the investment companies (Underlying Funds) in which it invests. The table above does not reflect the expenses of the Underlying Funds.
11
Table of Contents
| Security type / sector allocation and top 10 |
| equity holdings |
| Delaware Global Listed Real Assets Fund | As of October 31, 2021 (Unaudited) |
Sector designations may be different from the sector designations presented in other Fund materials. The sector designations may represent the investment manager’s internal sector classifications.
| Security type / sector | | Percentage of net assets |
| Corporate Bonds | | | 8.94% | |
| Basic Industry | | | 1.11% | |
| Capital Goods | | | 0.51% | |
| Communications | | | 2.65% | |
| Consumer Cyclical | | | 1.02% | |
| Consumer Non-Cyclical | | | 0.65% | |
| Energy | | | 1.71% | |
| Real Estate | | | 0.27% | |
| Transportation | | | 0.57% | |
| Utilities | | | 0.45% | |
| Non-Agency Commercial Mortgage-Backed Securities | | | 1.92% | |
| Loan Agreements | | | 2.66% | |
| Sovereign Bonds | | | 13.35% | |
| US Treasury Obligations | | | 6.63% | |
| Closed-Ended Trust | | | 0.29% | |
| Common Stock | | | 60.19% | |
| Communication Services | | | 0.99% | |
| Consumer Cyclical | | | 0.19% | |
| Consumer Discretionary | | | 0.43% | |
| Consumer Staples | | | 1.32% | |
| Energy | | | 9.04% | |
| Industrials | | | 10.30% | |
| Materials | | | 6.96% | |
| Real Estate Operating Companies/Developer | | | 2.88% | |
| REIT Diversified | | | 1.80% | |
| REIT Healthcare | | | 1.82% | |
| REIT Hotel | | | 0.40% | |
| REIT Industrial | | | 2.85% | |
| REIT Information Technology | | | 0.83% | |
| REIT Mall | | | 0.61% | |
| REIT Manufactured Housing | | | 0.54% | |
| REIT Multifamily | | | 2.74% | |
| REIT Office | | | 2.13% | |
| REIT Retail | | | 0.44% | |
| REIT Self-Storage | | | 0.98% | |
| REIT Shopping Center | | | 0.68% | |
| REIT Single Tenant | | | 0.41% | |
| REIT Specialty | | | 1.13% | |
| Utilities | | | 10.72% | |
12
Table of Contents
| Security type / sector | | Percentage of net assets |
| Master Limited Partnerships | | | 1.48% | |
| Short-Term Investments | | | 4.32% | |
| Total Value of Securities | | | 99.78% | |
| Receivables and Other Assets Net of Liabilities | | | 0.22% | |
| Total Net Assets | | | 100.00% | |
Holdings are for informational purposes only and are subject to change at any time. They are not a recommendation to buy, sell, or hold any security.
| Top 10 equity holdings | | Percentage of net assets |
| Denbury | | | 1.17% | |
| Prologis | | | 1.13% | |
| United Utilities Group | | | 1.00% | |
| Atmos Energy | | | 1.00% | |
| National Grid | | | 1.00% | |
| Atlantia | | | 1.00% | |
| Severn Trent | | | 1.00% | |
| Vinci | | | 1.00% | |
| Terna - Rete Elettrica Nazionale | | | 0.99% | |
| Sacyr | | | 0.99% | |
13
Table of Contents
| Schedule of investments | |
| Delaware Global Listed Real Assets Fund | October 31, 2021 |
| | | | | Principal | | | |
| | | | amount° | | Value (US $) |
| Corporate Bonds – 8.94% | | | | | |
| Basic Industry – 1.11% | | | | | |
| Chemours 144A 4.625% 11/15/29 # | | 175,000 | | $ | 168,656 |
| First Quantum Minerals 144A 6.875% 3/1/26 # | | 200,000 | | | 208,500 |
| Freeport-McMoRan 5.45% 3/15/43 | | 235,000 | | | 295,924 |
| New Gold 144A 6.375% 5/15/25 # | | 54,000 | | | 55,660 |
| Novelis | | | | | |
| | 144A 3.875% 8/15/31 # | | 255,000 | | | 249,275 |
| | 144A 4.75% 1/30/30 # | | 140,000 | | | 145,775 |
| Univar Solutions USA 144A 5.125% 12/1/27 # | | 265,000 | | | 276,594 |
| | | | | | | 1,400,384 |
| Capital Goods – 0.51% | | | | | |
| Clean Harbors 144A 5.125% 7/15/29 # | | 195,000 | | | 211,332 |
| Covanta Holding 6.00% 1/1/27 | | 75,000 | | | 77,625 |
| GFL Environmental 144A 5.125% 12/15/26 # | | 160,000 | | | 167,400 |
| Sealed Air 144A 4.00% 12/1/27 # | | 175,000 | | | 183,104 |
| | | | | | | 639,461 |
| Communications – 2.65% | | | | | |
| CCO Holdings 144A 5.375% 6/1/29 # | | 250,000 | | | 268,937 |
| Clear Channel Outdoor Holdings | | | | | |
| | 144A 7.50% 6/1/29 # | | 40,000 | | | 40,975 |
| | 144A 7.75% 4/15/28 # | | 40,000 | | | 41,478 |
| CSC Holdings 144A 3.375% 2/15/31 # | | 200,000 | | | 182,400 |
| Cumulus Media New Holdings 144A 6.75% 7/1/26 # | | 43,000 | | | 44,774 |
| Gray Escrow II 144A 5.375% 11/15/31 # | | 180,000 | | | 182,025 |
| Lamar Media 3.75% 2/15/28 | | 175,000 | | | 177,109 |
| LCPR Senior Secured Financing DAC 144A 6.75% 10/15/27 # | | 216,000 | | | 227,070 |
| Level 3 Financing 144A 4.25% 7/1/28 # | | 190,000 | | | 188,093 |
| Lumen Technologies | | | | | |
| | 144A 4.00% 2/15/27 # | | 90,000 | | | 90,567 |
| | 144A 5.125% 12/15/26 # | | 120,000 | | | 122,938 |
| Nexstar Media 144A 5.625% 7/15/27 # | | 213,000 | | | 224,981 |
| Outfront Media Capital 144A 4.625% 3/15/30 # | | 245,000 | | | 245,233 |
| Sirius XM Radio 144A 5.50% 7/1/29 # | | 215,000 | | | 232,200 |
| Sprint Capital 8.75% 3/15/32 | | 65,000 | | | 97,370 |
| Terrier Media Buyer 144A 8.875% 12/15/27 # | | 210,000 | | | 222,407 |
| T-Mobile USA | | | | | |
| | 3.375% 4/15/29 | | 60,000 | | | 61,725 |
| | 4.75% 2/1/28 | | 105,000 | | | 110,906 |
| Virgin Media Secured Finance 144A 5.50% 5/15/29 # | | 200,000 | | | 211,282 |
| Vmed O2 UK Financing I 144A 4.25% 1/31/31 # | | 200,000 | | | 194,991 |
14
Table of Contents
| | | | | Principal
amount° | | Value (US $) |
| Corporate Bonds (continued) | | | | | |
| Communications (continued) | | | | | |
| Zayo Group Holdings 144A 4.00% 3/1/27 # | | 175,000 | | $ | 170,188 |
| | | | | | | 3,337,649 |
| Consumer Cyclical – 1.02% | | | | | |
| Carnival | | | | | |
| | 144A 5.75% 3/1/27 # | | 150,000 | | | 152,813 |
| | 144A 7.625% 3/1/26 # | | 35,000 | | | 36,919 |
| Hilton Domestic Operating | | | | | |
| | 144A 4.00% 5/1/31 # | | 85,000 | | | 85,515 |
| | 4.875% 1/15/30 | | 200,000 | | | 213,746 |
| Lennar 5.00% 6/15/27 | | 95,000 | | | 108,900 |
| MGM Growth Properties Operating Partnership 5.75% 2/1/27 | | 216,000 | | | 246,510 |
| Murphy Oil USA 144A 3.75% 2/15/31 # | | 100,000 | | | 98,500 |
| Royal Caribbean Cruises 144A 5.50% 4/1/28 # | | 150,000 | | | 152,813 |
| Wyndham Hotels & Resorts 144A 4.375% 8/15/28 # | | 175,000 | | | 181,002 |
| | | | | | | 1,276,718 |
| Consumer Non-Cyclical – 0.65% | | | | | |
| HCA | | | | | |
| | 3.50% 9/1/30 | | 10,000 | | | 10,528 |
| | 5.375% 2/1/25 | | 70,000 | | | 77,962 |
| | 5.875% 2/1/29 | | 210,000 | | | 250,207 |
| JBS USA LUX 144A 5.50% 1/15/30 # | | 160,000 | | | 175,400 |
| Pilgrim’s Pride 144A 5.875% 9/30/27 # | | 77,000 | | | 81,288 |
| Tenet Healthcare | | | | | |
| | 144A 4.25% 6/1/29 # | | 60,000 | | | 60,812 |
| | 6.875% 11/15/31 | | 135,000 | | | 154,744 |
| | | | | | | 810,941 |
| Energy – 1.71% | | | | | |
| CNX Resources | | | | | |
| | 144A 6.00% 1/15/29 # | | 65,000 | | | 68,656 |
| | 144A 7.25% 3/14/27 # | | 100,000 | | | 106,450 |
| Crestwood Midstream Partners | | | | | |
| | 144A 5.625% 5/1/27 # | | 82,000 | | | 84,058 |
| | 144A 6.00% 2/1/29 # | | 209,000 | | | 216,872 |
| DCP Midstream Operating 5.125% 5/15/29 | | 210,000 | | | 238,092 |
| Genesis Energy 6.50% 10/1/25 | | 170,000 | | | 167,844 |
| Marathon Oil 4.40% 7/15/27 | | 75,000 | | | 83,205 |
| Murphy Oil | | | | | |
| | 5.875% 12/1/27 | | 195,000 | | | 203,287 |
| | 6.375% 7/15/28 | | 105,000 | | | 111,048 |
15
Table of Contents
Schedule of investments
Delaware Global Listed Real Assets Fund
| | | | | Principal
amount° | | Value (US $) |
| Corporate Bonds (continued) | | | | | |
| Energy (continued) | | | | | |
| NuStar Logistics | | | | | |
| | 6.00% 6/1/26 | | 90,000 | | $ | 95,753 |
| | 6.375% 10/1/30 | | 80,000 | | | 87,788 |
| Occidental Petroleum | | | | | |
| | 6.60% 3/15/46 | | 55,000 | | | 70,450 |
| | 6.625% 9/1/30 | | 40,000 | | | 48,996 |
| Southwestern Energy 7.75% 10/1/27 | | 225,000 | | | 241,875 |
| Targa Resources Partners | | | | | |
| | 4.875% 2/1/31 | | 195,000 | | | 210,499 |
| | 5.375% 2/1/27 | | 105,000 | | | 108,806 |
| | | | | | | 2,143,679 |
| Real Estate – 0.27% | | | | | |
| HAT Holdings I 144A 3.75% 9/15/30 # | | 100,000 | | | 99,508 |
| XHR 144A 4.875% 6/1/29 # | | 235,000 | | | 241,392 |
| | | | | | | 340,900 |
| Transportation – 0.57% | | | | | |
| Air Canada 144A 3.875% 8/15/26 # | | 255,000 | | | 258,506 |
| Delta Air Lines | | | | | |
| | 144A 7.00% 5/1/25 # | | 82,000 | | | 95,713 |
| | 7.375% 1/15/26 | | 67,000 | | | 78,822 |
| United Airlines Holdings 4.875% 1/15/25 | | 280,000 | | | 288,752 |
| | | | | | | 721,793 |
| Utilities – 0.45% | | | | | |
| Calpine 144A 5.00% 2/1/31 # | | 35,000 | | | 34,350 |
| NRG Energy 144A 3.625% 2/15/31 # | | 95,000 | | | 92,577 |
| PG&E 5.25% 7/1/30 | | 85,000 | | | 88,910 |
| TerraForm Power Operating 144A 4.75% 1/15/30 # | | 130,000 | | | 134,857 |
| Vistra Operations | | | | | |
| | 144A 5.00% 7/31/27 # | | 70,000 | | | 71,838 |
| | 144A 5.50% 9/1/26 # | | 70,000 | | | 72,167 |
| | 144A 5.625% 2/15/27 # | | 75,000 | | | 77,368 |
| | | | | | | 572,067 |
| Total Corporate Bonds (cost $10,911,573) | | | | | 11,243,592 |
| | | |
| Non-Agency Commercial Mortgage-Backed Securities – 1.92% | | | | | |
| Cantor Commercial Real Estate Lending | | | | | |
| | Series 2019-CF1 B 4.178% 5/15/52 ● | | 200,000 | | | 220,873 |
| Citigroup Commercial Mortgage Trust | | | | | |
| | Series 2019-C7 A4 3.102% 12/15/72 | | 600,000 | | | 643,677 |
16
Table of Contents
| | | | | | | Principal
amount° | | Value (US $) |
| Non-Agency Commercial Mortgage-Backed Securities (continued) | | | | | | | |
| GS Mortgage Securities Trust | | | | | | | |
| | Series 2017-GS6 B 3.869% 5/10/50 | | | | 730,000 | | $ | 784,374 |
| Morgan Stanley Capital I Trust | | | | | | | |
| | Series 2016-BNK2 B 3.485% 11/15/49 | | | | 740,000 | | | 759,029 |
| Total Non-Agency Commercial Mortgage-Backed Securities (cost $2,381,220) | | | | | | | 2,407,953 |
| | | |
| Loan Agreements – 2.66% | | | | | | | |
| Calpine | | | | | | | |
| | 2.09% (LIBOR01M + 2.00%) 4/5/26 ● | | | | 320,621 | | | 317,323 |
| | 2.59% (LIBOR01M + 2.50%) 12/16/27 ● | | | | 82,385 | | | 82,183 |
| Calpine Construction Finance Tranche B 2.087% (LIBOR01M + | | | | | | | |
| | 2.00%) 1/15/25 ● | | | | 124,588 | | | 123,381 |
| Castlelake Aviation Tranche B TBD 10/22/26 X | | | | 225,000 | | | 224,625 |
| CenturyLink Tranche B 2.337% (LIBOR01M + 2.25%) 3/15/27 ● | | | | 442,125 | | | 437,612 |
| Charter Communications Operating | | | | | | | |
| | Tranche B2 1.84% (LIBOR01M + 1.75%) 2/1/27 ● | | | | 259,491 | | | 257,987 |
| CSC Holdings 2.34% (LIBOR01M + 2.25%) 7/17/25 ● | | | | 249,130 | | | 243,940 |
| Hamilton Projects Acquiror 5.75% (LIBOR03M + 4.75%) | | | | | | | |
| | 6/17/27 ● | | | | 296,250 | | | 296,805 |
| HCA Tranche B 1.837% (LIBOR01M + 1.75%) 6/30/28 ● | | | | 473,813 | | | 477,281 |
| Lamar Media Tranche B 1.584% (LIBOR01M + 1.50%) 2/6/27 ● | | | | 169,139 | | | 168,575 |
| Pilot Travel Centers Tranche B 2.087% (LIBOR01M + 2.00%) | | | | | | | |
| | 8/4/28 ● | | | | 175,000 | | | 174,180 |
| Sinclair Television Group Tranche B-3 3.09% (LIBOR01M + | | | | | | | |
| | 3.00%) 4/1/28 ● | | | | 99,750 | | | 98,524 |
| Tecta America 1st Lien 5.00% (LIBOR01M + 4.25%) 4/10/28 ● | | | | 269,325 | | | 270,335 |
| Vistra Operations 1.836% - 1.837% (LIBOR01M + 1.75%) | | | | | | | |
| | 12/31/25 ● | | | | 166,741 | | | 165,371 |
| Total Loan Agreements (cost $3,343,516) | | | | | | | 3,338,122 |
| | | | | | | | |
| Sovereign Bonds – 13.35%Δ | | | | | | | |
| Australia – 0.41% | | | | | | | |
| Australia Government Bonds | | | | | | | |
| | 0.75% 11/21/27 | | AUD | | 563,797 | | | 488,585 |
| | 2.50% 9/20/30 | | AUD | | 19,994 | | | 23,193 |
| | | | | | | | | 511,778 |
| Canada – 0.66% | | | | | | | |
| Canadian Government Real Return Bonds | | | | | | | |
| | 4.00% 12/1/31 | | CAD | | 475,944 | | | 548,485 |
17
Table of Contents
Schedule of investments
Delaware Global Listed Real Assets Fund
| | | | | | | Principal
amount° | | Value (US $) |
| Sovereign Bonds∆ (continued) | | | | | | | |
| Canada (continued) | | | | | | | |
| Canadian Government Real Return Bonds | | | | | | | |
| | 4.25% 12/1/26 | | CAD | | 284,142 | | $ | 287,485 |
| | | | | | | | | 835,970 |
| France – 1.96% | | | | | | | |
| French Republic Government Bond OAT | | | | | | | |
| | 0.10% 3/1/25 | | EUR | | 439,205 | | | 539,055 |
| | 0.10% 3/1/28 | | EUR | | 900,304 | | | 1,153,149 |
| | 144A 1.80% 7/25/40 # | | EUR | | 200,367 | | | 388,133 |
| | 3.15% 7/25/32 | | EUR | | 216,306 | | | 389,339 |
| | | | | | | | | 2,469,676 |
| Germany – 0.78% | | | | | | | |
| Deutsche Bundesrepublik Inflation Linked Bond 0.10% 4/15/26 | | EUR | | 772,320 | | | 986,029 |
| | | | | | | | | 986,029 |
| Italy – 2.10% | | | | | | | |
| Italy Buoni Poliennali Del Tesoro | | | | | | | |
| | 0.10% 5/15/23 | | EUR | | 1,337,909 | | | 1,599,305 |
| | 144A 2.55% 9/15/41 # | | EUR | | 274,047 | | | 486,387 |
| | 144A 3.10% 9/15/26 # | | EUR | | 390,427 | | | 553,415 |
| | | | | | | | | 2,639,107 |
| Japan – 0.43% | | | | | | | |
| Japanese Government CPI Linked Bond 0.10% 3/10/29 | | JPY | | 59,554,016 | | | 541,120 |
| | | | | | | | | 541,120 |
| Spain – 0.70% | | | | | | | |
| Spain Government Inflation Linked Bond 0.15% 11/30/23 | | EUR | | 714,646 | | | 874,228 |
| | | | | | | | | 874,228 |
| United Kingdom – 6.31% | | | | | | | |
| United Kingdom Inflation-Linked Gilt | | | | | | | |
| | 0.125% 3/22/44 | | GBP | | 869,869 | | | 2,103,505 |
| | 0.125% 3/22/58 | | GBP | | 282,308 | | | 907,229 |
| | 0.125% 3/22/68 | | GBP | | 179,738 | | | 741,322 |
| | 0.25% 3/22/52 | | GBP | | 457,196 | | | 1,342,041 |
| | 1.125% 11/22/37 | | GBP | | 530,462 | | | 1,284,376 |
| | 1.25% 11/22/32 | | GBP | | 737,595 | | | 1,552,836 |
| | | | | | | | | 7,931,309 |
| Total Sovereign Bonds (cost $15,794,067) | | | | | | | 16,789,217 |
18
Table of Contents
| | | Principal | | | |
| | | | amount° | | Value (US $) |
| US Treasury Obligations – 6.63% | | | | | |
| US Treasury Inflation Indexed Bonds | | | | | |
| 0.125% 2/15/51 | | 474,944 | | $ | 540,739 |
| 1.375% 2/15/44 | | 468,350 | | | 654,368 |
| US Treasury Inflation Indexed Notes | | | | | |
| 0.125% 10/15/25 | | 4,068,659 | | | 4,422,509 |
| 0.125% 1/15/31 | | 2,200,585 | | | 2,442,777 |
| US Treasury Note | | | | | |
| 1.25% 8/15/31 | | 280,000 | | | 272,125 |
| Total US Treasury Obligations (cost $8,152,807) | | | | | 8,332,518 |
| | | | | | |
| | | Number of | | | |
| | | shares | | | |
| Common Stock – 60.19% | | | | | |
| Communication Services – 0.99% | | | | | |
| Vantage Towers | | 36,043 | | | 1,239,138 |
| | | | | | 1,239,138 |
| Consumer Cyclical – 0.19% | | | | | |
| Safestore Holdings | | 14,471 | | | 238,048 |
| | | | | | 238,048 |
| Consumer Discretionary – 0.43% | | | | | |
| Archaea Energy † | | 28,689 | | | 542,796 |
| | | | | | 542,796 |
| Consumer Staples – 1.32% | | | | | |
| Archer-Daniels-Midland | | 7,555 | | | 485,333 |
| Bunge | | 7,970 | | | 738,341 |
| Darling Ingredients † | | 5,125 | | | 433,165 |
| | | | | | 1,656,839 |
| Energy – 9.04% | | | | | |
| Ardmore Shipping † | | 62,261 | | | 247,176 |
| Chevron | | 7,110 | | | 814,024 |
| Denbury † | | 17,333 | | | 1,467,412 |
| Enbridge | | 29,209 | | | 1,223,493 |
| EQT † | | 39,098 | | | 778,441 |
| Equinor ADR | | 28,559 | | | 726,255 |
| Kimbell Royalty Partners | | 59,361 | | | 895,758 |
| Schlumberger | | 31,677 | | | 1,021,900 |
| Suncor Energy | | 41,715 | | | 1,097,142 |
| TC Energy | | 22,398 | | | 1,211,657 |
| Valaris † | | 11,715 | | | 412,602 |
| Valero Energy | | 11,597 | | | 896,796 |
19
Table of Contents
Schedule of investments
Delaware Global Listed Real Assets Fund
| | | Number of | | | |
| | | | shares | | Value (US $) |
| Common Stock (continued) | | | | | |
| Energy (continued) | | | | | |
| Vine Energy Class A † | | 33,674 | | $ | 574,815 |
| | | | | | 11,367,471 |
| Industrials – 10.30% | | | | | |
| ALEATICA † | | 1,115,642 | | | 991,658 |
| Arcosa | | 19,915 | | | 1,030,203 |
| Atlantia † | | 64,962 | | | 1,254,480 |
| Atlas Arteria | | 250,452 | | | 1,168,095 |
| East Japan Railway | | 19,000 | | | 1,181,592 |
| Enav 144A #, † | | 266,123 | | | 1,165,949 |
| Li-Cycle Holdings † | | 52,207 | | | 675,558 |
| Sacyr | | 438,012 | | | 1,245,601 |
| Sunrun † | | 10,526 | | | 607,140 |
| Sydney Airport † | | 192,998 | | | 1,189,047 |
| Transurban Group | | 117,659 | | | 1,189,561 |
| Vinci | | 11,729 | | | 1,252,419 |
| | | | | | 12,951,303 |
| Materials – 6.96% | | | | | |
| Acadian Timber | | 23,672 | | | 352,326 |
| Air Products and Chemicals | | 2,981 | | | 893,734 |
| Anglo American | | 9,772 | | | 372,117 |
| BHP Group | | 31,220 | | | 859,090 |
| CF Industries Holdings | | 13,904 | | | 789,747 |
| Hudbay Minerals | | 80,292 | | | 558,832 |
| Louisiana-Pacific | | 6,982 | | | 411,449 |
| Newmont | | 22,538 | | | 1,217,052 |
| Nutrien | | 16,996 | | | 1,188,191 |
| Pan American Silver | | 10,254 | | | 262,398 |
| Steel Dynamics | | 5,202 | | | 343,748 |
| West Fraser Timber | | 5,344 | | | 427,874 |
| Wheaton Precious Metals | | 26,662 | | | 1,077,412 |
| | | | | | 8,753,970 |
| Real Estate Operating Companies/Developer – 2.88% | | | | | |
| Castellum | | 12,920 | | | 343,611 |
| CK Asset Holdings | | 72,500 | | | 447,738 |
| Grainger | | 45,876 | | | 193,876 |
| Hang Lung Properties | | 60,000 | | | 139,271 |
| Intershop Holding | | 36 | | | 22,529 |
| Kojamo | | 11,721 | | | 261,911 |
| Mitsubishi Estate | | 27,500 | | | 416,933 |
| Mitsui Fudosan | | 11,100 | | | 253,067 |
20
Table of Contents
| | | Number of | | | |
| | | | shares | | Value (US $) |
| Common Stock (continued) | | | | | |
| Real Estate Operating Companies/Developer (continued) | | | | | |
| New World Development | | 24,031 | | $ | 104,241 |
| Nyfosa | | 19,154 | | | 323,174 |
| Sirius Real Estate | | 68,897 | | | 127,479 |
| Sun Hung Kai Properties | | 37,500 | | | 498,843 |
| TAG Immobilien | | 4,648 | | | 141,205 |
| Tokyo Tatemono | | 9,096 | | | 133,278 |
| Wihlborgs Fastigheter | | 9,090 | | | 215,078 |
| | | | | | 3,622,234 |
| REIT Diversified – 1.80% | | | | | |
| Activia Properties | | 69 | | | 282,720 |
| Ascendas Real Estate Investment Trust | | 48,935 | | | 112,131 |
| Charter Hall Group | | 4,219 | | | 55,001 |
| Fastighets Balder Class B † | | 1,080 | | | 78,246 |
| Inmobiliaria Colonial Socimi | | 4,627 | | | 44,984 |
| Mapletree Logistics Trust | | 161,200 | | | 241,471 |
| NIPPON REIT Investment | | 69 | | | 265,163 |
| Stockland | | 9,438 | | | 32,304 |
| Weyerhaeuser | | 32,168 | | | 1,149,041 |
| | | | | | 2,261,061 |
| REIT Healthcare – 1.82% | | | | | |
| Alexandria Real Estate Equities | | 3,220 | | | 657,331 |
| Assura | | 154,767 | | | 154,407 |
| CareTrust REIT | | 14,877 | | | 308,698 |
| Healthcare Realty Trust | | 5,093 | | | 168,375 |
| Healthpeak Properties | | 7,348 | | | 260,927 |
| Impact Healthcare Reit | | 20,000 | | | 32,353 |
| Omega Healthcare Investors | | 2,373 | | | 69,671 |
| Sabra Health Care REIT | | 13,023 | | | 184,275 |
| Universal Health Realty Income Trust | | 1,499 | | | 85,398 |
| Welltower | | 4,546 | | | 365,498 |
| | | | | | 2,286,933 |
| REIT Hotel – 0.40% | | | | | |
| Gaming and Leisure Properties | | 646 | | | 31,325 |
| VICI Properties | | 15,821 | | | 464,346 |
| | | | | | 495,671 |
| REIT Industrial – 2.85% | | | | | |
| Duke Realty | | 4,805 | | | 270,233 |
| GLP J-REIT | | 62 | | | 101,126 |
| Goodman Group | | 7,635 | | | 125,781 |
21
Table of Contents
Schedule of investments
Delaware Global Listed Real Assets Fund
| | | Number of | | | |
| | | | shares | | Value (US $) |
| Common Stock (continued) | | | | | |
| REIT Industrial (continued) | | | | | |
| Granite Real Estate Investment Trust | | 4,207 | | $ | 341,020 |
| Industrial & Infrastructure Fund Investment | | 125 | | | 228,668 |
| Mapletree Industrial Trust | | 111,090 | | | 226,546 |
| Prologis | | 9,796 | | | 1,420,028 |
| Rexford Industrial Realty | | 5,208 | | | 349,978 |
| Segro | | 16,825 | | | 297,609 |
| Tritax Big Box REIT | | 73,221 | | | 225,465 |
| | | | | | 3,586,454 |
| REIT Information Technology – 0.83% | | | | | |
| American Tower | | 300 | | | 84,591 |
| Digital Realty Trust | | 1,887 | | | 297,787 |
| Equinix | | 701 | | | 586,786 |
| SBA Communications | | 226 | | | 78,045 |
| | | | | | 1,047,209 |
| REIT Mall – 0.61% | | | | | |
| Simon Property Group | | 5,268 | | | 772,183 |
| | | | | | 772,183 |
| REIT Manufactured Housing – 0.54% | | | | | |
| Equity LifeStyle Properties | | 6,157 | | | 520,328 |
| Sun Communities | | 823 | | | 161,292 |
| | | | | | 681,620 |
| REIT Multifamily – 2.74% | | | | | |
| Apartment Income REIT | | 2,522 | | | 135,204 |
| AvalonBay Communities | | 2,881 | | | 681,875 |
| Camden Property Trust | | 853 | | | 139,124 |
| Canadian Apartment Properties REIT | | 3,644 | | | 177,931 |
| Daiwa Securities Living Investments | | 204 | | | 205,835 |
| Equity Residential | | 6,269 | | | 541,641 |
| Essex Property Trust | | 1,805 | | | 613,574 |
| Killam Apartment Real Estate Investment Trust | | 7,013 | | | 128,859 |
| UDR | | 2,848 | | | 158,149 |
| Vonovia | | 10,861 | | | 658,652 |
| | | | | | 3,440,844 |
| REIT Office – 2.13% | | | | | |
| Allied Properties Real Estate Investment Trust | | 7,241 | | | 250,240 |
| Boston Properties | | 2,687 | | | 305,351 |
| Columbia Property Trust | | 3,022 | | | 57,932 |
| Cousins Properties | | 4,552 | | | 180,305 |
| Daiwa Office Investment | | 25 | | | 161,219 |
22
Table of Contents
| | | Number of | | | |
| | | shares | | Value (US $) |
| Common Stock (continued) | | | | | |
| REIT Office (continued) | | | | | |
| | Equity Commonwealth † | | 11,384 | | $ | 295,187 |
| Highwoods Properties | | 6,036 | | | 270,654 |
| Hudson Pacific Properties | | 7,650 | | | 196,987 |
| Kilroy Realty | | 6,386 | | | 430,289 |
| Piedmont Office Realty Trust Class A | | 16,568 | | | 294,248 |
| SL Green Realty | | 3,427 | | | 240,130 |
| | | | | | 2,682,542 |
| REIT Retail – 0.44% | | | | | |
| Deutsche EuroShop | | 2,774 | | | 56,343 |
| Japan Metropolitan Fund Invest | | 163 | | | 149,449 |
| Link REIT | | 38,900 | | | 344,978 |
| | | | | | 550,770 |
| REIT Self-Storage – 0.98% | | | | | |
| Extra Space Storage | | 3,724 | | | 735,006 |
| Life Storage | | 1,924 | | | 257,450 |
| Public Storage | | 732 | | | 243,156 |
| | | | | | 1,235,612 |
| REIT Shopping Center – 0.68% | | | | | |
| Alexander’s | | 656 | | | 182,880 |
| Federal Realty Investment Trust | | 1,030 | | | 123,961 |
| Regency Centers | | 1,608 | | | 113,219 |
| Retail Opportunity Investments | | 12,050 | | | 214,128 |
| SITE Centers | | 13,785 | | | 219,044 |
| | | | | | 853,232 |
| REIT Single Tenant – 0.41% | | | | | |
| Four Corners Property Trust | | 6,869 | | | 199,201 |
| Spirit Realty Capital | | 6,445 | | | 315,354 |
| | | | | | 514,555 |
| REIT Specialty – 1.13% | | | | | |
| Civitas Social Housing | | 113,646 | | | 146,043 |
| Essential Properties Realty Trust | | 3,208 | | | 95,566 |
| Innovative Industrial Properties | | 1,211 | | | 318,602 |
| Invitation Homes | | 15,436 | | | 636,735 |
| Waypoint REIT | | 105,587 | | | 216,838 |
| | | | | | 1,413,784 |
| Utilities – 10.72% | | | | | |
| APA Group | | 183,830 | | | 1,133,946 |
| Atmos Energy | | 13,707 | | | 1,262,689 |
23
Table of Contents
Schedule of investments
Delaware Global Listed Real Assets Fund
| | | Number of | | | |
| | | | shares | | Value (US $) |
| Common Stock (continued) | | | | | |
| Utilities (continued) | | | | | |
| Hydro One | | 48,941 | | $ | 1,169,348 |
| National Grid | | 98,324 | | | 1,258,687 |
| PPL | | 42,102 | | | 1,212,538 |
| Sempra Energy | | 9,491 | | | 1,211,336 |
| Severn Trent | | 33,461 | | | 1,253,814 |
| Snam | | 217,128 | | | 1,229,147 |
| Spark Infrastructure Group | | 580,247 | | | 1,226,539 |
| Terna - Rete Elettrica Nazionale | | 167,736 | | | 1,249,122 |
| United Utilities Group | | 88,983 | | | 1,264,661 |
| | | | | | 13,471,827 |
| Total Common Stock (cost $63,070,073) | | | | | 75,666,096 |
| |
| | | Principal | | | |
| | | amount° | | | |
| Closed-Ended Trust – 0.29% | | | | | |
| Sprott Physical Uranium Trust † | | 32,718 | | | 363,768 |
| Total Closed-Ended Trust (cost $233,324) | | | | | 363,768 |
| | | | | | | |
| | | Number of | | | |
| | | shares | | | |
| Master Limited Partnerships – 1.48% | | | | | |
| Black Stone Minerals | | 62,195 | | | 778,059 |
| Enviva Partners | | 16,229 | | | 1,086,694 |
| Total Master Limited Partnerships (cost $1,194,514) | | | | | 1,864,753 |
| | | | | | |
| Short-Term Investments – 4.32% | | | | | |
| Money Market Mutual Funds – 4.32% | | | | | |
| BlackRock FedFund – Institutional Shares (seven-day effective | | | | | |
| yield 0.03%) | | 1,358,197 | | | 1,358,197 |
| Fidelity Investments Money Market Government Portfolio – | | | | | |
| Class I (seven-day effective yield 0.01%) | | 1,358,197 | | | 1,358,197 |
| GS Financial Square Government Fund – Institutional Shares | | | | | |
| (seven-day effective yield 0.03%) | | 1,358,197 | | | 1,358,197 |
24
Table of Contents
| | | Number of | | | |
| | | | shares | | Value (US $) |
| Short-Term Investments (continued) | | | | | |
| Money Market Mutual Funds (continued) | | | | | |
| Morgan Stanley Government Portfolio – Institutional Share | | | | | |
| Class (seven-day effective yield 0.03%) | | 1,358,197 | | $ | 1,358,197 |
| Total Short-Term Investments (cost $5,432,788) | | | | | 5,432,788 |
| Total Value of Securities–99.78% | | | | | |
| (cost $110,513,882) | | | | $ | 125,438,807 |
| ° | Principal amount shown is stated in USD unless noted that the security is denominated in another currency. |
| # | Security exempt from registration under Rule 144A of the Securities Act of 1933, as amended. At October 31, 2021, the aggregate value of Rule 144A securities was $9,830,093, which represents 7.82% of the Fund’s net assets. See Note 11 in “Notes to financial statements.” |
| ● | Variable rate investment. Rates reset periodically. Rate shown reflects the rate in effect at October 31, 2021. For securities based on a published reference rate and spread, the reference rate and spread are indicated in their descriptions. The reference rate descriptions (i.e. LIBOR03M, LIBOR06M, etc.) used in this report are identical for different securities, but the underlying reference rates may differ due to the timing of the reset period. Certain variable rate securities are not based on a published reference rate and spread but are determined by the issuer or agent and are based on current market conditions, or for mortgage-backed securities, are impacted by the individual mortgages which are paying off over time. These securities do not indicate a reference rate and spread in their descriptions. |
| X | This loan will settle after October 31, 2021, at which time the interest rate, based on the LIBOR and the agreed upon spread on trade date, will be reflected. |
| Δ | Securities have been classified by country of origin. |
| † | Non-income producing security. |
The following foreign currency exchange contracts were outstanding at October 31, 2021:1
Foreign Currency Exchange Contracts
| | Currency to | | | | | | | Settlement | | Unrealized | | Unrealized |
| Counterparty | | Receive (Deliver) | | In Exchange For | | Date | | Appreciation | | Depreciation |
| BNYM | | CAD | | 32,698 | | | USD | | (26,384 | ) | | 11/2/21 | | $ | 36 | | $ | – | |
| CITI | | CAD | | (30,000 | ) | | USD | | 23,624 | | | 11/19/21 | | | – | | | (616 | ) |
| CITI | | EUR | | (11,000 | ) | | USD | | 13,015 | | | 11/19/21 | | | 294 | | | – | |
| JPMCB | | AUD | | (648,318 | ) | | USD | | 478,413 | | | 11/19/21 | | | – | | | (9,325 | ) |
| JPMCB | | CAD | | (1,025,440 | ) | | USD | | 810,218 | | | 11/19/21 | | | – | | | (18,342 | ) |
| JPMCB | | EUR | | (6,127,282 | ) | | USD | | 7,244,737 | | | 11/19/21 | | | 158,711 | | | – | |
| JPMCB | | GBP | | (5,964,416 | ) | | USD | | 8,216,982 | | | 11/19/21 | | | 54,264 | | | – | |
| JPMCB | | JPY | | (60,571,697 | ) | | USD | | 549,537 | | | 11/19/21 | | | 18,015 | | | – | |
25
Table of Contents
Schedule of investments
Delaware Global Listed Real Assets Fund
Foreign Currency Exchange Contracts
| | Currency to | | | | Settlement | | Unrealized | | Unrealized |
| Counterparty | | Receive (Deliver) | | In Exchange For | | Date | | Appreciation | | Depreciation |
| Total Foreign Currency Exchange Contracts | | | | | | | | $ | 231,320 | | $ | (28,283 | ) |
The use of foreign currency exchange contracts involves elements of market risk and risks in excess of the amounts disclosed in the financial statements. The foreign currency exchange contracts presented above represent the Fund’s total exposure in such contracts, whereas only the net unrealized appreciation (depreciation) is reflected in the Fund’s net assets.
| 1 | See Note 8 in “Notes to financial statements.” |
Summary of abbreviations:
ADR – American Depositary Receipt
BNYM – Bank of New York Mellon
CITI – Citigroup
CPI – Consumer Price Index
DAC – Designated Activity Company
GS – Goldman Sachs
ICE – Intercontinental Exchange, Inc.
JPMCB – JPMorgan Chase Bank
LIBOR – London interbank offered rate
LIBOR01M – ICE LIBOR USD 1 Month
LIBOR03M – ICE LIBOR USD 3 Month
LIBOR06M – ICE LIBOR USD 6 Month
OAT – Obligations Assimilables du Tresor
REIT – Real Estate Investment Trust
TBD – To be determined
Summary of currencies:
AUD – Australian Dollar
CAD – Canadian Dollar
EUR – European Monetary Unit
GBP – British Pound Sterling
JPY – Japanese Yen
USD – US Dollar
See accompanying notes, which are an integral part of the financial statements.
26
Table of Contents
| Statement of assets and liabilities | |
| Delaware Global Listed Real Assets Fund | October 31, 2021 |
| Assets: | | | |
| | Investments, at value* | | $ | 125,438,807 |
| Cash | | | 106,526 |
| Cash collateral due from brokers | | | 110,000 |
| Foreign currencies, at valueΔ | | | 161,211 |
| Unrealized appreciation on foreign currency exchange contracts | | | 231,320 |
| Dividends and interest receivable | | | 230,049 |
| Receivable for fund shares sold | | | 151,084 |
| Receivable for securities sold | | | 136,208 |
| Foreign tax reclaims receivable | | | 52,400 |
| Total Assets | | | 126,617,605 |
| Liabilities: | | | |
| Payable for securities purchased | | | 607,241 |
| Investment management fees payable to affiliates | | | 88,546 |
| Payable for fund shares redeemed | | | 58,629 |
| Other accrued expenses | | | 36,855 |
| Unrealized depreciation on foreign currency exchange contracts | | | 28,283 |
| Reports and statements to shareholders expenses payable to non-affiliates | | | 22,768 |
| Dividend disbursing and transfer agent fees and expenses payable to | | | |
| non-affiliates | | | 18,814 |
| Accounting and administration fees payable to non-affiliates | | | 18,701 |
| Distribution fees payable to affiliates | | | 12,511 |
| Audit and tax fees payable | | | 4,365 |
| Dividend disbursing and transfer agent fees and expenses payable to affiliates | | | 912 |
| Accounting and administration expenses payable to affiliates | | | 722 |
| Legal fees payable to affiliates | | | 369 |
| Trustees’ fees and expenses payable to affiliates | | | 179 |
| Reports and statements to shareholders expenses payable to affiliates | | | 164 |
| Total Liabilities | | | 899,059 |
| Total Net Assets | | $ | 125,718,546 |
| | | | |
| Net Assets Consist of: | | | |
| Paid-in capital | | $ | 106,570,693 |
| Total distributable earnings (loss) | | | 19,147,853 |
| Total Net Assets | | $ | 125,718,546 |
27
Table of Contents
Statement of assets and liabilities
Delaware Global Listed Real Assets Fund
| Net Asset Value | | | | |
| | | | | |
| Class A: | | | | |
| Net assets | | $ | 45,150,779 | |
| Shares of beneficial interest outstanding, unlimited authorization, no par | | | 3,077,278 | |
| Net asset value per share | | $ | 14.67 | |
| Sales charge | | | 5.75 | % |
| Offering price per share, equal to net asset value per share / (1 - sales charge) | | $ | 15.56 | |
| | | | | |
| Class C: | | | | |
| Net assets | | $ | 1,600,401 | |
| Shares of beneficial interest outstanding, unlimited authorization, no par | | | 109,402 | |
| Net asset value per share | | $ | 14.63 | |
| | | | | |
| Class R: | | | | |
| Net assets | | $ | 4,046,345 | |
| Shares of beneficial interest outstanding, unlimited authorization, no par | | | 276,194 | |
| Net asset value per share | | $ | 14.65 | |
| | | | | |
| Institutional Class: | | | | |
| Net assets | | $ | 66,426,105 | |
| Shares of beneficial interest outstanding, unlimited authorization, no par | | | 4,504,123 | |
| Net asset value per share | | $ | 14.75 | |
| | | | | |
| Class R6: | | | | |
| Net assets | | $ | 8,494,916 | |
| Shares of beneficial interest outstanding, unlimited authorization, no par | | | 577,133 | |
| Net asset value per share | | $ | 14.72 | |
| ____________________ | | | | |
| *Investments, at cost | | $ | 110,513,882 | |
| Δ Foreign currencies, at cost | | | 161,429 | |
See accompanying notes, which are an integral part of the financial statements.
28
Table of Contents
| Statement of operations | |
| Delaware Global Listed Real Assets Fund | Year ended October 31, 2021 |
| Investment Income: | | | | |
| | Dividends | | $ | 2,100,065 | |
| Interest | | | 1,279,606 | |
| Foreign tax withheld | | | (107,880 | ) |
| | | | 3,271,791 | |
| | | | | |
| Expenses: | | | | |
| Management fees | | | 857,450 | |
| Distribution expenses — Class A | | | 109,089 | |
| Distribution expenses — Class C | | | 18,353 | |
| Distribution expenses — Class R | | | 21,420 | |
| Dividend disbursing and transfer agent fees and expenses | | | 135,900 | |
| Registration fees | | | 78,623 | |
| Accounting and administration expenses | | | 57,289 | |
| Reports and statements to shareholders expenses | | | 42,898 | |
| Audit and tax fees | | | 35,116 | |
| Custodian fees | | | 24,532 | |
| Legal fees | | | 19,170 | |
| Trustees’ fees and expenses | | | 4,262 | |
| Other | | | 40,839 | |
| | | | 1,444,941 | |
| Less expenses waived | | | (62,332 | ) |
| Less expenses paid indirectly | | | (109 | ) |
| Total operating expenses | | | 1,382,500 | |
| Net Investment Income | | | 1,889,291 | |
29
Table of Contents
Statement of operations
Delaware Global Listed Real Assets Fund
| Net Realized and Unrealized Gain (Loss): | | | | |
| | Net realized gain (loss) on: | | | | |
| | | Investments | | $ | 11,611,567 | |
| | Foreign currencies | | | 232,848 | |
| | Foreign currency exchange contracts | | | (289,532 | ) |
| | Futures contracts | | | (41,712 | ) |
| | Options purchased | | | (7,955 | ) |
| | Options written | | | 742 | |
| Net realized gain | | | 11,505,958 | |
| | | | | | |
| Net change in unrealized appreciation (depreciation) of: | | | | |
| | Investments | | | 15,514,684 | |
| | Foreign currencies | | | (1,311 | ) |
| | Foreign currency exchange contracts | | | 176,986 | |
| Net change in unrealized appreciation (depreciation) | | | 15,690,359 | |
| Net Realized and Unrealized Gain | | | 27,196,317 | |
| Net Increase in Net Assets Resulting from Operations | | $ | 29,085,608 | |
See accompanying notes, which are an integral part of the financial statements.
30
Table of Contents
Statements of changes in net assets
Delaware Global Listed Real Assets Fund
| | | | | Year ended |
| | | | 10/31/21 | | | 10/31/20 |
| Increase (Decrease) in Net Assets from Operations: | | | | | | | | |
| Net investment income | | $ | 1,889,291 | | | $ | 1,769,540 | |
| Net realized gain (loss) | | | 11,505,958 | | | | (7,440,479 | ) |
| Net change in unrealized appreciation (depreciation) | | | 15,690,359 | | | | (3,246,471 | ) |
| Net increase (decrease) in net assets resulting from | | | | | | | | |
| | operations | | | 29,085,608 | | | | (8,917,410 | ) |
| | | | | | | | | | | |
| Dividends and Distributions to Shareholders from: | | | | | | | | |
| Distributable earnings: | | | | | | | | |
| | Class A | | | (654,834 | ) | | | (1,745,688 | ) |
| | Class C | | | (11,448 | ) | | | (118,337 | ) |
| | Class R | | | (53,343 | ) | | | (166,430 | ) |
| | Institutional Class | | | (992,558 | ) | | | (1,899,985 | ) |
| | Class R6 | | | (145,471 | ) | | | (199,625 | ) |
| | | | | (1,857,654 | ) | | | (4,130,065 | ) |
| | | | | | | | | | | |
| Capital Share Transactions: | | | | | | | | |
| Proceeds from shares sold: | | | | | | | | |
| | Class A | | | 2,689,031 | | | | 2,295,906 | |
| | Class C | | | 399,879 | | | | 148,905 | |
| | Class R | | | 354,394 | | | | 680,867 | |
| | Institutional Class | | | 19,902,409 | | | | 57,798,443 | |
| | Class R6 | | | 584,559 | | | | 2,483,801 | |
| | | | | | | | | | | |
| Net asset value of shares issued upon reinvestment of | | | | | | | | |
| | dividends and distributions: | | | | | | | | |
| | Class A | | | 625,966 | | | | 1,721,119 | |
| | Class C | | | 11,434 | | | | 114,957 | |
| | Class R | | | 53,342 | | | | 166,429 | |
| | Institutional Class | | | 991,000 | | | | 1,894,914 | |
| | Class R6 | | | 95,250 | | | | 190,525 | |
| | | | | 25,707,264 | | | | 67,495,866 | |
31
Table of Contents
Statements of changes in net assets
Delaware Global Listed Real Assets Fund
| | | | | Year ended |
| | | | 10/31/21 | | 10/31/20 |
| Capital Share Transactions (continued): | | | | | | | | |
| Cost of shares redeemed: | | | | | | | | |
| | Class A | | $ | (7,633,401 | ) | | $ | (10,576,342 | ) |
| | Class C | | | (1,626,595 | ) | | | (1,605,277 | ) |
| | Class R | | | (1,585,560 | ) | | | (1,100,917 | ) |
| | Institutional Class | | | (14,431,801 | ) | | | (19,767,429 | ) |
| | Class R6 | | | (637,295 | ) | | | (898,258 | ) |
| | | | | (25,914,652 | ) | | | (33,948,223 | ) |
| | | | | | | | | | | |
| Increase (decrease) in net assets derived from capital share | | | | | | | | |
| | transactions | | | (207,388 | ) | | | 33,547,643 | |
| Net Increase in Net Assets | | | 27,020,566 | | | | 20,500,168 | |
| | | | | | | | | | | |
| Net Assets: | | | | | | | | |
| Beginning of year | | | 98,697,980 | | | | 78,197,812 | |
| End of year | | $ | 125,718,546 | | | $ | 98,697,980 | |
See accompanying notes, which are an integral part of the financial statements.
32
Table of Contents
Financial highlights
Delaware Global Listed Real Assets Fund Class A
Selected data for each share of the Fund outstanding throughout each period were as follows:
| Net asset value, beginning of period |
| |
| Income (loss) from investment operations: |
| Net investment income2 |
| Net realized and unrealized gain (loss) |
| Total from investment operations |
| |
| Less dividends and distributions from: |
| Net investment income |
| Net realized gain |
| Return of capital |
| Total dividends and distributions |
| |
| Net asset value, end of period |
| |
| Total return3 |
| |
| Ratios and supplemental data: |
| Net assets, end of period (000 omitted) |
| Ratio of expenses to average net assets5 |
| Ratio of expenses to average net assets prior to fees waived5 |
| Ratio of net investment income to average net assets |
| Ratio of net investment income to average net assets prior to fees waived |
| Portfolio turnover |
| 1 | Prior to the close of business on August 19, 2019, the Fund invested primarily in securities of companies principally engaged in the real estate industry. Since the close of business on August 19, 2019, the Fund has been repositioned to invest primarily in listed real assets securities (Repositioning). The historical returns prior to that time do not reflect the Repositioning. |
| 2 | Calculated using average shares outstanding. |
| 3 | Total return is based on the change in net asset value of a share during the period and assumes reinvestment of dividends and distributions at net asset value and does not reflect the impact of a sales charge. |
| 4 | Total return during the period reflects a waiver by the manager. Performance would have been lower had the waiver not been in effect. |
| 5 | Expense ratios do not include expenses of the Underlying Funds in which the Fund invests. |
See accompanying notes, which are an integral part of the financial statements.
34
Table of Contents
| | Year ended | |
| | 10/31/21 | | | 10/31/20 | | | 10/31/191 | | | 10/31/18 | | | 10/31/17 | | |
| | $ | 11.43 | | | $ | 12.88 | | | $ | 10.87 | | | $ | 11.36 | | | $ | 14.28 | | |
| | | | | | | | | | | | | | | | | | | | | | |
| | | | | | | | | | | | | | | | | | | | | | |
| | | 0.21 | | | | 0.19 | | | | 0.14 | | | | 0.19 | | | | 0.08 | | |
| | | 3.24 | | | | (1.18 | ) | | | 2.07 | | | | (0.21 | ) | | | 0.03 | | |
| | | 3.45 | | | | (0.99 | ) | | | 2.21 | | | | (0.02 | ) | | | 0.11 | | |
| | | | | | | | | | | | | | | | | | | | | | |
| | | | | | | | | | | | | | | | | | | | | | |
| | | (0.21 | ) | | | (0.14 | ) | | | (0.20 | ) | | | (0.16 | ) | | | (0.21 | ) | |
| | | — | | | | (0.32 | ) | | | — | | | | (0.26 | ) | | | (2.82 | ) | |
| | | — | | | | — | | | | — | | | | (0.05 | ) | | | — | | |
| | | (0.21 | ) | | | (0.46 | ) | | | (0.20 | ) | | | (0.47 | ) | | | (3.03 | ) | |
| | | | | | | | | | | | | | | | | | | | | | |
| | $ | 14.67 | | | $ | 11.43 | | | $ | 12.88 | | | $ | 10.87 | | | $ | 11.36 | | |
| | | | | | | | | | | | | | | | | | | | | | |
| | | 30.28% | 4 | | | (7.86% | )4 | | | 20.55% | 4 | | | (0.26% | )4 | | | 0.90% | | |
| | | | | | | | | | | | | | | | | | | | | | |
| | | | | | | | | | | | | | | | | | | | | | |
| | $ | 45,151 | | | $ | 38,879 | | | $ | 51,133 | | | $ | 50,627 | | | $ | 65,824 | | |
| | | 1.33% | | | | 1.37% | | | | 1.42% | | | | 1.39% | | | | 1.44% | | |
| | | 1.39% | | | | 1.57% | | | | 1.58% | | | | 1.41% | | | | 1.44% | | |
| | | 1.53% | | | | 1.62% | | | | 1.21% | | | | 1.76% | | | | 0.71% | | |
| | | 1.47% | | | | 1.42% | | | | 1.05% | | | | 1.74% | | | | 0.71% | | |
| | | 60% | | | | 84% | | | | 125% | | | | 120% | | | | 145% | | |
35
Table of Contents
Financial highlights
Delaware Global Listed Real Assets Fund Class C
Selected data for each share of the Fund outstanding throughout each period were as follows:
| Net asset value, beginning of period |
| |
| Income (loss) from investment operations: |
| Net investment income (loss)2 |
| Net realized and unrealized gain (loss) |
| Total from investment operations |
| |
| Less dividends and distributions from: |
| Net investment income |
| Net realized gain |
| Return of capital |
| Total dividends and distributions |
| |
| Net asset value, end of period |
| |
| Total return4 |
| |
| Ratios and supplemental data: |
| Net assets, end of period (000 omitted) |
| Ratio of expenses to average net assets6 |
| Ratio of expenses to average net assets prior to fees waived6 |
| Ratio of net investment income (loss) to average net assets |
| Ratio of net investment income (loss) to average net assets prior to fees waived |
| Portfolio turnover |
| 1 | Prior to the close of business on August 19, 2019, the Fund invested primarily in securities of companies principally engaged in the real estate industry. Since the close of business on August 19, 2019, the Fund has been repositioned to invest primarily in listed real assets securities (Repositioning). The historical returns prior to that time do not reflect the Repositioning. |
| 2 | Calculated using average shares outstanding. |
| 3 | Amount is less than $(0.005) per share. |
| 4 | Total return is based on the change in net asset value of a share during the period and assumes reinvestment of dividends and distributions at net asset value and does not reflect the impact of a sales charge. |
| 5 | Total return during the period reflects a waiver by the manager. Performance would have been lower had the waiver not been in effect. |
| 6 | Expense ratios do not include expenses of the Underlying Funds in which the Fund invests. |
See accompanying notes, which are an integral part of the financial statements.
36
Table of Contents
| | Year ended | |
| | 10/31/21 | | | 10/31/20 | | | 10/31/191 | | | 10/31/18 | | | 10/31/17 | | |
| | $ | 11.39 | | | $ | 12.85 | | | $ | 10.85 | | | $ | 11.31 | | | $ | 14.24 | | |
| | | | | | | | | | | | | | | | | | | | | | |
| | | | | | | | | | | | | | | | | | | | | | |
| | | 0.10 | | | | 0.10 | | | | 0.05 | | | | 0.11 | | | | —3 | | |
| | | 3.23 | | | | (1.17 | ) | | | 2.07 | | | | (0.21 | ) | | | 0.02 | | |
| | | 3.33 | | | | (1.07 | ) | | | 2.12 | | | | (0.10 | ) | | | 0.02 | | |
| | | | | | | | | | | | | | | | | | | | | | |
| | | | | | | | | | | | | | | | | | | | | | |
| | | (0.09 | ) | | | (0.07 | ) | | | (0.12 | ) | | | (0.05 | ) | | | (0.13 | ) | |
| | | — | | | | (0.32 | ) | | | — | | | | (0.26 | ) | | | (2.82 | ) | |
| | | — | | | | — | | | | — | | | | (0.05 | ) | | | — | | |
| | | (0.09 | ) | | | (0.39 | ) | | | (0.12 | ) | | | (0.36 | ) | | | (2.95 | ) | |
| | | | | | | | | | | | | | | | | | | | | | |
| | $ | 14.63 | | | $ | 11.39 | | | $ | 12.85 | | | $ | 10.85 | | | $ | 11.31 | | |
| | | | | | | | | | | | | | | | | | | | | | |
| | | 29.31% | 5 | | | (8.55% | )5 | | | 19.64% | 5 | | | (0.99% | )5 | | | 0.13% | | |
| | | | | | | | | | | | | | | | | | | | | | |
| | | | | | | | | | | | | | | | | | | | | | |
| | $ | 1,601 | | | $ | 2,302 | | | $ | 4,082 | | | $ | 4,810 | | | $ | 13,331 | | |
| | | 2.08% | | | | 2.12% | | | | 2.17% | | | | 2.14% | | | | 2.19% | | |
| | | 2.14% | | | | 2.32% | | | | 2.33% | | | | 2.16% | | | | 2.19% | | |
| | | 0.78% | | | | 0.87% | | | | 0.46% | | | | 1.01% | | | | (0.04% | ) | |
| | | 0.72% | | | | 0.67% | | | | 0.30% | | | | 0.99% | | | | (0.04% | ) | |
| | | 60% | | | | 84% | | | | 125% | | | | 120% | | | | 145% | | |
37
Table of Contents
Financial highlights
Delaware Global Listed Real Assets Fund Class R
Selected data for each share of the Fund outstanding throughout each period were as follows:
| Net asset value, beginning of period |
| |
| Income (loss) from investment operations: |
| Net investment income2 |
| Net realized and unrealized gain (loss) |
| Total from investment operations |
| |
| Less dividends and distributions from: |
| Net investment income |
| Net realized gain |
| Return of capital |
| Total dividends and distributions |
| |
| Net asset value, end of period |
| |
| Total return3 |
| |
| Ratios and supplemental data: |
| Net assets, end of period (000 omitted) |
| Ratio of expenses to average net assets5 |
| Ratio of expenses to average net assets prior to fees waived5 |
| Ratio of net investment income to average net assets |
| Ratio of net investment income to average net assets prior to fees waived |
| Portfolio turnover |
| 1 | Prior to the close of business on August 19, 2019, the Fund invested primarily in securities of companies principally engaged in the real estate industry. Since the close of business on August 19, 2019, the Fund has been repositioned to invest primarily in listed real assets securities (Repositioning). The historical returns prior to that time do not reflect the Repositioning. |
| 2 | Calculated using average shares outstanding. |
| 3 | Total return is based on the change in net asset value of a share during the period and assumes reinvestment of dividends and distributions at net asset value. |
| 4 | Total return during the period reflects a waiver by the manager. Performance would have been lower had the waiver not been in effect. |
| 5 | Expense ratios do not include expenses of the Underlying Funds in which the Fund invests. |
See accompanying notes, which are an integral part of the financial statements.
38
Table of Contents
| Year ended |
| | 10/31/21 | | 10/31/20 | | 10/31/191 | | 10/31/18 | | 10/31/17 | |
| $ | 11.41 | | | $ | 12.87 | | | $ | 10.86 | | | $ | 11.35 | | | $ | 14.27 | | |
| | | | | | | | | | | | | | | | | | | | | |
| | | | | | | | | | | | | | | | | | | | | |
| | 0.17 | | | | 0.16 | | | | 0.11 | | | | 0.17 | | | | 0.05 | | |
| | 3.24 | | | | (1.18 | ) | | | 2.07 | | | | (0.22 | ) | | | 0.04 | | |
| | 3.41 | | | | (1.02 | ) | | | 2.18 | | | | (0.05 | ) | | | 0.09 | | |
| | | | | | | | | | | | | | | | | | | | | |
| | | | | | | | | | | | | | | | | | | | | |
| | (0.17 | ) | | | (0.12 | ) | | | (0.17 | ) | | | (0.13 | ) | | | (0.19 | ) | |
| | — | | | | (0.32 | ) | | | — | | | | (0.26 | ) | | | (2.82 | ) | |
| | — | | | | — | | | | — | | | | (0.05 | ) | | | — | | |
| | (0.17 | ) | | | (0.44 | ) | | | (0.17 | ) | | | (0.44 | ) | | | (3.01 | ) | |
| | | | | | | | | | | | | | | | | | | | | |
| $ | 14.65 | | | $ | 11.41 | | | $ | 12.87 | | | $ | 10.86 | | | $ | 11.35 | | |
| | | | | | | | | | | | | | | | | | | | | |
| | 30.02% | 4 | | | (8.14% | )4 | | | 20.30% | 4 | | | (0.54% | )4 | | | 0.66% | | |
| | | | | | | | | | | | | | | | | | | | | |
| | | | | | | | | | | | | | | | | | | | | |
| $ | 4,046 | | | $ | 4,149 | | | $ | 4,966 | | | $ | 4,934 | | | $ | 7,885 | | |
| | 1.58% | | | | 1.62% | | | | 1.67% | | | | 1.64% | | | | 1.69% | | |
| | 1.64% | | | | 1.82% | | | | 1.83% | | | | 1.66% | | | | 1.69% | | |
| | 1.28% | | | | 1.37% | | | | 0.96% | | | | 1.51% | | | | 0.46% | | |
| | 1.22% | | | | 1.17% | | | | 0.80% | | | | 1.49% | | | | 0.46% | | |
| | 60% | | | | 84% | | | | 125% | | | | 120% | | | | 145% | | |
39
Table of Contents
Financial highlights
Delaware Global Listed Real Assets Fund Institutional Class
Selected data for each share of the Fund outstanding throughout each period were as follows:
| Net asset value, beginning of period |
| |
| Income (loss) from investment operations: |
| Net investment income2 |
| Net realized and unrealized gain (loss) |
| Total from investment operations |
| |
| Less dividends and distributions from: |
| Net investment income |
| Net realized gain |
| Return of capital |
| Total dividends and distributions |
| |
| Net asset value, end of period |
| |
| Total return4 |
| |
| Ratios and supplemental data: |
| Net assets, end of period (000 omitted) |
| Ratio of expenses to average net assets6 |
| Ratio of expenses to average net assets prior to fees waived6 |
| Ratio of net investment income to average net assets |
| Ratio of net investment income to average net assets prior to fees waived |
| Portfolio turnover |
1 | Prior to the close of business on August 19, 2019, the Fund invested primarily in securities of companies principally engaged in the real estate industry. Since the close of business on August 19, 2019, the Fund has been repositioned to invest primarily in listed real assets securities (Repositioning). The historical returns prior to that time do not reflect the Repositioning. |
2 | Calculated using average shares outstanding. |
3 | Amount is less than $0.005 per share. |
4 | Total return is based on the change in net asset value of a share during the period and assumes reinvestment of dividends and distributions at net asset value. |
5 | Total return during the period reflects a waiver by the manager. Performance would have been lower had the waiver not been in effect. |
6 | Expense ratios do not include expenses of the Underlying Funds in which the Fund invests. |
See accompanying notes, which are an integral part of the financial statements.
40
Table of Contents
| Year ended |
| 10/31/21 | | 10/31/20 | | 10/31/191 | | 10/31/18 | | 10/31/17 | |
| $ | 11.49 | | | $ | 12.94 | | | $ | 10.91 | | | $ | 11.41 | | | $ | 14.33 | | |
| | | | | | | | | | | | | | | | | | | | | |
| | | | | | | | | | | | | | | | | | | | | |
| | 0.25 | | | | 0.22 | | | | 0.17 | | | | 0.22 | | | | 0.12 | | |
| | 3.25 | | | | (1.19 | ) | | | 2.09 | | | | (0.22 | ) | | | 0.02 | | |
| | 3.50 | | | | (0.97 | ) | | | 2.26 | | | | — | 3 | | | 0.14 | | |
| | | | | | | | | | | | | | | | | | | | | |
| | | | | | | | | | | | | | | | | | | | | |
| | (0.24 | ) | | | (0.16 | ) | | | (0.23 | ) | | | (0.19 | ) | | | (0.24 | ) | |
| | — | | | | (0.32 | ) | | | — | | | | (0.26 | ) | | | (2.82 | ) | |
| | — | | | | — | | | | — | | | | (0.05 | ) | | | — | | |
| | (0.24 | ) | | | (0.48 | ) | | | (0.23 | ) | | | (0.50 | ) | | | (3.06 | ) | |
| | | | | | | | | | | | | | | | | | | | | |
| $ | 14.75 | | | $ | 11.49 | | | $ | 12.94 | | | $ | 10.91 | | | $ | 11.41 | | |
| | | | | | | | | | | | | | | | | | | | | |
| | 30.62% | 5 | | | (7.63% | )5 | | | 20.94% | 5 | | | (0.08% | )5 | | | 1.14% | | |
| | | | | | | | | | | | | | | | | | | | | |
| | | | | | | | | | | | | | | | | | | | | |
| $ | 66,426 | | | $ | 46,769 | | | $ | 12,621 | | | $ | 13,741 | | | $ | 16,988 | | |
| | 1.08% | | | | 1.12% | | | | 1.17% | | | | 1.14% | | | | 1.19% | | |
| | 1.14% | | | | 1.32% | | | | 1.33% | | | | 1.16% | | | | 1.19% | | |
| | 1.78% | | | | 1.87% | | | | 1.46% | | | | 2.01% | | | | 0.96% | | |
| | 1.72% | | | | 1.67% | | | | 1.30% | | | | 1.99% | | | | 0.96% | | |
| | 60% | | | | 84% | | | | 125% | | | | 120% | | | | 145% | | |
41
Table of Contents
Financial highlights
Delaware Global Listed Real Assets Fund Class R6
Selected data for each share of the Fund outstanding throughout each period were as follows:
| Net asset value, beginning of period |
| |
| Income (loss) from investment operations: |
| Net investment income2 |
| Net realized and unrealized gain (loss) |
| Total from investment operations |
| |
| Less dividends and distributions from: |
| Net investment income |
| Net realized gain |
| Return of capital |
| Total dividends and distributions |
| |
| Net asset value, end of period |
| |
| Total return3 |
| |
| Ratios and supplemental data: |
| Net assets, end of period (000 omitted) |
| Ratio of expenses to average net assets5 |
| Ratio of expenses to average net assets prior to fees waived5 |
| Ratio of net investment income to average net assets |
| Ratio of net investment income to average net assets prior to fees waived |
| Portfolio turnover |
1 | Prior to the close of business on August 19, 2019, the Fund invested primarily in securities of companies principally engaged in the real estate industry. Since the close of business on August 19, 2019, the Fund has been repositioned to invest primarily in listed real assets securities (Repositioning). The historical returns prior to that time do not reflect the Repositioning. |
2 | Calculated using average shares outstanding. |
3 | Total return is based on the change in net asset value of a share during the period and assumes reinvestment of dividends and distributions at net asset value. |
4 | Total return during the period reflects a waiver by the manager. Performance would have been lower had the waiver not been in effect. |
5 | Expense ratios do not include expenses of the Underlying Funds in which the Fund invests. |
See accompanying notes, which are an integral part of the financial statements.
42
Table of Contents
| Year ended | |
| | 10/31/21 | | 10/31/20 | | 10/31/191 | | 10/31/18 | | 10/31/17 | |
| $ | 11.47 | | | $ | 12.91 | | | $ | 10.89 | | | $ | 11.41 | | | $ | 14.33 | | |
| | | |
| | | |
| | 0.26 | | | | 0.23 | | | | 0.18 | | | | 0.24 | | | | 0.13 | | |
| | 3.24 | | | | (1.18 | ) | | | 2.08 | | | | (0.23 | ) | | | 0.03 | | |
| | 3.50 | | | | (0.95 | ) | | | 2.26 | | | | 0.01 | | | | 0.16 | | |
| | | |
| | | |
| | (0.25 | ) | | | (0.17 | ) | | | (0.24 | ) | | | (0.22 | ) | | | (0.26 | ) | |
| | — | | | | (0.32 | ) | | | — | | | | (0.26 | ) | | | (2.82 | ) | |
| | — | | | | — | | | | — | | | | (0.05 | ) | | | — | | |
| | (0.25 | ) | | | (0.49 | ) | | | (0.24 | ) | | | (0.53 | ) | | | (3.08 | ) | |
| | | |
| $ | 14.72 | | | $ | 11.47 | | | $ | 12.91 | | | $ | 10.89 | | | $ | 11.41 | | |
| | | |
| | 30.71% | 4 | | | (7.51%) | 4 | | | 21.00% | 4 | | | 0.09% | 4 | | | 1.28% | | |
| | | |
| | | |
| $ | 8,495 | | | $ | 6,599 | | | $ | 5,396 | | | $ | 4,876 | | | $ | 21,155 | | |
| | 1.00% | | | | 1.02% | | | | 1.07% | | | | 1.01% | | | | 1.04% | | |
| | 1.04% | | | | 1.22% | | | | 1.23% | | | | 1.03% | | | | 1.04% | | |
| | 1.86% | | | | 1.97% | | | | 1.56% | | | | 2.14% | | | | 1.11% | | |
| | 1.82% | | | | 1.77% | | | | 1.40% | | | | 2.12% | | | | 1.11% | | |
| | 60% | | | | 84% | | | | 125% | | | | 120% | | | | 145% | | |
43
Table of Contents
| Notes to financial statements |
| Delaware Global Listed Real Assets Fund | October 31, 2021 |
Delaware Global Listed Real Assets Fund (Fund) is a series of Delaware Pooled® Trust (Trust), which is organized as a Delaware statutory trust. The Trust is an open-end investment company. The Fund is considered diversified under the Investment Company Act of 1940, as amended, and offers Class A, Class C, Class R, Institutional Class, and Class R6 shares. Class A shares are sold with a maximum front-end sales charge of 5.75%. There is no front-end sales charge when you purchase $1,000,000 or more of Class A shares. However, if Delaware Distributors, L.P. (DDLP) paid your financial intermediary a commission on your purchase of $1,000,000 or more of Class A shares, for shares purchased prior to July 1, 2020, you will have to pay a limited contingent deferred sales charge (Limited CDSC) of 1.00% if you redeem these shares within the first year after your purchase and 0.50% if you redeem shares within the second year; and for shares purchased on or after July 1, 2020, you will have to pay a Limited CDSC of 1.00% if you redeem these shares within the first 18 months after your purchase; unless a specific waiver of the Limited CDSC applies. Class C shares are sold with a CDSC of 1.00%, which will be incurred if redeemed during the first 12 months. Class R, Institutional Class, and Class R6 shares are not subject to a sales charge and are offered for sale exclusively to certain eligible investors. In addition, Class R6 shares do not pay any service fees, sub-accounting fees, and/or sub-transfer agency fees to any brokers, dealers, or other financial intermediaries. This report contains information relating only to Delaware Global Listed Real Assets Fund. All other series of Delaware Pooled Trust, the Macquarie Institutional Portfolios, are included in a separate report.
1. Significant Accounting Policies
The Fund follows accounting and reporting guidance under Financial Accounting Standards Board (FASB) Accounting Standards Codification Topic 946, Financial Services — Investment Companies. The following accounting policies are in accordance with US generally accepted accounting principles (US GAAP) and are consistently followed by the Fund.
Security Valuation — Equity securities, except those traded on the Nasdaq Stock Market LLC (Nasdaq), are valued at the last quoted sales price as of the time of the regular close of the New York Stock Exchange on the valuation date. Equity securities traded on the Nasdaq are valued in accordance with the Nasdaq Official Closing Price, which may not be the last sales price. If, on a particular day, an equity security does not trade, the mean between the bid and ask prices will be used, which approximates fair value. Equity securities listed on a foreign exchange are normally valued at the last quoted sales price on the valuation date. Debt securities are valued based upon valuations provided by an independent pricing service or broker and reviewed by management. To the extent current market prices are not available, the pricing service may take into account developments related to the specific security, as well as transactions in comparable securities. US government and agency securities are valued at the mean between the bid and ask prices, which approximates fair value. Valuations for fixed income securities utilize matrix systems, which reflect such factors as security prices, yields, maturities, and ratings, and are supplemented by dealer and exchange quotations. For asset-backed securities, collateralized mortgage obligations (CMOs), commercial mortgage securities, and US government agency mortgage securities, pricing vendors utilize matrix pricing which considers prepayment speed, attributes of the collateral, yield or price of bonds of comparable quality, coupon, maturity, and type as well as broker/dealer-supplied prices. Open-end investment companies are valued at their published net asset
44
Table of Contents
value (NAV). Foreign currency exchange contracts and foreign cross currency exchange contracts are valued at the mean between the bid and ask prices, which approximates fair value. Interpolated values are derived when the settlement date of the contract is an interim date for which quotations are not available. Futures contracts and options on futures contracts are valued at the daily quoted settlement prices. Exchange-traded options are valued at the last reported sale price or, if no sales are reported, at the mean between the last reported bid and ask prices, which approximates fair value. Generally, other securities and assets for which market quotations are not readily available are valued at fair value as determined in good faith under the direction of the Trust’s Board of Trustees (Board). In determining whether market quotations are readily available or fair valuation will be used, various factors will be taken into consideration, such as market closures or suspension of trading in a security. The Fund may use fair value pricing more frequently for securities traded primarily in non-US markets because, among other things, most foreign markets close well before the Fund values its securities, generally as of 4:00pm Eastern time. The earlier close of these foreign markets gives rise to the possibility that significant events, including broad market moves, government actions or pronouncements, aftermarket trading, or news events may have occurred in the interim. Whenever such a significant event occurs, the Fund may value foreign securities using fair value prices based on third-party vendor modeling tools (international fair value pricing). Restricted securities are valued at fair value using methods approved by the Board.
Federal and Foreign Income Taxes — No provision for federal income taxes has been made as the Fund intends to continue to qualify for federal income tax purposes as a regulated investment company under Subchapter M of the Internal Revenue Code of 1986, as amended, and make the requisite distributions to shareholders. The Fund evaluates tax positions taken or expected to be taken in the course of preparing the Fund’s tax returns to determine whether the tax positions are “more-likely-than-not” of being sustained by the applicable tax authority. Tax positions not deemed to meet the “more-likely-than-not” threshold are recorded as a tax benefit or expense in the current year. Management has analyzed the Fund’s tax positions taken or expected to be taken on the Fund’s federal income tax returns through the year ended October 31, 2021, and for all open tax years (years ended October 31, 2018–October 31, 2020), and has concluded that no provision for federal income tax is required in the Fund’s financial statements. In regard to foreign taxes only, the Fund has open tax years in certain foreign countries in which it invests that may date back to the inception of the Fund. If applicable, the Fund recognizes interest accrued on unrecognized tax benefits in interest expense and penalties in “Other” on the “Statement of operations.” During the year ended October 31, 2021, the Fund did not incur any interest or tax penalties.
Class Accounting — Investment income, common expenses, and realized and unrealized gain (loss) on investments are allocated to the various classes of the Fund on the basis of daily net assets of each class. Distribution expenses relating to a specific class are charged directly to that class. Class R6 shares will not be allocated any expenses related to service fees, sub-accounting fees, and/or sub-transfer agency fees paid to brokers, dealers, or other financial intermediaries.
Foreign Currency Transactions — Transactions denominated in foreign currencies are recorded at the prevailing exchange rates on the valuation date in accordance with the Fund’s prospectus. The value of all assets and liabilities denominated in foreign currencies is translated daily into US dollars at the exchange rate of such currencies against the US dollar. Transaction gains or losses resulting from
45
Table of Contents
Notes to financial statements
Delaware Global Listed Real Assets Fund
1. Significant Accounting Policies (continued)
changes in exchange rates during the reporting period or upon settlement of the foreign currency transaction are reported in operations for the current period. The Fund generally bifurcates that portion of realized gains and losses on investments in debt securities which is due to changes in foreign exchange rates from that which is due to changes in market prices of debt securities. That portion of gains (losses), attributable to changes in foreign exchange rates, is included on the “Statement of operations” under “Net realized gain (loss) on foreign currencies.” The Fund reports certain foreign currency related transactions as components of realized gains (losses) for financial reporting purposes, whereas such components are treated as ordinary income (loss) for federal income tax purposes.
Use of Estimates — The preparation of financial statements in conformity with US GAAP requires management to make estimates and assumptions that affect the fair value of investments, the reported amounts of assets and liabilities and disclosure of contingent assets and liabilities at the date of the financial statements, and the reported amounts of revenues and expenses during the reporting period. Actual results could differ from those estimates and the differences could be material.
Other — Expenses directly attributable to the Fund are charged directly to the Fund. Other expenses common to various funds within the Delaware Funds® by Macquarie (Delaware Funds) are generally allocated among such fund on the basis of average net assets. Management fees and certain other expenses are paid monthly. Security transactions are recorded on the date the securities are purchased or sold (trade date) for financial reporting purposes. Costs used in calculating realized gains and losses on the sale of investment securities are those of the specific securities sold. Dividend income is recorded on the ex-dividend date and interest income is recorded on the accrual basis. Discounts and premiums on debt securities are accreted or amortized to interest income, respectively, over the lives of the respective securities using the effective interest method. Premiums on callable debt securities are amortized to interest income to the earliest call date using the effective interest method. Realized gains (losses) on paydowns of asset- and mortgage-backed securities are classified as interest income. Distributions received from investments in real estate investment trusts (REITs) are recorded as dividend income on the ex-dividend date, subject to reclassification upon notice of the character of such distributions by the issuer, which are estimated. Distributions received from investments in limited partnerships are recorded as return of capital on investments on the ex-dividend date. Foreign dividends are also recorded on the ex-dividend date or as soon after the ex-dividend date that the Fund is aware of such dividends, net of all tax withholdings, a portion of which may be reclaimable. Withholding taxes and reclaims on foreign dividends have been recorded in accordance with the Fund’s understanding of the applicable country’s tax rules and rates. The Fund declares and pays dividends from net investment income and distributions from net realized gain on investments, if any, annually. The Fund may distribute more frequently, if necessary for tax purposes. Dividends and distributions, if any, are recorded on the ex-dividend date.
The Fund receives earnings credits from its custodian when positive cash balances are maintained, which may be used to offset custody fees. There were no such earnings credits for the year ended October 31, 2021.
46
Table of Contents
The Fund receives earnings credits from its transfer agent when positive cash balances are maintained, which may be used to offset transfer agent fees. If the amount earned is greater than $1, the expenses paid under this arrangement are included on the “Statement of operations” under “Dividend disbursing and transfer agent fees and expenses” with the corresponding expenses offset included under “Less expenses paid indirectly.” For the year ended October 31, 2021, the Fund earned $109 under this arrangement.
2. Investment Management, Administration Agreements, and Other Transactions with Affiliates
In accordance with the terms of its investment management agreement, the Fund pays Delaware Management Company (DMC), a series of Macquarie Investment Management Business Trust and the investment manager, an annual fee which is calculated daily and paid monthly at the rates of 0.75% on the first $500 million of average daily net assets of the Fund, 0.70% on the next $500 million, 0.65% on the next $1.5 billion, and 0.60% on average daily net assets in excess of $2.5 billion.
DMC has contractually agreed to waive all or a portion, if any, of its management fee and/or pay/reimburse expenses (excluding any distribution and service (12b-1) fees, acquired fund fees and expenses, taxes, interest, short sale dividend and interest expenses, brokerage fees, certain insurance costs, and nonroutine expenses or costs, including, but not limited to, those relating to reorganizations, litigation, conducting shareholder meetings, and liquidations), in order to prevent total annual fund operating expenses from exceeding 1.08% of the Fund’s average daily net assets for all share classes other than Class R6 from February 26, 2021 through April 30, 2021 and 1.00% of the Fund’s average daily net assets of the Class R6 shares from November 1, 2020 through October 31, 2021.* From November 1, 2020 through February 25, 2021, the waiver was 1.15% for all share classes other than Class R6. These waivers and reimbursements may only be terminated only by agreement of DMC and the Fund. The waivers and reimbursements are accrued daily and received monthly.
Macquarie Investment Management Austria Kapitalanlage AG (MIMAK) is primarily responsible for the day-to-day management of the Fund’s portfolio and determines its asset allocation. For these services, DMC, not the Fund, pays MIMAK a fee, which is 0.18% of the average daily net assets of the Fund.
DMC may permit its affiliates, Macquarie Investment Management Global Limited (MIMGL) and Macquarie Funds Management Hong Kong Limited (together, the “Affiliated Sub-Advisors”), to execute Fund equity security trades on its behalf. DMC may also seek quantitative support from MIMGL. Although the Affiliated Sub-Advisors serve as sub-advisors, DMC has ultimate responsibility for all investment advisory services. For these services, DMC, not the Fund, may pay each Affiliated Sub-Advisor a portion of its investment management fee.
DMC may seek investment advice and recommendations from its affiliates Macquarie Investment Management Europe Limited, Macquarie Investment Management Austria Kapitalanlage AG, and Macquarie Investment Management Global Limited (together, the “Affiliated Sub-Advisors”). The Manager may also permit these Affiliated Sub-Advisors to execute security trades for the Fund on behalf of DMC and exercise investment discretion for securities in certain markets where DMC believes it will be beneficial to utilize an Affiliated Sub-Advisor’s specialized market knowledge. Although the Affiliated
47
Table of Contents
Notes to financial statements
Delaware Global Listed Real Assets Fund
2. Investment Management, Administration Agreements, and Other Transactions with Affiliates (continued)
Sub-Advisors serve as sub-advisors, DMC has ultimate responsibility for all investment advisory services. For these services, DMC, not the Fund, pays each Affiliated Sub-Advisor a portion of its investment management fee.
Delaware Investments Fund Services Company (DIFSC), an affiliate of DMC, provides fund accounting and financial administrative oversight services to the Fund. For these services, DIFSC’s fees are calculated daily and paid monthly, based on the aggregate daily net assets of all funds within the Delaware Funds at the following annual rates: 0.00475% of the first $35 billion; 0.0040% of the next $10 billion; and 0.0025% of aggregate average daily net assets in excess of $45 billion (Total Fee). Each fund in the Delaware Funds pays a minimum of $4,000, which, in aggregate, is subtracted from the Total Fee. Each fund then pays its portion of the remainder of the Total Fee on a relative NAV basis. This amount is included on the “Statement of operations” under “Accounting and administration expenses.” For the year ended October 31, 2021, the Fund was charged $7,941 for these services.
DIFSC is also the transfer agent and dividend disbursing agent of the Fund. For these services, DIFSC’s fees are calculated daily and paid monthly, based on the aggregate daily net assets of the retail funds within the Delaware Funds at the following annual rates: 0.014% of the first $20 billion; 0.011% of the next $5 billion; 0.007% of the next $5 billion; 0.005% of the next $20 billion; and 0.0025% of average daily net assets in excess of $50 billion. The fees payable to DIFSC under the shareholder services agreement described above are allocated among all retail funds in the Delaware Funds on a relative NAV basis. This amount is included on the “Statement of operations” under “Dividend disbursing and transfer agent fees and expenses.” For the year ended October 31, 2021, the Fund was charged $9,714 for these services. Pursuant to a sub-transfer agency agreement between DIFSC and BNY Mellon Investment Servicing (US) Inc. (BNYMIS), BNYMIS provides certain sub-transfer agency services to the Fund. Sub-transfer agency fees are paid by the Fund and are also included on the “Statement of operations” under “Dividend disbursing and transfer agent fees and expenses.” The fees are calculated daily and paid as invoices are received on a monthly or quarterly basis.
Pursuant to a distribution agreement and distribution plan, the Fund pays DDLP, the distributor and an affiliate of DMC, an annual 12b-1 fee of 0.25%, 1.00%, and 0.50% of the average daily net assets of the Class A, Class C, and Class R shares, respectively. These fees are calculated daily and paid monthly. Institutional Class and Class R6 shares do not pay 12b-1 fee.
As provided in the investment management agreement, the Fund bears a portion of the cost of certain resources shared with DMC, including the cost of internal personnel of DMC and/or its affiliates that provide legal and regulatory reporting services to the Fund. For the year ended October 31, 2021, the Fund was charged $7,468 for internal legal and regulatory reporting services provided by DMC and/or its affiliates’ employees. This amount is included on the “Statement of operations” under “Legal fees.”
For the year ended October 31, 2021, DDLP earned $2,236 for commissions on sales of the Fund’s Class A shares. For the year ended October 31, 2021, DDLP received gross CDSC commissions of $17 and $5 on redemptions of the Fund’s Class A and Class C shares, respectively, and these
48
Table of Contents
commissions were entirely used to offset upfront commissions previously paid by DDLP to broker/dealers on sales of those shares.
Trustees’ fees include expenses accrued by the Fund for each Trustee’s retainer and meeting fees. Certain officers of DMC, DIFSC, and DDLP are officers and/or Trustees of the Trust. These officers and Trustees are paid no compensation by the Fund.
In addition to the management fees and other expenses of the Fund, the Fund indirectly bears the investment management fees and other expenses of the investment companies (Underlying Funds) in which it invests. The amount of these fees and expenses incurred indirectly by the Fund will vary based upon the expense and fee levels of the Underlying Funds and the number of shares that are owned of the Underlying Funds at different times.
____________________
| * | The aggregate contractual waiver period covering this report is from February 28, 2020 through March 1, 2022. |
3. Investments
For the year ended October 31, 2021, the Fund made purchases and sales of investment securities other than short-term investments as follows:
| Purchases other than US government securities | $ | 55,563,079 |
| Purchases of US government securities | | 9,989,624 |
| Sales other than US government securities | | 64,480,614 |
| Sales of US government securities | | 6,084,521 |
The tax cost of investments and derivatives includes adjustments to net unrealized appreciation (depreciation) which may not necessarily be final tax cost basis adjustments, but approximate the tax basis unrealized gains and losses that may be realized and distributed to shareholders. At October 31, 2021, the cost and unrealized appreciation (depreciation) of investments and derivatives for federal income tax purposes for the Fund were as follows:
| Cost of investments and derivatives | $ | 112,182,656 | |
| Aggregate unrealized appreciation of investments and derivatives | $ | 15,582,511 | |
| Aggregate unrealized depreciation of investments and derivatives | | (2,123,323 | ) |
| Net unrealized appreciation of investments and derivatives | $ | 13,459,188 | |
US GAAP defines fair value as the price that the Fund would receive to sell an asset or pay to transfer a liability in an orderly transaction between market participants at the measurement date under current market conditions. A three-level hierarchy for fair value measurements has been established based upon the transparency of inputs to the valuation of an asset or liability. Inputs may be observable or unobservable and refer broadly to the assumptions that market participants would use in pricing the asset or liability. Observable inputs reflect the assumptions market participants would use in pricing the asset or liability based on market data obtained from sources independent of the reporting entity. Unobservable inputs reflect the reporting entity’s own assumptions about the assumptions that market participants would use in pricing the asset or liability based on the best information available under the
49
Table of Contents
Notes to financial statements
Delaware Global Listed Real Assets Fund
3. Investments (continued)
circumstances. The Fund’s investment in its entirety is assigned a level based upon the observability of the inputs which are significant to the overall valuation. The three-level hierarchy of inputs is summarized as follows:
| Level 1 – | Inputs are quoted prices in active markets for identical investments. (Examples: equity securities, open-end investment companies, futures contracts, and exchange-traded options contracts) |
| Level 2 – | Other observable inputs, including, but not limited to: quoted prices for similar assets or liabilities in markets that are active, quoted prices for identical or similar assets or liabilities in markets that are not active, inputs other than quoted prices that are observable for the assets or liabilities (such as interest rates, yield curves, volatilities, prepayment speeds, loss severities, credit risks, and default rates) or other market-corroborated inputs. (Examples: debt securities, government securities, swap contracts, foreign currency exchange contracts, foreign securities utilizing international fair value pricing, broker-quoted securities, and fair valued securities) |
| Level 3 – | Significant unobservable inputs, including the Fund’s own assumptions used to determine the fair value of investments. (Examples: broker-quoted securities and fair valued securities) |
Level 3 investments are valued using significant unobservable inputs. The Fund may also use an income-based valuation approach in which the anticipated future cash flows of the investment are discounted to calculate fair value. Discounts may also be applied due to the nature or duration of any restrictions on the disposition of the investments. Valuations may also be based upon current market prices of securities that are comparable in coupon, rating, maturity, and industry. The derived value of a Level 3 investment may not represent the value which is received upon disposition and this could impact the results of operations.
The following table summarizes the valuation of the Fund’s investments by fair value hierarchy levels as of October 31, 2021:
| | Level 1 | | Level 2 | | Total |
| Securities | | | | | | | | | |
| Assets: | | | | | | | | | |
| Closed-Ended Trust | | $ | 363,768 | | $ | — | | $ | 363,768 |
| Common Stock | | | 75,666,096 | | | — | | | 75,666,096 |
| Corporate Bonds | | | — | | | 11,243,592 | | | 11,243,592 |
| Loan Agreements | | | — | | | 3,338,122 | | | 3,338,122 |
| Master Limited Partnerships | | | 1,864,753 | | | — | | | 1,864,753 |
| Non-Agency Commercial Mortgage-Backed Securities | | | — | | | 2,407,953 | | | 2,407,953 |
| Sovereign Bonds | | | — | | | 16,789,217 | | | 16,789,217 |
| US Treasury Obligations | | | — | | | 8,332,518 | | | 8,332,518 |
| Short-Term Investments | | | 5,432,788 | | | — | | | 5,432,788 |
| Total Value of Securities | | $ | 83,327,405 | | $ | 42,111,402 | | $ | 125,438,807 |
50
Table of Contents
| | Level 1 | | Level 2 | | Total |
| Derivatives1 | | | | | | | | | | | |
| Assets: | | | | | | | | | | | |
| Foreign Currency Exchange Contracts | | $ | — | | $ | 231,320 | | | $ | 231,320 | |
| Liabilities: | | | | | | | | | | | |
| Foreign Currency Exchange Contracts | | $ | — | | $ | (28,283 | ) | | $ | (28,283 | ) |
| 1 | Foreign currency exchange contracts are valued at the unrealized appreciation (depreciation) on the instrument at the year end. |
During the year ended October 31, 2021, there were no transfers into or out of Level 3 investments. The Fund’s policy is to recognize transfers into or out of Level 3 investments based on fair value at the beginning of the reporting period.
A reconciliation of Level 3 investments is presented when the Fund has a significant amount of Level 3 investments at the beginning, interim, or end of the period in relation to the Fund’s net assets. During the year ended October 31, 2021, there were no Level 3 investments.
4. Dividend and Distribution Information
Income and long-term capital gain distributions are determined in accordance with federal income tax regulations, which may differ from US GAAP. Additionally, distributions from net gains on foreign currency transactions and net short-term gains on sales of investment securities are treated as ordinary income for federal income tax purposes. The tax character of dividends and distributions paid during the years ended October 31, 2021 and 2020 were as follows:
| | Year ended |
| | 10/31/21 | | 10/31/20 |
| Ordinary income | | $ | 1,857,654 | | $ | 2,361,787 |
| Long-term capital gains | | | — | | | 1,768,278 |
| Total | | $ | 1,857,654 | | $ | 4,130,065 |
5. Components of Net Assets on a Tax Basis
As of October 31, 2021, the components of net assets on a tax basis were as follows:
| Shares of beneficial interest | | $ | 106,570,693 |
| Undistributed ordinary income | | | 1,727,020 |
| Undistributed long-term capital gains | | | 3,961,645 |
| Unrealized appreciation (depreciation) of investments, foreign currencies, and | | | |
| derivatives | | | 13,459,188 |
| Net assets | | $ | 125,718,546 |
The differences between book basis and tax basis components of net assets are primarily attributable to tax deferral of losses on wash sales, tax deferral of losses on straddles, mark-to-market of foreign
51
Table of Contents
Notes to financial statements
Delaware Global Listed Real Assets Fund
5. Components of Net Assets on a Tax Basis (continued)
currency exchange contracts, tax treatment on partnership investments, tax recognition of unrealized gain on passive foreign investment companies, and market discount and premium on debt instruments.
For financial reporting purposes, capital accounts are adjusted to reflect the tax character of permanent book/tax differences. Reclassifications are primarily due to tax treatment of partnership non-deductible expense and the tax treatment of passive foreign investment companies. Results of operations and net assets were not affected by these reclassifications. For the year ended October 31, 2021, the Fund recorded the following reclassifications:
| Paid-in capital | | $ | (150 | ) |
| Total distributable earnings (loss) | | | 150 | |
For federal income tax purposes, capital loss carryforwards may be carried forward and applied against future capital gains. At October 31, 2021, the Fund utilized $6,660,838 of capital loss carryforwards.
6. Capital Shares
Transactions in capital shares were as follows:
| | | Year ended |
| | | 10/31/21 | | 10/31/20 |
| Shares sold: | | | | | | |
| | Class A | | 198,836 | | | 194,483 | |
| Class C | | 28,408 | | | 12,696 | |
| Class R | | 26,311 | | | 56,811 | |
| Institutional Class | | 1,431,877 | | | 4,639,833 | |
| Class R6 | | 41,597 | | | 215,919 | |
| | | | | | | |
| Shares issued upon reinvestment of dividends and distributions: | | | | | | |
| Class A | | 45,426 | | | 142,428 | |
| Class C | | 832 | | | 9,310 | |
| Class R | | 3,879 | | | 13,696 | |
| Institutional Class | | 71,400 | | | 156,940 | |
| Class R6 | | 6,891 | | | 15,880 | |
| | | 1,855,457 | | | 5,457,996 | |
| | | | | | | | |
| Shares redeemed: | | | | | | |
| Class A | | (568,419 | ) | | (905,111 | ) |
| Class C | | (121,998 | ) | | (137,516 | ) |
| Class R | | (117,471 | ) | | (92,886 | ) |
| Institutional Class | | (1,070,459 | ) | | (1,700,957 | ) |
| Class R6 | | (46,833 | ) | | (74,264 | ) |
| | | (1,925,180 | ) | | (2,910,734 | ) |
| Net increase (decrease) | | (69,723 | ) | | 2,547,262 | |
52
Table of Contents
Certain shareholders may exchange shares of one class for shares of another class in the same Fund. These exchange transactions are included as subscriptions and redemptions in the table on the previous page and on the “Statements of changes in net assets.” For the years ended October 31, 2021 and 2020, the Fund had the following exchange transactions:
| | Exchange Redemptions | | Exchange Subscriptions | | |
| | | | | | | | Institutional | | | | |
| | Class A | | Class C | | Class A | | Class | | Class R6 | | |
| | Shares | | Shares | | Shares | | Shares | | Shares | | Value |
| Year ended | | | | | | | | | | | | |
| 10/31/21 | | 11,701 | | 8,520 | | 8,494 | | 11,519 | | 120 | | $260,280 |
| 10/31/20 | | 7,530 | | 5,831 | | 5,109 | | 8,190 | | — | | 155,178 |
7. Line of Credit
The Fund, along with certain other funds in the Delaware Funds (Participants), was a participant in a $275,000,000 revolving line of credit (Agreement) intended to be used for temporary or emergency purposes as an additional source of liquidity to fund redemptions of investor shares. Under the Agreement, the Participants were charged an annual commitment fee of 0.15%, which was allocated across the Participants based on a weighted average of the respective net assets of each Participant. The Participants were permitted to borrow up to a maximum of one-third of their net assets under the Agreement. Each Participant was individually, and not jointly, liable for its particular advances, if any, under the line of credit. The line of credit available under the Agreement expired on November 2, 2020.
On November 2, 2020, the Fund, along with the other Participants entered into an amendment to the Agreement for an amount of $225,000,000 to be used as described above. It operates in substantially the same manner as the original Agreement with the addition of an upfront fee of 0.05%, which was allocated across the Participants. The line of credit available under the Agreement expires on November 1, 2021.
The Fund had no amounts outstanding as of October 31, 2021, or at any time during the year then ended.
8. Derivatives
US GAAP requires disclosures that enable investors to understand: (1) how and why an entity uses derivatives; (2) how they are accounted for; and (3) how they affect an entity’s results of operations and financial position.
Foreign Currency Exchange Contracts — The Fund may enter into foreign currency exchange contracts and foreign cross currency exchange contracts as a way of managing foreign exchange rate risk. The Fund may enter into these contracts to fix the US dollar value of a security that it has agreed to buy or sell for the period between the date the trade was entered into and the date the security is delivered and paid for. The Fund may also enter into these contracts to hedge the US dollar value of securities it already owns that are denominated in foreign currencies. In addition, the Fund may enter into these contracts to facilitate or expedite the settlement of portfolio transactions. The change in value is
53
Table of Contents
Notes to financial statements
Delaware Global Listed Real Assets Fund
8. Derivatives (continued)
recorded as an unrealized gain or loss. When the contract is closed, a realized gain or loss is recorded equal to the difference between the value of the contract at the time it was opened and the value at the time it was closed.
The use of foreign currency exchange contracts and foreign cross currency exchange contracts does not eliminate fluctuations in the underlying prices of the securities, but does establish a rate of exchange that can be achieved in the future. Although foreign currency exchange contracts and foreign cross currency exchange contracts limit the risk of loss due to an unfavorable change in the value of the hedged currency, they also limit any potential gain that might result should the value of the currency change favorably. In addition, the Fund could be exposed to risks if the counterparties to the contracts are unable to meet the terms of their contracts. The Fund’s maximum risk of loss from counterparty credit risk is the value of its currency exchanged with the counterparty. The risk is generally mitigated by having a netting arrangement between the Fund and the counterparty and by the posting of collateral by the counterparty to the Fund to cover the Fund’s exposure to the counterparty.
During the year ended October 31, 2021, the Fund entered into foreign currency exchange contracts to fix the US dollar value of a security between trade date and settlement date and to hedge the US dollar value of securities it already owns that are denominated in foreign currencies to increase/decrease exposure to foreign currencies.
Futures Contracts — A futures contract is an agreement in which the writer (or seller) of the contract agrees to deliver to the buyer an amount of cash or securities equal to a specific dollar amount times the difference between the value of a specific security or index at the close of the last trading day of the contract and the price at which the agreement is made. The Fund may use futures contracts in the normal course of pursuing its investment objective. The Fund may invest in futures contracts to hedge its existing portfolio securities against fluctuations in value caused by changes in interest rates or market conditions. Upon entering into a futures contract, the Fund deposits cash or pledges US government securities to a broker, equal to the minimum “initial margin” requirements of the exchange on which the contract is traded. Subsequent payments are received from the broker or paid to the broker each day, based on the daily fluctuation in the market value of the contract. These receipts or payments are known as “variation margin” and are recorded daily by the Fund as unrealized gains or losses until the contracts are closed. When the contracts are closed, the Fund records a realized gain or loss equal to the difference between the value of the contract at the time it was opened and the value at the time it was closed. Risks of entering into futures contracts include potential imperfect correlation between the futures contracts and the underlying securities and the possibility of an illiquid secondary market for these instruments. When investing in futures, there is reduced counterparty credit risk to the Fund because futures are exchange-traded and the exchange’s clearinghouse, as counterparty to all exchange-traded futures, guarantees against default. No futures contracts were outstanding at October 31, 2021.
During the year ended October 31, 2021, the Fund used futures contracts to hedge the Fund’s existing portfolio securities against fluctuations in value caused by changes in interest rates or market conditions.
54
Table of Contents
Options Contracts — The Fund may enter into options contracts in the normal course of pursuing its investment objective. The Fund may buy or write options contracts for any number of reasons, including without limitation: to manage the Fund’s exposure to changes in securities prices caused by interest rates or market conditions and foreign currencies; as an efficient means of adjusting the Fund’s overall exposure to certain markets; to protect the value of portfolio securities; and as a cash management tool. The Fund may buy or write call or put options on securities, futures, swaps, swaptions, financial indices, and foreign currencies. When the Fund buys an option, a premium is paid and an asset is recorded and adjusted on a daily basis to reflect the current market value of the option purchased. When the Fund writes an option, a premium is received and a liability is recorded and adjusted on a daily basis to reflect the current market value of the option written. Premiums received from writing options that expire unexercised are treated by the Fund on the expiration date as realized gains. The difference between the premium received and the amount paid on effecting a closing purchase transaction, including brokerage commissions, is treated as realized gain or loss. If a call option is exercised, the premium is added to the proceeds from the sale of the underlying security in determining whether the Fund has a realized gain or loss. If a put option is exercised, the premium reduces the cost basis of the securities purchased by the Fund. The Fund, as writer of an option, bears the market risk of an unfavorable change in the price of the security underlying the written option. When writing options, the Fund is subject to minimal counterparty risk because the counterparty is only obligated to pay premiums and does not bear the market risk of an unfavorable market change. No options contracts were outstanding at October 31, 2021.
During the year ended October 31, 2021, the Fund used options contracts to manage the Fund’s exposure to changes in securities prices caused by interest rates or market conditions.
Fair values of derivative instruments as of October 31, 2021 were as follows:
| | Asset Derivatives Fair Value |
| Statement of Assets and | | | Currency | |
| Liabilities Location | | | Contracts | |
| Unrealized appreciation on foreign currency exchange contracts | | | $ | 231,320 | | |
| | | | | | | |
| | Liability Derivatives Fair Value |
| Statement of Assets and | | | Currency | |
| Liabilities Location | | | Contracts | |
| Unrealized depreciation on foreign currency exchange contracts | | | $ | (28,283 | ) | |
55
Table of Contents
Notes to financial statements
Delaware Global Listed Real Assets Fund
8. Derivatives (continued)
The effect of derivative instruments on the “Statement of operations” for the year ended October 31, 2021 was as follows:
| | Net Realized Gain (Loss) on: |
| | Foreign | | | | | | | | | | | | | | | | | | | |
| | Currency | | | | | | | | | | | | | | | | | | | |
| | Exchange | | Futures | | Options | | Options | | | | |
| | Contracts | | Contracts | | Purchased | | Written | | Total |
| Currency | | | | | | | | | | | | | | | | | | | | | | | |
| contracts | | $ | (289,532 | ) | | $ | — | | | | $ | — | | | | | $ | — | | | $ | (289,532 | ) |
| Interest rate | | | | | | | | | | | | | | | | | | | | | | | |
| contracts | | | — | | | | (41,712 | ) | | | | — | | | | | | — | | | | (41,712 | ) |
| Equity | | | | | | | | | | | | | | | | | | | | | | | |
| contracts | | | — | | | | — | | | | | (7,955 | ) | | | | | 742 | | | | (7,213 | ) |
| Total | | $ | (289,532 | ) | | $ | (41,712 | ) | | | $ | (7,955 | ) | | | | $ | 742 | | | $ | (338,457 | ) |
| | Net Change in Unrealized Appreciation (Depreciation) of: |
| | Foreign |
| | Currency |
| | Exchange |
| | Contracts |
| Currency | | | | | |
| contracts | | | $ | 176,986 | |
The table below summarizes the average balance of derivative holdings by the Fund during the year ended October 31, 2021:
| | Long Derivative | | Short Derivative |
| | Volume | | Volume |
| Foreign currency exchange contracts (average notional value) | | $ | 87,314 | | $ | 12,221,218 |
| Futures contracts (average notional value) | | | 349,025 | | | 53,518 |
| Options contracts (average value)* | | | 73 | | | 18 |
| * | Long represents purchased options and short represents written options. |
9. Offsetting
The Fund entered into an International Swaps and Derivatives Association, Inc. Master Agreement (ISDA Master Agreement) or a similar agreement with certain of its derivative contract counterparties in order to better define its contractual rights and to secure rights that will help the Fund mitigate its counterparty risk. An ISDA Master Agreement is a bilateral agreement between the Fund and a counterparty that governs over-the-counter (OTC) derivatives and foreign exchange contracts and typically contains, among other things, collateral posting items and netting provisions in the event of a default and/or termination event. Under an ISDA Master Agreement, the Fund may, under certain circumstances, offset with the counterparty certain derivative financial instruments’ payables and/or receivables with collateral held and/or posted and create one single net payment. The provisions of the ISDA Master Agreement
56
Table of Contents
typically permit a single net payment in the event of default (close-out), including the bankruptcy or insolvency of the counterparty. However, bankruptcy or insolvency laws of a particular jurisdiction may impose restrictions on or prohibitions against the right of offset in bankruptcy, insolvency, or other events.
For financial reporting purposes, the Fund does not offset derivative assets and derivative liabilities that are subject to netting arrangements on the “Statement of assets and liabilities.”
At October 31, 2021, the Fund had the following assets and liabilities subject to offsetting provisions:
Offsetting of Financial Assets and Liabilities and Derivative Assets and Liabilities
| | Gross Value of | | Gross Value of | | | | |
| Counterparty | | Derivative Asset | | Derivative Liability | | Net Position |
| Bank of New York Mellon | | | $ | 36 | | | | $ | — | | | | $ | 36 | |
| Citigroup | | | | 294 | | | | | (616 | ) | | | | (322 | ) |
| JPMorgan Chase Bank | | | | 230,990 | | | | | (27,667 | ) | | | | 203,323 | |
| Total | | | $ | 231,320 | | | | $ | (28,283 | ) | | | $ | 203,037 | |
| | | | | | | | Fair Value of | | | | | | | | Fair Value of | | | | | | | | | | | |
| | | | | | | | Non-Cash | | Cash Collateral | | Non-Cash | | Cash Collateral | | | | | | |
| Counterparty | | Net Position | | Collateral Received | | Received | | Collateral Pledged | | Pledged | | Net Exposure(a) |
| Bank of New | | | | | | | | | | | | | | | | | | | | | | | | | | | | | | | | | |
| York Mellon | | | $ | 36 | | | | | $ | — | | | | $ | — | | | | | $ | — | | | | $ | — | | | | $ | 36 | | |
| Citigroup | | | | (322 | ) | | | | | — | | | | | — | | | | | | — | | | | | — | | | | | (322 | ) | |
| JPMorgan Chase | | | | | | | | | | | | | | | | | | | | | | | | | | | | | | | | | |
| Bank | | | | 203,323 | | | | | | — | | | | | (110,000 | ) | | | | | — | | | | | — | | | | | 93,323 | | |
| Total | | | $ | 203,037 | | | | | $ | — | | | | $ | (110,000 | ) | | | | $ | — | | | | $ | — | | | | $ | 93,037 | | |
| (a) | Net exposure represents the receivable (payable) that would be due from (to) the counterparty in the event of default. |
10. Securities Lending
The Fund, along with other funds in the Delaware Funds, may lend its securities pursuant to a security lending agreement (Lending Agreement) with The Bank of New York Mellon (BNY Mellon). At the time a security is loaned, the borrower must post collateral equal to the required percentage of the market value of the loaned security, including any accrued interest. The required percentage is: (1) 102% with respect to US securities and foreign securities that are denominated and payable in US dollars; and (2) 105% with respect to foreign securities. With respect to each loan, if on any business day the aggregate market value of securities collateral plus cash collateral held is less than the aggregate market value of the securities which are the subject of such loan, the borrower will be notified to provide additional collateral by the end of the following business day, which, together with the collateral already held, will be not less than the applicable initial collateral requirements for such security loan. If the aggregate market value of securities collateral and cash collateral held with respect to a security loan exceeds the applicable initial collateral requirement, upon the request of the borrower, BNY Mellon must return enough collateral to the borrower by the end of the following business day to reduce the value of the remaining collateral to the applicable initial collateral requirement for such security loan. As a result of the foregoing, the value
57
Table of Contents
Notes to financial statements
Delaware Global Listed Real Assets Fund
10. Securities Lending (continued)
of the collateral held with respect to a loaned security on any particular day, may be more or less than the value of the security on loan. The collateral percentage with respect to the market value of the loaned security is determined by the security lending agent.
Cash collateral received by each fund of the Trust is generally invested in a series of individual separate accounts, each corresponding to a fund. The investment guidelines permit each separate account to hold certain securities that would be considered eligible securities for a money market fund. Cash collateral received is generally invested in government securities; certain obligations issued by government sponsored enterprises; repurchase agreements collateralized by US Treasury securities; obligations issued by the central government of any Organization for Economic Cooperation and Development (OECD) country or its agencies, instrumentalities, or establishments; obligations of supranational organizations; commercial paper, notes, bonds, and other debt obligations; certificates of deposit, time deposits, and other bank obligations; and asset-backed securities. The Fund can also accept US government securities and letters of credit (non-cash collateral) in connection with securities loans.
In the event of default or bankruptcy by the lending agent, realization and/or retention of the collateral may be subject to legal proceedings. In the event the borrower fails to return loaned securities and the collateral received is insufficient to cover the value of the loaned securities and provided such collateral shortfall is not the result of investment losses, the lending agent has agreed to pay the amount of the shortfall to the Fund or, at the discretion of the lending agent, replace the loaned securities. The Fund continues to record dividends or interest, as applicable, on the securities loaned and is subject to changes in value of the securities loaned that may occur during the term of the loan. The Fund has the right under the Lending Agreement to recover the securities from the borrower on demand. With respect to security loans collateralized by non-cash collateral, the Fund receives loan premiums paid by the borrower. With respect to security loans collateralized by cash collateral, the earnings from the collateral investments are shared among the Fund, the security lending agent, and the borrower. The Fund records security lending income net of allocations to the security lending agent and the borrower.
The Fund may incur investment losses as a result of investing securities lending collateral. This could occur if an investment in the collateral investment account defaulted or became impaired. Under those circumstances, the value of the Fund’s cash collateral account may be less than the amount the Fund would be required to return to the borrowers of the securities and the Fund would be required to make up for this shortfall.
During the year ended October 31, 2021, the Fund had no securities out on loan.
11. Credit and Market Risk
Beginning in January 2020, global financial markets have experienced and may continue to experience significant volatility resulting from the spread of a novel coronavirus known as COVID-19. The outbreak of COVID-19 has resulted in travel and border restrictions, quarantines, supply chain disruptions, lower consumer demand, and general market uncertainty. The effects of COVID-19 have and may continue to
58
Table of Contents
adversely affect the global economy, the economies of certain nations, and individual issuers, all of which may negatively impact the Fund’s performance.
Investments in equity securities in general are subject to market risks that may cause their prices to fluctuate over time. Fluctuations in the value of equity securities in which the Fund invests will cause the NAV of the Fund to fluctuate.
The value of the Fund’s shares will be affected by factors particular to real estate, infrastructure, natural resources, and inflation-linked securities and related industries or sectors (such as government regulation) and may fluctuate more widely than that of a fund that invests in a broad range of industries.
The Fund invests in REITs and is subject to the risks associated with that industry. If the Fund holds real estate directly or receives rental income directly from real estate holdings, its tax status as a regulated investment company may be jeopardized. The Fund is also affected by interest rate changes, particularly if the REITs it holds use floating rate debt to finance their ongoing operations. The Fund also invests in real estate acquired as a result of ownership of securities or other instruments, including issuers that invest, deal, or otherwise engage in transactions in real estate or interests therein. These instruments may include interests in private equity limited partnerships or limited liability companies that hold real estate investments (Real Estate Limited Partnerships).
The value of commodities investments will generally be affected by overall market movements and factors specific to a particular industry or commodity, which may include weather, embargoes, tariffs, and economic health, political, international regulatory, and other developments. Exposure to the commodities markets may subject the Fund to greater volatility than investments in traditional securities. The investment team does not plan to always implement exposure to commodities in the Fund, however, they will consider holding commodity ETFs in market scenarios where inflation is running higher than normal and their asset allocation model signals for additional commodity exposure. In addition, the Fund may use futures and options on commodities for a variety of purposes such as hedging against adverse changes in the market prices of securities, as a substitute for purchasing or selling securities, to increase the Fund’s return as a non-hedging strategy that may be considered speculative and to manage the Fund’s portfolio characteristics.
The use of forward foreign currency contracts may substantially change a fund’s exposure to currency exchange rates and could result in losses to a fund if currencies do not perform as the portfolio manager expects. The use of these investments as a hedging technique to reduce a fund’s exposure to currency risks may also reduce its ability to benefit from favorable changes in currency exchange rates.
Investments related to gold and other precious metals are considered speculative and are affected by a variety of worldwide economic, financial, and political factors. The price of gold and other precious metals may fluctuate sharply over short periods of time due to changes in inflation or expectations regarding inflation in various countries, the availability of supplies of gold and other precious metals, changes in industrial and commercial demand, gold and other precious metals sales by governments, central banks, or international agencies, investment speculation, monetary and other economic policies of various governments, and government restrictions on private ownership of gold and other precious metals.
59
Table of Contents
Notes to financial statements
Delaware Global Listed Real Assets Fund
11. Credit and Market Risk (continued)
Infrastructure companies may be subject to a variety of factors that may adversely affect their business or operations, including high interest costs in connection with capital construction programs, high leverage, costs associated with environmental and other regulations, the effects of economic slowdown, surplus capacity, increased competition from other providers of services, uncertainties concerning the availability of fuel at reasonable prices, the effects of energy conservation policies, and other factors. Some of the specific risks that infrastructure companies may be particularly affected by, or subject to, include the following: regulatory risk, technology risk, regional or geographic risk, natural disasters risk, through-put risk, project risk, strategic asset risk, operation risk, customer risk, interest rate risk, inflation risk, and financing risk. Other factors that may affect the operations of infrastructure companies include difficulty in raising capital in adequate amounts on reasonable terms in periods of high inflation and unsettled capital markets, inexperience with and potential losses resulting from a developing deregulatory environment, increased susceptibility to terrorist acts or political actions, and general changes in market sentiment towards infrastructure assets. In addition, the change in presidential administration could significantly impact the regulation of United States financial markets and dramatically alter existing trade, tax, energy, and infrastructure policies, among others. It is not possible to predict what, if any, changes will be made or their potential effect on the economy, securities markets, or financial stability of the United States, or on the energy, natural resources, infrastructure, and other markets.
High yield securities, commonly known as “junk bonds,” are subject to reduced creditworthiness of issuers, increased risk of default, and a more limited and less liquid secondary market. High yield securities may also be subject to greater price volatility and risk of loss of income and principal than are higher-rated securities. High yield bonds are sometimes issued by municipalities that have less financial strength and therefore have less ability to make projected debt payments on the bonds.
The market value of Natural Resources Securities may be affected by numerous factors, including events occurring in nature, inflationary pressures, and international politics. Because the Fund invests significantly in Natural Resources Securities, there is the risk that the Fund will perform poorly during a downturn in the natural resource sector. For example, events occurring in nature (such as earthquakes or fires in prime natural resource areas) and political events (such as coups, military confrontations, or acts of terrorism) can affect the overall supply of a natural resource and the value of companies involved in such natural resource.
Energy infrastructure MLPs are subject to a variety of industry specific risk factors that may adversely affect their business or operations, including those due to commodity production, volumes, commodity prices, weather conditions, terrorist attacks, etc. They are also subject to significant federal, state, and local government regulation. Investment in MLPs may also have tax consequences for shareholders. If the Fund retains its investment until its basis is reduced to zero, subsequent distributions will be taxable at ordinary income rates and shareholders may receive corrected 1099s.
When interest rates rise, fixed income securities (i.e. debt obligations) generally will decline in value. These declines in value are greater for fixed income securities with longer maturities or durations.
60
Table of Contents
IBOR risk is the risk that changes related to the use of the London interbank offered rate (LIBOR) and other interbank offered rate (collectively, “IBORs”) could have adverse impacts on financial instruments that reference LIBOR (or the corresponding IBOR). The abandonment of LIBOR could affect the value and liquidity of instruments that reference LIBOR. The use of alternative reference rate products may impact investment strategy performance. These risks may also apply with respect to changes in connection with other IBORs, such as the euro overnight index average (EONIA), which are also the subject of recent reform.
Some countries in which the Fund may invest require governmental approval for the repatriation of investment income, capital or the proceeds of sales of securities by foreign investors. In addition, if there is deterioration in a country’s balance of payments or for other reasons, a country may impose temporary restrictions on foreign capital remittances abroad.
The securities exchanges of certain foreign markets are substantially smaller, less liquid, and more volatile than the major securities markets in the US. Consequently, acquisition and disposition of securities by the Fund may be inhibited. In addition, a significant portion of the aggregate market value of securities listed on the major securities exchanges in emerging markets is held by a smaller number of investors. This may limit the number of shares available for acquisition or disposition by the Fund.
The Fund invests in fixed income securities whose value is derived from an underlying pool of mortgages or consumer loans. The value of these securities is sensitive to changes in economic conditions, including delinquencies and/or defaults, and may be adversely affected by shifts in the market’s perception of the issuers and changes in interest rates. Investors receive principal and interest payments as the underlying mortgages and consumer loans are paid back. Some of these securities are CMOs. CMOs are debt securities issued by US government agencies or by financial institutions and other mortgage lenders, which are collateralized by a pool of mortgages held under an indenture. Prepayment of mortgages may shorten the stated maturity of the obligations and can result in a loss of premium, if any has been paid. Certain of these securities may be stripped (securities which provide only the principal or interest feature of the underlying security). The yield to maturity on an interest-only CMO is extremely sensitive not only to changes in prevailing interest rates, but also to the rate of principal payments (including prepayments) on the related underlying mortgage assets. A rapid rate of principal payments may have a material adverse effect on the Fund’s yield to maturity. If the underlying mortgage assets experience greater than anticipated prepayments of principal, the Fund may fail to fully recoup its initial investment in these securities even if the securities are rated in the highest rating categories.
The Fund invests in bank loans and other securities that may subject it to direct indebtedness risk, the risk that the Fund will not receive payment of principal, interest, and other amounts due in connection with these investments and will depend primarily on the financial condition of the borrower. Loans that are fully secured offer the Fund more protection than unsecured loans in the event of nonpayment of scheduled interest or principal, although there is no assurance that the liquidation of collateral from a secured loan would satisfy the corporate borrower’s obligation, or that the collateral can be liquidated. Some loans or claims may be in default at the time of purchase. Certain of the loans and the other direct indebtedness acquired by the Fund may involve revolving credit facilities or other standby financing commitments that obligate the Fund to pay additional cash on a certain date or on demand. These
61
Table of Contents
Notes to financial statements
Delaware Global Listed Real Assets Fund
11. Credit and Market Risk (continued)
commitments may require the Fund to increase its investment in a company at a time when the Fund might not otherwise decide to do so (including at a time when the company’s financial condition makes it unlikely that such amounts will be repaid). To the extent that the Fund is committed to advance additional funds, it will at all times hold and maintain cash or other high-grade debt obligations in an amount sufficient to meet such commitments. When a loan agreement is purchased, the Fund may pay an assignment fee. On an ongoing basis, the Fund may receive a commitment fee based on the undrawn portion of the underlying line of credit portion of a loan agreement. Prepayment penalty fees are received upon the prepayment of a loan agreement by the borrower. Prepayment penalty, facility, commitment, consent, and amendment fees are recorded to income as earned or paid.
As the Fund may be required to rely upon another lending institution to collect and pass on to the Fund amounts payable with respect to the loan and to enforce the Fund’s rights under the loan and other direct indebtedness, an insolvency, bankruptcy, or reorganization of the lending institution may delay or prevent the Fund from receiving such amounts. The highly leveraged nature of many loans may make them especially vulnerable to adverse changes in economic or market conditions. Investments in such loans and other direct indebtedness may involve additional risk to the Fund.
The Fund may invest up to 15% of its net assets in illiquid securities, which may include securities with contractual restrictions on resale, securities exempt from registration under Rule 144A promulgated under the Securities Act of 1933, as amended, and other securities which may not be readily marketable. The relative illiquidity of these securities may impair the Fund from disposing of them in a timely manner and at a fair price when it is necessary or desirable to do so. While maintaining oversight, the Board has delegated to DMC, the day-to-day functions of determining whether individual securities are liquid for purposes of the Fund’s limitation on investments in illiquid securities. Securities eligible for resale pursuant to Rule 144A, which are determined to be liquid, are not subject to the Fund’s 15% limit on investments in illiquid securities. Rule 144A securities have been identified on the “Schedule of investments.”
12. Contractual Obligations
The Fund enters into contracts in the normal course of business that contain a variety of indemnifications. The Fund’s maximum exposure under these arrangements is unknown. However, the Fund has not had prior claims or losses pursuant to these contracts. Management has reviewed the Fund’s existing contracts and expects the risk of loss to be remote.
13. Recent Accounting Pronouncements
In March 2020, FASB issued an Accounting Standards Update (ASU), ASU 2020-04, Reference Rate Reform (Topic 848) – Facilitation of the Effects of Reference Rate Reform on Financial Reporting. The amendments in ASU 2020-04 provide optional temporary financial reporting relief from the effect of certain types of contract modifications due to the planned discontinuation of LIBOR and other interbank-offered based reference rates as of the end of 2021. ASU 2020-04 is effective for certain
62
Table of Contents
reference rate-related contract modifications that occur during the period March 12, 2020 through December 31, 2022. As of the financial reporting period, Management is evaluating the impact of applying this ASU.
14. Subsequent Events
On November 1, 2021, the Fund, along with the other Participants, entered into an amendment to the agreement for a $355,000,000 revolving line of credit to be used as described in Note 7 and to be operated in substantially the same manner as the agreement described in Note 7. Under the amendment to the agreement, the Participants are charged an annual commitment fee of 0.15% with the addition of an upfront fee of 0.05%, which is allocated across the Participants based on a weighted average of the respective net assets of each Participant. The line of credit available under the agreement expires on October 31, 2022.
Management has determined that no other material events or transactions occurred subsequent to October 31, 2021, that would require recognition or disclosure in the Fund’s financial statements.
63
Table of Contents
Report of independent
registered public accounting firm
To the Board of Trustees of Delaware Pooled® Trust and Shareholders of Delaware Global Listed Real Assets Fund
Opinion on the Financial Statements
We have audited the accompanying statement of assets and liabilities, including the schedule of investments, of Delaware Global Listed Real Assets Fund (one of the series constituting Delaware Pooled® Trust, referred to hereafter as the “Fund”) as of October 31, 2021, the related statement of operations for the year ended October 31, 2021, the statements of changes in net assets for each of the two years in the period ended October 31, 2021, including the related notes, and the financial highlights for each of the five years in the period ended October 31, 2021 (collectively referred to as the “financial statements”). In our opinion, the financial statements present fairly, in all material respects, the financial position of the Fund as of October 31, 2021, the results of its operations for the year then ended, the changes in its net assets for each of the two years in the period ended October 31, 2021 and the financial highlights for each of the five years in the period ended October 31, 2021 in conformity with accounting principles generally accepted in the United States of America.
Basis for Opinion
These financial statements are the responsibility of the Fund’s management. Our responsibility is to express an opinion on the Fund’s financial statements based on our audits. We are a public accounting firm registered with the Public Company Accounting Oversight Board (United States) (PCAOB) and are required to be independent with respect to the Fund in accordance with the U.S. federal securities laws and the applicable rules and regulations of the Securities and Exchange Commission and the PCAOB.
We conducted our audits of these financial statements in accordance with the standards of the PCAOB. Those standards require that we plan and perform the audit to obtain reasonable assurance about whether the financial statements are free of material misstatement, whether due to error or fraud.
Our audits included performing procedures to assess the risks of material misstatement of the financial statements, whether due to error or fraud, and performing procedures that respond to those risks. Such procedures included examining, on a test basis, evidence regarding the amounts and disclosures in the financial statements. Our audits also included evaluating the accounting principles used and significant estimates made by management, as well as evaluating the overall presentation of the financial statements. Our procedures included confirmation of securities owned as of October 31, 2021 by correspondence with the custodian, transfer agents, agent banks and brokers; when replies were not received from brokers, we performed other auditing procedures. We believe that our audits provide a reasonable basis for our opinion.
/s/PricewaterhouseCoopers LLP
Philadelphia, Pennsylvania
December 20, 2021
We have served as the auditor of one or more investment companies in Delaware Funds® by Macquarie since 2010.
64
Table of Contents
Other Fund information (Unaudited)
Delaware Global Listed Real Assets Fund
Liquidity Risk Management Program
The Securities and Exchange Commission (the “SEC”) has adopted Rule 22e-4 under the Investment Company Act of 1940 (the “Liquidity Rule”), which requires all open-end funds (other than money market funds) to adopt and implement a program reasonably designed to assess and manage the fund’s “liquidity risk,” defined as the risk that the fund could not meet requests to redeem shares issued by the fund without significant dilution of remaining investors’ interests in the fund.
The Fund has adopted and implemented a liquidity risk management program in accordance with the Liquidity Rule (the “Program”). The Board has designated a member of the US Operational Risk Group of Macquarie Asset Management as the Program Administrator for each Fund in the Trust.
As required by the Liquidity Rule, the Program includes policies and procedures that provide for: (1) assessment, management, and review (no less frequently than annually) of the Fund’s liquidity risk; (2) classification of each of the Fund’s portfolio holdings into one of four liquidity categories (Highly Liquid, Moderately Liquid, Less Liquid, and Illiquid); (3) funds that do not primarily hold assets that are Highly Liquid, establishing and maintaining a minimum percentage of the Fund’s net assets in Highly Liquid investments (called a “Highly Liquid Investment Minimum” or “HLIM”); and (4) prohibiting the Fund’s acquisition of Illiquid investments if, immediately after the acquisition, the Fund would hold more than 15% of its net assets in Illiquid assets. The Program also requires reporting to the SEC (on a non-public basis) and to the Board if the Fund’s holdings of Illiquid assets exceed 15% of the Fund’s net assets. Funds with HLIMs must have procedures for addressing HLIM shortfalls, including reporting to the Board and, with respect to HLIM shortfalls lasting more than seven consecutive calendar days, reporting to the SEC (on a non-public basis).
In assessing and managing the Fund’s liquidity risk, the Program Administrator considers, as relevant, a variety of factors, including: (1) the Fund’s investment strategy and liquidity of portfolio investments during both normal and reasonably foreseeable stressed conditions; (2) short-term and long-term cash flow projections for the Fund during both normal and reasonably foreseeable stressed conditions; and (3) the Fund’s holdings of cash and cash equivalents and any borrowing arrangements. Classification of the Fund’s portfolio holdings in the four liquidity categories is based on the number of days it is reasonably expected to take to convert the investment to cash (for Highly Liquid and Moderately Liquid holdings) or to sell or dispose of the investment (for Less Liquid and Illiquid investments), in current market conditions without significantly changing the investment’s market value. The Fund primarily holds assets that are classified as Highly Liquid, and therefore is not required to establish an HLIM.
At a meeting of the Board held on May 25-27, 2021, the Program Administrator provided a written report to the Board addressing the Program’s operation and assessing the adequacy and effectiveness of its implementation for the period from April 1, 2020 through March 31, 2021. The report concluded that the Program is appropriately designed and effectively implemented and that it meets the requirements of Rule 22e-4 and the Fund’s liquidity needs. The Fund’s HLIM is set at an appropriate level and the Fund complied with its HLIM at all times during the reporting period.
65
Table of Contents
Other Fund information (Unaudited)
Delaware Global Listed Real Assets Fund
Tax Information
The information set forth below is for the Fund’s fiscal year as required by federal income tax laws. Shareholders, however, must report distributions on a calendar year basis for income tax purposes, which may include distributions for portions of two fiscal years of the Fund. Accordingly, the information needed by shareholders for income tax purposes will be sent to them in January of each year. Please consult your tax advisor for proper treatment of this information.
All disclosures are based on financial information available as of the date of this annual report and, accordingly are subject to change. For any and all items requiring reporting, it is the intention of the Fund to report the maximum amount permitted under the Internal Revenue Code and the regulations thereunder.
For the fiscal year ended October 31, 2021, the Fund reports distributions paid during the year as follows:
| (A) Ordinary Income Distributions (Tax Basis)* | | 100.00% |
| Total Distributions (Tax Basis) | | 100.00% |
| (B) Qualifying Dividends1 | | 19.57% |
____________________
| (A) | is based on a percentage of the Fund’s total distributions. |
| (B) | is based on the Fund’s ordinary income distributions. |
| 1 | Qualified dividends represent dividends which qualify for the corporate dividends received deduction. |
| * | For the fiscal year ended October 31, 2021, certain dividends paid by the Fund may be subject to a maximum tax rate of 20%. The percentage of dividends paid by the Fund from ordinary income reported as qualified income is 69.93%. Complete information will be computed and reported in conjunction with your 2021 Form 1099-DIV. |
Board consideration of Investment Advisory and Sub-Advisory Agreements for Delaware Global Listed Real Assets Fund at a meeting held August 10-12, 2021
At a meeting held on August 10-12, 2021 (the “Annual Meeting”), the Board of Trustees (the “Board”), including a majority of disinterested or independent Trustees, approved the renewal of the Investment Advisory and Sub-Advisory Agreements for Delaware Global Listed Real Assets Fund (the “Fund”). In making its decision, the Board considered information furnished at regular quarterly Board meetings, including reports detailing Fund performance, investment strategies, and expenses, as well as information prepared specifically in connection with the renewal of the investment advisory and sub-advisory contracts. Information furnished specifically in connection with the renewal of the Investment Management Agreement with Delaware Management Company (“DMC”), a series of Macquarie Investment Management Business Trust (“MIMBT”), and the Sub-Advisory Agreements with Macquarie Funds Management Hong Kong Limited (“MFMHK”), Macquarie Investment Management Global Limited (“MIMGL”), Macquarie Investment Management Europe Limited (“MIMEL”), and Macquarie Investment Management Austria Kapitalanlage AG (“MIMAK”) (the “Sub-Advisers”), included materials provided by DMC and its affiliates (collectively, “Macquarie Asset Management”) concerning, among other things, the nature, extent, and quality of services provided to the Fund; the costs of such
66
Table of Contents
services to the Fund, economies of scale; and the investment manager’s financial condition and profitability. In addition, in connection with the Annual Meeting, materials were provided to the Trustees in May 2021, including reports provided by Broadridge Financial Solutions (“Broadridge”). The Broadridge reports compared the Fund’s investment performance and expenses with those of other comparable mutual funds. The Independent Trustees reviewed and discussed the Broadridge reports with independent legal counsel to the Independent Trustees. In addition to the information noted above, the Board also requested and received information regarding DMC’s policy with respect to advisory fee levels and its breakpoint philosophy; the structure of portfolio manager compensation; comparative client fee information; and any constraints or limitations on the availability of securities for certain investment styles, which had in the past year inhibited, or which were likely in the future to inhibit, the investment manager’s ability to invest fully in accordance with Fund policies.
In considering information relating to the approval of the Fund’s advisory and sub-advisory agreements, as applicable, the Independent Trustees received assistance and advice from and met separately with independent legal counsel to the Independent Trustees and also received assistance and advice from an experienced and knowledgeable independent fund consultant, JDL Consultants, LLC (“JDL”). Although the Board gave attention to all information furnished, the following discussion identifies, under separate headings, the primary factors taken into account by the Board during its contract renewal considerations.
Nature, extent, and quality of services. The Board considered the services provided by DMC to the Fund and its shareholders. In reviewing the nature, extent, and quality of services, the Board considered reports furnished to it throughout the year, which covered matters such as the relative performance of the Fund; compliance of portfolio managers with the investment policies, strategies, and restrictions for the Fund; compliance by DMC and Delaware Distributors, L.P. (together, “Management”) personnel with the Code of Ethics adopted throughout the Delaware Funds by Macquarie® (“Delaware Funds”); and adherence to fair value pricing procedures as established by the Board. The Board was pleased with the current staffing of DMC and the emphasis placed on research in the investment process. The Board recognized DMC’s receipt of certain favorable industry distinctions during the past several years. The Board gave favorable consideration to DMC’s efforts to control expenses while maintaining service levels committed to Fund matters. The Board also noted the benefits provided to Fund shareholders through (a) each shareholder’s ability to: (i) exchange an investment in one Delaware Fund for the same class of shares in another Delaware Fund without a sales charge, or (ii) reinvest Fund dividends into additional shares of the Fund or into additional shares of other Delaware Funds, and (b) the privilege to combine holdings in other Delaware Funds to obtain a reduced sales charge. The Board was satisfied with the nature, extent, and quality of the overall services provided by DMC.
Nature, extent, and quality of services. The Board considered the services provided by each Sub-Adviser to the Fund. In reviewing the nature, extent, and quality of services, the Board considered reports furnished to it throughout the year at regular Board Meetings covering matters such as relative performance of the Fund; compliance of portfolio managers with the investment policies, strategies, and restrictions for the Fund; the compliance of Sub-Adviser personnel with its Code of Ethics; and adherence to fair value pricing procedures as established by the Board. The Board was pleased with the
67
Table of Contents
Other Fund information (Unaudited)
Delaware Global Listed Real Assets Fund
Board consideration of Investment Advisory and Sub-Advisory Agreements for Delaware Global Listed Real Assets Fund at a meeting held August 10-12, 2021 (continued)
current staffing of the Sub-Advisers and the emphasis placed on research in the investment process. The Board was satisfied with the nature, extent, and quality of the overall services provided by the Sub-Advisers.
Investment performance. The Board placed significant emphasis on the investment performance of the Fund in view of the importance of investment performance to shareholders. Although the Board considered performance reports and discussions with portfolio managers at Investment Committee meetings throughout the year, the Board gave particular weight to the Broadridge reports furnished for the Annual Meeting. The Broadridge reports prepared for the Fund showed the Fund’s investment performance in comparison to a group of similar funds (the “Performance Universe”). A fund with the best performance ranked first, and a fund with the poorest performance ranked last. The highest/best performing 25% of funds in the Performance Universe make up the first quartile; the next 25%, the second quartile; the next 25%, the third quartile; and the poorest/worst performing 25% of funds in the Performance Universe make up the fourth quartile. Comparative annualized performance for the Fund was shown for the past 1-, 3-, 5-, and 10-year periods, to the extent applicable, ended December 31, 2020. The Board’s objective is that the Fund’s performance for the 1-, 3-, and 5-year periods be at or above the median of its Performance Universe.
The Performance Universe for the Fund consisted of the Fund and all retail and institutional real return funds as selected by Broadridge. The Broadridge report comparison showed that the Fund’s total return for the 1- and 5-year periods was in the second quartile of its Performance Universe. The report further showed that the Fund’s total return for the 3- and 10-year periods was in the first quartile of its Performance Universe. The Board was satisfied with performance.
Comparative expenses. The Board considered expense data for the Delaware Funds. Management provided the Board with information on pricing levels and fee structures for the Fund as of its most recently completed fiscal year. The Board also focused on the comparative analysis of effective management fees and total expense ratios of the Fund versus effective management fees and total expense ratios of a group of similar funds (the “Expense Group”). In reviewing comparative costs, the Fund’s contractual management fee and the actual management fee incurred by the Fund were compared with the contractual management fees (assuming all funds in the Expense Group were similar in size to the Fund) and actual management fees (as reported by each fund) within the Expense Group, taking into account any applicable breakpoints and fee waivers. The Fund’s total expenses were also compared with those of its Expense Group and, for comparative consistency, included 12b-1 and non-12b-1 service fees. The Board’s objective is for each Fund’s total expense ratio to be competitive with those of the peer funds within its Expense Group.
The expense comparisons for the Fund showed that its actual management fee was in the quartile with the lowest expenses of its Expense Group and its total expenses were in the quartile with the highest expenses of its Expense Group. The Board gave favorable consideration to the Fund’s management fee but noted that the Fund’s total expenses were not in line with the Board’s objective. In evaluating the total expenses, the Board considered fee waivers in place through March 2022 and various initiatives implemented by Management, such as the negotiation of lower fees for fund accounting, fund
68
Table of Contents
accounting oversight, and custody services, which had created an opportunity for a further reduction in expenses. The Board was satisfied with Management’s efforts to improve the Fund’s total expense ratio and to bring it in line with the Board’s objective.
Management profitability. The Board considered the level of profits realized by DMC in connection with the operation of the Fund. In this respect, the Board reviewed the Investment Management Profitability Analysis that addressed the overall profitability of DMC’s business in providing management and other services to each of the individual funds and the Delaware Funds as a whole. Specific attention was given to the methodology used by DMC in allocating costs for the purpose of determining profitability. Management stated that the level of profits of DMC, to a certain extent, reflects recent operational cost savings and efficiencies initiated by DMC. The Board considered DMC’s efforts to improve services provided to Fund shareholders and to meet additional regulatory and compliance requirements resulting from recent industry-wide Securities and Exchange Commission initiatives. The Board also considered the extent to which DMC might derive ancillary benefits from fund operations, including the potential for procuring additional business as a result of the prestige and visibility associated with its role as service provider to the Delaware Funds and the benefits from allocation of fund brokerage to improve trading efficiencies. As part of its work, the Board also reviewed a report prepared by JDL regarding MIMBT profitability as compared to certain peer fund complexes and the Independent Trustees discussed with JDL personnel regarding DMC’s profitability in such context. The Board found that the management fees were reasonable in light of the services rendered and the level of profitability of DMC.
Management profitability. Trustees were also given available information on profits being realized by each of the Sub-Advisers in relation to the services being provided to the Fund and in relation to each Sub-Adviser’s overall investment advisory business, but believed such information to be of limited relevance because the sub-advisory fees are paid by DMC out of its management fee, and changes in the level of sub-advisory fees have no impact on Fund expenses. The Board was also provided information on potential fall-out benefits derived or to be derived by the Sub-Advisers in connection with their relationship to the Fund, such as reputational enhancement, soft dollar arrangements, or commissions paid to affiliated broker/dealers, as applicable.
Economies of scale. The Trustees considered whether economies of scale are realized by DMC as the Fund’s assets increase and the extent to which any economies of scale are reflected in the level of management fees charged. The Trustees reviewed the Fund’s advisory fee pricing and structure, approved by the Board and shareholders, which includes breakpoints, and which applies to most funds in the Delaware Funds complex. Breakpoints in the advisory fee occur when the advisory fee rate is reduced on assets in excess of specified levels. Breakpoints result in a lower advisory fee than would otherwise be the case in the absence of breakpoints, when the asset levels specified in the breakpoints are exceeded. Although, as of March 31, 2021, the Fund had not reached a size at which it could take advantage of any breakpoints in the applicable fee schedule, the Board recognized that the fee was structured so that, if the Fund increases sufficiently in size, then economies of scale may be shared.
69
Table of Contents
Board of trustees / directors and officers addendum
Delaware Funds by Macquarie®
A mutual fund is governed by a Board of Trustees/Directors (“Trustees”), which has oversight responsibility for the management of a fund’s business affairs. Trustees establish procedures and oversee and review the performance of the investment manager, the distributor, and others who perform services for the fund. The independent fund trustees, in particular, are advocates for shareholder interests. Each trustee has served in that capacity since he or she was elected to or appointed to the Board of Trustees, and will continue to serve until his or her retirement or the election of a new trustee in his or her place. The following is a list of the Trustees and Officers with certain background and related information.
| | | | | | | | Number of | | Other |
| | | | | | Principal | | Portfolios in Fund | | Directorships |
| Name, | | Position(s) | | | | Occupation(s) | | Complex Overseen | | Held by |
| Address, | | Held with | | Length of Time | | During the | | by Trustee | | Trustee |
| and Birth Date | | Fund(s) | | Served | | Past Five Years | | or Officer | | or Officer |
| Interested Trustee |
| Shawn K. Lytle1 | | President, | | President and | | Global Head of Macquarie | | 150 | | Trustee — UBS Relationship |
| 610 Market Street | | Chief Executive | | Chief Executive | | Investment Management2 | | | | Funds, SMA Relationship Trust, |
| Philadelphia, PA | | Officer, | | Officer | | (January 2019–Present) | | | | and UBS Funds |
| 19106-2354 | | and Trustee | | since August 2015 | | Head of Americas of | | | | (May 2010–April 2015) |
| February 1970 | | | | Trustee since | | Macquarie Group | | | | |
| | | | September 2015 | | (December 2017–Present) | | | | |
| | | | | | Deputy Global Head of | | | | |
| | | | | | Macquarie Investment | | | | |
| | | | | | Management | | | | |
| | | | | | (2017–2019) | | | | |
| | | | | | Head of Macquarie Investment | | | | |
| | | | | | Management Americas | | | | |
| | | | | | (2015–2017) | | | | |
70
Table of Contents
| | | | | | | | Number of | | Other |
| | | | | | Principal | | Portfolios in Fund | | Directorships |
| Name, | | Position(s) | | | | Occupation(s) | | Complex Overseen | | Held by |
| Address, | | Held with | | Length of Time | | During the | | by Trustee | | Trustee |
| and Birth Date | | Fund(s) | | Served | | Past Five Years | | or Officer | | or Officer |
| Independent Trustees | | | | | | | | | | |
| | | | | | | | | | | |
| Jerome D. | | Trustee | | Since January 2019 | | Managing Member, Stonebrook | | 150 | | None |
| Abernathy | | | | | | Capital Management, LLC | | | | |
| 610 Market Street | | | | | | (financial technology: macro | | | | |
| Philadelphia, PA | | | | | | factors and databases) | | | | |
| 19106-2354 | | | | | | (January 1993‒Present) | | | | |
| July 1959 | | | | | | | | | | |
| | | | | | | | | | | |
| Thomas L. Bennett | | Chair and Trustee | | Trustee since March | | Private Investor | | 150 | | None |
| 610 Market Street | | | | 2005 | | (March 2004–Present) | | | | |
| Philadelphia, PA | | | | Chair since March | | | | | | |
| 19106-2354 | | | | 2015 | | | | | | |
| October 1947 | | | | | | | | | | |
| | | | | | | | | | | |
| Ann D. Borowiec | | Trustee | | Since March 2015 | | Chief Executive Officer, Private | | 150 | | Director — Banco Santander |
| 610 Market Street | | | | | | Wealth Management | | | | International |
| Philadelphia, PA | | | | | | (2011–2013) and Market | | | | (October 2016–December 2019) |
| 19106-2354 | | | | | | Manager, New Jersey Private | | | | Director — Santander Bank, N.A. |
| November 1958 | | | | | | Bank (2005–2011) — J.P. | | | | (December 2016–December |
| | | | | | Morgan Chase & Co. | | | | 2019) |
71
Table of Contents
Board of trustees / directors and officers addendum
Delaware Funds by Macquarie®
| | | | | | | | Number of | | Other |
| | | | | | Principal | | Portfolios in Fund | | Directorships |
| Name, | | Position(s) | | | | Occupation(s) | | Complex Overseen | | Held by |
| Address, | | Held with | | Length of Time | | During the | | by Trustee | | Trustee |
| and Birth Date | | Fund(s) | | Served | | Past Five Years | | or Officer | | or Officer |
| | | | | | | | | | | |
| Joseph W. Chow | | Trustee | | Since January 2013 | | Private Investor | | 150 | | Director and Audit Committee |
| 610 Market Street | | | | | | (April 2011–Present) | | | | Member — Hercules Technology |
| Philadelphia, PA | | | | | | | | | | Growth Capital, Inc. |
| 19106-2354 | | | | | | | | | | (July 2004–July 2014) |
| January 1953 | | | | | | | | | | |
| | | | | | | | | | | |
| John A. Fry | | Trustee | | Since January 2001 | | President — Drexel University | | 150 | | Director; Compensation |
| 610 Market Street | | | | | | (August 2010–Present) | | | | Committee and Governance |
| Philadelphia, PA | | | | | | President — Franklin & Marshall | | | | Committee Member — |
| 19106-2354 | | | | | | College | | | | Community Health Systems |
| May 1960 | | | | | | (July 2002–June 2010) | | | | (May 2004–Present) |
| | | | | | | | | | Director — Drexel Morgan & Co. |
| | | | | | | | | | (2015–2019) |
| | | | | | | | | | Director, Audit and |
| | | | | | | | | | Compensation Committee |
| | | | | | | | | | Member — vTv Therapeutics Inc. |
| | | | | | | | | | (2017–Present) |
| | | | | | | | | | Director and Audit Committee |
| | | | | | | | | | Member — FS Credit Real Estate |
| | | | | | | | | | Income Trust, Inc. |
| | | | | | | | | | (2018–Present) |
| | | | | | | | | | Director — Federal Reserve |
| | | | | | | | | | Bank of Philadelphia |
| | | | | | | | | | (January 2020–Present) |
72
Table of Contents
| | | | Number of | Other |
| | | Principal | Portfolios in Fund | Directorships |
| Name, | Position(s) | | Occupation(s) | Complex Overseen | Held by |
| Address, | Held with | Length of Time | During the | by Trustee | Trustee |
| and Birth Date | Fund(s) | Served | Past Five Years | or Officer | or Officer |
| | | | | | |
| Frances A. | Trustee | Since September | Private Investor | 150 | Trust Manager and Audit |
| Sevilla-Sacasa | | 2011 | (January 2017–Present) | | Committee Chair — Camden |
| 610 Market Street | | | Chief Executive Officer — Banco | | Property Trust |
| Philadelphia, PA | | | Itaú International | | (August 2011–Present) |
| 19106-2354 | | | (April 2012–December 2016) | | Director; Audit |
| January 1956 | | | Executive Advisor to Dean | | and Compensation |
| | | (August 2011–March 2012) and | | Committee Member — |
| | | Interim Dean | | Callon Petroleum Company |
| | | (January 2011–July 2011) — | | (December 2019–Present) |
| | | University of Miami School of | | Director — New Senior |
| | | Business Administration | | Investment Group Inc. |
| | | President — U.S. Trust, Bank of | | (January 2021–September 2021) |
| | | America Private Wealth | | Director; Audit Committee |
| | | Management (Private Banking) | | Member — Carrizo Oil & Gas, |
| | | (July 2007‒December 2008) | | Inc. (March 2018–December |
| | | | | 2019) |
73
Table of Contents
Board of trustees / directors and officers addendum
Delaware Funds by Macquarie®
| | | | | | | | Number of | | Other |
| | | | | | Principal | | Portfolios in Fund | | Directorships |
| Name, | | Position(s) | | | | Occupation(s) | | Complex Overseen | | Held by |
| Address, | | Held with | | Length of Time | | During the | | by Trustee | | Trustee |
| and Birth Date | | Fund(s) | | Served | | Past Five Years | | or Officer | | or Officer |
| | | | | | | | | | |
| Thomas K. Whitford | | Trustee | | Since January 2013 | | Vice Chairman — PNC Financial | | 150 | | Director — HSBC North America |
| 610 Market Street | | | | | | Services Group | | | | Holdings Inc. |
| Philadelphia, PA | | | | | | (2010–April 2013) | | | | (December 2013–Present) |
| 19106-2354 | | | | | | | | | | Director — HSBC USA Inc. |
| March 1956 | | | | | | | | | | (July 2014–Present) |
| | | | | | | | | | Director — HSBC Bank USA, |
| | | | | | | | | | National Association |
| | | | | | | | | | (July 2014–March 2017) |
| | | | | | | | | | Director — HSBC Finance |
| | | | | | | | | | Corporation |
| | | | | | | | | | (December 2013–April 2018) |
74
Table of Contents
| | | | | | | | Number of | | Other |
| | | | | | Principal | | Portfolios in Fund | | Directorships |
| Name, | | Position(s) | | | | Occupation(s) | | Complex Overseen | | Held by |
| Address, | | Held with | | Length of Time | | During the | | by Trustee | | Trustee |
| and Birth Date | | Fund(s) | | Served | | Past Five Years | | or Officer | | or Officer |
| | | | | | | | | | | |
| Christianna Wood | | Trustee | | Since January 2019 | | Chief Executive Officer and | | 150 | | Director; Finance Committee and |
| 610 Market Street | | | | | | President — Gore Creek Capital, | | | | Audit Committee Member — |
| Philadelphia, PA | | | | | | Ltd. (August 2009–Present) | | | | H&R Block Corporation |
| 19106-2354 | | | | | | | | | | (July 2008–Present) |
| August 1959 | | | | | | | | | | Director; Investments |
| | | | | | | | | | Committee, Capital and Finance |
| | | | | | | | | | Committee, and Audit |
| | | | | | | | | | Committee Member — Grange |
| | | | | | | | | | Insurance (2013–Present) |
| | | | | | | | | | Trustee; Chair of Nominating and |
| | | | | | | | | | Governance Committee and |
| | | | | | | | | | Audit Committee Member — |
| | | | | | | | | | The Merger Fund |
| | | | | | | | | | (2013–October 2021), |
| | | | | | | | | | The Merger Fund VL |
| | | | | | | | | | (2013–October 2021); WCM |
| | | | | | | | | | Alternatives: Event-Driven Fund |
| | | | | | | | | | (2013–October 2021), and WCM |
| | | | | | | | | | Alternatives: Credit Event Fund |
| | | | | | | | | | (December 2017–October 2021) |
| | | | | | | | | | Director; Chair of Governance |
| | | | | | | | | | Committee and Audit Committee |
| | | | | | | | | | Member — International |
| | | | | | | | | | Securities Exchange (2010–2016) |
75
Table of Contents
Board of trustees / directors and officers addendum
Delaware Funds by Macquarie®
| | | | | | | | Number of | | Other |
| | | | | | Principal | | Portfolios in Fund | | Directorships |
| Name, | | Position(s) | | | | Occupation(s) | | Complex Overseen | | Held by |
| Address, | | Held with | | Length of Time | | During the | | by Trustee | | Trustee |
| and Birth Date | | Fund(s) | | Served | | Past Five Years | | or Officer | | or Officer |
| | | | | | | | | | | |
| Janet L. Yeomans | | Trustee | | Since April 1999 | | Vice President and Treasurer | | 150 | | Director; Personnel and |
| 610 Market Street | | | | | | (January 2006–July 2012), Vice | | | | Compensation Committee Chair; |
| Philadelphia, PA | | | | | | President — Mergers & | | | | Member of Nominating, |
| 19106-2354 | | | | | | Acquisitions | | | | Investments, and Audit |
| July 1948 | | | | | | (January 2003–January 2006), | | | | Committees for various periods |
| | | | | | and Vice President and Treasurer | | | | throughout directorship — |
| | | | | | (July 1995–January 2003) — 3M | | | | Okabena Company (2009–2017) |
| | | | | | Company | | | | |
| | | | | | | | | | | |
| Officers | | | | | | | | | | |
| | | | | | | | | | | |
| David F. Connor | | Senior Vice President, | | Senior Vice President, | | David F. Connor has served in | | 150 | | None3 |
| 610 Market Street | | General Counsel, and | | since May 2013; | | various capacities at different | | | | |
| Philadelphia, PA | | Secretary | | General Counsel | | times at Macquarie Investment | | | | |
| 19106-2354 | | | | since May 2015; | | Management. | | | | |
| December 1963 | | | | Secretary since | | | | | | |
| | | | October 2005 | | | | | | |
| | | | | | | | | | | |
| Daniel V. Geatens | | Senior Vice President | | Senior Vice President | | Daniel V. Geatens has served in | | 150 | | None3 |
| 610 Market Street | | and Treasurer | | and Treasurer since | | various capacities at different | | | | |
| Philadelphia, PA | | | | October 2007 | | times at Macquarie Investment | | | | |
| 19106-2354 | | | | | | Management. | | | | |
| October 1972 | | | | | | | | | | |
76
Table of Contents
| | | | | | | | Number of | | Other |
| | | | | | Principal | | Portfolios in Fund | | Directorships |
| Name, | | Position(s) | | | | Occupation(s) | | Complex Overseen | | Held by |
| Address, | | Held with | | Length of Time | | During the | | by Trustee | | Trustee |
| and Birth Date | | Fund(s) | | Served | | Past Five Years | | or Officer | | or Officer |
| | | | | | | | | | |
| Richard Salus | | Senior Vice President | | Senior Vice President | | Richard Salus has served in | | 150 | | None |
| 610 Market Street | | and Chief Financial | | and Chief Financial | | various capacities at different | | | | |
| Philadelphia, PA | | Officer | | Officer since | | times at Macquarie Investment | | | | |
| 19106-2354 | | | | November 2006 | | Management. | | | | |
| October 1963 | | | | | | | | | | |
| 1 | Shawn K. Lytle is considered to be an “Interested Trustee” because he is an executive officer of the Fund’s(s’) investment advisor. |
| 2 | Macquarie Investment Management is the marketing name for Macquarie Management Holdings, Inc. and its subsidiaries, including the Fund’s(s’) investment advisor, principal underwriter, and its transfer agent. |
| 3 | David F. Connor serves as Senior Vice President and Secretary, and Daniel V. Geatens serves as Senior Vice President, Treasurer, and Chief Financial Officer, for the six portfolios of the Optimum Fund Trust, which have the same investment advisor, principal underwriter, and transfer agent as the registrant. Mr. Geatens also serves as the Chief Financial Officer and Treasurer for Macquarie Global Infrastructure Total Return Fund Inc. |
The Statement of Additional Information for the Fund(s) includes additional information about the Trustees and Officers and is available, without charge, upon request by calling 800 523-1918.
77
Table of Contents
About the organization
Board of trustees |
| | | | | | |
Shawn K. Lytle
President and
Chief Executive Officer
Delaware Funds
by Macquarie®
Philadelphia, PA | | Ann D. Borowiec
Former Chief Executive
Officer
Private Wealth Management
J.P. Morgan Chase & Co.
New York, NY | | Frances A.
Sevilla-Sacasa
Former Chief Executive
Officer
Banco Itaú International
Miami, FL | | Christianna Wood
Chief Executive Officer
and President
Gore Creek Capital, Ltd.
Golden, CO |
| | | | | | | |
Jerome D. Abernathy
Managing Member,
Stonebrook Capital
Management, LLC
Jersey City, NJ | | Joseph W. Chow
Former Executive Vice
President
State Street Corporation
Boston, MA | | Thomas K. Whitford
Former Vice Chairman
PNC Financial Services
Group
Pittsburgh, PA | | Janet L. Yeomans
Former Vice President and
Treasurer
3M Company
St. Paul, MN |
| | | | | | | |
Thomas L. Bennett
Chairman of the Board
Delaware Funds
by Macquarie
Private Investor
Rosemont, PA | | John A. Fry
President
Drexel University
Philadelphia, PA | | | | |
| | | | | | | |
Affiliated officers | | | | | | |
| | | | | | | |
David F. Connor
Senior Vice President,
General Counsel,
and Secretary
Delaware Funds
by Macquarie
Philadelphia, PA | | Daniel V. Geatens
Senior Vice President and
Treasurer
Delaware Funds
by Macquarie
Philadelphia, PA | | Richard Salus
Senior Vice President and
Chief Financial Officer
Delaware Funds
by Macquarie
Philadelphia, PA | | |
| | | | | | | |
This annual report is for the information of Delaware Global Listed Real Assets Fund shareholders, but it may be used with prospective investors when preceded or accompanied by the Delaware Fund fact sheet for the most recently completed calendar quarter. These documents are available at delawarefunds.com/literature. |
The Fund files its complete schedule of portfolio holdings with the Securities and Exchange Commission (SEC) for the first and third quarters of each fiscal year on Form N-PORT. The Fund’s Forms N-PORT, as well as a description of the policies and procedures that the Fund uses to determine how to vote proxies (if any) relating to portfolio securities, are available without charge (i) upon request, by calling 800 523-1918; and (ii) on the SEC’s website at sec.gov. In addition, a description of the policies and procedures that the Fund uses to determine how to vote proxies (if any) relating to portfolio securities and the Schedule of Investments included in the Fund’s most recent Form N-PORT are available without charge on the Fund’s website at delawarefunds.com/literature. The Fund’s Forms N-PORT may be reviewed and copied at the SEC’s Public Reference Room in Washington, D.C.; information on the operation of the Public Reference Room may be obtained by calling 800 SEC-0330.
Information (if any) regarding how the Fund voted proxies relating to portfolio securities during the most recently disclosed 12-month period ended June 30 is available without charge (i) through the Fund’s website at delawarefunds.com/proxy; and (ii) on the SEC’s website at sec.gov.
78
Item 2. Code of Ethics
The registrant has adopted a code of ethics that applies to the registrant’s principal executive officer, principal financial officer, principal accounting officer or controller, or persons performing similar functions, regardless of whether these individuals are employed by the registrant or a third party. A copy of the registrant’s Code of Business Ethics has been posted on the Delaware Funds by Macquarie® Internet Web site at www.delawarefunds.com. Any amendments to the Code of Business Ethics, and information on any waiver from its provisions granted by the registrant, will also be posted on this Web site within five business days of such amendment or waiver and will remain on the Web site for at least 12 months.
Item 3. Audit Committee Financial Expert
The registrant’s Board of Trustees has determined that certain members of the registrant’s Audit Committee are audit committee financial experts, as defined below. For purposes of this item, an “audit committee financial expert” is a person who has the following attributes:
a. An understanding of generally accepted accounting principles and financial statements;
b. The ability to assess the general application of such principles in connection with the accounting for estimates, accruals, and reserves;
c. Experience preparing, auditing, analyzing, or evaluating financial statements that present a breadth and level of complexity of accounting issues that are generally comparable to the breadth and complexity of issues that can reasonably be expected to be raised by the registrant’s financial statements, or experience actively supervising one or more persons engaged in such activities;
d. An understanding of internal controls and procedures for financial reporting; and
e. An understanding of audit committee functions.
An “audit committee financial expert” shall have acquired such attributes through:
a. Education and experience as a principal financial officer, principal accounting officer, controller, public accountant, or auditor or experience in one or more positions that involve the performance of similar functions;
b. Experience actively supervising a principal financial officer, principal accounting officer, controller, public accountant, auditor, or person performing similar functions;
c. Experience overseeing or assessing the performance of companies or public accountants with respect to the preparation, auditing, or evaluation of financial statements; or
d. Other relevant experience.
The registrant’s Board of Trustees has also determined that each member of the registrant’s Audit Committee is independent. In order to be “independent” for purposes of this item, the Audit Committee member may not: (i) other than in his or her capacity as a member of the Board of Trustees or any committee thereof, accept directly or indirectly any consulting, advisory or other compensatory fee from the issuer; or (ii) be an “interested person” of the registrant as defined in Section 2(a)(19) of the Investment Company Act of 1940.
The names of the audit committee financial experts on the registrant’s Audit Committee are set forth below:
Jerome D. Abernathy
John A. Fry
Thomas K. Whitford, Chair
Christianna Wood
Item 4. Principal Accountant Fees and Services
(a) Audit fees.
The aggregate fees billed for services provided to the registrant by its independent auditors for the audit of the registrant’s annual financial statements and for services normally provided by the independent auditors in connection with statutory and regulatory filings or engagements were $113,508 for the fiscal year ended October 31, 2021.
The aggregate fees billed for services provided to the registrant by its independent auditors for the audit of the registrant’s annual financial statements and for services normally provided by the independent auditors in connection with statutory and regulatory filings or engagements were $231,810 for the fiscal year ended October 31, 2020.
(b) Audit-related fees.
The aggregate fees billed by the registrant’s independent auditors for services relating to the performance of the audit of the registrant’s financial statements and not reported under paragraph (a) of this Item were $0 for the fiscal year ended October 31, 2021.
The aggregate fees billed by the registrant’s independent auditors for services relating to the performance of the audit of the financial statements of the registrant’s investment adviser and other service providers under common control with the adviser and that relate directly to the operations or financial reporting of the registrant were $1,134,001 for the registrant’s fiscal year ended October 31, 2021. The percentage of these fees relating to services approved by the registrant’s Audit Committee pursuant to the de minimis exception from the pre-approval requirement in Rule 2-01(c)(7)(i)(C) of Regulation S-X was 0%. These audit-related services were as follows: year end audit procedures; group reporting and subsidiary statutory audits.
The aggregate fees billed by the registrant’s independent auditors for services relating to the performance of the audit of the registrant’s financial statements and not reported under paragraph (a) of this Item were $0 for the fiscal year ended October 31, 2020.
The aggregate fees billed by the registrant’s independent auditors for services relating to the performance of the audit of the financial statements of the registrant’s investment adviser and other service providers under common control with the adviser and that relate directly to the operations or financial reporting of the registrant were $903,282 for the registrant’s fiscal year ended October 31, 2020. The percentage of these fees relating to services approved by the registrant’s Audit Committee pursuant to the de minimis exception from the pre-approval requirement in Rule 2-01(c)(7)(i)(C) of Regulation S-X was 0%. These audit-related services were as follows: year end audit procedures; group reporting and subsidiary statutory audits.
(c) Tax fees.
The aggregate fees billed by the registrant’s independent auditors for tax-related services provided to the registrant were $22,212 for the fiscal year ended October 31, 2021. The percentage of these fees relating to services approved by the registrant’s Audit Committee pursuant to the de minimis exception from the pre-approval requirement in Rule 2-01(c)(7)(i)(C) of Regulation S-X was 0%. These tax-related services were as follows: review of income tax returns and review of annual excise distribution calculations.
The aggregate fees billed by the registrant’s independent auditors for tax-related services provided to the registrant’s investment adviser and other service providers under common control with the adviser and that relate directly to the operations or financial reporting of the registrant were $0 for the registrant’s fiscal year ended October 31, 2021.
The aggregate fees billed by the registrant’s independent auditors for tax-related services provided to the registrant were $41,230 for the fiscal year ended October 31, 2020. The percentage of these fees relating to services approved by the registrant’s Audit Committee pursuant to the de minimis exception from the pre-approval requirement in Rule 2-01(c)(7)(i)(C) of Regulation S-X was 0%. These tax-related services were as follows: review of income tax returns and review of annual excise distribution calculations.
The aggregate fees billed by the registrant’s independent auditors for tax-related services provided to the registrant’s investment adviser and other service providers under common control with the adviser and that relate directly to the operations or financial reporting of the registrant were $0 for the registrant’s fiscal year ended October 31, 2020.
(d) All other fees.
The aggregate fees billed for all services provided by the independent auditors to the registrant other than those set forth in paragraphs (a), (b) and (c) of this Item were $0 for the fiscal year ended October 31, 2021.
The aggregate fees billed for all services other than those set forth in paragraphs (b) and (c) of this Item provided by the registrant’s independent auditors to the registrant’s adviser and other service providers under common control with the adviser and that relate directly to the operations or financial reporting of the registrant were $0 for the registrant’s fiscal year ended October 31, 2021. The percentage of these fees relating to services approved by the registrant’s Audit Committee pursuant to the de minimis exception from the pre-approval requirement in Rule 2-01(c)(7)(i)(C) of Regulation S-X was 0%.
The aggregate fees billed for all services provided by the independent auditors to the registrant other than those set forth in paragraphs (a), (b) and (c) of this Item were $0 for the fiscal year ended October 31, 2020.
The aggregate fees billed for all services other than those set forth in paragraphs (b) and (c) of this Item provided by the registrant’s independent auditors to the registrant’s adviser and other service providers under common control with the adviser and that relate directly to the operations or financial reporting of the registrant were $0 for the registrant’s fiscal year ended October 31, 2020. The percentage of these fees relating to services approved by the registrant’s Audit Committee pursuant to the de minimis exception from the pre-approval requirement in Rule 2-01(c)(7)(i)(C) of Regulation S-X was 0%.
(e) The registrant’s Audit Committee has established pre-approval policies and procedures as permitted by Rule 2-01(c)(7)(i)(B) of Regulation S-X (the “Pre-Approval Policy”) with respect to services provided by the registrant’s independent auditors. Pursuant to the Pre-Approval Policy, the Audit Committee has pre-approved the services set forth in the table below with respect to the registrant up to the specified fee limits. Certain fee limits are based on aggregate fees to the registrant and other registrants within the Delaware Funds by Macquarie®.
| Service | Range of Fees |
| Audit Services | |
| Statutory audits or financial audits for new Funds | up to $50,000 per Fund |
| Services associated with SEC registration statements (e.g., Form N-1A, Form N-14, etc.), periodic reports and other documents filed with the SEC or other documents issued in connection with securities offerings (e.g., comfort letters for closed-end Fund offerings, consents), and assistance in responding to SEC comment letters | up to $10,000 per Fund |
| Consultations by Fund management as to the accounting or disclosure treatment of transactions or events and/or the actual or potential impact of final or proposed rules, standards or interpretations by the SEC, FASB, or other regulatory or standard-setting bodies (Note: Under SEC rules, some consultations may be considered “audit-related services” rather than “audit services”) | up to $25,000 in the aggregate |
| Audit-Related Services | |
| Consultations by Fund management as to the accounting or disclosure treatment of transactions or events and /or the actual or potential impact of final or proposed rules, standards or interpretations by the SEC, FASB, or other regulatory or standard-setting bodies (Note: Under SEC rules, some consultations may be considered “audit services” rather than “audit-related services”) | up to $25,000 in the aggregate |
| Tax Services | |
U.S. federal, state and local and international tax planning and advice (e.g., consulting on statutory, regulatory or administrative developments, evaluation of Funds’ tax compliance function, etc.) | up to $25,000 in the aggregate |
U.S. federal, state and local tax compliance (e.g., excise distribution reviews, etc.) | up to $5,000 per Fund |
| Review of federal, state, local and international income, franchise and other tax returns | up to $5,000 per Fund |
Under the Pre-Approval Policy, the Audit Committee has also pre-approved the services set forth in the table below with respect to the registrant’s investment adviser and other entities controlling, controlled by or under common control with the investment adviser that provide ongoing services to the registrant (the “Control Affiliates”) up to the specified fee limit. This fee limit is based on aggregate fees to the investment adviser and its Control Affiliates.
| Service | Range of Fees |
| Non-Audit Services | |
| Services associated with periodic reports and other documents filed with the SEC and assistance in responding to SEC comment letters | up to $10,000 in the aggregate |
The Pre-Approval Policy requires the registrant’s independent auditors to report to the Audit Committee at each of its regular meetings regarding all services initiated since the last such report was rendered, including those services authorized by the Pre-Approval Policy.
(f) Not applicable.
(g) The aggregate non-audit fees billed by the registrant’s independent auditors for services rendered to the registrant and to its investment adviser and other service providers under common control with the adviser were $9,044,000 and $5,607,000 for the registrant’s fiscal years ended October 31, 2021 and October 31, 2020, respectively.
(h) In connection with its selection of the independent auditors, the registrant’s Audit Committee has considered the independent auditors’ provision of non-audit services to the registrant’s investment adviser and other service providers under common control with the adviser that were not required to be pre-approved pursuant to Rule 2-01(c)(7)(ii) of Regulation S-X. The Audit Committee has determined that the independent auditors’ provision of these services is compatible with maintaining the auditors’ independence.
Item 5. Audit Committee of Listed Registrants
Not applicable.
Item 6. Investments
(a) Included as part of report to shareholders filed under Item 1 of this Form N-CSR.
(b) Divestment of securities in accordance with Section 13(c) of the Investment Company Act of 1940.
Not applicable.
Item 7. Disclosure of Proxy Voting Policies and Procedures for Closed-End Management Investment Companies
Not applicable.
Item 8. Portfolio Managers of Closed-End Management Investment Companies
Not applicable.
Item 9. Purchases of Equity Securities by Closed-End Management Investment Companies and Affiliated Purchasers
Not applicable.
Item 10. Submission of Matters to a Vote of Security Holders
Not applicable.
Item 11. Controls and Procedures
The registrant’s principal executive officer and principal financial officer have evaluated the registrant’s disclosure controls and procedures within 90 days of the filing of this report and have concluded that they are effective in providing reasonable assurance that the information required to be disclosed by the registrant in its reports or statements filed under the Securities Exchange Act of 1934 is recorded, processed, summarized and reported within the time periods specified in the rules and forms of the Securities and Exchange Commission.
There were no significant changes in the registrant’s internal control over financial reporting that occurred during the period covered by the report to stockholders included herein that have materially affected, or are reasonably likely to materially affect, the registrant’s internal control over financial reporting.
Item 12. Disclosure of Securities Lending Activities for Closed-End Management Investment Companies
Not applicable.
Item 13. Exhibits
SIGNATURES
Pursuant to the requirements of the Securities Exchange Act of 1934 and the Investment Company Act of 1940, the registrant has duly caused this report to be signed on its behalf, by the undersigned, thereunto duly authorized.
DELAWARE POOLED® TRUST
| /s/ SHAWN K. LYTLE |
| By: | Shawn K. Lytle |
| Title: | President and Chief Executive Officer |
| Date: | January 5, 2022 |
Pursuant to the requirements of the Securities Exchange Act of 1934 and the Investment Company Act of 1940, this report has been signed below by the following persons on behalf of the registrant and in the capacities and on the dates indicated.
| /s/ SHAWN K. LYTLE |
| By: | Shawn K. Lytle |
| Title: | President and Chief Executive Officer |
| Date: | January 5, 2022 |
| |
| |
| /s/ RICHARD SALUS |
| By: | Richard Salus |
| Title: | Chief Financial Officer |
| Date: | January 5, 2022 |