Item 1. Reports to Stockholders

| | |
Annual report 2014 | | |
| |
October 31, 2014 | | |
| |
U.S. equities | | U.S. fixed income |
The Large-Cap Value Equity Portfolio | | The High-Yield Bond Portfolio |
The Select 20 Portfolio | | The Core Plus Fixed Income Portfolio |
The Large-Cap Growth Equity Portfolio | | |
The Focus Smid-Cap Growth Equity Portfolio | | |
| | International equities |
| | The International Equity Portfolio |
| | The Labor Select International Equity Portfolio |
| | The Emerging Markets Portfolio |
| | The Emerging Markets Portfolio II |

This page intentionally left blank.
Delaware Pooled® Trust
Delaware Pooled Trust, based in Philadelphia, is a registered investment company that offers no-load, open-end equity and fixed income mutual funds to institutional and high net worth individual investors.
Delaware Management Company, a series of Delaware Management Business Trust, serves as investment advisor for the Portfolios. Mondrian Investment Partners Limited serves as investment sub-advisor for The International Equity Portfolio,* The Labor Select International Equity Portfolio, and The Emerging Markets* Portfolio. Jackson Square Partners, LLC, serves as investment sub-advisor for The Select 20 Portfolio, The Large-Cap Growth Equity Portfolio, and The Focus-Smid Cap Growth Equity Portfolio.
The performance quoted in this report represents past performance and does not guarantee future results. Investment return and principal value of an investment will fluctuate so that shares, when redeemed, may be worth more or less than their original cost. Current performance may be lower or higher than the performance quoted. Performance data current to the most recent month end may be obtained by calling 800 231-8002 or visiting delawareinvestments.com/institutional/performance. Carefully consider the Portfolios’ investment objectives, risk factors, charges, and expenses before investing. This and other information can be found in the Portfolios’ prospectus and, if available, its summary prospectus, which may be obtained by visiting delawareinvestments.com or calling 800 231-8002. Investors should read the prospectus and, if available, the summary prospectus carefully before investing. Performance includes reinvestment of all distributions.
Portfolios are not FDIC insured and are not guaranteed. It is possible to lose the principal amount invested. Mutual fund advisory services are provided by Delaware Management Company, a series of Delaware Management Business Trust (DMBT), which is a registered investment advisor. Delaware Investments is the marketing name of Delaware Management Holdings, Inc. (DMHI) and its subsidiaries.
Investments in the Portfolios are not and will not be deposits with or liabilities of Macquarie Bank Limited ABN 46 008 583 542 and its holding companies, including their subsidiaries or related companies (Macquarie Group), and are subject to investment risk, including possible delays in repayment and loss of income and capital invested. No Macquarie Group company guarantees or will guarantee the performance of the Portfolios, the repayment of capital from the Portfolios, or any particular rate of return.
*Closed to new investors.
©2014 Delaware Management Holdings, Inc.
All third-party marks cited are the property of their respective owners.
Portfolio objectives and strategies
The Large-Cap Value Equity Portfolio seeks long-term capital appreciation. The Portfolio invests primarily in securities of large-capitalization companies that we believe have long-term capital appreciation potential. The Portfolio currently defines large-capitalization stocks as those with market capitalizations of $5 billion or greater at the time of purchase. Typically, we seek to select securities that we believe are undervalued in relation to their intrinsic value as indicated by multiple factors.
The Select 20 Portfolio seeks long-term capital appreciation. The Portfolio seeks to achieve its objective by investing in a portfolio of twenty (20) securities, primarily common stocks of companies that the Portfolio’s sub-advisor, Jackson Square Partners, LLC believes have long-term capital appreciation potential and are expected to grow faster than the U.S. economy.
The Large-Cap Growth Equity Portfolio seeks capital appreciation. The Portfolio invests primarily in common stocks of growth-oriented companies that the Portfolio’s sub-advisor, Jackson Square Partners, LLC (“JSP”), believes have long-term capital appreciation potential and expects to grow faster than the U.S. economy. For purposes of the Portfolio, JSP generally considers large-capitalization companies to be those that, at the time of purchase, have total market capitalizations within the range of market capitalizations of companies in the Russell 1000® Growth Index.
The Focus Smid-Cap Growth Equity Portfolio seeks long-term capital appreciation. The Portfolio invests primarily in common stocks of growth-oriented companies that the Portfolio’s sub-advisor, Jackson Square Partners, LLC believes have long-term capital appreciation potential and expects to grow faster than the U.S. economy. For purposes of this Portfolio, small-market capitalization companies are those companies whose market capitalization is similar to the market capitalization of companies in the Russell 2000® Growth Index, and mid-market capitalization companies are those companies whose market capitalization is similar to the market capitalization of companies in the Russell Midcap® Growth Index. The two indices listed above are for purposes of determining range and not for targeting portfolio management.
The High-Yield Bond Portfolio seeks high total return. The Portfolio will primarily invest its assets at the time of purchase in: (1) corporate bonds rated BB or lower by Standard & Poor’s (S&P) or similarly rated by another nationally recognized statistical rating organization; (2) securities issued or guaranteed by the U.S. government, its agencies, or instrumentalities; or (3) commercial paper of companies rated A-1 or A-2 by S&P, rated P-1 or P-2 by Moody’s Investors Service, Inc. (Moody’s), or unrated but considered to be of comparable quality.
The Core Plus Fixed Income Portfolio seeks maximum long-term total return, consistent with reasonable risk. The Portfolio allocates its investments principally among three sectors of the fixed income securities markets: U.S. investment grade sector, U.S. high yield sector, and international sector.
The International Equity Portfolio seeks maximum long-term total return. The Portfolio invests primarily in equity securities of companies that are organized, have a majority of their assets, or derive most of their operating income outside the United States, and that, in the opinion of Mondrian Investment Partners Limited, the Portfolio’s sub-advisor, are undervalued at the time of purchase based on the sub-advisor’s fundamental analysis. Investments will be made mainly in marketable securities of companies in developed countries. The International Equity Portfolio is presently closed to new investors.
The Labor Select International Equity Portfolio seeks maximum long-term total return. The Portfolio invests primarily in equity securities of companies that are organized, have a majority of their assets, or derive most of their operating income outside of the United States, and that, in the opinion of Mondrian Investment Partners Limited (“Mondrian”), the Portfolio’s sub-advisor, are undervalued at the time of purchase based on the rigorous fundamental analysis that the sub-advisor employs. In addition to following these quantitative guidelines, Mondrian will select securities of issuers that present certain characteristics that are compatible or operate in accordance with certain investment policies or restrictions followed by organized labor.
The Emerging Markets Portfolio seeks long-term capital appreciation. The Portfolio generally invests in equity securities of companies that are organized in, have a majority of their assets in, or derive a majority of their operating income from emerging countries. The Emerging Markets Portfolio is presently closed to new investors.
The Emerging Markets Portfolio II seeks long-term capital appreciation. The Portfolio invests primarily in a broad range of equity securities of companies located in emerging market countries. The Portfolio may invest in companies of any size. The portfolio manager believes that although market price and intrinsic business value are positively correlated in the long run, short-term divergences can emerge. The Portfolio seeks to take advantage of these divergences through a fundamental, bottom-up approach. The Portfolio invests in securities of companies with sustainable franchises when they are trading at a discount to the portfolio manager’s intrinsic value estimate for that security.
2
Carefully consider the Portfolios’ investment objectives, risk factors, charges, and expenses before investing. This and other information can be found in the Portfolios’ prospectus and, if available, its summary prospectus, which may be obtained by visiting delawareinvestments.com or calling 800 231-8002. Investors should read the applicable prospectus and, if available, the applicable summary prospectus carefully before investing.
The Portfolios of Delaware Pooled ® Trust (DPT) are designed exclusively for institutional investors and high net worth individuals.
International investments entail risks not ordinarily associated with U.S. investments including fluctuation in currency values, differences in accounting principles, or economic or political instability in other nations. Investing in emerging markets can be riskier than investing in established foreign markets due to increased volatility and lower trading volume.
Narrowly focused investments may exhibit higher volatility than investments in multiple industry sectors.
The Portfolios’ share prices and yields will fluctuate in response to movements in stock prices.
Fixed income securities and bond funds can lose value, and investors can lose principal, as interest rates rise. They also may be affected by economic conditions that hinder an issuer ’s ability to make interest and principal payments on its debt.
The Portfolios may also be subject to prepayment risk, the risk that the principal of a fixed income security that is held by the Portfolios may be prepaid prior to maturity, potentially forcing the Portfolios to reinvest that money at a lower interest rate.
Securities in the lowest of the rating categories considered to be investment grade (that is, Baa or BBB) have some speculative characteristics.
High yielding, noninvestment grade bonds (junk bonds) involve higher risk than investment grade bonds.
The high yield secondary market is particularly susceptible to liquidity problems when institutional investors, such as mutual funds and certain other financial institutions, temporarily stop buying bonds for regulatory, financial, or other reasons. In addition, a less liquid secondary market makes it more difficult for a Portfolio to obtain precise valuations of the high yield securities in its portfolio.
Certain Portfolios expect to hold a concentrated portfolio of a limited number of securities; those Portfolios’ risk is increased because each investment has a greater effect on that Portfolio’s overall performance.
The Select 20 Portfolio is considered “nondiversified” as defined in the Investment Company Act of 1940. “Nondiversified” Portfolios may allocate more of their net assets to investments in single securities than “diversified” Portfolios. Resulting adverse effects may subject this Portfolio to greater risks and volatility.
Portfolio management review
Delaware Pooled® Trust — The Large-Cap Value Equity Portfolio
October 31, 2014
For the fiscal year ended Oct. 31, 2014, Delaware Pooled Trust — The Large-Cap Value Equity Portfolio returned +16.19% at net asset value (NAV) with all distributions reinvested. This result modestly trailed the Portfolio’s benchmark, the Russell 1000® Value Index, which gained +16.46% during the period. Complete annualized performance for The Large-Cap Value Equity Portfolio is shown in the table on page 5.
It was a relatively strong 12-month period for stocks, despite a pickup in market volatility late in the fiscal year. Corporate earnings growth remained positive, if slower than in the years immediately following the global financial crisis. Meanwhile, the U.S. economy continued its slow but steady expansion, as did the country’s employment picture. As of the end of October 2014, the national jobless rate was 5.8% — the lowest level since July 2008 — and down from 7.2% a year earlier. (Source: U.S. Commerce Department.)
Late in the fiscal year, the U.S. Federal Reserve wrapped up its quantitative-easing economic stimulus program, though it reiterated plans to maintain its benchmark short-term interest rate near zero for some time longer. This commitment helped boost stock prices, even in the face of various global challenges, including renewed concerns about the European economy, serious geopolitical risks in Russia and the Middle East, and a sharp decline in the price of oil that weighed heavily on energy stocks.
Detractors from the Portfolio’s performance included securities in the healthcare, telecommunications, and energy sectors. Security selection in the healthcare sector was a source of weakness. In this sector, the Portfolio’s position in drugmaker Pfizer failed to gain much ground (returning 1% during the Portfolio’s fiscal year). Various factors weighed on Pfizer’s shares, including a series of revenue declines and a failed effort to acquire U.K.-based competitor AstraZeneca. Despite the underperformance, we continued to hold Pfizer in the Portfolio at fiscal year end and maintained a positive long-term outlook for the company.
The telecommunication services sector was another source of underperformance. Here, AT&T was the weakest individual performer, advancing just 1%. The company’s new discounted pricing plan has succeeded in reducing customer turnover but has also put pressure on revenues. Nevertheless, we still consider AT&T to be an undervalued stock with a strong balance sheet and believe it may be well positioned to benefit from various growth opportunities.
Within the struggling energy group, Occidental Petroleum was another source of underperformance. The company’s shares declined approximately -5% during the Portfolio’s fiscal year, due somewhat to more limited exposure to North American shale drilling than some of the company’s competitors. We continue to hold the stock because we believe it is undervalued and the company has what we view as attractive assets in California and Texas.
On the positive side, stock selection was strong in the industrials sector. Two defense contractors, Northrop Grumman and Raytheon, were strong performers for the Portfolio, gaining 31% and 29%, respectively, during the Portfolio’s fiscal year. In our opinion, both companies have been successful in cutting costs, managing through an environment of declining defense spending, and taking such shareholder-friendly steps as buying back shares and increasing dividends.
The information technology sector also added value, especially a position in Broadcom, which makes semiconductors for communications applications. Broadcom’s shares rose sharply in June after the company announced plans to abandon its unprofitable cellular baseband business. The move boosted the company’s earnings and cash flow and set the stage for a 59% stock-price increase during the Portfolio’s fiscal year. At the end of the period, we continued to view Broadcom as a high-quality company with a strong balance sheet and favorable competitive position in many growing business segments.
We made relatively few changes to the Portfolio during the fiscal year. In financials, we sold a longtime stake in property casualty insurance company Travelers in March 2014, after the stock reached our price target. We used the proceeds to establish a new position in financial holding company BB&T. Meanwhile, within technology, we sold communications equipment maker Motorola Solutions, which similarly reached our target price, and, as of the end of the fiscal year, we were evaluating suitable alternatives for a replacement position.
At fiscal year end, we have aimed to position the Portfolio somewhat defensively, with a significant overweighting in the healthcare sector and modest overweightings in consumer staples and telecommunication services. We believe a generally defensive portfolio stance is prudent, given that the stock market now strikes us as fully valued. The one exception to the Portfolio’s defensive allocation is a relative overweighting in the energy sector. In this sector, we are taking a long-term view to see the potential for a reversal in the trends that have pushed down commodity prices. We are watching this segment of the market closely, however, and will not hesitate to re-evaluate the Portfolio’s positioning if recent pricing trends appear longer-lasting, in our view.
Regardless of market conditions, our approach remains consistent. We will continue to look for good businesses that may be available for purchase at what we view as compelling valuations because of temporary fundamental challenges and negative investor sentiment. We will continue to adhere to our process of searching for what we believe to be favorable relative values in the marketplace.
|
The views expressed are current as of the date of this report and subject to change. |
Performance summary
Delaware Pooled® Trust — The Large-Cap Value Equity Portfolio
The performance data quoted represent past performance; past performance does not guarantee future results. Investment return and principal value will fluctuate so your shares, when redeemed, may be worth more or less than their original cost. Current performance may be lower or higher than the performance data quoted. Please obtain the performance data for the most recent month end by calling 800 231-8002 or visiting our website at delawareinvestments.com.
Carefully consider the Portfolio’s investment objectives, risk factors, charges, and expenses before investing. This and other information can be found in the Portfolio’s prospectus and, if available, its summary prospectus, which may be obtained by visiting delawareinvestments.com or calling 800 231-8002. Investors should read the prospectus and, if available, the summary prospectus carefully before investing.
Portfolio and benchmark performance
| | | | | | | | | | |
Average annual total returns Periods ended Oct. 31, 2014 | | 1 year | | 3 years | | 5 years | | 10 years | | Lifetime |
The Large-Cap Value Equity Portfolio | | +16.19% | | +20.97% | | +18.50% | | +8.73% | | +10.26% |
Russell 1000 Value Index | | +16.46% | | +20.42% | | +16.49% | | +7.90% | | +10.30% |
Portfolio profile
Oct. 31, 2014
| | |
| Total net assets | | Number of holdings |
$139.8 million | | 32 |
Feb. 3, 1992
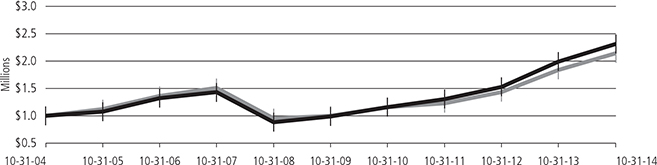
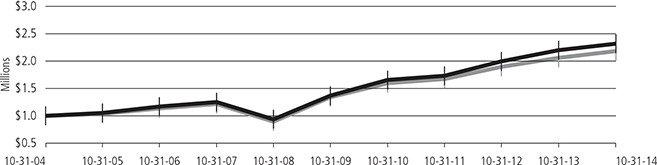
Growth of $1,000,000
| | | | |
| | | Starting value (Oct. 31, 2004) | | Ending value (Oct. 31, 2014) |
| | |
 The Large-Cap Value Equity Portfolio The Large-Cap Value Equity Portfolio
| | $1,000,000 | | $2,309,306 |
| | |
 Russell 1000 Value Index Russell 1000 Value Index
| | $1,000,000 | | $2,139,168 |
The performance graph assumes $1 million invested on Oct. 31, 2004, and includes reinvestment of all distributions. The performance graph does not reflect the deduction of taxes the shareholder would pay on Portfolio distributions or redemptions of Portfolio shares.
Total return assumes reinvestment of dividends and capital gains, but does not reflect reductions for taxes. Returns and share values will fluctuate so that shares, when redeemed, may be worth more or less than their original cost.
The most recent prospectus disclosed the Portfolio’s total operating expenses as 0.72%. Management has contractually agreed to reimburse certain expenses and/or waive its management fees from Nov. 1, 2013, through Oct. 31, 2014,* in order to prevent total annual Portfolio
Performance summary
Delaware Pooled® Trust — The Large-Cap Value Equity Portfolio
operating expenses (with certain exclusions) from exceeding, in an aggregate amount, 0.70% of the Portfolio’s average daily net assets, as described in the most recent prospectus.
Expense limitations were in effect during the period shown. Performance would have been lower had the expense limitations not been in effect.
The Russell 1000 Value Index measures the performance of the large-cap value segment of the U.S. equity universe. It includes those Russell 1000 companies with lower price-to-book ratios and lower forecasted growth values.
Index performance returns do not reflect any management fees, transaction costs, or expenses. Indices are unmanaged and one cannot invest directly in an index.
Investing involves risk, including the possible loss of principal.
Past performance is not a guarantee of future results.
* The contractual waiver period is from Feb. 28, 2013 through Feb. 27, 2015.
6
Portfolio management review
Delaware Pooled® Trust — The Select 20 Portfolio
October 31, 2014
For the fiscal year ended Oct. 31, 2014, Delaware Pooled Trust — The Select 20 Portfolio returned +15.92% at net asset value (NAV) with all distributions reinvested, underperforming its benchmark, the Russell 3000® Growth Index, which returned +16.39% for the same period. Complete annualized performance for The Select 20 Portfolio is shown in the table on page 8.
Despite several economic hurdles, U.S. stocks posted strong gains for the fiscal year ended Oct. 31, 2014. The S&P 500® Index gained a solid 17.27% during the period, recovering handily from several severe market dips, most notably in early February and mid-October 2014. Large-cap equities performed particularly well during the period, as indicated by the 16.78% gain in the Russell 1000® Index. Outside the United States, market conditions remained volatile for much of the fiscal year as evidenced by the MSCI EAFE Index decline of 0.60%. (Source: FactSet.) The tension between Russia and Ukraine, conflicts in the Middle East, and concerns about the Islamic State of Iraq and Syria (ISIS) increased anxiety for investors throughout the world.
In December 2013, the U.S. Federal Reserve, under the leadership of newly appointed Chairwoman Janet Yellen, announced it would begin reducing its $85-billion-per-month quantitative-easing (QE3) strategy, with the goal of ending it by late 2014. The Fed reduced its purchase of U.S. Treasurys by $10 billion on several occasions and eventually completed its purchase program in late October. The Fed indicated, however, that it would revisit the bond buyback strategy if the economy were to worsen.
Economic growth gained momentum during the last six months of the Portfolio’s fiscal year after a series of severe storms dampened consumer spending and housing activity for much of the winter. Consumer confidence rose during this period as job openings expanded somewhat and unemployment claims dropped. Consumer spending, capital purchases, and spending by local governments all added to gross domestic product, which grew 4.6% in the second quarter of 2014 and then another 3.5% in the third quarter (according to the U.S. Commerce Department’s advance estimate).
Allergan contributed to performance during the period. The stock experienced a strong rise in price following an acquisition offer from Canada-based Valeant Pharmaceuticals International. While Allergan rejected the acquisition, Valeant continued to aggressively pursue an acquisition of Allergan. We continue to hold the company and our discussions are focused on what we believe to be fair value for
Allergan under several different scenarios. While much attention has been focused on the potential acquisition, we continue to believe the company operates at a high level driven both by its core ophthalmology franchise and the growing use of Botox in both cosmetic and other medical indications.
VeriFone Systems likewise contributed to performance during the period. Management’s execution in driving the company’s international expansion as well as realizing synergies from recent strategic initiatives enabled the company to recover from a period of fundamental difficulty. Going forward, we believe the company could see some upside as the industry moves toward more secure payment methods. Several high-profile credit card “hacking” incidents could potentially result in VeriFone’s customers upgrading to point-of-sale terminals with tighter security standards and capabilities.
NeuStar detracted from performance during the period. The company experienced weakness as the approval process — allowing the company to remain the sole database provider of cell phone numbers and other related information for the North American wireless carrier industry — was in negotiations and had come increasingly into question. While we felt NeuStar may have ultimately gotten the renewal, at least in most of its current form, there were growing concerns. While we continue to believe the company has attractive business-model characteristics and an attractive cash-flow-based valuation, we decided to exit the Portfolio’s position during the period due to the company’s higher risk profile.
j2 Global was also a detractor from performance during the period. The stock declined early in the period as the company reported earnings results that missed consensus expectations. We felt the stock’s decline was likely an overreaction and that the company could continue to add incremental value for shareholders, in our opinion, by making many small, strategic, and financially sound acquisitions. While the stock has since recovered, it ended the period relatively flat during an overall strong up market.
Regardless of the economic outcome, we remain consistent in our long-term investment philosophy: We want to own what we view as strong secular-growth companies with solid business models and competitive positions that we believe can grow market share and have the potential to deliver shareholder value in a variety of market environments.
The views expressed are current as of the date of this report and subject to change.
Performance summary
Delaware Pooled® Trust — The Select 20 Portfolio
The performance data quoted represent past performance; past performance does not guarantee future results. Investment return and principal value will fluctuate so your shares, when redeemed, may be worth more or less than their original cost. Current performance may be lower or higher than the performance data quoted. Please obtain the performance data for the most recent month end by calling 800 231-8002 or visiting our website at delawareinvestments.com.
Carefully consider the Portfolio’s investment objectives, risk factors, charges, and expenses before investing. This and other information can be found in the Portfolio’s prospectus and, if available, its summary prospectus, which may be obtained by visiting delawareinvestments.com or calling 800 231-8002. Investors should read the prospectus and, if available, the summary prospectus carefully before investing.
Portfolio and benchmark performance
| | | | | | | | | | |
Average annual total returns Periods ended Oct. 31, 2014 | | 1 year | | 3 years | | 5 years | | 10 years | | Lifetime |
The Select 20 Portfolio | | +15.92% | | +17.95% | | +18.06% | | +8.72% | | +2.06% |
Russell 3000 Growth Index | | +16.39% | | +19.23% | | +17.52% | | +9.09% | | +1.79% |
Portfolio profile
Oct. 31, 2014
| | |
| Total net assets | | Number of holdings |
$90.4 million | | 22 |
March 31, 2000
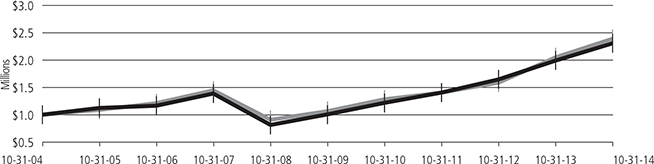
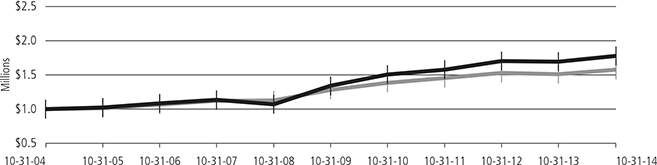
Growth of $1,000,000
| | | | |
| | | Starting value (Oct. 31, 2004) | | Ending value (Oct. 31, 2014) |
| | |
Russell 3000 Growth Index | | $1,000,000 | | $2,386,373 |
| | |
The Select 20 Portfolio | | $1,000,000 | | $2,307,121 |
The performance graph assumes $1 million invested on Oct. 31, 2004, and includes reinvestment of all distributions. The performance graph does not reflect the deduction of taxes the shareholder would pay on Portfolio distributions or redemptions of Portfolio shares.
Total return assumes reinvestment of dividends and capital gains, but does not reflect reductions for taxes. Returns and share values will fluctuate so that shares, when redeemed, may be worth more or less than their original cost.
The most recent prospectus disclosed the Portfolio’s total operating expenses as 0.85%. Management has contractually agreed to reimburse certain expenses and/or waive its management fees from Nov. 1, 2013, through Oct. 31, 2014,* in order to prevent total annual Portfolio
8
operating expenses (with certain exceptions) from exceeding, in an aggregate amount, 0.89% of the Portfolio’s average daily net assets, as described in the most recent prospectus.
Expense limitations were in effect during the period shown. Performance would have been lower had the expense limitations not been in effect.
The Russell 3000 Growth Index measures the performance of the broad growth segment of the U.S. equity universe. It includes those Russell 3000 companies with higher price-to-book ratios and higher forecasted growth values.
The Russell 1000 Index measures the performance of the large-cap segment of the U.S. equity universe.
The S&P 500 Index measures the performance of 500 mostly large-cap stocks weighted by market value, and is often used to represent performance of the U.S. stock market.
The MSCI EAFE Index measures equity market performance across developed market countries in Europe, Australasia, and the Far East. Index “net” return approximates the minimum possible dividend reinvestment, after deduction of withholding tax at the highest possible rate.
Index performance returns do not reflect any management fees, transaction costs, or expenses. Indices are unmanaged and one cannot invest directly in an index.
Investing involves risk, including the possible loss of principal.
Past performance is not a guarantee of future results.
Because the Portfolio expects to hold a concentrated portfolio of a limited number of securities, the Portfolio’s risk is increased because each investment has a greater effect on the Portfolio’s overall performance.
Investments in small and/or medium-sized companies typically exhibit greater risk and higher volatility than larger, more established companies.
“Nondiversified” Portfolios may allocate more of their net assets to investments in single securities than “diversified” Portfolios. Resulting adverse effects may subject these Portfolios to greater risks and volatility.
On Feb. 28, 2008, the Portfolio changed its investment strategy to limit its investments to no less than 15 securities and no more than 25 securities. The performance prior to Feb. 28, 2008 is that of the Portfolio’s predecessor, The All-Cap Growth Equity Portfolio.
* The contractual waiver period is from Feb. 28, 2013 through Feb. 27, 2015.
Portfolio management review
Delaware Pooled® Trust — The Large-Cap Growth Equity Portfolio
October 31, 2014
For the fiscal year ended Oct. 31, 2014, Delaware Pooled Trust — The Large-Cap Growth Equity Portfolio returned +17.10% at net asset value (NAV) with all distributions reinvested. The Portfolio slightly underperformed its benchmark, the Russell 1000® Growth Index, which returned +17.11% for the same period. Complete annualized performance for The Large-Cap Growth Equity Portfolio is shown in the table on page 11.
Despite several economic hurdles, U.S. stocks posted strong gains for the fiscal year ended Oct. 31, 2014. The S&P 500® Index gained a solid 17.27% during the period, recovering handily from several severe market dips, most notably in early February and mid-October 2014. Large-cap equities performed particularly well during the period, as indicated by the 16.78% gain in the Russell 1000® Index. Outside the United States, market conditions remained volatile for much of the fiscal year as evidenced by the MSCI EAFE Index decline of 0.60%. (Source: FactSet.) The tension between Russia and Ukraine, conflicts in the Middle East, and concerns about the Islamic State of Iraq and Syria (ISIS) increased anxiety for investors throughout the world.
In December 2013, the U.S. Federal Reserve, under the leadership of newly appointed Chairwoman Janet Yellen, announced it would begin reducing its $85-billion-per-month quantitative-easing (QE3) strategy, with the goal of ending it by late 2014. The Fed reduced its purchase of U.S. Treasurys by $10 billion on several occasions and eventually completed its purchase program in late October. The Fed indicated, however, that it would revisit the bond buyback strategy if the economy were to worsen.
Economic growth gained momentum during the last six months of the Portfolio’s fiscal year after a series of severe storms dampened consumer spending and housing activity for much of the winter. Consumer confidence rose during this period as job openings expanded somewhat and unemployment claims dropped. Consumer spending, capital purchases, and spending by local governments all added to gross domestic product, which grew 4.6% in the second quarter of 2014 and then another 3.5% in the third quarter (according to the U.S. Commerce Department’s advance estimate).
Allergan contributed to performance during the period. The stock experienced a strong rise in price following an acquisition offer from Canada-based Valeant Pharmaceuticals International. While Allergan rejected the acquisition, Valeant continued to aggressively pursue an acquisition of Allergan. We continue to hold the company and our discussions are focused on what we believe to be fair value for Allergan under several different scenarios. While much attention has been focused on the potential acquisition, we continue to believe the company operates at a high level driven both by its core
ophthalmology franchise and the growing use of Botox in both cosmetic and other medical indications.
Celgene likewise contributed to performance during the period as the company experienced several positive events throughout the year. The company made significant progress toward regulatory approval for expanded use of one of its drugs within the United Kingdom. It also achieved positive clinical advancements for a new drug to treat Crohn’s disease. Overall, Celgene, in our opinion, continues to be a leader in the treatment of blood cancers with a growing pipeline of breast, lung, and pancreatic cancer treatments. We believe the company continues to benefit from large growth prospects driven by additional indications for its drugs, by increased use of existing drugs, and by international growth opportunities.
Apple was a detractor from performance during the period due to the Portfolio’s lack of significant exposure to this strong-performing company. We sold the company due to growing concerns related to its future growth trajectory, margin compression, and product innovation, among others. We still believe Apple is not merely a hardware company, but rather a platform solution where customers tend to be sticky and buy into the “halo” effect of the Apple ecosystem. Therefore, we believe that the sustainability of Apple’s franchise will be stronger for a longer period of time and that the company deserves a higher valuation than the typical technology hardware company. However, as the risk-reward profile of this company had changed, we no longer felt the stock was as attractive relative to our other holdings in the portfolio and decided to exit the Portfolio’s position.
Syngenta detracted from performance during the period. In our experience, investors have shown increasing concern about future product development, margin compression, lack of progress in cost savings, industry lawsuits, and certain regulatory issues — most notably in China. We continue to believe that companies like Syngenta should benefit from the growing secular demand for their services, which can help increase crop yield and overall food quality. However, given Syngenta’s higher risk-reward trade-off as well as current headwinds that we think are unlikely to subside in the near-to-intermediate term, we decided to exit the Portfolio’s position during the period and allocate to more attractive opportunities.
Regardless of the economic outcome, we remain consistent in our long-term investment philosophy: We want to own what we view as strong secular-growth companies with solid business models and competitive positions that we believe can grow market share and have the potential to deliver shareholder value in a variety of market environments.
|
|
| The views expressed are current as of the date of this report and subject to change. |
Performance summary
Delaware Pooled® Trust — The Large-Cap Growth Equity Portfolio
The performance data quoted represent past performance; past performance does not guarantee future results. Investment return and principal value will fluctuate so your shares, when redeemed, may be worth more or less than their original cost. Current performance may be lower or higher than the performance data quoted. Please obtain the performance data for the most recent month end by calling 800 231-8002 or visiting our website at delawareinvestments.com.
Carefully consider the Portfolio’s investment objectives, risk factors, charges, and expenses before investing. This and other information can be found in the Portfolio’s prospectus and, if available, its summary prospectus, which may be obtained by visiting delawareinvestments.com or calling 800 231-8002. Investors should read the prospectus and, if available, the summary prospectus carefully before investing.
Portfolio and benchmark performance
| | | | | | | | | | |
Average annual total returns Periods ended Oct. 31, 2014 | | 1 year | | 3 years | | 5 years | | Lifetime | | |
The Large-Cap Growth Equity Portfolio | | +17.10% | | +20.34% | | +18.70% | | +8.42% | | |
Russell 1000 Growth Index | | +17.11% | | +19.30% | | +17.43% | | +9.08% | | |
Portfolio profile
Oct. 31, 2014
| | |
| Total net assets | | Number of holdings |
$277.3 million | | 30 |
Nov. 1, 2005
Growth of $1,000,000
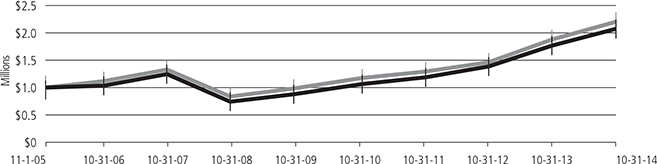
| | | | |
| | | Starting value (Nov. 1, 2005) | | Ending value (Oct. 31, 2014) |
| | |
Russell 1000 Growth Index | | $1,000,000 | | $2,196,171 |
| | |
The Large-Cap Growth Equity Portfolio | | $1,000,000 | | $2,069,749 |
The performance graph assumes $1 million invested on Nov. 1, 2005, and includes reinvestment of all distributions. The performance graph does not reflect the deduction of taxes the shareholder would pay on Portfolio distributions or redemptions of Portfolio shares.
Total return assumes reinvestment of dividends and capital gains, but does not reflect reductions for taxes. Returns and share values will fluctuate so that shares, when redeemed, may be worth more or less than their original cost.
The most recent prospectus disclosed the Portfolio’s total operating expenses as 0.65%. Management has contractually agreed to reimburse certain expenses and/or waive its management fees from Nov. 1, 2013, through Oct. 31, 2014,* in order to prevent total annual Portfolio
Performance summary
Delaware Pooled® Trust — The Large-Cap Growth Equity Portfolio
operating expenses (with certain exceptions) from exceeding, in an aggregate amount, 0.65% of the Portfolio’s average daily net assets, as described in the most recent prospectus.
Expense limitations were in effect during the period shown. Performance would have been lower had the expense limitations not been in effect.
The Russell 1000 Growth Index measures the performance of the large-cap growth segment of the U.S. equity universe. It includes those Russell 1000 companies with higher price-to-book ratios and higher forecasted growth values.
The S&P 500 Index measures the performance of 500 mostly large-cap stocks weighted by market value, and is often used to represent performance of the U.S. stock market.
The Russell 1000 Index measures the performance of the large-cap segment of the U.S. equity universe.
The MSCI EAFE Index measures equity market performance across developed market countries in Europe, Australasia, and the Far East. Index “net” return approximates the minimum possible dividend reinvestment, after deduction of withholding tax at the highest possible rate.
Index performance returns do not reflect any management fees, transaction costs, or expenses. Indices are unmanaged and one cannot invest directly in an index.
Investing involves risk, including the possible loss of principal.
Past performance is not a guarantee of future results.
Because the Portfolio expects to hold a concentrated portfolio of a limited number of securities, the Portfolio’s risk is increased because each investment has a greater effect on the Portfolio’s overall performance.
*The contractual waiver period is from Feb. 28, 2013 through Feb. 27, 2015.
12
Portfolio management review
Delaware Pooled® Trust — The Focus Smid-Cap Growth Equity Portfolio
October 31, 2014
For the fiscal year ended Oct. 31, 2014, Delaware Pooled Trust — The Focus Smid-Cap Growth Equity Portfolio returned +5.51% at net asset value (NAV) with all distributions reinvested. The Portfolio underperformed its benchmark, the Russell 2500™ Growth Index, which returned +10.24% for the same period. Complete annualized performance for The Focus Smid-Cap Growth Equity Portfolio is shown in the table on page 14.
Despite several economic hurdles, U.S. stocks posted strong gains for the fiscal year ended Oct. 31, 2014. The S&P 500® Index gained a solid 17.27% during the period, recovering handily from a number of market dips, most notably in early February and mid October 2014. Large-cap equities performed particularly well during the period, as indicated by the 16.78% gain in the Russell 1000® Index. Outside the United States, market conditions remained volatile for much of the fiscal year as evidenced by the MSCI EAFE Index decline of 0.60%. (Source: FactSet.) The tension between Russia and Ukraine, conflicts in the Middle East, and concerns about the Islamic State of Iraq and Syria (ISIS) increased anxiety for investors throughout the world.
In December 2013, the U.S. Federal Reserve, under the leadership of newly appointed Chairwoman Janet Yellen, announced it would begin reducing its $85-billion-per-month quantitative-easing (QE3) strategy, with the goal of ending it by late 2014. The Fed reduced its purchase of U.S. Treasurys by $10 billion on several occasions and eventually completed its purchase program in late October. The Fed indicated, however, that it would revisit the bond buyback strategy if the economy were to worsen.
Economic growth gained momentum during the last six months of the Portfolio’s fiscal year after a series of severe storms dampened consumer spending and housing activity for much of the winter. Consumer confidence rose during this period as job openings expanded somewhat and unemployment claims dropped. Consumer spending, capital purchases, and spending by local governments all added to gross domestic product, which grew 4.6% in the second quarter of 2014 and then another 3.5% in the third quarter (according to the U.S. Commerce Department’s advance estimate).
VeriFone Systems contributed to performance during the period. Management’s execution in driving the company’s international expansion as well as realizing synergies from recent strategic initiatives enabled the company to recover from a period of fundamental difficulty. Going forward, we believe the company could see some upside as the industry moves toward more secure payment methods. Several high-profile credit card “hacking” incidents could
result in VeriFone’s customers upgrading to point-of-sale terminals with tighter security standards and capabilities.
Heartland Payment Systems likewise contributed to performance during the period. The stock rose as the company further strengthened its business through recent acquisitions and strategic partnerships. The company recently announced it would acquire TouchNet Information Systems, a payment-processing company that serves higher-education institutions. The acquisition makes Heartland Payment Systems the largest provider of payment-processing services to the higher-education market and further diversifies the company’s business. We feel these recent efforts should be accretive to shareholder value over the long term. We continue to believe the company is well positioned to benefit from the secular global trend of payment transactions moving from paper currency to electronic transactions.
Core Laboratories was a detractor from performance during the period. The stock declined as investors grew increasingly concerned about utilization of Core Laboratories services by North American clients in the near term. We are willing to live with a certain degree of cyclicality in the energy industry given that this company’s solutions to site analysis are valuable throughout the cycle. In our view, this is a well-owned stock with little historical controversy and volatility. Therefore, we believe that investors may be overreacting to potentially transitory weakness in commodity prices, which we believe is contributing to a reasonable conservative assessment of industry conditions by company management.
NeuStar detracted from performance during the period. The company experienced weakness as the approval process — allowing the company to remain the sole database provider of cell phone numbers and other related information for the North American wireless carrier industry — was in negotiations and had come increasingly into question. While we felt NeuStar may have ultimately gotten the renewal, at least in most of its current form, there were growing concerns. While we continue to believe the company has attractive business-model characteristics and an attractive cash-flow-based valuation, we decided to exit the Portfolio’s position during the period due to the company’s higher risk profile.
Regardless of the economic outcome, we remain consistent in our long-term investment philosophy: We want to own what we view as strong secular-growth companies with solid business models and competitive positions that we believe can grow market share and have the potential to deliver shareholder value in a variety of market environments.
|
|
| The views expressed are current as of the date of this report and subject to change. |
Performance summary
Delaware Pooled® Trust — The Focus Smid-Cap Growth Equity Portfolio
The performance data quoted represent past performance; past performance does not guarantee future results. Investment return and principal value will fluctuate so your shares, when redeemed, may be worth more or less than their original cost. Current performance may be lower or higher than the performance data quoted. Please obtain the performance data for the most recent month end by calling 800 231-8002 or visiting our website at delawareinvestments.com.
Carefully consider the Portfolio’s investment objectives, risk factors, charges, and expenses before investing. This and other information can be found in the Portfolio’s prospectus and, if available, its summary prospectus, which may be obtained by visiting delawareinvestments.com or calling 800 231-8002. Investors should read the prospectus and, if available, the summary prospectus carefully before investing.
Portfolio and benchmark performance
| | | | | | | | | | |
Average annual total returns Periods ended Oct. 31, 2014 | | 1 year | | 3 years | | 5 years | | 10 years | | Lifetime |
The Focus Smid-Cap Growth Equity Portfolio | | +5.51% | | +14.42% | | +20.75% | | +11.83% | | +10.61% |
Russell 2500 Growth Index | | +10.24% | | +18.64% | | +19.20% | | +10.26% | | +9.63% |
Portfolio profile
Oct. 31, 2014
| | |
| Total net assets | | Number of holdings |
$43.3 million | | 26 |
Dec. 1, 2003
Growth of $1,000,000
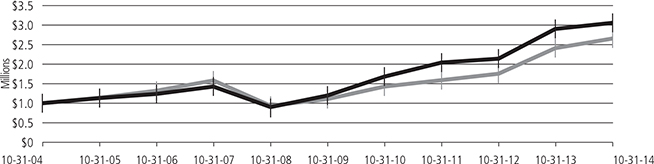
| | | | |
| | | Starting value (Oct. 31, 2004) | | Ending value (Oct. 31, 2014) |
| | |
The Focus Smid-Cap Growth Equity Portfolio | | $1,000,000 | | $3,058,406 |
| | |
Russell 2500 Growth Index | | $1,000,000 | | $2,656,668 |
The performance graph assumes $1 million invested on Oct. 31, 2004, and includes reinvestment of all distributions. The performance graph does not reflect the deduction of taxes the shareholder would pay on Portfolio distributions or redemptions of Portfolio shares.
Total return assumes reinvestment of dividends and capital gains, but does not reflect reductions for taxes. Returns and share values will fluctuate so that shares, when redeemed, may be worth more or less than their original cost.
The most recent prospectus disclosed the Portfolio’s total operating expenses as 0.89%. Management has contractually agreed to reimburse certain expenses and/or waive its management fees from Nov. 1, 2013, through Oct. 1, 2014,* in order to prevent total annual Portfolio
14
operating expenses (with certain exceptions) from exceeding, in an aggregate amount, 0.92% of the Portfolio’s average daily net assets, as described in the most recent prospectus.
Expense limitations were in effect during the period shown. Performance would have been lower had the expense limitations not been in effect.
The Russell 2500 Growth Index measures the performance of the small- to mid-cap growth segment of the U.S. equity universe. It includes those Russell 2500 companies with higher price-to-book ratios and higher forecasted growth values.
The S&P 500 Index measures the performance of 500 mostly large-cap stocks weighted by market value, and is often used to represent performance of the U.S. stock market.
The Russell 1000 Index measures the performance of the large-cap segment of the U.S. equity universe.
The MSCI EAFE Index measures equity market performance across developed market countries in Europe, Australasia, and the Far East. Index “net” return approximates the minimum possible dividend reinvestment, after deduction of withholding tax at the highest possible rate.
Index performance returns do not reflect any management fees, transaction costs, or expenses. Indices are unmanaged and one cannot invest directly in an index.
Investing involves risk, including the possible loss of principal.
Past performance is not a guarantee of future results.
Investments in small and/or medium-sized companies typically exhibit greater risk and higher volatility than larger, more established companies.
Because the Portfolio expects to hold a concentrated portfolio of a limited number of securities, the Portfolio’s risk is increased because each investment has a greater effect on the Portfolio’s overall performance.
*The contractual waiver period is from Feb. 28, 2013 through Feb. 27, 2015.
Portfolio management review
Delaware Pooled® Trust — The High-Yield Bond Portfolio
October 31, 2014
For the fiscal year ended Oct. 31, 2014, Delaware Pooled Trust — The High-Yield Bond Portfolio returned +5.23% at net asset value (NAV) with all distributions reinvested. For the same period, the Portfolio’s benchmark, the BofA Merrill Lynch U.S. High Yield Constrained Index, returned +5.85%. Complete annualized performance for The High-Yield Bond Portfolio is shown in the table on page 17.
Despite significant fluctuations in the macroeconomic and geopolitical environment, high yield securities remained among the strongest-performing sectors of the domestic bond market during the Portfolio’s fiscal year. However, those fluctuations triggered abrupt changes to investor sentiment that were reflected in heightened volatility across the entire fixed income asset class.
Evidence accumulated early in the Portfolio’s fiscal year that the U.S. economy was picking up steam after years of subpar growth. The U.S. Federal Reserve had pledged to keep benchmark interest rates at virtually zero for “a considerable time,” and the central bank’s third bond-buying program was in full swing. With financial markets awash in liquidity, risk assets of all types became primary beneficiaries. In fact, the lowest-rated credits were the strongest-performing within the high yield sector over the last three months of 2013.
Subsequent events called into question whether a normal recovery was indeed under way. Unusually fierce winter weather across much of the United States caused consumers to pull back and hunker down. Overseas, geopolitical unrest in Ukraine and a lingering economic slowdown in China were cause for concern. Yet, against that troubling backdrop, high yield bonds continued to perform well, with investors drawn to the sector by low default rates, strengthened balance sheets, reasonable spreads, and a clear income advantage over government and investment grade corporate debt. The global search for yield was even strong enough to overcome a burst of new issuance by below-investment-grade companies. However, economic and geopolitical worries caused relative strength within high yield to switch to higher-rated credits.
The positive correlation between performance and credit quality held firm during the final three months of the Portfolio’s fiscal year amid rising nominal yields and expanding credit spreads. Investors became
cautious due to renewed Russia-Ukraine tensions, the rise of the Islamic State of Iraq and Syria (ISIS) in the Middle East, the looming end to Fed bond buying, a secular growth slowdown in China, and tepid economic conditions in Europe. Those negative macroeconomic factors were exacerbated by weak technical conditions, as retail investors redeemed mutual fund shares while the supply of high yield debt expanded sharply.
The Portfolio’s exposure to basic industry and technology issues contributed to relative performance, while energy and utility exposure detracted from performance.
At the individual security level, the Portfolio benefited from its holdings in First Data (transaction processing), Salix Pharmaceuticals (drug manufacturing), Nuveen Investments (investment management), Ally Financial (financial services), and United Rentals (equipment rental). Detracting from relative performance were positions in Hercules Offshore (contract energy drilling), Samson International (energy exploration and production), Arch Coal (coal mining), Halcon Resources (energy exploration and production), and Quiksilver (outdoor sports retailer).
As the fiscal year ended, nearly half of the Portfolio’s assets were invested in B-rated securities, the middle rung on the sub-investment-grade credit ladder. From a sector standpoint, the largest share of Portfolio assets was in energy securities, an allocation representing a slight overweight to the benchmark. Overall, we believe the Portfolio is positioned to anticipate a renewed bout of volatility, given the historical tendency of securities underwriters to book gains before year end amid a seasonal erosion of liquidity. Longer-term, however, we continue to view the current moderate-growth, low-inflation environment as potentially favorable for high yield securities.
With respect to derivatives, we had positions in Treasury futures (representing a little more than 4% of Portfolio assets) to hedge against rate risk, and a position in a credit protection instrument to hedge against spread widening. These positions did not have a material effect on the Portfolio’s performance (that is, greater than 50 basis points).
The views expressed are current as of the date of this report and subject to change.
16
Performance summary
Delaware Pooled® Trust — The High-Yield Bond Portfolio
The performance data quoted represent past performance; past performance does not guarantee future results. Investment return and principal value will fluctuate so your shares, when redeemed, may be worth more or less than their original cost. Current performance may be lower or higher than the performance data quoted. Please obtain the performance data for the most recent month end by calling 800 231-8002 or visiting our website at delawareinvestments.com.
Carefully consider the Portfolio’s investment objectives, risk factors, charges, and expenses before investing. This and other information can be found in the Portfolio’s prospectus and, if available, its summary prospectus, which may be obtained by visiting delawareinvestments.com or calling 800 231-8002. Investors should read the prospectus and, if available, the summary prospectus carefully before investing.
Portfolio and benchmark performance
| | | | | | | | | | |
Average annual total returns Periods ended Oct. 31, 2014 | | 1 year | | 3 years | | 5 years | | 10 years | | Lifetime |
The High-Yield Bond Portfolio | | +5.23% | | +10.18% | | +11.06% | | +8.77% | | +8.36% |
BofA Merrill Lynch U.S. High Yield Constrained Index | | +5.85% | | +9.23% | | +10.22% | | +8.12% | | +7.35% |
Portfolio profile
Oct. 31, 2014
| | |
| Total net assets | | Number of holdings |
$143.2 million | | 253 |
Dec. 2, 1996
Growth of $1,000,000
| | | | |
| | | Starting value (Oct. 31, 2004) | | Ending value (Oct. 31, 2014) |
| | |
The High-Yield Bond Portfolio | | $1,000,000 | | $2,318,086 |
| | |
BofA Merrill Lynch U.S. High Yield Constrained Index | | $1,000,000 | | $2,183,635 |
The performance graph assumes $1 million invested on Oct. 31, 2004, and includes reinvestment of all distributions. The performance graph does not reflect the deduction of taxes the shareholder would pay on Portfolio distributions or redemptions of Portfolio shares.
Total return assumes reinvestment of dividends and capital gains, but does not reflect reductions for taxes. Returns and share values will fluctuate so that shares, when redeemed, may be worth more or less than their original cost.
The most recent prospectus disclosed the Portfolio’s total operating expenses as 0.57%. Management has contractually agreed to reimburse certain expenses and/or waive its management fees from Nov. 1, 2013, through Oct. 31, 2014,* in order to prevent total annual Portfolio
Performance summary
Delaware Pooled® Trust — The High-Yield Bond Portfolio
operating expenses (with certain exceptions) from exceeding, in an aggregate amount, 0.59% of the Portfolio’s average daily net assets, as described in the most recent prospectus.
Expense limitations were in effect during the period shown. Performance would have been lower had the expense limitations not been in effect.
The BofA Merrill Lynch U.S. High Yield Constrained Index tracks the performance of U.S. dollar–denominated high yield corporate debt publicly issued in the U.S. domestic market, but caps individual issuer exposure at 2% of the benchmark.
Index performance returns do not reflect any management fees, transaction costs, or expenses. Indices are unmanaged and one cannot invest directly in an index.
Investing involves risk, including the possible loss of principal.
Past performance is not a guarantee of future results.
Fixed income securities and bond funds can lose value, and investors can lose principal, as interest rates rise. They also may be affected by economic conditions that hinder an issuer’s ability to make interest and principal payments on its debt.
The Portfolio may also be subject to prepayment risk, the risk that the principal of a fixed income security that is held by the Portfolio may be prepaid prior to maturity, potentially forcing the Portfolio to reinvest that money at a lower interest rate.
High yielding, noninvestment grade bonds (junk bonds) involve higher risk than investment grade bonds. The high yield secondary market is particularly susceptible to liquidity problems when institutional investors, such as mutual funds and certain other financial institutions, temporarily stop buying bonds for regulatory, financial, or other reasons. In addition, a less liquid secondary market makes it more difficult for the Portfolio to obtain precise valuations of the high yield securities in its portfolio.
International investments entail risks not ordinarily associated with U.S. investments including fluctuations in currency values, differences in accounting principles, or economic or political instability in other nations. Investing in emerging markets can be riskier than investing in established foreign markets due to increased volatility and lower trading volume.
The Portfolio may invest in derivatives, which may involve additional expenses and are subject to risk, including the risk that an underlying security or securities index moves in the opposite direction from what the portfolio manager anticipated. A derivative transaction depends upon the counterparties’ ability to fulfill their contractual obligations.
The Portfolio may experience portfolio turnover in excess of 100%, which could result in higher transaction costs and tax liability.
Bond ratings are determined by a nationally recognized statistical rating organization (NRSRO).
*The contractual waiver period is from Feb. 28, 2013 through Feb. 27, 2015.
18
Portfolio management review
Delaware Pooled® Trust — The Core Plus Fixed Income Portfolio
October 31, 2014
For the fiscal year ended Oct. 31, 2014, Delaware Pooled Trust — The Core Plus Fixed Income Portfolio returned +5.02% at net asset value (NAV) with all distributions reinvested. The Portfolio’s benchmark, the Barclays U.S. Aggregate Index, returned +4.14% for the same period. Complete annualized performance for The Core Plus Fixed Income Portfolio is shown in the table on page 20.
As the Portfolio’s fiscal year began, the domestic economic outlook appeared to brighten after a troubling stretch of subpar growth and elevated unemployment. Improved investor sentiment caused market interest rates to push higher, with the yield on the benchmark 10-year Treasury note finishing 2013 at slightly more than 3%. Additionally, in December 2013, the U.S. Federal Reserve began the long-anticipated process of “tapering” its bond-buying program, with the stated objective of completing the program by the fall of 2014. Against this backdrop of economic optimism, lower-rated debt outperformed while Treasurys and mortgage-backed securities (MBS) lagged.
In the first few months of 2014, the United States experienced what was arguably the most severe winter weather in a generation. As U.S. consumers hunkered down, geopolitical tensions spiked in Ukraine, economic growth decelerated in China, and the euro zone flirted with deflation. These anti-growth factors combined to reverse the previous rise in market interest rates, with longer-duration bonds, BBB-rated corporates, and high yield and emerging market debt the primary beneficiaries.
As evidence accumulated that soft U.S. economic data during the winter months was mostly weather-related, cyclical sectors of the fixed income market rallied, with strength concentrated in high yield bonds and the lower rungs of the investment grade ladder. Meanwhile, the Treasury yield curve flattened, with long-term rates moving lower and short-term rates inching higher in anticipation of an initial Fed tightening in mid-2015.
The fiscal period ended amid a sharply bifurcated global economic environment. Despite uneven progress, the U.S. economy gathered momentum in late summer and early fall. But any upward pressure on yields that might have accompanied accelerating domestic growth was offset by additional unrest in Ukraine, the apparent acceptance of slower secular growth in China, and the continuing inability of European financial institutions to reverse the region’s economic torpor. The resulting flight to safety provided support to longer-duration and higher-quality bonds over the final weeks of the Portfolio’s fiscal year.
Most of the Portfolio’s outperformance for the full fiscal year can be attributed to sector weightings that were in place during the fourth quarter of 2013. At that time, the Portfolio was significantly underweight Treasury debt, a sector that lagged cyclical areas of the
fixed income market amid a surge in economic optimism. The Portfolio was also overweight investment grade and high yield bonds, each of which outperformed the benchmark as spreads tightened during the final months of 2013.
Security selection within the corporate sector contributed to relative performance. Conversely, the Portfolio’s focus on the intermediate portion of the yield curve detracted in late 2013, given that the decline in nominal yields was concentrated in longer-term securities, where the Portfolio maintained an underweight.
Despite the shift in economic backdrop in early 2014, many of the same trends remained in place within the fixed income market, further bolstering the Portfolio’s relative performance. Treasury debt continued to lag, while additional spread tightening underwrote outperformance among investment grade and high yield corporate bonds, as well as emerging market debt. However, the Portfolio’s underweight to government MBS had a negative effect on relative performance during the second half of the fiscal year, when MBS was the strongest-performing sector within the benchmark.
The Portfolio’s overweight allocation to the short-term and floating-rate sectors of the asset-backed securities market detracted as well. During the final three months of the fiscal year, the Portfolio gave back some of its accumulated outperformance to that point as Treasury securities rallied and credit spreads widened amid the global flight to safety.
Among the Portfolio’s derivative positions, we used interest rate futures in an attempt to adjust the Portfolio’s duration (which determines how a bond’s price is affected by interest rate changes). In addition, though we kept the Portfolio’s currency exposure relatively low over the course of the fiscal year, we did employ currency hedging (specifically, foreign currency exchange (FX) forwards) in an attempt to scale back the Portfolio’s foreign exchange risk. The Portfolio also employed credit default swap baskets to help reduce the credit risk associated with the Portfolio’s significant allocation to the below-investment-grade sector. As of the end of the fiscal year, the Portfolio held the following derivatives: a small credit default swap position on emerging market debt, Treasury futures, and a currency hedge on the Brazilian real. None of the Portfolio’s derivative positions during the fiscal year had a material impact on portfolio performance; that is, none affected returns by greater than 50 basis points.
At fiscal year end, the Portfolio was positioned for a longer-than-consensus period of ultralow policy rates, economic weakness abroad highlighted by pockets of deflation, and stable or falling market interest rates from already low levels.
|
|
| The views expressed are current as of the date of this report and subject to change. |
Performance summary
Delaware Pooled® Trust — The Core Plus Fixed Income Portfolio
The performance data quoted represent past performance; past performance does not guarantee future results. Investment return and principal value will fluctuate so your shares, when redeemed, may be worth more or less than their original cost. Current performance may be lower or higher than the performance data quoted. Please obtain the performance data for the most recent month end by calling 800 231-8002 or visiting our website at delawareinvestments.com.
Carefully consider the Portfolio’s investment objectives, risk factors, charges, and expenses before investing. This and other information can be found in the Portfolio’s prospectus and, if available, its summary prospectus, which may be obtained by visiting delawareinvestments.com or calling 800 231-8002. Investors should read the prospectus and, if available, the summary prospectus carefully before investing.
Portfolio and benchmark performance
| | | | | | | | | | |
Average annual total returns Periods ended Oct. 31, 2014 | | 1 year | | 3 years | | 5 years | | 10 years | | Lifetime |
The Core Plus Fixed Income Portfolio | | +5.02% | | +4.08% | | +5.77% | | +5.91% | | +6.40% |
Barclays U.S. Aggregate Index | | +4.14% | | +2.73% | | +4.22% | | +4.64% | | +4.94% |
Portfolio profile
Oct. 31, 2014
| | |
| Total net assets | | Number of holdings |
$77.0 million | | 642 |
June 28, 2002
Growth of $1,000,000
| | | | |
| | | Starting value (Oct. 31, 2004) | | Ending value (Oct. 31, 2014) |
The Core Plus Fixed Income Portfolio | | $1,000,000 | | $1,776,475 |
| | |
Barclays U.S. Aggregate Index | | $1,000,000 | | $1,573,313 |
The performance graph assumes $1 million invested on Oct. 31, 2004, and includes reinvestment of all distributions. The performance graph does not reflect the deduction of taxes the shareholder would pay on Portfolio distributions or redemptions of Portfolio shares.
Total return assumes reinvestment of dividends and capital gains, but does not reflect reductions for taxes. Returns and share values will fluctuate so that shares, when redeemed, may be worth more or less than their original cost.
The most recent prospectus disclosed the Portfolio’s total operating expenses as 0.70%. Management has contractually agreed to reimburse certain expenses and/or waive its management fees from Nov. 1, 2013, through Oct. 31, 2014,* in order to prevent total annual Portfolio
20
operating expenses (with certain exceptions) from exceeding, in an aggregate amount, 0.45% of the Portfolio’s average daily net assets, as described in the most recent prospectus.
Expense limitations were in effect during the period shown. Performance would have been lower had the expense limitations not been in effect.
The Barclays U.S. Aggregate Index is a broad composite that tracks the investment grade domestic bond market.
Index performance returns do not reflect any management fees, transaction costs, or expenses. Indices are unmanaged and one cannot invest directly in an index.
Investing involves risk, including the possible loss of principal.
Past performance is not a guarantee of future results.
Fixed income securities and bond funds can lose value, and investors can lose principal, as interest rates rise. They also may be affected by economic conditions that hinder an issuer’s ability to make interest and principal payments on its debt.
The Portfolio may also be subject to prepayment risk, the risk that the principal of a fixed income security that is held by the Portfolio may be prepaid prior to maturity, potentially forcing the Portfolio to reinvest that money at a lower interest rate.
Interest payments on inflation-indexed debt securities will vary as the principal and/or interest is adjusted for inflation.
International investments entail risks not ordinarily associated with U.S. investments including fluctuation in currency values, differences in accounting principles, or economic or political instability in other nations. Investing in emerging markets can be riskier than investing in established foreign markets due to increased volatility and lower trading volume.
High yielding, noninvestment grade bonds (junk bonds) involve higher risk than investment grade bonds. The high yield secondary market is particularly susceptible to liquidity problems when institutional investors, such as mutual funds and certain other financial institutions, temporarily stop buying bonds for regulatory, financial, or other reasons. In addition, a less liquid secondary market makes it more difficult for the Portfolio to obtain precise valuations of the high yield securities in its portfolio.
Because the Portfolio may invest in bank loans and other direct indebtedness, it is subject to the risk that the Portfolio will not receive payment of principal, interest, and other amounts due in connection with these investments, which primarily depend on the financial condition of the borrower and the lending institution.
The Portfolio may experience portfolio turnover in excess of 100%, which could result in higher transaction costs and tax liability.
Bond ratings are determined by a nationally recognized statistical rating organization (NRSRO).
*The contractual waiver period is from Feb. 28, 2013 through Feb. 27, 2015.
Portfolio management review
Delaware Pooled® Trust — The International Equity Portfolio
October 31, 2014
For the fiscal year ended Oct. 31, 2014, Delaware Pooled Trust — The International Equity Portfolio returned +1.46% at net asset value (NAV) with all distributions reinvested. The Portfolio’s benchmark, the MSCI EAFE Index, returned -0.17% (gross) and -0.60% (net) for the same period. Complete annualized performance for The International Equity Portfolio is shown in the table on page 24.
The Portfolio’s fiscal year was generally a weak period for non-U.S. equities; however, we should note that many companies in the Portfolio’s investment universe did turn in positive performance in local-currency terms. U.S.-based investors saw their returns reduced due to the strength of the dollar relative to other major currencies. Relative to the U.S. dollar, the British pound declined 0.4%, the Australian dollar lost 7.2%, the euro retreated by 7.8%, and the Japanese yen declined 12.5%.
That said, each of the major international equity markets experienced significant macroeconomic and, in many cases, political challenges that constrained investor enthusiasm. In the euro zone, Germany declined 5.5% for the 12-month period ended Oct. 31, 2014, due to lingering uncertainty about the status of its trade relationship with Russia. France was down 6.6%, owing to weak business and consumer confidence. Italy remained in political upheaval, with new Prime Minister Matteo Renzi presenting an ambitious program of structural reforms that may be difficult to implement owing to a fragmented parliamentary majority. The Italian equity market fell 2.7%. In contrast, Spain was up 1.8%, based on a period of political stability and some successful structural and economic reforms.
Outside of the euro zone, the United Kingdom eked out a positive return of 0.1%, though it experienced considerable volatility as the pound declined over fears related to Scotland’s vote for independence. The failure of that referendum in September 2014 helped restore investor confidence.
Asia’s largest developed market, Japan, had a difficult year that included an increase in the consumption tax rate, the implementation of the final “arrow” of Prime Minister Shinzo Abe’s three-part stimulus plan, and a surprise announcement for further monetary policy easing by the Bank of Japan. These events caused considerable volatility, and Japan declined 0.7% for the 12 months ended Oct. 31, 2014.
The Portfolio’s fiscal year was one in which traditionally defensive sectors generated strong returns while cyclically sensitive sectors lagged. The healthcare sector, for example, produced the highest return of 13.1%, driven in part by the prospects for increased merger and acquisition activity, as well as generally resilient earnings. Utilities did well — mainly on the back of declining bond yields — which created relative value for stocks in this sector. Finally, telecoms rose 1.8% based on an improved regulatory outlook and signs of industry consolidation, especially in Europe.
A relatively weak outlook for global economic growth weighed on the more cyclically sensitive sectors. Financials lagged slightly, declining 1.2% despite easier credit conditions and lots of liquidity. The energy sector also fared poorly, down 5.4%. Despite a promise of better capital discipline and cash flow management, these stocks declined as a result of concerns about the oil supply from Russia and the need to impose sanctions over its invasion of Ukraine. The materials sector generated the weakest return, down 7.4%. This result was primarily driven by weak demand for raw materials in emerging markets, especially China.
The following is a brief summary attribution showing how our decisions impacted Portfolio results:
— Country allocations added to relative returns, led by overweight positions in the strong Spanish and Israeli equity markets, which more than offset the impact of underweight exposure to the strong-performing Scandinavian markets.
— The Portfolio’s currency allocation added to relative investment returns, supported by our underweight allocation to the Japanese yen and overweight allocation to the Singaporean dollar.
— Sector allocation and stock selection both contributed strongly to relative returns. The Portfolio benefited from an overweight to the healthcare sector, as well as from stock selection in the utilities, consumer discretionary, and financial sectors. These positions more than offset the effects of poor stock selection in the consumer staples sector.
The Portfolio’s strongest-performing stocks included Teva Pharmaceutical Industries, the Israeli generics manufacturer, which led the way with a 55% return, driven by the success of its main branded drug, Copaxone. Iberdrola, the Spanish utility, rose nearly 20% as concerns about utility regulation dissipated and European bond yields contracted. French telecommunication services provider Orange rose more than 20% on signs that wireless industry consolidations gained support from the government.
Underperformers included U.K. food retailer Tesco, whose stock fell nearly 50% due to recessionary pressures in Europe combined with two negative profit warnings in less than a month. Dutch food retailer Koninklijke Ahold also lagged the broader index. It fell more than 9% based on profit taking and weak quarterly sales from its U.S. business. Finally, QBE Insurance Group, the Australian insurer, declined about 25% owing to unexpected increases in reserves for the company’s Latin American business.
The Portfolio’s derivatives exposure was limited to hedging 80% of its Australian dollar exposure, which represented 2% of the total portfolio. We implemented this hedging using three-month forward currency contracts that were unleveraged and fully covered. Our analysis showed that the Australian dollar was significantly overvalued against the U.S. dollar and we wished to protect the value
of the underlying investment in Australian equities. The Portfolio gained from this defensive strategy over the fiscal year.
We believe we have positioned the Portfolio to navigate a potentially volatile environment, with the objective of achieving long-term, stable, real returns while protecting on the downside.
The views expressed are current as of the date of this report and subject to change.
Performance summary
Delaware Pooled® Trust — The International Equity Portfolio
The performance data quoted represent past performance; past performance does not guarantee future results. Investment return and principal value will fluctuate so your shares, when redeemed, may be worth more or less than their original cost. Current performance may be lower or higher than the performance data quoted. Please obtain the performance data for the most recent month end by calling 800 231-8002 or visiting our website at delawareinvestments.com.
Carefully consider the Portfolio’s investment objectives, risk factors, charges, and expenses before investing. This and other information can be found in the Portfolio’s prospectus and, if available, its summary prospectus, which may be obtained by visiting delawareinvestments.com or calling 800 231-8002. Investors should read the prospectus and, if available, the summary prospectus carefully before investing.
Portfolio and benchmark performance
| | | | | | | | | | |
Average annual total returns Periods ended Oct. 31, 2014 | | 1 year | | 3 years | | 5 years | | 10 years | | Lifetime |
The International Equity Portfolio | | +1.46% | | +8.93% | | +6.86% | | +6.16% | | +8.02% |
MSCI EAFE Index (gross) | | – 0.17% | | +10.17% | | +6.99% | | +6.29% | | +6.24% |
MSCI EAFE Index (net) | | – 0.60% | | +9.68% | | +6.52% | | +5.80% | | +5.84% |
Portfolio profile
Oct. 31, 2014
| | |
| Total net assets | | Number of holdings |
$446.5 million | | 57 |
Feb. 4, 1992
Growth of $1,000,000

| | | | |
| | | Starting value (Oct. 31, 2004) | | Ending value (Oct. 31, 2014) |
| | |
MSCI EAFE Index (gross) | | $1,000,000 | | $1,840,196 |
| | |
The International Equity Portfolio | | $1,000,000 | | $1,818,600 |
| | |
 MSCI EAFE Index (net) MSCI EAFE Index (net)
| | $1,000,000 | | $1,758,123 |
The performance graph assumes $1 million invested on Oct. 31, 2004, and includes reinvestment of all distributions. The performance graph does not reflect the deduction of taxes the shareholder would pay on Portfolio distributions or redemptions of Portfolio shares.
Total return assumes reinvestment of dividends and capital gains, but does not reflect reductions for taxes. Returns and share values will fluctuate so that shares, when redeemed, may be worth more or less than their original cost.
The most recent prospectus disclosed the Portfolio’s total operating expenses as 0.88%.
24
The MSCI EAFE Index measures equity market performance across developed market countries in Europe, Australasia, and the Far East. Index “gross” return approximates the maximum possible dividend reinvestment. Index “net” return approximates the minimum possible dividend reinvestment, after deduction of withholding tax at the highest possible rate.
Index performance returns do not reflect any management fees, transaction costs, or expenses. Indices are unmanaged and one cannot invest directly in an index.
Investing involves risk, including the possible loss of principal.
Past performance is not a guarantee of future results.
International investments entail risks not ordinarily associated with U.S. investments including fluctuation in currency values, differences in accounting principles, or economic or political instability in other nations. Investing in emerging markets can be riskier than investing in established foreign markets due to increased volatility and lower trading volume.
If and when the Portfolio invests in forward foreign currency contracts or uses other investments to hedge against currency risks, the Portfolio will be subject to special risks, including counterparty risk.
The Portfolio is presently closed to new investors.
Portfolio management review
Delaware Pooled® Trust — The Labor Select International Equity Portfolio
October 31, 2014
For the fiscal year ended Oct. 31, 2014, Delaware Pooled Trust — The Labor Select International Equity Portfolio returned +0.86% at net asset value (NAV) with all distributions reinvested. The Portfolio’s benchmark, the MSCI EAFE Index, returned -0.17% (gross) and -0.60% (net) for the same period. Complete annualized performance for The Labor Select International Equity Portfolio is shown in the table on page 28.
The Portfolio’s fiscal year was generally a weak period for non-U.S. equities; however, we should note that many companies in the Portfolio’s investment universe did turn in positive performance in local-currency terms. U.S.-based investors saw their returns reduced due to the strength of the dollar relative to other major currencies. Relative to the U.S. dollar, the British pound declined 0.4%, the Australian dollar lost 7.2%, the euro retreated by 7.8%, and the Japanese yen declined 12.5%.
That said, each of the major international equity markets experienced significant macroeconomic and, in many cases, political challenges that constrained investor enthusiasm. In the euro zone, Germany declined 5.5% for the 12-month period ended Oct. 31, 2014, due to lingering uncertainty about the status of its trade relationship with Russia. France was down 6.6%, owing to weak business and consumer confidence. Italy remained in political upheaval, with new Prime Minister Matteo Renzi presenting an ambitious program of structural reforms that may be difficult to implement owing to a fragmented parliamentary majority. The Italian equity market fell 2.7% for the 12-month-period. In contrast, Spain was up 1.8%, based on a period of political stability and some successful structural and economic reforms.
Outside of the euro zone, the United Kingdom eked out a positive return of 0.1%, though it experienced considerable volatility as the pound declined over fears related to Scotland’s vote for independence. The failure of that referendum in September 2014 helped restore investor confidence.
Asia’s largest developed market, Japan, had a difficult year that included an increase in the consumption tax rate, the implementation of the final “arrow” of Prime Minister Shinzo Abe’s three-part stimulus plan, and a surprise announcement for further monetary policy easing by the Bank of Japan. These events caused considerable volatility, and Japan declined 0.7% for the 12 months ended Oct. 31, 2014.
The Portfolio’s fiscal year was one in which traditionally defensive sectors generated strong returns while cyclically sensitive sectors lagged. The healthcare sector, for example, produced the highest return of 13.1%, driven in part by the prospects for increased merger and acquisition activity, as well as generally resilient earnings. Utilities did well — mainly on the back of declining bond yields — which created relative value for stocks in this sector. Finally, telecoms
rose 1.8% based on an improved regulatory outlook and signs of industry consolidation, especially in Europe.
A relatively weak outlook for global economic growth weighed on the more cyclically sensitive sectors. Financials lagged slightly, declining 1.2% despite easier credit conditions and lots of liquidity. The energy sector also fared poorly, down 5.4%. Despite a promise of better capital discipline and cash flow management, these stocks declined as a result of concerns about the oil supply from Russia and the need to impose sanctions over its invasion of Ukraine. The materials sector generated the weakest return, down 7.4%. This result was primarily driven by weak demand for raw materials in emerging markets, especially China.
The following is a brief summary attribution showing how our decisions impacted Portfolio results:
— Country allocations added to relative returns, led by our overweight positions in the strong Spanish and Israeli equity markets, which more than offset the impact of underweight exposure to the strong-performing Scandinavian markets.
— The Portfolio’s currency allocation also added to relative investment returns, supported by our underweight allocation to the Japanese yen and overweight allocation to the Singaporean dollar.
— Sector allocation and stock selection both contributed strongly to relative returns. The Portfolio benefited from an overweight to the healthcare sector, as well as from stock selection in the utilities, consumer discretionary, and financial sectors. These positions more than offset the effects of poor stock selection in the consumer staples sector.
The Portfolio’s strongest-performing stocks included Teva Pharmaceutical Industries, the Israeli generics manufacturer, which led the way with a 55% return, driven by the success of its main branded drug, Copaxone. Iberdrola, the Spanish utility, rose nearly 20% as concerns about utility regulation dissipated and European bond yields contracted. French telecommunication services provider Orange rose more than 20% on signs that wireless industry consolidations gained support from the government.
Underperformers included U.K. food retailer Tesco, whose stock fell nearly 50% due to recessionary pressures in Europe combined with two negative profit warnings in less than a month. Dutch food retailer Koninklijke Ahold also lagged the broader index. It fell more than 9% based on profit taking and weak quarterly sales from its U.S. business. Finally, QBE Insurance Group, the Australian insurer, declined about 25% owing to unexpected increases in reserves for the company’s Latin American business.
The Portfolio’s derivatives exposure was limited to hedging 80% of its Australian dollar exposure, which represented 2% of the total portfolio. We implemented this hedging using three-month forward
currency contracts that were unleveraged and fully covered. Our analysis showed that the Australian dollar was significantly overvalued against the U.S. dollar and we wished to protect the value of the underlying investment in Australian equities. The Portfolio gained from this defensive strategy over the fiscal year.
We believe we have positioned the Portfolio to navigate a potentially volatile environment, with the objective of achieving long-term, stable, real returns while protecting on the downside.
The views expressed are current as of the date of this report and subject to change.
Performance summary
Delaware Pooled® Trust — The Labor Select International Equity Portfolio
The performance data quoted represent past performance; past performance does not guarantee future results. Investment return and principal value will fluctuate so your shares, when redeemed, may be worth more or less than their original cost. Current performance may be lower or higher than the performance data quoted. Please obtain the performance data for the most recent month end by calling 800 231-8002 or visiting our website at delawareinvestments.com.
Carefully consider the Portfolio’s investment objectives, risk factors, charges, and expenses before investing. This and other information can be found in the Portfolio’s prospectus and, if available, its summary prospectus, which may be obtained by visiting delawareinvestments.com or calling 800 231-8002. Investors should read the prospectus and, if available, the summary prospectus carefully before investing.
Portfolio and benchmark performance
| | | | | | | | | | |
Average annual total returns Periods ended Oct. 31, 2014 | | 1 year | | 3 years | | 5 years | | 10 years | | Lifetime |
The Labor Select International Equity Portfolio | | +0.86% | | +8.34% | | +6.17% | | +5.86% | | +7.70% |
MSCI EAFE Index (gross) | | – 0.17% | | +10.17% | | +6.99% | | +6.29% | | +5.28% |
MSCI EAFE Index (net) | | – 0.60% | | +9.68% | | +6.52% | | +5.80% | | +4.87% |
Portfolio profile
Oct. 31, 2014
| | |
| Total net assets | | Number of holdings |
$373.5 million | | 55 |
Dec. 19, 1995
Growth of $1,000,000
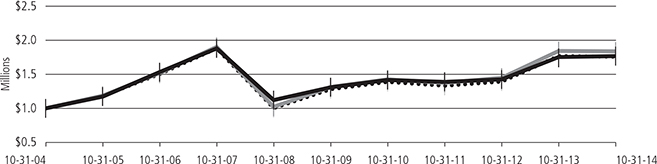
| | | | |
| | | Starting value (Oct. 31, 2004) | | Ending value (Oct. 31, 2014) |
| | |
MSCI EAFE Index (gross) | | $1,000,000 | | $1,840,196 |
| | |
The Labor Select International Equity Portfolio | | $1,000,000 | | $1,768,168 |
| | |
MSCI EAFE Index (net) | | $1,000,000 | | $1,758,123 |
The performance graph assumes $1 million invested on Oct. 31, 2004, and includes reinvestment of all distributions. The performance graph does not reflect the deduction of taxes the shareholder would pay on Portfolio distributions or redemptions of Portfolio shares.
Total return assumes reinvestment of dividends and capital gains, but does not reflect reductions for taxes. Returns and share values will fluctuate so that shares, when redeemed, may be worth more or less than their original cost.
28
The most recent prospectus disclosed the Portfolio’s total operating expenses as 0.88%.
The MSCI EAFE Index measures equity market performance across developed market countries in Europe, Australasia, and the Far East. Index “gross” return approximates the maximum possible dividend reinvestment. Index “net” return approximates the minimum possible dividend reinvestment, after deduction of withholding tax at the highest possible rate.
Index performance returns do not reflect any management fees, transaction costs, or expenses. Indices are unmanaged and one cannot invest directly in an index.
Investing involves risk, including the possible loss of principal.
Past performance is not a guarantee of future results.
International investments entail risks not ordinarily associated with U.S. investments including fluctuation in currency values, differences in accounting principles, or economic or political instability in other nations. Investing in emerging markets can be riskier than investing in established foreign markets due to increased volatility and lower trading volume.
If and when the Portfolio invests in forward foreign currency contracts or uses other investments to hedge against currency risks, the Portfolio will be subject to special risks, including counterparty risk.
Portfolio management review
Delaware Pooled® Trust — The Emerging Markets Portfolio
October 31, 2014
Delaware Pooled Trust — The Emerging Markets Portfolio returned +1.89% at net asset value (NAV) with all distributions reinvested for the fiscal year ended Oct. 31, 2014. The Portfolio’s benchmark, the MSCI Emerging Markets Index, returned +0.98% (gross) and +0.64% (net). Complete annualized performance for The Emerging Markets Portfolio is shown in the table on page 31.
Striking political changes in several key developing markets have had significant effects — both positive and negative — on performance for this asset class during the fiscal year (as has the growing strength of the U.S. dollar). In addition, global volatile market conditions and a generally weak economic environment throughout the fiscal year played a part in emerging markets’ lackluster performance numbers this fiscal year.
In our view, the fiscal year’s most positive political development occurred in India in May, when Narendra Modi was elected prime minister by a large majority. It appears to us that the markets believe he can push through the kinds of reforms needed to help India achieve its growth potential. India was up 29.3% for the fiscal year. A second welcome election result occurred in Indonesia, where market-friendly candidate Joko Widodo was elected president in July. Indonesia was up 9.9% for the fiscal year.
Counterbalancing these reform-oriented gains have been Russia and Brazil. For the fiscal year, Russia was down 24.4% while Brazil lost 9.6%. Russia’s woes went beyond the market backlash from its aggressive stance toward Ukraine — falling oil prices and a weak ruble also hurt. In Brazil, the global market’s declining appetite for commodities, along with a lack of confidence in its political leadership and ongoing structural issues, have continued to pressure this market. (Source: MSCI.)
The Portfolio’s overweight positions in India and Indonesia — along with stock selection in these two countries — were strong contributors to the Portfolio’s outperformance relative to its benchmark. The Portfolio’s underweight in Korea and overweight in Mexico also helped performance. Many of the Portfolio’s strongest-performing stocks are names within India. Axis Bank was up 81%; Larsen & Toubro, the engineering and construction company, was up 72%; and Rural Electrification Corp. was up 60%. In Indonesia, a weak currency (down 6%) dampened performance, but
our stock selection there benefited the Portfolio. Holdings in Bank Rakyat Indonesia were up 34%, Bank Mandiri was up 15%, and Perusahaan Gas Negara gained 13%.
We maintained an underweight in Russia, which served as a slight positive for the Portfolio relative to its benchmark. Two of the Portfolio’s Russian stocks were big disappointments. Russian holding Sberbank was down 38%, underperforming the market, and Gazprom lost 26%, which was more in line with the benchmark. Two of the Portfolio’s weakest-performing stocks were Brazilian companies. Vale, the iron ore producer, has struggled with weak iron ore prices; it was down 36%. Petrobras, the Brazilian energy company, declined 28%. A third Brazilian stock, EcoRodovias, a toll road operator, down 27%, also performed poorly.
In terms of sector performance, the Portfolio’s underweight in information technology, particularly in the software and services segment that includes the internet portals, was a negative for the Portfolio. Both the Chinese portal Tencent and the Korean portal Naver were a drag on the Portfolio’s performance in relative terms, as we did not own these stocks (both stocks advanced more than 40% during the fiscal year). On the plus side, an underweight in materials and overweights in telecommunications and utilities contributed to the Portfolio’s performance.
In terms of currencies, across all the emerging market economies, the basket of currencies was down 4% against the U.S. dollar. This made it more difficult for investors in many of these markets to realize gains. Among the most negatively affected were Russia (-20%), Chile (-11%), Turkey (-9%), and Brazil (-8%). The Indian rupee was flat, as was the Chinese yuan.
The Portfolio’s positioning in China during the fiscal year has been neutral to slightly underweight. China was up 6% for the period; maintaining a stable currency helped it outperform many other developing markets. Our view on China is that growth should gradually slow. We’ve held that assessment for some time, and thus far this has proved to be the case.
A primary focus of our strategy continues to be a strong value emphasis at the individual stock level, which we believe should serve the Portfolio well from a defensive perspective.
The views expressed are current as of the date of this report and subject to change.
30
Performance summary
Delaware Pooled® Trust — The Emerging Markets Portfolio
The performance data quoted represent past performance; past performance does not guarantee future results. Investment return and principal value will fluctuate so your shares, when redeemed, may be worth more or less than their original cost. Current performance may be lower or higher than the performance data quoted. Please obtain the performance data for the most recent month end by calling 800 231-8002 or visiting our website at delawareinvestments.com.
Carefully consider the Portfolio’s investment objectives, risk factors, charges, and expenses before investing. This and other information can be found in the Portfolio’s prospectus and, if available, its summary prospectus, which may be obtained by visiting delawareinvestments.com or calling 800 231-8002. Investors should read the prospectus and, if available, the summary prospectus carefully before investing.
Portfolio and benchmark performance
| | | | | | | | | | |
Average annual total returns Periods ended Oct. 31, 2014 | | 1 year | | 3 years | | 5 years | | 10 years | | Lifetime |
The Emerging Markets Portfolio | | +1.89% | | +4.33% | | +5.90% | | +10.66% | | +8.83% |
MSCI Emerging Markets Index (gross) | | +0.98% | | +3.59% | | +4.98% | | +10.90% | | +6.71% |
MSCI Emerging Markets Index (net) | | +0.64% | | +3.24% | | +4.64% | | +10.54% | | +6.43% |
Portfolio profile
Oct. 31, 2014
| | |
| Total net assets | | Number of holdings |
$310.2 million | | 78 |
| | |
| Inception date | | |
| April 16, 1997 | | |
Growth of $1,000,000
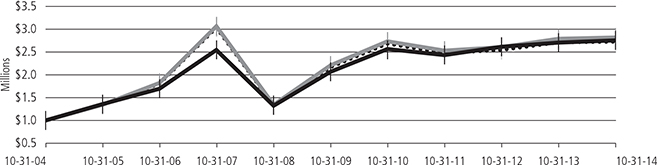
| | | | |
| | | Starting value (Oct. 31, 2004) | | Ending value (Oct. 31, 2014) |
| | |
MSCI Emerging Markets Index (gross) | | $1,000,000 | | $2,814,128 |
| | |
The Emerging Markets Portfolio | | $1,000,000 | | $2,754,790 |
| | |
MSCI Emerging Markets Index (net) | | $1,000,000 | | $2,724,821 |
The performance graph assumes $1 million invested on Oct. 31, 2004, and includes reinvestment of all distributions. The performance graph does not reflect the deduction of taxes the shareholder would pay on Portfolio distributions or redemptions of Portfolio shares.
Total return assumes reinvestment of dividends and capital gains, but does not reflect reductions for taxes. Returns and share values will fluctuate so that shares, when redeemed, may be worth more or less than their original cost.
Performance summary
Delaware Pooled® Trust — The Emerging Markets Portfolio
The most recent prospectus disclosed the Portfolio’s total operating expenses as 1.20%. The purchase reimbursement fee (0.55%) and redemption reimbursement fee (0.55%) are paid to the Portfolio. The fees are designed to reflect an approximation of the brokerage and other transaction costs associated with the investment of an investor’s purchase amount or the disposition of assets to meet redemptions, and to limit the extent to which the Portfolio (and, indirectly, the Portfolio’s existing shareholders) would have to bear such costs. In lieu of the reimbursement fees, investors in The Emerging Markets Portfolio may be permitted to utilize alternative purchase and redemption methods designed to accomplish the same economic effect as the reimbursement fees. Reimbursement fees applicable to purchases and redemptions of shares of the Portfolio are not reflected in the “Growth of $1,000,000” graph.
The MSCI Emerging Markets Index measures equity market performance across emerging market countries worldwide. Index “gross” return approximates the maximum possible dividend reinvestment. Index “net” return approximates the minimum possible dividend reinvestment, after deduction of withholding tax at the highest possible rate.
Index performance returns do not reflect any management fees, transaction costs, or expenses. Indices are unmanaged and one cannot invest directly in an index.
Investing involves risk, including the possible loss of principal.
Past performance is not a guarantee of future results.
International investments entail risks not ordinarily associated with U.S. investments including fluctuation in currency values, differences in accounting principles, or economic or political instability in other nations. Investing in emerging markets can be riskier than investing in established foreign markets due to increased volatility and lower trading volume.
If and when the Portfolio invests in forward foreign currency contracts or uses other investments to hedge against currency risks, the Portfolio will be subject to special risks, including counterparty risk.
Fixed income securities and bond funds can lose value, and investors can lose principal, as interest rates rise. They also may be affected by economic conditions that hinder an issuer’s ability to make interest and principal payments on its debt.
The Portfolio may also be subject to prepayment risk, the risk that the principal of a fixed income security that is held by the Portfolio may be prepaid prior to maturity, potentially forcing the Portfolio to reinvest that money at a lower interest rate.
High yielding, noninvestment grade bonds (junk bonds) involve higher risk than investment grade bonds.
The Portfolio may invest in derivatives, which may involve additional expenses and are subject to risk, including the risk that an underlying security or securities index moves in the opposite direction from what the portfolio manager anticipated. A derivative transaction depends upon the counterparties’ ability to fulfill their contractual obligations.
The Portfolio is presently closed to new investors.
32
Portfolio management review
Delaware Pooled® Trust — The Emerging Markets Portfolio II
October 31, 2014
For the fiscal year ended Oct. 31, 2014, Delaware Pooled Trust — The Emerging Markets Portfolio II returned +3.80% at net asset value (NAV) with all distributions reinvested. The Portfolio’s benchmark, the MSCI Emerging Markets Index, returned +0.98% (gross) and +0.64% (net) for the same period. Complete annualized performance for The Emerging Markets Portfolio II is shown in the table on page 34.
During the Portfolio’s fiscal year, we saw significant volatility and dispersion among markets and sectors. Macroeconomic and political issues strongly influenced the performance of emerging markets with positive results seen in India and negative effects in Russia and Brazil. Additionally, most emerging-market currencies depreciated against a strong U.S. dollar, particularly in countries with current account deficits, including Brazil, Turkey, and South Africa.
Equities in India rose 25% during the fiscal year in anticipation of substantial reforms by the newly formed government to boost the economy. Additionally, interest rate hikes have helped to moderate inflation, and India has made substantial progress in reducing its current account deficit. Taiwan, up 10%, also outperformed for the period, largely due to strength in the technology sector.
Chinese equities rose 6% in the wake of a comprehensive reform agenda and stimulus measures from the government, including relaxing home purchase restrictions and injecting liquidity into the banking system. But concerns over slowing economic growth persisted, which affected the industrials, financials, and materials sectors.
The Portfolio’s outperformance relative to its benchmark can be attributed to a number of factors, including stock selection in Brazil, China, South Korea, and Mexico. Detractors from relative performance include stock selection in India, Russia, and South Africa.
Among stocks, the Portfolio’s significant overweight positions in B2W Cia Digital, Baidu, KCC, Teva Pharmaceutical Industries, and Yahoo contributed to relative outperformance versus the
benchmark. B2W Cia Digital, a Brazilian online retailer, gained 85%. KCC, a South Korean manufacturer of paints and building materials, gained 40%. Baidu, the leading Chinese search engine, gained 48%. Israel-based Teva Pharmaceutical Industries gained 56%. Finally, Yahoo rose 40%.
Among the stocks that most detracted from performance were Chinese internet companies SINA (down 51%) and Sohu.com (down 27%). SINA experienced certain regulatory challenges regarding its online video content, while Sohu.com’s gaming business has slowed down as its key games have matured. The Portfolio also lost ground with two Russian telecommunication stocks. Mobile operator MegaFon was down 32% for the fiscal year, while Mobile Telesystems declined 33%.
In terms of country-level performance, the Portfolio’s stocks in South Korea provided favorable results, gaining 6% versus a 7% decline for the country benchmark. In Mexico, the Portfolio’s holdings returned 12% compared to 7% for the country benchmark. The Portfolio’s Chinese stocks gained 14% as compared to the benchmark’s 6% return. Additionally, even though the Portfolio had a negative return for Brazil (declining 0.42%), we outperformed the benchmark’s return in that market.
In Russia, both stock selection and our slight overweight position hurt the Portfolio’s performance. And in India, although our holdings in this market gained 12%, they failed to keep pace with the benchmark, which rose 29%. Shares of Reliance Industries (up 9%), the Portfolio’s largest position in India, underperformed the Indian market in part due to the government’s repeated delays in raising gas prices.
Our investment philosophy and process emphasize individual company fundamentals and valuations. The Portfolio’s strategy will continue to focus on investing in companies that we view as sustainable franchises and that trade at what we view as significant discounts to our estimates of their intrinsic value.
The views expressed are current as of the date of this report and subject to change.
Performance summary
Delaware Pooled® Trust — The Emerging Markets Portfolio II
The performance data quoted represent past performance; past performance does not guarantee future results. Investment return and principal value will fluctuate so your shares, when redeemed, may be worth more or less than their original cost. Current performance may be lower or higher than the performance data quoted. Please obtain the performance data for the most recent month end by calling 800 231-8002 or visiting our website at delawareinvestments.com.
Carefully consider the Portfolio’s investment objectives, risk factors, charges, and expenses before investing. This and other information can be found in the Portfolio’s prospectus and, if available, its summary prospectus, which may be obtained by visiting delawareinvestments.com or calling 800 231-8002. Investors should read the prospectus and, if available, the summary prospectus carefully before investing.
Portfolio and benchmark performance
| | | | | | |
Average annual total returns Periods ended Oct. 31, 2014 | | 1 year | | 3 years | | Lifetime |
The Emerging Markets Portfolio II | | +3.80% | | +7.52% | | +5.51% |
MSCI Emerging Markets Index (gross) | | +0.98% | | +3.59% | | +5.31% |
MSCI Emerging Markets Index (net) | | +0.64% | | +3.24% | | +4.96% |
Portfolio profile
Oct. 31, 2014
| | |
| Total net assets | | Number of holdings |
$42.5 million | | 114 |
| | |
| Inception date | | |
| June 23, 2010 | | |
Growth of $1,000,000
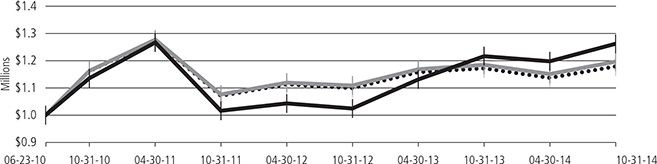
| | | | |
| | | Starting value (June 23, 2010) | | Ending value (Oct. 31, 2014) |
| | |
The Emerging Markets Portfolio II | | $1,000,000 | | $1,262,996 |
| | |
MSCI Emerging Markets Index (gross) | | $1,000,000 | | $1,197,229 |
| | |
MSCI Emerging Markets Index (net) | | $1,000,000 | | $1,179,839 |
The performance graph assumes $1 million invested on June 23, 2010, and includes reinvestment of all distributions. The performance graph does not reflect the deduction of taxes the shareholder would pay on Portfolio distributions or redemptions of Portfolio shares.
Total return assumes reinvestment of dividends and capital gains, but does not reflect reductions for taxes. Returns and share values will fluctuate so that shares, when redeemed, may be worth more or less than their original cost.
34
The most recent prospectus disclosed the Portfolio’s total operating expenses as 1.36%. Management has contractually agreed to reimburse certain expenses and/or waive its management fees from Nov. 1, 2013, through Oct. 31, 2014,* in order to prevent total annual Portfolio operating expenses (with certain exceptions) from exceeding, in an aggregate amount, 1.20% of the Portfolio’s average daily net assets, as described in the most recent prospectus.
Expense limitations were in effect during the period shown. Performance would have been lower had the expense limitations not been in effect.
The MSCI Emerging Markets Index measures equity market performance across emerging market countries worldwide. Index “gross” return approximates the maximum possible dividend reinvestment. Index “net” return approximates the minimum possible dividend reinvestment, after deduction of withholding tax at the highest possible rate.
Index performance returns do not reflect any management fees, transaction costs, or expenses. Indices are unmanaged and one cannot invest directly in an index.
Investing involves risk, including the possible loss of principal.
Past performance is not a guarantee of future results.
International investments entail risks not ordinarily associated with U.S. investments including fluctuation in currency values, differences in accounting principles, or economic or political instability in other nations. Investing in emerging markets can be riskier than investing in established foreign markets due to increased volatility and lower trading volume.
If and when the Portfolio invests in forward foreign currency contracts or uses other investments to hedge against currency risks, the Portfolio will be subject to special risks, including counterparty risk.
The Portfolio may invest in derivatives, which may involve additional expenses and are subject to risk, including the risk that an underlying security or securities index moves in the opposite direction from what the portfolio manager anticipated. A derivative transaction depends upon the counterparties’ ability to fulfill their contractual obligations.
*The contractual waiver period is from Feb. 28, 2013 through Feb. 27, 2015.
Disclosure of Portfolio expenses
For the six-month period from May 1, 2014 to October 31, 2014 (Unaudited)
As a shareholder of a Portfolio, you incur two types of costs: (1) transaction costs, including reimbursement fees on The Emerging Markets Portfolio; and (2) ongoing costs, including management fees and other Portfolio expenses. The following examples are intended to help you understand your ongoing costs (in dollars) of investing in a Portfolio and to compare these costs with the ongoing costs of investing in other mutual funds.
The examples are based on an investment of $1,000 invested at the beginning of the period and held for the entire six-month period from May 1, 2014 to Oct. 31, 2014.
Actual Expenses
The first section of the table shown, “Actual Portfolio return,” provides information about actual account values and actual expenses. You may use the information in this table, together with the amount you invested, to estimate the expenses that you paid over the period. Simply divide your account value by $1,000 (for example, an $8,600 account value divided by $1,000 = 8.6), then multiply the result by the number in the first section under the heading entitled “Expenses Paid During Period” to estimate the expenses you paid on your account during the period.
Hypothetical Example for Comparison Purposes
The second section of the table shown, “Hypothetical 5% return,” provides information about hypothetical account values and hypothetical expenses based on a Portfolio’s actual expense ratio and an assumed rate of return of 5% per year before expenses, which is not the Portfolio’s actual return. The hypothetical account values and expenses may not be used to estimate the actual ending account balance or expenses you paid for the period. You may use this information to compare the ongoing costs of investing in the Portfolio and other funds. To do so, compare this 5% hypothetical example with the 5% hypothetical examples that appear in the shareholder reports of other funds.
Please note that the expenses shown in the table are meant to highlight your ongoing costs only and do not reflect any transactional costs. Therefore, the second section of the table is useful in comparing ongoing costs only, and will not help you determine the relative total costs of owning different funds. In addition, if these transactional costs were included, your costs would have been higher. Certain of the Portfolios’ actual expenses shown in the table reflect fee waivers in effect. The expenses shown in the table assume reinvestment of all dividends and distributions.
In each case, “Expenses Paid During Period” are equal to the relevant Portfolio’s annualized expense ratio, multiplied by the average account value over the period, multiplied by 184/365 (to reflect the one-half year period).
Delaware Pooled® Trust
Expense Analysis of an Investment of $1,000
| | | | | | | | | | | | | | | | | | | | | | | | | |
| | | Beginning
Account
Value
5/1/14 | | Ending
Account
Value
10/31/14 | | Annualized Expense
Ratio | | Expenses Paid During Period
5/1/14 to 10/31/14 | | |
Actual Portfolio return† | | | |
The Large-Cap Value Equity Portfolio | | | | $1,000.00 | | | | | $1,076.90 | | | 0.69% | | | $ | 3.61 | | | |
The Select 20 Portfolio | | | | 1,000.00 | | | | | 1,096.20 | | | 0.87% | | | | 4.60 | | | |
The Large-Cap Growth Equity Portfolio | | | | 1,000.00 | | | | | 1,096.50 | | | 0.64% | | | | 3.38 | | | |
The Focus Smid-Cap Growth Equity Portfolio | | | | 1,000.00 | | | | | 1,081.70 | | | 0.92% | | | | 4.83 | | | |
The High-Yield Bond Portfolio | | | | 1,000.00 | | | | | 1,002.30 | | | 0.58% | | | | 2.93 | | | |
The Core Plus Fixed Income Portfolio | | | | 1,000.00 | | | | | 1,023.70 | | | 0.45% | | | | 2.30 | | | |
The International Equity Portfolio | | | | 1,000.00 | | | | | 946.20 | | | 0.84% | | | | 4.12 | | | |
The Labor Select International Equity Portfolio | | | | 1,000.00 | | | | | 938.30 | | | 0.85% | | | | 4.15 | | | |
The Emerging Markets Portfolio | | | | 1,000.00 | | | | | 1,028.50 | | | 1.11% | | | | 5.68 | | | |
The Emerging Markets Portfolio II | | | | 1,000.00 | | | | | 1,054.40 | | | 1.20% | | | | 6.21 | | | |
36
| | | | | | | | | | | | | | | | | | | | | | | | | |
| | | Beginning
Account
Value
5/1/14 | | Ending
Account
Value
10/31/14 | | Annualized Expense
Ratio | | Expenses
Paid
During
Period
5/1/14 to
10/31/14 | | |
Hypothetical 5% return (5% return before expenses) | | | |
The Large-Cap Value Equity Portfolio | | | | $1,000.00 | | | | | $1,021.73 | | | 0.69% | | | | $3.52 | | | |
The Select 20 Portfolio | | | | 1,000.00 | | | | | 1,020.82 | | | 0.87% | | | | 4.43 | | | |
The Large-Cap Growth Equity Portfolio | | | | 1,000.00 | | | | | 1,021.98 | | | 0.64% | | | | 3.26 | | | |
The Focus Smid-Cap Growth Equity Portfolio | | | | 1,000.00 | | | | | 1,020.57 | | | 0.92% | | | | 4.69 | | | |
The High-Yield Bond Portfolio | | | | 1,000.00 | | | | | 1,022.28 | | | 0.58% | | | | 2.96 | | | |
The Core Plus Fixed Income Portfolio | | | | 1,000.00 | | | | | 1,022.94 | | | 0.45% | | | | 2.29 | | | |
The International Equity Portfolio | | | | 1,000.00 | | | | | 1,020.97 | | | 0.84% | | | | 4.28 | | | |
The Labor Select International Equity Portfolio | | | | 1,000.00 | | | | | 1,020.92 | | | 0.85% | | | | 4.33 | | | |
The Emerging Markets Portfolio | | | | 1,000.00 | | | | | 1,019.61 | | | 1.11% | | | | 5.65 | | | |
The Emerging Markets Portfolio II | | | | 1,000.00 | | | | | 1,019.16 | | | 1.20% | | | | 6.11 | | | |
| † | Because actual returns reflect only the most recent six-month period, the returns shown may differ significantly from fiscal year returns. |
Security type / sector allocations
and top 10 equity holdings
Delaware Pooled® Trust — The Large-Cap Value Equity Portfolio
As of October 31, 2014 (Unaudited)
Sector designations may be different than the sector designations presented in other Portfolio materials. The sector designations may represent the investment manager’s internal sector classifications, which may result in the sector designations for one portfolio being different than another portfolio’s sector designations.
| | | | |
| Security type / sector | | Percentage
of net assets | |
Common Stock | | | 96.02% | |
Consumer Discretionary | | | 6.41% | |
Consumer Staples | | | 11.67% | |
Energy | | | 14.77% | |
Financials | | | 12.08% | |
Healthcare | | | 18.00% | |
Industrials | | | 9.19% | |
Information Technology | | | 12.05% | |
Materials | | | 2.85% | |
Telecommunications | | | 5.98% | |
Utilities | | | 3.02% | |
Short-Term Investments | | | 3.85% | |
Total Value of Securities | | | 99.87% | |
Receivables and Other Assets Net of Liabilities | | | 0.13% | |
Total Net Assets | | | 100.00% | |
Holdings are for informational purposes only and are subject to change at any time. They are not a recommendation to buy, sell, or hold any security.
| | | | |
| Top 10 equity holdings | | Percentage
of net assets | |
Lowe’s | | | 3.22% | |
Johnson Controls | | | 3.20% | |
Broadcom Class A | | | 3.19% | |
Northrop Grumman | | | 3.14% | |
Quest Diagnostics | | | 3.10% | |
Cardinal Health | | | 3.08% | |
Halliburton | | | 3.08% | |
Mondelez International Class A | | | 3.07% | |
ConocoPhillips | | | 3.06% | |
Waste Management | | | 3.06% | |
38
Delaware Pooled® Trust — The Select 20 Portfolio
As of October 31, 2014 (Unaudited)
Sector designations may be different than the sector designations presented in other Portfolio materials. The sector designations may represent the investment manager’s internal sector classifications, which may result in the sector designations for one portfolio being different than another portfolio’s sector designations.
| | | | |
| Security type / sector | | Percentage
of net assets | |
Common Stock² | | | 98.84% | |
Consumer Discretionary | | | 21.56% | |
Consumer Staples | | | 2.56% | |
Energy | | | 4.91% | |
Financial Services | | | 17.08% | |
Healthcare | | | 12.71% | |
Office REIT | | | 3.43% | |
Producer Durables | | | 5.07% | |
Technology* | | | 26.36% | |
Utilities | | | 5.16% | |
Short-Term Investments | | | 1.17% | |
Total Value of Securities | | | 100.01% | |
Liabilities Net of Receivables and Other Assets | | | (0.01%) | |
Total Net Assets | | | 100.00% | |
| ² | Narrow industries are utilized for compliance purposes for diversification whereas broad sectors are used for financial reporting. |
*To monitor compliance with the Portfolio’s concentration guidelines as described in the Portfolio’s Prospectus and Statement of Additional Information, the Technology sector (as disclosed herein for financial reporting purposes) is divided into various sub-categories or “industries,” in this case, computers, internet, semiconductors, and software. As of Oct. 31, 2014, such amounts, as a percentage of total net assets, were 4.32%, 5.61%, 5.29%, and 11.14%, respectively. The percentage in any such single industry will comply with the Portfolio’s concentration policy even if the percentage in the “Technology sector” for financial reporting purposes may exceed 25%.
Holdings are for informational purposes only and are subject to change at any time. They are not a recommendation to buy, sell, or hold any security.
| | | | |
| Top 10 equity holdings | | Percentage
of net assets | |
Visa Class A | | | 7.50% | |
Allergan | | | 7.05% | |
Microsoft | | | 6.30% | |
Celgene | | | 5.66% | |
QUALCOMM | | | 5.29% | |
j2 Global | | | 5.16% | |
Zebra Technologies | | | 5.07% | |
EOG Resources | | | 4.91% | |
Crown Castle International | | | 4.91% | |
Intuit | | | 4.84% | |
Security type / sector allocations
and top 10 equity holdings
Delaware Pooled® Trust — The Large-Cap Growth Equity Portfolio
As of October 31, 2014 (Unaudited)
Sector designations may be different than the sector designations presented in other Portfolio materials. The sector designations may represent the investment manager’s internal sector classifications, which may result in the sector designations for one portfolio being different than another portfolio’s sector designations.
| | | | |
| Security type / sector | | Percentage
of net assets | |
Common Stock² | | | 99.62% | |
Consumer Discretionary | | | 24.25% | |
Consumer Staples | | | 4.39% | |
Energy | | | 9.64% | |
Financial Services | | | 17.33% | |
Healthcare | | | 16.76% | |
Information Technology* | | | 27.25% | |
Short-Term Investments | | | 1.40% | |
Total Value of Securities | | | 101.02% | |
Liabilities Net of Receivables and Other Assets | | | (1.02%) | |
Total Net Assets | | | 100.00% | |
| ² | Narrow industries are utilized for compliance purposes for diversification whereas broad sectors are used for financial reporting. |
*To monitor compliance with the Portfolio’s concentration guidelines as described in the Portfolio’s Prospectus and Statement of Additional Information, the Information Technology sector (as disclosed herein for financial reporting purposes) is divided into various sub-categories or “industries,” in this case, internet, semiconductors, and software. As of October 31, 2014, such amounts, as a percentage of total net assets, were 11.24%, 4.28%, and 11.19%, respectively. The percentage in any such single industry will comply with the Portfolio’s concentration policy even if the percentage in the “Information Technology sector” for financial reporting purposes may exceed 25%.
Holdings are for informational purposes only and are subject to change at any time. They are not a recommendation to buy, sell, or hold any security.
| | | | |
| Top 10 equity holdings | | Percentage
of net assets | |
Celgene | | | 6.54% | |
Microsoft | | | 5.72% | |
Allergan | | | 5.59% | |
Visa Class A | | | 5.22% | |
QUALCOMM | | | 4.82% | |
MasterCard Class A | | | 4.79% | |
eBay | | | 4.52% | |
Crown Castle International | | | 4.51% | |
Walgreen | | | 4.39% | |
EOG Resources | | | 4.32% | |
40
Delaware Pooled® Trust — The Focus Smid-Cap Growth Equity Portfolio
As of October 31, 2014 (Unaudited)
Sector designations may be different than the sector designations presented in other Portfolio materials. The sector designations may represent the investment manager’s internal sector classifications, which may result in the sector designations for one portfolio being different than another portfolio’s sector designations.
| | | | |
| Security type / sector | | Percentage of net assets | |
Common Stock | | | 95.94% | |
Consumer Discretionary | | | 24.12% | |
Energy | | | 4.30% | |
Financial Services | | | 15.86% | |
Healthcare | | | 10.58% | |
Office REITs | | | 4.30% | |
Producer Durables | | | 15.71% | |
Technology | | | 16.07% | |
Utilities | | | 5.00% | |
Short-Term Investments | | | 4.20% | |
Total Value of Securities | | | 100.14% | |
Liabilities Net of Receivables and Other Assets | | | (0.14%) | |
Total Net Assets | | | 100.00% | |
Holdings are for informational purposes only and are subject to change at any time. They are not a recommendation to buy, sell, or hold any security.
| | | | |
| Top 10 equity holdings | | Percentage
of net assets | |
Heartland Payment Systems | | | 5.85% | |
DineEquity | | | 5.59% | |
MSCI Class A | | | 5.55% | |
Sally Beauty Holdings | | | 5.13% | |
j2 Global | | | 5.00% | |
Graco | | | 4.90% | |
Ulta Salon Cosmetics & Fragrance | | | 4.87% | |
Techne | | | 4.86% | |
Affiliated Managers Group | | | 4.45% | |
VeriFone Systems | | | 4.42% | |
Security type / sector allocations
Delaware Pooled® Trust — The High-Yield Bond Portfolio
As of October 31, 2014 (Unaudited)
Sector designations may be different than the sector designations presented in other Portfolio materials. The sector designations may represent the investment manager’s internal sector classifications, which may result in the sector designations for one portfolio being different than another portfolio’s sector designations.
| | | | |
| Security type / sector | | Percentage
of net assets | |
Convertible Bond | | | 0.23% | |
Corporate Bonds | | | 86.50% | |
Automobiles | | | 2.12% | |
Banking | | | 3.53% | |
Basic Industry | | | 10.16% | |
Capital Goods | | | 6.21% | |
Consumer Cyclical | | | 4.74% | |
Consumer Non-Cyclical | | | 1.70% | |
Energy | | | 15.09% | |
Financials | | | 1.33% | |
Healthcare | | | 6.55% | |
Insurance | | | 2.18% | |
Media | | | 10.84% | |
Services | | | 5.79% | |
Technology & Electronics | | | 4.62% | |
Telecommunications | | | 8.48% | |
Utilities | | | 3.16% | |
Senior Secured Loans | | | 5.97% | |
Common Stock | | | 0.00% | |
Convertible Preferred Stock | | | 0.07% | |
Preferred Stock | | | 1.63% | |
Short-Term Investments | | | 5.49% | |
Total Value of Securities | | | 99.89% | |
Receivables and Other Assets Net of Liabilities | | | 0.11% | |
Total Net Assets | | | 100.00% | |
42
Delaware Pooled® Trust — The Core Plus Fixed Income Portfolio
As of October 31, 2014 (Unaudited)
Sector designations may be different than the sector designations presented in other Portfolio materials. The sector designations may represent the investment manager’s internal sector classifications, which may result in the sector designations for one portfolio being different than another portfolio’s sector designations.
| | | | |
| Security type / sector | | Percentage
of net assets | |
Agency Asset-Backed Security | | | 0.19% | |
Agency Collateralized Mortgage Obligations | | | 1.05% | |
Agency Mortgage-Backed Securities | | | 25.88% | |
Agency Obligation | | | 0.12% | |
Commercial Mortgage-Backed Securities | | | 4.48% | |
Convertible Bonds | | | 0.27% | |
Corporate Bonds | | | 46.16% | |
Banking | | | 5.28% | |
Basic Industry | | | 3.43% | |
Brokerage | | | 0.43% | |
Capital Goods | | | 1.33% | |
Communications | | | 7.33% | |
Consumer Cyclical | | | 2.97% | |
Consumer Non-Cyclical | | | 5.30% | |
Electric | | | 5.80% | |
Energy | | | 4.53% | |
Financials | | | 0.98% | |
Insurance | | | 1.76% | |
Natural Gas | | | 1.81% | |
Real Estate | | | 1.58% | |
Technology | | | 1.81% | |
Transportation | | | 1.82% | |
| | | | |
| Security type / sector | | Percentage
of net assets | |
Municipal Bonds | | | 0.26% | |
Non-Agency Asset-Backed Securities | | | 4.03% | |
Non-Agency Collateralized Mortgage Obligations | | | 0.16% | |
Regional Bond | | | 0.12% | |
Senior Secured Loans | | | 8.13% | |
Sovereign Bonds | | | 0.46% | |
Supranational Bank | | | 0.04% | |
U.S. Treasury Obligations | | | 6.81% | |
Convertible Preferred Stock | | | 0.05% | |
Preferred Stock | | | 0.27% | |
Short-Term Investments | | | 18.82% | |
Total Value of Securities | | | 117.30% | |
Liabilities Net of Receivables and Other Assets | | | (17.30%) | |
Total Net Assets | | | 100.00% | |
Security type / country and sector allocations
Delaware Pooled® Trust — The International Equity Portfolio
As of October 31, 2014 (Unaudited)
Sector designations may be different than the sector designations presented in other Portfolio materials. The sector designations may represent the investment manager’s or sub-advisor’s internal sector classifications, which may result in the sector designations for one portfolio being different than another portfolio’s sector designations.
| | | | |
| Security type / country | | Percentage
of net assets | |
Common Stock | | | 99.03% | |
Australia | | | 2.55% | |
Belgium | | | 0.00% | |
China | | | 2.64% | |
France | | | 11.70% | |
Germany | | | 7.46% | |
Israel | | | 2.08% | |
Italy | | | 2.18% | |
Japan | | | 17.25% | |
Netherlands | | | 6.09% | |
Singapore | | | 4.62% | |
Spain | | | 6.99% | |
Sweden | | | 2.23% | |
Switzerland | | | 12.73% | |
Taiwan | | | 1.02% | |
United Kingdom | | | 19.49% | |
Short-Term Investments | | | 0.42% | |
Total Value of Securities | | | 99.45% | |
Receivables and Other Assets Net of Liabilities | | | 0.55% | |
Total Net Assets | | | 100.00% | |
| | | | |
| Common stock by sector | | Percentage
of net assets | |
Consumer Discretionary | | | 5.47% | |
Consumer Staples | | | 15.23% | |
Energy | | | 12.51% | |
Financials | | | 10.93% | |
Healthcare | | | 13.02% | |
Industrials | | | 9.61% | |
Information Technology | | | 8.37% | |
Materials | | | 2.01% | |
Telecommunication Services | | | 14.58% | |
Utilities | | | 7.30% | |
Total | | | 99.03% | |
44
Delaware Pooled® Trust — The Labor Select International Equity Portfolio
As of October 31, 2014 (Unaudited)
Sector designations may be different than the sector designations presented in other Portfolio materials. The sector designations may represent the investment manager’s or sub-advisor’s internal sector classifications, which may result in the sector designations for one portfolio being different than another portfolio’s sector designations.
| | | | |
| Security type / country | | Percentage
of net assets | |
Common Stock | | | 99.02% | |
Australia | | | 2.54% | |
Belgium | | | 0.00% | |
France | | | 13.46% | |
Germany | | | 7.34% | |
Israel | | | 2.07% | |
Japan | | | 18.15% | |
Netherlands | | | 6.41% | |
Singapore | | | 5.44% | |
Spain | | | 6.96% | |
Sweden | | | 2.35% | |
Switzerland | | | 12.78% | |
United Kingdom | | | 21.52% | |
Short-Term Investments | | | 0.72% | |
Total Value of Securities | | | 99.74% | |
Receivables and Other Assets Net of Liabilities | | | 0.26% | |
Total Net Assets | | | 100.00% | |
| | | | |
| Common stock by sector | | Percentage
of net assets | |
Consumer Discretionary | | | 5.45% | |
Consumer Staples | | | 16.21% | |
Energy | | | 11.34% | |
Financials | | | 10.97% | |
Healthcare | | | 13.20% | |
Industrials | | | 9.04% | |
Information Technology | | | 7.86% | |
Materials | | | 2.05% | |
Telecommunication Services | | | 13.68% | |
Utilities | | | 9.22% | |
Total | | | 99.02% | |
Security type / country and sector allocations
Delaware Pooled® Trust — The Emerging Markets Portfolio
As of October 31, 2014 (Unaudited)
Sector designations may be different than the sector designations presented in other Portfolio materials. The sector designations may represent the investment manager’s or sub-advisor’s internal sector classifications, which may result in the sector designations for one portfolio being different than another portfolio’s sector designations.
| | | | |
| Security type / country | | Percentage
of net assets | |
Common Stock | | | 94.85% | |
Brazil | | | 7.20% | |
Chile | | | 2.91% | |
China | | | 18.15% | |
Colombia | | | 0.43% | |
India | | | 8.51% | |
Indonesia | | | 4.05% | |
Kazakhstan | | | 0.70% | |
Malaysia | | | 5.49% | |
Mexico | | | 7.08% | |
Peru | | | 1.55% | |
Philippines | | | 2.20% | |
Qatar | | | 1.85% | |
Republic of Korea | | | 5.93% | |
Romania | | | 0.50% | |
Russia | | | 3.53% | |
South Africa | | | 3.04% | |
Taiwan | | | 7.92% | |
Thailand | | | 2.28% | |
Turkey | | | 4.60% | |
United Arab Emirates | | | 0.67% | |
United Kingdom | | | 3.99% | |
United States | | | 2.27% | |
Preferred Stock | | | 3.26% | |
Brazil | | | 2.55% | |
India | | | 0.04% | |
Republic of Korea | | | 0.67% | |
Short-Term Investments | | | 1.25% | |
Total Value of Securities | | | 99.36% | |
Receivables and Other Assets Net of Liabilities | | | 0.64% | |
Total Net Assets | | | 100.00% | |
| | | | |
| Common and preferred stock by sector | | Percentage
of net assets | |
Consumer Discretionary | | | 13.91% | |
Consumer Staples | | | 9.15% | |
Energy | | | 11.47% | |
Financials | | | 19.92% | |
Healthcare | | | 1.53% | |
Industrials | | | 8.80% | |
Information Technology | | | 10.69% | |
Materials | | | 3.71% | |
Telecommunication Services | | | 9.44% | |
Utilities | | | 9.49% | |
Total | | | 98.11% | |
46
Delaware Pooled® Trust — The Emerging Markets Portfolio II
As of October 31, 2014 (Unaudited)
Sector designations may be different than the sector designations presented in other Portfolio materials. The sector designations may represent the investment manager’s internal sector classifications, which may result in the sector designations for one portfolio being different than another portfolio’s sector designations.
| | | | |
| Security type / country | | Percentage
of net assets | |
Common Stock | | | 98.50% | |
Argentina | | | 1.51% | |
Bahrain | | | 0.03% | |
Brazil | | | 16.71% | |
Chile | | | 0.74% | |
China/Hong Kong | | | 17.29% | |
Colombia | | | 1.28% | |
India | | | 8.26% | |
Indonesia | | | 1.44% | |
Israel | | | 2.66% | |
Malaysia | | | 0.48% | |
Mexico | | | 7.47% | |
Netherlands | | | 0.73% | |
Peru | | | 0.25% | |
Poland | | | 0.67% | |
Republic of Korea | | | 20.88% | |
Russia | | | 4.73% | |
South Africa | | | 1.31% | |
Taiwan | | | 5.24% | |
Thailand | | | 1.40% | |
Turkey | | | 1.39% | |
United Kingdom | | | 0.21% | |
United States | | | 3.82% | |
Preferred Stock | | | 1.36% | |
Republic of Korea | | | 1.36% | |
Short-Term Investments | | | 2.59% | |
Total Value of Securities | | | 102.45% | |
Liabilities Net of Receivables and Other Assets | | | (2.45%) | |
Total Net Assets | | | 100.00% | |
| | | | |
| Common and preferred stock by sector | | Percentage
of net assets | |
Consumer Discretionary | | | 8.19% | |
Consumer Staples | | | 12.61% | |
Energy | | | 15.46% | |
Financials | | | 10.67% | |
Healthcare | | | 2.66% | |
Industrials | | | 3.98% | |
Information Technology | | | 22.04% | |
Materials | | | 8.48% | |
Telecommunication Services | | | 15.64% | |
Utilities | | | 0.13% | |
Total | | | 99.86% | |
Schedules of investments
Delaware Pooled® Trust — The Large-Cap Value Equity Portfolio
October 31, 2014
| | | | | | | | |
| | | Number of
shares | | | Value (U.S. $) | |
| |
Common Stock – 96.02% | |
| |
Consumer Discretionary – 6.41% | |
Johnson Controls | | | 94,600 | | | $ | 4,469,850 | |
Lowe’s | | | 78,600 | | | | 4,495,920 | |
| | | | | | | | |
| | | | | | | 8,965,770 | |
| | | | | | | | |
Consumer Staples – 11.67% | |
Archer-Daniels-Midland | | | 80,400 | | | | 3,778,800 | |
CVS Health | | | 47,900 | | | | 4,110,299 | |
Kraft Foods Group | | | 73,233 | | | | 4,126,680 | |
Mondelez International Class A | | | 121,900 | | | | 4,298,194 | |
| | | | | | | | |
| | | | | | | 16,313,973 | |
| | | | | | | | |
Energy – 14.77% | |
Chevron | | | 34,900 | | | | 4,186,255 | |
ConocoPhillips | | | 59,300 | | | | 4,278,495 | |
Halliburton | | | 78,100 | | | | 4,306,434 | |
Marathon Oil | | | 113,100 | | | | 4,003,740 | |
Occidental Petroleum | | | 43,600 | | | | 3,877,348 | |
| | | | | | | | |
| | | | | | | 20,652,272 | |
| | | | | | | | |
Financials – 12.08% | |
Allstate | | | 65,200 | | | | 4,228,220 | |
Bank of New York Mellon | | | 107,800 | | | | 4,174,016 | |
BB&T | | | 111,500 | | | | 4,223,620 | |
Marsh & McLennan | | | 78,400 | | | | 4,262,608 | |
| | | | | | | | |
| | | | | | | 16,888,464 | |
| | | | | | | | |
Healthcare – 18.00% | |
Baxter International | | | 57,900 | | | | 4,061,106 | |
Cardinal Health | | | 54,900 | | | | 4,308,552 | |
Johnson & Johnson | | | 39,100 | | | | 4,214,198 | |
Merck | | | 70,400 | | | | 4,078,976 | |
Pfizer | | | 139,211 | | | | 4,169,369 | |
Quest Diagnostics | | | 68,200 | | | | 4,327,972 | |
| | | | | | | | |
| | | | | | | 25,160,173 | |
| | | | | | | | |
Industrials – 9.19% | |
Northrop Grumman | | | 31,800 | | | | 4,387,128 | |
Raytheon | | | 40,200 | | | | 4,175,976 | |
Waste Management | | | 87,500 | | | | 4,277,875 | |
| | | | | | | | |
| | | | | | | 12,840,979 | |
| | | | | | | | |
Information Technology – 12.05% | |
Broadcom Class A | | | 106,400 | | | | 4,456,032 | |
Cisco Systems | | | 166,200 | | | | 4,066,914 | |
Intel | | | 121,000 | | | | 4,115,210 | |
Xerox | | | 316,700 | | | | 4,205,776 | |
| | | | | | | | |
| | | | | | | 16,843,932 | |
| | | | | | | | |
| | | | | | | | |
| | | Number of
shares | | | Value (U.S. $) | |
| |
Common Stock (continued) | |
| |
Materials – 2.85% | |
duPont (E.I.) deNemours | | | 57,600 | | | $ | 3,983,040 | |
| | | | | | | | |
| | | | | | | 3,983,040 | |
| | | | | | | | |
Telecommunications – 5.98% | |
AT&T | | | 118,600 | | | | 4,132,024 | |
Verizon Communications | | | 84,100 | | | | 4,226,025 | |
| | | | | | | | |
| | | | | | | 8,358,049 | |
| | | | | | | | |
Utilities – 3.02% | |
Edison International | | | 67,500 | | | | 4,224,150 | |
| | | | | | | | |
| | | | | | | 4,224,150 | |
| | | | | | | | |
| |
Total Common Stock
(cost $113,904,672) | | | | 134,230,802 | |
| | | | | | | | |
| | | Principal
amount° | | | | |
| |
Short-Term Investments – 3.85% | |
| |
Discount Notes – 1.81%≠ | |
Federal Home Loan
Bank | | | | | | | | |
0.025% 11/13/14 | | | 352,281 | | | | 352,280 | |
0.038% 11/19/14 | | | 1,519,543 | | | | 1,519,534 | |
0.077% 11/14/14 | | | 652,275 | | | | 652,273 | |
| | | | | | | | |
| | | | | | | 2,524,087 | |
| | | | | | | | |
Repurchase Agreements – 0.82% | |
Bank of America Merrill Lynch 0.06%, dated 10/31/14, to be repurchased on 11/3/14, repurchase price $365,179 (collateralized by U.S. government obligations 0.00%–2.75% 2/15/19–1/15/26 market value $372,481) | | | 365,177 | | | | 365,177 | |
Bank of Montreal 0.07%, dated 10/31/14, to be repurchased on 11/3/14, repurchase price $60,863 (collateralized by U.S. government obligations 0.00%–11.25% 10/31/14–5/15/44 market value $62,080) | | | 60,863 | | | | 60,863 | |
48
| | | | | | | | |
| | | Principal
amount° | | | Value (U.S. $) | |
| |
Short-Term Investments (continued) | |
| |
Repurchase Agreements (continued) | |
BNP Paribas
0.11%, dated 10/31/14, to be repurchased on 11/3/14, repurchase price $718,966 (collateralized by U.S. government obligations 0.00%–4.375% 8/31/15–11/15/42 market value $733,340) | | | 718,960 | | | $ | 718,960 | |
| | | | | | | | |
| | |
| | | | | | | 1,145,000 | |
| | | | | | | | |
U.S. Treasury Obligations – 1.22%≠ | |
U.S. Treasury Bills | | | | | | | | |
0.005% 12/26/14 | | | 1,639,303 | | | | 1,639,278 | |
0.093% 11/13/14 | | | 72,681 | | | | 72,681 | |
| | | | | | | | |
| | |
| | | | | | | 1,711,959 | |
| | | | | | | | |
| |
Total Short-Term Investments
(cost $5,381,020) | | | | 5,381,046 | |
| | | | | | | | |
Total Value of Securities – 99.87%
(cost $119,285,692) | | | $ | 139,611,848 | |
| | | | | | | | |
| ≠ | The rate shown is the effective yield at the time of purchase. |
| ° | Principal amount shown is stated in U.S. dollars unless noted that the security is denominated in another currency. |
See accompanying notes, which are an integral part of the financial statements.
Schedules of investments
Delaware Pooled® Trust — The Select 20 Portfolio
October 31, 2014
| | | | | | | | |
| | | Number of
shares | | | Value
(U.S. $) | |
| |
Common Stock – 98.84%² | |
| |
Consumer Discretionary – 21.56% | |
Discovery Communications Class A † | | | 94,615 | | | $ | 3,344,640 | |
eBay † | | | 66,635 | | | | 3,498,337 | |
L Brands | | | 57,355 | | | | 4,136,443 | |
Liberty Interactive Class A † | | | 152,845 | | | | 3,995,368 | |
Liberty Ventures Class A † | | | 27,492 | | | | 964,969 | |
Priceline Group † | | | 2,937 | | | | 3,542,639 | |
| | | | | | | | |
| | |
| | | | | | | 19,482,396 | |
| | | | | | | | |
Consumer Staples – 2.56% | |
Walgreen | | | 36,040 | | | | 2,314,489 | |
| | | | | | | | |
| | |
| | | | | | | 2,314,489 | |
| | | | | | | | |
Energy – 4.91% | |
EOG Resources | | | 46,720 | | | | 4,440,736 | |
| | | | | | | | |
| | |
| | | | | | | 4,440,736 | |
| | | | | | | | |
Financial Services – 17.08% | |
Crown Castle International | | | 56,840 | | | | 4,440,341 | |
IntercontinentalExchange | | | 20,270 | | | | 4,222,038 | |
Visa Class A | | | 28,050 | | | | 6,772,112 | |
| | | | | | | | |
| | |
| | | | | | | 15,434,491 | |
| | | | | | | | |
Healthcare – 12.71% | |
Allergan | | | 33,515 | | | | 6,369,861 | |
Celgene † | | | 47,715 | | | | 5,109,799 | |
| | | | | | | | |
| | |
| | | | | | | 11,479,660 | |
| | | | | | | | |
Office REIT – 3.43% | |
Equity Commonwealth | | | 115,880 | | | | 3,095,155 | |
| | | | | | | | |
| | |
| | | | | | | 3,095,155 | |
| | | | | | | | |
Producer Durables – 5.07% | |
Zebra Technologies † | | | 62,131 | | | | 4,582,161 | |
| | | | | | | | |
| | |
| | | | | | | 4,582,161 | |
| | | | | | | | |
Technology – 26.36% | |
Google Class A † | | | 4,500 | | | | 2,555,415 | |
Google Class C † | | | 4,494 | | | | 2,512,506 | |
Intuit | | | 49,655 | | | | 4,370,137 | |
Microsoft | | | 121,230 | | | | 5,691,749 | |
QUALCOMM | | | 60,865 | | | | 4,778,510 | |
VeriFone Systems † | | | 104,800 | | | | 3,904,848 | |
| | | | | | | | |
| | |
| | | | | | | 23,813,165 | |
| | | | | | | | |
| | | | | | | | |
| | | Number of
shares | | | Value
(U.S. $) | |
| |
Common Stock² (continued) | |
| |
Utilities – 5.16% | | | | | | | | |
j2 Global | | | 86,130 | | | $ | 4,658,773 | |
| | | | | | | | |
| | |
| | | | | | | 4,658,773 | |
| | | | | | | | |
| |
Total Common Stock
(cost $56,518,096) | | | | 89,301,026 | |
| | | | | | | | |
| | |
| | | Principal
amount° | | | | |
| |
Short-Term Investments – 1.17% | |
| |
Discount Notes – 0.58%≠ | |
Federal Home Loan Bank | | | | | |
0.025% 11/13/14 | | | 28,300 | | | | 28,300 | |
0.065% 11/19/14 | | | 437,506 | | | | 437,503 | |
0.077% 11/14/14 | | | 55,480 | | | | 55,479 | |
| | | | | | | | |
| | |
| | | | | | | 521,282 | |
| | | | | | | | |
U.S. Treasury Obligations – 0.59%≠ | |
U.S. Treasury Bills | | | | | |
0.005% 12/26/14 | | | 81,516 | | | | 81,514 | |
0.093% 11/13/14 | | | 457,824 | | | | 457,823 | |
| | | | | | | | |
| | |
| | | | | | | 539,337 | |
| | | | | | | | |
| |
Total Short-Term Investments
(cost $1,060,594) | | | | 1,060,619 | |
| | | | | | | | |
| |
Total Value of
Securities – 100.01%
(cost $57,578,690) | | | | $90,361,645 | |
| | | | | | | | |
| ² | Narrow industries are utilized for compliance purposes for diversification whereas broad sectors are used for financial reporting. |
| ≠ | The rate shown is the effective yield at the time of purchase. |
| ° | Principal amount shown is stated in U.S. dollars unless noted that the security is denominated in another currency. |
| † | Non-income-producing security. |
REIT – Real Estate Investment Trust
See accompanying notes, which are an integral part of the financial statements.
50
Delaware Pooled® Trust — The Large-Cap Growth Equity Portfolio
October 31, 2014
| | | | | | | | |
| | | Number of
shares | | | Value
(U.S. $) | |
| |
Common Stock – 99.62%² | |
| |
Consumer Discretionary – 24.25% | |
Discovery Communications Class A † | | | 66,508 | | | $ | 2,351,058 | |
Discovery Communications
Class C † | | | 202,911 | | | | 7,099,856 | |
eBay † | | | 238,894 | | | | 12,541,935 | |
L Brands | | | 149,922 | | | | 10,812,375 | |
Liberty Interactive Class A † | | | 379,849 | | | | 9,929,253 | |
Liberty Ventures Class A † | | | 54,003 | | | | 1,895,505 | |
NIKE Class B | | | 76,790 | | | | 7,139,166 | |
Priceline Group † | | | 9,541 | | | | 11,508,450 | |
Sally Beauty Holdings † | | | 135,415 | | | | 3,969,014 | |
| | | | | | | | |
| | |
| | | | | | | 67,246,612 | |
| | | | | | | | |
Consumer Staples – 4.39% | |
Walgreen | | | 189,350 | | | | 12,160,057 | |
| | | | | | | | |
| | |
| | | | | | | 12,160,057 | |
| | | | | | | | |
Energy – 9.64% | |
EOG Resources | | | 126,126 | | | | 11,988,276 | |
Kinder Morgan | | | 145,108 | | | | 5,615,680 | |
Williams | | | 164,235 | | | | 9,116,685 | |
| | | | | | | | |
| | |
| | | | | | | 26,720,641 | |
| | | | | | | | |
Financial Services – 17.33% | |
Crown Castle International | | | 160,122 | | | | 12,508,731 | |
IntercontinentalExchange | | | 37,486 | | | | 7,807,959 | |
MasterCard Class A | | | 158,512 | | | | 13,275,380 | |
Visa Class A | | | 59,921 | | | | 14,466,727 | |
| | | | | | | | |
| | |
| | | | | | | 48,058,797 | |
| | | | | | | | |
Healthcare – 16.76% | |
Allergan | | | 81,554 | | | | 15,500,153 | |
Celgene † | | | 169,366 | | | | 18,137,405 | |
Novo Nordisk ADR | | | 165,195 | | | | 7,463,510 | |
Perrigo | | | 33,383 | | | | 5,389,685 | |
| | | | | | | | |
| | |
| | | | | | | 46,490,753 | |
| | | | | | | | |
Information Technology – 27.25% | |
Adobe Systems † | | | 96,830 | | | | 6,789,720 | |
Baidu ADR † | | | 34,170 | | | | 8,158,771 | |
Equinix | | | 40,894 | | | | 8,542,756 | |
Google Class A † | | | 10,373 | | | | 5,890,515 | |
Google Class C † | | | 10,478 | | | | 5,858,040 | |
Intuit | | | 95,250 | | | | 8,382,953 | |
Microsoft | | | 338,028 | | | | 15,870,414 | |
| | | | | | | | |
| | | Number of
shares | | | Value
(U.S. $) | |
| |
Common Stock² (continued) | |
| |
Information Technology (continued) | |
QUALCOMM | | | 170,260 | | | $ | 13,367,113 | |
Yelp † | | | 45,321 | | | | 2,719,260 | |
| | | | | | | | |
| | |
| | | | | | | 75,579,542 | |
| | | | | | | | |
| |
Total Common Stock
(cost $192,431,692) | | | | 276,256,402 | |
| | | | | | | | |
| | |
| | | Principal
amount° | | | | |
| |
Short-Term Investments – 1.40% | |
| |
Repurchase Agreements – 1.40% | |
Bank of America Merrill Lynch 0.06%, dated 10/31/14, to be repurchased on 11/3/14, repurchase price $1,238,420 (collateralized by U.S. government obligations 0.00%–2.75% 2/15/19–1/15/26 market value $1,263,182) | | | 1,238,414 | | | | 1,238,414 | |
Bank of Montreal 0.07%, dated 10/31/14, to be repurchased on 11/3/14, repurchase price $206,403 (collateralized by U.S. government obligations 0.00%–11.25% 10/31/14–5/15/44 market value $210,530) | | | 206,402 | | | | 206,402 | |
BNP Paribas 0.11%, dated 10/31/14, to be repurchased on 11/3/14, repurchase price $2,438,207 (collateralized by U.S. government obligations 0.00%–4.375% 8/31/15–11/15/42 market value $2,486,950) | | | 2,438,184 | | | | 2,438,184 | |
| | | | | | | | |
| | |
| | | | | | | 3,883,000 | |
| | | | | | | | |
| |
Total Short-Term Investments
(cost $3,883,000) | | | | 3,883,000 | |
| | | | | | | | |
| |
Total Value of
Securities – 101.02%
(cost $196,314,692) | | | | $280,139,402 | |
| | | | | | | | |
Schedules of investments
Delaware Pooled® Trust — The Large-Cap Growth Equity Portfolio
| ² | Narrow industries are utilized for compliance purposes for diversification whereas broad sectors are used for financial reporting. |
| ° | Principal amount shown is stated in U.S. dollars unless noted that the security is denominated in another currency. |
| † | Non-income-producing security. |
ADR – American Depositary Receipt
See accompanying notes, which are an integral part of the financial statements.
52
Delaware Pooled® Trust — The Focus Smid-Cap Growth Equity Portfolio
October 31, 2014
| | | | | | | | |
| | | Number of
shares | | | Value
(U.S. $) | |
| |
Common Stock – 95.94% | |
| |
Consumer Discretionary – 24.12% | | | | | |
CBS Outdoor Americas | | | 29,800 | | | $ | 906,814 | |
Coupons.com † | | | 34,128 | | | | 475,062 | |
DineEquity | | | 27,175 | | | | 2,417,488 | |
Dunkin’ Brands Group | | | 24,250 | | | | 1,102,890 | |
K12 † | | | 7,411 | | | | 91,896 | |
Sally Beauty Holdings † | | | 75,700 | | | | 2,218,767 | |
Shutterstock † | | | 14,400 | | | | 1,119,744 | |
Ulta Salon Cosmetics & Fragrance † | | | 17,450 | | | | 2,108,135 | |
| | | | | | | | |
| | |
| | | | | | | 10,440,796 | |
| | | | | | | | |
Energy – 4.30% | |
Core Laboratories | | | 13,325 | | | | 1,859,237 | |
| | | | | | | | |
| | |
| | | | | | | 1,859,237 | |
| | | | | | | | |
Financial Services – 15.86% | |
Affiliated Managers Group † | | | 9,650 | | | | 1,927,973 | |
Heartland Payment Systems | | | 49,040 | | | | 2,532,916 | |
MSCI Class A | | | 51,525 | | | | 2,404,157 | |
| | | | | | | | |
| | |
| | | | | | | 6,865,046 | |
| | | | | | | | |
Healthcare – 10.58% | |
ABIOMED † | | | 50,827 | | | | 1,666,617 | |
athenahealth † | | | 6,625 | | | | 811,563 | |
Techne | | | 23,100 | | | | 2,103,255 | |
| | | | | | | | |
| | |
| | | | | | | 4,581,435 | |
| | | | | | | | |
Office REITs – 4.30% | |
Equity Commonwealth | | | 69,725 | | | | 1,862,355 | |
| | | | | | | | |
| | |
| | | | | | | 1,862,355 | |
| | | | | | | | |
Producer Durables – 15.71% | |
Expeditors International of Washington | | | 37,925 | | | | 1,617,881 | |
Graco | | | 27,000 | | | | 2,119,500 | |
Ritchie Bros Auctioneers | | | 53,700 | | | | 1,309,743 | |
Zebra Technologies † | | | 23,759 | | | | 1,752,226 | |
| | | | | | | | |
| | |
| | | | | | | 6,799,350 | |
| | | | | | | | |
Technology – 16.07% | |
Blackbaud | | | 39,225 | | | | 1,745,513 | |
Ellie Mae † | | | 18,575 | | | | 712,909 | |
Logitech International Class R † | | | 107,719 | | | | 1,524,664 | |
NIC | | | 57,325 | | | | 1,056,500 | |
VeriFone Systems † | | | 51,380 | | | | 1,914,419 | |
| | | | | | | | |
| | |
| | | | | | | 6,954,005 | |
| | | | | | | | |
| | | | | | | | |
| | | Number of
shares | | | Value
(U.S. $) | |
| |
Common Stock (continued) | |
| |
Utilities – 5.00% | | | | | | | | |
j2 Global | | | 40,000 | | | $ | 2,163,600 | |
| | | | | | | | |
| | |
| | | | | | | 2,163,600 | |
| | | | | | | | |
| |
Total Common Stock
(cost $30,307,793) | | | | 41,525,824 | |
| | | | | | | | |
| | |
| | | Principal
amount° | | | | |
| |
Short-Term Investments – 4.20% | |
| |
Discount Notes – 1.02%≠ | |
Federal Home Loan Bank | | | | | | | | |
0.025% 11/13/14 | | | 88,660 | | | | 88,659 | |
0.035% 11/19/14 | | | 354,639 | | | | 354,637 | |
| | | | | | | | |
| | |
| | | | | | | 443,296 | |
| | | | | | | | |
Repurchase Agreements – 1.69% | |
Bank of America Merrill Lynch 0.06%, dated 10/31/14, to be repurchased on 11/3/14, repurchase price $232,503 (collateralized by U.S. government obligations 0.00%–2.75% 2/15/19–1/15/26 market value $237,152) | | | 232,502 | | | | 232,502 | |
Bank of Montreal 0.07%, dated 10/31/14, to be repurchased on 11/3/14, repurchase price $38,750 (collateralized by U.S. government obligations 0.00%–11.25% 10/31/14–5/15/44 market value $39,525) | | | 38,750 | | | | 38,750 | |
BNP Paribas 0.11%, dated 10/31/14, to be repurchased on 11/3/14, repurchase price $457,752 (collateralized by U.S. government obligations 0.00%–4.375% 8/31/15–11/15/42 market value $466,904) | | | 457,748 | | | | 457,748 | |
| | | | | | | | |
| | |
| | | | | | | 729,000 | |
| | | | | | | | |
Schedules of investments
Delaware Pooled® Trust — The Focus Smid-Cap Growth Equity Portfolio
| | | | | | | | |
| | | Principal
amount° | | | Value
(U.S. $) | |
| |
Short-Term Investments (continued) | |
| |
U.S. Treasury Obligations – 1.49%≠ | |
U.S. Treasury Bills | | | | | | | | |
0.005% 12/26/14 | | | 410,575 | | | $ | 410,569 | |
0.093% 11/13/14 | | | 234,313 | | | | 234,312 | |
| | | | | | | | |
| | |
| | | | | | | 644,881 | |
| | | | | | | | |
| |
Total Short-Term Investments
(cost $1,817,170) | | | | 1,817,177 | |
| | | | | | | | |
| |
Total Value of Securities – 100.14%
(cost $32,124,963) | | | $ | 43,343,001 | |
| | | | | | | | |
| ≠ | The rate shown is the effective yield at the time of purchase. |
| ° | Principal amount shown is stated in U.S. dollars unless noted that the security is denominated in another currency. |
| † | Non-income-producing security. |
REIT – Real Estate Investment Trust
See accompanying notes, which are an integral part of the financial statements.
54
Delaware Pooled® Trust — The High-Yield Bond Portfolio
October 31, 2014
| | | | | | | | |
| | | Principal
amount° | | | Value
(U.S. $) | |
| |
Convertible Bond – 0.23% | |
| |
Salix Pharmaceuticals 1.50% exercise price $65.81, expiration date 3/15/19 | | | 150,000 | | | $ | 335,906 | |
| | | | | | | | |
| |
Total Convertible Bond
(cost $212,250) | | | | 335,906 | |
| | | | | | | | |
|
| |
Corporate Bonds – 86.50% | |
| |
Automobiles – 2.12% | |
Chassix 144A
9.25% 8/1/18 # | | | 515,000 | | | | 502,125 | |
General Motors | | | | | | | | |
4.875% 10/2/23 | | | 290,000 | | | | 312,113 | |
6.25% 10/2/43 | | | 375,000 | | | | 448,125 | |
International Automotive
Components Group 144A
9.125% 6/1/18 # | | | 721,000 | | | | 755,247 | |
Meritor | | | | | | | | |
6.25% 2/15/24 | | | 200,000 | | | | 205,000 | |
6.75% 6/15/21 | | | 375,000 | | | | 397,500 | |
Tupy Overseas 144A
6.625% 7/17/24 # | | | 400,000 | | | | 407,000 | |
| | | | | | | | |
| | |
| | | | | | | 3,027,110 | |
| | | | | | | | |
Banking – 3.53% | |
Bank of America | | | | | | | | |
6.25% 9/29/49 · | | | 195,000 | | | | 195,731 | |
6.50% 10/23/49 · | | | 430,000 | | | | 442,900 | |
Barclays Bank
7.625% 11/21/22 | | | 560,000 | | | | 611,100 | |
Credit Suisse Group 144A
7.50% 12/11/49 #· | | | 610,000 | | | | 649,833 | |
HSBC Holdings
6.375% 12/29/49 · | | | 650,000 | | | | 663,813 | |
JPMorgan Chase
6.75% 1/29/49 · | | | 695,000 | | | | 735,727 | |
Lloyds Banking Group
7.50% 4/30/49 · | | | 695,000 | | | | 724,537 | |
Popular 7.00% 7/1/19 | | | 1,023,000 | | | | 1,035,787 | |
| | | | | | | | |
| | |
| | | | | | | 5,059,428 | |
| | | | | | | | |
Basic Industry – 10.16% | |
AK Steel | | | | | | | | |
7.625% 5/15/20 | | | 687,000 | | | | 695,587 | |
7.625% 10/1/21 | | | 325,000 | | | | 326,625 | |
ArcelorMittal 6.125% 6/1/18 | | | 529,000 | | | | 567,353 | |
Arch Coal 144A 8.00% 1/15/19 # | | | 580,000 | | | | 379,900 | |
Builders FirstSource 144A 7.625%
6/1/21 # | | | 758,000 | | | | 790,215 | |
Cemex 144A
7.25% 1/15/21 # | | | 780,000 | | | | 843,375 | |
| | | | | | | | |
| | | Principal
amount° | | | Value
(U.S. $) | |
| |
Corporate Bonds (continued) | |
| |
Basic Industry (continued) | |
CPG Merger Sub 144A
8.00% 10/1/21 # | | | 610,000 | | | $ | 628,300 | |
First Quantum Minerals | | | | | | | | |
144A 6.75% 2/15/20 # | | | 303,000 | | | | 294,667 | |
144A 7.00% 2/15/21 # | | | 303,000 | | | | 298,834 | |
144A 7.25% 5/15/22 # | | | 400,000 | | | | 391,000 | |
FMG Resources August 2006 144A
6.875% 4/1/22 # | | | 827,000 | | | | 856,979 | |
Hardwoods Acquisition 144A
7.50% 8/1/21 # | | | 435,000 | | | | 441,525 | |
HD Supply
11.50% 7/15/20 | | | 550,000 | | | | 642,813 | |
JMC Steel Group 144A
8.25% 3/15/18 # | | | 481,000 | | | | 490,019 | |
Kissner Milling 144A
7.25% 6/1/19 # | | | 520,000 | | | | 531,700 | |
LSB Industries
7.75% 8/1/19 | | | 470,000 | | | | 503,934 | |
Lundin Mining 144A
7.875% 11/1/22 # | | | 675,000 | | | | 703,687 | |
New Gold 144A
6.25% 11/15/22 # | | | 564,000 | | | | 554,130 | |
Nortek
8.50% 4/15/21 | | | 432,000 | | | | 466,560 | |
NOVA Chemicals 144A
5.00% 5/1/25 # | | | 380,000 | | | | 393,300 | |
Polymer Group 144A
6.875% 6/1/19 # | | | 785,000 | | | | 778,131 | |
Ryerson | | | | | | | | |
9.00% 10/15/17 | | | 317,000 | | | | 334,435 | |
11.25% 10/15/18 | | | 89,000 | | | | 97,455 | |
Sappi Papier Holding 144A
6.625% 4/15/21 # | | | 200,000 | | | | 209,000 | |
Steel Dynamics 144A
5.50% 10/1/24 # | | | 405,000 | | | | 429,300 | |
TPC Group 144A
8.75% 12/15/20 # | | | 820,000 | | | | 862,025 | |
Wise Metals Group 144A
8.75% 12/15/18 # | | | 275,000 | | | | 298,375 | |
Wise Metals Intermediate Holdings 144A
9.75% 6/15/19 # | | | 180,000 | | | | 195,975 | |
WR Grace | | | | | | | | |
144A 5.125% 10/1/21 # | | | 260,000 | | | | 271,539 | |
144A 5.625% 10/1/24 # | | | 255,000 | | | | 269,663 | |
| | | | | | | | |
| | |
| | | | | | | 14,546,401 | |
| | | | | | | | |
Capital Goods – 6.21% | |
Accudyne Industries 144A
7.75% 12/15/20 # | | | 700,000 | | | | 731,500 | |
Ardagh Packaging Finance
144A 6.00% 6/30/21 # | | | 840,000 | | | | 830,550 | |
Schedules of investments
Delaware Pooled® Trust — The High-Yield Bond Portfolio
| | | | | | | | |
| | | Principal
amount° | | | Value
(U.S. $) | |
| |
Corporate Bonds (continued) | |
| |
Capital Goods (continued) | |
BWAY Holding 144A
9.125% 8/15/21 # | | | 1,095,000 | | | $ | 1,141,537 | |
Consolidated Container 144A
10.125% 7/15/20 # | | | 471,000 | | | | 445,095 | |
Gardner Denver 144A
6.875% 8/15/21 # | | | 799,000 | | | | 836,953 | |
Gates Global 144A
6.00% 7/15/22 # | | | 1,075,000 | | | | 1,048,125 | |
Milacron 144A
7.75% 2/15/21 # | | | 490,000 | | | | 512,050 | |
Plastipak Holdings 144A
6.50% 10/1/21 # | | | 485,000 | | | | 501,975 | |
Reynolds Group Issuer
8.25% 2/15/21 | | | 835,000 | | | | 901,800 | |
Signode Industrial
Group 144A
6.375% 5/1/22 # | | | 580,000 | | | | 564,050 | |
TransDigm | | | | | | | | |
6.00% 7/15/22 | | | 745,000 | | | | 757,106 | |
6.50% 7/15/24 | | | 605,000 | | | | 626,175 | |
| | | | | | | | |
| | |
| | | | | | | 8,896,916 | |
| | | | | | | | |
Consumer Cyclical – 4.74% | |
BI-LO 144A PIK
8.625% 9/15/18 #T | | | 735,000 | | | | 663,337 | |
DBP Holding 144A
7.75% 10/15/20 # | | | 411,000 | | | | 368,873 | |
K. Hovnanian
Enterprises 144A
8.00% 11/1/19 # | | | 355,000 | | | | 358,550 | |
Landry’s 144A
9.375% 5/1/20 # | | | 1,032,000 | | | | 1,108,110 | |
Men’s Wearhouse 144A
7.00% 7/1/22 # | | | 350,000 | | | | 364,437 | |
Michaels Stores 144A
5.875% 12/15/20 # | | | 485,000 | | | | 492,275 | |
Midas Intermediate
Holdco II 144A
7.875% 10/1/22 # | | | 450,000 | | | | 452,250 | |
Pantry
8.375% 8/1/20 | | | 554,000 | | | | 584,470 | |
Party City Holdings
8.875% 8/1/20 | | | 593,000 | | | | 646,370 | |
PC Nextco Holdings
8.75% 8/15/19 | | | 355,000 | | | | 362,100 | |
PF Chang’s China
Bistro 144A
10.25% 6/30/20 # | | | 439,000 | | | | 439,000 | |
Rite Aid
6.75% 6/15/21 | | | 750,000 | | | | 804,375 | |
Roundy’s Supermarkets 144A
10.25% 12/15/20 # | | | 155,000 | | | | 141,050 | |
| | | | | | | | |
| | |
| | | | | | | 6,785,197 | |
| | | | | | | | |
| | | | | | | | |
| | | Principal
amount° | | | Value
(U.S. $) | |
| |
Corporate Bonds (continued) | |
| |
Consumer Non-Cyclical – 1.70% | |
Crestview DS Merger Sub II
10.00% 9/1/21 | | | 405,000 | | | $ | 449,550 | |
Darling Ingredients
5.375% 1/15/22 | | | 235,000 | | | | 236,469 | |
JBS Investments 144A
7.75% 10/28/20 # | | | 685,000 | | | | 753,931 | |
Prestige Brands 144A
5.375% 12/15/21 # | | | 450,000 | | | | 437,625 | |
Spectrum Brands | | | | | | | | |
6.375% 11/15/20 | | | 103,000 | | | | 109,695 | |
6.625% 11/15/22 | | | 416,000 | | | | 448,240 | |
| | | | | | | | |
| | |
| | | | | | | 2,435,510 | |
| | | | | | | | |
Energy – 15.09% | | | | | | | | |
Baytex Energy | | | | | | | | |
144A 5.125%
6/1/21 # | | | 125,000 | | | | 122,500 | |
144A 5.625%
6/1/24 # | | | 595,000 | | | | 576,406 | |
California Resources | | | | | | | | |
144A 5.50%
9/15/21 # | | | 725,000 | | | | 740,406 | |
144A 6.00% 11/15/24 # | | | 680,000 | | | | 695,300 | |
Calumet Specialty Products Partners
7.625% 1/15/22 | | | 920,000 | | | | 943,000 | |
Chaparral Energy | | | | | | | | |
7.625% 11/15/22 | | | 267,000 | | | | 261,660 | |
8.25% 9/1/21 | | | 312,000 | | | | 315,120 | |
CHC Helicopter
9.375% 6/1/21 | | | 645,000 | | | | 688,537 | |
Chesapeake Energy | | | | | | | | |
4.875% 4/15/22 | | | 990,000 | | | | 1,017,473 | |
5.75% 3/15/23 | | | 35,000 | | | | 38,500 | |
Compressco Partners 144A
7.25% 8/15/22 # | | | 705,000 | | | | 699,713 | |
Energy Transfer Equity
5.875% 1/15/24 | | | 290,000 | | | | 305,950 | |
Energy XXI Gulf Coast 144A
6.875% 3/15/24 # | | | 635,000 | | | | 503,237 | |
Exterran Partners
6.00% 4/1/21 | | | 590,000 | | | | 572,300 | |
FTS International 144A
6.25% 5/1/22 # | | | 665,000 | | | | 631,750 | |
Genesis Energy
5.75% 2/15/21 | | | 665,000 | | | | 669,156 | |
Halcon Resources | | | | | | | | |
8.875% 5/15/21 | | | 339,000 | | | | 279,675 | |
9.75% 7/15/20 | | | 1,055,000 | | | | 885,541 | |
Hercules Offshore | | | | | | | | |
144A 6.75%
4/1/22 # | | | 655,000 | | | | 387,269 | |
144A 7.50% 10/1/21 # | | | 300,000 | | | | 188,250 | |
144A 8.75% 7/15/21 # | | | 175,000 | | | | 113,750 | |
56
| | | | | | | | |
| | | Principal
amount° | | | Value
(U.S. $) | |
| |
Corporate Bonds (continued) | |
| |
Energy (continued) | | | | | | | | |
Key Energy Services
6.75% 3/1/21 | | | 895,000 | | | $ | 801,025 | |
Laredo Petroleum | | | | | | | | |
5.625% 1/15/22 | | | 375,000 | | | | 371,250 | |
7.375% 5/1/22 | | | 346,000 | | | | 361,570 | |
Linn Energy | | | | | | | | |
6.50% 5/15/19 | | | 335,000 | | | | 314,900 | |
6.50% 9/15/21 | | | 305,000 | | | | 280,600 | |
Midstates Petroleum
9.25% 6/1/21 | | | 1,165,000 | | | | 996,075 | |
Murphy Oil USA
6.00% 8/15/23 | | | 615,000 | | | | 647,287 | |
Northern Blizzard
Resources 144A
7.25% 2/1/22 # | | | 404,000 | | | | 385,820 | |
Northern Oil & Gas
8.00% 6/1/20 | | | 580,000 | | | | 543,750 | |
NuStar Logistics
6.75% 2/1/21 | | | 400,000 | | | | 437,000 | |
Oasis Petroleum
6.875% 3/15/22 | | | 935,000 | | | | 977,075 | |
Ocean Rig UDW 144A
7.25% 4/1/19 # | | | 1,010,000 | | | | 868,600 | |
Offshore Group Investment
7.125% 4/1/23 | | | 170,000 | | | | 141,100 | |
PDC Energy
7.75% 10/15/22 | | | 535,000 | | | | 564,543 | |
Pioneer Energy
Services 144A
6.125% 3/15/22 # | | | 265,000 | | | | 247,113 | |
Regency Energy Partners
5.875% 3/1/22 | | | 630,000 | | | | 674,100 | |
Samson Investment
9.75% 2/15/20 | | | 926,000 | | | | 689,870 | |
SandRidge Energy
8.125% 10/15/22 | | | 861,000 | | | | 783,510 | |
Triangle USA
Petroleum 144A
6.75% 7/15/22 # | | | 400,000 | | | | 352,000 | |
Ultra Petroleum 144A
6.125% 10/1/24 # | | | 185,000 | | | | 175,981 | |
Warren Resources 144A
9.00% 8/1/22 # | | | 400,000 | | | | 361,000 | |
| | | | | | | | |
| | |
| | | | | | | 21,609,662 | |
| | | | | | | | |
Financials – 1.33% | | | | | | | | |
Consolidated Energy
Finance 144A
6.75% 10/15/19 # | | | 544,000 | | | | 556,240 | |
Infinity Acquisition 144A
7.25% 8/1/22 # | | | 780,000 | | | | 733,200 | |
Nuveen Investments 144A
9.50% 10/15/20 # | | | 504,000 | | | | 616,140 | |
| | | | | | | | |
| | |
| | | | | | | 1,905,580 | |
| | | | | | | | |
| | | | | | | | |
| | | Principal
amount° | | | Value
(U.S. $) | |
| |
Corporate Bonds (continued) | |
| |
Healthcare – 6.55% | | | | | | | | |
Air Medical Group Holdings
9.25% 11/1/18 | | | 312,000 | | | $ | 327,210 | |
Amsurg 144A
5.625% 7/15/22 # | | | 350,000 | | | | 364,394 | |
Community Health Systems 144A
6.875% 2/1/22 # | | | 735,000 | | | | 794,719 | |
6.875% 2/1/22 | | | 365,000 | | | | 394,656 | |
7.125% 7/15/20 | | | 163,000 | | | | 176,651 | |
8.00% 11/15/19 | | | 56,000 | | | | 60,620 | |
Crimson Merger Sub 144A
6.625% 5/15/22 # | | | 450,000 | | | | 421,313 | |
DaVita HealthCare Partners
5.125% 7/15/24 | | | 1,065,000 | | | | 1,088,297 | |
Immucor
11.125% 8/15/19 | | | 612,000 | | | | 670,140 | |
Kinetic Concepts | | | | | | | | |
10.50% 11/1/18 | | | 423,000 | | | | 467,415 | |
12.50% 11/1/19 | | | 290,000 | | | | 321,175 | |
Mallinckrodt International Finance
4.75% 4/15/23 | | | 345,000 | | | | 332,063 | |
MPH Acquisition
Holdings 144A
6.625% 4/1/22 # | | | 305,000 | | | | 319,869 | |
Par Pharmaceutical
7.375% 10/15/20 | | | 1,241,000 | | | | 1,324,767 | |
Salix
Pharmaceuticals 144A
6.00% 1/15/21 # | | | 755,000 | | | | 819,175 | |
Tenet Healthcare 144A
5.00% 3/1/19 # | | | 465,000 | | | | 466,744 | |
6.00% 10/1/20 | | | 285,000 | | | | 307,087 | |
8.125% 4/1/22 | | | 375,000 | | | | 430,781 | |
Valeant Pharmaceuticals International 144A
6.375% 10/15/20 # | | | 281,000 | | | | 289,430 | |
| | | | | | | | |
| | |
| | | | | | | 9,376,506 | |
| | | | | | | | |
Insurance – 2.18% | | | | | | | | |
American International Group
8.175% 5/15/58 • | | | 562,000 | | | | 765,725 | |
Hockey Merger
Sub 2 144A
7.875% 10/1/21 # | | | 645,000 | | | | 675,637 | |
Hub Holdings 144A PIK 8.125% 7/15/19 #T | | | 190,000 | | | | 189,525 | |
Onex USI Acquisition 144A
7.75% 1/15/21 # | | | 585,000 | | | | 595,237 | |
XL Group
6.50% 10/29/49 · | | | 925,000 | | | | 889,850 | |
| | | | | | | | |
| | |
| | | | | | | 3,115,974 | |
| | | | | | | | |
Media – 10.84% | | | | | | | | |
Altice 144A
7.75% 5/15/22 # | | | 690,000 | | | | 726,225 | |
Schedules of investments
Delaware Pooled® Trust — The High-Yield Bond Portfolio
| | | | | | | | |
| | | Principal
amount° | | | Value
(U.S. $) | |
| |
Corporate Bonds (continued) | |
| |
Media (continued) | | | | | | | | |
CBS Outdoor Americas Capital 144A
5.875% 3/15/25 # | | | 425,000 | | | $ | 447,313 | |
CCO Holdings
5.25% 9/30/22 | | | 499,000 | | | | 503,990 | |
CCOH Safari | | | | | | | | |
5.50% 12/1/22 | | | 425,000 | | | | 430,313 | |
5.75% 12/1/24 | | | 750,000 | | | | 756,094 | |
Columbus
International 144A
7.375% 3/30/21 # | | | 950,000 | | | | 1,010,563 | |
CSC Holdings 144A
5.25% 6/1/24 # | | | 1,096,000 | | | | 1,101,480 | |
DISH DBS
5.00% 3/15/23 | | | 240,000 | | | | 239,700 | |
Gannett | | | | | | | | |
144A 4.875% 9/15/21 # | | | 130,000 | | | | 131,300 | |
144A 5.50% 9/15/24 # | | | 455,000 | | | | 470,925 | |
Gray Television
7.50% 10/1/20 | | | 1,020,000 | | | | 1,072,275 | |
iHeartMedia | | | | | | | | |
144A 9.00% 9/15/22 # | | | 735,000 | | | | 740,513 | |
PIK 14.00%
2/1/21 ✤ | | | 631,250 | | | | 550,766 | |
MDC Partners 144A
6.75% 4/1/20 # | | | 670,000 | | | | 697,637 | |
Media General
Financing 144A
5.875% 11/15/22 # | | | 425,000 | | | | 429,250 | |
Mediacom Broadband
5.50% 4/15/21 | | | 400,000 | | | | 408,500 | |
Numericable Group | | | | | | | | |
144A 6.00% 5/15/22 # | | | 690,000 | | | | 706,387 | |
144A 6.25% 5/15/24 # | | | 200,000 | | | | 206,000 | |
RCN Telecom
Services 144A
8.50% 8/15/20 # | | | 490,000 | | | | 515,725 | |
Sinclair Television
Group 144A
5.625% 8/1/24 # | | | 970,000 | | | | 962,725 | |
Unitymedia KabelBW 144A
6.125% 1/15/25 # | | | 750,000 | | | | 784,687 | |
Virgin Media Finance | | | | | | | | |
144A 6.00% 10/15/24 # | | | 345,000 | | | | 360,094 | |
144A 6.375% 4/15/23 # | | | 800,000 | | | | 850,000 | |
VTR Finance 144A
6.875% 1/15/24 # | | | 1,345,000 | | | | 1,415,613 | |
| | | | | | | | |
| | |
| | | | | | | 15,518,075 | |
| | | | | | | | |
Services – 5.79% | |
AECOM Technology | | | | | | | | |
144A 5.75% 10/15/22 # | | | 260,000 | | | | 274,300 | |
144A 5.875% 10/15/24 # | | | 315,000 | | | | 333,900 | |
| | | | | | | | |
| | | Principal
amount° | | | Value
(U.S. $) | |
| |
Corporate Bonds (continued) | |
| |
Services (continued) | | | | | | | | |
Algeco Scotsman Global Finance 144A
10.75% 10/15/19 # | | | 1,065,000 | | | $ | 1,054,350 | |
Caesars Growth Properties Holdings 144A
9.375% 5/1/22 # | | | 440,000 | | | | 410,850 | |
Covanta Holding
5.875% 3/1/24 | | | 670,000 | | | | 695,125 | |
Geo Group
5.875% 10/15/24 | | | 435,000 | | | | 450,225 | |
Mattamy Group 144A
6.50% 11/15/20 # | | | 775,000 | | | | 788,563 | |
MCE Finance 144A
5.00% 2/15/21 # | | | 200,000 | | | | 198,000 | |
Navios South American Logistics 144A
7.25% 5/1/22 # | | | 605,000 | | | | 611,050 | |
Pinnacle Entertainment | | | | | | | | |
6.375% 8/1/21 | | | 265,000 | | | | 284,875 | |
7.75% 4/1/22 | | | 210,000 | | | | 230,475 | |
Stena 144A 7.00% 2/1/24 # | | | 725,000 | | | | 725,000 | |
United Rentals North America
5.75% 11/15/24 | | | 1,145,000 | | | | 1,203,681 | |
Vander Intermediate Holding II 144A PIK
9.75% 2/1/19 #T | | | 235,000 | | | | 249,687 | |
Watco 144A
6.375% 4/1/23 # | | | 280,000 | | | | 285,600 | |
West 144A
5.375% 7/15/22 # | | | 500,000 | | | | 486,250 | |
| | | | | | | | |
| | |
| | | | | | | 8,281,931 | |
| | | | | | | | |
Technology & Electronics – 4.62% | |
BMC Software Finance 144A
8.125% 7/15/21 # | | | 360,000 | | | | 346,500 | |
CommScope 144A
5.50% 6/15/24 # | | | 675,000 | | | | 685,969 | |
Entegris 144A
6.00% 4/1/22 # | | | 665,000 | | | | 679,963 | |
First Data | | | | | | | | |
11.25% 1/15/21 | | | 965,000 | | | | 1,114,575 | |
11.75% 8/15/21 | | | 885,000 | | | | 1,042,087 | |
First Data Holdings 144A PIK
14.50% 9/24/19 #✥ | | | 40,712 | | | | 43,226 | |
Infor Software Parent 144A PIK
7.125% 5/1/21 #T | | | 1,075,000 | | | | 1,093,813 | |
j2 Global 8.00% 8/1/20 | | | 702,000 | | | | 759,915 | |
NCR 6.375% 12/15/23 | | | 465,000 | | | | 492,900 | |
58
| | | | | | | | |
| | | Principal
amount° | | | Value
(U.S. $) | |
| |
Corporate Bonds (continued) | |
| |
Technology & Electronics (continued) | |
Viasystems 144A | | | | | | | | |
7.875% 5/1/19 # | | | 336,000 | | | $ | 357,840 | |
| | | | | | | | |
| | |
| | | | | | | 6,616,788 | |
| | | | | | | | |
Telecommunications – 8.48% | |
CenturyLink 6.75% 12/1/23 | | | 400,000 | | | | 445,500 | |
Cogent Communications | | | | | | | | |
Finance 144A | | | | | | | | |
5.625% 4/15/21 # | | | 605,000 | | | | 592,900 | |
Digicel Group | | | | | | | | |
144A 7.125% 4/1/22 # | | | 225,000 | | | | 226,687 | |
144A 8.25% 9/30/20 # | | | 1,050,000 | | | | 1,102,500 | |
Hughes Satellite Systems | | | | | | | | |
7.625% 6/15/21 | | | 439,000 | | | | 490,583 | |
Intelsat Luxembourg | | | | | | | | |
7.75% 6/1/21 | | | 960,000 | | | | 1,006,800 | |
8.125% 6/1/23 | | | 1,450,000 | | | | 1,547,875 | |
Level 3 Escrow II 144A | | | | | | | | |
5.375% 8/15/22 # | | | 715,000 | | | | 729,300 | |
Sprint | | | | | | | | |
144A 7.125% 6/15/24 # | | | 845,000 | | | | 871,406 | |
144A 7.25% 9/15/21 # | | | 980,000 | | | | 1,038,800 | |
144A 7.875% 9/15/23 # | | | 410,000 | | | | 444,850 | |
Sprint Capital 6.90% 5/1/19 | | | 145,000 | | | | 154,425 | |
T-Mobile USA | | | | | | | | |
6.00% 3/1/23 | | | 240,000 | | | | 247,800 | |
6.125% 1/15/22 | | | 195,000 | | | | 202,800 | |
6.25% 4/1/21 | | | 240,000 | | | | 251,400 | |
6.375% 3/1/25 | | | 430,000 | | | | 442,900 | |
Wind Acquisition Finance | | | | | | | | |
144A 4.75% 7/15/20 # | | | 310,000 | | | | 303,800 | |
144A 7.375% 4/23/21 # | | | 595,000 | | | | 583,100 | |
Windstream | | | | | | | | |
7.50% 6/1/22 | | | 360,000 | | | | 383,850 | |
7.50% 4/1/23 | | | 10,000 | | | | 10,550 | |
7.75% 10/1/21 | | | 370,000 | | | | 397,750 | |
Zayo Group 10.125% 7/1/20 | | | 602,000 | | | | 670,477 | |
| | | | | | | | |
| | |
| | | | | | | 12,146,053 | |
| | | | | | | | |
Utilities – 3.16% | |
AES 7.375% 7/1/21 | | | 68,000 | | | | 77,924 | |
AES Gener 144A | | | | | | | | |
8.375% 12/18/73 #· | | | 200,000 | | | | 224,750 | |
Calpine 5.375% 1/15/23 | | | 585,000 | | | | 591,581 | |
DPL 144A 6.75% 10/1/19 # | | | 555,000 | | | | 575,813 | |
Dynegy 5.875% 6/1/23 | | | 395,000 | | | | 389,075 | |
Dynegy Finance I | | | | | | | | |
144A 6.75% 11/1/19 # | | | 215,000 | | | | 222,794 | |
144A 7.375% 11/1/22 # | | | 340,000 | | | | 359,975 | |
| | | | | | | | |
| | | Principal
amount° | | | Value
(U.S. $) | |
| |
Corporate Bonds (continued) | |
| |
Utilities (continued) | |
144A 7.625% 11/1/24 # | | | 785,000 | | | $ | 833,081 | |
Elwood Energy | | | | | | | | |
8.159% 7/5/26 | | | 262,376 | | | | 293,861 | |
Enel 144A | | | | | | | | |
8.75%
9/24/73 #· | | | 820,000 | | | | 961,450 | |
| | | | | | | | |
| | |
| | | | | | | 4,530,304 | |
| | | | | | | | |
| |
Total Corporate Bonds
(cost $123,461,050) | | | | 123,851,435 | |
| | | | | | | | |
|
| |
Senior Secured Loans – 5.97%« | |
| |
Applied Systems 2nd Lien | | | | | | | | |
7.50% 1/15/22 | | | 849,000 | | | | 850,327 | |
Ashland Water 2nd Lien | | | | | | | | |
7.75% 7/2/22 | | | 250,000 | | | | 244,875 | |
Atkore International 2nd Lien | | | | | | | | |
7.75% 9/27/21 | | | 340,000 | | | | 336,175 | |
Azure Midstream Tranche B | | | | | | | | |
6.50% 10/21/18 | | | 116,962 | | | | 114,693 | |
BJ’s Wholesale Club 2nd Lien | | | | | | | | |
8.50% 3/31/20 | | | 675,000 | | | | 677,025 | |
Borgata Tranche B 1st Lien | | | | | | | | |
6.75% 8/15/18 | | | 602,665 | | | | 605,396 | |
Clear Channel | | | | | | | | |
Communications Tranche D | | | | | | | | |
6.904% 1/30/19 | | | 375,000 | | | | 355,219 | |
Flint Group 2nd Lien | | | | | | | | |
8.25% 5/2/22 | | | 700,000 | | | | 673,750 | |
Gentiva Health Services | | | | | | | | |
Tranche B | | | | | | | | |
6.50% 10/10/19 | | | 506,175 | | | | 507,757 | |
Hostess Brands 1st Lien | | | | | | | | |
6.75% 3/12/20 | | | 661,675 | | | | 675,735 | |
LTS Buyer 2nd Lien | | | | | | | | |
8.00% 3/15/21 | | | 98,038 | | | | 97,670 | |
Mauser Holdings 2nd Lien | | | | | | | | |
8.25% 6/30/22 | | | 725,000 | | | | 718,656 | |
Moxie Liberty Tranche B | | | | | | | | |
7.50% 8/21/20 | | | 345,000 | | | | 351,900 | |
Moxie Patriot (Panda Power Fund) Tranche B1 | | | | | | | | |
6.75% 12/19/20 | | | 340,000 | | | | 343,400 | |
Otterbox Tranche B | | | | | | | | |
5.75% 5/30/20 | | | 518,700 | | | | 514,485 | |
Polymer Group Tranche B | | | | | | | | |
5.25% 12/13/19 | | | 540,913 | | | | 542,096 | |
Rite Aid 2nd Lien | | | | | | | | |
5.75% 8/3/20 | | | 295,000 | | | | 297,089 | |
Samson Investment 2nd Lien | | | | | | | | |
5.00% 9/25/18 | | | 310,000 | | | | 288,300 | |
Schedules of investments
Delaware Pooled® Trust — The High-Yield Bond Portfolio
| | | | | | | | |
| | | Principal
amount° | | | Value (U.S. $) | |
| |
Senior Secured Loans« (continued) | |
| |
Vantage Drilling Tranche B
1st Lien 5.75% 3/28/19 | | | 387,053 | | | $ | 348,348 | |
| | | | | | | | |
| | |
Total Senior Secured Loans
(cost $8,669,440) | | | | | | | 8,542,896 | |
| | | | | | | | |
| | |
| | | Number of
shares | | | | |
| |
Common Stock – 0.00% | |
| |
Century Communications =† | | | 60,000 | | | | 0 | |
| | | | | | | | |
| | |
Total Common Stock
(cost $1,816) | | | | | | | 0 | |
| | | | | | | | |
|
| |
Convertible Preferred Stock – 0.07% | |
| |
SandRidge Energy 7.00% exercise price $7.76, expiration date 12/31/49 | | | 1,100 | | | | 92,813 | |
| | | | | | | | |
| | |
Total Convertible Preferred Stock
(cost $97,132) | | | | | | | 92,813 | |
| | | | | | | | |
|
| |
Preferred Stock – 1.63% | |
| |
Ally Financial | | | | | | | | |
144A 7.00% # | | | 1,400 | | | | 1,409,100 | |
8.50% · | | | 5,000 | | | | 132,400 | |
GMAC Capital Trust I | | | | | | | | |
8.125% · | | | 7,000 | | | | 187,110 | |
Regions Financial 6.375% | | | 24,000 | | | | 602,880 | |
| | | | | | | | |
| | |
Total Preferred Stock
(cost $2,020,768) | | | | | | | 2,331,490 | |
| | | | | | | | |
| | |
| | | Principal
amount° | | | | |
| |
Short-Term Investments – 5.49% | |
| |
Repurchase Agreements – 5.49% | | | | | |
Bank of America Merrill Lynch 0.06%, dated 10/31/14, to be repurchased on 11/3/14, repurchase price $2,508,733 (collateralized by U.S. government obligations 0.00%–2.75% 2/15/19–1/15/26 market value $2,558,895) | | | 2,508,720 | | | | 2,508,720 | |
| | | | | | | | |
| | | Principal
amount° | | | Value (U.S. $) | |
| |
Short-Term Investments (continued) | |
| |
Repurchase Agreements (continued) | | | | | |
Bank of Montreal 0.07%, dated 10/31/14, to be repurchased on 11/3/14, repurchase price $418,122 (collateralized by U.S. government obligations 0.00%–11.25% 10/31/14–5/15/44 market value $426,483) | | | 418,120 | | | $ | 418,120 | |
BNP Paribas 0.11%, dated 10/31/14, to be repurchased on 11/3/14, repurchase price $4,939,205 (collateralized by U.S. government obligations 0.00%–4.375% 8/31/15–11/15/42 market value $5,037,948) | | | 4,939,160 | | | | 4,939,160 | |
| | | | | | | | |
| |
Total Short-Term Investments
(cost $7,866,000) | | | | 7,866,000 | |
| | | | | | | | |
| |
Total Value of Securities – 99.89%
(cost $142,328,456) | | | $ | 143,020,540 | |
| | | | | | | | |
| # | Security exempt from registration under Rule 144A of the Securities Act of 1933, as amended. At Oct. 31, 2014, the aggregate value of Rule 144A securities was $69,969,439, which represents 48.87% of the Portfolio’s net assets. See Note 12 in “Notes to financial statements.” |
| ✤ | 86% of the income received was in the form of cash and 14% of the income received was in the form of additional par. |
| ✥ | 100% of the income received was in the form of additional par. |
| T | 100% of the income received was in the form of additional cash. |
| = | Security is being fair valued in accordance with the Portfolio’s fair valuation policy. At Oct. 31, 2014, the aggregate value of fair valued securities was $0, which represents 0.00% of the Portfolio’s net assets. See Note 1 in “Notes to financial statements.” |
| ° | Principal amount shown is stated in U.S. dollars unless noted that the security is denominated in another currency. |
| † | Non-income-producing security. |
| · | Variable rate security. The rate shown is the rate as of Oct. 31, 2014. Interest rates reset periodically. |
| « | Senior secured loans generally pay interest at rates which are periodically redetermined by reference to a base lending rate plus a premium. These base lending rates are generally: (i) the prime rate offered by one or more United States banks, (ii) the lending rate offered by one or more European banks such as the London Inter-Bank Offered |
60
Rate (LIBOR), and (iii) the certificate of deposit rate. Senior secured loans may be subject to restrictions on resale. Stated rate in effect at Oct. 31, 2014.
The following futures and swap contracts were outstanding at Oct. 31, 2014:1
Futures Contracts
| | | | | | | | | | | | | | | | |
Contracts to Buy (Sell) | | Notional
Cost
(Proceeds) | | | Notional
Value | | | Expiration
Date | | Unrealized
Appreciation
(Depreciation) | |
(8) | | U.S. Treasury 2 yr Notes | | $ | (1,751,274 | ) | | $ | (1,756,500 | ) | | 1/2/15 | | $ | (5,226 | ) |
(14) | | U.S. Treasury 5 yr Notes | | | (1,661,257 | ) | | | (1,672,016 | ) | | 1/2/15 | | | (10,758 | ) |
| | | | | | | | | | | | | | | | |
| | | | | |
| | | | $ | (3,412,531 | ) | | | | | | | | $ | (15,984 | ) |
| | | | | | | | | | | | | | | | |
Swap Contracts
CDS Contracts2
| | | | | | | | | | | | | | |
Counterparty | | Swap
Referenced
Obligation | | Notional
Value3 | | Annual
Protection
Payments | | | Termination
Date | | Unrealized
Appreciation
(Depreciation) | |
| | Protection Purchased: | | | | | | | | | | | | |
BNP | | ICE- CDX.NA.HY.23 | | 3,400,000 | | | 5.00 | % | | 12/20/19 | | $ | (98,674 | ) |
The use of futures and swap contracts involves elements of market risk and risks in excess of the amount disclosed in the financial statements. The notional values presented above represent the Portfolio’s total exposure in such contracts, whereas only the net unrealized appreciation (depreciation) is reflected in the Portfolio’s net assets.
1See Note 9 in “Notes to financial statements.”
2A CDS contract is a risk-transfer instrument through which one party (purchaser of protection) transfers to another party (seller of protection) the financial risk of a credit event (as defined in the CDS agreement), as it relates to a particular reference security or basket of securities (such as an index). Periodic payments (receipts) on such contracts are accrued daily and recorded as unrealized losses (gains) on swap contracts. Upon payment (receipt), such amounts are recorded as realized losses (gains) on swap contracts. Upfront payments made or received in connection with CDS contracts are amortized over the expected life of the CDS contracts as unrealized losses (gains) on swap contracts. The change in value of CDS contracts is recorded as unrealized appreciation or depreciation daily. A realized gain or loss is recorded upon a credit event (as defined in the CDS agreement) or the maturity or termination of the agreements.
3Notional value is stated in U.S. dollars unless noted that the swap is denominated in another currency.
Summary of abbreviations:
BNP – Banque Paribas
CDS – Credit Default Swap
CDX.NA.HY – Credit Default Swap Index North America High Yield
PIK – Pay-in-kind
yr – Year
See accompanying notes, which are an integral part of the financial statements.
Schedules of investments
Delaware Pooled® Trust — The Core Plus Fixed Income Portfolio
October 31, 2014
| | | | | | | | |
| | | Principal
amount° | | | Value
(U.S. $) | |
| |
Agency Asset-Backed Security – 0.19% | |
| |
Fannie Mae Grantor Trust | | | | | | | | |
Series 2003-T4 2A5 | | | | | | | | |
5.407% 9/26/33 | | | 134,798 | | | $ | 147,411 | |
| | | | | | | | |
| | |
Total Agency Asset-Backed Security
(cost $133,708) | | | | | | | 147,411 | |
| | | | | | | | |
|
| |
Agency Collateralized Mortgage
Obligations – 1.05% | |
| |
Fannie Mae REMICs | | | | | | | | |
Series 2002-90 A1 | | | | | | | | |
6.50% 6/25/42 | | | 15,731 | | | | 18,010 | |
Series 2002-90 A2 | | | | | | | | |
6.50% 11/25/42 | | | 35,371 | | | | 40,002 | |
Series 2012-122 SD | | | | | | | | |
5.948% 11/25/42 ·S | | | 89,074 | | | | 21,507 | |
Series 2013-38 AI | | | | | | | | |
3.00% 4/25/33 S | | | 175,311 | | | | 27,194 | |
Series 2013-44 DI | | | | | | | | |
3.00% 5/25/33 S | | | 229,121 | | | | 36,939 | |
Fannie Mae Whole Loan REMIC Trust | | | | | | | | |
Series 2004-W11 1A2 | | | | | | | | |
6.50% 5/25/44 | | | 28,989 | | | | 33,800 | |
Freddie Mac REMICs | | | | | | | | |
Series 1730 Z | | | | | | | | |
7.00% 5/15/24 | | | 61,161 | | | | 69,530 | |
Series 2326 ZQ | | | | | | | | |
6.50% 6/15/31 | | | 55,085 | | | | 62,545 | |
Series 3123 HT | | | | | | | | |
5.00% 3/15/26 | | | 183,719 | | | | 197,245 | |
Series 3656 PM | | | | | | | | |
5.00% 4/15/40 | | | 122,428 | | | | 135,311 | |
Series 4185 LI | | | | | | | | |
3.00% 3/15/33 S | | | 89,349 | | | | 14,596 | |
Series 4191 CI | | | | | | | | |
3.00% 4/15/33 S | | | 90,282 | | | | 12,741 | |
GNMA | | | | | | | | |
Series 2010-113 KE | | | | | | | | |
4.50% 9/20/40 | | | 125,000 | | | | 136,536 | |
| | | | | | | | |
| |
Total Agency Collateralized Mortgage Obligations
(cost $750,512) | | | | 805,956 | |
| | | | | | | | |
|
| |
Agency Mortgage-Backed Securities – 25.88% | |
| |
Fannie Mae | | | | | | | | |
6.50% 8/1/17 | | | 5,729 | | | | 5,986 | |
Fannie Mae ARM | | | | | | | | |
2.057% 8/1/34 · | | | 39,206 | | | | 41,402 | |
2.116% 3/1/38 · | | | 40,595 | | | | 43,275 | |
2.321% 4/1/36 · | | | 32,284 | | | | 34,431 | |
2.42% 5/1/43 · | | | 31,276 | | | | 31,296 | |
| | | | | | | | |
| | | Principal
amount° | | | Value
(U.S. $) | |
| |
Agency Mortgage-Backed Securities (continued) | |
| |
Fannie Mae ARM | | | | | | | | |
2.546% 6/1/43 · | | | 10,973 | | | $ | 11,064 | |
3.199% 4/1/44 · | | | 78,561 | | | | 81,490 | |
3.279% 3/1/44 · | | | 59,631 | | | | 62,234 | |
3.292% 9/1/43 · | | | 36,283 | | | | 37,639 | |
Fannie Mae Relocation
30 yr | | | | | | | | |
5.00% 11/1/33 | | | 2,765 | | | | 3,031 | |
5.00% 1/1/34 | | | 2,296 | | | | 2,518 | |
5.00% 11/1/34 | | | 5,107 | | | | 5,598 | |
5.00% 10/1/35 | | | 15,744 | | | | 17,245 | |
5.00% 1/1/36 | | | 20,579 | | | | 22,554 | |
Fannie Mae S.F. 15 yr | | | | | | | | |
2.50% 7/1/27 | | | 5,270 | | | | 5,378 | |
2.50% 10/1/27 | | | 37,753 | | | | 38,524 | |
2.50% 2/1/28 | | | 83,873 | | | | 85,583 | |
2.50% 5/1/28 | | | 12,916 | | | | 13,163 | |
3.50% 7/1/26 | | | 26,005 | | | | 27,542 | |
4.00% 4/1/24 | | | 16,702 | | | | 17,841 | |
4.00% 5/1/24 | | | 75,337 | | | | 80,508 | |
4.00% 5/1/25 | | | 23,478 | | | | 25,158 | |
4.00% 6/1/25 | | | 82,708 | | | | 88,589 | |
4.00% 11/1/25 | | | 84,369 | | | | 90,561 | |
4.00% 12/1/26 | | | 39,499 | | | | 42,217 | |
4.00% 5/1/27 | | | 82,968 | | | | 89,052 | |
4.00% 8/1/27 | | | 50,540 | | | | 54,130 | |
4.50% 1/1/20 | | | 7,206 | | | | 7,635 | |
5.00% 5/1/20 | | | 11,805 | | | | 12,608 | |
5.00% 7/1/20 | | | 2,334 | | | | 2,493 | |
5.00% 12/1/20 | | | 4,702 | | | | 5,023 | |
5.00% 5/1/21 | | | 2,075 | | | | 2,224 | |
5.00% 6/1/23 | | | 8,859 | | | | 9,581 | |
5.50% 5/1/20 | | | 196 | | | | 207 | |
5.50% 6/1/23 | | | 53,111 | | | | 58,535 | |
6.00% 8/1/22 | | | 33,496 | | | | 36,613 | |
Fannie Mae S.F. 15 yr TBA | | | | | | | | |
2.50% 12/1/29 | | | 384,000 | | | | 388,782 | |
Fannie Mae S.F. 20 yr | | | | | | | | |
3.00% 2/1/33 | | | 5,280 | | | | 5,406 | |
3.00% 8/1/33 | | | 14,706 | | | | 15,058 | |
3.00% 8/1/34 | | | 39,312 | | | | 40,034 | |
3.50% 9/1/33 | | | 21,602 | | | | 22,732 | |
4.00% 1/1/31 | | | 11,040 | | | | 11,845 | |
4.00% 2/1/31 | | | 30,571 | | | | 32,801 | |
5.00% 11/1/23 | | | 1,854 | | | | 2,053 | |
5.50% 8/1/28 | | | 63,981 | | | | 71,575 | |
5.50% 12/1/29 | | | 3,283 | | | | 3,669 | |
6.00% 12/1/21 | | | 2,964 | | | | 3,350 | |
6.00% 9/1/29 | | | 19,910 | | | | 22,506 | |
| | | | | | | | |
| | | Principal
amount° | | | Value (U.S.
$) | |
| |
Agency Mortgage-Backed Securities (continued) | |
| |
Fannie Mae S.F. 30 yr | | | | | | | | |
3.00% 7/1/42 | | | 32,075 | | | $ | 32,163 | |
3.00% 10/1/42 | | | 477,197 | | | | 478,372 | |
3.00% 12/1/42 | | | 73,718 | | | | 73,893 | |
3.00% 1/1/43 | | | 208,266 | | | | 208,713 | |
3.00% 2/1/43 | | | 22,879 | | | | 22,929 | |
3.00% 4/1/43 | | | 99,027 | | | | 99,232 | |
3.00% 5/1/43 | | | 57,668 | | | | 57,783 | |
3.50% 8/1/42 | | | 57,688 | | | | 59,801 | |
3.50% 1/1/43 | | | 357,547 | | | | 370,629 | |
4.00% 8/1/43 | | | 17,401 | | | | 18,554 | |
4.50% 7/1/36 | | | 9,157 | | | | 9,925 | |
4.50% 4/1/39 | | | 90,254 | | | | 98,031 | |
4.50% 11/1/40 | | | 25,821 | | | | 28,049 | |
4.50% 3/1/41 | | | 51,794 | | | | 56,260 | |
4.50% 4/1/41 | | | 96,928 | | | | 105,254 | |
4.50% 10/1/41 | | | 30,763 | | | | 33,366 | |
4.50% 11/1/41 | | | 27,485 | | | | 29,823 | |
4.50% 12/1/43 | | | 4,515 | | | | 4,912 | |
4.50% 5/1/44 | | | 19,861 | | | | 21,611 | |
5.00% 3/1/34 | | | 5,319 | | | | 5,904 | |
5.00% 2/1/35 | | | 57,085 | | | | 63,363 | |
5.00% 3/1/35 | | | 8,358 | | | | 9,281 | |
5.00% 6/1/35 | | | 9,215 | | | | 10,202 | |
5.00% 7/1/35 | | | 17,278 | | | | 19,169 | |
5.00% 10/1/35 | | | 39,790 | | | | 44,139 | |
5.00% 11/1/35 | | | 12,523 | | | | 13,896 | |
5.00% 4/1/37 | | | 10,802 | | | | 11,976 | |
5.00% 8/1/37 | | | 3,397 | | | | 3,769 | |
5.00% 2/1/38 | | | 11,155 | | | | 12,376 | |
5.50% 12/1/32 | | | 2,400 | | | | 2,700 | |
5.50% 4/1/34 | | | 8,444 | | | | 9,494 | |
5.50% 11/1/34 | | | 8,265 | | | | 9,285 | |
5.50% 12/1/34 | | | 73,563 | | | | 82,597 | |
5.50% 3/1/35 | | | 20,259 | | | | 22,751 | |
5.50% 5/1/35 | | | 14,511 | | | | 16,292 | |
5.50% 6/1/35 | | | 10,382 | | | | 11,662 | |
5.50% 12/1/35 | | | 9,088 | | | | 10,195 | |
5.50% 1/1/36 | | | 8,386 | | | | 9,420 | |
5.50% 4/1/36 | | | 4,782 | | | | 5,349 | |
5.50% 5/1/36 | | | 4,228 | | | | 4,742 | |
5.50% 7/1/36 | | | 3,477 | | | | 3,906 | |
5.50% 1/1/37 | | | 613 | | | | 688 | |
5.50% 2/1/37 | | | 31,910 | | | | 35,644 | |
5.50% 8/1/37 | | | 23,342 | | | | 26,206 | |
5.50% 1/1/38 | | | 793 | | | | 885 | |
5.50% 2/1/38 | | | 169,204 | | | | 188,969 | |
5.50% 4/1/38 | | | 125,759 | | | | 140,350 | |
5.50% 6/1/38 | | | 1,971 | | | | 2,198 | |
| | | | | | | | |
| | | Principal
amount° | | | Value (U.S.
$) | |
| |
Agency Mortgage-Backed Securities (continued) | |
| |
Fannie Mae S.F. 30 yr | | | | | | | | |
5.50% 9/1/38 | | | 33,675 | | | $ | 37,786 | |
5.50% 10/1/39 | | | 108,124 | | | | 120,614 | |
5.50% 11/1/39 | | | 76,621 | | | | 85,473 | |
5.50% 7/1/40 | | | 32,455 | | | | 36,228 | |
5.50% 9/1/41 | | | 13,573 | | | | 15,153 | |
6.00% 7/1/35 | | | 69,584 | | | | 79,259 | |
6.00% 6/1/36 | | | 4,020 | | | | 4,563 | |
6.00% 7/1/36 | | | 7,697 | | | | 8,751 | |
6.00% 12/1/36 | | | 5,036 | | | | 5,722 | |
6.00% 2/1/37 | | | 13,939 | | | | 15,822 | |
6.00% 6/1/37 | | | 2,510 | | | | 2,867 | |
6.00% 7/1/37 | | | 2,785 | | | | 3,166 | |
6.00% 8/1/37 | | | 31,704 | | | | 35,927 | |
6.00% 9/1/37 | | | 4,766 | | | | 5,405 | |
6.00% 11/1/37 | | | 6,223 | | | | 7,035 | |
6.00% 5/1/38 | | | 122,052 | | | | 138,060 | |
6.00% 7/1/38 | | | 1,789 | | | | 2,022 | |
6.00% 9/1/38 | | | 12,582 | | | | 14,224 | |
6.00% 10/1/38 | | | 51,660 | | | | 58,404 | |
6.00% 11/1/38 | | | 11,515 | | | | 13,074 | |
6.00% 1/1/39 | | | 21,867 | | | | 24,718 | |
6.00% 2/1/39 | | | 26,855 | | | | 30,535 | |
6.00% 9/1/39 | | | 186,900 | | | | 211,423 | |
6.00% 3/1/40 | | | 20,152 | | | | 22,780 | |
6.00% 4/1/40 | | | 11,163 | | | | 12,618 | |
6.00% 9/1/40 | | | 17,436 | | | | 19,769 | |
6.00% 11/1/40 | | | 7,353 | | | | 8,393 | |
6.00% 5/1/41 | | | 26,449 | | | | 29,970 | |
7.00% 12/1/33 | | | 9,055 | | | | 10,133 | |
7.00% 5/1/35 | | | 946 | | | | 1,054 | |
7.00% 6/1/35 | | | 2,314 | | | | 2,413 | |
7.00% 12/1/37 | | | 8,448 | | | | 9,033 | |
7.50% 6/1/31 | | | 1,412 | | | | 1,717 | |
7.50% 6/1/34 | | | 10,492 | | | | 12,057 | |
Fannie Mae S.F. 30 yr TBA | | | | | | | | |
3.00% 11/1/44 | | | 1,917,000 | | | | 1,917,299 | |
3.00% 12/1/44 | | | 2,017,000 | | | | 2,011,405 | |
3.50% 11/1/44 | | | 488,000 | | | | 504,622 | |
4.00% 11/1/44 | | | 2,318,000 | | | | 2,461,064 | |
4.00% 12/1/44 | | | 1,860,000 | | | | 1,969,529 | |
4.50% 11/1/44 | | | 2,157,000 | | | | 2,337,649 | |
4.50% 12/1/44 | | | 1,930,000 | | | | 2,087,416 | |
5.00% 11/1/44 | | | 42,000 | | | | 46,505 | |
Freddie Mac ARM | | | | | | | | |
2.316% 4/1/34 — | | | 2,437 | | | | 2,589 | |
2.526% 1/1/44 — | | | 127,636 | | | | 131,002 | |
Freddie Mac Relocation 30 yr | | | | | | | | |
5.00% 9/1/33 | | | 2,071 | | | | 2,271 | |
Schedules of investments
Delaware Pooled® Trust — The Core Plus Fixed Income Portfolio
| | | | | | | | |
| | | Principal
amount° | | | Value (U.S. $) | |
| |
Agency Mortgage-Backed Securities (continued) | |
| |
Freddie Mac S.F. 15 yr | | | | | | | | |
4.00% 12/1/24 | | | 14,485 | | | $ | 15,443 | |
4.00% 5/1/25 | | | 7,447 | | | | 7,960 | |
4.00% 8/1/25 | | | 19,099 | | | | 20,416 | |
4.00% 4/1/26 | | | 21,144 | | | | 22,633 | |
4.50% 8/1/24 | | | 37,725 | | | | 40,162 | |
4.50% 7/1/25 | | | 7,503 | | | | 7,983 | |
4.50% 6/1/26 | | | 17,628 | | | | 18,764 | |
Freddie Mac S.F. 20 yr | | | | | | | | |
3.50% 1/1/34 | | | 56,546 | | | | 59,101 | |
Freddie Mac S.F. 30 yr | | | | | | | | |
3.00% 10/1/42 | | | 32,969 | | | | 33,125 | |
3.00% 11/1/42 | | | 28,082 | | | | 28,303 | |
4.50% 10/1/39 | | | 13,735 | | | | 14,881 | |
4.50% 3/1/42 | | | 120,478 | | | | 130,582 | |
5.50% 3/1/34 | | | 4,905 | | | | 5,511 | |
5.50% 12/1/34 | | | 4,616 | | | | 5,204 | |
5.50% 9/1/35 | | | 81,172 | | | | 91,086 | |
5.50% 11/1/35 | | | 9,171 | | | | 10,265 | |
5.50% 6/1/36 | | | 3,037 | | | | 3,400 | |
5.50% 11/1/36 | | | 7,026 | | | | 7,854 | |
5.50% 12/1/36 | | | 1,636 | | | | 1,824 | |
5.50% 6/1/38 | | | 4,008 | | | | 4,474 | |
5.50% 3/1/40 | | | 17,301 | | | | 19,306 | |
5.50% 8/1/40 | | | 57,611 | | | | 64,256 | |
5.50% 1/1/41 | | | 17,976 | | | | 20,054 | |
5.50% 6/1/41 | | | 56,631 | | | | 63,173 | |
6.00% 2/1/36 | | | 10,446 | | | | 11,897 | |
6.00% 1/1/38 | | | 7,136 | | | | 8,053 | |
6.00% 6/1/38 | | | 18,980 | | | | 21,436 | |
6.00% 8/1/38 | | | 25,994 | | | | 29,435 | |
6.00% 5/1/40 | | | 7,769 | | | | 8,768 | |
7.00% 11/1/33 | | | 1,307 | | | | 1,541 | |
GNMA I S.F. 30 yr | | | | | | | | |
5.00% 6/15/40 | | | 10,624 | | | | 11,763 | |
7.00% 12/15/34 | | | 163,630 | | | | 193,213 | |
7.50% 12/15/31 | | | 369 | | | | 442 | |
7.50% 2/15/32 | | | 376 | | | | 456 | |
| | | | | | | | |
| |
Total Agency Mortgage-Backed
Securities
(cost $19,710,884) | | | | 19,939,730 | |
| | | | | | | | |
|
| |
Agency Obligation – 0.12% | |
| |
Tennessee Valley Authority | | | | | | | | |
2.875% 9/15/24 | | | 90,000 | | | | 90,308 | |
| | | | | | | | |
| | |
Total Agency Obligation
(cost $89,046) | | | | | | | 90,308 | |
| | | | | | | | |
| | | | | | | | |
| | | Principal
amount° | | | Value
(U.S. $) | |
| |
Commercial Mortgage-Backed Securities – 4.48% | |
| |
Banc of America Commercial Mortgage Trust | | | | | | | | |
Series 2007-4 AM 5.821% 2/10/51 · | | | 60,000 | | | $ | 65,764 | |
CD1 Commercial Mortgage Trust | | | | | | | | |
Series 2005-CD1 AM 5.226% 7/15/44 · | | | 60,000 | | | | 61,890 | |
Series 2005-CD1 C 5.226% 7/15/44 · | | | 20,000 | | | | 20,463 | |
Citigroup Commercial Mortgage Trust | | | | | | | | |
Series 2014-GC23 AS 3.863% 7/10/47 | | | 30,000 | | | | 30,738 | |
Series 2014-GC25 A4 3.635% 10/10/47 | | | 100,000 | | | | 102,640 | |
Commercial Mortgage Pass Through Certificates | | | | | | | | |
Series 2014-CR19 A5 3.796% 8/10/47 w | | | 40,000 | | | | 41,617 | |
Series 2014-CR20 A4 3.59% 11/10/47 w | | | 40,000 | | | | 41,022 | |
Series 2014-CR20 AM 3.938% 11/10/47 w | | | 30,000 | | | | 30,797 | |
Credit Suisse Commercial Mortgage Trust | | | | | | | | |
Series 2006-C1 AAB 5.463% 2/15/39 · | | | 22,035 | | | | 22,157 | |
DB-UBS Mortgage Trust | | | | | | | | |
Series 2011-LC1A A3 144A 5.002% 11/10/46 # Series 2011-LC1A A3 144A | | | 300,000 | | | | 338,356 | |
Series 2011-LC1A C 144A 5.557% 11/10/46 #· | | | 100,000 | | | | 112,556 | |
FREMF Mortgage Trust | | | | | | | | |
Series 2011-K10 B 144A 4.615% 11/25/49 #· | | | 140,000 | | | | 150,357 | |
Series 2011-K15 144A 4.931% 8/25/44 #· | | | 45,000 | | | | 49,114 | |
Series 2011-K702 B 144A 4.77% 4/25/44 #· | | | 20,000 | | | | 21,411 | |
Series 2011-K703 144A 4.884% 7/25/44 #· | | | 55,000 | | | | 59,100 | |
Series 2012-K19 B 144A 4.036% 5/25/45 #· | | | 15,000 | | | | 15,486 | |
Series 2012-K22 B 144A 3.686% 8/25/45 #· | | | 60,000 | | | | 60,254 | |
Series 2012-K708 B 144A 3.759% 2/25/45 #· | | | 150,000 | | | | 155,010 | |
Series 2013-K33 B 144A 3.504% 8/25/46 #· | | | 45,000 | | | | 44,103 | |
64
| | | | | | | | |
| | | Principal
amount° | | | Value
(U.S. $) | |
| |
Commercial Mortgage-Backed Securities (continued) | |
| |
FREMF Mortgage Trust | | | | | | | | |
Series 2013-K712 B 144A | | | | | | | | |
3.368% 5/25/45 #· | | | 195,000 | | | $ | 196,620 | |
Series 2013-K713 B 144A | | | | | | | | |
3.165% 4/25/46 #· | | | 110,000 | | | | 109,508 | |
Series 2014-K716 B 144A | | | | | | | | |
3.954% 8/25/47 #· | | | 35,000 | | | | 35,827 | |
Goldman Sachs Mortgage Securities II | | | | | | | | |
Series 2005-GG4 A4A | | | | | | | | |
4.751% 7/10/39 | | | 47,045 | | | | 47,338 | |
Goldman Sachs Mortgage Securities Trust | | | | | | | | |
Series 2006-GG6 A4 | | | | | | | | |
5.552% 4/10/38 · | | | 55,000 | | | | 57,073 | |
Series 2010-C1 C 144A | | | | | | | | |
5.635% 8/10/43 #· | | | 100,000 | | | | 109,211 | |
Grace Mortgage Trust | | | | | | | | |
Series 2014-GRCE A 144A | | | | | | | | |
3.369% 6/10/28 # | | | 200,000 | | | | 206,066 | |
Hilton USA Trust | | | | | | | | |
Series 2013-HLT AFX 144A | | | | | | | | |
2.662% 11/5/30 # | | | 235,000 | | | | 236,340 | |
Series 2013-HLT BFX 144A | | | | | | | | |
3.367% 11/5/30 # | | | 200,000 | | | | 201,727 | |
JPMBB Commercial Mortgage Securities Trust | | | | | | | | |
Series 2014-C18 A1 | | | | | | | | |
1.254% 2/15/47 | | | 44,966 | | | | 44,904 | |
Series 2014-C21 AS | | | | | | | | |
3.997% 8/15/47 | | | 30,000 | | | | 30,985 | |
Series 2014-C22 B | | | | | | | | |
4.562% 9/15/47 • | | | 40,000 | | | | 42,098 | |
JPMorgan Chase Commercial Mortgage Securities Trust | | | | | | | | |
Series 2005-CB11 E | | | | | | | | |
5.468% 8/12/37 · | | | 20,000 | | | | 21,526 | |
Series 2005-LDP5 D | | | | | | | | |
5.391% 12/15/44 · | | | 40,000 | | | | 41,274 | |
Series 2006-LDP8 AM | | | | | | | | |
5.44% 5/15/45 | | | 120,000 | | | | 127,946 | |
Series 2011-C5 B 144A | | | | | | | | |
5.323% 8/15/46 #· | | | 100,000 | | | | 113,422 | |
Lehman Brothers-UBS Commercial Mortgage Trust | | | | | | | | |
Series 2004-C1 A4 | | | | | | | | |
4.568% 1/15/31 | | | 3,963 | | | | 4,063 | |
Series 2006-C6 AJ | | | | | | | | |
5.452% 9/15/39 · | | | 65,000 | | | | 68,366 | |
| | | | | | | | |
| | | Principal
amount° | | | Value
(U.S. $) | |
| |
Commercial Mortgage-Backed Securities (continued) | |
| |
Lehman Brothers-UBS Commercial Mortgage Trust | | | | | | | | |
Series 2006-C6 AM | | | | | | | | |
5.413% 9/15/39 | | | 75,000 | | | $ | 80,384 | |
Morgan Stanley Bank of America Merrill Lynch Trust | | | | | | | | |
Series 2014-C18 A4 | | | | | | | | |
3.923% 10/15/47 | | | 55,000 | | | | 57,856 | |
Morgan Stanley Capital I Trust | | | | | | | | |
Series 2005-HQ7 AJ | | | | | | | | |
5.207% 11/14/42 · | | | 55,000 | | | | 56,510 | |
Series 2006-T21 AM | | | | | | | | |
5.204% 10/12/52 · | | | 55,000 | | | | 57,216 | |
TimberStar Trust 1 | | | | | | | | |
Series 2006-1A A 144A | | | | | | | | |
5.668% 10/15/36 # | | | 25,000 | | | | 26,847 | |
WF-RBS Commercial Mortgage Trust | | | | | | | | |
Series 2014-C23 A5 | | | | | | | | |
3.917% 10/15/57 | | | 50,000 | | | | 52,602 | |
| | | | | | | | |
| | |
Total Commercial Mortgage-Backed Securities
(cost $3,456,645) | | | | | | | 3,448,544 | |
| | | | | | | | |
|
| |
Convertible Bonds – 0.27% | |
| |
Alaska Communications | | | | | | | | |
Systems Group 6.25%exercise price $10.28,expiration date 4/27/18 | | | 7,000 | | | | 5,670 | |
Ares Capital 5.75% exercise price $19.13, expiration date 2/1/16 | | | 7,000 | | | | 7,306 | |
ArvinMeritor 4.00% exercise price $26.73, expiration date 2/12/27 f | | | 14,000 | | | | 14,560 | |
BGC Partners 4.50% exercise price $9.84, expiration date 7/13/16 | | | 10,000 | | | | 10,687 | |
Blucora 4.25% exercise price $21.66, expiration date 3/29/19 | | | 3,000 | | | | 3,096 | |
Chesapeake Energy 2.50% exercise price $47.77, expiration date 5/15/37 | | | 3,000 | | | | 2,989 | |
Ciena 144A 3.75% exercise price $20.17, expiration date 10/15/18 # | | | 7,000 | | | | 8,146 | |
Equinix 4.75% exercise price $84.32, expiration date 6/13/16 | | | 1,000 | | | | 2,598 | |
Schedules of investments
Delaware Pooled® Trust — The Core Plus Fixed Income Portfolio
| | | | | | | | |
| | | Principal
amount° | | | Value
(U.S. $) | |
| |
Convertible Bonds (continued) | |
| |
General Cable 4.50% exercise price $35.33, expiration date 11/15/29 f | | | 12,000 | | | $ | 7,973 | |
Gilead Sciences 1.625% exercise price $22.71, expiration date 4/29/16 | | | 4,000 | | | | 19,683 | |
Helix Energy Solutions Group 3.25% exercise | | | | | | | | |
price $25.02, expiration
date 3/12/32 | | | 6,000 | | | | 7,620 | |
Hologic 2.00% exercise price
$31.17, expiration
date 2/27/42 f | | | 7,000 | | | | 7,639 | |
Illumina 0.25% exercise
price $83.55, expiration
date 3/11/16 | | | 4,000 | | | | 9,230 | |
Intel 3.25% exercise price | | | | | | | | |
$21.71, expiration date | | | | | | | | |
8/1/39 | | | 6,000 | | | | 9,964 | |
Jefferies Group 3.875%exercise price
$45.19, expiration
date 10/31/29 | | | 8,000 | | | | 8,375 | |
Lexington Realty Trust 144A | | | | | | | | |
6.00% exercise price | | | | | | | | |
$6.68, expiration date | | | | | | | | |
1/11/30 # | | | 3,000 | | | | 4,854 | |
Liberty Interactive 0.75% exercise price $1,000.00, expiration date 3/30/43 | | | 7,000 | | | | 9,651 | |
MGM Resorts International | | | | | | | | |
4.25% exercise price | | | | | | | | |
$18.58, expiration date | | | | | | | | |
4/10/15 | | | 4,000 | | | | 5,140 | |
Mylan 3.75% exercise | | | | | | | | |
price $13.32, expiration | | | | | | | | |
date 9/15/15 | | | 2,000 | | | | 8,050 | |
Nuance Communications | | | | | | | | |
2.75% exercise price | | | | | | | | |
$32.30, expiration | | | | | | | | |
date 11/1/31 | | | 9,000 | | | | 8,826 | |
NuVasive 2.75% exercise
price $42.13, expiration
date 6/30/17 | | | 16,000 | | | | 19,310 | |
Peabody Energy 4.75%
exercise price $57.62,
expiration date 12/15/41 | | | 5,000 | | | | 3,338 | |
SanDisk 1.50% exercise
price $51.36, expiration
date 8/11/17 | | | 9,000 | | | | 17,128 | |
Titan Machinery 3.75%
exercise price $43.17,
expiration date 4/30/19 | | | 7,000 | | | | 5,399 | |
| | | | | | | | |
| | | Principal
amount° | | | Value
(U.S. $) | |
| |
Convertible Bonds (continued) | |
| |
Vector Group 2.50% exercise price $16.78, expiration date 1/14/19 • | | | 2,000 | | | $ | 2,866 | |
| | | | | | | | |
| |
Total Convertible Bonds
(cost $173,568) | | | | 210,098 | |
| | | | | | | | |
|
| |
Corporate Bonds – 46.16% | |
| |
Banking – 5.28% | | | | | | | | |
Bank of America | | | | | | | | |
4.25% 10/22/26 | | | 305,000 | | | | 303,442 | |
6.25% 9/29/49 • | | | 95,000 | | | | 95,356 | |
BB&T 5.25% 11/1/19 | | | 337,000 | | | | 380,490 | |
BBVA Banco Continental 144A | | | | | | | | |
5.00% 8/26/22 # | | | 40,000 | | | | 42,260 | |
BBVA Bancomer 144A | | | | | | | | |
7.25% 4/22/20 # | | | 100,000 | | | | 114,310 | |
City National 5.25% 9/15/20 | | | 70,000 | | | | 78,171 | |
Credit Suisse Group 144A | | | | | | | | |
6.25% 12/29/49 #• | | | 200,000 | | | | 195,100 | |
Export-Import Bank of China 144A | | | | | | | | |
2.50% 7/31/19 # | | | 200,000 | | | | 200,304 | |
Goldman Sachs Group | | | | | | | | |
6.15% 4/1/18 | | | 195,000 | | | | 220,453 | |
JPMorgan Chase | | | | | | | | |
3.875% 9/10/24 | | | 170,000 | | | | 169,100 | |
6.75% 1/29/49 • | | | 65,000 | | | | 68,809 | |
KeyBank 5.45% 3/3/16 | | | 250,000 | | | | 265,149 | |
Lloyds Banking Group | | | | | | | | |
7.50% 4/30/49 • | | | 200,000 | | | | 208,500 | |
Morgan Stanley | | | | | | | | |
4.35% 9/8/26 | | | 185,000 | | | | 185,758 | |
Northern Trust | | | | | | | | |
3.95% 10/30/25 | | | 40,000 | | | | 41,667 | |
Oversea-Chinese Banking 144A | | | | | | | | |
4.00% 10/15/24 #• | | | 200,000 | | | | 203,944 | |
PNC Bank 6.875% 4/1/18 | | | 250,000 | | | | 289,982 | |
PNC Preferred Funding Trust II 144A 1.457% 3/29/49 #• | | | 100,000 | | | | 96,125 | |
Santander Holdings USA | | | | | | | | |
3.45% 8/27/18 | | | 45,000 | | | | 46,988 | |
State Street 3.10% 5/15/23 | | | 75,000 | | | | 72,751 | |
SunTrust Banks | | | | | | | | |
2.35% 11/1/18 | | | 75,000 | | | | 75,546 | |
US Bancorp 3.60% 9/11/24 | | | 40,000 | | | | 40,328 | |
USB Capital IX | | | | | | | | |
3.50% 10/29/49 — | | | 355,000 | | | | 290,284 | |
66
| | | | | | | | |
| | | Principal
amount° | | | Value
(U.S. $) | |
| |
Corporate Bonds (continued) | | | | | | | | |
| |
Banking (continued) | | | | | | | | |
Wells Fargo | | | | | | | | |
4.10% 6/3/26 | | | 210,000 | | | $ | 213,291 | |
4.65% 11/4/44 | | | 115,000 | | | | 115,084 | |
Zions Bancorp | | | | | | | | |
4.50% 6/13/23 | | | 55,000 | | | | 57,926 | |
| | | | | | | | |
| | |
| | | | | | | 4,071,118 | |
| | | | | | | | |
Basic Industry – 3.43% | |
ArcelorMittal 10.35% 6/1/19 | | | 90,000 | | | | 111,487 | |
Celanese U.S. Holdings | | | | | | | | |
4.625% 11/15/22 | | | 70,000 | | | | 70,875 | |
CF Industries | | | | | | | | |
5.15% 3/15/34 | | | 120,000 | | | | 128,146 | |
5.375% 3/15/44 | | | 95,000 | | | | 101,433 | |
7.125% 5/1/20 | | | 125,000 | | | | 150,469 | |
Dow Chemical | | | | | | | | |
3.50% 10/1/24 | | | 145,000 | | | | 143,200 | |
4.25% 10/1/34 | | | 40,000 | | | | 38,843 | |
8.55% 5/15/19 | | | 209,000 | | | | 263,489 | |
FMG Resources August 2006 144A | | | | | | | | |
6.875% 4/1/22 # | | | 105,000 | | | | 108,806 | |
Georgia-Pacific | | | | | | | | |
8.00% 1/15/24 | | | 150,000 | | | | 202,877 | |
Gerdau Holdings 144A | | | | | | | | |
7.00% 1/20/20 # | | | 100,000 | | | | 114,120 | |
International Paper | | | | | | | | |
4.80% 6/15/44 | | | 15,000 | | | | 14,823 | |
6.00% 11/15/41 | | | 15,000 | | | | 17,348 | |
Monsanto 4.40% 7/15/44 | | | 315,000 | | | | 318,851 | |
Mosaic 5.625% 11/15/43 | | | 220,000 | | | | 249,188 | |
Novelis 8.75% 12/15/20 | | | 65,000 | | | | 71,256 | |
OCP 144A 5.625% 4/25/24 # | | | 200,000 | | | | 210,290 | |
Rock-Tenn 3.50% 3/1/20 | | | 70,000 | | | | 71,626 | |
Rockwood Specialties Group | | | | | | | | |
4.625% 10/15/20 | | | 30,000 | | | | 31,433 | |
Weyerhaeuser | | | | | | | | |
4.625% 9/15/23 | | | 150,000 | | | | 159,871 | |
Yamana Gold 144A | | | | | | | | |
4.95% 7/15/24 # | | | 65,000 | | | | 63,696 | |
| | | | | | | | |
| | |
| | | | | | | 2,642,127 | |
| | | | | | | | |
Brokerage – 0.43% | |
Jefferies Group | | | | | | | | |
5.125% 1/20/23 | | | 70,000 | | | | 74,303 | |
6.45% 6/8/27 | | | 30,000 | | | | 34,117 | |
6.50% 1/20/43 | | | 15,000 | | | | 16,866 | |
| | | | | | | | |
| | | Principal
amount° | | | Value
(U.S. $) | |
| |
Corporate Bonds (continued) | | | | | | | | |
| |
Brokerage (continued) | | | | | | | | |
Lazard Group | | | | | | | | |
6.85% 6/15/17 | | | 184,000 | | | $ | 207,399 | |
| | | | | | | | |
| | |
| | | | | | | 332,685 | |
| | | | | | | | |
Capital Goods – 1.33% | | | | | | | | |
Algeco Scotsman Global Finance | | | | | | | | |
144A 8.50% 10/15/18 # | | | 265,000 | | | | 276,925 | |
144A 10.75% 10/15/19 # | | | 200,000 | | | | 198,000 | |
Ball 5.75% 5/15/21 | | | 85,000 | | | | 89,569 | |
Crane | | | | | | | | |
2.75% 12/15/18 | | | 20,000 | | | | 20,364 | |
4.45% 12/15/23 | | | 95,000 | | | | 100,822 | |
Ingersoll-Rand Global Holding | | | | | | | | |
4.25% 6/15/23 | | | 145,000 | | | | 152,635 | |
Ingersoll-Rand Luxembourg | | | | | | | | |
Finance 3.55% 11/1/24 | | | 70,000 | | | | 69,216 | |
Textron 3.875% 3/1/25 | | | 35,000 | | | | 35,133 | |
Trinity Industries | | | | | | | | |
4.55% 10/1/24 | | | 80,000 | | | | 78,064 | |
| | | | | | | | |
| | |
| | | | | | | 1,020,728 | |
| | | | | | | | |
Communications – 7.33% | | | | | | | | |
America Movil | | | | | | | | |
5.00% 3/30/20 | | | 105,000 | | | | 116,272 | |
American Tower Trust I 144A | | | | | | | | |
3.07% 3/15/23 # | | | 65,000 | | | | 64,635 | |
Bharti Airtel International Netherlands 144A | | | | | | | | |
5.35% 5/20/24 # | | | 200,000 | | | | 215,936 | |
British Sky Broadcasting
Group 144A | | | | | | | | |
3.75% 9/16/24 # | | | 200,000 | | | | 201,062 | |
CC Holdings GS V | | | | | | | | |
3.849% 4/15/23 | | | 65,000 | | | | 64,786 | |
CenturyLink 5.80% 3/15/22 | | | 70,000 | | | | 74,550 | |
Columbus International 144A | | | | | | | | |
7.375% 3/30/21 # | | | 200,000 | | | | 212,750 | |
Comcast | | | | | | | | |
3.375% 2/15/25 | | | 245,000 | | | | 247,544 | |
4.20% 8/15/34 | | | 55,000 | | | | 55,697 | |
4.75% 3/1/44 | | | 25,000 | | | | 26,971 | |
Crown Castle Towers 144A | | | | | | | | |
4.883% 8/15/20 # | | | 275,000 | | | | 304,265 | |
Digicel Group 144A | | | | | | | | |
8.25% 9/30/20 # | | | 100,000 | | | | 105,000 | |
DIRECTV Holdings | | | | | | | | |
4.45% 4/1/24 | | | 220,000 | | | | 229,974 | |
5.15% 3/15/42 | | | 20,000 | | | | 20,397 | |
Schedules of investments
Delaware Pooled® Trust — The Core Plus Fixed Income Portfolio
| | | | | | | | |
| | | Principal
amount° | | | Value
(U.S. $) | |
| |
Corporate Bonds (continued) | |
| |
Communications (continued) | |
DISH DBS | | | | | | | | |
5.00% 3/15/23 | | | 295,000 | | | $ | 294,631 | |
7.875% 9/1/19 | | | 50,000 | | | | 58,187 | |
Intelsat Luxembourg | | | | | | | | |
8.125% 6/1/23 | | | 765,000 | | | | 816,637 | |
Mobile Telesystems 144A | | | | | | | | |
8.625% 6/22/20 # | | | 100,000 | | | | 109,290 | |
Omnicom Group | | | | | | | | |
3.65% 11/1/24 | | | 210,000 | | | | 209,043 | |
Orange 5.50% 2/6/44 | | | 20,000 | | | | 22,236 | |
SBA Tower Trust | | | | | | | | |
144A 2.24%
4/16/18 # | | | 45,000 | | | | 44,709 | |
144A 2.898% 10/15/19 # | | | 60,000 | | | | 60,159 | |
SES 144A 3.60% 4/4/23 # | | | 165,000 | | | | 168,626 | |
SES Global Americas Holdings 144A | | | | | | | | |
5.30% 3/25/44 # | | | 120,000 | | | | 130,584 | |
Sinclair Television Group | | | | | | | | |
6.125% 10/1/22 | | | 115,000 | | | | 119,600 | |
Sprint 144A | | | | | | | | |
7.125% 6/15/24 # | | | 100,000 | | | | 103,125 | |
Sprint Communications | | | | | | | | |
6.00% 12/1/16 | | | 55,000 | | | | 58,334 | |
6.00% 11/15/22 | | | 145,000 | | | | 145,181 | |
Telefonica Emisiones | | | | | | | | |
4.57% 4/27/23 | | | 150,000 | | | | 158,862 | |
6.421% 6/20/16 | | | 50,000 | | | | 54,272 | |
Telemar Norte Leste 144A | | | | | | | | |
5.50% 10/23/20 # | | | 100,000 | | | | 98,500 | |
Time Warner Cable | | | | | | | | |
4.00% 9/1/21 | | | 55,000 | | | | 58,324 | |
8.25% 4/1/19 | | | 175,000 | | | | 217,521 | |
UPCB Finance III 144A | | | | | | | | |
6.625% 7/1/20 # | | | 150,000 | | | | 158,625 | |
Verizon Communications | | | | | | | | |
3.00% 11/1/21 | | | 365,000 | | | | 362,769 | |
4.40% 11/1/34 | | | 115,000 | | | | 112,670 | |
5.15% 9/15/23 | | | 65,000 | | | | 72,845 | |
WPP Finance 2010 | | | | | | | | |
5.625% 11/15/43 | | | 65,000 | | | | 72,523 | |
| | | | | | | | |
| | |
| | | | | | | 5,647,092 | |
| | | | | | | | |
Consumer Cyclical – 2.97% | |
Bed Bath & Beyond | | | | | | | | |
4.915% 8/1/34 | | | 85,000 | | | | 84,668 | |
5.165% 8/1/44 | | | 65,000 | | | | 65,087 | |
Delphi 4.15% 3/15/24 | | | 95,000 | | | | 97,651 | |
Expedia 4.50% 8/15/24 | | | 55,000 | | | | 55,062 | |
| | | | | | | | |
| | | Principal
amount° | | | Value
(U.S. $) | |
| |
Corporate Bonds (continued) | |
| |
Consumer Cyclical (continued) | |
Ford Motor Credit | | | | | | | | |
3.664% 9/8/24 | | | 225,000 | | | $ | 224,146 | |
General Motors | | | | | | | | |
3.50% 10/2/18 | | | 50,000 | | | | 51,750 | |
General Motors Financial | | | | | | | | |
3.00% 9/25/17 | | | 65,000 | | | | 66,381 | |
4.375% 9/25/21 | | | 65,000 | | | | 68,175 | |
Host Hotels & Resorts | | | | | | | | |
3.75% 10/15/23 | | | 105,000 | | | | 104,171 | |
4.75% 3/1/23 | | | 75,000 | | | | 79,405 | |
5.875% 6/15/19 | | | 40,000 | | | | 42,153 | |
Hyundai Capital America 144A | | | | | | | | |
2.55% 2/6/19 # | | | 75,000 | | | | 75,652 | |
International Game Technology | | | | | | | | |
5.35% 10/15/23 | | | 110,000 | | | | 112,186 | |
INVISTA Finance 144A | | | | | | | | |
4.25% 10/15/19 # | | | 80,000 | | | | 80,700 | |
Magna International | | | | | | | | |
3.625% 6/15/24 | | | 115,000 | | | | 116,323 | |
Marriott International | | | | | | | | |
3.375% 10/15/20 | | | 50,000 | | | | 51,725 | |
QVC | | | | | | | | |
4.375% 3/15/23 | | | 95,000 | | | | 94,405 | |
144A 5.45%
8/15/34 # | | | 120,000 | | | | 116,384 | |
Signet UK Finance | | | | | | | | |
4.70% 6/15/24 | | | 105,000 | | | | 106,988 | |
Starwood Hotels & Resorts Worldwide | | | | | | | | |
3.75% 3/15/25 | | | 60,000 | | | | 60,327 | |
4.50% 10/1/34 | | | 35,000 | | | | 34,119 | |
TRW Automotive 144A | | | | | | | | |
4.45% 12/1/23 # | | | 180,000 | | | | 180,450 | |
Viacom | | | | | | | | |
3.25% 3/15/23 | | | 205,000 | | | | 198,413 | |
3.875% 4/1/24 | | | 45,000 | | | | 45,105 | |
Wyndham Worldwide | | | | | | | | |
4.25% 3/1/22 | | | 30,000 | | | | 30,320 | |
5.625% 3/1/21 | | | 40,000 | | | | 44,769 | |
| | | | | | | | |
| | |
| | | | | | | 2,286,515 | |
| | | | | | | | |
Consumer Non-Cyclical – 5.30% | |
Amgen 3.625% 5/22/24 | | | 65,000 | | | | 65,156 | |
Bayer U.S. Finance 144A | | | | | | | | |
3.375% 10/8/24 # | | | 200,000 | | | | 201,006 | |
Boston Scientific | | | | | | | | |
2.65% 10/1/18 | | | 55,000 | | | | 55,625 | |
6.00% 1/15/20 | | | 85,000 | | | | 97,602 | |
68
| | | | | | | | |
| | | Principal
amount° | | | Value
(U.S. $) | |
| |
Corporate Bonds (continued) | |
| |
Consumer Non-Cyclical (continued) | |
CareFusion 6.375% 8/1/19 | | | 120,000 | | | $ | 139,408 | |
CDK Global 144A
4.50% 10/15/24 # | | | 80,000 | | | | 79,808 | |
Celgene | | | | | | | | |
3.25% 8/15/22 | | | 225,000 | | | | 226,072 | |
3.95% 10/15/20 | | | 85,000 | | | | 90,348 | |
Community Health Systems
7.125% 7/15/20 | | | 470,000 | | | | 509,363 | |
Constellation Brands
4.25% 5/1/23 | | | 20,000 | | | | 20,150 | |
Express Scripts Holding | | | | | | | | |
2.25% 6/15/19 | | | 60,000 | | | | 59,716 | |
3.50% 6/15/24 | | | 140,000 | | | | 139,036 | |
Forest Laboratories 144A
4.375% 2/1/19 # | | | 90,000 | | | | 94,362 | |
Gilead Sciences
3.70% 4/1/24 | | | 110,000 | | | | 113,322 | |
JBS Investments 144A
7.75% 10/28/20 # | | | 200,000 | | | | 220,126 | |
McKesson
3.796% 3/15/24 | | | 325,000 | | | | 331,051 | |
Mylan 144A
6.00% 11/15/18 # | | | 120,000 | | | | 123,630 | |
Pernod-Ricard 144A
5.75% 4/7/21 # | | | 150,000 | | | | 171,856 | |
Perrigo
4.00% 11/15/23 | | | 200,000 | | | | 204,845 | |
Quest Diagnostics
2.70% 4/1/19 | | | 45,000 | | | | 45,573 | |
Sysco | | | | | | | | |
3.50% 10/2/24 | | | 85,000 | | | | 86,432 | |
4.35% 10/2/34 | | | 95,000 | | | | 97,891 | |
Thermo Fisher Scientific
2.40% 2/1/19 | | | 385,000 | | | | 387,571 | |
Zimmer Holdings
4.625% 11/30/19 | | | 120,000 | | | | 131,729 | |
Zoetis
3.25% 2/1/23 | | | 395,000 | | | | 392,025 | |
| | | | | | | | |
| | |
| | | | | | | 4,083,703 | |
| | | | | | | | |
Electric – 5.80% | | | | | | | | |
AES
7.375% 7/1/21 | | | 110,000 | | | | 126,053 | |
AES Gener 144A
5.25% 8/15/21 # | | | 200,000 | | | | 213,981 | |
Ameren Illinois
9.75% 11/15/18 | | | 295,000 | | | | 381,939 | |
American Electric Power
2.95% 12/15/22 | | | 30,000 | | | | 29,394 | |
American Transmission Systems 144A
5.25% 1/15/22 # | | | 50,000 | | | | 56,010 | |
Berkshire Hathaway Energy
3.75% 11/15/23 | | | 345,000 | | | | 357,991 | |
| | | | | | | | |
| | | Principal
amount° | | | Value
(U.S. $) | |
| |
Corporate Bonds (continued) | |
| |
Electric (continued) | |
CenterPoint Energy
5.95% 2/1/17 | | | 5,000 | | | $ | 5,516 | |
Cleveland Electric Illuminating
5.50% 8/15/24 | | | 75,000 | | | | 87,631 | |
CMS Energy
6.25% 2/1/20 | | | 35,000 | | | | 41,281 | |
ComEd Financing III
6.35% 3/15/33 | | | 60,000 | | | | 61,950 | |
Dominion Gas Holdings
3.55% 11/1/23 | | | 30,000 | | | | 30,779 | |
DTE Energy
3.50% 6/1/24 | | | 30,000 | | | | 30,476 | |
Electricite de France | | | | | | | | |
144A 4.60% 1/27/20 # | | | 45,000 | | | | 50,065 | |
144A 5.25% 1/29/49 #• | | | 200,000 | | | | 208,000 | |
Enel 144A
8.75% 9/24/73 #• | | | 400,000 | | | | 469,000 | |
Entergy Louisiana
4.05% 9/1/23 | | | 315,000 | | | | 337,557 | |
Great Plains Energy | | | | | | | | |
4.85% 6/1/21 | | | 35,000 | | | | 38,957 | |
5.292% 6/15/22 | | | 60,000 | | | | 69,052 | |
Indiana Michigan Power
3.20% 3/15/23 | | | 10,000 | | | | 10,047 | |
Integrys Energy Group
6.11% 12/1/66 • | | | 90,000 | | | | 91,619 | |
IPALCO Enterprises
5.00% 5/1/18 | | | 35,000 | | | | 37,275 | |
ITC Holdings
3.65% 6/15/24 | | | 100,000 | | | | 101,213 | |
LG&E & KU Energy | | | | | | | | |
3.75% 11/15/20 | | | 70,000 | | | | 73,333 | |
4.375% 10/1/21 | | | 165,000 | | | | 179,432 | |
Metropolitan Edison 144A
4.00% 4/15/25 # | | | 110,000 | | | | 111,334 | |
National Rural Utilities Cooperative Finance
4.75% 4/30/43 • | | | 70,000 | | | | 69,497 | |
NextEra Energy Capital Holdings
3.625% 6/15/23 | | | 290,000 | | | | 295,808 | |
NV Energy
6.25% 11/15/20 | | | 75,000 | | | | 88,650 | |
Pennsylvania Electric
5.20% 4/1/20 | | | 140,000 | | | | 155,913 | |
Public Service of New Hampshire
3.50% 11/1/23 | | | 45,000 | | | | 46,564 | |
Public Service of Oklahoma
5.15% 12/1/19 | | | 325,000 | | | | 365,190 | |
Puget Energy
6.00% 9/1/21 | | | 30,000 | | | | 34,883 | |
SCANA
4.125% 2/1/22 | | | 95,000 | | | | 99,042 | |
Schedules of investments
Delaware Pooled® Trust — The Core Plus Fixed Income Portfolio
| | | | | | | | |
| | | Principal
amount° | | | Value
(U.S. $) | |
| |
Corporate Bonds (continued) | |
| |
Electric (continued) | | | | | | | | |
Wisconsin Energy
6.25% 5/15/67 • | | | 110,000 | | | $ | 111,990 | |
| | | | | | | | |
| | |
| | | | | | | 4,467,422 | |
| | | | | | | | |
Energy – 4.53% | | | | | | | | |
Anadarko Petroleum
3.45% 7/15/24 | | | 65,000 | | | | 64,206 | |
BP Capital Markets | | | | | | | | |
2.521% 1/15/20 | | | 40,000 | | | | 40,225 | |
3.535% 11/4/24 | | | 50,000 | | | | 50,126 | |
Cimarex Energy
4.375% 6/1/24 | | | 55,000 | | | | 56,031 | |
CNOOC Nexen Finance 2014
4.25% 4/30/24 | | | 200,000 | | | | 207,032 | |
Continental Resources | | | | | | | | |
4.50% 4/15/23 | | | 210,000 | | | | 220,348 | |
4.90% 6/1/44 | | | 20,000 | | | | 19,828 | |
KazMunayGas National 144A
9.125% 7/2/18 # | | | 100,000 | | | | 118,625 | |
Marathon Petroleum
4.75% 9/15/44 | | | 265,000 | | | | 267,693 | |
Newfield Exploration
5.625% 7/1/24 | | | 50,000 | | | | 54,000 | |
Pacific Rubiales Energy 144A
5.375% 1/26/19 # | | | 113,000 | | | | 113,565 | |
Petrobras Global Finance
4.875% 3/17/20 | | | 140,000 | | | | 142,618 | |
Petrobras International Finance
5.375% 1/27/21 | | | 20,000 | | | | 20,577 | |
Petroleos de Venezuela
9.00% 11/17/21 | | | 25,000 | | | | 15,969 | |
Petroleos Mexicanos 144A
4.25% 1/15/25 # | | | 30,000 | | | | 30,444 | |
Plains Exploration & Production
6.50% 11/15/20 | | | 29,000 | | | | 31,741 | |
Pride International
6.875% 8/15/20 | | | 265,000 | | | | 310,137 | |
QEP Resources
5.375% 10/1/22 | | | 405,000 | | | | 400,950 | |
Samson Investment
9.75% 2/15/20 | | | 205,000 | | | | 152,725 | |
SandRidge Energy
8.125% 10/15/22 | | | 115,000 | | | | 104,650 | |
Statoil
2.90% 11/8/20 | | | 45,000 | | | | 46,217 | |
Sunoco Logistics Partners Operations
3.45% 1/15/23 | | | 210,000 | | | | 206,530 | |
Talisman Energy
5.50% 5/15/42 | | | 150,000 | | | | 147,173 | |
| | | | | | | | |
| | | Principal
amount° | | | Value
(U.S. $) | |
| |
Corporate Bonds (continued) | |
| |
Energy (continued) | | | | | | | | |
Whiting Petroleum
5.00% 3/15/19 | | | 405,000 | | | $ | 421,200 | |
Williams 4.55% 6/24/24 | | | 60,000 | | | | 58,896 | |
Woodside Finance 144A
8.75% 3/1/19 # | | | 130,000 | | | | 163,244 | |
YPF 144A
8.75% 4/4/24 # | | | 25,000 | | | | 25,906 | |
| | | | | | | | |
| | |
| | | | | | | 3,490,656 | |
| | | | | | | | |
Financials – 0.98% | | | | | | | | |
General Electric Capital | | | | | | | | |
2.10% 12/11/19 | | | 130,000 | | | | 130,730 | |
3.45% 5/15/24 | | | 85,000 | | | | 86,798 | |
5.55% 5/4/20 | | | 10,000 | | | | 11,547 | |
6.00% 8/7/19 | | | 90,000 | | | | 105,654 | |
7.125% 12/29/49 • | | | 100,000 | | | | 116,875 | |
Hutchison Whampoa International 14 144A
3.625% 10/31/24 # | | | 200,000 | | | | 199,088 | |
SUAM Finance 144A
4.875% 4/17/24 # | | | 100,000 | | | | 102,750 | |
| | | | | | | | |
| | |
| | | | | | | 753,442 | |
| | | | | | | | |
Insurance – 1.76% | | | | | | | | |
Allstate
5.75% 8/15/53 • | | | 60,000 | | | | 63,937 | |
American International Group
8.175% 5/15/58 • | | | 60,000 | | | | 81,750 | |
Berkshire Hathaway Finance
2.90% 10/15/20 | | | 65,000 | | | | 66,650 | |
Chubb
6.375% 3/29/67 • | | | 85,000 | | | | 93,075 | |
Five Corners Funding Trust 144A
4.419% 11/15/23 # | | | 300,000 | | | | 317,489 | |
Highmark | | | | | | | | |
144A 4.75% 5/15/21 # | | | 40,000 | | | | 41,038 | |
144A 6.125% 5/15/41 # | | | 15,000 | | | | 15,077 | |
Liberty Mutual Group | | | | | | | | |
144A 4.25% 6/15/23 # | | | 205,000 | | | | 212,402 | |
144A 4.95% 5/1/22 # | | | 25,000 | | | | 27,138 | |
MetLife
3.60% 4/10/24 | | | 85,000 | | | | 86,809 | |
Teachers Insurance & Annuity Association of America 144A 4.90% 9/15/44 # | | | 60,000 | | | | 63,862 | |
TIAA Asset Management Finance | | | | | | | | |
144A 2.95% 11/1/19 # | | | 100,000 | | | | 100,306 | |
144A 4.125% 11/1/24 # | | | 95,000 | | | | 95,697 | |
Voya Financial
5.65% 5/15/53 • | | | 45,000 | | | | 45,225 | |
70
| | | | | | | | |
| | | Principal amount° | | | Value (U.S. $) | |
| |
Corporate Bonds (continued) | |
| |
Insurance (continued) | | | | | | | | |
XL Group 6.50% 10/29/49 — | | | 45,000 | | | $ | 43,290 | |
| | | | | | | | |
| | |
| | | | | | | 1,353,745 | |
| | | | | | | | |
Natural Gas – 1.81% | |
El Paso Pipeline Partners
Operating 4.30% 5/1/24 | | | 145,000 | | | | 145,906 | |
Enbridge Energy Partners
8.05% 10/1/37 — | | | 100,000 | | | | 113,125 | |
Energy Transfer Partners | | | | | | | | |
5.15% 2/1/43 | | | 35,000 | | | | 35,021 | |
5.95% 10/1/43 | | | 130,000 | | | | 144,164 | |
9.70% 3/15/19 | | | 59,000 | | | | 75,646 | |
EnLink Midstream Partners
4.40% 4/1/24 | | | 105,000 | | | | 110,707 | |
Enterprise Products Operating | | | | | | | | |
4.05% 2/15/22 | | | 120,000 | | | | 126,691 | |
5.10% 2/15/45 | | | 65,000 | | | | 69,081 | |
7.034% 1/15/68 — | | | 120,000 | | | | 133,596 | |
Kinder Morgan Energy Partners
9.00% 2/1/19 | | | 115,000 | | | | 142,764 | |
Plains All American Pipeline
8.75% 5/1/19 | | | 100,000 | | | | 126,803 | |
TransCanada PipeLines
6.35% 5/15/67 — | | | 170,000 | | | | 172,125 | |
| | | | | | | | |
| | |
| | | | | | | 1,395,629 | |
| | | | | | | | |
Real Estate – 1.58% | |
Alexandria Real Estate Equities | | | | | | | | |
3.90% 6/15/23 | | | 40,000 | | | | 40,256 | |
4.50% 7/30/29 | | | 40,000 | | | | 40,660 | |
Carey (W.P.) 4.60% 4/1/24 | | | 55,000 | | | | 57,403 | |
CBL & Associates | | | | | | | | |
4.60% 10/15/24 | | | 125,000 | | | | 126,219 | |
5.25% 12/1/23 | | | 15,000 | | | | 15,986 | |
Corporate Office Properties | | | | | | | | |
3.60% 5/15/23 | | | 45,000 | | | | 43,410 | |
5.25% 2/15/24 | | | 55,000 | | | | 59,194 | |
DDR | | | | | | | | |
7.875% 9/1/20 | | | 165,000 | | | | 205,094 | |
9.625% 3/15/16 | | | 105,000 | | | | 116,996 | |
Digital Realty Trust
5.875% 2/1/20 | | | 55,000 | | | | 61,525 | |
Excel Trust 4.625% 5/15/24 | | | 40,000 | | | | 41,219 | |
Healthcare Trust of America
Holdings 3.375% 7/15/21 | | | 40,000 | | | | 39,979 | |
Hospitality Properties Trust
4.50% 3/15/25 | | | 65,000 | | | | 64,704 | |
| | | | | | | | |
| | | Principal amount° | | | Value (U.S. $) | |
| |
Corporate Bonds (continued) | |
| |
Real Estate (continued) | |
Regency Centers
5.875% 6/15/17 | | | 93,000 | | | $ | 102,928 | |
WEA Finance 144A
3.75% 9/17/24 # | | | 200,000 | | | | 202,909 | |
| | | | | | | | |
| | |
| | | | | | | 1,218,482 | |
| | | | | | | | |
Technology – 1.81% | |
Baidu 2.75% 6/9/19 | | | 200,000 | | | | 201,163 | |
BMC Software
Finance 144A
8.125%
7/15/21 # | | | 485,000 | | | | 466,813 | |
KLA-Tencor | | | | | | | | |
3.375% 11/1/19 | | | 15,000 | | | | 15,096 | |
4.65% 11/1/24 | | | 25,000 | | | | 25,130 | |
Motorola Solutions
4.00% 9/1/24 | | | 100,000 | | | | 98,517 | |
National Semiconductor
6.60% 6/15/17 | | | 155,000 | | | | 176,328 | |
NetApp 3.25% 12/15/22 | | | 55,000 | | | | 54,322 | |
Oracle | | | | | | | | |
3.40% 7/8/24 | | | 165,000 | | | | 167,063 | |
4.50% 7/8/44 | | | 55,000 | | | | 56,951 | |
Seagate HDD Cayman 144A 4.75% 1/1/25 # | | | 130,000 | | | | 132,113 | |
| | | | | | | | |
| | |
| | | | | | | 1,393,496 | |
| | | | | | | | |
Transportation – 1.82% | |
American Airlines 2014-1 Class A Pass Through Trust 3.70% 10/1/26 ¿ | | | 35,000 | | | | 34,869 | |
AP Moeller - Maersk | | | | | | | | |
144A 2.55% 9/22/19 # | | | 45,000 | | | | 45,425 | |
144A 3.75% 9/22/24 # | | | 60,000 | | | | 61,520 | |
Aviation Capital Group 144A
6.75% 4/6/21 # | | | 65,000 | | | | 74,425 | |
Brambles USA 144A
5.35% 4/1/20 # | | | 120,000 | | | | 135,367 | |
Burlington Northern Santa Fe | | | | | | | | |
3.40% 9/1/24 | | | 65,000 | | | | 65,396 | |
4.90% 4/1/44 | | | 95,000 | | | | 102,646 | |
DP World 144A
6.85% 7/2/37 # | | | 100,000 | | | | 115,250 | |
ERAC USA Finance 144A
5.25% 10/1/20 # | | | 235,000 | | | | 264,992 | |
Norfolk Southern
3.85% 1/15/24 | | | 55,000 | | | | 57,652 | |
Red de Carreteras de
Occidente 144A
9.00% 6/10/28 # | | | MXN 2,000,000 | | | | 143,187 | |
Schedules of investments
Delaware Pooled® Trust — The Core Plus Fixed Income Portfolio
| | | | | | | | |
| | | Principal
amount° | | | Value
(U.S. $) | |
| |
Corporate Bonds (continued) | |
| |
Transportation (continued) | |
United Airlines 2014-1 Class A Pass Through Trust
4.00% 4/11/26 ¿ | | | 30,000 | | | $ | 30,375 | |
United Airlines 2014-2 Class A Pass Through Trust
3.75% 9/3/26 ¿ | | | 70,000 | | | | 70,875 | |
United Parcel Service
5.125% 4/1/19 | | | 175,000 | | | | 197,369 | |
| | | | | | | | |
| | |
| | | | | | | 1,399,348 | |
| | | | | | | | |
| |
Total Corporate Bonds
(cost $34,643,315) | | | | 35,556,188 | |
| | | | | | | | |
| | |
| | | | | | | | |
| |
Municipal Bonds – 0.26% | |
| |
Golden State, California Tobacco Securitization Corporation Settlement Revenue (Asset-Backed Senior Notes)
Series A-1 | | | | | | | | |
5.125% 6/1/47 | | | 25,000 | | | | 18,688 | |
5.75% 6/1/47 | | | 25,000 | | | | 20,439 | |
New Jersey State Transportation Trust Fund
Series AA
5.00% 6/15/44 | | | 40,000 | | | | 42,966 | |
New York City,
New York
Series I 5.00% 8/1/22 | | | 20,000 | | | | 24,066 | |
New York State Thruway Authority Revenue
Series A 5.00% 5/1/19 | | | 30,000 | | | | 34,745 | |
State of Maryland Local Facilities Series A 5.00% 8/1/21 | | | 30,000 | | | | 36,593 | |
Texas Private Activity Bond Surface Transportation Revenue Bond (Senior Lien NTE Mobility Partners Segments 3) 6.75% 6/30/43 (AMT) | | | 20,000 | | | | 24,290 | |
| | | | | | | | |
| |
Total Municipal Bonds
(cost $188,731) | | | | 201,787 | |
| | | | | | | | |
| | |
| | | | | | | | |
| |
Non-Agency Asset-Backed Securities – 4.03% | |
| |
AEP Texas Central Transition Funding II
Series 2006-A A4
5.17% 1/1/18 | | | 100,000 | | | | 108,211 | |
Ally Master Owner Trust
Series 2013-1 A2
1.00% 2/15/18 | | | 100,000 | | | | 100,230 | |
| | | | | | | | |
| | | Principal
amount° | | | Value
(U.S. $) | |
| |
Non-Agency Asset-Backed Securities (continued) | |
| |
Ally Master Owner Trust
Series 2013-2 A
0.603% 4/15/18 • | | | 100,000 | | | $ | 100,147 | |
American Express Credit Account Master Trust | | | | | | | | |
Series 2013-2 A
0.573% 5/17/21 • | | | 100,000 | | | | 100,420 | |
Series 2014-3 A
1.49% 4/15/20 | | | 100,000 | | | | 100,448 | |
ARL Second
Series 2014-1A A1
144A 2.92% 6/15/44 # | | | 96,568 | | | | 96,001 | |
Avis Budget Rental Car Funding AESOP | | | | | | | | |
Series 2011-3A A 144A 3.41% 11/20/17 # | | | 100,000 | | | | 104,141 | |
Series 2013-1A A 144A
1.92% 9/20/19 # | | | 100,000 | | | | 99,923 | |
BA Credit Card Trust
Series 2014-A3 A
0.443% 1/15/20 • | | | 60,000 | | | | 60,002 | |
California Republic Auto
Receivables Trust
Series 2013-1 A2 144A
1.41% 9/17/18 # | | | 61,005 | | | | 61,471 | |
Capital One Multi-Asset Execution Trust | | | | | | | | |
Series 2007-A1 A1
0.203% 11/15/19 • | | | 100,000 | | | | 99,486 | |
Series 2007-A2 A2
0.233% 12/16/19 • | | | 100,000 | | | | 99,537 | |
Series 2013-A2 A2
0.333% 2/15/19 • | | | 125,000 | | | | 124,986 | |
Series 2014-A4 A
0.513% 6/15/22 • | | | 80,000 | | | | 80,048 | |
CenterPoint Energy Transition Bond IV
Series 2012-1 A3
3.028% 10/15/25 | | | 200,000 | | | | 203,114 | |
Citibank Credit Card Issuance Trust
Series 2013-A4 A4
0.573% 7/24/20 • | | | 100,000 | | | | 100,199 | |
Citicorp Residential Mortgage Trust
Series 2006-3 A5
5.948% 11/25/36 f | | | 300,000 | | | | 299,830 | |
Dell Equipment Finance Trust
Series 2014-1 A3 144A
0.94% 6/22/20 # | | | 100,000 | | | | 99,992 | |
72
| | | | | | | | |
| | | Principal
amount° | | | Value
(U.S. $) | |
| |
Non-Agency Asset-Backed Securities (continued) | |
| |
Ford Credit Auto
Owner Trust
Series 2014-2 A 144A
2.31% 4/15/26 # | | | 100,000 | | | $ | 100,242 | |
Golden Credit Card Trust
Series 2014-2A A 144A
0.603% 3/15/21 #• | | | 350,000 | | | | 349,542 | |
GreatAmerica Leasing Receivables
Series 2014-1 A3 144A
0.89% 7/15/17 # | | | 100,000 | | | | 100,065 | |
Hyundai Auto Lease Securitization Trust
Series 2014-A A4 144A
1.01% 9/15/17 # | | | 100,000 | | | | 100,222 | |
MASTR Specialized Loan Trust
Series 2005-2 A2 144A
5.006% 7/25/35 #• | | | 12,493 | | | | 12,487 | |
Mid-State Trust XI
Series 11 A1
4.864% 7/15/38 | | | 11,550 | | | | 12,288 | |
MMAF Equipment Finance
Series 2014-AA A4 144A
1.59% 2/8/22 # | | | 100,000 | | | | 99,641 | |
Trafigura Securitisation Finance
Series 2012-1A A 144A
2.553%
10/15/15 #• | | | 145,000 | | | | 145,515 | |
Volvo Financial Equipment | | | | | | | | |
Series 2014-1A A3 144A
0.82% 4/16/18 # | | | 50,000 | | | | 49,978 | |
Series 2014-1A B 144A
1.66% 11/16/20 # | | | 100,000 | | | | 99,874 | |
| | | | | | | | |
| |
Total Non-Agency Asset-Backed Securities
(cost $3,072,943) | | | | 3,108,040 | |
| | | | | | | | |
|
| |
Non-Agency Collateralized Mortgage Obligations – 0.16% | |
| |
American Tower Trust I 144A 1.551% 3/15/43 # | | | 30,000 | | | | 29,813 | |
Sequoia Mortgage Trust
Series 2013-11 B1 144A
3.713% 9/25/43 #• | | | 97,579 | | | | 95,015 | |
| | | | | | | | |
| |
Total Non-Agency Collateralized Mortgage Obligations
(cost $125,321) | | | | 124,828 | |
| | | | | | | | |
|
| |
Regional Bond – 0.12%D | |
| |
Canada – 0.12% | | | | | | | | |
Province of Quebec
2.875% 10/16/24 | | | 95,000 | | | | 94,712 | |
| | | | | | | | |
| |
Total Regional Bond (cost $94,232) | | | | 94,712 | |
| | | | | | | | |
| | | | | | | | |
| | | Principal
amount° | | | Value
(U.S. $) | |
| |
Senior Secured Loans – 8.13%« | |
| |
Activision Blizzard Tranche B
1st Lien 3.25% 9/12/20 | | | 131,363 | | | $ | 131,416 | |
ARAMARK Tranche E
3.25% 9/7/19 | | | 72,750 | | | | 71,962 | |
Azure Midstream Tranche B
6.50% 10/21/18 | | | 37,769 | | | | 37,036 | |
BJ’s Wholesale Club
2nd Lien
8.50% 3/31/20 | | | 105,000 | | | | 105,315 | |
BJ’s Wholesale Club Tranche B
1st Lien
4.50% 9/26/19 | | | 148,688 | | | | 147,254 | |
Calpine Construction Finance Tranche B
3.00% 5/1/20 | | | 148,125 | | | | 144,237 | |
Chrysler Group Tranche B 1st Lien
3.50% 5/24/17 | | | 192,728 | | | | 191,925 | |
Clear Channel Communications Tranche B
3.804% 1/29/16 | | | 332,876 | | | | 330,528 | |
DaVita Healthcare Partners Tranche B
3.50% 6/19/21 | | | 384,038 | | | | 380,917 | |
Drillships Financing Holding Tranche B1
6.00% 2/17/21 | | | 54,313 | | | | 52,163 | |
Emdeon 1st Lien
3.75% 11/2/18 | | | 106,222 | | | | 105,448 | |
Energy Transfer Equity
1st Lien
3.25% 12/2/19 | | | 125,000 | | | | 123,320 | |
Exgen Texas Power Tranche B
1st Lien
5.75% 9/16/21 | | | 155,000 | | | | 155,291 | |
First Data Tranche B
1st Lien
4.153% 3/24/21 | | | 84,068 | | | | 83,616 | |
HCA Tranche B4
2.983% 5/1/18 | | | 495,000 | | | | 493,247 | |
HCA Tranche B5
1st Lien
2.904% 3/31/17 | | | 124,740 | | | | 124,402 | |
Hilton Worldwide Finance Tranche B2
3.50% 9/23/20 | | | 309,491 | | | | 306,880 | |
Houghton International
1st Lien
4.00% 12/10/19 | | | 191,588 | | | | 190,270 | |
Houghton International
2nd Lien
9.50% 11/20/20 | | | 125,000 | | | | 126,250 | |
IASIS Healthcare Tranche B
1st Lien
4.50% 5/3/18 | | | 29,252 | | | | 29,279 | |
Immucor Tranche B2
5.00% 8/19/18 | | | 185,423 | | | | 185,462 | |
Intelsat Jackson Holdings Tranche B2
3.75% 6/30/19 | | | 143,958 | | | | 143,058 | |
Landry’s Tranche B
4.00% 4/24/18 | | | 173,768 | | | | 173,497 | |
Schedules of investments
Delaware Pooled® Trust – The Core Plus Fixed Income Portfolio
| | | | | | | | | | | | |
| | | | | | Principal
amount° | | | Value
(U.S. $) | |
| |
Senior Secured Loans« (continued) | |
| |
Level 3 Financing Tranche B
4.00% 1/15/20 | | | | | | | 50,000 | | | $ | 49,663 | |
OSI Restaurants Tranche B
1st Lien 3.50% 10/26/19 | | | | | | | 28,125 | | | | 27,907 | |
Patheon 4.25% 1/23/21 | | | | | | | 523,688 | | | | 510,221 | |
Rite Aid 2nd Lien
4.875% 6/13/21 | | | | | | | 350,000 | | | | 350,985 | |
Samson Investment
2nd Lien 5.00% 9/25/18 | | | | | | | 90,000 | | | | 83,700 | |
Scientific Games International
4.25% 5/22/20 | | | | | | | 193,538 | | | | 193,023 | |
Smart & Final Tranche B 1st Lien
4.75% 11/15/19 | | | | | | | 100,637 | | | | 100,574 | |
Sprouts Farmers
4.00% 4/12/20 | | | | | | | 127,617 | | | | 127,032 | |
Stena 1st Lien
4.00% 2/21/21 | | | | | | | 313,425 | | | | 308,724 | |
Univision Communications Tranche C4
4.00% 3/1/20 | | | | | | | 162,424 | | | | 161,020 | |
USI Insurance Services Tranche B
1st Lien 4.25% 12/3/18 | | | | | | | 49,129 | | | | 48,637 | |
Valeant Pharmaceuticals International Tranche BE
3.75% 8/5/20 | | | | | | | 159,961 | | | | 158,962 | |
Vantage Drilling Tranche B 1st Lien
5.00% 10/25/17 | | | | | | | 45,960 | | | | 43,202 | |
Zayo Group Tranche B 1st Lien
4.00% 7/2/19 | | | | | | | 266,822 | | | | 264,821 | |
| | | | | | | | | | | | |
| |
Total Senior Secured Loans
(cost $6,313,996) | | | | 6,261,244 | |
| | | | | | | | | | | | |
|
| |
Sovereign Bonds – 0.46%D | |
| |
Brazil – 0.09% | | | | | | | | | | | | |
Brazil Notas do Tesouro Nacional Series F | | | | | | | | | | | | |
10.00% 1/1/17 | | | BRL | | | | 31,000 | | | | 11,979 | |
10.00% 1/1/21 | | | BRL | | | | 156,000 | | | | 57,559 | |
| | | | | | | | | | | | |
| | | |
| | | | | | | | | | | 69,538 | |
| | | | | | | | | | | | |
Chile – 0.12% | | | | | | | | | | | | |
Chile Government International Bond 5.50% 8/5/20 | | | CLP | | | | 50,000,000 | | | | 91,846 | |
| | | | | | | | | | | | |
| | | |
| | | | | | | | | | | 91,846 | |
| | | | | | | | | | | | |
| | | | | | | | | | | | |
| | | | | | Principal
amount | | | Value
(U.S. $) | |
| |
Sovereign BondsD (continued) | |
| |
Colombia – 0.04% | | | | | | | | | | | | |
Colombia Government International Bond | | | | | | | | | | | | |
4.375% 3/21/23 | | | COP | | | | 30,000,000 | | | $ | 12,940 | |
9.85% 6/28/27 | | | COP | | | | 29,000,000 | | | | 18,108 | |
| | | | | | | | | | | | |
| | | |
| | | | | | | | | | | 31,048 | |
| | | | | | | | | | | | |
Hungary – 0.05% | | | | | | | | | | | | |
Hungary Government International Bond 5.375% 3/25/24 | | | | | | | 40,000 | | | | 42,904 | |
| | | | | | | | | | | | |
| | | |
| | | | | | | | | | | 42,904 | |
| | | | | | | | | | | | |
Indonesia – 0.04% | | | | | | | | | | | | |
Indonesia Treasury Bond 7.875% 4/15/19 | | | IDR | | | | 352,000,000 | | | | 29,229 | |
| | | | | | | | | | | | |
| | | |
| | | | | | | | | | | 29,229 | |
| | | | | | | | | | | | |
Mexico – 0.02% | | | | | | | | | | | | |
Mexican Bonos 8.00% 6/11/20 | | | MXN | | | | 170,000 | | | | 14,365 | |
| | | | | | | | | | | | |
| | | |
| | | | | | | | | | | 14,365 | |
| | | | | | | | | | | | |
Peru – 0.04% | | | | | | | | | | | | |
Peruvian Government International Bond 144A 5.70% 8/12/24 # | | | PEN | | | | 100,000 | | | | 34,089 | |
| | | | | | | | | | | | |
| | | |
| | | | | | | | | | | 34,089 | |
| | | | | | | | | | | | |
South Africa – 0.06% | | | | | |
South Africa Government Bond 8.00% 1/31/30 | | | ZAR | | | | 492,000 | | | | 43,595 | |
| | | | | | | | | | | | |
| | | |
| | | | | | | | | | | 43,595 | |
| | | | | | | | | | | | |
| |
Total Sovereign Bonds
(cost $363,217) | | | | 356,614 | |
| | | | | | | | | | | | |
|
| |
Supranational Bank – 0.04%« | |
| |
European Bank for Reconstruction & Development 6.00% 3/3/16 | | | INR | | | | 1,800,000 | | | | 29,492 | |
| | | | | | | | | | | | |
| |
Total Supranational Bank
(cost $29,527) | | | | 29,492 | |
| | | | | | | | | | | | |
|
| |
U.S. Treasury Obligations – 6.81% | |
| |
U.S. Treasury Bond 3.125% 8/15/44 | | | | | | | 2,790,000 | | | | 2,824,875 | |
U.S. Treasury Notes 1.75% 9/30/19 | | | | | | | 40,000 | | | | 40,269 | |
74
| | | | | | | | |
| | | Principal
amount | | | Value
(U.S. $) | |
| |
U.S. Treasury Obligations (continued) | |
| |
U.S. Treasury Notes
2.375% 8/15/24 ¥ | | | 2,370,000 | | | $ | 2,379,442 | |
| | | | | | | | |
| |
Total U.S. Treasury Obligations
(cost $5,168,712) | | | | 5,244,586 | |
| | | | | | | | |
| | | | | | | | |
| | | Number
of shares | | | | |
| |
Convertible Preferred Stock – 0.05% | | | | | |
| |
ArcelorMittal 6.00% exercise price $20.36, expiration date 12/21/15 | | | 125 | | | | 2,596 | |
Bank of America 7.25% exercise price $50.00, expiration date 12/31/49 | | | 1 | | | | 1,138 | |
Chesapeake Energy 144A 5.75% exercise price $26.14, expiration date 12/31/49 # | | | 4 | | | | 4,357 | |
Dominion Resources 6.125% exercise price $65.21, expiration date 4/1/16 | | | 60 | | | | 3,413 | |
HealthSouth 6.50% exercise price $29.70, expiration date 12/31/49 | | | 6 | | | | 8,431 | |
Intelsat 5.75% exercise price $22.05, expiration date 5/1/16 | | | 120 | | | | 6,173 | |
SandRidge Energy 8.50% exercise price $8.01, expiration date 12/31/49 | | | 79 | | | | 7,308 | |
Wells Fargo 7.50% exercise price $156.71, expiration date 12/31/49 | | | 7 | | | | 8,428 | |
| | | | | | | | |
| |
Total Convertible Preferred Stock
(cost $42,926) | | | | 41,844 | |
| | | | | | | | |
|
| |
Preferred Stock – 0.27% | | | | | | | | |
| |
Alabama Power 5.625% | | | 1,855 | | | | 46,189 | |
Integrys Energy Group 6.00% • | | | 1,950 | | | | 50,934 | |
National Retail Properties 5.70% | | | 1,225 | | | | 29,767 | |
Public Storage 5.20% | | | 1,200 | | | | 27,576 | |
Regions Financial 6.375% • | | | 2,100 | | | | 53,760 | |
| | | | | | | | |
| |
Total Preferred Stock
(cost $207,044) | | | | 208,226 | |
| | | | | | | | |
| | | | | | | | |
| | | Principal
amount° | | | Value
(U.S. $) | |
| |
Short-Term Investments – 18.82% | |
| |
Repurchase Agreements – 18.82% | |
Bank of America Merrill Lynch
0.06%, dated 10/31/14, to be repurchased on 11/3/14, repurchase price $4,623,263 (collateralized by U.S. government obligations 0.00%–2.75% 2/15/19–1/15/26 market value $4,715,705) | | | 4,623,240 | | | $ | 4,623,240 | |
Bank of Montreal 0.07%, dated 10/31/14, to be repurchased on 11/3/14, repurchase price $770,545 (collateralized by U.S. government obligations 0.00%–11.25% 10/31/14–5/15/44 market value $785,951) | | | 770,540 | | | | 770,540 | |
BNP Paribas
0.11%, dated 10/31/14, to be repurchased on 11/3/14, repurchase price $9,102,303 (collateralized by U.S. government obligations 0.00%–4.375% 8/31/15–11/15/42 market value $9,284,273) | | | 9,102,220 | | | | 9,102,220 | |
| | | | | | | | |
| | |
Total Short-Term Investments
(cost $14,496,000) | | | | | | | 14,496,000 | |
| | | | | | | | |
| | |
Total Value of
Securities – 117.30%
(cost $89,060,327) | | | | | | $ | 90,365,608 | |
| | | | | | | | |
| # | Security exempt from registration under Rule 144A of the Securities Act of 1933, as amended. At Oct. 31, 2014, the aggregate value of Rule 144A securities was $13,458,825 which represents 17.47% of the Portfolio’s net assets. See Note 12 in “Notes to financial statements.” |
| ¿ | Pass Through Agreement. Security represents the contractual right to receive a proportionate amount of underlying payments due to the counterparty pursuant to various agreements related to the rescheduling of obligations and the exchange of certain notes. |
| ° | Principal amount shown is stated in U.S. dollars unless noted that the security is denominated in another currency. |
Schedules of investments
Delaware Pooled® Trust — The Core Plus Fixed Income Portfolio
| — | Variable rate security. The rate shown is the rate as of Oct. 31, 2014. Interest rates reset periodically. |
| ¥ | Fully or partially pledged as collateral for futures contracts. |
| D | Securities have been classified by country of origin. |
| S | Interest only security. An interest only security is the interest only portion of a fixed income security which is separated and sold individually from the principal portion of the security. |
| « | Senior secured loans generally pay interest at rates which are periodically redetermined by reference to a base lending rate plus a premium. These base lending rates are generally: (i) the prime rate offered by one or more United States banks, (ii) the lending rate offered by one or more European banks such as the London Inter-Bank Offered Rate (LIBOR), and (iii) the certificate of deposit rate. Senior secured loans may be subject to restrictions on resale. Stated rate in effect at Oct. 31, 2014. |
| f | Step coupon bond. Coupon increases or decreases periodically based on a predetermined schedule. Stated rate in effect at Oct. 31, 2014. |
The following foreign currency exchange contracts, futures contracts, and swap contracts were outstanding at Oct. 31, 2014:1
Foreign Currency Exchange Contracts
| | | | | | | | | | | | | | | | |
Counterparty | | Contracts to
Receive
(Deliver) | | | In Exchange
For | | | Settlement
Date | | | Unrealized
Appreciation
(Depreciation) | |
BNYM | | BRL | 34,330 | | | USD | (14,122 | ) | | | 11/3/14 | | | $ | (282 | ) |
BNYM | | BRL | 40,662 | | | USD | (16,617 | ) | | | 11/4/14 | | | | (229 | ) |
UBS | | CLP | (20,415,479 | ) | | USD | 34,809 | | | | 11/21/14 | | | | (599 | ) |
| | | | | | | | | | | | | | | | |
| | | | | | | | | | | | | | $ | (1,110 | ) |
| | | | | | | | | | | | | | | | |
Futures Contracts
| | | | | | | | | | | | | | | | |
Contracts to Buy (Sell) | | Notional Cost
(Proceeds) | | | Notional
Value | | | Expiration
Date | | Unrealized
Appreciation
(Depreciation) | |
(63) | | U.S. Treasury 5 yr Notes | | $ | (7,504,611 | ) | | $ | (7,524,070 | ) | | 1/2/15 | | $ | (19,459 | ) |
Swap Contracts
CDS Contracts2
| | | | | | | | | | | | | | | | |
Counterparty | | Swap
Referenced
Obligation | | Notional
Value | | | Annual
Protection
Payments | | | Termination
Date | | Unrealized
Appreciation
(Depreciation) | |
| | Protection Purchased: | | | | | | | | | | | |
| | ICE-CDX.NA. | | | | | | | | | | | |
BCLY | | HY.23 | | $ | 385,000 | | | | 5.00% | | | 12/20/19 | | $ | (1,510 | ) |
The use of foreign currency exchange contracts, futures contracts, and swap contracts involves elements of market risk and risks in excess of
the amounts disclosed in the financial statements. The foreign currency exchange contracts and notional values presented above represent the Portfolio’s total exposure in such contracts, whereas only the net unrealized appreciation (depreciation) is reflected in the Portfolio’s net assets.
1See Note 9 in “Notes to financial statements.”
2A CDS contract is a risk-transfer instrument through which one party (purchaser of protection) transfers to another party (seller of protection) the financial risk of a credit event (as defined in the CDS agreement), as it relates to a particular reference security or basket of securities (such as an index). Periodic payments (receipts) on such contracts are accrued daily and recorded as unrealized losses (gains) on swap contracts. Upon payment (receipt), such amounts are recorded as realized losses (gains) on swap contracts. Upfront payments made or received in connection with CDS contracts are amortized over the expected life of the CDS contracts as unrealized losses (gains) on swap contracts. The change in value of CDS contracts is recorded as unrealized appreciation or depreciation daily. A realized gain or loss is recorded upon a credit event (as defined in the CDS agreement) or the maturity or termination of the agreement.
Summary of abbreviations:
AMT – Subject to Alternative Minimum Tax
ARM – Adjustable Rate Mortgage
BCLY – Barclays Bank
BNYM – BNY Mellon
BRL – Brazilian Real
CDS – Credit Default Swap
CDX.NA.HY – Credit Default Swap Index North America High Yield
CLP – Chilean Peso
GBP – British Pound Sterling
HSBC – Hong Kong Shanghai Bank
ICE – IntercontinentalExchange, Inc.
IDR – Indonesian Rupiah
JPY – Japanese Yen
MSC – Morgan Stanley Capital
NGN – Nigerian Naira
PLN – Polish Zloty
REMIC – Real Estate Mortgage Investment Conduit
S.F. – Single Family
TRY – Turkish Lira
UBS – Union Bank of Switzerland
USD – United States Dollar
yr – Year
ZAR – South African Rand
See accompanying notes, which are an integral part of the financial statements.
76
Delaware Pooled® Trust — The International Equity Portfolio
October 31, 2014
| | | | | | | | |
| | | Number of shares | | | Value (U.S. $) | |
| |
Common Stock – 99.03%D | |
| |
Australia – 2.55% | |
AMP | | | 1,061,159 | | | $ | 5,471,801 | |
QBE Insurance Group | | | 581,599 | | | | 5,907,161 | |
| | | | | | | | |
| | |
| | | | | | | 11,378,962 | |
| | | | | | | | |
Belgium – 0.00% | | | | | | | | |
Ageas VVPR Strip «=† | | | 36,617 | | | | 0 | |
| | | | | | | | |
| | |
| | | | | | | 0 | |
| | | | | | | | |
China – 2.64% | |
China Mobile | | | 593,500 | | | | 7,384,491 | |
Jardine Matheson Holdings | | | 73,215 | | | | 4,387,626 | |
| | | | | | | | |
| | |
| | | | | | | 11,772,117 | |
| | | | | | | | |
France – 11.70% | |
Cie de Saint-Gobain | | | 196,935 | | | | 8,464,887 | |
GDF Suez VVPR Strip =† | | | 162,519 | | | | 0 | |
Orange | | | 547,423 | | | | 8,714,831 | |
Sanofi | | | 134,285 | | | | 12,184,548 | |
Societe Generale | | | 105,498 | | | | 5,083,858 | |
Total | | | 196,823 | | | | 11,750,515 | |
Vallourec | | | 129,682 | | | | 4,739,313 | |
Vinci | | | 23,204 | | | | 1,324,391 | |
| | | | | | | | |
| | |
| | | | | | | 52,262,343 | |
| | | | | | | | |
Germany – 7.46% | |
Daimler | | | 72,951 | | | | 5,687,687 | |
Deutsche Telekom | | | 934,712 | | | | 14,088,658 | |
GEA Group | | | 22,167 | | | | 1,022,471 | |
RWE | | | 136,593 | | | | 4,846,371 | |
SAP | | | 112,849 | | | | 7,688,708 | |
| | | | | | | | |
| | |
| | | | | | | 33,333,895 | |
| | | | | | | | |
Israel – 2.08% | |
Teva Pharmaceutical Industries ADR | | | 164,616 | | | | 9,295,866 | |
| | | | | | | | |
| | |
| | | | | | | 9,295,866 | |
| | | | | | | | |
Italy – 2.18% | |
ENI | | | 457,834 | | | | 9,753,720 | |
| | | | | | | | |
| | |
| | | | | | | 9,753,720 | |
| | | | | | | | |
Japan – 17.25% | |
Canon | | | 382,500 | | | | 11,739,349 | |
Honda Motor | | | 271,100 | | | | 8,669,949 | |
Hoya | | | 151,100 | | | | 5,348,857 | |
Kao | | | 228,200 | | | | 8,901,625 | |
Kirin Holdings | | | 653,800 | | | | 8,479,408 | |
| | | | | | | | |
| | | Number of shares | | | Value (U.S. $) | |
| |
Common StockD (continued) | |
| |
Japan (continued) | |
NTT DOCOMO | | | 298,100 | | | $ | 5,029,512 | |
Seven & I Holdings | | | 177,173 | | | | 6,922,156 | |
Takeda Pharmaceutical | | | 252,200 | | | | 10,936,348 | |
Tokio Marine Holdings | | | 264,452 | | | | 8,483,502 | |
Tokyo Electron | | | 39,000 | | | | 2,501,364 | |
| | | | | | | | |
| | |
| | | | | | | 77,012,070 | |
| | | | | | | | |
Netherlands – 6.09% | |
Koninklijke Ahold | | | 640,218 | | | | 10,722,348 | |
Reed Elsevier | | | 251,443 | | | | 5,791,826 | |
Royal Dutch Shell Class A | | | 299,216 | | | | 10,699,663 | |
| | | | | | | | |
| | |
| | | | | | | 27,213,837 | |
| | | | | | | | |
Singapore – 4.62% | |
SembCorp Industries | | | 1,212,000 | | | | 4,584,925 | |
Singapore Telecommuni-cations | | | 2,913,602 | | | | 8,575,206 | |
United Overseas Bank | | | 416,542 | | | | 7,462,345 | |
| | | | | | | | |
| | |
| | | | | | | 20,622,476 | |
| | | | | | | | |
Spain – 6.99% | |
Banco Santander | | | 497,970 | | | | 4,399,653 | |
Iberdrola | | | 2,080,571 | | | | 14,727,601 | |
Telefonica | | | 803,553 | | | | 12,091,126 | |
| | | | | | | | |
| | |
| | | | | | | 31,218,380 | |
| | | | | | | | |
Sweden – 2.23% | |
Ericsson LM
Class B | | | 468,192 | | | | 5,531,671 | |
TeliaSonera | | | 636,407 | | | | 4,406,437 | |
| | | | | | | | |
| | |
| | | | | | | 9,938,108 | |
| | | | | | | | |
Switzerland – 12.73% | |
ABB † | | | 536,724 | | | | 11,771,956 | |
Nestle | | | 160,403 | | | | 11,759,960 | |
Novartis | | | 132,509 | | | | 12,294,021 | |
Syngenta | | | 29,078 | | | | 8,990,257 | |
Zurich Insurance Group † | | | 39,699 | | | | 12,010,935 | |
| | | | | | | | |
| | |
| | | | | | | 56,827,129 | |
| | | | | | | | |
Taiwan – 1.02% | |
Taiwan Semiconductor Manufacturing ADR | | | 206,732 | | | | 4,552,239 | |
| | | | | | | | |
| | |
| | | | | | | 4,552,239 | |
| | | | | | | | |
United Kingdom – 19.49% | |
AMEC | | | 326,212 | | | | 5,439,305 | |
BG Group | | | 560,476 | | | | 9,340,910 | |
BP | | | 1,230,136 | | | | 8,850,712 | |
Schedules of investments
Delaware Pooled® Trust — The International Equity Portfolio
| | | | | | | | |
| | | Number of shares | | | Value (U.S. $) | |
| |
Common StockD (continued) | |
| |
United Kingdom (continued) | |
G4S | | | 1,613,490 | | | $ | 6,604,413 | |
GlaxoSmithKline | | | 594,463 | | | | 13,443,166 | |
National Grid | | | 878,713 | | | | 13,040,066 | |
Pearson | | | 228,036 | | | | 4,268,033 | |
Tesco | | | 3,054,989 | | | | 8,480,618 | |
Unilever | | | 316,509 | | | | 12,731,732 | |
Vodafone Group | | | 1,446,518 | | | | 4,810,332 | |
| | | | | | | | |
| | |
| | | | | | | 87,009,287 | |
| | | | | | | | |
Total Common Stock
(cost $398,672,621) | | | | 442,190,429 | |
| | | | | | | | |
| | |
| | | Principal
amount° | | | | |
| |
Short-Term Investments – 0.42% | |
| |
Discount Notes – 0.33%≠ | | | | | |
Federal Home Loan Bank | | | | | |
0.025% 11/13/14 | | | 189,112 | | | | 189,111 | |
0.041% 11/19/14 | | | 881,890 | | | | 881,885 | |
0.077% 11/14/14 | | | 419,295 | | | | 419,293 | |
| | | | | | | | |
| | |
| | | | | | | 1,490,289 | |
| | | | | | | | |
Repurchase Agreements – 0.06% | | | | | |
Bank of America Merrill Lynch 0.06%, dated 10/31/14, to be repurchased on 11/3/14, repurchase price $87,388 (collateralized by U.S. government obligations 0.00%–2.75% 2/15/19–1/15/26 market value $89,135) | | | 87,387 | | | | 87,387 | |
Bank of Montreal 0.07%, dated 10/31/14, to be repurchased on 11/3/14, repurchase price $14,565 (collateralized by U.S. government obligations 0.00%–11.25% 10/31/14–5/15/44 market value $14,856) | | | 14,565 | | | | 14,565 | |
| | | | | | | | |
| | | Principal
amount° | | | Value (U.S. $) | |
| |
Short-Term Investments (continued) | |
| |
Repurchase Agreements (continued) | |
BNP Paribas
0.11%, dated 10/31/14, to be repurchased on 11/3/14, repurchase price $172,050 (collateralized by U.S. government obligations 0.00%–4.375% 8/31/15–11/15/42 market value $175,489) | | | 172,048 | | | $ | 172,048 | |
| | | | | | | | |
| | |
| | | | | | | 274,000 | |
| | | | | | | | |
U.S Treasury Obligation – 0.03%≠ | | | | | |
U.S. Treasury Bills 0.005% | | | | | |
12/26/14 | | | 124,971 | | | | 124,969 | |
| | | | | | | | |
| | |
| | | | | | | 124,969 | |
| | | | | | | | |
| |
Total Short-Term Investments
(cost $1,889,235) | | | | 1,889,258 | |
| | | | | | | | |
| |
Total Value of
Securities – 99.45%
(cost $400,561,856) | | | $ | 444,079,687 | |
| | | | | | | | |
| « | Dividend coupon which when presented with the corresponding coupon of the share benefits from a reduced withholding tax of 15% (rather than 25%) on dividends paid. |
| = | Security is being fair valued in accordance with the Portfolio’s fair value policy. At Oct. 31, 2014, the aggregate value of fair valued securities was $0, which represents 0.00% of the Portfolio’s net assets. See Note 1 in “Notes to financial statements.” |
| ≠ | The rate shown is the effective yield at the time of purchase. |
| ° | Principal amount shown is stated in U.S. dollars unless noted that the security is denominated in another currency. |
| † | Non-income-producing security. |
| D | Securities have been classified by country of origin. Aggregate classification by business sectors has been presented on page 44 in “Security type / country and sector allocations.” |
78
The following foreign currency exchange contracts were outstanding at Oct. 31, 2014:1
Foreign Currency Exchange Contracts
| | | | | | | | | | | | | | |
Counterparty | | Contracts to
Receive
(Deliver) | | | In
Exchange
For | | | Settlement Date | | Unrealized Appreciation (Depreciation) | |
BCLY | | SGD | (298,394 | ) | | USD | 232,425 | | | 11/5/14 | | $ | 170 | |
BNYM | | AUD | (10,394,500 | ) | | USD | 9,162,908 | | | 1/30/15 | | | 76,774 | |
NT | | JPY | (25,409,734 | ) | | USD | 227,367 | | | 11/6/14 | | | 1,060 | |
| | | | | | | | | | | | | | |
| | | | |
| | | | | | | | | | | | $ | 78,004 | |
| | | | | | | | | | | | | | |
The use of foreign currency exchange contracts involves elements of market risk and risks in excess of the amounts disclosed in the financial statements. The foreign currency exchange contracts presented above represent the Portfolio’s total exposure in such contracts, whereas only the net unrealized appreciation (depreciation) is reflected in the Portfolio’s net assets.
1See Note 9 in “Notes to financial statements.”
Summary of abbreviations:
ADR – American Depositary Receipt
AUD – Australian Dollar
BCLY – Barclays Bank
BNYM – BNY Mellon
JPY – Japanese Yen
NT – Northern Trust
SGD – Singapore Dollar
See accompanying notes, which are an integral part of the financial statements.
Schedules of investments
Delaware Pooled® Trust — The Labor Select International Equity Portfolio
October 31, 2014
| | | | | | | | |
| | | Number of shares | | | Value (U.S. $) | |
| |
Common Stock – 99.02%D | |
| |
Australia – 2.54% | |
AMP | | | 882,830 | | | $ | 4,552,258 | |
QBE Insurance Group | | | 485,863 | | | | 4,934,793 | |
| | | | | | | | |
| | |
| | | | | | | 9,487,051 | |
| | | | | | | | |
Belgium – 0.00% | |
Ageas VVPR Strip «=† | | | 15,275 | | | | 0 | |
| | | | | | | | |
| | |
| | | | | | | 0 | |
| | | | | | | | |
France – 13.46% | | | | | | | | |
Cie de Saint-Gobain | | | 180,262 | | | | 7,748,229 | |
GDF Suez | | | 319,994 | | | | 7,769,120 | |
GDF Suez VVPR Strip =† | | | 101,871 | | | | 0 | |
Orange | | | 456,423 | | | | 7,266,135 | |
Sanofi | | | 111,925 | | | | 10,155,680 | |
Societe Generale | | | 92,738 | | | | 4,468,965 | |
Total | | | 120,630 | | | | 7,201,722 | |
Vallourec | | | 113,996 | | | | 4,166,058 | |
Vinci | | | 25,943 | | | | 1,480,723 | |
| | | | | | | | |
| | |
| | | | | | | 50,256,632 | |
| | | | | | | | |
Germany – 7.34% | | | | | | | | |
Daimler | | | 60,333 | | | | 4,703,914 | |
GEA Group | | | 19,342 | | | | 892,166 | |
RWE | | | 99,701 | | | | 3,537,429 | |
SAP | | | 107,517 | | | | 7,325,424 | |
Telefonica Deutschland Holding | | | 2,227,004 | | | | 10,958,398 | |
| | | | | | | | |
| | |
| | | | | | | 27,417,331 | |
| | | | | | | | |
Israel – 2.07% | | | | | | | | |
Teva Pharmaceutical Industries ADR | | | 137,200 | | | | 7,747,684 | |
| | | | | | | | |
| | |
| | | | | | | 7,747,684 | |
| | | | | | | | |
Japan – 18.15% | | | | | | | | |
Canon | | | 345,000 | | | | 10,588,432 | |
Honda Motor | | | 230,400 | | | | 7,368,337 | |
Hoya | | | 123,000 | | | | 4,354,132 | |
Kao | | | 191,100 | | | | 7,454,428 | |
Kirin Holdings | | | 603,400 | | | | 7,825,749 | |
NTT DOCOMO | | | 248,000 | | | | 4,184,230 | |
Seven & I Holdings | | | 171,900 | | | | 6,716,140 | |
Takeda Pharmaceutical | | | 224,500 | | | | 9,735,171 | |
Tokio Marine Holdings | | | 230,900 | | | | 7,407,168 | |
Tokyo Electron | | | 33,500 | | | | 2,148,608 | |
| | | | | | | | |
| | |
| | | | | | | 67,782,395 | |
| | | | | | | | |
Netherlands – 6.41% | | | | | | | | |
Koninklijke Ahold | | | 514,756 | | | | 8,621,115 | |
| | | | | | | | |
| | | Number of shares | | | Value (U.S. $) | |
| |
Common StockD (continued) | |
| |
Netherlands (continued) | |
Reed Elsevier | | | 201,533 | | | $ | 4,642,182 | |
Royal Dutch Shell Class A | | | 298,862 | | | | 10,687,004 | |
| | | | | | | | |
| | |
| | | | | | | 23,950,301 | |
| | | | | | | | |
Singapore – 5.44% | | | | | | | | |
SembCorp Industries | | | 1,071,000 | | | | 4,051,530 | |
Singapore Telecommunications | | | 3,371,000 | | | | 9,921,403 | |
United Overseas Bank | | | 354,019 | | | | 6,342,247 | |
| | | | | | | | |
| | |
| | | | | | | 20,315,180 | |
| | | | | | | | |
Spain – 6.96% | | | | | | | | |
Banco Santander | | | 399,427 | | | | 3,529,008 | |
Iberdrola | | | 1,618,625 | | | | 11,457,654 | |
Telefonica | | | 732,483 | | | | 11,021,730 | |
| | | | | | | | |
| | |
| | | | | | | 26,008,392 | |
| | | | | | | | |
Sweden – 2.35% | | | | | | | | |
Ericsson Class B | | | 419,426 | | | | 4,955,502 | |
TeliaSonera | | | 554,548 | | | | 3,839,651 | |
| | | | | | | | |
| | |
| | | | | | | 8,795,153 | |
| | | | | | | | |
Switzerland – 12.78% | | | | | | | | |
ABB † | | | 439,018 | | | | 9,628,973 | |
Nestle | | | 143,010 | | | | 10,484,791 | |
Novartis | | | 110,134 | | | | 10,218,097 | |
Syngenta | | | 24,712 | | | | 7,640,389 | |
Zurich Insurance Group † | | | 32,228 | | | | 9,750,583 | |
| | | | | | | | |
| | |
| | | | | | | 47,722,833 | |
| | | | | | | | |
United Kingdom – 21.52% | |
AMEC | | | 320,615 | | | | 5,345,980 | |
BG Group | | | 521,457 | | | | 8,690,619 | |
BP | | | 1,447,823 | | | | 10,416,949 | |
G4S | | | 1,419,606 | | | | 5,810,798 | |
GlaxoSmithKline | | | 505,205 | | | | 11,424,688 | |
National Grid | | | 786,318 | | | | 11,668,928 | |
Pearson | | | 195,445 | | | | 3,658,044 | |
Sainsbury (J.) | | | 705,378 | | | | 2,778,879 | |
Tesco | | | 1,851,180 | | | | 5,138,857 | |
Unilever | | | 286,886 | | | | 11,540,132 | |
Vodafone Group | | | 1,170,150 | | | | 3,891,283 | |
| | | | | | | | |
| | |
| | | | | | | 80,365,157 | |
| | | | | | | | |
| | |
Total Common Stock
(cost $343,622,663) | | | | | | | 369,848,109 | |
| | | | | | | | |
80
| | | | | | | | |
| | | Principal amount° | | | Value (U.S. $) | |
| |
Short-Term Investments – 0.72% | | | | | |
| |
Repurchase Agreements – 0.72% | |
Bank of America Merrill Lynch 0.06%, dated 10/31/14, to be repurchased on 11/3/14, repurchase price $856,018 (collateralized by U.S. government obligations 0.00%–2.75% 2/15/19–1/15/26 market value $873,134) | | | 856,014 | | | $ | 856,014 | |
Bank of Montreal 0.07%, dated 10/31/14, to be repurchased on 11/3/14, repurchase price $142,670 (collateralized by U.S. government obligations 0.00%–11.25% 10/31/14–5/15/44 market value $145,522) | | | 142,669 | | | | 142,669 | |
BNP Paribas
0.11%, dated 10/31/14, to be repurchased on 11/3/14, repurchase price $1,685,333 (collateralized by U.S. government obligations 0.00%–4.375% 8/31/15–11/15/42 market value $1,719,025) | | | 1,685,317 | | | | 1,685,317 | |
| | | | | | | | |
| |
Total Short-Term Investments
(cost $2,684,000) | | | | 2,684,000 | |
| | | | | | | | |
| |
Total Value of
Securities – 99.74%
(cost $346,306,663) | | | $ | 372,532,109 | |
| | | | | | | | |
| « | Dividend coupon which when presented with the corresponding coupon of the share benefits from a reduced withholding tax of 15% (rather than 25%) on dividends paid. |
| = | Security is being fair valued in accordance with the Portfolio’s fair value policy. At Oct. 31, 2014, the aggregate value of fair valued securities was $0, which represents 0.00% of the Portfolio’s net assets. See Note 1 in “Notes to financial statements.” |
| ° | Principal amount shown is stated in U.S. dollars unless noted that the security is denominated in another currency. |
| † | Non-income-producing security. |
| D | Securities have been classified by country of origin. Aggregate classification by business sectors has been presented on page 45 in “Security type / country and sector allocations.” |
The following foreign currency exchange contracts were outstanding at Oct. 31, 2014:1
Foreign Currency Exchange Contracts
| | | | | | | | | | | | | | |
Counterparty | | Contracts to
Receive
(Deliver) | | | In
Exchange
For | | | Settlement Date | | Unrealized
Appreciation
(Depreciation) | |
BNYM | | AUD | (8,663,500) | | | USD | 7,637,005 | | | 1/30/15 | | $ | 63,988 | |
BNYM | | EUR | 93,695 | | | USD | (117,727) | | | 11/3/14 | | | (316 | ) |
| | | | | | | | | | | | | | |
| | | | | | | | | | | | $ | 63,672 | |
| | | | | | | | | | | | | | |
The use of foreign currency exchange contracts involves elements of market risk and risks in excess of the amount disclosed in the financial statements. The foreign currency exchange contracts presented above represent the Portfolio’s total exposure in such contracts, whereas only the net unrealized appreciation (depreciation) is reflected in the Portfolio’s net assets.
1See Note 9 in “Notes to financial statements.”
Summary of abbreviations:
ADR – American Depositary Receipt
AUD – Australian Dollar
BNYM – BNY Mellon
EUR – European Monetary Unit
USD – United States Dollar
VVPR Strip – Dividend Coupon
See accompanying notes, which are an integral part of the financial statements.
Schedules of investments
Delaware Pooled® Trust — The Emerging Markets Portfolio
October 31, 2014
| | | | | | | | |
| | | Number of
shares | | | Value
(U.S. $) | |
| |
Common Stock – 94.85%D | |
| |
Brazil – 7.20% | | | | | | | | |
AMBEV ADR | | | 466,300 | | | $ | 3,114,884 | |
CCR | | | 934,700 | | | | 6,958,766 | |
Cielo | | | 239,258 | | | | 3,928,419 | |
CPFL Energia | | | 355,580 | | | | 2,668,787 | |
EcoRodovias Infraestrutura e Logistica | | | 456,000 | | | | 2,038,770 | |
Transmissora Alianca de Energia Eletrica | | | 352,500 | | | | 2,617,222 | |
Vale ADR | | | 98,900 | | | | 997,901 | |
| | | | | | | | |
| | |
| | | | | | | 22,324,749 | |
| | | | | | | | |
Chile – 2.91% | | | | | | | | |
Banco Santander Chile ADR | | | 76,670 | | | | 1,624,637 | |
Cia Cervecerias Unidas | | | 186,631 | | | | 1,964,617 | |
Enersis ADR | | | 344,700 | | | | 5,442,813 | |
| | | | | | | | |
| | |
| | | | | | | 9,032,067 | |
| | | | | | | | |
China – 18.15%n | | | | | | | | |
Beijing Enterprises Holdings | | | 454,999 | | | | 3,714,855 | |
Belle International Holdings | | | 4,850,515 | | | | 6,172,285 | |
China BlueChemical Class H | | | 3,733,000 | | | | 1,325,605 | |
China Huishan Dairy Holdings | | | 11,189,000 | | | | 2,510,064 | |
China Mobile | | | 817,000 | | | | 10,165,340 | |
China Resources Power Holdings | | | 2,314,000 | | | | 6,735,102 | |
China Shenhua Energy Class H | | | 1,413,000 | | | | 3,982,515 | |
Golden Eagle Retail Group | | | 2,437,000 | | | | 2,987,530 | |
Hengan International Group | | | 397,500 | | | | 4,189,871 | |
Huabao International Holdings | | | 4,384,000 | | | | 3,134,740 | |
Jiangsu Expressway Class H | | | 3,520,000 | | | | 3,931,881 | |
Mindray Medical International ADR | | | 162,579 | | | | 4,737,552 | |
Sands China | | | 436,000 | | | | 2,719,328 | |
| | | | | | | | |
| | |
| | | | | | | 56,306,668 | |
| | | | | | | | |
Colombia – 0.43% | | | | | | | | |
Bancolombia ADR | | | 23,600 | | | | 1,335,052 | |
| | | | | | | | |
| | |
| | | | | | | 1,335,052 | |
| | | | | | | | |
India – 8.51% | | | | | | | | |
Axis Bank | | | 687,655 | | | | 4,920,700 | |
Cairn India | | | 842,272 | | | | 3,901,682 | |
Housing Development Finance | | | 285,982 | | | | 5,150,318 | |
Infosys | | | 47,143 | | | | 3,124,883 | |
Infosys ADR | | | 46,900 | | | | 3,135,734 | |
| | | | | | | | |
| | | Number of
shares | | | Value
(U.S. $) | |
| |
Common StockD (continued) | |
| |
India (continued) | | | | | | | | |
Larsen & Toubro | | | 107,768 | | | $ | 2,904,265 | |
Rural Electrification | | | 311,695 | | | | 1,531,101 | |
Zee Entertainment Enterprises | | | 307,129 | | | | 1,721,308 | |
| | | | | | | | |
| | |
| | | | | | | 26,389,991 | |
| | | | | | | | |
Indonesia – 4.05% | | | | | | | | |
Bank Mandiri | | | 5,098,500 | | | | 4,378,866 | |
Bank Rakyat Indonesia | | | 4,680,100 | | | | 4,288,826 | |
Perusahaan Gas Negara | | | 7,915,300 | | | | 3,898,996 | |
| | | | | | | | |
| | |
| | | | | | | 12,566,688 | |
| | | | | | | | |
Kazakhstan – 0.70% | | | | | | | | |
KazMunaiGas Exploration Production GDR | | | 135,119 | | | | 2,155,148 | |
| | | | | | | | |
| | |
| | | | | | | 2,155,148 | |
| | | | | | | | |
Malaysia – 5.49% | | | | | | | | |
AMMB Holdings | | | 1,936,100 | | | | 3,990,311 | |
Genting Malaysia | | | 2,494,400 | | | | 3,260,823 | |
Malayan Banking | | | 1,594,428 | | | | 4,701,977 | |
Tenaga Nasional | | | 1,250,800 | | | | 5,079,773 | |
| | | | | | | | |
| | |
| | | | | | | 17,032,884 | |
| | | | | | | | |
Mexico – 7.08% | | | | | | | | |
Arca Continental | | | 238,900 | | | | 1,538,143 | |
Compartamos | | | 770,400 | | | | 1,716,323 | |
Fibra Uno Administracion | | | 2,605,500 | | | | 9,043,596 | |
Grupo Aeroportuario del Pacifico ADR | | | 35,400 | | | | 2,412,510 | |
Grupo Financiero Santander Mexico Class B ADR | | | 353,214 | | | | 4,697,746 | |
Kimberly-Clark de Mexico Class A | | | 1,102,500 | | | | 2,565,896 | |
| | | | | | | | |
| | |
| | | | | | | 21,974,214 | |
| | | | | | | | |
Peru – 1.55% | | | | | | | | |
Credicorp | | | 29,830 | | | | 4,802,630 | |
| | | | | | | | |
| | |
| | | | | | | 4,802,630 | |
| | | | | | | | |
Philippines – 2.20% | | | | | | | | |
Philippine Long Distance Telephone ADR | | | 97,500 | | | | 6,837,675 | |
| | | | | | | | |
| | |
| | | | | | | 6,837,675 | |
| | | | | | | | |
Qatar – 1.85% | | | | | | | | |
Qatar Electricity & Water | | | 59,789 | | | | 2,991,461 | |
Qatar National Bank | | | 46,412 | | | | 2,737,774 | |
| | | | | | | | |
| | |
| | | | | | | 5,729,235 | |
| | | | | | | | |
82
| | | | | | | | |
| | | Number of
shares | | | Value
(U.S. $) | |
| |
Common StockD (continued) | |
| |
Republic of Korea – 5.93% | |
Hyundai Mobis | | | 35,031 | | | $ | 8,152,420 | |
Kangwon Land | | | 72,605 | | | | 2,361,583 | |
Samsung Electronics | | | 6,791 | | | | 7,877,151 | |
| | | | | | | | |
| | |
| | | | | | | 18,391,154 | |
| | | | | | | | |
Romania – 0.50% | |
Societatea Nationala de Gaze Naturale GDR | | | 163,108 | | | | 1,538,108 | |
| | | | | | | | |
| | |
| | | | | | | 1,538,108 | |
| | | | | | | | |
Russia – 3.53% | |
Gazprom ADR | | | 927,939 | | | | 6,148,351 | |
Sberbank of Russia ADR | | | 630,321 | | | | 4,799,862 | |
| | | | | | | | |
| | |
| | | | | | | 10,948,213 | |
| | | | | | | | |
South Africa – 3.04% | |
Bidvest Group | | | 93,948 | | | | 2,586,838 | |
Clicks Group | | | 238,567 | | | | 1,625,142 | |
Truworths International | | | 424,445 | | | | 2,910,243 | |
Woolworths Holdings | | | 325,468 | | | | 2,318,276 | |
| | | | | | | | |
| | |
| | | | | | | 9,440,499 | |
| | | | | | | | |
Taiwan – 7.92% | |
Asustek Computer | | | 282,000 | | | | 2,874,784 | |
Quanta Computer | | | 1,072,000 | | | | 2,694,568 | |
Taiwan Mobile | | | 2,077,000 | | | | 6,729,251 | |
Taiwan Semiconductor Manufacturing | | | 2,201,588 | | | | 9,528,722 | |
Teco Electric and Machinery | | | 2,467,000 | | | | 2,740,690 | |
| | | | | | | | |
| | |
| | | | | | | 24,568,015 | |
| | | | | | | | |
Thailand – 2.28% | |
PTT | | | 626,900 | | | | 7,074,492 | |
| | | | | | | | |
| | |
| | | | | | | 7,074,492 | |
| | | | | | | | |
Turkey – 4.60% | |
Tofas Turk Otomobil Fabrikasi | | | 208,590 | | | | 1,308,723 | |
Tupras Turkiye Petrol Rafinerileri | | | 341,804 | | | | 7,413,242 | |
Turk Telekomunikasyon | | | 1,934,278 | | | | 5,556,121 | |
| | | | | | | | |
| | |
| | | | | | | 14,278,086 | |
| | | | | | | | |
United Arab Emirates – 0.67% | |
First Gulf Bank | | | 414,067 | | | | 2,084,086 | |
| | | | | | | | |
| | |
| | | | | | | 2,084,086 | |
| | | | | | | | |
United Kingdom – 3.99% | |
Mondi | | | 89,783 | | | | 1,518,838 | |
| | | | | | | | |
| | | Number of
shares | | | Value
(U.S. $) | |
| |
Common StockD (continued) | |
| |
United Kingdom (continued) | |
SABMiller | | | 54,622 | | | $ | 3,079,294 | |
Unilever | | | 193,680 | | | | 7,790,874 | |
| | | | | | | | |
| | |
| | | | | | | 12,389,006 | |
| | | | | | | | |
United States – 2.27% | |
Yum! Brands | | | 98,141 | | | | 7,049,468 | |
| | | | | | | | |
| | |
| | | | | | | 7,049,468 | |
| | | | | | | | |
Total Common Stock
(cost $290,358,862) | | | | 294,248,128 | |
| | | | | | | | |
|
| |
Preferred Stock – 3.26%D | |
| |
Brazil – 2.55% | |
Petroleo Brasileiro 7.13% | | | 548,000 | | | | 3,378,839 | |
Vale ADR 11.62% | | | 516,500 | | | | 4,524,540 | |
| | | | | | | | |
| | | | | | | 7,903,379 | |
| | | | | | | | |
India – 0.04% | |
Zee Entertainment Enterprises 0.54% | | | 8,249,787 | | | | 114,198 | |
| | | | | | | | |
| | |
| | | | | | | 114,198 | |
| | | | | | | | |
Republic of Korea – 0.67% | |
Hyundai Motor 1.61% | | | 17,470 | | | | 2,078,599 | |
| | | | | | | | |
| | |
| | | | | | | 2,078,599 | |
| | | | | | | | |
Total Preferred Stock
(cost $15,613,196) | | | | 10,096,176 | |
| | | | | | | | |
| | |
| | | Principal
amount° | | | | |
| |
Short-Term Investments – 1.25% | |
| |
Discount Notes – 0.67%≠ | |
Federal Home Loan Bank | | | | | | | | |
0.025% 11/13/14 | | | 264,506 | | | | 264,505 | |
0.045% 11/19/14 | | | 1,392,697 | | | | 1,392,688 | |
0.077% 11/14/14 | | | 431,393 | | | | 431,392 | |
| | | | | | | | |
| | |
| | | | | | | 2,088,585 | |
| | | | | | | | |
Repurchase Agreements – 0.48% | |
Bank of America Merrill Lynch 0.06%, dated 10/31/14, to be repurchased on 11/3/14, repurchase price $470,108 (collateralized by U.S. government obligations 0.00%–2.75% 2/15/19–1/15/26 market value $479,508) | | | 470,106 | | | | 470,106 | |
Schedules of investments
Delaware Pooled® Trust – The Emerging Markets Portfolio
| | | | | | | | |
| | | Principal
amount° | | | Value (U.S. $) | |
| |
Short-Term Investments (continued) | |
| |
Repurchase Agreements (continued) | |
Bank of Montreal 0.07%, dated 10/31/14, to be repurchased on 11/3/14, repurchase price $78,351 (collateralized by U.S. government obligations 0.00%–11.25% 10/31/14–5/15/44 market value $79,918) | | | 78,351 | | | $ | 78,351 | |
BNP Paribas
0.11%, dated 10/31/14, to be repurchased on 11/3/14, repurchase price $925,552 (collateralized by U.S. government obligations 0.00%–4.375% 8/31/15–11/15/42 market value $944,055) | | | 925,543 | | | | 925,543 | |
| | | | | | | | |
| | |
| | | | | | | 1,474,000 | |
| | | | | | | | |
U.S. Treasury Obligations – 0.10%≠ | | | | | |
U.S. Treasury Bills | | | | | | | | |
0.005% 12/26/14 | | | 128,867 | | | | 128,865 | |
0.093% 11/13/14 | | | 175,101 | | | | 175,101 | |
| | | | | | | | |
| | |
| | | | | | | 303,966 | |
| | | | | | | | |
| |
Total Short-Term Investments
(cost $3,866,512) | | | | 3,866,551 | |
| | | | | | | | |
| |
Total Value of Securities – 99.36%
(cost $309,838,570) | | | $ | 308,210,855 | |
| | | | | | | | |
| ≠ | The rate shown is the effective yield at the time of purchase. |
| n | Securities listed and traded on the Hong Kong Stock Exchange. |
| ° | Principal amount shown is stated in U.S. dollars unless noted that the security is denominated in another currency. |
| D | Securities have been classified by country of origin. Aggregate classification by business sectors has been presented on page 46 in “Security type / country and sector allocations.” |
The following foreign currency exchange contracts were outstanding at Oct. 31, 2014:1
Foreign Currency Exchange Contracts
| | | | | | | | | | | | | | | | |
Counterparty | | Contracts to
Receive
(Deliver) | | | In
Exchange
For | | | Settlement
Date | | | Unrealized
Appreciation
(Depreciation) | |
BNYM | | BRL | 1,128,216 | | | USD | (469,700 | ) | | | 11/3/14 | | | $ | (14,865 | ) |
BNYM | | BRL | 315,390 | | | USD | (127,616 | ) | | | 11/4/14 | | | | (508 | ) |
BNYM | | INR | (5,344,082 | ) | | USD | 87,027 | | | | 11/5/14 | | | | 89 | |
BNYM | | KRW | (97,786,448 | ) | | USD | 91,865 | | | | 11/3/14 | | | | 865 | |
BNYM | | KRW | (1,017,169,165 | ) | | USD | 944,655 | | | | 11/4/14 | | | | (1,885 | ) |
BNYM | | QAR | 285,597 | | | USD | (78,548 | ) | | | 11/3/14 | | | | (121 | ) |
BNYM | | QAR | 499,168 | | | USD | (137,299 | ) | | | 11/4/14 | | | | (223 | ) |
BNYM | | THB | (3,547,756 | ) | | USD | 108,981 | | | | 11/4/14 | | | | 212 | |
| | | | | | | | | | | | | | | | |
| | | | |
| | | | | | | | | | | | | | $ | (16,436 | ) |
| | | | | | | | | | | | | | | | |
The use of foreign currency exchange contracts involves elements of market risk and risks in excess of the amount disclosed in the financial statements. The foreign currency exchange contracts presented above represent the Portfolio’s total exposure in such contracts, whereas only the net unrealized appreciation (depreciation) is reflected in the Portfolio’s net assets.
1See Note 9 in “Notes to financial statements.”
Summary of abbreviations:
ADR – American Depositary Receipt
BNYM – BNY Mellon
BRL – Brazilian Real
GDR – Global Depositary Receipt
INR – Indian Rupee
KRW – South Korean Won
QAR – Qatari Riyal
THB – Thailand Baht
USD – United States Dollar
See accompanying notes, which are an integral part of the financial statements.
84
Delaware Pooled® Trust – The Emerging Markets Portfolio II
October 31, 2014
| | | | | | | | |
| | | Number of
shares | | | Value (U.S. $) | |
| |
Common Stock – 98.50%D | |
| |
Argentina – 1.51% | |
Cresud ADR @ | | | 8,100 | | | $ | 85,050 | |
IRSA Inversiones y Represen-taciones ADR @ | | | 4,000 | | | | 58,920 | |
MercadoLibre | | | 1,600 | | | | 217,840 | |
YPF ADR | | | 8,000 | | | | 281,360 | |
| | | | | | | | |
| | |
| | | | | | | 643,170 | |
| | | | | | | | |
Bahrain – 0.03% | |
Aluminum Bahrain GDR 144A #@ | | | 1,800 | | | | 12,056 | |
| | | | | | | | |
| | |
| | | | | | | 12,056 | |
| | | | | | | | |
Brazil – 16.71% | |
America Latina Logistica | | | 36,422 | | | | 99,792 | |
B2W Cia Digital @† | | | 80,235 | | | | 1,045,108 | |
Banco Bradesco ADR | | | 7,373 | | | | 110,448 | |
Banco Santander Brasil ADR | | | 48,000 | | | | 263,040 | |
Brasil Foods ADR | | | 16,900 | | | | 440,245 | |
Braskem ADR | | | 12,800 | | | | 187,776 | |
Centrais Eletricas Brasileiras ADR | | | 21,300 | | | | 53,889 | |
Cyrela Brazil Realty | | | 15,780 | | | | 78,448 | |
Fibria Celulose ADR † | | | 40,300 | | | | 492,869 | |
Gerdau @ | | | 11,700 | | | | 43,340 | |
Gerdau ADR | | | 13,000 | | | | 58,890 | |
Gol Linhas Aereas Inteligentes ADR | | | 45,200 | | | | 233,684 | |
Hypermarcas † | | | 78,500 | | | | 548,315 | |
Itau Unibanco Holding ADR | | | 60,500 | | | | 892,980 | |
JBS | | | 32,815 | | | | 146,318 | |
Petroleo Brasileiro ADR | | | 53,200 | | | | 622,440 | |
Santos Brasil Participacoes | | | 5,900 | | | | 37,616 | |
Telefonica Brasil ADR | | | 3,255 | | | | 66,532 | |
Tim Participacoes ADR | | | 53,200 | | | | 1,464,064 | |
Vale ADR | | | 21,600 | | | | 217,944 | |
| | | | | | | | |
| | |
| | | | | | | 7,103,738 | |
| | | | | | | | |
Chile – 0.74% | |
Sociedad Quimica y Minera de Chile ADR | | | 13,300 | | | | 315,609 | |
| | | | | | | | |
| | |
| | | | | | | 315,609 | |
| | | | | | | | |
China/Hong Kong – 17.29% | |
Baidu ADR † | | | 11,500 | | | | 2,745,855 | |
China Mengniu Dairy | | | 67,000 | | | | 295,947 | |
China Mobile | | | 50,000 | | | | 622,114 | |
China Mobile ADR | | | 7,200 | | | | 447,048 | |
China Petroleum & Chemical | | | 94,000 | | | | 81,516 | |
| | | | | | | | |
| | | Number of
shares | | | Value (U.S. $) | |
| |
Common StockD (continued) | |
| |
China/Hong Kong (continued) | |
China Petroleum & Chemical ADR | | | 3,770 | | | $ | 327,915 | |
China Unicom Hong Kong ADR | | | 17,100 | | | | 256,158 | |
CNOOC ADR | | | 1,600 | | | | 250,192 | |
PetroChina ADR | | | 1,700 | | | | 213,350 | |
PetroChina Class H | | | 280,000 | | | | 350,538 | |
SINA † | | | 2,000 | | | | 81,940 | |
Sohu.com @† | | | 16,000 | | | | 777,440 | |
Tianjin Development Holdings @ | | | 190,000 | | | | 164,955 | |
Tingyi Cayman Islands Holding | | | 42,000 | | | | 104,483 | |
Tsingtao Brewery | | | 24,000 | | | | 177,409 | |
Uni-President China Holdings @ | | | 492,000 | | | | 454,868 | |
| | | | | | | | |
| | |
| | | | | | | 7,351,728 | |
| | | | | | | | |
Colombia – 1.28% | |
Bolsa De Valores De Colombia | | | 10,000 | | | | 107 | |
Cemex Latam Holdings † | | | 61,058 | | | | 543,068 | |
| | | | | | | | |
| | |
| | | | | | | 543,175 | |
| | | | | | | | |
India – 8.26% | |
Cairn India | | | 74,000 | | | | 342,792 | |
ICICI Bank ADR | | | 2,600 | | | | 146,536 | |
Reliance
Communications † | | | 90,082 | | | | 155,548 | |
Reliance Industries | | | 30,356 | | | | 492,644 | |
Reliance Industries GDR 144A # | | | 55,000 | | | | 1,777,726 | |
Steel Authority of India | | | 49,589 | | | | 67,116 | |
Tata Chemicals | | | 62,463 | | | | 413,958 | |
Ultratech Cement | | | 2,784 | | | | 115,493 | |
| | | | | | | | |
| | |
| | | | | | | 3,511,813 | |
| | | | | | | | |
Indonesia – 1.44% | |
Global Mediacom | | | 2,369,600 | | | | 384,587 | |
Tambang Batubara Bukit Asam Persero | | | 118,500 | | | | 127,133 | |
United Tractors | | | 67,106 | | | | 101,933 | |
| | | | | | | | |
| | |
| | | | | | | 613,653 | |
| | | | | | | | |
Israel – 2.66% | | | | | | | | |
Teva Pharmaceutical Industries ADR | | | 20,000 | | | | 1,129,400 | |
| | | | | | | | |
| | |
| | | | | | | 1,129,400 | |
| | | | | | | | |
Schedules of investments
Delaware Pooled® Trust – The Emerging Markets Portfolio II
| | | | | | | | |
| | | Number of
shares | | | Value
(U.S. $) | |
| |
Common StockD (continued) | |
| |
Malaysia – 0.48% | |
UEM Sunrise @ | | | 356,100 | | | $ | 203,501 | |
| | | | | | | | |
| | |
| | | | | | | 203,501 | |
| | | | | | | | |
Mexico – 7.47% | |
America Movil Series L ADR | | | 11,000 | | | | 268,510 | |
Cemex ADR † | | | 67,607 | | | | 831,566 | |
Empresas ICA ADR † | | | 27,200 | | | | 193,936 | |
Fomento Economico Mexicano ADR | | | 2,500 | | | | 240,600 | |
Grupo Financiero Banorte Class O | | | 24,300 | | | | 155,732 | |
Grupo Financiero Santander Mexico Class B ADR | | | 19,400 | | | | 258,020 | |
Grupo Televisa ADR | | | 30,000 | | | | 1,084,200 | |
Wal-Mart de Mexico Class V | | | 61,629 | | | | 142,928 | |
| | | | | | | | |
| | |
| | | | | | | 3,175,492 | |
| | | | | | | | |
Netherlands – 0.73% | |
Yandex Class A † | | | 10,800 | | | | 309,096 | |
| | | | | | | | |
| | |
| | | | | | | 309,096 | |
| | | | | | | | |
Peru – 0.25% | |
Cia de Minas
Buenaventura ADR | | | 11,500 | | | | 105,800 | |
| | | | | | | | |
| | |
| | | | | | | 105,800 | |
| | | | | | | | |
Poland – 0.67% | |
Jastrzebska Spolka Weglowa † | | | 2,926 | | | | 25,144 | |
Polski Koncern Naftowy Orlen | | | 8,460 | | | | 105,392 | |
Powszechna Kasa Oszczednosci Bank Polski | | | 13,921 | | | | 154,842 | |
| | | | | | | | |
| | |
| | | | | | | 285,378 | |
| | | | | | | | |
Republic of Korea – 20.88% | |
Hitejinro Holdings | | | 20,000 | | | | 233,307 | |
KB Financial Group ADR | | | 28,000 | | | | 1,083,600 | |
KCC @ | | | 1,455 | | | | 801,253 | |
KT ADR | | | 28,300 | | | | 433,839 | |
KT&G | | | 5,530 | | | | 487,037 | |
LG Display ADR † | | | 17,800 | | | | 267,356 | |
LG Electronics | | | 5,107 | | | | 310,234 | |
LG Uplus | | | 28,207 | | | | 288,537 | |
Lotte Chilsung Beverage @ | | | 425 | | | | 669,148 | |
Lotte Confectionery @ | | | 257 | | | | 459,711 | |
Samsung Electronics | | | 1,595 | | | | 1,850,104 | |
Samsung Life Insurance | | | 4,270 | | | | 463,279 | |
SK Telecom ADR | | | 55,000 | | | | 1,528,450 | |
| | | | | | | | |
| | |
| | | | | | | 8,875,855 | |
| | | | | | | | |
| | | | | | | | |
| | | Number of
shares | | | Value
(U.S. $) | |
| |
Common StockD (continued) | |
| |
Russia – 4.73% | |
Etalon Group | | | | | | | | |
GDR 144A #@= | | | 4,800 | | | $ | 14,770 | |
Gazprom ADR @ | | | 50,000 | | | | 331,291 | |
LUKOIL ADR | | | 3,400 | | | | 166,770 | |
LUKOIL ADR (London International Exchange) | | | 3,600 | | | | 176,470 | |
MegaFon GDR | | | 14,100 | | | | 329,940 | |
Mobile Telesystems ADR | | | 19,400 | | | | 277,420 | |
Moscow
Exchange = | | | 70,000 | | | | 94,330 | |
Rosneft GDR @ | | | 52,800 | | | | 293,864 | |
Sberbank @= | | | 141,095 | | | | 249,677 | |
VTB Bank @ | | | 16,155,925 | | | | 14,984 | |
VTB Bank GDR @ | | | 33,800 | | | | 62,804 | |
| | | | | | | | |
| | |
| | | | | | | 2,012,320 | |
| | | | | | | | |
South Africa – 1.31% | |
Anglo American Platinum † | | | 1,687 | | | | 53,331 | |
Impala Platinum Holdings † | | | 4,413 | | | | 32,202 | |
Sasol ADR | | | 5,200 | | | | 260,988 | |
Vodacom Group | | | 17,262 | | | | 209,683 | |
| | | | | | | | |
| | |
| | | | | | | 556,204 | |
| | | | | | | | |
Taiwan – 5.24% | |
Hon Hai Precision Industry | | | 281,404 | | | | 889,256 | |
Mitac Holdings | | | 472,000 | | | | 364,829 | |
Taiwan Semiconductor Manufacturing | | | 95,000 | | | | 411,171 | |
Taiwan
Semiconductor
Manufacturing ADR | | | 12,800 | | | | 281,856 | |
United Microelectronics | | | 634,000 | | | | 281,057 | |
| | | | | | | | |
| | |
| | | | | | | 2,228,169 | |
| | | | | | | | |
Thailand – 1.40% | |
Bangkok Bank | | | 37,099 | | | | 225,290 | |
PTT | | | 27,160 | | | | 306,497 | |
PTT Exploration & Production | | | 14,571 | | | | 65,460 | |
| | | | | | | | |
| | |
| | | | | | | 597,247 | |
| | | | | | | | |
Turkey – 1.39% | |
Anadolu Efes Biracilik Ve Malt Sanayii † | | | 19,910 | | | | 232,654 | |
Turkcell Iletisim Hizmetleri ADR † | | | 20,600 | | | | 301,378 | |
Turkiye Sise ve Cam Fabrikalari | | | 37,006 | | | | 56,268 | |
| | | | | | | | |
| | |
| | | | | | | 590,300 | |
| | | | | | | | |
86
| | | | | | | | |
| | | Number of
shares | | | Value
(U.S. $) | |
| |
Common StockD (continued) | |
| |
United Kingdom – 0.21% | |
Anglo American ADR | | | 8,400 | | | $ | 88,460 | |
| | | | | | | | |
| | |
| | | | | | | 88,460 | |
| | | | | | | | |
United States – 3.82% | |
Archer-Daniels-Midland | | | 11,900 | | | | 559,300 | |
Avon Products | | | 16,300 | | | | 169,520 | |
Yahoo † | | | 19,400 | | | | 893,370 | |
| | | | | | | | |
| | |
| | | | | | | 1,622,190 | |
| | | | | | | | |
Total Common Stock
(cost $37,938,666) | | | | | | | 41,874,354 | |
| | | | | | | | |
|
| |
Preferred Stock – 1.36%D | |
| |
Republic of Korea – 1.36% | |
LG Electronics 0.74% | | | 17,861 | | | | 578,794 | |
| | | | | | | | |
Total Preferred Stock
(cost $307,186) | | | | | | | 578,794 | |
| | | | | | | | |
| | |
| | | Principal
amount° | | | | |
| |
Short-Term Investments – 2.59% | |
| |
Repurchase Agreements – 2.59% | |
Bank of America Merrill Lynch 0.06%, dated 10/31/14, to be repurchased on 11/3/14, repurchase price $351,465 (collateralized by U.S. government obligations 0.00%–2.75% 2/15/19–1/15/26 market value $358,492) | | | 351,463 | | | | 351,463 | |
Bank of Montreal 0.07%, dated 10/31/14, to be repurchased on 11/3/14, repurchase price $58,578 (collateralized by U.S. government obligations 0.00%–11.25% 10/31/14–5/15/44 market value $59,749) | | | 58,577 | | | | 58,577 | |
| | | | | | | | |
| | | Principal
amount° | | | Value
(U.S. $) | |
| |
Short-Term Investments (continued) | |
| |
Repurchase Agreements (continued) | |
BNP Paribas
0.11%, dated 10/31/14, to be repurchased on 11/3/14, repurchase price $691,966 (collateralized by U.S. government obligations 0.00%–4.375% 8/31/15–11/15/42 market value $705,799) | | | 691,960 | | | $ | 691,960 | |
| | | | | | | | |
| |
Total Short-Term Investments
(cost $1,102,000) | | | | 1,102,000 | |
| | | | | | | | |
| |
Total Value of
Securities – 102.45%
(cost $39,347,852) | | | $ | 43,555,148 | |
| | | | | | | | |
| # | Security exempt from registration under Rule 144A of the Securities Act of 1933, as amended. At Oct. 31, 2014, the aggregate value of Rule 144A securities was $1,804,552, which represents 4.24% of the Portfolio’s net assets. See Note 12 in “Notes to financial statements.” |
| @ | Illiquid security. At Oct. 31, 2014, the aggregate value of illiquid securities was $5,742,740, which represents 13.51% of the Portfolio’s net assets. See Notes 12 in “Notes to financial statements.” |
| = | Security is being fair valued in accordance with the Portfolio’s fair valuation policy. At Oct. 31, 2014, the aggregate value of fair valued securities was $358,777, which represents 0.84% of the Portfolio’s net assets. See Note 1 in “Notes to financial statements.” |
| ° | Principal amount shown is stated in U.S. dollars unless noted that the security is denominated in another currency. |
| † | Non-income-producing security. |
| D | Securities have been classified by country of origin. Aggregate classification by business sectors has been presented on page 47 in “Security type / country and sector allocations.” |
Schedules of investments
Delaware Pooled® Trust — The Emerging Markets Portfolio II
The following foreign currency exchange contracts were outstanding at Oct. 31, 2014:1
Foreign Currency Exchange Contracts
| | | | | | | | | | | | | | | | |
Counterparty | | Contracts to
Receive (Deliver) | | | In
Exchange
For | | | Settlement
Date | | | Unrealized
Appreciation
(Depreciation) | |
BNYM | | HKD | (3,194,020) | | | USD | 412,066 | | | | 11/4/14 | | | $ | 214 | |
BNYM | | PLN | (1,222,200) | | | USD | 361,952 | | | | 11/4/14 | | | | (712 | ) |
BNYM | | ZAR | (920,027) | | | USD | 83,193 | | | | 11/7/14 | | | | (164 | ) |
| | | | | | | | | | | | | | | | |
| | | | |
| | | | | | | | | | | | | | $ | (662 | ) |
| | | | | | | | | | | | | | | | |
The use of foreign currency exchange contracts involves elements of market risk and risks in excess of the amounts disclosed in the financial statements. The foreign currency exchange contracts presented above represent the Portfolio’s total exposure in such
contracts, whereas only the net unrealized appreciation (depreciation) is reflected in the Portfolio’s net assets.
1See Note 9 in “Notes to financial statements.”
Summary of abbreviations:
ADR – American Depositary Receipt
BNYM – Bank of New York Mellon
GDR – Global Depositary Receipt
HKD – Hong Kong Dollar
PLN – Polish Zloty
USD – United States Dollar
ZAR – South African Rand
See accompanying notes, which are an integral part of the financial statements.
88
Statements of assets and liabilities
Delaware Pooled® Trust
October 31, 2014
| | | | | | | | | | | | |
| | | The | | | | | | The | |
| | | Large-Cap | | | The | | | Large-Cap | |
| | | Value Equity | | | Select 20 | | | Growth Equity | |
| | | Portfolio | | | Portfolio | | | Portfolio | |
Assets: | | | | | | | | | | | | |
Investments, at value1 | | $ | 134,230,802 | | | $ | 89,301,026 | | | $ | 276,256,402 | |
Short-term investments, at value2 | | | 4,236,046 | | | | 1,060,619 | | | | — | |
Repurchase agreements, at value3 | | | 1,145,000 | | | | — | | | | 3,883,000 | |
Cash | | | 84,963 | | | | — | | | | 21,980 | |
Dividends and interest receivable | | | 213,006 | | | | — | | | | 389,408 | |
Receivable for securities sold | | | — | | | | 18,466,579 | | | | — | |
| | | | | | | | | | | | |
Total assets | | | 139,909,817 | | | | 108,828,224 | | | | 280,550,790 | |
| | | | | | | | | | | | |
Liabilities: | | | | | | | | | | | | |
Cash overdraft | | | — | | | | 1,835,836 | | | | — | |
Payable for securities purchased | | | — | | | | — | | | | 3,040,181 | |
Payable for fund shares redeemed | | | — | | | | 16,523,134 | | | | — | |
Investment management fees payable | | | 63,072 | | | | 68,158 | | | | 122,221 | |
Other accrued expenses | | | 47,070 | | | | 44,910 | | | | 62,292 | |
Other affiliates payable | | | 2,009 | | | | 2,169 | | | | 3,906 | |
Trustees’ fees and expenses payable | | | 324 | | | | 260 | | | | 616 | |
| | | | | | | | | | | | |
Total liabilities | | | 112,475 | | | | 18,474,467 | | | | 3,229,216 | |
| | | | | | | | | | | | |
Total Net Assets | | $ | 139,797,342 | | | $ | 90,353,757 | | | $ | 277,321,574 | |
| | | | | | | | | | | | |
| | | |
Net Assets Consist of: | | | | | | | | | | | | |
Paid-in capital | | $ | 113,968,842 | | | $ | 33,144,831 | | | $ | 169,213,248 | |
Undistributed net investment income | | | 1,732,807 | | | | 45,929 | | | | 1,501,161 | |
Accumulated net realized gain on investments | | | 3,769,537 | | | | 24,380,042 | | | | 22,782,455 | |
Net unrealized appreciation of investments | | | 20,326,156 | | | | 32,782,955 | | | | 83,824,710 | |
| | | | | | | | | | | | |
Total Net Assets | | $ | 139,797,342 | | | $ | 90,353,757 | | | $ | 277,321,574 | |
| | | | | | | | | | | | |
| | | |
Net Asset Value | | | | | | | | | | | | |
| | | |
Portfolio Class | | | | | | | | | | | | |
Net assets | | $ | 139,797,342 | | | $ | 90,353,757 | | | $ | 277,321,574 | |
Shares of beneficial interest outstanding, unlimited authorization, no par | | | 5,064,074 | | | | 8,180,343 | | | | 16,270,299 | |
Net asset value per share | | $ | 27.61 | | | $ | 11.05 | | | $ | 17.04 | |
| | | |
| | | | | | | | | | | | |
1Investments, at cost | | $ | 113,904,672 | | | $ | 56,518,096 | | | $ | 192,431,692 | |
2Short-term investments, at cost | | | 4,236,020 | | | | 1,060,594 | | | | — | |
3Repurchase agreements, at cost | | | 1,145,000 | | | | — | | | | 3,883,000 | |
See accompanying notes, which are an integral part of the financial statements.
Statements of assets and liabilities
Delaware Pooled® Trust
| | | | | | | | | | |
| | | The | | The |
| | | Focus Smid-Cap | | High-Yield |
| | | Growth Equity | | Bond |
| | | Portfolio | | Portfolio |
Assets: | | | | | | | | | | |
Investments, at value1 | | | $ | 41,525,824 | | | | $ | 135,154,540 | |
Short-term investments, at value2 | | | | 1,088,177 | | | | | — | |
Repurchase agreements, at value3 | | | | 729,000 | | | | | 7,866,000 | |
Cash | | | | 9,464 | | | | | — | |
Cash collateral due from brokers | | | | — | | | | | 364,860 | |
Receivable for securities sold | | | | 82,213 | | | | | 2,048,431 | |
Dividends and interest receivable | | | | 11,902 | | | | | 2,251,337 | |
Receivable for fund shares sold | | | | — | | | | | 17,200 | |
Variation margin receivable on futures contracts | | | | — | | | | | 2,797 | |
| | | | | | | | | | |
Total assets | | | | 43,446,580 | | | | | 147,705,165 | |
| | | | | | | | | | |
Liabilities: | | | | | | | | | | |
Cash overdraft | | | | — | | | | | 42,826 | |
Payable for securities purchased | | | | 106,184 | | | | | 4,105,922 | |
Swap interest payable | | | | — | | | | | 18,889 | |
Other accrued expenses | | | | 36,488 | | | | | 58,312 | |
Investment management fees payable | | | | 22,148 | | | | | 54,403 | |
Other affiliates payable | | | | 563 | | | | | 2,686 | |
Trustees’ fees and expenses payable | | | | 86 | | | | | 338 | |
Unrealized loss on credit default swap contracts | | | | — | | | | | 98,674 | |
Upfront payments received on credit default swap contracts | | | | — | | | | | 140,648 | |
| | | | | | | | | | |
Total liabilities | | | | 165,469 | | | | | 4,522,698 | |
| | | | | | | | | | |
Total Net Assets | | | $ | 43,281,111 | | | | $ | 143,182,467 | |
| | | | | | | | | | |
| | |
Net Assets Consist of: | | | | | | | | | | |
Paid-in capital | | | $ | 22,692,323 | | | | $ | 133,764,467 | |
Undistributed net investment income | | | | — | | | | | 6,861,293 | |
Accumulated net realized gain on investments | | | | 9,370,750 | | | | | 1,986,837 | |
Net unrealized appreciation of investments and derivatives | | | | 11,218,038 | | | | | 569,870 | |
| | | | | | | | | | |
Total Net Assets | | | $ | 43,281,111 | | | | $ | 143,182,467 | |
| | | | | | | | | | |
| | |
Net Asset Value | | | | | | | | | | |
| | |
Portfolio Class | | | | | | | | | | |
Net assets | | | $ | 43,281,111 | | | | $ | 143,182,467 | |
Shares of beneficial interest outstanding, unlimited authorization, no par | | | | 1,980,820 | | | | | 16,625,419 | |
Net asset value per share | | | $ | 21.85 | | | | $ | 8.61 | |
| | | | | | | | | | |
1Investments, at cost | | | $ | 30,307,793 | | | | $ | 134,462,456 | |
2Short-term investments, at cost | | | | 1,088,170 | | | | | — | |
3Repurchase agreements, at cost | | | | 729,000 | | | | | 7,866,000 | |
See accompanying notes, which are an integral part of the financial statements.
90
| | | | | | | | | | | | |
| | | | | | | | | The | |
| | | The | | | The | | | Labor Select | |
| | | Core Plus | | | International | | | International | |
| | | Fixed Income | | | Equity | | | Equity | |
| | | Portfolio | | | Portfolio | | | Portfolio | |
Assets: | | | | | | | | | | | | |
Investments, at value1 | | $ | 75,869,608 | | | $ | 442,190,429 | | | $ | 369,848,109 | |
Short-term investments, at value2 | | | — | | | | 1,615,258 | | | | — | |
Repurchase agreements, at value3 | | | 14,496,000 | | | | 274,000 | | | | 2,684,000 | |
Cash | | | 167,033 | | | | 1,682 | | | | 2,899 | |
Foreign currencies, at value4 | | | 92,432 | | | | — | | | | 47,499 | |
Cash collateral due from brokers | | | 39,415 | | | | — | | | | — | |
Receivable for securities sold | | | 7,329,340 | | | | 3,274,645 | | | | 1,069,265 | |
Dividends and interest receivable | | | 533,643 | | | | 907,346 | | | | 1,153,113 | |
Variation margin receivable on futures contracts | | | 812 | | | | — | | | | — | |
Receivable for fund shares sold | | | — | | | | 1,000 | | | | — | |
Unrealized gain on foreign currency exchange contracts | | | — | | | | 78,004 | | | | 63,988 | |
| | | | | | | | | | | | |
Total assets | | | 98,528,283 | | | | 448,342,364 | | | | 374,868,873 | |
| | | | | | | | | | | | |
Liabilities: | | | | | | | | | | | | |
Payable for securities purchased | | | 21,387,764 | | | | 1,000,473 | | | | 1,014,070 | |
Swap interest payable | | | 2,139 | | | | — | | | | — | |
Payable for fund shares redeemed | | | — | | | | 399,365 | | | | — | |
Other accrued expenses | | | 62,614 | | | | 128,315 | | | | 115,494 | |
Investment management fees payable | | | 8,802 | | | | 279,281 | | | | 235,170 | |
Other affiliates payable | | | 2,966 | | | | 6,755 | | | | 5,727 | |
Trustees’ fees and expenses payable | | | 181 | | | | 1,074 | | | | 913 | |
Upfront payments received on credit default swap contracts | | | 25,581 | | | | — | | | | — | |
Unrealized loss on credit default swap contracts | | | 1,510 | | | | — | | | | — | |
Unrealized loss on foreign currency exchange contracts | | | 1,110 | | | | — | | | | 316 | |
Other liabilities | | | 20 | | | | — | | | | — | |
| | | | | | | | | | | | |
Total liabilities | | | 21,492,687 | | | | 1,815,263 | | | | 1,371,690 | |
| | | | | | | | | | | | |
Total Net Assets | | $ | 77,035,596 | | | $ | 446,527,101 | | | $ | 373,497,183 | |
| | | | | | | | | | | | |
| | | |
Net Assets Consist of: | | | | | | | | | | | | |
Paid-in capital | | $ | 74,687,736 | | | $ | 535,163,756 | | | $ | 398,328,573 | |
Undistributed net investment income | | | 1,820,073 | | | | 18,056,399 | | | | 18,377,722 | |
Accumulated net realized loss on investments | | | (750,339 | ) | | | (150,242,392 | ) | | | (69,386,305 | ) |
Net unrealized appreciation of investments and derivatives | | | 1,278,126 | | | | 43,549,338 | | | | 26,177,193 | |
| | | | | | | | | | | | |
Total Net Assets | | $ | 77,035,596 | | | $ | 446,527,101 | | | $ | 373,497,183 | |
| | | | | | | | | | | | |
| | | |
Net Asset Value | | | | | | | | | | | | |
| | | |
Portfolio Class | | | | | | | | | | | | |
Net assets | | $ | 77,035,596 | | | $ | 446,527,101 | | | $ | 373,497,183 | |
Shares of beneficial interest outstanding, unlimited authorization, no par | | | 7,431,693 | | | | 29,522,830 | | | | 25,333,898 | |
Net asset value per share | | $ | 10.37 | | | $ | 15.12 | | | $ | 14.74 | |
| | | | | | | | | | | | |
1Investments, at cost | | $ | 74,564,327 | | | $ | 398,672,621 | | | $ | 343,622,663 | |
2Short-term investments, at cost | | | — | | | | 1,615,235 | | | | — | |
3Repurchase agreements, at cost | | | 14,496,000 | | | | 274,000 | | | | 2,684,000 | |
4Foreign currencies, at cost | | | 97,889 | | | | — | | | | 50,138 | |
See accompanying notes, which are an integral part of the financial statements.
Statements of assets and liabilities
Delaware Pooled® Trust
| | | | | | | | |
| | | The | | | The | |
| | | Emerging | | | Emerging | |
| | | Markets | | | Markets | |
| | | Portfolio | | | Portfolio II | |
Assets: | | | | | | | | |
Investments, at value1 | | $ | 304,344,304 | | | $ | 42,453,148 | |
Short-term investments, at value2 | | | 2,392,551 | | | | — | |
Repurchase agreements, at value3 | | | 1,474,000 | | | | 1,102,000 | |
Foreign currencies, at value4 | | | 1,496,631 | | | | 18,744 | |
Cash | | | 79,083 | | | | — | |
Receivable for securities sold | | | 1,767,514 | | | | 1,027,660 | |
Dividends and interest receivable | | | 399,134 | | | | 23,335 | |
Receivable for fund shares sold | | | 140,000 | | | | — | |
Unrealized gain on foreign currency exchange contracts | | | 1,166 | | | | 214 | |
| | | | | | | | |
Total assets | | | 312,094,383 | | | | 44,625,101 | |
| | | | | | | | |
Liabilities: | | | | | | | | |
Cash overdraft | | | — | | | | 1,162 | |
Payable for securities purchased | | | 980,938 | | | | — | |
Payable for fund shares redeemed | | | — | | | | 2,023,000 | |
Investment management fees payable | | | 255,970 | | | | 31,949 | |
Other accrued expenses | | | 127,316 | | | | 45,021 | |
Other affiliates payable | | | 4,757 | | | | 996 | |
Trustees’ fees and expenses payable | | | 707 | | | | 104 | |
Unrealized loss on foreign currency exchange contracts | | | 17,602 | | | | 876 | |
Other liabilities | | | 496,178 | | | | 7,432 | |
| | | | | | | | |
Total liabilities | | | 1,883,468 | | | | 2,110,540 | |
| | | | | | | | |
Total Net Assets | | $ | 310,210,915 | | | $ | 42,514,561 | |
| | | | | | | | |
| | |
Net Assets Consist of: | | | | | | | | |
Paid-in capital | | $ | 294,134,606 | | | $ | 37,179,663 | |
Undistributed net investment income | | | 6,278,692 | | | | 5,590 | |
Accumulated net realized gain on investments | | | 11,946,173 | | | | 1,130,276 | |
Net unrealized appreciation (depreciation) of investments and derivatives | | | (2,148,556 | ) | | | 4,199,032 | |
| | | | | | | | |
Total Net Assets | | $ | 310,210,915 | | | $ | 42,514,561 | |
| | | | | | | | |
| | |
Net Asset Value | | | | | | | | |
| | |
Portfolio Class | | | | | | | | |
Net assets | | $ | 310,210,915 | | | $ | 42,514,561 | |
Shares of beneficial interest outstanding, unlimited authorization, no par | | | 31,803,015 | | | | 4,301,737 | |
Net asset value per share | | $ | 9.75 | | | $ | 9.88 | |
| | | | | | | | |
1Investments, at cost | | $ | 305,972,058 | | | $ | 38,245,852 | |
2Short-term investments, at cost | | | 2,392,512 | | | | — | |
3Repurchase agreements, at cost | | | 1,474,000 | | | | 1,102,000 | |
4Foreign currencies, at cost | | | 1,508,648 | | | | 18,866 | |
See accompanying notes, which are an integral part of the financial statements.
92
Statements of operations
Delaware Pooled® Trust
Year ended October 31, 2014
| | | | | | | | | | | | |
| | | The | | | | | | The | |
| | | Large-Cap | | | The | | | Large-Cap | |
| | | Value Equity | | | Select 20 | | | Growth Equity | |
| | | Portfolio | | | Portfolio | | | Portfolio | |
Investment Income: | | | | | | | | | | | | |
Dividends | | $ | 2,771,861 | | | $ | 1,162,698 | | | $ | 3,563,287 | |
Interest | | | 1,270 | | | | 2,412 | | | | 1,551 | |
Foreign tax withheld | | | — | | | | — | | | | (68,014 | ) |
| | | | | | | | | | | | |
| | | 2,773,131 | | | | 1,165,110 | | | | 3,496,824 | |
| | | | | | | | | | | | |
Expenses: | | | | | | | | | | | | |
Management fees | | | 609,103 | | | | 937,268 | | | | 1,439,450 | |
Accounting and administration expenses | | | 37,368 | | | | 44,166 | | | | 89,720 | |
Audit and tax | | | 30,090 | | | | 30,104 | | | | 30,110 | |
Registration fees | | | 23,526 | | | | 19,823 | | | | 19,891 | |
Dividend disbursing and transfer agent fees and expenses | | | 12,535 | | | | 14,568 | | | | 29,068 | |
Reports and statements to shareholders | | | 10,130 | | | | 8,579 | | | | 15,032 | |
Legal fees | | | 9,932 | | | | 12,545 | | | | 25,890 | |
Custodian fees | | | 6,045 | | | | 8,068 | | | | 13,964 | |
Trustees’ fees and expenses | | | 5,094 | | | | 6,381 | | | | 12,439 | |
Other | | | 6,510 | | | | 9,112 | | | | 11,682 | |
| | | | | | | | | | | | |
| | | 750,333 | | | | 1,090,614 | | | | 1,687,246 | |
Less expense paid indirectly | | | — | | | | (1 | ) | | | (1 | ) |
| | | | | | | | | | | | |
Total operating expenses | | | 750,333 | | | | 1,090,613 | | | | 1,687,245 | |
| | | | | | | | | | | | |
Net Investment Income | | | 2,022,798 | | | | 74,497 | | | | 1,809,579 | |
| | | | | | | | | | | | |
Net Realized and Unrealized Gain (Loss) | | | | | | | | | | | | |
Net realized gain on investments | | | 4,047,355 | | | | 25,918,447 | | | | 24,177,529 | |
Net change in unrealized appreciation (depreciation) of investments | | | 9,729,583 | | | | (7,284,821 | ) | | | 16,123,166 | |
| | | | | | | | | | | | |
| | | |
Net Realized and Unrealized Gain | | | 13,776,938 | | | | 18,633,626 | | | | 40,300,695 | |
| | | | | | | | | | | | |
Net Increase in Net Assets Resulting from Operations | | $ | 15,799,736 | | | $ | 18,708,123 | | | $ | 42,110,274 | |
| | | | | | | | | | | | |
See accompanying notes, which are an integral part of the financial statements.
Statements of operations
Delaware Pooled® Trust
| | | | | | | | | | |
| | | The | | The |
| | | Focus Smid-Cap | | High-Yield |
| | | Growth Equity | | Bond |
| | | Portfolio | | Portfolio |
Investment Income: | | | | | | | | | | |
Dividends | | | $ | 469,519 | | | | $ | 167,658 | |
Interest | | | | 1,034 | | | | | 8,672,339 | |
Foreign tax withheld | | | | (9,788 | ) | | | | — | |
| | | | | | | | | | |
| | | | 460,765 | | | | | 8,839,997 | |
| | | | | | | | | | |
Expenses: | | | | | | | | | | |
Management fees | | | | 406,093 | | | | | 627,739 | |
Audit and tax | | | | 30,138 | | | | | 37,203 | |
Accounting and administration expenses | | | | 18,907 | | | | | 47,785 | |
Custodian fees | | | | 6,681 | | | | | 10,404 | |
Dividend disbursing and transfer agent fees and expenses | | | | 6,358 | | | | | 15,621 | |
Reports and statements to shareholders | | | | 6,354 | | | | | 10,035 | |
Legal fees | | | | 5,243 | | | | | 13,060 | |
Registration fees | | | | 4,612 | | | | | 16,551 | |
Trustees’ fees and expenses | | | | 2,838 | | | | | 6,648 | |
Other | | | | 4,104 | | | | | 15,386 | |
| | | | | | | | | | |
| | | | 491,328 | | | | | 800,432 | |
Less expenses waived | | | | (5,103 | ) | | | | — | |
Less expense paid indirectly | | | | (1 | ) | | | | — | |
| | | | | | | | | | |
Total operating expenses | | | | 486,224 | | | | | 800,432 | |
| | | | | | | | | | |
Net Investment Income (Loss) | | | | (25,459 | ) | | | | 8,039,565 | |
| | | | | | | | | | |
| | |
Net Realized and Unrealized Gain (Loss) | | | | | | | | | | |
Net realized gain (loss) on: | | | | | | | | | | |
Investments | | | | 10,180,575 | | | | | 3,866,402 | |
Foreign currencies | | | | (6,024 | ) | | | | 112 | |
Foreign currency exchange contracts | | | | (6,005 | ) | | | | — | |
Futures contracts | | | | — | | | | | (97,426 | ) |
Swap contracts | | | | — | | | | | (85,804 | ) |
| | | | | | | | | | |
Net realized gain | | | | 10,168,546 | | | | | 3,683,284 | |
| | | | | | | | | | |
Net change in unrealized appreciation (depreciation) of: | | | | | | | | | | |
Investments | | | | (6,816,587 | ) | | | | (4,711,838 | ) |
Futures contracts | | | | — | | | | | (15,984 | ) |
Swap contracts | | | | — | | | | | (106,230 | ) |
| | | | | | | | | | |
Net change in unrealized appreciation (depreciation) | | | | (6,816,587 | ) | | | | (4,834,052 | ) |
| | | | | | | | | | |
Net Realized and Unrealized Gain (Loss) | | | | 3,351,959 | | | | | (1,150,768 | ) |
| | | | | | | | | | |
Net Increase in Net Assets Resulting from Operations | | | $ | 3,326,500 | | | | $ | 6,888,797 | |
| | | | | | | | | | |
See accompanying notes, which are an integral part of the financial statements.
94
| | | | | | | | | | | | | | | |
| | | The | | | | The |
| | | Core Plus | | The | | Labor Select |
| | | Fixed Income | | International Equity | | International Equity |
| | | Portfolio | | Portfolio | | Portfolio |
Investment Income: | | | | | | | | | | | | | | | |
Dividends | | | $ | 14,473 | | | | $ | 24,914,802 | | | | $ | 25,627,826 | |
Interest | | | | 2,378,131 | | | | | 1,281 | | | | | 1,776 | |
Foreign tax withheld | | | | (5 | ) | | | | (1,290,923 | ) | | | | (1,201,004 | ) |
| | | | | | | | | | | | | | | |
| | | | 2,392,599 | | | | | 23,625,160 | | | | | 24,428,598 | |
| | | | | | | | | | | | | | | |
Expenses: | | | | | | | | | | | | | | | |
Management fees | | | | 307,369 | | | | | 3,613,298 | | | | | 3,391,702 | |
Audit and tax | | | | 39,076 | | | | | 45,385 | | | | | 48,061 | |
Accounting and administration expenses | | | | 24,396 | | | | | 165,254 | | | | | 155,717 | |
Registration fees | | | | 20,072 | | | | | 15,613 | | | | | 18,812 | |
Custodian fees | | | | 19,883 | | | | | 132,373 | | | | | 121,906 | |
Dividend disbursing and transfer agent fees and expenses | | | | 7,926 | | | | | 73,783 | | | | | 50,957 | |
Reports and statements to shareholders | | | | 7,655 | | | | | 28,717 | | | | | 25,748 | |
Legal fees | | | | 6,947 | | | | | 46,261 | | | | | 44,775 | |
Trustees’ fees and expenses | | | | 3,334 | | | | | 23,198 | | | | | 22,208 | |
Other | | | | 27,462 | | | | | 21,585 | | | | | 21,625 | |
| | | | | | | | | | | | | | | |
| | | | 464,120 | | | | | 4,165,467 | | | | | 3,901,511 | |
Less expenses waived | | | | (142,766 | ) | | | | — | | | | | — | |
Less expense paid indirectly | | | | — | | | | | (2 | ) | | | | (1 | ) |
| | | | | | | | | | | | | | | |
Total operating expenses | | | | 321,354 | | | | | 4,165,465 | | | | | 3,901,510 | |
| | | | | | | | | | | | | | | |
Net Investment Income | | | | 2,071,245 | | | | | 19,459,695 | | | | | 20,527,088 | |
| | | | | | | | | | | | | | | |
| | | |
Net Realized and Unrealized Gain (Loss) | | | | | | | | | | | | | | | |
Net realized gain (loss) on: | | | | | | | | | | | | | | | |
Investments | | | | 1,283,791 | | | | | 33,234,242 | | | | | 31,450,346 | |
Foreign currencies | | | | (22,042 | ) | | | | (90,445 | ) | | | | 7,853 | |
Foreign currency exchange contracts | | | | 1,020 | | | | | 589,777 | | | | | 657,475 | |
Futures contracts | | | | 14,475 | | | | | — | | | | | — | |
Swap contracts | | | | (15,560 | ) | | | | — | | | | | — | |
| | | | | | | | | | | | | | | |
Net realized gain | | | | 1,261,684 | | | | | 33,733,574 | | | | | 32,115,674 | |
| | | | | | | | | | | | | | | |
Net change in unrealized appreciation (depreciation) of: | | | | | | | | | | | | | | | |
Investments | | | | 275,743 | | | | | (44,237,951 | ) | | | | (42,901,593 | ) |
Foreign currencies | | | | (5,097 | ) | | | | (71,626 | ) | | | | (183,997 | ) |
Foreign currency exchange contracts | | | | (1,720 | ) | | | | 12,254 | | | | | (35,433 | ) |
Futures contracts | | | | (15,257 | ) | | | | — | | | | | — | |
Swap contracts | | | | (1,581 | ) | | | | — | | | | | — | |
| | | | | | | | | | | | | | | |
Net change in unrealized appreciation (depreciation) | | | | 252,088 | | | | | (44,297,323 | ) | | | | (43,121,023 | ) |
| | | | | | | | | | | | | | | |
Net Realized and Unrealized Gain (Loss) | | | | 1,513,772 | | | | | (10,563,749 | ) | | | | (11,005,349 | ) |
| | | | | | | | | | | | | | | |
Net Increase in Net Assets Resulting from Operations | | | $ | 3,585,017 | | | | $ | 8,895,946 | | | | $ | 9,521,739 | |
| | | | | | | | | | | | | | | |
See accompanying notes, which are an integral part of the financial statements.
Statements of operations
Delaware Pooled® Trust
| | | | | | | | | | | | | | | | |
| | | The | | The |
| | | Emerging Markets | | Emerging Markets |
| | | Portfolio | | Portfolio II |
Investment Income: | | | | | | | | | | | | | | | | |
Dividends | | | | $ | 12,371,966 | | | | | | | $ | 866,728 | | | |
Interest | �� | | | | 2,451 | | | | | | | | 111 | | | |
Foreign tax withheld | | | | | (1,112,532 | ) | | | | | | | (71,852 | ) | | |
| | | | | | | | | | | | | | | | |
| | | | | 11,261,885 | | | | | | | | 794,987 | | | |
| | | | | | | | | | | | | | | | |
Expenses: | | | | | | | | | | | | | | | | |
Management fees | | | | | 3,300,805 | | | | | | | | 432,313 | | | |
Custodian fees | | | | | 212,120 | | | | | | | | 30,050 | | | |
Accounting and administration expenses | | | | | 113,088 | | | | | | | | 14,798 | | | |
Audit and tax | | | | | 68,937 | | | | | | | | 45,769 | | | |
Dividend disbursing and transfer agent fees and expenses | | | | | 37,178 | | | | | | | | 4,985 | | | |
Legal fees | | | | | 31,581 | | | | | | | | 4,303 | | | |
Reports and statements to shareholders | | | | | 18,128 | | | | | | | | 4,207 | | | |
Registration fees | | | | | 15,907 | | | | | | | | 23,158 | | | |
Trustees’ fees and expenses | | | | | 15,752 | | | | | | | | — | | | |
Trustees’ fees and expenses | | | | | — | | | | | | | | 2,045 | | | |
Other | | | | | 18,387 | | | | | | | | 9,492 | | | |
| | | | | | | | | | | | | | | | |
| | | | | 3,831,883 | | | | | | | | 571,120 | | | |
Less expenses waived | | | | | — | | | | | | | | (52,349 | ) | | |
Less expense paid indirectly | | | | | (1 | ) | | | | | | | — | | | |
| | | | | | | | | | | | | | | | |
Total operating expenses | | | | | 3,831,882 | | | | | | | | 518,771 | | | |
| | | | | | | | | | | | | | | | |
Net Investment Income | | | | | 7,430,003 | | | | | | | | 276,216 | | | |
| | | | | | | | | | | | | | | | |
| | | | | | |
Net Realized and Unrealized Gain (Loss) | | | | | | | | | | | | | | | | |
Net realized gain (loss) on: | | | | | | | | | | | | | | | | |
Investments | | | | | 12,921,050 | | | | | | | | 1,137,447 | | | |
Foreign currencies | | | | | (374,147 | ) | | | | | | | (14,766 | ) | | |
Foreign currency exchange contracts | | | | | (41,898 | ) | | | | | | | (6,074 | ) | | |
| | | | | | | | | | | | | | | | |
Net realized gain | | | | | 12,505,005 | | | | | | | | 1,116,607 | | | |
| | | | | | | | | | | | | | | | |
Net change in unrealized appreciation (depreciation) of: | | | | | | | | | | | | | | | | |
Investments | | | | | (13,013,720 | ) | | | | | | | 248,818 | | | |
Foreign currencies | | | | | (155,121 | ) | | | | | | | 4,000 | | | |
Foreign currency exchange contracts | | | | | (71,576 | ) | | | | | | | (1,417 | ) | | |
| | | | | | | | | | | | | | | | |
Net change in unrealized appreciation (depreciation) | | | | | (13,240,417 | ) | | | | | | | 251,401 | | | |
| | | | | | | | | | | | | | | | |
Net Realized and Unrealized Gain (Loss) | | | | | (735,412 | ) | | | | | | | 1,368,008 | | | |
| | | | | | | | | | | | | | | | |
Net Increase in Net Assets Resulting from Operations | | | | $ | 6,694,591 | | | | | | | $ | 1,644,224 | | | |
| | | | | | | | | | | | | | | | |
See accompanying notes, which are an integral part of the financial statements.
96
Statements of changes in net assets
Delaware Pooled® Trust
| | | | | | | | | | | | | | | | | | | | | | | | |
| | | The | | | | | | The | |
| | | Large-Cap | | | The | | | Large-Cap | |
| | | Value Equity | | | Select 20 | | | Growth Equity | |
| | | Portfolio | | | Portfolio | | | Portfolio | |
| | | Year ended | | | Year ended | | | Year ended | |
| | | 10/31/14 | | | 10/31/13 | | | 10/31/14 | | | 10/31/13 | | | 10/31/14 | | | 10/31/13 | |
Increase (Decrease) in Net Assets from Operations: | | | | | | | | | | | | | | | | | | | | | | | | |
Net investment income | | $ | 2,022,798 | | | $ | 985,861 | | | $ | 74,497 | | | $ | 319,707 | | | $ | 1,809,579 | | | $ | 1,090,664 | |
Net realized gain | | | 4,047,355 | | | | 1,129,169 | | | | 25,918,447 | | | | 3,671,786 | | | | 24,177,529 | | | | 37,524,122 | |
Net change in unrealized appreciation (depreciation) | | | 9,729,583 | | | | 9,974,396 | | | | (7,284,821 | ) | | | 27,207,181 | | | | 16,123,166 | | | | 17,165,268 | |
| | | | | | | | | | | | | | | | | | | | | | | | |
Net increase in net assets resulting from operations | | | 15,799,736 | | | | 12,089,426 | | | | 18,708,123 | | | | 31,198,674 | | | | 42,110,274 | | | | 55,780,054 | |
| | | | | | | | | | | | | | | | | | | | | | | | |
| | | | | | |
Dividends and Distributions to Shareholders from: | | | | | | | | | | | | | | | | | | | | | | | | |
Net investment income | | | (1,238,119 | ) | | | (173,059 | ) | | | (98,955 | ) | | | (249,320 | ) | | | (852,040 | ) | | | (991,897 | ) |
Net realized gain | | | (451,277 | ) | | | — | | | | (2,407,909 | ) | | | (1,994,562 | ) | | | — | | | | — | |
| | | | | | | | | | | | | | | | | | | | | | | | |
| | | (1,689,396 | ) | | | (173,059 | ) | | | (2,506,864 | ) | | | (2,243,882 | ) | | | (852,040 | ) | | | (991,897 | ) |
| | | | | | | | | | | | | | | | | | | | | | | | |
| | | | | | |
Capital Share Transactions: | | | | | | | | | | | | | | | | | | | | | | | | |
Proceeds from shares sold | | | 45,461,313 | | | | 68,782,191 | | | | 3,175,400 | | | | 53,855,543 | | | | 20,129,000 | | | | 40,823,622 | |
Net asset value of shares issued upon reinvestment of dividends and distributions | | | 1,235,465 | | | | 152,270 | | | | 1,848,361 | | | | 2,066,753 | | | | 737,927 | | | | 888,530 | |
| | | | | | | | | | | | | | | | | | | | | | | | |
| | | 46,696,778 | | | | 68,934,461 | | | | 5,023,761 | | | | 55,922,296 | | | | 20,866,927 | | | | 41,712,152 | |
| | | | | | | | | | | | | | | | | | | | | | | | |
Cost of shares redeemed | | | (10,246,939 | ) | | | (30,987 | ) | | | (118,953,511 | ) | | | (21,305,731 | ) | | | (39,761,752 | ) | | | (58,009,625 | ) |
| | | | | | | | | | | | | | | | | | | | | | | | |
Increase (decrease) in net assets derived from capital share transactions | | | 36,449,839 | | | | 68,903,474 | | | | (113,929,750 | ) | | | 34,616,565 | | | | (18,894,825 | ) | | | (16,297,473 | ) |
| | | | | | | | | | | | | | | | | | | | | | | | |
| | | | | | |
Net Increase (Decrease) in Net Assets | | | 50,560,179 | | | | 80,819,841 | | | | (97,728,491 | ) | | | 63,571,357 | | | | 22,363,409 | | | | 38,490,684 | |
| | | | | | |
Net Assets: | | | | | | | | | | | | | | | | | | | | | | | | |
Beginning of year | | | 89,237,163 | | | | 8,417,322 | | | | 188,082,248 | | | | 124,510,891 | | | | 254,958,165 | | | | 216,467,481 | |
| | | | | | | | | | | | | | | | | | | | | | | | |
End of year | | $ | 139,797,342 | | | $ | 89,237,163 | | | $ | 90,353,757 | | | $ | 188,082,248 | | | $ | 277,321,574 | | | $ | 254,958,165 | |
| | | | | | | | | | | | | | | | | | | | | | | | |
Undistributed net investment income | | $ | 1,732,807 | | | $ | 948,128 | | | $ | 45,929 | | | $ | 70,387 | | | $ | 1,501,161 | | | $ | 543,622 | |
| | | | | | | | | | | | | | | | | | | | | | | | |
See accompanying notes, which are an integral part of the financial statements.
Statements of changes in net assets
Delaware Pooled® Trust
| | | | | | | | | | | | | | | | |
| | | The | | | The | |
| | | Focus Smid-Cap | | | High-Yield | |
| | | Growth Equity | | | Bond | |
| | | Portfolio | | | Portfolio | |
| | | Year ended | | | Year ended | |
| | | 10/31/14 | | | 10/31/13 | | | 10/31/14 | | | 10/31/13 | |
Increase (Decrease) in Net Assets from Operations: | | | | | | | | | | | | | | | | |
Net investment income (loss) | | $ | (25,459 | ) | | $ | (13,708 | ) | | $ | 8,039,565 | | | $ | 7,864,546 | |
Net realized gain | | | 10,168,546 | | | | 172,366 | | | | 3,683,284 | | | | 2,381,935 | |
Net change in unrealized appreciation (depreciation) | | | (6,816,587 | ) | | | 16,517,843 | | | | (4,834,052 | ) | | | 1,772,823 | |
| | | | | | | | | | | | | | | | |
Net increase in net assets resulting from operations | | | 3,326,500 | | | | 16,676,501 | | | | 6,888,797 | | | | 12,019,304 | |
| | | | | | | | | | | | | | | | |
| | | | |
Dividends and Distributions to Shareholders from: | | | | | | | | | | | | | | | | |
Net investment income | | | (48,668 | ) | | | — | | | | (8,364,409 | ) | | | (6,283,328 | ) |
Net realized gain | | | — | | | | (355,678 | ) | | | — | | | | — | |
| | | | | | | | | | | | | | | | |
| | | (48,668 | ) | | | (355,678 | ) | | | (8,364,409 | ) | | | (6,283,328 | ) |
| | | | | | | | | | | | | | | | |
| | | | |
Capital Share Transactions: | | | | | | | | | | | | | | | | |
Proceeds from shares sold | | | 9,804,200 | | | | 60,479,561 | | | | 9,021,353 | | | | 26,315,242 | |
Net asset value of shares issued upon reinvestment of dividends and distributions | | | 44,060 | | | | 333,339 | | | | 6,925,632 | | | | 5,353,412 | |
| | | | | | | | | | | | | | | | |
| | | 9,848,260 | | | | 60,812,900 | | | | 15,946,985 | | | | 31,668,654 | |
| | | | | | | | | | | | | | | | |
Cost of shares redeemed | | | (59,279,351 | ) | | | (5,551,946 | ) | | | (6,599,065 | ) | | | (15,142,117 | ) |
| | | | | | | | | | | | | | | | |
Increase (decrease) in net assets derived from capital share transactions | | | (49,431,091 | ) | | | 55,260,954 | | | | 9,347,920 | | | | 16,526,537 | |
| | | | | | | | | | | | | | | | |
| | | | |
Net Increase (Decrease) in Net Assets | | | (46,153,259 | ) | | | 71,581,777 | | | | 7,872,308 | | | | 22,262,513 | |
| | | | |
Net Assets: | | | | | | | | | | | | | | | | |
Beginning of year | | | 89,434,370 | | | | 17,852,593 | | | | 135,310,159 | | | | 113,047,646 | |
| | | | | | | | | | | | | | | | |
End of year | | $ | 43,281,111 | | | $ | 89,434,370 | | | $ | 143,182,467 | | | $ | 135,310,159 | |
| | | | | | | | | | | | | | | | |
Undistributed (distributions in excess of) net investment income | | $ | — | | | $ | (13,827 | ) | | $ | 6,861,293 | | | $ | 7,005,280 | |
| | | | | | | | | | | | | | | | |
See accompanying notes, which are an integral part of the financial statements.
98
| | | | | | | | | | | | | | | | | | | | | | | | |
| | | The | | | The | | | The | |
| | | Core Plus | | | International | | | Labor Select | |
| | | Fixed Income | | | Equity | | | International Equity | |
| | | Portfolio | | | Portfolio | | | Portfolio | |
| | | Year ended | | | Year ended | | | Year ended | |
| | | 10/31/14 | | | 10/31/13 | | | 10/31/14 | | | 10/31/13 | | | 10/31/14 | | | 10/31/13 | |
Increase (Decrease) in Net Assets from Operations: | | | | | | | | | | | | | | | | | | | | | | | | |
Net investment income | | $ | 2,071,245 | | | $ | 1,473,498 | | | $ | 19,459,695 | | | $ | 11,391,205 | | | $ | 20,527,088 | | | $ | 12,347,009 | |
Net realized gain (loss) | | | 1,261,684 | | | | (282,854 | ) | | | 33,733,574 | | | | 2,693,762 | | | | 32,115,674 | | | | (3,515,146 | ) |
Net change in unrealized appreciation (depreciation) | | | 252,088 | | | | (1,437,592 | ) | | | (44,297,323 | ) | | | 87,959,007 | | | | (43,121,023 | ) | | | 96,563,474 | |
| | | | | | | | | | | | | | | | | | | | | | | | |
Net increase (decrease) in net assets resulting from operations | | | 3,585,017 | | | | (246,948 | ) | | | 8,895,946 | | | | 102,043,974 | | | | 9,521,739 | | | | 105,395,337 | |
| | | | | | | | | | | | | | | | | | | | | | | | |
| | | | | | |
Dividends and Distributions to Shareholders from: | | | | | | | | | | | | | | | | | | | | | | | | |
Net investment income | | | (1,349,489 | ) | | | (1,823,382 | ) | | | (13,166,001 | ) | | | (18,294,751 | ) | | | (15,240,625 | ) | | | (17,220,981 | ) |
| | | | | | | | | | | | | | | | | | | | | | | | |
| | | (1,349,489 | ) | | | (1,823,382 | ) | | | (13,166,001 | ) | | | (18,294,751 | ) | | | (15,240,625 | ) | | | (17,220,981 | ) |
| | | | | | | | | | | | | | | | | | | | | | | | |
| | | | | | |
Capital Share Transactions: | | | | | | | | | | | | | | | | | | | | | | | | |
Proceeds from shares sold | | | 18,225,000 | | | | 8,000,000 | | | | 31,493,180 | | | | 33,198,938 | | | | 27,424,401 | | | | 17,605,001 | |
Net asset value of shares issued upon reinvestment of dividends and distributions | | | 1,349,489 | | | | 1,823,381 | | | | 9,565,196 | | | | 12,102,585 | | | | 15,214,036 | | | | 17,196,165 | |
| | | | | | | | | | | | | | | | | | | | | | | | |
| | | 19,574,489 | | | | 9,823,381 | | | | 41,058,376 | | | | 45,301,523 | | | | 42,638,437 | | | | 34,801,166 | |
| | | | | | | | | | | | | | | | | | | | | | | | |
Cost of shares redeemed | | | (1,415,000 | ) | | | (11,425,575 | ) | | | (81,944,610 | ) | | | (105,194,498 | ) | | | (169,524,361 | ) | | | (126,400,968 | ) |
| | | | | | | | | | | | | | | | | | | | | | | | |
Increase (decrease) in net assets derived from capital share transactions | | | 18,159,489 | | | | (1,602,194 | ) | | | (40,886,234 | ) | | | (59,892,975 | ) | | | (126,885,924 | ) | | | (91,599,802 | ) |
| | | | | | | | | | | | | | | | | | | | | | | | |
Net Increase (Decrease) in Net Assets | | | 20,395,017 | | | | (3,672,524 | ) | | | (45,156,289 | ) | | | 23,856,248 | | | | (132,604,810 | ) | | | (3,425,446 | ) |
| | | | | | |
Net Assets: | | | | | | | | | | | | | | | | | | | | | | | | |
Beginning of year | | | 56,640,579 | | | | 60,313,103 | | | | 491,683,390 | | | | 467,827,142 | | | | 506,101,993 | | | | 509,527,439 | |
| | | | | | | | | | | | | | | | | | | | | | | | |
End of year | | $ | 77,035,596 | | | $ | 56,640,579 | | | $ | 446,527,101 | | | $ | 491,683,390 | | | $ | 373,497,183 | | | $ | 506,101,993 | |
| | | | | | | | | | | | | | | | | | | | | | | | |
Undistributed net investment income | | $ | 1,820,073 | | | $ | 1,060,488 | | | $ | 18,056,399 | | | $ | 11,263,373 | | | $ | 18,377,722 | | | $ | 12,425,931 | |
| | | | | | | | | | | | | | | | | | | | | | | | |
See accompanying notes, which are an integral part of the financial statements.
Statements of changes in net assets
Delaware Pooled® Trust
| | | | | | | | | | | | | | | | |
| | | The | | | The | |
| | | Emerging | | | Emerging | |
| | | Markets | | | Markets | |
| | | Portfolio | | | Portfolio II | |
| | | Year ended | | | Year ended | |
| | | 10/31/14 | | | 10/31/13 | | | 10/31/14 | | | 10/31/13 | |
Increase (Decrease) in Net Assets from Operations: | | | | | | | | | | | | | | | | |
Net investment income | | $ | 7,430,003 | | | $ | 6,319,003 | | | $ | 276,216 | | | $ | 300,768 | |
Net realized gain | | | 12,505,005 | | | | 12,757,899 | | | | 1,116,607 | | | | 342,515 | |
Net change in unrealized appreciation (depreciation) | | | (13,240,417 | ) | | | (12,912,719 | ) | | | 251,401 | | | | 5,505,095 | |
| | | | | | | | | | | | | | | | |
Net increase in net assets resulting from operations | | | 6,694,591 | | | | 6,164,183 | | | | 1,644,224 | | | | 6,148,378 | |
| | | | | | | | | | | | | | | | |
| | | | |
Dividends and Distributions to Shareholders from: | | | | | | | | | | | | | | | | |
Net investment income | | | (5,872,140 | ) | | | (7,465,935 | ) | | | (402,381 | ) | | | (149,047 | ) |
Return of capital | | | — | | | | (5,123,069 | ) | | | — | | | | — | |
Net realized gain | | | (11,018,509 | ) | | | — | | | | (161,827 | ) | | | — | |
| | | | | | | | | | | | | | | | |
| | | (16,890,649 | ) | | | (12,589,004 | ) | | | (564,208 | ) | | | (149,047 | ) |
| | | | | | | | | | | | | | | | |
| | | | |
Capital Share Transactions: | | | | | | | | | | | | | | | | |
Proceeds from shares sold | | | 31,579,483 | | | | 94,582,863 | | | | 1,570,049 | | | | 6,388,797 | |
Purchase reimbursement fees | | | 171,224 | | | | 520,217 | | | | — | | | | — | |
Net asset value of shares issued upon reinvestment of dividends and distributions | | | 14,226,136 | | | | 11,314,104 | | | | 564,207 | | | | 149,047 | |
| | | | | | | | | | | | | | | | |
| | | 45,976,843 | | | | 106,417,184 | | | | 2,134,256 | | | | 6,537,844 | |
| | | | | | | | | | | | | | | | |
Cost of shares redeemed | | | (59,835,193 | ) | | | (83,131,915 | ) | | | (2,923,000 | ) | | | — | |
Redemption reimbursement fees | | | 381,420 | | | | 214,129 | | | | — | | | | — | |
| | | | | | | | | | | | | | | | |
| | | (59,453,773 | ) | | | (82,917,786 | ) | | | (2,923,000 | ) | | | — | |
| | | | | | | | | | | | | | | | |
Increase (decrease) in net assets derived from capital share transactions | | | (13,476,930 | ) | | | 23,499,398 | | | | (788,744 | ) | | | 6,537,844 | |
| | | | | | | | | | | | | | | | |
Net Increase (Decrease) in Net Assets | | | (23,672,988 | ) | | | 17,074,577 | | | | 291,272 | | | | 12,537,175 | |
| | | | |
Net Assets: | | | | | | | | | | | | | | | | |
Beginning of year | | | 333,883,903 | | | | 316,809,326 | | | | 42,223,289 | | | | 29,686,114 | |
| | | | | | | | | | | | | | | | |
End of year | | $ | 310,210,915 | | | $ | 333,883,903 | | | $ | 42,514,561 | | | $ | 42,223,289 | |
| | | | | | | | | | | | | | | | |
Undistributed net investment income | | $ | 6,278,692 | | | $ | 5,882,167 | | | $ | 5,590 | | | $ | 152,595 | |
| | | | | | | | | | | | | | | | |
See accompanying notes, which are an integral part of the financial statements.
100
Financial highlights
Delaware Pooled® Trust — The Large-Cap Value Equity Portfolio
Selected data for each share of the Portfolio outstanding throughout each period were as follows:
| | | | | | | | | | | | | | | | | | | | |
| | | Year ended | |
| | | 10/31/14 | | | 10/31/13 | | | 10/31/12 | | | 10/31/11 | | | 10/31/10 | |
Net asset value, beginning of period | | $ | 24.190 | | | $ | 18.970 | | | $ | 16.570 | | | $ | 15.130 | | | $ | 13.290 | |
| | | | | |
Income from investment operations: | | | | | | | | | | | | | | | | | | | | |
Net investment income1 | | | 0.473 | | | | 0.440 | | | | 0.394 | | | | 0.346 | | | | 0.343 | |
Net realized and unrealized gain | | | 3.385 | | | | 5.170 | | | | 2.379 | | | | 1.579 | | | | 1.851 | |
| | | | | | | | | | | | | | | | | | | | |
Total from investment operations | | | 3.858 | | | | 5.610 | | | | 2.773 | | | | 1.925 | | | | 2.194 | |
| | | | | | | | | | | | | | | | | | | | |
| | | | | |
Less dividends and distributions from: | | | | | | | | | | | | | | | | | | | | |
Net investment income | | | (0.321 | ) | | | (0.390 | ) | | | (0.373 | ) | | | (0.485 | ) | | | (0.354 | ) |
Net realized gain | | | (0.117 | ) | | | — | | | | — | | | | — | | | | — | |
| | | | | | | | | | | | | | | | | | | | |
Total dividends and distributions | | | (0.438 | ) | | | (0.390 | ) | | | (0.373 | ) | | | (0.485 | ) | | | (0.354 | ) |
| | | | | | | | | | | | | | | | | | | | |
| | | | | |
Net asset value, end of period | | $ | 27.610 | | | $ | 24.190 | | | $ | 18.970 | | | $ | 16.570 | | | $ | 15.130 | |
| | | | | | | | | | | | | | | | | | | | |
| | | | | |
Total return2 | | | 16.19% | | | | 30.09% | | | | 17.12% | | | | 12.98% | | | | 16.80% | |
| | | | | |
Ratios and supplemental data: | | | | | | | | | | | | | | | | | | | | |
Net assets, end of period (000 omitted) | | $ | 139,797 | | | $ | 89,237 | | | $ | 8,417 | | | $ | 6,641 | | | $ | 6,592 | |
Ratio of expenses to average net assets | | | 0.68% | | | | 0.70% | | | | 0.70% | | | | 0.70% | | | | 0.70% | |
Ratio of expenses to average net assets prior to fees waived | | | 0.68% | | | | 0.72% | | | | 1.09% | | | | 1.24% | | | | 1.02% | |
Ratio of net investment income to average net assets | | | 1.83% | | | | 1.97% | | | | 2.21% | | | | 2.15% | | | | 2.46% | |
Ratio of net investment income to average net assets prior to fees waived | | | 1.83% | | | | 1.95% | | | | 1.82% | | | | 1.61% | | | | 2.14% | |
Portfolio turnover | | | 19% | | | | 9% | | | | 14% | | | | 133% | | | | 42% | |
|
| | |
| 1 | The average shares outstanding method has been applied for per share information. |
| 2 | Total investment return is based on the change in net asset value of a share during the period and assumes reinvestment of dividends and distributions at net asset value. Total investment return during some of the periods shown reflects a waiver by the manager. Performance would have been lower had the waiver not been in effect. |
See accompanying notes, which are an integral part of the financial statements.
Financial highlights
Delaware Pooled® Trust — The Select 20 Portfolio
Selected data for each share of the Portfolio outstanding throughout each period were as follows:
| | | | | | | | | | | | | | | | | | | | |
| | | Year ended | |
| | | 10/31/14 | | | 10/31/13 | | | 10/31/12 | | | 10/31/11 | | | 10/31/10 | |
Net asset value, beginning of period | | $ | 9.680 | | | $ | 8.140 | | | $ | 6.960 | | | $ | 6.040 | | | $ | 4.980 | |
| | | | | |
Income (loss) from investment operations: | | | | | | | | | | | | | | | | | | | | |
Net investment income (loss)1 | | | 0.006 | | | | 0.017 | | | | (0.002 | ) | | | 0.003 | | | | (0.019 | ) |
Net realized and unrealized gain | | | 1.516 | | | | 1.667 | | | | 1.184 | | | | 0.917 | | | | 1.079 | |
| | | | | | | | | | | | | | | | | | | | |
Total from investment operations | | | 1.522 | | | | 1.684 | | | | 1.182 | | | | 0.920 | | | | 1.060 | |
| | | | | | | | | | | | | | | | | | | | |
| | | | | |
Less dividends and distributions from: | | | | | | | | | | | | | | | | | | | | |
Net investment income | | | (0.006 | ) | | | (0.016 | ) | | | (0.002 | ) | | | — | | | | — | |
Net realized gain | | | (0.146 | ) | | | (0.128 | ) | | | — | | | | — | | | | — | |
| | | | | | | | | | | | | | | | | | | | |
Total dividends and distributions | | | (0.152 | ) | | | (0.144 | ) | | | (0.002 | ) | | | — | | | | — | |
| | | | | | | | | | | | | | | | | | | | |
| | | | | |
Net asset value, end of period | | $ | 11.050 | | | $ | 9.680 | | | $ | 8.140 | | | $ | 6.960 | | | $ | 6.040 | |
| | | | | | | | | | | | | | | | | | | | |
| | | | | |
Total return2 | | | 15.92% | | | | 21.00% | | | | 16.99% | | | | 15.23% | | | | 21.29% | |
| | | | | |
Ratios and supplemental data: | | | | | | | | | | | | | | | | | | | | |
Net assets, end of period (000 omitted) | | $ | 90,354 | | | $ | 188,082 | | | $ | 124,511 | | | $ | 45,978 | | | $ | 11,463 | |
Ratio of expenses to average net assets | | | 0.87% | | | | 0.85% | | | | 0.86% | | | | 0.89% | | | | 0.89% | |
Ratio of expenses to average net assets prior to fees waived | | | 0.87% | | | | 0.85% | | | | 0.87% | | | | 1.02% | | | | 1.24% | |
Ratio of net investment income (loss) to average net assets | | | 0.06% | | | | 0.20% | | | | (0.02% | ) | | | 0.04% | | | | (0.35% | ) |
Ratio of net investment income (loss) to average net assets prior to fees waived | | | 0.06% | | | | 0.20% | | | | (0.03% | ) | | | (0.09% | ) | | | (0.70% | ) |
Portfolio turnover | | | 21% | | | | 46% | | | | 42% | | | | 26% | | | | 80% | |
|
| | |
| 1 | The average shares outstanding method has been applied for per share information. |
| 2 | Total investment return is based on the change in net asset value of a share during the period and assumes reinvestment of dividends and distributions at net asset value. Total investment return during some of the periods shown reflects a waiver by the manager. Performance would have been lower had the waiver not been in effect. |
See accompanying notes, which are an integral part of the financial statements.
102
Delaware Pooled® Trust — The Large-Cap Growth Equity Portfolio
Selected data for each share of the Portfolio outstanding throughout each period were as follows:
| | | | | | | | | | | | | | | | | | | | |
| | | Year ended | |
| | | 10/31/14 | | | 10/31/13 | | | 10/31/12 | | | 10/31/11 | | | 10/31/10 | |
Net asset value, beginning of period | | $ | 14.600 | | | $ | 11.470 | | | $ | 9.880 | | | $ | 8.900 | | | $ | 7.350 | |
| | | | | |
Income from investment operations: | | | | | | | | | | | | | | | | | | | | |
Net investment income1 | | | 0.109 | | | | 0.062 | | | | 0.027 | | | | 0.053 | | | | 0.008 | |
Net realized and unrealized gain | | | 2.381 | | | | 3.121 | | | | 1.589 | | | | 0.962 | | | | 1.559 | |
| | | | | | | | | | | | | | | | | | | | |
Total from investment operations | | | 2.490 | | | | 3.183 | | | | 1.616 | | | | 1.015 | | | | 1.567 | |
| | | | | | | | | | | | | | | | | | | | |
| | | | | |
Less dividends and distributions from: | | | | | | | | | | | | | | | | | | | | |
Net investment income | | | (0.050 | ) | | | (0.053 | ) | | | (0.026 | ) | | | (0.035 | ) | | | (0.017 | ) |
| | | | | | | | | | | | | | | | | | | | |
Total dividends and distributions | | | (0.050 | ) | | | (0.053 | ) | | | (0.026 | ) | | | (0.035 | ) | | | (0.017 | ) |
| | | | | | | | | | | | | | | | | | | | |
| | | | | |
Net asset value, end of period | | $ | 17.040 | | | $ | 14.600 | | | $ | 11.470 | | | $ | 9.880 | | | $ | 8.900 | |
| | | | | | | | | | | | | | | | | | | | |
| | | | | |
Total return2 | | | 17.10% | | | | 27.86% | | | | 16.40% | | | | 11.43% | | | | 21.35% | |
| | | | | |
Ratios and supplemental data: | | | | | | | | | | | | | | | | | | | | |
Net assets, end of period (000 omitted) | | $ | 277,322 | | | $ | 254,958 | | | $ | 216,467 | | | $ | 170,531 | | | $ | 244,124 | |
Ratio of expenses to average net assets | | | 0.64% | | | | 0.65% | | | | 0.65% | | | | 0.64% | | | | 0.65% | |
Ratio of net investment income to average net assets | | | 0.69% | | | | 0.48% | | | | 0.25% | | | | 0.55% | | | | 0.10% | |
Portfolio turnover | | | 30% | | | | 38% | | | | 40%3 | | | | 19% | | | | 22% | |
|
| | |
| 1 | The average shares outstanding method has been applied for per share information. |
| 2 | Total investment return is based on the change in net asset value of a share during the period and assumes reinvestment of dividends and distributions at net asset value. |
| 3 | Excludes the value of Portfolio securities received or delivered as a result of in-kind purchases or redemptions of the Portfolio’s capital shares. |
See accompanying notes, which are an integral part of the financial statements.
Financial highlights
Delaware Pooled® Trust — The Focus Smid-Cap Growth Equity Portfolio
Selected data for each share of the Portfolio outstanding throughout each period were as follows:
| | | | | | | | | | | | | | | | | | | | |
| | | Year ended | |
| | | 10/31/14 | | | 10/31/13 | | | 10/31/12 | | | 10/31/11 | | | 10/31/10 | |
Net asset value, beginning of period | | $ | 20.720 | | | $ | 15.500 | | | $ | 14.810 | | | $ | 12.290 | | | $ | 8.710 | |
| | | | | |
Income (loss) from investment operations: | | | | | | | | | | | | | | | | | | | | |
Net investment income (loss)1 | | | (0.010 | ) | | | (0.005 | ) | | | (0.022 | ) | | | 0.079 | | | | (0.031 | ) |
Net realized and unrealized gain | | | 1.152 | | | | 5.446 | | | | 0.723 | | | | 2.547 | | | | 3.611 | |
| | | | | | | | | | | | | | | | | | | | |
Total from investment operations | | | 1.142 | | | | 5.441 | | | | 0.701 | | | | 2.626 | | | | 3.580 | |
| | | | | | | | | | | | | | | | | | | | |
| | | | | |
Less dividends and distributions from: | | | | | | | | | | | | | | | | | | | | |
Net investment income | | | (0.012 | ) | | | — | | | | (0.011 | ) | | | (0.106 | ) | | | — | |
Net realized gain | | | — | | | | (0.221 | ) | | | — | | | | — | | | | — | |
| | | | | | | | | | | | | | | | | | | | |
Total dividends and distributions | | | (0.012 | ) | | | (0.221 | ) | | | (0.011 | ) | | | (0.106 | ) | | | — | |
| | | | | | | | | | | | | | | | | | | | |
| | | | | |
Net asset value, end of period | | $ | 21.850 | | | $ | 20.720 | | | $ | 15.500 | | | $ | 14.810 | | | $ | 12.290 | |
| | | | | | | | | | | | | | | | | | | | |
| | | | | |
Total return2 | | | 5.51% | | | | 35.56% | | | | 4.74% | | | | 21.44% | | | | 41.10% | |
| | | | | |
Ratios and supplemental data: | | | | | | | | | | | | | | | | | | | | |
Net assets, end of period (000 omitted) | | $ | 43,281 | | | $ | 89,434 | | | $ | 17,853 | | | $ | 16,721 | | | $ | 4,613 | |
Ratio of expenses to average net assets | | | 0.90% | | | | 0.89% | | | | 0.92% | | | | 0.92% | | | | 0.92% | |
Ratio of expenses to average net assets prior to fees waived | | | 0.91% | | | | 0.89% | | | | 0.94% | | | | 1.05% | | | | 1.44% | |
Ratio of net investment income (loss) to average net assets | | | (0.05% | ) | | | (0.03% | ) | | | (0.14% | ) | | | 0.54% | | | | (0.30% | ) |
Ratio of net investment income (loss) to average net assets prior to fees waived | | | (0.06% | ) | | | (0.03% | ) | | | (0.16% | ) | | | 0.41% | | | | (0.82% | ) |
Portfolio turnover | | | 40% | | | | 26% | | | | 44% | | | | 16% | | | | 86% | |
|
| | |
| 1 | The average shares outstanding method has been applied for per share information. |
| 2 | Total investment return is based on the change in net asset value of a share during the period and assumes reinvestment of dividends and distributions at net asset value. Total investment return during all of the periods shown reflects a waiver by the manager. Performance would have been lower had the waiver not been in effect. |
See accompanying notes, which are an integral part of the financial statements.
104
Delaware Pooled® Trust — The High-Yield Bond Portfolio
Selected data for each share of the Portfolio outstanding throughout each period were as follows:
| | | | | | | | | | | | | | | | | | | | |
| | | Year ended | |
| | | 10/31/14 | | | 10/31/13 | | | 10/31/12 | | | 10/31/11 | | | 10/31/10 | |
Net asset value, beginning of period | | $ | 8.720 | | | $ | 8.350 | | | $ | 7.830 | | | $ | 8.110 | | | $ | 7.350 | |
| | | | | |
Income (loss) from investment operations: | | | | | | | | | | | | | | | | | | | | |
Net investment income1 | | | 0.496 | | | | 0.529 | | | | 0.592 | | | | 0.613 | | | | 0.691 | |
Net realized and unrealized gain (loss) | | | (0.063 | ) | | | 0.291 | | | | 0.511 | | | | (0.274 | ) | | | 0.731 | |
| | | | | | | | | | | | | | | | | | | | |
Total from investment operations | | | 0.433 | | | | 0.820 | | | | 1.103 | | | | 0.339 | | | | 1.422 | |
| | | | | | | | | | | | | | | | | | | | |
| | | | | |
Less dividends and distributions from: | | | | | | | | | | | | | | | | | | | | |
Net investment income | | | (0.543 | ) | | | (0.450 | ) | | | (0.583 | ) | | | (0.619 | ) | | | (0.662 | ) |
| | | | | | | | | | | | | | | | | | | | |
Total dividends and distributions | | | (0.543 | ) | | | (0.450 | ) | | | (0.583 | ) | | | (0.619 | ) | | | (0.662 | ) |
| | | | | | | | | | | | | | | | | | | | |
| | | | | |
Net asset value, end of period | | $ | 8.610 | | | $ | 8.720 | | | $ | 8.350 | | | $ | 7.830 | | | $ | 8.110 | |
| | | | | | | | | | | | | | | | | | | | |
| | | | | |
Total return2 | | | 5.23% | | | | 10.24% | | | | 15.31% | | | | 4.52% | | | | 20.85% | |
| | | | | |
Ratios and supplemental data: | | | | | | | | | | | | | | | | | | | | |
Net assets, end of period (000 omitted) | | $ | 143,182 | | | $ | 135,310 | | | $ | 113,048 | | | $ | 57,840 | | | $ | 29,437 | |
Ratio of expenses to average net assets | | | 0.57% | | | | 0.57% | | | | 0.58% | | | | 0.59% | | | | 0.59% | |
Ratio of expenses to average net assets prior to fees waived | | | 0.57% | | | | 0.57% | | | | 0.58% | | | | 0.60% | | | | 0.74% | |
Ratio of net investment income to average net assets | | | 5.76% | | | | 6.29% | | | | 7.53% | | | | 7.82% | | | | 9.29% | |
Ratio of net investment income to average net assets prior to fees waived | | | 5.76% | | | | 6.29% | | | | 7.53% | | | | 7.81% | | | | 9.14% | |
Portfolio turnover | | | 101% | | | | 90% | | | | 68% | | | | 77% | | | | 144% | |
|
| | |
| 1 | The average shares outstanding method has been applied for per share information. |
| 2 | Total investment return is based on the change in net asset value of a share during the period and assumes reinvestment of dividends and distributions at net asset value. Total investment return during some of the periods shown reflects a waiver by the manager. Performance would have been lower had the waiver not been in effect. |
See accompanying notes, which are an integral part of the financial statements.
Financial highlights
Delaware Pooled® Trust — The Core Plus Fixed Income Portfolio
Selected data for each share of the Portfolio outstanding throughout each period were as follows:
| | | | | | | | | | | | | | | | | | | | |
| | | Year ended | |
| | | 10/31/14 | | | 10/31/13 | | | 10/31/12 | | | 10/31/11 | | | 10/31/10 | |
Net asset value, beginning of period | | $ | 10.100 | | | $ | 10.540 | | | $ | 10.050 | | | $ | 10.130 | | | $ | 9.700 | |
| | | | | |
Income (loss) from investment operations: | | | | | | | | | | | | | | | | | | | | |
Net investment income1 | | | 0.294 | | | | 0.289 | | | | 0.320 | | | | 0.369 | | | | 0.463 | |
Net realized and unrealized gain (loss) | | | 0.201 | | | | (0.346 | ) | | | 0.460 | | | | 0.081 | | | | 0.660 | |
| | | | | | | | | | | | | | | | | | | | |
Total from investment operations | | | 0.495 | | | | (0.057 | ) | | | 0.780 | | | | 0.450 | | | | 1.123 | |
| | | | | | | | | | | | | | | | | | | | |
| | | | | |
Less dividends and distributions from: | | | | | | | | | | | | | | | | | | | | |
Net investment income | | | (0.225 | ) | | | (0.383 | ) | | | (0.290 | ) | | | (0.530 | ) | | | (0.693 | ) |
| | | | | | | | | | | | | | | | | | | | |
Total dividends and distributions | | | (0.225 | ) | | | (0.383 | ) | | | (0.290 | ) | | | (0.530 | ) | | | (0.693 | ) |
| | | | | | | | | | | | | | | | | | | | |
| | | | | |
Net asset value, end of period | | $ | 10.370 | | | $ | 10.100 | | | $ | 10.540 | | | $ | 10.050 | | | $ | 10.130 | |
| | | | | | | | | | | | | | | | | | | | |
| | | | | |
Total return2 | | | 5.02% | | | | (0.55% | ) | | | 7.95% | | | | 4.80% | | | | 12.05% | |
| | | | | |
Ratios and supplemental data: | | | | | | | | | | | | | | | | | | | | |
Net assets, end of period (000 omitted) | | $ | 77,036 | | | $ | 56,641 | | | $ | 60,313 | | | $ | 53,851 | | | $ | 50,305 | |
Ratio of expenses to average net assets | | | 0.45% | | | | 0.45% | | | | 0.45% | | | | 0.45% | | | | 0.45% | |
Ratio of expenses to average net assets prior to fees waived | | | 0.65% | | | | 0.70% | | | | 0.62% | | | | 0.64% | | | | 0.65% | |
Ratio of net investment income to average net assets | | | 2.90% | | | | 2.84% | | | | 3.14% | | | | 3.77% | | | | 4.80% | |
Ratio of net investment income to average net assets prior to fees waived | | | 2.70% | | | | 2.59% | | | | 2.97% | | | | 3.58% | | | | 4.60% | |
Portfolio turnover | | | 339% | | | | 358% | | | | 327% | | | | 273% | | | | 239% | |
|
| | |
| 1 | The average shares outstanding method has been applied for per share information. |
| 2 | Total investment return is based on the change in net asset value of a share during the period and assumes reinvestment of dividends and distributions at net asset value. Total investment return during all of the periods shown reflects a waiver by the manager. Performance would have been lower had the waiver not been in effect. |
See accompanying notes, which are an integral part of the financial statements.
106
Delaware Pooled® Trust — The International Equity Portfolio
Selected data for each share of the Portfolio outstanding throughout each period were as follows:
| | | | | | | | | | | | | | | | | | | | |
| | | Year ended | |
| | | 10/31/14 | | | 10/31/13 | | | 10/31/12 | | | 10/31/11 | | | 10/31/10 | |
Net asset value, beginning of period | | $ | 15.340 | | | $ | 12.840 | | | $ | 13.120 | | | $ | 13.680 | | | $ | 12.980 | |
| | | | | |
Income (loss) from investment operations: | | | | | | | | | | | | | | | | | | | | |
Net investment income1 | | | 0.629 | | | | 0.337 | | | | 0.441 | | | | 0.471 | | | | 0.406 | |
Net realized and unrealized gain (loss) | | | (0.429 | ) | | | 2.700 | | | | (0.183 | ) | | | (0.596 | ) | | | 0.712 | |
| | | | | | | | | | | | | | | | | | | | |
Total from investment operations | | | 0.200 | | | | 3.037 | | | | 0.258 | | | | (0.125 | ) | | | 1.118 | |
| | | | | | | | | | | | | | | | | | | | |
| | | | | |
Less dividends and distributions from: | | | | | | | | | | | | | | | | | | | | |
Net investment income | | | (0.420 | ) | | | (0.537 | ) | | | (0.538 | ) | | | (0.435 | ) | | | (0.418 | ) |
| | | | | | | | | | | | | | | | | | | | |
Total dividends and distributions | | | (0.420 | ) | | | (0.537 | ) | | | (0.538 | ) | | | (0.435 | ) | | | (0.418 | ) |
| | | | | | | | | | | | | | | | | | | | |
| | | | | |
Net asset value, end of period | | $ | 15.120 | | | $ | 15.340 | | | $ | 12.840 | | | $ | 13.120 | | | $ | 13.680 | |
| | | | | | | | | | | | | | | | | | | | |
| | | | | |
Total return2 | | | 1.46% | | | | 24.59% | | | | 2.26% | | | | (0.88% | ) | | | 8.77% | |
| | | | | |
Ratios and supplemental data: | | | | | | | | | | | | | | | | | | | | |
Net assets, end of period (000 omitted) | | $ | 446,527 | | | $ | 491,683 | | | $ | 467,827 | | | $ | 589,109 | | | $ | 809,011 | |
Ratio of expenses to average net assets | | | 0.86% | | | | 0.88% | | | | 0.85% | | | | 0.77% | | | | 0.87% | |
Ratio of net investment income to average net assets | | | 4.04% | | | | 2.48% | | | | 3.56% | | | | 3.48% | | | | 3.18% | |
Portfolio turnover | | | 21% | | | | 20% | | | | 16%3 | | | | 22% | | | | 18% | |
|
| | |
| 1 | The average shares outstanding method has been applied for per share information. |
| 2 | Total investment return is based on the change in net asset value of a share during the period and assumes reinvestment of dividends and distributions at net asset value. |
| 3 | Excludes the value of Portfolio securities received or delivered as a result of in-kind purchases or redemptions of the Portfolio’s capital shares. |
See accompanying notes, which are an integral part of the financial statements.
Financial highlights
Delaware Pooled® Trust — The Labor Select International Equity Portfolio
Selected data for each share of the Portfolio outstanding throughout each period were as follows:
| | | | | | | | | | | | | | | | | | | | |
| | | Year ended | |
| | | 10/31/14 | | | 10/31/13 | | | 10/31/12 | | | 10/31/11 | | | 10/31/10 | |
Net asset value, beginning of period | | $ | 15.070 | | | $ | 12.650 | | | $ | 12.920 | | | $ | 13.570 | | | $ | 12.930 | |
| | | | | |
Income (loss) from investment operations: | | | | | | | | | | | | | | | | | | | | |
Net investment income1 | | | 0.693 | | | | 0.324 | | | | 0.441 | | | | 0.451 | | | | 0.390 | |
Net realized and unrealized gain (loss) | | | (0.573 | ) | | | 2.516 | | | | (0.176 | ) | | | (0.695 | ) | | | 0.626 | |
| | | | | | | | | | | | | | | | | | | | |
Total from investment operations | | | 0.120 | | | | 2.840 | | | | 0.265 | | | | (0.244 | ) | | | 1.016 | |
| | | | | | | | | | | | | | | | | | | | |
| | | | | |
Less dividends and distributions from: | | | | | | | | | | | | | | | | | | | | |
Net investment income | | | (0.450 | ) | | | (0.420 | ) | | | (0.535 | ) | | | (0.406 | ) | | | (0.376 | ) |
| | | | | | | | | | | | | | | | | | | | |
Total dividends and distributions | | | (0.450 | ) | | | (0.420 | ) | | | (0.535 | ) | | | (0.406 | ) | | | (0.376 | ) |
| | | | | | | | | | | | | | | | | | | | |
| | | | | |
Net asset value, end of period | | $ | 14.740 | | | $ | 15.070 | | | $ | 12.650 | | | $ | 12.920 | | | $ | 13.570 | |
| | | | | | | | | | | | | | | | | | | | |
| | | | | |
Total return2 | | | 0.86% | | | | 23.11% | | | | 2.40% | | | | (1.79% | ) | | | 8.00% | |
| | | | | |
Ratios and supplemental data: | | | | | | | | | | | | | | | | | | | | |
Net assets, end of period (000 omitted) | | $ | 373,497 | | | $ | 506,102 | | | $ | 509,527 | | | $ | 572,642 | | | $ | 740,952 | |
Ratio of expenses to average net assets | | | 0.86% | | | | 0.88% | | | | 0.87% | | | | 0.85% | | | | 0.87% | |
Ratio of net investment income to average net assets | | | 4.54% | | | | 2.43% | | | | 3.59% | | | | 3.37% | | | | 3.07% | |
Portfolio turnover | | | 23% | | | | 16% | | | | 17% | | | | 20% | | | | 13% | |
|
| | |
| 1 | The average shares outstanding method has been applied for per share information. |
| 2 | Total investment return is based on the change in net asset value of a share during the period and assumes reinvestment of dividends and distributions at net asset value. |
See accompanying notes, which are an integral part of the financial statements.
108
Delaware Pooled® Trust — The Emerging Markets Portfolio
Selected data for each share of the Portfolio outstanding throughout each period were as follows:
| | | | | | | | | | | | | | | | | | | | |
| | | Year ended | |
| | | 10/31/14 | | | 10/31/13 | | | 10/31/12 | | | 10/31/11 | | | 10/31/10 | |
Net asset value, beginning of period | | $ | 10.110 | | | $ | 10.160 | | | $ | 10.510 | | | $ | 11.420 | | | $ | 9.430 | |
| | | | | |
Income (loss) from investment operations: | | | | | | | | | | | | | | | | | | | | |
Net investment income1 | | | 0.216 | | | | 0.175 | | | | 0.177 | | | | 0.266 | | | | 0.259 | |
Net realized and unrealized gain (loss) | | | (0.080 | ) | | | 0.158 | | | | 0.467 | | | | (0.873 | ) | | | 1.926 | |
| | | | | | | | | | | | | | | | | | | | |
Total from investment operations | | | 0.136 | | | | 0.333 | | | | 0.644 | | | | (0.607 | ) | | | 2.185 | |
| | | | | | | | | | | | | | | | | | | | |
| | | | | |
Less dividends and distributions from: | | | | | | | | | | | | | | | | | | | | |
Net investment income | | | (0.178 | ) | | | (0.239 | ) | | | (0.220 | ) | | | (0.330 | ) | | | (0.212 | ) |
Net realized gain | | | (0.334 | ) | | | (0.164 | ) | | | (0.798 | ) | | | — | | | | — | |
| | | | | | | | | | | | | | | | | | | | |
Total dividends and distributions | | | (0.512 | ) | | | (0.403 | ) | | | (1.018 | ) | | | (0.330 | ) | | | (0.212 | ) |
| | | | | | | | | | | | | | | | | | | | |
| | | | | |
Reimbursement fees: | | | | | | | | | | | | | | | | | | | | |
Purchase reimbursement fees1,2 | | | 0.005 | | | | 0.014 | | | | 0.006 | | | | 0.005 | | | | 0.009 | |
Redemption reimbursement fees1,2 | | | 0.011 | | | | 0.006 | | | | 0.018 | | | | 0.022 | | | | 0.008 | |
| | | | | | | | | | | | | | | | | | | | |
| | | 0.016 | | | | 0.020 | | | | 0.024 | | | | 0.027 | | | | 0.017 | |
| | | | | | | | | | | | | | | | | | | | |
| | | | | |
Net asset value, end of period | | $ | 9.750 | | | $ | 10.110 | | | $ | 10.160 | | | $ | 10.510 | | | $ | 11.420 | |
| | | | | | | | | | | | | | | | | | | | |
| | | | | |
Total return3 | | | 1.89% | | | | 3.36% | | | | 7.81% | | | | (5.22% | ) | | | 23.79% | |
| | | | | |
Ratios and supplemental data: | | | | | | | | | | | | | | | | | | | | |
Net assets, end of period (000 omitted) | | $ | 310,211 | | | $ | 333,884 | | | $ | 316,809 | | | $ | 531,527 | | | $ | 750,190 | |
Ratio of expenses to average net assets | | | 1.16% | | | | 1.20% | | | | 1.20% | | | | 1.14% | | | | 1.17% | |
Ratio of net investment income to average net assets | | | 2.25% | | | | 1.72% | | | | 1.80% | | | | 2.41% | | | | 2.57% | |
Portfolio turnover | | | 30% | | | | 40%4 | | | | 38%4 | | | | 39% | | | | 39% | |
|
| | |
| 1 | The average shares outstanding method has been applied for per share information. |
| 2 | The Portfolio charges a 0.55% purchase reimbursement fee and a 0.55% redemption reimbursement fee, which are retained by the Portfolio. |
| 3 | Total investment return is based on the change in net asset value of a share during the period and assumes reinvestment of dividends and distributions at net asset value. Total investment return does not reflect the purchase reimbursement fee and redemption reimbursement fee. |
| 4 | Excludes the value of Portfolio securities received or delivered as a result of in-kind purchases or redemptions of the Portfolio’s capital shares. |
See accompanying notes, which are an integral part of the financial statements.
Financial highlights
Delaware Pooled® Trust — The Emerging Markets Portfolio II
Selected data for each share of the Portfolio outstanding throughout each period were as follows:
| | | | | | | | | | | | | | | | | | | | |
| | | | | | | | | | | | | | | 6/23/101 | |
| | | Year ended | | | to | |
| | | 10/31/14 | | | 10/31/13 | | | 10/31/12 | | | 10/31/11 | | | 10/31/10 | |
Net asset value, beginning of period | | $ | 9.650 | | | $ | 8.170 | | | $ | 8.550 | | | $ | 9.660 | | | $ | 8.500 | |
| | | | | |
Income (loss) from investment operations: | | | | | | | | | | | | | | | | | | | | |
Net investment income2 | | | 0.062 | | | | 0.075 | | | | 0.070 | | | | 0.089 | | | | 0.019 | |
Net realized and unrealized gain (loss) | | | 0.297 | | | | 1.446 | | | | (0.028 | ) | | | (1.099 | ) | | | 1.141 | |
| | | | | | | | | | | | | | | | | | | | |
Total from investment operations | | | 0.359 | | | | 1.521 | | | | 0.042 | | | | (1.010 | ) | | | 1.160 | |
| | | | | | | | | | | | | | | | | | | | |
| | | | | |
Less dividends and distributions from: | | | | | | | | | | | | | | | | | | | | |
Net investment income | | | (0.092 | ) | | | (0.041 | ) | | | (0.128 | ) | | | (0.026 | ) | | | — | |
Net realized gain | | | (0.037 | ) | | | — | | | | (0.294 | ) | | | (0.074 | ) | | | — | |
| | | | | | | | | | | | | | | | | | | | |
Total dividends and distributions | | | (0.129 | ) | | | (0.041 | ) | | | (0.422 | ) | | | (0.100 | ) | | | — | |
| | | | | | | | | | | | | | | | | | | | |
| | | | | |
Net asset value, end of period | | $ | 9.880 | | | $ | 9.650 | | | $ | 8.170 | | | $ | 8.550 | | | $ | 9.660 | |
| | | | | | | | | | | | | | | | | | | | |
| | | | | |
Total return3 | | | 3.80% | | | | 18.68% | | | | 0.89% | | | | (10.58% | ) | | | 13.65% | |
| | | | | |
Ratios and supplemental data: | | | | | | | | | | | | | | | | | | | | |
Net assets, end of period (000 omitted) | | $ | 42,515 | | | $ | 42,223 | | | $ | 29,686 | | | $ | 15,339 | | | $ | 11,364 | |
Ratio of expenses to average net assets | | | 1.20% | | | | 1.20% | | | | 1.20% | | | | 1.25% | | | | 1.40% | |
Ratio of expenses to average net assets prior to fees waived | | | 1.32% | | | | 1.36% | | | | 1.41% | | | | 1.64% | | | | 2.17% | |
Ratio of net investment income to average net assets | | | 0.64% | | | | 0.85% | | | | 0.87% | | | | 0.94% | | | | 0.59% | |
Ratio of net investment income (loss) to average net assets prior to fees waived | | | 0.52% | | | | 0.69% | | | | 0.66% | | | | 0.55% | | | | (0.18% | ) |
Portfolio turnover | | | 11% | | | | 11% | | | | 12% | | | | 23% | | | | 9% | |
|
| | |
| 1 | Date of commencement of operations; ratios have been annualized and total return and portfolio turnover have not been annualized. |
| 2 | The average shares outstanding method has been applied for per share information. |
| 3 | Total investment return is based on the change in net asset value of a share during the period and assumes reinvestment of dividends and distributions at net asset value. Total investment return during all of the periods shown reflects a waiver by the manager. Performance would have been lower had the waiver not been in effect. |
See accompanying notes, which are an integral part of the financial statements.
110
Notes to financial statements
Delaware Pooled® Trust
October 31, 2014
Delaware Pooled Trust (Trust) is organized as a Delaware statutory trust and offers 11 separate Portfolios. These financial statements and the related notes pertain to The Large-Cap Value Equity Portfolio, The Select 20 Portfolio, The Large-Cap Growth Equity Portfolio, The Focus Smid-Cap Growth Equity Portfolio, The High-Yield Bond Portfolio, The Core Plus Fixed Income Portfolio, The International Equity Portfolio, The Labor Select International Equity Portfolio, The Emerging Markets Portfolio, and The Emerging Markets Portfolio II (each, a Portfolio, or collectively, Portfolios). The Real Estate Investment Trust Portfolio is included in a separate report. The Trust is an open-end investment company. Each Portfolio is considered diversified under the Investment Company Act of 1940, as amended, except for The Select 20 Portfolio which is non-diversified. Each Portfolio offers one class of shares.
The investment objective of The Large-Cap Value Equity Portfolio is to seek long-term capital appreciation.
The investment objective of The Select 20 Portfolio is to seek long-term capital appreciation.
The investment objective of The Large-Cap Growth Equity Portfolio is to seek capital appreciation.
The investment objective of The Focus Smid-Cap Growth Equity Portfolio is to seek long-term capital appreciation.
The investment objective of The High-Yield Bond Portfolio is to seek high total return.
The investment objective of The Core Plus Fixed Income Portfolio is to seek maximum long-term total return, consistent with reasonable risk.
The investment objective of The International Equity Portfolio is to seek maximum long-term total return.
The investment objective of The Labor Select International Equity Portfolio is to seek maximum long-term total return.
The investment objective of The Emerging Markets Portfolio is to seek long-term capital appreciation.
The investment objective of The Emerging Markets Portfolio II is to seek long-term capital appreciation.
1. Significant Accounting Policies
The following accounting policies are in accordance with U.S. generally accepted accounting principles (U.S. GAAP) and are consistently followed by the Portfolios.
Security Valuation — Equity securities, except those traded on the Nasdaq Stock Market, Inc. (Nasdaq), are valued at the last quoted sales price as of the time of the regular close of the New York Stock Exchange on the valuation date. Securities traded on the Nasdaq are valued in accordance with the Nasdaq Official Closing Price, which may not be the last sales price. If, on a particular day, an equity security does not trade, then the mean between the bid and ask prices will be used, which approximates fair value. Securities listed on a foreign exchange are normally valued at the last quoted sales price on the valuation date. Debt securities, credit default swap (CDS) contracts and interest rate swap contracts are valued based upon valuations provided by an independent pricing service or broker/counterparty and reviewed by management. To the extent current market prices are not available, the pricing service may take into account developments related to the specific security, as well as transactions in comparable securities. U.S. government and agency securities are valued at the mean between the bid and ask prices, which approximates fair value. Valuations for fixed income securities utilize matrix systems, which reflect such factors as security prices, yields, maturities, and ratings, and are supplemented by dealer and exchange quotations. For asset-backed securities, collateralized mortgage obligations, commercial mortgage securities and U.S. government agency mortgage securities, pricing vendors utilize matrix pricing which considers prepayment speed, attributes of the collateral, yield or price of bonds of comparable quality, coupon, maturity, and type as well as broker/dealer-supplied prices. Swap prices are derived using daily swap curves and models that incorporate a number of market data factors, such as discounted cash flows, trades, and values of the underlying reference instruments. Foreign currency exchange contracts and foreign cross currency exchange contracts are valued at the mean between the bid and ask prices, which approximates fair value. Interpolated values are derived when the settlement date of the contract is an interim date for which quotations are not available. Futures contracts and options on futures contracts are valued at the daily quoted settlement prices. Exchange-traded options are valued at the last reported sale price or, if no sales are reported, at the mean between the last reported bid and ask prices, which approximates fair value. Generally, other securities and assets for which market quotations are not readily available are valued at fair value as determined in good faith under the direction of the Trust’s Board of Trustees (Board). In determining whether market quotations are readily available or fair valuation will be used, various factors will be taken into consideration, such as market closures or suspension of trading in a security. The Portfolios may use fair value pricing more frequently for securities traded primarily in non-U.S. markets because, among other things, most foreign markets close well before the Portfolios value their securities, generally as of 4:00 p.m. Eastern time. The earlier close of these foreign markets gives rise to the possibility that significant
Notes to financial statements
Delaware Pooled® Trust
1. Significant Accounting Policies (continued)
events, including broad market moves, government actions or pronouncements, aftermarket trading, or news events may have occurred in the interim. To account for this, the Portfolios may frequently value foreign securities using fair value prices based on third-party vendor modeling tools (international fair value pricing).
Federal and Foreign Income Taxes — No provision for federal income taxes has been made as each Portfolio intends to continue to qualify for federal income tax purposes as a regulated investment company under Subchapter M of the Internal Revenue Code of 1986, as amended, and make the requisite distributions to shareholders. Each Portfolio evaluates tax positions taken or expected to be taken in the course of preparing each Portfolio’s tax returns to determine whether the tax positions are “more-likely-than-not” of being sustained by the applicable tax authority. Tax positions not deemed to meet the “more-likely-than-not” threshold are recorded as a tax benefit or expense in the current year. Management has analyzed each Portfolio’s tax positions taken for all open federal income tax years (Oct. 31, 2011 – Oct. 31, 2014), and has concluded that no provision for federal income tax is required in each Portfolio’s financial statements. In regard to foreign taxes only, each Portfolio has open tax years in certain foreign countries it invests in that may date back to the inception of each Portfolio.
Repurchase Agreements — Each Portfolio may purchase certain U.S. government securities subject to the counterparty’s agreement to repurchase them at an agreed upon date and price. The counterparty will be required on a daily basis to maintain the value of the collateral subject to the agreement at not less than the repurchase price (including accrued interest). The agreements are conditioned upon the collateral being deposited under the Federal Reserve book-entry system with each Portfolio’s custodian or a third-party sub-custodian. In the event of default or bankruptcy by the other party to the agreement, retention of the collateral may be subject to legal proceedings. All open repurchase agreements as of the date of this report were entered into on Oct. 31, 2014.
To Be Announced Trades (TBA) — Each Portfolio may contract to purchase or sell securities for a fixed price at a transaction date beyond the customary settlement period (examples: when issued, delayed delivery, forward commitment, or TBA transactions) consistent with each Portfolio’s ability to manage its investment portfolios and meet redemption requests. These transactions involve a commitment by each Portfolio to purchase or sell securities for a predetermined price or yield with payment and delivery taking place more than three days in the future, or after a period longer than the customary settlement period for that type of security. No interest will be earned by each Portfolio on such purchases until the securities are delivered; however, the market value may change prior to delivery.
Foreign Currency Transactions — Transactions denominated in foreign currencies are recorded at the prevailing exchange rates on the valuation date in accordance with each Portfolio’s prospectus. The value of all assets and liabilities denominated in foreign currencies is translated daily into U.S. dollars at the exchange rate of such currencies against the U.S. dollar. Transaction gains or losses resulting from changes in exchange rates during the reporting period or upon settlement of the foreign currency transaction are reported in operations for the current period. Each Portfolio generally bifurcates that portion of realized gains and losses on investments in debt securities which is due to changes in foreign exchange rates from that which is due to changes in market prices of debt securities. That portion of gains (losses) is included in the “Statements of operations” under “Net realized gain (loss) on foreign currencies.” For foreign equity securities, these changes are included in “Net realized and unrealized gain or loss on investments.” Each Portfolio reports certain foreign currency related transactions as components of realized gains (losses) for financial reporting purposes, whereas such components are treated as ordinary income (loss) for federal income tax purposes.
Use of Estimates — The preparation of financial statements in conformity with U.S. GAAP requires management to make estimates and assumptions that affect the fair value of investments, the reported amounts of assets and liabilities and disclosure of contingent assets and liabilities at the date of the financial statements, and the reported amounts of revenues and expenses during the reporting period. Actual results could differ from those estimates and the differences could be material.
Reimbursement Fees — The Emerging Markets Portfolio may charge a 0.55% purchase reimbursement fee and a 0.55% redemption reimbursement fee. These fees are designed to reflect an approximation of the brokerage and other transaction costs associated with the investment of an investor’s purchase amount or the disposition of assets to meet redemptions, and to limit the extent to which the Portfolio (and, indirectly, the Portfolio’s existing shareholders) would have to bear such costs. These fees are accounted for as an addition to paid-in capital for the Portfolio in the “Statements of changes in net assets.”
Other — Expenses directly attributable to each Portfolio are charged directly to the Portfolio. Other expenses common to various funds within the Delaware Investments®Family of Funds are generally allocated among such funds on the basis of average net assets. Management fees and some other expenses are paid monthly. Security transactions are recorded on the date the securities are purchased or sold (trade date) for financial reporting purposes. Costs used in calculating realized gains and losses on the sale of investment securities are those of the specific
112
securities sold. Interest income is recorded on the accrual basis. Discounts and premiums on debt securities are amortized to interest income over the lives of the respective securities using the effective interest method. Dividend income is recorded on the ex-dividend date. Realized gains (losses) on paydowns of asset- and mortgage-backed securities are classified as interest income. Distributions received from investments in Real Estate Investment Trusts (REITs) are recorded as dividend income on the ex-dividend date, subject to reclassification upon notice of the character of such distributions by the issuer. Foreign dividends are also recorded on the ex-dividend date or as soon after the ex-dividend date that a Portfolio is aware of such dividends, net of all tax withholdings, a portion of which may be reclaimable. Withholding taxes and reclaims on foreign dividends and interest have been recorded in accordance with each Portfolio’s understanding of the applicable country’s tax rules and rates. Each Portfolio may pay foreign capital gains taxes on certain foreign securities held, which are reported as components of realized losses for financial reporting purposes, whereas such components are treated as ordinary loss for federal income tax purposes.
Each Portfolio declares and pays dividends from net investment income and distributions from net realized gain on investments, if any, annually. Dividends and distributions, if any, are recorded on the ex-dividend date. Each Portfolio may distribute more frequently, if necessary for tax purposes.
Subject to seeking best execution, each Portfolio may direct certain security trades to brokers who have agreed to rebate a portion of the related brokerage commission to each Portfolio in cash. In general, best execution refers to many factors, including the price paid or received for a security, the commission charged, the promptness and reliability of execution, the confidentiality and placement accorded the order, and other factors affecting the overall benefit obtained by the Portfolio on the transaction. Such commission rebates are included in realized gain on investments in the accompanying financial statements. The total commission rebates for the year ended Oct. 31, 2014 are as follows:
| | | | | |
| | | Commission Rebates |
The Large-Cap Growth Equity Portfolio | | $1,977 |
The Focus Smid-Cap Growth Equity Portfolio | | 97 |
Each Portfolio may receive earnings credits from its custodian when positive cash balances are maintained, which may be used to offset custody fees. There were no earnings credits for the year ended Oct. 31, 2014.
Each Portfolio may receive earnings credits from its transfer agent when positive cash balances are maintained, which may be used to offset transfer agent fees. If the amount earned is greater than one dollar, the expense paid under this arrangement is included on the “Statements of operations” under “Dividend disbursing and transfer agent fees and expenses” with the corresponding expense offset shown under “Less expense paid indirectly.” For the year ended Oct. 31, 2014, earnings credits are as follows:
| | | | | |
| | | Earnings Credits |
The Select 20 Portfolio | | $1 |
The Large-Cap Growth Equity Portfolio | | 1 |
The Focus Smid-Cap Growth Equity Portfolio | | 1 |
The International Equity Portfolio | | 2 |
The Labor Select International Equity Portfolio | | 1 |
The Emerging Markets Portfolio | | 1 |
2. Investment Management, Administration Agreements, and Other Transactions with Affiliates
In accordance with the terms of the investment management agreements, Delaware Management Company (DMC), a series of Delaware Management Business Trust and the investment manager of the Portfolios, will receive an annual fee, which is calculated daily based on the average daily net assets of each Portfolio.
DMC has contractually agreed to waive that portion, if any, of its management fees and reimburse each Portfolio (except for The International Equity Portfolio, The Labor Select International Equity Portfolio and The Emerging Markets Portfolio) to the extent necessary to ensure that annual operating expenses, (excluding any 12b-1 fees, taxes, interest, short sale and dividend interest expenses, acquired fund fees and expenses, brokerage fees, certain insurance costs, and nonroutine expenses or costs, including, but not limited to, those relating to reorganizations, litigation, conducting shareholder meetings and liquidations) do not exceed specified percentages of average daily net assets of each Portfolio from Nov. 1, 2013 through Oct. 31, 2014.* For purposes of these waivers and reimbursements, nonroutine expenses may also
Notes to financial statements
Delaware Pooled® Trust
2. Investment Management, Administration Agreements, and Other Transactions with Affiliates (continued)
include such additional costs and expenses as may be agreed upon from time to time by the Portfolios’ Board and DMC. These expense waivers and reimbursements apply only to expenses paid directly by the Portfolios.
The management fee rates and the operating expense limitation rates in effect for the year ended Oct. 31, 2014, are as follows:
| | | | |
| | | Management
fee as a percentage
of average daily
net assets (per annum) | | Contractual
operating expense
limitation as
a percentage
of average daily
net assets (per annum)† |
The Large-Cap Value Equity Portfolio | | 0.55% | | 0.70% |
The Select 20 Portfolio | | 0.75% | | 0.89% |
The Large-Cap Growth Equity Portfolio | | 0.55% | | 0.65% |
The Focus Smid-Cap Growth Equity Portfolio | | 0.75% | | 0.92% |
The High-Yield Bond Portfolio | | 0.45% | | 0.59% |
The Core Plus Fixed Income Portfolio | | 0.43% | | 0.45% |
The International Equity Portfolio | | 0.75% | | N/A |
The Labor Select International Equity Portfolio | | 0.75% | | N/A |
The Emerging Markets Portfolio | | 1.00% | | N/A |
The Emerging Markets Portfolio II | | 1.00% | | 1.20% |
| † | These operating expense limitations exclude certain expenses, such as 12b-1 fees, taxes, interest, short sale and dividend interest expenses, acquired fund fees and expenses, brokerage fees, certain insurance costs, and nonroutine expenses or costs, including, but not limited to, those relating to reorganizations, litigation, conducting shareholder meetings, and liquidations. In some instances, a Portfolio’s annual operating expenses may be lower than the contracted operating expense limitations. |
Mondrian Investment Partners Limited (Mondrian) furnishes investment sub-advisory services to The International Equity Portfolio, The Labor Select International Equity Portfolio, and The Emerging Markets Portfolio. For these services, DMC, not the Portfolios, pays Mondrian the following percentages of the Portfolios’ average daily net assets:
| | |
| | | Sub-advisory fee as a
percentage of average daily
net assets (per annum) |
The International Equity Portfolio | | 0.36% |
The Labor Select International Equity Portfolio | | 0.30% |
The Emerging Markets Portfolio | | 0.75% |
Effective May 16, 2014, Jackson Square Partners, LLC (JSP) furnishes investment sub-advisory services to The Select 20 Portfolio, The Large-Cap Growth Equity Portfolio, and The Focus Smid-Cap Growth Equity Portfolio. Prior to May 16, 2014, the Portfolios were not sub-advised. For these services, DMC, not the Portfolios, pays JSP the following percentages of the Portfolio’s average daily net assets:
| | |
| | | Sub-advisory fee as a
percentage of average daily
net assets (per annum) |
The Select 20 Portfolio | | 0.375% |
The Large-Cap Growth Equity Portfolio | | 0.275% |
The Focus Smid-Cap Growth Equity Portfolio | | 0.375% |
Delaware Service Company, Inc. (DSC), an affiliate of DMC, provides fund accounting and financial administration oversight services to each Portfolio. For these services, each Portfolio pays DSC fees based on the aggregate daily net assets of the Delaware Investments® Family of Funds at the following annual rate: 0.0050% of the first $30 billion; 0.0045% of the next $10 billion; 0.0040% of the next $10 billion; and 0.0025% of aggregate average daily net assets in excess of $50 billion. The fees payable to DSC under the service agreement described above are allocated among all funds in the Delaware Investments Family of Funds on a relative net asset value basis. These amounts are included in the
114
“Statements of operations” under “Accounting and administrative expenses.” For the year ended Oct. 31, 2014, each Portfolio was charged for these services as follows:
| | | | |
The Large-Cap Value Equity Portfolio | | $ | 4,914 | |
The Select 20 Portfolio | | | 6,003 | |
The Large-Cap Growth Equity Portfolio | | | 12,564 | |
The Focus Smid-Cap Growth Equity Portfolio | | | 2,604 | |
The High-Yield Bond Portfolio | | | 6,696 | |
The Core Plus Fixed Income Portfolio | | | 3,430 | |
The International Equity Portfolio | | | 23,130 | |
The Labor Select International Equity Portfolio | | | 21,721 | |
The Emerging Markets Portfolio | | | 15,844 | |
The Emerging Markets Portfolio II | | | 2,075 | |
DSC is also the transfer agent and dividend disbursing agent of each Portfolio. For these services, each Portfolio pays DSC fees at the annual rate of 0.0075% of each Portfolio’s average daily net assets. These amounts are included in the “Statements of operations” under “Dividend disbursing and transfer agent fees and expenses.” For the year ended Oct. 31, 2014, each Portfolio was charged the following amounts for these services:
| | | | |
The Large-Cap Value Equity Portfolio | | $ | 7,990 | |
The Select 20 Portfolio | | | 9,373 | |
The Large-Cap Growth Equity Portfolio | | | 19,629 | |
The Focus Smid-Cap Growth Equity Portfolio | | | 4,061 | |
The High-Yield Bond Portfolio | | | 10,462 | |
The Core Plus Fixed Income Portfolio | | | 5,361 | |
The International Equity Portfolio | | | 36,133 | |
The Labor Select International Equity Portfolio | | | 33,917 | |
The Emerging Markets Portfolio | | | 24,756 | |
The Emerging Markets Portfolio II | | | 3,242 | |
Pursuant to a sub-transfer agency agreement between DSC and BNY Mellon Investment Servicing (US) Inc. (BNYMIS), BNYMIS provides certain sub-transfer agency services to each Portfolio. Sub-transfer agency fees are passed on to and paid directly by each Portfolio.
As provided in the investment management agreement, each Portfolio bears a portion of the cost of resources shared with DMC, including the cost of internal personnel of DMC and/or its affiliates that provide legal, tax, and regulatory reporting services to the Portfolios. These amounts are included in the “Statements of operations” under “Legal fees.” For the year ended Oct. 31, 2014, each Portfolio was charged for internal legal, tax, and regulatory reporting services provided by DMC and/or its affiliates’ employees as follows:
| | | | |
The Large-Cap Value Equity Portfolio | | $ | 4,290 | |
The Select 20 Portfolio | | | 5,704 | |
The Large-Cap Growth Equity Portfolio | | | 10,347 | |
The Focus Smid-Cap Growth Equity Portfolio | | | 2,275 | |
The High-Yield Bond Portfolio | | | 5,454 | |
The Core Plus Fixed Income Portfolio | | | 2,735 | |
The International Equity Portfolio | | | 19,086 | |
The Labor Select International Equity Portfolio | | | 18,184 | |
The Emerging Markets Portfolio | | | 13,072 | |
The Emerging Markets Portfolio II | | | 1,685 | |
Trustees’ fees include expenses accrued by each Portfolio for each Trustee’s retainer and meeting fees. Certain officers of DMC, DSC, and DDLP are officers and/or Trustees of the Trust. These officers and Trustees are paid no compensation by the Portfolios.
* The contractual waiver period is Feb. 28, 2013 through Feb. 27, 2015.
Notes to financial statements
Delaware Pooled® Trust
3. Investments
For the year ended Oct. 31, 2014, each Portfolio made purchases and sales of investment securities other than short-term investments as follows:
| | | | | | | | | | | | | | | | |
| | | Purchases
other than
U.S. government
securities | | | Purchases of
U.S. government
securities | | | Sales
other than
U.S. government
securities | | | Sales of
U.S. government
securities | |
The Large-Cap Value Equity Portfolio | | | $ 52,422,005 | | | | $ — | | | | $ 20,301,937 | | | | $ — | |
The Select 20 Portfolio | | | 25,344,405 | | | | — | | | | 128,755,283 | | | | — | |
The Large-Cap Growth Equity Portfolio | | | 77,535,334 | | | | — | | | | 92,192,491 | | | | — | |
The Focus Smid-Cap Growth Equity Portfolio | | | 20,851,098 | | | | — | | | | 66,796,099 | | | | — | |
The High-Yield Bond Portfolio | | | 144,117,328 | | | | — | | | | 132,558,292 | | | | — | |
The Core Plus Fixed Income Portfolio | | | 204,519,352 | | | | 50,278,269 | | | | 182,553,422 | | | | 52,364,083 | |
The International Equity Portfolio | | | 99,004,755 | | | | — | | | | 139,635,671 | | | | — | |
The Labor Select International Equity Portfolio | | | 100,092,266 | | | | — | | | | 221,785,667 | | | | — | |
The Emerging Markets Portfolio | | | 95,894,709 | | | | — | | | | 118,495,962 | | | | — | |
The Emerging Markets Portfolio II | | | 4,897,623 | | | | — | | | | 6,127,160 | | | | — | |
At Oct. 31, 2014, the cost of investments and unrealized appreciation (depreciation) for federal income tax purposes for each Portfolio were as follows:
| | | | | | | | | | | | | | | | |
| | | Cost of
investments | | | Aggregate
unrealized
appreciation | | | Aggregate
unrealized
depreciation | | | Net unrealized
appreciation
(depreciation) | |
The Large-Cap Value Equity Portfolio | | $ | 119,301,296 | | | $ | 20,650,145 | | | $ | (339,593) | | | $ | 20,310,552 | |
The Select 20 Portfolio | | | 58,241,860 | | | | 33,522,920 | | | | (1,403,135) | | | | 32,119,785 | |
The Large-Cap Growth Equity Portfolio | | | 196,954,286 | | | | 87,040,405 | | | | (3,855,289) | | | | 83,185,116 | |
The Focus Smid-Cap Growth Equity Portfolio | | | 32,686,004 | | | | 11,585,911 | | | | (928,914) | | | | 10,656,997 | |
The High-Yield Bond Portfolio | | | 142,490,908 | | | | 3,690,299 | | | | (3,160,667) | | | | 529,632 | |
The Core Plus Fixed Income Portfolio | | | 89,113,203 | | | | 1,683,641 | | | | (431,236) | | | | 1,252,405 | |
The International Equity Portfolio | | | 405,261,183 | | | | 83,729,874 | | | | (44,911,370) | | | | 38,818,504 | |
The Labor Select International Equity Portfolio | | | 350,070,538 | | | | 63,517,745 | | | | (41,056,174) | | | | 22,461,571 | |
The Emerging Markets Portfolio | | | 311,882,661 | | | | 36,408,466 | | | | (40,080,272) | | | | (3,671,806) | |
The Emerging Markets Portfolio II | | | 39,943,167 | | | | 9,272,520 | | | | (5,660,539) | | | | 3,611,981 | |
U. S. GAAP defines fair value as the price that each Portfolio would receive to sell an asset or pay to transfer a liability in an orderly transaction between market participants at the measurement date under current market conditions. A three-level hierarchy for fair value measurements has been established based upon the transparency of inputs to the valuation of an asset or liability. Inputs may be observable or unobservable and refer broadly to the assumptions that market participants would use in pricing the asset or liability. Observable inputs reflect the assumptions market participants would use in pricing the asset or liability based on market data obtained from sources independent of the reporting entity. Unobservable inputs reflect the reporting entity’s own assumptions about the assumptions that market participants would use in pricing the asset or liability developed based on the best information available under the circumstances. Each Portfolio’s investment in its entirety is assigned a level based upon the observability of the inputs which are significant to the overall valuation. The three-level hierarchy of inputs is summarized below.
| | | | |
| Level 1 | | – | | Inputs are quoted prices in active markets for identical investments. (Examples: equity securities, open-end investment companies, futures contracts, exchange-traded options contracts) |
| | |
| Level 2 | | – | | Other observable inputs, including, but not limited to: quoted prices for similar assets or liabilities in markets that are active, quoted prices for identical or similar assets or liabilities in markets that are not active, inputs other than quoted prices that are observable for the assets or liabilities (such as interest rates, yield curves, volatilities, prepayment speeds, loss severities, credit risks, and default rates) or other market-corroborated inputs. (Examples: debt securities, government securities, swap contracts, foreign currency exchange contracts, foreign securities utilizing international fair value pricing, broker-quoted securities, fair valued securities) |
116
| | | | |
| Level 3 | | – | | Significant unobservable inputs, including each Portfolio’s own assumptions used to determine the fair value of investments. (Examples: broker-quoted securities, fair valued securities) |
Level 3 investments are valued using significant unobservable inputs. Each Portfolio may also use an income-based valuation approach in which the anticipated future cash flows of the investment are discounted to calculate fair value. Discounts may also be applied due to the nature or duration of any restrictions on the disposition of the investments. Valuations may also be based upon current market prices of securities that are comparable in coupon, rating, maturity, and industry. The derived value of a Level 3 investment may not represent the value which is received upon disposition and this could impact the results of operations.
The following table summarizes the valuation of The Large-Cap Value Equity Portfolio’s investments by fair value hierarchy levels as of Oct. 31, 2014:
| | | | | | | | | | | | |
| | | Level 1 | | | Level 2 | | | Total | |
Common Stock | | $ | 134,230,802 | | | $ | — | | | $ | 134,230,802 | |
Short-Term Investments | | | — | | | | 5,381,046 | | | | 5,381,046 | |
| | | | | | | | | | | | |
Total | | $ | 134,230,802 | | | $ | 5,381,046 | | | $ | 139,611,848 | |
| | | | | | | | | | | | |
The following table summarizes the valuation of The Select 20 Portfolio’s investments by fair value hierarchy levels as of Oct. 31, 2014:
| | | | | | | | | | | | |
| | | Level 1 | | | Level 2 | | | Total | |
Common Stock | | $ | 89,301,026 | | | $ | — | | | $ | 89,301,026 | |
Short-Term Investments | | | — | | | | 1,060,619 | | | | 1,060,619 | |
| | | | | | | | | | | | |
Total | | $ | 89,301,026 | | | $ | 1,060,619 | | | $ | 90,361,645 | |
| | | | | | | | | | | | |
The following table summarizes the valuation of The Large-Cap Growth Equity Portfolio’s investments by fair value hierarchy levels as of Oct. 31, 2014:
| | | | | | | | | | | | |
| | | Level 1 | | | Level 2 | | | Total | |
Common Stock | | $ | 276,256,402 | | | $ | — | | | $ | 276,256,402 | |
Short-Term Investments | | | — | | | | 3,883,000 | | | | 3,883,000 | |
| | | | | | | | | | | | |
Total | | $ | 276,256,402 | | | $ | 3,883,000 | | | $ | 280,139,402 | |
| | | | | | | | | | | | |
The following table summarizes the valuation of The Focus Smid-Cap Growth Equity Portfolio’s investments by fair value hierarchy levels as of Oct. 31, 2014:
| | | | | | | | | | | | |
| | | Level 1 | | | Level 2 | | | Total | |
Common Stock | | | | | | | | | | | | |
Consumer Discretionary | | $ | 10,440,796 | | | $ | — | | | $ | 10,440,796 | |
Energy | | | 1,859,237 | | | | — | | | | 1,859,237 | |
Financial Services | | | 6,865,046 | | | | — | | | | 6,865,046 | |
Healthcare | | | 4,581,435 | | | | — | | | | 4,581,435 | |
Office REITs | | | 1,862,355 | | | | — | | | | 1,862,355 | |
Producer Durables | | | 6,799,350 | | | | — | | | | 6,799,350 | |
Technology | | | 5,429,341 | | | | 1,524,664 | | | | 6,954,005 | |
Utilities | | | 2,163,600 | | | | — | | | | 2,163,600 | |
Short-Term Investments | | | — | | | | 1,817,177 | | | | 1,817,177 | |
| | | | | | | | | | | | |
Total | | $ | 40,001,160 | | | $ | 3,341,841 | | | $ | 43,343,001 | |
| | | | | | | | | | | | |
Notes to financial statements
Delaware Pooled® Trust
3. Investments (continued)
The following table summarizes the valuation of The High-Yield Bond Portfolio’s investments by fair value hierarchy levels as of Oct. 31, 2014:
| | | | | | | | | | | | | | | | |
| | | Level 1 | | | Level 2 | | | Level 3 | | | Total | |
Corporate Debt | | $ | — | | | $ | 124,187,341 | | | $ | — | | | $ | 124,187,341 | |
Senior Secured Loans1 | | | — | | | | 8,199,496 | | | | 343,400 | | | | 8,542,896 | |
Common Stock | | | — | | | | — | | | | — | | | | — | |
Convertible Preferred Stock | | | — | | | | 92,813 | | | | — | | | | 92,813 | |
Preferred Stock2 | | | 922,390 | | | | 1,409,100 | | | | — | | | | 2,331,490 | |
Short-Term Investments | | | — | | | | 7,866,000 | | | | — | | | | 7,866,000 | |
| | | | | | | | | | | | | | | | |
| | | | |
Total | | $ | 922,390 | | | $ | 141,754,750 | | | $ | 343,400 | | | $ | 143,020,540 | |
| | | | | | | | | | | | | | | | |
Futures Contracts | | $ | (15,984 | ) | | $ | — | | | $ | — | | | $ | (15,984 | ) |
Swap Contracts | | | — | | | | (98,674 | ) | | | — | | | | (98,674 | ) |
1Security type is valued across multiple levels. The amounts attributed to Level 2 investments and Level 3 investments represent 95.98% and 4.02%, respectively, of the total market value of this security type. Level 2 investments represent investments with observable inputs and Level 3 investments represent investments with unobservable inputs.
2Security type is valued across multiple levels. The amounts attributed to Level 1 investments and Level 2 investments represent 39.56% and 60.44%, respectively, of the total market value of this security type. Level 1 investments represent exchange traded investments and Level 2 investments represent investments with observable inputs.
The following table summarizes the valuation of The Core Plus Fixed Income Portfolio’s investments by fair value hierarchy levels as of Oct. 31, 2014:
| | | | | | | | | | | | | | | | |
| | | Level 1 | | | Level 2 | | | Level 3 | | | Total | |
Agency, Asset-Backed &
Mortgage-Backed Securities1 | | $ | — | | | $ | 27,592,998 | | | $ | 71,819 | | | $ | 27,664,817 | |
Corporate Debt | | | — | | | | 35,766,286 | | | | — | | | | 35,766,286 | |
Foreign Debt | | | — | | | | 480,818 | | | | — | | | | 480,818 | |
Senior Secured Loans | | | — | | | | 6,261,244 | | | | — | | | | 6,261,244 | |
Municipal Bonds | | | — | | | | 201,787 | | | | — | | | | 201,787 | |
Convertible Preferred Stock2 | | | 18,014 | | | | 23,830 | | | | — | | | | 41,844 | |
Preferred Stock | | | 208,226 | | | | — | | | | — | | | | 208,226 | |
U.S. Treasury Obligations | | | — | | | | 5,244,586 | | | | — | | | | 5,244,586 | |
Short-Term Investments | | | — | | | | 14,496,000 | | | | — | | | | 14,496,000 | |
| | | | | | | | | | | | | | | | |
Total | | $ | 226,240 | | | $ | 90,067,549 | | | $ | 71,819 | | | $ | 90,365,608 | |
| | | | | | | | | | | | | | | | |
Foreign Currency Exchange
Contracts | | $ | — | | | $ | (1,110 | ) | | $ | — | | | $ | (1,110 | ) |
Futures Contracts | | | (19,459 | ) | | | — | | | | — | | | | (19,459 | ) |
Swap Contracts | | | — | | | | (1,510 | ) | | | — | | | | (1,510 | ) |
1Security type is valued across multiple levels. The amounts attributed to Level 2 investments and Level 3 investments represent 99.74% and 0.26%, respectively, of the total market value of this security type. Level 2 investments represent investments with observable inputs and Level 3 investments represent investments with unobservable inputs.
2Security type is valued across multiple levels. The amounts attributed to Level 1 investments and Level 2 investments represent 43.05% and 56.95%, respectively, of the total market value of this security type. Level 1 investments represent exchange traded investments and Level 2 investments represent investments with observable inputs.
118
The following table summarizes the valuation of The International Equity Portfolio’s investments by fair value hierarchy levels as of Oct. 31, 2014:
| | | | | | | | | | | | | | | | | | | | |
| | | Level 1 | | Level 2 | | Level 3 | | Total |
Common Stock | | | | | | | | | | | | | | | | | | | | |
Australia | | | $ | — | | | | $ | 11,378,962 | | | | $ | — | | | | $ | 11,378,962 | |
Belgium | | | | — | | | | | — | | | | | — | | | | | — | |
China | | | | — | | | | | 11,772,117 | | | | | — | | | | | 11,772,117 | |
France | | | | — | | | | | 52,262,343 | | | | | — | | | | | 52,262,343 | |
Germany | | | | — | | | | | 33,333,895 | | | | | — | | | | | 33,333,895 | |
Israel | | | | 9,295,866 | | | | | — | | | | | — | | | | | 9,295,866 | |
Italy | | | | — | | | | | 9,753,720 | | | | | — | | | | | 9,753,720 | |
Japan | | | | — | | | | | 77,012,070 | | | | | — | | | | | 77,012,070 | |
Netherlands | | | | — | | | | | 27,213,837 | | | | | — | | | | | 27,213,837 | |
Singapore | | | | — | | | | | 20,622,476 | | | | | — | | | | | 20,622,476 | |
Spain | | | | — | | | | | 31,218,380 | | | | | — | | | | | 31,218,380 | |
Sweden | | | | — | | | | | 9,938,108 | | | | | — | | | | | 9,938,108 | |
Switzerland | | | | — | | | | | 56,827,129 | | | | | — | | | | | 56,827,129 | |
Taiwan | | | | 4,552,239 | | | | | — | | | | | — | | | | | 4,552,239 | |
United Kingdom | | | | 4,268,033 | | | | | 82,741,254 | | | | | — | | | | | 87,009,287 | |
Short-Term Investments | | | | — | | | | | 1,889,258 | | | | | — | | | | | 1,889,258 | |
| | | | | | | | | | | | | | | | | | | | |
Total | | | $ | 18,116,138 | | | | $ | 425,963,549 | | | | $ | — | | | | $ | 444,079,687 | |
| | | | | | | | | | | | | | | | | | | | |
Foreign Currency Exchange Contracts | | | $ | — | | | | $ | 78,004 | | | | $ | — | | | | $ | 78,004 | |
The following table summarizes the valuation of The Labor Select International Equity Portfolio’s investments by fair value hierarchy levels as of Oct. 31, 2014:
| | | | | | | | | | | | | | | | | | | | |
| | | Level 1 | | Level 2 | | Level 3 | | Total |
Common Stock | | | | | | | | | | | | | | | | | | | | |
Australia | | | $ | — | | | | $ | 9,487,051 | | | | $ | — | | | | $ | 9,487,051 | |
Belgium | | | | — | | | | | — | | | | | — | | | | | — | |
France | | | | — | | | | | 50,256,632 | | | | | — | | | | | 50,256,632 | |
Germany | | | | — | | | | | 27,417,331 | | | | | — | | | | | 27,417,331 | |
Israel | | | | 7,747,684 | | | | | — | | | | | — | | | | | 7,747,684 | |
Japan | | | | — | | | | | 67,782,395 | | | | | — | | | | | 67,782,395 | |
Netherlands | | | | — | | | | | 23,950,301 | | | | | — | | | | | 23,950,301 | |
Singapore | | | | — | | | | | 20,315,180 | | | | | — | | | | | 20,315,180 | |
Spain | | | | — | | | | | 26,008,392 | | | | | — | | | | | 26,008,392 | |
Sweden | | | | — | | | | | 8,795,153 | | | | | — | | | | | 8,795,153 | |
Switzerland | | | | — | | | | | 47,722,833 | | | | | — | | | | | 47,722,833 | |
United Kingdom | | | | 3,658,044 | | | | | 76,707,113 | | | | | — | | | | | 80,365,157 | |
Short-Term Investment | | | | — | | | | | 2,684,000 | | | | | — | | | | | 2,684,000 | |
| | | | | | | | | | | | | | | | | | | | |
Total | | | $ | 11,405,728 | | | | $ | 361,126,381 | | | | $ | — | | | | $ | 372,532,109 | |
| | | | | | | | | | | | | | | | | | | | |
Foreign Currency Exchange Contracts | | | $ | — | | | | $ | 63,672 | | | | $ | — | | | | $ | 63,672 | |
Notes to financial statements
Delaware Pooled® Trust
3. Investments (continued)
The following table summarizes the valuation of The Emerging Market Portfolio’s investments by fair value hierarchy levels as of Oct. 31, 2014:
| | | | | | | | | | | | |
| | | Level 1 | | | Level 2 | | | Total | |
Common Stock | | | | | | | | | | | | |
Brazil | | $ | 22,324,749 | | | $ | — | | | $ | 22,324,749 | |
Chile | | | 9,032,067 | | | | — | | | | 9,032,067 | |
China | | | 4,737,552 | | | | 51,569,116 | | | | 56,306,668 | |
Colombia | | | 1,335,052 | | | | — | | | | 1,335,052 | |
India | | | 8,056,434 | | | | 18,333,557 | | | | 26,389,991 | |
Indonesia | | | — | | | | 12,566,688 | | | | 12,566,688 | |
Kazakhstan | | | 2,155,148 | | | | — | | | | 2,155,148 | |
Malaysia | | | — | | | | 17,032,884 | | | | 17,032,884 | |
Mexico | | | 21,974,214 | | | | — | | | | 21,974,214 | |
Peru | | | 4,802,630 | | | | — | | | | 4,802,630 | |
Philippines | | | 6,837,675 | | | | — | | | | 6,837,675 | |
Qatar | | | 2,991,461 | | | | 2,737,774 | | | | 5,729,235 | |
Republic of Korea | | | — | | | | 18,391,154 | | | | 18,391,154 | |
Romania | | | 1,538,108 | | | | — | | | | 1,538,108 | |
Russia | | | — | | | | 10,948,213 | | | | 10,948,213 | |
South Africa | | | 1,625,142 | | | | 7,815,357 | | | | 9,440,499 | |
Taiwan | | | 6,729,251 | | | | 17,838,764 | | | | 24,568,015 | |
Thailand | | | 7,074,492 | | | | — | | | | 7,074,492 | |
Turkey | | | — | | | | 14,278,086 | | | | 14,278,086 | |
United Arab Emirates | | | — | | | | 2,084,086 | | | | 2,084,086 | |
United Kingdom | | | — | | | | 12,389,006 | | | | 12,389,006 | |
United States | | | 7,049,468 | | | | — | | | | 7,049,468 | |
Preferred Stock1 | | | 8,017,577 | | | | 2,078,599 | | | | 10,096,176 | |
Short-Term Investments | | | — | | | | 3,866,551 | | | | 3,866,551 | |
| | | | | | | | | | | | |
Total | | $ | 116,281,020 | | | $ | 191,929,835 | | | $ | 308,210,855 | |
| | | | | | | | | | | | |
Foreign Currency Exchange Contracts | | $ | — | | | $ | (16,436 | ) | | $ | (16,436 | ) |
1Security type is valued across multiple levels. The amounts attributed to Level 1 investments and Level 2 investments represent 79.41% and 20.59%, respectively, of the total market value of this security type. Level 1 investments represent exchange traded investments and Level 2 investments represent investments with observable inputs.
120
The following table summarizes the valuation of The Emerging Market Portfolio II’s investments by fair value hierarchy levels as of Oct. 31, 2014:
| | | | | | | | | | | | |
| | | Level 1 | | | Level 2 | | | Total | |
Common Stock | | | | | | | | | | | | |
Argentina | | $ | 643,170 | | | $ | — | | | $ | 643,170 | |
Bahrain | | | — | | | | 12,056 | | | | 12,056 | |
Brazil | | | 7,103,738 | | | | — | | | | 7,103,738 | |
Chile | | | 315,609 | | | | — | | | | 315,609 | |
China/Hong Kong | | | 5,554,766 | | | | 1,796,962 | | | | 7,351,728 | |
Colombia | | | 543,175 | | | | — | | | | 543,175 | |
India | | | 146,536 | | | | 3,365,277 | | | | 3,511,813 | |
Indonesia | | | — | | | | 613,653 | | | | 613,653 | |
Israel | | | 1,129,400 | | | | — | | | | 1,129,400 | |
Malaysia | | | — | | | | 203,501 | | | | 203,501 | |
Mexico | | | 3,175,492 | | | | — | | | | 3,175,492 | |
Netherlands | | | 309,096 | | | | — | | | | 309,096 | |
Peru | | | 105,800 | | | | — | | | | 105,800 | |
Poland | | | — | | | | 285,378 | | | | 285,378 | |
Republic of Korea | | | 3,313,245 | | | | 5,562,610 | | | | 8,875,855 | |
Russia | | | 1,130,798 | | | | 881,522 | | | | 2,012,320 | |
South Africa | | | 260,988 | | | | 295,216 | | | | 556,204 | |
Taiwan | | | 281,856 | | | | 1,946,313 | | | | 2,228,169 | |
Thailand | | | 371,957 | | | | 225,290 | | | | 597,247 | |
Turkey | | | 301,378 | | | | 288,922 | | | | 590,300 | |
United Kingdom | | | 88,460 | | | | — | | | | 88,460 | |
United States | | | 1,622,190 | | | | — | | | | 1,622,190 | |
Preferred Stock | | | — | | | | 578,794 | | | | 578,794 | |
Short-Term Investments | | | — | | | | 1,102,000 | | | | 1,102,000 | |
| | | | | | | | | | | | |
Total | | $ | 26,397,654 | | | $ | 17,157,494 | | | $ | 43,555,148 | |
| | | | | | | | | | | | |
| | | |
Foreign Currency Exchange
Contracts | | $ | — | | | $ | (662 | ) | | $ | (662 | ) |
The securities that have been deemed worthless on the “Schedules of investments” are considered to be Level 3 securities in these tables.
During the year ended Oct. 31, 2014, there were no transfers between Level 1 investments, Level 2 investments, or Level 3 investments that had a significant impact to each Portfolio. This does not include transfers between Level 1 investments and Level 2 investments due to each Portfolio utilizing international fair value pricing during the period. In accordance with the fair valuation procedures described in Note 1, international fair value pricing of securities in each Portfolio occurs when market volatility exceeds an established rolling threshold. If the threshold is exceeded on a given date, then prices of international securities (those that traded on exchanges that close at a different time than the time that each Portfolio’s net asset value is determined) will be established using a separate pricing feed from a third party vendor designed to establish a price for each such security as of the time that each Portfolio’s net asset value is determined. Further, international fair value pricing uses other observable market-based inputs in place of the closing exchange price due to the events occurring after the close of the exchange or market on which the investment is principally traded, causing a change in classification between levels. Each Portfolio’s policy is to recognize transfers at the beginning of the reporting period.
A reconciliation of Level 3 investments is presented when a Portfolio has a significant amount of Level 3 investments at the beginning, interim, or end of the period in relation to net assets. Management has determined not to provide additional disclosure on Level 3 inputs under ASU No. 2011-04 since the Level 3 investments are not considered significant to each Portfolio’s net assets at the end of the year.
Notes to financial statements
Delaware Pooled® Trust
4. Dividend and Distribution Information
Income and long-term capital gain distributions are determined in accordance with federal income tax regulations, which may differ from U.S. GAAP. Additionally, distributions from net gains on foreign currency transactions and net short-term gains on sales of investment securities are treated as ordinary income for federal income tax purposes. The tax character of dividends and distributions paid during the years ended Oct. 31, 2014 and 2013 was as follows:
| | | | | | | | | | | | |
| | | Ordinary
income | | | Long-term
capital gain | | | Total | |
Year ended Oct. 31, 2014: | | | | | | | | | | | | |
The Large-Cap Value Equity Portfolio | | $ | 1,238,119 | | | $ | 451,277 | | | $ | 1,689,396 | |
The Select 20 Portfolio | | | 98,955 | | | | 2,407,909 | | | | 2,506,864 | |
The Large-Cap Growth Equity Portfolio | | | 852,040 | | | | — | | | | 852,040 | |
The Focus Smid-Cap Growth Equity Portfolio | | | 48,668 | | | | — | | | | 48,668 | |
The High-Yield Bond Portfolio | | | 8,364,409 | | | | — | | | | 8,364,409 | |
The Core Plus Fixed Income Portfolio | | | 1,349,489 | | | | — | | | | 1,349,489 | |
The International Equity Portfolio | | | 13,166,001 | | | | — | | | | 13,166,001 | |
The Labor Select International Equity Portfolio | | | 15,240,625 | | | | — | | | | 15,240,625 | |
The Emerging Markets Portfolio | | | 7,191,722 | | | | 9,698,927 | | | | 16,890,649 | |
The Emerging Markets Portfolio II | | | 402,381 | | | | 161,827 | | | | 564,208 | |
| | | |
| | | Ordinary
income | | | Long-term
capital gain | | | Total | |
Year ended Oct. 31, 2013: | | | | | | | | | | | | |
The Large-Cap Value Equity Portfolio | | $ | 173,059 | | | $ | — | | | $ | 173,059 | |
The Select 20 Portfolio | | | 619,737 | | | | 1,624,145 | | | | 2,243,882 | |
The Large-Cap Growth Equity Portfolio | | | 991,897 | | | | — | | | | 991,897 | |
The Focus Smid-Cap Growth Equity Portfolio | | | 232 | | | | 355,446 | | | | 355,678 | |
The High-Yield Bond Portfolio | | | 6,283,328 | | | | — | | | | 6,283,328 | |
The Core Plus Fixed Income Portfolio | | | 1,823,382 | | | | — | | | | 1,823,382 | |
The International Equity Portfolio | | | 18,294,751 | | | | — | | | | 18,294,751 | |
The Labor Select International Equity Portfolio | | | 17,220,981 | | | | — | | | | 17,220,981 | |
The Emerging Markets Portfolio | | | 7,465,935 | | | | 5,123,069 | | | | 12,589,004 | |
The Emerging Markets Portfolio II | | | 149,047 | | | | — | | | | 149,047 | |
5. Components of Net Assets on a Tax Basis
As of Oct. 31, 2014, the components of net assets on a tax basis were as follows:
| | | | | | | | | | | | | | | | | | | | |
| | | The
Large-Cap
Value Equity
Portfolio | | The
Select 20
Portfolio | | The
Large-Cap
Growth Equity
Portfolio | | The
Focus Smid-Cap
Growth Equity
Portfolio |
Shares of beneficial interest | | | $ | 113,968,842 | | | | $ | 33,144,831 | | | | $ | 169,213,248 | | | | | $22,692,323 | |
Undistributed ordinary income | | | | 1,893,170 | | | | | 2,164,305 | | | | | 1,501,161 | | | | | 2,790,095 | |
Undistributed long-term capital gain | | | | 3,624,778 | | | | | 22,924,836 | | | | | 23,422,049 | | | | | 7,141,696 | |
Unrealized appreciation | | | | 20,310,552 | | | | | 32,119,785 | | | | | 83,185,116 | | | | | 10,656,997 | |
| | | | | | | | | | | | | | | | | | | | |
Net assets | | | $ | 139,797,342 | | | | $ | 90,353,757 | | | | $ | 277,321,574 | | | | | $43,281,111 | |
| | | | | | | | | | | | | | | | | | | | |
122
| | | | | | | | | | | | | | | |
| | | The
High-Yield
Bond
Portfolio | | The
Core Plus
Fixed Income
Portfolio | | The
International
Equity
Portfolio |
Shares of beneficial interest | | | $ | 133,764,467 | | | | $ | 74,687,736 | | | | $ | 535,163,756 | |
Undistributed ordinary income | | | | 6,757,095 | | | | | 1,824,883 | | | | | 18,134,233 | |
Undistributed long-term capital gain | | | | 2,131,273 | | | | | — | | | | | — | |
Other temporary differences | | | | — | | | | | (76,204 | ) | | | | — | |
Capital loss carryforwards | | | | — | | | | | (648,084 | ) | | | | (145,543,065 | ) |
Unrealized appreciation | | | | 529,632 | | | | | 1,247,265 | | | | | 38,772,177 | |
| | | | | | | | | | | | | | | |
Net assets | | | $ | 143,182,467 | | | | $ | 77,035,596 | | | | $ | 446,527,101 | |
| | | | | | | | | | | | | | | |
| | | | | | | | | | | | | | | |
| | | |
| | | Labor Select
International
Equity
Portfolio | | The
Emerging
Markets
Portfolio | | The
Emerging
Markets
Portfolio II |
Shares of beneficial interest | | | $ | 398,328,573 | | | | $ | 294,134,606 | | | | $ | 37,179,663 | |
Undistributed ordinary income | | | | 18,441,710 | | | | | 7,002,818 | | | | | 646,896 | |
Undistributed long-term capital gain | | | | — | | | | | 13,249,834 | | | | | 1,084,121 | |
Capital loss carryforwards | | | | (65,622,430 | ) | | | | — | | | | | — | |
Unrealized appreciation (depreciation) | | | | 22,349,330 | | | | | (4,176,343 | ) | | | | 3,603,881 | |
| | | | | | | | | | | | | | | |
Net assets | | | $ | 373,497,183 | | | | $ | 310,210,915 | | | | $ | 42,514,561 | |
| | | | | | | | | | | | | | | |
The differences between book basis and tax basis components of net assets are primarily attributable to tax deferral of losses on wash sales, mark-to-market on futures contracts, mark-to-market on foreign currency exchange contracts, tax deferral of losses on straddles, tax treatment of passive foreign investment companies, contingent payment debt instruments, tax treatment of trust preferred securities, tax treatment of market discount and premium on debt instruments, and CDS contracts.
For financial reporting purposes, capital accounts are adjusted to reflect the tax character of permanent book/tax differences. Reclassifications are primarily due to tax treatment of net operating losses, gain (loss) on foreign currency transactions, dividends and distributions, market discount and premium on certain debt instruments, contingent payment debt instruments, CDS contracts, tax treatment of foreign capital gains taxes, and paydown gains (losses) on mortgage- and asset-backed securities. Results of operations and net assets were not affected by these reclassifications. For year ended Oct. 31, 2014, the following Portfolios recorded the following reclassifications.
| | | | | | | | | | |
| | | Undistributed
(distributions in excess of)
net investment income (loss) | | Accumulated
net realized
gain (loss) |
The Focus Smid-Cap Growth Equity Portfolio | | | | $ 87,954 | | | | $ | (87,954 | ) |
The High-Yield Bond Portfolio | | | | 180,857 | | | | | (180,857 | ) |
The Core Plus Fixed Income Portfolio | | | | 37,829 | | | | | (37,829 | ) |
The International Equity Portfolio | | | | 499,332 | | | | | (499,332 | ) |
The Labor Select International Equity Portfolio | | | | 665,328 | | | | | (665,328 | ) |
The Emerging Markets Portfolio | | | | (1,161,338) | | | | | 1,161,338 | |
The Emerging Markets Portfolio II | | | | (20,840) | | | | | 20,840 | |
For federal income tax purposes, capital loss carryforwards may be carried forward and applied against future gains.
Notes to financial statements
Delaware Pooled® Trust
5. Components of Net Assets on a Tax Basis (continued)
In 2014, the following Portfolios utilized capital loss carryforwards as follows:
| | | | | |
| | | Capital loss
carryforwards
utilized |
The Large-Cap Value Equity Portfolio | | | $ | 207,581 | |
The Select 20 Portfolio | | | | 707,317 | |
The Large-Cap Growth Equity Portfolio | | | | 129,337 | |
The Focus Smid-Cap Growth Equity Portfolio | | | | 237,690 | |
The High-Yield Bond Portfolio | | | | 1,262,438 | |
The Core Plus Fixed Income Portfolio | | | | 1,267,031 | |
The International Equity Portfolio | | | | 32,467,767 | |
The Labor Select International Equity Portfolio | | | | 32,348,606 | |
Capital loss carryforwards remaining at Oct. 31, 2014 for the following Portfolios will expire as follows:
| | | | | | | | | | | | | | | | |
| | | Year of expiration | |
| | | 2016 | | | 2017 | | | 2018 | | | Total | |
The Core Plus Fixed Income Portfolio | | $ | 648,084 | | | $ | — | | | $ | — | | | $ | 648,084 | |
The International Equity Portfolio | | | — | | | | 131,683,584 | | | | 13,859,481 | | | | 145,543,065 | |
The Labor Select International Equity Portfolio | | | — | | | | 47,146,628 | | | | 18,475,802 | | | | 65,622,430 | |
On Dec. 22, 2010, the Regulated Investment Company Modernization Act of 2010 (Act) was enacted, which changed various technical rules governing the tax treatment of regulated investment companies. The changes were generally effective for taxable years beginning after the date of enactment. Under the Act, the Portfolios are permitted to carry forward capital losses incurred in taxable years beginning after the date of enactment for an unlimited period. However, any losses incurred during those future taxable years will be required to be utilized prior to the losses incurred in pre-enactment taxable years, which carry an expiration date. As a result of this ordering rule, pre-enactment capital loss carryforwards may be more likely to expire unused. Additionally, post-enactment capital loss carryforwards will retain their character as either short-term or long-term capital losses rather than being considered all short-term as permitted under previous regulation.
At Oct. 31, 2014, there were no capital loss carryforwards under the Act in any of the Portfolios.
124
6. Capital Shares
Transactions in capital shares were as follows:
| | | | | | | | | | | | | | | | |
| | | Shares
sold | | | Shares issued
upon reinvestment
of dividends
and distributions | | | Shares
redeemed | | | Net
increase
(decrease) | |
Year ended Oct. 31, 2014: | | | | | | | | | | | | | | | | |
The Large-Cap Value Equity Portfolio | | | 1,729,199 | | | | 50,863 | | | | (404,716 | ) | | | 1,375,346 | |
The Select 20 Portfolio | | | 318,550 | | | | 188,416 | | | | (11,749,979 | ) | | | (11,243,013 | ) |
The Large-Cap Growth Equity Portfolio | | | 1,282,232 | | | | 48,484 | | | | (2,518,987 | ) | | | (1,188,271 | ) |
The Focus Smid-Cap Growth Equity Portfolio | | | 465,364 | | | | 2,054 | | | | (2,803,693 | ) | | | (2,336,275 | ) |
The High-Yield Bond Portfolio | | | 1,042,416 | | | | 838,454 | | | | (769,914 | ) | | | 1,110,956 | |
The Core Plus Fixed Income Portfolio | | | 1,827,309 | | | | 137,283 | | | | (140,461 | ) | | | 1,824,131 | |
The International Equity Portfolio | | | 2,003,255 | | | | 652,915 | | | | (5,191,846 | ) | | | (2,535,676 | ) |
The Labor Select International Equity Portfolio | | | 1,775,454 | | | | 1,055,797 | | | | (11,084,045 | ) | | | (8,252,794 | ) |
The Emerging Markets Portfolio | | | 3,293,614 | | | | 1,541,293 | | | | (6,054,513 | ) | | | (1,219,606 | ) |
The Emerging Markets Portfolio II | | | 162,328 | | | | 60,407 | | | | (294,701 | ) | | | (71,966 | ) |
| | | | |
Year ended Oct. 31, 2013: | | | | | | | | | | | | | | | | |
The Large-Cap Value Equity Portfolio | | | 3,238,512 | | | | 7,881 | | | | (1,407 | ) | | | 3,244,986 | |
The Select 20 Portfolio | | | 6,235,756 | | | | 251,430 | | | | (2,364,083 | ) | | | 4,123,103 | |
The Large-Cap Growth Equity Portfolio | | | 3,060,795 | | | | 75,813 | | | | (4,546,188 | ) | | | (1,409,580 | ) |
The Focus Smid-Cap Growth Equity Portfolio | | | 3,463,696 | | | | 21,232 | | | | (319,494 | ) | | | 3,165,434 | |
The High-Yield Bond Portfolio | | | 3,147,620 | | | | 661,732 | | | | (1,836,274 | ) | | | 1,973,078 | |
The Core Plus Fixed Income Portfolio | | | 790,881 | | | | 179,998 | | | | (1,086,362 | ) | | | (115,483 | ) |
The International Equity Portfolio | | | 2,498,536 | | | | 948,479 | | | | (7,835,395 | ) | | | (4,388,380 | ) |
The Labor Select International Equity Portfolio | | | 1,359,454 | | | | 1,369,121 | | | | (9,408,303 | ) | | | (6,679,728 | ) |
The Emerging Markets Portfolio | | | 9,043,259 | | | | 1,086,850 | | | | (8,284,117 | ) | | | 1,845,992 | |
The Emerging Markets Portfolio II | | | 721,050 | | | | 17,352 | | | | — | | | | 738,402 | |
7. Unfunded Commitments
The High-Yield Bond Portfolio may invest in floating rate loans. In connection with these investments, the Portfolio may also enter into unfunded corporate loan commitments (commitments). Commitments may obligate the Portfolio to furnish temporary financing to a borrower until permanent financing can be arranged. In connection with these commitments, the Portfolio earns a commitment fee, typically set as a percentage of the commitment amount. As of Oct. 31, 2014, the Portfolio has an unfunded loan commitment of $131,291 for Ziggo which it has contracted to sell. The commitment is expected to remain open until Dec. 31, 2014.
8. Line of Credit
Each Portfolio, along with certain other funds in the Delaware Investments® Family of Funds (Participants), was a participant in a $125,000,000 revolving line of credit to be used for temporary or emergency purposes as an additional source of liquidity to fund redemptions of investor shares. Under the agreement, the Participants were charged an annual commitment fee of 0.08%, which was allocated across the Participants on the basis of each Participant’s allocation of the entire facility. The Participants were permitted to borrow up to a maximum of one third of their net assets under the agreement. Each Participant was individually, and not jointly, liable for its particular advances, if any, under the line of credit. The line of credit under the agreement expired on Nov. 12, 2013.
On Nov. 12, 2013, each Portfolio, along with the other Participants, entered into an amendment to the agreement for a $225,000,000 revolving line of credit. The line of credit was to be used as described above and operated in substantially the same manner as the agreement described above. The line of credit available under the agreement expired on Nov. 10, 2014.
Each Portfolio had no amounts outstanding as of Oct. 31, 2014 or at any time during the year then ended.
Notes to financial statements
Delaware Pooled® Trust
9. Derivatives
U.S. GAAP requires disclosures that enable investors to understand: (1) how and why an entity uses derivatives; (2) how they are accounted for; and (3) how they affect an entity’s results of operations and financial position.
Foreign Currency Exchange Contracts — Each Portfolio may enter into foreign currency exchange contracts and foreign cross currency exchange contracts as a way of managing foreign exchange rate risk. Each Portfolio may enter into these contracts to fix the U.S. dollar value of a security that it has agreed to buy or sell for the period between the date the trade was entered into and the date the security is delivered and paid for. Each Portfolio may also use these contracts to hedge the U.S. dollar value of securities it already owns that are denominated in foreign currencies. In addition, each Portfolio may enter into these contracts to facilitate or expedite the settlement of portfolio transactions. The change in value is recorded as an unrealized gain or loss. When the contract is closed, a realized gain or loss is recorded equal to the difference between the value of the contract at the time it was opened and the value at the time it was closed.
The use of foreign currency exchange contracts and foreign cross currency exchange contracts does not eliminate fluctuations in the underlying prices of the securities, but does establish a rate of exchange that can be achieved in the future. Although foreign currency exchange contracts and foreign cross currency exchange contracts limit the risk of loss due to an unfavorable change in the value of the hedged currency, they also limit any potential gain that might result should the value of the currency change favorably. In addition, each Portfolio could be exposed to risks if the counterparties to the contracts are unable to meet the terms of their contracts. Each Portfolio’s maximum risk of loss from counterparty credit risk is the value of its currency exchanged with the counterparty. The risk is generally mitigated by having a netting arrangement between each Portfolio and the counterparty and by the posting of collateral by the counterparty to the Portfolio to cover each Portfolio’s exposure to the counterparty.
The Core Plus Fixed Income Portfolio, The International Equity Portfolio, and The Labor Select International Equity Portfolio entered into foreign currency exchange contracts and foreign cross currency exchange contracts in order to hedge the U.S. dollar value of securities they already own that are denominated in foreign currencies. The Focus Smid-Cap Growth Equity Portfolio, The Emerging Markets Portfolio, and The Emerging Markets Portfolio II entered into foreign currency exchange contracts and foreign cross currency exchange contracts to facilitate or expedite the settlement of portfolio transactions.
Futures Contracts — A futures contract is an agreement in which the writer (or seller) of the contract agrees to deliver to the buyer an amount of cash or securities equal to a specific dollar amount times the difference between the value of a specific security or index at the close of the last trading day of the contract and the price at which the agreement is made. The Select 20, The Large-Cap Growth Equity, The Focus Smid-Cap Growth Equity, The High-Yield Bond, The Core Plus Fixed Income, The Emerging Markets, and The Emerging Markets II Portfolios may use futures in the normal course of pursuing their respective investment objectives. Each Portfolio may invest in futures contracts to hedge its existing portfolio securities against fluctuations in fair value caused by changes in prevailing market interest rates or market conditions. Upon entering into a futures contract, a Portfolio deposits cash or pledges U.S. government securities to a broker, equal to the minimum “initial margin” requirements of the exchange on which the contract is traded. Subsequent payments are received from the broker or paid to the broker each day, based on the daily fluctuation in the market value of the contract. These receipts or payments are known as “variation margin” and are recorded daily by each Portfolio as unrealized gains or losses until the contracts are closed. When the contracts are closed, the Portfolio records a realized gain or loss equal to the difference between the value of the contract at the time it was opened and the value at the time it was closed. Risks of entering into futures contracts include potential imperfect correlation between the futures contracts and the underlying securities and the possibility of an illiquid secondary market for these instruments. When investing in futures, there is reduced counterparty credit risk to each Portfolio because futures are exchange-traded and the exchange’s clearinghouse, as counterparty to all exchange-traded futures, guarantees against default.
The High-Yield Bond Portfolio and The Core Plus Fixed Income Portfolio entered into futures contracts in order to hedge the Portfolios’ existing portfolio securities against fluctuations in value caused by changes in interest rates or market conditions.
Options Contracts — Each Portfolio may enter into options contracts in the normal course of pursuing its respective investment objective. Each Portfolio may buy or write options contracts for any number of reasons, including without limitation: to manage each Portfolio’s exposure to changes in securities prices caused by interest rates or market conditions and foreign currencies; as an efficient means of adjusting each Portfolio’s overall exposure to certain markets; to protect the value of portfolio securities; and as a cash management tool. Each Portfolio may buy or write call or put options on securities, financial indices, futures, swaps, and foreign currencies. When each Portfolio buys an option, a premium is paid and an asset is recorded and adjusted on a daily basis to reflect the current market value of the option purchased. When each Portfolio writes an option, a premium is received and a liability is recorded and adjusted on a daily basis to reflect the current market value of
126
the option written. Premiums received from writing options that expire unexercised are treated by each Portfolio on the expiration date as realized gains. The difference between the premium received and the amount paid on effecting a closing purchase transaction, including brokerage commissions, is treated as realized gain or loss. If a call option is exercised, the premium is added to the proceeds from the sale of the underlying security in determining whether each Portfolio has a realized gain or loss. If a put option is exercised, the premium reduces the cost basis of the securities purchased by each Portfolio. Each Portfolio, as writer of an option, bears the market risk of an unfavorable change in the price of the security underlying the written option. When writing options, each Portfolio is subject to minimal counterparty risk because the counterparty is only obligated to pay premiums and does not bear the market risk of an unfavorable market change.
The Core Plus Fixed Income Portfolio purchased option contracts in order to manage the Portfolio’s exposure to changes in securities prices caused by interest rates or market conditions.
There were no transactions in options written during the year ended Oct. 31, 2014.
Swap Contracts — The High-Yield Bond Portfolio and The Core Plus Fixed Income Portfolio may enter into credit default swap (CDS) contracts in accordance with their investment objectives. The Core Plus Fixed Income Portfolio may enter into interest rate swap contracts in accordance with its investment objective. The Portfolio may use interest rate swaps to adjust the Portfolio’s sensitivity to interest rates or to hedge against changes in interest rates. The Portfolios may enter into CDS contracts in order to hedge against a credit event, to enhance total return, or to gain exposure to certain securities or markets. The Portfolios will not be permitted to enter into any swap transactions unless, at the time of entering into such transactions, the unsecured long-term debt of the actual counterparty, combined with any credit enhancements, is rated at least BBB- by Standard & Poor’s Financial Services LLC (S&P) or Baa3 by Moody’s Investors Service, Inc. (Moody’s) or is determined to be of equivalent quality by DMC.
Interest Rate Swaps — An interest rate swap contract is an exchange of interest rates between counterparties. In one instance, an interest rate swap involves payments received by the Portfolio from another party based on a variable or floating interest rate, in return for making payments based on a fixed interest rate. An interest rate swap can also work in reverse with the Portfolio receiving payments based on a fixed interest rate and making payments based on a variable or floating interest rate. Interest rate swaps may be used to adjust the Portfolio’s sensitivity to interest rates or to hedge against changes in interest rates. Periodic payments on such contracts are accrued daily and recorded as unrealized appreciation/depreciation on swap contracts. Upon periodic payment/receipt or termination of the contract, such amounts are recorded as realized gains or losses on swap contracts. A Portfolio’s maximum risk of loss from counterparty credit risk is the discounted net value of the cash flows to be received from/paid to the counterparty over the interest rate swap contract’s remaining life, to the extent that the amount is positive. This risk is mitigated by (1) for bilateral swap contracts, having netting arrangements between each Portfolio and the counterparty and by the posting of collateral by the counterparty to each Portfolio to cover the Portfolios’ exposure to the counterparty or (2) for cleared swaps, trading these instruments through a central counterparty.
Credit Default Swaps — A CDS contract is a risk-transfer instrument through which one party (purchaser of protection) transfers to another party (seller of protection) the financial risk of a credit event (as defined in the CDS agreement), as it relates to a particular reference security or basket of securities (such as an index). In exchange for the protection offered by the seller of protection, the purchaser of protection agrees to pay the seller of protection a periodic amount at a stated rate that is applied to the notional amount of the CDS contract. In addition, an upfront payment may be made or received by a Portfolio in connection with an unwinding or assignment of a CDS contract. Upon the occurrence of a credit event, the seller of protection would pay the par (or other agreed-upon) value of the reference security (or basket of securities) to the counterparty. Credit events generally include, among others, bankruptcy, failure to pay, and obligation default.
During the year ended Oct. 31, 2014, the Portfolios entered into CDS contracts as purchasers of protection. Periodic payments (receipts) on such contracts are accrued daily and recorded as unrealized losses (gains) on swap contracts. Upon payment (receipt), such amounts are recorded as realized losses (gains) on swap contracts. Upfront payments made or received in connection with CDS contracts are amortized over the expected life of the CDS contracts as unrealized losses (gains) on swap contracts. The change in value of CDS contracts is recorded daily as unrealized appreciation or depreciation. A realized gain or loss is recorded upon a credit event (as defined in the CDS agreement) or the maturity or termination of the agreement. Initial margin and variation margin are posted to central counterparties for central cleared CDS basket trades as determined by the applicable central counterparty. During the year ended Oct. 31, 2014, the Portfolios did not enter into any CDS contracts as a seller of protection.
CDS contracts may involve greater risks than if a Portfolio had invested in the reference obligation directly. CDS contracts are subject to general market risk, liquidity risk, counterparty risk, and credit risk. A Portfolio’s maximum risk of loss from counterparty credit risk, either as the seller of protection or the buyer of protection, is the fair value of the contract. This risk is mitigated by (1) for bilateral swap contracts, having netting
Notes to financial statements
Delaware Pooled® Trust
9. Derivatives (continued)
arrangements between each Portfolio and the counterparty and by the posting of collateral by the counterparty to each Portfolio to cover the Portfolios’ exposure to the counterparty or (2) for cleared swaps, trading these instruments through a central counterparty.
During the year ended Oct. 31, 2014, The High-Yield Bond Portfolio and The Core Plus Fixed Income Portfolio entered into CDS contracts in order to hedge against a credit event.
Swaps Generally — The value of open swaps may differ from that which would be realized in the event a Portfolio terminated its position in the contract on a given day. Risks of entering into these contracts include the potential inability of the counterparty to meet the terms of the contracts. This type of risk is generally limited to the amount of favorable movement in the value of the underlying security, instrument, or basket of instruments, if any, at the day of default. Risks also arise from potential losses from adverse market movements and such losses could exceed the unrealized amounts shown on the “Schedules of investments.”
At Oct. 31, 2014, The High-Yield Bond Portfolio and The Core Plus Fixed Income Portfolio posted $364,860 and $39,415, respectively, in cash collateral for centrally cleared swap contracts, which is presented as “Cash collateral due from brokers” on the “Statements of assets and liabilities.”
Fair values of derivative instruments as of Oct. 31, 2014 were as follows:
| | | | | | | | | | | | | | | | | | | | |
| The High-Yield Bond Portfolio |
| | | Asset Derivatives | | | | | Liability Derivatives | | | |
| | | Statement of Assets and Liabilities
Location | | Fair Value | | Statement of Assets and Liabilities
Location | | Fair Value |
Interest rate contracts
(Futures contracts) | | Variation margin receivable on futures contracts | | | | $ | — | | | | | Variation margin receivable on futures contracts | | | | $ | (15,984 | )* | | |
Credit contracts
(Swap contracts) | | Unrealized gain of credit default swap contracts | | | | | — | | | | | Unrealized loss of credit default swap contracts | | | | | (98,674 | ) | | |
| | | | | | | | | | | | | | | | | | | | |
Total | | | | | | $ | — | | | | | | | | | $ | (114,658 | ) | | |
| | | | | | | | | | | | | | | | | | | | |
|
The Core Plus Fixed Income Portfolio |
| | | Asset Derivatives | | | | | Liability Derivatives | | | |
| | | Statement of Assets and Liabilities
Location | | Fair Value | | Statement of Assets and Liabilities
Location | | Fair Value |
Forward currency exchange contracts
(Foreign currency
exchange contracts) | | Unrealized gain on foreign
currency exchange
contracts | | | | $ | — | | | | | Unrealized loss on foreign
currency exchange
contracts | | | | $ | (1,110 | ) | | |
Interest rate contracts
(Futures contracts) | | Variation margin receivable
on futures contracts | | | | | — | * | | | | Variation margin receivable
on futures contracts | | | | | (19,459 | )* | | |
Credit contracts
(Swap contracts) | | Unrealized gain of credit
default swap contracts | | | | | — | | | | | Unrealized loss of credit default swap contracts | | | | | (1,510 | ) | | |
| | | | | | | | | | | | | | | | | | | | |
Total | | | | | | $ | — | | | | | | | | | $ | (22,079 | ) | | |
| | | | | | | | | | | | | | | | | | | | |
| * | Includes cumulative appreciation (depreciation) of futures contracts from the date the contracts are opened through Oct. 31, 2014. Only current day variation margin is reported on the “Statements of assets and liabilities.” |
128
The effect of derivative instruments on the “Statements of operations” for the year ended Oct. 31, 2014 was as follows:
| | | | | | | | | | | | | | | |
| | | The High-Yield Bond Portfolio Net Realized Loss on: |
| | | Futures
Contracts | | Swap
Contracts | | Total |
Interest rate contracts | | | $ | (97,426 | ) | | | $ | — | | | | $ | (97,426 | ) |
Credit contracts | | | | — | | | | | (85,804 | ) | | | | (85,804 | ) |
| | | | | | | | | | | | | | | |
Total | | | $ | (97,426 | ) | | | $ | (85,804 | ) | | | $ | (183,230 | ) |
| | | | | | | | | | | | | | | |
| |
| | | Net Change in Unrealized Appreciation
(Depreciation) of: |
| | | Futures
Contracts | | Swaps
Contracts | | Total |
Interest rate contracts | | | $ | (15,984 | ) | | | $ | — | | | | $ | (15,984 | ) |
Credit contracts | | | | — | | | | | (106,230 | ) | | | | (106,230 | ) |
| | | | | | | | | | | | | | | |
Total | | | $ | (15,984 | ) | | | $ | (106,230 | ) | | | $ | (122,214 | ) |
| | | | | | | | | | | | | | | |
| | | | | | | | | | | | | | | | | | | | |
| | | The Core Plus Fixed Income Portfolio
Net Realized Gain on: |
| | | Foreign
Currency
Exchange
Contracts | | Futures
Contracts | | Swap
Contracts | | Total |
Forward currency exchange contracts | | | $ | 1,020 | | | | $ | — | | | | $ | — | | | | $ | 1,020 | |
Equity contracts | | | | — | | | | | 14,475 | | | | | — | | | | | 14,475 | |
Credit contracts | | | | — | | | | | — | | | | | (15,560 | ) | | | | (15,560 | ) |
| | | | | | | | | | | | | | | | | | | | |
Total | | | $ | 1,020 | | | | $ | 14,475 | | | | $ | (15,560 | ) | | | $ | (65 | ) |
| | | | | | | | | | | | | | | | | | | | |
| |
| | | Net Change in Unrealized Appreciation (Depreciation) of: |
| | | Foreign
Currency
Exchange
Contracts | | Futures
Contracts | | Swaps
Contracts | | Total |
Forward currency exchange contracts | | | $ | (1,720 | ) | | | $ | — | | | | $ | — | | | | $ | (1,720 | ) |
Interest rate contracts | | | | — | | | | | (15,257 | ) | | | | — | | | | | (15,257 | ) |
Credit contracts | | | | — | | | | | — | | | | | (1,581 | ) | | | | (1,581 | ) |
| | | | | | | | | | | | | | | | | | | | |
Total | | | $ | (1,720 | ) | | | $ | (15,257 | ) | | | $ | (1,581 | ) | | | $ | (18,558 | ) |
| | | | | | | | | | | | | | | | | | | | |
At Oct. 31, 2014, The International Equity Portfolio, The Labor Select International Equity Portfolio, The Emerging Markets Portfolio, and The Emerging Markets Portfolio II had foreign currency risk, which is disclosed in the “Statements of assets and liabilities” and “Statements of operations.”
Notes to financial statements
Delaware Pooled® Trust
9. Derivatives (continued)
Derivatives Generally. The tables below summarize the average balance of derivative holdings by each Portfolio during the year ended Oct. 31, 2014.
| | | | | | | | | | | | | | |
| | | The Focus Smid-Cap Growth Equity Portfolio | |
| | | Long Derivative Volume | | | Short Derivative Volume | |
Foreign currency exchange contracts (average cost) | | USD | | | 14,428 | | | | USD | | | | 8,796 | |
| |
| | | The High-Yield Bond Portfolio | |
| | | Long Derivative Volume | | | Short Derivative Volume | |
Futures contracts (average notional value) | | USD | | | — | | | | USD | | | | 3,766,705 | |
CDS contracts (average notional value)* | | | | | 262,055 | | | | | | | | — | |
| |
| | | The Core Plus Fixed Income Portfolio | |
| | | Long Derivative Volume | | | Short Derivative Volume | |
Foreign currency exchange contracts (average cost) | | USD | | | 47,263 | | | | USD | | | | 165,275 | |
Futures contracts (average notional value) | | | | | 2,006,899 | | | | | | | | 5,483,669 | |
Options contracts (average notional value) | | | | | 231 | | | | | | | | — | |
CDS contracts (average notional value)* | | | | | 156,008 | | | | | | | | — | |
| | EUR | | | 7,589 | | | | | | | | — | |
| |
| | | The International Equity Portfolio | |
| | | Long Derivative Volume | | | Short Derivative Volume | |
Foreign currency exchange contracts (average cost) | | USD | | | 291,937 | | | | USD | | | | 10,106,625 | |
| |
| | | The Labor Select International Equity Portfolio | |
| | | Long Derivative Volume | | | Short Derivative Volume | |
Foreign currency exchange contracts (average cost) | | USD | | | 276,185 | | | | USD | | | | 10,067,657 | |
| |
| | | The Emerging Markets Portfolio | |
| | | Long Derivative Volume | | | Short Derivative Volume | |
Foreign currency exchange contracts (average cost) | | USD | | | 276,375 | | | | USD | | | | 244,612 | |
| |
| | | The Emerging Markets Portfolio II | |
| | | Long Derivative Volume | | | Short Derivative Volume | |
Foreign currency exchange contracts (average cost) | | USD | | | 12,804 | | | | USD | | | | 11,338 | |
*Long represents buying protection and short represents selling protection.
10. Offsetting
In December 2011, the Financial Accounting Standards Board (FASB) issued guidance that expands current disclosure requirements on the offsetting of certain assets and liabilities. The disclosures are required for investments and derivative financial instruments subject to master netting or similar agreements which are eligible for offset in the “Statements of assets and liabilities” and require an entity to disclose both gross and net information about such investments and transactions in financial statements. In January 2013, the FASB issued guidance that clarifies which investments and transactions are subject to the offsetting disclosure requirements. The scope of the disclosure requirements for offsetting is limited to derivative instruments, repurchase agreements and reverse repurchase agreements, and securities borrowing. The guidance is effective for financial statements with fiscal years beginning on or after Jan. 1, 2013, and interim periods within those fiscal years. The Portfolios adopted the disclosure provisions on offsetting during the current reporting period.
In order to better define their contractual rights and to secure rights that will help each Portfolio mitigate its counterparty risk, the Portfolios entered into an International Swaps and Derivatives Association, Inc. Master Agreement (ISDA Master Agreement) or a similar agreement with each of their derivative contract counterparties. An ISDA Master Agreement is a bilateral agreement between each Portfolio and a counterparty that governs over-the-counter (OTC) derivatives and foreign exchange contracts and typically contains, among other things, collateral posting items and netting provisions in the event of a default and/or termination event. Under an ISDA Master Agreement, each Portfolio may, under certain circumstances, offset with the counterparty certain derivative financial instrument’s payables and/or receivables with collateral held and/
130
or posted and create one single net payment. The provisions of the ISDA Master Agreement typically permit a single net payment in the event of default (close-out) netting including the bankruptcy or insolvency of the counterparty. However, bankruptcy or insolvency laws of a particular jurisdiction may impose restrictions on or prohibitions against the right of offset in bankruptcy, insolvency or other events.
For financial reporting purposes, the Portfolios do not offset derivative assets and derivative liabilities that are subject to netting arrangements in the “Statements of assets and liabilities.”
At Oct. 31, 2014, the Portfolios had the following assets and liabilities subject to offsetting provisions:
Offsetting of Financial Assets and Liabilities and Derivative Assets and Liabilities
| | | | | | | | | | | | | | | | | | | | |
| | | The Large-Cap Value Equity Portfolio |
Master Repurchase Agreements Counterparty | | Repurchase
Agreements | | Fair Value of
Non-Cash
Collateral
Received | | Cash
Collateral
Received | | Net Amount(a) |
| | | | |
Bank of America Merrill Lynch | | | $ | 365,177 | | | | $ | (365,177 | ) | | | $ | — | | | | $ | — | |
Bank of Montreal | | | | 60,863 | | | | | (60,863 | ) | | | | — | | | | | — | |
BNP Paribas | | | | 718,960 | | | | | (718,960 | ) | | | | — | | | | | — | |
| | | | | | | | | | | | | | | | | | | | |
Total | | | $ | 1,145,000 | | | | $ | (1,145,000 | ) | | | $ | — | | | | $ | — | |
| | | | | | | | | | | | | | | | | | | | |
| |
| | | The Large-Cap Growth Equity Portfolio |
Master Repurchase Agreements Counterparty | | Repurchase
Agreements | | Fair Value of
Non-Cash
Collateral
Received | | Cash
Collateral
Received | | Net Amount(a) |
| | | | |
Bank of America Merrill Lynch | | | $ | 1,238,414 | | | | $ | (1,238,414 | ) | | | $ | — | | | | $ | — | |
Bank of Montreal | | | | 206,402 | | | | | (206,402 | ) | | | | — | | | | | — | |
BNP Paribas | | | | 2,438,184 | | | | | (2,438,184 | ) | | | | — | | | | | — | |
| | | | | | | | | | | | | | | | | | | | |
Total | | | $ | 3,883,000 | | | | $ | (3,883,000 | ) | | | $ | — | | | | $ | — | |
| | | | | | | | | | | | | | | | | | | | |
| | | | | | | | | | | | | | | | | | | | |
| |
| | | The Focus Smid-Cap Growth Equity Portfolio |
Master Repurchase Agreements Counterparty | | Repurchase
Agreements | | Fair Value of
Non-Cash
Collateral
Received | | Cash
Collateral
Received | | Net Amount(a) |
| | | | |
Bank of America Merrill Lynch | | | $ | 232,502 | | | | $ | (232,502 | ) | | | $ | — | | | | $ | — | |
Bank of Montreal | | | | 38,750 | | | | | (38,750 | ) | | | | — | | | | | — | |
BNP Paribas | | | | 457,748 | | | | | (457,748 | ) | | | | — | | | | | — | |
| | | | | | | | | | | | | | | | | | | | |
Total | | | $ | 729,000 | | | | $ | (729,000 | ) | | | $ | — | | | | $ | — | |
| | | | | | | | | | | | | | | | | | | | |
Notes to financial statements
Delaware Pooled® Trust
10. Offsetting (continued)
| | | | | | | | | | | | | | | |
| The High-Yield Bond Portfolio |
Counterparty | | Gross Value of
Derivative Asset | | Gross Value of
Derivative Liability | | Net Position |
BNP Paribas | | | $ | — | | | | $ | (98,674 | ) | | | $ | (98,674 | ) |
| | | | | | | | | | | | | | | | | | | | | | | | | | | | | | |
| | | | | Fair Value of
Non-Cash
Collateral | | Cash Collateral | | Fair Value of
Non-Cash
Collateral | | Cash
Collateral | | |
Counterparty | | Net Position | | Received | | Received | | Pledged | | Pledged | | Net Amount(a) |
BNP Paribas | | $(98,674) | | | $ | — | | | | $ | — | | | | | — | | | | $ | 98,674 | | | | $ | — | |
| | | | | | | | | | | | | | | | | | | | |
| The High-Yield Bond Portfolio |
Master Repurchase Agreements Counterparty | | Repurchase
Agreements | | Fair Value of
Non-Cash
Collateral
Received | | Cash
Collateral
Received | | Net Amount(a) |
| | | | |
Bank of America Merrill Lynch | | | $ | 2,508,720 | | | | $ | (2,508,720 | ) | | | $ | — | | | | $ | — | |
Bank of Montreal | | | | 418,120 | | | | | (418,120 | ) | | | | — | | | | | — | |
BNP Paribas | | | | 4,939,160 | | | | | (4,939,160 | ) | | | | — | | | | | — | |
| | | | | | | | | | | | | | | | | | | | |
Total | | | $ | 7,866,000 | | | | $ | (7,866,000 | ) | | | $ | — | | | | $ | — | |
| | | | | | | | | | | | | | | | | | | | |
| | | | | | | | | | | | | | | |
| The Core Plus Fixed Income Portfolio |
Counterparty | | Gross Value of
Derivative Asset | | Gross Value of
Derivative Liability | | Net Position |
Barclays Bank | | | $ | — | | | | $ | (1,510 | ) | | | $ | (1,510 | ) |
BNY Mellon | | | | — | | | | | (511 | ) | | | | (511 | ) |
Union Bank of Switzerland | | | | — | | | | | (599 | ) | | | | (599 | ) |
| | | | | | | | | | | | | | | |
Total | | | $ | — | | | | $ | (2,620 | ) | | | $ | (2,620 | ) |
| | | | | | | | | | | | | | | |
| | | | | | | | | | | | | | | | | | | | | | | | | | | | | | |
| | | | | Fair Value of
Non-Cash
Collateral | | Cash Collateral | | Fair Value of
Non-Cash
Collateral | | Cash
Collateral | | |
Counterparty | | Net Position | | Received | | Received | | Pledged | | Pledged | | Net Amount(a) |
Barclays Bank | | | $ | (1,510 | ) | | | $ | — | | | | $ | — | | | | $ | — | | | | $ | 1,510 | | | | $ | — | |
BNY Mellon | | | | (511 | ) | | | | — | | | | | — | | | | | — | | | | | — | | | | | (511 | ) |
Union Bank of Switzerland | | | | (599 | ) | | | | — | | | | | — | | | | | — | | | | | — | | | | | (599 | ) |
| | | | | | | | | | | | | | | | | | | | | | | | | | | | | | |
Total | | | $ | (2,620 | ) | | | $ | — | | | | $ | — | | | | $ | — | | | | $ | 1,510 | | | | $ | (1,110 | ) |
| | | | | | | | | | | | | | | | | | | | | | | | | | | | | | |
| | | | | | | | | | | | | | | | | | | | |
| The Core Plus Fixed Income Portfolio |
Master Repurchase Agreements Counterparty | | Repurchase
Agreements | | Fair Value of
Non-Cash
Collateral
Received | | Cash Collateral
Received | | Net Amount(a) |
| | | | |
Bank of America Merrill Lynch | | | $ | 4,623,240 | | | | $ | — | | | | $ | — | | | | $ | 4,623,240 | |
Bank of Montreal | | | | 770,540 | | | | | — | | | | | — | | | | | 770,540 | |
BNP Paribas | | | | 9,102,220 | | | | | — | | | | | — | | | | | 9,102,220 | |
| | | | | | | | | | | | | | | | | | | | |
Total | | | $ | 14,496,000 | | | | $ | — | | | | $ | — | | | | $ | 14,496,000 | |
| | | | | | | | | | | | | | | | | | | | |
132
| | | | | | | | | | | | | | | |
| The International Equity Portfolio |
Counterparty | | Gross Value of
Derivative Asset | | Gross Value of
Derivative Liability | | Net Position |
Barclays Bank | | | $ | 170 | | | | $ | — | | | | $ | 170 | |
BNY Mellon | | | | 76,774 | | | | | — | | | | | 76,774 | |
Northern Trust | | | | 1,060 | | | | | — | | | | | 1,060 | |
| | | | | | | | | | | | | | | |
Total | | | $ | 78,004 | | | | $ | — | | | | $ | 78,004 | |
| | | | | | | | | | | | | | | |
| | | | | | | | | | | | | | | | | | | | | | | | | | | | | | |
| | | | | Fair Value of
Non-Cash
Collateral | | Cash Collateral | | Fair Value of
Non-Cash
Collateral | | Cash
Collateral | | |
Counterparty | | Net Position | | Received | | Received | | Pledged | | Pledged | | Net Amount(a) |
Barclays Bank | | | $ | 170 | | | | $ | — | | | | $ | — | | | | $ | — | | | | $ | — | | | | $ | 170 | |
BNY Mellon | | | | 76,774 | | | | | — | | | | | — | | | | | — | | | | | — | | | | | 76,774 | |
Northern Trust | | | | 1,060 | | | | | — | | | | | — | | | | | — | | | | | — | | | | | 1,060 | |
| | | | | | | | | | | | | | | | | | | | | | | | | | | | | | |
Total | | | $ | 78,004 | | | | $ | — | | | | $ | — | | | | $ | — | | | | $ | — | | | | $ | 78,004 | |
| | | | | | | | | | | | | | | | | | | | | | | | | | | | | | |
| | | | | | | | | | | | | | | | | | | | |
| The International Equity Portfolio |
Master Repurchase Agreements Counterparty | | Repurchase
Agreements | | Fair Value of
Non-Cash
Collateral
Received | | Cash
Collateral
Received | | Net Amount(a) |
| | | | |
Bank of America Merrill Lynch | | | $ | 87,387 | | | | $ | (87,387 | ) | | | $ | — | | | | $ | — | |
Bank of Montreal | | | | 14,565 | | | | | (14,565 | ) | | | | — | | | | | — | |
BNP Paribas | | | | 172,048 | | | | | (172,048 | ) | | | | — | | | | | — | |
| | | | | | | | | | | | | | | | | | | | |
Total | | | $ | 274,000 | | | | $ | (274,000 | ) | | | $ | — | | | | $ | — | |
| | | | | | | | | | | | | | | | | | | | |
| | | | | | | | | | | | | | | |
| The Labor Select International Equity Portfolio |
Counterparty | | Gross Value of
Derivative Asset | | Gross Value of
Derivative Liability | | Net Position |
BNY Mellon | | | $ | 63,988 | | | | $ | (316 | ) | | | $ | 63,672 | |
| | | | | | | | | | | | | | | | | | | | | | | | | | | | | | |
| | | | | Fair Value of
Non-Cash
Collateral | | Cash
Collateral | | Fair Value of
Non-Cash
Collateral | | Cash
Collateral | | |
Counterparty | | Net Position | | Received | | Received | | Pledged | | Pledged | | Net Amount(a) |
BNY Mellon | | | $ | 63,672 | | | | $ | — | | | | $ | — | | | | $ | — | | | | $ | — | | | | $ | 63,672 | |
| | | | | | | | | | | | | | | | | | | | |
| The Labor Select International Equity Portfolio |
Master Repurchase Agreements Counterparty | | Repurchase
Agreements | | Fair Value of
Non-Cash
Collateral
Received | | Cash
Collateral
Received | | Net Amount(a) |
| | | | |
Bank of America Merrill Lynch | | | $ | 856,014 | | | | $ | (856,014 | ) | | | $ | — | | | | $ | — | |
Bank of Montreal | | | | 142,669 | | | | | (142,669 | ) | | | | — | | | | | — | |
BNP Paribas | | | | 1,685,317 | | | | | (1,685,317 | ) | | | | — | | | | | — | |
| | | | | | | | | | | | | | | | | | | | |
Total | | | $ | 2,684,000 | | | | $ | (2,684,000 | ) | | | $ | — | | | | $ | — | |
| | | | | | | | | | | | | | | | | | | | |
Notes to financial statements
Delaware Pooled® Trust
10. Offsetting (continued)
| | | | | | | | | | | | | | | |
| The Emerging Markets Portfolio |
Counterparty | | Gross Value of
Derivative Asset | | Gross Value of
Derivative Liability | | Net Position |
BNY Mellon | | | $ | 1,166 | | | | $ | (17,602 | ) | | | | $ | (16,436) |
| | | | | | | | | | | | | | | | | | | | | | | | | | | | | | |
| | | | | Fair Value of Non-Cash Collateral | | Cash Collateral | | Fair Value of
Non-Cash
Collateral | | Cash
Collateral | | |
Counterparty | | Net Position | | Received | | Received | | Pledged | | Pledged | | Net Amount(a) |
BNY Mellon | | $(16,436) | | $— | | $— | | $— | | $— | | $(16,436) |
| | | | | | | | | | | | | | | | | | | | |
| The Emerging Markets Portfolio |
| | | | | | | | | | | | | | | | | | | | |
| | | | | Fair Value of
Non-Cash | | | | |
Master Repurchase Agreements Counterparty | | Repurchase
Agreements | | Collateral
Received | | Collateral
Received | | Net Amount(a) |
| | | | |
Bank of America Merrill Lynch | | | $ | 470,106 | | | | $ | (470,106 | ) | | | $ | — | | | | $ | — | |
Bank of Montreal | | | | 78,351 | | | | | (78,351 | ) | | | | — | | | | | — | |
BNP Paribas | | | | 925,543 | | | | | (925,543 | ) | | | | — | | | | | — | |
| | | | | | | | | | | | | | | | | | | | |
Total | | | $ | 1,474,000 | | | | $ | (1,474,000 | ) | | | $ | — | | | | $ | — | |
| | | | | | | | | | | | | | | | | | | | |
| | | | | | | | | | | | | | | |
| The Emerging Markets Portfolio II |
Counterparty | | Gross Value of
Derivative Asset | | Gross Value of
Derivative Liability | | Net Position |
BNY Mellon | | | $ | 214 | | | | $ | (876 | ) | | | | $ | (662) |
| | | | | | | | | | | | | | | | | | | | | | | | | | | | | | |
| | | | | Fair Value of
Non-Cash Collateral | | Cash Collateral | | Fair Value of
Non-Cash Collateral | | Cash Collateral | | |
Counterparty | | Net Position | | Received | | Received | | Pledged | | Pledged | | Net Amount(a) |
BNY Mellon | | $(662) | | $— | | $— | | $— | | $— | | $(662) |
| | | | | | | | | | | | | | | | | | | | |
| The Emerging Markets Portfolio II |
| | | | | | | | | | | | | | | | | | | | |
| | | | | Fair Value of
Non-Cash | | Cash | | |
Master Repurchase Agreements Counterparty | | Repurchase
Agreements | | Collateral
Received | | Collateral
Received | | Net Amount(a) |
Bank of America Merrill Lynch | | | $ | 351,463 | | | | $ | (351,463 | ) | | | $ | — | | | | $ | — | |
Bank of Montreal | | | | 58,577 | | | | | (58,577 | ) | | | | — | | | | | — | |
BNP Paribas | | | | 691,960 | | | | | (691,960 | ) | | | | — | | | | | — | |
| | | | | | | | | | | | | | | | | | | | |
Total | | | $ | 1,102,000 | | | | $ | (1,102,000 | ) | | | $ | — | | | | $ | — | |
| | | | | | | | | | | | | | | | | | | | |
(a)Net amount represents the receivable/(payable) that would be due from/(to) the counterparty in the event of default.
11. Securities Lending
Each Portfolio, along with other funds in the Delaware Investments® Family of Funds, may lend its securities pursuant to a security lending agreement (Lending Agreement) with The Bank of New York Mellon (BNY Mellon). At the time a security is loaned, the borrower must post collateral equal to the required percentage of the market value of the loaned security, including any accrued interest. The required percentage is: (1) 102% with respect to U.S. securities and foreign securities that are denominated and payable in U.S. dollars; and (2) 105% with respect to foreign securities. With respect to each loan, if on any business day the aggregate market value of securities collateral plus cash collateral held is less than the aggregate market value of the securities which are the subject of such loan, the borrower will be notified to provide additional
134
collateral by the end of the following business day which, together with the collateral already held, will be not less than the applicable initial collateral requirements for such security loan. If the aggregate market value of securities collateral and cash collateral held with respect to a security loan exceeds the applicable initial collateral requirement, upon the request of the borrower, BNY Mellon must return enough collateral to the borrower by the end of the following business day to reduce the value of the remaining collateral to the applicable initial collateral requirement for such security loan. As a result of the foregoing, the value of the collateral held with respect to a loaned security on any particular day may be more or less than the value of security on loan.
Cash collateral received is generally invested in the Delaware Investments Collateral Fund No. 1 (Collective Trust) established by BNY Mellon for the purpose of investment on behalf of funds managed by DMC that participate in BNY Mellon’s securities lending program. The Collective Trust may invest in U.S. government securities and high-quality corporate debt, asset-backed and other money market securities, and in repurchase agreements collateralized by such securities, provided that the Collective Trust will generally have a dollar-weighted average portfolio maturity of 60 days or less. Each Portfolio can also accept U.S. government securities and letters of credit (non-cash collateral) in connection with securities loans. In the event of default or bankruptcy by the lending agent, realization and/or retention of the collateral may be subject to legal proceedings. In the event the borrower fails to return loaned securities and the collateral received is insufficient to cover the value of the loaned securities and provided such collateral shortfall is not the result of investment losses, the lending agent has agreed to pay the amount of the shortfall to each Portfolio or, at the discretion of the lending agent, replace the loaned securities. Each Portfolio continues to record dividends or interest, as applicable, on the securities loaned and is subject to changes in value of the securities loaned that may occur during the term of the loan. Each Portfolio has the right under the Lending Agreement to recover the securities from the borrower on demand. With respect to security loans collateralized by non-cash collateral, each Portfolio receives loan premiums paid by the borrower. With respect to security loans collateralized by cash collateral, the earnings from the collateral investments are shared among each Portfolio, the security lending agent and the borrower. Each Portfolio records security lending income net of allocations to the security lending agent and the borrower.
The Collective Trust used for the investment of cash collateral received from borrowers of securities seeks to maintain a net asset value per unit of $1.00, but there can be no assurance that it will always be able to do so. Each Portfolio may incur investment losses as a result of investing securities lending collateral in the Collective Trust. This could occur if an investment in the Collateral Trust defaulted or if it were necessary to liquidate assets in the Collateral Trust to meet returns on outstanding security loans at a time when the Collateral Trust’s net asset value per unit was less than $1.00. Under those circumstances, each Portfolio may not receive an amount from the Collateral Trust that is equal in amount to the collateral each Portfolio would be required to return to the borrower of the securities and each Portfolio would be required to make up for this shortfall.
During the year ended Oct. 31, 2014, none of the Portfolios had securities out on loan.
12. Credit and Market Risk
Some countries in which The International Equity, The Labor Select International Equity, The Emerging Markets, and The Emerging Markets II Portfolios invest require governmental approval for the repatriation of investment income, capital, or the proceeds of sales of securities by foreign investors. In addition, if there is deterioration in a country’s balance of payments or for other reasons, a country may impose temporary restrictions on foreign capital remittances abroad.
The securities exchanges of certain foreign markets are substantially smaller, less liquid and more volatile than the major securities markets in the United States. Consequently, acquisition and disposition of securities by each Portfolio may be inhibited. In addition, a significant portion of the aggregate market value of securities listed on the major securities exchanges in emerging markets is held by a smaller number of investors. This may limit the number of shares available for acquisition or disposition by each Portfolio.
The High-Yield Bond Portfolio invests a portion of its assets in high yield fixed income securities which are securities rated lower than BBB-by S&P and lower than Baa3 by Moody’s, or similarly rated by another nationally recognized statistical rating organization. The Core Plus Fixed Income Portfolio invests a portion of its assets in high yield fixed income securities which are securities rated BB or lower by S&P and Ba or lower by Moody’s, or similarly rated by another nationally recognized statistical rating organization. Investments in these higher yielding securities are generally accompanied by a greater degree of credit risk than higher rated securities. Additionally, lower rated securities may be more susceptible to adverse economic and competitive industry conditions than investment grade securities.
The High-Yield Bond Portfolio and The Core Plus Fixed Income Portfolio invest in bank loans and other securities that may subject them to direct indebtedness risk, the risk that each Portfolio will not receive payment of principal, interest and other amounts due in connection with these investments and will depend primarily on the financial condition of the borrower. Loans that are fully secured offer each Portfolio more
Notes to financial statements
Delaware Pooled® Trust
12. Credit and Market Risk (continued)
protection than unsecured loans in the event of nonpayment of scheduled interest or principal, although there is no assurance that the liquidation of collateral from a secured loan would satisfy the corporate borrower’s obligation, or that the collateral can be liquidated. Some loans or claims may be in default at the time of purchase. Certain of the loans and the other direct indebtedness acquired by each Portfolio may involve revolving credit facilities or other standby financing commitments that obligate each Portfolio to pay additional cash on a certain date or on demand. These commitments may require each Portfolio to increase its investment in a company at a time when each Portfolio might not otherwise decide to do so (including at a time when the company’s financial condition makes it unlikely that such amounts will be repaid). To the extent that each Portfolio is committed to advance additional funds, it will at all times hold and maintain cash or other high grade debt obligations in an amount sufficient to meet such commitments.
As each Portfolio may be required to rely upon another lending institution to collect and pass on to each Portfolio amounts payable with respect to the loan and to enforce each Portfolio’s rights under the loan and other direct indebtedness, an insolvency, bankruptcy, or reorganization of the lending institution may delay or prevent each Portfolio from receiving such amounts. The highly leveraged nature of many loans may make them especially vulnerable to adverse changes in economic or market conditions. Investments in such loans and other direct indebtedness may involve additional risk to each Portfolio.
The Core Plus Fixed Income Portfolio invests in fixed income securities whose value is derived from an underlying pool of mortgages or consumer loans. The value of these securities is sensitive to changes in economic conditions, including delinquencies and/or defaults, and may be adversely affected by shifts in the market’s perception of the issuers and changes in interest rates. Investors receive principal and interest payments as the underlying mortgages and consumer loans are paid back. Some of these securities are collateralized mortgage obligations (CMOs). CMOs are debt securities issued by U.S. government agencies or by financial institutions and other mortgage lenders, which are collateralized by a pool of mortgages held under an indenture. Prepayment of mortgages may shorten the stated maturity of the obligations and can result in a loss of premium, if any has been paid. Certain of these securities may be stripped (securities which provide only the principal or interest feature of the underlying security). The yield to maturity on an interest-only CMO is extremely sensitive not only to changes in prevailing interest rates, but also to the rate of principal payments (including prepayments) on the related underlying mortgage assets. A rapid rate of principal payments may have a material adverse effect on the Portfolio’s yield to maturity. If the underlying mortgage assets experience greater than anticipated prepayments of principal, the Portfolio may fail to fully recoup its initial investment in these securities even if the securities are rated in the highest rating categories.
The High-Yield Bond Portfolio and The Core Plus Fixed Income Portfolio invest in certain obligations that may have liquidity protection designed to ensure that the receipt of payments due on the underlying security is timely. Such protection may be provided through guarantees, insurance policies or letters of credit obtained by the issuer or sponsor through third parties, through various means of structuring the transaction or through a combination of such approaches. Each Portfolio will not pay any additional fees for such credit support, although the existence of credit support may increase the price of a security.
The Select 20 and The Focus Smid-Cap Growth Equity Portfolios invest a significant portion of their assets in small- and mid-sized companies and may be subject to certain risks associated with ownership of securities of such companies. Investments in small- or mid-sized companies may be more volatile than investments in larger companies for a number of reasons, which include more limited financial resources or a dependence on narrow product lines.
Because The Large-Cap Value Equity, The Select 20, The Large-Cap Growth Equity, and The Focus Smid-Cap Growth Equity Portfolios expect to hold a concentrated portfolio of a limited number of securities, the Portfolios’ risk is increased because each investment has a greater effect on the Portfolio’s overall performance.
The International Equity Portfolio may invest up to 10% its net assets in illiquid securities, which may include securities with contractual restrictions on resale, securities exempt from registration under Rule 144A of the Securities Act of 1933, as amended, and other securities, which may not be readily marketable. The Large-Cap Value Equity, The Select 20, The Large-Cap Growth Equity, The Focus Smid-Cap Growth Equity, The High-Yield Bond, The Core Plus Fixed Income, The Labor Select International Equity, The Emerging Markets, and The Emerging Markets II Portfolios may invest up to 15% of each Portfolio’s net assets in such securities. The relative illiquidity of these securities may impair each Portfolio from disposing of them in a timely manner and at a fair price when it is necessary or desirable to do so. While maintaining oversight, the Portfolios’ Board has delegated to DMC the day-to-day functions of determining whether individual securities are liquid for purposes of each Portfolio’s limitation on investments in illiquid securities. Securities eligible for resale pursuant to Rule 144A, which are
136
determined to be liquid, are not subject to the Portfolios’ limit on investments in illiquid securities. Rule 144A and illiquid securities have been identified in the “Schedules of investments.”
13. Contractual Obligations
Each Portfolio enters into contracts in the normal course of business that contain a variety of indemnifications. Each Portfolio’s maximum exposure under these arrangements is unknown. However, the Portfolios have not had prior claims or losses pursuant to these contracts. Management has reviewed each Portfolio’s existing contracts and expects the risk of loss to be remote.
14. Recent Accounting Pronouncements
In June 2014, the FASB issued guidance to improve the financial reporting of reverse repurchase agreements and other similar transactions. The guidance includes expanded disclosure requirements for entities that enter into reverse repurchase agreements and similar transactions accounted for as secured borrowings. The guidance is effective for financial statements with fiscal years beginning on or after Dec. 15, 2014 and interim periods within those fiscal years. Management is evaluating the impact, if any, of this guidance on the Portfolios’ financial statement disclosures.
15. Subsequent Events
Effective Nov. 1, 2014, Delaware Investments Fund Services Company (DIFSC), an affiliate of DMC, provides fund accounting and financial administration oversight services to the Portfolios. Also effective Nov. 1, 2014, DIFSC is the transfer agent and dividend disbursing agent of the Portfolios.
On Nov. 10, 2014, each Portfolio, along with the other Participants, entered into an agreement for a $275,000,000 revolving line of credit to be used as described in Note 7 and to be operated in substantially the same manner as the agreement described in Note 7. The line of credit under the agreement expires on Nov. 9, 2015.
Management has determined that no other material events or transactions occurred subsequent to Oct. 31, 2014 that would require recognition or disclosure in each Portfolio’s financial statements.
Report of independent
registered public accounting firm
To the Board of Trustees of Delaware Pooled® Trust and the Shareholders of The Large-Cap Value Equity Portfolio, The Select 20 Portfolio, The Large-Cap Growth Equity Portfolio, The Focus Smid-Cap Growth Equity Portfolio, The High-Yield Bond Portfolio, The Core Plus Fixed Income Portfolio, The International Equity Portfolio, The Labor Select International Equity Portfolio, The Emerging Markets Portfolio and The Emerging Markets Portfolio II:
In our opinion, the accompanying statements of assets and liabilities, including the schedules of investments, and the related statements of operations and of changes in net assets and the financial highlights present fairly, in all material respects, the financial position of The Large-Cap Value Equity Portfolio, The Select 20 Portfolio, The Large-Cap Growth Equity Portfolio, The Focus Smid-Cap Growth Equity Portfolio, The High-Yield Bond Portfolio, The Core Plus Fixed Income Portfolio, The International Equity Portfolio, The Labor Select International Equity Portfolio, The Emerging Markets Portfolio and The Emerging Markets Portfolio II (ten of the series constituting Delaware Pooled Trust, hereafter collectively referred to as the “Funds”) at October 31, 2014, the results of each of their operations for the year then ended, the changes in each of their net assets for each of the two years in the period then ended and the financial highlights for each of the five years in the period then ended, in conformity with accounting principles generally accepted in the United States of America. These financial statements and financial highlights (hereafter referred to as “financial statements”) are the responsibility of the Funds’ management. Our responsibility is to express an opinion on these financial statements based on our audits. We conducted our audits of these financial statements in accordance with the standards of the Public Company Accounting Oversight Board (United States). Those standards require that we plan and perform the audit to obtain reasonable assurance about whether the financial statements are free of material misstatement. An audit includes examining, on a test basis, evidence supporting the amounts and disclosures in the financial statements, assessing the accounting principles used and significant estimates made by management, and evaluating the overall financial statement presentation. We believe that our audits, which included confirmation of securities at October 31, 2014 by correspondence with the custodian and brokers, and the application of alternative auditing procedures where confirmations of security purchases had not been received, provide a reasonable basis for our opinion.
PricewaterhouseCoopers LLP
Philadelphia, Pennsylvania
December 17, 2014
138
Other Portfolio information
(Unaudited)
Delaware Pooled® Trust
Board Consideration of Investment Advisory Agreements
At a meeting held on Aug. 19–21, 2014 (the “Annual Meeting”), the Board of Trustees (the “Board”), including a majority of disinterested or independent Trustees, approved the renewal of the Investment Management Agreements for each of the series of Delaware Pooled Trust (each, a “Portfolio” and together, the “Portfolios”). In making its decision, the Board considered information furnished at regular quarterly Board meetings, including reports detailing Portfolio performance, investment strategies and expenses, as well as information prepared specifically in connection with the renewal of the investment advisory and sub-advisory contracts. Information furnished specifically in connection with the renewal of the Investment Management Agreements with Delaware Management Company (“DMC”) included materials provided by DMC and its affiliates (“Delaware Investments”) concerning, among other things, the nature, extent and quality of services provided to the Portfolios, the costs of such services to the Portfolios, economies of scale and the financial condition and profitability of Delaware Investments. In addition, in connection with the Annual Meeting, reports were provided to the Trustees in May 2014 and included reports provided by Lipper, Inc., an independent statistical compilation organization (“Lipper”). The Lipper reports compared each Portfolio’s investment performance and expenses with those of other comparable mutual funds. The Independent Trustees reviewed and discussed the Lipper reports with independent legal counsel to the Independent Trustees. The Board requested and received information regarding DMC’s policy with respect to advisory fee levels and its breakpoint philosophy; the structure of portfolio manager compensation; the investment manager’s profitability; comparative client fee information; and any constraints or limitations on the availability of securities for certain investment styles, which had in the past year inhibited, or which were likely in the future to inhibit, DMC’s ability to invest fully in accordance with Portfolio policies.
In considering information relating to the approval of each Portfolio’s advisory agreement, the Independent Trustees received assistance and advice from and met separately with independent legal counsel to the Independent Trustees. Although the Board gave attention to all information furnished, the following discussion identifies, under separate headings, the primary factors taken into account by the Board during its contract renewal considerations.
Nature, Extent and Quality of Service. The Board considered the services provided by Delaware Investments to the Portfolios and their shareholders. In reviewing the nature, extent and quality of services, the Board considered reports furnished to it throughout the year, which covered matters such as the relative performance of the Portfolio, compliance of portfolio managers with the investment policies, strategies and restrictions for the Portfolios, compliance by DMC and Delaware Distributors, L.P. (together, “Management”) personnel with the Code of Ethics adopted throughout the Delaware Investments® Family of Funds complex and adherence to fair value pricing procedures as established by the Board. The Board was pleased with the current staffing of the Portfolios’ investment advisor and the emphasis placed on research in the investment process. The Board recognized DMC’s recent receipt of several industry distinctions. The Board gave favorable consideration to DMC’s efforts to control expenditures while maintaining service levels committed to fund matters. The Board noted that in November 2013 Management negotiated a substantial reduction in fees for fund accounting services provided to the Portfolios. The Board once again noted the benefits provided to Portfolio shareholders through each shareholder’s ability to exchange investments between Portfolios or the institutional class shares of other Delaware Investments funds and to reinvest Portfolio dividends into additional shares of the Portfolio or into additional shares of other Delaware Investments funds. The Board was satisfied with the nature, extent and quality of the overall services provided by Delaware Investments. The Board noted that, on Aug. 20, 2014, it had approved Management’s proposal to liquidate and dissolve The Core Focus Fixed Income Portfolio and The Real Estate Investment Trust Portfolio II, which was expected to take effect in the fourth quarter of 2014.
Nature, Extent and Quality of Service. The Board considered the services to be provided by Mondrian to each of The Emerging Markets Portfolio, The International Equity Portfolio and The Labor Select International Equity Portfolio and their shareholders, as applicable. In reviewing the nature, extent and quality of services, the Board noted that reports will be furnished to it throughout the year at regular Board Meetings covering matters such as relative performance of the Portfolios, compliance of portfolio managers with the investment policies, strategies and restrictions for the Portfolios, the compliance of Mondrian personnel with the Code of Ethics and adherence to fair value pricing procedures as established by the Board. The Board was pleased with the current staffing of Mondrian and the emphasis placed on research in the investment process. The Board was satisfied with the nature, extent and quality of the overall services proposed to be provided by Mondrian.
Investment Performance. The Board placed significant emphasis on the investment performance of the Portfolios in view of the importance of investment performance to shareholders. Although the Board gave appropriate consideration to performance reports and discussions with portfolio managers at Board meetings throughout the year, the Board gave particular weight to the Lipper reports furnished for the 15(c) Meeting. The Lipper reports prepared for each Portfolio showed the investment performance of its shares in comparison to a group of similar funds as selected by Lipper (the “Performance Universe”). A fund with the best performance ranked first, and a fund with the poorest performance ranked last. The highest/best performing 25% of funds in the Performance Universe make up the first quartile; the next 25%, the second quartile; the next 25%, the third quartile; and the poorest/worst performing 25% of funds in the Performance Universe make up the
Other Portfolio information
(Unaudited)
Delaware Pooled® Trust
Board Consideration of Investment Advisory Agreements (continued)
fourth quartile. Comparative annualized performance for the Portfolios was shown for the past one-, three-, five-, and ten-year periods, to the extent applicable, ended March 31, 2014. The Board’s objective is that each Portfolio’s performance for the periods considered be at or above the median of its Performance Universe. The following paragraphs summarize the performance results for the Portfolios and the Board’s view of such performance.
The Core Focus Fixed Income Portfolio – The Performance Universe for the Portfolio consisted of the Portfolio and all retail and institutional core bond funds as selected by Lipper. The Lipper report comparison showed that the Portfolio’s total return for the one-year period was in the fourth quartile of its Performance Universe. The report further showed that the Portfolio’s total return for the three- and five-year periods was in the second quartile of its Performance Universe. The Board observed that the Portfolio’s one-year performance was not in line with the Board’s objective. In evaluating the Portfolio’s performance, the Board considered the Portfolio’s longer-term performance results, which were quite strong, and consequently, the Board was satisfied with performance.
The Core Plus Fixed Income Portfolio – The Performance Universe for the Portfolio consisted of the Portfolio and all retail and institutional core plus bond funds as selected by Lipper. The Lipper report comparison showed that the Portfolio’s total return for the one-year period was in the third quartile of its Performance Universe. The report further showed that the Portfolio’s total return for the three-year period was in the second quartile of its Performance Universe and the Portfolio’s total return for the five- and ten-year periods was in the first quartile of its Performance Universe. The Board was satisfied with performance.
The Emerging Markets Portfolio – The Performance Universe for the Portfolio consisted of the Portfolio and all retail and institutional emerging markets funds as selected by Lipper. The Lipper report comparison showed that the Portfolio’s total return for the one-year period was in the fourth quartile of its Performance Universe. The report further showed that the Portfolio’s total return for the three- and ten-year periods was in the first quartile of its Performance Universe and the Portfolio’s total return for the five-year period was in the second quartile of its Performance Universe. The Board observed that the Portfolio’s one-year performance was not in line with the Board’s objective. In evaluating the Portfolio’s performance, the Board considered the Portfolio’s longer-term performance results, which were quite strong, and consequently, the Board was satisfied with performance.
The Emerging Markets Portfolio II – The Performance Universe for the Portfolio consisted of the Portfolio and all retail and institutional emerging markets funds as selected by Lipper. The Lipper report comparison showed that the Portfolio’s total return for the one-year period was in the first quartile of its Performance Universe. The report further showed that the Portfolio’s total return for the three-year period was in the second quartile of its Performance Universe. The Board was satisfied with performance.
The Focus Smid-Cap Growth Equity Portfolio – The Performance Universe for the Portfolio consisted of the Portfolio and all retail and institutional mid-cap growth funds as selected by Lipper. The Lipper report comparison showed that the Portfolio’s total return for the one-year period was in the third quartile of its Performance Universe. The report further showed that the Portfolio’s total return for the three-year period was in the second quartile of its Performance Universe and the Portfolio’s total return for the five- and ten-year periods was in the first quartile of its Performance Universe. The Board was satisfied with performance.
The High-Yield Bond Portfolio – The Performance Universe for the Portfolio consisted of the Portfolio and all retail and institutional high yield funds as selected by Lipper. The Lipper report comparison showed that the Portfolio’s total return for the one-, three-, five-, and ten-year periods was in the first quartile of its Performance Universe. The Board was satisfied with performance.
The International Equity Portfolio – The Performance Universe for the Portfolio consisted of the Portfolio and all retail and institutional international large cap value funds as selected by Lipper. The Lipper report comparison showed that the Portfolio’s total return for the one-, three-, and ten-year periods was in the first quartile of its Performance Universe. The report further showed that the Portfolio’s total return for five-year period was in the second quartile of its Performance Universe. The Board was satisfied with performance.
The Labor Select International Equity Portfolio – The Performance Universe for the Portfolio consisted of the Portfolio and all retail and institutional international large cap value funds as selected by Lipper. The Lipper report comparison showed that the Portfolio’s total return for the one- and three-year periods was in the first quartile of its Performance Universe. The report further showed that the Portfolio’s total return for the five- and ten-year periods was in the third quartile and second quartile, respectively, of its Performance Universe. The Board was satisfied with performance.
The Large-Cap Growth Equity Portfolio – The Performance Universe for the Portfolio consisted of the Portfolio and all retail and institutional large cap growth funds as selected by Lipper. The Lipper report comparison showed that the Portfolio’s total return for the one-year period was
140
in the third quartile of its Performance Universe. The report further showed that the Portfolio’s total return for the three- and five-year periods was in the first quartile of its Performance Universe. The Board observed that the Portfolio’s one-year performance was not in line with the Board’s objective. In evaluating the Portfolio’s performance, the Board considered the Portfolio’s longer-term performance results, which were quite strong, and consequently, the Board was satisfied with performance.
The Large-Cap Value Equity Portfolio – The Performance Universe for the Portfolio consisted of the Portfolio and all retail and institutional large-cap value funds as selected by Lipper. The Lipper report comparison showed that the Portfolio’s total return for the one-year period was in the second quartile of its Performance Universe. The report further showed that the Portfolio’s total return for the three-, five-, and ten-year periods was in the first quartile of its Performance Universe. The Board was satisfied with performance.
The Real Estate Investment Trust Portfolio II – The Performance Universe for the Portfolio consisted of the Portfolio and all retail and institutional real estate funds as selected by Lipper. The Lipper report comparison showed that the Portfolio’s total return for the one-year period was in the second quartile of its Performance Universe. The report further showed that the Portfolio’s total return for the three-year period was in the first quartile and the Portfolio’s total return for the five- and ten-year periods was in the third quartile of its Performance Universe. The Board was satisfied with performance.
The Select 20 Portfolio – The Performance Universe for the Portfolio consisted of the Portfolio and all retail and institutional multi-cap growth funds as selected by Lipper. The Lipper report comparison showed that the Portfolio’s total return for the one-year period was in the fourth quartile of its Performance Universe. The report further showed that the Portfolio’s total return for the three-, five-, and ten-year periods was in the first quartile, second quartile and third quartile, respectively, of its Performance Universe. The Board observed that the Portfolio’s one-year performance was not in line with the Board’s objective. In evaluating the Portfolio’s performance, the Board considered the Portfolio’s longer-term performance results. The Board was satisfied with performance.
Comparative Expenses. The Board considered expense comparison data for the Delaware Investments® Family of Funds. Management provided the Board with information on pricing levels and fee structures for the Portfolios as of its most recent fiscal year end. The Board also focused on the comparative analysis of effective management fees and total expense ratios of each Portfolio versus effective management fees and expense ratios of a group of similar funds as selected by Lipper (the “Expense Group”). In reviewing comparative costs, each Portfolio’s contractual management fee and the actual management fee incurred by the Portfolio were compared with the contractual management fees (assuming all funds in the Expense Group were similar in size to the Portfolio) and actual management fees (as reported by each fund) within the Expense Group, taking into account any applicable breakpoints and fee waivers. Each Portfolio’s total expenses were also compared with those of its Expense Group. The Board considered fees paid to Delaware Investments for non-management services. The Board’s objective is to limit each Portfolio’s total expense ratio to be competitive with that of the Expense Group. The following paragraphs summarize the expense results for the Portfolios and the Board’s view of such expenses.
The Core Focus Fixed Income Portfolio – The expense comparisons for the Portfolio showed that its contractual management fee and total expenses were both in the quartile with the lowest expenses of its Expense Group. The Board was extremely satisfied with the management fee and total expenses of the Portfolio in comparison to those of its Expense Group.
The Core Plus Fixed Income Portfolio – The expense comparisons for the Portfolio showed that its actual management fee and total expenses were in the quartile with the lowest expenses of its Expense Group. The Board was satisfied with the management fee and total expenses of the Portfolio in comparison to those of its Expense Group.
The Emerging Markets Portfolio – The expense comparisons for the Portfolio showed that its actual management fee was in the quartile with the second lowest expenses of its Expense Group and its total expenses were in the quartile with the lowest expenses of its Expense Group. The Board was satisfied with the management fee and total expenses of the Portfolio in comparison to those of its Expense Group.
The Emerging Markets Portfolio II – The expense comparisons for the Portfolio showed that its actual management fee was in the quartile with the second highest expenses of its Expense Group and its total expenses were in the quartile with the lowest expenses of its Expense Group. The Board was satisfied with the total expenses of the Portfolio in comparison to those of its Expense Group.
The Focus Smid-Cap Growth Equity Portfolio – The expense comparisons for the Portfolio showed that its actual management fee was in the quartile with the second highest expenses of its Expense Group and its total expenses were in the quartile with the lowest expenses of its Expense Group. The Board was satisfied with the total expenses of the Portfolio in comparison to those of its Expense Group.
Other Portfolio information
(Unaudited)
Delaware Pooled® Trust
Board Consideration of Investment Advisory Agreements (continued)
The High-Yield Bond Portfolio – The expense comparisons for the Portfolio showed that its actual management fee was in the quartile with the second lowest expenses of its Expense Group and its total expenses were in the quartile with the lowest expenses of its Expense Group. The Board was satisfied with the management fee and total expenses of the Portfolio in comparison to those of its Expense Group.
The International Equity Portfolio – The expense comparisons for the Portfolio showed that its actual management fee was in the quartile with the second lowest expenses of its Expense Group and its total expenses were in the quartile with the lowest expenses of its Expense Group. The Board was satisfied with the management fee and total expenses of the Portfolio in comparison to those of its Expense Group.
The Labor Select International Equity Portfolio – The expense comparisons for the Portfolio showed that its actual management fee was in the quartile with the second lowest expenses of its Expense Group and its total expenses were in the quartile with the lowest expenses of its Expense Group. The Board was satisfied with the management fee and total expenses of the Portfolio in comparison to those of its Expense Group.
The Large-Cap Growth Equity Portfolio – The expense comparisons for the Portfolio showed that its actual management fee and total expenses were both in the quartile with the lowest expenses of its Expense Group. The Board was satisfied with the management fee and total expenses of the Portfolio in comparison to those of its Expense Group.
The Large-Cap Value Equity Portfolio – The expense comparisons for the Portfolio showed that its actual management fee and total expenses were both in the quartile with the lowest expenses of its Expense Group. The Board was satisfied with the management fee and total expenses of the Portfolio in comparison to those of its Expense Group.
The Real Estate Investment Trust Portfolio II – The expense comparisons for the Portfolio showed that its contractual management fee and total expenses were in the quartile with the lowest expenses of the Expense Group. The Board was extremely satisfied with the management fee and total expenses of the Portfolio in comparison to those of its Expense Group.
The Select 20 Portfolio – The expense comparisons for the Portfolio showed that its actual management fee was in the quartile with the second highest expenses of its Expense Group and its total expenses were in the quartile with the second lowest expense of its Expense Group. The Board was satisfied with the total expenses of the Portfolio in comparison to those of its Expense Group.
Management Profitability. The Board considered the level of profits, if any, realized by Delaware Investments in connection with the operation of the Portfolios. In this respect, the Board reviewed the Investment Management Profitability Analysis that addressed the overall profitability of Delaware Investments’ business in providing management and other services to each of the individual funds and the Delaware Investments Family of Funds as a whole. Specific attention was given to the methodology followed in allocating costs for the purpose of determining profitability. Management stated that the level of profits of Delaware Investments, to a certain extent, reflects recent operational cost savings and efficiencies initiated by Delaware Investments. The Board considered Delaware Investments’ efforts to improve services provided to fund shareholders and to meet additional regulatory and compliance requirements resulting from recent industry-wide Securities and Exchange Commission initiatives. The Board also considered the extent to which Delaware Investments might derive ancillary benefits from fund operations, including the potential for procuring additional business as a result of the prestige and visibility associated with its role as service provider to the Delaware Investments Family of Funds and the benefits from allocation of fund brokerage to improve trading efficiencies. The Board found that the management fees were reasonable in light of the services rendered and the profitability of Delaware Investments.
Management Profitability. Trustees were also given available information on profits being realized by Mondrian in relation to the services being provided to The Emerging Markets Portfolio, The International Equity Portfolio and The Labor Select International Equity Portfolio or in relation to Mondrian’s overall investment advisory business, but believed such information to be of limited relevance since the sub-advisory fees are paid by DMC out of its management fee and changes in the level of sub-advisory fees do not impact Portfolio expenses. The Board was also provided information on potential fall-out benefits derived or to be derived by Mondrian in connection with its relationship to the Portfolios, such as reputational enhancement, soft dollar arrangements or commissions paid to affiliated broker-dealers.
Economies of Scale. The Trustees considered whether economies of scale are realized by Delaware Investments as each Portfolio’s assets increase and the extent to which any economies of scale are reflected in the level of management fees charged. The Trustees reviewed the standardized advisory fee pricing and structure approved by the Board and shareholders which does not include breakpoints. Breakpoints in the advisory fee occur when the advisory fee rate is reduced on assets in excess of specified levels. Breakpoints result in a lower advisory fee than would otherwise be the case on all assets when the asset levels specified are exceeded. Benchmarking analysis indicated that less than one quarter of competing funds in the institutional market employ breakpoints. Management believed, and the Board agreed, that the Portfolios
142
were priced with relatively low management fees to reflect potential economies of scale at all asset levels. The Board noted that the fee under the management contracts for The Core Plus Fixed Income Portfolio did not fall within the standard structure. With respect to The Core Plus Fixed Income Portfolio, Management explained that the portfolio management fee was priced slightly lower than the standard fee rate for special domestic funds.
Board consideration of The Large-Cap Growth Equity Portfolio, The Focus Smid-Cap Growth Equity Portfolio, and The Select 20 Portfolio sub-advisory agreement with Jackson Square Partners, LLC
At a meeting held on Feb. 18–20, 2014 (Meeting), the Board of Trustees (Board), including a majority of disinterested or Independent Trustees, approved a Sub-Advisory Agreement for The Large-Cap Growth Equity Portfolio, The Focus Smid-Cap Growth Equity Portfolio, and The Select 20 Portfolio (each a Portfolio and collectively the Portfolios). In making its decision, the Board considered information prepared specifically in connection with the approval of the Sub-advisory Agreement. Information furnished specifically in connection with the approval of the Sub-advisory Agreement with Jackson Square Partners, LLC (JSP) included materials provided by JSP concerning, among other things, the nature, extent and quality of service provided to the Portfolios, the costs of such services to the Portfolios, economies of scale and the financial condition and profitability of JSP. In addition, the Board considered reports prepared by Lipper, Inc., an independent statistical compilation organization (“Lipper”), which compared the Portfolios’ investment performance and expenses with those of other comparable mutual funds.
In considering information relating to the approval of the Sub-advisory Agreement, the Independent Trustees received assistance and advice from and met separately with independent legal counsel to the Independent Trustees. Although the Board gave attention to all information furnished, the following discussion identifies, under separate headings, the primary factors taken into account by the Board during its contract approval considerations.
Nature, Extent and Quality of Service. The Board considered the continuity of investment management to be provided to the Portfolios and its shareholders. Management provided certain information to the Board regarding the transition of the current portfolio management team (Focus Growth Team) to JSP (Transaction). Following the close of the Transaction, the Focus Growth Team would continue to provide portfolio management services to the Portfolios as owners or employees of JSP. In reviewing the nature, extent, and quality of services, the Board considered that the same personnel will be providing portfolio management services to the Portfolios following the completion of the Transaction, and therefore, considered the many reports furnished to them throughout 2012 and 2013 at regular Board meetings covering matters such as the relative performance of the Portfolios, and the compliance of portfolio managers with the investment policies, strategies, and restrictions for the Portfolios. The Board was pleased with the emphasis placed on research and risk management in the investment process. The Board concluded that it was satisfied with the nature, extent, and quality of the overall services to be provided by JSP.
In addition, the Board considered that in connection with the Transaction, Delaware Investments Advisers Partner, Inc. (DIAP) and JSP would enter into a transaction services agreement. Under the terms of this agreement, DIAP and certain of its affiliates would provide compliance and other administrative support to JSP for an 18-month period following the close of the Transaction.
Investment Performance. The Board considered the overall investment performance of the Focus Growth Team and the Portfolios. The Board placed significant emphasis on the investment performance of the Portfolios in view of its importance to shareholders. The Board reviewed reports prepared by Lipper Inc. (“Lipper”) for each Portfolio that showed the Portfolio’s investment performance as of March 31, 2013 in comparison to a group of funds selected by Lipper as being similar to the Portfolio (the “Performance Universe”). A fund with the best performance ranked first, and a fund with the poorest performance ranked last. The highest/best performing 25% of funds in the Performance Universe make up the first quartile; the next 25%, the second quartile; the next 25%, the third quartile; and the poorest/worst performing 25% of funds in the Performance Universe make up the fourth quartile. Annualized investment performance for each Portfolio was shown for the past one-, three-, five-, and ten-year periods, as applicable, compared to that of the Performance Universe. The Board’s objective was that each Portfolio’s performance for the periods considered be at or above the median of its Performance Universe. In addition, the Board reviewed more recent Lipper data that had been provided at the quarterly Board meetings held since March 31, 2013. With respect to each Portfolio’s performance as of Dec. 31, 2013, they noted:
The Large-Cap Growth Equity Portfolio – The Performance Universe for the Portfolio consisted of the Portfolio and all retail and institutional large-cap growth funds as selected by Lipper. The Lipper report comparison showed that the Portfolio’s total return for the one-year period was in the second quartile of its Performance Universe. The report further showed that the Portfolio’s total return for the three- and five-year periods was in the first quartile of its Performance Universe.
Other Portfolio information
(Unaudited)
Delaware Pooled® Trust
Board consideration of The Large-Cap Growth Equity Portfolio, The Focus Smid-Cap Growth Equity Portfolio, and The Select 20 Portfolio sub-advisory agreement with Jackson Square Partners, LLC (continued)
The Focus Smid-Cap Growth Equity Portfolio – The Performance Universe for the Portfolio consisted of the Portfolio and all retail and institutional mid-cap growth funds as selected by Lipper. The Lipper report comparison showed that the Portfolio’s total return for the one-, three-, five-, and ten-year periods was in the first quartile of its Performance Universe.
The Select 20 Portfolio – The Performance Universe for the Portfolio consisted of the Portfolio and all retail and institutional multi-cap growth funds as selected by Lipper. The Lipper report comparison showed that the Portfolio’s total return for the one-year period was in the fourth quartile of its Performance Universe. The report further showed that the Portfolio’s total return for the three- and five-year periods was in the first quartile of its Performance Universe, and the Portfolio’s total return for the ten-year period was in the third quartile of its Performance Universe.
The Board noted that they were satisfied with the overall performance of the Portfolios. Moreover, the Board concluded that the Transaction was unlikely to have any effect on JSP’s management of the Portfolios or their investment performance because the current portfolio management personnel will continue to provide portfolio management services to the Portfolios.
Comparative Expenses. The Board also evaluated expense comparison data for the Portfolios. JSP provided the Board with information on pricing levels and fee structures for the Portfolios and comparative funds. The Board noted that JSP’s fees will be paid by the Portfolios’ advisor, Delaware Management Company (DMC), not by the Portfolios. They also focused on the comparative analysis of the effective management fees (including sub-advisory fees) and total expense ratios of each Portfolio versus the effective management fees (including sub-advisory fees) and expense ratios of a group of funds selected by Lipper as being similar to the Portfolio (Expense Group). In reviewing comparative costs, each Portfolio’s contractual management fee (including sub-advisory fees) and the actual management fee incurred by the Portfolio were compared with the contractual management fees (assuming all funds in the Expense Group were similar in size to the applicable Portfolio) and actual management fees (as reported by each fund) of other funds within the Expense Group. Each Portfolio’s total expenses were also compared with those of its Expense Group. The Board’s objective was for each Portfolio’s total expense ratio to be competitive with that of the Expense Group. They concluded that, because the sub-advisory fee rate paid by DMC on behalf of the Portfolios would not change, the Portfolios’ expenses were satisfactory.
Management Profitability. Because JSP did not have historical operations, it provided a pro forma profitability analysis to the Board, and the Board considered the level of profits expected to be realized by JSP as part of their annual contract evaluation. The Board discussed the transition services to be provided to JSP by Delaware Investments and the cost of providing those services. The Board also considered the extent to which JSP might derive ancillary benefits from the Portfolios’ operations, including the potential for procuring additional business as a result of the prestige and visibility associated with its role as Sub-advisor to the Portfolios and the benefits from allocation of the Portfolios’ brokerage to improve trading efficiencies. The Board concluded that the sub-advisory fee was reasonable in light of the services to be rendered.
Economies of Scale. The Board considered whether economies of scale would be realized by JSP and the extent to which any economies of scale would be reflected in the level of sub-advisory fees. The Board considered the fact that several of the funds to be managed by JSP had already reached breakpoints in their management fees.
Fall-out Benefits. The Board considered that JSP may derive reputational, strategic and other benefits from its association with the Portfolios, and evaluated the extent to which JSP might derive ancillary benefits from Portfolio operations, including the potential for procuring additional business as a result of its role as a service provider to the Portfolios and the benefits from allocation of Portfolio brokerage to improve trading efficiencies. However, the Board concluded that (i) such benefits did not impose a cost or burden on the Portfolios or their shareholders, and (ii) such benefits would probably have an indirectly beneficial effect on the Portfolios and their shareholders because of the added importance that JSP might attach to the Portfolios as a result of the fall-out benefits that the Portfolios conveyed.
144
Tax Information
The information set forth below is for each Portfolio’s fiscal year as required by federal laws. Shareholders, however, must report distributions on a calendar year basis for income tax purposes, which may include distributions for portions of two fiscal years of a fund. Accordingly, the information needed by shareholders for income tax purposes will be sent to them in January of each year. Please consult your tax advisor for proper treatment of this information.
All disclosures are based on financial information available as of the date of this annual report and, accordingly are subject to change. For any and all items requiring reporting, it is the intention of each Portfolio to report the maximum amount permitted under the Internal Revenue Code and the regulations thereunder.
For the fiscal year ended Oct. 31, 2014, each Portfolio reports distributions paid during the year as follows:
| | | | | | | | | | | | | | | | | | | | |
| | | (A) | | | | | | |
| | | Long-Term | | (B) | | | | |
| | | Capital Gain | | Ordinary Income | | Total | | (C) |
| | | Distributions | | Distributions* | | Distributions | | Qualifying |
| | | Tax Basis | | (Tax Basis) | | (Tax Basis) | | Dividends1 |
The Large-Cap Value Equity Portfolio | | | | 26.71 | % | | | | 73.29 | % | | | | 100.00 | % | | | | 100.00 | % |
The Select 20 Portfolio | | | | 96.05 | % | | | | 3.95 | % | | | | 100.00 | % | | | | 85.08 | % |
The Large-Cap Growth Equity Portfolio | | | | — | | | | | 100.00 | % | | | | 100.00 | % | | | | 100.00 | % |
The Focus Smid-Cap Growth Equity Portfolio | | | | — | | | | | 100.00 | % | | | | 100.00 | % | | | | 16.67 | % |
The High-Yield Bond Portfolio | | | | — | | | | | 100.00 | % | | | | 100.00 | % | | | | 1.65 | % |
The Core Plus Fixed Income Portfolio | | | | — | | | | | 100.00 | % | | | | 100.00 | % | | | | 0.43 | % |
The International Equity Portfolio | | | | — | | | | | 100.00 | % | | | | 100.00 | % | | | | 0.01 | % |
The Labor Select International Equity Portfolio | | | | — | | | | | 100.00 | % | | | | 100.00 | % | | | | — | |
The Emerging Markets Portfolio | | | | 57.42 | % | | | | 42.58 | % | | | | 100.00 | % | | | | 2.26 | % |
The Emerging Markets Portfolio II | | | | 28.68 | % | | | | 71.32 | % | | | | 100.00 | % | | | | 3.86 | % |
(A) and (B) are based on a percentage of each Portfolio’s total distributions.
(C) is based on a percentage of each Portfolio’s ordinary income distributions.
1Qualifying dividends represent dividends which qualify for the corporate dividends received deduction.
*For the fiscal year ended Oct. 31, 2014, certain dividends paid by the Portfolios may be subject to a maximum tax rate of 15%, as provided for by the Jobs and Growth Tax Relief Reconciliation Act of 2003 and as extended by the Tax Relief, Unemployment Insurance Reauthorization and Jobs Creation Act of 2010, and made permanent by the American Taxpayer Relief Act of 2012. The Portfolios intend to report the following percentages to be taxed at a maximum rate of 15%. Complete information will be computed and reported in conjunction with your 2014 Form 1099-DIV, as applicable.
| | | | | |
| | | Maximum amount to be |
| | | Taxed at a maximum rate of 15% |
The Large-Cap Value Equity Portfolio | | | | 100.00 | % |
The Select 20 Portfolio | | | | 85.07 | % |
The Large-Cap Growth Equity Portfolio | | | | 100.00 | % |
The Focus Smid-Cap Growth Equity Portfolio | | | | 14.39 | % |
The High-Yield Bond Portfolio | | | | 1.69 | % |
The Core Plus Fixed Income Portfolio | | | | 0.73 | % |
The International Equity Portfolio | | | | 98.82 | % |
The Labor Select International Equity Portfolio | | | | 97.81 | % |
The Emerging Markets Portfolio | | | | 99.58 | % |
The Emerging Markets Portfolio II | | | | 99.98 | % |
The International Equity Portfolio, The Labor Select International Equity Portfolio, The Emerging Markets Portfolio and The Emerging Markets Portfolio II intend to pass through foreign tax credits in the maximum amount of $819,350, $674,618, $652,950, and $55,159, respectively. The gross foreign source income earned during the fiscal year 2014 was $21,180,986, $20,988,248, $11,219,624, and $850,841, respectively. Complete information will be computed and reported in conjunction with your 2014 Form 1099-DIV.
Other Portfolio information
(Unaudited)
Delaware Pooled® Trust
For the fiscal year ended Oct. 31, 2014, certain interest income paid by the Portfolios, determined to be Qualified Interest Income and Qualified Short-Term Capital Gain may be subject to relief from U.S. withholding for foreign shareholders, as provided by the American Jobs Creation Act of 2004 and as extended by Tax Relief Unemployment Insurance Reauthorization and Job Creations Act of 2010, and by the American Taxpayer Relief Act of 2012. For the fiscal year ended Oct. 31, 2014, the following Portfolios have reported maximum distributions of Qualified Interest Income and Qualified Short-Term Capital Gain as follows:
| | | | | | | | | | |
| | | | | Qualified |
| | | Qualified Interest Income | | Short-Term Capital Gain |
The Large-Cap Value Equity Portfolio | | $926 | | $ 160,363 |
The Select 20 Portfolio | | $154 | | $2,118,376 |
The Large-Cap Growth Equity Portfolio | | $818 | | $ — |
146
Fund management
Kristen E. Bartholdson
Vice President, Senior Portfolio Manager — The Large-Cap Value Equity Portfolio
Kristen E. Bartholdson is a senior portfolio manager for the firm’s Large-Cap Value team. Prior to joining the firm in 2006 as an associate portfolio manager, she worked at Susquehanna International Group from 2004 to 2006, where she was an equity research salesperson. From 2000 to 2004 she worked in equity research at Credit Suisse, most recently as an associate analyst in investment strategy. Bartholdson earned her bachelor’s degree in economics from Princeton University.
Nigel Bliss
Senior Portfolio Manager – Mondrian Investment Partners Ltd. — The International Equity Portfolio and
The Labor Select International Equity Portfolio
Mr. Bliss has a BA (Hons) Degree in Geography from the University of Manchester. He holds the ASIP designation and is a member of the CFA Institute and the CFA Society of the UK. He commenced his career at Cazenove & Co. and moved to join Mondrian in 1995. Mr. Bliss is a senior portfolio manager in the Non-US Equity Team. He has had significant experience analyzing securities in the Pacific Basin region and in the global materials, utilities, property, and industrials sectors. In recent years Mr. Bliss has taken responsibility for leading coverage of securities listed in the UK and Scandinavian markets whilst still maintaining his sector specialization. Mr. Bliss is a member of Mondrian’s Non-US Equity Strategy Committee.
Christopher J. Bonavico, CFA
Portfolio Manager, Equity Analyst – Jackson Square Partners, LLC — The Focus Smid-Cap Growth Equity Portfolio, The Large-Cap Growth Equity Portfolio, and The Select 20 Portfolio
Christopher J. Bonavico became a member of Jackson Square Partners (JSP), at its inception in May 2014 as a portfolio manager and equity analyst. Jackson Square Partners manages large-cap growth, smid-cap growth, all-cap growth, and global growth portfolios. Prior to joining JSP, he was a portfolio manager and equity analyst on the Delaware Investments Focus Growth Equity team from April 2005 to April 2014. The Focus Growth Equity team managed large-cap growth, smid-cap growth, all-cap growth, and global growth portfolios. Prior to Delaware Investments, he was a principal and portfolio manager at Transamerica Investment Management, where he managed sub-advised funds and institutional separate accounts. Before joining Transamerica in 1993, he was a research analyst for Salomon Brothers. Bonavico received his bachelor’s degree in economics from the University of Delaware.
Kenneth F. Broad, CFA
Portfolio Manager, Equity Analyst – Jackson Square Partners, LLC — The Focus Smid-Cap Growth Equity Portfolio and The Select 20 Portfolio
Kenneth F. Broad became a member of Jackson Square Partners (JSP), at its inception in May 2014 as a portfolio manager and equity analyst. Jackson Square Partners manages large-cap growth, smid-cap growth, all-cap growth, and global growth portfolios. Prior to joining JSP, he was a portfolio manager and equity analyst on the Delaware Investments Focus Growth Equity team from April 2005 to April 2014. The Focus Growth Equity team managed large-cap growth, smid-cap growth, all-cap growth, and global growth portfolios. Prior to Delaware Investments, he was a principal and portfolio manager at Transamerica Investment Management, where he managed sub-advised funds and institutional separate accounts. Before joining Transamerica in 2000, he was a portfolio manager with The Franklin Templeton Group and was a consultant in the business valuation and merger and acquisition group at KPMG Peat Marwick. He received an MBA from the University of California at Los Angeles and his bachelor’s degree in economics from Colgate University.
Adam H. Brown, CFA
Vice President, Portfolio Manager — The High-Yield Bond Portfolio
Adam H. Brown is a portfolio manager on the firm’s taxable fixed income team. He manages the bank loan portfolios and is a co-portfolio manager for the high yield portfolios. Brown joined Delaware Investments in April 2011 as part of the firm’s integration of Macquarie Four Corners Capital Management, where he worked since 2002. At Four Corners, he was a co-portfolio manager on four collateralized loan obligations (CLOs) and a senior research analyst supporting noninvestment grade portfolios. Before that, Brown was with the predecessor of Wells Fargo Securities, where he worked in the leveraged finance group arranging senior secured bank loans and high yield bond financings for financial sponsors and corporate issuers. He earned a bachelor’s degree in accounting from the University of Florida and an MBA from the A.B. Freeman School of Business at Tulane University.
Other Portfolio information
(Unaudited)
Delaware Pooled® Trust
Liu-Er Chen, CFA
Senior Vice President, Chief Investment Officer – Emerging Markets and Healthcare — The Emerging Markets Portfolio II
Liu-Er Chen heads the firm’s global Emerging Markets team, and he is also the portfolio manager for Delaware Healthcare Fund, which launched in September 2007. Prior to joining Delaware Investments in September 2006 in his current position, he spent nearly 11 years at Evergreen Investment Management Company, where he most recently worked as managing director and senior portfolio manager. He co-managed the Evergreen Emerging Markets Growth Fund from 1999 to 2001, and became the Fund’s sole manager in 2001. He was also the sole manager of the Evergreen Health Care Fund since its inception in 1999. Chen began his career at Evergreen in 1995 as an analyst covering Asian and global healthcare stocks, before being promoted to portfolio manager in 1998. Prior to his career in asset management, Chen worked for three years in sales, marketing, and business development for major American and European pharmaceutical and medical device companies. He is licensed to practice medicine in China and has experience in medical research at both the Chinese Academy of Sciences and Cornell Medical School. He holds an MBA with a concentration in management from Columbia Business School.
Ginny Chong, CFA
Senior Portfolio Manager – Mondrian Investment Partners Ltd. — The Emerging Markets Portfolio
Prior to joining Mondrian in 2000, Ms. Chong worked for PricewaterhouseCoopers in Vancouver, within the Corporate Finance and Investment Banking Division where she qualified as a Canadian Chartered Accountant. Ms. Chong has a degree in Commerce from the University of British Columbia, Vancouver. Ms. Chong is presently a senior portfolio manager within the Emerging Markets Team. Ms. Chong is a CFA Charterholder and is a member of the CFA Institute and the CFA Society of the UK.
Craig C. Dembek, CFA
Senior Vice President, Co-Head of Credit Research, Senior Research Analyst — The Core Plus Fixed Income Portfolio and The High-Yield Bond Portfolio
Craig C. Dembek is co-head of credit research and senior research analyst on the firm’s taxable fixed income team with primary responsibility for banks, brokers, insurance companies, and real estate investment trusts (REITs), as well as oversight for other sectors. He rejoined the firm in March 2007. During his previous time at Delaware Investments, from April 1999 to January 2001, he was a senior investment grade credit analyst. Most recently, he spent four years at Chartwell Investment Partners as a senior fixed income analyst and Turner Investment Partners as a senior fixed income analyst and portfolio manager. Dembek also spent two years at Stein, Roe & Farnham as a senior fixed income analyst. Earlier in his career, he worked for two years as a lead bank analyst at the Federal Reserve Bank of Boston. Dembek earned a bachelor’s degree in finance from Michigan State University and an MBA with a concentration in finance from the University of Vermont.
Elizabeth A. Desmond
Director, Chief Investment Officer – International Equities – Mondrian Investment Partners Ltd. — The International Equity Portfolio and The Labor Select International Equity Portfolio
Ms. Desmond is a graduate of Wellesley College and the Masters Program in East Asian Studies at Stanford University. After working for the Japanese government for two years, she began her investment career as a Pacific Basin investment manager with Shearson Lehman Global Asset Management. Prior to joining Mondrian in 1991, she was a Pacific Basin Equity Analyst and senior portfolio manager at Hill Samuel Investment Advisers Ltd. Ms. Desmond is a CFA Charterholder, and a member of the CFA Institute and the CFA Society of the UK.
Roger A. Early, CPA, CFA
Managing Director, Co-Head of Fixed Income Investments, Senior Vice President, Co-Chief Investment Officer – Total Return Fixed Income Strategy — The Core Plus Fixed Income Portfolio
Roger A. Early rejoined Delaware Investments in March 2007 as a member of the firm’s taxable fixed income portfolio management team, with primary responsibility for portfolio construction and strategic asset allocation. He became co-head of the team in December 2014. During his previous time at the firm, from 1994 to 2001, he was a senior portfolio manager in the same area, and he left Delaware Investments as head of its U.S. investment grade fixed income group. In recent years, Early was a senior portfolio manager at Chartwell Investment Partners and Rittenhouse Financial and was the chief investment officer for fixed income at Turner Investments. Prior to joining Delaware Investments in 1994, he worked for more than 10 years at Federated Investors where he managed more than $25 billion in mutual fund and institutional portfolios in the short-term and investment grade markets. He left the firm as head of institutional fixed income management. Earlier in his career, he held management positions with the Federal Reserve Bank, PNC Financial, Touche Ross, and Rockwell International. Early earned his
148
bachelor’s degree in economics from The Wharton School of the University of Pennsylvania and an MBA with concentrations in finance and accounting from the University of Pittsburgh. He is a member of the CFA Society of Philadelphia.
Christopher M. Ericksen, CFA
Portfolio Manager, Equity Analyst – Jackson Square Partners, LLC — The Large-Cap Growth Equity Portfolio
Christopher M. Ericksen became a member of Jackson Square Partners (JSP), at its inception in May 2014 as a portfolio manager and equity analyst. Jackson Square Partners manages large-cap growth, smid-cap growth, all-cap growth, and global growth portfolios. Prior to joining JSP, he was a portfolio manager and equity analyst on the Delaware Investments Focus Growth Equity team from April 2005 to April 2014. The Focus Growth team managed large-cap growth, smid-cap growth, all-cap growth, and global growth portfolios. Prior to joining Delaware Investments, he was a portfolio manager at Transamerica Investment Management, where he also managed institutional separate accounts. Before joining Transamerica in 2004, he was a vice president at Goldman Sachs. During his 10 years there, he worked in investment banking as well as investment management. Ericksen received his bachelor’s degree from Carnegie Mellon University, with majors in industrial management, economics, and political science.
Paul Grillo, CFA
Senior Vice President, Co-Chief Investment Officer – Total Return Fixed Income Strategy — The Core Plus Focus Fixed Income Portfolio
Paul Grillo is a member of the firm’s taxable fixed income portfolio management team with primary responsibility for portfolio construction and strategic asset allocation. He is also a member of the firm’s asset allocation committee, which is responsible for building and managing multi-asset class portfolios. He joined Delaware Investments in 1992 as a mortgage-backed and asset-backed securities analyst, assuming portfolio management responsibilities in the mid-1990s. Grillo serves as lead portfolio manager for the firm’s Diversified Income products and has been influential in the growth and distribution of the firm’s multisector strategies. Prior to joining Delaware Investments, Grillo was a mortgage strategist and trader at Dreyfus Corporation. He also worked as a mortgage strategist and portfolio manager at Chemical Investment Group and as a financial analyst at Chemical Bank. Grillo holds a bachelor’s degree in business management from North Carolina State University and an MBA with a concentration in finance from Pace University.
Gregory J.P. Halton, CFA
Senior Portfolio Manager – Mondrian Investment Partners Ltd. — The Emerging Markets Portfolio
Having graduated from St Catherine’s College, Oxford in 2000 with a MEng (Hons) in Engineering Science, Mr. Halton worked in the global equity division of Deutsche Asset Management before joining Mondrian in 2004. Mr. Halton is a senior portfolio manager within the Emerging Markets Team. Mr. Halton is a CFA Charterholder and is a member of the CFA Institute and the CFA Society of the UK.
J. David Hillmeyer, CFA
Vice President, Senior Portfolio Manager — The Core Plus Fixed Income Portfolio
J. David Hillmeyer is a member of the firm’s taxable fixed income portfolio management team. He is responsible for portfolio construction and asset allocation of the diversified floating rate strategy and serves as co-portfolio manager for fixed rate multisector, core plus, and investment grade corporate bond strategies. Additionally, he serves as co-portfolio manager for the fixed rate multisector and core plus strategies. Prior to joining Delaware Investments in August 2007 as a vice president and corporate bond trader, he worked for more than 11 years in various roles at Hartford Investment Management Company, including senior corporate bond trader, high yield portfolio manager / trader, and quantitative analyst. He began his career as an investment advisor in January 1989 at Shawmut Bank, leaving the firm as an investment officer in November 1995. Hillmeyer earned his bachelor’s degree from Colorado State University, and he is a member of the CFA Society of Philadelphia and the Philadelphia Council for Business Economics.
Nikhil G. Lalvani, CFA
Vice President, Senior Portfolio Manager — The Large-Cap Value Equity Portfolio
Nikhil G. Lalvani is a senior portfolio manager for the firm’s Large-Cap Value team. At Delaware Investments, Lalvani has worked as both a fundamental and quantitative analyst. Prior to joining the firm in 1997 as an account analyst, he was a research associate with Bloomberg. Lalvani holds a bachelor’s degree in finance from The Pennsylvania State University. He is a member of the CFA Institute and the CFA Society of Philadelphia.
Other Portfolio information
(Unaudited)
Delaware Pooled® Trust
Anthony A. Lombardi, CFA
Vice President, Senior Portfolio Manager — The Large-Cap Value Equity Portfolio
Anthony A. Lombardi is a senior portfolio manager for the firm’s Large-Cap Value team. Prior to joining the firm in 2004 in his current role, Lombardi was a director at Merrill Lynch Investment Managers. He joined Merrill Lynch Investment Managers’ Capital Management Group in 1998 and last worked as a director and portfolio manager for the U.S. Active Large-Cap Value team, managing mutual funds and separate accounts for institutions and private clients. From 1990 to 1997, he worked at Dean Witter Reynolds as a sell-side equity research analyst, last serving as a vice president. He began his career as an investment analyst with Crossland Savings. Lombardi graduated from Hofstra University, receiving a bachelor’s degree in finance and an MBA in finance with a concentration in portfolio management. He is a member of the New York Society of Security Analysts and the CFA Institute.
Paul A. Matlack, CFA
Senior Vice President, Senior Portfolio Manager, Fixed Income Strategist — The Core Plus Fixed Income Portfolio and The High-Yield Bond Portfolio
Paul A. Matlack is a strategist and senior portfolio manager for the firm’s fixed income team. Matlack rejoined the firm in May 2010. During his previous time at Delaware Investments, from September 1989 to October 2000, he was senior credit analyst, senior portfolio manager, and left the firm as co-head of the high yield group. Most recently, he worked at Chartwell Investment Partners from September 2003 to April 2010 as senior portfolio manager in fixed income, where he managed core, core plus, and high yield strategies. Prior to that, Matlack held senior roles at Turner Investment Partners, PNC Bank, and Mellon Bank. He earned a bachelor’s degree in international relations from the University of Pennsylvania and an MBA with a concentration in finance from George Washington University.
John P. McCarthy, CFA
Senior Vice President, Co-Head of Credit Research, Senior Research Analyst — The Core Plus Fixed Income Portfolio and The High-Yield Bond Portfolio
John P. McCarthy is co-head of credit research and senior research analyst on the firm’s taxable fixed income team, responsible for industrials, steel, metals, and mining. He rejoined Delaware Investments in March 2007 after he worked in the firm’s fixed income area from 1990 to 2000 as a senior high yield analyst and high yield trader, and from 2001 to 2002 as a municipal bond trader. Most recently, he was a senior high yield analyst/trader at Chartwell Investment Partners. McCarthy earned a bachelor’s degree in business administration from Babson College, and he is a member of the CFA Society of Philadelphia.
Andrew Miller
Chief Investment Officer – Emerging Market Equities – Mondrian Investment Partners Ltd. — The Emerging Markets Portfolio
Mr. Miller is a graduate of the University of Birmingham. Prior to joining Mondrian in 2000, he worked in the Investment Management department of PricewaterhouseCoopers, where he was responsible for the analysis and audit of various investment vehicles. Mr. Miller is presently Chief Investment Officer within the Emerging Markets Team. Mr. Miller holds the ASIP designation and is a member of the CFA Institute and the CFA Society of the UK.
D. Tysen Nutt Jr.
Senior Vice President, Senior Portfolio Manager, Team Leader — The Large-Cap Value Equity Portfolio
D. Tysen Nutt Jr. is senior portfolio manager and team leader for the firm’s Large-Cap Value team. Before joining Delaware Investments in 2004 as senior vice president and senior portfolio manager, Nutt led the U.S. Active Large-Cap Value team within Merrill Lynch Investment Managers, where he managed mutual funds and separate accounts for institutions and private clients. He departed Merrill Lynch Investment Managers as a managing director. Prior to joining Merrill Lynch Investment Managers in 1994, Nutt was with Van Deventer & Hoch where he managed large-cap value portfolios for institutions and private clients. He began his investment career at Dean Witter Reynolds, where he eventually became vice president, investments. Nutt earned his bachelor’s degree from Dartmouth College, and he is a member of the New York Society of Security Analysts and the CFA Institute.
150
Melissa J. A. Platt, CFA
Portfolio Manager – Mondrian Investment Partners Ltd. — The International Equity Portfolio and The Labor Select International Equity Portfolio
Ms. Platt is an Economics and Finance graduate of Massey University, New Zealand. She started her career as a consultant at KPMG Corporate Finance. She then moved to FundSource Research for 3 years as an investment analyst and later as research manager. Ms. Platt joined Mondrian in 2004 and is a portfolio manager in the Non-US Equity Team. Ms. Platt is a CFA Charterholder, a member of the CFA Institute and a member of the CFA Society of the UK.
Andrew R. Porter, CFA
Senior Portfolio Manager – Mondrian Investment Partners Ltd. — The International Equity Portfolio and The Labor Select International Equity Portfolio
Mr. Porter studied at Magdalen College, Oxford University graduating with a first class degree in Chemistry. He also has an MSc in Economics from the University of London. Mr. Porter started his career as a consultant and trainee chartered accountant at Deloitte and Touche. Prior to joining Mondrian in 2003, Mr. Porter worked at Frank Russell, part of the team managing the multi-manager funds in the Asia Pacific region. Mr. Porter is a CFA Charterholder, a member of the CFA Institute and a member of the CFA Society of the UK. Mr. Porter is a member of Mondrian’s Non-US Equity Strategy Committee.
Daniel J. Prislin, CFA
Portfolio Manager, Equity Analyst – Jackson Square Partners, LLC — The Large-Cap Growth Equity Portfolio and The Select 20 Portfolio
Daniel J. Prislin became a member of Jackson Square Partners (JSP), at its inception in May 2014 as a portfolio manager and equity analyst. Jackson Square Partners manages large-cap growth, smid-cap growth, all-cap growth, and global growth portfolios. Prior to joining JSP, he was a portfolio manager and equity analyst on the Delaware Investments Focus Growth Equity team from April 2005 to April 2014. The Focus Growth Equity team managed large-cap growth, smid-cap growth, all-cap growth, and global growth portfolios. Prior to joining Delaware Investments, he was a principal and portfolio manager at Transamerica Investment Management, where he managed sub-advised funds and institutional separate accounts. Prior to joining Transamerica in 1998, he was a portfolio manager with The Franklin Templeton Group. Prislin received an MBA and bachelor’s degree in business administration from the University of California at Berkeley.
Christopher M. Testa, CFA
Senior Vice President, Senior Portfolio Manager — The Core Plus Fixed Income Portfolio and The High-Yield Bond Portfolio
Christopher M. Testa joined Delaware Investments in January 2014 as a senior portfolio manager in the firm’s corporate credit portfolio management group. He manages both investment grade and high yield corporate credit. Prior to joining the firm, Testa worked as a portfolio manager who focused on high yield credit at S. Goldman Asset Management from 2009 to 2012 and Princeton Advisory Group from 2012 to 2013. Previously, he served as head of U.S. credit at Drake Management, and prior to that he was head of credit research and a high yield portfolio manager at Goldman Sachs Asset Management. Testa has more than 20 years of experience analyzing and investing in high yield and distressed credit. He earned his bachelor’s degree in economics, with a minor in government, from Hamilton College, and an MBA in finance with a concentration in investments from The Wharton School of the University of Pennsylvania.
Jeffrey S. Van Harte, CFA
Chairman, Chief Investment Officer – Jackson Square Partners, LLC — The Large-Cap Growth Equity Portfolio and The Select 20 Portfolio
Jeffrey S. Van Harte became a member of Jackson Square Partners (JSP), at its inception in May 2014 as chairman and chief investment officer. Jackson Square Partners manages large-cap growth, smid-cap growth, all-cap growth, and global growth portfolios. Prior to joining JSP, he was the chief investment officer of the Delaware Investments Focus Growth Equity team from April 2005 to April 2014. The Focus Growth Equity team managed large-cap growth, smid-cap growth, all-cap growth, and global growth portfolios. Prior to Delaware Investments, he was a principal and executive vice president at Transamerica Investment Management. Van Harte has been managing portfolios and separate accounts for 30 years. Before becoming a portfolio manager, Van Harte was a securities analyst and trader for Transamerica Investment Services, which he joined in 1980. Van Harte received his bachelor’s degree in finance from California State University at Fullerton.
Other Portfolio information
(Unaudited)
Delaware Pooled® Trust
Robert A. Vogel Jr., CFA
Vice President, Senior Portfolio Manager — The Large-Cap Value Equity Portfolio
Robert A. Vogel Jr. is a senior portfolio manager for the firm’s Large-Cap Value team. Prior to joining Delaware Investments in 2004 as vice president and senior portfolio manager, he worked at Merrill Lynch Investment Managers for more than seven years, where he rose to the position of director and portfolio manager within the U.S. Active Large-Cap Value team. He began his career in 1992 as a financial consultant at Merrill Lynch. Vogel graduated from Loyola University Maryland, earning both bachelor’s and master’s degrees in finance. He also earned an MBA with a concentration in finance from The Wharton School of the University of Pennsylvania. Vogel is a member of the New York Society of Security Analysts, the CFA Institute, and the CFA Society of Philadelphia.
152
This page intentionally left blank.
Board of trustees / directors and officers addendum
Delaware Investments® Family of Funds
A mutual fund is governed by a Board of Trustees / Directors (“Trustees”), which has oversight responsibility for the management of a fund’s business affairs. Trustees establish procedures and oversee and review the performance of the investment manager, the distributor, and others who perform services for the fund. The independent fund trustees, in particular, are advocates for shareholder interests. Each trustee has served in that capacity since he or she was elected to or appointed to the Board of Trustees, and will continue to serve until his or her retirement or the election of a new trustee in his or her place. The following is a list of the Trustees and Officers with certain background and related information.
| | | | | | | | | | |
Name, Address, and Birth Date | | Position(s) Held with Fund(s) | | Length of Time
Served | | Principal Occupation(s) During the Past Five Years | | Number of
Portfolios in Fund
Complex Overseen
by Trustee or Officer | | Other
Directorships
Held by
Trustee
or Officer |
Interested Trustee |
Patrick P. Coyne1 2005 Market Street Philadelphia, PA 19103 April 1963 | | Chairman, President,
Chief Executive Officer,
and Trustee | | Chairman and Trustee
since Aug. 16, 2006 | | Patrick P. Coyne has
served in various executive capacities
at different times at
Delaware Investments.2 | | 65 | | Board of Governors
Member
Investment Company
Institute (ICI) |
| | | | President and Chief Executive Officer since Aug. 1, 2006 | | | | | | Director and Audit
Committee Member
Kaydon Corp.
(2007–2013) |
Independent Trustees |
Thomas L. Bennett 2005 Market Street Philadelphia, PA 19103 October 1947 | | Trustee | | Since March 2005 | | Private Investor
(March 2004–Present) | | 65 | | Director
Bryn Mawr Bank Corp.
(BMTC)
(2007–2011) |
Joseph W. Chow 2005 Market Street Philadelphia, PA 19103 January 1953 | | Trustee | | Since January 2013 | | Executive Vice President
(Emerging Economies Strategies,
Risk and Corporate Administration)
State Street Corporation
(July 2004–March 2011) | | 65 | | Director and Audit
Committee
Member – Hercules
Technology Growth
Capital, Inc.
(2004–2014) |
John A. Fry 2005 Market Street Philadelphia, PA 19103 May 1960 | | Trustee | | Since January 2001 | | President
Drexel University
(August 2010–Present) | | 65 | | Director —
Hershey Trust Company
Director, Audit
Committee, and
Governance
Committee Member
Community Health
Systems |
| | | | | | | President
Franklin & Marshall College
(July 2002–July 2010) | | | |
Lucinda S. Landreth 2005 Market Street Philadelphia, PA 19103 June 1947 | | Trustee | | Since March 2005 | | Private Investor
(2004–Present) | | 65 | | None |
154
| | | | | | | | | | |
Name, Address, and Birth Date | | Position(s) Held with Fund(s) | | Length of Time Served | | Principal Occupation(s) During the Past Five Years | | Number of Portfolios in Fund Complex Overseen by Trustee or Officer | | Other Directorships Held by Trustee or Officer |
Independent Trustees (continued) | | | | | | |
Frances A. Sevilla-Sacasa 2005 Market Street Philadelphia, PA 19103 January 1956 | | Trustee | | Since September 2011 | | Chief Executive Officer — Banco Itaú International (April 2012–Present) Executive Advisor to Dean (August 2011–March 2012) and Interim Dean (January 2011–July 2011) — University of Miami School of Business Administration President — U.S. Trust, Bank of America Private Wealth Management (Private Banking) (July 2007-December 2008) | | 65 | | Trust Manager and Audit Committee
Member — Camden
Property Trust |
Thomas K. Whitford 2005 Market Street Philadelphia, PA 19103 March 1956 | | Trustee | | Since January 2013 | | Vice Chairman (2010–April 2013) Chief Administrative Officer (2008–2010) and Executive Vice President and Chief Administrative Officer (2007–2009) — PNC Financial Services Group | | 65 | | Director — HSBC Finance Corporation and HSBC North America Holdings Inc. |
Janet L. Yeomans 2005 Market Street Philadelphia, PA 19103 July 1948 | | Trustee | | Since April 1999 | | Vice President and Treasurer (January 2006–July 2012) Vice President — Mergers & Acquisitions (January 2003–January 2006), and
Vice President and Treasurer
(July 1995–January 2003)
3M Corporation | | 65 | | Director, Audit and Compliance Committee Chair, Investment Committee Member and Governance Committee Member
Okabena Company Chair — 3M Investment Management Company (2005–2012) |
J. Richard Zecher 2005 Market Street Philadelphia, PA 19103 July 1940 | | Trustee | | Since March 2005 | | Founder Investor Analytics (Risk Management) (May 1999–Present) Founder P/E Investments (Hedge Fund) (September 1996–Present) | | 65 | | Director and Compensation Committee Member Investor Analytics Director — P/E Investments |
Board of trustees / directors and officers addendum
Delaware Investments® Family of Funds
| | | | | | | | | | | | |
Name, Address, and Birth Date | | Position(s) Held with Fund(s) | | Length of Time Served | | Principal Occupation(s) During the Past Five Years | | Number of Portfolios in Fund Complex Overseen by Trustee or Officer | | | | Other Directorships Held by Trustee or Officer |
Officers | | | | | | |
David F. Connor 2005 Market Street Philadelphia, PA 19103 December 1963 | | Senior Vice President, Deputy General Counsel, and Secretary | | Senior Vice President, Deputy General Counsel since May 2013; Vice President, Deputy General Counsel September 2000 – May 2013; Secretary since October 2005 | | David F. Connor has served as
Deputy General Counsel of Delaware Investments
since 2000. | | 65 | | | | None3 |
Daniel V. Geatens 2005 Market Street Philadelphia, PA 19103 October 1972 | | Vice President and Treasurer | | Treasurer since October 2007 | | Daniel V. Geatens has served in various capacities at different times at Delaware Investments. | | 65 | | | | None3 |
David P. O’Connor 2005 Market Street Philadelphia, PA 19103 February 1966 | | Executive Vice President, General Counsel and Chief Legal Officer | | Executive Vice President
since February 2012; Senior Vice President October 2005 – February 2012; General Counsel and Chief Legal Officer since October 2005 | | David P. O’Connor has served in various executive and legal capacities at different times at Delaware Investments. | | 65 | | | | None3 |
Richard Salus 2005 Market Street Philadelphia, PA 19103 October 1963 | | Senior Vice President and Chief Financial Officer | | Chief Financial Officer since November 2006 | | Richard Salus has served in
various executive capacities at different times at Delaware Investments. | | 65 | | | | None3 |
| 1 | Patrick P. Coyne is considered to be an “Interested Trustee” because he is an executive officer of the Fund’s(s’) investment advisor. |
| 2 | Delaware Investments is the marketing name for Delaware Management Holdings, Inc. and its subsidiaries, including the Fund’s(s’) investment advisor, principal underwriter, and its transfer agent. |
| 3 | David F. Connor, Daniel V. Geatens, David P. O’Connor, and Richard Salus serve in similar capacities for the six portfolios of the Optimum Fund Trust, which have the same investment advisor, principal underwriter, and transfer agent as the registrant. |
The Statement of Additional Information for the Fund(s) includes additional information about the Trustees and Officers and is available, without charge, upon request by calling 800 523-1918.
156
Portfolio managers
| | | | |
Kristen E. Bartholdson Vice President and Senior Portfolio Manager Nigel Bliss Senior Portfolio Manager Mondrian Investment Partners Limited Christopher J. Bonavico Portfolio Manager, Equity Analyst –– Jackson Square Partners, LLC Kenneth F. Broad Portfolio Manager, Equity Analyst –– Jackson Square Partners, LLC Adam H. Brown Vice President and Portfolio Manager Liu-Er Chen Senior Vice President, Chief Investment Officer — Emerging Markets and Healthcare Ginny Chong Senior Portfolio Manager Mondrian Investment Partners Limited Craig C. Dembek Senior Vice President, Co-Head of Credit Research, Senior Research Analyst Elizabeth A. Desmond Director and Chief Investment Officer — International Equities Mondrian Investment Partners Limited Roger A. Early Managing Director, Co-Head of Fixed Income Investments, Senior Vice President and Co-Chief Investment Officer — Total Return Fixed Income Strategy Christopher M. Ericksen Portfolio Manager, Equity Analyst –– Jackson Square Partners, LLC | | Paul Grillo Senior Vice President and Co-Chief Investment Officer — Total Return Fixed Income Strategy Gregory J.P. Halton Senior Portfolio Manager Mondrian Investment Partners Limited J. David Hillmeyer Vice President and Senior Portfolio Manager Nikhil G. Lalvani Vice President and Senior Portfolio Manager Anthony A. Lombardi Vice President and Senior Portfolio Manager Paul A. Matlack Senior Vice President, Senior Portfolio Manager, Fixed Income Strategist John P. McCarthy Senior Vice President, Co-Head of Credit Research, Senior Research Analyst Andrew Miller Chief Investment Officer — Emerging Market Equities Mondrian Investment Partners Limited D. Tysen Nutt Jr. Senior Vice President, Senior Portfolio Manager, and Team Leader —
Large-Cap Value Focus Equity Melissa J.A. Platt Portfolio Manager Mondrian Investment Partners Limited Andrew R. Porter Senior Portfolio Manager Mondrian Investment Partners Limited | | Daniel J. Prislin Portfolio Manager, Equity Analyst — Jackson Square Partners, LLC Christopher M. Testa Senior Vice President and Senior Portfolio Manager Jeffrey S. Van Harte Chairman, Chief Investment Officer — Jackson Square Partners, LLC Robert A. Vogel Jr. Vice President and Senior Portfolio Manager |
157
Custodian
The Bank of New York Mellon
One Wall Street
New York, NY 10286
Independent registered public accounting firm
PricewaterhouseCoopers LLP
Two Commerce Square, Suite 1700
2001 Market Street
Philadelphia, PA 19103-7042
Investment advisor
Delaware Management Company, a series of Delaware Management Business Trust
2005 Market Street
Philadelphia, PA 19103
Investment sub-advisor for certain Portfolios
Mondrian Investment Partners Limited
Fifth Floor
10 Gresham Street
London EC2V 7JD
United Kingdom
Jackson Square Partners, LLC
101 California Street
Suite 3750
San Francisco, CA 94111
Delaware Investments, a member of Macquarie Group, refers to DMHI and its subsidiaries. Macquarie Group refers to Macquarie Group Limited and its subsidiaries and affiliates worldwide.
The Portfolios are distributed by Delaware Distributors, L.P., an affiliate of DMBT, DMHI, and Macquarie Group Limited.
Each Portfolio files its complete schedule of portfolio holdings with the Securities and Exchange Commission for the first and third quarters of each fiscal year on Form N-Q. Each Portfolio’s Forms N-Q, as well as a description of the policies and procedures that each Portfolio uses to determine how to vote proxies (if any) relating to portfolio securities are available without charge (i) upon request, by calling 800 231-8002; (ii) on the Portfolios’ website at delawareinvestments.com; and (iii) on the Commission’s website at sec.gov. Each Portfolio’s Forms N-Q may be reviewed and copied at the Commission’s Public Reference Room in Washington, D.C.; information on the operation of the Public Reference Room may be obtained by calling 800 SEC-0330.
Information (if any) regarding how each Portfolio voted proxies relating to portfolio securities during the most recently disclosed 12-month period ended June 30 is available without charge (i) through the Portfolios’ website at delawareinvestments.com; and (ii) on the Commission’s website at sec.gov.
This report was prepared for investors in the Delaware Pooled ® Trust Portfolios. It may be distributed to others only if preceded or accompanied by a current Delaware Pooled Trust prospectus, which contains details about charges, expenses, investment objectives, and operating policies of the Portfolios. All Delaware Pooled Trust Portfolios are offered by prospectus only. The return and principal value of an investment in a Portfolio will fluctuate so that shares, when redeemed, may be worth more or less than their original cost.
Carefully consider the Portfolios’ investment objectives, risk factors, charges, and expenses before investing. This and other information can be found in the Portfolios’ prospectus, which may be obtained by visiting delawareinvestments.com or calling 800 231-8002. Investors should read the prospectus carefully before investing.
| | |

(13627) AR-DPT 20100 12/14 | | 2005 Market Street Philadelphia, PA 19103 Telephone 800 231-8002 Fax 215 255-1162 Printed in the USA |

Annual report
Alternative / specialty mutual fund
Delaware REIT Fund
October 31, 2014
Carefully consider the Fund’s investment objectives, risk factors, charges, and expenses before investing. This and other information can be found in the Fund’s prospectus and its summary prospectus, which may be obtained by visiting delawareinvestments.com or calling 800 523-1918. Investors should read the prospectus and the summary prospectus carefully before investing.
You can obtain shareholder reports and prospectuses online instead of in the mail.
Visit delawareinvestments.com/edelivery.
Experience Delaware Investments
Delaware Investments is committed to the pursuit of consistently superior asset management and unparalleled client service. We believe in our investment processes, which seek to deliver consistent results, and in convenient services that help add value for our clients.
If you are interested in learning more about creating an investment plan, contact your financial advisor.
You can learn more about Delaware Investments or obtain a prospectus for Delaware REIT Fund at delawareinvestments.com.
Manage your investments online
| — | | 24-hour access to your account information |
| — | | Check your account balance and recent transactions |
| — | | Request statements or literature |
| — | | Make purchases and redemptions |
Delaware Management Holdings, Inc. and its subsidiaries (collectively known by the marketing name of Delaware Investments) are wholly owned subsidiaries of Macquarie Group Limited, a global provider of banking, financial, advisory, investment and funds management services.
Investments in Delaware REIT Fund are not and will not be deposits with or liabilities of Macquarie Bank Limited ABN
46 008 583 542 and its holding companies, including their subsidiaries or related companies (Macquarie Group), and are subject to investment risk, including possible delays in repayment and loss of income and capital invested. No Macquarie Group company guarantees or will guarantee the performance of the Fund, the repayment of capital from the Fund, or any particular rate of return.
Table of contents
Unless otherwise noted, views expressed herein are current as of Oct. 31, 2014, and subject to change.
Funds are not FDIC insured and are not guaranteed. It is possible to lose the principal amount invested.
Mutual fund advisory services provided by Delaware Management Company, a series of Delaware Management Business Trust, which is a registered investment advisor. Delaware Investments, a member of Macquarie Group, refers to Delaware Management Holdings, Inc. and its subsidiaries, including the Fund’s distributor, Delaware Distributors, L.P. Macquarie Group refers to Macquarie Group Limited and its subsidiaries and affiliates worldwide.
©2014 Delaware Management Holdings, Inc.
All third-party marks cited are the property of their respective owners.
| | |
Portfolio management review | | |
| Delaware REIT Fund | | November 11, 2014 |
| | | | | | | | |
| Performance preview (for the year ended October 31, 2014) | | | | | | |
Delaware REIT Fund (Class A shares) | | | 1-year return | | | | +18.53 | % |
FTSE NAREIT Equity REITs Index (benchmark) | | | 1-year return | | | | +19.06 | % |
Past performance does not guarantee future results.
For complete, annualized performance for Delaware REIT Fund, please see the table on page 4.
The performance of Class A shares excludes the applicable sales charge and reflects the reinvestment of all distributions. Index performance returns do not reflect any management fees, transaction costs, or expenses. Indices are unmanaged and one cannot invest directly in an index.
Market conditions were generally supportive for real estate investment trusts (REITs) during the Fund’s fiscal year ended Oct. 31, 2014, with domestic real estate equities, as represented by the FTSE NAREIT Equity REITs Index, advancing 19%.
Several factors contributed to the favorable backdrop for real estate stocks:
| — | | Interest rates declined. In part because of slower-than-anticipated global economic growth, the yield on the 10-year U.S. Treasury note fell from 2.65% at the start of the period to 2.35% on Oct. 31, 2014. |
| — | | Financing costs dropped. The U.S. Federal Reserve made clear that it planned to maintain its benchmark short-term interest rate at close to zero for an extended period. Because REITs are capital intensive — meaning they directly benefit from lower interest rates because they can thus finance their property acquisitions more cheaply — they responded well to a declining cost of capital. |
| — | | Real estate fundamentals remained beneficial. Slow economic growth over the past several years has translated into limited incentive for developers to build new properties. A combination of constrained supply of new buildings and solid demand from tenants was a generally favorable mix for REITs. |
In this positive environment for real estate securities, many different types of property stocks enjoyed generally favorable results. Short-duration property sectors such as lodging and apartments — which tend to carry higher risk because of their shorter leases — performed particularly well, as did manufactured homes and regional malls.
Fund performance
For the fiscal year ended Oct. 31, 2014, Delaware REIT Fund (Class A shares) returned +18.53% at net asset value and +11.69% at maximum offer price (both returns assume reinvestment of all distributions). The Fund’s benchmark, the FTSE NAREIT Equity REITs Index, returned +19.06% during the same time period. Complete annualized performance for Delaware REIT Fund is shown in the table on page 4.
Performance challenges
The Fund performed well on an absolute basis, despite modestly trailing the benchmark. In relative terms, the Fund’s biggest disadvantage was its moderate cash stake of about 3% of the portfolio, on average, during the 12 months. We believed this allocation was appropriate, given the degree to which REIT valuations rose during the period, to provide some defense against a possible correction in the REIT market. Of course,
1
Portfolio management review
Delaware REIT Fund
having any cash at all sitting on the sidelines during a rising market proved detrimental.
Several individual positions hampered results relative to the benchmark. The single largest detractor was the Fund’s substantial underweight position in data center operator Digital Realty Trust, whose shares bounced back after a difficult 2013. Despite the stock’s gains during the Fund’s fiscal year, we remained concerned about Digital Realty Trust’s growth rate and relatively expensive valuation, and these contributed to our decision not to own a position in the stock for most of the period, including at period end.
Another challenge for the Fund was its position in DDR, an operator of retail “power centers” — large outdoor shopping malls that typically combine a handful of big-box stores with smaller retailers and restaurants. DDR saw its shares underperform the rest of the shopping center category, as power centers failed to see the same level of stock price increases as other retail- oriented REITs. At period end, we maintained the Fund’s overweight position in DDR, given our expectation for strong demand for this subsector of shopping centers.
First Industrial Realty Trust also weighed on Fund results. First Industrial, along with many other industrial REITs, saw its shares lag because of the market’s concerns about excess supply in the industrial sector. The stock rebounded sharply in October 2014, however, and we took advantage of the recovery to reduce the Fund’s position.
Sources of outperformance
The Fund’s strongest relative contribution came from its underweight position in American Realty Capital Properties, a so-called “freestanding” or triple-net REIT, meaning that tenants agree to pay their own real estate taxes, insurance costs, and maintenance expenses. We had gradually reduced the Fund’s position in this stock and owned only a small stake by late October, when an accounting
scandal caused the company’s shares to lose about 28% of their market value in the final three trading days of the Fund’s fiscal year. Although the Fund was hurt by its position in American Realty Capital Properties, we believe we were fortunate to have relatively little exposure to the stock when news of the scandal broke.
The Fund’s substantial underweighting in the healthcare sector was another source of strength for the Fund during the period. Healthcare property REITs lagged the overall market’s return by several percentage points, due in part to the relatively large size of the sector’s biggest companies, which made it difficult for them to achieve significant growth. Anticipated new supply from senior housing facilities also depressed prices. In particular, the Fund benefited from underweighting positions in Health Care REIT and HCP. We completely sold the Fund’s HCP position by period end.
The benchmark’s two strongest-performing sectors were lodging and apartments, both of which we overweighted. Among lodging names, the Fund was especially helped by a position in Strategic Hotels & Resorts, an owner of luxury properties that, in our view, has profited from improved management operations and the high-quality nature of its property locations. Within apartments, Essex Property Trust performed well due to a variety of factors, from its emphasis on strong West Coast markets to notable improvements in occupancy rates, expense management, and operations.
Positioning at period end
At the close of the fiscal year, the Fund maintained its overweight allocation to the apartment sector, as we believe this group continued to display relatively steady cash-flow growth. Gradually improving U.S. economic growth has translated into more demand for apartments. The supply of apartment space has picked up somewhat, but it is only back to average levels.
2
The Fund also remained overweight in lodging REITs. Revenue per available room or RevPAR, a common metric of hotel industry performance, has been healthy, benefiting from limited supply and favorable demand, particularly from business and leisure groups. In contrast, plentiful supply in the healthcare sector left us wary about that segment and factored in our decision to maintain a below-benchmark allocation at fiscal year end.
We have closely watched the investment activity occurring in U.S. real estate. In our opinion, heavy demand from global institutional and sovereign investors has led to rising REIT valuations and asset prices that have been increasing faster than cash flows. We believe REIT valuations have stretched to the point that, if investment flows start to reverse, it could adversely affect REIT prices. As a result, we have positioned the Fund to be slightly more defensive, maintaining a higher-than-typical cash position and focusing on what we consider more attractively priced stocks.
3
| | |
Performance summary | | |
| Delaware REIT Fund | | October 31, 2014 |
The performance data quoted represent past performance; past performance does not guarantee future results. Investment return and principal value will fluctuate so your shares, when redeemed, may be worth more or less than their original cost. Please obtain the performance data current for the most recent month end by calling 800 523-1918 or visiting our website at delawareinvestments.com/performance. Current performance may be lower or higher than the performance data quoted.
| | | | | | | | | | | | |
| Fund and benchmark performance1,2 | | Average annual total returns through October 31, 2014 | |
| | | 1 year | | | 5 years | | | 10 years | |
Class A (Est. Dec. 6, 1995) | | | | | | | | | | | | |
Excluding sales charge | | | +18.53% | | | | +18.24% | | | | +7.93% | |
Including sales charge | | | +11.69% | | | | +16.84% | | | | +7.29% | |
Class C (Est. Nov. 11, 1997) | | | | | | | | | | | | |
Excluding sales charge | | | +17.68% | | | | +17.37% | | | | +7.12% | |
Including sales charge | | | +16.68% | | | | +17.37% | | | | +7.12% | |
Class R (Est. June 2, 2003) | | | | | | | | | | | | |
Excluding sales charge | | | +18.24% | | | | +17.95% | | | | +7.65% | |
Including sales charge | | | +18.24% | | | | +17.95% | | | | +7.65% | |
Institutional Class (Est. Nov. 11, 1997) | | | | | | | | | | | | |
Excluding sales charge | | | +18.80% | | | | +18.55% | | | | +8.20% | |
Including sales charge | | | +18.80% | | | | +18.55% | | | | +8.20% | |
FTSE NAREIT Equity REITs Index | | | +19.06% | | | | +19.19% | | | | +8.86% | |
1 Returns reflect the reinvestment of all distributions and are presented both with and without the applicable sales charges described below. Returns do not reflect the deduction of taxes the shareholder would pay on Fund distributions or redemptions of Fund shares.
Expense limitations were in effect for certain classes during some or all of the periods shown in the “Fund and benchmark performance” table. Expenses for each class are listed on the “Fund expense ratios” table on page 5. Performance would have been lower had expense limitations not been in effect.
Class A shares are sold with a maximum front-end sales charge of 5.75%, and have an annual distribution and service fee of 0.25% of average daily net assets. Performance for Class A shares,
excluding sales charges, assumes that no front-end sales charge applied.
Class C shares are sold with a contingent deferred sales charge of 1.00% if redeemed during the first 12 months. They are also subject to an annual distribution and service fee of 1.00% of average daily net assets.
Performance for Class C shares, excluding sales charges, assumes either that contingent deferred sales charges did not apply or that the investment was not redeemed.
Class R shares are available only for certain retirement plan products. They are sold without a sales charge and have an annual distribution and service fee of 0.50% of average daily net assets.
Institutional Class shares are available without sales or asset-based distribution charges only to certain eligible institutional accounts.
4
The “Fund and benchmark performance” table and the “Performance of a $10,000 investment” graph do not reflect the deduction of taxes the shareholder would pay on Fund distributions or redemptions of Fund shares.
Narrowly focused investments may exhibit higher volatility than investments in multiple industry sectors.
REIT investments are subject to many of the risks associated with direct real estate ownership,
including changes in economic conditions, credit risk, and interest rate fluctuations. A REIT fund’s tax status as a regulated investment company could be jeopardized if it holds real estate directly, as a result of defaults, or receives rental income from real estate holdings.
“Nondiversified” Funds may allocate more of their net assets to investments in single securities than “diversified” Funds. Resulting adverse effects may subject these Funds to greater risks and volatility.
2 The Fund’s expense ratios, as described in the most recent prospectus, are disclosed in the following “Fund expense ratios” table.
| | | | | | | | |
| Fund expense ratios | | Class A | | Class C | | Class R | | Institutional Class |
Total annual operating expenses | | 1.31% | | 2.06% | | 1.56% | | 1.06% |
(without fee waivers) | | | | | | | | |
Net expenses | | 1.31% | | 2.06% | | 1.56% | | 1.06% |
(including fee waivers, if any) | | | | | | | | |
Type of waiver | | n/a | | n/a | | n/a | | n/a |
5
Performance summary
Delaware REIT Fund
Performance of a $10,000 investment1
Average annual total returns from Oct. 31, 2004, through Oct. 31, 2014
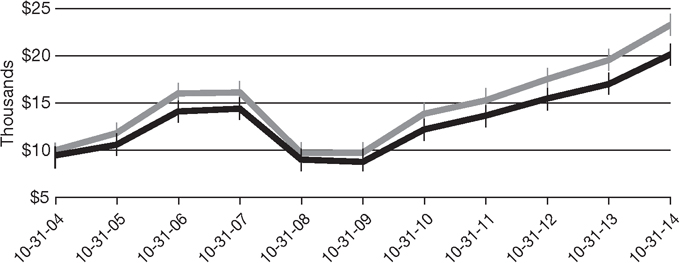
| | | | | | | | | | |
| For the period beginning Oct. 31, 2004 through Oct. 31, 2014 | | | Starting value | | | | Ending value | |
 | | FTSE NAREIT Equity REITs Index | | | $10,000 | | | | $23,381 | |
 | | Delaware REIT Fund — Class A shares | | | $9,425 | | | | $20,218 | |
1 The “Performance of a $10,000 investment” graph assumes $10,000 invested in Class A shares of the Fund on Oct. 31, 2004, and includes the effect of a 5.75% front-end sales charge and the reinvestment of all distributions. The graph does not reflect the deduction of taxes the shareholders would pay on Fund distributions or redemptions of Fund shares. Expense limitations were in effect for some or all of the periods shown. Performance would have been lower had expense limitations not been in effect. Expenses are listed in the “Fund expense ratios” table on page 5. Please note additional details on pages 4 through 6.
The graph also assumes $10,000 invested in the FTSE NAREIT Equity REITs Index as of Oct. 31, 2004. The FTSE NAREIT Equity REITs Index measures the performance of all publicly traded equity real estate investment trusts (REITs) traded on U.S. exchanges, excluding timber and infrastructure REITs.
Index performance returns do not reflect any management fees, transaction costs, or expenses. Indices are unmanaged and one cannot invest directly in an index. Past performance is not a guarantee of future results.
Performance of other Fund classes will vary due to different charges and expenses.
| | | | | | |
| | | Nasdaq symbols | | CUSIPs | | |
Class A | | DPREX | | 246248868 | | |
Class C | | DPRCX | | 246248793 | | |
Class R | | DPRRX | | 246248561 | | |
Institutional Class | | DPRSX | | 246248777 | | |
6
Disclosure of Fund expenses
For the six-month period from May 1, 2014 to October 31, 2014 (Unaudited)
As a shareholder of the Fund, you incur two types of costs: (1) transaction costs, including sales charges (loads) on purchase payments, reinvested dividends, or other distributions; redemption fees; and exchange fees; and (2) ongoing costs, including management fees; distribution and/or service (12b-1) fees; and other Fund expenses. This example is intended to help you understand your ongoing costs (in dollars) of investing in the Fund and to compare these costs with the ongoing costs of investing in other mutual funds.
The example is based on an investment of $1,000 invested at the beginning of the period and held for the entire six-month period from May 1, 2014 to Oct. 31, 2014.
Actual expenses
The first section of the table shown, “Actual Fund return,” provides information about actual account values and actual expenses. You may use the information in this section of the table, together with the amount you invested, to estimate the expenses that you paid over the period. Simply divide your account value by $1,000 (for example, an $8,600 account value divided by $1,000 = 8.6), then multiply the result by the number in the first section under the heading entitled “Expenses Paid During Period” to estimate the expenses you paid on your account during this period.
Hypothetical example for comparison purposes
The second section of the table shown, “Hypothetical 5% return,” provides information about hypothetical account values and hypothetical expenses based on the Fund’s actual expense ratio and an assumed rate of return of 5% per year before expenses, which is not the Fund’s actual return. The hypothetical account values and expenses may not be used to estimate the actual ending account balance or expenses you paid for the period. You may use this information to compare the ongoing costs of investing in the Fund and other funds. To do so, compare this 5% hypothetical example with the 5% hypothetical examples that appear in the shareholder reports of the other funds.
Please note that the expenses shown in the table are meant to highlight your ongoing costs only and do not reflect any transactional costs, such as sales charges (loads), redemption fees, or exchange fees. Therefore, the second section of the table is useful in comparing ongoing costs only, and will not help you determine the relative total costs of owning different funds. In addition, if these transactional costs were included, your costs would have been higher. The expenses shown in the table assume reinvestment of all dividends and distributions.
7
Disclosure of Fund expenses
For the six-month period from May 1, 2014 to October 31, 2014 (Unaudited)
Delaware REIT Fund
Expense analysis of an investment of $1,000
| | | | | | | | | | | | | | | | | | | | |
| | | Beginning | | Ending | | | | Expenses |
| | | Account Value | | Account Value | | Annualized | | Paid During Period |
| | | 5/1/14 | | 10/31/14 | | Expense Ratio | | 5/1/14 to 10/31/14* |
Actual Fund return† | | | | | | | | | | | | | | | | | | | | |
Class A | | | | $1,000.00 | | | | | $1,098.30 | | | | | 1.34 | % | | | | $7.09 | |
Class C | | | | 1,000.00 | | | | | 1,094.30 | | | | | 2.09 | % | | | | 11.03 | |
Class R | | | | 1,000.00 | | | | | 1,096.90 | | | | | 1.59 | % | | | | 8.40 | |
Institutional Class | | | | 1,000.00 | | | | | 1,099.50 | | | | | 1.09 | % | | | | 5.77 | |
Hypothetical 5% return (5% return before expenses) | | | | | | | | | | | | | | | | | | | | |
Class A | | | | $1,000.00 | | | | | $1,018.45 | | | | | 1.34 | % | | | | $6.82 | |
Class C | | | | 1,000.00 | | | | | 1,014.67 | | | | | 2.09 | % | | | | 10.61 | |
Class R | | | | 1,000.00 | | | | | 1,017.19 | | | | | 1.59 | % | | | | 8.08 | |
Institutional Class | | | | 1,000.00 | | | | | 1,019.71 | | | | | 1.09 | % | | | | 5.55 | |
| * | “Expenses Paid During Period” are equal to the Fund’s annualized expense ratio, multiplied by the average account value over the period, multiplied by 184/365 (to reflect the one-half year period). |
| † | Because actual returns reflect only the most recent six-month period, the returns shown may differ significantly from fiscal year returns. |
8
Security type / sector allocation and top 10 equity holdings
| | |
Delaware REIT Fund | | As of October 31, 2014 (Unaudited) |
Sector designations may be different than the sector designations presented in other fund materials. The sector designations may represent the investment manager’s internal sector classifications, which may result in the sector designations for one fund being different than another fund’s sector designations.
| | | | | | | |
| Security type / sector | | Percentage of net assets | | |
Common Stocks | | | | 96.49 | % | | |
Diversified REITs | | | | 3.78 | % | | |
Healthcare REITs | | | | 9.14 | % | | |
Hotel REITs | | | | 10.92 | % | | |
Industrial REITs | | | | 5.44 | % | | |
Mall REITs | | | | 15.04 | % | | |
Manufactured Housing REIT | | | | 0.71 | % | | |
Multifamily REITs | | | | 18.90 | % | | |
Office REITs | | | | 12.84 | % | | |
Office/Industrial REITs | | | | 4.47 | % | | |
Self-Storage REITs | | | | 4.68 | % | | |
Shopping Center REITs | | | | 8.33 | % | | |
Single Tenant REIT | | | | 1.38 | % | | |
Specialty REITs | | | | 0.86 | % | | |
Short-Term Investments | | | | 2.53 | % | | |
Total Value of Securities | | | | 99.02 | % | | |
Receivables and Other Assets Net of Liabilities | | | | 0.98 | % | | |
Total Net Assets | | | | 100.00 | % | | |
Holdings are for informational purposes only and are subject to change at any time. They are not a recommendation to buy, sell, or hold any security.
| | | | | | | |
| Top 10 equity holdings | | Percentage of net assets | | |
Simon Property Group | | | | 10.27 | % | | |
Health Care REIT | | | | 4.96 | % | | |
Boston Properties | | | | 4.73 | % | | |
Host Hotels & Resorts | | | | 4.66 | % | | |
Equity Residential | | | | 4.26 | % | | |
AvalonBay Communities | | | | 4.14 | % | | |
Public Storage | | | | 3.88 | % | | |
Prologis | | | | 3.77 | % | | |
General Growth Properties | | | | 3.72 | % | | |
Essex Property Trust | | | | 2.91 | % | | |
9
Schedule of investments
| | |
| Delaware REIT Fund | | October 31, 2014 |
| | | | | | | | |
| | | Number of shares | | | Value (U.S. $) | |
Common Stock – 96.49% | | | | | | | | |
Diversified REITs – 3.78% | | | | | | | | |
Vornado Realty Trust | | | 66,832 | | | $ | 7,316,767 | |
Washington Real Estate Investment Trust | | | 81,500 | | | | 2,303,190 | |
| | | | | | | | |
| | | | | | | 9,619,957 | |
| | | | | | | | |
Healthcare REITs – 9.14% | | | | | | | | |
Health Care REIT | | | 177,600 | | | | 12,629,136 | |
Healthcare Realty Trust | | | 103,499 | | | | 2,739,619 | |
Healthcare Trust of America Class A | | | 240,000 | | | | 3,081,600 | |
Ventas | | | 70,077 | | | | 4,800,975 | |
| | | | | | | | |
| | | | | | | 23,251,330 | |
| | | | | | | | |
Hotel REITs – 10.92% | | | | | | | | |
DiamondRock Hospitality | | | 234,200 | | | | 3,360,770 | |
Host Hotels & Resorts | | | 508,164 | | | | 11,845,303 | |
Pebblebrook Hotel Trust | | | 97,313 | | | | 4,145,534 | |
RLJ Lodging Trust | | | 127,410 | | | | 4,105,150 | |
Starwood Hotels & Resorts Worldwide | | | 18,500 | | | | 1,418,210 | |
Strategic Hotels & Resorts † | | | 225,600 | | | | 2,898,960 | |
| | | | | | | | |
| | | | | | | 27,773,927 | |
| | | | | | | | |
Industrial REITs – 5.44% | | | | | | | | |
DCT Industrial Trust | | | 386,907 | | | | 3,315,793 | |
First Industrial Realty Trust | | | 48,170 | | | | 940,760 | |
Prologis | | | 230,209 | | | | 9,588,205 | |
| | | | | | | | |
| | | | | | | 13,844,758 | |
| | | | | | | | |
Mall REITs – 15.04% | | | | | | | | |
General Growth Properties | | | 365,111 | | | | 9,460,026 | |
Simon Property Group | | | 145,758 | | | | 26,121,291 | |
Taubman Centers | | | 35,400 | | | | 2,692,170 | |
| | | | | | | | |
| | | | | | | 38,273,487 | |
| | | | | | | | |
Manufactured Housing REIT – 0.71% | | | | | | | | |
Equity Lifestyle Properties | | | 36,636 | | | | 1,798,828 | |
| | | | | | | | |
| | | | | | | 1,798,828 | |
| | | | | | | | |
Multifamily REITs – 18.90% | | | | | | | | |
American Campus Communities | | | 89,900 | | | | 3,530,373 | |
Apartment Investment & Management | | | 88,000 | | | | 3,149,520 | |
AvalonBay Communities | | | 67,551 | | | | 10,527,148 | |
Camden Property Trust | | | 53,386 | | | | 4,093,105 | |
Equity Residential | | | 155,823 | | | | 10,839,048 | |
Essex Property Trust | | | 36,727 | | | | 7,410,039 | |
Post Properties | | | 50,000 | | | | 2,797,000 | |
UDR | | | 190,100 | | | | 5,746,723 | |
| | | | | | | | |
| | | | | | | 48,092,956 | |
| | | | | | | | |
10
| | | | | | | | |
| | | Number of shares | | | Value (U.S. $) | |
Common Stock (continued) | | | | | | | | |
Office REITs – 12.84% | | | | | | | | |
Boston Properties | | | 94,874 | | | $ | 12,025,279 | |
Brandywine Realty Trust | | | 57,001 | | | | 879,525 | |
Douglas Emmett | | | 44,800 | | | | 1,260,224 | |
Equity Commonwealth | | | 77,100 | | | | 2,059,341 | |
Gramercy Property Trust | | | 297,900 | | | | 1,861,875 | |
Highwoods Properties | | | 124,100 | | | | 5,320,167 | |
Kilroy Realty | | | 68,575 | | | | 4,645,271 | |
SL Green Realty | | | 39,862 | | | | 4,612,033 | |
| | | | | | | | |
| | | | | | | 32,663,715 | |
| | | | | | | | |
Office/Industrial REITs – 4.47% | | | | | | | | |
CyrusOne | | | 50,000 | | | | 1,365,500 | |
Duke Realty | | | 336,300 | | | | 6,376,248 | |
Liberty Property Trust | | | 21,275 | | | | 739,732 | |
PS Business Parks | | | 34,429 | | | | 2,899,610 | |
| | | | | | | | |
| | | | | | | 11,381,090 | |
| | | | | | | | |
Self-Storage REITs – 4.68% | | | | | | | | |
Extra Space Storage | | | 34,994 | | | | 2,035,251 | |
Public Storage | | | 53,602 | | | | 9,880,993 | |
| | | | | | | | |
| | | | | | | 11,916,244 | |
| | | | | | | | |
Shopping Center REITs – 8.33% | | | | | | | | |
DDR | | | 325,675 | | | | 5,907,745 | |
Kimco Realty | | | 186,379 | | | | 4,650,156 | |
Kite Realty Group Trust | | | 73,400 | | | | 1,900,326 | |
Ramco-Gershenson Properties Trust | | | 171,300 | | | | 2,994,324 | |
Regency Centers | | | 94,319 | | | | 5,725,163 | |
| | | | | | | | |
| | | | | | | 21,177,714 | |
| | | | | | | | |
Single Tenant REIT – 1.38% | | | | | | | | |
Spirit Realty Capital | | | 295,611 | | | | 3,517,771 | |
| | | | | | | | |
| | | | | | | 3,517,771 | |
| | | | | | | | |
Specialty REITs – 0.86% | | | | | | | | |
American Residential Properties † | | | 80,849 | | | | 1,536,131 | |
EPR Properties | | | 11,500 | | | | 645,150 | |
| | | | | | | | |
| | | | | | | 2,181,281 | |
| | | | | | | | |
Total Common Stock (cost $207,031,292) | | | | | | | 245,493,058 | |
| | | | | | | | |
| | |
| | | Principal amount° | | | | |
Short-Term Investments – 2.53% | | | | | | | | |
Discount Notes – 1.15%≠ | | | | | | | | |
Federal Home Loan Bank | | | | | | | | |
0.025% 11/13/14 | | | 239,890 | | | | 239,889 | |
11
Schedule of investments
Delaware REIT Fund
| | | | | | | | |
| | | Principal amount° | | | Value (U.S. $) | |
Short-Term Investments (continued) | | | | | | | | |
Discount Notes ≠ (continued) | | | | | | | | |
Federal Home Loan Bank | | | | | | | | |
0.049% 11/19/14 | | | 1,498,869 | | | $ | 1,498,860 | |
0.077% 11/14/14 | | | 1,179,591 | | | | 1,179,587 | |
| | | | | | | | |
| | | | | | | 2,918,336 | |
| | | | | | | | |
Repurchase Agreements – 0.75% | | | | | | | | |
Bank of America Merrill Lynch | | | | | | | | |
0.06%, dated 10/31/14, to be repurchased on 11/3/14, repurchase price $611,715 (collateralized by U.S. government obligations 0.00%–2.75% 2/15/19–1/15/26 market value $623,946) | | | 611,712 | | | | 611,712 | |
Bank of Montreal | | | | | | | | |
0.07%, dated 10/31/14, to be repurchased on 11/3/14, repurchase price $101,953 (collateralized by U.S. government obligations 0.00%–11.25% 10/31/14–5/15/44 market value $103,991) | | | 101,952 | | | | 101,952 | |
BNP Paribas | | | | | | | | |
0.11%, dated 10/31/14, to be repurchased on 11/3/14, repurchase price $1,204,347 (collateralized by U.S. government obligations 0.00%–4.375% 8/31/15–11/15/42 market value $1,228,424) | | | 1,204,336 | | | | 1,204,336 | |
| | | | | | | | |
| | | | | | | 1,918,000 | |
| | | | | | | | |
U.S. Treasury Obligations – 0.63%≠ | | | | | | | | |
U.S. Treasury Bills | | | | | | | | |
0.005% 12/26/14 | | | 1,215,242 | | | | 1,215,224 | |
0.093% 11/13/14 | | | 384,076 | | | | 384,075 | |
| | | | | | | | |
| | | | | | | 1,599,299 | |
| | | | | | | | |
Total Short-Term Investments (cost $6,435,575) | | | | | | | 6,435,635 | |
| | | | | | | | |
Total Value of Securities – 99.02%
(cost $213,466,867) | | | | | | $ | 251,928,693 | |
| | | | | | | | |
| ≠ | The rate shown is the effective yield at the time of purchase. |
| ° | Principal amount shown is stated in U.S. dollars unless noted that the security is denominated in another currency. |
| † | Non-income-producing security. |
REIT – Real Estate Investment Trust
See accompanying notes, which are an integral part of the financial statements.
12
Statement of assets and liabilities
| | |
| Delaware REIT Fund | | October 31, 2014 |
| | | | |
Assets: | | | | |
Investments, at value1 | | $ | 245,493,058 | |
Short-term investments, at value2 | | | 6,435,635 | |
Cash | | | 160,183 | |
Receivable for securities sold | | | 4,815,102 | |
Receivable for fund shares sold | | | 2,130,503 | |
Dividends and interest receivable | | | 4,593 | |
| | | | |
Total assets | | | 259,039,074 | |
| | | | |
Liabilities: | | | | |
Payable for securities purchased | | | 3,966,630 | |
Payable for fund shares redeemed | | | 294,493 | |
Other accrued expenses | | | 155,260 | |
Investment management fees payable | | | 152,966 | |
Distribution fees payable to affiliates | | | 43,180 | |
Other affiliates payable | | | 14,684 | |
Trustees’ fees and expenses payable | | | 547 | |
| | | | |
Total liabilities | | | 4,627,760 | |
| | | | |
Total Net Assets | | $ | 254,411,314 | |
| | | | |
| |
Net Assets Consist of: | | | | |
Paid-in capital | | $ | 208,247,715 | |
Accumulated net realized gain on investments | | | 7,701,773 | |
Net unrealized appreciation of investments | | | 38,461,826 | |
| | | | |
Total Net Assets | | $ | 254,411,314 | |
| | | | |
13
| | | | |
Net Asset Value | | | | |
Class A: | | | | |
Net assets | | $ | 98,985,832 | |
Shares of beneficial interest outstanding, unlimited authorization, no par | | | 6,341,800 | |
Net asset value per share | | $ | 15.61 | |
Sales charge | | | 5.75 | % |
Offering price per share, equal to net asset value per share / (1 – sales charge) | | $ | 16.56 | |
| |
Class C: | | | | |
Net assets | | $ | 23,170,686 | |
Shares of beneficial interest outstanding, unlimited authorization, no par | | | 1,486,366 | |
Net asset value per share | | $ | 15.59 | |
| |
Class R: | | | | |
Net assets | | $ | 12,614,368 | |
Shares of beneficial interest outstanding, unlimited authorization, no par | | | 808,151 | |
Net asset value per share | | $ | 15.61 | |
| |
Institutional Class: | | | | |
Net assets | | $ | 119,640,428 | |
Shares of beneficial interest outstanding, unlimited authorization, no par | | | 7,648,201 | |
Net asset value per share | | $ | 15.64 | |
| |
1 Investments, at cost | | $ | 207,031,292 | |
| 2 Short-term investments, at cost | | | 6,435,575 | |
See accompanying notes, which are an integral part of the financial statements.
14
Statement of operations
| | |
| Delaware REIT Fund | | Year ended October 31, 2014 |
| | | | |
Investment Income: | | | | |
Dividends | | $ | 5,156,189 | |
Interest | | | 2,992 | |
| | | | |
| | | 5,159,181 | |
| | | | |
Expenses: | | | | |
Management fees | | | 1,739,610 | |
Distribution expenses – Class A | | | 226,080 | |
Distribution expenses – Class B* | | | 4,562 | |
Distribution expenses – Class C | | | 210,102 | |
Distribution expenses – Class R | | | 53,841 | |
Dividend disbursing and transfer agent fees and expenses | | | 406,213 | |
Reports and statements to shareholders | | | 104,958 | |
Registration fees | | | 94,291 | |
Accounting and administration expenses | | | 79,395 | |
Audit and tax | | | 32,026 | |
Legal fees | | | 20,963 | |
Custodian fees | | | 12,598 | |
Trustees’ fees and expenses | | | 11,079 | |
Other | | | 19,744 | |
| | | | |
| | | 3,015,462 | |
Less waived distribution expenses – Class B | | | (3,427 | ) |
Less expense paid indirectly | | | (203 | ) |
| | | | |
Total operating expenses | | | 3,011,832 | |
| | | | |
Net Investment Income | | | 2,147,349 | |
| | | | |
| |
Net Realized and Unrealized Gain: | | | | |
Net realized gain on investments | | | 14,342,077 | |
Net change in unrealized appreciation (depreciation) of investments | | | 23,485,829 | |
| | | | |
Net Realized and Unrealized Gain | | | 37,827,906 | |
| | | | |
Net Increase in Net Assets Resulting from Operations | | $ | 39,975,255 | |
| | | | |
*Effective Sept. 25, 2014, all remaining shares of Class B were converted to Class A shares.
See accompanying notes, which are an integral part of the financial statements.
15
Statements of changes in net assets
Delaware REIT Fund
| | | | | | | | |
| | �� | Year ended | |
| | | 10/31/14 | | | 10/31/13 | |
Increase (Decrease) in Net Assets from Operations: | | | | | | | | |
Net investment income | | $ | 2,147,349 | | | $ | 2,640,000 | |
Net realized gain | | | 14,342,077 | | | | 22,710,073 | |
Net change in unrealized appreciation (depreciation) | | | 23,485,829 | | | | (4,749,406 | ) |
| | | | | | | | |
Net increase in net assets resulting from operations | | | 39,975,255 | | | | 20,600,667 | |
| | | | | | | | |
| | |
Dividends and Distributions to Shareholders from: | | | | | | | | |
Net investment income: | | | | | | | | |
Class A | | | (1,608,611 | ) | | | (1,537,412 | ) |
Class B | | | (7,621 | ) | | | (10,085 | ) |
Class C | | | (220,273 | ) | | | (204,635 | ) |
Class R | | | (166,996 | ) | | | (152,568 | ) |
Institutional Class | | | (2,230,880 | ) | | | (2,061,079 | ) |
| | |
Net realized gain: | | | | | | | | |
Class A | | | (2,793,786 | ) | | | — | |
Class B | | | (18,951 | ) | | | — | |
Class C | | | (643,989 | ) | | | — | |
Class R | | | (309,110 | ) | | | — | |
Institutional Class | | | (3,303,719 | ) | | | — | |
| | | | | | | | |
| | | (11,303,936 | ) | | | (3,965,779 | ) |
| | | | | | | | |
| | |
Capital Share Transactions: | | | | | | | | |
Proceeds from shares sold: | | | | | | | | |
Class A | | | 19,218,001 | | | | 21,435,863 | |
Class B | | | 15 | | | | 4,815 | |
Class C | | | 3,276,207 | | | | 3,529,498 | |
Class R | | | 4,493,898 | | | | 3,988,597 | |
Institutional Class | | | 20,111,578 | | | | 22,651,709 | |
| | |
Net asset value of shares based upon reinvestment of dividends and distributions: | | | | | | | | |
Class A | | | 4,211,290 | | | | 1,459,400 | |
Class B | | | 26,418 | | | | 10,015 | |
Class C | | | 848,285 | | | | 200,037 | |
Class R | | | 471,716 | | | | 152,527 | |
Institutional Class | | | 5,509,412 | | | | 2,051,653 | |
| | | | | | | | |
| | | 58,166,820 | | | | 55,484,114 | |
| | | | | | | | |
16
| | | | | | | | |
| | | Year ended | |
| | | 10/31/14 | | | 10/31/13 | |
Capital Share Transactions (continued): | | | | | | | | |
Cost of shares redeemed: | | | | | | | | |
Class A | | $ | (26,964,999 | ) | | $ | (20,735,287 | ) |
Class B | | | (797,702 | ) | | | (1,242,967 | ) |
Class C | | | (4,586,951 | ) | | | (4,415,661 | ) |
Class R | | | (4,199,109 | ) | | | (3,779,165 | ) |
Institutional Class | | | (26,042,255 | ) | | | (27,498,734 | ) |
| | | | | | | | |
| | | (62,591,016 | ) | | | (57,671,814 | ) |
| | | | | | | | |
Decrease in net assets derived from capital share transactions | | | (4,424,196 | ) | | | (2,187,700 | ) |
| | | | | | | | |
Net Increase in Net Assets | | | 24,247,123 | | | | 14,447,188 | |
| | |
Net Assets: | | | | | | | | |
Beginning of year | | | 230,164,191 | | | | 215,717,003 | |
| | | | | | | | |
End of year (there was no undistributed net investment income at either year end) | | $ | 254,411,314 | | | $ | 230,164,191 | |
| | | | | | | | |
See accompanying notes, which are an integral part of the financial statements.
17
Financial highlights
Delaware REIT Fund Class A
Selected data for each share of the Fund outstanding throughout each period were as follows:
|
Net asset value, beginning of period |
|
Income from investment operations: |
Net investment income1 |
Net realized and unrealized gain |
Total from investment operations |
|
Less dividends and distributions from: |
Net investment income |
Net realized gain |
Total dividends and distributions |
|
Net asset value, end of period |
|
Total return2 |
|
Ratios and supplemental data: |
Net assets, end of period (000 omitted) |
Ratio of expenses to average net assets |
Ratio of expenses to average net assets prior to fees waived |
Ratio of net investment income to average net assets |
Ratio of net investment income to average net assets prior to fees waived |
Portfolio turnover |
| 1 | The average shares outstanding method has been applied for per share information. |
| 2 | Total investment return is based on the change in net asset value of a share during the period and assumes reinvestment of dividends and distributions at net asset value and does not reflect the impact of a sales charge. Total investment return during some of the periods shown reflects waivers by the manager and/or distributor. Performance would have been lower had the waivers not been in effect. |
See accompanying notes, which are an integral part of the financial statements.
18
| | | | | | | | | | | | | | | | | | | | |
| | | | | | | | | | | | | | | | |
| | | | | | | | | | | | | | | | |
| | | Year ended | |
| | | | |
| | | 10/31/14 | | | 10/31/13 | | | 10/31/12 | | | 10/31/11 | | | 10/31/10 | |
| |
| | $ | 13.870 | | | $ | 12.850 | | | $ | 11.530 | | | $ | 10.460 | | | $ | 7.630 | |
| | | | | |
| | | | | | | | | | | | | | | | | | | | |
| | | 0.125 | | | | 0.153 | | | | 0.122 | | | | 0.098 | | | | 0.131 | |
| | | 2.308 | | | | 1.100 | | | | 1.412 | | | | 1.145 | | | | 2.886 | |
| | | | | | | | | | | | | | | | | | | | |
| | | 2.433 | | | | 1.253 | | | | 1.534 | | | | 1.243 | | | | 3.017 | |
| | | | | | | | | | | | | | | | | | | | |
| | | | | |
| | | | | | | | | | | | | | | | | | | | |
| | | (0.254 | ) | | | (0.233 | ) | | | (0.214 | ) | | | (0.173 | ) | | | (0.187 | ) |
| | | (0.439 | ) | | | — | | | | — | | | | — | | | | — | |
| | | | | | | | | | | | | | | | | | | | |
| | | (0.693 | ) | | | (0.233 | ) | | | (0.214 | ) | | | (0.173 | ) | | | (0.187 | ) |
| | | | | | | | | | | | | | | | | | | | |
| | | | | |
| | $ | 15.610 | | | $ | 13.870 | | | $ | 12.850 | | | $ | 11.530 | | | $ | 10.460 | |
| | | | | | | | | | | | | | | | | | | | |
| | | | | |
| | | 18.53% | | | | 9.82% | | | | 13.38% | | | | 12.01% | | | | 39.84% | |
| | | | | |
| | | | | | | | | | | | | | | | | | | | |
| | $ | 98,986 | | | $ | 91,593 | | | $ | 83,114 | | | $ | 75,149 | | | $ | 82,646 | |
| | | 1.34% | | | | 1.31% | | | | 1.30% | | | | 1.51% | | | | 1.53% | |
| | | 1.34% | | | | 1.36% | | | | 1.35% | | | | 1.57% | | | | 1.62% | |
| | | 0.89% | | | | 1.11% | | | | 0.98% | | | | 0.89% | | | | 1.42% | |
| | | 0.89% | | | | 1.06% | | | | 0.93% | | | | 0.83% | | | | 1.33% | |
| | | | 83% | | | | 101% | | | | 87% | | | | 129% | | | | 175% | |
19
Financial highlights
Delaware REIT Fund Class C
Selected data for each share of the Fund outstanding throughout each period were as follows:
|
Net asset value, beginning of period |
|
Income from investment operations: |
Net investment income1 |
Net realized and unrealized gain |
Total from investment operations |
|
Less dividends and distributions from: |
Net investment income |
Net realized gain |
Total dividends and distributions |
|
Net asset value, end of period |
|
Total return2 |
|
Ratios and supplemental data: |
Net assets, end of period (000 omitted) |
Ratio of expenses to average net assets |
Ratio of expenses to average net assets prior to fees waived |
Ratio of net investment income to average net assets |
Ratio of net investment income to average net assets prior to fees waived |
Portfolio turnover |
| 1 | The average shares outstanding method has been applied for per share information. |
| 2 | Total investment return is based on the change in net asset value of a share during the period and assumes reinvestment of dividends and distributions at net asset value and does not reflect the impact of a sales charge. Total investment return during some of the periods shown reflects a waiver by the manager. Performance would have been lower had the waiver not been in effect. |
See accompanying notes, which are an integral part of the financial statements.
20
| | | | | | | | | | | | | | | | | | | | |
| | | | | | | | | | | | | | | | |
| | | | | | | | | | | | | | | | |
| | | Year ended | |
| | | | |
| | | 10/31/14 | | | 10/31/13 | | | 10/31/12 | | | 10/31/11 | | | 10/31/10 | |
| |
| | $ | 13.860 | | | $ | 12.830 | | | $ | 11.510 | | | $ | 10.450 | | | $ | 7.620 | |
| | | | | |
| | | | | | | | | | | | | | | | | | | | |
| | | 0.019 | | | | 0.050 | | | | 0.028 | | | | 0.015 | | | | 0.062 | |
| | | 2.299 | | | | 1.111 | | | | 1.415 | | | | 1.136 | | | | 2.887 | |
| | | | | | | | | | | | | | | | | | | | |
| | | 2.318 | | | | 1.161 | | | | 1.443 | | | | 1.151 | | | | 2.949 | |
| | | | | | | | | | | | | | | | | | | | |
| | | | | |
| | | | | | | | | | | | | | | | | | | | |
| | | (0.149 | ) | | | (0.131 | ) | | | (0.123 | ) | | | (0.091 | ) | | | (0.119 | ) |
| | | (0.439 | ) | | | — | | | | — | | | | — | | | | — | |
| | | | | | | | | | | | | | | | | | | | |
| | | (0.588 | ) | | | (0.131 | ) | | | (0.123 | ) | | | (0.091 | ) | | | (0.119 | ) |
| | | | | | | | | | | | | | | | | | | | |
| | | | | |
| | $ | 15.590 | | | $ | 13.860 | | | $ | 12.830 | | | $ | 11.510 | | | $ | 10.450 | |
| | | | | | | | | | | | | | | | | | | | |
| | | | | |
| | | 17.68% | | | | 9.00% | | | | 12.57% | | | | 11.08% | | | | 38.88% | |
| | | | | |
| | | | | | | | | | | | | | | | | | | | |
| | $ | 23,171 | | | $ | 21,083 | | | $ | 20,198 | | | $ | 18,345 | | | $ | 18,713 | |
| | | 2.09% | | | | 2.06% | | | | 2.05% | | | | 2.26% | | | | 2.28% | |
| | | 2.09% | | | | 2.06% | | | | 2.05% | | | | 2.27% | | | | 2.32% | |
| | | 0.14% | | | | 0.36% | | | | 0.23% | | | | 0.14% | | | | 0.67% | |
| | | 0.14% | | | | 0.36% | | | | 0.23% | | | | 0.13% | | | | 0.63% | |
| | | | 83% | | | | 101% | | | | 87% | | | | 129% | | | | 175% | |
21
Financial highlights
Delaware REIT Fund Class R
Selected data for each share of the Fund outstanding throughout each period were as follows:
|
Net asset value, beginning of period |
|
Income from investment operations: |
Net investment income1 |
Net realized and unrealized gain |
Total from investment operations |
|
Less dividends and distributions from: |
Net investment income |
Net realized gain |
Total dividends and distributions |
|
Net asset value, end of period |
|
Total return2 |
|
Ratios and supplemental data: |
Net assets, end of period (000 omitted) |
Ratio of expenses to average net assets |
Ratio of expenses to average net assets prior to fees waived |
Ratio of net investment income to average net assets |
Ratio of net investment income to average net assets prior to fees waived |
Portfolio turnover |
| 1 | The average shares outstanding method has been applied for per share information. |
| 2 | Total investment return is based on the change in net asset value of a share during the period and assumes reinvestment of dividends and distributions at net asset value. Total investment return during some of the periods shown reflects waivers by the manager and/or distributor. Performance would have been lower had the waivers not been in effect. |
See accompanying notes, which are an integral part of the financial statements.
22
| | | | | | | | | | | | | | | | | | | | |
| | | | | | | | | | | | | | | | |
| | | | | | | | | | | | | | | | |
| | | Year ended | |
| | | | |
| | | 10/31/14 | | | 10/31/13 | | | 10/31/12 | | | 10/31/11 | | | 10/31/10 | |
| |
| | $ | 13.870 | | | $ | 12.850 | | | $ | 11.530 | | | $ | 10.460 | | | $ | 7.630 | |
| | | | | |
| | | | | | | | | | | | | | | | | | | | |
| | | 0.091 | | | | 0.119 | | | | 0.091 | | | | 0.071 | | | | 0.109 | |
| | | 2.307 | | | | 1.100 | | | | 1.412 | | | | 1.145 | | | | 2.885 | |
| | | | | | | | | | | | | | | | | | | | |
| | | 2.398 | | | | 1.219 | | | | 1.503 | | | | 1.216 | | | | 2.994 | |
| | | | | | | | | | | | | | | | | | | | |
| | | | | |
| | | | | | | | | | | | | | | | | | | | |
| | | (0.219 | ) | | | (0.199 | ) | | | (0.183 | ) | | | (0.146 | ) | | | (0.164 | ) |
| | | (0.439 | ) | | | — | | | | — | | | | — | | | | — | |
| | | | | | | | | | | | | | | | | | | | |
| | | (0.658 | ) | | | (0.199 | ) | | | (0.183 | ) | | | (0.146 | ) | | | (0.164 | ) |
| | | | | | | | | | | | | | | | | | | | |
| | | | | |
| | $ | 15.610 | | | $ | 13.870 | | | $ | 12.850 | | | $ | 11.530 | | | $ | 10.460 | |
| | | | | | | | | | | | | | | | | | | | |
| | | | | |
| | | 18.24% | | | | 9.54% | | | | 13.09% | | | | 11.73% | | | | 39.50% | |
| | | | | |
| | | | | | | | | | | | | | | | | | | | |
| | $ | 12,614 | | | $ | 10,503 | | | $ | 9,446 | | | $ | 6,368 | | | $ | 5,680 | |
| | | 1.59% | | | | 1.56% | | | | 1.55% | | | | 1.76% | | | | 1.78% | |
| | | 1.59% | | | | 1.65% | | | | 1.65% | | | | 1.87% | | | | 1.92% | |
| | | 0.64% | | | | 0.86% | | | | 0.73% | | | | 0.64% | | | | 1.17% | |
| | | 0.64% | | | | 0.77% | | | | 0.63% | | | | 0.53% | | | | 1.03% | |
| | | | 83% | | | | 101% | | | | 87% | | | | 129% | | | | 175% | |
23
Financial highlights
Delaware REIT Fund Institutional Class
Selected data for each share of the Fund outstanding throughout each period were as follows:
|
Net asset value, beginning of period |
|
Income from investment operations: |
Net investment income1 |
Net realized and unrealized gain |
Total from investment operations |
|
Less dividends and distributions from: |
Net investment income |
Net realized gain |
Total dividends and distributions |
|
Net asset value, end of period |
|
Total return2 |
|
Ratios and supplemental data: |
Net assets, end of period (000 omitted) |
Ratio of expenses to average net assets |
Ratio of expenses to average net assets prior to fees waived |
Ratio of net investment income to average net assets |
Ratio of net investment income to average net assets prior to fees waived |
Portfolio turnover |
| 1 | The average shares outstanding method has been applied for per share information. |
| 2 | Total investment return is based on the change in net asset value of a share during the period and assumes reinvestment of dividends and distributions at net asset value. Total investment return during some of the periods shown reflects a waiver by the manager. Performance would have been lower had the waiver not been in effect. |
See accompanying notes, which are an integral part of the financial statements.
24
| | | | | | | | | | | | | | | | | | | | |
| | | | | | | | | | | | | | | | |
| | | | | | | | | | | | | | | | |
| | | Year ended | |
| | | | |
| | | 10/31/14 | | | 10/31/13 | | | 10/31/12 | | | 10/31/11 | | | 10/31/10 | |
| |
| | $ | 13.900 | | | $ | 12.880 | | | $ | 11.550 | | | $ | 10.480 | | | $ | 7.640 | |
| | | | | |
| | | | | | | | | | | | | | | | | | | | |
| | | 0.161 | | | | 0.188 | | | | 0.153 | | | | 0.127 | | | | 0.155 | |
| | | 2.308 | | | | 1.099 | | | | 1.422 | | | | 1.144 | | | | 2.893 | |
| | | | | | | | | | | | | | | | | | | | |
| | | 2.469 | | | | 1.287 | | | | 1.575 | | | | 1.271 | | | | 3.048 | |
| | | | | | | | | | | | | | | | | | | | |
| | | | | |
| | | | | | | | | | | | | | | | | | | | |
| | | (0.290 | ) | | | (0.267 | ) | | | (0.245 | ) | | | (0.201 | ) | | | (0.208 | ) |
| | | (0.439 | ) | | | — | | | | — | | | | — | | | | — | |
| | | | | | | | | | | | | | | | | | | | |
| | | (0.729 | ) | | | (0.267 | ) | | | (0.245 | ) | | | (0.201 | ) | | | (0.208 | ) |
| | | | | | | | | | | | | | | | | | | | |
| | | | | |
| | $ | 15.640 | | | $ | 13.900 | | | $ | 12.880 | | | $ | 11.550 | | | $ | 10.480 | |
| | | | | | | | | | | | | | | | | | | | |
| | | | | |
| | | 18.80% | | | | 10.07% | | | | 13.72% | | | | 12.27% | | | | 40.23% | |
| | | | | |
| | | | | | | | | | | | | | | | | | | | |
| | $ | 119,640 | | | $ | 106,221 | | | $ | 101,102 | | | $ | 98,003 | | | $ | 96,243 | |
| | | 1.09% | | | | 1.06% | | | | 1.05% | | | | 1.26% | | | | 1.28% | |
| | | 1.09% | | | | 1.06% | | | | 1.05% | | | | 1.27% | | | | 1.32% | |
| | | 1.14% | | | | 1.36% | | | | 1.23% | | | | 1.14% | | | | 1.67% | |
| | | 1.14% | | | | 1.36% | | | | 1.23% | | | | 1.13% | | | | 1.63% | |
| | | | 83% | | | | 101% | | | | 87% | | | | 129% | | | | 175% | |
25
| | |
Notes to financial statements | | |
| Delaware REIT Fund | | October 31, 2014 |
The Real Estate Investment Trust Portfolio (Delaware REIT Fund or Fund) is a series of Delaware Pooled® Trust (Trust), which is organized as a Delaware statutory trust. The Trust is an open-end investment company. The Fund is considered nondiversified under the Investment Company Act of 1940, as amended, and offers Class A, Class C, Class R, and Institutional Class shares. Class A shares are sold with a maximum front-end sales charge of 5.75%. Class A share purchases of $1,000,000 or more will incur a contingent deferred sales charge (CDSC) of 1.00% if redeemed during the first year and 0.50% during the second year, provided that Delaware Distributors, L.P. (DDLP) paid a financial advisor a commission on the purchase of those shares. Effective Sept. 25, 2014, all remaining shares of Class B were converted to Class A shares. Prior to Sept. 25, 2014, Class B shares could be purchased only through dividend reinvestment and certain permitted exchanges. Prior to June 1, 2007, Class B shares were sold with a CDSC that declined from 4.00% to zero depending upon the period of time the shares were held. Class B shares automatically converted to Class A shares on a quarterly basis approximately eight years after purchase. Class C shares are sold with a CDSC of 1.00%, if redeemed during the first 12 months. Class R and Institutional Class shares are not subject to a sales charge and are offered for sale exclusively to certain eligible investors. This report contains information relating only to Delaware REIT Fund. All other Delaware Pooled Trust Portfolios are included in a separate report.
The investment objectives of the Fund are to seek maximum long-term total return, with capital appreciation as a secondary objective. It seeks to achieve its objectives by investing primarily in securities of companies principally engaged in the real estate industry.
1. Significant Accounting Policies
The following accounting policies are in accordance with U.S. generally accepted accounting principles (U.S. GAAP) and are consistently followed by the Fund.
Security Valuation — Equity securities, except those traded on the Nasdaq Stock Market, Inc. (Nasdaq), are valued at the last quoted sales price as of the time of the regular close of the New York Stock Exchange on the valuation date. Securities traded on the Nasdaq are valued in accordance with the Nasdaq Official Closing Price, which may not be the last sales price. If, on a particular day, an equity security does not trade, then the mean between the bid and ask prices will be used, which approximates fair value. U.S. government and agency securities are valued at the mean between the bid and ask prices, which approximates fair value. Generally, other securities and assets for which market quotations are not readily available are valued at fair value as determined in good faith under the direction of the Fund’s Board of Trustees (Board). In determining whether market quotations are readily available or fair valuation will be used, various factors will be taken into consideration, such as market closures or suspension of trading in a security.
Federal Income Taxes — No provision for federal income taxes has been made as the Fund intends to continue to qualify for federal income tax purposes as a regulated investment company under Subchapter M of the Internal Revenue Code of 1986, as amended, and make the requisite distributions to shareholders. The Fund evaluates tax positions taken or expected to be taken in the course of preparing the Fund’s tax returns to determine whether the tax positions are “more-likely-than-not” of being sustained by the applicable tax authority. Tax positions not deemed to meet the “more-likely-than-not” threshold are recorded as a tax benefit or expense in the current year. Management has analyzed
26
the Fund’s tax positions taken for all open federal income tax years (Oct. 31, 2011-0ct. 31, 2014), and has concluded that no provision for federal income tax is required in the Fund’s financial statements.
Class Accounting — Investment income, common expenses, and realized and unrealized gain (loss) on investments are allocated to the various classes of the Fund on the basis of daily net assets of each class. Distribution expenses relating to a specific class are charged directly to that class.
Repurchase Agreements — The Fund may purchase certain U.S. government securities subject to the counterparty’s agreement to repurchase them at an agreed upon date and price. The counterparty will be required on a daily basis to maintain the value of the collateral subject to the agreement at not less than the repurchase price (including accrued interest). The agreements are conditioned upon the collateral being deposited under the Federal Reserve book-entry system with the Fund’s custodian or a third-party sub-custodian. In the event of default or bankruptcy by the other party to the agreement, retention of the collateral may be subject to legal proceedings. All open repurchase agreements as of the date of this report were entered into on Oct. 31, 2014.
Use of Estimates — The preparation of financial statements in conformity with U.S. GAAP requires management to make estimates and assumptions that affect the fair value of investments, the reported amounts of assets and liabilities and disclosure of contingent assets and liabilities at the date of the financial statements, and the reported amounts of revenues and expenses during the reporting period. Actual results could differ from those estimates and the differences could be material.
Other — Expenses directly attributable to the Fund are charged directly to the Fund. Other expenses common to various funds within the Delaware Investments® Family of Funds are generally allocated among such funds on the basis of average net assets. Management fees and some other expenses are paid monthly. Security transactions are recorded on the date the securities are purchased or sold (trade date) for financial reporting purposes. Costs used in calculating realized gains and losses on the sale of investment securities are those of the specific securities sold. Dividend income is recorded on the ex-dividend date and interest income is recorded on the accrual basis. Distributions received from investments in Real Estate Investment Trusts (REITs) are recorded as dividend income on the ex-dividend date, subject to reclassification upon notice of the character of such distributions by the issuer. The financial statements reflect an estimate of the reclassification of the distribution character. The Fund declares and pays dividends from net investment income quarterly and net realized gain on investments, if any, annually. The Fund may distribute more frequently, if necessary for tax purposes. Dividends and distributions, if any, are recorded on the ex-dividend date.
Subject to seeking best execution, the Fund may direct certain security trades to brokers who have agreed to rebate a portion of the related brokerage commission to the Fund in cash. In general, best execution refers to many factors, including the price paid or received for a security, the commission charged, the promptness and reliability of execution, the confidentiality and placement accorded the order, and other factors affecting the overall benefit obtained by the Fund on the transaction. There were no commission rebates for the year ended Oct. 31, 2014.
The Fund may receive earnings credits from its custodian when positive cash balances are maintained, which may be used to offset custody fees. There were no earnings credits for the year ended Oct. 31, 2014.
27
Notes to financial statements
Delaware REIT Fund
1. Significant Accounting Policies (continued)
The Fund receives earnings credits from its transfer agent when positive cash balances are maintained, which may be used to offset transfer agent fees. If the amount earned is greater than one dollar, the expense paid under this arrangement is included on the “Statement of operations” under “Dividend disbursing and transfer agent fees and expenses” with the corresponding expense offset shown under “Less expense paid indirectly.” For the year ended Oct. 31, 2014, the Fund earned $203 under this agreement.
2. Investment Management, Administration Agreements and Other Transactions with Affiliates
In accordance with the terms of its investment management agreement, the Fund pays Delaware Management Company (DMC), a series of Delaware Management Business Trust and the investment manager, an annual fee which is calculated daily at the rate of 0.75% on the first $500 million of the average daily net assets of the Fund; 0.70% on the next $500 million; 0.65% on the next $1.5 billion; and 0.60% on average daily net assets in excess of $2.5 billion.
Prior to Feb. 28, 2014, DMC had contractually agreed to waive that portion, if any, of its management fee and reimbursed the Fund to the extent necessary to ensure that total annual operating expenses (excluding any 12b-1 fees, taxes, interest, inverse floater program expenses, short sales and dividend interest expenses, brokerage fees, certain insurance costs, acquired fund fees and expenses, and nonroutine expenses or costs, including, but not limited to, those relating to reorganizations, litigation, conducting shareholder meetings, and liquidations, (collectively nonroutine expenses)) did not exceed 1.25% of the Fund’s average daily net assets. For purposes of this waiver and reimbursement, nonroutine expenses may also include such additional costs and expenses as may be agreed upon from time to time by the Fund’s Board and DMC. This expense waiver and reimbursement applied only to expenses paid directly by the Fund.
Delaware Service Company, Inc. (DSC), an affiliate of DMC, provides fund accounting and financial administration oversight services to the Fund. For these services, the Fund pays DSC fees based on the aggregate daily net assets of the Delaware Investments® Family of Funds at the following annual rate: 0.0050% on the first $30 billion; 0.0045% on the next $10 billion; 0.0040% on the next $10 billion; and 0.0025% on aggregate average daily net assets in excess of $50 billion. The fees payable to DSC under the service agreement described above are allocated among all Funds in the Delaware Investments Family of Funds on a relative net asset value basis. For the year ended Oct. 31, 2014, the Fund was charged $11,133 for these services. This amount is included on the “Statement of operations” under “Accounting and administration expenses.”
DSC is also the transfer agent and dividend disbursing agent of the Fund. For these services, the Fund pays DSC fees based on the aggregate daily net assets of the retail funds within the Delaware Investments Family of Funds at the following annual rate: 0.025% on the first $20 billion; 0.020% on the next $5 billion; 0.015% on the next $5 billion; and 0.013% on average daily net assets in excess of $30 billion. This amount is included on the “Statement of operations” under “Dividend disbursing and transfer agent fees and expenses.” For the year ended Oct. 31, 2014, the amount charged by DSC was $50,291. Pursuant to a sub-transfer agency agreement between DSC and BNY Mellon Investment Servicing (US) Inc. (BNYMIS), BNYMIS provides certain sub-transfer agency services to the Fund. Sub-transfer agency fees are passed on to and paid directly by the Fund.
28
Pursuant to a distribution agreement and distribution plan, the Fund pays DDLP, the distributor and an affiliate of DMC, an annual distribution and service fee of 0.25% of the average daily net assets of the Class A shares, 1.00% of the average daily net assets of the Class B and Class C shares, and 0.50% of the average daily net assets of the Class R shares. Institutional Class shares pay no distribution and service fee. DDLP had contracted to waive distribution and service fee in order to limit distribution and service fee of Class B shares to 0.25% of the average daily net assets.
As provided in the investment management agreement, the Fund bears a portion of the cost of certain resources shared with DMC, including the cost of internal personnel of DMC and/or its affiliates that provide legal, tax, and regulatory reporting services to the Fund. For the year ended Oct. 31, 2014, the Fund was charged $6,497 for internal legal, tax, and regulatory reporting services provided by DMC and/or its affiliates’ employees. This amount is included on the “Statement of operations” under “Legal fees.”
For the year ended Oct. 31, 2014, DDLP earned $13,176 for commissions on sales of the Fund’s Class A shares. For the year ended Oct. 31, 2014, DDLP received gross CDSC commissions of $91 and $189 on redemptions of the Fund’s Class A and Class C shares, respectively, and these commissions were entirely used to offset upfront commissions previously paid by DDLP to broker/dealers on sales of those shares.
Trustees’ fees include expenses accrued by the Fund for each Trustee’s retainer and meeting fees. Certain officers of DMC, DSC, and DDLP are officers and/or Trustees of the Trust. These officers and Trustees are paid no compensation by the Fund.
3. Investments
For the year ended Oct. 31, 2014, the Fund made purchases and sales of investment securities other than short-term investments as follows:
| | | | |
Purchases | | $ | 188,145,563 | |
Sales | | $ | 199,670,869 | |
At Oct. 31, 2014, the cost of investments and unrealized appreciation (depreciation) for federal income tax purposes were as follows:
| | | | |
Cost of investments | | $ | 217,155,455 | |
| | | | |
Aggregate unrealized appreciation | | $ | 38,641,545 | |
Aggregate unrealized depreciation | | | (3,868,307 | ) |
| | | | |
Net unrealized appreciation | | $ | 34,773,238 | |
| | | | |
U.S. GAAP defines fair value as the price that the Fund would receive to sell an asset or pay to transfer a liability in an orderly transaction between market participants at the measurement date under current market conditions. A three-level hierarchy for fair value measurements has been established based upon the transparency of inputs to the valuation of an asset or liability. Inputs may be observable or unobservable and refer broadly to the assumptions that market participants would use in pricing the asset or liability. Observable inputs reflect the assumptions market participants would use in pricing the asset or liability based on market data obtained from sources independent of the reporting entity. Unobservable inputs reflect the reporting entity’s own assumptions about the assumptions that market participants would use in pricing the asset or liability developed based on the best information available
29
Notes to financial statements
Delaware REIT Fund
3. Investments (continued)
under the circumstances. The Fund’s investment in its entirety is assigned a level based upon the observability of the inputs which are significant to the overall valuation. The three-level hierarchy of inputs is summarized below.
Level 1 – Inputs are quoted prices in active markets for identical investments. (Examples: equity securities, open-end investment companies, futures contracts, exchange-traded options contracts)
Level 2 – Other observable inputs, including, but not limited to: quoted prices for similar assets or liabilities in markets that are active, quoted prices for identical or similar assets or liabilities in markets that are not active, inputs other than quoted prices that are observable for the assets or liabilities (such as interest rates, yield curves, volatilities, prepayment speeds, loss severities, credit risks, and default rates) or other market-corroborated inputs. (Examples: debt securities, government securities, swap contracts, foreign currency exchange contracts, foreign securities utilizing international fair value pricing, broker-quoted securities, fair valued securities)
Level 3 – Significant unobservable inputs, including the Fund’s own assumptions used to determine the fair value of investments. (Examples: broker-quoted securities, fair valued securities)
Level 3 investments are valued using significant unobservable inputs. The Fund may also use an income-based valuation approach in which the anticipated future cash flows of the investment are discounted to calculate fair value. Discounts may also be applied due to the nature or duration of any restrictions on the disposition of the investments. Valuations may also be based upon current market prices of securities that are comparable in coupon, rating, maturity, and industry. The derived value of a Level 3 investment may not represent the value which is received upon disposition and this could impact the results of operations.
The following table summarizes the valuation of the Fund’s investments by fair value hierarchy levels as of Oct. 31, 2014:
| | | | | | | | | | | | |
| | | Level 1 | | | Level 2 | | | Total | |
Common Stock | | $ | 245,493,058 | | | $ | — | | | $ | 245,493,058 | |
Short-Term Investments | | | — | | | | 6,435,635 | | | | 6,435,635 | |
| | | | | | | | | | | | |
Total | | $ | 245,493,058 | | | $ | 6,435,635 | | | $ | 251,928,693 | |
| | | | | | | | | | | | |
During the year ended Oct. 31, 2014, there were no transfers between Level 1 investments, Level 2 investments, or Level 3 investments that had a significant impact to the Fund. The Fund’s policy is to recognize transfers between levels at the beginning of the reporting period.
A reconciliation of Level 3 investments is presented when the Fund has a significant amount of Level 3 investments at the beginning, interim, or end of the period in relation to net assets. At Oct. 31, 2014, there were no Level 3 investments.
4. Dividends and Distribution Information
Income and long-term capital gain distributions are determined in accordance with federal income tax regulations, which may differ from U.S. GAAP. Additionally, distributions from net short-term gains on
30
sales of investment securities are treated as ordinary income for federal income tax purposes. The tax character of dividends and distributions paid during the years ended Oct. 31, 2014 and 2013 was as follows:
| | | | | | | | |
| | | Year ended | |
| | | 10/31/14 | | | 10/31/13 | |
Ordinary income | | $ | 4,234,381 | | | $ | 2,399,906 | |
Long-term capital gains | | | 7,069,555 | | | | 1,565,873 | |
| | | | | | | | |
Total | | $ | 11,303,936 | | | $ | 3,965,779 | |
| | | | | | | | |
5. Components of Net Assets on a Tax Basis
As of Oct. 31, 2014, the components of net assets on a tax basis were as follows:
| | | | |
Shares of beneficial interest | | $ | 208,247,715 | |
*Undistributed ordinary income | | | 426,452 | |
*Undistributed long-term capital gains | | | 10,963,909 | |
Unrealized appreciation | | | 34,773,238 | |
| | | | |
Net assets | | $ | 254,411,314 | |
| | | | |
*The undistributed earnings for the Fund are estimated pending final notification of the tax character of distributions received from investments in REITs.
The differences between book basis and tax basis components of net assets are primarily attributable to tax deferral of losses on wash sales.
For financial reporting purposes, capital accounts are adjusted to reflect the tax character of permanent book/tax differences. Reclassifications are primarily due to dividends and distributions and tax treatment of REIT adjustments. Results of operations and net assets were not affected by these reclassifications. For the year ended Oct. 31, 2014, the Fund recorded the following reclassifications:
| | | | |
Undistributed net investment income | | $ | 2,087,032 | |
Accumulated net realized gain | | | (2,087,032 | ) |
31
Notes to financial statements
Delaware REIT Fund
6. Capital Shares
Transactions in capital shares were as follows:
| | | | | | | | |
| | | Year ended | |
| | | 10/31/14 | | | 10/31/13 | |
Shares sold: | | | | | | | | |
Class A | | | 1,340,926 | | | | 1,536,686 | |
Class B | | | 1 | | | | 328 | |
Class C | | | 228,822 | | | | 254,572 | |
Class R | | | 316,050 | | | | 289,140 | |
Institutional Class | | | 1,429,626 | | | | 1,646,756 | |
| | |
Shares issued upon reinvestment of dividends and distributions: | | | | | | | | |
Class A | | | 319,834 | | | | 108,277 | |
Class B | | | 2,028 | | | | 744 | |
Class C | | | 64,991 | | | | 14,834 | |
Class R | | | 35,837 | | | | 11,310 | |
Institutional Class | | | 416,035 | | | | 151,935 | |
| | | | | | | | |
| | | 4,154,150 | | | | 4,014,582 | |
| | | | | | | | |
| | |
Shares redeemed: | | | | | | | | |
Class A | | | (1,921,542 | ) | | | (1,509,862 | ) |
Class B | | | (57,147 | ) | | | (90,700 | ) |
Class C | | | (329,125 | ) | | | (321,375 | ) |
Class R | | | (300,856 | ) | | | (278,395 | ) |
Institutional Class | | | (1,838,197 | ) | | | (2,008,321 | ) |
| | | | | | | | |
| | | (4,446,867 | ) | | | (4,208,653 | ) |
| | | | | | | | |
Net decrease | | | (292,717 | ) | | | (194,071 | ) |
| | | | | | | | |
For the years ended Oct. 31, 2014 and 2013, 25,030 Class B shares were converted to 25,009 Class A shares valued at $352,617 and 23,638 Class B shares were converted to 23,575 Class A shares valued at $324,264, respectively. The respective amounts are included in Class B redemptions and Class A subscriptions in the table above and the “Statements of changes in net assets.”
7. Line of Credit
The Fund, along with certain other funds in the Delaware Investments® Family of Funds (Participants), was a participant in a $125,000,000 revolving line of credit to be used for temporary or emergency purposes as an additional source of liquidity to fund redemptions of investor shares. Under the agreement, the Participants were charged an annual commitment fee of 0.08%, which was allocated across the Participants on the basis of each Participant’s allocation of the entire facility. The Participants were permitted to borrow up to a maximum of one third of their net assets under the agreement. Each Participant was individually, and not jointly, liable for its particular advances, if any, under the line of credit. The line of credit under the agreement expired on Nov. 12, 2013.
32
On Nov. 12, 2013, the Fund, along with the other Participants, entered into an amendment to the agreement for a $225,000,000 revolving line of credit. The line of credit is to be used as described above and operates in substantially the same manner as the original agreement. The line of credit available under the agreement expired on Nov. 10, 2014.
The Fund had no amounts outstanding as of Oct. 31, 2014, or at any time during the year then ended.
8. Offsetting
In December 2011, the Financial Accounting Standards Board (FASB) issued guidance that expands disclosure requirements on the offsetting of certain assets and liabilities. The disclosures are required for investments and derivative financial instruments subject to master netting or similar agreements which are eligible for offset on the “Statement of assets and liabilities” and require an entity to disclose both gross and net information about such investments and transactions in the financial statements. In January 2013, the FASB issued guidance that clarifies which investments and transactions are subject to the offsetting disclosure requirements. The scope of the disclosure requirements for offsetting is limited to derivative instruments, repurchase agreements and reverse repurchase agreements, and securities borrowing. The guidance is effective for financial statements with fiscal years beginning on or after Jan. 1, 2013, and interim periods within those fiscal years. The Fund adopted the disclosure provisions on offsetting during the current reporting period.
In order to better define its contractual rights and to secure rights that will help the Fund mitigate its counterparty risk, the Fund entered into an International Swaps and Derivatives Association, Inc. Master Agreement (ISDA Master Agreement) or a similar agreement with each of its derivative contract counterparties. An ISDA Master Agreement is a bilateral agreement between the Fund and a counterparty that governs over-the-counter (OTC) derivatives and foreign exchange contracts and typically contains, among other things, collateral posting items and netting provisions in the event of a default and/or termination event. Under an ISDA Master Agreement, the Fund may, under certain circumstances, offset with the counterparty certain derivative financial instruments’ payables and/or receivables with collateral held and/or posted and create one single net payment. The provisions of the ISDA Master Agreement typically permit a single net payment in the event of default (close-out) netting including the bankruptcy or insolvency of the counterparty. However, bankruptcy or insolvency laws of a particular jurisdiction may impose restrictions on or prohibitions against the right of offset in bankruptcy, insolvency or other events.
For financial reporting purposes, the Fund does not offset derivative assets and derivative liabilities that are subject to netting arrangements on the “Statement of assets and liabilities.”
33
Notes to financial statements
Delaware REIT Fund
8. Offsetting (continued)
At Oct. 31, 2014, the Fund had the following assets and liabilities subject to offsetting provisions:
Master Repurchase Agreements
| | | | | | | | | | | | | | | | | | | | |
| Counterparty | | Repurchase Agreements | | Fair Value of Non-Cash Collateral Received | | Cash Collateral
Received | | Net Amount(a) |
Bank of America Merrill Lynch | | | | $ 611,712 | | | | | $ (611,712 | ) | | | $ | — | | | | | $— | |
Bank of Montreal | | | | 101,952 | | | | | (101,952 | ) | | | | — | | | | | — | |
BNP Paribas | | | | 1,204,336 | | | | | (1,204,336 | ) | | | | — | | | | | — | |
| | | | | | | | | | | | | | | | | | | | |
Total | | | | $1,918,000 | | | | | $ (1,918,000 | ) | | | $ | — | | | | | $— | |
| | | | | | | | | | | | | | | | | | | | |
(a)Net amount represents the receivable/(payable) that would be due from/(to) the counterparty in the event of default.
9. Securities Lending
The Fund, along with other funds in the Delaware Investments® Family of Funds, may lend its securities pursuant to a security lending agreement (Lending Agreement) with The Bank of New York Mellon (BNY Mellon). At the time a security is loaned, the borrower must post collateral equal to the required percentage of the market value of the loaned security, including any accrued interest. The required percentage is: (1) 102% with respect to U.S. securities and foreign securities that are denominated and payable in U.S. dollars; and (2) 105% with respect to foreign securities. With respect to each loan, if on any business day the aggregate market value of securities collateral plus cash collateral held is less than the aggregate market value of the securities which are the subject of such loan, the borrower will be notified to provide additional collateral by the end of the following business day which, together with the collateral already held, will be not less than the applicable initial collateral requirements for such security loan. If the aggregate market value of securities collateral and cash collateral held with respect to a security loan exceeds the applicable initial collateral requirement, upon the request of the borrower, BNY Mellon must return enough collateral to the borrower by the end of the following business day to reduce the value of the remaining collateral to the applicable initial collateral requirement for such security loan. As a result of the foregoing, the value of the collateral held with respect to a loaned security on any particular day may be more or less than the value of the security on loan.
Cash collateral received is generally invested in the Delaware Investments Collateral Fund No. 1 (Collective Trust) established by BNY Mellon for the purpose of investment on behalf of funds managed by DMC that participate in BNY Mellon’s securities lending program. The Collective Trust may invest in U.S. government securities and high-quality corporate debt, asset-backed and other money market securities, and in repurchase agreements collateralized by such securities, provided that the Collective Trust will generally have a dollar-weighted average portfolio maturity of 60 days or less. The Fund can also accept U.S. government securities and letters of credit (non-cash collateral) in connection with securities loans. In the event of default or bankruptcy by the lending agent, realization and/or retention of the collateral may be subject to legal proceedings. In the event the borrower fails to return the loaned securities and the collateral received is insufficient to cover the value of the loaned securities and provided such collateral shortfall is not the result of investment losses, the lending agent has agreed to
34
pay the amount of the shortfall to the Fund or, at the discretion of the lending agent, replace the loaned securities. The Fund continues to record dividends or interest, as applicable, on the securities loaned and is subject to changes in value of the securities loaned that may occur during the term of the loan. The Fund has the right under the Lending Agreement to recover the securities from the borrower on demand. With respect to security loans collateralized by non-cash collateral, the Fund receives loan premiums paid by the borrower. With respect to security loans collateralized by cash collateral, the earnings from the collateral investments are shared among the Fund, the security lending agent and the borrower. The Fund records security lending income net of allocations to the security lending agent and the borrower.
The Collective Trust used for the investment of cash collateral received from borrowers of securities seeks to maintain a net asset value per unit of $1.00, but there can be no assurance that it will always be able to do so. The Fund may incur investment losses as a result of investing securities lending collateral in the Collective Trust. This could occur if an investment in the Collective Trust defaulted or if it were necessary to liquidate assets in the Collective Trust to meet returns on outstanding security loans at a time when the Collective Trust’s net asset value per unit was less than $1.00. Under those circumstances, the Fund may not receive an amount from the Collective Trust that is equal in amount to the collateral the Fund would be required to return to the borrower of the securities and the Fund would be required to make up for this shortfall.
During the year ended Oct. 31, 2014, the Fund had no securities out on loan.
10. Credit and Market Risk
The Fund concentrates its investments in the real estate industry and is subject to the risks associated with that industry. If the Fund holds real estate directly as a result of defaults or receives rental income directly from real estate holdings, its tax status as a regulated investment company may be jeopardized. The Fund is also affected by interest rate changes, particularly if the REITs it holds use floating rate debt to finance their ongoing operations. Its investments may also tend to fluctuate more in value than a portfolio that invests in a broader range of industries.
The Fund may invest up to 15% of its net assets in illiquid securities, which may include securities with contractual restrictions on resale, securities exempt from registration under Rule 144A of the Securities Act of 1933, as amended, and other securities which may not be readily marketable. The relative illiquidity of these securities may impair the Fund from disposing of them in a timely manner and at a fair price when it is necessary or desirable to do so. While maintaining oversight, the Fund’s Board has delegated to DMC, the day-to-day functions of determining whether individual securities are liquid for purposes of the Fund’s limitation on investments in illiquid securities. Securities eligible for resale pursuant to Rule 144A, which are determined to be liquid, are not subject to the Fund’s 15% limit on investments in illiquid securities. As of Oct. 31, 2014, there were no Rule 144A securities held by the Fund and no securities have been determined to be illiquid under the Fund’s Liquidity Procedures.
11. Contractual Obligations
The Fund enters into contracts in the normal course of business that contain a variety of indemnifications. The Fund’s maximum exposure under these arrangements is unknown. However, the
35
Notes to financial statements
Delaware REIT Fund
11. Contractual Obligations (continued)
Fund has not had prior claims or losses pursuant to these contracts. Management has reviewed the Fund’s existing contracts and expects the risk of loss to be remote.
12. Recent Accounting Pronouncements
In June 2014, the Financial Accounting Standards Board issued guidance to improve the financial reporting of reverse repurchase agreements and other similar transactions. The guidance includes expanded disclosure requirements for entities that enter into reverse repurchase agreements and similar transactions accounted for as secured borrowings. The guidance is effective for financial statements with fiscal years beginning on or after Dec. 15, 2014 and interim periods within those fiscal years. Management is evaluating the impact, if any, of this guidance on the Fund’s financial statement disclosures.
13. Subsequent Events
Effective Nov. 1, 2014, Delaware Investments Fund Services Company (DIFSC), an affiliate of DMC, provides fund accounting and financial administration oversight services to the Fund. Also effective Nov. 1, 2014, DIFSC is the transfer agent and dividend disbursing agent of the Fund.
On Nov. 10, 2014, the Fund, along with the other Participants, entered into an agreement for a $275,000,000 revolving line of credit to be used as described in Note 7 and to be operated in substantially the same manner as the agreement described in Note 7. The line of credit under the agreement expires on Nov. 9, 2015.
Management has determined that no other material events or transactions occurred subsequent to Oct. 31, 2014 that would require recognition or disclosure in the Fund’s financial statements.
36
Report of independent
registered public accounting firm
To the Board of Trustees of Delaware Pooled® Trust
and the Shareholders of The Real Estate Investment Trust Portfolio:
In our opinion, the accompanying statement of assets and liabilities, including the schedule of investments, and the related statements of operations and of changes in net assets and the financial highlights present fairly, in all material respects, the financial position of The Real Estate Investment Trust Portfolio (one of the series constituting Delaware Pooled Trust, hereafter referred to as the “Fund”) at October 31, 2014, the results of its operations for the year then ended, the changes in its net assets for each of the two years in the period then ended and the financial highlights for each of the five years in the period then ended, in conformity with accounting principles generally accepted in the United States of America. These financial statements and financial highlights (hereafter referred to as “financial statements”) are the responsibility of the Fund’s management. Our responsibility is to express an opinion on these financial statements based on our audits. We conducted our audits of these financial statements in accordance with the standards of the Public Company Accounting Oversight Board (United States). Those standards require that we plan and perform the audit to obtain reasonable assurance about whether the financial statements are free of material misstatement. An audit includes examining, on a test basis, evidence supporting the amounts and disclosures in the financial statements, assessing the accounting principles used and significant estimates made by management, and evaluating the overall financial statement presentation. We believe that our audits, which included confirmation of securities at October 31, 2014 by correspondence with the custodian and brokers, and the application of alternative auditing procedures where confirmations of security purchases had not been received, provide a reasonable basis for our opinion.
PricewaterhouseCoopers LLP
Philadelphia, Pennsylvania
December 17, 2014
37
Other Fund information (Unaudited)
Delaware REIT Fund
Tax Information
The information set forth below is for the Fund’s fiscal year as required by federal income tax laws. Shareholders, however, must report distributions on a calendar year basis for income tax purposes, which may include distributions for portions of two fiscal years of a fund. Accordingly, the information needed by shareholders for income tax purposes will be sent to them in January of each year. Please consult your tax advisor for proper treatment of this information.
All disclosures are based on financial information available as of the date of this annual report and, accordingly are subject to change. For any and all items requiring reporting, it is the intention of the Fund to report the maximum amount permitted under the Internal Revenue Code and the regulations thereunder.
For the fiscal year ended Oct. 31, 2014, the Fund reports distributions paid during the year as follows:
| | | | |
(A) Long-Term Capital Gains Distributions (Tax Basis) | | | 62.54 | % |
(B) Ordinary Income Distributions (Tax Basis)* | | | 37.46 | % |
Total Distributions | | | 100.00 | % |
(A) and (B) are based on a percentage of the Fund’s total distributions.
Board consideration of Delaware REIT Fund investment advisory agreement
At a meeting held on Aug. 19–21, 2014 (the “Annual Meeting”), the Board of Trustees (the “Board”), including a majority of disinterested or independent Trustees, approved the renewal of the Investment Management Agreement for Delaware REIT Fund (the “Fund”). In making its decision, the Board considered information furnished at regular quarterly Board meetings, including reports detailing Fund performance, investment strategies and expenses, as well as information prepared specifically in connection with the renewal of the investment advisory and sub-advisory contracts. Information furnished specifically in connection with the renewal of the Investment Management Agreement with Delaware Management Company (“DMC”) included materials provided by DMC and its affiliates (“Delaware Investments”) concerning, among other things, the nature, extent and quality of services provided to the Fund, the costs of such services to the Fund, economies of scale and the financial condition and profitability of Delaware Investments. In addition, in connection with the Annual Meeting, reports were provided to the Trustees in May 2014 and included reports provided by Lipper, Inc., an independent statistical compilation organization (“Lipper”). The Lipper reports compared the Fund’s investment performance and expenses with those of other comparable mutual funds. The Independent Trustees reviewed and discussed the Lipper reports with independent legal counsel to the Independent Trustees. The Board requested and received information regarding DMC’s policy with respect to advisory fee levels and its breakpoint philosophy; the structure of portfolio manager compensation; the investment manager’s profitability; comparative client fee information; and any constraints or limitations on the availability of securities for certain investment styles, which had in the past year inhibited, or which were likely in the future to inhibit, DMC’s ability to invest fully in accordance with Fund policies.
In considering information relating to the approval of the Fund’s advisory agreement, the Independent Trustees received assistance and advice from and met separately with independent legal counsel to the Independent Trustees. Although the Board gave attention to all information furnished, the following
38
discussion identifies, under separate headings, the primary factors taken into account by the Board during its contract renewal considerations.
Nature, Extent and Quality of Service. The Board considered the services provided by Delaware Investments to the Fund and its shareholders. In reviewing the nature, extent and quality of services, the Board considered reports furnished to it throughout the year, which covered matters such as the relative performance of the Fund, compliance of portfolio managers with the investment policies, strategies and restrictions for the Fund, compliance by DMC and Delaware Distributors, L.P. (together, “Management”) personnel with the Code of Ethics adopted throughout the Delaware Investments® Family of Funds complex and adherence to fair value pricing procedures as established by the Board. The Board was pleased with the current staffing of the Fund’s investment manager and the emphasis placed on research in the investment process. The Board recognized DMC’s recent receipt of several industry distinctions. The Board gave favorable consideration to DMC’s efforts to control expenditures while maintaining service levels committed to Fund matters. The Board noted that, in the third and fourth quarters of 2013, Management reduced the maximum 12b-1 fee for certain funds; and in November 2013, Management negotiated a substantial reduction in fees for fund accounting services provided to the Funds. The Board noted the benefits provided to Fund shareholders through each shareholder’s ability to exchange an investment in one Delaware Investments fund for the same class of shares in another Delaware Investments fund without a sales charge, to reinvest Fund dividends into additional shares of the Fund or into additional shares of other Delaware Investments funds and the privilege to combine holdings in other Delaware Investments funds to obtain a reduced sales charge. The Board was satisfied with the nature, extent and quality of the overall services provided by Delaware Investments.
Investment Performance. The Board placed significant emphasis on the investment performance of the Fund in view of the importance of investment performance to shareholders. Although the Board gave appropriate consideration to performance reports and discussions with portfolio managers at Investment Committee meetings throughout the year, the Board gave particular weight to the Lipper reports furnished for the Annual Meeting. The Lipper reports prepared for the Fund showed the investment performance of its Class A shares in comparison to a group of similar funds as selected by Lipper (the “Performance Universe”). A fund with the best performance ranked first, and a fund with the poorest performance ranked last. The highest/best performing 25% of funds in the Performance Universe make up the first quartile; the next 25%, the second quartile; the next 25%, the third quartile; and the poorest/ worst performing 25% of funds in the Performance Universe make up the fourth quartile. Comparative annualized performance for the Fund was shown for the past one-, three-, five- and ten-year periods, to the extent applicable, ended March 31, 2014. The Board’s objective is that the Fund’s performance for the periods considered be at or above the median of its Performance Universe. The following paragraph summarizes the performance results for the Fund and the Board’s view of such performance.
The Performance Universe for the Fund consisted of the Fund and all retail and institutional real estate funds as selected by Lipper. The Lipper report comparison showed that the Fund’s total return for the one-year period was in the second quartile of its Performance Universe. The report further showed that the Fund’s total return for the three-year period was in the first quartile of its Performance Universe and the Fund’s total return for the five- and ten-year periods was in the third quartile of its Performance Universe. The Board determined that the Fund’s performance results were mixed. However, on balance, performance was slightly better than median and thus, the Board was satisfied with performance.
39
Other Fund information (Unaudited)
Delaware REIT Fund
Board consideration of Delaware REIT Fund investment advisory agreement (continued)
Comparative Expenses. The Board considered expense comparison data for the Delaware Investments® Family of Funds. Management provided the Board with information on pricing levels and fee structures for the Fund as of its most recently completed fiscal year. The Board also focused on the comparative analysis of effective management fees and total expense ratios of the Fund versus effective management fees and expense ratios of a group of similar funds as selected by Lipper (the “Expense Group”). In reviewing comparative costs, the Fund’s contractual management fee and the actual management fee incurred by the Fund were compared with the contractual management fees (assuming all funds in the Expense Group were similar in size to the Fund) and actual management fees (as reported by each fund) within the Expense Group, taking into account any applicable breakpoints and fee waivers. The Fund’s total expenses were also compared with those of its Expense Group. The Lipper total expenses, for comparative consistency, were shown by Lipper for Class A shares and comparative total expenses including 12b-1 and non-12b-1 service fees. The Board considered fees paid to Delaware Investments for non-management services. The Board’s objective is to limit the Fund’s total expense ratio to be competitive with that of the Expense Group. The following paragraph summarizes the expense results for the Fund and the Board’s view of such expenses.
The expense comparisons for the Fund showed that its actual management fee and total expenses were in the quartile with the second lowest expenses of its Expense Group. The Board was satisfied with the management fee and total expenses of the Fund in comparison to those of its Expense Group as shown in the Lipper report.
Management Profitability. The Board considered the level of profits realized by Delaware Investments in connection with the operation of the Fund. In this respect, the Board reviewed the Investment Management Profitability Analysis that addressed the overall profitability of Delaware Investments’ business in providing management and other services to each of the individual funds and the Delaware Investments Family of Funds as a whole. Specific attention was given to the methodology followed in allocating costs for the purpose of determining profitability. Management stated that the level of profits of Delaware Investments, to a certain extent, reflects recent operational cost savings and efficiencies initiated by Delaware Investments. The Board considered Delaware Investments’ efforts to improve services provided to fund shareholders and to meet additional regulatory and compliance requirements resulting from recent industry-wide Securities and Exchange Commission initiatives. The Board also considered the extent to which Delaware Investments might derive ancillary benefits from fund operations, including the potential for procuring additional business as a result of the prestige and visibility associated with its role as service provider to the Delaware Investments Family of Funds and the benefits from allocation of fund brokerage to improve trading efficiencies. The Board found that the management fees were reasonable in light of the services rendered and the level of profitability of Delaware Investments.
Economies of Scale. The Trustees considered whether economies of scale are realized by Delaware Investments as the Fund’s assets increase and the extent to which any economies of scale are reflected in the level of management fees charged. The Trustees reviewed the standardized advisory fee pricing and structure, approved by the Board and shareholders, which includes breakpoints. Breakpoints in the advisory fee occur when the advisory fee rate is reduced on assets in excess of specified levels. Breakpoints result in a lower advisory fee than would otherwise be the case on all assets when the asset
40
levels specified are exceeded. The Board noted that the fee under the Fund’s management contract fell within the standard structure. Although the Fund has not reached a size at which it can take advantage of breakpoints, the Board recognized that the fee was structured so that when the Fund grows, economies of scale may be shared.
41
Board of trustees / directors and officers addendum
Delaware Investments® Family of Funds
A mutual fund is governed by a Board of Trustees / Directors (“Trustees”), which has oversight responsibility for the management of a fund’s business affairs. Trustees establish procedures and oversee and review the performance of the investment manager, the distributor, and others who perform services for the fund. The independent fund trustees, in particular, are advocates
| | | | |
Name, Address, and Birth Date | | Position(s) Held with Fund(s) | | Length of Time Served |
Interested Trustees | | | | |
Patrick P. Coyne1 2005 Market Street Philadelphia, PA 19103 April 1963 | | Chairman, President, Chief Executive Officer, and Trustee | | Chairman and Trustee since August 16, 2006 President and Chief Executive Officer since August 1, 2006 |
Independent Trustees | | | | |
Thomas L. Bennett 2005 Market Street Philadelphia, PA 19103 October 1947 | | Trustee | | Since March 2005 |
Joseph W. Chow 2005 Market Street Philadelphia, PA 19103 January 1953 | | Trustee | | Since January 2013 |
John A. Fry 2005 Market Street Philadelphia, PA 19103 May 1960 | | Trustee | | Since January 2001 |
| 1 | Patrick P. Coyne is considered to be an “Interested Trustee” because he is an executive officer of the Fund’s(s’) investment advisor. |
42
for shareholder interests. Each trustee has served in that capacity since he or she was elected to or appointed to the Board of Trustees, and will continue to serve until his or her retirement or the election of a new trustee in his or her place. The following is a list of the Trustees and Officers with certain background and related information.
| | | | |
Principal Occupation(s) During Past 5 Years | | Number of Portfolios in Fund Complex Overseen by Trustee or Officer | | Other Directorships Held by Trustee or Officer |
| | |
| | | | |
Patrick P. Coyne has served in various executive capacities at different times at Delaware Investments.2 | | 65 | | Board of Governors Member Investment Company Institute (ICI) Director and Audit Committee Member Kaydon Corp. (2007–2013) |
| | |
| | | | |
Private Investor (March 2004–Present) | | 65 | | Director Bryn Mawr Bank Corp. (BMTC) (2007–2011) |
Executive Vice President (Emerging Economies Strategies, Risk and Corporate Administration) State Street Corporation (July 2004–March 2011 ) | | 65 | | Director and Audit Committee Member — Hercules Technology Growth Capital, Inc. (2004–2014) |
President Drexel University (August 2010–Present) President Franklin & Marshall College (July 2002–July 2010) | | 65 | | Director — Hershey Trust Company Director, Audit Committee, and Governance Committee Member Community Health Systems |
| 2 | Delaware Investments is the marketing name for Delaware Management Holdings, Inc. and its subsidiaries, including the Fund’s(s’) investment advisor, principal underwriter, and its transfer agent. |
43
Board of trustees / directors and officers addendum
Delaware Investments® Family of Funds
| | | | |
Name, Address, and Birth Date | | Position(s) Held with Fund(s) | | Length of Time Served |
Independent Trustees (continued) | | | | |
Lucinda S. Landreth 2005 Market Street Philadelphia, PA 19103 June 1947 | | Trustee | | Since March 2005 |
Frances A. Sevilla-Sacasa 2005 Market Street Philadelphia, PA 19103 January 1956 | | Trustee | | Since September 2011 |
Thomas K. Whitford 2005 Market Street Philadelphia, PA 19103 March 1956 | | Trustee | | Since January 2013 |
44
| | | | |
Principal Occupation(s) During Past 5 Years | | Number of Portfolios in Fund Complex Overseen by Trustee or Officer | | Other Directorships Held by Trustee or Officer |
| | |
| | | | |
Private Investor (2004–Present) | | 65 | | None |
Chief Executive Officer — Banco Itaú International (April 2012–Present) Executive Advisor to Dean (August 2011–March 2012) and Interim Dean (January 2011–July 2011) — University of Miami School of Business Administration President — U.S. Trust, Bank of America Private Wealth Management (Private Banking) (July 2007–December 2008) | | 65 | | Trust Manager and Audit Committee Member — Camden Property Trust |
Vice Chairman (2010–April 2013) Chief Administrative Officer (2008–2010) and Executive Vice President and Chief Administrative Officer (2007–2009) — PNC Financial Services Group | | 65 | | Director — HSBC Finance Corporation and HSBC North America Holdings Inc. |
45
Board of trustees / directors and officers addendum
Delaware Investments® Family of Funds
| | | | |
Name, Address, and Birth Date | | Position(s) Held with Fund(s) | | Length of Time Served |
Independent Trustees (continued) | | | | |
Janet L. Yeomans 2005 Market Street Philadelphia, PA 19103 July 1948 | | Trustee | | Since April 1999 |
J. Richard Zecher 2005 Market Street Philadelphia, PA 19103 July 1940 | | Trustee | | Since March 2005 |
46
| | | | |
Principal Occupation(s) During Past 5 Years | | Number of Portfolios in Fund Complex Overseen by Trustee or Officer | | Other Directorships Held by Trustee or Officer |
| | |
| | | | |
Vice President and Treasurer (January 2006–July 2012) Vice President — Mergers & Acquisitions (January 2003–January 2006), and Vice President and Treasurer (July 1995–January 2003) 3M Corporation | | 65 | | Director, Audit and Compliance Committee Chair, Investment Committee Member and Governance Committee Member Okabena Company Chair — 3M Investment Management Company (2005–2012) |
Founder Investor Analytics (Risk Management) (May 1999–Present) Founder P/E Investments (Hedge Fund) (September 1996–Present) | | 65 | | Director and Compensation Committee Chairman Investor Analytics Director — P/E Investments |
47
Board of trustees / directors and officers addendum
Delaware Investments® Family of Funds
| | | | |
Name, Address, and Birth Date | | Position(s) Held with Fund(s) | | Length of Time Served |
Officers | | | | |
David F. Connor 2005 Market Street Philadelphia, PA 19103 December 1963 | | Senior Vice President, Deputy General Counsel, and Secretary | | Senior Vice President, Deputy General Counsel since May 2013; Vice President, Deputy General Counsel September 2000 – May 2013; Secretary since October 2005 |
Daniel V. Geatens 2005 Market Street Philadelphia, PA 19103 October 1972 | | Vice President and Treasurer | | Treasurer since October 2007 |
David P. O’Connor 2005 Market Street Philadelphia, PA 19103 February 1966 | | Executive Vice President, General Counsel and Chief Legal Officer | | Executive Vice President since February 2012; Senior Vice President October 2005 – February 2012; General Counsel and Chief Legal Officer since October 2005 |
Richard Salus 2005 Market Street Philadelphia, PA 19103 October 1963 | | Senior Vice President and Chief Financial Officer | | Chief Financial Officer since November 2006 |
The Statement of Additional Information for the Fund(s) includes additional information about the Trustees and Officers and is available, without charge, upon request by calling 800 523-1918.
48
| | | | |
Principal Occupation(s) During Past 5 Years | | Number of Portfolios in Fund Complex Overseen by Trustee or Officer | | Other Directorships Held by Trustee or Officer |
| | |
| | | | |
David F. Connor has served as Deputy General Counsel of Delaware Investments since 2000. | | 65 | | None3 |
Daniel V. Geatens has served in various capacities at different times at Delaware Investments. | | 65 | | None3 |
David P. O’Connor has served in various executive and legal capacities at different times at Delaware Investments. | | 65 | | None3 |
Richard Salus has served in various executive capacities at different times at Delaware Investments. | | 65 | | None3 |
| 3 | David F. Connor, Daniel V. Geatens, David P. O’Connor, and Richard Salus serve in similar capacities for the six portfolios of the Optimum Fund Trust, which have the same investment advisor, principal underwriter, and transfer agent as the registrant. |
49
About the organization
| | | | | | |
Board of trustees | | | | | | |
Patrick P. Coyne | | Joseph W. Chow | | Lucinda S. Landreth | | Thomas K. Whitford |
Chairman, President, and | | Former Executive Vice | | Former Chief Investment | | Former Vice Chairman |
Chief Executive Officer | | President | | Officer | | PNC Financial Services Group |
Delaware Investments® | | State Street Corporation | | Assurant, Inc. | | Pittsburgh, PA |
Family of Funds Philadelphia, PA Thomas L. Bennett Private Investor Rosemont, PA | | Brookline, MA John A. Fry President Drexel University Philadelphia, PA | | Philadelphia, PA Frances A. Sevilla-Sacasa Chief Executive Officer Banco Itaú International Miami, FL | | Janet L. Yeomans Former Vice President and Treasurer 3M Corporation St. Paul, MN J. Richard Zecher Founder Investor Analytics Scottsdale, AZ |
| | | | |
| | | |
Affiliated officers | | | | | | |
David F. Connor | | Daniel V. Geatens | | David P. O’Connor | | Richard Salus |
Senior Vice President, | | Vice President and | | Executive Vice President, | | Senior Vice President and |
Deputy General Counsel, | | Treasurer | | General Counsel, | | Chief Financial Officer |
and Secretary | | Delaware Investments | | and Chief Legal Officer | | Delaware Investments |
Delaware Investments | | Family of Funds | | Delaware Investments | | Family of Funds |
Family of Funds | | Philadelphia, PA | | Family of Funds | | Philadelphia, PA |
Philadelphia, PA | | | | Philadelphia, PA | | |
This annual report is for the information of Delaware REIT Fund shareholders, but it may be used with prospective investors when preceded or accompanied by the Delaware Investments Fund fact sheet for the most recently completed calendar quarter. These documents are available at delawareinvestments.com.
Delaware Investments is the marketing name of Delaware Management Holdings, Inc. and its subsidiaries.
The Fund files its complete schedule of portfolio holdings with the Securities and Exchange Commission (SEC) for the first and third quarters of each fiscal year on Form N-Q. The Fund’s Forms N-Q, as well as a description of the policies and procedures that the Fund uses to determine how to vote proxies (if any) relating to portfolio securities are available without charge (i) upon request, by calling 800 523-1918; and (ii) on the SEC’s website at sec.gov. In addition, a description of the policies and procedures that the Fund uses to determine how to vote proxies (if any) relating to portfolio securities and the Fund’s Schedule of Investments are available without charge on the Fund’s website at delawareinvestments.com. The Fund’s Forms N-Q may be reviewed and copied at the SEC’s Public Reference Room in Washington, D.C.; information on the operation of the Public Reference Room may be obtained by calling 800 SEC-0330.
Information (if any) regarding how the Fund voted proxies relating to portfolio securities during the most recently disclosed 12-month period ended June 30 is available without charge (i) through the Fund’s website at delawareinvestments.com; and (ii) on the SEC’s website at sec.gov.
50
Item 2. Code of Ethics
The registrant has adopted a code of ethics that applies to the registrant’s principal executive officer, principal financial officer, principal accounting officer or controller, or persons performing similar functions, regardless of whether these individuals are employed by the registrant or a third party. A copy of the registrant’s Code of Business Ethics has been posted on the Delaware Investments Internet Web site at www.delawareinvestments.com. Any amendments to the Code of Business Ethics, and information on any waiver from its provisions granted by the registrant, will also be posted on this Web site within five business days of such amendment or waiver and will remain on the Web site for at least 12 months.
Item 3. Audit Committee Financial Expert
The registrant’s Board of Trustees/Directors has determined that certain members of the registrant’s Audit Committee are audit committee financial experts, as defined below. For purposes of this item, an “audit committee financial expert” is a person who has the following attributes:
a. An understanding of generally accepted accounting principles and financial statements;
b. The ability to assess the general application of such principles in connection with the accounting for estimates, accruals, and reserves;
c. Experience preparing, auditing, analyzing, or evaluating financial statements that present a breadth and level of complexity of accounting issues that are generally comparable to the breadth and complexity of issues that can reasonably be expected to be raised by the registrant’s financial statements, or experience actively supervising one or more persons engaged in such activities;
d. An understanding of internal controls and procedures for financial reporting; and
e. An understanding of audit committee functions.
An “audit committee financial expert” shall have acquired such attributes through:
a. Education and experience as a principal financial officer, principal accounting officer, controller, public accountant, or auditor or experience in one or more positions that involve the performance of similar functions;
b. Experience actively supervising a principal financial officer, principal accounting officer, controller, public accountant, auditor, or person performing similar functions;
c. Experience overseeing or assessing the performance of companies or public accountants with respect to the preparation, auditing, or evaluation of financial statements; or
d. Other relevant experience.
The registrant’s Board of Trustees/Directors has also determined that each member of the registrant’s Audit Committee is independent. In order to be “independent” for purposes of this item, the Audit Committee member may not: (i) other than in his or her capacity as a member of the Board of Trustees/Directors or any committee thereof, accept directly or indirectly any consulting, advisory or other compensatory fee from the issuer; or (ii) be an “interested person” of the registrant as defined in Section 2(a)(19) of the Investment Company Act of 1940.
The names of the audit committee financial experts on the registrant’s Audit Committee are set forth below:
Item 4. Principal Accountant Fees and Services
The aggregate fees billed for services provided to the registrant by its independent auditors for the audit of the registrant’s annual financial statements and for services normally provided by the independent auditors in connection with statutory and regulatory filings or engagements were $330,175 for the fiscal year ended October 31, 2014.
The aggregate fees billed for services provided to the registrant by its independent auditors for the audit of the registrant’s annual financial statements and for services normally provided by the independent auditors in connection with statutory and regulatory filings or engagements were $317,855 for the fiscal year ended October 31, 2013.
The aggregate fees billed by the registrant’s independent auditors for services relating to the performance of the audit of the registrant’s financial statements and not reported under paragraph (a) of this Item were $0 for the fiscal year ended October 31, 2014.
The aggregate fees billed by the registrant’s independent auditors for services relating to the performance of the audit of the registrant’s financial statements and not reported under paragraph (a) of this Item were $0 for the fiscal year ended October 31, 2013.
The aggregate fees billed by the registrant’s independent auditors for tax-related services provided to the registrant’s investment adviser and other service providers under common control with the adviser and that relate directly to the operations or financial reporting of the registrant were $0 for the registrant’s fiscal year ended October 31, 2014.
The aggregate fees billed by the registrant’s independent auditors for tax-related services provided to the registrant’s investment adviser and other service providers under common control with the adviser and that relate directly to the operations or financial reporting of the registrant were $0 for the registrant’s fiscal year ended October 31, 2013.
The aggregate fees billed for all services provided by the independent auditors to the registrant other than those set forth in paragraphs (a), (b) and (c) of this Item were $0 for the fiscal year ended October 31, 2014.
The aggregate fees billed for all services provided by the independent auditors to the registrant other than those set forth in paragraphs (a), (b) and (c) of this Item were $0 for the fiscal year ended October 31, 2013.
(e) The registrant’s Audit Committee has established pre-approval policies and procedures as permitted by Rule 2-01(c)(7)(i)(B) of Regulation S-X (the “Pre-Approval Policy”) with respect to services provided by the registrant’s independent auditors. Pursuant to the Pre-Approval Policy, the Audit Committee has pre-approved the services set forth in the table below with respect to the registrant up to the specified fee limits. Certain fee limits are based on aggregate fees to the registrant and other registrants within the Delaware Investments Family of Funds.
Under the Pre-Approval Policy, the Audit Committee has also pre-approved the services set forth in the table below with respect to the registrant’s investment adviser and other entities controlling, controlled by or under common control with the investment adviser that provide ongoing services to the registrant (the “Control Affiliates”) up to the specified fee limit. This fee limit is based on aggregate fees to the investment adviser and its Control Affiliates.
The Pre-Approval Policy requires the registrant’s independent auditors to report to the Audit Committee at each of its regular meetings regarding all services initiated since the last such report was rendered, including those services authorized by the Pre-Approval Policy.
(f) Not applicable.
(g) The aggregate non-audit fees billed by the registrant’s independent auditors for services rendered to the registrant and to its investment adviser and other service providers under common control with the adviser were $5,653,375 and $7,732,970 for the registrant’s fiscal years ended October 31, 2014 and October 31, 2013, respectively.
(h) In connection with its selection of the independent auditors, the registrant’s Audit Committee has considered the independent auditors’ provision of non-audit services to the registrant’s investment adviser and other service providers under common control with the adviser that were not required to be pre-approved pursuant to Rule 2-01(c)(7)(ii) of Regulation S-X. The Audit Committee has determined that the independent auditors’ provision of these services is compatible with maintaining the auditors’ independence.
Item 5. Audit Committee of Listed Registrants
Not applicable.
Item 6. Investments
(a) Included as part of report to shareholders filed under Item 1 of this Form N-CSR.
(b) Divestment of securities in accordance with Section 13(c) of the Investment Company Act of 1940.
Not applicable.
Item 7. Disclosure of Proxy Voting Policies and Procedures for Closed-End Management Investment Companies
Not applicable.
Item 8. Portfolio Managers of Closed-End Management Investment Companies
Not applicable.
Item 9. Purchases of Equity Securities by Closed-End Management Investment Company and Affiliated Purchasers
Not applicable.
Item 10. Submission of Matters to a Vote of Security Holders
Not applicable.
Item 11. Controls and Procedures
The registrant’s principal executive officer and principal financial officer have evaluated the registrant’s disclosure controls and procedures within 90 days of the filing of this report and have concluded that they are effective in providing reasonable assurance that the information required to be disclosed by the registrant in its reports or statements filed under the Securities Exchange Act of 1934 is recorded, processed, summarized and reported within the time periods specified in the rules and forms of the Securities and Exchange Commission.
There were no significant changes in the registrant’s internal control over financial reporting that occurred during the second fiscal quarter of the period covered by the report to stockholders included herein (i.e., the registrant’s fourth fiscal quarter) that have materially affected, or are reasonably likely to materially affect, the registrant’s internal control over financial reporting.
Item 12. Exhibits
Not applicable.
(2) Certifications of Principal Executive Officer and Principal Financial Officer pursuant to Rule 30a-2 under the Investment Company Act of 1940 are attached hereto as Exhibit 99.CERT.
(3) Written solicitations to purchase securities pursuant to Rule 23c-1 under the Securities Exchange Act of 1934.
Not applicable.
Pursuant to the requirements of the Securities Exchange Act of 1934 and the Investment Company Act of 1940, the registrant has duly caused this report to be signed on its behalf, by the undersigned, thereunto duly authorized.
Pursuant to the requirements of the Securities Exchange Act of 1934 and the Investment Company Act of 1940, this report has been signed below by the following persons on behalf of the registrant and in the capacities and on the dates indicated.