UNITED STATES SECURITIES AND EXCHANGE COMMISSION
Washington, D.C. 20549
FORM N-CSR
CERTIFIED SHAREHOLDER REPORT OF REGISTERED MANAGEMENT
INVESTMENT COMPANIES
| Investment Company Act file number: | | 811-06322 |
| | | |
| Exact name of registrant as specified in charter: | | Delaware Pooled® Trust |
| | | |
| Address of principal executive offices: | | 2005 Market Street |
| | | Philadelphia, PA 19103 |
| | | |
| Name and address of agent for service: | | David F. Connor, Esq. |
| | | 2005 Market Street |
| | | Philadelphia, PA 19103 |
| | | |
| Registrant’s telephone number, including area code: | | (800) 523-1918 |
| | | |
| Date of fiscal year end: | | October 31 |
| | | |
| Date of reporting period: | | October 31, 2011 |
Item 1. Reports to Stockholders

| Annual report 2011 |
| |
| October 31, 2011 |
| | | |
| | | |
| U.S. equities | | International equities |
| The Large-Cap Value Equity Portfolio | | The International Equity Portfolio |
| The Select 20 Portfolio | | The Labor Select International Equity Portfolio |
| The Large-Cap Growth Equity Portfolio | | The Emerging Markets Portfolio |
| The Focus Smid-Cap Growth Equity Portfolio | | The Emerging Markets Portfolio II |
| The Real Estate Investment Trust Portfolio II | | The Global Real Estate Securities Portfolio |
| | | |
| U.S. fixed income | | International fixed income |
| The Core Focus Fixed Income Portfolio | | The Global Fixed Income Portfolio |
| The High-Yield Bond Portfolio | | |
| The Core Plus Fixed Income Portfolio | | |
Contents
| Portfolio objectives | 2 |
| The Large-Cap Value Equity Portfolio | 4 |
| The Select 20 Portfolio | 8 |
| The Large-Cap Growth Equity Portfolio | 12 |
| The Focus Smid-Cap Growth Equity Portfolio | 16 |
| The Real Estate Investment Trust Portfolio II | 20 |
| The Core Focus Fixed Income Portfolio | 24 |
| The High-Yield Bond Portfolio | 28 |
| The Core Plus Fixed Income Portfolio | 32 |
| The International Equity Portfolio | 36 |
| The Labor Select International Equity Portfolio | 40 |
| The Emerging Markets Portfolio | 44 |
| The Emerging Markets Portfolio II | 48 |
| The Global Real Estate Securities Portfolio | 52 |
| The Global Fixed Income Portfolio | 56 |
| Disclosure of Portfolio expenses | 60 |
| Security type, sector allocations, country allocations, | |
| and top 10 equity holdings | 62 |
| Statements of net assets | 74 |
| Statements of operations | 117 |
| Statements of changes in net assets | 121 |
| Financial highlights | 126 |
| Notes to financial statements | 141 |
| Report of independent registered | |
| public accounting firm | 167 |
| Other Portfolio information | 168 |
| Board of trustees/directors and officers addendum | 180 |
Delaware Pooled® Trust
Delaware Pooled Trust, based in Philadelphia, is a registered investment company that offers no-load, open-end equity and fixed income mutual funds to institutional and high net worth individual investors.
Delaware Management Company, a series of Delaware Management Business Trust, serves as investment advisor for the available investment Portfolios. Mondrian Investment Partners Limited serves as investment sub-advisor for The International Equity,* Labor Select International Equity, Emerging Markets,* and Global Fixed Income* Portfolios.
Shareholder services
Delaware Investments provides its Delaware Pooled Trust shareholders with annual and semiannual reports, monthly account reports, and other communications.
A dedicated shareholder services staff is available to assist with account questions and provide net asset values of the Delaware Pooled Trust Portfolios weekdays from 9 a.m. to 5 p.m. Eastern time. Shareholders may call 800 231-8002 or write to: Client Services, Delaware Pooled Trust, 2005 Market Street, Philadelphia, PA 19103.
The performance quoted in this report represents past performance and does not guarantee future results. Investment return and principal value of an investment will fluctuate so that shares, when redeemed, may be worth more or less than their original cost. Current performance may be lower or higher than the performance quoted. Performance data current to the most recent month end may be obtained by calling 800 231-8002 or visiting www.delawareinvestments.com/institutional/performance. Carefully consider the Portfolios’ investment objectives, risk factors, charges, and expenses before investing. This and other information can be found in the Portfolios’ prospectus and, if available, their summary prospectuses, which may be obtained by visiting www.delawareinvestments.com or calling 800 231-8002. Investors should read the prospectus and, if available, the summary prospectus carefully before investing. Performance includes reinvestment of all distributions.
Funds are not FDIC insured and are not guaranteed. It is possible to lose the principal amount invested. Mutual fund advisory services are provided by Delaware Management Company, a series of Delaware Management Business Trust (DMBT), which is a registered investment advisor. Delaware Investments is the marketing name of Delaware Management Holdings, Inc. (DMHI) and its subsidiaries.
| *Closed to new investors. | |
| ©2011 Delaware Management Holdings, Inc. | 2011 Annual report · Delaware Pooled Trust |
| All third-party trademarks cited are the property of their respective owners. | |
1
Portfolio objectives
The Large-Cap Value Equity Portfolio seeks long-term capital appreciation. The Portfolio invests primarily in securities of large-capitalization companies that we believe have long-term capital appreciation potential. The Portfolio currently defines large-capitalization stocks as those with market capitalizations of $5 billion or greater at the time of purchase. Typically, we seek to select securities that we believe are undervalued in relation to their intrinsic value as indicated by multiple factors.
The Select 20 Portfolio seeks long-term capital appreciation. The Portfolio seeks to achieve its objective by investing in a portfolio of twenty (20) securities, primarily common stocks of companies that we believe have long-term capital appreciation potential and are expected to grow faster than the U.S. economy.
The Large-Cap Growth Equity Portfolio seeks capital appreciation. The Portfolio invests primarily in common stocks of growth-oriented companies that we believe have long-term capital appreciation potential and expect to grow faster than the U.S. economy. For purposes of the Portfolio, we generally consider large-capitalization companies to be those that, at the time of purchase, have total market capitalizations within the range of market capitalizations of companies in the Russell 1000® Growth Index.
The Focus Smid-Cap Growth Equity Portfolio seeks long-term capital appreciation. The Portfolio invests primarily in common stocks of growth-oriented companies that we believe have long-term capital appreciation potential and expect to grow faster than the U.S. economy. For purposes of the Portfolio, we will generally consider companies that, at the time of purchase, have total market capitalizations within the range of market capitalizations of companies in the Russell 2500™ Growth Index.
The Real Estate Investment Trust Portfolio II seeks maximum long-term total return, with capital appreciation as a secondary objective. The Portfolio invests primarily in securities of companies principally engaged in the real estate industry.
The Core Focus Fixed Income Portfolio seeks maximum long-term total return, consistent with reasonable risk. The Portfolio will invest primarily in a diversified portfolio of investment grade, fixed income obligations, including securities issued or guaranteed by the U.S. government, its agencies or instrumentalities (U.S. government securities), mortgage-backed securities, asset-backed securities, corporate bonds, and other fixed income securities.
The High-Yield Bond Portfolio seeks high total return. The Portfolio will primarily invest its assets at the time of purchase in: (1) corporate bonds rated BB or lower by Standard & Poor’s (S&P) or similarly rated by another nationally recognized statistical rating organization; (2) securities issued or guaranteed by the U.S. government, its agencies or instrumentalities; or (3) commercial paper of companies rated A-1 or A-2 by S&P, rated P-1 or P-2 by Moody’s Investors Service, Inc., or unrated but considered to be of comparable quality.
The Core Plus Fixed Income Portfolio seeks maximum long-term total return, consistent with reasonable risk. The Portfolio allocates its investments principally among three sectors of the fixed income securities markets: U.S. investment grade sector, U.S. high yield sector, and international sector.
The International Equity Portfolio seeks maximum long-term total return. The Portfolio invests primarily in equity securities of companies that are organized, have a majority of their assets, or derive most of their operating income outside the United States, and that, in our opinion, are undervalued at the time of purchase based on our fundamental analysis. Investments will be made mainly in marketable securities of companies in developed countries. The International Equity Portfolio is presently closed to new investors.
The Labor Select International Equity Portfolio seeks maximum long-term total return. The Portfolio invests primarily in equity securities of companies that are organized, have a majority of their assets, or derive most of their operating income outside of the United States, and that, in our opinion, are undervalued at the time of purchase based on the rigorous fundamental analysis that we employ. In addition to following these quantitative guidelines, we will select securities of issuers that present certain characteristics that are compatible or operate in accordance with certain investment policies or restrictions followed by organized labor.
2011 Annual report · Delaware Pooled Trust
2
The Emerging Markets Portfolio seeks long-term capital appreciation. The Portfolio, an international fund, generally invests in equity securities of companies that are organized in, have a majority of their assets in, or derive a majority of their operating income from emerging countries. The Emerging Markets Portfolio is presently closed to new investors.
The Emerging Markets Portfolio II seeks long-term capital appreciation. The Portfolio invests primarily in equity securities of issuers from emerging or developing foreign countries. Under normal market conditions, at least 80% of the Portfolio’s total assets will be invested in equity securities of issuers from countries whose economies are considered to be emerging. The Portfolio’s investment manager considers an “emerging country” to be any country that is: (1) generally recognized to be an emerging or developing country by the international financial community, including the World Bank and the International Finance Corporation; (2) classified by the United Nations as developing; or (3) included in the International Finance Corporation Free Index or the MSCI Emerging Markets Index.
The Global Real Estate Securities Portfolio seeks maximum long-term total return through a combination of current income and capital appreciation. Under normal circumstances, the Portfolio will invest at least 80% of its net assets in securities issued by U.S. and non-U.S. companies in the real estate and real estate–related sectors. The Portfolio may invest in companies across all market capitalizations and may invest its assets in securities of companies located in emerging market countries. Under normal circumstances, the Portfolio will invest at least 40% of its total assets in securities of non-U.S. issuers.
The Global Fixed Income Portfolio seeks current income consistent with the preservation of principal. The Portfolio invests primarily in fixed income securities that may also provide the potential for capital appreciation. The Portfolio is a global fund that invests in issuers located throughout the world. The Global Fixed Income Portfolio is presently closed to new investors.
Carefully consider the Portfolios’ investment objectives, risk factors, charges, and expenses before investing. This and other information can be found in the Portfolios’ prospectus and, if available, their summary prospectuses, which may be obtained by visiting www.delawareinvestments.com or calling 800 231-8002. Investors should read the prospectus and, if available, the summary prospectus carefully before investing.
The Portfolios of Delaware Pooled® Trust (DPT) are designed exclusively for institutional investors and high net worth individuals.
International investments entail risks not ordinarily associated with U.S. investments including fluctuation in currency values, differences in accounting principles, or economic or political instability in other nations. Investing in emerging markets can be riskier than investing in established foreign markets due to increased volatility and lower trading volume.
Narrowly focused investments may exhibit higher volatility than investments in multiple industry sectors.
REIT investments are subject to many of the risks associated with direct real estate ownership, including changes in economic conditions, credit risk, and interest rate fluctuations.
A REIT fund’s tax status as a regulated investment company could be jeopardized if it holds real estate directly, as a result of defaults, or receives rental income from real estate holdings.
The Portfolios’ share prices and yields will fluctuate in response to movements in stock prices.
Fixed income securities and bond funds can lose value, and investors can lose principal, as interest rates rise. They also may be affected by economic conditions that hinder an issuer’s ability to make interest and principal payments on its debt.
The Portfolios may also be subject to prepayment risk, the risk that the principal of a fixed income security that is held by the Portfolios may be prepaid prior to maturity, potentially forcing the Portfolios to reinvest that money at a lower interest rate.
Securities in the lowest of the rating categories considered to be investment grade (that is, Baa or BBB) have some speculative characteristics.
High yielding, noninvestment grade bonds (junk bonds) involve higher risk than investment grade bonds.
The high yield secondary market is particularly susceptible to liquidity problems when institutional investors, such as mutual funds and certain other financial institutions, temporarily stop buying bonds for regulatory, financial, or other reasons. In addition, a less liquid secondary market makes it more difficult for a Portfolio to obtain precise valuations of the high yield securities in its portfolio.
Because the Portfolios expect to hold a concentrated portfolio of a limited number of securities, the Portfolios’ risk is increased because each investment has a greater effect on the Portfolios’ overall performance.
The Portfolios will be affected primarily by changes in stock prices.
The Real Estate Investment Trust II, The Global Real Estate Securities, The Select 20, and The Global Fixed Income Portfolios are considered “nondiversified” as defined in the Investment Company Act of 1940. “Nondiversified” Portfolios may allocate more of their net assets to investments in single securities than “diversified” Portfolios. Resulting adverse effects may subject these Portfolios to greater risks and volatility.
2011 Annual report · Delaware Pooled Trust
3
Portfolio management review
Delaware Pooled® Trust — The Large-Cap Value Equity Portfolio
October 31, 2011
For the fiscal year ended Oct. 31, 2011, Delaware Pooled Trust — The Large-Cap Value Equity Portfolio returned +12.98% at net asset value (NAV) with all distributions reinvested. The Portfolio outperformed its benchmark, the Russell 1000® Value Index, which returned +6.16% during the same period. Complete annualized performance for The Large-Cap Value Equity Portfolio is shown in the table on page 6.
In the first half of the Portfolio’s fiscal year, stock prices generally climbed as corporate earnings remained healthy and investors anticipated a continued slow-but-steady economic recovery. Market conditions abruptly soured in late July 2011, however, as several unresolved issues took center stage:
- Concerns mounted about rising debt levels in Greece, Italy, and other financially challenged countries in the euro zone.
- A political battle in Washington, D.C., surrounding the lifting of the U.S. federal debt ceiling triggered new worries about the United States’ ability to manage its fiscal situation.
- Similar concerns caused credit rating agency Standard & Poor’s to downgrade the sovereign credit rating of the United States from the highest level of AAA to AA+.
- These events took place against a backdrop of sustained high unemployment and increasing signs of global economic weakness.
While August and September 2011 saw dramatic price swings in both directions, October witnessed sharp gains in the stock market, as many investors became more optimistic that European policy makers could resolve the region’s debt crisis, while economic growth in the U.S. appeared to be more resilient than many had feared.
In this environment, the Portfolio outpaced the benchmark largely due to successful sector allocation decisions and strong stock picking. In sector terms, our decision to underweight financial stocks proved quite helpful, given financials’ status as the worst-performing group in the benchmark index during the fiscal year. A modest relative overweighting in energy (the market’s top-performing sector) also had a meaningful positive effect on relative results, as did a small cash position during periods when the market was in a steep decline.
From the standpoint of stock selection, several holdings in the energy sector were notable contributors to performance during the fiscal year. National Oilwell Varco, a maker of components for oil drilling rigs, benefited from a resurgence in demand that caused the stock’s price to increase sharply. We sold the stock after it reached our price target. Another significant outperformer in the energy sector was oil exploration and production company Marathon Oil. Security selection in the information technology sector was another source of strength, led by Motorola Solutions. Motorola Solutions generated steady financial performance amid difficult economic conditions.
Among performance detractors, the weakest relative performer was document-management company Xerox. The company’s shares fared poorly as many investors were concerned about the effects of reduced government and healthcare spending on Xerox’s services business. Also, despite the Portfolio’s favorable results overall from the struggling financial sector, several individual holdings in this group were disappointing performers. Insurance company Allstate, for example, had a challenging year, given a large number of severe storms that increased payouts to policyholders. Another noteworthy detractor in the financials sector was Bank of New York Mellon, which had difficulty growing fee income in the current market environment.
The views expressed are current as of the date of this report and are subject to change.
2011 Annual report · Delaware Pooled Trust
4
At the end of the fiscal year, we maintained the Portfolio’s defensive positioning, as we continue to anticipate slow economic growth for some time. We believe that conditions justify a conservative approach until we see sustainable improvement.
Given this backdrop, we maintained the Portfolio’s underweighting relative to the benchmark index within traditionally economically sensitive sectors such as financials and consumer discretionary, while remaining relatively overweight in more defensive groups, including healthcare and consumer staples. One potential exception is the information technology sector. Despite this sector’s economic sensitivity, we were overweight at the end of the fiscal year because we identified a number of companies displaying strong balance sheets, good cash flows, and other characteristics that we routinely favor for investment. Stocks of these companies were available for purchase at what we saw as undeservedly low prices.
As of the end of the Portfolio’s fiscal year, valuations across the market struck us as generally higher than they should be, given the sluggish economic situation. While circumstances can change quickly, we expect to maintain our less-cyclical positioning until we see more lasting improvements in market and economic conditions.
2011 Annual report · Delaware Pooled Trust
5
Performance summary
Delaware Pooled® Trust — The Large-Cap Value Equity Portfolio
The performance data quoted represent past performance; past performance does not guarantee future results. Investment return and principal value will fluctuate so your shares, when redeemed, may be worth more or less than their original cost. Current performance may be lower or higher than the performance data quoted. Please obtain the performance data for the most recent month end by calling 800 231-8002 or visiting our website at www.delawareinvestments.com.
Carefully consider the Portfolio’s investment objectives, risk factors, charges, and expenses before investing. This and other information can be found in the Portfolio’s prospectus and, if available, its summary prospectus, which may be obtained by visiting www.delawareinvestments.com or calling 800 231-8002. Investors should read the prospectus and, if available, the summary prospectus carefully before investing.
| Portfolio performance | | | | | | | | | | |
| Average annual total returns | | | | | | | | | | |
| Periods ended Oct. 31, 2011 | | 1 year | | 3 years | | 5 years | | 10 years | | Lifetime |
| | +12.98% | | +13.95% | | -0.25% | | +4.85% | | +8.72% |
| Portfolio profile |
| Oct. 31, 2011 |
| |
| Total net assets |
| $6.6 million |
| |
| Number of holdings |
| 37 |
| |
| Inception date |
| Feb. 3, 1992 |
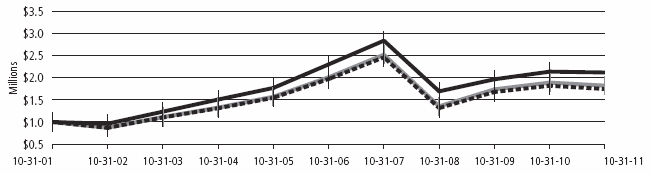
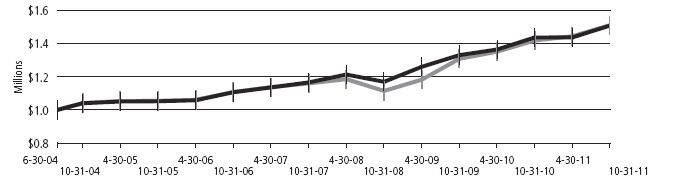
Growth of $1,000,000
| | | | Starting value (Oct. 31, 2001) | | Ending value (Oct. 31, 2011) |
| | The Large-Cap Value Equity Portfolio | | $1,000,000 | | $1,605,466 |
| | Russell 1000 Value Index | | $1,000,000 | | $1,563,565 |
2011 Annual report · Delaware Pooled Trust
6
The performance graph assumes $1 million invested on Oct. 31, 2001, and includes reinvestment of all distributions. The performance graph does not reflect the deduction of taxes the shareholder would pay on Portfolio distributions or redemptions of Portfolio shares.
Total return assumes reinvestment of dividends and capital gains, but does not reflect reductions for taxes. Returns and share values will fluctuate so that shares, when redeemed, may be worth more or less than their original cost.
The most recent prospectus designated the Portfolio’s total operating expenses as 1.02%. Management has contractually agreed to reimburse certain expenses and/or waive its management fees from Feb. 28, 2011, through Feb. 28, 2012, in order to prevent total annual Portfolio operating expenses from exceeding, in an aggregate amount, 0.70% of the Portfolio’s average daily net assets, as described in the most recent prospectus.
Expense limitations were in effect during the period shown. Performance would have been lower had the expense limitations not been in effect.
The Russell 1000 Value Index measures the performance of the large-cap value segment of the U.S. equity universe. It includes those Russell 1000 companies with lower price-to-book ratios and lower forecasted growth values.
Index performance returns do not reflect any management fees, transaction costs, or expenses. Indices are unmanaged and one cannot invest directly in an index.
Past performance is not a guarantee of future results.
2011 Annual report · Delaware Pooled Trust
7
Portfolio management review
Delaware Pooled® Trust — The Select 20 Portfolio
October 31, 2011
During the first several months of the Portfolio’s fiscal year ended Oct. 31, 2011, investors generally adopted an optimistic tone, seemingly focusing on several positive macroeconomic developments, including: the injection of additional stimulus by the Federal Reserve, a bipartisan deal to extend the Bush-era tax cuts (which also included stimulus measures), and still slowly improving economic conditions in the United States. (Data: Bloomberg.)
Starting in the spring and summer months of 2011, however, investors began responding to a pause in economic growth, as well as broad euro zone fears related primarily to the increasing risk of a Greek debt restructuring and possible default. Major equity indices reflected the increased level of uncertainty, generally declining through most of May and much of June.
For the most part, this trend continued through the final months of the Portfolio’s fiscal year, as market activity largely centered on the daily news coming out of the euro zone, which was predominantly negative. For example, the Greek government teetered on the edge of default as it awaited approval on an additional expanded bailout package. Additionally, many investors kept a close eye on activity in Spain and Italy, as both countries — each a major euro-zone economy — attempted to enact austerity measures aimed at staving off a potential default. These events, combined with a slowing economic environment across Europe, the United States, and even many emerging economies, took a significant toll on investors. The S&P 500® Index, for example, experienced a steep decline through July 2011 and into early August before recovering part of those losses.
Within this environment, Delaware Pooled Trust — The Select 20 Portfolio returned +15.23% at net asset value (NAV) with all distributions reinvested for the fiscal year ended Oct. 31, 2011. The Portfolio’s benchmark, the Russell 3000® Growth Index, returned +9.92% for the same period. Complete annualized performance for The Select 20 Portfolio is shown in the table on page 10. As is customary with this Portfolio, returns were generated largely from our stock selection decisions as opposed to sector allocation choices.
MasterCard was one of the Portfolio’s top contributors — we continued to hold the stock even through talks of credit/debit card transaction fee reductions as part of the financial overhaul legislation. We believed banks would be affected far more than credit card companies whose related fees were much smaller. We opportunistically added to the Portfolio’s position when investors punished the stock because of the anticipated reform. When the Fed announced final recommendations that were more favorable than initially feared, investors were able to focus on strong company fundamentals and the growing global trend of consumers shifting from paper to plastic.
Priceline.com was another solid contributor and its “name your own price” model seemed to fit in well with today’s value-conscious consumer. While priceline.com’s business model is attractive, the more interesting story, in our view, is the company’s higher-margin European business that matches travelers with the smaller independent hotels that are more prevalent than large chains abroad. This segment has represented the real growth of priceline.com and the company will seek to match its success in other fragmented hotel markets, such as those in Asia.
Crown Castle International, which operates and leases wireless towers throughout the U.S., detracted from the Portfolio’s performance when it posted negative returns due to investor fears that potential industry consolidations would slow plans for infrastructure spending. While a proposed merger now faces antitrust issues, Crown Castle has continued to report solid earnings from enhanced wireless demand and investors generally seem to be regaining confidence.
The Portfolio’s position in Strayer Education, a private educational institute, also hurt overall performance. The institute has struggled with declining revenue from shrinking enrollment. The entire
The views expressed are current as of the date of this report and are subject to change.
2011 Annual report · Delaware Pooled Trust
8
for-profit education industry has suffered for several quarters largely due to enhanced government scrutiny and stricter regulations concerning recruiting, enrollment, and financial assistance. The “gainful employment” rules placed aid restrictions on programs that insufficiently prepare students for finding well-paying jobs, a tough feat in this challenging economic environment. Strayer is an industry leader that we believe will survive and even benefit, as competitors fail and the labor market ultimately improves.
Regardless of the economy, we remain consistent in our long-term investment philosophy: We want to own what we view as strong secular-growth companies. We seek companies with solid business models and competitive positions that we believe can grow market share, and which have the potential to deliver shareholder value in a variety of market environments.
2011 Annual report · Delaware Pooled Trust
9
Performance summary
Delaware Pooled® Trust — The Select 20 Portfolio
The performance data quoted represent past performance; past performance does not guarantee future results. Investment return and principal value will fluctuate so your shares, when redeemed, may be worth more or less than their original cost. Current performance may be lower or higher than the performance data quoted. Please obtain the performance data for the most recent month end by calling 800 231-8002 or visiting our website at www.delawareinvestments.com.
Carefully consider the Portfolio’s investment objectives, risk factors, charges, and expenses before investing. This and other information can be found in the Portfolio’s prospectus and, if available, its summary prospectus, which may be obtained by visiting www.delawareinvestments.com or calling 800 231-8002. Investors should read the prospectus and, if available, the summary prospectus carefully before investing.
| Portfolio performance | | | | | | | | | | |
| Average annual total returns | | | | | | | | | | |
| Periods ended Oct. 31, 2011 | | 1 year | | 3 years | | 5 years | | 10 years | | Lifetime |
| | +15.23% | | +19.96% | | +3.86% | | +4.07% | | -1.69% |
| Portfolio profile |
| Oct. 31, 2011 |
| |
| Total net assets |
| $46 million |
| |
| Number of holdings |
| 24 |
| Inception date |
| March 31, 2000 |
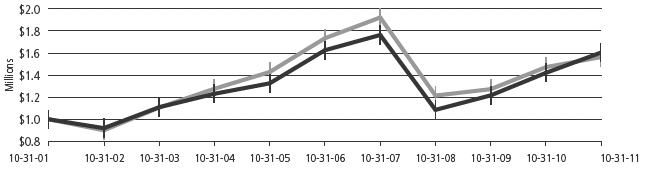
Growth of $1,000,000
| | | | Starting value (Oct. 31, 2001) | | Ending value (Oct. 31, 2011) |
| The Select 20 Portfolio | | $1,000,000 | | $1,490,079 |
| Russell 3000 Growth Index | | $1,000,000 | | $1,443,524 |
2011 Annual report · Delaware Pooled Trust
10
The performance graph assumes $1 million invested on Oct. 31, 2001, and includes reinvestment of all distributions. The performance graph does not reflect the deduction of taxes the shareholder would pay on Portfolio distributions or redemptions of Portfolio shares.
Total return assumes reinvestment of dividends and capital gains, but does not reflect reductions for taxes. Returns and share values will fluctuate so that shares, when redeemed, may be worth more or less than their original cost.
The most recent prospectus designated the Portfolio’s total operating expenses as 1.24%. Management has contractually agreed to reimburse certain expenses and/or waive its management fees from Feb. 28, 2011, through Feb. 28, 2012, in order to prevent total annual Portfolio operating expenses from exceeding, in an aggregate amount, 0.89% of the Portfolio’s average daily net assets, as described in the most recent prospectus.
Expense limitations were in effect during the period shown. Performance would have been lower had the expense limitations not been in effect.
The Russell 3000 Growth Index measures the performance of the broad growth segment of the U.S. equity universe. It includes those Russell 3000 companies with higher price-to-book ratios and higher forecasted growth values.
The S&P 500 Index, mentioned on page 8, measures the performance of 500 mostly large-cap stocks weighted by market value, and is often used to represent performance of the U.S. stock market.
Index performance returns do not reflect any management fees, transaction costs, or expenses. Indices are unmanaged and one cannot invest directly in an index.
Past performance is not a guarantee of future results.
Because the Portfolio expects to hold a concentrated portfolio of a limited number of securities, the Portfolio's risk is increased because each investment has a greater effect on the Portfolio's overall performance.
Investments in small and/or medium-sized companies typically exhibit greater risk and higher volatility than larger, more established companies.
“Nondiversified” Portfolios may allocate more of their net assets to investments in single securities than “diversified” Portfolios. Resulting adverse effects may subject these Portfolios to greater risks and volatility.
On February 28, 2008, the Portfolio changed its investment strategy to limit its investments to no less than 15 securities and no more than 25 securities. The performance prior to February 28, 2008 is that of the Portfolio’s predecessor, The All-Cap Growth Equity Portfolio.
2011 Annual report · Delaware Pooled Trust
11
Portfolio management review
Delaware Pooled® Trust — The Large-Cap Growth Equity Portfolio
October 31, 2011
During the first several months of the Portfolio’s fiscal year ended Oct. 31, 2011, investors generally adopted an optimistic tone, seemingly focusing on several positive macroeconomic developments, including: the injection of additional stimulus by the Federal Reserve, a bipartisan deal to extend the Bush-era tax cuts (which also included stimulus measures), and still slowly improving economic conditions in the United States. (Data: Bloomberg.)
Starting in the spring and summer months of 2011, however, investors began responding to a pause in economic growth, as well as broad euro zone fears related primarily to the increasing risk of a Greek debt restructuring and possible default. Major equity indices reflected the increased level of uncertainty, generally declining through most of May and much of June.
For the most part, this trend continued through the final months of the Portfolio’s fiscal year, as market activity largely centered on the daily news coming out of the euro zone, which was predominantly negative. For example, the Greek government teetered on the edge of default as it awaited approval on an additional expanded bailout package. Additionally, many investors kept a close eye on activity in Spain and Italy, as both countries — each a major euro-zone economy — attempted to enact austerity measures aimed at staving off a potential default. These events, combined with a slowing economic environment across Europe, the United States, and even many emerging economies, took a significant toll on investors. The S&P 500® Index, for example, experienced a steep decline through July 2011 and into early August before recovering part of those losses.
Within this environment, Delaware Pooled Trust — The Large-Cap Growth Equity Portfolio returned +11.43% at net asset value (NAV) with all distributions reinvested for the fiscal year ended Oct. 31, 2011. The Portfolio’s benchmark, the Russell 1000® Growth Index, returned +9.92% for the same period. Complete annualized performance for The Large-Cap Growth Equity Portfolio is shown in the table on page 14. As is customary with this Portfolio, returns were generated largely from our stock selection decisions as opposed to sector allocation choices.
MasterCard was one of the Portfolio’s top contributors — we continued to hold the stock even through talks of credit/debit card transaction fee reductions as part of the financial overhaul legislation. We believed banks would be affected far more than credit card companies whose related fees were much smaller. We opportunistically added to the Portfolio’s position when investors seemed to punish the stock because of the anticipated reform. When the Fed announced final recommendations that were more favorable than initially feared, investors were able to focus on strong company fundamentals and the growing global trend of consumers shifting from paper to plastic.
Priceline.com was another solid contributor and its “name your own price” model seemed to fit in well with today’s value-conscious consumer. While priceline.com’s business model is attractive, the more interesting story, in our view, is the company’s higher-margin European business that matches travelers with the smaller independent hotels that are more prevalent than large chains abroad. This segment has represented the real growth of priceline.com and the company will seek to match its success in other fragmented hotel markets, such as those in Asia.
Staples, the nation’s largest office supply retailer, was a notable detractor for the fiscal year. During the Portfolio’s fiscal year, many investors grew concerned about the growth prospects for the office supply space as a whole, as Staples missed earnings and revenue forecasts in the weaker economy. While consumers and businesses have generally remained quite cost-conscious, Staples has gained market share at home and abroad and we believe the company looks primed to benefit from a future recovery.
The views expressed are current as of the date of this report and are subject to change.
2011 Annual report · Delaware Pooled Trust
12
Crown Castle International, which operates and leases wireless towers throughout the U.S., detracted from the Portfolio’s performance when it posted negative returns due to investor fears that potential industry consolidations would slow plans for infrastructure spending. While a proposed merger now faces antitrust issues, Crown Castle has continued to report solid earnings from enhanced wireless demand and investors generally seem to be regaining confidence.
Regardless of the economy, we remain consistent in our long-term investment philosophy: We want to own what we view as strong secular-growth companies. We seek companies with solid business models and competitive positions that we believe can grow market share, and which have the potential to deliver shareholder value in a variety of market environments.
2011 Annual report · Delaware Pooled Trust
13
Performance summary
Delaware Pooled® Trust — The Large-Cap Growth Equity Portfolio
The performance data quoted represent past performance; past performance does not guarantee future results. Investment return and principal value will fluctuate so your shares, when redeemed, may be worth more or less than their original cost. Current performance may be lower or higher than the performance data quoted. Please obtain the performance data for the most recent month end by calling 800 231-8002 or visiting our website at www.delawareinvestments.com.
Carefully consider the Portfolio’s investment objectives, risk factors, charges, and expenses before investing. This and other information can be found in the Portfolio’s prospectus and, if available, its summary prospectus, which may be obtained by visiting www.delawareinvestments.com or calling 800 231-8002. Investors should read the prospectus and, if available, the summary prospectus carefully before investing.
| Portfolio performance | | | | | | | | |
| Average annual total returns | | | | | | | | |
| Periods ended Oct. 31, 2011 | | 1 year | | 3 years | | 5 years | | Lifetime |
| | +11.43% | | +17.02% | | +2.82% | | +2.91% |
| Portfolio profile |
| Oct. 31, 2011 |
| |
| Total net assets |
| $170.5 million |
| |
| Number of holdings |
| 32 |
| Inception date |
| Nov. 1, 2005 |
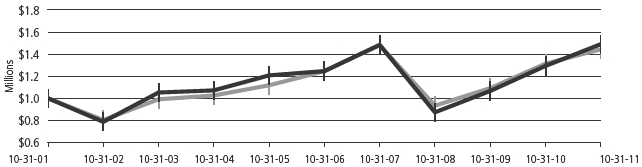
Growth of $1,000,000
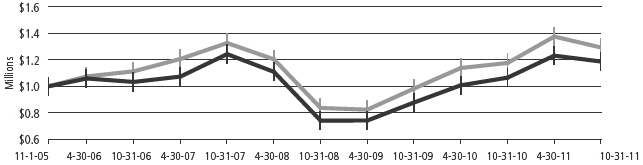
| | | | Starting value (Nov. 1, 2005) | | Ending value (Oct. 31, 2011) |
| Russell 1000 Growth Index | | $1,000,000 | | $1,293,445 |
| The Large-Cap Growth Equity Portfolio | | $1,000,000 | | $1,187,578 |
2011 Annual report · Delaware Pooled Trust
14
The performance graph assumes $1 million invested on Nov. 1, 2005, and includes reinvestment of all distributions. The performance graph does not reflect the deduction of taxes the shareholder would pay on Portfolio distributions or redemptions of Portfolio shares.
Total return assumes reinvestment of dividends and capital gains, but does not reflect reductions for taxes. Returns and share values will fluctuate so that shares, when redeemed, may be worth more or less than their original cost.
The most recent prospectus designated the Portfolio’s total operating expenses as 0.65%. Management has contractually agreed to reimburse certain expenses and/or waive its management fees from Feb. 28, 2011, through Feb. 28, 2012, in order to prevent total annual Portfolio operating expenses from exceeding, in an aggregate amount, 0.65% of the Portfolio’s average daily net assets, as described in the most recent prospectus.
Expense limitations were in effect during the period shown. Performance would have been lower had the expense limitations not been in effect.
The Russell 1000 Growth Index measures the performance of the large-cap growth segment of the U.S. equity universe. It includes those Russell 1000 companies with higher price-to-book ratios and higher forecasted growth values.
The S&P 500 Index, mentioned on page 12, measures the performance of 500 mostly large-cap stocks weighted by market value, and is often used to represent performance of the U.S. stock market.
Index performance returns do not reflect any management fees, transaction costs, or expenses. Indices are unmanaged and one cannot invest directly in an index.
Past performance is not a guarantee of future results.
Because the Portfolio expects to hold a concentrated portfolio of a limited number of securities, the Portfolio’s risk is increased because each investment has a greater effect on the Portfolio’s overall performance.
2011 Annual report · Delaware Pooled Trust
15
Portfolio management review
Delaware Pooled® Trust — The Focus Smid-Cap Growth Equity Portfolio
October 31, 2011
During the first several months of the Portfolio’s fiscal year ended Oct. 31, 2011, investors generally adopted an optimistic tone, seemingly focusing on several positive macroeconomic developments, including: the injection of additional stimulus by the Federal Reserve, a bipartisan deal to extend the Bush-era tax cuts (which also included stimulus measures), and still slowly improving economic conditions in the United States. (Data: Bloomberg.)
Starting in the spring and summer months of 2011, however, investors began responding to a pause in economic growth, as well as broad euro zone fears related primarily to the increasing risk of a Greek debt restructuring and possible default. Major equity indices reflected the increased level of uncertainty, generally declining through most of May and much of June.
For the most part, this trend continued through the final months of the Portfolio’s fiscal year, as market activity largely centered on the daily news coming out of the euro zone, which was predominantly negative. For example, the Greek government teetered on the edge of default as it awaited approval on an additional expanded bailout package. Additionally, many investors kept a close eye on activity in Spain and Italy, as both countries — each a major euro-zone economy — attempted to enact austerity measures aimed at staving off a potential default. These events, combined with a slowing economic environment across Europe, the United States, and even many emerging economies, took a significant toll on investors. The S&P 500® Index, for example, experienced a steep decline through July 2011 and into early August before recovering part of those losses.
Within this environment, Delaware Pooled Trust — The Focus Smid-Cap Growth Equity Portfolio returned +21.44% at net asset value (NAV) with all distributions reinvested for the fiscal year ended Oct. 31, 2011. The Portfolio’s benchmark, the Russell 2500™ Growth Index, returned +11.91% for the same period. Complete annualized performance for The Focus Smid-Cap Growth Equity Portfolio is shown in the table on page 18.
Weight Watchers International is the leading global provider of weight-management products and services. While the company continues to derive solid income from its traditional member meetings, it has expanded its market toward an increasing amount of internet and royalty revenue streams, which result in higher company margins. As a result, earnings have grown incrementally through its expanding subscriber base. Weight Watchers was the largest contributor to Portfolio performance during the fiscal year.
Peet’s Coffee & Tea is a specialty coffee roaster that markets its products through retail, restaurants, and company-owned stores. Though coffee prices have risen for the past few years, the gourmet segment of the market seems to be in solid growth mode. The company’s successful direct distribution model has resulted in special displays and premium product placements in chain stores and discount retailers that carry its brands. This positioning represents a significant advantage for gourmet coffee brands like Peet’s, which are generally priced more expensively than other offerings in the same aisles. Earnings remained solid throughout the fiscal year and we added to the Portfolio’s position as growth prospects looked strong for the long term.
The Portfolio was not without its detractors. The Portfolio’s position in Strayer Education, a private educational institute, hurt overall performance. The institute has struggled with declining revenue from shrinking enrollment. The entire for-profit education industry has suffered for several quarters largely due to enhanced government scrutiny and stricter regulations concerning recruiting, enrollment, and financial assistance. The “gainful employment” rules placed aid restrictions on programs that insufficiently prepare
The views expressed are current as of the date of this report and are subject to change.
2011 Annual report · Delaware Pooled Trust
16
students for finding well-paying jobs, a tough feat in this challenging economic environment. Strayer is an industry leader that we believe will survive and even benefit, as competitors fail and the labor market ultimately improves.
SBA Communications, which operates and leases wireless towers throughout the U.S., also posted negative returns due to investor fears that potential industry consolidations would slow down plans for infrastructure spending. While a proposed merger now faces antitrust issues, SBA Communications has continued to report solid earnings from enhanced wireless demand and investors generally seem to be regaining confidence.
Regardless of the economy, we remain consistent in our long-term investment philosophy: We want to own what we view as strong secular-growth companies. We seek companies with solid business models and competitive positions that we believe can grow market share, and which have the potential to deliver shareholder value in a variety of market environments.
2011 Annual report · Delaware Pooled Trust
17
Performance summary
Delaware Pooled® Trust — The Focus Smid-Cap Growth Equity Portfolio
The performance data quoted represent past performance; past performance does not guarantee future results. Investment return and principal value will fluctuate so your shares, when redeemed, may be worth more or less than their original cost. Current performance may be lower or higher than the performance data quoted. Please obtain the performance data for the most recent month end by calling 800 231-8002 or visiting our website at www.delawareinvestments.com.
Carefully consider the Portfolio’s investment objectives, risk factors, charges, and expenses before investing. This and other information can be found in the Portfolio’s prospectus and, if available, its summary prospectus, which may be obtained by visiting www.delawareinvestments.com or calling 800 231-8002. Investors should read the prospectus and, if available, the summary prospectus carefully before investing.
| Portfolio performance | | | | | | | | |
| Average annual total returns | | | | | | | | |
| Periods ended Oct. 31, 2011 | | 1 year | | 3 years | | 5 years | | Lifetime |
| | +21.44% | | +31.62% | | +10.65% | | +9.20% |
| Portfolio profile |
| Oct. 31, 2011 |
| |
| Total net assets |
| $16.7 million |
| |
| Number of holdings |
| 29 |
| Inception date |
| Dec. 1, 2003 |
Growth of $1,000,000

| | | | Starting value (Dec. 1, 2003) | | Ending value (Oct. 31, 2011) |
| The Focus Smid-Cap Growth Equity Portfolio | | $1,000,000 | | $2,007,863 |
| Russell 2500 Growth Index | | $1,000,000 | | $1,609,480 |
2011 Annual report · Delaware Pooled Trust
18
The performance graph assumes $1 million invested on Dec. 1, 2003, and includes reinvestment of all distributions. The performance graph does not reflect the deduction of taxes the shareholder would pay on Portfolio distributions or redemptions of Portfolio shares.
Total return assumes reinvestment of dividends and capital gains, but does not reflect reductions for taxes. Returns and share values will fluctuate so that shares, when redeemed, may be worth more or less than their original cost.
The most recent prospectus designated the Portfolio’s total operating expenses as 1.44%. Management has contractually agreed to reimburse certain expenses and/or waive its management fees from Feb. 28, 2011, through Feb. 28, 2012, in order to prevent total annual Portfolio operating expenses from exceeding, in an aggregate amount, 0.92% of the Portfolio’s average daily net assets, as described in the most recent prospectus.
Expense limitations were in effect during the period shown. Performance would have been lower had the expense limitations not been in effect.
The Russell 2500 Growth Index measures the performance of the small- to mid-cap growth segment of the U.S. equity universe. It includes those Russell 2500 companies with higher price-to-book ratios and higher forecasted growth values.
The S&P 500 Index, mentioned on page 16, measures the performance of 500 mostly large-cap stocks weighted by market value, and is often used to represent performance of the U.S. stock market.
Index performance returns do not reflect any management fees, transaction costs, or expenses. Indices are unmanaged and one cannot invest directly in an index.
Past performance is not a guarantee of future results.
Investments in small and/or medium-sized companies typically exhibit greater risk and higher volatility than larger, more established companies.
Because the Portfolio expects to hold a concentrated portfolio of a limited number of securities, the Portfolio’s risk is increased because each investment has a greater effect on the Portfolio’s overall performance.
Instances of high double-digit returns are unusual, cannot be sustained, and were primarily achieved during favorable market conditions.
2011 Annual report · Delaware Pooled Trust
19
Portfolio management review
Delaware Pooled® Trust — The Real Estate Investment Trust Portfolio II
October 31, 2011
For its fiscal year ended Oct. 31, 2011, Delaware Pooled Trust — The Real Estate Investment Trust Portfolio II returned +12.37% at net asset value (NAV) with all distributions reinvested. In comparison, the Portfolio’s benchmark, the FTSE NAREIT Equity REITs Index, advanced by 10.34% during the same period. Complete annualized performance for The Real Estate Investment Trust Portfolio II is shown in the table on page 22.
The Portfolio’s fiscal year was a highly volatile period for U.S. real estate investment trusts (REITs). Early in the fiscal year, REIT prices climbed steadily, posting an upward trend that lasted until early July 2011 as investors embraced the prospect of a moderate economic recovery.
In late July and early August 2011, REIT prices dropped sharply, but they rebounded in subsequent weeks. Over the remaining months of the Portfolio’s fiscal year, big price moves occurred regularly, with the rally in late August followed by a steep drop in September and then another impressive recovery in October.
Despite the up-and-down nature of the market, REITs enjoyed solid gains overall during the Portfolio’s fiscal year, as a favorable supply-demand balance, coupled with readily available financing at attractive prices, provided supportive conditions for property companies.
The Portfolio enjoyed strong results relative to its benchmark, more due to returns of individual securities than through sector allocation.
For much of the fiscal year, we tilted the Portfolio toward high-quality mall, apartment, and self-storage companies, as we believed these businesses were potentially well positioned to take advantage of low interest rates and the pricing power and occupancy rates made possible by tight property supply.
In the mall sector, for example, one of the Portfolio’s top-performing securities for the fiscal year was Simon Property Group, the largest position in both the Portfolio and the benchmark. We believe Simon Property Group is a high-quality company with a good management team and a healthy balance sheet, and its stock was supported by the limited supply of mall space and attractive financing costs.
The Portfolio was also helped by its overweight allocation to the strong-performing apartment sector, as well as security selection within that sector. Another solid contributor to relative returns was Home Properties, which was not one of the apartment sector’s better performers in absolute terms, but we made a timely sale of the security late in the fiscal year. Relative portfolio performance was modestly hampered by an underweight position in AvalonBay Communities, an index constituent that fared relatively well. We reduced the Portfolio’s position in this high-quality apartment company because we believed its shares were somewhat expensive and that better opportunities existed elsewhere.
Public Storage, a leading self-storage company that enjoyed durable pricing power and affordable financing costs, was another notable outperformer for the Portfolio.
The Portfolio’s modest cash position worked against relative returns in an up market (the benchmark does not include a cash stake). Elsewhere, a handful of individual securities provided a modest degree of underperformance. The Portfolio’s weakest individual holding during the fiscal year was Digital Realty Trust, an owner and operator of data-center space. Suburban office company Brandywine Realty Trust and lodging company Marriott International also hampered the Portfolio’s relative results.
The views expressed are current as of the date of this report and are subject to change.
2011 Annual report · Delaware Pooled Trust
20
For the majority of the Portfolio’s fiscal year, we also opted to underweight lodging stocks because of concerns about the health of the economy. This approach generally worked well for the Portfolio, and late in the fiscal year, we selectively took advantage of opportunities to buy high-quality lodging stocks whose low prices failed to reflect what we believed to be their underlying value.
Toward the end of the fiscal year, we moved defensively as the market rallied to trim the Portfolio’s allocation to stocks whose prices had risen beyond what we considered reasonable. At the same time, we also often added to stocks that we believed were fundamentally solid but still attractively valued.
We remain confident about the individual stocks in the Portfolio, but are mindful of the macroeconomic risks facing investors today. We believe the excess levels of debt in Europe (and to a lesser extent, in the United States) bear close scrutiny, and will not hesitate to make changes to the Portfolio as conditions evolve. We continue to assess the market environment day by day in an attempt to position the Portfolio to perform well as the landscape changes. Property companies require affordable and available investment capital in order to thrive, and it is with this in mind that we continue to closely monitor the general health and functioning of the capital markets.
2011 Annual report · Delaware Pooled Trust
21
Performance summary
Delaware Pooled® Trust — The Real Estate Investment Trust Portfolio II
The performance data quoted represent past performance; past performance does not guarantee future results. Investment return and principal value will fluctuate so your shares, when redeemed, may be worth more or less than their original cost. Current performance may be lower or higher than the performance data quoted. Please obtain the performance data for the most recent month end by calling 800 231-8002 or visiting our website at www.delawareinvestments.com.
Carefully consider the Portfolio’s investment objectives, risk factors, charges, and expenses before investing. This and other information can be found in the Portfolio’s prospectus and, if available, its summary prospectus, which may be obtained by visiting www.delawareinvestments.com or calling 800 231-8002. Investors should read the prospectus and, if available, the summary prospectus carefully before investing.
| Portfolio performance | | | | | | | | | | |
| Average annual total returns | | | | | | | | | | |
| Periods ended Oct. 31, 2011 | | 1 year | | 3 years | | 5 years | | 10 years | | Lifetime |
| | +12.37% | | +15.15% | | -0.39% | | +10.28% | | +8.65% |
| Portfolio profile |
| Oct. 31, 2011 |
| |
| Total net assets |
| $3.1 million |
| |
| Number of holdings |
| 53 |
| Inception date |
| Nov. 4, 1997 |
Growth of $1,000,000

| | | | Starting value (Oct. 31, 2001) | | Ending value (Oct. 31, 2011) |
| FTSE NAREIT Equity REITs Index | | $1,000,000 | | $2,835,487 |
| FTSE NAREIT All Equity REITs Index | | $1,000,000 | | $2,831,020 |
| The Real Estate Investment Trust Portfolio II | | $1,000,000 | | $2,660,766 |
2011 Annual report · Delaware Pooled Trust
22
The performance graph assumes $1 million invested on Oct. 31, 2001, and includes reinvestment of all distributions. The performance graph does not reflect the deduction of taxes the shareholder would pay on Portfolio distributions or redemptions of Portfolio shares.
Total return assumes reinvestment of dividends and capital gains, but does not reflect reductions for taxes. Returns and share values will fluctuate so that shares, when redeemed, may be worth more or less than their original cost.
The most recent prospectus designated the Portfolio’s total operating expenses as 1.81%. Management has contractually agreed to reimburse certain expenses and/or waive its management fees from Feb. 28, 2011, through Feb. 28, 2012, in order to prevent total annual Portfolio operating expenses from exceeding, in an aggregate amount, 0.95% of the Portfolio’s average daily net assets, as described in the most recent prospectus.
Expense limitations were in effect during the period shown. Performance would have been lower had the expense limitations not been in effect.
The FTSE NAREIT Equity REITs Index measures the performance of all publicly traded equity real estate investment trusts (REITs) traded on U.S. exchanges, excluding timber REITs. The FTSE NAREIT All Equity REITs Index measures the performance of all publicly traded equity real estate investment trusts traded on U.S. exchanges. Effective Dec. 20, 2010: (1) FTSE changed the composition of the FTSE NAREIT Equity REITs Index to exclude timber REITs; (2) FTSE created the FTSE NAREIT All Equity REITs Index with the components of the former FTSE NAREIT Equity REITs Index, including timber REITs; and (3) the Portfolio changed its benchmark index from the FTSE NAREIT All Equity REITs Index (former FTSE NAREIT Equity REITs Index) to the newly constituted FTSE NAREIT Equity REITs Index. The rationale for the change was that the Portfolio’s portfolio managers believe the new index is more appropriate for the Portfolio’s investment style. The FTSE NAREIT All Equity REITs Index may be excluded from this comparison in the future.
Index performance returns do not reflect any management fees, transaction costs, or expenses. Indices are unmanaged and one cannot invest directly in an index.
Past performance is not a guarantee of future results.
“Nondiversified” Portfolios may allocate more of their net assets to investments in single securities than “diversified” Portfolios. Resulting adverse effects may subject Portfolios to greater risks and volatility.
Narrowly focused investments may exhibit higher volatility than investments in multiple industry sectors.
REIT investments are subject to many of the risks associated with direct real estate ownership, including changes in economic conditions, credit risk, and interest rate fluctuations. A REIT fund’s tax status as a regulated investment company could be jeopardized if it holds real estate directly, as a result of defaults, or receives rental income from real estate holdings.
2011 Annual report · Delaware Pooled Trust
23
Portfolio management review
Delaware Pooled® Trust — The Core Focus Fixed Income Portfolio
October 31, 2011
At the beginning of the Portfolio’s fiscal year ended Oct. 31, 2011, financial markets were pressured by continuing credit concerns in the euro zone, tightening policy actions in China, and the political shift signaled by the mid-term U.S. Congressional elections, as well as by mixed reactions and results following the Federal Reserve’s second round of quantitative easing, often called QE2.
As the Portfolio’s fiscal year progressed, headwinds included sharply higher food and energy costs (often related to unrest in the Middle East and North Africa) as well as the earthquake-related nuclear disaster in Japan, which provided a setback to some Japanese multinational corporations and to global growth. These factors were offset by the positive response in risk markets to central bank–created liquidity, including QE2. Late in the fiscal year, the market experienced brief bounces due to perceived progress toward crisis resolution in Europe, but these moments of optimism were generally short-lived.
Despite considerable economic headwinds, the fiscal year was generally favorable to the fixed income market as a whole due to accommodative monetary policy from the Fed, value in many areas of the corporate bond market, and strong demand for yield in light of low interest rates.
Against this backdrop, Delaware Pooled Trust — The Core Focus Fixed Income Portfolio returned +6.49% at net asset value (NAV) with all distributions reinvested for the fiscal year ended Oct. 31, 2011. The Portfolio’s benchmark, the Barclays Capital U.S. Aggregate Index, returned +5.00% for the same period. Complete annualized performance for The Core Focus Fixed Income Portfolio is shown in the table on page 26.
The Portfolio’s relative returns for its fiscal year were aided by a continued overweight in investment grade corporate bonds, including an emphasis on lower-medium- and medium-grade (BBB- and A-rated) issues, as well as the generally positive effects of security selection. Among investment grade U.S. corporate bonds, we believed that bonds rated BBB and A generally offered the best risk-reward trade-off, and thus emphasized Portfolio positions in those categories. These bonds sometimes experienced volatility, but overall aided relative return.
The Portfolio generally remained underweight in government-backed or agency mortgage-backed securities (MBS), as we believed these securities remained expensive for much of the fiscal year. These areas of the market underperformed during this period.
Despite the Portfolio’s bias toward higher-quality commercial mortgage-backed securities (CMBS), its overweight position in this category detracted from its relative return. An overweight allocation in asset-backed securities (ABS) had a similarly negative effect. The negative ramifications of both allocations were particularly notable during the latter parts of the fiscal year.
We have suggested for several years that the nature of the 2008 recession was much different than the typical inventory-cycle type of recession experienced periodically during the last 50-plus years. Unlike other recessions, the 2008 balance-sheet recession was driven by the combination of overly leveraged and indebted parties (both individuals and corporations), as well as a sharp decline in the value of assets those parties held. As we are witnessing today, the effects of a balance sheet recession tend to last considerably longer and may cause any recovery to be less than robust.
The views expressed are current as of the date of this report and are subject to change.
2011 Annual report · Delaware Pooled Trust
24
Unfortunately, the key solution to an inventory-cycle recession — lower short-term rates — has had only a marginal effect on the current recovery. Instead, governments in many of the largest developed nations have turned to deficit spending and increased indebtedness as the short-term solution. While this approach has had positive short-term economic effects at times, the long-term effects of replacing private debt with more debt and leverage at the sovereign level are unclear.
Our current basic belief is that long-lasting solutions in the U.S. must include policy changes that encourage productivity gains. There needs to be a general realization among policy makers and others that we should all live within our means today, in order to build a base for strong economic growth in the future. We believe that the U.S. can only be headed down the true road toward a sustainable recovery and expansion when policy makers stop “papering over” economic problems and begin to move away from near-term solutions or economic issues at hand that month.
Additionally, the effects of a fiscal and credit contraction in the euro zone will likely have profound negative effects on that region’s economics throughout the next few years. We believe these strong economic effects should spill over to the U.S. and emerging markets, and will seek ways to mitigate their potentially harmful effects. Several hedges, including currency exposure for instance, have already been administered in the Portfolio. In the months ahead, we will continue to monitor these events and adjust the Portfolio accordingly.
2011 Annual report · Delaware Pooled Trust
25
Performance summary
Delaware Pooled® Trust — The Core Focus Fixed Income Portfolio
The performance data quoted represent past performance; past performance does not guarantee future results. Investment return and principal value will fluctuate so your shares, when redeemed, may be worth more or less than their original cost. Current performance may be lower or higher than the performance data quoted. Please obtain the performance data for the most recent month end by calling 800 231-8002 or visiting our website at www.delawareinvestments.com.
Carefully consider the Portfolio’s investment objectives, risk factors, charges, and expenses before investing. This and other information can be found in the Portfolio’s prospectus and, if available, its summary prospectus, which may be obtained by visiting www.delawareinvestments.com or calling 800 231-8002. Investors should read the prospectus and, if available, the summary prospectus carefully before investing.
| Portfolio performance | | | | | | | | |
| Average annual total returns | | | | | | | | |
| Periods ended Oct. 31, 2011 | | 1 year | | 3 years | | 5 years | | Lifetime |
| | +6.49% | | +10.69% | | +6.41% | | +5.80% |
| Portfolio profile |
| Oct. 31, 2011 |
| |
| Total net assets |
| $6.2 million |
| |
| Number of holdings |
| 172 |
| Inception date |
| June 30, 2004 |
Growth of $1,000,000
| | | | | Starting value (June 30, 2004) | | Ending value (Oct. 31, 2011) |
| | The Core Focus Fixed Income Portfolio | | $1,000,000 | | $1,512,091 |
| | Barclays Capital U.S. Aggregate Index | | $1,000,000 | | $1,510,043 |
2011 Annual report · Delaware Pooled Trust
26
The performance graph assumes $1 million invested on June 30, 2004, and includes reinvestment of all distributions. The performance graph does not reflect the deduction of taxes the shareholder would pay on Portfolio distributions or redemptions of Portfolio shares.
Total return assumes reinvestment of dividends and capital gains, but does not reflect reductions for taxes. Returns and share values will fluctuate so that shares, when redeemed, may be worth more or less than their original cost.
The most recent prospectus designated the Portfolio’s total operating expenses as 0.76%. Management has contractually agreed to reimburse certain expenses and/or waive its management fees from Feb. 28, 2011, through Feb. 28, 2012, in order to prevent total annual Portfolio operating expenses from exceeding, in an aggregate amount, 0.43% of the Portfolio’s average daily net assets, as described in the most recent prospectus.
Expense limitations were in effect during the period shown. Performance would have been lower had the expense limitations not been in effect.
The Barclays Capital U.S. Aggregate Index is a broad composite of more than 8,000 securities that tracks the investment grade domestic bond market.
Index performance returns do not reflect any management fees, transaction costs, or expenses. Indices are unmanaged and one cannot invest directly in an index.
Past performance is not a guarantee of future results.
Fixed income securities and bond funds can lose value, and investors can lose principal, as interest rates rise. They also may be affected by economic conditions that hinder an issuer’s ability to make interest and principal payments on its debt.
The Portfolio may also be subject to prepayment risk, the risk that the principal of a fixed income security that is held by the Portfolio may be prepaid prior to maturity, potentially forcing the Portfolio to reinvest that money at a lower interest rate.
The Portfolio may invest in derivatives, which may involve additional expenses and are subject to risk, including the risk that an underlying security or securities index moves in the opposite direction from what the portfolio manager anticipated. A derivative transaction depends upon the counterparties’ ability to fulfill their contractual obligations.
International investments entail risks not ordinarily associated with U.S. investments including fluctuation in currency values, differences in accounting principles, or economic or political instability in other nations. Investing in emerging markets can be riskier than investing in established foreign markets due to increased volatility and lower trading volume.
The Portfolio may be invested in foreign corporate bonds, which have special risks not ordinarily associated with domestic investments, such as currency fluctuations, economic and political change, and different accounting standards.
The Portfolio may experience portfolio turnover in excess of 100%, which could result in higher transaction costs and tax liability.
2011 Annual report · Delaware Pooled Trust
27
Portfolio management review
Delaware Pooled® Trust — The High-Yield Bond Portfolio
October 31, 2011
Delaware Pooled Trust — The High-Yield Bond Portfolio returned +4.52% at net asset value (NAV) with all distributions reinvested for the fiscal year ended Oct. 31, 2011. For the same period, the Portfolio’s benchmark, the BofA Merrill Lynch U.S. High Yield Constrained Index, returned +4.85%. Complete annualized performance for The High-Yield Bond Portfolio is shown in the table on page 30.
The Portfolio’s fiscal year was a tale of two halves. The first half, encompassing the fourth quarter of 2010 and the first quarter of 2011, saw a surprisingly strong high yield bond market in the face of sluggish macroeconomic numbers, persistent sovereign debt concerns in Europe, tighter policy initiatives in China, the earthquake-related nuclear crisis in Japan, and a sharp rise in U.S. Treasury yields. Throughout this period, investor demand for yield gave the market a steady bid for high yield bonds. Demand for lower-rated credits softened during the second half of the fiscal year as the debt difficulties in Europe became protracted and uncertainty over Chinese policy issues lingered.
Bonds regarded as having lower quality generally outperformed higher-quality bonds during the first half of the fiscal year. This trend of lower quality outpacing higher quality on a total return basis was generally true across industries as well. For example, the strongest-performing industries during this period, such as broadcasting, financials, and energy, are usually categorized as lower-credit-quality industries. Automotive, retail, and healthcare were the worst-performing sectors during the Portfolio’s fiscal year, and they are usually categorized as some of the higher-quality sectors in the high yield market.
The downgrading of U.S. government debt by Standard & Poor’s weakened demand in the second half of the fiscal year, with fund flows turning negative in August 2011. We attribute this weakening to an increased level of risk aversion among investors.
Many investors seemed to seek out higher-quality issues during this period, as lower-quality issues substantially underperformed higher-quality issues. Reversing the trend recorded earlier in the fiscal year, the best-performing industries included energy and healthcare (which are usually categorized as higher-credit-quality industries, and are typically more defensive during downturns), while metals and mining, housing, and diversified media were the worst-performing sectors for this period (they are usually categorized as some of the more cyclical sectors in the high yield bond market).
The Portfolio maintained an overweight allocation to lower-credit-quality bonds such as CCC- and B-rated credits for the entire fiscal year. This aided return during the first half of this period, though the emphasis on higher-quality (less distressed) securities within the lower-credit-quality spectrum slightly muted this positive effect. CCC- and B-rated issues hindered performance during the second half of the fiscal year, but the relatively high quality of the issues once again diminished the negative effect.
Over the course of the fiscal year, defaults and distressed-debt exchanges steadily abated as areas of focus and concern in the high yield bond and leveraged loan markets. We believe the decrease in default expectations is attributable to the relative historical strength in demand for new issuance. It should be noted, however, that new issuance toward the end of the fiscal year tapered off considerably, at one point matching the lowest new-issuance volume since the first quarter of 2009.
Our outlook for most of the industries and companies that we follow is still optimistic based on what we view as improving fundamentals, improving liquidity, and still-attractive valuations. Much depends on continued economic improvement and access to new funds for high yield bond issuers. Currently, it appears that financing is only available to companies in the upper tiers of the credit-quality spectrum, due primarily to the volatility and risk aversion caused by the European sovereign debt crisis.
The views expressed are current as of the date of this report and are subject to change.
2011 Annual report · Delaware Pooled Trust
28
While we believe default expectations should stay low, we remain cautious about the global growth picture. The bottom line is that we are currently embracing risk in the Portfolio while remaining cognizant of credit-quality considerations. Currently, we view the most attractive part of the high yield bond market to be in medium- to lower-quality B-rated bonds as well as in higher-quality CCC-rated bonds. We think it is prudent to be selective in the most distressed part of the high yield bond market, represented by CCC-rated bonds. We continue to favor high yield bonds over leveraged loans given what we consider the large valuation gap that currently exists.
2011 Annual report · Delaware Pooled Trust
29
Performance summary
Delaware Pooled® Trust — The High-Yield Bond Portfolio
The performance data quoted represent past performance; past performance does not guarantee future results. Investment return and principal value will fluctuate so your shares, when redeemed, may be worth more or less than their original cost. Current performance may be lower or higher than the performance data quoted. Please obtain the performance data for the most recent month end by calling 800 231-8002 or visiting our website at www.delawareinvestments.com.
Carefully consider the Portfolio’s investment objectives, risk factors, charges, and expenses before investing. This and other information can be found in the Portfolio’s prospectus and, if available, its summary prospectus, which may be obtained by visiting www.delawareinvestments.com or calling 800 231-8002. Investors should read the prospectus and, if available, the summary prospectus carefully before investing.
| Portfolio performance | | | | | | | | | | |
| Average annual total returns | | | | | | | | | | |
| Periods ended Oct. 31, 2011 | | 1 year | | 3 years | | 5 years | | 10 years | | Lifetime |
| | +4.52% | | +22.74% | | +8.14% | | +10.50% | | +7.99% |
| Portfolio profile |
| Oct. 31, 2011 |
| |
| Total net assets |
| $57.8 million |
| |
| Number of holdings |
| 229 |
| |
| Inception date |
| Dec. 2, 1996 |
Growth of $1,000,000
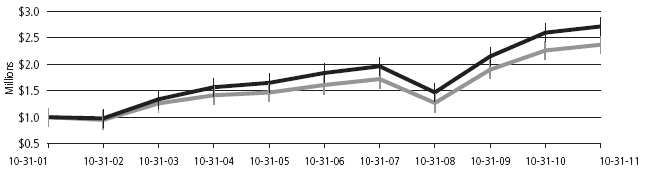
| | | Starting value (Oct. 31, 2001) | | Ending value (Oct. 31, 2011) |
| The High-Yield Bond Portfolio | | $1,000,000 | | $2,713,624 |
| BofA Merrill Lynch U.S. High Yield Constrained Index | | $1,000,000 | | $2,368,454 |
2011 Annual report · Delaware Pooled Trust
30
The performance graph assumes $1 million invested on Oct. 31, 2001, and includes reinvestment of all distributions. The performance graph does not reflect the deduction of taxes the shareholder would pay on Portfolio distributions or redemptions of Portfolio shares.
Total return assumes reinvestment of dividends and capital gains, but does not reflect reductions for taxes. Returns and share values will fluctuate so that shares, when redeemed, may be worth more or less than their original cost.
The most recent prospectus designated the Portfolio’s total operating expenses as 0.74%. Management has contractually agreed to reimburse certain expenses and/or waive its management fees from Feb. 28, 2011, through Feb. 28, 2012, in order to prevent total annual Portfolio operating expenses from exceeding, in an aggregate amount, 0.59% of the Portfolio’s average daily net assets, as described in the most recent prospectus.
Expense limitations were in effect during the period shown. Performance would have been lower had the expense limitations not been in effect.
The BofA Merrill Lynch U.S. High Yield Constrained Index, formerly the Merrill Lynch U.S. High Yield Master II Constrained Index, tracks the performance of U.S. dollar–denominated high yield corporate debt publicly issued in the U.S. domestic market, but caps individual issuer exposure at 2% of the benchmark.
Index performance returns do not reflect any management fees, transaction costs, or expenses. Indices are unmanaged and one cannot invest directly in an index.
Past performance is not a guarantee of future results.
Fixed income securities and bond funds can lose value, and investors can lose principal, as interest rates rise. They also may be affected by economic conditions that hinder an issuer’s ability to make interest and principal payments on its debt.
The Portfolio may also be subject to prepayment risk, the risk that the principal of a fixed income security that is held by the Portfolio may be prepaid prior to maturity, potentially forcing the Portfolio to reinvest that money at a lower interest rate.
The Portfolio may invest in derivatives, which may involve additional expenses and are subject to risk, including the risk that an underlying security or securities index moves in the opposite direction from what the portfolio manager anticipated. A derivative transaction depends upon the counterparties’ ability to fulfill their contractual obligations.
International investments entail risks not ordinarily associated with U.S. investments including fluctuation in currency values, differences in accounting principles, or economic or political instability in other nations. Investing in emerging markets can be riskier than investing in established foreign markets due to increased volatility and lower trading volume.
If and when the Portfolio invests in forward foreign currency contracts or uses other investments to hedge against currency risks, the Portfolio will be subject to special risks, including counterparty risk.
High yielding, noninvestment grade bonds (junk bonds) involve higher risk than investment grade bonds. The high yield secondary market is particularly susceptible to liquidity problems when institutional investors, such as mutual funds and certain other financial institutions, temporarily stop buying bonds for regulatory, financial, or other reasons. In addition, a less liquid secondary market makes it more difficult for the Fund to obtain precise valuations of the high yield securities in its portfolio.
The Portfolio may experience portfolio turnover in excess of 100%, which could result in higher transaction costs and tax liability.
Instances of high double-digit returns are unusual, cannot be sustained, and were primarily achieved during favorable market conditions.
2011 Annual report · Delaware Pooled Trust
31
Portfolio management review
Delaware Pooled® Trust — The Core Plus Fixed Income Portfolio
October 31, 2011
At the beginning of the Portfolio’s fiscal year ended Oct. 31, 2011, financial markets were pressured by continuing credit concerns in the euro zone, tightening policy actions in China, and the political shift signaled by the mid-term U.S. Congressional elections, as well as by mixed reactions and results following the Federal Reserve’s second round of quantitative easing, often called QE2.
As the Portfolio’s fiscal year progressed, headwinds included sharply higher food and energy costs (often related to unrest in the Middle East and North Africa) as well as the earthquake-related nuclear disaster in Japan, which provided a setback to some Japanese multinational corporations and to global growth. These factors were offset by the positive response in risk markets to central bank–created liquidity, including QE2. Late in the fiscal year, the market experienced brief bounces due to perceived progress toward crisis resolution in Europe, but these moments of optimism were generally short-lived.
Despite considerable economic headwinds, the fiscal year was generally favorable to the fixed income market as a whole due to accommodative monetary policy from the Fed, value in many areas of the corporate bond market, and strong demand for yield in light of low interest rates.
Against this backdrop, Delaware Pooled Trust — The Core Plus Fixed Income Portfolio returned +4.80% at net asset value (NAV) with all distributions reinvested for the fiscal year ended Oct. 31, 2011. The Portfolio’s benchmark, the Barclays Capital U.S. Aggregate Index, returned +5.00% for the same period. Complete annualized performance for The Core Plus Fixed Income Portfolio is shown in the table on page 34.
The Portfolio’s relative returns for its fiscal year were aided by a continued overweight in investment grade corporate bonds, including an emphasis on lower-medium- and medium-grade (BBB- and A-rated) issues, as well as the generally positive effects of security selection.
Our investment-management focus continued to be about quality, liquidity, downside protection, and seeking exceptional value for taking risk. Among investment grade U.S. corporate bonds, we concluded that bonds rated BBB and A rated generally offered the best risk-reward trade-off, and thus emphasized Portfolio positions in those categories. These bonds sometimes experienced volatility, but overall aided relative return.
The Portfolio generally remained underweight in government-backed or agency mortgage-backed securities (MBS), as we believed these securities remained expensive for much of the fiscal year. These areas of the market underperformed during this period.
Despite the Portfolio’s bias toward higher-quality commercial mortgage-backed securities (CMBS), its overweight position in this category detracted from its relative return. An overweight allocation to asset-backed securities (ABS) had a similarly negative effect. The negative ramifications of both allocations were particularly notable during the latter parts of the fiscal year.
Though the high yield bond market started the fiscal year relatively well, it underperformed other fixed income sectors during the year as lower-quality issues did not directly participate in the interest-rate-driven rally in bond prices. Overall, the Portfolio’s exposure to high yield securities hurt relative performance. Investments in bank loans had a similar effect.
Positions in emerging market debt also had a negative effect on Portfolio performance for the fiscal year. U.S. dollar–based securities, as well as issues denominated in local currencies (such as Mexico and South Africa) underperformed. Though the value of the U.S. dollar fluctuated during the fiscal year, it was broadly weaker against emerging market currencies.
The views expressed are current as of the date of this report and are subject to change.
2011 Annual report · Delaware Pooled Trust
32
Finally, bonds issued within developed markets (denominated in local currencies) boosted the Portfolio’s total returns during the fiscal year as interest rates fell. Currencies weakened, however, and the Portfolio’s exposures in Australia and Canada were sources of currency-based price weakness. Currency hedges within the Portfolio partially offset this generally negative currency effect.
We have suggested for several years that the nature of the 2008 recession was much different than the typical inventory-cycle type of recession experienced periodically during the last 50-plus years. Unlike other recessions, the 2008 balance-sheet recession was driven by the combination of overly leveraged and indebted parties (both individuals and corporations), as well as a sharp decline in the value of assets those parties held. As we are witnessing today, the effects of a balance sheet recession tend to last considerably longer and may cause any recovery to be less than robust.
Unfortunately, the key solution to an inventory-cycle recession — lower short-term rates — has had only a marginal effect on the current recovery. Instead, governments in many of the largest developed nations have turned to deficit spending and increased indebtedness as the short-term solution. While this approach has had positive short-term economic effects at times, we believe the long-term effects of replacing private debt with more debt and leverage at the sovereign level are unclear.
Our current basic belief is that long-lasting solutions in the U.S. must include policy changes that encourage productivity gains. There needs to be a general realization among policy makers and others that we should all live within our means today, in order to build a base for strong economic growth in the future. We believe that the U.S. can only be headed down the true road toward a sustainable recovery and expansion when policy makers stop “papering over” economic problems and begin to move away from near-term solutions or economic issues at hand that month.
Additionally, the effects of a fiscal and credit contraction in the euro zone should have profound negative effects on that region’s economics throughout the next few years. We believe these strong economic effects should spill over to the U.S. and emerging markets, and will seek ways to mitigate their potentially harmful effects. Several hedges, including currency exposure for instance, have already been administered in the Portfolio. In the months ahead, we will continue to monitor these events and adjust the Portfolio accordingly.
2011 Annual report · Delaware Pooled Trust
33
Performance summary
Delaware Pooled® Trust — The Core Plus Fixed Income Portfolio
The performance data quoted represent past performance; past performance does not guarantee future results. Investment return and principal value will fluctuate so your shares, when redeemed, may be worth more or less than their original cost. Current performance may be lower or higher than the performance data quoted. Please obtain the performance data for the most recent month end by calling 800 231-8002 or visiting our website at www.delawareinvestments.com.
Carefully consider the Portfolio’s investment objectives, risk factors, charges, and expenses before investing. This and other information can be found in the Portfolio’s prospectus and, if available, its summary prospectus, which may be obtained by visiting www.delawareinvestments.com or calling 800 231-8002. Investors should read the prospectus and, if available, the summary prospectus carefully before investing.
| Portfolio performance | | | | | | | | |
| Average annual total returns | | | | | | | | |
| Periods ended Oct. 31, 2011 | | 1 year | | 3 years | | 5 years | | Lifetime |
| | +4.80% | | +13.82% | | +7.76% | | +7.16% |
| Portfolio profile |
| Oct. 31, 2011 |
| |
| Total net assets |
| $53.9 million |
| |
| Number of holdings |
| 407 |
| |
| Inception date |
| June 28, 2002 |
Growth of $1,000,000
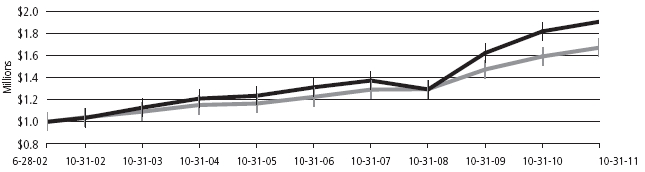
| | | Starting value (June 28, 2002) | | Ending value (Oct. 31, 2011) |
| The Core Plus Fixed Income Portfolio | | $1,000,000 | | $1,908,021 |
| Barclays Capital U.S. Aggregate Index | | $1,000,000 | | $1,672,547 |
2011 Annual report · Delaware Pooled Trust
34
The performance graph assumes $1 million invested on June 28, 2002, and includes reinvestment of all distributions. The performance graph does not reflect the deduction of taxes the shareholder would pay on Portfolio distributions or redemptions of Portfolio shares.
Total return assumes reinvestment of dividends and capital gains, but does not reflect reductions for taxes. Returns and share values will fluctuate so that shares, when redeemed, may be worth more or less than their original cost.
The most recent prospectus designated the Portfolio’s total operating expenses as 0.65%. Management has contractually agreed to reimburse certain expenses and/or waive its management fees from Feb. 28, 2011, through Feb. 28, 2012, in order to prevent total annual Portfolio operating expenses from exceeding, in an aggregate amount, 0.45% of the Portfolio’s average daily net assets, as described in the most recent prospectus.
Expense limitations were in effect during the period shown. Performance would have been lower had the expense limitations not been in effect.
The Barclays Capital U.S. Aggregate Index is a broad composite of more than 8,000 securities that tracks the investment grade domestic bond market.
Index performance returns do not reflect any management fees, transaction costs, or expenses. Indices are unmanaged and one cannot invest directly in an index.
Past performance is not a guarantee of future results.
Fixed income securities and bond funds can lose value, and investors can lose principal, as interest rates rise. They also may be affected by economic conditions that hinder an issuer’s ability to make interest and principal payments on its debt.
The Portfolio may also be subject to prepayment risk, the risk that the principal of a fixed income security that is held by the Portfolio may be prepaid prior to maturity, potentially forcing the Portfolio to reinvest that money at a lower interest rate.
The Portfolio may invest in derivatives, which may involve additional expenses and are subject to risk, including the risk that an underlying security or securities index moves in the opposite direction from what the portfolio manager anticipated. A derivative transaction depends upon the counterparties’ ability to fulfill their contractual obligations.
International investments entail risks not ordinarily associated with U.S. investments including fluctuation in currency values, differences in accounting principles, or economic or political instability in other nations. Investing in emerging markets can be riskier than investing in established foreign markets due to increased volatility and lower trading volume.
The Portfolio may be invested in foreign corporate bonds, which have special risks not ordinarily associated with domestic investments, such as currency fluctuations, economic and political change, and different accounting standards.
High yielding, noninvestment grade bonds (junk bonds) involve higher risk than investment grade bonds. The high yield secondary market is particularly susceptible to liquidity problems when institutional investors, such as mutual funds and certain other financial institutions, temporarily stop buying bonds for regulatory, financial, or other reasons. In addition, a less liquid secondary market makes it more difficult for the Fund to obtain precise valuations of the high yield securities in its portfolio.
The Portfolio may experience portfolio turnover in excess of 100%, which could result in higher transaction costs and tax liability.
2011 Annual report · Delaware Pooled Trust
35
Portfolio management review
Delaware Pooled® Trust — The International Equity Portfolio
October 31, 2011
Delaware Pooled Trust — The International Equity Portfolio returned -0.88% at net asset value (NAV) with all distributions reinvested for the fiscal year ended Oct. 31, 2011. The Portfolio’s benchmark, the MSCI EAFE Index, returned -3.64% (gross) and -4.08% (net) for the same period. Complete annualized performance for The International Equity Portfolio is shown in the table on page 38.
In general, the Portfolio had a good fiscal year on a relative basis. However, it was a difficult time for equities across the globe, due to the lingering debt problems in Europe, as well as Japan’s earthquake, tsunami, and nuclear crisis in March 2011.
Over the last five years, the Pacific region has outperformed Europe, and this period was no exception, with Australasian and Japanese stocks leading the way. Australia has been quite resilient through recent years, based partly on its strength in commodities and materials. Additionally, Australasian currencies were helped by attractively high interest rates. Despite political upheaval (six different prime ministers in the last five years, since Junichiro Koizumi left the office in September 2006), Japanese equities were generally strong for different reasons. Traditionally more defensive Japanese stocks, namely in the consumer staples, healthcare, and telecommunications sectors, rebounded significantly and generally performed well. Japanese market returns were also helped by the yen’s movements. Despite depreciating after the March 2011 earthquake, the yen ultimately appreciated 3.5% over the fiscal year.
Europe was a mixed bag during the fiscal year. Not surprisingly, Greece was the weakest market in the region. The contagion effect was real and present; however, not all of the troubled markets — Spain, Italy, Portugal, and Ireland — were affected equally. Irish authorities reacted quickly during the recession, putting in place a new parliament, a new prime minister, and new austerity measures. The Irish government has also managed to keep corporate tax rates generally low, which has attracted employers (one prominent example is Twitter). In our opinion, the debt issues in Spain are not as bad as many had believed. The Bank of Spain has been effective in enforcing high capital positions in the financial sector, and it has been proactive in reorganizing the weaker regional banks, known as cajas. The surprising weakness of France, however, has stood in contrast to Spain. Generally considered one of the stalwarts of the euro zone, French equity markets underperformed due to concerns about their exposure to sovereign debt in the weak peripheral markets.
The Portfolio had no exposure to Greece or Portugal through the fiscal year, a fact that notably added to the Portfolio’s relative performance. The Portfolio’s lack of exposure to other small European countries such as Belgium and Denmark was also positive. However, overweight positions in Spain, Italy, and France held back returns. All told, however, the Portfolio’s country weights added value on a relative basis.
In managing the Portfolio, we kept a close eye on consumer demand throughout the world. We increased defensive positioning in the consumer staples sector, focusing on firms that we believed had strong positions in their local market, good property portfolios, strong private label exposure, and an ability to expand profitably overseas. We also continued to find good value in the telecommunications and healthcare sectors.
The Portfolio’s underweight positions also worked well during the fiscal year. We had limited exposure to European banks, preferring insurance companies of the non-life variety instead. In the materials sector, we remained underweight as, in our view, valuations still looked stretched.
The views expressed are current as of the date of this report and are subject to change.
2011 Annual report · Delaware Pooled Trust
36
The following individual stocks had the greatest effect on the Portfolio’s performance:
Telstra is the incumbent telecommunications company in Australia. Bolstered by a nearly finalized agreement with the Australian government for the rollout of a new fiber network, the company’s stock advanced by 25.7% in dollar terms over the Portfolio’s fiscal year.
Seven & I Holdings’ stock declined in spring 2011 because many of the company’s supermarkets were in the Tohoku, Japan, area, which experienced power shortages after being hit by the tsunami. We felt the selling was overdone and bought more shares after it had declined. The stock finished the fiscal year up 16.2%.
Unilever is the Anglo–Dutch brand-name consumer staple stock which derives about 60% of its earnings from emerging markets. We believe it’s a well-run company and a strong defensive stock. The share price advanced 17% during the fiscal year due, in our opinion, to the company’s mix of price and volume growth.
French retailer Carrefour suffered from a variety of setbacks during the fiscal year, including corporate governance issues, strategic missteps with the rollout of its new hypermarkets, and fraud within its Brazilian business. The stock declined 50% during the fiscal year. We used the declines as a buying opportunity, as we have confidence in the long-term outlook for the company.
Intesa Sanpaolo is an Italian bank whose stock price fell nearly 46% during the fiscal year. Sovereign debt concerns and rising funding costs within Italy were the chief reasons for this decline.
RWE, the German utility, faltered in the wake of the nuclear accident in Japan. Thirty percent (30%) of its nuclear capacity was shut off by government order. Despite RWE taking legal action against the government, this loss weighed on both operating results and the company’s capital position. As a result, the stock declined by almost 40%. We added to the Portfolio’s position in this stock due to our belief that the company’s diversified energy sources will likely be in demand going forward.
2011 Annual report · Delaware Pooled Trust
37
Performance summary
Delaware Pooled® Trust — The International Equity Portfolio
The performance data quoted represent past performance; past performance does not guarantee future results. Investment return and principal value will fluctuate so your shares, when redeemed, may be worth more or less than their original cost. Current performance may be lower or higher than the performance data quoted. Please obtain the performance data for the most recent month end by calling 800 231-8002 or visiting our website at www.delawareinvestments.com.
Carefully consider the Portfolio’s investment objectives, risk factors, charges, and expenses before investing. This and other information can be found in the Portfolio’s prospectus and, if available, its summary prospectus, which may be obtained by visiting www.delawareinvestments.com or calling 800 231-8002. Investors should read the prospectus and, if available, the summary prospectus carefully before investing.
| Portfolio performance | | | | | | | | | | |
Average annual total returns | | | | | | | | | | |
| Periods ended Oct. 31, 2011 | | 1 year | | 3 years | | 5 years | | 10 years | | Lifetime |
| | -0.88% | | +7.77% | | -1.64% | | +7.81% | | +7.88% |
Portfolio profile
Oct. 31, 2011
| Total net assets | |
| $589.1 million | |
| |
| Number of holdings | |
| 57 | |
| |
| Inception date | |
| Feb. 4, 1992 | |
Growth of $1,000,000
| | | | | |
| | | Starting value (Oct. 31, 2001) | | Ending value (Oct. 31, 2011) |
| The International Equity Portfolio | | $1,000,000 | | $2,121,454 |
| MSCI EAFE Index (gross) | | $1,000,000 | | $1,822,845 |
| MSCI EAFE Index (net) | | $1,000,000 | | $1,745,972 |
2011 Annual report · Delaware Pooled Trust
38
The performance graph assumes $1 million invested on Oct. 31, 2001, and includes reinvestment of all distributions. The performance graph does not reflect the deduction of taxes the shareholder would pay on Portfolio distributions or redemptions of Portfolio shares.
Total return assumes reinvestment of dividends and capital gains, but does not reflect reductions for taxes. Returns and share values will fluctuate so that shares, when redeemed, may be worth more or less than their original cost.
The most recent prospectus designated the Portfolio’s total operating expenses as 0.87%.
The MSCI EAFE Index measures equity market performance across developed market countries in Europe, Australasia, and the Far East. Index “gross” return approximates the maximum possible dividend reinvestment. Index “net” return approximates the minimum possible dividend reinvestment, after deduction of withholding tax at the highest possible rate.
Index performance returns do not reflect any management fees, transaction costs, or expenses. Indices are unmanaged and one cannot invest directly in an index.
Past performance is not a guarantee of future results.
International investments entail risks not ordinarily associated with U.S. investments including fluctuation in currency values, differences in accounting principles, or economic or political instability in other nations. Investing in emerging markets can be riskier than investing in established foreign markets due to increased volatility and lower trading volume.
If and when the Portfolio invests in forward foreign currency contracts or uses other investments to hedge against currency risks, the Portfolio will be subject to special risks, including counterparty risk.
The Portfolio is presently closed to new investors.
2011 Annual report · Delaware Pooled Trust
39
Portfolio management review
Delaware Pooled® Trust — The Labor Select International Equity Portfolio
October 31, 2011
Delaware Pooled Trust — The Labor Select International Equity Portfolio returned -1.79% at net asset value (NAV) with all distributions reinvested for the fiscal year ended Oct. 31, 2011. The Portfolio’s benchmark, the MSCI EAFE Index, returned -3.64% (gross) and -4.08% (net) for the same period. Complete annualized performance for The Labor Select International Equity Portfolio is shown in the table on page 42.
In general, the Portfolio had a good fiscal year on a relative basis. However, it was a difficult time for equities across the globe, due to the lingering debt problems in Europe, as well as Japan’s earthquake, tsunami, and nuclear crisis in March 2011.
Over the last five years, the Pacific region has outperformed Europe, and this period was no exception, with Australasian and Japanese stocks leading the way. Australia has been quite resilient through recent years, based partly on its strength in commodities and materials. Additionally, Australasian currencies were helped by attractively high interest rates. Despite political upheaval (six different prime ministers in the last five years, since Junichiro Koizumi left the office in September 2006), Japanese equities were generally strong for different reasons. Traditionally more defensive Japanese stocks, namely in the consumer staples, healthcare, and telecommunications sectors, rebounded significantly and generally performed well. Japanese market returns were also helped by the yen’s movements. Despite depreciating after the March 2011 earthquake, the yen ultimately appreciated 3.5% over the fiscal year.
Europe was a mixed bag during the fiscal year. Not surprisingly, Greece was the weakest market in the region. The contagion effect was real and present; however, not all of the troubled markets — Spain, Italy, Portugal, and Ireland — were affected equally. Irish authorities reacted quickly during the recession, putting in place a new parliament, a new prime minister, and new austerity measures. The Irish government has also managed to keep corporate tax rates generally low, which has attracted employers (one prominent example is Twitter). In our opinion, the debt issues in Spain are not as bad as many had believed. The Bank of Spain has been effective in enforcing high capital positions in the financial sector, and it has been proactive in reorganizing the weaker regional banks, known as cajas. The surprising weakness of France, however, has stood in contrast to Spain. Generally considered one of the stalwarts of the euro zone, French equity markets underperformed due to concerns about their exposure to sovereign debt in the weak peripheral markets.
The Portfolio had no exposure to Greece or Portugal through the fiscal year, a fact that notably added to the Portfolio’s relative performance. The Portfolio’s lack of exposure to other small European countries such as Belgium and Denmark was also positive. However, overweight positions in Spain, Italy, and France held back returns. All told, however, our country weights added value on a relative basis.
In managing the Portfolio, we kept a close eye on consumer demand throughout the world. We increased defensive positioning in the consumer staples sector, focusing on firms that we believed had strong positions in their local market, good property portfolios, strong private label exposure, and an ability to expand profitably overseas. We also continued to find good value in the telecommunications and healthcare sectors.
The Portfolio’s underweight positions also worked well during the fiscal year. We had limited exposure to European banks, preferring insurance companies of the non-life variety instead. In the materials sector, we remained underweight as, in our view, valuations still looked stretched.
The views expressed are current as of the date of this report and are subject to change.
2011 Annual report · Delaware Pooled Trust
40
The following individual stocks had the greatest effect on the Portfolio’s performance:
Telstra is the incumbent telecommunications company in Australia. Bolstered by a nearly finalized agreement with the Australian government for the rollout of a new fiber network, the company’s stock advanced by 25.7% in dollar terms over the Portfolio’s fiscal year.
Seven & I Holdings’ stock declined in spring 2011 because many of the company’s supermarkets were in the area around Tohoku, Japan, which experienced power shortages after being hit by the tsunami. We felt the selling was overdone and bought more shares after it had declined. The stock finished the fiscal year up 16.2%.
Unilever is the Anglo–Dutch brand-name consumer staple stock which derives about 60% of its earnings from emerging markets. We believe it’s a well-run company and a strong defensive stock. The share price advanced 17% during the fiscal year due, in our opinion, to the company’s mix of price and volume growth.
French retailer Carrefour suffered from a variety of setbacks during the fiscal year, including corporate governance issues, strategic missteps with the rollout of its new hypermarkets, and fraud within its Brazilian business. The stock declined 50% during the fiscal year. We used the declines as a buying opportunity, as we have confidence in the long-term outlook for the company.
Intesa Sanpaolo is an Italian bank whose stock price fell nearly 46% during the fiscal year. Sovereign debt concerns and rising funding costs within Italy were the chief reasons for this decline.
RWE, the German utility, faltered in the wake of the nuclear accident in Japan. Thirty percent (30%) of its nuclear capacity was shut off by government order. Despite RWE taking legal action against the government, this loss weighed on both operating results and the company’s capital position. As a result, the stock declined by almost 40%. We added to the Portfolio’s position in this stock due to our belief that the company’s diversified energy sources will likely be in demand going forward.
2011 Annual report · Delaware Pooled Trust
41
Performance summary
Delaware Pooled® Trust — The Labor Select International Equity Portfolio
The performance data quoted represent past performance; past performance does not guarantee future results. Investment return and principal value will fluctuate so your shares, when redeemed, may be worth more or less than their original cost. Current performance may be lower or higher than the performance data quoted. Please obtain the performance data for the most recent month end by calling 800 231-8002 or visiting our website at www.delawareinvestments.com.
Carefully consider the Portfolio’s investment objectives, risk factors, charges, and expenses before investing. This and other information can be found in the Portfolio’s prospectus and, if available, its summary prospectus, which may be obtained by visiting www.delawareinvestments.com or calling 800 231-8002. Investors should read the prospectus and, if available, the summary prospectus carefully before investing.
Portfolio performance | | | | | | | | | | |
Average annual total returns | | | | | | | | | | |
| Periods ended Oct. 31, 2011 | | 1 year | | 3 years | | 5 years | | 10 years | | Lifetime |
| | -1.79% | | +7.39% | | -1.97% | | +7.80% | | +7.58% |
Portfolio profile
Oct. 31, 2011
| Total net assets | |
| $572.6 million | |
| |
| Number of holdings | |
| 52 | |
| | |
| Inception date | |
| Dec. 19, 1995 | |
Growth of $1,000,000
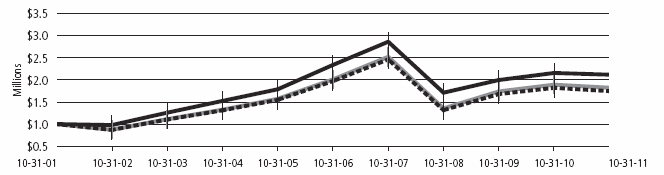
| | | | | |
| | | Starting value (Oct. 31, 2001) | | Ending value (Oct. 31, 2011) |
| The Labor Select International Equity Portfolio | | $1,000,000 | | $2,119,008 |
| MSCI EAFE Index (gross) | | $1,000,000 | | $1,822,845 |
| MSCI EAFE Index (net) | | $1,000,000 | | $1,745,972 |
2011 Annual report · Delaware Pooled Trust
42
The performance graph assumes $1 million invested on Oct. 31, 2001, and includes reinvestment of all distributions. The performance graph does not reflect the deduction of taxes the shareholder would pay on Portfolio distributions or redemptions of Portfolio shares.
Total return assumes reinvestment of dividends and capital gains, but does not reflect reductions for taxes. Returns and share values will fluctuate so that shares, when redeemed, may be worth more or less than their original cost.
The most recent prospectus designated the Portfolio’s total operating expenses as 0.87%.
The MSCI EAFE Index measures equity market performance across developed market countries in Europe, Australasia, and the Far East. Index “gross” return approximates the maximum possible dividend reinvestment. Index “net” return approximates the minimum possible dividend reinvestment, after deduction of withholding tax at the highest possible rate.
Index performance returns do not reflect any management fees, transaction costs, or expenses. Indices are unmanaged and one cannot invest directly in an index.
Past performance is not a guarantee of future results.
International investments entail risks not ordinarily associated with U.S. investments including fluctuation in currency values, differences in accounting principles, or economic or political instability in other nations. Investing in emerging markets can be riskier than investing in established foreign markets due to increased volatility and lower trading volume.
If and when the Portfolio invests in forward foreign currency contracts or uses other investments to hedge against currency risks, the Portfolio will be subject to special risks, including counterparty risk.
2011 Annual report · Delaware Pooled Trust
43
Portfolio management review
Delaware Pooled® Trust — The Emerging Markets Portfolio
October 31, 2011
Throughout most of the Portfolio’s fiscal year ended Oct. 31, 2011, emerging market stocks were drawn into the same narrative of diminished expectations for global growth as that of many developed market stocks as, generally speaking, developed economies struggled with structural debt challenges.
Delaware Pooled Trust — The Emerging Markets Portfolio returned -5.22% at net asset value (NAV) with all distributions reinvested for the fiscal year ended Oct. 31, 2011. The Portfolio’s benchmark, the MSCI Emerging Markets Index, returned -7.44% (gross) and -7.73% (net) for the same period. Complete annualized performance for The Emerging Markets Portfolio is shown in the table on page 46.
The greatest contributor to the Portfolio’s performance for the fiscal year was strong relative stock performance in Brazil and China. Conversely, our investments in India, as well as the Portfolio’s exposure to the Turkish lira, which corrected sharply downward during the fiscal year, were the most significant detractors from Portfolio performance.
We are surprised that emerging markets suffered so badly during the fiscal year. Clearly, many developed market economies are in deep trouble, and as a result emerging markets’ exports to the developed world have suffered. But as a whole, emerging market countries, having invested in repairing their national balance sheets, continued to have reasonably vibrant domestic economies and healthier economic fundamentals than those of the developed world, in our opinion. In other words, relative to the developed world at least, we believed that these markets remained in generally strong positions. In this light, the rebound that took place in the emerging markets during October 2011 did not necessarily come as a surprise to us.
In our opinion, China is the most important piece of the emerging markets jigsaw puzzle and arguably the most important part of the global economic puzzle. China’s economy — still growing at about 9% per year in real terms — remains one of the fastest-growing economies in the world. Yet the Chinese equity market was down nearly 16% during the fiscal year. Granted, the Chinese government gave investors an excuse to sell as it attempted to slow China’s economy. However, to us, China appears to be on track for a soft landing, and its economy remains very attractive by global standards.
Specifically, we believe that valuations in China have been relatively attractive, and we gradually increased the Portfolio’s weighting in the country during this period of weakness. We have focused particularly on the domestic side of the Chinese economy. Clearly, exports have not been in a position to thrive in the way that they have in the past. But domestic spending is being encouraged by the government and is supported by the increasingly large spending power of China’s new middle class.
Over the Portfolio’s fiscal year, we’ve been involved in a number of domestic spending stories. One of the companies we added to the Portfolio was the instant noodle company Tingyi. Tingyi was a significant contributor to the Portfolio’s performance. Though we sold the stock at an absolute loss (about 5%), it had shown solid relative performance and its sale made way for stocks with more attractive valuations.
We added to another holding, Hengan International Group, a maker of a variety of paper-related products from tissues to sanitary towels to disposable diapers. We thought the stock had room for further appreciation (although it had already performed well). Similar to China, many investors have been quite wary of India.
The views expressed are current as of the date of this report and are subject to change.
2011 Annual report · Delaware Pooled Trust
44
India’s stock market declined nearly 20% for the Portfolio’s fiscal year. Unlike China, however, India’s government does not have China’s immense financial muscle. India as a country has very high government debt relative to its gross domestic product (GDP) and massive infrastructure barriers. While we believe there are huge challenges toward India’s progress, we worked to find stocks that we believed were not pushed to unrealistically high levels by investors who ignored those challenges. The fact that the market was weak over this period gave us some opportunities in relative terms. We moved to a slight overweight position in India, but we remain very selective there.
Several of the largest detractors for its fiscal year were Indian companies. Rural Electrification Corporation (REC), down more than 50%, knocked relative performance down more than 1% during this period. REC is a financing organization for new electric power companies and projects; there have been a number of high-publicity problems in this arena with accusations of heavy-handed government involvement. We believe that the prospects are not as grim as REC’s stock slide would suggest, which is why we still held it as of the end of the fiscal year. Axis Bank (-26%) was also among the bottom 10 detractors from performance during this period.
Our two highest-performing stocks were Brazilian companies. Both companies rebounded from what we viewed as oversold positions in 2010. Redecard (up 38%) and Cielo (up 21%) are both credit card processors. In Brazil, there’s still a very low penetration rate for credit and debit cards. Yet neither company takes credit risks on the cards; they simply process the payments and stand to benefit from a growing volume of credit transactions. We continued to maintain our overweight position in Brazil at the end of the fiscal year — Brazil remains a market that we have reasonable faith in, given the government’s efforts to pay down its debt and moderate the country’s currency, among other factors.
In conclusion, we believe the discontinuities in the emerging markets during the fiscal year played to our relative strengths. In a difficult fiscal year like the one that just ended, we believe our strong adherence to a value strategy made our Portfolio relatively resilient.
Looking ahead, the political risks to be faced in the emerging markets remain, but the economic risks have reduced in recent years while those of the developed world have risen. We believe that our careful assessment and defensive approach to risk and reward has the potential to serve our investors well.
2011 Annual report · Delaware Pooled Trust
45
Performance summary
Delaware Pooled® Trust — The Emerging Markets Portfolio
The performance data quoted represent past performance; past performance does not guarantee future results. Investment return and principal value will fluctuate so your shares, when redeemed, may be worth more or less than their original cost. Current performance may be lower or higher than the performance data quoted. Please obtain the performance data for the most recent month end by calling 800 231-8002 or visiting our website at www.delawareinvestments.com.
Carefully consider the Portfolio’s investment objectives, risk factors, charges, and expenses before investing. This and other information can be found in the Portfolio’s prospectus and, if available, its summary prospectus, which may be obtained by visiting www.delawareinvestments.com or calling 800 231-8002. Investors should read the prospectus and, if available, the summary prospectus carefully before investing.
| Portfolio performance | | | | | | | | | | |
| Average annual total returns | | | | | | | | | | |
| Periods ended Oct. 31, 2011 | | 1 year | | 3 years | | 5 years | | 10 years | | Lifetime |
| | -5.22% | | +22.60% | | +7.45% | | +18.80% | | +9.78% |
| Portfolio profile |
| Oct. 31, 2011 |
| |
| Total net assets |
| $531.5 million |
| Inception date |
| April 16, 1997 |
Growth of $1,000,000
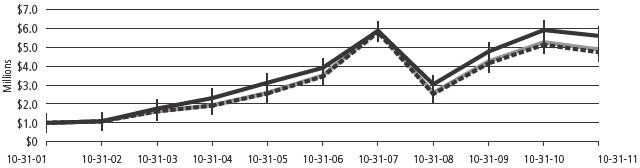
| | | | Starting value (Oct. 31, 2001) | | Ending value (Oct. 31, 2011) |
| The Emerging Markets Portfolio | | $1,000,000 | | $5,597,542 |
| MSCI Emerging Markets Index (gross) | | $1,000,000 | | $4,874,894 |
| MSCI Emerging Markets Index (net) | | $1,000,000 | | $4,731,496 |
2011 Annual report · Delaware Pooled Trust
46
The performance graph assumes $1 million invested on Oct. 31, 2001, and includes reinvestment of all distributions. The performance graph does not reflect the deduction of taxes the shareholder would pay on Portfolio distributions or redemptions of Portfolio shares.
Total return assumes reinvestment of dividends and capital gains, but does not reflect reductions for taxes. Returns and share values will fluctuate so that shares, when redeemed, may be worth more or less than their original cost.
The most recent prospectus designated the Portfolio’s total operating expenses as 1.17%. The purchase reimbursement fee (0.55%) and redemption reimbursement fee (0.55%) are paid to the Portfolio. The fees are designed to reflect an approximation of the brokerage and other transaction costs associated with the investment of an investor’s purchase amount or the disposition of assets to meet redemptions, and to limit the extent to which the Portfolio (and, indirectly, the Portfolio’s existing shareholders) would have to bear such costs. In lieu of the reimbursement fees, investors in The Emerging Markets Portfolio may be permitted to utilize alternative purchase and redemption methods designed to accomplish the same economic effect as the reimbursement fees. Reimbursement fees applicable to purchases and redemptions of shares of the Portfolio are not reflected in the “Performance of $1,000,000” chart.
The MSCI Emerging Markets Index measures equity market performance across emerging market countries worldwide. Index “gross” return approximates the maximum possible dividend reinvestment. Index “net” return approximates the minimum possible dividend reinvestment, after deduction of withholding tax at the highest possible rate.
Index performance returns do not reflect any management fees, transaction costs, or expenses. Indices are unmanaged and one cannot invest directly in an index.
Past performance is not a guarantee of future results.
Fixed income securities and bond funds can lose value, and investors can lose principal, as interest rates rise. They also may be affected by economic conditions that hinder an issuer’s ability to make interest and principal payments on its debt.
The Portfolio may also be subject to prepayment risk, the risk that the principal of a fixed income security that is held by the Portfolio may be prepaid prior to maturity, potentially forcing the Portfolio to reinvest that money at a lower interest rate.
High yielding, noninvestment grade bonds (junk bonds) involve higher risk than investment grade bonds.
The Portfolio may invest in derivatives, which may involve additional expenses and are subject to risk, including the risk that an underlying security or securities index moves in the opposite direction from what the portfolio manager anticipated. A derivative transaction depends upon the counterparties’ ability to fulfill their contractual obligations.
International investments entail risks not ordinarily associated with U.S. investments including fluctuation in currency values, differences in accounting principles, or economic or political instability in other nations. Investing in emerging markets can be riskier than investing in established foreign markets due to increased volatility and lower trading volume.
If and when the Portfolio invests in forward foreign currency contracts or uses other investments to hedge against currency risks, the Portfolio will be subject to special risks, including counterparty risk.
Instances of high double-digit returns are unusual, cannot be sustained, and were primarily achieved during favorable market conditions.
The Portfolio is presently closed to new investors.
2011 Annual report · Delaware Pooled Trust
47
Portfolio management review
Delaware Pooled® Trust — The Emerging Markets Portfolio II
October 31, 2011
The MSCI Emerging Markets Index declined during the Portfolio’s fiscal year ended Oct. 31, 2011, as emerging countries were ensnared in the risk aversion that plagued global equity markets during much of the period.
Generally speaking, investors became increasingly concerned about European markets as the sovereign debt crisis continued at a rapid boil, calling the creditworthiness of several peripheral nations into question. While most headlines focused on developed markets within the region, negative sentiment spilled over to emerging markets as well; as measured by MSCI, European emerging market equities posted a collective decline of more than 10% during the 12-month period.
Countries within Central and Eastern Europe were among those that exhibited the weakest returns within the benchmark, as evidenced by declines in Turkey and Hungary (both down nearly 34%). Sentiment toward these markets was negatively affected by the broader (and increasingly bleak) European debt situation. In Hungary, securities markets were tamed by weakness in the banking industry, as certain banks underperformed on news of potential mortgage restructurings. (The restructurings were related to new measures allowing loans denominated in foreign currencies to be repaid at lower-than-market rates.)
As noted above, emerging market equities suffered from headwinds that continued to challenge financial markets around the world. In what was a period of widespread negative performance, only a handful of countries saw gains within their equity markets. (These included Indonesia and South Korea, each of which recorded a gain of more than 5% for the Portfolio’s fiscal year.)
For the fiscal year ended Oct. 31, 2011, Delaware Pooled Trust — The Emerging Markets Portfolio II returned -10.58% at net asset value (NAV) with all distributions reinvested. The Portfolio’s benchmark, the MSCI Emerging Markets Index, returned -7.44% (gross) and -7.73% (net) for the same period. Complete annualized performance for The Emerging Markets Portfolio II is shown in the table on page 50.
The Portfolio’s underperformance compared to that of the benchmark index was primarily due to the Portfolio’s allocation to certain underperforming countries. These positions offset the generally positive stock selection decisions we made during the fiscal year. The negative ramifications of the Portfolio’s country allocations were generally spread throughout different regions of the world. The Portfolio’s overweight allocations to Argentina and Turkey were among the largest detractors from relative performance.
Looking more closely at stock selection relative to the benchmark index, strength was particularly visible in several countries. In China, for instance, the Portfolio’s holdings declined by nearly 3% collectively, while Chinese stocks within the benchmark fell nearly 16% as a group. Taiwan was another example, with the Portfolio’s holdings advancing slightly more than 5% while benchmark index constituents dropped more than 2% collectively. In China, notable individual contributors included shares of China Unicom, which outperformed the broad markets as the company continued to show encouraging 3G subscriber acquisition trends. The company also launched a low-priced smartphone that was well received. These shares helped to offset some of the Portfolio’s detractors in China, of which Industrial and Commercial Bank of China is one example. In Taiwan, meanwhile, shares of HTC were among the notable contributors, advancing 11% and ending the fiscal year among the strongest positive contributors across the entire Portfolio. However, detractors included the Taiwanese electronics component manufacturer and assembler Hon Hai Precision Industry, as the company struggled at times with efforts to increase margins to a sustainably profitable level.
The views expressed are current as of the date of this report and are subject to change.
2011 Annual report · Delaware Pooled Trust
48
We believe that broad financial markets should continue to exhibit uncertainty in the coming months, and that investors will likely focus even more so on headwinds facing deleveraging developed economies. However, we remain positive on emerging markets fundamentals, including strong gross domestic product (GDP) growth and generally strong balance sheets that we believe provide emerging economies with the ability to combat rising risks more effectively than they were able to do in the past. As always, our investment process seeks to maintain a balance between risk and reward, and calls for a continued focus on companies that we believe are trading at discounts to our own estimate of their intrinsic value.
2011 Annual report · Delaware Pooled Trust
49
Performance summary
Delaware Pooled® Trust — The Emerging Markets Portfolio II
The performance data quoted represent past performance; past performance does not guarantee future results. Investment return and principal value will fluctuate so your shares, when redeemed, may be worth more or less than their original cost. Current performance may be lower or higher than the performance data quoted. Please obtain the performance data for the most recent month end by calling 800 231-8002 or visiting our website at www.delawareinvestments.com.
Carefully consider the Portfolio’s investment objectives, risk factors, charges, and expenses before investing. This and other information can be found in the Portfolio’s prospectus and, if available, its summary prospectus, which may be obtained by visiting www.delawareinvestments.com or calling 800 231-8002. Investors should read the prospectus and, if available, the summary prospectus carefully before investing.
| Portfolio performance | | | | |
| Average annual total returns | | | | |
| Periods ended Oct. 31, 2011 | | 1 year | | Lifetime |
| | -10.58% | | +1.19% |
| Portfolio profile |
| Oct. 31, 2011 |
| |
| Total net assets |
| $15.3 million |
| Inception date |
| June 23, 2010 |
Growth of $1,000,000

| | | | Starting value (June 23, 2010) | | Ending value (Oct. 31, 2011) |
| MSCI Emerging Markets Index (gross) | | $1,000,000 | | $1,076,822 |
| MSCI Emerging Markets Index (net) | | $1,000,000 | | $1,072,190 |
| The Emerging Markets Portfolio II | | $1,000,000 | | $1,016,220 |
2011 Annual report · Delaware Pooled Trust
50
The performance graph assumes $1 million invested on June 23, 2010, and includes reinvestment of all distributions. The performance graph does not reflect the deduction of taxes the shareholder would pay on Portfolio distributions or redemptions of Portfolio shares.
Total return assumes reinvestment of dividends and capital gains, but does not reflect reductions for taxes. Returns and share values will fluctuate so that shares, when redeemed, may be worth more or less than their original cost.
The most recent prospectus designated the Portfolio’s total operating expenses as 2.17%. Management has contractually agreed to reimburse certain expenses and/or waive its management fees from Feb. 28, 2011, through Feb. 28, 2012, in order to prevent total annual Portfolio operating expenses from exceeding, in an aggregate amount, 1.20% of the Portfolio’s average daily net assets, as described in the most recent prospectus.
Expense limitations were in effect during the period shown. Performance would have been lower had the expense limitations not been in effect.
The MSCI Emerging Markets Index measures equity market performance across emerging market countries worldwide. Index “gross” return approximates the maximum possible dividend reinvestment. Index “net” return approximates the minimum possible dividend reinvestment, after deduction of withholding tax at the highest possible rate.
Index performance returns do not reflect any management fees, transaction costs, or expenses. Indices are unmanaged and one cannot invest directly in an index.
Past performance is not a guarantee of future results.
Fixed income securities and bond funds can lose value, and investors can lose principal, as interest rates rise. They also may be affected by economic conditions that hinder an issuer’s ability to make interest and principal payments on its debt.
The Portfolio may also be subject to prepayment risk, the risk that the principal of a fixed income security that is held by the Portfolio may be prepaid prior to maturity, potentially forcing the Portfolio to reinvest that money at a lower interest rate.
High yielding, noninvestment grade bonds (junk bonds) involve higher risk than investment grade bonds.
The Portfolio may invest in derivatives, which may involve additional expenses and are subject to risk, including the risk that an underlying security or securities index moves in the opposite direction from what the portfolio manager anticipated. A derivative transaction depends upon the counterparties’ ability to fulfill their contractual obligations.
International investments entail risks not ordinarily associated with U.S. investments including fluctuation in currency values, differences in accounting principles, or economic or political instability in other nations. Investing in emerging markets can be riskier than investing in established foreign markets due to increased volatility and lower trading volume.
If and when the Portfolio invests in forward foreign currency contracts or uses other investments to hedge against currency risks, the Portfolio will be subject to special risks, including counterparty risk.
The Portfolio may experience portfolio turnover in excess of 100%, which could result in higher transaction costs and tax liability.
2011 Annual report · Delaware Pooled Trust
51
Portfolio management review
Delaware Pooled® Trust — The Global Real Estate Securities Portfolio
October 31, 2011
Global real estate markets grappled with periods of volatility during the fiscal year ended Oct. 31, 2011, finishing this period with a mild cumulative gain of 0.53% (as measured by the FTSE EPRA/NAREIT Developed Index).
If there was a notably choppy period during the fiscal year, it was during August and September 2011. During this time, concerns about sovereign debt, particularly in Europe (and more specifically, in Greece), caused a significant downturn in financial markets globally. Uncertainty about the sustainability of the global economic recovery was another dampener on stock performance. Economic indicators recorded mixed results, and general clarity about the future was in short supply.
As the Portfolio’s fiscal year drew to a close, debt and equity markets around the world were suffering significant losses. Real estate equities clearly were not immune, as the FTSE EPRA/NAREIT Developed Index lost 17.30% of its value during the three months that ended in October 2011. During this time, the euro zone’s handling of its debt issues seemed to be the biggest area of concern for many investors, and this debt impasse placed severe pressure on real estate equities in most European countries. Not surprisingly, Spain, Italy, and Greece were the worst-performing countries during this three-month period, each losing more than 40%, though France and Germany also were subject to investor selling, each falling more than 20%.
The other major issue that plagued the global economic landscape, in our view, was the potential slowing of growth in China, as the Chinese central bank continued to raise interest rates and instill other measures in an attempt to control inflation and prevent asset bubbles.
Delaware Pooled Trust — The Global Real Estate Securities Portfolio Original Class shares returned +2.10% at net asset value (NAV) with all distributions reinvested for the fiscal year ended Oct. 31, 2011. The Portfolio’s benchmark, the FTSE EPRA/NAREIT Developed Index, returned +0.67% for the same period. Complete annualized performance for The Global Real Estate Securities Portfolio is shown in the table on page 54.
Broadly speaking, the Portfolio’s relative outperformance was explained by the positive effects of the investment team’s individual stock choices, complemented by the positive effects of the Portfolio’s allocations to specific countries.
At the country level, notable outperformance versus the benchmark was registered in Canada and the United States. Canadian holdings advanced by slightly more than 20%, compared to 9% for Canadian constituents within that index. Notable contributors to the Portfolio’s performance included Canadian Real Estate Investment Trust, which was viewed favorably by many investors due to its low leverage and diversified asset base.
In the U.S., stock selection was the main performance driver, while the Portfolio’s allocation versus the benchmark index also had a positive effect. Notable contributors to return included AvalonBay Communities and Camden Property Trust.
The Portfolio underperformed the benchmark index in Japan and Switzerland. Japanese holdings trailed index constituents by more than one percentage point for the fiscal year; notable detractors included Mitsui Fudosan and Tokyu Livable. Both companies realized significant declines in the aftermath of the earthquake and tsunami that shook Japan in March 2011. The outlook for Tokyu Livable (which generates revenue from transaction fees) became particularly negative, and the company’s shares were consequently removed from the Portfolio.
The views expressed are current as of the date of this report and are subject to change.
2011 Annual report · Delaware Pooled Trust
52
In Switzerland, meanwhile, the Portfolio’s lone holding, PSP Swiss Property, advanced reasonably well for its fiscal year but nevertheless trailed the substantial advance posted by benchmark constituents. The negative effects of the stock’s relative underperformance were combined with the negative effects of the Portfolio’s overall underweight to Swiss companies.
At this writing, we believe the dominant global macroeconomic and political issues could have a considerable effect on future global economic health. While we strive to provide value to shareholder clients by identifying portfolio investments based on solid company fundamentals, we remain cognizant of today’s particularly opaque market environment. In our view, performance of global real estate securities, including deviations across countries, may be heavily reliant on macroeconomic developments for the foreseeable future. From rising interest rates and slowing growth in Asia, to the debt crisis and austerity measures in Europe, the moving pieces affecting the global economy and markets could have many potential outcomes. As such, we believe it is prudent to position the Portfolio for a market with above-average volatility and much investor indecision.
Ultimately, we believe real estate securities performance should eventually tie back to growth prospects and cost of capital. For now, the U.S. and Canada remain attractive, in our opinion. Canada’s economy is arguably one of the world’s most stable. Though the U.S. has kept debt costs low with help from the Federal Reserve, we are closely monitoring adverse developments in the commercial mortgage-backed securities and credit default swap markets that could increase the cost of capital for U.S. real estate investment trusts. We are also concerned about rising interest rates in Asia. In Europe, meanwhile, we believe that if the European Central Bank begins to take significant action to right the ship, the region could eventually begin to look more attractive. At the end of the fiscal year, our general intention was to keep the Portfolio invested conservatively through the near term, with a bias toward larger, higher-quality companies with lower leverage.
2011 Annual report · Delaware Pooled Trust
53
Performance summary
Delaware Pooled® Trust — The Global Real Estate Securities Portfolio
The performance data quoted represent past performance; past performance does not guarantee future results. Investment return and principal value will fluctuate so your shares, when redeemed, may be worth more or less than their original cost. Current performance may be lower or higher than the performance data quoted. Please obtain the performance data for the most recent month end by calling 800 231-8002 or visiting our website at www.delawareinvestments.com.
Carefully consider the Portfolio’s investment objectives, risk factors, charges, and expenses before investing. This and other information can be found in the Portfolio’s prospectus and, if available, its summary prospectus, which may be obtained by visiting www.delawareinvestments.com or calling 800 231-8002. Investors should read the prospectus and, if available, the summary prospectus carefully before investing.
| Portfolio performance | | | | | | |
| Average annual total returns | | | | | | |
| Periods ended Oct. 31, 2011 | | 1 year | | 3 years | | Lifetime |
| Original Class | | +2.10% | | +12.77% | | -4.93% |
| Class P | | +1.68% | | +12.47% | | -5.19% |
| Portfolio profile |
| Oct. 31, 2011 |
| |
| Total net assets |
| $49.4 million |
| |
| Number of holdings |
| 97 |
| Inception date |
| Jan. 10, 2007 |
The Global Real Estate Securities Portfolio offers two classes of shares: Original Class and Class P. The Portfolio Performance table and Growth of $1,000,000 chart reflect the Original Class performance.
Growth of $1,000,000

| | | | Starting value (Jan. 10, 2007) | | Ending value (Oct. 31, 2011) |
| FTSE EPRA/NAREIT Developed Index | | $1,000,000 | | $808,183 |
| The Global Real Estate Securities Portfolio (Original Class) | | $1,000,000 | | $784,207 |
2011 Annual report · Delaware Pooled Trust
54
The performance graph assumes $1 million invested on Jan. 10, 2007, and includes reinvestment of all distributions. The performance graph does not reflect the deduction of taxes the shareholder would pay on Portfolio distributions or redemptions of Portfolio shares.
Total return assumes reinvestment of dividends and capital gains, but does not reflect reductions for taxes. Returns and share values will fluctuate so that shares, when redeemed, may be worth more or less than their original cost.
The most recent prospectus designated the Portfolio’s total operating expenses for Class P shares as 1.25%, excluding 12b-1 fees.
Management has contractually agreed to reimburse certain expenses and/or waive its management fees from Feb. 28, 2011 through Feb. 28, 2012, in order to prevent total annual Portfolio operating expenses from exceeding, in an aggregate amount, 1.08%, excluding 12b-1 fees, of the Portfolio’s average daily net assets as described in the most recent Class P prospectus. Original Class shares are not subject to sales charges or 12b-1 fees and are available to investors investing $1 million in The Global Real Estate Securities Portfolio or in the aggregate across the portfolios comprising Delaware Pooled® Trust, subject to certain exceptions. Class P shares charge a 12b-1 fee of 0.25% but are not subject to sales charges. Class P shares are available to defined contribution plans making a minimum investment of $5 million, subject to certain exceptions. Please see the applicable prospectus for more information concerning the eligibility, fees and expenses for each class.
Expense limitations were in effect during the period shown. Performance would have been lower had the expense limitations not been in effect.
The FTSE EPRA/NAREIT Developed Index, formerly referred to as the FTSE EPRA/NAREIT Global Real Estate Index, tracks the performance of listed real estate companies and real estate investment trusts (REITs) worldwide, based in U.S. dollars.
Index performance returns do not reflect any management fees, transaction costs, or expenses. Indices are unmanaged and one cannot invest directly in an index.
Past performance is not a guarantee of future results.
International investments entail risks not ordinarily associated with U.S. investments including fluctuation in currency values, differences in accounting principles, or economic or political instability in other nations. Investing in emerging markets can be riskier than investing in established foreign markets due to increased volatility and lower trading volume.
“Nondiversified” Portfolios may allocate more of their net assets to investments in single securities than “diversified” Portfolios. Resulting adverse effects may subject Portfolios to greater risks and volatility.
The Portfolio may experience portfolio turnover in excess of 100%, which could result in higher transaction costs and tax liability.
Narrowly focused investments may exhibit higher volatility than investments in multiple industry sectors.
REIT investments are subject to many of the risks associated with direct real estate ownership, including changes in economic conditions, credit risk, and interest rate fluctuations.
A REIT fund’s tax status as a regulated investment company could be jeopardized if it holds real estate directly, as a result of defaults, or receives rental income from real estate holdings.
2011 Annual report · Delaware Pooled Trust
55
Portfolio management review
Delaware Pooled® Trust — The Global Fixed Income Portfolio
October 31, 2011
Delaware Pooled Trust — The Global Fixed Income Portfolio returned +3.08% at net asset value (NAV) with all distributions reinvested for the fiscal year ended Oct. 31, 2011. The Portfolio’s benchmark, the Citigroup® World Government Bond Index, returned +3.73% for the same period. Complete annualized performance for The Global Fixed Income Portfolio is shown in the table on page 58.
The Portfolio outperformed its benchmark during the first nine months of the fiscal year ended Oct. 31, 2011. Unfortunately, the Portfolio gave back that advantage in the final three months of the fiscal year, largely due to its exposure to currency weakness in Poland and Mexico — markets in which the Portfolio was overweight versus the benchmark. The Portfolio also lost ground, in relative terms, due to an underperforming position in corporate bonds and a portfolio duration strategy that was slightly shorter than that of the benchmark index.
The Portfolio’s fiscal year was a challenging one for many investors in government bonds, as all dominant markets faced ongoing economic difficulties. The euro zone stands out in this regard, as political leaders struggled to address the fundamental problem of economic union without fiscal union. The Portfolio had a significant underweight position (versus the benchmark index) to government debt in each of the major “problem countries,” including Portugal, Italy, Ireland, Spain, and Greece, during much of the fiscal year and, since May 2011, held a zero weight in these markets. In particular, the zero weight to Italy since May was an important positive driver of relative performance. For some time, we’ve believed that any position in these markets has been too reliant on the policy response of euro-zone finance ministers. In our opinion, this response has so far been discordant, lacking in credibility, and far from successful.
Toward the end of the Portfolio’s fiscal year, the European Central Bank (ECB) temporarily propped up the market for Spanish and Italian government debt by intervening in its Securities and Markets Program. The Bundesbank, Germany’s central bank, resisted the ECB’s decision as Germany’s President Angela Merkel called into question the legality of the ECB’s intervention. While the ECB’s actions temporarily lowered yields on Spanish and Italian government debt, they widened toward the end of the fiscal year. All of this uncertainty cast a shadow of contagion across Europe’s strongest markets and world markets as a whole.
The Portfolio’s overweight to the U.S. bond market, which we held between February and October 2011, added to its relative performance, as this market was relatively strong during that period. U.S. Treasurys, however, ended the fiscal year with relatively low yields and, consequently in our opinion, less value. A number of factors conspired to push yields on U.S. Treasurys to historically low levels. First, the U.S. economy itself suffered from concerns of a prolonged slowdown or a “double dip” recession. Second, euro zone worries led to much demand for U.S. government bonds. Third, the Federal Reserve decided to change the composition of its balance sheet, selling short-term debt and buying longer-dated Treasurys in a bid to push nominal yields down at the longer end of the curve.
As of the end of the fiscal year, Japan remained an attractive market, in our opinion, with relatively high yields. Government bond yields contracted to a lesser degree relative to other major developed markets. The earthquake, tsunami, and nuclear catastrophe in Japan had little effect on government bond yields: 10-year Japanese government bond yields were broadly unchanged during the fiscal year and the catastrophe had a limited effect on the inflation outlook. If history serves as any guide, efforts to rebuild Japan could offset the initial plunge in gross domestic product (GDP).
Additionally, the Australian market produced strong returns during the fiscal year, particularly in U.S. dollar terms. The Australian dollar reached multidecade highs during this period, buoyed by high domestic interest rates, and by rising commodity prices, which boosted the value of Australian exports. In our opinion, however, the
The views expressed are current as of the date of this report and are subject to change.
2011 Annual report · Delaware Pooled Trust
56
Australian dollar was highly overvalued versus the U.S. dollar at the end of the fiscal year. In fact, the Australian economy became more unbalanced over the course of the fiscal year, as demand from China spurred an increase in exports of minerals and energy products during the past decade. But, in our view, this trend has left Australia exposed to a slowdown in China. Furthermore, we believe that this is an increasing risk, as the Chinese housing market looked increasingly fragile toward the end of the fiscal year.
Within this environment, the Portfolio finished the fiscal year with underweight positions in the United States, the United Kingdom, and the euro zone, where we believe yields remained low. The Portfolio remained overweight in Japan, Poland, and Mexico, where we believed yields were more attractive. The Portfolio’s duration remained somewhat shorter than that of the benchmark index. We view this as a defensive position to guard against rising interest rates, as yields were low in a historical context. Generally speaking, we saw selective value in corporate credit, where we maintain a modest overweight.
2011 Annual report · Delaware Pooled Trust
57
Performance summary
Delaware Pooled® Trust — The Global Fixed Income Portfolio
The performance data quoted represent past performance; past performance does not guarantee future results. Investment return and principal value will fluctuate so your shares, when redeemed, may be worth more or less than their original cost. Current performance may be lower or higher than the performance data quoted. Please obtain the performance data for the most recent month end by calling 800 231-8002 or visiting our website at www.delawareinvestments.com.
Carefully consider the Portfolio’s investment objectives, risk factors, charges, and expenses before investing. This and other information can be found in the Portfolio’s prospectus and, if available, its summary prospectus, which may be obtained by visiting www.delawareinvestments.com or calling 800 231-8002. Investors should read the prospectus and, if available, the summary prospectus carefully before investing.
| Portfolio performance | | | | | | | | | | |
| Average annual total returns | | | | | | | | | | |
| Periods ended Oct. 31, 2011 | | 1 year | | 3 years | | 5 years | | 10 years | | Lifetime |
| | +3.08% | | +10.05% | | +8.53% | | +9.44% | | +8.35% |
| Portfolio profile |
| Oct. 31, 2011 |
| |
| Total net assets |
| $83.8 million |
| |
| Number of holdings |
| 50 |
| Inception date |
| Nov. 30, 1992 |
Growth of $1,000,000
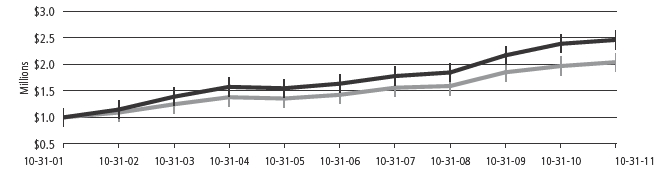
| | | | Starting value (Oct. 31, 2001) | | Ending value (Oct. 31, 2011) |
| The Global Fixed Income Portfolio | | $1,000,000 | | $2,463,757 |
| Citigroup World Government Bond Index | | $1,000,000 | | $2,043,194 |
2011 Annual report · Delaware Pooled Trust
58
The performance graph assumes $1 million invested on Oct. 31, 2001, and includes reinvestment of all distributions. The performance graph does not reflect the deduction of taxes the shareholder would pay on Portfolio distributions or redemptions of Portfolio shares.
Total return assumes reinvestment of dividends and capital gains, but does not reflect reductions for taxes. Returns and share values will fluctuate so that shares, when redeemed, may be worth more or less than their original cost.
The most recent prospectus designated the Portfolio’s total operating expenses as 0.64%. Management has contractually agreed to reimburse certain expenses and/or waive its management fees from Feb. 28, 2011, through Feb. 28, 2012, in order to prevent total annual Portfolio operating expenses from exceeding, in an aggregate amount, 0.60% of the Portfolio’s average daily net assets, as described in the most recent prospectus.
Expense limitations were in effect during the period shown. Performance would have been lower had the expense limitations not been in effect.
The Citigroup World Government Bond Index is a market capitalization–weighted benchmark that tracks the performance of 23 world government bond markets.
Index performance returns do not reflect any management fees, transaction costs, or expenses. Indices are unmanaged and one cannot invest directly in an index.
Past performance is not a guarantee of future results.
Fixed income securities and bond funds can lose value, and investors can lose principal, as interest rates rise. They also may be affected by economic conditions that hinder an issuer’s ability to make interest and principal payments on its debt.
The Portfolio may also be subject to prepayment risk, the risk that the principal of a fixed income security that is held by the Portfolio may be prepaid prior to maturity, potentially forcing the Portfolio to reinvest that money at a lower interest rate.
The Portfolio may invest in derivatives, which may involve additional expenses and are subject to risk, including the risk that an underlying security or securities index moves in the opposite direction from what the portfolio manager anticipated. A derivative transaction depends upon the counterparties’ ability to fulfill their contractual obligations.
International investments entail risks not ordinarily associated with U.S. investments including fluctuation in currency values, differences in accounting principles, or economic or political instability in other nations. Investing in emerging markets can be riskier than investing in established foreign markets due to increased volatility and lower trading volume.
If and when the Portfolio invests in forward foreign currency contracts or uses other investments to hedge against currency risks, the Portfolio will be subject to special risks, including counterparty risk.
“Nondiversified” Portfolios may allocate more of their net assets to investments in single securities than “diversified” Portfolios. Resulting adverse effects may subject these Portfolios to greater risks and volatility.
The Portfolio may experience portfolio turnover in excess of 100%, which could result in higher transaction costs and tax liability.
The Portfolio is presently closed to new investors.
2011 Annual report · Delaware Pooled Trust
59
Disclosure of Portfolio expenses
For the six month period from May 1, 2011 to October 31, 2011
As a shareholder of a Portfolio, you incur two types of costs: (1) transaction costs, including reimbursement fees on The Emerging Markets Portfolio; and (2) ongoing costs, including management fees; distribution and/or service (12b-1) fees on Class P shares of The Global Real Estate Securities Portfolio and other Portfolio expenses. The following examples are intended to help you understand your ongoing costs (in dollars) of investing in a Portfolio and to compare these costs with the ongoing costs of investing in other mutual funds.
The Examples are based on an investment of $1,000 invested at the beginning of the period and held for the entire six month period from May 1, 2011 to October 31, 2011.
Actual Expenses
The first section of the table shown, “Actual Portfolio Return,” provides information about actual account values and actual expenses. You may use the information in this table, together with the amount you invested, to estimate the expenses that you paid over the period. Simply divide your account value by $1,000 (for example, an $8,600 account value divided by $1,000 = 8.6), then multiply the result by the number in the first section under the heading entitled “Expenses Paid During Period” to estimate the expenses you paid on your account during the period.
Hypothetical Example for Comparison Purposes
The second section of the table shown, “Hypothetical 5% Return,” provides information about hypothetical account values and hypothetical expenses based on a Portfolio’s actual expense ratio and an assumed rate of return of 5% per year before expenses, which is not the Portfolio’s actual return. The hypothetical account values and expenses may not be used to estimate the actual ending account balance or expenses you paid for the period. You may use this information to compare the ongoing costs of investing in the Portfolio and other funds. To do so, compare this 5% hypothetical example with the 5% hypothetical examples that appear in the shareholder reports of other funds.
Please note that the expenses shown in the table are meant to highlight your ongoing costs only and do not reflect any transactional costs. Therefore, the second section of the table is useful in comparing ongoing costs only, and will not help you determine the relative total costs of owning different funds. In addition, if these transactional costs were included, your costs would have been higher. Certain of the Portfolios’ actual expenses shown in the table reflect fee waivers in effect. The expenses shown in the table assume reinvestment of all dividends and distributions.
In each case, “Expenses Paid During Period” are equal to the relevant Portfolio’s annualized expense ratio, multiplied by the average account value over the period, multiplied by 184/365 (to reflect the one-half year period).
Delaware Pooled® Trust
Expense Analysis of an Investment of $1,000
| | | | | | | | | | | | | Expenses |
| | Beginning | | Ending | | | | | | | Paid During |
| | Account | | Account | | Annualized | | Period |
| | Value | | Value | | Expense | | 5/1/11 to |
| | 5/1/11 | | 10/31/11 | | Ratio | | 10/31/11 |
| Actual Portfolio Return | | | | | | | | | | | | | |
| The Large-Cap | | | | | | | | | | | | | | | |
| Value Equity | | | | | | | | | | | | | | | |
| Portfolio | | $1,000.00 | | | $952.80 | | | | 0.70 | % | | | | $3.45 | |
| The Select 20 | | | | | | | | | | | | | | | |
| Portfolio | | 1,000.00 | | | 992.90 | | | | 0.89 | % | | | | 4.47 | |
| The Large-Cap | | | | | | | | | | | | | | | |
| Growth Equity | | | | | | | | | | | | | | | |
| Portfolio | | 1,000.00 | | | 963.90 | | | | 0.63 | % | | | | 3.12 | |
| The Focus Smid-Cap | | | | | | | | | | | | | | | |
| Growth Equity | | | | | | | | | | | | | | | |
| Portfolio | | 1,000.00 | | | 940.30 | | | | 0.92 | % | | | | 4.50 | |
| The Real Estate | | | | | | | | | | | | | | | |
| Investment Trust | | | | | | | | | | | | | | | |
| Portfolio II | | 1,000.00 | | | 972.70 | | | | 0.95 | % | | | | 4.72 | |
| The Core Focus | | | | | | | | | | | | | | | |
| Fixed Income | | | | | | | | | | | | | | | |
| Portfolio | | 1,000.00 | | | 1,046.10 | | | | 0.43 | % | | | | 2.22 | |
| The High-Yield | | | | | | | | | | | | | | | |
| Bond Portfolio | | 1,000.00 | | | 971.50 | | | | 0.59 | % | | | | 2.93 | |
| The Core Plus | | | | | | | | | | | | | | | |
| Fixed Income | | | | | | | | | | | | | | | |
| Portfolio | | 1,000.00 | | | 1,035.00 | | | | 0.45 | % | | | | 2.31 | |
| The International | | | | | | | | | | | | | | | |
| Equity Portfolio | | 1,000.00 | | | 895.00 | | | | 0.67 | % | | | | 3.20 | |
| The Labor Select | | | | | | | | | | | | | | | |
| International Equity | | | | | | | | | | | | | |
| Portfolio | | 1,000.00 | | | 894.70 | | | | 0.83 | % | | | | 3.96 | |
| The Emerging | | | | | | | | | | | | | | | |
| Markets Portfolio | | 1,000.00 | | | 891.40 | | | | 1.12 | % | | | | 5.34 | |
| The Emerging | | | | | | | | | | | | | | | |
| Markets Portfolio II | | 1,000.00 | | | 802.10 | | | | 1.20 | % | | | | 5.45 | |
| The Global Real Estate | | | | | | | | | | | | | |
| Securities Portfolio | | | | | | | | | | | | | | | |
| Original Class | | 1,000.00 | | | 916.70 | | | | 1.08 | % | | | | 5.22 | |
2011 Annual report · Delaware Pooled Trust
60
| | | | | | | | | | | | | | Expenses |
| | Beginning | | Ending | | | | | | | Paid During |
| | Account | | Account | | Annualized | | Period |
| | Value | | Value | | Expense | | 5/1/11 to |
| | 5/1/11 | | 10/31/11 | | Ratio | | 10/31/11 |
| Actual Portfolio Return (continued) | | | | | | | | | | |
| The Global Real | | | | | | | | | | | | | | | | |
| Estate Securities | | | | | | | | | | | | | | | | |
| Portfolio Class P | | $ | 1,000.00 | | $ | 914.80 | | | | 1.33 | % | | | | $6.42 | |
| The Global Fixed | | | | | | | | | | | | | | | | |
| Income Portfolio | | | 1,000.00 | | | 1,022.20 | | | | 0.58 | % | | | | 2.96 | |
| Hypothetical 5% Return (5% return before expenses) | | | | | | |
| The Large-Cap | | | | | | | | | | | | | | | | |
| Value Equity | | | | | | | | | | | | | | | | |
| Portfolio | | $ | 1,000.00 | | $ | 1,021.68 | | | | 0.70 | % | | | | $3.57 | |
| The Select 20 | | | | | | | | | | | | | | | | |
| Portfolio | | | 1,000.00 | | | 1,020.72 | | | | 0.89 | % | | | | 4.53 | |
| The Large-Cap | | | | | | | | | | | | | | | | |
| Growth Equity | | | | | | | | | | | | | | | | |
| Portfolio | | | 1,000.00 | | | 1,022.03 | | | | 0.63 | % | | | | 3.21 | |
| The Focus Smid-Cap | | | | | | | | | | | | | | | | |
| Growth Equity | | | | | | | | | | | | | | | | |
| Portfolio | | | 1,000.00 | | | 1,020.57 | | | | 0.92 | % | | | | 4.69 | |
| The Real Estate | | | | | | | | | | | | | | | | |
| Investment Trust | | | | | | | | | | | | | | | | |
| Portfolio II | | | 1,000.00 | | | 1,020.42 | | | | 0.95 | % | | | | 4.84 | |
| The Core Focus | | | | | | | | | | | | | | | | |
| Fixed Income | | | | | | | | | | | | | | | | |
| Portfolio | | | 1,000.00 | | | 1,023.04 | | | | 0.43 | % | | | | 2.19 | |
| The High-Yield | | | | | | | | | | | | | | | | |
| Bond Portfolio | | | 1,000.00 | | | 1,022.23 | | | | 0.59 | % | | | | 3.01 | |
| The Core Plus | | | | | | | | | | | | | | | | |
| Fixed Income | | | | | | | | | | | | | | | | |
| Portfolio | | | 1,000.00 | | | 1,022.94 | | | | 0.45 | % | | | | 2.29 | |
| The International | | | | | | | | | | | | | | | | |
| Equity Portfolio | | | 1,000.00 | | | 1,021.82 | | | | 0.67 | % | | | | 3.41 | |
| The Labor Select | | | | | | | | | | | | | | | | |
| International | | | | | | | | | | | | | | | | |
| Equity Portfolio | | | 1,000.00 | | | 1,021.02 | | | | 0.83 | % | | | | 4.23 | |
| The Emerging | | | | | | | | | | | | | | | | |
| Markets Portfolio | | | 1,000.00 | | | 1,019.56 | | | | 1.12 | % | | | | 5.70 | |
| The Emerging | | | | | | | | | | | | | | | | |
| Markets Portfolio II | | | 1,000.00 | | | 1,019.16 | | | | 1.20 | % | | | | 6.11 | |
| The Global Real Estate | | | | | | | | | | | | | | | | |
| Securities Portfolio | | | | | | | | | | | | | | | | |
| Original Class | | | 1,000.00 | | | 1,019.76 | | | | 1.08 | % | | | | 5.50 | |
| The Global Real Estate | | | | | | | | | | | | | | | | |
| Securities Portfolio | | | | | | | | | | | | | | | | |
| Class P | | | 1,000.00 | | | 1,018.50 | | | | 1.33 | % | | | | 6.77 | |
| The Global Fixed | | | | | | | | | | | | | | | | |
| Income Portfolio | | | 1,000.00 | | | 1,022.28 | | | | 0.58 | % | | | | 2.96 | |
2011 Annual report · Delaware Pooled Trust
61
Security type/sector allocations and
top 10 equity holdings
Delaware Pooled® Trust
As of October 31, 2011
Sector designations may be different than the sector designations presented in other Portfolio materials. The sector designations may represent the investment manager’s internal sector classifications, which may result in the sector designations for one portfolio being different than another portfolio’s sector designations.
| The Large-Cap Value Equity Portfolio | | | |
| | Percentage |
| Security type/Sector | | of Net Assets |
| Common Stock | | 98.10 | % |
| Consumer Discretionary | | 6.00 | % |
| Consumer Staples | | 14.49 | % |
| Energy | | 12.24 | % |
| Financials | | 11.88 | % |
| Healthcare | | 17.37 | % |
| Industrials | | 8.81 | % |
| Information Technology | | 12.66 | % |
| Materials | | 3.11 | % |
| Telecommunications | | 5.68 | % |
| Utilities | | 5.86 | % |
| Short-Term Investments | | 1.75 | % |
| Total Value of Securities | | 99.85 | % |
| Receivables and Other Assets Net of Liabilities | | 0.15 | % |
| Total Net Assets | | 100.00 | % |
Holdings are for informational purposes only and are subject to change at any time. They are not a recommendation to buy, sell, or hold any security.
| | Percentage |
| Top 10 Equity Holdings | | of Net Assets |
| Cisco Systems | | 3.46 | % |
| Marathon Oil | | 3.25 | % |
| Comcast Class A | | 3.21 | % |
| Chevron | | 3.16 | % |
| Safeway | | 3.15 | % |
| Edison International | | 3.12 | % |
| duPont (E.I.) deNemours | | 3.11 | % |
| Xerox | | 3.09 | % |
| Marsh & McLennan | | 3.09 | % |
| Travelers | | 3.08 | % |
The Select 20 Portfolio
| | Percentage |
| Security type/Sector | | of Net Assets |
| Common Stock² | | 96.97 | % |
| Consumer Discretionary | | 16.51 | % |
| Energy | | 4.46 | % |
| Financial Services | | 15.43 | % |
| Healthcare | | 14.51 | % |
| Materials & Processing | | 4.05 | % |
| Technology | | 37.22 | % |
| Utilities | | 4.79 | % |
| Short-Term Investments | | 2.03 | % |
| Total Value of Securities | | 99.00 | % |
| Receivables and Other Assets Net of Liabilities | | 1.00 | % |
| Total Net Assets | | 100.00 | % |
²Narrow industries are utilized for compliance purposes for diversification whereas broad sectors are used for financial reporting.
Holdings are for informational purposes only and are subject to change at any time. They are not a recommendation to buy, sell, or hold any security.
| | Percentage |
| Top 10 Equity Holdings | | of Net Assets |
| Apple | | 10.61 | % |
| Allergan | | 6.75 | % |
| MasterCard Class A | | 5.82 | % |
| IntercontinentalExchange | | 5.55 | % |
| QUALCOMM | | 5.42 | % |
| Intuit | | 4.84 | % |
| Google Class A | | 4.80 | % |
| J2 Global Communications | | 4.79 | % |
| EOG Resources | | 4.46 | % |
| Apollo Group Class A | | 4.42 | % |
2011 Annual report · Delaware Pooled Trust
62
Delaware Pooled® Trust
As of October 31, 2011
Sector designations may be different than the sector designations presented in other Portfolio materials. The sector designations may represent the investment manager’s internal sector classifications, which may result in the sector designations for one portfolio being different than another portfolio’s sector designations.
| The Large-Cap Growth Equity Portfolio | | |
| | | |
| Percentage |
| Security type/Sector | of Net Assets |
| Common Stock² | 98.99% | |
| Consumer Discretionary | 17.84% | |
| Consumer Staples | 2.69% | |
| Energy | 7.13% | |
| Financial Services | 17.92% | |
| Healthcare | 9.58% | |
| Materials & Processing | 2.88% | |
| Producer Durables | 8.26% | |
| Technology | 32.69% | |
| Short-Term Investments | 0.84% | |
| Securities Lending Collateral | 1.61% | |
| Total Value of Securities | 101.44% | |
| Obligation to Return Securities Lending Collateral | (1.74% | ) |
| Receivables and Other Assets Net of Other Liabilities | 0.30% | |
| Total Net Assets | 100.00% | |
²Narrow industries are utilized for compliance purposes for diversification whereas broad sectors are used for financial reporting.
Holdings are for informational purposes only and are subject to change at any time. They are not a recommendation to buy, sell, or hold any security.
| Percentage |
| Top 10 Equity Holdings | of Net Assets |
| Apple | 7.58% | |
| Visa Class A | 5.25% | |
| MasterCard Class A | 5.21% | |
| Google Class A | 5.07% | |
| QUALCOMM | 4.99% | |
| EOG Resources | 4.84% | |
| Allergan | 4.77% | |
| Intuit | 4.12% | |
| IntercontinentalExchange | 4.03% | |
| Apollo Group Class A | 3.97% | |
| The Focus Smid-Cap Growth Equity Portfolio | | |
| | | |
| Percentage |
| Security type/Sector | of Net Assets |
| Common Stock | 95.33% | |
| Consumer Discretionary | 22.95% | |
| Consumer Staples | 4.08% | |
| Energy | 4.81% | |
| Financials | 14.97% | |
| Healthcare | 11.92% | |
| Producer Durables | 9.14% | |
| Technology | 22.71% | |
| Utilities | 4.75% | |
| Short-Term Investments | 4.75% | |
| Total Value of Securities | 100.08% | |
| Liabilities Net of Receivables and Other Assets | (0.08% | ) |
| Total Net Assets | 100.00% | |
Holdings are for informational purposes only and are subject to change at any time. They are not a recommendation to buy, sell, or hold any security.
| Percentage |
| Top 10 Equity Holdings | of Net Assets |
| Weight Watchers International | 6.60% | |
| Core Laboratories | 4.81% | |
| j2 Global Communications | 4.75% | |
| SBA Communications Class A | 4.64% | |
| IntercontinentalExchange | 4.23% | |
| Teradata | 4.17% | |
| VeriFone Systems | 4.14% | |
| Peet’s Coffee & Tea | 4.08% | |
| Affiliated Managers Group | 4.02% | |
| Graco | 3.98% | |
2011 Annual report · Delaware Pooled Trust
(continues) 63
Security type/sector allocations and
top 10 equity holdings
Delaware Pooled® Trust — The Real Estate Investment Trust Portfolio II
As of October 31, 2011
Sector designations may be different than the sector designations presented in other Portfolio materials. The sector designations may represent the investment manager’s internal sector classifications, which may result in the sector designations for one portfolio being different than another portfolio’s sector designations.
| Percentage |
| Security type/Sector | of Net Assets |
| Common Stock | 94.00% | |
| Diversified REITs | 4.28% | |
| Healthcare REITs | 11.02% | |
| Hotel REITs | 5.23% | |
| Industrial REITs | 5.57% | |
| Mall REITs | 18.04% | |
| Manufactured Housing REIT | 1.30% | |
| Multifamily REITs | 17.38% | |
| Office REITs | 11.64% | |
| Office/Industrial REITs | 3.55% | |
| Real Estate Operating Company | 0.72% | |
| Self-Storage REITs | 5.46% | |
| Shopping Center REITs | 7.77% | |
| Single Tenant REIT | 1.29% | |
| Specialty REIT | 0.75% | |
| Exchange-Traded Fund | 1.47% | |
| Short-Term Investments | 3.87% | |
| Total Value of Securities | 99.34% | |
| Receivables and Other Assets Net of Liabilities | 0.66% | |
| Total Net Assets | 100.00% | |
Holdings are for informational purposes only and are subject to change at any time. They are not a recommendation to buy, sell, or hold any security.
| Percentage |
| Top 10 Equity Holdings | of Net Assets |
| Simon Property Group | 11.55% | |
| ProLogis | 4.99% | |
| Equity Residential | 4.86% | |
| Public Storage | 4.71% | |
| Host Hotels & Resorts | 4.28% | |
| Ventas | 4.26% | |
| Boston Properties | 4.17% | |
| HCP | 4.04% | |
| AvalonBay Communities | 3.58% | |
| Vornado Realty Trust | 3.39% | |
2011 Annual report · Delaware Pooled Trust
64
Security type/sector allocations
Delaware Pooled® Trust — The Core Focus Fixed Income Portfolio
As of October 31, 2011
Sector designations may be different than the sector designations presented in other Portfolio materials. The sector designations may represent the investment manager’s internal sector classifications, which may result in the sector designations for one portfolio being different than another portfolio’s sector designations.
| Percentage |
| Security type/Sector | of Net Assets |
| Agency Asset-Backed Security | 0.33% | |
| Agency Collateralized Mortgage Obligations | 2.67% | |
| Agency Mortgage-Backed Securities | 25.31% | |
| Agency Obligation | 0.48% | |
| Commercial Mortgage-Backed Securities | 4.38% | |
| Corporate Bonds | 24.41% | |
| Banking | 6.20% | |
| Basic Industry | 1.84% | |
| Brokerage | 0.57% | |
| Capital Goods | 0.25% | |
| Communications | 2.33% | |
| Consumer Cyclical | 0.80% | |
| Consumer Non-Cyclical | 2.64% | |
| Electric | 2.87% | |
| Energy | 1.52% | |
| Finance Companies | 0.76% | |
| Insurance | 1.05% | |
| Natural Gas | 0.91% | |
| Real Estate | 0.83% | |
| Technology | 1.07% | |
| Transportation | 0.77% | |
| Municipal Bond | 3.14% | |
| Non-Agency Asset-Backed Securities | 3.59% | |
| Non-Agency Collateralized Mortgage Obligations | 1.18% | |
| Regional Bonds | 0.66% | |
| Sovereign Bond | 0.42% | |
| Supranational Banks | 0.56% | |
| U.S. Treasury Obligations | 21.80% | |
| Preferred Stock | 0.38% | |
| Short-Term Investments | 27.69% | |
| Securities Lending Collateral | 0.34% | |
| Total Value of Securities | 117.34% | |
| Obligation to Return Securities Lending Collateral | (1.02% | ) |
| Other Liabilities Net of Receivables and Other Assets | (16.32% | ) |
| Total Net Assets | 100.00% | |
2011 Annual report · Delaware Pooled Trust
(continues) 65
Security type/sector allocations
Delaware Pooled® Trust — The High-Yield Bond Portfolio
As of October 31, 2011
Sector designations may be different than the sector designations presented in other Portfolio materials. The sector designations may represent the investment manager’s internal sector classifications, which may result in the sector designations for one portfolio being different than another portfolio’s sector designations.
| Percentage |
| Security type/Sector | of Net Assets |
| Corporate Bonds | 91.78% | |
| Automotive | 4.60% | |
| Banking | 3.58% | |
| Basic Industry | 12.97% | |
| Capital Goods | 5.51% | |
| Consumer Cyclical | 5.02% | |
| Consumer Non-Cyclical | 3.69% | |
| Energy | 11.35% | |
| Financials | 2.08% | |
| Healthcare | 5.80% | |
| Insurance | 2.44% | |
| Media | 6.22% | |
| Services | 11.13% | |
| Technology & Electronics | 6.76% | |
| Telecommunications | 8.88% | |
| Utilities | 1.75% | |
| Senior Secured Loans | 1.85% | |
| Common Stock | 0.21% | |
| Preferred Stock | 1.77% | |
| Warrant | 0.00% | |
| Short-Term Investments | 2.34% | |
| Securities Lending Collateral | 11.33% | |
| Total Value of Securities | 109.28% | |
| Obligation to Return Securities Lending Collateral | (11.38% | ) |
| Receivables and Other Assets Net of Other Liabilities | 2.10% | |
| Total Net Assets | 100.00% | |
2011 Annual report · Delaware Pooled Trust
66
Delaware Pooled® Trust — The Core Plus Fixed Income Portfolio
As of October 31, 2011
Sector designations may be different than the sector designations presented in other Portfolio materials. The sector designations may represent the investment manager’s internal sector classifications, which may result in the sector designations for one portfolio being different than another portfolio’s sector designations.
| Percentage |
| Security type/Sector | of Net Assets |
| Agency Asset-Backed Securities | 0.26% | |
| Agency Collateralized Mortgage Obligations | 2.91% | |
| Agency Mortgage-Backed Securities | 13.30% | |
| Commercial Mortgage-Backed Securities | 5.59% | |
| Convertible Bonds | 0.51% | |
| Corporate Bonds | 42.92% | |
| Banking | 6.81% | |
| Basic Industry | 4.26% | |
| Brokerage | 0.64% | |
| Capital Goods | 1.11% | |
| Communications | 5.15% | |
| Consumer Cyclical | 2.24% | |
| Consumer Non-Cyclical | 5.26% | |
| Electric | 3.46% | |
| Energy | 3.70% | |
| Finance Companies | 2.60% | |
| Insurance | 1.26% | |
| Natural Gas | 2.00% | |
| Real Estate | 1.62% | |
| Technology | 1.35% | |
| Transportation | 1.46% | |
| Non-Agency Asset-Backed Securities | 2.70% | |
| Non-Agency Collateralized Mortgage Obligations | 0.49% | |
| Regional Bonds | 2.59% | |
| Senior Secured Loans | 3.68% | |
| Sovereign Bonds | 4.57% | |
| Supranational Banks | 0.67% | |
| U.S. Treasury Obligations | 13.08% | |
| Preferred Stock | 0.30% | |
| Short-Term Investment | 12.97% | |
| Securities Lending Collateral | 2.03% | |
| Total Value of Securities | 108.57% | |
| Obligation to Return Securities Lending Collateral | (2.12% | ) |
| Other Liabilities Net of Receivables and Other Assets | (6.45% | ) |
| Total Net Assets | 100.00% | |
2011 Annual report · Delaware Pooled Trust
(continues) 67
Security type/country and sector allocations
Delaware Pooled® Trust — The International Equity Portfolio
As of October 31, 2011
Sector designations may be different than the sector designations presented in other Portfolio materials. The sector designations may represent the investment manager’s or sub-adviser’s internal sector classifications, which may result in the sector designations for one portfolio being different than another portfolio’s sector designations.
| Percentage |
| Security type/Country | of Net Assets |
| Common Stock | 98.71% | |
| Australia | 7.22% | |
| Belgium | 0.00% | |
| France | 14.59% | |
| Germany | 5.24% | |
| Ireland | 1.33% | |
| Israel | 2.06% | |
| Italy | 3.92% | |
| Japan | 19.22% | |
| Netherlands | 5.27% | |
| Singapore | 4.00% | |
| Spain | 6.82% | |
| Switzerland | 6.29% | |
| Taiwan | 1.63% | |
| United Kingdom | 21.12% | |
| Short-Term Investments | 1.10% | |
| Securities Lending Collateral | 0.56% | |
| Total Value of Securities | 100.37% | |
| Obligation to Return Securities Lending Collateral | (0.80% | ) |
| Receivables and Other Assets Net of Other Liabilities | 0.43% | |
| Total Net Assets | 100.00% | |
| Percentage |
| Common Stock by Sector | of Net Assets |
| Consumer Discretionary | 5.26% | |
| Consumer Staples | 16.20% | |
| Energy | 13.05% | |
| Financials | 13.41% | |
| Healthcare | 15.93% | |
| Industrials | 6.17% | |
| Information Technology | 6.68% | |
| Materials | 2.43% | |
| Telecommunication Services | 14.40% | |
| Utilities | 5.18% | |
| Total | 98.71% | |
2011 Annual report · Delaware Pooled Trust
68
Delaware Pooled® Trust — The Labor Select International Equity Portfolio
As of October 31, 2011
Sector designations may be different than the sector designations presented in other Portfolio materials. The sector designations may represent the investment manager’s or sub-adviser’s internal sector classifications, which may result in the sector designations for one portfolio being different than another portfolio’s sector designations.
| Percentage |
| Security type/Country | of Net Assets |
| Common Stock | 96.67% | |
| Australia | 7.96% | |
| Belgium | 0.00% | |
| France | 16.08% | |
| Germany | 2.63% | |
| Ireland | 1.66% | |
| Israel | 2.11% | |
| Italy | 1.32% | |
| Japan | 18.82% | |
| Netherlands | 6.01% | |
| Singapore | 4.41% | |
| Spain | 6.88% | |
| Switzerland | 6.59% | |
| United Kingdom | 22.20% | |
| Short-Term Investments | 3.08% | |
| Securities Lending Collateral | 3.39% | |
| Total Value of Securities | 103.14% | |
| Obligation to Return Securities Lending Collateral | (3.48% | ) |
| Receivables and Other Assets Net of Other Liabilities | 0.34% | |
| Total Net Assets | 100.00% | |
| Percentage |
| Common Stock by Sector | of Net Assets |
| Consumer Discretionary | 5.19% | |
| Consumer Staples | 14.15% | |
| Energy | 11.70% | |
| Financials | 15.05% | |
| Healthcare | 16.14% | |
| Industrials | 5.16% | |
| Information Technology | 5.20% | |
| Materials | 2.76% | |
| Telecommunication Services | 13.88% | |
| Utilities | 7.44% | |
| Total | 96.67% | |
2011 Annual report · Delaware Pooled Trust
(continues) 69
Security type/country and sector allocations
Delaware Pooled® Trust — The Emerging Markets Portfolio
As of October 31, 2011
Sector designations may be different than the sector designations presented in other Portfolio materials. The sector designations may represent the investment manager’s or sub-adviser’s internal sector classifications, which may result in the sector designations for one portfolio being different than another portfolio’s sector designations.
| Percentage |
| Security type/Country | of Net Assets |
| Common Stock | 92.22% | |
| Brazil | 13.45% | |
| Chile | 2.40% | |
| China | 23.59% | |
| Colombia | 0.54% | |
| India | 9.46% | |
| Indonesia | 3.82% | |
| Kazakhstan | 0.87% | |
| Malaysia | 1.17% | |
| Mexico | 4.70% | |
| Peru | 2.18% | |
| Philippines | 1.77% | |
| Poland | 0.70% | |
| Republic of Korea | 5.09% | |
| Russia | 3.23% | |
| South Africa | 5.15% | |
| Taiwan | 6.65% | |
| Thailand | 4.01% | |
| Turkey | 3.44% | |
| Preferred Stock | 6.29% | |
| Brazil | 4.63% | |
| Republic of Korea | 1.66% | |
| Short-Term Investments | 1.41% | |
| Securities Lending Collateral | 2.75% | |
| Total Value of Securities | 102.67% | |
| Obligation to Return Securities Lending Collateral | (2.85% | ) |
| Receivables and Other Assets Net of Other Liabilities | 0.18% | |
| Total Net Assets | 100.00% | |
| Percentage |
| Common and Preferred Stock by Sector | of Net Assets |
| Consumer Discretionary | 8.78% | |
| Consumer Staples | 6.72% | |
| Energy | 13.90% | |
| Financials | 21.99% | |
| Healthcare | 0.80% | |
| Industrials | 9.55% | |
| Information Technology | 12.63% | |
| Materials | 7.12% | |
| Telecommunication Services | 6.96% | |
| Utilities | 10.06% | |
| Total | 98.51% | |
2011 Annual report · Delaware Pooled Trust
70
Delaware Pooled® Trust — The Emerging Markets Portfolio II
As of October 31, 2011
Sector designations may be different than the sector designations presented in other Portfolio materials. The sector designations may represent the investment manager’s internal sector classifications, which may result in the sector designations for one portfolio being different than another portfolio’s sector designations.
| Percentage |
| Security type/Country | of Net Assets |
| Common Stock | 97.79% | |
| Argentina | 0.83% | |
| Bahrain | 0.07% | |
| Brazil | 16.92% | |
| China/Hong Kong | 13.26% | |
| Guernsey | 0.15% | |
| Hungary | 0.58% | |
| India | 3.83% | |
| Indonesia | 1.60% | |
| Israel | 0.62% | |
| Malaysia | 1.96% | |
| Mexico | 5.94% | |
| Peru | 1.27% | |
| Poland | 1.64% | |
| Republic of Korea | 16.81% | |
| Russia | 5.99% | |
| South Africa | 5.87% | |
| Taiwan | 7.25% | |
| Thailand | 2.29% | |
| Turkey | 1.91% | |
| United Kingdom | 0.68% | |
| United States | 8.32% | |
| Short-Term Investment | 1.07% | |
| Total Value of Securities | 98.86% | |
| Receivables and Other Assets Net of Liabilities | 1.14% | |
| Total Net Assets | 100.00% | |
| Percentage |
| Common Stock by Sector | of Net Assets |
| Consumer Discretionary | 3.36% | |
| Consumer Staples | 16.65% | |
| Energy | 14.35% | |
| Financials | 17.53% | |
| Industrials | 4.58% | |
| Information Technology | 14.22% | |
| Materials | 13.21% | |
| Telecommunication Services | 13.16% | |
| Utilities | 0.73% | |
| Total | 97.79% | |
2011 Annual report · Delaware Pooled Trust
(continues) 71
Security type/country and sector allocations
Delaware Pooled® Trust — The Global Real Estate Securities Portfolio
As of October 31, 2011
Sector designations may be different than the sector designations presented in other Portfolio materials. The sector designations may represent the investment manager’s internal sector classifications, which may result in the sector designations for one portfolio being different than another portfolio’s sector designations.
| Percentage |
| Security type/Country | of Net Assets |
| Common Stock | 99.14 | % |
| Australia | 9.20 | % |
| Austria | 0.61 | % |
| Belgium | 0.98 | % |
| Brazil | 0.35 | % |
| Canada | 5.52 | % |
| China/Hong Kong | 12.17 | % |
| France | 3.47 | % |
| Germany | 1.37 | % |
| Japan | 7.62 | % |
| Netherlands | 0.35 | % |
| Singapore | 3.62 | % |
| Switzerland | 0.60 | % |
| United Kingdom | 6.51 | % |
| United States | 46.77 | % |
| Warrant | 0.00 | % |
| Short-Term Investments | 2.91 | % |
| Securities Lending Collateral | 9.72 | % |
| Total Value of Securities | 111.77 | % |
| Obligation to Return Securities Lending Collateral | (10.53 | %) |
| Other Liabilities Net of Receivables and Other Assets | (1.24 | %) |
| Total Net Assets | 100.00 | % |
| Percentage |
| Common Stock by Sector | of Net Assets |
| Diversified REITs | 24.60 | % |
| Healthcare REITs | 5.82 | % |
| Hotel REITs | 2.26 | % |
| Industrial REITs | 3.08 | % |
| Mall REITs | 9.09 | % |
| Manufactured Homes REIT | 0.83 | % |
| Multifamily REITs | 8.62 | % |
| Office REITs | 11.12 | % |
| Real Estate Operating Companies | 19.45 | % |
| Self-Storage REITs | 3.25 | % |
| Shopping Center REITs | 10.34 | % |
| Single Tenant REIT | 0.68 | % |
| Total | 99.14 | % |
2011 Annual report · Delaware Pooled Trust
72
Security type/country allocations
Delaware Pooled® Trust — The Global Fixed Income Portfolio
As of October 31, 2011
| Percentage |
| Security type/Country | of Net Assets |
| Corporate Bonds | 15.60 | % |
| Austria | 3.05 | % |
| Germany | 7.03 | % |
| Netherlands | 3.19 | % |
| Spain | 0.55 | % |
| United Kingdom | 1.78 | % |
| Sovereign Bonds | 61.32 | % |
| Canada | 4.40 | % |
| Denmark | 3.99 | % |
| Germany | 9.97 | % |
| Japan | 17.80 | % |
| Mexico | 3.93 | % |
| Netherlands | 5.19 | % |
| Norway | 3.54 | % |
| Poland | 6.59 | % |
| Qatar | 2.27 | % |
| Slovakia | 2.06 | % |
| Slovenia | 1.58 | % |
| Supranational Banks | 8.31 | % |
| U.S. Treasury Obligations | 11.67 | % |
| Short-Term Investments | 0.84 | % |
| Total Value of Securities | 97.74 | % |
| Receivables and Other Assets Net of Liabilities | 2.26 | % |
| Total Net Assets | 100.00 | % |
2011 Annual report · Delaware Pooled Trust
73
Statements of net assets
Delaware Pooled® Trust — The Large-Cap Value Equity Portfolio
October 31, 2011
| | Number of | | | | |
| | Shares | | Value | |
| Common Stock – 98.10% | | | | | | |
| Consumer Discretionary – 6.00% | | | | | | |
| Comcast Class A | | 9,100 | | $ | 213,395 | |
| Lowe’s | | 8,800 | | | 184,976 | |
| | | | | | 398,371 | |
| Consumer Staples – 14.49% | | | | | | |
| Archer-Daniels-Midland | | 6,800 | | | 196,792 | |
| CVS Caremark | | 5,100 | | | 185,130 | |
| Kimberly-Clark | | 2,700 | | | 188,217 | |
| Kraft Foods Class A | | 5,200 | | | 182,936 | |
| Safeway | | 10,800 | | | 209,196 | |
| | | | | | 962,271 | |
| Energy – 12.24% | | | | | | |
| Chevron | | 2,000 | | | 210,100 | |
| ConocoPhillips | | 2,700 | | | 188,055 | |
| Marathon Oil | | 8,300 | | | 216,049 | |
| Williams | | 6,600 | | | 198,726 | |
| | | | | | 812,930 | |
| Financials – 11.88% | | | | | | |
| Allstate | | 6,900 | | | 181,746 | |
| Bank of New York Mellon | | 9,300 | | | 197,904 | |
| Marsh & McLennan | | 6,700 | | | 205,154 | |
| Travelers | | 3,500 | | | 204,225 | |
| | | | | | 789,029 | |
| Healthcare – 17.37% | | | | | | |
| Baxter International | | 3,300 | | | 181,434 | |
| Cardinal Health | | 4,400 | | | 194,788 | |
| Johnson & Johnson | | 2,900 | | | 186,731 | |
| Merck | | 5,700 | | | 196,650 | |
| Pfizer | | 10,311 | | | 198,590 | |
| Quest Diagnostics | | 3,500 | | | 195,300 | |
| | | | | | 1,153,493 | |
| Industrials – 8.81% | | | | | | |
| Northrop Grumman | | 3,400 | | | 196,350 | |
| Raytheon | | 4,400 | | | 194,436 | |
| Waste Management | | 5,900 | | | 194,287 | |
| | | | | | 585,073 | |
| Information Technology – 12.66% | | | | | | |
| Cisco Systems | | 12,400 | | | 229,772 | |
| Intel | | 8,300 | | | 203,682 | |
| Motorola Solutions | | 4,300 | | | 201,713 | |
| Xerox | | 25,100 | | | 205,318 | |
| | | | | | 840,485 | |
| Materials – 3.11% | | | | | | |
| duPont (E.I.) deNemours | | 4,300 | | | 206,701 | |
| | | | | | 206,701 | |
| Telecommunications – 5.68% | | | | | | |
| AT&T | | 6,300 | | | 184,653 | |
| Verizon Communications | | 5,200 | | | 192,296 | |
| | | | | | 376,949 | |
| Utilities – 5.86% | | | | | | |
| Edison International | | 5,100 | | | 207,060 | |
| Progress Energy | | 3,500 | | | 182,350 | |
| | | | | | 389,410 | |
| Total Common Stock | | | | | | |
| (cost $6,668,467) | | | | | 6,514,712 | |
| Principal | | | | |
| | Amount | | | | |
| Short-Term Investments – 1.75% | | | | | | |
| ≠Discount Notes – 1.02% | | | | | | |
| Federal Home Loan Bank | | | | | | |
| 0.003% 11/30/11 | $ | 18,585 | | | 18,585 | |
| 0.01% 12/23/11 | | 2,692 | | | 2,692 | |
| 0.04% 11/2/11 | | 10,797 | | | 10,797 | |
| Freddie Mac 0.05% 11/2/11 | | 35,769 | | | 35,770 | |
| | | | | | 67,844 | |
| Repurchase Agreement – 0.73% | | | | | | |
| BNP Paribas 0.08%, dated 10/31/11, | | | | | | |
| to be repurchased on 11/1/11, | | | | | | |
| repurchase price $48,000 (collateralized | | | | | | |
| by U.S. government obligations | | | | | | |
| 0.25%-4.625% 2/29/12-2/15/21, | | | | | | |
| market value $48,960) | | 48,000 | | | 48,000 | |
| | | | | | 48,000 | |
| Total Short-Term Investments | | | | | | |
| (cost $115,844) | | | | | 115,844 | |
| |
| Total Value of Securities – 99.85% | | | | | | |
| (cost $6,784,311) | | | | | 6,630,556 | |
| Receivables and Other Assets | | | | | | |
| Net of Liabilities – 0.15% | | | | | 10,212 | |
| Net Assets Applicable to 400,803 | | | | | | |
| Shares Outstanding; Equivalent to | | | | | | |
| $16.57 Per Share – 100.00% | | | | $ | 6,640,768 | |
| |
| Components of Net Assets at October 31, 2011: | | | | |
| Shares of beneficial interest | | | | | | |
| (unlimited authorization – no par) | | | | $ | 7,862,263 | |
| Undistributed net investment income | | | | | 119,894 | |
| Accumulated net realized loss on investments | | | | | (1,187,634 | ) |
| Net unrealized depreciation of investments | | | | | (153,755 | ) |
| Total net assets | | | | $ | 6,640,768 | |
≠The rate shown is the effective yield at the time of purchase.
See accompanying notes, which are an integral part of the financial statements.
2011 Annual report · Delaware Pooled Trust
74
Delaware Pooled® Trust — The Select 20 Portfolio
October 31, 2011
| | Number of | | | | |
| | | Shares | | Value | |
| Common Stock – 96.97%² | | | | | | |
| Consumer Discretionary – 16.51% | | | | | | |
| † | Apollo Group Class A | | 42,950 | | $ | 2,033,683 | |
| Lowe’s | | 88,900 | | | 1,868,678 | |
| † | priceline.com | | 3,775 | | | 1,916,643 | |
| Strayer Education | | 20,800 | | | 1,772,368 | |
| | | | | | 7,591,372 | |
| Energy – 4.46% | | | | | | |
| EOG Resources | | 22,950 | | | 2,052,419 | |
| | | | | | 2,052,419 | |
| Financial Services – 15.43% | | | | | | |
| † | IntercontinentalExchange | | 19,650 | | | 2,552,142 | |
| MasterCard Class A | | 7,700 | | | 2,673,748 | |
| Visa Class A | | 20,050 | | | 1,869,863 | |
| | | | | | 7,095,753 | |
| Healthcare – 14.51% | | | | | | |
| Allergan | | 36,900 | | | 3,104,028 | |
| Novo-Nordisk ADR | | 16,600 | | | 1,764,580 | |
| Perrigo | | 19,950 | | | 1,801,086 | |
| | | | | | 6,669,694 | |
| Materials & Processing – 4.05% | | | | | | |
| Syngenta ADR | | 30,500 | | | 1,862,635 | |
| | | | | | 1,862,635 | |
| Technology – 37.22% | | | | | | |
| † | Apple | | 12,050 | | | 4,877,598 | |
| † | Crown Castle International | | 47,350 | | | 1,958,396 | |
| † | Google Class A | | 3,725 | | | 2,207,584 | |
| Intuit | | 41,500 | | | 2,227,305 | |
| † | Polycom | | 98,300 | | | 1,624,899 | |
| QUALCOMM | | 48,300 | | | 2,492,280 | |
| VeriSign | | 53,800 | | | 1,726,442 | |
| | | | | | 17,114,504 | |
| Utilities – 4.79% | | | | | | |
| j2 Global Communications | | 71,500 | | | 2,200,770 | |
| | | | | | 2,200,770 | |
| Total Common Stock | | | | | | |
| (cost $40,570,227) | | | | | 44,587,147 | |
| | | | | | |
| | Principal | | | | |
| | Amount | | | |
| Short-Term Investments – 2.03% | | | | | | |
| ≠Discount Notes – 1.29% | | | | | | |
| Federal Home Loan Bank | | | | | | |
| 0.003% 11/30/11 | $ | 427,791 | | $ | 427,788 | |
| 0.01% 12/23/11 | | 61,967 | | | 61,966 | |
| 0.04% 11/2/11 | | 23,489 | | | 23,489 | |
| Freddie Mac 0.05% 11/2/11 | | 77,817 | | | 77,817 | |
| | | | | | 591,060 | |
| Repurchase Agreement – 0.74% | | | | | | |
| BNP Paribas 0.08%, dated 10/31/11, | | | | | | |
| to be repurchased on 11/1/11, | | | | | | |
| repurchase price $339,001 | | | | | | |
| (collateralized by U.S. government | | | | | | |
| obligations 0.25%-4.625% | | | | | | |
| 2/29/12-2/15/21, market | | | | | | |
| value $345,780) | | 339,000 | | | 339,000 | |
| | | | | | 339,000 | |
| Total Short-Term Investments | | | | | | |
| (cost $930,062) | | | | | 930,060 | |
| |
| Total Value of Securities – 99.00% | | | | | | |
| (cost $41,500,289) | | | | | 45,517,207 | |
| Receivables and Other Assets | | | | | | |
| Net of Liabilities – 1.00% | | | | | 460,724 | |
| Net Assets Applicable to 6,603,937 | | | | | | |
| Shares Outstanding; Equivalent to | | | | | | |
| $6.96 per share – 100.00% | | | | $ | 45,977,931 | |
| |
| Components of Net Assets at October 31, 2011: | | | | |
| Shares of beneficial interest | | | | | | |
| (unlimited authorization – no par) | | | | $ | 44,936,340 | |
| Undistributed net investment income | | | | | 10,052 | |
| Accumulated net realized loss on investments | | | | | (2,985,379 | ) |
| Net unrealized appreciation of investments | | | | | 4,016,918 | |
| Total net assets | | | | $ | 45,977,931 | |
| ² | Narrow industries are utilized for compliance purposes for diversification whereas broad sectors are used for financial reporting. |
| † | Non income producing security. |
| ≠ | The rate shown is the effective yield at time of purchase. |
ADR — American Depositary Receipt
See accompanying notes, which are an integral part of the financial statements.
2011 Annual report · Delaware Pooled Trust
(continues) 75
Statements of net assets
Delaware Pooled® Trust — The Large-Cap Growth Equity Portfolio
October 31, 2011
| | Number of | | | | |
| | | Shares | | Value | |
| Common Stock – 98.99%² | | | | | | |
| Consumer Discretionary – 17.84% | | | | | | |
| † | Apollo Group Class A | | 142,800 | | $ | 6,761,580 | |
| †* | Ctrip.com International ADR | | 100,800 | | | 3,513,888 | |
| Lowe’s | | 183,000 | | | 3,846,660 | |
| NIKE Class B | | 54,700 | | | 5,270,345 | |
| † | priceline.com | | 13,125 | | | 6,663,825 | |
| Staples | | 291,900 | | | 4,366,824 | |
| | | | | | 30,423,122 | |
| Consumer Staples – 2.69% | | | | | | |
| Walgreen | | 138,300 | | | 4,591,560 | |
| | | | | | 4,591,560 | |
| Energy – 7.13% | | | | | | |
| El Paso | | 156,300 | | | 3,909,063 | |
| EOG Resources | | 92,200 | | | 8,245,446 | |
| | | | | | 12,154,509 | |
| Financial Services – 17.92% | | | | | | |
| CME Group | | 21,250 | | | 5,855,650 | |
| † | IntercontinentalExchange | | 52,900 | | | 6,870,652 | |
| MasterCard Class A | | 25,575 | | | 8,880,663 | |
| Visa Class A | | 95,950 | | | 8,948,297 | |
| | | | | | 30,555,262 | |
| Healthcare – 9.58% | | | | | | |
| Allergan | | 96,700 | | | 8,134,404 | |
| Novo Nordisk ADR | | 46,050 | | | 4,895,115 | |
| Perrigo | | 36,600 | | | 3,304,248 | |
| | | | | | 16,333,767 | |
| Materials & Processing – 2.88% | | | | | | |
| Syngenta ADR | | 80,500 | | | 4,916,135 | |
| | | | | | 4,916,135 | |
| Producer Durables – 8.26% | | | | | | |
| Caterpillar | | 33,800 | | | 3,192,748 | |
| † | Crown Castle International | | 157,700 | | | 6,522,472 | |
| Expeditors International of Washington | | 95,700 | | | 4,363,920 | |
| | | | | | 14,079,140 | |
| Technology – 32.69% | | | | | | |
| † | Adobe Systems | | 165,600 | | | 4,870,296 | |
| † | Apple | | 31,950 | | | 12,932,721 | |
| † | Google Class A | | 14,600 | | | 8,652,544 | |
| Intuit | | 130,800 | | | 7,020,036 | |
| † | Polycom | | 155,600 | | | 2,572,068 | |
| QUALCOMM | | 164,900 | | | 8,508,840 | |
| † | Teradata | | 79,200 | | | 4,725,072 | |
| * | VeriSign | | 201,400 | | | 6,462,926 | |
| | | | | | 55,744,503 | |
| Total Common Stock | | | | | | |
| (cost $129,367,312) | | | | | 168,797,998 | |
| | | | | | | |
| | Principal | | | | |
| | | Amount | | | |
| Short-Term Investments – 0.84% | | | | | | |
| ≠Discount Notes – 0.38% | | | | | | |
| Federal Home Loan Bank | | | | | | |
| 0.003% 11/30/11 | $ | 325,082 | | | 325,079 | |
| 0.01% 12/23/11 | | 47,089 | | | 47,089 | |
| 0.04% 11/2/11 | | 66,390 | | | 66,390 | |
| Freddie Mac 0.05% 11/2/11 | | 219,943 | | | 219,943 | |
| | | | | | 658,501 | |
| Repurchase Agreement – 0.46% | | | | | | |
| BNP Paribas 0.08%, dated 10/31/11, | | | | | | |
| to be repurchased on 11/1/11, | | | | | | |
| repurchase price $781,002 | | | | | | |
| (collateralized by U.S. government | | | | | | |
| obligations 0.25% - 4.625% | | | | | | |
| 2/29/12 – 2/15/21, market value | | | | | | |
| $796,620) | | 781,000 | | | 781,000 | |
| | | | | | | 781,000 | |
| Total Short-Term Investments | | | | | | |
| (cost $1,439,503) | | | | | 1,439,501 | |
| |
| Total Value of Securities Before Securities | | | | |
| Lending Collateral – 99.83% | | | | | | |
| (cost $130,806,815) | | | | | 170,237,499 | |
| | Number of | | | | |
| | | Shares | | | | |
| Securities Lending Collateral** – 1.61% | | | | | | |
| Investment Companies | | | | | | |
| BNY Mellon SL DBT II | | | | | | |
| Liquidating Fund | | 112,883 | | | 109,350 | |
| Delaware Investments Collateral | | | | | | |
| Fund No. 1 | | 2,645,783 | | | 2,645,783 | |
| †@ | Mellon GSL Reinvestment Trust II | | 213,107 | | | 0 | |
| Total Securities Lending Collateral | | | | | | |
| (cost $2,971,773) | | | | | 2,755,133 | |
| |
| Total Value of Securities – 101.44% | | | | | | |
| (cost $133,778,588) | | | | | 172,992,632 | © |
| Obligation to Return Securities | | | | | | |
| Lending Collateral** – (1.74%) | | | | | (2,971,773 | ) |
| Receivables and Other Assets | | | | | | |
| Net of Other Liabilities – 0.30% | | | | | 510,262 | |
| Net Assets Applicable to 17,255,126 | | | | | | |
| Shares Outstanding; Equivalent to | | | | | | |
| $9.88 Per Share – 100.00% | | | | $ | 170,531,121 | |
2011 Annual report · Delaware Pooled Trust
76
| | | | |
| Components of Net Assets at October 31, 2011: | | | |
| Shares of beneficial interest | | | |
| (unlimited authorization – no par) | $ | 186,430,118 | |
| Undistributed net investment income | | 426,423 | |
| Accumulated net realized loss on investments | | (55,539,464 | ) |
| Net unrealized appreciation of investments | | 39,214,044 | |
| Total net assets | $ | 170,531,121 | |
| ² | Narrow industries are utilized for compliance purposes for diversification whereas broad sectors are used for financial reporting. |
| † | Non income producing security. |
| ≠ | The rate shown is the effective yield at the time of purchase. |
| * | Fully or partially on loan. |
| ** | See Note 9 in “Notes to financial statements” for additional information on securities lending collateral. |
| © | Includes $2,787,408 of securities loaned. |
| @ | Illiquid security. At October 31, 2011, the aggregate amount of illiquid securities was $0, which represented 0.00% of the Portfolio’s net assets. See Note 10 in “Notes to financial statements.” |
ADR – American Depositary Receipt
See accompanying notes, which are an integral part of the financial statements.
2011 Annual report · Delaware Pooled Trust
(continues) 77
Statements of net assets
Delaware Pooled® Trust — The Focus Smid-Cap Growth Equity Portfolio
October 31, 2011
| | Number of | | | | |
| | | Shares | | Value | |
| Common Stock – 95.33% | | | | | | |
| Consumer Discretionary – 22.95% | | | | | | |
| † | DineEquity | | 12,700 | | $ | 596,392 | |
| Fastenal | | 15,000 | | | 571,350 | |
| Gentex | | 13,900 | | | 418,668 | |
| † | Interval Leisure Group | | 17,800 | | | 245,818 | |
| † | ITT Educational Services | | 5,200 | | | 322,192 | |
| | Strayer Education | | 6,800 | | | 579,428 | |
| Weight Watchers International | | 14,800 | | | 1,104,375 | |
| | | | | | 3,838,223 | |
| Consumer Staples – 4.08% | | | | | | |
| † | Peet’s Coffee & Tea | | 10,700 | | | 681,804 | |
| | | | | | 681,804 | |
| Energy – 4.81% | | | | | | |
| Core Laboratories | | 7,425 | | | 803,831 | |
| | | | | | 803,831 | |
| Financials – 14.97% | | | | | | |
| † | Affiliated Managers Group | | 7,250 | | | 671,423 | |
| Heartland Payment Systems | | 24,600 | | | 535,296 | |
| † | IntercontinentalExchange | | 5,450 | | | 707,845 | |
| † | MSCI Class A | | 17,650 | | | 589,334 | |
| | | | | | 2,503,898 | |
| Healthcare – 11.92% | | | | | | |
| † | ABIOMED | | 21,800 | | | 328,308 | |
| † | athenahealth | | 7,800 | | | 412,698 | |
| Perrigo | | 6,550 | | | 591,334 | |
| Techne | | 9,600 | | | 660,480 | |
| | | | | | 1,992,820 | |
| Producer Durables – 9.14% | | | | | | |
| Expeditors International of Washington | | 12,700 | | | 579,120 | |
| Graco | | 15,500 | | | 665,570 | |
| Ritchie Bros Auctioneers | | 14,200 | | | 283,148 | |
| | | | | | 1,527,838 | |
| Technology – 22.71% | | | | | | |
| Blackbaud | | 22,100 | | | 619,463 | |
| † | Polycom | | 27,300 | | | 451,269 | |
| † | SBA Communications Class A | | 20,350 | | | 775,132 | |
| † | Teradata | | 11,700 | | | 698,022 | |
| † | VeriFone Systems | | 16,400 | | | 692,244 | |
| VeriSign | | 17,500 | | | 561,575 | |
| | | | | | 3,797,705 | |
| Utilities – 4.75% | | | | | | |
| j2 Global Communications | | 25,800 | | | 794,124 | |
| | | | | | 794,124 | |
| Total Common Stock | | | | | | |
| (cost $14,544,723) | | | | | 15,940,243 | |
| | | | | | | |
| | Principal | | | | |
| | Amount | | | |
| Short-Term Investments – 4.75% | | | | | | |
| ≠Discount Notes – 1.63% | | | | | | |
| Federal Home Loan Bank | | | | | | |
| 0.003% 11/30/11 | $ | 238,024 | | | 238,022 | |
| 0.01% 12/23/11 | | 34,479 | | | 34,478 | |
| | | | | | 272,500 | |
| Repurchase Agreement – 3.12% | | | | | | |
| BNP Paribas 0.08%, dated 10/31/11, | | | | | | |
| to be repurchased on 11/1/11, | | | | | | |
| repurchase price $522,001 | | | | | | |
| (collateralized by U.S. government | | | | | | |
| obligations 0.25%-4.625% 2/29/12- | | | | | | |
| 2/15/21; market value $532,440) | | 522,000 | | | 522,000 | |
| | | | | | 522,000 | |
| Total Short-Term Investments | | | | | | |
| (cost $794,501) | | | | | 794,500 | |
| |
| Total Value of Securities – 100.08% | | | | | | |
| (cost $15,339,224) | | | | | 16,734,743 | |
| Liabilities Net of Receivables and | | | | | | |
| Other Assets – (0.08%) | | | | | (13,359 | ) |
| Net Assets Applicable to 1,128,697 | | | | | | |
| Shares Outstanding; Equivalent to | | | | | | |
| $14.81 Per Share – 100.00% | | | | $ | 16,721,384 | |
| |
| Components of Net Assets at October 31, 2011: | | | | |
| Shares of beneficial interest | | | | | | |
| (unlimited authorization – no par) | | | | $ | 16,413,692 | |
| Undistributed net investment income | | | | | 10,851 | |
| Accumulated net realized loss on investments | | | | | (1,098,678 | ) |
| Net unrealized appreciation of investments | | | | | 1,395,519 | |
| Total net assets | | | | $ | 16,721,384 | |
| † | Non income producing security. |
| ≠ | The rate shown is the effective yield at the time of purchase. |
See accompanying notes, which are an integral part of the financial statements.
2011 Annual report · Delaware Pooled Trust
78
Delaware Pooled® Trust — The Real Estate Investment Trust Portfolio II
October 31, 2011
| Number of | | | |
| Shares | | Value |
| Common Stock – 94.00% | | | | | |
| Diversified REITs – 4.28% | | | | | |
| Lexington Realty Trust | | 2,180 | | $ | 17,135 |
| Vornado Realty Trust | | 1,275 | | | 105,582 |
| Washington Real Estate Investment Trust | | 355 | | | 10,281 |
| | | | | 132,998 |
| Healthcare REITs – 11.02% | | | | | |
| Cogdell Spencer | | 890 | | | 3,596 |
| HCP | | 3,155 | | | 125,727 |
| Health Care REIT | | 1,540 | | | 81,143 |
| Ventas | | 2,380 | | | 132,351 |
| | | | | 342,817 |
| Hotel REITs – 5.23% | | | | | |
| Host Hotels & Resorts | | 9,328 | | | 133,111 |
| LaSalle Hotel Properties | | 575 | | | 13,748 |
| †Strategic Hotels & Resorts | | 2,765 | | | 15,733 |
| | | | | 162,592 |
| Industrial REITs – 5.57% | | | | | |
| DCT Industrial Trust | | 3,590 | | | 17,806 |
| ProLogis | | 5,220 | | | 155,348 |
| | | | | 173,154 |
| Mall REITs – 18.04% | | | | | |
| CBL & Associates Properties | | 1,250 | | | 19,225 |
| General Growth Properties | | 3,193 | | | 46,937 |
| Macerich | | 1,928 | | | 95,937 |
| Simon Property Group | | 2,796 | | | 359,117 |
| Taubman Centers | | 650 | | | 39,800 |
| | | | | 561,016 |
| Manufactured Housing REIT – 1.30% | | | | | |
| Equity Lifestyle Properties | | 610 | | | 40,339 |
| | | | | 40,339 |
| Multifamily REITs – 17.38% | | | | | |
| Apartment Investment & Management | | 470 | | | 11,595 |
| AvalonBay Communities | | 832 | | | 111,230 |
| BRE Properties | | 915 | | | 45,860 |
| Camden Property Trust | | 580 | | | 35,171 |
| Colonial Properties Trust | | 1,905 | | | 38,633 |
| Education Realty Trust | | 2,385 | | | 22,061 |
| Equity Residential | | 2,575 | | | 151,100 |
| Essex Property Trust | | 509 | | | 72,665 |
| UDR | | 2,091 | | | 52,129 |
| | | | | 540,444 |
| Office REITs – 11.64% | | | | | |
| Alexandria Real Estate Equities | | 545 | | | 36,019 |
| Boston Properties | | 1,310 | | | 129,677 |
| Brandywine Realty Trust | | 1,805 | | | 16,444 |
| Douglas Emmett | | 1,655 | | | 32,273 |
| Highwoods Properties | | 880 | | | 27,262 |
| Kilroy Realty | | 1,160 | | | 42,560 |
| SL Green Realty | | 1,130 | | | 77,959 |
| | | | | | 362,194 |
| Office/Industrial REITs – 3.55% | | | | | |
| Digital Realty Trust | | 680 | | | 42,385 |
| Duke Realty | | 805 | | | 9,885 |
| Liberty Property Trust | | 1,170 | | | 37,440 |
| PS Business Parks | | 390 | | | 20,760 |
| | | | | 110,470 |
| Real Estate Operating Company – 0.72% | | | | | |
| Starwood Hotels & Resorts Worldwide | | 450 | | | 22,550 |
| | | | | 22,550 |
| Self-Storage REITs – 5.46% | | | | | |
| Extra Space Storage | | 1,035 | | | 23,319 |
| Public Storage | | 1,135 | | | 146,471 |
| | | | | | 169,790 |
| Shopping Center REITs – 7.77% | | | | | |
| Acadia Realty Trust | | 830 | | | 17,198 |
| DDR Corp | | 4,760 | | | 60,976 |
| Federal Realty Investment Trust | | 608 | | | 53,966 |
| Kimco Realty | | 4,720 | | | 82,458 |
| Regency Centers | | 665 | | | 27,238 |
| | | | | | 241,836 |
| Single Tenant REIT – 1.29% | | | | | |
| National Retail Properties | | 1,470 | | | 40,058 |
| | | | | | 40,058 |
| Specialty REIT – 0.75% | | | | | |
| Rayonier | | 557 | | | 23,244 |
| | | | | | 23,244 |
| Total Common Stock | | | | | |
| (cost $2,640,288) | | | | | 2,923,502 |
| |
| Exchange-Traded Fund – 1.47% | | | | | |
| iShares Dow Jones U.S. Real Estate | | | | | |
| Index Fund | | 800 | | | 45,792 |
| Total Exchange-Traded Fund | | | | | |
| (cost $43,678) | | | | | 45,792 |
| |
| | Principal | | | |
| | Amount | | | |
| Short-Term Investments – 3.87% | | | | | |
| ≠Discount Notes – 1.56% | | | | | |
| Federal Home Loan Bank | | | | | |
| 0.003% 11/30/11 | $ | 37,497 | | | 37,496 |
| 0.01% 12/23/11 | | 5,432 | | | 5,432 |
| 0.04% 11/2/11 | | 1,263 | | | 1,263 |
| Freddie Mac 0.05% 11/2/11 | | 4,186 | | | 4,186 |
| | | | | 48,377 |
2011 Annual report · Delaware Pooled Trust
(continues) 79
Statements of net assets
Delaware Pooled® Trust — The Real Estate Investment Trust Portfolio II
| Principal | | | | |
| Amount | | Value | |
| Short-Term Investments (continued) | | | | | | |
| Repurchase Agreements – 2.31% | | | | | | |
| BNP Paribas 0.08%, dated 10/31/11, | | | | | | |
| to be repurchased on 11/1/11, | | | | | | |
| repurchase price $72,000 (collateralized | | | | |
| by U.S. government obligations | | | | | | |
| 0.25%-4.625% 2/29/12-2/15/21; | | | | | | |
| market value $73,440) | $ | 72,000 | | $ | 72,000 | |
| | | | | | 72,000 | |
| Total Short-Term Investments | | | | | | |
| (cost $120,378) | | | | | 120,377 | |
| |
| Total Value of Securities – 99.34% | | | | | | |
| (cost $2,804,344) | | | | | 3,089,671 | |
| Receivables and Other Assets | | | | | | |
| Net of Liabilities – 0.66% | | | | | 20,589 | |
| Net Assets Applicable to 484,848 Shares | | | | | | |
| Outstanding; Equivalent to $6.41 | | | | | | |
| Per Share – 100.00% | | | | $ | 3,110,260 | |
| |
| Components of Net Assets at October 31, 2011: | | | | |
| Shares of beneficial interest | | | | | | |
| (unlimited authorization – no par) | | | | $ | 5,571,271 | |
| Undistributed net investment income | | | | | 20,118 | |
| Accumulated net realized loss on investments | | | | | (2,766,456 | ) |
| Net unrealized appreciation of investments | | | | | 285,327 | |
| Total net assets | | | | $ | 3,110,260 | |
| † | Non income producing security. |
| ≠ | The rate shown is the effective yield at time of purchase. |
REIT — Real Estate Investment Trust
See accompanying notes, which are an integral part of the financial statements.
2011 Annual report · Delaware Pooled Trust
80
Delaware Pooled® Trust — The Core Focus Fixed Income Portfolio
October 31, 2011
| | Principal | | Value |
| | | Amount (U.S. $) | | (U.S. $) |
| Agency Asset-Backed Security – 0.33% | | | |
| Fannie Mae Grantor Trust | | | | | |
| Series 2003-T4 2A5 | | | | | |
| 5.407% 9/26/33 | $ | 19,257 | | $ | 20,308 |
| Total Agency Asset-Backed Security | | | | | |
| (cost $19,070) | | | | | 20,308 |
| |
| Agency Collateralized Mortgage Obligations – 2.67% | | | |
| Fannie Mae REMICs | | | | | |
| Series 2010-35 AB | | | | | |
| 5.00% 11/25/49 | | 23,881 | | | 25,809 |
| •Series 2011-105 FP | | | | | |
| 0.645% 6/25/41 | | 59,395 | | | 59,269 |
| • | Freddie Mac REMIC | | | | | |
| Series 3800 AF | | | | | |
| 0.743% 2/15/41 | | 81,104 | | | 81,225 |
| Total Agency Collateralized | | | | | |
| Mortgage Obligations | | | | | |
| (cost $166,022) | | | | | 166,303 |
| |
| Agency Mortgage-Backed Securities – 25.31% | | | |
| Fannie Mae S.F. 15 yr | | | | | |
| 4.00% 11/1/25 | | 155,911 | | | 165,400 |
| 4.50% 8/1/19 | | 5,534 | | | 5,931 |
| 5.00% 1/1/20 | | 4,620 | | | 4,988 |
| 5.00% 6/1/20 | | 961 | | | 1,038 |
| 5.00% 2/1/21 | | 4,592 | | | 4,953 |
| Fannie Mae S.F. 15 yr TBA | | | | | |
| 3.50% 11/1/26 | | 320,000 | | | 332,450 |
| 4.00% 11/1/26 | | 60,000 | | | 63,047 |
| Fannie Mae S.F. 30 yr | | | | | |
| 6.00% 10/1/35 | | 12,423 | | | 13,759 |
| | 6.00% 7/1/38 | | 15,706 | | | 17,252 |
| 6.00% 9/1/38 | | 53,516 | | | 58,751 |
| 6.00% 3/1/39 | | 4,334 | | | 4,761 |
| Fannie Mae S.F. 30 yr TBA | | | | | |
| 3.50% 12/1/40 | | 55,000 | | | 55,748 |
| 3.50% 11/1/41 | | 70,000 | | | 71,138 |
| 4.00% 12/1/41 | | 120,000 | | | 124,425 |
| 5.50% 11/1/38 | | 110,000 | | | 119,316 |
| 6.00% 11/1/38 | | 370,000 | | | 405,438 |
| Freddie Mac S.F. 15 yr | | | | | |
| 5.50% 7/1/24 | | 117,257 | | | 126,856 |
| Total Agency Mortgage-Backed | | | | | |
| Securities (cost $1,567,625) | | | | | 1,575,251 |
| |
| Agency Obligation – 0.48% | | | | | |
| • | Fannie Mae 0.31% 10/17/13 | | 30,000 | | | 29,975 |
| Total Agency Obligation | | | | | |
| (cost $29,988) | | | | | 29,975 |
| | | | | | |
| Commercial Mortgage-Backed Securities – 4.38% | | | | | |
| • | BAML Commercial | | | | | |
| Mortgage Securities | | | | | |
| Series 2004-3 A5 | | | | | |
| 5.544% 6/10/39 | | 13,827 | | | 15,049 |
| Series 2005-6 A4 | | | | | |
| 5.194% 9/10/47 | | 35,000 | | | 38,761 |
| • | Bear Stearns Commercial Mortgage | | | | | |
| Securities Series 2006-PW12 A4 | | | | | |
| 5.72% 9/11/38 | | 20,000 | | | 22,443 |
| w• | Commercial Mortgage Pass | | | | | |
| Through Certificates | | | | | |
| Series 2005-C6 A5A | | | | | |
| 5.116% 6/10/44 | | 25,000 | | | 27,339 |
| • | Credit Suisse Mortgage Capital | | | | | |
| Certificates Series 2006-C1 AAB | | | | | |
| 5.42% 2/15/39 | | 25,626 | | | 26,960 |
| Goldman Sachs Mortgage Securities II | | | | | |
| Series 2005-GG4 A4 | | | | | |
| 4.761% 7/10/39 | | 35,000 | | | 37,323 |
| Series 2005-GG4 A4A | | | | | |
| 4.751% 7/10/39 | | 25,000 | | | 26,728 |
| • | JPMorgan Chase Commercial | | | | | |
| Mortgage Securities | | | | | |
| Series 2005-LDP3 A4A | | | | | |
| 4.936% 8/15/42 | | 25,000 | | | 27,511 |
| Series 2005-LDP5 A4 | | | | | |
| 5.205% 12/15/44 | | 20,000 | | | 22,341 |
| • | Morgan Stanley Capital I | | | | | |
| Series 2007-T27 A4 | | | | | |
| 5.641% 6/11/42 | | 25,000 | | | 28,381 |
| Total Commercial Mortgage-Backed | | | | | |
| Securities (cost $235,544) | | | | | 272,836 |
| |
| Corporate Bonds – 24.41% | | | | | |
| Banking – 6.20% | | | | | |
| Abbey National Treasury Services | | | | | |
| 4.00% 4/27/16 | | 15,000 | | | 14,326 |
| Capital One Financial 4.75% 7/15/21 | | 30,000 | | | 31,546 |
| City National 5.25% 9/15/20 | | 10,000 | | | 10,213 |
| Fifth Third Bancorp 3.625% 1/25/16 | | 15,000 | | | 15,396 |
| JPMorgan Chase 4.35% 8/15/21 | | 25,000 | | | 25,058 |
| JPMorgan Chase Capital XXV | | | | | |
| 6.80% 10/1/37 | | 26,000 | | | 26,046 |
| KeyCorp 5.10% 3/24/21 | | 20,000 | | | 20,832 |
| PNC Funding 5.625% 2/1/17 | | 63,000 | | | 69,185 |
| Santander Holdings USA | | | | | |
| 4.625% 4/19/16 | | 5,000 | | | 4,929 |
| SunTrust Banks | | | | | |
| 3.50% 1/20/17 | | 10,000 | | | 10,079 |
| 3.60% 4/15/16 | | 5,000 | | | 5,127 |
| SVB Financial Group | | | | | |
| | 5.375% 9/15/20 | | 15,000 | | | 15,507 |
2011 Annual report · Delaware Pooled Trust
(continues) 81
Statements of net assets
Delaware Pooled® Trust — The Core Focus Fixed Income Portfolio
| | Principal | | Value |
| | | Amount (U.S. $) | | (U.S. $) |
| Corporate Bonds (continued) | | | | | |
| Banking (continued) | | | | | |
| • | USB Capital IX | | | | | |
| 3.50% 4/15/49 | $ | 123,000 | | $ | 89,620 |
| Wachovia | | | | | |
| •0.773% 10/15/16 | | 5,000 | | | 4,365 |
| 5.25% 8/1/14 | | 5,000 | | | 5,336 |
| 5.625% 10/15/16 | | 35,000 | | | 38,129 |
| | | | | | 385,694 |
| Basic Industry – 1.84% | | | | | |
| Alcoa | | | | | |
| | 5.40% 4/15/21 | | 5,000 | | | 4,963 |
| 6.75% 7/15/18 | | 10,000 | | | 10,866 |
| ArcelorMittal 9.85% 6/1/19 | | 5,000 | | | 5,940 |
| Dow Chemical | | | | | |
| 4.25% 11/15/20 | | 10,000 | | | 10,322 |
| 8.55% 5/15/19 | | 10,000 | | | 13,010 |
| duPont (E.I.) deNemours | | | | | |
| 4.25% 4/1/21 | | 20,000 | | | 22,350 |
| International Paper | | | | | |
| 9.375% 5/15/19 | | 10,000 | | | 12,841 |
| # | Kinross Gold 144A 5.125% 9/1/21 | | 10,000 | | | 9,680 |
| Lubrizol 5.50% 10/1/14 | | 5,000 | | | 5,599 |
| Mosaic 3.75% 11/15/21 | | 15,000 | | | 15,380 |
| Teck Resources 9.75% 5/15/14 | | 3,000 | | | 3,575 |
| | | | | | 114,526 |
| Brokerage – 0.57% | | | | | |
| Jefferies Group | | | | | |
| 6.25% 1/15/36 | | 5,000 | | | 4,313 |
| 6.45% 6/8/27 | | 19,000 | | | 17,920 |
| Lazard Group 6.85% 6/15/17 | | 12,000 | | | 12,938 |
| | | | | | 35,171 |
| Capital Goods – 0.25% | | | | | |
| Republic Services 4.75% 5/15/23 | | 5,000 | | | 5,489 |
| Waste Management 2.60% 9/1/16 | | 10,000 | | | 10,166 |
| | | | | | 15,655 |
| Communications – 2.33% | | | | | |
| American Tower 5.90% 11/1/21 | | 10,000 | | | 11,074 |
| # | Crown Castle Towers 144A | | | | | |
| 4.883% 8/15/20 | | 40,000 | | | 40,962 |
| France Telecom 4.125% 9/14/21 | | 5,000 | | | 5,162 |
| Qwest | | | | | |
| 6.75% 12/1/21 | | 5,000 | | | 5,325 |
| 8.375% 5/1/16 | | 20,000 | | | 22,950 |
| Telefonica Emisiones | | | | | |
| 5.462% 2/16/21 | | 5,000 | | | 5,077 |
| Time Warner Cable 8.25% 4/1/19 | | 10,000 | | | 12,754 |
| Verizon Communications | | | | | |
| 3.50% 11/1/21 | | 30,000 | | | 30,328 |
| # | Vivendi 144A 6.625% 4/4/18 | | 10,000 | | | 11,534 |
| | | | | | 145,166 |
| Consumer Cyclical – 0.80% | | | | | |
| CVS Caremark 5.75% 5/15/41 | | 15,000 | | | 17,406 |
| Darden Restaurants | | | | | |
| 4.50% 10/15/21 | | 5,000 | | | 5,162 |
| Historic TW 6.875% 6/15/18 | | 10,000 | | | 11,938 |
| Time Warner 5.375% 10/15/41 | | 10,000 | | | 10,585 |
| Western Union 3.65% 8/22/18 | | 5,000 | | | 4,979 |
| | | | | | 50,070 |
| Consumer Non-Cyclical – 2.64% | | | | | |
| Amgen 3.45% 10/1/20 | | 5,000 | | | 5,191 |
| Boston Scientific 6.00% 1/15/20 | | 5,000 | | | 5,593 |
| CareFusion 6.375% 8/1/19 | | 10,000 | | | 11,816 |
| Celgene 3.95% 10/15/20 | | 10,000 | | | 10,113 |
| Covidien International Finance | | | | | |
| 4.20% 6/15/20 | | 10,000 | | | 10,969 |
| DENTSPLY International | | | | | |
| 4.125% 8/15/21 | | 20,000 | | | 20,743 |
| Hospira 6.40% 5/15/15 | | 10,000 | | | 11,144 |
| Medco Health Solutions | | | | | |
| 4.125% 9/15/20 | | 5,000 | | | 5,065 |
| PerkinElmer 5.00% 11/15/21 | | 5,000 | | | 5,156 |
| Quest Diagnostics 4.70% 4/1/21 | | 20,000 | | | 21,445 |
| Smucker (J.M.) 3.50% 10/15/21 | | 30,000 | | | 30,479 |
| Thermo Fisher Scientific | | | | | |
| 3.60% 8/15/21 | | 5,000 | | | 5,188 |
| # | Woolworths 144A | | | | | |
| 3.15% 4/12/16 | | 10,000 | | | 10,406 |
| 4.55% 4/12/21 | | 10,000 | | | 10,964 |
| | | | | | 164,272 |
| Electric – 2.87% | | | | | |
| Ameren Illinois 9.75% 11/15/18 | | 60,000 | | | 79,664 |
| # | American Transmission Systems 144A | | | | | |
| 5.25% 1/15/22 | | 5,000 | | | 5,346 |
| Carolina Power & Light | | | | | |
| 3.00% 9/15/21 | | 10,000 | | | 10,128 |
| CenterPoint Energy 5.95% 2/1/17 | | 5,000 | | | 5,637 |
| Commonwealth Edison | | | | | |
| 3.40% 9/1/21 | | 15,000 | | | 15,340 |
| Florida Power 3.10% 8/15/21 | | 10,000 | | | 10,212 |
| LG&E and KU Energy | | | | | |
| 3.75% 11/15/20 | | 5,000 | | | 4,962 |
| #144A 4.375% 10/1/21 | | 10,000 | | | 10,222 |
| Pennsylvania Electric 5.20% 4/1/20 | | 10,000 | | | 11,075 |
| PPL Electric Utilities 3.00% 9/15/21 | | 5,000 | | | 4,958 |
| Southern California Edison | | | | | |
| 5.50% 8/15/18 | | 5,000 | | | 5,913 |
| Wisconsin Electric Power | | | | | |
| 2.95% 9/15/21 | | 5,000 | | | 5,064 |
| • | Wisconsin Energy 6.25% 5/15/67 | | 10,000 | | | 9,911 |
| | | | | | 178,432 |
2011 Annual report · Delaware Pooled Trust
82
| | Principal | | Value |
| | | Amount (U.S. $) | | (U.S. $) |
| Corporate Bonds (continued) | | | | | |
| Energy – 1.52% | | | | | |
| Ensco 4.70% 3/15/21 | $ | 5,000 | | $ | 5,271 |
| Noble Energy 8.25% 3/1/19 | | 5,000 | | | 6,588 |
| Petrobras International Finance | | | | | |
| 5.375% 1/27/21 | | 10,000 | | | 10,619 |
| 5.875% 3/1/18 | | 5,000 | | | 5,400 |
| Pride International 6.875% 8/15/20 | | 20,000 | | | 24,173 |
| Transocean 6.50% 11/15/20 | | 15,000 | | | 16,758 |
| Weatherford International | | | | | |
| 9.625% 3/1/19 | | 10,000 | | | 13,058 |
| # | Woodside Finance 144A | | | | | |
| 8.75% 3/1/19 | | 10,000 | | | 12,931 |
| | | | | | 94,798 |
| Finance Companies – 0.76% | | | | | |
| General Electric Capital | | | | | |
| 4.65% 10/17/21 | | 10,000 | | | 10,322 |
| 5.30% 2/11/21 | | 30,000 | | | 31,987 |
| John Deere Capital 3.15% 10/15/21 | | 5,000 | | | 5,133 |
| | | | | | 47,442 |
| Insurance – 1.05% | | | | | |
| • | Chubb 6.375% 3/29/67 | | 5,000 | | | 5,050 |
| # | Highmark 144A 4.75% 5/15/21 | | 10,000 | | | 10,122 |
| MetLife 6.40% 12/15/36 | | 40,000 | | | 39,495 |
| Prudential Financial | | | | | |
| 3.875% 1/14/15 | | 5,000 | | | 5,229 |
| 6.00% 12/1/17 | | 5,000 | | | 5,727 |
| | | | | | 65,623 |
| Natural Gas – 0.91% | | | | | |
| Enterprise Products Operating | | | | | |
| 9.75% 1/31/14 | | 10,000 | | | 11,688 |
| Kinder Morgan Energy Partners | | | | | |
| 9.00% 2/1/19 | | 5,000 | | | 6,420 |
| Plains All American Pipeline | | | | | |
| 8.75% 5/1/19 | | 5,000 | | | 6,413 |
| Sempra Energy | | | | | |
| 6.15% 6/15/18 | | 10,000 | | | 11,779 |
| Southern Natural Gas | | | | | |
| 4.40% 6/15/21 | | 5,000 | | | 5,054 |
| • | TransCanada PipeLines | | | | | |
| 6.35% 5/15/67 | | 15,000 | | | 15,305 |
| | | | | | 56,659 |
| Real Estate – 0.83% | | | | | |
| Brandywine Operating Partnership | | | | | |
| 4.95% 4/15/18 | | 10,000 | | | 9,712 |
| Digital Realty Trust | | | | | |
| 5.25% 3/15/21 | | 10,000 | | | 9,782 |
| 5.875% 2/1/20 | | 5,000 | | | 5,173 |
| Health Care REIT 5.25% 1/15/22 | | 10,000 | | | 9,580 |
| Regency Centers 5.875% 6/15/17 | | 7,000 | | | 7,697 |
| # | WEA Finance 144A | | | | | |
| 4.625% 5/10/21 | | 10,000 | | | 9,920 |
| | | | | | 51,864 |
| Technology – 1.07% | | | | | |
| Applied Materials 4.30% 6/15/21 | | 10,000 | | | 10,818 |
| Hewlett-Packard | | | | | |
| 4.30% 6/1/21 | | 15,000 | | | 15,657 |
| 4.375% 9/15/21 | | 5,000 | | | 5,256 |
| National Semiconductor | | | | | |
| 6.60% 6/15/17 | | 10,000 | | | 12,174 |
| # | Seagate Technology International | | | | | |
| 144A 10.00% 5/1/14 | | 5,000 | | | 5,713 |
| Xerox | | | | | |
| 4.50% 5/15/21 | | 5,000 | | | 5,217 |
| 6.35% 5/15/18 | | 10,000 | | | 11,432 |
| | | | | | 66,267 |
| Transportation – 0.77% | | | | | |
| Burlington Northern Santa Fe | | | | | |
| 4.10% 6/1/21 | | 15,000 | | | 16,042 |
| CSX 4.25% 6/1/21 | | 20,000 | | | 21,463 |
| Ryder System 3.50% 6/1/17 | | 10,000 | | | 10,341 |
| | | | | | 47,846 |
| Total Corporate Bonds | | | | | |
| (cost $1,455,764) | | | | | 1,519,485 |
| |
| Municipal Bond – 3.14% | | | | | |
| Massachusetts Development | | | | | |
| Finance Agency Revenue | | | | | |
| (Harvard University) Series B-1 | | | | | |
| 5.00% 10/15/40 | | 175,000 | | | 195,671 |
| Total Municipal Bond | | | | | |
| (cost $182,802) | | | | | 195,671 |
| |
| Non-Agency Asset-Backed Securities – 3.59% | | | |
| CNH Equipment Trust | | | | | |
| Series 2010-A A4 | | | | | |
| 2.49% 1/15/16 | | 45,000 | | | 46,144 |
| # | Great America Leasing Receivables | | | | | |
| Series 2011-1 A3 144A | | | | | |
| 1.69% 2/15/14 | | 25,000 | | | 25,135 |
| John Deere Owner Trust | | | | | |
| Series 2009-A A4 | | | | | |
| 3.96% 5/16/16 | | 45,000 | | | 45,773 |
| Series 2010-A A4 | | | | | |
| 2.13% 10/17/16 | | 30,000 | | | 30,664 |
| Series 2011-A A4 | | | | | |
| 1.96% 4/16/18 | | 10,000 | | | 10,259 |
| • | Merrill Auto Trust Securitization | | | | | |
| Series 2007-1 A4 | | | | | |
| 0.303% 12/15/13 | | 3,688 | | | 3,687 |
| Mid-State Trust Series 11 A1 | | | | | |
| 4.864% 7/15/38 | | 11,472 | | | 11,506 |
| # | Navistar Financial Owner Trust | | | | | |
| Series 2010-B A3 144A | | | | | |
| 1.08% 3/18/14 | | 50,000 | | | 49,993 |
| Total Non-Agency Asset-Backed | | | | | |
| Securities (cost $221,515) | | | | | 223,161 |
2011 Annual report · Delaware Pooled Trust
(continues) 83
Statements of net assets
Delaware Pooled® Trust — The Core Focus Fixed Income Portfolio
| | Principal | | Value | |
| | | Amount (U.S. $) | | (U.S. $) | |
| Non-Agency Collateralized Mortgage Obligations – 1.18% | |
| w# | Countrywide Home Loan Mortgage | | | | | | |
| Pass Through Trust | | | | | | |
| Series 2005-R2 2A4 144A | | | | | | |
| 8.50% 6/25/35 | $ | 63,485 | | $ | 65,468 | |
| •# | MASTR Specialized Loan Trust | | | | | | |
| Series 2005-2 A2 144A | | | | | | |
| 5.006% 7/25/35 | | 8,170 | | | 8,213 | |
| Total Non-Agency Collateralized | | | | | | |
| Mortgage Obligations | | | | | | |
| (cost $73,946) | | | | | 73,681 | |
| | |
| Regional Bonds – 0.66%Δ | | | | | | |
| Canada – 0.66% | | | | | | |
| New Brunswick Province | | | | | | |
| 2.75% 6/15/18 | | 10,000 | | | 10,321 | |
| Ontario Province | | | | | | |
| 2.30% 5/10/16 | | 15,000 | | | 15,367 | |
| 3.00% 7/16/18 | | 15,000 | | | 15,549 | |
| Total Regional Bonds | | | | | | |
| (cost $39,987) | | | | | 41,237 | |
| | |
| Sovereign Bond – 0.42%Δ | | | | | | |
| Norway – 0.42% | | | | | | |
| Eksportfinans 3.00% 11/17/14 | | 25,000 | | | 26,116 | |
| Total Sovereign Bond | | | | | | |
| (cost $25,178) | | | | | 26,116 | |
| | |
| Supranational Banks – 0.56% | | | | | | |
| Inter-American Development Bank | | | | | | |
| | 3.875% 10/28/41 | | 5,000 | | | 5,027 | |
| International Finance | | | | | | |
| 0.65% 11/1/13 | | 30,000 | | | 29,986 | |
| Total Supranational Banks | | | | | | |
| (cost $34,988) | | | | | 35,013 | |
| | |
| U.S. Treasury Obligations – 21.80% | | | | | | |
| U.S. Treasury Bonds | | | | | | |
| 3.50% 2/15/39 | | 55,000 | | | 58,180 | |
| 4.375% 5/15/41 | | 75,000 | | | 92,074 | |
| U.S. Treasury Notes | | | | | | |
| 1.00% 10/31/16 | | 510,000 | | | 509,840 | |
| *1.375% 9/30/18 | | 5,000 | | | 4,929 | |
| *2.125% 8/15/21 | | 695,000 | | | 692,071 | |
| Total U.S. Treasury Obligations | | | | | | |
| (cost $1,359,220) | | | | | 1,357,094 | |
| | |
| | Number of | | | | |
| | Shares | | | | |
| Preferred Stock – 0.38% | | | | | | |
| Alabama Power 5.625% | | 620 | | | 15,655 | |
| •PNC Financial Services Group 8.25% | | 8,000 | | | 8,163 | |
| Total Preferred Stock | | | | | | |
| (cost $21,581) | | | | | 23,818 | |
| | | | | | |
| Principal | | | |
| Amount (U.S. $) | | | |
| Short-Term Investments – 27.69% | | | | | | |
| ≠Discount Notes – 11.51% | | | | | | |
| Federal Home Loan Bank | | | | | | |
| 0.003% 11/30/11 | $ | 548,107 | | | 548,103 | |
| 0.01% 12/23/11 | | 79,395 | | | 79,394 | |
| 0.04% 11/2/11 | | 20,618 | | | 20,618 | |
| Freddie Mac 0.05% 11/2/11 | | 68,304 | | | 68,304 | |
| | | | | | 716,419 | |
| Repurchase Agreements – 16.18% | | | | | | |
| BNP Paribas 0.08%, dated | | | | | | |
| 10/31/11, to be repurchased | | | | | | |
| on 11/1/11, repurchase price | | | | | | |
| $1,007,002 (collateralized by U.S. | | | | | | |
| government obligations | | | | | | |
| 0.25%-4.625% 2/29/12-2/15/21, | | | | | | |
| market value $1,027,140) | | 1,007,000 | | | 1,007,000 | |
| | | | | | 1,007,000 | |
| Total Short-Term Investments | | | | | | |
| (cost $1,723,422) | | | | | 1,723,419 | |
| |
| Total Value of Securities | | | | | | |
| Before Securities Lending | | | | | | |
| Collateral – 117.00% (cost $7,156,652) | | | | | 7,283,368 | |
| |
| | Number of | | | | |
| | Shares | | | | |
| Securities Lending Collateral** – 0.34% | | | | | | |
| Investment Companies | | | | | | |
| BNY Mellon SL DBT II | | | | | | |
| Liquidating Fund | | 21,710 | | | 21,031 | |
| @† | Mellon GSL Reinvestment Trust II | | 41,609 | | | 0 | |
| Total Securities Lending Collateral | | | | | | |
| (cost $63,319) | | | | | 21,031 | |
| |
| Total Value of Securities – 117.34% | | | | | | |
| (cost $7,219,971) | | | | | 7,304,399 | © |
| Obligation to Return Securities | | | | | | |
| Lending Collateral** – (1.02%) | | | | | (63,319 | ) |
| Other Liabilities Net of Receivables | | | | | | |
| and Other Assets – (16.32%) | | | | | (1,016,222 | )z |
| Net Assets Applicable to 638,671 | | | | | | |
| Shares Outstanding; Equivalent | | | | | | |
| to $9.75 Per Share – 100.00% | | | | $ | 6,224,858 | |
| |
| Components of Net Assets at October 31, 2011: | | | | |
| Shares of beneficial interest | | | | | | |
| (unlimited authorization – no par) | | | | $ | 5,977,065 | |
| Undistributed net investment income | | | | | 179,918 | |
| Accumulated net realized loss on investments | | | | | (17,232 | ) |
| Net unrealized appreciation of investments | | | | | 85,107 | |
| Total net assets | | | | $ | 6,224,858 | |
2011 Annual report · Delaware Pooled Trust
84
| |
| • | Variable rate security. The rate shown is the rate as of October 31, 2011. Interest rates reset periodically. |
| w | Pass Through Agreement. Security represents the contractual right to receive a proportionate amount of underlying payments due to the counterparty pursuant to various agreements related to the rescheduling of obligations and the exchange of certain notes. |
| # | Security exempt from registration under Rule 144A of the Securities Act of 1933, as amended. At October 31, 2011, the aggregate amount of Rule 144A securities was $286,609, which represented 4.60% of the Portfolio’s net assets. See Note 10 in “Notes to financial statements.” |
| Δ | Securities have been classified by country of origin. |
| * | Fully or partially on loan. |
| ≠ | The rate shown is the effective yield at the time of purchase. |
| ** | See Note 9 in “Notes to financial statements” for additional information on securities lending collateral and non-cash collateral. |
| @ | Illiquid security. At October 31, 2011, the aggregate amount of illiquid securities was $0, which represented 0.00% of the Portfolio’s net assets. See Note 10 in “Notes to financial statements.” |
| † | Non income producing security. |
| © | Includes $213,067 of securities loaned. |
| z | Of this amount, $1,404,336 represents payable for securities purchased as of October 31, 2011. |
Summary of Abbreviations:
BAML — Bank of America Merrill Lynch
MASTR — Mortgage Asset Securitization Transactions, Inc.
REIT — Real Estate Investment Trust
REMIC — Real Estate Mortgage Investment Conduit
S.F. — Single Family
TBA — To be announced
yr — Year
See accompanying notes, which are an integral part of the financial statements.
| | | |
| The Core Focus Fixed Income Portfolio | | |
| Statement of Assets and Liabilities | | |
| October 31, 2011 | | |
| |
| Assets: | | |
| Investments, at value1 | $ | 5,559,949 |
| Short-term investments, at value | | 1,723,419 |
| Short-term investments held as | | |
| collateral for loaned securities, at value | | 21,031 |
| Cash | | 161,039 |
| Receivable for securities sold | | 207,828 |
| Dividends, interest and | | |
| securities lending income receivable | | 31,118 |
| Due from DMC | | 1,625 |
| Total assets | | 7,706,009 |
| |
| Liabilities: | | |
| Payable for securities purchased | | 1,404,336 |
| Due to manager and affiliates | | 114 |
| Other accrued expenses | | 13,382 |
| Obligation to return securities lending collateral | | 63,319 |
| Total liabilities | | 1,481,151 |
| |
| Total net assets | $ | 6,224,858 |
| |
| Investments, at cost | $ | 5,433,230 |
| Short-term investments, at cost | | 1,723,422 |
| Short-term investments held as | | |
| collateral for loaned securities, at cost | | 63,319 |
| |
| 1Including securities on loan | | 213,067 |
See accompanying notes, which are an integral part of the financial statements.
2011 Annual report · Delaware Pooled Trust
(continues) 85
Statements of net assets
Delaware Pooled® Trust — The High-Yield Bond Portfolio
October 31, 2011
| | Principal | | Value |
| | | Amount (U.S. $) | | (U.S. $) |
| Corporate Bonds – 91.78% | | | | | |
| Automotive – 4.60% | | | | | |
| American Axle & Manufacturing | | | | | |
| 7.75% 11/15/19 | $ | 205,000 | | $ | 206,538 |
| *7.875% 3/1/17 | | 289,000 | | | 294,058 |
| ArvinMeritor 8.125% 9/15/15 | | 261,000 | | | 247,950 |
| # | Chrysler Group 144A | | | | | |
| 8.25% 6/15/21 | | 760,000 | | | 699,199 |
| Dana Holding 6.75% 2/15/21 | | 252,000 | | | 257,040 |
| Ford Motor Credit | | | | | |
| 12.00% 5/15/15 | | 135,000 | | | 170,454 |
| # | International Automotive | | | | | |
| Components Group 144A | | | | | |
| 9.125% 6/1/18 | | 195,000 | | | 193,050 |
| # | Jaguar Land Rover 144A | | | | | |
| 8.125% 5/15/21 | | 290,000 | | | 287,100 |
| # | Pinafore 144A 9.25% 10/1/18 | | 277,000 | | | 303,315 |
| | | | | | 2,658,704 |
| Banking – 3.58% | | | | | |
| BAC Capital Trust VI | | | | | |
| 5.625% 3/8/35 | | 490,000 | | | 385,708 |
| • | Fifth Third Capital Trust IV | | | | | |
| 6.50% 4/15/37 | | 409,000 | | | 401,843 |
| •# | HBOS Capital Funding 144A | | | | | |
| 6.071% 6/29/49 | | 658,000 | | | 467,179 |
| • | Regions Financing Trust ll | | | | | |
| 6.625% 5/15/47 | | 495,000 | | | 408,375 |
| • | SunTrust Capital VIII | | | | | |
| 6.10% 12/15/36 | | 415,000 | | | 410,073 |
| | | | | | 2,073,178 |
| Basic Industry – 12.97% | | | | | |
| * | AK Steel 7.625% 5/15/20 | | 420,000 | | | 394,800 |
| # | Algoma Acquisition 144A | | | | | |
| 9.875% 6/15/15 | | 351,000 | | | 286,065 |
| # | APERAM 144A 7.75% 4/1/18 | | 220,000 | | | 194,700 |
| # | Appleton Papers 144A | | | | | |
| 10.50% 6/15/15 | | 136,000 | | | 136,680 |
| * | Associated Materials | | | | | |
| 9.125% 11/1/17 | | 218,000 | | | 199,470 |
| # | Building Materials Corp. of | | | | | |
| America 144A 6.75% 5/1/21 | | 293,000 | | | 304,720 |
| # | Cemex Espana Luxembourg 144A | | | | | |
| 9.25% 5/12/20 | | 605,000 | | | 485,512 |
| # | FMG Resources August 2006 | | | | | |
| 144A 7.00% 11/1/15 | | 204,000 | | | 205,020 |
| Headwaters 7.625% 4/1/19 | | 249,000 | | | 217,875 |
| Hexion US Finance | | | | | |
| 8.875% 2/1/18 | | 36,000 | | | 35,730 |
| 9.00% 11/15/20 | | 170,000 | | | 149,175 |
| # | Ineos Group Holdings 144A | | | | | |
| 8.50% 2/15/16 | | 360,000 | | | 306,000 |
| Interface 7.625% 12/1/18 | | 211,000 | | | 222,078 |
| # | International Wire Group Holdings | | | | | |
| 144A 9.75% 4/15/15 | | 100,000 | | | 102,500 |
| James River Coal 7.875% 4/1/19 | | 216,000 | | | 184,680 |
| # | JMC Steel Group 144A | | | | | |
| 8.25% 3/15/18 | | 258,000 | | | 256,710 |
| # | Kinove German Bondco 144A | | | | | |
| 9.625% 6/15/18 | | 250,000 | | | 242,500 |
| # | Longview Fibre Paper & | | | | | |
| Packaging 144A | | | | | |
| 8.00% 6/1/16 | | 290,000 | | | 295,800 |
| # | MacDermid 144A 9.50% 4/15/17 | | 355,000 | | | 339,025 |
| *# | Masonite International 144A | | | | | |
| 8.25% 4/15/21 | | 280,000 | | | 277,900 |
| # | Millar Western Forest Products | | | | | |
| 144A 8.50% 4/1/21 | | 205,000 | | | 156,825 |
| Momentive Performance | | | | | |
| Materials 9.00% 1/15/21 | | 572,000 | | | 486,199 |
| # | Murray Energy 144A | | | | | |
| 10.25% 10/15/15 | | 279,000 | | | 274,815 |
| # | Nalco 144A 6.625% 1/15/19 | | 178,000 | | | 199,360 |
| Norcraft Finance 144A | | | | | |
| 10.50% 12/15/15 | | 316,000 | | | 306,520 |
| # | Nortek 144A 8.50% 4/15/21 | | 310,000 | | | 276,675 |
| * | Ply Gem Industries | | | | | |
| 13.125% 7/15/14 | | 294,000 | | | 295,470 |
| Polypore International | | | | | |
| 7.50% 11/15/17 | | 297,000 | | | 304,425 |
| =@ | Port Townsend 12.431% 8/27/12 | | 11,980 | | | 5,451 |
| Ryerson | | | | | |
| •7.629% 11/1/14 | | 123,000 | | | 113,775 |
| 12.00% 11/1/15 | | 242,000 | | | 248,050 |
| | | | | | 7,504,505 |
| Capital Goods – 5.51% | | | | | |
| Berry Plastics | | | | | |
| 9.75% 1/15/21 | | 299,000 | | | 300,495 |
| 10.25% 3/1/16 | | 151,000 | | | 148,735 |
| # | DAE Aviation Holdings 144A | | | | | |
| 11.25% 8/1/15 | | 284,000 | | | 299,620 |
| Kratos Defense & Security | | | | | |
| Solutions 10.00% 6/1/17 | | 250,000 | | | 260,000 |
| Manitowoc 9.50% 2/15/18 | | 250,000 | | | 268,750 |
| * | Mueller Water Products | | | | | |
| 7.375% 6/1/17 | | 325,000 | | | 287,625 |
| Pregis 12.375% 10/15/13 | | 311,000 | | | 284,565 |
| # | Reynolds Group Issuer 144A | | | | | |
| 8.25% 2/15/21 | | 100,000 | | | 92,250 |
| 9.00% 4/15/19 | | 325,000 | | | 315,250 |
| 9.875% 8/15/19 | | 545,000 | | | 547,725 |
| # | Sealed Air 144A | | | | | |
| 8.125% 9/15/19 | | 65,000 | | | 70,688 |
| 8.375% 9/15/21 | | 90,000 | | | 97,650 |
| TriMas 9.75% 12/15/17 | | 197,000 | | | 211,775 |
| | | | | | 3,185,128 |
| Consumer Cyclical – 5.02% | | | | | |
| Brown Shoe 7.125% 5/15/19 | | 225,000 | | | 207,000 |
| # | Burlington Coat Factory | | | | | |
| Warehouse 144A | | | | | |
| 10.00% 2/15/19 | | 451,000 | | | 448,744 |
2011 Annual report · Delaware Pooled Trust
86
| | Principal | | Value |
| | | Amount (U.S. $) | | (U.S. $) |
| Corporate Bonds (continued) | | | | | |
| Consumer Cyclical (continued) | | | | | |
| # | Chiron Merger Sub 144A | | | | | |
| 10.50% 11/1/18 | $ | 85,000 | | $ | 86,169 |
| * | CKE Restaurants | | | | | |
| 11.375% 7/15/18 | | 244,000 | | | 263,520 |
| Dave & Buster’s 11.00% 6/1/18 | | 341,000 | | | 359,755 |
| DineEquity 9.50% 10/30/18 | | 404,000 | | | 430,260 |
| Express Finance 8.75% 3/1/18 | | 176,000 | | | 189,640 |
| Hanesbrands 6.375% 12/15/20 | | 89,000 | | | 90,335 |
| # | Icon Health & Fitness 144A | | | | | |
| 11.875% 10/15/16 | | 109,000 | | | 92,105 |
| # | Needle Merger Sub 144A | | | | | |
| 8.125% 3/15/19 | | 161,000 | | | 154,560 |
| OSI Restaurant Partners | | | | | |
| 10.00% 6/15/15 | | 285,000 | | | 294,975 |
| Quiksilver 6.875% 4/15/15 | | 153,000 | | | 144,968 |
| Tops Markets 10.125% 10/15/15 | | 137,000 | | | 140,425 |
| | | | | | 2,902,456 |
| Consumer Non-Cyclical – 3.69% | | | | | |
| # | Armored Autogroup 144A | | | | | |
| 9.25% 11/1/18 | | 317,000 | | | 283,715 |
| # | Blue Merger Sub 144A | | | | | |
| 7.625% 2/15/19 | | 324,000 | | | 309,420 |
| * | Dean Foods 7.00% 6/1/16 | | 218,000 | | | 220,180 |
| NBTY 9.00% 10/1/18 | | 372,000 | | | 401,295 |
| * | Pinnacle Foods Finance | | | | | |
| 10.625% 4/1/17 | | 356,000 | | | 370,240 |
| # | Scotts Miracle-Gro 144A | | | | | |
| 6.625% 12/15/20 | | 77,000 | | | 79,888 |
| * | Visant 10.00% 10/1/17 | | 173,000 | | | 168,675 |
| # | Viskase 144A 9.875% 1/15/18 | | 294,000 | | | 301,350 |
| | | | | | 2,134,763 |
| Energy – 11.35% | | | | | |
| American Petroleum Tankers | | | | | |
| 10.25% 5/1/15 | | 233,000 | | | 240,573 |
| Antero Resources Finance | | | | | |
| 9.375% 12/1/17 | | 258,000 | | | 286,380 |
| # | Calumet Specialty Products | | | | | |
| Partners 144A 9.375% 5/1/19 | | 430,000 | | | 414,949 |
| Chaparral Energy 8.25% 9/1/21 | | 428,000 | | | 437,629 |
| Chesapeake Energy | | | | | |
| 6.625% 8/15/20 | | 217,000 | | | 236,259 |
| 6.875% 11/15/20 | | 33,000 | | | 36,383 |
| 7.25% 12/15/18 | | 12,000 | | | 13,410 |
| Comstock Resources | | | | | |
| 7.75% 4/1/19 | | 255,000 | | | 251,175 |
| Copano Energy 7.75% 6/1/18 | | 178,000 | | | 186,900 |
| Crosstex Energy 8.875% 2/15/18 | | 200,000 | | | 213,000 |
| # | Helix Energy Solutions Group | | | | | |
| 144A 9.50% 1/15/16 | | 370,000 | | | 390,350 |
| # | Hercules Offshore 144A | | | | | |
| 10.50% 10/15/17 | | 274,000 | | | 275,370 |
| # | Hilcorp Energy I 144A | | | | | |
| 8.00% 2/15/20 | | 287,000 | | | 309,960 |
| Holly 9.875% 6/15/17 | | 188,000 | | | 206,800 |
| # | Laredo Petroleum 144A | | | | | |
| 9.50% 2/15/19 | | 342,000 | | | 364,230 |
| Linn Energy | | | | | |
| 8.625% 4/15/20 | | 240,000 | | | 265,800 |
| #144A 6.50% 5/15/19 | | 45,000 | | | 45,450 |
| # | NFR Energy 144A 9.75% 2/15/17 | | 471,000 | | | 419,190 |
| # | Oasis Petroleum 144A | | | | | |
| 7.25% 2/1/19 | | 249,000 | | | 263,940 |
| Offshore Group Investments | | | | | |
| 11.50% 8/1/15 | | 203,000 | | | 222,285 |
| #144A 11.50% 8/1/15 | | 25,000 | | | 27,375 |
| PetroHawk Energy 7.25% 8/15/18 | | 284,000 | | | 326,600 |
| Petroleum Development | | | | | |
| 12.00% 2/15/18 | | 264,000 | | | 287,760 |
| Pioneer Drilling 9.875% 3/15/18 | | 268,000 | | | 280,060 |
| Quicksilver Resources | | | | | |
| 7.125% 4/1/16 | | 283,000 | | | 281,939 |
| SandRidge Energy | | | | | |
| 8.75% 1/15/20 | | 64,000 | | | 66,400 |
| #144A 7.50% 3/15/21 | | 224,000 | | | 217,280 |
| | | | | | 6,567,447 |
| Financials – 2.08% | | | | | |
| E Trade Financial PIK | | | | | |
| 12.50% 11/30/17 | | 252,000 | | | 291,690 |
| •# | ILFC E-Capital Trust I 144A | | | | | |
| 4.77% 12/21/65 | | 135,000 | | | 92,931 |
| •# | ILFC E-Capital Trust II 144A | | | | | |
| 6.25% 12/21/65 | | 250,000 | | | 182,500 |
| Nuveen Investments | | | | | |
| 10.50% 11/15/15 | | 466,000 | | | 468,330 |
| #144A 10.50% 11/15/15 | | 168,000 | | | 167,160 |
| | | | | | 1,202,611 |
| Healthcare – 5.80% | | | | | |
| Accellent 10.00% 11/1/17 | | 166,000 | | | 150,230 |
| # | AMGH Merger Sub 144A | | | | | |
| 9.25% 11/1/18 | | 270,000 | | | 282,150 |
| Biomet 11.625% 10/15/17 | | 294,000 | | | 321,930 |
| Community Health Systems | | | | | |
| 8.875% 7/15/15 | | 265,000 | | | 271,956 |
| DJO Finance 9.75% 10/15/17 | | 376,000 | | | 311,140 |
| *# | HCA Holdings 144A | | | | | |
| 7.75% 5/15/21 | | 155,000 | | | 155,775 |
| * | HealthSouth 7.75% 9/15/22 | | 62,000 | | | 62,310 |
| # | Immucor 144A 11.125% 8/15/19 | | 135,000 | | | 140,400 |
| # | inVentiv Health 144A | | | | | |
| 10.00% 8/15/18 | | 241,000 | | | 232,565 |
| Lantheus Medical Imaging | | | | | |
| 9.75% 5/15/17 | | 373,000 | | | 343,160 |
| # | Multiplan 144A 9.875% 9/1/18 | | 337,000 | | | 348,795 |
| Radiation Therapy Services | | | | | |
| 9.875% 4/15/17 | | 283,000 | | | 237,013 |
2011 Annual report · Delaware Pooled Trust
(continues) 87
Statements of net assets
Delaware Pooled® Trust — The High-Yield Bond Portfolio
| | Principal | | Value |
| | | Amount (U.S. $) | | (U.S. $) |
| Corporate Bonds (continued) | | | | | |
| Healthcare (continued) | | | | | |
| Radnet Management | | | | | |
| 10.375% 4/1/18 | $ | 247,000 | | $ | 223,535 |
| # | STHI Holding 144A | | | | | |
| 8.00% 3/15/18 | | 267,000 | | | 273,675 |
| | | | | | 3,354,634 |
| Insurance – 2.44% | | | | | |
| • | American International Group | | | | | |
| | 8.175% 5/15/58 | | 342,000 | | | 331,313 |
| • | ING Groep NV 5.775% 12/29/49 | | 567,000 | | | 452,182 |
| •# | Liberty Mutual Group 144A | | | | | |
| 7.00% 3/15/37 | | 289,000 | | | 254,320 |
| • | XL Group 6.50% 12/31/49 | | 437,000 | | | 371,450 |
| | | | | | 1,409,265 |
| Media – 6.22% | | | | | |
| Affinion Group 7.875% 12/15/18 | | 374,000 | | | 330,055 |
| # | AMC Networks 144A | | | | | |
| 7.75% 7/15/21 | | 295,000 | | | 321,550 |
| # | AMO Escrow 144A | | | | | |
| 11.50% 12/15/17 | | 147,000 | | | 133,035 |
| * | Cablevision Systems | | | | | |
| 8.00% 4/15/20 | | 133,000 | | | 140,980 |
| CCO Holdings | | | | | |
| 7.00% 1/15/19 | | 27,000 | | | 28,148 |
| *8.125% 4/30/20 | | 390,000 | | | 424,124 |
| Clear Channel Communications | | | | | |
| 9.00% 3/1/21 | | 317,000 | | | 283,715 |
| DISH DBS 7.875% 9/1/19 | | 57,000 | | | 62,843 |
| * | Entravision Communications | | | | | |
| 8.75% 8/1/17 | | 165,000 | | | 164,588 |
| MDC Partners | | | | | |
| 11.00% 11/1/16 | | 272,000 | | | 295,800 |
| #144A 11.00% 11/1/16 | | 95,000 | | | 102,363 |
| Nexstar Broadcasting | | | | | |
| 8.875% 4/15/17 | | 255,000 | | | 260,100 |
| *# | Ono Finance II 144A | | | | | |
| 10.875% 7/15/19 | | 415,000 | | | 375,574 |
| # | UPC Holding 144A | | | | | |
| 9.875% 4/15/18 | | 100,000 | | | 109,250 |
| Virgin Media Finance | | | | | |
| 8.375% 10/15/19 | | 100,000 | | | 111,750 |
| WMG Acquisition 9.50% 6/15/16 | | 170,000 | | | 181,050 |
| # | XM Satellite Radio 144A | | | | | |
| 7.625% 11/1/18 | | 251,000 | | | 271,708 |
| | | | | | 3,596,633 |
| Services – 11.13% | | | | | |
| *# | ARAMARK Holdings PIK 144A | | | | | |
| 8.625% 5/1/16 | | 430,000 | | | 448,275 |
| Beazer Homes USA | | | | | |
| 9.125% 6/15/18 | | 94,000 | | | 67,680 |
| 9.125% 5/15/19 | | 363,000 | | | 259,545 |
| Cardtronics 8.25% 9/1/18 | | 127,000 | | | 134,938 |
| Casella Waste Systems | | | | | |
| 7.75% 2/15/19 | | 336,000 | | | 324,240 |
| 11.00% 7/15/14 | | 163,000 | | | 176,855 |
| # | Delta Air Lines 144A | | | | | |
| 12.25% 3/15/15 | | 232,000 | | | 251,720 |
| # | Equinox Holdings 144A | | | | | |
| 9.50% 2/1/16 | | 253,000 | | | 256,795 |
| * | Geo Group 6.625% 2/15/21 | | 83,000 | | | 83,000 |
| * | Harrah’s Operating | | | | | |
| 10.00% 12/15/18 | | 692,000 | | | 525,054 |
| Kansas City Southern de Mexico | | | | | |
| 6.125% 6/15/21 | | 85,000 | | | 89,250 |
| 8.00% 2/1/18 | | 191,000 | | | 213,920 |
| Kansas City Southern Railway | | | | | |
| 13.00% 12/15/13 | | 19,000 | | | 21,731 |
| * | Marina District Finance | | | | | |
| 9.875% 8/15/18 | | 98,000 | | | 97,265 |
| MGM Resorts International | | | | | |
| 11.375% 3/1/18 | | 834,000 | | | 911,144 |
| M/I Homes 8.625% 11/15/18 | | 453,000 | | | 409,965 |
| Peninsula Gaming | | | | | |
| 10.75% 8/15/17 | | 150,000 | | | 155,250 |
| PHH 9.25% 3/1/16 | | 230,000 | | | 238,050 |
| * | Pinnacle Entertainment | | | | | |
| 8.75% 5/15/20 | | 287,000 | | | 291,305 |
| RSC Equipment Rental lll | | | | | |
| 8.25% 2/1/21 | | 217,000 | | | 221,340 |
| 10.25% 11/15/19 | | 61,000 | | | 67,100 |
| # | Seven Seas Cruises 144A | | | | | |
| 9.125% 5/15/19 | | 410,000 | | | 420,250 |
| Standard Pacific 10.75% 9/15/16 | | 120,000 | | | 124,800 |
| * | Swift Services Holdings | | | | | |
| 10.00% 11/15/18 | | 95,000 | | | 98,800 |
| *# | Swift Transportation 144A | | | | | |
| 12.50% 5/15/17 | | 183,000 | | | 178,883 |
| # | United Air Lines 144A | | | | | |
| 12.00% 11/1/13 | | 351,000 | | | 371,183 |
| | | | | | 6,438,338 |
| Technology & Electronics – 6.76% | | | | | |
| Advanced Micro Devices | | | | | |
| 7.75% 8/1/20 | | 425,000 | | | 433,500 |
| Aspect Software | | | | | |
| 10.625% 5/15/17 | | 268,000 | | | 272,020 |
| Avaya | | | | | |
| 9.75% 11/1/15 | | 50,000 | | | 44,500 |
| #144A 7.00% 4/1/19 | | 295,000 | | | 284,675 |
| PIK 10.125% 11/1/15 | | 190,000 | | | 169,575 |
| CDW 12.535% 10/12/17 | | 275,000 | | | 265,375 |
| * | First Data 11.25% 3/31/16 | | 667,000 | | | 596,965 |
| GXS Worldwide 9.75% 6/15/15 | | 299,000 | | | 279,565 |
| # | iGate 144A 9.00% 5/1/16 | | 280,000 | | | 280,000 |
| MagnaChip Semiconductor | | | | | |
| 10.50% 4/15/18 | | 194,000 | | | 199,335 |
| # | MedAssets 144A | | | | | |
| 8.00% 11/15/18 | | 149,000 | | | 146,765 |
2011 Annual report · Delaware Pooled Trust
88
| | Principal | | Value |
| | | Amount (U.S. $) | | (U.S. $) |
| Corporate Bonds (continued) | | | | | |
| Technology & Electronics (continued) | | | | | |
| # | Seagate HDD Cayman 144A | | | | | |
| 7.75% 12/15/18 | $ | 312,000 | | $ | 327,600 |
| # | Telcordia Technologies 144A | | | | | |
| 11.00% 5/1/18 | | 486,000 | | | 607,500 |
| | | | | | 3,907,375 |
| Telecommunications – 8.88% | | | | | |
| # | Clear Channel Communications | | | | | |
| 144A 12.00% 12/1/15 | | 629,000 | | | 540,940 |
| # | Columbus International 144A | | | | | |
| 11.50% 11/20/14 | | 110,000 | | | 114,950 |
| * | Cricket Communications | | | | | |
| 7.75% 10/15/20 | | 289,000 | | | 247,818 |
| # | Digicel Group 144A | | | | | |
| 8.875% 1/15/15 | | 155,000 | | | 157,713 |
| 10.50% 4/15/18 | | 265,000 | | | 275,600 |
| # | EH Holding 144A | | | | | |
| 7.625% 6/15/21 | | 230,000 | | | 239,200 |
| # | Integra Telecom Holdings 144A | | | | | |
| 10.75% 4/15/16 | | 215,000 | | | 190,275 |
| Intelsat Bermuda | | | | | |
| 11.25% 2/4/17 | | 614,000 | | | 610,929 |
| PIK 11.50% 2/4/17 | | 337,432 | | | 338,276 |
| Level 3 Communications | | | | | |
| 11.875% 2/1/19 | | 140,000 | | | 152,950 |
| * | Level 3 Financing 10.00% 2/1/18 | | 312,000 | | | 332,280 |
| NII Capital 7.625% 4/1/21 | | 139,000 | | | 143,865 |
| PAETEC Holding 9.875% 12/1/18 | | 204,000 | | | 225,420 |
| *# | Satmex Escrow 144A | | | | | |
| 9.50% 5/15/17 | | 140,000 | | | 144,200 |
| Sprint Capital 8.75% 3/15/32 | | 284,000 | | | 237,140 |
| Syniverse Holdings | | | | | |
| 9.125% 1/15/19 | | 275,000 | | | 287,375 |
| Telesat Canada 12.50% 11/1/17 | | 177,000 | | | 198,461 |
| West 7.875% 1/15/19 | | 285,000 | | | 290,700 |
| # | Wind Acquisition Finance 144A | | | | | |
| 11.75% 7/15/17 | | 410,000 | | | 407,950 |
| | | | | | 5,136,042 |
| Utilities – 1.75% | | | | | |
| # | Calpine 144A | | | | | |
| 7.50% 2/15/21 | | 175,000 | | | 184,625 |
| 7.875% 1/15/23 | | 115,000 | | | 121,900 |
| Elwood Energy 8.159% 7/5/26 | | 58,296 | | | 55,090 |
| * | GenOn Energy 9.50% 10/15/18 | | 144,000 | | | 152,640 |
| * | Mirant Americas 8.50% 10/1/21 | | 350,000 | | | 344,750 |
| • | Puget Sound Energy | | | | | |
| 6.974% 6/1/67 | | 155,000 | | | 154,159 |
| | | | | | 1,013,164 |
| Total Corporate Bonds | | | | | |
| (cost $54,626,205) | | | | | 53,084,243 |
| | | | | | |
| «Senior Secured Loans – 1.85% | | | | | |
| Brock Holdings III | | | | | |
| 10.00% 2/15/18 | | 80,000 | | | 74,400 |
| Clear Channel Communication | | | | | |
| Tranche B 3.889% 1/29/16 | | 365,000 | | | 287,284 |
| Dynegy Power 1st Lien | | | | | |
| 9.25% 7/11/16 | | 140,000 | | | 140,300 |
| PQ 6.74% 7/30/15 | | 145,000 | | | 129,920 |
| Texas Competitive Electric | | | | | |
| Holdings 3.76% 10/10/14 | | 585,000 | | | 437,937 |
| Total Senior Secured Loans | | | | | |
| (cost $1,101,975) | | | | | 1,069,841 |
| |
| | Number of | | | |
| | Shares | | | |
| Common Stock– 0.21% | | | | | |
| † | Alliance HealthCare Service | | 5,166 | | | 5,734 |
| =†∏ | Avado Brands | | 121 | | | 0 |
| =† | Century Communications | | 60,000 | | | 0 |
| † | DIRECTV Class A | | 1,200 | | | 54,552 |
| † | Flextronics International | | 3,700 | | | 24,291 |
| † | GenOn Energy | | 59 | | | 180 |
| † | GeoEye | | 450 | | | 15,107 |
| †* | Mobile Mini | | 1,294 | | | 23,473 |
| =†∏ | PT Holdings | | 40 | | | 0 |
| Total Common Stock | | | | | |
| (cost $146,177) | | | | | 123,337 |
| |
| Preferred Stock – 1.77% | | | | | |
| Ally Financial | | | | | |
| •∏8.50% | | 15,000 | | | 291,000 |
| #144A 1.179% | | 700 | | | 522,091 |
| • | GMAC Capital Trust I 8.125% | | 10,000 | | | 209,600 |
| =† | PT Holdings | | 8 | | | 0 |
| Total Preferred Stock | | | | | |
| (cost $1,070,535) | | | | | 1,022,691 |
| |
| Warrant – 0.00% | | | | | |
| ∏=@†PT Holdings | | 8 | | | 0 |
| Total Warrant (cost $192) | | | | | 0 |
2011 Annual report · Delaware Pooled Trust
(continues) 89
Statements of net assets
Delaware Pooled® Trust — The High-Yield Bond Portfolio
| | | Principal | | Value | |
| | | | Amount (U.S. $) | | (U.S. $) | |
| Short-Term Investments – 2.34% | | | | | | | |
| Repurchase Agreements – 2.34% | | | | | | | |
| BNP Paribas 0.08%, dated | | | | | | | |
| 10/31/11, to be repurchased | | | | | | | |
| on 11/1/11, repurchase price | | | | | | | |
| | $1,356,003 (collateralized by | | | | | | | |
| U.S. government obligations | | | | | | | |
| | 0.25%-4.625% 2/29/12- | | | | | | | |
| 2/15/21, market value | | | | | | | |
| $1,383,120) | | $ | 1,356,000 | | $ | 1,356,000 | |
| Total Short-Term Investments | | | | | | | |
| (cost $1,356,000) | | | | | | 1,356,000 | |
| |
| Total Value of Securities Before Securities | | | | |
| Lending Collateral – 97.95% | | | | | | | |
| (cost $58,301,084) | | | | | | 56,656,112 | |
| |
| | | Number of | | | | |
| | | Shares | | | | |
| Securities Lending Collateral** – 11.33% | | | | |
| Investment Companies | | | | | | | |
| BNY Mellon SL DBT II | | | | | | | |
| Liquidating Fund | | | 16,974 | | | 16,443 | |
| Delaware Investments | | | | | | | |
| Collateral Fund No.1 | | | 6,534,386 | | | 6,534,386 | |
| @† | Mellon GSL Reinvestment Trust II | | | 31,196 | | | 0 | |
| Securities Lending Collateral | | | | | | | |
| (cost $6,582,556) | | | | | | 6,550,829 | |
| |
| Total Value of Securities – 109.28% | | | | | | | |
| (cost $64,883,640) | | | | | | 63,206,941 | © |
| Obligation to Return Securities | | | | | | | |
| Lending Collateral** – (11.38%) | | | | | | (6,582,556 | ) |
| Receivables and Other Assets | | | | | | | |
| Net of Other Liabilities – 2.10% | | | | | | 1,215,890 | |
| Net Assets Applicable to 7,384,297 | | | | | | | |
| Shares Outstanding; Equivalent to | | | | | | | |
| $7.83 Per Share – 100.00% | | | | | $ | 57,840,275 | |
| |
| Components of Net Assets at October 31, 2011: | | | | |
| Shares of beneficial interest | | | | | | | |
| (unlimited authorization – no par) | | | | | $ | 58,905,296 | |
| Undistributed net investment income | | | | | | 3,521,603 | |
| Accumulated net realized loss on investments | | | (2,909,925 | ) |
| Net unrealized depreciation of investments | | | | | | (1,676,699 | ) |
| Total net assets | | | | | $ | 57,840,275 | |
| * | Fully or partially on loan. |
| # | Security exempt from registration under Rule 144A of the Securities Act of 1933, as amended. At October 31, 2011, the aggregate amount of Rule 144A securities was $22,114,719, which represented 38.23% of the Portfolio’s net assets. See Note 10 in “Notes to financial statements.” |
| • | Variable rate security. The rate shown is the rate as of October 31, 2011. Interest rates reset periodically. |
| = | Security is being fair valued in accordance with the Portfolio’s fair valuation policy. At October 31, 2011, the aggregate amount of fair valued securities was $5,451, which represented 0.01% of the Portfolio’s net assets. See Note 1 in “Notes to financial statements.” |
| @ | Illiquid security. At October 31, 2011, the aggregate amount of illiquid securities was $5,451, which represented 0.01% of the Portfolio’s net assets. See Note 10 in “Notes to financial statements.” |
| « | Senior Secured Loans generally pay interest at rates which are periodically redetermined by reference to a base lending rate plus a premium. These base lending rates are generally: (i) the prime rate offered by one or more United States banks, (ii) the lending rate offered by one or more European banks such as the London Inter-Bank Offered Rate (LIBOR), and (iii) the certificate of deposit rate. Senior Secured Loans may be subject to restrictions on resale. Stated rate in effect at October 31, 2011. |
| † | Non income producing security. |
| ∏ | Restricted security. These investments are in securities not registered under the Securities Act of 1933, as amended and have certain restrictions on resale which may limit their liquidity. At October 31, 2011, the aggregate amount of restricted securities was $291,000, which represented 0.50% of the Portfolio’s net assets. See Note 10 in “Notes to financial statements.” |
| Investment | | | Date of Acquisition | | Cost | | Value |
| Ally Financial 8.50% | | 3/22/11 | | $ | 374,400 | | $ | 291,000 |
| Avado Brands | | 4/2/02 | | | 13,605 | | | 0 |
| PT Holdings warrants | | 8/27/07 | | | 192 | | | 0 |
| PT Holdings | | | | | | | | |
| common stock | | 9/12/07 | | | 24,960 | | | 0 |
| Total | | | | $ | 413,157 | | $ | 291,000 |
| ** | See Note 9 in “Notes to financial statements” for additional information on securities lending collateral. |
| © | Includes $5,922,424 of securities loaned. |
PIK – Pay-in-kind
See accompanying notes, which are an integral part of the financial statements.
2011 Annual report · Delaware Pooled Trust
90
Delaware Pooled® Trust — The Core Plus Fixed Income Portfolio
October 31, 2011
| | | | Principal | | Value |
| | | | | Amount° | | (U.S. $) |
| Agency Asset-Backed Securities – 0.26% | | | |
| Fannie Mae Grantor Trust | | | | | | | |
| | Series 2003-T4 2A5 | | | | | | | |
| | 5.407% 9/26/33 | | USD | | 134,798 | | $ | 142,155 |
| Total Agency Asset-Backed Securities | | | | | | | |
| (cost $133,708) | | | | | | | 142,155 |
| | | |
| Agency Collateralized Mortgage Obligations – 2.91% |
| Fannie Mae Grantor Trust | | | | | | | |
| | Series 2001-T8 A2 | | | | | | | |
| | 9.50% 7/25/41 | | | | 10,819 | | | 12,854 |
| Fannie Mae REMICs | | | | | | | |
| | Series 2002-90 A1 | | | | | | | |
| | 6.50% 6/25/42 | | | | 20,447 | | | 23,893 |
| | Series 2002-90 A2 | | | | | | | |
| | 6.50% 11/25/42 | | | | 49,945 | | | 56,914 |
| | Series 2003-122 AJ | | | | | | | |
| | 4.50% 2/25/28 | | | | 47,498 | | | 48,699 |
| Fannie Mae Whole Loan | | | | | | | |
| | Series 2004-W11 1A2 | | | | | | | |
| | 6.50% 5/25/44 | | | | 42,679 | | | 48,887 |
| Freddie Mac REMICs | | | | | | | |
| | Series 1730 Z | | | | | | | |
| | 7.00% 5/15/24 | | | | 124,878 | | | 142,297 |
| | Series 2326 ZQ | | | | | | | |
| | 6.50% 6/15/31 | | | | 114,177 | | | 131,399 |
| | Series 2662 MA | | | | | | | |
| | 4.50% 10/15/31 | | | | 25,579 | | | 25,969 |
| | Series 3022 MB | | | | | | | |
| | 5.00% 12/15/28 | | | | 92,321 | | | 93,297 |
| | Series 3123 HT | | | | | | | |
| | 5.00% 3/15/26 | | | | 270,000 | | | 301,925 |
| | Series 3131 MC | | | | | | | |
| | 5.50% 4/15/33 | | | | 335,000 | | | 360,711 |
| | Series 3656 PM | | | | | | | |
| | 5.00% 4/15/40 | | | | 125,000 | | | 139,359 |
| GNMA Series 2010-113 KE | | | | | | | |
| | 4.50% 9/20/40 | | | | 125,000 | | | 136,835 |
| NCUA Guaranteed Notes | | | | | | | |
| | Series 2010-C1 A2 | | | | | | | |
| | 2.90% 10/29/20 | | | | 40,000 | | | 41,751 |
| Total Agency Collateralized Mortgage | | | | | | | |
| Obligations (cost $1,428,360) | | | | | | | 1,564,790 |
| | | |
| Agency Mortgage-Backed Securities – 13.30% | | | |
| Fannie Mae 6.50% 8/1/17 | | | | 23,348 | | | 25,590 |
| • | Fannie Mae ARM | | | | | | | |
| | 2.339% 8/1/34 | | | | 66,381 | | | 69,824 |
| | 2.531% 4/1/36 | | | | 62,210 | | | 65,411 |
| | 4.892% 3/1/38 | | | | 122,540 | | | 130,489 |
| Fannie Mae Relocation 30 yr | | | | | | | |
| | 5.00% 11/1/33 | | | | 15,271 | | | 16,290 |
| | 5.00% 11/1/34 | | | | 41,363 | | | 44,123 |
| | 5.00% 10/1/35 | | | | 68,533 | | | 73,105 |
| | 5.00% 1/1/36 | | | | 116,033 | | | 123,774 |
| | Pool 763656 5.00% 1/1/34 | | | | 15,722 | | | 16,771 |
| | Pool 763742 5.00% 1/1/34 | | | | 7,413 | | | 7,908 |
| Fannie Mae S.F. 15 yr | | | | | | | |
| | 4.00% 7/1/25 | | | | 112,497 | | | 118,289 |
| | 4.00% 8/1/25 | | | | 153,479 | | | 161,382 |
| | 4.00% 11/1/25 | | | | 169,667 | | | 179,994 |
| | 4.50% 1/1/20 | | | | 21,809 | | | 23,375 |
| | 5.00% 7/1/14 | | | | 2,152 | | | 2,311 |
| | 5.00% 12/1/16 | | | | 3,234 | | | 3,489 |
| | 5.00% 5/1/20 | | | | 28,062 | | | 30,335 |
| | 5.00% 7/1/20 | | | | 7,595 | | | 8,201 |
| | 5.00% 5/1/21 | | | | 6,194 | | | 6,692 |
| | 5.50% 5/1/20 | | | | 715 | | | 778 |
| | 5.50% 6/1/23 | | | | 177,646 | | | 192,707 |
| | 6.00% 8/1/22 | | | | 97,251 | | | 105,783 |
| Fannie Mae S.F. 15 yr TBA | | | | | | | |
| | 3.50% 11/1/26 | | | | 1,355,000 | | | 1,407,717 |
| Fannie Mae S.F. 20 yr | | | | | | | |
| | 5.50% 8/1/28 | | | | 254,289 | | | 275,863 |
| Fannie Mae S.F. 30 yr | | | | | | | |
| | 5.00% 3/1/34 | | | | 16,888 | | | 18,226 |
| | 5.00% 5/1/35 | | | | 27,425 | | | 29,572 |
| | 5.00% 6/1/35 | | | | 46,198 | | | 50,150 |
| | 5.00% 7/1/35 | | | | 41,508 | | | 44,758 |
| | 5.00% 12/1/37 | | | | 40,049 | | | 43,141 |
| | 5.00% 2/1/38 | | | | 31,229 | | | 33,639 |
| | 7.00% 12/1/33 | | | | 20,281 | | | 23,374 |
| | 7.00% 5/1/35 | | | | 3,894 | | | 4,466 |
| | 7.00% 6/1/35 | | | | 6,253 | | | 7,171 |
| | 7.00% 12/1/37 | | | | 71,237 | | | 81,723 |
| | 7.50% 6/1/31 | | | | 2,613 | | | 3,056 |
| | 7.50% 6/1/34 | | | | 29,871 | | | 34,879 |
| | Pool 808130 5.00% 3/1/35 | | | | 7,381 | | | 7,959 |
| | Pool 814334 5.00% 3/1/35 | | | | 36,828 | | | 39,721 |
| Fannie Mae S.F. 30 yr TBA | | | | | | | |
| | 3.50% 11/1/41 | | | | 460,000 | | | 466,253 |
| | 4.00% 11/1/41 | | | | 730,000 | | | 758,744 |
| | 5.50% 11/1/41 | | | | 900,000 | | | 976,219 |
| | 6.00% 11/1/41 | | | | 1,000,000 | | | 1,095,781 |
| • | Freddie Mac ARM | | | | | | | |
| | 2.783% 4/1/34 | | | | 5,559 | | | 5,861 |
| Freddie Mac Relocation 30 yr | | | | | | | |
| | 5.00% 9/1/33 | | | | 11,114 | | | 11,839 |
| Freddie Mac S.F. 30 yr | | | | | | | |
| | 7.00% 11/1/33 | | | | 2,709 | | | 3,129 |
| GNMA I S.F. 30 yr | | | | | | | |
| | 7.00% 12/15/34 | | | | 289,636 | | | 331,662 |
| | 7.50% 1/15/30 | | | | 1,452 | | | 1,707 |
| | 7.50% 12/15/31 | | | | 652 | | | 765 |
| | 7.50% 2/15/32 | | | | 620 | | | 728 |
| Total Agency Mortgage-Backed | | | | | | | |
| Securities (cost $7,025,385) | | | | | | | 7,164,724 |
2011 Annual report · Delaware Pooled Trust
(continues) 91
Statements of net assets
Delaware Pooled® Trust — The Core Plus Fixed Income Portfolio
| | | | | Principal | | Value |
| | | | Amount° | | (U.S. $) |
| Commercial Mortgage-Backed Securities – 5.59% | | | |
| # | American Tower Trust | | | | | | | |
| | Series 2007-1A AFX 144A | | | | | | | |
| | 5.42% 4/15/37 | | USD | | 95,000 | | $ | 101,321 |
| • | Bank of America Merrill | | | | | | | |
| | Lynch Commercial | | | | | | | |
| | Mortgage Securities | | | | | | | |
| | Series 2005-1 A5 | | | | | | | |
| | 5.163% 11/10/42 | | | | 55,000 | | | 60,676 |
| • | Bear Stearns Commercial | | | | | | | |
| | Mortgage Securities | | | | | | | |
| | Series 2005-T20 A4A | | | | | | | |
| | 5.147% 10/12/42 | | | | 30,000 | | | 33,505 |
| | Series 2006-PW12 A4 | | | | | | | |
| | 5.72% 9/11/38 | | | | 45,000 | | | 50,498 |
| # | CFCRE Commercial Mortgage | | | | | | | |
| | Trust Series 2011-C1 A2 | | | | | | | |
| | 144A 3.759% 4/15/44 | | | | 100,000 | | | 102,088 |
| w | Commercial Mortgage Pass | | | | | | | |
| | Through Certificates | | | | | | | |
| • | Series 2005-C6 A5A | | | | | | | |
| | | 5.116% 6/10/44 | | | | 160,000 | | | 174,969 |
| | Series 2006-C7 A2 | | | | | | | |
| | 5.69% 6/10/46 | | | | 21,745 | | | 21,730 |
| • | Credit Suisse Mortgage | | | | | | | |
| | Capital Certificates | | | | | | | |
| | Series 2006-C1 AAB | | | | | | | |
| | 5.42% 2/15/39 | | | | 145,214 | | | 152,771 |
| Goldman Sachs Mortgage | | | | | | | |
| | Securities II | | | | | | | |
| *• | Series 2004-GG2 A6 | | | | | | | |
| | 5.396% 8/10/38 | | | | 175,000 | | | 187,787 |
| | Series 2005-GG4 A4 | | | | | | | |
| | 4.761% 7/10/39 | | | | 250,000 | | | 266,594 |
| | Series 2005-GG4 A4A | | | | | | | |
| | 4.751% 7/10/39 | | | | 140,000 | | | 149,674 |
| • | Series 2006-GG6 A4 | | | | | | | |
| | 5.553% 4/10/38 | | | | 155,000 | | | 167,132 |
| # | Series 2010-C1 A2 144A | | | | | | | |
| | 4.592% 8/10/43 | | | | 100,000 | | | 106,350 |
| •# | Series 2010-C1 C 144A | | | | | | | |
| | 5.635% 8/10/43 | | | | 100,000 | | | 84,425 |
| • | Greenwich Capital | | | | | | | |
| | Commercial Funding | | | | | | | |
| | Series 2005-GG5 A5 | | | | | | | |
| | 5.224% 4/10/37 | | | | 200,000 | | | 213,660 |
| • | JPMorgan Chase Commercial | | | | | | | |
| | Mortgage Securities | | | | | | | |
| | Series 2005-LDP4 A4 | | | | | | | |
| | 4.918% 10/15/42 | | | | 65,000 | | | 70,889 |
| | Series 2005-LDP5 A4 | | | | | | | |
| | 5.205% 12/15/44 | | | | 55,000 | | | 61,438 |
| Lehman Brothers-UBS | | | | | | | |
| | Commercial Mortgage Trust | | | | | | | |
| | Series 2004-C1 A4 | | | | | | | |
| | 4.568% 1/15/31 | | | | 95,000 | | | 100,502 |
| • | Morgan Stanley Capital I | | | | | | | |
| | Series 2007-T27 A4 | | | | | | | |
| | 5.641% 6/11/42 | | | | 335,000 | | | 380,306 |
| •# | Morgan Stanley Dean Witter | | | | | | | |
| | Capital I Series 2001-TOP1 E | | | | | | | |
| | 144A 7.44% 2/15/33 | | | | 100,000 | | | 99,512 |
| •# | Nationslink Funding | | | | | | | |
| | Series 1998-2 F 144A | | | | | | | |
| | 7.105% 8/20/30 | | | | 24,622 | | | 25,876 |
| # | OBP Depositor Trust | | | | | | | |
| | Series 2010-OBP A 144A | | | | | | | |
| | 4.646% 7/15/45 | | | | 100,000 | | | 106,656 |
| # | Timberstar Trust | | | | | | | |
| | Series 2006-1A A 144A | | | | | | | |
| | 5.668% 10/15/36 | | | | 205,000 | | | 228,447 |
| # | WF-RBS Commercial Mortgage | | | | | | | |
| | Trust Series 2011-C3 A4 144A | | | | | | | |
| | 4.375% 3/15/44 | | | | 65,000 | | | 65,667 |
| Total Commercial Mortgage-Backed | | | | | | | |
| Securities (cost $2,724,632) | | | | | | | 3,012,473 |
| | |
| Convertible Bonds – 0.51% | | | | | | | |
| ϕ | Hologic 2.00% | | | | | | | |
| | exercise price $38.59, | | | | | | | |
| | expiration date 12/15/37 | | | | 120,000 | | | 113,550 |
| Linear Technology 3.00% | | | | | | | |
| | exercise price $44.11, | | | | | | | |
| | expiration date 5/1/27 | | | | 125,000 | | | 131,406 |
| Transocean 1.50% | | | | | | | |
| | exercise price $164.19 | | | | | | | |
| | expiration date 12/15/37 | | | | 30,000 | | | 30,075 |
| Total Convertible Bonds | | | | | | | |
| (cost $248,516) | | | | | | | 275,031 |
| | |
| Corporate Bonds – 42.92% | | | | | | | |
| Banking – 6.81% | | | | | | | |
| Abbey National Treasury | | | | | | | |
| | Services 4.00% 4/27/16 | | | | 60,000 | | | 57,303 |
| BB&T 5.25% 11/1/19 | | | | 322,000 | | | 348,851 |
| • | Bear Stearns 5.248% 12/7/12 | | AUD | | 110,000 | | | 114,719 |
| Capital One Financial | | | | | | | |
| | 4.75% 7/15/21 | | USD | | 110,000 | | | 115,669 |
| City National 5.25% 9/15/20 | | | | 80,000 | | | 81,701 |
| @# | CoBank 144A | | | | | | | |
| | 7.875% 4/16/18 | | | | 250,000 | | | 300,905 |
| # | Export-Import Bank of Korea | | | | | | | |
| | 144A 5.25% 2/10/14 | | | | 320,000 | | | 337,901 |
| Fifth Third Bancorp | | | | | | | |
| | 3.625% 1/25/16 | | | | 165,000 | | | 169,358 |
| • | Fifth Third Capital Trust IV | | | | | | | |
| | 6.50% 4/15/37 | | | | 50,000 | | | 49,125 |
| JPMorgan Chase | | | | | | | |
| | 4.35% 8/15/21 | | | | 170,000 | | | 170,393 |
2011 Annual report · Delaware Pooled Trust
92
| | | Principal | | Value |
| | | | Amount° | | (U.S. $) |
| Corporate Bonds (continued) | | | | | | | |
| Banking (continued) | | | | | | | |
| JPMorgan Chase Capital XXV | | | | | | | |
| 6.80% 10/1/37 | | USD | | 120,000 | | $ | 120,213 |
| KeyBank 5.45% 3/3/16 | | | | 250,000 | | | 268,551 |
| Korea Development Bank | | | | | | | |
| 8.00% 1/23/14 | | | | 100,000 | | | 111,631 |
| PNC Bank 6.875% 4/1/18 | | | | 250,000 | | | 285,425 |
| | PNC Funding | | | | | | | |
| 5.125% 2/8/20 | | | | 115,000 | | | 127,347 |
| 5.25% 11/15/15 | | | | 135,000 | | | 146,697 |
| SunTrust Banks 3.50% 1/20/17 | | | | 175,000 | | | 176,377 |
| • | SunTrust Capital VIII | | | | | | | |
| 6.10% 12/15/36 | | | | 55,000 | | | 54,347 |
| US Bancorp 4.125% 5/24/21 | | | | 50,000 | | | 55,168 |
| • | USB Capital IX 3.50% 10/29/49 | | | | 365,000 | | | 265,950 |
| Wachovia | | | | | | | |
| •0.773% 10/15/16 | | | | 50,000 | | | 43,652 |
| 5.25% 8/1/14 | | | | 55,000 | | | 58,696 |
| 5.625% 10/15/16 | | | | 150,000 | | | 163,408 |
| Zions Bancorporation | | | | | | | |
| 7.75% 9/23/14 | | | | 40,000 | | | 42,584 |
| | | | | | | | 3,665,971 |
| Basic Industry – 4.26% | | | | | | | |
| * | AK Steel 7.625% 5/15/20 | | | | 120,000 | | | 112,800 |
| Alcoa 6.75% 7/15/18 | | | | 160,000 | | | 173,863 |
| ArcelorMittal 9.85% 6/1/19 | | | | 305,000 | | | 362,335 |
| Barrick North America Finance | | | | | | | |
| 4.40% 5/30/21 | | | | 30,000 | | | 32,587 |
| # | Codelco 144A 3.75% 11/4/20 | | | | 572,000 | | | 577,251 |
| Dow Chemical | | | | | | | |
| 4.25% 11/15/20 | | | | 32,000 | | | 33,030 |
| 8.55% 5/15/19 | | | | 184,000 | | | 239,382 |
| Georgia-Pacific | | | | | | | |
| 8.00% 1/15/24 | | | | 105,000 | | | 138,618 |
| #144A 5.40% 11/1/20 | | | | 55,000 | | | 61,429 |
| Hexion Finance 8.875% 2/1/18 | | | | 85,000 | | | 84,363 |
| International Paper | | | | | | | |
| 9.375% 5/15/19 | | | | 80,000 | | | 102,732 |
| # | Kinross Gold 144A | | | | | | | |
| 5.125% 9/1/21 | | | | 65,000 | | | 62,922 |
| Mosaic | | | | | | | |
| 3.75% 11/15/21 | | | | 160,000 | | | 164,037 |
| 4.875% 11/15/41 | | | | 35,000 | | | 35,944 |
| Novelis 8.75% 12/15/20 | | | | 65,000 | | | 71,175 |
| Teck Resources 9.75% 5/15/14 | | | | 34,000 | | | 40,522 |
| | | | | | | | 2,292,990 |
| Brokerage – 0.64% | | | | | | | |
| Jefferies Group | | | | | | | |
| 6.25% 1/15/36 | | | | 10,000 | | | 8,626 |
| 6.45% 6/8/27 | | | | 160,000 | | | 150,904 |
| Lazard Group 6.85% 6/15/17 | | | | 174,000 | | | 187,597 |
| | | | | | | | 347,127 |
| Capital Goods – 1.11% | | | | | | | |
| * | Ball 5.75% 5/15/21 | | | | 250,000 | | | 259,375 |
| *•# | Cemex SAB 144A | | | | | | | |
| 5.369% 9/30/15 | | | | 150,000 | | | 112,500 |
| # | Meccanica Holdings USA 144A | | | | | | | |
| 6.25% 7/15/19 | | | | 100,000 | | | 95,295 |
| Republic Services | | | | | | | |
| 4.75% 5/15/23 | | | | 40,000 | | | 43,914 |
| 5.70% 5/15/41 | | | | 5,000 | | | 5,878 |
| Waste Management | | | | | | | |
| 2.60% 9/1/16 | | | | 80,000 | | | 81,328 |
| | | | | | | | 598,290 |
| Communications – 5.15% | | | | | | | |
| America Movil 5.00% 3/30/20 | | | | 105,000 | | | 117,959 |
| American Tower | | | | | | | |
| 5.90% 11/1/21 | | | | 85,000 | | | 94,125 |
| CenturyLink 6.45% 6/15/21 | | | | 55,000 | | | 55,190 |
| # | Clearwire Communications | | | | | | | |
| 144A 12.00% 12/1/15 | | | | 105,000 | | | 90,300 |
| * | Cricket Communications | | | | | | | |
| 7.75% 10/15/20 | | | | 75,000 | | | 64,313 |
| # | Crown Castle Towers 144A | | | | | | | |
| 4.883% 8/15/20 | | | | 250,000 | | | 256,018 |
| DIRECTV Holdings | | | | | | | |
| 5.00% 3/1/21 | | | | 140,000 | | | 153,545 |
| DISH DBS 7.875% 9/1/19 | | | | 110,000 | | | 121,275 |
| France Telecom | | | | | | | |
| 4.125% 9/14/21 | | | | 90,000 | | | 92,908 |
| Intelsat Bermuda | | | | | | | |
| 11.25% 2/4/17 | | | | 260,000 | | | 258,700 |
| Qwest | | | | | | | |
| 6.75% 12/1/21 | | | | 50,000 | | | 53,250 |
| 8.375% 5/1/16 | | | | 170,000 | | | 195,075 |
| Sprint Nextel | | | | | | | |
| 6.00% 12/1/16 | | | | 55,000 | | | 48,125 |
| 8.375% 8/15/17 | | | | 65,000 | | | 60,125 |
| Telecom Italia Capital | | | | | | | |
| 5.25% 10/1/15 | | | | 190,000 | | | 185,183 |
| Telefonica Emisiones | | | | | | | |
| 5.462% 2/16/21 | | | | 50,000 | | | 50,767 |
| 6.421% 6/20/16 | | | | 50,000 | | | 53,572 |
| Time Warner Cable | | | | | | | |
| 8.25% 4/1/19 | | | | 100,000 | | | 127,537 |
| # | UPCB Finance III 144A | | | | | | | |
| 6.625% 7/1/20 | | | | 150,000 | | | 150,000 |
| Verizon Communications | | | | | | | |
| 3.50% 11/1/21 | | | | 75,000 | | | 75,822 |
| Virgin Media Secured Finance | | | | | | | |
| 6.50% 1/15/18 | | | | 300,000 | | | 324,750 |
| # | Vivendi 144A 6.625% 4/4/18 | | | | 125,000 | | | 144,174 |
| | | | | | | | 2,772,713 |
| Consumer Cyclical – 2.24% | | | | | | | |
| CVS Caremark 5.75% 5/15/41 | | | | 110,000 | | | 127,638 |
| Darden Restaurants | | | | | | | |
| 4.50% 10/15/21 | | | | 30,000 | | | 30,972 |
2011 Annual report · Delaware Pooled Trust
(continues) 93
Statements of net assets
Delaware Pooled® Trust — The Core Plus Fixed Income Portfolio
| | | Principal | | Value |
| | | | Amount° | | (U.S. $) |
| Corporate Bonds (continued) | | | | | | | |
| Consumer Cyclical (continued) | | | | | | | |
| Ford Motor Credit | | | | | | | |
| 12.00% 5/15/15 | | USD | | 100,000 | | $ | 126,262 |
| * | Goodyear Tire & Rubber | | | | | | | |
| 8.25% 8/15/20 | | | | 95,000 | | | 102,125 |
| Hanesbrands 6.375% 12/15/20 | | | | 70,000 | | | 71,050 |
| Historic TW 6.875% 6/15/18 | | | | 120,000 | | | 143,261 |
| * | Macy’s Retail Holdings | | | | | | | |
| 5.90% 12/1/16 | | | | 82,000 | | | 91,748 |
| MGM Resorts International | | | | | | | |
| 11.125% 11/15/17 | | | | 120,000 | | | 136,800 |
| 11.375% 3/1/18 | | | | 60,000 | | | 65,550 |
| | 13.00% 11/15/13 | | | | 15,000 | | | 17,363 |
| Time Warner 5.375% 10/15/41 | | | | 85,000 | | | 89,975 |
| Western Union 3.65% 8/22/18 | | | | 105,000 | | | 104,558 |
| Wyndham Worldwide | | | | | | | |
| 5.625% 3/1/21 | | | | 35,000 | | | 35,955 |
| 5.75% 2/1/18 | | | | 60,000 | | | 63,039 |
| | | | | | | | 1,206,296 |
| Consumer Non-Cyclical – 5.26% | | | | | | | |
| Amgen 3.45% 10/1/20 | | | | 140,000 | | | 145,336 |
| Bio-Rad Laboratories | | | | | | | |
| 4.875% 12/15/20 | | | | 15,000 | | | 15,690 |
| # | Blue Merger Subordinate 144A | | | | | | | |
| 7.625% 2/15/19 | | | | 45,000 | | | 42,975 |
| Boston Scientific | | | | | | | |
| 6.00% 1/15/20 | | | | 50,000 | | | 55,928 |
| CareFusion 6.375% 8/1/19 | | | | 255,000 | | | 301,305 |
| Celgene | | | | | | | |
| 2.45% 10/15/15 | | | | 30,000 | | | 30,322 |
| 3.95% 10/15/20 | | | | 95,000 | | | 96,071 |
| Coca-Cola Enterprises | | | | | | | |
| 3.50% 9/15/20 | | | | 200,000 | | | 205,373 |
| Covidien International Finance | | | | | | | |
| 4.20% 6/15/20 | | | | 160,000 | | | 175,498 |
| DENTSPLY International | | | | | | | |
| 4.125% 8/15/21 | | | | 105,000 | | | 108,899 |
| Express Scripts 3.125% 5/15/16 | | | | 10,000 | | | 10,238 |
| Hospira 6.40% 5/15/15 | | | | 230,000 | | | 256,316 |
| Medco Health Solutions | | | | | | | |
| 4.125% 9/15/20 | | | | 55,000 | | | 55,712 |
| 7.125% 3/15/18 | | | | 70,000 | | | 83,485 |
| # | Mylan 144A 6.00% 11/15/18 | | | | 120,000 | | | 126,600 |
| PerkinElmer 5.00% 11/15/21 | | | | 45,000 | | | 46,405 |
| # | Pernod-Ricard 144A | | | | | | | |
| 4.45% 1/15/22 | | | | 150,000 | | | 154,726 |
| Quest Diagnostics | | | | | | | |
| 4.70% 4/1/21 | | | | 90,000 | | | 96,503 |
| 4.75% 1/30/20 | | | | 15,000 | | | 16,165 |
| Sara Lee 4.10% 9/15/20 | | | | 37,000 | | | 37,272 |
| Smucker (J.M.) 3.50% 10/15/21 | | | | 145,000 | | | 147,318 |
| Teva Pharmaceutical Finance III | | | | | | | |
| 1.70% 3/21/14 | | | | 15,000 | | | 15,099 |
| Thermo Fisher Scientific | | | | | | | |
| 3.60% 8/15/21 | | | | 55,000 | | | 57,068 |
| # | Woolworths 144A | | | | | | | |
| 3.15% 4/12/16 | | | | 75,000 | | | 78,047 |
| 4.55% 4/12/21 | | | | 95,000 | | | 104,160 |
| Yale University 2.90% 10/15/14 | | | | 160,000 | | | 170,042 |
| Zimmer Holdings | | | | | | | |
| 4.625% 11/30/19 | | | | 180,000 | | | 198,122 |
| | | | | | | | 2,830,675 |
| Electric – 3.46% | | | | | | | |
| Ameren Illinois 9.75% 11/15/18 | | | | 310,000 | | | 411,599 |
| # | American Transmission Systems | | | | | | | |
| 144A 5.25% 1/15/22 | | | | 145,000 | | | 155,032 |
| Carolina Power & Light | | | | | | | |
| 3.00% 9/15/21 | | | | 40,000 | | | 40,512 |
| CenterPoint Energy | | | | | | | |
| 5.95% 2/1/17 | | | | 70,000 | | | 78,916 |
| CMS Energy | | | | | | | |
| 4.25% 9/30/15 | | | | 45,000 | | | 45,773 |
| 6.25% 2/1/20 | | | | 30,000 | | | 32,082 |
| Commonwealth Edison | | | | | | | |
| 3.40% 9/1/21 | | | | 40,000 | | | 40,907 |
| 4.00% 8/1/20 | | | | 20,000 | | | 21,448 |
| 5.80% 3/15/18 | | | | 40,000 | | | 47,079 |
| Duke Energy Carolinas | | | | | | | |
| 3.90% 6/15/21 | | | | 10,000 | | | 10,939 |
| Florida Power | | | | | | | |
| 3.10% 8/15/21 | | | | 45,000 | | | 45,954 |
| 5.65% 6/15/18 | | | | 20,000 | | | 23,752 |
| # | Ipalco Enterprises 144A | | | | | | | |
| 5.00% 5/1/18 | | | | 35,000 | | | 35,613 |
| LG&E and KU Energy | | | | | | | |
| 3.75% 11/15/20 | | | | 40,000 | | | 39,697 |
| #144A 4.375% 10/1/21 | | | | 130,000 | | | 132,883 |
| Pennsylvania Electric | | | | | | | |
| 5.20% 4/1/20 | | | | 75,000 | | | 83,066 |
| @# | Power Receivables Finance | | | | | | | |
| 144A 6.29% 1/1/12 | | | | 4,647 | | | 4,651 |
| • | PPL Capital Funding | | | | | | | |
| 6.70% 3/30/67 | | | | 5,000 | | | 4,830 |
| PPL Electric Utilities | | | | | | | |
| 3.00% 9/15/21 | | | | 45,000 | | | 44,618 |
| Public Service Oklahoma | | | | | | | |
| 5.15% 12/1/19 | | | | 115,000 | | | 127,395 |
| Puget Energy 6.00% 9/1/21 | | | | 30,000 | | | 31,067 |
| • | Puget Sound Energy | | | | | | | |
| 6.974% 6/1/67 | | | | 110,000 | | | 109,403 |
| Southern California Edison | | | | | | | |
| 5.50% 8/15/18 | | | | 135,000 | | | 159,658 |
| Wisconsin Electric Power | | | | | | | |
| 2.95% 9/15/21 | | | | 10,000 | | | 10,128 |
| • | Wisconsin Energy | | | | | | | |
| 6.25% 5/15/67 | | | | 130,000 | | | 128,848 |
| | | | | | | | 1,865,850 |
2011 Annual report · Delaware Pooled Trust
94
| | | Principal | | Value |
| | | | Amount° | | (U.S. $) |
| Corporate Bonds (continued) | | | | | | | |
| Energy – 3.70% | | | | | | | |
| # | BG Energy Capital 144A | | | | | | | |
| 4.00% 10/15/21 | | USD | | 200,000 | | $ | 206,636 |
| BP Capital Markets | | | | | | | |
| 3.561% 11/1/21 | | | | 35,000 | | | 35,563 |
| Chesapeake Energy | | | | | | | |
| 6.125% 2/15/21 | | | | 45,000 | | | 47,363 |
| 6.625% 8/15/20 | | | | 8,000 | | | 8,710 |
| 6.875% 11/15/20 | | | | 8,000 | | | 8,820 |
| 9.50% 2/15/15 | | | | 45,000 | | | 51,750 |
| | Ecopetrol 7.625% 7/23/19 | | | | 22,000 | | | 26,466 |
| # | ENI 144A 4.15% 10/1/20 | | | | 100,000 | | | 100,605 |
| Noble Energy 8.25% 3/1/19 | | | | 120,000 | | | 158,100 |
| Pemex Project Funding Master | | | | | | | |
| Trust 6.625% 6/15/35 | | | | 50,000 | | | 55,000 |
| Petrobras International Finance | | | | | | | |
| 5.375% 1/27/21 | | | | 135,000 | | | 143,361 |
| 5.75% 1/20/20 | | | | 30,000 | | | 32,519 |
| 5.875% 3/1/18 | | | | 20,000 | | | 21,600 |
| PetroHawk Energy | | | | | | | |
| 7.25% 8/15/18 | | | | 115,000 | | | 132,250 |
| Pride International | | | | | | | |
| 6.875% 8/15/20 | | | | 240,000 | | | 290,067 |
| Range Resources | | | | | | | |
| 8.00% 5/15/19 | | | | 110,000 | | | 123,200 |
| SandRidge Energy | | | | | | | |
| 8.75% 1/15/20 | | | | 115,000 | | | 119,313 |
| Transocean 6.50% 11/15/20 | | | | 90,000 | | | 100,547 |
| Weatherford International | | | | | | | |
| 9.625% 3/1/19 | | | | 70,000 | | | 91,409 |
| Williams | | | | | | | |
| 7.75% 6/15/31 | | | | 30,000 | | | 37,592 |
| 8.75% 3/15/32 | | | | 30,000 | | | 40,957 |
| # | Woodside Finance 144A | | | | | | | |
| 8.125% 3/1/14 | | | | 5,000 | | | 5,694 |
| 8.75% 3/1/19 | | | | 120,000 | | | 155,176 |
| | | | | | | | 1,992,698 |
| Finance Companies – 2.60% | | | | | | | |
| # | CDP Financial 144A | | | | | | | |
| 4.40% 11/25/19 | | | | 250,000 | | | 272,090 |
| General Electric Capital | | | | | | | |
| 4.65% 10/17/21 | | | | 65,000 | | | 67,091 |
| 5.30% 2/11/21 | | | | 100,000 | | | 106,622 |
| 6.00% 8/7/19 | | | | 425,000 | | | 483,633 |
| •# | ILFC E-Capital Trust II 144A | | | | | | | |
| 6.25% 12/21/65 | | | | 130,000 | | | 94,900 |
| International Lease Finance | | | | | | | |
| 6.25% 5/15/19 | | | | 53,000 | | | 49,963 |
| 8.75% 3/15/17 | | | | 15,000 | | | 15,848 |
| # | IPIC GMTN 144A 5.50% 3/1/22 | | | | 200,000 | | | 199,200 |
| John Deere Capital | | | | | | | |
| 3.15% 10/15/21 | | | | 35,000 | | | 35,934 |
| PHH 9.25% 3/1/16 | | | | 70,000 | | | 72,450 |
| | | | | | | | 1,397,731 |
| Insurance – 1.26% | | | | | | | |
| American International Group | | | | | | | |
| 8.25% 8/15/18 | | | | 100,000 | | | 112,819 |
| • | Chubb 6.375% 3/29/67 | | | | 85,000 | | | 85,850 |
| Coventry Health Care | | | | | | | |
| 5.45% 6/15/21 | | | | 120,000 | | | 131,760 |
| # | Highmark 144A | | | | | | | |
| 4.75% 5/15/21 | | | | 65,000 | | | 65,795 |
| 6.125% 5/15/41 | | | | 15,000 | | | 15,914 |
| • | ING Groep 5.775% 12/29/49 | | | | 40,000 | | | 31,900 |
| MetLife 6.817% 8/15/18 | | | | 35,000 | | | 41,767 |
| Prudential Financial | | | | | | | |
| 3.875% 1/14/15 | | | | 60,000 | | | 62,754 |
| 6.00% 12/1/17 | | | | 115,000 | | | 131,731 |
| @=w‡# | Twin Reefs Pass Through Trust | | | | | | | |
| 144A 0.00% 12/31/49 | | | | 300,000 | | | 0 |
| | | | | | | | 680,290 |
| Natural Gas – 2.00% | | | | | | | |
| El Paso Pipeline Partners | | | | | | | |
| Operating 6.50% 4/1/20 | | | | 55,000 | | | 61,179 |
| *• | Enbridge Energy Partners | | | | | | | |
| 8.05% 10/1/37 | | | | 115,000 | | | 119,879 |
| Energy Transfer Partners | | | | | | | |
| 9.70% 3/15/19 | | | | 120,000 | | | 148,532 |
| Enterprise Products Operating | | | | | | | |
| •7.034% 1/15/68 | | | | 135,000 | | | 139,224 |
| 9.75% 1/31/14 | | | | 60,000 | | | 70,130 |
| Kinder Morgan Energy Partners | | | | | | | |
| 9.00% 2/1/19 | | | | 105,000 | | | 134,824 |
| * | Plains All American Pipeline | | | | | | | |
| 8.75% 5/1/19 | | | | 90,000 | | | 115,428 |
| Sempra Energy 6.15% 6/15/18 | | | | 90,000 | | | 106,009 |
| • | TransCanada PipeLines | | | | | | | |
| 6.35% 5/15/67 | | | | 180,000 | | | 183,663 |
| | | | | | | | 1,078,868 |
| Real Estate – 1.62% | | | | | | | |
| Brandywine Operating | | | | | | | |
| Partnership 4.95% 4/15/18 | | | | 65,000 | | | 63,130 |
| Developers Diversified Realty | | | | | | | |
| 7.875% 9/1/20 | | | | 160,000 | | | 173,461 |
| 9.625% 3/15/16 | | | | 105,000 | | | 121,445 |
| Digital Realty Trust | | | | | | | |
| 5.25% 3/15/21 | | | | 90,000 | | | 88,042 |
| 5.875% 2/1/20 | | | | 50,000 | | | 51,727 |
| Health Care REIT | | | | | | | |
| 5.25% 1/15/22 | | | | 95,000 | | | 91,011 |
| Host Hotels & Resorts | | | | | | | |
| 6.00% 11/1/20 | | | | 45,000 | | | 46,575 |
| #144A 5.875% 6/15/19 | | | | 40,000 | | | 40,700 |
| Regency Centers | | | | | | | |
| 5.875% 6/15/17 | | | | 93,000 | | | 102,254 |
| # | WEA Finance 144A | | | | | | | |
| 4.625% 5/10/21 | | | | 95,000 | | | 94,242 |
| | | | | | | | 872,587 |
2011 Annual report · Delaware Pooled Trust
(continues) 95
Statements of net assets
Delaware Pooled® Trust — The Core Plus Fixed Income Portfolio
| | | Principal | | Value |
| | | | Amount° | | (U.S. $) |
| Corporate Bonds (continued) | | | | | | | |
| Technology – 1.35% | | | | | | | |
| GXS Worldwide 9.75% 6/15/15 | | USD | | 120,000 | | $ | 112,200 |
| Hewlett-Packard | | | | | | | |
| *4.30% 6/1/21 | | | | 55,000 | | | 57,414 |
| 4.375% 9/15/21 | | | | 90,000 | | | 94,600 |
| National Semiconductor | | | | | | | |
| 6.60% 6/15/17 | | | | 140,000 | | | 170,433 |
| # | Seagate Technology | | | | | | | |
| International 144A | | | | | | | |
| 10.00% 5/1/14 | | | | 63,000 | | | 71,978 |
| Symantec 4.20% 9/15/20 | | | | 10,000 | | | 10,036 |
| Xerox | | | | | | | |
| 4.50% 5/15/21 | | | | 85,000 | | | 88,683 |
| 6.35% 5/15/18 | | | | 105,000 | | | 120,034 |
| | | | | | | | 725,378 |
| Transportation – 1.46% | | | | | | | |
| # | Brambles USA 144A | | | | | | | |
| 3.95% 4/1/15 | | | | 65,000 | | | 67,809 |
| 5.35% 4/1/20 | | | | 115,000 | | | 124,277 |
| Burlington Northern Santa Fe | | | | | | | |
| 3.45% 9/15/21 | | | | 15,000 | | | 15,308 |
| 5.65% 5/1/17 | | | | 55,000 | | | 63,340 |
| CSX | | | | | | | |
| 4.25% 6/1/21 | | | | 10,000 | | | 10,732 |
| 4.75% 5/30/42 | | | | 150,000 | | | 154,033 |
| 5.50% 4/15/41 | | | | 25,000 | | | 28,582 |
| # | ERAC USA Finance 144A | | | | | | | |
| 5.25% 10/1/20 | | | | 215,000 | | | 232,458 |
| Ryder System 3.50% 6/1/17 | | | | 85,000 | | | 87,896 |
| | | | | | | | 784,435 |
| Total Corporate Bonds | | | | | | | |
| (cost $22,631,263) | | | | | | | 23,111,899 |
| |
| Non-Agency Asset-Backed Securities – 2.70% | | | |
| • | Ally Master Owner Trust | | | | | | | |
| Series 2011-1 A1 | | | | | | | |
| 1.113% 1/15/16 | | | | 100,000 | | | 100,334 |
| • | American Express Credit | | | | | | | |
| Account Master Trust | | | | | | | |
| Series 2010-1 B | | | | | | | |
| 0.843% 11/16/15 | | | | 100,000 | | | 100,001 |
| # | Avis Budget Rental Car Funding | | | | | | | |
| Series 2011-2A A 144A | | | | | | | |
| 2.37% 11/20/14 | | | | 100,000 | | | 100,692 |
| # | Cabela’s Master Credit Card Trust | | | | | | | |
| Series 2010-2A A1 144A | | | | | | | |
| 2.29% 9/17/18 | | | | 100,000 | | | 103,130 |
| Capital One Multi-Asset | | | | | | | |
| Execution Trust | | | | | | | |
| •Series 2007-A1 A1 | | | | | | | |
| 0.293% 11/15/19 | | | | 100,000 | | | 97,375 |
| Series 2007-A7 A7 | | | | | | | |
| 5.75% 7/15/20 | | | | 100,000 | | | 117,494 |
| # | CIT Equipment Collateral | | | | | | | |
| Series 2009-VT1 A3 144A | | | | | | | |
| 3.07% 8/15/16 | | | | 8,305 | | | 8,318 |
| Series 2010-VT1A A3 144A | | | | | | | |
| 2.41% 5/15/13 | | | | 80,616 | | | 80,871 |
| Citicorp Residential | | | | | | | |
| Mortgage Securities | | | | | | | |
| Series 2006-3 A5 | | | | | | | |
| 5.948% 11/25/36 | | | | 300,000 | | | 223,959 |
| # | Ford Auto Securitization Trust | | | | | | | |
| Series 2011-R1A A3 144A | | | | | | | |
| 3.02% 2/15/16 | | CAD | | 100,000 | | | 102,180 |
| # | Great America | | | | | | | |
| Leasing Receivables | | | | | | | |
| Series 2011-1 A3 144A | | | | | | | |
| 1.69% 2/15/14 | | USD | | 75,000 | | | 75,406 |
| Harley-Davidson Motorcycle Trust | | | | | | | |
| Series 2009-4 A3 | | | | | | | |
| 1.87% 2/17/14 | | | | 54,297 | | | 54,469 |
| John Deere Owner Trust | | | | | | | |
| Series 2010-A A4 | | | | | | | |
| 2.13% 10/17/16 | | | | 90,000 | | | 91,992 |
| Series 2011-A A4 | | | | | | | |
| 1.96% 4/16/18 | | | | 70,000 | | | 71,813 |
| • | Merrill Auto Trust Securitization | | | | | | | |
| Series 2007-1 A4 | | | | | | | |
| 0.303% 12/15/13 | | | | 10,141 | | | 10,140 |
| Mid-State Trust Series 11 A1 | | | | | | | |
| 4.864% 7/15/38 | | | | 13,767 | | | 13,808 |
| # | Sonic Capital Series 2011-1A | | | | | | | |
| A2 144A 5.438% 5/20/41 | | | | 98,750 | | | 100,478 |
| Total Non-Agency Asset-Backed | | | | | | | |
| Securities (cost $1,485,343) | | | | | | | 1,452,460 |
| |
| Non-Agency Collateralized Mortgage Obligations – 0.49% |
| Citicorp Mortgage Securities | | | | | | | |
| Series 2006-4 3A1 | | | | | | | |
| 5.50% 8/25/21 | | | | 2,110 | | | 2,111 |
| •w | Countrywide Home Loan | | | | | | | |
| Mortgage Pass Through Trust | | | | | | | |
| Series 2006-HYB1 3A1 | | | | | | | |
| 2.77% 3/20/36 | | | | 138,596 | | | 74,813 |
| First Horizon Asset Securities | | | | | | | |
| Series 2006-3 1A11 | | | | | | | |
| 6.25% 11/25/36 | | | | 4,588 | | | 4,573 |
| •# | GSMPS Mortgage Loan Trust | | | | | | | |
| Series 1999-2 A 144A | | | | | | | |
| 7.647% 9/19/27 | | | | 39,087 | | | 39,933 |
| Lehman Mortgage Trust | | | | | | | |
| Series 2005-2 2A3 | | | | | | | |
| 5.50% 12/25/35 | | | | 29,108 | | | 28,846 |
| •# | MASTR Specialized Loan Trust | | | | | | | |
| Series 2005-2 A2 144A | | | | | | | |
| 5.006% 7/25/35 | | | | 62,093 | | | 62,422 |
2011 Annual report · Delaware Pooled Trust
96
| | | Principal | | Value |
| | | | Amount° | | (U.S. $) |
| Non-Agency Collateralized Mortgage Obligations (continued) |
| Wells Fargo Mortgage Backed | | | | | | | |
| Securities Trust Series 2006- | | | | | | | |
| 4 1A8 5.75% 4/25/36 | | USD | | 52,724 | | $ | 52,157 |
| Total Non-Agency Collateralized | | | | | | | |
| Mortgage Obligations | | | | | | | |
| (cost $305,721) | | | | | | | 264,855 |
| |
| Regional Bonds – 2.59%Δ | | | | | | | |
| Australia – 1.89% | | | | | | | |
| New South Wales Treasury | | | | | | | |
| | 6.00% 4/1/19 | | AUD | 484,000 | | | 548,117 |
| Queensland Treasury | | | | | | | |
| 6.25% 6/14/19 | | AUD | 408,000 | | | 466,414 |
| | | | | | | | 1,014,531 |
| Canada – 0.70% | | | | | | | |
| New Brunswick Province | | | | | | | |
| 2.75% 6/15/18 | | USD | | 90,000 | | | 92,891 |
| Ontario Province | | | | | | | |
| 2.30% 5/10/16 | | | | 130,000 | | | 133,179 |
| 3.00% 7/16/18 | | | | 135,000 | | | 139,942 |
| Quebec Province | | | | | | | |
| 4.25% 12/1/21 | | CAD | | 11,000 | | | 11,883 |
| | | | | | | | 377,895 |
| Total Regional Bonds | | | | | | | |
| (cost $1,352,139) | | | | | | | 1,392,426 |
| |
| «Senior Secured Loans – 3.68% | | | | | | | |
| Alliance HealthCare Services | | | | | | | |
| 7.25% 6/1/16 | | USD | | 46,758 | | | 42,333 |
| @ | API Technologies Tranche B | | | | | | | |
| 7.75% 6/1/16 | | | | 29,912 | | | 28,790 |
| ATI Holdings 7.50% 3/12/16 | | | | 112,792 | | | 108,750 |
| BNY ConvergEx Group | | | | | | | |
| 8.75% 11/29/17 | | | | 14,779 | | | 14,828 |
| 8.75% 12/16/17 | | | | 35,221 | | | 35,339 |
| Brickman Group Holdings | | | | | | | |
| Tranche B 7.25% 10/14/16 | | | | 49,625 | | | 49,666 |
| Burlington Coat Factory | | | | | | | |
| Warehouse Tranche B | | | | | | | |
| 6.25% 2/10/17 | | | | 49,499 | | | 48,571 |
| Charter Communications | | | | | | | |
| Operating Tranche B | | | | | | | |
| 7.25% 3/6/14 | | | | 6,639 | | | 6,661 |
| Chester Downs & Marina | | | | | | | |
| 12.375% 12/31/16 | | | | 72,250 | | | 72,762 |
| Chrysler Group 6.00% 4/28/17 | | | | 95,675 | | | 90,174 |
| CityCenter Holdings | | | | | | | |
| 7.50% 1/10/15 | | | | 40,000 | | | 39,970 |
| Clear Channel Communications | | | | | | | |
| 3.639% 7/30/14 | | | | 40,000 | | | 35,400 |
| Consolidated Container | | | | | | | |
| 5.75% 9/28/14 | | | | 30,000 | | | 24,956 |
| Delos Aircraft Tranche 2 | | | | | | | |
| 7.00% 3/17/16 | | | | 55,000 | | | 55,573 |
| First Data Tranche B2 | | | | | | | |
| 2.995% 9/24/14 | | | | 195,087 | | | 181,160 |
| Frac Tech International Tranche B | | | | | | | |
| 6.25% 4/19/16 | | | | 153,747 | | | 153,170 |
| Goodman Global Tranche B | | | | | | | |
| 5.75% 10/28/16 | | | | 41,542 | | | 41,600 |
| Grifols Tranche B 6.00% 6/4/16 | | | | 49,875 | | | 50,114 |
| Harrahs Operating Tranche B1 | | | | | | | |
| 3.418% 1/28/15 | | | | 60,000 | | | 52,963 |
| Houghton International Tranche B | | | | | | | |
| 6.75% 1/11/16 | | | | 49,536 | | | 49,536 |
| International Lease Finance | | | | | | | |
| Tranche 1 6.75% 3/17/15 | | | | 75,000 | | | 75,516 |
| Level 3 Financing Tranche B | | | | | | | |
| 11.50% 3/13/14 | | | | 135,000 | | | 140,963 |
| MGM MIRAGE Tranche E | | | | | | | |
| 7.00% 2/21/14 | | | | 60,000 | | | 58,641 |
| Multiplan 4.75% 8/26/17 | | | | 29,763 | | | 28,803 |
| Nuveen Investment | | | | | | | |
| 5.863% 5/13/17 | | | | 100,000 | | | 96,350 |
| 2nd Lien 12.50% 7/9/15 | | | | 65,000 | | | 67,519 |
| OSI Restaurant | | | | | | | |
| 2.563% 6/13/14 | | | | 67,724 | | | 64,902 |
| 2.593% 6/14/13 | | | | 6,627 | | | 6,351 |
| PQ 6.74% 7/30/15 | | | | 50,000 | | | 44,800 |
| Reynolds Group Holdings | | | | | | | |
| 6.50% 7/7/18 | | | | 10,000 | | | 9,983 |
| Toys R Us Delaware Tranche B | | | | | | | |
| 6.00% 9/1/16 | | | | 49,500 | | | 48,912 |
| Univision Communications | | | | | | | |
| 4.489% 3/29/17 | | | | 68,725 | | | 62,687 |
| Visant 5.25% 12/31/16 | | | | 99,250 | | | 94,474 |
| Total Senior Secured Loans | | | | | | | |
| (cost $1,986,340) | | | | | | | 1,982,217 |
| |
| Sovereign Bonds – 4.57%Δ | | | | | | | |
| Austria – 0.05% | | | | | | | |
| Austria Government | | | | | | | |
| 3.20% 2/20/17 | | EUR | | 20,000 | | | 29,125 |
| | | | | | | | 29,125 |
| Brazil – 0.16% | | | | | | | |
| Republic of Brazil | | | | | | | |
| 8.875% 10/14/19 | | USD | | 60,000 | | | 83,490 |
| | | | | | | | 83,490 |
| Canada – 0.92% | | | | | | | |
| Canadian Government | | | | | | | |
| 3.25% 6/1/21 | | CAD | | 214,000 | | | 231,504 |
| 3.75% 6/1/19 | | CAD | | 124,000 | | | 139,089 |
| 4.00% 6/1/17 | | CAD | | 73,000 | | | 82,173 |
| 4.00% 6/1/41 | | CAD | | 34,000 | | | 40,913 |
| | | | | | | | 493,679 |
| Chile – 0.20% | | | | | | | |
| Chile Government International | | | | | | | |
| 5.50% 8/5/20 | | CLP | 50,000,000 | | | 108,047 |
| | | | | | | | 108,047 |
2011 Annual report · Delaware Pooled Trust
(continues) 97
Statements of net assets
Delaware Pooled® Trust — The Core Plus Fixed Income Portfolio
| | | Principal | | Value |
| | | | Amount° | | (U.S. $) |
| Sovereign Bonds (continued) | | | | | | | |
| Finland – 0.01% | | | | | | | |
| Finland Government | | | | | | | |
| 3.50% 4/15/21 | | EUR | | 5,000 | | $ | 7,501 |
| | | | | | | | 7,501 |
| Indonesia – 0.33% | | | | | | | |
| Indonesia Treasury Bond | | | | | | | |
| 8.25% 7/15/21 | | IDR | | 538,000,000 | | | 69,414 |
| 10.50% 8/15/30 | | IDR | | 160,000,000 | | | 24,276 |
| | 11.00% 11/15/20 | | IDR | | 572,000,000 | | | 85,326 |
| | | | | | | | 179,016 |
| Mexico – 0.52% | | | | | | | |
| Mexican Bonos | | | | | | | |
| 7.50% 6/3/27 | | MXN | | 1,930,600 | | | 154,208 |
| 8.50% 5/31/29 | | MXN | | 1,465,600 | | | 125,794 |
| | | | | | | | 280,002 |
| Norway – 1.08% | | | | | | | |
| Norway Government | | | | | | | |
| 4.25% 5/19/17 | | NOK | | 189,000 | | | 37,316 |
| 4.50% 5/22/19 | | NOK | | 1,249,000 | | | 253,793 |
| 5.00% 5/15/15 | | NOK | | 1,460,000 | | | 288,425 |
| | | | | | | | 579,534 |
| Philippines – 0.24% | | | | | | | |
| Republic of Philippines | | | | | | | |
| 9.50% 10/21/24 | | USD | | 90,000 | | | 129,938 |
| | | | | | | | 129,938 |
| Poland – 0.17% | | | | | | | |
| Poland Government | | | | | | | |
| 5.25% 10/25/17 | | PLN | | 82,000 | | | 25,812 |
| Poland Government | | | | | | | |
| International | | | | | | | |
| 5.00% 3/23/22 | | USD | | 41,000 | | | 40,539 |
| 5.125% 4/21/21 | | | | 24,000 | | | 24,540 |
| | | | | | | | 90,891 |
| Russia – 0.09% | | | | | | | |
| Russian-Eurobond | | | | | | | |
| 7.50% 3/31/30 | | | | 41,750 | | | 49,578 |
| | | | | | | | 49,578 |
| South Africa – 0.49% | | | | | | | |
| South Africa Government | | | | | | | |
| 7.25% 1/15/20 | | ZAR | | 555,000 | | | 67,021 |
| 8.00% 12/21/18 | | ZAR | | 1,162,000 | | | 149,843 |
| South Africa Government | | | | | | | |
| International 6.50% 6/2/14 | | USD | | 40,000 | | | 44,348 |
| | | | | | | | 261,212 |
| Sweden – 0.27% | | | | | | | |
| Swedish Government | | | | | | | |
| 3.00% 7/12/16 | | SEK | | 490,000 | | | 80,088 |
| 5.00% 12/1/20 | | SEK | | 335,000 | | | 64,562 |
| | | | | | | | 144,650 |
| Turkey – 0.04% | | | | | | | |
| Republic of Turkey | | | | | | | |
| 7.375% 2/5/25 | | USD | | 20,000 | | | 23,850 |
| | | | | | | | 23,850 |
| Total Sovereign Bonds | | | | | | | |
| (cost $2,383,267) | | | | | | | 2,460,513 |
| | | | | | | | |
| Supranational Banks – 0.67% | | | | | | | |
| Inter-American Development | | | | | | | |
| Bank 3.875% 10/28/41 | | | | 40,000 | | | 40,213 |
| International Bank for | | | | | | | |
| Reconstruction & | | | | | | | |
| Development | | | | | | | |
| 3.375% 4/30/15 | | NOK | | 250,000 | | | 46,211 |
| 7.50% 7/30/14 | | NZD | | 309,000 | | | 275,538 |
| Total Supranational Banks | | | | | | | |
| (cost $316,625) | | | | | | | 361,962 |
| |
| U.S. Treasury Obligations – 13.08% | | | | | | | |
| U.S. Treasury Bonds | | | | | | | |
| 3.50% 2/15/39 | | USD | | 135,000 | | | 142,805 |
| ∞4.375% 5/15/41 | | | | 1,105,000 | | | 1,356,560 |
| U.S. Treasury Notes | | | | | | | |
| 1.00% 10/31/16 | | | | 3,540,000 | | | 3,538,888 |
| *1.375% 9/30/18 | | | | 40,000 | | | 39,431 |
| *2.125% 8/15/21 | | | | 1,975,000 | | | 1,966,677 |
| Total U.S. Treasury Obligations | | | | | | | |
| (cost $7,095,916) | | | | | | | 7,044,361 |
| |
| | | Number of | | | |
| | | | | Shares | | | |
| Preferred Stock – 0.30% | | | | | | | |
| Alabama Power 5.625% | | | | 1,855 | | | 46,839 |
| • | PNC Financial Services Group 8.25% | | 110,000 | | | 112,239 |
| Total Preferred Stocks | | | | | | | |
| (cost $153,583) | | | | | | | 159,078 |
| |
| | | | | Principal | | | |
| | | | | Amount | | | |
| Short Term Investment – 12.97% | | | | | | | |
| Repurchase Agreement – 12.97% | | | | | | | |
| BNP Paribas 0.08%, dated | | | | | | | |
| 10/31/11, to be repurchased | | | | | | | |
| on 11/1/11, repurchase price | | | | | | | |
| $6,986,016 (collateralized | | | | | | | |
| by U.S. government | | | | | | | |
| obligations 0.25%-4.625% | | | | | | | |
| 2/29/12-2/15/21, market | | | | | | | |
| value $7,125,720) | | | | | | | |
| Total Short Term investment | | | | | | | |
| (cost $6,986,000) | | USD | | 6,986,000 | | | 6,986,000 |
| | | | | | | | 6,986,000 |
| |
| Total Value of Securities Before Securities | | | | | |
| Lending Collateral – 106.54% | | | | | | | |
| (cost $56,256,798) | | | | | | | 57,374,944 |
2011 Annual report · Delaware Pooled Trust
98
| | | Number of | | Value | |
| | Shares | | (U.S. $) | |
| Securities Lending Collateral** – 2.03% | | | | | | |
| Investment Companies | | | | | | |
| BNY Mellon SL DBT II | | | | | | |
| Liquidating Fund | | 26,052 | | $ | 25,237 | |
| Delaware Investments | | | | | | |
| Collateral Fund No.1 | | 1,067,572 | | | 1,067,572 | |
| @† | Mellon GSL Reinvestment Trust II | | 49,094 | | | 0 | |
| Total Securities Lending Collateral | | | | | | |
| (cost $1,142,718) | | | | | 1,092,809 | |
| |
| Total Value of Securities – 108.57% | | | | | | |
| (cost $57,399,516) | | | | | 58,467,753 | © |
| Obligation to Return Securities | | | | | | |
| Lending Collateral** – (2.12%) | | | | | (1,142,718 | ) |
| Other Liabilities Net of Receivables and | | | | | | |
| Other Assets – (6.45%) | | | | | (3,473,977 | )z |
| Net Assets Applicable to 5,357,333 | | | | | | |
| Shares Outstanding; Equivalent to | | | | | | |
| $10.05 Per Share – 100.00% | | | | $ | 53,851,058 | |
| | | | | | | |
| Components of Net Assets at October 31, 2011: | | | | | | |
| Shares of beneficial interest | | | | | | |
| (unlimited authorization – no par) | | | | $ | 54,532,154 | |
| Undistributed net investment income | | | | | 1,490,239 | |
| Accumulated net realized loss on investments | | | | | (3,208,935 | ) |
| Net unrealized appreciation of investments and | | | | | | |
| foreign currencies | | | | | 1,037,600 | |
| Total net assets | | | | $ | 53,851,058 | |
| ° | Principal amount is stated in the currency in which each security is denominated. |
| • | Variable rate security. The rate shown is the rate as of October 31, 2011. Interest rates reset periodically. |
| w | Pass Through Agreement. Security represents the contractual right to receive a proportionate amount of underlying payments due to the counterparty pursuant to various agreements related to the rescheduling of obligations and the exchange of certain notes. |
| # | Security exempt from registration under Rule 144A of the Securities Act of 1933, as amended. At October 31, 2011, the aggregate amount of Rule 144A securities was $6,364,628 which represented 11.82% of the Portfolio’s net assets. See Note 10 in “Notes to financial statements.” |
| * | Fully or partially on loan. |
| Φ | Step coupon bond. Coupon increases or decreases periodically based on a predetermined schedule. Stated rate in effect at October 31, 2011. |
| @ | Illiquid security. At October 31, 2011, the aggregate amount of illiquid securities was $334,346 which represented 0.62% of the Portfolio’s net assets. See Note 10 in “Notes to financial statements.” |
| = | Security is being fair valued in accordance with the Portfolio’s fair valuation policy. At October 31, 2011, the aggregate amount of fair valued securities was $0, which represented 0.00% of the Portfolio’s net assets. See Note 1 in “Notes to financial statements.” |
| ‡ | Non income producing security. Security is currently in default. |
| Δ | Securities have been classified by country of origin. |
| « | Senior Secured Loans generally pay interest at rates which are periodically redetermined by reference to a base lending rate plus a premium. These base lending rates are generally: (i) the prime rate offered by one or more United States banks, (ii) the lending rate offered by one or more European banks such as the London Inter-Bank Offered Rate (LIBOR), and (iii) the certificate of deposit rate. Senior Secured Loans may be subject to restrictions on resale. Stated rate in effect at October 31, 2011. |
| ∞ | Fully or partially pledged as collateral for futures contracts. |
| † | Non income producing security. |
| ** | See Note 9 in “Notes to financial statements” for additional information on securities lending collateral and non-cash collateral. |
| © | Includes $3,266,065 of securities loaned. |
| z | Of this amount, $6,691,820 represents payable for securities purchased as of October 31, 2011. |
2011 Annual report · Delaware Pooled Trust
(continues) 99
Statements of net assets
Delaware Pooled® Trust — The Core Plus Fixed Income Portfolio
| |
The following foreign currency exchange contracts, futures contracts and swap contract were outstanding at October 31, 2011:1 |
Foreign Currency Exchange Contracts
| | | | | | | | | | | | | | | Unrealized |
| | | Contracts to | | | | | | | Settlement | | Appreciation |
| Counterparty | | | Receive (Deliver) | | In Exchange For | | Date | | (Depreciation) |
| BAML | | | AUD | | (245,494 | ) | | USD | | 261,429 | | | 12/9/11 | | | $ | 3,791 | | |
| BAML | | | CAD | | (310,953 | ) | | USD | | 311,926 | | | 12/9/11 | | | | 534 | | |
| BAML | | | CLP | | (25,307,500 | ) | | USD | | 50,000 | | | 12/9/11 | | | | (1,782 | ) | |
| BAML | | | EUR | | (335,374 | ) | | USD | | 474,448 | | | 12/9/11 | | | | 10,402 | | |
| BAML | | | IDR | | (767,350,000 | ) | | USD | | 86,462 | | | 12/9/11 | | | | 149 | | |
| BAML | | | JPY | | 7,763,900 | | | USD | | (102,547 | ) | | 12/9/11 | | | | (3,164 | ) | |
| BAML | | | MXN | | (922,396 | ) | | USD | | 70,008 | | | 12/9/11 | | | | 1,126 | | |
| BAML | | | NOK | | (994,212 | ) | | USD | | 182,910 | | | 12/9/11 | | | | 4,633 | | |
| BAML | | | PLN | | (188,706 | ) | | USD | | 61,322 | | | 12/9/11 | | | | 2,265 | | |
| BAML | | | ZAR | | (313,000 | ) | | USD | | 40,356 | | | 11/2/11 | | | | 934 | | |
| BAML | | | ZAR | | (1,696,884 | ) | | USD | | 217,572 | | | 12/9/11 | | | | 5,042 | | |
| BCLY | | | EUR | | (74,336 | ) | | USD | | 105,175 | | | 12/9/11 | | | | 2,319 | | |
| CITI | | | EUR | | (142,587 | ) | | USD | | 201,779 | | | 12/9/11 | | | | 4,487 | | |
| CITI | | | NOK | | (283,510 | ) | | USD | | 52,204 | | | 12/9/11 | | | | 1,367 | | |
| GSC | | | AUD | | (129,036 | ) | | USD | | 137,173 | | | 12/9/11 | | | | 1,754 | | |
| GSC | | | GBP | | (26,398 | ) | | USD | | 42,498 | | | 12/9/11 | | | | 71 | | |
| HSBC | | | AUD | | (443,937 | ) | | USD | | 472,971 | | | 12/9/11 | | | | 7,074 | | |
| HSBC | | | EUR | | 81 | | | USD | | (115 | ) | | 12/9/11 | | | | (3 | ) | |
| HSBC | | | NOK | | (319,286 | ) | | USD | | 58,798 | | | 12/9/11 | | | | 1,545 | | |
| JPMC | | | EUR | | (46,836 | ) | | USD | | 66,294 | | | 12/9/11 | | | | 1,489 | | |
| JPMC | | | NOK | | (453,396 | ) | | USD | | 83,489 | | | 12/9/11 | | | | 2,188 | | |
| MNB | | | EUR | | (7,200 | ) | | USD | | 10,195 | | | 11/1/11 | | | | 229 | | |
| MSC | | | AUD | | (102,713 | ) | | USD | | 109,430 | | | 12/9/11 | | | | 1,637 | | |
| MSC | | | EUR | | (216,906 | ) | | USD | | 306,819 | | | 12/9/11 | | | | 6,695 | | |
| MSC | | | GBP | | (52,266 | ) | | USD | | 84,116 | | | 12/9/11 | | | | 112 | | |
| MSC | | | KRW | | 371,911,000 | | | USD | | (335,751 | ) | | 12/9/11 | | | | (2,364 | ) | |
| MSC | | | NOK | | (387,527 | ) | | USD | | 71,296 | | | 12/9/11 | | | | 1,807 | | |
| | | | | | | | | | | | | | | | $ | 54,337 | | |
Futures Contracts
| | | | | | | | | | | | | Unrealized |
| Contract | | | Notional | | Notional | | Expiration | | Appreciation |
| to Buy | | | | Cost | | Value | | Date | | (Depreciation) |
| 4 | | Euro-Bund | | | $ | 745,588 | | $ | 767,302 | | 12/8/11 | | | $ | 21,714 | |
| 3 | | U.S. Treasury | | | | | | | | | | | | | | |
| | 10 yr Notes | | | | 382,884 | | | 387,188 | | 12/20/11 | | | | 4,304 | |
| 21 | | U.S. Treasury | | | | | | | | | | | | | | |
| | Long Bond | | | | 2,888,586 | | | 2,919,656 | | 11/25/11 | | | | 31,070 | |
| 4 | | U.S. Ultra Bond | | | | 583,136 | | | 609,500 | | 12/20/11 | | | | 26,364 | |
| | | | | $ | 4,600,194 | | | | | | | | $ | 83,452 | |
Swap Contracts
CDS Contracts
| Counterparty | | | Swap &
Referenced Obligation | | Notional
Value | | Annual
Protection
Payments | | Termination
Date | | Unrealized
Appreciation
(Depreciation) |
| | | Protection Purchased: | | | | | | | | | | | | | | | | |
| BAML | | | CDX.NA.HY.17 | | USD | | 1,050,000 | | 5.00% | | | 12/20/16 | | | | $ | (39,754 | ) | |
| BAML | | | ITRAXX Europe | | | | | | | | | | | | | | | | |
| | | Subordinate | | | | | | | | | | | | | | | | |
| | | Financials 16.1 | | | | | | | | | | | | | | | | |
| | | 5 yr CDS | | EUR | | 750,000 | | 5.00% | | | 12/20/16 | | | | | (42,772 | ) | |
| BAML | | | Kingdom of Spain | | | | | | | | | | | | | | | | |
| | | 5 yr CDS | | USD | | 147,000 | | 1.00% | | | 12/20/15 | | | | | (245 | ) | |
| BCLY | | | ITRAXX Europe | | | | | | | | | | | | | | | | |
| | | Subordinate | | | | | | | | | | | | | | | | |
| | | Financials 16.1 | | | | | | | | | | | | | | | | |
| | | 5 yr CDS | | EUR | | 325,000 | | 5.00% | | | 12/20/16 | | | | | (16,314 | ) | |
| | | Kingdom of Spain | | | | | | | | | | | | | | | | |
| BCLY | | | 5 yr CDS | | USD | | 151,000 | | 1.00% | | | 3/20/15 | | | | | 8,953 | | |
| BCLY | | | 5 yr CDS | | | | 70,000 | | 1.00% | | | 3/21/16 | | | | | 115 | | |
| BCLY | | | Republic of France | | | | | | | | | | | | | | | | |
| | | 5 yr CDS | | | | 90,000 | | 0.25% | | | 9/20/16 | | | | | (872 | ) | |
| GSC | | | CDX.NA.HY.17 | | | | 130,000 | | 5.00% | | | 12/20/16 | | | | | (4,922 | ) | |
| GSC | | | Republic of France | | | | | | | | | | | | | | | | |
| | | 5 yr CDS | | | | 39,000 | | 0.25% | | | 9/20/16 | | | | | (303 | ) | |
| JPMC | | | CDX.NA.HY.17 | | | | 1,250,000 | | 5.00% | | | 12/20/16 | | | | | (50,664 | ) | |
| JPMC | | | ITRAXX Europe | | | | | | | | | | | | | | | | |
| | | Crossover 16.1 | | | | | | | | | | | | | | | | |
| | | 5 yr CDS | | EUR | | 270,000 | | 5.00% | | | 12/20/16 | | | | | (13,315 | ) | |
| JPMC | | | MeadWestvaco | | | | | | | | | | | | | | | | |
| | | 5 yr CDS | | USD | | 65,000 | | 1.00% | | | 12/20/16 | | | | | (1,447 | ) | |
| JPMC | | | Portuguese Republic | | | | | | | | | | | | | | | | |
| | | 5 yr CDS | | | | 85,000 | | 1.00% | | | 6/20/15 | | | | | 22,395 | | |
| JPMC | | | Republic of France | | | | | | | | | | | | | | | | |
| | | 5 yr CDS | | | | 65,000 | | 0.25% | | | 9/20/16 | | | | | (613 | ) | |
| MSC | | | CDX.NA.HY.17 | | | | 100,000 | | 5.00% | | | 12/20/16 | | | | | (4,160 | ) | |
| MSC | | | Citigroup 5 yr CDS | | | | 85,000 | | 1.00% | | | 12/20/16 | | | | | (355 | ) | |
| MSC | | | Japan 5 yr CDS | | | | 80,000 | | 1.00% | | | 9/20/16 | | | | | (652 | ) | |
| MSC | | | Kingdom of Belgium | | | | | | | | | | | | | | | | |
| | | 5 yr CDS | | | | 63,000 | | 1.00% | | | 12/20/16 | | | | | (828 | ) | |
| MSC | | | Kingdom of Spain | | | | | | | | | | | | | | | | |
| | | 5 yr CDS | | | | 130,000 | | 1.00% | | | 6/20/16 | | | | | 2,522 | | |
| MSC | | | People’s Republic of | | | | | | | | | | | | | | | | |
| | | China 5 yr CDS | | | | 250,000 | | 1.00% | | | 12/20/16 | | | | | (9,138 | ) | |
| | | Republic of France | | | | | | | | | | | | | | | | |
| MSC | | | 5 yr CDS | | | | 100,000 | | 0.25% | | | 9/20/16 | | | | | (742 | ) | |
| MSC | | | 5 yr CDS | | | | 55,000 | | 0.25% | | | 12/20/16 | | | | | (683 | ) | |
| MSC | | | Republic of Italy | | | | | | | | | | | | | | | | |
| | | 5 yr CDS | | | | 80,000 | | 1.00% | | | 9/20/16 | | | | | 2,852 | | |
| MSC | | | State of Israel | | | | | | | | | | | | | | | | |
| | | 5 yr CDS | | | | 80,000 | | 1.00% | | | 9/20/16 | | | | | (1,106 | ) | |
| | | | | | | | | | | | | | | | $ | (152,048 | ) | |
2011 Annual report · Delaware Pooled Trust
100
| Counterparty | | | Swap &
Referenced Obligation | | Notional
Value | | Annual
Protection
Payments | | Termination
Date | | Unrealized
Appreciation
(Depreciation) |
| | | Protection Sold/Moody’s Rating: | | | | | | | | | |
| JPMC | | | Georgia Pacific | | | | | | | | | | | | | | | | |
| | | 5 yr CDS/Baa | | USD | | 65,000 | | 1.00% | | | 12/20/16 | | | | $ | 1,429 | | |
| JPMC | | | Tyson Foods CDS/Ba | | | | 70,000 | | 1.00% | | | 3/20/16 | | | | | 1,289 | | |
| MSC | | | General Electric | | | | | | | | | | | | | | | | |
| | | Capital/Aa | | | | 85,000 | | 1.00% | | | 12/20/16 | | | | | 3,026 | | |
| | | | | | | | | | | | | | | | $ | 5,744 | | |
| Total | | | | | | | | | | | | | | | | $ | (146,304 | ) | |
The use of foreign currency exchange contracts, futures contracts and swap contracts involves elements of market risk and risks in excess of the amounts recognized in the financial statements. The notional values presented above represent the Portfolio’s total exposure in such contracts, whereas only the net unrealized appreciation (depreciation) is reflected in the Portfolio’s net assets.
1See Note 8 in “Notes to financial statements.”
Summary of Abbreviations:
ARM — Adjustable Rate Mortgage
AUD — Australian Dollar
BAML — Bank of America Merrill Lynch
BCLY — Barclays Bank
CAD — Canadian Dollar
CDS — Credit Default Swap
CITI — Citigroup Global Markets
CLP — Chilean Peso
EUR — European Monetary Unit
GBP — British Pound Sterling
GNMA — Government National Mortgage Association
GSC — Goldman Sachs Capital
GSMPS — Goldman Sachs Reperforming Mortgage Securities
HSBC — Hong Kong Shanghai Bank
HY — High Yield
IDR — Indonesian Rupiah
JPMC — JPMorgan Chase Bank
JPY — Japanese Yen
KRW — South Korean Won
MASTR — Mortgage Asset Securitization Transactions, Inc.
MNB — Mellon National Bank
MSC — Morgan Stanley Capital
MXN — Mexican Peso
NCUA — National Credit Union Administration
NOK — Norwegian Krone
NZD — New Zealand Dollar
PLN — Polish Zloty
REIT — Real Estate Investment Trust
REMIC — Real Estate Mortgage Investment Conduit
SEK — Swedish Krona
S.F. — Single Family
USD — United States Dollar
TBA — To be announced
yr — Year
ZAR — South African Rand
See accompanying notes, which are an integral part of the financial statements.
2011 Annual report · Delaware Pooled Trust
(continues) 101
Statements of net assets
Delaware Pooled® Trust — The International Equity Portfolio
October 31, 2011
| | | Number of | | Value |
| | | Shares | | (U.S. $) |
| Common Stock – 98.71%Δ | | | | | |
| Australia – 7.22% | | | | | |
| Amcor | | 1,346,254 | | $ | 9,855,122 |
| AMP | | 1,920,992 | | | 8,568,783 |
| QBE Insurance Group | | 642,121 | | | 9,889,748 |
| Telstra | | 4,299,783 | | | 13,969,070 |
| Treasury Wine Estates | | 63,938 | | | 249,788 |
| | | | | | 42,532,511 |
| Belgium – 0.00% | | | | | |
| û† | Ageas VVPR Strip | | 732,357 | | | 1,014 |
| | | | | | 1,014 |
| France – 14.59% | | | | | |
| Carrefour | | 513,388 | | | 13,587,640 |
| Compagnie de Saint-Gobain | | 181,929 | | | 8,411,038 |
| France Telecom | | 876,721 | | | 15,767,542 |
| † | GDF Suez | | 162,519 | | | 225 |
| Sanofi-Aventis | | 242,646 | | | 17,364,304 |
| Societe Generale | | 224,285 | | | 6,423,761 |
| Total | | 323,060 | | | 16,861,861 |
| Vinci | | 153,472 | | | 7,528,460 |
| | | | | | 85,944,831 |
| Germany – 5.24% | | | | | |
| Deutsche Telekom | | 1,171,235 | | | 14,884,365 |
| RWE | | 374,550 | | | 15,971,114 |
| | | | | | 30,855,479 |
| Ireland – 1.33% | | | | | |
| Experian | | 602,241 | | | 7,823,566 |
| | | | | | 7,823,566 |
| Israel – 2.06% | | | | | |
| Teva Pharmaceutical Industries ADR | | 297,100 | | | 12,136,535 |
| | | | | | 12,136,535 |
| Italy – 3.92% | | | | | |
| ENI | | 709,419 | | | 15,686,035 |
| Intesa Sanpaolo | | 4,189,330 | | | 7,396,581 |
| | | | | | 23,082,616 |
| Japan – 19.22% | | | | | |
| Astellas Pharma | | 400,500 | | | 14,647,657 |
| Canon | | 398,300 | | | 18,081,947 |
| Hoya | | 146,200 | | | 3,193,998 |
| Kao | | 494,800 | | | 12,980,764 |
| Nintendo | | 38,200 | | | 5,763,257 |
| Seven & I Holdings | | 615,973 | | | 16,437,697 |
| Shin-Etsu Chemical | | 86,400 | | | 4,437,054 |
| Takeda Pharmaceutical | | 335,000 | | | 15,102,267 |
| Tokio Marine Holdings | | 461,652 | | | 11,007,854 |
| Toyota Motor | | 266,600 | | | 8,851,328 |
| Trend Micro | | 77,000 | | | 2,753,591 |
| | | | | | 113,257,414 |
| Netherlands – 5.27% | | | | | |
| † | ING Groep CVA | | 896,737 | | | 7,733,264 |
| Koninklijke Ahold | | 1,067,789 | | | 13,646,900 |
| Reed Elsevier | | 787,540 | | | 9,674,224 |
| | | | | | 31,054,388 |
| Singapore – 4.00% | | | | | |
| Jardine Matheson Holdings | | 136,815 | | | 6,895,283 |
| Singapore Telecommunications | | 3,396,602 | | | 8,584,252 |
| United Overseas Bank | | 596,642 | | | 8,088,760 |
| | | | | | 23,568,295 |
| Spain – 6.82% | | | | | |
| Banco Santander | | 674,005 | | | 5,706,540 |
| † | Distribuidora Internacional | | | | | |
| de Alimentacion | | 369,559 | | | 1,690,590 |
| Iberdrola | | 2,012,333 | | | 14,563,906 |
| Telefonica | | 857,119 | | | 18,221,087 |
| | | | | | 40,182,123 |
| Switzerland – 6.29% | | | | | |
| Novartis | | 305,564 | | | 17,215,014 |
| SGS | | 3,314 | | | 5,685,255 |
| Zurich Financial Services | | 61,575 | | | 14,190,372 |
| | | | | | 37,090,641 |
| Taiwan – 1.63% | | | | | |
| Taiwan Semiconductor | | | | | |
| Manufacturing ADR | | 759,632 | | | 9,586,556 |
| | | | | | 9,586,556 |
| United Kingdom – 21.12% | | | | | |
| BG Group | | 525,286 | | | 11,390,308 |
| BP | | 2,059,954 | | | 15,158,860 |
| Compass Group | | 1,370,146 | | | 12,442,084 |
| GlaxoSmithKline | | 776,156 | | | 17,418,771 |
| Royal Dutch Shell Class A | | 501,470 | | | 17,787,722 |
| Tesco | | 2,956,187 | | | 19,059,765 |
| Unilever | | 529,605 | | | 17,752,442 |
| Vodafone Group | | 4,825,902 | | | 13,400,013 |
| | | | | | 124,409,965 |
| Total Common Stock | | | | | |
| (cost $580,355,365) | | | | | 581,525,934 |
| | | | | |
| | Principal | | | |
| | Amount (U.S. $) | | | |
| Short-Term Investments – 1.10% | | | | | |
| ≠Discount Notes – 0.23% | | | | | |
| Federal Home Loan Bank | | | | | |
| 0.003% 11/30/11 | | $1,021,220 | | | 1,021,211 |
| 0.01% 12/23/11 | | 147,928 | | | 147,926 |
| 0.04% 11/2/11 | | 48,529 | | | 48,529 |
| Freddie Mac 0.05% 11/2/11 | | 160,772 | | | 160,772 |
| | | | | | 1,378,438 |
2011 Annual report · Delaware Pooled Trust
102
| | | Principal | | Value | |
| | | Amount (U.S. $) | | (U.S. $) | |
| Short-Term Investments (continued) | | | | | | |
| Repurchase Agreement – 0.87% | | | | | | |
| BNP Paribas 0.08%, dated 10/31/11, | | | | | | |
| to be repurchased on 11/1/11, | | | | | | |
| repurchase price $5,101,011 | | | | | | |
| (collateralized by U.S. government | | | | | | |
| obligations 0.25%-4.625% | | | | | | |
| 2/29/12-2/15/21, market | | | | | | |
| value $5,203,020) | | $5,101,000 | | $ | 5,101,000 | |
| | | | | | 5,101,000 | |
| Total Short-Term Investments | | | | | | |
| (cost $6,479,443) | | | | | 6,479,438 | |
| |
| Total Value of Securities Before Securities | | | | |
| Lending Collateral – 99.81% | | | | | | |
| (cost $586,834,808) | | | | | 588,005,372 | |
| |
| | Number of | | | | |
| | Shares | | | | |
| Securities Lending Collateral** – 0.56% | | | | |
| Investment Companies | | | | | | |
| BNY Mellon SL DBT II | | | | | | |
| Liquidating Fund | | 521,936 | | | 505,599 | |
| Delaware Investments | | | | | | |
| Collateral Fund No. 1 | | 2,760,881 | | | 2,760,881 | |
| †@ | Mellon GSL Reinvestment Trust II | | 1,430,950 | | | 0 | |
| Total Securities Lending Collateral | | | | | | |
| (cost $4,713,767) | | | | | 3,266,480 | |
| |
| Total Value of Securities – 100.37% | | | | | | |
| (cost $591,548,575) | | | | | 591,271,852 | © |
| Obligation to Return Securities | | | | | | |
| Lending Collateral** – (0.80%) | | | | | (4,713,767 | ) |
| Receivables and Other Assets | | | | | | |
| Net of Other Liabilities – 0.43% | | | | | 2,551,079 | |
| Net Assets Applicable to 44,905,882 | | | | | | |
| Shares Outstanding; Equivalent to | | | | | | |
| $13.12 Per Share – 100.00% | | | | $ | 589,109,164 | |
| |
| Components of Net Assets at October 31, 2011: | | | | |
| Shares of beneficial interest | | | | | | |
| (unlimited authorization – no par) | | | | $ | 742,519,625 | |
| Undistributed net investment income | | | | | 21,513,372 | |
| Accumulated net realized loss on investments | | | (174,689,659 | ) |
| Net unrealized depreciation of investments | | | | | | |
| and foreign currencies | | | | | (234,174 | ) |
| Total net assets | | | | $ | 589,109,164 | |
| Δ | Securities have been classified by country of origin. Classification by type of business has been presented on page 68 in “Security type/country and sector allocations.” |
| @ | Illiquid security. At October 31, 2011, the aggregate amount of illiquid securities was $0, which represented 0% of the Portfolio’s net assets. See Note 10 in “Notes to financial statements.” |
| † | Non income producing security. |
| ≠ | The rate shown is the effective yield at the time of purchase. |
| ** | See Note 9 in “Notes to financial statements” for additional information on securities lending collateral. |
| © | There are no securities on loan at 10/31/11. |
| û | Dividend coupon which when presented with the corresponding coupon of the share benefits from a reduced withholding tax of 15% (rather than 25%) on dividends paid. |
The following foreign currency exchange contracts were outstanding at October 31, 2011:1
Foreign Currency Exchange Contracts
| | | | | | | | | | | | | | | Unrealized |
| | | Contracts to | | | | | | | Settlement | | Appreciation |
| Counterparty | | | Deliver | | In Exchange For | | Date | | (Depreciation) |
| MNB | | | AUD | | (26,561,000 | ) | | USD | | 27,876,035 | | | 1/31/12 | | | $ | 177,869 | | |
| MNB | | | CHF | | (12,196,000 | ) | | USD | | 13,626,816 | | | 1/31/12 | | | | (293,250 | ) | |
| | | | | | | | | | | | | | | | $ | (115,381 | ) | |
The use of foreign currency exchange contracts involves elements of market risk and risks in excess of the amounts recognized in the financial statements. The notional values presented above represent the Portfolio’s total exposure in such contracts, whereas only the net unrealized appreciation (depreciation) is reflected in the Portfolio’s net assets.
1See Note 8 in ”Notes to financial statements.”
Summary of Abbreviations:
ADR — American Depositary Receipts
AUD — Australian Dollar
CHF — Swiss Franc
CVA — Dutch Certificate
MNB — Mellon National Bank
USD — United States Dollar
VVPR Strip — Dividend Coupon
See accompanying notes, which are an integral part of the financial statements
2011 Annual report · Delaware Pooled Trust
(continues) 103
Statements of net assets
Delaware Pooled® Trust — The Labor Select International Equity Portfolio
October 31, 2011
| | | Number of | | Value |
| | | Shares | | (U.S. $) |
| Common Stock – 96.67%Δ | | | | | |
| Australia – 7.96% | | | | | |
| Amcor | | 1,584,038 | | $ | 11,595,797 |
| AMP | | 1,877,730 | | | 8,375,808 |
| QBE Insurance Group | | 667,495 | | | 10,280,551 |
| Telstra | | 4,556,440 | | | 14,802,893 |
| Treasury Wine Estates | | 138,307 | | | 540,330 |
| | | | | | 45,595,379 |
| Belgium – 0.00% | | | | | |
| û† | Ageas VVPR Strip | | 305,506 | | | 423 |
| | | | | | 423 |
| France – 16.08% | | | | | |
| Carrefour | | 488,250 | | | 12,922,322 |
| Cie de Saint-Gobain | | 126,419 | | | 5,844,670 |
| France Telecom | | 978,849 | | | 17,604,280 |
| GDF Suez | | 505,938 | | | 14,258,283 |
| † | GDF Suez Strip | | 101,871 | | | 141 |
| Sanofi-Aventis | | 228,027 | | | 16,318,136 |
| Societe Generale | | 217,991 | | | 6,243,494 |
| Total | | 197,261 | | | 10,295,882 |
| Vinci | | 174,804 | | | 8,574,886 |
| | | | | | 92,062,094 |
| Germany – 2.63% | | | | | |
| RWE | | 353,641 | | | 15,079,537 |
| | | | | | 15,079,537 |
| Ireland – 1.66% | | | | | |
| Experian | | 731,612 | | | 9,504,193 |
| | | | | | 9,504,193 |
| Israel – 2.11% | | | | | |
| Teva Pharmaceutical Industries ADR | | 295,200 | | | 12,058,920 |
| | | | | | 12,058,920 |
| Italy – 1.32% | | | | | |
| Intesa Sanpaolo | | 4,289,670 | | | 7,573,738 |
| | | | | | 7,573,738 |
| Japan – 18.82% | | | | | |
| Astellas Pharma | | 388,700 | | | 14,216,091 |
| Canon | | 409,800 | | | 18,604,020 |
| Hoya | | 138,600 | | | 3,027,963 |
| Kao | | 480,200 | | | 12,597,742 |
| Nintendo | | 37,000 | | | 5,582,213 |
| Seven & I Holdings | | 747,900 | | | 19,958,267 |
| Shin-Etsu Chemical | | 81,700 | | | 4,195,686 |
| Takeda Pharmaceutical | | 320,100 | | | 14,430,554 |
| Tokio Marine Holdings | | 528,600 | | | 12,604,195 |
| Trend Micro | | 72,000 | | | 2,574,787 |
| | | | | | 107,791,518 |
| Netherlands – 6.01% | | | | | |
| † | ING Groep CVA | | 805,640 | | | 6,947,663 |
| Koninklijke Ahold | | 1,246,603 | | | 15,932,236 |
| Reed Elsevier | | 936,420 | | | 11,503,082 |
| | | | | | 34,382,981 |
| Singapore – 4.41% | | | | | |
| Singapore Telecommunications | | 4,432,000 | | | 11,201,019 |
| United Overseas Bank | | 1,034,705 | | | 14,027,642 |
| | | | | | 25,228,661 |
| Spain – 6.88% | | | | | |
| Banco Santander | | 692,624 | | | 5,864,180 |
| † | Distribuidora Internacional | | | | | |
| de Alimentacion | | 409,814 | | | 1,874,742 |
| Iberdrola | | 1,830,758 | | | 13,249,789 |
| * | Telefonica | | 866,504 | | | 18,420,597 |
| | | | | | 39,409,308 |
| Switzerland – 6.59% | | | | | |
| Novartis | | 316,510 | | | 17,831,695 |
| SGS | | 3,291 | | | 5,645,798 |
| Zurich Financial Services | | 61,890 | | | 14,262,966 |
| | | | | | 37,740,459 |
| United Kingdom – 22.20% | | | | | |
| BG Group | | 799,211 | | | 17,330,101 |
| BP | | 2,412,059 | | | 17,749,942 |
| Compass Group | | 2,008,591 | | | 18,239,704 |
| GlaxoSmithKline | | 780,046 | | | 17,506,072 |
| * | Royal Dutch Shell Class A | | 608,286 | | | 21,576,609 |
| Unilever | | 514,151 | | | 17,234,422 |
| Vodafone Group | | 6,295,775 | | | 17,481,388 |
| | | | | | 127,118,238 |
| Total Common Stock | | | | | |
| (cost $575,954,409) | | | | | 553,545,449 |
| |
| | Principal
Amount (U.S. $) | | | |
| Short-Term Investments – 3.08% | | | | | |
| ≠Discount Notes – 0.79% | | | | | |
| Federal Home Loan Bank | | | | | |
| 0.003% 11/30/11 | $ | 3,921,523 | | | 3,921,492 |
| 0.01% 12/23/11 | | 568,048 | | | 568,040 |
| 0.04% 11/2/11 | | 8,155 | | | 8,155 |
| Freddie Mac 0.05% 11/2/11 | | 27,017 | | | 27,017 |
| | | | | | 4,524,704 |
| Repurchase Agreement – 2.29% | | | | | |
| BNP Paribas 0.08%, dated | | | | | |
| 10/31/11, to be repurchased | | | | | |
| on 11/1/11, repurchase price | | | | | |
| $13,115,029 (collateralized | | | | | |
| by U.S. government | | | | | |
| obligations 0.25%-4.625% | | | | | |
| 2/29/12-2/15/21, market | | | | | |
| value $13,377,300) | | 13,115,000 | | | 13,115,000 |
| | | | | | 13,115,000 |
| Total Short-Term Investments | | | | | |
| (cost $17,639,726) | | | | | 17,639,704 |
| |
| Total Value of Securities Before | | | | | |
| Securities Lending Collateral – 99.75% | | | |
| (cost $593,594,135) | | | | | 571,185,153 |
2011 Annual report · Delaware Pooled Trust
104
| | | Number of | | Value | |
| | | Shares | | (U.S. $) | |
| Securities Lending Collateral** – 3.39% | | | | |
| Investment Companies | | | | | | |
| BNY Mellon SL DBT II | | | | | | |
| Liquidating Fund | | 293,729 | | $ | 284,536 | |
| Delaware Investments | | | | | | |
| Collateral Fund No.1 | | 19,124,513 | | | 19,124,513 | |
| @†Mellon GSL Reinvestment Trust II | | 494,977 | | | 0 | |
| Total Securities Lending Collateral | | | | | | |
| (cost $19,913,219) | | | | | 19,409,049 | |
| | |
| Total Value of Securities – 103.14% | | | | | | |
| (cost $613,507,354) | | | | | 590,594,202 | © |
| Obligation to Return Securities | | | | | | |
| Lending Collateral** – (3.48%) | | | | | (19,913,219 | ) |
| Receivables and Other Assets | | | | | | |
| Net of Other Liabilities – 0.34% | | | | | 1,961,140 | |
| Net Assets Applicable to 44,309,613 | | | | | | |
| Shares Outstanding; Equivalent to | | | | | | |
| $12.92 per share – 100.00% | | | | $ | 572,642,123 | |
| | |
| Components of Net Assets at October 31, 2011: | | | | |
| Shares of beneficial interest | | | | | | |
| (unlimited authorization – no par) | | | | $ | 667,484,626 | |
| Undistributed net investment income | | | | | 19,713,120 | |
| Accumulated net realized loss on investments | | | (91,618,131 | ) |
| Net unrealized depreciation of investments | | | | | | |
| and foreign currencies | | | | | (22,937,492 | ) |
| Total net assets | | | | $ | 572,642,123 | |
| Δ | Securities have been classified by country of origin. Classification by type of business has been presented on page 69 in “Security type/country and sector allocations.” |
| † | Non income producing security. |
| * | Fully or partially on loan. |
| ** | See Note 9 in “Notes to financial statements” for additional information on securities lending collateral. |
| © | Includes $1,283,348 of securities loaned. |
| ≠ | The rate shown is the effective yield at time of purchase. |
| @ | Illiquid security. At October 31, 2011, the aggregate amount of illiquid securities was $0, which represented 0.00% of the Portfolio’s net assets. See Note 10 in “Notes to financial statements.” |
| û | Dividend coupon which when presented with the corresponding coupon of the share benefits from a reduced withholding tax of 15% (rather than 25%) on dividends paid. |
The following foreign currency exchange contracts were outstanding at October 31, 2011:1
Foreign Currency Exchange Contracts
| | | | | | | | | | | | | | | Unrealized |
| | | Contracts to | | | | | | | Settlement | | Appreciation |
| Counterparty | | | Deliver | | In Exchange For | | Date | | (Depreciation) |
| MNB | | | AUD | | (29,674,000 | ) | | USD | | 31,143,160 | | | 1/31/12 | | | $ | 198,715 | | |
| MNB | | | CHF | | (12,234,000 | ) | | USD | | 13,669,274 | | | 1/31/12 | | | | (294,163 | ) | |
| | | | | | | | | | | | | | | | $ | (95,448 | ) | |
The use of foreign currency exchange contracts involves elements of market risk and risks in excess of the amount recognized in the financial statements. The notional values presented above represent the Portfolio’s total exposure in such contracts, whereas only the net unrealized appreciation (depreciation) is reflected in the Portfolio’s net assets.
1See Note 8 in “Notes to financial statements.”
Summary of Abbreviations:
ADR — American Depositary Receipt
AUD — Australian Dollar
CHF — Swiss Franc
CVA — Dutch Certificate
MNB — Mellon National Bank
USD — United States Dollar
VVPR Strip — Dividend Coupon
See accompanying notes, which are an integral part of the financial statements.
2011 Annual report · Delaware Pooled Trust
(continues) 105
Statements of net assets
Delaware Pooled® Trust — The Emerging Markets Portfolio
October 31, 2011
| | | Number of | | Value |
| | | Shares | | (U.S. $) |
| Common Stock – 92.22%Δ | | | | | |
| Brazil – 13.45% | | | | | |
| @ | AES Tiete | | 63,394 | | $ | 792,610 |
| AmBev ADR | | 284,000 | | | 9,576,480 |
| CCR | | 378,800 | | | 10,438,397 |
| Cia Siderurgica Nacional ADR | | 508,600 | | | 4,760,496 |
| Cielo | | 332,274 | | | 8,867,993 |
| CPFL Energia | | 549,080 | | | 7,040,963 |
| Diagnosticos da America | | 282,000 | | | 2,272,816 |
| Itau Unibanco Holding ADR | | 256,200 | | | 4,898,544 |
| Redecard | | 505,700 | | | 8,404,774 |
| Vale ADR | | 611,600 | | | 14,433,760 |
| | | | | | 71,486,833 |
| Chile – 2.40% | | | | | |
| Enersis ADR | | 564,100 | | | 11,073,283 |
| # | Inversiones Aguas Metropolitan | | | | | |
| 144A ADR | | 53,200 | | | 1,672,172 |
| | | | | | 12,745,455 |
| nChina – 23.59% | | | | | |
| Beijing Enterprises Holdings | | 1,268,499 | | | 7,019,719 |
| Belle International Holdings | | 3,143,515 | | | 6,165,146 |
| China BlueChemical Class H | | 7,333,000 | | | 5,746,368 |
| China Construction Bank Class H | | 18,622,770 | | | 13,682,805 |
| China Gas Holdings | | 11,526,000 | | | 3,307,663 |
| China Merchants | | | | | |
| Holdings International | | 2,830,000 | | | 8,732,610 |
| China Mobile | | 1,202,500 | | | 11,428,971 |
| China Resources Power Holdings | | 5,730,000 | | | 10,176,791 |
| China Shenhua Energy Class H | | 2,806,500 | | | 12,839,154 |
| * | China Shipping Development | | | | | |
| Class H | | 5,646,000 | | | 3,991,618 |
| ENN Energy Holdings | | 1,038,000 | | | 3,750,843 |
| Hengan International Group | | 725,500 | | | 6,288,888 |
| * | Huabao International Holdings | | 4,974,000 | | | 3,159,772 |
| Industrial & Commercial Bank of | | | | | |
| China Class H | | 22,463,803 | | | 14,027,820 |
| Jiangsu Expressway Class H | | 6,976,000 | | | 6,012,695 |
| * | Want Want China Holdings | | 9,753,000 | | | 9,042,505 |
| | | | | | 125,373,368 |
| Colombia – 0.54% | | | | | |
| BanColombia ADR | | 45,900 | | | 2,863,242 |
| | | | | | 2,863,242 |
| India – 9.46% | | | | | |
| Axis Bank | | 471,068 | | | 11,133,527 |
| HCL Technologies | | 602,382 | | | 5,443,429 |
| Larsen & Toubro | | 380,328 | | | 10,971,105 |
| Rural Electrification | | 2,449,956 | | | 9,007,226 |
| Tata Motors | | 3,399,669 | | | 13,713,408 |
| | | | | | 50,268,695 |
| Indonesia – 3.82% | | | | | |
| Astra International | | 1,292,000 | | | 9,962,331 |
| Perusahaan Gas Negara | | 31,419,500 | | | 10,363,965 |
| | | | | | 20,326,296 |
| Kazakhstan – 0.87% | | | | | |
| KazMunaiGas Exploration | | | | | |
| Production GDR | | 272,666 | | | 4,635,770 |
| | | | | | 4,635,770 |
| Malaysia – 1.17% | | | | | |
| Maxis | | 3,577,200 | | | 6,220,844 |
| | | | | | 6,220,844 |
| Mexico – 4.70% | | | | | |
| * | Compartamos | | 4,098,300 | | | 6,328,662 |
| Grupo Aeroportuario del | | | | | |
| Pacifico ADR | | 103,900 | | | 3,601,174 |
| Grupo Mexico Series B | | 3,518,500 | | | 9,743,059 |
| Grupo Televisa ADR | | 119,100 | | | 2,540,403 |
| Kimberly-Clark de Mexico Class A | | 482,700 | | | 2,744,567 |
| | | | | | 24,957,865 |
| Peru – 2.18% | | | | | |
| Credicorp | | 106,530 | | | 11,588,333 |
| | | | | | 11,588,333 |
| Philippines – 1.77% | | | | | |
| Philippine Long Distance | | | | | |
| Telephone ADR | | 169,400 | | | 9,408,476 |
| | | | | | 9,408,476 |
| Poland – 0.70% | | | | | |
| Bank Pekao | | 40,060 | | | 1,854,531 |
| PGE | | 300,246 | | | 1,846,741 |
| | | | | | 3,701,272 |
| Republic of Korea – 5.09% | | | | | |
| Kangwon Land | | 205,560 | | | 5,459,448 |
| KB Financial Group | | 220,894 | | | 8,525,917 |
| Samsung Electronics | | 15,268 | | | 13,094,592 |
| | | | | | 27,079,957 |
| Russia – 3.23% | | | | | |
| Gazprom ADR | | 700,097 | | | 8,128,126 |
| LUKOIL ADR | | 156,364 | | | 9,022,203 |
| | | | | | 17,150,329 |
| South Africa – 5.15% | | | | | |
| African Bank Investments | | 1,196,632 | | | 5,165,227 |
| Clicks Group | | 671,472 | | | 3,507,612 |
| Life Healthcare Group Holdings | | 804,768 | | | 1,950,342 |
| Sasol | | 194,310 | | | 8,736,554 |
| Tiger Brands | | 280,062 | | | 8,034,496 |
| | | | | | 27,394,231 |
| Taiwan – 6.65% | | | | | |
| Chunghwa Telecom | | 758,836 | | | 2,538,785 |
| Chunghwa Telecom ADR | | 220,838 | | | 7,426,782 |
| HTC | | 337,000 | | | 7,573,587 |
| Lite-On Technology | | 914,300 | | | 862,769 |
| Quanta Computer | | 1,417,000 | | | 2,788,428 |
| Taiwan Semiconductor Manufacturing | | 5,141,588 | | | 12,529,416 |
| Wistron | | 1,394,326 | | | 1,613,653 |
| | | | | | 35,333,420 |
2011 Annual report · Delaware Pooled Trust
106
| | | Number of | | Value | |
| | | Shares | | (U.S. $) | |
| Common Stock (continued) | | | | | | |
| Thailand – 4.01% | | | | | | |
| Kasikornbank Foreign | | 538,154 | | $ | 2,174,064 | |
| Kasikornbank NVDR | | 2,077,500 | | | 8,285,390 | |
| PTT PCL Foreign | | 1,093,200 | | | 10,882,212 | |
| | | | | | 21,341,666 | |
| Turkey – 3.44% | | | | | | |
| Tofas Turk Otomobil Fabrikasi | | 642,675 | | | 2,469,410 | |
| Tupras Turkiye Petrol Rafinerileri | | 358,062 | | | 8,065,591 | |
| * | Turkiye Garanti Bankasi | | 2,215,232 | | | 7,770,319 | |
| | | | | | 18,305,320 | |
| Total Common Stock | | | | | | |
| (cost $480,255,220) | | | | | 490,181,372 | |
| | |
| Preferred Stock – 6.29% | | | | | | |
| Brazil – 4.63% | | | | | | |
| AES Tiete | | 241,600 | | | 3,458,262 | |
| Investimentos Itau | | 1,524,357 | | | 9,578,274 | |
| Petroleo Brasiliero | | 926,600 | | | 11,590,594 | |
| | | | | | 24,627,130 | |
| Republic of Korea – 1.66% | | | | | | |
| Hyundai Motor 2.91% | | 42,651 | | | 2,845,436 | |
| Samsung Electronics 2.25% | | 10,494 | | | 5,965,006 | |
| | | | | | 8,810,442 | |
| Total Preferred Stock | | | | | | |
| (cost $27,772,424) | | | | | 33,437,572 | |
| | |
| | | Principal | | | | |
| | | Amount (U.S. $) | | | | |
| Short-Term Investments – 1.41% | | | | | | |
| ≠Discount Notes – 0.12% | | | | | | |
| Federal Home Loan Bank | | | | | | |
| 0.003% 11/30/11 | | $ 539,955 | | | 539,951 | |
| 0.01% 12/23/11 | | 78,215 | | | 78,214 | |
| | | | | | 618,165 | |
| Repurchase Agreement – 1.29% | | | | | | |
| BNP Paribas 0.08%, dated 10/31/11, | | | | | | |
| to be repurchased on 11/1/11, | | | | | | |
| repurchase price $6,867,015 | | | | | | |
| (collateralized by U.S. government | | | | | | |
| obligations 0.25%-4.625% | | | | | | |
| 2/29/12-2/15/21, market value | | | | | | |
| $7,004,340) | | 6,867,000 | | | 6,867,000 | |
| | | | | | 6,867,000 | |
| Total Short-Term Investments | | | | | | |
| (cost $7,485,168) | | | | | 7,485,165 | |
| | |
| Total Value of Securities Before Securities | | | | |
| Lending Collateral – 99.92% | | | | | | |
| (cost $515,512,812) | | | | | 531,104,109 | |
| | | | | | | |
| | | Number of | | | |
| | | Shares | | | |
| Securities Lending Collateral** – 2.75% | | | | |
| Investment Companies | | | | | | |
| BNY Mellon SL DBT II | | | | | | |
| Liquidating Fund | | 313,670 | | | 303,852 | |
| Delaware Investments | | | | | | |
| Collateral Fund No 1 | | 14,303,250 | | | 14,303,250 | |
| @† | Mellon GSL Reinvestment Trust II | | 546,716 | | | 0 | |
| Total Securities Lending Collateral | | | | | | |
| (cost $15,163,636) | | | | | 14,607,102 | |
| |
| Total Value of Securities – 102.67% | | | | | | |
| (cost $530,676,448) | | | | | 545,711,211 | © |
| Obligation to Return Securities | | | | | | |
| Lending Collateral** – (2.85%) | | | | | (15,163,636 | ) |
| Receivables and Other Assets | | | | | | |
| Net of Other Liabilities – 0.18% | | | | | 979,020 | |
| Net Assets Applicable to 50,593,916 | | | | | | |
| Shares Outstanding; Equivalent to | | | | | | |
| $10.51 Per Share – 100.00% | | | | $ | 531,526,595 | |
| |
| Components of Net Assets at October 31, 2011: | | | | |
| Shares of beneficial interest | | | | | | |
| (unlimited authorization – no par) | | | | $ | 465,668,883 | |
| Undistributed net investment income | | | | | 11,016,448 | |
| Accumulated net realized gain on investments | | | 39,932,373 | |
| Net unrealized appreciation of investments | | | | | | |
| and foreign currencies | | | | | 14,908,891 | |
| Total net assets | | | | $ | 531,526,595 | |
| Δ | Securities have been classified by country of origin. Classification by type of business has been presented on page 70 in “Security type/country and sector allocations.” |
| * | Fully or partially on loan. |
| @ | Illiquid security. At October 31, 2011, the aggregate amount of illiquid securities was $792,610, which represented 0.15% of the Portfolio’s net assets. See Note 10 in “Notes to financial statements.” |
| # | Security exempt from registration under Rule 144A of the Securities Act of 1933, as amended. At October 31, 2011, the aggregate amount of Rule 144A securities was $1,672,172 which represented 0.31% of the Portfolio’s net assets. See Note 10 in “Notes to financial statements.” |
| n | Securities listed and traded on the Hong Kong Stock Exchange. These securities have significant business operations in China. |
| † | Non income producing security. |
| ≠ | The rate shown is the effective yield at the time of purchase. |
| ** | See Note 9 in “Notes to financial statements” for additional information on securities lending collateral. |
| © | Includes $13,796,620 of securities loaned. |
2011 Annual report · Delaware Pooled Trust
(continues) 107
Statements of net assets
Delaware Pooled® Trust — The Emerging Markets Portfolio
| | | | | | | |
| The following foreign currency exchange contracts were outstanding at October 31, 2011:1 | | | | | | |
| | |
| Foreign Currency Exchange Contracts |
| | |
| | | | | | | | | | | | | Unrealized |
| | | | | | | | | | | Settlement | | Appreciation |
| Counterparty | | | Contracts to Receive | | In Exchange For | | Date | | (Depreciation) |
| MNB | | IDR | | 1,486,365,443 | | USD | | (168,522 | ) | | 11/1/11 | | | $ | (637 | ) | |
| MNB | | INR | | 15,398,852 | | USD | | (315,201 | ) | | 11/1/11 | | | | 1,069 | | |
| MNB | | TRY | | 114,026 | | USD | | (65,120 | ) | | 11/1/11 | | | | (672 | ) | |
| MNB | | TWD | | 83,443,600 | | USD | | (2,793,559 | ) | | 11/1/11 | | | | (4,432 | ) | |
| MNB | | ZAR | | 708,320 | | USD | | (91,607 | ) | | 11/2/11 | | | | (2,395 | ) | |
| | | | | | | | | | | | | | $ | (7,067 | ) | |
The use of foreign currency exchange contracts involves elements of market risk and risks in excess of the amount recognized in the financial statements. The notional values presented above represent the Portfolio’s total exposure in such contracts, whereas only the net unrealized appreciation (depreciation) is reflected in the Portfolio’s net assets.
1See Note 8 in “Notes to financial statements.”
Summary of Abbreviations:
ADR — American Depositary Receipt
GDR — Global Depositary Receipt
IDR — Indonesian Rupiah
INR — Indian Rupee
MNB — Mellon National Bank
NVDR — Non-Voting Depositary Receipt
TRY — Turkish Lira
TWD — Taiwan Dollar
USD — United States Dollar
ZAR — South African Rand
See accompanying notes, which are an integral part of the financial statements
2011 Annual report · Delaware Pooled Trust
108
Delaware Pooled® Trust — The Emerging Markets Portfolio II
October 31, 2011
| | | | Number of | | Value |
| | | Shares | | (U.S. $) |
| Common Stock – 97.79%Δ | | | | | |
| Argentina – 0.83% | | | | | |
| @ | Cresud ADR | | 7,700 | | $ | 89,397 |
| @ | IRSA Inversiones y Representaciones ADR | | 3,800 | | | 38,228 |
| | | | | | | 127,625 |
| Bahrain – 0.07% | | | | | |
| @# | Aluminum Bahrain 144A GDR | | 1,800 | | | 11,459 |
| | | | | | 11,459 |
| Brazil – 16.92% | | | | | |
| All America Latina Logistica | | 15,413 | | | 77,101 |
| B2W Cia Global Do Varejo | | 5,926 | | | 48,175 |
| Banco Bradesco ADR | | 5,230 | | | 95,186 |
| Banco Santander Brasil ADR | | 17,500 | | | 159,250 |
| Brasil Foods ADR | | 7,000 | | | 147,350 |
| Braskem ADR | | 4,600 | | | 82,984 |
| Centrais Eletricas Brasileiras ADR | | 4,800 | | | 47,760 |
| Cia Brasileira de Distribuicao Grupo | | | | | |
| Pao de Acucar ADR | | 1,800 | | | 70,542 |
| Cyrela Brazil Realty | | | | | |
| Empreendimentos e Participacoes | | 3,280 | | | 28,919 |
| Fibria Celulose ADR | | 19,000 | | | 168,530 |
| @ | Gerdau | | 11,700 | | | 89,869 |
| Gerdau ADR | | 13,000 | | | 117,260 |
| Gol Linhas Aereas Inteligentes ADR | | 17,700 | | | 141,954 |
| Hypermarcas | | 16,100 | | | 87,569 |
| Itau Unibanco Holding ADR | | 4,400 | | | 84,128 |
| Light | | 4,100 | | | 64,609 |
| Petroleo Brasileiro ADR | | 21,700 | | | 586,118 |
| Santos Brasil Participacoes | | 4,800 | | | 71,139 |
| Telefonica Brasil Class B ADR | | 3,255 | | | 94,460 |
| Vale ADR | | 13,100 | | | 332,871 |
| | | | | | 2,595,774 |
| China/Hong Kong – 13.26% | | | | | |
| Alibaba.com | | 16,500 | | | 19,377 |
| † | Baidu ADR | | 400 | | | 56,072 |
| Bank of China | | 144,000 | | | 51,251 |
| China Coal Energy | | 76,000 | | | 94,660 |
| China Construction Bank | | 135,590 | | | 99,623 |
| China Mengniu Dairy | | 27,000 | | | 86,035 |
| China Mobile ADR | | 6,400 | | | 304,385 |
| China Telecom | | 258,000 | | | 159,291 |
| China Unicom ADR | | 11,100 | | | 223,221 |
| CNOOC ADR | | 800 | | | 150,888 |
| Industrial & Commercial | | | | | |
| Bank of China | | 265,999 | | | 166,107 |
| Leoch International Technology | | 6,000 | | | 1,961 |
| PetroChina ADR | | 1,100 | | | 142,571 |
| † | Renren ADR | | 400 | | | 2,816 |
| @† | Shanda Interactive Entertainment ADR | | 3,700 | | | 147,075 |
| † | Sina | | 1,900 | | | 154,451 |
| @† | Tianjin Development Holdings | | 56,000 | | | 26,130 |
| Tingyi Cayman Islands Holding | | 26,000 | | | 73,949 |
| Tsingtao Brewery Class H | | 14,000 | | | 71,192 |
| † | Xueda Education Group ADR | | 1,000 | | | 3,320 |
| | | | | | 2,034,375 |
| Guernsey – 0.15% | | | | | |
| =@#† | Etalon Group 144A | | 4,800 | | | 23,606 |
| | | | | | 23,606 |
| Hungary – 0.58% | | | | | |
| OTP Bank | | 5,627 | | | 88,261 |
| | | | | | 88,261 |
| India – 3.83% | | | | | |
| ICICI Bank ADR | | 2,500 | | | 92,900 |
| # | Reliance Industries 144A GDR | | 7,000 | | | 253,078 |
| Steel Authority of India | | 32,248 | | | 73,794 |
| Ultratech Cement | | 1,689 | | | 39,879 |
| @ | United Spirits | | 7,130 | | | 127,829 |
| | | | | | 587,480 |
| Indonesia – 1.60% | | | | | |
| Tambang Batubara Bukit Asam | | 62,000 | | | 127,142 |
| United Tractors | | 43,106 | | | 118,565 |
| | | | | | 245,707 |
| Israel – 0.62% | | | | | |
| Israel Chemicals | | 8,000 | | | 94,913 |
| | | | | | 94,913 |
| Malaysia – 1.96% | | | | | |
| @ | KLCC Property Holdings | | 106,900 | | | 108,267 |
| Petronas Chemicals Group | | 28,600 | | | 59,663 |
| @† | UEM Land Holdings | | 186,100 | | | 132,306 |
| | | | | | 300,236 |
| Mexico – 5.94% | | | | | |
| America Movil Class L ADR | | 5,600 | | | 142,352 |
| Cemex ADR | | 36,752 | | | 160,606 |
| † | Empresas ICA ADR | | 14,800 | | | 78,884 |
| Fomento Economico Mexicano ADR | | 1,700 | | | 113,985 |
| Grupo Financiero Banorte | | 15,000 | | | 51,105 |
| Grupo Televisa ADR | | 13,200 | | | 281,557 |
| Wal-Mart de Mexico | | 31,822 | | | 82,059 |
| | | | | | 910,548 |
| Peru – 1.27% | | | | | |
| Cia de Minas Buenaventura ADR | | 2,900 | | | 118,697 |
| Credicorp | | 700 | | | 76,146 |
| | | | | | 194,843 |
| Poland – 1.64% | | | | | |
| † | Jastrzebska Spolka Weglowa | | 1,900 | | | 55,607 |
| Polski Koncern Naftowy Orlen | | 5,225 | | | 64,510 |
| Powszechna Kasa Oszczednosci | | | | | |
| Bank Polski | | 3,400 | | | 38,665 |
| Powszechny Zaklad Ubezpieczen | | 876 | | | 92,761 |
| | | | | | 251,543 |
| Republic of Korea – 16.81% | | | | | |
| @ | KB Financial Group ADR | | 6,400 | | | 249,920 |
| @ | KCC | | 771 | | | 186,189 |
| KT ADR | | 12,100 | | | 201,828 |
| KT&G | | 3,604 | | | 225,179 |
| LG Display ADR | | 5,200 | | | 52,312 |
| LG Electronics | | 1,463 | | | 96,492 |
| LG Uplus | | 14,420 | | | 85,557 |
| @ | Lotte Chilsung Beverage | | 305 | | | 341,137 |
2011 Annual report · Delaware Pooled Trust
(continues) 109
Statements of net assets
Delaware Pooled® Trust — The Emerging Markets Portfolio II
| | | | Number of | | Value | |
| | | Shares | | (U.S. $) | |
| Common Stock (continued) | | | | | | | |
| Republic of Korea (continued) | | | | | | | |
| @ | Lotte Confectionery | | | 136 | | $ | 211,865 | |
| POSCO ADR | | | 900 | | | 77,328 | |
| Samsung Electronics | | | 565 | | | 484,573 | |
| # | Samsung Life Insurance 144A | | | 2,250 | | | 173,849 | |
| SK Telecom ADR | | | 13,000 | | | 192,270 | |
| | | | | | | 2,578,499 | |
| Russia – 5.99% | | | | | | | |
| Gazprom ADR | | | 19,900 | | | 231,038 | |
| LUKOIL ADR | | | 2,300 | | | 132,710 | |
| MMC Norilsk Nickel ADR | | | 4,200 | | | 81,904 | |
| Mobile Telesystems ADR | | | 2,600 | | | 37,154 | |
| † | Rosneft Oil GDR | | | 16,700 | | | 118,330 | |
| @ | Sberbank | | | 74,858 | | | 209,977 | |
| VTB Bank GDR | | | 22,600 | | | 108,022 | |
| | | | | | | 919,135 | |
| South Africa – 5.87% | | | | | | | |
| Anglo American Platinum | | | 1,115 | | | 80,269 | |
| ArcelorMittal South Africa | | | 14,944 | | | 126,198 | |
| Impala Platinum Holdings | | | 2,858 | | | 65,621 | |
| MTN Group | | | 7,858 | | | 136,546 | |
| Sasol ADR | | | 2,800 | | | 126,672 | |
| Standard Bank Group | | | 14,135 | | | 173,526 | |
| Vodacom Group | | | 16,926 | | | 190,897 | |
| | | | | | | 899,729 | |
| Taiwan – 7.25% | | | | | | | |
| Cathay Financial Holding | | | 68,085 | | | 81,194 | |
| Chunghwa Telecom ADR | | | 3,500 | | | 117,705 | |
| Fubon Financial Holding | | | 84,096 | | | 98,597 | |
| Hon Hai Precision Industry | | | 117,376 | | | 321,773 | |
| HTC | | | 3,310 | | | 74,387 | |
| MediaTek | | | 5,003 | | | 52,503 | |
| Taiwan Semiconductor | | | | | | | |
| Manufacturing | | | 42,000 | | | 102,349 | |
| Taiwan Semiconductor | | | | | | | |
| Manufacturing ADR | | | 8,600 | | | 108,532 | |
| United Microelectronics | | | 352,000 | | | 154,553 | |
| | | | | | | 1,111,593 | |
| Thailand – 2.29% | | | | | | | |
| Bangkok Bank | | | 19,280 | | | 92,922 | |
| PTT | | | 14,306 | | | 142,409 | |
| PTT Exploration & Production | | | 5,800 | | | 30,377 | |
| Siam Cement NVDR | | | 8,400 | | | 85,314 | |
| | | | | | | 351,022 | |
| Turkey – 1.91% | | | | | | | |
| Torunlar Gayrimenkul Yatirim Ortakligi | | | 8,367 | | | 23,183 | |
| Turkcell Iletisim Hizmet ADR | | | 10,800 | | | 133,056 | |
| Turkiye Is Bankasi Class C | | | 34,641 | | | 80,494 | |
| @ | Turkiye Sise ve Cam Fabrikalari | | | 29,459 | | | 56,229 | |
| | | | | | | 292,962 | |
| United Kingdom – 0.68% | | | | | | | |
| Anglo American ADR | | | 5,600 | | | 103,654 | |
| | | | | | | 103,654 | |
| United States – 8.32% | | | | | | | |
| Archer-Daniels-Midland | | | 7,800 | | | 225,732 | |
| Avon Products | | | 25,400 | | | 464,312 | |
| Bunge | | | 2,200 | | | 135,894 | |
| † | MEMC Electronic Materials | | | 8,100 | | | 48,519 | |
| † | Yahoo | | | 25,700 | | | 401,948 | |
| | | | | | | 1,276,405 | |
| Total Common Stock (cost $16,288,855) | | | | | | 14,999,369 | |
| |
| | | | Principal | | | | |
| | | | Amount (U.S. $) | | | | |
| Short-Term Investment – 1.07% | | | | | | | |
| Repurchase Agreement – 1.07% | | | | | | | |
| BNP Paribas 0.08%, dated | | | | | | | |
| 10/31/11, to be repurchased | | | | | | | |
| on 11/1/11, repurchase price | | | | | | | |
| $164,000 (collateralized by U.S. | | | | | | | |
| government obligations 0.25%- | | | | | | | |
| 4.625% 2/29/12-2/15/21; market | | | | | | | |
| value $167,280) | | $ | 164,000 | | | 164,000 | |
| Total Short-Term Investment | | | | | | | |
| (cost $164,000) | | | | | | 164,000 | |
| |
| Total Value of Securities – 98.86% | | | | | | | |
| (cost $16,452,855) | | | | | | 15,163,369 | |
| Receivables and Other Assets | | | | | | | |
| Net of Liabilities – 1.14% | | | | | | 175,623 | |
| Net Assets Applicable to 1,793,704 | | | | | | | |
| Shares Outstanding; Equivalent to | | | | | | | |
| $8.55 Per Share – 100.00% | | | | | $ | 15,338,992 | |
| |
| Components of Net Assets at October 31, 2011: | | | | |
| Shares of beneficial interest | | | | | | | |
| (unlimited authorization – no par) | | | | | $ | 16,019,054 | |
| Undistributed net investment income | | | | | | 95,191 | |
| Accumulated net realized gain on investments | | | | | | 523,278 | |
| Net unrealized depreciation of investments and | | | | | | | |
| foreign currencies | | | | | | (1,298,531 | ) |
| Total net assets | | | | | $ | 15,338,992 | |
2011 Annual report · Delaware Pooled Trust
110
| | |
| Δ | Securities have been classified by country of origin. Classification by type of business has been presented on page 71 in “Security type/country and sector allocations.” |
| † | Non income producing security. |
| # | Security exempt from registration under Rule 144A of the Securities Act of 1933, as amended. At October 31, 2011, the aggregate amount of Rule 144A securities was $461,992, which represented 3.01% of the Portfolio’s net assets. See Note 10 in “Notes to financial statements.” |
| @ | Illiquid security. At October 31, 2011, the aggregate amount of illiquid securities was $2,049,483, which represented 13.36% of the Portfolio’s net assets. See Note 10 in “Notes to financial statements.” |
| = | Security is being fair valued in accordance with the Portfolio’s fair valuation policy. At October 31, 2011, the aggregate amount of fair valued securities was $23,606 which represented 0.15% of the Portfolio’s net assets. See Note 1 in “Notes to financial statements.” |
Summary of Abbreviations:
ADR — American Depositary Receipt
GDR — Global Depositary Receipt
NVDR — Non-Voting Depositary Receipt
See accompanying notes, which are an integral part of the financial statements.
2011 Annual report · Delaware Pooled Trust
(continues) 111
Statements of net assets
Delaware Pooled® Trust — The Global Real Estate Securities Portfolio
October 31, 2011
| | | | Number of | | Value |
| | | Shares | | (U.S. $) |
| Common Stock – 99.14%Δ | | | | | |
| Australia – 9.20% | | | | | |
| CFS Retail Property Trust | | 215,954 | | $ | 411,906 |
| Dexus Property Group | | 901,723 | | | 802,595 |
| Goodman Group | | 812,048 | | | 528,002 |
| GPT Group | | 194,973 | | | 643,835 |
| =@† | GPT Group-In Specie | | 1,337,300 | | | 0 |
| Investa Office Fund | | 470,364 | | | 307,674 |
| Mirvac Group | | 356,344 | | | 466,894 |
| Westfield Group | | 171,659 | | | 1,382,708 |
| | | | | | 4,543,614 |
| Austria – 0.61% | | | | | |
| Conwert Immobilien Invest | | 21,984 | | | 299,734 |
| | | | | | 299,734 |
| Belgium – 0.98% | | | | | |
| Cofinimmo | | 3,961 | | | 483,025 |
| | | | | | 483,025 |
| Brazil – 0.35% | | | | | |
| Cyrela | | 19,600 | | | 172,807 |
| | | | | | 172,807 |
| Canada – 5.52% | | | | | |
| * | Boardwalk Real Estate Investment Trust | | 12,280 | | | 599,199 |
| * | Calloway Real Estate Investment Trust | | 28,993 | | | 764,311 |
| * | Canadian Real Estate Investment Trust | | 18,061 | | | 642,314 |
| * | First Capital Realty | | 24,081 | | | 392,721 |
| * | H&R Real Estate Investment Trust | | 14,840 | | | 323,828 |
| | | | | | 2,722,373 |
| China/Hong Kong – 12.17% | | | | | |
| * | Champion REIT | | 765,155 | | | 315,675 |
| * | China Overseas Land & Investment | | 265,164 | | | 490,657 |
| Hang Lung Properties | | 230,642 | | | 839,956 |
| Hongkong Land Holdings | | 64,000 | | | 336,322 |
| Link REIT | | 252,500 | | | 867,147 |
| Shimao Property Holdings | | 313,000 | | | 305,588 |
| Soho China | | 280,425 | | | 199,934 |
| Sun Hung Kai Properties | | 144,735 | | | 1,992,825 |
| Wharf Holdings | | 124,200 | | | 660,650 |
| | | | | | 6,008,754 |
| France – 3.47% | | | | | |
| ICADE | | 3,452 | | | 309,046 |
| Klepierre | | 10,351 | | | 322,742 |
| Unibail-Rodamco | | 5,444 | | | 1,082,670 |
| | | | | | 1,714,458 |
| Germany – 1.37% | | | | | |
| Alstria Office REIT | | 14,225 | | | 182,462 |
| Deutsche Wohnen | | 33,482 | | | 493,128 |
| | | | | | 675,590 |
| Japan – 7.62% | | | | | |
| Japan Prime Realty Investment | | 129 | | | 308,929 |
| Japan Real Estate Investment | | 23 | | | 196,183 |
| Mitsubishi Estate | | 83,772 | | | 1,418,850 |
| Mitsui Fudosan | | 87,446 | | | 1,454,251 |
| United Urban Investment | | 339 | | | 382,271 |
| | | | | | | 3,760,484 |
| Netherlands – 0.35% | | | | | |
| Nieuwe Steen Investments | | 11,619 | | | 172,086 |
| | | | | | 172,086 |
| Singapore – 3.62% | | | | | |
| CapitaCommerical Trust | | 277,600 | | | 247,887 |
| CapitaLand | | 98,145 | | | 211,364 |
| † | Global Logistic Properties | | 291,000 | | | 405,007 |
| Mapletree Logistics Trust | | 524,760 | | | 356,247 |
| Parkway Life Real Estate Investment Trust | | 397,812 | | | 567,463 |
| | | | | | 1,787,968 |
| Switzerland – 0.60% | | | | | |
| PSP Swiss Property | | 3,261 | | | 296,703 |
| | | | | | 296,703 |
| United Kingdom – 6.51% | | | | | |
| British Land | | 123,013 | | | 1,006,385 |
| Derwent London | | 18,835 | | | 512,677 |
| Great Portland Estates | | 79,132 | | | 473,057 |
| Hammerson | | 113,723 | | | 742,964 |
| Shaftesbury | | 59,357 | | | 479,652 |
| | | | | | 3,214,735 |
| United States – 46.77% | | | | | |
| Alexandria Real Estate Equities | | 5,466 | | | 361,248 |
| Apartment Investment & Management | | 5,861 | | | 144,591 |
| AvalonBay Communities | | 6,341 | | | 847,728 |
| Boston Properties | | 10,329 | | | 1,022,468 |
| Brandywine Realty Trust | | 24,417 | | | 222,439 |
| BRE Properties | | 11,471 | | | 574,927 |
| Camden Property Trust | | 2,629 | | | 159,423 |
| CBL & Associates Properties | | 14,781 | | | 227,332 |
| Cogdell Spencer | | 27,313 | | | 110,345 |
| Colonial Properties Trust | | 14,960 | | | 303,389 |
| DCT Industrial Trust | | 49,697 | | | 246,497 |
| DDR | | 33,790 | | | 432,850 |
| * | Digital Realty Trust | | 7,802 | | | 486,299 |
| * | Douglas Emmett | | 22,951 | | | 447,545 |
| Duke Realty | | 13,184 | | | 161,900 |
| * | DuPont Fabros Technology | | 4,935 | | | 102,599 |
| Education Realty Trust | | 36,259 | | | 335,396 |
| Equity Lifestyle Properties | | 6,187 | | | 409,146 |
| Equity Residential | | 20,864 | | | 1,224,299 |
| * | Extra Space Storage | | 22,786 | | | 513,369 |
| Federal Realty Investment Trust | | 4,972 | | | 441,315 |
| General Growth Properties | | 13,173 | | | 193,643 |
| Glimcher Realty Trust | | 19,487 | | | 178,501 |
| * | HCP | | 19,210 | | | 765,519 |
| * | Highwoods Properties | | 5,336 | | | 165,309 |
| Host Hotels & Resorts | | 66,796 | | | 953,179 |
| Kilroy Realty | | 9,365 | | | 343,602 |
| Kimco Realty | | 30,856 | | | 539,054 |
| Lexington Reality Trust | | 23,726 | | | 186,486 |
| * | Liberty Property Trust | | 5,705 | | | 182,560 |
| Macerich | | 17,835 | | | 887,470 |
2011 Annual report · Delaware Pooled Trust
112
| | | | Number of | | Value | |
| | | Shares | | (U.S. $) | |
| Common Stock (continued) | | | | | | | |
| United States (continued) | | | | | | | |
| National Retail Properties | | | 12,319 | | $ | 335,693 | |
| ProLogis | | | 42,766 | | | 1,272,715 | |
| PS Business Parks | | | 5,109 | | | 271,952 | |
| Public Storage | | | 8,453 | | | 1,090,860 | |
| Regency Centers | | | 6,491 | | | 265,871 | |
| Simon Property Group | | | 18,975 | | | 2,437,148 | |
| SL Green Realty | | | 9,677 | | | 667,616 | |
| Starwood Hotels & Resorts Worldwide | | | 5,853 | | | 293,294 | |
| † | Strategic Hotel & Resorts | | | 28,922 | | | 164,566 | |
| Taubman Centers | | | 9,177 | | | 561,908 | |
| UDR | | | 14,723 | | | 367,044 | |
| Ventas | | | 25,713 | | | 1,429,899 | |
| Vornado Realty Trust | | | 8,026 | | | 664,633 | |
| * | Washington Real Estate Investment Trust | | | 3,238 | | | 93,772 | |
| | | | | | | 23,087,399 | |
| Total Common Stock | | | | | | | |
| (cost $47,498,529) | | | | | | 48,939,730 | |
| |
| Warrant – 0.00% | | | | | | | |
| = | Nieuwe Steen | | | 12,954 | | | 0 | |
| Total Warrant (cost $0) | | | | | | 0 | |
| |
| | | Principal | | | | |
| | | Amount (U.S. $) | | | | |
| Short-Term Investments – 2.91% | | | | | | | |
| ≠Discount Notes – 1.97% | | | | | | | |
| Federal Home Loan Bank | | | | | | | |
| 0.003% 11/30/11 | | $ | 806,672 | | | 806,666 | |
| 0.01% 12/23/11 | | | 116,850 | | | 116,848 | |
| 0.04% 11/2/11 | | | 11,601 | | | 11,601 | |
| Freddie Mac 0.05% 11/2/11 | | | 38,433 | | | 38,433 | |
| | | | | | | 973,548 | |
| Repurchase Agreement – 0.94% | | | | | | | |
| BNP Paribas 0.08%, dated | | | | | | | |
| 10/31/11, to be repurchased | | | | | | | |
| on 11/1/11, repurchase price | | | | | | | |
| $464,001 (collateralized by U.S. | | | | | | | |
| government obligations 0.25%- | | | | | | | |
| 4.625% 2/29/12-2/15/21; | | | | | | | |
| market value $473,280) | | | 464,000 | | | 464,000 | |
| | | | | | | 464,000 | |
| Total Short-Term Investments | | | | | | | |
| (cost $1,437,552) | | | | | | 1,437,548 | |
| |
| Total Value of Securities Before Securities | | | | |
| Lending Collateral – 102.05% | | | | | | | |
| (cost $48,936,081) | | | | | | 50,377,278 | |
| | | | | | | | |
| | | Number of | | | |
| | | Shares | | | |
| Securities Lending Collateral** – 9.72% | | | | | | | |
| Investment Companies | | | | | | | |
| BNY Mellon SL DBT II | | | | | | | |
| Liquidating Fund | | | 95,564 | | | 92,573 | |
| Delaware Investments | | | | | | | |
| Collateral Fund No.1 | | | 4,707,908 | | | 4,707,908 | |
| @† | Mellon GSL Reinvestment | | | | | | | |
| Trust II | | | 394,559 | | | 0 | |
| Total Securities Lending Collateral | | | | | | | |
| (cost $5,198,031) | | | | | | 4,800,481 | |
| |
| Total Value of Securities – 111.77% | | | | | | | |
| (cost $54,134,112) | | | | | | 55,177,759 | © |
| Obligation to Return Securities | | | | | | | |
| Lending Collateral** – (10.53%) | | | | | | (5,198,031 | ) |
| Other Liabilities Net of Receivables and | | | | | | | |
| Other Assets – (1.24%) | | | | | | (612,550 | ) |
| Net Assets Applicable to 9,160,049 | | | | | | | |
| Shares Outstanding – 100.00% | | | | | $ | 49,367,178 | |
| |
| Net Asset Value – Delaware Pooled® Trust – | | | | | | | |
| The Global Real Estate Securities Portfolio | | | | | | | |
| Original Class ($49,359,418 / 9,158,605 Shares) | | | | | | | $5.39 | |
| Net Asset Value – Delaware Pooled Trust – | | | | | | | |
| The Global Real Estate Securities Portfolio | | | | | | | |
| Class P ($7,760 / 1,444 Shares) | | | | | | | $5.37 | |
| |
| Components of Net Assets at October 31, 2011: | | | | | |
| Shares of beneficial interest | | | | | | | |
| (unlimited authorization – no par) | | | | $ | 157,314,625 | |
| Undistributed net investment income | | | | | | 1,276,350 | |
| Accumulated net realized loss on investments | | | (110,266,506 | ) |
| Net unrealized appreciation of investments | | | | | | | |
| | and foreign currencies | | | | | | 1,042,709 | |
| Total net assets | | | | | $ | 49,367,178 | |
| Δ | Securities have been classified by country of origin. Classification by type of business has been presented on page 72 in “Security type/country and sector allocations.” |
| * | Fully or partially on loan. |
| † | Non income producing security. |
| = | Security is being fair valued in accordance with the Portfolio’s fair valuation policy. At October 31, 2011, the aggregate amount of fair valued securities was $0, which represented 0% of the Portfolio’s net assets. See Note 1 in “Notes to financial statements.” |
| @ | Illiquid security. At October 31, 2011, the aggregate amount of illiquid securities was $0, which represented 0.00% of the Portfolio’s net assets. See Note 10 in “Notes to financial statements.” |
| ≠ | The rate shown is the effective yield at time of purchase. |
| ** | See Note 9 in “Notes to financial statements” for additional information on securities lending collateral. |
| © | Includes $4,941,157 of securities loaned. |
2011 Annual report · Delaware Pooled Trust
(continues) 113
Statements of net assets
Delaware Pooled® Trust — The Global Real Estate Securities Portfolio
The following foreign currency exchange contracts were outstanding at October 31, 2011:1Foreign Currency Exchange Contracts
| | | | | | | | | | | | | | Unrealized |
| | Contracts to | | | | | | | Settlement | | Appreciation |
| Counterparty | | | Receive (Deliver) | | In Exchange For | | Date | | (Depreciation) |
| MNB | | AUD | | (6,604 | ) | | USD | | 6,959 | | | 11/1/11 | | | $ | (4 | ) | |
| MNB | | HKD | | 2,226,755 | | | USD | | (286,868 | ) | | 11/1/11 | | | | (238 | ) | |
| MNB | | HKD | | 1,433,605 | | | USD | | (184,657 | ) | | 11/2/11 | | | | (122 | ) | |
| MNB | | SGD | | 508,558 | | | USD | | (409,929 | ) | | 11/2/11 | | | | (4,801 | ) | |
| | | | | | | | | | | | | | | $ | (5,165 | ) | |
The use of foreign currency exchange contracts involves elements of market risk and risks in excess of the amounts recognized in the financial statements. The notional values presented above represent the Portfolio’s total exposure in such contracts, whereas only the net unrealized appreciation (depreciation) is reflected in the Portfolio’s net assets.
1See Note 8 in “Notes to financial statements.”
Summary of Abbreviations:
AUD — Australian Dollar
HKD — Hong Kong Dollar
MNB — Mellon National Bank
REIT — Real Estate Investment Trust
SGD — Singapore Dollar
USD — United States Dollar
See accompanying notes, which are an integral part of the financial statements.
2011 Annual report · Delaware Pooled Trust
114
Delaware Pooled® Trust — The Global Fixed Income Portfolio
October 31, 2011
| | | | Principal° | | Value |
| | | Amount | | (U.S. $) |
| Corporate Bonds – 15.60%Δ | | | | | | | |
| Austria – 3.05% | | | | | | | |
| | Oesterreichische Kontrollbank | | | | | | | |
| 4.875% 2/16/16 | | USD | | 2,226,000 | | $ | 2,554,731 |
| | | | | | | | 2,554,731 |
| Germany – 7.03% | | | | | | | |
| KFW 5.25% 7/4/12 | | EUR | | 1,220,000 | | | 1,738,573 |
| Rentenbank 1.375% 4/25/13 | | JPY | | 319,000,000 | | | 4,147,017 |
| | | | | | | | 5,885,590 |
| Netherlands – 3.19% | | | | | | | |
| ING Bank | | | | | | | |
| 3.90% 3/19/14 | | USD | | 1,010,000 | | | 1,080,575 |
| •6.125% 5/29/23 | | EUR | | 665,000 | | | 855,659 |
| Telefonica Europe | | | | | | | |
| 8.25% 9/15/30 | | USD | | 607,000 | | | 739,880 |
| | | | | | | | 2,676,114 |
| Spain – 0.55% | | | | | | | |
| Telefonica Emisiones | | | | | | | |
| 5.877% 7/15/19 | | USD | | 445,000 | | | 462,446 |
| | | | | | | | 462,446 |
| United Kingdom – 1.78% | | | | | | | |
| HSBC Holdings 6.25% 3/19/18 | | EUR | | 700,000 | | | 1,024,169 |
| • | Lloyds TSB Bank | | | | | | | |
| 5.625% 3/5/18 | | EUR | | 411,000 | | | 464,447 |
| | | | | | | | 1,488,616 |
| Total Corporate Bonds | | | | | | | |
| (cost $10,934,759) | | | | | | | 13,067,497 |
| | | | | | | | |
| Sovereign Bonds – 61.32%Δ | | | | | | | |
| Canada – 4.40% | | | | | | | |
| Canada Government | | | | | | | |
| International Bond | | | | | | | |
| 3.50% 1/13/20 | | EUR | | 2,400,000 | | | 3,684,811 |
| | | | | | | | 3,684,811 |
| Denmark – 3.99% | | | | | | | |
| Denmark Government | | | | | | | |
| International Bond | | | | | | | |
| 2.75% 11/15/11 | | USD | | 3,340,000 | | | 3,342,568 |
| | | | | | | | 3,342,568 |
| Germany – 9.97% | | | | | | | |
| Bundesobligation | | | | | | | |
| 1.75% 10/9/15 | | EUR | | 330,000 | | | 471,215 |
| Bundesschatzanweisungen | | | | | | | |
| 0.75% 9/14/12 | | EUR | | 280,000 | | | 388,637 |
| Deutschland Republic | | | | | | | |
| 3.75% 1/4/15 | | EUR | | 2,480,000 | | | 3,752,530 |
| 3.75% 1/4/17 | | EUR | | 1,600,000 | | | 2,495,751 |
| 4.75% 7/4/28 | | EUR | | 75,000 | | | 130,923 |
| 6.25% 1/4/24 | | EUR | | 571,000 | | | 1,110,250 |
| | | | | | | | 8,349,306 |
| Japan – 17.80% | | | | | | | |
| Japan Government | | | | | | | |
| 10 yr Bond 0.50% 6/20/13 | | JPY | | 230,000,000 | | $ | 2,959,757 |
| 10 yr Bond 1.00% 9/20/20 | | JPY | | 120,000,000 | | | 1,548,018 |
| 10 yr Bond 1.30% 12/20/14 | | JPY | | 300,000,000 | | | 3,963,818 |
| 10 yr Bond 1.40% 9/20/15 | | JPY | | 200,000,000 | | | 2,667,030 |
| 10 yr Bond 1.50% 9/20/18 | | JPY | | 240,000,000 | | | 3,256,538 |
| 30 yr Bond 2.30% 6/20/35 | | JPY | | 37,150,000 | | | 513,521 |
| | | | | | | | 14,908,682 |
| Mexico – 3.93% | | | | | | | |
| Mexican Bonos | | | | | | | |
| 6.50% 6/10/21 | | MXN | | 23,000,000 | | | 1,770,851 |
| 8.50% 12/13/18 | | MXN | | 10,200,000 | | | 892,293 |
| 9.50% 12/18/14 | | MXN | | 7,400,000 | | | 630,765 |
| | | | | | | | 3,293,909 |
| Netherlands – 5.19% | | | | | | | |
| Netherlands Government Bond | | | | | | | |
| 3.25% 7/15/21 | | EUR | | 100,000 | | | 147,948 |
| 3.75% 1/15/42 | | EUR | | 1,050,000 | | | 1,705,841 |
| 4.25% 7/15/13 | | EUR | | 1,700,000 | | | 2,493,150 |
| | | | | | | | 4,346,939 |
| Norway – 3.54% | | | | | | | |
| Eksportfinans 1.60% 3/20/14 | | JPY | | 225,000,000 | | | 2,965,928 |
| | | | | | | | 2,965,928 |
| Poland – 6.59% | | | | | | | |
| Poland Government Bond | | | | | | | |
| 5.25% 10/25/17 | | PLN | | 10,000,000 | | | 3,147,817 |
| 5.50% 10/25/19 | | PLN | | 4,550,000 | | | 1,429,164 |
| 5.75% 9/23/22 | | PLN | | 3,000,000 | | | 947,207 |
| | | | | | | | 5,524,188 |
| Qatar – 2.27% | | | | | | | |
| # | Qatar Government | | | | | | | |
| International Bond 144A | | | | | | | |
| 5.25% 1/20/20 | | USD | | 1,707,000 | | | 1,899,038 |
| | | | | | | | 1,899,038 |
| Slovakia – 2.06% | | | | | | | |
| Slovakia Government Bond | | | | | | | |
| 4.90% 2/11/14 | | EUR | | 1,188,345 | | | 1,730,627 |
| | | | | | | | 1,730,627 |
| Slovenia – 1.58% | | | | | | | |
| Republic of Slovenia | | | | | | | |
| 4.375% 2/6/19 | | EUR | | 1,002,000 | | | 1,324,368 |
| | | | | | | | 1,324,368 |
| Total Sovereign Bonds | | | | | | | |
| (cost $50,667,988) | | | | | | | 51,370,364 |
2011 Annual report · Delaware Pooled Trust
(continues) 115
Statements of net assets
Delaware Pooled® Trust — The Global Fixed Income Portfolio
| | Principal° | | Value | |
| | | Amount | | (U.S. $) | |
| Supranational Banks – 8.31% | | | | | | | |
| Asian Development Bank | | | | | | | |
| 2.35% 6/21/27 | JPY | | 190,000,000 | | $ | 2,683,887 | |
| European Investment Bank | | | | | | | |
| 1.40% 6/20/17 | JPY | | 115,000,000 | | | 1,540,150 | |
| 1.90% 1/26/26 | JPY | | 163,400,000 | | | 2,191,896 | |
| Nordic Investment Bank | | | | | | | |
| 1.70% 4/27/17 | JPY | | 40,000,000 | | | 543,734 | |
| Total Supranational Banks | | | | | | | |
| (cost $5,691,089) | | | | | | 6,959,667 | |
| | |
| U.S. Treasury Obligations – 11.67% | | | | | | |
| U.S. Treasury Bonds | | | | | | | |
| 4.50% 5/15/38 | USD | | 1,200,000 | | | 1,494,563 | |
| U.S. Treasury Notes | | | | | | | |
| 0.75% 6/15/14 | | | 450,000 | | | 454,606 | |
| 1.875% 8/31/17 | | | 670,000 | | | 692,508 | |
| 2.375% 3/31/16 | | | 2,650,000 | | | 2,827,841 | |
| 2.375% 6/30/18 | | | 1,600,000 | | | 1,687,250 | |
| 2.625% 1/31/18 | | | 800,000 | | | 859,500 | |
| 3.625% 8/15/19 | | | 540,000 | | | 613,153 | |
| 3.75% 11/15/18 | | | 1,002,000 | | | 1,146,507 | |
| Total U.S. Treasury Obligations | | | | | | | |
| (cost $9,062,951) | | | | | | 9,775,928 | |
| | |
| Short-Term Investments – 0.84% | | | | | | | |
| ≠Discount Notes – 0.35% | | | | | | | |
| Federal Home Loan Bank | | | | | | | |
| 0.003% 11/30/11 | | | 258,892 | | | 258,889 | |
| 0.01% 12/23/11 | | | 37,501 | | | 37,501 | |
| | | | | | | 296,390 | |
| Repurchase Agreement – 0.49% | | | | | | | |
| BNP Paribas 0.08%, dated 10/31/11, | | | | | | |
| to be repurchased on 11/1/11, | | | | | | | |
| repurchase price $413,001 | | | | | | | |
| (collateralized by U.S. | | | | | | | |
| government obligations | | | | | | | |
| 0.25%-4.625% 2/29/12-2/15/21; | | | | | | |
| market value $421,260) | | | 413,000 | | | 413,000 | |
| | | | | | | 413,000 | |
| Total Short-Term Investments | | | | | | | |
| (cost $709,392) | | | | | | 709,390 | |
| | |
| Total Value of Securities – 97.74% | | | | | | | |
| (cost $77,066,179) | | | | | | 81,882,846 | |
| Receivables and Other Assets | | | | | | | |
| Net of Liabilities – 2.26% | | | | | | 1,893,786 | |
| Net Assets Applicable to 7,273,295 Shares | | | | |
| Outstanding; Equivalent to | | | | | | | |
| $11.52 Per Share – 100.00% | | | | | $ | 83,776,632 | |
| | | | | | | | |
| Components of Net Assets at October 31, 2011: | | | | | | | |
| Shares of beneficial interest | | | | | | | |
| (unlimited authorization – no par) | | | | | $ | 69,934,927 | |
| Undistributed net investment income | | | | | | 9,280,508 | |
| Accumulated net realized gain on investments | | | | | | (317,451 | ) |
| Net unrealized appreciation of investments | | | | | | | |
| and foreign currencies | | | | | | 4,878,648 | |
| Total net assets | | | | | $ | 83,776,632 | |
| ° | Principal amount is stated in the currency in which each security is denominated. |
| Δ | Securities have been classified by country of origin. |
| • | Variable rate security. The rate shown is the rate as of October 31, 2011. Interest rates reset periodically. |
| ≠ | The rate shown is the effective yield at the time of purchase. |
| # | Security exempt from registration under Rule 144A of the Securities Act of 1933, as amended. At October 31, 2011, the aggregate amount of Rule 144A securities was $1,899,038, which represented 2.27% of the Portfolio’s net assets. See Note 10 in “Notes to financial statements.” |
The following foreign cross currency exchange contract was outstanding at October 31, 2011:1
Foreign Currency Exchange Contracts
| | | | | | | | Unrealized |
| | Contracts to | | | | | | Appreciation |
| Counterparty | | Deliver | | In Exchange For | | Settlement Date | | (Depreciation) |
| MNB | | EUR (3,296,791) | | GBP 2,890,000 | | 1/31/12 | | $81,509 |
The use of foreign cross currency exchange contracts involves elements of market risk and risks in excess of the amounts recognized in the financial statements. The notional value presented above represents the Portfolio’s total exposure in such contracts, whereas only the net unrealized appreciation (depreciation) is reflected in the Portfolio’s net assets.
1See Note 8 in “Notes to financial statements.”
EUR — European Monetary Unit
GBP — British Pound Sterling
JPY — Japanese Yen
MNB — Mellon National Bank
MXN — Mexican Peso
PLN — Polish Zloty
USD — United States Dollar
See accompanying Notes, which are an integral part of the financial statements.
2011 Annual report · Delaware Pooled Trust
116
Statements of operations
Delaware Pooled® Trust
Year Ended October 31, 2011
| | The | | | | | | The | | The |
| | Large-Cap | | The | | Large-Cap | | Focus Smid-Cap |
| | Value Equity | | Select 20 | | Growth Equity | | Growth Equity |
| | Portfolio | | Portfolio | | Portfolio | | Portfolio |
| Investment Income: | | | | | | | | | | | | | | | | |
| Dividends | | $ | 190,235 | | | $ | 222,966 | | | $ | 2,375,749 | | | $ | 142,893 | |
| Interest | | | 72 | | | | 629 | | | | 585 | | | | 187 | |
| Securities lending income | | | — | | | | — | | | | 10,215 | | | | — | |
| Foreign tax withheld | | | — | | | | — | | | | (15,899 | ) | | | (1,258 | ) |
| | | 190,307 | | | | 223,595 | | | | 2,370,650 | | | | 141,822 | |
| |
| Expenses: | | | | | | | | | | | | | | | | |
| Management fees | | | 36,785 | | | | 180,758 | | | | 1,093,990 | | | | 72,737 | |
| Registration fees | | | 19,156 | | | | 27,102 | | | | 18,536 | | | | 3,010 | |
| Audit and tax | | | 11,465 | | | | 11,513 | | | | 22,344 | | | | 11,097 | |
| Dues and services | | | 3,658 | | | | 3,761 | | | | 4,783 | | | | 1,838 | |
| Dividend disbursing and transfer agent fees and expenses | | | 3,348 | | | | 6,220 | | | | 19,163 | | | | 3,741 | |
| Reports and statements to shareholders | | | 3,196 | | | | 1,921 | | | | 7,252 | | | | 2,561 | |
| Accounting and administration expenses | | | 2,630 | | | | 9,475 | | | | 78,223 | | | | 3,812 | |
| Pricing fees | | | 725 | | | | 637 | | | | 715 | | | | 663 | |
| Custodian fees | | | 671 | | | | 1,641 | | | | 5,241 | | | | 798 | |
| Legal fees | | | 424 | | | | 1,507 | | | | 13,543 | | | | 625 | |
| Trustees’ fees | | | 352 | | | | 1,125 | | | | 10,634 | | | | 479 | |
| Insurance fees | | | 197 | | | | 296 | | | | 5,492 | | | | 99 | |
| Consulting fees | | | 66 | | | | 205 | | | | 1,778 | | | | 112 | |
| Trustees’ expenses | | | 25 | | | | 68 | | | | 793 | | | | 28 | |
| | | 82,698 | | | | 246,229 | | | | 1,282,487 | | | | 101,600 | |
| Less fees waived | | | (35,801 | ) | | | (32,685 | ) | | | — | | | | (12,496 | ) |
| Less expense paid indirectly | | | — | | | | (1 | ) | | | (1 | ) | | | — | |
| |
| Total operating expenses | | | 46,897 | | | | 213,543 | | | | 1,282,486 | | | | 89,104 | |
| |
| Net Investment Income | | | 143,410 | | | | 10,052 | | | | 1,088,164 | | | | 52,718 | |
| |
| Net Realized and Unrealized Gain (Loss) on Investments: | | | | | | | | | | | | | | | | |
| Net realized gain on investments | | | 1,503,263 | | | | 209,856 | | | | 26,325,273 | | | | 218,423 | |
| Net change in unrealized appreciation/depreciation | | | | | | | | | | | | | | | | |
| of investments | | | (838,965 | ) | | | 2,150,173 | | | | (3,280,481 | ) | | | 383,099 | |
| Net Realized and Unrealized Gain on Investments | | | 664,298 | | | | 2,360,029 | | | | 23,044,792 | | | | 601,522 | |
| |
| Net Increase In Net Assets | | | | | | | | | | | | | | | | |
| Resulting from Operations | | $ | 807,708 | | | $ | 2,370,081 | | | $ | 24,132,956 | | | $ | 654,240 | |
See accompanying notes, which are an integral part of the financial statements.
2011 Annual report · Delaware Pooled Trust
(continues) 117
Statements of operations
Delaware Pooled® Trust
| | The | | | | | | | | | | | | |
| | Real Estate | | The | | The | | The |
| | Investment | | Core Focus | | High-Yield | | Core Plus |
| | Trust | | Fixed Income | | Bond | | Fixed Income |
| | Portfolio II | | Portfolio | | Portfolio | | Portfolio |
| Investment Income: | | | | | | | | | | | | | | | | |
| Dividends | | $ | 58,569 | | | $ | 2,139 | | | $ | 66,559 | | | $ | 16,301 | |
| Interest | | | 42 | | | | 288,730 | | | | 3,912,729 | | | | 2,068,494 | |
| Securities lending income | | | — | | | | 1,533 | | | | 37,429 | | | | 5,857 | |
| Foreign tax withheld | | | (48 | ) | | | — | | | | — | | | | (4,062 | ) |
| | | 58,563 | | | | 292,402 | | | | 4,016,717 | | | | 2,086,590 | |
| |
| Expenses: | | | | | | | | | | | | | | | | |
| Management fees | | | 22,172 | | | | 39,595 | | | | 215,009 | | | | 212,520 | |
| Registration fees | | | 15,055 | | | | 19,631 | | | | 13,569 | | | | 17,476 | |
| Audit and tax | | | 11,058 | | | | 11,882 | | | | 12,138 | | | | 13,653 | |
| Dues and services | | | 3,425 | | | | 2,832 | | | | 3,208 | | | | 3,002 | |
| Dividend disbursing and transfer agent fees and expenses | | | 3,033 | | | | 3,608 | | | | 7,667 | | | | 6,905 | |
| Custodian fees | | | 1,681 | | | | 2,509 | | | | 3,167 | | | | 13,012 | |
| Accounting and administration expenses | | | 1,162 | | | | 3,895 | | | | 18,782 | | | | 20,423 | |
| Reports and statements to shareholders | | | 1,084 | | | | 1,530 | | | | 2,294 | | | | 2,985 | |
| Pricing fees | | | 831 | | | | 7,436 | | | | 4,939 | | | | 17,162 | |
| Legal fees | | | 172 | | | | 486 | | | | 3,602 | | | | 3,468 | |
| Trustees’ fees | | | 155 | | | | 596 | | | | 2,347 | | | | 2,601 | |
| Insurance fees | | | 92 | | | | 434 | | | | 616 | | | | 1,197 | |
| Consulting fees | | | 31 | | | | 104 | | | | 472 | | | | 487 | |
| Trustees’ expenses | | | 12 | | | | 54 | | | | 147 | | | | 182 | |
| | | | 59,963 | | | | 94,592 | | | | 287,957 | | | | 315,073 | |
| Less fees waived | | | (31,851 | ) | | | (51,864 | ) | | | (6,780 | ) | | | (92,170 | ) |
| |
| Total operating expenses | | | 28,112 | | | | 42,728 | | | | 281,177 | | | | 222,903 | |
| |
| Net Investment Income | | | 30,451 | | | | 249,674 | | | | 3,735,540 | | | | 1,863,687 | |
| |
| Net Realized and Unrealized Gain (Loss) | | | | | | | | | | | | | | | | |
| on Investments and Foreign Currencies: | | | | | | | | | | | | | | | | |
| Net realized gain (loss) on: | | | | | | | | | | | | | | | | |
| Investments | | | 352,467 | | | | 542,157 | | | | 883,160 | | | | 1,507,536 | |
| Futures contracts | | | — | | | | — | | | | — | | | | 268,146 | |
| Swap contracts | | | — | | | | 662 | | | | — | | | | 178,551 | |
| Foreign currencies | | | — | | | | — | | | | — | | | | 203,019 | |
| Foreign currency exchange contracts | | | — | | | | — | | | | — | | | | (301,709 | ) |
| Options written | | | — | | | | — | | | | — | | | | (1,384 | ) |
| Net realized gain | | | 352,467 | | | | 542,819 | | | | 883,160 | | | | 1,854,159 | |
| Net change in unrealized appreciation/depreciation | | | | | | | | | | | | | | | | |
| of investments and foreign currencies | | | (38,811 | ) | | | (642,762 | ) | | | (3,496,322 | ) | | | (1,347,247 | ) |
| Net Realized and Unrealized Gain (Loss) | | | | | | | | | | | | | | | | |
| on Investments and Foreign Currencies | | | 313,656 | | | | (99,943 | ) | | | (2,613,162 | ) | | | 506,912 | |
| |
| Net Increase In Net Assets | | | | | | | | | | | | | | | | |
| Resulting from Operations | | $ | 344,107 | | | $ | 149,731 | | | $ | 1,122,378 | | | $ | 2,370,599 | |
See accompanying notes, which are an integral part of the financial statements.
2011 Annual report · Delaware Pooled Trust
118
| | | | | | The | | | | | | | | |
| | The | | Labor Select | | The | | The |
| | International | | International | | Emerging | | Emerging |
| | Equity | | Equity | | Markets | | Markets |
| | Portfolio | | Portfolio | | Portfolio | | Portfolio II |
| Investment Income: | | | | | | | | | | | | | | | | |
| Dividends | | $ | 31,682,608 | | | $ | 29,707,439 | | | $ | 22,571,633 | | | $ | 324,672 | |
| Interest | | | 8,458 | | | | 23,640 | | | | 4,248 | | | | — | |
| Securities lending income | | | 729,123 | | | | 1,144,849 | | | | 134,716 | | | | 3,004 | |
| Foreign tax withheld | | | (2,598,160 | ) | | | (2,455,502 | ) | | | (1,895,134 | ) | | | (25,051 | ) |
| | | 29,822,029 | | | | 28,420,426 | | | | 20,815,463 | | | | 302,625 | |
| |
| Expenses: | | | | | | | | | | | | | | | | |
| Management fees | | | 4,590,367 | | | | 4,964,491 | | | | 5,666,931 | | | | 138,009 | |
| Accounting and administration expenses | | | 275,810 | | | | 264,797 | | | | 230,469 | | | | 5,426 | |
| Custodian fees | | | 255,781 | | | | 245,690 | | | | 537,027 | | | | 20,918 | |
| Dividend disbursing and transfer agent fees and expenses | | | 62,088 | | | | 57,882 | | | | 50,286 | | | | 3,678 | |
| Legal fees | | | 49,878 | | | | 51,997 | | | | 43,343 | | | | 1,032 | |
| Audit and tax | | | 49,563 | | | | 44,870 | | | | 57,511 | | | | 15,591 | |
| Trustees’ fees | | | 37,928 | | | | 36,235 | | | | 32,144 | | | | 725 | |
| Registration fees | | | 28,378 | | | | 13,866 | | | | 23,782 | | | | 32,099 | |
| Reports and statements to shareholders | | | 24,469 | | | | 23,166 | | | | 20,892 | | | | 1,574 | |
| Insurance fees | | | 19,375 | | | | 18,113 | | | | 14,996 | | | | 160 | |
| Dues and services | | | 8,779 | | | | 7,664 | | | | 7,044 | | | | 3,501 | |
| Consulting fees | | | 6,889 | | | | 6,473 | | | | 5,856 | | | | 142 | |
| Trustees’ expenses | | | 2,749 | | | | 2,600 | | | | 2,282 | | | | 47 | |
| Pricing fees | | | 1,987 | | | | 2,215 | | | | 1,860 | | | | 3,029 | |
| | | | 5,414,041 | | | | 5,740,059 | | | | 6,694,423 | | | | 225,931 | |
| Less fees waived | | | — | | | | — | | | | — | | | | (52,820 | ) |
| Less expense paid indirectly | | | (5 | ) | | | (3 | ) | | | (1 | ) | | | — | |
| |
| Total operating expenses | | | 5,414,036 | | | | 5,740,056 | | | | 6,694,422 | | | | 173,111 | |
| |
| Net Investment Income | | | 24,407,993 | | | | 22,680,370 | | | | 14,121,041 | | | | 129,514 | |
| |
| Net Realized and Unrealized Gain (Loss) | | | | | | | | | | | | | | | | |
| on Investments and Foreign Currencies: | | | | | | | | | | | | | | | | |
| Net realized gain (loss) on: | | | | | | | | | | | | | | | | |
| Investments | | | 9,483,417 | | | | 12,574,836 | | | | 67,528,185 | | | | 523,491 | |
| Redemptions in kind* | | | — | | | | — | | | | 1,176,448 | | | | — | |
| Foreign currencies | | | (265,141 | ) | | | 207,856 | | | | (1,241,657 | ) | | | (12,540 | ) |
| Foreign currency contracts | | | (449,019 | ) | | | (1,142,887 | ) | | | (772,166 | ) | | | (4,515 | ) |
| Net realized gain | | | 8,769,257 | | | | 11,639,805 | | | | 66,690,810 | | | | 506,436 | |
| Net change in unrealized appreciation/depreciation | | | | | | | | | | | | | | | | |
| of investments and foreign currencies | | | (36,036,582 | ) | | | (39,040,237 | ) | | | (107,193,261 | ) | | | (2,562,825 | ) |
| Net Realized and Unrealized Loss | | | | | | | | | | | | | | | | |
| on Investments and Foreign Currencies | | | (27,267,325 | ) | | | (27,400,432 | ) | | | (40,502,451 | ) | | | (2,056,389 | ) |
| |
| Net Decrease In Net Assets | | | | | | | | | | | | | | | | |
| Resulting from Operations | | $ | (2,859,332 | ) | | $ | (4,720,062 | ) | | $ | (26,381,410 | ) | | $ | (1,926,875 | ) |
*See Note 12 in “Notes to financial statements.”
See accompanying notes, which are an integral part of the financial statements.
2011 Annual report · Delaware Pooled Trust
(continues) 119
Statements of operations
Delaware Pooled® Trust
| | The | | | | |
| | Global | | The |
| | Real Estate | | Global Fixed |
| | Securities | | Income |
| | Portfolio | | Portfolio |
| Investment Income: | | | | | | | | |
| Dividends | | $ | 2,329,161 | | | $ | — | |
| Interest | | | 8,151 | | | | 3,202,891 | |
| Securities lending income | | | 40,565 | | | | — | |
| Foreign tax withheld | | | (98,604 | ) | | | — | |
| | | 2,279,273 | | | | 3,202,891 | |
| |
| Expenses: | | | | | | | | |
| Management fees | | | 553,728 | | | | 537,620 | |
| Registration fees | | | 36,856 | | | | 14,392 | |
| Custodian fees | | | 28,689 | | | | 41,221 | |
| Accounting and administration expenses | | | 21,994 | | | | 43,260 | |
| Audit and tax | | | 14,483 | | | | 17,310 | |
| Dividend disbursing and transfer agent fees and expenses | | | 11,770 | | | | 11,791 | |
| Reports and statements to shareholders | | | 8,437 | | | | 6,785 | |
| Dues and services | | | 6,192 | | | | 2,820 | |
| Legal fees | | | 3,894 | | | | 8,417 | |
| Trustees’ fees | | | 3,024 | | | | 5,921 | |
| Pricing fees | | | 2,433 | | | | 1,832 | |
| Insurance fees | | | 1,424 | | | | 3,236 | |
| Consulting fees | | | 571 | | | | 1,013 | |
| Trustees’ expenses | | | 213 | | | | 440 | |
| Distribution expenses – Class P | | | 20 | | | | — | |
| | | | 693,728 | | | | 696,058 | |
| Less fees waived | | | (57,868 | ) | | | (44,011 | ) |
| Less expense paid indirectly | | | — | | | | (1 | ) |
| |
| Total operating expenses | | | 635,860 | | | | 652,046 | |
| |
| Net Investment Income | | | 1,643,413 | | | | 2,550,845 | |
| |
| Net Realized and Unrealized Gain (Loss) | | | | | | | | |
| on Investments and Foreign Currencies: | | | | | | | | |
| Net realized gain (loss) on: | | | | | | | | |
| Investments | | | 6,714,808 | | | | 1,098,109 | |
| Redemptions in kind* | | | — | | | | 2,275,633 | |
| Foreign currencies | | | 8,625 | | | | 7,815,990 | |
| Foreign currency exchange contracts | | | (148,798 | ) | | | (174,422 | ) |
| Net realized gain | | | 6,574,635 | | | | 11,015,310 | |
| Net change in unrealized appreciation/depreciation | | | | | | | | |
| of investments and foreign currencies | | | (6,921,809 | ) | | | (11,423,378 | ) |
| Net Realized and Unrealized Loss | | | | | | | | |
| on Investments and Foreign Currencies | | | (347,174 | ) | | | (408,068 | ) |
| |
| Net Increase In Net Assets | | | | | | | | |
| Resulting from Operations | | $ | 1,296,239 | | | $ | 2,142,777 | |
*See Note 12 in “Notes to financial statements.”
See accompanying notes, which are an integral part of the financial statements.
2011 Annual report · Delaware Pooled Trust
120
Statements of changes in net assets
Delaware Pooled® Trust
| | The | | | | | | | | | | The |
| | Large-Cap | | The | | Large-Cap |
| | Value Equity | | Select 20 | | Growth Equity |
| | Portfolio | | Portfolio | | Portfolio |
| | Year | | Year | | Year | | Year | | Year | | Year |
| | Ended | | Ended | | Ended | | Ended | | Ended | | Ended |
| | 10/31/11 | | 10/31/10 | | 10/31/11 | | 10/31/10 | | 10/31/11 | | 10/31/10 |
| Increase (Decrease) in Net Assets | | | | | | | | | | | | | | | | | | | | | | | | |
| from Operations: | | | | | | | | | | | | | | | | | | | | | | | | |
| Net investment income (loss) | | $ | 143,410 | | | $ | 251,031 | | | $ | 10,052 | | | $ | (34,021 | ) | | $ | 1,088,164 | | | $ | 241,621 | |
| Net realized gain (loss) on investments | | | | | | | | | | | | | | | | | | | | | | | | |
| and foreign currencies | | | 1,503,263 | | | | (282,221 | ) | | | 209,856 | | | | 914,331 | | | | 26,325,273 | | | | (2,867,161 | ) |
| Net change in unrealized appreciation/ | | | | | | | | | | | | | | | | | | | | | | | | |
| depreciation of investments | | | | | | | | | | | | | | | | | | | | | | | | |
| and foreign currencies | | | (838,965 | ) | | | 1,308,792 | | | | 2,150,173 | | | | 947,840 | | | | (3,280,481 | ) | | | 50,038,601 | |
| Net increase in net assets | | | | | | | | | | | | | | | | | | | | | | | | |
| resulting from operations | | | 807,708 | | | | 1,277,602 | | | | 2,370,081 | | | | 1,828,150 | | | | 24,132,956 | | | | 47,413,061 | |
| |
| Dividends and Distributions to | | | | | | | | | | | | | | | | | | | | | | | | |
| Shareholders from: | | | | | | | | | | | | | | | | | | | | | | | | |
| Net investment income | | | (211,314 | ) | | | (269,213 | ) | | | — | | | | — | | | | (826,516 | ) | | | (554,027 | ) |
| | | | (211,314 | ) | | | (269,213 | ) | | | — | | | | — | | | | (826,516 | ) | | | (554,027 | ) |
| Capital Share Transactions: | | | | | | | | | | | | | | | | | | | | | | | | |
| Proceeds from shares sold | | | 7,593,991 | | | | 2,445,843 | | | | 34,840,063 | | | | 4,016,982 | | | | 5,377,033 | | | | 6,352,687 | |
| Net asset value of shares issued upon | | | | | | | | | | | | | | | | | | | | | | | | |
| reinvestment of dividends and distributions | | | 211,314 | | | | 236,772 | | | | — | | | | — | | | | 707,154 | | | | 384,354 | |
| | | | 7,805,305 | | | | 2,682,615 | | | | 34,840,063 | | | | 4,016,982 | | | | 6,084,187 | | | | 6,737,041 | |
| Cost of shares repurchased | | | (8,353,164 | ) | | | (7,203,677 | ) | | | (2,694,982 | ) | | | (4,586,057 | ) | | | (102,983,563 | ) | | | (60,488,649 | ) |
| Increase (decrease) in net assets derived | | | | | | | | | | | | | | | | | | | | | | | | |
| from capital share transactions | | | (547,859 | ) | | | (4,521,062 | ) | | | 32,145,081 | | | | (569,075 | ) | | | (96,899,376 | ) | | | (53,751,608 | ) |
| |
| Net Increase (Decrease) In Net Assets | | | 48,535 | | | | (3,512,673 | ) | | | 34,515,162 | | | | 1,259,075 | | | | (73,592,936 | ) | | | (6,892,574 | ) |
| |
| Net Assets: | | | | | | | | | | | | | | | | | | | | | | | | |
| Beginning of year | | | 6,592,233 | | | | 10,104,906 | | | | 11,462,769 | | | | 10,203,694 | | | | 244,124,057 | | | | 251,016,631 | |
| End of year | | $ | 6,640,768 | | | $ | 6,592,233 | | | $ | 45,977,931 | | | $ | 11,462,769 | | | $ | 170,531,121 | | | $ | 244,124,057 | |
| |
| Undistributed net investment income | | $ | 119,894 | | | $ | 187,798 | | | $ | 10,052 | | | $ | — | | | $ | 426,423 | | | $ | 164,775 | |
See accompanying notes, which are an integral part of the financial statements.
2011 Annual report · Delaware Pooled Trust
(continues) 121
Statements of changes in net assets
Delaware Pooled® Trust
| | The | | The | | The |
| | Focus Smid-Cap | | Real Estate | | Core Focus |
| | Growth Equity | | Investment Trust | | Fixed Income |
| | Portfolio | | Portfolio II | | Portfolio |
| | Year | | Year | | Year | | Year | | Year | | Year |
| | Ended | | Ended | | Ended | | Ended | | Ended | | Ended |
| | 10/31/11 | | 10/31/10 | | 10/31/11 | | 10/31/10 | | 10/31/11 | | 10/31/10 |
| Increase (Decrease) in Net Assets | | | | | | | | | | | | | | | | | | | | | | | | |
| from Operations: | | | | | | | | | | | | | | | | | | | | | | | | |
| Net investment income (loss) | | $ | 52,718 | | | $ | (10,697 | ) | | $ | 30,451 | | | $ | 70,264 | | | $ | 249,674 | | | $ | 609,147 | |
| Net realized gain on investments | | | | | | | | | | | | | | | | | | | | | | | | |
| and foreign currencies | | | 218,423 | | | | 792,755 | | | | 352,467 | | | | 1,591,763 | | | | 542,819 | | | | 699,256 | |
| Net change in unrealized appreciation/ | | | | | | | | | | | | | | | | | | | | | | | | |
| depreciation of investments | | | | | | | | | | | | | | | | | | | | | | | | |
| and foreign currencies | | | 383,099 | | | | 569,157 | | | | (38,811 | ) | | | (237,783 | ) | | | (642,762 | ) | | | 268,406 | |
| Net increase in net assets | | | | | | | | | | | | | | | | | | | | | | | | |
| resulting from operations | | | 654,240 | | | | 1,351,215 | | | | 344,107 | | | | 1,424,244 | | | | 149,731 | | | | 1,576,809 | |
| |
| Dividends and Distributions to | | | | | | | | | | | | | | | | | | | | | | | | |
| Shareholders from: | | | | | | | | | | | | | | | | | | | | | | | | |
| Net investment income | | | (41,867 | ) | | | — | | | | (40,124 | ) | | | (148,549 | ) | | | (567,674 | ) | | | (946,676 | ) |
| | | (41,867 | ) | | | — | | | | (40,124 | ) | | | (148,549 | ) | | | (567,674 | ) | | | (946,676 | ) |
| Capital Share Transactions: | | | | | | | | | | | | | | | | | | | | | | | | |
| Proceeds from shares sold | | | 11,706,628 | | | | 2,004,183 | | | | — | | | | — | | | | 575,000 | | | | 421,393 | |
| Net asset value of shares issued upon | | | | | | | | | | | | | | | | | | | | | | | | |
| reinvestment of dividends and distributions | | | 35,984 | | | | — | | | | 40,124 | | | | 148,549 | | | | 567,674 | | | | 905,776 | |
| | | 11,742,612 | | | | 2,004,183 | | | | 40,124 | | | | 148,549 | | | | 1,142,674 | | | | 1,327,169 | |
| Cost of shares repurchased | | | (246,877 | ) | | | (2,192,256 | ) | | | — | | | | (3,888,879 | ) | | | (13,707,750 | ) | | | (3,299,702 | ) |
| Increase (decrease) in net assets derived | | | | | | | | | | | | | | | | | | | | | | | | |
| from capital share transactions | | | 11,495,735 | | | | (188,073 | ) | | | 40,124 | | | | (3,740,330 | ) | | | (12,565,076 | ) | | | (1,972,533 | ) |
| |
| Net Increase (Decrease) In Net Assets | | | 12,108,108 | | | | 1,163,142 | | | | 344,107 | | | | (2,464,635 | ) | | | (12,983,019 | ) | | | (1,342,400 | ) |
| |
| Net Assets: | | | | | | | | | | | | | | | | | | | | | | | | |
| Beginning of year | | | 4,613,276 | | | | 3,450,134 | | | | 2,766,153 | | | | 5,230,788 | | | | 19,207,877 | | | | 20,550,277 | |
| End of year | | $ | 16,721,384 | | | $ | 4,613,276 | | | $ | 3,110,260 | | | $ | 2,766,153 | | | $ | 6,224,858 | | | $ | 19,207,877 | |
| |
| Undistributed net investment income | | $ | 10,851 | | | $ | — | | | $ | 20,118 | | | $ | 29,791 | | | $ | 179,918 | | | $ | 486,815 | |
See accompanying notes, which are an integral part of the financial statements.2011 Annual report · Delaware Pooled Trust
122
| | The | | The | | The |
| | High-Yield | | Core Plus | | International |
| | Bond | | Fixed Income | | Equity |
| | Portfolio | | Portfolio | | Portfolio |
| | Year | | Year | | Year | | Year | | Year | | Year |
| | Ended | | Ended | | Ended | | Ended | | Ended | | Ended |
| | 10/31/11 | | 10/31/10 | | 10/31/11 | | 10/31/10 | | 10/31/11 | | 10/31/10 |
| Increase (Decrease) in Net Assets | | | | | | | | | | | | | | | | | | | | | | | | |
| from Operations: | | | | | | | | | | | | | | | | | | | | | | | | |
| Net investment income | | $ | 3,735,540 | | | $ | 2,143,227 | | | $ | 1,863,687 | | | $ | 2,500,683 | | | $ | 24,407,993 | | | $ | 26,651,692 | |
| Net realized gain (loss) on investments | | | | | | | | | | | | | | | | | | | | | | | | |
| and foreign currencies | | | 883,160 | | | | 1,970,289 | | | | 1,854,159 | | | | 2,455,546 | | | | 8,769,257 | | | | (17,553,145 | ) |
| Net change in unrealized appreciation/ | | | | | | | | | | | | | | | | | | | | | | | | |
| depreciation of investments | | | | | | | | | | | | | | | | | | | | | | | | |
| and foreign currencies | | | (3,496,322 | ) | | | 351,969 | | | | (1,347,247 | ) | | | 987,308 | | | | (36,036,582 | ) | | | 54,969,318 | |
| Net increase (decrease) in net assets | | | | | | | | | | | | | | | | | | | | | | | | |
| resulting from operations | | | 1,122,378 | | | | 4,465,485 | | | | 2,370,599 | | | | 5,943,537 | | | | (2,859,332 | ) | | | 64,067,865 | |
| |
| Dividends and Distributions to | | | | | | | | | | | | | | | | | | | | | | | | |
| Shareholders from: | | | | | | | | | | | | | | | | | | | | | | | | |
| Net investment income | | | (2,250,664 | ) | | | (2,139,650 | ) | | | (2,534,908 | ) | | | (3,595,170 | ) | | | (25,012,020 | ) | | | (28,823,614 | ) |
| | | (2,250,664 | ) | | | (2,139,650 | ) | | | (2,534,908 | ) | | | (3,595,170 | ) | | | (25,012,020 | ) | | | (28,823,614 | ) |
| Capital Share Transactions: | | | | | | | | | | | | | | | | | | | | | | | | |
| Proceeds from shares sold | | | 32,392,897 | | | | 8,437,231 | | | | 6,140,001 | | | | 3,516,375 | | | | 34,030,531 | | | | 64,318,903 | |
| Net asset value of shares issued upon | | | | | | | | | | | | | | | | | | | | | | | | |
| reinvestment of dividends and distributions | | | 2,250,663 | | | | 2,139,649 | | | | 2,534,907 | | | | 3,595,169 | | | | 13,948,935 | | | | 14,979,774 | |
| | | 34,643,560 | | | | 10,576,880 | | | | 8,674,908 | | | | 7,111,544 | | | | 47,979,466 | | | | 79,298,677 | |
| Cost of shares repurchased | | | (5,111,965 | ) | | | (7,082,668 | ) | | | (4,965,000 | ) | | | (12,757,770 | ) | | | (240,010,080 | ) | | | (218,588,260 | ) |
| Increase (decrease) in net assets derived | | | | | | | | | | | | | | | | | | | | | | | | |
| from capital share transactions | | | 29,531,595 | | | | 3,494,212 | | | | 3,709,908 | | | | (5,646,226 | ) | | | (192,030,614 | ) | | | (139,289,583 | ) |
| |
| Net Increase (Decrease) In Net Assets | | | 28,403,309 | | | | 5,820,047 | | | | 3,545,599 | | | | (3,297,859 | ) | | | (219,901,966 | ) | | | (104,045,332 | ) |
| |
| Net Assets: | | | | | | | | | | | | | | | | | | | | | | | | |
| Beginning of year | | | 29,436,966 | | | | 23,616,919 | | | | 50,305,459 | | | | 53,603,318 | | | | 809,011,130 | | | | 913,056,462 | |
| End of year | | $ | 57,840,275 | | | $ | 29,436,966 | | | $ | 53,851,058 | | | $ | 50,305,459 | | | $ | 589,109,164 | | | $ | 809,011,130 | |
| |
| Undistributed net investment income | | $ | 3,521,603 | | | $ | 1,817,897 | | | $ | 1,490,239 | | | $ | 2,294,011 | | | $ | 21,513,372 | | | $ | 22,831,559 | |
See accompanying notes, which are an integral part of the financial statements.
2011 Annual report · Delaware Pooled Trust
(continues) 123
Statements of changes in net assets
Delaware Pooled® Trust
| | The | | The | | The |
| | Labor Select | | Emerging | | Emerging |
| | International Equity | | Markets | | Markets |
| | Portfolio | | Portfolio | | Portfolio II |
| | Year | | Year | | Year | | Year | | Year | | 6/23/10* |
| | Ended | | Ended | | Ended | | Ended | | Ended | | to |
| | 10/31/11 | | 10/31/10 | | 10/31/11 | | 10/31/10 | | 10/31/11 | | 10/31/10 |
| Increase (Decrease) in Net Assets | | | | | | | | | | | | | | | | | | | | | | | | |
| from Operations: | | | | | | | | | | | | | | | | | | | | | | | | |
| Net investment income | | $ | 22,680,370 | | | $ | 23,071,622 | | | $ | 14,121,041 | | | $ | 16,648,177 | | | $ | 129,514 | | | $ | 21,989 | |
| Net realized gain (loss) on investments | | | | | | | | | | | | | | | | | | | | | | | | |
| and foreign currencies | | | 11,639,805 | | | | (17,048,455 | ) | | | 66,690,810 | | | | 27,877,749 | | | | 506,436 | | | | 78,177 | |
| Net change in unrealized appreciation/ | | | | | | | | | | | | | | | | | | | | | | | | |
| depreciation of investments | | | | | | | | | | | | | | | | | | | | | | | | |
| and foreign currencies | | | (39,040,237 | ) | | | 47,866,697 | | | | (107,193,261 | ) | | | 102,109,216 | | | | (2,562,825 | ) | | | 1,264,294 | |
| Net increase (decrease) in net assets | | | | | | | | | | | | | | | | | | | | | | | | |
| resulting from operations | | | (4,720,062 | ) | | | 53,889,864 | | | | (26,381,410 | ) | | | 146,635,142 | | | | (1,926,875 | ) | | | 1,364,460 | |
| |
| Dividends and Distributions to | | | | | | | | | | | | | | | | | | | | | | | | |
| Shareholders from: | | | | | | | | | | | | | | | | | | | | | | | | |
| Net investment income | | | (22,010,265 | ) | | | (22,976,321 | ) | | | (16,918,513 | ) | | | (13,508,314 | ) | | | (30,588 | ) | | | — | |
| Net realized gain on investments | | | — | | | | — | | | | — | | | | — | | | | (87,059 | ) | | | — | |
| | | (22,010,265 | ) | | | (22,976,321 | ) | | | (16,918,513 | ) | | | (13,508,314 | ) | | | (117,647 | ) | | | — | |
| Capital Share Transactions: | | | | | | | | | | | | | | | | | | | | | | | | |
| Proceeds from shares sold | | | 14,449,698 | | | | 33,763,426 | | | | 52,338,384 | | | | 99,252,230 | | | | 6,955,569 | | | | 10,000,017 | |
| Purchase reimbursement fees | | | | | | | — | | | | 290,352 | | | | 549,874 | | | | — | | | | — | |
| Net asset value of shares issued | | | | | | | | | | | | | | | | | | | | | | | | |
| upon reinvestment of dividends | | | | | | | | | | | | | | | | | | | | | | | | |
| and distributions | | | 22,010,264 | | | | 22,846,615 | | | | 16,562,741 | | | | 13,194,917 | | | | 117,647 | | | | — | |
| | | 36,459,962 | | | | 56,610,041 | | | | 69,191,477 | | | | 112,997,021 | | | | 7,073,216 | | | | 10,000,017 | |
| Cost of shares repurchased | | | (178,039,136 | ) | | | (144,289,705 | ) | | | (245,725,632 | ) | | | (94,063,461 | ) | | | (1,054,179 | ) | | | — | |
| Redemption reimbursement fees | | | — | | | | — | | | | 1,170,221 | | | | 491,691 | | | | — | | | | — | |
| | | (178,039,136 | ) | | | (144,289,705 | ) | | | (244,555,411 | ) | | | (93,571,770 | ) | | | (1,054,179 | ) | | | — | |
| Increase (decrease) in net assets derived | | | | | | | | | | | | | | | | | | | | | | | | |
| from capital share transactions | | | (141,579,174 | ) | | | (87,679,664 | ) | | | (175,363,934 | ) | | | 19,425,251 | | | | 6,019,037 | | | | 10,000,017 | |
| |
| Net Increase (Decrease) In Net Assets | | | (168,309,501 | ) | | | (56,766,121 | ) | | | (218,663,857 | ) | | | 152,552,079 | | | | 3,974,515 | | | | 11,364,477 | |
| |
| Net Assets: | | | | | | | | | | | | | | | | | | | | | | | | |
| Beginning of period | | | 740,951,624 | | | | 797,717,745 | | | | 750,190,452 | | | | 597,638,373 | | | | 11,364,477 | | | | — | |
| End of period | | $ | 572,642,123 | | | $ | 740,951,624 | | | $ | 531,526,595 | | | $ | 750,190,452 | | | $ | 15,338,992 | | | $ | 11,364,477 | |
| |
| Undistributed net investment income | | $ | 19,713,120 | | | $ | 19,978,046 | | | $ | 11,016,448 | | | $ | 15,442,928 | | | $ | 95,191 | | | $ | 13,320 | |
*Commencement of operations.
See accompanying notes, which are an integral part of the financial statements.
2011 Annual report · Delaware Pooled Trust
124
| | The | | | | | | | | |
| | Global | | The |
| | Real Estate | | Global |
| | Securities | | Fixed Income |
| | Portfolio | | Portfolio |
| | Year | | Year | | Year | | Year |
| | Ended | | Ended | | Ended | | Ended |
| | 10/31/11 | | 10/31/10 | | 10/31/11 | | 10/31/10 |
| Increase (Decrease) in Net Assets | | | | | | | | | | | | | | | | |
| from Operations: | | | | | | | | | | | | | | | | |
| Net investment income | | $ | 1,643,413 | | | $ | 1,559,719 | | | $ | 2,550,845 | | | $ | 3,674,075 | |
| Net realized gain on investments | | | | | | | | | | | | | | | | |
| and foreign currencies | | | 6,574,635 | | | | 6,110,093 | | | | 11,015,310 | | | | 3,063,846 | |
| Net change in unrealized appreciation/ | | | | | | | | | | | | | | | | |
| depreciation of investments | | | | | | | | | | | | | | | | |
| and foreign currencies | | | (6,921,809 | ) | | | 4,475,820 | | | | (11,423,378 | ) | | | 6,182,029 | |
| Net increase in net assets | | | | | | | | | | | | | | | | |
| resulting from operations | | | 1,296,239 | | | | 12,145,632 | | | | 2,142,777 | | | | 12,919,950 | |
| |
| Dividends and Distributions to | | | | | | | | | | | | | | | | |
| Shareholders from: | | | | | | | | | | | | | | | | |
| Net investment income | | | | | | | | | | | | | | | | |
| Original Class | | | (5,063,856 | ) | | | (3,905,697 | ) | | | (5,618,617 | ) | | | (8,038,391 | ) |
| Class P | | | (645 | ) | | | (444 | ) | | | — | | | | — | |
| | | (5,064,501 | ) | | | (3,906,141 | ) | | | (5,618,617 | ) | | | (8,038,391 | ) |
| Capital Share Transactions: | | | | | | | | | | | | | | | | |
| Proceeds from shares sold | | | | | | | | | | | | | | | | |
| Original Class | | | 7,162,052 | | | | 16,986,524 | | | | 6,624,611 | | | | 11,960,772 | |
| Net asset value of shares issued upon | | | | | | | | | | | | | | | | |
| reinvestment of dividends and | | | | | | | | | | | | | | | | |
| distributions | | | | | | | | | | | | | | | | |
| Original Class | | | 4,620,122 | | | | 3,574,567 | | | | 4,824,555 | | | | 6,831,379 | |
| Class P | | | 645 | | | | 444 | | | | — | | | | — | |
| | | 11,782,819 | | | | 20,561,535 | | | | 11,449,166 | | | | 18,792,151 | |
| Cost of shares repurchased | | | | | | | | | | | | | | | | |
| Original Class | | | (18,962,474 | ) | | | (23,252,817 | ) | | | (64,477,324 | ) | | | (26,597,470 | ) |
| Decrease in net assets derived | | | | | | | | | | | | | | | | |
| from capital share transactions | | | (7,179,655 | ) | | | (2,691,282 | ) | | | (53,028,158 | ) | | | (7,805,319 | ) |
| |
| Net Increase (Decrease) In Net Assets | | | (10,947,917 | ) | | | 5,548,209 | | | | (56,503,998 | ) | | | (2,923,760 | ) |
| |
| Net Assets: | | | | | | | | | | | | | | | | |
| Beginning of year | | | 60,315,095 | | | | 54,766,886 | | | | 140,280,630 | | | | 143,204,390 | |
| End of year | | $ | 49,367,178 | | | $ | 60,315,095 | | | $ | 83,776,632 | | | $ | 140,280,630 | |
| |
| Undistributed net investment income | | $ | 1,276,350 | | | $ | 2,001,250 | | | $ | 9,280,508 | | | $ | 4,027,932 | |
See accompanying notes, which are an integral part of the financial statements.
2011 Annual report · Delaware Pooled Trust
125
Financial highlights
Delaware Pooled® Trust — The Large-Cap Value Equity Portfolio
Selected data for each share of the Portfolio outstanding throughout each period were as follows:
| | Year Ended | |
| | 10/31/11 | | 10/31/10 | | 10/31/09 | | 10/31/08 | | 10/31/07 | |
| Net asset value, beginning of period | | $15.130 | | | $13.290 | | | $12.190 | | | $22.370 | | | $20.960 | | |
| | |
| Income (loss) from investment operations: | | | | | | | | | | | | | | | | |
| Net investment income1 | | 0.346 | | | 0.343 | | | 0.354 | | | 0.403 | | | 0.439 | | |
| Net realized and unrealized gain (loss) on investments | | 1.579 | | | 1.851 | | | 1.067 | | | (8.186 | ) | | 1.315 | | |
| Total from investment operations | | 1.925 | | | 2.194 | | | 1.421 | | | (7.783 | ) | | 1.754 | | |
| | |
| Less dividends and distributions from: | | | | | | | | | | | | | | | | |
| Net investment income | | (0.485 | ) | | (0.354 | ) | | (0.321 | ) | | (0.613 | ) | | (0.344 | ) | |
| Net realized gain on investments | | — | | | — | | | — | | | (1.784 | ) | | — | | |
| Total dividends and distributions | | (0.485 | ) | | (0.354 | ) | | (0.321 | ) | | (2.397 | ) | | (0.344 | ) | |
| | |
| Net asset value, end of period | | $16.570 | | | $15.130 | | | $13.290 | | | $12.190 | | | $22.370 | | |
| | |
| Total return2 | | 12.98% | | | 16.80% | | | 12.12% | | | (38.48% | ) | | 8.49% | | |
| | |
| Ratios and supplemental data: | | | | | | | | | | | | | | | | |
| Net assets, end of period (000 omitted) | | $6,641 | | | $6,592 | | | $10,105 | | | $8,988 | | | $10,278 | | |
| Ratio of expenses to average net assets | | 0.70% | | | 0.70% | | | 0.69% | | | 0.68% | | | 0.69% | | |
| Ratio of expenses to average net assets | | | | | | | | | | | | | | | | |
| prior to fees waived and expense paid indirectly | | 1.24% | | | 1.02% | | | 0.98% | | | 1.16% | | | 1.00% | | |
| Ratio of net investment income to average net assets | | 2.15% | | | 2.46% | | | 2.99% | | | 2.43% | | | 2.00% | | |
| Ratio of net investment income to average net assets | | | | | | | | | | | | | | | | |
| prior to fees waived and expense paid indirectly | | 1.61% | | | 2.14% | | | 2.70% | | | 1.95% | | | 1.69% | | |
| Portfolio turnover | | 133% | | | 42% | | | 26% | | | 34% | | | 14% | | |
1 The average shares outstanding method has been applied for per share information.
2 Total investment return is based on the change in net asset value of a share during the period and assumes reinvestment of dividends and distributions at net asset value. Total investment return during all of the periods shown reflects a waiver by the manager. Performance would have been lower had the waiver not been in effect.
See accompanying notes, which are an integral part of the financial statements.
2011 Annual report · Delaware Pooled Trust
126
Delaware Pooled® Trust — The Select 20 Portfolio
Selected data for each share of the Portfolio outstanding throughout each period were as follows:
| | | | |
| | Year Ended | |
| | 10/31/11 | | 10/31/10 | | 10/31/09 | | 10/31/08 | | 10/31/07 | |
| Net asset value, beginning of period | | $6.040 | | | $4.980 | | | $4.040 | | | $6.880 | | | $5.770 | | |
| | |
| Income (loss) from investment operations: | | | | | | | | | | | | | | | | |
| Net investment income (loss)1 | | 0.003 | | | (0.019 | ) | | (0.012 | ) | | 0.008 | | | (0.016 | ) | |
| Net realized and unrealized gain (loss) on investments | | | | | | | | | | | | | | | | |
| and foreign currencies | | 0.917 | | | 1.079 | | | 0.959 | | | (2.848 | ) | | 1.126 | | |
| Total from investment operations | | 0.920 | | | 1.060 | | | 0.947 | | | (2.840 | ) | | 1.110 | | |
| | |
| Less dividends and distributions from: | | | | | | | | | | | | | | | | |
| Net investment income | | — | | | — | | | (0.004 | ) | | — | | | — | | |
| Return of capital | | — | | | — | | | (0.003 | ) | | — | | | — | | |
| Total dividends and distributions | | — | | | — | | | (0.007 | ) | | — | | | — | | |
| | |
| Net asset value, end of period | | $6.960 | | | $6.040 | | | $4.980 | | | $4.040 | | | $6.880 | | |
| | |
| Total return2 | | 15.23% | | | 21.29% | | | 23.51% | | | (41.28% | ) | | 19.24% | | |
| | |
| Ratios and supplemental data: | | | | | | | | | | | | | | | | |
| Net assets, end of period (000 omitted) | | $45,978 | | | $11,463 | | | $10,204 | | | $8,933 | | | $2,633 | | |
| Ratio of expenses to average net assets | | 0.89% | | | 0.89% | | | 0.89% | | | 0.89% | | | 0.90% | | |
| Ratio of expenses to average net assets | | | | | | | | | | | | | | | | |
| prior to fees waived and expense paid indirectly | | 1.02% | | | 1.24% | | | 1.18% | | | 1.64% | | | 1.23% | | |
| Ratio of net investment income (loss) to average net assets | | 0.04% | | | (0.35% | ) | | (0.29% | ) | | 0.15% | | | (0.26% | ) | |
| Ratio of net investment loss to average net assets | | | | | | | | | | | | | | | | |
| prior to fees waived and expense paid indirectly | | (0.09% | ) | | (0.70% | ) | | (0.58% | ) | | (0.60% | ) | | (0.59% | ) | |
| Portfolio turnover | | 26% | | | 80% | | | 53% | | | 61% | | | 47% | | |
1 The average shares outstanding method has been applied for per share information.
2 Total investment return is based on the change in net asset value of a share during the period and assumes reinvestment of dividends and distributions at net asset value. Total investment return during all of the periods shown reflects a waiver by the manager. Performance would have been lower had the waiver not been in effect.
See accompanying notes, which are an integral part of the financial statements.
2011 Annual report · Delaware Pooled Trust
(continues) 127
Financial highlights
Delaware Pooled® Trust — The Large-Cap Growth Equity Portfolio
Selected data for each share of the Portfolio outstanding throughout each period were as follows:
| | Year Ended | |
| | 10/31/11 | | 10/31/10 | | 10/31/09 | | 10/31/08 | | 10/31/07 | |
| Net asset value, beginning of period | | $8.900 | | | $7.350 | | | $6.220 | | | $10.560 | | | $8.780 | | |
| | |
| Income (loss) from investment operations: | | | | | | | | | | | | | | | | |
| Net investment income1 | | 0.053 | | | 0.008 | | | 0.020 | | | 0.018 | | | 0.016 | | |
| Net realized and unrealized gain (loss) on investments | | | | | | | | | | | | | | | | |
| and foreign currencies | | 0.962 | | | 1.559 | | | 1.135 | | | (4.256 | ) | | 1.768 | | |
| Total from investment operations | | 1.015 | | | 1.567 | | | 1.155 | | | (4.238 | ) | | 1.784 | | |
| | |
| Less dividends and distributions from: | | | | | | | | | | | | | | | | |
| Net investment income | | (0.035 | ) | | (0.017 | ) | | (0.025 | ) | | (0.014 | ) | | (0.004 | ) | |
| Net realized gain on investments | | — | | | — | | | — | | | (0.088 | ) | | — | | |
| Total dividends and distributions | | (0.035 | ) | | (0.017 | ) | | (0.025 | ) | | (0.102 | ) | | (0.004 | ) | |
| | |
| Net asset value, end of period | | $9.880 | | | $8.900 | | | $7.350 | | | $6.220 | | | $10.560 | | |
| | |
| Total return2 | | 11.43% | | | 21.35% | | | 18.51% | | | (40.50% | ) | | 20.33% | | |
| | |
| Ratios and supplemental data: | | | | | | | | | | | | | | | | |
| Net assets, end of period (000 omitted) | | $170,531 | | | $244,124 | | | $251,017 | | | $258,526 | | | $460,900 | | |
| Ratio of expenses to average net assets | | 0.64% | | | 0.65% | | | 0.65% | | | 0.65% | | | 0.64% | | |
| Ratio of expenses to average net assets | | | | | | | | | | | | | | | | |
| prior to fees waived and expense paid indirectly | | 0.64% | | | 0.65% | | | 0.66% | | | 0.65% | | | 0.64% | | |
| Ratio of net investment income to average net assets | | 0.55% | | | 0.10% | | | 0.32% | | | 0.20% | | | 0.17% | | |
| Ratio of net investment income to average net assets | | | | | | | | | | | | | | | | |
| prior to fees waived and expense paid indirectly | | 0.55% | | | 0.10% | | | 0.31% | | | 0.20% | | | 0.17% | | |
| Portfolio turnover | | 19% | | | 22% | | | 30% | | | 38% | | | 25% | | |
1 The average shares outstanding method has been applied for per share information.
2 Total investment return is based on the change in net asset value of a share during the period and assumes reinvestment of dividends and distributions at net asset value. Total investment return during some of the periods shown reflects a waiver by the manager. Performance would have been lower had the waiver not been in effect.
See accompanying notes, which are an integral part of the financial statements.
2011 Annual report · Delaware Pooled Trust
128
Delaware Pooled® Trust — The Focus Smid-Cap Growth Equity Portfolio
Selected data for each share of the Portfolio outstanding throughout each period were as follows:
| | Year Ended | |
| | 10/31/11 | | 10/31/10 | | 10/31/09 | | 10/31/08 | | 10/31/07 | |
| Net asset value, beginning of period | | $12.290 | | | $8.710 | | | $6.580 | | | $11.360 | | | $10.290 | | |
| | |
| Income (loss) from investment operations: | | | | | | | | | | | | | | | | |
| Net investment income (loss)1 | | 0.079 | | | (0.031 | ) | | 0.013 | | | 0.056 | | | 0.018 | | |
| Net realized and unrealized gain (loss) on investments | | | | | | | | | | | | | | | | |
| and foreign currencies | | 2.547 | | | 3.611 | | | 2.173 | | | (4.079 | ) | | 1.527 | | |
| Total from investment operations | | 2.626 | | | 3.580 | | | 2.186 | | | (4.023 | ) | | 1.545 | | |
| | |
| Less dividends and distributions from: | | | | | | | | | | | | | | | | |
| Net investment income | | (0.106 | ) | | — | | | (0.056 | ) | | (0.031 | ) | | (0.013 | ) | |
| Net realized gain on investments | | — | | | — | | | — | | | (0.726 | ) | | (0.462 | ) | |
| Total dividends and distributions | | (0.106 | ) | | — | | | (0.056 | ) | | (0.757 | ) | | (0.475 | ) | |
| | |
| Net asset value, end of period | | $14.810 | | | $12.290 | | | $8.710 | | | $6.580 | | | $11.360 | | |
| | |
| Total return2 | | 21.44% | | | 41.10% | | | 33.07% | | | (37.44% | ) | | 15.77% | | |
| | |
| Ratios and supplemental data: | | | | | | | | | | | | | | | | |
| Net assets, end of period (000 omitted) | | $16,721 | | | $4,613 | | | $3,450 | | | $4,305 | | | $8,781 | | |
| Ratio of expenses to average net assets | | 0.92% | | | 0.92% | | | 0.92% | | | 0.92% | | | 0.93% | | |
| Ratio of expenses to average net assets | | | | | | | | | | | | | | | | |
| prior to fees waived and expense paid indirectly | | 1.05% | | | 1.44% | | | 1.48% | | | 1.12% | | | 1.11% | | |
| Ratio of net investment income (loss) to average net assets | | 0.54% | | | (0.30% | ) | | 0.19% | | | 0.63% | | | 0.18% | | |
| Ratio of net investment income (loss) to average net assets | | | | | | | | | | | | | | | | |
| prior to fees waived and expense paid indirectly | | 0.41% | | | (0.82% | ) | | (0.37% | ) | | 0.43% | | | (0.01% | ) | |
| Portfolio turnover | | 16% | | | 86% | | | 51% | | | 43% | | | 33% | | |
1 The average shares outstanding method has been applied for per share information.
2 Total investment return is based on the change in net asset value of a share during the period and assumes reinvestment of dividends and distributions at net asset value. Total investment return during all of the periods shown reflects a waiver by the manager. Performance would have been lower had the waiver not been in effect.
See accompanying notes, which are an integral part of the financial statements.
2011 Annual report · Delaware Pooled Trust
(continues) 129
Financial highlights
Delaware Pooled® Trust — The Real Estate Investment Trust Portfolio II
Selected data for each share of the Portfolio outstanding throughout each period were as follows:
| | Year Ended | |
| | 10/31/11 | | 10/31/10 | | 10/31/09 | | 10/31/08 | | 10/31/07 | |
| Net asset value, beginning of period | | $5.790 | | | $4.260 | | | $4.680 | | | $13.600 | | | $30.730 | | |
| | |
| Income (loss) from investment operations: | | | | | | | | | | | | | | | | |
| Net investment income1 | | 0.063 | | | 0.090 | | | 0.129 | | | 0.157 | | | 0.150 | | |
| Net realized and unrealized gain (loss) on investments | | 0.641 | | | 1.561 | | | (0.290 | ) | | (3.806 | ) | | 0.763 | | |
| Total from investment operations | | 0.704 | | | 1.651 | | | (0.161 | ) | | (3.649 | ) | | 0.913 | | |
| | |
| Less dividends and distributions from: | | | | | | | | | | | | | | | | |
| Net investment income | | (0.084 | ) | | (0.121 | ) | | (0.259 | ) | | (0.124 | ) | | (0.205 | ) | |
| Net realized gain on investments | | — | | | — | | | — | | | (5.147 | ) | | (17.838 | ) | |
| Total dividends and distributions | | (0.084 | ) | | (0.121 | ) | | (0.259 | ) | | (5.271 | ) | | (18.043 | ) | |
| | |
| Net asset value, end of period | | $6.410 | | | $5.790 | | | $4.260 | | | $4.680 | | | $13.600 | | |
| | |
| Total return2 | | 12.37% | | | 39.51% | | | (2.62% | ) | | (37.42% | ) | | 2.41% | | |
| | |
| Ratios and supplemental data: | | | | | | | | | | | | | | | | |
| Net assets, end of period (000 omitted) | | $3,110 | | | $2,766 | | | $5,231 | | | $5,346 | | | $13,789 | | |
| Ratio of expenses to average net assets | | 0.95% | | | 0.95% | | | 0.91% | | | 0.86% | | | 0.88% | | |
| Ratio of expenses to average net assets | | | | | | | | | | | | | | | | |
| prior to fees waived and expense paid indirectly | | 2.03% | | | 1.81% | | | 1.53% | | | 1.20% | | | 0.98% | | |
| Ratio of net investment income to average net assets | | 1.03% | | | 1.82% | | | 3.57% | | | 2.27% | | | 0.97% | | |
| Ratio of net investment income to average net assets | | | | | | | | | | | | | | | | |
| prior to fees waived and expense paid indirectly | | (0.05% | ) | | 0.96% | | | 2.95% | | | 1.93% | | | 0.87% | | |
| Portfolio turnover | | 138% | | | 192% | | | 169% | | | 121% | | | 93% | | |
1 The average shares outstanding method has been applied for per share information.
2 Total investment return is based on the change in net asset value of a share during the period and assumes reinvestment of dividends and distributions at net asset value. Total investment return during all of the periods shown reflects a waiver by the manager. Performance would have been lower had the waiver not been in effect.
See accompanying notes, which are an integral part of the financial statements.
2011 Annual report · Delaware Pooled Trust
130
Delaware Pooled® Trust — The Core Focus Fixed Income Portfolio
Selected data for each share of the Portfolio outstanding throughout each period were as follows:
| | Year Ended | |
| | 10/31/11 | | 10/31/10 | | 10/31/09 | | 10/31/08 | | 10/31/07 | |
| Net asset value, beginning of period | | $9.440 | | | $9.120 | | | $8.150 | | | $9.140 | | | $9.100 | | |
| | |
| Income (loss) from investment operations: | | | | | | | | | | | | | | | | |
| Net investment income1 | | 0.234 | | | 0.284 | | | 0.414 | | | 0.403 | | | 0.444 | | |
| Net realized and unrealized gain (loss) on investments | | | | | | | | | | | | | | | | |
| and foreign currencies | | 0.355 | | | 0.456 | | | 0.968 | | | (0.753 | ) | | (0.030 | ) | |
| Total from investment operations | | 0.589 | | | 0.740 | | | 1.382 | | | (0.350 | ) | | 0.414 | | |
| | |
| Less dividends and distributions from: | | | | | | | | | | | | | | | | |
| Net investment income | | (0.279 | ) | | (0.420 | ) | | (0.412 | ) | | (0.640 | ) | | (0.374 | ) | |
| Total dividends and distributions | | (0.279 | ) | | (0.420 | ) | | (0.412 | ) | | (0.640 | ) | | (0.374 | ) | |
| | |
| Net asset value, end of period | | $9.750 | | | $9.440 | | | $9.120 | | | $8.150 | | | $9.140 | | |
| | |
| Total return2 | | 6.49% | | | 8.46% | | | 17.41% | | | (4.13% | ) | | 4.70% | | |
| | |
| Ratios and supplemental data: | | | | | | | | | | | | | | | | |
| Net assets, end of period (000 omitted) | | $6,225 | | | $19,208 | | | $20,550 | | | $30,111 | | | $41,311 | | |
| Ratio of expenses to average net assets | | 0.43% | | | 0.43% | | | 0.43% | | | 0.42% | | | 0.37% | | |
| Ratio of expenses to average net assets | | | | | | | | | | | | | | | | |
| prior to fees waived and expense paid indirectly | | 0.96% | | | 0.76% | | | 0.71% | | | 0.63% | | | 0.56% | | |
| Ratio of net investment income to average net assets | | 2.53% | | | 3.13% | | | 4.94% | | | 4.63% | | | 4.96% | | |
| Ratio of net investment income to average net assets | | | | | | | | | | | | | | | | |
| prior to fees waived and expense paid indirectly | | 2.00% | | | 2.80% | | | 4.66% | | | 4.39% | | | 4.75% | | |
| Portfolio turnover | | 535% | | | 437% | | | 299% | | | 359% | | | 505% | | |
1 The average shares outstanding method has been applied for per share information.
2 Total investment return is based on the change in net asset value of a share during the period and assumes reinvestment of dividends and distributions at net asset value. Total investment return during all of the periods shown reflects a waiver by the manager. Performance would have been lower had the waiver not been in effect.
See accompanying notes, which are an integral part of the financial statements.
2011 Annual report · Delaware Pooled Trust
(continues) 131
Financial highlights
Delaware Pooled® Trust — The High-Yield Bond Portfolio
Selected data for each share of the Portfolio outstanding throughout each period were as follows:
| | Year Ended | |
| | 10/31/11 | | 10/31/10 | | 10/31/09 | | 10/31/08 | | 10/31/07 | |
| Net asset value, beginning of period | | $8.110 | | | $7.350 | | | $5.580 | | | $8.060 | | | $8.160 | | |
| | |
| Income (loss) from investment operations: | | | | | | | | | | | | | | | | |
| Net investment income1 | | 0.613 | | | 0.691 | | | 0.656 | | | 0.590 | | | 0.595 | | |
| Net realized and unrealized gain (loss) on investments | | (0.274 | ) | | 0.731 | | | 1.634 | | | (2.492 | ) | | (0.062 | ) | |
| Total from investment operations | | 0.339 | | | 1.422 | | | 2.290 | | | (1.902 | ) | | 0.533 | | |
| | |
| Less dividends and distributions from: | | | | | | | | | | | | | | | | |
| Net investment income | | (0.619 | ) | | (0.662 | ) | | (0.520 | ) | | (0.578 | ) | | (0.633 | ) | |
| Total dividends and distributions | | (0.619 | ) | | (0.662 | ) | | (0.520 | ) | | (0.578 | ) | | (0.633 | ) | |
| | |
| Net asset value, end of period | | $7.830 | | | $8.110 | | | $7.350 | | | $5.580 | | | $8.060 | | |
| | |
| Total return2 | | 4.52% | | | 20.85 | % | | 46.38% | | | (25.30% | ) | | 6.89% | | |
| | |
| Ratios and supplemental data: | | | | | | | | | | | | | | | | |
| Net assets, end of period (000 omitted) | | $57,840 | | | $29,437 | | | $23,617 | | | $19,814 | | | $21,497 | | |
| Ratio of expenses to average net assets | | 0.59% | | | 0.59% | | | 0.59% | | | 0.54% | | | 0.43% | | |
| Ratio of expenses to average net assets | | | | | | | | | | | | | | | | |
| prior to fees waived and expense paid indirectly | | 0.60% | | | 0.74% | | | 0.78% | | | 0.77% | | | 0.70% | | |
| Ratio of net investment income to average net assets | | 7.82% | | | 9.29% | | | 11.05% | | | 8.25% | | | 7.45% | | |
| Ratio of net investment income to average net assets | | | | | | | | | | | | | | | | |
| prior to fees waived and expense paid indirectly | | 7.81% | | | 9.14% | | | 10.86% | | | 8.02% | | | 7.18% | | |
| Portfolio turnover | | 77% | | | 144% | | | 119% | | | 132% | | | 177% | | |
1 The average shares outstanding method has been applied for per share information.
2 Total investment return is based on the change in net asset value of a share during the period and assumes reinvestment of dividends and distributions at net asset value. Total investment return during all of the periods shown reflects a waiver by the manager. Performance would have been lower had the waiver not been in effect.
See accompanying notes, which are an integral part of the financial statements.
2011 Annual report · Delaware Pooled Trust
132
Delaware Pooled® Trust — The Core Plus Fixed Income Portfolio
Selected data for each share of the Portfolio outstanding throughout each period were as follows:
| | Year Ended | |
| | 10/31/11 | | 10/31/10 | | 10/31/09 | | 10/31/08 | | 10/31/07 | |
| Net asset value, beginning of period | | $10.130 | | | $9.700 | | | $8.290 | | | $9.540 | | | $9.550 | | |
| | |
| Income (loss) from investment operations: | | | | | | | | | | | | | | | | |
| Net investment income1 | | 0.369 | | | 0.463 | | | 0.506 | | | 0.467 | | | 0.495 | | |
| Net realized and unrealized gain (loss) on investments | | | | | | | | | | | | | | | | |
| and foreign currencies | | 0.081 | | | 0.660 | | | 1.474 | | | (0.991 | ) | | (0.065 | ) | |
| Total from investment operations | | 0.450 | | | 1.123 | | | 1.980 | | | (0.524 | ) | | 0.430 | | |
| | |
| Less dividends and distributions from: | | | | | | | | | | | | | | | | |
| Net investment income | | (0.530 | ) | | (0.693 | ) | | (0.570 | ) | | (0.726 | ) | | (0.440 | ) | |
| Total dividends and distributions | | (0.530 | ) | | (0.693 | ) | | (0.570 | ) | | (0.726 | ) | | (0.440 | ) | |
| | |
| Net asset value, end of period | | $10.050 | | | $10.130 | | | $9.700 | | | $8.290 | | | $9.540 | | |
| | |
| Total return2 | | 4.80% | | | 12.05% | | | 25.55% | | | (5.91% | ) | | 4.66% | | |
| | |
| Ratios and supplemental data: | | | | | | | | | | | | | | | | |
| Net assets, end of period (000 omitted) | | $53,851 | | | $50,305 | | | $53,603 | | | $111,496 | | | $190,308 | | |
| Ratio of expenses to average net assets | | 0.45% | | | 0.45% | | | 0.45% | | | 0.42% | | | 0.38% | | |
| Ratio of expenses to average net assets | | | | | | | | | | | | | | | | |
| prior to fees waived and expense paid indirectly | | 0.64% | | | 0.65% | | | 0.61% | | | 0.57% | | | 0.54% | | |
| Ratio of net investment income to average net assets | | 3.77% | | | 4.80% | | | 5.95% | | | 5.19% | | | 5.29% | | |
| Ratio of net investment income to average net assets | | | | | | | | | | | | | | | | |
| prior to fees waived and expense paid indirectly | | 3.58% | | | 4.60% | | | 5.79% | | | 5.03% | | | 5.12% | | |
| Portfolio turnover | | 273% | | | 239% | | | 218% | | | 315% | | | 503% | | |
1 The average shares outstanding method has been applied for per share information.
2 Total investment return is based on the change in net asset value of a share during the period and assumes reinvestment of dividends and distributions at net asset value. Total investment return during all of the periods shown reflects a waiver by the manager. Performance would have been lower had the waiver not been in effect.
See accompanying notes, which are an integral part of the financial statements.
2011 Annual report · Delaware Pooled Trust
(continues) 133
Financial highlights
Delaware Pooled® Trust — The International Equity Portfolio
Selected data for each share of the Portfolio outstanding throughout each period were as follows:
| | Year Ended | |
| | 10/31/11 | | 10/31/10 | | 10/31/09 | | 10/31/08 | | 10/31/07 | |
| Net asset value, beginning of period | | $13.680 | | | $12.980 | | | $14.480 | | | $27.200 | | | $25.330 | | |
| | |
| Income (loss) from investment operations: | | | | | | | | | | | | | | | | |
| Net investment income1 | | 0.471 | | | 0.406 | | | 0.382 | | | 0.757 | | | 0.680 | | |
| Net realized and unrealized gain (loss) on investments | | | | | | | | | | | | | | | | |
| and foreign currencies | | (0.596 | ) | | 0.712 | | | 1.296 | | | (10.746 | ) | | 4.632 | | |
| Total from investment operations | | (0.125 | ) | | 1.118 | | | 1.678 | | | (9.989 | ) | | 5.312 | | |
| | |
| Less dividends and distributions from: | | | | | | | | | | | | | | | | |
| Net investment income | | (0.435 | ) | | (0.418 | ) | | (1.383 | ) | | (0.574 | ) | | (0.707 | ) | |
| Net realized gain on investments | | — | | | — | | | (1.795 | ) | | (2.157 | ) | | (2.735 | ) | |
| Total dividends and distributions | | (0.435 | ) | | (0.418 | ) | | (3.178 | ) | | (2.731 | ) | | (3.442 | ) | |
| | |
| Net asset value, end of period | | $13.120 | | | $13.680 | | | $12.980 | | | $14.480 | | | $27.200 | | |
| | |
| Total return2 | | (0.88% | ) | | 8.77% | | | 16.11% | | | (40.40% | ) | | 23.35% | | |
| | |
| Ratios and supplemental data: | | | | | | | | | | | | | | | | |
| Net assets, end of period (000 omitted) | | $589,109 | | | $809,011 | | | $913,056 | | | $1,086,795 | | | $2,519,761 | | |
| Ratio of expenses to average net assets | | 0.77% | | | 0.87% | | | 0.88% | | | 0.87% | | | 0.88% | | |
| Ratio of net investment income to average net assets | | 3.48% | | | 3.18% | | | 3.35% | | | 3.58% | | | 2.73% | | |
| Portfolio turnover | | 22% | | | 18% | | | 18% | | | 9% | | | 17% | | |
1 The average shares outstanding method has been applied for per share information.
2 Total investment return is based on the change in net asset value of a share during the period and assumes reinvestment of dividends and distributions at net asset value.
See accompanying notes, which are an integral part of the financial statements.
2011 Annual report · Delaware Pooled Trust
134
Delaware Pooled® Trust — The Labor Select International Equity Portfolio
Selected data for each share of the Portfolio outstanding throughout each period were as follows:
| | Year Ended | |
| | 10/31/11 | | 10/31/10 | | 10/31/09 | | 10/31/08 | | 10/31/07 | |
| Net asset value, beginning of period | | $13.570 | | | $12.930 | | | $12.410 | | | $24.530 | | | $22.380 | | |
| | |
| Income (loss) from investment operations: | | | | | | | | | | | | | | | | |
| Net investment income1 | | 0.451 | | | 0.390 | | | 0.364 | | | 0.647 | | | 0.616 | | |
| Net realized and unrealized gain (loss) on investments | | | | | | | | | | | | | | | | |
| and foreign currencies | | (0.695 | ) | | 0.626 | | | 1.445 | | | (9.221 | ) | | 3.980 | | |
| Total from investment operations | | (0.244 | ) | | 1.016 | | | 1.809 | | | (8.574 | ) | | 4.596 | | |
| | |
| Less dividends and distributions from: | | | | | | | | | | | | | | | | |
| Net investment income | | (0.406 | ) | | (0.376 | ) | | (0.869 | ) | | (0.473 | ) | | (0.549 | ) | |
| Net realized gain on investments | | — | | | — | | | (0.420 | ) | | (3.073 | ) | | (1.897 | ) | |
| Total dividends and distributions | | (0.406 | ) | | (0.376 | ) | | (1.289 | ) | | (3.546 | ) | | (2.446 | ) | |
| | |
| Net asset value, end of period | | $12.920 | | | $13.570 | | | $12.930 | | | $12.410 | | | $24.530 | | |
| | |
| Total return2 | | (1.79% | ) | | 8.00% | | | 16.76% | | | (40.31% | ) | | 22.43% | | |
| | |
| Ratios and supplemental data: | | | | | | | | | | | | | | | | |
| Net assets, end of period (000 omitted) | | $572,642 | | | $740,952 | | | $797,718 | | | $639,519 | | | $1,093,092 | | |
| Ratio of expenses to average net assets | | 0.85% | | | 0.87% | | | 0.88% | | | 0.87% | | | 0.88% | | |
| Ratio of net investment income to average net assets | | 3.37% | | | 3.07% | | | 3.26% | | | 3.59% | | | 2.75% | | |
| Portfolio turnover | | 20% | | | 13% | | | 11% | | | 10% | | | 28% | | |
1 The average shares outstanding method has been applied for per share information.
2 Total investment return is based on the change in net asset value of a share during the period and assumes reinvestment of dividends and distributions at net asset value.
See accompanying notes, which are an integral part of the financial statements.
2011 Annual report · Delaware Pooled Trust
(continues) 135
Financial highlights
Delaware Pooled® Trust — The Emerging Markets Portfolio
Selected data for each share of the Portfolio outstanding throughout each period were as follows:
| | Year Ended | |
| | 10/31/11 | | 10/31/10 | | 10/31/09 | | 10/31/08 | | 10/31/07 | |
| Net asset value, beginning of period | | $11.420 | | | $9.430 | | | $7.580 | | | $18.780 | | | $15.360 | | |
| | |
| Income (loss) from investment operations: | | | | | | | | | | | | | | | | |
| Net investment income1 | | 0.266 | | | 0.259 | | | 0.200 | | | 0.347 | | | 0.379 | | |
| Net realized and unrealized gain (loss) on investments | | | | | | | | | | | | | | | | |
| and foreign currencies | | (0.873 | ) | | 1.926 | | | 3.208 | | | (7.707 | ) | | 6.084 | | |
| Total from investment operations | | (0.607 | ) | | 2.185 | | | 3.408 | | | (7.360 | ) | | 6.463 | | |
| | |
| Less dividends and distributions from: | | | | | | | | | | | | | | | | |
| Net investment income | | (0.330 | ) | | (0.212 | ) | | (0.303 | ) | | (0.402 | ) | | (0.369 | ) | |
| Net realized gain on investments | | — | | | — | | | (1.268 | ) | | (3.447 | ) | | (2.727 | ) | |
| Total dividends and distributions | | (0.330 | ) | | (0.212 | ) | | (1.571 | ) | | (3.849 | ) | | (3.096 | ) | |
| | |
| Reimbursement fees: | | | | | | | | | | | | | | | | |
| Purchase reimbursement fees1,2 | | 0.005 | | | 0.009 | | | 0.002 | | | 0.002 | | | 0.038 | | |
| Redemption reimbursement fees1,2 | | 0.022 | | | 0.008 | | | 0.011 | | | 0.007 | | | 0.015 | | |
| | 0.027 | | | 0.017 | | | 0.013 | | | 0.009 | | | 0.053 | | |
| | |
| Net asset value, end of period | | $10.510 | | | $11.420 | | | $9.430 | | | $7.580 | | | $18.780 | | |
| | |
| Total return3 | | (5.22% | ) | | 23.79% | | | 57.05% | | | (48.23% | ) | | 49.98% | | |
| | |
| Ratios and supplemental data: | | | | | | | | | | | | | | | | |
| Net assets, end of period (000 omitted) | | $531,527 | | | $750,190 | | | $597,638 | | | $469,392 | | | $964,310 | | |
| Ratio of expenses to average net assets | | 1.14% | | | 1.17% | | | 1.16% | | | 1.15% | | | 1.28% | | |
| Ratio of net investment income to average net assets | | 2.41% | | | 2.57% | | | 2.71% | | | 2.66% | | | 2.46% | | |
| Portfolio turnover | | 39% | | | 39% | | | 40% | | | 43% | | | 47% | | |
1 The average shares outstanding method has been applied for per share information.
2 The Portfolio charges a 0.55% purchase reimbursement fee and a 0.55% redemption reimbursement fee, which are retained by the Portfolio.
3 Total investment return is based on the change in net asset value of a share during the period and assumes reinvestment of dividends and distributions at net asset value. Total investment return does not reflect the purchase reimbursement fee and redemption reimbursement fee.
See accompanying notes, which are an integral part of the financial statements.
2011 Annual report · Delaware Pooled Trust
136
Delaware Pooled® Trust — The Emerging Markets Portfolio II
Selected data for each share of the Portfolio outstanding throughout each period were as follows:
| | Year | | 6/23/101 | |
| | Ended | | to | |
| | 10/31/11 | | 10/31/10 | |
| Net asset value, beginning of period | | $9.660 | | | $8.500 | | |
| | |
| Income (loss) from investment operations: | | | | | | | |
| Net investment income2 | | 0.089 | | | 0.019 | | |
| Net realized and unrealized gain (loss) on investments | | | | | | | |
| and foreign currencies | | (1.099 | ) | | 1.141 | | |
| Total from investment operations | | (1.010 | ) | | 1.160 | | |
| | |
| Less dividends and distributions from: | | | | | | | |
| Net investment income | | (0.026 | ) | | — | | |
| Net realized gain on investments | | (0.074 | ) | | — | | |
| Total dividends and distributions | | (0.100 | ) | | — | | |
| | |
| Net asset value, end of period | | $8.550 | | | $9.660 | | |
| | |
| Total return3 | | (10.58% | ) | | 13.65% | | |
| | |
| Ratios and supplemental data: | | | | | | | |
| Net assets, end of period (000 omitted) | | $15,339 | | | $11,364 | | |
| Ratio of expenses to average net assets | | 1.25% | | | 1.40% | | |
| Ratio of expenses to average net assets | | | | | | | |
| prior to fees waived and expense paid indirectly | | 1.64% | | | 2.17% | | |
| Ratio of net investment income to average net assets | | 0.94% | | | 0.59% | | |
| Ratio of net investment income (loss) to average net assets | | | | | | | |
| prior to fees waived and expense paid indirectly | | 0.55% | | | (0.18% | ) | |
| Portfolio turnover | | 23% | | | 9% | | |
1 Date of commencement of operations; ratios have been annualized and total return and portfolio turnover have not been annualized.
2 The average shares outstanding method has been applied for per share information.
3 Total investment return is based on the change in net asset value of a share during the period and assumes reinvestment of dividends and distributions at net asset value. Total investment return during all of the periods shown reflects a waiver by the manager. Performance would have been lower had the waiver not been in effect.
See accompanying notes, which are an integral part of the financial statements.
2011 Annual report · Delaware Pooled Trust
(continues) 137
Financial highlights
Delaware Pooled® Trust — The Global Real Estate Securities Portfolio
Selected data for each share of the Portfolio outstanding throughout each period were as follows:
| | Original Class | |
| | | | | | | | | | | | | | 1/10/071 | |
| | Year Ended | | to | |
| | 10/31/11 | | 10/31/10 | | 10/31/09 | | 10/31/08 | | 10/31/07 | |
| Net asset value, beginning of period | | $5.790 | | | $5.050 | | | $4.430 | | | $9.020 | | | $8.500 | | |
| | |
| Income (loss) from investment operations: | | | | | | | | | | | | | | | | |
| Net investment income2 | | 0.163 | | | 0.142 | | | 0.139 | | | 0.155 | | | 0.118 | | |
| Net realized and unrealized gain (loss) on investments | | | | | | | | | | | | | | | | |
| and foreign currencies | | (0.061 | ) | | 0.971 | | | 0.490 | | | (4.409 | ) | | 0.402 | | |
| Total from investment operations | | 0.102 | | | 1.113 | | | 0.629 | | | (4.254 | ) | | 0.520 | | |
| | |
| Less dividends and distributions from: | | | | | | | | | | | | | | | | |
| Net investment income | | (0.502 | ) | | (0.373 | ) | | (0.009 | ) | | (0.336 | ) | | — | | |
| Total dividends and distributions | | (0.502 | ) | | (0.373 | ) | | (0.009 | ) | | (0.336 | ) | | — | | |
| | |
| Net asset value, end of period | | $5.390 | | | $5.790 | | | $5.050 | | | $4.430 | | | $9.020 | | |
| | |
| Total return3 | | 2.10% | | | 23.49% | | | 13.75% | | | (48.74% | ) | | 6.12% | | |
| | |
| Ratios and supplemental data: | | | | | | | | | | | | | | | | |
| Net assets, end of period (000 omitted) | | $49,359 | | | $60,307 | | | $54,761 | | | $87,945 | | | $336,203 | | |
| Ratio of expenses to average net assets | | 1.14% | | | 1.25% | | | 1.07% | | | 1.09% | | | 1.09% | | |
| Ratio of expenses to average net assets | | | | | | | | | | | | | | | | |
| prior to fees waived and expense paid indirectly | | 1.24% | | | 1.25% | | | 1.21% | | | 1.12% | | | 1.10% | | |
| Ratio of net investment income to average net assets | | 2.94% | | | 2.77% | | | 3.45% | | | 2.21% | | | 1.71% | | |
| Ratio of net investment income to average net assets | | | | | | | | | | | | | | | | |
| prior to fees waived and expense paid indirectly | | 2.84% | | | 2.77% | | | 3.31% | | | 2.17% | | | 1.70% | | |
| Portfolio turnover | | 155% | | | 185% | | | 124% | | | 96% | | | 56% | | |
1 Date of commencement of operations; ratios and portfolio turnover have been annualized and total return has not been annualized.
2 The average shares outstanding method has been applied for per share information.
3 Total investment return is based on the change in net asset value of a share during the period and assumes reinvestment of dividends and distributions at net asset value. Total investment return during some of the periods shown reflects a waiver by the manager. Performance would have been lower had the waiver not been in effect.
See accompanying notes, which are an integral part of the financial statements.
2011 Annual report · Delaware Pooled Trust
138
Delaware Pooled® Trust — The Global Real Estate Securities Portfolio
Selected data for each share of the Portfolio outstanding throughout each period were as follows:
| | Class P | |
| | | | | | | | | | | | | | 1/10/071 | |
| | Year Ended | | to | |
| | 10/31/11 | | 10/31/10 | | 10/31/09 | | 10/31/08 | | 10/31/07 | |
| Net asset value, beginning of period | | $5.780 | | | $5.040 | | | $4.420 | | | $9.000 | | | $8.500 | | |
| | |
| Income (loss) from investment operations: | | | | | | | | | | | | | | | | |
| Net investment income2 | | 0.148 | | | 0.129 | | | 0.129 | | | 0.137 | | | 0.101 | | |
| Net realized and unrealized gain (loss) on investments | | | | | | | | | | | | | | | | |
| and foreign currencies | | (0.069 | ) | | 0.973 | | | 0.491 | | | (4.402 | ) | | 0.399 | | |
| Total from investment operations | | 0.079 | | | 1.102 | | | 0.620 | | | (4.265 | ) | | 0.500 | | |
| | |
| Less dividends and distributions from: | | | | | | | | | | | | | | | | |
| Net investment income | | (0.489 | ) | | (0.362 | ) | | — | | | (0.315 | ) | | — | | |
| Total dividends and distributions | | (0.489 | ) | | (0.362 | ) | | — | | | (0.315 | ) | | — | | |
| | |
| Net asset value, end of period | | $5.370 | | | $5.780 | | | $5.040 | | | $4.420 | | | $9.000 | | |
| | |
| Total return3 | | 1.68% | | | 23.26% | | | 14.03% | | | (48.88% | ) | | 5.88% | | |
| | |
| Ratios and supplemental data: | | | | | | | | | | | | | | | | |
| Net assets, end of period (000 omitted) | | $8 | | | $8 | | | $6 | | | $6 | | | $11 | | |
| Ratio of expenses to average net assets | | 1.39% | | | 1.50% | | | 1.32% | | | 1.34% | | | 1.34% | | |
| Ratio of expenses to average net assets | | | | | | | | | | | | | | | | |
| prior to fees waived and expense paid indirectly | | 1.49% | | | 1.50% | | | 1.46% | | | 1.37% | | | 1.35% | | |
| Ratio of net investment income to average net assets | | 2.69% | | | 2.52% | | | 3.20% | | | 1.96% | | | 1.46% | | |
| Ratio of net investment income to average net assets | | | | | | | | | | | | | | | | |
| prior to fees waived and expense paid indirectly | | 2.59% | | | 2.52% | | | 3.06% | | | 1.92% | | | 1.45% | | |
| Portfolio turnover | | 155% | | | 185% | | | 124% | | | 96% | | | 56% | | |
1 Date of commencement of operations; ratios and portfolio turnover have been annualized and total return has not been annualized.
2 The average shares outstanding method has been applied for per share information.
3 Total investment return is based on the change in net asset value of a share during the period and assumes reinvestment of dividends and distributions at net asset value. Total investment return during some of the periods shown reflects a waiver by the manager. Performance would have been lower had the waiver not been in effect.
See accompanying notes, which are an integral part of the financial statements.
2011 Annual report · Delaware Pooled Trust
(continues) 139
Financial highlights
Delaware Pooled® Trust — The Global Fixed Income Portfolio
Selected data for each share of the Portfolio outstanding throughout each period were as follows:
| | Year Ended | |
| | 10/31/11 | | 10/31/10 | | 10/31/09 | | 10/31/08 | | 10/31/07 | |
| Net asset value, beginning of period | | $11.680 | | | $11.280 | | | $11.730 | | | $11.820 | | | $11.330 | | |
| | |
| Income from investment operations: | | | | | | | | | | | | | | | | |
| Net investment income1 | | 0.259 | | | 0.299 | | | 0.324 | | | 0.304 | | | 0.266 | | |
| Net realized and unrealized gain on investments | | | | | | | | | | | | | | | | |
| and foreign currencies | | 0.060 | | | 0.767 | | | 1.494 | | | 0.143 | | | 0.695 | | |
| Total from investment operations | | 0.319 | | | 1.066 | | | 1.818 | | | 0.447 | | | 0.961 | | |
| | |
| Less dividends and distributions from: | | | | | | | | | | | | | | | | |
| Net investment income | | (0.479 | ) | | (0.666 | ) | | (2.268 | ) | | (0.537 | ) | | (0.471 | ) | |
| Total dividends and distributions | | (0.479 | ) | | (0.666 | ) | | (2.268 | ) | | (0.537 | ) | | (0.471 | ) | |
| | |
| Net asset value, end of period | | $11.520 | | | $11.680 | | | $11.280 | | | $11.730 | | | $11.820 | | |
| | |
| Total return2 | | 3.08% | | | 10.03% | | | 17.52% | | | 3.81% | | | 8.80% | | |
| | |
| Ratios and supplemental data: | | | | | | | | | | | | | | | | |
| Net assets, end of period (000 omitted) | | $83,777 | | | $140,281 | | | $143,204 | | | $171,162 | | | $282,899 | | |
| Ratio of expenses to average net assets | | 0.59% | | | 0.60% | | | 0.60% | | | 0.60% | | | 0.61% | | |
| Ratio of expenses to average net assets | | | | | | | | | | | | | | | | |
| prior to fees waived and expense paid indirectly | | 0.63% | | | 0.64% | | | 0.65% | | | 0.62% | | | 0.63% | | |
| Ratio of net investment income to average net assets | | 2.32% | | | 2.75% | | | 3.06% | | | 2.51% | | | 2.38% | | |
| Ratio of net investment income to average net assets | | | | | | | | | | | | | | | | |
| prior to fees waived and expense paid indirectly | | 2.28% | | | 2.71% | | | 3.01% | | | 2.49% | | | 2.36% | | |
| Portfolio turnover | | 89% | | | 39% | | | 100% | | | 54% | | | 44% | | |
1 The average shares outstanding method has been applied for per share information.
2 Total investment return is based on the change in net asset value of a share during the period and assumes reinvestment of dividends and distributions at net asset value. Total investment return during all of the periods shown reflects a waiver by the manager. Performance would have been lower had the waiver not been in effect.
See accompanying notes, which are an integral part of the financial statements.
2011 Annual report · Delaware Pooled Trust
140
Notes to financial statements
Delaware Pooled® Trust
October 31, 2011
Delaware Pooled Trust (Trust) is organized as a Delaware statutory trust and offers 15 separate Portfolios. These financial statements and the related notes pertain to The Large-Cap Value Equity Portfolio, The Select 20 Portfolio, The Large-Cap Growth Equity Portfolio, The Focus Smid-Cap Growth Equity Portfolio, The Real Estate Investment Trust Portfolio II, The Core Focus Fixed Income Portfolio, The High-Yield Bond Portfolio, The Core Plus Fixed Income Portfolio, The International Equity Portfolio, The Labor Select International Equity Portfolio, The Emerging Markets Portfolio, The Emerging Markets Portfolio II, The Global Real Estate Securities Portfolio, and The Global Fixed Income Portfolio (each, a Portfolio, or collectively, Portfolios). The Real Estate Investment Trust Portfolio is included in a separate report. The Trust is an open-end investment company. Each Portfolio is considered diversified under the Investment Company Act of 1940, as amended, except for The Select 20, The Real Estate Investment Trust II, The Global Real Estate Securities, and The Global Fixed Income Portfolios, which are nondiversified. Each Portfolio offers one class of shares except for The Global Real Estate Securities Portfolio which offers Original Class and Class P shares. The Original Class shares do not carry a 12b-1 fee and the Class P shares carry a 12b-1 fee.
The investment objective of The Large-Cap Value Equity Portfolio is to seek long-term capital appreciation.
The investment objective of The Select 20 Portfolio is to seek long-term capital appreciation.
The investment objective of The Large-Cap Growth Equity Portfolio is to seek capital appreciation.
The investment objective of The Focus Smid-Cap Growth Equity Portfolio is to seek long-term capital appreciation.
The investment objective of The Real Estate Investment Trust Portfolio II is to seek maximum long-term total return, with capital appreciation as a secondary objective.
The investment objective of The Core Focus Fixed Income Portfolio is to seek maximum long-term total return, consistent with reasonable risk.
The investment objective of The High-Yield Bond Portfolio is to seek high total return.
The investment objective of The Core Plus Fixed Income Portfolio is to seek maximum long-term total return, consistent with reasonable risk.
The investment objective of The International Equity Portfolio is to seek maximum long-term total return.
The investment objective of The Labor Select International Equity Portfolio is to seek maximum long-term total return.
The investment objective of The Emerging Markets Portfolio is to seek long-term capital appreciation.
The investment objective of The Emerging Markets Portfolio II is to seek long-term capital appreciation.
The investment objective of The Global Real Estate Securities Portfolio is to seek maximum long-term total return through a combination of current income and capital appreciation.
The investment objective of The Global Fixed Income Portfolio is to seek current income consistent with the preservation of principal.
1. Significant Accounting Policies
The following accounting policies are in accordance with U.S. generally accepted accounting principles (U.S. GAAP) and are consistently followed by the Portfolios.
Security Valuation — Equity securities, except those traded on the Nasdaq Stock Market, Inc. (Nasdaq), are valued at the last quoted sales price as of the time of the regular close of the New York Stock Exchange (NYSE) on the valuation date. Securities traded on the Nasdaq are valued in accordance with the Nasdaq Official Closing Price, which may not be the last sales price. If on a particular day an equity security does not trade, then the mean between the bid and ask prices will be used, which approximates fair value. Securities listed on a foreign exchange are valued at the last quoted sales price on the valuation date. Short-term debt securities are valued at market value. U.S. government and agency securities are valued at the mean between the bid and ask prices, which approximates fair value. Other debt securities, credit default swap (CDS) contracts and interest rate swap contracts are valued based upon valuations provided by an independent pricing service or broker and reviewed by management. To the extent current market prices are not available, the pricing service may take into account developments related to the specific security, as well as transactions in comparable securities. Investment company securities are valued at net asset value per share. Foreign currency exchange contracts and foreign cross currency exchange contracts are valued at the mean between the bid and ask prices, which approximates fair value. Interpolated values are derived when the settlement date of the contract is an interim date for which quotations are not available. Futures contracts and options on futures contracts are valued at the daily quoted settlement prices. Exchange-traded options are valued at the last reported sale price or, if no sales are reported, at the mean between the last reported bid and ask prices. Generally, other securities and assets for which market quotations are not readily available are valued at fair value as determined in good faith under the direction of the Trust’s Board of Trustees (Board). In determining whether market quotations are readily available or fair valuation will be used, various factors will be taken into consideration, such as market closures or suspension of trading in a security. The Portfolios may use fair value pricing more frequently for securities traded primarily in non-U.S. markets because, among other things, most foreign markets close well before
2011 Annual report · Delaware Pooled Trust
(continues) 141
Notes to financial statements
Delaware Pooled® Trust
1. Significant Accounting Policies (continued)
the Portfolios value their securities, generally as of 4:00 p.m. Eastern time. The earlier close of these foreign markets gives rise to the possibility that significant events, including broad market moves, government actions or pronouncements, aftermarket trading, or news events may have occurred in the interim. To account for this, the Portfolios may frequently value foreign securities using fair value prices based on third-party vendor modeling tools (international fair value pricing).
Federal Income Taxes — No provision for federal income taxes has been made as each Portfolio intends to continue to qualify for federal income tax purposes as a regulated investment company under Subchapter M of the Internal Revenue Code of 1986, as amended, and make the requisite distributions to shareholders. The Portfolios evaluate tax positions taken or expected to be taken in the course of preparing the Portfolios’ tax returns to determine whether the tax positions are “more-likely-than-not” of being sustained by the applicable tax authority. Tax positions not deemed to meet the more-likely-than-not threshold would be recorded as a tax benefit or expense in the current year. Management has analyzed the Portfolios’ tax positions taken on federal income tax returns for all open tax years (October 31, 2008 – October 31, 2011, as applicable), and has concluded that no provision for federal income tax is required in the Portfolios’ financial statements.
Class Accounting — Investment income, common expenses and realized and unrealized gain (loss) on investments are allocated to the classes of The Global Real Estate Securities Portfolio on the basis of daily net assets of each class. Distribution expenses relating to a specific class are charged directly to that class.
Repurchase Agreements — Each Portfolio may purchase certain U.S. government securities subject to the counterparty’s agreement to repurchase them at an agreed upon date and price. The counterparty will be required on a daily basis to maintain the value of the collateral subject to the agreement at not less than the repurchase price (including accrued interest). The agreements are conditioned upon the collateral being deposited under the Federal Reserve book-entry system with the Portfolios’ custodian or a third party sub-custodian. In the event of default or bankruptcy by the other party to the agreement, retention of the collateral may be subject to legal proceedings. All open repurchase agreements were entered into on October 31, 2011.
To Be Announced Trades — The Portfolios may contract to purchase securities for a fixed price at a transaction date beyond the customary settlement period (e.g., “when issued,” “delayed delivery,” “forward commitment,” or “TBA transactions”) consistent with the Portfolios’ ability to manage their investment portfolios and meet redemption requests. These transactions involve a commitment by the Portfolios to purchase securities for a predetermined price or yield with payment and delivery taking place more than three days in the future, or after a period longer than the customary settlement period for that type of security. No interest will be earned by the Portfolios on such purchases until the securities are delivered; however the market value may change prior to delivery.
Mortgage Dollar Rolls — The Core Focus Fixed Income and The Core Plus Fixed Income Portfolios may enter into mortgage “dollar rolls” in which the Portfolios sell mortgage-backed securities for delivery in the current month and simultaneously contract to repurchase substantially similar (same type, coupon, and maturity) securities on a specified future date. Any difference between the sale price and the purchase price is netted against the interest income foregone on the securities to arrive at an implied borrowing (reverse repurchase) rate. Alternatively, the sale and purchase transactions which constitute the dollar roll can be executed at the same price, with the Portfolio being paid a fee as consideration for entering into the commitment to purchase. Dollar rolls may be renewed prior to cash settlement and initially may involve only a firm commitment agreement by the Portfolio to buy a security. The Portfolios account for mortgage-dollar-roll transactions as purchases and sales. These transactions will increase the Portfolios’ portfolio turnover rate.
Foreign Currency Transactions — Transactions denominated in foreign currencies are recorded at the prevailing exchange rates on the valuation date in accordance with the Portfolios’ prospectuses. The value of all assets and liabilities denominated in foreign currencies is translated into U.S. dollars at the exchange rate of such currencies against the U.S. dollar daily. Transaction gains or losses resulting from changes in exchange rates during the reporting period or upon settlement of the foreign currency transaction are reported in operations for the current period. The Portfolios generally isolate that portion of realized gains and losses on investments in debt securities which is due to changes in foreign exchange rates from that which is due to changes in market prices of debt securities. For foreign equity securities, these changes are included in net realized and unrealized gain or loss on investments. The Portfolios report certain foreign currency related transactions as components of realized gains (losses) for financial reporting purposes, whereas such components are treated as ordinary income (loss) for federal income tax purposes.
Use of Estimates — The preparation of financial statements in conformity with U.S. GAAP requires management to make estimates and assumptions that affect the fair value of investments, the reported amounts of assets and liabilities and disclosure of contingent assets and liabilities at the date of the financial statements and the reported amounts of revenues and expenses during the reporting period. Actual results could differ from those estimates and the differences could be material.
Reimbursement Fees — The Emerging Markets Portfolio may charge a 0.55% purchase reimbursement fee and a 0.55% redemption reimbursement fee. These fees are designed to reflect an approximation of the brokerage and other transaction costs associated with the investment of an investor’s purchase amount or the disposition of assets to meet redemptions, and to limit the extent to which the Portfolio (and, indirectly, the Portfolio’s existing shareholders) would have to bear such costs. These fees are accounted for as an addition to paid-in capital for the Portfolio in the statements of changes in net assets.
2011 Annual report · Delaware Pooled Trust
142
Other — Expenses directly attributable to the Portfolios are charged directly to the Portfolios. Other expenses common to various funds within the Delaware Investments® Family of Funds are generally allocated amongst such funds on the basis of average net assets. Management fees and some other expenses are paid monthly. Security transactions are recorded on the date the securities are purchased or sold (trade date) for financial reporting purposes. Costs used in calculating realized gains and losses on the sale of investment securities are those of the specific securities sold. Interest income is recorded on the accrual basis. Discounts and premiums on non-convertible debt securities are amortized to interest income over the lives of the respective securities. Dividend income is recorded on the ex-dividend date. Realized gains (losses) on paydowns of mortgage- and asset-backed securities are classified as interest income. Distributions received from investments in Real Estate Investment Trusts (REITs) are recorded as dividend income on the ex-dividend date, subject to reclassification upon notice of the character of such distribution by the issuer. The financial statements reflect an estimate of the reclassification of the distribution character for The Real Estate Investment Trust Portfolio II and The Global Real Estate Securities Portfolio. Foreign dividends are also recorded on the ex-dividend date or as soon after the ex-dividend date that a Portfolio is aware of such dividends, net of all nonrebatable tax withholdings. Withholding taxes on foreign dividends have been recorded in accordance with each Portfolio’s understanding of the applicable country’s tax rules and rates.
Each Portfolio declares and pays dividends from net investment income, if any, annually. All Portfolios declare and pay distributions from net realized gain on investments, if any, annually. Dividends and distributions, if any, are recorded on the ex-dividend date. Each Portfolio may distribute income dividends and capital gains more frequently, if necessary for tax purposes.
Subject to seeking best execution, the Portfolios may direct certain security trades to brokers who have agreed to rebate a portion of the related brokerage commission to each Portfolio in cash. In general, best execution refers to many factors, including the price paid or received for a security, the commission charged, the promptness and reliability of execution, the confidentiality and placement accorded the order, and other factors affecting the overall benefit obtained by the Portfolio on the transaction. Such commission rebates are included in realized gain on investments in the accompanying financial statements. The total commission rebates for the year ended October 31, 2011 are as follows:
| | Commission Rebates |
| The Select 20 Portfolio | | | $ | 772 | |
| The Large-Cap Growth Equity Portfolio | | | | 2,318 | |
| The Focus Smid-Cap Growth Equity Portfolio | | | | 881 | |
The Portfolios may receive earnings credits from their custodian when positive cash balances are maintained, which are used to offset custody fees. There were no earnings credits for the year ended October 31, 2011.
The Portfolios may receive earnings credits from their transfer agent when positive cash balances are maintained, which are used to offset transfer agent fees. The expense paid under this arrangement is included in dividend disbursing and transfer agent fees and expenses on the statements of operations with the corresponding expense offset shown as “expense paid indirectly.”
2. Investment Management, Administration Agreements, and Other Transactions with Affiliates
In accordance with the terms of the investment management agreements, Delaware Management Company (DMC), a series of Delaware Management Business Trust and the investment manager of the Portfolios, will receive an annual fee, which is calculated daily based on the average daily net assets of each Portfolio.
DMC has contractually agreed to waive that portion, if any, of its management fees and reimburse each Portfolio (except for The International Equity Portfolio, The Labor Select International Equity Portfolio and The Emerging Markets Portfolio) to the extent necessary to ensure that annual operating expenses, (excluding any 12b-1 plan and certain other expenses) do not exceed specified percentages of average daily net assets of each Portfolio until February 28, 2012. For purposes of these waivers and reimbursements, nonroutine expenses may also include such additional costs and expenses as may be agreed upon from time to time by the Portfolios’ Board and DMC. These expense waivers and reimbursements apply only to expenses paid directly by the Portfolios.
2011 Annual report · Delaware Pooled Trust
(continues) 143
Notes to financial statements
Delaware Pooled® Trust
2. Investment Management, Administration Agreements, and Other Transactions with Affiliates (continued)
The management fee rates and the operating expense limitation rates in effect for the year ended October 31, 2011 are as follows:
| | | | | | Contractual |
| | | | | | operating expense |
| | Management | | limitation as |
| | fee as a percentage | | a percentage |
| | of average daily net | | of average daily |
| | assets (per annum) | | net assets (per annum)† |
| The Large-Cap Value Equity Portfolio | | | 0.55% | | | | 0.70% | |
| The Select 20 Portfolio | | | 0.75% | | | | 0.89% | |
| The Large-Cap Growth Equity Portfolio | | | 0.55% | | | | 0.65% | |
| The Focus Smid-Cap Growth Equity Portfolio | | | 0.75% | | | | 0.92% | |
| The Real Estate Investment Trust Portfolio II | | | 0.75% | | | | 0.95% | |
| The Core Focus Fixed Income Portfolio | | | 0.40% | | | | 0.43% | |
| The High-Yield Bond Portfolio | | | 0.45% | | | | 0.59% | |
| The Core Plus Fixed Income Portfolio | | | 0.43% | | | | 0.45% | |
| The International Equity Portfolio | | | 0.75% | | | | — | †† |
| The Labor Select International Equity Portfolio | | | 0.75% | | | | — | |
| The Emerging Markets Portfolio | | | 1.00% | | | | — | |
| The Emerging Markets Portfolio II | | | 1.00% | | | | 1.20% | ††† |
| The Global Real Estate Securities Portfolio | | | 0.99% | * | | | 1.08% | ** |
| The Global Fixed Income Portfolio | | | 0.50% | | | | 0.60% | |
| † | These operating expense limitations exclude certain expenses, such as 12b-1 plan expenses, taxes, interest, inverse floater program expenses, brokerage fees, certain insurance costs, and nonroutine expenses or costs, including, but not limited to, those relating to reorganizations, litigation, conducting shareholder meetings, and liquidations. |
| †† | Prior to 2/28/11, there was an expense limitation of 0.90% of average daily net assets for The International Equity Portfolio. |
††† | Prior to 2/28/11, the expense limitation was 1.40% of average daily net assets for The Emerging Markets Portfolio II. |
| * | 0.99% on the first $100 million; 0.90% on the next $150 million; 0.80% on assets in excess of $250 million. |
| ** | Prior to 2/28/11, there was no expense limitation for The Global Real Estate Securities Portfolio. |
Mondrian Investment Partners Limited (Mondrian) furnishes investment sub-advisory services to The International Equity Portfolio, The Labor Select International Equity Portfolio, The Emerging Markets Portfolio, and The Global Fixed Income Portfolio. For these services, DMC, not the Portfolios, pays Mondrian the following percentages of the Portfolios’ average daily net assets.
| | Sub-advisory fee as a |
| | percentage of average daily |
| | net assets (per annum) |
| The International Equity Portfolio | | 0.36% |
| The Labor Select International Equity Portfolio | | 0.30% |
| The Emerging Markets Portfolio | | 0.75% |
| The Global Fixed Income Portfolio | | 0.30% |
2011 Annual report · Delaware Pooled Trust
144
Delaware Service Company, Inc. (DSC), an affiliate of DMC, provides fund accounting and financial administration oversight services to the Portfolios. For these services, the Portfolios pay DSC fees based on the aggregate daily net assets of the Delaware Investments® Family of Funds at the following annual rate: 0.0050% of the first $30 billion; 0.0045% of the next $10 billion; 0.0040% of the next $10 billion; and 0.0025% of aggregate average daily net assets in excess of $50 billion. The fees payable to DSC under the service agreement described above are allocated among all Funds in the Delaware Investments® Family of Funds on a relative net asset value basis. For the year ended October 31, 2011, the Portfolios were charged for these services as follows:
| The Large-Cap Value Equity Portfolio | $ | 331 |
| The Select 20 Portfolio | | 1,193 |
| The Large-Cap Growth Equity Portfolio | | 9,847 |
| The Focus Smid-Cap Growth Equity Portfolio | | 480 |
| The Real Estate Investment Trust Portfolio II | | 146 |
| The Core Focus Fixed Income Portfolio | | 490 |
| The High-Yield Bond Portfolio | | 2,364 |
| The Core Plus Fixed Income Portfolio | | 2,446 |
| The International Equity Portfolio | | 34,717 |
| The Labor Select International Equity Portfolio | | 33,331 |
| The Emerging Markets Portfolio | | 29,009 |
| The Emerging Markets Portfolio II | | 683 |
| The Global Real Estate Securities Portfolio | | 2,768 |
| The Global Fixed Income Portfolio | | 5,446 |
The Bank of New York Mellon (BNY Mellon) provides custody, fund accounting and financial administration services to the Portfolios.
DSC also provides dividend disbursing and transfer agency services. The Portfolios pay DSC a monthly asset-based fee for these services.
Pursuant to a distribution agreement and distribution plan, The Global Real Estate Securities Portfolio pays Delaware Distributors, L.P. (DDLP), the distributor and an affiliate of DMC, an annual distribution and service fee not to exceed 0.25% of the average daily net assets of the Class P shares. Original Class shares pay no distribution and service expenses.
At October 31, 2011, each Portfolio had receivables due from or liabilities payable to affiliates as follows:
| | | | | | Dividend | | | | | | | | | | |
| | | | | | disbursing, | | | | | | | | | | |
| | | | | | transfer | | | | | | | | | | |
| | | | | | agent and | | | | | | | | | | |
| | | | | | fund accounting | | | | | | | Receivable |
| | | | | | oversight | | | | | | | from DMC |
| Investment management | | fees, and | | Other expenses | | under |
| fee payable to | | other expenses | | payable to | | expense limitation |
| DMC | | payable to DSC | | DMC and affiliates* | | agreement |
| The Large-Cap Value Equity Portfolio | | $ | — | | | | $ | 67 | | | | $ | 48 | | | | $ | 3,824 | |
| The Select 20 Portfolio | | | 19,884 | | | | | 449 | | | | | 298 | | | | | — | |
| The Large-Cap Growth Equity Portfolio | | | 77,500 | | | | | 1,755 | | | | | 1,243 | | | | | — | |
| The Focus Smid-Cap Growth Equity Portfolio | | | 9,133 | | | | | 169 | | | | | 117 | | | | | — | |
| The Real Estate Investment Trust Portfolio II | | | — | | | | | 30 | | | | | 22 | | | | | 3,554 | |
| The Core Focus Fixed Income Portfolio | | | — | | | | | 65 | | | | | 49 | | | | | 1,625 | |
| The High-Yield Bond Portfolio | | | 21,110 | | | | | 584 | | | | | 425 | | | | | — | |
| The Core Plus Fixed Income Portfolio | | | 8,273 | | | | | 532 | | | | | 398 | | | | | — | |
| The International Equity Portfolio | | | 193,410 | | | | | 6,175 | | | | | 4,465 | | | | | — | |
| The Labor Select International Equity Portfolio | | | 360,268 | | | | | 5,982 | | | | | 4,276 | | | | | — | |
| The Emerging Markets Portfolio | | | 424,995 | | | | | 5,292 | | | | | 3,771 | | | | | — | |
| The Emerging Markets Portfolio II | | | 8,865 | | | | | 155 | | | | | 110 | | | | | — | |
| The Global Real Estate Securities Portfolio | | | 40,871 | | | | | 498 | | | | | 363 | | | | | — | |
| The Global Fixed Income Portfolio | | | 31,835 | | | | | 904 | | | | | 704 | | | | | — | |
*DMC, as part of its administrative services, pays operating expenses on behalf of the Portfolios and is reimbursed on a periodic basis. Expenses include items such as printing of shareholder reports, fees for audit, legal and tax services, registration fees, and trustees’ fees.
2011 Annual report · Delaware Pooled Trust
(continues) 145
Notes to financial statements
Delaware Pooled® Trust
2. Investment Management, Administration Agreements, and Other Transactions with Affiliates (continued)
As provided in the investment management agreement, the Portfolios bear the cost of certain legal and tax services, including internal legal and tax services provided to the Portfolios by DMC and/or its affiliates’ employees. For the year ended October 31, 2011, the Portfolios were charged for internal legal and tax services by DMC and/or its affiliates’ employees as follows:
| The Large-Cap Value Equity Portfolio | $ | 169 |
| The Select 20 Portfolio | | 736 |
| The Large-Cap Growth Equity Portfolio | | 4,730 |
| The Focus Smid-Cap Growth Equity Portfolio | | 276 |
| The Real Estate Investment Trust Portfolio II | | 79 |
| The Core Focus Fixed Income Portfolio | | 134 |
| The High-Yield Bond Portfolio | | 1,424 |
| The Core Plus Fixed Income Portfolio | | 1,209 |
| The International Equity Portfolio | | 17,208 |
| The Labor Select International Equity Portfolio | | 17,112 |
| The Emerging Markets Portfolio | | 14,585 |
| The Emerging Markets Portfolio II | | 390 |
| The Global Real Estate Securities Portfolio | | 1,414 |
| The Global Fixed Income Portfolio | | 2,566 |
Trustees’ fees include expenses accrued by each Portfolio for each Trustee’s retainer and meeting fees. Certain officers of DMC, DSC, and DDLP are officers and/or Trustees of the Trust. These officers and Trustees are paid no compensation by the Portfolios.
3. Investments
For the year ended October 31, 2011, each Portfolio made purchases and sales of investment securities other than short-term investments as follows:
| Purchases | | | | | | | Sales | | | | | |
| other than | | Purchases of | | other than | | Sales of |
| U.S. government | | U.S. government | | U.S. government | | U.S. government |
| securities | | securities | | securities | | securities |
| The Large-Cap Value Equity Portfolio | | $ | 8,746,857 | | | | $ | — | | | | $ | 9,394,622 | | | | $ | — | |
| The Select 20 Portfolio | | | 37,635,462 | | | | | — | | | | | 6,032,325 | | | | | — | |
| The Large-Cap Growth Equity Portfolio | | | 37,975,605 | | | | | — | | | | | 135,202,859 | | | | | — | |
| The Focus Smid-Cap Growth Equity Portfolio | | | 12,498,902 | | | | | — | | | | | 1,547,654 | | | | | — | |
| The Real Estate Investment Trust Portfolio II | | | 4,014,249 | | | | | — | | | | | 3,993,162 | | | | | — | |
| The Core Focus Fixed Income Portfolio | | | 28,748,738 | | | | | 21,911,171 | | | | | 41,413,123 | | | | | 22,357,109 | |
| The High-Yield Bond Portfolio | | | 64,175,625 | | | | | — | | | | | 34,631,755 | | | | | — | |
| The Core Plus Fixed Income Portfolio | | | 96,859,774 | | | | | 35,760,628 | | | | | 100,183,081 | | | | | 30,695,291 | |
| The International Equity Portfolio | | | 151,107,699 | | | | | — | | | | | 346,014,794 | | | | | — | |
| The Labor Select International Equity Portfolio | | | 131,267,166 | | | | | — | | | | | 280,140,334 | | | | | — | |
| The Emerging Markets Portfolio | | | 226,102,391 | | | | | — | | | | | 405,332,561 | | | | | — | |
| The Emerging Markets Portfolio II | | | 8,988,534 | | | | | — | | | | | 3,107,470 | | | | | — | |
| The Global Real Estate Securities Portfolio | | | 84,813,249 | | | | | — | | | | | 92,766,098 | | | | | — | |
| The Global Fixed Income Portfolio | | | 72,462,044 | | | | | 22,858,931 | | | | | 116,082,981 | | | | | 34,642,777 | |
2011 Annual report · Delaware Pooled Trust
146
At October 31, 2011, the cost of investments and unrealized appreciation (depreciation) for federal income tax purposes for each Portfolio were as follows:
| | | | | | | | | | | | | | | | | Net |
| | | | | | Aggregate | | Aggregate | | Unrealized |
| Cost of | | unrealized | | unrealized | | appreciation |
| investments | | appreciation | | depreciation | | (depreciation) |
| The Large-Cap Value Equity Portfolio | | $ | 6,939,913 | | | | $ | 140,676 | | | | $ | (450,033 | ) | | | | $ | (309,357 | ) | |
| The Select 20 Portfolio | | | 41,672,214 | | | | | 5,344,886 | | | | | (1,499,893 | ) | | | | | 3,844,993 | | |
| The Large-Cap Growth Equity Portfolio | | | 137,941,380 | | | | | 43,097,442 | | | | | (8,046,190 | ) | | | | | 35,051,252 | | |
| The Focus Smid-Cap Growth Equity Portfolio | | | 15,621,983 | | | | | 2,073,560 | | | | | (960,800 | ) | | | | | 1,112,760 | | |
| The Real Estate Investment Trust Portfolio II | | | 3,013,366 | | | | | 317,067 | | | | | (240,762 | ) | | | | | 76,305 | | |
| The Core Focus Fixed Income Portfolio | | | 7,199,153 | | | | | 146,127 | | | | | (61,912 | ) | | | | | 84,215 | | |
| The High-Yield Bond Portfolio | | | 64,975,967 | | | | | 926,704 | | | | | (2,695,730 | ) | | | | | (1,769,026 | ) | |
| The Core Plus Fixed Income Portfolio | | | 57,495,705 | | | | | 2,159,570 | | | | | (1,187,522 | ) | | | | | 972,048 | | |
| The International Equity Portfolio | | | 596,346,755 | | | | | 104,964,331 | | | | | (110,039,234 | ) | | | | | (5,074,903 | ) | |
| The Labor Select International Equity Portfolio | | | 615,063,334 | | | | | 105,097,873 | | | | | (129,567,005 | ) | | | | | (24,469,132 | ) | |
| The Emerging Markets Portfolio | | | 533,655,704 | | | | | 58,524,893 | | | | | (46,469,386 | ) | | | | | 12,055,507 | | |
| The Emerging Markets Portfolio II | | | 16,556,365 | | | | | 918,068 | | | | | (2,311,064 | ) | | | | | (1,392,996 | ) | |
| The Global Real Estate Securities Portfolio | | | 57,506,662 | | | | | 4,321,931 | | | | | (6,650,834 | ) | | | | | (2,328,903 | ) | |
| The Global Fixed Income Portfolio | | | 77,500,496 | | | | | 6,193,575 | | | | | (1,811,225 | ) | | | | | 4,382,350 | | |
U.S. GAAP defines fair value as the price that each Portfolio would receive to sell an asset or pay to transfer a liability in an orderly transaction between market participants at the measurement date under current market conditions. A three level hierarchy for fair value measurements has been established based upon the transparency of inputs to the valuation of an asset or liability. Inputs may be observable or unobservable and refer broadly to the assumptions that market participants would use in pricing the asset or liability. Observable inputs reflect the assumptions market participants would use in pricing the asset or liability based on market data obtained from sources independent of the reporting entity. Unobservable inputs reflect the reporting entity’s own assumptions about the assumptions that market participants would use in pricing the asset or liability developed based on the best information available under the circumstances. Each Portfolio’s investment in its entirety is assigned a level based upon the observability of the inputs, which are significant to the overall valuation. The three level hierarchy of inputs is summarized below.
| Level 1 – | inputs are quoted prices in active markets for identical investments (e.g., equity securities, open-end investment companies, futures contracts, options contracts) |
| |
| Level 2 – | other observable inputs (including, but not limited to: quoted prices for similar assets or liabilities in markets that are active, quoted prices for identical or similar assets or liabilities in markets that are not active, inputs other than quoted prices that are observable for the assets or liabilities (such as interest rates, yield curves, volatilities, prepayment speeds, loss severities, credit risks and default rates) or other market-corroborated inputs) (e.g., debt securities, government securities, swap contracts, foreign currency exchange contracts, foreign securities utilizing international fair value pricing) |
| |
| Level 3 – | inputs are significant unobservable inputs (including the Fund’s own assumptions used to determine the fair value of investments) (e.g., broker-quoted securities, fair valued securities) The following table summarizes the valuation of The Large-Cap Value Equity Portfolio’s investments by fair value hierarchy levels as of October 31, 2011: |
| Level 1 | | Level 2 | | Total |
| Common Stock | $ | 6,514,712 | | $ | — | | $ | 6,514,712 |
| Short-Term Investments | | 48,000 | | | 67,844 | | | 115,844 |
| Total | $ | 6,562,712 | | $ | 67,844 | | $ | 6,630,556 |
There were no unobservable inputs used to value investments at the beginning or end of the year.
2011 Annual report · Delaware Pooled Trust
(continues) 147
Notes to financial statements
Delaware Pooled® Trust
3. Investments (continued)
The following table summarizes the valuation of The Select 20 Portfolio’s investments by fair value hierarchy levels as of October 31, 2011:
| Level 1 | | Level 2 | | Total |
| Common Stock | $ | 44,587,147 | | $ | — | | $ | 44,587,147 |
| Short-Term Investments | | 339,000 | | | 591,060 | | | 930,060 |
| Total | $ | 44,926,147 | | $ | 591,060 | | $ | 45,517,207 |
There were no unobservable inputs used to value investments at the beginning or end of the year.
The following table summarizes the valuation of The Large-Cap Growth Equity Portfolio’s investments by fair value hierarchy levels as of October 31, 2011:
| Level 1 | | Level 2 | | Level 3 | | Total |
| Common Stock | $ | 168,797,998 | | $ | — | | $ | — | | $ | 168,797,998 |
| Short-Term Investments | | 781,000 | | | 658,501 | | | — | | | 1,439,501 |
| Securities Lending Collateral | | — | | | 2,755,133 | | | — | | | 2,755,133 |
| Total | $ | 169,578,998 | | $ | 3,413,634 | | $ | — | | $ | 172,992,632 |
The following is a reconciliation of investments in which significant unobservable inputs (Level 3) were used in determining fair value:
| The Large-Cap Growth Equity Portfolio |
| Securities |
| Lending |
| Collateral |
| Balance as of 10/31/10 | | $ | 11,605 | | |
| Sales | | | (11,359 | ) | |
| Net change in unrealized appreciation/depreciation | | | (246 | ) | |
| Balance as of 10/31/11 | | $ | — | | |
| | |
| Net change in unrealized appreciation/depreciation | | | | | |
| from investments still held as of 10/31/11 | | $ | (11,017 | ) | |
The following table summarizes the valuation of The Focus Smid-Cap Growth Equity Portfolio’s investments by fair value hierarchy levels as of October 31, 2011:
| Level 1 | | Level 2 | | Total |
| Common Stock | $ | 15,940,243 | | $ | — | | $ | 15,940,243 |
| Short-Term Investments | | 522,000 | | | 272,500 | | | 794,500 |
| Total | $ | 16,462,243 | | $ | 272,500 | | $ | 16,734,743 |
There were no unobservable inputs used to value investments at the beginning or end of the year.
The following table summarizes the valuation of The Real Estate Investment Trust Portfolio II’s investments by fair value hierarchy levels as of October 31, 2011:
| Level 1 | | Level 2 | | Total |
| Common Stock | $ | 2,923,502 | | $ | — | | $ | 2,923,502 |
| Investment companies | | 45,792 | | | — | | | 45,792 |
| Short-Term Investments | | 72,000 | | | 48,377 | | | 120,377 |
| Total | $ | 3,041,294 | | $ | 48,377 | | $ | 3,089,671 |
There were no unobservable inputs used to value investments at the beginning or end of the year.
2011 Annual report · Delaware Pooled Trust
148
The following table summarizes the valuation of The Core Focus Fixed Income Portfolio’s investments by fair value hierarchy levels as of October 31, 2011:
| Level 1 | | Level 2 | | Level 3 | | Total |
| Agency, Asset-Backed and Mortgage-Backed Securities | $ | — | | $ | 2,361,515 | | $ | — | | $ | 2,361,515 |
| Corporate Debt | | — | | | 1,519,485 | | | — | | | 1,519,485 |
| Foreign Debt | | — | | | 102,366 | | | — | | | 102,366 |
| Municipal Bonds | | — | | | 195,671 | | | — | | | 195,671 |
| U.S. Treasury Obligations | | — | | | 1,357,094 | | | — | | | 1,357,094 |
| Short-Term Investments | | 1,007,000 | | | 716,419 | | | — | | | 1,723,419 |
| Securities Lending Collateral | | — | | | — | | | — | | | — |
| Preferred Stock | | 15,655 | | | 8,163 | | | — | | | 23,818 |
| Total | $ | 1,022,655 | | $ | 6,260,713 | | $ | — | | $ | 7,283,368 |
The following is a reconciliation of investments in which significant unobservable inputs (Level 3) were used in determining fair value:
| The Core Focus Fixed Income Portfolio |
| Agency, Asset- | | | | | | | | |
| Backed and | | | | | | | | |
| Mortgage- | | Securities | | | | |
| Backed | | Lending | | | | |
| Securities | | Collateral | | Total |
| Balance as of 10/31/10 | $ | 100,500 | | | $ | 2,266 | | | $ | 102,766 | |
| Sales | | (100,309 | ) | | | (2,218 | ) | | | (102,527 | ) |
| Net realized gains | | 309 | | | | — | | | | 309 | |
| Net change in unrealized appreciation/depreciation | | (500 | ) | | | (48 | ) | | | (548 | ) |
| Balance as of 10/31/11 | $ | — | | | $ | — | | | $ | — | |
| |
| Net change in unrealized appreciation/depreciation | | | | | | | | | | | |
| from investments still held as of 10/31/11 | $ | — | | | $ | (2,151 | ) | | $ | (2,151 | ) |
The following table summarizes the valuation of The High-Yield Bond Portfolio’s investments by fair value hierarchy levels as of October 31, 2011:
| Level 1 | | Level 2 | | Level 3 | | Total |
| Common Stock | $ | 123,337 | | $ | — | | $ | — | | $ | 123,337 |
| Corporate Debt | | — | | | 54,148,633 | | | 5,451 | | | 54,154,084 |
| Other | | 500,600 | | | 522,091 | | | — | | | 1,022,691 |
| Short-Term Investment | | 1,356,000 | | | — | | | — | | | 1,356,000 |
| Securities Lending Collateral | | — | | | 6,550,829 | | | — | | | 6,550,829 |
| Total | $ | 1,979,937 | | $ | 61,221,553 | | $ | 5,451 | | $ | 63,206,941 |
2011 Annual report · Delaware Pooled Trust
(continues) 149
Notes to financial statements
Delaware Pooled® Trust
3. Investments (continued)
The following is a reconciliation of investments in which significant unobservable inputs (Level 3) were used in determining fair value:
| The High Yield Bond Portfolio |
| | | | | | | | | Securities | | | | | | | | |
| Common | | Corporate | | Lending | | | | | | | | |
| Stock | | Debt | | Collateral | | Other | | Total |
| Balance as of 10/31/10 | $ | — | | | $ | 8,501 | | | $ | 1,699 | | | $ | 1 | | | $ | 10,201 | |
| Purchases | | — | | | | 116 | | | | — | | | | — | | | | 116 | |
| Sales | | (284 | ) | | | (81 | ) | | | (1,663 | ) | | | (1 | ) | | | (2,029 | ) |
| Net realized gain | | — | | | | — | | | | — | | | | 1 | | | | 1 | |
| Net change in unrealized appreciation/depreciation | | 284 | | | | (3,085 | ) | | | (36 | ) | | | (1 | ) | | | (2,838 | ) |
| Balance as of 10/31/11 | $ | — | | | $ | 5,451 | | | $ | — | | | $ | — | | | $ | 5,451 | |
| |
| Net change in unrealized appreciation/depreciation | | | | | | | | | | | | | | | | | | | |
| from investments still held as of 10/31/11 | $ | 284 | | | $ | (3,166 | ) | | $ | (1,613 | ) | | $ | — | | | $ | (4,495 | ) |
The following table summarizes the valuation of The Core Plus Fixed Income Portfolio’s investments by fair value hierarchy levels as of October 31, 2011:
| Level 1 | | Level 2 | | Level 3 | | Total |
| Agency, Asset-Backed and Mortgage-Backed Securities | $ | — | | $ | 13,499,277 | | | $ | 102,180 | | $ | 13,601,457 | |
| Corporate Debt | | — | | | 25,369,147 | | | | — | | | 25,369,147 | |
| Foreign Debt | | — | | | 4,214,901 | | | | — | | | 4,214,901 | |
| U.S. Treasury Obligations | | — | | | 7,044,361 | | | | — | | | 7,044,361 | |
| Short-Term Investments | | 6,986,000 | | | — | | | | — | | | 6,986,000 | |
| Securities Lending Collateral | | — | | | 1,092,809 | | | | — | | | 1,092,809 | |
| Preferred Stock | | 46,839 | | | 112,239 | | | | — | | | 159,078 | |
| Total | $ | 7,032,839 | | $ | 51,332,734 | | | $ | 102,180 | | $ | 58,467,753 | |
| |
| Foreign Currency Exchange Contracts | $ | — | | $ | 54,337 | | | $ | — | | $ | 54,337 | |
| Futures Contracts | | 83,452 | | | — | | | | — | | | 83,452 | |
| Swap Contracts | | — | | | (146,304 | ) | | | — | | | (146,304 | ) |
The following is a reconciliation of investments in which significant unobservable inputs (Level 3) were used in determining fair value:
| The Core Plus Fixed Income Portfolio |
| Agency, Asset- | | | | | | | | | | | | |
| Backed and | | | | | | | | | | | | |
| Mortgage- | | | | | | Securities | | | | |
| Backed | | Corporate | | Lending | | | | |
| Securities | | Debt | | Collateral | | Total |
| Balance as of 10/31/10 | | $ | — | | | $ | 107,069 | | | $ | 2,673 | | | $ | 109,742 | |
| Purchases | | | 101,698 | | | | — | | | | — | | | | 101,698 | |
| Sales | | | — | | | | (108,675 | ) | | | (2,617 | ) | | | (111,292 | ) |
| Net realized gain | | | — | | | | 7,448 | | | | — | | | | 7,448 | |
| Net change in unrealized appreciation/depreciation | | | 482 | | | | (5,842 | ) | | | (56 | ) | | | (5,416 | ) |
| Balance as of 10/31/11 | | $ | 102,180 | | | $ | — | | | $ | — | | | $ | 102,180 | |
| |
| Net change in unrealized appreciation/depreciation | | | | | | | | | | | | | | | | |
| from investments still held as of 10/31/11 | | $ | 482 | | | $ | — | | | $ | (2,538 | ) | | $ | (2,056 | ) |
2011 Annual report · Delaware Pooled Trust
150
The following table summarizes the valuation of The International Equity Portfolio’s investments by fair value hierarchy levels as of October 31, 2011:
| Level 1 | | Level 2 | | Level 3 | | Total |
| Common Stock | $ | 21,723,091 | | $ | 559,802,843 | | | $ | — | | $ | 581,525,934 | |
| Short-Term Investments | | 5,101,000 | | | 1,378,438 | | | | — | | | 6,479,438 | |
| Securities Lending Collateral | | — | | | 3,266,480 | | | | — | | | 3,266,480 | |
| Total | $ | 26,824,091 | | $ | 564,447,761 | | | $ | — | | $ | 591,271,852 | |
| |
| Foreign Currency Exchange Contracts | $ | — | | $ | (115,381 | ) | | $ | — | | $ | (115,381 | ) |
As a result of utilizing international fair value pricing at October 31, 2011, the majority of the portfolio was categorized as Level 2.
The following is a reconciliation of investments in which significant unobservable inputs (Level 3) were used in determining fair value:
| The International Equity Portfolio |
| Securities |
| Lending |
| Collateral |
| Balance as of 10/31/10 | | $ | 77,923 | | |
| Sales | | | (76,268 | ) | |
| Net change in unrealized appreciation/depreciation | | | (1,655 | ) | |
| Balance as of 10/31/11 | | $ | — | | |
| | |
| Net change in unrealized appreciation/depreciation | | | | | |
| from investments still held as of 10/31/11 | | $ | (73,980 | ) | |
The following table summarizes the valuation of The Labor Select International Equity Portfolio’s investments by fair value hierarchy levels as of October 31, 2011:
| Level 1 | | Level 2 | | Level 3 | | Total |
| Common Stock | $ | 12,058,920 | | $ | 541,486,529 | | $ | — | | $ | 553,545,449 | |
| Short-Term Investments | | 13,115,000 | | | 4,524,704 | | | — | | | 17,639,704 | |
| Securities Lending Collateral | | — | | | 19,409,049 | | | — | | | 19,409,049 | |
| Total | $ | 25,173,920 | | $ | 565,420,282 | | $ | — | | $ | 590,594,202 | |
| |
| Foreign Currency Exchange Contracts | $ | — | | $ | (95,448 | ) | $ | — | | $ | (95,448 | ) |
As a result of utilizing international fair value pricing at October 31, 2011, the majority of the portfolio was categorized as Level 2.
The following is a reconciliation of investments in which significant unobservable inputs (Level 3) were used in determining fair value:
| The Labor Select |
| International Equity Portfolio |
| Securities |
| Lending |
| Collateral |
| Balance as of 10/31/10 | | $ | 26,954 | | |
| Sales | | | (26,381 | ) | |
| Net change in unrealized appreciation/depreciation | | | (573 | ) | |
| Balance as of 10/31/11 | | $ | — | | |
| | |
| Net change in unrealized appreciation/depreciation | | | | | |
| from investments still held as of 10/31/11 | | $ | (25,590 | ) | |
2011 Annual report · Delaware Pooled Trust
(continues) 151
Notes to financial statements
Delaware Pooled® Trust
3. Investments (continued)
The following table summarizes the valuation of The Emerging Market Portfolio’s investments by fair value hierarchy levels as of October 31, 2011:
| Level 1 | | Level 2 | | Level 3 | | Total |
| Common Stock | $ | 166,837,355 | | $ | 323,344,017 | | | $ | — | | $ | 490,181,372 | |
| Preferred Stock | | 24,627,130 | | | 8,810,442 | | | | — | | | 33,437,572 | |
| Short-Term Investments | | 6,867,000 | | | 618,165 | | | | — | | | 7,485,165 | |
| Securities Lending Collateral | | — | | | 14,607,102 | | | | — | | | 14,607,102 | |
| Total | $ | 198,331,485 | | $ | 347,379,726 | | | $ | — | | $ | 545,711,211 | |
| |
| Foreign Currency Exchange Contracts | $ | — | | $ | (7,067 | ) | | $ | — | | $ | (7,067 | ) |
As a result of utilizing international fair value pricing at October 31, 2011, the majority of the portfolio was categorized as Level 2.
The following is a reconciliation of investments in which significant unobservable inputs (Level 3) were used in determining fair value:
| The Emerging Markets Portfolio |
| Securities |
| Lending |
| Collateral |
| Balance as of 10/31/10 | | $ | 29,772 | | |
| Sales | | | (29,139 | ) | |
| Net change in unrealized appreciation/depreciation | | | (633 | ) | |
| Balance as of 10/31/11 | | $ | — | | |
| | |
| Net change in unrealized appreciation/depreciation | | | | | |
| from investments still held as of 10/31/11 | | $ | (28,266 | ) | |
The following table summarizes the valuation of The Emerging Market Portfolio II’s investments by fair value hierarchy levels as of October 31, 2011:
| Level 1 | | Level 2 | | Level 3 | | Total |
| Common Stock | $ | 8,426,180 | | $ | 6,549,583 | | $ | 23,606 | | $ | 14,999,369 |
| Short-Term Investment | | 164,000 | | | — | | | — | | | 164,000 |
| Total | $ | 8,590,180 | | $ | 6,549,583 | | $ | 23,606 | | $ | 15,163,369 |
As a result of utilizing international fair value pricing at October 31, 2011, a portion of the portfolio was categorized as Level 2.
The following is a reconciliation of investments in which significant unobservable inputs (Level 3) were used in determining fair value:
| The Emerging Markets Portfolio II |
| Common |
| Stock |
| Balance as of 10/31/10 | | $ | — | | |
| Purchases | | | 60,900 | | |
| Sales | | | (26,675 | ) | |
| Net realized loss | | | (625 | ) | |
| Net change in unrealized appreciation/depreciation | | | (9,994 | ) | |
| Balance as of 10/31/11 | | $ | 23,606 | | |
| | |
| Net change in unrealized appreciation/depreciation | | | | | |
| from investments still held as of 10/31/11 | | $ | (9,994 | ) | |
2011 Annual report · Delaware Pooled Trust
152
The following table summarizes the valuation of The Global Real Estate Securities Portfolio’s investments by fair value hierarchy levels as of October 31, 2011:
| Level 1 | | Level 2 | | Level 3 | | Total |
| Common Stock | $ | 25,982,578 | | $ | 22,957,152 | | | $ | — | | $ | 48,939,730 | |
| Short-Term Investments | | 464,000 | | | 973,548 | | | | — | | | 1,437,548 | |
| Securities Lending Collateral | | — | | | 4,800,481 | | | | — | | | 4,800,481 | |
| Total | $ | 26,446,578 | | $ | 28,731,181 | | | $ | — | | $ | 55,177,759 | |
| |
| Foreign Currency Exchange Contracts | $ | — | | $ | (5,165 | ) | | $ | — | | $ | (5,165 | ) |
As a result of utilizing international fair value pricing at October 31, 2011, a portion of the portfolio was categorized as Level 2.
The following is a reconciliation of investments in which significant unobservable inputs (Level 3) were used in determining fair value:
| The Global Real Estate Securities Portfolio |
| Securities |
| Lending |
| Collateral |
| Balance as of 10/31/10 | | $ | 21,486 | | |
| Sales | | | (21,030 | ) | |
| Net change in unrealized appreciation/depreciation | | | (456 | ) | |
| Balance as of 10/31/11 | | $ | — | | |
| | |
| Net change in unrealized appreciation/depreciation | | | | | |
| from investments still held as of 10/31/11 | | $ | (20,399 | ) | |
The following table summarizes the valuation of The Global Fixed Income Portfolio’s investments by fair value hierarchy levels as of October 31, 2011:
| Level 1 | | Level 2 | | Total |
| Foreign Debt | $ | — | | $ | 71,397,528 | | $ | 71,397,528 |
| U.S. Treasury Obligations | | — | | | 9,775,928 | | | 9,775,928 |
| Short-Term Investments | | 413,000 | | | 296,390 | | | 709,390 |
| Total | $ | 413,000 | | $ | 81,469,846 | | $ | 81,882,846 |
| |
| Foreign Currency Exchange Contracts | $ | — | | $ | 81,509 | | $ | 81,509 |
There were no unobservable inputs used to value investments at the beginning or end of the year.
During the year ended October 31, 2011, there were no transfers between Level 1 investments and Level 2 investments that had a material impact to the Portfolios. This does not include transfers between Level 1 investments and Level 2 investments due to the Portfolios utilizing international fair value pricing during the year.
2011 Annual report · Delaware Pooled Trust
(continues) 153
Notes to financial statements
Delaware Pooled® Trust
4. Dividend and Distribution Information
Income and long-term capital gain distributions are determined in accordance with federal income tax regulations, which may differ from U.S. GAAP. Additionally, distributions from net gains on foreign currency transactions and net short-term gains on sales of investment securities are treated as ordinary income for federal income tax purposes. The tax character of dividends and distributions paid during the years ended October 31, 2011 and October 31, 2010 was as follows:
| | | Ordinary |
| | income |
| Year ended October 31, 2011: | | |
| The Large-Cap Value Equity Portfolio | $ | 211,314 |
| The Large-Cap Growth Equity Portfolio | | 826,516 |
| The Focus Smid-Cap Growth Equity Portfolio | | 41,867 |
| The Real Estate Investment Trust Portfolio II | | 40,124 |
| The Core Focus Fixed Income Portfolio | | 567,674 |
| The High-Yield Bond Portfolio | | 2,250,664 |
| The Core Plus Fixed Income Portfolio | | 2,534,908 |
| The International Equity Portfolio | | 25,012,020 |
| The Labor Select International Equity Portfolio | | 22,010,265 |
| | The Emerging Markets Portfolio | | 16,918,513 |
| The Emerging Markets Portfolio II | | 117,647 |
| The Global Real Estate Securities Portfolio | | 5,064,501 |
| The Global Fixed Income Portfolio | | 5,618,617 |
| |
| | Ordinary |
| | income |
| Year ended October 31, 2010: | | |
| The Large-Cap Value Equity Portfolio | $ | 269,213 |
| The Large-Cap Growth Equity Portfolio | | 554,027 |
| The Real Estate Investment Trust Portfolio II | | 148,549 |
| The Core Focus Fixed Income Portfolio | | 946,676 |
| The High-Yield Bond Portfolio | | 2,139,650 |
| The Core Plus Fixed Income Portfolio | | 3,595,170 |
| The International Equity Portfolio | | 28,823,614 |
| The Labor Select International Equity Portfolio | | 22,976,321 |
| The Emerging Markets Portfolio | | 13,508,314 |
| The Global Real Estate Securities Portfolio | | 3,906,141 |
| The Global Fixed Income Portfolio | | 8,038,391 |
2011 Annual report · Delaware Pooled Trust
154
5. Components of Net Assets on a Tax Basis
As of October 31, 2011, the components of net assets on a tax basis were as follows:
| | The | | | | | | The | | The |
| | Large-Cap | | The | | Large-Cap | | Focus Smid-Cap |
| | Value Equity | | Select 20 | | Growth Equity | | Growth Equity |
| | Portfolio | | Portfolio | | Portfolio | | Portfolio |
| Shares of beneficial interest | | $ | 7,862,263 | | | $ | 44,936,340 | | | $ | 186,430,117 | | | | $ | 16,413,692 | | |
| Undistributed ordinary income | | | 119,894 | | | | 10,052 | | | | 426,423 | | | | | 10,851 | | |
| Capital loss carryforwards | | | (1,032,032 | ) | | | (2,813,454 | ) | | | (51,376,671 | ) | | | | (815,919 | ) | |
| Unrealized appreciation (depreciation) of investments | | | (309,357 | ) | | | 3,844,993 | | | | 35,051,252 | | | | | 1,112,760 | | |
| Net assets | | $ | 6,640,768 | | | $ | 45,977,931 | | | $ | 170,531,121 | | | | $ | 16,721,384 | | |
| | The | | The | | The | | The |
| | Real Estate | | Core Focus | | High-Yield | | Core Plus |
| | Investment Trust | | Fixed Income | | Bond | | Fixed Income |
| | Portfolio II* | | Portfolio | | Portfolio | | Portfolio |
| Shares of beneficial interest | | | $ | 5,571,271 | | | | | $ | 5,977,065 | | | | $ | 58,905,296 | | | | $ | 54,532,154 | | |
| Undistributed ordinary income | | | | 20,118 | | | | | | 179,918 | | | | | 3,521,603 | | | | | 1,546,077 | | |
| Capital loss carryforwards | | | | (2,557,434 | ) | | | | | (16,340 | ) | | | | (2,817,600 | ) | | | | (3,093,943 | ) | |
| Other temporary differences | | | | — | | | | | | — | | | | | — | | | | | 43,066 | | |
| Unrealized appreciation of investments | | | | | | | | | | | | | | | | | | | | | | |
| and foreign currencies | | | | 76,305 | | | | | | 84,215 | | | | | (1,769,024 | ) | | | | 823,704 | | |
| Net assets | | | $ | 3,110,260 | | | | | $ | 6,224,858 | | | | $ | 57,840,275 | | | | $ | 53,851,058 | | |
| | | | | | The | | | | | | | | | |
| | The | | Labor Select | | The | | | | | | |
| | International | | International | | Emerging | | | | | | |
| | Equity | | Equity | | Markets | | | | | | |
| | Portfolio | | Portfolio | | Portfolio | | | | | | |
| Shares of beneficial interest | | $ | 742,519,625 | | | $ | 667,484,626 | | | $ | 465,668,883 | | | | | | |
| Undistributed ordinary income | | | 21,397,991 | | | | 19,617,672 | | | | 11,630,092 | | | | | | |
| Undistributed long-term capital gain | | | — | | | | — | | | | 42,295,590 | | | | | | |
| Capital loss carryforwards | | | (169,891,479 | ) | | | (90,062,151 | ) | | | — | | | | | | |
| Unrealized appreciation (depreciation) of investments | | | | | | | | | | | | | | | | | |
| and foreign currencies | | | (4,916,973 | ) | | | (24,398,024 | ) | | | 11,932,030 | | | | | | |
| Net assets | | $ | 589,109,164 | | | $ | 572,642,123 | | | $ | 531,526,595 | | | | | | |
2011 Annual report · Delaware Pooled Trust
(continues) 155
Notes to financial statements
Delaware Pooled® Trust
5. Components of Net Assets on a Tax Basis (continued)
| | | | | | The | | The |
| | The | | Global | | Global |
| | Emerging | | Real Estate | | Fixed |
| | Markets | | Securities | | Income |
| | Portfolio II | | Portfolio* | | Portfolio |
| Shares of beneficial interest | | $ | 16,019,054 | | | $ | 157,314,625 | | | $ | 69,934,927 | |
| Undistributed ordinary income | | | 721,107 | | | | 2,045,633 | | | | 9,501,199 | |
| Undistributed long-term capital gain | | | 872 | | | | — | | | | — | |
| Capital loss carryforwards | | | — | | | | (107,663,239 | ) | | | — | |
| Other temporary differences | | | — | | | | — | | | | (22,316 | ) |
| Unrealized appreciation (depreciation) of investments | | | | | | | | | | | | |
| and foreign currencies | | | (1,402,041 | ) | | | (2,329,841 | ) | | | 4,362,822 | |
| Net assets | | $ | 15,338,992 | | | $ | 49,367,178 | | | $ | 83,776,632 | |
*The undistributed earnings for The Real Estate Investment Trust Portfolio II and The Global Real Estate Securities Portfolio are estimated pending final notification of the tax character of distributions received from investments in Real Estate Investment Trusts.
The differences between book basis and tax basis components of net assets are primarily attributable to tax deferral of losses on wash sales, mark-to-market on futures contracts, mark-to-market on forward foreign currency contracts, straddle loss deferrals, tax recognition of unrealized gain on passive foreign investment companies, contingent payment debt instruments, the tax treatment of market discount and premium on debt instruments, and CDS contracts.
For financial reporting purposes, capital accounts are adjusted to reflect the tax character of permanent book/tax differences. Reclassifications are primarily due to tax treatment of net operating losses, gain (loss) on foreign currency transactions, dividends and distributions, market discount and premium on certain debt instruments, passive foreign investment companies, CDS and interest rate swaps, tax treatment of Brazilian taxes and paydown gains (losses) on mortgage- and asset-backed securities. Results of operations and net assets were not affected by these reclassifications. For the year ended October 31, 2011, the Portfolios recorded the following reclassifications.
| | Undistributed | | Accumulated | | | | |
| | (distributions in excess of) | | net realized | | Paid-in |
| | net investment income (loss) | | gain (loss) | | Capital |
| The Select 20 Portfolio | | | $ | — | | | | $ | 319,328 | | | $ | (319,328 | ) |
| The Core Focus Fixed Income Portfolio | | | | 11,103 | | | | | (11,103 | ) | | | — | |
| The High-Yield Bond Portfolio | | | | 218,830 | | | | | (218,830 | ) | | | — | |
| The Core Plus Fixed Income Portfolio | | | | (132,551 | ) | | | | 132,551 | | | | — | |
| The International Equity Portfolio | | | | (714,160 | ) | | | | 714,160 | | | | — | |
| The Labor Select International Equity Portfolio | | | | (935,031 | ) | | | | 935,031 | | | | — | |
| The Emerging Markets Portfolio | | | | (1,629,008 | ) | | | | 513,608 | | | | 1,115,400 | |
| The Emerging Markets Portfolio II | | | | (17,055 | ) | | | | 17,055 | | | | — | |
| The Global Real Estate Securities Portfolio | | | | 2,696,188 | | | | | (2,701,121 | ) | | | 4,933 | |
| The Global Fixed Income Portfolio | | | | 8,320,348 | | | | | (10,595,980 | ) | | | 2,275,632 | |
2011 Annual report · Delaware Pooled Trust
156
For federal income tax purposes, capital loss carryforwards may be carried forward and applied against future gains.
In 2011, the Portfolios utilized capital loss carryforwards as follows:
| | Capital loss |
| | carryforwards utilized |
| The Large-Cap Value Equity Portfolio | | | $ | 1,362,874 | |
| The Select 20 Portfolio | | | | 277,389 | |
| The Large-Cap Growth Equity Portfolio | | | | 26,973,954 | |
| The Focus Smid-Cap Growth Equity Portfolio | | | | 201,699 | |
| The Real Estate Investment Trust Portfolio II | | | | 232,567 | |
| The Core Focus Fixed Income Portfolio | | | | 504,001 | |
| The High-Yield Bond Portfolio | | | | 834,927 | |
| The Core Plus Fixed Income Portfolio | | | | 2,004,493 | |
| The International Equity Portfolio | | | | 12,025,743 | |
| The Labor Select International Equity Portfolio | | | | 13,769,120 | |
| The Emerging Markets Portfolio | | | | 24,783,996 | |
| The Global Real Estate Securities Portfolio | | | | 1,570,264 | |
| The Global Fixed Income Portfolio | | | | 38,911 | |
| | | | | | |
| In 2011, the following capital loss carryforwards expired: | | | | | |
| | | Capital loss |
| | carryforwards expired |
| The Select 20 Portfolio | | | $319,328 | |
Capital loss carryforwards remaining at October 31, 2011 will expire as follows:
| | Year of expiration |
| | 2014 | | 2016 | | 2017 | | 2018 | | Total |
| The Large-Cap Value Equity Portfolio | | $ | — | | $ | 280,822 | | $ | 751,210 | | $ | — | | $ | 1,032,032 |
| The Select 20 Portfolio | | | 76,954 | | | 106,744 | | | 2,629,756 | | | — | | | 2,813,454 |
| The Large-Cap Growth Equity Portfolio | | | — | | | — | | | 49,183,718 | | | 2,192,953 | | | 51,376,671 |
| The Focus Smid-Cap Growth Equity Portfolio | | | — | | | — | | | 815,919 | | | — | | | 815,919 |
| The Real Estate Investment Trust Portfolio II | | | — | | | 1,013,634 | | | 1,521,902 | | | 21,898 | | | 2,557,434 |
| The Core Focus Fixed Income Portfolio | | | — | | | — | | | 16,340 | | | — | | | 16,340 |
| The High-Yield Bond Portfolio | | | — | | | 602,259 | | | 2,215,341 | | | — | | | 2,817,600 |
| The Core Plus Fixed Income Portfolio | | | — | | | 812,564 | | | 2,281,379 | | | — | | | 3,093,943 |
| The International Equity Portfolio | | | — | | | — | | | 156,031,998 | | | 13,859,481 | | | 169,891,479 |
| The Labor Select International Equity Portfolio | | | — | | | — | | | 71,586,349 | | | 18,475,802 | | | 90,062,151 |
| The Global Real Estate Securities Portfolio | | | — | | | 53,477,898 | | | 50,784,384 | | | 3,400,957 | | | 107,663,239 |
On December 22, 2010, the Regulated Investment Company Modernization Act of 2010 (the Act) was enacted, which changed various technical rules governing the tax treatment of regulated investment companies. The changes are generally effective for taxable years beginning after the date of enactment. Under the Act, the Series will be permitted to carry forward capital losses incurred in taxable years beginning after the date of enactment for an unlimited period. However, any losses incurred during those future taxable years will be required to be utilized prior to the losses incurred in pre-enactment taxable years, which carry an expiration date. As a result of this ordering rule, pre-enactment capital loss carryforwards may be more likely to expire unused. Additionally, post-enactment capital loss carryforwards will retain their character as either short-term or long-term capital losses rather than being considered all short-term as permitted under previous regulation.
2011 Annual report · Delaware Pooled Trust
(continues) 157
Notes to financial statements
Delaware Pooled® Trust
6. Capital Shares
Transactions in capital shares were as follows:
| | | | Shares issued | | | | | | |
| | | | upon reinvestment | | | | | Net |
| | Shares | | of dividends | | Shares | | increase |
| | sold | | and distributions | | repurchased | | (decrease) |
| Year ended October 31, 2011: | | | | | | | | | | | | |
| The Large-Cap Value Equity Portfolio | | 456,892 | | | 13,757 | | | (505,546 | ) | | (34,897 | ) |
| The Select 20 Portfolio | | 5,104,499 | | | — | | | (399,742 | ) | | 4,704,757 | |
| The Large-Cap Growth Equity Portfolio | | 557,240 | | | 76,367 | | | (10,795,913 | ) | | (10,162,306 | ) |
| The Focus Smid-Cap Growth Equity Portfolio | | 769,111 | | | 2,648 | | | (18,535 | ) | | 753,224 | |
| The Real Estate Investment Trust Portfolio II | | — | | | 7,178 | | | — | | | 7,178 | |
| The Core Focus Fixed Income Portfolio | | 61,040 | | | 63,215 | | | (1,520,258 | ) | | (1,396,003 | ) |
| The High-Yield Bond Portfolio | | 4,099,938 | | | 300,088 | | | (645,896 | ) | | 3,754,130 | |
| The Core Plus Fixed Income Portfolio | | 625,535 | | | 269,671 | | | (505,487 | ) | | 389,719 | |
| The International Equity Portfolio | | 2,513,236 | | | 1,072,995 | | | (17,810,194 | ) | | (14,223,963 | ) |
| The Labor Select International Equity Portfolio | | 1,109,058 | | | 1,706,222 | | | (13,111,471 | ) | | (10,296,191 | ) |
| The Emerging Markets Portfolio | | 4,894,763 | | | 1,497,535 | | | (21,496,933 | ) | | (15,104,635 | ) |
| The Emerging Markets Portfolio II | | 709,618 | | | 12,091 | | | (104,478 | ) | | 617,231 | |
| The Global Real Estate Securities Portfolio — Original Class | | 1,295,717 | | | 890,197 | | | (3,439,667 | ) | | (1,253,753 | ) |
| The Global Real Estate Securities Portfolio — Class P | | — | | | 125 | | | — | | | 125 | |
| The Global Fixed Income Portfolio | | 597,597 | | | 454,718 | | | (5,784,410 | ) | | (4,732,095 | ) |
| |
| Year ended October 31, 2010: | | | | | | | | | | | | |
| The Large-Cap Value Equity Portfolio | | 175,466 | | | 17,372 | | | (517,627 | ) | | (324,789 | ) |
| The Select 20 Portfolio | | 687,803 | | | — | | | (837,298 | ) | | (149,495 | ) |
| The Large-Cap Growth Equity Portfolio | | 798,974 | | | 48,225 | | | (7,591,330 | ) | | (6,744,131 | ) |
| The Focus Smid-Cap Growth Equity Portfolio | | 181,698 | | | — | | | (202,377 | ) | | (20,679 | ) |
| The Real Estate Investment Trust Portfolio II | | — | | | 32,434 | | | (782,439 | ) | | (750,005 | ) |
| The Core Focus Fixed Income Portfolio | | 47,913 | | | 103,164 | | | (370,394 | ) | | (219,317 | ) |
| The High-Yield Bond Portfolio | | 1,099,387 | | | 307,863 | | | (988,798 | ) | | 418,452 | |
| The Core Plus Fixed Income Portfolio | | 369,239 | | | 389,931 | | | (1,317,236 | ) | | (558,066 | ) |
| The International Equity Portfolio | | 5,047,375 | | | 1,149,637 | | | (17,437,364 | ) | | (11,240,352 | ) |
| The Labor Select International Equity Portfolio | | 2,681,964 | | | 1,762,856 | | | (11,523,071 | ) | | (7,078,251 | ) |
| The Emerging Markets Portfolio | | 9,917,765 | | | 1,381,667 | | | (9,003,085 | ) | | 2,296,347 | |
| The Emerging Markets Portfolio II* | | 1,176,473 | | | — | | | — | | | 1,176,473 | |
| The Global Real Estate Securities Portfolio — Original Class | | 3,376,120 | | | 738,547 | | | (4,538,708 | ) | | (424,041 | ) |
| The Global Real Estate Securities Portfolio — Class P | | — | | | 91 | | | — | | | 91 | |
| The Global Fixed Income Portfolio | | 1,096,047 | | | 642,047 | | | (2,422,757 | ) | | (684,663 | ) |
| | | | | | | | | | | | | |
| *Commenced operations June 23, 2010. | | | | | | | | | | | | |
2011 Annual report · Delaware Pooled Trust
158
7. Line of Credit
The Portfolios, along with certain other funds in the Delaware Investments® Family of Funds (Participants), were participants in a $35,000,000 revolving line of credit to be used for temporary or emergency purposes as an additional source of liquidity to fund redemptions of investor shares. Under the agreement, the Participants were charged an annual commitment fee, which was allocated across the Participants on the basis of each Participant’s allocation of the entire facility. The Participants were permitted to borrow up to a maximum of one third of their net assets under the agreement. The line of credit expired on November 16, 2010.
The Portfolios, along with the other Participants, entered into amendments to the agreement for a $50,000,000 and $100,000,000 revolving line of credit on November 16, 2010 and August 1, 2011, respectively. The line of credit under the agreement as amended expired on November 15, 2011.
On November 15, 2011, the Portfolios, along with the other Participants, entered into an agreement for a $125,000,000 revolving line of credit. The agreement is to be used as described above and operates in substantially the same manner as the original agreement. The agreement expires on November 13, 2012. The Portfolios had no amounts outstanding as of October 31, 2011 or at any time during the year then ended.
8. Derivatives
U.S. GAAP requires disclosures that enable investors to understand: 1) how and why an entity uses derivatives; 2) how they are accounted for; and 3) how they affect an entity’s results of operations and financial position.
Foreign Currency Exchange Contracts — The Select 20, The Large-Cap Growth Equity, The Focus Smid-Cap Growth Equity, The Real Estate Investment Trust II, The Core Focus Fixed Income, The High-Yield Bond, The Core Plus Fixed Income, The International Equity, The Labor Select International Equity, The Emerging Markets, The Emerging Markets II, The Global Real Estate Securities, and The Global Fixed Income Portfolios may enter into foreign currency exchange contracts and foreign cross-currency exchange contracts as a way of managing foreign exchange rate risk. The Portfolios may enter into these contracts to fix the U.S. dollar value of a security that they have agreed to buy or sell for the period between the date the trade was entered into and the date the security is delivered and paid for. The Portfolios may also use these contracts to hedge the U.S. dollar value of securities they already own that are denominated in foreign currencies. The change in value is recorded as an unrealized gain or loss. When the contract is closed, a realized gain or loss is recorded equal to the difference between the value of the contract at the time it was opened and the value at the time it was closed.
The use of foreign currency exchange contracts and foreign cross-currency exchange contracts does not eliminate fluctuations in the underlying prices of the securities, but does establish a rate of exchange that can be achieved in the future. Although foreign currency exchange contracts limit the risk of loss due to an unfavorable change in the value of the hedged currency, they also limit any potential gain that might result should the value of the currency change favorably. In addition, the Portfolios could be exposed to risks if the counterparties to the contracts are unable to meet the terms of their contracts. The Portfolios’ maximum risk of loss from counterparty credit risk is the value of its currency exchanged with the counterparty. The risk is generally mitigated by having a netting arrangement between a Portfolio and the counterparty and by the posting of collateral by the counterparty to a Portfolio to cover a Portfolio’s exposure to the counterparty.
Futures Contracts — A futures contract is an agreement in which the writer (or seller) of the contract agrees to deliver to the buyer an amount of cash or securities equal to a specific dollar amount times the difference between the value of a specific security or index at the close of the last trading day of the contract and the price at which the agreement is made. The Select 20, The Large-Cap Growth Equity, The Focus Smid-Cap Growth Equity, The Real Estate Investment Trust II, The Core Focus Fixed Income, The Core Plus Fixed Income, The Emerging Markets, The Emerging Markets II, and The Global Real Estate Securities Portfolios may use futures in the normal course of pursuing their investment objectives. Each Portfolio may invest in financial futures contracts to hedge their existing portfolio securities against fluctuations in fair value caused by changes in prevailing market interest rates. Upon entering into a futures contract, a Portfolio deposits cash or pledges U.S. government securities to a broker, equal to the minimum “initial margin” requirements of the exchange on which the contract is traded. Subsequent payments are received from the broker or paid to the broker each day, based on the daily fluctuation in the market value of the contract. These receipts or payments are known as “variation margin” and are recorded daily by each Portfolio as unrealized gains or losses until the contracts are closed. When the contracts are closed, the Portfolio records a realized gain or loss equal to the difference between the value of the contract at the time it was opened and the value at the time it was closed. Risks of entering into futures contracts include potential imperfect correlation between the futures contracts and the underlying securities and the possibility of an illiquid secondary market for these instruments. When investing in futures, there is minimal counterparty credit risk to a Portfolio because futures are exchange traded and the exchange’s clearinghouse, as counterparty to all exchange-traded futures, guarantees against default.
Options Contracts — The Portfolios may buy or write options contracts for any number of reasons, including: to manage a Portfolio’s exposure to changes in securities prices and foreign currencies; as an efficient means of adjusting a Portfolio’s overall exposure to certain markets; to protect the value of portfolio securities; and as a cash management tool. A Portfolio may buy or write call or put options on securities, financial indices, and foreign currencies. When a Portfolio buys an option, a premium is paid and an asset is recorded and adjusted on a daily basis to reflect the current market value of the options purchased. When a Portfolio writes an option, a premium is received and a liability is recorded and adjusted on a daily basis to reflect the current market value of the options written. Premiums received from writing options that expire unexercised are treated by a Portfolio on
2011 Annual report · Delaware Pooled Trust
(continues) 159
Notes to financial statements
Delaware Pooled® Trust
8. Derivatives (continued)
the expiration date as realized gains. The difference between the premium received and the amount paid on effecting a closing purchase transaction, including brokerage commissions, is treated as realized gain or loss. If a call option is exercised, the premium is added to the proceeds from the sale of the underlying security in determining whether the Portfolio has a realized gain or loss. If a put option is exercised, the premium reduces the cost basis of the securities purchased by the Portfolio. A Portfolio, as writer of an option, bears the market risk of an unfavorable change in the price of the security underlying the written option. When writing options, a Portfolio is subject to minimal counterparty risk because the counterparty is only obligated to pay premiums and does not bear the market risk of an unfavorable market change.
Transactions in written options during the year ended October 31, 2011 for The Core Plus Fixed Income Portfolio was as follows:
| | Number of | | | | | | |
| | Contracts | | Premium |
| Options outstanding at October 31, 2010 | | | — | | | | | $ | — | | |
| Options written | | | 2 | | | | | | 464 | | |
| Options terminated in closing purchase transactions | | | (2 | ) | | | | | (464 | ) | |
| Options outstanding at October 31, 2011 | | | — | | | | | $ | — | | |
Swap Contracts — The Core Focus Fixed Income Portfolio and The Core Plus Fixed Income Portfolio may enter into interest rate swap contracts, index swap contracts, inflation swap contracts and credit default swap (CDS) contracts in accordance with their investment objectives. The High-Yield Bond Portfolio may enter into CDS contracts in accordance with its investment objective. The Portfolios may use interest rate swaps to adjust the Portfolios’ sensitivity to interest rates or to hedge against changes in interest rates. Index swaps may be used to gain exposure to markets that the Portfolios invest in, such as the corporate bond market. The Portfolios may also use index swaps as a substitute for futures or options contracts if such contracts are not directly available to the Portfolios on favorable terms. The Portfolios may use inflation swaps to hedge the inflation risk in nominal bonds, there-by creating synthetic inflation-indexed bonds. The Portfolios may enter into CDS contracts in order to hedge against a credit event, to enhance total return, or to gain exposure to certain securities or markets.
Interest Rate Swaps. An interest rate swap contract is an exchange of interest rates between counterparties. In one instance, an interest rate swap involves payments received by a Portfolio from another party based on a variable or floating interest rate, in return for making payments based on a fixed interest rate. An interest rate swap can also work in reverse with a Portfolio receiving payments based on a fixed interest rate and making payments based on a variable or floating interest rate. Interest rate swaps may be used to adjust a Portfolio’s sensitivity to interest rates or to hedge against changes in interest rates. Periodic payments on such contracts are accrued daily and recorded as unrealized appreciation/depreciation on swap contracts. Upon periodic payment/receipt or termination of the contract, such amounts are recorded as realized gains or losses on swap contracts. A Portfolio’s maximum risk of loss from counterparty credit risk is the discounted net value of the cash flows to be received from/paid to the counterparty over the interest rate swap contract’s remaining life, to the extent that the amount is positive. This risk is mitigated by having a netting arrangement between a Portfolio and the counterparty and by the posting of collateral by the counterparty to a Portfolio to cover a Portfolio’s exposure to the counterparty.
Index swaps. Index swaps involve commitments to pay interest in exchange for a market-linked return based on a notional amount. To the extent the total return of the security, instrument or basket of instruments underlying the transaction exceeds the offsetting interest obligation, a Portfolio will receive a payment from the counterparty. To the extent the total return of the security, instrument or basket of instruments underlying the transaction falls short of the offsetting interest obligation, a Portfolio will make a payment to the counterparty. The change in value of swap contracts outstanding, if any, is recorded as unrealized appreciation or depreciation daily. A realized gain or loss is recorded on maturity or termination of the swap contract. A Portfolio’s maximum risk of loss from counterparty credit risk is the discounted net value of the cash flows to be received from/paid to the counterparty over the index swap contract’s remaining life, to the extent that the amount is positive. This risk is mitigated by having a netting arrangement between a Portfolio and the counterparty and by the posting of collateral by the counterparty to a Portfolio to cover a Portfolio’s exposure to the counterparty.
Inflation Swaps. Inflation swap agreements involve commitments to pay a regular stream of inflation-indexed cash payments in exchange for receiving a stream of nominal interest payments (or vice versa), where both payment streams are based on notional amounts. The nominal interest payments may be based on either a fixed interest rate or variable interest rate such as London Interbank Offered Rate (LIBOR). The change in value of swap contracts outstanding, if any, is recorded as unrealized appreciation or depreciation daily. A realized gain or loss is recorded on maturity or termination of the swap contract. The Portfolio’s maximum risk of loss from counterparty credit risk is the discounted net value of the cash flows to be received from/paid to the counterparty over the index swap contract’s remaining life, to the extent that the amount is positive. This risk is mitigated by having a netting arrangement between the Portfolio and the counterparty and by the posting of collateral by the counterparty to the Portfolio to cover the Portfolio’s exposure to the counterparty.
2011 Annual report · Delaware Pooled Trust
160
Credit Default Swaps. A CDS contract is a risk-transfer instrument through which one party (purchaser of protection) transfers to another party (seller of protection) the financial risk of a credit event (as defined in the CDS agreement), as it relates to a particular referenced security or basket of securities (such as an index). In exchange for the protection offered by the seller of protection, the purchaser of protection agrees to pay the seller of protection a periodic amount at a stated rate that is applied to the notional amount of the CDS contract. In addition, an upfront payment may be made or received by a Portfolio in connection with an unwinding or assignment of a CDS contract. Upon the occurrence of a credit event, the seller of protection would pay the par (or other agreed-upon) value of the referenced security (or basket of securities) to the counterparty. Credit events generally include, among others, bankruptcy, failure to pay, and obligation default.
During the year ended October 31, 2011, the Portfolios entered into CDS contracts as purchasers and sellers of protection. Periodic payments (receipts) on such contracts are accrued daily and recorded as unrealized losses (gains) on swap contracts. Upon payment (receipt), such amounts are recorded as realized losses (gains) on swap contracts. Upfront payments made or received in connection with CDS contracts are amortized over the expected life of the CDS contracts as realized losses (gains) on swap contracts. The change in value of CDS contracts is recorded as unrealized appreciation or depreciation daily. A realized gain or loss is recorded upon a credit event (as defined in the CDS agreement) or the maturity or termination of the agreement.
At October 31, 2011, the net unrealized depreciation of credit default swaps for The Core Plus Fixed Income Portfolio was $146,304. If a credit event had occurred for all swap transactions where collateral posting was required as of October 31, 2011, the swaps’ credit related features would have been triggered and The Core Plus Fixed Income Portfolio would have received EUR 1,345,000 and USD 3,945,000 less the value of the contracts’ related reference obligations. The Core Plus Fixed Income Portfolio received securities collateral of $187,000 for certain open derivatives.
As disclosed in the footnotes to the statement of net assets, at October 31, 2011, the notional value of the protection sold for The Core Plus Fixed Income Portfolio was $220,000, which reflects the maximum potential amount the Portfolio could be required to make as a seller of credit protection if a credit event occurs. The quoted market prices and resulting market values for credit default swap agreements on securities and credit indices serve as an indicator of the current status of the payment/performance risk and represent the likelihood of an expected liability (or profit) for the credit derivative if the swap agreement has been closed/sold as of the period end. Increasing market values, in absolute terms when compared to the notional amount of the swap, represent a deterioration of the reference entity’s credit soundness and a greater likelihood of risk of default or other credit event occurring as defined under the terms of the agreement. At October 31, 2011, the net unrealized appreciation of the protection sold was $5,744.
Credit default swaps may involve greater risks than if a Portfolio had invested in the referenced obligation directly. Credit default swaps are subject to general market risk, liquidity risk, counterparty risk and credit risk. A Portfolio’s maximum risk of loss from counterparty credit risk, either as the seller of protection or the buyer of protection, is the fair value of the contract. This risk is mitigated by having a netting arrangement between a Portfolio and the counterparty and by the posting of collateral by the counterparty to a Portfolio to cover a Portfolio’s exposure to the counterparty.
Swaps Generally. Because there is no organized market for swap contracts, the value of open swaps may differ from that which would be realized in the event a Portfolio terminated its position in the agreement. Risks of entering into these agreements include the potential inability of the counterparty to meet the terms of the contracts. This type of risk is generally limited to the amount of favorable movements in the value of the underlying security, instrument, or basket of instruments, if any, at the day of default. Risks also arise from potential losses from adverse market movements and such losses could exceed the unrealized amounts shown on the statements of net assets.
Fair values of derivative instruments as of October 31, 2011 were as follows:
| | The Core Plus Fixed Income Portfolio |
| | Asset Derivatives | | Liability Derivatives |
| | Statement of Net Assets Location | | Fair Value | | Statement of Net Assets Location | | Fair Value |
| Forward currency exchange contracts | | Other liabilities net of receivables | | | | | | Other liabilities net of receivables | | | | |
| (Foreign currency exchange contracts) | | and other assets | | $ | 54,337 | | | and other assets | | $ | — | |
| Interest rate contracts | | Other liabilities net of receivables | | | | | | Other liabilities net of receivables | | | | |
| (Futures contracts) | | and other assets | | | 83,452 | * | | and other assets | | | — | |
| Credit and inflation contracts | | Other liabilities net of receivables | | | | | | Other liabilities net of receivables | | | | |
| (Swap contracts) | | and other assets | | | — | | | and other assets | | | (146,304 | ) |
| Total | | | | $ | 137,789 | | | | | $ | (146,304 | ) |
*Includes cumulative depreciation of futures contracts from the date the contracts are opened through October 31, 2011. Only current day variation margin is reported with the Portfolio’s assets and liabilities.
2011 Annual report · Delaware Pooled Trust
(continues) 161
Notes to financial statements
Delaware Pooled® Trust
8. Derivatives (continued)
The effect of derivative instruments on the statement of operations for the year ended October 31, 2011 was as follows:
| | The Core Plus Fixed Income Portfolio |
| | | | | | | | | | Change in Unrealized |
| | | | | | | | | | Appreciation |
| | | | Realized Gain or | | or Depreciation |
| | | | Loss on Derivatives | | on Derivatives |
| | Location of Gain or Loss on Derivatives Recognized in Income | | Recognized in Income | | Recognized in Income |
| Forward currency exchange contracts | | Net realized loss on foreign currencies and net | | | | | | | | | | | | |
| (Foreign currency exchange contracts) | | change in unrealized appreciation/depreciation of | | | | | | | | | | | | |
| | investments and foreign currencies | | | $ | (301,709 | ) | | | | $ | 56,527 | | |
| Interest rate contracts | | Net realized gain on futures contracts and net | | | | | | | | | | | | |
| (Futures contracts) | | change in unrealized appreciation/depreciation of | | | | | | | | | | | | |
| | investments and foreign currencies | | | | 289,820 | | | | | | 55,963 | | |
| Equity contracts | | Net realized loss on written options and net | | | | | | | | | | | | |
| (Written Options) | | change in unrealized appreciation/depreciation of | | | | | | | | | | | | |
| | investments and foreign currencies | | | | (1,384 | ) | | | | | — | | |
| Credit contracts | | Net realized gain on swap contracts and net | | | | | | | | | | | | |
| (Swap and Inflation contracts) | | change in unrealized appreciation/depreciation of | | | | | | | | | | | | |
| | investments and foreign currencies | | | | 178,551 | | | | | | (174,820 | ) | |
| Total | | | | | $ | 165,278 | | | | | $ | (62,330 | ) | |
The table below summarizes the average balance of derivative holdings by each Portfolio during the year ended October 31, 2011. The average balance of derivatives held is generally similar to the volume of derivative activity for the year ended October 31, 2011.
| | | | | | | Asset Derivative Volume | | | | | | | | | | |
| | Forward Foreign | | Futures | | Option | | Swap |
| | Currency | | Contracts | | Contracts | | Contracts |
| | Contracts | | (Average | | (Average | | (Average |
| | (Average Cost) | | Notional Amount) | | Notional Amount) | | Notional Amount) |
| The Core Focus Fixed Income Portfolio | | | $ | — | | | | $ | — | | | | $ | — | | | | $ | 10,452 | |
| The Core Plus Fixed Income Portfolio | | | | 507,197 | | | | | 2,656,822 | | | | | 551 | | | | | 305,836 | |
| The International Equity Portfolio | | | | 258,966 | | | | | — | | | | | — | | | | | — | |
| The Labor Select International Equity Portfolio | | | | 186,672 | | | | | — | | | | | — | | | | | — | |
| The Emerging Markets Portfolio | | | | 205,539 | | | | | — | | | | | — | | | | | — | |
| The Emerging Markets Portfolio II | | | | 10,715 | | | | | — | | | | | — | | | | | — | |
| The Global Real Estate Securities Portfolio | | | | 130,613 | | | | | — | | | | | — | | | | | — | |
| The Global Fixed Income Portfolio | | | | 4,233,939 | | | | | — | | | | | — | | | | | — | |
| | | | | | | Liability Derivative Volume | | | | | | | | | | |
| | Forward Foreign | | Futures | | Option | | Swap |
| | Currency | | Contracts | | Contracts | | Contracts |
| | Contracts | | (Average | | (Average | | (Average |
| | (Average Cost) | | Notional Amount) | | Notional Cost) | | Notional Value) |
| The Core Focus Fixed Income Portfolio | | | $ | — | | | | $ | — | | | | $ | — | | | | $ | — | |
| The Core Plus Fixed Income Portfolio | | | | 1,065,306 | | | | | 1,077,988 | | | | | 4 | | | | | 1,752,595 | |
| The International Equity Portfolio | | | | 18,614,775 | | | | | — | | | | | — | | | | | — | |
| The Labor Select International Equity Portfolio | | | | 20,075,942 | | | | | — | | | | | — | | | | | — | |
| The Emerging Markets Portfolio | | | | 474,334 | | | | | — | | | | | — | | | | | — | |
| The Emerging Markets Portfolio II | | | | 4,064 | | | | | — | | | | | — | | | | | — | |
| The Global Real Estate Securities Portfolio | | | | 148,664 | | | | | — | | | | | — | | | | | — | |
| The Global Fixed Income Portfolio | | | | 4,252,984 | | | | | — | | | | | — | | | | | — | |
2011 Annual report · Delaware Pooled Trust
162
9. Securities Lending
The Portfolios, along with other funds in the Delaware Investments® Family of Funds, may lend their securities pursuant to a security lending agreement (Lending Agreement) with The Bank of New York Mellon (BNY Mellon). At the time a security is loaned, the borrower must post collateral equal to the required percentage of the market value of the loaned security, including any accrued interest. The required percentage is: (i) 102% with respect to U.S. securities and foreign securities that are denominated and payable in U.S. dollars; and (ii) 105% with respect to foreign securities. With respect to each loan, if on any business day the aggregate market value of securities collateral plus cash collateral held is less than the aggregate market value of the securities which are the subject of such loan, the borrower will be notified to provide additional collateral by the end of the following business day which, together with the collateral already held, will be not less than the applicable initial collateral requirements for such security loan. If the aggregate market value of securities collateral and cash collateral held with respect to a security loan exceeds the applicable initial collateral requirement, upon request of the borrower BNY Mellon must return enough collateral to the borrower by the end of the following business day to reduce the value of the remaining collateral to the applicable initial collateral requirement for such security loan. As a result of the foregoing, the value of the collateral held with respect to a loaned security may be temporarily more or less than the value of security on loan.
Cash collateral received is generally invested in the Delaware Investments Collateral Fund No. 1 (Collective Trust) established by BNY Mellon for the purpose of investment on behalf of funds managed by DMC that participate in BNY Mellon’s securities lending program. The Collective Trust may invest in U.S. government securities and high quality corporate debt, asset-backed and other money market securities and in repurchase agreements collateralized by such securities, provided that the Collective Trust will generally have a dollar-weighted average portfolio maturity of 60 days or less. The Collective Trust seeks to maintain a net asset value per unit of $1.00, but there can be no assurance that it will always be able to do so. The Portfolios may incur investment losses as a result of investing securities lending collateral in the Collective Trust or another collateral investment pool. This could occur if an investment in a collateral investment pool defaulted or if it were necessary to liquidate assets in the collateral investment pool to meet returns on outstanding security loans at a time when the collateral investment pool’s net asset value per unit was less than $1.00. Under those circumstances, the Portfolios may not receive an amount from the collateral investment pool that is equal in amount to the collateral the Fund would be required to return to the borrower of the securities and the Portfolios would be required to make up for this shortfall. Effective April 20, 2009, BNY Mellon transferred the assets of the Portfolios’ previous collateral investment pool other than cash and assets with a maturity of one business day or less to the BNY Mellon SL DBT II Liquidating Fund (Liquidating Fund), effectively bifurcating the previous collateral investment pool. The Portfolios’ exposure to the Liquidating Fund is expected to decrease as the Liquidating Fund’s assets mature or are sold. In October 2008, BNY Mellon transferred certain distressed securities from the previous collateral investment pool into the Mellon GSL Reinvestment Trust II. The Portfolios can also accept U.S. government securities and letters of credit (non-cash collateral) in connection with securities loans. In the event of default or bankruptcy by the lending agent, realization and/or retention of the collateral may be subject to legal proceedings. In the event the borrower fails to return loaned securities and the collateral received is insufficient to cover the value of the loaned securities and provided such collateral shortfall is not the result of investment losses, the lending agent has agreed to pay the amount of the shortfall to the Portfolios or, at the discretion of the lending agent, replace the loaned securities. The Portfolios continue to record dividends or interest, as applicable, on the securities loaned and are subject to change in value of the securities loaned that may occur during the term of the loan. The Portfolios have the right under the Lending Agreement to recover the securities from the borrower on demand. With respect to security loans collateralized by non-cash collateral, the Portfolios receive loan premiums paid by the borrower. With respect to security loans collateralized by cash collateral, the earnings from the collateral investments are shared among the Portfolios, the security lending agent and the borrower. The Portfolios record security lending income net of allocations to the security lending agent and the borrower.
At October 31, 2011, the value of securities on loan and the value of invested collateral are presented below, for which the Portfolios received collateral, comprised of non-cash collateral and cash collateral. Investments purchased with cash collateral are presented on the statements of net assets under the caption “Securities Lending Collateral.”
| | Value | | | | | Cash | | Value of |
| | of securities | | Non-cash | | collateral | | invested |
| | on loan | | collateral | | received | | collateral |
| The Large-Cap Growth Equity Portfolio | | $ | 2,787,408 | | $ | — | | $ | 2,971,773 | | | $ | 2,755,133 |
| The Core Focus Fixed Income Portfolio | | | 213,067 | | | 215,803 | | | 63,319 | | | | 21,031 |
| The High-Yield Bond Portfolio | | | 5,922,424 | | | — | | | 6,582,556 | | | | 6,550,829 |
| The Core Plus Fixed Income Portfolio | | | 3,266,065 | | | 2,198,974 | | | 1,142,718 | | | | 1,092,809 |
| The International Equity Portfolio | | | — | | | — | | | 4,713,767 | * | | | 3,266,480 |
| The Labor Select International Equity Portfolio | | | 1,283,348 | | | — | | | 19,913,219 | | | | 19,409,049 |
| The Emerging Markets Portfolio | | | 13,796,620 | | | — | | | 15,163,636 | | | | 14,607,102 |
| The Global Real Estate Securities Portfolio | | | 4,941,157 | | | — | | | 5,198,031 | | | | 4,800,481 |
* The cash collateral received for The International Equity Portfolio represents a pre-collateralized loan.
2011 Annual report · Delaware Pooled Trust
(continues) 163
Notes to financial statements
Delaware Pooled® Trust
10. Credit and Market Risk
Some countries in which The International Equity, The Labor Select International Equity, The Emerging Markets, The Emerging Markets II, The Global Real Estate Securities, and The Global Fixed Income Portfolios invest require governmental approval for the repatriation of investment income, capital or the proceeds of sales of securities by foreign investors. In addition, if there is deterioration in a country’s balance of payments or for other reasons, a country may impose temporary restrictions on foreign capital remittances abroad.
The securities exchanges of certain foreign markets are substantially smaller, less liquid and more volatile than the major securities markets in the United States. Consequently, acquisition and disposition of securities by the Portfolios may be inhibited. In addition, a significant portion of the aggregate market value of equity securities listed on the major securities exchanges in emerging markets is held by a smaller number of investors. This may limit the number of shares available for acquisition or disposition by the Portfolios.
The High Yield Bond Portfolio invests a portion of its assets in high yield fixed income securities which are securities rated lower than BBB- by Standard & Poor’s (S&P) and Baa3 by Moody’s Investor Services (Moody’s), or similarly rated by another nationally recognized statistical rating organization. The Core Plus Fixed Income Portfolio invests a portion of its assets in high yield fixed income securities which are securities rated BB or lower by S&P and Ba or lower by Moody’s, or similarly rated by another nationally recognized statistical rating organization. Investments in these higher yielding securities are generally accompanied by a greater degree of credit risk than higher rated securities. Additionally, lower rated securities may be more susceptible to adverse economic and competitive industry conditions than investment grade securities.
The Core Focus Fixed Income, The Core Plus Fixed Income, The Global Real Estate Securities, and The Global Fixed Income Portfolios invest in fixed income securities whose value is derived from an underlying pool of mortgages or consumer loans. The value of these securities is sensitive to changes in economic conditions, including delinquencies and/or defaults, and may be adversely affected by shifts in the market’s perception of the issuers and changes in interest rates. Investors receive principal and interest payments as the underlying mortgages and consumer loans are paid back. Some of these securities are collateralized mortgage obligations (CMOs). CMOs are debt securities issued by U.S. government agencies or by financial institutions and other mortgage lenders, which are collateralized by a pool of mortgages held under an indenture. Prepayment of mortgages may shorten the stated maturity of the obligations and can result in a loss of premium, if any has been paid. Certain of these securities may be stripped (securities which provide only the principal or interest feature of the underlying security). The yield to maturity on an interest-only CMO is extremely sensitive not only to changes in prevailing interest rates, but also to the rate of principal payments (including prepayments) on the related underlying mortgage assets. A rapid rate of principal payments may have a material adverse effect on the Portfolios’ yield to maturity. If the underlying mortgage assets experience greater than anticipated prepayments of principal, the Portfolios may fail to fully recoup their initial investments in these securities even if the securities are rated in the highest rating categories.
The International Equity and The Global Fixed Income Portfolios may invest up to 10% of each Portfolio’s net assets in illiquid securities, which may include securities with contractual restrictions on resale, securities exempt from registration under Rule 144A of the Securities Act of 1933, as amended, and other securities, which may not be readily marketable. The Large-Cap Value Equity, The Select 20, The Large-Cap Growth Equity, The Focus Smid-Cap Growth Equity, The Real Estate Investment Trust II, The Core Focus Fixed Income, The High-Yield Bond, The Core Plus Fixed Income, The Labor Select International Equity, The Emerging Markets, The Emerging Markets II, and The Global Real Estate Securities Portfolios may invest up to 15% of each Portfolio’s net assets in such securities. The relative illiquidity of these securities may impair each Portfolio from disposing of them in a timely manner and at a fair price when it is necessary or desirable to do so. While maintaining oversight, the Portfolios’ Board of Trustees has delegated to DMC the day-to-day functions of determining whether individual securities are liquid for purposes of the Portfolios’ limitation on investments in illiquid securities. Securities eligible for resale pursuant to Rule 144A, which are determined to be liquid, are not subject to the Portfolios’ limit on investments in illiquid securities. Rule 144A and illiquid securities have been identified on the statements of net assets.
The Select 20, The Focus Smid-Cap Growth Equity, and The Global Real Estate Securities Portfolios invest a significant portion of their assets in small- and mid-sized companies and may be subject to certain risks associated with ownership of securities of such companies. Investments in small- or mid-sized companies may be more volatile than investments in larger companies for a number of reasons, which include more limited financial resources or a dependence on narrow product lines.
The Real Estate Investment Trust Portfolio II and The Global Real Estate Securities Portfolio concentrate their investments in the real estate industry and are subject to the risks associated with that industry. If a Portfolio holds real estate directly as a result of defaults or receives rental income directly from real estate holdings, its tax status as a regulated investment company may be jeopardized. These Portfolios are also affected by interest rate changes, particularly if the real estate investment trusts they hold use floating rate debt to finance their ongoing operations. Each Portfolio’s investments may also tend to fluctuate more in value than a portfolio that invests in a broader range of industries.
11. Contractual Obligations
The Portfolios enter into contracts in the normal course of business that contain a variety of indemnifications. The Portfolios’ maximum exposure under these arrangements is unknown. However, the Portfolios have not had prior claims or losses pursuant to these contracts. Management has reviewed the Portfolios’ existing contracts and expects the risk of loss to be remote.
2011 Annual report · Delaware Pooled Trust
164
12. In-Kind Redemptions
During the year ended October 31, 2011, the following portfolios satisfied withdrawal requests with transfers of securities and cash, resulting in net realized gain.
| | Securities and cash | | Net realized gain |
| The Emerging Markets Portfolio | | $14,578,113 | | $1,176,448 |
| The Global Fixed Income Portfolio | | 32,829,482 | | 2,275,633 |
13. Subsequent Events
Proxy Results
At a Special Meeting of Shareholders of Delaware Pooled Trust (the Trust), on behalf of The International Equity Portfolio (the Portfolio), held on November 21, 2011 and reconvened on November 23, 2011, the shareholders of the Portfolio voted to approve a new investment advisory agreement among The International Equity Portfolio, Delaware Management Company and Mondrian Investment Partners Limited.
| The International Equity Portfolio | | | |
| Shares Voted For | | 30,588,085.897 | |
| Percentage of Outstanding Shares | | 65.391 | % |
| Percentage of Shares Voted | | 99.943 | % |
| Shares Voted Against | | 4,663.475 | |
| Percentage of Outstanding Shares | | 0.010 | % |
| Percentage of Shares Voted | | 0.015 | % |
| Shares Abstained | | 13,079.934 | |
| Percentage of Outstanding Shares | | 0.028 | % |
| Percentage of Shares Voted | | 0.042 | % |
| Broker Non-Votes | | | |
Management has determined that no other material events or transactions occurred subsequent to October 31, 2011 that would require recognition or disclosure in the Portfolios’ financial statements.
14. Tax Information (Unaudited)
The information set forth below is for each Portfolio’s fiscal year as required by federal laws. Shareholders, however, must report distributions on a calendar year basis for income tax purposes, which may include distributions for portions of two fiscal years of a fund. Accordingly, the information needed by shareholders for income tax purposes will be sent to them in January of each year. Please consult your tax advisor for proper treatment of this information. All designations are based on financial information available as of the date of this annual report and, accordingly are subject to change. For any and all items requiring designation, it is the intention of each Portfolio to designate the maximum amount permitted under the Internal Revenue Code and the regulations thereunder.
2011 Annual report · Delaware Pooled Trust
(continues) 165
Notes to financial statements
Delaware Pooled® Trust
14. Tax Information (Unaudited) (continued)
For the fiscal year ended October 31, 2011, each Portfolio designates distributions paid during the year as follows:
| | (A) | | (B) | | | | | | | | | | |
| | Long-Term | | Ordinary | | | | Total | | | | |
| | Capital Gains | | Income | | Return | | Distribution | | | | |
| | Distributions | | Distributions* | | of Capital | | Qualifying | | (C) |
| | (Tax Basis) | | (Tax Basis) | | (Tax Basis) | | (Tax Basis) | | Dividends1 |
| The Large-Cap Value Equity Portfolio | | — | | 100 | % | | | — | | 100 | % | | | 100 | % | |
| The Large-Cap Growth Equity Portfolio | | — | | 100 | % | | | — | | 100 | % | | | 100 | % | |
| The Focus Smid-Cap Growth Equity Portfolio | | — | | 100 | % | | | — | | 100 | % | | | — | | |
| The Real Estate Investment Trust Portfolio II | | — | | 100 | % | | | — | | 100 | % | | | 1 | % | |
| The Core Focus Fixed Income Portfolio | | — | | 100 | % | | | — | | 100 | % | | | — | | |
| The High-Yield Bond Portfolio | | — | | 100 | % | | | — | | 100 | % | | | — | | |
| The Core Plus Fixed Income Portfolio | | — | | 100 | % | | | — | | 100 | % | | | — | | |
| The International Equity Portfolio | | — | | 100 | % | | | — | | 100 | % | | | — | | |
| The Labor Select International Equity Portfolio | | — | | 100 | % | | | — | | 100 | % | | | — | | |
| The Emerging Markets Portfolio | | — | | 100 | % | | | — | | 100 | % | | | — | | |
| The Emerging Markets Portfolio II | | — | | 100 | % | | | — | | 100 | % | | | 17 | % | |
| The Global Real Estate Securities Portfolio | | — | | 100 | % | | | — | | 100 | % | | | — | | |
| The Global Fixed Income Portfolio | | — | | 100 | % | | | — | | 100 | % | | | — | | |
(A) and (B) are based on a percentage of each Portfolio’s total distributions. |
| (C) is based on a percentage of each Portfolio’s ordinary income distributions. |
| 1 | Qualifying dividends represent dividends which qualify for the corporate dividends received deduction. |
| * | For the fiscal year ended October 31, 2011, certain dividends paid by the Portfolios may be subject to a maximum tax rate of 15%, as provided for by the Jobs and Growth Tax Relief Reconciliation Act of 2003, and as extended by Tax Relief, Unemployment Insurance Reauthorization and Jobs Creation Act of 2010. The Portfolios intend to designate the following amounts to be taxed at a maximum rate of 15%. Complete information will be computed and reported in conjunction with your 2011 Form 1099-DIV. |
| | Maximum amount to be |
| | Taxed at a maximum rate of 15% |
| The Large-Cap Value Equity Portfolio | | | $ | 189,075 | | |
| The Large-Cap Growth Equity Portfolio | | | | 826,516 | | |
| The Real Estate Investment Trust Portfolio II | | | | 250 | | |
| The Core Focus Fixed Income Portfolio | | | | 654 | | |
| The High-Yield Bond Portfolio | | | | 1,140 | | |
| The Core Plus Fixed Income Portfolio | | | | 14 | | |
| The International Equity Portfolio | | | | 3,103,542 | | |
| The Emerging Markets Portfolio | | | | 193,908 | | |
| The Emerging Markets Portfolio II | | | | 26,845 | | |
| The Global Real Estate Securities Portfolio | | | | 6,059 | | |
The International Equity Portfolio, The Labor Select International Equity Portfolio, The Emerging Markets Portfolio, The Emerging Markets Portfolio II and The Global Real Estate Securities Portfolio intend to pass through foreign tax credits in the maximum amount of $1,674,469, $1,274,644, $1,112,247, $13,918 and $47,949, respectively. The gross foreign source income earned during the fiscal year 2011 was $29,207,298, $29,707,439, $22,571,633, $307,501 and $1,782,063, respectively. Complete information will be computed and reported in conjunction with your 2011 Form 1099-DIV.
2011 Annual report · Delaware Pooled Trust
166
Report of independent
registered public accounting firm
To the Board of Trustees of Delaware Pooled Trust and the Shareholders of The Large-Cap Value Equity Portfolio, The Select 20 Portfolio, The Large-Cap Growth Equity Portfolio, The Focus Smid-Cap Growth Equity Portfolio, The Real Estate Investment Trust Portfolio II, The Core Focus Fixed Income Portfolio, The High-Yield Bond Portfolio, The Core Plus Fixed Income Portfolio, The International Equity Portfolio, The Labor Select International Equity Portfolio, The Emerging Markets Portfolio, The Emerging Markets Portfolio II, The Global Real Estate Securities Portfolio and The Global Fixed Income Portfolio:
In our opinion, the accompanying statements of net assets and statement of assets and liabilities, and the related statements of operations and of changes in net assets and the financial highlights present fairly, in all material respects, the financial position of The Large-Cap Value Equity Portfolio, The Select 20 Portfolio, The Large-Cap Growth Equity Portfolio, The Focus Smid-Cap Growth Equity Portfolio, The Real Estate Investment Trust Portfolio II, The Core Focus Fixed Income Portfolio, The High-Yield Bond Portfolio, The Core Plus Fixed Income Portfolio, The International Equity Portfolio, The Labor Select International Equity Portfolio, The Emerging Markets Portfolio, The Emerging Markets Portfolio II, The Global Real Estate Securities Portfolio and The Global Fixed Income Portfolio (fourteen of the series constituting Delaware Pooled Trust, hereafter collectively referred to as the “Funds”) at October 31, 2011, the results of each of their operations for the year then ended and the changes in each of their net assets and the financial highlights for each of the two periods then ended, in conformity with accounting principles generally accepted in the United States of America. These financial statements and financial highlights (hereafter referred to as “financial statements”) are the responsibility of the Funds’ management; our responsibility is to express an opinion on these financial statements based on our audits. We conducted our audits of these financial statements in accordance with the standards of the Public Company Accounting Oversight Board (United States). Those standards require that we plan and perform the audit to obtain reasonable assurance about whether the financial statements are free of material misstatement. An audit includes examining, on a test basis, evidence supporting the amounts and disclosures in the financial statements, assessing the accounting principles used and significant estimates made by management, and evaluating the overall financial statement presentation. We believe that our audits, which included confirmation of securities at October 31, 2011 by correspondence with the custodian and brokers, provide a reasonable basis for our opinion. The financial highlights for the year ended October 31, 2009 and for all prior periods presented were audited by other independent accountants whose report dated December 22, 2009 expressed an unqualified opinion on those statements.
PricewaterhouseCoopers LLP
Philadelphia, Pennsylvania
December 22, 2011
2011 Annual report · Delaware Pooled Trust
167
Other Portfolio information
(Unaudited)
Delaware Pooled® Trust
Board Consideration of Investment Advisory Agreements
At a meeting held on August 16-17, 2011 (the “Annual Meeting”), the Board of Trustees (the “Board”), including a majority of disinterested or independent Trustees, approved the renewal of the Investment Advisory Agreements and Sub-Advisory Agreements, as applicable, for each of the series of Delaware Pooled Trust (each, a “Portfolio” and together, the “Portfolios”). In making its decision, the Board considered information furnished specifically in connection with the renewal of the Investment Advisory Agreements with Delaware Management Company (“DMC”) and Sub-advisory Agreement with Mondrian Investment Partners Limited (“Mondrian”), which included materials provided by DMC and its affiliates (“Delaware Investments”) and Mondrian, as applicable, concerning, among other things, the nature, extent and quality of services provided to the Portfolios, the costs of such services to the Portfolios, economies of scale and the financial condition and profitability of Delaware Investments. In addition, in connection with the Annual Meeting, reports were provided in May 2011 and included independent historical and comparative reports provided by Lipper, Inc., an independent statistical compilation organization (“Lipper”). The Lipper reports compared each Portfolio’s investment performance and expenses with those of other comparable mutual funds. The independent Trustees reviewed and discussed the Lipper reports with independent legal counsel to the independent Trustees. The Board requested and received information regarding DMC’s policy with respect to advisory fee levels and its breakpoint philosophy; the structure of portfolio manager compensation; the investment manager’s profitability; and any constraints or limitations on the availability of securities in certain investment styles, which had in the past year inhibited, or which were likely in the future to inhibit, DMC’s or Mondrian’s ability to invest fully in accordance with Portfolio policies.
In considering information relating to the approval of each Portfolio’s advisory and sub-advisory agreements, the independent Trustees received assistance and advice from and met separately with independent legal counsel to the independent Trustees. Although the Board gave attention to all information furnished, the following discussion identifies, under separate headings, the primary factors taken into account by the Board during its contract renewal considerations.
Nature, Extent and Quality of Service. The Board considered the services provided by Delaware Investments to the Portfolios and their shareholders. In reviewing the nature, extent and quality of services, the Board considered reports furnished to it throughout the year, which covered matters such as the relative performance of the Portfolios, compliance of portfolio managers with the investment policies, strategies and restrictions for the Portfolios, compliance by DMC and Delaware Distributors, L.P. (together, “Management”) personnel with the Code of Ethics adopted throughout the Delaware Investments Family of Funds complex and adherence to fair value pricing procedures as established by the Board. The Board was pleased with the current staffing of the Portfolios’ investment advisor and the emphasis placed on research in the investment process. The Board gave favorable consideration to DMC’s efforts to control expenditures while maintaining service levels committed to fund matters. The Board noted that in July 2011 Management implemented measures to reduce overall costs and improve transfer agent and shareholder servicing functions through outsourcing. It is expected that such measures will improve the quality and lower the cost of delivering transfer agent and shareholder servicing services to the Portfolios. The Board once again noted the benefits provided to Portfolio shareholders through each shareholder’s ability to exchange investments between Portfolios or the institutional class shares of other Delaware Investments funds and to reinvest Portfolio dividends into additional shares of the same Portfolio or into additional shares of other Delaware Investments funds. The Board was satisfied with the nature, extent and quality of the overall services provided by Delaware Investments.
Nature, Extent and Quality of Service. The Board considered the services to be provided by Mondrian to the Portfolios and their shareholders, as applicable. In reviewing the nature, extent and quality of services, the Board noted that reports are furnished to it throughout the year at regular Board Meetings covering matters such as relative performance of the Portfolios, compliance of portfolio managers with the investment policies, strategies and restrictions for the Portfolios, the compliance of Mondrian personnel with the Code of Ethics and adherence to fair value pricing procedures as established by the Board. The Board was pleased with the current staffing of Mondrian and the emphasis placed on research in the investment process. The Board was satisfied with the nature, extent and quality of the overall services proposed to be provided by Mondrian.
Investment Performance. The Board placed significant emphasis on the investment performance of the Portfolios in view of its importance to shareholders. Although the Board gave appropriate consideration to performance reports and discussions with portfolio managers at Board meetings throughout the year, the Board gave particular weight to the Lipper reports furnished for the Annual Meeting. The Lipper reports prepared for each Portfolio showed the investment performance of its shares in comparison to a group of similar funds as selected by Lipper (the “Performance Universe”). A fund with the best performance ranked first, and a fund with the poorest performance ranked last. The highest/best performing 25% of funds in the Performance Universe make up the first quartile; the next 25%, the second quartile; the next 25%, the third quartile; and the poorest/worst performing 25% of funds in the Performance Universe make up the fourth quartile. Comparative annualized performance for the Portfolios was shown for the past one-, three-, five- and ten-year periods, as applicable, ended March 31, 2011. The Board’s objective is that each Portfolio’s performance for the periods considered be at or above the median of its Performance Universe. The following paragraphs summarize the performance results for the Portfolios and the Board’s view of such performance.
The Core Focus Fixed Income Portfolio – The Performance Universe for the Portfolio consisted of the Portfolio and all retail and institutional intermediate investment-grade debt funds as selected by Lipper. The Lipper report comparison showed that the Portfolio’s total return for the one- and three-year periods was in the third quartile of its Performance Universe. The report further showed that the Portfolio’s total return for the five-year period was in the second quartile. The Board noted that the Portfolio’s performance results were mixed. In evaluating the Portfolio’s performance, the Board considered the numerous investment and performance reports delivered by Management personnel to the Board’s Investments Committee. The Board was satisfied that Management was taking action to improve Portfolio performance and to meet the Board’s performance objective.
2011 Annual report · Delaware Pooled Trust
168
The Core Plus Fixed Income Portfolio – The Performance Universe for the Portfolio consisted of the Portfolio and all retail and institutional intermediate investment-grade debt funds as selected by Lipper. The Lipper report comparison showed that the Portfolio’s total return for the one-year period was in the second quartile of its Performance Universe. The report further showed that the Portfolio’s total return for the three- and five-year periods was in the first quartile. The Board was satisfied with performance.
The Emerging Markets Portfolio – The Performance Universe for the Portfolio consisted of the Portfolio and all retail and institutional emerging markets funds as selected by Lipper. The Lipper report comparison showed that the Portfolio’s total return for the three-, five- and ten-year periods was in the first quartile of its Performance Universe. The report further showed that the Portfolio’s total return for the one-year period was in the third quartile. The Board was satisfied with performance.
The Emerging Markets Portfolio II – The Performance Universe for the Portfolio consisted of the Portfolio and all retail and institutional emerging markets funds as selected by Lipper. The Lipper report comparison showed that the Portfolio’s total return for the one-year period was in the second quartile. The Board was satisfied with performance.
The Focus Smid-Cap Growth Equity Portfolio – The Performance Universe for the Portfolio consisted of the Portfolio and all retail and institutional mid cap growth funds as selected by Lipper. The Lipper report comparison showed that the Portfolio’s total return for the one-, three- and five-year periods was in the first quartile of its Performance Universe. The Board was satisfied with performance.
The Global Fixed Income Portfolio – The Performance Universe for the Portfolio consisted of the Portfolio and all retail and institutional global income funds as selected by Lipper. The Lipper report comparison showed that the Portfolio’s total return for the one- and three-year periods was in the second quartile of its Performance Universe. The report further showed that the Portfolio’s total return for the five- and ten-year periods was in the first quartile of its Performance Universe. The Board was satisfied with performance.
The Global Real Estate Securities Portfolio – The Performance Universe for the Portfolio consisted of the Portfolio and all retail and institutional global real estate funds as selected by Lipper. The Lipper report comparison showed that the Portfolio’s total return for the one-year period was in the first quartile of its Performance Universe. The report further showed that the Portfolio’s total return for the three-year period was in the third quartile. The Portfolio’s performance results were mixed but tended toward above median, which was acceptable.
The High-Yield Bond Portfolio – The Performance Universe for the Portfolio consisted of the Portfolio and all retail and institutional high current yield funds as selected by Lipper. The Lipper report comparison showed that the Portfolio’s total return for the one-, three-, five- and ten-year periods was in the first quartile of its Performance Universe. The Board was satisfied with performance.
The International Equity Portfolio – The Performance Universe for the Portfolio consisted of the Portfolio and all retail and institutional international large cap value funds as selected by Lipper. The Lipper report comparison showed that the Portfolio’s total return for the five- and ten-year periods was in the first quartile of its Performance Universe. The report further showed that the Portfolio’s total return for the one- and three-year periods was in the third and second quartiles, respectively, of its Performance Universe. The Board was satisfied with performance.
The Labor Select International Equity Portfolio – The Performance Universe for the Portfolio consisted of the Portfolio and all retail and institutional international large cap core funds as selected by Lipper. The Lipper report comparison showed that the Portfolio’s total return for the one-, three-, five- and ten-year periods was in the fourth, third, second and first quartiles, respectively, of its Performance Universe. The Board noted that the Portfolio’s performance results were mixed. In evaluating the Portfolio’s performance, the Board considered the numerous investment and performance reports delivered by Management personnel to the Board’s Investments Committee. The Board was satisfied that Management was taking action to improve Portfolio performance and to meet the Board’s performance objective.
The Large Cap Growth Equity Portfolio – The Performance Universe for the Portfolio consisted of the Portfolio and all retail and institutional large cap growth funds as selected by Lipper. The Lipper report comparison showed that the Portfolio’s total return for the one- and three-year periods was in the second quartile of its Performance Universe. The report further showed that the Portfolio’s total return for the five-year period was in the third quartile. The Portfolio’s performance results were mixed but tended toward above median, which was acceptable.
The Large-Cap Value Equity Portfolio – The Performance Universe for the Portfolio consisted of the Portfolio and all retail and institutional large-cap value funds as selected by Lipper. The Lipper report comparison showed that the Portfolio’s total return for the one-, three- and five-year periods was in the first quartile of its Performance Universe. The report further showed that the Portfolio’s total return for the ten-year period was in the second quartile. The Board was satisfied with performance.
2011 Annual report · Delaware Pooled Trust
(continues) 169
Other Portfolio information
(Unaudited)
Delaware Pooled® Trust
Board Consideration of Investment Advisory Agreements (continued)
The Real Estate Investment Trust Portfolio II – The Performance Universe for the Portfolio consisted of the Portfolio and all retail and institutional real estate funds as selected by Lipper. The Lipper report comparison showed that the Portfolio’s total return for the one-, three- and ten- year periods was in the third quartile of its Performance Universe. The report further showed that the Portfolio’s total return for the five-year period was in the second quartile. The Portfolio’s performance results were not in line with the Board’s objective. In evaluating the Portfolio’s performance, the Board considered the numerous investment and performance reports delivered by Management personnel to the Board’s Investments Committee. The Board was satisfied that Management was taking action to improve Portfolio performance and to meet the Board’s performance objective.
The Select 20 Portfolio – The Performance Universe for the Portfolio consisted of the Portfolio and all retail and institutional multi-cap growth funds as selected by Lipper. The Lipper report comparison showed that the Portfolio’s total return for the one-, three-, five- and ten-year periods was in the third quartile of its Performance Universe. The Portfolio’s performance results were not in line with the Board’s objective. In evaluating the Portfolio’s performance, the Board considered the numerous investment and performance reports delivered by Management personnel to the Board’s Investments Committee. The Board was satisfied that Management was taking action to improve Portfolio performance and to meet the Board’s performance objective.
Comparative Expenses. The Board considered expense comparison data for the Delaware Investments Family of Funds. Management provided the Board with information on pricing levels and fee structures for each Portfolio as of its most recent fiscal year end. The Board also focused on the comparative analysis of effective management fees and total expense ratios of each Portfolio versus effective management fees and expense ratios of a group of similar funds as selected by Lipper (the “Expense Group”). In reviewing comparative costs, each Portfolio’s contractual management fee and the actual management fee incurred by the Portfolio were compared with the contractual management fees (assuming all funds in the Expense Group were similar in size to the Portfolio) and actual management fees (as reported by each fund) within the Expense Group, taking into account any applicable breakpoints and fee waivers. Each Portfolio’s total expenses were also compared with those of its Expense Group. The Board considered fees paid to Delaware Investments for non-management services. The Board’s objective is to limit each Portfolio’s total expense ratio to be competitive with that of the Expense Group. The following paragraphs summarize the expense results for the Portfolios and the Board’s view of such expenses.
The Core Focus Fixed Income Portfolio – The expense comparisons for the Portfolio showed that its actual management fee and total expenses were in the quartile with the lowest expenses of its Expense Group. The Board was satisfied with the management fee and total expenses of the Portfolio in comparison to those of its Expense Group.
The Core Plus Fixed Income Portfolio – The expense comparisons for the Portfolio showed that its actual management fee was in the quartile with the second lowest expenses of its Expense Group and its total expenses were in the quartile with the lowest expenses of its Expense Group. The Board was satisfied with the management fee and total expenses of the Portfolio in comparison to those of its Expense Group.
The Emerging Markets Portfolio – The expense comparisons for the Portfolio showed that its actual management fee was in the quartile with the second lowest expenses of its Expense Group and its total expenses were in the quartile with the lowest expenses of its Expense Group. The Board was satisfied with the management fee and total expenses of the Portfolio in comparison to those of its Expense Group. The Board also considered the subadvisory fee charged by Mondrian with respect to the Portfolio as well as information on the fees charged by Mondrian with respect to similar products.
The Emerging Markets Portfolio II – The expense comparisons for the Portfolio showed that its actual management fee was in the quartile with the lowest expenses of its Expense Group and its total expenses were in the quartile with the second highest expenses of its Expense Group. The Board gave favorable consideration to the Fund’s management fee, but noted that the Fund’s total expenses were not in line with the Board’s objective. In evaluating the total expenses, the Board considered fee waivers in place through February 2012 and various initiatives implemented by Management, such as the outsourcing of certain transfer agency services, creating an opportunity for a reduction in expenses. The Board was satisfied with Management’s efforts to improve the Portfolio’s total expense ratio and bring it in line with the Board’s objective.
The Focus Smid-Cap Growth Equity Portfolio – The expense comparisons for the Portfolio showed that its actual management fee was in the quartile with the lowest expenses of its Expense Group and its total expenses were in the quartile with the second lowest expenses of its Expense Group. The Board was satisfied with the management fee and total expenses of the Portfolio in comparison to those of its Expense Groups.
The Global Fixed Income Portfolio – The expense comparisons for the Portfolio showed that its actual management fee and total expenses were in the quartile with the lowest expenses of its Expense Group. The Board was satisfied with the management fee and total expenses of the Portfolio in comparison to those of its Expense Group. The Board also considered the subadvisory fee charged by Mondrian with respect to the Portfolio as well as information on the fees charged by Mondrian with respect to similar products.
The Global Real Estate Securities Portfolio – The expense comparisons for the Portfolio showed that its actual management fee and total expenses were in the quartile with the highest expenses of its Expense Group. The Board noted that the Portfolio’s total expenses were not in line with the Boards’ objective. In evaluating the total expenses, the Board considered fee waivers in place through February 2012 and various initiatives implemented by Management, such as the outsourcing of certain transfer agency services, creating an opportunity for a reduction in expenses. The Board was satisfied with Management’s efforts to improve the Portfolio’s total expense ratio and bring it in line with the Board’s objective.
2011 Annual report · Delaware Pooled Trust
170
The High-Yield Bond Portfolio – The expense comparisons for the Portfolio showed that its actual management fee and total expenses were in the quartile with the lowest expenses of its Expense Group. The Board was satisfied with the management fee and total expenses of the Portfolio in comparison to those of its Expense Group.
The International Equity Portfolio – The expense comparisons for the Portfolio showed that its actual management fee was in the quartile with the second lowest expenses of its Expense Group and its total return was in the quartile with the lowest expenses of its Expense Group. The Board was satisfied with the management fee and total expenses of the Portfolio in comparison to those of its Expense Group.
The Labor Select International Equity Portfolio – The expense comparisons for the Portfolio showed that its actual management fee and total expenses were in the quartile with the second lowest expenses of its Expense Group. The Board was satisfied with the management fee and total expenses of the Portfolio in comparison to those of its Expense Group. The Board also considered the subadvisory fee charged by Mondrian with respect to the Portfolio as well as information on the fees charged by Mondrian with respect to similar products.
The Large-Cap Growth Equity Portfolio – The expense comparisons for the Portfolio showed that its actual management fee and total expenses were in the quartile with the lowest expenses of its Expense Group. The Board was satisfied with the management fee and total expenses of the Portfolio in comparison to those of its Expense Group.
The Large-Cap Value Equity Portfolio – The expense comparisons for the Portfolio showed that its actual management fee and total expenses were in the quartile with the lowest expenses of its Expense Group. The Board was satisfied with the management fee and total expenses of the Portfolio in comparison to those of its Expense Group.
The Real Estate Investment Trust Portfolio II – The expense comparisons for the Portfolio showed that its contractual management fee and total expenses were in the quartile with the lowest expenses of the Expense Group. The Board was satisfied with the management fee and total expenses of the Portfolio in comparison to those of its Expense Group.
The Select 20 Portfolio – The expense comparisons for the Portfolio showed that its actual management fee was in the quartile with the second lowest expenses of its Expense Group and its total return was in the quartile with the lowest expense of its Expense Group. The Board was satisfied with the management fee and total expenses of the Portfolio in comparison to those of its Expense Group.
Management Profitability. The Board considered the level of profits, if any, realized by Delaware Investments in connection with the operation of the Portfolios. In this respect, the Board reviewed the Investment Management Profitability Analysis that addressed the overall profitability of Delaware Investments’ business in providing management and other services to each of the individual funds and the Delaware Investments Family of Funds as a whole. Specific attention was given to the methodology followed in allocating costs for the purpose of determining profitability. Management stated that the level of profits of Delaware Investments, to a certain extent, reflect recent operational cost savings and efficiencies initiated by Delaware Investments. The Board considered Delaware Investments’ efforts to improve services provided to fund shareholders and to meet additional regulatory and compliance requirements resulting from recent industry-wide Securities and Exchange Commission initiatives. The Board was also given profitability information provided by Mondrian with respect to the Portfolios that it sub-advises. The Board also considered the extent to which Delaware Investments and Mondrian might derive ancillary benefits from fund operations, including the potential for procuring additional business as a result of the prestige and visibility associated with its role as service provider to the Delaware Investments Family of Funds and the benefits from allocation of fund brokerage to improve trading efficiencies. The Board found that the management fees were reasonable in light of the services rendered and the profitability of Delaware Investments.
Economies of Scale. The Trustees considered whether economies of scale are realized by Delaware Investments as each Portfolio’s assets increase and the extent to which any economies of scale are reflected in the level of management fees charged. The Trustees reviewed the standardized advisory fee pricing and structure approved by the Board and shareholders which, for The Global Real Estate Securities Portfolio, includes breakpoints. Breakpoints in the advisory fee occur when the advisory fee rate is reduced on assets in excess of specified levels. Breakpoints result in a lower advisory fee than would otherwise be the case on all assets when the asset levels specified are exceeded. Benchmarking analysis indicated that less than one quarter of competing funds in the institutional market employ breakpoints. Management believed, and the Board agreed, that the Portfolios were priced with relatively low management fees to reflect potential economies of scale at all asset levels. The Board noted that the fee under the management contracts for each of The Emerging Markets Portfolio II and The Global Real Estate Securities Portfolio did not fall within the standard structure. With respect to The Emerging Markets Portfolio II, Management explained that the portfolio management fee was priced in between the management fee for each of standard international equity funds and special international equity funds. With respect to The Global Real Estate Securities Portfolio, Management explained that the Portfolio’s fee is based on the combination of special international equity and special domestic equity features within the Portfolio. Although the Global Real Estate Securities portfolio has not reached a size at which it can take advantage of breakpoints, the Board recognized that the fee was structured so that if the Portfolio grows, economies of scale may be shared.
2011 Annual report · Delaware Pooled Trust
(continues) 171
Other Portfolio information
(Unaudited)
Delaware Pooled® Trust
Change in Independent Registered Public Accounting Firm
Due to independence matters under the Securities and Exchange Commission’s auditor independence rules relating to the January 4, 2010 acquisition of Delaware Investments (including DMC, DDLP and DSC) by Macquarie Group, Ernst & Young LLP (E&Y) has resigned as the independent registered public accounting firm for Delaware Pooled Trust (the Trust) effective May 20, 2010. At a meeting held on May 20, 2010, the Board of Trustees of the Trust, upon recommendation of the Audit Committee, selected PricewaterhouseCoopers LLP (PwC) to serve as the independent registered public accounting firm for the Trust for the fiscal year ending October 31, 2010. During the fiscal years ended October 31, 2009 and 2008, E&Y’s audit reports on the financial statements of the Trust did not contain any adverse opinion or disclaimer of opinion, nor were they qualified or modified as to uncertainty, audit scope, or accounting principles. In addition, there were no disagreements between the Trust and E&Y on accounting principles, financial statements disclosures or audit scope, which, if not resolved to the satisfaction of E&Y, would have caused them to make reference to the disagreement in their reports. Neither the Trust nor anyone on its behalf has consulted with PwC at any time prior to their selection with respect to the application of accounting principles to a specified transaction, either completed or proposed or the type of audit opinion that might be rendered on the Trust’s financial statements.
Fund management
Robert Akester
Senior Portfolio Manager — Mondrian Investment Partners Limited
The Emerging Markets Portfolio
A graduate of University College, London, Robert Akester joined Mondrian in 1996. Prior to joining Mondrian he was a Director of Hill Samuel Investment Management where he had responsibility for significant overseas clients and Far Eastern markets. Akester is an Associate of the Institute of Actuaries and holder of its Certificate in Finance and Investment. He has nearly 40 years of investment experience, including more than 30 years of involvement in emerging markets. Akester is a Senior Portfolio Manager in the Emerging Markets Portfolio team.
Damon J. Andres, CFA
Vice President, Senior Portfolio Manager
The Global Real Estate Securities Portfolio
The Real Estate Investment Trust Portfolio II
Damon J. Andres, who joined Delaware Investments in 1994 as an analyst, currently serves as a portfolio manager for the firm’s real estate securities and income solutions (RESIS) group. He also serves as a portfolio manager for the firm’s Dividend Income products. From 1991 to 1994, he performed investment-consulting services as a consulting associate with Cambridge Associates. Andres earned a bachelor’s degree in business administration with an emphasis in finance and accounting from the University of Richmond.
Kristen E. Bartholdson
Vice President, Senior Portfolio Manager
The Large-Cap Value Equity Portfolio
Kristen E. Bartholdson is a senior portfolio manager for the firm’s Large-Cap Value team. Prior to joining the firm in 2006 as an associate portfolio manager, she worked at Susquehanna International Group from 2004 to 2006, where she was an equity research salesperson. From 2000 to 2004 she worked in equity research at Credit Suisse, most recently as an associate analyst in investment strategy. Bartholdson earned her bachelor’s degree in economics from Princeton University.
2011 Annual report · Delaware Pooled Trust
172
Joanna Bates
Senior Portfolio Manager — Mondrian Investment Partners Limited
The Global Fixed Income Portfolio
Joanna Bates is a graduate of London University. She joined Mondrian’s fixed income team in 1997, before which she was Associate Director of Fixed Interest at Hill Samuel Investment Management. She has also worked for Fidelity International and Save & Prosper as a fund manager and analyst for global bond markets. At Mondrian, Bates is a Senior Portfolio Manager with many client relationships including those based in Japan. Her research specialties are emerging market currencies and debt. Bates holds the ASIP designation and is a member of the CFA Institute and the CFA Society of the UK.
Nigel Bliss
Senior Portfolio Manager — Mondrian Investment Partners Limited
The Labor Select International Equity Portfolio
Nigel Bliss is a graduate of the University of Manchester. He commenced his career at Cazenove & Co. and moved to join Mondrian in 1995. Bliss is a Senior Portfolio Manager in the Pacific Team where his country research focus lies with Greater China. His sector coverage includes property, utilities, energy, and industrials. Bliss is an Associate of the UK Society of Investment Professionals. He holds the ASIP designation and is a member of the CFA Institute and the CFA Society of the UK.
Christopher J. Bonavico, CFA
Vice President, Senior Portfolio Manager, Equity Analyst
The Select 20 Portfolio
The Focus Smid-Cap Growth Equity Portfolio
The Large-Cap Growth Equity Portfolio
Christopher J. Bonavico joined Delaware Investments in April 2005 as a senior portfolio manager on the firm’s Focus Growth Equity team, which manages large-cap growth, smid-cap growth, all-cap growth, and global growth portfolios. Prior to joining the firm, he was a principal and portfolio manager at Transamerica Investment Management, where he managed sub-advised funds and institutional separate accounts. Before joining Transamerica in 1993, he was a research analyst for Salomon Brothers. Bonavico received his bachelor’s degree in economics from the University of Delaware.
Kenneth F. Broad, CFA
Vice President, Senior Portfolio Manager, Equity Analyst
The Select 20 Portfolio
The Focus Smid-Cap Growth Equity Portfolio
Kenneth F. Broad joined Delaware Investments in April 2005 as a senior portfolio manager on the firm’s Focus Growth Equity team, which manages large-cap growth, smid-cap growth, all-cap growth, and global growth portfolios. Prior to joining the firm, he was a principal and portfolio manager at Transamerica Investment Management, where he also managed sub-advised funds and institutional separate accounts. Before joining Transamerica in 2000, he was a portfolio manager with The Franklin Templeton Group and was a consultant in the business valuation and merger and acquisition group at KPMG Peat Marwick. He received an MBA from the University of California at Los Angeles and his bachelor’s degree in economics from Colgate University.
2011 Annual report · Delaware Pooled Trust
(continues) 173
Other Portfolio information
(Unaudited)
Delaware Pooled® Trust
Liu-Er Chen, CFA
Senior Vice President, Chief Investment Officer — Emerging Markets and Healthcare
The Emerging Markets Portfolio II
Liu-Er Chen heads the firm’s global Emerging Markets team, and he is also the portfolio manager for Delaware Healthcare Fund, which launched in September 2007, and a global opportunities hedge fund. Prior to joining Delaware Investments in September 2006 in his current position, he spent nearly 11 years at Evergreen Investment Management Company, where he most recently served as managing director and senior portfolio manager. He co-managed the Evergreen Emerging Markets Growth Fund from 1999 to 2001, and became the Fund’s sole manager in 2001. He also served as the sole manager of the Evergreen Health Care Fund since its inception in 1999. Chen began his career at Evergreen in 1995 as an analyst covering Asian and global healthcare stocks, before being promoted to portfolio manager in 1998. Prior to his career in asset management, Chen worked for three years in sales, marketing, and business development for major American and European pharmaceutical and medical device companies. He is licensed to practice medicine in China and has experience in medical research at both the Chinese Academy of Sciences and Cornell Medical School. He holds an MBA with a concentration in management from Columbia Business School.
Thomas H. Chow, CFA
Senior Vice President, Senior Portfolio Manager
The Core Focus Fixed Income Portfolio
The Core Plus Fixed Income Portfolio
Thomas H. Chow is a member of the firm’s taxable fixed income portfolio management team, with primary responsibility for portfolio construction and strategic asset allocation in investment grade credit exposures. He is the lead portfolio manager for Delaware Corporate Bond Fund and Delaware Extended Duration Bond Fund, as well as several institutional mandates. His experience includes significant exposure to asset liability management strategies and credit risk opportunities. Prior to joining Delaware Investments in 2001 as a portfolio manager working on the Lincoln General Account, he was a trader of high grade and high yield securities, and was involved in the portfolio management of collateralized bond obligations (CBOs) and insurance portfolios at SunAmerica/AIG from 1997 to 2001. Before that, he was an analyst, trader, and portfolio manager at Conseco Capital Management from 1989 to 1997. Chow received a bachelor’s degree in business analysis from Indiana University, and he is a Fellow of Life Management Institute.
Elizabeth A. Desmond
Director/Chief Investment Officer, International Equities
Mondrian Investment Partners Limited
The International Equity Portfolio
Elizabeth A. Desmond is a graduate of Wellesley College and the masters program in East Asian Studies at Stanford University. After working for the Japanese government for two years, she began her investment career as a Pacific Basin investment manager with Shearson Lehman Global Asset Management. Prior to joining Mondrian in 1991, she was a Pacific Basin Equity Analyst and Senior Portfolio Manager at Hill Samuel Investment Advisers Ltd. Desmond is a CFA Charterholder, and a member of the CFA Institute and the CFA Society of the UK.
2011 Annual report · Delaware Pooled Trust
174
Chuck M. Devereux
Senior Vice President, Director of Credit Research
The High-Yield Bond Portfolio
The Core Focus Fixed Income Portfolio
Chuck M. Devereux is the head of the firm’s taxable credit research department. In addition, he serves as a consultant for the team responsible for portfolio management of some of the firm’s fixed income products. Prior to April 2007, he was a senior vice president and co-head of the firm’s private placements group, which has responsibility for managing a portfolio of approximately $8 billion of privately placed securities. Prior to joining Delaware Investments in 2001, Devereux was employed by Valuemetrics/VM Equity Partners, a financial advisory and investment banking firm, where he participated in financial advisory and capital-raising efforts for privately held, middle-market companies. These efforts included placements of traditional corporate debt and equity as well as mezzanine and venture-capital financings. Prior to Valuemetrics/VM Equity Partners, he was a trust officer in the privately held asset division of the Northern Trust Corporation for three years. Devereux earned an MBA with a concentration in finance from DePaul University and a bachelor’s degree in economics from St. Joseph’s College.
Roger A. Early, CPA, CFA, CFP
Senior Vice President, Co-Chief Investment Officer — Total Return Fixed Income Strategy
The Core Focus Fixed Income Portfolio
The Core Plus Fixed Income Portfolio
Roger A. Early rejoined Delaware Investments in March 2007 as a member of the firm’s taxable fixed income portfolio management team, with primary responsibility for portfolio construction and strategic asset allocation. During his previous time at the firm, from 1994 to 2001, he was a senior portfolio manager in the same area, and he left Delaware Investments as head of its U.S. investment grade fixed income group. In recent years, Early was a senior portfolio manager at Chartwell Investment Partners and Rittenhouse Financial and served as the chief investment officer for fixed income at Turner Investments. Prior to joining Delaware Investments in 1994, he worked for more than 10 years at Federated Investors where he managed more than $25 billion in mutual fund and institutional portfolios in the short-term and investment grade markets. He left the firm as head of institutional fixed income management. Earlier in his career, he held management positions with the Federal Reserve Bank, PNC Financial, Touche Ross, and Rockwell International. Early earned his bachelor’s degree in economics from The Wharton School of the University of Pennsylvania and an MBA with concentrations in finance and accounting from the University of Pittsburgh. He is a member of the CFA Society of Philadelphia.
Christopher M. Ericksen, CFA
Vice President, Portfolio Manager, Equity Analyst
The Large-Cap Growth Equity Portfolio
Christopher M. Ericksen joined Delaware Investments in April 2005 as a portfolio manager on the firm’s Focus Growth Equity team, which manages large-cap growth, smid-cap growth, all-cap growth, and global growth portfolios. Prior to joining the firm, he was a portfolio manager at Transamerica Investment Management, where he also managed institutional separate accounts. Before joining Transamerica in 2004, he was a vice president at Goldman Sachs. During his 10 years there, he worked in investment banking as well as investment management. Ericksen received his bachelor’s degree from Carnegie Mellon University, with majors in industrial management, economics, and political science.
2011 Annual report · Delaware Pooled Trust
(continues) 175
Other Portfolio information
(Unaudited)
Delaware Pooled® Trust
Clive A. Gillmore
Chief Executive Officer
Mondrian Investment Partners Limited
The International Equity Portfolio
The Labor Select International Equity Portfolio
The Emerging Markets Portfolio
The Global Fixed Income Portfolio
Clive A. Gillmore is a graduate of the University of Warwick and has completed the Investment Management Program at the London Business School. In 1990, Gillmore joined Mondrian Investment Partners’ predecessor organization as a founding member, having previously worked as a Senior Portfolio Manager for Hill Samuel Investment Advisers Ltd., and a Portfolio Manager at Legal and General Investment Management. He has more than 20 years’ experience analyzing equity markets and securities around the world and has managed client portfolios with a wide range of mandates. Gillmore is CEO of Mondrian. He is a member of Mondrian’s Equity Strategy Committee, Chairman of the Emerging Markets Strategy Committee (where his research specialization lies), and a member of the Management Steering Committee.
Paul Grillo, CFA
Senior Vice President, Co-Chief Investment Officer — Total Return Fixed Income Strategy
The Core Focus Fixed Income Portfolio
The Core Plus Fixed Income Portfolio
Paul Grillo is a member of the firm’s taxable fixed income portfolio management team with primary responsibility for portfolio construction and strategic asset allocation. He is also a member of the firm’s asset allocation committee, which is responsible for building and managing multi-asset class portfolios. He joined Delaware Investments in 1992 as a mortgage-backed and asset-backed securities analyst, assuming portfolio management responsibilities in the mid-1990s. Grillo serves as co-lead portfolio manager for the firm’s Diversified Income products and has been influential in the growth and distribution of the firm’s multisector strategies. Prior to joining Delaware Investments, Grillo served as a mortgage strategist and trader at Dreyfus Corporation. He also worked as a mortgage strategist and portfolio manager at Chemical Investment Group and as a financial analyst at Chemical Bank. Grillo holds a bachelor’s degree in business management from North Carolina State University and an MBA with a concentration in finance from Pace University.
John Kirk
Deputy Chief Executive Officer — Mondrian Investment Partners Limited
The Global Fixed Income Portfolio
John Kirk is a Math graduate from the University of Wales and has an M.A. in operations research from Lancaster University. Before joining Mondrian in 1998, Kirk was at Royal Bank of Canada in London, where he was responsible for European and Asian Fixed Income. Kirk started his career at Ford Motor Company as a member of their operations research group. Kirk leads Mondrian’s credit research and heads the Global Credit Valuation Committee.
2011 Annual report · Delaware Pooled Trust
176
Nikhil G. Lalvani, CFA
Vice President, Senior Portfolio Manager
The Large-Cap Value Equity Portfolio
Nikhil G. Lalvani is a senior portfolio manager for the firm’s Large-Cap Value team. At Delaware Investments, Lalvani has served as both a fundamental and quantitative analyst. Prior to joining the firm in 1997 as an account analyst, he was a research associate with Bloomberg. Lalvani holds a bachelor’s degree in finance from The Pennsylvania State University. He is a member of the CFA Institute and the CFA Society of Philadelphia.
Emma R. E. Lewis
Senior Portfolio Manager — Mondrian Investment Partners Limited
The Labor Select International Equity Portfolio
Emma R.E. Lewis is a graduate of Pembroke College, Oxford University, where she completed her Masters in Philosophy and Theology. She joined Mondrian in 1995, assuming analytical responsibilities in the Pacific Basin Team. Lewis is currently a Senior Portfolio Manager at Mondrian where she manages international portfolios. Prior to joining Mondrian, she began her investment career at the Dutch bank ABN AMRO and later joined Fuji Investment Management. Lewis holds the ASIP designation and is a member of the CFA Institute and the CFA Society of the UK.
Anthony A. Lombardi, CFA
Vice President, Senior Portfolio Manager
The Large-Cap Value Equity Portfolio
Anthony A. Lombardi is a senior portfolio manager for the firm’s Large-Cap Value team. Prior to joining the firm in 2004 in his current role, Lombardi was a director at Merrill Lynch Investment Managers. He joined Merrill Lynch Investment Managers’ Capital Management Group in 1998 and last served as a portfolio manager for the U.S. Active Large-Cap Value team, managing mutual funds and separate accounts for institutions and private clients. From 1990 to 1997, he worked at Dean Witter Reynolds as a sell-side equity research analyst. He began his career as an investment analyst with Crossland Savings. Lombardi graduated from Hofstra University, receiving a bachelor’s degree in finance and an MBA with a concentration in finance. He is a member of the New York Society of Security Analysts and the CFA Institute.
Kevin P. Loome, CFA
Senior Vice President, Senior Portfolio Manager, Head of High Yield Investments
The High-Yield Bond Portfolio
The Core Plus Fixed Income Portfolio
Kevin P. Loome is head of the High Yield fixed income team, responsible for portfolio construction and strategic asset allocation of all high yield fixed income assets. Prior to joining Delaware Investments in August 2007 in his current position, Loome spent 11 years at T. Rowe Price, starting as an analyst and leaving the firm as a portfolio manager. He began his career with Morgan Stanley as a corporate finance analyst in the New York and London offices. Loome received his bachelor’s degree in commerce from the University of Virginia and earned an MBA from the Tuck School of Business at Dartmouth.
2011 Annual report · Delaware Pooled Trust
(continues) 177
Other Portfolio information
(Unaudited)
Delaware Pooled® Trust
Nigel G. May
Deputy Chief Executive Officer — Mondrian Investment Partners Limited
The International Equity Portfolio
Nigel G. May is a graduate of Sidney Sussex College, Cambridge University, where he completed his Masters in Engineering. He joined Mondrian in 1991. Having led the European team’s research effort since 1995, he now has responsibility for several investment products, including Global Equity. May was formerly a Senior Portfolio Manager and analyst with Hill Samuel Investment Advisers Ltd., having joined the Hill Samuel Investment Group in 1986. He holds the ASIP designation and is a member of the CFA Institute and the CFA Society of the UK.
Christopher A. Moth
Director/Chief Investment Officer, Global Fixed Income and Currency — Mondrian Investment Partners Limited
The Global Fixed Income Portfolio
Christopher A. Moth is an actuarial graduate from The City University in London, and was later awarded the Certificate in Finance & Investment from the London Institute of Actuaries. He joined Mondrian in 1992, after working for the GRE insurance company where he was responsible for quantitative models and projections. He has made key contributions to the development of Mondrian’s fixed income product, and was primarily responsible for the structure of the company’s in-house systems to control and facilitate the investment process. Moth chairs the Global Fixed Income and Currency Committee meeting.
D. Tysen Nutt Jr.
Senior Vice President, Senior Portfolio Manager, Team Leader
The Large-Cap Value Equity Portfolio
D. Tysen Nutt Jr. is senior portfolio manager and team leader for the firm’s Large-Cap Value team. Before joining Delaware Investments in 2004 as senior vice president and senior portfolio manager, Nutt led the U.S. Active Large-Cap Value team within Merrill Lynch Investment Managers, where he managed mutual funds and separate accounts for institutions and private clients. He departed Merrill Lynch Investment Managers as a managing director. Prior to joining Merrill Lynch Investment Managers in 1994, Nutt was with Van Deventer & Hoch where he managed large-cap value portfolios for institutions and private clients. He began his investment career at Dean Witter Reynolds, where he eventually became vice president, investments. Nutt earned his bachelor’s degree from Dartmouth College, and he is a member of the New York Society of Security Analysts and the CFA Institute.
Daniel J. Prislin, CFA
Vice President, Senior Portfolio Manager, Equity Analyst
The Select 20 Portfolio
The Large-Cap Growth Equity Portfolio
Daniel J. Prislin joined Delaware Investments in April 2005 as a senior portfolio manager on the firm’s Focus Growth Equity team, which manages large-cap growth, smid-cap growth, all-cap growth, and global growth portfolios. Prior to joining the firm, he was a principal and portfolio manager at Transamerica Investment Management, where he also managed sub-advised funds and institutional separate accounts. Prior to joining Transamerica in 1998, he was a portfolio manager with The Franklin Templeton Group. Prislin received an MBA and bachelor’s degree in business administration from the University of California at Berkeley.
2011 Annual report · Delaware Pooled Trust
178
David G. Tilles
Executive Chairman of Mondrian Investment Partners Limited
The International Equity Portfolio
The Labor Select International Equity Portfolio
The Emerging Markets Portfolio
The Global Fixed Income Portfolio
David G. Tilles was educated at the Sorbonne, Warwick University, and Heidelberg University. Prior to joining Mondrian in 1990 as founding managing director and chief investment officer, he spent 16 years with Hill Samuel in London, serving in a number of investment capacities. Tilles was appointed executive chairman in November 2007. He holds the ASIP designation and is a member of the CFA Institute and the CFA Society of the UK.
Jeffrey S. Van Harte, CFA
Senior Vice President, Chief Investment Officer — Focus Growth Equity
The Select 20 Portfolio
The Large-Cap Growth Equity Portfolio
Jeffrey S. Van Harte is the chief investment officer for the Focus Growth Equity team, which manages large-cap growth, smid-cap growth, all-cap growth, and global growth portfolios. Prior to joining Delaware Investments in April 2005 in his current position, he was a principal and executive vice president at Transamerica Investment Management. Van Harte has been managing portfolios and separate accounts for more than 20 years. Before becoming a portfolio manager, Van Harte was a securities analyst and trader for Transamerica Investment Services, which he joined in 1980. Van Harte received his bachelor’s degree in finance from California State University at Fullerton.
Robert A. Vogel Jr., CFA
Vice President, Senior Portfolio Manager
The Large-Cap Value Equity Portfolio
Robert A. Vogel Jr. is a senior portfolio manager for the firm’s Large-Cap Value team. Prior to joining Delaware Investments in 2004 as vice president and senior portfolio manager, he worked at Merrill Lynch Investment Managers for more than seven years, where he rose to the position of director and portfolio manager within the U.S. Active Large-Cap Value team. He began his career in 1992 as a financial consultant at Merrill Lynch. Vogel graduated from Loyola University Maryland, earning both bachelor’s and master’s degrees in finance. He also earned an MBA with a concentration in finance from The Wharton School of the University of Pennsylvania. Vogel is a member of the New York Society of Security Analysts, the CFA Institute, and the CFA Society of Philadelphia.
Babak “Bob” Zenouzi
Senior Vice President, Chief Investment Officer — Real Estate Securities and Income Solutions (RESIS)
The Global Real Estate Securities Portfolio
The Real Estate Investment Trust Portfolio II
Bob Zenouzi is the lead manager for the real estate securities and income solutions (RESIS) group at Delaware Investments, which includes the team, its process, and its institutional and retail products, which he created during his prior time with the firm. He also focuses on opportunities in Japan, Singapore, and Malaysia for the firm’s global REIT product. Additionally, he serves as lead portfolio manager for the firm’s Dividend Income products, which he helped to create in the 1990s. He is also a member of the firm’s asset allocation committee, which is responsible for building and managing multi-asset class portfolios. He rejoined Delaware Investments in May 2006 as senior portfolio manager and head of real estate securities. In his first term with the firm, he spent seven years as an analyst and portfolio manager, leaving in 1999 to work at Chartwell Investment Partners, where from 1999 to 2006 he was a partner and senior portfolio manager on Chartwell’s Small-Cap Value portfolio. He began his career with The Boston Company, where he held several positions in accounting and financial analysis. Zenouzi earned a master’s degree in finance from Boston College and a bachelor’s degree from Babson College. He is a member of the National Association of Real Estate Investment Trusts and the Urban Land Institute.
2011 Annual report · Delaware Pooled Trust
179
Board of trustees/directors
and officers addendum
Delaware Investments® Family of Funds
A mutual fund is governed by a Board of Trustees/Directors (“Trustees”), which has oversight responsibility for the management of a fund’s business affairs. Trustees establish procedures and oversee and review the performance of the investment manager, the distributor, and others who perform services for the fund. The independent fund trustees, in particular, are advocates for shareholder interests. Each trustee has served in that capacity since he or she was elected to or appointed to the Board of Trustees, and will continue to serve until his or her retirement or the election of a new trustee in his or her place. The following is a list of the Trustees and Officers with certain background and related information.
| | | | Number of | |
| | | | Portfolios in Fund | Other |
| Name, | | | | Complex Overseen | Directorships |
| Address, | Position(s) | Length of | Principal Occupation(s) | by Trustee | Held by |
| and Birth Date | Held with Fund(s) | Time Served | During Past 5 Years | or Officer | Trustee or Officer |
| Interested Trustees | | | | | |
| Patrick P. Coyne1 | Chairman, | Chairman and Trustee | Patrick P. Coyne has served in | 74 | Director and Audit |
| 2005 Market Street | President, | since August 16, 2006 | various executive capacities | | Committee Member |
| Philadelphia, PA 19103 | Chief Executive | | at different times at | | Kaydon Corp. |
| Officer, and | President and | Delaware Investments.2 | | |
| April 1963 | Trustee | Chief Executive Officer | | | Board of Governors Member |
| | since August 1, 2006 | | | Investment Company |
| | | | | Institute (ICI) |
| |
| | | | | Finance Committee Member |
| | | | | St. John Vianney Roman |
| | | | | Catholic Church |
| |
| | | | | Board of Trustees |
| | | | | Agnes Irwin School |
| |
| | | | | Member of Investment |
| | | | | Committee |
| | | | | Cradle of Liberty Council, |
| | | | | BSA |
| | | | | (2007–2010) |
| Independent Trustees | | | | | |
|
| Thomas L. Bennett | Trustee | Since March 2005 | Private Investor | 74 | Chairman of Investment |
| 2005 Market Street | | | (March 2004–Present) | | Committee |
| Philadelphia, PA 19103 | | | | | Pennsylvania Academy of |
| | | Investment Manager | | Fine Arts |
| October 1947 | | | Morgan Stanley & Co. | | |
| | | (January 1984–March 2004) | | Investment Committee and |
| | | | | Governance Committee |
| | | | | Member |
| | | | | Pennsylvania Horticultural |
| | | | | Society |
| |
| | | | | Director |
| | | | | Bryn Mawr Bank Corp. (BMTC) |
| | | | | (2007–2011) |
2011 Annual report · Delaware Pooled Trust
180
| | | | Number of | |
| | | | Portfolios in Fund | Other |
| Name, | | | | Complex Overseen | Directorships |
| Address, | Position(s) | Length of | Principal Occupation(s) | by Trustee | Held by |
| and Birth Date | Held with Fund(s) | Time Served | During Past 5 Years | or Officer | Trustee or Officer |
| Independent Trustees (continued) | | | | |
| John A. Fry | Trustee | Since January 2001 | President | 74 | Board of Governors Member — |
| 2005 Market Street | | | Drexel University | | NASDAQ OMX PHLX LLC |
| Philadelphia, PA 19103 | | | (August 2010–Present) | | |
| | | | | Director and Audit |
| May 1960 | | | President | | Committee Member |
| | | Franklin & Marshall College | | Community Health Systems |
| | | (July 2002–July 2010) | | |
| | | | | Director — Ecore |
| | | | | International |
| | | | | (2009–2010) |
| |
| | | | | Director — Allied |
| | | | | Barton Securities Holdings |
| | | | | (2005–2008) |
| Anthony D. Knerr | Trustee | Since April 1990 | Managing Director | 74 | None |
| 2005 Market Street | | | Anthony Knerr & Associates | | |
| Philadelphia, PA 19103 | | | (Strategic Consulting) | | |
| | | (1990–Present) | | |
| December 1938 | | | | | |
| Lucinda S. Landreth | Trustee | Since March 2005 | Chief Investment Officer | 74 | None |
| 2005 Market Street | | | Assurant, Inc. (Insurance) | | |
| Philadelphia, PA 19103 | | | (2002–2004) | | |
| |
| June 1947 | | | | | |
|
| Ann R. Leven | Trustee | Since October 1989 | Consultant | 74 | Director and Audit |
| 2005 Market Street | | | ARL Associates | | Committee Chair |
| Philadelphia, PA 19103 | | | (Financial Planning) | | Systemax Inc. |
| | | (1983–Present) | | (2001–2009) |
| November 1940 | | | | | |
| | | | | Director and Audit |
| | | | | Committee Chairperson |
| | | | | Andy Warhol Foundation |
| | | | | (1999–2007) |
| Frances A. Sevilla-Sacasa | Trustee | Since September 2011 | Executive Advisor to Dean | 74 | Trust Manager — Camden |
| 2005 Market Street | | | (since August 2011) and | | Property Trust |
| Philadelphia, PA 19103 | | | Interim Dean | | (since August 2011) |
| | | (January 2011–July 2011) — | | |
| January 1956 | | | University of Miami School of | | Board of Trustees |
| | | Business Administration | | Thunderbird School of |
| | | | | Global Management |
| | | President — U.S. Trust, | | (2007–2011) |
| | | Bank of America Private | | |
| | | Wealth Management | | Board of Trustees |
| | | (Private Banking) | | Carrollton School of the |
| | | (July 2007–December 2008) | | Sacred Heart |
| | | | | (since 2007) |
| | | President and Director | | |
| | | (November 2005–June 2007) and | | Board Member |
| | | Chief Executive Officer | | Foreign Policy Association |
| | | (April 2007–June 2007) — | | (since 2006) |
| | | U.S. Trust Company | | |
| | | (Private Banking) | | Board of Trustees |
| | | | | Georgetown Preparatory School |
| | | | | (2005–2011) |
| |
| | | | | | Board of Trustees |
| | | | | Miami City Ballet |
| | | | | (2000–2011) |
| |
| | | | | | Board of Trustees |
| | | | | St. Thomas University |
| | | | | (2005–2011) |
2011 Annual report · Delaware Pooled Trust
(continues) 181
| | | | Number of | |
| | | | Portfolios in Fund | Other |
| Name, | | | | Complex Overseen | Directorships |
| Address, | Position(s) | Length of | Principal Occupation(s) | by Trustee | Held by |
| and Birth Date | Held with Fund(s) | Time Served | During Past 5 Years | or Officer | Trustee or Officer |
| Independent Trustees (continued) | | | | |
| Janet L. Yeomans | Trustee | Since April 1999 | Vice President and Treasurer | 74 | Director and Audit |
| 2005 Market Street | | | (January 2006–Present) | | Committee Member |
| Philadelphia, PA 19103 | | | Vice President — Mergers & | | Okabena Company |
| | | Acquisitions | | |
| July 1948 | | | (January 2003–January 2006), | | Chair — 3M |
| | | and Vice President | | Investment Management |
| | | and Treasurer | | Company |
| | | (July 1995–January 2003) | | |
| | | 3M Corporation | | |
|
| J. Richard Zecher | Trustee | Since March 2005 | Founder | 74 | Director and Audit |
| 2005 Market Street | | | Investor Analytics | | Committee Member |
| Philadelphia, | | | (Risk Management) | | Investor Analytics |
| PA 19103 | | | (May 1999–Present) | | |
| |
| July 1940 | | | Founder | | Director |
| | | Sutton Asset Management | | Oxigene, Inc. |
| | | (Hedge Fund) | | (2003–2008) |
| | | (September 1996–Present) | | |
| Officers | | | | | |
| David F. Connor | Vice President, | Vice President since | David F. Connor has served as | 74 | None3 |
| 2005 Market Street | Deputy General | September 2000 | Vice President and Deputy | | |
| Philadelphia, | Counsel, and Secretary | and Secretary | General Counsel of | | |
| PA 19103 | | since October 2005 | Delaware Investments | | |
| | | | since 2000. | | |
| December 1963 | | | | | |
|
| Daniel V. Geatens | Vice President | Treasurer | Daniel V. Geatens has served | 74 | None3 |
| 2005 Market Street | and Treasurer | since October 2007 | in various capacities at | | |
| Philadelphia, | | | different times at | | |
| PA 19103 | | | Delaware Investments. | | |
| |
| October 1972 | | | | | |
|
| David P. O’Connor | Senior Vice President, | Senior Vice President, | David P. O’Connor has served in | 74 | None3 |
| 2005 Market Street | General Counsel, | General Counsel, and | various executive and legal | | |
| Philadelphia, | and Chief | Chief Legal Officer | capacities at different times | | |
| PA 19103 | Legal Officer | since October 2005 | at Delaware Investments. | | |
| |
| February 1966 | | | | | |
|
| Richard Salus | Senior Vice President | Chief Financial | Richard Salus has served in | 74 | None3 |
| 2005 Market Street | and Chief | Officer since | various executive capacities | | |
| Philadelphia, | Financial Officer | November 2006 | at different times at | | |
| PA 19103 | | | Delaware Investments. | | |
| |
| October 1963 | | | | | |
1 Patrick P. Coyne is considered to be an “Interested Trustee” because he is an executive officer of the Fund’s(s’) investment advisor.
2 Delaware Investments is the marketing name for Delaware Management Holdings, Inc. and its subsidiaries, including the Fund’s(s’) investment advisor, principal underwriter, and its transfer agent.
3 David F. Connor, Daniel V. Geatens, David P. O’Connor, and Richard Salus serve in similar capacities for the six portfolios of the Optimum Fund Trust, which have the same investment advisor, principal underwriter, and transfer agent as the registrant.
The Statement of Additional Information for the Fund(s) includes additional information about the Trustees and Officers and is available, without charge, upon request by calling 800 523-1918.
2011 Annual report · Delaware Pooled Trust
182
Fund officers and portfolio managers
Patrick P. Coyne
Chairman, President, and
Chief Executive Officer —
Delaware Investments® Family of Funds Robert Akester
Senior Portfolio Manager
Mondrian Investment Partners Limited Damon J. Andres
Vice President and Senior Portfolio
Manager Kristen E. Bartholdson
Vice President and Portfolio Manager Joanna Bates
Senior Portfolio Manager
Mondrian Investment Partners Limited Nigel Bliss
Senior Portfolio Manager
Mondrian Investment Partners Limited Christopher J. Bonavico
Vice President, Senior Portfolio Manager, and
Equity Analyst Kenneth F. Broad
Vice President, Senior Portfolio Manager, and
Equity Analyst Liu-Er Chen
Senior Vice President,
Chief Investment Officer — Emerging
Markets and Healthcare Thomas H. Chow
Senior Vice President and Senior Portfolio Manager | | Elizabeth A. Desmond
Director and Chief Investment Officer —
International Equities
Mondrian Investment Partners Limited Chuck M. Devereux
Senior Vice President and Director of
Credit Research Roger A. Early
Senior Vice President and
Co-Chief Investment Officer —
Total Return Fixed Income Strategy Christopher M. Ericksen
Vice President, Portfolio Manager, and
Equity Analyst Clive A. Gillmore
Chief Executive Officer
Mondrian Investment Partners Limited Paul Grillo
Senior Vice President and
Co-Chief Investment Officer —
Total Return Fixed Income Strategy John Kirk
Deputy CEO
Mondrian Investment Partners Limited Nikhil G. Lalvani
Vice President and Senior Portfolio
Manager Emma R. E. Lewis
Senior Portfolio Manager
Mondrian Investment Partners Limited Anthony A. Lombardi
Vice President and Senior Portfolio
Manager | | Kevin P. Loome
Senior Vice President, Senior Portfolio
Manager, and Head of High Yield
Investments Nigel G. May
Deputy CEO —
Developed Equity Markets
Mondrian Investment Partners Limited Christopher A. Moth
Director and Chief Investment Officer
Global Fixed Income and Currency
Mondrian Investment Partners Limited D. Tysen Nutt Jr.
Senior Vice President, Senior Portfolio
Manager, and Team Leader — Large-Cap
Value Focus Equity Daniel J. Prislin
Vice President, Senior Portfolio Manager,
and Equity Analyst David G. Tilles
Executive Chairman
Mondrian Investment Partners Limited Jeffrey S. Van Harte
Senior Vice President and Chief
Investment Officer — Focus Growth Equity Robert A. Vogel Jr.
Vice President and Senior Portfolio
Manager Babak (Bob) Zenouzi
Senior Vice President, Chief Investment
Officer — REIT Equity |
2011 Annual report · Delaware Pooled Trust
183
Custodian
The Bank of New York Mellon
One Wall Street
New York, NY 10286
Independent registered public accounting firm
PricewaterhouseCoopers LLP
Two Commerce Square, Suite 1700
2001 Market Street
Philadelphia, Pennsylvania 19103-7042
Investment advisor
Delaware Management Company, a series of Delaware Management Business Trust
2005 Market Street
Philadelphia, PA 19103
Investment sub-advisor for certain Portfolios
Mondrian Investment Partners Limited
Fifth Floor
10 Gresham Street
London EC2V 7JD
United Kingdom
Investments in the Portfolios are not and will not be deposits with or liabilities of Macquarie Bank Limited ABN 46 008 583 542 and its holding companies, including their subsidiaries or related companies, and are subject to investment risk, including possible delays in repayment and loss of income and capital invested. No Macquarie Group company guarantees or will guarantee the performance of the Portfolios, the repayment of capital from the Portfolios, or any particular rate of return. Delaware Investments, a member of Macquarie Group, refers to DMHI and its subsidiaries. Macquarie Group refers to Macquarie Group Limited and its subsidiaries and affiliates worldwide. The Portfolios are distributed by Delaware Distributors, L.P., an affiliate of DMBT, DMHI, and Macquarie Group Limited. Each Portfolio files its complete schedule of portfolio holdings with the Securities and Exchange Commission for the first and third quarters of each fiscal year on Form N-Q. Each Portfolio’s Forms N-Q, as well as a description of the policies and procedures that each Portfolio uses to determine how to vote proxies (if any) relating to portfolio securities are available without charge (i) upon request, by calling 800 231-8002; (ii) on the Portfolios’ website at www.delawareinvestments.com; and (iii) on the Commission’s website at www.sec.gov. Each Portfolio’s Forms N-Q may be reviewed and copied at the Commission’s Public Reference Room in Washington, D.C.; information on the operation of the Public Reference Room may be obtained by calling 800 SEC-0330. Information (if any) regarding how each Portfolio voted proxies relating to portfolio securities during the most recently disclosed 12-month period ended June 30 is available without charge (i) through the Portfolios’ website at www.delawareinvestments.com; and (ii) on the Commission’s website at www.sec.gov. |
This report was prepared for investors in the Delaware Pooled® Trust Portfolios. It may be distributed to others only if preceded or accompanied by a current Delaware Pooled Trust prospectus, which contains details about charges, expenses, investment objectives, and operating policies of the Portfolios. All Delaware Pooled Trust Portfolios are offered by prospectus only. The return and principal value of an investment in a Portfolio will fluctuate so that shares, when redeemed, may be worth more or less than their original cost.
Carefully consider the Portfolios’ investment objectives, risk factors, charges, and expenses before investing. This and other information can be found in the Portfolios’ prospectus, and, if available, its summary prospectus, which may be obtained by visiting www.delawareinvestments.com or calling 800 231-8002. Investors should read the prospectus carefully before investing. |
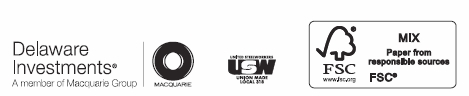 | 2005 Market Street |
| Philadelphia, Pennsylvania 19103 |
| Telephone 800 231-8002 |
| Fax 215 255-1162 |
| (8156) | | Printed in the USA |
| AR-DPT [10/11] DG3 12/11 | | MF1111019 PO17168 |

Annual report Delaware REIT Fund October 31, 2011 Alternative / specialty mutual fund |
Carefully consider the Fund’s investment objectives, risk factors, charges, and expenses before investing. This and other information can be found in the Fund’s prospectus and, if available, its summary prospectus, which may be obtained by visiting www.delawareinvestments.com or calling 800 523-1918. Investors should read the prospectus and, if available, the summary prospectus carefully before investing. |
You can obtain shareholder reports and prospectuses online instead of in the mail.
Visit www.delawareinvestments.com/edelivery. |
Experience Delaware Investments
Delaware Investments is committed to the pursuit of consistently superior asset management and unparalleled client service. We believe in our investment processes, which seek to deliver consistent results, and in convenient services that help add value for our clients.
If you are interested in learning more about creating an investment plan, contact your financial advisor.
You can learn more about Delaware Investments or obtain a prospectus for Delaware REIT Fund at www.delawareinvestments.com.
Manage your investments online
- 24-hour access to your account information
- Obtain share prices
- Check your account balance and recent transactions
- Request statements or literature
- Make purchases and redemptions
Delaware Management Holdings, Inc. and its subsidiaries (collectively known by the marketing name of Delaware Investments) are wholly owned subsidiaries of Macquarie Group Limited, a global provider of banking, financial, advisory, investment and funds management services.
Investments in Delaware REIT Fund are not and will not be deposits with or liabilities of Macquarie Bank Limited ABN 46 008 583 542 and its holding companies, including their subsidiaries or related companies (Macquarie Group), and are subject to investment risk, including possible delays in repayment and loss of income and capital invested. No Macquarie Group company guarantees or will guarantee the performance of the Fund, the repayment of capital from the Fund, or any particular rate of return.
| Table of contents | | |
| Portfolio management review | | 1 |
| Performance summary | | 4 |
| Disclosure of Fund expenses | | 8 |
| Security type/sector allocation and | | |
| top 10 equity holdings | | 10 |
| Statement of net assets | | 12 |
| Statement of operations | | 18 |
| Statements of changes in net assets | | 20 |
| Financial highlights | | 22 |
| Notes to financial statements | | 32 |
| Report of independent registered | | |
| public accounting firm | | 43 |
| Other Fund information | | 44 |
| Board of trustees/directors and | | |
| officers addendum | | 48 |
| About the organization | | 58 |
Unless otherwise noted, views expressed herein are current as of Oct. 31, 2011, and subject to change.
Funds are not FDIC insured and are not guaranteed. It is possible to lose the principal amount invested.
Mutual fund advisory services provided by Delaware Management Company, a series of Delaware Management Business Trust, which is a registered investment advisor. Delaware Investments, a member of Macquarie Group, refers to Delaware Management Holdings, Inc. and its subsidiaries, including the Fund’s distributor, Delaware Distributors, L.P. Macquarie Group refers to Macquarie Group Limited and its subsidiaries and affiliates worldwide.
© 2011 Delaware Management Holdings, Inc.
All third-party trademarks cited are the property of their respective owners.
Portfolio management review
| Delaware REIT Fund | November 8, 2011 |
| Performance preview (for the year ended October 31, 2011) |
| Delaware REIT Fund (Class A shares) | | 1-year return | | +12.01% |
| FTSE NAREIT Equity REITs Index (new benchmark) | | 1-year return | | +10.34% |
| FTSE NAREIT All Equity REITs Index (formerly known as the | | | | |
| FTSE NAREIT Equity REITs Index) (previous benchmark) | | 1-year return | | +10.16% |
Past performance does not guarantee future results.
For complete, annualized performance for Delaware REIT Fund, please see the table on page 4.
The performance of Class A shares excludes the applicable sales charge and reflects the reinvestment of all distributions.
Index performance returns do not reflect any management fees, transaction costs, or expenses. Indices are unmanaged and one cannot invest directly in an index.
The Fund’s fiscal year was a highly volatile period for U.S. real estate investment trusts (REITs). Early in the fiscal year, REIT prices climbed steadily, posting an upward trend that lasted until early July 2011 as investors seemed to embrace the prospect of a moderate economic recovery. As July wore on, however, conditions deteriorated quickly, with several factors weighing on REITs — from worsening fears about the European debt crisis to political battles in Washington D.C., which culminated in early August as the rating agency Standard & Poor’s downgraded the U.S. sovereign credit rating.
In late July and early August 2011, REIT prices dropped sharply, but they rebounded in subsequent weeks. Over the remaining months of the Fund’s fiscal year, big price moves occurred regularly, with the rally in late August followed by a steep drop in September and then another impressive recovery in October.
Despite the up-and-down nature of the market, REITs enjoyed solid gains overall during the Fund’s fiscal year, as a favorable supply-demand balance, coupled with readily available financing at attractive prices, provided supportive conditions for property companies. Because real estate companies typically depend on debt financing to build and operate their properties, their bottom line directly profits when financing is affordable. Similarly, when the supply of properties is limited compared with demand, property owners can raise rents, which in turn boosts their companies’ income.
For its fiscal year ended Oct. 31, 2011, Delaware REIT Fund (Class A shares) returned +12.01% at net asset value and +5.55% at maximum offer price (both figures reflect reinvestment of all distributions). In comparison, the Fund’s benchmark, the FTSE NAREIT Equity REITs Index, advanced by 10.34% during the same period. For the complete annualized performance of Delaware REIT Fund, please see the table on page 4.
During its fiscal year, the Fund enjoyed strong results relative to its benchmark, largely due to the favorable returns of the individual securities selected for the Fund’s portfolio.
For much of the Fund’s fiscal year, we tilted the portfolio toward high-quality mall, apartment, and self-storage companies, as we believed these businesses would be especially well positioned to take advantage of the lower interest rate environment (and,
1
Portfolio management review
Delaware REIT Fund
therefore, lower financing costs), as well as the pricing power and increased occupancies made possible by tight property supplies.
In the mall sector, for example, one of the Fund’s top-performing securities for the fiscal year was Simon Property Group, the largest position in both the Fund and the benchmark index. We believe Simon Property Group is an extremely high-quality company with a good management team and a healthy balance sheet, and its stock was supported by the limited supply of mall space and attractive financing costs.
The Fund was also helped by its overweight allocation to the apartment sector, as well as its security selection within this sector. The turmoil in the housing market has helped apartment companies in recent years, as more people are renting homes rather than owning them. In addition, the difficulty for many private builders to obtain commercial mortgages has resulted in much tighter supply for apartments than usual, which in turn has allowed for higher rents.
Another solid performer was Home Properties, which was not one of the apartment sector’s better performers in absolute terms, but we made a timely sale of the security late in the Fund’s fiscal year. Also within the sector, Fund performance was modestly hampered by an underweight position in AvalonBay Communities, a benchmark index constituent that fared relatively well. We de-emphasized this high-quality apartment company because we believed its shares were somewhat expensive and that better opportunities existed elsewhere.
We remain confident about the individual stocks in the Fund’s portfolio, but we are mindful of the broader macroeconomic risks facing investors today. These include:
- The excessive levels of debt in Europe (and to a lesser extent, in the United States)
- The functioning of the capital markets, whose health is closely tied to that of property companies
2
Public Storage, a leading self-storage company that enjoyed durable pricing power and affordable financing costs, was another notable outperformer for the Fund.
Given the Fund’s solid relative performance, few factors had a substantial negative effect on its performance. One disappointment in relative terms was the Fund’s modest cash position, which worked against returns in an up market (the index does not include a cash stake). Elsewhere, a handful of individual securities provided a modest degree of underperformance. The portfolio’s weakest individual holding during the fiscal year was Digital Realty Trust, an owner and operator of data-center space. Suburban office company Brandywine Realty Trust and lodging company Marriott International also hampered the Fund’s relative results. We sold Marriott during the fiscal year as we were concerned about an economic slowdown and believed Marriott would be affected by slower growth in revenue per available room. In addition, it became apparent that the company was losing market share.
As mentioned earlier, we favored high-quality mall, apartment, and self-storage REITs that we believed could benefit from a favorable supply-demand balance and low-cost financing. For the majority of the Fund’s fiscal year, we also opted to underweight lodging stocks because of concerns about the health of the economy, as lodging stocks can be economically sensitive. This approach worked well for the Fund, and late in the fiscal year, we selectively took advantage of opportunities to buy high-quality lodging stocks whose low prices we believed failed to reflect what we saw as their underlying value.
Toward the end of the Fund’s fiscal year, we began to position the Fund’s portfolio slightly more defensively in response to a significant rally by REIT stocks. Our approach was to trim the Fund’s allocation to stocks whose prices had risen beyond what we considered reasonable, while adding to the Fund’s holdings in stocks that we believed were fundamentally solid but still attractively valued.
We remain confident about the Fund’s individual holdings, but we are mindful of the broader macroeconomic risks facing investors today. We believe the excessive levels of debt in Europe (and to a lesser extent, in the U.S.) bear close scrutiny, and we will not hesitate to make changes as conditions evolve. In the meantime, we believe effective portfolio management is about successfully waging one small battle after another. We view it as our job to assess the market environment day by day and to position the Fund’s portfolio as effectively as possible to perform well as the landscape changes. In particular, we plan to continue to closely observe the functioning of the capital markets, whose health is closely tied to that of property companies, which require affordable and available investment capital in order to thrive.
3
Performance summary
| Delaware REIT Fund | October 31, 2011 |
The performance data quoted represent past performance; past performance does not guarantee future results. Investment return and principal value will fluctuate so your shares, when redeemed, may be worth more or less than their original cost. Please obtain the performance data current for the most recent month end by calling 800 523-1918 or visiting our website at www.delawareinvestments.com/performance. Current performance may be lower or higher than the performance data quoted.
| Fund performance1,2 | | Average annual total returns through October 31, 2011 |
| | 1 year | | 5 years | | 10 years | | Lifetime |
| Class A (Est. Dec. 6, 1995) | | | | | | | | |
| Excluding sales charge | | +12.01% | | -0.61% | | +9.98% | | n/a |
| Including sales charge | | +5.55% | | -1.78% | | +9.33% | | n/a |
| Class B (Est. Nov. 11, 1997) | | | | | | | | |
| Excluding sales charge | | +11.08% | | -1.36% | | +9.32% | | n/a |
| Including sales charge | | +7.08% | | -1.58% | | +9.32% | | n/a |
| Class C (Est. Nov. 11, 1997) | | | | | | | | |
| Excluding sales charge | | +11.08% | | -1.36% | | +9.15% | | n/a |
| Including sales charge | | +10.08% | | -1.36% | | +9.15% | | n/a |
| Class R (Est. June 2, 2003) | | | | | | | | |
| Excluding sales charge | | +11.73% | | -0.86% | | n/a | | +9.00% |
| Including sales charge | | +11.73% | | -0.86% | | n/a | | +9.00% |
| Institutional Class (Est. Nov. 11, 1997) | | | | | | | | |
| Excluding sales charge | | +12.27% | | -0.37% | | +10.25% | | n/a |
| Including sales charge | | +12.27% | | -0.37% | | +10.25% | | n/a |
1 Returns reflect the reinvestment of all distributions and are presented both with and without the applicable sales charges described below. Returns do not reflect the deduction of taxes the shareholder would pay on Fund distributions or redemptions of Fund shares.
Expense limitations were in effect for certain classes during some or all of the periods shown in the “Fund performance” chart. The current expenses for each class are listed on the “Fund expense ratios” table on page 5. Performance would have been lower had expense limitations not been in effect.
Class A shares are sold with a maximum front-end sales charge of up to 5.75%, and have an annual distribution and service fee of up to 0.30% of average daily net assets. This fee has been contractually limited to 0.25% of average daily net assets from Feb. 28, 2011, through Feb. 28, 2012.
Class B shares may be purchased only through dividend reinvestment and certain permitted exchanges as described in the prospectus. Please see the prospectus for additional information on Class B shares. Class B shares have a contingent deferred sales charge that declines from 4.00% to zero depending on the period of time the shares are held. They are also subject to an annual distribution and service fee of up to 1.00% of average daily net assets. Class B shares will automatically
4
convert to Class A shares on a quarterly basis approximately eight years after purchase. Ten-year and lifetime performance figures for Class B shares reflect conversion to Class A shares after approximately eight years.
Class C shares are sold with a contingent deferred sales charge of 1.00% if redeemed during the first 12 months. They are also subject to an annual distribution and service fee of up to 1.00% of average daily net assets.
Performance for Class B and C shares, excluding sales charges, assumes either that contingent deferred sales charges did not apply or that the investment was not redeemed.
Class R shares are available only for certain retirement plan products. They are sold without a sales charge and have an annual distribution and service fee of up to 0.60% of average daily net assets, which has been limited contractually to 0.50% from Feb. 28, 2011, through Feb. 28, 2012.
Institutional Class shares are available without sales or asset-based distribution charges only to certain eligible institutional accounts.
The “Fund performance” table and the “Performance of a $10,000 investment” graph do not reflect the deduction of taxes the shareholder would pay on Fund distributions or redemptions of Fund shares.
Narrowly focused investments may exhibit higher volatility than investments in multiple industry sectors.
REIT investments are subject to many of the risks associated with direct real estate ownership, including changes in economic conditions, credit risk, and interest rate fluctuations. A REIT fund’s tax status as a regulated investment company could be jeopardized if it holds real estate directly, as a result of defaults, or receives rental income from real estate holdings.
“Nondiversified” Funds may allocate more of their net assets to investments in single securities than “diversified” Funds. Resulting adverse effects may subject these Funds to greater risks and volatility.
2 The Fund’s expense ratios, as described in the most recent prospectus, are disclosed in the following “Fund expense ratios” table. Delaware Investments has agreed to reimburse certain expenses and/or waive certain fees in order to prevent total fund operating expenses (excluding certain fees and expenses) from exceeding 1.30% of the Fund’s average daily net assets from Feb. 28, 2011, through Feb. 28, 2012. Please see the most recent prospectus and any applicable supplement(s) for additional information on these fee waivers and/or reimbursements.
| Fund expense ratios | | Class A | | Class B | | Class C | | Class R | | Institutional Class |
| Total annual operating expenses | | 1.62% | | 2.32% | | 2.32% | | 1.92% | | 1.32% |
| (without fee waivers) | | | | | | | | | | |
| Net expenses | | 1.55% | | 2.30% | | 2.30% | | 1.80% | | 1.30% |
| (including fee waivers, if any) | | | | | | | | | | |
| Type of waiver | | Contractual | | Contractual | | Contractual | | Contractual | | Contractual |
5
Performance summary
Delaware REIT Fund
Performance of a $10,000 investment1
Average annual total returns from Oct. 31, 2001, through Oct. 31, 2011
| For period beginning Oct. 31, 2001, through Oct. 31, 2011 | Starting value | Ending value |
| | FTSE NAREIT Equity REITs Index | $10,000 | $28,355 |
| | FTSE NAREIT All Equity REITs Index | $10,000 | $28,310 |
| | Delaware REIT Fund — Class A Shares | $9,425 | $24,396 |
1The “Performance of a $10,000 investment” graph assumes $10,000 invested in Class A shares of the Fund on Oct. 31, 2001, and includes the effect of a 5.75% front-end sales charge and the reinvestment of all distributions. The graph does not reflect the deduction of taxes the shareholders would pay on Fund distributions or redemptions of Fund shares. Expense limitations were in effect for some or all of the periods shown. Performance would have been lower had expense limitations not been in effect. Current expenses are listed in the “Fund expense ratios” table on page 5. Please note additional details on pages 4 through 7.
The chart also assumes $10,000 invested in the FTSE NAREIT Equity REITs Index and the FTSE NAREIT All Equity REITs Index as of Oct. 31, 2001. The FTSE NAREIT Equity REITs Index measures the performance of all publicly traded equity real estate investment trusts (REITs) traded on U.S. exchanges, excluding timber REITs. The FTSE NAREIT All Equity REITs Index measures the performance of all publicly traded equity real estate investment trusts traded on U.S. exchanges. Effective December 20, 2010: (1) FTSE changed the composition of the FTSE NAREIT Equity REITs Index to exclude timber REITs; (2) FTSE created the FTSE NAREIT All Equity REITs Index with the components of the former FTSE NAREIT Equity REITs Index, including timber REITs; and (3) the Fund changed its benchmark index from the FTSE NAREIT All Equity REITs Index (former FTSE NAREIT Equity REITs Index) to the newly constituted FTSE NAREIT Equity REITs Index. The rationale for the change was that the Fund’s portfolio managers believe the new index is more appropriate for the Fund’s investment style.
6
Index performance returns do not reflect any management fees, transaction costs, or expenses. Indices are unmanaged and one cannot invest directly in an index.
Past performance is not a guarantee of future results.
Performance of other Fund classes will vary due to different charges and expenses.
| | Nasdaq symbols | | CUSIPs | |
| Class A | | DPREX | | 246248868 | |
| Class B | | DPRBX | | 246248819 | |
| Class C | | DPRCX | | 246248793 | |
| Class R | | DPRRX | | 246248561 | |
| Institutional Class | | DPRSX | | 246248777 | |
7
Disclosure of Fund expenses
For the six-month period from May 1, 2011 to October 31, 2011
As a shareholder of the Fund, you incur two types of costs: (1) transaction costs, including sales charges (loads) on purchase payments, reinvested dividends, or other distributions; redemption fees; and exchange fees; and (2) ongoing costs, including management fees; distribution and/or service (12b-1) fees; and other Fund expenses. This example is intended to help you understand your ongoing costs (in dollars) of investing in the Fund and to compare these costs with the ongoing costs of investing in other mutual funds.
The example is based on an investment of $1,000 invested at the beginning of the period and held for the entire six-month period from May 1, 2011 to October 31, 2011.
Actual expenses
The first section of the table shown, “Actual Fund return,” provides information about actual account values and actual expenses. You may use the information in this section of the table, together with the amount you invested, to estimate the expenses that you paid over the period. Simply divide your account value by $1,000 (for example, an $8,600 account value divided by $1,000 = 8.6), then multiply the result by the number in the first section under the heading entitled “Expenses Paid During Period” to estimate the expenses you paid on your account during this period.
Hypothetical example for comparison purposes
The second section of the table shown, “Hypothetical 5% return,” provides information about hypothetical account values and hypothetical expenses based on the Fund’s actual expense ratio and an assumed rate of return of 5% per year before expenses, which is not the Fund’s actual return. The hypothetical account values and expenses may not be used to estimate the actual ending account balance or expenses you paid for the period. You may use this information to compare the ongoing costs of investing in the Fund and other funds. To do so, compare this 5% hypothetical example with the 5% hypothetical examples that appear in the shareholder reports of the other funds.
Please note that the expenses shown in the table are meant to highlight your ongoing costs only and do not reflect any transactional costs, such as sales charges (loads), redemption fees, or exchange fees. Therefore, the second section of the table is useful in comparing ongoing costs only, and will not help you determine the relative total costs of owning different funds. In addition, if these transactional costs were included, your costs would have been higher. The Fund’s expenses shown in the table reflect fee waivers in effect. The expenses shown in the table assume reinvestment of all dividends and distributions.
8
Delaware REIT Fund
Expense analysis of an investment of $1,000
| | Beginning | | Ending | | | | Expenses |
| | Account Value | | Account Value | | Annualized | | Paid During Period |
| | 5/1/11 | | 10/31/11 | | Expense Ratio | | 5/1/11 to 10/31/11* |
| Actual Fund return | | | | | | | | | | | | | | | | | |
| Class A | | | $ | 1,000.00 | | | | $ | 971.00 | | | 1.47% | | | $ | 7.30 | |
| Class B | | | | 1,000.00 | | | | | 967.10 | | | 2.22% | | | | 11.01 | |
| Class C | | | | 1,000.00 | | | | | 967.10 | | | 2.22% | | | | 11.01 | |
| Class R | | | | 1,000.00 | | | | | 969.80 | | | 1.72% | | | | 8.54 | |
| Institutional Class | | | | 1,000.00 | | | | | 972.30 | | | 1.22% | | | | 6.06 | |
| Hypothetical 5% return (5% return before expenses) | | | | | | | | |
| Class A | | | $ | 1,000.00 | | | | $ | 1,017.80 | | | 1.47% | | | $ | 7.48 | |
| Class B | | | | 1,000.00 | | | | | 1,014.01 | | | 2.22% | | | | 11.27 | |
| Class C | | | | 1,000.00 | | | | | 1,014.01 | | | 2.22% | | | | 11.27 | |
| Class R | | | | 1,000.00 | | | | | 1,016.53 | | | 1.72% | | | | 8.74 | |
| Institutional Class | | | | 1,000.00 | | | | | 1,019.06 | | | 1.22% | | | | 6.21 | |
*“Expenses Paid During Period” are equal to the Fund’s annualized expense ratio, multiplied by the average account value over the period, multiplied by 184/365 (to reflect the one-half year period).
9
Security type/sector allocation and
top 10 equity holdings |
| Delaware REIT Fund | As of October 31, 2011 |
Sector designations may be different than the sector designations presented in other Fund materials. The sector designations may represent the investment manager’s internal sector classifications, which may result in the sector designations for one fund being different than another fund’s sector designations.
| Security type/sector | Percentage of net assets |
| Common Stock | 94.62 | % |
| Diversified REITs | 4.28 | % |
| Healthcare REITs | 11.23 | % |
| Hotel REITs | 5.24 | % |
| Industrial REITs | 5.59 | % |
| Mall REITs | 18.13 | % |
| Manufactured Housing REITs | 1.30 | % |
| Multifamily REITs | 17.46 | % |
| Office REITs | 11.73 | % |
| Office/Industrial REITs | 3.59 | % |
| Real Estate Operating Companies | 0.72 | % |
| Self-Storage REITs | 5.48 | % |
| Shopping Center REITs | 7.83 | % |
| Single Tenant REIT | 1.29 | % |
| Specialty REIT | 0.75 | % |
| Exchange-Traded Fund | 1.51 | % |
| Short-Term Investments | 3.00 | % |
| Securities Lending Collateral | 18.07 | % |
| Total Value of Securities | 117.20 | % |
| Obligation to Return Securities Lending Collateral | (18.36 | %) |
| Receivables and Other Assets Net of Other Liabilities | 1.16 | % |
| Total Net Assets | 100.00 | % |
10
Holdings are for informational purposes only and are subject to change at any time. They are not a recommendation to buy, sell, or hold any security.
| Top 10 equity holdings | Percentage of net assets |
| Simon Property Group | 11.61 | % |
| ProLogis | 5.01 | % |
| Equity Residential | 4.90 | % |
| Public Storage | 4.73 | % |
| Ventas | 4.30 | % |
| Host Hotels & Resorts | 4.29 | % |
| Boston Properties | 4.19 | % |
| HCP | 4.18 | % |
| AvalonBay Communities | 3.56 | % |
| Vornado Realty Trust | 3.40 | % |
11
Statement of net assets |
| Delaware REIT Fund | October 31, 2011 |
| | | Number of shares | | Value |
| Common Stock – 94.62% | | | | |
| Diversified REITs – 4.28% | | | | |
| Lexington Realty Trust | 141,780 | | $ | 1,114,391 |
| Vornado Realty Trust | 82,832 | | | 6,859,318 |
| * | Washington Real Estate Investment Trust | 23,080 | | | 668,397 |
| | | | | 8,642,106 |
| Healthcare REITs – 11.23% | | | | |
| Cogdell Spencer | 63,800 | | | 257,752 |
| * | HCP | 211,530 | | | 8,429,471 |
| * | Health Care REIT | 100,571 | | | 5,299,086 |
| * | Ventas | 155,877 | | | 8,668,319 |
| | | | | 22,654,628 |
| Hotel REITs – 5.24% | | | | |
| Host Hotels & Resorts | 605,928 | | | 8,646,592 |
| * | LaSalle Hotel Properties | 37,561 | | | 898,084 |
| † | Strategic Hotels & Resorts | 180,700 | | | 1,028,183 |
| | | | | 10,572,859 |
| Industrial REITs – 5.59% | | | | |
| * | DCT Industrial Trust | 233,525 | | | 1,158,284 |
| ProLogis | 339,906 | | | 10,115,603 |
| | | | | 11,273,887 |
| Mall REITs – 18.13% | | | | |
| CBL & Associates Properties | 81,200 | | | 1,248,856 |
| General Growth Properties | 207,811 | | | 3,054,822 |
| * | Macerich | 125,951 | | | 6,267,322 |
| * | Simon Property Group | 182,367 | | | 23,423,217 |
| Taubman Centers | 42,200 | | | 2,583,906 |
| | | | | 36,578,123 |
| Manufactured Housing REIT – 1.30% | | | | |
| * | Equity Lifestyle Properties | 39,618 | | | 2,619,938 |
| | | | | 2,619,938 |
| Multifamily REITs – 17.46% | | | | |
| Apartment Investment & Management | 30,500 | | | 752,435 |
| AvalonBay Communities | 53,751 | | | 7,185,971 |
| BRE Properties | 59,229 | | | 2,968,557 |
| Camden Property Trust | 38,186 | | | 2,315,599 |
| * | Colonial Properties Trust | 123,372 | | | 2,501,984 |
| Education Realty Trust | 162,000 | | | 1,498,500 |
12
| | | Number of shares | | Value |
| Common Stock (continued) | | | | |
| Multifamily REITs (continued) | | | | |
| Equity Residential | 168,323 | | $ | 9,877,194 |
| * | Essex Property Trust | 33,127 | | | 4,729,211 |
| UDR | 136,048 | | | 3,391,677 |
| | | | | 35,221,128 |
| Office REITs – 11.73% | | | | |
| * | Alexandria Real Estate Equities | 35,479 | | | 2,344,807 |
| * | Boston Properties | 85,474 | | | 8,461,072 |
| * | Brandywine Realty Trust | 115,115 | | | 1,048,698 |
| * | Douglas Emmett | 110,200 | | | 2,148,900 |
| * | Highwoods Properties | 57,600 | | | 1,784,448 |
| * | Kilroy Realty | 75,660 | | | 2,775,965 |
| SL Green Realty | 73,757 | | | 5,088,495 |
| | | | | 23,652,385 |
| Office/Industrial REITs – 3.59% | | | | |
| * | Digital Realty Trust | 44,323 | | | 2,762,652 |
| Duke Realty | 52,400 | | | 643,472 |
| * | Liberty Property Trust | 76,050 | | | 2,433,600 |
| PS Business Parks | 26,129 | | | 1,390,847 |
| | | | | 7,230,571 |
| Real Estate Operating Companies – 0.72% | | | | |
| Starwood Hotels & Resorts Worldwide | 29,100 | | | 1,458,201 |
| | | | | 1,458,201 |
| Self-Storage REITs – 5.48% | | | | |
| * | Extra Space Storage | 67,462 | | | 1,519,919 |
| Public Storage | 73,866 | | | 9,532,407 |
| | | | | 11,052,326 |
| Shopping Center REITs – 7.83% | | | | |
| * | Acadia Realty Trust | 54,040 | | | 1,119,709 |
| DDR | 309,775 | | | 3,968,218 |
| * | Federal Realty Investment Trust | 41,176 | | | 3,654,782 |
| * | Kimco Realty | 301,879 | | | 5,273,825 |
| * | Regency Centers | 43,431 | | | 1,778,934 |
| | | | | 15,795,468 |
| Single Tenant REIT – 1.29% | | | | |
| * | National Retail Properties | 95,775 | | | 2,609,869 |
| | | | | 2,609,869 |
13
Statement of net assets
Delaware REIT Fund
| | | Number of shares | | | Value |
| Common Stock (continued) | | | | | |
| Specialty REIT – 0.75% | | | | | |
| Rayonier | | 36,257 | | $ | 1,513,005 |
| | | | | | 1,513,005 |
| Total Common Stock (cost $172,090,855) | | | | | 190,874,494 |
| |
| Exchange-Traded Fund – 1.51% | | | | | |
| * | iShares Dow Jones U.S. Real Estate Index Fund | | 53,300 | | | 3,050,892 |
| Total Exchange-Traded Fund (cost $2,845,681) | | | | | 3,050,892 |
| |
| | Principal amount | | | |
| Short-Term Investments – 3.00% | | | | | |
| ≠Discount Notes – 1.28% | | | | | |
| Federal Home Loan Bank | | | | | |
| 0.003% 11/30/11 | $ | 2,128,520 | | | 2,128,503 |
| 0.01% 12/23/11 | | 308,324 | | | 308,320 |
| 0.04% 11/2/11 | | 30,955 | | | 30,955 |
| | Freddie Mac 0.05% 11/2/11 | | 102,551 | | | 102,551 |
| | | | | | 2,570,329 |
| Repurchase Agreement – 1.72% | | | | | |
| BNP Paribas 0.08%, dated 10/31/11, to | | | | | |
| be repurchased on 11/1/11, repurchase price | | | | | |
| $3,477,008 (collateralized by U.S. government | | | | | |
| obligations 0.25%-4.625% 2/29/12–2/15/21, | | | | | |
| market value $3,546,540) | | 3,477,000 | | | 3,477,000 |
| | | | | | 3,477,000 |
| Total Short-Term Investments (cost $6,047,341) | | | | | 6,047,329 |
| |
| Total Value of Securities Before Securities | | | | | |
| Lending Collateral – 99.13% | | | | | |
| (cost $180,983,877) | | | | | 199,972,715 |
14
| | | Number of shares | | | Value | |
| Securities Lending Collateral** – 18.07% | | | | | |
| Investment Companies | | | | | |
| BNY Mellon SL DBT II Liquidating Fund | 166,925 | | $ | 161,700 | |
| Delaware Investments Collateral Fund No.1 | 36,282,239 | | | 36,282,239 | |
| @†Mellon GSL Reinvestment Trust II | 580,111 | | | 0 | |
| Total Securities Lending Collateral | | | | | |
| (cost $37,029,275) | | | | 36,443,939 | |
| |
| Total Value of Securities – 117.20% | | | | | |
| (cost $218,013,152) | | | | 236,416,654 | © |
| Obligation to Return Securities | | | | | |
| Lending Collateral** – (18.36%) | | | | (37,029,275 | ) |
| Receivables and Other Assets | | | | | |
| Net of Other Liabilities – 1.16% | | | | 2,340,123 | |
| Net Assets Applicable to 17,486,401 | | | | | |
| Shares Outstanding – 100.00% | | | $ | 201,727,502 | |
| |
| Net Asset Value – Delaware REIT Fund | | | | | |
| | Class A ($75,148,641 / 6,519,967 Shares) | | | | | $11.53 | |
| Net Asset Value – Delaware REIT Fund | | | | | |
| Class B ($3,862,844 / 335,619 Shares) | | | | | $11.51 | |
| Net Asset Value – Delaware REIT Fund | | | | | |
| Class C ($18,344,906 / 1,593,327 Shares) | | | | | $11.51 | |
| Net Asset Value – Delaware REIT Fund | | | | | |
| Class R ($6,368,464 / 552,544 Shares) | | | | | $11.53 | |
| Net Asset Value – Delaware REIT Fund | | | | | |
| Institutional Class ($98,002,647 / 8,484,944 Shares) | | | | | $11.55 | |
| |
| Components of Net Assets at October 31, 2011: | | | | | |
| Shares of beneficial interest (unlimited authorization – no par) | | $ | 224,409,689 | |
| Accumulated net realized loss on investments | | | | (41,085,689 | ) |
| Net unrealized appreciation of investments | | | | 18,403,502 | |
| Total net assets | | | $ | 201,727,502 | |
15
Statement of net assets
Delaware REIT Fund
| | |
| * | Fully or partially on loan. |
| † | Non income producing security. |
| ≠ | The rate shown is the effective yield at the time of purchase. |
| ** | See Note 8 in “Notes to financial statements” for additional information on securities lending collateral. |
| @ | Illiquid security. At October 31, 2011, the aggregate amount of illiquid securities was $0, which represented 0.00% of the Fund’s net assets. See Note 9 in “Notes to financial statements.” |
| © | Includes $35,976,842 of securities loaned. |
| Net Asset Value and Offering Price Per Share – | | |
| Delaware REIT Fund | | |
| Net asset value Class A (A) | | $11.53 |
| Sales charge (5.75% of offering price) (B) | | 0.70 |
| Offering price | | $12.23 |
| (A) | Net asset value per share, as illustrated, is the amount which would be paid upon redemption or repurchase of shares. |
| (B) | See the current prospectus for purchases of $50,000 or more. |
REIT — Real Estate Investment Trust
See accompanying notes, which are an integral part of the financial statements.
16
| Statement of operations | |
| Delaware REIT Fund | Year Ended October 31, 2011 |
| Investment Income: | | | | | | | |
| Dividends | $ | 4,964,487 | | | | | |
| Securities lending income | | 72,066 | | | | | |
| Interest | | 1,980 | | | | | |
| Foreign tax withheld | | (3,354 | ) | | $ | 5,035,179 | |
| |
| Expenses: | | | | | | | |
| Management fees | | 1,575,076 | | | | | |
| Dividend disbursing and transfer agent fees and expenses | | 743,183 | | | | | |
| Distribution expenses – Class A | | 231,763 | | | | | |
| Distribution expenses – Class B | | 54,938 | | | | | |
| Distribution expenses – Class C | | 190,216 | | | | | |
| Distribution expenses – Class R | | 36,616 | | | | | |
| Reports and statements to shareholders | | 96,905 | | | | | |
| Registration fees | | 88,863 | | | | | |
| Accounting and administration expenses | | 82,579 | | | | | |
| Audit and tax | | 22,903 | | | | | |
| Legal fees | | 12,831 | | | | | |
| Dues and services | | 11,749 | | | | | |
| Trustees’ fees | | 11,185 | | | | | |
| Custodian fees | | 5,922 | | | | | |
| Insurance fees | | 4,811 | | | | | |
| Pricing fees | | 2,823 | | | | | |
| Consulting fees | | 2,190 | | | | | |
| Trustees’ expenses | | 781 | | | | 3,175,334 | |
| Less fees waived | | | | | | (18,141 | ) |
| Less waived distribution expenses – Class A | | | | | | (38,645 | ) |
| Less waived distribution expenses – Class R | | | | | | (6,103 | ) |
| Less expense paid indirectly | | | | | | (196 | ) |
| Total operating expenses | | | | | | 3,112,249 | |
| Net Investment Income | | | | | | 1,922,930 | |
18
| Net Realized and Unrealized Gain (Loss) on Investments: | | | |
| Net realized gain on investments | $ | 29,456,388 | |
| Net change in unrealized appreciation/depreciation of investments | | (7,594,181 | ) |
| Net Realized and Unrealized Gain on Investments | | 21,862,207 | |
| |
| Net Increase in Net Assets Resulting from Operations | $ | 23,785,137 | |
See accompanying notes, which are an integral part of the financial statements.
19
Statements of changes in net assets
Delaware REIT Fund
| Year Ended |
| 10/31/11 | | 10/31/10 |
| Increase (Decrease) in Net Assets from Operations: | | | | | | | |
| Net investment income | $ | 1,922,930 | | | $ | 3,276,581 | |
| Net realized gain on investments | | 29,456,388 | | | | 65,363,700 | |
| Net change in unrealized | | | | | | | |
| appreciation/depreciation of investments | | (7,594,181 | ) | | | 4,915,772 | |
| Net increase in net assets resulting from operations | | 23,785,137 | | | | 73,556,053 | |
| |
| Dividends and Distributions to Shareholders from: | | | | | | | |
| Net investment income: | | | | | | | |
| Class A | | (1,196,436 | ) | | | (1,509,601 | ) |
| Class B | | (39,797 | ) | | | (122,646 | ) |
| Class C | | (155,030 | ) | | | (231,161 | ) |
| Class R | | (80,792 | ) | | | (82,422 | ) |
| Institutional Class | | (1,838,764 | ) | | | (2,458,561 | ) |
| | | (3,310,819 | ) | | | (4,404,391 | ) |
| |
| Capital Share Transactions: | | | | | | | |
| Proceeds from shares sold: | | | | | | | |
| Class A | | 14,141,867 | | | | 16,852,164 | |
| Class B | | 27,380 | | | | 87,749 | |
| Class C | | 2,174,858 | | | | 1,313,361 | |
| Class R | | 2,194,345 | | | | 2,390,840 | |
| Institutional Class | | 26,944,199 | | | | 52,397,545 | |
| |
| Net asset value of shares issued upon reinvestment | | | | | | | |
| of dividends and distributions: | | | | | | | |
| Class A | | 1,089,522 | | | | 1,374,874 | |
| Class B | | 36,674 | | | | 110,571 | |
| Class C | | 144,152 | | | | 210,675 | |
| Class R | | 80,705 | | | | 82,258 | |
| Institutional Class | | 1,790,713 | | | | 2,375,634 | |
| | 48,624,415 | | | | 77,195,671 | |
20
| Year Ended |
| 10/31/11 | | 10/31/10 |
| Capital Share Transactions (continued): | | | | | | | |
| Cost of shares repurchased: | | | | | | | |
| Class A | $ | (30,207,746 | ) | | $ | (22,632,013 | ) |
| Class B | | (4,132,128 | ) | | | (7,213,848 | ) |
| Class C | | (4,520,039 | ) | | | (4,723,235 | ) |
| Class R | | (2,170,126 | ) | | | (1,757,314 | ) |
| Institutional Class | | (37,016,402 | ) | | | (93,812,092 | ) |
| | | (78,046,441 | ) | | | (130,138,502 | ) |
| Decrease in net assets derived from capital | | | | | | | |
| share transactions | | (29,422,026 | ) | | | (52,942,831 | ) |
| Net Increase (decrease) in Net Assets | | (8,947,708 | ) | | | 16,208,831 | |
| |
| Net Assets: | | | | | | | |
| Beginning of year | | 210,675,210 | | | | 194,466,379 | |
| End of year (there was no undistributed income at either | | | | | | | |
| year end) | $ | 201,727,502 | | | $ | 210,675,210 | |
See accompanying notes, which are an integral part of the financial statements.
21
Financial highlights
Delaware REIT Fund Class A
Selected data for each share of the Fund outstanding throughout each period were as follows:
| Net asset value, beginning of period |
| |
| Income (loss) from investment operations: |
| Net investment income1 |
| Net realized and unrealized gain (loss) on investments |
| Total from investment operations |
| |
| Less dividends and distributions from: |
| Net investment income |
| Net realized gain on investments |
| Return of capital |
| Total dividends and distributions |
| |
| Net asset value, end of period |
| |
| Total return2 |
| |
| Ratios and supplemental data: |
| Net assets, end of period (000 omitted) |
| Ratio of expenses to average net assets |
| Ratio of expenses to average net assets |
| prior to fees waived and expense paid indirectly |
| Ratio of net investment income to average net assets |
| Ratio of net investment income to average net assets |
| prior to fees waived and expense paid indirectly |
| Portfolio turnover |
1 The average shares outstanding method has been applied for per share information. |
2 Total investment return is based on the change in net asset value of a share during the period and assumes reinvestment of dividends and distributions at net asset value and does not reflect the impact of a sales charge. Total investment return during all of the periods shown reflects waivers by the manager and/or distributor. Performance would have been lower had the waivers not been in effect. |
See accompanying notes, which are an integral part of the financial statements.
22
| | Year Ended |
| | 10/31/11 | | | 10/31/10 | | | 10/31/09 | | | 10/31/08 | | | 10/31/07 | |
| | $10.460 | | | $ 7.630 | | | $ 8.200 | | | $17.690 | | | $24.180 | |
| | | |
| | | |
| | 0.098 | | | 0.131 | | | 0.221 | | | 0.225 | | | 0.149 | |
| | 1.145 | | | 2.886 | | | (0.509 | ) | | (5.793 | ) | | 0.372 | |
| | 1.243 | | | 3.017 | | | (0.288 | ) | | (5.568 | ) | | 0.521 | |
| | | |
| | | |
| | (0.173 | ) | | (0.187 | ) | | (0.224 | ) | | (0.339 | ) | | (0.380 | ) |
| | — | | | — | | | — | | | (3.583 | ) | | (6.631 | ) |
| | — | | | — | | | (0.058 | ) | | — | | | — | |
| | (0.173 | ) | | (0.187 | ) | | (0.282 | ) | | (3.922 | ) | | (7.011 | ) |
| | | |
| | $11.530 | | | $10.460 | | | $ 7.630 | | | $ 8.200 | | | $17.690 | |
| | | |
| | 12.01% | | | 39.84% | | | (2.97% | ) | | (37.85% | ) | | 2.33% | |
| | | |
| | | |
| | $75,149 | | | $82,646 | | | $64,237 | | | $73,445 | | | $153,051 | |
| | 1.51% | | | 1.53% | | | 1.48% | | | 1.48% | | | 1.36% | |
| | | |
| | 1.57% | | | 1.62% | | | 1.88% | | | 1.59% | | | 1.41% | |
| | 0.89% | | | 1.42% | | | 3.38% | | | 1.82% | | | 0.79% | |
| | | |
| | 0.83% | | | 1.33% | | | 2.98% | | | 1.71% | | | 0.74% | |
| | 129% | | | 175% | | | 174% | | | 115% | | | 82% | |
23
Financial highlights
Delaware REIT Fund Class B
Selected data for each share of the Fund outstanding throughout each period were as follows:
| Net asset value, beginning of period |
| |
| Income (loss) from investment operations: |
| Net investment income1 |
| Net realized and unrealized gain (loss) on investments |
| Total from investment operations |
| |
| Less dividends and distributions from: |
| Net investment income |
| Net realized gain on investments |
| Return of capital |
| Total dividends and distributions |
| |
| Net asset value, end of period |
| |
| Total return2 |
| |
| Ratios and supplemental data: |
| Net assets, end of period (000 omitted) |
| Ratio of expenses to average net assets |
| Ratio of expenses to average net assets |
| prior to fees waived and expense paid indirectly |
| Ratio of net investment income to average net assets |
| Ratio of net investment income to average net assets |
| prior to fees waived and expense paid indirectly |
| Portfolio turnover |
1 The average shares outstanding method has been applied for per share information. |
2 Total investment return is based on the change in net asset value of a share during the period and assumes reinvestment of dividends and distributions at net asset value and does not reflect the impact of a sales charge. Total investment return during some of the periods shown reflects a waiver by the manager. Performance would have been lower had the waiver not been in effect. |
See accompanying notes, which are an integral part of the financial statements.
24
| Year Ended |
| | 10/31/11 | | | 10/31/10 | | | 10/31/09 | | | 10/31/08 | | | 10/31/07 | |
| | $10.450 | | | $ 7.620 | | | $ 8.190 | | | $17.680 | | | $24.150 | |
| | | |
| | | |
| | 0.015 | | | 0.061 | | | 0.173 | | | 0.138 | | | 0.006 | |
| | 1.136 | | | 2.888 | | | (0.511 | ) | | (5.793 | ) | | 0.373 | |
| | 1.151 | | | 2.949 | | | (0.338 | ) | | (5.655 | ) | | 0.379 | |
| | | |
| | | |
| | (0.091 | ) | | (0.119 | ) | | (0.174 | ) | | (0.252 | ) | | (0.218 | ) |
| | — | | | — | | | — | | | (3.583 | ) | | (6.631 | ) |
| | — | | | — | | | (0.058 | ) | | — | | | — | |
| | (0.091 | ) | | (0.119 | ) | | (0.232 | ) | | (3.835 | ) | | (6.849 | ) |
| | | |
| | $11.510 | | | $10.450 | | | $ 7.620 | | | $ 8.190 | | | $17.680 | |
| | | |
| | 11.08% | | | 38.88% | | | (3.73% | ) | | (38.28% | ) | | 1.52% | |
| | | |
| | | |
| | $3,863 | | | $7,393 | | | $10,985 | | | $17,831 | | | $48,300 | |
| | 2.26% | | | 2.28% | | | 2.23% | | | 2.23% | | | 2.11% | |
| | | |
| | 2.27% | | | 2.32% | | | 2.58% | | | 2.29% | | | 2.11% | |
| | 0.14% | | | 0.67% | | | 2.63% | | | 1.07% | | | 0.04% | |
| | | |
| | 0.13% | | | 0.63% | | | 2.28% | | | 1.01% | | | 0.04% | |
| | 129% | | | 175% | | | 174% | | | 115% | | | 82% | |
25
Financial highlights
Delaware REIT Fund Class C
Selected data for each share of the Fund outstanding throughout each period were as follows:
| Net asset value, beginning of period |
| |
| Income (loss) from investment operations: |
| Net investment income1 |
| Net realized and unrealized gain (loss) on investments |
| Total from investment operations |
| |
| Less dividends and distributions from: |
| Net investment income |
| Net realized gain on investments |
| Return of capital |
| Total dividends and distributions |
| |
| Net asset value, end of period |
| |
| Total return2 |
| |
| Ratios and supplemental data: |
| Net assets, end of period (000 omitted) |
| Ratio of expenses to average net assets |
| Ratio of expenses to average net assets |
| prior to fees waived and expense paid indirectly |
| Ratio of net investment income to average net assets |
| Ratio of net investment income to average net assets |
| prior to fees waived and expense paid indirectly |
| Portfolio turnover |
1 The average shares outstanding method has been applied for per share information. |
2 Total investment return is based on the change in net asset value of a share during the period and assumes reinvestment of dividends and distributions at net asset value and does not reflect the impact of a sales charge. Total investment return during some of the periods shown reflects a waiver by the manager. Performance would have been lower had the waiver not been in effect. |
See accompanying notes, which are an integral part of the financial statements.
26
| Year Ended |
| | 10/31/11 | | | 10/31/10 | | | 10/31/09 | | | 10/31/08 | | | 10/31/07 | |
| | $10.450 | | | $ 7.620 | | | $ 8.190 | | | $17.680 | | | $24.150 | |
| | | |
| | | |
| | 0.015 | | | 0.062 | | | 0.173 | | | 0.136 | | | 0.006 | |
| | 1.136 | | | 2.887 | | | (0.511 | ) | | (5.791 | ) | | 0.373 | |
| | 1.151 | | | 2.949 | | | (0.338 | ) | | (5.655 | ) | | 0.379 | |
| | | |
| | | |
| | (0.091 | ) | | (0.119 | ) | | (0.174 | ) | | (0.252 | ) | | (0.218 | ) |
| | — | | | — | | | — | | | (3.583 | ) | | (6.631 | ) |
| | — | | | — | | | (0.058 | ) | | — | | | — | |
| | (0.091 | ) | | (0.119 | ) | | (0.232 | ) | | (3.835 | ) | | (6.849 | ) |
| | | |
| | $11.510 | | | $10.450 | | | $ 7.620 | | | $ 8.190 | | | $17.680 | |
| | | |
| | 11.08% | | | 38.88% | | | (3.73% | ) | | (38.33% | ) | | 1.58% | |
| | | |
| | | |
| | $18,345 | | | $18,713 | | | $16,314 | | | $22,695 | | | $50,819 | |
| | 2.26% | | | 2.28% | | | 2.23% | | | 2.23% | | | 2.11% | |
| | | |
| | 2.27% | | | 2.32% | | | 2.58% | | | 2.29% | | | 2.11% | |
| | 0.14% | | | 0.67% | | | 2.63% | | | 1.07% | | | 0.04% | |
| | | |
| | 0.13% | | | 0.63% | | | 2.28% | | | 1.01% | | | 0.04% | |
| | 129% | | | 175% | | | 174% | | | 115% | | | 82% | |
27
Financial highlights
Delaware REIT Fund Class R
Selected data for each share of the Fund outstanding throughout each period were as follows:
| Net asset value, beginning of period |
| |
| Income (loss) from investment operations: |
| Net investment income1 |
| Net realized and unrealized gain (loss) on investments |
| Total from investment operations |
| |
| Less dividends and distributions from: |
| Net investment income |
| Net realized gain on investments |
| Return of capital |
| Total dividends and distributions |
| |
| Net asset value, end of period |
| |
| Total return2 |
| |
| Ratios and supplemental data: |
| Net assets, end of period (000 omitted) |
| Ratio of expenses to average net assets |
| Ratio of expenses to average net assets |
| prior to fees waived and expense paid indirectly |
| Ratio of net investment income to average net assets |
| Ratio of net investment income to average net assets |
| prior to fees waived and expense paid indirectly |
| Portfolio turnover |
1 The average shares outstanding method has been applied for per share information. |
2 Total investment return is based on the change in net asset value of a share during the period and assumes reinvestment of dividends and distributions at net asset value. Total investment return during all of the periods shown reflects waivers by the manager and/or distributor. Performance would have been lower had the waivers not been in effect. |
See accompanying notes, which are an integral part of the financial statements.
28
| Year Ended |
| | 10/31/11 | | | 10/31/10 | | | 10/31/09 | | | 10/31/08 | | | 10/31/07 | |
| | $10.460 | | | $ 7.630 | | | $ 8.200 | | | $17.690 | | | $24.180 | |
| | | |
| | | |
| | 0.071 | | | 0.109 | | | 0.205 | | | 0.191 | | | 0.102 | |
| | 1.145 | | | 2.885 | | | (0.509 | ) | | (5.789 | ) | | 0.363 | |
| | 1.216 | | | 2.994 | | | (0.304 | ) | | (5.598 | ) | | 0.465 | |
| | | |
| | | |
| | (0.146 | ) | | (0.164 | ) | | (0.208 | ) | | (0.309 | ) | | (0.324 | ) |
| | — | | | — | | | — | | | (3.583 | ) | | (6.631 | ) |
| | — | | | — | | | (0.058 | ) | | — | | | — | |
| | (0.146 | ) | | (0.164 | ) | | (0.266 | ) | | (3.892 | ) | | (6.955 | ) |
| | | |
| | $11.530 | | | $10.460 | | | $ 7.630 | | | $ 8.200 | | | $17.690 | |
| | | |
| | 11.73% | | | 39.50% | | | (3.21% | ) | | (38.00% | ) | | 2.03% | |
| | | |
| | | |
| | $6,368 | | | $5,680 | | | $3,596 | | | $3,395 | | | $5,734 | |
| | 1.76% | | | 1.78% | | | 1.73% | | | 1.73% | | | 1.61% | |
| | | |
| | 1.87% | | | 1.92% | | | 2.18% | | | 1.89% | | | 1.71% | |
| | 0.64% | | | 1.17% | | | 3.13% | | | 1.57% | | | 0.54% | |
| | | |
| | 0.53% | | | 1.03% | | | 2.68% | | | 1.41% | | | 0.44% | |
| | 129% | | | 175% | | | 174% | | | 115% | | | 82% | |
29
Financial highlights
Delaware REIT Fund Institutional Class
Selected data for each share of the Fund outstanding throughout each period were as follows:
| Net asset value, beginning of period |
| |
| Income (loss) from investment operations: |
| Net investment income1 |
| Net realized and unrealized gain (loss) on investments |
| Total from investment operations |
| |
| Less dividends and distributions from: |
| Net investment income |
| Net realized gain on investments |
| Return of capital |
| Total dividends and distributions |
| |
| Net asset value, end of period |
| |
| Total return2 |
| |
| Ratios and supplemental data: |
| Net assets, end of period (000 omitted) |
| Ratio of expenses to average net assets |
| Ratio of expenses to average net assets |
| prior to fees waived and expense paid indirectly |
| Ratio of net investment income to average net assets |
| Ratio of net investment income to average net assets |
| prior to fees waived and expense paid indirectly |
| Portfolio turnover |
1 The average shares outstanding method has been applied for per share information. |
2 Total investment return is based on the change in net asset value of a share during the period and assumes reinvestment of dividends and distributions at net asset value. Total investment return during some of the periods shown reflects a waiver by the manager. Performance would have been lower had the waiver not been in effect. |
See accompanying notes, which are an integral part of the financial statements.
30
| Year Ended |
| | 10/31/11 | | | 10/31/10 | | | 10/31/09 | | | 10/31/08 | | | 10/31/07 | |
| | $10.480 | | | $ 7.640 | | | $ 8.220 | | | $17.710 | | | $24.210 | |
| | | |
| | | |
| | 0.127 | | | 0.155 | | | 0.238 | | | 0.247 | | | 0.196 | |
| | 1.144 | | | 2.893 | | | (0.520 | ) | | (5.784 | ) | | 0.366 | |
| | 1.271 | | | 3.048 | | | (0.282 | ) | | (5.537 | ) | | 0.562 | |
| | | |
| | | |
| | (0.201 | ) | | (0.208 | ) | | (0.240 | ) | | (0.370 | ) | | (0.431 | ) |
| | — | | | — | | | — | | | (3.583 | ) | | (6.631 | ) |
| | — | | | — | | | (0.058 | ) | | — | | | — | |
| | (0.201 | ) | | (0.208 | ) | | (0.298 | ) | | (3.953 | ) | | (7.062 | ) |
| | | |
| | $11.550 | | | $10.480 | | | $ 7.640 | | | $ 8.220 | | | $17.710 | |
| | | |
| | 12.27% | | | 40.23% | | | (2.72% | ) | | (37.66% | ) | | 2.56% | |
| | | |
| | | |
| | $98,003 | | | $96,243 | | | $99,334 | | | $87,430 | | | $106,145 | |
| | 1.26% | | | 1.28% | | | 1.23% | | | 1.23% | | | 1.11% | |
| | | |
| | 1.27% | | | 1.32% | | | 1.58% | | | 1.29% | | | 1.11% | |
| | 1.14% | | | 1.67% | | | 3.63% | | | 2.07% | | | 1.04% | |
| | | |
| | 1.13% | | | 1.63% | | | 3.28% | | | 2.01% | | | 1.04% | |
| | 129% | | | 175% | | | 174% | | | 115% | | | 82% | |
31
| Notes to financial statements | |
| Delaware REIT Fund | | October 31, 2011 |
The Real Estate Investment Trust Portfolio (Delaware REIT Fund or Fund) is a series of Delaware Pooled® Trust (Trust), which is organized as a Delaware statutory trust. The Trust is an open-end investment company. The Fund is considered non-diversified under the Investment Company Act of 1940, as amended, and offers Class A, Class B, Class C, Class R and Institutional Class shares. Class A shares are sold with a maximum front-end sales charge of up to 5.75%. Class A share purchases of $1,000,000 or more will incur a contingent deferred sales charge (CDSC) of 1% if redeemed during the first year and 0.50% during the second year, provided that Delaware Distributors, L.P. (DDLP) paid a financial advisor a commission on the purchase of those shares. Class B shares may be purchased only through dividend reinvestment and certain permitted exchanges. Prior to June 1, 2007, Class B shares were sold with a CDSC that declined from 4% to zero depending upon the period of time the shares were held. Class B shares will automatically convert to Class A shares on a quarterly basis approximately eight years after purchase. Class C shares are sold with a CDSC of 1%, if redeemed during the first twelve months. Class R and Institutional Class shares are not subject to a sales charge and are offered for sale exclusively to certain eligible investors. This report contains information relating only to the Delaware REIT Fund. All other Delaware Pooled Trust portfolios are included in a separate report.
The investment objectives of the Fund are to seek maximum long-term total return, with capital appreciation as a secondary objective. It seeks to achieve its objectives by investing primarily in securities of companies principally engaged in the real estate industry.
1. Significant Accounting Policies
The following accounting policies are in accordance with U.S. generally accepted accounting principles (U.S. GAAP) and are consistently followed by the Fund.
Security Valuation — Equity securities, except those traded on the Nasdaq Stock Market, Inc. (Nasdaq), are valued at the last quoted sales price as of the time of the regular close of the New York Stock Exchange (NYSE) on the valuation date. Securities traded on the Nasdaq are valued in accordance with the Nasdaq Official Closing Price, which may not be the last sales price. If on a particular day an equity security does not trade, then the mean between the bid and ask prices will be used, which approximates fair value. Short-term debt securities are valued at market value. U.S. government and agency securities are valued at the mean between the bid and ask prices, which approximates fair value. Open-end investment companies are valued at their published net asset value. Investment company securities are valued at net asset value per share. Generally, other securities and assets for which market quotations are not readily available are valued at fair value as determined in good faith under the direction of the Fund’s Board of Trustees (Board). In determining whether market quotations are readily available or fair valuation will be used, various factors will be taken into consideration, such as market closures or suspension of trading in a security. The Fund may use fair value pricing more frequently for securities traded primarily in non-U.S. markets because, among other things, most foreign markets close well before the Fund values its securities, generally as of 4:00 p.m. Eastern time. The earlier close of these
32
foreign markets gives rise to the possibility that significant events, including broad market moves, government actions or pronouncements, aftermarket trading, or news events may have occurred in the interim. To account for this, the Fund may frequently value foreign securities using fair value prices based on third-party vendor modeling tools (international fair value pricing).
Federal Income Taxes — No provision for federal income taxes has been made as the Fund intends to continue to qualify for federal income tax purposes as a regulated investment company under Subchapter M of the Internal Revenue Code of 1986, as amended, and make the requisite distributions to shareholders. The Fund evaluates tax positions taken or expected to be taken in the course of preparing the Fund’s tax returns to determine whether the tax positions are “more-likely-than-not” of being sustained by the applicable tax authority. Tax positions not deemed to meet the more-likely-than-not threshold are recorded as a tax benefit or expense in the current year. Management has analyzed the Fund’s tax positions taken on federal income tax returns for all open tax years (October 31, 2008–October 31, 2011), and has concluded that no provision for federal income tax is required in the Fund’s financial statements.
Class Accounting — Investment income, common expenses and realized and unrealized gain (loss) on investments are allocated to the various classes of the Fund on the basis of daily net assets of each class. Distribution expenses relating to a specific class are charged directly to that class.
Repurchase Agreements — The Fund may purchase certain U.S. government securities subject to the counterparty’s agreement to repurchase them at an agreed upon date and price. The counterparty will be required on a daily basis to maintain the value of the collateral subject to the agreement at not less than the repurchase price (including accrued interest). The agreements are conditioned upon the collateral being deposited under the Federal Reserve book-entry system with the Fund’s custodian or a third party sub-custodian. In the event of default or bankruptcy by the other party to the agreement, retention of the collateral may be subject to legal proceedings. All open repurchase agreements were entered into on October 31, 2011.
Use of Estimates — The preparation of financial statements in conformity with U.S. GAAP requires management to make estimates and assumptions that affect the fair value of investments, reported amounts of assets and liabilities and disclosure of contingent assets and liabilities at the date of the financial statements and the reported amounts of revenues and expenses during the reporting period. Actual results could differ from those estimates and the differences could be material.
Other — Expenses directly attributable to the Fund are charged directly to the Fund. Other expenses common to various funds within the Delaware Investments® Family of Funds are generally allocated amongst such funds on the basis of average net assets. Management fees and some other expenses are paid monthly. Security transactions are recorded on the
33
Notes to financial statements
Delaware REIT Fund
1. Significant Accounting Policies (continued)
date the securities are purchased or sold (trade date) for financial reporting purposes. Costs used in calculating realized gains and losses on the sale of investment securities are those of the specific securities sold. Dividend income is recorded on the ex-dividend date and interest income is recorded on the accrual basis. Distributions received from investments in Real Estate Investment Trusts (REITs) are recorded as dividend income on the ex-dividend date, subject to reclassification upon notice of the character of such distributions by the issuer. The Fund declares and pays dividends from net investment income quarterly and distributions from net realized gain on investments, if any, annually. The Fund may distribute income dividends and capital gains more frequently, if necessary for tax purposes. Dividends and distributions, if any, are recorded on the ex-dividend date.
Subject to seeking best execution, the Fund may direct certain security trades to brokers who have agreed to rebate a portion of the related brokerage commission to the Fund in cash. In general, best execution refers to many factors, including the price paid or received for a security, the commission charged, the promptness and reliability of execution, the confidentiality and placement accorded the order, and other factors affecting the overall benefit obtained by the Fund on the transaction. There were no commission rebates for the year ended October 31, 2011.
The Fund may receive earnings credits from its custodian when positive cash balances are maintained, which are used to offset custody fees. There were no earnings credits for the year ended October 31, 2011.
The Fund receives earnings credits from its transfer agent when positive cash balances are maintained, which are used to offset transfer agent fees. The expense paid under this arrangement is included in dividend disbursing and transfer agent fees and expenses on the statement of operations with the corresponding expense offset shown as “expense paid indirectly.” For the year ended October 31, 2011, the Fund earned $196 under this agreement.
2. Investment Management, Administration Agreements and Other Transactions with Affiliates
In accordance with the terms of its investment management agreement, the Fund pays Delaware Management Company (DMC), a series of Delaware Management Business Trust and the investment manager, an annual fee which is calculated daily at the rate of 0.75% on the first $500 million of average daily net assets of the Fund, 0.70% on the next $500 million, 0.65% on the next $1.5 billion and 0.60% on average daily net assets in excess of $2.5 billion.
DMC has contractually agreed to waive that portion, if any, of its management fee and reimburse the Fund to the extent necessary to ensure that total annual operating expenses (excluding any 12b-1 plan and certain other expenses) do not exceed 1.30% of average daily net assets of the Fund through February 28, 2012. These waivers and reimbursements may only be terminated by agreement of the Manager and the Fund. This expense waiver and reimbursement apply only to expenses paid directly to the Fund.
34
Delaware Service Company, Inc. (DSC), an affiliate of DMC, provides fund accounting and financial administration oversight services to the Fund. For these services, the Fund pays DSC fees based on the aggregate daily net assets of the Delaware Investments® Family of Funds at the following annual rate: 0.0050% of the first $30 billion; 0.0045% of the next $10 billion; 0.0040% of the next $10 billion; and 0.0025% of aggregate average daily net assets in excess of $50 billion. The fees payable to DSC under the service agreement described above are allocated among all Funds in the Delaware Investments Family of Funds on a relative net asset value basis. For the year ended October 31, 2011, the Fund was charged $ 10,394 for these services.
DSC also provides dividend disbursing and transfer agent services. Prior to July 18, 2011, the Fund paid DSC a monthly fee based on the number of shareholder accounts for dividend disbursing and transfer agent services. Effective July 18, 2011, the Fund pays DSC a monthly asset-based fee for these services.
Pursuant to a distribution agreement and distribution plan, the Fund pays DDLP, the distributor and an affiliate of DMC, an annual distribution and service fee not to exceed 0.30% of the average daily net assets of the Class A shares, 1.00% of the average daily net assets of the Class B and Class C shares and 0.60% of the average daily net assets of the Class R shares. Institutional Class shares pay no distribution and service expenses. DDLP has contracted to limit the Class A and Class R shares’ 12b-1 fees through February 28, 2012 to more than 0.25% and 0.50%, respectively, of the classes’ average daily net assets.
At October 31, 2011, the Fund had liabilities payable to affiliates as follows:
| Investment management fee payable to DMC | $ | 118,573 |
| Dividend disbursing, transfer agent and fund accounting | | |
| oversight fees and other expenses payable to DSC | | 7,718 |
| Distribution fees payable to DDLP | | 34,419 |
| Other expenses payable to DMC and affiliates* | | 1,998 |
*DMC, as part of its administrative services, pays operating expenses on behalf of the Fund and is reimbursed on a periodic basis. Expenses include items such as printing of shareholder reports, fees for audit, legal and tax services, registration fees and trustees’ fees.
As provided in the investment management agreement, the Fund bears the cost of certain legal and tax services, including internal legal and tax services provided to the Fund by DMC and/or its affiliates’ employees. For the year ended October 31, 2011, the Fund was charged $3,717 for internal legal and tax services provided by DMC and/or its affiliates’ employees.
For the year ended October 31, 2011, DDLP earned $15,004 for commissions on sales of the Fund’s Class A shares. For the year ended October 31, 2011, DDLP received gross CDSC commissions of $ 6, $1,502 and $349 on redemptions of the Fund’s Class A, Class B and Class C shares, respectively, and these commissions were entirely used to offset up-front commissions previously paid by DDLP to broker/dealers on sales of those shares.
35
Notes to financial statements
Delaware REIT Fund
2. Investment Management, Administration Agreements and Other Transactions with Affiliates (continued)
Trustees’ fees include expenses accrued by the Fund for each Trustee’s retainer and meeting fees. Certain officers of DMC, DSC and DDLP are officers and/or Trustees of the Trust. These officers and Trustees are paid no compensation by the Fund.
3. Investments
For the year ended October 31, 2011, the Fund made purchases of $269,372,116 and sales of $304,011,898 of investment securities other than short-term investments.
At October 31, 2011, the cost of investments for federal income tax purposes was $229,762,974. At October 31, 2011, net unrealized appreciation was $ 6,653,680, of which $ 22,146,349 related to unrealized appreciation of investments and $ 15,492,669 related to unrealized depreciation of investments.
U.S. GAAP defines fair value as the price that the Fund would receive to sell an asset or pay to transfer a liability in an orderly transaction between market participants at the measurement date under current market conditions. A three level hierarchy for fair value measurements has been established based upon the transparency of inputs to the valuation of an asset or liability. Inputs may be observable or unobservable and refer broadly to the assumptions that market participants would use in pricing the asset or liability. Observable inputs reflect the assumptions market participants would use in pricing the asset or liability based on market data obtained from sources independent of the reporting entity. Unobservable inputs reflect the reporting entity’s own assumptions about the assumptions that market participants would use in pricing the asset or liability developed based on the best information available under the circumstances. The Fund’s investment in its entirety is assigned a level based upon the observability of the inputs which are significant to the overall valuation. The three level hierarchy of inputs is summarized below.
| Level 1 – | inputs are quoted prices in active markets for identical investments (e.g., equity securities, open-end investment companies, futures contracts, options contracts) |
| |
| Level 2 – | other observable inputs (including, but not limited to: quoted prices for similar assets or liabilities in markets that are active, quoted prices for identical or similar assets or liabilities in markets that are not active, inputs other than quoted prices that are observable for the assets or liabilities (such as interest rates, yield curves, volatilities, prepayment speeds, loss severities, credit risks and default rates) or other market-corroborated inputs) (e.g., debt securities, government securities, swap contracts, foreign currency exchange contracts, foreign securities utilizing international fair value pricing) |
| |
| Level 3 – | inputs are significant unobservable inputs (including the Fund’s own assumptions used to determine the fair value of investments) (e.g., broker-quoted securities, fair valued securities) |
36
The following table summarizes the valuation of the Fund’s investments by fair value hierarchy levels as of October 31, 2011:
| Level 1 | | Level 2 | | Level 3 | | Total |
| Common Stock | $ | 190,874,494 | | $ | — | | | $— | | | $ | 190,874,494 |
| Exchange-Traded Fund | | 3,050,892 | | | — | | | — | | | | 3,050,892 |
| Short-Term Investments | | 3,477,000 | | | 2,570,329 | | | — | | | | 6,047,329 |
| Securities Lending Collateral | | — | | | 36,443,939 | | | — | | | | 36,443,939 |
| Total | $ | 197,402,386 | | $ | 39,014,268 | | | $— | | | $ | 236,416,654 |
The following is a reconciliation of investments in which significant unobservable inputs (Level 3) were used in determining fair value:
| Security |
| Lending |
| Collateral |
| Balance as of 10/31/10 | $ | 31,590 | |
| Sales | | (30,919 | ) |
| Net change in unrealized appreciation/depreciation | | (671 | ) |
| Balance as of 10/31/11 | $ | — | |
| |
| Net change in unrealized appreciation/depreciation | | | |
| from investments still held as of 10/31/11 | $ | (29,991 | ) |
During the year ended October 31, 2011, there were no transfers between Level 1 investments, Level 2 investments or Level 3 investments that had a material impact to the Fund.
4. Dividends and Distribution Information
Income and long-term capital gain distributions are determined in accordance with federal income tax regulations, which may differ from U.S. GAAP. Additionally, distributions from net short-term gains on sales of investment securities are treated as ordinary income for federal income tax purposes. The tax character of dividends and distributions paid during the years ended October 31, 2011 and 2010 was as follows:
| Year Ended |
| 10/31/11 | | 10/31/10 |
| Ordinary income | $3,310,819 | | $4,404,391 |
37
Notes to financial statements
Delaware REIT Fund
5. Components of Net Assets on a Tax Basis
As of October 31, 2011, the components of net assets on a tax basis were as follows:
| Shares of beneficial interest | $ | 224,409,689 | |
| Capital loss carryforwards | | (29,335,868 | ) |
| Unrealized appreciation of investments | | 6,653,681 | |
| Net assets | $ | 201,727,502 | |
The undistributed earnings for the Delaware REIT Fund are estimated pending final notification of the tax character of distributions received from investments in REITs.
The differences between book basis and tax basis components of net assets are primarily attributable to tax deferral of losses on wash sales.
For financial reporting purposes, capital accounts are adjusted to reflect the tax character of permanent book/tax differences. Reclassifications are primarily due to tax treatment of dividends and distributions and in-kind distributions of shareholder redemptions. Results of operations and net assets were not affected by these reclassifications. For the year ended October 31, 2011, the Fund recorded the following reclassifications:
| Undistributed net investment income | $ | 1,387,889 | |
| Paid-in capital | | (1,387,889 | ) |
For federal income tax purposes, capital loss carryforwards may be carried forward and applied against future capital gains. $20,920,819 was utilized in 2011. Capital loss carryforwards remaining at October 31, 2011 will expire as follows: $29,335,868 expires in 2017.
On December 22, 2010, the Regulated Investment Company Modernization Act of 2010 (the Act) was enacted, which changed various technical rules governing the tax treatment of regulated investment companies. The changes are generally effective for taxable years beginning after the date of enactment. Under the Act, the Fund will be permitted to carry forward capital losses incurred in taxable years beginning after the date of enactment for an unlimited period. However, any losses incurred during those future taxable years will be required to be utilized prior to the losses incurred in pre-enactment taxable years, which carry an expiration date. As a result of this ordering rule, pre-enactment capital loss carryforwards may be more likely to expire unused. Additionally, post-enactment capital loss carryforwards will retain their character as either short-term or long-term capital losses rather than being considered all short-term as permitted under previous regulation.
38
6. Capital Shares
Transactions in capital shares were as follows:
| Year Ended |
| 10/31/11 | | 10/31/10 |
| Shares sold: | | | | | |
| Class A | 1,285,369 | | | 1,792,835 | |
| Class B | 2,476 | | | 8,865 | |
| Class C | 199,439 | | | 142,522 | |
| Class R | 198,344 | | | 254,887 | |
| Institutional Class | 2,456,013 | | | 5,600,897 | |
| |
| Shares issued upon reinvestment of dividends and distributions: | | | | | |
| Class A | 100,989 | | | 146,361 | |
| Class B | 3,390 | | | 11,885 | |
| Class C | 13,353 | | | 22,451 | |
| Class R | 7,472 | | | 8,730 | |
| Institutional Class | 165,325 | | | 253,180 | |
| | 4,432,170 | | | 8,242,613 | |
| Shares repurchased: | | | | | |
| Class A | (2,766,428 | ) | | (2,459,341 | ) |
| Class B | (377,998 | ) | | (754,876 | ) |
| Class C | (410,170 | ) | | (514,716 | ) |
| Class R | (196,257 | ) | | (191,969 | ) |
| Institutional Class | (3,316,116 | ) | | (9,673,184 | ) |
| (7,066,969 | ) | | (13,594,086 | ) |
| Net decrease | (2,634,799 | ) | | (5,351,473 | ) |
For the years ended October 31, 2011 and 2010, 199,570 Class B shares were converted to 199,021 Class A shares valued at $2,174,143 and 470,992 Class B shares were converted to 469,869 Class A shares valued at $4,596,472, respectively. The respective amounts are included in Class B redemptions and Class A subscriptions in the table above and the statements of changes in net assets.
7. Line of Credit
The Fund, along with certain other funds in the Delaware Investments® Family of Funds (Participants), was a participant in a $35,000,000 revolving line of credit to be used for temporary or emergency purposes as an additional source of liquidity to fund redemptions of investor shares. Under the agreement, the Participants were charged an annual commitment fee, which was allocated across the Participants on the basis of each Participant’s allocation of the entire facility. The Participants were permitted to borrow up to a maximum of one third of their net assets under the agreement. The line of credit expired on November 16, 2010.
39
Notes to financial statements
Delaware REIT Fund
7. Line of Credit (continued)
The Fund, along with the other Participants, entered into amendments to the agreement for a $50,000,000 and $100,000,000 revolving line of credit on November 16, 2010 and August 1, 2011, respectively. The line of credit under the agreement as amended expired on November 15, 2011.
On November 15, 2011, the Fund, along with the other Participants, entered into an amendment to the agreement for a $125,000,000 revolving line of credit. The agreement is to be used as described above and operates in substantially the same manner as the original agreement. The agreement expires on November 13, 2012. The Fund had no amounts outstanding as of October 31, 2011 or at any time during the year then ended.
8. Securities Lending
The Fund, along with other funds in the Delaware Investments® Family of Funds, may lend its securities pursuant to a security lending agreement (Lending Agreement) with The Bank of New York Mellon (BNY Mellon). At the time a security is loaned, the borrower must post collateral equal to the required percentage of the market value of the loaned security, including any accrued interest. The required percentage is: (i) 102% with respect to U.S. securities and foreign securities that are denominated and payable in U.S. dollars; and (ii) 105% with respect to foreign securities. With respect to each loan, if on any business day the aggregate market value of securities collateral plus cash collateral held is less than the aggregate market value of the securities which are the subject of such loan, the borrower will be notified to provide additional collateral by the end of the following business day which, together with the collateral already held, will be not less than the applicable initial collateral requirements for such security loan. If the aggregate market value of securities collateral and cash collateral held with respect to a security loan exceeds the applicable initial collateral requirement, upon request of the borrower BNY Mellon must return enough collateral to the borrower by the end of the following business day to reduce the value of the remaining initial collateral to the applicable collateral requirement for such security loan. As a result of the foregoing, the value of the collateral held with respect to a loaned security may be temporarily more or less than the value of the security on loan.
Cash collateral received is generally invested in the Delaware Investments Collateral Fund No. 1 (Collective Trust) established by BNY Mellon for the purpose of investment on behalf of funds by DMC that participate in BNY Mellon’s securities lending program. The Collective Trust may invest in U.S. government securities and high quality corporate debt, asset-backed and other money market securities and in repurchase agreements collateralized by such securities, provided that the Collective Trust will generally have a dollar-weighted average portfolio maturity of 60 days or less. The Collective Trust seeks to maintain a net asset value per unit of $1.00, but there can be no assurance that it will always be able to do so. The Fund may incur investment losses as a result of investing securities lending collateral in the Collective Trust or another collateral investment pool. This could occur if an investment in a collateral investment pool defaulted or if it were necessary to liquidate assets in the collateral investment pool to meet returns on outstanding
40
security loans at a time when the collateral investment pool’s net asset value per unit was less than $1.00. Under those circumstances, the Fund may not receive an amount from the collateral investment pool that is equal in amount to the collateral the Fund would be required to return to the borrower of the securities and the Fund would be required to make up for this shortfall. Effective April 20, 2009, BNY Mellon transferred the assets of the Fund’s previous collateral investment pool other than cash and assets with a maturity of one business day or less to the BNY Mellon SL DBT II Liquidating Fund (Liquidating Fund), effectively bifurcating the previous collateral investment pool. The Fund’s exposure to the Liquidating Fund is expected to decrease as the Liquidating Fund’s assets mature or are sold. In October 2008, BNY Mellon transferred certain distressed securities from the previous collateral investment pool into the Mellon GSL Reinvestment Trust II. The Fund can also accept U.S. government securities and letters of credit (non-cash collateral) in connection with securities loans. In the event of default or bankruptcy by the lending agent, realization and/or retention of the collateral may be subject to legal proceedings. In the event the borrower fails to return loaned securities and the collateral received is insufficient to cover the value of the loaned securities and provided such collateral shortfall is not the result of investment losses, the lending agent has agreed to pay the amount of the shortfall to the Fund or, at the discretion of the lending agent, replace the loaned securities. The Fund continues to record dividends or interest, as applicable, on the securities loaned and is subject to changes in value of the securities loaned that may occur during the term of the loan. The Fund has the right under the Lending Agreement to recover the securities from the borrower on demand. With respect to security loans collateralized by non-cash collateral, the Fund receives loan premiums paid by the borrower. With respect to security loans collateralized by cash collateral, the earnings from the collateral investments are shared among the Fund, the security lending agent and the borrower. The Fund records security lending income net of allocations to the security lending agent and the borrower.
At October 31, 2011, the value of securities on loan was $35,976,842, for which cash collateral was received and invested in accordance with the Lending Agreement. At October 31, 2011, the value of invested collateral was $36,443,939. These investments are presented on the statement of net assets under the caption “Securities Lending Collateral.”
9. Credit and Market Risk
The Fund concentrates its investments in the real estate industry and is subject to the risks associated with that industry. If the Fund holds real estate directly as a result of defaults or receives rental income directly from real estate holdings, its tax status as a regulated investment company may be jeopardized. The Fund is also affected by interest rate changes, particularly if the REITs it holds use floating rate debt to finance their ongoing operations. Its investments may also tend to fluctuate more in value than a portfolio that invests in a broader range of industries.
41
Notes to financial statements
Delaware REIT Fund
9. Credit and Market Risk (continued)
The Fund may invest up to 15% of its net assets in illiquid securities, which may include securities with contractual restrictions on resale, securities exempt from registration under Rule 144A of the Securities Act of 1933, as amended, and other securities which may not be readily marketable. The relative illiquidity of these securities may impair the Fund from disposing of them in a timely manner and at a fair price when it is necessary or desirable to do so. While maintaining oversight, the Fund’s Board has delegated to DMC the day-to-day functions of determining whether individual securities are liquid for purposes of the Fund’s limitation on investments in illiquid securities. Securities eligible for resale pursuant to Rule 144A, which are determined to be liquid, are not subject to the Fund’s 15% limit on investments in illiquid securities. As of October 31, 2011, there were no Rule 144A securities. Illiquid securities have been identified on the statement of net assets.
10. Contractual Obligations
The Fund enters into contracts in the normal course of business that contain a variety of indemnifications. The Fund’s maximum exposure under these arrangements is unknown. However, the Fund has not had prior claims or losses pursuant to these contracts. Management has reviewed the Fund’s existing contracts and expects the risk of loss to be remote.
11. Subsequent Events
Management has determined that no material events or transactions occurred subsequent to October 31, 2011 that would require recognition or disclosure in the Fund’s financial statements.
12. Tax Information (Unaudited)
The information set forth below is for the Fund’s fiscal year as required by federal income tax laws. Shareholders, however, must report distributions on a calendar year basis for income tax purposes, which may include distributions for portions of two fiscal years of a fund. Accordingly, the information needed by shareholders for income tax purposes will be sent to them in January of each year. Please consult your tax advisor for proper treatment of this information.
All designations are based on financial information available as of the date of this annual report and, accordingly are subject to change. For any and all items requiring designation, it is the intention of the Fund to designate the maximum amount permitted under the Internal Revenue Code and the regulations thereunder.
For the fiscal year ended October 31, 2011, the Fund designates distributions paid during the year as follows:
| (A) Ordinary Income Distributions (Tax Basis) | 100% |
(A) is based on a percentage of the Fund’s total distributions.
42
Report of independent
registered public accounting firm
To the Board of Trustees of Delaware Pooled® Trust
and the Shareholders of The Real Estate Investment Trust Portfolio:
In our opinion, the accompanying statement of net assets and the related statements of operations and of changes in net assets and the financial highlights present fairly, in all material respects, the financial position of The Real Estate Investment Trust Portfolio (one of the series constituting Delaware Pooled Trust, hereafter referred to as the “Fund”) at October 31, 2011, the results of its operations for the year then ended and the changes in its net assets and the financial highlights for each of the two years in the period then ended, in conformity with accounting principles generally accepted in the United States of America. These financial statements and financial highlights (hereafter referred to as “financial statements”) are the responsibility of the Fund’s management; our responsibility is to express an opinion on these financial statements based on our audits. We conducted our audits of these financial statements in accordance with the standards of the Public Company Accounting Oversight Board (United States). Those standards require that we plan and perform the audit to obtain reasonable assurance about whether the financial statements are free of material misstatement. An audit includes examining, on a test basis, evidence supporting the amounts and disclosures in the financial statements, assessing the accounting principles used and significant estimates made by management, and evaluating the overall financial statement presentation. We believe that our audits, which included confirmation of securities at October 31, 2011 by correspondence with the custodian and brokers, provide a reasonable basis for our opinion. The financial highlights for each of the three years in the period ended October 31, 2009 were audited by other independent accountants whose report dated December 22, 2009 expressed an unqualified opinion on those statements.
PricewaterhouseCoopers LLP
Philadelphia, Pennsylvania
December 22, 2011
43
Other Fund information
Delaware REIT Fund
Board Consideration of Delaware REIT Fund Investment Advisory Agreement
At a meeting held on August 16–17, 2011 (the “Annual Meeting”), the Board of Trustees (the “Board”), including a majority of disinterested or independent Trustees, approved the renewal of the Investment Advisory Agreement for the Delaware REIT Fund (the “Fund”). In making its decision, the Board considered information furnished specifically in connection with the renewal of the Investment Advisory Agreement with Delaware Management Company (“DMC”), which included materials provided by DMC and its affiliates (“Delaware Investments”) concerning, among other things, the nature, extent and quality of services provided to the Fund, the costs of such services to the Fund, economies of scale and the financial condition and profitability of Delaware Investments. In addition, in connection with the Annual Meeting, reports were provided in May 2011 and included independent historical and comparative reports provided by Lipper, Inc., an independent statistical compilation organization (“Lipper”). The Lipper reports compared the Fund’s investment performance and expenses with those of other comparable mutual funds. The independent Trustees reviewed and discussed the Lipper reports with independent legal counsel to the independent Trustees. The Board requested and received information regarding DMC’s policy with respect to advisory fee levels and its breakpoint philosophy; the structure of portfolio manager compensation; the investment manager’s profitability; and any constraints or limitations on the availability of securities in certain investment styles, which had in the past year inhibited, or which were likely in the future to inhibit, DMC’s ability to invest fully in accordance with Fund policies.
In considering information relating to the approval of the Fund’s advisory agreement, the independent Trustees received assistance and advice from and met separately with independent legal counsel to the independent Trustees. Although the Board gave attention to all information furnished, the following discussion identifies, under separate headings, the primary factors taken into account by the Board during its contract renewal considerations.
Nature, Extent and Quality of Service. The Board considered the services provided by Delaware Investments to the Fund and its shareholders. In reviewing the nature, extent and quality of services, the Board considered reports furnished to it throughout the year, which covered matters such as the relative performance of the Fund, compliance of portfolio managers with the investment policies, strategies and restrictions for the Fund, compliance by DMC and Delaware Distributors, L.P. (together, “Management”) personnel with the Code of Ethics adopted throughout the Delaware Investments® Family of Funds complex and adherence to fair value pricing procedures as established by the Board. The Board was pleased with the current staffing of the Fund’s investment advisor and the emphasis placed on research in the investment process. The Board gave favorable consideration to DMC’s efforts to control expenditures while maintaining service levels committed to fund matters. The Board noted that in July 2011 Management implemented measures to reduce overall costs and improve transfer agent and shareholder servicing functions through outsourcing. It is expected that such measures will improve the quality and lower the cost of delivering transfer agent and shareholder servicing services to the Fund. The Board once again noted
44
the benefits provided to Fund shareholders through each shareholder’s ability to exchange an investment in one Delaware Investments® fund for the same class of shares in another Delaware Investments fund without a sales charge, to reinvest Fund dividends into additional shares of the Fund or into additional shares of other Delaware Investments funds and the privilege to combine holdings in other Delaware Investments funds to obtain a reduced sales charge. The Board was satisfied with the nature, extent and quality of the overall services provided by Delaware Investments.
Investment Performance. The Board placed significant emphasis on the investment performance of the Fund in view of its importance to shareholders. Although the Board gave appropriate consideration to performance reports and discussions with portfolio managers at Investment Committee meetings throughout the year, the Board gave particular weight to the Lipper reports furnished for the Annual Meeting. The Lipper reports prepared for the Fund showed the investment performance of its Class A shares in comparison to a group of similar funds as selected by Lipper (the “Performance Universe”). A fund with the best performance ranked first, and a fund with the poorest performance ranked last. The highest/best performing 25% of funds in the Performance Universe make up the first quartile; the next 25%, the second quartile; the next 25%, the third quartile; and the poorest/worst performing 25% of funds in the Performance Universe make up the fourth quartile. Comparative annualized performance for the Fund was shown for the past one-, three-, five- and ten-year periods, as applicable, ended March 31, 2011. The Board’s objective is that the Fund’s performance for the periods considered be at or above the median of its Performance Universe. The following paragraph summarizes the performance results for the Fund and the Board’s view of such performance.
The Performance Universe for the Fund consisted of the Fund and all retail and institutional real estate funds as selected by Lipper. The Lipper report comparison showed that the Fund’s total return for the one- and five-year periods was in the second quartile of its Performance Universe. The report further showed that the Fund’s total return for the three- and ten-year periods was in the third quartile. The Board determined that the Fund’s performance results were mixed. Observing that the Fund’s one- and five-year performance was above median, the Board was satisfied with performance.
Comparative Expenses. The Board considered expense comparison data for the Delaware Investments Family of Funds. Management provided the Board with information on pricing levels and fee structures for the Fund as of its most recently completed fiscal year. The Board also focused on the comparative analysis of effective management fees and total expense ratios of the Fund versus effective management fees and expense ratios of a group of similar funds as selected by Lipper (the “Expense Group”). In reviewing comparative costs, the Fund’s contractual management fee and the actual management fee incurred by the Fund were compared with the contractual management fees (assuming all funds in the Expense Group were similar in size to the Fund) and actual management fees (as reported by each fund) within the Expense Group, taking into account any applicable breakpoints
45
Other Fund information
Delaware REIT Fund
Board Consideration of Delaware REIT Fund Investment Advisory Agreement (continued)
and fee waivers. The Fund’s total expenses were also compared with those of its Expense Group. The Lipper total expenses, for comparative consistency, were shown by Lipper for Class A shares and comparative total expenses including 12b-1 and non 12b-1 service fees. The Board considered fees paid to Delaware Investments for non-management services. The Board’s objective is to limit the Fund’s total expense ratio to be competitive with that of the Expense Group. The following paragraph summarizes the expense results for the Fund and the Board’s view of such expenses.
The expense comparisons for the Fund showed that its actual management fee was in the quartile with the second lowest expenses of its Expense Group and its total expenses were in the quartile with the highest expenses of its Expense Group. The Board gave favorable consideration to the Fund’s management fee, but noted that the Fund’s total expenses were not in line with the Board’s objective. In evaluating the total expenses, the Board considered fee waivers in place through February 2012 and various initiatives implemented by Management, such as the outsourcing of certain transfer agency services, creating an opportunity for a reduction in expenses. The Board was satisfied with Management’s efforts to improve the Fund’s total expense ratio and bring it in line with the Board’s objective.
Management Profitability. The Board considered the level of profits realized by Delaware Investments in connection with the operation of the Fund. In this respect, the Board reviewed the Investment Management Profitability Analysis that addressed the overall profitability of Delaware Investments’ business in providing management and other services to each of the individual funds and the Delaware Investments® Family of Funds as a whole. Specific attention was given to the methodology followed in allocating costs for the purpose of determining profitability. Management stated that the level of profits of Delaware Investments, to a certain extent, reflect recent operational cost savings and efficiencies initiated by Delaware Investments. The Board considered Delaware Investments’ efforts to improve services provided to fund shareholders and to meet additional regulatory and compliance requirements resulting from recent industry-wide Securities and Exchange Commission initiatives. The Board also considered the extent to which Delaware Investments might derive ancillary benefits from fund operations, including the potential for procuring additional business as a result of the prestige and visibility associated with its role as service provider to the Delaware Investments Family of Funds and the benefits from allocation of fund brokerage to improve trading efficiencies. The Board found that the management fees were reasonable in light of the services rendered and the level of profitability of Delaware Investments.
46
Economies of Scale. The Trustees considered whether economies of scale are realized by Delaware Investments as the Fund’s assets increase and the extent to which any economies of scale are reflected in the level of management fees charged. The Trustees reviewed the standardized advisory fee pricing and structure, approved by the Board and shareholders, which includes breakpoints. Breakpoints in the advisory fee occur when the advisory fee rate is reduced on assets in excess of specified levels. Breakpoints result in a lower advisory fee than would otherwise be the case on all assets when the asset levels specified are exceeded. The Board noted that the fee under the Fund’s management contract fell within the standard structure. Although the Fund has not reached a size at which it can take advantage of breakpoints, the Board recognized that the fee was structured so that when the Fund grows, economies of scale may be shared.
Change in Independent Registered Public Accounting Firm
Due to independence matters under the Securities and Exchange Commission’s auditor independence rules relating to the January 4, 2010 acquisition of Delaware Investments (including DMC, DDLP and DSC) by Macquarie Group, Ernst & Young LLP (E&Y) has resigned as the independent registered public accounting firm for Delaware Pooled® Trust (the Trust) effective May 20, 2010. At a meeting held on May 20, 2010, the Board of Trustees of the Trust, upon recommendation of the Audit Committee, selected PricewaterhouseCoopers LLP (PwC) to serve as the independent registered public accounting firm for the Trust for the fiscal year ending October 31, 2010. During the fiscal years ended October 31, 2009 and 2008, E&Y’s audit reports on the financial statements of the Trust did not contain any adverse opinion or disclaimer of opinion, nor were they qualified or modified as to uncertainty, audit scope, or accounting principles. In addition, there were no disagreements between the Trust and E&Y on accounting principles, financial statements disclosures or audit scope, which, if not resolved to the satisfaction of E&Y, would have caused them to make reference to the disagreement in their reports. Neither the Trust nor anyone on its behalf has consulted with PwC at any time prior to their selection with respect to the application of accounting principles to a specified transaction, either completed or proposed or the type of audit opinion that might be rendered on the Trust’s financial statements.
47
Board of trustees/directors and officers addendum
Delaware Investments® Family of Funds
A mutual fund is governed by a Board of Trustees/Directors (“Trustees”), which has oversight responsibility for the management of a fund’s business affairs. Trustees establish procedures and oversee and review the performance of the investment manager, the distributor, and others who perform services for the fund. The independent fund trustees, in particular, are advocates
| Name, Address, | | Position(s) | | Length of |
| and Birth Date | | Held with Fund(s) | | Time Served |
| Interested Trustees | | | | |
| | | | |
| | | | | |
| Patrick P. Coyne1 | | Chairman, President, | | Chairman and Trustee |
| 2005 Market Street | | Chief Executive Officer, | | since August 16, 2006 |
| Philadelphia, PA 19103 | | and Trustee | | |
| April 1963 | | | | President and |
| | | | Chief Executive Officer |
| | | | | since August 1, 2006 |
| | | | | |
| | | | | |
| | | | | |
| | | | | |
| | | | | |
| | | | | |
| | | | | |
| | | | | |
| | | | | |
| | | | | |
| | | | | |
| | | | | |
| | | | | |
| | | | | |
| | | | | |
| | | | | |
| | | | | |
| | | | | |
1 Patrick P. Coyne is considered to be an “Interested Trustee” because he is an executive officer of the Fund’s(s’) investment advisor.
48
for shareholder interests. Each trustee has served in that capacity since he or she was elected to or appointed to the Board of Trustees, and will continue to serve until his or her retirement or the election of a new trustee in his or her place. The following is a list of the Trustees and Officers with certain background and related information.
| | Number of Portfolios in | | |
| Principal Occupation(s) | | Fund Complex Overseen | | Other Directorships |
| During Past 5 Years | | by Trustee or Officer | | Held by Trustee or Officer |
| |
| |
| Patrick P. Coyne has served in | | 74 | | Director and Audit |
| various executive capacities | | | | Committee Member |
| at different times at | | | | Kaydon Corp. |
| Delaware Investments.2 | | | | |
| | | | Board of Governors Member |
| | | | Investment Company |
| | | | Institute (ICI) |
| |
| | | | Finance Committee Member |
| | | | St. John Vianney Roman |
| | | | Catholic Church |
| |
| | | | Board of Trustees |
| | | | Agnes Irwin School |
| |
| | | | Member of Investment |
| | | | Committee |
| | | | Cradle of Liberty Council, |
| | | | BSA |
| | | | (2007–2010) |
| | | | |
| | | | |
| | | | |
2 Delaware Investments is the marketing name for Delaware Management Holdings, Inc. and its subsidiaries, including the Fund’s(s’) investment advisor, principal underwriter, and its transfer agent.
49
Board of trustees/directors and officers addendum
Delaware Investments® Family of Funds
| Name, Address, | | Position(s) | | Length of |
| and Birth Date | | Held with Fund(s) | | Time Served |
| Independent Trustees | | | | |
| |
| Thomas L. Bennett | | Trustee | | Since March 2005 |
| 2005 Market Street | | | | |
| Philadelphia, PA 19103 | | | | |
| October 1947 | | | | |
| |
| |
| |
| |
| |
| |
| |
| |
| |
| |
| |
| John A. Fry | | Trustee | | Since January 2001 |
| 2005 Market Street | | | | |
| Philadelphia, PA 19103 | | | | |
| May 1960 | | | | |
| |
| |
| |
| |
| |
| |
| |
| |
| |
| |
| |
| Anthony D. Knerr | | Trustee | | Since April 1990 |
| 2005 Market Street | | | | |
| Philadelphia, PA 19103 | | | | |
| December 1938 | | | | |
| |
| Lucinda S. Landreth | | Trustee | | Since March 2005 |
| 2005 Market Street | | | | |
| Philadelphia, PA 19103 | | | | |
| June 1947 | | | | |
| |
50
| | | Number of Portfolios in | | |
| Principal Occupation(s) | | Fund Complex Overseen | | Other Directorships |
| During Past 5 Years | | by Trustee or Officer | | Held by Trustee or Officer |
| | | | | |
| |
| Private Investor | | 74 | | Chairman of Investment |
| (March 2004–Present) | | | | Committee |
| | | | Pennsylvania Academy of |
| Investment Manager | | | | Fine Arts |
| Morgan Stanley & Co. | | | | |
| (January 1984–March 2004) | | | | Investment Committee and |
| | | | | Governance Committee |
| | | | | Member |
| | | | | Pennsylvania Horticultural |
| | | | | Society |
| | | | | |
| | | | | Director |
| | | | | Bryn Mawr Bank Corp. (BMTC) |
| | | | | (2007–2011) |
| |
| President | | 74 | | Board of Governors Member — |
| Drexel University | | | | NASDAQ OMX PHLX LLC |
| (August 2010–Present) | | | | |
| | | | | Director and Audit |
| President | | | | Committee Member |
| Franklin & Marshall College | | | | Community Health Systems |
| (July 2002–July 2010) | | | | |
| | | | | Director — Ecore |
| | | | International |
| | | | (2009–2010) |
| | | | |
| | | | Director — Allied |
| | | | Barton Securities Holdings |
| | | | (2005–2008) |
| |
| Managing Director | | 74 | | None |
| Anthony Knerr & Associates | | | | |
| (Strategic Consulting) | | | | |
| (1990–Present) | | | | |
| |
| Chief Investment Officer | | 74 | | None |
| Assurant, Inc. (Insurance) | | | | |
| (2002–2004) | | | | |
| | | | | |
| |
51
Board of trustees/directors and officers addendum
Delaware Investments® Family of Funds
| Name, Address, | | Position(s) | | Length of |
| and Birth Date | | Held with Fund(s) | | Time Served |
| Independent Trustees (continued) | | | | |
| |
| Ann R. Leven | | Trustee | | Since October 1989 |
| 2005 Market Street | | | | |
| Philadelphia, PA 19103 | | | | |
| November 1940 | | | | |
| |
| |
| |
| |
| |
| |
| |
| Frances A. Sevilla-Sacasa | | Trustee | | Since September 2011 |
| 2005 Market Street | | | | |
| Philadelphia, PA 19103 | | | | |
| January 1956 | | | | |
| |
| |
| |
| |
| |
| |
| |
| |
| |
| |
| |
| |
| |
| |
| |
| |
| |
| |
| |
| |
| |
| |
| |
| |
| |
| |
| |
52
| | Number of Portfolios in | | |
| Principal Occupation(s) | | Fund Complex Overseen | | Other Directorships |
| During Past 5 Years | | by Trustee or Officer | | Held by Trustee or Officer |
| |
| |
| Consultant | | 74 | | Director and Audit |
| ARL Associates | | | | Committee Chair |
| (Financial Planning) | | | | Systemax Inc. |
| (1983–Present) | | | | (2001–2009) |
| |
| | | | Director and Audit |
| | | | Committee Chairperson |
| | | | Andy Warhol Foundation |
| | | | (1999–2007) |
| | | | |
| Executive Advisor to Dean | | 74 | | Trust Manager — Camden |
| (since August 2011) and | | | | Property Trust |
| Interim Dean | | | | (since August 2011) |
| (January 2011–July 2011) — | | | | |
| University of Miami School of | | | | Board of Trustees |
| Business Administration | | | | Thunderbird School of |
| | | | | Global Management |
| President — U.S. Trust, | | | | (2007–2011) |
| Bank of America Private | | | | |
| Wealth Management | | | | Board of Trustees |
| (Private Banking) | | | | Carrollton School of the |
| (July 2007–December 2008) | | | | Sacred Heart |
| | | | | (since 2007) |
| President and Director | | | | |
| (November 2005–June 2007) and | | | | Board Member |
| Chief Executive Officer | | | | Foreign Policy Association |
| (April 2007–June 2007) — | | | | (since 2006) |
| U.S. Trust Company | | | | |
| (Private Banking) | | | | Board of Trustees |
| | | | Georgetown Preparatory School |
| | | | (2005–2011) |
| |
| | | | Board of Trustees |
| | | | Miami City Ballet |
| | | | (2000–2011) |
| |
| | | | Board of Trustees |
| | | | St. Thomas University |
| | | | (2005–2011) |
| | | | |
53
Board of trustees/directors and officers addendum
Delaware Investments® Family of Funds
| Name, Address, | | Position(s) | | Length of |
| and Birth Date | | Held with Fund(s) | | Time Served |
| Independent Trustees (continued) | | | | |
| |
| Janet L. Yeomans | | Trustee | | Since April 1999 |
| 2005 Market Street | | | | |
| Philadelphia, PA 19103 | | | | |
| July 1948 | | | | |
| |
| |
| |
| |
| J. Richard Zecher | | Trustee | | Since March 2005 |
| 2005 Market Street | | | | |
| Philadelphia, PA 19103 | | | | |
| July 1940 | | | | |
| |
| |
| | | | | |
| | | | | |
| | | | | |
| | | | | |
| | | | | |
| | | | | |
| | | | | |
| | | | | |
| | | | | |
| | | | | |
| | | | | |
| | | | | |
| | | | | |
| | | | | |
| |
54
| | Number of Portfolios in | | |
| Principal Occupation(s) | | Fund Complex Overseen | | Other Directorships |
| During Past 5 Years | | by Trustee or Officer | | Held by Trustee or Officer |
| |
| |
| Vice President and Treasurer | | 74 | | Director and Audit |
| (January 2006–Present) | | | | Committee Member |
| Vice President — Mergers & Acquisitions | | | | Okabena Company |
| (January 2003–January 2006), and | | | | |
| Vice President and Treasurer | | | | Chair — 3M |
| (July 1995–January 2003) | | | | Investment Management |
| 3M Corporation | | | | Company |
| | | | |
| Founder | | 74 | | Director and Audit |
| Investor Analytics | | | | Committee Member |
| (Risk Management) | | | | Investor Analytics |
| (May 1999–Present) | | | | |
| | | | | Director |
| Founder | | | | Oxigene, Inc. |
| Sutton Asset Management | | | | (2003–2008) |
| (Hedge Fund) | | | | |
| (September 1996–Present) | | | | |
| | | | | |
| | | | | |
| | | | | |
| | | | | |
| | | | | |
| | | | | |
| | | | | |
| | | | | |
| | | | | |
| | | | | |
| | | | | |
| | | | | |
55
Board of trustees/directors and officers addendum
Delaware Investments® Family of Funds
| Name, Address, | | Position(s) | | Length of |
| and Birth Date | | Held with Fund(s) | | Time Served |
| Officers | | | | |
| | | | | |
| David F. Connor | | Vice President, | | Vice President since |
| 2005 Market Street | | Deputy General | | September 2000 |
| Philadelphia, PA 19103 | | Counsel, and Secretary | | and Secretary since |
| December 1963 | | | | October 2005 |
| |
| |
| Daniel V. Geatens | | Vice President | | Treasurer |
| 2005 Market Street | | and Treasurer | | since October 2007 |
| Philadelphia, PA 19103 | | | | |
| October 1972 | | | | |
| |
| David P. O’Connor | | Senior Vice President, | | Senior Vice President, |
| 2005 Market Street | | General Counsel, | | General Counsel, and |
| Philadelphia, PA 19103 | | and Chief Legal Officer | | Chief Legal Officer |
| February 1966 | | | | since October 2005 |
| |
| Richard Salus | | Senior Vice President | | Chief Financial Officer |
| 2005 Market Street | | and Chief Financial Officer | | since November 2006 |
| Philadelphia, PA 19103 | | | | |
| October 1963 | | | | |
| |
The Statement of Additional Information for the Fund(s) includes additional information about the Trustees and Officers and is available, without charge, upon request by calling 800 523-1918.
56
| | Number of Portfolios in | | |
| Principal Occupation(s) | | Fund Complex Overseen | | Other Directorships |
| During Past 5 Years | | by Trustee or Officer | | Held by Trustee or Officer |
| |
| |
| David F. Connor has served as | | 74 | | None3 |
| Vice President and Deputy | | | | |
| General Counsel of | | | | |
| Delaware Investments | | | | |
| since 2000. | | | | |
| |
| Daniel V. Geatens has served | | 74 | | None3 |
| in various capacities at | | | | |
| different times at | | | | |
| Delaware Investments. | | | | |
| |
| David P. O’Connor has served in | | 74 | | None3 |
| various executive and legal | | | | |
| capacities at different times | | | | |
| at Delaware Investments. | | | | |
| |
| Richard Salus has served in | | 74 | | None3 |
| various executive capacities | | | | |
| at different times at | | | | |
| Delaware Investments. | | | | |
| |
3 David F. Connor, Daniel V. Geatens, David P. O’Connor, and Richard Salus serve in similar capacities for the six portfolios of the Optimum Fund Trust, which have the same investment advisor, principal underwriter, and transfer agent as the registrant.
57
About the organization
| Board of trustees |
Patrick P. Coyne
Chairman, President, and
Chief Executive Officer
Delaware Investments®
Family of Funds
Philadelphia, PA Thomas L. Bennett
Private Investor
Rosemont, PA John A. Fry
President
Drexel University
Philadelphia, PA | Anthony D. Knerr
Founder and Managing
Director
Anthony Knerr &
Associates
New York, NY Lucinda S. Landreth
Former Chief Investment
Officer
Assurant, Inc.
Philadelphia, PA | Ann R. Leven
Consultant
ARL Associates
New York, NY Frances A. Sevilla-Sacasa
Executive Advisor to Dean, University of Miami School of Business Administration Coral Gables, FL | Janet L. Yeomans
Vice President and
Treasurer
3M Corporation
St. Paul, MN J. Richard Zecher
Founder
Investor Analytics
Scottsdale, AZ |
| | | | |
| Affiliated officers |
David F. Connor
Vice President, Deputy
General Counsel, and
Secretary
Delaware Investments
Family of Funds
Philadelphia, PA | Daniel V. Geatens
Vice President and
Treasurer
Delaware Investments
Family of Funds
Philadelphia, PA | David P. O’Connor
Senior Vice President,
General Counsel,
and Chief Legal Officer
Delaware Investments
Family of Funds
Philadelphia, PA | Richard Salus
Senior Vice President and
Chief Financial Officer
Delaware Investments
Family of Funds
Philadelphia, PA |
This annual report is for the information of Delaware REIT Fund shareholders, but it may be used with prospective investors when preceded or accompanied by the Delaware Investments Fund fact sheet for the most recently completed calendar quarter. These documents are available at www.delawareinvestments.com. |
Delaware Investments is the marketing name of Delaware Management Holdings, Inc. and its subsidiaries. The Fund files its complete schedule of portfolio holdings with the Securities and Exchange Commission (SEC) for the first and third quarters of each fiscal year on Form N-Q. The Fund’s Forms N-Q, as well as a description of the policies and procedures that the Fund uses to determine how to vote proxies (if any) relating to portfolio securities are available without charge (i) upon request, by calling 800 523-1918; and (ii) on the SEC’s website at www.sec.gov. In addition, a description of the policies and procedures that the Fund uses to determine how to vote proxies (if any) relating to portfolio securities and the Fund’s Schedule of Investments are available without charge on the Fund’s website at www.delawareinvestments.com. The Fund’s Forms N-Q may be reviewed and copied at the SEC’s Public Reference Room in Washington, D.C.; information on the operation of the Public Reference Room may be obtained by calling 800 SEC-0330. Information (if any) regarding how the Fund voted proxies relating to portfolio securities during the most recently disclosed 12-month period ended June 30 is available without charge (i) through the Funds’ website at www.delawareinvestments.com; and (ii) on the SEC’s website at www.sec.gov. |
58
Item 2. Code of Ethics
The registrant has adopted a code of ethics that applies to the registrant’s principal executive officer, principal financial officer, principal accounting officer or controller, or persons performing similar functions, regardless of whether these individuals are employed by the registrant or a third party. A copy of the registrant’s Code of Business Ethics has been posted on the Delaware Investments Internet Web site at www.delawareinvestments.com. Any amendments to the Code of Business Ethics, and information on any waiver from its provisions granted by the registrant, will also be posted on this Web site within five business days of such amendment or waiver and will remain on the Web site for at least 12 months.
Item 3. Audit Committee Financial Expert
The registrant’s Board of Trustees/Directors has determined that certain members of the registrant’s Audit Committee are audit committee financial experts, as defined below. For purposes of this item, an “audit committee financial expert” is a person who has the following attributes:
a. An understanding of generally accepted accounting principles and financial statements;
b. The ability to assess the general application of such principles in connection with the accounting for estimates, accruals, and reserves;
c. Experience preparing, auditing, analyzing, or evaluating financial statements that present a breadth and level of complexity of accounting issues that are generally comparable to the breadth and complexity of issues that can reasonably be expected to be raised by the registrant’s financial statements, or experience actively supervising one or more persons engaged in such activities;
d. An understanding of internal controls and procedures for financial reporting; and
e. An understanding of audit committee functions.
An “audit committee financial expert” shall have acquired such attributes through:
a. Education and experience as a principal financial officer, principal accounting officer, controller, public accountant, or auditor or experience in one or more positions that involve the performance of similar functions;
b. Experience actively supervising a principal financial officer, principal accounting officer, controller, public accountant, auditor, or person performing similar functions;
c. Experience overseeing or assessing the performance of companies or public accountants with respect to the preparation, auditing, or evaluation of financial statements; or
d. Other relevant experience.
The registrant’s Board of Trustees/Directors has also determined that each member of the registrant’s Audit Committee is independent. In order to be “independent” for purposes of this item, the Audit Committee member may not: (i) other than in his or her capacity as a member of the Board of Trustees/Directors or any committee thereof, accept directly or indirectly any consulting, advisory or other compensatory fee from the issuer; or (ii) be an “interested person” of the registrant as defined in Section 2(a)(19) of the Investment Company Act of 1940.
The names of the audit committee financial experts on the registrant’s Audit Committee are set forth below:
John A. Fry
Ann R. Leven
Frances A. Sevilla-Sacasa
Janet L. Yeomans
Item 4. Principal Accountant Fees and Services
(a) Audit fees.
The aggregate fees billed for services provided to the registrant by its independent auditors for the audit of the registrant’s annual financial statements and for services normally provided by the independent auditors in connection with statutory and regulatory filings or engagements were $222,300 for the fiscal year ended October 31, 2011.
The aggregate fees billed for services provided to the registrant by its independent auditors for the audit of the registrant’s annual financial statements and for services normally provided by the independent auditors in connection with statutory and regulatory filings or engagements were $271,800 for the fiscal year ended October 31, 2010.
(b) Audit-related fees.
The aggregate fees billed by the registrant’s independent auditors for services relating to the performance of the audit of the registrant’s financial statements and not reported under paragraph (a) of this Item were $0 for the fiscal year ended October 31, 2011.
The aggregate fees billed by the registrant’s independent auditors for services relating to the performance of the audit of the financial statements of the registrant’s investment adviser and other service providers under common control with the adviser and that relate directly to the operations or financial reporting of the registrant were $593,000 for the registrant’s fiscal year ended October 31, 2011. The percentage of these fees relating to services approved by the registrant’s Audit Committee pursuant to the de minimis exception from the pre-approval requirement in Rule 2-01(c)(7)(i)(C) of Regulation S-X was 0%. These audit-related services were as follows: year end audit procedures; reporting up and subsidiary statutory audits.
The aggregate fees billed by the registrant’s independent auditors for services relating to the performance of the audit of the registrant’s financial statements and not reported under paragraph (a) of this Item were $0 for the fiscal year ended October 31, 2010.
The aggregate fees billed by the registrant’s independent auditors for services relating to the performance of the audit of the financial statements of the registrant’s investment adviser and other service providers under common control with the adviser and that relate directly to the operations or financial reporting of the registrant were $84,000 for the registrant’s fiscal year ended October 31, 2010. The percentage of these fees relating to services approved by the registrant’s Audit Committee pursuant to the de minimis exception from the pre-approval requirement in Rule 2-01(c)(7)(i)(C) of Regulation S-X was 0%. These audit-related services were as follows: audit procedures performed on Delaware Investments for its consolidation into Macquarie’s financial statements as of March 31, 2010.
(c) Tax fees.
The aggregate fees billed by the registrant’s independent auditors for tax-related services provided to the registrant were $40,950 for the fiscal year ended October 31, 2011. The percentage of these fees relating to services approved by the registrant’s Audit Committee pursuant to the de minimis exception from the pre-approval requirement in Rule 2-01(c)(7)(i)(C) of Regulation S-X was 0%. These tax-related services were as follows: review of income tax returns and review of annual excise distribution calculations.
The aggregate fees billed by the registrant’s independent auditors for tax-related services provided to the registrant’s investment adviser and other service providers under common control with the adviser and that relate directly to the operations or financial reporting of the registrant were $0 for the registrant’s fiscal year ended October 31, 2011.
The aggregate fees billed by the registrant’s independent auditors for tax-related services provided to the registrant were $49,350 for the fiscal year ended October 31, 2010. The percentage of these fees relating to services approved by the registrant’s Audit Committee pursuant to the de minimis exception from the pre-approval requirement in Rule 2-01(c)(7)(i)(C) of Regulation S-X was 0%. These tax-related services were as follows: review of income tax returns and review of annual excise distribution calculations.
The aggregate fees billed by the registrant’s independent auditors for tax-related services provided to the registrant’s investment adviser and other service providers under common control with the adviser and that relate directly to the operations or financial reporting of the registrant were $10,000 for the registrant’s fiscal year ended October 31, 2010.
(d) All other fees.
The aggregate fees billed for all services provided by the independent auditors to the registrant other than those set forth in paragraphs (a), (b) and (c) of this Item were $0 for the fiscal year ended October 31, 2011.
The aggregate fees billed for all services other than those set forth in paragraphs (b) and (c) of this Item provided by the registrant’s independent auditors to the registrant’s adviser and other service providers under common control with the adviser and that relate directly to the operations or financial reporting of the registrant were $25,000 for the registrant’s fiscal year ended October 31, 2011. The percentage of these fees relating to services approved by the registrant’s Audit Committee pursuant to the de minimis exception from the pre-approval requirement in Rule 2-01(c)(7)(i)(C) of Regulation S-X was 0%. These other services were as follows: attest examination of management's assertion to the controls in place at the transfer agent to be in compliance with Rule 17ad-13(a)(3) of the Securities Exchange Act of 1934.
The aggregate fees billed for all services provided by the independent auditors to the registrant other than those set forth in paragraphs (a), (b) and (c) of this Item were $0 for the fiscal year ended October 31, 2010.
The aggregate fees billed for all services other than those set forth in paragraphs (b) and (c) of this Item provided by the registrant’s independent auditors to the registrant’s adviser and other service providers under common control with the adviser and that relate directly to the operations or financial reporting of the registrant were $0 for the registrant’s fiscal year ended October 31, 2010.
(e) The registrant’s Audit Committee has established pre-approval policies and procedures as permitted by Rule 2-01(c)(7)(i)(B) of Regulation S-X (the “Pre-Approval Policy”) with respect to services provided by the registrant’s independent auditors. Pursuant to the Pre-Approval Policy, the Audit Committee has pre-approved the services set forth in the table below with respect to the registrant up to the specified fee limits. Certain fee limits are based on aggregate fees to the registrant and other registrants within the Delaware Investments Family of Funds.
| Service | Range of Fees |
| Audit Services | |
| Statutory audits or financial audits for new Funds | up to $25,000 per Fund |
| Services associated with SEC registration statements (e.g., Form N-1A, Form N-14, etc.), periodic reports and other documents filed with the SEC or other documents issued in connection with securities offerings (e.g., comfort letters for closed-end Fund offerings, consents), and assistance in responding to SEC comment letters |
up to $10,000 per Fund |
| Consultations by Fund management as to the accounting or disclosure treatment of transactions or events and/or the actual or potential impact of final or proposed rules, standards or interpretations by the SEC, FASB, or other regulatory or standard-setting bodies (Note: Under SEC rules, some consultations may be considered “audit-related services” rather than “audit services”) |
up to $25,000 in the aggregate |
| Audit-Related Services | |
| Consultations by Fund management as to the accounting or disclosure treatment of transactions or events and /or the actual or potential impact of final or proposed rules, standards or interpretations by the SEC, FASB, or other regulatory or standard-setting bodies (Note: Under SEC rules, some consultations may be considered “audit services” rather than “audit-related services”) |
up to $25,000 in the aggregate |
| Tax Services | |
| U.S. federal, state and local and international tax planning and advice (e.g., consulting on statutory, regulatory or administrative developments, evaluation of Funds’ tax compliance function, etc.) | up to $25,000 in the aggregate |
| U.S. federal, state and local tax compliance (e.g., excise distribution reviews, etc.) | up to $5,000 per Fund |
| Review of federal, state, local and international income, franchise and other tax returns | up to $5,000 per Fund |
Under the Pre-Approval Policy, the Audit Committee has also pre-approved the services set forth in the table below with respect to the registrant’s investment adviser and other entities controlling, controlled by or under common control with the investment adviser that provide ongoing services to the registrant (the “Control Affiliates”) up to the specified fee limit. This fee limit is based on aggregate fees to the investment adviser and its Control Affiliates.
| Service | Range of Fees |
| Non-Audit Services | |
| Services associated with periodic reports and other documents filed with the SEC and assistance in responding to SEC comment letters | up to $10,000 in the aggregate |
The Pre-Approval Policy requires the registrant’s independent auditors to report to the Audit Committee at each of its regular meetings regarding all services initiated since the last such report was rendered, including those services authorized by the Pre-Approval Policy.
(f) Not applicable.
(g) The aggregate non-audit fees billed by the registrant’s independent auditors for services rendered to the registrant and to its investment adviser and other service providers under common control with the adviser were $5,228,766 and $0 for the registrant’s fiscal years ended October 31, 2011 and October 31, 2010, respectively.
(h) In connection with its selection of the independent auditors, the registrant’s Audit Committee has considered the independent auditors’ provision of non-audit services to the registrant’s investment adviser and other service providers under common control with the adviser that were not required to be pre-approved pursuant to Rule 2-01(c)(7)(ii) of Regulation S-X. The Audit Committee has determined that the independent auditors’ provision of these services is compatible with maintaining the auditors’ independence.
Item 5. Audit Committee of Listed Registrants
Not applicable.
Item 6. Investments
(a) Included as part of report to shareholders filed under Item 1 of this Form N-CSR.
(b) Divestment of securities in accordance with Section 13(c) of the Investment Company Act of 1940.
Not applicable.
Item 7. Disclosure of Proxy Voting Policies and Procedures for Closed-End Management Investment Companies
Not applicable.
Item 8. Portfolio Managers of Closed-End Management Investment Companies
Not applicable.
Item 9. Purchases of Equity Securities by Closed-End Management Investment Company and Affiliated Purchasers
Not applicable.
Item 10. Submission of Matters to a Vote of Security Holders
Not applicable.
Item 11. Controls and Procedures
The registrant’s principal executive officer and principal financial officer have evaluated the registrant’s disclosure controls and procedures within 90 days of the filing of this report and have concluded that they are effective in providing reasonable assurance that the information required to be disclosed by the registrant in its reports or statements filed under the Securities Exchange Act of 1934 is recorded, processed, summarized and reported within the time periods specified in the rules and forms of the Securities and Exchange Commission.
There were no significant changes in the registrant’s internal control over financial reporting that occurred during the second fiscal quarter of the period covered by the report to stockholders included herein (i.e., the registrant’s fourth fiscal quarter) that have materially affected, or are reasonably likely to materially affect, the registrant’s internal control over financial reporting.
Item 12. Exhibits
| (a) | (1) Code of Ethics |
| |
| | Not applicable. |
| |
| | (2) Certifications of Principal Executive Officer and Principal Financial Officer pursuant to Rule 30a-2 under the Investment Company Act of 1940 are attached hereto as Exhibit 99.CERT. |
| |
| | (3) Written solicitations to purchase securities pursuant to Rule 23c-1 under the Securities Exchange Act of 1934. |
| |
| | Not applicable. |
| |
| (b) | Certifications pursuant to Section 906 of the Sarbanes-Oxley Act of 2002 are furnished herewith as Exhibit 99.906CERT. |
SIGNATURES
Pursuant to the requirements of the Securities Exchange Act of 1934 and the Investment Company Act of 1940, the registrant has duly caused this report to be signed on its behalf, by the undersigned, thereunto duly authorized.
Name of Registrant: DELAWARE POOLED® TRUST
| /s/ PATRICK P. COYNE |
| By: | Patrick P. Coyne |
| Title: | Chief Executive Officer |
| Date: | January 3, 2012 |
Pursuant to the requirements of the Securities Exchange Act of 1934 and the Investment Company Act of 1940, this report has been signed below by the following persons on behalf of the registrant and in the capacities and on the dates indicated.
| /s/ PATRICK P. COYNE |
| By: | Patrick P. Coyne |
| Title: | Chief Executive Officer |
| Date: | January 3, 2012 |
| |
| |
| /s/ RICHARD SALUS |
| By: | Richard Salus |
| Title: | Chief Financial Officer |
| Date: | January 3, 2012 |