UNITED STATES
SECURITIES AND EXCHANGE COMMISSION
Washington, DC 20549
FORM N-CSRS
CERTIFIED SHAREHOLDER REPORT OF REGISTERED MANAGEMENT INVESTMENT COMPANIES
Investment Company Act file number_811-06336
__Franklin Templeton International Trust
(Exact name of registrant as specified in charter)
One Franklin Parkway, San Mateo, CA 94403-1906
(Address of principal executive offices) (Zip code)
Craig S. Tyle, One Franklin Parkway, San Mateo, CA 94403-1906
(Name and address of agent for service)
Registrant's telephone number, including area code: _650 312-2000
Date of fiscal year end: 5/31
Date of reporting period: _11/30/13
Item 1. Reports to Stockholders.
| | | | | |
| | Contents | | | |
| Shareholder Letter | 1 | Semiannual Report | | Consolidated Financial Statements | 35 |
| | | Franklin Templeton Global Allocation Fund | 3 | Notes to Consolidated Financial Statements | 39 |
| | | Performance Summary | 9 | Shareholder Information | 58 |
| | | Your Fund’s Expenses | 12 | | |
| | | Consolidated Financial Highlights and | | | |
| | | Consolidated Statement of Investments | 14 | | |
| 1
Semiannual Report
Franklin Templeton Global Allocation Fund
Your Fund’s Goal and Main Investments: Franklin Templeton Global Allocation Fund seeks total return. Under normal market conditions, the Fund strategically invests in a diversified core portfolio of equity and fixed income investments, and tactically adjusts the Fund’s exposure to certain asset classes, regions, currencies and sectors independent of the investment processes of the core portfolio’s investment strategies.
Performance data represent past performance, which does not guarantee future results. Investment return and principal value will fluctuate, and you may have a gain or loss when you sell your shares. Current performance may differ from figures shown. Please visit franklintempleton.com or call (800) 342-5236 for most recent month-end performance.
This semiannual report for Franklin Templeton Global Allocation Fund covers the period ended November 30, 2013.
Performance Overview
Franklin Templeton Global Allocation Fund – Class A delivered a +4.45% cumulative total return for the six months under review. In comparison, the Fund’s blended benchmark generated a +6.22% total return. The blended benchmark is a combination of MSCI All Country World Index (ACWI), which measures stock performance in developed and emerging markets; Citigroup World Government Bond Index (WGBI), which measures performance of investment-grade world government bonds; Dow Jones-UBS Commodity Index Total ReturnSM (DJ-UBSCITRSM), which measures performance of fully collateralized positions of underlying commodity futures; and Payden & Rygel (P&R) 90 Day U.S.
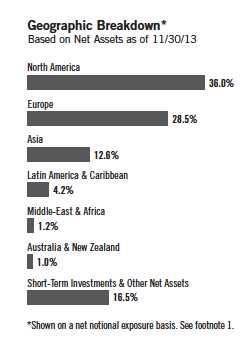
1. Reflects all equity, fixed income and currency positions, including derivatives. The Fund tactically adjusts its exposure to certain asset classes, regions, currencies and sectors through use of various derivative instruments (primarily stock index futures, government bond futures, equity total return swaps, and currency and currency index forwards and futures). The resulting “net notional” exposure generally illustrates how much of the Fund’s assets within each category may be exposed to risk. Notional exposure may differ significantly from amounts included in the Fund’s net asset value calculation and reflected in its financial statements. The use of derivative instruments may allow tactical adjustments to be made quickly and efficiently, and the historical data provided may differ significantly from the Fund’s current allocations.
The dollar value, number of shares or principal amount, and names of all portfolio holdings are listed in the Fund’s Statement of Investments (SOI). The SOI begins on page 18.
Semiannual Report | 3
T-Bill Index, a proxy for short-term investments and other net assets.2 You can find more of the Fund’s performance data in the Performance Summary beginning on page 9.
Economic and Market Overview
Developed markets helped lead the global economy during the six-month period under review as the U.S. economic recovery accelerated, Europe exited its long recession, and many central banks’ accommodative policies provided support for financial markets. Increasing export levels helped Asian economies generally improve during the period. Furthermore, increased liquidity resulting from the U.S. Federal Reserve Board’s (Fed’s) asset purchase program helped counterbalance a slowing growth trend in emerging markets. Overall, global stocks moved higher during the period, as measured by the MSCI World Index, while rising interest rates weighed on global bond performance, as measured by the Barclays Global Aggregate Index.
In the U.S., positive employment and residential real estate trends generally exceeded expectations, the economy expanded at its fastest pace in more than a year and several major U.S. equity indexes reached new nominal highs. Notably, the national jobless rate declined to its lowest level since 2008. However, market volatility surfaced surrounding speculation over the timing of the Fed’s tapering of its asset purchase program, the potential for military intervention in Syria and a partial U.S. federal government shutdown. After hinting bond purchases might be curtailed earlier than anticipated, in September Fed Chairman Ben Bernanke surprised investors by promising to maintain the bond-buying program until the Fed observed economic improvement. However, toward period-end, improving U.S. employment data reignited speculation that tapering could begin as early as December.
In Europe, the eurozone unemployment rate improved for the first time in more than two years, and accommodative policies remained intact as the European Central Bank lowered its benchmark interest rate in November following the region’s marginal economic growth. Earlier in the period, rising exports and increased domestic consumption helped the eurozone economy
2. Source: © 2013 Morningstar. All Rights Reserved. The information contained herein: (1) is proprietary to Morningstar and/or its content providers; (2) may not be copied or distributed; and (3) is not warranted to be accurate, complete or timely. Neither Morningstar nor its content providers are responsible for any damages or losses arising from any use of this information. The Dow Jones-UBS Commodity IndicesSM are a joint product of DJI Opco, LLC, a subsidiary of S&P Dow Jones Indices LLC, and UBS Securities LLC (“UBS”) and have been licensed for use to S&P Opco, LLC and Franklin Templeton Companies, LLC. S&P® is a registered trademark of Standard & Poor’s Financial Services LLC, Dow Jones® and DJ are registered trademarks of Dow Jones Trademark Holdings LLC, and “UBS” is a registered trademark of UBS AG. The Fund’s blended benchmark is currently weighted 50% for the MSCI ACWI, 35% for the Citigroup WGBI, 5% for the DJ-UBSCITR and 10% for the P&R 90 Day U.S. Treasury Bill Index. For the period from 5/31/13 through 11/30/13, the MSCI ACWI had a +10.74% total return, the Citigroup WGBI had a +2.12% total return, the DJ-UBSCITR had a -4.89% total return, and the P&R 90 Day U.S. Treasury Bill Index had a +0.02% total return. The indexes are unmanaged and include reinvestment of any income or distributions. One cannot invest directly in an index, and an index is not representative of the Fund’s portfolio.
4 | Semiannual Report
exit its protracted recession. Outside of the eurozone, U.K. gross domestic product (GDP) climbed at its fastest quarterly pace in years.
In Asia, the Bank of Japan set an explicit inflation target and pledged to double bond purchases in an unprecedented wave of policy reform. Following encouraging GDP growth in the second quarter, growth slowed in the third quarter, tempering expectations for Prime Minister Shinzo Abe’s economic initiatives. Near period-end, the Bank of Japan raised its economic growth forecast for the next fiscal year to 1.5% from 1.3%. In South Korea, higher demand for smartphones and automobiles helped exports increase.
Emerging market central banks tended to be less accommodative than their developed market peers. Brazil’s and India’s central banks raised interest rates amid rising inflation, and China’s central bank tightened liquidity to curb real estate and credit speculation. Elsewhere in Asian emerging markets, lower global commodity prices and export levels contributed to slowing economic growth for several countries.
Investment Strategy
We manage the Fund using a multi-manager approach. While we are responsible for the Fund’s overall investments, we employ various other investment managers within Franklin Templeton Investments (subadvisors) who independently manage separate portions of the Fund’s core equity and fixed income portfolio in accordance with the following strategies: all-cap U.S. growth equity, non-U.S. growth equity, deep value equity, non-U.S. value equity, emerging markets equity, global fixed income and global low duration fixed income. The allocations to each strategy may change from time to time and are subject to periodic rebalancing as market values of the portfolio’s securities change or at our discretion.
Under normal market conditions, the Fund’s baseline allocation between broad asset classes is 50% global equity (U.S./international/emerging), 35% global fixed income (U.S./international/emerging), 5% commodity-linked instruments, and 10% cash and derivative instruments. We manage portions of the Fund’s core portfolio, as well as the Fund’s tactical allocation portion, and rebalance the Fund’s portfolio to maintain the baseline strategic allocation to various asset classes and investment strategies. We may change the baseline strategic allocation from time to time.
The tactical allocation portion of the Fund is composed of cash and various derivative instruments, which may include currency forward contracts, equity index futures contracts, equity total return swaps and interest rate futures. We make tactical investment decisions based on quantitative research and a systematic investment strategy driven by bottom-up fundamental analysis, top-down
What is a currency forward contract?
A currency forward contract, or a currency forward, is an agreement between the Fund and a counterparty to buy or sell a foreign currency at a specific exchange rate on a future date.
What is a futures contract?
A futures contract, or a future, is an agreement between the Fund and a counterparty made through a U.S. or foreign futures exchange to buy or sell a security at a specific price on a future date.
What is an equity swap?
A swap agreement, such as an equity total return swap, is a contract between the Fund and a counterparty to exchange on a future date the returns, or differentials in rates of return, that would have been earned or realized if a notional amount were invested in specific instruments.
Semiannual Report | 5
macroeconomic analysis and short-term sentiment indicators. The tactical allocation portion of the Fund is intended to manage the Fund’s overall allocation to equity, fixed income and cash and to adjust the Fund’s country/regional and currency exposures. Although we do not attempt to time the entire market’s direction, we keep the flexibility to shift the Fund’s net exposure (the value of securities held long less the value of securities held short) depending on which market opportunities look more attractive. The Fund may, from time to time, have a net short position in certain asset classes, regions, currencies and sectors.
Manager’s Discussion
For the six-month period ended November 30, 2013, the cumulative total return of Franklin Templeton Global Allocation Fund’s multi-asset portfolio trailed that of its blended benchmark. An overweighting to cash and related assets, and the Fund’s currency positions detracted from relative performance. An underweighted commodities allocation contributed to relative performance as the asset class posted negative returns.
Baseline Strategic Allocation
At period-end, the Fund’s largest asset class exposure was to global equities, which was consistent with their significant structural weight in the baseline strategic asset allocation. Regionally, the largest equity weightings were in Europe and North America, with the U.S., Germany and the U.K. making up the largest country exposures. Germany and the U.K. also finished the period as the largest country overweightings relative to the blended benchmark, followed by South Korea. Conversely, the largest underweightings were in the U.S., Japan and Switzerland. Within the fixed income allocation, the largest regional weightings at period-end were in North America, Asia and Australia. At the country level, the largest fixed income exposures were in the U.S. and Australia. Relative to the blended benchmark, the largest country overweightings were in the U.S., Australia and South Korea, which is not part of the Citigroup WGBI. The largest fixed income underweightings were in Germany, the U.K and Japan.
Tactical Asset Allocation
At period-end, the Fund’s tactical asset allocation included allocations to global equities and fixed income in developed markets, in addition to currency positions. Equity allocations, through the use of index futures, included long positions in German, South Korean, U.K. and French stocks and short positions in Dutch, Swiss, Canadian, Japanese and U.S. stocks.3 Within fixed income, we maintained
3. A long position involves borrowing a security, commodity or currency with the expectation that the asset will subsequently rise in value. A short position involves the sale of a borrowed security, commodity or currency with the expectation that the asset will subsequently fall in value.
6 | Semiannual Report
long futures positions in U.S. Treasuries and Australian government bonds, as well as short futures positions in German Bunds, U.K. Gilts and Canadian government bonds. The currency component of the tactical asset allocation included long positions in the U.S. dollar and Norwegian krone and short exposures to the Japanese yen, British pound and euro, which we achieved through the use of currency forwards.
Equity
For the overall portfolio, the equity portion contributed to relative performance resulting from the Fund’s security selection relative to the benchmark, despite a detractive underweighting. An overweighting in Europe added value, particularly in Germany. An overweighting in South Korea also helped. Elsewhere, an underweighting in Japanese and Spanish stocks hampered relative performance, as those markets performed well throughout the period. An overweighting in non-U.S. value stocks also contributed. Stock selection, especially in the U.S., contributed to relative performance. Furthermore, certain sector exposures, including stock selection in information technology and consumer discretionary, also added value.4
Fixed Income
For the overall portfolio, security selection across the fixed income markets contributed to relative performance, primarily arising from a short position in the U.K., established using bond futures. Holding shorter maturities in the U.S. also added value. An overweighted position in Ireland, and allocation to South Korea (not part of the Citigroup WGBI) also contributed. We used bond futures to establish a long position in Australian government bonds and a short position in German Bunds, with each contributing to relative performance. A positive country allocation effect and underweighted allocation to fixed income holdings in general helped relative performance as bond market returns were generally positive across the countries included in the Citigroup WGBI. Conversely, the Fund’s overweighting to Treasuries detracted from relative performance.
Currencies
Overall, currency positions detracted from performance relative to the blended benchmark. The euro appreciated 5.06% against the U.S. dollar during the period, and the short euro position, achieved via currency forward contracts, was a key detractor from relative performance.5 The British pound and Swiss franc also strengthened against the U.S. dollar, leading the short positions in
4. Information technology comprises semiconductors and semiconductor equipment, software and services, and technology hardware and equipment in the SOI. Consumer discretionary comprises automobiles and components, consumer durables and apparel, consumer services, media and retailing in the SOI.
5. Source: IDC/Exshare.
| | |
| Portfolio Breakdown* | | |
| 11/30/13 | | |
| % of Total | |
| Net Assets | |
| Stocks, Equity Index Futures | | |
| & Total Return Swaps | 64.4 | % |
| Energy | 7.7 | % |
| Materials | 5.5 | % |
| Pharmaceuticals, Biotechnology | | |
| & Life Sciences | 4.9 | % |
| Software & Services | 4.8 | % |
| Banks | 4.8 | % |
| Capital Goods | 4.5 | % |
| Diversified Financials | 3.3 | % |
| Technology Hardware & Equipment | 2.7 | % |
| Health Care Equipment & Services | 2.6 | % |
| Insurance | 2.3 | % |
| Equity Index Futures | 8.7 | % |
| Total Return Swaps** | -3.6 | % |
| Other | 16.2 | % |
| Bonds, Interest Rate Futures | | |
| & Interest Rate Swaps | 19.6 | % |
| Foreign Government & Agency Securities | 18.4 | % |
| U.S. Government & Agency Securities | 10.3 | % |
| Interest Rate Futures - U.S. Government | 8.7 | % |
| Corporate Bonds | 2.6 | % |
| Interest Rate Swaps** | -0.7 | % |
| Interest Rate Futures – | | |
| Foreign Government** | -19.7 | % |
| Commodities | 4.4 | % |
| Exchange Traded Notes | 4.4 | % |
| Money Market Funds | | |
| & Other Net Assets | 11.6 | % |
*Shown on a net notional exposure basis. See footnote 1.
**A negative figure reflects net “short” exposure, designed to benefit if the value of the associated asset decreases. Conversely, the Fund’s value would potentially decline if the value of the associated asset increases. See footnote 1.
Semiannual Report | 7
these currencies to detract from relative performance. Somewhat offsetting the negative effects of euro, pound and franc appreciation were short positions in the Japanese yen and the Australian dollar, as these currencies declined versus the U.S. dollar.
We thank you for your participation in Franklin Templeton Global Allocation Fund and look forward to serving your future investment needs.

CFA® is a trademark owned by CFA Institute.
The foregoing information reflects our analysis, opinions and portfolio holdings as of November 30, 2013, the end of the reporting period. The way we implement our main investment strategies and the resulting portfolio holdings may change depending on factors such as market and economic conditions. These opinions may not be relied upon as investment advice or an offer for a particular security. The information is not a complete analysis of every aspect of any market, country, industry, security or the Fund. Statements of fact are from sources considered reliable, but the investment manager makes no representation or warranty as to their completeness or accuracy. Although historical performance is no guarantee of future results, these insights may help you understand our investment management philosophy.
Todd Saunders assumed portfolio manager responsibilities for the Fund in October 2013. He is a vice president of Tactical Allocation for Franklin Templeton Multi Asset Solutions, responsible for operational management of global tactical asset allocation strategies. Mr. Saunders has 17 years of experience in managing global macro portfolios. Prior to joining Franklin Templeton Investments in 2011, he was CFO and COO at Bayswater Asset Management LLC, a global macro hedge fund based in San Francisco. Before that, he was a founding partner at Kevian Capital, a global macro and long/short global equity hedge fund. Mr. Saunders began his career in global investments at Mellon Capital Management as a portfolio manager and specialist overseeing quantitative models operational integration.
8 | Semiannual Report
Performance Summary as of 11/30/13
Your dividend income will vary depending on dividends or interest paid by securities in the Fund’s portfolio, adjusted for operating expenses of each class. Capital gain distributions are net profits realized from the sale of portfolio securities. The performance table does not reflect any taxes that a shareholder would pay on Fund dividends, capital gain distributions, if any, or any realized gains on the sale of Fund shares. Total return reflects reinvestment of the Fund’s dividends and capital gain distributions, if any, and any unrealized gains or losses.
| | | | | | |
| Price and Distribution Information | | | | | | |
| Class A (Symbol: FGAAX) | | Change | | 11/30/13 | | 5/31/13 |
| Net Asset Value (NAV) | +$ | 0.48 | $ | 11.26 | $ | 10.78 |
| Class C (Symbol: n/a) | | Change | | 11/30/13 | | 5/31/13 |
| Net Asset Value (NAV) | +$ | 0.45 | $ | 11.17 | $ | 10.72 |
| Class R (Symbol: n/a) | | Change | | 11/30/13 | | 5/31/13 |
| Net Asset Value (NAV) | +$ | 0.47 | $ | 11.23 | $ | 10.76 |
| Advisor Class (Symbol: FGAZX) | | Change | | 11/30/13 | | 5/31/13 |
| Net Asset Value (NAV) | +$ | 0.50 | $ | 11.29 | $ | 10.79 |
Semiannual Report | 9
Performance Summary (continued)
Performance1
Cumulative total return excludes sales charges. Average annual total returns and value of $10,000 investment include maximum sales charges. Class A: 5.75% maximum initial sales charge; Class C: 1% contingent deferred sales charge in first year only; Class R/Advisor Class: no sales charges.
| | | | | | | | | |
| Class A | | 6-Month | | | 1-Year | | | Inception (9/1/11) | |
| Cumulative Total Return2 | + | 4.45 | % | + | 9.45 | % | + | 15.33 | % |
| Average Annual Total Return3 | | -1.57 | % | + | 3.15 | % | + | 3.78 | % |
| Value of $10,000 Investment4 | $ | 9,843 | | $ | 10,315 | | $ | 10,870 | |
| Avg. Ann. Total Return (12/31/13)5 | | | | + | 3.10 | % | + | 4.37 | % |
| Total Annual Operating Expenses6 | | 1.32% (with waiver) | | | 1.59% (without waiver) | |
| Class C | | 6-Month | | | 1-Year | | | Inception (9/1/11) | |
| Cumulative Total Return2 | + | 4.20 | % | + | 8.68 | % | + | 13.30 | % |
| Average Annual Total Return3 | + | 3.20 | % | + | 7.68 | % | + | 5.72 | % |
| Value of $10,000 Investment4 | $ | 10,320 | | $ | 10,768 | | $ | 11,330 | |
| Avg. Ann. Total Return (12/31/13)5 | | | | + | 7.65 | % | + | 6.24 | % |
| Total Annual Operating Expenses6 | | 2.02% (with waiver) | | | 2.29% (without waiver) | |
| Class R | | 6-Month | | | 1-Year | | | Inception (9/1/11) | |
| Cumulative Total Return2 | + | 4.37 | % | + | 9.18 | % | + | 14.41 | % |
| Average Annual Total Return3 | + | 4.37 | % | + | 9.18 | % | + | 6.18 | % |
| Value of $10,000 Investment4 | $ | 10,437 | | $ | 10,918 | | $ | 11,441 | |
| Avg. Ann. Total Return (12/31/13)5 | | | | + | 9.11 | % | + | 6.68 | % |
| Total Annual Operating Expenses6 | | 1.52% (with waiver) | | | 1.79% (without waiver) | |
| Advisor Class | | 6-Month | | | 1-Year | | | Inception (9/1/11) | |
| Cumulative Total Return2 | + | 4.63 | % | + | 9.67 | % | + | 15.67 | % |
| Average Annual Total Return3 | + | 4.63 | % | + | 9.67 | % | + | 6.69 | % |
| Value of $10,000 Investment4 | $ | 10,463 | | $ | 10,967 | | $ | 11,567 | |
| Avg. Ann. Total Return (12/31/13)5 | | | | + | 9.70 | % | + | 7.22 | % |
| Total Annual Operating Expenses6 | | 1.02% (with waiver) | | | 1.29% (without waiver) | |
Performance data represent past performance, which does not guarantee future results. Investment return and principal value will fluctuate, and you may have a gain or loss when you sell your shares. Current performance may differ from figures shown. For most recent month-end performance, go to franklintempleton.com or call (800) 342-5236.
10 | Semiannual Report
Performance Summary (continued)
Endnotes
All investments involve risks, including possible loss of principal. Generally, investors should be comfortable with fluctuation in the value of their investments, especially over the short term. Stock prices fluctuate, sometimes rapidly and dramatically, due to factors affecting individual companies, particular industries or sectors, or general conditions. Bond prices generally move in the opposite direction of interest rates. Thus, as prices of bonds in the Fund adjust to a rise in interest rates, the Fund’s share price may decline. Changes in the financial strength of a bond issuer or in a bond’s credit rating may affect its value. Foreign investing carries additional risks such as currency and market volatility and political or social instability, risks that are heightened in developing countries. Derivatives, including currency management strategies, involve costs and can create economic leverage in the portfolio that may result in significant volatility and cause the Fund to participate in losses (as well as enable gains) on an amount that exceeds the Fund’s initial investment. The Fund may not achieve the anticipated benefits, and may realize losses when a counterparty fails to perform as promised. Because the Fund allocates assets to a variety of investment strategies involving certain risks, the Fund is subject to those same risks. These and other risks are described more fully in the Fund’s prospectus. The Fund is actively managed but there is no guarantee that the manager’s investment decisions will produce the desired results.
| |
Class C: Class R: | These shares have higher annual fees and expenses than Class A shares. Shares are available to certain eligible investors as described in the prospectus. These shares have higher annual fees and expenses than Class A shares. |
Advisor Class: | Shares are available to certain eligible investors as described in the prospectus. |
1. The Fund has an expense reduction contractually guaranteed through at least 9/30/14 and a fee waiver associated with its investments in a Franklin Templeton money fund, contractually guaranteed through at least its current fiscal year end. Fund investment results reflect the expense reduction and fee waiver, to the extent applicable; without these reductions, the results would have been lower.
2. Cumulative total return represents the change in value of an investment over the periods indicated.
3. Average annual total return represents the average annual change in value of an investment over the periods indicated. Six-month return has not been annualized.
4. These figures represent the value of a hypothetical $10,000 investment in the Fund over the periods indicated.
5. In accordance with SEC rules, we provide standardized average annual total return information through the latest calendar quarter.
6. Figures are as stated in the Fund’s current prospectus. In periods of market volatility, assets may decline significantly, causing total annual Fund operating expenses to become higher than the figures shown.
Semiannual Report | 11
Your Fund’s Expenses
As a Fund shareholder, you can incur two types of costs:
- Transaction costs, including sales charges (loads) on Fund purchases; and
- Ongoing Fund costs, including management fees, distribution and service (12b-1) fees, and other Fund expenses. All mutual funds have ongoing costs, sometimes referred to as operating expenses.
The following table shows ongoing costs of investing in the Fund and can help you understand these costs and compare them with those of other mutual funds. The table assumes a $1,000 investment held for the six months indicated.
Actual Fund Expenses
The first line (Actual) for each share class listed in the table provides actual account values and expenses. The “Ending Account Value” is derived from the Fund’s actual return, which includes the effect of Fund expenses.
You can estimate the expenses you paid during the period by following these steps. Of course, your account value and expenses will differ from those in this illustration:
| 1. | Divide your account value by $1,000. |
| | If an account had an $8,600 value, then $8,600 ÷ $1,000 = 8.6. |
| 2. | Multiply the result by the number under the heading “Expenses Paid During Period.” |
| | If Expenses Paid During Period were $7.50, then 8.6 x $7.50 = $64.50. |
In this illustration, the estimated expenses paid this period are $64.50.
Hypothetical Example for Comparison with Other Funds
Information in the second line (Hypothetical) for each class in the table can help you compare ongoing costs of investing in the Fund with those of other mutual funds. This information may not be used to estimate the actual ending account balance or expenses you paid during the period. The hypothetical “Ending Account Value” is based on the actual expense ratio for each class and an assumed 5% annual rate of return before expenses, which does not represent the Fund’s actual return. The figure under the heading “Expenses Paid During Period” shows the hypothetical expenses your account would have incurred under this scenario. You can compare this figure with the 5% hypothetical examples that appear in shareholder reports of other funds.
12 | Semiannual Report
Your Fund’s Expenses (continued)
Please note that expenses shown in the table are meant to highlight ongoing costs and do not reflect any transaction costs, such as sales charges. Therefore, the second line for each class is useful in comparing ongoing costs only, and will not help you compare total costs of owning different funds. In addition, if transaction costs were included, your total costs would have been higher. Please refer to the Fund prospectus for additional information on operating expenses.
| | | | | | |
| | | Beginning Account | | Ending Account | | Expenses Paid During |
| Class A | | Value 6/1/13 | | Value 11/30/13 | | Period* 6/1/13–11/30/13 |
| Actual | $ | 1,000 | $ | 1,044.50 | $ | 6.10 |
| Hypothetical (5% return before expenses) | $ | 1,000 | $ | 1,019.10 | $ | 6.02 |
| Class C | | | | | | |
| Actual | $ | 1,000 | $ | 1,042.00 | $ | 9.88 |
| Hypothetical (5% return before expenses) | $ | 1,000 | $ | 1,015.39 | $ | 9.75 |
| Class R | | | | | | |
| Actual | $ | 1,000 | $ | 1,043.70 | $ | 7.68 |
| Hypothetical (5% return before expenses) | $ | 1,000 | $ | 1,017.55 | $ | 7.59 |
| Advisor Class | | | | | | |
| Actual | $ | 1,000 | $ | 1,046.30 | $ | 5.13 |
| Hypothetical (5% return before expenses) | $ | 1,000 | $ | 1,020.05 | $ | 5.06 |
*Expenses are calculated using the most recent six-month expense ratio, net of expense waivers, annualized for each class (A: 1.19%; C: 1.93%; R: 1.50%; and Advisor: 1.00%), multiplied by the average account value over the period, multiplied by 183/365 to reflect the one-half year period.
Semiannual Report | 13
Franklin Templeton International Trust
Consolidated Financial Highlights
| | | | | | | | | | |
| Franklin Templeton Global Allocation Fund | | | | | | | | | | |
| | | Six Months Ended | | | | Year Ended | |
| | | November 30, 2013 | May 31, | |
| Class A | | (unaudited) | | | | 2013 | | | 2012 | a |
| Per share operating performance | | | | | | | | | | |
| (for a share outstanding throughout the period) | | | | | | | | | | |
| Net asset value, beginning of period | $ | 10.78 | | | $ | 9.53 | | $ | 10.00 | |
| Income from investment operationsb: | | | | | | | | | | |
| Net investment incomec | | 0.02 | | | | 0.08 | | | 0.06 | |
| Net realized and unrealized gains (losses) | | 0.46 | | | | 1.36 | | | (0.47 | ) |
| Total from investment operations | | 0.48 | | | | 1.44 | | | (0.41 | ) |
| Less distributions from net investment income and net foreign currency gains | | — | | | | (0.19 | ) | | (0.06 | ) |
| Net asset value, end of period | $ | 11.26 | | $ | 10.78 | | $ | 9.53 | |
| |
| Total returnd | | 4.45 | % | | 15.22 | % | | (4.09 | )% |
| |
| Ratios to average net assetse | | | | | | | | | | |
| Expenses before waiver and payments by affiliates | | 1.73 | % | | 2.10 | % | | 2.85 | % |
| Expenses net of waiver and payments by affiliates | | 1.19 | %f | | 1.16 | % | | 1.08 | % |
| Net investment income | | 0.49 | % | | 0.76 | % | | 0.79 | % |
| |
| Supplemental data | | | | | | | | | | |
| Net assets, end of period (000’s) | $ | 23,171 | | $ | 23,472 | | $ | 18,055 | |
| Portfolio turnover rate | | 19.19 | % | | 47.73 | % | | 15.34 | % |
aFor the period September 1, 2011 (commencement of operations) to May 31, 2012.
bThe amount shown for a share outstanding throughout the period may not correlate with the Consolidated Statement of Operations for the period due to the timing of sales and
repurchases of the Fund shares in relation to income earned and/or fluctuating market value of the investments of the Fund.
cBased on average daily shares outstanding.
dTotal return does not reflect sales commissions or contingent deferred sales charges, if applicable, and is not annualized for periods less than one year.
eRatios are annualized for periods less than one year.
fBenefit of expense reduction rounds to less than 0.01%.
14 | The accompanying notes are an integral part of these consolidated financial statements. | Semiannual Report
Franklin Templeton International Trust
Consolidated Financial Highlights (continued)
| | | | | | | | | |
| Franklin Templeton Global Allocation Fund | | | | | | | | | |
| | | Six Months Ended | | | Year Ended | |
| | | November 30, 2013 | | | May 31, | |
| Class C | | (unaudited) | | | 2013 | | | 2012 | a |
| Per share operating performance | | | | | | | | | |
| (for a share outstanding throughout the period) | | | | | | | | | |
| Net asset value, beginning of period | $ | 10.72 | | $ | 9.49 | | $ | 10.00 | |
| Income from investment operationsb: | | | | | | | | | |
| Net investment income (loss)c | | (0.01 | ) | | —d | | | —d | |
| Net realized and unrealized gains (losses) | | 0.46 | | | 1.36 | | | (0.48 | ) |
| Total from investment operations | | 0.45 | | | 1.36 | | | (0.48 | ) |
| Less distributions from net investment income and net foreign currency gains | | — | | | (0.13 | ) | | (0.03 | ) |
| Net asset value, end of period | $ | 11.17 | | $ | 10.72 | | $ | 9.49 | |
| |
| Total returne | | 4.20 | % | | 14.40 | % | | (4.77 | )% |
| |
| Ratios to average net assetsf | | | | | | | | | |
| Expenses before waiver and payments by affiliates | | 2.47 | % | | 2.86 | % | | 3.69 | % |
| Expenses net of waiver and payments by affiliates | | 1.93 | %g | | 1.92 | % | | 1.92 | % |
| Net investment income (loss) | | (0.25 | )% | | —%h | | | (0.05 | )% |
| |
| Supplemental data | | | | | | | | | |
| Net assets, end of period (000’s) | $ | 6,010 | | $ | 6,315 | | $ | 3,639 | |
| Portfolio turnover rate | | 19.19 | % | | 47.73 | % | | 15.34 | % |
aFor the period September 1, 2011 (commencement of operations) to May 31, 2012.
bThe amount shown for a share outstanding throughout the period may not correlate with the Consolidated Statement of Operations for the period due to the timing of sales and
repurchases of the Fund shares in relation to income earned and/or fluctuating market value of the investments of the Fund.
cBased on average daily shares outstanding.
dAmount rounds to less than $0.01 per share.
eTotal return does not reflect sales commissions or contingent deferred sales charges, if applicable, and is not annualized for periods less than one year.
fRatios are annualized for periods less than one year.
gBenefit of expense reduction rounds to less than 0.01%.
hRounds to less than 0.01%.
Semiannual Report | The accompanying notes are an integral part of these consolidated financial statements. | 15
Franklin Templeton International Trust
Consolidated Financial Highlights (continued)
| | | | | | | | | |
| Franklin Templeton Global Allocation Fund | | | | | | | | | |
| | | Six Months Ended | | | Year Ended | |
| | | November 30, 2013 | | | May 31, | |
| Class R | | (unaudited) | | | 2013 | | | 2012 | a |
| Per share operating performance | | | | | | | | | |
| (for a share outstanding throughout the period) | | | | | | | | | |
| Net asset value, beginning of period | $ | 10.76 | | $ | 9.51 | | $ | 10.00 | |
| Income from investment operationsb: | | | | | | | | | |
| Net investment incomec | | 0.01 | | | 0.04 | | | 0.02 | |
| Net realized and unrealized gains (losses) | | 0.46 | | | 1.37 | | | (0.47 | ) |
| Total from investment operations | | 0.47 | | | 1.41 | | | (0.45 | ) |
| Less distributions from net investment income and net foreign currency gains | | — | | | (0.16 | ) | | (0.04 | ) |
| Net asset value, end of period | $ | 11.23 | | $ | 10.76 | | $ | 9.51 | |
| |
| Total returnd | | 4.37 | % | | 14.84 | % | | (4.45 | )% |
| |
| Ratios to average net assetse | | | | | | | | | |
| Expenses before waiver and payments by affiliates | | 2.04 | % | | 2.44 | % | | 3.27 | % |
| Expenses net of waiver and payments by affiliates | | 1.50 | %f | | 1.50 | % | | 1.50 | % |
| Net investment income | | 0.18 | % | | 0.42 | % | | 0.37 | % |
| |
| Supplemental data | | | | | | | | | |
| Net assets, end of period (000’s) | $ | 2,274 | | $ | 2,155 | | $ | 1,903 | |
| Portfolio turnover rate | | 19.19 | % | | 47.73 | % | | 15.34 | % |
aFor the period September 1, 2011 (commencement of operations) to May 31, 2012.
bThe amount shown for a share outstanding throughout the period may not correlate with the Consolidated Statement of Operations for the period due to the timing of sales and
repurchases of the Fund shares in relation to income earned and/or fluctuating market value of the investments of the Fund.
cBased on average daily shares outstanding.
dTotal return is not annualized for periods less than one year.
eRatios are annualized for periods less than one year.
fBenefit of expense reduction rounds to less than 0.01%.
16 | The accompanying notes are an integral part of these consolidated financial statements. | Semiannual Report
Franklin Templeton International Trust
Consolidated Financial Highlights (continued)
| | | | | | | | | | |
| Franklin Templeton Global Allocation Fund | | | | | | | | | | |
| | | Six Months Ended | | | | Year Ended | |
| | | November 30, 2013 | May 31, | |
| Advisor Class | | (unaudited) | | | | 2013 | | | 2012 | a |
| Per share operating performance | | | | | | | | | | |
| (for a share outstanding throughout the period) | | | | | | | | | | |
| Net asset value, beginning of period | $ | 10.79 | | | $ | 9.53 | | $ | 10.00 | |
| Income from investment operationsb: | | | | | | | | | | |
| Net investment incomec | | 0.04 | | | | 0.09 | | | 0.06 | |
| Net realized and unrealized gains (losses) | | 0.46 | | | | 1.38 | | | (0.47 | ) |
| Total from investment operations | | 0.50 | | | | 1.47 | | | (0.41 | ) |
| Less distributions from net investment income and net foreign currency gains | | — | | | | (0.21 | ) | | (0.06 | ) |
| Net asset value, end of period | $ | 11.29 | | $ | 10.79 | | $ | 9.53 | |
| |
| Total returnd | | 4.63 | % | | 15.47 | % | | (4.09 | )% |
| |
| Ratios to average net assetse | | | | | | | | | | |
| Expenses before waiver and payments by affiliates | | 1.54 | % | | 1.94 | % | | 2.77 | % |
| Expenses net of waiver and payments by affiliates | | 1.00 | %f | | 1.00 | % | | 1.00 | % |
| Net investment income | | 0.68 | % | | 0.92 | % | | 0.87 | % |
| |
| Supplemental data | | | | | | | | | | |
| Net assets, end of period (000’s) | $ | 13,251 | | $ | 14,511 | | $ | 12,654 | |
| Portfolio turnover rate | | 19.19 | % | | 47.73 | % | | 15.34 | % |
aFor the period September 1, 2011 (commencement of operations) to May 31, 2012.
bThe amount shown for a share outstanding throughout the period may not correlate with the Consolidated Statement of Operations for the period due to the timing of sales and
repurchases of the Fund shares in relation to income earned and/or fluctuating market value of the investments of the Fund.
cBased on average daily shares outstanding.
dTotal return is not annualized for periods less than one year.
eRatios are annualized for periods less than one year.
fBenefit of expense reduction rounds to less than 0.01%.
Semiannual Report | The accompanying notes are an integral part of these consolidated financial statements. | 17
Franklin Templeton International Trust
Consolidated Statement of Investments, November 30, 2013 (unaudited)
| | | | |
| Franklin Templeton Global Allocation Fund | Country | Shares | | Value |
| Common Stocks 54.7% | | | | |
| Automobiles & Components 1.2% | | | | |
| BorgWarner Inc. | United States | 530 | $ | 56,800 |
| Brilliance China Automotive Holdings Ltd. | China | 114,000 | | 199,689 |
| Cie Generale des Etablissements Michelin, B | France | 400 | | 43,442 |
| aGeneral Motors Co. | United States | 1,686 | | 65,299 |
| Hyundai Mobis | South Korea | 224 | | 64,985 |
| Nissan Motor Co. Ltd. | Japan | 4,000 | | 36,554 |
| Toyota Motor Corp. | Japan | 1,400 | | 87,205 |
| | | | | 553,974 |
| Banks 4.3% | | | | |
| Bank Danamon Indonesia Tbk PT | Indonesia | 121,000 | | 38,437 |
| Bank of Nova Scotia | Canada | 2,500 | | 153,580 |
| BNP Paribas SA | France | 2,610 | | 195,885 |
| China Merchants Bank Co. Ltd., H | China | 72,201 | | 154,225 |
| CIT Group Inc. | United States | 778 | | 39,273 |
| Columbia Banking System Inc. | United States | 512 | | 14,193 |
| aCommerzbank AG | Germany | 1,015 | | 15,084 |
| Hana Financial Group Inc. | South Korea | 3,230 | | 121,177 |
| HSBC Holdings PLC | United Kingdom | 1,660 | | 18,513 |
| Itau Unibanco Holding SA, ADR | Brazil | 6,160 | | 86,671 |
| KB Financial Group Inc. | South Korea | 4,010 | | 150,440 |
| aLloyds Banking Group PLC | United Kingdom | 43,420 | | 54,971 |
| PNC Financial Services Group Inc. | United States | 1,318 | | 101,420 |
| Siam Commercial Bank PCL, fgn. | Thailand | 5,700 | | 27,918 |
| aSignature Bank/New York NY | United States | 900 | | 95,625 |
| Societe Generale | France | 1,658 | | 95,348 |
| SunTrust Banks Inc. | United States | 1,318 | | 47,751 |
| UniCredit SpA | Italy | 18,101 | | 131,302 |
| United Bank Ltd. | Pakistan | 101,700 | | 122,893 |
| United Overseas Bank Ltd. | Singapore | 9,100 | | 151,697 |
| Wells Fargo & Co. | United States | 2,307 | | 101,554 |
| | | | | 1,917,957 |
| Capital Goods 4.2% | | | | |
| Alstom SA | France | 910 | | 33,407 |
| BAE Systems PLC | United Kingdom | 8,000 | | 55,937 |
| The Boeing Co. | United States | 470 | | 63,097 |
| Carillion PLC | United Kingdom | 8,330 | | 41,044 |
| Caterpillar Inc. | United States | 429 | | 36,293 |
| aChart Industries Inc. | United States | 500 | | 48,650 |
| aCNH Industrial NV | Netherlands | 3,079 | | 35,196 |
| Compagnie de Saint-Gobain | France | 470 | | 24,989 |
| Danaher Corp. | United States | 870 | | 65,076 |
| Fastenal Co. | United States | 650 | | 30,244 |
| Honeywell International Inc. | United States | 310 | | 27,438 |
| Huntington Ingalls Industries Inc. | United States | 620 | | 50,983 |
| Hyundai Development Co. | South Korea | 5,880 | | 126,967 |
| ITOCHU Corp. | Japan | 8,500 | | 107,220 |
| aJacobs Engineering Group Inc. | United States | 570 | | 34,069 |
18 | Semiannual Report
Franklin Templeton International Trust
Consolidated Statement of Investments, November 30, 2013 (unaudited) (continued)
| | | | |
| Franklin Templeton Global Allocation Fund | Country | Shares | | Value |
| Common Stocks (continued) | | | | |
| Capital Goods (continued) | | | | |
| aKloeckner & Co. SE | Germany | 2,190 | $ | 30,582 |
| Koninklijke Philips NV | Netherlands | 870 | | 31,135 |
| MTU Aero Engines AG | Germany | 1,600 | | 150,359 |
| Noble Group Ltd. | Hong Kong | 192,000 | | 169,059 |
| Pall Corp. | United States | 710 | | 59,427 |
| Precision Castparts Corp. | United States | 370 | | 95,626 |
| Rockwell Automation Inc. | United States | 250 | | 28,395 |
| Roper Industries Inc. | United States | 530 | | 68,741 |
| SembCorp Marine Ltd. | Singapore | 20,000 | | 70,760 |
| Shanghai Electric Group Co. Ltd. | China | 52,000 | | 18,781 |
| Siemens AG | Germany | 440 | | 58,096 |
| SIG PLC | United Kingdom | 18,570 | | 65,226 |
| Stanley Black & Decker Inc. | United States | 346 | | 28,161 |
| aUnited Rentals Inc. | United States | 1,040 | | 71,479 |
| Weir Group PLC | United Kingdom | 4,600 | | 161,197 |
| | | | | 1,887,634 |
| Commercial & Professional Services 0.9% | | | | |
| Experian PLC | United Kingdom | 8,400 | | 154,908 |
| Nielsen Holdings NV | United States | 700 | | 30,212 |
| SGS SA | Switzerland | 70 | | 157,726 |
| aStericycle Inc. | United States | 680 | | 79,886 |
| | | | | 422,732 |
| Consumer Durables & Apparel 1.1% | | | | |
| Burberry Group PLC | United Kingdom | 6,700 | | 167,392 |
| Luxottica Group SpA | Italy | 2,800 | | 148,261 |
| Namco Bandai Holdings Inc. | Japan | 1,700 | | 34,540 |
| NIKE Inc., B | United States | 530 | | 41,944 |
| Nikon Corp. | Japan | 800 | | 15,168 |
| Ralph Lauren Corp. | United States | 270 | | 47,312 |
| aUnder Armour Inc., A | United States | 530 | | 42,771 |
| | | | | 497,388 |
| Consumer Services 0.7% | | | | |
| aChipotle Mexican Grill Inc. | United States | 80 | | 41,909 |
| Starbucks Corp. | United States | 750 | | 61,095 |
| Whitbread PLC | United Kingdom | 2,700 | | 157,567 |
| Wynn Resorts Ltd. | United States | 340 | | 56,396 |
| | | | | 316,967 |
| Diversified Financials 3.1% | | | | |
| Aberdeen Asset Management PLC | United Kingdom | 23,500 | | 189,185 |
| AGF Management Ltd. | Canada | 1,300 | | 17,574 |
| Azimut Holding SpA | Italy | 6,300 | | 161,146 |
| Citigroup Inc. | United States | 1,253 | | 66,309 |
| Credit Suisse Group AG | Switzerland | 3,618 | | 107,658 |
| Deutsche Boerse AG | Germany | 2,426 | | 187,579 |
| Discover Financial Services | United States | 800 | | 42,640 |
| aGAM Holding Ltd. | Switzerland | 1,140 | | 20,934 |
| |
| | | Semiannual Report | 19 |
Franklin Templeton International Trust
Consolidated Statement of Investments, November 30, 2013 (unaudited) (continued)
| | | | |
| Franklin Templeton Global Allocation Fund | Country | Shares | | Value |
| Common Stocks (continued) | | | | |
| Diversified Financials (continued) | | | | |
| aING Groep NV, IDR | Netherlands | 18,103 | $ | 235,042 |
| aIntercontinentalexchange Group Inc. | United States | 220 | | 46,924 |
| JPMorgan Chase & Co. | United States | 1,341 | | 76,732 |
| KIWOOM Securities Co. Ltd. | South Korea | 415 | | 21,452 |
| Korea Investment Holdings Co. Ltd. | South Korea | 620 | | 23,817 |
| Man Group PLC | United Kingdom | 33,410 | | 48,457 |
| MLP AG | Germany | 3,790 | | 25,330 |
| Morgan Stanley | United States | 1,135 | | 35,525 |
| T. Rowe Price Group Inc. | United States | 1,010 | | 81,264 |
| Value Partners Group Ltd. | Hong Kong | 9,400 | | 6,232 |
| | | | | 1,393,800 |
| Energy 7.0% | | | | |
| Anadarko Petroleum Corp. | United States | 300 | | 26,646 |
| Apache Corp. | United States | 1,067 | | 97,620 |
| Baker Hughes Inc. | United States | 2,741 | | 156,127 |
| BG Group PLC | United Kingdom | 2,065 | | 42,160 |
| BP PLC | United Kingdom | 19,444 | | 153,265 |
| China Shenhua Energy Co. Ltd., H | China | 19,500 | | 66,152 |
| CNOOC Ltd. | China | 55,000 | | 112,800 |
| CONSOL Energy Inc. | United States | 1,463 | | 52,053 |
| Eni SpA | Italy | 2,510 | | 60,384 |
| Ensco PLC, A | United States | 437 | | 25,818 |
| Ensign Energy Services Inc. | Canada | 6,200 | | 94,796 |
| Fugro NV, IDR | Netherlands | 2,700 | | 164,184 |
| Gazprom OAO, ADR | Russia | 23,800 | | 205,275 |
| Inner Mongolia Yitai Coal Co. Ltd., B | China | 52,200 | | 97,823 |
| LUKOIL Holdings, ADR (London Stock Exchange) | Russia | 1,850 | | 114,654 |
| Marathon Oil Corp. | United States | 2,589 | | 93,308 |
| Murphy Oil Corp. | United States | 639 | | 41,490 |
| National Oilwell Varco Inc. | United States | 570 | | 46,455 |
| Noble Corp PLC | United States | 1,440 | | 54,893 |
| Noble Energy Inc. | United States | 850 | | 59,704 |
| Oceaneering International Inc. | United States | 380 | | 29,332 |
| PetroChina Co. Ltd., H | China | 78,000 | | 92,260 |
| Petroleo Brasileiro SA, ADR | Brazil | 1,487 | | 23,703 |
| bReliance Industries Ltd., GDR, 144A | India | 4,580 | | 125,034 |
| Royal Dutch Shell PLC, A | United Kingdom | 2,400 | | 80,281 |
| Royal Dutch Shell PLC, B | United Kingdom | 2,730 | | 95,778 |
| aSBM Offshore NV | Netherlands | 2,011 | | 40,211 |
| Schlumberger Ltd. | United States | 770 | | 68,083 |
| Statoil ASA | Norway | 4,310 | | 97,278 |
| Suncor Energy Inc. | Canada | 2,200 | | 75,482 |
| Talisman Energy Inc. | Canada | 5,511 | | 64,533 |
| Talisman Energy Inc. | Canada | 1,681 | | 19,853 |
| cTMK OAO, GDR, Reg S | Russia | 10,450 | | 118,973 |
| Total SA, B | France | 2,340 | | 141,752 |
20 | Semiannual Report
Franklin Templeton International Trust
Consolidated Statement of Investments, November 30, 2013 (unaudited) (continued)
| | | | |
| Franklin Templeton Global Allocation Fund | Country | Shares | | Value |
| Common Stocks (continued) | | | | |
| Energy (continued) | | | | |
| Transocean Ltd. | United States | 1,143 | $ | 57,584 |
| Trican Well Service Ltd. | Canada | 6,300 | | 74,781 |
| WorleyParsons Ltd. | Australia | 9,300 | | 138,522 |
| aWPX Energy Inc. | United States | 508 | | 9,444 |
| | | | | 3,118,491 |
| Food & Staples Retailing 1.3% | | | | |
| CVS Caremark Corp. | United States | 1,323 | | 88,588 |
| The Kroger Co. | United States | 1,996 | | 83,333 |
| Metro AG | Germany | 1,092 | | 54,722 |
| Tesco PLC | United Kingdom | 37,039 | | 210,807 |
| Walgreen Co. | United States | 1,118 | | 66,185 |
| Whole Foods Market Inc. | United States | 1,160 | | 65,656 |
| | | | | 569,291 |
| Food, Beverage & Tobacco 1.1% | | | | |
| Altria Group Inc. | United States | 1,491 | | 55,137 |
| British American Tobacco PLC | United Kingdom | 1,658 | | 88,426 |
| Coca-Cola Enterprises Inc. | United Kingdom | 893 | | 37,452 |
| Dr. Pepper Snapple Group Inc. | United States | 716 | | 34,554 |
| Imperial Tobacco Group PLC | United Kingdom | 1,331 | | 50,604 |
| Lorillard Inc. | United States | 1,217 | | 62,469 |
| Mead Johnson Nutrition Co., A | United States | 500 | | 42,255 |
| aMonster Beverage Corp. | United States | 470 | | 27,815 |
| PepsiCo Inc. | United States | 700 | | 59,122 |
| Pernod Ricard SA | France | 151 | | 17,113 |
| Philip Morris International Inc. | United States | 351 | | 30,024 |
| | | | | 504,971 |
| Health Care Equipment & Services 2.5% | | | | |
| Abbott Laboratories | United States | 1,630 | | 62,250 |
| aCerner Corp. | United States | 1,000 | | 57,470 |
| Cigna Corp. | United States | 1,283 | | 112,198 |
| Cochlear Ltd. | Australia | 2,800 | | 149,171 |
| aDaVita HealthCare Partners Inc. | United States | 740 | | 44,067 |
| Elekta AB, B | Sweden | 10,300 | | 154,374 |
| Essilor International SA | France | 1,300 | | 136,347 |
| aExpress Scripts Holding Co. | United States | 550 | | 37,042 |
| Getinge AB, B | Sweden | 1,207 | | 37,726 |
| McKesson Corp. | United States | 310 | | 51,426 |
| Medtronic Inc. | United States | 2,053 | | 117,678 |
| Nobel Biocare Holding AG | Switzerland | 2,136 | | 31,450 |
| Shanghai Pharmaceuticals Holding Co. Ltd., H | China | 16,000 | | 37,355 |
| Stryker Corp. | United States | 348 | | 25,898 |
| UnitedHealth Group Inc. | United States | 65 | | 4,841 |
| WellPoint Inc. | United States | 490 | | 45,511 |
| | | | | 1,104,804 |
Semiannual Report | 21
Franklin Templeton International Trust
Consolidated Statement of Investments, November 30, 2013 (unaudited) (continued)
| | | | | | |
| | | Franklin Templeton Global Allocation Fund | Country | Shares | | Value |
| | | Common Stocks (continued) | | | | |
| | | Household & Personal Products 0.8% | | | | |
| | | Avon Products Inc. | United States | 2,199 | $ | 39,208 |
| | | Hengan International Group Co. Ltd. | China | 13,000 | | 163,828 |
| | | Reckitt Benckiser Group PLC | United Kingdom | 2,050 | | 164,615 |
| | | | | | | 367,651 |
| | | Insurance 2.2% | | | | |
| | | ACE Ltd. | United States | 1,475 | | 151,600 |
| | | Aegon NV | Netherlands | 17,125 | | 152,114 |
| | | Aflac Inc. | United States | 800 | | 53,096 |
| | | aAlleghany Corp. | United States | 140 | | 55,174 |
| | | American International Group Inc. | United States | 2,549 | | 126,813 |
| | | Aviva PLC | United Kingdom | 19,480 | | 136,765 |
| | | AXA SA | France | 4,800 | | 125,744 |
| | | China Life Insurance Co. Ltd., H | China | 5,000 | | 16,156 |
| | | MetLife Inc. | United States | 1,078 | | 56,261 |
| | | Muenchener Rueckversicherungs-Gesellschaft AG | Germany | 220 | | 48,115 |
| | | Swiss Re AG | Switzerland | 340 | | 30,243 |
| | | Zurich Insurance Group AG | Switzerland | 116 | | 32,355 |
| | | | | | | 984,436 |
| | | Materials 4.7% | | | | |
| | | Airgas Inc. | United States | 360 | | 39,107 |
| | | Akzo Nobel NV | Netherlands | 1,060 | | 79,814 |
| | | Anglo American PLC (Johannesburg Stock Exchange) | United Kingdom | 4,774 | | 105,958 |
| | | Anglo American PLC (London Stock Exchange) | United Kingdom | 1,510 | | 33,311 |
| | | Antofagasta PLC | Chile | 6,600 | | 85,685 |
| | | Arab Potash Co. PLC | Jordan | 2,244 | | 91,466 |
| | | CRH PLC | Ireland | 2,770 | | 70,213 |
| | | Cytec Industries Inc. | United States | 700 | | 62,636 |
| | | Domtar Corp. | United States | 227 | | 19,411 |
| | | Ecolab Inc. | United States | 1,220 | | 130,747 |
| | | Freeport-McMoRan Copper & Gold Inc., B | United States | 2,205 | | 76,491 |
| | | HudBay Minerals Inc. | Canada | 6,500 | | 46,844 |
| | | Impala Platinum Holdings Ltd. | South Africa | 14,000 | | 162,288 |
| | | International Paper Co. | United States | 1,655 | | 77,206 |
| | | MeadWestvaco Corp. | United States | 1,125 | | 39,499 |
| | | POSCO | South Korea | 298 | | 92,226 |
| | | Praxair Inc. | United States | 410 | | 51,767 |
| | | Rexam PLC | United Kingdom | 4,020 | | 32,856 |
| | | Sika AG | Switzerland | 47 | | 154,317 |
| | | Symrise AG | Germany | 3,650 | | 161,636 |
| | | Syngenta AG | Switzerland | 400 | | 157,053 |
| | | cTata Steel Ltd., GDR, Reg S | India | 21,673 | | 137,786 |
| | | aThyssenKrupp AG | Germany | 1,324 | | 34,648 |
| | | Umicore SA | Belgium | 3,300 | | 147,504 |
| | | | | | | 2,090,469 |
| | | Media 1.8% | | | | |
| | | British Sky Broadcasting Group PLC | United Kingdom | 463 | | 6,198 |
| | | CBS Corp., B | United States | 843 | | 49,366 |
| |
| 22 | | | Semiannual Report | | | | |
Franklin Templeton International Trust
Consolidated Statement of Investments, November 30, 2013 (unaudited) (continued)
| | | | |
| Franklin Templeton Global Allocation Fund | Country | Shares | | Value |
| Common Stocks (continued) | | | | |
| Media (continued) | | | | |
| aCharter Communications Inc., A | United States | 400 | $ | 54,040 |
| Comcast Corp., Special A | United States | 323 | | 15,552 |
| aDiscovery Communications Inc., C | United States | 910 | | 73,501 |
| ITV PLC | United Kingdom | 52,000 | | 161,512 |
| Reed Elsevier PLC | United Kingdom | 5,732 | | 82,854 |
| Sirius XM Holdings Inc. | United States | 18,170 | | 68,501 |
| Time Warner Cable Inc. | United States | 548 | | 75,745 |
| Twenty-First Century Fox Inc., A | United States | 1,050 | | 35,164 |
| Twenty-First Century Fox Inc., B | United States | 3,259 | | 107,645 |
| The Walt Disney Co. | United States | 1,200 | | 84,648 |
| | | | | 814,726 |
| Pharmaceuticals, Biotechnology & Life Sciences 4.6% | | | | |
| aActavis PLC | Ireland | 600 | | 97,842 |
| Amgen Inc. | United States | 480 | | 54,758 |
| aBiogen Idec Inc. | United States | 350 | | 101,839 |
| Bristol-Myers Squibb Co. | United States | 1,650 | | 84,777 |
| aCelgene Corp. | United States | 810 | | 131,034 |
| CSL Ltd. | Australia | 2,500 | | 156,533 |
| Eli Lilly & Co. | United States | 699 | | 35,104 |
| Gerresheimer AG | Germany | 540 | | 36,431 |
| aGilead Sciences Inc. | United States | 1,930 | | 144,383 |
| GlaxoSmithKline PLC | United Kingdom | 5,590 | | 147,957 |
| aHospira Inc. | United States | 664 | | 26,102 |
| aIllumina Inc. | United States | 420 | | 41,160 |
| Ipsen SA | France | 750 | | 35,301 |
| Lonza Group AG | Switzerland | 540 | | 50,296 |
| Merck & Co. Inc. | United States | 3,377 | | 168,276 |
| Novartis AG | Switzerland | 550 | | 43,462 |
| Novo Nordisk AS, B | Denmark | 680 | | 121,781 |
| aQuintiles Transnational Holdings Inc. | United States | 700 | | 30,233 |
| Roche Holding AG | Switzerland | 980 | | 273,129 |
| Sanofi | France | 1,160 | | 122,656 |
| Teva Pharmaceutical Industries Ltd., ADR | Israel | 2,922 | | 119,101 |
| aWaters Corp. | United States | 130 | | 12,939 |
| | | | | 2,035,094 |
| Real Estate 0.3% | | | | |
| American Tower Corp. | United States | 500 | | 38,885 |
| Brookfield Office Properties Inc. | United States | 359 | | 6,893 |
| Land and Houses PCL, fgn. | Thailand | 282,800 | | 91,752 |
| | | | | 137,530 |
| Retailing 1.6% | | | | |
| aAmazon.com Inc. | United States | 260 | | 102,341 |
| aDollar General Corp. | United States | 460 | | 26,193 |
| Dollarama Inc. | Canada | 1,700 | | 137,249 |
| Kingfisher PLC | United Kingdom | 10,480 | | 64,399 |
| Kohl’s Corp. | United States | 794 | | 43,892 |
| Marks & Spencer Group PLC | United Kingdom | 7,550 | | 60,132 |
| |
| | | Semiannual Report | 23 |
Franklin Templeton International Trust
Consolidated Statement of Investments, November 30, 2013 (unaudited) (continued)
| | | | |
| Franklin Templeton Global Allocation Fund | Country | Shares | | Value |
| Common Stocks (continued) | | | | |
| Retailing (continued) | | | | |
| aPriceline.com Inc. | United States | 70 | $ | 83,463 |
| Start Today Co. Ltd. | Japan | 4,700 | | 120,500 |
| Tractor Supply Co. | United States | 680 | | 49,783 |
| aTripAdvisor Inc. | United States | 350 | | 30,912 |
| | | | | 718,864 |
| Semiconductors & Semiconductor Equipment 1.5% | | | | |
| ARM Holdings PLC | United Kingdom | 8,800 | | 146,452 |
| ASML Holding NV | Netherlands | 1,680 | | 157,215 |
| Microchip Technology Inc. | United States | 1,600 | | 69,264 |
| Samsung Electronics Co. Ltd. | South Korea | 134 | | 189,183 |
| aTrina Solar Ltd., ADR | China | 2,103 | | 29,442 |
| Xilinx Inc. | United States | 1,600 | | 71,088 |
| | | | | 662,644 |
| Software & Services 4.5% | | | | |
| aANSYS Inc. | United States | 490 | | 41,978 |
| Capcom Co. Ltd. | Japan | 2,200 | | 42,529 |
| aCheck Point Software Technologies Ltd. | Israel | 2,400 | | 148,464 |
| Dassault Systemes SA | France | 1,100 | | 126,218 |
| Daum Communication Corp. | South Korea | 206 | | 16,527 |
| aeBay Inc. | United States | 720 | | 36,374 |
| aFacebook Inc., A | United States | 1,760 | | 82,738 |
| aGoogle Inc., A | United States | 193 | | 204,501 |
| Infosys Ltd., ADR | India | 3,200 | | 172,864 |
| aLinkedIn Corp., A | United States | 310 | | 69,449 |
| MasterCard Inc., A | United States | 210 | | 159,770 |
| MercadoLibre Inc. | Argentina | 1,230 | | 136,173 |
| Microsoft Corp. | United States | 4,155 | | 158,430 |
| aNetSuite Inc. | United States | 580 | | 55,726 |
| The Sage Group PLC | United Kingdom | 26,518 | | 151,133 |
| aSalesforce.com Inc. | United States | 1,340 | | 69,801 |
| aServiceNow Inc. | United States | 890 | | 47,268 |
| Symantec Corp. | United States | 3,214 | | 72,283 |
| Trend Micro Inc. | Japan | 1,200 | | 46,981 |
| aVantiv Inc., A | United States | 900 | | 27,270 |
| Visa Inc., A | United States | 480 | | 97,661 |
| aYahoo! Inc. | United States | 1,300 | | 48,074 |
| | | | | 2,012,212 |
| Technology Hardware & Equipment 2.5% | | | | |
| Apple Inc. | United States | 604 | | 335,866 |
| Cisco Systems Inc. | United States | 7,150 | | 151,938 |
| Digital China Holdings Ltd. | China | 22,000 | | 25,682 |
| Ericsson, B | Sweden | 2,707 | | 33,720 |
| aFlextronics International Ltd. | Singapore | 5,420 | | 41,084 |
| Hewlett-Packard Co. | United States | 2,032 | | 55,575 |
| Kingboard Chemical Holdings Ltd. | Hong Kong | 25,700 | | 69,449 |
| QUALCOMM Inc. | United States | 1,400 | | 103,012 |
24 | Semiannual Report
Franklin Templeton International Trust
Consolidated Statement of Investments, November 30, 2013 (unaudited) (continued)
| | | | |
| Franklin Templeton Global Allocation Fund | Country | Shares | | Value |
| Common Stocks (continued) | | | | |
| Technology Hardware & Equipment (continued) | | | | |
| TE Connectivity Ltd. | United States | 752 | $ | 39,645 |
| aTrimble Navigation Ltd. | United States | 1,400 | | 44,660 |
| Xerox Corp. | United States | 6,962 | | 79,228 |
| YASKAWA Electric Corp. | Japan | 11,000 | | 147,347 |
| | | | | 1,127,206 |
| Telecommunication Services 1.4% | | | | |
| China Mobile Ltd. | China | 2,500 | | 26,926 |
| China Telecom Corp. Ltd., H | China | 106,000 | | 57,289 |
| Orange SA | France | 3,230 | | 42,187 |
| aSBA Communications Corp. | United States | 670 | | 57,064 |
| Telefonica SA | Spain | 5,445 | | 89,571 |
| Telenor ASA | Norway | 2,490 | | 59,814 |
| Vivendi SA | France | 1,795 | | 45,585 |
| Vodafone Group PLC | United Kingdom | 62,009 | | 230,101 |
| | | | | 608,537 |
| Transportation 1.1% | | | | |
| A.P. Moeller-Maersk AS, B | Denmark | 7 | | 70,999 |
| Canadian Pacific Railway Ltd. | Canada | 370 | | 56,935 |
| aDeutsche Lufthansa AG | Germany | 2,700 | | 58,628 |
| DSV AS, B | Denmark | 5,200 | | 159,078 |
| aHub Group Inc., A | United States | 920 | | 34,620 |
| Kansas City Southern | United States | 330 | | 39,936 |
| Union Pacific Corp. | United States | 400 | | 64,816 |
| | | | | 485,012 |
| Utilities 0.3% | | | | |
| Centrais Eletricas Brasileiras SA | Brazil | 3,400 | | 8,617 |
| Centrais Eletricas Brasileiras SA (Eletrobras), ADR | Brazil | 2,500 | | 6,400 |
| Entergy Corp. | United States | 344 | | 21,290 |
| Exelon Corp. | United States | 1,066 | | 28,686 |
| GDF Suez | France | 1,079 | | 25,020 |
| NRG Energy Inc. | United States | 1,607 | | 42,521 |
| | | | | 132,534 |
| Total Common Stocks (Cost $19,163,887) | | | | 24,464,924 |
| Preferred Stocks 0.9% | | | | |
| Banks 0.2% | | | | |
| Banco Bradesco SA, ADR, pfd. | Brazil | 6,600 | | 87,582 |
| Energy 0.2% | | | | |
| Petroleo Brasileiro SA, ADR, pfd. | Brazil | 6,258 | | 103,507 |
| Materials 0.5% | | | | |
| Vale SA, ADR, pfd., A | Brazil | 15,400 | | 216,062 |
| Total Preferred Stocks (Cost $515,794) | | | | 407,151 |
Semiannual Report | 25
Franklin Templeton International Trust
Consolidated Statement of Investments, November 30, 2013 (unaudited) (continued)
| | | | |
| Franklin Templeton Global Allocation Fund | Country | Principal Amount* | | Value |
| Corporate Bonds 2.4% | | | | |
| Banks 0.5% | | | | |
| Bank of Montreal, senior note, 1.45%, 4/09/18 | Canada | 100,000 | $ | 98,429 |
| HSBC USA Inc., senior note, 2.375%, 2/13/15 | United Kingdom | 120,000 | | 122,688 |
| | | | | 221,117 |
| Capital Goods 0.2% | | | | |
| John Deere Capital Corp., 0.70%, 9/04/15 | United States | 90,000 | | 90,490 |
| Energy 0.4% | | | | |
| Chevron Corp., senior note, 0.889%, 6/24/16 | United States | 150,000 | | 150,821 |
| bNGPL PipeCo LLC, | | | | |
| secured note, 144A, 7.119%, 12/15/17 | United States | 6,000 | | 5,550 |
| senior secured note, 144A, 9.625%, 6/01/19 | United States | 25,000 | | 24,875 |
| | | | | 181,246 |
| Food & Staples Retailing 0.3% | | | | |
| Costco Wholesale Corp., senior note, 1.125%, 12/15/17 | United States | 150,000 | | 149,047 |
| Food, Beverage & Tobacco 0.3% | | | | |
| Anheuser-Busch InBev Finance, senior note, 0.80%, 1/15/16 | Belgium | 150,000 | | 150,400 |
| Media 0.4% | | | | |
| Clear Channel Communications Inc., senior secured note, first lien, | | | | |
| 9.00%, 12/15/19 | United States | 65,000 | | 66,625 |
| The Walt Disney Co., senior note, 1.10%, 12/01/17 | United States | 110,000 | | 109,201 |
| | | | | 175,826 |
| Technology Hardware & Equipment 0.2% | | | | |
| bAvaya Inc., | | | | |
| senior note, 144A, 10.50%, 3/01/21 | United States | 22,000 | | 20,020 |
| senior secured note, 144A, 7.00%, 4/01/19 | United States | 17,000 | | 16,618 |
| Hewlett-Packard Co., senior note, 2.35%, 3/15/15 | United States | 50,000 | | 50,890 |
| | | | | 87,528 |
| Transportation 0.1% | | | | |
| bAmerican Airlines Inc., senior secured note, 144A, 7.50%, 3/15/16 | United States | 23,000 | | 28,233 |
| Total Corporate Bonds (Cost $1,066,427) | | | | 1,083,887 |
| d,eSenior Floating Rate Interests 0.1% | | | | |
| Technology Hardware & Equipment 0.1% | | | | |
| Avaya Inc., | | | | |
| Tranche B-3 Term Loan, 4.736%, 10/26/17 | United States | 20,890 | | 20,049 |
| Tranche B-5 Term Loan, 8.00%, 3/31/18 | United States | 4,971 | | 4,958 |
| Total Senior Floating Rate Interests (Cost $23,508) | | | | 25,007 |
| |
| | | Units | | |
| fExchange Traded Notes (Cost $2,068,326) 4.1% | | | | |
| Energy 4.1% | | | | |
| a,g,hiPATH Dow Jones-UBS Commodity Index Total Return ETN, 6/12/36 | United States | 51,100 | | 1,855,441 |
26 | Semiannual Report
Franklin Templeton International Trust
Consolidated Statement of Investments, November 30, 2013 (unaudited) (continued)
| | | | | |
| Franklin Templeton Global Allocation Fund | Country | Principal Amount* | | | Value |
| Foreign Government and Agency Securities 14.0% | | | | | |
| Government of Canada, | | | | | |
| 2.25%, 8/01/14 | Canada | 18,000 | CAD | $ | 17,100 |
| 1.00%, 11/01/14 | Canada | 50,000 | CAD | | 47,106 |
| 2.00%, 12/01/14 | Canada | 48,000 | CAD | | 45,669 |
| 1.00%, 2/01/15 | Canada | 132,000 | CAD | | 124,356 |
| Government of France, | | | | | |
| 3.25%, 4/25/16 | France | 125,000 | EUR | | 181,689 |
| bsenior note, 144A, 1.375%, 1/29/18 | France | 152,000 | | | 149,696 |
| Government of Hungary, | | | | | |
| 5.50%, 2/12/14 | Hungary | 10,500,000 | HUF | | 47,541 |
| 4.125%, 2/19/18 | Hungary | 50,000 | | | 50,250 |
| 5.375%, 2/21/23 | Hungary | 80,000 | | | 78,270 |
| senior note, 6.25%, 1/29/20 | Hungary | 32,000 | | | 34,480 |
| senior note, 6.375%, 3/29/21 | Hungary | 6,000 | | | 6,458 |
| csenior note, Reg S, 4.375%, 7/04/17 | Hungary | 95,000 | EUR | | 132,590 |
| csenior note, Reg S, 5.75%, 6/11/18 | Hungary | 10,000 | EUR | | 14,518 |
| Government of Ireland, | | | | | |
| 5.50%, 10/18/17 | Ireland | 40,300 | EUR | | 62,218 |
| 5.90%, 10/18/19 | Ireland | 26,000 | EUR | | 41,382 |
| 4.50%, 4/18/20 | Ireland | 40,000 | EUR | | 59,157 |
| 5.00%, 10/18/20 | Ireland | 123,000 | EUR | | 186,883 |
| senior bond, 4.50%, 10/18/18 | Ireland | 11,000 | EUR | | 16,532 |
| senior bond, 4.40%, 6/18/19 | Ireland | 37,000 | EUR | | 55,145 |
| senior bond, 5.40%, 3/13/25 | Ireland | 131,670 | EUR | | 202,487 |
| Government of Malaysia, | | | | | |
| 3.434%, 8/15/14 | Malaysia | 960,000 | MYR | | 298,792 |
| 3.741%, 2/27/15 | Malaysia | 120,000 | MYR | | 37,539 |
| 3.835%, 8/12/15 | Malaysia | 70,000 | MYR | | 21,989 |
| 4.72%, 9/30/15 | Malaysia | 507,000 | MYR | | 161,872 |
| 3.197%, 10/15/15 | Malaysia | 40,000 | MYR | | 12,435 |
| Government of Mexico, | | | | | |
| 8.00%, 12/19/13 | Mexico | 38,700 | i MXN | | 295,809 |
| 9.50%, 12/18/14 | Mexico | 23,700 | i MXN | | 191,656 |
| 6.00%, 6/18/15 | Mexico | 4,720 | i MXN | | 37,265 |
| 8.00%, 12/17/15 | Mexico | 10,770 | i MXN | | 88,894 |
| 6.25%, 6/16/16 | Mexico | 290 | i MXN | | 2,334 |
| bGovernment of Netherlands, 144A, zero cpn., 4/15/16 | Netherlands | 120,000 | EUR | | 161,907 |
| Government of Poland, | | | | | |
| 5.75%, 4/25/14 | Poland | 1,000,000 | PLN | | 327,213 |
| 5.50%, 4/25/15 | Poland | 235,000 | PLN | | 78,812 |
| 6.25%, 10/24/15 | Poland | 6,000 | PLN | | 2,059 |
| 5.00%, 4/25/16 | Poland | 165,000 | PLN | | 55,655 |
| Strip, 7/25/14 | Poland | 90,000 | PLN | | 28,646 |
| Strip, 7/25/15 | Poland | 491,000 | PLN | | 151,677 |
| Strip, 1/25/16 | Poland | 485,000 | PLN | | 147,058 |
| Government of Singapore, senior bond, 0.25%, 2/01/14 | Singapore | 322,000 | SGD | | 256,567 |
| bGovernment of Slovenia, senior note, 144A, 5.85%, 5/10/23 | Slovenia | 200,000 | | | 202,026 |
| Government of Sweden, 6.75%, 5/05/14 | Sweden | 1,670,000 | SEK | | 260,937 |
| bGovernment of Ukraine, 144A, 7.75%, 9/23/20 | Ukraine | 280,000 | | | 247,800 |
Semiannual Report | 27
Franklin Templeton International Trust
Consolidated Statement of Investments, November 30, 2013 (unaudited) (continued)
| | | | | | | |
| | | Franklin Templeton Global Allocation Fund | Country | Principal Amount* | | | Value |
| | | Foreign Government and Agency Securities (continued) | | | | | |
| | | Korea Monetary Stabilization Bond, | | | | | |
| | | senior bond, 2.47%, 4/02/15 | South Korea | 38,900,000 | KRW | $ | 36,629 |
| | | senior bond, 2.80%, 8/02/15 | South Korea | 181,710,000 | KRW | | 171,546 |
| | | senior note, 2.78%, 10/02/14 | South Korea | 71,000,000 | KRW | | 67,174 |
| | | senior note, 2.84%, 12/02/14 | South Korea | 14,730,000 | KRW | | 13,941 |
| | | senior note, 2.74%, 2/02/15 | South Korea | 40,790,000 | KRW | | 38,556 |
| | | senior note, 2.76%, 6/02/15 | South Korea | 50,000,000 | KRW | | 47,225 |
| | | Korea Treasury Bond, | | | | | |
| | | senior bond, 3.00%, 12/10/13 | South Korea | 365,000,000 | KRW | | 344,949 |
| | | senior note, 3.25%, 12/10/14 | South Korea | 92,800,000 | KRW | | 88,178 |
| | | senior note, 3.25%, 6/10/15 | South Korea | 80,160,000 | KRW | | 76,243 |
| | | senior note, 2.75%, 12/10/15 | South Korea | 216,120,000 | KRW | | 203,626 |
| | | jMexican Udibonos, Index Linked, | | | | | |
| | | 4.50%, 12/18/14 | Mexico | 557 | k MXN | | 4,470 |
| | | 5.00%, 6/16/16 | Mexico | 57,897 | k MXN | | 490,410 |
| | | 3.50%, 12/14/17 | Mexico | 1,808 | k MXN | | 15,073 |
| | | 4.00%, 6/13/19 | Mexico | 1,707 | k MXN | | 14,689 |
| | | 2.50%, 12/10/20 | Mexico | 352 | k MXN | | 2,778 |
| | | Total Foreign Government and Agency Securities | | | | | |
| | | (Cost $6,073,897) | | | | | 6,237,956 |
| | | U.S. Government and Agency Securities 7.3% | | | | | |
| | | FHLB, | | | | | |
| | | 0.25%, 2/20/15 | United States | 375,000 | | | 375,247 |
| | | 0.375%, 6/24/16 | United States | 190,000 | | | 189,908 |
| | | U.S. Treasury Note, | | | | | |
| | | 0.625%, 7/15/14 | United States | 1,375,000 | | | 1,379,243 |
| | | 0.375%, 3/15/15 | United States | 150,000 | | | 150,346 |
| | | 1.00%, 8/31/16 | United States | 1,085,000 | | | 1,100,130 |
| | | jIndex Linked, 0.125%, 4/15/18 | United States | 63,812 | | | 65,833 |
| | | Total U.S. Government and Agency Securities | | | | | |
| | | (Cost $3,244,732) | | | | | 3,260,707 |
| |
| | | | | Contracts | | | |
| | | Options Purchased (Cost $1,852) 0.0%† | | | | | |
| | | Puts – Exchange-Traded | | | | | |
| | | Telecommunication Services 0.0%† | | | | | |
| | | Verizon Communications Inc., December Strike Price $55, Expires | | | | | |
| | | 12/21/13 | United States | 4 | | | 2,160 |
| | | Total Investments before Short Term Investments | �� | | | | |
| | | (Cost $32,158,423) | | | | | 37,337,233 |
| |
| | | | | Principal Amount* | | | |
| | | Short Term Investments 12.4% | | | | | |
| | | Foreign Government and Agency Securities 3.3% | | | | | |
| | | lBank of Negara Monetary Notes, 12/19/13 - 11/06/14 | Malaysia | 1,317,000 | MYR | | 401,570 |
| | | Government of Canada, | | | | | |
| | | 1.00%, 2/01/14 | Canada | 92,000 | CAD | | 86,672 |
| | | 2.00%, 3/01/14 | Canada | 20,000 | CAD | | 18,890 |
| 28 | | | Semiannual Report | | | | | |
Franklin Templeton International Trust
Consolidated Statement of Investments, November 30, 2013 (unaudited) (continued)
| | | | | |
| Franklin Templeton Global Allocation Fund | Country | Principal Amount* | | | Value |
| Short Term Investments (continued) | | | | | |
| Foreign Government and Agency Securities (continued) | | | | | |
| Government of Germany, 2.25%, 4/11/14 | Germany | 125,000 | EUR | $ | 171,086 |
| Government of Poland, Strip, 1/25/14 | Poland | 500,000 | PLN | | 160,998 |
| Korea Monetary Stabilization Bond, | | | | | |
| senior bond, 2.72%, 9/09/14 | South Korea | 18,000,000 | KRW | | 17,019 |
| senior note, 2.57%, 6/09/14 | South Korea | 126,000,000 | KRW | | 119,057 |
| lMexico Treasury Bills, 12/11/13 - 4/30/14 | Mexico | 121,060 | mMXN | | 91,393 |
| lMonetary Authority of Singapore Treasury Bill, 1/03/14 | Singapore | 270,000 | SGD | | 215,109 |
| lSingapore Treasury Bills, 1/10/14 - 1/24/14 | Singapore | 201,000 | SGD | | 160,128 |
| lSweden Treasury Bill, 12/18/13 | Sweden | 120,000 | SEK | | 18,290 |
| Total Foreign Government and Agency Securities | | | | | |
| (Cost $1,464,699) | | | | | 1,460,212 |
| U.S. Government and Agency Securities (Cost $1,050,496) 2.3% | | | | | |
| U.S. Treasury Note, 0.25%, 3/31/14 | United States | 1,050,000 | | | 1,050,431 |
| Total Investments before Money Market Funds | | | | | |
| (Cost $34,673,618) | | | | | 39,847,876 |
| |
| | | Shares | | | |
| Money Market Funds (Cost $3,046,319) 6.8% | | | | | |
| a,nInstitutional Fiduciary Trust Money Market Portfolio | United States | 3,046,319 | | | 3,046,319 |
| Total Investments (Cost $37,719,937) 95.9% | | | | | 42,894,195 |
| Other Assets, less Liabilities 4.1% | | | | | 1,812,148 |
| Net Assets 100.0% | | | | $ | 44,706,343 |
†Rounds to less than 0.1% of net assets.
*The principal amount is stated in U.S. dollars unless otherwise indicated.
aNon-income producing.
bSecurity was purchased pursuant to Rule 144A under the Securities Act of 1933 and may be sold in transactions exempt from registration only to qualified institutional buyers or in
a public offering registered under the Securities Act of 1933. These securities have been deemed liquid under guidelines approved by the Trust’s Board of Trustees. At November 30,
2013, the aggregate value of these securities was $981,759, representing 2.20% of net assets.
cSecurity was purchased pursuant to Regulation S under the Securities Act of 1933, which exempts from registration securities offered and sold outside of the United States. Such a
security cannot be sold in the United States without either an effective registration statement filed pursuant to the Securities Act of 1933, or pursuant to an exemption from regis-
tration. These securities have been deemed liquid under guidelines approved by the Trust’s Board of Trustees. At November 30, 2013, the aggregate value of these securities was
$403,867, representing 0.90% of net assets.
dSee Note 1(g) regarding senior floating rate interests.
eThe coupon rate shown represents the rate at period end.
fSee Note 1(e) regarding exchange traded notes.
gSecurity does not guarantee any return of principal at maturity, upon redemption or otherwise. Cash payment at maturity or upon early redemption is based on the performance of
the indicated index less an investor fee.
hThe security is owned by GAF Holdings Corp., a wholly-owned subsidiary of the Fund. See Note 1(f).
iPrincipal amount is stated in 100 Mexican Peso Units.
jPrincipal amount of security is adjusted for inflation. See Note 1(i).
kPrincipal amount is stated in 100 Unidad de Inversion Units.
lThe security is traded on a discount basis with no stated coupon rate.
mPrincipal amount is stated in 10 Mexican Peso Units.
nSee Note 7 regarding investments in the Institutional Fiduciary Trust Money Market Portfolio.
Semiannual Report | 29
Franklin Templeton International Trust
Consolidated Statement of Investments, November 30, 2013 (unaudited) (continued)
Franklin Templeton Global Allocation Fund
At November 30, 2013, the Fund had the following financial futures contracts outstanding. See Note 1(c).
| | | | | | | | | | |
| Financial Futures Contracts | | | | | | | | | | |
| |
| | | Number of | | Notional | Expiration | | Unrealized | | Unrealized | |
| Description | Type | Contracts | | Value | Date | | Appreciation Depreciation | |
| Equity Contracts | | | | | | | | | | |
| Amsterdam Index | Short | 4 | $ | 431,210 | 12/20/13 | $ | — | $ | (6,465 | ) |
| CAC 40 Index | Long | 10 | | 582,210 | 12/20/13 | | 7,244 | | — | |
| DAX Index | Long | 12 | | 3,835,171 | 12/20/13 | | 289,693 | | — | |
| FTSE 100 Index | Long | 12 | | 1,305,405 | 12/20/13 | | 14,786 | | — | |
| KOSPI 200 Index | Long | 16 | | 2,042,317 | 12/12/13 | | 68,329 | | — | |
| S&P 500 E-Mini | Short | 25 | | 2,255,125 | 12/20/13 | | — | | (152,951 | ) |
| S&P/TSX 60 Index | Short | 4 | | 581,215 | 12/19/13 | | — | | (32,824 | ) |
| TOPIX Index | Short | 7 | | 862,826 | 12/12/13 | | — | | (59,483 | ) |
| Unrealized appreciation (depreciation) on equity contracts | | | | | $ | 380,052 | $ | (251,723 | ) |
| |
| Interest Rate Contracts | | | | | | | | | | |
| Australian 10 Yr. Bond | Long | 42 | | 4,395,680 | 12/16/13 | | — | | (14,186 | ) |
| Canadian 10 Yr. Bond | Short | 2 | | 242,487 | 3/20/14 | | 691 | | — | |
| Euro-Bund | Short | 45 | | 8,662,449 | 12/6/13 | | — | | (186,265 | ) |
| Long Gilt | Short | 21 | | 3,742,515 | 3/27/14 | | 6,795 | | — | |
| U.S. Treasury 10 Yr. Note | Long | 29 | | 3,635,875 | 3/20/14 | | 2,177 | | — | |
| Unrealized appreciation (depreciation) on interest rate contracts | | | | | 9,663 | | (200,451 | ) |
| Net unrealized appreciation (depreciation) on financial futures contracts | | | | | | $ | (62,459 | ) |
| | | | | | | | | | |
| At November 30, 2013, the Fund had the following forward exchange contracts outstanding. See Note 1(c). | | |
| |
| Forward Exchange Contracts | | | | | | | | | | |
| | | | | Contract | Settlement | | Unrealized | Unrealized | |
| Currency | Counterparty | Type | Quantity | Amount* | Date | | Appreciation Depreciation | |
| Indian Rupee | JPHQ | Buy | 11,380,800 | 170,703 | 12/04/13 | $ | 11,451 | $ | — | |
| Indian Rupee | JPHQ | Sell | 11,380,800 | 182,268 | 12/04/13 | | 114 | | — | |
| Australian Dollar | DBAB | Sell | 230,000 | 211,293 | 12/18/13 | | 2,027 | | — | |
| British Pound | DBAB | Sell | 900,000 | 1,426,956 | 12/18/13 | | — | | (44,879 | ) |
| Canadian Dollar | DBAB | Sell | 1,210,000 | 1,167,956 | 12/18/13 | | 28,615 | | — | |
| Euro | DBAB | Sell | 1,308,000 | 1,734,851 | 12/18/13 | | — | | (41,925 | ) |
| Japanese Yen | DBAB | Sell | 138,000,000 | 1,389,869 | 12/18/13 | | 42,288 | | — | |
| Norwegian Krone | DBAB | Buy | 4,750,000 | 797,150 | 12/18/13 | | — | | (23,090 | ) |
| South Korean Won | JPHQ | Sell | 397,922,400 | 363,790 | 12/18/13 | | — | | (11,721 | ) |
| Swedish Krona | DBAB | Buy | 3,137,000 | 476,643 | 12/18/13 | | 1,449 | | — | |
| Swiss Franc | DBAB | Sell | 900,000 | 965,034 | 12/18/13 | | — | | (27,770 | ) |
| Euro | UBSW | Sell | 108,000 | 143,575 | 12/20/13 | | — | | (3,131 | ) |
| Euro | RBS | Buy | 392,000 | 530,364 | 12/27/13 | | 2,125 | | — | |
| Polish Zloty | RBS | Buy | 400,000 | 127,632 | 12/27/13 | | 1,378 | | — | |
| Euro | DBAB | Sell | 24,773 | 32,557 | 1/07/14 | | — | | (1,095 | ) |
| Euro | BOFA | Sell | 54,060 | 70,718 | 1/17/14 | | — | | (2,718 | ) |
| Euro | BONY | Sell | 408 | 543 | 1/17/14 | | — | | (11 | ) |
| |
| 30 | Semiannual Report | | | | | | | | | | |
Franklin Templeton International Trust
Consolidated Statement of Investments, November 30, 2013 (unaudited) (continued)
| | | | | | | | | | |
| Franklin Templeton Global Allocation Fund | | | | | | | | | |
| |
| Forward Exchange Contracts (continued) | | | | | | | | | |
| | | | | Contract | Settlement | | Unrealized | | Unrealized | |
| Currency | Counterparty | Type | Quantity | Amount* | Date | | Appreciation Depreciation | |
| Euro | BZWS | Sell | 49,245 | 64,307 | 1/17/14 | $ | — | $ | (2,589 | ) |
| Euro | DBAB | Sell | 3,429 | 4,541 | 1/17/14 | | — | | (117 | ) |
| Euro | FBCO | Sell | 1,360 | 1,862 | 1/17/14 | | 14 | | — | |
| Euro | FBCO | Sell | 7,513 | 10,079 | 1/17/14 | | — | | (127 | ) |
| Euro | HSBC | Buy | 215 | 292 | 1/17/14 | | — | | (1 | ) |
| Euro | HSBC | Sell | 1,559 | 2,131 | 1/17/14 | | 13 | | — | |
| Euro | HSBC | Sell | 4,958 | 6,688 | 1/17/14 | | — | | (47 | ) |
| Euro | SSBT | Sell | 1,134 | 1,516 | 1/17/14 | | — | | (25 | ) |
| Euro | SSBT | Sell | 565 | 773 | 1/17/14 | | 6 | | — | |
| Japanese Yen | DBAB | Sell | 3,820,000 | 43,092 | 1/17/14 | | 5,782 | | — | |
| Japanese Yen | JPHQ | Sell | 6,930,000 | 78,267 | 1/17/14 | | 10,582 | | — | |
| Euro | DBAB | Sell | 64,000 | 86,336 | 1/31/14 | | — | | (606 | ) |
| Euro | DBAB | Sell | 113,000 | 151,638 | 2/11/14 | | — | | (1,871 | ) |
| Japanese Yen | HSBC | Sell | 4,290,000 | 46,123 | 2/12/14 | | 4,218 | | — | |
| Japanese Yen | JPHQ | Sell | 4,287,000 | 46,115 | 2/12/14 | | 4,239 | | — | |
| South Korean Won | FBCO | Buy | 4,605,319 | 4,297 | 2/12/14 | | 33 | | — | |
| South Korean Won | FBCO | Sell | 89,007,319 | 83,185 | 2/12/14 | | — | | (513 | ) |
| South Korean Won | HSBC | Sell | 1,166,809 | 1,099 | 2/12/14 | | 2 | | — | |
| Japanese Yen | CITI | Sell | 5,680,000 | 61,467 | 2/13/14 | | 5,983 | | — | |
| Japanese Yen | JPHQ | Sell | 2,850,000 | 30,795 | 2/13/14 | | 2,956 | | — | |
| Japanese Yen | JPHQ | Sell | 2,850,000 | 30,780 | 2/18/14 | | 2,940 | | — | |
| Malaysian Ringgit | HSBC | Buy | 49,054 | 14,547 | 2/18/14 | | 665 | | — | |
| British Pound | BOFA | Sell | 288,070 | 447,857 | 2/19/14 | | — | | (23,015 | ) |
| British Pound | FBCO | Sell | 21,964 | 35,146 | 2/19/14 | | — | | (756 | ) |
| British Pound | HSBC | Buy | 28,480 | 44,142 | 2/19/14 | | 2,411 | | — | |
| British Pound | HSBC | Sell | 5,098 | 8,121 | 2/19/14 | | — | | (212 | ) |
| British Pound | SSBT | Sell | 5,600 | 8,698 | 2/19/14 | | — | | (455 | ) |
| Japanese Yen | CITI | Sell | 2,840,000 | 30,770 | 2/19/14 | | 3,027 | | — | |
| Japanese Yen | GSFX | Sell | 2,850,000 | 30,746 | 2/19/14 | | 2,905 | | — | |
| Japanese Yen | BZWS | Sell | 1,420,000 | 15,339 | 2/25/14 | | 1,467 | | — | |
| Euro | BZWS | Sell | 70,528 | 94,209 | 2/27/14 | | — | | (1,605 | ) |
| Japanese Yen | BZWS | Sell | 2,840,000 | 30,708 | 2/27/14 | | 2,964 | | — | |
| Japanese Yen | DBAB | Sell | 915,000 | 9,996 | 2/27/14 | | 1,058 | | — | |
| Indian Rupee | JPHQ | Buy | 11,380,800 | 178,382 | 2/28/14 | | — | | (324 | ) |
| Euro | DBAB | Sell | 83,517 | 109,887 | 3/03/14 | | — | | (3,574 | ) |
| Euro | BZWS | Sell | 7,491 | 9,802 | 3/07/14 | | — | | (375 | ) |
| Euro | DBAB | Sell | 40,000 | 52,356 | 3/07/14 | | — | | (1,986 | ) |
| Japanese Yen | BZWS | Sell | 3,863,800 | 38,972 | 3/07/14 | | 1,225 | | — | |
| Euro | BZWS | Sell | 12,953 | 16,874 | 3/10/14 | | — | | (723 | ) |
| Euro | CITI | Sell | 25,814 | 33,725 | 3/10/14 | | — | | (1,345 | ) |
| Mexican Peso | HSBC | Buy | 753,430 | 57,352 | 3/10/14 | | — | | (313 | ) |
| Malaysian Ringgit | HSBC | Buy | 113,809 | 35,915 | 3/11/14 | | — | | (620 | ) |
| Malaysian Ringgit | JPHQ | Buy | 30,630 | 9,672 | 3/12/14 | | — | | (173 | ) |
| Euro | BZWS | Sell | 4,551 | 5,922 | 3/17/14 | | — | | (261 | ) |
| Euro | CITI | Sell | 2,661 | 3,454 | 3/18/14 | | — | | (161 | ) |
| |
| | | | | | | | Semiannual Report | 31 | |
Franklin Templeton International Trust
Consolidated Statement of Investments, November 30, 2013 (unaudited) (continued)
| | | | | | | | | | | | | |
| | | Franklin Templeton Global Allocation Fund | | | | | | | | | | |
| |
| | | Forward Exchange Contracts (continued) | | | | | | | | | | |
| | | | | | | Contract | | Settlement | | Unrealized | | Unrealized | |
| | | Currency | Counterparty | Type | Quantity | Amount* | | Date | | Appreciation Depreciation | |
| | | Malaysian Ringgit | DBAB | Buy | 38,299 | 11,505 | | 3/18/14 | $ | 373 | $ | — | |
| | | Hungary Forint | DBAB | Buy | 8,203,000 | 25,977 | EUR | 3/19/14 | | 1,450 | | — | |
| | | Hungary Forint | JPHQ | Buy | 2,458,480 | 7,793 | EUR | 3/19/14 | | 424 | | — | |
| | | Japanese Yen | CITI | Sell | 3,100,000 | 32,650 | | 3/19/14 | | 2,363 | | — | |
| | | Hungary Forint | JPHQ | Buy | 4,113,000 | 12,988 | EUR | 3/20/14 | | 776 | | — | |
| | | Euro | BZWS | Sell | 4,538 | 5,893 | | 3/21/14 | | — | | (272 | ) |
| | | Hungary Forint | JPHQ | Buy | 4,091,000 | 12,989 | EUR | 3/21/14 | | 676 | | — | |
| | | Japanese Yen | BZWS | Sell | 1,580,000 | 16,702 | | 3/24/14 | | 1,265 | | — | |
| | | Japanese Yen | DBAB | Sell | 1,542,000 | 16,333 | | 3/24/14 | | 1,266 | | — | |
| | | Euro | CITI | Sell | 9,009 | 11,718 | | 3/26/14 | | — | | (522 | ) |
| | | Euro | DBAB | Sell | 4,566 | 5,887 | | 3/31/14 | | — | | (316 | ) |
| | | Euro | DBAB | Buy | 4,566 | 5,960 | | 3/31/14 | | 244 | | — | |
| | | Euro | DBAB | Sell | 2,665 | 3,425 | | 4/03/14 | | — | | (196 | ) |
| | | Euro | BZWS | Sell | 4,483 | 5,770 | | 4/07/14 | | — | | (321 | ) |
| | | Euro | DBAB | Sell | 5,365 | 7,021 | | 4/11/14 | | — | | (268 | ) |
| | | Euro | HSBC | Sell | 5,386 | 7,050 | | 4/16/14 | | — | | (268 | ) |
| | | Japanese Yen | BZWS | Sell | 1,270,000 | 13,056 | | 4/21/14 | | 645 | | — | |
| | | Japanese Yen | JPHQ | Sell | 760,000 | 7,802 | | 4/21/14 | | 375 | | — | |
| | | Euro | BZWS | Sell | 4,457 | 5,870 | | 4/22/14 | | — | | (186 | ) |
| | | Euro | JPHQ | Sell | 865 | 1,132 | | 4/22/14 | | — | | (43 | ) |
| | | Japanese Yen | JPHQ | Sell | 880,000 | 8,990 | | 4/22/14 | | 390 | | — | |
| | | Euro | BZWS | Sell | 3,615 | 4,715 | | 4/30/14 | | — | | (197 | ) |
| | | Euro | DBAB | Sell | 16,000 | 21,242 | | 4/30/14 | | — | | (497 | ) |
| | | Euro | BZWS | Sell | 9,004 | 11,934 | | 5/05/14 | | — | | (299 | ) |
| | | Euro | GSFX | Sell | 4,537 | 5,969 | | 5/07/14 | | — | | (196 | ) |
| | | Euro | CITI | Sell | 9,840 | 12,987 | | 5/13/14 | | — | | (382 | ) |
| | | Euro | BOFA | Sell | 58,752 | 78,990 | | 5/15/14 | | — | | (837 | ) |
| | | Euro | BZWS | Sell | 3,672 | 4,779 | | 5/16/14 | | — | | (210 | ) |
| | | Euro | BOFA | Sell | 789 | 1,064 | | 5/19/14 | | — | | (8 | ) |
| | | Euro | BZWS | Sell | 19,084 | 24,566 | | 5/21/14 | | — | | (1,364 | ) |
| | | Swedish Krona | BZWS | Buy | 480,000 | 53,359 | EUR | 5/21/14 | | 437 | | — | |
| | | Euro | JPHQ | Sell | 11,547 | 14,929 | | 5/23/14 | | — | | (760 | ) |
| | | Euro | BZWS | Sell | 5,324 | 6,879 | | 5/30/14 | | — | | (355 | ) |
| | | Euro | BZWS | Sell | 13,300 | 17,337 | | 6/05/14 | | — | | (735 | ) |
| | | Japanese Yen | CITI | Sell | 3,100,000 | 31,259 | | 6/09/14 | | 955 | | — | |
| | | Japanese Yen | HSBC | Sell | 4,600,000 | 46,460 | | 6/09/14 | | 1,492 | | — | |
| | | Japanese Yen | JPHQ | Sell | 3,100,000 | 31,135 | | 6/09/14 | | 831 | | — | |
| | | Japanese Yen | BZWS | Sell | 4,130,000 | 42,439 | | 6/10/14 | | 2,066 | | — | |
| | | Japanese Yen | HSBC | Sell | 4,400,000 | 45,487 | | 6/10/14 | | 2,474 | | — | |
| | | Japanese Yen | JPHQ | Sell | 2,980,000 | 30,286 | | 6/10/14 | | 1,154 | | — | |
| | | Japanese Yen | DBAB | Sell | 1,500,000 | 15,609 | | 6/11/14 | | 946 | | — | |
| | | Japanese Yen | JPHQ | Sell | 4,080,000 | 42,490 | | 6/11/14 | | 2,605 | | — | |
| | | Japanese Yen | JPHQ | Sell | 1,700,000 | 17,992 | | 6/17/14 | | 1,373 | | — | |
| | | Euro | BZWS | Sell | 1,929 | 2,590 | | 6/20/14 | | — | | (31 | ) |
| | | Euro | DBAB | Sell | 12,000 | 15,872 | | 7/25/14 | | — | | (436 | ) |
| |
| 32 | | | Semiannual Report | | | | | | | | | | | |
Franklin Templeton International Trust
Consolidated Statement of Investments, November 30, 2013 (unaudited) (continued)
| | | | | | | | | | | |
| Franklin Templeton Global Allocation Fund | | | | | | | | | | |
| |
| Forward Exchange Contracts (continued) | | | | | | | | | | |
| | | | | Contract | | Settlement | | Unrealized | | Unrealized | |
| Currency | Counterparty | Type | Quantity | Amount* | | Date | | Appreciation Depreciation | |
| Euro | GSFX | Sell | 12,000 | 15,886 | | 7/25/14 | $ | — | $ | (421 | ) |
| Euro | JPHQ | Sell | 16,000 | 21,271 | | 7/31/14 | | — | | (473 | ) |
| Euro | UBSW | Sell | 17,000 | 22,625 | | 8/01/14 | | — | | (478 | ) |
| Euro | HSBC | Sell | 16,000 | 21,207 | | 8/04/14 | | — | | (537 | ) |
| Euro | BZWS | Sell | 8,000 | 10,610 | | 8/05/14 | | — | | (262 | ) |
| Japanese Yen | CITI | Sell | 34,544,250 | 356,104 | | 8/29/14 | | 18,179 | | — | |
| Japanese Yen | JPHQ | Sell | 33,831,600 | 348,171 | | 8/29/14 | | 17,217 | | — | |
| Philippine Peso | JPHQ | Buy | 10,959,000 | 246,936 | | 8/29/14 | | 5,857 | | — | |
| Swedish Krona | DBAB | Buy | 3,003,165 | 341,548 | EUR | 8/29/14 | | — | | (8,823 | ) |
| Euro | DBAB | Sell | 805,000 | 1,066,062 | | 9/03/14 | | — | | (28,034 | ) |
| Chilean Peso | DBAB | Buy | 114,700,000 | 214,754 | | 9/05/14 | | — | | (5,828 | ) |
| Hungary Forint | JPHQ | Buy | 4,038,000 | 13,320 | EUR | 9/23/14 | | — | | (206 | ) |
| Hungary Forint | JPHQ | Buy | 3,232,000 | 10,554 | EUR | 9/25/14 | | — | | (20 | ) |
| Euro | DBAB | Sell | 32,000 | 43,182 | | 9/26/14 | | — | | (314 | ) |
| Mexican Peso | DBAB | Buy | 1,296,000 | 95,716 | | 10/14/14 | | 675 | | — | |
| Chilean Peso | CITI | Buy | 160,137,000 | 307,778 | | 10/20/14 | | — | | (17,399 | ) |
| Japanese Yen | JPHQ | Sell | 6,550,000 | 66,728 | | 10/20/14 | | 2,620 | | — | |
| Euro | BZWS | Sell | 174,000 | 237,945 | | 10/21/14 | | 1,417 | | — | |
| Japanese Yen | BZWS | Sell | 840,000 | 8,614 | | 10/22/14 | | 391 | | — | |
| Euro | JPHQ | Sell | 17,084 | 22,780 | | 11/12/14 | | — | | (445 | ) |
| Japanese Yen | JPHQ | Sell | 1,300,000 | 13,146 | | 11/13/14 | | 418 | | — | |
| Japanese Yen | DBAB | Sell | 1,634,000 | 16,447 | | 11/14/14 | | 449 | | — | |
| Euro | DBAB | Sell | 21,573 | 28,999 | | 11/17/14 | | — | | (329 | ) |
| Euro | JPHQ | Sell | 21,301 | 28,833 | | 11/20/14 | | — | | (126 | ) |
| Brazilian Real | HSBC | Buy | 110,000 | 44,643 | | 11/21/14 | | — | | (1,389 | ) |
| Unrealized appreciation (depreciation) | | | | | | | 213,740 | | (271,917 | ) |
| Net unrealized appreciation (depreciation) | | | | | | | | $ | (58,177 | ) |
| |
| *In U.S. dollars unless otherwise indicated. | | | | | | | | | | | |
At November 30, 2013, the Fund had the following interest rate swap contracts outstanding. See Note 1(c).
| | | | | | | | | |
| Interest Rate Swap Contracts | | | | | | | | | |
| | Counterparty/ | | | Notional | | Unrealized | | Unrealized | |
| Description | Exchange | Expiration Date | | Amount | | Appreciation | | Depreciation | |
| Centrally Cleared Swaps | | | | | | | | | |
| Receive Floating rate 3-month USD BBA LIBOR Pay Fixed rate semiannual 3.018% | CME | 8/22/23 | $ | 190,000 | $ | — | $ | (5,306 | ) |
| Receive Floating rate 3-month USD BBA LIBOR Pay Fixed rate semiannual 3.848% | CME | 8/22/43 | | 110,000 | | — | | (2,850 | ) |
| Net unrealized appreciation (depreciation) | | | | | | | $ | (8,156 | ) |
Semiannual Report | 33
Franklin Templeton International Trust
Consolidated Statement of Investments, November 30, 2013 (unaudited) (continued)
Franklin Templeton Global Allocation Fund
At November 30, 2013, the Fund had the following total return swap contracts outstanding. See Note 1(c).
| | | | | | | | | |
| Total Return Swap Contracts | | | | | | | | | |
| | Counterparty/ | Notional | | Number of | Expiration | Unrealized | | Unrealized | |
| Description | Exchange | Amount | | Contracts | Date | Appreciation | | Depreciation | |
| OTC Swaps | | | | | | | | | |
| Traded Index | | | | | | | | | |
| Swiss Market Index Bullet Swap | MSCO | 1,489,860 | CHF | 18 | 12/20/13 | $ — | $ | (5,531 | ) |
| OTC Swaps unrealized appreciation (depreciation) | | | | | | | $ | (5,531 | ) |
| |
| See Abbreviations on page 57. | | | | | | | | | |
34 | The accompanying notes are an integral part of these consolidated financial statements. | Semiannual Report
Franklin Templeton International Trust
Consolidated Financial Statements
Consolidated Statement of Assets and Liabilities
November 30, 2013 (unaudited)
| | | |
| | | Franklin Templeton | |
| | | Global Allocation | |
| | | Fund | |
| Assets: | | | |
| Investments in securities: | | | |
| Cost - Unaffiliated issuers | $ | 34,673,618 | |
| Cost - Sweep Money Fund (Note 7) | | 3,046,319 | |
| Total cost of investments | $ | 37,719,937 | |
| Value - Unaffiliated issuers | $ | 39,847,876 | |
| Value - Sweep Money Fund (Note 7) | | 3,046,319 | |
| Total value of investments | | 42,894,195 | |
| Cash | | 423,423 | |
| Restricted cash (Note 1d) | | 59,400 | |
| Foreign currency, at value (cost $44,998) | | 45,011 | |
| Receivables: | | | |
| Investment securities sold | | 23,241 | |
| Capital shares sold | | 2,787 | |
| Dividends and interest | | 164,015 | |
| Affiliates | | 8,073 | |
| Due from brokers | | 1,334,868 | |
| Variation margin | | 12,688 | |
| Unrealized appreciation on forward exchange contracts | | 213,740 | |
| Total assets | | 45,181,441 | |
| Liabilities: | | | |
| Payables: | | | |
| Investment securities purchased | | 77,850 | |
| Capital shares redeemed | | 4,281 | |
| Management fees | | 17,455 | |
| Distribution fees | | 9,516 | |
| Transfer agent fees | | 19,272 | |
| Due to brokers | | 59,400 | |
| Unrealized depreciation on forward exchange contracts | | 271,917 | |
| Unrealized depreciation on OTC swap contracts | | 5,531 | |
| Deferred tax | | 221 | |
| Accrued expenses and other liabilities | | 9,655 | |
| Total liabilities | | 475,098 | |
| Net assets, at value | $ | 44,706,343 | |
| Net assets consist of: | | | |
| Paid-in capital | $ | 39,076,308 | |
| Undistributed net investment income | | 883,857 | |
| Net unrealized appreciation (depreciation) | | 5,045,171 | |
| Accumulated net realized gain (loss) | | (298,993 | ) |
| Net assets, at value | $ | 44,706,343 | |
Semiannual Report | The accompanying notes are an integral part of these consolidated financial statements. | 35
Franklin Templeton International Trust
Consolidated Financial Statements (continued)
Consolidated Statement of Assets and Liabilities (continued)
November 30, 2013 (unaudited)
| | | |
| | | | Franklin Templeton |
| | | | Global Allocation |
| | | | Fund |
| Class A: | | | |
| Net assets, at value | $ | | 23,171,283 |
| Shares outstanding | | | 2,057,655 |
| Net asset value per sharea | | $ | 11.26 |
| Maximum offering price per share (net asset value per share ÷ 94.25%) | | $ | 11.95 |
| Class C: | | | |
| Net assets, at value | $ | | 6,010,194 |
| Shares outstanding | | | 538,286 |
| Net asset value and maximum offering price per sharea | | $ | 11.17 |
| Class R: | | | |
| Net assets, at value | $ | | 2,273,834 |
| Shares outstanding | | | 202,451 |
| Net asset value and maximum offering price per share | | $ | 11.23 |
| Advisor Class: | | | |
| Net assets, at value | $ | | 13,251,032 |
| Shares outstanding | | | 1,174,063 |
| Net asset value and maximum offering price per share | | $ | 11.29 |
| |
| |
| aRedemption price is equal to net asset value less contingent deferred sales charges, if applicable. | | | |
36 | The accompanying notes are an integral part of these consolidated financial statements. | Semiannual Report
Franklin Templeton International Trust
Consolidated Financial Statements (continued)
Consolidated Statement of Operations
for the six months ended November 30, 2013 (unaudited)
| | | |
| | | Franklin Templeton | |
| | | Global Allocation | |
| | | Fund | |
| Investment income: | | | |
| Dividends (net of foreign taxes of $13,175) | $ | 233,217 | |
| Interest (net of foreign taxes of $2,044) | | 141,789 | |
| Total investment income | | 375,006 | |
| Expenses: | | | |
| Management fees (Note 3a) | | 211,754 | |
| Administrative fees (Note 3b) | | 770 | |
| Distribution fees: (Note 3c) | | | |
| Class A | | 28,268 | |
| Class C | | 29,025 | |
| Class R | | 5,459 | |
| Transfer agent fees: (Note 3e) | | | |
| Class A | | 9,332 | |
| Class C | | 2,603 | |
| Class R | | 918 | |
| Advisor Class | | 5,983 | |
| Custodian fees (Note 4) | | 3,500 | |
| Reports to shareholders | | 11,379 | |
| Registration and filing fees | | 32,688 | |
| Professional fees | | 41,191 | |
| Other | | 23,411 | |
| Total expenses | | 406,281 | |
| Expense reductions (Note 4) | | (10 | ) |
| Expenses waived/paid by affiliates (Note 3f) | | (121,060 | ) |
| Net expenses | | 285,211 | |
| Net investment income | | 89,795 | |
| Realized and unrealized gains (losses): | | | |
| Net realized gain (loss) from: | | | |
| Investments | | 504,245 | |
| Foreign currency transactions | | (43,710 | ) |
| Futures contracts | | (151,316 | ) |
| Swap contracts | | (69,482 | ) |
| Net realized gain (loss) | | 239,737 | |
| Net change in unrealized appreciation (depreciation) on: | | | |
| Investments | | 1,695,567 | |
| Translation of other assets and liabilities denominated in foreign currencies | | (141,014 | ) |
| Change in deferred taxes on unrealized appreciation | | (221 | ) |
| Net change in unrealized appreciation (depreciation) | | 1,554,332 | |
| Net realized and unrealized gain (loss) | | 1,794,069 | |
| Net increase (decrease) in net assets resulting from operations | $ | 1,883,864 | |
Semiannual Report | The accompanying notes are an integral part of these consolidated financial statements. | 37
Franklin Templeton International Trust
Consolidated Financial Statements (continued)
| | | | | | |
| Consolidated Statements of Changes in Net Assets | | | | | | |
| |
| |
| | | Franklin Templeton | |
| | | Global Allocation Fund | |
| | | Six Months Ended | | | | |
| | | November 30, 2013 | | | Year Ended | |
| | | (unaudited) | | | May 31, 2013 | |
| Increase (decrease) in net assets: | | | | | | |
| Operations: | | | | | | |
| Net investment income | $ | 89,795 | | $ | 303,284 | |
| Net realized gain (loss) from investments, written options, foreign currency transactions, | | | | | | |
| futures contracts and swap contracts | | 239,737 | | | 305,609 | |
| Net change in unrealized appreciation (depreciation) on investments, translation of other | | | | | | |
| assets and liabilities denominated in foreign currencies and deferred taxes | | 1,554,332 | | | 5,169,329 | |
| Net increase (decrease) in net assets resulting from operations | | 1,883,864 | | | 5,778,222 | |
| Distributions to shareholders from: | | | | | | |
| Net investment income and net foreign currency gains: | | | | | | |
| Class A | | — | | | (402,416 | ) |
| Class C | | — | | | (63,603 | ) |
| Class R | | — | | | (31,141 | ) |
| Advisor Class | | — | | | (273,230 | ) |
| Total distributions to shareholders | | — | | | (770,390 | ) |
| Capital share transactions: (Note 2) | | | | | | |
| Class A | | (1,207,863 | ) | | 2,893,112 | |
| Class C | | (540,188 | ) | | 2,117,484 | |
| Class R | | 24,837 | | | 2,342 | |
| Advisor Class | | (1,907,023 | ) | | 181,598 | |
| Total capital share transactions | | (3,630,237 | ) | | 5,194,536 | |
| Net increase (decrease) in net assets | | (1,746,373 | ) | | 10,202,368 | |
| Net assets: | | | | | | |
| Beginning of period | | 46,452,716 | | | 36,250,348 | |
| End of period | $ | 44,706,343 | | $ | 46,452,716 | |
| Undistributed net investment income included in net assets: | | | | | | |
| End of period | $ | 883,857 | | $ | 794,062 | |
38 | The accompanying notes are an integral part of these consolidated financial statements. | Semiannual Report
Franklin Templeton International Trust
Notes to Consolidated Financial Statements (unaudited)
Franklin Templeton Global Allocation Fund
1. ORGANIZATION AND SIGNIFICANT ACCOUNTING POLICIES
Franklin Templeton International Trust (Trust) is registered under the Investment Company Act of 1940, as amended, (1940 Act) as an open-end investment company, consisting of four separate funds. The Franklin Templeton Global Allocation Fund (Fund) is included in this report. The financial statements of the remaining funds in the Trust are presented separately. The Fund offers four classes of shares: Class A, Class C, Class R, and Advisor Class. Each class of shares differs by its initial sales load, contingent deferred sales charges, voting rights on matters affecting a single class, its exchange privilege and fees primarily due to differing arrangements for distribution and transfer agent fees.
The following summarizes the Fund’s significant accounting policies.
a. Financial Instrument Valuation
The Fund’s investments in financial instruments are carried at fair value daily. Fair value is the price that would be received to sell an asset or paid to transfer a liability in an orderly transaction between market participants on the measurement date. Under procedures approved by the Trust’s Board of Trustees (the Board), the Fund’s administrator, investment manager and other affiliates have formed the Valuation and Liquidity Oversight Committee (VLOC). The VLOC provides administration and oversight of the Fund’s valuation policies and procedures, which are approved annually by the Board. Among other things, these procedures allow the Fund to utilize independent pricing services, quotations from securities and financial instrument dealers, and other market sources to determine fair value.
Equity securities, exchange traded funds and derivative financial instruments (derivatives) listed on an exchange or on the NASDAQ National Market System are valued at the last quoted sale price or the official closing price of the day, respectively. Foreign equity securities are valued as of the close of trading on the foreign stock exchange on which the security is primarily traded, or the NYSE, whichever is earlier. The value is then converted into its U.S. dollar equivalent at the foreign exchange rate in effect at the close of the NYSE on the day that the value of the security is determined. Over-the-counter (OTC) securities are valued within the range of the most recent quoted bid and ask prices. Securities that trade in multiple markets or on multiple exchanges are valued according to the broadest and most representative market. Certain equity securities are valued based upon fundamental characteristics or relationships to similar securities.
Debt securities generally trade in the OTC market rather than on a securities exchange. The Fund’s pricing services use multiple valuation techniques to determine fair value. In instances where sufficient market activity exists, the pricing services may utilize a market-based approach through which quotes from market makers are used to determine fair value. In instances where sufficient market activity may not exist or is limited, the pricing services also utilize proprietary valuation models which may consider market characteristics such as benchmark yield curves,
Semiannual Report | 39
Franklin Templeton International Trust
Notes to Consolidated Financial Statements (unaudited) (continued)
Franklin Templeton Global Allocation Fund
| 1. | ORGANIZATION AND SIGNIFICANT ACCOUNTING POLICIES (continued) |
| a. | Financial Instrument Valuation (continued) |
credit spreads, estimated default rates, anticipated market interest rate volatility, coupon rates, anticipated timing of principal repayments, underlying collateral, and other unique security features in order to estimate the relevant cash flows, which are then discounted to calculate the fair value. Securities denominated in a foreign currency are converted into their U.S. dollar equivalent at the foreign exchange rate in effect at the close of the NYSE on the date that the values of the foreign debt securities are determined.
Certain derivatives trade in the OTC market. The Fund’s pricing services use various techniques including industry standard option pricing models and proprietary discounted cash flow models to determine the fair value of those instruments. The Fund’s net benefit or obligation under the derivative contract, as measured by the fair value of the contract, is included in net assets.
The Fund has procedures to determine the fair value of financial instruments for which market prices are not reliable or readily available. Under these procedures, the VLOC convenes on a regular basis to review such financial instruments and considers a number of factors, including significant unobservable valuation inputs, when arriving at fair value. The VLOC primarily employs a market-based approach which may use related or comparable assets or liabilities, recent transactions, market multiples, book values, and other relevant information for the investment to determine the fair value of the investment. An income-based valuation approach may also be used in which the anticipated future cash flows of the investment are discounted to calculate fair value. Discounts may also be applied due to the nature or duration of any restrictions on the disposition of the investments. Due to the inherent uncertainty of valuations of such investments, the fair values may differ significantly from the values that would have been used had an active market existed. The VLOC employs various methods for calibrating these valuation approaches including a regular review of key inputs and assumptions, transactional back-testing or disposition analysis, and reviews of any related market activity.
Trading in securities on foreign securities stock exchanges and OTC markets may be completed before the daily close of business on the NYSE. Occasionally, events occur between the time at which trading in a foreign security is completed and the close of the NYSE that might call into question the reliability of the value of a portfolio security held by the Fund. As a result, differences may arise between the value of the Fund’s portfolio securities as determined at the foreign market close and the latest indications of value at the close of the NYSE. In order to minimize the potential for these differences, the VLOC monitors price movements following the close of trading in foreign stock markets through a series of country specific market proxies (such as baskets of American Depositary Receipts, futures contracts and exchange traded funds). These price movements are measured against established trigger thresholds for each specific market
40 | Semiannual Report
Franklin Templeton International Trust
Notes to Consolidated Financial Statements (unaudited) (continued)
Franklin Templeton Global Allocation Fund
| 1. | ORGANIZATION AND SIGNIFICANT ACCOUNTING POLICIES (continued) |
| a. | Financial Instrument Valuation (continued) |
proxy to assist in determining if an event has occurred that may call into question the reliability of the values of the foreign securities held by the Fund. If such an event occurs, the securities may be valued using fair value procedures, which may include the use of independent pricing services.
In addition, certain foreign markets may be open on days that the NYSE is closed, which could result in differences between the value of the Fund’s portfolio securities on the last business day and the last calendar day of the reporting period. Any significant security valuation changes due to an open foreign market are adjusted and reflected by the Fund for financial reporting purposes.
b. Foreign Currency Translation
Portfolio securities and other assets and liabilities denominated in foreign currencies are translated into U.S. dollars based on the exchange rate of such currencies against U.S. dollars on the date of valuation. The Fund may enter into foreign currency exchange contracts to facilitate transactions denominated in a foreign currency. Purchases and sales of securities, income and expense items denominated in foreign currencies are translated into U.S. dollars at the exchange rate in effect on the transaction date. Portfolio securities and assets and liabilities denominated in foreign currencies contain risks that those currencies will decline in value relative to the U.S. dollar. Occasionally, events may impact the availability or reliability of foreign exchange rates used to convert the U.S. dollar equivalent value. If such an event occurs, the foreign exchange rate will be valued at fair value using procedures established and approved by the Board.
The Fund does not separately report the effect of changes in foreign exchange rates from changes in market prices on securities held. Such changes are included in net realized and unrealized gain or loss from investments on the Consolidated Statement of Operations.
Realized foreign exchange gains or losses arise from sales of foreign currencies, currency gains or losses realized between the trade and settlement dates on securities transactions and the difference between the recorded amounts of dividends, interest, and foreign withholding taxes and the U.S. dollar equivalent of the amounts actually received or paid. Net unrealized foreign exchange gains and losses arise from changes in foreign exchange rates on foreign denominated assets and liabilities other than investments in securities held at the end of the reporting period.
c. Derivative Financial Instruments
The Fund invested in derivatives in order to manage risk or gain exposure to various other investments or markets. Derivatives are financial contracts based on an underlying or notional amount, require no initial investment or an initial net investment that is smaller than would normally be required to have a similar response to changes in market factors, and require or
Semiannual Report | 41
Franklin Templeton International Trust
Notes to Consolidated Financial Statements (unaudited) (continued)
Franklin Templeton Global Allocation Fund
| 1. | ORGANIZATION AND SIGNIFICANT ACCOUNTING POLICIES (continued) |
| c. | Derivative Financial Instruments (continued) |
permit net settlement. Derivatives contain various risks including the potential inability of the counterparty to fulfill their obligations under the terms of the contract, the potential for an illiquid secondary market, and/or the potential for market movements which expose the Fund to gains or losses in excess of the amounts shown on the Consolidated Statement of Assets and Liabilities. Realized gain and loss and unrealized appreciation and depreciation on these contracts for the period are included in the Consolidated Statement of Operations.
Derivative counterparty credit risk is managed through a formal evaluation of the creditworthiness of all potential counterparties. The Fund attempts to reduce its exposure to counterparty credit risk on OTC derivatives, whenever possible, by entering into International Swaps and Derivatives Association (ISDA) master agreements with certain counterparties. These agreements contain various provisions, including but not limited to collateral requirements, events of default, or early termination. Termination events applicable to the counterparty include certain deteriorations in the credit quality of the counterparty. Termination events applicable to the Fund include failure of the Fund to maintain certain net asset levels and/or limit the decline in net assets over various periods of time. In the event of default or early termination, the ISDA master agreement gives the non-defaulting party the right to net and close-out all transactions traded, whether or not arising under the ISDA agreement, to one net amount payable by one counterparty to the other. However, absent an event of default or early termination, OTC derivative assets and liabilities are presented gross and not offset in the Consolidated Statement of Assets and Liabilities. Early termination by the counterparty may result in an immediate payment by the Fund of any net liability owed to that counterparty under the ISDA agreement.
Collateral requirements differ by type of derivative. Collateral or initial margin requirements are set by the broker or exchange clearing house for exchange traded and centrally cleared derivatives. Initial margin deposited is held at the exchange and can be in the form of cash and/or securities. For OTC derivatives traded under an ISDA master agreement, posting of collateral is required by either the fund or the applicable counterparty if the total net exposure of all OTC derivatives with the applicable counterparty exceeds the minimum transfer amount, which typically ranges from $100,000 to $250,000, and can vary depending on the counterparty and the type of the agreement. Generally, collateral is determined at the close of fund business each day and any additional collateral required due to changes in derivative values may be delivered by the fund or the counterparty within a few business days. Collateral pledged and/or received by the fund for OTC derivatives, if any, is held in segregated accounts with the fund’s custodian/counterparty broker and can be in the form of cash and/or securities. Unrestricted cash may be invested according to the Fund’s investment objectives.
42 | Semiannual Report
Franklin Templeton International Trust
Notes to Consolidated Financial Statements (unaudited) (continued)
Franklin Templeton Global Allocation Fund
| 1. | ORGANIZATION AND SIGNIFICANT ACCOUNTING POLICIES (continued) |
| c. | Derivative Financial Instruments (continued) |
The Fund entered into exchange traded financial futures contracts primarily to manage and/or gain exposure to interest rate or equity price risk, and certain foreign securities. A futures contract is an agreement between the Fund and a counterparty to buy or sell an asset for a specified price on a future date. Required initial margins are pledged by the Fund, and the daily change in fair value is accounted for as a variation margin payable or receivable on the Consolidated Statement of Assets and Liabilities.
The Fund entered into OTC forward exchange contracts primarily to manage and/or gain exposure to certain foreign currencies. A forward exchange contract is an agreement between the Fund and a counterparty to buy or sell a foreign currency at a specific exchange rate on a future date.
The Fund entered into interest rate swap contracts primarily to manage interest rate risk. An interest rate swap is an agreement between the Fund and a counterparty to exchange cash flows based on the difference between two interest rates, applied to a notional amount. These agreements may be privately negotiated in the over-the-counter market (“OTC interest rate swaps”) or may be executed on a registered exchange (“centrally cleared interest rate swaps”). For centrally cleared interest rate swaps, required initial margins are pledged by the Fund, and the daily change in fair value is accounted for as a variation margin payable or receivable on the Consolidated Statement of Assets and Liabilities. Over the term of the contract, contractually required payments to be paid and to be received are accrued daily and recorded as unrealized depreciation and appreciation until the payments are made, at which time they are realized.
The Fund entered into OTC total return swap contracts primarily to manage and/or gain exposure to equity price risk of an underlying asset. A total return swap is an agreement between the Fund and a counterparty to exchange a market linked return for a floating rate payment, both based upon a notional amount. Over the term of the contract, contractually required payments to be paid or received are accrued daily and recorded as unrealized depreciation or appreciation until the payments are made, at which time they are realized. Payments received or paid to recognize changes in the value of the underlying asset are recorded as realized gain or loss.
The Fund purchased or wrote exchange traded option contracts primarily to manage and/or gain exposure to equity price risk. An option is a contract entitling the holder to purchase or sell a specific amount of shares or units of an asset or notional amount of a swap (swaption), at a specified price. Options purchased are recorded as an asset while options written are recorded as a liability. Upon exercise of an option, the acquisition cost or sales proceeds of the underlying investment is adjusted by any premium received or paid. Upon expiration of an option, any premium received or paid is recorded as a realized gain or loss. Upon closing an option other than through expiration or exercise, the difference between the premium and the cost to close the position is recorded as a realized gain or loss.
See Note 9 regarding other derivative information.
Semiannual Report | 43
Franklin Templeton International Trust
Notes to Consolidated Financial Statements (unaudited) (continued)
Franklin Templeton Global Allocation Fund
| 1. | ORGANIZATION AND SIGNIFICANT ACCOUNTING POLICIES (continued) |
| d. | Restricted Cash |
At November 30, 2013, the Fund received restricted cash in connection with investments in certain derivative securities. Restricted cash is held in a segregated account with the Fund’s custodian and is reflected in the Consolidated Statement of Assets and Liabilities.
e. Exchange Traded Notes
The Fund purchases exchange traded notes. Exchange traded notes are senior, unsecured, unsub-ordinated debt securities issued by an underwriting bank. Exchange traded notes are designed to provide investors access to the returns of various market benchmarks and intended to replicate the economic effects that would apply had the Fund directly purchased the underlying referenced asset or basket of assets. The risks of exchange traded notes include the credit risk of the issuer, counterparty risk, and the potential inability of the Fund to dispose of the exchange traded note in the normal course of business.
f. Investment in GAF Holdings Corp. (GAF Subsidiary)
The Fund invests in certain financial instruments through its investment in the GAF Subsidiary. The GAF Subsidiary is a Cayman Islands exempted Liability Company, is a wholly-owned subsidiary of the Fund, and is able to invest in certain financial instruments consistent with the investment objective of the Fund. At November 30, 2013, the GAF Subsidiary’s investment as well as any other assets and liabilities of the GAF Subsidiary are reflected in the Fund’s Consolidated Statement of Investments and Consolidated Statement of Assets and Liabilities. The financial statements have been consolidated and include the accounts of the Fund and the GAF Subsidiary. All intercompany transactions and balances have been eliminated. At November 30, 2013, the net assets of the GAF Subsidiary were $2,237,235, representing 5.00% of the Fund’s consolidated net assets. The Fund’s investment in the GAF Subsidiary is limited to 25% of consolidated assets.
g. Senior Floating Rate Interests
The Fund invests in senior secured corporate loans that pay interest at rates which are periodically reset by reference to a base lending rate plus a spread. These base lending rates are generally the prime rate offered by a designated U.S. bank or the London InterBank Offered Rate (LIBOR). Senior secured corporate loans often require prepayment of principal from excess cash flows or at the discretion of the borrower. As a result, actual maturity may be substantially less than the stated maturity. Senior secured corporate loans in which the Fund invests are generally readily marketable, but may be subject to certain restrictions on resale.
44 | Semiannual Report
Franklin Templeton International Trust
Notes to Consolidated Financial Statements (unaudited) (continued)
Franklin Templeton Global Allocation Fund
| 1. | ORGANIZATION AND SIGNIFICANT ACCOUNTING POLICIES (continued) |
| h. | Income and Deferred Taxes |
It is the Fund’s policy to qualify as a regulated investment company under the Internal Revenue Code. The Fund intends to distribute to shareholders substantially all of its taxable income and net realized gains to relieve it from federal income and excise taxes. As a result, no provision for U.S. federal income taxes is required.
The Fund may be subject to foreign taxation related to income received, capital gains on the sale of securities and certain foreign currency transactions in the foreign jurisdictions in which it invests. Foreign taxes, if any, are recorded based on the tax regulations and rates that exist in the foreign markets in which the Fund invests. When a capital gain tax is determined to apply the Fund records an estimated deferred tax liability in an amount that would be payable if the securities were disposed of on the valuation date.
The Fund recognizes the tax benefits of uncertain tax positions only when the position is “more likely than not” to be sustained upon examination by the tax authorities based on the technical merits of the tax position. As of November 30, 2013, and for all open tax years, the Fund has determined that no liability for unrecognized tax benefits is required in the Fund’s financial statements related to uncertain tax positions taken on a tax return (or expected to be taken on future tax returns). Open tax years are those that remain subject to examination and are based on each tax jurisdiction statute of limitation.
i. Security Transactions, Investment Income, Expenses and Distributions
Security transactions are accounted for on trade date. Realized gains and losses on security transactions are determined on a specific identification basis. Interest income and estimated expenses are accrued daily. Amortization of premium and accretion of discount on debt securities are included in interest income. Dividend income is recorded on the ex-dividend date except that certain dividends from foreign securities are recognized as soon as the Fund is notified of the ex-dividend date. Distributions to shareholders are recorded on the ex-dividend date and are determined according to income tax regulations (tax basis). Distributable earnings determined on a tax basis may differ from earnings recorded in accordance with accounting principles generally accepted in the United States of America. These differences may be permanent or temporary. Permanent differences are reclassified among capital accounts to reflect their tax character. These reclassifications have no impact on net assets or the results of operations. Temporary differences are not reclassified, as they may reverse in subsequent periods.
Common expenses incurred by the Trust are allocated among the funds based on the ratio of net assets of each fund to the combined net assets of the Trust. Fund specific expenses are charged directly to the fund that incurred the expense.
Semiannual Report | 45
Franklin Templeton International Trust
Notes to Consolidated Financial Statements (unaudited) (continued)
Franklin Templeton Global Allocation Fund
| 1. | ORGANIZATION AND SIGNIFICANT ACCOUNTING POLICIES (continued) |
| i. | Security Transactions, Investment Income, Expenses and Distributions (continued) |
Realized and unrealized gains and losses and net investment income, not including class specific expenses, are allocated daily to each class of shares based upon the relative proportion of net assets of each class. Differences in per share distributions, by class, are generally due to differences in class specific expenses.
Inflation-indexed bonds are adjusted for inflation through periodic increases or decreases in the security’s interest accruals, face amount, or principal redemption value, by amounts corresponding to the rate of inflation as measured by an index. Any increase or decrease in the face amount or principal redemption value will be included as interest income on the Consolidated Statement of Operations.
j. Accounting Estimates
The preparation of financial statements in accordance with accounting principles generally accepted in the United States of America requires management to make estimates and assumptions that affect the reported amounts of assets and liabilities at the date of the financial statements and the amounts of income and expenses during the reporting period. Actual results could differ from those estimates.
k. Guarantees and Indemnifications
Under the Trust’s organizational documents, its officers and trustees are indemnified by the Trust against certain liabilities arising out of the performance of their duties to the Trust. Additionally, in the normal course of business, the Trust, on behalf of the Fund, enters into contracts with service providers that contain general indemnification clauses. The Trust’s maximum exposure under these arrangements is unknown as this would involve future claims that may be made against the Trust that have not yet occurred. Currently, the Trust expects the risk of loss to be remote.
2. SHARES OF BENEFICIAL INTEREST
At November 30, 2013, there were an unlimited number of shares authorized (without par value).
Transactions in the Fund’s shares were as follows:
| | | | | | | | | | |
| | Six Months Ended | | Year Ended | |
| | November 30, 2013 | | May 31, 2013 | |
| | Shares | | | Amount | | Shares | | | Amount | |
| Class A Shares: | | | | | | | | | | |
| Shares sold | 331,900 | | $ | 3,630,662 | | 716,072 | | $ | 7,472,067 | |
| Shares issued in reinvestment of | | | | | | | | | | |
| distributions | — | | | — | | 14,233 | | | 148,024 | |
| Shares redeemed | (452,055 | ) | | (4,838,525 | ) | (447,532 | ) | | (4,726,979 | ) |
| Net increase (decrease) | (120,155 | ) | $ | (1,207,863 | ) | 282,773 | | $ | 2,893,112 | |
| 46 | Semiannual Report | | | | | | | | | | |
Franklin Templeton International Trust
Notes to Consolidated Financial Statements (unaudited) (continued)
| | | | | | | | | | | |
| Franklin Templeton Global Allocation Fund | | | | | | | | | | | |
| |
| 2. SHARES OF BENEFICIAL INTEREST (continued) | | | | | | | | | | | |
| |
| | Six Months Ended | | Year Ended | |
| | November 30, 2013 | | May 31, 2013 | |
| | Shares | | | | Amount | | Shares | | | Amount | |
| Class C Shares: | | | | | | | | | | | |
| Shares sold | 103,871 | | $ | 1,122,729 | | 240,247 | | $ | 2,478,372 | |
| Shares issued in reinvestment of | | | | | | | | | | | |
| distributions | — | | | | — | | 3,453 | | | 35,846 | |
| Shares redeemed | (154,583 | ) | | | (1,662,917 | ) | (37,964 | ) | | (396,734 | ) |
| Net increase (decrease) | (50,712 | ) | | $ | (540,188 | ) | 205,736 | | $ | 2,117,484 | |
| Class R Shares: | | | | | | | | | | | |
| Shares sold | 2,228 | | | $ | 24,837 | | 221 | | $ | 2,321 | |
| Shares issued in reinvestment of | | | | | | | | | | | |
| distributions | — | | | | — | | 2 | | | 21 | |
| Net increase (decrease) | 2,228 | | | $ | 24,837 | | 223 | | $ | 2,342 | |
| Advisor Class Shares: | | | | | | | | | | | |
| Shares sold | 20,950 | | | $ | 226,234 | | 64,328 | | $ | 668,503 | |
| Shares issued in reinvestment of | | | | | | | | | | | |
| distributions | — | | | | — | | 472 | | | 4,910 | |
| Shares redeemed | (192,051 | ) | | | (2,133,257 | ) | (47,142 | ) | | (491,815 | ) |
| Net increase (decrease) | (171,101 | ) | $ | (1,907,023 | ) | 17,658 | | $ | 181,598 | |
3. TRANSACTIONS WITH AFFILIATES
Franklin Resources, Inc. is the holding company for various subsidiaries that together are referred to as Franklin Templeton Investments. Certain officers and trustees of the Trust are also officers and/or directors of the following subsidiaries:
| |
| Subsidiary | Affiliation |
| Franklin Advisers, Inc. (Advisers) | Investment manager |
| Franklin Mutual Advisers, LLC (Franklin Mutual) | Investment manager |
| Franklin Templeton Institutional, LLC (FT Institutional) | Investment manager |
| Franklin Templeton Investment Management Limited (FTIML) | Investment manager |
| Templeton Asset Management Ltd. (TAML) | Investment manager |
| Templeton Global Advisors Limited (TGAL) | Investment manager |
| Templeton Investment Counsel, LLC (TIC) | Investment manager |
| Franklin Templeton Services, LLC (FT Services) | Administrative manager |
| Franklin Templeton Distributors, Inc. (Distributors) | Principal underwriter |
| Franklin Templeton Investor Services, LLC (Investor Services) | Transfer agent |
Semiannual Report | 47
Franklin Templeton International Trust
Notes to Consolidated Financial Statements (unaudited) (continued)
Franklin Templeton Global Allocation Fund
| 3. | TRANSACTIONS WITH AFFILIATES (continued) |
| a. | Management Fees |
The Fund pays an investment management fee to Advisers based on the average daily net assets of the Fund as follows:
| | |
| Annualized Fee Rate | | Net Assets |
| 0.950 | % | Up to and including $1 billion |
| 0.930 | % | Over $1 billion, up to and including $5 billion |
| 0.910 | % | Over $5 billion, up to and including $10 billion |
| 0.890 | % | Over $10 billion, up to and including $15 billion |
| 0.870 | % | Over $15 billion, up to and including $20 billion |
| 0.850 | % | In excess of $20 billion |
Management fees paid by the Fund are reduced on assets invested in the GAF Subsidiary, in an amount not to exceed the management fees paid by GAF Subsidiary.
The GAF Subsidiary pays an investment management fee to Advisers based on the average daily net assets of the GAF Subsidiary as follows:
| | |
| Annualized Fee Rate | | Net Assets |
| 0.950 | % | Up to and including $1 billion |
| 0.930 | % | Over $1 billion, up to and including $5 billion |
| 0.910 | % | Over $5 billion, up to and including $10 billion |
| 0.890 | % | Over $10 billion, up to and including $15 billion |
| 0.870 | % | Over $15 billion, up to and including $20 billion |
| 0.850 | % | In excess of $20 billion |
Effective October 1, 2013, the GAF Subsidiary combined its investment management and administration agreements as approved by the Board. The fees paid under the combined agreement do not exceed the aggregate fees that were paid under each of the separate agreements.
Prior to October 1, 2013, the GAF Subsidiary paid fees to Advisers based on the average daily net assets of the GAF Subsidiary as follows:
| | |
| Annualized Fee Rate | | Net Assets |
| 0.750 | % | Up to and including $1 billion |
| 0.730 | % | Over $1 billion, up to and including $5 billion |
| 0.710 | % | Over $5 billion, up to and including $10 billion |
| 0.690 | % | Over $10 billion, up to and including $15 billion |
| 0.670 | % | Over $15 billion, up to and including $20 billion |
| 0.650 | % | In excess of $20 billion |
48 | Semiannual Report
Franklin Templeton International Trust
Notes to Consolidated Financial Statements (unaudited) (continued)
Franklin Templeton Global Allocation Fund
| 3. | TRANSACTIONS WITH AFFILIATES (continued) |
| a. | Management Fees (continued) |
Under a subadvisory agreement, Franklin Mutual, FT Institutional, FTIML, TAML, TGAL, and TIC, affiliates of Advisers, provide subadvisory services to the Fund. The subadvisory fee is paid by Advisers based on the average daily net assets, and is not an additional expense of the Fund.
b. Administrative Fees
Under an agreement with Advisers, FT Services provides administrative services to the Fund. The fee is paid by Advisers based on the Fund’s average daily net assets, and is not an additional expense of the Fund.
Effective October 1, 2013, under an agreement with Advisers, FT Services provides administrative services to the GAF Subsidiary. The fee is paid by Advisers based on the GAF Subsidiary’s average daily net assets, and is not an additional expense of the GAF Subsidiary.
Prior to October 1, 2013, the GAF Subsidiary paid administrative fees to FT Services of 0.20% per year of the average daily net assets of the GAF Subsidiary. Administrative fees paid by the Fund were reduced on assets invested in the GAF Subsidiary, in an amount not to exceed the administrative fees paid by the GAF Subsidiary.
c. Distribution Fees
The Board has adopted distribution plans for each share class, with the exception of Advisor Class shares, pursuant to Rule 12b-1 under the 1940 Act. Distribution fees are not charged on shares held by affiliates. Under the Fund’s Class A reimbursement distribution plan, the Fund reimburses Distributors for costs incurred in connection with the servicing, sale and distribution of the Fund’s shares up to the maximum annual plan rate. Under the Class A reimbursement distribution plan, costs exceeding the maximum for the current plan year cannot be reimbursed in subsequent periods. In addition, under the Fund’s Class C and R compensation distribution plans, the Fund pays Distributors for costs incurred in connection with the servicing, sale and distribution of the Fund’s shares up to the maximum annual plan rate for each class. The plan year, for purposes of monitoring compliance with the maximum annual plan rates, is February 1 through January 31.
The maximum annual plan rates, based on the average daily net assets, for each class, are as follows:
| | |
| Class A | 0.30 | % |
| Class C | 1.00 | % |
| Class R | 0.50 | % |
Semiannual Report | 49
Franklin Templeton International Trust
Notes to Consolidated Financial Statements (unaudited) (continued)
Franklin Templeton Global Allocation Fund
| 3. | TRANSACTIONS WITH AFFILIATES (continued) |
| d. | Sales Charges/Underwriting Agreements |
Front-end sales charges and contingent deferred sales charges (CDSC) do not represent expenses of the Fund. These charges are deducted from the proceeds of sales of Fund shares prior to investment or from redemption proceeds prior to remittance, as applicable. Distributors have advised the Fund of the following commission transactions related to the sales and redemptions of the Fund’s shares for the period:
| | |
| Sales charges retained net of commissions paid to unaffiliated | | |
| broker/dealers | $ | 7,114 |
| CDSC retained | $ | 2,824 |
e. Transfer Agent Fees
Each class of shares pays transfer agent fees to Investor Services for its performance of shareholder servicing obligations and reimburses Investor Services for out of pocket expenses incurred, including shareholding servicing fees paid to third parties. These fees are allocated daily based upon their relative proportion of such classes’ aggregate net assets.
For the period ended November 30, 2013, the Fund paid transfer agent fees of $18,836, of which $9,444 was retained by Investor Services.
f. Waiver and Expense Reimbursements
Advisers has contractually agreed in advance to waive or limit its fees and to assume as its own expense certain expenses otherwise payable by the Fund so that the expenses (excluding distribution fees and acquired fund fees and expenses) for each class of the Fund do not exceed 1.00% based on the average net assets of each class (other than certain non-routine expenses or costs, including those relating to litigation, indemnification, reorganizations, and liquidations) until September 30, 2014.
g. Other Affiliated Transactions
At November 30, 2013, Advisers owned 59.15% of the Fund’s outstanding shares. Investment activities of this investment company could have a material impact on the Fund.
4. EXPENSE OFFSET ARRANGEMENT
The Fund has entered into an arrangement with its custodian whereby credits realized as a result of uninvested cash balances are used to reduce a portion of the Fund’s custodian expenses. During the period ended November 30, 2013, the custodian fees were reduced as noted in the Consolidated Statement of Operations.
50 | Semiannual Report
Franklin Templeton International Trust
Notes to Consolidated Financial Statements (unaudited) (continued)
Franklin Templeton Global Allocation Fund
5. INCOME TAXES
For tax purposes, capital losses may be carried over to offset future capital gains, if any. At May 31, 2013, the Fund had short-term capital loss carryforwards of $282,890.
At November 30, 2013, the cost of investments and net unrealized appreciation (depreciation) for income tax purposes were as follows:
| | | |
| Cost of investments | $ | 38,020,354 | |
| |
| Unrealized appreciation | $ | 6,015,294 | |
| Unrealized depreciation | | (1,141,453 | ) |
| Net unrealized appreciation (depreciation) | $ | 4,873,841 | |
Differences between income and/or capital gains as determined on a book basis and a tax basis are primarily due to differing treatments of foreign currency transactions, wash sales and financial futures transactions.
6. INVESTMENT TRANSACTIONS
Purchases and sales of investments (excluding short term securities) for the period ended November 30, 2013, aggregated $7,236,705 and $10,456,839, respectively.
7. INVESTMENTS IN INSTITUTIONAL FIDUCIARY TRUST MONEY MARKET PORTFOLIO
The Fund invests in the Institutional Fiduciary Trust Money Market Portfolio (Sweep Money Fund), an open-end investment company managed by Advisers. Management fees paid by the Fund are reduced on assets invested in the Sweep Money Fund, in an amount not to exceed the management and administrative fees paid by the Sweep Money Fund.
8. CONCENTRATION OF RISK
Investing in foreign securities may include certain risks and considerations not typically associated with investing in U.S. securities, such as fluctuating currency values and changing local and regional economic, political and social conditions, which may result in greater market volatility. In addition, certain foreign securities may not be as liquid as U.S. securities.
Semiannual Report | 51
Franklin Templeton International Trust
Notes to Consolidated Financial Statements (unaudited) (continued)
Franklin Templeton Global Allocation Fund
9. OTHER DERIVATIVE INFORMATION
At November 30, 2013, the Fund’s investments in derivative contracts are reflected on the Consolidated Statement of Assets and Liabilities as follows:
| | | | | | | | |
| | Asset Derivatives | | Liability Derivatives | |
| Derivative Contracts | Consolidated Statement | | | | Consolidated Statement | | | |
| Not Accounted for as | of Assets and | | Fair Value | | of Assets and | | Fair Value | |
| Hedging Instruments | Liabilities Locations | | Amount | | Liabilities Locations | | Amount | |
| Interest rate contracts | Variation margin / Net assets | | | | Net assets consist of – net | | | |
| | consist of – net unrealized | | | | unrealized appreciation | | | |
| | appreciation (depreciation) | $ | 9,663 | a | (depreciation) | $ | 208,607 | a |
| Foreign exchange | | | | | | | | |
| contracts | Unrealized appreciation on | | | | Unrealized depreciation on | | | |
| | forward exchange contracts / | | | | forward exchange contracts / | | | |
| | Net assets consist of – net | | | | Net assets consist of – net | | | |
| | unrealized appreciation | | | | unrealized appreciation | | | |
| | (depreciation) | | 213,740 | | (depreciation) | | 271,917 | |
| Equity contracts | Variation margin / Net assets | | | | Unrealized depreciation on | | | |
| | consist of – net unrealized | | | | OTC swap contracts / Net | | | |
| | appreciation depreciation) | | 382,212 | a | assets consist of – net | | | |
| | | | | | unrealized appreciation | | | |
| | | | | | (depreciation) | | 257,254 | a |
aIncludes cumulative appreciation (depreciation) of futures contracts and centrally cleared swaps as reported in the Consolidated Statement of Investments. Only current day’s variation margin is separately reported within the Consolidated Statement of Assets and Liabilities.
For the period ended November 30, 2013, the effect of derivative contracts on the Fund’s Consolidated Statement of Operations was as follows:
| | | | | | | |
| | | | | | | Change in | |
| | | | | | | Unrealized | |
| Derivative Contracts | | | Realized Gain | | | Appreciation | |
| Not Accounted for as | | | (Loss) for | | | (Depreciation) | |
| Hedging Instruments | Consolidated Statement of Operations Locations | | the Period | | | for the Period | |
| Interest rate contracts | Net realized gain (loss) from futures / swap contracts / | | | | | | |
| Net change in unrealized appreciation (depreciation) |
| | on investments | $ | 213,377 | | $ | (160,600 | ) |
| Foreign exchange contracts | Net realized gain (loss) from foreign currency transactions / | | | | | | |
| Net change in unrealized appreciation (depreciation) |
| | on translation of other assets and liabilities denominated | | | | | | |
| | in foreign currencies | | (48,154 | ) | | (234,707 | ) |
| Equity contracts | Net realized gain (loss) from investments, futures contracts, | | | | | | |
| | and swap contracts / Net change in unrealized appreciation | | | | |
| | (depreciation) on investments | | (434,175 | ) | | (18,260 | ) |
For the period ended November 30, 2013, the average month end fair value of derivatives represented 2.61% of average month end net assets. The average month end number of open derivative contracts for the period was 214.
52 | Semiannual Report
Franklin Templeton International Trust
Notes to Consolidated Financial Statements (unaudited) (continued)
Franklin Templeton Global Allocation Fund
9. OTHER DERIVATIVE INFORMATION (continued)
See Note 1(c) regarding derivative financial instruments.
At November 30, 2013, the Fund’s OTC derivative assets and liabilities, are as follows:
| | | | |
| | | Gross and Net Amounts of Assets and Liabilities |
| | | Presented in the |
| | | Consolidated Statement of Assets and Liabilities |
| | | Assetsa | | Liabilitiesa |
| Derivatives | | | | |
| Forward Exchange Contracts | $ | 213,740 | $ | 271,917 |
| Swap Contracts | | — | | 5,531 |
| Total | $ | 213,740 | $ | 277,448 |
aAbsent an event of default or early termination, OTC derivative assets and liabilities are presented gross and not offset in the Consolidated Statement of Assets and Liabilities.
At November 30, 2013, the Fund’s OTC derivative assets which may be offset against the Fund’s derivative liabilities, and collateral received from the counterparty, is as follows:
| | | | | | | | | | | |
| | | | | Amounts Not Offset in the | | |
| | | | | Consolidated Statement of | | |
| | | | | Assets and Liabilities | | |
| | | Gross and | | | | | | | | | |
| | | Net Amounts | | | | | | | | | |
| | | of Assets | | | | | | | | | |
| | | Presented in | | | | | | | | | |
| | | the Consolidated | | Financial | | | Financial | | | | |
| | | Statement | | Instruments Instruments | | Cash | | Net Amount |
| | | of Assets | | Available for | | | Collateral | | Collateral | | (Not less |
| | | and Liabilities | | Offset | | | Received | | Receiveda | | than zero) |
| Counterparty | | | | | | | | | | | |
| BZWS | $ | 11,877 | $ | (9,785 | ) | $ | — | $ | — | $ | 2,092 |
| CITI | | 30,507 | | (19,809 | ) | | — | | — | | 10,698 |
| DBAB | | 86,622 | | (86,622 | ) | | — | | — | | — |
| FBCO | | 47 | | (47 | ) | | — | | — | | — |
| GSFX | | 2,905 | | (617 | ) | | — | | — | | 2,288 |
| HSBC | | 11,275 | | (3,387 | ) | | — | | — | | 7,888 |
| JPHQ | | 66,998 | | (14,291 | ) | | — | | — | | 52,707 |
| RBS | | 3,503 | | — | | | — | | — | | 3,503 |
| SSBT | | 6 | | (6 | ) | | — | | — | | — |
| Total | $ | 213,740 | $ | (134,564 | ) | $ | — | $ | — | $ | 79,176 |
aIn some instances, the collateral amounts disclosed in the table above were adjusted due to the requirement to limit the collateral amounts to avoid the effect of overcollateralization. Actual collateral received and/or pledged may be more than the amounts disclosed herein.
Semiannual Report | 53
Franklin Templeton International Trust
Notes to Consolidated Financial Statements (unaudited) (continued)
Franklin Templeton Global Allocation Fund
9. OTHER DERIVATIVE INFORMATION (continued)
At November 30, 2013, the Fund’s OTC derivative liabilities which may be offset against the Fund’s derivative assets, and collateral pledged to the counterparty, is as follows:
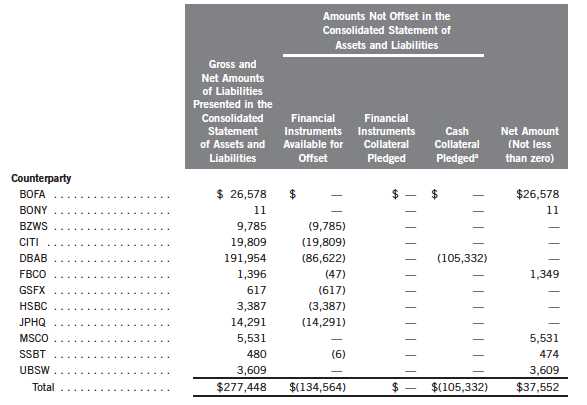
aIn some instances, the collateral amounts disclosed in the table above were adjusted due to the requirement to limit the collateral amounts to avoid the effect of overcollateralization. Actual collateral received and/or pledged may be more than the amounts disclosed herein.
See Note 1(c) regarding derivative financial instruments.
10. CREDIT FACILITY
The Fund, together with other U.S. registered and foreign investment funds (collectively, Borrowers), managed by Franklin Templeton Investments, are borrowers in a joint syndicated senior unsecured credit facility totaling $1.5 billion (Global Credit Facility) which matures on January 17, 2014. This Global Credit Facility provides a source of funds to the Borrowers for temporary and emergency purposes, including the ability to meet future unanticipated or unusually large redemption requests.
54 | Semiannual Report
Franklin Templeton International Trust
Notes to Consolidated Financial Statements (unaudited) (continued)
Franklin Templeton Global Allocation Fund
10. CREDIT FACILITY (continued)
Under the terms of the Global Credit Facility, the Fund shall, in addition to interest charged on any borrowings made by the Fund and other costs incurred by the Fund, pay its share of fees and expenses incurred in connection with the implementation and maintenance of the Global Credit Facility, based upon its relative share of the aggregate net assets of all of the Borrowers, including an annual commitment fee of 0.07% based upon the unused portion of the Global Credit Facility. These fees are reflected in other expenses on the Consolidated Statement of Operations. During the period ended November 30, 2013, the Fund did not use the Global Credit Facility.
11. FAIR VALUE MEASUREMENTS
The Fund follows a fair value hierarchy that distinguishes between market data obtained from independent sources (observable inputs) and the Fund’s own market assumptions (unobservable inputs). These inputs are used in determining the value of the Fund’s financial instruments and are summarized in the following fair value hierarchy:
- Level 1 – quoted prices in active markets for identical financial instruments
- Level 2 – other significant observable inputs (including quoted prices for similar financial instruments, interest rates, prepayment speed, credit risk, etc.)
- Level 3 – significant unobservable inputs (including the Fund’s own assumptions in determining the fair value of financial instruments)
The inputs or methodology used for valuing financial instruments are not an indication of the risk associated with investing in those financial instruments.
For movements between the levels within the fair value hierarchy, the Fund has adopted a policy of recognizing the transfers as of the date of the underlying event which caused the movement.
Semiannual Report | 55
Franklin Templeton International Trust
Notes to Consolidated Financial Statements (unaudited) (continued)
Franklin Templeton Global Allocation Fund
| 11. | FAIR VALUE MEASUREMENTS (continued) |
| | A summary of inputs used as of November 30, 2013, in valuing the Fund’s assets and liabilities carried at fair value, is as follows: |
| | | | | | | | |
| | | Level 1 | | Level 2 | | Level 3 | | Total |
| Assets: | | | | | | | | |
| Investments in Securities: | | | | | | | | |
| Equity Investments:a | | | | | | | | |
| Capital Goods | $ | 1,865,584 | $ | 22,050 | $ | — | $ | 1,887,634 |
| Energy | | 3,016,723 | | 205,275 | | — | | 3,221,998 |
| Other Equity Investmentsb | | 19,762,443 | | — | | — | | 19,762,443 |
| Corporate Bonds | | — | | 1,083,887 | | — | | 1,083,887 |
| Senior Floating Rate Interests | | — | | 25,007 | | — | | 25,007 |
| Exchange Traded Notes | | 1,855,441 | | — | | — | | 1,855,441 |
| Foreign Government and Agency Securities | | — | | 6,237,956 | | — | | 6,237,956 |
| U.S. Government and Agency Securities | | — | | 3,260,707 | | — | | 3,260,707 |
| Options Purchased | | 2,160 | | — | | — | | 2,160 |
| Short Term Investments | | 3,046,319 | | 2,510,643 | | — | | 5,556,962 |
| Total Investments in Securities | $ | 29,548,670 | $ | 13,345,525 | $ | — | $ | 42,894,195 |
| Forward Exchange Contracts | | — | | 213,740 | | — | | 213,740 |
| Futures Contracts | | 389,715 | | — | | — | | 389,715 |
| Liabilities: | | | | | | | | |
| Swaps | | — | | 13,687 | | — | | 13,687 |
| Forward Exchange Contracts | | — | | 271,917 | | — | | 271,917 |
| Futures Contracts | | 452,174 | | — | | — | | 452,174 |
| |
| aIncludes common and preferred stocks. | | | | | | | | |
| bFor detailed categories, see the accompanying Consolidated Statement of Investments. | | | | | | |
12. NEW ACCOUNTING PRONOUNCEMENTS
In June 2013, the Financial Accounting Standards Board (FASB) issued Accounting Standards Update (ASU) No. 2013-08, Investment Companies (Topic 946): Amendments to the Scope, Measurement, and Disclosure Requirements. The ASU modifies the criteria used in defining an investment company under U.S. Generally Accepted Accounting Principles and also sets forth certain measurement and disclosure requirements. Under the ASU, an entity that is registered under the 1940 Act automatically qualifies as an investment company. The ASU is effective for interim and annual reporting periods beginning after December 15, 2013. The Fund is currently reviewing the requirements and believes the adoption of this ASU will not have a material impact on its consolidated financial statements.
56 | Semiannual Report
Franklin Templeton International Trust
Notes to Consolidated Financial Statements (unaudited) (continued)
Franklin Templeton Global Allocation Fund
13. SUBSEQUENT EVENTS
The Fund has evaluated subsequent events through the issuance of the consolidated financial statements and determined that no events have occurred that require disclosure.
| | | | | | |
| ABBREVIATIONS | | | | | |
| |
| Counterparty / Exchange | Currency | Selected Portfolio |
| BOFA | -Bankof America Corp. | AUD | - Australian Dollar | ADR | - | American Depositary |
| BONY | -Bankof New York | CAD | -CanadianDollar | | | Receipt |
| BZWS | - Barclays Bank PLC | CHF | - Swiss Franc | ETN | - | Exchange Traded Note |
| CITI | - Citigroup, Inc. | EUR | - Euro | FHLB - | Federal Home Loan Bank |
| CME | - Chicago Mercantile | HUF | -HungarianForint | GDR | - | Global Depositary Receipt |
| | Exchange | IDR | -IndonesianRupiah | IDR | - | InternationalDepositary |
| DBAB | - Deutsche Bank AG | ILS | - New Israeli Shekel | | | Receipt |
| FBCO | - Credit Suisse Group AG | KRW | - South Korean Won | | | |
| GSFX | - Goldman Sachs Bank | MXN | - Mexican Peso | | | |
| HSBC | - HSBC Bank USA, NA. | MYR | - Malaysian Ringgit | | | |
| JPHQ | - JP Morgan Chase & Co. | PLN | - Polish Zloty | | | |
| MSCO | - Morgan Stanley | SEK | - Swedish Krona | | | |
| RBS | - The Royal Bank of Scotland | SGD | -SingaporeDollar | | | |
| | Group PLC | | | | | |
| SSBT | - State Street Bank Corp. | | | | | |
| UBSW | - UBS AG | | | | | |
Semiannual Report | 57
Franklin Templeton International Trust
Shareholder Information
Franklin Templeton Global Allocation Fund
Proxy Voting Policies and Procedures
The Fund’s investment manager has established Proxy Voting Policies and Procedures (Policies) that the Fund uses to determine how to vote proxies relating to portfolio securities. Shareholders may view the Fund’s complete Policies online at franklintempleton.com. Alternatively, shareholders may request copies of the Policies free of charge by calling the Proxy Group collect at (954) 527-7678 or by sending a written request to: Franklin Templeton Companies, LLC, 300 S.E. 2nd Street, Fort Lauderdale, FL 33301, Attention: Proxy Group. Copies of the Fund’s proxy voting records are also made available online at franklintempleton.com and posted on the U.S. Securities and Exchange Commission’s website at sec.gov and reflect the most recent 12-month period ended June 30.
Quarterly Statement of Investments
The Fund files a complete statement of investments with the U.S. Securities and Exchange Commission for the first and third quarters for each fiscal year on Form N-Q. Shareholders may view the filed Form N-Q by visiting the Commission’s website at sec.gov. The filed form may also be viewed and copied at the Commission’s Public Reference Room in Washington, DC. Information regarding the operations of the Public Reference Room may be obtained by calling (800) SEC-0330.
58 | Semiannual Report
This page intentionally left blank.
This page intentionally left blank.
Item 2. Code of Ethics.
(a) The Registrant has adopted a code of ethics that applies to its principal executive officers and principal financial and accounting officer.
(c) N/A
(d) N/A
(f) Pursuant to Item 12(a)(1), the Registrant is attaching as an exhibit a copy of its code of ethics that applies to its principal executive officers and principal financial and accounting officer.
Item 3. Audit Committee Financial Expert.
(a)(1) The Registrant has an audit committee financial expert serving on its audit committee.
(2) The audit committee financial expert is John B. Wilson and he is "independent" as defined under the relevant Securities and Exchange Commission Rules and Releases.
Item 4. Principal Accountant Fees and Services. N/A
Item 5. Audit Committee of Listed Registrants. N/A
Item 6. Schedule of Investments. N/A
Item 7. Disclosure of Proxy Voting Policies and Procedures for Closed-End Management Investment Companies. N/A
Item 8. Portfolio Managers of Closed-End Management Investment Companies. N/A
Item 9. Purchases of Equity Securities by Closed-End Management Investment Company and Affiliated Purchasers. N/A
Item 10. Submission of Matters to a Vote of Security Holders.
There have been no changes to the procedures by which shareholders may recommend nominees to the Registrant's Board of Trustees that would require disclosure herein.
Item 11. Controls and Procedures.
(a) Evaluation of Disclosure Controls and Procedures. The Registrant maintains disclosure controls and procedures that are designed to ensure that information required to be disclosed in the Registrant’s filings under the Securities Exchange Act of 1934 and the Investment Company Act of 1940 is recorded, processed, summarized and reported within the periods specified in the rules and forms of the Securities and Exchange Commission. Such information is accumulated and communicated to the Registrant’s management, including its principal executive officer and principal financial officer, as appropriate, to allow timely decisions regarding required disclosure. The Registrant’s management, including the principal executive officer and the principal financial officer, recognizes that any set of controls and procedures, no matter how well designed and operated, can provide only reasonable assurance of achieving the desired control objectives.
Within 90 days prior to the filing date of this Shareholder Report on Form N-CSR, the Registrant had carried out an evaluation, under the supervision and with the participation of the Registrant’s management, including the Registrant’s principal executive officer and the Registrant’s principal financial officer, of the effectiveness of the design and operation of the Registrant’s disclosure controls and procedures. Based on such evaluation, the Registrant’s principal executive officer and principal financial officer concluded that the Registrant’s disclosure controls and procedures are effective.
(b) Changes in Internal Controls. There have been no changes in the Registrant’s internal controls or in other factors that could materially affect the internal controls over financial reporting subsequent to the date of their evaluation in connection with the preparation of this Shareholder Report on Form N-CSR.
Item 12. Exhibits.
(a) (1) Code of Ethics
(a) (2) Certifications pursuant to Section 302 of the Sarbanes-Oxley Act of 2002 of Laura F. Fergerson, Chief Executive Officer - Finance and Administration, and Gaston Gardey, Chief Financial Officer and Chief Accounting Officer
(b) Certifications pursuant to Section 906 of the Sarbanes-Oxley Act of 2002 of Laura F. Fergerson, Chief Executive Officer - Finance and Administration, and Gaston Gardey, Chief Financial Officer and Chief Accounting Officer
SIGNATURES
Pursuant to the requirements of the Securities Exchange Act of 1934 and the Investment Company Act of 1940, the registrant has duly caused this report to be signed on its behalf by the undersigned, thereunto duly authorized.
FRANKLIN TEMPLETON INTERNATIONAL TRUST
By /s/LAURA F. FERGERSON
Laura F. Fergerson
Chief Executive Officer –
Finance and Administration
Date January 27, 2014
Pursuant to the requirements of the Securities Exchange Act of 1934 and the Investment Company Act of 1940, this report has been signed below by the following persons on behalf of the registrant and in the capacities and on the dates indicated.
By /s/LAURA F. FERGERSON
Laura F. Fergerson
Chief Executive Officer –
Finance and Administration
Date January 27, 2014
By /s/GASTON GARDEY
Gaston Gardey
Chief Financial Officer and
Chief Accounting Officer
Date January 27, 2014