UNITED STATES
SECURITIES AND EXCHANGE COMMISSION
WASHINGTON, D.C. 20549
FORM 10-K
(Mark One)
[ X ]ANNUAL REPORT PURSUANT TO SECTION 13 OR 15(d) OF THE SECURITIES EXCHANGE ACT OF 1934
For the fiscal year ended June 30, 2014
OR
[ ]TRANSITION REPORT PURSUANT TO SECTION 13 OR 15(d) OF THE SECURITIES EXCHANGE ACT OF 1934
For the transition period from _____ to ______
Commission file number 000-19483
SWS GROUP, INC.
(Exact name of registrant as specified in its charter)
| |
| |
Delaware | 75-2040825 |
(State or other jurisdiction of | (I.R.S. Employer |
incorporation or organization) | Identification No.) |
| |
1201 Elm Street, Suite 3500, Dallas, Texas | 75270 |
(Address of principal executive offices) | (Zip Code) |
Registrant's telephone number, including area code (214) 859-1800
Securities registered pursuant to Section 12(b) of the Act:
| | | | |
| Title of each class | | Name of each exchange on which registered | |
| Common Stock, par value $0.10 per share | | New York Stock Exchange | |
Securities registered pursuant to Section 12(g) of the Act: None
Indicate by check mark if the registrant is a well-known seasoned issuer, as defined in Rule 405 of the Securities Act. Yes____ No__X__
Indicate by check mark if the registrant is not required to file reports pursuant to Section 13 or Section 15(d) of the Act. Yes_____ No_X___
Indicate by check mark whether the registrant (1) has filed all reports required to be filed by Section 13 or 15(d) of the Securities Exchange Act of 1934 during the preceding 12 months (or for such shorter period that the registrant was required to file such reports), and (2) has been subject to such filing requirements for the past 90 days. Yes X No ______
Indicate by check mark whether the registrant has submitted electronically and posted on its corporate Web site, if any, every Interactive Data File required to be submitted and posted pursuant to Rule 405 of Regulation S-T (§232.405 of this chapter) during the preceding 12 months (or for such shorter period that the registrant was required to submit and post such files). Yes X No _____
Indicate by check mark if disclosure of delinquent filers pursuant to Item 405 of Regulation S-K (§229.405 of this chapter) is not contained herein, and will not be contained, to the best of registrant's knowledge, in definitive proxy or information statements incorporated by reference in Part III of this Form 10-K or any amendment to this Form 10-K. _____
Indicate by check mark whether the registrant is a large accelerated filer, an accelerated filer, a non-accelerated filer or a smaller reporting company. See the definitions of "large accelerated filer," "accelerated filer" and "smaller reporting company" in Rule 12b-2 of the Exchange Act. (Check one):
| | |
Large accelerated filer____ | | Accelerated filer __X__ |
Non-accelerated filer ____ (Do not check if a smaller reporting company) | Smaller reporting company ____ |
Indicate by check mark whether the registrant is a shell company (as defined in Rule 12b-2 of the Exchange Act).
Yes _______ No __X____
The aggregate market value of voting and non-voting common equity held by non-affiliates on December 31, 2013 was $230,621,000 based on the closing price of the registrant’s common stock, $6.08 per share, as reported on the New York Stock Exchange on December 31, 2013. For purposes of this computation, all officers, directors and 10% beneficial owners of the registrant are deemed to be affiliates. Such determination should not be deemed an admission that such officers, directors or 10% beneficial owners are, in fact, affiliates of the registrant.
As of August 30, 2014, there were 33,239,459 shares of the registrant's common stock, $0.10 par value, outstanding.
DOCUMENTS INCORPORATED BY REFERENCE
Certain information required to be disclosed in Part III of this Annual Report on Form 10-K will be included in an amendment to this report which will be filed not later than 120 days after the end of the fiscal year covered by this report.
SWS GROUP, INC. AND SUBSIDIARIES
INDEX TO 2014 ANNUAL REPORT ON FORM 10-K
For purposes of this report, unless the context otherwise indicates, references to “we,” “us,” “our,” “SWS” and the “company” mean SWS Group, Inc. collectively with all of our subsidiaries, and references to "SWS Group" mean solely SWS Group, Inc. as a single entity.
FORWARD-LOOKING STATEMENTS
From time to time we make statements (including some contained in this report) that predict or forecast future events, depend on future events for their accuracy, or otherwise contain "forward-looking" information and constitute “forward-looking statements” within the meaning of applicable U.S. securities laws. Such statements are generally identifiable by terminology such as “plans,” “expects,” “estimates,” “budgets,” “intends,” “anticipates,” “believes,” “projects,” “indicates,” “targets,” “objective,” “could,” “should,” “may” or other similar words. By their very nature, forward-looking statements require us to make assumptions that may not materialize or that may not be accurate. Readers should not place undue reliance on forward-looking statements and should recognize that such statements are predictions of future results, which may not occur as anticipated. Actual results may differ materially as a result of various factors, some of which are outside of our control, including:
| · | | failure to obtain the approval of stockholders of SWS in connection with the proposed transaction with Hilltop Holdings Inc. (“Hilltop”); |
| · | | the failure to consummate or delay in consummating the proposed transaction for other reasons; |
| · | | the timing to consummate the proposed transaction; |
| · | | the risk that a condition to closing of the proposed transaction may not be satisfied; |
| · | | the risk that a regulatory approval that may be required for the proposed transaction is delayed, is not obtained, or is obtained subject to conditions that are not anticipated; |
| · | | Hilltop’s ability to achieve the synergies and value creation contemplated by the proposed transaction; |
| · | | Hilltop’s ability to promptly and effectively integrate its and SWS’s businesses; |
| · | | the diversion of management time on transaction-related issues; |
| · | | the interest rate environment; |
| · | | the volume of trading in securities; |
| · | | the liquidity in capital markets; |
| · | | the volatility and general level of securities prices and interest rates; |
| · | | the ability to meet regulatory capital requirements administered by federal agencies; |
| · | | the level of customer margin loan activity and the size of customer account balances; |
| · | | the demand for real estate in Texas, New Mexico and the national market; |
| · | | the credit-worthiness of our correspondents, trading counterparties and of our banking and margin customers; |
| · | | the demand for investment banking services; |
| · | | general economic conditions, especially in Texas and New Mexico, and investor sentiment and confidence; |
| · | | the value of collateral securing the loans we hold; |
| · | | competitive conditions in each of our business segments; |
| · | | changes in accounting, tax and regulatory compliance requirements; |
| · | | changes in federal, state and local tax rates; |
| · | | the ability to attract and retain key personnel; |
| · | | the availability of borrowings under credit lines, credit agreements and credit facilities; |
| · | | the potential misconduct or errors by our employees or by entities with whom we conduct business; |
| · | | the ability of borrowers to meet their contractual obligations and the adequacy of our allowance for loan losses; and |
| · | | the potential for litigation and other regulatory liability. |
Our future operating results also depend on our operating expenses, which are subject to fluctuation due to:
| · | | variations in the level of compensation expense incurred as a result of changes in the number of total employees, competitive factors or other market variables; |
| · | | variations in expenses and capital costs, including depreciation, amortization and other non-cash charges incurred to maintain our infrastructure; and |
| · | | unanticipated costs which may be incurred from time to time in connection with litigation, regulation and compliance, loan analyses and modifications or other contingencies. |
Other factors, risks and uncertainties that could cause actual results to differ materially from our expectations discussed in this report include those factors described in the sections titled Item 1. “Business,” Item 1A. “Risk Factors,” Item 7. “Management's Discussion and Analysis of Financial Condition and Results of Operations - Overview,” “-Financial Condition,” and “-Critical Accounting Policies and Estimates” and those discussed in our other reports filed with and available from the Securities and Exchange Commission (the "SEC"). Our forward-looking statements are based on current beliefs, assumptions and expectations. All forward-looking statements speak only as of the date on which they are made and, except as required by law, we expressly disclaim any obligation or undertaking to disseminate any updates or revisions to any forward-looking statements contained herein to reflect any change in our expectations with regard thereto or any change in events, conditions or circumstances upon which any statement is based.
IMPORTANT INFORMATION FOR INVESTORS AND SHAREHOLDERS
This Annual Report on Form 10-K does not constitute an offer to sell or the solicitation of an offer to buy any securities or a solicitation of any vote or approval, nor shall there be any sale of securities in any jurisdiction in which such offer, solicitation or sale would be unlawful prior to registration or qualification under the securities laws of such jurisdiction. Hilltop has filed with the SEC a registration statement on Form S-4 containing a proxy statement/prospectus of SWS and Hilltop, and SWS and Hilltop will each file other documents with respect to the proposed transaction and a definitive proxy statement/prospectus will be mailed to shareholders of SWS. INVESTORS AND SECURITY HOLDERS OF SWS ARE URGED TO READ THE PROXY STATEMENT/PROSPECTUS AND OTHER DOCUMENTS THAT WILL BE FILED WITH THE SEC CAREFULLY AND IN THEIR ENTIRETY WHEN THEY BECOME AVAILABLE BECAUSE THEY WILL CONTAIN IMPORTANT INFORMATION. Investors and security holders of SWS will be able to obtain free copies of the registration statement and the proxy statement/prospectus (when available) and other documents filed with the SEC by SWS or Hilltop through the website maintained by the SEC at www.sec.gov. Copies of the documents filed with the SEC by SWS will be available free of charge on SWS’s internet website at www.swst.com or by contacting SWS’s Investor Relations Department at (214) 859-1800. Copies of the documents filed with the SEC by Hilltop will be available free of charge on Hilltop’s internet website at www.hilltop-holdings.com or by contacting Hilltop’s Investor Relations Department at (214) 252-4029.
SWS, Hilltop, their respective directors and certain of their executive officers and other members of management and employees may be considered participants in the solicitation of proxies in connection with the proposed transaction. Information about the directors of SWS is set forth in its most recent proxy statement, which was filed with the SEC on October 3, 2013. Information about the executive officers of SWS is set forth herein for the year ended June 30, 2014. Information about the directors and executive officers of Hilltop is set forth in its most recent proxy statement, which was filed with the SEC on May 2, 2014. Other information regarding the participants in the proxy solicitations and a description of their direct and indirect interests, by security holdings or otherwise, will be contained in the proxy statement/prospectus and other relevant materials to be filed with the SEC when they become available.
PART I
ITEM 1. BUSINESS
We are a diversified financial services holding company focused on delivering a broad range of investment banking, commercial banking and related financial services to corporate, individual and institutional investors, broker/dealers, governmental entities and financial intermediaries. We are the largest full-service brokerage firm headquartered in the Southwestern United States (based on the number of financial advisors).
SWS Group is a Delaware corporation that was incorporated in 1972, and that has its common stock listed on the New York Stock Exchange (“NYSE”). Our principal executive offices are located at 1201 Elm Street, Suite 3500, Dallas, Texas 75270. Our telephone number is (214) 859-1800 and our website is www.swsgroupinc.com. We do not intend for information contained on our website to be part of this Annual Report on Form 10-K (this “Form 10-K”). We file annual, quarterly and current reports, proxy statements and other information with the SEC. You may read and copy any document we file with the SEC at the SEC’s public reference room at 100 F Street, N.E., Washington, DC 20549. Please call the SEC at 1-800-SEC-0330 for information on the public reference room.
The SEC also maintains an Internet site at www.sec.gov that contains our annual, quarterly and current reports, proxy and information statements and other electronic filings. We make available free of charge on or through our website our annual, quarterly and current reports and amendments to those reports as soon as reasonably practicable after we electronically file such material with or furnish it to the SEC. Additionally, we will provide electronic or paper copies of our filings free of charge upon request.
Our principal brokerage subsidiary, Southwest Securities, Inc. (“Southwest Securities”), is a registered clearing broker/dealer and a member of the NYSE. It is also a member of the Financial Industry Regulatory Authority (“FINRA”), Securities Investor Protection Corporation (“SIPC”), and other regulatory and trade organizations.
Southwest Securities provides integrated trade execution, clearing and client account processing to over 140 financial service organizations, which include correspondent broker/dealers and registered investment advisors in 29 states and Canada. Southwest Securities serves individual investors through its private client group offices in Texas, California and Oklahoma and also serves institutional investors nationwide. Southwest Securities also extends margin credit and lends securities and manages and participates in underwriting equity and fixed income securities. For the fiscal year ended June 30, 2014, revenues from Southwest Securities accounted for approximately 76% of our consolidated revenues.
We also operate SWS Financial Services, Inc. (“SWS Financial”), an introducing broker/dealer subsidiary that is also registered with FINRA. SWS Financial contracts with 278 individual registered representatives (who are FINRA licensed salespersons) for the administration of their securities business. While these registered representatives must conduct all of their securities business through SWS Financial, they may separately conduct insurance, real estate brokerage or other business for other companies or for their own accounts. The registered representatives are responsible for all of their direct expenses and are paid higher commission rates than Southwest Securities' registered representatives to compensate them for their added expenses. SWS Financial is a correspondent of Southwest Securities, which clears all customer transactions on a fully disclosed basis.
We offer full-service, traditional and Internet banking through Southwest Securities, FSB (the “Bank”). The Bank is a federally chartered savings bank, organized and existing under the laws of the United States and regulated by the Office of the Comptroller of the Currency (the “OCC”) since July 21, 2011. Prior to July 21, 2011, the Bank was regulated by the Office of Thrift Supervision (“OTS”). As of July 21, 2011, the Federal Reserve Board (“FRB”) began supervising and regulating SWS Group and SWS Banc Holdings, Inc. (“SWS Banc”). The Bank conducts business from its main operating facilities and headquarters in Dallas, Texas and eight banking center locations in Texas and New Mexico. In 2003, SWS Banc was incorporated in the state of Delaware as a wholly-owned subsidiary of SWS Group, and became the sole stockholder of the Bank in 2004.
On March 31, 2014, we entered into an Agreement and Plan of Merger (“Merger Agreement”) with Hilltop and Peruna LLC, a wholly-owned subsidiary of Hilltop (“Peruna”), whereby if the merger contemplated therein is completed, we will become a wholly-owned subsidiary of Hilltop. If the merger is completed, each share of SWS Group common stock will be converted into the right to receive $1.94 in cash and 0.2496 of a share of Hilltop common stock. The value of the merger consideration may fluctuate based upon the market value of Hilltop common stock. We currently anticipate that completion of the merger will occur by the end of 2014, subject to receiving the approval of our stockholders and regulators and other customary closing conditions.
If the proposed merger with Hilltop occurs, Hilltop’s warrant to acquire our common stock, if outstanding, will be cancelled. See Item 7. “Management’s Discussion and Analysis of Financial Condition and Results of Operations - Overview - Loan from Hilltop and Oak Hill.”
Concurrently with the execution of the Merger Agreement, we entered into a Letter Agreement with Oak Hill Capital Partners III, L.P. (“OHCP”) and Oak Hill Capital Management Partners III, L.P. (collectively with OHCP, “Oak Hill”), dated March 31, 2014 (the “Oak Hill Letter Agreement”). Pursuant to the Oak Hill Letter Agreement and the Merger Agreement, at the closing of the proposed merger with Hilltop, Oak Hill will deliver to SWS Group the certificates evidencing its warrants and any loans of Oak Hill to SWS Group that are then outstanding under the Credit Agreement by and among Oak Hill, Hilltop and us, dated as of July 29, 2011 (the “Credit Agreement”), and we will issue and deliver to Oak Hill, in exchange for its warrants and loans, the following consideration: (i) the merger consideration that Oak Hill would have been entitled to receive upon consummation of the merger if its warrants had been exercised immediately prior to the effective time of the merger and (ii) an amount equal to the Applicable Premium (as defined in the Credit Agreement, being a calculation of the present value of all required interest payments due on a loan through its maturity date on the date the loan is repaid) calculated as if the loans held by Oak Hill were prepaid in full as of the closing date of the merger.
PRODUCTS AND SERVICES
In fiscal 2014, we operated through four business segments grouped primarily by products, services and customer base: clearing, retail, institutional and banking. The segments are managed separately based on the types of products and services offered and their related client bases and are consistent with how we manage our business and assess our performance. For more information about each of these business segments, see Item 7. “Management’s Discussion and Analysis of Financial Condition and Results of Operations”. Also see Note 23 in the Notes to the Consolidated Financial Statements for the fiscal years ended June 30, 2014, June 30, 2013 and June 29, 2012 included under Item 8. “Financial Statements and Supplementary Data” for information regarding the revenues, income (loss) and total assets of each of our business segments.
Clearing. The Clearing segment provides clearing and execution services for other broker/dealers (predominantly on a fully disclosed basis). Our clientele includes general securities broker/dealers and firms specializing in high-volume trading. We currently support a wide range of clearing clients, including discount and full-service brokerage firms, registered investment advisors and institutional firms. High-volume trading firms trade actively on a proprietary basis or provide services to those customers who trade actively on a daily basis.
In a fully disclosed clearing transaction, the identity of the clearing client’s (“correspondent”) customer is known to us and we physically maintain the client’s account and perform a variety of services as agent for the correspondent. Revenues in this segment are generated primarily through transaction charges to our correspondent firms for clearing their trades according to a contractual schedule.
In addition to clearing trades, we tailor our services to meet the specific needs of our clients and offer products and services such as recordkeeping, trade reporting, accounting, general back-office support, securities and margin lending, reorganization assistance and custody of securities.
As of June 30, 2014, we provided clearing services for two high-volume trading firms. The nature of services provided to the customers of high-volume trading firms and the internal costs necessary to support them are substantially lower than the standard correspondent costs and services. Accordingly, fees for services to these correspondents, on a per trade basis, are discounted substantially from the fees normally charged to other customers.
The terms of our agreements with our correspondents define the allocation of financial, operational and regulatory responsibility arising from the clearing relationship. To the extent that the correspondent has available financial resources, we are protected against claims by customers of the correspondent arising from actions by the correspondent; however, if the correspondent is unable to meet its financial obligations, dissatisfied customers may attempt to recover from us.
Retail. The Retail segment includes the sale of retail securities, insurance products and managed accounts. This segment generates revenue primarily through commissions charged on securities transactions, fees from managed accounts and the sale of insurance products as well as net interest income from retail customer account balances.
Retail Securities. We act as securities broker for retail investors in the purchase and sale of securities, options, commodities and futures contracts that are traded on various exchanges or in the over-the-counter market through our employee registered representatives or our independent contractor arrangements. As a securities broker, we extend margin credit on a secured basis to our retail customers in order to facilitate securities transactions. Through our insurance subsidiaries, we hold insurance licenses to facilitate the sale of insurance and annuity products by our financial advisors to retail clients. In most cases, we charge commissions to our clients in accordance with our established commission schedule, subject to certain discounts based upon the client’s level of business, the trade size and other relevant factors. Some of our registered representatives also maintain licenses to sell certain insurance products. Southwest Securities is registered with the Commodity Futures Trading Commission ("CFTC") as a non-guaranteed introducing broker and is a member of the National Futures Association ("NFA"). Southwest Securities is also a fully disclosed client of two of the largest futures commission merchants in the United States.
Our financial advisors work with their individual clients to create investment portfolios based on the client's specific financial goals and tolerance for risk. We provide access to fee-based platforms and a wide array of products and services including access to investment management programs that can be tailored to the individual client relationship to enhance the financial advisor's business and benefit his or her clients.
At June 30, 2014, Southwest Securities employed 153 registered representatives in 16 retail brokerage offices (with one office located in each of Austin, Dallas, Houston, League City, Longview, Lufkin, Plano, San Antonio and Southlake, Texas; one office located in each of Oklahoma City and Norman, Oklahoma and one office located in each of Beverly Hills, Monterey, Sacramento, San Diego and San Francisco, California). In addition, at June 30, 2014, SWS Financial had contracts with 278 independent retail representatives for the administration of their securities business.
Insurance. Southwest Financial Insurance Agency, Inc. and Southwest Insurance Agency, Inc (collectively, "SWS Insurance") hold insurance agency licenses in 43 states in order to allow our registered representatives to sell insurance and annuity products to their retail customers. We retain no underwriting risk related to the insurance and annuity products that SWS Insurance sells.
Managed Accounts. Through the Investment Management Group of Southwest Securities, we provide a number of advisory programs that offer advisors a wide array of products and services for their advisory business.
Margin Lending. We extend credit on a secured basis directly to our customers, the customers of correspondent firms and the correspondent firms themselves in order to facilitate securities transactions. This credit, which generates interest income, is known as "margin lending" and is conducted primarily in our clearing and retail segments. We extend margin credit to correspondent firms only to the extent that such firms pledge their own ("proprietary") assets as collateral. Our correspondents are required to indemnify us against margin losses in their customers’ accounts. Because we must rely on the guarantees and general creditworthiness of our correspondents, we may be exposed to significant risk of loss if they are unable to meet their financial commitments should there be a substantial adverse change in the value of the margined securities.
In customer margin transactions, the client borrows money from us to purchase securities or for other purposes. The loan is collateralized by the securities purchased or by other securities owned by the client. Interest is charged to clients on the amount borrowed to finance margin transactions at a floating rate. The interest rate charged depends on the average net debit balance in the client’s accounts, the activity level in the accounts and the applicable cost of funds. The amount of the loan is subject to the margin regulations ("Regulation T") of the Board of Governors of the Federal Reserve System, FINRA margin requirements and our internal policies. In most transactions, Regulation T limits the amount loaned to a customer for the purchase of securities to 50% of the purchase price. Furthermore, in the event of a decline in the value of the collateral, FINRA requirements regulate the percentage of client cash or securities that must be deposited as collateral for the loan. Because we permit clients to make margin purchases, we are subject to the risk that the value of our collateral could fall below the amount of that client's indebtedness. Agreements with margin account clients permit us to liquidate the clients’ securities with or without prior notice in the event of an insufficient amount of margin collateral. Despite those agreements, we may be unable to liquidate the clients’ securities for a number of reasons including, but not limited to, a thin trading market, an excessive concentration or the issuance of a trading halt.
The primary source of funds to finance client margin account balances is credit balances in the client’s account. We generally pay interest to clients on these credit balances at a rate determined periodically. SEC regulations restrict the use of client funds to the financing of client activities including margin account balances. Excess customer credit balances, as defined by SEC regulations, are invested in short-term securities segregated for the exclusive benefit of customers as required by SEC regulations. We generate net interest income when there is a positive interest rate spread between the interest rate earned from margin lending and segregated short-term investments and the interest rate paid on customer credit balances.
Institutional. The Institutional segment serves institutional customers in the areas of securities borrowing and lending, municipal finance, sales, trading and underwriting of taxable and tax-exempt fixed income securities and equity trading. Revenues in the institutional segment are derived from the net interest spread on stock loan transactions, commission and trading income from fixed income and equity products and investment banking fees from taxable and municipal securities transactions.
Securities Lending Activities. Our securities borrowing and lending business includes borrowing and lending securities for other broker/dealers, lending institutions and our own clearing and retail operations. These activities involve borrowing securities to cover short sales and to complete transactions in which clients have failed to deliver securities by the required settlement date and lending securities to other broker/dealers for similar purposes.
When borrowing securities, we are required to deposit cash or other collateral or to post a letter of credit with the lender, and we generally receive a rebate (based on the amount of cash deposited) or a fee calculated to yield a negotiated rate of return. When lending securities, we receive cash or similar collateral and generally pay interest (based on the amount of cash deposited)
to the other party to the transaction. We generate net interest income when there is a positive interest rate spread between the interest rate on cash or similar collateral we deposit and the interest rate paid on cash or similar collateral we receive.
Securities borrowing and lending transactions are executed pursuant to written agreements with counterparties that generally require securities borrowed and loaned to be marked-to-market on a daily basis, excess collateral to be refunded, and deficit collateral to be furnished. Collateral adjustments are made on a daily basis through the facilities of various clearinghouses. We are a principal in these securities borrowing and lending transactions and are liable for losses in the event of a failure of any other party to honor its contractual obligation. Our management sets credit limits with each counterparty and reviews these limits regularly to monitor the risk level with each counterparty. The securities lending business is conducted primarily from Southwest Securities’ New Jersey office using a specialized sales force.
Municipal Finance. Our municipal finance business earns investment banking revenues by assisting public entity clients in meeting their financial needs and advising them on the most advantageous means of raising capital. Our municipal finance professionals assist public bodies in originating, syndicating and distributing securities of municipalities and political subdivisions.
Southwest Securities maintains municipal finance branch offices in Allen, Dallas and San Antonio, Texas; Aliso Viejo, Cardiff, Encino and Huntington Beach, California; Palm Beach Gardens, Florida; Chicago, Illinois; Lexington, Kentucky; New York, New York; Albuquerque, New Mexico; Charlotte, North Carolina; Columbia, South Carolina and Memphis, Tennessee.
Participation in firm commitment municipal underwritings can expose us to material risk because we may not be able to sell the securities we have committed to purchase at the initial offering price. In addition, federal and state securities laws and regulations also affect the activities of underwriters and impose substantial potential liabilities for violations of such laws and regulations in connection with sales of securities by underwriters to the public.
Fixed Income Sales and Equity Trading. Our fixed income sales and trading group specializes in trading and underwriting U.S. government and government agency bonds, corporate bonds, municipal bonds, mortgage-backed, asset-backed and commercial mortgage-backed securities and structured products. The clients of our fixed income group include corporations, insurance companies, banks, mutual funds, money managers and other institutions. Southwest Securities has fixed income offices in Dallas, Texas; Encino and San Francisco, California; Aspen and Evergreen, Colorado; Ft. Lauderdale and Palm Beach Gardens, Florida; Chicago, Illinois; and New York, New York.
Our equity trading department focuses on executing equity and option orders on an agency basis for clients. We also have a portfolio trading group that executes large institutional portfolios.
Our syndicate department, housed within our fixed income sales group, coordinates the distribution of managed and co-managed corporate equity underwritings, accepts invitations to participate in competitive or negotiated underwritings managed by other investment banking firms and allocates and markets our selling allotments to institutional clients and to other broker/dealers.
Banking. The Banking segment offers traditional banking products and services through eight full-service banking centers with six banking centers located in Texas, one located in each of Arlington, Dallas, El Paso, Fort Worth, Granbury and Waxahachie, and two banking centers located in New Mexico, one located in each of Albuquerque and Ruidoso. Our focus in business banking includes small business ("SBA") lending. We originate the majority of our loans internally, and we believe this business model helps us build more valuable relationships with our customers.
The Bank offers a full array of deposit products, including checking, savings, money market and certificates of deposit. As a full-service lender, the Bank offers competitive rates and terms on business loans, as well as a full line of consumer loans. Customers have access to comprehensive Internet banking services and online bill payment. The Bank offers commercial loans, commercial real estate loans and consumer loans, primarily in Texas and New Mexico.
Our mortgage purchase division purchases participations in newly originated residential loans (mainly 1-4 family residential loans) from various mortgage bankers nationwide. The purchased mortgage loans held for investment are held by the Bank on average for 25 days or less. Approximately 95% of the loans conform to the standards of Fannie Mae, Freddie Mac or Ginnie Mae, and the rest are “A” credit jumbo loans. As of the date of this report, the Bank had 36 customer/originators across the nation. Although the Bank is exposed to credit risk before the loans are sold by the mortgage company, currently there is no recourse to the Bank after the mortgage company sells the loans to the secondary investors.
The Bank earns substantially all of its net revenues on the spread between the interest rates charged to customers on loans and the interest rates paid to depositors as well as interest income from investments.
Revenues by Source
The following table shows our revenues by source for the last three fiscal years (dollars in thousands):
| | | | | | | | | | | | |
| | | | | | | | | | | | |
| | 2014 | | 2013 | | 2012 |
| | Amount | Percent | | Amount | Percent | | Amount | Percent |
Net revenues from clearing operations | | $ 8,839 | 3 | % | | $ 8,719 | 3 | % | | $ 9,385 | 3 | % |
Commissions: | | | | | | | | | | | | |
Listed equities | | 157 | - | | | 191 | - | | | 163 | - | |
Over-the-counter equities | | 30,882 | 10 | | | 42,234 | 13 | | | 35,119 | 10 | |
Corporate bonds | | 16,996 | 5 | | | 17,824 | 6 | | | 19,082 | 6 | |
Government bonds and mortgage-backed | | | | | | | | | | | | |
securities | | 11,083 | 3 | | | 7,837 | 2 | | | 14,275 | 4 | |
Municipal bonds | | 36,180 | 12 | | | 37,268 | 12 | | | 46,687 | 13 | |
Options | | 768 | - | | | 831 | - | | | 1,058 | - | |
Mutual funds | | 15,482 | 5 | | | 14,639 | 5 | | | 11,739 | 3 | |
Other | | 7,986 | 3 | | | 4,796 | 1 | | | 3,732 | 1 | |
| | 119,534 | | | | 125,620 | | | | 131,855 | | |
Interest | | 87,067 | 28 | | | 97,350 | 30 | | | 122,120 | 35 | |
Investment banking fees: | | | | | | | | | | | | |
Corporate finance | | - | - | | | 3,613 | 1 | | | 4,606 | 1 | |
Municipal finance | | 18,263 | 6 | | | 18,149 | 6 | | | 17,076 | 5 | |
Taxable fixed income | | 3,734 | 1 | | | 8,995 | 3 | | | 8,489 | 2 | |
Other (trading and other) | | - | - | | | (2) | - | | | - | - | |
| | 21,997 | | | | 30,755 | | | | 30,171 | | |
Advisory and administrative fees: | | | | | | | | | | | | |
Money market funds | | - | - | | | - | - | | | (552) | - | |
Managed account fees | | 15,525 | 5 | | | 12,008 | 4 | | | 9,206 | 3 | |
Other | | 2,499 | 1 | | | 2,492 | 1 | | | 1,989 | - | |
| | 18,024 | | | | 14,500 | | | | 10,643 | | |
Net gains on principal transactions: | | | | | | | | | | | | |
Equity securities | | 240 | - | | | 1,027 | - | | | 44 | - | |
Municipal securities | | 17,285 | 6 | | | 3,519 | 1 | | | 19,511 | 5 | |
Corporate bonds | | 5,392 | 2 | | | 5,469 | 2 | | | 4,931 | 1 | |
Government issues | | 769 | - | | | (514) | - | | | (3,286) | - | |
Other | | 5,969 | 2 | | | 7,894 | 2 | | | 6,849 | 2 | |
| | 29,655 | | | | 17,395 | | | | 28,049 | | |
Other: | | | | | | | | | | | | |
Insurance products | | 14,151 | 5 | | | 15,221 | 5 | | | 13,563 | 4 | |
Other security accounts fee revenue | | 2,694 | 1 | | | 2,506 | 1 | | | 2,645 | 1 | |
Floor brokerage | | 934 | - | | | 705 | - | | | 814 | - | |
Non-interest bank revenue | | 1,937 | - | | | 2,678 | 1 | | | 2,714 | 1 | |
Regulatory fees | | 217 | - | | | 302 | - | | | 293 | - | |
Other | | 6,239 | 2 | | | 2,363 | 1 | | | 1,489 | - | |
| | 26,172 | | | | 23,775 | | | | 21,518 | | |
Total revenue | | $ 311,288 | 100 | % | | $ 318,114 | 100 | % | | $ 353,741 | 100 | % |
COMPETITION
We encounter intense competition in our businesses. We compete directly with securities firms and banks, many of which have substantially greater capital and other resources than we have. We also encounter competition from insurance companies and financial institutions in many elements of our businesses.
Our brokerage subsidiaries compete with other brokerage and financial services companies principally on the basis of service, product selection, price, location and reputation. We compete with discount brokerage firms that do not offer equivalent services but offer discounted prices. We compete for the correspondent clearing business on the basis of service, reputation, financial strength, price, technology and product selection.
Competition for successful securities traders, stock loan professionals and investment bankers among securities firms and other competitors is intense, as is competition for experienced financial advisors. We recognize the importance of hiring and retaining skilled professionals so we invest heavily in the recruiting process. The failure to attract and retain skilled professionals could have a material adverse effect on our business and on our performance.
The Bank also operates in an intensely competitive environment. This environment includes other banks, credit unions, nonbank lenders and insurance companies. The competition ranges from small community banks to large multinational commercial banks. As with the securities industry, the ability to attract and retain skilled professionals is critical to the Bank’s success. To enhance these activities the Bank utilizes SWS for assistance in recruiting and educational programs. The Bank competes for community banking customers locally based on reputation, service, location and price. The Bank also competes nationally for the purchase of residential loans through its mortgage purchase division.
REGULATION
We operate in the financial services industry as, among other things, a securities broker/dealer, an SEC registered investment adviser and a bank. As a result, our businesses are highly regulated by U.S. federal and state regulatory agencies, self-regulatory organizations and national securities exchanges and, to a lesser extent, by foreign governmental agencies and financial regulatory bodies. As a matter of public policy, regulatory bodies in the United States are charged with, among other things, safeguarding the integrity of the securities and other financial markets and with protecting the interests of customers, including depositors, the Federal Deposit Insurance Fund (“DIF”), and the banking system as a whole, not with protecting the interests of regulated entities or their creditors or stockholders.
Important laws and regulations that are applicable to us are described below. The description is a summary that is qualified in its entirety by reference to the full text of the statutes, regulations and policies that are described. Also, such statutes, regulations and policies are continually under review by Congress and state legislatures and federal, state and other regulatory bodies.
We are regulated by the SEC and are subject to the disclosure and regulatory requirements of the Securities Act of 1933, as amended, and the Securities Exchange Act of 1934, as amended (the "Exchange Act") and the regulations promulgated hereunder, as administered by the SEC. As a public company with common stock listed on the NYSE, we are subject to corporate governance requirements established by the SEC and the NYSE, as well as applicable federal and state law. Under the Sarbanes-Oxley Act of 2002, as amended (the “Sarbanes-Oxley Act”), we are required to meet certain requirements regarding business dealings with members of our Board of Directors (“BOD”), the structure of our Audit Committee and ethical standards for our senior financial officers. Also, under Section 404 of the Sarbanes-Oxley Act, we are required to assess the effectiveness of our internal controls over financial reporting and to obtain an opinion from our independent auditors regarding the effectiveness of our internal controls over financial reporting. Under applicable SEC rules and NYSE listing standards, we are required to comply with other standards of corporate governance, including having a majority of independent directors serve on our BOD, and the establishment of independent audit, compensation and corporate governance committees.
SWS Group is a legal entity that is separate and distinct from its banking and non-banking subsidiaries. The principal sources of funds for SWS Group are cash dividends paid by its subsidiaries, capital contributions from the sale of its securities, investment income, and borrowings. Federal laws normally limit the amount of dividends or other capital distributions that a banking institution can pay, and the Bank must obtain prior approval from the OCC before it can pay dividends to us.
Due to the economic crisis, many new regulations and statutes have been proposed or enacted over the past several years that contain wide-ranging proposals for altering the structures, regulations and competitive relationships of financial institutions operating and doing business in the United States. Most notably, on July 21, 2010, the Dodd-Frank Wall Street Reform and Consumer Protection Act (the “Dodd-Frank Act”) was enacted.
The Dodd-Frank Act sought to restore responsibility and accountability to the U.S. financial system by significantly altering the regulation of financial institutions and the financial services industry. Most of the provisions contained in the Dodd-Frank Act have delayed effective dates, and full implementation will require many new rules to be issued by federal regulatory agencies over the next several years. While we continue to closely monitor the implementation of the Dodd-Frank Act, including new and proposed regulations, the full impact of the new rules on our business is still uncertain.
Among other things, the Dodd-Frank Act:
| · | | Established the Consumer Financial Protection Bureau (the “Bureau”), an independent organization within the Federal Reserve that (i) protects consumers through education, (ii) promulgates regulations that implement specified consumer protection laws applicable to all entities offering consumer financial products or services and (iii) enforces the regulations that it promulgates. |
| · | | Established the Financial Stability Oversight Council, which has the authority to identify and monitor institutions and systems which pose a systemic risk to the financial system, and to impose standards regarding capital, leverage, liquidity, risk management and other requirements for these financial institutions. |
| · | | Abolished the OTS and transferred its functions, powers, authorities, rights, and duties related to the following to other federal banking agencies on July 21, 2011: |
| o | | Those related to the supervision of savings and loan holding companies and their subsidiaries (other than depository institutions) were transferred to the FRB; |
| o | | Those related to federal savings associations were transferred to the OCC; and |
| o | | Those related to state savings associations were transferred to the Federal Deposit Insurance Corporation (“FDIC”). |
| · | | Established minimum capital requirements for depository institution holding companies. |
| · | | Changed the base for FDIC insurance assessments. |
| · | | Increased the minimum reserve ratio for the DIF from 1.15% to 1.35%. |
| · | | Permanently increased the deposit insurance coverage amount from $100,000 to $250,000. |
| · | | Directed the Federal Reserve to establish interchange fees for debit cards pursuant to a restrictive “reasonable and proportional cost” per transaction standard. |
| · | | Limited the ability of banking organizations to sponsor or invest in private equity and hedge funds and to engage in proprietary trading. |
| · | | Granted the U.S. government the authority to liquidate or take emergency measures with respect to troubled nonbank financial companies, including the establishment of an orderly liquidation fund. |
| · | | Increased regulation of asset-backed securities, including a requirement that issuers of asset-backed securities retain at least 5% of the risk of the asset-backed securities. |
| · | | Increased regulation of mortgage originations, including originator compensation, and minimum repayment standards. |
| · | | Established new disclosure and other requirements relating to executive compensation and corporate governance. |
| · | | Increased the transparency of non-hedging derivative trading activity, with the goal of limiting speculation and increasing accountability in the commodities and derivatives (including swaps) markets. |
| · | | Removed the prohibition on paying interest on demand deposit accounts. |
From time to time, various legislative and regulatory initiatives are introduced in Congress and state legislatures, as well as by regulatory bodies. These initiatives may include proposals to expand or contract the powers of holding companies and depository institutions or proposals to substantially change the regulatory system for financial institutions. Such legislation could change banking and brokerage statutes and our operating environment in substantial and unpredictable ways. If enacted, such legislation or regulatory changes could increase or decrease our cost of doing business (including increased compliance costs), limit or expand permissible activities or affect the competitive balance among banks, savings associations, credit unions, and other financial institutions. We cannot predict whether any such legislation or regulatory initiatives will be enacted, and, if enacted, the impact that it, and any implementing regulations, would have on our financial condition or results of operations. Any change in statutes, regulations or regulatory policies, or their implementation, interpretation, or enforcement, applicable to us or any of our subsidiaries could have a material adverse effect on our business.
Regulation of SWS Group. SWS Group is regulated under the Savings and Loan Holding Company Act, as amended (the “SLHC Act”), and its subsidiaries that are not functionally regulated are subject to inspection, examination and supervision by the FRB.
The FRB has the power to order any savings and loan holding company or its subsidiaries to terminate any activity or to terminate its ownership or control of any subsidiary when the FRB has reasonable grounds to believe that continuation of such activity or such ownership or control constitutes a serious risk to the financial soundness, safety or stability of any bank subsidiary of the holding company.
The Dodd-Frank Act requires the federal financial regulatory agencies to adopt rules that prohibit banks, bank holding companies and their affiliates from engaging in proprietary trading and investing in and sponsoring certain unregistered investment companies (including hedge funds and private equity funds), subject to certain exceptions. This provision is commonly called the “Volcker Rule”. Final rules to implement the Volcker Rule were issued by the federal financial regulatory agencies on December 10, 2013, with an effective date of April 1, 2014 and a compliance date of July 21, 2015. The Company’s securities trading and investment activities, which occur at the holding company, the broker/dealer and the Bank, are subject to these final rules. The final rules are highly complex, and many aspects of their application and interpretation by regulators remain uncertain.
FRB policy has historically required bank holding companies to act as a source of financial and managerial strength to their subsidiary banks. The Dodd-Frank Act codified this policy as a statutory requirement for savings and loan holding companies, including SWS Group. Under this requirement, SWS Group is expected to commit resources to support the Bank, including at times when it may not be in a financial position to provide such resources. Any capital loans by a holding company to any of its subsidiary banks are subordinate in right of payment to depositors and to certain other indebtedness of such subsidiary banks. In the event of a holding company’s bankruptcy, any commitment by the holding company to a federal bank regulatory agency to maintain the capital of a subsidiary bank will be assumed by the bankruptcy trustee and entitled to priority of payment. The implementing regulations for this “source of strength” statute have not been proposed.
Regulation of the Securities Business. The securities industry in the United States is subject to extensive regulation under federal and state laws and regulations. Our U.S. broker/dealer subsidiaries are registered with the SEC and FINRA. Self-regulatory organizations such as FINRA have also enacted rules (which are subject to approval by the SEC) that govern their members and the industry. Securities firms are subject to regulation by state securities commissions in the states in which they conduct business. Southwest Securities and SWS Financial are registered in all 50 states and the District of Columbia. Southwest Securities is also registered in the U.S. Virgin Islands and Puerto Rico. Federal, state and other regulatory authorities have the power to undertake periodic examinations of our securities broker/dealer operations for the purpose of assuring our compliance with the applicable rules and regulations.
Broker/dealers are subject to regulations that cover all aspects of the securities business, including the manner in which securities transactions are effected, net capital requirements, recordkeeping and reporting procedures, relationships and conflicts with customers, the handling of cash and margin accounts, sales methods and conduct, experience and training requirements for certain employees, the conduct of investment banking and research activities and the manner in which we prevent and detect money-laundering activities. Legislation and changes in rules promulgated by the SEC and by self-regulatory organizations or changes in the interpretation or enforcement of existing laws and rules often directly affect the method of operation and profitability of broker/dealers. The SEC, self-regulatory organizations and states may conduct administrative and enforcement proceedings that can result in censure, fine, suspension or revocation of our U.S. broker/dealer subsidiaries, our officers or employees.
Our broker/dealer subsidiaries are subject to the SEC’s net capital rule (Rule 15c3-1 under the Exchange Act). Generally, a broker/dealer’s net capital is equal to its net worth plus qualified subordinated debt less deductions for non-allowable (or non-liquid) assets and other adjustments and operational charges. The SEC and FINRA impose rules that require notification when net capital falls below a certain threshold. These rules also dictate the ratio of debt-to-equity in the regulatory capital composition of a broker/dealer and constrain the ability of a broker/dealer to expand its business under certain circumstances. If a firm fails to maintain the required net capital, it may be subject to suspension or revocation of registration by the applicable regulatory authority, and suspension or revocation by these regulators could ultimately lead to the firm’s liquidation. Our broker/dealer subsidiaries that hold customers’ funds and securities are subject to the SEC’s customer protection rule (Rule 15c3-3 under the Exchange Act), which generally provides that such broker/dealers maintain physical possession or control of all fully-paid securities and excess margin securities carried for the account of customers and maintain certain reserves of cash or qualified securities.
Compliance with the net capital requirements may limit our operations, requiring the intensive use of capital. Such rules require that a certain percentage of our assets be maintained in relatively liquid form and therefore act to restrict our ability to withdraw capital from our broker/dealer subsidiaries, which in turn may limit our ability to pay dividends, repay debt or redeem or purchase shares of our outstanding common stock. Any change in such rules or the imposition of new rules affecting the scope, coverage, calculation or amount of capital requirements, or a significant operating loss or any unusually large charge against capital, could adversely affect our ability to pay dividends, repay debt, meet our debt covenant requirements or to expand
or maintain our operations. In addition, such rules may require us to make substantial capital contributions into one or more of our broker/dealer subsidiaries in order for such subsidiaries to comply with such rules, either in the form of cash or subordinated loans made in accordance with the requirements of the SEC’s net capital rule. As of June 30, 2014, Southwest Securities had regulatory net capital, as defined by Rule 15c3-1 under the Exchange Act, of $156.4 million, which exceeded the amounts required by $149.8 million. As of June 30, 2014, SWS Financial had regulatory net capital, as defined by Rule 15c3-1 under the Exchange Act, of $1.1 million, which exceeded the amounts required by $0.9 million. However, the amount of net excess capital can change dramatically within a short period of time due to a variety of factors.
Our broker/dealer subsidiaries are required by federal law to belong to the SIPC, whose primary function is to provide financial protection for the customers of failing brokerage firms. SIPC provides protection for clients’ cash and securities up to $500,000 per customer account, of which a maximum of $250,000 may be in cash.
Our broker/dealer subsidiaries must also comply with the USA PATRIOT Act of 2001, as amended, (the “Patriot Act”), and other rules and regulations designed to fight international money laundering and to block terrorist access to the U.S. financial system. We are required to have systems and procedures to ensure compliance with such laws and regulations.
Southwest Securities and SWS Financial are registered with, and subject to oversight and inspection by, the SEC as investment advisers under the Investment Advisers Act of 1940, as amended. The investment advisory business of our subsidiaries is subject to significant federal regulation, including with respect to wrap fee programs, the management of client accounts, the safeguarding of client assets, client fees and disclosures, transactions among affiliates and recordkeeping and reporting procedures. Legislation and changes in regulations promulgated by the SEC or changes in the interpretation or enforcement of existing laws and regulations often directly affect the method of operation and profitability of investment advisers. The SEC may conduct administrative and enforcement proceedings that can result in censure, fine, suspension, revocation or expulsion of the investment advisory business of our subsidiaries, our officers or employees.
Certain activities of some SWS subsidiaries are regulated by the CFTC and various commodity exchanges. Southwest Securities and SWS Financial are registered as introducing brokers with the CFTC and NFA. The CFTC also has net capital regulations (CFTC Rule 1.17) that must be satisfied. Our futures business is also regulated by the NFA, a registered futures association. Violation of the rules of the CFTC, the NFA or the commodity exchanges could result in remedial actions including fines, registration restrictions or terminations, trading prohibitions or revocations of commodity exchange memberships.
Provisions of the Volcker Rule and the final rules implementing the Volcker Rule restrict certain activities provided by our broker/dealer, including proprietary trading. For purposes of the Volcker Rule, purchases or sales of financial instruments such as securities, derivatives, contracts of sale of commodities for future delivery or options on the foregoing for the purpose of short-term gain are deemed to be proprietary trading (with financial instruments held for less than 60 days presumed to be for proprietary trading unless an alternative purpose can be demonstrated), unless certain exemptions apply. Exempted activities include, among others, the following: 1) underwriting; 2) market making; 3) risk mitigating hedging; 4) trading in certain government securities; 5) employee compensation plans and 6) transactions entered into on behalf of and for the account of clients as agent, broker, custodian or in a trustee or fiduciary capacity. While management continues to assess compliance with the Volcker Rule, we have reviewed our processes and procedures in regard to proprietary trading and we believe we are currently complying with the provisions of the Volcker Rule regarding proprietary trading. However, it remains uncertain how the scope of applicable restrictions and exceptions will be interpreted and administered by the relevant regulators. Absent further regulatory guidance, we are required to make certain assumptions as to the degree to which our activities, processes and procedures in these areas comply with the requirements of the Volcker Rule. If these assumptions are not accurate or if our implementation of compliance processes and procedures is not consistent with regulatory expectations, we may be required to make certain changes to our business activities, processes or procedures, which could further increase our compliance and regulatory risks and costs.
Banking Regulations. We are subject to the extensive regulatory framework applicable to savings and loan holding companies as well as federal savings associations.
As a savings and loan holding company, we are subject to regulation and examination by the FRB. The Bank is subject to regulation and examination by the OCC (its primary federal regulator). The banking regulators, including the OCC, FDIC and FRB have broad and, in some cases, overlapping authority to prohibit activities of holding companies, federal savings banks, their non-banking subsidiaries, directors, officers and other institution affiliated parties (such as attorneys and accountants) that represent unsafe and unsound banking practices or that constitute violations of laws or regulations. The OCC can assess civil money penalties for violations of law, certain orders, written conditions or written agreements with the OCC, as well as certain knowing and reckless activities, if those activities caused a substantial loss to a depository institution. The penalties can be as high as $1.375 million for each day the activities continue.
The Dodd-Frank Act transferred the functions of the OTS as they relate to the Bank to the OCC, and as they relate to SWS Group, to the FRB on July 21, 2011 (“Transfer Date”). Eventually, we will be required to comply with capital and activity requirements similar to those currently applicable to bank holding companies. On the Transfer Date, the OCC published a final rule clarifying the application of its rules to federal savings banks in certain areas, including assessments, preemption of state law, visitorial powers and other clarifying administrative matters and we will be required to be in compliance with the new
minimum capital requirements (also known as Basel III, see discussion below) for depository institution holding companies and banks for reporting periods beginning after January 1, 2015.
The Dodd-Frank Act also requires the FRB to mandate that any bank holding company or savings and loan holding company serve as a “source of strength” for any subsidiary that is a depository institution. The Dodd-Frank Act gave the federal banking agencies one year after the Transfer Date to issue joint final rules related to the “source of strength” requirement, however, these rules have not been proposed. “Source of strength” is defined as the ability of a company that directly or indirectly owns or controls an insured depository institution to provide financial assistance to such insured depository institution in the event of the financial distress of the insured depository institution. Once these rules are finalized, SWS Group will be required to be a “source of strength” for the Bank.
In July 2010, the FDIC voted to revise its existing Memorandum of Understanding with the primary federal regulators to enhance the FDIC’s existing authority over insured depository institutions that the FDIC does not directly supervise. As a result, the Bank may be subject to increased supervision by the FDIC.
With very limited exceptions, we may not be acquired by any company or by any individual without the approval of a governing bank regulatory agency. That agency must complete an application review, and generally the public must have an opportunity to comment on any proposed acquisition. Without prior approval from the FRB, we may not acquire more than five percent of the voting stock of any savings institution or bank. The Dodd-Frank Act restricts a bank that is the subject of a formal enforcement action or a memorandum of understanding with respect to a significant supervisory matter from converting its charter, subject to certain exceptions.
The Bank is currently subject to OCC capital requirements. Federal statutes and OCC regulations have established four ratios for measuring an institution’s capital adequacy: a “Tier 1 (core) capital” ratio — the ratio of an institution’s Tier 1 capital to adjusted tangible assets; a “Tier 1 risk-based capital” ratio — an institution’s adjusted Tier 1 capital as a percentage of total risk-weighted assets; a “total risk-based capital” ratio — the percentage of total risk-based capital to total risk-weighted assets; and a “tangible equity” ratio — the ratio of tangible capital to total tangible assets.
Federal statutes and OCC regulations have established five capital categories for federal savings banks: well-capitalized, adequately capitalized, undercapitalized, significantly undercapitalized and critically undercapitalized. The federal banking agencies have jointly specified by regulation the relevant capital level for each category. An institution is defined as well-capitalized when its total risk-based capital ratio is at least 10%, its Tier 1 risk-based capital ratio is at least 6%, its Tier 1 (core) capital ratio is at least 5%, and it is not subject to any federal supervisory order or directive to meet a specific capital level. As of June 30, 2014, the Bank was deemed to be “well capitalized,” without giving effect to the final Basel III rule. See also Note 18 in the Notes to the Consolidated Financial Statements for the fiscal years ended June 30, 2014, June 30, 2013 and June 29, 2012 included under Item 8. “Financial Statements and Supplementary Data.”
In December 2010, the Basel Committee on Banking Supervision (the “Basel Committee”) released a revised final framework for the regulation of capital and liquidity of internationally active banking organizations. These new frameworks are generally referred to as “Basel III”. In July 2013, the OCC and FRB approved their final rule that implements the Basel III regulatory capital reform and certain changes required by the Dodd-Frank Act in the United States. Under the final rule, minimum requirements will increase for both the quantity and quality of capital held by banking organizations, including the company and the Bank. In addition, under the final rule, there is a new requirement to maintain a ratio of common equity Tier 1 capital ratio to risk-weighted assets. The Basel III final rule will be effective for SWS Group and the Bank on January 1, 2015. To be well capitalized for purposes of the prompt correction action levels of the Basel III final rule, an insured depository institution must maintain a total risk-based capital ratio of 10% or more; a Tier 1 risk-based capital ratio of 8% or more; a common equity Tier 1 capital ratio of 6.5% or more; and a leverage ratio of 5% or more. An adequately-capitalized depository institution must maintain a total risk-based capital ratio of 8% or more; a Tier 1 risk-based capital ratio of 6% or more; a common equity Tier 1 capital ratio of 4.5% or more; and a leverage ratio of 4% or more. An insured depository institution is undercapitalized under the final rule if its total capital ratio is less than 8%, if its Tier 1 risk-based capital ratio is less than 6%, its common equity Tier 1 capital ratio is less than 4.5%, or its leverage ratio is less than 4%. If an institution’s Tier 1 risk-based capital ratio is less than 4%, or its common equity Tier 1 capital ratio is less than 3%, it would be considered significantly undercapitalized. The other numerical capital ratio thresholds for being significantly undercapitalized are the same as the current rules.
Under the Basel III final rule, the new common equity Tier 1 capital to risk-weighted assets ratio, the Tier 1 risk-based capital ratio and the total capital ratio will also have a capital conservation buffer of 2.5% of risk-weighted assets that will phase in beginning on January 1, 2016 though January 1, 2019. An institution will be subject to limitations on paying dividends, engaging in share repurchases, and paying discretionary bonuses if its capital level falls below the buffer amount. On the quality of capital side, the Basel III final rule emphasizes common equity Tier 1 capital, the most loss-absorbing form of capital, and implements strict eligibility criteria for regulatory capital instruments. The Basel III final rule also improves the methodology for calculating risk-weighted assets to enhance risk sensitivity.
Under the Basel III final rule, the Bank will now calculate tangible equity based on average total assets rather than period-end total assets. Bank regulators are required to take “prompt corrective action”, or PCA, to resolve problems associated with insured depository institutions whose capital declines below certain levels. Federal banking agencies are required to take various mandatory supervisory actions and are authorized to take other discretionary actions with respect to institutions that are “undercapitalized,” “significantly undercapitalized” or “critically undercapitalized.” The severity of the action depends upon the capital category in which the institution is placed. The new capital conservation buffer is designed to absorb losses in stressful periods and the banking agencies believe that it is appropriate for a depository institution to be able to use some of its capital conservation buffer without being considered less than well capitalized for PCA purposes. Generally, subject to a narrow exception, the banking regulator must appoint a receiver or conservator for an institution that is critically undercapitalized.
In the event an institution becomes undercapitalized, it must submit an acceptable capital restoration plan to the appropriate regulator. The capital restoration plan will not be accepted by the regulators unless, among other requirements, each company having control of the undercapitalized institution guarantees the subsidiary’s compliance with the capital restoration plan up to a certain specified amount. Any such guarantee from a depository institution’s holding company is entitled to a priority of payment in bankruptcy.
The aggregate liability of the holding company of an undercapitalized depository institution is limited to the lesser of 5% of the institution’s assets at the time it became undercapitalized or the amount necessary to cause the institution to be “adequately capitalized.” The bank regulators have greater power in situations where an institution becomes “significantly” or “critically” undercapitalized or fails to submit a capital restoration plan. However, the guarantee can be limited for a holding company that is a “functionally regulated affiliate” of the depository institution, such as a holding company that is a broker/dealer registered with the SEC, if the functional regulator of the affiliate objects. For example, the FRB could require an SEC registered broker/dealer holding company for an undercapitalized federal savings bank to guarantee the bank’s capital restoration plan, subject to the limitations summarized above and subject to an objection from the holding company’s functional regulator, the SEC.
An undercapitalized institution is also generally prohibited from increasing its average total assets, making acquisitions, establishing branches or engaging in any new line of business, except under an accepted capital restoration plan or with FDIC approval. The prompt corrective action regulations also establish procedures for downgrading an institution to a lower capital category based on supervisory factors other than capital.
The FDIC insures the deposits of the Bank up to the applicable maximum in each account, or up to $250,000 per account. FDIC deposit insurance is backed by the full faith and credit of the U.S. government.
All FDIC insured institutions are required to pay assessments to the FDIC based on their average assets. In fiscal 2012, the Bank paid an assessment rate of 23 basis points. Due to continued improvement in the credit quality of the Bank’s loan portfolio, the FDIC assessment rate was decreased to 14 basis points in the second half of fiscal 2013. Due to additional improvement in the credit quality of the Bank’s loan portfolio in fiscal 2014, the assessment rate currently stands at 7 basis points. The Bank believes that these changes will result in significant future FDIC insurance cost savings.
All FDIC insured institutions are required to pay additional assessments to the FDIC at an annual rate of approximately 0.64 basis points of average assets to fund interest payments on bonds issued by the Financing Corporation, an agency of the federal government established to recapitalize the predecessor to the Savings Association Insurance Fund. These assessments will continue until the Financing Corporation bonds mature in 2017 through 2019.
Under the Dodd-Frank Act, the FDIC was given much greater discretion to manage the DIF, including where to set the designated reserve ratio (“DRR”). The Dodd-Frank Act increased the DRR from 1.15% to 1.35% and left unchanged the requirement that the FDIC Board set the DRR annually. The FDIC Board must set the DRR according to the following factors: (i) risk of loss to the insurance fund; (ii) economic conditions affecting the banking industry; (iii) preventing sharp swings in the assessment rates and (iv) any other factors it deems important. Based on those factors, the FDIC Board decided to set the DRR at 2.00% based on a historical analysis of losses to the DIF. The analysis showed in order to maintain a positive fund balance and steady, predictable assessment rates, the DRR must be at least 2.00% as a long-term, minimum goal. The DRR increase may increase FDIC deposit insurance assessments in the future.
Numerous regulations promulgated by the federal banking agencies, including the Bureau, as amended from time to time, affect the business operations of the Bank. These include regulations relating to holding company regulation, equal credit opportunity, electronic fund transfers, fair credit reporting, fair debt collection, service members civil relief, collection of checks, insider lending, lending limits, truth in lending, truth in savings, home ownership and equity protection, transactions with affiliates and availability of funds. Under FRB regulations, the Bank is required to maintain a reserve against its transaction accounts (primarily interest-bearing and noninterest-bearing checking accounts). Because reserves must generally be maintained in cash or in noninterest-bearing accounts, the historical effect of the reserve requirements is to increase the Bank’s cost of funds. The Federal Reserve banks are authorized to pay interest on reserves, subject to regulations of the FRB, effective October 1, 2008.
The Bank is subject to regulation by the Bureau, established by the Dodd-Frank Act as an independent entity within the Federal Reserve, which has the authority to promulgate consumer protection regulations applicable to all entities offering consumer financial services or products, including banks. The Bureau has broad rule-making authority for a wide range of consumer protection laws, including but not limited to, laws relating to alternative mortgage transaction parity, consumer leasing, electronic fund transfers, equal credit opportunity, fair credit billing, fair credit reporting, home owners protection, fair debt collection practices, lack of deposit insurance, consumer financial privacy, home mortgage disclosure, home ownership and equity protection, real estate settlement procedures, mortgage licensing, truth in lending and truth in savings, among other laws. The Bureau also has the authority to prohibit “unfair, deceptive or abusive” acts and practices related to offering consumer financial services or products. Because the Bank has less than $10 billion in total assets, the primary federal regulator with examination authority over the Bank for compliance with consumer financial protection laws is the OCC.
The Gramm-Leach-Bliley Act (“GLBA”) includes provisions that give consumers protections regarding the transfer and use of their nonpublic personal information by financial institutions. In addition, states are permitted under the GLBA to have their own privacy laws, which may offer greater protection to consumers than the GLBA. Numerous states in which the Bank does business have enacted such laws.
The Bank Secrecy Act, the PATRIOT Act and rules and regulation of the Office of Foreign Assets Control (“OFAC Rules”) include numerous provisions designed to fight international money laundering and to block terrorist access to the U.S. financial system. We have established policies and procedures to ensure compliance with the provisions of the Bank Secrecy Act, the PATRIOT Act and OFAC Rules.
The Community Reinvestment Act of 1977 (“CRA”) requires deposit institutions to assist in meeting the credit needs of their market areas consistent with safe and sound banking practice. Under the CRA, each depository institution is required to help meet the credit needs of its market areas by, among other things, providing credit to low- and moderate-income individuals and communities. Depository institutions are periodically examined for compliance with the CRA and are assigned ratings. The primary federal regulatory agency assigns one of four possible ratings to an institution’s CRA performance and is required to make public an institution’s rating and written evaluation. The four possible ratings of meeting community credit needs are outstanding, satisfactory, needs to improve and substantial non-compliance. The OCC has recently completed its examination of the Bank’s compliance with the CRA. As of the date of this report, we have not received the results from this examination. However, in our last completed examination, we received a “satisfactory” CRA rating from the OTS.
The Bank has committed $8.0 million to three investments in limited partnership equity funds as a cost effective way of meeting its obligations under the CRA. As of June 30, 2014, the Bank had invested $480,000 of its aggregate commitment to the three funds. These investments are subject to the Volcker Rule provisions of the Dodd-Frank Act. The Volcker Rule prohibits, and would require banking entities to restructure and unwind, certain investments and relationships with “covered funds” as defined in the Volcker Rule. Based on management’s interpretation of the Volcker Rule and the final rules implementing the Volcker Rule, the Bank’s equity method investments in these funds would be excluded from the definition of “covered funds” as these investments would meet the definition of “public welfare investment funds” designed primarily to promote the public welfare. The Bank also believes that one of these investments would fall within the exemption for “small business investment companies” under the final rules. Also, the Bank believes that its held to maturity and available for sale investments, which constitute investments in U.S. government agency and municipal obligations, would fall within applicable exceptions from the prohibition on proprietary trading under the Volcker Rule. If the Bank’s interpretation of the applicable requirements and exceptions is not accurate or consistent with regulatory interpretations, this could increase the Bank’s compliance and regulatory risks and costs, and the Bank could be forced to liquidate certain investments.
Transactions between the Bank and its nonbanking affiliates, including us, are subject to Section 23A of the Federal Reserve Act. In general, Section 23A imposes limits on the amount of such transactions, and also requires certain levels of collateral for loans to affiliated parties. Affiliate transactions are also subject to Section 23B of the Federal Reserve Act, which generally requires that certain transactions between the Bank and its affiliates be on substantially the same terms, or at least terms as favorable to the Bank, as those prevailing at the time for comparable transactions with or involving other nonaffiliated persons. The FRB’s Regulation W implements Section 23A and 23B of the Federal Reserve Act and codifies prior interpretive guidance with respect to affiliate transactions. On July 21, 2011, an amendment made in the Dodd-Frank Act became effective to amend the definition of “affiliate” in Section 23A of the Federal Reserve Act to include “any investment fund with respect to which a member bank or an affiliate thereof is an investment advisor.”
The restrictions on loans to directors, executive officers, principal stockholders and their related interests (collectively referred to herein as “insiders”) contained in the Federal Reserve Act and Regulation O apply to all insured depository institutions, their subsidiaries and holding companies. These restrictions include limits on loans to one borrower and conditions that must be met before such a loan can be made. There is also an aggregate limitation on all loans to insiders and their related interests. These loans cannot exceed the institution’s total unimpaired capital and surplus, and the OCC may determine that a lesser amount is appropriate. Insiders are subject to enforcement actions for knowingly accepting loans in violation of applicable restrictions. On July 21, 2011, an amendment made in the Dodd-Frank Act became effective to amend the statutes placing limitations on loans to insiders by including credit exposures to the person arising from a derivatives transaction, repurchase agreement, reverse repurchase agreement, securities lending transaction or securities borrowing transaction between the member bank and the person within the definition of an extension of credit to an insider.
Subject to various exceptions, savings and loan holding companies and their affiliates are generally prohibited from tying the provision of certain services, such as extensions of credit, to certain other services offered by a holding company or its affiliates.
We are subject to the requirements of the Secure and Fair Enforcement for Mortgage Licensing Act of 2008 (the “SAFE Act”). The SAFE Act requires mortgage loan originators who are employees of regulated institutions (including banks and certain of their subsidiaries) to be registered with the Nationwide Mortgage Licensing System and Registry (the “Registry”), a database established by the Conference of State Bank Supervisors and the American Association of Residential Mortgage Regulators to support the licensing of mortgage loan originators by each state. As part of this registration process, mortgage loan originators must furnish the Registry with background information and fingerprints for a background check. The SAFE Act generally prohibits employees of a regulated financial institution from originating residential mortgage loans without first registering with the Registry and maintaining that registration. Financial institutions must also adopt policies and procedures to ensure compliance with the SAFE Act.
Although our lending activities expose us to some risk of liability for environmental hazards, we do not currently have any significant liabilities for environmental matters.
INSURANCE
Our broker/dealer subsidiaries are required by federal law to belong to the SIPC. SIPC provides protection for clients up to $500,000 each with a limitation of $250,000 for claims for cash balances for all of our broker/dealers. Southwest Securities purchases insurance which, when combined with the SIPC insurance, provides insurance coverage for Southwest Securities and SWS Financial in certain circumstances for securities held in clients' accounts with a $100 million aggregate limit.
The Bank’s deposits are insured by the DIF, which is administered by the FDIC, up to applicable limits of $250,000 for each depositor in accordance with FDIC rules. The FDIC’s DIF is funded by assessments on insured depository institutions, which depend on the risk category of an institution and the amount of insured deposits that it holds. The FDIC may increase or decrease the assessment rate schedule on a semi-annual basis.
EMPLOYEES
At June 30, 2014, we employed 892 individuals. Southwest Securities, SWS Financial and SWS Insurance employed 747 of these individuals, 199 of whom were full-time registered representatives, and the Bank employed 145 individuals. In addition, 278 registered representatives were affiliated with SWS Financial as independent contractors.
CUSTOMERS
As of the date of this report, we provided full-service securities brokerage to approximately 55,000 client accounts and clearing services to approximately 98,000 additional client accounts. No single client accounted for a material percentage of our total business.
As of the date of this report, we provided deposit and loan services to approximately 86,000 customers through the Bank and its subsidiaries, which included approximately 83,000 Southwest Securities’ customer accounts. No single customer accounted for a material percentage of the Bank’s or our total business.
TRADEMARKS
We own various registered trademarks and service marks, including "Southwest Securities," "SWS," "SWS Financial," "Southwest Securities, FSB," and "SWS Group," which are not material to our business. We also own various design marks related to logos for various business segments.
EXECUTIVE OFFICERS OF THE REGISTRANT
The following table lists our executive officers and their respective ages and positions on September 5, 2014, followed by a brief description of their business experience over the past five years. Each listed person has been appointed to the indicated office by our BOD.
| | | | |
Name | | Age | | Position |
James H. Ross | | 64 | | Director, President and Chief Executive Officer |
J. Michael Edge | | 37 | | Executive Vice President, Interim Chief Financial Officer and Treasurer |
Daniel R. Leland | | 53 | | Executive Vice President |
Richard H. Litton | | 67 | | Executive Vice President |
W. Norman Thompson | | 58 | | Executive Vice President and Chief Information Officer |
Allen R. Tubb | | 60 | | Executive Vice President, General Counsel and Secretary |
Robert A. Chereck | | 66 | | Executive Chairman and President of Southwest Securities, FSB |
James H. Ross was named President, Chief Executive Officer and a member of the BOD of SWS Group on October 28, 2010. Prior to October 28, 2010, Mr. Ross had served as interim Chief Executive Officer and a member of the BOD since August 18, 2010. He previously served as Executive Vice President since November 2004 and, in September 2007, was elected President and Chief Executive Officer of Southwest Securities. Mr. Ross served as the Director of the Private Client Group at Southwest Securities from March 2004 to March 2008. He served as Chief Executive Officer of SWS Financial from September 2004 to April 2011. Mr. Ross came to Southwest Securities in 2004 to head the Private Client Group’s brokerage office in Dallas, Texas. Prior to coming to Southwest Securities, Mr. Ross was with UBS Paine Webber, where, from April 1991 to December 2003, Mr. Ross held various positions ranging from financial advisor to branch manager. He began his securities industry career in 1975.
J. Michael Edge was named interim Chief Financial Officer and Treasurer on September 30, 2013. Mr. Edge previously served as the Company’s Senior Vice President of Finance and Investor Relations since December 2011. Previously, Mr. Edge served as Director of Finance and Investor Relations from August 2009 through November 2011, Financial Analyst from January 2005 through July 2009, and Internal Auditor from October 2000 through December 2004. Prior to joining SWS, Mr. Edge served as Assistant Vice President—Senior Risk Analyst at Bank One from June 1998 through October 2000. Mr. Edge is a Certified Public Accountant and holds a Bachelor of Business Administration degree in Finance from Texas A&M University and a Master of Business Administration degree with concentrations in Financial Consulting and Accounting from Southern Methodist University. Mr. Edge also holds Series 7 and Series 27 securities licenses and is a graduate of the Securities Industry Institute of the University of Pennsylvania’s Wharton School of Business.
Daniel R. Leland has served as our Executive Vice President since May 2007. Mr. Leland was also Executive Vice President from February 1999 to September 2004. He served as President and Chief Executive Officer of Southwest Securities from August 2002 to September 2004. He also served as Executive Vice President of Southwest Securities from July 1995 to August 2002 and was re-elected in February 2006. Mr. Leland began his career at Barre & Company in June 1983 where he was employed in various capacities in fixed income sales and trading before becoming President of Barre & Company in 1993. Mr. Leland has been an arbitrator for the National Association of Securities Dealers (NASD) and is a past Vice Chairman of the District 6 Business Conduct Committee. He is a past board member of the Bond Dealers of America and previously served as the chair of the Taxable Committee.
Richard H. Litton has served as our Executive Vice President and as Executive Vice President of Southwest Securities for the Public Finance Division since July 1995. Beginning in September 2006, he became primarily responsible for the entire municipal securities product area of Southwest Securities. Previously, Mr. Litton was President of a regional investment bank and headed the Municipal Group in the Southwest for Merrill Lynch. Mr. Litton served on various advisory committees for the Texas House of Representatives’ Financial Institutions Committee, is a past director of the Municipal Advisory Council of Texas and currently serves on the Municipal Executive Committee and the Municipal Legal Advisory Committee of the Securities Industry and Financial Markets Association (SIFMA).
W. Norman Thompson has served as our Executive Vice President and Chief Information Officer since January 1995. Mr. Thompson was employed by Kenneth Leventhal & Co. (now a part of Ernst & Young LLP) in various capacities ranging from Audit Manager to Senior Consulting Manager from 1987 to 1994. Previously, Mr. Thompson was an auditor with KPMG LLP from 1981 to 1987. In the capacities he held with both Kenneth Leventhal & Co. and KPMG LLP, he was heavily involved in information technology auditing and consulting.
Allen R. Tubb was elected as our Vice President, General Counsel and Secretary in August 2002 and Executive Vice President in November 2011. He joined SWS as Corporate Counsel and Secretary in October 1999. From 1979 to 1999, Mr. Tubb was employed with Oryx Energy Company and its predecessor Sun Exploration and Production Company in various capacities including Chief Counsel, Worldwide Exploration and Production. Mr. Tubb is a member of the Texas Bar Association.
Robert A. Chereck has served as Executive Chairman and President of Southwest Securities, FSB since May 2012. Prior to joining Southwest Securities, FSB, Mr. Chereck was Executive Vice President, Southwest Division Manager and Dallas Regional
President with Wells Fargo Bank, N.A., (“Wells Fargo”) in Dallas. He began with Wells Fargo in 1996 when the company acquired First Interstate Bank of Texas, N.A., where Mr. Chereck served as the Group Manager overseeing all of the wholesale activities of the bank. At Wells Fargo, he was Executive Vice President and Division Manager of 11 regional banking offices in New Mexico, Oklahoma and Texas. Mr. Chereck also managed the Energy Group of Wells Fargo until 2008. Mr. Chereck has also served as President and Owner of Norwich Financial Associates, Inc., a financial services and consulting company in Dallas, and as Managing Director of Mason Best Company, a privately held merchant banking firm. He began his career with InterFirst Bank Dallas, where he served in a variety of senior-level positions, including Executive Vice President managing the Dallas Corporate Division. Mr. Chereck is currently Chairman of the Board of Children’s Medical Center and Chairman of the Dallas Citizens Council. He is Past Chairman of the Dallas Regional Chamber and serves on the Board’s Executive Committee. Mr. Chereck has also served three terms on the City of Dallas Housing Finance Corporation and was a member of the Downtown Dallas Association Board. In addition, he is a member of the Advisory Council for the University of Texas McCombs Business School. He earned a Bachelor of Arts in political science and a Master of Business Administration in finance and accounting from the University of Texas at Austin.
ITEM 1A. RISK FACTORS
Our business, reputation, financial condition, operating results and cash flows can be impacted by a number of factors. Many of these factors are beyond our control and may significantly impact us during periods of market volatility or reduced liquidity. The potential harm from any one of these risks, or others, could cause our actual results to vary materially from recent results or from anticipated future results. Some risks may adversely impact not only our own operations, but the banking or securities industry in general which could also produce marked swings in the trading price of our securities. Although the risks described below are those that management believes are the most significant, these are not the only risks facing our company. Additional risks and uncertainties not currently known to us or that we currently do not deem to be material may also materially affect our business, reputation, financial condition, operating results and cash flows. We may amend or supplement these risk factors from time to time in the reports we file with the SEC.
RISKS SPECIFIC TO THE MERGER
Because the market price of Hilltop common stock will fluctuate and the per share merger consideration may be adjusted, our stockholders cannot be sure of the value of the merger consideration they will receive. Upon completion of the merger, each share of our common stock will be converted into merger consideration consisting of $1.94 in cash and 0.2496 of a share of Hilltop common stock. Because the stock portion of the merger consideration is based on a fixed ratio, the market value of the merger consideration may at any given time vary from the closing price of Hilltop common stock on the date the merger was announced. Any change in the market price of Hilltop common stock prior to completion of the merger will affect the market value of the merger consideration that our stockholders will receive upon completion of the merger. We are not permitted to terminate the Merger Agreement or resolicit the vote of our stockholders solely because of changes in the market price of Hilltop’s common stock, and there will be no adjustment to the merger consideration for changes in such market price. Stock price changes may result from a variety of factors, including general market and economic conditions, changes in Hilltop’s or our respective businesses, operations and prospects, and regulatory considerations. Many of these factors are beyond our control.
The merger is subject to the receipt of consents and approvals from government entities that may take longer than expected or may impose conditions that are not presently anticipated or that could have an adverse effect on the combined company following the merger. The merger is conditioned on the receipt of all requisite governmental and regulatory authorizations, consents, orders and approvals from the Federal Reserve Board and the Texas Department of Banking and, if applicable, the expiration or termination of the waiting period under the Hart-Scott-Rodino Antitrust Improvements Act of 1976, as amended. These government entities may impose conditions on the completion of the merger or require changes to the terms of the merger. There can be no assurance that material conditions or changes will not be imposed that are in addition to the capital commitments we have in place with the OCC, and such conditions or changes could have the effect of delaying or preventing completion of the merger or imposing additional costs on or limiting the revenues of the combined company following the merger, any of which might have an adverse effect on the combined company following the merger.
We will be subject to business uncertainties, and we are subject to contractual restrictions while the merger is pending. Uncertainty about the effect of the merger on employees and customers may have an adverse effect on us. These uncertainties may impair our ability to attract, retain and motivate key personnel while the merger is pending, and could cause customers and others that deal with us to seek to change existing business relationships with us. Retention of certain employees may be challenging during the pendency of the merger, as certain employees may experience uncertainty about their future roles. If key employees depart because of issues relating to such uncertainty or a desire not to remain with the business, our business could be negatively impacted.
In addition, the Merger Agreement restricts us from taking certain specified actions until the merger occurs without the consent of Hilltop. These restrictions may prevent us from pursuing business opportunities that may arise prior to the completion
of the merger and may affect our strategic business plans. Lastly, our business may be indirectly adversely affected by the failure to pursue other opportunities due to the focus of management on the merger.
The merger is subject to certain closing conditions that, if not satisfied or waived, will result in the merger not being completed, which may cause the price of our common stock to decline. The merger is subject to customary conditions to closing, including the receipt of required regulatory approvals and approval of our stockholders. If any condition to the merger is not satisfied or waived, the merger will not be completed. In addition, Hilltop and we may terminate the merger agreement under certain circumstances even if the merger is approved by our stockholders, including if the merger has not been consummated by March 31, 2015. If the merger is not completed, the trading price of our common stock may decline to the extent that the current market price reflects an assumption that the merger will be completed. In addition, neither company would realize any of the expected benefits of the merger. If the merger is not completed, additional risks could materialize, which could materially and adversely affect our business, financial condition and results of operations.
The Merger Agreement limits our ability to pursue an alternative transaction and requires us to pay a termination fee of $8 million under certain circumstances relating to alternative acquisition proposals. Under the Merger Agreement, we agreed that we will not, and will cause our subsidiaries not to, and will use our reasonable best efforts to cause our or their respective officers, directors, employees, representatives or agents not to, knowingly encourage, solicit, participate in, knowingly facilitate or initiate discussions, negotiations, inquiries, proposals or offers with or provide any non-public information to, any person relating to any third party acquisition or any inquiry, proposal or offer reasonably likely to lead to a third party acquisition, subject to exceptions set forth in the Merger Agreement. The Merger Agreement also provides for the payment by us of a termination fee in the amount of $8 million in the event that Hilltop terminates the Merger Agreement for certain reasons including a change in the recommendation of our BOD or a termination of the Merger Agreement in certain circumstances followed by an acquisition of, or an agreement to acquire, us by a third party. These provisions may discourage a potential competing acquiror that might have an interest in acquiring all or a significant part of us from considering or proposing such an acquisition.
Our Credit Agreement with Hilltop and Oak Hill contains a covenant restricting our ability to enter into alternative transactions and Hilltop has not waived this covenant. The terms of the Credit Agreement with Hilltop and Oak Hill include a covenant prohibiting us from undergoing a “Fundamental Change,” which includes any merger, amalgamation or consolidation, and which we would breach by engaging in a merger, amalgamation or consolidation unless compliance were waived by each of Hilltop and Oak Hill. During the parties’ negotiations with respect to the merger, Hilltop indicated to us that it would not be willing to grant a waiver of this covenant to permit a third party transaction. The existence of the this covenant, and Hilltop’s unwillingness to waive it, may have discouraged and may continue to discourage potential competing acquirors that might have an interest in acquiring all or a significant part of us from considering or proposing such an acquisition.
Termination of the Merger Agreement could negatively impact us. If the Merger Agreement is terminated, there may be various consequences. For example, our business may have been adversely impacted by the failure to pursue other beneficial opportunities due to the focus of management on the merger, without realizing any of the anticipated benefits of the merger. A termination of the Merger Agreement may also damage our reputation and franchise value. If the Merger Agreement is terminated and our BOD seeks another merger or business combination, our stockholders cannot be certain that we will be able to find a party willing to engage in a transaction or to pay the equivalent or greater consideration than that which Hilltop has agreed to pay in the merger.
The combined company expects to incur substantial expenses related to the merger. The combined company expects to incur substantial expenses in connection with completing the merger and combining the business, operations, networks, systems, technologies, policies and procedures of the two companies. Although we have assumed that a certain level of transaction and combination expenses would be incurred, there are a number of factors beyond our control that could affect the total amount or the timing of our combination expenses. Many of the expenses that will be incurred, by their nature, are difficult to accurately estimate. Due to these factors, the transaction and combination expenses associated with the merger could, particularly in the near term, exceed the savings that the combined company expects to achieve from the elimination of duplicative expenses and the realization of economies of scale and cost savings related to the combination of the businesses following the completion of the merger. As a result of these expenses, we expect to take charges against our earnings before and after the completion of the merger. The charges taken in connection with the merger are expected to be significant, although the aggregate amount and timing of such charges are uncertain. Further, if the merger is not completed, we would have to recognize these expenses without realizing the expected benefits of the merger.
If completed, the merger may not produce its anticipated results, and Hilltop and we may be unable to combine our operations in the manner expected. We and Hilltop entered into the Merger Agreement with the expectation that the merger will result in various benefits. Achieving the anticipated benefits of the merger is subject to a number of uncertainties, including whether the organizations can be combined in an efficient, effective and timely manner.
It is possible that the transition process could take longer than anticipated and could result in the loss of valuable employees, the disruption of each company’s ongoing businesses, controls, procedures, policies and compensation arrangements, any of which could adversely affect the combined company’s ability to achieve the anticipated benefits of the merger. The
combined company’s results of operations could also be adversely affected by any issues attributable to either company’s operations that arise or are based on events or actions that occur prior to the closing of the merger. The companies may have difficulty addressing possible differences in corporate cultures and management philosophies. The transition process is subject to a number of uncertainties, and no assurance can be given that the anticipated benefits will be realized or, if realized, the timing of their realization. Failure to achieve these anticipated benefits could result in increased costs or decreases in the amount of expected revenues and could adversely affect the combined company’s future business, financial condition, operating results and prospects.
The completion of the merger may trigger change in control provisions in certain agreements to which we are a party. The completion of the merger may trigger change in control provisions in certain agreements to which we are a party. If we and Hilltop are unable to negotiate consents or waivers of those provisions, the counterparties may exercise their rights and remedies under the agreements (including terminating the agreements or seeking monetary penalties). Even if we or Hilltop are able to obtain consents or waivers, the counterparties may demand a fee for such consents or waivers or seek to renegotiate the agreements on materially less favorable terms than those currently in place.
Pending litigation against us could result in an injunction preventing the completion of the merger or a judgment resulting in the payment of damages. In connection with the merger, purported stockholders have filed putative shareholder class action lawsuits against us and the members of our BOD. Among other remedies, the plaintiffs seek to enjoin the merger. If the cases are not resolved, these lawsuits could prevent or delay completion of the merger and result in substantial costs to us, including any costs associated with the indemnification of directors and officers. Plaintiffs may file additional lawsuits against us and/or the directors and officers of the company, in connection with the merger. The defense or settlement of any lawsuit or claim that remains unresolved at the time the merger is completed may adversely affect our business, financial condition, results of operations and cash flows.
RISKS SPECIFIC TO OUR INDUSTRIES
Compliance with regulatory reform legislation may increase our costs and limit our ability to pursue business opportunities. On July 21, 2010, the President of the United States signed into law the Dodd-Frank Act. The full impact of the Dodd-Frank Act and its implementing regulations on the financial services industry in general, and on us in particular, is still being determined. SWS Group and the Bank will be subject to additional significant regulatory requirements, which may have a material impact on each or both of them, or SWS as a whole. The principal effects of the Dodd-Frank Act on our business include:
| · | | changes to the supervisory structure for SWS Group and the Bank; |
| · | | changes to regulatory capital requirements applicable to SWS Group and the Bank; |
| · | | establishment of the Bureau with broad authority to issue new consumer protection regulations; |
| · | | increases in the minimum reserve ratio for the deposit insurance fund of the FDIC to 2% and a change in the base for FDIC insurance assessments; and |
| · | | proposed prohibitions on “proprietary trading” and proposed limitations with respect to the sponsorship of, and investment in, hedge funds and private equity under the Volcker Rule. |
As a result of the Dodd-Frank Act, the OTS was abolished and, on July 21, 2011, the OCC took over supervision and regulation of federal thrifts, such as the Bank, and the FRB took over supervision and regulation of savings and loan holding companies, including SWS Group. As a result, we are subject to the regulatory capital and activity requirements, including the new Basel III regulatory capital framework approved by the FRB in July 2013. The Dodd-Frank Act also requires that SWS Group serve as a “source of strength” for the Bank, however, implementing regulations have not been proposed.
The Dodd-Frank Act created a new independent regulatory body, the Bureau, which was given broad rulemaking authority to implement the consumer protection laws that apply to banks and thrifts and to prohibit “unfair, deceptive or abusive” acts and practices. The Dodd-Frank Act permits states to adopt consumer protection laws and regulations that are stricter than those regulations promulgated by this new independent regulatory body.
Full implementation of the Dodd-Frank Act will require many new rules to be issued by numerous federal regulatory agencies over the next several years. We expect that several aspects of the Dodd-Frank Act may affect our business, including, without limitation, increased capital requirements, increased mortgage regulation, restrictions on proprietary trading in securities, restrictions on investments in hedge funds and private equity funds, executive compensation restrictions and disclosure and reporting requirements.
Given the significance of the changes and the additional regulatory action required for many of the new provisions, we cannot predict all of the ways or the degree to which our business, financial condition and results of operations may be affected by the Dodd-Frank Act once it is fully implemented. Compliance with these new laws and regulations likely will result in additional costs, which could be significant and may adversely impact our results of operations, financial condition, and liquidity. For additional discussion of the Dodd-Frank Act, see "Item 1. Business-Regulation” included elsewhere in this report.
We may be adversely affected by increased governmental and regulatory scrutiny or negative publicity. Governmental and regulatory scrutiny from regulators, legislative bodies and law enforcement agencies with respect to matters relating to compensation, our business practices, our past actions and other matters has increased dramatically in the past several years. The financial crisis and the current political and public sentiment regarding financial institutions has resulted in a significant amount of adverse press coverage, as well as adverse statements or charges by regulators or other government officials. Press coverage and other public statements that assert some form of wrongdoing often result in some type of investigation by regulators, legislators and law enforcement officials or in lawsuits. Responding to these investigations and lawsuits, regardless of the ultimate outcome of the proceeding, is time consuming and expensive and can divert the time and effort of our senior management from our business. Penalties and fines sought by regulatory authorities have increased substantially over the last several years, and certain regulators have been more likely in recent years to commence enforcement actions or to advance or support legislation targeted at the financial services industry. Adverse publicity, governmental and regulatory scrutiny and legal and enforcement proceedings can also have a negative impact on our reputation and on the morale and performance of our employees, which could adversely affect our business, financial condition, and results of operations or cash flows.
Failure to comply with state and federal laws governing our securities and banking operations, or the regulations adopted by certain self-regulatory agencies could have a material adverse effect on our business. Broker/dealers, investment advisors and banks are subject to regulation in almost every facet of their operations. Our ability to comply with these regulations depends largely on the establishment and maintenance of an effective compliance system as well as our ability to attract and retain qualified compliance personnel. We could be subject to disciplinary or other actions due to alleged non-compliance with these laws or regulations or possibly for the alleged non-compliance of our correspondents. If non-compliance is alleged by a regulatory authority, our management’s efforts could be diverted to responding to such claim and we could be subject to a range of possible consequences, including the payment of fines and the suspension of one or more portions of our business. Our clearing contracts generally include automatic termination provisions that are triggered in the event we are suspended from any of the national exchanges of which we are a member for failure to comply with the rules or regulations thereof. In addition, the failure of the Bank to maintain its status as “well capitalized” could lead to regulatory sanctions and limitations and could lead federal banking agencies to take prompt corrective action. Failure to comply with these laws and regulations could have a material adverse effect on our business, financial condition, results of operations or cash flows.
The impact of the changing regulatory capital requirements and new capital rules are uncertain. In July 2013, the OCC and FRB approved a final rule that will substantially amend the risk-based capital rules applicable to SWS Group and the Bank. The final rule implements the “Basel III” regulatory capital reforms and changes required by the Dodd-Frank Act. The final rule includes new minimum risk-based capital and leverage ratios, which will be effective for SWS Group and the Bank on January 1, 2015, and refines the definition of what constitutes “capital” for purposes of calculating these ratios. The new minimum capital requirements will be: (i) a new common equity Tier 1 capital ratio of 4.5%; (ii) a Tier 1 to risk-based assets capital ratio of 6% (increased from 4%); (iii) a total capital ratio of 8% (unchanged from current rules); and (iv) a Tier 1 leverage ratio of 4%. The final rule also establishes a “capital conservation buffer” of 2.5% above the new regulatory minimum capital ratios and will result in the following minimum ratios: (i) a common equity Tier 1 capital ratio of 7.0%; (ii) a Tier 1 to risk-based assets capital ratio of 8.5%; and (iii) a total capital ratio of 10.5%. The new capital conservation buffer requirement would be phased in beginning in January 2016 at 0.625% of risk-weighted assets and would increase each year until fully implemented in January 2019. An institution will be subject to limitations on paying dividends, engaging in share repurchases, and paying discretionary bonuses if its capital level falls below the buffer amount. These limitations will establish a maximum percentage of eligible retained income that can be utilized for such actions. The application of more stringent capital requirements for SWS Group and the Bank could, among other things, adversely affect our results of operations and growth, require the raising of additional capital, restrict our ability to pay dividends or repurchase shares and result in regulatory actions if we were to be unable to comply with such requirements.
In July 2013, the SEC adopted various amendments to Rules 15c3-1 and 15c3-3 under the Exchange Act related to, among other things, securities lending, certain new deductions from net capital, proprietary accounts of broker/dealer customers, certain broker/dealer insolvency events and corresponding related amendments to books and records rules.
Our business has been and may continue to be materially and adversely affected by financial market conditions and economic conditions generally. Our business is affected by conditions in the financial markets and economic conditions generally around the world. The financial services industry and the securities markets generally are materially and adversely affected by recessionary or volatile environments which can cause significant declines in the value of nearly all asset classes. Concerns about financial institution profitability and solvency as a result of general market conditions, particularly in the credit markets, may cause our customers and clients to reduce the level of business that they do with us. Declines in asset values, the lack of liquidity, general uncertainty about economic and market activity and a lack of consumer and investor confidence have negatively impacted, and may continue to negatively impact, our business.
Our financial performance is highly dependent on the business environment in which we operate. A favorable business environment is generally characterized by, among other factors, high global gross domestic product growth, stable geopolitical conditions, transparent and efficient capital markets, liquid markets with active investors, low inflation, high business and consumer confidence, active new issuance markets for fixed income and equity securities and strong business earnings. Slowing
growth, contraction of credit, increasing energy prices, declines in business or investor confidence or risk tolerance, increases in inflation, higher unemployment, outbreaks of hostilities or other geopolitical instability, corporate, political or other scandals that reduce investor confidence in capital markets and natural disasters, among other things, can affect the global financial markets. In addition, economic or political pressures in a country or region may cause local market disruptions and currency devaluations, which may also affect markets generally. In the event of changes in market conditions, such as interest or foreign exchange rates, equity, fixed income, commodity or real estate valuations, liquidity, availability of credit or volatility, our business could be adversely affected.
Overall, the business environment since 2008 has been difficult. While many economists believe the recession ended in June 2009 and while select factors indicate signs of improvement, significant uncertainty still remains. Unemployment and tight credit markets continue to create a fragile economic environment, and there is no guarantee that conditions will not worsen again leading to further decline in economic and market conditions. Although Texas was largely insulated from severe job loss and real estate market deterioration at the start of the recession, it experienced distress in residential and commercial real estate values as well as elevated unemployment. These conditions had, and will continue to have, a direct and material impact on our results of operations and financial condition because performance in the financial services industry is heavily influenced by the overall strength of economic conditions and financial market activity.
Our ability to access capital markets is dependent on market conditions and our credit standing, which could change unfavorably. Factors that are significant to the determination of our credit worthiness or otherwise affect our ability to raise financing include the level and volatility of our earnings and whether we have net losses, our relative competitive position in the markets in which we operate, our product diversification, our ability to retain key personnel, our risk profile, our risk management policies, our cash liquidity, our capital adequacy, our corporate lending credit risk and legal and regulatory developments. Additionally, market conditions can be unfavorable for our industry causing banks and other liquidity sources to reduce or limit credit to our industry. This could limit the availability of, and thus our access to, capital and/or increase the cost of funding new or existing businesses.
Our revenues may decrease if securities transaction volumes decline. Our securities business depends upon the general volume of trading in the U.S. securities markets. If the volume of securities transactions should decline, revenues from our securities brokerage, securities lending and clearing businesses would decrease and our business, financial condition, results of operations or cash flows would be materially and adversely impacted.
Market fluctuations could adversely impact our securities business. We are subject to risks as a result of fluctuations in the securities markets. Our securities trading, market-making and underwriting activities involve the purchase and sale of securities as a principal, which subjects our capital to significant risks. Market conditions could limit our ability to sell securities purchased or to purchase securities sold in such transactions. If price levels for equity securities decline generally, the market value of equity securities that we hold in our inventory could decrease and trading volumes could decline. In addition, if interest rates increase, the value of debt securities we hold in our inventory would decrease. Rapid or significant market fluctuations could adversely affect our business, financial condition, results of operations and cash flow.
In addition, during periods of market disruption, it may be difficult to value certain assets if comparable sales become less frequent or market data becomes less observable. Certain classes of assets or loan collateral that were in active markets with significant observable data may become illiquid due to the current financial environment. In such cases, asset valuations may require more estimation and subjective judgment. Rapidly changing real estate market conditions could materially impact the valuation of assets and loan collateral as reported in our financial statements and changes in estimated values could vary significantly from one period to the next. Decreases in value may have a material adverse effect on our business, financial condition or results of operations.
The soundness of other financial institutions could adversely affect us. Our ability to engage in routine funding transactions could be adversely affected by the actions and commercial soundness of other financial institutions. Financial services institutions are interrelated as a result of trading, clearing, counterparty or other relationships. We have exposure to many different counterparties and we routinely execute transactions with counterparties in the financial services industry, including brokers and dealers, commercial banks, credit unions, investment banks, mutual and hedge funds, and other institutional clients. As a result, defaults by, or even negative speculation about, one or more financial services institutions, or the financial services industry in general, have led to market wide liquidity problems and could lead to losses or defaults by us or by other institutions. Many of these transactions expose us to credit risk in the event of default of our counterparty or client. In addition, our credit risk may be exacerbated when the collateral held by us cannot be realized or is liquidated at prices not sufficient to recover the full amount of the receivable due us. Any such losses could be material and could materially and adversely affect our business, financial condition, results of operations or cash flows.
RISKS RELATED TO OUR COMPANY
Agreements with Hilltop and Oak Hill provide them with influence over certain matters requiring director and stockholder approval. In connection with loans made under the Credit Agreement by and among Oak Hill and Hilltop (the “Investors”) and us, the Investors were each issued warrants to purchase an aggregate of 8,695,652 shares of our common stock (the “Warrants”). For each Investor, the Warrants represent approximately 17% of our common stock (assuming that all of the Warrants are exercised in full). The Investors have the right to exercise the Warrants to purchase shares of our common stock at an agreed upon exercise price.
Pursuant to an Investor Rights Agreement, by and between the Investors and us, dated as of July 29, 2011 (the “Investor Rights Agreement”), each of the Investors has the right to appoint one representative of the Investor to serve as a member of our BOD, and one representative of the Investor to serve as an observer of the BOD. Our BOD consists of 10 directors, including five who qualify as independent under the NYSE listing standards and the two directors who were appointed by the Investors. The representatives of Oak Hill and Hilltop appointed to serve as members of the BOD share in the duties of the BOD by generally participating in and voting during board meetings.
The Credit Agreement with the Investors contains certain covenants, including a covenant that prohibits us from prepaying the loan other than following a period during which the closing price for our common stock exceeds 150% of the exercise price of the warrants (i.e., exceeds $8.625) for 20 out of any 30 consecutive trading days and a covenant that prohibits us from undergoing a “Fundamental Change,” which includes any merger, amalgamation or consolidation.
As a result of the Warrants, Investor Rights Agreement and the Credit Agreement, the Investors have influence over certain matters requiring director and stockholder approval, including, among other things, any merger, consolidation or sale of all or substantially all of the Company’s assets and the election of certain members of the BOD.
Deteriorating credit quality, particularly in commercial, construction and real estate loans, has adversely impacted the Bank and may adversely impact the Bank. Beginning in fiscal 2009, the Bank began to experience a downturn in the overall credit performance of its real estate loans held for investment, as well as acceleration in the deterioration of general economic conditions in Texas and other areas of the United States. This deterioration, as well as increases in Texas unemployment levels, worsened in the third quarter of fiscal 2010. These conditions caused increased financial stress on many of the Bank’s borrowers and negatively impacted their ability to repay their loans. Classified and non-performing assets increased significantly in fiscal 2010 and 2011 and real estate collateral values continued to decline in both fiscal 2010 and 2011. Due to these factors, the Bank significantly increased its loan loss reserves in fiscal 2010 and 2011.
Both classified and non-performing assets have improved throughout fiscal 2012, 2013 and 2014, and in fiscal 2014 and 2013, the Bank recognized a recapture for loan losses of $5.4 million and $7.7 million, respectively. Deterioration in the credit quality of the Bank's real estate loan portfolio could significantly increase non-performing loans, require additional increases in loan loss reserves and elevate charge-off levels. The occurrence of any of these events could have a material adverse effect on the Bank's capital, financial condition or results of operations and increase the risk of additional regulatory action.
The Bank is subject to regulatory capital requirements that may limit its operations and potential growth. The Bank is a federal savings bank that is subject to comprehensive supervision and regulation of the OCC, including risk-based, leverage and tangible capital ratio requirements. Capital requirements may rise above normal levels when the Bank experiences deteriorating earnings and credit quality, and the OCC may increase the Bank’s capital requirements based on general economic conditions and the Bank’s particular condition, risk profile and growth plans. The Bank has made a commitment to the OCC that the Bank will, among other things: (i) adhere to the Bank’s written business and capital plan as amended from time to time and (ii) maintain a Tier 1 (core) capital ratio at least equal to nine percent (9%) and a total risk-based capital ratio of at least twelve percent (12%). Compliance with capital requirements may limit the Bank’s operations that require the intensive use of capital and could adversely affect the Bank’s ability to expand or maintain present business levels.
The preparation of our consolidated financial statements requires the use of estimates that may vary from actual results and new accounting standards could adversely affect future reported results. The preparation of our consolidated financial statements in conformity with accounting principles generally accepted in the United States of America (“GAAP”) requires management to make estimates and assumptions that affect the reported amounts of assets and liabilities, disclosure of contingent assets and liabilities at the date of the consolidated financial statements and the reported amounts of revenues and expenses during the reporting period. Such estimates and assumptions may require management to make difficult, subjective and complex judgments about matters that are inherently uncertain. See Item 7. “Management's Discussion and Analysis of Financial Condition and Results of Operations – Critical Accounting Estimates,” for additional information on the nature of these estimates.
Our financial instruments, including certain trading assets and liabilities, available for sale securities, certain loans, interest rate swaps and warrants, require management to make a determination of their fair value in order to prepare our consolidated financial statements. Where quoted market prices are not available, we may make fair value determinations based on internally developed models or other means which ultimately rely to some degree on our judgment. Some of these instruments
and other assets and liabilities may have no direct observable inputs, making their valuation particularly subjective, being based on significant estimation and judgment by management. In addition, sudden illiquidity in markets or declines in prices of certain securities may make it more difficult to value certain items, which may lead to the possibility that such valuations will be subject to change or adjustment and could lead to declines in our earnings in subsequent periods.
Our accounting policies and methods are fundamental to how we record and report our financial condition and results of operations. From time to time the Financial Accounting Standards Board (“FASB”) and the SEC change the financial accounting and reporting standards that govern the preparation of our financial statements. In addition, accounting standard setters and those who interpret the accounting standards may change or even reverse their previous interpretations or positions on how these standards should be applied. These changes can be hard to predict and can materially impact how we record and report our financial condition and results of operations. In some cases, we could be required to apply a new or revised standard retroactively, resulting in a restatement of prior period financial statements.
Failure to achieve and maintain effective internal controls could result in a misstatement of our financial statements. Pursuant to Section 404 of the Sarbanes-Oxley Act, we are required to furnish an annual report by our management assessing the effectiveness of our internal control over financial reporting. This assessment must include disclosure of any material weaknesses in our internal control over financial reporting identified by management. A material weakness is a control deficiency, or a combination of deficiencies, that results in more than a remote likelihood that a material misstatement of our annual or interim financial statements will not be prevented or detected.
Ineffective internal controls could adversely impact our ability to provide timely and accurate financial information. If we are unsuccessful in maintaining effective internal controls, we may be unable to accurately and timely report financial information or maintain effective disclosure controls and procedures. Any such failure in the future could also adversely affect the results of periodic management evaluations and annual auditor attestation reports regarding disclosure controls and the effectiveness of our internal control over financial reporting required under Section 404 of the Sarbanes-Oxley Act and the rules promulgated hereunder. If we are unable to report financial information in a timely and accurate manner or to maintain effective disclosure controls and procedures, we could be in default under our Credit Agreement or be subject to, among other things, investigations or regulatory or enforcement actions by the SEC, the FRB, the FDIC, the OCC or other governmental authorities. In addition, any failure to maintain effective internal controls could cause investors to lose confidence in the accuracy and completeness of our financial reports, which in turn could cause our stock price to decline.
Risk management processes may not fully mitigate exposure to the various risks that we face, including market, liquidity and credit risk. We continue to refine our risk management techniques, strategies and assessment methods on an ongoing basis. However, risk management techniques and strategies, both ours and those available to the market generally, may not be fully effective in mitigating our risk exposure in all economic market environments or against all types of risk. For example, we might fail to identify or anticipate particular risks that our systems are capable of identifying, or the systems that we use, and that are used within the industry generally, may not be capable of identifying certain risks. Some of our strategies for managing risk are based upon our use of observed historical market behavior. We apply statistical and other tools to these observations to quantify our risk exposure. Any failures in our risk management techniques and strategies to accurately quantify our risk exposure could limit our ability to manage risks. In addition, any risk management failures could cause our losses to be significantly greater than the historical measures indicate. Further, our quantified modeling does not take all risks into account. As a result, we also take a qualitative approach in reducing our risk. Our qualitative approach to managing those risks could also prove insufficient, exposing us to material unanticipated losses.
Our business is significantly dependent on net interest margins. The profitability of our margin and stock lending businesses depends to a great extent on the difference between interest income earned on loans and investments of customer cash balances and the interest expense paid on customer cash balances and borrowings. The earnings and cash flows of the Bank are also dependent upon the difference between interest income earned on interest-earning assets such as loans and securities and interest expense paid on interest-bearing liabilities such as deposits and borrowed funds.
Interest rates are sensitive to many factors that are beyond our control, including general economic conditions and policies of various governmental and regulatory agencies and, in particular, the Board of Governors of the Federal Reserve System. Changes in monetary policy, including changes in interest rates, could affect the interest we receive on loans and securities and the amount of interest we pay on deposits and borrowings. Such changes could also affect our ability to originate loans and obtain deposits and the fair value of our financial assets and liabilities. If the interest rates paid on deposits and other borrowings increase at a faster rate than the interest rates received on loans and other investments, our net interest income, and therefore our earnings, could be adversely affected. Earnings could also be adversely affected if the interest rates received on loans and other investments fall more quickly than the interest rates paid on deposits and other borrowings.
Our net interest margins may decrease based on the mix of assets in the Bank’s portfolio and our investment strategy. In recent years, interest rates have declined to levels that have negatively impacted the net interest margin at the Bank and the broker/dealer. Additionally, as we have repositioned the Bank’s balance sheet to include a portfolio of conservative investment securities, the net interest margin on these assets is likely to be less than we have historically earned on our loan portfolio. Our earnings and results of operations could be adversely affected by any reduction in our net interest margin due to our investment
policies, returns on investments or market dynamics. Additionally, the Bank expects to periodically experience "gaps" in the interest rate sensitivities of its assets and liabilities, meaning that either the Bank’s interest-bearing liabilities will be more sensitive to changes in market interest rates than the Bank’s interest-earning assets, or vice versa. In either event, if market interest rates should move contrary to the Bank’s position, this "gap" may work against the Bank, and the Bank’s earnings may be adversely affected.
As part of the Bank’s risk mitigation strategy to reduce its exposure to variability in interest payments on the Bank’s variable rate deposits, forward-start interest rate swaps designated as cash flow hedging instruments have been utilized. The Bank’s forward-start interest rate swaps exchange fixed for variable interest payments beginning at a pre-specified date in the future according to the terms of the swap agreements. There is no guarantee that the structure of these derivative transactions will operate as designed and remain effective. If these transactions are not effective, our results of operations could be adversely affected.
We may not be able to reduce our operating expenses as a way to reduce any operating losses. To the extent our net interest income declines or we face other declines in revenues, we may look to reduce our operating expenses where possible. However, we have limited control over certain costs, and in particular, the cost of meeting regulatory requirements and our cost to access capital or financing, if needed. If we are unable to reduce our operating expenses, our financial condition, results of operations or cash flows could be adversely affected.
Our margin lending, stock lending, securities trading and execution, bank lending and mortgage purchase businesses are all subject to credit risk. Credit risk in all areas of our business increases if securities prices decline rapidly because the value of our collateral could fall below the amount of the indebtedness it secures. In rapidly appreciating markets, credit risk increases due to short positions. Our securities lending business as well as our securities trading and execution businesses subject us to credit risk if a counterparty fails to perform or if collateral securing its obligations is insufficient. In securities transactions, we are subject to credit risk during the period between the execution of a trade and the settlement by the customer.
In addition, the Bank is exposed to the risk that its loan customers may not repay their loans in accordance with their terms, the collateral securing the loans may be insufficient, or its loan loss reserve may be inadequate to fully compensate the Bank for the outstanding balance of the loan plus the costs to dispose of the collateral. Our mortgage warehousing activities subject us to credit risk during the period between funding by the Bank and when the mortgage company sells the loan to a secondary investor.
Significant failures by our customers, including correspondents, or clients to honor their obligations, together with insufficient collateral and reserves, could have a material adverse affect on our business, financial condition, results of operations or cash flows.
Our investment advisory business may be affected by the poor investment performance of our investment products. Poor investment returns and declines in client assets in our investment advisory business, due to either general market conditions or underperformance (relative to our competitors or to benchmarks) by our investment products, affects our ability to retain existing assets, prevent clients from transferring their assets out of our products or their accounts, or inhibit our ability to attract new clients or additional assets from existing clients. This could adversely affect our advisory business and the advisory fees that we earn on client assets.
The Bank’s allowance for loan losses may not be sufficient to cover actual loan losses. The Bank’s borrowers may fail to repay their loans according to the loan terms, and the collateral securing the payment of these loans may be insufficient to assure repayment. Such loan losses could have a material adverse effect on our operating results. We make various assumptions, estimates and judgments about the collectability of the Bank’s loan portfolio, including the creditworthiness of the borrowers and the value of the real estate and other assets serving as collateral for the loans. In determining the amount of the allowance for loan losses, the Bank relies on a number of factors, including its experience and evaluation of economic conditions. If the Bank’s assumptions prove to be incorrect, its allowance for loan losses may not be sufficient to cover losses inherent in its loan portfolio, and adjustments may be necessary that would have a material adverse effect on our operating results.
The Bank’s commercial real estate, commercial and mortgage lending businesses are dependent on the general health of the Texas and New Mexico economies. Any downturn in the Texas and New Mexico local economies could adversely affect the Bank’s commercial real estate, commercial and mortgage lending businesses, and consequently our financial condition, results of operations and cash flows. Additionally, any decline in real estate values generally and in Texas and New Mexico specifically could impair the value of our collateral and our ability to sell the collateral upon any foreclosure. In the event of a default with respect to any of these loans, the amounts we receive upon sale of the collateral may be insufficient to recover the outstanding principal and interest on the loan.
Our business and prospects, including our ability to attract and retain customers, clients and employees, may be adversely affected if our reputation is harmed. Our business is subject to significant reputational risks. If we fail, or appear to fail, to deal appropriately with various legal, regulatory or business issues, our reputation, business and prospects, including
our ability to attract and retain customers, clients and employees, could be seriously harmed. This could be the case not only in situations involving actual violations of law but also in circumstances where no laws have been violated. Our reputation could be harmed in many different ways, including as a result of the perceived or actual failure to address conflicts of interest or ethical issues, failure to comply with legal or regulatory requirements, allegations of money laundering, violation of privacy policies, failure to properly maintain customer, client and employee personal information, failure to maintain adequate or accurate records, allegations of unfair sales and trading practices, and improper identification of the legal, reputational, credit, liquidity and market risks inherent in our products. Publicity of a failure to appropriately address these issues could result in litigation claims or subject us to enforcement actions, fines and penalties and cause us to incur related costs and expenses. Legal liability or regulatory actions as a result of negative publicity could in turn cause significant additional reputational harm.
We depend on the highly skilled, and often specialized, individuals we employ. Competition for the services of personnel in our loan production, private client group, securities lending and trading businesses is intense, and we may not be able to retain them. We generally do not enter into employment or noncompetition agreements with our employees. Our business, financial condition, operating results or cash flows could be materially impacted if we were to lose the services of certain of our loan production, private client group, securities lending or trading professionals. In particular, in our retail and institutional securities brokerage business, we depend on the brokers and financial advisors that advise our customers and clients, certain of whom generate significant income for us.
We depend on our computer and communications systems and an interruption in service would negatively affect our business. Our businesses rely on electronic data processing and communications systems. The effective use of technology allows us to better serve customers and clients, increases efficiency and reduces costs. Our continued success will depend, in part, upon our ability to successfully maintain, secure and upgrade the capability of our systems, our ability to address the needs of our clients by using technology to provide products and services that satisfy their demands and our ability to retain skilled information technology employees. Significant malfunctions or failures of our computer systems, computer security, software or any other systems in the trading process (e.g., record retention and data processing functions performed by third parties, and third party software, such as Internet browsers) could cause delays in customer trading activity. Such delays could cause substantial losses for customers and could subject us to claims from customers for losses, including litigation claiming fraud or negligence. In addition, if our computer and communications systems fail to operate properly, regulations would restrict our ability to conduct business. Any such failure could prevent us from collecting funds relating to customer and client transactions, which would materially impact our cash flows. Any computer or communications system failure or decrease in computer system performance that causes interruptions in our operations could have a material adverse effect on our business, financial condition, results of operations or cash flows.
The financial services industry is continually undergoing rapid technological change with frequent introductions of new technology-driven products and services. Many of our competitors have substantially greater resources to invest in technological improvements. We may not be able to effectively or timely implement new technology-driven products and services or be successful in marketing these products and services to our customers and clients. Failure to successfully keep pace with technological change affecting the financial services industry could have a material adverse impact on our business, our financial condition, and results of operations or cash flows.
Our computer systems and network infrastructure could be vulnerable to security problems. Third parties may attempt to penetrate our network security and may be able to penetrate our network security to misappropriate proprietary information which could have a material adverse effect on our business. We rely on encryption and authentication technology licensed from third parties to provide the security and authentication necessary to effect secure transmissions of confidential information. Advances in computer capabilities, discoveries in the field of cryptography and other discoveries, events or developments could lead to a compromise or breach of the algorithms that our licensed encryption and authentication technology uses to protect such confidential information. We may be required to expend significant capital and resources and engage the services of third parties to protect against the threat of such security, encryption and authentication technology breaches or to alleviate problems caused by such breaches. Security breaches or the inadvertent transmission of computer viruses could expose us to a risk of loss or litigation and possible liability which could have a material adverse affect on our business, financial condition, results of operations or cash flows.
Our Credit Agreement with Hilltop and Oak Hill contains restrictions and covenants that impact our business and expose us to risks that could adversely affect our liquidity and financial condition. On July 29, 2011, we entered into a Credit Agreement which contains customary covenants that require us to, among other things:
| · | | maintain a tangible net worth at least equal to the sum of $275.0 million and 20% of cumulative consolidated net income (as defined in the Credit Agreement) for each fiscal quarter for which consolidated net income is positive; |
| · | | maintain a minimum unrestricted cash balance (as defined in the Credit Agreement) of at least $4.0 million; and |
| · | | maintain an excess net capital balance at Southwest Securities of at least $100.0 million as of the end of each calendar month. |
In addition, certain of these covenants limit our and certain of our subsidiaries’ ability to, among other things:
| · | | incur additional indebtedness; |
| · | | dispose of or acquire certain assets; |
| · | | pay dividends on our capital stock; |
| · | | make investments, including acquisitions; and |
| · | | enter into transactions with affiliates. |
If we are unable to generate sufficient cash flow or otherwise obtain the funds necessary to make required payments under the Credit Agreement, or we fail to comply with the requirements of our indebtedness, we could be in default under the Credit Agreement. Any default that is not cured or waived could result in the acceleration of the obligations under the Credit Agreement. Any such default which actually causes an acceleration of obligations could have a material adverse effect on our liquidity, financial condition or cash flows. Additionally, the covenants in such agreement or future debt agreements may restrict the conduct of our business, which could adversely affect our business by, among other things, limiting our ability to engage in financings, mergers, acquisitions and other corporate opportunities that may be beneficial to our business.
Misconduct or errors by our employees or entities with which we do business could harm us and are difficult to detect and prevent. There have been a number of highly publicized cases involving fraud or other misconduct by employees in the financial services industry in recent years, and we run the risk that employee misconduct or employee errors could occur at our company. For example, misconduct could result from the improper use or disclosure of confidential information, and error could involve the failure to follow or implement procedures, either of which could result in regulatory sanctions and serious reputational or financial harm. It is not always possible to deter misconduct or errors and the precautions we take to detect and prevent this activity may not be effective in all cases. Our ability to detect and prevent misconduct or errors by entities with which we do business may be even more limited. We may suffer reputational harm for any misconduct or errors by our employees or those entities with which we do business.
We face liquidity risk, which is the potential inability to repay short-term borrowings with new borrowings or assets that can be quickly converted into cash while meeting other ongoing obligations. Our liquidity may be impaired due to circumstances that we may be unable to control, such as general market disruptions or an operational problem that affects our trading clients, depositors, third parties or ourselves. Our ability to sell assets may also be impaired by regulatory constraints or if other market participants are seeking to sell similar assets at the same time. Our inability to borrow funds or sell assets to meet maturing obligations may have an adverse effect on our business, financial condition, results of operations or cash flows.
In addition, if our customers decide not to invest with us, our liquidity could be adversely affected. If our retail banking and securities clients withdraw their deposits or our institutional customers withdraw their trading lines with us, our liquidity would be impaired. Furthermore, we currently have access to advances from the Federal Home Loan Bank (“FHLB”). If we become subject to regulatory actions, we may not have access to these advances and our liquidity could be impaired.
Our securities business is subject to numerous operational risks. Our securities business must be able to consistently and reliably obtain securities pricing information and accurately assess loan values, process transactions and provide reports and other customer or client services. Any failure to keep current and accurate books and records can render us liable to disciplinary action by governmental and self-regulatory authorities, as well as to claims by our customers and clients. If any of our financial, portfolio accounting or other data processing systems do not operate properly or are disabled, or if there are other shortcomings or failures in our internal processes, people or systems, we could suffer an impairment to our liquidity, a financial loss, a disruption of our businesses, liability to our customers and clients, regulatory problems or damage to our reputation. These systems may fail to operate properly or become disabled as a result of events that are wholly or partially beyond our control, including a disruption of electrical or communications services or our inability to occupy one or more of our buildings. In addition, our operations are dependent upon information from, and communications with, third parties, and operational problems at third parties may adversely affect our ability to carry on our business.
We are subject to risks relating to litigation and potential securities law liabilities. Many aspects of our business involve substantial risks of liability. In the normal course of our business, we have been subject to claims by customers and clients alleging unauthorized trading, churning, mismanagement, suitability of investments, breach of fiduciary duty or other alleged misconduct by our employees or brokers. We are sometimes brought into lawsuits based on allegations concerning our correspondents. As underwriters, we are subject to substantial potential liability for material misstatements and omissions in prospectuses and other communications with respect to underwritten offerings of securities. Prolonged litigation producing significant legal expenses or a substantial settlement or adverse judgment could have a material adverse effect on our business, financial condition, results of operations or cash flows.
We face strong competition from larger firms. The financial services business is intensely competitive and we expect it to remain so. We compete on the basis of a number of factors, including client relationships, reputation, the abilities of our professionals, market focus and the relative quality and price of our services and products. Many of our competitors have a broader range of products and services, greater financial and marketing resources, larger customer bases, greater name
recognition, more professionals to serve their clients’ needs and better established relationships with clients than we have. These larger competitors may be better able to respond to industry change, compete for skilled professionals, finance acquisitions, fund internal growth and compete for market share generally.
Our portfolio trading business is highly price competitive and serves a very limited market. Our portfolio trading business serves one small component of the portfolio trading execution market with a small customer base and a high service model, charging competitive commission rates. Consequently, growing or maintaining market share is very price sensitive. We rely upon a high level of customer service and product customization to maintain our market share; however, should prevailing market prices fall, or the size of our market segment or customer base decline, our profitability would be adversely impacted. In addition, in our portfolio trading business, we purchase securities as principal, which subjects our capital to significant risks. See “– Market fluctuations could adversely impact our securities business.”
Our existing correspondents may choose to perform their own clearing services, move their clearing business to one of our competitors or exit the business. As our correspondents’ operations grow, they often consider the option of performing clearing functions themselves, in a process referred to as "self-clearing." The option to convert to self-clearing operations may be attractive due to the fact that as the transaction volume of a broker/dealer grows, the cost of implementing the necessary infrastructure for self-clearing may eventually be offset by the elimination of per transaction processing fees that would otherwise be paid to a clearing firm. Additionally, performing their own clearing services allows self-clearing broker/dealers to retain their customers’ margin balances, free credit balances and securities for use in margin lending activities. Furthermore, our correspondents’ may decide to use the clearing services of one of our competitors or exit the business. Any significant loss of correspondents due to self-clearing or because of their use of a competitor’s clearing service could have a material adverse affect on our business, financial condition, results of operations or cash flows.
Several of our product lines rely on favorable tax treatment and changes in federal tax law could impact the attractiveness of these products to our customers. We offer a variety of services and products, such as Individual Retirement Accounts and municipal bonds that rely on favorable federal income tax treatment to be attractive to our customers. Should favorable tax treatment of these products be eliminated or reduced, sales of these products could be materially impacted, which could have a material adverse effect on our business, financial condition, results of operations or cash flows.
Our businesses may be adversely affected by new or changing tax laws. Our business can be directly or indirectly adversely affected by new tax legislation, the expiration of existing tax laws, or the interpretation of existing tax laws. In the normal course of business, we are subject to reviews by federal, state and local tax authorities. Reviews by federal, state and local tax authorities may result in adjustments to the timing or amount of taxes due which could adversely affect our business, financial condition, results of operations or cash flows.
We may not be able to realize the value of our deferred tax assets. We recognize deferred tax assets and liabilities based on differences between the financial statement carrying amounts and the tax basis of assets and liabilities. As of June 30, 2014, our net deferred tax assets were approximately $37.7 million, before our $35.5 million valuation allowance. We regularly review our deferred tax assets for recoverability based on our history of earnings, expectations for future earnings and expected timing of reversals of temporary differences. Realization of deferred tax assets ultimately depends on the existence of sufficient taxable income, including taxable income in prior carry-back years, as well as future taxable income. A period of sustained losses or other changes in facts and circumstances could require us to recognize changes in the valuation allowance. If we fail to realize our deferred tax assets or we determine that increases to the deferred tax asset valuation allowance is required in future reporting periods, our financial condition, results of operations or cash flows may be materially adversely affected.
Rising insurance costs and regulations could adversely affect our business. Our operations and financial results are subject to risks and uncertainties associated with the increasing costs and regulations related to our use of a combination of insurance, self-insured retention and self-insurance for a number of risks, including, without limitation, property and casualty, workers’ compensation, general liability, and the company-funded portion of employee-related health care benefits. While the nature and scope of increasing costs and regulatory changes cannot be predicted, they could have a material adverse effect on our business, financial condition, results of operations or cash flows.
The exercise of our outstanding warrants would significantly dilute the ownership interest of existing stockholders. The exercise by Hilltop and/or Oak Hill of all or a substantial portion of our outstanding warrants would significantly dilute the ownership interests of existing stockholders. Any sales in the public market of the common stock issuable upon such exercise could adversely affect prevailing market prices of our common stock.
Our operations rely on external vendors. We rely on certain external vendors to provide products and services necessary to maintain our day-to-day operations, particularly in the areas of operations, treasury management systems, information technology and security, exposing us to the risk that these vendors will not perform as required by our agreements. An external vendor’s failure to perform in accordance with our agreement could be disruptive to our operations, which could have a material adverse impact on our business, financial condition and results of operations.
An investment in our securities is not an insured deposit. Our common stock, preferred stock and indebtedness are not bank deposits and, therefore, are not insured against loss by the FDIC, any other deposit insurance fund or by any other public or private entity. Investment in our common stock is inherently risky for the reasons described in this “Risk Factors” section and elsewhere in this report and is subject to the same market forces that affect the price of securities of any company. As a result, if you acquire our common stock, preferred stock or indebtedness, you may lose some or all of your investment.
Anti-takeover provisions of our restated certificate of incorporation, restated bylaws and Delaware law may make it more difficult for you to receive a change in control premium. Certain provisions of our restated certificate of incorporation and restated bylaws could make a merger, tender offer or proxy contest more difficult, even if such events were perceived by many of our stockholders as beneficial to their interests. These provisions include advance notice for nominations of directors and stockholders’ proposals, and authority to issue “blank check” preferred stock with such designations, rights and preferences as may be determined from time to time by the BOD. In addition, as a Delaware corporation, we are subject to Section 203 of the Delaware General Corporation Law which, in general, prevents an interested stockholder, defined generally as a person owning 15% or more of a corporation’s outstanding voting stock, from engaging in a business combination with our company for three years following the date that person became an interested stockholder unless certain specified conditions are satisfied.
ITEM 1B. UNRESOLVED STAFF COMMENTS
None.
ITEM 2. PROPERTIES
Our principal executive offices and primary broker/dealer and banking operations are located in approximately 156,000 square-feet of leased space in an office building in Dallas, Texas. The lease expires in 2020. Our other office locations are leased and generally do not exceed 30,000 square feet of space. We conduct our clearing operations primarily at our Dallas headquarters, and our securities lending activities are conducted from our office in Old Bridge, New Jersey.
We have 16 retail brokerage offices with nine offices located in Texas, five offices located in California and two offices located in Oklahoma.
We have 15 municipal finance branches, with four offices located in California, three offices located in Texas and one office located in each of Florida, Illinois, Kentucky, New Mexico, New York, North Carolina, South Carolina and Tennessee. We have 10 fixed income branch offices, three offices located in Florida, two offices located in each of California and Colorado, and one office located in each of Illinois, New York and Texas.
The Bank leases branch offices in Fort Worth, Dallas and El Paso, Texas, and Albuquerque and Ruidoso, New Mexico. The Bank also owns a non-operational drive-in facility located in central Arlington, Texas. The Bank owns its banking facilities in Granbury, Waxahachie and South Arlington, Texas.
The company has developed business continuity plans that are designed to permit continued operation of business critical functions in the event of disruptions to our Dallas, Texas headquarters facility as well as critical facilities used by our major subsidiaries. Our critical activities can be relocated among our normal operating facilities and our business recovery centers in South Arlington and Southlake, Texas and a disaster recovery center in Richardson, Texas. The center located in South Arlington utilizes space in the property owned by the Bank and the Southlake center’s facilities are leased. Our Richardson facility houses redundant securities and bank processing facilities adequate to replace those found in our primary data center. Our disaster recovery plans are periodically tested, and we participate in industry-wide tests within the securities industry.
Management believes that our present facilities are adequate for the business for the foreseeable future, exclusive of expansion opportunities.
ITEM 3. LEGAL PROCEEDINGS
In the general course of our brokerage business and the business of clearing for other brokerage firms, we have been named as defendants in various pending lawsuits and arbitration and regulatory proceedings. These claims allege violations of various federal and state securities laws, among other matters. The Bank is also involved in certain claims and legal actions arising in the ordinary course of business. We believe that resolution of these claims will not result in a material adverse effect on our business, consolidated financial condition, results of operations or cash flows.
Merger Litigation. Two putative class actions on behalf of purported stockholders of SWS challenging the proposed merger of SWS Group and Peruna are pending in the Court of Chancery of the State of Delaware. Both lawsuits name as defendants SWS, the individual members of the BOD, Hilltop, and Peruna, (Joseph Arceri v. SWS Group, Inc. et al and Chaile Steinberg v. SWS Group, Inc. et al filed April 8, 2014 and April 11, 2014, respectively), On May 13, 2014, the Delaware Chancery Court consolidated the two actions for all purposes. On June 10, 2014, plaintiffs filed a consolidated amended complaint.
The complaint generally alleges, among other things, that the BOD breached its fiduciary duties to stockholders by failing to take steps to maximize stockholder value or to engage in a fair sale process before approving the merger, and that the other defendants aided and abetted such breaches of fiduciary duty. The complaint alleges, among other things, that the BOD labored under conflicts of interest, and that certain provisions of the Merger Agreement unduly restrict our ability to negotiate with other potential bidders, and that the Form S-4 filed by Hilltop on May 29, 2014 omits or misstates certain material information. The complaint seeks relief that includes, among other things, an injunction prohibiting the consummation of the merger, rescission to the extent the merger terms have already been implemented, damages for the alleged breaches of fiduciary duty, and the payment of plaintiffs’ attorneys’ fees and costs. On June 16, 2014, plaintiffs moved for a preliminary injunction prohibiting the consummation of the merger, and for expedited proceedings in connection therewith. Pursuant to negotiations between the parties to the lawsuit, plaintiffs subsequently withdrew those motions.
We believe the claims are without merit and intend to defend against them vigorously. There can be no assurance, however, with regard to the outcome of this lawsuit. Currently, a loss resulting from these claims is not considered probable or reasonably estimable in amount.
ITEM 4. MINE SAFETY DISCLOSURES
Not applicable.
PART II
ITEM 5. MARKET FOR REGISTRANT'S COMMON EQUITY, RELATED STOCKHOLDER MATTERS AND ISSUER PURCHASES OF EQUITY SECURITIES
Market for Common Stock. Our common stock trades on the NYSE under the symbol "SWS." At August 30, 2014, there were 94 holders of record of our common stock and approximately 4,120 beneficial holders of our common stock. The following table sets forth for the periods indicated the high and low market prices for the common stock and the cash dividend declared per common share:
| | | | | | | | |
July 1, 2013 to June 30, 2014 | | 1st Qtr. | | 2nd Qtr. | | 3rd Qtr. | | 4th Qtr. |
Cash dividend declared per common share | | $ - | | $ - | | $ - | | $ - |
Stock price range | | | | | | | | |
High | | $ 6.28 | | $ 6.59 | | $ 8.29 | | $ 8.06 |
Low | | $ 5.19 | | $ 5.31 | | $ 6.01 | | $ 6.95 |
| | | | | | | | |
June 30, 2012 to June 30, 2013 | | 1st Qtr. | | 2nd Qtr. | | 3rd Qtr. | | 4th Qtr. |
Cash dividend declared per common share | | $ - | | $ - | | $ - | | $ - |
Stock price range | | | | | | | | |
High | | $ 6.58 | | $ 6.33 | | $ 6.82 | | $ 6.29 |
Low | | $ 5.23 | | $ 4.02 | | $ 5.32 | | $ 5.30 |
Stock Performance Graph and Cumulative Total Return. The following table compares the cumulative total stockholder return on our common stock for the 60-month period from June 2009 through June 2014, with the cumulative total return of the Wilshire 5000 Index and the Nasdaq Financial Index over the same period. The graph depicts the results of investing $100 in our common stock, Wilshire 5000 Index and the Nasdaq Financial Index in June 2009, including the reinvestment of dividends.
COMPARISON OF 5 YEAR CUMULATIVE TOTAL RETURN*
Among SWS Group, Inc., Wilshire 5000 Index and the NASDAQ Financial Index
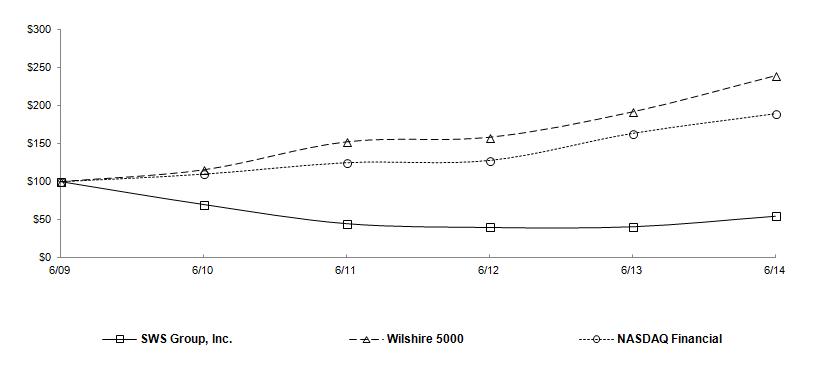
*$100 invested on 6/30/09 in stock or index, including reinvestment of dividends. Represents amount invested as of June 30th of the applicable year.
| | | | | | | |
| | 6/09 | 6/10 | 6/11 | 6/12 | 6/13 | 6/14 |
| | | | | | | |
SWS Group, Inc. | | 100.00 | 70.11 | 45.00 | 40.05 | 40.95 | 54.70 |
Wilshire 5000 | | 100.00 | 115.68 | 152.69 | 158.73 | 192.23 | 240.14 |
NASDAQ Financial | | 100.00 | 109.77 | 124.90 | 127.79 | 163.27 | 189.17 |
Stock Repurchases. We did not repurchase any common stock during the quarter ended June 30, 2014. We do not currently have a repurchase plan approved by our BOD.
Dividend policy. On a quarterly basis, the BOD determines whether we will pay a cash dividend. The payment and rate of dividends on our common stock is subject to several factors including limitations imposed by the terms of our Credit Agreement with Hilltop and Oak Hill, regulatory approval, operating results, our financial requirements, and the availability of funds from our subsidiaries, including the broker/dealer subsidiaries, which may be subject to restrictions under the net capital rules of the SEC and FINRA, and the Bank, which may be subject to restrictions by federal banking agencies. Specifically, our Credit Agreement with Hilltop and Oak Hill limits our quarterly cash dividend to $0.01 per share and only so long as we are not in default of any terms of the Credit Agreement. We currently intend to retain earnings and do not plan to pay dividends on our common stock in the near future.
Equity Compensation Plan Information
Restricted Stock Plan. On November 15, 2012, the stockholders of SWS Group, Inc. approved the adoption of the SWS Group, Inc. 2012 Restricted Stock Plan (“2012 Restricted Stock Plan”). The 2012 Restricted Stock Plan allows for awards of restricted stock to SWS’s directors, officers and employees and authorizes up to 2,630,000 shares of SWS’s common stock to be delivered pursuant to awards granted under the 2012 Restricted Stock Plan. The 2012 Restricted Stock Plan expires on November 15, 2022.
On November 12, 2003, our stockholders approved the adoption of the SWS Group, Inc. 2003 Restricted Stock Plan ("2003 Restricted Stock Plan"). In November 2007, the stockholders of SWS Group approved an amendment to the 2003 Restricted Stock Plan to increase the number of shares available thereunder by 500,000 shares. The Restricted Stock Plan allows for awards of up to 1,250,000 shares of our common stock to our directors, officers and employees. No more than 300,000 of the authorized shares may be newly issued shares of common stock. The Restricted Stock Plan terminated on August 21, 2013.
The vesting period for awards under the 2003 Restricted Stock Plan and the 2012 Restricted Stock Plan is determined on an individualized basis by the Compensation Committee of the BOD. In general, restricted stock granted to employees under the restricted stock plans fully vests after three years or is subject to a four year cliff vesting schedule, and restricted stock granted to non-employee directors vests on the first anniversary of the date of grant. At June 30, 2014, the total number of shares of restricted stock outstanding under the 2012 Restricted Stock Plan and the 2003 Restricted Stock Plan was 417,137 shares and the total number of shares available for future awards under the 2012 Restricted Stock Plan was 2,383,016 shares.
Deferred Compensation Plan. On November 10, 2004, the stockholders of SWS Group approved the 2005 Deferred Compensation Plan, with an effective date of January 1, 2005, for eligible officers and employees to defer a portion of their bonus compensation and commissions. The deferred compensation plan was designed to comply with the American Jobs Creation Act of 2004. Contributions to the deferred compensation plan consist of employee pre-tax contributions and SWS Group’s matching contributions, in the form of SWS Group common stock, up to a specified limit.
The assets of the deferred compensation plan include investments in SWS Group’s common stock, Westwood Holdings Group, Inc.’s ("Westwood") common stock and company-owned life insurance ("COLI"). Investments in SWS Group’s common stock are carried at cost and are held as treasury stock with an offsetting deferred compensation liability in the equity section of the Consolidated Statements of Financial Condition. The deferred compensation plan limited the number of shares of SWS Group common stock that may be issued to 375,000 shares. On November 17, 2009, the stockholders of SWS Group voted to increase the authorized number of shares of SWS Group common stock available for issuance under the deferred compensation plan from 375,000 shares to 675,000 shares. The number of shares of SWS Group common stock available for future issuance under the plan was 126,679 at June 30, 2014. Investments in Westwood’s common stock are carried at market value and recorded as securities available for sale. Investments in COLI are carried at the cash surrender value of the insurance policies and recorded in other assets in the Consolidated Statements of Financial Condition.
For the fiscal year ended June 30, 2014, we had approximately $22.8 million in deferred compensation plan assets, including $0.4 million in cash, with a market value of $21.8 million. At June 30, 2014, $3.2 million was invested in 310,941 shares of our common stock. Approximately $1.8 million of compensation expense was recorded for participant contributions and employer matching contributions related to the deferred compensation plan in fiscal 2014.
The trustee of the deferred compensation plan is Wilmington Trust Company.
Stock Option Plans. We did not have any active stock option plans at June 30, 2014. All previously issued outstanding options under the SWS Group, Inc. stock option plans have expired. See Note 1(u) in the Notes to the Consolidated Financial Statements for the fiscal years ended June 30, 2014, June 30, 2013 and June 29, 2012 included under Item 8. “Financial Statements and Supplementary Data.”
The following table sets forth certain information concerning our equity compensation plans approved by our stockholders as of June 30, 2014.
| | | | | | | | | |
EQUITY COMPENSATION PLAN INFORMATION |
| | | | | | | | Number of securities |
| | Number of | | | | | remaining available for |
| | securities to be | | | | | future issuance under |
| | issued upon | | Weighted-average | | equity compensation |
| | exercise of | | exercise price of | | plans (excluding |
| | outstanding | | outstanding | | securities reflected in |
Plan category | | options and rights | | options and rights | | the first column) |
Equity compensation plans | | | | | | | | | |
approved by stockholders | | 715,328 | (1) | | $ - | | | 3,449,789 | (2) |
Total | | 715,328 | | | $ - | | | 3,449,789 | |
_______________________
| (1) | | Amount represents 310,941 stock units credited to participants’ accounts under the deferred compensation plan and 404,387 stock units credited to participants’ accounts under the 401(k) plan (See Note 19 in the Notes to the Consolidated Financial Statements |
for the fiscal years ended June 30, 2014, June 30, 2013 and June 29, 2012 included under Item 8. “Financial Statements and Supplementary Data.”). |
| (2) | | Amount represents 126,679 shares available for future issuance under the deferred compensation plan, 2,383,016 shares available for future issuance under the 2012 Restricted Stock Plan and 940,094 shares available for future issuance under the 401(k) plan. |
ITEM 6. SELECTED FINANCIAL DATA
The selected financial data presented below for the five fiscal years ended June 30, 2014 have been derived from our Consolidated Financial Statements as audited by our independent registered public accounting firm. The historical financial data are qualified in their entirety by, and should be read in conjunction with, the Consolidated Financial Statements and the notes thereto, the other financial information contained in this report and “Management’s Discussion and Analysis of Financial Condition and Results of Operation – Events and Transactions.”
| | | | | | | | | | | | | | | |
| | (In thousands, except ratios and per share amounts) |
| | Fiscal Year Ended |
| | June 30, | | June 30, | | June 29, | | June 24, | | | June 25, | |
| | 2014 | | 2013 | | 2012 | | 2011 | | | 2010 | |
Consolidated Operating Results: | | | | | | | | | | | | | | | |
Total revenue | | $ 311,288 | | | $ 318,114 | | | $ 353,741 | | | $ 389,819 | | | $ 422,227 | |
Net revenue (1) | | 266,362 | | | 271,653 | | | 293,423 | | | 342,064 | | | 366,971 | |
Net loss | | (7,078) | | | (33,445) | | | (4,729) | | | (23,203) | | | (2,893) | |
Loss per share – basic(2) | | $ (0.21) | | | $ (1.02) | | | $ (0.14) | | | $ (0.71) | | | $ (0.10) | |
Loss per share – diluted(2) | | $ (0.21) | | | $ (1.02) | | | $ (0.14) | | | $ (0.71) | | | $ (0.10) | |
Weighted average shares outstanding – basic(2) | | 32,997 | | | 32,870 | | | 32,650 | | | 32,515 | | | 30,253 | |
Weighted average shares outstanding – diluted(2) | | 32,997 | | | 32,870 | | | 32,650 | | | 32,515 | | | 30,253 | |
Cash dividends declared per common share | | $ - | | | $ - | | | $ - | | | $ 0.12 | | | $ 0.36 | |
| | | | | | | | | | | | | | | |
Consolidated Financial Condition: | | | | | | | | | | | | | | | |
Total assets | | $ 4,075,906 | | | $ 3,780,373 | | | $ 3,546,843 | | | $ 3,802,157 | | | $ 4,530,691 | |
Long-term debt(3) | | 163,348 | | | 165,181 | | | 138,450 | | | 86,247 | | | 99,107 | |
Stockholders’ equity | | 309,872 | | | 315,286 | | | 355,702 | | | 357,469 | | | 383,394 | |
Shares outstanding | | 32,757 | | | 32,629 | | | 32,576 | | | 32,285 | | | 32,342 | |
Book value per common share | | $ 9.46 | | | $ 9.66 | | | $ 10.92 | | | $ 11.07 | | | $ 11.85 | |
| | | | | | | | | | | | | | | |
Bank Performance Ratios: | | | | | | | | | | | | | | | |
Return on assets | | 0.4 | % | | 0.5 | % | | 0.2 | % | | (2.1) | % | | (0.8) | % |
Return on equity | | 3.0 | % | | 3.5 | % | | 1.5 | % | | (21.4) | % | | (9.1) | % |
Equity to assets ratio | | 13.8 | % | | 13.1 | % | | 12.0 | % | | 9.7 | % | | 9.2 | % |
_____________
| (1) | | Net revenue is equal to total revenues less interest expense. |
| (2) | | Unvested share-based payment awards that contain non-forfeitable rights to dividends or dividend equivalents (paid or unpaid) are treated as participating securities and are factored into the calculation of earnings per share (“EPS”), except in periods with a net loss, when they are excluded. |
| (3) | | Includes FHLB advances with maturities in excess of one year. For fiscal years 2014, 2013 and 2012, includes the $100.0 million Credit Agreement with Hilltop and Oak Hill net of a $12.2 million, $16.9 million and $20.9 million discount at June 30, 2014 and 2013 and June 29, 2012, respectively. |
ITEM 7. MANAGEMENT'S DISCUSSION AND ANALYSIS OF FINANCIAL
CONDITION AND RESULTS OF OPERATIONS
OVERVIEW
We are engaged in full-service securities brokerage and full-service commercial banking. During the twelve-months ended June 30, 2014, 87% of our total revenues were generated by our full-service brokerage business and 13% of our total revenues were generated by our commercial banking business. While brokerage and banking revenues are dependent upon trading volumes and interest rates, which may fluctuate significantly, a large portion of our expenses are fixed. Consequently, net operating results can vary significantly from period to period.
Our business is also subject to substantial governmental regulation and changes in legal, regulatory, accounting, tax and compliance requirements, which may have a substantial impact on our business and results of operations. We also face substantial competition in each of our lines of business. See “Forward-Looking Statements,” Item 1. “Business-Competition,” Item 1. “Business-Regulation” and Item 1A. “Risk Factors.”
We operate through four segments grouped primarily by products, services and customer base: clearing, retail, institutional and banking.
Clearing. The Clearing segment provides clearing and execution services for other broker/dealers (predominantly on a fully disclosed basis). Our clientele includes general securities broker/dealers and firms specializing in high-volume trading. We currently support a wide range of clearing clients, including discount and full-service brokerage firms, registered investment advisors and institutional firms. In addition to clearing trades, we tailor our services to meet the specific needs of our clients and offer products and services such as recordkeeping, trade reporting, accounting, general back-office support, securities and margin lending, reorganization assistance and custody of securities.
Revenues in this segment are generated primarily through transaction charges to our correspondents for clearing their trades. Revenue is also earned from various fees and other processing charges as well as through net interest income on correspondent customer balances.
Retail. The Retail segment includes the sale of retail securities (such as equities, mutual funds and fixed income products), insurance products and managed accounts through the activities of our employee that are registered representatives and our independent contractors. As a securities broker, we extend margin credit on a secured basis to our retail customers in order to facilitate securities transactions. This segment generates revenue primarily through commissions charged on securities transactions, fees from managed accounts and the sale of insurance products as well as net interest income from retail customer balances.
Institutional. The Institutional segment serves institutional customers in the areas of securities borrowing and lending, municipal finance, sales, trading and underwriting of taxable and tax-exempt fixed income securities and equity trading. Our securities borrowing and lending business includes borrowing and lending securities for other broker/dealers, lending institutions, and our own clearing and retail operations. Our municipal finance business earns investment banking revenues by assisting public entity clients in originating, syndicating and distributing securities of municipalities and political subdivisions.
Our fixed income sales and trading group specializes in trading and underwriting U.S. government and government agency bonds, corporate bonds, municipal bonds, mortgage-backed, asset-backed and commercial mortgage-backed securities and structured products. The clients of our fixed income group include corporations, insurance companies, banks, mutual funds, money managers and other institutions. Our equity trading department focuses on executing equity and option orders on an agency basis for clients. We also have a portfolio trading group that executes large institutional portfolio trades.
Revenues in the institutional segment are derived from the net interest spread on stock loan transactions, commissions, and trading income from fixed income and equity products and investment banking fees from taxable and municipal securities transactions.
Banking. The Banking segment offers traditional banking products and services. We specialize in three primary areas, business banking, focusing on industrial and small business lending, commercial real estate lending and mortgage purchase. We originate the majority of our loans internally, and we believe this business model helps us build more valuable relationships with our customers.
The Bank earns substantially all of its net revenues on the spread between the interest rates charged to customers on loans and the interest rates paid to depositors as well as interest income from investments.
The Bank has committed to the OCC that the Bank will, among other things: (i) adhere to the Bank’s written business and capital plan as amended from time to time; and (ii) maintain a Tier 1 capital ratio at least equal to nine percent (9%) of adjusted total assets and a total risk-based capital ratio of at least twelve percent (12%). As of June 30, 2014, the Bank was in compliance with these commitments.
The "other" category includes SWS Group, corporate administration and SWS Capital Corporation, which is a dormant entity.
Loan from Hilltop and Oak Hill
In March 2011, we entered into a Funding Agreement (the “Funding Agreement”) with Hilltop and Oak Hill. On July 29, 2011, after receipt of stockholder and regulatory approval, we completed the following transactions contemplated by the Funding Agreement:
| · | | entered into a $100.0 million, five year, unsecured Credit Agreement with Hilltop and Oak Hill that accrues interest at 8% per annum; |
| · | | issued warrants to Hilltop and Oak Hill allowing each to purchase up to 8,695,652 shares of our common stock at an exercise price of $5.75 per share (subject to anti-dilution adjustments), representing approximately 17% of the outstanding common stock of the company for each investor (assuming the warrants are exercised in full); and |
| · | | granted Hilltop and Oak Hill certain rights, including certain registration rights, preemptive rights, and the right for each to appoint one person to our BOD for so long as each owns 9.9% or more of the outstanding shares of our common stock or securities convertible into at least 9.9% of our outstanding common stock. Mr. Gerald J. Ford and Mr. J. Taylor Crandall have been appointed and elected as directors of SWS Group on behalf of Hilltop and Oak Hill, respectively, pursuant to this right. |
We entered into the Credit Agreement with Hilltop and Oak Hill to ensure that the Bank would maintain adequate capital ratios under an Order to Cease and Desist and could continue to reduce classified assets in a strategic and efficient manner, as well as to ensure that the broker/dealer business lines would operate without disruption. See also Note 16 in the Notes to the Consolidated Financial Statements for the fiscal years ended June 30, 2014, June 30, 2013 and June 29, 2012 included under Item 8. “Financial Statements and Supplementary Data” for additional discussion on the Credit Agreement with Hilltop and Oak Hill.
The funds advanced pursuant to the Credit Agreement with Hilltop and Oak Hill were recorded on our Consolidated Statements of Financial Condition as restricted cash. We are required to keep these funds in a restricted account until our BOD, Hilltop and Oak Hill determine the amount(s) to be distributed to our subsidiaries. Upon the approval of the BOD, Hilltop and Oak Hill, SWS Group contributed $20.0 million of this cash to the Bank as capital in the second quarter of fiscal 2012, loaned $20.0 million to Southwest Securities in the third quarter of fiscal 2012 to use in general operations by reducing Southwest Securities’ use of short-term borrowings for the financing of the company’s day-to-day cash management needs, paid $20.0 million toward its intercompany payable to Southwest Securities and contributed $10.0 million in capital to Southwest Securities in the fourth quarter of fiscal 2012. In the third quarter of fiscal 2013, the $20.0 million loan from SWS Group to Southwest Securities was repaid and the BOD, Hilltop and Oak Hill approved, and SWS Group contributed, $20.0 million of cash as a capital contribution to Southwest Securities. During the third quarter of fiscal 2014, upon approval by the BOD, Hilltop and Oak Hill, the remaining $30.0 million was loaned to Southwest Securities to use in general operations reducing Southwest Securities’ use of short-term borrowings for the financing of its day-to-day cash management needs.
Merger Agreement
On March 31, 2014, we entered into an Agreement and Plan of Merger (“Merger Agreement”) with Hilltop and Peruna, whereby if the merger contemplated therein is completed, we will become a wholly-owned subsidiary of Hilltop. If the merger is completed, each share of SWS Group common stock will be converted into the right to receive $1.94 in cash and 0.2496 of a share of Hilltop common stock. The value of the merger consideration may fluctuate based upon the market value of Hilltop common stock. We currently anticipate that completion of the merger will occur by the end of 2014, subject to receiving the approval of our stockholders and regulators and other customary closing conditions.
If the proposed merger with Hilltop occurs, Hilltop’s warrant to acquire our common stock, if outstanding, will be cancelled.
Concurrently with the execution of the Merger Agreement, we entered into a Letter Agreement with Oak Hill dated March 31, 2014 (the “Oak Hill Letter Agreement”). Pursuant to the Oak Hill Letter Agreement and the Merger Agreement, at the closing of the proposed merger with Hilltop, Oak Hill will deliver to SWS Group the certificates evidencing its warrants and any loans of Oak Hill to SWS Group then outstanding under the Credit Agreement, and we will issue and deliver to Oak Hill, in exchange for its warrants and loans, the following consideration: (i) the merger consideration that Oak Hill would have been
entitled to receive upon consummation of the merger if its warrants had been exercised immediately prior to the effective time of the merger and (ii) an amount equal to the Applicable Premium (as defined in the Credit Agreement, being a calculation of the present value of all required interest payments due on a loan through its maturity date on the date the loan is repaid) calculated as if the loans held by Oak Hill were prepaid in full as of the closing date of the merger.
Business Environment
Performance in the financial services industry in which we operate is highly correlated to the overall strength of the economy and financial market activity. Overall market conditions are a product of many factors, which are beyond our control and can be unpredictable. These factors may affect the financial decisions made by investors, including their level of participation in the financial markets, which may in turn, affect our business results. With respect to financial market activity, our profitability is sensitive to a variety of factors, including the volatility of the equity and fixed income markets, the level and shape of various yield curves, the volume of trading in securities, the value of our customers’ assets under management, the demand for loans, the value of real estate in our market areas and the current political environment.
As of June 30, 2014, equity market indices were up versus a year ago with the Dow Jones Industrial Average (the “DJIA”) up 12.9%, the Standard & Poor’s 500 Index (“S&P 500”) up 22.0% and the NASDAQ Composite Index (“NASDAQ”) up 29.5%. The DJIA closed at 16,826.60 on June 30, 2014 up from 14,909.60 and 12,880.09 on June 30, 2013 and June 29, 2012, respectively. While the indexes showed improvement and reached closing prices that have not been reached since 2008, the average daily trading volume on the NYSE decreased 8% as compared to the same period of our prior fiscal year. The continued uncertainty in the economic environment, with the federal government shutdown in October 2013, the required implementation by businesses and individuals of the Patient Protection and Affordable Care Act, continued low levels of workforce participation and high unemployment rates, each contributed to volatility during fiscal 2014. For our clearing, retail and in particular our institutional segment, the uncertainty about the Federal Reserve’s plans for monetary easing added to the volatility in interest rates and fixed income inventory valuations. For our banking segment, this uncertainty makes it difficult to mitigate interest rate risk in a rising interest rate environment.
Continued economic and regulatory uncertainty also created a challenging operating environment for us in fiscal 2014. The national unemployment rate, which was approximately 6.1% at the end of June 2014, was down from a high of 10.0% at the end of December 2009, and 7.6% at the end of June 2013, but remains at historically high levels. The FRB reduced the federal funds target rate to 0 - 0.25% on December 16, 2008 and announced in January 2013, and reaffirmed as recently as the June 2014 Federal Open Market Committee meeting, that it anticipated that rates were unlikely to increase as long as the unemployment rate remained above 6.5%, the short-term inflation rate was projected to be no more than 0.5% above the Federal Open Market Committee’s 2% longer-run goal, and longer-term inflation expectations continue to be stable.
The disruptions and developments in the world economy and the credit markets over the past three years resulted in a range of actions by the U.S. and foreign governments to attempt to bring liquidity and order to the financial markets and to prevent an extended recession in the world economy. For more details regarding some of the actions taken by U.S. and foreign governments, see the discussion under Item 1. “Business-Regulation.”
Government intervention in the markets for the past several years has created artificially low short-term interest rates. Public announcements by the FRB regarding timing of reduced intervention or increased interest rates has led to substantial volatility in the fixed income markets. This volatility has produced and could continue to produce material changes in the value of our fixed income trading portfolio.
Texas, along with the rest of the country, experienced distress in residential and commercial real estate values as well as elevated unemployment rates beginning in the last calendar quarter of 2010. Real estate values, along with unemployment statistics, have improved in fiscal 2014; however, with the improvement, competition in the banking business has increased as loan demand is not yet robust.
Impact of Economic Environment
Brokerage: Volatility in the U.S. credit and mortgage markets, low interest rates and reduced volume in the U.S. stock markets continue to have an adverse effect on several aspects of our brokerage business, including depressed net interest margins, reduced liquidity and lower trading volumes.
Exposure to European Sovereign Debt
We have no exposure to European sovereign debt or direct exposure to European banks. However, we do participate in securities lending with U.S. subsidiaries of several European banks. Receivables from securities lending are secured by collateral equal to 102% of the market value of the underlying securities, and the collateral is adjusted daily to maintain the 102% margin.
Net Interest Margins
Historically, the profitability of our brokerage business has been highly dependent upon net interest income. We earn net interest income on the spread between the interest rates earned and paid on customer and correspondent balances
as well as from our securities lending business. With interest rates at historically low levels, the interest rate spread we are able to earn has been reduced, primarily from the extremely low yields on our portfolio of assets segregated for regulatory purposes. Additionally, the interest rate spread in our securities lending business has declined. Lastly, because the yields on money market funds have declined significantly, revenue sharing arrangements with our primary money market fund providers have been substantially reduced. We do not expect any significant changes in these dynamics until short-term interest rates rise.
We have taken actions to mitigate the impact of this margin contraction by renegotiating arrangements with our clearing customers, changing the mix of our assets segregated for regulatory purposes and developing new business in our securities lending portfolio. Despite these actions, profits from net interest remain substantially below historical levels.
Liquidity
Dislocation in the credit markets has led to increased liquidity risk. All but $45.0 million of our borrowing arrangements are uncommitted lines of credit and, as such, can be reduced or eliminated at any time by the lenders extending the credit. While we have not experienced any reductions in our uncommitted borrowing capacity, over the past three years, our lenders have taken actions that indicate their concerns regarding liquidity in the marketplace. These actions included reduced advance rates for certain security types, more stringent requirements for collateral, higher interest rates and pre-funding of daily settlements. Should our lenders take any actions that could negatively impact the terms of our lending arrangements, the cost of conducting our business would increase and our volume of business would be limited.
The volatility in the U.S. stock markets and the recent policy changes at our various clearing houses, following the financial crisis in 2008, has also impacted our liquidity through increased margin requirements. These margin requirements are determined by the clearing houses through a combination of risk formulas that are periodically adjusted to reflect perceived risk in the market. To the extent we are required to post cash or other collateral to meet these requirements, we will have less liquidity to finance our other business. We expect these margin requirements may increase over the next 9-12 months.
Valuation of Securities
We regularly trade mortgage, asset-backed and other types of fixed income securities. We monitor our trading limits daily to ensure that these securities are maintained at levels we consider prudent given current market conditions. We price these securities using a third-party pricing service and we review the prices monthly to ensure reasonable valuations. At June 30, 2014, we held mortgage and asset-backed securities of approximately $28.1 million included in securities owned, at fair value on the Consolidated Statements of Financial Condition.
Bank: Shortly after closing the Hilltop and Oak Hill transaction, we contributed $20.0 million in capital to the Bank. We believe the $20.0 million capital contribution provided the Bank with a sound foundation and with flexibility to accelerate the reduction of classified assets.
The Bank continued to reduce classified assets during fiscal 2014. Classified assets were $41.3 million at June 30, 2014, down from $67.6 million at June 30, 2013. Classified assets as a percentage of total capital plus the allowance for loan losses was 22.7% at June 30, 2014 and 37.4% at June 30, 2013. Non-performing assets (a subset of classified assets) decreased to $22.9 million at June 30, 2014 from $38.0 million at June 30, 2013. The Bank has significantly reduced classified assets and improved performance over the past seven quarters, but the reduction in classified assets could slow and additional loans could be moved to problem status should the economic environment deteriorate.
The Bank’s loan loss allowance at June 30, 2014 was $7.9 million, or 1.82% of loans held for investment, excluding purchased mortgage loans held for investment and loans measured at fair value, as compared to $12.3 million, or 2.85% of loans held for investment, excluding purchased mortgage loans held for investment and loans measured at fair value, at June 30, 2013.
The Tier 1 (core) capital ratio was 14.1% and the total risk-based capital ratio was 25.5% at June 30, 2014, as compared to 13.5% and 24.9%, respectively, at June 30, 2013 (without giving effect to the Basel III final rules). With the stability of these capital ratios, the Bank’s management has focused on diversifying the balance sheet by reducing loan concentrations and building an investment portfolio. In conjunction with building an investment portfolio, the Bank entered into $140.0 million of interest rate swaps, to reduce deposit cost variability by focusing on protecting earnings in a rising interest rate environment. The Bank held $115.0 million of interest rate swaps at June 30, 2014. The Bank plans to continue implementing this strategy, along with other balance sheet considerations, to manage interest rate risk. The Bank’s liquidity has increased due to reduced mortgage purchase program volumes. Because the volumes have not been replaced with current loan originations, the Bank made two loan purchases in the third quarter of fiscal 2014. The loans purchased were all single family residence mortgages and totaled approximately $40.0 million.
The Bank is focused on implementing and executing its business plan, which includes the continued diversification of the balance sheet and conservative growth strategies. The Bank’s available for sale investment portfolio was $494.7 million and $503.1 million at June 30, 2014 and June 30, 2013, respectively. The Bank plans to continue to manage a tiered investment
portfolio designed to provide cash flows for loan originations. At June 30, 2014 and June 30, 2013, the Bank’s mortgage purchase program loan balance was $133.9 million and $174.0 million, respectively. These loans are held for investment on average for 25 days or less, which substantially limits credit risk.
The primary funding source for the Bank’s balance sheet growth is core deposits from Southwest Securities’ brokerage customers. These core deposits provide the Bank with a stable and low cost funding source. At June 30, 2014 and June 30, 2013, the Bank had $873.1 million and $878.4 million, respectively, in funds on deposit from customers of Southwest Securities, representing approximately 87.3% and 88.4%, respectively, of the Bank’s total deposits.
Events and Transactions
A description of material events and transactions impacting our results of operations in the periods presented are discussed below:
Merger Agreement. During fiscal 2014, we incurred expenses of approximately $3.8 million in legal and professional fees recorded in other expenses on the Consolidated Statements of Comprehensive Loss in connection with entry into the Merger Agreement and the proposed merger with Hilltop. We expect to incur additional costs until the merger is completed.
Employee reduction. Due to our decline in total revenues for the past three fiscal years, management determined that expense reductions were needed in order to improve operating results and execute our strategic business plan. As a result, we reduced the number of our employees by approximately 7% during the three-months ended September 30, 2013 and recorded in commissions and other employee compensation on the Consolidated Statements of Comprehensive Loss approximately $1.2 million in severance expense for the three-months ended September 30, 2013. While we continue to monitor our staffing needs, we do not anticipate any additional headcount reductions at this time.
Deferred tax asset valuation allowance. Deferred tax assets derived from operating losses are realized when we generate consolidated taxable income within the applicable carryback and carryforward periods. In the fourth quarter of fiscal 2013, based on an evaluation of our historical results of operations and various other factors, management determined that it was appropriate to increase the valuation allowance for its remaining deferred tax assets with the exception of the Bank’s available for sale securities. See additional discussion regarding our deferred tax asset valuation allowance in Note 17 in the Notes to the Consolidated Financial Statements. In fiscal 2013, management determined that an increase in the valuation allowance was appropriate after reviewing the impact of our fiscal 2013 fourth quarter operating results and our fiscal 2014 financial forecast. Accordingly, we increased our valuation allowance by $30.0 million from $872,000 at June 29, 2012 to $30.9 million at June 30, 2013. Based on activity in the current fiscal year, we increased our valuation allowance by $4.6 million from $30.9 million at June 30, 2013 to $35.5 million at June 30, 2014.
Warrant valuation. The warrants issued to Hilltop and Oak Hill are presented as liabilities carried at fair value on the Consolidated Statement of Financial Condition. During fiscal 2014, the value of these warrants increased primarily due to the increase in the market value of our common stock. The closing price of our common stock increased from $5.45 at June 30, 2013 to $7.28 at June 30, 2014. The increase in the price of our common stock, combined with other factors, resulted in an unrealized pre-tax loss of $3.6 million.
During fiscal 2013, the value of these warrants decreased primarily due to the decrease in the derived volatility of our common stock from 52% at June 30, 2012 to 51% at June 30, 2013 and the effect of the time to maturity. The decrease in value resulted in an unrealized pre-tax gain of $3.6 million for fiscal 2013.
Recapture in allowance for loan loss. The quality of the Bank’s assets continued to improve in fiscal 2014 resulting in a recapture of $5.4 million of the Bank’s provision for loan loss for the year ended June 30, 2014. For the year ended June 30, 2013, the Bank recorded a $7.7 million recapture of its provision for loan loss. See the discussion above under “Overview—Business Environment—Impact of Economic Environment—Bank”, “Financial Condition – Loans and Allowance for Probable Loan Losses” and Note 5 in the Notes to the Consolidated Financial Statements for fiscal years June 30, 2014, June 30, 2013, and June 29, 2012 included in Item 8 “Financial Statements and Supplementary Data.”
Auction rate security. Since fiscal 2010, we held an auction rate municipal bond at 95.7% of par. As a result of a trade in a similar security at a value less than par and related market conditions, we determined that our security should be written down to 92.5% of par in the first quarter of fiscal 2013. This resulted in a $702,000 write down at September 28, 2012. During the third quarter of fiscal 2013, we sold this security with no gain or loss recognized on the transaction.
Transaction with Hilltop and Oak Hill. In March 2011, we entered into a Funding Agreement with Hilltop and Oak Hill and on July 29, 2011, after receipt of stockholder and regulatory approval, we completed the transactions contemplated by the Funding Agreement and entered into a $100.0 million, five year, unsecured Credit Agreement with Hilltop and Oak Hill that accrues interest at 8% per annum. For fiscal 2014, 2013 and 2012, we recorded interest expense of $13.2 million, $12.5 million and $11.0 million, respectively.
RESULTS OF OPERATIONS
Consolidated
Net losses for the fiscal years ended June 30, 2014, June 30, 2013 and June 29, 2012 were $7.1 million, $33.4 million and $4.7 million, respectively. Fiscal years 2014, 2013 and 2012 contained 252, 249 and 256 trading days, respectively. We estimate the impact on total revenues of the seven day decrease in trading days from fiscal 2012 to fiscal 2013 was approximately $4.3 million.
Southwest Securities was custodian for $32.7 billion, $30.0 billion and $29.2 billion in total customer assets at June 30, 2014, June 30, 2013 and June 29, 2012, respectively.
The following is a summary of fiscal year–to–fiscal year increases (decreases) in categories of net revenues and operating expenses (dollars in thousands):
| | | | | | | | |
| | | | | | | | |
| | Change | | Change |
| | Fiscal 2013 to 2014 | | Fiscal 2012 to 2013 |
| | Amount | Percent | | Amount | Percent |
Net revenues: | | | | | | | | |
Net revenues from clearing operations | | $ 120 | 1 | % | | $ (666) | (7) | % |
Commissions | | (6,086) | (5) | | | (6,235) | (5) | |
Net interest | | (8,748) | (17) | | | (10,913) | (18) | |
Investment banking, advisory and administrative fees | | (5,234) | (12) | | | 4,441 | 11 | |
Net gains on principal transactions | | 12,260 | 70 | | | (10,654) | (38) | |
Other | | 2,397 | 10 | | | 2,257 | 10 | |
| | $ (5,291) | (2) | % | | $ (21,770) | (7) | % |
| | | | | | | | |
| | | | | | | | |
Operating expenses: | | | | | | | | |
Commissions and other employee compensation | | $ (10,776) | (5) | % | | $ (1,389) | (1) | % |
Occupancy, equipment and computer service costs | | (664) | (2) | | | (591) | (2) | |
Communications | | 158 | 1 | | | 897 | 7 | |
Floor brokerage and clearing organization charges | | 555 | 14 | | | (261) | (6) | |
Advertising and promotional | | (790) | (26) | | | (52) | (2) | |
Recapture of loan loss | | 2,357 | 31 | | | (10,193) | >(100) | |
Unrealized net gain/loss on warrant valuation | | 7,212 | >100 | | | (7,287) | >(100) | |
Other | | (3,923) | (13) | | | (2,144) | (6) | |
| | (5,871) | (2) | | | (21,020) | (7) | |
Pre-tax income (loss) | | $ 580 | 9 | % | | $ (750) | (13) | % |
Fiscal 2014 versus 2013
Net revenues decreased $5.3 million for the fiscal year ended June 30, 2014 as compared to the prior fiscal year. Net interest revenue decreased $8.7 million primarily driven by a $6.3 million decrease in net interest revenue in our banking segment due to a 24% decrease in our average loan balance and a 50 basis point decrease in the net interest yield at the Bank as compared to the same period of the prior fiscal year. Net interest revenue in the institutional segment decreased $2.0 million primarily due to a $1.7 million decrease in net interest earned in our fixed income businesses and a $0.3 million decrease in net interest income in the stock loan business primarily due to an 11 basis point decrease in our average net interest spread, which was partially offset by a 28% increase in our average stock borrowed portfolio balances. In addition, net interest revenue decreased $0.7 million in the other segment due to a $0.6 million increase in the accretion expense on the discount of the $100.0 million of indebtedness under the Credit Agreement.
Commissions revenue decreased $6.1 million. Institutional commissions were down $4.4 million primarily due to lower portfolio trading transaction volume in fiscal 2014 compared to fiscal 2013. Our retail segment commissions revenue decreased $1.7 million primarily due to a decrease in the number of independent representatives and customer activity at SWS Financial.
Investment banking, advisory, and administrative fees decreased $5.2 million for the fiscal year ended June 30, 2014 compared to the prior fiscal year. Institutional segment fees decreased $8.8 million due to a $5.2 million reduction in underwriting fees earned by our taxable fixed income group and a $3.6 million decrease in corporate finance fees as we exited the business in June 2013. Retail advisory fees increased $3.6 million as assets under management grew 14% from the prior fiscal year offsetting a portion of the decline.
Net gains on principal transactions increased $12.3 million for the fiscal year ended June 30, 2014 compared to the prior fiscal year due primarily due to a $15.2 million increase in the institutional segment. This increase was mainly attributable to improved market stability in our municipal finance and taxable fixed income businesses after a noted decline in the later half of the prior fiscal year as a result of the challenging market environment. Particularly, in the fourth quarter of the prior year, municipal and taxable yields increased significantly and the yield on the 10-year treasury note increased by approximately 65 basis points from April 2013 to June 2013. This dramatic rise in rates resulted in corresponding trading losses in our fourth fiscal quarter of 2013. Net gains on principal transactions in the other segment decreased $2.9 million as fiscal year 2013 included a $3.6 million realized gain related to the sale of our shares of USHS common stock.
Other revenues increased $2.4 million. This improvement was due to a $2.0 million increase in third party servicing fees in our clearing and retail segments and a $1.0 million increase in gains related to the valuation adjustment for our deferred compensation plan investments. In addition, income from the holding company’s limited partnership venture capital fund improved $0.7 million in the other segment, offsetting a $1.1 million decline in retail insurance revenues. Other revenue in the banking segment decreased $0.7 million due to a $1.6 million decline in gains recognized on the valuation of the Bank’s equity method investments and a $1.6 million reduction in gains on SBA loan sales. Net REO losses declined $1.6 million and gains on available for sale securities improved $0.7 million offsetting these declines.
Operating expenses decreased $5.9 million for the fiscal year ended June 30, 2014 as compared to the prior fiscal year. Commissions and other employee compensation expense reductions of $10.8 million included a $9.0 million decrease in employee salaries and benefits primarily resulting from the staff reductions in the first three-months of fiscal 2014 and our exit from the corporate finance business in June 2013 and a $2.4 million decrease in incentive compensation, which was partially offset by a $0.7 million increase in deferred compensation expense.
Other expenses decreased $3.9 million primarily due to a $1.5 million decrease in REO expenses, a $1.2 million decrease in the REO loss provision, a $1.1 million decrease in regulatory fees and a $0.4 million decrease in outside services at the Bank as asset quality improved, reducing problem asset costs. A $3.1 million decline in ongoing legal and professional fees was offset by $3.8 million of legal and professional fees incurred in connection with the proposed merger with Hilltop.
Lastly, the Bank recorded a $2.4 million decrease in its loan loss recapture for the fiscal year ended June 30, 2014 when compared to the prior fiscal year. We recorded a $5.4 million loan loss recapture for fiscal 2014 and a $7.7 million loan loss recapture for fiscal 2013.
Offsetting these operating expense reductions, we recorded $7.2 million of additional expense related to the warrant valuation. We recognized a $3.6 million loss on the warrant valuation for fiscal 2014 and a $3.6 million gain on the warrant valuation for fiscal 2013.
Fiscal 2013 versus 2012
Net revenues decreased $21.8 million from fiscal 2012 to fiscal 2013. The largest components of the decrease were a $10.7 million decrease in net gains on principal transactions, a $10.9 million decrease in net interest and a $6.2 million decrease in commissions, offset by a $4.4 million increase in investment banking, advisory and administrative fees and $2.3 million increase in other revenue. The $10.7 million decrease in net gains on principal transactions was primarily driven by a $14.7 million decrease in our institutional segment, with $12.5 million coming from our municipal distribution business and $2.3 million from our taxable fixed income business as a result of the market environment during the third and fourth quarters of fiscal 2013. These decreases were offset by the $3.6 million realized gain on the sale of our shares of U.S. Home Systems, Inc. (“USHS”) common stock.
The $10.9 million decrease in net interest revenue was primarily driven by a $5.8 million decrease in net interest revenue in our banking segment due to a 21% decrease in our average loan balance and a 30 basis point decrease in net interest yield at the Bank as compared to the same period of the prior fiscal year. The institutional segment contributed an additional $3.2 million of the net interest revenue decrease primarily due to a 12 basis point decrease in our average net interest spread in our stock lending business and an 8% decrease in our average stock lending portfolio. Interest expense under the Credit Agreement contributed $1.5 million of the decrease in net interest revenue as there was one month less of interest expense for fiscal 2012.
The $6.2 million decrease in commissions revenue from fiscal 2012 to fiscal 2013 was due to a $4.7 million decrease in the institutional segment and a $1.5 million decrease in commissions in the retail segment. Both decreases were due in part to a decrease in the number of trading days from 256 days in fiscal year 2012 to 249 days in fiscal year 2013. The decrease in commissions in the retail segment was also due to the loss of a team of high performing independent registered representatives.
The decrease in commissions in the institutional segment was also due to the narrowing of bid/ask spreads and an increase in market volatility in the last half of the year.
The $4.4 million increase in investment banking and advisory fees was primarily due to a 43% increase in our assets under management and an increase in administrative fee income from revenue sharing with money market fund providers in our clearing and retail segments. The $2.3 million increase in other revenues was primarily a result of a $1.7 million increase in the sale of insurance products in our retail segment, a $1.3 million increase in the value of our deferred compensation investments and a $2.3 million increase in gains on the sale of loans. These increases were partially offset by a $1.0 million increase in net losses on the sale of real estate owned (“REO”) and a $0.4 million decrease in the gains from sale of securities.
Operating expenses decreased $21.0 million in fiscal year 2013 as compared to the same period of the prior fiscal year. The largest components of this decrease were a $10.2 million decrease in our provision for loan loss, a $7.3 million decrease in expense related to the change in the value of the warrants, a $2.1 million decrease in other expenses and a $1.4 million decrease in commissions and other employee compensation expense. We recognized a loan loss recapture of $7.7 million for fiscal year 2013 compared to a provision of $2.5 million for fiscal year 2012. We recognized a $3.6 million gain on the warrant valuation in fiscal year 2013 and a $3.7 million loss on the warrant valuation in fiscal year 2012. The $2.1 million decrease in other expenses in fiscal 2013 was primarily due to a $1.7 million decrease in legal fees from fiscal year 2012. The $1.4 million decrease in commissions and other employee compensation was primarily due to overall segment revenue declines leading to a decrease in commission expense and incentive compensation of $8.9 million. These decreases were partially offset by an increase in our liability to participants in the deferred compensation plan of $1.4 million and salary and benefit expenses of $6.1 million.
Net Interest Income
We generate net interest income from our brokerage segments and our banking segment. Net interest income from the brokerage segments is dependent upon the level of customer and stock loan balances as well as the spread between the interest rates we earn on those assets compared to the cost of funds. Net interest is the primary source of income for the Bank and represents the amount by which interest and fees generated by earning assets exceed the cost of funds. The Bank’s cost of funds consists primarily of interest paid to the Bank’s depositors on interest-bearing accounts and long-term borrowings with the FHLB. Net interest income from our brokerage, corporate and banking segments were as follows for the fiscal years 2014, 2013 and 2012 (in thousands):
| | | | | | | |
| | | | | | | |
| | 2014 | | 2013 | | 2012 (2) | |
Brokerage | | $ 19,994 | | $ 21,773 | | $ 25,547 | |
Bank | | 35,114 | | 41,423 | | 47,228 | |
SWS Group(1) | | (12,967) | | (12,307) | | (10,973) | |
Net interest | | $ 42,141 | | $ 50,889 | | $ 61,802 | |
__________
| (1) | | Consists primarily of interest expense under the Credit Agreement with Hilltop and Oak Hill. |
| (2) | | The net interest reported for the Bank is for the period ended June 30, 2012. |
Average balances of interest earning assets and interest-bearing liabilities in our brokerage operations were as follows for the fiscal years ended June 30, 2014, June 30, 2013 and June 29, 2012 (in thousands):
| | | | | | | |
| | | | | | | |
| | 2014 | | 2013 | | 2012 | |
Average interest-earning assets: | | | | | | | |
Customer margin balances | | $ 241,000 | | $ 235,497 | | $ 231,269 | |
Assets segregated for regulatory purposes | | 186,000 | | 187,221 | | 218,193 | |
Stock borrowed | | 1,972,000 | | 1,540,000 | | 1,636,000 | |
| | | | | | | |
| | | | | | | |
Average interest-bearing liabilities: | | | | | | | |
Customer funds on deposit, including short credits | | $ 341,000 | | $ 328,738 | | $ 344,828 | |
Stock loaned | | 1,892,000 | | 1,481,000 | | 1,611,000 | |
Net interest revenue generated by each segment is reviewed in detail in the segment analysis below.
Income Tax Expense (Benefit)
For fiscal 2014, income tax expense (effective rate of -15.8%) differed from the amount that would have otherwise been calculated by applying the federal corporate tax rate (35%) to loss before income tax expense due to the value of COLI, tax exempt interest and an increase in the value of our deferred tax valuation allowance. See further discussion regarding reconciliation of the effective income tax rate and the federal corporate income tax rate in Note 17 in the Notes to the Consolidated Financial Statements for the fiscal years ended June 30, 2014, June 30, 2013 and June 29, 2012 included under Item 8. “Financial Statements and Supplementary Data.”
For fiscal 2013, income tax expense (effective rate of -400.0%) differed from the amount that would have otherwise been calculated by applying the federal corporate income tax rate (35%) to loss before income tax expense due to non-deductible compensation and a $30.0 million increase in our valuation allowance offset by tax exempt interest, state income taxes and decreases in the value of COLI.
Periodic reviews of the carrying amount of deferred tax assets are made to determine if the establishment of a valuation allowance is necessary when it is more likely than not that all or a portion of a deferred tax asset will not be realized. In fiscal 2013, management considered all available evidence, both positive and negative from the following expected sources of income, while assessing the realization of its deferred tax assets: expected future reversals of deferred tax assets and liabilities, projected future taxable income, cumulative losses in recent years and tax planning strategies. In making such judgments, significant weight was given to evidence that can be objectively verified. Accounting Standards Codification (“ASC") 740, “Income Taxes” provides that a cumulative loss in recent years is significant negative evidence in considering whether deferred tax assets are realizable and also restricts the reliance on projections of future taxable income to support the recovery of deferred tax assets. The company previously had an allowance for deferred tax assets associated with its capital losses from investments. Based on an evaluation of the positive and negative evidence, management determined that it was appropriate to increase the valuation allowance for its remaining deferred tax assets, except for the Bank’s available for sale securities. See also Note 17 in the Notes to the Consolidated Financial Statements for the fiscal years ended June 30, 2014, June 30, 2013 and June 29, 2012 included under Item 8. “Financial Statements and Supplementary Data.”
For fiscal 2012, income tax benefit (effective rate of 20.4%) differed from the amount that would have otherwise been calculated by applying the federal corporate income tax rate (35%) to loss before income tax benefit due to state income taxes and other permanently excluded items, such as tax exempt interest and compensation.
Segment Information
The following is a summary of net revenues and pre-tax income (loss) by segment for fiscal 2014, 2013 and 2012 (dollars in thousands):
| | | | | | | | | | | | |
| | | | | | | | | | | | |
| | June 30, | | | | | June 30, | | | | | June 29, |
| | 2014 | | % Change | | 2013 | | % Change | | 2012(1) |
Net revenues: | | | | | | | | | | | | |
Clearing | | $ 20,244 | | 7 | % | | $ 18,938 | | 2 | % | | $ 18,614 |
Retail | | 112,457 | | 2 | | | 110,440 | | 3 | | | 106,882 |
Institutional | | 108,211 | | - | | | 107,947 | | (17) | | | 130,077 |
Banking | | 37,051 | | (16) | | | 44,101 | | (12) | | | 49,942 |
Other | | (11,601) | | (19) | | | (9,773) | | 19 | | | (12,092) |
Total | | $ 266,362 | | (2) | % | | $ 271,653 | | (7) | % | | $ 293,423 |
| | | | | | | | | | | | |
Pre-tax income (loss): | | | | | | | | | | | | |
Clearing | | $ 3,286 | | >100 | % | | $ (481) | | 73 | % | | $ (1,754) |
Retail | | 9,593 | | >100 | | | 2,498 | | >100 | | | (1,906) |
Institutional | | 23,515 | | 13 | | | 20,866 | | (47) | | | 39,654 |
Banking | | 10,754 | | (16) | | | 12,742 | | 74 | | | 7,316 |
Other | | (53,258) | | (25) | | | (42,315) | | 14 | | | (49,250) |
Total | | $ (6,110) | | 9 | % | | $ (6,690) | | (13) | % | | $ (5,940) |
__________
(1) The net revenues and pre-tax income reported for the banking segment is for the period ended June 30, 2012.
Clearing. The following is a summary of the results for the clearing segment for fiscal 2014, 2013 and 2012 (dollars in thousands):
| | | | | | | | | | | | |
| | | | | | | | | | | | |
| | June 30, | | | | | June 30, | | | | | June 29, |
| | 2014 | | % Change | | 2013 | | % Change | | 2012 |
Net revenue from clearing | | $ 8,838 | | 1 | % | | $ 8,718 | | (7) | % | | $ 9,383 |
Net interest | | 6,099 | | 1 | | | 6,063 | | - | | | 6,056 |
Other | | 5,307 | | 28 | | | 4,157 | | 31 | | | 3,175 |
Net revenues | | 20,244 | | 7 | | | 18,938 | | 2 | | | 18,614 |
| | | | | | | | | | | | |
Operating expenses | | 16,958 | | (13) | | | 19,419 | | (5) | | | 20,368 |
Pre-tax income (loss) | | $ 3,286 | | >100 | % | | $ (481) | | 73 | % | | $ (1,754) |
| | | | | | | | | | | | |
Daily average customer margin | | | | | | | | | | | | |
balance | | $ 110,000 | | 12 | % | | $ 98,000 | | (13) | % | | $ 112,000 |
Daily average customer funds | | . | | | | | | | | | | |
on deposit | | $ 162,000 | | (6) | % | | $ 173,000 | | (8) | % | | $ 188,000 |
Total correspondent clearing customer assets under custody were $16.9 billion, $15.1 billion and $14.7 billion at June 30, 2014, June 30, 2013 and June 29, 2012, respectively.
The following table reflects the number of client transactions processed for each of the last three fiscal years and the number of correspondents at the end of each fiscal year:
| | | | | | | |
| | | | | | | |
| | | |
| | Fiscal 2014 | | Fiscal 2013 | | Fiscal 2012 | |
Tickets for high-volume trading firms | | 42,398 | | 324,151 | | 959,646 | |
Tickets for general securities broker/dealers | | 666,281 | | 645,446 | | 714,460 | |
Total tickets | | 708,679 | | 969,597 | | 1,674,106 | |
Correspondents | | 141 | | 151 | | 153 | |
Fiscal 2014 versus 2013
For the fiscal year ended June 30, 2014, net revenues in the clearing segment increased 7% while clearing fee revenues increased 1%. Other revenues increased 28% compared to fiscal year 2013.
The 1% increase in clearing fee revenue for the fiscal year ended June 30, 2014 when compared to the fiscal year ended June 30, 2013 was primarily due to a 3% increase in the number of general securities tickets processed and an increase in the revenue per ticket. Revenue per ticket increased approximately 39% from $8.99 for the fiscal year ended June 30, 2013 to $12.47 for the fiscal year ended June 30, 2014. The change in the mix of tickets processed led to an increase in revenue per ticket as fees charged to high-volume trading firms are discounted substantially from the fees charged to general securities broker/dealers. Management believes that the increase in clearing volume for general security broker/dealers corresponds with improved conditions in the equity markets. For the fiscal year ended June 30, 2014 compared to the fiscal year ended June 30, 2013, tickets processed for high-volume trading firms decreased 87%. Approximately one-half of this decline was due to the loss of one correspondent through a broker/dealer withdrawal.
The increase in other revenue was primarily driven by a $1.2 million increase in third party servicing fee income.
Operating expenses decreased 13% for the year ended June 30, 2014 as compared to the prior fiscal year primarily due to a 44% decrease in compensation expense and a 9% decrease in operations and information technology expenses due primarily to headcount reductions.
Fiscal 2013 versus 2012
For fiscal 2013, net revenues in the clearing segment increased 2% while clearing fee revenues decreased 7% and other revenues increased 31% compared to fiscal year 2012.
The $0.7 million decrease in clearing revenue was primarily due to lower activity levels for existing correspondents and a decrease from 256 trading days in fiscal year 2012 to 249 trading days in fiscal 2013. The decrease in clearing fee revenues was offset by an increase in other revenues primarily due to a $0.5 million increase in revenue sharing with money market fund providers and increased earnings on customer assets.
For fiscal 2013 compared to fiscal 2012, tickets processed for high-volume trading firms decreased 66% while tickets processed for general securities broker/dealers decreased by 10%. Revenue per ticket increased approximately 60% from $5.61 for fiscal 2012 to $8.99 for fiscal 2013. The change in the mix of tickets processed led to an increase in revenue per ticket as fees charged to high-volume trading firms are discounted substantially from the fees charged to general securities broker/dealers.
Operating expenses for fiscal 2013 decreased $0.9 million, or 5%, from fiscal 2012 primarily due to a decrease in operations and information technology expenses.
Retail. The following is a summary of the results for the retail segment for fiscal 2014, 2013 and 2012 (dollars in thousands):
| | | | | | | | | | | |
| | | | | | | | | | | |
| | June 30, | | | | | June 30, | | | | June 29, |
| | 2014 | | % Change | | 2013 | | % Change | 2012 |
Net revenues: | | | | | | | | | | | |
Private Client Group (PCG) | | | | | | | | | | | |
Commissions | | $ 51,007 | | - | % | | $ 50,774 | | 6 | % | $ 47,885 |
Advisory fees | | 11,694 | | 27 | | | 9,207 | | 33 | | 6,904 |
Insurance products | | 4,019 | | (2) | | | 4,096 | | (8) | | 4,434 |
Other | | 831 | | >100 | | | 354 | | >100 | | (18) |
Net interest revenue | | 2,483 | | 11 | | | 2,232 | | (21) | | 2,813 |
| | 70,034 | | 5 | | | 66,663 | | 7 | | 62,018 |
Independent registered | | | | | | | | | | | |
representatives (SWS Financial) | | | | | | | | | | | |
Commissions | | 22,573 | | (8) | | | 24,537 | | (15) | | 28,937 |
Advisory fees | | 4,356 | | 19 | | | 3,673 | | 24 | | 2,972 |
Insurance products | | 8,746 | | (9) | | | 9,613 | | 23 | | 7,828 |
Other | | 1,417 | | 26 | | | 1,129 | | 20 | | 940 |
Net interest revenue | | 1,082 | | (2) | | | 1,099 | | 20 | | 919 |
| | 38,174 | | (5) | | | 40,051 | | (4) | | 41,596 |
Other | | | | | | | | | | | |
Commissions | | 453 | | 6 | | | 427 | | (1) | | 432 |
Advisory fees | | 2,066 | | 25 | | | 1,656 | | 20 | | 1,380 |
Insurance products | | 1,385 | | (8) | | | 1,511 | | 16 | | 1,299 |
Other | | 345 | | >100 | | | 132 | | (16) | | 157 |
| | 4,249 | | 14 | | | 3,726 | | 14 | | 3,268 |
Total | | 112,457 | | 2 | | | 110,440 | | 3 | | 106,882 |
| | | | | | | | | | | |
Operating expenses | | 102,864 | | (5) | | | 107,942 | | (1) | | 108,788 |
Pre-tax income | | $ 9,593 | | >100 | % | | $ 2,498 | | >100 | % | $ (1,906) |
| | | | | | | | | | | |
Daily average customer margin balances | | $ 127,000 | | (6) | % | | $ 135,000 | | 18 | % | $ 114,000 |
Daily average customer funds on deposit | | $ 118,000 | | 7 | % | | $ 110,000 | | 16 | % | $ 95,000 |
| | | | | | | | | | | |
PCG representatives | | 153 | | (8) | % | | 167 | | 1 | % | 166 |
SWS Financial representatives | | 278 | | (6) | | | 297 | | (4) | | 310 |
Fiscal 2014 versus 2013
Net revenues in the retail segment increased 2% for the fiscal year ended June 30, 2014 as compared to the prior fiscal year. Improvement in PCG accounted for most of the additional revenues reflecting underlying improvement in retail client activity and success in retaining key producers. Advisory fees increased $3.6 million with improvements in all areas due to a 14% increase in assets under management. Commissions revenue was down $1.7 million primarily due to a 6% decrease in the number of independent representatives and a decrease in customer activity at SWS Financial. Other revenues remained relatively flat for fiscal year 2014 as compared to the prior fiscal year as a $1.1 million decrease in insurance related income was offset by a $0.9 million increase in third party servicing fee income.
Total customer assets were $15.4 billion at June 30, 2014 and $14.3 billion at June 30, 2013. Assets under management were $1.2 billion at June 30, 2014 versus $1.1 billion at June 30, 2013.
Operating expenses decreased 5% for the fiscal year ended June 30, 2014 as compared to the prior fiscal year. This decrease was primarily due to a $2.3 million decrease in commissions and other employee compensation expense, $0.8 million decrease in legal expenses, a $0.7 million reduction in operations and information technology expense and a $0.5 million decrease in travel and entertainment expenses.
Fiscal 2013 versus 2012
Net revenues in the retail segment increased 3% in fiscal 2013 compared to fiscal 2012 despite the seven fewer trading days during the fiscal 2013 period. Advisory fees were up in all areas of the retail business due to a 43% increase in assets under management as well as increased fees from money market fund revenue sharing. In addition, insurance products revenue was up 12% from the prior year period. Commission revenues increased 6% in our PCG group while representative turnover resulted in an overall 15% reduction in commissions revenue at SWS Financial.
Total customer assets were $14.3 billion at June 30, 2013 and $13.6 billion at June 29, 2012. Assets under management were $1.1 billion at June 30, 2013 versus $761.1 million at June 29, 2012.
Operating expenses decreased 1% from fiscal 2012 to fiscal 2013. This decrease was primarily due to a $2.5 million decrease in legal expenses offset by a $1.1 million increase in commissions and other employee compensation primarily at our PCG group.
Institutional. The following is a summary of the results for the institutional segment for fiscal 2014, 2013 and 2012 (dollars in thousands):
| | | | | | | | | | | | |
| | | | | | | | | | | | |
| | June 30, | | | | | June 30, | | | | | June 29, |
| | 2014 | | % Change | | 2013 | | % Change | | 2012 |
Net revenues: | | | | | | | | | | | | |
Commissions | | | | | | | | | | | | |
Taxable fixed income | | $ 26,988 | | 14 | % | | $ 23,747 | | (12) | % | | $ 27,097 |
Municipal finance | | 8,933 | | (19) | | | 11,037 | | (13) | | | 12,624 |
Portfolio trading | | 9,426 | | (37) | | | 14,937 | | 2 | | | 14,684 |
| | 45,347 | | (9) | | | 49,721 | | (9) | | | 54,405 |
Investment banking fees | | | | | | | | | | | | |
Taxable fixed income | | 3,734 | | (58) | | | 8,995 | | 6 | | | 8,489 |
Municipal finance | | 18,263 | | 1 | | | 18,149 | | 6 | | | 17,076 |
Corporate finance | | - | | (100) | | | 3,613 | | (22) | | | 4,606 |
Other | | - | | - | | | (2) | | - | | | - |
| | 21,997 | | (28) | | | 30,755 | | 2 | | | 30,171 |
Net gains on principal | | | | | | | | | | | | |
transactions | | | | | | | | | | | | |
Taxable fixed income | | 12,265 | | 34 | | | 9,182 | | (20) | | | 11,479 |
Municipal finance | | 17,297 | | >100 | | | 5,223 | | (71) | | | 17,725 |
Other | | (16) | | 38 | | | (26) | | 73 | | | (98) |
| | 29,546 | | 105 | | | 14,379 | | (51) | | | 29,106 |
Other | | 944 | | 32 | | | 714 | | (13) | | | 816 |
Net interest revenue | | | | | | | | | | | | |
Stock loan | | 8,711 | | (3) | | | 8,990 | | (22) | | | 11,572 |
Other | | 1,666 | | (51) | | | 3,388 | | (15) | | | 4,007 |
Total | | 108,211 | | - | | | 107,947 | | (17) | | | 130,077 |
Operating expenses | | 84,696 | | (3) | | | 87,081 | | (4) | | | 90,423 |
Pre-tax income | | $ 23,515 | | 13 | % | | $ 20,866 | | (47) | % | | $ 39,654 |
| | | | | | | | | | | | |
Taxable fixed income | | | | | | | | | | | | |
representatives | | 27 | | (29) | % | | 38 | | 15 | % | | 33 |
Municipal distribution | | | | | | | | | | | | |
representatives | | 19 | | (27) | % | | 26 | | 8 | % | | 24 |
Average balances of interest-earning assets and interest-bearing liabilities for the institutional segment as of June 30, 2014, June 30, 2013 and June 29, 2012 were as follows (in thousands):
| | | | | | | |
| | | | | | | |
| | | |
| | 2014 | | 2013 | | 2012 | |
Daily average interest-earning assets: | | | | | | | |
Stock borrowed | | $ 1,972,000 | | $ 1,540,000 | | $ 1,636,000 | |
Daily average interest-bearing liabilities: | | | | | | | |
Stock loaned | | $ 1,892,000 | | $ 1,481,000 | | $ 1,611,000 | |
The following table sets forth the number and aggregate dollar amount of new municipal bond underwritings conducted by Southwest Securities for the last three fiscal years:
| | | | |
| | | | |
| | | | Aggregate |
Fiscal | | Number of | | Amount of |
Year | | Issues | | Offerings |
2014 | | 564 | | $ 42,014,166,000 |
2013 | | 682 | | $ 48,311,688,000 |
2012 | | 570 | | $ 37,273,632,000 |
Fiscal 2014 versus 2013
Net revenues in the institutional segment were flat while pre-tax income was up 13% for the fiscal year ended June 30, 2014 as compared to the fiscal year ended June 30, 2013. Commissions revenue decreased $4.4 million primarily driven by a $5.5 million decrease in the portfolio trading business on lower trading volumes and a $2.1 million decrease in the municipal finance business when compared to the same period in the prior fiscal year. The decrease was offset by a $3.2 million increase in taxable fixed income commissions. Investment banking, advisory and administrative fees decreased $8.8 million primarily due to a $5.2 million reduction in underwriting fees earned by our taxable fixed income group. In addition, corporate finance fees were down $3.6 million as we exited the business in the fourth quarter of fiscal 2013. Net interest revenue decreased $2.0 million primarily due to a $1.7 million decline in net interest earned in our fixed income businesses. In addition, our stock lending business was down $0.3 million due to an 11 basis point decrease in the average net interest spread, which was partially offset by a 28% increase in our average stock lending balances. Net gains on principal transactions increased $15.2 million primarily due to a $12.1 million increase in municipal finance trading gains and a $3.1 million increase in our taxable fixed income gains. The increase in trading gains was primarily the result of market turbulence in the later half of the prior fiscal year, particularly in the fourth quarter in which municipal and taxable yields increased significantly and the yield on the 10-year treasury note increased by approximately 65 basis points from April 2013 to June 2013. This dramatic rise in rates resulted in corresponding trading losses in our fourth fiscal quarter of 2013.
Operating expenses decreased 3% during the fiscal year ended June 30, 2014, primarily due to a $3.3 million decrease in compensation expense due to our exit from the corporate finance line of business in the fourth quarter of fiscal 2013. These savings were partially offset by a $0.6 million increase in quotation costs and a $0.4 million increase in floor brokerage and clearing organization costs.
Fiscal 2013 versus 2012
Net revenues from the institutional segment decreased 17% while pre-tax income was down 47% from fiscal 2012 to fiscal 2013. This decrease was due primarily to a $14.7 million decrease in net gains on principal transactions, a $4.7 million decrease in commission revenues and a $3.2 million decrease in net interest revenue. The decrease in net gains on principal transactions was primarily due to a $12.5 million decrease in municipal finance trading gains and a $2.3 million decrease in taxable fixed income gains. The decrease in both the taxable fixed income and municipal finance trading gains was primarily the result of the challenging market environment in the latter half of fiscal 2013, particularly in the fourth quarter in which municipal and taxable yields increased significantly and the yield on the 10-year treasury note increased by approximately 65 basis points from April 2013 to June 2013. This dramatic rise in rates resulted in corresponding trading losses in our fourth fiscal quarter of 2013.
The decrease in commission revenues was primarily driven by a $3.4 million decrease in taxable fixed income and a $1.6 million decrease in municipal finance. The decreases in taxable fixed income and municipal finance were primarily attributable to the narrowing of bid/ask spreads and an increase in market volatility.
Net interest revenue decreased $3.2 million for fiscal 2013 as compared to fiscal 2012. This decrease in net interest revenue was primarily due to a 12 basis point decrease in the average net interest spread in our stock loan business and a 6% reduction in average stock borrow balances. Other net interest decreased $0.6 million for fiscal year 2013 primarily due to an increase in borrowing costs for our municipal and taxable fixed income businesses.
Operating expenses decreased 4% for fiscal 2013 as compared to fiscal 2012, primarily due to a $6.6 million decrease in compensation expenses due to weaker segment revenues offset by a $1.1 million increase in quotations and a $0.9 million increase in operations and technology expense.
Banking. The following is a summary of the results for the banking segment for fiscal 2014, 2013 and 2012 (dollars in thousands):
| | | | | | | | | | | | | |
| | | | | | | | | | | | | |
| | June 30, | | | | | June 30, | | | | | June 30, | |
| | 2014 | | % Change | | 2013 | | % Change | | 2012 | |
Net revenues: | | | | | | | | | | | | | |
Net interest revenue | | $ 35,114 | | (15) | % | | $ 41,423 | | (12) | % | | $ 47,228 | |
Other | | 1,937 | | (28) | | | 2,678 | | (1) | | | 2,714 | |
Total net revenues | | 37,051 | | (16) | | | 44,101 | | (12) | | | 49,942 | |
| | | | | | | | | | | | | |
Operating expenses | | 26,297 | | (16) | | | 31,359 | | (26) | | | 42,626 | |
Pre-tax income | | $ 10,754 | | (16) | % | | $ 12,742 | | 74 | % | | $ 7,316 | |
Fiscal 2014 versus 2013
The Bank’s net revenues decreased $7.1 million due primarily to a $6.3 million reduction in net interest revenues and a $0.7 million decrease in other revenues for the fiscal year ended June 30, 2014 as compared to the fiscal year ended June 30, 2013. The decrease in net interest revenue is primarily due to the 24% decrease in average loan balances, as well as a 50 basis point decrease in the net yield on interest earning assets as excess cash generated from loan repayments was reinvested in an investment portfolio with lower comparable yields. The decrease in other revenue was due to a $1.6 million decline in the valuation of the Bank’s equity method investments, a $1.6 million decrease in gains on SBA loan sales, a $0.2 million increase in losses recognized in relation to the Bank’s investment in interest rate swaps and a $0.2 million increase in losses recognized on the sale of fixed assets, which was partially offset by a $1.6 million decrease in net losses on the sale of REO, a $0.7 million increase in gains from the sale of available for sale securities, and a $0.6 million increase in the fair value of REO foreclosed property where appraised values were greater than the loan’s book value.
The Bank’s operating expenses decreased $5.1 million for the fiscal year ended June 30, 2014 compared to the fiscal year ended June 30, 2013. The expense reduction was primarily attributable to a $2.8 million decrease in commissions and other employee compensation. Other operating expense savings included a $2.7 million decrease in REO related expenses, which included a $1.2 million decrease in the REO loss provision, a $0.8 million decrease in the Bank’s regulatory fees, a $0.6 million decrease in outside services and legal expenses. Reductions in REO related expenses and regulatory fees were due to continued REO reduction and overall improvement at the Bank.
In addition, the decrease in operating expenses was partially offset by a $2.4 million decrease in the Bank’s loan loss recapture.
Fiscal 2013 versus 2012
For fiscal year 2013, the Bank’s net revenues decreased 12% compared to fiscal 2012 due primarily to a $5.8 million reduction in net interest. This reduction in net interest was primarily due to the 21% decrease in average loan balances, as well as a 30 basis point decrease in the net yield on interest-earning assets. The reduction in net interest yield was due to the roll off of the held for investment loan portfolio with proceeds being invested in the Bank’s investment portfolio. This portfolio is weighted to provide liquidity as the Bank begins to record net loan originations. For the 2013 fiscal year-to-date, the Bank had originations of $5.6 billion and repayments on loans of $5.8 billion.
The Bank’s operating expenses decreased $11.3 million, or 26%, for fiscal 2013 compared to fiscal 2012 and was primarily attributable to the $10.2 million decrease in the provision for loan losses as the Bank recorded $2.5 million in provision expense for fiscal 2012 compared to a $7.7 million loan loss recapture for fiscal 2013. Other operating expenses decreased $1.1 million for fiscal 2013 compared to fiscal 2012. This decrease was due primarily to a $0.8 million decrease in legal expenses, a $0.7 million decrease in REO related expenses and a $0.5 million decrease in regulatory fees. These decreases were offset by a $1.4 million increase in commission and other employee compensation and a $0.5 million increase in the REO loss provision.
Net Interest Income
The following table sets forth an analysis of the Bank’s net interest income by each major category of interest-earning assets and interest-bearing liabilities for fiscal 2014, 2013 and 2012 (dollars in thousands):
| | | | | | | | | | | | | | | | | | | | | | |
| | | | | | | | | | | | | | | | | | | | | | |
| | 2014 | | 2013 | | 2012 | |
| | | | Interest | | | | | | | Interest | | | | | | | Interest | | | | |
| | Average | | Income/ | | Yield/ | | Average | | Income/ | | Yield/ | | Average | | Income/ | | Yield/ | |
| | Balance | | Expense(*) | | Rate | | Balance | | Expense(*) | | Rate | | Balance | | Expense(*) | | Rate | |
Assets: | | | | | | | | | | | | | | | | | | | | | | |
Interest-earning assets: | | | | | | | | | | | | | | | | | | | | | | |
Loans: | | | | | | | | | | | | | | | | | | | | | | |
Residential construction | | $ 1,043 | | $ 18 | | 1.7 | % | | $ 2,664 | | $ 118 | | 4.4 | % | | $ 14,849 | | $ 726 | | 4.9 | % | |
Lot and land development | | 6,754 | | 683 | | 10.1 | | | 12,775 | | 776 | | 6.1 | | | 36,606 | | 1,678 | | 4.6 | | |
1-4 family | | 152,723 | | 7,437 | | 4.9 | | | 321,576 | | 16,279 | | 5.1 | | | 278,699 | | 15,551 | | 5.6 | | |
Commercial real estate and | | | | | | | | | | | | | | | | | | | | | | |
multifamily | | 317,550 | | 15,877 | | 5.0 | | | 315,316 | | 17,039 | | 5.4 | | | 439,674 | | 23,533 | | 5.4 | | |
Commercial | | 67,027 | | 2,638 | | 3.9 | | | 67,702 | | 3,322 | | 4.9 | | | 141,352 | | 7,166 | | 5.1 | | |
Consumer | | 2,368 | | 89 | | 3.8 | | | 1,785 | | 110 | | 6.2 | | | 2,661 | | 165 | | 6.2 | | |
Total loans | | 547,465 | | 26,742 | | | | | 721,818 | | 37,644 | | | | | 913,841 | | 48,819 | | | | |
Investments: | | | | | | | | | | | | | | | | | | | | | | |
Money market | | 55,717 | | 287 | | 0.5 | | | 24,732 | | 123 | | 0.5 | | | 1,250 | | 3 | | 0.2 | | |
U.S. government and government | | | | | | | | | | | | | | | | | | | | | | |
agency obligations – held to | | | | | | | | | | | | | | | | | | | | | | |
maturity | | 14,720 | | 353 | | 2.4 | | | 21,718 | | 516 | | 2.4 | | | 30,419 | | 736 | | 2.4 | | |
U.S. government and government | | | | | | | | | | | | | | | | | | | | | | |
agency obligations – available for | | | | | | | | | | | | | | | | | | | | | | |
sale | | 527,396 | | 9,746 | | 1.9 | | | 358,466 | | 5,833 | | 1.6 | | | 104,184 | | 1,745 | | 1.7 | | |
Municipal obligations – available | | | | | | | | | | | | | | | | | | | | | | |
for sale | | 39,888 | | 612 | | 1.5 | | | 14,060 | | 189 | | 1.4 | | | 32 | | 1 | | 1.7 | | |
Interest bearing deposits in banks | | 1,333 | | - | | - | | | 3,219 | | 1 | | - | | | 1,949 | | - | | - | | |
Federal reserve funds | | 49,679 | | 138 | | 0.3 | | | 116,706 | | 293 | | 0.3 | | | 246,639 | | 634 | | 0.3 | | |
Investments – other | | 4,537 | | 17 | | 0.4 | | | 3,627 | | 13 | | 0.4 | | | 4,668 | | 18 | | 0.4 | | |
Total interest-earning assets | | $ 1,240,735 | | $ 37,895 | | 3.1 | % | | $ 1,264,346 | | $ 44,612 | | 3.5 | % | | $ 1,302,982 | | $ 51,956 | | 4.0 | % | |
| | | | | | | | | | | | | | | | | | | | |
Non interest-earning assets: | | | | | | | | | | | | | | | | | | | | | | |
Cash and due from banks | | 3,227 | | | | | | | 3,544 | | | | | | | 4,676 | | | | | | |
Other assets | | 23,193 | | | | | | | 37,981 | | | | | | | 20,379 | | | | | | |
| | $ 1,267,155 | | | | | | | $ 1,305,871 | | | | | | | $ 1,328,037 | | | | | | |
| | | | | | | | | | | | | | | | | | | | | | |
Liabilities and Stockholder’s Equity: | | | | | | | | | | | | | | | | | | | | | | |
Interest-bearing liabilities: | | | | | | | | | | | | | | | | | | | | | | |
Certificates of deposit | | $ 28,267 | | $ 250 | | 0.9 | % | | $ 33,294 | | $ 324 | | 1.0 | % | | $ 41,774 | | $ 460 | | 1.1 | % | |
Money market accounts | | 18,129 | | 9 | | 0.1 | | | 19,884 | | 10 | | 0.1 | | | 23,970 | | 12 | | 0.1 | | |
Interest-bearing demand accounts | | 8,470 | | 6 | | 0.1 | | | 8,844 | | 5 | | 0.1 | | | 9,739 | | 6 | | 0.1 | | |
Savings accounts | | 883,373 | | 90 | | - | | | 939,950 | | 129 | | - | | | 943,267 | | 330 | | - | | |
Federal Home Loan Bank advances | | 93,152 | | 2,426 | | 2.6 | | | 70,402 | | 2,721 | | 3.9 | | | 86,184 | | 3,920 | | 4.6 | | |
Other financed borrowings | | 3 | | - | | - | | | - | | - | | - | | | 8 | | - | | - | | |
| | $ 1,031,394 | | $ 2,781 | | 0.3 | % | | $ 1,072,374 | | $ 3,189 | | 0.3 | % | | $ 1,104,942 | | $ 4,728 | | 0.4 | % | |
| | | | | | | | | | | | | | | | | | | | | | |
| | | | | | | | | | | | | | | | | | | | | | |
| | | |
| | 2014 | | 2013 | | 2012 | |
| | | | Interest | | | | | | | Interest | | | | | | | Interest | | | | |
| | Average | | Income/ | | Yield/ | | Average | | Income/ | | Yield/ | | Average | | Income/ | | Yield/ | |
| | Balance | | Expense(*) | | Rate | | Balance | | Expense(*) | | Rate | | Balance | | Expense(*) | | Rate | |
Non interest-bearing liabilities: | | | | | | | | | | | | | | | | | | | | | | |
Non interest-bearing demand | | | | | | | | | | | | | | | | | | | | | | |
accounts | | $ 59,079 | | | | | | | $ 56,340 | | | | | | | $ 59,364 | | | | | | |
Other liabilities | | 6,613 | | | | | | | 6,489 | | | | | | | 4,370 | | | | | | |
| | 1,097,086 | | | | | | | 1,135,203 | | | | | | | 1,168,676 | | | | | | |
Stockholder’s equity | | 170,069 | | | | | | | 170,668 | | | | | | | 159,361 | | | | | | |
| | $ 1,267,155 | | | | | | | $ 1,305,871 | | | | | | | $ 1,328,037 | | | | | | |
| | | | | | | | | | | | | | | | | | | | | | |
Net interest income | | | | $ 35,114 | | | | | | | $ 41,423 | | | | | | | $ 47,228 | | | | |
| | | | | | | | | | | | | | | | | | | | | | |
Net yield on interest-earning assets | | | | | | 2.8 | % | | | | | | 3.3 | % | | | | | | 3.6 | % | |
__________
(*) Loan fees included in interest income for fiscal 2014, 2013 and 2012 were $1,496, $2,221 and $2,083, respectively.
A number of factors, including interest rate trends, changes in the U.S. economy, competition and the scheduled maturities and interest rate sensitivity of the loan portfolios and deposits, affect the interest rate spreads earned by the Bank.
The following table sets forth a summary of the changes in the Bank’s interest income and interest expense resulting from changes in volume and rate (in thousands):
| | | | | | | | | | | | | | | | |
| | | | | | | | | | | | | | | | |
| | 2013 to 2014 | | 2012 to 2013 |
| | | | | | | | | | | | | | | | |
| | Total | | Attributed to | | Total | | Attributed to |
| | Change | | Volume | | Rate | | Mix | | Change | | Volume | | Rate | | Mix |
Interest income: | | | | | | | | | | | | | | | | |
Loans: | | | | | | | | | | | | | | | | |
Residential construction | | $ (100) | | $ (71) | | $ (72) | | $ 43 | | $ (608) | | $ (596) | | $ (69) | | $ 57 |
Lot and land development | | (93) | | (366) | | 515 | | (242) | | (902) | | (1,092) | | 546 | | (356) |
1-4 family | | (8,842) | | (8,548) | | (619) | | 325 | | 728 | | 2,392 | | (1,442) | | (222) |
Commercial real estate and | | | | | | | | | | | | | | | | |
multifamily | | (1,162) | | 120 | | (1,273) | | (9) | | (6,494) | | (6,656) | | 226 | | (64) |
Commercial | | (684) | | (33) | | (658) | | 7 | | (3,844) | | (3,734) | | (230) | | 120 |
Consumer | | (21) | | 36 | | (43) | | (14) | | (55) | | (55) | | - | | - |
Investments: | | | | | | | | | | | | | | | | |
Money market | | 164 | | 155 | | 4 | | 5 | | 120 | | 45 | | 4 | | 71 |
U.S. government and | | | | | | | | | | | | | | | | |
government agency obligations – | | | | | | | | | | | | | | | | |
held to maturity | | (163) | | (166) | | 5 | | (2) | | (220) | | (210) | | (13) | | 3 |
U.S. government and government | | | | | | | | | | | | | | | | |
agency obligations – available | | | | | | | | | | | | | | | | |
for sale | | 3,913 | | 2,749 | | 791 | | 373 | | 4,088 | | 4,258 | | (49) | | (121) |
Municipal obligation – available | | | | | | | | | | | | | | | | |
for sale | | 423 | | 347 | | 27 | | 49 | | 188 | | 233 | | - | | (45) |
Interest bearing deposits in banks | | (1) | | (1) | | (1) | | 1 | | 1 | | - | | - | | 1 |
Federal reserve funds | | (155) | | (168) | | 30 | | (17) | | (341) | | (334) | | (15) | | 8 |
Investments – other | | 4 | | 3 | | 1 | | - | | (5) | | (4) | | (1) | | - |
| | $ (6,717) | | $ (5,943) | | $ (1,293) | | $ 519 | | $ (7,344) | | $ (5,753) | | $ (1,043) | | $ (548) |
| | | | | | | | | | | | | | | | |
| | | | | | | | | | | | | | | | |
| | 2013 to 2014 | | 2012 to 2013 |
| | | | | | | | | | | | | | | | |
| | Total | | Attributed to | | Total | | Attributed to |
| | Change | | Volume | | Rate | | Mix | | Change | | Volume | | Rate | | Mix |
Interest expense: | | | | | | | | | | | | | | | | |
Certificates of deposit | | $ (74) | | $ (49) | | $ (29) | | $ 4 | | $ (136) | | $ (93) | | $ (54) | | $ 11 |
Money market accounts | | (1) | | (1) | | - | | - | | (2) | | (2) | | - | | - |
Interest bearing deposits in banks | | 1 | | - | | 1 | | - | | (1) | | (1) | | - | | - |
Savings accounts | | (39) | | (8) | | (33) | | 2 | | (201) | | (1) | | (200) | | - |
Federal Home Loan Bank | | | | | | | | | | | | | | | | |
advances | | (295) | | 879 | | (888) | | (286) | | (1,199) | | (718) | | (589) | | 108 |
| | (408) | | 821 | | (949) | | (280) | | (1,539) | | (815) | | (843) | | 119 |
Net interest income | | $ (6,309) | | $ (6,764) | | $ (344) | | $ 799 | | $ (5,805) | | $ (4,938) | | $ (200) | | $ (667) |
Other. The following discusses the financial results for the other segment comprised of SWS Group, corporate administration and SWS Capital Corporation.
Fiscal 2014 versus 2013
Pre-tax loss from the other segment was $52.3 million for the fiscal year ended June 30, 2014 compared to a pre-tax loss of $42.3 million for the fiscal year ended June 30, 2013. The primary driver of the $10.9 million increase in the pre-tax loss was related to the change in warrant valuation resulting in a $7.2 million increase in expense in the fiscal year ended June 30, 2014 compared to fiscal year ended June 30, 2013. We recorded a $3.6 million unrealized loss on the valuation of the warrants held by Hilltop and Oak Hill for the fiscal year ended June 30, 2014 compared to a $3.6 million unrealized gain on the valuation for the warrants held by Hilltop and Oak Hill for the fiscal year ended June 30, 2013.
Net revenues decreased $1.8 million for the fiscal year ended June 30, 2014 compared to the fiscal year ended June 30, 2013. The decrease was primarily due to a $3.6 million realized gain recognized from the sale of our shares of USHS common stock in fiscal 2013 and a $0.6 million increase in interest expense caused by an increase in the accretion expense on the discount of the $100.0 million of indebtedness under the Credit Agreement, offset by a $1.0 million increase in the valuation adjustment for our deferred compensation plan investments, a $0.7 million loss incurred in fiscal 2013 related to our municipal auction rate bond and a $0.7 million improvement in earnings on SWS Group’s equity method investments.
Overall operating expenses increased $1.9 million for the fiscal year ended June 30, 2014 compared to the fiscal year ended June 30, 2013 primarily due to $3.8 million in merger related fees and higher deferred compensation expense which increased $0.9 million, offset by a $2.5 million decrease in administrative incentive compensation, salary expense and benefits and a $0.4 million decrease in other legal fees.
Fiscal 2013 versus 2012
Pre-tax loss from the other segment was $42.3 million for fiscal year 2013 compared to a pre-tax loss of $49.3 million for fiscal year 2012. The primary driver of the $7.0 million decrease in the pre-tax loss was related to the recognition of a $3.6 million unrealized gain on the valuation of the warrants held by Hilltop and Oak Hill for the fiscal year 2013 compared to a $3.7 million unrealized loss on the valuation for the warrants held by Hilltop and Oak Hill for the fiscal year 2012.
Net revenues increased $2.3 million for fiscal 2013 compared to fiscal 2012. The increase in net revenues was primarily due to the $3.6 million gain recognized from our sale of USHS shares in addition to a $1.3 million increase in the value of our deferred compensation plan’s investments. These increases were partially offset by a $0.7 million write down in fair value of an auction rate municipal bond and a $1.5 million increase in interest expense related to the outstanding borrowings under the Credit Agreement with Hilltop and Oak Hill in fiscal 2013 compared to fiscal 2012 which included one less month of interest expense.
Operating expenses increased $2.7 million for the fiscal year 2013 as compared to the fiscal year 2012 primarily due to a $1.4 million increase in the value of our deferred compensation plan’s funds and a $1.2 million increase in legal expenses.
FINANCIAL CONDITION
Investments
In fiscal 2014, the Bank implemented an investment strategy to diversify its balance sheet, absorb excess liquidity, and maximize interest income through investment in a conservative securities portfolio. The securities portfolio is structured to provide cash flows to ensure that adequate funds are available for new loan originations.
The book value of the Bank’s investment portfolio at June 30, 2014, 2013 and 2012 was as follows (in thousands):
| | | | | | | |
| | | | | | | |
| | 2014 | | 2013 | | 2012 | |
Government-sponsored enterprises— | | | | | | | |
held to maturity securities | | $ 12,549 | | $ 17,423 | | $ 25,904 | |
Government-sponsored enterprises— | | | | | | | |
FHLB stock | | 4,080 | | 4,657 | | 3,830 | |
Government-sponsored enterprises— | | | | | | | |
available for sale securities | | 452,513 | | 474,906 | | 301,071 | |
Municipal obligations— | | | | | | | |
available for sale securities | | 42,202 | | 28,224 | | 2,936 | |
Equity method investments | | 3,278 | | 3,844 | | 5,300 | |
| | $ 514,622 | | $ 529,054 | | $ 339,041 | |
Loans and Allowance for Probable Loan Losses
The Bank grants loans to customers primarily within Texas and New Mexico. In the ordinary course of business, the Bank also purchases mortgage loans that have been originated in various areas of the United States. Although the Bank has a diversified loan portfolio, a substantial portion of its portfolio is dependent upon the general economic conditions in Texas and New Mexico. Substantially all of the Bank’s loans are collateralized with real estate.
The allowance for loan losses is maintained to absorb management’s estimate of probable loan losses inherent in the loan portfolio at each reporting date. The allowance for loan losses is established as losses are estimated to have occurred through a provision for loan losses charged to earnings. Loan losses are charged against the allowance when management determines the collection of principal is remote. Subsequent recoveries are recorded through the allowance. The determination of an adequate allowance is inherently subjective, as it requires estimates that are susceptible to significant revision as additional information becomes available or circumstances change.
The allowance for loan losses consists of a specific and a general allowance component.
The specific component provides for estimated probable losses for loans identified as impaired. A loan is considered impaired when, based on current information and events, it is probable that the Bank will be unable to collect all amounts of principal and interest when due according to the contractual terms of the loan agreement. Management considers the borrower’s financial condition, payment status, historical payment record and any adverse situations affecting the borrower’s ability to repay when evaluating whether a loan is deemed impaired. Loans that experience insignificant payment delays and shortfalls generally are not classified as impaired. Management determines the significance of payment delays and shortfalls on a case-by-case basis taking into consideration all circumstances surrounding the loan and the borrower, including the length of delay, the reasons for the delay, the borrower’s prior payment record and the amount of shortfall in relation to the principal and interest outstanding.
A specific reserve is recorded when and to the extent (i) the present value of expected future cash flows discounted at the loan’s original effective rate, (ii) the fair value of collateral if the loan is collateral-dependent or (iii) the observable market price of the impaired loan is lower than its recorded investment. If the fair value of collateral is used to measure impairment of a collateral-dependent loan and repayment is dependent on the sale of the collateral, the fair value is adjusted to incorporate estimated costs to sell. Impaired loans that are collateral-dependent are primarily measured for impairment using the fair value of the collateral as determined by third party appraisals using the income approach, recent comparable sales data or a combination thereof. In certain instances it is necessary for management to adjust the appraised value, less estimated costs to sell, to reflect changes in fair value occurring subsequent to the appraisal date. Management considers a guarantor’s capacity and willingness to perform, when appropriate, and the borrower’s resources available for repayment when measuring impairment.
The general allowance provides for estimated and probable losses inherent in the remainder of the Bank’s loan portfolio. The general allowance is determined through a statistical calculation based on the Bank's historical loss experience adjusted for
certain qualitative factors as deemed appropriate by management. The statistical calculation is conducted on a disaggregated basis for groups of homogeneous loans with similar risk characteristics (product types). The historical loss element is calculated as the average ratio of charge-offs, net of recoveries, to the average recorded investment for the current and previous seven quarters. See Note 5 in the Notes to the Consolidated Financial Statements for the fiscal years ended June 30, 2014, June 30, 2013 and June 29, 2012 included under Item 8. “Financial Statements and Supplementary Data” for additional information concerning the historical loss element of the general component of the allowance for loan losses. Management adjusts the historical loss rates to reflect deterioration in the real estate market, current market environment for commercial loans, credit quality to reflect increased credit risk not captured in the historical loss, significant concentrations of product types and trends in portfolio volume to capture additional risk of loss associated with the total loan portfolio. Prevailing economic conditions and specific industry trends are taken into consideration when establishing the adjustments to historical loss rates.
Certain types of loans, such as option adjustable rate mortgage (“ARM”) products, junior lien mortgages, high loan-to-value ratio mortgages, single family interest only loans, sub-prime loans, and loans with initial "teaser" rates, can have a greater risk of non-collection than other loans. At June 30, 2014, the Bank had $7.1 million in junior lien mortgages. These loans represented less than 2% of the Bank’s total loans at June 30, 2014. At June 30, 2014, the Bank did not have any exposure to sub-prime loans or loans with initial teaser rates and had no single family interest only loans.
At June 30, 2014, the Bank’s loan portfolio included a total of $1.0 million in loans with high loan-to-value ratios. High loan-to-value ratios are defined by regulation and range from 75%-90% depending on the type of loan. At June 30, 2014, all of these loans were 1-4 single family or lot loans to home builders in North Texas. We addressed the additional risk in these loans in our allowance calculation primarily through our review of the real estate market deterioration adjustment to the historical loss ratio. Additionally, at June 30, 2014, the Bank had no loans with a high loan-to-value ratio that were deemed impaired. Regulatory guidelines suggest that high loan-to-value ratio loans should not exceed 100% of total capital. At June 30, 2014, the Bank’s high loan-to-value ratio loans represented less than 1% of total capital.
We obtain appraisals on real estate loans at the time of origination from third party appraisers approved by the Bank’s BOD. We may also obtain additional appraisals when the borrower’s performance indicates it may default. After a loan default and foreclosure, we obtain new appraisals to determine the fair value of the foreclosed asset. We obtain updated appraisals on foreclosed properties on an annual basis, or more frequently if required by market conditions, until we sell the property.
Management reviews the loan loss computation methodology on a quarterly basis to determine if the factors used in the calculation are appropriate. In the past four years, because our problem loans and losses were concentrated in real estate related loans, we paid particular attention to real estate market deterioration and the concentration of capital in our real estate related loans. Improvement or additional deterioration in the residential and commercial real estate market may have an impact on these factors in future quarters. To the extent we underestimate the impact of these risks, our allowance for loan losses could be materially understated.
Loans receivable, including loans measured at fair value, at June 30, 2014, 2013, 2012, 2011 and 2010 are summarized as follows (in thousands):
| | | | | | | | | | | |
| | | | | | | | | | | |
| | 2014 | | 2013 | | 2012 | | 2011 | | 2010 | |
Residential | | | | | | | | | | | |
Purchased mortgage loans held | | | | | | | | | | | |
for sale | | $ - | | $ - | | $ - | | $ - | | $ 424,055 | |
Purchased mortgage loans | | | | | | | | | | | |
held for investment | | 133,854 | | 174,037 | | 294,341 | | 100,239 | | - | |
1-4 family | | 83,290 | | 59,910 | | 88,826 | | 116,799 | | 152,795 | |
| | 217,144 | | 233,947 | | 383,167 | | 217,038 | | 576,850 | |
Lot and land development | | | | | | | | | | | |
Residential land | | 1,585 | | 3,102 | | 10,459 | | 40,247 | | 84,669 | |
Commercial land | | 3,567 | | 5,886 | | 7,972 | | 19,743 | | 36,414 | |
| | $ 5,152 | | $ 8,988 | | $ 18,431 | | $ 59,990 | | $ 121,083 | |
| | | | | | | | | | | |
Residential construction | | $ 650 | | $ 1,367 | | $ 3,954 | | $ 33,296 | | $ 80,463 | |
Commercial construction | | 9,722 | | 1,668 | | 10,605 | | 36,117 | | 40,495 | |
Commercial real estate | | 183,568 | | 214,446 | | 316,392 | | 407,697 | | 514,930 | |
Multifamily | | 141,131 | | 99,833 | | 20,110 | | 60,813 | | 83,003 | |
Commercial loans | | 61,420 | | 58,718 | | 101,440 | | 173,195 | | 191,745 | |
Consumer loans | | 3,511 | | 1,959 | | 1,943 | | 3,055 | | 4,692 | |
| | | | | | | | | | | |
Loans held for immediate sale: | | | | | | | | | | | |
Commercial real estate | | - | | - | | - | | 4,810 | | - | |
Commercial loans | | - | | - | | - | | 326 | | - | |
1-4 family | | - | | - | | - | | 105 | | - | |
| | - | | - | | - | | 5,241 | | - | |
| | 622,298 | | 620,926 | | 856,042 | | 996,442 | | 1,613,261 | |
Allowance for probable loan loss (*) | | (7,942) | | (12,343) | | (22,402) | | (44,433) | | (35,141) | |
| | $ 614,356 | | $ 608,583 | | $ 833,640 | | $ 952,009 | | $ 1,578,120 | |
| | | | | | | | | | | |
__________
(*) There is no allowance for probable loan loss for loans measured at fair value. There is a $136 allowance for loan loss for the fiscal year ended June 30, 2014 and no allowance for probable loan loss for fiscal years ended June 30, 2013, 2012, 2011 and 2010 for purchased mortgage loans held for investment. Purchase mortgage loans held for investment are held on average for 25 days or less, substantially reducing credit risk.
The decrease in purchased mortgage loans held for investment from June 30, 2013 to June 30, 2014 was representative of an overall decline in the mortgage industry’s production levels. The nature of purchased mortgage loans held for investment business is volatile and subject to significant variation depending on interest rates, competition and general economic conditions.
The following table shows the scheduled maturities of certain loan categories at June 30, 2014, and segregates those loans with fixed interest rates from those with floating or adjustable rates (in thousands):
| | | | | | | | |
| | | | | | | | |
| | 1 year | | 1-5 | | Over 5 | | |
| | or less | | years | | years | | Total |
Commercial construction, commercial | | | | | | | | |
real estate and multifamily loans | | $ 44,729 | | $ 118,616 | | $ 171,076 | | $ 334,421 |
Commercial loans | | 27,351 | | 23,240 | | 10,829 | | 61,420 |
Residential construction loans | | - | | 650 | | - | | 650 |
Total | | $ 72,080 | | $ 142,506 | | $ 181,905 | | $ 396,491 |
| | | | | | | | |
Amount of loans based upon: | | | | | | | | |
Floating or adjustable interest rates | | $ 58,574 | | $ 73,867 | | $ 147,067 | | $ 279,508 |
Fixed interest rates | | 13,506 | | 68,639 | | 34,838 | | 116,983 |
Total | | $ 72,080 | | $ 142,506 | | $ 181,905 | | $ 396,491 |
We maintain an internally classified loan list that helps us assess the overall quality of the loan portfolio and the adequacy of the allowance for loan losses. Loans on this list are classified as substandard, doubtful or loss based on probability of repayment, collateral valuation and related collectability. This list is used to identify loans that are considered non-performing.
We classify loans as non-performing when they are 90 days or more past due as to principal or interest or when reasonable doubt exists as to timely collectability. The Bank uses a standardized review process to determine which non-performing loans should be placed on non-accrual status. At the time a loan is placed on non-accrual status, we reverse previously accrued and uncollected interest against interest income. We recognize interest income on non-accrual loans to the extent we receive cash payments for the loans with respect to which ultimate full collection is likely. For loans where full collection is not likely, we apply interest payments to the outstanding principal and we recognize income only if full payment is made.
Non-performing assets and classified loans as of June 30, 2014, 2013, 2012, 2011 and 2010 were as follows (dollars in thousands):
| | | | | | | | | | | |
| | | | | | | | | | | |
| | 2014 | | 2013 | | 2012 | | 2011 | | 2010 | |
Loans accounted for on a non- | | | | | | | | | | | |
accrual basis | | | | | | | | | | | |
1-4 family | | $ 5,686 | | $ 7,792 | | $ 18,443 | | $ 3,377 | | $ 6,065 | |
Lot and land development | | 291 | | 2,418 | | 2,965 | | 17,888 | | 8,776 | |
Multifamily | | - | | - | | - | | 14,493 | | 2,394 | |
Residential construction | | 546 | | 601 | | 648 | | 4,799 | | 3,809 | |
Commercial real estate | | 3,946 | | 7,611 | | 12,175 | | 20,626 | | 16,911 | |
Commercial loans | | 3,852 | | 4,024 | | 3,120 | | 3,166 | | 462 | |
Consumer loans | | - | | - | | 3 | | 21 | | 11 | |
| | 14,321 | | 22,446 | | 37,354 | | 64,370 | | 38,428 | |
Non-performing loans as a | | | | | | | | | | | |
percentage of total loans | | 2.3% | | 3.6% | | 4.4% | | 6.5% | | 2.4% | |
| | | | | | | | | | | |
Loans past due 90 days or more, | | | | | | | | | | | |
not included above | | | | | | | | | | | |
1-4 family | | - | | - | | - | | - | | 29 | |
Residential construction | | - | | - | | - | | - | | - | |
| | - | | - | | - | | - | | 29 | |
REO | | | | | | | | | | | |
1-4 family | | 1,587 | | 1,801 | | 495 | | 686 | | 5,862 | |
Lot and land development | | 775 | | 4,008 | | 10,513 | | 17,957 | | 19,565 | |
Multifamily | | - | | - | | 8,367 | | - | | - | |
Residential construction | | - | | - | | 1,607 | | 1,021 | | 7,673 | |
Commercial real estate | | 2,103 | | 4,065 | | 11,005 | | 3,658 | | 11,150 | |
Commercial loans | | 410 | | 291 | | 270 | | 135 | | 612 | |
Consumer loans | | - | | - | | - | | 73 | | - | |
| | 4,875 | | 10,165 | | 32,257 | | 23,530 | | 44,862 | |
| | | | | | | | | | | |
Other repossessed assets (“ORA”) | | - | | - | | - | | 1,032 | | 1,332 | |
Performing troubled debt | | | | | | | | | | | |
restructuring (*) | | 3,673 | | 5,349 | | 3,102 | | 540 | | 9,009 | |
Non-performing assets | | $ 22,869 | | $ 37,960 | | $ 72,713 | | $ 89,472 | | $ 93,660 | |
| | | | | | | | | | | |
Non-performing assets as a | | | | | | | | | | | |
percentage of total assets | | 1.8% | | 3.0% | | 5.6% | | 6.6% | | 5.3% | |
| | | | | | | | | | | |
Current classified assets | | | | | | | | | | | |
1-4 family | | $ 74 | | $ 223 | | $ 2,912 | | $ 14,963 | | $ 7,355 | |
Lot and land development | | 303 | | 965 | | 2,401 | | 13,533 | | 22,802 | |
Multifamily | | - | | 692 | | 714 | | 5,751 | | - | |
Residential construction | | - | | - | | - | | 7,174 | | 6,886 | |
Commercial real estate | | 16,288 | | 22,616 | | 29,126 | | 86,017 | | 57,127 | |
Commercial loans | | 1,801 | | 5,114 | | 2,816 | | 11,570 | | 3,926 | |
Consumer loans | | - | | - | | - | | - | | - | |
| | 18,466 | | 29,610 | | 37,969 | | 139,008 | | 98,096 | |
Total classified assets | | | | | | | | | | | |
1-4 family | | 7,346 | | 10,080 | | 22,987 | | 19,076 | | 19,311 | |
Lot and land development | | 1,755 | | 7,391 | | 16,301 | | 49,868 | | 51,143 | |
Multifamily | | - | | 692 | | 9,081 | | 20,244 | | 2,394 | |
Residential construction | | 546 | | 601 | | 2,255 | | 12,994 | | 18,368 | |
Commercial real estate | | 25,352 | | 38,801 | | 53,700 | | 110,301 | | 93,724 | |
Commercial loans | | 6,336 | | 10,005 | | 6,355 | | 15,903 | | 6,805 | |
Consumer loans | | - | | - | | 3 | | 94 | | 11 | |
| | $ 41,335 | | $ 67,570 | | $ 110,682 | | $ 228,480 | | $ 191,756 | |
| | | | | | | | | | | |
_________
(*) The remaining balance of loans modified as a troubled debt restructuring is included in non-performing loans. See discussion of the Bank’s troubled debt restructuring loans in Note 5 in the Notes to the Consolidated Financial Statements for the fiscal years ended June 30, 2014, June 30, 2013 and June 29, 2012 included under Item 8. “Financial Statements and Supplementary Data.”
Approximately $0.7 million, $1.0 million and $1.1 million of gross interest income would have been recorded in fiscal 2014, 2013 and 2012, respectively, had the non-accrual loans been recorded in accordance with their original terms. Interest income recorded on the non-accrual loans, prior to being placed on non-accrual status, in fiscal 2014, 2013 and 2012 totaled approximately $0.1 million, $0.3 million and $1.2 million, respectively.
Total classified assets to Bank capital plus allowance for loan loss was 22.7% at June 30, 2014. Classified assets decreased $26.2 million from June 30, 2013 to June 30, 2014 and substantially all classified loans by collateral location are in Texas. Bank management continues to reduce the classified asset ratio through the disposal of these assets. Depending on the method used, the Bank may be required to record additional write-downs of these assets. While management is diligently working to dispose of these assets quickly, lack of demand for certain property types, length of sales cycle and manpower limitations will impact the time required to ultimately reduce the classified assets to a more acceptable level.
The following table presents an analysis of REO for the fiscal years ended June 30, 2014, 2013, 2012, 2011 and 2010 (in thousands):
| | | | | | | | | | |
| | | | | | | | | | |
| | 2014 | | 2013 | | 2012 | | 2011 | | 2010 |
Balance at beginning of period | | $ 10,165 | | $ 32,257 | | $ 23,530 | | $ 44,862 | | $ 25,301 |
Foreclosures | | 5,192 | | 11,688 | | 28,313 | | 44,251 | | 55,649 |
Sales | | (10,014) | | (32,328) | | (18,547) | | (51,578) | | (30,757) |
Write-downs | | (468) | | (1,657) | | (1,175) | | (14,221) | | (5,522) |
Other | | - | | 205 | | 136 | | 216 | | 191 |
Balance at end of period | | $ 4,875 | | $ 10,165 | | $ 32,257 | | $ 23,530 | | $ 44,862 |
The following table presents the Bank’s classified assets as of June 30, 2014 by year of origination of the loan (in thousands):
| | | | | | | | | | |
| | | | | | | | | | |
| | | | | | Performing | | | | |
| | Non- | | | | Troubled | | Current | | |
Year | | Performing | | | | Debt | | Classified | | |
Originated | | Loans | | REO | | Restructuring | | Assets | | Total |
Fiscal 2008 or prior | | $ 2,566 | | $ 3,649 | | $ 564 | | $ 8,389 | | $ 15,168 |
Fiscal 2009 | | 3,066 | | 927 | | - | | 5,050 | | 9,043 |
Fiscal 2010 | | 8,417 | | 299 | | 1,318 | | 2,186 | | 12,220 |
Fiscal 2011 | | 272 | | - | | 34 | | 813 | | 1,119 |
Fiscal 2012 | | - | | - | | 95 | | 21 | | 116 |
Fiscal 2013 | | - | | - | | 1,662 | | 1,959 | | 3,621 |
Fiscal 2014 | | - | | - | | - | | 48 | | 48 |
| | $ 14,321 | | $ 4,875 | | $ 3,673 | | $ 18,466 | | $ 41,335 |
The following table presents an analysis of the allowance for probable loan losses for the fiscal years ended June 30, 2014, 2013, 2012, 2011 and 2010 (dollars in thousands):
| | | | | | | | | | |
| | | | | | | | | | |
| | 2014 | | 2013 | | 2012 | | 2011 | | 2010 |
Balance at beginning of period | | $ 12,343 | | $ 22,402 | | $ 44,433 | | $ 35,141 | | $ 14,731 |
Continuing operations: | | | | | | | | | | |
Charge-offs: | | | | | | | | | | |
Residential construction | | - | | - | | 1,513 | | 2,000 | | 3,788 |
Lot and land development | | 4 | | 182 | | 2,588 | | 5,510 | | 5,841 |
1-4 family | | 315 | | 524 | | 2,804 | | 4,956 | | 2,617 |
Commercial real estate | | 51 | | 2,131 | | 7,505 | | 26,505 | | 9,823 |
Multifamily | | - | | - | | 6,954 | | 812 | | 2,391 |
Commercial loans | | 67 | | 1,659 | | 4,260 | | 2,562 | | 1,796 |
Consumer loans | | - | | - | | 11 | | 1 | | 28 |
Total charge-offs | | 437 | | 4,496 | | 25,635 | | 42,346 | | 26,284 |
Recoveries: | | | | | | | | | | |
Residential construction | | 129 | | 194 | | 158 | | 238 | | 15 |
Lot and land development | | 211 | | 215 | | 209 | | 194 | | 1,398 |
1-4 family | | 265 | | 97 | | 179 | | 133 | | 122 |
Commercial real estate | | 713 | | 230 | | 383 | | 35 | | 8 |
Multifamily | | - | | 1,000 | | - | | - | | - |
Commercial loans | | 79 | | 409 | | 199 | | 70 | | 30 |
Consumer loans | | - | | 10 | | 1 | | 1 | | 3 |
Total recoveries | | 1,397 | | 2,155 | | 1,129 | | 671 | | 1,576 |
Net recoveries (charge-offs) | | 960 | | (2,341) | | (24,506) | | (41,675) | | (24,708) |
(Recapture)/ provision of loan loss charged | | | | | | | | | | |
to operations | | (5,361) | | (7,718) | | 2,475 | | 50,967 | | 45,118 |
| | (4,401) | | (10,059) | | (22,031) | | 9,292 | | 20,410 |
Balance at end of period | | $ 7,942 | | $ 12,343 | | $ 22,402 | | $ 44,433 | | $ 35,141 |
| | | | | | | | | | |
Ratio of net (recoveries) charge-offs | | | | | | | | | | |
during the period to average loans | | | | | | | | | | |
outstanding during the period | | 0.18% | | -0.32% | | -2.68% | | -3.36% | | -1.72% |
The Bank frequently reviews and updates its processes and procedures for the extension of credit, allowance for loan loss computation and internal asset review and classification. Recent changes include more stringent underwriting guidelines for loan-to-value ratios, guarantor’s financial condition, owner-occupied versus investor loans and speculative versus custom construction. The Bank currently requires more extensive documentation and data than it did in prior years in order to reclassify existing non-performing loans as performing loans. The Bank is also updating appraisals more frequently, including for performing loans, which serve as an early indicator of loan deterioration.
As a result of the current economic environment, the Bank significantly limited the growth of its loan portfolio in fiscal 2011 and 2012 in order to allocate the time, resources and capital necessary to support the existing loan portfolio. During fiscal 2013, the Bank reestablished marketing efforts to implement a conservative loan growth plan which we believe will enhance our core earnings in future years. Throughout fiscal 2014, the Bank has continued these marketing efforts in order to grow the Bank’s loan portfolio.
The allowance for probable loan losses by type of loans as of June 30, 2014, 2013, 2012, 2011 and 2010 was as follows (dollars in thousands):
| | | | | | | | | | | | | | | | | | | | | | | | | |
| | | | | | | | | | | | | | | | | | | | | | | | | |
| | 2014 | | 2013 | | 2012 | |
| | | | | | Percent | | | | | | Percent | | | | | | Percent | |
| | | | Percent | | of the | | | | Percent | | of the | | | | Percent | | of the | |
| | | | of loans | | allowance | | | | of loans | | allowance | | | | of loans | | allowance | |
| | | | to total | | for loan | | | | to total | | for loan | | | | to total | | for loan | |
| | Amount | | loans | | loss | | Amount | | loans | | loss | | Amount | | loans | | loss | |
Residential construction | | $ 1 | | 0.1 | % | | - | % | | $ 49 | | 0.2 | % | | 0.4 | % | | $ 350 | | 0.5 | % | | 1.6 | % | |
Lot and land development | | 27 | | 0.8 | | | 0.3 | | | 374 | | 1.4 | | | 3.0 | | | 1,310 | | 2.1 | | | 5.9 | | |
1-4 family | | 1,449 | | 34.9 | | | 18.2 | | | 1,528 | | 37.7 | | | 12.4 | | | 3,235 | | 44.8 | | | 14.4 | | |
Commercial real estate | | 2,603 | | 31.1 | | | 32.8 | | | 3,290 | | 34.8 | | | 26.7 | | | 10,628 | | 38.2 | | | 47.4 | | |
Multifamily | | 2,630 | | 22.7 | | | 33.1 | | | 3,567 | | 16.1 | | | 28.9 | | | 2,866 | | 2.3 | | | 12.8 | | |
Commercial loans | | 1,219 | | 9.9 | | | 15.4 | | | 3,530 | | 9.5 | | | 28.6 | | | 4,004 | | 11.9 | | | 17.9 | | |
Consumer loans | | 13 | | 0.5 | | | 0.2 | | | 5 | | 0.3 | | | - | | | 9 | | 0.2 | | | - | | |
| | $ 7,942 | | 100.0 | % | | 100.0 | % | | $ 12,343 | | 100.0 | % | | 100.0 | % | | $ 22,402 | | 100.0 | % | | 100.0 | % | |
| | | | | | | | | | | | | | | | | | | | | | | | | |
| | | | | | | | | | | | | | | | | | | | | | | | | |
| | | | | | | | | | 2011 | | 2010 | |
| | | | | | | | | | | | | | Percent | | | | | | Percent | |
| | | | | | | | | | | | Percent | | of the | | | | Percent | | of the | |
| | | | | | | | | | | | of loans | | allowance | | | | of loans | | allowance | |
| | | | | | | | | | | | to total | | for loan | | | | to total | | for loan | |
| | | | | | | | | | Amount | | loans | | loss | | Amount | | loans | | loss | |
Residential construction | | | | | | | | | | $ 531 | | 7.0 | % | | 1.2 | % | | $ 3,362 | | 8.0 | % | | 9.6 | % | |
Lot and land development | | | | | | | | | | 3,168 | | 6.0 | | | 7.1 | | | 4,808 | | 7.5 | | | 13.7 | | |
1-4 family | | | | | | | | | | 6,107 | | 21.8 | | | 13.7 | | | 3,542 | | 35.8 | | | 10.1 | | |
Commercial real estate | | | | | | | | | | 28,306 | | 41.4 | | | 63.7 | | | 19,733 | | 31.9 | | | 56.1 | | |
Multifamily | | | | | | | | | | 871 | | 6.1 | | | 2.0 | | | 812 | | 4.6 | | | 2.3 | | |
Commercial loans | | | | | | | | | | 5,417 | | 17.4 | | | 12.2 | | | 2,853 | | 11.9 | | | 8.1 | | |
Consumer loans | | | | | | | | | | 33 | | 0.3 | | | 0.1 | | | 31 | | 0.3 | | | 0.1 | | |
| | | | | | | | | | $ 44,433 | | 100.0 | % | | 100.0 | % | | $ 35,141 | | 100.0 | % | | 100.0 | % | |
At June 30, 2014, approximately 32.8% of the Bank’s loan loss allowance was allocated to its commercial real estate loan portfolio while the Bank’s commercial real estate loan portfolio represented approximately 31.1% of its total loan portfolio. This is up from June 30, 2013 when 26.7% of the Bank’s loan loss allowance was allocated to its commercial real estate loan portfolio. Commercial real estate loans tend to be individually larger than residential loans and deterioration in this portfolio can lead to volatility in our earnings. At June 30, 2014, the loan loss allowance related to multifamily loans was 33.1% as compared to multifamily loans constituting 22.7% of the Bank’s total loan portfolio. The larger allocation of the allowance to multifamily loans reflects the recent growth in this portfolio.
Additionally, at June 30, 2014, 15.4% of the Bank’s loan loss allowance was allocated to its commercial loans portfolio, while the Bank’s commercial loan portfolio represented approximately 9.9% of its total loan portfolio. This decrease in percentage of the allowance for loan loss from June 30, 2013 was due primarily to the $2.1 million payment received on an outstanding loan for which the Bank had a specific impairment reserve recorded.
The Bank’s written loan policies address specific underwriting standards for commercial real estate loans. These policies include loan to value requirements, cash flow requirements, acceptable amortization periods and appraisal guidelines. In addition, specific covenants, unique to each relationship, may be used where deemed appropriate to further protect the lending relationship. Collateral in the commercial real estate portfolio varies from owner-occupied properties to investor properties. We periodically review the portfolio for concentrations by industry as well as geography. All commercial relationships are stress tested at the time of origination and major relationships are also stress tested on an annual basis.
Deposits
Average deposits and the average interest rate paid on the deposits for fiscal 2014, 2013 and 2012 can be found in the discussion of the Bank’s net interest income under the caption "-Results of Operations-Segment Information-Banking."
The Bank had $11.5 million and $12.5 million in certificates of deposit of $100,000 or greater at June 30, 2014 and 2013, respectively. The Bank is funded primarily by deposits from SWS’s brokerage customers, which are classified as core deposits. These core deposits provide the Bank with a stable and low cost funding source. The Bank also utilizes long-term FHLB borrowings to match long-term fixed rate loan funding. At June 30, 2014, the Bank had $873.1 million in funds on deposit from customers of Southwest Securities, representing approximately 87% of the Bank’s total deposits.
Short Term Borrowings and Advances from Federal Home Loan Bank
The following table represents short term borrowings and advances from the FHLB that were due within one year during the fiscal years ended June 30, 2014, 2013 and 2012 (dollars in thousands):
| | | | | | | | | | | | | | | | |
| | | | | | | | | | | | | | | | |
| | | | |
| | 2014 | | 2013 | | 2012 | |
| | | | Interest | | | | Interest | | | | Interest | |
| | Amount | | Rate | | Amount | | Rate | | Amount | | Rate | |
At end of period | | $ 1,551 | | 4.11 | % | | $ 15,486 | | 3.93 | % | | $ 9,267 | | 4.04 | % | |
Average balance during period | | 11,612 | | 3.96 | % | | 14,133 | | 4.04 | % | | 13,243 | | 4.75 | % | |
Maximum month-end balance during year | | 15,307 | | - | | | 17,009 | | - | | | 15,046 | | - | | |
LIQUIDITY AND CAPITAL RESOURCES
Management believes that our current assets and available liquidity are adequate to meet our liquidity needs over the next 12 months. However, our forecast may not prove to be accurate or we may need to raise additional capital. As a result, from time to time, management evaluates various opportunities to supplement the company’s sources of liquidity and capital. In fiscal 2012, this evaluation led to us entering into the Credit Agreement with Hilltop and Oak Hill, as discussed below. Should we determine we need to obtain additional debt at SWS Group, we would require regulatory approval and approval from Hilltop and Oak Hill.
Credit Agreement
On July 29, 2011, we entered into a Credit Agreement with Hilltop and Oak Hill pursuant to which we obtained a $100.0 million, five year, unsecured loan that accrues interest at a rate of 8% per annum. In addition, we issued warrants to Hilltop and Oak Hill allowing each to purchase up to 8,695,652 shares of common stock at an exercise price of $5.75 per share (subject to anti-dilution adjustments), representing approximately 17% of our common stock per investor as of July 29, 2011 (assuming the warrants are excercised in full). The Credit Agreement contains restrictions and covenants that we must adhere to as long as the unsecured loan is outstanding. As of June 30, 2014, SWS Group had utilized all of the $100.0 million under the unsecured loan by (i) contributing $20.0 million in capital to the Bank to promote growth in the Bank’s loan portfolio, (ii) reducing SWS Group’s intercompany payable to Southwest Securities by $20.0 million, (iii) contributing $30.0 million in capital to Southwest Securities and (iv) loaning $30.0 million to Southwest Securities to use in general operations by reducing Southwest Securities’ use of short-term borrowings for the financing of its day-to-day cash management needs. See Note 16 in the Notes to the Consolidated Financial Statements for the fiscal years ended June 30, 2014, June 30, 2013 and June 29, 2012 included under Item 8. “Financial Statements and Supplementary Data” for additional information concerning this Credit Agreement.
Brokerage
A substantial portion of our assets are highly liquid in nature and consist mainly of cash or assets that are readily convertible into cash. Our equity capital, short-term bank borrowings, interest bearing and non-interest bearing client credit balances, correspondent deposits and other payables finance these assets. We maintain an allowance for doubtful accounts that represents amounts that are necessary in the judgment of management to adequately absorb losses from known and inherent risks in receivables from clients, clients of correspondents and correspondents. The highly liquid nature of our assets provides us with flexibility in financing and managing our anticipated operating needs. Management believes that the present liquidity position of the brokerage businesses is adequate to meet its needs over the next 12 months.
Short-Term Borrowings. At June 30, 2014, we had short-term borrowing availability under broker loan lines, a $20.0 million unsecured line of credit and a $45.0 million revolving committed credit facility, each of which is described below.
Broker Loan Lines. At June 30, 2014, we had uncommitted broker loan lines of up to $400.0 million. These lines of credit are used primarily to finance securities owned, securities held for correspondent broker/dealer accounts and receivables in customers’ margin accounts. These lines may also be used to release pledged collateral against day loans. These credit arrangements are provided on an "as offered" basis, are not committed lines of credit and can be terminated at any time by the
lender. Any outstanding balances under these credit arrangements are due on demand and bear interest at rates indexed to the federal funds rate. At June 30, 2014, $59.0 million was outstanding under these secured arrangements, which was collateralized by securities held for firm accounts valued at $99.2 million. Our ability to borrow additional funds is limited by our eligible collateral. See additional discussion under Item 1A. “Risk Factors."
Unsecured Line of Credit. We also have a $20.0 million unsecured line of credit that is due on demand and bears interest at rates indexed to the federal funds rate. This credit arrangement is provided on an "as offered" basis and is not a committed line of credit. The total amount of borrowings available under this line of credit is reduced by the amount outstanding under any unsecured letters of credit at the time of borrowing. At June 30, 2014, we had no outstanding unsecured letters of credit, there were no amounts outstanding on this line, and we had $20.0 million available for borrowing under this line of credit.
Revolving Committed Credit Facility. On January 28, 2011, Southwest Securities entered into a $45.0 million committed revolving credit facility with an unaffiliated bank. The commitment fee for the credit facility is 0.375% per annum and, when drawn, the interest rate is equal to the federal funds rate plus 125 basis points. The credit facility requires Southwest Securities to maintain tangible net worth of $150.0 million. As of June 30, 2014, there was no outstanding balance under this credit facility.
Net Capital Requirements. Our broker/dealer subsidiaries are subject to the requirements of the SEC relating to liquidity, capital standards and the use of client funds and securities. The amount of the broker/dealer subsidiaries’ net assets that may be distributed to the parent of the broker/dealer is subject to restrictions under applicable net capital rules. Historically, we have operated in excess of the minimum net capital requirements. See Note 18 in the Notes to the Consolidated Financial Statements for the fiscal years ended June 30, 2014, June 30, 2013 and June 29, 2012 included under Item 8. “Financial Statements and Supplementary Data” for additional information concerning these requirements.
Secured Borrowings. We participate in transactions involving securities sold under repurchase agreements (“repos”), which are secured borrowings that we record in our statement of financial condition as other liabilities. These securities generally mature within one to four days from the transaction date. Securities sold under repurchase agreements are reflected at the amount of cash received in connection with the transactions. We may be required to provide additional collateral based on the fair value of the underlying securities.
Banking
Liquidity is monitored daily to ensure the Bank’s ability to meet deposit withdrawals, maintain reserve requirements and otherwise sustain operations. The Bank’s liquidity is maintained in the form of readily marketable loans and investment securities, balances with the FHLB, Federal Reserve Bank of Dallas, federal funds sold to correspondent banks and vault cash. At June 30, 2014, the Bank had net borrowing capacity from the FHLB of $142.8 million. In addition, at June 30, 2014, the Bank had the ability to borrow up to $42.9 million in funds from the Federal Reserve Bank of Dallas under its secondary credit program.
In the second quarter of fiscal 2010, the Bank entered into a secured line of credit agreement with the Federal Reserve Bank of Dallas. This line of credit is secured by the Bank's commercial loan portfolio. This line is due on demand and bears interest at a rate of 50 basis points over the federal funds target rate. At June 30, 2014, there were no amounts outstanding under this line of credit.
The Bank’s asset and liability management policy is intended to manage interest rate risk. The Bank manages the periodic repricing of its interest-earning assets and its interest-bearing liabilities. Overall interest rate risk is monitored through reports showing both sensitivity ratios, a simulation model, and existing "GAP" data. (See the Bank’s GAP analysis in "-Risk Management-Market Risk-Interest Rate Risk-Banking.") At June 30, 2014, $873.1 million of the Bank’s deposits were from the brokerage customers of Southwest Securities.
Capital Requirements. The Bank is subject to various regulatory capital requirements administered by federal agencies. Quantitative measures, established by regulation to ensure capital adequacy, require maintaining minimum amounts and ratios of total and Tier 1 capital (as defined in 12 CFR 165 and 12 CFR 167) to risk-weighted assets (as defined) and of Tier 1 (core) capital (as defined) to adjusted assets (as defined) (without giving effect to the Basel III final rule). At June 30, 2014, the Bank had a total risk-based capital ratio of 25.5% and the Bank had a Tier 1 (core) capital ratio of 14.1%. At June 30, 2014, the Bank had a Tier 1 risk-based capital ratio of 24.4%. Under federal law, the OCC may require the Bank to apply other measures of risk-weight or capital ratios that the OCC deems appropriate. In connection with the termination of the Order to Cease and Desist, Order No. WN-11-0003, effective on February 4, 2011, on January 14, 2013, the Bank committed to the OCC that the Bank would, among other things, maintain a Tier 1 capital ratio at least equal to 9% of adjusted total assets and a total risk-based capital ratio of at least 12%.
The Bank has historically met all of its capital adequacy requirements. As of June 30, 2014, the Bank met all capital requirements to which it was subject and satisfied the requirements to be defined as well-capitalized.
Off-Balance Sheet Arrangements
We generally do not enter into off-balance sheet arrangements, as defined by the SEC. However, our broker/dealer subsidiaries enter into transactions in the normal course of business that expose us to off-balance sheet risk. See Note 27 in the Notes to the Consolidated Financial Statements for the fiscal years ended June 30, 2014, June 30, 2013 and June 29, 2012 included under Item 8. “Financial Statements and Supplementary Data.”
Contractual Obligations and Contingent Payments
| | | | | | | | | | | | |
| | | | | | | | | | | | |
| | Payments Due |
(in thousands) | | | | Less than 1 | | | | | | More than | | |
| | Total | | year | | 1-3 years | | 3-5 years | | 5 years | | Other (5) |
Long-term debt (1) | | $ 175,579 | | $ - | | $ 105,112 | | $ 49,166 | | $ 21,301 | | $ - |
Interest on long- | | | | | | | | | | | | |
term debt (2) | | 41,211 | | 15,656 | | 19,180 | | 2,067 | | 4,308 | | - |
Certificates of deposit | | 26,961 | | 22,741 | | 3,415 | | 805 | | - | | - |
Uncertain tax positions | | 149 | | - | | - | | - | | - | | 149 |
Other leases (3) | | 40,483 | | 8,095 | | 12,736 | | 9,481 | | 10,171 | | - |
Investment commitments | | 7,520 | | 7,520 | | - | | - | | - | | - |
Purchase obligations | | 16,841 | | 11,082 | | 5,071 | | 688 | | - | | - |
Deferred compensation (4) | | 6,115 | | 1,033 | | 1,553 | | 1,801 | | 1,728 | | - |
Scholarship endowment | | 300 | | - | | - | | - | | - | | 300 |
Total | | $ 315,159 | | $ 66,127 | | $ 147,067 | | $ 64,008 | | $ 37,508 | | $ 449 |
__________
(1) Long-term debt is comprised of advances from the FHLB with maturities greater than one year and outstanding borrowings under the Credit Agreement with Hilltop and Oak Hill.
(2) Amount of interest payable includes the interest on advances from the FHLB based on rates ranging from less than 1% to 6% and outstanding borrowings under the Credit Agreement with Hilltop and Oak Hill based on an effective interest rate of 15%.
(3) Of the $40,483 in lease commitments, no amounts are reserved for impairment.
(4) We have commitments to our employees for deferred compensation in the amount of $6,115 that become payable in future fiscal years as defined by the plan and determined by participants who have formally requested payment of their plan balances. See Note 19 in the Notes to the Consolidated Financial Statements for the fiscal years ended June 30, 2014, June 30, 2013 and June 29, 2012 included under Item 8. “Financial Statements and Supplementary Data.”
(5)Due date cannot be estimated. See Note 1(s), Note 17 and Note 24 in the Notes to the Consolidated Financial Statements for the fiscal years ended June 30, 2014, June 30, 2013 and June 29, 2012 included under Item 8. “Financial Statements and Supplementary Data.”
Cash Flow
Net cash provided by operating activities totaled $48.2 million in fiscal 2014 and net cash used in operating activities totaled $64.5 million and $1.5 million in fiscal 2013 and 2012, respectively. The net cash provided by operating activities for the fiscal year ended June 30, 2014 was due to the $86.5 million decrease in net receivable from broker, dealer and clearing organizations and a $50.7 million decrease in client accounts offset by a $20.6 million increase in securities purchased under agreements to resell, a net $39.4 million increase in our securities inventory and a $25.5 million increase in our customer reserve requirement. The net cash used in operating activities for fiscal 2013 was due to the $89.2 million increase in net receivable from broker, dealer and clearing organization accounts, a $42.5 million increase in net receivable from client accounts and a $26.8 million increase in securities purchased under agreements to resell. These increases were offset by an $86.1 million decrease in our net trading inventory and an $11.6 million decrease in assets segregated for regulatory purposes.
Net cash used in investing activities was $5.4 million and $219.8 million in fiscal 2014 and 2012, respectively, and cash provided by investing activities was $59.6 million in fiscal 2013. For fiscal 2014, cash used in investing activities was due to purchases of securities of $177.1 million and offset by cash used for loan originations net of proceeds from cash received at the Bank from loan pay-downs of $10.6 million and proceeds from the Bank’s investments and loans held for investment of $175.1 million. The primary reason for the increase in cash provided by investing activities in fiscal 2013 as compared to fiscal 2012 was proceeds from cash received at the Bank from loan pay-downs net of originations of $203.5 million, along with $51.1 million in proceeds from the sale of REO, loans, and other assets at the Bank, were used to increase the Bank’s net investment portfolio by $190.2 million.
Net cash used in financing activities totaled $54.2 million for fiscal 2014 and net cash provided by financing activities totaled $34.1 million and $4.3 million for fiscal 2013 and 2012, respectively. For fiscal 2014, the primary driver of the cash used
in financing activities was a decrease in net cash proceeds from short-term borrowings and advances form the FHLB offset by an increase in deposits at the Bank. The primary driver of the cash provided by financing activities in fiscal 2013 was an increase in cash proceeds from short term borrowings and the FHLB, offset by a decrease in deposits at the Bank.
We expect that cash flows provided by operating activities and short-term borrowings will be the primary source of working capital for the next 12 months.
Treasury Stock
We periodically repurchase our shares of common stock. We currently have no approved plan, and any such plan would require, in addition to BOD approval, the approval of Hilltop, Oak Hill and regulatory authorities.
The trustee under our deferred compensation plan periodically purchases shares of our common stock in the open market in accordance with the terms of the plan. This stock is classified as treasury stock in our consolidated financial statements, but participates in future dividends declared by us. During fiscal year 2014, the plan purchased 50,000 shares of common stock at a cost of approximately $288,000, or $5.76 per share, and approximately 40,719 shares were sold or distributed to participants pursuant to the plan. See Item 5. “Market for Registrant’s Common Equity, Related Stockholder Matters and Issuer Purchases of Equity Securities.”
As restricted stock grants vest, grantees may sell a portion of their vested shares to us to cover the tax liabilities arising from vesting. As a result, in fiscal 2014, we repurchased approximately 1,100 shares of common stock with a market value of approximately $6,100, or an average of $5.55 per share, to cover tax liabilities.
Inflation
Our financial statements included herein have been prepared in accordance with GAAP. GAAP requires us to measure our financial position and operating results primarily in terms of historic dollars. Changes in the relative value of money due to inflation or recession are generally not considered under GAAP. Our assets are primarily monetary, consisting of cash, securities inventory and receivables from customers and broker/dealers. These monetary assets are generally liquid and turn over rapidly and, consequently, are not significantly affected by inflation. The rate of inflation affects various expenses of the company, such as employee compensation and benefits, communications, and occupancy and equipment, which may not be readily recoverable in the price of our services. The rate of inflation can also have a significant impact on securities prices and on investment preferences by our customers, generally. In management’s opinion, changes in interest rates affect the financial condition of a financial services firm to a greater degree than changes in the inflation rate. While interest rates are greatly influenced by changes in the inflation rate, they do not necessarily change at the same rate or in the same magnitude as the inflation rate. Interest rates are highly sensitive to many factors that are beyond our control, including changes in the expected rate of inflation, the influence of general and local economic conditions and the monetary and fiscal policies of the United States government, its agencies and various other governmental regulatory authorities among other things. See Item 1A, “Risk Factors - Risks Specific to Our Industries.”
RISK MANAGEMENT
In an effort to assist the company in managing enterprise risk, and at the BOD’s request, the company engaged a firm to perform an analysis of the company’s enterprise risk management process in 2010. During fiscal 2011, based on the BOD’s recommendations, we initiated an enterprise risk management program and formed an enterprise risk management committee. Enterprise risk is viewed as the threat from an event, action or loss of opportunity that, if it occurs or has occurred, may adversely affect any, or any combination of, our company objectives, business strategies, business model, regulatory compliance, reputation and existence. The committee works with our various departments and committees to manage our enterprise risk management program and reports the results of this work to the Audit Committee of the BOD on a quarterly basis. During fiscal 2013, we hired a full time risk manager for the consolidated group who serves as the primary liaison with our risk management consultants. We continue to utilize the consultants to improve risk management processes, procedures and reporting.
We manage risk exposure through the involvement of various levels of management. We establish, maintain and regularly monitor maximum positions by industry and issuer in both trading and inventory accounts. Current and proposed underwriting, banking and other commitments are subject to due diligence reviews by senior management, as well as professionals in the appropriate business and support units. The Bank seeks to reduce the risk of significant adverse effects of market rate fluctuations by minimizing the difference between rate-sensitive assets and liabilities, referred to as "GAP," and maintaining an interest rate sensitivity position within a particular timeframe. Credit risk related to various financing activities is reduced by the industry practice of obtaining and maintaining collateral. We monitor our exposure to counterparty risk through the use of credit information, the monitoring of collateral values and the establishment of credit limits. We have established various risk management committees that are responsible for reviewing and managing risk related to interest rates, trading positions, margin and other credit risk and risks from capital market transactions.
Credit Risk
A description of the credit risk for our brokerage and banking segments is as follows:
Brokerage. Credit risk arises from the potential nonperformance by counterparties, customers or debt security issuers. We are exposed to credit risk as a trading counterparty and as a stock loan counterparty to dealers and customers, as a holder of securities and as a member of clearing organizations. We have established credit risk committees to review our credit exposure in our various business units. These committees are composed of senior management of the company. Credit exposure is also associated with customer margin accounts, which are monitored daily. We monitor exposure to individual securities and perform sensitivity analysis on a regular basis in connection with our margin lending activities. We adjust our margin requirements if we believe our risk exposure is not appropriate based on market conditions.
Banking. Credit risk is the possibility that a borrower or counterparty will fail to meet its obligations in accordance with agreed terms and is inherent in all types of lending. The Bank has developed and continues to update its policies and procedures to provide a process for managing credit risk. These policies and procedures include underwriting guidelines, credit and collateral tracking and detailed loan approval procedures. The Bank also maintains a detailed loan review process to monitor the quality of its loan portfolio. The Bank makes loans to customers primarily within Texas and New Mexico. The Bank also purchases mortgage loans, which have been originated in other areas of the United States. Although the Bank has a diversified loan portfolio, a substantial portion of its portfolio is dependent upon the general economic conditions in Texas and New Mexico. Policies and procedures, which are in place to manage credit risk, are designed to be responsive to changes in these economic conditions.
Operational Risk
Operational risk refers generally to risk of loss resulting from our operations, including but not limited to, improper or unauthorized execution and processing of transactions, deficiencies in our operating systems, and inadequacies or breaches in our control processes. We operate in diverse markets and rely on the ability of our employees and systems to process large numbers of transactions. In order to mitigate and control operational risk, we have developed and continue to enhance specific policies and procedures that are designed to identify and manage operational risk at appropriate levels. We also use periodic self-assessments and internal audit examinations as further review of the effectiveness of our controls and procedures in mitigating our operational risk.
Legal Risk
Legal risk includes the risk of non-compliance with applicable legal and regulatory requirements. We are subject to extensive regulation in the different jurisdictions in which we conduct business. We have established procedures based on legal and regulatory requirements that are designed to reasonably ensure compliance with applicable statutory and regulatory requirements. We also have established procedures that are designed to ensure that executive management’s policies relating to conduct, ethics and business practices are followed. In connection with our business, we have various procedures addressing significant issues such as regulatory capital requirements, sales and trading practices, new products, use and safekeeping of customer funds and securities, granting credit, collection activities, money laundering, privacy and record keeping.
Market Risk
Market risk generally represents the risk of loss that may result from the potential change in value of a financial instrument as a result of fluctuations in interest rates, market prices, investor expectations and changes in credit ratings of the issuer. Our exposure to market risk is directly related to our role as a financial intermediary in customer-related transactions and to our proprietary trading activities and securities lending activities.
Interest Rate Risk. A description of the interest rate risk for our brokerage and banking segments is as follows:
Brokerage. Interest rate risk is a consequence of maintaining inventory positions and trading in interest rate sensitive financial instruments and maintaining a matched stock loan book. Our fixed income activities also expose us to the risk of loss related to changes in credit spreads. Credit spread risk arises from the potential that changes in an issuer’s credit rating or credit perception could affect the value of financial instruments.
Banking. Our primary emphasis in interest rate risk management for the Bank is the matching of assets and liabilities of similar cash flow and re-pricing time frames. This matching of assets and liabilities reduces exposure to interest rate movements and aids in stabilizing positive interest spreads. We strive to structure our balance sheet as a natural hedge by matching floating rate assets with variable short term funding and by matching fixed rate liabilities with similar longer term fixed rate assets. The Bank has established percentage change limits in both interest margin and net portfolio value. To verify that the Bank is within the limits established for interest margin, the Bank prepares an analysis of net interest margin based on various shifts in interest rates. To verify that the Bank is within the limits established for net portfolio value, the Bank analyzes
data prepared using internal modeling data for net portfolio value. These analyses are conducted on a quarterly basis for the Bank’s BOD.
The following table illustrates the estimated change in net interest margin based on shifts in interest rates of positive 300 basis points to negative 100 basis points:
| | |
| | |
Hypothetical Change in Interest Rates | | Projected Change in Net Interest Margin |
+300 | | -24.32% |
+200 | | -16.87% |
+100 | | -8.57% |
0 | | 0.00% |
-100 | | -13.01% |
The following GAP Analysis table indicates the Bank’s interest rate sensitivity position at June 30, 2014 (in thousands):
| | | | | | | | |
| | | | | | | | |
| | Repricing Opportunities |
| | 0-6 months | | 7-12 months | | 1-3 years | | 3+ years |
Earning assets: | | | | | | | | |
Loans-net | | $ 410,905 | | $ 35,875 | | $ 93,151 | | $ 74,425 |
Securities and FHLB stock | | 63,547 | | 53,928 | | 131,198 | | 262,671 |
Interest-bearing deposits | | 77,634 | | - | | - | | - |
Total earning assets | | 552,086 | | 89,803 | | 224,349 | | 337,096 |
| | | | | | | | |
Interest-bearing liabilities: | | | | | | | | |
Transaction accounts and savings | | 904,381 | | - | | - | | - |
Certificates of deposit | | 12,206 | | 10,534 | | 3,415 | | 806 |
Borrowings | | 1,551 | | - | | 11,979 | | 63,600 |
Total interest-bearing liabilities | | 918,138 | | 10,534 | | 15,394 | | 64,406 |
| | | | | | | | |
GAP | | $ (366,052) | | $ 79,269 | | $ 208,955 | | $ 272,690 |
| | | | | | | | |
Cumulative GAP | | $ (366,052) | | $ (286,783) | | $ (77,828) | | $ 194,862 |
Market Price Risk. We are exposed to market price risk as a result of making markets and taking proprietary positions in securities. Market price risk results from changes in the level or volatility of prices, which affect the value of securities or instruments that derive their value from a particular stock or bond, a basket of stocks or bonds or an index.
The following table categorizes “Securities owned, at fair value” net of “Securities sold, not yet purchased, at fair value,” which are in our securities owned and securities sold, not yet purchased, portfolios and “Securities available for sale” in our available-for-sale portfolio which are subject to interest rate and market price risk at June 30, 2014 (dollars in thousands):
| | | | | | | | | | | | | | | |
| | | | | | | | | | |
| | | | | | | | | | |
| | Years to Maturity |
| | 1 or less | | 1 to 5 | | 5 to 10 | | Over 10 | | Total |
Trading securities, at fair value | | | | | | | | | | |
Municipal obligations | | $ 110 | | $ 2,880 | | $ 14,621 | | $ 34,627 | | $ 52,238 |
U.S. government and government | | | | | | | | | | |
agency obligations | | 7,399 | | (23,521) | | (8,256) | | 546 | | (23,832) |
Corporate obligations | | (2,259) | | 11,820 | | 6,415 | | 32,922 | | 48,898 |
Total debt securities | | $ 5,250 | | $ (8,821) | | $ 12,780 | | $ 68,095 | | $ 77,304 |
Corporate equity securities | | - | | - | | - | | 1,155 | | 1,155 |
Other | | 35,811 | | - | | - | | - | | 35,811 |
| | $ 41,061 | | $ (8,821) | | $ 12,780 | | $ 69,250 | | $ 114,270 |
| | | | | | | | | | |
| | | | | | | | | | |
| | | | | | | | | | | | | | | |
| | | | | | | | | | | | | | | |
| | Years to Maturity | |
| | 1 or less | | 1 to 5 | | 5 to 10 | | Over 10 | | Total |
Weighted average yield | | | | | | | | | | | | | | | |
Municipal obligations | | 0.16 | % | | 1.39 | % | | 2.23 | % | | 4.30 | % | | 3.55 | % |
U.S. government and government | | | | | | | | | | | | | | | |
agency obligations | | 0.04 | | | 1.44 | | | 2.32 | | | 3.26 | | | 2.17 | |
Corporate obligations | | 0.96 | | | 2.23 | | | 3.88 | | | 4.68 | | | 3.60 | |
| | | | | | | | | | | | | | | |
Available-for-sale securities, at fair | | | | | | | | | | | | | | | |
value | | | | | | | | | | | | | | | |
Securities available for sale | | $ 109,366 | | | $ 219,308 | | | $ 130,139 | | | $ 36,035 | | | $ 494,848 | |
CRITICAL ACCOUNTING POLICIES AND ESTIMATES
Our discussion and analysis of our financial condition and results of operations are based on our consolidated financial statements, which have been prepared in accordance with GAAP. The preparation of these consolidated financial statements requires management to make estimates and assumptions that affect reported amounts of assets, liabilities, revenues, expenses and related disclosures. We review our estimates on an on-going basis. We base our estimates on our experience and on various other assumptions that we believe to be reasonable under the circumstances. Actual results may differ from these estimates under different assumptions or conditions. The following policies involve a higher degree of judgment than do our other significant accounting policies detailed in Note 1 in the Notes to the Consolidated Financial Statements for the fiscal years ended June 30, 2014, June 30, 2013 and June 29, 2012 included under Item 8. “Financial Statements and Supplementary Data.”
Fair Value
We adopted the fair value accounting standard of the FASB effective June 28, 2008. Fair value accounting establishes a framework for measuring fair value and expands disclosures about fair value measurements.
Under fair value accounting, fair value refers to the price that would be received upon the sale of an asset or paid to transfer a liability in an orderly transaction between market participants in the principal market in which the reporting entity transacts. The standard clarifies the principle that fair value should be based on the assumptions market participants would use when pricing the asset or liability. In support of this principle, the standard establishes a fair value hierarchy that prioritizes the information used to develop those assumptions. The fair value hierarchy gives the highest priority to quoted prices in active markets and the lowest priority to unobservable data. Under the standard, fair value measurements are separately disclosed by level within the fair value hierarchy. The standard describes three levels of inputs that may be used to measure fair value:
| | |
| | |
| | |
| | |
| • | Level 1 — Quoted prices in an active market for identical assets or liabilities. We value the following assets and liabilities utilizing Level 1 inputs: (i) our deferred compensation plan’s investment in Westwood’s common stock and (ii) certain inventories held in our securities owned and securities sold, not yet purchased portfolio. Valuation of these instruments does not require a high degree of judgment as the valuations are based on quoted prices in active markets that are readily available. |
| | |
| | |
| | |
| | |
| | |
| • | Level 2 — Observable inputs other than Level 1 prices, such as quoted prices for similar assets or liabilities in active markets; quoted prices in markets that are not active; or other inputs that are observable or can be corroborated by observable market data for substantially the full term of the assets or liabilities. We value the following assets and liabilities utilizing Level 2 inputs: (i) certain inventories held in our securities owned and securities sold, not yet purchased portfolio; (ii) securities in our available for sale portfolio and (iii) the Bank’s investment in interest rate swaps. These financial instruments are valued by quoted prices that are less frequent than those in active markets or by models that use various assumptions that are derived from or supported by data that is generally observable in the marketplace. Valuations in this category are inherently less reliable than quoted market prices due to the degree of subjectivity involved in determining appropriate methodologies and the applicable observable market underlying assumptions. |
| | |
| | |
| | |
| | |
| • | Level 3 — Unobservable inputs that are supported by little or no market activity and that are significant to the fair value of the assets and liabilities. We value the following assets and liabilities utilizing Level 3 inputs: (i) the Bank’s loans measured at fair value; (ii) certain inventories held in our securities owned portfolio and (iii) the warrants issued to Hilltop and Oak Hill. These financial instruments have significant inputs that cannot be validated by readily determinable market data and generally involve considerable judgment by management. Our Level 3 assets represented 7% of our total assets measured at fair value at June 30, 2014. Our Level 3 liabilities represented 18% of our total liabilities measured at fair value at June 30, 2014. All of our Level 3 liabilities consist of the warrants issued to Hilltop and Oak Hill. |
The availability of observable inputs can vary for different assets. Fair value is a market-based measure; therefore, when market observable inputs are not available, our judgment is applied to reflect those judgments that we believe a market participant would use in valuing the same asset or liability. We use prices and inputs that are current as of the measurement date even in periods of market disruption or illiquidity. Greater judgment in valuation is required when inputs are less observable or unobservable in the marketplace and judgment must be applied in determining the appropriateness of available prices, particularly in assessing whether available data reflects current prices and/or reflects the results of recent market transactions. The valuation of financial instruments classified in Level 3 of the fair value hierarchy involves the greatest amount of management judgment.
Valuation Process for Financial Instruments. Financial instruments are valued at quoted market prices, if available. For financial instruments that do not have readily determinable fair values through quoted market prices, the determination of fair value is based upon consideration of available information including current financial information, fair values of underlying financial instruments and quotations for similar instruments. Certain financial instruments have bid and ask prices that can be observed in the marketplace. For financial instruments whose inputs are based on bid-ask prices, mid-market pricing is applied and adjusted to the point within the bid-ask range that meets our best estimate of fair value.
The valuation process for financial instruments may include the use of valuation models and other techniques. Management makes adjustments to valuations derived from valuation models based on a number of factors, including but not limited to, the size of the position in the financial instrument in an inactive market, the features of the financial instrument such as its complexity, the market in which the financial instrument is traded or if a financial instrument is subject to sales restrictions that would result in a price less than the quoted market price. Adjustments from the price derived from a valuation model reflect management’s judgment that other participants in the market for the financial instrument would consider the same factors in valuing the financial instrument.
Management makes assumptions about risk, uncertainties and market conditions in preparing adjustments to prices derived from a valuation model. Results from valuation models and valuation techniques in one period may not be indicative of future period fair value measurements.
Certain financial instruments and other assets trade infrequently and therefore have outdated market prices. As a result, we may use alternative valuation models as methods for determining fair value of these assets. When using alternative valuation techniques or valuation models, the following techniques are applied to different financial instrument classes:
●Non-agency mortgage-backed and other asset-backed securities are valued by benchmarking to yields from market prices for comparable securities and calibrated based on expected cash flow characteristics of the underlying assets.
The following is a description of the valuation methodologies used for instruments measured at fair value on a recurring basis and recognized in the accompanying statement of financial condition, as well as the general classification of such instruments pursuant to the valuation hierarchy.
Loans measured at fair value. The fair value of loans for which the fair value option has been elected is calculated based on the present value of expected future discounted cash flows using market interest rates currently being offered for loans with similar terms to borrowers with comparable credit risk. Due to lack of observable market data, these loans are classified as Level 3.
Securities Owned and Securities Sold, Not Yet Purchased Portfolio. Securities classified as Level 1 securities primarily consist of financial instruments whose values are based on quoted market prices in active markets such as corporate equity securities and U.S. government and government agency obligations, primarily U.S. treasury securities.
Securities classified as Level 2 securities include financial instruments that are valued using models or other valuation methodologies. These models are primarily industry standard models that consider various assumptions, including time value, yield curve, volatility factors, current market and contractual prices for the underlying financial instruments, as well as other relevant economic measures. Substantially all of these assumptions are observable in the marketplace, can be derived from observable data or are supported by observable levels at which transactions are executed in the marketplace. Securities in this category include corporate obligations, U.S. government and government agency obligations and municipal obligations.
Securities classified as Level 3 securities are securities whose fair values are estimated based on internally developed models or methodologies, including discounted cash flow, utilizing significant inputs that are generally less readily observable. The models and methodologies considered the quality of the underlying loans, any related secondary market activity and expectations regarding future interest rate movements. Included in this category are certain corporate equity securities, corporate and municipal obligations.
Securities Available for Sale. Because quoted market prices are available in an active market, our deferred compensation plan’s investment in Westwood’s common stock is classified within Level 1 of the valuation hierarchy. Our investments in U.S. government and government agency obligations and municipal obligations held by the Bank as available for sale are valued in a similar manner to our Level 2 securities owned and securities sold, not yet purchased portfolio, noted above.
Interest rate swaps. Interest rate swaps are valued using an income approach incorporating various assumptions, including the term of the swap, the notional amount of the swap, discount rates interpolated based on relevant swap curves, the rate on the fixed leg of the swap and a credit value adjustment for counterparty non-performance. The approach also takes into consideration the potential impact of collateralization and netting agreements. These interest rate swaps are classified as Level 2.
Stock purchase warrants. The warrants held by Hilltop and Oak Hill are valued quarterly using a binomial model. The model considers the following variables: price and volatility of our common stock, treasury yield, annual dividend, and the remaining life of the warrants. The derived volatility estimate considers both the historical and implied forward volatility of our common stock. All else being equal, the warrants will lose time value as they near maturity. Other than remaining life, the primary drivers of value are the price and volatility of our common stock. As the volatility and/or stock price increase, the value of the warrants increase as well. The movement of these two variables will amplify or offset one another depending on the direction and velocity of their movements. These securities are classified as Level 3.
Contingencies
Accounting for contingencies requires the use of judgment and estimates in assessing the magnitude of the exposure and the likely outcome of the situation. In many cases, the outcome will be determined by third parties, which may include governmental or judicial bodies. The provisions made in our consolidated financial statements, as well as the related disclosures, represent management’s best estimates of the current status of such matters and their potential outcome based on a review of the facts and, when warranted, in consultation with outside legal counsel. Management evaluates and revises its estimates on a quarterly basis. Adverse legal or arbitration judgments, inability to collect receivables, sudden declines in the fair value of securities held in margin accounts or other actions could result in material changes to the estimates recorded in these financial statements. Resolution of these matters in amounts different from what has been accrued in the consolidated financial statements could materially impact our financial position and results of operations.
Long-Lived Assets and Goodwill
Our long-lived assets are subject to impairment testing if specific events warrant the review. We test goodwill for impairment at least annually. The impairment test is based on determining the fair value of the specified reporting units. Judgment is required in assessing the effects of external factors, including market conditions, and projecting future operating results. These judgments and assumptions could materially change the value of the specified reporting units and, therefore, could materially impact our consolidated financial statements. If actual external conditions and future operating results differ from management’s judgments, impairment charges may be necessary to reduce the carrying value of these assets to the appropriate fair value. See additional discussion in Note 1(k) in the Notes to the Consolidated Financial Statements for the fiscal years ended June 30, 2014, June 30, 2013 and June 29, 2012 included under Item 8. “Financial Statements and Supplementary Data”.
Allowance for Probable Loan Losses
We provide an allowance for probable loan losses. The allowance for loan losses is established as losses are estimated to have occurred through a provision for loan losses charged to earnings. Loan losses are charged against the allowance when management believes the uncollectability of a loan balance is confirmed. Subsequent recoveries, if any, are credited to the allowance. Should actual losses differ from management’s estimates, our consolidated financial statements could be materially impacted.
The allowance for loan losses is evaluated on a regular basis by management and is based upon management’s periodic review of the collectability of the loans in light of historical experience, the nature and volume of the loan portfolio, adverse situations that may affect the borrower’s ability to repay, estimated value of any underlying collateral and prevailing economic conditions. This evaluation is inherently subjective, as it requires estimates that are susceptible to significant revision as more information becomes available.
The allowance consists of specific and general components. The specific component relates to loans that are classified as doubtful, substandard or special mention. For such loans that are also classified as impaired, an allowance is established when the collateral value (or discounted cash flows or observable market price) of the impaired loan is lower than the carrying value of that loan. The general component covers all loans and is based on historical loss experience adjusted for qualitative factors.
These factors include: concentrations of risk in the portfolio, estimated changes in the value of underlying collateral, and changes in the volume and growth in the portfolio.
Impaired loans are accounted for at the fair value of the collateral. If the loan is collateral dependent, the net present value of expected future cash flows discounted at the loan’s effective interest rate or at the observable market price of the loan.
A loan is considered impaired when, based on current information and events, it is probable that the Bank will be unable to collect the scheduled payments of principal or interest when due according to the contractual terms of the loan agreement. Factors considered by management in determining impairment include payment status, collateral value, and the probability of collecting scheduled principal and interest payments when due. Loans that experience insignificant payment delays and payment shortfalls generally are not classified as impaired. Management determines the significance of payment delays and payment shortfalls on a case-by-case basis, taking into consideration all of the circumstances surrounding the loan and the borrower, including the length of the delay, the reasons for the delay, the borrower’s prior payment record, and the amount of the shortfall in relation to the principal and interest owed.
Income Tax Accrual and Allowance for Deferred Tax Assets
We operate in multiple taxing jurisdictions, and as a result, accruals for tax contingencies require us to make estimates and judgments with respect to the ultimate tax liability in any given fiscal year. Actual results could vary from these estimates. Changes in tax laws, new tax rulings, or results of tax audits could cause management’s estimates to change. In our opinion, adequate provisions for income taxes have been made for all fiscal years.
We record net deferred tax assets to the extent management believes these assets are more likely than not to be realized. In making such determination, management considers all available positive and negative evidence, including: expected future reversals of deferred tax assets and liabilities, projected future taxable income, cumulative losses in recent years and tax planning strategies and recent financial operations. A valuation allowance is established against deferred tax assets when management determines that these deferred assets are more likely to not be realized. In the event management subsequently determines that we would be able to realize deferred income tax assets in excess of their net recorded amount, we would reduce the valuation allowance, which would reduce the provision for income taxes.
RECENT Accounting Pronouncements
See Note 1(y) in the Notes to the Consolidated Financial Statements for the fiscal years ended June 30, 2014, June 30, 2013 and June 29, 2012 included under Item 8. “Financial Statements and Supplementary Data” for information regarding the effect of new accounting pronouncements on our consolidated financial statements.
ITEM 7A. QUANTITATIVE AND QUALITATIVE DISCLOSURES ABOUT MARKET RISK
The information required by this item is incorporated herein by reference to Item 7. “Management’s Discussion and Analysis of Financial Condition and Results of Operations-Market Risk."
ITEM 8. FINANCIAL STATEMENTS AND SUPPLEMENTARY DATA
The company’s consolidated financial statements and supplementary data are included in pages F-2 through F-59 of this Annual Report on Form 10-K. See accompanying Item 15. “Exhibits and Financial Statement Schedules" and “Index to the Financial Statements” on page F-1.
UNAUDITED QUARTERLY FINANCIAL INFORMATION
(In thousands, except per share amounts)
| | | | | | | | |
| | 2014 |
| | 1st Qtr. | | 2nd Qtr. | | 3rd Qtr. | | 4th Qtr. |
Revenues | | $ 80,043 | | $ 79,935 | | $ 77,488 | | $ 73,822 |
Net income (loss) | | 323 | | 1,660 | | (8,757) | | (304) |
Comprehensive (loss) income | | (434) | | (1,640) | | (6,697) | | 2,508 |
Earnings (loss) per share – basic | | $ 0.01 | | $ 0.05 | | $ (0.27) | | $ (0.01) |
Earnings (loss) per share – diluted | | $ 0.01 | | $ 0.05 | | $ (0.27) | | $ (0.01) |
Cash dividend declared per common share | | $ - | | $ - | | $ - | | $ - |
Stock price range | | | | | | | | |
High | | $ 6.28 | | $ 6.59 | | $ 8.29 | | $ 8.06 |
Low | | $ 5.19 | | $ 5.31 | | $ 6.01 | | $ 6.95 |
| | | | | | | | |
| | 2013 |
| | 1st Qtr. | | 2nd Qtr. | | 3rd Qtr. | | 4th Qtr. |
Revenues | | $ 86,424 | | $ 85,057 | | $ 78,055 | | $ 68,578 |
Net (loss) income | | (5,644) | | 10,369 | | (5,718) | | (32,452) |
Comprehensive (loss) income | | (3,346) | | 7,536 | | (6,443) | | (39,271) |
(Loss) earnings per share – basic | | $ (0.17) | | $ 0.32 | | $ (0.17) | | $ (0.99) |
(Loss) earnings per share – diluted | | $ (0.17) | | $ 0.09 | | $ (0.17) | | $ (0.99) |
Cash dividend declared per common share | | $ - | | $ - | | $ - | | $ - |
Stock price range | | | | | | | | |
High | | $ 6.58 | | $ 6.33 | | $ 6.82 | | $ 6.29 |
Low | | $ 5.23 | | $ 4.02 | | $ 5.32 | | $ 5.30 |
ITEM 9. CHANGES IN AND DISAGREEMENTS WITH ACCOUNTANTS
ON ACCOUNTING AND FINANCIAL DISCLOSURE
None.
ITEM 9A. CONTROLS AND PROCEDURES
Evaluation of Disclosure Controls and Procedures.
Our management, including the principal executive officer and principal financial officer, has evaluated the effectiveness of the design and operation of our disclosure controls and procedures (as defined in Rule 13a-15(e) and Rule 15d-15(e) under the Exchange Act) as of June 30, 2014. Based on such evaluation, our management, including the principal executive officer and principal financial officer, has concluded that as of June 30, 2014, our disclosure controls and procedures were effective for the purpose of ensuring that information required to be disclosed by us in the reports that we file or submit under the Exchange Act is recorded, processed, summarized and reported, within the periods specified in the SEC’s rules and forms.
Changes in Internal Control Over Financial Reporting.
The Company completed a transition to the new 2013 Committee of Sponsoring Organization of the Treadway Commission (“COSO”) framework during the fourth quarter of 2014. This was completed by performing an assessment of our internal control over financial reporting and reviewing compliance with the 17 principles outlined by the 2013 COSO framework. Compliance with the 2013 COSO framework was obtained through enhancing our control documentation as all of the procedures
that were added to our controls’ documentation were procedures already in place at the Company and have been and continue to be part of our day-to-day operations.
Other than the foregoing changes, there have not been any changes in our internal control over financial reporting (as defined in Rule 13a-15(f) and 15d-15(f) under the Exchange Act) during the quarter ended June 30, 2014 that have materially affected or are reasonably likely to materially affect our internal control over financial reporting.
Management’s Report on Internal Control Over Financial Reporting.
Our management is responsible for establishing and maintaining adequate internal control over financial reporting as defined by Rule 13a-15(f) and Rule 15d-15(f) under the Exchange Act. Our internal control over financial reporting is designed to provide reasonable assurance regarding the reliability of financial reporting and the preparation of financial statements for external purposes in accordance with GAAP. Because of its inherent limitations, internal control over financial reporting may not prevent or detect misstatements. Also, projections of any evaluation of effectiveness to future periods are subject to the risk that controls may become inadequate because of changes in conditions, or that the degree of compliance with the policies or procedures may deteriorate.
Our management assessed the effectiveness of our internal control over financial reporting as of June 30, 2014. In making this assessment, we used the criteria set forth by COSO in its 2013 Internal Control-Integrated Framework. A control system, no matter how well conceived, implemented and operated, can provide only reasonable, not absolute, assurance that the objectives of the internal control system are met. Because of such inherent limitations, no evaluation of controls can provide absolute assurance that all control issues, if any, within a company have been detected. Based on our assessment and those criteria, our management concluded that our internal control over financial reporting was effective as of June 30, 2014.
Our independent registered public accounting firm has audited the effectiveness of our internal control over financial reporting as of June 30, 2014 as stated in their report, dated September 5, 2014, which appears herein.
ITEM 9B. OTHER INFORMATION
The table set forth below presents the amount awarded under our cash bonus plan for fiscal 2014 and the amount of common stock awarded under the 2012 Restricted Stock Plan to each of our named executive officers. Our BOD approved the awards on August 20, 2014.
| | | | | |
| | Amount | | Restricted Stock Plan |
| | paid under | | Dollar | Number of |
| | the cash | | Value | Shares to be |
Name and Position | | bonus plan | | ($) | Granted (1) |
James H. Ross | | | | | |
President and Chief | | | | | |
Executive Officer | | $ 225,000 | | $ 300,000 | 41,152 |
J. Michael Edge | | | | | |
Executive Vice President, Interim Chief | | | | | |
Financial Officer and Treasurer | | $ 67,500 | | $ 75,000 | 10,288 |
Daniel R. Leland | | | | | |
Executive Vice President | | $ 230,000 | | $ 120,000 | 16,461 |
Richard H. Litton | | | | | |
Executive Vice President | | $ 407,322 | | $ 385,983 | 52,947 |
Robert A. Chereck | | | | | |
Executive Chairman and President | | | | | |
of Southwest Securities, FSB | | $ 140,175 | | $ - | - |
____________________
(1) These values are based on the last reported sales price of our common stock on the NYSE on August 20, 2014, which was $7.29 per share.
PART III
ITEM 10. DIRECTORS, EXECUTIVE OFFICERS AND CORPORATE GOVERNANCE
Certain information required to be disclosed in Item 10 of this report will be included in an amendment to this report which will be filed not later than 120 days after the end of the fiscal year covered by this report.
ITEM 11. EXECUTIVE COMPENSATION
Certain information required to be disclosed in Item 11 of this report will be included in an amendment to this report which will be filed not later than 120 days after the end of the fiscal year covered by this report.
ITEM 12. SECURITY OWNERSHIP OF CERTAIN BENEFICIAL OWNERS AND MANAGEMENT
AND RELATED STOCKHOLDER MATTERS
Certain information required to be disclosed in Item 12 of this report will be included in an amendment to this report which will be filed not later than 120 days after the end of the fiscal year covered by this report.
ITEM 13. CERTAIN RELATIONSHIPS AND RELATED TRANSACTIONS, AND DIRECTOR INDEPENDENCE
Certain information required to be disclosed in Item 13 of this report will be included in an amendment to this report which will be filed not later than 120 days after the end of the fiscal year covered by this report.
ITEM 14. PRINCIPAL ACCOUNTANT FEES AND SERVICES
Certain information required to be disclosed in Item 14 of this report will be included in an amendment to this report which will be filed not later than 120 days after the end of the fiscal year covered by this report.
PART IV
ITEM 15. EXHIBITS AND FINANCIAL STATEMENT SCHEDULES
(a)List of documents filed as a part of this report:
1.The financial statements required to be filed with this report are listed in the index appearing on page F-1 of this report.
2.The following consolidated financial statement schedules of the Registrant and its subsidiaries, and the Reports of Independent Registered Public Accounting Firm thereon, are attached hereto:
| |
| |
| |
Exhibit Number | |
S-1 | Schedule I – Condensed Financial Information of Registrant |
All other schedules for which provision is made in the applicable accounting regulations of the SEC are not required under the related instructions or are inapplicable, and therefore have been omitted.
3.The following exhibits of the Registrant and its subsidiaries are attached hereto as required by Item 15(b):
| | |
| | |
| Exhibit Number | |
| 2.1 | Agreement and Plan of Merger by and among SWS Group, Inc., Hilltop Holdings Inc. and Peruna LLC, dated as of March 31, 2014 incorporated by reference to Exhibit 2.1 to the Registrant’s Current Report on Form 8-K filed April 3, 2014 |
| 3.1 | Restated Certificate of Incorporation of the Registrant incorporated by reference to Exhibit 3.1 to the Registrant’s Current Report on Form 8-K filed October 15, 2009 |
| 3.2 | Restated By-laws of the Registrant incorporated by reference to Exhibit 3.2 to the Registrant’s Current Report on Form 8-K filed February 28, 2014 |
| 3.3 | Certificate of Designations of Non-Voting Perpetual Participating Preferred Stock, Series A of SWS Group, Inc. incorporated by reference to Exhibit 3.1 to the Registrant’s Current Report on Form 8-K filed August 1, 2011 |
| 4.1 | Warrant to purchase up to 8,695,652 shares of Common Stock, issued on July 29, 2011 to Hilltop Holdings Inc. incorporated by reference to Exhibit 4.1 to the Registrant’s Current Report on Form 8-K filed August 1, 2011 |
| 4.2 | Warrant to purchase up to 8,419,148 shares of Common Stock, issued on July 29, 2011 to Oak Hill Capital Partners III, L.P. incorporated by reference to Exhibit 4.2 to the Registrant’s Current Report on Form 8-K filed August 1, 2011 |
| 4.3 | Warrant to purchase up to 276,504 shares of Common Stock, issued on July 29, 2011 to Oak Hill Capital Management Partners III, L.P. incorporated by reference to Exhibit 4.3 to the Registrant’s Current Report on Form 8-K filed August 1, 2011 |
| 4.4 | Investor Rights Agreement dated as of July 29, 2011 among SWS Group, Inc., Hilltop Holdings Inc., Oak Hill Capital Partners III, L.P. and Oak Hill Capital Management Partners III, L.P. incorporated by reference to Exhibit 4.4 to the Registrant’s Current Report on Form 8-K filed August 1, 2011 |
| 10.1+ | SWS Group, Inc. 2003 Restricted Stock Plan incorporated by reference to Appendix B to the Registrant’s Proxy Statement filed October 9, 2003 |
| 10.2+ | Form of SWS Group, Inc. Restricted Stock Plan Agreement for Non-Employee Directors for the 2003 Restricted Stock Plan incorporated by reference to Exhibit 10.8 to the Registrant’s Current Report on Form 8-K filed March 3, 2005 |
| 10.3+ | Form of SWS Group, Inc. Restricted Stock Plan Agreement for Employees for the 2003 Restricted Stock Plan incorporated by reference to Exhibit 10.9 to the registrant’s Current Report on Form 8-K filed March 3, 2005 |
| 10.4+ | SWS Group, Inc. Amended and Restated Deferred Compensation Plan—Effective July 1, 1999 incorporated by reference to Appendix C to the Registrant’s Proxy Statement filed October 9, 2003 |
| 10.5+ | SWS Group, Inc. 2005 Deferred Compensation Plan incorporated by reference to Appendix A to the Registrant’s Proxy Statement filed October 6, 2004 |
| 10.6+ | Form of Plan Agreement for the SWS Group, Inc. 2005 Deferred Compensation Plan incorporated by reference to Exhibit 10.16 to the Registrant’s Current Report on Form 8-K filed November 12, 2004 |
| 10.7+ | Form of Election Form for the SWS Group, Inc. 2005 Deferred Compensation Plan incorporated by reference to Exhibit 10.17 to the Registrant’s Current Report on Form 8-K filed November 12, 2004 |
| 10.8+ | Description of Registrant’s executive cash bonus plan incorporated by reference to Exhibit 10.14 to the Registrant’s Annual Report on Form 10-K filed September 20, 2005 |
| 10.9+ | Description of Registrant’s director compensation arrangement incorporated by reference to Exhibit 10.15 to the Registrant’s Quarterly Report on Form 10-Q filed February 9, 2005 |
| 10.10 | Funding Agreement dated as of March 20, 2011 among SWS Group, Inc. Hilltop Holdings Inc., Oak Hill Capital Partners III, L.P. and Oak Hill Capital Management Partners III, L.P. incorporated by reference to Exhibit 10.1 to the Regristrant's Current Report on Form 8-K filed March 21, 2011 |
| 10.11 | Credit Agreement dated as of July 29, 2011 among SWS Group, Inc., Hilltop Holdings Inc., Oak Hill Capital Partners III, L.P. and Oak Hill Capital Management Partners III, L.P. incorporated by reference to Exhibit 10.1 to the Registrant’s Current Report on Form 8-K filed August 1, 2011 |
| 10.12+ | Form of SWS Group, Inc. Restricted Stock Plan Agreement for Employees for the 2003 Restricted Stock Plan incorporated by reference to Exhibit 10.1 to the Registrant’s Quarterly Report on Form 10-Q filed February 8, 2012 |
| 10.13+ | SWS Group, Inc. 2012 Restricted Stock Plan incorporated by reference to Appendix A to the Registrant’s Proxy Statement filed October 4, 2012 |
| 10.14+ | Form of SWS Group, Inc. Restricted Stock Agreement for Outside Directors for the 2012 Restricted Stock Plan incorporated by reference to Exhibit 4.9 to the Registrant’s Registration Statement on Form S-8 filed November 21, 2012 |
| 10.15+ | Form of SWS Group, Inc. Restricted Stock Agreement for Employees for the 2012 Restricted Stock Plan incorporated by reference to Exhibit 4.10 to the Registrant’s Registration Statement on Form S-8 filed November 21, 2012 |
| 10.16 | Letter Agreement by and among SWS Group, Inc., Oak Hill Capital Partners III, L.P. and Oak Hill Capital Management Partners III, L.P., dated as of March 31, 2014 incorporated by reference to Exhibit 10.1 the Registrant’s Current Report on Form 8-K filed April 3, 2014 |
| 10.17+* | Form of Amended SWS Group, Inc. 2012 Restricted Stock Plan |
| 10.18+* | Form of Amended SWS Group, Inc. Restricted Stock Agreement for Employees for the 2012 Restricted Stock Plan |
| 21.1* | Subsidiaries |
| 23.1* | Consent of Grant Thornton LLP |
| 31.1* | Chief Executive Officer Certification filed pursuant to Section 302 of the Sarbanes-Oxley Act of 2002 |
| 31.2* | Chief Financial Officer Certification filed pursuant to Section 302 of the Sarbanes-Oxley Act of 2002 |
| 32.1# | Chief Executive Officer Certification furnished pursuant to Section 906 of the Sarbanes-Oxley Act of 2002 |
| 32.2# | Chief Financial Officer Certification furnished pursuant to Section 906 of the Sarbanes-Oxley Act of 2002 |
| 101 | The following materials from SWS Group, Inc.’s Annual Report on Form 10-K for the year ended June 30, 2014, formatted in XBRL (Extensible Business Reporting Language): (i) Consolidated Statements of Financial Condition as of June 30, 2014 and June 30, 2013; (ii) Consolidated Statements of Comprehensive Loss for the years ended June 30, 2014, June 30, 2013 and June 29, 2012; (iii) Consolidated Statements of Stockholders' Equity for the years ended June 30, 2014, June 30, 2013 and June 29, 2012; (iv) Consolidated Statements of Cash Flows for the years ended June 30, 2014, June 30, 2013 and June 29, 2012; (v) Notes to Consolidated Financial Statements; and (vi) Schedule I - Condensed Financial Information of Registrant. |
| | |
* Filed herewith
+ Management contract or compensatory plan or arrangement.
# The certification attached as Exhibits 32.1 and 32.2 to this Annual Report on Form 10-K shall not be deemed to be “filed” for purposes of Section 18 of the Securities Exchange Act of 1934 (“the Exchange Act”), or otherwise subject to the liability of that section, and shall not be part of any registration statement or other document filed under the Securities Act of 1933, as amended, or the Exchange Act, except as shall be expressly set forth by specific reference in such filing.
SIGNATURES
Pursuant to the requirements of Section 13 or 15(d) of the Securities Exchange Act of 1934, the Registrant has duly caused this report to be signed on its behalf by the undersigned, thereunto duly authorized.
| | | |
| | | |
September 5, 2014 | | | /S/ James H. Ross |
(Date) | | | (Signature) |
| | | James H. Ross |
| | | Director, President and Chief Executive Officer |
| | | (Principal Executive Officer) |
Pursuant to the requirements of the Securities Exchange Act of 1934, this report has been signed below by the following persons on behalf of the Registrant and in the capacities and on the date indicated.
| | | |
| | | |
September 5, 2014 | | | /S/ Joel T. Williams III |
(Date) | | | (Signature) |
| | | Joel T. Williams III |
| | | Chairman of the Board |
| | | |
September 5, 2014 | | | /S/ James H. Ross |
(Date) | | | (Signature) |
| | | James H. Ross |
| | | Director, President and Chief Executive Officer |
| | | (Principal Executive Officer) |
| | | |
September 5, 2014 | | | /S/ J. Michael Edge |
(Date) | | | (Signature) |
| | | J. Michael Edge |
| | | Chief Financial Officer |
| | | (Principal Financial Officer) |
| | | |
| | | |
September 5, 2014 | | | /S/ Laura Leventhal |
(Date) | | | (Signature) |
| | | Laura Leventhal |
| | | Chief Accounting Officer |
| | | (Principal Accounting Officer) |
| | | |
September 5, 2014 | | | /S/ Robert A. Buchholz |
(Date) | | | (Signature) |
| | | Robert A. Buchholz |
| | | Director |
| | | |
September 5, 2014 | | | /S/ Brodie L. Cobb |
(Date) | | | (Signature) |
| | | Brodie L. Cobb |
| | | Director |
| | | |
September 5, 2014 | | | /S/ J. Taylor Crandall |
(Date) | | | (Signature) |
| | | J. Taylor Crandall |
| | | Director |
| | | |
| | | |
| | | |
September 5, 2014 | | | /S/ Christie S. Flanagan |
(Date) | | | (Signature) |
| | | Christie S. Flanagan |
| | | Director |
| | | |
September 5, 2014 | | | /S/ Gerald J. Ford |
(Date) | | | (Signature) |
| | | Gerald J. Ford |
| | | Director |
| | | |
September 5, 2014 | | | /S/ Larry A. Jobe |
(Date) | | | (Signature) |
| | | Larry A. Jobe |
| | | Director |
| | | |
September 5, 2014 | | | /S/ Tyree B. Miller |
(Date) | | | (Signature) |
| | | Tyree B. Miller |
| | | Director |
| | | |
September 5, 2014 | | | /S/ Mike Moses, Ed.D. |
(Date) | | | (Signature) |
| | | Mike Moses, Ed.D. |
| | | Director |
| | | |
| | | |
SWS Group, Inc. and Subsidiaries
CONSOLIDATED STATEMENTS OF CASH FLOWS
Years ended June 30, 2014, June 30, 2013, and June 29, 2012
(In thousands)
| | | | | | |
| | | | | | |
| | 2014 | | 2013 | | 2012 |
Cash flows from operating activities: | | | | | | |
Net loss | | $ (7,078) | | $ (33,445) | | $ (4,729) |
Adjustments to reconcile net loss to net cash | | | | | | |
provided by (used in) operating activities | | | | | | |
Depreciation and amortization | | 5,394 | | 5,482 | | 5,779 |
Accretion of discount on long-term debt | | 4,667 | | 4,026 | | 3,212 |
Amortization of deferred debt issuance costs | | 492 | | 492 | | 451 |
Increase (decrease) in fair value of warrants | | 3,599 | | (3,613) | | 3,674 |
Amortization of premiums /discounts on loans purchased | | 12 | | (84) | | (90) |
Amortization of premiums /discounts on investment securities | | 2,484 | | 1,985 | | 934 |
Amortization of prepayment penalty on advances from FHLB | | 46 | | 34 | | - |
Provision for doubtful accounts on receivables from customers | | 960 | | 960 | | 480 |
(Recapture) provision of loan loss and write downs on real estate | | | | | | |
owned (“REO”) | | (4,893) | | (6,061) | | 3,776 |
Deferred income tax (benefit) expense | | (4,336) | | (2,596) | | 9,023 |
Allowance for deferred tax asset | | 4,582 | | 29,998 | | 28 |
Deferred compensation for deferred compensation plan and | | | | | | |
restricted stock plans | | (2,055) | | (980) | | 547 |
(Gain) loss on sale of loans | | (558) | | (2,253) | | 9 |
Loss (gain) on fixed assets transactions | | 196 | | 195 | | (1) |
Gain on sale of available for sale investment securities | | (781) | | (3,650) | | (557) |
(Gain) loss on sale of REO and other repossessed assets | | (619) | | 1,007 | | (25) |
Gain on issuer’s redemption of investment securities | | - | | (20) | | - |
Loss (gain) on equity in earnings of unconsolidated ventures | | 835 | | (124) | | (572) |
Dividend received on investments | | (19) | | (16) | | (61) |
Gain (loss) on fair value option of loans | | (860) | | 145 | | - |
Loss (gain) on interest rate swaps | | 1,093 | | (145) | | - |
Shortfall for taxes on vesting restricted stock | | - | | - | | 62 |
Change in operating assets and liabilities: | | | | | | |
Decrease in restricted cash | | 49 | | - | | - |
(Increase) decrease in assets segregated for regulatory purposes | | (25,503) | | 11,562 | | 62,026 |
Net change in broker, dealer and clearing organization accounts | | 86,538 | | (89,176) | | (23,837) |
Net change in client accounts | | 50,746 | | (42,485) | | (66,845) |
(Increase) decrease in securities owned | | (25,992) | | 21,518 | | (9,564) |
(Increase) decrease in securities purchased under agreements to resell | | (20,586) | | (26,810) | | 17,463 |
Decrease (increase) in other assets | | 1,321 | | 6,815 | | (7,043) |
(Decrease) increase in drafts payable | | (1,248) | | 3,919 | | 1,314 |
(Decrease) increase in securities sold, not yet purchased | | (13,380) | | 64,580 | | 1,494 |
(Decrease) increase in other liabilities | | (6,956) | | (5,763) | | 1,552 |
Net cash provided by (used in) operating activities | | 48,150 | | (64,503) | | (1,500) |
(continued) | | | | | | |
| | | | | | |
| | | | | | |
(continued) | | 2014 | | 2013 | | 2012 |
Cash flows from investing activities: | | | | | | |
Purchase of fixed assets and capitalized improvements on REO | | $ (3,541) | | $ (4,257) | | $ (3,842) |
Proceeds from the sale of fixed assets and real estate | | 10,695 | | 31,333 | | 19,559 |
Loan originations and purchases | | (2,290,374) | | (5,566,038) | | (4,043,938) |
Loan repayments | | 2,279,746 | | 5,769,538 | | 4,129,802 |
Purchase of investment securities | | (177,085) | | (312,716) | | (384,730) |
Proceeds from the sale of investment securities | | 68,984 | | 30,352 | | 67,493 |
Proceeds from the issuer’s redemption of investment securities | | 7,500 | | 41,500 | | - |
Cash received on investments | | 54,800 | | 50,650 | | 22,924 |
Proceeds from the sale of loans held for investment | | 6,429 | | 19,782 | | 1,751 |
Proceeds from the sale of FHLB stock | | 638 | | 744 | | 1,143 |
Purchases of FHLB stock | | (45) | | (1,557) | | - |
Proceeds from the maturity of available for sale securities | | 37,635 | | 495 | | - |
Cash paid to unwind/ terminate interest rate swap positions | | (458) | | - | | - |
Investment in unconsolidated subsidiaries | | (300) | | (180) | | - |
Investment of proceeds received from Hilltop Holdings, Inc., Oak | | | | | | |
Hill Capital Partners III, L.P. and Oak Hill Capital Management | | | | | | |
Partners III, L.P. in restricted fund | | - | | - | | (30,000) |
Net cash (used in) provided by investing activities | | (5,376) | | 59,646 | | (219,838) |
| | | | | | |
Cash flows from financing activities: | | | | | | |
Payments on short-term borrowings | | (2,296,403) | | (2,251,350) | | (2,534,350) |
Cash proceeds from short-term borrowings | | 2,253,903 | | 2,315,350 | | 2,491,850 |
Increase (decrease) in deposits | | 6,420 | | (68,514) | | (44,238) |
Advances from the FHLB | | 5,540 | | 50,009 | | - |
Payments on advances from the FHLB | | (26,020) | | (20,953) | | (26,071) |
Fee payment for FHLB restructuring | | - | | (166) | | - |
Shortfall for taxes on vesting of restricted stock | | - | | - | | (62) |
Cash proceeds on securities sold under agreements to repurchase | | 2,331 | | 9,546 | | 17,152 |
Cash proceeds received from Hilltop Holdings, Inc., Oak Hill Capital | | | | | | |
Partners III, L.P and Oak Hill Capital Management Partners III, L.P. | | - | | - | | 100,000 |
Proceeds related to deferred compensation plan | | 317 | | 276 | | 309 |
Purchase of treasury stock related to deferred compensation plan | | (288) | | (121) | | (329) |
Net cash (used in) provided by financing activities | | (54,200) | | 34,077 | | 4,261 |
| | | | | | |
Net (decrease) increase in cash and cash equivalents | | (11,426) | | 29,220 | | (217,077) |
Cash and cash equivalents at beginning of period | | 111,046 | | 81,826 | | 298,903 |
Cash and cash equivalents at end of period | | $ 99,620 | | $ 111,046 | | $ 81,826 |
| | | | | | |
Supplemental schedule of non-cash investing and financing activities: | | | | | | |
Grants of restricted stock | | $ 2,071 | | $ 676 | | $ 3,628 |
Foreclosures on loans | | $ 5,192 | | $ 11,688 | | $ 28,359 |
Investments sold not settled | | $ 23,723 | | $ - | | $ - |
Investments purchased not settled | | $ - | | $ 7,120 | | $ - |
| | | | | | |
Supplemental disclosure of cash flow information: | | | | | | |
Cash paid during the year for: | | | | | | |
Interest | | $ 40,012 | | $ 42,479 | | $ 69,079 |
Income taxes | | $ - | | $ - | | $ - |
See accompanying Notes to Consolidated Financial Statements.
NOTES TO THE CONSOLIDATED FINANCIAL STATEMENTS
1.SIGNIFICANT ACCOUNTING POLICIES
(a) General and Basis of Presentation
The consolidated financial statements include the accounts of SWS Group, Inc. (“SWS Group”) and its consolidated subsidiaries listed below (collectively with SWS Group, “SWS” or the “Company”). All significant intercompany balances and transactions are eliminated upon consolidation. Each of the subsidiaries listed below are 100% owned.
| |
Southwest Securities, Inc. | "Southwest Securities" |
SWS Financial Services, Inc. | "SWS Financial" |
Southwest Financial Insurance Agency, Inc. | |
Southwest Insurance Agency, Inc. | collectively, “SWS Insurance” |
SWS Banc Holding, Inc. | "SWS Banc" |
Southwest Securities, FSB | "Bank" |
FSB Development, LLC | “FSB Development” |
Southwest Capital Corporation | “SWS Capital” |
Southwest Investment Advisors, Inc. | “Southwest Advisors” |
| |
Southwest Securities is a New York Stock Exchange ("NYSE") member clearing broker/dealer. Southwest Securities and SWS Financial are members of the Financial Industry Regulatory Authority (“FINRA”). Southwest Securities and SWS Financial are also registered with the Securities and Exchange Commission (the "SEC") as broker/dealers under the Securities Exchange Act of 1934, as amended ("Exchange Act"), and as registered investment advisers under the Investment Advisers Act of 1940, as amended.
SWS Insurance holds insurance agency licenses in 43 states for the purpose of facilitating the sale of insurance and annuities for Southwest Securities and its correspondents. The Company retains no underwriting risk related to the insurance and annuity products that SWS Insurance sells.
The Bank is a federally chartered savings bank regulated by the Office of the Comptroller of the Currency ("OCC"). The Board of Governors of the Federal Reserve System (“FRB”) supervises and regulates SWS Group and SWS Banc. SWS Banc is a wholly-owned subsidiary of SWS Group and became the sole shareholder of the Bank in 2004.
FSB Development was formed to develop single-family residential lots. For all periods reported, herein, it had no investments.
SWS Capital and Southwest Advisors are dormant entities.
Out of Period Adjustment. During the fiscal year ended June 30, 2014, the Company recorded out-of-period adjustments that affected the consolidated results of operations for the year ended June 30, 2014. The out-of-period adjustments related primarily to the incorrect recording of incentive compensation and an overpayment of federal income taxes. The impact of these adjustments resulted in a decrease of $949,000 and $1,524,000 to loss before income tax expense and net loss, respectively for the year ended June 30, 2014. The impact of correcting these errors in the prior periods would have resulted in a decrease of $949,000 and $1,674,000 to loss before income tax expense and net loss, respectively, for the year ended June 30, 2013. Management evaluated the effect of the adjustments on the Company’s financial statements under the provisions of the SEC’s Staff Accounting Bulletins No. 108 and No. 99 and concluded that they were immaterial to the current year and prior years’ financial statements.
Change in Fiscal Year End and Consolidated Financial Statements. On May 23, 2013, the Board of Directors of the Company, acting on the recommendation of the Federal Reserve Bank of Dallas, approved a change to the Company’s fiscal year end from the last Friday of June to June 30th. This change was effective for the Company’s fiscal year ended June 30, 2013.
Prior to fiscal year ended June 30, 2013, the annual consolidated financial statements of SWS were prepared as of the last Friday of the month, and the Bank’s annual financial statements were prepared as of June 30. Any individually material transactions were reviewed and recorded in the appropriate fiscal year.
Merger Agreement. On March 31, 2014, the Company entered into an Agreement and Plan of Merger (“Merger Agreement”) with Hilltop Holdings, Inc. (“Hilltop”) and Peruna LLC, a wholly-owned subsidiary of Hilltop (“Peruna”), whereby if the merger contemplated therein is completed, the Company will become a wholly-owned subsidiary of Hilltop. If the merger is completed, each share of SWS Group common stock will be converted into the right to receive $1.94 in cash and 0.2496 of a share of Hilltop common stock. The value of the merger consideration may fluctuate based upon the market value of Hilltop common stock. It is currently anticipated that the completion of the merger will occur by the end of 2014 subject to the receipt of SWS Group stockholders and regulators approval and other customary closing conditions.
During fiscal 2014, the Company incurred expenses of approximately $3,787,000 in legal and professional fees recorded in other expenses on the Consolidated Statements of Comprehensive Loss in connection with the proposed merger with Hilltop. Additional costs are expected to be incurred until the merger is completed.
Regulatory. The final provisions of the Volcker Rule of the Dodd-Frank Wall Street Reform and Consumer Protection Act (the “Dodd-Frank Act”) were issued December 10, 2013, with an effective date of April 1, 2014 and a compliance date of July 21, 2015. The Volcker Rule provisions of the Dodd-Frank Act require the federal financial regulatory agencies to adopt rules that prohibit banks, bank holding companies, and their affiliates from engaging in proprietary trading and investing in and sponsoring certain unregistered investment companies (including hedge funds and private equity funds), subject to certain exceptions. The Company’s securities trading and investment activities at the holding company, the broker/dealer and the Bank are subject to these final provisions. The final rules are highly complex, and many aspects of their application remain uncertain.
Based on management’s interpretation of the final provisions of the rule, the Bank’s equity method investments would be excluded from the definition of a “covered” fund as these investments would meet the definition of “public welfare investment” funds, “designed primarily to promote the public welfare.” Currently, the Bank invests in these funds as a cost effective way of meeting its obligations under the Community Reinvestment Act of 1977 (“CRA”). One of these investments also meets the definition of a small business investment company. SWS Group’s equity method investment in a venture capital fund would also be excluded from the definition of a “covered” fund as this investment meets the definition of a small business investment company. In addition, at June 30, 2014, the Bank’s investment portfolio does not contain other securities subject to the Volcker Rule such as collateralized loan obligations (CLO’s) or non-agency collateralized mortgage obligations (CMO’s). The Bank’s held to maturity and available for sale investments are all exempt from the Volcker Rule as these securities are investments in U.S. government, agency and municipal obligations, which are permitted under the provisions of the Volcker Rule.
Provisions of the Volcker Rule and the final rules implementing the Volcker Rule restrict certain activities provided by Southwest Securities, including proprietary trading. For purposes of the Volcker Rule, purchases or sales of financial instruments such as securities, derivatives, contracts of sale of commodities for future delivery or options on the foregoing for the purpose of short-term gain are deemed to be proprietary trading (with financial instruments held for less than 60 days presumed to be for proprietary trading unless an alternative purpose can be demonstrated), unless certain exemptions apply. Exempted activities include, among others, the following: 1) underwriting; 2) market making; 3) risk mitigating hedging; 4) trading in certain government securities; 5) employee compensation plans and 6) transactions entered into on behalf of and for the account of clients as agent, broker, custodian or in a trustee or fiduciary capacity. While management continues to assess compliance with the Volcker Rule, we have reviewed our processes and procedures in regard to proprietary trading and we believe we are currently complying with the provisions of the Volcker Rule regarding proprietary trading. However, it remains uncertain how the scope of applicable restrictions and exceptions will be interpreted and administered. Absent further regulatory guidance, we are required to make certain assumptions as to the degree to which our activities, processes and procedures in these areas comply with the requirements of the Volcker Rule. If these assumptions are not accurate or if our implementation is not consistent with regulatory expectations, we may be required to make certain changes to our business activities, processes or procedures, which could further increase our compliance and regulatory risks and costs. The Volcker Rule requires and management believes the Company will have an active compliance program for proprietary trading by July 2015.
Discontinued operations. Effective June 30, 2013, the Company made the strategic decision to exit its corporate finance business. Included in loss before income tax expense (benefit) and net loss on the Consolidated Statements of Comprehensive Loss is (loss) income before income tax expense (benefit) and net (loss) income from the Company’s corporate finance business for fiscal years 2013 and 2012 (in thousands):
| | | |
| | | |
| 2013 | | 2012 |
(Loss) income before income tax expense (benefit) | $ (431) | | $ 174 |
Net (loss) income | (280) | | 113 |
| | | |
(b) Use of Estimates
The preparation of consolidated financial statements in conformity with accounting principles generally accepted in the United States of America (“GAAP”) requires management to make estimates and assumptions that affect the reported amounts of assets and liabilities and disclosure of contingent assets and liabilities at the date of the consolidated financial statements and the reported amounts of revenues and expenses during the reporting period. Actual results could differ from those estimates.
(c) Cash and Cash Equivalents
For the purposes of the Consolidated Statements of Cash Flows, SWS considers cash to include cash on hand and in bank accounts. In addition, SWS considers funds due from banks and interest bearing deposits in other banks to be cash. Highly liquid debt instruments purchased with maturities of three months or less, when acquired, are considered to be cash equivalents. The Federal Deposit Insurance Corporation (“FDIC”) insures deposit accounts up to $250,000. At June 30, 2014 and June 30, 2013, cash balances included $81,378,000 and $37,833,000 of cash, respectively, that was not federally insured because the amounts exceeded federal insurance limits. This at-risk amount is subject to fluctuation on a daily basis, but management does not believe there is significant risk on these deposits.
The Bank is required to maintain reserve balances on hand or with the Federal Reserve Bank of Dallas. At June 30, 2014 and 2013, these reserve balances amounted to $1,612,000 and $1,649,000, respectively.
(d) Restricted Cash and Cash Equivalents
Restricted cash and cash equivalents represents funds received from Hilltop and Oak Hill Capital Partners III, L.P. (“OHCP”) and Oak Hill Capital Management Partners III, L.P. (collectively with OHCP, “Oak Hill”) upon completion of the $100,000,000, five year, unsecured credit agreement from Hilltop and Oak Hill (the “Credit Agreement”) that was entered into on July 29, 2011. The Company is required to keep these funds in a restricted account until the Company’s Board of Directors, Hilltop and Oak Hill determine the amount(s) to be distributed to the Company’s subsidiaries. See additional discussion in, Note 16, Debt Issued with Stock Purchase Warrants. Upon approval of the Board of Directors, Hilltop and Oak Hill, SWS Group contributed $20,000,000 of this cash in the second quarter of fiscal 2012 to the Bank as capital, loaned Southwest Securities $20,000,000 in the third quarter of fiscal 2012 to use in general operations by reducing Southwest Securities’ use of short-term borrowings for the financing of its day-to-day cash management needs, reduced its intercompany payable to Southwest Securities by $20,000,000 and contributed $10,000,000 in capital to Southwest Securities in the fourth quarter of fiscal 2012. On March 28, 2013, the $20,000,000 loan from SWS Group to Southwest Securities was repaid and the Company’s Board of Directors, Hilltop and Oak Hill approved a $20,000,000 capital contribution to Southwest Securities. The remaining $30,000,000 was loaned to Southwest Securities to use in general operations and to reduce its use of short-term borrowings to finance its day-to-day cash management needs in the third quarter of fiscal 2014. Restricted cash and cash equivalents are excluded from cash and cash equivalents in the Consolidated Statements of Financial Condition and Consolidated Statements of Cash Flows. The Company holds restricted cash and cash equivalents in money market funds.
(e) Securities Transactions
Proprietary securities transactions are recorded on a trade date basis, as if they had settled. Clients’ securities and commodities transactions are reported on a settlement date basis with the related commission income and expenses reported on a trade date basis.
(f) Securities Lending Activities
Securities borrowed and securities loaned transactions are generally reported as collateralized financings except where letters of credit or other securities are used as collateral. Securities borrowed transactions require the Company to deposit cash, letters of credit, or other collateral with the lender. With respect to securities loaned, the Company receives collateral in the form of cash in an amount generally in excess of the fair value of securities loaned. The Company monitors the fair value of securities borrowed and loaned on a daily basis, with additional collateral obtained or refunded as necessary. Securities borrowed and securities loaned transactions are recorded at the amount of cash collateral advanced or received adjusted for additional collateral obtained or received. Interest on such transactions is accrued and included in the Consolidated Statements of Financial Condition in receivables from and payables to brokers, dealers and clearing organizations.
(g) Loans and Allowance for Loan Losses
Loans that management has the intent and ability to hold for the foreseeable future or until maturity or pay-off are reported at their outstanding principal balance adjusted for any charge-offs, the allowance for probable loan losses, and any deferred fees or costs on originated loans and unamortized premiums or discounts on purchased loans. Interest income is accrued on the unpaid principal balance.
Loan origination and commitment fees and certain related direct costs are deferred and amortized to interest income, generally over the contractual lives of the loans, using the interest method. Discounts on first mortgage, consumer and other loans are amortized to income using the interest method over the remaining period to contractual maturity.
The accrual of interest on impaired loans is discontinued when, in management’s opinion, the borrower may be unable to meet payments as they become due. When interest accrual is discontinued, all unpaid accrued interest is reversed. Interest income is subsequently recognized to the extent cash payments are received for loans where ultimate full collection is likely. For loans where ultimate collection is not likely, interest payments are applied to the outstanding principal and income is only recognized if full payment is made. Loans are returned to accrual status when all the principal and interest amounts contractually due are brought current and future payments are reasonably assured.
Purchased Mortgage Loans Held for Investment. Loan participations in the Bank’s mortgage purchase program are acquired from various mortgage companies and valued at amortized cost. These loans are pre-sold by the mortgage company to secondary investors who have been approved by the Bank. The purchased mortgage loans held for investment are held on average for 25 days or less.
Loans Measured at Fair Value. As permitted by Accounting Standards Codification (“ASC") 825, “Financial Instruments,” the Bank has elected to measure certain loans at fair value. Management has elected the fair value option for these items to offset the corresponding change in fair value of the related interest rate swap agreements. The change in fair value is recorded in other revenue on the Consolidated Statements of Comprehensive Loss. For additional discussion regarding these loans and the related interest rate swaps, see Note 5, Loans and Allowance for Probable Loan Losses and Note 11, Interest Rate Swaps.
Allowance for Loan Losses. The allowance for loan losses is maintained to absorb management’s estimate of probable loan losses inherent in the Bank’s loan portfolio at each reporting date. The allowance for loan losses is established as losses are estimated to have occurred through a provision for loan losses charged to earnings. Loan losses are charged against the allowance when management confirms the uncollectibility of the principal loan balance. Subsequent recoveries, if any, are recorded through the allowance. The determination of an adequate allowance is inherently subjective, as it requires estimates that are susceptible to significant revision as additional information becomes available or circumstances change.
The allowance for loan losses is evaluated on a regular basis by management and is based upon management’s periodic review of the collectibility of the loans in light of historical experience, the nature and volume of the loan portfolio, adverse situations that may affect the borrower’s ability to repay, estimated value of any underlying collateral and prevailing economic conditions. The allowance for loan losses consists of a specific and a general allowance component.
The specific allowance component provides for estimated probable losses for loans identified as impaired. A loan is considered impaired when, based on current information and events, it is probable that the Bank will be unable to collect all amounts of principal and interest when due according to the contractual terms of the loan agreement. Management considers the borrower’s financial condition, payment status, historical payment record, and any adverse situations affecting the borrower’s ability to repay when evaluating whether a loan is deemed impaired. Loans that experience insignificant payment delays and shortfalls generally are not classified as impaired. Management determines the significance of payment delays and shortfalls on a case-by-case basis taking into consideration all circumstances surrounding the loan and the borrower, including the length of delay, the reasons for the delay, the borrower’s prior payment record, and the amount of shortfall in relation to the principal and interest outstanding.
A specific reserve is recorded when and to the extent the recorded value of the loan is greater than (1) the present value of expected future cash flows discounted at the loan’s original effective rate, (2) fair value of collateral if the loan is collateral-dependent or (3) observable market price of the impaired loan. If the fair value of collateral is used to measure impairment of a collateral-dependent loan and repayment is dependent on the sale of the collateral, the fair value is adjusted to incorporate estimated costs to sell the collateral. Impaired loans that are collateral-dependent are primarily measured for impairment using the fair value of the collateral as determined by third party appraisals using the income approach, recent comparable sales data, or a combination thereof. In certain instances it is necessary for management to adjust the appraised value, less estimated costs to sell the collateral, to reflect changes in fair value occurring subsequent to the appraisal date. Management considers a guarantor’s capacity and willingness to perform, when appropriate, and the borrower’s resources available for repayment when measuring impairment.
The general allowance provides for estimated and probable losses inherent in the remainder of the Bank’s loan portfolio. The general allowance is determined through a statistical calculation based on the Bank's historical loss experience adjusted for certain qualitative factors as deemed appropriate by management. The statistical calculation is conducted on a disaggregated basis for groups of homogeneous loans with similar risk characteristics (product types). The historical loss element is calculated as the average ratio of charge-offs, net of recoveries, to the average recorded investment for the current and previous seven quarters. Management may adjust the historical loss rates to reflect increased credit risk not captured in the historical loss, additional risk of loss associated with the total loan portfolio or other circumstances, such as deterioration in the real estate market, current market environment for commercial loans, credit quality, significant concentrations of product types and trends in portfolio volume. In addition, prevailing economic conditions and specific industry trends are taken into consideration when establishing the adjustments to historical loss rates.
For additional discussion regarding the calculation of the Company’s allowance for probable loan losses see Note 5, Loans and Allowance for Probable Loan Losses.
(h) Securities Owned
Marketable securities are carried at fair value. The increase or decrease in net unrealized appreciation or depreciation of securities owned is credited or charged to operations and is included in net gains on principal transactions in the Consolidated Statements of Comprehensive Loss. SWS records the fair value of securities owned on a trade date basis. See Note 1(x) and Note 26, Fair Value of Financial Instruments.
(i) Securities Held to Maturity
Bonds and notes for which the Company has the intent and ability to hold to maturity are reported at cost, adjusted for premiums and discounts that are recognized in interest income using the interest method over the period to maturity.
(j) Securities Purchased Under Agreements to Resell and Securities Sold Under Agreements to Repurchase
Transactions involving purchases of securities under agreements to resell (reverse repurchase agreements or reverse repos) or sales of securities under agreements to repurchase (repurchase agreements or repos) are accounted for as collateralized financings except where the Company does not have an agreement to sell (or purchase) the same or substantially the same securities before maturity at a fixed or determinable price. It is the policy of the Company to obtain possession of collateral with a fair value equal to or in excess of the principal amount loaned under resale agreements. Collateral is valued daily, and the Company may require counterparties to deposit additional collateral or return collateral pledged when appropriate. Interest payable on these amounts is included in the Consolidated Statements of Financial Condition in other liabilities.
(k) Goodwill
Goodwill is the excess of the aggregate purchase price over the estimated fair value of the net assets acquired in a business combination at the date of acquisition. Goodwill is not amortized, however, the Company assesses goodwill for impairment on an annual basis, at year-end, and whenever events or circumstances change that would make it more likely than not that an impairment may have occurred. Goodwill impairment is evaluated at the reporting unit level. SWS has two reporting units with goodwill: Clearing with $4,254,000 and Institutional Brokerage with $3,298,000, both of which are part of Southwest Securities.
The Company assessed the fair value of its goodwill for fiscal 2014 based on the concepts outlined in Accounting Standards Update (“ASU”) 2011-08. Based on the results of its assessment, SWS’s goodwill balance was not impaired as the fair value of each reporting unit exceeded its carrying value. The fair value of the business units with goodwill were determined by using a weighted average of a discounted cash flow model estimate of fair value and a market multiple approach to fair value.
There were no changes in the carrying value of goodwill during the fiscal years ended June 30, 2014, June 30, 2013 and June 29, 2012.
(l) Investments
Limited partnership investments are accounted for under the equity method of accounting in accordance with ASC 323, “Investments-Equity Method and Joint Ventures.”
(m) Interest Rate Swaps in Cash Flow Hedging Relationships
The Bank recognizes interest rate swaps as either assets or liabilities in the Consolidated Statements of Financial Condition. A portion of the Bank’s investment in interest rate swaps are derivatives designated in cash flow hedging relationships. The Bank has formally documented the following in regard to these hedging relationships: (i) its risk management objective; (ii) the strategy used for undertaking the hedge; (iii) the hedging instrument; (iv) the hedged transaction; (iv) the nature of the risk being hedged; (v) how the hedging instrument’s effectiveness in offsetting the hedged risk will be assessed prospectively and retrospectively; (vi) a description of the method used to measure ineffectiveness and (vii) a description of the method used for sale, extinguishments or termination of hedging instruments. The Bank has also formally assessed, both at the inception of the hedging relationship and on an ongoing basis, whether the derivatives that are used in the cash flow hedging relationships are highly effective in offsetting changes in cash flows of hedged transactions. See additional discussion in Note 11, Interest Rate Swaps.
(n) Real Estate Owned (“REO”) and Other Repossessed Assets
REO and other repossessed assets, which include transportation vehicles, are valued at the lower of cost or market, less a selling discount and are included in other assets in the Consolidated Statements of Financial Condition. For those investments where the REO is valued at market, the value is determined by third party appraisals or if the REO is subject to a sales contract, by the accepted sales amount. In addition, under certain circumstances, the Bank adjusts appraised values to more accurately reflect the economic conditions of the area at the time of valuation or to reflect changes in market value occurring subsequent to the appraisal date. The amount of subsequent REO write-downs required to reflect current fair value was $468,000, $1,657,000, and $1,175,000 for fiscal years 2014, 2013 and 2012, respectively. The amount of subsequent other repossessed assets write-downs required to reflect current fair value was $126,000 for fiscal year 2012. There were no write-downs for fiscal years 2014 and 2013.
(o) Fixed Assets and Depreciation
Fixed assets are comprised of furniture, computer hardware, equipment and leasehold improvements and are included in other assets in the Consolidated Statements of Financial Condition. Additions, improvements and expenditures for repairs and maintenance that significantly extend the useful life of an asset are capitalized. Other expenditures for repairs and maintenance are charged to expense in the period incurred. Depreciation of furniture and equipment is provided over the estimated useful lives of the assets (from three to seven years), and depreciation on leasehold improvements is provided over the shorter of the useful life or the lease term (up to fifteen years) using the straight-line method. Depreciation of buildings is provided over the useful life (up to forty years) using the straight-line method. Depreciation expense totaled approximately $5,384,000, $5,472,000, and $5,763,000, for fiscal years 2014, 2013 and 2012, respectively.
Property consisted of the following at June 30, 2014 and June 30, 2013 (in thousands):
| | | | |
| | | | |
| June 30, 2014 | | June 30, 2013 | |
Land | $ 1,912 | | $ 2,104 | |
Buildings | 4,981 | | 4,977 | |
Furniture and equipment | 48,491 | | 50,182 | |
Leasehold improvements | 15,715 | | 15,253 | |
| 71,099 | | 72,516 | |
Less: accumulated depreciation | (55,235) | | (54,550) | |
Net property | $ 15,864 | | $ 17,966 | |
| | | | |
Furniture, equipment and leasehold improvements are tested for potential impairment whenever events or changes in circumstances suggest that an asset’s or asset group’s carrying value may not be fully recoverable. An impairment loss, calculated as the difference between the estimated fair value and the carrying value of an asset or asset group, is recognized if the sum of the expected undiscounted cash flows relating to the asset or asset group is less than the corresponding carrying value.
(p) Consolidation of Variable Interest Entities
An entity is defined as a variable interest entity (“VIE”) and subject to consolidation if: (1) the total equity investment at risk is not sufficient to permit the entity to finance its activities without additional subordinated financial support provided by any parties or (2) the holders of the equity investment at risk in the entity lack the ability to make significant decisions about the entity’s operations or are not obligated to absorb the expected losses or receive the expected returns of the entity.
The reporting entity, if any, which has a controlling financial interest in a VIE is required to possess: (1) the power to direct the activities of a VIE that most significantly impact the VIE’s economic performance and (2) the obligation to absorb potentially significant losses or the right to receive potentially significant benefits from the VIE. The entity which has a controlling financial interest is determined to be the primary beneficiary of the VIE and is required to consolidate the entity in its financial statements.
In addition, a reporting entity is required to reevaluate whether an entity is a VIE, and if the entity is determined to be a VIE, whether the reporting entity is the primary beneficiary of the VIE, periodically upon the occurrence of certain events known as reconsideration events. A loan modified in a troubled debt restructuring (“TDR”) triggers a reconsideration event. See Note 5, Loans and Allowance for Probable Loan Losses for additional information.
(q) Servicing Assets
During fiscal 2014 and 2013, the Bank sold $5,934,000 of SBA loans resulting in a gain of $558,000 and $17,664,000 of SBA loans resulting in a gain of $2,253,000, respectively. In addition, in connection with the fiscal 2014 and 2013 sales, the Bank recorded servicing assets of $116,000 and $418,000, respectively. At June 30, 2014 and June 30, 2013, the servicing assets had a value of $447,000 and $412,000, respectively. The Bank accounts for its servicing rights in accordance with ASC 860-50, “Servicing Assets and Liabilities,” (“ASC 860”) at amortized cost. The codification requires that servicing rights acquired through the origination of loans, which are sold with servicing rights retained, are recognized as separate assets. Servicing assets are recorded as the difference between the contractual servicing fees and adequate compensation for performing the servicing, and are periodically reviewed and adjusted for any impairment. The amount of impairment recognized, if any, is the amount by which the servicing assets exceed their fair value. During fiscal 2014, the Bank recorded a servicing asset valuation allowance of $12,400. There was no servicing asset valuation allowance recorded for fiscal 2013. Fair value of the servicing assets is estimated using discounted cash flows based on current market interest rates. See Note 1(x) and Note 26, Fair Value of Financial Instruments. Servicing rights are amortized in proportion to, and over the period of the related net servicing income.
(r) Drafts Payable
In the normal course of business, SWS uses drafts to make payments relating to its brokerage transactions. These drafts are presented for payment through an unaffiliated bank and are sent to SWS daily for review and acceptance. Upon acceptance, the drafts are paid and charged against cash.
(s) Federal Income Taxes
SWS and its subsidiaries file a consolidated federal income tax return. Income taxes are accounted for under the asset and liability method. Deferred tax assets and liabilities are recognized for the estimated future tax consequences attributable to differences between the financial statement carrying amounts of existing assets and liabilities and their respective tax bases. Deferred tax assets and liabilities are measured using enacted tax rates in effect for the year in which those temporary differences are expected to be recovered or settled. The effect on deferred tax assets and liabilities of a change in tax rates is recognized in income in the period that includes the date of the tax rate changes.
The Company records net deferred tax assets to the extent the Company believes these assets are more likely than not to be realized. In making such determination, the Company considers all available positive and negative evidence, including future reversals of existing taxable temporary differences, projected future taxable income, tax planning strategies and recent financial operations. A valuation allowance is established against deferred tax assets when the Company determines that they are more likely to not be realized than realized. In the event the Company subsequently determines that it would be able to realize deferred income tax assets in excess of their net recorded amount, the Company would reduce the valuation allowance, which would reduce the provision for income taxes.
Deferred tax assets derived from operating losses are realized when the Company generates consolidated taxable income within the applicable carry-back and carryforward periods. Based on an evaluation of the positive and negative evidence, management determined in the fourth quarter of fiscal 2013 that it was appropriate to increase the valuation allowance for the Company’s remaining deferred tax assets, with the exception of the Bank’s available for sale securities after reviewing the impact of the Company’s fourth quarter operating results and the Company’s fiscal 2014 financial forecast. Accordingly, the Company’s valuation allowance increased by $29,998,000 from $872,000 at June 29, 2012 to $30,870,000 at June 30, 2013. In fiscal 2014, the valuation allowance increased by $4,582,000 to $35,452,000 at June 30, 2014 based on activity in the current fiscal year. See Note 17, Income Taxes for a detail of the Company’s deferred tax assets.
(t) Treasury Stock
Periodically, SWS repurchases shares of common stock under a plan approved by the Board of Directors. Prior to February 28, 2013, SWS was authorized to repurchase 500,000 shares of common stock from time to time in the open market. During fiscal years 2014 and 2013, SWS Group did not repurchase any shares of common stock under this plan. As of June 30, 2014, the Company was not authorized to repurchase shares of common stock under a repurchase agreement and did not intend to repurchase any shares of common stock. Any repurchase of shares of common stock by the Company would require approval from the Company’s Board of Directors, Hilltop, Oak Hill and regulatory authorities.
Treasury stock is also repurchased periodically under the Company’s deferred compensation plan and the restricted stock plan. See Note 19, Employee Benefits.
(u) Stock-Based Compensation
SWS accounts for the SWS Group, Inc. 2003 Restricted Stock Plan ("2003 Restricted Stock Plan") and the 2012 Restricted Stock Plan (“2012 Restricted Stock Plan”) under the recognition and measurement principles of the Financial Accounting Standards Board’s (“FASB”) accounting codification. See Note 19, Employee Benefits.
(v) Loss Per Share ("EPS")
SWS provides a presentation of basic and diluted EPS. Basic EPS excludes dilution and is computed by dividing net income by weighted average common shares outstanding for the period. Diluted EPS reflects the potential dilution that would occur if contracts to issue common stock were exercised. Unvested share-based payment awards that contain non-forfeiture rights to dividends or dividend equivalents (paid or unpaid) are treated as participating securities and are factored into the calculation of basic and diluted EPS, except in periods with a net loss, when they are excluded. See Note 22, Loss Per Share for additional detail regarding the Company’s calculation of EPS.
(w) Other Comprehensive Income (Loss)
Net holding gains and losses represent the unrealized holding gains and losses on securities available for sale. See Note 9, Securities Available for Sale.
For the interest rate swaps that are designated and qualify as part of a cash flow hedging relationship, changes in the fair value are recognized in accumulated other comprehensive income to the extent the derivative is effective at offsetting the changes in cash flows being hedged until the hedged item affects earnings. The effective portion of the gain or loss on the derivative is reported as a component of other comprehensive income and reclassified into earnings in the same period or periods during which the hedged transaction affects earnings. Gains and losses on the derivative representing hedge ineffectiveness and changes in fair value of the derivative instruments not designated in a cash flow hedging relationship are recognized in other revenue on the Consolidated Statements of Comprehensive Loss. See Note 11, Interest Rate Swaps.
(x) Fair Value of Financial Instruments
Fair value accounting establishes a framework for measuring fair value. Under fair value accounting, fair value refers to the price that would be received to sell an asset or paid to transfer a liability in an orderly transaction between market participants on the measurement date in the principal market in which the reporting entity transacts. Further, fair value should be based on the assumptions market participants would use when pricing the asset or liability. In support of this principle, fair value accounting establishes a fair value hierarchy that prioritizes the information used to develop those assumptions. The fair value hierarchy gives the highest priority to quoted prices in active markets and the lowest priority to unobservable data. Under the standard, fair value measurements are separately disclosed by level within the fair value hierarchy. The standard describes three levels of inputs that may be used to measure fair value:
| | |
| • | Level 1 — Quoted prices in an active market for identical assets or liabilities. The Company values the following assets and liabilities utilizing Level 1 inputs: (1) the Company’s deferred compensation plan’s investment in Westwood Holdings Group, Inc.’s (“Westwood”) common stock; and (2) certain inventories held in the Company's securities owned and securities sold, not yet purchased portfolio. Valuation of these instruments does not require a high degree of judgment as the valuations are based on quoted prices in active markets that are readily available. |
| | |
| • | Level 2 — Observable inputs other than Level 1 prices, such as quoted prices for similar assets or liabilities in active markets; quoted prices in markets that are not active; or other inputs that are observable or can be corroborated by observable market data for substantially the full term of the assets or liabilities. The Company values the following assets and liabilities utilizing Level 2 inputs: (1) certain inventories held in the Company’s securities owned and securities sold, not yet purchased portfolio; (2) securities in the available for sale portfolio; and (3) the Bank’s investment in interest rate swaps. These financial instruments are valued by quoted prices that are less frequent than those in active markets or by models that use various assumptions that are derived from or supported by data that is generally observable in the marketplace. Valuations in this category are inherently less reliable than quoted market prices due to the degree of subjectivity involved in determining appropriate methodologies and the applicable underlying observable market assumptions. |
| | |
| • | Level 3 — Unobservable inputs that are supported by little or no market activity and that are significant to the fair value of the assets and liabilities. The Company values the following assets and liabilities utilizing Level 3 inputs: (1) the Bank’s loans measured at fair value; (2) certain inventories held in the Company's securities owned portfolio; and (3) the warrants. These financial instruments have significant inputs that cannot be validated by readily determinable market data and generally involve considerable judgment by management. |
The following is a description of the valuation methodologies used for instruments measured at fair value on recurring and non-recurring bases and recognized in the Consolidated Statements of Financial Condition, as well as the general classification of such instruments pursuant to the valuation hierarchy.
Recurring Fair Value Measurements
Loans measured at fair value. The loans are independently valued quarterly using a discounted cash flow model which factors in the relevant contractual loan terms and then present value back to a market-based discount rate. The market based discount rate is based on how the subject loans would be priced as of the valuation date and therefore include normal credit loss expectations, given the underlying underwriting standards including loan to value ratio and debt coverage ratios for the subject portfolio. The rate at which the loans are discounted is based upon London Interbank Offered Rate (LIBOR), the anticipated Bank preferential return and the terms of the loans. These loans are classified within Level 3 of the valuation hierarchy. During the second quarter of fiscal 2014, the Company transferred the loans measured at fair value from Level 2 to Level 3 due to a lack of observable data to support a Level 2 valuation.
Securities Owned and Securities Sold, Not Yet Purchased Portfolio. Securities classified as Level 1 securities primarily consist of financial instruments whose value is based on quoted market prices in active markets such as corporate equity securities and U.S. government and government agency obligations, primarily U.S. treasury securities.
Securities classified as Level 2 securities include financial instruments that are valued using models or other valuation methodologies. These models are primarily industry standard models that consider various assumptions, including time value, yield curve, volatility factors, current market and contractual prices for the underlying financial instruments, as well as other relevant economic measures. Substantially all of these assumptions are observable in the marketplace, can be derived from observable data or are supported by observable levels at which transactions are executed in the marketplace. Securities in this category include corporate obligations, U.S. government and government agency obligations and municipal obligations.
Securities classified as Level 3 securities are securities whose fair value is estimated based on internally developed models or methodologies, including discounted cash flow, utilizing significant inputs that are generally less readily observable. The models and methodologies consider the quality of the underlying loans, any related secondary market activity and expectations regarding future interest rate movements. Included in this category are certain corporate equity securities, corporate and municipal obligations.
Securities Available for Sale. Because quoted market prices are available in an active market, the Company’s deferred compensation plan’s investment in Westwood’s common stock are classified within Level 1 of the valuation hierarchy. The Company’s investments in U.S. government and government agency and municipal obligations held by the Bank as available for sale are valued in a similar manner to the Company’s Level 2 securities owned and securities sold, not yet purchased portfolio, noted above.
Interest Rate Swaps. The fair value of interest rate swaps is determined using an income approach incorporating various assumptions, including the term of the swap, the notional amount of the swap, discount rates interpolated based on relevant swap curves, the rate on the fixed leg of the swap and a credit value adjustment for counterparty non-performance. The approach also takes into consideration the potential impact of collateralization and netting agreements. Because substantially all of these assumptions are observable in the marketplace, can be derived from observable data or are supported by observable levels at which transactions are executed in the marketplace, the interest rate swaps are classified within Level 2 of the valuation hierarchy.
Warrants. The warrants held by Hilltop and Oak Hill are valued using a binomial model which forecasts the Company’s potential stock price at certain points in time between the valuation date and expiration date of the warrants. In addition to the Company’s stock price, variables in the model include the risk free rate of return, dividend yield, time to maturity and volatility of the Company’s stock price. The warrants are classified within Level 3 of the valuation hierarchy.
Substantially all of SWS’s brokerage assets and liabilities are carried at market value or at amounts which, because of their short-term nature, approximate current fair value.
Non-recurring Fair Value Measurements
Impaired loans held for investment. Certain impaired loans are reported at fair value through the recognition of a specific valuation allowance or a partial principal charge-off. The fair value of an impaired loan is primarily determined based on the present value of the loan’s expected future cash flows discounted at the loan’s original effective rate or the fair value of collateral if the loan is collateral-dependent. If the fair value of collateral is used to measure impairment of a collateral-dependent loan and repayment is dependent on the sale of the collateral, the fair value is adjusted to incorporate estimated costs to sell the collateral. Impaired loans that are collateral-dependent are primarily measured for impairment using the fair value of the collateral as determined by third party appraisals using the income approach, recent comparable sales data or a combination thereof. In certain instances it is necessary for management to adjust the appraised value, less estimated costs to sell the collateral, to reflect changes in fair value occurring subsequent to the appraisal date. Therefore, impaired loans reported at fair value in the Consolidated Statements of Financial Condition are classified as Level 3 in the fair value hierarchy.
REO. See Note 1(n), Real Estate Owned (“REO”) and Other Repossessed Assets for discussion of the valuation of these assets. REO assets are valued using Level 3 valuation methodologies as the inputs utilized to determine fair value require significant judgment and estimation.
Impaired Servicing Assets. See Note 1(q), Servicing Assets for discussion of the valuation of these assets. Servicing assets are valued using discounted cash flow model discounted with market rates.
Other Fair Value Disclosures
The following is a description of the valuation methodologies used for financial instruments not measured at fair value in the Consolidated Statements of Financial Condition, but for which fair value is required to be disclosed in accordance with ASC 820, “Fair Value Measurements and Disclosure”. See Note 26, Fair Value of Financial Instruments for additional information, including the hierarchy levels for these financial instruments.
Securities held to maturity. Fair values of securities held to maturity are based on the Company’s fair value policies regarding U.S. government and government agency obligations discussed above under – Recurring Fair Value Measurements – Securities Owned and Securities Sold, Not Yet Purchased Portfolio.
Loans. Fair values of loans receivable, including purchased mortgage loans held for investment, are estimated for portfolios of loans with similar characteristics. Loans are segregated by type, such as real estate, commercial and consumer, which are further segregated into fixed and adjustable rate interest terms. The fair value of loans receivable is calculated by discounting expected future cash flows through the estimated maturity using interest rates currently being offered for loans with similar terms to borrowers of similar credit quality. Loan fair value estimates include judgments regarding future expected loss experience and risk characteristics.
Servicing assets. See Note 1(q), Servicing Assets for discussion of the valuation of these assets.
Deposits. The fair value of deposits with no stated maturity, such as interest-bearing checking accounts, passbook savings accounts and advance payments from borrowers for taxes and insurance, is based on current market rates for deposits payable on demand. The fair value of certificates of deposit is based on the discounted value of contractual cash flows. The discount rate is estimated using the rates currently offered for deposits of similar remaining maturities.
Advances from FHLB. The fair value of advances from FHLB is based on the discounted value of contractual cash flows. The discount rate is estimated using the rates currently offered for borrowings of similar remaining maturities.
Long-term debt. The fair value of long-term debt is estimated using a discounted cash flow model with assumptions regarding the factors a market participant would consider in valuing the liability, including credit and liquidity risk.
(y) Accounting Pronouncements
The FASB and the SEC have recently issued the following statements and interpretations, which are applicable to SWS. Any other new accounting pronouncements not specifically identified in our disclosures are not applicable to SWS.
Accounting Standards Update (“ASU”) 2013-11, “Presentation of an Unrecognized Tax Benefit When a Net Operating Loss Carryforward, a Similar Tax Loss, or a Tax Credit Carryforward Exists (“ASU 2013-11”).” In July 2013, the FASB issued ASU 2013-11 which explicitly states the guidance for the presentation of unrecognized tax benefits when a net operating loss carryforward, similar tax loss, or a tax credit carryforward exits. This pronouncement clarifies the presentation of the unrecognized tax benefit as there is not currently a standard industry practice. This pronouncement states an unrecognized tax benefit, or portion of an unrecognized tax benefit, should be presented in the financial statements as a reduction to the deferred tax asset for a net operating loss carryforward, a similar loss, or a tax credit carryforward. The presentation is limited if the net operating loss carryforward, a similar tax loss, or a tax credit carryforward is not available at the reporting date due to tax law or the entity does not recognize its deferred tax asset. In addition, the unrecognized tax benefit should be presented as a liability separate from the deferred tax asset. The adoption of ASU 2013-11 will not impact the Company’s results of operations or financial position, but will impact the Company’s disclosures about the presentation of the deferred tax liability and asset. ASU 2013-11 is effective for annual reporting periods beginning after December 15, 2014; the Company’s first quarter of fiscal 2015. The Company is in the process of evaluating the impact of ASU 2013-11 on its financial statements and processes.
ASU 2014-04, “Receivables—Troubled Debt Restructuring by Creditors (“ASU 2014-04”).” In January 2014, the FASB issued ASU 2014-04 to clarify that when an in substance repossession or foreclosure occurs, a creditor is considered to have received physical possession of residential real estate property collateralizing a consumer mortgage loan upon either (1) the creditor obtaining legal title to the residential real estate property upon completion of a foreclosure or (2) the borrower conveying all interest in the residential real estate property to the creditor to satisfy that loan through completion of a deed in lieu of foreclosure or through a similar legal agreement. Additionally, the amendments require interim and annual disclosure of both (1) the amount of foreclosed residential real estate property held by the creditor and (2) the recorded investment in consumer mortgage loans collateralized by residential real estate property that are in the process of foreclosure according to local requirements of the applicable jurisdiction. ASU 2014-04 is effective for annual periods, and interim periods within those annual periods, beginning after December 15, 2014; the Company’s first quarter of fiscal 2016. The Company is in the process of evaluating the impact of ASU 2014-04 on its financial statements and processes.
ASU 2014-08, “Presentation of Financial Statements (Topic 205) and Property, Plant, and Equipment (Topic 360): Reporting Discontinued Operations and Disclosures of Disposals of Components of an Entity) (“ASU 2014-08”).” In April 2014, the FASB issued guidance on reporting discontinued operations and disclosures of the discontinued operations due to disposals of small groups of assets that are recurring in nature, which could cause the presentation of their disclosure to possibly be misleading to stakeholders. The main provisions revolve around the disclosure of a disposal of a component of an entity or group of components if the disposal represents a strategic shift that has or will have major effects on an entity’s operations and financial results. This update requires companies to disclose the assets, liabilities, operating and investing cash flows, pre-tax profit and loss, and significant non-cash items of the discontinued operations in comparative periods. ASU 2014-08 is effective for disposals that occur within the annual periods, and interim periods within those annual periods, beginning after December 15, 2014; the Company’s first quarter of fiscal 2016. The Company is in the process of evaluating the impact of ASU 2014-08 on its financial statements and processes.
ASU 2014-09 – “Revenue from Contracts with Customers (Topic 606) (“ASU 2014-09”).” In May 2014, the FASB issued ASU 2014-09 to enhance the presentation of revenue from contracts. The guidance was released to ensure consistency for revenue recognition across industries and generally accepted accounting principles (“GAAP”) and International Financial Reporting Standards (“IFRS”). The main provision of the principle is that an entity should recognize revenue to depict the transfer of promised goods or services to customers in an amount that reflects the consideration to which the entity expects to be entitled in exchange for those goods or services. The guidance affects companies which enter into contracts for goods or services in exchange for the transfer of nonfinancial assets unless those contracts are within the scope of other standards. ASU 2014-09 is effective for annual periods, and interim periods within those annual periods, beginning after December 15, 2017; the Company’s first quarter of fiscal 2019. The Company is in the process of evaluating the impact of ASU 2014-09 on its financial statements and processes.
ASU 2014-11 – “Transfers and Servicing (Topic 860): Repurchase- to- Maturity Transactions, Repurchase Financings, and Disclosures (“ASU 2014-11”).” In June 2014, the FASB issued ASU 2014-11 to amend pronouncements related to the disclosure of repurchase-to-maturity transactions to be accounted for as secured borrowings. This update will create consistency with how repurchase agreements are disclosed. Information will be required for sale transactions that are economically similar to repurchase agreements. In addition, the amendments require disclosure of the types of collateral pledged in repurchase agreements, securities lending transactions, and repurchase-to-maturity transactions and the tenor of those transactions. Updated secured borrowing accounting will be applicable for transactions that involve a transfer of a financial asset executed at the same time with a repurchase agreement with the same counterparty (a repurchase financing). ASU 2014-11 is effective for disposals occurring after annual periods, and interim periods within those annual periods, starting December 15, 2014; the Company’s first quarter of fiscal 2016. The Company is in the process of evaluating the impact of ASU 2014-11 on its financial statements and processes.
2.ASSETS SEGREGATED FOR REGULATORY PURPOSES
At June 30, 2014, SWS held cash of approximately $190,240,000 segregated in special reserve bank accounts for the exclusive benefit of customers under Rule 15c3-3 under the Exchange Act. SWS had no reserve deposits in special reserve bank accounts for the Proprietary Accounts of Brokers (the "PAB") at June 30, 2014.
At June 30, 2013, SWS held cash of approximately $164,737,000 segregated in special reserve bank accounts for the exclusive benefit of customers under Rule 15c3-3 under the Exchange Act. SWS had no reserve deposits in special reserve bank accounts for the PAB at June 30, 2013.
3.RECEIVABLE FROM AND PAYABLE TO BROKERS, DEALERS AND CLEARING ORGANIZATIONS
At June 30, 2014 and June 30, 2013, SWS had receivable from and payable to brokers, dealers and clearing organizations related to the following (in thousands):
| | | | |
| | | | |
| 2014 | | 2013 | |
Receivable: | | | | |
Securities failed to deliver | $ 23,865 | | $ 9,708 | |
Securities borrowed | 1,878,752 | | 1,546,376 | |
Correspondent broker/dealers | 33,982 | | 45,435 | |
Clearing organizations | 48,553 | | 25,285 | |
Other | 7,789 | | 71,670 | |
| $ 1,992,941 | | $ 1,698,474 | |
| | | | |
Payable: | | | | |
Securities failed to receive | $ 28,210 | | $ 39,024 | |
Securities loaned | 1,834,089 | | 1,471,319 | |
Correspondent broker/dealers | 14,386 | | 16,352 | |
Other | 37,291 | | 6,276 | |
| $ 1,913,976 | | $ 1,532,971 | |
| | | | |
Securities failed to deliver and receive represent the contractual value of securities that have not been delivered or received subsequent to settlement date. Securities borrowed and loaned represent deposits made to or received from other broker/dealers relating to these transactions. These deposits approximate the market value of the underlying securities.
SWS clears securities transactions for correspondent broker/dealers. Proprietary settled securities and related transactions for these correspondents are included in the receivable from and payable to brokers, dealers and clearing organizations.
SWS participates in the securities borrowing and lending business by borrowing and lending securities other than those of its clients. SWS obtains or releases collateral as prices of the underlying securities fluctuate. Both of these activities are reported on a gross basis by counterparty. The following table provides information about these receivables and related collateral amounts at June 30, 2014 and 2013.
| | | | | | | | | |
| | | | | | | | | |
June 30, 2014 | | | | | | | | |
(in thousands) | | | | | | Gross amounts not offset in the statement of financial position |
Description | Gross amounts
of recognized
assets/
liabilities | | Gross amounts
offset in the
statement of
financial position | | Net amounts of
assets presented in the statement of
financial position | | Financial instruments | Cash collateral | Net amount |
Securities Borrowed | $ 1,878,752 | | $ - | | $ 1,878,752 | | $ (1,878,752) | $ - | $ - |
Securities Loaned (1) | 1,834,089 | | - | | 1,834,089 | | (1,834,089) | - | - |
| | | | | | | | | |
| | | | | | | | | |
| | | | | | | | | |
June 30, 2013 | | | | | | | | |
(in thousands) | | | | | | Gross amounts not offset in the statement of financial position |
Description | Gross amounts
of recognized
assets/
liabilities | | Gross amounts
offset in the
statement of
financial position | | Net amounts of
assets presented in the statement of
financial position | | Financial instruments | Cash collateral | Net amount |
Securities Borrowed | $ 1,546,376 | | $ - | | $ 1,546,376 | | $ (1,546,376) | $ - | $ - |
Securities Loaned (1) | 1,471,319 | | - | | 1,471,319 | | (1,471,319) | - | - |
| | | | | | | | | |
____________________
(1) Under securities lending agreements, SWS repledged $1,807,198,000 and $1,452,911,000 at June 30, 2014 and 2013, respectively.
4.RECEIVABLE FROM AND PAYABLE TO CLIENTS
Receivable from and payable to clients include amounts due on cash and margin transactions. Included in these amounts are receivable from and payable to noncustomers (as defined by Rule 15c3-3 under the Exchange Act, principally officers, directors and related accounts), which aggregated approximately $241,000 and $221,000, respectively, at June 30, 2014 and $766,000 and $10,000, respectively, at June 30, 2013. Securities owned by customers and noncustomers that collateralize the receivable are not reflected in the accompanying consolidated financial statements.
SWS pays interest on certain customer "free credit" balances available for reinvestment. The aggregate balance of such funds was approximately $313,166,000 and $304,016,000 at June 30, 2014 and June 30, 2013, respectively. At June 30, 2014 and during fiscal year 2014, the weighted average interest rate and the interest rate paid on these balances was 0.02%. During fiscal 2013, the weighted average interest rate and the interest rate paid on these balances was 0.02%.
SWS maintains an allowance for doubtful accounts which represents amounts, that in the judgment of management, are necessary to adequately absorb losses from known and inherent risks in receivables from customers. Provisions made to this allowance are charged to operations and are included in other expense in the Consolidated Statements of Comprehensive Loss. At June 30, 2014 and June 30, 2013, all unsecured customer receivables are provided for in this allowance. The allowance was $150,000 and $168,000 at June 30, 2014 and June 30, 2013, respectively.
5.LOANS AND ALLOWANCE FOR PROBABLE LOAN LOSSES
The Bank grants loans to customers primarily within Texas and New Mexico. Although the Bank has a diversified loan portfolio, a substantial portion of its portfolio is dependent upon the general economic conditions in Texas and New Mexico.
Loans receivable at June 30, 2014 and June 30, 2013 are summarized as follows and include unamortized discounts and premiums and deferred loan fees and costs of $498,000 and $997,000 at June 30, 2014 and 2013, respectively (in thousands):
| | | |
| | | |
| 2014 | | 2013 |
Loans measured at fair value: | | | |
Commercial real estate | $ 9,901 | | $ 2,662 |
Multifamily | 43,247 | | 11,095 |
| 53,148 | | 13,757 |
Other loans receivable: | | | |
Residential construction | 650 | | 1,367 |
Lot and land development | 5,152 | | 8,988 |
1-4 family | 217,144 | | 233,947 |
Commercial real estate | 183,389 | | 213,452 |
Multifamily | 97,884 | | 88,738 |
Commercial loans | 61,420 | | 58,718 |
Consumer loans | 3,511 | | 1,959 |
| 569,150 | | 607,169 |
| 622,298 | | 620,926 |
Allowance for probable loan losses | (7,942) | | (12,343) |
| $ 614,356 | | $ 608,583 |
At June 30, 2014 and 2013, the 1-4 family loans included $133,854,000 and $174,037,000, respectively, of purchased mortgage loans held for investment. The loans, which are subject to policies and procedures governing credit underwriting standards and funding requirements, consisted of participations in newly originated residential loans from various mortgage bankers nationwide purchased at par. Loans purchased, excluding certain purchased loans which have shown evidence of deterioration since origination as of the date of the acquisition, that management has the intent and ability to hold for the foreseeable future or until maturity or pay-off are stated at the amount of unpaid principal, reduced by unearned income and an allowance for loan losses. The Bank assessed accounting for all loans acquired during the year and none of these loans meet the criteria for ASC 310-30 “Loans and Debt Securities Acquired with Deteriorated Credit Quality” (“ASC 310-30”).
The Bank’s liquidity has increased due to lower mortgage purchase program volumes. Because the volumes have not been replaced with current loan originations, the Bank made two loan purchases in the third quarter of 2014. The loans purchased were all single family residence mortgages and totaled approximately $40,000,000.
To supplement the originated held for investment loan portfolio, the Bank may purchase loans or pools of loans. For any potential purchase, detailed due diligence is performed to ensure credit quality is in line with the credit standards of originated loans. To determine applicability of ASC 310-30, the credit due diligence includes reviews of collateral values, accuracy and completeness of loan documentation, appropriate credit scores, and underwriting standards that are in line with the Bank’s debt to income standards. The codification requires that loans acquired are recorded at a price less than its contractually required payments receivable. The difference between the price and the contractually required payments receivable is attributable to the time value of money. The Bank does not have any loans accounted for under ASC 310-30 for the periods presented in these financials statements. All purchase documents are reviewed to determine sale treatment and compliance with ASC 860. Completed purchases are included in the appropriate category for allowance for loan loss calculations.
As of June 30, 2014 and 2013, the ratio of loan loss allowance to ending loan balance, excluding purchased mortgage loans held for investment and loans measured at fair value, was 1.82% and 2.85%, respectively. At June 30, 2014, the Bank recorded a loan loss allowance for purchased mortgage loans held for investment greater than 30 days old of $136,000. At June 30, 2013, there was no loan loss allowance for purchased mortgage loans held for investment because they are held on average for 25 days or less, which substantially reduces credit risk.
Loans receivable on non-accrual status as of June 30, 2014 and 2013 were as follows (in thousands):
| | | |
| | | |
| June 30, 2014 | | June 30, 2013 |
Residential construction | $ 546 | | $ 601 |
Lot and land development | 291 | | 2,418 |
1-4 family | 5,686 | | 7,792 |
Commercial real estate | 3,946 | | 7,611 |
Commercial loans | 3,852 | | 4,024 |
| $ 14,321 | | $ 22,446 |
Loans are classified as non-performing when they are 90 days or more past due as to principal or interest or when reasonable doubt exists as to timely collectibility. The Bank uses a standardized review process to determine which loans should be placed on non-accrual status. At the time a loan is placed on non-accrual status, previously accrued and uncollected interest is reversed against interest income. Interest income on non-accrual loans is subsequently recognized to the extent cash payments are received for loans where full collection is likely. For loans where full collection is not likely, interest payments are applied to the outstanding principal and interest income is only recognized if full payment is made. The average recorded investment in non-accrual loans at June 30, 2014 and 2013 was approximately $16,614,000 and $25,516,000, respectively. There was $86,000, $226,000 and $1,186,000 of interest income recorded on the non-accrual loans, prior to being placed on non-accrual status, in the fiscal years 2014, 2013, and 2012.
The following tables highlight the Bank’s recorded investment and unpaid principal balance for impaired loans by type as well as the related allowance, average recorded investment and interest income recognized as of June 30, 2014 and 2013 (in thousands):
| | | | | | | | | |
| | | | | | | | | |
| Recorded Investment(1) | | Unpaid Principal Balance(1) | | Related Allowance | | Average Recorded Investment(2) | | Interest Income Recognized(3) |
June 30, 2014 | | | | | | | | | |
With no related allowance recorded: | | | | | | | | | |
Residential construction | $ 551 | | $ 738 | | $ - | | $ 483 | | $ - |
Lot and land development | 677 | | 776 | | - | | 309 | | 30 |
1-4 family | 5,182 | | 6,827 | | - | | 5,513 | | 32 |
Commercial real estate | 6,852 | | 8,015 | | - | | 6,005 | | 65 |
Commercial loans | 336 | | 356 | | - | | 3,851 | | 55 |
| 13,598 | | 16,712 | | - | | 16,161 | | 182 |
| | | | | | | | | |
| | | | | | | | | |
| Recorded Investment(1) | | Unpaid Principal Balance(1) | | Related Allowance | | Average Recorded Investment(2) | | Interest Income Recognized(3) |
June 30, 2014 | | | | | | | | | |
With an allowance recorded: | | | | | | | | | |
Residential construction | $ - | | $ - | | $ - | | $ 90 | | $ - |
Lot and land development | - | | - | | - | | 935 | | - |
1-4 family | 490 | | 493 | | 39 | | 1,930 | | - |
Commercial real estate | 2,606 | | 2,652 | | 458 | | 2,203 | | 66 |
Commercial loans | 3,783 | | 3,832 | | 410 | | 1,979 | | - |
| 6,879 | | 6,977 | | 907 | | 7,137 | | 66 |
| | | | | | | | | |
| | | | | | | | | |
June 30, 2014 | | | | | | | | | |
Total | | | | | | | | | |
Residential construction | $ 551 | | $ 738 | | $ - | | $ 573 | | $ - |
Lot and land development | 677 | | 776 | | - | | 1,244 | | 30 |
1-4 family | 5,672 | | 7,320 | | 39 | | 7,443 | | 32 |
Commercial real estate | 9,458 | | 10,667 | | 458 | | 8,208 | | 131 |
Commercial loans | 4,119 | | 4,188 | | 410 | | 5,830 | | 55 |
| $ 20,477 | | $ 23,689 | | $ 907 | | $ 23,298 | | $ 248 |
| | | | | | | | | |
| | | | | | | | | |
| | | | | | | | | |
| | | | | | | | | |
June 30, 2013 | | | | | | | | | |
With no related allowance recorded: | | | | | | | | | |
Residential construction | $ 383 | | $ 471 | | $ - | | $ 438 | | $ - |
Lot and land development | 102 | | 324 | | - | | 807 | | - |
1-4 family | 5,818 | | 7,712 | | - | | 7,674 | | 17 |
Commercial real estate | 9,006 | | 12,239 | | - | | 7,785 | | 167 |
Commercial loans | 4,430 | | 5,092 | | - | | 1,582 | | 26 |
| 19,739 | | 25,838 | | - | | 18,286 | | 210 |
| | | | | | | | | |
| | | | | | | | | |
| Recorded Investment(1) | | Unpaid Principal Balance(1) | | Related Allowance | | Average Recorded Investment(2) | | Interest Income Recognized(3) |
June 30, 2013 | | | | | | | | | |
With an allowance recorded: | | | | | | | | | |
Residential construction | $ 222 | | $ 283 | | $ 23 | | $ 191 | | $ - |
Lot and land development | 2,326 | | 2,543 | | 233 | | 1,879 | | - |
1-4 family | 3,543 | | 3,870 | | 178 | | 6,398 | | 67 |
Commercial real estate | 3,265 | | 4,188 | | 105 | | 10,048 | | 15 |
Commercial loans | 3,037 | | 3,032 | | 2,090 | | 2,288 | | 129 |
| 12,393 | | 13,916 | | 2,629 | | 20,804 | | 211 |
| | | | | | | | | |
| | | | | | | | | |
| | | | | | | | | |
June 30, 2013 | | | | | | | | | |
Total | | | | | | | | | |
Residential construction | $ 605 | | $ 754 | | $ 23 | | $ 629 | | $ - |
Lot and land development | 2,428 | | 2,867 | | 233 | | 2,686 | | - |
1-4 family | 9,361 | | 11,582 | | 178 | | 14,072 | | 84 |
Commercial real estate | 12,271 | | 16,427 | | 105 | | 17,833 | | 182 |
Commercial loans | 7,467 | | 8,124 | | 2,090 | | 3,870 | | 155 |
| $ 32,132 | | $ 39,754 | | $ 2,629 | | $ 39,090 | | $ 421 |
| | | | | | | | | |
____________________
| (1) | | The difference between the unpaid principal balance and the recorded investment of impaired loans with no related allowance recorded is primarily comprised of partial charge-offs that were previously recognized |
| (2) | | Represents the average recorded investment for the fiscal years ended June 30, 2014 and 2013, respectively. |
| (3) | | Represents interest income recognized on impaired loans for the fiscal years ended June 30, 2014 and 2013, respectively. |
The Bank prepares a criticized and classified loan report that it uses to assist in calculating an adequate allowance for loan losses. The following tables summarize this report and highlight the overall quality of the Bank’s financing receivables as of June 30, 2014 and 2013 (in thousands):
| | | | | | | |
| | | | | | | |
| Pass | | Special Mention(1) | | Substandard(2) | | Total |
| | | | | | | |
June 30, 2014 | | | | | | | |
Loans measured at fair value: | | | | | | | |
Commercial real estate | $ 9,901 | | $ - | | $ - | | $ 9,901 |
Multifamily | 43,247 | | - | | - | | 43,247 |
| 53,148 | | - | | - | | 53,148 |
Other loans receivable: | | | | | | | |
Residential construction | 104 | | - | | 546 | | 650 |
Lot and land development | 4,172 | | - | | 980 | | 5,152 |
1-4 family | 211,278 | | 107 | | 5,759 | | 217,144 |
Commercial real estate | 155,619 | | 4,522 | | 23,248 | | 183,389 |
Multifamily | 97,884 | | - | | - | | 97,884 |
Commercial loans | 47,397 | | 8,096 | | 5,927 | | 61,420 |
Consumer loans | 3,511 | | - | | - | | 3,511 |
| 519,965 | | 12,725 | | 36,460 | | 569,150 |
| $ 573,113 | | $ 12,725 | | $ 36,460 | | $ 622,298 |
| | | | | | | |
| | | | | | | |
| Pass | | Special Mention(1) | | Substandard(2) | | Total |
| | | | | | | |
June 30, 2013 | | | | | | | |
Loans measured at fair value: | | | | | | | |
Commercial real estate | $ 2,662 | | $ - | | $ - | | $ 2,662 |
Multifamily | 11,095 | | - | | - | | 11,095 |
| 13,757 | | - | | - | | 13,757 |
Other loans receivable: | | | | | | | |
Residential construction | 766 | | - | | 601 | | 1,367 |
Lot and land development | 5,605 | | - | | 3,383 | | 8,988 |
1-4 family | 225,434 | | 234 | | 8,279 | | 233,947 |
Commercial real estate | 171,085 | | 7,631 | | 34,736 | | 213,452 |
Multifamily | 88,046 | | - | | 692 | | 88,738 |
Commercial loans | 47,680 | | 1,324 | | 9,714 | | 58,718 |
Consumer loans | 1,959 | | - | | - | | 1,959 |
| 540,575 | | 9,189 | | 57,405 | | 607,169 |
| $ 554,332 | | $ 9,189 | | $ 57,405 | | $ 620,926 |
____________________
| (1) | | These loans are currently protected by the current sound worth and paying capacity of the obligor, but have a potential weakness that would create a higher credit risk. |
| (2) | | These loans exhibit well-defined weaknesses that could jeopardize the ultimate collection of all or part of the debt. Substandard loans are inadequately protected by the current sound worth and paying capacity of the obligor or of the collateral pledged. They are characterized by the distinct possibility that the Bank will sustain some loss if the deficiencies are not corrected. Loss potential, while existing in the aggregate for substandard assets, does not have to exist in individual assets classified as “Substandard.” |
The following tables highlight the age of the Bank’s past due financing receivables as of June 30, 2014 and 2013 (in thousands):
| | | | | | | | | | | | | |
| | | | | | | | | | | | | |
| 30-59 Days Past Due | | 60-89 Days Past Due | | 90 Days and Greater Past Due | | Total Past Due | | Current | | Total Financing Receivables | | Recorded Investment > 90 Days and Accruing |
June 30, 2014 | | | | | | | | | | | | | |
Loans measured at fair value: | | | | | | | | | | | | | |
Commercial real estate | $ - | | $ - | | $ - | | $ - | | $ 9,901 | | $ 9,901 | | $ - |
Multifamily | - | | - | | - | | - | | 43,247 | | 43,247 | | - |
| - | | - | | - | | - | | 53,148 | | 53,148 | | - |
Other loans receivable: | | | | | | | | | | | | | |
Residential construction | - | | - | | - | | - | | 650 | | 650 | | - |
Lot and land development | - | | - | | 14 | | 14 | | 5,138 | | 5,152 | | - |
1-4 family | 117 | | 643 | | 740 | | 1,500 | | 215,644 | | 217,144 | | - |
Commercial real estate | 3,008 | | 1,782 | | 1,190 | | 5,980 | | 177,409 | | 183,389 | | - |
Multifamily | - | | - | | - | | - | | 97,884 | | 97,884 | | - |
Commercial loans | 3 | | 785 | | 3,688 | | 4,476 | | 56,944 | | 61,420 | | - |
Consumer loans | - | | - | | - | | - | | 3,511 | | 3,511 | | - |
| 3,128 | | 3,210 | | 5,632 | | 11,970 | | 557,180 | | 569,150 | | - |
| $ 3,128 | | $ 3,210 | | $ 5,632 | | $ 11,970 | | $ 610,328 | | $ 622,298 | | $ - |
| | | | | | | | | | | | | |
| | | | | | | | | | | | | |
| 30-59 Days Past Due | | 60-89 Days Past Due | | 90 Days and Greater Past Due | | Total Past Due | | Current | | Total Financing Receivables | | Recorded Investment > 90 Days and Accruing |
June 30, 2013 | | | | | | | | | | | | | |
Loans measured at fair value: | | | | | | | | | | | | | |
Commercial real estate | $ - | | $ - | | $ - | | $ - | | $ 2,662 | | $ 2,662 | | $ - |
Multifamily | - | | - | | - | | - | | 11,095 | | 11,095 | | - |
| - | | - | | - | | - | | 13,757 | | 13,757 | | - |
Other loans receivable: | | | | | | | | | | | | | |
Residential construction | - | | - | | - | | - | | 1,367 | | 1,367 | | - |
Lot and land development | 173 | | 370 | | 80 | | 623 | | 8,365 | | 8,988 | | - |
1-4 family | 914 | | 234 | | 2,816 | | 3,964 | | 229,983 | | 233,947 | | - |
Commercial real estate | 1,396 | | 1,153 | | 4,826 | | 7,375 | | 206,077 | | 213,452 | | - |
Multifamily | 692 | | - | | - | | 692 | | 88,046 | | 88,738 | | - |
Commercial loans | 750 | | 3,812 | | 135 | | 4,697 | | 54,021 | | 58,718 | | - |
Consumer loans | - | | - | | - | | - | | 1,959 | | 1,959 | | - |
| 3,925 | | 5,569 | | 7,857 | | 17,351 | | 589,818 | | 607,169 | | - |
| $ 3,925 | | $ 5,569 | | $ 7,857 | | $ 17,351 | | $ 603,575 | | $ 620,926 | | $ - |
In certain circumstances, the Bank modifies the terms of its loans to a troubled borrower. Modifications may include extending the maturity date, reducing the stated interest rate, rescheduling future cash flows or some combination thereof. The Bank accounts for the modification as a TDR.
Loans that have been modified in a TDR continue to be considered restructured until paid in full. These loans, including loans restructured in the prior 12 months that defaulted during the period, are individually evaluated for impairment taking into consideration payment status, collateral value, and the probability of collecting scheduled principal and interest payments when due. A specific allowance for an impaired loan that has been modified in a TDR is established when the loan’s fair value is lower than its recorded investment. In addition, the historical loss rates of loans modified in TDRs, by portfolio segment, are factored into the formula utilized to determine the general allowance for probable loan losses.
The table below presents the recorded investment in loans modified in TDRs as of June 30, 2014 and 2013 (in thousands):
| | | | |
| | | | |
| | June 30, 2014 | | June 30, 2013 |
Residential construction | | $ 551 | | $ 605 |
Lot and land development | | 662 | | 4,927 |
1-4 family | | 4,932 | | 7,690 |
Commercial real estate | | 6,812 | | 4,574 |
Commercial | | 656 | | 497 |
| | $ 13,613 | | $ 18,293 |
| | | | |
The allowance for loan losses associated with loans modified in TDRs as of June 30, 2014 and 2013, was $96,000 and $447,000, respectively. The recorded investment includes $4,615,000 and $6,685,000 of loans on accrual status as of June 30, 2014 and 2013, respectively. Loans modified in TDRs are placed on accrual status when a reasonable period of payment performance by the borrower demonstrates the ability and capacity to meet the restructured terms.
The following table summarizes the financial effects of loan modifications accounted for as TDRs that occurred during fiscal 2014 and 2013 (dollars in thousands):
| | | | | | | | | | | | |
| | | | | | | | | | | | |
| |
June 30, 2014
| |
June 30, 2013
|
| | Number of Contracts | | Pre-Modification Outstanding Recorded Investment | | Post-Modification Outstanding Recorded Investment(1) | | Number of Contracts | | Pre-Modification Outstanding Recorded Investment | | Post-Modification Outstanding Recorded Investment(1) |
Residential construction | | - | | $ - | | $ - | | 4 | | $ 648 | | $ 648 |
Lot and land development | | - | | - | | - | | 8 | | 4,331 | | 4,331 |
1-4 family | | 4 | | 243 | | 243 | | 11 | | 1,927 | | 1,906 |
Commercial real estate | | 3 | | 3,991 | | 3,991 | | 5 | | 3,232 | | 3,227 |
Commercial | | 1 | | 168 | | 168 | | 2 | | 259 | | 259 |
| | 8 | | $ 4,402 | | $ 4,402 | | 30 | | $ 10,397 | | $ 10,371 |
____________
(1) Post-modification balances include direct charge-offs recorded at the time of modification.
The table below summarizes the type of loan modifications made and the post modification outstanding recorded investment for TDRs during fiscal 2014 and 2013 (in thousands):
| | | | |
| | | | |
| | Amount of TDR Loan Modifications |
Type of Modification | | June 30, 2014 | | June 30, 2013 |
Maturity date extension | | $ 103 | | $ 1,475 |
Reduction of the stated interest rate | | - | | 60 |
Rescheduled future cash flows | | 4,159 | | 983 |
Combination of maturity date extension | | | | |
and rescheduling of future cash flows | | 31 | | 4,942 |
Combination of maturity date extension | | | | |
and reduction of the stated interest rate | | 109 | | 706 |
Combination of maturity date extension, | | | | |
reduction of the stated interest rate, | | | | |
and rescheduling of future cash flows | | - | | 2,013 |
Combination of reduction of the stated interest rate | | | | |
and rescheduling of future cash flows | | - | | 192 |
| | $ 4,402 | | $ 10,371 |
Loan modifications accounted for as TDRs within the previous 12 months that subsequently defaulted (a payment default is defined as a loan 60 days or more past due) during fiscal 2014 and 2013 are summarized in the following table (dollars in thousands):
| | | | | | | | |
| |
June 30, 2014
| |
June 30, 2013
|
| | Number of Contracts | | Recorded Investment | | Number of Contracts | | Recorded Investment |
1-4 family | | 2 | | $ 272 | | 1 | | $ 1,799 |
Commercial | | - | | - | | 2 | | 839 |
| | 2 | | $ 272 | | 3 | | $ 2,638 |
The Bank has elected to measure certain loans at fair value. See discussion in Note 1(x), Fair Value of Financial Instruments and Note 1(g), Loans and Allowance for Loan Losses. The Bank recognized interest income on loans measured at fair value separately from other changes in fair value. As of June 30, 2014, there were no loans measured at fair value on non-accrual status or 90 days or more past due and still accruing.
The following tables summarize the amortized cost, gross unrealized gains and losses and the fair value of loans measured at fair value at June 30, 2014 and 2013 for the Bank (in thousands):
| | | | | | | |
| | | | | | | |
| | | Gross | | Gross | | |
| Amortized | | Unrealized | | Unrealized | | Fair |
| Cost | | Gains (1) | | Losses (1) | | Value |
June 30, 2014 | | | | | | | |
Commercial real estate | $ 9,791 | | $ 131 | | $ (21) | | $ 9,901 |
Multifamily | 42,642 | | 610 | | (5) | | 43,247 |
| $ 52,433 | | $ 741 | | $ (26) | | $ 53,148 |
| | | | | |
| | | | | |
| | | Gross | | |
| Amortized | | Unrealized | | Fair |
| Cost | | Losses (1) | | Value |
June 30, 2013 | | | | | |
Commercial real estate | $ 2,787 | | $ (125) | | $ 2,662 |
Multifamily | 11,115 | | (20) | | 11,095 |
| $ 13,902 | | $ (145) | | $ 13,757 |
____________
(1) Unrealized gains (losses) are recorded in other revenues on the Consolidated Statements of Comprehensive Loss.
Variable Interest Entities.
The loans to commercial borrowers noted in the table below, which have been modified as a troubled debt restructuring, triggering a reconsideration event, meet the definition of a VIE because the legal entities have a total equity investment at risk that is not sufficient to permit the entity to finance its activities without additional subordinated financial support, leading to the borrowers request for a loan modification. The Company, however, does not meet the definition of a primary beneficiary of the legal entities even though the Company has customary lender’s rights and remedies, as provided in the related promissory notes and loan agreements. The Company does not possess the power to direct the activities of the legal entities that most significantly impact the legal entities economic performance nor does the Company have the obligation to absorb potentially significant losses or the right to receive potentially significant benefits from the legal entities. Accordingly, the legal entities are not consolidated in the Company’s financial statements.
The following table presents the carrying amount and maximum exposure to loss associated with the Company’s variable interests in unconsolidated VIEs as of June 30, 2014 and 2013 (dollars in thousands):
| | | | | | | |
| | | | | | | |
| June 30, 2014 | | June 30, 2013 |
| Number of VIEs | Carrying Amount of Assets | Maximum Exposure to Loss | | Number of VIEs | Carrying Amount of Assets | Maximum Exposure to Loss |
| | | | | | | |
Loans to commercial | | | | | | | |
borrowers | 10 | $ 7,794 | $ 6,481 | | 17 | $ 10,639 | $ 9,072 |
| | | | | | | |
The carrying amount of the Company’s recorded investment in these loans is included in loans, net of allowance for loan losses in the Consolidated Statements of Financial Condition.
6.SECURITIES OWNED AND SECURITIES SOLD, NOT YET PURCHASED
Securities owned and securities sold, not yet purchased at June 30, 2014 and 2013 consisted of the following (in thousands):
| | | | |
| | | | |
| | 2014 | | 2013 |
Securities owned: | | | | |
Corporate equity securities | | $ 1,155 | | $ 1,520 |
Municipal obligations | | 52,247 | | 30,116 |
U.S. government and government agency obligations | | 50,559 | | 41,529 |
Corporate obligations | | 95,712 | | 127,899 |
Other-primarily unit investment trusts | | 35,952 | | 8,569 |
| | $ 235,625 | | $ 209,633 |
| | | | |
Securities sold, not yet purchased: | | | | |
Municipal obligations | | $ 9 | | $ 10 |
U.S. government and government agency obligations | | 74,391 | | 54,086 |
Corporate obligations | | 46,814 | | 80,639 |
Other | | 141 | | - |
| | $ 121,355 | | $ 134,735 |
| | | | |
Securities owned and securities sold, not yet purchased are carried at fair value. See additional discussion in Note 1(x), Fair Value of Financial Instruments.
Some of these securities were pledged as collateral to secure short-term borrowings (see Note 13, Short-Term Borrowings) and as security deposits at clearing organizations for the Company’s clearing business. At June 30, 2014 and 2013, securities pledged as security deposits at clearing organizations were $7,099,000 and $3,000,000, respectively.
The Company also enters into “to-be-announced” securities (“TBAs”) in order to assist clients (generally small to mid-size mortgage loan originators) in hedging the interest rate risk associated with the mortgages owned by the clients. In general, the Company will enter into a TBA purchase agreement with the client and then immediately enter into a TBA sale agreement with identical terms and the same settlement date with a separate counter-party. The Company earns revenue through a commission charged to the customer. Because the Company has purchased and sold the same security, it is no longer exposed to market movements of the underlying TBA. At June 30, 2014, the Company had unsettled TBA purchase contracts and offsetting TBA sale agreements in the notional amount of $1,081,284,000.
7.SECURITIES HELD TO MATURITY
Securities held to maturity consisted of the following (in thousands):
| | | | |
| | | | |
| June 30, 2014 | | June 30, 2013 | |
| | | | |
Government National Mortgage | | | | |
Association ("GNMA") Securities | $ 12,549 | | $ 17,423 | |
| | | | |
In March 2011, the Bank purchased GNMA securities at a cost of $35,525,000, including a premium of $525,000. The premium is amortized over the period from the date of purchase to the stated maturity date (15 years) of the GNMA securities using the interest method. These securities are classified as held to maturity and are accounted for at amortized cost. The weighted average yield on this investment is expected to be 2.4% and the weighted average maturity is expected to be 2.0 years.
The Bank recorded $77,000, $117,000 and $190,000 in amortization of the premiums during fiscal years 2014, 2013 and 2012, respectively. During fiscal years 2014, 2013 and 2012 the Bank received $5,239,000, $9,019,000 and $8,992,000 of principal and interest payments, respectively, recording $442,000, $654,000 and $910,000 in interest, respectively.
The amortized cost, estimated fair value and unrecognized holding gain of securities held to maturity at June 30, 2014, by contractual maturity date, are shown below (in thousands). Expected maturities will differ from contractual maturities because borrowers may have the right to call or repay obligations with or without call or prepayment penalties.
| | | | | |
| | | | | |
| Securities Held to Maturity |
| Amortized Cost | | Fair Value | | Unrecognized Holding Gain |
| | | | | |
Due after ten years | $ 12,549 | | $ 12,952 | | $ 403 |
| | | | | |
8.SECURITIES PURCHASED/SOLD UNDER AGREEMENTS TO RESELL/REPURCHASE
At June 30, 2014 and 2013, SWS held reverse repurchase agreements collateralized by U.S. government and government agency obligations and securities sold under repurchase agreements. These securities are reported on a gross basis in the Consolidated Statements of Financial Condition.
Securities sold under repurchase agreements, which are secured borrowings, generally mature within one to four days from the transaction date. Securities sold under repurchase agreements are reflected at the amount of cash received in connection with the transactions. The Company may be required to provide additional collateral based on the fair value of the underlying securities. The Company monitors the fair value of the underlying securities on a daily basis. Interest on these amounts is accrued and is included in the Consolidated Statements of Financial Condition in other liabilities.
The following table provides information about these instruments and any related collateral amounts at June 30, 2014 and 2013 (in thousands):
| | | | | | | | | |
| | | | | | | | | |
June 30, 2014 | | | | | | | | |
| | | | | | Gross amounts not offset in the statement of financial position |
Description | Gross amounts
of recognized
assets/
liabilities | | Gross amounts
offset in the
statement of
financial position | | Net amounts of
assets presented in the statement of
financial position | | Financial instruments | Cash collateral | Net amount |
Reverse | | | | | | | | | |
Repurchase | | | | | | | | | |
Agreements | $ 72,582 | | $ - | | $ 72,582 | | $ (72,346) | $ - | $ 236 |
Repurchase | | | | | | | | | |
Agreements | 39,343 | | - | | 39,343 | | (39,343) | - | - |
| | | | | | | | | |
| | | | | | | | | |
June 30, 2013 | | | | | | | | |
| | | | | | Gross amounts not offset in the statement of financial position |
Description | Gross amounts
of recognized
assets/
liabilities | | Gross amounts
offset in the
statement of
financial position | | Net amounts of
assets presented in the statement of
financial position | | Financial instruments | Cash collateral | Net amount |
Reverse | | | | | | | | | |
Repurchase | | | | | | | | | |
Agreements | $ 51,996 | | $ - | | $ 51,996 | | $ (51,808) | $ - | $ 188 |
Repurchase | | | | | | | | | |
Agreements | 37,012 | | - | | 37,012 | | (37,012) | - | - |
| | | | | | | | | |
9.SECURITIES AVAILABLE FOR SALE
SWS Group owns shares of common stock of Westwood Group, Inc. (“Westwood”), which it classifies as securities available for sale. In addition to the shares of common stock owned by SWS Group, the Bank owns U.S. government and government agency and municipal obligations that are available for sale. The unrealized holding gains (losses), net of tax, related to these securities are recorded as a separate component of stockholders’ equity on the Consolidated Statements of Financial Condition.
The following tables summarize the cost of equity securities, amortized cost of debt securities and market value of these investments at June 30, 2014 and 2013 (dollars in thousands):
| | | | | | |
| | | | | | |
| | Original/ | Gross | Gross | Gross | |
| Shares | Amortized | Unrealized | Unrealized | Realized | Market |
| Held | Cost | Gains | Losses | Losses | Value |
June 2014 | | | | | | |
Westwood common stock | 2,219 | $ 7 | $ 216 | $ - | $ (90) | $ 133 |
Continuous unrealized loss less than | | | | | | |
12 months: | | | | | | |
U.S. government and government | | | | | | |
agency obligations | N/A | 204,265 | 869 | (476) | - | 204,658 |
Municipal obligations | N/A | 24,982 | 325 | (8) | - | 25,299 |
Continuous unrealized loss for 12 | | | | | | |
months or greater: | | | | | | |
U.S. government and government | | | | | | |
agency obligations | N/A | 254,643 | - | (6,788) | - | 247,855 |
Municipal obligations | N/A | 17,125 | - | (222) | - | 16,903 |
| | $ 501,022 | $ 1,410 | $ (7,494) | $ (90) | $ 494,848 |
| | | | | | |
| | | | | | |
| | | | | | |
| | Original/ | Gross | Gross | Gross | |
| Shares | Amortized | Unrealized | Unrealized | Realized | Market |
| Held | Cost | Gains | Losses | Losses | Value |
June 2013 | | | | | | |
Westwood common stock | 3,405 | $ 7 | $ 170 | $ - | $ (31) | $ 146 |
Continuous unrealized loss less than | | | | | | |
12 months: | | | | | | |
U.S. government and government | | | | | | |
agency obligations | N/A | 479,970 | 138 | (9,239) | - | 470,869 |
Municipal obligations | N/A | 29,289 | - | (1,065) | - | 28,224 |
Continuous unrealized loss for 12 | | | | | | |
months or greater: | | | | | | |
U.S. government and government | | | | | | |
agency obligations | N/A | 4,127 | - | (90) | - | 4,037 |
| | $ 513,393 | $ 308 | $ (10,394) | $ (31) | $ 503,276 |
| | | | | | |
In fiscal 2014 and 2013, the Bank purchased U.S. government and government agency and municipal obligations securities at a cost of $177,085,000 and $319,836,000, including a net premium of $2,335,000 and $6,279,000, respectively. The premium is amortized over the period from the date of purchase to the stated maturity date (weighted average of 4.13 years at June 30, 2014 and 4.51 years at June 30, 2013) using the interest method.
During fiscal 2014, 2013 and 2012, the Bank recorded $2,407,000, $1,868,000 and $744,000, respectively, in amortization of the premium and received $62,629,000, $47,129,000 and $16,718,000, respectively, of principal and interest payments, recording $12,640,000, $7,585,000 and $2,393,000, respectively, in interest income on these securities.
During fiscal 2014, U.S. government and municipal obligations of $37,635,000 matured and the issuer redeemed $7,500,000 of U.S. government agency securities, purchased at a discount, at par, resulting in no gain. During fiscal 2013, municipal obligations of $495,000 matured and the issuer redeemed $41,500,000 of U.S. government agency securities, purchased at a discount, at par, resulting in a gain of $20,000.
During fiscal 2013, the Company recognized a realized gain of $3,550,000 in net gains on principal transactions and a $2,308,000 (the $3,550,000 net of tax) reclassification adjustment from accumulated other comprehensive income from the sale of shares of U.S. Home Systems, Inc. (USHS) common stock owned by SWS Group at June 29, 2012. In fiscal 2014, 2013 and 2012, the Bank sold $91,926,000, $25,788,000 and $66,936,000, respectively, in U.S. government and government agency securities, recognizing gains of $781,000, $100,000 and $557,000, respectively, in other revenue, a $508,000 (the $781,000 net of tax), $65,000 (the $100,000 net of tax) and $362,000 (the $557,000 net of tax), respectively, reclassification adjustment from accumulated other comprehensive income, respectively.
For the U.S. government and government agency obligations which were in a continuous unrealized loss position for 12 months or longer as of June 30, 2014, the Bank reviewed the circumstances of the loss position and determined that a permanent impairment was not necessary. The Bank conducts an other-than-temporary impairment (“OTTI”) analysis on a quarterly basis. A decline in the fair market value of the security below the recorded amount and the severity and duration of the decline triggers the OTTI analysis. For securities where the decline in fair market value is below the amortized cost, OTTI would be recognized if: (i) the Bank had the intent to sell the security, (ii) the Bank determines that it is more likely than not that the Bank would be required to sell the security before recovery of its amortized cost and (iii) the Bank does not expect to recover the entire amortized cost of the security. In estimating the Bank’s ability to recover the amortized cost basis of a security, the Bank considers the length of time the fair market value of the security has been less than the amortized cost, the extent to which the fair market value of the security is less than the amortized cost, the overall performance of the security and the financial condition of the issuer.
10.INVESTMENTS
SWS has interests in four investment partnerships that it accounts for under the equity method, which approximates fair value as described in Note 1(x), Fair Value of Financial Instruments. One is a limited partnership venture capital fund in which SWS has invested $5,000,000. Based on a review of the fair value of this limited partnership interest, SWS determined that its share of the investments made by the limited partnership should be valued at $530,000 as of June 30, 2014 and $513,000 as of June 30, 2013. SWS recorded net gains of $17,000 on this investment for fiscal year 2014 and net losses of $640,000 and $620,000 on this investment for fiscal years 2013 and 2012, respectively. In fiscal 2013, SWS received cash distributions of $341,000 from this investment. The limited partnership venture capital fund has entered into an agreement with the Small Business Administration (“SBA”) for a self-liquidation plan.
Two investments are limited partnership equity funds to which the Bank has commitments of $3,000,000 and $2,000,000, respectively, and are considered cost effective ways of meeting its obligations under the CRA. As of June 30, 2014 and June 30, 2013, the Bank’s recorded investments in these partnerships were $3,046,000 and $3,782,000, respectively. During the fiscal years 2014, 2013 and 2012, the Bank recorded a net loss of $736,000 and net gains of $882,000 and $1,192,000, respectively, related to these investments. During the fiscal year 2014, the Bank received no cash distributions and during fiscal years 2013 and 2012, the Bank received distributions of $2,400,000 and $517,000, respectively, from these investments.
On January 28, 2009, the Bank executed a $4,500,000 loan agreement with one of the partnerships. The loan was amended on November 16, 2009 to increase the note amount to $5,000,000. The loan was renewed on September 26, 2012 with a maturity date of January 2, 2013. At December 31, 2012, the loan was paid in full. Prior to December 31, 2012, for the six-months ended December 31, 2012 and twelve-months ended June 30, 2012, the Bank earned approximately $111,000 and $243,000 in interest income, respectively.
On December 31, 2012, the Bank executed a new $5,000,000 loan agreement with one of the partnerships with a maturity date of December 31, 2015. At June 30, 2014 and 2013, the outstanding balance was $3,848,000 and $2,549,000, respectively. The loan bears interest at a rate of 4.25% per annum and interest is due monthly. The Bank earned approximately $125,000 and $55,000 in interest income for the fiscal year ended June 30, 2014 and the six-months ended June 30, 2013, respectively.
In April 2012, the Bank acquired an interest in a private investment fund to obtain additional credit for its obligations under the CRA. The Bank has committed to invest $3,000,000 in the fund and to date has contributed $480,000 in the fund, including $300,000 invested pursuant to capital calls in November 2013 and March 2014. During the fiscal years 2014 and 2013, the Bank recorded net losses of $116,000 and $118,000, respectively, related to this investment. The recorded investment in this fund was $232,000 and $62,000 at June 30, 2014 and June 30, 2013, respectively. During fiscal year 2014, the Bank received a cash
distribution of $14,000 from this investment. During fiscal year 2013, the Bank received no cash distribution from this investment.
11.INTEREST RATE SWAPS
In fiscal years 2013 and 2014, the Bank entered into forward-start interest rate swaps to mitigate risk from its exposure to variability in interest payments on the Bank’s variable rate deposits. The Bank’s forward-start interest rate swaps exchange fixed for variable interest payments beginning at a pre-specified date in the future according to the terms of the swap agreements and are designated as cash flow hedges. As of June 30, 2014 and June 30, 2013, the notional amount of interest rate swap agreements designated as cash flow hedging instruments was $115,000,000 with a net fair value of $(1,018,000), and $100,000,000 with a net fair value of $1,789,000, respectively, included in other assets and other liabilities, on the Consolidated Statements of Financial Condition. During fiscal year 2014, the Bank recognized net losses of $479,000 in other revenue on the Consolidated Statements of Comprehensive Loss as a result of the termination of two liability position swaps and cash flow hedging ineffectiveness, with a loss of $286,000 related to the termination of $446,000 of liability position swaps and a loss of $180,000 for hedging ineffectiveness. The effective portion of gains and losses on the terminated derivative instruments designated and qualifying as cash flow hedges recorded in accumulated other comprehensive income during the term of the hedging relationship and reclassified into earnings during 2014 was a loss of $13,000.
In addition, interest rate swaps are used by the Bank to manage interest rate risk on certain fixed rate loans funded with variable rate deposits which exposes the Bank to potential variability in its net interest margin. These fixed rate loans include terms matching the interest rate swaps and are recorded at fair value under the fair value option election. See discussion in Note 5, Loans and Allowance for Probable Loan Losses for information regarding these loans valued at fair value. As of June 30, 2014 and June 30, 2013, the notional amount of interest rate swaps outstanding related to fixed rate loan transactions was $52,433,000 with a net fair value of $(457,000), and $13,902,000 with a fair value of $145,000, respectively, included in other assets and other liabilities on the Consolidated Statements of Financial Condition. During the three-months ended December 31, 2013, the Bank paid its counterparty $12,000 to terminate one interest rate swap.
For the fiscal year 2014, net losses recognized in other revenue on the Consolidated Statements of Comprehensive Loss as a result of changes in fair value of the interest rate swaps, not designated as cash flow hedges, were $614,000. For the fiscal year 2013, there were $145,000 gains recognized as a result of changes in fair value in other revenue on the Consolidated Statements of Comprehensive Loss.
At June 30, 2014 and 2013, the Bank had two securities with combined carrying amounts of approximately $9,516,000 and $9,967,000, respectively, and fair value amounts of approximately $9,372,000 and $9,673,000, respectively, pledged to secure interest rate swaps.
12.INTANGIBLE ASSETS
On March 22, 2006, the Company entered into an agreement with TD Ameritrade Holding Corporation, ("Ameritrade") to transfer Ameritrade’s correspondent clearing clients to the Company. This transaction closed in July 2006. As a result of this transaction, the Company recorded a customer relationship intangible of $5,060,000. The intangible asset was amortized over a five year period at a rate based on the estimated future economic benefit of the customer relationships. This intangible asset was fully amortized in July 2011 and SWS recognized approximately $6,000 of amortization expense in fiscal year 2012.
13.SHORT-TERM BORROWINGS
Brokerage.
Uncommitted lines of credit
Southwest Securities has credit arrangements with commercial banks, which include broker loan lines up to $400,000,000. These lines of credit are used primarily to finance securities owned, securities held for correspondent broker/dealer accounts, receivables in customers’ margin accounts and underwriting activities. These lines may also be used to release pledged collateral against day loans. These credit arrangements are provided on an “as offered” basis and are not committed lines of credit. These arrangements can be terminated at any time by the lender. Any outstanding balance under these credit arrangements is due on demand and bears interest at rates indexed to the federal funds rate (0.09% at June 30, 2014 and 0.07% at June 30, 2013). The total amount of borrowings available under these lines of credit is reduced by the amount available under the options trading unsecured letter of credit, referenced below. At June 30, 2014, the amount outstanding under these secured arrangements was $59,000,000, which was collateralized by securities held for firm accounts valued at $99,202,000. At June 30, 2013, the amount outstanding under these secured arrangements was $86,500,000, which was collateralized by securities held for firm accounts valued at $120,568,000.
At June 30, 2014 and June 30, 2013, Southwest Securities had a $20,000,000 unsecured line of credit that is due on demand and bears interest at rates indexed to the federal funds rate. This credit arrangement is provided on an “as offered” basis and is not a committed line of credit. The total amount of borrowings available under this line of credit is reduced by the amount outstanding
on the line and under any unsecured letters of credit at the time of borrowing. At June 30, 2014 and June 30, 2013, there were no amounts outstanding on this line. At June 30, 2014 and 2013, the total amount available for borrowing was $20,000,000.
Committed lines of credit
On January 28, 2011, Southwest Securities entered into an agreement with an unaffiliated bank for a $45,000,000 committed revolving credit facility. The commitment fee is 37.5 basis points per annum, and when drawn, the interest rate is equal to the federal funds rate plus 125 basis points. The agreement provides that Southwest Securities must maintain a tangible net worth of at least $150,000,000. The agreement was renewed on January 23, 2014 and has the same terms as the initial agreement. As of June 30, 2014, there were no outstanding amounts under the committed revolving credit facility and as of June 30, 2013, there was $45,000,000 outstanding. The secured borrowing was collateralized by securities with a value of $68,605,000 at June 30, 2013.
Letters of credit
At June 30, 2013, SWS had an irrevocable letter of credit agreement pledged to support customer open options positions with an options clearing organization. Until drawn, the letter of credit bears interest at a rate of 0.5% per annum and is renewable semi-annually. If drawn, the letter of credit bears interest at a rate of 0.5% per annum plus a fee. At June 30, 2013, the maximum amount available under this letter of credit agreement was $75,000,000. At June 30, 2013, the Company had outstanding, undrawn letters of credit of $50,000,000, bearing interest at a rate of 0.5% per annum. The letter of credit was fully collateralized by marketable securities held in client and non-client margin accounts with a value of $71,035,000 at June 30, 2013. The letter of credit was not renewed in the third quarter of fiscal 2014.
The Company also pledges customer securities to the Option Clearing Corporation to support open customer positions. At June 30, 2014, the Company had pledged $74,326,000 to support these open customer positions.
In addition to using customer securities to collateralize short-term borrowings, SWS also loans client securities as collateral in conjunction with SWS’s securities lending activities. At June 30, 2014, approximately $328,172,000 of client securities under customer margin loans was available to be pledged, of which SWS had pledged $26,890,000 under securities loan agreements. At June 30, 2013, approximately $329,013,000 of client securities under customer margin loans was available to be pledged, of which SWS had pledged $18,408,000 under securities loan agreements.
Banking.
In the second quarter of fiscal 2010, the Bank entered into a secured line of credit agreement with the Federal Reserve Bank of Dallas. This line of credit is secured by the Bank's commercial loan portfolio. This line is due on demand and bears interest at a rate equal to the federal funds target rate plus 50 basis points. At June 30, 2014 and June 30, 2013, the total amount available under this line was $42,857,000 and $28,267,000, respectively. There was no amount outstanding at June 30, 2014 and June 30, 2013.
14.DEPOSITS
The Bank’s deposits at June 30, 2014 and 2013 consisted of the following (dollars in thousands):
| | | | | | | | |
| | | | | | | | |
| 2014 | | | 2013 | |
| Amount | Percent | | Amount | Percent | |
| | | | | | | | |
Noninterest bearing demand accounts | $ 68,797 | 6.9 | % | | $ 55,221 | 5.5 | % | |
Interest bearing demand accounts | 7,921 | 0.8 | | | 7,723 | 0.8 | | |
Savings accounts | 880,212 | 88.0 | | | 883,229 | 88.9 | | |
Limited access money market accounts | 16,248 | 1.6 | | | 17,212 | 1.7 | | |
Certificates of deposit, less than $100,000 | 15,434 | 1.5 | | | 17,829 | 1.8 | | |
Certificates of deposit, $100,000 and greater | 11,527 | 1.2 | | | 12,505 | 1.3 | | |
| $ 1,000,139 | 100.0 | % | | $ 993,719 | 100.0 | % | |
| | | | | | | | |
The weighted average interest rate on the Bank’s deposits was approximately 0.04% at both June 30, 2014 and 2013, respectively.
At June 30, 2014, scheduled maturities of certificates of deposit were as follows (in thousands):
| | | | | | | | | | | | |
| | | | | | | | | | | | |
| 1 Year or Less | | > 1 Year Through 2 Years | | > 2 Years Through 3 Years | | > 3 Years Through 4 Years | | Thereafter | | Total | |
Certificates of deposit, less than $100,000 | $ 12,907 | | $ 1,393 | | $ 328 | | $ 424 | | $ 382 | | $ 15,434 | |
Certificates of deposit, $100,000 and greater | 9,833 | | 1,366 | | 328 | | - | | - | | 11,527 | |
| $ 22,740 | | $ 2,759 | | $ 656 | | $ 424 | | $ 382 | | $ 26,961 | |
| | | | | | | | | | | | |
The Bank is funded primarily by core deposits, with interest-bearing savings accounts from Southwest Securities’ customers making up a significant source of these deposits.
15.ADVANCES FROM THE FEDERAL HOME LOAN BANK
At June 30, 2014 and 2013, advances from the FHLB were due as follows (in thousands):
| | | |
| | | |
| 2014 | | 2013 |
Maturity: | | | |
Due in one year | $ 1,551 | | $ 15,486 |
Due in two years | 5,198 | | 1,859 |
Due in five years | 49,166 | | 48,956 |
Due in seven years | 8,292 | | 12,809 |
Due in ten years | 4,266 | | 8,424 |
Due in twenty years | 8,743 | | 10,163 |
| 77,216 | | 97,697 |
Restructuring prepayment penalty | (86) | | (132) |
| $ 77,130 | | $ 97,565 |
| | | |
The advances from the FHLB had interest rates ranging from less than 1% to 6% and were collateralized by approximately $220,052,000 in qualifying loans at June 30, 2014 (calculated at March 31, 2014). The weighted average interest rate was 2.3% at June 30, 2014. At June 30, 2013 (calculated at March 31, 2013), the advances from the FHLB had interest rates from less than 1% to 6% and were collateralized by approximately $181,000,000 in qualifying loans. The weighted average interest rate was 2.7% at June 30, 2013.
During the second quarter of fiscal 2013, the Bank restructured a portion of its fixed-rate FHLB advances with lower-cost FHLB advances. Upon restructuring, the Bank incurred a $166,000 prepayment penalty, which is being amortized using the effective interest method over the contractual term of the restructured advances. Amortization expense for the fiscal years 2014 and 2013 was $46,000 and $34,000, respectively.
At June 30, 2014, the Bank had net borrowing capacity with the FHLB of $142,836,000.
16.DEBT ISSUED WITH STOCK PURCHASE WARRANTS
On March 20, 2011, the Company entered into a Funding Agreement (the “Funding Agreement”) with Hilltop and Oak Hill. On July 29, 2011, after receipt of stockholder and regulatory approval, the Company completed the following transactions contemplated by the Funding Agreement:
| · | | entered into a $100,000,000, five year, unsecured credit agreement with Hilltop and Oak Hill that accrues interest at a rate of 8% per annum; |
| · | | issued warrants to Hilltop and Oak Hill allowing each to purchase up to 8,695,652 shares of the Company’s common stock; and |
| · | | granted Hilltop and Oak Hill certain rights, including certain registration rights, preemptive rights, and the right for each to appoint one person to the Company’s Board of Directors for so long as each owns 9.9% or more of all of the outstanding shares of the Company’s common stock or securities convertible into at least 9.9% of the Company’s outstanding common stock. |
On July 29, 2011, in connection with the loans made by Hilltop and Oak Hill under the Credit Agreement, the Company issued a warrant to Hilltop to purchase up to 8,695,652 shares of common stock (and in certain cases described below, shares of Non-Voting Perpetual Participating Preferred Stock, Series A (the “Series A Preferred Stock”)), and warrants to Oak Hill to purchase up to 8,695,652 shares of common stock (and in certain cases described below, shares of Series A Preferred Stock). These warrants are exercisable for five years and have a fixed exercise price of $5.75 per share, subject to standard anti-dilution adjustments for extraordinary corporate transactions, such as stock splits, dividends and combinations, the issuance of stock purchase rights, debt or asset distributions (including cash), tender offers or exchange offers and entry into certain business combinations. In addition, the warrants have a weighted average anti-dilution adjustment in the event the Company issues shares of common stock at less than 90% of the market price of the common stock on the date prior to the pricing of such shares. For each of Hilltop and Oak Hill, the warrants represent approximately 17% of the Company’s common stock for each investor as of June 30, 2014 (assuming that the warrants are exercised in full).
The warrants provide that the Company would only issue shares of Series A Preferred Stock upon the exercise of warrants if it is necessary to prevent Hilltop or Oak Hill from owning or being deemed to own shares of the Company’s common stock in excess of the “Ownership Limit” provided in the warrants. The “Ownership Limit” is 24.9% of any class of the securities of the Company or such level that Hilltop or Oak Hill reasonably determines would prevent them from being deemed to control the Company for purposes of the federal banking laws and regulations specified in the warrants. No shares of Series A Preferred Stock are issued or outstanding at June 30, 2014 and June 30, 2013. For additional discussion concerning the Series A Preferred Stock see the discussion in Note 20, Preferred Stock.
The warrants are recorded as a liability in the Consolidated Statements of Financial Condition at fair value. Initial and subsequent valuations of the warrants use a binomial valuation model. At initial valuation, July 29, 2011, the closing stock price was $5.45 per share yielding a fair value of $24,136,000. At June 30, 2014 and June 30, 2013, the closing stock prices used in the binomial valuation model were $7.28 and $5.45, respectively, and the warrants were valued at $27,796,000 and $24,197,000, respectively. The change in fair value for fiscal years 2014, 2013 and 2012 of $(3,599,000), $3,613,000 and $(3,674,000), respectively, was reflected as an unrealized loss on warrants valuation for fiscal 2014 and 2012 and an unrealized gain on warrant valuation for fiscal 2013 on the Consolidated Statements of Comprehensive Loss. The warrants are classified as Level 3 in the fair value hierarchy as disclosed in Note 26, Fair Value of Financial Instruments.
The loan is recorded as a liability with an 8% interest rate, a five year term and an effective interest rate of 14.9%. At July 29, 2011, the discount on the loan was initially valued at $24,136,000 and is being accreted using the effective interest method. For fiscal years 2014, 2013 and 2012, the Company recorded $4,667,000, $4,026,000 and $3,212,000, respectively, in accretion expense on the discount. The resulting long-term debt balance at June 30, 2014 and 2013 was $87,769,000 and $83,102,000, respectively. For both fiscal years 2014, 2013 and 2012, the cash portion of the interest expense paid on the loan to Hilltop and Oak Hill was $8,000,000, $8,000,000 and $7,355,000, respectively.
At July 29, 2011, legal and accounting fees, printing costs and other expenses associated with the loan and warrants totaled $2,459,000 and are being amortized on a straight-line method, which approximates the effective interest method, over the term of the loan. For both fiscal years 2014, 2013 and 2012, interest expense charged to operations was $492,000, $492,000 and $451,000, respectively.
The Company recorded total interest expense for this obligation for the fiscal years 2014, 2013 and 2012 on the Consolidated Statements of Comprehensive Loss of $13,159,000, $12,518,000 and $11,018,000, respectively.
The Credit Agreement contains customary financial covenants which require the Company to, among other things:
| · | | maintain a tangible net worth at least equal to the sum of $275,000,000 and 20% of cumulative consolidated net income (as defined in the Credit Agreement) for each fiscal quarter for which consolidated net income is positive; |
| · | | maintain a minimum unrestricted cash balance (as defined in the Credit Agreement) of at least $4,000,000; |
| · | | maintain an excess net capital balance at Southwest Securities of at least $100,000,000 as of the end of each calendar month; and |
| · | | maintain a total risk-based capital ratio, Tier 1 risk-based capital ratio and leverage ratio for the Bank that ensures the Bank is considered well capitalized or is required by federal law or regulation or action or directive by the Federal Reserve Board. |
In addition, the covenants limit the Company’s and certain of the Company’s subsidiaries’ ability to, among other things:
| · | | incur additional indebtedness; |
| · | | dispose of or acquire certain assets; |
| · | | pay dividends on the Company’s capital stock; |
| · | | make investments, including acquisitions; and |
| · | | enter into transactions with affiliates. |
The Company was in compliance with the financial covenants under the Credit Agreement as of June 30, 2014. Should the Company determine it needs additional debt at SWS Group, the Company would require regulatory approval and approval from Hilltop and Oak Hill.
If the proposed merger with Hilltop occurs, Hilltop’s warrant to acquire the Company’s common stock, if outstanding, will be cancelled.
Concurrently with the execution of the Merger Agreement, the Company entered into a Letter Agreement with Oak Hill dated March 31, 2014 (the “Oak Hill Letter Agreement”). Pursuant to the Oak Hill Letter Agreement and the Merger Agreement, at the closing of the proposed merger with Hilltop, Oak Hill will deliver to the Company the certificates evidencing its warrants and any loans of Oak Hill to the Company that are then outstanding under the Credit Agreement, and SWS will issue and deliver to Oak Hill, in exchange for its warrants and loans, the following consideration: (i) the merger consideration that Oak Hill would have been entitled to receive upon consummation of the merger if its warrants had been exercised immediately prior to the effective time of the merger and (ii) an amount equal to the Applicable Premium (as defined in the Credit Agreement, being a calculation of the present value of all required interest payments due on a loan through its maturity date on the date the loan is repaid) calculated as if the loans held by Oak Hill were prepaid in full as of the closing date of the merger.
17.INCOME TAXES
Income tax expense (benefit) for the fiscal years 2014, 2013 and 2012 (effective rate of -15.8% in fiscal 2014, -400.0% in fiscal 2013 and 20.4% in fiscal 2012) differs from the amount that would otherwise have been calculated by applying the federal corporate tax rate (35% in fiscal years 2014, 2013 and 2012) to loss before income tax expense (benefit) and is comprised of the following (in thousands):
| | | | | |
| | | | | |
| 2014 | | 2013 | | 2012 |
Income tax benefit at the statutory rate | $ (2,138) | | $ (2,341) | | $ (2,079) |
Tax exempt interest | (1,160) | | (998) | | (872) |
Tax exempt income from company-owned | | | | | |
life insurance ("COLI") | (735) | | (377) | | 74 |
State income taxes, net of federal tax benefit | 173 | | (419) | | 284 |
Non-deductible meals and entertainment | 116 | | 195 | | 189 |
Non-deductible compensation | (17) | | 1,017 | | 1,234 |
Valuation allowance | 4,648 | | 29,998 | | 28 |
Return to accrual adjustment | 66 | | (76) | | (26) |
Other, net | 15 | | (244) | | (43) |
| $ 968 | | $ 26,755 | | $ (1,211) |
| | | | | |
Income taxes as set forth in the Consolidated Statements of Comprehensive Loss consisted of the following components (in thousands):
| | | | | |
| | | | | |
| 2014 | | 2013 | | 2012 |
Current | | | | | |
Federal | $ 82 | | $ (76) | | $ (10,402) |
State | 640 | | (571) | | 140 |
| $ 722 | | $ (647) | | $ (10,262) |
| | | | | |
Deferred | | | | | |
Federal | $ 432 | | $ 27,159 | | $ 8,777 |
State | (186) | | 243 | | 274 |
| 246 | | 27,402 | | 9,051 |
Total income tax expense (benefit) | $ 968 | | $ 26,755 | | $ (1,211) |
| | | | | |
The tax effects of temporary differences that give rise to the deferred tax assets and deferred tax liabilities as of June 30, 2014 and 2013 are presented below (in thousands):
| | | | |
| | | | |
| 2014 | | 2013 | |
Deferred tax assets: | | | | |
Employee compensation plans | $ 11,216 | | $ 11,378 | |
Net operating loss carryforward | 12,914 | | 10,507 | |
Allowance for probable loan losses | 2,462 | | 3,400 | |
Securities available for sale | 2,205 | | 3,589 | |
Bad debt reserve | 1,902 | | 2,177 | |
Deferred rent | 1,853 | | 1,631 | |
Long-term debt | 1,406 | | - | |
State taxes | 1,095 | | 909 | |
Investment in unconsolidated ventures | 1,069 | | 909 | |
REO | 718 | | 139 | |
Deferred income on loans | 585 | | 810 | |
Interest rate swaps in cash flow hedging relationships | 240 | | - | |
Other | 836 | | 513 | |
Gross deferred tax assets | 38,501 | | 35,962 | |
Valuation allowance | (35,452) | | (30,870) | |
Net deferred tax assets | 3,049 | | 5,092 | |
| | | | |
Deferred tax liabilities: | | | | |
Interest rate swaps in cash flow hedging relationships | $ - | | $ (626) | |
Fixed assets, net | (115) | | (426) | |
Investment in unconsolidated ventures | - | | (120) | |
Long-term debt | - | | (82) | |
Other | (729) | | (249) | |
Total gross deferred tax liabilities | (844) | | (1,503) | |
Net deferred tax assets – included in other assets on the | | | | |
Consolidated Statements of Financial Condition | $ 2,205 | | $ 3,589 | |
| | | | |
Periodic reviews of the carrying amount of deferred tax assets are made to determine if the establishment of a valuation allowance is necessary when it is more likely than not that all or a portion of a deferred tax asset will not be realized. In assessing the realization of deferred tax assets, management considers all available evidence, both positive and negative, from the following expected sources of income: expected future reversals of deferred tax assets and liabilities, projected future taxable income, cumulative losses in recent years and tax planning strategies. In making such judgments, significant weight is given to evidence that can be objectively verified. ASC 740, “Income Taxes” provides that a cumulative loss in recent years is significant negative evidence in considering whether deferred tax assets are realizable and also restricts the reliance on projections of future taxable income to support the recovery of deferred tax assets. As of June 30, 2012, the Company had an allowance for deferred tax assets associated with its capital losses from investments. At June 30, 2013, based on an evaluation of the positive and negative evidence, management determined that it was appropriate to increase the valuation allowance for its remaining deferred tax assets, except for the Bank’s securities available for sale. Accordingly, the Company increased its allowance by $29,998,000 from $872,000 at June 29, 2012 to $30,870,000 at June 30, 2013. Based on activity in the current fiscal period, the allowance increased by $4,582,000 resulting in a valuation allowance of $35,452,000 at June 30, 2014. Despite the valuation allowance, these assets remain available to offset future taxable income.
Management did not establish a valuation allowance for the deferred tax asset generated on the Bank’s unrealized losses of its securities available for sale of $2,205,000, because the Bank currently has the intent and ability to hold these securities until they recover in value. The Company intends to maintain a valuation allowance with respect to its deferred tax assets, other than the Bank’s securities available for sale, until sufficient positive evidence exists to support its reduction or reversal.
The Company had a deferred tax asset for net operating losses for federal income tax purposes of approximately $12,914,000 and $10,507,000 at June 30, 2014 and 2013, respectively. In order to utilize the operating loss carryforwards, the Company must generate sufficient taxable income within the applicable carryforward period. If certain substantial changes in the Company’s ownership occur, there would be an annual limitation on the amount of the carryforwards that could be utilized.
A reconciliation of beginning and ending amounts of the net liability of uncertain tax positions is as follows (in thousands):
| | | | | |
| | | | | |
| June 30, 2014 | | June 30, 2013 | | June 29, 2012 |
Balance at the beginning of the year | $ 295 | | $ 1,125 | | $ 1,394 |
Increases as a result of tax positions taken during prior years | 32 | | - | | 551 |
Increases as a result of tax positions taken during the current period | - | | 20 | | 71 |
Decreases as a result of tax positions taken during prior years | (13) | | (381) | | (558) |
Decreases as a result of tax positions taken during the current period | (20) | | (10) | | - |
Lapse of applicable statute of limitations | (145) | | (361) | | (99) |
Settlements | - | | (98) | | (234) |
Balance at the end of the year | $ 149 | | $ 295 | | $ 1,125 |
While the Company expects that the net liability for uncertain tax positions will change during the next 12 months, the Company does not believe that the change will have a significant impact on its consolidated financial position or results of operations.
The Company recognizes interest and penalties on income taxes in income tax expense. Included in the net liability is accrued interest and penalties of $41,000 and $9,000, net of federal expense and benefit, as of June 30, 2014 and June 30, 2013, respectively. During the fiscal years ended June 30, 2014, June 30, 2013, and June 29, 2012, the Company recognized approximately $32,000, $(271,000), and $(42,000), net of federal expense (benefit), respectively, in interest and penalties in income tax expense. The total amount of unrecognized income tax benefits that if recognized would reduce income tax expense was approximately $108,000, $286,000 and $845,000 as of June 30, 2014, June 30, 2013 and June 29, 2012, respectively.
With limited exception, SWS is no longer subject to U.S. federal, state or local tax audits by taxing authorities for years preceding 2010. The Joint Committee completed its review of the Company’s federal tax returns for 2008 through 2011 with no exceptions, thereby concluding the matter.
18.REGULATORY CAPITAL REQUIREMENTS
Brokerage. The Company’s broker/dealer subsidiaries are subject to the SEC Uniform Net Capital Rule (the "Rule"), which requires the maintenance of minimum net capital. Southwest Securities has elected to use the alternative method, permitted by the Rule, which requires that it maintain minimum net capital, as defined in Rule 15c3-1 under the Exchange Act, equal to the greater of $1,000,000 or 2% of aggregate debit balances, as defined in Rule 15c3-3 under the Exchange Act. Additionally, the net capital rule of the NYSE provides that equity capital may not be withdrawn or cash dividends paid if resulting net capital would be less than 5% of the aggregate debit items. At June 30, 2014 and 2013, the net capital position of Southwest Securities was as follows (in thousands):
| | | | | | |
| | | | | | |
| June 30, 2014 | | | June 30, 2013 | | |
| | | | | | |
Net capital | $ 156,423 | | | $ 141,112 | | |
Less: required net capital | 6,577 | | | 6,843 | | |
Excess net capital | $ 149,846 | | | $ 134,269 | | |
Net capital as a percent of aggregate debit items | 47.6 | % | | 41.2 | % | |
Net capital in excess of 5% aggregate debit items | $ 139,981 | | | $ 124,005 | | |
| | | | | | |
SWS Financial follows the primary (aggregate indebtedness) method under Rule 15c3-1 under the Exchange Act, which requires the maintenance of the larger of minimum net capital of $250,000 or 1/15 of aggregate indebtedness. At June 30, 2014 and 2013, the net capital position of SWS Financial was as follows (in thousands):
| | | | | | |
| | | | | | |
| June 30, 2014 | | | June 30, 2013 | | |
| | | | | | |
Net capital | $ 1,141 | | | $ 713 | | |
Less: required net capital | 250 | | | 250 | | |
Excess net capital | $ 891 | | | $ 463 | | |
| | | | | | |
Banking. The Bank is subject to various regulatory capital requirements administered by federal agencies. Quantitative measures, established by regulation to ensure capital adequacy, require maintaining minimum amounts and ratios (set forth in the table below) of total and Tier 1 capital (as defined in 12 CFR 165 and 12 CFR 167) to risk-weighted assets (as defined) and of Tier 1 (core) capital (as defined) to adjusted assets (as defined). Federal statutes and OCC regulations have established five capital categories for federal savings banks: well-capitalized, adequately capitalized, undercapitalized, significantly undercapitalized, and critically undercapitalized. The federal banking agencies have jointly specified by regulation the relevant capital level for each category. An institution is defined as well-capitalized when its total risk-based capital ratio is at least 10.00%, its Tier 1 risk-based capital ratio is at least 6.00%, its Tier 1 (core) capital ratio is at least 5.00%, and it is not subject to any federal supervisory order or directive to meet a specific capital level. At June 30, 2014, the Bank met all capital requirements to which it was subject and satisfied the requirements to be defined as well capitalized.
Until terminated on January 14, 2013, the Bank was restricted by and subject to the Order to Cease and Desist, Order No. WN-11-003, effective on February 4, 2011 (the “Order”), originally issued by the Office of Thrift Supervision and then administered by the OCC. In connection with the termination of the Order on January 14, 2013, the Bank committed to the OCC that the Bank would, among other things: (i) adhere to the Bank’s written business and capital plan as amended from time to time and (ii) maintain a Tier 1 (core) capital ratio at least equal to nine percent (9%) and a total risk-based capital ratio of at least twelve percent (12%).
The Bank’s capital amounts and ratios at June 30, 2014 and 2013 were as follows (dollars in thousands):
| | | | | | | | | | | | | | | | |
| | | | | | | | | | | | | | | | |
| | Actual | | For Capital Adequacy Purposes | | To Be Well Capitalized Under Prompt Corrective Action Provisions | | | | |
| | Amount | Ratio | | Amount | Ratio | | Amount | Ratio | | | | |
June 30, 2014 | | | | | | | | | | | | | | | | |
Total risk-based capital | | $ 185,582 | 25.5 | % | | $ 58,147 | 8.0 | % | | $ 72,683 | 10.0 | % | | | | |
Tier I risk-based capital | | 177,640 | 24.4 | | | 29,073 | 4.0 | | | 43,610 | 6.0 | | | | | |
Tier I (core) capital | | 177,640 | 14.1 | | | 50,508 | 4.0 | | | 63,135 | 5.0 | | | | | |
| | | | | | | | | | | | | | | | |
| | Actual | | For Capital Adequacy Purposes | | To Be Well Capitalized Under Prompt Corrective Action Provisions | | |
| | Amount | Ratio | | Amount | Ratio | | Amount | Ratio | | | |
June 30, 2013 | | | | | | | | | | | | | | | | |
Total risk-based capital | | $ 181,909 | 24.9 | % | | $ 58,465 | 8.0 | % | | $ 73,081 | 10.0 | % | | | | |
Tier I risk-based capital | | 172,734 | 23.6 | | | 29,233 | 4.0 | | | 43,849 | 6.0 | | | | | |
Tier I (core) capital | | 172,734 | 13.5 | | | 51,081 | 4.0 | | | 63,851 | 5.0 | | | | | |
| | | | | | | | | | | | | | | | |
19.EMPLOYEE BENEFITS
Profit Sharing/401(k) Plan. SWS has a defined contribution profit sharing/401(k) plan covering substantially all of its employees. Employer provided profit sharing plan benefits become fully vested after six years of service by the participant. Profit sharing contributions are accrued and funded at SWS’s discretion. There were no profit sharing contributions in fiscal years 2014, 2013 and 2012. The Company contributes a matching contribution equal to 100% of the participant’s salary reduction amount not in excess of 4% of the individual’s compensation. SWS’s matching contributions vest immediately and the expense totaled approximately $3,952,000, $4,086,000 and $3,979,000 in fiscal years 2014, 2013 and 2012, respectively.
Employees have an option to purchase shares of SWS Group’s common stock held as an investment in the 401(k) plan. The 401(k) may purchase up to 1,500,000 of SWS Group’s common stock and at June 30, 2014, the total number of shares available for future purchases was 940,094.
Deferred Compensation Plan. SWS Group provides a deferred compensation plan for eligible officers and employees to defer a portion of their bonus compensation and commissions. The assets of the deferred compensation plan include investments in SWS Group common stock, Westwood common stock and COLI. Investments in SWS Group common stock are carried at cost and are held as treasury stock with an offsetting deferred compensation liability in the equity section of the Consolidated Statements of Financial Condition. Investments in Westwood common stock are carried at market value and recorded as securities available for sale. Investments in COLI are carried at the cash surrender value of the insurance policies and recorded in other assets in the Consolidated Statements of Financial Condition.
At June 30, 2014 and June 30, 2013, the Company had approximately $22,752,000 and $19,290,000 in deferred compensation plan assets, including cash balances of $383,000 and $666,000, respectively. The fair value of SWS Group common stock held in the deferred compensation plan at June 30, 2014 and June 30, 2013 was $2,264,000 and $1,644,000, respectively. The fair value of Westwood common stock held in the deferred compensation plan at June 30, 2014 and June 30, 2013 was $133,000 and $146,000, respectively. The cash surrender value of COLI held in the deferred compensation plan at June 30, 2014 and 2013 was $19,027,000 and $16,926,000, respectively. Funds totaling $3,209,000 were invested in 310,941 shares of SWS Group common stock, with the remainder invested in Westwood common stock and COLI as of June 30, 2014. Funds totaling $3,345,000 were invested in 301,660 shares of SWS Group common stock, with the remainder invested in Westwood common stock and COLI as of June 30, 2013. Approximately $1,751,000, $1,738,000 and $1,645,000 of compensation expense was recorded for participant contributions and employer matching contributions related to the deferred compensation plan in fiscal years 2014, 2013 and 2012, respectively. The trustee of the deferred compensation plan is Wilmington Trust Company.
The trustee under the deferred compensation plan periodically purchases the Company’s common stock in the open market in accordance with the terms of the plan. This stock is classified as treasury stock in the consolidated financial statements, but participates in dividends declared by SWS. The plan purchased 50,000 shares during fiscal 2014 at a cost of $288,000, or $5.76 per share. The plan purchased 20,675 shares during fiscal 2013 at a cost of $121,000, or $5.86 per share. During fiscal years 2014 and 2013, 40,719 and 24,867 shares, respectively, were sold or distributed pursuant to the plan.
Stock Option Plan. At June 30, 2014 and June 30, 2013, SWS had no active stock option plans and, as of August 22, 2012, all outstanding options to acquire shares of common stock under the 1996 Plan had expired.
A summary of the status of SWS’s outstanding stock options as of June 29, 2012 is presented below:
| | |
| | |
| 2012 |
| | Weighted- |
| Underlying | Average |
| Shares | Exercise Price |
| | |
Outstanding, beginning of period | 198,069 | $ 9.54 |
Exercised | - | - |
Forfeited | (99,744) | 10.13 |
Outstanding, end of period | 98,325 | $ 8.95 |
Exercisable, end of period | 98,325 | |
| | |
Restricted Stock Plan. The 2003 Restricted Stock Plan allowed for awards of up to 1,250,000 shares of SWS Group’s common stock to SWS’s directors, officers and employees. No more than 300,000 of the authorized shares could be newly issued shares of common stock. The 2003 Restricted Stock Plan terminated on August 21, 2013. On November 15, 2012, the stockholders of SWS Group, Inc. approved the adoption of the 2012 Restricted Stock Plan. The 2012 Restricted Stock Plan allows for awards of stock to
SWS’s directors, officers and employees and authorizes up to 2,630,000 shares of SWS’s common stock to be delivered pursuant to awards granted under the 2012 Restricted Stock Plan. The 2012 Restricted Stock Plan terminates on November 15, 2022. The vesting period for awards is determined on an individual basis by the Compensation Committee of the Board of Directors. In general, restricted stock granted to employees under the 2012 and 2003 Restricted Stock Plans vests in equal amounts on each anniversary of the date of grant over a three year period or is subject to a four year cliff vesting schedule, and restricted stock granted to non-employee directors vests on the first anniversary of the date of grant.
During fiscal 2012, the Board of Directors approved grants to various officers and employees totaling 348,810 shares with a weighted average market value of $7.02 per share. During fiscal 2013, the Board of Directors approved grants to various officers and employees totaling 65,079 shares of restricted stock with a weighted average market value of $4.84 per share. During fiscal year 2014, the Board of Directors approved grants to various officers and employees totaling 199,891 shares of restricted stock with a weighted average market value of $5.64 per share. As a result of these grants, SWS recorded deferred compensation in additional paid in capital of approximately $3,543,000. For the fiscal years 2014, 2013 and 2012, SWS recognized compensation expense related to restricted stock grants of approximately $901,000, $1,090,000 and $1,155,000, respectively.
Upon vesting of the shares granted under the Company’s restricted stock plans, the grantees may choose to sell a portion of their vested shares to the Company to cover the tax liabilities arising from the vesting. The table below summarizes the number and fair value of vested shares repurchased to cover grantees’ tax liabilities (dollars in thousands, except share and per share amounts).
| | | | |
| | | | |
| | Purchase | | Weighted- Average |
| Shares Purchased | Price | | Price per Share |
| | | | |
Fiscal year ended | | | | |
June 30, 2014 | 1,094 | $ 6 | | $ 5.55 |
June 30, 2013 | 9,618 | $ 56 | | $ 5.83 |
| | | | |
At June 30, 2014, the total number of shares outstanding under the Restricted Stock Plan was 417,137 and the total number of shares available for future issuance was 2,383,016.
20.PREFERRED STOCK
On March 17, 2011 in conjunction with the transaction with Hilltop and Oak Hill, the Board of Directors created the Series A Preferred Stock, par value $1.00 per share. The Company has 17,400 authorized shares of Series A Preferred Stock, and no shares were issued or outstanding at June 30, 2014 and 2013. If any shares of Series A Preferred Stock are issued, the Series A Preferred Stock will not be entitled to vote with the common stock and will be convertible into shares of common stock at a fixed conversion ratio of 1,000 shares of common stock for each share of Series A Preferred Stock outstanding. The conversion ratio is subject to certain anti-dilution adjustments for extraordinary corporate transactions, such as stock splits, dividends and combinations, the issuance of stock purchase rights, debt or asset distributions (including cash), tender offers or exchange offers and entry into a shareholder rights plan. Each share of Series A Preferred Stock would automatically convert into shares of common stock if such shares were transferred by Hilltop or Oak Hill to a non-affiliate. See additional discussion concerning the Series A Preferred Stock in Note 16, Debt Issued with Stock Purchase Warrants.
21.INTEREST INCOME AND INTEREST EXPENSE
For the fiscal years ended June 30, 2014, June 30, 2013 and June 29, 2012 and, for the Bank, for fiscal years ended June 30, 2014, 2013 and 2012, the components of interest income and expense were as follows (in thousands):
| | | | | | |
| | For the Fiscal Year Ended |
| | June 2014 | | June 2013 | | June 2012 |
| | | | | | |
Interest income: | | | | | | |
Customer margin accounts | | $ 8,849 | | $ 8,236 | | $ 8,604 |
Assets segregated for regulatory purposes | | 126 | | 121 | | 197 |
Stock borrowed | | 34,683 | | 36,074 | | 52,620 |
Loans | | 26,742 | | 37,644 | | 48,819 |
Bank investments | | 11,153 | | 6,968 | | 3,137 |
Other | | 5,514 | | 8,307 | | 8,743 |
| | $ 87,067 | | $ 97,350 | | $ 122,120 |
| | | | | | |
Interest expense: | | | | | | |
Customer funds on deposit | | $ 120 | | $ 232 | | $ 342 |
Stock loaned | | 25,972 | | 27,084 | | 41,048 |
Deposits | | 355 | | 468 | | 808 |
Federal Home Loan Bank | | 2,426 | | 2,721 | | 3,920 |
Long-term debt | | 13,159 | | 12,518 | | 11,018 |
Other | | 2,894 | | 3,438 | | 3,182 |
| | 44,926 | | 46,461 | | 60,318 |
Total net interest revenue | | $ 42,141 | | $ 50,889 | | $ 61,802 |
| | | | | | |
22.LOSS PER SHARE
The following reconciles the weighted average shares outstanding used in the basic and diluted EPS computations for fiscal years 2014, 2013 and 2012 (in thousands, except share and per share amounts):
| | | | | |
| | | | | |
| 2014 | | 2013 | | 2012 |
| | | | | |
Net loss | $ (7,078) | | $ (33,445) | | $ (4,729) |
| | | | | |
Weighted average shares outstanding – basic | 32,996,779 | | 32,870,003 | | 32,649,544 |
Effect of dilutive securities | - | | - | | - |
Weighted average shares outstanding – diluted | 32,996,779 | | 32,870,003 | | 32,649,544 |
| | | | | |
Loss per share – basic | | | | | |
Net loss | $ (0.21) | | $ (1.02) | | $ (0.14) |
| | | | | |
Loss per share – diluted | | | | | |
Net loss | $ (0.21) | | $ (1.02) | | $ (0.14) |
| | | | | |
Unvested share-based payment awards that contain non-forfeitable rights to dividends or dividend equivalents (paid or unpaid) are treated as participating securities and are factored into the calculation of EPS, except in periods with a net loss, when they are excluded.
As a result of the net loss for the fiscal years 2014, 2013 and 2012, the warrants to acquire 17,391,304 shares of common stock were anti-dilutive and were excluded from the calculation of diluted weighted average shares outstanding and diluted EPS.
At June 29, 2012, options to acquire approximately 98,000 shares of common stock were outstanding under SWS’s stock option plans, see Note 19, Employee Benefits. As a result of the net loss in fiscal year 2012, all options were anti-dilutive and were
excluded from the calculation of diluted weighted average shares outstanding and diluted EPS. As a result of the expiration of all options to acquire shares of common stock on August 22, 2012, there was no effect on the calculation of diluted weighted average shares outstanding or diluted EPS in fiscal year 2013.
The Company did not declare a dividend during the fiscal years 2014, 2013 and 2012.
On a quarterly basis, the Board of Directors determines whether the Company will pay a cash dividend. The payment and rate of dividends on the Company’s common stock is subject to several factors including limitations imposed by the terms of the Credit Agreement with Hilltop and Oak Hill, regulatory approval, operating results, the Company’s financial requirements, and the availability of funds from the Company’s subsidiaries, including the broker/dealer subsidiaries, which may be subject to restrictions under the net capital rules of the SEC and FINRA, and the Bank, which may be subject to restrictions by federal banking agencies. Specifically, the Credit Agreement with Hilltop and Oak Hill only allows the Company to pay a quarterly cash dividend of $0.01 per share when the Company is not in default of any terms of the Credit Agreement. The Company currently intends to retain earnings to fund operations and does not plan to pay dividends on its common stock in the near future.
23.SEGMENT REPORTING
SWS operates the following four business segments:
| · | | Clearing: The clearing segment provides clearing and execution services (generally on a fully disclosed basis) for securities broker/dealers, for bank affiliated firms and firms specializing in high volume trading. |
| · | | Retail Brokerage: The retail brokerage segment includes retail securities products and services (equities, mutual funds and fixed income products), insurance products and managed accounts and encompasses the activities of the Company’s employees that are registered representatives and the Company’s independent contractors who are under contract with SWS Financial. |
| · | | Institutional Brokerage: The institutional brokerage segment serves institutional customers in securities borrowing and lending, municipal finance, sales, trading and underwriting of taxable and tax-exempt fixed income securities and equity trading. |
| · | | Banking: The Bank offers traditional banking products and services, focusing on industrial and small business lending, commercial real estate lending and mortgage purchase. |
Clearing and institutional brokerage services are offered exclusively through Southwest Securities. The Bank and its subsidiary comprise the banking segment. Retail brokerage services are offered through Southwest Securities (the Private Client Group and the Investment Management Group departments), SWS Insurance and SWS Financial (which contracts with independent representatives for the administration of their securities business).
SWS's segments are managed separately based on types of products and services offered and their related client bases. The segments are consistent with how the Company manages its resources and assesses its performance. Management assesses performance based primarily on income before income taxes and net interest revenue (expense). As a result, SWS reports net interest revenue (expense) by segment. SWS's business segment information is prepared using the following methodologies:
| · | | the financial results for each segment are determined using the same policies as those described in Note 1, Significant Accounting Policies; |
| · | | segment financial information includes the allocation of interest based on each segment’s earned interest spreads; |
| · | | information system and operational expenses are allocated based on each segment’s usage; |
| · | | shared securities execution facilities expenses are allocated to the segments based on production levels; |
| · | | money market fee revenue is allocated based on each segment’s average balances; and |
| · | | clearing charges are allocated based on clearing levels from each segment. |
Intersegment balances are eliminated upon consolidation and have been applied to the appropriate segment.
The "other" category includes SWS Group, corporate administration and SWS Capital. SWS Capital is a dormant entity that holds approximately $20,000 of assets. SWS Group is a holding company that owns various investments.
The following table presents the Company’s operations by the segments outlined above for the fiscal years 2014, 2013 and 2012:
| | | | | | | |
| | | | | | | |
| FINANCIAL INFORMATION | |
(in thousands) | Clearing | Retail Brokerage | Institutional Brokerage | Banking | Other Consolidated Entities | Consolidated SWS Group, Inc. | |
June 30, 2014 | | | | | | | |
| | | | | | | |
Operating revenue | $ 14,145 | $ 108,892 | $ 97,834 | $ 1,937 | $ 1,413 | $ 224,221 | |
Net intersegment revenues | (712) | 706 | (231) | 3,278 | (3,041) | - | |
Net interest revenue | 6,099 | 3,565 | 10,377 | 35,114 | (13,014) | 42,141 | |
Net revenues | 20,244 | 112,457 | 108,211 | 37,051 | (11,601) | 266,362 | |
Non-interest expenses | 16,958 | 102,864 | 84,696 | 26,297 | 38,058 | 268,873 | |
Other losses | - | - | - | - | (3,599) | (3,599) | |
Depreciation and amortization | 20 | 843 | 312 | 1,480 | 2,739 | 5,394 | |
Net income (loss) before taxes | 3,286 | 9,593 | 23,515 | 10,754 | (53,258) | (6,110) | |
Assets (*) | 271,381 | 211,105 | 2,240,750 | 1,257,799 | 10,235 | 3,991,270 | |
| | | | | | | |
June 30, 2013 | | | | | | | |
| | | | | | | |
Operating revenue | $ 12,875 | $ 107,109 | $ 95,569 | $ 2,678 | $ 2,533 | $ 220,764 | |
Net intersegment revenues | (725) | 714 | (227) | 3,458 | (3,220) | - | |
Net interest revenue | 6,063 | 3,331 | 12,378 | 41,423 | (12,306) | 50,889 | |
Net revenues | 18,938 | 110,440 | 107,947 | 44,101 | (9,773) | 271,653 | |
Non-interest expenses | 19,419 | 107,942 | 87,081 | 31,359 | 36,155 | 281,956 | |
Other gains | - | - | - | - | 3,613 | 3,613 | |
Depreciation and amortization | 66 | 872 | 421 | 1,747 | 2,376 | 5,482 | |
Net income (loss) before taxes | (481) | 2,498 | 20,866 | 12,742 | (42,315) | (6,690) | |
Assets (*) | 260,824 | 212,001 | 1,836,469 | 1,269,308 | 36,093 | 3,614,695 | |
| | | | | | | |
June 29, 2012 | | | | | | | |
| | | | | | | |
Operating revenue | $ 12,558 | $ 103,150 | $ 114,498 | $ 2,714 | $ (1,299) | $ 231,621 | |
Net intersegment revenues | (770) | 676 | 128 | 3,657 | (3,691) | - | |
Net interest revenue | 6,056 | 3,732 | 15,579 | 47,228 | (10,793) | 61,802 | |
Net revenues | 18,614 | 106,882 | 130,077 | 49,942 | (12,092) | 293,423 | |
Non-interest expenses | 20,368 | 108,788 | 90,423 | 42,626 | 33,484 | 295,689 | |
Other losses | - | - | - | - | (3,674) | (3,674) | |
Depreciation and amortization | 75 | 921 | 416 | 1,922 | 2,445 | 5,779 | |
Net income (loss) before taxes | (1,754) | (1,906) | 39,654 | 7,316 | (49,250) | (5,940) | |
Assets (*) | 279,367 | 203,916 | 1,600,659 | 1,306,653 | 71,564 | 3,462,159 | |
| | | | | | | |
________
(*) Assets are reconciled to total assets as presented in the June 30, 2014, June 30, 2013 and June 29, 2012 Consolidated Statements of Financial Condition as follows (in thousands):
| | | | | | |
| | | | | | |
| | | | | | |
| June 30, 2014 | | June 30, 2013 | | June 29, 2012 | |
Amount as presented above | $ 3,991,270 | | $ 3,614,695 | | $ 3,462,159 | |
Reconciling items: | | | | | | |
Unallocated assets: | | | | | | |
Cash | 16,709 | | 12,071 | | 9,365 | |
Receivables from brokers, dealers and clearing | | | | | | |
organizations | 31,655 | | 81,378 | | 44,780 | |
Receivable from clients, net of allowances | 19,171 | | 51,437 | | 17,231 | |
Other assets | 31,271 | | 24,037 | | 20,504 | |
Unallocated eliminations | (14,170) | | (3,245) | | (7,196) | |
Total assets | $ 4,075,906 | | $ 3,780,373 | | $ 3,546,843 | |
| | | | | | |
24.COMMITMENTS, CONTINGENCIES AND GUARANTEES
Commitments and Contingencies.
Litigation. In the general course of its brokerage business and the business of clearing for other brokerage firms, SWS Group and/or its subsidiaries have been named as defendants in various lawsuits and arbitration proceedings. These claims allege, among other things, violations of various federal and state securities laws. The Bank is also involved in certain legal claims and actions arising in the ordinary course of business. Management believes that resolution of these claims will not result in any material adverse effect on SWS’s consolidated financial condition, results of operations or cash flows.
The Company has been named as a defendant in three lawsuits related to a $35,000,000 bond offering that was 40% underwritten by M.L. Stern & Co., LLC. SWS Group purchased M.L. Stern & Co., LLC in 2008. The offering took place in November 2005, and the lawsuit was filed in November 2009.
The discovery stage of the lawsuits has been completed and a trial date has been set. The ultimate amount of liability associated with the lawsuits cannot currently be determined. However, the Company believes it is at least reasonably possible that a loss related to this matter will be incurred. At June 30, 2014 and 2013, the Company had a recorded liability of approximately $1,000,000 related to this matter.
Merger Litigation. Two putative class actions on behalf of purported stockholders of the Company challenging the proposed merger of the Company and Peruna are pending in the Court of Chancery of the State of Delaware. Both lawsuits name as defendants the Company, the members of the BOD, Hilltop, and Peruna, (Joseph Arceri v. SWS Group, Inc. et al and Chaile Steinberg v. SWS Group, Inc. et al filed April 8, 2014 and April 11, 2014, respectively). On May 13, 2014, the Delaware Chancery Court consolidated the two actions for all purposes. On June 10, 2014, plaintiffs filed a consolidated amended complaint.
The complaint generally alleges, among other things, that the BOD breached its fiduciary duties to stockholders by failing to take steps to maximize stockholder value or to engage in a fair sale process before approving the merger, and that the other defendants aided and abetted such breaches of fiduciary duty. The complaint alleges, among other things, that the BOD labored under conflicts of interest, and that certain provisions of the Merger Agreement unduly restrict the Company’s ability to negotiate with other potential bidders, and that the Form S-4 filed by Hilltop on May 29, 2014 omits or misstates certain material information. The complaint seeks relief that includes, among other things, an injunction prohibiting the consummation of the merger, rescission to the extent the merger terms have already been implemented, damages for the alleged breaches of fiduciary duty, and the payment of plaintiffs’ attorneys’ fees and costs. On June 16, 2014, plaintiffs moved for a preliminary injunction prohibiting the consummation of the merger, and for expedited proceedings in connection therewith. Pursuant to negotiations between the parties to the lawsuit, plaintiffs subsequently withdrew those motions.
The Company believes the claims are without merit and intends to defend against them vigorously. There can be no assurance, however, with regard to the outcome of this lawsuit. Currently, a loss resulting from these claims is not considered probable or reasonably estimable in amount.
Contingency. In February 2011, a limited partnership venture capital fund in which the Company invested received a proposed assessment of transferee liability from the Internal Revenue Service (“IRS”) for the tax period ended December 31, 2005. The proposed assessment is approximately $8,000,000, not including penalties of approximately $3,000,000.
The Company would be responsible for approximately $2,500,000 of the proposed assessment including penalties based on its partnership interest. Interest is also accruing on this proposed assessment. As of June 30, 2014, the Company has not accrued an amount on the financial statements due to the uncertainty regarding the proposed assessment. The matter relates to certain transactions that occurred during 2005 concerning one of the limited partnership venture capital fund’s subsidiaries. The limited partnership venture capital fund engaged tax counsel and filed a tax court petition in February 2014. Management of the limited partnership venture capital fund believes that the ultimate outcome will be favorable; however, the limited partnership venture capital fund can give no assurance that it will prevail.
Leases. SWS leases its offices and certain data processing equipment used in its brokerage operations under non-cancelable operating lease agreements. The Company recognizes escalating lease payments on a straight line basis over the term of each respective lease with the difference between cash payment and rent expense recorded as deferred rent and included in other liabilities in the Consolidated Statements of Financial Condition. Rental expense for facilities and equipment leases for fiscal years 2014, 2013 and 2012 aggregated approximately $9,648,000, $10,349,000 and $10,944,000, respectively.
The future rental payments for the non-cancelable operating leases at June 30, 2014 are included in the table below (in thousands). Of the $40,483,000 in lease commitments, no amounts have been reserved for as impaired.
| | |
| | |
| Operating | |
| Leases | |
Fiscal year: | | |
2015 | $ 8,095 | |
2016 | 6,950 | |
2017 | 5,786 | |
2018 | 4,888 | |
2019 | 4,593 | |
Thereafter | 10,171 | |
Total minimum lease payments | $ 40,483 | |
| | |
Bank’s Equity Investments. The Bank has committed to invest $3,000,000 and $2,000,000 in two limited partnership equity funds. These commitments end in fiscal 2017 and fiscal 2020, respectively, unless the limited partners elect to terminate the commitment period at an earlier date in accordance with the terms of the partnership agreement. Also, in April 2012, the Bank acquired an interest in a private investment fund to obtain additional credit for its obligations under the CRA. The Bank has committed to invest $3,000,000 in the fund. As of June 30, 2014, $480,000 in contributions have been made by the Bank to this fund. The commitment in the private investment fund expires in fiscal 2022 with the possibility of two additional one-year extensions.
Underwriting. Through its participation in underwriting corporate and municipal securities, SWS could expose itself to material risk that securities SWS has committed to purchase cannot be sold at the initial offering price. Federal and state securities laws and regulations also affect the activities of underwriters and impose substantial potential liabilities for violations in connection with sales of securities by underwriters to the public. At June 30, 2014, the Company had $3,715,000 of potential liabilities due under outstanding underwriting arrangements.
Guarantees. The Bank faces the risk of credit loss under commitments to extend credit and stand-by letters of credit up to the contractual amount of these instruments in the event of breach by the other party to the instrument. The Bank uses the same credit policies in making commitments and conditional obligations as it does for instruments reported on the Consolidated Statements of Financial Condition.
As of June 30, 2014, the Bank had issued stand-by letters of credit in the amount of $137,000. The recourse provision of the letters of credit allows the amount of the letters of credit to become a part of the fully collateralized loans with total repayment as a first lien. The collateral on these letters of credit consists of certificates of deposit.
In the ordinary course of business, the Bank enters into loan agreements where the Bank commits to lend a specified amount of money to a borrower. At any point in time, there could be amounts that have not been advanced on the loan to the borrower, representing unfunded commitments, as well as amounts that have been disbursed but repaid, which are available for re-borrowing under a revolving line of credit. As of June 30, 2014, the Bank had commitments of $54,924,000 relating to revolving lines of credit and unfunded commitments. In addition, as of June 30, 2014, the Bank had approved unfunded new loans in the amount of $9,009,000.
Commitments to extend credit are agreements to lend to a customer as long as there is no violation of any condition established in the contract. Commitments generally have fixed expiration dates or other termination clauses and may require the payment of a fee. Since many of the commitments are expected to expire unused, the total Bank’s commitments do not necessarily represent future cash requirements. The Bank evaluates the customer’s creditworthiness on a case-by-case basis. The amount and type of collateral obtained, if deemed necessary by the Bank upon extension of credit, varies and is based on management’s credit evaluation of the counterparty. The Bank did not incur any significant losses on its commitments during fiscal 2014. In addition, management does not believe the Bank will incur material losses as a result of its outstanding commitments at June 30, 2014.
The Company provides representations and warranties to counterparties in connection with a variety of commercial transactions and occasionally indemnifies counterparties against potential losses caused by the breach of those representations and warranties. These indemnification obligations generally are standard contractual indemnities and are entered into in the normal course of business. The maximum potential amount of future payments that the Company could be required to make under these indemnities cannot be estimated. However, the Company believes that it is unlikely it will have to make material payments under these arrangements and has not recorded any contingent liability in the consolidated financial statements for these indemnities.
Southwest Securities is a member of multiple exchanges and clearinghouses. Under the membership agreements, members are generally required to guarantee the performance of other members. Additionally, if a member becomes unable to satisfy its obligations to the clearinghouse, other members would be required to meet shortfalls. To mitigate these performance risks, the exchanges and clearinghouses often require members to post collateral. SWS’s maximum potential liability under these arrangements cannot be quantified. However, the potential for the Company to be required to make payments under these arrangements is unlikely. Accordingly, the Company has not recorded any contingent liability in the consolidated financial statements for these arrangements.
25.AFFILIATE TRANSACTIONS
Clients and correspondents of SWS have the option to invest in a savings account called Bank Insured Deposits at the Bank. These funds are FDIC insured up to $250,000. The funds are considered core deposits and are the primary funding source for the Bank. The Bank’s total core deposits were $1,000,597,000 and $993,871,000 at June 30, 2014 and June 30, 2013, respectively. At June 30, 2014 and June 30, 2013, clients of Southwest Securities had invested $873,136,000 and $878,434,000, respectively, in Bank Insured Deposits at the Bank.
In the ordinary course of business, the Bank has transactions, including borrowings and deposits, with its executive officers, directors and their affiliates. It is the policy of the Bank that such transactions are on the same terms, including interest rates and collateral requirements, as those prevailing at the time for comparable transactions with unaffiliated persons. There were $3,245,000 at June 30, 2014 and $3,358,000 at June 30, 2013 of such borrowings outstanding. The Bank recorded $197,000 and $203,000 of interest income on affiliate loans in fiscal years 2014 and 2013, respectively, and no interest income on affiliate loans in fiscal 2012. Aggregate deposits from affiliates totaled approximately $1,097,000 and $1,664,000 at June 30, 2014 and 2013, respectively.
26.FAIR VALUE OF FINANCIAL INSTRUMENTS
Recurring Fair Value Measurements.
The following tables summarize by level within the fair value hierarchy “Loans measured at fair value,” “Securities owned, at fair value,” “Securities available for sale”, “Securities sold, not yet purchased, at fair value”, “Interest Rate Swaps” and “Warrants” which were measured at fair value on a recurring basis at June 30, 2014 and 2013. See Note 1(x), Fair Value of Financial Instruments.
| | | | | | |
| | | | | | |
(in thousands) | Level 1 | Level 2 | Level 3 | Total | |
June 30, 2014 | | | | | | |
ASSETS | | | | | | |
Loans measured at fair value | | | | | | |
Loans measured at fair value | $ - | $ - | $ | 53,148 | $ 53,148 | |
| $ - | $ - | $ | 53,148 | $ 53,148 | |
| | | | | | |
Securities owned, at fair value | | | | | | |
Corporate equity securities | $ 680 | $ - | $ | 475 | $ 1,155 | |
Municipal obligations | - | 48,224 | | 4,023 | 52,247 | |
U.S. government and government agency obligations | 8,013 | 42,546 | | - | 50,559 | |
Corporate obligations | - | 95,625 | | 87 | 95,712 | |
Other | 982 | 34,970 | | - | 35,952 | |
| $ 9,675 | $ 221,365 | $ | 4,585 | $ 235,625 | |
| | | | | | |
Securities available for sale | | | | | | |
Westwood common stock | $ 133 | $ - | $ | - | $ 133 | |
U.S. government and government agency obligations | - | 452,513 | | - | 452,513 | |
Municipal obligations | - | 42,202 | | - | 42,202 | |
| $ 133 | $ 494,715 | $ | - | $ 494,848 | |
| | | | | | |
LIABILITIES | | | | | | |
Securities sold, not yet purchased, at fair value | | | | | | |
Municipal obligations | $ - | $ 9 | $ | - | $ 9 | |
U.S. government and government agency obligations | 72,708 | 1,683 | | - | 74,391 | |
Corporate obligations | - | 46,814 | | - | 46,814 | |
Other | - | 141 | | - | 141 | |
| $ 72,708 | $ 48,647 | $ | - | $ 121,355 | |
| | | | | | |
Interest Rate Swaps - Net | | | | | | |
Interest Rate Swaps - Net | $ - | $ 1,475 | $ | - | $ 1,475 | |
| $ - | $ 1,475 | $ | - | $ 1,475 | |
| | | | | | |
Warrants | | | | | | |
Warrants | $ - | $ - | $ | 27,796 | $ 27,796 | |
| $ - | $ - | $ | 27,796 | $ 27,796 | |
| | | | | | |
Net assets (liabilities) | $ (62,900) | $ 665,958 | $ | 29,937 | $ 632,995 | |
| | | | | | |
| | | | | | |
| | | | | | |
(in thousands) | Level 1 | Level 2 | Level 3 | Total | |
June 30, 2013 | | | | | | |
ASSETS | | | | | | |
Loans measured at fair value | | | | | | |
Loans measured at fair value | $ - | $ 13,757 | $ | - | $ 13,757 | |
| $ - | $ 13,757 | $ | - | $ 13,757 | |
| | | | | | |
Securities owned, at fair value | | | | | | |
Corporate equity securities | $ 895 | $ - | $ | 625 | $ 1,520 | |
Municipal obligations | - | 30,116 | | - | 30,116 | |
U.S. government and government agency obligations | 3,300 | 38,229 | | - | 41,529 | |
Corporate obligations | - | 127,779 | | 120 | 127,899 | |
Other | 692 | 7,877 | | - | 8,569 | |
| $ 4,887 | $ 204,001 | $ | 745 | $ 209,633 | |
| | | | | | |
Securities available for sale | | | | | | |
Westwood common stock | $ 146 | $ - | $ | - | $ 146 | |
U.S. government and government agency obligations | - | 474,906 | | - | 474,906 | |
Municipal obligations | - | 28,224 | | - | 28,224 | |
| $ 146 | $ 503,130 | $ | - | $ 503,276 | |
| | | | | | |
Interest Rate Swaps | | | | | | |
Interest Rate Swaps | $ - | $ 1,934 | $ | - | $ 1,934 | |
| $ - | $ 1,934 | $ | - | $ 1,934 | |
| | | | | | |
LIABILITIES | | | | | | |
Securities sold, not yet purchased, at fair value | | | | | | |
Municipal obligations | $ - | $ 10 | $ | - | $ 10 | |
U.S. government and government agency obligations | 45,415 | 8,671 | | - | 54,086 | |
Corporate obligations | - | 80,639 | | - | 80,639 | |
| $ 45,415 | $ 89,320 | $ | - | $ 134,735 | |
| | | | | | |
Warrants | | | | | | |
Warrants | $ - | $ - | $ | 24,197 | $ 24,197 | |
| $ - | $ - | $ | 24,197 | $ 24,197 | |
| | | | | | |
Net assets (liabilities) | $ (40,382) | $ 633,502 | $ | (23,452) | $ 569,668 | |
| | | | | | |
The following table provides a reconciliation of the beginning and ending balances for the major classes of assets and (liabilities) measured at fair value using significant unobservable inputs (Level 3):
| | | | | | |
| | | | | | |
(in thousands) | Loans | Corporate Equity Securities | Municipal Obligations | Corporate Obligations | Warrants | Total |
Ending balance at June 30, 2013 | $ - | $ 625 | $ - | $ 120 | $ (24,197) | $ (23,452) |
Redemption/sale of security | - | (150) | - | - | - | (150) |
Unrealized loss | - | - | - | (40) | - | (40) |
Unrealized gain | 664 | - | - | 7 | - | 671 |
Transfers from Level 2 to Level 3 | 35,333 | - | 4,023 | - | - | 39,356 |
Loan pay downs | (479) | - | - | - | - | (479) |
Loan originations with the | | | | | | |
execution of interest rate swaps | 17,630 | - | - | - | - | 17,630 |
Decrease in warrants valuation | | | | | | |
(unrealized gain) | - | - | - | - | 5,204 | 5,204 |
Increase in warrants valuation | | | | | | |
(unrealized loss) | - | - | - | - | (8,803) | (8,803) |
Ending balance at June 30, 2014 | $ 53,148 | $ 475 | $ 4,023 | $ 87 | $ (27,796) | $ 29,937 |
At the end of each respective quarterly reporting period, the Company recognizes transfers of financial instruments between levels. During the fiscal year 2014, the Company transferred the loans measured at fair value and $4,023,000 of municipal bonds from Level 2 to Level 3 due to a lack of observable data to support a Level 2 valuation.
Changes in unrealized gains (losses) and realized gains (losses) for corporate obligations, municipal bonds and corporate equity securities are presented in net gains on principal transactions on the Consolidated Statements of Comprehensive Loss. Changes in unrealized gain (loss) for the warrants are presented in unrealized gain (loss) on warrants valuation on the Consolidated Statements of Comprehensive Loss. The total unrealized loss included in earnings related to assets and liabilities still held for the fiscal years 2014 and 2013 was $8,843,000 and $12,102,000, respectively. The total unrealized gains included in earnings related to assets and liabilities still held for the fiscal years 2014 and 2013 was $6,070,000 and $15,638,000, respectively. A realized loss of $3,308,000 was recognized for fiscal 2013 in association with the Level 3 corporate obligations.
In fiscal year 2014, the Company redeemed six auction rate preferred securities valued at the time of sale at $150,000, recognizing no gain or loss on the redemptions.
In the fiscal year 2013, the Company sold one municipal auction rate bond and redeemed one auction rate preferred security valued at the time of sale at $20,304,000 and $50,000, respectively, recognizing no gain or loss on the transactions. In fiscal 2013, a total unrealized loss of $702,000, representing a write-down on the municipal auction rate bond, was recognized.
The following table highlights, for each asset and liability measured at fair value on a recurring basis and categorized within Level 3 of the fair value hierarchy, the significant unobservable inputs used in the fair value measurement as of June 30, 2014 (dollars in thousands):
| | | | | |
| | | | | |
Asset/Liability | Fair Value | Valuation Technique(s) | Unobservable Inputs | Range (Weighted-Average) | |
| | | | | |
Loans measured at fair value | | | | | |
Loans measured at fair value | $ 53,148 | Discounted cash flow | Discount Rate | 4.09%-5.08%
(4.45%) | |
| | | | | |
Securities owned, at fair value | | | | | |
Corporate equity securities- auction rate preferred | 475 | Analysis of comparable securities | N/A | N/A | |
| | | | | |
Municipal Obligations | 4,023 | Discounted cash flow | N/A | N/A | |
| | | | | |
Corporate obligations | 87 | Discounted cash flow | N/A | N/A | |
Warrants | | | | | |
Warrants | 27,796 | Binomial Model | Derived Volatility | 25% - 32% (28%) | |
The loans are independently valued quarterly using a discounted cash flow model which factors in the relevant contractual loan terms and then present valued back to a market-based discount rate. The market-based discount rate is based on how the subject loans would be priced as of the valuation date and therefore include normal credit loss expectations, given the underlying underwriting standards including loan to value ratio and debt coverage ratios for the subject portfolio. The rate at which the loans are discounted is based upon London Interbank Offered Rate (LIBOR), Bank preferential return and terms of the loan.
At June 30, 2014, the Company held 19 auction rate preferred securities that, based on observed values of comparable securities, were valued at their par value of $475,000. Since June 2010, the Company has held up to $1,825,000 in Level 3 auction rate preferred securities, of which $1,350,000 have been redeemed at par. The remaining $475,000 of auction rate preferred securities are similar to those that were previously redeemed, and the Company anticipates that the remaining securities will also be redeemed at par. While a liquidity discount has been considered for these securities, the Company does not believe a discount is warranted. To the extent these securities are redeemed at a price below par, the Company would consider revaluing any remaining securities at a discounted price.
The Company holds municipal bond obligations in an entity which is currently undergoing restructuring and has been under a letter of intent to be acquired since February 2013. Due to the restructuring transaction, the bond is not readily traded in the market. The municipal obligations are valued using a discounted cash flow model with observable market data, however, due to the decrease in the number of transactions from which to evaluate the bond’s market environment, the Company has determined that these bonds should be valued at Level 3. The valuation method is listed in the table above. The Company will continue to monitor the trading and deal progress to ensure an accurate valuation is utilized.
The Company holds $3,505,000 of corporate obligation bonds currently valued at $87,000. The corporate bonds are valued using a discounted cash flow model with observable market data, however, due to the distressed nature of these bonds, the Company has determined that these bonds should be valued at Level 3.
The warrants issued to Hilltop and Oak Hill are valued quarterly using a binomial model that considers the following variables: price and volatility of the Company’s stock, treasury yield, annual dividend and the remaining life of the warrants. The derived volatility estimate considers both the historical and implied forward volatility of the Company’s common stock. The primary drivers of the value of the warrants are the price and volatility of the Company’s common stock. As the volatility and/or stock price increase, the value of the warrants increase as well. The movement of these two variables will amplify or offset one another depending on the direction and velocity of their movements. In addition, the warrants will lose time value as they near their contractual expiration date.
Non-Recurring Fair Value Measurements.
Certain financial and non-financial instruments are not measured at fair value on an ongoing basis but are subject to fair value measurement in certain circumstances; for example, when there is evidence of impairment or in other situations where the lower of cost or fair value method of accounting is applied.
The following table summarizes by level within the fair value hierarchy the Company’s financial and non-financial instruments which were measured at fair value on a non-recurring basis at June 30, 2014 and June 30, 2013 (in thousands):
| | | | | | |
| | | | | | |
June 2014 | | Level 1 | Level 2 | Level 3 | Total | |
Impaired loans (1) | | $ - | $ - | $ 13,713 | $ 13,713 | |
REO | | - | - | 4,875 | 4,875 | |
Impaired servicing assets | | - | - | 447 | 447 | |
| | $ - | $ - | $ 19,035 | $ 19,035 | |
| | | | | | |
June 2013 | | | | | | |
Impaired loans (1) | | $ - | $ - | $ 20,086 | $ 20,086 | |
REO | | - | - | 10,165 | 10,165 | |
| | $ - | $ - | $ 30,251 | $ 30,251 | |
| | | | | | |
_____________
(1) Includes certain impaired loans measured at fair value through the allocation of specific valuation allowances or principal charge-offs.
For the fiscal years ended June 30, 2014 and 2013, adjustments to the fair value of impaired loans resulted in a charge to earnings as a provision for loan loss of $714,000 and $3,718,000, respectively. For the fiscal years ended June 30, 2014 and 2013, adjustments to the fair value of REO property held at June 30, 2014 and 2013, respectively, resulted in a charge to earnings as a write-down of REOs of $252,000 and $1,396,000, respectively. For the fiscal year ended June 30, 2014, adjustments to the fair value of servicing assets resulted in a charge to earnings as an impairment for servicing assets of $12,400.
Other Fair Value Disclosures.
The Company’s fair value policies for instruments measured at fair value in accordance with the disclosure requirements of ASC 820 “Fair Value Measurements and Disclosures” are discussed in Note 1(x) Fair Value of Financial Instruments – Other Fair Value Disclosures. The recorded amounts, fair value and level of fair value hierarchy of the Company’s financial instruments at June 30, 2014 and 2013 were as follows (in thousands):
| | | | | | | |
| | | | | | | |
| | June 30, 2014 | | June 30, 2013 | |
| Level | Recorded Value | Fair Value | | Recorded Value | Fair Value | |
Financial assets: | | | | | | | |
Cash and cash equivalents | 1 | $ 99,620 | $ 99,620 | | $ 111,046 | $ 111,046 | |
Restricted cash and cash equivalents | 1 | - | - | | 30,047 | 30,047 | |
| | | | | | | |
Securities held to maturity: | | | | | | | |
GNMA securities | 2 | 12,549 | 12,952 | | 17,423 | 17,965 | |
Loans, net: | | | | | | | |
Purchase mortgage loans held for investment | 3 | 133,854 | 133,618 | | 174,037 | 173,738 | |
Other loans held for investment | 3 | 427,354 | 429,062 | | 420,789 | 437,916 | |
Servicing assets | 3 | 447 | 447 | | 412 | 414 | |
| | | | | | | |
Financial liabilities: | | | | | | | |
Short-Term Borrowings | 1 | 59,000 | 59,000 | | 131,500 | 131,500 | |
Deposits: | | | | | | | |
Deposits with no stated maturity | 2 | 973,178 | 968,072 | | 963,385 | 959,578 | |
Time deposits | 2 | 26,961 | 27,136 | | 30,334 | 30,736 | |
Advances from FHLB | 2 | 77,130 | 78,891 | | 97,565 | 100,408 | |
Long-term debt | 3 | 87,769 | 99,841 | | 83,102 | 86,822 | |
| | | | | | | |
27.FINANCIAL INSTRUMENTS WITH OFF-STATEMENT OF FINANCIAL CONDITION RISK
In the normal course of business, the broker/dealer subsidiaries engage in activities involving the execution, settlement and financing of various securities transactions. These activities may expose SWS to off-statement of financial condition credit and market risks in the event the customer or counterparty is unable to fulfill its contractual obligation. Such risks may be increased by volatile trading markets.
As part of its normal brokerage activities, SWS sells securities not yet purchased (short sales) for its own account. The establishment of short positions exposes SWS to off-statement of financial condition market risk if prices increase, as SWS may be obligated to acquire the securities at prevailing market prices.
SWS seeks to control the risks associated with its customer activities, including those of customer accounts of its correspondents for which it provides clearing services, by requiring customers to maintain margin collateral in compliance with various regulatory and internal guidelines. The required margin levels are monitored daily and, pursuant to such guidelines, customers are required to deposit additional collateral or to reduce positions when necessary.
A portion of SWS’s customer activity involves short sales and the writing of option contracts. Such transactions may require SWS to purchase or sell financial instruments at prevailing market prices in order to fulfill the customer’s obligations.
At times, SWS lends money using reverse repurchase agreements. These positions are collateralized by U.S. government and government agency securities. Such transactions may expose SWS to off-statement of financial condition risk in the event such borrowers do not repay the loans and the value of collateral held is less than that of the underlying receivable. These agreements provide SWS with the right to maintain the relationship between market value of the collateral and the receivable.
SWS arranges secured financing by pledging securities owned and unpaid customer securities for short-term borrowings to satisfy margin deposits of clearing organizations. SWS also actively participates in the borrowing and lending of securities. In the event the counterparty in these and other securities loaned transactions is unable to return such securities pledged or borrowed or to repay the deposit placed with them, SWS may be exposed to the risks of acquiring the securities at prevailing market prices or holding collateral possessing a market value less than that of the related pledged securities. SWS seeks to
control the risks by monitoring the market value of securities pledged and requiring adjustments of collateral levels where necessary.
The Bank is a party to financial instruments with off-statement of financial condition risk in the normal course of business to meet the financing needs of its customers. These financial instruments involve, to varying degrees, elements of credit and interest rate risk in excess of the amount recognized in the Consolidated Statements of Financial Condition.