| UNITED STATES |
| SECURITIES AND EXCHANGE COMMISSION |
| Washington, D.C. 20549 |
| |
| |
| FORM N-CSR |
| |
| CERTIFIED SHAREHOLDER REPORT OF REGISTERED MANAGEMENT |
| INVESTMENT COMPANIES |
| |
| Investment Company Act file number 811-6395 |
| |
| DREYFUS NEW YORK MUNICIPAL CASH MANAGEMENT |
| (Exact name of Registrant as specified in charter) |
| |
| |
| c/o The Dreyfus Corporation |
| 200 Park Avenue |
| New York, New York 10166 |
| (Address of principal executive offices) (Zip code) |
| |
| Mark N. Jacobs, Esq. |
| 200 Park Avenue |
| New York, New York 10166 |
| (Name and address of agent for service) |
| |
| Registrant's telephone number, including area code: (212) 922-6000 |
| Date of fiscal year end: | | 1/31 |
| Date of reporting period: | | 1/31/07 |
FORM N-CSR
Item 1. Reports to Stockholders.

| Contents | | |
| |
| The Funds | | |
| |
|
| Letter to Shareholders (Taxable) | | 3 |
| Letter to Shareholders (Tax-Exempt) | | 5 |
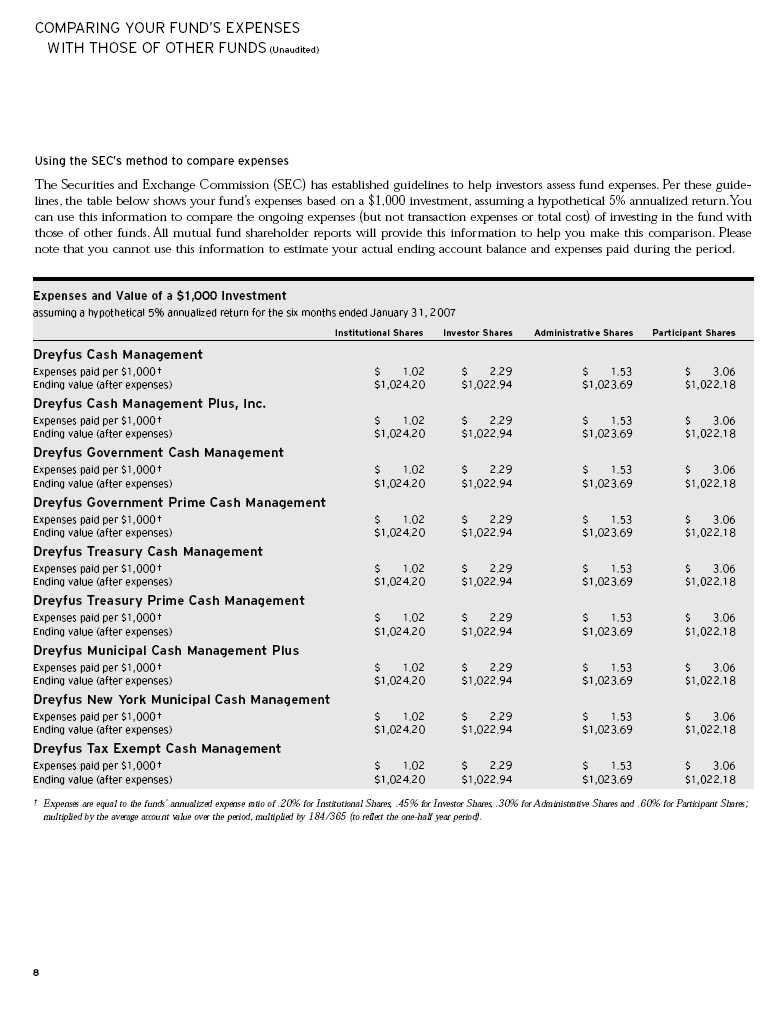
| Understanding Your Fund’s Expenses | | 7 |
| Comparing Your Fund’s Expenses | | |
| With Those of Other Funds | | 8 |
| Statements of Investments | | 9 |
| Statements of Assets and Liabilities | | 46 |
| Statements of Operations | | 48 |
| Statements of Changes in Net Assets | | 50 |
| Financial Highlights | | 54 |
| Notes to Financial Statements | | 63 |
| Report of Independent Registered | | |
| Public Accounting Firm | | 67 |
| Important Tax Information | | 68 |
| Board Members Information | | 69 |
| Officers of the Funds | | 70 |
| For More Information | | |
| |
|
| Back cover | | |
The views expressed in this report reflect those of the portfolio manager only through the end of the period covered and do not necessarily represent the views of Dreyfus or any other person in the Dreyfus organization. Any such views are subject to change at any time based upon market or other conditions and Dreyfus disclaims any responsibility to update such views. These views may not be relied on as investment advice and, because investment decisions for a Dreyfus fund are based on numerous factors, may not be relied on as an indication of trading intent on behalf of any Dreyfus fund.
• Not FDIC-Insured • Not Bank-Guaranteed • May Lose Value
Dreyfus Cash Management Funds
The Funds

Dear Shareholder:
We are pleased to present the annual report for Dreyfus Cash Management Funds (Taxable). For the 12-month period ended January 31, 2007, the six Dreyfus Cash Management Funds listed below produced the following yields and effective yields:1
| | | | | Effective |
| | | Yield (%) | | Yield (%) |
| |
| |
|
| Dreyfus Cash Management | | | | |
| Institutional Shares | | 4.95 | | 5.07 |
| Investor Shares | | 4.70 | | 4.80 |
| Administrative Shares | | 4.85 | | 4.96 |
| Participant Shares | | 4.55 | | 4.65 |
| |
| |
|
| Dreyfus Cash Management Plus, Inc. | | |
| Institutional Shares | | 4.94 | | 5.06 |
| Investor Shares | | 4.69 | | 4.80 |
| Administrative Shares | | 4.84 | | 4.95 |
| Participant Shares | | 4.55 | | 4.64 |
| |
| |
|
| Dreyfus Government Cash Management | | |
| Institutional Shares | | 4.87 | | 4.98 |
| Investor Shares | | 4.62 | | 4.72 |
| Administrative Shares | | 4.77 | | 4.88 |
| Participant Shares | | 4.47 | | 4.56 |
| |
| |
|
| Dreyfus Government Prime Cash Management |
| Institutional Shares | | 4.84 | | 4.95 |
| Investor Shares | | 4.59 | | 4.69 |
| Administrative Shares | | 4.74 | | 4.85 |
| Participant Shares | | 4.44 | | 4.53 |
| |
| |
|
| Dreyfus Treasury Cash Management | | |
| Institutional Shares | | 4.79 | | 4.89 |
| Investor Shares | | 4.54 | | 4.63 |
| Administrative Shares | | 4.69 | | 4.79 |
| Participant Shares | | 4.38 | | 4.47 |
| |
| |
|
| Dreyfus Treasury Prime Cash Management |
| Institutional Shares | | 4.58 | | 4.68 |
| Investor Shares | | 4.34 | | 4.42 |
| Administrative Shares | | 4.49 | | 4.58 |
| Participant Shares | | 4.19 | | 4.27 |
Economic and Market Environment
The reporting period proved to be a time of transition for the U.S. economy and Federal Reserve Board (the “Fed”) policy. Gross domestic product expanded at a
robust 5.6% annualized rate in the first quarter of 2006, generally encouraging equity investors but causing some nervousness in bond markets. Low unemployment and strong consumer confidence began to rekindle fixed-income investors’ inflation concerns and, despite another increase in short-term interest rates by the Fed in March, the U.S. Treasury securities yield curve steepened.
By the spring, investors’ economic concerns intensified. Hawkish comments from Fed members in early May sparked sharp declines in longer-term bond prices. In addition, a falling unemployment rate stoked fears that wage inflation might accelerate. Hence, investors widely expected the Fed’s rate hike in May to 5% and its move in June to 5.25% .
The outlook for future Fed action became cloudier over the summer amid worries that an overly aggressive Fed might trigger a recession.These concerns were compounded when it later was announced that U.S. GDP expanded at a more moderate 2.6% annualized rate during the second quarter. Indeed, the U.S. economy appeared to slow further over the summer, when housing markets softened. The Fed cited a slower economy when it left short-term interest rates unchanged at 5.25% in August, the first pause after more than two years of steady rate hikes.
The Fed again left overnight interest rates unchanged in September.While core inflation data remained elevated, the Fed indicated that it expected those pressures to moderate as the economy slowed. In fact, tumbling oil prices put a lid on one of the main drivers of the market’s inflation fears. At the same time, a decline in the unemployment rate helped to reassure investors that the economy probably was headed for a soft landing. Expectations of slower economic growth were later verified when it was announced that U.S. GDP growth had moderated to an annualized 2.0% in the third quarter of the year.
As was widely expected, the Fed continued to hold overnight interest rates steady at its meeting in late October. Still, Fed members indicated that further policy firming might be needed if inflation remained above the Fed’s comfort zone.
The Fed’s concerns appeared to be warranted when December showed healthy employment gains. However, other economic data — including declines in consumer confidence and orders for durable goods — suggested that the economy continued to slow, but at a gradual pace that seemed to hold little risk of recession. Accordingly, the Fed left the federal funds rate unchanged at its December meeting.
As 2007 began, some analysts began to predict that further economic weakness might compel the Fed to reduce interest rates later in the year. However, the U.S. economy appeared to gain new momentum in January, when the U.S. Department of Labor reported that weekly wages rose by an inflation-adjusted 2.1% in 2006. Meanwhile, the government also announced that the U.S. economy overall grew at an estimated 3.5% annualized rate in the fourth quarter, faster than anticipated.Yet, inflation drove consumer prices higher at a relatively moderate 2.5% rate in 2006, the lowest annual increase since 2003.
The combination of stronger-than-expected economic growth and subdued inflation delayed expectations of any changes in Fed policy. Indeed, some investors came to believe that the Fed would remain on the sidelines for much of 2007 as it scrutinized new economic data to assess the impact of its previous tightening campaign on the economy and inflation. The Fed did just that at its meeting in late January, when it left the federal funds rate at 5.25% for the fifth consecutive time.
Portfolio Focus
Over the first half of the reporting period, as short-term interest rates rose, we maintained the funds’ weighted average maturities in a range we considered shorter than industry averages.After the Fed paused in its tightening campaign in August, we increased the funds’ weighted average maturities to the neutral range. However, with yield differences along the money market yield curve near historically narrow levels, it made little sense to establish a longer maturity position.
Although Fed members seem comfortable with interest rates for now, they stand ready to change monetary policy as conditions warrant.Therefore, after a multi-year period in which Fed actions were predictable, we believe that we have entered a more uncertain time, in which every piece of economic data is likely to be scrutinized for its possible impact on monetary policy. Current economic data suggest that the Fed could remain on hold for some time. However, new economic data may paint a different picture, making a relatively cautious investment posture prudent.

| February 15, 2007 |
| New York, N.Y. |
An investment in the fund is not insured or guaranteed by the FDIC or any other government agency. Although the fund seeks to preserve the value of your investment at $1.00 per share, it is possible to lose money by investing in the fund.
1 Effective yield is based upon dividends declared daily and reinvested monthly. Past performance is no guarantee of future results.Yields fluctuate.

Dear Shareholder:
We are pleased to present the annual report for Dreyfus Cash Management Funds (Tax Exempt). For the 12-month period ended January 31, 2007, the three tax-exempt money market portfolios that comprise Dreyfus Cash Management Funds (Tax Exempt) produced the following yields and effective yields:1
| | | | | Effective |
| | | Yield (%) | | Yield (%) |
| |
| |
|
| Dreyfus Municipal Cash Management Plus | | |
| Institutional Shares | | 3.32 | | 3.37 |
| Investor Shares | | 3.07 | | 3.11 |
| Administrative Shares | | 3.22 | | 3.27 |
| Participant Shares | | 2.92 | | 2.96 |
| |
| |
|
| Dreyfus New York Municipal Cash Management |
| Institutional Shares | | 3.31 | | 3.36 |
| Investor Shares | | 3.06 | | 3.10 |
| Administrative Shares | | 3.21 | | 3.25 |
| Participant Shares | | 2.91 | | 2.94 |
| |
| |
|
| Dreyfus Tax Exempt Cash Management | | |
| Institutional Shares | | 3.29 | | 3.34 |
| Investor Shares | | 3.04 | | 3.08 |
| Administrative Shares | | 3.19 | | 3.24 |
| Participant Shares | | 2.89 | | 2.93 |
Economic and Market Environment
As it had since June 2004, the Federal Reserve Board (“the Fed”) at the beginning of 2006 continued to raise short-term interest rates in a growing U.S. economy. Nonetheless, labor markets continued to strengthen, energy prices remained volatile and inflation concerns intensified over the first few months of the reporting period. By May, resurgent energy prices and hawkish comments from Fed members led investors to revise upward their expectations for inflation and interest rates. In late June, the Fed increased the overnight federal funds rate to 5.25%, its highest level in more than five years.
However, a softening housing market during the summer of 2006 helped to relieve investors’ inflation concerns. The Fed appeared to lend credence to a more moderate inflation outlook when it refrained from raising interest rates at its meeting in early August, its first pause in more than two years.
The Fed continued to hold interest rates steady in September, October and December, citing the likelihood that slower economic growth would reduce inflationary pressures. Expectations of slower economic growth were verified late in 2006 when it was announced that U.S.GDP growth had moderated to an annualized 2.0% in the third quarter of the year, down from 2.6% and 5.6% annualized rates in the second and first quarters of 2006, respectively.
However, the U.S. economy appeared to gain new momentum in the closing weeks of 2006 and the beginning of 2007. Employment gains accelerated unexpectedly in December, while crude oil prices fell to their lowest levels since June 2005. In January, the U.S. Department of Labor reported that weekly wages rose by an inflation-adjusted 2.1% in 2006, which many analysts saw as further evidence of a robust labor market. Meanwhile, the government also announced that the U.S. economy overall grew at an estimated 3.5% annualized rate in the fourth quarter, faster than anticipated.Yet, inflation drove consumer prices higher at a relatively moderate 2.5% rate in 2006, the lowest annual increase since 2003.
The combination of stronger-than-expected economic growth and subdued inflation delayed expectations of any changes in Fed policy. Indeed, many analysts predicted that the Fed would remain on the sidelines for much of 2007 as it scrutinized new economic data to assess the impact of its previous tightening campaign on the economy and inflation.The Fed did just
that at its meeting in late January, when it left the federal funds rate at 5.25% for the fifth consecutive time.
Although yields of tax-exempt money market securities rose along with interest rates over the first half of the reporting period, yields of shorter-dated instruments rose more sharply than longer-dated instruments. By the reporting period’s second half,there was little difference in the yields of securities with maturities between six months and four years.Investors therefore continued to focus on tax-exempt instruments maturing in six months or less.
Technical factors also helped limit the rise in tax-exempt money market yields.The growing U.S. economy reduced the borrowing needs of several states and municipalities, and some issuers revised their borrowing programs to rely more heavily on short-term variable-rate demand notes, resulting in sharply reduced issuance of one-year municipal notes. Yet, investor demand remained strong, as evidenced by an increase in money market fund assets to record levels. This balance between supply-and-demand was particularly apparent in New York, where strong financial results from Wall Street helped support tax receipts and reduced the state’s and city’s need to borrow.
In this environment, we generally maintained the funds’ weighted average maturities in a range we considered to be roughly in line with industry averages. Whenever possible, however, we attempted to smooth out the funds’ yields by limiting their exposure to variable-rate instruments. Instead, we found opportunities in tax-exempt commercial paper and seasoned municipal notes and bonds.
As of the end of the reporting period, the funds’ weighted average maturities stood in a range that was slightly longer than industry averages, due in part to our focus on commercial paper. In addition, we have attempted to maintain the funds’ yields over the winter months, when a dearth of new issuance tends to put downward pressure on yields. Many of the funds’ holdings mature in April and May, a strategy designed to make cash available for new purchases at a time when selling pressure caused by income tax payments generally causes yields to rise.

| February 15, 2007 |
| New York, N.Y. |
An investment in each fund is not insured or guaranteed by the FDIC or any other government agency. Although each fund seeks to preserve the value of your investment at $1.00 per share, it is possible to lose money by investing in the funds.
1 Effective yield is based upon dividends declared daily and reinvested monthly. Past performance is no guarantee of future results.Yields fluctuate. For the national funds, income may be subject to state and local taxes. For the New York fund, income may be subject to state and local taxes for out-of-state residents. For each fund, some income may be subject to the federal alternative minimum tax (AMT).
6

| STATEMENT OF INVESTMENTS |
| January 31, 2007 |
| | | Principal | | |
| Dreyfus Cash Management | | Amount ($) | | Value ($) |
| |
| |
|
| |
| Negotiable Bank Certificates of Deposit—24.4% | | |
| |
|
| Banco Bilbao Vizcaya Argentaria Puerto Rico (Yankee) | | |
| 5.31%, 5/2/07 | | 250,000,000 | | 250,000,000 |
| Bank of America N.A. | | | | |
| 5.32%, 3/21/07 | | 75,000,000 a | | 75,000,000 |
| Bank of Ireland (Yankee) | | | | |
| 5.31%, 4/18/07 | | 50,000,000 b | | 50,000,000 |
| Bank of Tokyo-Mitsubishi Ltd. (Yankee) | | | | |
| 5.31%, 2/6/07 | | 500,000,000 | | 500,000,000 |
| Barclays Bank PLC (Yankee) | | | | |
| 5.31%, 4/10/07 | | 400,000,000 | | 400,000,000 |
| Bayerische Hypo-und Vereinsbank AG (Yankee) | | |
| 5.34%, 4/30/07 | | 350,000,000 | | 350,000,000 |
| DEPFA BANK PLC (Yankee) | | | | |
| 5.29%—5.32%, 2/5/07—3/6/07 | | 675,000,000 b | | 675,000,000 |
| HBOS PLC (London) | | | | |
| 5.32%, 5/21/07 | | 412,000,000 | | 412,000,000 |
| HBOS Treasury Services PLC (London) | | | | |
| 5.30%—5.31%, 2/12/07—3/7/07 | | 200,000,000 | | 200,000,000 |
| HSH Nordbank AG (Yankee) | | | | |
| 5.32%—5.33%, 4/30/07—5/21/07 | | 300,000,000 b | | 300,000,000 |
| Societe Generale (London) | | | | |
| 5.32%, 2/5/07 | | 5,000,000 | | 5,000,035 |
| Total Negotiable Bank Certificates of Deposit | | |
| (cost $3,217,000,035) | | | | 3,217,000,035 |
| |
| |
|
| |
| Commercial Paper—57.8% | | | | |
| |
| |
|
| Abbey National North America LLC | | | | |
| 5.28%, 2/1/07 | | 300,000,000 | | 300,000,000 |
| Alliance & Leicester PLC | | | | |
| 5.31%, 4/18/07 | | 175,000,000 | | 173,064,111 |
| Amstel Funding Corp. | | | | |
| 5.31%, 3/28/07—4/2/07 | | 124,369,000 b | | 123,338,212 |
| Amsterdam Funding Corp. | | | | |
| 5.31%—5.32%, 2/5/07—4/24/07 | | 160,000,000 b | | 158,551,981 |
| ASB Finance Ltd. | | | | |
| 5.30%, 3/7/07 | | 50,000,000 b | | 49,753,028 |
| Atlantis One Funding Corp. | | | | |
| 5.31%—5.33%, 2/21/07—4/3/07 | | 258,504,000 b | | 256,709,049 |
| Bank of America Corp. | | | | |
| 5.32%, 5/18/07 | | 142,000,000 | | 139,813,279 |
| Bank of Ireland | | | | |
| 5.31%, 5/1/07 | | 80,000,000 b | | 78,962,656 |
STATEMENT OF INVESTMENTS (continued)
| | | Principal | | |
| Dreyfus Cash Management (continued) | | Amount ($) | | Value ($) |
| |
| |
|
| |
| Commercial Paper (continued) | | | | |
| |
| |
|
| Bear Stearns Cos. Inc. | | | | |
| 5.34%, 3/15/07 | | 200,000,000 | | 198,784,333 |
| Beta Finance Inc. | | | | |
| 5.30%—5.31%, 3/15/07—4/3/07 | | 170,000,000 b | | 168,908,922 |
| Cancara Asset Securitisation Ltd. | | | | |
| 5.32%, 2/14/07 | | 100,877,000 b | | 100,685,754 |
| CBA (Delaware) Finance Inc. | | | | |
| 5.29%—5.31%, 2/16/07—5/18/07 | | 177,500,000 | | 176,090,492 |
| CC (USA) Inc. | | | | |
| 5.31%, 4/10/07 | | 100,000,000 b | | 99,016,833 |
| CIESCO LLC | | | | |
| 5.30%, 2/27/07 | | 100,000,000 b | | 99,621,917 |
| Citigroup Funding Inc. | | | | |
| 5.33%, 3/2/07—3/5/07 | | 300,000,000 | | 298,664,354 |
| CRC Funding LLC | | | | |
| 5.30%, 2/27/07 | | 200,000,000 b | | 199,243,833 |
| Crown Point Capital Co. LLC | | | | |
| 5.33%, 5/17/07 | | 108,370,000 b | | 106,729,549 |
| Deutsche Bank Financial LLC | | | | |
| 5.27%, 2/1/07 | | 300,000,000 | | 300,000,000 |
| DnB NOR Bank ASA | | | | |
| 5.33%, 3/19/07—3/21/07 | | 120,000,000 | | 119,184,017 |
| FCAR Owner Trust, Ser. I | | | | |
| 5.32%—5.38%, 2/23/07—3/19/07 | | 224,970,000 | | 223,550,624 |
| FCAR Owner Trust, Ser. II | | | | |
| 5.33%, 4/23/07—4/24/07 | | 350,000,000 | | 345,832,181 |
| General Electric Capital Corp. | | | | |
| 5.31%, 2/20/07 | | 222,000,000 | | 221,386,047 |
| General Electric Capital Services Inc. | | | | |
| 5.31%, 2/20/07 | | 100,000,000 | | 99,723,445 |
| Govco Inc. | | | | |
| 5.30%—5.32%, 3/5/07—5/15/07 | | 95,000,000 b | | 93,846,339 |
| Harrier Finance Funding Ltd. | | | | |
| 5.32%—5.34%, 2/22/07—4/26/07 | | 514,000,000 b | | 508,449,883 |
| K2 (USA) LLC | | | | |
| 5.31%—5.32%, 2/22/07—5/4/07 | | 133,500,000 b | | 132,784,125 |
| Morgan Stanley | | | | |
| 5.31%—5.32%, 5/4/07—5/7/07 | | 275,000,000 | | 271,233,625 |
| Santander Central Hispano | | | | |
| Finance (Delaware) Inc. | | | | |
| 5.34%, 4/27/07 | | 118,000,000 | | 116,551,222 |
| Simba Funding Corp. | | | | |
| 5.34%, 3/16/07—3/23/07 | | 472,074,000 b | | 468,891,447 |
| Skandinaviska Enskilda Banken AB | | | | |
| 5.31%—5.32%, 4/4/07—5/10/07 | | 345,000,000 | | 341,405,143 |
| | | Principal | | |
| Dreyfus Cash Management (continued) | | Amount ($) | | Value ($) |
| |
| |
|
| |
| Commercial Paper (continued) | | | | |
| |
| |
|
| Societe Generale N.A. Inc. | | | | |
| 5.31%, 2/5/07—5/8/07 | | 580,200,000 | | 573,866,556 |
| Stadshypotek Delaware Inc. | | | | |
| 5.31%, 4/17/07 | | 59,500,000 b | | 58,850,458 |
| Svenska Handelsbanken | | | | |
| 5.31%, 4/5/07 | | 250,000,000 | | 247,709,687 |
| Thames Asset Global Securitization No. 1 Inc. | | | | |
| 5.30%, 3/5/07 | | 36,026,000 b | | 35,858,519 |
| UniCredito Italiano Bank PLC | | | | |
| 5.34%, 4/18/07 | | 149,000,000 b | | 147,361,166 |
| Windmill Funding Corp. | | | | |
| 5.31%—5.33%, 4/24/07—5/16/07 | | 575,750,000 b | | 568,000,357 |
| Total Commercial Paper | | | | |
| (cost $7,602,423,144) | | | | 7,602,423,144 |
| |
| |
|
| |
| Corporate Notes—12.1% | | | | |
| |
| |
|
| Bank of America N.A. | | | | |
| 5.32%, 5/25/07 | | 250,000,000 a | | 250,000,000 |
| Fifth Third Bancorp | | | | |
| 5.32%, 2/23/07 | | 200,000,000 a,b | | 200,000,000 |
| General Electric Capital Corp. | | | | |
| 5.28%, 2/26/07 | | 100,000,000 a | | 100,000,000 |
| Harrier Finance Funding Ltd. | | | | |
| 5.31%, 5/18/07 | | 125,000,000 a,b | | 124,997,767 |
| Links Finance LLC | | | | |
| 5.32%, 11/20/07 | | 100,000,000 a,b | | 99,992,000 |
| Morgan Stanley | | | | |
| 5.34%, 2/5/07 | | 250,000,000 a | | 250,000,000 |
| Sigma Finance Inc. | | | | |
| 5.32%—5.33%, 8/15/07—1/15/08 | | 575,000,000 a,b | | 574,972,823 |
| Total Corporate Notes | | | | |
| (cost $1,599,962,590) | | | | 1,599,962,590 |
| |
| |
|
| |
| Time Deposits—6.7% | | | | |
| |
| |
|
| Branch Banking & Trust Co. (Grand Cayman) | | | | |
| 5.28%, 2/1/07 | | 300,000,000 | | 300,000,000 |
| Dexia Credit Local (Grand Cayman) | | | | |
| 5.28%, 2/1/07 | | 200,000,000 | | 200,000,000 |
| Landesbank Hessen-Thueringen Girozentrale (Grand Cayman) | | |
| 5.29%, 2/1/07 | | 200,000,000 | | 200,000,000 |
| State Street Bank and Trust Co., Boston, MA (Grand Cayman) | | |
| 5.28%, 2/1/07 | | 181,000,000 | | 181,000,000 |
| Total Time Deposits | | | | |
| (cost $881,000,000) | | | | 881,000,000 |
| | STATEMENT OF INVESTMENTS (continued)
|
| | | | | Principal | | |
| Dreyfus Cash Management (continued) | | Amount ($) | | Value ($) |
| |
| |
|
| |
| Repurchase Agreements—1.5% | | | | | | |
| |
| |
| |
|
| UBS Securities LLC | | | | | | |
| 5.26%, dated 1/31/07, due 2/1/07 in the amount of | | | | |
| $200,029,222 (fully collateralized by $201,250,000 | | | | |
| Federal Home Loan Mortgage Corp., Notes, 5.125%, due | | | | |
| 4/18/08, value $204,001,609) | | | | | | |
| (cost $200,000,000) | | | | 200,000,000 | | 200,000,000 |
| |
| |
| |
|
| |
| Total Investments (cost $13,500,385,769) | | | | 102.5% | | 13,500,385,769 |
| |
| Liabilities, Less Cash and Receivables | | | | (2.5%) | | (327,969,413) |
| |
| Net Assets | | | | 100.0% | | 13,172,416,356 |
| |
| a Variable rate security—interest rate subject to periodic change. | | | | |
| b Securities exempt from registration under Rule 144A of the Securities Act of 1933.These securities may be resold in transactions exempt from registration, normally to qualified |
| institutional buyers. At January 31, 2007, these securities amounted to $5,480,526,618 or 41.6% of net assets. | | |
| |
|
| |
| |
| |
| |
| Portfolio Summary (Unaudited) † | | | | | | |
| |
| | | Value (%) | | | | Value (%) |
| |
| |
| |
|
| Banking | | 58.8 | | Asset-Backed/Single Seller | | 4.3 |
| Asset-Backed/Structured Investment Vehicles | | 13.0 | | Asset-Backed/Securities Arbitrage Vehicles | | 3.5 |
| Asset-Backed/Multi-Seller Programs | | 10.4 | | Repurchase Agreements | | 1.5 |
| Brokerage Firms | | 5.5 | | | | |
| Finance | | 5.5 | | | | 102.5 |
| |
| † Based on net assets. | | | | | | |
| See notes to financial statements. | | | | | | |
| STATEMENT OF INVESTMENTS |
| January 31, 2007 |
| | | Principal | | |
| Dreyfus Cash Management Plus, Inc. | | Amount ($) | | Value ($) |
| |
| |
|
| |
| Negotiable Bank Certificates of Deposit—28.1% | | | | |
| |
| |
|
| Alliance & Leicester PLC (London) | | | | |
| 5.33%, 3/5/07 | | 150,000,000 | | 150,000,000 |
| Bank of Ireland (Yankee) | | | | |
| 5.31%, 4/18/07 | | 200,000,000 a | | 200,000,000 |
| Barclays Bank PLC (Yankee) | | | | |
| 5.25%, 6/8/07 | | 350,000,000 | | 350,000,000 |
| Calyon (Yankee) | | | | |
| 5.33%, 5/10/07 | | 415,000,000 | | 415,000,000 |
| DEPFA BANK PLC (Yankee) | | | | |
| 5.30%—5.32%, 2/16/07—4/4/07 | | 430,000,000 a | | 430,000,000 |
| HSH Nordbank AG (Yankee) | | | | |
| 5.31%—5.32%, 2/12/07—2/15/07 | | 450,000,000 a | | 450,000,000 |
| Landesbank Baden-Wurttemberg (London) | | | | |
| 5.31%, 2/6/07 | | 100,000,000 | | 100,000,094 |
| Mizuho Corporate Bank Ltd. (Yankee) | | | | |
| 5.32%, 2/16/07—2/23/07 | | 250,000,000 | | 250,000,411 |
| Northern Rock PLC (London) | | | | |
| 5.31%, 2/12/07 | | 100,000,000 | | 100,000,000 |
| Societe Generale (London) | | | | |
| 5.31%, 3/12/07 | | 50,000,000 | | 49,999,735 |
| UniCredito Italiano SpA (London) (Yankee) | | | | |
| 5.32%—5.33%, 2/12/07—5/7/07 | | 385,000,000 | | 384,997,690 |
| Total Negotiable Bank Certificates of Deposit | | | | |
| (cost $2,879,997,930) | | | | 2,879,997,930 |
| |
| |
|
| |
| Commercial Paper—50.8% | | | | |
| |
| |
|
| Abbey National North America LLC | | | | |
| 5.28%, 2/1/07 | | 200,000,000 | | 200,000,000 |
| Amsterdam Funding Corp. | | | | |
| 5.31%, 5/3/07 | | 250,750,000 a | | 247,441,354 |
| ASB Bank Ltd. | | | | |
| 5.32%, 2/9/07 | | 25,000,000 | | 24,970,833 |
| ASB Finance Ltd. | | | | |
| 5.25%—5.32%, 2/8/07—5/30/07 | | 207,372,000 a | | 205,013,727 |
| Atlantis One Funding Corp. | | | | |
| 5.32%, 2/12/07—2/14/07 | | 290,410,000 a | | 289,932,348 |
| Bank of America Corp. | | | | |
| 5.27%, 5/7/07 | | 90,000,000 | | 88,775,688 |
| Barclays U.S. Funding Corp. | | | | |
| 5.33%, 2/14/07 | | 40,000,000 | | 39,924,022 |
| Bear Stearns Cos. Inc. | | | | |
| 5.32%, 2/16/07 | | 60,000,000 | | 59,868,750 |
| Beta Finance Inc. | | | | |
| 5.31%, 4/3/07 | | 40,000,000 a | | 39,644,844 |
| Cancara Asset Securitisation Ltd. | | | | |
| 5.32%, 2/14/07 | | 114,564,000 a | | 114,346,806 |
| | STATEMENT OF INVESTMENTS (continued)
|
| | | Principal | | |
| Dreyfus Cash Management Plus, Inc. (continued) | | Amount ($) | | Value ($) |
| |
| |
|
| |
| Commercial Paper (continued) | | | | |
| |
| |
|
| CHARTA LLC | | | | |
| 5.31%-5.32%, 2/8/07-5/2/07 | | 200,000,000 a | | 198,587,819 |
| Citigroup Funding Inc. | | | | |
| 5.32%—5.33%, 2/16/07—2/27/07 | | 450,000,000 | | 448,614,583 |
| Concord Minutemen Capital Co. LLC | | | | |
| 5.34%, 2/21/07 | | 31,446,000 a | | 31,354,807 |
| CRC Funding LLC | | | | |
| 5.32%, 2/9/07 | | 50,000,000 a | | 49,941,611 |
| Crown Point Capital Co. LLC | | | | |
| 5.31%, 4/4/07 | | 304,021,000 a | | 301,277,379 |
| Cullinan Finance Ltd. | | | | |
| 5.31%—5.32%, 4/25/07 | | 174,000,000 a | | 171,918,879 |
| Daimler Chrysler Revolving Auto Conduit LLC | | | | |
| 5.34%—5.35%, 2/12/07—2/15/07 | | 94,341,000 | | 94,168,416 |
| Daimler Chrysler Revolving Auto Conduit LLC, Ser. II | | | | |
| 5.33%—5.35%, 2/13/07—2/22/07 | | 106,960,000 | | 106,732,554 |
| Danske Corp., Delaware | | | | |
| 5.32%, 4/27/07 | | 75,000,000 | | 74,081,823 |
| Deutsche Bank Financial LLC | | | | |
| 5.27%, 2/1/07 | | 200,000,000 | | 200,000,000 |
| Edison Asset Securitization L.L.C. | | | | |
| 5.31%, 2/8/07 | | 23,817,000 a | | 23,792,872 |
| Fairway Finance Company LLC | | | | |
| 5.34%, 3/16/07 | | 38,998,000 a | | 38,752,518 |
| Falcon Asset Securitization Corp. | | | | |
| 5.32%, 2/16/07 | | 152,933,000 a | | 152,598,140 |
| FCAR Owner Trust, Ser. I | | | | |
| 5.33%, 2/12/07 | | 150,000,000 | | 149,758,917 |
| Harrier Finance Funding Ltd. | | | | |
| 5.31%, 4/12/07 | | 65,000,000 a | | 64,337,722 |
| K2 (USA) LLC | | | | |
| 5.32%, 2/22/07 | | 37,200,000 a | | 37,086,075 |
| Liquid Funding Ltd. | | | | |
| 5.32%, 3/5/07 | | 29,414,000 a | | 29,276,212 |
| Nationwide Building Society | | | | |
| 5.32%, 2/9/07 | | 100,000,000 | | 99,883,222 |
| Northern Rock PLC | | | | |
| 5.32%, 2/6/07 | | 91,900,000 | | 91,832,990 |
| Raiffeisen Zentralbank Oesterreich | | | | |
| 5.32%, 2/13/07—5/14/07 | | 341,410,000 | | 337,316,317 |
| Ranger Funding Company, LLC | | | | |
| 5.31%, 4/3/07 | | 49,536,000 a | | 49,096,175 |
| Sigma Finance Inc. | | | | |
| 5.31%—5.32%, 3/29/07—5/1/07 | | 235,000,000 a | | 232,921,564 |
| Simba Funding Corp. | | | | |
| 5.34%, 3/19/07 | | 100,000,000 a | | 99,326,611 |
14
| | | Principal | | |
| Dreyfus Cash Management Plus, Inc. (continued) | | Amount ($) | | Value ($) |
| |
| |
|
| |
| Commercial Paper (continued) | | | | |
| |
| |
|
| Societe Generale N.A. Inc. | | | | |
| 5.25%—5.31%, 5/8/07—6/6/07 | | 410,000,000 | | 403,296,292 |
| Swedbank (ForeningsSparbanken AB) | | | | |
| 5.31%, 4/30/07 | | 100,000,000 | | 98,719,111 |
| Three Pillars Funding LLC | | | | |
| 5.32%, 4/18/07 | | 30,403,000 a | | 30,066,033 |
| Westpac Securities NZ Ltd. | | | | |
| 5.32%, 2/8/07—2/12/07 | | 106,265,000 a | | 106,136,566 |
| WestpacTrust Securities NZ Ltd. | | | | |
| 5.32%, 4/26/07 | | 178,550,000 | | 176,389,843 |
| Total Commercial Paper | | | | |
| (cost $5,207,183,423) | | | | 5,207,183,423 |
| |
| |
|
| |
| Corporate Notes—8.1% | | | | |
| |
| |
|
| Bank of America N.A. | | | | |
| 5.32%, 5/25/07 | | 375,000,000 b | | 375,000,000 |
| General Electric Capital Corp. | | | | |
| 5.28%, 2/27/07 | | 100,000,000 b | | 100,000,000 |
| Harrier Finance Funding Ltd. | | | | |
| 5.31%, 5/18/07 | | 75,000,000 a,b | | 74,998,660 |
| Links Finance LLC | | | | |
| 5.33%, 10/16/07 | | 100,000,000 a,b | | 99,992,959 |
| Sigma Finance Inc. | | | | |
| 5.33%, 8/15/07 | | 175,000,000 a,b | | 174,995,325 |
| Total Corporate Notes | | | | |
| (cost $824,986,944) | | | | 824,986,944 |
| |
| |
|
| |
| Promissory Note—3.2% | | | | |
| |
| |
|
| Goldman Sachs Group Inc. | | | | |
| 5.45%, 2/2/07 | | | | |
| (cost $325,000,000) | | 325,000,000 | | 325,000,000 |
| |
| |
|
| |
| Time Deposits—10.6% | | | | |
| |
| |
|
| Dexia Credit Local (Grand Cayman) | | | | |
| 5.28%, 2/1/07 | | 300,000,000 | | 300,000,000 |
| Landesbank Hessen-Thueringen | | | | |
| Girozentrale (Grand Cayman) | | | | |
| 5.29%, 2/1/07 | | 200,000,000 | | 200,000,000 |
| PNC Bank N.A., Pittsburgh, PA (Nassau) | | | | |
| 5.28%, 2/1/07 | | 450,000,000 | | 450,000,000 |
| State Street Bank and Trust Co., Boston, MA (Grand Cayman) | | | | |
| 5.28%, 2/1/07 | | 135,000,000 | | 135,000,000 |
| Total Time Deposits | | | | |
| (cost $1,085,000,000) | | | | 1,085,000,000 |
STATEMENT OF INVESTMENTS (continued)
| | | | | Principal | | |
| Dreyfus Cash Management Plus, Inc. (continued) | | Amount ($) | | Value ($) |
| |
| |
|
| |
| Repurchase Agreements—1.0% | | | | | | |
| |
| |
| |
|
| UBS Securities LLC | | | | | | |
| 5.26%, dated 1/31/07, due 2/1/07 in the amount of | | | | |
| $100,014,611 (fully collateralized by $100,625,000 | | | | |
| Federal Home Loan Mortgage Corp. Notes, 5.125%, due | | | | |
| 4/18/08, value $102,000,804) | | | | | | |
| (cost $100,000,000) | | | | 100,000,000 | | 100,000,000 |
| |
| |
| |
|
| |
| Total Investments (cost $10,422,168,297) | | | | 101.8% | | 10,422,168,297 |
| |
| Liabilities, Less Cash and Receivables | | | | (1.8%) | | (180,224,839) |
| |
| Net Assets | | | | 100.0% | | 10,241,943,458 |
| |
| a Securities exempt from registration under Rule 144A of the Securities Act of 1933.These securities may be resold in transactions exempt from registration, normally to qualified |
| institutional buyers. At January 31, 2007, these securities amounted to $3,942,837,006 or 38.5% of net assets. | | |
| b Variable rate security—interest rate subject to periodic change. | | | | |
| |
| |
|
| |
| |
| |
| |
| Portfolio Summary (Unaudited) † | | | | | | |
| |
| | | Value (%) | | | | Value (%) |
| |
| |
| |
|
| Banking | | 64.3 | | Asset-Backed/Single Seller | | 3.4 |
| Asset-Backed/Multi-Seller Programs | | 12.1 | | Building And Construction | | 1.9 |
| Asset-Backed/Structured Investment Vehicles | | 9.0 | | Asset-Backed/Securities Arbitrage Vehicles | | 1.0 |
| Finance | | 5.3 | | Repurchase Agreements | | 1.0 |
| Brokerage Firms | | 3.8 | | | | 101.8 |
| |
| † Based on net assets. | | | | | | |
| See notes to financial statements. | | | | | | |
16
| STATEMENT OF INVESTMENTS |
| January 31, 2007 |
| | | Annualized | | | | |
| | | Yield on | | | | |
| | | Date of | | Principal | | |
| Dreyfus Government Cash Management | | Purchase (%) | | Amount ($) | | Value ($) |
| |
| |
| |
|
| |
| U.S. Government Agencies—54.7% | | | | | | |
| |
| |
| |
|
| Federal Farm Credit Bank: | | | | | | |
| 4/11/08 | | 5.24 | | 325,000,000 a | | 324,887,364 |
| 5/13/08 | | 5.23 | | 125,000,000 a | | 124,968,934 |
| Federal Home Loan Bank System | | | | | | |
| 3/30/07 | | 5.21 | | 50,000,000 | | 49,903,593 |
| Federal Home Loan Mortgage Corp.: | | | | | | |
| 2/6/07 | | 5.31 | | 338,125,000 | | 337,882,208 |
| 3/9/07 | | 5.23 | | 501,742,000 | | 499,163,046 |
| 4/17/07 | | 5.20 | | 171,236,000 | | 169,427,320 |
| 11/21/07 | | 5.23 | | 502,050,000 | | 502,050,000 |
| Federal National Mortgage Association: | | | | | | |
| 2/7/07 | | 5.31 | | 150,000,000 | | 149,870,750 |
| 4/11/07 | | 5.20 | | 30,000,000 | | 29,708,475 |
| 4/18/07 | | 5.20 | | 300,000,000 | | 296,789,000 |
| Total U.S. Government Agencies | | | | | | |
| (cost $2,484,650,690) | | | | | | 2,484,650,690 |
| |
| |
| |
|
| |
| Repurchase Agreements—45.3% | | | | | | |
| |
| |
| |
|
| Banc of America Securities LLC | | | | | | |
| dated 1/31/07, due 2/1/07 in the amount of $550,079,444 (fully | | | | | | |
| collateralized by $207,924,000 U.S. Treasury Bills, due 3/15/07, | | | | | | |
| value $206,701,407 and $357,621,000 U.S Treasury Notes, 4%-5.125%, | | | | |
| due 6/30/11-2/15/14, value $354,299,462) | | 5.20 | | 550,000,000 | | 550,000,000 |
| Barclays Financial LLC | | | | | | |
| dated 1/31/07, due 2/1/07 in the amount of $100,013,889 (fully | | | | | | |
| collateralized by $102,745,000 U.S. Treasury Notes, 3%, | | | | | | |
| due 2/15/08, value $102,000,836) | | 5.00 | | 100,000,000 | | 100,000,000 |
| Citigroup Global Markets Holdings Inc. | | | | | | |
| dated 1/31/07, due 2/1/07 in the amount of $402,057,508 (fully | | | | | | |
| collateralized by $80,000,000 Federal Home Loan Bank System, Bonds, | | | | |
| 0%, due 11/9/15-2/3/16, value $81,642,416, $3,000,000 Federal Home Loan | | | | |
| Mortgage Corp., Bonds, 8%, due 12/28/21, value $2,850,000 and $335,855,000 | | | | |
| Federal Home Loan Mortgage Corp., Notes, 5%-8.72%, due | | | | | | |
| 10/5/16-12/28/21, value $325,548,495) | | 5.15 | | 402,000,000 | | 402,000,000 |
| Goldman, Sachs & Co. | | | | | | |
| dated 1/31/07, due 2/1/07 in the amount of $150,021,250 (fully | | | | | | |
| collateralized by $24,015,000 U.S. Treasury Bills, due 5/17/07-6/28/07, | | | | |
| value $23,633,584, $48,406,000 U.S Treasury Bonds, 9%-13.25%, due | | | | |
| 5/15/14-11/15/18, value $64,059,602 and $65,422,000 U.S Treasury | | | | |
| Notes, 3%-5.50%, due 2/15/08-5/15/14, value $65,307,235) | | 5.10 | | 150,000,000 | | 150,000,000 |
| Goldman, Sachs & Co. | | | | | | |
| dated 1/31/07, due 2/1/07 in the amount of $155,020,451 (fully | | | | | | |
| collateralized by $35,687,000 U.S. Treasury Bills, due 2/8/07-7/26/07, | | | | |
| value $35,316,354, $34,806,000 U.S Treasury Bonds, | | | | | | |
| 4.50%-10.625%, due 8/15/15-2/15/36, value $42,278,063 | | | | | | |
| and $81,478,000 U.S Treasury Notes, 3.50%-5%, due | | | | | | |
| 6/30/07-11/15/16, value $80,506,143) | | 4.75 | | 155,000,000 | | 155,000,000 |
| | STATEMENT OF INVESTMENTS (continued)
|
| | | | | Annualized | | | | |
| | | | | Yield on | | | | |
| | | | | Date of | | Principal | | |
| Dreyfus Government Cash Management (continued) | | Purchase (%) | | Amount ($) | | Value ($) |
| |
| |
| |
|
| |
| Repurchase Agreements (continued) | | | | | | | | |
| |
| |
| |
| |
|
| Morgan Stanley | | | | | | | | |
| dated 1/31/07, due 2/1/07 in the amount of $350,050,556 (fully | | | | | | |
| collateralized by $359,441,000 U.S. Treasury Bills, due | | | | | | |
| 2/15/07-4/12/07, value $357,000,556) | | | | 5.20 | | 350,000,000 | | 350,000,000 |
| UBS Securities LLC | | | | | | | | |
| dated 1/31/07, due 2/1/07 in the amount of $350,050,556 (fully | | | | | | |
| collateralized by $358,770,000 U.S. Treasury Notes, 4.75%, due | | | | | | |
| 1/31/12, value $357,004,871) | | | | 5.20 | | 350,000,000 | | 350,000,000 |
| Total Repurchase Agreements | | | | | | | | |
| (cost $2,057,000,000) | | | | | | | | 2,057,000,000 |
| |
| |
| |
| |
|
| |
| Total Investments (cost $4,541,650,690) | | | | | | 100.0% | | 4,541,650,690 |
| Cash and Receivables (Net) | | | | | | .0% | | 1,474,110 |
| Net Assets | | | | | | 100.0% | | 4,543,124,800 |
| |
| a Variable rate security—interest rate subject to periodic change. | | | | | | |
| |
| |
| |
|
| |
| |
| |
| |
| Portfolio Summary (Unaudited) † | | | | | | | | |
| | | Value (%) | | | | | | Value (%) |
| |
| |
| |
| |
|
| Repurchase Agreements | | 45.3 | | Federal Farm Credit Bank | | | | 9.9 |
| Federal Home Loan Mortgage Corp. | | 33.2 | | Federal Home Loan Bank System | | | | 1.1 |
| Federal National Mortgage Association | | 10.5 | | | | | | 100.0 |
| |
| † Based on net assets. | | | | | | | | |
| See notes to financial statements. | | | | | | | | |
18
| STATEMENT OF INVESTMENTS |
| January 31, 2007 |
| | | | | Annualized | | | | |
| | | | | Yield on | | | | |
| | | | | Date of | | Principal | | |
| Dreyfus Government Prime Cash Management | | Purchase (%) | | Amount ($) | | Value ($) |
| |
| |
| |
|
| |
| U.S. Government Agencies—99.9% | | | | | | | | |
| |
| |
| |
| |
|
| Federal Farm Credit Bank: | | | | | | | | |
| 2/16/07 | | | | 5.18 | | 25,000,000 | | 24,946,667 |
| 2/27/07 | | | | 5.18 | | 41,000,000 | | 40,848,095 |
| 3/16/07 | | | | 5.16 | | 42,000,000 | | 41,746,157 |
| 3/28/07 | | | | 5.20 | | 23,072,000 | | 22,890,821 |
| 3/30/07 | | | | 5.19 | | 73,382,000 | | 72,785,955 |
| 7/25/07 | | | | 5.20 | | 75,000,000 | | 73,165,750 |
| 8/15/07 | | | | 5.25 | | 50,000,000 a | | 49,994,821 |
| 11/9/07 | | | | 5.25 | | 50,000,000 a | | 49,992,507 |
| 4/11/08 | | | | 5.24 | | 100,000,000 a | | 99,965,343 |
| 5/27/08 | | | | 5.24 | | 100,000,000 a | | 99,973,122 |
| 7/21/08 | | | | 5.26 | | 50,000,000 a | | 49,985,962 |
| Federal Home Loan Bank System: | | | | | | | | |
| 2/1/07 | | | | 5.00 | | 186,000,000 | | 186,000,000 |
| 2/2/07 | | | | 5.12 | | 100,000,000 | | 100,000,000 |
| 2/21/07 | | | | 5.20 | | 80,000,000 | | 79,771,778 |
| 2/23/07 | | | | 5.25 | | 20,585,000 | | 20,520,592 |
| 2/28/07 | | | | 5.22 | | 131,216,000 | | 130,714,005 |
| 3/2/07 | | | | 5.21 | | 25,000,000 | | 24,896,486 |
| 3/28/07 | | | | 5.19 | | 75,000,000 | | 74,415,052 |
| 4/4/07 | | | | 5.22 | | 100,000,000 | | 99,113,400 |
| 4/9/07 | | | | 5.20 | | 100,000,000 | | 99,045,250 |
| 4/20/07 | | | | 5.17 | | 80,325,000 | | 79,446,111 |
| 4/25/07 | | | | 5.20 | | 75,000,000 | | 74,111,727 |
| 5/15/07 | | | | 5.21 | | 6,260,000 | | 6,214,002 |
| 6/13/07 | | | | 5.21 | | 1,515,000 | | 1,508,135 |
| 7/11/07 | | | | 5.21 | | 63,000,000 | | 61,576,480 |
| Tennessee Valley Authority: | | | | | | | | |
| 3/1/07 | | | | 5.15 | | 111,429,000 | | 110,985,576 |
| 3/8/07 | | | | 5.15 | | 159,001,000 | | 158,210,301 |
| |
| |
| |
| |
|
| |
| Total Investments (cost $1,932,824,095) | | | | | | 99.9% | | 1,932,824,095 |
| |
| Cash and Receivables (Net) | | | | | | .1% | | 2,711,198 |
| |
| Net Assets | | | | | | 100.0% | | 1,935,535,293 |
| |
| a Variable rate security—interest rate subject to periodic change. | | | | | | |
| |
| |
| |
|
| |
| |
| |
| |
| Portfolio Summary (Unaudited) † | | | | | | | | |
| |
| | | Value (%) | | | | | | Value (%) |
| |
| |
| |
| |
|
| Federal Home Loan Bank System | | 53.6 | | Tennessee Valley Authority | | | | 13.9 |
| Federal Farm Credit Bank | | 32.4 | | | | | | 99.9 |
| |
| † Based on net assets. | | | | | | | | |
| See notes to financial statements. | | | | | | | | |
| STATEMENT OF INVESTMENTS |
| January 31, 2007 |
| | | Annualized | | | | |
| | | Yield on | | | | |
| | | Date of | | Principal | | |
| Dreyfus Treasury Cash Management | | Purchase (%) | | Amount ($) | | Value ($) |
| |
| |
| |
|
| |
| Repurchase Agreements—100.3% | | | | | | |
| |
| |
| |
|
| Banc of America Securities LLC | | | | | | |
| dated 1/31/07, due 2/1/07 in the amount of $700,101,111 (fully | | | | | | |
| collateralized by $729,984,000 U.S. Treasury Notes, 3.375%-3.50%, | | | | |
| due 8/15/09-9/15/09, value $714,000,589) | | 5.20 | | 700,000,000 | | 700,000,000 |
| Barclays Financial LLC | | | | | | |
| dated 1/31/07, due 2/1/07 in the amount of $50,006,944 (fully | | | | | | |
| collateralized by $50,258,000 U.S. Treasury Notes, 4.625%, | | | | | | |
| due 2/29/08, value $51,000,695) | | 5.00 | | 50,000,000 | | 50,000,000 |
| Bear Stearns Cos. Inc. | | | | | | |
| dated 1/31/07, due 2/1/07 in the amount of $500,071,944 (fully | | | | | | |
| collateralized by $273,665,000 U.S. Treasury Bills, due 4/26/07-7/19/07, | | | | |
| value $268,454,807 and $239,049,000 U.S. Treasury Notes, | | | | | | |
| 3%-4.25%, due 11/15/07-11/30/07, value $237,998,798 ) | | 5.18 | | 500,000,000 | | 500,000,000 |
| CIBC World Markets PLC | | | | | | |
| dated 1/31/07, due 2/1/07 in the amount of $189,027,195 (fully | | | | | | |
| collateralized by $195,966,000 U.S. Treasury Notes, 3.375%-4.875%, | | | | |
| due 8/31/08-9/15/09, value $192,783,377) | | 5.18 | | 189,000,000 | | 189,000,000 |
| Citigroup Global Markets Holdings Inc. | | | | | | |
| dated 1/31/07, due 2/1/07 in the amount of $700,100,139 (fully | | | | | | |
| collateralized by $63,433,000 U.S. Treasury Bonds, 7.50%-8.125%, | | | | |
| due 11/15/16-11/15/21, value $81,562,690, $30,462,000 U.S. Treasury | | | | |
| Notes, 3.625%, due 6/30/07, value $30,367,394 and $1,271,400,000 | | | | |
| U.S. Treasury Strips, due 5/15/09-2/15/36, value $602,070,852) | | 5.15 | | 700,000,000 | | 700,000,000 |
| Credit Suisse (USA) Inc. | | | | | | |
| dated 1/31/07, due 2/1/07 in the amount of $450,064,625 (fully | | | | | | |
| collateralized by $453,667,000 U.S. Treasury Notes, 2.25%-6.125%, | | | | |
| due 2/15/07-8/15/07, value $458,131,424) | | 5.17 | | 450,000,000 | | 450,000,000 |
| Goldman, Sachs & Co. | | | | | | |
| dated 1/31/07, due 2/1/07 in the amount of $200,028,333 (fully | | | | | | |
| collateralized by $187,046,000 U.S. Treasury Bills, due 3/15/07, | | | | | | |
| value $185,966,745 and $16,783,000 U.S. Treasury Bonds, | | | | | | |
| 5.375%, due 2/15/31, value $18,033,788) | | 5.10 | | 200,000,000 | | 200,000,000 |
| Goldman, Sachs & Co. | | | | | | |
| dated 1/31/07, due 2/1/07 in the amount of $274,036,153 | | | | | | |
| (fully collateralized by $280,224,000 U.S. Treasury Bills, | | | | | | |
| due 2/8/07-3/15/07, value $279,480,379) | | 4.75 | | 274,000,000 | | 274,000,000 |
| J.P. Morgan Chase & Co. | | | | | | |
| dated 1/31/07, due 2/1/07 in the amount of $700,100,139 | | | | | | |
| (fully collateralized by $723,585,000 U.S. Treasury Bills, | | | | | | |
| due 3/8/07-7/19/07, value $713,935,761) | | 5.15 | | 700,000,000 | | 700,000,000 |
| Merrill Lynch & Co. Inc. | | | | | | |
| dated 1/31/07, due 2/1/07 in the amount of $700,101,306 | | | | | | |
| (fully collateralized by $709,429,000 U.S. Treasury Notes, | | | | | | |
| 4.125%, due 8/15/08, value $714,000,287) | | 5.21 | | 700,000,000 | | 700,000,000 |
| | | Annualized | | | | |
| | | Yield on | | | | |
| | | Date of | | Principal | | |
| Dreyfus Treasury Cash Management (continued) | | Purchase (%) | | Amount ($) | | Value ($) |
| |
| |
| |
|
| |
| Repurchase Agreements (continued) | | | | | | |
| |
| |
| |
|
| Morgan Stanley | | | | | | |
| dated 1/31/07, due 2/1/07 in the amount of $150,021,667 | | | | | | |
| (fully collateralized by $420,544,000 U.S. Treasury Strips, | | | | | | |
| due 8/15/26-2/15/27, value $153,959,343) | | 5.20 | | 150,000,000 | | 150,000,000 |
| UBS Securities LLC | | | | | | |
| dated 1/31/07, due 2/1/07 in the amount of $700,101,111 | | | | | | |
| (fully collateralized by $713,916,000 U.S. Treasury Notes, | | | | | | |
| 4.50%-4.75%, due 12/31/08-11/30/11, value $714,001,488) | | 5.20 | | 700,000,000 | | 700,000,000 |
| |
| |
| |
|
| |
| Total Investments (cost $5,313,000,000) | | �� | | 100.3% | | 5,313,000,000 |
| Liabilities, Less Cash and Receivables | | | | (.3%) | | (15,485,118) |
| Net Assets | | | | 100.0% | | 5,297,514,882 |
| |
| |
| |
|
| |
| |
| |
| |
| Portfolio Summary (Unaudited) † | | | | | | |
| Value (%) | | | | | | |
| |
| |
| |
|
| Repurchase Agreements 100.3 | | | | | | |
| |
| † Based on net assets. | | | | | | |
| See notes to financial statements. | | | | | | |
| STATEMENT OF INVESTMENTS |
| January 31, 2007 |
| | | | | Annualized | | | | |
| | | | | Yield on | | | | |
| | | | | Date of | | Principal | | |
| Dreyfus Treasury Prime Cash Management | | Purchase (%) | | Amount ($) | | Value ($) |
| |
| |
| |
|
| |
| U.S. Treasury Bills—100.2% | | | | | | | | |
| |
| |
| |
| |
|
| 2/1/07 | | | | 4.87 | | 9,200,000 | | 9,200,000 |
| 2/8/07 | | | | 4.85 | | 25,700,000 | | 25,675,820 |
| 2/15/07 | | | | 4.86 | | 37,000,000 | | 36,930,261 |
| 2/22/07 | | | | 4.86 | | 194,000,000 | | 193,451,813 |
| 3/1/07 | | | | 4.84 | | 191,914,000 | | 191,199,007 |
| 3/8/07 | | | | 4.86 | | 147,160,000 | | 146,471,753 |
| 3/15/07 | | | | 5.01 | | 200,000,000 | | 198,859,105 |
| 3/22/07 | | | | 4.88 | | 54,000,000 | | 53,645,607 |
| 3/29/07 | | | | 4.92 | | 67,000,000 | | 66,492,959 |
| 4/12/07 | | | | 5.02 | | 214,000,000 | | 211,941,553 |
| 4/19/07 | | | | 5.02 | | 100,000,000 | | 98,946,597 |
| 5/3/07 | | | | 5.03 | | 100,000,000 | | 98,755,069 |
| 5/17/07 | | | | 5.08 | | 294,000,000 | | 289,751,087 |
| 5/31/07 | | | | 5.05 | | 100,000,000 | | 98,373,667 |
| 6/7/07 | | | | 4.96 | | 70,000,000 | | 68,814,200 |
| |
| |
| |
| |
|
| Total Investments (cost $1,788,508,498) | | | | 100.2% | | 1,788,508,498 |
| Liabilities, Less Cash and Receivables | | | | | | (.2%) | | (4,442,794) |
| Net Assets | | | | | | 100.0% | | 1,784,065,704 |
| |
| |
| |
| |
|
| |
| |
| |
| |
| Portfolio Summary (Unaudited) † | | | | | | | | |
| | | Value (%) | | | | |
| |
| |
| |
|
| U.S. Treasury Bills | | 100.2 | | | | |
| |
| † Based on net assets. | | | | | | | | |
| See notes to financial statements. | | | | | | | | |
| STATEMENT OF INVESTMENTS |
| January 31, 2007 |
| | | Coupon | | Maturity | | Principal | | | | |
| Dreyfus Municipal Cash Management Plus | | Rate (%) | | Date | | Amount ($) | | Value ($) |
| |
| |
| |
| |
|
| |
| Short-Term Investments—104.8% | | | | | | | | | | |
| |
| |
| |
| |
| |
|
| Alabama—2.1% | | | | | | | | | | |
| Jefferson County, Sewer Revenue Warrants, Refunding | | | | | | | | | | |
| (Insured; XLCA and Liquidity Facility; JPMorgan Chase Bank) | | 3.63 | | 2/7/07 | | 22,900,000 | | a | | 22,900,000 |
| Arizona—2.7% | | | | | | | | | | |
| Maricopa County Industrial Development Authority, | | | | | | | | | | |
| MFHR (San Clemente Apartments Project) | | | | | | | | | | |
| (Insured; FNMA and Liquidity Facility; FNMA) | | 3.91 | | 2/7/07 | | 1,010,000 | | a | | 1,010,000 |
| Phoenix Civic Improvement Corporation, Airport Revenue (Merlots | | | | | | | | | | |
| Program) (Insured; FGIC and Liquidity Facility; Wachovia Bank) | | 3.58 | | 2/7/07 | | 4,615,000 | | a,b | | 4,615,000 |
| Roaring Fork Municipal Products LLC (Pima County Industrial | | | | | | | | | | |
| Development Authority) (GIC; Trinity Funding Corporation | | | | | | | | | | |
| and Liquidity Facility; The Bank of New York) | | 3.76 | | 2/7/07 | | 4,303,000 | | a,b | | 4,303,000 |
| Salt River Project Agricultural Improvement and Power District, | | | | | | | | | | |
| CP (Salt River Project) (Liquidity Facility: Bank of America, | | | | | | | | | | |
| Bank One, Citibank NA, JPMorgan Chase Bank, | | | | | | | | | | |
| Marshall and Isley Bank and Wells Fargo Bank) | | 3.57 | | 3/14/07 | | 19,950,000 | | | | 19,950,000 |
| California—1.5% | | | | | | | | | | |
| FHLMC Multifamily Certificates, Revenue | | | | | | | | | | |
| (Insured; FHLMC and Liquidity Facility; FHLMC) | | 3.71 | | 2/7/07 | | 16,675,390 | | a,b | | 16,675,390 |
| Colorado—3.2% | | | | | | | | | | |
| Colorado Education Loan Program, TRAN | | 3.75 | | 8/3/07 | | 12,000,000 | | | | 12,011,932 |
| Colorado Housing and Finance Authority, EDR | | | | | | | | | | |
| (Wanco Inc. Project) (LOC; U.S. Bank NA) | | 3.81 | | 2/7/07 | | 3,235,000 | | a | | 3,235,000 |
| Erie, COP (LOC; Key Bank) | | 3.67 | | 2/7/07 | | 4,270,000 | | a | | 4,270,000 |
| Vail, MFHR (Middle Creek Apartments) (Liquidity Facility; Merrill Lynch | | | | | | | | | | |
| Capital Services and LOC; Ixis Corporate and Investment Bank) | | 3.74 | | 2/7/07 | | 16,025,000 | | a,b | | 16,025,000 |
| Delaware—.3% | | | | | | | | | | |
| Delaware Economic Development Authority, Revenue (Saint | | | | | | | | | | |
| Anne’s Episcopal School Project) (LOC; Wilmington Trust Co.) | | 3.75 | | 2/7/07 | | 3,900,000 | | a | | 3,900,000 |
| District of Columbia—1.0% | | | | | | | | | | |
| Bank of New York Municipal Certificates Trust, Revenue | | | | | | | | | | |
| (District of Columbia Housing Finance Agency) (GIC; Trinity | | | | | | | | | | |
| Funding Corporation and Liquidity Facility; The Bank of New York) | | 3.75 | | 2/7/07 | | 5,375,000 | | a,b | | 5,375,000 |
| District of Columbia, Revenue, Refunding (American | | | | | | | | | | |
| Association of Homes and Services for the Aging, Inc. | | | | | | | | | | |
| Issue) (LOC; Unicredito Italiano SPA) | | 3.66 | | 2/7/07 | | 5,545,000 | | a | | 5,545,000 |
| Florida—4.5% | | | | | | | | | | |
| Broward County Housing Finance Authority, MFHR | | | | | | | | | | |
| (Cypress Grove Apartments Project) (Liquidity Facility; | | | | | | | | | | |
| American International Group Funding Inc.) | | 3.76 | | 2/7/07 | | 5,000,000 | | a | | 5,000,000 |
| Miami-Dade County Industrial Development Authority, | | | | | | | | | | |
| IDR (Fine Art Lamps Project) (LOC; SunTrust Bank) | | 3.67 | | 2/7/07 | | 3,650,000 | | a | | 3,650,000 |
| Orange County Housing Finance Authority, Homeowner Revenue | | | | | | | | | | |
| (Insured: FNMA and GNMA and Liquidity Facility; Lehman Liquidity LLC) | | 3.60 | | 2/7/07 | | 2,240,000 | | a,b | | 2,240,000 |
| Sunshine State Governmental Financing Commission, | | | | | | | | | | |
| Revenue, CP (Liquidity Facility; DEPFA Bank PLC) | | 3.65 | | 2/12/07 | | 20,000,000 | | | | 20,000,000 |
| Sunshine State Governmental Financing Commission, | | | | | | | | | | |
| Revenue, CP (Liquidity Facility; DEPFA Bank PLC) | | 3.54 | | 3/8/07 | | 7,965,000 | | | | 7,965,000 |
The Funds 23
| | STATEMENT OF INVESTMENTS (continued)
|
| Dreyfus Municipal | | Coupon | | Maturity | | Principal | | | | |
| Cash Management Plus (continued) | | Rate (%) | | Date | | Amount ($) | | Value ($) |
| |
| |
| |
| |
|
| |
| Short-Term Investments (continued) | | | | | | | | | | |
| |
| |
| |
| |
| |
|
| Florida (continued) | | | | | | | | | | |
| Sunshine State Governmental Financing Commission, | | | | | | | | | | |
| Revenue, CP (Liquidity Facility; Dexia Credit Locale) | | 3.55 | | 2/15/07 | | 1,240,000 | | | | 1,240,000 |
| Sunshine State Governmental Financing Commission, | | | | | | | | | | |
| Revenue, CP (Liquidity Facility; Dexia Credit Locale) | | 3.60 | | 3/6/07 | | 10,000,000 | | | | 10,000,000 |
| Georgia—4.3% | | | | | | | | | | |
| Atlanta, Subordinate Lien Tax Allocation | | | | | | | | | | |
| (Atlantic Station Project) (LOC; Wachovia Bank) | | 3.71 | | 2/7/07 | | 4,000,000 | | a | | 4,000,000 |
| Atlanta Urban Residential Finance Authority, MFHR | | | | | | | | | | |
| (Lindbergh City Center Apartments Project) (LOC; Regions Bank) | | 3.68 | | 2/7/07 | | 5,000,000 | | a | | 5,000,000 |
| Municipal Electric Authority of Georgia, CP | | | | | | | | | | |
| (LOC; JPMorgan Chase Bank) | | 3.62 | | 2/9/07 | | 10,000,000 | | | | 10,000,000 |
| Savannah Economic Development Authority, | | | | | | | | | | |
| Exempt Facility Revenue (Home Depot Project) | | 3.67 | | 2/7/07 | | 17,000,000 | | a | | 17,000,000 |
| Willacoochee Development Authority, PCR | | | | | | | | | | |
| (Langboard Inc. Project) (LOC; SunTrust Bank) | | 3.67 | | 2/7/07 | | 12,000,000 | | a | | 12,000,000 |
| Illinois—1.7% | | | | | | | | | | |
| Chicago, Collateralized SFMR | | 3.85 | | 2/14/08 | | 7,500,000 | | c | | 7,500,000 |
| Chicago, IDR (Victoria Limited LLC Project) (LOC; ABN-AMRO) | | 3.68 | | 2/7/07 | | 3,500,000 | | a | | 3,500,000 |
| Upper Illinois River Valley Development Authority, SWDR | | | | | | | | | | |
| (Exolon-Esk Co. Project) (LOC; Bank of America) | | 3.69 | | 2/7/07 | | 8,405,000 | | a | | 8,405,000 |
| Indiana—3.3% | | | | | | | | | | |
| Elkhart County, EDR (Four Seasons Manufacturing | | | | | | | | | | |
| Project) (LOC; National City Bank) | | 3.74 | | 2/7/07 | | 3,950,000 | | a | | 3,950,000 |
| Hammond, Sewer and Solid Waste Disposal Revenue, | | | | | | | | | | |
| Refunding (Cargill Inc. Project) | | 3.58 | | 2/7/07 | | 6,500,000 | | a | | 6,500,000 |
| Indiana Bond Bank (Interim Advance Funding Program Notes) | | 3.65 | | 2/1/07 | | 20,000,000 | | | | 20,000,000 |
| Indiana Finance Authority, EDR (JRL Leasing, Inc. | | | | | | | | | | |
| and LaSarre Co., LLC Project) (LOC; National City Bank) | | 3.74 | | 2/7/07 | | 3,800,000 | | a | | 3,800,000 |
| Saint Joseph County, Health Care Facility Revenue | | | | | | | | | | |
| (South Bend Medical Foundation Project) | | | | | | | | | | |
| (LOC; National City Bank) | | 3.69 | | 2/7/07 | | 2,800,000 | | a | | 2,800,000 |
| Iowa—.4% | | | | | | | | | | |
| Iowa Finance Authority, SFMR (Mortgage-Backed Securities | | | | | | | | | | |
| Program) (Liquidity Facility; State Street Bank and Trust Co.) | | 3.66 | | 2/7/07 | | 4,500,000 | | a | | 4,500,000 |
| Kansas—2.1% | | | | | | | | | | |
| Junction City, Temporary Notes | | 5.00 | | 8/1/07 | | 2,000,000 | | | | 2,007,181 |
| Junction City, Temporary Notes | | 5.00 | | 12/1/07 | | 2,500,000 | | | | 2,519,123 |
| Mission, MFHR, Refunding (The Falls | | | | | | | | | | |
| Apartments Project) (Insured; FNMA) | | 3.72 | | 2/7/07 | | 3,350,000 | | a | | 3,350,000 |
| Unified Government of Wyandotte County/ | | | | | | | | | | |
| Kansas City, Municipal Temporary Notes | | 3.53 | | 4/1/07 | | 5,920,000 | | | | 5,920,000 |
| Unified Government of Wyandotte County/ | | | | | | | | | | |
| Kansas City, Municipal Temporary Notes | | 3.60 | | 11/1/07 | | 10,000,000 | | | | 10,000,000 |
| Kentucky—3.6% | | | | | | | | | | |
| Kenton County Airport Board, Special Facilities Revenue | | | | | | | | | | |
| (Airis Cincinnati LLC Project) (LOC; Deutsche Postbank) | | 3.73 | | 2/7/07 | | 31,800,000 | | a | | 31,800,000 |
24
| Dreyfus Municipal | | Coupon | | Maturity | | Principal | | | | |
| Cash Management Plus (continued) | | Rate (%) | | Date | | Amount ($) | | Value ($) |
| |
| |
| |
| |
|
| |
| Short-Term Investments (continued) | | | | | | | | | | |
| |
| |
| |
| |
| |
|
| Kentucky (continued) | | | | | | | | | | |
| Kentucky Rural Water Finance Corporation, | | | | | | | | | | |
| Public Projects Construction Notes | | 3.63 | | 4/2/07 | | 8,500,000 | | | | 8,500,000 |
| Louisiana—6.5% | | | | | | | | | | |
| Bank of New York Municipal Certificates Trust | | | | | | | | | | |
| (Lake Charles Harbor and Terminal District) (Liquidity | | | | | | | | | | |
| Facility; The Bank of New York and LOC; The Bank of New York) | | 3.75 | | 2/7/07 | | 10,000,000 | | a,b | | 10,000,000 |
| Calcasieu Parish Inc. Industrial Development Board, | | | | | | | | | | |
| Environmental Revenue (CITGO Petroleum | | | | | | | | | | |
| Corporation Project) (LOC; Natexis Banques Populares) | | 3.79 | | 2/1/07 | | 30,000,000 | | a | | 30,000,000 |
| Louisiana Public Facilities Authority, Revenue | | | | | | | | | | |
| (Comm-Care Louisiana Project) (LOC; JPMorgan Chase Bank) | | 3.63 | | 2/7/07 | | 6,000,000 | | a | | 6,000,000 |
| Morgan Keegan Municipal Product Trust Receipts | | | | | | | | | | |
| (New Orleans Finance Authority) (Liquidity Facility; Lloyds | | | | | | | | | | |
| TSB Bank PLC and LOC; Transamerica Life and Insurance) | | 3.71 | | 2/7/07 | | 25,000,000 | | a,b | | 25,000,000 |
| Maine—.2% | | | | | | | | | | |
| Auburn, Obligation Securities Revenue | | | | | | | | | | |
| (J&A Properties and United Fabricants Strainrite Project) | | | | | | | | | | |
| (LOC; Citizens Bank of Massachusetts) | | 3.58 | | 2/7/07 | | 2,380,000 | | a | | 2,380,000 |
| Maryland—.2% | | | | | | | | | | |
| Maryland Economic Development Corporation, Revenue, | | | | | | | | | | |
| Refunding (United Cerebral Palsy Project) (LOC; M&T Bank) | | 3.73 | | 2/7/07 | | 2,144,500 | | a | | 2,144,500 |
| Massachusetts—2.5% | | | | | | | | | | |
| Massachusetts, CP (LOC; Dexia Credit Locale) | | 3.63 | | 2/20/07 | | 12,000,000 | | | | 12,000,000 |
| Massachusetts Development Finance Agency, Revenue | | | | | | | | | | |
| (Northfield Mount Hermon School Issue) (Insured; | | | | | | | | | | |
| Radian Bank and Liquidity Facility; Bank of America) | | 3.68 | | 2/7/07 | | 5,000,000 | | a | | 5,000,000 |
| Massachusetts Development Finance Agency, Revenue | | | | | | | | | | |
| (Suffolk University Issue) (Insured; Assured Guaranty | | | | | | | | | | |
| and Liquidity Facility; Citizens Bank of Massachusetts) | | 3.55 | | 2/7/07 | | 6,400,000 | | a | | 6,400,000 |
| Massachusetts Development Finance Authority, Multifamily | | | | | | | | | | |
| Revenue (Kennedy Lofts Project) (Liquidity Facility; | | | | | | | | | | |
| Merrill Lynch Capital Services and LOC; Merrill Lynch and Co. Inc.) | | 3.72 | | 2/7/07 | | 4,000,000 | | a,b | | 4,000,000 |
| Michigan—2.9% | | | | | | | | | | |
| Michigan Hospital Finance Authority, HR (Chelsea | | | | | | | | | | |
| Community Hospital) (LOC; National City Bank) | | 3.65 | | 2/7/07 | | 3,620,000 | | a | | 3,620,000 |
| Michigan Hospital Finance Authority, Revenue (Health | | | | | | | | | | |
| Care Equipment Loan Program) (LOC; ABN-AMRO) | | 3.54 | | 2/7/07 | | 5,000,000 | | a | | 5,000,000 |
| Michigan Strategic Fund, LOR | | | | | | | | | | |
| (HME Inc. Project) (LOC; Fifth Third Bank) | | 3.72 | | 2/7/07 | | 2,050,000 | | a | | 2,050,000 |
| Michigan Strategic Fund, LOR | | | | | | | | | | |
| (Kaumagraph Flint Corp. Project) (LOC; Bank One) | | 3.60 | | 2/7/07 | | 2,400,000 | | a | | 2,400,000 |
| Michigan Strategic Fund, LOR | | | | | | | | | | |
| (PFG Enterprises Inc. Project) (LOC; Huntington NB) | | 3.91 | | 2/7/07 | | 2,660,000 | | a | | 2,660,000 |
| Oakland County Economic Development Corporation, LOR | | | | | | | | | | |
| (Michigan Seamless Tube LLC Project) (LOC; ABM-AMRO) | | 3.78 | | 2/7/07 | | 3,300,000 | | a | | 3,300,000 |
| Pittsfield Township Economic Development Corporation, LOR, | | | | | | | | | | |
| Refunding (Arbor Project) (LOC; Comerica Bank) | | 3.69 | | 2/7/07 | | 4,800,000 | | a | | 4,800,000 |
The Funds 25
| | STATEMENT OF INVESTMENTS (continued)
|
| Dreyfus Municipal | | Coupon | | Maturity | | Principal | | | | |
| Cash Management Plus (continued) | | Rate (%) | | Date | | Amount ($) | | Value ($) |
| |
| |
| |
| |
|
| |
| Short-Term Investments (continued) | | | | | | | | | | |
| |
| |
| |
| |
| |
|
| Michigan (continued) | | | | | | | | | | |
| Roaring Fork Municipal Products LLC (Michigan Higher | | | | | | | | | | |
| Education Student Loan Authority) (Insured; AMBAC | | | | | | | | | | |
| and Liquidity Facility; The Bank of New York) | | 3.73 | | 2/7/07 | | 8,747,000 | | a,b | | 8,747,000 |
| Minnesota—2.2% | | | | | | | | | | |
| Minneapolis and Saint Paul Metropolitan Airports | | | | | | | | | | |
| Commission, Airport Revenue (Insured; AMBAC | | | | | | | | | | |
| and Liquidity Facility; Goldman Sachs Group) | | 3.66 | | 2/7/07 | | 25,000,000 | | a,b | | 25,000,000 |
| Missouri—.3% | | | | | | | | | | |
| Saint Louis Industrial Development Authority, MFHR | | | | | | | | | | |
| (Windward Estates Project) (GIC; IXIS Corporate and | | | | | | | | | | |
| Investment Bank and Liquidity Facility; Merrill Lynch Capital Services) | | 3.74 | | 2/7/07 | | 3,570,000 | | a,b | | 3,570,000 |
| Nevada—1.2% | | | | | | | | | | |
| Roaring Fork Municipal Products LLC, Revenue | | | | | | | | | | |
| (Insured; FNMA and Liquidity Facility; The Bank of New York) | | 3.76 | | 2/7/07 | | 13,535,000 | | a,b | | 13,535,000 |
| New Hampshire—.5% | | | | | | | | | | |
| New Hampshire Business Finance Authority, | | | | | | | | | | |
| Water Facility Revenue (Pennichuck Water Works, Inc. Project) | | | | | | | | | | |
| (Insured; AMBAC and Liquidity Facility; FHLB) | | 3.62 | | 4/1/07 | | 5,930,000 | | | | 5,930,000 |
| New Mexico—.5% | | | | | | | | | | |
| Dona Ana County, IDR (Foamex Products Inc. Project) | | | | | | | | | | |
| (LOC; Bank of Nova Scotia) | | 3.66 | | 2/7/07 | | 5,900,000 | | a | | 5,900,000 |
| New York—5.6% | | | | | | | | | | |
| New York City Municipal Water Finance Authority, CP | | | | | | | | | | |
| (Liquidity Facility: Dexia Credit Locale and JPMorgan Chase Bank) | | 3.67 | | 2/8/07 | | 15,000,000 | | | | 15,000,000 |
| New York City Municipal Water Finance Authority, CP | | | | | | | | | | |
| (LOC: Landesbank Baden Wurttemberg | | | | | | | | | | |
| and Landesbank Hessen-Thuringen Girozentrale) | | 3.52 | | 2/8/07 | | 20,000,000 | | | | 20,000,000 |
| New York City Municipal Water Finance Authority, CP | | | | | | | | | | |
| (LOC: Landesbank Baden Wurttemberg | | | | | | | | | | |
| and Landesbank Hessen-Thuringen Girozentrale) | | 3.60 | | 2/14/07 | | 10,000,000 | | | | 10,000,000 |
| TSASC Inc. of New York, Tobacco Settlement | | | | | | | | | | |
| Asset-Backed Bonds (Liquidity Facility; Merrill Lynch) | | 3.67 | | 2/7/07 | | 3,280,000 | | a,b | | 3,280,000 |
| Westchester Tobacco Asset Securitization Corporation, | | | | | | | | | | |
| Tobacco Settlement Asset-Backed Bonds (Liquidity Facility; | | | | | | | | | | |
| Merrill Lynch Capital Services and LOC; Merrill Lynch) | | 3.66 | | 2/7/07 | | 13,865,000 | | a,b | | 13,865,000 |
| North Carolina—.5% | | | | | | | | | | |
| Burke County Industrial Facilities and Pollution Control Financing | | | | | | | | | | |
| Authority, IDR (Bauer Industries Inc. Project) (LOC; Bank of Montreal) | | 3.73 | | 2/7/07 | | 1,455,000 | | a | | 1,455,000 |
| Durham County, Multifamily Revenue (Falls Pointe Apartments) | | | | | | | | | | |
| (Liquidity Facility; Merrill Lynch and LOC; Merrill Lynch) | | 3.72 | | 2/7/07 | | 4,500,000 | | a,b | | 4,500,000 |
| Ohio—3.9% | | | | | | | | | | |
| Cuyahoga County, IDR (King Nut Project) (LOC; Key Bank) | | 3.76 | | 2/7/07 | | 3,230,000 | | a | | 3,230,000 |
| Hamilton County, Hospital Facilities Revenue (Christ Hospital) | | | | | | | | | | |
| (Insured; FSA and Liquidity Facility; Svenska Handelsbanken) | | 3.69 | | 2/7/07 | | 10,000,000 | | a,b | | 10,000,000 |
| Middletown, Hospital Facilities Revenue (Middletown Hospital Group) | | | | | | | | | | |
| (Liquidity Facility; Merrill Lynch Capital Services and LOC; Merrill Lynch) | | 3.69 | | 2/7/07 | | 20,510,000 | | a,b | | 20,510,000 |
| Ohio Water Development Authority, PCR, Refunding (FirstEnergy | | | | | | | | | | |
| Nuclear Generation Corp. Project) (LOC; Barclays Bank PLC) | | 3.56 | | 2/7/07 | | 9,700,000 | | a | | 9,700,000 |
26
| Dreyfus Municipal | | Coupon | | Maturity | | Principal | | | | |
| Cash Management Plus (continued) | | Rate (%) | | Date | | Amount ($) | | Value ($) |
| |
| |
| |
| |
|
| |
| Short-Term Investments (continued) | | | | | | | | | | |
| |
| |
| |
| |
| |
|
| Oklahoma—1.3% | | | | | | | | | | |
| Tulsa County Industrial Authority, Capital Improvements | | | | | | | | | | |
| Revenue (Liquidity Facility; Bank of America) | | 3.60 | | 5/15/07 | | 15,000,000 | | | | 15,000,000 |
| Oregon—.9% | | | | | | | | | | |
| Oregon, Homeowner Revenue (Liquidity Facility; Landesbank Hessen- | | | | | | | | | | |
| Thuringen Girozentrale and LOC; Trinity Funding Corporation) | | 3.69 | | 2/7/07 | | 10,445,000 | | a,b | | 10,445,000 |
| Pennsylvania—12.4% | | | | | | | | | | |
| Beaver County Industrial Development Authority, EIR | | | | | | | | | | |
| (BASF Corporation Project) (LOC; BASF AG) | | 3.79 | | 2/1/07 | | 4,000,000 | | a | | 4,000,000 |
| Chartiers Valley Industrial and Commercial Development | | | | | | | | | | |
| Authority (Wesley Hills Project) (LOC; Fifth Third Bank) | | 3.65 | | 2/7/07 | | 8,400,000 | | a | | 8,400,000 |
| Dauphin County General Authority, Revenue | | | | | | | | | | |
| (School District Pooled Financing Program) (Insured; | | | | | | | | | | |
| FSA and Liquidity Facility: Bank of Nova Scotia and KBC Bank) | | 3.53 | | 2/7/07 | | 15,925,000 | | a | | 15,925,000 |
| Dauphin County General Authority, Revenue | | | | | | | | | | |
| (School District Pooled Financing Program | | | | | | | | | | |
| II) (Insured; AMBAC and Liquidity Facility; Bank of Nova Scotia) | | 3.64 | | 2/7/07 | | 2,375,000 | | a | | 2,375,000 |
| Delaware County Authority, Health System Revenue (Mercy Health | | | | | | | | | | |
| System of Southeastern Pennsylvania Issue) (Liquidity Facility; | | | | | | | | | | |
| Westdeutsche Landesbank and LOC; Westdeutsche Landesbank) | | 3.69 | | 2/7/07 | | 8,985,000 | | a,b | | 8,985,000 |
| Emmaus General Authority (Pennsylvania Variable Rate Loan Program) | | 3.65 | | 2/7/07 | | 5,000,000 | | a | | 5,000,000 |
| Emmaus General Authority, Local Government | | | | | | | | | | |
| Revenue (LOC; DEPFA Bank PLC) | | 3.53 | | 2/7/07 | | 7,800,000 | | a | | 7,800,000 |
| Emmaus General Authority, Local Government | | | | | | | | | | |
| Revenue (LOC; DEPFA Bank PLC) | | 3.53 | | 2/7/07 | | 5,500,000 | | a | | 5,500,000 |
| Emmaus General Authority, Local Government | | | | | | | | | | |
| Revenue (LOC; DEPFA Bank PLC) | | 3.53 | | 2/7/07 | | 6,400,000 | | a | | 6,400,000 |
| Emmaus General Authority, Local Government | | | | | | | | | | |
| Revenue (LOC; DEPFA Bank PLC) | | 3.53 | | 2/7/07 | | 17,300,000 | | a | | 17,300,000 |
| Franklin County Industrial Development Authority, | | | | | | | | | | |
| Revenue (Menno Haven Project) (Insured; | | | | | | | | | | |
| Radian Bank and Liquidity Facility; Bank of America) | | 3.66 | | 2/7/07 | | 15,550,000 | | a | | 15,550,000 |
| Lancaster Municipal Authority, Revenue | | | | | | | | | | |
| (Ephrata Community Hospital Project) (LOC; Fulton Bank) | | 3.60 | | 2/7/07 | | 3,800,000 | | a | | 3,800,000 |
| Lancaster Municipal Authority, Revenue | | | | | | | | | | |
| (Garden Spot Village Project) (LOC; Fulton Bank) | | 3.55 | | 2/7/07 | | 7,435,000 | | a | | 7,435,000 |
| Montgomery County Industrial Development Authority, Revenue | | | | | | | | | | |
| (Recigno Laboratories, Inc. Project) (LOC; Wachovia Bank) | | 3.78 | | 2/7/07 | | 1,530,000 | | a | | 1,530,000 |
| Pennsylvania Higher Education Assistance Agency, | | | | | | | | | | |
| Student Loan Revenue (Insured; AMBAC and | | | | | | | | | | |
| Liquidity Facility; Morgan Stanley Bank) | | 3.56 | | 2/7/07 | | 5,100,000 | | a | | 5,100,000 |
| Philadelphia, Airport Revenue, Refunding (Insured; | | | | | | | | | | |
| MBIA and Liquidity Facility; JPMorgan Chase Bank) | | 3.58 | | 2/7/07 | | 10,900,000 | | a | | 10,900,000 |
| West Cornwall Township Municipal Authority, GO Notes, | | | | | | | | | | |
| Refunding (Bethlehem Area School District Project) | | | | | | | | | | |
| (Insured; FSA and Liquidity Facility; Dexia Credit Locale) | | 3.64 | | 2/7/07 | | 9,800,000 | | a | | 9,800,000 |
| West Cornwall Township Municipal Authority, Revenue | | | | | | | | | | |
| (Pennsylvania General Government Loan Program) | | | | | | | | | | |
| (Insured; FSA and Liquidity Facility; Dexia Credit Locale) | | 3.64 | | 2/7/07 | | 1,103,000 | | a | | 1,103,000 |
The Funds 27
| | STATEMENT OF INVESTMENTS (continued)
|
| Dreyfus Municipal | | Coupon | | Maturity | | Principal | | | | |
| Cash Management Plus (continued) | | Rate (%) | | Date | | Amount ($) | | Value ($) |
| |
| |
| |
| |
|
| |
| Short-Term Investments (continued) | | | | | | | | | | |
| |
| |
| |
| |
| |
|
| South Carolina—3.8% | | | | | | | | | | |
| Berkeley County, Exempt Facility Industrial Revenue | | | | | | | | | | |
| (Amoco Chemical Company Project) | | 3.79 | | 2/1/07 | | 25,400,000 | | a | | 25,400,000 |
| South Carolina Association of Governmental Organizations, COP, TAN | | 4.25 | | 4/13/07 | | 12,000,000 | | | | 12,007,463 |
| South Carolina Jobs-Economic Development Authority, | | | | | | | | | | |
| HR (Oconee Memorial Hospital, Inc. Project) (Insured; | | | | | | | | | | |
| Radian Group and Liquidity Facility; Wachovia Bank) | | 3.67 | | 2/7/07 | | 5,400,000 | | a | | 5,400,000 |
| Tennessee—1.7% | | | | | | | | | | |
| Tennessee Energy Acquisition Corporation, Gas Project Revenue | | | | | | | | | | |
| (Merlots Program) (Liquidity Facility; The Bank of New York) | | 3.54 | | 2/7/07 | | 18,935,000 | | a,b | | 18,935,000 |
| Texas—15.1% | | | | | | | | | | |
| ABN AMRO Munitops Certificates Trust, Water Revenue (Tarrant Regional | | | | | | | | |
| Water District) (Insured; FGIC and Liquidity Facility; ABN-AMRO) | | 3.66 | | 2/7/07 | | 4,800,000 | | a,b | | 4,800,000 |
| Austin, Utility System Revenue, CP (LOC: Bayerische Landesbank, | | | | | | | | | | |
| JPMorgan Chase Bank and State Street Bank and Trust Co.) | | 3.60 | | 3/1/07 | | 7,000,000 | | | | 7,000,000 |
| Bexar County Housing Finance Corporation, MFHR (Gates | | | | | | | | | | |
| Capernum Apartments Project) (Liquidity Facility; Merrill Lynch) | | 3.72 | | 2/7/07 | | 3,920,000 | | a,b | | 3,920,000 |
| Brazos River Harbor Navigation Distict, Harbor Revenue | | | | | | | | | | |
| (BASF Corporation Project) | | 3.79 | | 2/1/07 | | 7,000,000 | | a | | 7,000,000 |
| Dallas Housing Finance Corporation, MFHR | | | | | | | | | | |
| (Southern Terrace Apartments) (Liquidity Facility; | | | | | | | | | | |
| Merrill Lynch Capital Services and LOC; Merrill Lynch) | | 3.72 | | 2/7/07 | | 8,660,000 | | a,b | | 8,660,000 |
| East Texas Housing Finance Corporation, MFHR (Southwest | | | | | | | | | | |
| Pines Apartments Project) (Liquidity Facility; Merrill Lynch) | | 3.72 | | 2/7/07 | | 4,320,000 | | a,b | | 4,320,000 |
| El Paso County Hospital District, GO Notes (Putters Program) | | | | | | | | | | |
| (Insured; AMBAC and Liquidity Facility; Deutsche Postbank) | | 3.66 | | 2/7/07 | | 3,475,000 | | a,b | | 3,475,000 |
| Fort Bend County, Toll Road Revenue (Putters Program) | | | | | | | | | | |
| (Insured; FGIC and Liquidity Facility; PB Finance Inc.) | | 3.66 | | 2/7/07 | | 2,775,000 | | a,b | | 2,775,000 |
| Harris County Housing Finance Corporation, MFHR (Primrose Skyline | | | | | | | | | | |
| Apartments) (Liquidity Facility; Merrill Lynch and LOC; Merrill Lynch) | | 3.72 | | 2/7/07 | | 13,145,000 | | a,b | | 13,145,000 |
| Harris County Metropolitan Transit Authority, Sales | | | | | | | | | | |
| and Use Tax Revenue, CP (LOC; DEPFA Bank PLC) | | 3.70 | | 7/12/07 | | 11,000,000 | | | | 11,000,000 |
| Montgomery County Housing Finance Corporation, MFHR | | | | | | | | | | |
| (Park at Woodline Townhomes) (LOC; Citibank NA) | | 3.62 | | 2/7/07 | | 7,500,000 | | a | | 7,500,000 |
| North Central Texas Health Facilities Development Corporation, | | | | | | | | | | |
| Revenue, CP (Methodist Hospital) (Insured; | | | | | | | | | | |
| AMBAC and Liquidity Facility; Dexia Credit Locale) | | 3.62 | | 5/2/07 | | 10,000,000 | | | | 10,000,000 |
| Permian Basin Regional Housing Finance Corporation, SFMR | | | | | | | | | | |
| (Mortgage Backed Securities Program) (GIC; Aegon NV) | | 4.12 | | 6/1/07 | | 5,455,000 | | | | 5,455,000 |
| Revenue Bond Certificate Series Trust Various States, | | | | | | | | | | |
| Housing Revenue (Pebble Brooke) (GIC; AIG Funding Inc.) | | 3.87 | | 2/7/07 | | 7,000,000 | | a,b | | 7,000,000 |
| Revenue Bond Certificate Series Trust Various States, | | | | | | | | | | |
| Revenue (Chimney Project) (GIC; AIG Funding Inc.) | | 3.87 | | 2/7/07 | | 6,180,000 | | a,b | | 6,180,000 |
| San Antonio, Water System, CP (Liquidity Facility; Bank of America) | | 3.58 | | 5/15/07 | | 11,000,000 | | | | 10,999,910 |
| Texas Affordable Housing Corporation, MFHR | | | | | | | | | | |
| (American Housing Foundation Portfolio) (Insured; MBIA | | | | | | | | | | |
| and Liquidity Facility; Branch Banking and Trust Company) | | 3.65 | | 2/7/07 | | 9,970,000 | | a,b | | 9,970,000 |
| Texas Department of Housing and Community Affairs, | | | | | | | | | | |
| MFHR (Ash Creek Apartments) (Liquidity | | | | | | | | | | |
| Facility; Merrill Lynch and LOC; Merrill Lynch) | | 3.72 | | 2/7/07 | | 7,500,000 | | a,b | | 7,500,000 |
28
| Dreyfus Municipal | | Coupon | | Maturity | | Principal | | | | |
| Cash Management Plus (continued) | | Rate (%) | | Date | | Amount ($) | | Value ($) |
| |
| |
| |
| |
|
| |
| Short-Term Investments (continued) | | | | | | | | | | |
| |
| |
| |
| |
| |
|
| Texas (continued) | | | | | | | | | | |
| Texas Public Finance Authority, Revenue, CP | | 3.57 | | 3/13/07 | | 15,100,000 | | | | 15,100,000 |
| Texas Transportation Commission, State Highway Fund First | | | | | | | | | | |
| Tier Revenue (Liquidity Facility; Banco Bilboa Vizcaya ARG) | | 3.51 | | 2/7/07 | | 12,500,000 | | a | | 12,500,000 |
| University of Texas, University Revenue, CP | | 3.63 | | 3/13/07 | | 8,830,000 | | | | 8,830,000 |
| Vermont—1.3% | | | | | | | | | | |
| University of Vermont and State Agricultural College, CP | | 3.60 | | 3/13/07 | | 9,575,000 | | | | 9,575,000 |
| Vermont Economic Development Authority, Revenue, CP (Economic | | | | | | | | | | |
| Development Capital Program) (LOC; JPMorgan Chase Bank) | | 3.70 | | 4/17/07 | | 5,000,000 | | | | 5,000,000 |
| Virginia—1.4% | | | | | | | | | | |
| Morgan Keegan Municipal Products Inc., Revenue (Virginia Housing | | | | | | | | | | |
| Development Authority) (Liquidity Facility; BNP Paribas) | | 3.71 | | 2/7/07 | | 6,740,000 | | a,b | | 6,740,000 |
| Norfolk Economic Development Authority, | | | | | | | | | | |
| New Empowerment Zone Facility Revenue (Metropolitan | | | | | | | | | | |
| Machine Corp. Project) (LOC; Wachovia Bank) | | 3.68 | | 2/7/07 | | 6,100,000 | | a | | 6,100,000 |
| Virginia Beach Development Authority, IDR, Refunding (Giant | | | | | | | | | | |
| Square Shopping Center Co. LLP Project) (LOC; Wachovia Bank) | | 3.68 | | 2/7/07 | | 3,300,000 | | a | | 3,300,000 |
| Washington—3.9% | | | | | | | | | | |
| Everett Industrial Development Corporation, Exempt | | | | | | | | | | |
| Facilities Revenue (Kimberly Clark Corp. Project) | | 3.60 | | 2/7/07 | | 3,200,000 | | a | | 3,200,000 |
| Pierce County Economic Development Corporation, Multi-Mode | | | | | | | | | | |
| Industrial Revenue (SeaTac Packaging Project) (LOC; HSBC Bank USA) | | 3.68 | | 2/7/07 | | 5,590,000 | | a | | 5,590,000 |
| Port of Seattle, Revenue (Insured; FGIC and Liquidity Facility; BNP Paribas) | | 3.68 | | 2/7/07 | | 2,870,000 | | a,b | | 2,870,000 |
| Washington Economic Development Finance Authority, | | | | | | | | | | |
| SWDR (Cedar Grove Composing Project) (LOC; Wells Fargo Bank) | | 3.62 | | 2/7/07 | | 5,000,000 | | a | | 5,000,000 |
| Washington Economic Development Finance Authority, | | | | | | | | | | |
| SWDR (Lemay Enterprises Project) (LOC; Bank of America) | | 3.62 | | 2/7/07 | | 5,660,000 | | a | | 5,660,000 |
| Washington Economic Development Finance Authority, | | | | | | | | | | |
| SWDR (Waste Management Project) (LOC; Bank of America) | | 3.57 | | 2/7/07 | | 5,500,000 | | a | | 5,500,000 |
| Washington Housing Finance Commission, MFHR | | | | | | | | | | |
| (Queen Anne Project) (LOC; Bank of America) | | 3.71 | | 2/7/07 | | 7,500,000 | | a | | 7,500,000 |
| Washington Housing Finance Commission, MFHR (The Vintage at | | | | | | | | | | |
| Chehalis Senior Living Project) (Liquidity Facility; FNMA and LOC; FNMA) | | 3.68 | | 2/7/07 | | 8,190,000 | | a | | 8,190,000 |
| Wisconsin—.7% | | | | | | | | | | |
| Howard-Suamico School District, BAN | | 4.00 | | 2/1/08 | | 8,300,000 | | c | | 8,310,209 |
| Wyoming—4.6% | | | | | | | | | | |
| Campbell County, IDR (Two Elk Power Generation Station | | | | | | | | | | |
| Project) (GIC; American International Group Funding Inc.) | | 3.80 | | 11/30/07 | | 21,300,000 | | | | 21,300,000 |
| Campbell County, IDR (Two Elk Power Generation | | | | | | | | | | |
| Station Project) (LOC; Citibank NA) | | 3.80 | | 11/30/07 | | 10,000,000 | | | | 10,000,000 |
| Natrona County, HR, Refunding (Wyoming Medical Center Project) | | | | | | | | | | |
| (Insured; AMBAC and Liquidity Facility; Bank of Nova Scotia) | | 3.52 | | 2/7/07 | | 20,000,000 | | a | | 20,000,000 |
| |
| |
| |
| |
| |
|
| |
| Total Investments (cost $1,168,993,688) | | | | | | 104.8% | | | | 1,168,993,708 |
| Liabilities, Less Cash and Receivables | | | | | | (4.8%) | | (53,340,881) |
| Net Assets | | | | | | 100.0% | | | | 1,115,652,827 |
| See footnotes on page 45. |
| See notes to financial statements. |
| STATEMENT OF INVESTMENTS |
| January 31, 2007 |
| Dreyfus New York | | Coupon | | Maturity | | Principal | | | | |
| Municipal Cash Management | | Rate (%) | | Date | | Amount ($) | | Value ($) |
| |
| |
| |
| |
|
| |
| Short-Term Investments—98.8% | | | | | | | | | | |
| |
| |
| |
| |
| |
|
| Albany Industrial Development Agency, Senior | | | | | | | | | | |
| Housing Revenue (South Mall Towers Albany, | | | | | | | | | | |
| L.P. Project) (Insured; FNMA and Liquidity Facility; FNMA) | | 3.65 | | 2/7/07 | | 6,700,000 | | a | | 6,700,000 |
| Binghamton, GO Notes, BAN | | 4.00 | | 2/2/07 | | 7,200,000 | | | | 7,200,083 |
| Chautauqua County, GO Notes, TAN | | 4.00 | | 12/21/07 | | 3,500,000 | | | | 3,511,997 |
| Chautauqua County Industrial Development Agency, Civic | | | | | | | | | | |
| Facility Revenue (Gerry Homes Project) (LOC; HSBC Bank USA) | | 3.80 | | 2/7/07 | | 13,400,000 | | a | | 13,400,000 |
| Chemung County Industrial Development Agency, IDR | | | | | | | | | | |
| (MMARS 2nd Program) (LOC; HSBC Bank USA) | | 3.80 | | 2/7/07 | | 1,140,000 | | a | | 1,140,000 |
| Colonie, GO Notes, BAN | | 4.25 | | 4/5/07 | | 2,000,000 | | | | 2,001,697 |
| Dutchess County Industrial Development Agency, | | | | | | | | | | |
| Civic Facility Revenue, Refunding (Lutheran Center | | | | | | | | | | |
| at Poughkeepsie, Inc. Project) (LOC; Key Bank) | | 3.64 | | 2/7/07 | | 3,815,000 | | a | | 3,815,000 |
| Erie County Industrial Development Agency, | | | | | | | | | | |
| Civic Facility Revenue (D’Youville College Project) | | | | | | | | | | |
| (LOC; HSBC Bank USA) | | 3.80 | | 2/7/07 | | 7,115,000 | | a | | 7,115,000 |
| Erie County Industrial Development Agency, Civic Facility | | | | | | | | | | |
| Revenue (Heritage Center Project) (LOC; Key Bank) | | 3.69 | | 2/7/07 | | 2,255,000 | | a | | 2,255,000 |
| Erie County Industrial Development Agency, Civic Facility | | | | | | | | | | |
| Revenue (YMCA of Greater Buffalo Project) (LOC; HSBC Bank USA) | | 3.80 | | 2/7/07 | | 1,125,000 | | a | | 1,125,000 |
| Erie County Industrial Development Agency, Civic Facility | | | | | | | | | | |
| Revenue (YMCA of Greater Buffalo Project) (LOC; HSBC Bank USA) | | 3.80 | | 2/7/07 | | 3,850,000 | | a | | 3,850,000 |
| Erie County Tobacco Asset Securitization Corporation, | | | | | | | | | | |
| Tobacco Settlement Asset-Backed Bonds | | | | | | | | | | |
| (Liquidity Facility; Merrill Lynch and LOC; Merrill Lynch) | | 3.66 | | 2/7/07 | | 3,245,000 | | a,b | | 3,245,000 |
| Hempstead Town Industrial Development Agency, | | | | | | | | | | |
| Multifamily Revenue (Terrace 100 LP Facility) | | | | | | | | | | |
| (Liquidity Facility; Bank of America and LOC; Bank of America) | | 3.66 | | 2/7/07 | | 6,220,000 | | a,b | | 6,220,000 |
| Herkimer County Industrial Development Agency, IDR | | | | | | | | | | |
| (F.E. Hale Manufacturing Company Facility) (LOC; HSBC Bank USA) | | 3.80 | | 2/7/07 | | 2,290,000 | | a | | 2,290,000 |
| Metropolitan Transportation Authority, Dedicated Tax Fund, | | | | | | | | | | |
| Refunding (Insured; XLCA and Liquidity Facility; Citibank NA) | | 3.61 | | 2/7/07 | | 11,000,000 | | a | | 11,000,000 |
| Monroe County Industrial Development Agency, Civic Facility | | | | | | | | | | |
| Revenue (DePaul Properties, Inc. Project) (LOC; Key Bank) | | 3.62 | | 2/7/07 | | 500,000 | | a | | 500,000 |
| Monroe County Industrial Development Agency, IDR | | | | | | | | | | |
| (Chaney Enterprise) (LOC; M&T Bank) | | 3.81 | | 2/7/07 | | 2,550,000 | | a | | 2,550,000 |
| Monroe County Industrial Development Agency, IDR | | | | | | | | | | |
| (Genesee Metal Stampings Inc. Facility) (LOC; HSBC Bank USA) | | 3.80 | | 2/7/07 | | 810,000 | | a | | 810,000 |
| Monroe County Industrial Development Agency, LR | | | | | | | | | | |
| (Robert Weslayan College Project) (LOC; M&T Bank) | | 3.66 | | 2/7/07 | | 2,800,000 | | a | | 2,800,000 |
| Nassau County, GO Notes, TAN | | 4.25 | | 9/30/07 | | 12,000,000 | | | | 12,056,063 |
| Nassau County Industrial Development Agency, Civic Facility | | | | | | | | | | |
| Revenue (Saint Mary’s Children Project) (LOC; Commerce Bank) | | 3.66 | | 2/7/07 | | 1,860,000 | | a | | 1,860,000 |
| Nassau County Tobacco Settlement Corporation, | | | | | | | | | | |
| Tobacco Settlement Asset-Backed Bonds (Liquidity Facility; | | | | | | | | | | |
| Merrill Lynch Capital Services and LOC; Merrill Lynch) | | 3.67 | | 2/7/07 | | 10,000,000 | | a,b | | 10,000,000 |
| Dreyfus New York | | Coupon | | Maturity | | Principal | | | | |
| Municipal Cash Management (continued) | | Rate (%) | | Date | | Amount ($) | | Value ($) |
| |
| |
| |
| |
|
| |
| Short-Term Investments (continued) | | | | | | | | | | |
| |
| |
| |
| |
| |
|
| New York City (Liquidity Facility; Merrill Lynch) | | 3.66 | | 2/7/07 | | 7,000,000 | | a,b | | 7,000,000 |
| New York City (LOC; California Public Employees Retirement System) | | 3.66 | | 2/1/07 | | 3,000,000 | | a | | 3,000,000 |
| New York City (LOC; California State Teachers Retirement System) | | 3.66 | | 2/1/07 | | 3,675,000 | | a | | 3,675,000 |
| New York City, CP (Insured; MBIA and Liquidity Facility; | | | | | | | | | | |
| Landesbank Hessen-Thuringen Girozentrale) | | 3.65 | | 2/20/07 | | 6,000,000 | | | | 6,000,000 |
| New York City, GO Notes | | 6.25 | | 4/15/07 | | 4,000,000 | | d | | 4,060,775 |
| New York City, GO Notes | | 5.00 | | 8/1/07 | | 7,325,000 | | | | 7,374,629 |
| New York City, GO Notes | | 7.25 | | 8/15/07 | | 2,490,000 | | | | 2,537,967 |
| New York City Industrial Development Agency, Civic Facility | | | | | | | | | | |
| Revenue (Birch Wathen Lenox School Project) (LOC; Allied Irish Bank) | | 3.63 | | 2/7/07 | | 5,250,000 | | a | | 5,250,000 |
| New York City Industrial Development Agency, Civic Facility | | | | | | | | | | |
| Revenue (French Institute-Alliance Francaise de New York—Federation | | | | | | | | |
| of French Alliances in the United States Project) (LOC; M&T Bank) | | 3.68 | | 2/7/07 | | 2,450,000 | | a | | 2,450,000 |
| New York City Industrial Development Agency, | | | | | | | | | | |
| Civic Facility Revenue (Jewish Community Center | | | | | | | | | | |
| on the Upper West Side, Inc. Project) (LOC; M&T Bank) | | 3.66 | | 2/7/07 | | 5,000,000 | | a | | 5,000,000 |
| New York City Industrial Development Agency, | | | | | | | | | | |
| Civic Facility Revenue (Sephardic Community | | | | | | | | | | |
| Youth Center, Inc. Project) (LOC; M&T Bank) | | 3.66 | | 2/7/07 | | 5,000,000 | | a | | 5,000,000 |
| New York City Industrial Development Agency, | | | | | | | | | | |
| Civic Facility Revenue (Village Community | | | | | | | | | | |
| School Project) (LOC; M&T Bank) | | 3.68 | | 2/7/07 | | 2,440,000 | | a | | 2,440,000 |
| New York City Industrial Development Agency, | | | | | | | | | | |
| Civic Facilty Revenue (Wartburg Lutheran Home for the | | | | | | | | | | |
| Aging and Wartburg Nursing Home, Inc. Project) (LOC; Key Bank) | | 3.64 | | 2/7/07 | | 9,000,000 | | a | | 9,000,000 |
| New York City Industrial Development Agency, IDR, | | | | | | | | | | |
| Refunding (Plaza Packaging Project) (LOC; The Bank of New York) | | 3.77 | | 2/7/07 | | 1,065,000 | | a | | 1,065,000 |
| New York City Industrial Development Agency, | | | | | | | | | | |
| Liberty Revenue (7 World Trade Center, LLC Project) | | | | | | | | | | |
| (LOC; Citibank NA and Liquidity Facility; Citibank NA) | | 3.65 | | 2/7/07 | | 2,200,000 | | a,b | | 2,200,000 |
| New York City Industrial Development Agency, | | | | | | | | | | |
| Special Facility Revenue (Terminal One Group | | | | | | | | | | |
| Association, L.P. Project) (Liquidity Facility; Merrill Lynch) | | 3.66 | | 2/7/07 | | 8,200,000 | | a,b | | 8,200,000 |
| New York City Municipal Water Finance Authority, CP | | | | | | | | | | |
| (Liquidity Facility: Dexia Credit Locale and JPMorgan Chase Bank) | | 3.67 | | 2/8/07 | | 15,000,000 | | | | 15,000,000 |
| New York City Municipal Water Finance Authority, CP | | | | | | | | | | |
| (Liquidity Facility: Dexia Credit Locale and JPMorgan Chase Bank) | | 3.60 | | 2/15/07 | | 6,700,000 | | | | 6,700,000 |
| New York City Municipal Water Finance Authority, CP | | | | | | | | | | |
| (LOC: Landesbank Baden Wurttemberg and | | | | | | | | | | |
| Landesbank Hessen-Thuringen Girozentrale) | | 3.52 | | 2/8/07 | | 5,000,000 | | | | 5,000,000 |
| New York City Municipal Water Finance Authority, CP | | | | | | | | | | |
| (LOC: Landesbank Baden Wurttemberg and | | | | | | | | | | |
| Landesbank Hessen-Thuringen Girozentrale) | | 3.60 | | 2/14/07 | | 11,400,000 | | | | 11,400,000 |
| New York City Municipal Water Finance Authority, CP | | | | | | | | | | |
| (LOC: Landesbank Baden Wurttemberg and | | | | | | | | | | |
| Landesbank Hessen-Thuringen Girozentrale) | | 3.60 | | 2/15/07 | | 20,000,000 | | | | 20,000,000 |
| | STATEMENT OF INVESTMENTS (continued)
|
| Dreyfus New York | | Coupon | | Maturity | | Principal | | | | |
| Municipal Cash Management (continued) | | Rate (%) | | Date | | Amount ($) | | Value ($) |
| |
| |
| |
| |
|
| |
| Short-Term Investments (continued) | | | | | | | | | | |
| |
| |
| |
| |
| |
|
| New York City Municipal Water Finance Authority, | | | | | | | | | | |
| Water and Sewer System Revenue (Putters Program) | | | | | | | | | | |
| (Liquidity Facility; JPMorgan Chase Bank) | | 3.65 | | 2/7/07 | | 7,360,000 | | a,b | | 7,360,000 |
| New York City Transitional Finance Authority, | | | | | | | | | | |
| General Capital Purpose BAN | | 4.25 | | 6/29/07 | | 17,600,000 | | | | 17,651,085 |
| New York Counties Tobacco Trust I, Revenue (Liquidity Facility; | | | | | | | | | | |
| Merrill Lynch and LOC; Merrill Lynch) | | 3.66 | | 2/7/07 | | 9,610,000 | | a,b | | 9,610,000 |
| New York Counties Tobacco Trust IV, Tobacco Settlement | | | | | | | | | | |
| Pass-Through Bonds (Liquidity Facility; Merrill Lynch | | | | | | | | | | |
| Capital Services and LOC; Merrill Lynch) | | 3.66 | | 2/7/07 | | 15,225,000 | | a,b | | 15,225,000 |
| New York Liberty Development Corporation, Revenue | | | | | | | | | | |
| (Goldman Sachs Headquarters Issue) (Liquidity Facility; Citibank NA) | | 3.65 | | 2/7/07 | | 9,300,000 | | a,b | | 9,300,000 |
| New York Liberty Development Corporation, Revenue | | | | | | | | | | |
| (Goldman Sachs Headquarters Issue) | | | | | | | | | | |
| (Liquidity Facility; Merrill Lynch Capital Services) | | 3.66 | | 2/7/07 | | 5,290,000 | | a,b | | 5,290,000 |
| New York State, CP (LOC: Bayerische Landesbank, JPMorgan | | | | | | | | | | |
| Chase Bank and Landesbank Hessen-Thuringen Girozentrale) | | 3.53 | | 2/15/07 | | 8,400,000 | | | | 8,400,000 |
| New York State Dormitory Authority, Revenue (Mount Sinai NYU | | | | | | | | | | |
| Health Obligated Group) (Liquidity Facility; Merrill Lynch) | | 3.66 | | 2/7/07 | | 9,335,000 | | a,b | | 9,335,000 |
| New York State Dormitory Authority, Revenue (Oxford University | | | | | | | | | | |
| Press Inc.) (LOC; Landesbank Hessen-Thuringen Girozentrale) | | 3.75 | | 2/1/07 | | 6,600,000 | | a | | 6,600,000 |
| New York State Dormitory Authority, Revenue | | | | | | | | | | |
| (Park Ridge Hospital Inc.) (LOC; JPMorgan Chase Bank) | | 3.62 | | 2/7/07 | | 10,400,000 | | a | | 10,400,000 |
| New York State Dormitory Authority, Revenue (Pratt Institute) | | | | | | | | | | |
| (Insured; Radian Bank and Liquidity Facility; Citibank NA) | | 3.65 | | 2/7/07 | | 6,400,000 | | a | | 6,400,000 |
| New York State Dormitory Authority, Service Contract | | | | | | | | | | |
| Revenue (School District Rescue Program Issue) | | 5.00 | | 4/1/07 | | 1,800,000 | | | | 1,804,048 |
| New York State Housing Finance Agency, Housing Revenue | | | | | | | | | | |
| (33 West End Avenue Apartments) (LOC; HSBC Bank USA) | | 3.54 | | 2/7/07 | | 9,000,000 | | a | | 9,000,000 |
| New York State Housing Finance Agency, Housing Revenue | | | | | | | | | | |
| (66 West 38th Street) (Liquidity Facility; FNMA and LOC; FNMA) | | 3.54 | | 2/7/07 | | 10,500,000 | | a | | 10,500,000 |
| New York State Housing Finance Agency, Housing Revenue | | | | | | | | | | |
| (240 East 39th Street) (LOC; FNMA) | | 3.51 | | 2/7/07 | | 8,100,000 | | a | | 8,100,000 |
| New York State Housing Finance Agency, Housing Revenue | | | | | | | | | | |
| (250 West 93rd Street) (LOC; Bank of America) | | 3.55 | | 2/7/07 | | 5,000,000 | | a | | 5,000,000 |
| New York State Housing Finance Agency, Housing Revenue | | | | | | | | | | |
| (Avalon Bowery Place II) (LOC; Bank of America) | | 3.56 | | 2/7/07 | | 8,500,000 | | a | | 8,500,000 |
| New York State Power Authority, CP (Liquidity Facility: | | | | | | | | | | |
| Bank of Nova Scotia, JPMorgan Chase Bank, Landesbank | | | | | | | | | | |
| Baden-Wurttemberg, State Street Bank and Trust Co., | | | | | | | | | | |
| The Bank of New York and Wachovia Bank) | | 3.60 | | 3/8/07 | | 8,000,000 | | | | 8,000,000 |
| New York State Thruway Authority, Second General | | | | | | | | | | |
| Highway and Bridge Trust Fund Revenue | | 4.25 | | 4/1/07 | | 16,240,000 | | | | 16,254,411 |
| Dreyfus New York | | Coupon | | Maturity | | Principal | | | | |
| Municipal Cash Management (continued) | | Rate (%) | | Date | | Amount ($) | | Value ($) |
| |
| |
| |
| |
|
| |
| Short-Term Investments (continued) | | | | | | | | | | |
| |
| |
| |
| |
| |
|
| Oneida County Industrial Development Agency, | | | | | | | | | | |
| Civic Facility Revenue (Mohawk Valley Community | | | | | | | | | | |
| College Dormitory Corporation Project) (LOC; Citibank NA) | | 3.60 | | 2/7/07 | | 8,470,000 | | a | | 8,470,000 |
| Ontario County Industrial Development Agency, IDR | | | | | | | | | | |
| (Dixit Enterprises) (LOC; HSBC Bank USA) | | 3.80 | | 2/7/07 | | 2,900,000 | | a | | 2,900,000 |
| Orange County Industrial Development Agency, | | | | | | | | | | |
| Civic Facility Revenue (Saint Luke’s | | | | | | | | | | |
| Cornwall Hospital Project) (LOC; Key Bank) | | 3.64 | | 2/7/07 | | 4,000,000 | | a | | 4,000,000 |
| Patchogue-Medford Union Free School District, GO Notes, TAN | | 4.50 | | 6/29/07 | | 5,000,000 | | | | 5,012,494 |
| Port Authority of New York and New Jersey | | | | | | | | | | |
| (Consolidated Bonds, 146th Series) | | | | | | | | | | |
| (Insured; FSA and Liquidity Facility; Dexia Credit Locale) | | 3.66 | | 2/7/07 | | 15,000,000 | | a,b | | 15,000,000 |
| Poughkeepsie Industrial Development Agency, | | | | | | | | | | |
| Senior Living Facility Revenue (Manor at | | | | | | | | | | |
| Woodside Project) (LOC; The Bank of New York) | | 3.67 | | 2/7/07 | | 4,800,000 | | a | | 4,800,000 |
| Rensselaer Industrial Development Agency, IDR | | | | | | | | | | |
| (Capital View Office Park Project) (LOC; M&T Bank) | | 3.85 | | 12/31/07 | | 4,670,000 | | | | 4,670,000 |
| Rensselaer Industrial Development Agency, Senior Housing | | | | | | | | | | |
| Revenue (Brunswick Senior Housing Project) (LOC; FHLB) | | 3.72 | | 2/1/07 | | 4,390,000 | | a | | 4,390,000 |
| Roaring Fork Municipal Products LLC, Revenue (Ramapo | | | | | | | | | | |
| Housing Authority) (Liquidity Facility; The Bank of New York) | | 3.70 | | 2/7/07 | | 10,385,000 | | a,b | | 10,385,000 |
| Saint Lawrence County Industrial Development Agency, | | | | | | | | | | |
| Civic Facility Revenue, Refunding (Claxton-Hepburn | | | | | | | | | | |
| Medical Center Project) (LOC; Key Bank) | | 3.64 | | 2/7/07 | | 4,000,000 | | a | | 4,000,000 |
| Schenectady, GO Notes, BAN (LOC; Bank of America) | | 4.50 | | 5/24/07 | | 3,300,000 | | | | 3,308,103 |
| Shenendehowa Central School District, GO Notes, BAN | | 4.50 | | 6/29/07 | | 4,000,000 | | | | 4,000,000 |
| South Country Central School District at Brookhaven, GO Notes, BAN | | 4.25 | | 1/18/08 | | 1,000,000 | | | | 1,004,164 |
| Suffolk County Industrial Development Agency, IDR | | | | | | | | | | |
| (Belmont Villas LLC Facility) (Insured; FNMA) | | 3.65 | | 2/7/07 | | 6,000,000 | | a | | 6,000,000 |
| Syracuse Industrial Development Agency, Civic Facility Revenue | | | | | | | | | | |
| (Community Development Properties-Larned Project) (LOC; M&T Bank) | | 3.66 | | 2/7/07 | | 5,870,000 | | a | | 5,870,000 |
| Tompkins County Industrial Development Agency, Civic | | | | | | | | | | |
| Facility Revenue (Cortland College) (LOC; HSBC Bank USA) | | 3.62 | | 2/7/07 | | 4,150,000 | | a | | 4,150,000 |
| Tompkins County Industrial Development Agency, Civic | | | | | | | | | | |
| Facility Revenue (Tompkins Cortland Community College | | | | | | | | | | |
| Foundation, Inc. Project) (LOC; Citizens Bank of Massachusetts) | | 3.62 | | 2/7/07 | | 3,460,000 | | a | | 3,460,000 |
| TSASC Inc. of New York, Tobacco Settlement | | | | | | | | | | |
| Asset-Backed Bonds (Liquidity Facility; Merrill Lynch) | | 3.67 | | 2/7/07 | | 23,585,000 | | a,b | | 23,585,000 |
| TSASC Inc. of New York, Tobacco Settlement | | | | | | | | | | |
| Asset-Backed Bonds (Liquidity Facility; Merrill Lynch) | | 3.70 | | 2/7/07 | | 5,000,000 | | a,b | | 5,000,000 |
| Ulster County Industrial Development Agency, IDR | | | | | | | | | | |
| (Selux Corporation Project) (LOC; M&T Bank) | | 3.76 | | 2/7/07 | | 1,735,000 | | a | | 1,735,000 |
| | STATEMENT OF INVESTMENTS (continued)
|
| Dreyfus New York | | Coupon | | Maturity | | Principal | | | | |
| Municipal Cash Management (continued) | | Rate (%) | | Date | | Amount ($) | | Value ($) |
| |
| |
| |
| |
|
| |
| Short-Term Investments (continued) | | | | | | | | | | |
| |
| |
| |
| |
| |
|
| Westchester County Industrial Development Agency, | | | | | | | | | | |
| Civic Facility Revenue (The Masters School | | | | | | | | | | |
| Civic Facility) (LOC; Allied Irish Bank) | | 3.63 | | 2/7/07 | | 3,435,000 | | a | | 3,435,000 |
| Westchester County Industrial Development Agency, | | | | | | | | | | |
| Civic Facility Revenue (The Rye YMCA Project) (LOC; Allied Irish Bank) | | 3.61 | | 2/7/07 | | 2,750,000 | | a | | 2,750,000 |
| Westchester County Industrial Development Agency, | | | | | | | | | | |
| Commercial Facility Revenue (Panorama Flight | | | | | | | | | | |
| Service Inc. Project) (LOC; The Bank of New York) | | 3.53 | | 2/7/07 | | 4,730,000 | | a | | 4,730,000 |
| Westchester Tobacco Asset Securitization Corporation, | | | | | | | | | | |
| Tobacco Settlement Asset-Backed Bonds | | | | | | | | | | |
| (Liquidity Facility; Merrill Lynch and LOC; Merrill Lynch) | | 3.66 | | 2/7/07 | | 4,300,000 | | a,b | | 4,300,000 |
| Yonkers Industrial Development Agency, MFHR (Main Street | | | | | | | | | | |
| Lofts Yonkers LLC Project) (LOC; M&T Bank) | | 3.71 | | 2/7/07 | | 15,000,000 | | a | | 15,000,000 |
| Yonkers Industrial Development Agency, Revenue (Merlots Program) | | | | | | | | | | |
| (Insured; GNMA and Liquidity Facility; Wachovia Bank) | | 3.57 | | 2/7/07 | | 4,215,000 | | a,b | | 4,215,000 |
| |
| |
| |
| |
| |
|
| |
| Total Investments (cost $566,697,516) | | | | | | 98.8% | | | | 566,697,516 |
| Cash and Receivables (Net) | | | | | | 1.2% | | | | 6,745,640 |
| Net Assets | | | | | | 100.0% | | | | 573,443,156 |
| See footnotes on page 45. |
| See notes to financial statements. |
| STATEMENT OF INVESTMENTS |
| January 31, 2007 |
| Dreyfus Tax Exempt | | Coupon | | Maturity | | Principal | | | | |
| Cash Management | | Rate (%) | | Date | | Amount ($) | | Value ($) |
| |
| |
| |
| |
|
| Short-Term Investments—99.7% | | | | | | | | | | |
| |
| |
| |
| |
| |
|
| Alabama—1.9% | | | | | | | | | | |
| Greater Montgomery Educational Building Authority, Educational | | | | | | | | | | |
| Facility Revenue (Huntingdon College Project) (LOC; Regions Bank) | | 3.64 | | 2/7/07 | | 16,116,000 | | a | | 16,116,000 |
| Jefferson County, Sewer Revenue Warrants, Refunding | | | | | | | | | | |
| (Insured; XLCA and Liquidity Facility; JPMorgan Chase Bank) | | 3.63 | | 2/7/07 | | 20,000,000 | | a | | 20,000,000 |
| Mobile Industrial Development Board, PCR, | | | | | | | | | | |
| Refunding (Alabama Power Company Project) | | 3.73 | | 2/7/07 | | 12,000,000 | | a | | 12,000,000 |
| University of Alabama Board of Trustees, General | | | | | | | | | | |
| Revenue (University of Alabama) (Insured; | | | | | | | | | | |
| MBIA and Liquidity Facility; Southtrust Bank) | | 3.63 | | 2/7/07 | | 6,435,000 | | a | | 6,435,000 |
| Arizona—1.4% | | | | | | | | | | |
| Arizona Health Facilities Authority, Revenue | | | | | | | | | | |
| (La Loma Village) (LOC; Citibank NA) | | 3.66 | | 2/7/07 | | 7,000,000 | | a | | 7,000,000 |
| Phoenix Civic Improvement Corporation, Excise Tax | | | | | | | | | | |
| Revenue (Putters Program) (Civic Plaza Expansion Project) | | | | | | | | | | |
| (Insured; FGIC and Liquidity Facility; PB Capital Finance) | | 3.66 | | 2/7/07 | | 8,255,000 | | a,b | | 8,255,000 |
| Salt River Project Agricultural Improvement | | | | | | | | | | |
| and Power District, CP (Salt River Project) (Liquidity Facility: | | | | | | | | | | |
| Bank of America, Bank One, Citibank NA, JPMorgan | | | | | | | | | | |
| Chase Bank, Marshall and Isley Bank and Wells Fargo Bank) | | 3.57 | | 3/8/07 | | 24,000,000 | | | | 24,000,000 |
| Arkansas—.3% | | | | | | | | | | |
| Benton County Public Facilities Board, | | | | | | | | | | |
| College Parking Facility Revenue (NorthWest | | | | | | | | | | |
| Arkansas Community College Project) (LOC; Regions Bank) | | 3.63 | | 2/7/07 | | 8,250,000 | | a | | 8,250,000 |
| Colorado—2.2% | | | | | | | | | | |
| ABN AMRO Munitops Certificate Trust, Revenue (Denver City and | | | | | | | | | | |
| County Airport) (Insured; XLCA and Liquidity Facility; ABN-AMRO) | | 3.66 | | 2/7/07 | | 22,345,000 | | a,b | | 22,345,000 |
| Colorado Education Loan Program, TRAN | | 3.75 | | 8/3/07 | | 20,000,000 | | | | 20,019,888 |
| Southern Ute Indian Tribe of the | | | | | | | | | | |
| Southern Ute Indian Reservation, Revenue | | 3.67 | | 2/7/07 | | 21,000,000 | | a | | 21,000,000 |
| Delaware—.7% | | | | | | | | | | |
| Delaware Economic Development Authority, MFHR | | | | | | | | | | |
| (School House Project) (LOC; HSBC Bank USA) | | 3.70 | | 2/7/07 | | 13,500,000 | | a | | 13,500,000 |
| Delaware Economic Development Authority, Revenue (Connections | | | | | | | | | | |
| CSP Project) (LOC; Mercantile-Safe Deposit and Trust Company) | | 3.66 | | 2/7/07 | | 7,035,000 | | a | | 7,035,000 |
| Florida—3.9% | | | | | | | | | | |
| Broward County, Sales Tax Revenue, CP | | | | | | | | | | |
| (Liquidity Facility; Dexia Credit Locale) | | 3.60 | | 6/6/07 | | 10,000,000 | | | | 10,000,000 |
| JEA, Electric System Revenue, CP (Liquidity Facility; | | | | | | | | | | |
| Landesbank Hessen-Thuringen Girozentrale) | | 3.65 | | 5/29/07 | | 15,000,000 | | | | 15,000,000 |
| Orange County Health Facilities Authority, | | | | | | | | | | |
| Revenue, CP (LOC; SunTrust Bank) | | 3.66 | | 3/27/07 | | 10,900,000 | | | | 10,900,000 |
| Palm Beach County Educational Facilities Authority, | | | | | | | | | | |
| Educational Facilities Revenue (Palm Beach Atlantic | | | | | | | | | | |
| College, Inc. Project) (LOC; Bank of America) | | 3.63 | | 2/7/07 | | 11,000,000 | | a | | 11,000,000 |
| Sunshine State Governmental Financing Commission, | | | | | | | | | | |
| Revenue, CP (Liquidity Facility; DEPFA Bank PLC) | | 3.60 | | 2/8/07 | | 10,000,000 | | | | 10,000,000 |
| | STATEMENT OF INVESTMENTS (continued)
|
| Dreyfus Tax Exempt | | Coupon | | Maturity | | Principal | | | | |
| Cash Management (continued) | | Rate (%) | | Date | | Amount ($) | | Value ($) |
| |
| |
| |
| |
|
| |
| Short-Term Investments (continued) | | | | | | | | | | |
| |
| |
| |
| |
| |
|
| Florida (continued) | | | | | | | | | | |
| Sunshine State Governmental Financing Commission, | | | | | | | | | | |
| Revenue, CP (Liquidity Facility; DEPFA Bank PLC) | | 3.60 | | 3/6/07 | | 10,000,000 | | | | 10,000,000 |
| Sunshine State Governmental Financing Commission, | | | | | | | | | | |
| Revenue, CP (Liquidity Facility; DEPFA Bank PLC) | | 3.54 | | 3/8/07 | | 14,890,000 | | | | 14,890,000 |
| Sunshine State Governmental Financing Commission, | | | | | | | | | | |
| Revenue, CP (Liquidity Facility; Dexia Credit Locale) | | 3.54 | | 3/8/07 | | 19,170,000 | | | | 19,170,000 |
| Tampa, Educational Facilities Revenue | | | | | | | | | | |
| (Trinity School for Children Project) (LOC; Regions Bank) | | 3.64 | | 2/7/07 | | 4,980,000 | | a | | 4,980,000 |
| Volusia County Educational Facilities Authority, | | | | | | | | | | |
| Educational Facilities Revenue (Embry-Riddle | | | | | | | | | | |
| Aeronautical University, Inc. Project) (Insured; | | | | | | | | | | |
| Radian Bank and Liquidity Facility; Citibank NA) | | 3.66 | | 2/7/07 | | 5,645,000 | | a,b | | 5,645,000 |
| Georgia—5.3% | | | | | | | | | | |
| Atlanta, Airport General Revenue, Refunding | | | | | | | | | | |
| (Hartsfield International Airport) (Insured; MBIA | | | | | | | | | | |
| and Liquidity Facility; Bayerische Landesbank) | | 3.65 | | 2/7/07 | | 65,330,000 | | a | | 65,330,000 |
| Fulton County Housing Authority, MFHR (Liquidity Facility; Merrill | | | | | | | | | | |
| Lynch Capital Services and LOC; Merrill Lynch Capital Services) | | 3.69 | | 2/7/07 | | 25,365,000 | | a,b | | 25,365,000 |
| Metropolitan Atlanta Rapid Transit Authority, | | | | | | | | | | |
| Sales Tax Revenue, CP (LOC; Dexia Credit Locale) | | 3.63 | | 3/12/07 | | 12,500,000 | | | | 12,500,000 |
| Municipal Electric Authority of Georgia, CP (LOC: Bayerische | | | | | | | | | | |
| Landesbank, Wachovia Bank and Westdeutsche Landesbank) | | 3.60 | | 4/12/07 | | 30,000,000 | | | | 30,000,000 |
| Municipal Electric Authority of Georgia, | | | | | | | | | | |
| CP (LOC; JPMorgan Chase Bank) | | 3.62 | | 2/9/07 | | 20,000,000 | | | | 20,000,000 |
| Hawaii—.5% | | | | | | | | | | |
| Hawaii Department of Budget and Finance, Special Purpose | | | | | | | | | | |
| Revenue (Hawaii Pacific Health Obligated Group) (Insured; | | | | | | | | | | |
| Radian Bank and Liquidity Facility; Bank of Nova Scotia) | | 3.60 | | 2/7/07 | | 14,500,000 | | a | | 14,500,000 |
| Idaho—.1% | | | | | | | | | | |
| Idaho Housing and Finance Association, Nonprofit Facilities Revenue | | | | | | | | |
| (Albertson College of Idaho Project) (LOC; Key Bank) | | 3.64 | | 2/7/07 | | 4,070,000 | | a | | 4,070,000 |
| Illinois—2.2% | | | | | | | | | | |
| Chicago O’Hare International Airport, General Airport Third Lien | | | | | | | | | | |
| Revenue (Insured; FGIC and Liquidity Facility; PB Finance Inc.) | | 3.66 | | 2/7/07 | | 5,110,000 | | a,b | | 5,110,000 |
| Illinois, GO Notes (Merlots Program) (Insured; | | | | | | | | | | |
| FSA and Liquidity Facility; Wachovia Bank) | | 3.53 | | 2/7/07 | | 16,880,000 | | a,b | | 16,880,000 |
| Illinois, GO Notes (Merlots Program) (Insured; | | | | | | | | | | |
| MBIA and Liquidity Facility; Wachovia Bank) | | 3.53 | | 2/7/07 | | 9,935,000 | | a,b | | 9,935,000 |
| Regional Transportation Authority, GO Notes (Merlots Program) | | | | | | | | | | |
| (Insured; MBIA and Liquidity Facility; Wachovia Bank) | | 3.53 | | 2/7/07 | | 10,085,000 | | a,b | | 10,085,000 |
| Roaring Fork Municipal Products LLC (Chicago, | | | | | | | | | | |
| Second Lien Water Revenue) (Insured; | | | | | | | | | | |
| AMBAC and Liquidity Facility; The Bank of New York) | | 3.68 | | 2/7/07 | | 6,450,000 | | a,b | | 6,450,000 |
| Roaring Fork Municipal Products LLC (Chicago Board of Education) | | | | | | | | |
| (Insured; FSA and Liquidity Facility; The Bank of New York) | | 3.69 | | 2/7/07 | | 13,450,000 | | a,b | | 13,450,000 |
| Dreyfus Tax Exempt | | Coupon | | Maturity | | Principal | | | | |
| Cash Management (continued) | | Rate (%) | | Date | | Amount ($) | | Value ($) |
| |
| |
| |
| |
|
| |
| Short-Term Investments (continued) | | | | | | | | | | |
| |
| |
| |
| |
| |
|
| Indiana—3.2% | | | | | | | | | | |
| Indiana Health Facility Financing Authority, | | | | | | | | | | |
| Revenue (Ascension Health Credit Group) | | 3.62 | | 6/1/07 | | 14,000,000 | | | | 14,000,000 |
| Indianapolis Local Public Improvement Bond Bank, Notes | | 4.00 | | 7/5/07 | | 51,425,000 | | | | 51,520,639 |
| Indianapolis Local Public Improvement Bond Bank, Notes | | 4.00 | | 7/5/07 | | 6,375,000 | | | | 6,386,856 |
| Merrillville Community School Corporation, Temporary Loan Warrants | | 4.00 | | 12/31/07 | | 20,000,000 | | | | 20,070,373 |
| Iowa—3.0% | | | | | | | | | | |
| Iowa, TRAN | | 4.25 | | 6/29/07 | | 40,000,000 | | | | 40,114,735 |
| Iowa Finance Authority, Health Facilities Revenue | | | | | | | | | | |
| (Care Initiatives Project) (LOC; KBC Bank) | | 3.78 | | 2/1/07 | | 5,000,000 | | a | | 5,000,000 |
| Louisa County, PCR, Refunding (Midwest Power Systems Inc. Project) | | 3.57 | | 2/7/07 | | 27,900,000 | | a | | 27,900,000 |
| Tobacco Settlement Authority of Iowa, | | | | | | | | | | |
| Tobacco Settlement Asset-Backed Bonds (Liquidity Facility; | | | | | | | | | | |
| Citibank NA and LOC; Citigroup Global Market Holdings) | | 3.66 | | 2/7/07 | | 11,810,000 | | a,b | | 11,810,000 |
| Kansas—.5% | | | | | | | | | | |
| Olathe, Temporary Notes | | 4.00 | | 6/1/07 | | 15,500,000 | | | | 15,521,941 |
| Kentucky—.7% | | | | | | | | | | |
| Madisonville, HR (Trover Clinic Foundation, Incorporated) (Insured; | | | | | | | | | | |
| Assured Guaranty and Liquidity Facility; JPMorgan Chase Bank) | | 3.64 | | 2/7/07 | | 19,250,000 | | a | | 19,250,000 |
| Louisiana—3.2% | | | | | | | | | | |
| Bank of New York Municipal Certificates Trust (Liquidity Facility; | | | | | | | | | | |
| The Bank of New York and LOC; The Bank of New York) | | 3.70 | | 2/7/07 | | 18,910,000 | | a,b | | 18,910,000 |
| Louisiana Municipal Natural Gas Purchasing | | | | | | | | | | |
| and Distribution Authority, Revenue (Putters Program) | | | | | | | | | | |
| (Gas Project Number 1) (Liquidity Facility; JPMorgan Chase | | | | | | | | | | |
| Bank and LOC; JPMorgan Chase Bank) | | 3.67 | | 2/7/07 | | 29,000,000 | | a,b | | 29,000,000 |
| Louisiana Public Facilities Authority, HR (Touro Infirmany | | | | | | | | | | |
| Project) (Liquidity Facility; Merrill Lynch) | | 3.67 | | 2/7/07 | | 34,045,000 | | a,b | | 34,045,000 |
| Tobacco Settlement Financing Corporation of Louisiana, Tobacco | | | | | | | | | | |
| Settlement Asset-Backed Bonds (Liquidity Facility; Merrill Lynch) | | 3.70 | | 2/7/07 | | 9,115,000 | | a,b | | 9,115,000 |
| Maryland—.2% | | | | | | | | | | |
| Frederick County, Revenue, Refunding (Manekin- | | | | | | | | | | |
| Frederick Associates Facility) (LOC; M&T Bank) | | 3.73 | | 2/7/07 | | 2,700,000 | | a | | 2,700,000 |
| Maryland Economic Development Corporation, Revenue | | | | | | | | | | |
| (Legal Aid Bureau Inc. Facility) (LOC; M&T Bank) | | 3.68 | | 2/7/07 | | 2,475,000 | | a | | 2,475,000 |
| Massachusetts—3.8% | | | | | | | | | | |
| Massachusetts, CP (LOC; Dexia Credit Locale) | | 3.63 | | 2/20/07 | | 5,000,000 | | | | 5,000,000 |
| Massachusetts Development Finance Agency, Revenue | | | | | | | | | | |
| (Lesley University Issue) (LOC; Bank of America) | | 3.65 | | 2/7/07 | | 7,300,000 | | a | | 7,300,000 |
| Massachusetts Development Finance Agency, Revenue | | | | | | | | | | |
| (Northfield Mount Hermon School Issue) (Insured; | | | | | | | | | | |
| Radian Bank and Liquidity Facility; Bank of America) | | 3.68 | | 2/7/07 | | 15,000,000 | | a | | 15,000,000 |
| Massachusetts Development Finance Agency, Revenue | | | | | | | | | | |
| (Suffolk University Issue) (Insured; Radian Bank and Liquidity | | | | | | | | | | |
| Facility: Bank of America and State Street Bank and Trust Co.) | | 3.58 | | 2/7/07 | | 32,700,000 | | a | | 32,700,000 |
| | STATEMENT OF INVESTMENTS (continued)
|
| Dreyfus Tax Exempt | | Coupon | | Maturity | | Principal | | | | |
| Cash Management (continued) | | Rate (%) | | Date | | Amount ($) | | Value ($) |
| |
| |
| |
| |
|
| |
| Short-Term Investments (continued) | | | | | | | | | | |
| |
| |
| |
| |
| |
|
| Massachusetts (continued) | | | | | | | | | | |
| Massachusetts Development Finance Agency, Revenue | | | | | | | | | | |
| (Wentworth Institute of Technology, Inc. Issue) | | | | | | | | | | |
| (Insured; Radian Bank and Liquidity Facility; Bank of America) | | 3.68 | | 2/7/07 | | 17,900,000 | | a | | 17,900,000 |
| Massachusetts Health and Educational Facilities | | | | | | | | | | |
| Authority, CP (Harvard University Issue) | | 3.58 | | 2/9/07 | | 10,500,000 | | | | 10,500,000 |
| Massachusetts Health and Educational Facilities | | | | | | | | | | |
| Authority, Revenue (Cape Cod Healthcare Obligated Group Issue) | | | | | | | | | | |
| (Insured; Assured Guaranty and Liquidity Facility; Bank of America) | | 3.64 | | 2/7/07 | | 20,000,000 | | a | | 20,000,000 |
| Michigan—5.3% | | | | | | | | | | |
| Detroit, GO Notes, TAN (LOC; Scotia Bank) | | 4.50 | | 3/1/07 | | 11,945,000 | | | | 11,951,879 |
| Detroit, Sewage Disposal Revenue (Merlots Program) | | | | | | | | | | |
| (Insured; FGIC and Liquidity Facility; Wachovia Bank) | | 3.53 | | 2/7/07 | | 22,015,000 | | a,b | | 22,015,000 |
| Detroit Downtown Development Authority, LR, Refunding | | | | | | | | | | |
| (Millender Center Project) (LOC; HSBC Bank USA) | | 3.75 | | 2/7/07 | | 17,200,000 | | a | | 17,200,000 |
| Detroit Water Supply System, Water Revenue (Merlots Program) | | | | | | | | | | |
| (Insured; MBIA and Liquidity Facility; Wachovia Bank) | | 3.53 | | 2/7/07 | | 10,470,000 | | a,b | | 10,470,000 |
| Michigan, GO Notes (LOC; DEPFA Bank PLC) | | 4.25 | | 9/28/07 | | 30,000,000 | | | | 30,143,152 |
| Michigan Building Authority, Revenue, CP (LOC: State | | | | | | | | | | |
| Street Bank and Trust Co. and The Bank of New York) | | 3.55 | | 2/22/07 | | 8,930,000 | | | | 8,930,000 |
| Michigan Higher Education Facilities Authority, Revenue, | | | | | | | | | | |
| Refunding (Walsh College Project) (LOC; Commerce Bank) | | 3.65 | | 2/7/07 | | 10,195,000 | | a | | 10,195,000 |
| Michigan Hospital Finance Authority, Revenue (Healthcare | | | | | | | | | | |
| Equipment Loan Program) (LOC; Fifth Third Bank) | | 3.54 | | 2/7/07 | | 10,000,000 | | a | | 10,000,000 |
| Michigan Hospital Finance Authority, Revenue (Healthcare | | | | | | | | | | |
| Equipment Loan Program) (LOC; Fifth Third Bank) | | 3.54 | | 2/7/07 | | 15,000,000 | | a | | 15,000,000 |
| Michigan Hospital Finance Authority, Revenue (Healthcare | | | | | | | | | | |
| Equipment Loan Program) (LOC; Fifth Third Bank) | | 3.54 | | 2/7/07 | | 5,200,000 | | a | | 5,200,000 |
| Waterford Township Economic Development Corporation, LOR, | | | | | | | | | | |
| Refunding (Canterbury Health Care Inc. Project) (LOC; KBC Bank) | | 3.66 | | 2/7/07 | | 10,815,000 | | a | | 10,815,000 |
| Minnesota—2.2% | | | | | | | | | | |
| Rochester, Health Care Facilities Revenue, CP (Mayo Foundation) | | 3.56 | | 3/8/07 | | 30,000,000 | | | | 30,000,000 |
| Rochester, Health Care Facilities Revenue, CP (Mayo Foundation) | | | | | | | | | | |
| (Liquidity Facility; Wells Fargo Bank) | | 3.55 | | 2/8/07 | | 5,000,000 | | | | 5,000,000 |
| Rochester, Health Care Facilities Revenue, CP (Mayo Foundation) | | | | | | | | | | |
| (Liquidity Facility; Wells Fargo Bank) | | 3.58 | | 2/12/07 | | 21,500,000 | | | | 21,500,000 |
| Southern Minnesota Municipal Power Agency, | | | | | | | | | | |
| Power Supply System Revenue, CP (Liquidity Facility; | | | | | | | | | | |
| Landesbank Hessen-Thuringen Girozentrale) | | 3.58 | | 3/7/07 | | 6,100,000 | | | | 6,100,000 |
| Mississippi—1.1% | | | | | | | | | | |
| Mississippi Business Finance Corporation, Health Care Facilities Revenue | | | | | | | | |
| (Rush Medical Foundation Project) (LOC; Regions Bank) | | 3.65 | | 2/7/07 | | 25,000,000 | | a | | 25,000,000 |
| Mississippi Business Finance Corporation, Revenue (Outback 98 | | | | | | | | | | |
| West CC, LLC Project) (LOC; First Tennessee Bank N.A.) | | 3.64 | | 2/7/07 | | 5,600,000 | | a | | 5,600,000 |
| Dreyfus Tax Exempt | | Coupon | | Maturity | | Principal | | | | |
| Cash Management (continued) | | Rate (%) | | Date | | Amount ($) | | Value ($) |
| |
| |
| |
| |
|
| |
| Short-Term Investments (continued) | | | | | | | | | | |
| |
| |
| |
| |
| |
|
| Missouri—.4% | | | | | | | | | | |
| Saint Louis, General Fund Revenue, TRAN | | 4.50 | | 6/29/07 | | 10,000,000 | | | | 10,029,312 |
| Nebraska—.8% | | | | | | | | | | |
| Nebhelp Inc., Revenue (Insured; MBIA and Liquidity | | | | | | | | | | |
| Facility; Lloyds TSB Bank PLC) | | 3.60 | | 2/7/07 | | 11,780,000 | | a | | 11,780,000 |
| Scotts Bluff County Hospital Authority Number 1, HR, | | | | | | | | | | |
| Refunding (Regional West Medical Center) | | | | | | | | | | |
| (Insured; Radian and Liquidity Facility; Key Bank) | | 3.64 | | 2/7/07 | | 9,800,000 | | a | | 9,800,000 |
| Nevada—2.4% | | | | | | | | | | |
| Clark County, Highway Revenue, CP (Motor Vehicle Fuel | | | | | | | | | | |
| Tax) (LOC; Landesbank Hessen-Thuringen Girozentrale) | | 3.65 | | 5/29/07 | | 17,500,000 | | | | 17,500,000 |
| Clark County School District, GO Notes (Merlots Program) | | | | | | | | | | |
| (Insured; FSA and Liquidity Facility; Wachovia Bank) | | 3.53 | | 2/7/07 | | 9,890,000 | | a,b | | 9,890,000 |
| Clark County School District, GO Notes (Putters Program) | | | | | | | | | | |
| (Insured; FSA and Liquidity Facility; PB Capital Finance) | | 3.66 | | 2/7/07 | | 6,935,000 | | a,b | | 6,935,000 |
| Las Vegas Valley Water District, CP (LOC: | | | | | | | | | | |
| BNP Paribas and Lloyds TSB Bank PLC) | | 3.56 | | 2/12/07 | | 34,600,000 | | | | 34,600,000 |
| New Hampshire—.3% | | | | | | | | | | |
| New Hampshire Health and Education Facilities | | | | | | | | | | |
| Authority, HR (Catholic Medical Center Issue) | | | | | | | | | | |
| (LOC; Citizens Bank of Massachusetts) | | 3.63 | | 2/7/07 | | 9,395,000 | | a | | 9,395,000 |
| New Jersey—.3% | | | | | | | | | | |
| New Jersey, TRAN | | 4.50 | | 6/22/07 | | 9,650,000 | | | | 9,682,368 |
| New York—4.5% | | | | | | | | | | |
| New York City Municipal Water Finance Authority, CP | | | | | | | | | | |
| (LOC: Landesbank Baden Wurttemberg and | | | | | | | | | | |
| Landesbank Hessen-Thuringen Girozentrale) | | 3.60 | | 2/14/07 | | 10,000,000 | | | | 10,000,000 |
| New York City Municipal Water Finance Authority, CP | | | | | | | | | | |
| (LOC: Landesbank Baden Wurttemberg and | | | | | | | | | | |
| Landesbank Hessen-Thuringen Girozentrale) | | 3.60 | | 2/15/07 | | 15,000,000 | | | | 15,000,000 |
| New York City Transitional Finance Authority, | | | | | | | | | | |
| General Capital Purpose BAN | | 4.25 | | 6/29/07 | | 75,000,000 | | | | 75,216,857 |
| Tobacco Settlement Financing Corporation of New York, | | | | | | | | | | |
| Asset Backed Revenue Bonds (State Contingency | | | | | | �� | | | | |
| Contract Secured) (Liquidity Facility; DEPFA Bank PLC) | | 3.66 | | 2/7/07 | | 17,495,000 | | a,b | | 17,495,000 |
| Tobacco Settlement Financing Corporation of New York, | | | | | | | | | | |
| Revenue (Liquidity Facility: Landesbank Hessen- | | | | | | | | | | |
| Thuringen Girozentrale and Merril Lynch) | | 3.66 | | 2/7/07 | | 10,000,000 | | a,b | | 10,000,000 |
| Ohio—3.2% | | | | | | | | | | |
| Akron Bath Copley Joint Township Hospital District, Health | | | | | | | | | | |
| Care Facilities Revenue (Sumner Project) (LOC; KBC Bank) | | 3.64 | | 2/7/07 | | 5,300,000 | | a | | 5,300,000 |
| Cincinnati School District, GO Notes (Putters Program) | | | | | | | | | | |
| (Insured; FSA and Liquidity Facility; PB Capital Finance) | | 3.66 | | 2/7/07 | | 6,835,000 | | a,b | | 6,835,000 |
| | STATEMENT OF INVESTMENTS (continued)
|
| Dreyfus Tax Exempt | | Coupon | | Maturity | | Principal | | | | |
| Cash Management (continued) | | Rate (%) | | Date | | Amount ($) | | Value ($) |
| |
| |
| |
| |
|
| |
| Short-Term Investments (continued) | | | | | | | | | | |
| |
| |
| |
| |
| |
|
| Ohio (continued) | | | | | | | | | | |
| Cleveland-Cuyahoga County Port Authority, Revenue, | | | | | | | | | | |
| Refunding (Judson Project) (LOC; National City Bank) | | 3.66 | | 2/7/07 | | 11,320,000 | | a | | 11,320,000 |
| Franklin County, Health Care Facilities Refunding and | | | | | | | | | | |
| Improvement Revenue (Ohio Presbyterian Retirement Services) | | | | | | | | | | |
| (Insured; Radian Group and Liquidity Facility; National City Bank) | | 3.64 | | 2/7/07 | | 12,000,000 | | a | | 12,000,000 |
| Franklin County, Health Care Facilities Revenue | | | | | | | | | | |
| (Creekside at the Village Project) (LOC; Key Bank) | | 3.64 | | 2/7/07 | | 7,250,000 | | a | | 7,250,000 |
| Hamilton County, Hospital Facilities Revenue (Christ Hospital) | | | | | | | | | | |
| (Insured; FSA and Liquidity Facility; Svenska Handelsbanken) | | 3.69 | | 2/7/07 | | 45,000,000 | | a,b | | 45,000,000 |
| Ohio Higher Education Facility, Revenue | | | | | | | | | | |
| (Ashland University Project) (LOC; Key Bank) | | 3.66 | | 2/7/07 | | 4,800,000 | | a | | 4,800,000 |
| Oklahoma—.4% | | | | | | | | | | |
| Oklahoma Water Resources Board, State Loan Program | | | | | | | | | | |
| Revenue (Liquidity Facility; Lloyds TSB Bank PLC) | | 3.60 | | 3/1/07 | | 3,450,000 | | | | 3,450,000 |
| Oklahoma Water Resources Board, State Loan Program | | | | | | | | | | |
| Revenue (Liquidity Facility; State Street Bank and Trust Co.) | | 3.55 | | 4/1/07 | | 2,665,000 | | | | 2,665,000 |
| Oklahoma Water Resources Board, State Loan Program | | | | | | | | | | |
| Revenue (Liquidity Facility; Bank of America) | | 3.55 | | 4/1/07 | | 5,000,000 | | | | 5,000,000 |
| Oregon—.8% | | | | | | | | | | |
| Oregon, Homeowner Revenue (Liquidity Facility; Landesbank | | | | | | | | | | |
| Hessen-Thuringen Girozentrale and LOC; Trinity Funding Group) | | 3.67 | | 2/7/07 | | 8,960,000 | | a,b | | 8,960,000 |
| Salem Hospital Facility Authority, Revenue | | | | | | | | | | |
| (Capital Manor, Inc. Project) (LOC; Bank of America) | | 3.66 | | 2/7/07 | | 5,670,000 | | a | | 5,670,000 |
| Salem Hospital Facility Authority, Revenue, Refunding | | | | | | | | | | |
| (Capital Manor, Inc. Project) (LOC; Bank of America) | | 3.66 | | 2/7/07 | | 9,150,000 | | a | | 9,150,000 |
| Pennsylvania—17.8% | | | | | | | | | | |
| Bethlehem Area School District, GO Notes | | | | | | | | | | |
| (Insured; FSA and Liquidity Facility; Dexia Credit Locale) | | 3.64 | | 2/7/07 | | 54,990,000 | | a | | 54,990,000 |
| Chestnut Ridge School District, GO | | | | | | | | | | |
| (Insured; FSA and Liquidity Facility; Dexia Credit Locale) | | 3.64 | | 2/7/07 | | 10,875,000 | | a | | 10,875,000 |
| Dauphin County General Authority, Revenue (Insured; | | | | | | | | | | |
| FSA and Liquidity Facility: Bank of Nova Scotia and KBC Bank) | | 3.53 | | 2/7/07 | | 65,100,000 | | a | | 65,100,000 |
| Dauphin County General Authority, Revenue (Insured; | | | | | | | | | | |
| FSA and Liquidity Facility: Bank of Nova Scotia and KBC Bank) | | 3.53 | | 2/7/07 | | 14,010,000 | | a | | 14,010,000 |
| Dauphin County General Authority, Revenue | | | | | | | | | | |
| (School District Pooled Financing Program II) | | | | | | | | | | |
| (Insured; AMBAC and Liquidity Facility; Bank of Nova Scotia) | | 3.64 | | 2/7/07 | | 90,465,000 | | a | | 90,465,000 |
| Emmaus General Authority | | | | | | | | | | |
| (Pennsylvania Variable Rate Loan Program) | | 3.65 | | 2/7/07 | | 38,615,000 | | a | | 38,615,000 |
| Emmaus General Authority, Local Government | | | | | | | | | | |
| Revenue (GIC; Goldman Sachs and Co.) | | 3.53 | | 2/7/07 | | 10,000,000 | | a | | 10,000,000 |
| Emmaus General Authority, Local Government | | | | | | | | | | |
| Revenue (GIC; Goldman Sachs and Co.) | | 3.53 | | 2/7/07 | | 14,500,000 | | a | | 14,500,000 |
| Emmaus General Authority, Local Government | | | | | | | | | | |
| Revenue (LOC; DEPFA Bank PLC) | | 3.53 | | 2/7/07 | | 8,000,000 | | a | | 8,000,000 |
| Emmaus General Authority, Local Government | | | | | | | | | | |
| Revenue (LOC; DEPFA Bank PLC) | | 3.53 | | 2/7/07 | | 10,600,000 | | a | | 10,600,000 |
40
| Dreyfus Tax Exempt | | Coupon | | Maturity | | Principal | | | | |
| Cash Management (continued) | | Rate (%) | | Date | | Amount ($) | | Value ($) |
| |
| |
| |
| |
|
| |
| Short-Term Investments (continued) | | | | | | | | | | |
| |
| |
| |
| |
| |
|
| Pennsylvania (continued) | | | | | | | | | | |
| Emmaus General Authority, Local Government | | | | | | | | | | |
| Revenue (LOC; DEPFA Bank PLC) | | 3.53 | | 2/7/07 | | 13,000,000 | | a | | 13,000,000 |
| Emmaus General Authority, Local Government | | | | | | | | | | |
| Revenue (LOC; DEPFA Bank PLC) | | 3.53 | | 2/7/07 | | 4,000,000 | | a | | 4,000,000 |
| Emmaus General Authority, Local Government | | | | | | | | | | |
| Revenue (LOC; DEPFA Bank PLC) | | 3.53 | | 2/7/07 | | 11,900,000 | | a | | 11,900,000 |
| Emmaus General Authority, Local Government | | | | | | | | | | |
| Revenue (LOC; Goldman Sachs and Co.) | | 3.53 | | 2/7/07 | | 13,075,000 | | a | | 13,075,000 |
| Harrisburg Authority, Water Revenue, Refunding | | | | | | | | | | |
| (Insured; FGIC and Liquidity Facility; FGIC) | | 3.66 | | 2/7/07 | | 14,405,000 | | a | | 14,405,000 |
| Lancaster County, GO Notes (Insured; FSA and | | | | | | | | | | |
| Liquidity Facility; Royal Bank of Canada) | | 3.64 | | 2/7/07 | | 20,205,000 | | a | | 20,205,000 |
| Lancaster County Hospital Authority, Health Center | | | | | | | | | | |
| Revenue (Luthercare Project) (LOC; M&T Bank) | | 3.66 | | 2/7/07 | | 14,180,000 | | a | | 14,180,000 |
| Lebanon County Health Facilities Authority, | | | | | | | | | | |
| Revenue (Cornwall Manor Project) (Insured; | | | | | | | | | | |
| Radian Bank and Liquidity Facility; Bank of America) | | 3.69 | | 2/7/07 | | 5,510,000 | | a | | 5,510,000 |
| Pennsylvania Higher Educational Facilities Authority, | | | | | | | | | | |
| Student Housing Revenue (Washington and Jefferson | | | | | | | | | | |
| Development Corp.— Washington and Jefferson | | | | | | | | | | |
| College Project) (LOC; Unicredito Italiano SPA) | | 3.64 | | 2/7/07 | | 8,000,000 | | a | | 8,000,000 |
| Philadelphia School District, GO Notes, TRAN (LOC; Bank of America) | | 4.50 | | 6/29/07 | | 14,500,000 | | | | 14,540,762 |
| Schuylkill County, GO Notes (Insured; AMBAC | | | | | | | | | | |
| and Liquidity Facility; Wachovia Bank) | | 3.66 | | 2/7/07 | | 6,420,000 | | a | | 6,420,000 |
| Spring Grove Area School District, GO Notes (Insured; | | | | | | | | | | |
| FSA and Liquidity Facility; Dexia Credit Locale) | | 3.64 | | 2/7/07 | | 17,495,000 | | a | | 17,495,000 |
| Spring Grove Area School District, GO Notes (Insured; | | | | | | | | | | |
| FSA and Liquidity Facility; Dexia Credit Locale) | | 3.64 | | 2/7/07 | | 20,000,000 | | a | | 20,000,000 |
| West Cornwall Township Municipal Authority, GO Notes, | | | | | | | | | | |
| Refunding (Bethlehem Area School District Project) | | | | | | | | | | |
| (Insured; FSA and Liquidity Facility; Dexia Credit Locale) | | 3.64 | | 2/7/07 | | 28,500,000 | | a | | 28,500,000 |
| West Cornwall Township Municipal Authority, Revenue | | | | | | | | | | |
| (Pennsylvania General Government Loan Program) | | | | | | | | | | |
| (Insured; FSA and Liquidity Facility; Dexia Credit Locale) | | 3.64 | | 2/7/07 | | 3,482,000 | | a | | 3,482,000 |
| South Carolina—.5% | | | | | | | | | | |
| Greer, Combined Utilities System Revenue (Merlots Program) | | | | | | | | | | |
| (Insured; AMBAC and Liquidity Facility; Wachovia Bank) | | 3.53 | | 2/7/07 | | 8,300,000 | | a,b | | 8,300,000 |
| South Carolina Jobs—Economic Development Authority, | | | | | | | | | | |
| Health Facilities Revenue, Refunding (The Episcopal Church Home) | | | | | | | | | | |
| (Insured; Radian Bank and Liquidity Facility; Wachovia Bank) | | 3.64 | | 2/7/07 | | 6,920,000 | | a | | 6,920,000 |
| South Dakota—.5% | | | | | | | | | | |
| South Dakota Housing Development Authority, SFMR (Liquidity Facility; | | | | | | | | |
| Merrill Lynch Capital Services and LOC; Pallas Capital Corporation) | | 3.69 | | 2/7/07 | | 13,080,000 | | a,b | | 13,080,000 |
| Tennessee—10.6% | | | | | | | | | | |
| Blount County Public Building Authority, | | | | | | | | | | |
| Local Government Public Improvement Revenue | | | | | | | | | | |
| (Insured; AMBAC and Liquidity Facility; Regions Bank) | | 3.63 | | 2/7/07 | | 3,555,000 | | a | | 3,555,000 |
The Funds 41
STATEMENT OF INVESTMENTS (continued)
| Dreyfus Tax Exempt | | Coupon | | Maturity | | Principal | | | | |
| Cash Management (continued) | | Rate (%) | | Date | | Amount ($) | | Value ($) |
| |
| |
| |
| |
|
| |
| Short-Term Investments (continued) | | | | | | | | | | |
| |
| |
| |
| |
| |
|
| Tennessee (continued) | | | | | | | | | | |
| Blount County Public Building Authority, | | | | | | | | | | |
| Local Government Public Improvement Revenue | | | | | | | | | | |
| (Insured; AMBAC and Liquidity Facility; Regions Bank) | | 3.63 | | 2/7/07 | | 5,000,000 | | a | | 5,000,000 |
| Blount County Public Building Authority, | | | | | | | | | | |
| Local Government Public Improvement Revenue | | | | | | | | | | |
| (Insured; AMBAC and Liquidity Facility; Regions Bank) | | 3.63 | | 2/7/07 | | 6,500,000 | | a | | 6,500,000 |
| Claiborne County Industrial Development Board, Revenue | | | | | | | | | | |
| (Lincoln Memorial University Project) (LOC; Amsouth Bank) | | 3.64 | | 2/7/07 | | 9,000,000 | | a | | 9,000,000 |
| Franklin Industrial Development Board, Multifamily Revenue | | | | | | | | | | |
| (Landings Apartment Project) (Liquidity Facility; | | | | | | | | | | |
| Goldman Sachs Group and LOC; Goldman Sachs Group) | | 3.95 | | 2/7/07 | | 30,720,000 | | a,b | | 30,720,000 |
| Knoxville, Wastewater Systems Revenue (Putters Program) | | | | | | | | | | |
| (Insured; MBIA and Liquidity Facility; PB Finance Inc.) | | 3.66 | | 2/7/07 | | 8,085,000 | | a,b | | 8,085,000 |
| Metropolitan Government Nashville and Davidson County Health | | | | | | | | | | |
| and Education Facilities Board, Revenue, CP (Vanderbilt University) | | 3.55 | | 2/28/07 | | 15,000,000 | | | | 15,000,000 |
| Municipal Energy Acquisition Corporation, | | | | | | | | | | |
| Gas Revenue (Putters Program) (Liquidity Facility; | | | | | | | | | | |
| JPMorgan Chase Bank and LOC; JPMorgan Chase Bank) | | 3.67 | | 2/7/07 | | 13,375,000 | | a,b | | 13,375,000 |
| Sevier County Public Building Authority, | | | | | | | | | | |
| Local Government Public Improvement Revenue | | | | | | | | | | |
| (Insured; AMBAC and Liquidity Facility; KBC Bank) | | 3.63 | | 2/7/07 | | 7,395,000 | | a | | 7,395,000 |
| Sevier County Public Building Authority, | | | | | | | | | | |
| Local Government Public Improvement Revenue (Insured; AMBAC | | | | | | | | | | |
| and Liquidity Facility; Landesbank Hessen-Thuringen Girozentrale) | | 3.63 | | 2/7/07 | | 7,485,000 | | a | | 7,485,000 |
| Sevier County Public Building Authority, Local Government | | | | | | | | | | |
| Public Improvement Revenue (Insured; AMBAC and | | | | | | | | | | |
| Liquidity Facility; Landesbank Hessen-Thuringen Girozentrale) | | 3.63 | | 2/7/07 | | 10,000,000 | | a | | 10,000,000 |
| Shelby County Health, Educational and Housing Facility Board, | | | | | | | | | | |
| HR (Methodist Healthcare) (Insured; MBIA) | | 5.50 | | 4/1/07 | | 1,755,000 | | | | 1,760,374 |
| Shelby County Health, Educational and Housing Facility Board, | | | | | | | | | | |
| HR (Methodist Healthcare) (Insured; MBIA) | | 5.50 | | 4/1/07 | | 1,740,000 | | | | 1,745,328 |
| Tennergy Corporation, Gas Revenue (Putters Program) | | | | | | | | | | |
| (Liquidity Facility; JPMorgan Chase Bank) | | 3.67 | | 2/7/07 | | 25,000,000 | | a,b | | 25,000,000 |
| Tennergy Corporation, Gas Revenue | | | | | | | | | | |
| (Putters Program) (LOC; BNP Paribas) | | 3.66 | | 2/7/07 | | 92,725,000 | | a,b | | 92,725,000 |
| Tennessee Energy Acquisition Corporation, | | | | | | | | | | |
| Gas Project Revenue (Liquidity Facility; | | | | | | | | | | |
| Goldman Sachs Group and LOC; Goldman Sachs Group) | | 3.66 | | 2/7/07 | | 50,000,000 | | a,b | | 50,000,000 |
| Tennessee Energy Acquisition Corporation, | | | | | | | | | | |
| Gas Project Revenue (Merlots Program) | | | | | | | | | | |
| (Liquidity Facility; The Bank of New York) | | 3.54 | | 2/7/07 | | 20,000,000 | | a,b | | 20,000,000 |
| Texas—9.1% | | | | | | | | | | |
| ABN AMRO Munitops Certificates Trust, | | | | | | | | | | |
| Water Revenue (Tarrant Regional Water District) | | | | | | | | | | |
| (Insured; FGIC and Liquidity Facility; ABN-AMRO) | | 3.66 | | 2/7/07 | | 10,260,000 | | a,b | | 10,260,000 |
| Dallas, Airport System Revenue (Insured; AMBAC) | | 5.00 | | 4/1/07 | | 6,000,000 | | | | 6,014,186 |
| Dreyfus Tax Exempt | | Coupon | | Maturity | | Principal | | | | |
| Cash Management (continued) | | Rate (%) | | Date | | Amount ($) | | Value ($) |
| |
| |
| |
| |
|
| |
| Short-Term Investments (continued) | | | | | | | | | | |
| |
| |
| |
| |
| |
|
| Texas (continued) | | | | | | | | | | |
| Dallas Area Rapid Transit, Transportation | | | | | | | | | | |
| Revenue (Merlots Program) (Insured: AMBAC | | | | | | | | | | |
| and FGIC and Liquidity Facility; Wachovia Bank) | | 3.53 | | 2/7/07 | | 24,055,000 | | a,b | | 24,055,000 |
| Harris County, GO Notes, TAN | | 4.50 | | 2/28/07 | | 7,300,000 | | | | 7,304,247 |
| Harris County Metropolitan Transit Authority, | | | | | | | | | | |
| Sales Tax and Use Tax Revenue, CP (LOC; DEPFA Bank PLC) | | 3.70 | | 8/15/07 | | 20,000,000 | | | | 20,000,000 |
| Houston, Airport System Revenue, CP | | | | | | | | | | |
| (LOC; Dexia Credit Locale) | | 3.53 | | 3/7/07 | | 20,000,000 | | | | 20,000,000 |
| Houston, CP (Liquidity Facility; DEPFA Bank PLC) | | 3.63 | | 2/6/07 | | 5,000,000 | | | | 5,000,000 |
| Houston, CP (Liquidity Facility; DEPFA Bank PLC) | | 3.60 | | 3/13/07 | | 35,000,000 | | | | 35,000,000 |
| Houston, Utility System Revenue, CP (Liquidity Facility: | | | | | | | | | | |
| Dexia Credit Locale and Landesbank Baden-Wurttemberg) | | 3.62 | | 2/15/07 | | 7,000,000 | | | | 7,000,000 |
| Lower Colorado River Authority, Revenue, | | | | | | | | | | |
| CP (LCRA Transportation Services Corporation) | | | | | | | | | | |
| (Liquidity Facility; JPMorgan Chase Bank) | | 3.50 | | 2/8/07 | | 30,700,000 | | | | 30,700,000 |
| North Central Texas Health Facilities Development | | | | | | | | | | |
| Corporation, Revenue, CP (Methodist Hospital) | | | | | | | | | | |
| (Insured; AMBAC and Liquidity Facility; Dexia Credit Locale) | | 3.53 | | 2/6/07 | | 24,000,000 | | | | 24,000,000 |
| North Central Texas Health Facilities Development | | | | | | | | | | |
| Corporation, Revenue, CP (Methodist Hospital) | | | | | | | | | | |
| (Insured; AMBAC and Liquidity Facility; Dexia Credit Locale) | | 3.57 | | 2/15/07 | | 20,000,000 | | | | 20,000,000 |
| North Central Texas Health Facilities Development | | | | | | | | | | |
| Corporation, Revenue, CP (Methodist Hospital) | | | | | | | | | | |
| (Insured; AMBAC and Liquidity Facility; Dexia Credit Locale) | | 3.62 | | 5/2/07 | | 12,000,000 | | | | 12,000,000 |
| San Antonio, Water Revenue (Merlots Program) | | | | | | | | | | |
| (Liquidity Facility; Wachovia Bank) | | 3.53 | | 2/7/07 | | 10,000,000 | | a,b | | 10,000,000 |
| San Antonio, Water System, CP | | | | | | | | | | |
| (Liquidity Facility; Bank of America) | | 3.57 | | 3/14/07 | | 17,700,000 | | | | 17,700,000 |
| Spring Independent School District, Schoolhouse | | | | | | | | | | |
| (Insured; FSA and Liquidity Facility; Dexia Credit Locale) | | 3.75 | | 8/15/07 | | 5,000,000 | | | | 5,000,000 |
| Texas Municipal Gas Acquisition and Supply Corporation I, | | | | | | | | | | |
| Gas Supply Revenue (Liquidity Facility; Merrill Lynch | | | | | | | | | | |
| Capital Services and LOC; Merrill Lynch Capital Services) | | 3.68 | | 2/7/07 | | 5,325,000 | | a,b | | 5,325,000 |
| Vermont—1.0% | | | | | | | | | | |
| University of Vermont and State Argricultural College, CP | | 3.62 | | 2/13/07 | | 2,000,000 | | | | 2,000,000 |
| Vermont Educational and Health Buildings Financing | | | | | | | | | | |
| Agency, HR (Rutland Regional Medical Center Project) | | | | | | | | | | |
| (Insured; Radian Group and Liquidity Facility; TD Banknorth N.A.) | | 3.73 | | 2/1/07 | | 7,530,000 | | a | | 7,530,000 |
| Vermont Educational and Health Buildings Financing | | | | | | | | | | |
| Agency, HR (Rutland Regional Medical Center Project) | | | | | | | | | | |
| (Insured; Radian Group and Liquidity Facility; TD BankNorth N.A.) | | 3.73 | | 2/1/07 | | 19,025,000 | | a | | 19,025,000 |
| Virginia—2.3% | | | | | | | | | | |
| Alexandria Industrial Development Authority, Revenue | | | | | | | | | | |
| (Institute for Defense Analyses Project) (Insured; | | | | | | | | | | |
| AMBAC and Liquidity Facility; Wachovia Bank) | | 3.65 | | 2/7/07 | | 13,675,000 | | a | | 13,675,000 |
| | STATEMENT OF INVESTMENTS (continued)
|
| | | | | | | Principal | | | | |
| Dreyfus Tax Exempt Cash Management (continued) | | | | | | Amount ($) | | Value ($) |
| |
| |
| |
| |
|
| |
| Short-Term Investments (continued) | | | | | | | | | | |
| |
| |
| |
| |
| |
|
| Virginia (continued) | | | | | | | | | | |
| Norfolk Redevelopment and Housing Authority, | | | | | | | | | | |
| First Mortgage Revenue (Fort Norfolk Retirement | | | | | | | | | | |
| Community, Inc.— Harbor’s Edge Project) (LOC; HSH Nordbank AG) | | 3.63 | | 2/7/07 | | 20,000,000 | | a | | 20,000,000 |
| Tobacco Settlement Financing Corporation of Virginia, Tobacco | | | | | | | | | | |
| Settlement Asset-Backed Bonds (Liquidity Facility; Merrill Lynch) | | 3.66 | | 2/7/07 | | 7,500,000 | | a,b | | 7,500,000 |
| Virginia Housing Development Authority, | | | | | | | | | | |
| Commonwealth Mortgage Revenue | | 3.79 | | 2/13/07 | | 24,000,000 | | | | 24,000,000 |
| Washington—2.0% | | | | | | | | | | |
| Energy Northwest, Electric Revenue, Refunding | | | | | | | | | | |
| (Putters Program) (Columbia Generating Station) | | | | | | | | | | |
| (Insured; AMBAC and Liquidity Facility; PB Finance Inc.) | | 3.66 | | 2/7/07 | | 5,235,000 | | a,b | | 5,235,000 |
| Washington, GO Notes (Merlots Program) (Insured: FGIC | | | | | | | | | | |
| and MBIA and Liquidity Facility; Wachovia Bank) | | 3.53 | | 2/7/07 | | 20,000,000 | | a,b | | 20,000,000 |
| Washington Health Care Facilities Authority, Revenue | | | | | | | | | | |
| (Seattle Cancer Care Alliance) (LOC; Key Bank) | | 3.65 | | 2/7/07 | | 4,150,000 | | a | | 4,150,000 |
| Washington Higher Education Facilities Authority, Revenue | | | | | | | | | | |
| (Saint Martin’s College Project) (LOC; U.S. Bank NA) | | 3.68 | | 2/7/07 | | 6,695,000 | | a | | 6,695,000 |
| Washington Housing Finance Commission, Nonprofit Revenue, | | | | | | | | | | |
| Refunding (Horizon House Project) (LOC; Bank of America) | | 3.64 | | 2/7/07 | | 19,800,000 | | a | | 19,800,000 |
| Wisconsin—.8% | | | | | | | | | | |
| Badger Tobacco Asset Securitization Corporation, | | | | | | | | | | |
| Tobacco Settlement Asset-Backed Bonds (Liquidity | | | | | | | | | | |
| Facility: Lloyds TSB Bank PLC and Merrill Lynch) | | 3.67 | | 2/7/07 | | 5,860,000 | | a,b | | 5,860,000 |
| Wisconsin Health and Educational Facilities Authority, Revenue | | | | | | | | | | |
| (Saint John’s Communities, Inc.) (Insured; Radian Bank | | | | | | | | | | |
| and Liquidity Facility; Marshall and Ilsley Bank) | | 3.64 | | 2/7/07 | | 5,700,000 | | a | | 5,700,000 |
| Wisconsin Public Power Inc., Power Supply System | | | | | | | | | | |
| Revenue (Putters Program) (Insured; AMBAC | | | | | | | | | | |
| and Liquidity Facility; PB Capital Finance) | | 3.66 | | 2/7/07 | | 10,360,000 | | a,b | | 10,360,000 |
| Wyoming—.3% | | | | | | | | | | |
| Natrona County, HR, Refunding (Wyoming Medical Center Project) | | | | | | | | | | |
| (Insured; AMBAC and Liquidity Facility; Bank of Nova Scotia) | | 3.52 | | 2/7/07 | | 8,700,000 | | a | | 8,700,000 |
| |
| |
| |
| |
| |
|
| |
| Total Investments (cost $2,854,380,897) | | | | | | 99.7% | | | | 2,854,380,897 |
| Cash and Receivables (Net) | | | | | | .3% | | | | 9,221,731 |
| Net Assets | | | | | | 100.0% | | | | 2,863,602,628 |
| See footnotes on page 45. |
| See notes to financial statements. |
STATEMENT OF INVESTMENTS (continued)
| Summary of Abbreviations | | | | |
| |
| ACA | | American Capital Access | | AGC | | ACE Guaranty Corporation |
| AGIC | | Asset Guaranty Insurance Company | | AMBAC | | American Municipal Bond Assurance Corporation |
| ARRN | | Adjustable Rate Receipt Notes | | BAN | | Bond Anticipation Notes |
| BIGI | | Bond Investors Guaranty Insurance | | BPA | | Bond Purchase Agreement |
| CGIC | | Capital Guaranty Insurance Company | | CIC | | Continental Insurance Company |
| CIFG | | CDC Ixis Financial Guaranty | | CMAC | | Capital Market Assurance Corporation |
| COP | | Certificate of Participation | | CP | | Commercial Paper |
| EDR | | Economic Development Revenue | | EIR | | Environmental Improvement Revenue |
| FGIC | | Financial Guaranty Insurance Company | | FHA | | Federal Housing Administration |
| FHLB | | Federal Home Loan Bank | | FHLMC | | Federal Home Loan Mortgage Corporation |
| FNMA | | Federal National Mortgage Association | | FSA | | Financial Security Assurance |
| GAN | | Grant Anticipation Notes | | GIC | | Guaranteed Investment Contract |
| GNMA | | Government National Mortgage Association | | GO | | General Obligation |
| HR | | Hospital Revenue | | IDB | | Industrial Development Board |
| IDC | | Industrial Development Corporation | | IDR | | Industrial Development Revenue |
| LOC | | Letter of Credit | | LOR | | Limited Obligation Revenue |
| LR | | Lease Revenue | | MBIA | | Municipal Bond Investors |
| | | | | | | Assurance Insurance Corporation |
| MFHR | | Multi-Family Housing Revenue | | MFMR | | Multi-Family Mortgage Revenue |
| PCR | | Pollution Control Revenue | | PILOT | | Payment in Lieu of Taxes |
| RAC | | Revenue Anticipation Certificates | | RAN | | Revenue Anticipation Notes |
| RAW | | Revenue Anticipation Warrants | | RRR | | Resources Recovery Revenue |
| SAAN | | State Aid Anticipation Notes | | SBPA | | Standby Bond Purchase Agreement |
| SFHR | | Single Family Housing Revenue | | SFMR | | Single Family Mortgage Revenue |
| SONYMA | | State of New York Mortgage Agency | | SWDR | | Solid Waste Disposal Revenue |
| TAN | | Tax Anticipation Notes | | TAW | | Tax Anticipation Warrants |
| TRAN | | Tax and Revenue Anticipation Notes | | XLCA | | XL Capital Assurance |
| Summary of Combined Ratings (Unaudited) | | | | | | |
| | | | | | | | | Value (%) † | | |
| | | | | |
| |
| |
|
| | | | | | | Dreyfus | | Dreyfus | | Dreyfus |
| | | | | | | Municipal Cash | | New York | | Tax Exempt |
| | | | | | | Management | | Municipal Cash | | Cash |
| Fitch or | | Moody’s | | or Standard & Poor’s | | Plus | | Management | | Management |
| |
| |
| |
| |
| |
|
| F1+, F1 | | VMIG1, MIG1, P1 | | SP1+, SP1, A1+, A1 | | 88.1 | | 86.9 | | 95.6 |
| AAA, AA, A e | | Aaa, Aa, A e | | AAA, AA, A e | | 5.5 | | 6.5 | | 4.4 |
| Not Rated f | | Not Rated f | | Not Rated f | | 6.4 | | 6.6 | | .0 |
| | | | | | | 100.0 | | 100.0 | | 100.0 |
| |
| † Based on total investments. | | | | | | | | | | |
| a Securities payable on demand.Variable interest rate—subject to periodic change. | | | | | | |
| b Securities exempt from registration under Rule 144A of the Securities Act of 1933.These securities may be resold in transactions exempt from registration, normally to qualified |
| institutional buyers. At January 31, 2007, Dreyfus Municipal Cash Management Plus amounted to $310,960,390 or 27.9%, Dreyfus New York Municipal Cash Management |
| amounted to $155,470,000 or 27.1%, and Dreyfus Tax Exempt Cash Management amounted to $723,880,000 or 25.3% of net assets. | | | | |
| c Purchased on delayed delivery basis. | | | | | | | | |
| d These securities are prerefunded; the date shown represents the prerefunded date. Bonds which are prerefunded are collateralized by U.S. Government securities which are held in escrow |
| and are used to pay principal and interest on the municipal issue and to retire the bonds in full at the earliest refunding date. | | | | |
| e Notes which are not F, MIG or SP rated are represented by bond ratings of the issuers. | | | | | | |
| f Securities which, while not rated by Fitch, Moody’s and Standard & Poor’s, have been determined by the Manager to be of comparable quality to those rated securities in which the fund |
| may invest. | | | | | | | | | | |
| See notes to financial statements. | | | | | | | | | | |
| STATEMENT OF ASSETS AND LIABILITIES |
| (amounts in thousands, except Net Asset Value Per Share) |
| |
| January 31, 2007 |
| | | | | Dreyfus | | Dreyfus | | Dreyfus | | Dreyfus | | Dreyfus |
| | | Dreyfus | | Cash | | Government | | Government | | Treasury | | Treasury |
| | | Cash | | Management | | Cash | | Prime Cash | | Cash | | Prime Cash |
| | | Management | | Plus, Inc. | | Management | | Management | | Management | | Management |
| |
| |
| |
| |
| |
| |
|
| Assets ($): | | | | | | | | | | | | |
| Investments at value—Note 1(a,b) † | | 13,500,386 | | 10,422,168 | | 4,541,651a | | 1,932,824 | | 5,313,000a | | 1,788,508 |
| Cash | | — | | — | | — | | 434 | | — | | — |
| Interest receivable | | 45,757 | | 36,895 | | 8,669 | | 4,284 | | 761 | | — |
| | | 13,546,143 | | 10,459,063 | | 4,550,320 | | 1,937,542 | | 5,313,761 | | 1,788,508 |
| |
| |
| |
| |
| |
| |
|
| Liabilities ($): | | | | | | | | | | | | |
| Due to The Dreyfus Corporation | | | | | | | | | | | | |
| and affiliates—Note 2(b) | | 2,760 | | 2,370 | | 981 | | 507 | | 1,253 | | 423 |
| Cash overdraft due to Custodian | | 41,647 | | 8,323 | | 5,908 | | — | | 14,993 | | 3,988 |
| Payable for investment securities purchased | | 328,963 | | 197,409 | | — | | — | | — | | — |
| Payable for shares of Beneficial | | | | | | | | | | | | |
| Interest/Common Stock redeemed | | 357 | | 9,018 | | 306 | | 1,500 | | — | | 32 |
| | | 373,727 | | 217,120 | | 7,195 | | 2,007 | | 16,246 | | 4,443 |
| |
| |
| |
| |
| |
| |
|
| Net Assets ($) | | 13,172,416 | | 10,241,943 | | 4,543,125 | | 1,935,535 | | 5,297,515 | | 1,784,065 |
| |
| |
| |
| |
| |
| |
|
| Composition of Net Assets ($): | | | | | | | | | | | | |
| Paid-in capital | | 13,173,972 | | 10,250,504 | | 4,545,962 | | 1,935,537 | | 5,297,611 | | 1,784,691 |
| Accumulated net realized gain | | | | | | | | | | | | |
| (loss) on investments | | (1,556) | | (8,561) | | (2,837) | | (2) | | (96) | | (626) |
| |
| |
| |
| |
| |
| |
|
| Net Assets ($) | | 13,172,416 | | 10,241,943 | | 4,543,125 | | 1,935,535 | | 5,297,515 | | 1,784,065 |
| |
| |
| |
| |
| |
| |
|
| Net Asset Value Per Share | | | | | | | | | | | | |
| Institutional Shares | | | | | | | | | | | | |
| Net Assets ($) | | 11,062,589 | | 6,494,627 | | 3,117,774 | | 1,004,903 | | 3,429,301 | | 1,043,487 |
| Shares Outstanding | | 11,063,923 | | 6,501,354 | | 3,119,656 | | 1,004,905 | | 3,429,363 | | 1,044,055 |
| Net Asset Value Per Share ($) | | 1.00 | | 1.00 | | 1.00 | | 1.00 | | 1.00 | | 1.00 |
| |
| |
| |
| |
| |
| |
|
| Investor Shares | | | | | | | | | | | | |
| Net Assets ($) | | 1,589,716 | | 1,657,909 | | 908,788 | | 275,457 | | 1,470,861 | | 614,517 |
| Shares Outstanding | | 1,589,868 | | 1,658,866 | | 909,424 | | 275,451 | | 1,470,889 | | 614,587 |
| Net Asset Value Per Share ($) | | 1.00 | | 1.00 | | 1.00 | | 1.00 | | 1.00 | | 1.00 |
| |
| |
| |
| |
| |
| |
|
| Administrative Shares | | | | | | | | | | | | |
| Net Assets ($) | | 314,553 | | 1,148,039 | | 320,297 | | 313,691 | | 140,629 | | 4,621 |
| Shares Outstanding | | 314,596 | | 1,148,502 | | 320,471 | | 313,684 | | 140,631 | | 4,616 |
| Net Asset Value Per Share ($) | | 1.00 | | 1.00 | | 1.00 | | 1.00 | | 1.00 | | 1.00 |
| |
| |
| |
| |
| |
| |
|
| Participant Shares | | | | | | | | | | | | |
| Net Assets ($) | | 205,558 | | 941,368 | | 196,266 | | 341,484 | | 256,724 | | 121,441 |
| Shares Outstanding | | 205,585 | | 941,783 | | 196,411 | | 341,497 | | 256,728 | | 121,433 |
| Net Asset Value Per Share ($) | | 1.00 | | 1.00 | | 1.00 | | 1.00 | | 1.00 | | 1.00 |
| |
| |
| |
| |
| |
| |
|
| † Investments at cost ($) | | 13,500,386 | | 10,323,478 | | 4,541,651 | | 1,932,824 | | 5,313,000 | | 1,788,508 |
| |
| a Amount includes repurchase agreements of $2,057,000,000 and $5,313,000,000 for Dreyfus Government Cash Management and Dreyfus Treasury Cash Management, respectively, |
| See Note 1(b). | | | | | | | | | | | | |
| See notes to financial statements. | | | | | | | | | | | | |
46
| | | Dreyfus | | Dreyfus | | Dreyfus |
| | | Municipal Cash | | New York | | Tax Exempt |
| | | Management | | Municipal Cash | | Cash |
| | | Plus | | Management | | Management |
| |
| |
| |
|
| Assets ($): | | | | | | |
| Investments at value—Note 1(a) † | | 1,168,994 | | 566,698 | | 2,854,381 |
| Cash | | — | | 4,105 | | — |
| Interest receivable | | 5,383 | | 3,055 | | 16,475 |
| | | 1,174,377 | | 573,858 | | 2,870,856 |
| |
| |
| |
|
| Liabilities ($): | | | | | | |
| Due to The Dreyfus Corporation and affiliates—Note 2(b) | | 267 | | 113 | | 493 |
| Cash overdraft due to Custodian | | 27,968 | | — | | 6,755 |
| Payable for investment securities purchased | | 30,060 | | — | | — |
| Payable for shares of Beneficial Interest redeemed | | 429 | | 302 | | 5 |
| | | 58,724 | | 415 | | 7,253 |
| |
| |
| |
|
| Net Assets ($) | | 1,115,653 | | 573,443 | | 2,863,603 |
| |
| |
| |
|
| Composition of Net Assets ($): | | | | | | |
| Paid-in capital | | 1,115,653 | | 573,367 | | 2,863,595 |
| Accumulated net realized gain (loss) on investments | | — | | 76 | | 8 |
| |
| |
| |
|
| Net Assets ($) | | 1,115,653 | | 573,443 | | 2,863,603 |
| |
| |
| |
|
| Net Asset Value Per Share | | | | | | |
| Instititutional Shares | | | | | | |
| Net Assets ($) | | 595,509 | | 376,896 | | 2,333,187 |
| Shares Outstanding | | 595,628 | | 376,844 | | 2,333,237 |
| Net Asset Value Per Share ($) | | 1.00 | | 1.00 | | 1.00 |
| |
| |
| |
|
| Investor Shares | | | | | | |
| Net Assets ($) | | 206,261 | | 120,292 | | 288,210 |
| Shares Outstanding | | 206,245 | | 120,275 | | 288,207 |
| Net Asset Value Per Share ($) | | 1.00 | | 1.00 | | 1.00 |
| |
| |
| |
|
| Administrative Shares | | | | | | |
| Net Assets ($) | | 291,246 | | 36,381 | | 212,508 |
| Shares Outstanding | | 291,231 | | 36,378 | | 212,474 |
| Net Asset Value Per Share ($) | | 1.00 | | 1.00 | | 1.00 |
| |
| |
| |
|
| Participant Shares | | | | | | |
| Net Assets ($) | | 22,637 | | 39,874 | | 29,698 |
| Shares Outstanding | | 22,632 | | 39,874 | | 29,677 |
| Net Asset Value Per Share ($) | | 1.00 | | 1.00 | | 1.00 |
| |
| |
| |
|
| † Investments at cost ($) | | 1,168,994 | | 566,698 | | 2,854,381 |
See notes to financial statements.
|
| STATEMENT OF OPERATIONS |
| (amounts in thousands) |
| |
| Year Ended January 31, 2007 |
| | | | | Dreyfus | | Dreyfus | | Dreyfus | | Dreyfus | | Dreyfus |
| | | Dreyfus | | Cash | | Government | | Government | | Treasury | | Treasury |
| | | Cash | | Management | | Cash | | Prime Cash | | Cash | | Prime Cash |
| | | Management | | Plus, Inc. | | Management | | Management | | Management | | Management |
| |
| |
| |
| |
| |
| |
|
| Investment Income ($): | | | | | | | | | | | | |
| Interest Income | | 678,377 | | 477,963 | | 230,001 | | 84,351 | | 225,759 | | 91,527 |
| Expenses: | | | | | | | | | | | | |
| Management fee—Note 2(a) | | 26,210 | | 18,509 | | 9,053 | | 3,335 | | 9,029 | | 3,845 |
| Distribution fees—Note 2(b) | | 4,237 | | 7,310 | | 3,557 | | 2,042 | | 4,443 | | 2,148 |
| Total Expenses | | 30,447 | | 25,819 | | 12,610 | | 5,377 | | 13,472 | | 5,993 |
| Investment Income—Net | | 647,930 | | 452,144 | | 217,391 | | 78,974 | | 212,287 | | 85,534 |
| |
| |
| |
| |
| |
| |
|
| Net Realized Gain (Loss) on | | | | | | | | | | | | |
| Investments—Note 1(b) ($) | | — | | — | | (37) | | (1) | | (44) | | (323) |
| Net Increase in Net Assets | | | | | | | | | | | | |
| Resulting from Operations | | 647,930 | | 452,144 | | 217,354 | | 78,973 | | 212,243 | | 85,211 |
| | See notes to financial statements.
|
| | | Dreyfus | | Dreyfus | | Dreyfus |
| | | Municipal Cash | | New York | | Tax Exempt |
| | | Management | | Municipal Cash | | Cash |
| | | Plus | | Management | | Management |
| |
| |
| |
|
| Investment Income ($): | | | | | | |
| Interest Income | | 37,638 | | 17,607 | | 105,362 |
| Expenses: | | | | | | |
| Management fee—Note 2(a) | | 2,132 | | 1,003 | | 6,039 |
| Distribution fees—Note 2(b) | | 720 | | 383 | | 945 |
| Total Expenses | | 2,852 | | 1,386 | | 6,984 |
| Investment Income—Net | | 34,786 | | 16,221 | | 98,378 |
| |
| |
| |
|
| Net Realized Gain (Loss) on Investments—Note 1(b) ($) | | 2 | | 76 | | 83 |
| Net Increase in Net Assets Resulting from Operations | | 34,788 | | 16,297 | | 98,461 |
See notes to financial statements.
| STATEMENT OF CHANGES IN NET ASSETS |
| (amounts in thousands) |
| | | Dreyfus Cash Management | | Dreyfus Cash Management Plus, Inc. |
| |
| |
|
| | | Year Ended January 31, | | Year Ended January 31, |
| | | 2007 | | 2006 | | 2007 | | 2006 |
| |
| |
| |
| |
|
| Operations ($): | | | | | | | | |
| Investment income—net | | 647,930 | | 401,369 | | 452,144 | | 292,369 |
| Net realized gain (loss) on investments | | — | | (154) | | — | | (798) |
| Net Increase (Decrease) in Net Assets | | | | | | | | |
| Resulting from Operations | | 647,930 | | 401,215 | | 452,144 | | 291,571 |
| |
| |
| |
| |
|
| Dividends to Shareholders from ($): | | | | | | | | |
| Investment income—net: | | | | | | | | |
| Institutional Shares | | (565,805) | | (351,357) | | (305,367) | | (223,829) |
| Investor Shares | | (57,732) | | (35,602) | | (63,198) | | (35,763) |
| Administrative Shares | | (14,545) | | (8,404) | | (49,833) | | (19,166) |
| Participant Shares | | (9,848) | | (6,006) | | (33,746) | | (13,611) |
| Total Dividends | | (647,930) | | (401,369) | | (452,144) | | (292,369) |
| |
| |
| |
| |
|
| Beneficial Interest/Capital Stock | | | | | | | | |
| Transactions ($1.00 per share): | | | | | | | | |
| Net proceeds from shares sold: | | | | | | | | |
| Institutional Shares | | 102,137,430 | | 88,227,691 | | 82,632,783 | | 102,606,751 |
| Investor Shares | | 12,712,990 | | 8,207,749 | | 6,245,463 | | 5,299,272 |
| Administrative Shares | | 3,102,069 | | 3,067,374 | | 5,795,174 | | 5,033,982 |
| Participant Shares | | 1,361,084 | | 1,793,568 | | 3,071,131 | | 2,572,684 |
| Dividends reinvested: | | | | | | | | |
| Institutional Shares | | 168,884 | | 85,179 | | 120,877 | | 86,879 |
| Investor Shares | | 16,521 | | 10,546 | | 56,642 | | 32,664 |
| Administrative Shares | | 4,427 | | 2,320 | | 49,247 | | 19,092 |
| Participant Shares | | 8,013 | | 5,063 | | 32,839 | | 13,140 |
| Cost of shares redeemed: | | | | | | | | |
| Institutional Shares | | (100,727,903) | | (88,111,203) | | (82,166,637) | | (105,251,149) |
| Investor Shares | | (12,377,419) | | (8,048,703) | | (5,919,618) | | (5,114,620) |
| Administrative Shares | | (3,042,612) | | (3,085,440) | | (5,489,719) | | (4,759,710) |
| Participant Shares | | (1,374,003) | | (1,832,003) | | (2,862,522) | | (2,348,416) |
| Increase (Decrease) in Net Assets from | | | | | | | | |
| Beneficial Interest/Capital Stock Transactions | | 1,989,481 | | 322,141 | | 1,565,660 | | (1,809,431) |
| Total Increase (Decrease) In Net Assets | | 1,989,481 | | 321,987 | | 1,565,660 | | (1,810,229) |
| |
| |
| |
| |
|
| Net Assets ($): | | | | | | | | |
| Beginning of Period | | 11,182,935 | | 10,860,948 | | 8,676,283 | | 10,486,512 |
| End of Period | | 13,172,416 | | 11,182,935 | | 10,241,943 | | 8,676,283 |
See notes to financial statements.
| | | Dreyfus Government | | Dreyfus Government |
| | | Cash Management | | Prime Cash Management |
| |
| |
|
| | | Year Ended January 31, | | Year Ended January 31, |
| | | 2007 | | 2006 | | 2007 | | 2006 |
| |
| |
| |
| |
|
| Operations ($): | | | | | | | | |
| Investment income—net | | 217,391 | | 147,524 | | 78,974 | | 38,083 |
| Net realized gain (loss) on investments | | (37) | | (284) | | (1) | | 51 |
| Net Increase (Decrease) in Net Assets | | | | | | | | |
| Resulting from Operations | | 217,354 | | 147,240 | | 78,973 | | 38,134 |
| |
| |
| |
| |
|
| Dividends to Shareholders from ($): | | | | | | | | |
| Investment income—net: | | | | | | | | |
| Institutional Shares | | (151,006) | | (101,439) | | (44,534) | | (19,681) |
| Investor Shares | | (42,175) | | (31,627) | | (11,467) | | (6,581) |
| Administrative Shares | | (13,086) | | (6,881) | | (9,295) | | (5,413) |
| Participant Shares | | (11,124) | | (7,577) | | (13,678) | | (6,408) |
| Total Dividends | | (217,391) | | (147,524) | | (78,974) | | (38,083) |
| |
| |
| |
| |
|
| Beneficial Interest Transactions ($1.00 per share): | | | | | | |
| Net proceeds from shares sold: | | | | | | | | |
| Institutional Shares | | 29,602,789 | | 25,264,718 | | 4,798,429 | | 2,989,497 |
| Investor Shares | | 6,108,135 | | 6,351,977 | | 525,736 | | 421,201 |
| Administrative Shares | | 1,851,747 | | 1,451,334 | | 3,769,622 | | 2,090,491 |
| Participant Shares | | 1,510,479 | | 1,304,455 | | 1,651,006 | | 1,558,755 |
| Dividends reinvested: | | | | | | | | |
| Institutional Shares | | 61,313 | | 41,829 | | 32,069 | | 16,829 |
| Investor Shares | | 34,641 | | 25,617 | | 11,063 | | 6,059 |
| Administrative Shares | | 11,946 | | 5,866 | | 8,477 | | 5,016 |
| Participant Shares | | 9,164 | | 6,077 | | 12,245 | | 5,580 |
| Cost of shares redeemed: | | | | | | | | |
| Institutional Shares | | (29,388,591) | | (26,035,234) | | (4,599,038) | | (2,769,866) |
| Investor Shares | | (6,284,070) | | (6,614,704) | | (503,523) | | (394,068) |
| Administrative Shares | | (1,782,909) | | (1,530,875) | | (3,674,731) | | (2,085,241) |
| Participant Shares | | (1,567,294) | | (1,355,837) | | (1,529,419) | | (1,586,703) |
| Increase (Decrease) in Net Assets from | | | | | | | | |
| Beneficial Interest Transactions | | 167,350 | | (1,084,777) | | 501,936 | | 257,550 |
| Total Increase (Decrease) In Net Assets | | 167,313 | | (1,085,061) | | 501,935 | | 257,601 |
| |
| |
| |
| |
|
| Net Assets ($): | | | | | | | | |
| Beginning of Period | | 4,375,812 | | 5,460,873 | | 1,433,600 | | 1,175,999 |
| End of Period | | 4,543,125 | | 4,375,812 | | 1,935,535 | | 1,433,600 |
See notes to financial statements.
| STATEMENT OF CHANGES IN NET ASSETS (continued) |
| (amounts in thousands) |
| | | Dreyfus Treasury Cash Management | | Dreyfus Treasury Prime Cash Management |
| |
| |
|
| | | Year Ended January 31, | | Year Ended January 31, |
| | | 2007 | | 2006 | | 2007 | | 2006 |
| |
| |
| |
| |
|
| Operations ($): | | | | | | | | |
| Investment income—net | | 212,287 | | 138,913 | | 85,534 | | 68,040 |
| Net realized gain (loss) on investments | | (44) | | (39) | | (323) | | (65) |
| Net Increase (Decrease) in Net Assets | | | | | | | | |
| Resulting from Operations | | 212,243 | | 138,874 | | 85,211 | | 67,975 |
| |
| |
| |
| |
|
| Dividends to Shareholders from ($): | | | | | | | | |
| Investment income—net: | | | | | | | | |
| Institutional Shares | | (135,008) | | (92,357) | | (52,494) | | (44,635) |
| Investor Shares | | (63,070) | | (38,654) | | (26,471) | | (18,263) |
| Administrative Shares | | (4,382) | | (2,274) | | (441) | | (818) |
| Participant Shares | | (9,827) | | (5,628) | | (6,128) | | (4,324) |
| Total Dividends | | (212,287) | | (138,913) | | (85,534) | | (68,040) |
| |
| |
| |
| |
|
| Beneficial Interest Transactions ($1.00 per share): | | | | | | |
| Net proceeds from shares sold: | | | | | | | | |
| Institutional Shares | | 24,189,105 | | 33,378,971 | | 5,278,720 | | 9,320,877 |
| Investor Shares | | 10,798,967 | | 9,589,674 | | 2,419,986 | | 3,104,509 |
| Administrative Shares | | 1,151,481 | | 717,102 | | 43,474 | | 121,635 |
| Participant Shares | | 1,107,947 | | 531,943 | | 741,686 | | 848,315 |
| Dividends reinvested: | | | | | | | | |
| Institutional Shares | | 39,802 | | 25,325 | | 21,344 | | 20,119 |
| Investor Shares | | 3,305 | | 3,982 | | 10,705 | | 9,667 |
| Administrative Shares | | 4,039 | | 2,082 | | 431 | | 797 |
| Participant Shares | | 4,359 | | 2,389 | | 2,649 | | 1,196 |
| Cost of shares redeemed: | | | | | | | | |
| Institutional Shares | | (23,816,626) | | (32,738,634) | | (5,743,676) | | (9,187,163) |
| Investor Shares | | (10,651,720) | | (9,437,450) | | (2,467,024) | | (3,075,940) |
| Administrative Shares | | (1,101,677) | | (681,475) | | (65,470) | | (134,971) |
| Participant Shares | | (1,075,037) | | (524,471) | | (975,092) | | (591,166) |
| Increase (Decrease) in Net Assets from | | | | | | | | |
| Beneficial Interest Transactions | | 653,945 | | 869,438 | | (732,267) | | 437,875 |
| Total Increase (Decrease) In Net Assets | | 653,901 | | 869,399 | | (732,590) | | 437,810 |
| |
| |
| |
| |
|
| Net Assets ($): | | | | | | | | |
| Beginning of Period | | 4,643,614 | | 3,774,215 | | 2,516,655 | | 2,078,845 |
| End of Period | | 5,297,515 | | 4,643,614 | | 1,784,065 | | 2,516,655 |
| |
| See notes to financial statements. | | | | | | | | |
52
| | | Dreyfus Municipal Cash | | Dreyfus New York Municipal | | Dreyfus Tax Exempt |
| | | Management Plus | | Cash Management | | Cash Management |
| |
| |
| |
|
| | | Year Ended January 31, | | Year Ended January 31, | | Year Ended January 31, |
| | | 2007 | | 2006 | | 2007 | | 2006 | | 2007 | | 2006 |
| |
| |
| |
| |
| |
| |
|
| Operations ($): | | | | | | | | | | | | |
| Investment income—net | | 34,786 | | 21,037 | | 16,221 | | 10,185 | | 98,378 | | 71,085 |
| Net realized gain (loss) on investments | | 2 | | (2) | | 76 | | 4 | | 83 | | (16) |
| Net unrealized appreciation | | | | | | | | | | | | |
| (depreciation) on investments | | — | | — | | — | | — | | — | | (20) |
| Net Increase (Decrease) in Net Assets | | | | | | | | | | | | |
| Resulting from Operations | | 34,788 | | 21,035 | | 16,297 | | 10,189 | | 98,461 | | 71,049 |
| |
| |
| |
| |
| |
| |
|
| Dividends to Shareholders from ($): | | | | | | | | | | | | |
| Investment income—net: | | | | | | | | | | | | |
| Institutional Shares | | (22,573) | | (14,367) | | (11,020) | | (8,052) | | (84,782) | | (62,218) |
| Investor Shares | | (5,226) | | (3,035) | | (3,957) | | (1,924) | | (8,204) | | (4,769) |
| Administrative Shares | | (6,242) | | (3,133) | | (1,043) | | (104) | | (4,449) | | (3,333) |
| Participant Shares | | (745) | | (502) | | (205) | | (105) | | (943) | | (765) |
| Total Dividends | | (34,786) | | (21,037) | | (16,225) | | (10,185) | | (98,378) | | (71,085) |
| |
| |
| |
| |
| |
| |
|
| Beneficial Interest Transactions ($1.00 per share): | | | | | | | | | | |
| Net proceeds from shares sold: | | | | | | | | | | | | |
| Institutional Shares | | 8,300,868 | | 7,796,226 | | 1,191,904 | | 1,170,390 | | 16,375,981 | | 21,865,326 |
| Investor Shares | | 814,722 | | 859,699 | | 429,173 | | 473,007 | | 1,013,704 | | 887,506 |
| Administrative Shares | | 1,042,223 | | 882,779 | | 172,138 | | 37,565 | | 797,151 | | 689,339 |
| Participant Shares | | 49,773 | | 93,973 | | 56,542 | | 23,299 | | 209,633 | | 253,871 |
| Dividends reinvested: | | | | | | | | | | | | |
| Institutional Shares | | 15,989 | | 9,026 | | 3,879 | | 2,875 | | 36,740 | | 27,380 |
| Investor Shares | | 5,214 | | 3,018 | | 3,951 | | 1,923 | | 4,297 | | 2,610 |
| Administrative Shares | | 6,127 | | 3,002 | | 973 | | 103 | | 3,506 | | 2,163 |
| Participant Shares | | 745 | | 493 | | 203 | | 101 | | 405 | | 374 |
| Cost of shares redeemed: | | | | | | | | | | | | |
| Institutional Shares | | (8,359,657) | | (7,666,537) | | (1,162,402) | | (1,166,195) | | (16,724,793) | | (21,757,895) |
| Investor Shares | | (793,379) | | (788,006) | | (437,862) | | (420,813) | | (984,608) | | (875,277) |
| Administrative Shares | | (894,434) | | (877,167) | | (144,984) | | (30,159) | | (693,353) | | (861,639) |
| Participant Shares | | (53,103) | | (89,402) | | (19,343) | | (26,435) | | (221,843) | | (232,067) |
| Increase (Decrease) in Net Assets from | | | | | | | | | | | | |
| Beneficial Interest Transactions | | 135,088 | | 227,104 | | 94,172 | | 65,661 | | (183,180) | | 1,691 |
| Total Increase (Decrease) In Net Assets | | 135,090 | | 227,102 | | 94,244 | | 65,665 | | (183,097) | | 1,655 |
| |
| |
| |
| |
| |
| |
|
| Net Assets ($): | | | | | | | | | | | | |
| Beginning of Period | | 980,563 | | 753,461 | | 479,199 | | 413,534 | | 3,046,700 | | 3,045,045 |
| End of Period | | 1,115,653 | | 980,563 | | 573,443 | | 479,199 | | 2,863,603 | | 3,046,700 |
| |
| See notes to financial statements. | | | | | | | | | | | | |
FINANCIAL HIGHLIGHTS
The following tables describe the performance for each share class for the fiscal periods indicated. All information reflects financial results for a single fund share. Total return shows how much your investment in the fund would have increased (or decreased) during each period, assuming you had reinvested all dividends and distributions. These figures have been derived from the fund’s financial statements.
| | | | | Per Share Data ($) | | | | Ratios/Supplemental Data (%) |
| |
| |
| |
| |
|
| | | | | | | | | | | | | | | Ratio of Net | | |
| | | Net Asset | | | | Dividends | | Net Asset | | | | Ratio of | | Investment | | Net Assets |
| | | Value | | Net | | from Net | | Value | | | | Expenses | | Income to | | End of |
| | | Beginning | | Investment | | Investment | | End | | Total | | to Average | | Average | | Period |
| | | of Period | | Income | | Income | | of Period | | Return (%) | | Net Assets | | Net Assets ($ x1,000,000) |
| |
| |
| |
| |
| |
| |
| |
|
| |
| Dreyfus Cash Management | | | | | | | | | | | | | | |
| Institutional Shares | | | | | | | | | | | | | | | | |
| Year Ended January 31, | | | | | | | | | | | | | | | | |
| 2007 | | 1.00 | | .050 | | (.050) | | 1.00 | | 5.07 | | .20 | | 4.98 | | 11,063 |
| 2006 | | 1.00 | | .032 | | (.032) | | 1.00 | | 3.28 | | .20 | | 3.24 | | 9,484 |
| 2005 | | 1.00 | | .013 | | (.013) | | 1.00 | | 1.31 | | .20 | | 1.30 | | 9,283 |
| 2004 | | 1.00 | | .010 | | (.010) | | 1.00 | | .99 | | .20 | | .99 | | 9,507 |
| 2003 | | 1.00 | | .016 | | (.016) | | 1.00 | | 1.66 | | .20 | | 1.65 | | 11,410 |
| Investor Shares | | | | | | | | | | | | | | | | |
| Year Ended January 31, | | | | | | | | | | | | | | | | |
| 2007 | | 1.00 | | .047 | | (.047) | | 1.00 | | 4.80 | | .45 | | 4.73 | | 1,590 |
| 2006 | | 1.00 | | .030 | | (.030) | | 1.00 | | 3.03 | | .45 | | 2.99 | | 1,238 |
| 2005 | | 1.00 | | .011 | | (.011) | | 1.00 | | 1.06 | | .45 | | 1.05 | | 1,068 |
| 2004 | | 1.00 | | .007 | | (.007) | | 1.00 | | .74 | | .45 | | .74 | | 1,254 |
| 2003 | | 1.00 | | .014 | | (.014) | | 1.00 | | 1.41 | | .45 | | 1.40 | | 1,814 |
| Administrative Shares | | | | | | | | | | | | | | | | |
| Year Ended January 31, | | | | | | | | | | | | | | | | |
| 2007 | | 1.00 | | .049 | | (.049) | | 1.00 | | 4.96 | | .30 | | 4.88 | | 315 |
| 2006 | | 1.00 | | .031 | | (.031) | | 1.00 | | 3.18 | | .30 | | 3.14 | | 251 |
| 2005 | | 1.00 | | .012 | | (.012) | | 1.00 | | 1.21 | | .30 | | 1.20 | | 266 |
| 2004 | | 1.00 | | .009 | | (.009) | | 1.00 | | .89 | | .30 | | .89 | | 255 |
| 2003 | | 1.00 | | .015 | | (.015) | | 1.00 | | 1.56 | | .30 | | 1.55 | | 669 |
| Participant Shares | | | | | | | | | | | | | | | | |
| Year Ended January 31, | | | | | | | | | | | | | | | | |
| 2007 | | 1.00 | | .046 | | (.046) | | 1.00 | | 4.65 | | .60 | | 4.58 | | 206 |
| 2006 | | 1.00 | | .028 | | (.028) | | 1.00 | | 2.87 | | .60 | | 2.84 | | 210 |
| 2005 | | 1.00 | | .009 | | (.009) | | 1.00 | | .91 | | .60 | | .90 | | 244 |
| 2004 | | 1.00 | | .006 | | (.006) | | 1.00 | | .59 | | .60 | | .59 | | 132 |
| 2003 | | 1.00 | | .012 | | (.012) | | 1.00 | | 1.26 | | .60 | | 1.25 | | 118 |
| |
| See notes to financial statements. | | | | | | | | | | | | | | | | |
54
| | | | | Per Share Data ($) | | | | Ratios/Supplemental Data (%) |
| |
| |
| |
| |
|
| | | | | | | | | | | | | | | Ratio of Net | | |
| | | Net Asset | | | | Dividends | | Net Asset | | | | Ratio of | | Investment | | Net Assets |
| | | Value | | Net | | from Net | | Value | | | | Expenses | | Income to | | End of |
| | | Beginning | | Investment | | Investment | | End | | Total | | to Average | | Average | | Period |
| | | of Period | | Income | | Income | | of Period | | Return (%) | | Net Assets | | Net Assets ($ x1,000,000) |
| |
| |
| |
| |
| |
| |
| |
|
| |
| Dreyfus Cash Management Plus, Inc. | | | | | | | | | | | | | | |
| Institutional Shares | | | | | | | | | | | | | | | | |
| Year Ended January 31, | | | | | | | | | | | | | | | | |
| 2007 | | 1.00 | | .049 | | (.049) | | 1.00 | | 5.06 | | .20 | | 4.95 | | 6,495 |
| 2006 | | 1.00 | | .032 | | (.032) | | 1.00 | | 3.29 | | .20 | | 3.23 | | 5,908 |
| 2005 | | 1.00 | | .013 | | (.013) | | 1.00 | | 1.32 | | .20 | | 1.23 | | 8,466 |
| 2004 | | 1.00 | | .011 | | (.011) | | 1.00 | | 1.06 | | .20 | | 1.07 | | 14,249 |
| 2003 | | 1.00 | | .018 | | (.018) | | 1.00 | | 1.78 | | .20 | | 1.78 | | 24,637 |
| Investor Shares | | | | | | | | | | | | | | | | |
| Year Ended January 31, | | | | | | | | | | | | | | | | |
| 2007 | | 1.00 | | .047 | | (.047) | | 1.00 | | 4.80 | | .45 | | 4.70 | | 1,658 |
| 2006 | | 1.00 | | .030 | | (.030) | | 1.00 | | 3.03 | | .45 | | 2.98 | | 1,275 |
| 2005 | | 1.00 | | .011 | | (.011) | | 1.00 | | 1.07 | | .45 | | .98 | | 1,058 |
| 2004 | | 1.00 | | .008 | | (.008) | | 1.00 | | .81 | | .45 | | .82 | | 1,203 |
| 2003 | | 1.00 | | .015 | | (.015) | | 1.00 | | 1.53 | | .45 | | 1.53 | | 2,166 |
| Administrative Shares | | | | | | | | | | | | | | | | |
| Year Ended January 31, | | | | | | | | | | | | | | | | |
| 2007 | | 1.00 | | .048 | | (.048) | | 1.00 | | 4.95 | | .30 | | 4.85 | | 1,148 |
| 2006 | | 1.00 | | .031 | | (.031) | | 1.00 | | 3.19 | | .30 | | 3.13 | | 793 |
| 2005 | | 1.00 | | .012 | | (.012) | | 1.00 | | 1.22 | | .30 | | 1.13 | | 500 |
| 2004 | | 1.00 | | .010 | | (.010) | | 1.00 | | .96 | | .30 | | .97 | | 1,579 |
| 2003 | | 1.00 | | .017 | | (.017) | | 1.00 | | 1.68 | | .30 | | 1.68 | | 2,030 |
| Participant Shares | | | | | | | | | | | | | | | | |
| Year Ended January 31, | | | | | | | | | | | | | | | | |
| 2007 | | 1.00 | | .045 | | (.045) | | 1.00 | | 4.64 | | .60 | | 4.55 | | 941 |
| 2006 | | 1.00 | | .028 | | (.028) | | 1.00 | | 2.88 | | .60 | | 2.83 | | 700 |
| 2005 | | 1.00 | | .009 | | (.009) | | 1.00 | | .92 | | .60 | | .83 | | 463 |
| 2004 | | 1.00 | | .007 | | (.007) | | 1.00 | | .65 | | .60 | | .67 | | 957 |
| 2003 | | 1.00 | | .014 | | (.014) | | 1.00 | | 1.38 | | .60 | | 1.38 | | 1,028 |
| |
| See notes to financial statements. | | | | | | | | | | | | | | | | |
| | FINANCIAL HIGHLIGHTS (continued)
|
| | | | | Per Share Data ($) | | | | Ratios/Supplemental Data (%) |
| |
| |
| |
| |
|
| | | | | | | | | | | | | | | Ratio of Net | | |
| | | Net Asset | | | | Dividends | | Net Asset | | | | Ratio of | | Investment | | Net Assets |
| | | Value | | Net | | from Net | | Value | | | | Expenses | | Income to | | End of |
| | | Beginning | | Investment | | Investment | | End | | Total | | to Average | | Average | | Period |
| | | of Period | | Income | | Income | | of Period | | Return (%) | | Net Assets | | Net Assets ($ x1,000,000) |
| |
| |
| |
| |
| |
| |
| |
|
| |
| Dreyfus Government Cash Management | | | | | | | | | | | | | | |
| Institutional Shares | | | | | | | | | | | | | | | | |
| Year Ended January 31, | | | | | | | | | | | | | | | | |
| 2007 | | 1.00 | | .049 | | (.049) | | 1.00 | | 4.99 | | .20 | | 4.89 | | 3,118 |
| 2006 | | 1.00 | | .032 | | (.032) | | 1.00 | | 3.23 | | .20 | | 3.15 | | 2,842 |
| 2005 | | 1.00 | | .013 | | (.013) | | 1.00 | | 1.26 | | .20 | | 1.20 | | 3,571 |
| 2004 | | 1.00 | | .010 | | (.010) | | 1.00 | | 1.03 | | .20 | | 1.03 | | 5,409 |
| 2003 | | 1.00 | | .017 | | (.017) | | 1.00 | | 1.75 | | .20 | | 1.74 | | 8,084 |
| Investor Shares | | | | | | | | | | | | | | | | |
| Year Ended January 31, | | | | | | | | | | | | | | | | |
| 2007 | | 1.00 | | .046 | | (.046) | | 1.00 | | 4.72 | | .45 | | 4.64 | | 909 |
| 2006 | | 1.00 | | .029 | | (.029) | | 1.00 | | 2.97 | | .45 | | 2.90 | | 1,050 |
| 2005 | | 1.00 | | .010 | | (.010) | | 1.00 | | 1.01 | | .45 | | .95 | | 1,287 |
| 2004 | | 1.00 | | .008 | | (.008) | | 1.00 | | .78 | | .45 | | .78 | | 1,307 |
| 2003 | | 1.00 | | .015 | | (.015) | | 1.00 | | 1.50 | | .45 | | 1.49 | | 1,591 |
| Administrative Shares | | | | | | | | | | | | | | | | |
| Year Ended January 31, | | | | | | | | | | | | | | | | |
| 2007 | | 1.00 | | .048 | | (.048) | | 1.00 | | 4.88 | | .30 | | 4.79 | | 320 |
| 2006 | | 1.00 | | .031 | | (.031) | | 1.00 | | 3.12 | | .30 | | 3.05 | | 240 |
| 2005 | | 1.00 | | .012 | | (.012) | | 1.00 | | 1.16 | | .30 | | 1.10 | | 313 |
| 2004 | | 1.00 | | .009 | | (.009) | | 1.00 | | .93 | | .30 | | .93 | | 900 |
| 2003 | | 1.00 | | .016 | | (.016) | | 1.00 | | 1.65 | | .30 | | 1.64 | | 1,138 |
| Participant Shares | | | | | | | | | | | | | | | | |
| Year Ended January 31, | | | | | | | | | | | | | | | | |
| 2007 | | 1.00 | | .045 | | (.045) | | 1.00 | | 4.57 | | .60 | | 4.49 | | 196 |
| 2006 | | 1.00 | | .028 | | (.028) | | 1.00 | | 2.81 | | .60 | | 2.75 | | 244 |
| 2005 | | 1.00 | | .009 | | (.009) | | 1.00 | | .86 | | .60 | | .80 | | 289 |
| 2004 | | 1.00 | | .006 | | (.006) | | 1.00 | | .62 | | .60 | | .63 | | 607 |
| 2003 | | 1.00 | | .013 | | (.013) | | 1.00 | | 1.35 | | .60 | | 1.34 | | 645 |
| |
| See notes to financial statements. | | | | | | | | | | | | | | | | |
56
| | | | | Per Share Data ($) | | | | Ratios/Supplemental Data (%) |
| |
| |
| |
| |
|
| | | | | | | | | | | | | | | Ratio of Net | | |
| | | Net Asset | | | | Dividends | | Net Asset | | | | Ratio of | | Investment | | Net Assets |
| | | Value | | Net | | from Net | | Value | | | | Expenses | | Income to | | End of |
| | | Beginning | | Investment | | Investment | | End | | Total | | to Average | | Average | | Period |
| | | of Period | | Income | | Income | | of Period | | Return (%) | | Net Assets | | Net Assets ($ x1,000,000) |
| |
| |
| |
| |
| |
| |
| |
|
| |
| Dreyfus Government Prime Cash Management | | | | | | | | | | | | | | |
| Institutional Shares | | | | | | | | | | | | | | | | |
| Year Ended January 31, | | | | | | | | | | | | | | | | |
| 2007 | | 1.00 | | .048 | | (.048) | | 1.00 | | 4.95 | | .20 | | 4.86 | | 1,005 |
| 2006 | | 1.00 | | .031 | | (.031) | | 1.00 | | 3.18 | | .20 | | 3.21 | | 773 |
| 2005 | | 1.00 | | .012 | | (.012) | | 1.00 | | 1.21 | | .20 | | 1.19 | | 537 |
| 2004 | | 1.00 | | .009 | | (.009) | | 1.00 | | .94 | | .20 | | .91 | | 415 |
| 2003 | | 1.00 | | .016 | | (.016) | | 1.00 | | 1.61 | | .20 | | 1.60 | | 285 |
| Investor Shares | | | | | | | | | | | | | | | | |
| Year Ended January 31, | | | | | | | | | | | | | | | | |
| 2007 | | 1.00 | | .046 | | (.046) | | 1.00 | | 4.69 | | .45 | | 4.61 | | 275 |
| 2006 | | 1.00 | | .029 | | (.029) | | 1.00 | | 2.92 | | .45 | | 2.96 | | 242 |
| 2005 | | 1.00 | | .010 | | (.010) | | 1.00 | | .96 | | .45 | | .94 | | 209 |
| 2004 | | 1.00 | | .007 | | (.007) | | 1.00 | | .69 | | .45 | | .66 | | 243 |
| 2003 | | 1.00 | | .014 | | (.014) | | 1.00 | | 1.36 | | .45 | | 1.35 | | 273 |
| Administrative Shares | | | | | | | | | | | | | | | | |
| Year Ended January 31, | | | | | | | | | | | | | | | | |
| 2007 | | 1.00 | | .047 | | (.047) | | 1.00 | | 4.85 | | .30 | | 4.76 | | 314 |
| 2006 | | 1.00 | | .030 | | (.030) | | 1.00 | | 3.08 | | .30 | | 3.11 | | 210 |
| 2005 | | 1.00 | | .011 | | (.011) | | 1.00 | | 1.11 | | .30 | | 1.09 | | 200 |
| 2004 | | 1.00 | | .008 | | (.008) | | 1.00 | | .84 | | .30 | | .81 | | 130 |
| 2003 | | 1.00 | | .015 | | (.015) | | 1.00 | | 1.51 | | .30 | | 1.50 | | 216 |
| Participant Shares | | | | | | | | | | | | | | | | |
| Year Ended January 31, | | | | | | | | | | | | | | | | |
| 2007 | | 1.00 | | .044 | | (.044) | | 1.00 | | 4.53 | | .60 | | 4.46 | | 341 |
| 2006 | | 1.00 | | .027 | | (.027) | | 1.00 | | 2.77 | | .60 | | 2.81 | | 208 |
| 2005 | | 1.00 | | .008 | | (.008) | | 1.00 | | .81 | | .60 | | .79 | | 230 |
| 2004 | | 1.00 | | .005 | | (.005) | | 1.00 | | .54 | | .60 | | .51 | | 229 |
| 2003 | | 1.00 | | .012 | | (.012) | | 1.00 | | 1.21 | | .60 | | 1.20 | | 325 |
| |
| See notes to financial statements. | | | | | | | | | | | | | | | | |
| | FINANCIAL HIGHLIGHTS (continued)
|
| | | | | Per Share Data ($) | | | | Ratios/Supplemental Data (%) |
| |
| |
| |
| |
|
| | | | | | | | | | | | | | | Ratio of Net | | |
| | | Net Asset | | | | Dividends | | Net Asset | | | | Ratio of | | Investment | | Net Assets |
| | | Value | | Net | | from Net | | Value | | | | Expenses | | Income to | | End of |
| | | Beginning | | Investment | | Investment | | End | | Total | | to Average | | Average | | Period |
| | | of Period | | Income | | Income | | of Period | | Return (%) | | Net Assets | | Net Assets ($ x1,000,000) |
| |
| |
| |
| |
| |
| |
| |
|
| |
| Dreyfus Treasury Cash Management | | | | | | | | | | | | | | |
| Institutional Shares | | | | | | | | | | | | | | | | |
| Year Ended January 31, | | | | | | | | | | | | | | | | |
| 2007 | | 1.00 | | .048 | | (.048) | | 1.00 | | 4.89 | | .20 | | 4.80 | | 3,429 |
| 2006 | | 1.00 | | .031 | | (.031) | | 1.00 | | 3.10 | | .20 | | 3.08 | | 3,017 |
| 2005 | | 1.00 | | .012 | | (.012) | | 1.00 | | 1.19 | | .20 | | 1.16 | | 2,351 |
| 2004 | | 1.00 | | .009 | | (.009) | | 1.00 | | .93 | | .20 | | .93 | | 3,312 |
| 2003 | | 1.00 | | .016 | | (.016) | | 1.00 | | 1.59 | | .20 | | 1.57 | | 3,397 |
| Investor Shares | | | | | | | | | | | | | | | | |
| Year Ended January 31, | | | | | | | | | | | | | | | | |
| 2007 | | 1.00 | | .045 | | (.045) | | 1.00 | | 4.63 | | .45 | | 4.55 | | 1,471 |
| 2006 | | 1.00 | | .028 | | (.028) | | 1.00 | | 2.84 | | .45 | | 2.83 | | 1,320 |
| 2005 | | 1.00 | | .009 | | (.009) | | 1.00 | | .94 | | .45 | | .91 | | 1,164 |
| 2004 | | 1.00 | | .007 | | (.007) | | 1.00 | | .68 | | .45 | | .68 | | 1,288 |
| 2003 | | 1.00 | | .013 | | (.013) | | 1.00 | | 1.34 | | .45 | | 1.32 | | 999 |
| Administrative Shares | | | | | | | | | | | | | | | | |
| Year Ended January 31, | | | | | | | | | | | | | | | | |
| 2007 | | 1.00 | | .047 | | (.047) | | 1.00 | | 4.79 | | .30 | | 4.70 | | 141 |
| 2006 | | 1.00 | | .030 | | (.030) | | 1.00 | | 3.00 | | .30 | | 2.98 | | 87 |
| 2005 | | 1.00 | | .011 | | (.011) | | 1.00 | | 1.09 | | .30 | | 1.06 | | 49 |
| 2004 | | 1.00 | | .008 | | (.008) | | 1.00 | | .83 | | .30 | | .83 | | 20 |
| 2003 | | 1.00 | | .015 | | (.015) | | 1.00 | | 1.49 | | .30 | | 1.47 | | 23 |
| Participant Shares | | | | | | | | | | | | | | | | |
| Year Ended January 31, | | | | | | | | | | | | | | | | |
| 2007 | | 1.00 | | .044 | | (.044) | | 1.00 | | 4.47 | | .60 | | 4.40 | | 257 |
| 2006 | | 1.00 | | .027 | | (.027) | | 1.00 | | 2.69 | | .60 | | 2.68 | | 219 |
| 2005 | | 1.00 | | .008 | | (.008) | | 1.00 | | .79 | | .60 | | .76 | | 210 |
| 2004 | | 1.00 | | .005 | | (.005) | | 1.00 | | .52 | | .60 | | .53 | | 123 |
| 2003 | | 1.00 | | .012 | | (.012) | | 1.00 | | 1.19 | | .60 | | 1.17 | | 52 |
| |
| See notes to financial statements. | | | | | | | | | | | | | | | | |
58
| | | | | Per Share Data ($) | | | | Ratios/Supplemental Data (%) |
| |
| |
| |
| |
|
| | | | | | | | | | | | | | | Ratio of Net | | |
| | | Net Asset | | | | Dividends | | Net Asset | | | | Ratio of | | Investment | | Net Assets |
| | | Value | | Net | | from Net | | Value | | | | Expenses | | Income to | | End of |
| | | Beginning | | Investment | | Investment | | End | | Total | | to Average | | Average | | Period |
| | | of Period | | Income | | Income | | of Period | | Return (%) | | Net Assets | | Net Assets ($ x1,000,000) |
| |
| |
| |
| |
| |
| |
| |
|
| |
| Dreyfus Treasury Prime Cash Management | | | | | | | | | | | | | | |
| Institutional Shares | | | | | | | | | | | | | | | | |
| Year Ended January 31, | | | | | | | | | | | | | | | | |
| 2007 | | 1.00 | | .046 | | (.046) | | 1.00 | | 4.68 | | .20 | | 4.57 | | 1,043 |
| 2006 | | 1.00 | | .029 | | (.029) | | 1.00 | | 2.96 | | .20 | | 2.93 | | 1,487 |
| 2005 | | 1.00 | | .012 | | (.012) | | 1.00 | | 1.17 | | .20 | | 1.14 | | 1,333 |
| 2004 | | 1.00 | | .009 | | (.009) | | 1.00 | | .92 | | .20 | | .93 | | 1,785 |
| 2003 | | 1.00 | | .016 | | (.016) | | 1.00 | | 1.58 | | .20 | | 1.56 | | 3,291 |
| Investor Shares | | | | | | | | | | | | | | | | |
| Year Ended January 31, | | | | | | | | | | | | | | | | |
| 2007 | | 1.00 | | .043 | | (.043) | | 1.00 | | 4.43 | | .45 | | 4.32 | | 615 |
| 2006 | | 1.00 | | .027 | | (.027) | | 1.00 | | 2.70 | | .45 | | 2.68 | | 651 |
| 2005 | | 1.00 | | .009 | | (.009) | | 1.00 | | .92 | | .45 | | .89 | | 613 |
| 2004 | | 1.00 | | .007 | | (.007) | | 1.00 | | .67 | | .45 | | .68 | | 794 |
| 2003 | | 1.00 | | .013 | | (.013) | | 1.00 | | 1.32 | | .45 | | 1.31 | | 1,261 |
| Administrative Shares | | | | | | | | | | | | | | | | |
| Year Ended January 31, | | | | | | | | | | | | | | | | |
| 2007 | | 1.00 | | .045 | | (.045) | | 1.00 | | 4.59 | | .30 | | 4.47 | | 5 |
| 2006 | | 1.00 | | .028 | | (.028) | | 1.00 | | 2.86 | | .30 | | 2.83 | | 26 |
| 2005 | | 1.00 | | .011 | | (.011) | | 1.00 | | 1.07 | | .30 | | 1.04 | | 39 |
| 2004 | | 1.00 | | .008 | | (.008) | | 1.00 | | .82 | | .30 | | .83 | | 97 |
| 2003 | | 1.00 | | .015 | | (.015) | | 1.00 | | 1.48 | | .30 | | 1.46 | | 205 |
| Participant Shares | | | | | | | | | | | | | | | | |
| Year Ended January 31, | | | | | | | | | | | | | | | | |
| 2007 | | 1.00 | | .042 | | (.042) | | 1.00 | | 4.27 | | .60 | | 4.17 | | 121 |
| 2006 | | 1.00 | | .025 | | (.025) | | 1.00 | | 2.55 | | .60 | | 2.53 | | 352 |
| 2005 | | 1.00 | | .008 | | (.008) | | 1.00 | | .76 | | .60 | | .74 | | 94 |
| 2004 | | 1.00 | | .005 | | (.005) | | 1.00 | | .52 | | .60 | | .53 | | 179 |
| 2003 | | 1.00 | | .012 | | (.012) | | 1.00 | | 1.18 | | .60 | | 1.16 | | 321 |
| |
| See notes to financial statements. | | | | | | | | | | | | | | | | |
| | FINANCIAL HIGHLIGHTS (continued)
|
| | | | | Per Share Data ($) | | | | Ratios/Supplemental Data (%) |
| |
| |
| |
| |
|
| | | | | | | | | | | | | | | Ratio of Net | | |
| | | Net Asset | | | | Dividends | | Net Asset | | | | Ratio of | | Investment | | Net Assets |
| | | Value | | Net | | from Net | | Value | | | | Expenses | | Income to | | End of |
| | | Beginning | | Investment | | Investment | | End | | Total | | to Average | | Average | | Period |
| | | of Period | | Income | | Income | | of Period | | Return (%) | | Net Assets | | Net Assets ($ x1,000,000) |
| |
| |
| |
| |
| |
| |
| |
|
| |
| Dreyfus Municipal Cash Management Plus | | | | | | | | | | | | | | |
| Institutional Shares | | | | | | | | | | | | | | | | |
| Year Ended January 31, | | | | | | | | | | | | | | | | |
| 2007 | | 1.00 | | .033 | | (.033) | | 1.00 | | 3.37 | | .20 | | 3.33 | | 596 |
| 2006 | | 1.00 | | .024 | | (.024) | | 1.00 | | 2.39 | | .20 | | 2.34 | | 638 |
| 2005 | | 1.00 | | .011 | | (.011) | | 1.00 | | 1.13 | | .20 | | 1.07 | | 500 |
| 2004 | | 1.00 | | .009 | | (.009) | | 1.00 | | .93 | | .20 | | .92 | | 722 |
| 2003 | | 1.00 | | .013 | | (.013) | | 1.00 | | 1.33 | | .20 | | 1.31 | | 224 |
| Investor Shares | | | | | | | | | | | | | | | | |
| Year Ended January 31, | | | | | | | | | | | | | | | | |
| 2007 | | 1.00 | | .031 | | (.031) | | 1.00 | | 3.11 | | .45 | | 3.08 | | 206 |
| 2006 | | 1.00 | | .021 | | (.021) | | 1.00 | | 2.13 | | .45 | | 2.09 | | 180 |
| 2005 | | 1.00 | | .009 | | (.009) | | 1.00 | | .88 | | .45 | | .82 | | 105 |
| 2004 | | 1.00 | | .007 | | (.007) | | 1.00 | | .68 | | .45 | | .67 | | 88 |
| 2003 | | 1.00 | | .011 | | (.011) | | 1.00 | | 1.08 | | .45 | | 1.06 | | 92 |
| Administrative Shares | | | | | | | | | | | | | | | | |
| Year Ended January 31, | | | | | | | | | | | | | | | | |
| 2007 | | 1.00 | | .032 | | (.032) | | 1.00 | | 3.27 | | .30 | | 3.23 | | 291 |
| 2006 | | 1.00 | | .023 | | (.023) | | 1.00 | | 2.29 | | .30 | | 2.24 | | 137 |
| 2005 | | 1.00 | | .010 | | (.010) | | 1.00 | | 1.03 | | .30 | | .97 | | 129 |
| 2004 | | 1.00 | | .008 | | (.008) | | 1.00 | | .83 | | .30 | | .82 | | 108 |
| 2003 | | 1.00 | | .012 | | (.012) | | 1.00 | | 1.23 | | .30 | | 1.21 | | 110 |
| Participant Shares | | | | | | | | | | | | | | | | |
| Year Ended January 31, | | | | | | | | | | | | | | | | |
| 2007 | | 1.00 | | .029 | | (.029) | | 1.00 | | 2.96 | | .60 | | 2.93 | | 23 |
| 2006 | | 1.00 | | .020 | | (.020) | | 1.00 | | 1.98 | | .60 | | 1.94 | | 25 |
| 2005 | | 1.00 | | .007 | | (.007) | | 1.00 | | .73 | | .60 | | .67 | | 20 |
| 2004 | | 1.00 | | .005 | | (.005) | | 1.00 | | .52 | | .60 | | .52 | | 19 |
| 2003 | | 1.00 | | .009 | | (.009) | | 1.00 | | .93 | | .60 | | .91 | | 16 |
| |
| See notes to financial statements. | | | | | | | | | | | | | | | | |
60
| | | | | Per Share Data ($) | | | | Ratios/Supplemental Data (%) |
| |
| |
| |
| |
|
| | | | | | | | | | | | | | | Ratio of Net | | |
| | | Net Asset | | | | Dividends | | Net Asset | | | | Ratio of | | Investment | | Net Assets |
| | | Value | | Net | | from Net | | Value | | | | Expenses | | Income to | | End of |
| | | Beginning | | Investment | | Investment | | End | | Total | | to Average | | Average | | Period |
| | | of Period | | Income | | Income | | of Period | | Return (%) | | Net Assets | | Net Assets ($ x1,000,000) |
| |
| |
| |
| |
| |
| |
| |
|
| |
| Dreyfus New York Municipal Cash Management | | | | | | | | | | | | | | |
| Institutional Shares | | | | | | | | | | | | | | | | |
| Year Ended January 31, | | | | | | | | | | | | | | | | |
| 2007 | | 1.00 | | .033 | | (.033) | | 1.00 | | 3.36 | | .20 | | 3.31 | | 377 |
| 2006 | | 1.00 | | .023 | | (.023) | | 1.00 | | 2.36 | | .20 | | 2.33 | | 343 |
| 2005 | | 1.00 | | .011 | | (.011) | | 1.00 | | 1.10 | | .20 | | 1.12 | | 336 |
| 2004 | | 1.00 | | .009 | | (.009) | | 1.00 | | .88 | | .20 | | .89 | | 308 |
| 2003 | | 1.00 | | .013 | | (.013) | | 1.00 | | 1.26 | | .20 | | 1.25 | | 417 |
| Investor Shares | | | | | | | | | | | | | | | | |
| Year Ended January 31, | | | | | | | | | | | | | | | | |
| 2007 | | 1.00 | | .031 | | (.031) | | 1.00 | | 3.10 | | .45 | | 3.06 | | 120 |
| 2006 | | 1.00 | | .021 | | (.021) | | 1.00 | | 2.11 | | .45 | | 2.08 | | 125 |
| 2005 | | 1.00 | | .008 | | (.008) | | 1.00 | | .85 | | .45 | | .87 | | 71 |
| 2004 | | 1.00 | | .006 | | (.006) | | 1.00 | | .63 | | .45 | | .64 | | 28 |
| 2003 | | 1.00 | | .010 | | (.010) | | 1.00 | | 1.01 | | .45 | | 1.00 | | 21 |
| Administrative Shares | | | | | | | | | | | | | | | | |
| Year Ended January 31, | | | | | | | | | | | | | | | | |
| 2007 | | 1.00 | | .032 | | (.032) | | 1.00 | | 3.25 | | .30 | | 3.21 | | 36 |
| 2006 | | 1.00 | | .022 | | (.022) | | 1.00 | | 2.26 | | .30 | | 2.23 | | 8 |
| 2005 | | 1.00 | | .010 | | (.010) | | 1.00 | | 1.00 | | .30 | | 1.02 | | 1 |
| 2004 | | 1.00 | | .008 | | (.008) | | 1.00 | | .79 | | .30 | | .79 | | —a |
| 2003 | | 1.00 | | .011 | | (.011) | | 1.00 | | 1.15 | | .30 | | 1.15 | | 6 |
| Participant Shares | | | | | | | | | | | | | | | | |
| Year Ended January 31, | | | | | | | | | | | | | | | | |
| 2007 | | 1.00 | | .029 | | (.029) | | 1.00 | | 2.94 | | .60 | | 2.91 | | 40 |
| 2006 | | 1.00 | | .019 | | (.019) | | 1.00 | | 1.95 | | .60 | | 1.93 | | 3 |
| 2005 | | 1.00 | | .007 | | (.007) | | 1.00 | | .70 | | .60 | | .72 | | 6 |
| 2004 | | 1.00 | | .005 | | (.005) | | 1.00 | | .48 | | .60 | | .49 | | 2 |
| 2003 | | 1.00 | | .009 | | (.009) | | 1.00 | | .86 | | .60 | | .85 | | 2 |
| |
| a Amount represents less than $1 million. | | | | | | | | | | | | | | |
| See notes to financial statements. | | | | | | | | | | | | | | | | |
| | FINANCIAL HIGHLIGHTS (continued)
|
| | | | | Per Share Data ($) | | | | Ratios/Supplemental Data (%) |
| |
| |
| |
| |
|
| | | | | | | | | | | | | | | Ratio of Net | | |
| | | Net Asset | | | | Dividends | | Net Asset | | | | Ratio of | | Investment | | Net Assets |
| | | Value | | Net | | from Net | | Value | | | | Expenses | | Income to | | End of |
| | | Beginning | | Investment | | Investment | | End | | Total | | to Average | | Average | | Period |
| | | of Period | | Income | | Income | | of Period | | Return (%) | | Net Assets | | Net Assets ($ x1,000,000) |
| |
| |
| |
| |
| |
| |
| |
|
| |
| Dreyfus Tax Exempt Cash Management | | | | | | | | | | | | | | |
| Institutional Shares | | | | | | | | | | | | | | | | |
| Year Ended January 31, | | | | | | | | | | | | | | | | |
| 2007 | | 1.00 | | .033 | | (.033) | | 1.00 | | 3.34 | | .20 | | 3.29 | | 2,333 |
| 2006 | | 1.00 | | .023 | | (.023) | | 1.00 | | 2.36 | | .20 | | 2.35 | | 2,645 |
| 2005 | | 1.00 | | .011 | | (.011) | | 1.00 | | 1.12 | | .20 | | 1.14 | | 2,510 |
| 2004 | | 1.00 | | .009 | | (.009) | | 1.00 | | .90 | | .20 | | .89 | | 1,934 |
| 2003 | | 1.00 | | .013 | | (.013) | | 1.00 | | 1.29 | | .20 | | 1.28 | | 2,073 |
| Investor Shares | | | | | | | | | | | | | | | | |
| Year Ended January 31, | | | | | | | | | | | | | | | | |
| 2007 | | 1.00 | | .030 | | (.030) | | 1.00 | | 3.08 | | .45 | | 3.04 | | 288 |
| 2006 | | 1.00 | | .021 | | (.021) | | 1.00 | | 2.11 | | .45 | | 2.10 | | 255 |
| 2005 | | 1.00 | | .009 | | (.009) | | 1.00 | | .87 | | .45 | | .89 | | 240 |
| 2004 | | 1.00 | | .006 | | (.006) | | 1.00 | | .65 | | .45 | | .64 | | 122 |
| 2003 | | 1.00 | | .010 | | (.010) | | 1.00 | | 1.04 | | .45 | | 1.03 | | 119 |
| Administrative Shares | | | | | | | | | | | | | | | | |
| Year Ended January 31, | | | | | | | | | | | | | | | | |
| 2007 | | 1.00 | | .032 | | (.032) | | 1.00 | | 3.24 | | .30 | | 3.19 | | 213 |
| 2006 | | 1.00 | | .022 | | (.022) | | 1.00 | | 2.26 | | .30 | | 2.25 | | 105 |
| 2005 | | 1.00 | | .010 | | (.010) | | 1.00 | | 1.02 | | .30 | | 1.04 | | 275 |
| 2004 | | 1.00 | | .008 | | (.008) | | 1.00 | | .80 | | .30 | | .79 | | 312 |
| 2003 | | 1.00 | | .012 | | (.012) | | 1.00 | | 1.19 | | .30 | | 1.18 | | 185 |
| Participant Shares | | | | | | | | | | | | | | | | |
| Year Ended January 31, | | | | | | | | | | | | | | | | |
| 2007 | | 1.00 | | .029 | | (.029) | | 1.00 | | 2.93 | | .60 | | 2.89 | | 30 |
| 2006 | | 1.00 | | .019 | | (.019) | | 1.00 | | 1.96 | | .60 | | 1.95 | | 42 |
| 2005 | | 1.00 | | .007 | | (.007) | | 1.00 | | .72 | | .60 | | .74 | | 19 |
| 2004 | | 1.00 | | .005 | | (.005) | | 1.00 | | .50 | | .60 | | .49 | | 46 |
| 2003 | | 1.00 | | .009 | | (.009) | | 1.00 | | .89 | | .60 | | .88 | | 139 |
| |
| See notes to financial statements. | | | | | | | | | | | | | | | | |
62
NOTES TO FINANCIAL STATEMENTS
NOTE 1—Significant Accounting Policies:
Dreyfus Cash Management,Dreyfus Cash Management Plus, Inc., Dreyfus Government Cash Management, Dreyfus Government Prime Cash Management, Dreyfus Treasury Cash Management, Dreyfus Treasury Prime Cash Management, Dreyfus Municipal Cash Management Plus, Dreyfus New York Municipal Cash Management and Dreyfus Tax Exempt Cash Management, (each, a “fund” and collectively, the “funds”) are open-end management investment companies registered under the Investment Company Act of 1940, as amended (the “Act”). Each fund, other than Dreyfus New York Municipal Cash Management, is diversified. Dreyfus New York Municipal Cash Management is non-diversified. Dreyfus Government Cash Management and Dreyfus Government Prime Cash Management are each a separate series of Dreyfus Government Cash Management Funds (the “Company”) which currently offers two series. Each fund’s investment objective is to provide investors with as high a level of current income as is consistent with the preservation of capital and the maintenance of liquidity and, in the case of Dreyfus Municipal Cash Management Plus and Dreyfus Tax Exempt Cash Management only, which is exempt from federal income tax, and, in the case of Dreyfus New York Municipal Cash Management only, which is exempt from federal, New York state and New York city personal income taxes. The Dreyfus Corporation (the “Manager” or “Dreyfus”) serves as each fund’s investment adviser. The Manager is a wholly-owned subsidiary of Mellon Financial Corporation (“Mellon Financial”).
On December 4, 2006, Mellon Financial and The Bank of New York Company, Inc. announced that they had entered into a definitive agreement to merge.The new company will be called The Bank of New York Mellon Corporation. As part of this transaction, Dreyfus would become a wholly-owned subsidiary of The Bank of New York Mellon Corporation.The transaction is subject to certain regulatory approvals and the approval of The Bank of New York Company, Inc.’s and Mellon Financial’s shareholders, as well as other customary conditions to closing. Subject to such approvals and the satisfaction of the other conditions, Mellon Financial and The Bank of New York Company, Inc. expect the transaction to be completed in the third quarter of 2007.
Dreyfus Service Corporation (the “Distributor”), a wholly-owned subsidiary of the Manager, is the distributor of the funds’ shares, which are sold to the public without a sales charge. Each fund offers the following classes of shares: Institutional Shares, Investor Shares, Administrative Shares and Participant Shares. Investor Shares, Administrative Shares and Participant Shares are subject to a Service Plan adopted pursuant to Rule 12b-1 under the Act. Other differences between the classes include the services offered to and the expenses borne by each class and certain voting rights. Income, expenses (other than expenses attributable to a specific class), and realized and unrealized gains or losses on investments are allocated to each class of shares based on its relative net assets.
It is each fund’s policy to maintain a continuous net asset value per share of $1.00; each fund has adopted certain investment, portfolio valuation and dividend and distribution policies to enable it to do so. There is no assurance, however, that any fund will be able to maintain a stable net asset value per share of $1.00.
Each fund’s financial statements are prepared in accordance with U.S. generally accepted accounting principles, which may require the use of management estimates and assumptions. Actual results could differ from those estimates.
The funds enter into contracts that contain a variety of indemnifications. The funds’ maximum exposure under these arrangements is unknown. The funds do not anticipate recognizing any loss related to these arrangements.
(a) Portfolio valuation: Investments in securities are valued at amortized cost in accordance with Rule 2a-7 of the Act, which has been determined by the Board members to represent the fair value of each fund’s investments.
On September 20, 2006, the Financial Accounting Standards Board (FASB) released Statement of Financial Accounting Standards No. 157 “Fair Value Measurements” (“FAS 157”). FAS 157 establishes an authoritative definition of fair value, sets out a framework for measuring fair value, and requires additional disclosures about fair-value measurements. The application of FAS 157 is required for fiscal years beginning after November 15, 2007 and interim periods within those fiscal years. Management does not
NOTES TO FINANCIAL STATEMENTS (continued)
believe that the application of this standard will have a material impact on the financial statements of the fund.
(b) Securities transactions and investment income:
Securities transactions are recorded on a trade date basis. Realized gain and loss from securities transactions are recorded on the identified cost basis. Interest income, adjusted for accretion of discount and amortization of premium on investments, is earned from settlement date and recognized on the accrual basis. Cost of investments represents amortized cost.
Dreyfus New York Municipal Cash Management follows an investment policy of investing primarily in municipal obligations of one state. Economic changes affecting the state and certain of its public bodies and municipalities may affect the ability of issuers within the state to pay interest on, or repay principal of, municipal obligations held by the fund.
Dreyfus Cash Management, Dreyfus Cash Management Plus, Inc., Dreyfus Government Cash Management and Dreyfus Treasury Cash Management may enter into repurchase agreements with financial institutions, deemed to be creditworthy by the Manager, subject to the seller’s agreement to repurchase and the fund’s agreement to resell such securities at a mutually agreed upon price. Securities purchased subject to repurchase agreements are deposited with the funds’ custodians and, pursuant to the terms of the repurchase agreement, must have an aggregate market value greater than or equal to the repurchase price plus accrued interest at all times. If the value of the underlying securities falls below the value of the repurchase price plus accrued interest, the fund will require the seller to deposit additional collateral by the next business day. If the request for additional collateral is not met, or the seller defaults on its repurchase obligation, the fund maintains the right to sell the underlying securities at market value and may claim any resulting loss against the seller.
(c) Expenses: With regards to the Company, expenses directly attributable to each series are charged to that series’ operations; expenses which are applicable to both series are allocated between them.
(d) Dividends to shareholders: It is the policy of each fund to declare dividends from investment income-net on each business day. Such dividends are paid monthly. Dividends from net realized capital gain, if any, are normally declared and paid annually, but each fund may make distributions on a more frequent basis to comply with the distribution requirements of the Internal Revenue Code of 1986, as amended (the “Code”).To the extent that net realized capital gain can be offset by capital loss carryovers, it is the policy of each fund not to distribute such gain.
(e) Federal income taxes: It is the policy of each fund (except for Dreyfus Municipal Cash Management Plus, Dreyfus New York Municipal Cash Management and Dreyfus Tax Exempt Cash Management) to continue to qualify as a regulated investment company, if such qualification is in the best interests of its shareholders, by complying with the applicable provisions of the Code and to make distributions of taxable income sufficient to relieve it from substantially all federal income and excise taxes.
It is the policy of Dreyfus Municipal Cash Management Plus, Dreyfus New York Municipal Cash Management and Dreyfus Tax Exempt Cash Management to continue to qualify as a regulated investment company, which can distribute tax exempt dividends, by complying with the applicable provisions of the Code and to make distributions of income sufficient to relieve it from substantially all federal income and excise taxes.
On July 13, 2006, the FASB released FASB Interpretation No. 48, “Accounting for Uncertainty in Income Taxes” (FIN 48). FIN 48 provides guidance for how uncertain tax positions should be recognized, measured, presented and disclosed in the financial statements. FIN 48 requires the evaluation of tax positions taken or expected to be taken in the course of preparing the portfolio’s tax returns to determine whether the tax positions are “more-likely-than-not” of being sustained by the applicable tax authority.Tax positions not deemed to meet the more-likely-than-not threshold would be recorded as a tax benefit or expense in the current year.Adoption of FIN 48 is required for fiscal years
64
beginning after December 15, 2006 and is to be applied to all open tax years as of the effective date. Management does not believe that the application of this standard will have a material impact on the financial statements of the fund.
At January 31, 2007, the components of accumulated earnings on a tax basis were substantially the same as for financial reporting purposes.
Table 1 summarizes each fund’s accumulated capital loss carryover available to be applied against future net securities profits, if any, realized subsequent to January 31, 2007.
The tax character of each fund’s distributions paid to shareholders (except for Dreyfus Municipal Cash Management Plus, Dreyfus New York Municipal Cash Management and Dreyfus Tax Exempt Cash Management) during the fiscal periods ended January 31, 2007 and January 31, 2006, were all ordinary income.
The tax character of distributions paid to shareholders of Dreyfus Municipal Cash Management Plus, Dreyfus New York Municipal Cash Management and Dreyfus Tax Exempt Cash Management during the fiscal periods ended January 31, 2007 and January 31, 2006, were all tax exempt income.
During the period ended January 31, 2007, as a result of permanent book to tax differences, primarily due to dividend reclassification, Dreyfus New York Municipal Cash Management increased accumulated undistributed investment income-net by $4,000 and decreased accumulated net realized gain (loss) on investments by the same amount. Net assets were not affected by this reclassification.
At January 31, 2007, the cost of investments for federal income tax purposes was substantially the same as the cost for financial reporting purposes (see the Statements of Investments).
NOTE 2—Management Fee and Other Transactions with Affiliates:
(a) Pursuant to separate management agreements with the Manager, the management fee of each fund is computed at the annual rate of .20% of the value of such fund’s average daily net assets and is payable monthly.
As to each fund, unless the Manager gives a fund’s investors 90 days notice to the contrary, the Manager, and not the fund, will be liable for fund expenses (exclusive of taxes, brokerage fees, interest on borrowings and extraordinary expenses) other than the following expenses, which will be borne by the fund: the management fee, and with respect to the fund’s Investor Shares, Administrative Shares and Participant Shares, Rule 12b-1 Service Plan expenses.
(b) Under each fund’s Service Plan (the “Plan”) adopted pursuant to Rule 12b-1 under the Act, relating to its Investor Shares, Administrative Shares and Participant Shares, each fund pays the Distributor for distributing such classes of shares, for advertising and marketing relating to such classes of shares, for providing certain services relating to shareholder accounts in such classes of shares, such as answering shareholder inquiries regarding the fund and providing reports and other information and services
| Table 1. | | | | | | | | | | | | | | |
| |
| |
| |
| |
| |
| |
| |
|
| |
| | | | | | | Expiring in fiscal: | | ($ x 1,000) | | |
| | | 2009† | | 2011† | | 2012† | | 2013† | | 2014† | | 2015† | | Total |
| Dreyfus Cash Management | | — | | — | | — | | 18 | | 1,538 | | — | | 1,556 |
| Dreyfus Cash Management Plus, Inc. | | — | | — | | — | | 562 | | 7,999 | | — | | 8,561 |
| Dreyfus Government Cash Management | | — | | — | | 172 | | — | | 2,628 | | 37 | | 2,837 |
| Dreyfus Government Prime Cash Management | | — | | — | | — | | 1 | | — | | 1 | | 2 |
| Dreyfus Treasury Cash Management | | — | | — | | — | | 13 | | 39 | | 44 | | 96 |
| Dreyfus Treasury Prime Cash Management | | 61 | | — | | 70 | | 107 | | 65 | | 323 | | 626 |
| |
| † If not applied, the carryovers expire in the above years. | | | | | | | | | | | | | | |
| | NOTES TO FINANCIAL STATEMENTS (continued)
|
related to the maintenance of shareholder accounts (“Servicing”), at an aggregate annual rate of .25%, .10% and .40% of the value of the average daily net assets of Investor Shares,Administrative Shares and Participant Shares, respec-tively.The Distributor may pay one or more Service Agents (a securities dealer, financial institution or other industry professional) a fee in respect of a fund’s, Investor Shares, Administrative Shares and Participant Shares owned by shareholders with whom the Service Agent has a Servicing relationship or for whom the Service Agent is the dealer or holder of record.The Distributor determines the amounts, if any, to be paid to Service Agents under the Plan and the basis on which such payments are made. The fees payable under each Plan are payable without regard to actual expenses incurred. Table 2 summarizes the amount each fund was charged pursuant to the Plan during the period ended January 31, 2007.
Table 3 summarizes the components of Due to The Dreyfus Corporation and affiliates in the Statements of Assets and Liabilities for each fund.
(c) Each fund (except for Dreyfus New York Municipal Cash Management) pays its Board members an annual fee of $3,000 and an attendance fee of $500 per meeting. Dreyfus New York Municipal Cash Management pays its Board members an annual fee of $1,000 and an attendance fee of $500 per meet-ing.These amounts are borne by the Manager as to each fund pursuant to the undertakings in effect. See Note 2(a).
NOTE 3—Capital Share Transactions:
Each fund (except for Dreyfus Cash Management Plus, Inc.) is authorized to issue an unlimited number of $.001 par value shares of Beneficial Interest. Dreyfus Cash Management Plus, Inc. is authorized to issue 90 billion shares of $.001 par value Common Stock.
| Table 2. | | | | | | | | |
| |
| |
| |
| |
|
| |
| | | Investor | | Administrative | | Participant |
| | | Shares ($) | | | | Shares ($) | | Shares ($) |
| |
| |
| |
| |
|
| Dreyfus Cash Management | | 3,069,220 | | | | 300,946 | | 867,057 |
| Dreyfus Cash Management Plus, Inc. | | 3,348,496 | | | | 1,015,466 | | 2,945,818 |
| Dreyfus Government Cash Management | | 2,286,514 | | | | 275,393 | | 994,497 |
| Dreyfus Government Prime Cash Management | | 624,803 | | | | 196,529 | | 1,220,827 |
| Dreyfus Treasury Cash Management | | 3,455,019 | | | | 93,248 | | 895,112 |
| Dreyfus Treasury Prime Cash Management | | 1,526,368 | | | | 10,338 | | 611,509 |
| Dreyfus Municipal Cash Management Plus | | 424,865 | | | | 192,387 | | 102,175 |
| Dreyfus New York Municipal Cash Management | | 323,445 | | | | 32,160 | | 27,568 |
| Dreyfus Tax Exempt Cash Management | | 674,731 | | | | 138,522 | | 131,444 |
| |
| |
| Table 3. | | | | | | | | |
| |
| |
| |
| |
|
| |
| | | | | Management | | | | |
| | | | | Fees ($) | | Distribution Fees ($) |
| |
| |
| |
|
| Dreyfus Cash Management | | | | 2,337,530 | | | | 422,045 |
| Dreyfus Cash Management Plus, Inc. | | | | 1,560,381 | | | | 809,196 |
| Dreyfus Government Cash Management | | | | 678,513 | | | | 302,534 |
| Dreyfus Government Prime Cash Management | | | | 312,694 | | | | 194,674 |
| Dreyfus Treasury Cash Management | | | | 831,952 | | | | 421,360 |
| Dreyfus Treasury Prime Cash Management | | | | 242,804 | | | | 179,924 |
| Dreyfus Municipal Cash Management Plus | | | | 187,862 | | | | 78,901 |
| Dreyfus New York Municipal Cash Management | | | | 69,804 | | | | 42,968 |
| Dreyfus Tax Exempt Cash Management | | | | 409,491 | | | | 83,762 |
66
REPORT OF INDEPENDENT REGISTERED PUBLIC ACCOUNTING FIRM
Shareholders and Board of Trustees/Directors
Dreyfus Cash Management
Dreyfus Cash Management Plus, Inc. Dreyfus Government Cash Management Dreyfus Government Prime Cash Management Dreyfus Treasury Cash Management Dreyfus Treasury Prime Cash Management Dreyfus Municipal Cash Management Plus Dreyfus New York Municipal Cash Management Dreyfus Tax Exempt Cash Management
We have audited the accompanying statements of assets and liabilities, including the statements of investments, of Dreyfus Cash Management, Dreyfus Cash Management Plus, Inc., Dreyfus Government Cash Management, Dreyfus Government Prime Cash Management, Dreyfus Treasury Cash Management, Dreyfus Treasury Prime Cash Management, Dreyfus Municipal Cash Management Plus, Dreyfus New York Municipal Cash Management and Dreyfus Tax Exempt Cash Management (the “Funds”) as of January 31, 2007, and the related statements of operations for the year then ended, the statements of changes in net assets for each of the two years in the period then ended, and financial highlights for each of the years indicated therein. These financial statements and financial highlights are the responsibility of the Funds management. Our responsibility is to express an opinion on these financial statements and financial highlights based on our audits.
We conducted our audits in accordance with the standards of the Public Company Accounting Oversight Board (United States). Those standards require that we plan and perform the audit to obtain reasonable assurance about whether the financial statements and financial highlights are free of material misstatement.We were not engaged to perform an audit of the Funds internal control over financial reporting. Our audits included consideration of internal control over financial reporting as a basis for designing audit procedures that are appropriate in the circumstances, but not for the purpose of expressing an opinion on the effectiveness of the Funds internal control over financial report-ing.Accordingly, we express no such opinion.An audit also includes examining, on a test basis, evidence supporting the amounts and disclosures in the financial statements and financial highlights, assessing the accounting principles used and significant estimates made by management, and evaluating the overall financial statement presentation. Our procedures included confirmation of securities owned as of January 31, 2007 by correspondence with the custodian and others or by other appropriate auditing procedures where replies from others were not received. We believe that our audits provide a reasonable basis for our opinion.
In our opinion, the financial statements and financial highlights referred to above present fairly, in all material respects, the financial position of each of the funds referred to above at January 31, 2007, the results of their operations for the year then ended, the changes in their net assets for each of the two years in the period then ended, and the financial highlights for each of the indicated years, in conformity with U.S. generally accepted accounting principles.
IMPORTANT TAX INFORMATION (Unaudited)
In accordance with federal tax law, Dreyfus Tax Exempt Cash Management, Dreyfus Municipal Cash Management Plus and Dreyfus New York Municipal Cash Management hereby makes the following designations regarding the dividends paid from investment income-net during their fiscal year ended January 31, 2007:
As required by federal tax law rules, shareholders will receive notification of their portion of the funds’ exempt-interest dividends paid for the 2007 calendar year on Form 1099–INT, which will be mailed by January 31, 2008.
For State individual income tax purposes Dreyfus Government Prime Cash Management and Dreyfus Treasury Prime Cash Management hereby designate the following
percentage of ordinary dividends paid during the fiscal year ended January 31, 2007 as attributable to interest income from direct obligations of the United States. Such dividends are currently exempt from taxation for income tax purposes in most states, including New York, California and the District of Columbia:
| Dreyfus Government Prime | | |
| Cash Management | | 100.00% |
| Dreyfus Treasury Prime | | |
| Cash Management | | 100.00% |
The funds below designate the following percentage of ordianry income dividends paid during the fiscal year ended January 31, 2007 as qualifying “interest related dividends”:
| Dreyfus Cash Management | | 88.51% |
| Dreyfus Government Cash Management | | 100.00% |
| Dreyfus Government Prime | | |
| Cash Management | | 100.00% |
| Dreyfus Treasury Cash Management | | 100.00% |
| Dreyfus Cash Management Plus, Inc | | 84.63% |
| Dreyfus Treasury Prime Cash Management | | 100.00% |
68
BOARD MEMBERS INFORMATION (Unaudited)
| Joseph S. DiMartino (63) |
| Chairman of the Board (1995) |
| Principal Occupation During Past 5 Years: |
| • Corporate Director and Trustee |
Other Board Memberships and Affiliations:
- The Muscular Dystrophy Association, Director
- Century Business Services, Inc., a provider of outsourcing functions for small and medium size companies, Director
- The Newark Group, a provider of a national market of paper recovery facilities, paperboard mills and paperboard converting plants, Director
- Sunair Services Corporation, engaging the design, manufacture and sale of high frequency systems for long-range voice and data communications, as well as providing certain outdoor-related services to homes and businesses, Director
No. of Portfolios for which Board Member Serves: 190
———————
| David W. Burke (70) |
| Board Member (1994) |
| Principal Occupation During Past 5 Years: |
| • Corporate Director and Trustee. |
Other Board Memberships and Affiliations:
- John F. Kennedy Library Foundation, Director
- U.S.S. Constitution Museum, Director
No. of Portfolios for which Board Member Serves: 81
———————
| Isabel Dunst (59) |
| Board Member (1991) |
| Principal Occupation During Past 5 Years: |
| • Partner, Hogan & Hartson |
| Other Board Memberships and Affiliations: |
| • Union of Reform Judaism, a religious organization,Trustee |
No. of Portfolios for which Board Member Serves: 9
| Warren B. Rudman (76) |
| Board Member (1993) |
Principal Occupation During Past 5 Years:
- Of Counsel to (from January 1993 to December 31, 2003, Partner in) the law firm Paul,Weiss, Rifkind,Wharton & Garrison, LLP
Other Board Memberships and Affiliations:
- Collins & Aikman Corporation, Director
- Allied Waste Corporation, Director
- Raytheon Company, Director
- Boston Scientific, Director
No. of Portfolios for which Board Member Serves: 41
———————
| Benaree Pratt Wiley (60) |
| Board Member (2007) |
Principal Occupation During Past 5 Years:
- Principal,The Wiley Group, a firm specializing in strategy and business development (2005-present)
- President and CEO,The Partnership, an organization dedicated to increasing the representation of African Americans in positions of leadership, influence and decision-making in Boston, MA (1991-2005)
Other Board Memberships and Affiliations:
- Boston College,Trustee
- Blue Cross Blue Shield of Massachusetts, Director
- Commonwealth Institute, Director
- Efficacy Institute, Director
- PepsiCo African-American,Advisory Board
- The Boston Foundation, Director
- Harvard Business School Alumni Board, Director
No. of Portfolios for which Board Member Serves: 36
———————
Once elected all Board Members serve for an indefinite term, but achieve Emeritus status upon reaching age 80.The address of the Board Members and Officers is in c/o The Dreyfus Corporation, 200 Park Avenue, New York, New York 10166. Additional information about the Board Members is available in the fund’s Statement of Additional Information which can be obtained from Dreyfus free of charge by calling this toll free number: 1-800-554-4611.
Lyle Gramley, Emeritus Board Member
OFFICERS OF THE FUNDS (Unaudited)
| J. DAVID OFFICER, President since December 2006. | | JOSEPH M. CHIOFFI, Vice President and Assistant Secretary |
| Chief Operating Officer,Vice Chairman and a director of the Manager, | | since August 2005. |
| and an officer of 90 investment companies (comprised of 190 portfolios) | | Associate General Counsel of the Manager, and an officer of 91 |
| managed by the Manager. He is 58 years old and has been an employee | | investment companies (comprised of 206 portfolios) managed by the |
| of the Manager since April 1, 1998. | | Manager. He is 45 years old and has been an employee of the Manager |
| |
| CHARLES CARDONA, Executive Vice President | | since June 2000. |
| since November 2001. | | JANETTE E. FARRAGHER, Vice President and Assistant |
| Vice Chairman and a Director of the Manager, Executive Vice President | | Secretary since August 2005. |
| of the Distributor, President of Dreyfus Institutional Services Division, | | Associate General Counsel of the Manager, and an officer of 91 |
| and an officer of 12 investment companies (comprised of 16 portfolios) | | investment companies (comprised of 206 portfolios) managed by the |
| managed by the Manager. He is 51 years old and has been an employee | | Manager. She is 44 years old and has been an employee of the Manager |
| of the Manager since February 1981 | | since February 1984. |
| |
| MARK N. JACOBS, Vice President since March 2000. | | JOHN B. HAMMALIAN, Vice President and Assistant Secretary |
| Executive Vice President, Secretary and General Counsel of the Manager, | | since August 2005. |
| and an officer of 91 investment companies (comprised of 206 portfolios) | | Associate General Counsel of the Manager, and an officer of 91 |
| managed by the Manager. He is 60 years old and has been an employee | | investment companies (comprised of 206 portfolios) managed by the |
| of the Manager since June 1977. | | Manager. He is 43 years old and has been an employee of the Manager |
| |
| MICHAEL A. ROSENBERG, Vice President and Secretary since | | since February 1991. |
| August 2005. | | ROBERT R. MULLERY, Vice President and Assistant Secretary |
| Associate General Counsel of the Manager, and an officer of 91 | | since August 2005. |
| investment companies (comprised of 206 portfolios) managed by the | | Associate General Counsel of the Manager, and an officer of 91 |
| Manager. He is 46 years old and has been an employee of the Manager | | investment companies (comprised of 206 portfolios) managed by the |
| since October 1991. | | Manager. He is 55 years old and has been an employee of the Manager |
| |
| JAMES BITETTO, Vice President and Assistant Secretary since | | since May 1986. |
| August 2005. | | JEFF PRUSNOFSKY, Vice President and Assistant Secretary |
| Associate General Counsel and Assistant Secretary of the Manager, and an | | since August 2005. |
| officer of 91 investment companies (comprised of 206 portfolios) | | Associate General Counsel of the Manager, and an officer of 91 |
| managed by the Manager. He is 40 years old and has been an employee | | investment companies (comprised of 206 portfolios) managed by the |
| of the Manager since December 1996. | | Manager. He is 41 years old and has been an employee of the Manager |
| |
| JONI LACKS CHARATAN, Vice President and Assistant | | since October 1990. |
| Secretary since August 2005. | | JAMES WINDELS, Treasurer since November 2001. |
| Associate General Counsel of the Manager, and an officer of 91 | | Director-Mutual Fund Accounting of the Manager, and an officer of 91 |
| investment companies (comprised of 206 portfolios) managed by the | | investment companies (comprised of 206 portfolios) managed by the |
| Manager. She is 51 years old and has been an employee of the Manager | | Manager. He is 48 years old and has been an employee of the Manager |
| since October 1988. | | since April 1985. |
| ERIK D. NAVILOFF, Assistant Treasurer since August 2005. | | JOSEPH W. CONNOLLY, Chief Compliance Officer since October |
| Senior Accounting Manager - Taxable Fixed Income Funds of the | | 2004. |
| Manager, and an officer of 91 investment companies (comprised of 206 | | Chief Compliance Officer of the Manager and The Dreyfus Family of |
| portfolios) managed by the Manager. He is 38 years old and has been an | | Funds (91 investment companies, comprised of 206 portfolios). From |
| employee of the Manager since November 1992. | | November 2001 through March 2004, Mr. Connolly was first Vice- |
| |
| ROBERT ROBOL, Assistant Treasurer since August 2003. | | President, Mutual Fund Servicing for Mellon Global Securities Services. |
| | | In that capacity, Mr. Connolly was responsible for managing Mellon’s |
| Senior Accounting Manager — Money Market and Municipal Bond | | Custody, Fund Accounting and Fund Administration services to third- |
| Funds of the Manager, and an officer of 91 investment companies | | party mutual fund clients. He is 49 years old and has served in various |
| (comprised of 206 portfolios) managed by the Manager. He is 42 years | | capacities with the Manager since 1980, including manager of the firm’s |
| old and has been an employee of the Manager since October 1988. | | Fund Accounting Department from 1997 through October 2001. |
| |
| ROBERT SVAGNA, Assistant Treasurer since December 2005. | | WILLIAM GERMENIS, Anti-Money Laundering Compliance |
| Senior Accounting Manager - Equity Funds of the Manager, and an | | Officer since October 2002. |
| officer of 91 investment companies (comprised of 206 portfolios) | | Vice President and Anti-Money Laundering Compliance Officer of the |
| managed by the Manager. He is 39 years old and has been an employee | | Distributor, and the Anti-Money Laundering Compliance Officer of 87 |
| of the Manager since November 1990. | | investment companies (comprised of 202 portfolios) managed by the |
| GAVIN C. REILLY, Assistant Treasurer since December 2005. | | Manager. He is 36 years old and has been an employee of the Distributor |
| | | since October 1998. |
| Tax Manager of the Investment Accounting and Support Department of | | |
| the Manager, and an officer of 91 investment companies (comprised of | | |
| 206 portfolios) managed by the Manager. He is 38 years old and has been | | |
| an employee of the Manager since April 1991. | | |
The Funds 71
For More Information
| Dreyfus Cash Management Funds | | Transfer Agent & |
| 200 Park Avenue | | Dividend Disbursing Agent |
| New York, NY 10166 | | Dreyfus Transfer, Inc. |
| Manager | | 200 Park Avenue |
| | | New York, NY 10166 |
| The Dreyfus Corporation | | |
| 200 Park Avenue | | Distributor |
| New York, NY 10166 | | Dreyfus Service Corporation |
| Custodian | | 200 Park Avenue |
| | | New York, NY 10166 |
| The Bank of New York | | |
| One Wall Street | | |
| New York, NY 10286 | | |
| Ticker Symbols: | | | | | | | | |
| Dreyfus Cash Management | | Institutional: DICXX | | Investor: DVCXX | | Administrative: DACXX | | Participant: DPCXX |
| Dreyfus Cash Management Plus, Inc. | | Institutional: DCIXX | | Investor: DCVXX | | Administrative: DCAXX | | Participant: DCPXX |
| Dreyfus Government Cash Management | | Institutional: DGCXX | | Investor: DGVXX | | Administrative: DAGXX | | Participant: DPGXX |
| Dreyfus Government Prime Cash Management | | Institutional: DIPXX | | Investor: DVPXX | | Administrative: DAPXX | | Participant: DGPXX |
| Dreyfus Municipal Cash Management Plus | | Institutional: DIMXX | | Investor: DVMXX | | Administrative: DAMXX | | Participant: DMPXX |
| Dreyfus New York Municipal Cash Management | | Institutional: DIYXX | | Investor: DVYXX | | Administrative: DAYXX | | Participant: DPYXX |
| Dreyfus Tax Exempt Cash Management | | Institutional: DEIXX | | Investor: DEVXX | | Administrative: DEAXX | | Participant: DEPXX |
| Dreyfus Treasury Cash Management | | Institutional: DTRXX | | Investor: DTVXX | | Administrative: DTAXX | | Participant: DTPXX |
| Dreyfus Treasury Prime Cash Management | | Institutional: DIRXX | | Investor: DVRXX | | Administrative: DARXX | | Participant: DPRXX |
Telephone Call your Dreyfus Investments Division representative or 1-800-346-3621
E-mail Access Dreyfus Investments Division at www.dreyfus.com.
You can obtain product information and E-mail requests for information or literature.
Mail Dreyfus Investments Division, 144 Glenn Curtiss Boulevard, Uniondale, NY 11556-0144
Each fund files its complete schedule of portfolio holdings with the Securities and Exchange Commission (“SEC”) for the first and third quarters of each fiscal year on Form N-Q. Each fund’s Forms N-Q are available on the SEC’s website at http://www.sec.gov and may be reviewed and copied at the SEC’s Public Reference Room in Washington, DC. Information on the operation of the Public Reference Room may be obtained by calling 1-202-551-8090.
Information regarding how each fund voted proxies relating to portfolio securities for the 12-month period ended June 30, 2006, is available on the SEC’s website at http://www.sec.gov and without charge, upon request, by calling 1-800-645-6561.
© 2007 Dreyfus Service Corporation

Item 2. Code of Ethics.
The Registrant has adopted a code of ethics that applies to the Registrant's principal executive officer, principal financial officer, principal accounting officer or controller, or persons performing similar functions. There have been no amendments to, or waivers in connection with, the Code of Ethics during the period covered by this Report.
Item 3. Audit Committee Financial Expert.
The Registrant's Board has determined that Joseph S. DiMartino, a member of the Audit Committee of the Board, is an audit committee financial expert as defined by the Securities and Exchange Commission (the "SEC"). Mr. DiMartino is "independent" as defined by the SEC for purposes of audit committee financial expert determinations.
Item 4. Principal Accountant Fees and Services
(a) Audit Fees. The aggregate fees billed for each of the last two fiscal years (the "Reporting Periods") for professional services rendered by the Registrant's principal accountant (the "Auditor") for the audit of the Registrant's annual financial statements, or services that are normally provided by the Auditor in connection with the statutory and regulatory filings or engagements for the Reporting Periods, were $24,681 in 2006 and $24,681 in 2007.
(b) Audit-Related Fees. The aggregate fees billed in the Reporting Periods for assurance and related services by the Auditor that are reasonably related to the performance of the audit of the Registrant's financial statements and are not reported under paragraph (a) of this Item 4 were $0 in 2006 and $0 in 2007.
The aggregate fees billed in the Reporting Periods for non-audit assurance and related services by the Auditor to the Registrant's investment adviser (not including any sub-investment adviser whose role is primarily portfolio management and is subcontracted with or overseen by another investment adviser), and any entity controlling, controlled by or under common control with the investment adviser that provides ongoing services to the Registrant ("Service Affiliates"), that were reasonably related to the performance of the annual audit of the Service Affiliate, which required pre-approval by the Audit Committee were $0 in 2006 and $0 in 2007.
Note: For the second paragraph in each of (b) through (d) of this Item 4, certain of such services were not pre-approved prior to May 6, 2003, when such services were required to be pre-approved. On and after May 6, 2003, 100% of all services provided by the Auditor were pre-approved as required. For comparative purposes, the fees shown assume that all such services were pre-approved, including services that were not pre-approved prior to the compliance date of the pre-approval requirement.
(c) Tax Fees. The aggregate fees billed in the Reporting Periods for professional services rendered by the Auditor for tax compliance, tax advice and tax planning ("Tax Services") were $3,066 in 2006 and $3,271 in 2007. These services consisted of (i) review or preparation of U.S. federal, state, local and excise tax returns; (ii) U.S. federal, state and local tax planning, advice and assistance regarding statutory, regulatory or administrative developments, (iii) tax advice regarding tax qualification matters and/or treatment of various financial instruments held or proposed to be acquired or held.
The aggregate fees billed in the Reporting Periods for Tax Services by the Auditor to Service Affiliates which required pre-approval by the Audit Committee were $0 in 2006 and $0 in 2007.
(d) All Other Fees. The aggregate fees billed in the Reporting Periods for products and services provided by the Auditor, other than the services reported in paragraphs (a) through (c) of this Item, were $15 in 2006 and $21 in 2007. These services consisted of a review of the Registrant's anti-money laundering program.
The aggregate fees billed in the Reporting Periods for Non-Audit Services by the Auditor to Service Affiliates, other than the services reported in paragraphs (b) through (c) of this Item, which required pre-approval by the Audit Committee were $0 in 2006 and $0 in 2007.
Audit Committee Pre-Approval Policies and Procedures. The Registrant's Audit Committee has established policies and procedures (the "Policy") for pre-approval (within specified fee limits) of the Auditor's engagements for non-audit services to the Registrant and Service Affiliates without specific case-by-case consideration. Pre-approval considerations include whether the proposed services are compatible with maintaining the Auditor's independence. Pre-approvals pursuant to the Policy are considered annually.
Non-Audit Fees. The aggregate non-audit fees billed by the Auditor for services rendered to the Registrant, and rendered to Service Affiliates, for the Reporting Periods were $791,626 in 2006 and $405,626 in 2007.
Auditor Independence. The Registrant's Audit Committee has considered whether the provision of non-audit services that were rendered to Service Affiliates which were not pre-approved (not requiring pre-approval) is compatible with maintaining the Auditor's independence.
| Item 5. | | Audit Committee of Listed Registrants. |
| | | Not applicable. | | [CLOSED-END FUNDS ONLY] |
| Item 6. | | Schedule of Investments. |
| | | Not applicable. | | |
| Item 7. | | Disclosure of Proxy Voting Policies and Procedures for Closed-End Management |
| | | Investment Companies. |
| | | Not applicable. | | [CLOSED-END FUNDS ONLY] |
| Item 8. | | Portfolio Managers of Closed-End Management Investment Companies. |
| | | Not applicable. | | [CLOSED-END FUNDS ONLY, beginning with reports for periods ended |
| | | | | on and after December 31, 2005] |
| Item 9. | | Purchases of Equity Securities by Closed-End Management Investment Companies and |
| | | Affiliated Purchasers. |
| | | Not applicable. | | [CLOSED-END FUNDS ONLY] |
| Item 10. | | Submission of Matters to a Vote of Security Holders. |
The Registrant has a Nominating Committee (the "Committee"), which is responsible for selecting and nominating persons for election or appointment by the Registrant's Board as Board members. The
Committee has adopted a Nominating Committee Charter (the "Charter"). Pursuant to the Charter, the Committee will consider recommendations for nominees from shareholders submitted to the Secretary of the Registrant, c/o The Dreyfus Corporation Legal Department, 200 Park Avenue, 8th Floor East, New York, New York 10166. A nomination submission must include information regarding the recommended nominee as specified in the Charter. This information includes all information relating to a recommended nominee that is required to be disclosed in solicitations or proxy statements for the election of Board members, as well as information sufficient to evaluate the factors to be considered by the Committee, including character and integrity, business and professional experience, and whether the person has the ability to apply sound and independent business judgment and would act in the interests of the Registrant and its shareholders.
Nomination submissions are required to be accompanied by a written consent of the individual to stand for election if nominated by the Board and to serve if elected by the shareholders, and such additional information must be provided regarding the recommended nominee as reasonably requested by the Committee.
Item 11. Controls and Procedures.
(a) The Registrant's principal executive and principal financial officers have concluded, based on their evaluation of the Registrant's disclosure controls and procedures as of a date within 90 days of the filing date of this report, that the Registrant's disclosure controls and procedures are reasonably designed to ensure that information required to be disclosed by the Registrant on Form N-CSR is recorded, processed, summarized and reported within the required time periods and that information required to be disclosed by the Registrant in the reports that it files or submits on Form N-CSR is accumulated and communicated to the Registrant's management, including its principal executive and principal financial officers, as appropriate to allow timely decisions regarding required disclosure.
(b) There were no changes to the Registrant's internal control over financial reporting that occurred during the second fiscal quarter of the period covered by this report that have materially affected, or are reasonably likely to materially affect, the Registrant's internal control over financial reporting.
Item 12. Exhibits.
(a)(1) Code of ethics referred to in Item 2.
(a)(2) Certifications of principal executive and principal financial officers as required by Rule 30a-2(a) under the Investment Company Act of 1940.
(a)(3) Not applicable.
(b) Certification of principal executive and principal financial officers as required by Rule 30a-2(b) under the Investment Company Act of 1940.
Pursuant to the requirements of the Securities Exchange Act of 1934 and the Investment Company Act of 1940, the Registrant has duly caused this Report to be signed on its behalf by the undersigned, thereunto duly authorized.
| Dreyfus New York Municipal Cash Management |
| By: | | /s/ J. David Officer |
| | | J. David Officer |
| | | President |
| Date: | | March 22, 2007 |
| Pursuant to the requirements of the Securities Exchange Act of 1934 and the Investment Company Act of |
| 1940, this Report has been signed below by the following persons on behalf of the Registrant and in the |
| capacities and on the dates indicated. |
| By: | | /s/ J. David Officer |
| | | J. David Officer |
| | | President |
| Date: | | March 22, 2007 |
| By: | | /s/ James Windels |
| | | James Windels |
| | | Treasurer |
| Date: | | March 22, 2007 |
| EXHIBIT INDEX |
| | | (a)(1) | | Code of ethics referred to in Item 2. |
| | | (a)(2) | | Certifications of principal executive and principal financial officers as required by Rule 30a- |
| | | 2(a) under the Investment Company Act of 1940. (EX-99.CERT) |
| | | (b) | | Certification of principal executive and principal financial officers as required by |
| | | Rule 30a-2(b) under the Investment Company Act of 1940. (EX-99.906CERT) |