| UNITED STATES |
| SECURITIES AND EXCHANGE COMMISSION |
| Washington, D.C. 20549 |
| |
| |
| FORM N-CSR |
| |
| CERTIFIED SHAREHOLDER REPORT OF REGISTERED MANAGEMENT |
| INVESTMENT COMPANIES |
| |
| Investment Company Act file number 811-6395 |
| |
| DREYFUS NEW YORK MUNICIPAL CASH MANAGEMENT |
| (Exact name of Registrant as specified in charter) |
| |
| |
| c/o The Dreyfus Corporation |
| 200 Park Avenue |
| New York, New York 10166 |
| (Address of principal executive offices) (Zip code) |
| |
| Mark N. Jacobs, Esq. |
| 200 Park Avenue |
| New York, New York 10166 |
| (Name and address of agent for service) |
| |
| Registrant's telephone number, including area code: (212) 922-6000 |
| Date of fiscal year end: | | 1/31 |
| Date of reporting period: | | 1/31/06 |
FORM N-CSR
Item 1. Reports to Stockholders.
| Contents | | |
| |
| The Funds | | |
| |
|
| Letter to Shareholders (Taxable) | | 3 |
| Letter to Shareholders (Tax-Exempt) | | 5 |
| Understanding Your Fund’s Expenses | | 7 |
| Comparing Your Fund’s Expenses | | |
| With Those of Other Funds | | 8 |
| Statements of Investments | | 9 |
| Statements of Assets and Liabilities | | 40 |
| Statements of Operations | | 42 |
| Statements of Changes in Net Assets | | 44 |
| Financial Highlights | | 48 |
| Notes to Financial Statements | | 57 |
| Report of Independent Registered | | |
| Public Accounting Firm | | 61 |
| Important Tax Information | | 62 |
| Board Members Information | | 63 |
| Officers of the Funds | | 64 |
| For More Information | | |
| |
|
| Back cover | | |
The views expressed in this report reflect those of the portfolio manager only through the end of the period covered and do not necessarily represent the views of Dreyfus or any other person in the Dreyfus organization. Any such views are subject to change at any time based upon market or other conditions and Dreyfus disclaims any responsibility to update such views. These views may not be relied on as investment advice and, because investment decisions for a Dreyfus fund are based on numerous factors, may not be relied on as an indication of trading intent on behalf of any Dreyfus fund.
• Not FDIC-Insured • Not Bank-Guaranteed • May Lose Value
Dreyfus Cash Management Funds
The Funds

Dear Shareholder:
We are pleased to present the annual report for Dreyfus Cash Management Funds (Taxable). For the 12-month period ended January 31, 2006, the six Dreyfus Cash Management Funds listed below produced the following yields and effective yields:1
| | | | | Effective |
| | | Yield (%) | | Yield (%) |
| |
| |
|
| Dreyfus Cash Management | | | | |
| Institutional Shares | | 3.24 | | 3.28 |
| Investor Shares | | 2.99 | | 3.03 |
| Administrative Shares | | 3.14 | | 3.18 |
| Participant Shares | | 2.84 | | 2.87 |
| |
| |
|
| Dreyfus Cash Management Plus, Inc. | | |
| Institutional Shares | | 3.24 | | 3.29 |
| Investor Shares | | 2.99 | | 3.03 |
| Administrative Shares | | 3.14 | | 3.19 |
| Participant Shares | | 2.84 | | 2.88 |
| |
| |
|
| Dreyfus Government Cash Management | | |
| Institutional Shares | | 3.18 | | 3.23 |
| Investor Shares | | 2.93 | | 2.97 |
| Administrative Shares | | 3.08 | | 3.12 |
| Participant Shares | | 2.78 | | 2.82 |
| |
| |
|
| Dreyfus Government Prime Cash Management |
| Institutional Shares | | 3.14 | | 3.18 |
| Investor Shares | | 2.89 | | 2.92 |
| Administrative Shares | | 3.03 | | 3.08 |
| Participant Shares | | 2.73 | | 2.77 |
| |
| |
|
| Dreyfus Treasury Cash Management | | |
| Institutional Shares | | 3.06 | | 3.10 |
| Investor Shares | | 2.81 | | 2.84 |
| Administrative Shares | | 2.96 | | 3.00 |
| Participant Shares | | 2.66 | | 2.69 |
| |
| |
|
| Dreyfus Treasury Prime Cash Management |
| Institutional Shares | | 2.92 | | 2.96 |
| Investor Shares | | 2.67 | | 2.70 |
| Administrative Shares | | 2.82 | | 2.86 |
| Participant Shares | | 2.52 | | 2.55 |
Economic and Market Environment
Although the overnight federal funds rate began the reporting period at 2.25% after approximately seven months of gradual increases, long-dormant inflationary
pressures appeared to intensify during the first quarter of 2005 when energy prices moved sharply higher. It was no surprise, therefore, that the Federal Reserve Board (the “Fed”) raised the federal funds rate at its February and March 2005 meetings to 2.75% .It later was revealed that the U.S. economy expanded at a relatively moderate 3.5% rate over the first three months of 2005.
Although concerns in the spring that the U.S. economy might have hit a soft patch proved to be short-lived, soaring energy prices and the possibility of slower global economic growth weighed on investor sentiment. Still, the Fed implemented rate hikes in May and June, raising the federal funds rate to 3.25% . U.S. GDP grew at a 3.3% annualized rate during the second quarter of 2005.
In July and August, stronger employment data helped convince investors that economic growth was solid. While inflationary pressures appeared to stay contained due to steep discounts from automobile manufacturers and apparel retailers, oil and gas prices continued to escalate.The Fed raised the federal funds rate to 3.5% at its meeting on August 9. On August 29, however, Hurricane Katrina struck the Gulf Coast, and oil prices spiked to more than $70 per barrel, reigniting concerns about a possible economic slowdown. Although some analysts believed that the Gulf Coast hurricanes might prompt the Fed to pause at its September 20 meeting, the Fed remained on course, increasing the federal funds rate to 3.75% .. It was later announced that U.S. GDP grew at a relatively robust 4.1% annualized rate during the third quarter of 2005.
As was widely expected, the Fed hiked interest rates in early November when the economy continued to exhibit signs of strength. December saw the creation of 108,000 new jobs and a decline in the unemployment rate to 4.9% . These statistics appeared to confirm that the U.S. economy would finish 2005 on solid footing, and the twin drags caused by higher energy prices and the Gulf Coast hurricanes
The Funds 3
apparently were not sufficient to offset strength in broad sectors of the domestic economy.
The Fed implemented its final rate increase of 2005 at its meeting on December 10, leaving the federal funds rate at 4.25% by year-end. However, the Fed changed some of the language in its announcement of the increase, which many analysts interpreted as a signal that the credit tightening campaign might be nearing completion.This view was reinforced shortly after the start of 2006, when minutes from the December meeting showed that some Fed members had expressed concern that further rate hikes might restrict economic growth. However, the U.S. Department of Commerce later estimated that U.S. GDP expanded at a lower-than-expected 1.1% during the fourth quarter, apparently due to weakness in consumer spending and corporate capital expenditures. It also was estimated that the U.S. economy grew at a 3.5% rate for 2005 overall.
The economy’s surprisingly weak performance for the fourth quarter appeared to be offset by more encouraging news from the labor market, including a reduction in the unemployment rate to 4.7% for December. As expected, the Fed implemented its fourteenth consecutive rate hike at its meeting on January 31, the last day of the reporting period.The Fed again revised the language in its statement accompanying the increase, indicating that “some further policy firming may be needed….” This change was widely viewed as an attempt to give the new Fed Chairman, Ben Bernanke, flexibility to set his own course.
Portfolio Focus
Investors currently are facing greater uncertainty regarding Fed policy under a new chairman. In addition, the Fed appears ready to give greater weight to incoming economic data when deciding whether to continue the tightening process at upcoming meetings. Therefore, we have continued to maintain the funds’ relatively defensive posture, in which we focused primarily on securities with maturities of six months or less in an attempt to maintain the liquidity required to capture higher yields as they became available. Generally, we have set the funds’ weighted average maturities according to the proximity of upcoming Fed meetings. However, we are prepared to increase the funds’ weighted average maturities should we see more concrete signs that short-term interest rates have peaked.
Sincerely,
Patricia A. Larkin
Senior Portfolio Manager
|
February 15, 2006
New York, N.Y.
|
An investment in the fund is not insured or guaranteed by the FDIC or
any other government agency. Although the fund seeks to preserve the value
of your investment at $1.00 per share, it is possible to lose money by
investing in the fund.
1 Effective yield is based upon dividends declared daily and reinvested
monthly. Past performance is no guarantee of future results.Yields fluctuate.
|
4

Dear Shareholder:
We are pleased to present the annual report for Dreyfus Cash Management Funds (Tax Exempt). For the 12-month period ended January 31, 2006, the three tax-exempt money market portfolios that comprise Dreyfus Cash Management Funds (Tax Exempt) produced the following yields and effective yields:1
| | | | | Effective |
| | | Yield (%) | | Yield (%) |
| |
| |
|
| Dreyfus Municipal Cash Management Plus | | |
| Institutional Shares | | 2.36 | | 2.39 |
| Investor Shares | | 2.11 | | 2.13 |
| Administrative Shares | | 2.26 | | 2.29 |
| Participant Shares | | 1.96 | | 1.98 |
| |
| |
|
| Dreyfus New York Municipal Cash Management |
| Institutional Shares | | 2.34 | | 2.36 |
| Investor Shares | | 2.09 | | 2.11 |
| Administrative Shares | | 2.24 | | 2.26 |
| Participant Shares | | 1.94 | | 1.95 |
| |
| |
|
| Dreyfus Tax Exempt Cash Management | | |
| Institutional Shares | | 2.33 | | 2.36 |
| Investor Shares | | 2.08 | | 2.10 |
| Administrative Shares | | 2.24 | | 2.26 |
| Participant Shares | | 1.94 | | 1.95 |
Economic and Market Environment
While the U.S. economy grew at a relatively steady pace over the reporting period, and inflationary pressures generally remained subdued, investor sentiment waxed and waned throughout the year in response to each release of new economic data.
During the first half of the reporting period, energy prices moved sharply higher and long-dormant inflationary pressures appeared to intensify. It was no surprise, therefore, that the Federal Reserve Board (the “Fed”) raised short-term interest rates at its meetings in February, March, May and June, driving the federal funds rate from 2.25% at the start of the reporting period to 3.25% by the end of July. The U.S. Department of Commerce reported that the U.S.
economy expanded at relatively moderate 3.5% and 3.3% annualized rates during the first quarter and second quarters of 2005, respectively.
Strong employment data over the summer helped convince investors that U.S. economic growth was solid, and the Fed raised rates to 3.5% on August 9. On August 29, however, Hurricane Katrina struck the Gulf Coast, reigniting concerns about a possible economic slowdown. However, the Fed remained on course, increasing the federal funds rate to 3.75% in September. U.S. GDP grew at a relatively robust 4.1% annualized rate during the third quarter of 2005.
As expected, the Fed raised interest rates again in November and December. Despite a lower-than-expected 1.1% GDP growth estimate for the fourth quarter, strong employment data appeared to confirm that the U.S. economy finished 2005 on solid footing. January 2006 began on an optimistic note when the minutes from the Fed’s December meeting suggested that the credit tightening cycle might be nearing its end. Yet, the Fed raised the federal funds rate for the 14th consecutive time on January 31, the last day of the reporting period, to 4.5% .
Yields of tax-exempt money market instruments generally rose along with the federal funds rate, reaching their highest levels in more than four years. However, yields of shorter-dated money market securities tended to rise more sharply than longer-dated securities, causing yield differences along the tax-exempt yield curve to narrow. By the end of the reporting period, there was little difference in the yields provided by tax-exempt securities with maturities between six months and four years.As a result, investor demand continued to focus primarily on instruments maturing in six months or less.
Although there was less need among municipalities for short-term borrowing to cover budget shortfalls in the recovering economy, the conversion of longer-term municipal notes and bonds into their component parts
The Funds 5
caused the supply of newly issued municipal money market securities to rise to record levels. In fact, in the spring of 2005, seasonal factors enabled tax-exempt instruments to temporarily reach yields that were equal to those of taxable money market securities.
Like many other states, New York’s fiscal condition improved in the strengthening economy. Higher levels of personal income and corporate franchise taxes during the reporting period helped boost reserves that could be used to offset future budget shortfalls stemming from rising energy and health care costs. Credit improvement was particularly evident in New York City, where rising real estate values and record bonuses on Wall Street have relieved budget pressures.
Portfolio Focus
During most of the reporting period, we focused primarily on municipal securities with maturities of six months or less in order to maintain liquidity and keep funds available for higher yielding instruments as they became available. However, most money market funds employed a similar strategy, and the industry’s weighted average maturity remained relatively low.
With yields of variable-rate demand notes at unusually low levels, we found what we believed to be more attractive income opportunities from tax-exempt commercial paper, municipal notes and seasoned bonds with maturities between one and six months. We attempted to “ladder” the fund’s holdings within
this maturity range to protect its yield while ensuring that funds would remain available for reinvestment as interest rates rose.
As of the reporting period’s end, stronger-than-expected employment data appeared to suggest that the U.S. economy remains on a path of sustainable growth. In addition, short-term interest rates remain relatively low by historical standards, and the new Fed chairman, Ben Bernanke, may want to show world markets that he is committed to fighting inflation. Accordingly, we have continued to focus on shorter-term instruments that provide the liquidity we need to capture higher yields as they arise.
Sincerely,
Colleen Meehan
Senior Portfolio Manager
|
February 15, 2006
New York, N.Y.
|
| | | An investment in each fund is not insured or guaranteed by the FDIC or |
| | | any other government agency. Although each fund seeks to preserve the |
| | | value of your investment at $1.00 per share, it is possible to lose money |
| | | by investing in the funds. |
| 1 | | Effective yield is based upon dividends declared daily and reinvested |
| | | monthly. Past performance is no guarantee of future results.Yields fluctuate. |
| | | For the national funds, income may be subject to state and local taxes. For |
| | | the New York fund, income may be subject to state and local taxes for out- |
| | | of-state residents. For each fund, some income may be subject to the federal |
| | | alternative minimum tax (AMT). |
6
UNDERSTANDING YOUR FUND’S EXPENSES (Unaudited)
As a mutual fund investor, you pay ongoing expenses, such as management fees and other expenses. Using the information below, you can estimate how these expenses affect your investment and compare them with the expenses of other funds.You also may pay one-time transaction expenses, including sales charges (loads) and redemptions fees, which are not shown in this section and would have resulted in higher total expenses. For more information, see your fund’s prospectus or talk to your financial adviser.
Review your fund’s expenses
The table below shows the expenses you would have paid on a $1,000 investment in each class of each fund from August 1,2005 to January 31, 2006. It also shows how much a $1,000 investment would be worth at the close of the period, assuming actual returns and expenses.
| | Expenses and Value of a $1,000 Investment
assuming actual returns for the six months ended January 31, 2006
|
| | | Institutional Shares | | Investor Shares | | Administrative Shares | | Participant Shares |
| |
| |
| |
| |
|
| Dreyfus Cash Management | | | | | | | | |
| Expenses paid per $1,000 † | | $1.02 | | $2.29 | | $1.53 | | $3.05 |
| Ending value (after expenses) | | $1,019.00 | | $1,017.70 | | $1,018.50 | | $1,016.90 |
| Dreyfus Cash Management Plus, Inc. | | | | | | | | |
| Expenses paid per $1,000 † | | $1.02 | | $2.29 | | $1.53 | | $3.05 |
| Ending value (after expenses) | | $1,019.00 | | $1,017.70 | | $1,018.50 | | $1,017.00 |
| Dreyfus Government Cash Management | | | | | | | | |
| Expenses paid per $1,000† | | $1.02 | | $2.29 | | $1.53 | | $3.05 |
| Ending value (after expenses) | | $1,018.70 | | $1,017.40 | | $1,018.20 | | $1,016.70 |
| Dreyfus Government Prime Cash Management | | | | | | |
| Expenses paid per $1,000 † | | $1.02 | | $2.29 | | $1.53 | | $3.05 |
| Ending value (after expenses) | | $1,018.50 | | $1,017.20 | | $1,018.00 | | $1,016.40 |
| Dreyfus Treasury Cash Management | | | | | | | | |
| Expenses paid per $1,000 † | | $1.02 | | $2.29 | | $1.53 | | $3.05 |
| Ending value (after expenses) | | $1,017.90 | | $1,016.70 | | $1,017.40 | | $1,015.90 |
| Dreyfus Treasury Prime Cash Management | | | | | | |
| Expenses paid per $1,000 † | | $1.02 | | $2.29 | | $1.52 | | $3.05 |
| Ending value (after expenses) | | $1,017.20 | | $1,015.90 | | $1,016.70 | | $1,015.10 |
| Dreyfus Municipal Cash Management Plus | | | | | | | | |
| Expenses paid per $1,000 † | | $1.01 | | $2.28 | | $1.52 | | $3.04 |
| Ending value (after expenses) | | $1,013.20 | | $1,011.90 | | $1,012.70 | | $1,011.20 |
| Dreyfus New York Municipal Cash Management | | | | | | |
| Expenses paid per $1,000 † | | $1.01 | | $2.28 | | $1.52 | | $3.04 |
| Ending value (after expenses) | | $1,013.10 | | $1,011.80 | | $1,012.60 | | $1,011.10 |
| Dreyfus Tax Exempt Cash Management | | | | | | | | |
| Expenses paid per $1,000 † | | $1.01 | | $2.28 | | $1.52 | | $3.04 |
| Ending value (after expenses) | | $1,013.10 | | $1,011.90 | | $1,012.60 | | $1,011.10 |
† Expenses are equal to the funds’ annualized expense ratio of .20% for Institutional Shares, .45% for Investor Shares, .30% for Administrative Shares and .60% for Participant Shares; multiplied by the average account value over the period, multiplied by 184/365 (to reflect the one-half year period).
The Funds 7
COMPARING YOUR FUND’S EXPENSES
WITH THOSE OF OTHER FUNDS (Unaudited)
|
Using the SEC’s method to compare expenses
The Securities and Exchange Commission (SEC) has established guidelines to help investors assess fund expenses. Per these guidelines, the table below shows your fund’s expenses based on a $1,000 investment, assuming a hypothetical 5% annualized return.You can use this information to compare the ongoing expenses (but not transaction expenses or total cost) of investing in the fund with those of other funds. All mutual fund shareholder reports will provide this information to help you make this comparison. Please note that you cannot use this information to estimate your actual ending account balance and expenses paid during the period.
Expenses and Value of a $1,000 Investment
assuming a hypothetical 5% annualized return for the six months ended January 31, 2006
|
| | | Institutional Shares | | Investor Shares | | Administrative Shares | | Participant Shares |
| |
| |
| |
| |
|
| Dreyfus Cash Management | | | | | | | | |
| Expenses paid per $1,000 † | | $1.02 | | $2.29 | | $1.53 | | $3.06 |
| Ending value (after expenses) | | $1,024.20 | | $1,022.94 | | $1,023.69 | | $1,022.18 |
| Dreyfus Cash Management Plus, Inc. | | | | | | | | |
| Expenses paid per $1,000 † | | $1.02 | | $2.29 | | $1.53 | | $3.06 |
| Ending value (after expenses) | | $1,024.20 | | $1,022.94 | | $1,023.69 | | $1,022.18 |
| Dreyfus Government Cash Management | | | | | | | | |
| Expenses paid per $1,000 † | | $1.02 | | $2.29 | | $1.53 | | $3.06 |
| Ending value (after expenses) | | $1,024.20 | | $1,022.94 | | $1,023.69 | | $1,022.18 |
| Dreyfus Government Prime Cash Management | | | | | | |
| Expenses paid per $1,000 † | | $1.02 | | $2.29 | | $1.53 | | $3.06 |
| Ending value (after expenses) | | $1,024.20 | | $1,022.94 | | $1,023.69 | | $1,022.18 |
| Dreyfus Treasury Cash Management | | | | | | | | |
| Expenses paid per $1,000 † | | $1.02 | | $2.29 | | $1.53 | | $3.06 |
| Ending value (after expenses) | | $1,024.20 | | $1,022.94 | | $1,023.69 | | $1,022.18 |
| Dreyfus Treasury Prime Cash Management | | | | | | |
| Expenses paid per $1,000 † | | $1.02 | | $2.29 | | $1.53 | | $3.06 |
| Ending value (after expenses) | | $1,024.20 | | $1,022.94 | | $1,023.69 | | $1,022.18 |
| Dreyfus Municipal Cash Management Plus | | | | | | | | |
| Expenses paid per $1,000 † | | $1.02 | | $2.29 | | $1.53 | | $3.06 |
| Ending value (after expenses) | | $1,024.20 | | $1,022.94 | | $1,023.69 | | $1,022.18 |
| Dreyfus New York Municipal Cash Management | | | | | | |
| Expenses paid per $1,000 † | | $1.02 | | $2.29 | | $1.53 | | $3.06 |
| Ending value (after expenses) | | $1,024.20 | | $1,022.94 | | $1,023.69 | | $1,022.18 |
| Dreyfus Tax Exempt Cash Management | | | | | | | | |
| Expenses paid per $1,000 † | | $1.02 | | $2.29 | | $1.53 | | $3.06 |
| Ending value (after expenses) | | $1,024.20 | | $1,022.94 | | $1,023.69 | | $1,022.18 |
† Expenses are equal to the funds’ annualized expense ratio of .20% for Institutional Shares, .45% for Investor Shares, .30% for Administrative Shares and .60% for Participant Shares; multiplied by the average account value over the period, multiplied by 184/365 (to reflect the one-half year period).
| | STATEMENT OF INVESTMENTS
January 31, 2006
|
| | | Principal | | |
| Dreyfus Cash Management | | Amount ($) | | Value ($) |
| |
| |
|
| |
| Negotiable Bank Certificates of Deposit—48.8% | | |
| |
|
| Alliance & Leicester PLC (London) | | | | |
| 3.78%, 3/6/2006 | | 50,000,000 | | 50,000,000 |
| Allied Irish Banks N.A. (Yankee) | | | | |
| 3.78%, 3/6/2006 | | 200,000,000 | | 200,000,000 |
| American Express Centurion Bank | | | | |
| 4.40%, 2/21/2006-2/24/2006 | | 400,000,000 | | 400,000,000 |
| BNP Paribas (Yankee) | | | | |
| 4.21%-4.48%, 2/2/2006-4/7/2006 | | 460,000,000 | | 460,000,000 |
| Calyon New York Branch (Yankee) | | | | |
| 4.28%, 2/1/2006 | | 275,000,000 | | 275,000,000 |
| Credit Suisse First Boston Inc. (Yankee) | | | | |
| 4.21%-4.39%, 2/2/2006-2/22/2006 | | 450,000,000 | | 450,000,000 |
| DEPFA BANK PLC (Yankee) | | | | |
| 4.21%-4.37%, 2/2/2006-2/13/2006 | | 500,000,000 | | 500,000,000 |
| Dexia Credit Local (Yankee) | | | | |
| 4.32%, 2/6/2006 | | 600,000,000 | | 600,000,000 |
| First Tennessee Bank | | | | |
| 4.22%—4.39%, 2/2/2006—2/21/2006 | | 500,000,000 | | 500,000,000 |
| HBOS Treasury Services PLC (Yankee) | | | | |
| 4.22%, 2/3/2006 | | 100,000,000 | | 100,000,000 |
| HSH Nordbank AG (Yankee) | | | | |
| 4.40%, 2/22/2006 | | 100,000,000 | | 100,000,000 |
| Natexis Banques Populaires (Yankee) | | | | |
| 4.21%-4.48%, 2/3/2006-4/7/2006 | | 600,000,000 | | 599,999,959 |
| Royal Bank of Scotland PLC (Yankee) | | | | |
| 3.78%, 3/6/2006 | | 300,000,000 | | 300,000,000 |
| Societe Generale (Yankee) | | | | |
| 4.48%, 4/6/2006 | | 450,000,000 | | 450,000,000 |
| Svenska Handelsbanken (Yankee) | | | | |
| 4.32%-4.48%, 2/8/2006-4/6/2006 | | 467,000,000 | | 467,000,000 |
| Total Negotiable Bank Certificates of Deposit | | |
| (cost $5,451,999,959) | | | | 5,451,999,959 |
| |
| |
|
| Commercial Paper—43.6% | | | | |
| |
| |
|
| Amstel Funding Corp. | | | | |
| 4.40%, 2/21/2006 | | 35,076,000 a | | 34,990,843 |
| ASB Bank Ltd. | | | | |
| 4.62%, 4/26/2006 | | 50,000,000 | | 49,466,833 |
| Bank of America Corp. | | | | |
| 4.37%, 2/13/2006 | | 30,000,000 | | 29,956,600 |
| Barclays U.S. Funding Corp. | | | | |
| 4.37%—4.48%, 2/13/2006—4/6/2006 | | 590,000,000 | | 588,053,556 |
| Bear Stearns Cos. Inc. | | | | |
| 4.23%-4.51%, 2/2/2006-4/10/2006 | | 345,000,000 | | 342,841,317 |
| Beethoven Funding Corp. | | | | |
| 4.36%, 2/3/2006 | | 48,728,000 a | | 48,716,278 |
| Beta Finance Inc. | | | | |
| 4.48%, 4/6/2006 | | 70,000,000 a | | 69,449,333 |
The Funds 9
STATEMENT OF INVESTMENTS (continued)
| | | Principal | | |
| Dreyfus Cash Management (continued) | | Amount ($) | | Value ($) |
| |
| |
|
| |
| Commercial Paper (continued) | | | | |
| |
| |
|
| CAFCO LLC | | | | |
| 4.33%-4.34%, 2/6/2006-2/8/2006 | | 185,000,000 a | | 184,873,233 |
| Charta LLC | | | | |
| 4.33%, 2/6/2006 | | 150,000,000 a | | 149,910,416 |
| CIESCO LLC | | | | |
| 4.48%, 4/4/2006 | | 100,000,000 a | | 99,237,056 |
| Citigroup Global Market Holdings Inc. | | | | |
| 4.39%, 2/21/2006 | | 300,000,000 | | 299,273,333 |
| CRC Funding LLC | | | | |
| 4.40%, 2/23/2006 | | 100,000,000 a | | 99,732,944 |
| Cullinan Finance Ltd. | | | | |
| 4.50%, 4/6/2006-4/10/2006 | | 47,527,000 a | | 47,137,507 |
| DEPFA BANK PLC | | | | |
| 4.48%, 4/6/2006 | | 50,000,000 | | 49,606,222 |
| Deutsche Bank Financial LLC | | | | |
| 4.48%, 2/1/2006 | | 150,000,000 | | 150,000,000 |
| Fairway Finance Co. LLC | | | | |
| 4.22%, 2/1/2006 | | 19,075,000 a | | 19,075,000 |
| Falcon Asset Securitization Corp. | | | | |
| 4.39%, 2/16/2006 | | 34,889,000 a | | 34,825,618 |
| General Electric Capital Corp. | | | | |
| 4.21%, 2/1/2006 | | 500,000,000 | | 500,000,000 |
| General Electric Capital Services Inc. | | | | |
| 4.32%, 2/6/2006 | | 150,000,000 | | 149,910,625 |
| Harrier Finance Funding Ltd. | | | | |
| 3.78%-4.47%, 2/28/2006-3/21/2006 | | 193,000,000 a | | 192,249,495 |
| HSH Nordbank AG | | | | |
| 4.40%, 2/22/2006 | | 100,000,000 | | 99,745,375 |
| Intesa Funding LLC | | | | |
| 4.33%-4.39%, 2/6/2006-2/21/2006 | | 450,000,000 | | 449,366,979 |
| Premier Asset Collateralized Entity LLC | | | | |
| 4.40%, 2/14/2006-2/23/2006 | | 85,000,000 a | | 84,783,928 |
| Prudential Funding LLC | | | | |
| 4.48%, 2/1/2006 | | 150,000,000 | | 150,000,000 |
| Scaldis Capital Ltd. | | | | |
| 4.22%, 2/1/2006 | | 20,938,000 a | | 20,938,000 |
| Sigma Finance Inc. | | | | |
| 4.40%, 2/23/2006 | | 25,000,000 a | | 24,933,236 |
| Skandinaviska Enskilda Banken AB | | | | |
| 3.78%, 3/2/2006 | | 200,000,000 | | 199,402,278 |
| Toyota Motor Credit Corp. | | | | |
| 4.32%, 2/8/2006 | | 100,000,000 a | | 99,916,583 |
| UBS Finance Delaware LLC | | | | |
| 4.47%, 2/1/2006 | | 200,000,000 | | 200,000,000 |
| Westpac Banking Corp. | | | | |
| 4.48%, 4/4/2006-4/6/2006 | | 409,252,000 | | 406,073,029 |
| Total Commercial Paper | | | | |
| (cost $4,874,465,617) | | | �� | 4,874,465,617 |
10
| | | Principal | | |
| Dreyfus Cash Management (continued) | | Amount ($) | | Value ($) |
| |
| |
|
| |
| Corporate Notes—5.1% | | | | |
| |
| |
|
| Fifth Third Bancorp | | | | |
| 4.49%, 11/23/2009 | | 200,000,000 b | | 200,000,000 |
| Harrier Finance Funding Ltd. | | | | |
| 4.32%, 11/15/2006 | | 125,000,000 a,b | | 125,000,000 |
| Morgan Stanley | | | | |
| 4.37%, 2/3/2011 | | 250,000,000 b | | 250,000,000 |
| Total Corporate Notes | | | | |
| (cost $575,000,000) | | | | 575,000,000 |
| |
| |
|
| U.S. Government Agencies—2.1% | | | | |
| |
| |
|
| Federal Home Loan Banks | | | | |
| 4.31%, 4/11/2006 | | | | |
| (cost $234,973,322) | | 235,000,000 b | | 234,973,322 |
| |
| |
|
| Time Deposit—.3% | | | | |
| |
| |
|
| State Street Bank & Trust Co. (Grand Cayman) | | | | |
| 4.45%, 2/1/2006 | | | | |
| (cost $37,000,000) | | 37,000,000 | | 37,000,000 |
| |
| |
|
| Total Investments (cost $11,173,438,898) | | 99.9% | | 11,173,438,898 |
| Cash and Receivables (Net) | | .1% | | 9,495,864 |
| Net Assets | | 100.0% | | 11,182,934,762 |
a Securities exempt from registration under Rule 144A of the Securities Act of 1933.These securities may be resold in transactions exempt from registration, normally to qualified
institutional buyers. At January 31, 2006, these securities amounted to $1,335,769,470 or 11.9% of net assets.
b Variable interest rate—subject to periodic change.
|
| Portfolio Summary † | | | | | | |
| |
| | | Value (%) | | | | Value (%) |
| |
| |
| |
|
| Banking | | 73.6 | | Asset-Backed/Structured Investment Vehicles | | 4.9 |
| Finance | | 6.7 | | U.S. Government Agencies | | 2.1 |
| Asset Backed/Multiseller Programs | | 6.0 | | Insurance | | 1.3 |
| Brokerage Firms | | 5.3 | | | | 99.9 |
† Based on net assets.
See notes to financial statements.
|
The Funds 11
| | STATEMENT OF INVESTMENTS
January 31, 2006
|
| | | Principal | | |
| Dreyfus Cash Management Plus, Inc. | | Amount ($) | | Value ($) |
| |
| |
|
| |
| Negotiable Bank Certificates of Deposit—55.0% | | | | |
| |
| |
|
| Abbey National Treasury Services PLC (Yankee) | | | | |
| 4.00%, 2/28/2006 | | 175,000,000 | | 175,000,000 |
| American Express Bank, FSB | | | | |
| 4.40%, 2/21/2006-2/24/2006 | | 300,000,000 | | 300,000,000 |
| Banca Intesa SpA (Yankee) | | | | |
| 4.21%, 2/2/2006 | | 200,000,000 | | 200,000,000 |
| Bank of the West (Yankee) | | | | |
| 4.48%, 4/7/2006 | | 200,000,000 | | 200,000,000 |
| Bank of Tokyo-Mitsubishi Ltd. (Yankee) | | | | |
| 4.50%, 4/5/2006 | | 350,000,000 | | 350,000,000 |
| BNP Paribas (Yankee) | | | | |
| 4.21%, 2/2/2006 | | 50,000,000 | | 50,000,000 |
| Calyon/New York Branch (Yankee) | | | | |
| 3.78%, 3/6/2006 | | 200,000,000 | | 200,000,000 |
| Credit Suisse First Boston Inc. (Yankee) | | | | |
| 4.39%, 2/22/2006 | | 315,000,000 | | 315,000,000 |
| DEPFA BANK PLC (Yankee) | | | | |
| 4.48%, 4/5/2006 | | 450,000,000 | | 450,000,000 |
| Deutsche Bank Financial LLC (Yankee) | | | | |
| 4.00%, 2/24/2006 | | 200,000,000 | | 200,000,000 |
| Dexia Credit Local (Yankee) | | | | |
| 4.32%-4.48%, 2/6/2006-4/7/2006 | | 500,000,000 | | 500,000,000 |
| HSH Nordbank AG (Yankee) | | | | |
| 4.00%-4.48%, 2/24/2006-4/7/2006 | | 350,000,000 | | 350,000,968 |
| Landesbank Baden-Wuerttemberg (Yankee) | | | | |
| 3.78%, 3/6/2006 | | 100,000,000 | | 100,000,450 |
| Landesbank Hessen-Thueringen Girozentrale (Yankee) | | | | |
| 4.22%, 2/2/2006 | | 200,000,000 | | 200,000,000 |
| Natexis Banques Populaires (Yankee) | | | | |
| 4.21%-4.33%, 2/3/2006-2/8/2006 | | 475,000,000 | | 474,999,890 |
| Nordea Bank Finland PLC (Yankee) | | | | |
| 4.21%, 2/2/2006 | | 100,000,000 | | 100,000,000 |
| Royal Bank of Canada (Yankee) | | | | |
| 4.01%, 2/28/2006 | | 225,000,000 | | 225,000,000 |
| Svenska Handelsbanken (Yankee) | | | | |
| 4.32%, 2/8/2006 | | 383,000,000 | | 383,000,000 |
| Total Negotiable Bank Certificates of Deposit | | | | |
| (cost $4,773,001,308) | | | | 4,773,001,308 |
| |
| |
|
| Commercial Paper—40.2% | | | | |
| |
| |
|
| Amstel Funding Corp. | | | | |
| 4.33%, 2/6/2006 | | 92,843,000 a | | 92,787,552 |
| Amsterdam Funding Corp. | | | | |
| 4.33%, 2/7/2006 | | 102,000,000 a | | 101,926,900 |
| Atlantis One Funding Corp. | | | | |
| 4.33%, 2/6/2006 | | 25,189,000 a | | 25,173,957 |
| | | Principal | | |
| Dreyfus Cash Management Plus, Inc. (continued) | | Amount ($) | | Value ($) |
| |
| |
|
| |
| Commercial Paper (continued) | | | | |
| |
| |
|
| Bank of America Corp. | | | | |
| 4.48%, 4/6/2006 | | 275,000,000 | | 272,834,222 |
| Barclays U.S. Funding Corp. | | | | |
| 4.22%, 2/2/2006 | | 200,000,000 | | 199,976,806 |
| Beethoven Funding Corp. | | | | |
| 4.34%, 2/3/2006 | | 91,101,000 a | | 91,079,186 |
| Beta Finance Inc. | | | | |
| 4.48%, 4/6/2006 | | 30,000,000 a | | 29,764,000 |
| CAFCO LLC | | | | |
| 4.23%, 2/2/2006 | | 100,000,000 a | | 99,988,389 |
| Citigroup Global Markets Holdings Inc. | | | | |
| 4.39%-4.48%, 2/22/2006-4/5/2006 | | 430,000,000 | | 427,708,258 |
| CRC Funding LLC | | | | |
| 4.32%-4.41%, 2/2/2006-2/27/2006 | | 390,000,000 a | | 389,127,685 |
| Cullinan Finance Ltd. | | | | |
| 4.47%, 3/16/2006 | | 71,580,000 a | | 71,202,097 |
| Deutsche Bank Financial LLC | | | | |
| 4.48%, 2/1/2006 | | 100,000,000 | | 100,000,000 |
| FCAR Owner Trust Ser. 1 | | | | |
| 4.23%-4.49%, 2/3/2006-4/6/2006 | | 417,000,000 | | 414,878,244 |
| General Electric Capital Services Inc. | | | | |
| 4.32%, 2/7/2006 | | 150,000,000 | | 149,892,750 |
| HSH Nordbank AG | | | | |
| 4.45%, 3/17/2006 | | 100,000,000 | | 99,462,222 |
| Intesa Funding LLC | | | | |
| 4.39%, 2/21/2006 | | 200,000,000 | | 199,516,111 |
| Premier Asset Collateralized Entity (PACE) | | | | |
| 4.45%, 3/22/2006 | | 19,200,000 a | | 19,085,013 |
| Prudential Funding LLC | | | | |
| 4.48%, 2/1/2006 | | 100,000,000 | | 100,000,000 |
| Sigma Finance Inc. | | | | |
| 4.40%, 2/23/2006 | | 100,000,000 a | | 99,732,944 |
| Swedbank | | | | |
| 4.21%, 2/3/2006 | | 100,000,000 | | 99,976,861 |
| Thames Asset Global Securitization No. 1 Inc. | | | | |
| 4.33%, 2/6/2006 | | 72,143,000 a | | 72,099,915 |
| UBS Finance Delaware LLC | | | | |
| 4.47%, 2/1/2006 | | 50,000,000 | | 50,000,000 |
| UniCredito Italiano SpA | | | | |
| 4.45%, 3/16/2006 | | 50,000,000 | | 49,737,222 |
| Westpac Banking Corp. | | | | |
| 4.45%, 3/15/2006 | | 200,000,000 | | 198,973,333 |
| Windmill Funding Corp. | | | | |
| 4.33%, 2/7/2006 | | 30,000,000 a | | 29,978,500 |
| Total Commercial Paper | | | | |
| (cost $3,484,902,167) | | | | 3,484,902,167 |
The Funds 13
STATEMENT OF INVESTMENTS (continued)
| | | Principal | | |
| Dreyfus Cash Management Plus, Inc. (continued) | | Amount ($) | | Value ($) |
| |
| |
|
| |
| Time Deposits—4.5% | | | | |
| |
| |
|
| Banco Bilbao Vizcaya Argentaria, S.A. (Grand Cayman) | | | | |
| 4.44%, 2/1/2006 | | 100,000,000 | | 100,000,000 |
| Key Bank U.S.A., N.A. (Grand Cayman) | | | | |
| 4.38%, 2/1/2006 | | 275,000,000 | | 275,000,000 |
| State Street Bank and Trust Co. (Grand Cayman) | | | | |
| 4.45%, 2/1/2006 | | 17,000,000 | | 17,000,000 |
| Total Time Deposits | | | | |
| (cost $392,000,000) | | | | 392,000,000 |
| |
| |
|
| Total Investments (cost $8,649,903,475) | | 99.7% | | 8,649,903,475 |
| Cash and Receivables (Net) | | .3% | | 26,379,800 |
| Net Assets | | 100.0% | | 8,676,283,275 |
a Securities exempt from registration, under Rule 144A of the Securities Act of 1933.These securities may be resold in transactions exempt from registration, normally to qualified institutional buyers. At January 31, 2006, these securities amounted to $1,121,946,138 or 12.9% of net assets.
| Portfolio Summary (Unaudited) † | | | | | | |
| |
| | | Value (%) | | | | Value (%) |
| |
| |
| |
|
| Banking | | 80.9 | | Finance | | 1.7 |
| Asset Backed/Multiseller Programs | | 8.6 | | Insurance | | 1.2 |
| Asset Backed/Single Seller | | 4.8 | | | | |
| Asset-Backed/Structured Investment Vehicles | | 2.5 | | | | 99.7 |
† Based on net assets.
See notes to financial statements.
|
14
| | STATEMENT OF INVESTMENTS
January 31, 2006
|
| | | Annualized | | | | |
| | | Yield on | | | | |
| | | Date of | | Principal | | |
| Dreyfus Government Cash Management | | Purchase (%) | | Amount ($) | | Value ($) |
| |
| |
| |
|
| |
| U.S. Government Agencies—93.9% | | | | | | |
| |
| |
| |
|
| Federal Farm Credit Banks, Floating Rate Notes: | | | | | | |
| 2/14/2006 | | 4.29 a | | 100,000,000 | | 99,998,944 |
| 3/21/2006 | | 4.29 a | | 100,000,000 | | 99,998,703 |
| 6/1/2006 | | 4.29 a | | 275,000,000 | | 274,999,987 |
| 10/6/2006 | | 4.29 a | | 125,000,000 | | 124,974,917 |
| Federal Home Loan Banks, Discount Notes: | | | | | | |
| 2/1/2006 | | 4.34 | | 1,450,000,000 | | 1,450,000,000 |
| 2/15/2006 | | 4.18 | | 40,512,000 | | 40,446,776 |
| 3/31/2006 | | 4.34 | | 250,000,000 | | 248,272,083 |
| Federal Home Loan Banks, Floating Rate Note, | | | | | | |
| 4/11/2006 | | 4.31 a | | 250,000,000 | | 249,971,630 |
| Federal Home Loan Mortgage Corp., Discount Notes: | | | | | | |
| 2/14/2006 | | 4.18 | | 192,310,000 | | 192,022,497 |
| 4/25/2006 | | 4.50 | | 73,658,000 | | 72,902,289 |
| Federal National Mortgage Association, Discount Notes: | | | | | | |
| 2/15/2006 | | 4.06 | | 395,176,000 | | 394,558,839 |
| 3/1/2006 | | 4.27 | | 500,000,000 | | 498,356,944 |
| 3/29/2006 | | 4.36 | | 164,770,000 | | 163,665,309 |
| 4/26/2006 | | 4.50 | | 200,015,000 | | 197,938,178 |
| Total U.S. Government Agencies | | | | | | |
| (cost $4,108,107,096) | | | | | | 4,108,107,096 |
| |
| |
| |
|
| Repurchase Agreement—6.2% | | | | | | |
| |
| |
| |
|
| Goldman, Sachs & Co. | | | | | | |
| dated 1/31/2006, due 2/1/2006 in the amount of $272,032,867 | | | | |
| (fully collateralized by $464,080,625 U.S. Treasury Strips, | | | | |
| due 2/15/2008—2/15/2027, value $277,440,000) | | | | | | |
| (cost $272,000,000) | | 4.35 | | 272,000,000 | | 272,000,000 |
| |
| |
| |
|
| |
| Total Investments (cost $4,380,107,096) | | | | 100.1% | | 4,380,107,096 |
| Liabilities, Less Cash and Receivables | | | | (.1%) | | (4,294,723) |
| Net Assets | | | | 100.0% | | 4,375,812,373 |
a Variable interest rate—subject to periodic change.
| Portfolio Summary † | | | | | | |
| | | Value (%) | | | | Value (%) |
| |
| |
| |
|
| Federal Home Loan Banks | | 45.4 | | Federal Home Loan Mortgage Corp. | | 6.1 |
| Federal National Mortgage Association | | 28.7 | | Repurchase Agreement | | 6.2 |
| Federal Farm Credit Banks | | 13.7 | | | | 100.1 |
† Based on net assets.
See notes to financial statements.
|
The Funds 15
| | STATEMENT OF INVESTMENTS
January 31, 2006
|
| | | Annualized | | | | | | |
| | | Yield on | | | | | | |
| | | Date of | | | | Principal | | |
| Dreyfus Government Prime Cash Management | | Purchase (%) | | Amount ($) | | Value ($) |
| |
| |
| |
|
| |
| U.S. Government Agencies—100.0% | | | | | | | | |
| |
| |
| |
| |
|
| Federal Farm Credit Banks, Discount Notes: | | | | | | | | |
| 2/7/2006 | | 4.22 | | | | 75,000,000 | | 74,947,625 |
| 2/24/2006 | | 4.27 | | | | 75,000,000 | | 74,797,313 |
| Federal Farm Credit Banks, Floating Rate Notes: | | | | | | | | |
| 2/14/2006 | | 4.29 | | a | | 25,000,000 | | 24,999,736 |
| 3/21/2006 | | 4.29 | | a | | 50,000,000 | | 49,999,352 |
| 6/1/2006 | | 4.29 | | a | | 50,000,000 | | 50,000,000 |
| 10/6/2006 | | 4.29 | | a | | 50,000,000 | | 49,989,967 |
| 11/9/2007 | | 4.25 | | a | | 50,000,000 | | 49,982,775 |
| Federal Home Loan Bank System, Discount Notes: | | | | | | | | |
| 2/1/2006 | | 4.10 | | | | 75,000,000 | | 75,000,000 |
| 2/1/2006 | | 4.34 | | | | 395,000,000 | | 395,000,000 |
| 2/3/2006 | | 4.20 | | | | 180,000,000 | | 179,958,100 |
| 2/3/2006 | | 4.21 | | | | 20,217,000 | | 20,212,283 |
| 2/15/2006 | | 4.27 | | | | 150,000,000 | | 149,752,667 |
| 3/1/2006 | | 4.27 | | | | 100,000,000 | | 99,671,778 |
| 4/26/2006 | | 4.50 | | | | 140,594,000 | | 139,134,166 |
| |
| |
| |
| |
|
| |
| Total Investments (cost $1,433,445,762) | | | | | | 100.0% | | 1,433,445,762 |
| Cash and Receivables (Net) | | | | | | .0% | | 153,780 |
| Net Assets | | | | | | 100.0% | | 1,433,599,542 |
a Variable interest rate—subject to periodic change.
| Portfolio Summary † | | | | | | |
| | | Value (%) | | | | Value (%) |
| |
| |
| |
|
| Federal Home Loan Banks | | 73.9 | | Federal Farm Credit Banks | | 26.1 |
| | | | | | | 100.0 |
| | † Based on net assets.
See notes to financial statements.
|
16
STATEMENT OF INVESTMENTS
January 31, 2006
|
| | | Annualized | | | | |
| | | Yield on | | | | |
| | | Date of | | Principal | | |
| Dreyfus Treasury Cash Management | | Purchase (%) | | Amount ($) | | Value ($) |
| |
| |
| |
|
| |
| U.S. Treasury Bills—25.4% | | | | | | |
| |
| |
| |
|
| 3/23/2006 | | 3.72 | | 200,000,000 | | 198,986,111 |
| 7/6/2006 | | 4.30 | | 500,000,000 | | 490,926,042 |
| 7/13/2006 | | 4.33 | | 500,000,000 | | 490,460,000 |
| Total U.S. Treasury Bills | | | | | | |
| (cost $1,180,372,153) | | | | | | 1,180,372,153 |
| |
| |
| |
|
| |
| Repurchase Agreements—74.9% | | | | | | |
| |
| |
| |
|
| ABN AMRO Bank NV | | | | | | |
| dated 1/31/2006, due 2/1/2006 in the amount of $550,066,764 | | | | |
| (fully collateralized by $571,761,000 U.S. Treasury Notes, | | | | | | |
| 2.875%-3.375%, due 11/30/2006-11/15/2008, | | | | | | |
| value $561,000,826) | | 4.37 | | 550,000,000 | | 550,000,000 |
| Banc of America Securities | | | | | | |
| dated 1/31/2006, due 2/1/2006 in the amount of $550,066,917 | | | | |
| (fully collateralized by $41,930,000 U.S. Treasury Bonds, | | | | | | |
| 3.625%-9.875%, due 11/15/2015-4/15/2028, value | | | | | | |
| $59,117,707 and $487,263,000 U.S. Treasury | | | | | | |
| Notes, 2%-6%, due 1/15/2008-7/15/2014, | | | | | | |
| value $501,882,566) | | 4.38 | | 550,000,000 | | 550,000,000 |
| Barclays Capital Inc. | | | | | | |
| dated 1/31/2006, due 2/1/2006 in the amount of $194,023,172 | | | | |
| (fully collateralized by $101,410,000 U.S. Treasury Bonds, | | | | | | |
| 7.875%-8.125%, due 2/15/2021-8/15/2021, | | | | | | |
| value $141,560,581 and $56,591,000 | | | | | | |
| U.S. Treasury Notes, 2.75%, due 6/30/2006, | | | | | | |
| value $56,319,644) | | 4.30 | | 194,000,000 | | 194,000,000 |
| Credit Suisse First Boston LLC | | | | | | |
| dated 1/31/2006, due 2/1/2006 in the amount of $500,060,417 | | | | |
| (fully collateralized by $265,000,000 U.S. Treasury Bills, | | | | | | |
| due 5/11/2006, value $261,772,141 | | | | | | |
| and $245,715,000 U.S. Treasury Notes, | | | | | | |
| 4.625%, due 5/15/2006, value $248,218,664) | | 4.35 | | 500,000,000 | | 500,000,000 |
| Goldman, Sachs & Co. | | | | | | |
| dated 1/31/2006, due 2/1/2006 in the amount of $303,034,929 | | | | |
| (fully collateralized by $77,908,000 U.S. Treasury Bills, | | | | | | |
| due 2/16/2006-5/11/2006, value $77,433,094, $700,000 | | | | |
| U.S. Treasury Bonds, 3.625%, due 4/15/2028, value $1,113,118, | | | | |
| and $234,411,000 U.S. Treasury Notes, | | | | | | |
| 3.375%-4%, due 2/15/2008-2/15/2015, | | | | | | |
| value $230,513,997) | | 4.15 | | 303,000,000 | | 303,000,000 |
| J.P. Morgan Securities | | | | | | |
| dated 1/31/2006, due 2/1/2006 in the amount of $328,039,542 | | | | |
| (fully collateralized by $341,660,000 U.S. Treasury Bills, | | | | | | |
| due 7/20/2006, value $334,561,310) | | 4.34 | | 328,000,000 | | 328,000,000 |
The Funds 17
STATEMENT OF INVESTMENTS (continued)
| | | Annualized | | | | |
| | | Yield on | | | | |
| | | Date of | | Principal | | |
| Dreyfus Treasury Cash Management (continued) | | Purchase (%) | | Amount ($) | | Value ($) |
| |
| |
| |
|
| |
| Repurchase Agreements (continued) | | | | | | |
| |
| |
| |
|
| Morgan Stanley & Co. | | | | | | |
| dated 1/31/2006, due 2/1/2006 in the amount of $550,066,917 | | | | | | |
| (fully collateralized by $1,019,482,000 U.S. Treasury Strips, | | | | | | |
| due 2/15/2018-11/15/2019, value $561,601,249) | | 4.38 | | 550,000,000 | | 550,000,000 |
| UBS Warburg LLC | | | | | | |
| dated 1/31/2006, due 2/1/2006 in the amount of $500,060,417 | | | | | | |
| (fully collateralized by $515,412,000 U.S. Treasury Bills, | | | | | | |
| due 4/27/2006, value $510,000,174) | | 4.35 | | 500,000,000 | | 500,000,000 |
| Total Repurchase Agreements | | | | | | |
| (cost $3,475,000,000) | | | | | | 3,475,000,000 |
| |
| |
| |
|
| |
| Total Investments (cost $4,655,372,153) | | | | 100.3% | | 4,655,372,153 |
| |
| Liabilities, Less Cash and Receivables | | | | (.3%) | | (11,757,884) |
| |
| Net Assets | | | | 100.0% | | 4,643,614,269 |
| Portfolio Summary † | | | | | | |
| | | Value (%) | | | | Value (%) |
| |
| |
| |
|
| Repurchase Agreements | | 74.9 | | U.S. Treasury Bills | | 25.4 |
| | | | | | | 100.3 |
† Based on net assets.
See notes to financial statements.
|
18
| | STATEMENT OF INVESTMENTS
January 31, 2006
|
| | | Annualized | | | | |
| | | Yield on | | | | |
| | | Date of | | Principal | | |
| Dreyfus Treasury Prime Cash Management | | Purchase (%) | | Amount ($) | | Value ($) |
| |
| |
| |
|
| |
| U.S. Treasury Bills—83.6% | | | | | | |
| |
| |
| |
|
| 2/9/2006 | | 3.63 | | 81,500,000 | | 81,435,253 |
| 2/23/2006 | | 4.05 | | 1,500,000 | | 1,496,306 |
| 3/2/2006 | | 3.88 | | 759,856,000 | | 757,499,646 |
| 3/9/2006 | | 3.95 | | 77,886,000 | | 77,580,852 |
| 3/23/2006 | | 4.03 | | 88,900,000 | | 88,407,131 |
| 3/30/2006 | | 4.18 | | 45,500,000 | | 45,201,343 |
| 4/13/2006 | | 4.08 | | 835,900,000 | | 829,254,175 |
| 4/20/2006 | | 4.05 | | 225,000,000 | | 223,055,417 |
| Total U.S. Treasury Bills | | | | | | |
| (cost $2,103,930,123) | | | | | | 2,103,930,123 |
| |
| |
| |
|
| U.S. Treasury Notes—16.5% | | | | | | |
| |
| |
| |
|
| 1.50%, 3/31/2006 | | | | | | |
| (cost $415,292,580) | | 4.04 | | 417,000,000 | | 415,292,580 |
| |
| |
| |
|
| Total Investments (cost $2,519,222,703) | | | | 100.1% | | 2,519,222,703 |
| Liabilities, Less Cash and Receivables | | | | (.1%) | | (2,567,441) |
| Net Assets | | | | 100.0% | | 2,516,655,262 |
| Portfolio Summary † | | | | | | |
| | | Value (%) | | | | Value (%) |
| |
| |
| |
|
| U.S. Treasury Bills | | 83.6 | | U.S. Treasury Notes | | 16.5 |
| | | | | | | 100.1 |
† Based on net assets.
See notes to financial statements.
|
The Funds 19
| | STATEMENT OF INVESTMENTS
January 31, 2006
|
| | | Principal | | | | |
| Dreyfus Municipal Cash Management Plus | | Amount ($) | | Value ($) |
| |
| |
|
| |
| Tax Exempt Investments—101.6% | | | | | | |
| |
| |
| |
|
| Alabama—5.1% | | | | | | |
| Columbia Industrial Development Board, PCR | | | | | | |
| (Alabama Power Co. Project) 3.11% | | 9,800,000 | | a | | 9,800,000 |
| Homewood Educational Building Authority, | | | | | | |
| Revenue (Samford University) | | | | | | |
| 3.04% (Liquidity Facility; Southtrust Bank) | | 3,715,000 | | a | | 3,715,000 |
| Jefferson County, GO Warrants | | | | | | |
| 3.04% (Liquidity Facility: Bayerische Landesbank | | | | | | |
| and JPMorgan Chase Bank) | | 36,700,000 | | a | | 36,700,000 |
| Arizona—4.7% | | | | | | |
| Maricopa County Industrial Development Authority, | | | | | | |
| MFHR: | | | | | | |
| Refunding (San Martin Apartments Project) 3.05% | | | | | | |
| (Insured; FNMA and Liquidity Facility; FNMA) | | 7,200,000 | | a | | 7,200,000 |
| (San Clemente Apartments Project) 3.31% | | | | | | |
| (Insured; FNMA and Liquidity Facility; FNMA) | | 1,010,000 | | a | | 1,010,000 |
| Phoenix Civic Improvement Corporation: | | | | | | |
| Airport Revenue | | | | | | |
| (Merlots Program) 3.11% (Insured; FGIC and | | | | | | |
| Liquidity Facility; Wachovia Bank) | | 4,645,000 | | a,b | | 4,645,000 |
| Water System Revenue: | | | | | | |
| 3.06% (Insured; MBIA and Liquidity Facility; Merrill Lynch) | | 10,990,000 | | a,b | | 10,990,000 |
| 3.06% (Insured; MBIA and Liquidity Facility; Merrill Lynch) | | 14,320,000 | | a,b | | 14,320,000 |
| Roaring Fork Municipal Products, Revenue, | | | | | | |
| COP 3.10% (Insured; MBIA and Liquidity Facility; The Bank of New York) | | 8,065,000 | | a,b | | 8,065,000 |
| California—2.9% | | | | | | |
| California, RAN 4.50%, 6/30/2006 | | 8,000,000 | | | | 8,048,040 |
| FHLMC Multifamily Certificates Housing Revenue 3.12% | | | | | | |
| (Liquidity Facility; FHLMC and LOC; FHLMC) | | 16,771,698 | | a,b | | 16,771,698 |
| Golden State Tobacco Securitization Corporation, Tobacco | | | | | | |
| Settlement Revenue 3.04% Liquidity Facility; Merrill Lynch) | | 4,000,000 | | a,b | | 4,000,000 |
| Colorado—4.6% | | | | | | |
| Colorado Health Facilities Authority, Health Care Facilities Revenue | | | | | | |
| (Christian Living Campus) 3.05% (LOC; HSH Nordbank) | | 4,275,000 | | a | | 4,275,000 |
| Colorado Housing and Finance Authority, EDR | | | | | | |
| (Wanco Inc. Project) 3.17% (LOC; U.S. Bank NA) | | 3,500,000 | | a | | 3,500,000 |
| Denver City and County, Airport Revenue, Refunding | | | | | | |
| 3.07% (Insured; MBIA and Liquidity Facility; Bank One) | | 5,000,000 | | a | | 5,000,000 |
| Erie, COP 3.08% (LOC; Key Bank) | | 4,365,000 | | a | | 4,365,000 |
| Lower Colorado River Authority, | | | | | | |
| CP: | | | | | | |
| 3.15%, 2/16/2006 (Liquidity Facility; JPMorgan Chase Bank) | | 6,800,000 | | | | 6,800,000 |
| 3.10%, 3/9/2006 (Liquidity Facility; JPMorgan Chase Bank) | | 10,000,000 | | | | 10,000,000 |
| Southern Ute Indian Tribe of Southern Ute Indian | | | | | | |
| Reservation, Industrial Revenue 3.09% | | 11,000,000 | | a | | 11,000,000 |
| | | Principal | | | | |
| Dreyfus Municipal Cash Management Plus (continued) | | Amount ($) | | Value ($) |
| |
| |
|
| |
| Tax Exempt Investments (continued) | | | | | | |
| |
| |
| |
|
| Delaware—3.5% | | | | | | |
| Delaware Economic Development Authority: | | | | | | |
| EDR | | | | | | |
| (Hospital Billing and Collection Service, LTD. Project) | | | | | | |
| 3% (Insured; AMBAC and Liquidity Facility; Morgan Stanley) | | 30,000,000 | | a | | 30,000,000 |
| Private Schools Revenue | | | | | | |
| (Saint Anne’s Episcopal School Project) | | | | | | |
| 3.10% (LOC; Wilmington Trust Co.) | | 4,000,000 | | a | | 4,000,000 |
| District of Columbia—1.6% | | | | | | |
| Bank of New York Municipal Certificates Trust | | | | | | |
| 3.17% (GIC; Trinity Plus Funding and Liquidity | | | | | | |
| Facility; The Bank of New York) | | 10,000,000 | | a,b | | 10,000,000 |
| District of Columbia, Revenue | | | | | | |
| (American Association Homes and Services) | | | | | | |
| 3.07% (LOC: Unicredito Italiano SPA) | | 5,545,000 | | a | | 5,545,000 |
| Florida—2.1% | | | | | | |
| Jacksonville, PCR | | | | | | |
| (Florida Power and Light Co. Project) 3.15% | | 9,525,000 | | a | | 9,525,000 |
| Miami-Dade County Industrial Development Authority, | | | | | | |
| IDR (Fine Art Lamps Project) 3.08% (LOC; SunTrust Bank) | | 3,850,000 | | a | | 3,850,000 |
| Orange County Housing Finance Authority, | | | | | | |
| Homeowner Revenue 3.13% (Insured: FNMA and | | | | | | |
| GNMA and Liquidity Facility; Lehman Liquidity LLC) | | 3,755,000 | | a,b | | 3,755,000 |
| Orange County Industrial Development Authority, IDR | | | | | | |
| (Central Florida YMCA Project) 3.07% (LOC; Bank of America) | | 3,900,000 | | a | | 3,900,000 |
| Georgia—1.2% | | | | | | |
| Atlanta Urban Residential Finance Authority, | | | | | | |
| MFHR: | | | | | | |
| (Auburn Glenn Apartments) 3.08% (LOC; Wachovia Bank) | | 5,000,000 | | a | | 5,000,000 |
| (Lindbergh City Center Apartments) 3.09% (LOC; Regions Bank) | | 5,000,000 | | a | | 5,000,000 |
| Metropolitan Atlanta Rapid Transit Authority, CP | | | | | | |
| 3.15%, 2/16/2006 (LOC; Dexia Credit Locale) | | 1,500,000 | | | | 1,500,000 |
| Idaho—.5% | | | | | | |
| Idaho Housing and Finance Association, SFMR | | | | | | |
| 2.50%, 2/1/2006 (Liquidity Facility; Lloyds TSB Bank PLC) | | 5,000,000 | | | | 5,000,000 |
| Illinois—5.8% | | | | | | |
| Chicago, IDR (Victoria Limited LLC Project) | | | | | | |
| 3.10% (LOC; ABN-AMRO) | | 3,650,000 | | a | | 3,650,000 |
| Chicago Board of Education, GO 3.03% (Insured; CIFG | | | | | | |
| and Liquidity Facility; Dexia Credit Locale) | | 15,000,000 | | a | | 15,000,000 |
| Chicago School Finance Authority, GO School Assistance, | | | | | | |
| Refunding 4.96%, 6/1/2006 (Insured; FGIC) | | 1,395,000 | | | | 1,402,982 |
| Illinois (Merlots Program) 3.06% (Insured; FGIC | | | | | | |
| and Liquidity Facility; Wachovia Bank) | | 5,350,000 | | a,b | | 5,350,000 |
The Funds 21
STATEMENT OF INVESTMENTS (continued)
| | | Principal | | | | |
| Dreyfus Municipal Cash Management Plus (continued) | | Amount ($) | | Value ($) |
| |
| |
|
| |
| Tax Exempt Investments (continued) | | | | | | |
| |
| |
| |
|
| Illinois (continued) | | | | | | |
| Illinois Finance Authority, Revenue | | | | | | |
| (The Landing at Plymouth Place Project): | | | | | | |
| 3.04% (LOC; Lloyds TSB Bank PLC) | | 5,000,000 | | a | | 5,000,000 |
| 3.04% (LOC; ABN-AMRO) | | 10,000,000 | | a | | 10,000,000 |
| Illinois Health Facilities Authority, Health Care Facilities | | | | | | |
| Revenue, CP (Evanston Hospital Corp.) 2.90%, 2/23/2006 | | 8,000,000 | | | | 8,000,000 |
| Upper Illinois River Valley Development Authority, | | | | | | |
| SWDR (Exolon-Esk Co. Project) 3.10% (LOC; Bank of America) | | 8,405,000 | | a | | 8,405,000 |
| Indiana—4.3% | | | | | | |
| Elkhart County, EDR (Four Seasons Manufacturing | | | | | | |
| Project) 3.15% (LOC; National City Bank) | | 4,000,000 | | a | | 4,000,000 |
| Hammond, Sewer and Solid Waste Disposal | | | | | | |
| Revenue, Refunding (Cargill Inc. Project) 3.09% | | 6,500,000 | | a | | 6,500,000 |
| Indiana Bond Bank, Revenue (Interim Advance | | | | | | |
| Funding Program Notes) 3.09%, 2/2/2006 | | 10,000,000 | | | | 10,000,000 |
| Indiana Educational Facilities Authority, College and University | | | | | | |
| Revenue (Martin University Project) 3.05% (LOC; Key Bank) | | 3,235,000 | | a | | 3,235,000 |
| Indiana Health Facility Financing Authority, Health Facility | | | | | | |
| Revenue (Clark Memorial Hospital Project) 3.14% (LOC; Bank One) | | 8,690,000 | | a | | 8,690,000 |
| Indiana Toll Road Commission, Toll Road Revenue | | | | | | |
| (Merlots Program) 3.06% (Liquidity Facility; Wachovia Bank) | | 3,280,000 | | a,b,c | | 3,280,000 |
| Indianapolis Local Public Improvement Bond Bank, | | | | | | |
| Revenue 4.50%, 7/6/2006 | | 3,025,000 | | | | 3,040,783 |
| Saint Joseph County, Health Care Facility Revenue | | | | | | |
| (South Bend Medical Foundation Project) | | | | | | |
| 3.10% (LOC; National City Bank) | | 3,000,000 | | a | | 3,000,000 |
| Iowa—.5% | | | | | | |
| Iowa Finance Authority, SFMR (Backed Securities Program) | | | | | | |
| 3.07% (Liquidity Facility; State Street Bank and Trust Co.) | | 4,500,000 | | a | | 4,500,000 |
| Kansas—.3% | | | | | | |
| Mission, MFHR, Refunding | | | | | | |
| (The Falls Apartments Project) 3.01% (Insured; FNMA) | | 3,350,000 | | a | | 3,350,000 |
| Kentucky—4.2% | | | | | | |
| Kenton County Airport Board, Special Facilities Revenue | | | | | | |
| (Airis Cincinnati LLC) 3.14% (LOC; Deutsche Bank) | | 31,800,000 | | a | | 31,800,000 |
| Roaring Fork Municipal Products LLC, Revenue 3.16% (Insured; | | | | | | |
| AMBAC and Liquidity Facility; The Bank of New York) | | 9,535,000 | | a,b | | 9,535,000 |
| Louisiana—.7% | | | | | | |
| New Orleans, Sewer Service Revenue, BAN | | | | | | |
| 2.99%, 7/26/2006 | | 7,000,000 | | | | 7,000,000 |
| Maine—.9% | | | | | | |
| Auburn, Obligation Securities Revenue | | | | | | |
| (J&A Properties) 3.09% (LOC; Citizens Bank of Massachusetts) | | 2,550,000 | | a | | 2,550,000 |
| Finance Authority of Maine, Private Schools Revenue | | | | | | |
| (Kents Hill School) 3.02% (LOC; Allied Irish Banks) | | 6,000,000 | | a | | 6,000,000 |
| | | Principal | | | | |
| Dreyfus Municipal Cash Management Plus (continued) | | Amount ($) | | Value ($) |
| |
| |
|
| |
| Tax Exempt Investments (continued) | | | | | | |
| |
| |
| |
|
| Maryland—.2% | | | | | | |
| Maryland Economic Development Corporation, Revenue, Refunding | | | | | | |
| (United Cerebral Palsy Project) 3.14% (LOC; M&T Bank) | | 2,229,500 | | a | | 2,229,500 |
| Massachusetts—6.2% | | | | | | |
| Massachusetts, GO, Refunding 3% (Liquidity Facility; | | | | | | |
| Landesbank Hessen-Thuringen Girozentrale) | | 36,500,000 | | a | | 36,500,000 |
| Massachusetts Development Finance Agency: | | | | | | |
| CP | | | | | | |
| (Nantucket Electric Co.) 3.20%, 2/22/2006 | | 7,000,000 | | | | 7,000,000 |
| Revenue: | | | | | | |
| College and University (Suffolk Unversity) | | | | | | |
| 3.07% (Insured; Assured Guaranty and Liquidity | | | | | | |
| Facility; Citizens Bank of Massachusetts) | | 7,500,000 | | a | | 7,500,000 |
| Private Schools (North Field Mount Hermon) 3.10% (Insured; | | | | | | |
| Radian Bank and Liquidity Facility; Bank of America) | | 5,000,000 | | a | | 5,000,000 |
| Pembroke, GO Notes, BAN 3.95%, 8/3/2006 | | 5,000,000 | | | | 5,027,525 |
| Michigan—5.7% | | | | | | |
| Detroit, GO Notes, RAN 3.94%, 4/3/2006 | | 15,000,000 | | | | 15,033,660 |
| Michigan, GO Notes 4.44%, 9/29/2006 | | 7,600,000 | | | | 7,662,332 |
| Michigan Hospital Finance Authority, | | | | | | |
| Revenue: | | | | | | |
| (Chelsea Community Hospital) 3.06% (LOC; National City Bank) | | 3,685,000 | | a | | 3,685,000 |
| (Health Care Equipment Loan Program) 3.07% (LOC; ABN-AMRO) | | 5,000,000 | | a | | 5,000,000 |
| Michigan Municipal Bond Authority, Revenue | | | | | | |
| 3.98%, 8/18/2006 (LOC; JPMorgan Chase Bank) | | 10,500,000 | | | | 10,541,895 |
| Michigan Strategic Fund, LOR: | | | | | | |
| (HME Inc. Project) 3.11% (LOC; Fifth Third Bank) | | 2,235,000 | | a | | 2,235,000 |
| (Kaumagraph Flint Corp. Project) 3.13% (LOC; Bank One) | | 2,600,000 | | a | | 2,600,000 |
| (Peckham Vocational Industries Project) 3.16% (LOC; ABN-AMRO) | | 2,225,000 | | a | | 2,225,000 |
| (PFG Enterprises Inc. Project) 3.32% (LOC; Huntington NB) | | 2,875,000 | | a | | 2,875,000 |
| Oakland County Economic Development Corporation, | | | | | | |
| LOR (Michigan Seamless Tube LLC) 3.19% (LOC; ABN-AMRO) | | 4,000,000 | | a | | 4,000,000 |
| Minnesota—1.0% | | | | | | |
| Minneapolis-Saint Paul Metropolitan Airports Commission, Airport | | | | | | |
| Revenue 3.06% (Insured; FGIC and Liquidity Facility; Merrill Lynch) | | 9,685,000 | | a,b | | 9,685,000 |
| Missouri—3.3% | | | | | | |
| Kansas City Industrial Development Authority, Revenue | | | | | | |
| (Ewing Marion Kauffman Foundation Project) 3.07% | | 23,600,000 | | a | | 23,600,000 |
| Missouri Health and Educational Facilities Authority, | | | | | | |
| Health Facilities Revenue (Deaconess Long Term | | | | | | |
| Care of Missouri, Inc.) 3.05% (LOC; Bank One) | | 8,345,000 | | a | | 8,345,000 |
| Nevada—1.4% | | | | | | |
| Roaring Fork Municipal Products LLC, Revenue 3.17% | | | | | | |
| (Insured; FNMA and Liquidity Facility; The Bank of New York) | | 13,565,000 | | a,b | | 13,565,000 |
| New Jersey—1.5% | | | | | | |
| New Jersey, TRAN 3.95%, 6/23/2006 | | 15,000,000 | | | | 15,065,806 |
The Funds 23
STATEMENT OF INVESTMENTS (continued)
| | | Principal | | | | |
| Dreyfus Municipal Cash Management Plus (continued) | | Amount ($) | | Value ($) |
| |
| |
|
| |
| Tax Exempt Investments (continued) | | | | | | |
| |
| |
| |
|
| New Mexico—.6% | | | | | | |
| Dona Ana County, IDR (Foamex Products Inc. Project) 3.09% (LOC; Bank of Nova Scotia) | | 5,900,000 | | a | | 5,900,000 |
| North Carolina—1.2% | | | | | | |
| Board of Governors of The University of North Carolina, CP 3.10%, 4/6/2006 | | 10,000,000 | | | | 10,000,000 |
| Burke County Industrial Facilities and Pollution Control Financing Authority, | | | | | | |
| Industrial Revenue (Bauer Industries Inc. Project) 3.13% (LOC; Bank of Montreal) | | 1,655,000 | | a | | 1,655,000 |
| Ohio—2.7% | | | | | | |
| Butler County, Capital Funding Revenue | | | | | | |
| (CCAO Low Cost Capital) 3.04% (LOC; U.S. Bank NA) | | 3,255,000 | | a | | 3,255,000 |
| Hamilton County: | | | | | | |
| Health Care Facilities Revenue (Twin Towers and | | | | | | |
| Twin Lakes Project) 3.05% (LOC; U.S. Bank NA) | | 8,000,000 | | a | | 8,000,000 |
| Hospital Facilities Revenue 3.11% (Insured; FSA and | | | | | | |
| Liquidity Facility; Svenska Handelsbanken) | | 10,000,000 | | a,b | | 10,000,000 |
| University of Cincinnati, General Receipts, BAN 4.44%, 1/25/2007 | | 5,000,000 | | | | 5,056,946 |
| Oregon—1.5% | | | | | | |
| Oregon, Homeowner Revenue | | | | | | |
| 3.11% (Liquidity Facility; Merrill Lynch) | | 14,450,000 | | a,b | | 14,450,000 |
| Pennsylvania—10.9% | | | | | | |
| Dauphin County General Authority, Revenue (School | | | | | | |
| District Pooled Financing Program) 3.05% | | | | | | |
| (Insured; AMBAC and Liquidity Facility; Bank of Nova Scotia) | | 2,250,000 | | a | | 2,250,000 |
| Emmaus General Authority, Revenue: | | | | | | |
| 3.05% (LOC; DEPFA Bank) | | 5,250,000 | | a | | 5,250,000 |
| Local Government: | | | | | | |
| 3.05% (LOC; DEPFA Bank) | | 6,200,000 | | a | | 6,200,000 |
| 3.05% (GIC; Goldman Sachs and Co.) | | 9,000,000 | | a | | 9,000,000 |
| Lancaster Municipal Authority, Revenue (Ephrata | | | | | | |
| Community Hospital Project) 3.13% (LOC; Fulton Bank) | | 4,000,000 | | a | | 4,000,000 |
| Montgomery County Industrial Development Authority: | | | | | | |
| Industrial Revenue (Recigno Laboratories) | | | | | | |
| 3.18% (LOC; Wachovia Bank) | | 1,685,000 | | a | | 1,685,000 |
| PCR, CP | | | | | | |
| (Exelon Generation Project) 3.15%, | | | | | | |
| 3/14/2006 (LOC; Banque Nationale de Paris) | | 10,000,000 | | | | 10,000,000 |
| North Lebanon Township Municipal Authority, Sewer Revenue | | | | | | |
| 3.07% (Insured; FSA and Liquidity Facility; Dexia Credit Locale) | | 3,400,000 | | a | | 3,400,000 |
| Pennsylvania Housing Finance Agency, SFHR | | | | | | |
| 3.05% (Liquidity Facility; DEPFA Bank) | | 30,000,000 | | a | | 30,000,000 |
| Philadelphia, Airport Revenue, Refunding | | | | | | |
| 3.10% (Insured; MBIA and Liquidity Facility; JPMorgan Chase Bank) | | 11,000,000 | | a | | 11,000,000 |
| Philadelphia Authority for Industrial Development, Revenue | | | | | | |
| (Gift of Life Donor Program Project) 3.05% (LOC; Commerce Bank) | | 12,940,000 | | a | | 12,940,000 |
| Venango Industrial Development Authority, RRR, CP (Scrubgrass | | | | | | |
| Power Corp. Project) 3.20%, 2/9/2006 (LOC; Dexia Credit Locale) | | 7,992,000 | | | | 7,992,000 |
| West Cornwall Township Municipal Authority, Revenue | | | | | | |
| (Pennsylvania General Government Loan Program) | | | | | | |
| 3.05% (Insured; FSA and Liquidity Facility; Dexia Credit Locale) | | 2,923,000 | | a | | 2,923,000 |
24
| | | Principal | | | | |
| Dreyfus Municipal Cash Management Plus (continued) | | Amount ($) | | Value ($) |
| |
| |
|
| |
| Tax Exempt Investments (continued) | | | | | | |
| |
| |
| |
|
| Texas—12.7% | | | | | | |
| Bexar County Housing Finance Corporation, MFHR (Gates Capernaum | | | | | | |
| Apartments Project) 3.15% (Liquidity Facility; Merrill Lynch) | | 3,980,000 | | a,b | | 3,980,000 |
| Brazos River Authority, PCR, Refunding (TXU Energy | | | | | | |
| Co. Project) 3.10% (LOC; Wachovia Bank) | | 5,700,000 | | a | | 5,700,000 |
| East Texas Housing Finance Corporation, MFHR | | | | | | |
| 3.15% (Liquidity Facility; Merrill Lynch and LOC; Merrill Lynch) | | 4,320,000 | | a,b | | 4,320,000 |
| Harris County, GO, CP 3.19%, 5/10/2006 (Liquidity | | | | | | |
| Facility: Bank of Nova Scotia and Lloyds TSB Bank) | | 5,000,000 | | | | 5,000,000 |
| Harris County Housing Finance Corporation, MFHR | | | | | | |
| 3.15% (Liquidity Facility; Merrill Lynch and LOC; Merrill Lynch) | | 13,145,000 | | a,b | | 13,145,000 |
| Harris County Industrial Development Corporation, SWDR | | | | | | |
| (Deer Park Refining LP Project) 3.17% | | 10,200,000 | | a | | 10,200,000 |
| Houston, Airport System Revenue, CP | | | | | | |
| 3.15%, 5/8/2006 (LOC; Dexia Credit Locale) | | 5,500,000 | | | | 5,500,000 |
| Mansfield Independent School District, GO 3.06% (Insured: Permanent | | | | | | |
| School Fund Guaranteed and Liquidity Facility; Deutsche Bank) | | 5,635,000 | | a,b | | 5,635,000 |
| Montgomery County Housing Finance Corporation, | | | | | | |
| MFHR (Park at Woodline Townhomes) 3.14% (LOC; Citibank NA) | | 7,500,000 | | a | | 7,500,000 |
| Revenue Bond Certificate Series Trust, Various States | | | | | | |
| Revenue: | | | | | | |
| (Chimney Project) 3.46% (GIC; AIG Funding Inc.) | | 6,210,000 | | a,b | | 6,210,000 |
| (Pebble Brooke) 3.46% (GIC; AIG Funding Inc.) | | 7,000,000 | | a,b | | 7,000,000 |
| San Antonio, Water Revenue, Refunding 3.04% (Insured; | | | | | | |
| MBIA and Liquidity Facility; JPMorgan Chase Bank) | | 19,850,000 | | a | | 19,850,000 |
| Texas, GO Notes, TRAN 4.50%, 8/31/2006 | | 12,000,000 | | | | 12,100,197 |
| Texas Department of Housing and Community Affairs, MFHR | | | | | | |
| 3.15% (Liquidity Facility; Merrill Lynch and LOC; Merrill Lynch) | | 7,500,000 | | a,b | | 7,500,000 |
| Texas Public Finance Authority, GO, CP 3.15%, 5/10/2006 | | 10,900,000 | | | | 10,900,000 |
| Vermont—1.1% | | | | | | |
| Vermont Economic Development Authority, CP (Economic Development | | | | | | |
| Capital Program) 3.15%, 4/25/2006 (LOC; JPMorgan Chase Bank) | | 10,650,000 | | | | 10,650,000 |
| Virginia—4.4% | | | | | | |
| Norfolk Economic Development Authority, New Empowerment Zone Facility | | | | | | |
| Revenue (Metropolitan Machine Corp. Project) 3.08% (LOC; Wachovia Bank) | | 6,600,000 | | a | | 6,600,000 |
| Norfolk Redevelopment and Housing Authority, Revenue, Refunding (Old Dominion | | | | | | |
| University Project) 3.02% (Insured; CIFG and Liquidity Facility; Bank of America) | | 20,000,000 | | a | | 20,000,000 |
| Virginia Beach Development Authority, IDR, | | | | | | |
| Refunding (Giant Square Shopping Center Co. L.L.P. Project) | | | | | | |
| 3.08% (LOC; Wachovia Bank) | | 3,500,000 | | a | | 3,500,000 |
| Virginia Housing Development Authority, Commomwealth | | | | | | |
| Mortgage Revenue 3.01%, 5/16/2006 | | 10,000,000 | | | | 10,000,000 |
| Winchester Industrial Development Authority, Residential Care Facility Revenue | | | | | | |
| (Westminister-Canterbury of Winchester, Inc.) 3.05% (LOC; Branch Banking and Trust Co.) | | 3,000,000 | | a | | 3,000,000 |
| Washington—3.3% | | | | | | |
| Everett Industrial Development Corporation, Exempt Facilities Revenue | | | | | | |
| (Kimberly Clark Corp. Project) 3.10% | | 3,200,000 | | a | | 3,200,000 |
The Funds 25
STATEMENT OF INVESTMENTS (continued)
| | | Principal | | | | |
| Dreyfus Municipal Cash Management Plus (continued) | | Amount ($) | | Value ($) |
| |
| |
|
| |
| Tax Exempt Investments (continued) | | | | | | |
| |
| |
| |
|
| Washington (continued) | | | | | | |
| Port of Seattle, Revenue | | | | | | |
| 3.10% (Insured; FGIC and Liquidity Facility; BNP Paribas) | | 2,870,000 | | a,b | | 2,870,000 |
| Seattle Housing Authority, Revenue | | | | | | |
| (Newholly Project-Phase III) 3.10% (LOC; Key Bank) | | 2,450,000 | | a | | 2,450,000 |
| Washington Economic Development Finance Authority, | | | | | | |
| SWDR: | | | | | | |
| (Cedar Grove Composing Project) 3.10% (LOC; Wells Fargo Bank) | | 5,400,000 | | a | | 5,400,000 |
| (Lemay Enterprises Project) 3.10% (LOC; Bank of America) | | 5,665,000 | | a | | 5,665,000 |
| (Waste Management Project) 3.10% (LOC; Bank of America) | | 5,500,000 | | a | | 5,500,000 |
| Washington Housing Finance Commission, | | | | | | |
| MFHR (Queen Anne Project) 3.11% (LOC; Bank of America) | | 7,500,000 | | a | | 7,500,000 |
| Wyoming—1.0% | | | | | | |
| Campbell County, IDR | | | | | | |
| (Two Elk Power Generation Project) 3.50%, 12/1/2006 (GIC; Citibank NA) | | 10,000,000 | | | | 10,000,000 |
| |
| |
| |
|
| |
| Total Investments (cost $995,776,364) | | 101.6% | | | | 995,776,364 |
| Liabilities, Less Cash and Receivables | | (1.6%) | | (15,213,767) |
| Net Assets | | 100.0% | | | | 980,562,597 |
| | See footnotes on page 39.
See notes to financial statements.
|
| | STATEMENT OF INVESTMENTS
January 31, 2006
|
| | | Principal | | | | |
| Dreyfus New York Municipal Cash Management | | Amount ($) | | Value ($) |
| |
| |
|
| |
| Tax Exempt Investments—99.5% | | | | | | |
| |
| |
| |
|
| New York—98.6% | | | | | | |
| Albany Industrial Development Agency, | | | | | | |
| Housing Revenue (South Mall Towers Albany, L.P. Project) | | | | | | |
| 3.05% (Insured; FNMA and Liquidity Facility; FNMA) | | 6,700,000 | | a | | 6,700,000 |
| Allegany County, GO Notes, BAN 4.25%, 9/27/2006 | | | | | | |
| (LOC; JPMorgan Chase Bank) | | 2,800,000 | | | | 2,817,786 |
| Chautauqua County Industrial Development Agency, Civic Facility | | | | | | |
| Revenue (Gerry Homes Project) 3.10% (LOC; HSBC Bank USA) | | 13,850,000 | | a | | 13,850,000 |
| Chemung County Industrial Development Agency, | | | | | | |
| IDR (MMARS 2nd Program) 3.15% (LOC; HSBC Bank USA) | | 1,140,000 | | a | | 1,140,000 |
| Dutchess County Industrial Development Agency, Civic Facility Revenue, | | | | | | |
| Refunding (Lutheran Center) 3.02% (LOC; Key Bank) | | 3,930,000 | | a | | 3,930,000 |
| Erie County Industrial Development Agency: | | | | | | |
| Civic Facility Revenue: | | | | | | |
| (D’Youville College Project) 3.10% (LOC; HSBC Bank USA) | | 7,310,000 | | a | | 7,310,000 |
| (Heritage Center Project) 3.10% (LOC; Key Bank) | | 2,445,000 | | a | | 2,445,000 |
| (YMCA of Greater Buffalo Project): | | | | | | |
| 3.10% (LOC; HSBC Bank USA) | | 1,350,000 | | a | | 1,350,000 |
| 3.10% (LOC; HSBC Bank USA) | | 4,000,000 | | a | | 4,000,000 |
| School Facility Revenue | | | | | | |
| 3.05% (Insured; FSA and Liquidity Facility; Goldman Sachs) | | 3,900,000 | | a,b | | 3,900,000 |
| Erie County Tobacco Asset Securitization Corporation, | | | | | | |
| Revenue 3.10% (Liquidity Facility; Merrill Lynch and LOC; Merrill Lynch) | | 3,245,000 | | a,b | | 3,245,000 |
| Herkimer County Industrial Development Agency, | | | | | | |
| IDR (F.E. Hale Manufacturing Co.) 3.15% (LOC; HSBC Bank USA) | | 2,450,000 | | a | | 2,450,000 |
| Islip Industrial Development Agency, IDR (Brentwood | | | | | | |
| Distribution Co. Facility) 3.01% (LOC; Bank of America) | | 3,750,000 | | a | | 3,750,000 |
| Metropolitan Transportation Authority: | | | | | | |
| Dedicated Tax Fund 2.99% (Insured; AMBAC | | | | | | |
| and Liquidity Facility; Wachovia Bank) | | 17,400,000 | | a | | 17,400,000 |
| Transportation Revenue 3.05% (Insured; AMBAC | | | | | | |
| and Liquidity Facility; The Bank of New York) | | 5,665,000 | | a,b | | 5,665,000 |
| Monroe County Industrial Development Agency: | | | | | | |
| Industrial Revenue: | | | | | | |
| (Chaney Enterprise) 3.22% (LOC; M&T Bank) | | 2,700,000 | | a | | 2,700,000 |
| (Genesee Metal Stampings) 3.20% (LOC; HSBC Bank USA) | | 910,000 | | a | | 910,000 |
| LR (Robert Weslayan College) 3.05% (LOC; M&T Bank) | | 2,900,000 | | a | | 2,900,000 |
| Nassau County Industrial Development Agency: | | | | | | |
| Civic Facility Revenue (Saint Mary’s Children Project) 3.07% (LOC; Commerce Bank) | | 2,015,000 | | a | | 2,015,000 |
| Revenue (Bryant Landing Project) 3.12% | | | | | | |
| (Liquidity Facility; Merrill Lynch and LOC; Merrill Lynch) | | 5,000,000 | | a,b | | 5,000,000 |
| New York City: | | | | | | |
| 3.04% (Insured; MBIA and Liquidity Facility; Wachovia Bank) | | 6,050,000 | | a | | 6,050,000 |
| 3.04% (Insured; MBIA and Liquidity Facility; Rabobank Nederland) | | 4,000,000 | | a | | 4,000,000 |
| 3.08% (Liquidity Facility; Merrill Lynch) | | 7,000,000 | | a,b | | 7,000,000 |
| 3.08% (Liquidity Facility; Dexia Credit Local and LOC; Dexia Credit Local) | | 1,775,000 | | a,b | | 1,775,000 |
| 3.09% (Liquidity Facility; Citigroup Inc.) | | 5,000,000 | | a,b | | 5,000,000 |
| 6.70%, 8/1/2006 | | 3,000,000 | | | | 3,055,498 |
| CP 3.10%, 2/16/2006 (Insured; MBIA and Liquidity Facility; | | | | | | |
| Landesbank Hessen-Thuringen Girozentrale) | | 15,000,000 | | | | 15,000,000 |
The Funds 27
STATEMENT OF INVESTMENTS (continued)
| | | Principal | | | | |
| Dreyfus New York Municipal Cash Management (continued) | | Amount ($) | | Value ($) |
| |
| |
|
| |
| Tax Exempt Investments (continued) | | | | | | |
| |
| |
| |
|
| New York (continued) | | | | | | |
| New York City Industrial Development Agency: | | | | | | |
| Civic Facility Revenue: | | | | | | |
| (Birch Wathen Lenox School Project) 3.05% (LOC; Allied Irish Bank) | | 3,625,000 | | a | | 3,625,000 |
| (Brooklyn United Methodist Project) 3% (LOC; The Bank of New York) | | 3,720,000 | | a | | 3,720,000 |
| (French Institute Alliance) 3.10% (LOC; M&T Bank) | | 2,550,000 | | a | | 2,550,000 |
| (Jewish Community Center) 3.05% (LOC; M&T Bank) | | 5,000,000 | | a | | 5,000,000 |
| (Village Community School Project) 3.10% (LOC; M&T Bank) | | 2,450,000 | | a | | 2,450,000 |
| IDR, Refunding (Plaza Packaging Project) 3.15% (LOC; The Bank of New York) | | 1,370,000 | | a | | 1,370,000 |
| Special Facilities Revenue 3.08% (Liquidity Facility; Merrill Lynch) | | 8,200,000 | | a,b | | 8,200,000 |
| New York City Municipal Water Finance Authority: | | | | | | |
| CP 3.12%, 4/13/2006 (Liquidity Facility: Dexia Credit Locale and JPMorgan Chase Bank) | | 10,000,000 | | | | 10,000,000 |
| Water and Sewer System Revenue 3.01% (Liquidity Facility; Dexia Credit Locale) | | 10,000,000 | | a | | 10,000,000 |
| New York Counties Tobacco Trust I, Revenue 3.10% | | | | | | |
| (Liquidity Facility; Merrill Lynch and LOC; Merrill Lynch) | | 8,000,000 | | a,b | | 8,000,000 |
| New York State, GO: | | | | | | |
| 2.83%, 2/6/2006 (LOC; Dexia Credit Locale) | | 5,600,000 | | | | 5,600,000 |
| Refunding 6.46%, 7/15/2006 | | 1,000,000 | | | | 1,015,256 |
| New York State Dormitory Authority: | | | | | | |
| CP (Mount Sinai Medical School) 3.05%, 2/17/2006 (LOC; JPMorgan Chase Bank) | | 6,200,000 | | | | 6,200,000 |
| Income Tax Revenue 3.04% (Insured; AMBAC and Liquidity Facility; Morgan Stanley) | | 10,765,000 | | a,b | | 10,765,000 |
| (Mental Health Services Facilities) 4.86%, 2/15/2006 | | 4,145,000 | | | | 4,148,218 |
| (New York State Rehabilitation Association | | | | | | |
| Pooled Loan Program Number 2) 3.97%, 7/1/2006 (Insured; CIFG) | | 1,120,000 | | | | 1,123,395 |
| (Park Ridge Hospital Inc.) 3.01% (LOC; JPMorgan Chase Bank) | | 10,900,000 | | a | | 10,900,000 |
| (Pratt Institute) 3.07% (Insured; Radian Bank and Liquidity Facility; Citibank N.A.) | | 6,500,000 | | a | | 6,500,000 |
| New York State Housing Finance Agency: | | | | | | |
| LR 3.08% (Liquidity Facility; Merrill Lynch) | | 4,990,000 | | a,b | | 4,990,000 |
| Revenue: | | | | | | |
| (33 West End Avenue Apartments) 3.07% (LOC; HSBC Bank USA) | | 9,000,000 | | a | | 9,000,000 |
| (240 East 39th Street Housing) 3.05% (LOC; FNMA) | | 8,100,000 | | a | | 8,100,000 |
| (250 West 93rd Street) 3.06% (LOC; Bank of America) | | 5,000,000 | | a | | 5,000,000 |
| (360 West 43 Street) 3.03% (Liquidity Facility; FNMA) | | 5,050,000 | | a | | 5,050,000 |
| (400 3rd Avenue Apartments) 3.08% (LOC; Key Bank) | | 4,500,000 | | a | | 4,500,000 |
| (Biltmore Tower Housing) 3.04% (Insured; FNMA and Liquidity Facility; FNMA) | | 16,000,000 | | a | | 16,000,000 |
| (Chelsea Apartments) 3.07% (Insured; FNMA) | | 15,100,000 | | a | | 15,100,000 |
| (Rip Van Winkle House) 3.05% (Insured; FHLMC and Liquidity Facility; FHLMC) | | 5,700,000 | | a | | 5,700,000 |
| (Saville Housing) 3.04% (Insured; FHLMC and Liquidity Facility; FHLMC) | | 15,000,000 | | a | | 15,000,000 |
| New York State Thruway Authority, Service Contract Revenue | | | | | | |
| (Local Highway and Bridge) 4.76%, 4/1/2006 | | 10,000,000 | | | | 10,037,027 |
| New York State Urban Development Corporation, Revenue | | | | | | |
| 3.05% (Insured; FGIC and Liquidity Facility; Merrill Lynch) | | 19,670,000 | | a,b | | 19,670,000 |
| Oneida County Industrial Development Agency, Civic Facility Revenue (Mohawk | | | | | | |
| Valley Community College Dormitory Corporation Project) 3.02% (LOC; Citibank N.A.) | | 8,470,000 | | a | | 8,470,000 |
| Ontario County Industrial Development Agency, IDR | | | | | | |
| (Dixit Enterprises) 3.15% (LOC; HSBC Bank USA) | | 3,000,000 | | a | | 3,000,000 |
| Port Authority of New York and New Jersey: | | | | | | |
| CP 3.20%, 7/12/2006 (Liquidity Facility; Landesbank Hessen-Thuringen Gironzentrale) | | 15,000,000 | | | | 15,000,000 |
| Transit Revenue 3.07% (Insured; CIFG and Liquidity Facility; Merrill Lynch) | | 5,895,000 | | a,b | | 5,895,000 |
| | | Principal | | | | |
| Dreyfus New York Municipal Cash Management (continued) | | Amount ($) | | Value ($) |
| |
| |
|
| |
| Tax Exempt Investments (continued) | | | | | | |
| |
| |
| |
|
| New York (continued) | | | | | | |
| Poughkeepsie Industrial Development Agency, Senior Living Facility Revenue | | | | | | |
| (Manor at Woodside Project) 3.05% (LOC; The Bank of New York) | | 4,900,000 | | a | | 4,900,000 |
| Rensselaer Industrial Development Agency, IDR (Capital View | | | | | | |
| Office Park Project) 3.78%, 12/31/2006 (LOC; M&T Bank) | | 5,015,000 | | | | 5,015,000 |
| Roaring Fork Municipal Products LLC, Revenue | | | | | | |
| 3.09% (Liquidity Facility; The Bank of New York) | | 10,385,000 | | a,b | | 10,385,000 |
| Sachem Central School District at Holbrook, GO Notes, | | | | | | |
| TAN 3.69%, 6/22/2006 | | 12,000,000 | | | | 12,044,673 |
| Suffolk County Industrial Development Agency, IDR (Belmont | | | | | | |
| Villas LLC Facility) 3.05% (Insured; FNMA and Liquidity Facility; FNMA) | | 6,000,000 | | a | | 6,000,000 |
| Syracuse Industrial Development Agency, Civic Facility Revenue (Community | | | | | | |
| Development Properties-Larned Project) 3.05% (LOC; M&T Bank) | | 6,200,000 | | a | | 6,200,000 |
| Tompkins County Industrial Development Agency, College and | | | | | | |
| University Revenue (Cortland College) 3.10% (LOC; HSBC Bank USA) | | 4,350,000 | | a | | 4,350,000 |
| Ulster County Industrial Development Agency, IDR | | | | | | |
| (Selux Corporation Project) 3.17% (LOC; M&T Bank) | | 1,910,000 | | a | | 1,910,000 |
| Westchester County Industrial Development Agency: | | | | | | |
| Civic Facility Revenue: | | | | | | |
| (The Masters School) 3.05% (LOC; Allied Irish Bank) | | 3,440,000 | | a | | 3,440,000 |
| (Young Men’s Christian Association) 3.02% (LOC; Allied Irish Bank) | | 3,000,000 | | a | | 3,000,000 |
| Commercial Facility Revenue (Panorama Flight Service Inc. Project) | | | | | | |
| 3.05% (LOC; The Bank of New York) | | 4,875,000 | | a | | 4,875,000 |
| Westchester Tobacco Asset Securitization Corporation, | | | | | | |
| Revenue 3.10% (Liquidity Facility; Merrill Lynch and LOC; Merrill Lynch) | | 4,300,000 | | a,b | | 4,300,000 |
| Yonkers Industrial Development Agency: | | | | | | |
| MFHR | | | | | | |
| (Main Street Lofts Yonkers LLC Project) 3.12% (LOC; M&T Bank) | | 15,000,000 | | a | | 15,000,000 |
| Revenue (Merlots Program) 3.10% (Insured; GNMA | | | | | | |
| and Liquidity Facility; Wachovia Bank) | | 4,215,000 | | a,b | | 4,215,000 |
| U.S. Related—.9% | | | | | | |
| Commonwealth of Puerto Rico, TRAN | | | | | | |
| 4.46%, 7/28/2006 (LOC: Bank of Nova Scotia, Banque Paribas, Citibank N.A., Dexia | | | | | | |
| Credit Locale, Fortis Bank, Royal Bank of Canada and State Street Bank and Trust Co.) | | 4,000,000 | | | | 4,024,260 |
| |
| |
| |
|
| |
| Total Investments (cost $476,696,113) | | 99.5% | | | | 476,696,113 |
| Cash and Receivables (Net) | | .5% | | | | 2,502,527 |
| Net Assets | | 100.0% | | | | 479,198,640 |
| | See footnotes on page 39.
See notes to financial statements.
|
The Funds 29
| | STATEMENT OF INVESTMENTS
January 31, 2006
|
| | | Principal | | | | |
| Dreyfus Tax Exempt Cash Management | | Amount ($) | | Value ($) |
| |
| |
|
| |
| Tax Exempt Investments—104.5% | | | | | | |
| |
| |
| |
|
| Alabama—4.3% | | | | | | |
| DCH Health Care Authority, Health Care Facilities Revenue | | | | | | |
| 3.03% (LOC; Regions Bank) | | 10,000,000 | | a | | 10,000,000 |
| Jefferson County, | | | | | | |
| Sewer Revenue, Refunding: | | | | | | |
| 3.02% (Insured; XLCA and Liquidity Facility; Bank of America) | | 10,000,000 | | a | | 10,000,000 |
| 3.02% (Insured; XLCA and Liquidity Facility; Bank of Nova Scotia) | | 43,700,000 | | a | | 43,700,000 |
| 3.03% (Insured; XLCA and Liquidity Facility; Societe Generale) | | 10,000,000 | | a | | 10,000,000 |
| 3.05% (Insured; XLCA and Liquidity Facility; JPMorgan Chase Bank) | | 25,000,000 | | a | | 25,000,000 |
| University of Alabama, General Revenue | | | | | | |
| 3.03% (Insured; MBIA and Liquidity Facility; Southtrust Bank) | | 31,920,000 | | a | | 31,920,000 |
| Arkansas—.3% | | | | | | |
| Benton County Public Facilities Board, College Parking Revenue | | | | | | |
| (Northwest Arkansas Community) 3.04% (LOC; Regions Bank) | | 8,250,000 | | a | | 8,250,000 |
| Arizona—1.4% | | | | | | |
| ABN AMRO Munitops Certificate Trust, Sales Tax Revenue (Civic Plaza | | | | | | |
| Expansion Project) 3.05% (Insured; FGIC and Liquidity Facility; ABN-AMRO) | | 13,700,000 | | a,b | | 13,700,000 |
| Phoenix Civic Improvement Corp.: | | | | | | |
| Excise Tax Revenue (Putters Program) | | | | | | |
| 3.10% (Insured; FGIC and Liquidity Facility; PB Capital Finance) | | 8,285,000 | | a,b | | 8,285,000 |
| Water System Revenue 3.06% (Insured; MBIA and Liquidity Facility; Merrill Lynch) | | 19,960,000 | | a,b | | 19,960,000 |
| California—.7% | | | | | | |
| California, RAN 4.50%, 6/30/2006 | | 22,000,000 | | | | 22,132,109 |
| Colorado—4.0% | | | | | | |
| ABN AMRO Munitops Certificate Trust (Denver City and County Airport) | | | | | | |
| 3.07% (Insured; XCLA and Liquidity Facility; ABN-AMRO) | | 22,345,000 | | a,b | | 22,345,000 |
| Colorado Educational and Cultural Facilities Authority, Revenue | | | | | | |
| (EOP Charlotte JW, LLC Project) 3.07% (LOC; KBC Bank) | | 10,000,000 | | a | | 10,000,000 |
| Denver Urban Renewal Authority, Tax Increment Revenue | | | | | | |
| 3.11% (Liquidity Facility; Merrill Lynch) | | 12,495,000 | | a,b | | 12,495,000 |
| Lower Colorado River Authority, Revenue, CP: | | | | | | |
| 3.15%, 2/16/2006 (Liquidity Facility; JPMorgan Chase Bank) | | 36,000,000 | | | | 36,000,000 |
| 3.10%, 3/9/2006 (Liquidity Facility; JPMorgan Chase Bank) | | 40,000,000 | | | | 40,000,000 |
| Delaware—.4% | | | | | | |
| Delaware Economic Development Authority, MFHR | | | | | | |
| (School House Project) 3.15% (LOC; HSBC Bank USA) | | 13,500,000 | | a | | 13,500,000 |
| District of Columbia—1.3% | | | | | | |
| District of Columbia: | | | | | | |
| (American College of Cardiology) 3.03% (LOC; SunTrust Bank) | | 13,200,000 | | a | | 13,200,000 |
| (Georgetown Day School Issue) 3.03% (LOC; SunTrust Bank) | | 19,000,000 | | a | | 19,000,000 |
| GO Notes (Merlots Program) 3.06% (Insured; AMBAC | | | | | | |
| and Liquidity Facility; Wachovia Bank) | | 7,320,000 | | a,b | | 7,320,000 |
| Florida—1.8% | | | | | | |
| Orange County Health Facilities Authority, Revenue, | | | | | | |
| CP 3.20%, 3/23/2006 (LOC; SunTrust Bank) | | 10,000,000 | | | | 10,000,000 |
| Sunshine State Governmental Financing Commission, CP | | | | | | |
| 3.12%, 3/7/2006 (Liquidity Facility; DEPFA Bank PLC) | | 40,000,000 | | | | 40,000,000 |
| Tampa Bay Water, Utility System Revenue | | | | | | |
| (Merlots Program) 3.06% (Insured; FGIC and Liquidity Facility; Wachovia Bank) | | 5,670,000 | | a,b | | 5,670,000 |
30
| | | Principal | | | | |
| Dreyfus Tax Exempt Cash Management (continued) | | Amount ($) | | Value ($) |
| |
| |
|
| |
| Tax Exempt Investments (continued) | | | | | | |
| |
| |
| |
|
| Georgia—6.2% | | | | | | |
| Atlanta, Airport Insured General Revenue (Hartsfield International Airport) | | | | | | |
| 3.03% (Insured; MBIA and Liquidity Facility; Bayerische Landesbank) | | 78,330,000 | | a | | 78,330,000 |
| Burke County Development Authority of Georgia, CP | | | | | | |
| 3.05%, 2/10/2006 (Insured; AMBAC and Liquidity Facility; Rabobank Nederland) | | 28,425,000 | | | | 28,425,000 |
| Fulton County Housing Authority, MFHR | | | | | | |
| 3.07% (LOC; FHLMC and Liquidity Facility; FHLMC) | | 40,365,000 | | a,b | | 40,365,000 |
| Metropolitan Atlanta Rapid Transit Authority, CP | | | | | | |
| 3.05%, 3/6/2006 (LOC; Dexia Credit Locale) | | 17,500,000 | | | | 17,500,000 |
| Municipal Electric Authority of Georgia, CP | | | | | | |
| 3.08%, 2/14/2006 (LOC; JPMorgan Chase Bank) | | 15,870,000 | | | | 15,870,000 |
| Residential Care Facilities for the Elderly Authority of Fulton County, | | | | | | |
| Revenue (Canterbury Court Project) 3.05% (LOC; HSH Nordbank) | | 7,500,000 | | a | | 7,500,000 |
| Idaho—.1% | | | | | | |
| Idaho Housing and Finance Association, Nonprofit Facilities Revenue | | | | | | |
| (Albertson College of Idaho Project) 3.05% (LOC; Key Bank) | | 4,250,000 | | a | | 4,250,000 |
| Illinois—8.1% | | | | | | |
| Chicago Board of Education, GO: | | | | | | |
| 3.03% (Insured; CIFG and Liquidity Facility; Dexia Credit Locale) | | 15,000,000 | | a | | 15,000,000 |
| 3.06% (Insured; AMBAC and Liquidity Facility; Dexia Credit Locale) | | 11,940,000 | | a,b | | 11,940,000 |
| Chicago O’hare International Airport, Revenue | | | | | | |
| 3.06% (Insured; CIFG and Liquidity Facility; DEPFA Bank PLC) | | 50,000,000 | | a | | 50,000,000 |
| Illinois, GO Notes: | | | | | | |
| 5.15%, 4/1/2006 | | 10,000,000 | | | | 10,037,836 |
| (Merlots Program): | | | | | | |
| 3.06% (Insured; FSA and Liquidity Facility; Wachovia Bank) | | 16,900,000 | | a,b | | 16,900,000 |
| 3.06% (Insured; MBIA and Liquidity Facility; Wachovia Bank) | | 9,950,000 | | a,b | | 9,950,000 |
| (Rehabilitation Institute of Chicago Project) | | | | | | |
| 3.05% (LOC; Bank of America) | | 10,100,000 | | a | | 10,100,000 |
| Illinois Educational Facilities Authority: | | | | | | |
| (Illinois Institute of Technology) 3.05% (LOC; Bank of Montreal) | | 16,760,000 | | a | | 16,760,000 |
| (Lake Forest Graduate School) 3.04% (LOC; Fifth Third Bank) | | 5,000,000 | | a | | 5,000,000 |
| Illinois Health Facilities Authority, Revenue | | | | | | |
| CP (Evanston Hospital Corp.): | | | | | | |
| 2.87%, 2/9/2006 | | 10,000,000 | | | | 10,000,000 |
| 2.87%, 2/9/2006 | | 10,000,000 | | | | 10,000,000 |
| 2.87%, 2/9/2006 | | 10,000,000 | | | | 10,000,000 |
| 2.87%, 2/16/2006 | | 15,000,000 | | | | 15,000,000 |
| 2.90%, 2/23/2006 | | 10,000,000 | | | | 10,000,000 |
| 3.18%, 3/9/2006 | | 30,000,000 | | | | 30,000,000 |
| Regional Transportation Authority, | | | | | | |
| GO Notes (Merlots Program): | | | | | | |
| 3.06% (Insured; MBIA and Liquidity Facility; Wachovia Bank) | | 4,915,000 | | a,b | | 4,915,000 |
| 3.06% (Insured; MBIA and Liquidity Facility; Wachovia Bank) | | 10,120,000 | | a,b | | 10,120,000 |
| Indiana—4.1% | | | | | | |
| Indiana Bond Bank, Interim Advance Funding | | | | | | |
| Program Notes 3.09%, 2/2/2006 | | 41,925,000 | | | | 41,925,000 |
| Indiana Health Facility Financing Authority, Health Facility Revenue | | | | | | |
| (Clark Memorial Hospital Project) 3.14% (LOC; JPMorgan Chase Bank) | | 8,660,000 | | a | | 8,660,000 |
The Funds 31
STATEMENT OF INVESTMENTS (continued)
| | | Principal | | | | |
| Dreyfus Tax Exempt Cash Management (continued) | | Amount ($) | | Value ($) |
| |
| |
|
| |
| Tax Exempt Investments (continued) | | | | | | |
| |
| |
| |
|
| Indiana (continued) | | | | | | |
| Indianapolis Local Public Improvement Bond Bank: | | | | | | |
| Notes 4.50%, 7/6/2006 | | 35,000,000 | | | | 35,182,612 |
| (Waterworks Project) | | | | | | |
| 3.02% (Insured; MBIA and Liquidity Facility; DEPFA Bank PLC) | | 25,000,000 | | a | | 25,000,000 |
| Merrillville Community School Corp., | | | | | | |
| Warrants 4.25%, 12/29/2006 | | 12,800,000 | | | | 12,909,568 |
| Iowa—2.5% | | | | | | |
| Iowa, GO, TAN, 4.46%, 6/30/2006 | | 40,000,000 | | | | 40,206,046 |
| Louisa County, PCR, Refunding (Midwest Power System Inc. Project) 3.10% | | 27,900,000 | | a | | 27,900,000 |
| Tobacco Settlement Authority of Iowa, Tobacco Settlement Revenue | | | | | | |
| 3.08% (Liquidity Facility; Citibank NA) | | 8,350,000 | | a,b | | 8,350,000 |
| Kansas—2.1% | | | | | | |
| Kansas City, MFHR, Refunding (Wood View Apartments Project) | | | | | | |
| 3.04% (Insured; FHLB and Liquidity Facility; FHLB) | | 10,195,000 | | a | | 10,195,000 |
| Midwest Tax-Exempt Bond Grantor Trust, Revenue | | | | | | |
| 3.37% (LOC; Huntington NB) | | 7,975,450 | | a,b | | 7,975,450 |
| Wichita, GO Notes: | | | | | | |
| 3.67%, 2/9/2006 | | 15,000,000 | | | | 15,003,765 |
| 4.48%, 8/10/2006 | | 30,000,000 | | d | | 30,194,400 |
| Kentucky—1.2% | | | | | | |
| Jefferson County: | | | | | | |
| Retirement Home Revenue | | | | | | |
| (Nazareth Library Project) 3.04% (LOC; Fifth Third Bank) | | 12,390,000 | | a | | 12,390,000 |
| Student Housing Industrial Building Revenue (University of | | | | | | |
| Louisville Project) 3.04% (LOC; Wachovia Bank) | | 19,535,000 | | a | | 19,535,000 |
| Lexington-Fayette Urban County Government, Educational Building Revenue, | | | | | | |
| Refunding (Lexington Christian) 3.04% (LOC; Fifth Third Bank) | | 4,565,000 | | a | | 4,565,000 |
| Louisiana—3.9% | | | | | | |
| Board of Supervisors of Louisiana State University and Agricultural and | | | | | | |
| Mechanical College 3.04% (Insured; AMBAC and Liquidity Facility; BNP Paribas) | | 15,290,000 | | a | | 15,290,000 |
| Louisiana Local Government Environmental Facilities and | | | | | | |
| Community Development Authority, Revenues (Merlots Program) | | | | | | |
| 3.06% (Insured; AMBAC and Liquidity Facility; Wachovia Bank) | | 8,150,000 | | a,b | | 8,150,000 |
| Louisiana Public Facilities Authority: | | | | | | |
| HR: | | | | | | |
| (CP Program Hospital Equipment Financing) 3.04% (LOC; Bank One) | | 33,200,000 | | a | | 33,200,000 |
| 3.09% (Liquidity Facility; Merrill Lynch) | | 34,045,000 | | a,b | | 34,045,000 |
| LR 3.12% (Liquidity Facility; Societe Generale) | | 10,000,000 | | a | | 10,000,000 |
| New Orleans, Sewage Service Revenue, BAN 2.99%, 7/26/2006 | | 10,000,000 | | | | 10,000,000 |
| Tobacco Settlement Financing Corporation of Louisiana, Revenue | | | | | | |
| 3.14% (Liquidity Facility; Merrill Lynch) | | 9,115,000 | | a,b | | 9,115,000 |
| Maryland—1.0% | | | | | | |
| Frederick County, Industrial Revenue, Refunding | | | | | | |
| (Manekin-Frederick Facility) 3.12% (LOC; M&T Bank) | | 2,840,000 | | a | | 2,840,000 |
| Maryland Economic Development Corporation, Revenue | | | | | | |
| (Legal Aid Bureau Inc. Facility) 3.09% (LOC; M&T Bank) | | 2,590,000 | | a | | 2,590,000 |
| | | Principal | | | | |
| Dreyfus Tax Exempt Cash Management (continued) | | Amount ($) | | Value ($) |
| |
| |
|
| |
| Tax Exempt Investments (continued) | | | | | | |
| |
| |
| |
|
| Maryland (continued) | | | | | | |
| Maryland Health and Higher Educational Facility Authority: | | | | | | |
| LR (John Hopkins Hospital) 4.75%, 8/1/2006 | | 2,665,000 | | | | 2,686,324 |
| Revenue, Refunding (Adventist Healthcare) 3.04% (LOC; M&T Bank) | | 16,000,000 | | a | | 16,000,000 |
| Montgomery County, EDR 3.04% (LOC; M&T Bank) | | 6,000,000 | | a | | 6,000,000 |
| Massachusetts—3.4% | | | | | | |
| Massachusetts Development Finance Agency: | | | | | | |
| College and University Revenue (Suffolk University) 3.10% (Insured; Radian | | | | | | |
| Bank and Liquidity Facility: Bank of America and State Street Bank and Trust Co.) | | 31,100,000 | | a | | 31,100,000 |
| Revenue: | | | | | | |
| (Lesley University) 3.07% (LOC; Bank of America) | | 7,600,000 | | a | | 7,600,000 |
| (Northfield Mount Harmon) 3.10% (Insured; Radian | | | | | | |
| Bank and Liquidity Facility; Bank of America) | | 15,000,000 | | a | | 15,000,000 |
| Massachusetts Health and Educational Facilities Authority, Revenue (Cape Cod | | | | | | |
| Healthcare Inc.) 3.08% (Insured; Assured Guaranty and Liquidity Facility; Bank of America) | | 15,000,000 | | a | | 15,000,000 |
| Pembroke, GO Notes, BAN 3.95%, 8/3/2006 | | 15,000,000 | | | | 15,082,576 |
| Salem, GO Notes, BAN 3.90%, 4/12/2006 | | 4,246,418 | | | | 4,252,297 |
| Silver Lake Regional School District, GO Notes, BAN 3.46%, 3/30/2006 | | 14,550,000 | | | | 14,569,558 |
| Michigan—5.6% | | | | | | |
| Detroit, Sewage Disposal Revenue (Merlots Program): | | | | | | |
| 3.06% (Insured; FGIC and Liquidity Facility; Wachovia Bank) | | 22,045,000 | | a,b | | 22,045,000 |
| 3.06% (Insured; MBIA and Liquidity Facility; Wachovia Bank) | | 10,170,000 | | a,b | | 10,170,000 |
| Detroit Downtown Development Authority, LR Refunding | | | | | | |
| (Millender Center Project) 3.15% (LOC; HSBC Bank USA) | | 17,200,000 | | a | | 17,200,000 |
| Detroit Water Supply System, Water Revenue (Merlots Program) | | | | | | |
| 3.06% (Insured; MBIA and Liquidity Facility; Wachovia Bank) | | 10,475,000 | | a,b | | 10,475,000 |
| Michigan Higher Education Facilities Authority, Revenue | | | | | | |
| (Walsh College Project) 3.08% (LOC; Commerce Bank) | | 10,845,000 | | a | | 10,845,000 |
| Michigan Hospital Finance Authority, Revenue (Healthcare | | | | | | |
| Equipment Loan Program) 3.07% (LOC; Fifth Third Bank) | | 52,900,000 | | a | | 52,900,000 |
| Michigan Municipal Bond Authority, Notes: | | | | | | |
| RAN (Detroit School District) | | 10,000,000 | | | | 10,014,747 |
| 3.71%, 3/21/2006 (LOC; JPMorgan Chase Bank) | | | | | | |
| 3.98%, 8/18/2006 (LOC; JPMorgan Chase Bank) | | 25,000,000 | | | | 25,099,750 |
| Waterford Township Economic Development Corporation, | | | | | | |
| LOR (Canterbury Health Care Inc.) 3.07% (LOC; KBC Bank) | | 11,000,000 | | a | | 11,000,000 |
| Minnesota—.4% | | | | | | |
| Oak Park Heights, MFHR, Refunding (Boutwells Landing) | | | | | | |
| 3.04% (LOC; FHLMC and Liquidity Facility; FHLMC) | | 12,000,000 | | a | | 12,000,000 |
| Mississippi—1.3% | | | | | | |
| Medical Center Educational Building Corporation, Revenue (Pediatric and | | | | | | |
| Research Facilities Project) 3.04% (Insured; AMBAC and Liquidity Facility; Bank One) | | 27,490,000 | | a | | 27,490,000 |
| Mississippi Development Bank, Special Obligation Revenue (Merlots Program) | | | | | | |
| 3.06% (Insured; AMBAC and Liquidity Facility; Wachovia Bank) | | 7,500,000 | | a,b | | 7,500,000 |
| Mississippi Hospital Equipment and Facilities Authority, Revenue | | | | | | |
| (Mississippi Methodist Hospital) 3.15% (LOC; First Tennessee Bank) | | 5,935,000 | | a | | 5,935,000 |
The Funds 33
STATEMENT OF INVESTMENTS (continued)
| | | Principal | | | | |
| Dreyfus Tax Exempt Cash Management (continued) | | Amount ($) | | Value ($) |
| |
| |
|
| |
| Tax Exempt Investments (continued) | | | | | | |
| |
| |
| |
|
| Nebraska—.7% | | | | | | |
| Nebhelp Inc., Revenue 3.10% (Insured; MBIA and Liquidity Facility; Lloyds TSB Bank) | | 11,780,000 | | a | | 11,780,000 |
| Scotts Bluff County Hospital Authority Number 1, HR, Refunding (Regional | | | | | | |
| West Medical Center) 3.08% (Insured; Radian and Liquidity Facility; Key Bank) | | 10,000,000 | | a | | 10,000,000 |
| Nevada—.7% | | | | | | |
| Clark County School District, GO Notes: | | | | | | |
| (Merlots Program) 3.06% (Insured; FSA and Liquidity Facility; Wachovia Bank) | | 9,920,000 | | a,b | | 9,920,000 |
| (Putters Program) 3.10% (Insured; FSA and Liquidity Facility; PB Capital Finance) | | 6,960,000 | | a,b | | 6,960,000 |
| Las Vegas Valley Water District, CP | | | | | | |
| 3.08%, 2/8/2006 (LOC: BNP Paribas and Lloyds TSB Bank PLC) | | 5,800,000 | | | | 5,800,000 |
| New Jersey—1.3% | | | | | | |
| New Jersey, TRAN 3.95%, 6/23/2006 | | 20,000,000 | | | | 20,087,742 |
| Union County, GO Unlimited Notes, BAN 3.22%, 3/1/2006 | | 20,000,000 | | | | 20,008,030 |
| New York—1.3% | | | | | | |
| Nassau County Tobacco Settlement Corporation, Revenue | | | | | | |
| 3.10% (Liquidity Facility; Merrill Lynch) | | 7,590,000 | | a,b | | 7,590,000 |
| New York Counties Tobacco Trust I, Revenue 3.10% (Liquidity Facility; Merrill Lynch) | | 21,525,000 | | a,b | | 21,525,000 |
| Tobacco Settlement Financing Corporation of New York, Revenue 3.08% | | | | | | |
| (Liquidity Facility: Landesbank Hessen-Thuringen Girozentrale and Merrill Lynch) | | 10,000,000 | | a,b | | 10,000,000 |
| North Carolina—.4% | | | | | | |
| North Carolina Medical Care Commission, Health Care Facilities Revenue | | | | | | |
| (Person Memorial Hospital) 3.05% (LOC; Branch Banking and Trust Co.) | | 12,000,000 | | a | | 12,000,000 |
| Ohio—3.5% | | | | | | |
| Akron Bath Copley Joint Township Hospital District, Health Care | | | | | | |
| Facilities Revenue (Sumner Project) 3.05% (LOC; KBC Bank) | | 7,100,000 | | a | | 7,100,000 |
| Cincinnati School District, GO Notes (Putters Program) | | | | | | |
| 3.10% (Insured; FSA and Liquidity Facility; PB Capital Finance) | | 6,855,000 | | a,b | | 6,855,000 |
| Cleveland City School District, RAN 5.34%, 6/1/2006 (Insured; AMBAC) | | 4,365,000 | | | | 4,396,665 |
| Cleveland—Cuyahoga County Port Authority, Revenue | | | | | | |
| (Judson Project) 3.07% (LOC; National City Bank) | | 11,505,000 | | a | | 11,505,000 |
| Cuyahoga County, HR (Metrohealth System) 3.07% LOC; National City Bank) | | 10,000,000 | | a | | 10,000,000 |
| Franklin County, Health Care Facilities Revenue | | | | | | |
| (Creekside at the Village Project) 3.05% (LOC; Key Bank) | | 7,250,000 | | a | | 7,250,000 |
| Hamilton County, Hospital Facilities Revenue | | | | | | |
| 3.11% (Insured; FSA and Liquidity Facility; Svenska Handelsbanken) | | 55,000,000 | | a,b | | 55,000,000 |
| Ohio State Higher Educational Facility, College and University | | | | | | |
| Revenue (Ashland University Project) 3.07% (LOC; Key Bank) | | 4,900,000 | | a | | 4,900,000 |
| Oklahoma—1.3% | | | | | | |
| Tulsa County Industrial Authority, Capital Improvements Revenue | | | | | | |
| 3.11%, 5/15/2006 (Liquidity Facility; Bank of America) | | 40,000,000 | | | | 40,000,000 |
| Oregon—.7% | | | | | | |
| Oregon, Homeowner Revenue | | | | | | |
| 3.07% (LOC; Trinity Funding Group and Liquidity Facility; Merrill Lynch) | | 11,000,000 | | a,b | | 11,000,000 |
| Salem Hospital Facility Authority, Revenue, Refunding | | | | | | |
| (Capital Manor Inc. Project) 3.07% (LOC; Bank of America) | | 9,360,000 | | a | | 9,360,000 |
| | | Principal | | | | |
| Dreyfus Tax Exempt Cash Management (continued) | | Amount ($) | | Value ($) |
| |
| |
|
| |
| Tax Exempt Investments (continued) | | | | | | |
| |
| |
| |
|
| Pennsylvania—17.3% | | | | | | |
| Bethlehem Area School District, GO Notes | | | | | | |
| 3.05% (Insured; FSA and Liquidity Facility; Dexia Credit Locale) | | 19,995,000 | | a | | 19,995,000 |
| Chester County Health and Educational Facilities, Retired Community Revenue | | | | | | |
| (Kendal-Crosslands Communities Project) 3.05% (LOC; Allied Irish Bank) | | 5,725,000 | | a | | 5,725,000 |
| Cumberland County Municipal Authority, Revenue | | | | | | |
| (Wesley Affiliated Services) 3.05% (LOC; KBC Bank) | | 8,000,000 | | a | | 8,000,000 |
| Dallastown Area School District, GO Notes | | | | | | |
| 3.07% (Insured; FGIC and Liquidity Facility; BNP Paribas) | | 4,600,000 | | a | | 4,600,000 |
| Dauphin County General Authority, Revenue: | | | | | | |
| 3.05% (Insured; FSA and Liquidity Facility: Bank of Nova Scotia and KBC Bank) | | 14,640,000 | | a | | 14,640,000 |
| 3.05% (Insured; FSA and Liquidity Facility: Bank of Nova Scotia and KBC Bank) | | 49,700,000 | | a | | 49,700,000 |
| (School District Pooled Financing Program II) | | | | | | |
| 3.05% (Insured; AMBAC and Liquidity Facility; Bank of Nova Scotia) | | 90,465,000 | | a | | 90,465,000 |
| Emmaus General Authority, Revenue: | | | | | | |
| 3.05% (LOC; DEPFA Bank) | | 5,000,000 | | a | | 5,000,000 |
| 3.05% (LOC; DEPFA Bank) | | 11,100,000 | | a | | 11,100,000 |
| 3.05% (LOC; DEPFA Bank) | | 13,500,000 | | a | | 13,500,000 |
| 3.05% (LOC; DEPFA Bank) | | 13,075,000 | | a | | 13,075,000 |
| 3.05% (LOC; DEPFA Bank) | | 33,300,000 | | a | | 33,300,000 |
| Local Government: | | | | | | |
| 3.05% (LOC; DEPFA Bank) | | 4,800,000 | | a | | 4,800,000 |
| 3.05% (LOC; DEPFA Bank) | | 7,200,000 | | a | | 7,200,000 |
| 3.05% (LOC; DEPFA Bank) | | 7,900,000 | | a | | 7,900,000 |
| 3.05% (LOC; DEPFA Bank) | | 8,000,000 | | a | | 8,000,000 |
| 3.05% (LOC; DEPFA Bank) | | 10,600,000 | | a | | 10,600,000 |
| 3.05% (LOC; DEPFA Bank) | | 12,000,000 | | a | | 12,000,000 |
| Fayette County Hospital Authority, Refunding | | | | | | |
| (Mount Macrina Manor Project) 3.04% (LOC; National City Bank) | | 3,925,000 | | a | | 3,925,000 |
| Lancaster County, GO Notes | | | | | | |
| 3.05% (Insured; FSA and Liquidity Facility; Royal Bank of Canada) | | 20,775,000 | | a | | 20,775,000 |
| Lancaster County Hospital Authority, Revenue | | | | | | |
| (Luthercare Project) 3.07% (LOC; M&T Bank) | | 13,705,000 | | a | | 13,705,000 |
| Lebanon County Health Facilities Authority: | | | | | | |
| Health Center Revenue (United Church of | | | | | | |
| Christ Homes) 3.03% (LOC; M&T Bank) | | 8,025,000 | | a | | 8,025,000 |
| Revenue (Cornwall Manor Project) 3.12% (Insured; Radian | | | | | | |
| Bank and Liquidity Facility; Bank of America) | | 5,700,000 | | a | | 5,700,000 |
| Montgomery County Higher Education and Health Authority, | | | | | | |
| Private Schools Revenue (William Penn Charter) 3.05% (LOC; PNC Bank) | | 10,595,000 | | a | | 10,595,000 |
| Montgomery County Industrial Development Authority, Revenue: | | | | | | |
| CP (Exelon Generation Project): | | | | | | |
| 3.10%, 3/10/2006 (LOC; Wachovia Bank) | | 10,000,000 | | | | 10,000,000 |
| 3.15%, 3/14/2006 (LOC; Banque Nationale de Paris) | | 12,000,000 | | | | 12,000,000 |
| (Northwestern Human Services) 3.11% (LOC; Commerce Bank) | | 13,930,000 | | a | | 13,930,000 |
| New Garden General Authority, Municipal Revenue (Municipal Pooled | | | | | | |
| Financing Program I) 3.13% (Insured; AMBAC and Liquidity Facility: | | | | | | |
| Bank of Nova Scotia and Dexia Credit Locale) | | 30,750,000 | | a | | 30,750,000 |
The Funds 35
STATEMENT OF INVESTMENTS (continued)
| | | Principal | | | | |
| Dreyfus Tax Exempt Cash Management (continued) | | Amount ($) | | Value ($) |
| |
| |
|
| |
| Tax Exempt Investments (continued) | | | | | | |
| |
| |
| |
|
| Pennsylvania (continued) | | | | | | |
| Pennsylvania, GO Notes (Merlots Program) | | | | | | |
| 3.06% (Insured; MBIA and Liquidity Facility; Wachovia Bank) | | 5,820,000 | | a,b | | 5,820,000 |
| Pennsylvania Higher Educational Facilities Authority, Revenue (Student | | | | | | |
| Association Housing Project) 3.03% (LOC: Citizens Bank of Pennsylvania) | | 10,000,000 | | a | | 10,000,000 |
| Schuylkill County, GO Notes | | | | | | |
| 3.07% (Insured; AMBAC and Liquidity Facility; Wachovia Bank) | | 6,710,000 | | a | | 6,710,000 |
| Spring Grove Area School District, GO | | | | | | |
| 3.05% (Insured; FSA and Liquidity Facility; Dexia Credit Local) | | 17,500,000 | | a | | 17,500,000 |
| West Cornwall Township Municipal Authority: | | | | | | |
| GO Notes, Refunding (Bethlehem School District Project) | | | | | | |
| 3.05% (Insured; FSA and Liquidity Facility; Dexia Credit Locale) | | 28,600,000 | | a | | 28,600,000 |
| Revenue (Pennsylvania General Government Loan Program) | | | | | | |
| 3.05% (Insured; FSA and Liquidity Facility; Dexia Credit Locale) | | 8,267,000 | | a | | 8,267,000 |
| South Carolina—1.7% | | | | | | |
| Charleston County School District Development Corporation, | | | | | | |
| GO Notes, TAN 3.70%, 4/13/2006 | | 24,400,000 | | | | 24,455,808 |
| Greer, Combined Utilities System Revenue | | | | | | |
| (Merlots Program) 3.06% (Insured; AMBAC and Liquidity Facility; Wachovia Bank) | | 8,310,000 | | a,b | | 8,310,000 |
| South Carolina Jobs Economic Development Authority, Health Facilities | | | | | | |
| Revenue, Refunding (Episcopal Church Home) 3.12% | | | | | | |
| (Insured; Radian Bank and Liquidity Facility; Wachovia Bank) | | 14,015,000 | | a | | 14,015,000 |
| South Carolina Transportation Infrastructure Bank, Revenue | | | | | | |
| 3.06% (Insured; AMBAC and Liquidity Facility; CIFG) | | 6,645,000 | | a,b | | 6,645,000 |
| Tennessee—3.8% | | | | | | |
| Blount County Public Building Authority, Revenue | | | | | | |
| Local Government Public Improvement: | | | | | | |
| 3.04% (Insured; AMBAC and Liquidity Facility; Regions Bank) | | 4,370,000 | | a | | 4,370,000 |
| 3.04% (Insured; AMBAC and Liquidity Facility; Regions Bank) | | 5,000,000 | | a | | 5,000,000 |
| 3.04% (Insured; AMBAC and Liquidity Facility; Regions Bank) | | 6,500,000 | | a | | 6,500,000 |
| Memphis, GO | | | | | | |
| 3.06% (Insured; MBIA and Liquidity Facility; Merrill Lynch) | | 22,990,000 | | a,b | | 22,990,000 |
| Sevier County Public Building Authority: | | | | | | |
| Local Government Public Improvement Revenue: | | | | | | |
| 3.04% (Insured; AMBAC and Liquidity Facility; KBC Bank) | | 8,105,000 | | a | | 8,105,000 |
| 3.04% (Insured; AMBAC and Liquidity Facility; Landesbank Hessen-Thuringen Girozentrale) | | 7,930,000 | | a | | 7,930,000 |
| 3.04% (Insured; AMBAC and Liquidity Facility; Landesbank Hessen-Thuringen Girozentrale) | | 9,650,000 | | a | | 9,650,000 |
| Water Revenue 3.04% (Insured; AMBAC and Liquidity Facility; KBC Bank) | | 12,500,000 | | a | | 12,500,000 |
| Shelby County, GO Notes (Public Improvement) | | | | | | |
| 3.03% (Liquidity Facility; Landesbank Hessen-Thuringen Girozentrale) | | 40,000,000 | | a | | 40,000,000 |
| Texas—8.6% | | | | | | |
| Dallas, GO 3.06% (Liquidity Facility; Citibank NA) | | 10,000,000 | | a,b | | 10,000,000 |
| Dallas Area Rapid Transit, Transportation Revenue (Merlots Program) | | | | | | |
| 3.06% (Insured: AMBAC and FGIC and Liquidity Facility; Wachovia Bank) | | 24,065,000 | | a,b | | 24,065,000 |
| Harris County, CP: | | | | | | |
| GO 3.15%, 4/11/2006 (Liquidity Facility: Bank of Nova Scotia and Lloyds TSB Bank PLC) | | 5,950,000 | | | | 5,950,000 |
| (Metropolitan Transportation Authority): | | | | | | |
| 3.10%, 4/6/2006 (LOC; DEPFA Bank PLC) | | 10,000,000 | | | | 10,000,000 |
| 3.10%, 4/7/2006 (LOC; DEPFA Bank PLC) | | 15,000,000 | | | | 15,000,000 |
36
| | | Principal | | | | |
| Dreyfus Tax Exempt Cash Management (continued) | | Amount ($) | | Value ($) |
| |
| |
|
| |
| Tax Exempt Investments (continued) | | | | | | |
| |
| |
| |
|
| Texas (continued) | | | | | | |
| Harris County Health Facilities Development Corp., | | | | | | |
| Nursing Home Revenue (Saint Lukes Hospital): | | | | | | |
| 3.05% (LOC: Citibank NA and JPMorgan Chase Bank) | | 22,000,000 | | a | | 22,000,000 |
| 3.07% (Liquidity Facility: Bank of America, Bayerische Landesbank, | | | | | | |
| JPMorgan Chase Bank, Northern Trust Co. and Saint Lukes Hospital) | | 100,000 | | a | | 100,000 |
| North Texas Tollway Authority, Dallas North Thruway System Revenue | | | | | | |
| 3.03% (Insured; FGIC and Liquidity Facility; DEPFA Bank PLC) | | 20,000,000 | | a | | 20,000,000 |
| San Antonio: | | | | | | |
| Electric and Gas Revenue, CP 3.20%, 6/8/2006 (Liquidity Facility: | | | | | | |
| Bank of America and State Street Bank and Trust Co.) | | 12,100,000 | | | | 12,100,000 |
| Water Revenue (Merlots Program) 3.06% (Liquidity Facility; Wachovia Bank) | | 10,000,000 | | a,b | | 10,000,000 |
| Texas: | | | | | | |
| TRAN 4.50%, 8/31/2006 | | 77,600,000 | | | | 78,239,210 |
| 3.06% (Liquidity Facility; Merrill Lynch) | | 4,165,000 | | a,b | | 4,165,000 |
| Texas Public Financing Authority, CP: | | | | | | |
| 3.05%, 3/2/2006 | | 12,200,000 | | | | 12,200,000 |
| 3.19%, 5/10/2006 (Liquidity Facility; Texas Permanent School Fund) | | 25,000,000 | | | | 25,000,000 |
| University of Texas System Board of Regents, CP 3.12%, 4/12/2006 | | 14,073,000 | | | | 14,073,000 |
| Utah—1.0% | | | | | | |
| Intermountain Power Agency, Power Supply Revenue: | | | | | | |
| 2.77%, 3/15/2006 (Insured; AMBAC and Liquidity Facility; | | | | | | |
| Landesbank Hessen-Thuringen Girozentrale) | | 10,000,000 | | | | 10,000,000 |
| CP 3.10%, 3/9/2006 (LOC; JPMorgan Chase Bank) | | 10,000,000 | | | | 10,000,000 |
| Utah Water Finance Agency, Water Revenue | | | | | | |
| 3.06% (Insured; AMBAC and Liquidity Facility; JPMorgan Chase Bank) | | 10,000,000 | | a | | 10,000,000 |
| Vermont—.7% | | | | | | |
| ABN AMRO Munitops Certificate Trust, | | | | | | |
| Revenue (University of Vermont and State Agriculture College) | | | | | | |
| 3.06% (Insured; MBIA and Liquidity Facility; ABN-AMRO) | | 14,995,000 | | a,b | | 14,995,000 |
| Vermont Educational and Health Buildings Financing Agency: | | | | | | |
| College and University Revenue (Capital Asset | | | | | | |
| Financing Program) 3.12% (LOC; M&T Bank) | | 920,000 | | a | | 920,000 |
| Revenue (Rutland Regional Medical Project) | | | | | | |
| 3.09% (Insured; Radian Bank and Liquidity Facility; Bank of America) | | 5,655,000 | | a | | 5,655,000 |
| Virginia—2.7% | | | | | | |
| Alexandria Industrial Development Authority, Revenue | | | | | | |
| (Institute for Defense Analyses) 3.07% (Insured; | | | | | | |
| AMBAC and Liquidity Facility; Wachovia Bank) | | 14,690,000 | | a | | 14,690,000 |
| Morgan Keegan Municipal Products Inc., Revenue | | | | | | |
| 3.06% (Liquidity Facility; BNP Paribas) | | 40,000,000 | | a,b | | 40,000,000 |
| Norfolk Redevelopment and Housing Authority, Revenue | | | | | | |
| (Retirement Community) 3.04% (LOC; HSH Nordbank AG) | | 20,000,000 | | a | | 20,000,000 |
| Tobacco Settlement Financing Corporation of Virginia | | | | | | |
| 3.10% (Liquidity Facility; Merrill Lynch ) | | 7,500,000 | | a,b | | 7,500,000 |
| Washington—3.0% | | | | | | |
| Washington, GO Notes (Merlots Program): | | | | | | |
| 3.06% (Insured: FGIC and MBIA and Liquidity Facility; Wachovia Bank) | | 20,005,000 | | a,b | | 20,005,000 |
| 3.06% (Insured; MBIA and Liquidity Facility; Wachovia Bank) | | 5,935,000 | | a,b | | 5,935,000 |
The Funds 37
STATEMENT OF INVESTMENTS (continued)
| | | Principal | | | | |
| Dreyfus Tax Exempt Cash Management (continued) | | Amount ($) | | Value ($) |
| |
| |
|
| |
| Tax Exempt Investments (continued) | | | | | | |
| |
| |
| |
|
| Washington (continued) | | | | | | |
| Washington Health Care Facilities Authority, Revenues | | | | | | |
| (Seattle Cancer Care): | | | | | | |
| 3.05% (LOC; Key Bank) | | 4,250,000 | | a | | 4,250,000 |
| 3.05% (LOC; Key Bank) | | 20,655,000 | | a | | 20,655,000 |
| Washington Higher Education Facilities Authority, | | | | | | |
| Revenue (Saint Martins College Project) 3.09% (LOC; U.S. Bank NA) | | 6,910,000 | | a | | 6,910,000 |
| Washington Housing Finance Commission, Nonprofit Housing Revenue | | | | | | |
| (Horizon House Project) 3.05% (LOC; Bank of America) | | 20,000,000 | | a | | 20,000,000 |
| Washington Public Power Supply System Project Number 3, Electric Revenue, | | | | | | |
| Refunding 3.05% (Insured: MBIA and Liquidity Facility; Credit Suisse First Boston) | | 12,890,000 | | a | | 12,890,000 |
| Wisconsin—.7% | | | | | | |
| Badger Tobacco Asset Securitization Corporation, Tobacco Settlement Revenue | | | | | | |
| 3.11% (Liquidity Facility: Lloyds TBS Bank and Merrill Lynch) | | 6,120,000 | | a,b | | 6,120,000 |
| Wisconsin Health and Educational Facilities Authority, HR (Saint Johns Communities) | | | | | | |
| 3.08% (Insured; Radian and Liquidity Facility; Marshall and Isley Bank) | | 6,000,000 | | a | | 6,000,000 |
| Wisconsin Public Power Inc., Power Supply System Revenue (Putters Program) | | | | | | |
| 3.10% (Insured; AMBAC and Liquidity Facility; PB Capital Finance) | | 10,395,000 | | a,b | | 10,395,000 |
| Wyoming—1.0% | | | | | | |
| Natrona County, HR (Wyoming Medical Center Project) | | | | | | |
| 3.05% (Insured; AMBAC and Liquidity Facility; Bank of Nova Scotia) | | 29,760,000 | | a | | 29,760,000 |
| |
| |
| |
|
| |
| Total Investments (cost $3,184,609,493) | | 104.5% | | | | 3,184,609,493 |
| Liabilities, Less Cash and Receivables | | (4.5%) | | (137,909,096) |
| Net Assets | | 100.0% | | | | 3,046,700,397 |
| | See footnotes on page 39.
See notes to financial statements.
|

| Summary of Combined Ratings (Unaudited) | | | | | | | | | | |
| | | | | | | | | | | | | Value (%) † | | |
| | | | | | | | | |
| |
| |
|
| | | | | | | | | | | Dreyfus | | Dreyfus | | Dreyfus |
| | | | | | | | | | | Municipal Cash | | New York | | Tax Exempt |
| | | | | | | | | | | Management | | Municipal Cash | | Cash |
| Fitch | | or | | Moody’s | | or | | Standard & Poor’s | | Plus | | Management | | Management |
| | | |
| | | |
| |
| |
| |
|
| F1+, F1 | | | | VMIG1, MIG1, P1 | | | | SP1+, SP1, A1+, A1 | | 90.9 | | 93.4 | | 90.1 |
| AAA, AA, A e | | | | Aaa, Aa, A e | | | | AAA, AA, A e | | 3.0 | | 4.2 | | 6.3 |
| Not Rated f | | | | Not Rated f | | | | Not Rated f | | 6.1 | | 2.4 | | 3.6 |
| | | | | | | | | | | 100.0 | | 100.0 | | 100.0 |
† Based on total investments.
a Securities payable on demand.Variable interest rate—subject to periodic change.
b Securities exempt from registration under Rule 144A of the Securities Act of 1933.These securities may be resold in transactions exempt from registration, normally to qualified
institutional buyers. At January 31, 2006, Dreyfus Municipal Cash Management Plus amounted to $189,071,698 or 19.3%, Dreyfus New York Municipal Cash Management
amounted to $108,005,000 or 22.5%, and Dreyfus Tax Exempt Cash Management amounted to $627,585,450 or 20.6% of net assets.
c These securities are prerefunded; the date shown represents the prerefunded date. Bonds which are prerefunded are collateralized by U.S. Government securities which are held in escrow
and are used to pay principal and interest on the municipal issue and to retire the bonds in full at the earliest refunding date.
d Purchased on a delayed delivery basis.
e Notes which are not F, MIG and SP rated are represented by bond ratings of the issuers.
f Securities which, while not rated by Fitch, Moody’s and Standard & Poor’s, have been determined by the Manager to be of comparable quality to those rated securities in which the fund
may invest.
See notes to financial statements.
|
The Funds 39
| | STATEMENT OF ASSETS AND LIABILITIES
(amounts in thousands, except Net Asset Value Per Share)
January 31, 2006
|
| | | | | Dreyfus | | Dreyfus | | Dreyfus | | Dreyfus | | Dreyfus |
| | | Dreyfus | | Cash | | Government | | Government | | Treasury | | Treasury |
| | | Cash | | Management | | Cash | | Prime Cash | | Cash | | Prime Cash |
| | | Management | | Plus, Inc. | | Management | | Management | | Management | | Management |
| |
| |
| |
| |
| |
| |
|
| Assets ($): | | | | | | | | | | | | |
| Investments at value—Note 1(a,b) † | | 11,173,439 | | 8,649,903 | | 4,380,107a | | 1,433,446 | | 4,655,372a | | 2,519,223 |
| Interest receivable | | 43,410 | | 40,993 | | 4,446 | | 1,475 | | 419 | | 2,130 |
| | | 11,216,849 | | 8,690,896 | | 4,384,553 | | 1,434,921 | | 4,655,791 | | 2,521,353 |
| |
| |
| |
| |
| |
| |
|
| Liabilities ($): | | | | | | | | | | | | |
| Due to The Dreyfus Corporation | | | | | | | | | | | | |
| and affiliates—Note 2(b) | | 2,464 | | 2,192 | | 1,076 | | 374 | | 1,236 | | 683 |
| Cash overdraft due to Custodian | | 30,390 | | 2,899 | | 7,054 | | 947 | | 10,901 | | 4,013 |
| Payable for shares of Beneficial | | | | | | | | | | | | |
| Interest/Common Stock redeemed | | 1,060 | | 9,522 | | 611 | | — | | 40 | | 2 |
| | | 33,914 | | 14,613 | | 8,741 | | 1,321 | | 12,177 | | 4,698 |
| |
| |
| |
| |
| |
| |
|
| Net Assets ($) | | 11,182,935 | | 8,676,283 | | 4,375,812 | | 1,433,600 | | 4,643,614 | | 2,516,655 |
| |
| |
| |
| |
| |
| |
|
| Composition of Net Assets ($): | | | | | | | | | | | | |
| Paid-in capital | | 11,184,491 | | 8,684,844 | | 4,378,612 | | 1,433,601 | | 4,643,666 | | 2,516,958 |
| Accumulated net realized gain | | | | | | | | | | | | |
| (loss) on investments | | (1,556) | | (8,561) | | (2,800) | | (1) | | (52) | | (303) |
| |
| |
| |
| |
| |
| |
|
| Net Assets ($) | | 11,182,935 | | 8,676,283 | | 4,375,812 | | 1,433,600 | | 4,643,614 | | 2,516,655 |
| |
| |
| |
| |
| |
| |
|
| Net Asset Value Per Share | | | | | | | | | | | | |
| Institutional Shares | | | | | | | | | | | | |
| Net Assets ($) | | 9,484,178 | | 5,907,604 | | 2,842,290 | | 773,444 | | 3,017,048 | | 1,487,278 |
| Shares Outstanding | | 9,485,512 | | 5,914,331 | | 2,844,145 | | 773,445 | | 3,017,082 | | 1,487,667 |
| Net Asset Value Per Share ($) | | 1.00 | | 1.00 | | 1.00 | | 1.00 | | 1.00 | | 1.00 |
| |
| |
| |
| |
| |
| |
|
| Investor Shares | | | | | | | | | | | | |
| Net Assets ($) | | 1,237,624 | | 1,275,421 | | 1,050,089 | | 242,181 | | 1,320,322 | | 650,940 |
| Shares Outstanding | | 1,237,776 | | 1,276,379 | | 1,050,718 | | 242,175 | | 1,320,337 | | 650,920 |
| Net Asset Value Per Share ($) | | 1.00 | | 1.00 | | 1.00 | | 1.00 | | 1.00 | | 1.00 |
| |
| |
| |
| |
| |
| |
|
| Administrative Shares | | | | | | | | | | | | |
| Net Assets ($) | | 250,669 | | 793,337 | | 239,514 | | 210,324 | | 86,787 | | 26,189 |
| Shares Outstanding | | 250,712 | | 793,800 | | 239,687 | | 210,316 | | 86,788 | | 26,181 |
| Net Asset Value Per Share ($) | | 1.00 | | 1.00 | | 1.00 | | 1.00 | | 1.00 | | 1.00 |
| |
| |
| |
| |
| |
| |
|
| Participant Shares | | | | | | | | | | | | |
| Net Assets ($) | | 210,464 | | 699,921 | | 243,919 | | 207,651 | | 219,457 | | 352,248 |
| Shares Outstanding | | 210,491 | | 700,335 | | 244,062 | | 207,665 | | 219,459 | | 352,190 |
| Net Asset Value Per Share ($) | | 1.00 | | 1.00 | | 1.00 | | 1.00 | | 1.00 | | 1.00 |
| |
| |
| |
| |
| |
| |
|
| † Investments at cost ($) | | 11,173,439 | | 8,649,903 | | 4,380,107 | | 1,433,446 | | 4,655,372 | | 2,519,223 |
| | a Amount includes repurchase agreements of $272,000,000 and $3,475,000,000 for Dreyfus Government Cash Management and Dreyfus Treasury Cash Management, respectively.
See Note 1(b).
See notes to financial statements.
|
| | | Dreyfus | | Dreyfus | | Dreyfus |
| | | Municipal Cash | | New York | | Tax Exempt |
| | | Management | | Municipal Cash | | Cash |
| | | Plus | | Management | | Management |
| |
| |
| |
|
| Assets ($): | | | | | | |
| Investments at value—Note 1(a) † | | 995,776 | | 476,696 | | 3,184,609 |
| Cash | | — | | 648 | | — |
| Interest receivable | | 4,344 | | 2,122 | | 14,244 |
| | | 1,000,120 | | 479,466 | | 3,198,853 |
| |
| |
| |
|
| Liabilities ($): | | | | | | |
| Due to The Dreyfus Corporation | | | | | | |
| and affiliates—Note 2(b) | | 180 | | 82 | | 572 |
| Cash overdraft due to Custodian | | 8,587 | | — | | 95,800 |
| Payable for investment securities purchased | | 10,731 | | — | | 55,744 |
| Payable for shares of Beneficial Interest redeemed | | 59 | | 185 | | 37 |
| | | 19,557 | | 267 | | 152,153 |
| |
| |
| |
|
| Net Assets ($) | | 980,563 | | 479,199 | | 3,046,700 |
| |
| |
| |
|
| Composition of Net Assets ($): | | | | | | |
| Paid-in capital | | 980,565 | | 479,195 | | 3,046,775 |
| Accumulated net realized gain (loss) on investments | | (2) | | 4 | | (75) |
| |
| |
| |
|
| Net Assets ($) | | 980,563 | | 479,199 | | 3,046,700 |
| |
| |
| |
|
| Net Asset Value Per Share | | | | | | |
| Institutional Shares | | | | | | |
| Net Assets ($) | | 638,307 | | 343,465 | | 2,645,184 |
| Shares Outstanding | | 638,428 | | 343,463 | | 2,645,309 |
| Net Asset Value Per Share ($) | | 1.00 | | 1.00 | | 1.00 |
| |
| |
| |
|
| Investor Shares | | | | | | |
| Net Assets ($) | | 179,705 | | 125,011 | | 254,811 |
| Shares Outstanding | | 179,689 | | 125,013 | | 254,814 |
| Net Asset Value Per Share ($) | | 1.00 | | 1.00 | | 1.00 |
| |
| |
| |
|
| Administrative Shares | | | | | | |
| Net Assets ($) | | 137,330 | | 8,251 | | 105,204 |
| Shares Outstanding | | 137,315 | | 8,251 | | 105,170 |
| Net Asset Value Per Share ($) | | 1.00 | | 1.00 | | 1.00 |
| |
| |
| |
|
| Participant Shares | | | | | | |
| Net Assets ($) | | 25,221 | | 2,472 | | 41,501 |
| Shares Outstanding | | 25,217 | | 2,472 | | 41,482 |
| Net Asset Value Per Share ($) | | 1.00 | | 1.00 | | 1.00 |
| |
| |
| |
|
| † Investments at cost ($) | | 995,776 | | 476,696 | | 3,184,609 |
See notes to financial statements.
The Funds 41
| | STATEMENT OF OPERATIONS
(amounts in thousands)
Year Ended January 31, 2006
|
| | | | | Dreyfus | | Dreyfus | | Dreyfus | | Dreyfus | | Dreyfus |
| | | Dreyfus | | Cash | | Government | | Government | | Treasury | | Treasury |
| | | Cash | | Management | | Cash | | Prime Cash | | Cash | | Prime Cash |
| | | Management | | Plus, Inc. | | Management | | Management | | Management | | Management |
| |
| |
| |
| |
| |
| |
|
| Investment Income ($): | | | | | | | | | | | | |
| Interest Income | | 430,438 | | 316,116 | | 161,159 | | 42,255 | | 152,559 | | 75,183 |
| Expenses: | | | | | | | | | | | | |
| Management fee—Note 2(a) | | 25,001 | | 18,334 | | 9,611 | | 2,499 | | 9,305 | | 4,782 |
| Distribution fees—Note 2(b) | | 4,068 | | 5,413 | | 4,024 | | 1,673 | | 4,341 | | 2,361 |
| Total Expenses | | 29,069 | | 23,747 | | 13,635 | | 4,172 | | 13,646 | | 7,143 |
| Investment Income-Net | | 401,369 | | 292,369 | | 147,524 | | 38,083 | | 138,913 | | 68,040 |
| |
| |
| |
| |
| |
| |
|
| Net Realized Gain (Loss) on | | | | | | | | | | | | |
| Investments—Note 1(b) ($) | | (154) | | (798) | | (284) | | 51 | | (39) | | (65) |
| Net Increase in Net Assets | | | | | | | | | | | | |
| Resulting from Operations | | 401,215 | | 291,571 | | 147,240 | | 38,134 | | 138,874 | | 67,975 |
See notes to financial statements.
| | | Dreyfus | | Dreyfus | | Dreyfus |
| | | Municipal Cash | | New York | | Tax Exempt |
| | | Management | | Municipal Cash | | Cash |
| | | Plus | | Management | | Management |
| |
| |
| |
|
| Investment Income ($): | | | | | | |
| Interest Income | | 23,467 | | 11,331 | | 78,121 |
| Expenses: | | | | | | |
| Management fee—Note 2(a) | | 1,838 | | 892 | | 6,148 |
| Distribution fees—Note 2(b) | | 592 | | 254 | | 888 |
| Total Expenses | | 2,430 | | 1,146 | | 7,036 |
| Investment Income—Net | | 21,037 | | 10,185 | | 71,085 |
| |
| |
| |
|
| Net Realized and Unrealized Gain (Loss) | | | | | | |
| on Investments—Note 1(b) ($): | | | | | | |
| Net realized gain (loss) on investments | | (2) | | 4 | | (16) |
| Net unrealized (depreciation) on investments | | — | | — | | (20) |
| Net Realized and Unrealized Gain (Loss) on Investments | | (2) | | 4 | | (36) |
| Net Increase in Net Assets Resulting from Operations | | 21,035 | | 10,189 | | 71,049 |
See notes to financial statements.
The Funds 43
STATEMENT OF CHANGES IN NET ASSETS
(amounts in thousands)
|
| | | Dreyfus Cash Management | | Dreyfus Cash Management Plus, Inc. |
| |
| |
|
| | | Year Ended January 31, | | Year Ended January 31, |
| | | 2006 | | 2005 | | 2006 | | 2005 |
| |
| |
| |
| |
|
| Operations ($): | | | | | | | | |
| Investment income—net | | 401,369 | | 151,361 | | 292,369 | | 157,454 |
| Net realized gain (loss) on investments | | (154) | | (1,402) | | (798) | | (7,763) |
| Net Increase (Decrease) in Net Assets | | | | | | | | |
| Resulting from Operations | | 401,215 | | 149,959 | | 291,571 | | 149,691 |
| |
| |
| |
| |
|
| Dividends to Shareholders from ($): | | | | | | | | |
| Investment income—net: | | | | | | | | |
| Institutional Shares | | (351,357) | | (134,565) | | (223,829) | | (129,766) |
| Investor Shares | | (35,602) | | (11,904) | | (35,763) | | (11,097) |
| Administrative Shares | | (8,404) | | (3,190) | | (19,166) | | (11,428) |
| Participant Shares | | (6,006) | | (1,707) | | (13,611) | | (5,177) |
| Total Dividends | | (401,369) | | (151,366) | | (292,369) | | (157,468) |
| |
| |
| |
| |
|
| Beneficial Interest/Capital Stock | | | | | | | | |
| Transactions ($1.00 per share): | | | | | | | | |
| Net proceeds from shares sold: | | | | | | | | |
| Institutional Shares | | 88,227,691 | | 82,058,116 | | 102,606,751 | | 108,944,784 |
| Investor Shares | | 8,207,749 | | 8,400,276 | | 5,299,272 | | 5,426,074 |
| Administrative Shares | | 3,067,374 | | 2,185,394 | | 5,033,982 | | 7,994,674 |
| Participant Shares | | 1,793,568 | | 1,566,998 | | 2,572,684 | | 2,836,509 |
| Dividends reinvested: | | | | | | | | |
| Institutional Shares | | 85,179 | | 28,183 | | 86,879 | | 62,090 |
| Investor Shares | | 10,546 | | 5,382 | | 32,664 | | 10,396 |
| Administrative Shares | | 2,320 | | 1,216 | | 19,092 | | 10,567 |
| Participant Shares | | 5,063 | | 1,472 | | 13,140 | | 4,898 |
| Cost of shares redeemed: | | | | | | | | |
| Institutional Shares | | (88,111,203) | | (82,309,129) | | (105,251,149) | | (114,784,316) |
| Investor Shares | | (8,048,703) | | (8,591,977) | | (5,114,620) | | (5,579,680) |
| Administrative Shares | | (3,085,440) | | (2,174,696) | | (4,759,710) | | (9,084,131) |
| Participant Shares | | (1,832,003) | | (1,456,526) | | (2,348,416) | | (3,335,647) |
| Increase (Decrease) in Net Assets from | | | | | | | | |
| Beneficial Interest/Capital Stock Transactions | | 322,141 | | (285,291) | | (1,809,431) | | (7,493,782) |
| Total Increase (Decrease) In Net Assets | | 321,987 | | (286,698) | | (1,810,229) | | (7,501,559) |
| |
| |
| |
| |
|
| Net Assets ($): | | | | | | | | |
| Beginning of Period | | 10,860,948 | | 11,147,646 | | 10,486,512 | | 17,988,071 |
| End of Period | | 11,182,935 | | 10,860,948 | | 8,676,283 | | 10,486,512 |
See notes to financial statements.
| | | Dreyfus Government | | Dreyfus Government |
| | | Cash Management | | Prime Cash Management |
| |
| |
|
| | | Year Ended January 31, | | Year Ended January 31, |
| | | 2006 | | 2005 | | 2006 | | 2005 |
| |
| |
| |
| |
|
| Operations ($): | | | | | | | | |
| Investment income—net | | 147,524 | | 82,476 | | 38,083 | | 11,696 |
| Net realized gain (loss) on investments | | (284) | | (2,343) | | 51 | | (2) |
| Net Increase (Decrease) in Net Assets | | | | | | | | |
| Resulting from Operations | | 147,240 | | 80,133 | | 38,134 | | 11,694 |
| |
| |
| |
| |
|
| Dividends to Shareholders from ($): | | | | | | | | |
| Investment income—net: | | | | | | | | |
| Institutional Shares | | (101,439) | | (57,170) | | (19,681) | | (5,782) |
| Investor Shares | | (31,627) | | (13,130) | | (6,581) | | (2,115) |
| Administrative Shares | | (6,881) | | (8,495) | | (5,413) | | (1,926) |
| Participant Shares | | (7,577) | | (3,681) | | (6,408) | | (1,873) |
| Total Dividends | | (147,524) | | (82,476) | | (38,083) | | (11,696) |
| |
| |
| |
| |
|
| Beneficial Interest Transactions ($1.00 per share): | | | | | | |
| Net proceeds from shares sold: | | | | | | | | |
| Institutional Shares | | 25,264,718 | | 35,840,907 | | 2,989,497 | | 2,053,576 |
| Investor Shares | | 6,351,977 | | 8,643,866 | | 421,201 | | 423,187 |
| Administrative Shares | | 1,451,334 | | 2,824,724 | | 2,090,491 | | 1,645,993 |
| Participant Shares | | 1,304,455 | | 1,240,336 | | 1,558,755 | | 1,478,450 |
| Dividends reinvested: | | | | | | | | |
| Institutional Shares | | 41,829 | | 28,356 | | 16,829 | | 5,403 |
| Investor Shares | | 25,617 | | 10,487 | | 6,059 | | 1,912 |
| Administrative Shares | | 5,866 | | 4,634 | | 5,016 | | 1,806 |
| Participant Shares | | 6,077 | | 2,772 | | 5,580 | | 1,676 |
| Cost of shares redeemed: | | | | | | | | |
| Institutional Shares | | (26,035,234) | | (37,706,021) | | (2,769,866) | | (1,936,748) |
| Investor Shares | | (6,614,704) | | (8,672,987) | | (394,068) | | (459,007) |
| Administrative Shares | | (1,530,875) | | (3,415,869) | | (2,085,241) | | (1,578,051) |
| Participant Shares | | (1,355,837) | | (1,560,874) | | (1,586,703) | | (1,479,569) |
| Increase (Decrease) in Net Assets from | | | | | | | | |
| Beneficial Interest Transactions | | (1,084,777) | | (2,759,669) | | 257,550 | | 158,628 |
| Total Increase (Decrease) In Net Assets | | (1,085,061) | | (2,762,012) | | 257,601 | | 158,626 |
| |
| |
| |
| |
|
| Net Assets ($): | | | | | | | | |
| Beginning of Period | | 5,460,873 | | 8,222,885 | | 1,175,999 | | 1,017,373 |
| End of Period | | 4,375,812 | | 5,460,873 | | 1,433,600 | | 1,175,999 |
See notes to financial statements.
The Funds 45
| | STATEMENT OF CHANGES IN NET ASSETS (continued)
(amounts in thousands)
|
| | | Dreyfus Treasury Cash Management | | Dreyfus Treasury Prime Cash Management |
| |
| |
|
| | | Year Ended January 31, | | Year Ended January 31, |
| | | 2006 | | 2005 | | 2006 | | 2005 |
| |
| |
| |
| |
|
| Operations ($): | | | | | | | | |
| Investment income—net | | 138,913 | | 50,863 | | 68,040 | | 27,236 |
| Net realized gain (loss) on investments | | (39) | | (13) | | (65) | | (107) |
| Net Increase (Decrease) in Net Assets | | | | | | | | |
| Resulting from Operations | | 138,874 | | 50,850 | | 67,975 | | 27,129 |
| |
| |
| |
| |
|
| Dividends to Shareholders from ($): | | | | | | | | |
| Investment income—net: | | | | | | | | |
| Institutional Shares | | (92,357) | | (36,329) | | (44,635) | | (18,186) |
| Investor Shares | | (38,654) | | (12,519) | | (18,263) | | (7,190) |
| Administrative Shares | | (2,274) | | (702) | | (818) | | (944) |
| Participant Shares | | (5,628) | | (1,319) | | (4,324) | | (916) |
| Total Dividends | | (138,913) | | (50,869) | | (68,040) | | (27,236) |
| |
| |
| |
| |
|
| Beneficial Interest Transactions ($1.00 per share): | | | | | | |
| Net proceeds from shares sold: | | | | | | | | |
| Institutional Shares | | 33,378,971 | | 28,718,334 | | 9,320,877 | | 7,396,051 |
| Investor Shares | | 9,589,674 | | 10,475,329 | | 3,104,509 | | 3,101,095 |
| Administrative Shares | | 717,102 | | 1,598,791 | | 121,635 | | 417,062 |
| Participant Shares | | 531,943 | | 522,034 | | 848,315 | | 758,139 |
| Dividends reinvested: | | | | | | | | |
| Institutional Shares | | 25,325 | | 9,755 | | 20,119 | | 4,474 |
| Investor Shares | | 3,982 | | 2,684 | | 9,667 | | 4,615 |
| Administrative Shares | | 2,082 | | 673 | | 797 | | 477 |
| Participant Shares | | 2,389 | | 555 | | 1,196 | | 530 |
| Cost of shares redeemed: | | | | | | | | |
| Institutional Shares | | (32,738,634) | | (29,689,199) | | (9,187,163) | | (7,852,071) |
| Investor Shares | | (9,437,450) | | (10,601,846) | | (3,075,940) | | (3,287,434) |
| Administrative Shares | | (681,475) | | (1,570,519) | | (134,971) | | (475,999) |
| Participant Shares | | (524,471) | | (436,198) | | (591,166) | | (843,005) |
| Increase (Decrease) in Net Assets from | | | | | | | | |
| Beneficial Interest Transactions | | 869,438 | | (969,607) | | 437,875 | | (776,066) |
| Total Increase (Decrease) In Net Assets | | 869,399 | | (969,626) | | 437,810 | | (776,173) |
| |
| |
| |
| |
|
| Net Assets ($): | | | | | | | | |
| Beginning of Period | | 3,774,215 | | 4,743,841 | | 2,078,845 | | 2,855,018 |
| End of Period | | 4,643,614 | | 3,774,215 | | 2,516,655 | | 2,078,845 |
See notes to financial statements.
| | | Dreyfus Municipal Cash | | Dreyfus New York Municipal | | Dreyfus Tax Exempt |
| | | Management Plus | | Cash Management | | Cash Management |
| |
| |
| |
|
| | | Year Ended January 31, | | Year Ended January 31, | | Year Ended January 31, |
| | | 2006 | | 2005 | | 2006 | | 2005 | | 2006 | | 2005 |
| |
| |
| |
| |
| |
| |
|
| Operations ($): | | | | | | | | | | | | |
| Investment income—net | | 21,037 | | 7,738 | | 10,185 | | 4,109 | | 71,085 | | 30,059 |
| Net realized gain (loss) on investments | | (2) | | — | | 4 | | — | | (16) | | 41 |
| Net unrealized appreciation | | | | | | | | | | | | |
| (depreciation) on investments | | — | | — | | — | | — | | (20) | | 20 |
| Net Increase (Decrease) in Net Assets | | | | | | | | | | | | |
| Resulting from Operations | | 21,035 | | 7,738 | | 10,189 | | 4,109 | | 71,049 | | 30,120 |
| |
| |
| |
| |
| |
| |
|
| Dividends to Shareholders from ($): | | | | | | | | | | | | |
| Investment income—net: | | | | | | | | | | | | |
| Institutional Shares | | (14,367) | | (5,514) | | (8,052) | | (3,572) | | (62,218) | | (25,118) |
| Investor Shares | | (3,035) | | (908) | | (1,924) | | (477) | | (4,769) | | (1,976) |
| Administrative Shares | | (3,133) | | (1,173) | | (104) | | (24) | | (3,333) | | (2,779) |
| Participant Shares | | (502) | | (143) | | (105) | | (36) | | (765) | | (186) |
| Total Dividends | | (21,037) | | (7,738) | | (10,185) | | (4,109) | | (71,085) | | (30,059) |
| |
| |
| |
| |
| |
| |
|
| Beneficial Interest Transactions ($1.00 per share): | | | | | | | | | | |
| Net proceeds from shares sold: | | | | | | | | | | | | |
| Institutional Shares | | 7,796,226 | | 4,167,702 | | 1,170,390 | | 843,446 | | 21,865,326 | | 13,958,789 |
| Investor Shares | | 859,699 | | 640,910 | | 473,007 | | 207,302 | | 887,506 | | 906,264 |
| Administrative Shares | | 882,779 | | 540,201 | | 37,565 | | 26,011 | | 689,339 | | 831,263 |
| Participant Shares | | 93,973 | | 136,925 | | 23,299 | | 17,571 | | 253,871 | | 160,781 |
| Dividends reinvested: | | | | | | | | | | | | |
| Institutional Shares | | 9,026 | | 4,083 | | 2,875 | | 904 | | 27,380 | | 12,018 |
| Investor Shares | | 3,018 | | 797 | | 1,923 | | 476 | | 2,610 | | 1,165 |
| Administrative Shares | | 3,002 | | 1,164 | | 103 | | 24 | | 2,163 | | 1,779 |
| Participant Shares | | 493 | | 142 | | 101 | | 35 | | 374 | | 36 |
| Cost of shares redeemed: | | | | | | | | | | | | |
| Institutional Shares | | (7,666,537) | | (4,394,515) | | (1,166,195) | | (815,537) | | (21,757,895) | | (13,394,916) |
| Investor Shares | | (788,006) | | (624,431) | | (420,813) | | (165,122) | | (875,277) | | (789,809) |
| Administrative Shares | | (877,167) | | (521,193) | | (30,159) | | (25,529) | | (861,639) | | (870,002) |
| Participant Shares | | (89,402) | | (135,479) | | (26,435) | | (14,500) | | (232,067) | | (187,955) |
| Increase (Decrease) in Net Assets from | | | | | | | | | | | | |
| Beneficial Interest Transactions | | 227,104 | | (183,694) | | 65,661 | | 75,081 | | 1,691 | | 629,413 |
| Total Increase (Decrease) In Net Assets | | 227,102 | | (183,694) | | 65,665 | | 75,081 | | 1,655 | | 629,474 |
| |
| |
| |
| |
| |
| |
|
| Net Assets ($): | | | | | | | | | | | | |
| Beginning of Period | | 753,461 | | 937,155 | | 413,534 | | 338,453 | | 3,045,045 | | 2,415,571 |
| End of Period | | 980,563 | | 753,461 | | 479,199 | | 413,534 | | 3,046,700 | | 3,045,045 |
See notes to financial statements.
The Funds 47
FINANCIAL HIGHLIGHTS
The following tables describe the performance for each share class for the fiscal periods indicated. All information reflects financial results for a single fund share. Total return shows how much your investment in the fund would have increased (or decreased) during each period, assuming you had reinvested all dividends and distributions. These figures have been derived from the fund’s financial statements.
| | | | | Per Share Data ($) | | | | Ratios/Supplemental Data (%) |
| |
| |
| |
| |
|
| | | | | | | | | | | | | | | Ratio of Net | | |
| | | Net Asset | | | | Dividends | | Net Asset | | | | Ratio of | | Investment | | Net Assets |
| | | Value | | Net | | from Net | | Value | | | | Expenses | | Income to | | End of |
| | | Beginning | | Investment | | Investment | | End | | Total | | to Average | | Average | | Period |
| | | of Period | | Income | | Income | | of Period | | Return (%) | | Net Assets | | Net Assets ($ x1,000,000) |
| |
| |
| |
| |
| |
| |
| |
|
| |
| Dreyfus Cash Management | | | | | | | | | | | | | | |
| Institutional Shares | | | | | | | | | | | | | | | | |
| Year Ended January 31, | | | | | | | | | | | | | | | | |
| 2006 | | 1.00 | | .032 | | (.032) | | 1.00 | | 3.28 | | .20 | | 3.24 | | 9,484 |
| 2005 | | 1.00 | | .013 | | (.013) | | 1.00 | | 1.31 | | .20 | | 1.30 | | 9,283 |
| 2004 | | 1.00 | | .010 | | (.010) | | 1.00 | | .99 | | .20 | | .99 | | 9,507 |
| 2003 | | 1.00 | | .016 | | (.016) | | 1.00 | | 1.66 | | .20 | | 1.65 | | 11,410 |
| 2002 | | 1.00 | | .037 | | (.037) | | 1.00 | | 3.77 | | .20 | | 3.64 | | 13,260 |
| Investor Shares | | | | | | | | | | | | | | | | |
| Year Ended January 31, | | | | | | | | | | | | | | | | |
| 2006 | | 1.00 | | .030 | | (.030) | | 1.00 | | 3.03 | | .45 | | 2.99 | | 1,238 |
| 2005 | | 1.00 | | .011 | | (.011) | | 1.00 | | 1.06 | | .45 | | 1.05 | | 1,068 |
| 2004 | | 1.00 | | .007 | | (.007) | | 1.00 | | .74 | | .45 | | .74 | | 1,254 |
| 2003 | | 1.00 | | .014 | | (.014) | | 1.00 | | 1.41 | | .45 | | 1.40 | | 1,814 |
| 2002 | | 1.00 | | .035 | | (.035) | | 1.00 | | 3.51 | | .45 | | 3.39 | | 1,286 |
| Administrative Shares | | | | | | | | | | | | | | | | |
| Year Ended January 31, | | | | | | | | | | | | | | | | |
| 2006 | | 1.00 | | .031 | | (.031) | | 1.00 | | 3.18 | | .30 | | 3.14 | | 251 |
| 2005 | | 1.00 | | .012 | | (.012) | | 1.00 | | 1.21 | | .30 | | 1.20 | | 266 |
| 2004 | | 1.00 | | .009 | | (.009) | | 1.00 | | .89 | | .30 | | .89 | | 255 |
| 2003 | | 1.00 | | .015 | | (.015) | | 1.00 | | 1.56 | | .30 | | 1.55 | | 669 |
| 2002 | | 1.00 | | .036 | | (.036) | | 1.00 | | 3.67 | | .30 | | 3.54 | | 506 |
| Participant Shares | | | | | | | | | | | | | | | | |
| Year Ended January 31, | | | | | | | | | | | | | | | | |
| 2006 | | 1.00 | | .028 | | (.028) | | 1.00 | | 2.87 | | .60 | | 2.84 | | 210 |
| 2005 | | 1.00 | | .009 | | (.009) | | 1.00 | | .91 | | .60 | | .90 | | 244 |
| 2004 | | 1.00 | | .006 | | (.006) | | 1.00 | | .59 | | .60 | | .59 | | 132 |
| 2003 | | 1.00 | | .012 | | (.012) | | 1.00 | | 1.26 | | .60 | | 1.25 | | 118 |
| 2002 | | 1.00 | | .033 | | (.033) | | 1.00 | | 3.36 | | .60 | | 3.24 | | 201 |
See notes to financial statements.
| | | | | Per Share Data ($) | | | | Ratios/Supplemental Data (%) |
| |
| |
| |
| |
|
| | | | | | | | | | | | | | | Ratio of Net | | |
| | | Net Asset | | | | Dividends | | Net Asset | | | | Ratio of | | Investment | | Net Assets |
| | | Value | | Net | | from Net | | Value | | | | Expenses | | Income to | | End of |
| | | Beginning | | Investment | | Investment | | End | | Total | | to Average | | Average | | Period |
| | | of Period | | Income | | Income | | of Period | | Return (%) | | Net Assets | | Net Assets ($ x1,000,000) |
| |
| |
| |
| |
| |
| |
| |
|
| |
| Dreyfus Cash Management Plus, Inc. | | | | | | | | | | | | | | |
| Institutional Shares | | | | | | | | | | | | | | | | |
| Year Ended January 31, | | | | | | | | | | | | | | | | |
| 2006 | | 1.00 | | .032 | | (.032) | | 1.00 | | 3.29 | | .20 | | 3.23 | | 5,908 |
| 2005 | | 1.00 | | .013 | | (.013) | | 1.00 | | 1.32 | | .20 | | 1.23 | | 8,466 |
| 2004 | | 1.00 | | .011 | | (.011) | | 1.00 | | 1.06 | | .20 | | 1.07 | | 14,249 |
| 2003 | | 1.00 | | .018 | | (.018) | | 1.00 | | 1.78 | | .20 | | 1.78 | | 24,637 |
| 2002 | | 1.00 | | .038 | | (.038) | | 1.00 | | 3.91 | | .20 | | 3.54 | | 27,179 |
| Investor Shares | | | | | | | | | | | | | | | | |
| Year Ended January 31, | | | | | | | | | | | | | | | | |
| 2006 | | 1.00 | | .030 | | (.030) | | 1.00 | | 3.03 | | .45 | | 2.98 | | 1,275 |
| 2005 | | 1.00 | | .011 | | (.011) | | 1.00 | | 1.07 | | .45 | | .98 | | 1,058 |
| 2004 | | 1.00 | | .008 | | (.008) | | 1.00 | | .81 | | .45 | | .82 | | 1,203 |
| 2003 | | 1.00 | | .015 | | (.015) | | 1.00 | | 1.53 | | .45 | | 1.53 | | 2,166 |
| 2002 | | 1.00 | | .036 | | (.036) | | 1.00 | | 3.66 | | .45 | | 3.29 | | 1,547 |
| Administrative Shares | | | | | | | | | | | | | | | | |
| Year Ended January 31, | | | | | | | | | | | | | | | | |
| 2006 | | 1.00 | | .031 | | (.031) | | 1.00 | | 3.19 | | .30 | | 3.13 | | 793 |
| 2005 | | 1.00 | | .012 | | (.012) | | 1.00 | | 1.22 | | .30 | | 1.13 | | 500 |
| 2004 | | 1.00 | | .010 | | (.010) | | 1.00 | | .96 | | .30 | | .97 | | 1,579 |
| 2003 | | 1.00 | | .017 | | (.017) | | 1.00 | | 1.68 | | .30 | | 1.68 | | 2,030 |
| 2002 | | 1.00 | | .037 | | (.037) | | 1.00 | | 3.81 | | .30 | | 3.44 | | 932 |
| Participant Shares | | | | | | | | | | | | | | | | |
| Year Ended January 31, | | | | | | | | | | | | | | | | |
| 2006 | | 1.00 | | .028 | | (.028) | | 1.00 | | 2.88 | | .60 | | 2.83 | | 700 |
| 2005 | | 1.00 | | .009 | | (.009) | | 1.00 | | .92 | | .60 | | .83 | | 463 |
| 2004 | | 1.00 | | .007 | | (.007) | | 1.00 | | .65 | | .60 | | .67 | | 957 |
| 2003 | | 1.00 | | .014 | | (.014) | | 1.00 | | 1.38 | | .60 | | 1.38 | | 1,028 |
| 2002 | | 1.00 | | .034 | | (.034) | | 1.00 | | 3.50 | | .60 | | 3.14 | | 491 |
See notes to financial statements.
The Funds 49
F I N A N C I A L H I G H L I G H T S (continued)
| | | | | Per Share Data ($) | | | | Ratios/Supplemental Data (%) |
| |
| |
| |
| |
|
| | | | | | | | | | | | | | | Ratio of Net | | |
| | | Net Asset | | | | Dividends | | Net Asset | | | | Ratio of | | Investment | | Net Assets |
| | | Value | | Net | | from Net | | Value | | | | Expenses | | Income to | | End of |
| | | Beginning | | Investment | | Investment | | End | | Total | | to Average | | Average | | Period |
| | | of Period | | Income | | Income | | of Period | | Return (%) | | Net Assets | | Net Assets ($ x1,000,000) |
| |
| |
| |
| |
| |
| |
| |
|
| |
| Dreyfus Government Cash Management | | | | | | | | | | | | | | |
| Institutional Shares | | | | | | | | | | | | | | | | |
| Year Ended January 31, | | | | | | | | | | | | | | | | |
| 2006 | | 1.00 | | .032 | | (.032) | | 1.00 | | 3.23 | | .20 | | 3.15 | | 2,842 |
| 2005 | | 1.00 | | .013 | | (.013) | | 1.00 | | 1.26 | | .20 | | 1.20 | | 3,571 |
| 2004 | | 1.00 | | .010 | | (.010) | | 1.00 | | 1.03 | | .20 | | 1.03 | | 5,409 |
| 2003 | | 1.00 | | .017 | | (.017) | | 1.00 | | 1.75 | | .20 | | 1.74 | | 8,084 |
| 2002 | | 1.00 | | .037 | | (.037) | | 1.00 | | 3.81 | | .20 | | 3.55 | | 7,049 |
| Investor Shares | | | | | | | | | | | | | | | | |
| Year Ended January 31, | | | | | | | | | | | | | | | | |
| 2006 | | 1.00 | | .029 | | (.029) | | 1.00 | | 2.97 | | .45 | | 2.90 | | 1,050 |
| 2005 | | 1.00 | | .010 | | (.010) | | 1.00 | | 1.01 | | .45 | | .95 | | 1,287 |
| 2004 | | 1.00 | | .008 | | (.008) | | 1.00 | | .78 | | .45 | | .78 | | 1,307 |
| 2003 | | 1.00 | | .015 | | (.015) | | 1.00 | | 1.50 | | .45 | | 1.49 | | 1,591 |
| 2002 | | 1.00 | | .035 | | (.035) | | 1.00 | | 3.55 | | .45 | | 3.30 | | 1,510 |
| Administrative Shares | | | | | | | | | | | | | | | | |
| Year Ended January 31, | | | | | | | | | | | | | | | | |
| 2006 | | 1.00 | | .031 | | (.031) | | 1.00 | | 3.12 | | .30 | | 3.05 | | 240 |
| 2005 | | 1.00 | | .012 | | (.012) | | 1.00 | | 1.16 | | .30 | | 1.10 | | 313 |
| 2004 | | 1.00 | | .009 | | (.009) | | 1.00 | | .93 | | .30 | | .93 | | 900 |
| 2003 | | 1.00 | | .016 | | (.016) | | 1.00 | | 1.65 | | .30 | | 1.64 | | 1,138 |
| 2002 | | 1.00 | | .036 | | (.036) | | 1.00 | | 3.71 | | .30 | | 3.45 | | 623 |
| Participant Shares | | | | | | | | | | | | | | | | |
| Year Ended January 31, | | | | | | | | | | | | | | | | |
| 2006 | | 1.00 | | .028 | | (.028) | | 1.00 | | 2.81 | | .60 | | 2.75 | | 244 |
| 2005 | | 1.00 | | .009 | | (.009) | | 1.00 | | .86 | | .60 | | .80 | | 289 |
| 2004 | | 1.00 | | .006 | | (.006) | | 1.00 | | .62 | | .60 | | .63 | | 607 |
| 2003 | | 1.00 | | .013 | | (.013) | | 1.00 | | 1.35 | | .60 | | 1.34 | | 645 |
| 2002 | | 1.00 | | .033 | | (.033) | | 1.00 | | 3.40 | | .60 | | 3.15 | | 523 |
See notes to financial statements.
| | | | | Per Share Data ($) | | | | Ratios/Supplemental Data (%) |
| |
| |
| |
| |
|
| | | | | | | | | | | | | | | Ratio of Net | | |
| | | Net Asset | | | | Dividends | | Net Asset | | | | Ratio of | | Investment | | Net Assets |
| | | Value | | Net | | from Net | | Value | | | | Expenses | | Income to | | End of |
| | | Beginning | | Investment | | Investment | | End | | Total | | to Average | | Average | | Period |
| | | of Period | | Income | | Income | | of Period | | Return (%) | | Net Assets | | Net Assets ($ x1,000,000) |
| |
| |
| |
| |
| |
| |
| |
|
| |
| Dreyfus Government Prime Cash Management | | | | | | | | | | | | | | |
| Institutional Shares | | | | | | | | | | | | | | | | |
| Year Ended January 31, | | | | | | | | | | | | | | | | |
| 2006 | | 1.00 | | .031 | | (.031) | | 1.00 | | 3.18 | | .20 | | 3.21 | | 773 |
| 2005 | | 1.00 | | .012 | | (.012) | | 1.00 | | 1.21 | | .20 | | 1.19 | | 537 |
| 2004 | | 1.00 | | .009 | | (.009) | | 1.00 | | .94 | | .20 | | .91 | | 415 |
| 2003 | | 1.00 | | .016 | | (.016) | | 1.00 | | 1.61 | | .20 | | 1.60 | | 285 |
| 2002 | | 1.00 | | .035 | | (.035) | | 1.00 | | 3.56 | | .20 | | 3.39 | | 360 |
| Investor Shares | | | | | | | | | | | | | | | | |
| Year Ended January 31, | | | | | | | | | | | | | | | | |
| 2006 | | 1.00 | | .029 | | (.029) | | 1.00 | | 2.92 | | .45 | | 2.96 | | 242 |
| 2005 | | 1.00 | | .010 | | (.010) | | 1.00 | | .96 | | .45 | | .94 | | 209 |
| 2004 | | 1.00 | | .007 | | (.007) | | 1.00 | | .69 | | .45 | | .66 | | 243 |
| 2003 | | 1.00 | | .014 | | (.014) | | 1.00 | | 1.36 | | .45 | | 1.35 | | 273 |
| 2002 | | 1.00 | | .033 | | (.033) | | 1.00 | | 3.31 | | .45 | | 3.14 | | 196 |
| Administrative Shares | | | | | | | | | | | | | | | | |
| Year Ended January 31, | | | | | | | | | | | | | | | | |
| 2006 | | 1.00 | | .030 | | (.030) | | 1.00 | | 3.08 | | .30 | | 3.11 | | 210 |
| 2005 | | 1.00 | | .011 | | (.011) | | 1.00 | | 1.11 | | .30 | | 1.09 | | 200 |
| 2004 | | 1.00 | | .008 | | (.008) | | 1.00 | | .84 | | .30 | | .81 | | 130 |
| 2003 | | 1.00 | | .015 | | (.015) | | 1.00 | | 1.51 | | .30 | | 1.50 | | 216 |
| 2002 | | 1.00 | | .034 | | (.034) | | 1.00 | | 3.46 | | .30 | | 3.29 | | 86 |
| Participant Shares | | | | | | | | | | | | | | | | |
| Year Ended January 31, | | | | | | | | | | | | | | | | |
| 2006 | | 1.00 | | .027 | | (.027) | | 1.00 | | 2.77 | | .60 | | 2.81 | | 208 |
| 2005 | | 1.00 | | .008 | | (.008) | | 1.00 | | .81 | | .60 | | .79 | | 230 |
| 2004 | | 1.00 | | .005 | | (.005) | | 1.00 | | .54 | | .60 | | .51 | | 229 |
| 2003 | | 1.00 | | .012 | | (.012) | | 1.00 | | 1.21 | | .60 | | 1.20 | | 325 |
| 2002 | | 1.00 | | .031 | | (.031) | | 1.00 | | 3.15 | | .60 | | 2.99 | | 399 |
See notes to financial statements.
The Funds 51
F I N A N C I A L H I G H L I G H T S (continued)
| | | | | Per Share Data ($) | | | | Ratios/Supplemental Data (%) |
| |
| |
| |
| |
|
| | | | | | | | | | | | | | | Ratio of Net | | |
| | | Net Asset | | | | Dividends | | Net Asset | | | | Ratio of | | Investment | | Net Assets |
| | | Value | | Net | | from Net | | Value | | | | Expenses | | Income to | | End of |
| | | Beginning | | Investment | | Investment | | End | | Total | | to Average | | Average | | Period |
| | | of Period | | Income | | Income | | of Period | | Return (%) | | Net Assets | | Net Assets ($ x1,000,000) |
| |
| |
| |
| |
| |
| |
| |
|
| |
| Dreyfus Treasury Cash Management | | | | | | | | | | | | | | |
| Institutional Shares | | | | | | | | | | | | | | | | |
| Year Ended January 31, | | | | | | | | | | | | | | | | |
| 2006 | | 1.00 | | .031 | | (.031) | | 1.00 | | 3.10 | | .20 | | 3.08 | | 3,017 |
| 2005 | | 1.00 | | .012 | | (.012) | | 1.00 | | 1.19 | | .20 | | 1.16 | | 2,351 |
| 2004 | | 1.00 | | .009 | | (.009) | | 1.00 | | .93 | | .20 | | .93 | | 3,312 |
| 2003 | | 1.00 | | .016 | | (.016) | | 1.00 | | 1.59 | | .20 | | 1.57 | | 3,397 |
| 2002 | | 1.00 | | .036 | | (.036) | | 1.00 | | 3.62 | | .20 | | 3.42 | | 2,787 |
| Investor Shares | | | | | | | | | | | | | | | | |
| Year Ended January 31, | | | | | | | | | | | | | | | | |
| 2006 | | 1.00 | | .028 | | (.028) | | 1.00 | | 2.84 | | .45 | | 2.83 | | 1,320 |
| 2005 | | 1.00 | | .009 | | (.009) | | 1.00 | | .94 | | .45 | | .91 | | 1,164 |
| 2004 | | 1.00 | | .007 | | (.007) | | 1.00 | | .68 | | .45 | | .68 | | 1,288 |
| 2003 | | 1.00 | | .013 | | (.013) | | 1.00 | | 1.34 | | .45 | | 1.32 | | 999 |
| 2002 | | 1.00 | | .033 | | (.033) | | 1.00 | | 3.36 | | .45 | | 3.17 | | 1,035 |
| Administrative Shares | | | | | | | | | | | | | | | | |
| Year Ended January 31, | | | | | | | | | | | | | | | | |
| 2006 | | 1.00 | | .030 | | (.030) | | 1.00 | | 3.00 | | .30 | | 2.98 | | 87 |
| 2005 | | 1.00 | | .011 | | (.011) | | 1.00 | | 1.09 | | .30 | | 1.06 | | 49 |
| 2004 | | 1.00 | | .008 | | (.008) | | 1.00 | | .83 | | .30 | | .83 | | 20 |
| 2003 | | 1.00 | | .015 | | (.015) | | 1.00 | | 1.49 | | .30 | | 1.47 | | 23 |
| 2002 | | 1.00 | | .035 | | (.035) | | 1.00 | | 3.52 | | .30 | | 3.32 | | 127 |
| Participant Shares | | | | | | | | | | | | | | | | |
| Year Ended January 31, | | | | | | | | | | | | | | | | |
| 2006 | | 1.00 | | .027 | | (.027) | | 1.00 | | 2.69 | | .60 | | 2.68 | | 219 |
| 2005 | | 1.00 | | .008 | | (.008) | | 1.00 | | .79 | | .60 | | .76 | | 210 |
| 2004 | | 1.00 | | .005 | | (.005) | | 1.00 | | .52 | | .60 | | .53 | | 123 |
| 2003 | | 1.00 | | .012 | | (.012) | | 1.00 | | 1.19 | | .60 | | 1.17 | | 52 |
| 2002 | | 1.00 | | .032 | | (.032) | | 1.00 | | 3.21 | | .60 | | 3.02 | | 121 |
See notes to financial statements.
| | | | | Per Share Data ($) | | | | Ratios/Supplemental Data (%) |
| |
| |
| |
| |
|
| | | | | | | | | | | | | | | Ratio of Net | | |
| | | Net Asset | | | | Dividends | | Net Asset | | | | Ratio of | | Investment | | Net Assets |
| | | Value | | Net | | from Net | | Value | | | | Expenses | | Income to | | End of |
| | | Beginning | | Investment | | Investment | | End | | Total | | to Average | | Average | | Period |
| | | of Period | | Income | | Income | | of Period | | Return (%) | | Net Assets | | Net Assets ($ x1,000,000) |
| |
| |
| |
| |
| |
| |
| |
|
| |
| Dreyfus Treasury Prime Cash Management | | | | | | | | | | | | | | |
| Institutional Shares | | | | | | | | | | | | | | | | |
| Year Ended January 31, | | | | | | | | | | | | | | | | |
| 2006 | | 1.00 | | .029 | | (.029) | | 1.00 | | 2.96 | | .20 | | 2.93 | | 1,487 |
| 2005 | | 1.00 | | .012 | | (.012) | | 1.00 | | 1.17 | | .20 | | 1.14 | | 1,333 |
| 2004 | | 1.00 | | .009 | | (.009) | | 1.00 | | .92 | | .20 | | .93 | | 1,785 |
| 2003 | | 1.00 | | .016 | | (.016) | | 1.00 | | 1.58 | | .20 | | 1.56 | | 3,291 |
| 2002 | | 1.00 | | .036 | | (.036) | | 1.00 | | 3.68 | | .20 | | 3.40 | | 3,331 |
| Investor Shares | | | | | | | | | | | | | | | | |
| Year Ended January 31, | | | | | | | | | | | | | | | | |
| 2006 | | 1.00 | | .027 | | (.027) | | 1.00 | | 2.70 | | .45 | | 2.68 | | 651 |
| 2005 | | 1.00 | | .009 | | (.009) | | 1.00 | | .92 | | .45 | | .89 | | 613 |
| 2004 | | 1.00 | | .007 | | (.007) | | 1.00 | | .67 | | .45 | | .68 | | 794 |
| 2003 | | 1.00 | | .013 | | (.013) | | 1.00 | | 1.32 | | .45 | | 1.31 | | 1,261 |
| 2002 | | 1.00 | | .034 | | (.034) | | 1.00 | | 3.42 | | .45 | | 3.15 | | 1,300 |
| Administrative Shares | | | | | | | | | | | | | | | | |
| Year Ended January 31, | | | | | | | | | | | | | | | | |
| 2006 | | 1.00 | | .028 | | (.028) | | 1.00 | | 2.86 | | .30 | | 2.83 | | 26 |
| 2005 | | 1.00 | | .011 | | (.011) | | 1.00 | | 1.07 | | .30 | | 1.04 | | 39 |
| 2004 | | 1.00 | | .008 | | (.008) | | 1.00 | | .82 | | .30 | | .83 | | 97 |
| 2003 | | 1.00 | | .015 | | (.015) | | 1.00 | | 1.48 | | .30 | | 1.46 | | 205 |
| 2002 | | 1.00 | | .035 | | (.035) | | 1.00 | | 3.57 | | .30 | | 3.30 | | 62 |
| Participant Shares | | | | | | | | | | | | | | | | |
| Year Ended January 31, | | | | | | | | | | | | | | | | |
| 2006 | | 1.00 | | .025 | | (.025) | | 1.00 | | 2.55 | | .60 | | 2.53 | | 352 |
| 2005 | | 1.00 | | .008 | | (.008) | | 1.00 | | .76 | | .60 | | .74 | | 94 |
| 2004 | | 1.00 | | .005 | | (.005) | | 1.00 | | .52 | | .60 | | .53 | | 179 |
| 2003 | | 1.00 | | .012 | | (.012) | | 1.00 | | 1.18 | | .60 | | 1.16 | | 321 |
| 2002 | | 1.00 | | .032 | | (.032) | | 1.00 | | 3.26 | | .60 | | 3.00 | | 522 |
See notes to financial statements.
The Funds 53
F I N A N C I A L H I G H L I G H T S (continued)
| | | | | Per Share Data ($) | | | | Ratios/Supplemental Data (%) |
| |
| |
| |
| |
|
| | | | | | | | | | | | | | | Ratio of Net | | |
| | | Net Asset | | | | Dividends | | Net Asset | | | | Ratio of | | Investment | | Net Assets |
| | | Value | | Net | | from Net | | Value | | | | Expenses | | Income to | | End of |
| | | Beginning | | Investment | | Investment | | End | | Total | | to Average | | Average | | Period |
| | | of Period | | Income | | Income | | of Period | | Return (%) | | Net Assets | | Net Assets ($ x1,000,000) |
| |
| |
| |
| |
| |
| |
| |
|
| |
| Dreyfus Municipal Cash Management Plus | | | | | | | | | | | | | | |
| Institutional Shares | | | | | | | | | | | | | | | | |
| Year Ended January 31, | | | | | | | | | | | | | | | | |
| 2006 | | 1.00 | | .024 | | (.024) | | 1.00 | | 2.39 | | .20 | | 2.34 | | 638 |
| 2005 | | 1.00 | | .011 | | (.011) | | 1.00 | | 1.13 | | .20 | | 1.07 | | 500 |
| 2004 | | 1.00 | | .009 | | (.009) | | 1.00 | | .93 | | .20 | | .92 | | 722 |
| 2003 | | 1.00 | | .013 | | (.013) | | 1.00 | | 1.33 | | .20 | | 1.31 | | 224 |
| 2002 | | 1.00 | | .026 | | (.026) | | 1.00 | | 2.59 | | .20 | | 2.52 | | 125 |
| Investor Shares | | | | | | | | | | | | | | | | |
| Year Ended January 31, | | | | | | | | | | | | | | | | |
| 2006 | | 1.00 | | .021 | | (.021) | | 1.00 | | 2.13 | | .45 | | 2.09 | | 180 |
| 2005 | | 1.00 | | .009 | | (.009) | | 1.00 | | .88 | | .45 | | .82 | | 105 |
| 2004 | | 1.00 | | .007 | | (.007) | | 1.00 | | .68 | | .45 | | .67 | | 88 |
| 2003 | | 1.00 | | .011 | | (.011) | | 1.00 | | 1.08 | | .45 | | 1.06 | | 92 |
| 2002 | | 1.00 | | .023 | | (.023) | | 1.00 | | 2.34 | | .45 | | 2.27 | | 63 |
| Administrative Shares | | | | | | | | | | | | | | | | |
| Year Ended January 31, | | | | | | | | | | | | | | | | |
| 2006 | | 1.00 | | .023 | | (.023) | | 1.00 | | 2.29 | | .30 | | 2.24 | | 137 |
| 2005 | | 1.00 | | .010 | | (.010) | | 1.00 | | 1.03 | | .30 | | .97 | | 129 |
| 2004 | | 1.00 | | .008 | | (.008) | | 1.00 | | .83 | | .30 | | .82 | | 108 |
| 2003 | | 1.00 | | .012 | | (.012) | | 1.00 | | 1.23 | | .30 | | 1.21 | | 110 |
| 2002 | | 1.00 | | .025 | | (.025) | | 1.00 | | 2.48 | | .30 | | 2.42 | | 71 |
| Participant Shares | | | | | | | | | | | | | | | | |
| Year Ended January 31, | | | | | | | | | | | | | | | | |
| 2006 | | 1.00 | | .020 | | (.020) | | 1.00 | | 1.98 | | .60 | | 1.94 | | 25 |
| 2005 | | 1.00 | | .007 | | (.007) | | 1.00 | | .73 | | .60 | | .67 | | 20 |
| 2004 | | 1.00 | | .005 | | (.005) | | 1.00 | | .52 | | .60 | | .52 | | 19 |
| 2003 | | 1.00 | | .009 | | (.009) | | 1.00 | | .93 | | .60 | | .91 | | 16 |
| 2002 | | 1.00 | | .022 | | (.022) | | 1.00 | | 2.18 | | .60 | | 2.12 | | 16 |
See notes to financial statements.
| | | | | Per Share Data ($) | | | | Ratios/Supplemental Data (%) |
| |
| |
| |
| |
|
| | | | | | | | | | | | | | | Ratio of Net | | |
| | | Net Asset | | | | Dividends | | Net Asset | | | | Ratio of | | Investment | | Net Assets |
| | | Value | | Net | | from Net | | Value | | | | Expenses | | Income to | | End of |
| | | Beginning | | Investment | | Investment | | End | | Total | | to Average | | Average | | Period |
| | | of Period | | Income | | Income | | of Period | | Return (%) | | Net Assets | | Net Assets ($ x1,000,000) |
| |
| |
| |
| |
| |
| |
| |
|
| |
| Dreyfus New York Municipal Cash Management | | | | | | | | | | | | | | |
| Institutional Shares | | | | | | | | | | | | | | | | |
| Year Ended January 31, | | | | | | | | | | | | | | | | |
| 2006 | | 1.00 | | .023 | | (.023) | | 1.00 | | 2.36 | | .20 | | 2.33 | | 343 |
| 2005 | | 1.00 | | .011 | | (.011) | | 1.00 | | 1.10 | | .20 | | 1.12 | | 336 |
| 2004 | | 1.00 | | .009 | | (.009) | | 1.00 | | .88 | | .20 | | .89 | | 308 |
| 2003 | | 1.00 | | .013 | | (.013) | | 1.00 | | 1.26 | | .20 | | 1.25 | | 417 |
| 2002 | | 1.00 | | .024 | | (.024) | | 1.00 | | 2.41 | | .20 | | 2.24 | | 588 |
| Investor Shares | | | | | | | | | | | | | | | | |
| Year Ended January 31, | | | | | | | | | | | | | | | | |
| 2006 | | 1.00 | | .021 | | (.021) | | 1.00 | | 2.11 | | .45 | | 2.08 | | 125 |
| 2005 | | 1.00 | | .008 | | (.008) | | 1.00 | | .85 | | .45 | | .87 | | 71 |
| 2004 | | 1.00 | | .006 | | (.006) | | 1.00 | | .63 | | .45 | | .64 | | 28 |
| 2003 | | 1.00 | | .010 | | (.010) | | 1.00 | | 1.01 | | .45 | | 1.00 | | 21 |
| 2002 | | 1.00 | | .021 | | (.021) | | 1.00 | | 2.15 | | .45 | | 1.99 | | 17 |
| Administrative Shares | | | | | | | | | | | | | | | | |
| Year Ended January 31, | | | | | | | | | | | | | | | | |
| 2006 | | 1.00 | | .022 | | (.022) | | 1.00 | | 2.26 | | .30 | | 2.23 | | 8 |
| 2005 | | 1.00 | | .010 | | (.010) | | 1.00 | | 1.00 | | .30 | | 1.02 | | 1 |
| 2004 | | 1.00 | | .008 | | (.008) | | 1.00 | | .79 | | .30 | | .79 | | —a |
| 2003 | | 1.00 | | .011 | | (.011) | | 1.00 | | 1.15 | | .30 | | 1.15 | | 6 |
| 2002 | | 1.00 | | .023 | | (.023) | | 1.00 | | 2.30 | | .30 | | 2.14 | | 3 |
| Participant Shares | | | | | | | | | | | | | | | | |
| Year Ended January 31, | | | | | | | | | | | | | | | | |
| 2006 | | 1.00 | | .019 | | (.019) | | 1.00 | | 1.95 | | .60 | | 1.93 | | 3 |
| 2005 | | 1.00 | | .007 | | (.007) | | 1.00 | | .70 | | .60 | | .72 | | 6 |
| 2004 | | 1.00 | | .005 | | (.005) | | 1.00 | | .48 | | .60 | | .49 | | 2 |
| 2003 | | 1.00 | | .009 | | (.009) | | 1.00 | | .86 | | .60 | | .85 | | 2 |
| 2002 | | 1.00 | | .020 | | (.020) | | 1.00 | | 2.04 | | .60 | | 1.84 | | —a |
| | a Amount represents less than $1 million.
See notes to financial statements.
|
The Funds 55
F I N A N C I A L H I G H L I G H T S (continued)
| | | | | Per Share Data ($) | | | | Ratios/Supplemental Data (%) |
| |
| |
| |
| |
|
| | | | | | | | | | | | | | | Ratio of Net | | |
| | | Net Asset | | | | Dividends | | Net Asset | | | | Ratio of | | Investment | | Net Assets |
| | | Value | | Net | | from Net | | Value | | | | Expenses | | Income to | | End of |
| | | Beginning | | Investment | | Investment | | End | | Total | | to Average | | Average | | Period |
| | | of Period | | Income | | Income | | of Period | | Return (%) | | Net Assets | | Net Assets ($ x1,000,000) |
| |
| |
| |
| |
| |
| |
| |
|
| |
| Dreyfus Tax Exempt Cash Management | | | | | | | | | | | | | | |
| Institutional Shares | | | | | | | | | | | | | | | | |
| Year Ended January 31, | | | | | | | | | | | | | | | | |
| 2006 | | 1.00 | | .023 | | (.023) | | 1.00 | | 2.36 | | .20 | | 2.35 | | 2,645 |
| 2005 | | 1.00 | | .011 | | (.011) | | 1.00 | | 1.12 | | .20 | | 1.14 | | 2,510 |
| 2004 | | 1.00 | | .009 | | (.009) | | 1.00 | | .90 | | .20 | | .89 | | 1,934 |
| 2003 | | 1.00 | | .013 | | (.013) | | 1.00 | | 1.29 | | .20 | | 1.28 | | 2,073 |
| 2002 | | 1.00 | | .025 | | (.025) | | 1.00 | | 2.50 | | .20 | | 2.40 | | 1,880 |
| Investor Shares | | | | | | | | | | | | | | | | |
| Year Ended January 31, | | | | | | | | | | | | | | | | |
| 2006 | | 1.00 | | .021 | | (.021) | | 1.00 | | 2.11 | | .45 | | 2.10 | | 255 |
| 2005 | | 1.00 | | .009 | | (.009) | | 1.00 | | .87 | | .45 | | .89 | | 240 |
| 2004 | | 1.00 | | .006 | | (.006) | | 1.00 | | .65 | | .45 | | .64 | | 122 |
| 2003 | | 1.00 | | .010 | | (.010) | | 1.00 | | 1.04 | | .45 | | 1.03 | | 119 |
| 2002 | | 1.00 | | .022 | | (.022) | | 1.00 | | 2.25 | | .45 | | 2.15 | | 195 |
| Administrative Shares | | | | | | | | | | | | | | | | |
| Year Ended January 31, | | | | | | | | | | | | | | | | |
| 2006 | | 1.00 | | .022 | | (.022) | | 1.00 | | 2.26 | | .30 | | 2.25 | | 105 |
| 2005 | | 1.00 | | .010 | | (.010) | | 1.00 | | 1.02 | | .30 | | 1.04 | | 275 |
| 2004 | | 1.00 | | .008 | | (.008) | | 1.00 | | .80 | | .30 | | .79 | | 312 |
| 2003 | | 1.00 | | .012 | | (.012) | | 1.00 | | 1.19 | | .30 | | 1.18 | | 185 |
| 2002 | | 1.00 | | .024 | | (.024) | | 1.00 | | 2.40 | | .30 | | 2.30 | | 7 |
| Participant Shares | | | | | | | | | | | | | | | | |
| Year Ended January 31, | | | | | | | | | | | | | | | | |
| 2006 | | 1.00 | | .019 | | (.019) | | 1.00 | | 1.96 | | .60 | | 1.95 | | 42 |
| 2005 | | 1.00 | | .007 | | (.007) | | 1.00 | | .72 | | .60 | | .74 | | 19 |
| 2004 | | 1.00 | | .005 | | (.005) | | 1.00 | | .50 | | .60 | | .49 | | 46 |
| 2003 | | 1.00 | | .009 | | (.009) | | 1.00 | | .89 | | .60 | | .88 | | 139 |
| 2002 | | 1.00 | | .021 | | (.021) | | 1.00 | | 2.10 | | .60 | | 2.00 | | 151 |
See notes to financial statements.
NOTES TO FINANCIAL STATEMENTS
NOTE 1—Significant Accounting Policies:
Dreyfus Cash Management, Dreyfus Cash Management Plus, Inc., Dreyfus Government Cash Management, Dreyfus Government Prime Cash Management, Dreyfus Treasury Cash Management, Dreyfus Treasury Prime Cash Management, Dreyfus Municipal Cash Management Plus, Dreyfus New York Municipal Cash Management and Dreyfus Tax Exempt Cash Management, (each, a “fund” and collectively, the “funds”) are open-end management investment companies registered under the Investment Company Act of 1940, as amended (the “Act”). Each fund, other than Dreyfus New York Municipal Cash Management, is diversified. Dreyfus New York Municipal Cash Management is non-diversified. Dreyfus Government Cash Management and Dreyfus Government Prime Cash Management are each a separate series of Dreyfus Government Cash Management Funds (the “Company”) which currently offers two series. Each fund’s investment objective is to provide investors with as high a level of current income as is consistent with the preservation of capital and the maintenance of liquidity and, in the case of Dreyfus Municipal Cash Management Plus and Dreyfus Tax Exempt Cash Management only, which is exempt from federal income tax, and, in the case of Dreyfus New York Municipal Cash Management only, which is exempt from federal, New York state and New York city personal income taxes. The Dreyfus Corporation (the “Manager” or “Dreyfus”) serves as each fund’s investment adviser. The Manager is a wholly-owned subsidiary of Mellon Financial Corporation (“Mellon Financial”).
Dreyfus Service Corporation (the “Distributor”), a wholly-owned subsidiary of the Manager, is the distributor of the funds’ shares, which are sold to the public without a sales charge. Each fund offers the following classes of shares: Institutional Shares, Investor Shares, Administrative Shares and Participant Shares. Investor Shares, Administrative Shares and Participant Shares are subject to a Service Plan adopted pursuant to Rule 12b-1 under the Act. Other differences between the classes include the services offered to and the expenses borne by each class and certain voting rights. Income, expenses (other than expenses attributable to a specific class), and realized and unrealized gains or
losses on investments are allocated to each class of shares based on its relative net assets.
It is each fund’s policy to maintain a continuous net asset value per share of $1.00; each fund has adopted certain investment, portfolio valuation and dividend and distribution policies to enable it to do so. There is no assurance, however, that any fund will be able to maintain a stable net asset value per share of $1.00.
Each fund’s financial statements are prepared in accordance with U.S. generally accepted accounting principles, which may require the use of management estimates and assumptions. Actual results could differ from those estimates.
The funds enter into contracts that contain a variety of indemnifications. The funds’ maximum exposure under these arrangements is unknown. The funds do not anticipate recognizing any loss related to these arrangements.
(a) Portfolio valuation: Investments in securities are valued at amortized cost in accordance with Rule 2a-7 of the Act, which has been determined by the Board members to represent the fair value of each fund’s investments.
(b) Securities transactions and investment income:
Securities transactions are recorded on a trade date basis. Realized gain and loss from securities transactions are recorded on the identified cost basis. Interest income, adjusted for accretion of discount and amortization of premium on investments, is earned from settlement date and recognized on the accrual basis. Cost of investments represents amortized cost.
Dreyfus New York Municipal Cash Management follows an investment policy of investing primarily in municipal obligations of one state. Economic changes affecting the state and certain of its public bodies and municipalities may affect the ability of issuers within the state to pay interest on, or repay principal of, municipal obligations held by the fund.
Dreyfus Cash Management, Dreyfus Cash Management Plus, Inc., Dreyfus Government Cash Management and Dreyfus Treasury Cash Management may enter into repurchase agreements with financial institutions, deemed to be creditworthy by the Manager, subject to the seller’s agree-
The Funds 57
NOTES TO FINANCIAL STATEMENTS (continued)
ment to repurchase and the fund’s agreement to resell such securities at a mutually agreed upon price. Securities purchased subject to repurchase agreements are deposited with the funds’ custodians and, pursuant to the terms of the repurchase agreement, must have an aggregate market value greater than or equal to the repurchase price plus accrued interest at all times. If the value of the underlying securities falls below the value of the repurchase price plus accrued interest, the fund will require the seller to deposit additional collateral by the next business day. If the request for additional collateral is not met, or the seller defaults on its repurchase obligation, the fund maintains the right to sell the underlying securities at market value and may claim any resulting loss against the seller.
(c) Expenses: With regards to the Company, expenses directly attributable to each series are charged to that series’ operations; expenses which are applicable to both series are allocated between them.
(d) Dividends to shareholders: It is the policy of each fund to declare dividends from investment income-net on each business day. Such dividends are paid monthly. Dividends from net realized capital gain, if any, are normally declared and paid annually, but each fund may make distributions on a more frequent basis to comply with the distribution requirements of the Internal Revenue Code of 1986, as amended (the “Code”).To the extent that net real-
ized capital gain can be offset by capital loss carryovers, it is the policy of each fund not to distribute such gain.
(e) Federal income taxes: It is the policy of each fund (except for Dreyfus Municipal Cash Management Plus, Dreyfus New York Municipal Cash Management and Dreyfus Tax Exempt Cash Management) to continue to qualify as a regulated investment company, if such qualification is in the best interests of its shareholders, by complying with the applicable provisions of the Code and to make distributions of taxable income sufficient to relieve it from substantially all federal income and excise taxes.
It is the policy of Dreyfus Municipal Cash Management Plus, Dreyfus New York Municipal Cash Management and Dreyfus Tax Exempt Cash Management to continue to qualify as a regulated investment company, which can distribute tax exempt dividends, by complying with the applicable provisions of the Code and to make distributions of income sufficient to relieve it from substantially all federal income and excise taxes.
At January 31, 2006, the components of accumulated earnings on a tax basis were substantially the same as for financial reporting purposes.
Table 1 summarizes each fund’s accumulated capital loss carryover available to be applied against future net securities profits, if any, realized subsequent to January 31, 2006.
Table 1.
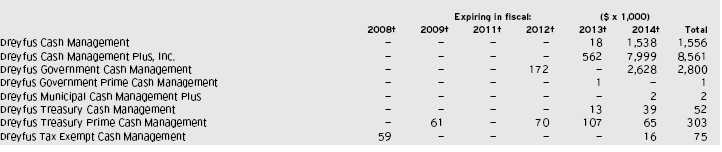
58
† If not applied, the carryovers expire in the above years.
The tax character of each fund’s distributions paid to shareholders (except for Dreyfus Municipal Cash Management Plus, Dreyfus New York Municipal Cash Management and Dreyfus Tax Exempt Cash Management) during the fiscal periods ended January 31, 2006 and January 31, 2005, respectively, were all ordinary income.
The tax character of distributions paid to shareholders of Dreyfus Municipal Cash Management Plus, Dreyfus New York Municipal Cash Management and Dreyfus Tax Exempt Cash Management during the fiscal periods ended January 31, 2006 and January 31, 2005, respectively, were all tax exempt income.
During the period ended January 31, 2006, as a result of permanent book to tax differences, primarily due to dividend reclassification for tax purposes, Dreyfus Government Prime Cash Management decreased accumulated net realized gains (losses) on investments and increased accumulated undistributed investment income-net by the same amounts. Net assets of the fund were not affected by this reclassification. The amount of the reclassification was $2,910.
At January 31, 2006, the cost of investments for federal income tax purposes was substantially the same as the cost for financial reporting purposes (see the Statements of Investments).
NOTE 2—Management Fee and Other Transactions with Affiliates:
(a) Pursuant to separate management agreements with the Manager, the management fee of each fund is computed at the annual rate of .20% of the value of such fund’s average daily net assets and is payable monthly.
As to each fund, unless the Manager gives a fund’s investors 90 days notice to the contrary, the Manager, and not the
fund, will be liable for fund expenses (exclusive of taxes, brokerage fees, interest on borrowings and extraordinary expenses) other than the following expenses, which will be borne by the fund: the management fee, and with respect to the fund’s Investor Shares, Administrative Shares and Participant Shares, Rule 12b-1 Service Plan expenses.
(b) Under each fund’s Service Plan (the “Plan”) adopted pursuant to Rule 12b-1 under the Act, relating to its Investor Shares, Administrative Shares and Participant Shares, each fund pays the Distributor for distributing such classes of shares, for advertising and marketing relating to such classes of shares, for providing certain services relating to shareholder accounts in such classes of shares, such as answering shareholder inquiries regarding the fund and providing reports and other information, and services related to the maintenance of shareholder accounts (“Servicing”), at an aggregate annual rate of .25%, .10% and .40% of the value of the average daily net assets of Investor Shares,Administrative Shares and Participant Shares, respec-tively.The Distributor may pay one or more Service Agents (a securities dealer, financial institution or other industry professional) a fee in respect of a funds’, Investor Shares, Administrative Shares and Participant Shares owned by shareholders with whom the Service Agent has a Servicing relationship or for whom the Service Agent is the dealer or holder of record.The Distributor determines the amounts, if any, to be paid to Service Agents under the Plan and the basis on which such payments are made. The fees payable under each Plan are payable without regard to actual expenses incurred. Table 2 summarizes the amount each fund was charged pursuant to the Plan during the period ended January 31, 2006.
The Funds 59
NOTES TO FINANCIAL STATEMENTS (continued)
Table 3 summarizes the components of Due to The Dreyfus Corporation and affiliates in the Statements of Assets and Liabilities for each fund.
(c) Each fund (except for Dreyfus New York Municipal Cash Management) pays its Board members an annual fee of $3,000 and an attendance fee of $500 per meeting. Dreyfus New York Municipal Cash Management pays its Board members an annual fee of $1,000 and an attendance fee of $500 per meeting. These amounts are borne by the Manager as to each fund pursuant to the undertakings in effect. See Note 2(a).
NOTE 3—Capital Share Transactions:
Each fund (except for Dreyfus Cash Management Plus, Inc.) is authorized to issue an unlimited number of $.001 par value shares of Beneficial Interest. Dreyfus Cash Management Plus, Inc. is authorized to issue 90 billion shares of $.001 par value Common Stock.
| Table 2. | | | | | | |
| |
| |
| |
|
| |
| | | Investor | | Administrative | | Participant |
| | | Shares ($) | | Shares ($) | | Shares ($) |
| |
| |
| |
|
| Dreyfus Cash Management | | 2,935,854 | | 270,534 | | 861,865 |
| Dreyfus Cash Management Plus, Inc. | | 2,957,860 | | 598,988 | | 1,856,155 |
| Dreyfus Government Cash Management | | 2,698,879 | | 232,422 | | 1,092,870 |
| Dreyfus Government Prime Cash Management | | 567,003 | | 176,701 | | 929,714 |
| Dreyfus Treasury Cash Management | | 3,418,873 | | 73,638 | | 848,408 |
| Dreyfus Treasury Prime Cash Management | | 1,719,275 | | 28,107 | | 613,580 |
| Dreyfus Municipal Cash Management Plus | | 352,607 | | 138,478 | | 100,955 |
| Dreyfus New York Municipal Cash Management | | 227,295 | | 4,484 | | 21,786 |
| Dreyfus Tax Exempt Cash Management | | 575,866 | | 159,129 | | 153,160 |
| Table 3. | | | | |
| |
| |
|
| |
| | | Management | | Rule 12b-1 |
| | | Fees ($) | | Service Plan Fees ($) |
| |
| |
|
| Dreyfus Cash Management | | 2,094,812 | | 369,707 |
| Dreyfus Cash Management Plus, Inc. | | 1,625,782 | | 565,982 |
| Dreyfus Government Cash Management | | 739,341 | | 336,363 |
| Dreyfus Government Prime Cash Management | | 226,942 | | 147,221 |
| Dreyfus Treasury Cash Management | | 872,038 | | 363,865 |
| Dreyfus Treasury Prime Cash Management | | 427,394 | | 255,825 |
| Dreyfus Municipal Cash Management Plus | | 119,252 | | 60,826 |
| Dreyfus New York Municipal Cash Management | | 57,309 | | 24,514 |
| Dreyfus Tax Exempt Cash Management | | 499,254 | | 72,710 |
60
REPORT OF INDEPENDENT REGISTERED PUBLIC ACCOUNTING FIRM
Shareholders and Board of Trustees/Directors
Dreyfus Cash Management
Dreyfus Cash Management Plus, Inc.
Dreyfus Government Cash Management
Dreyfus Government Prime Cash Management
Dreyfus Treasury Cash Management
Dreyfus Treasury Prime Cash Management
Dreyfus Municipal Cash Management Plus
Dreyfus New York Municipal Cash Management
Dreyfus Tax Exempt Cash Management
|
We have audited the accompanying statements of assets and liabilities, including the statements of investments, of Dreyfus Cash Management, Dreyfus Cash Management Plus, Inc., Dreyfus Government Cash Management, Dreyfus Government Prime Cash Management, Dreyfus Treasury Cash Management, Dreyfus Treasury Prime Cash Management, Dreyfus Municipal Cash Management Plus, Dreyfus New York Municipal Cash Management and Dreyfus Tax Exempt Cash Management (the “Funds”) as of January 31, 2006, and the related statements of operations for the year then ended, the statements of changes in net assets for each of the two years in the period then ended, and financial highlights for each of the years indicated therein. These financial statements and financial highlights are the responsibility of the Funds’ management. Our responsibility is to express an opinion on these financial statements and financial highlights based on our audits.
We conducted our audits in accordance with the standards of the Public Company Accounting Oversight Board (United States). Those standards require that we plan and perform the audit to obtain reasonable assurance about
whether the financial statements and financial highlights are free of material misstatement.We were not engaged to perform an audit of the Funds’ internal control over financial reporting. Our audits included consideration of internal control over financial reporting as a basis for designing audit procedures that are appropriate in the circumstances, but not for the purpose of expressing an opinion on the effectiveness of the Funds’ internal control over financial reporting. Accordingly, we express no such opinion. An audit also includes examining, on a test basis, evidence supporting the amounts and disclosures in the financial statements and financial highlights, assessing the accounting principles used and significant estimates made by management, and evaluating the overall financial statement presentation. Our procedures included confirmation of securities owned as of January 31, 2006 by correspondence with the custodian and others or by other appropriate auditing procedures where replies from others were not received. We believe that our audits provide a reasonable basis for our opinion.
In our opinion, the financial statements and financial highlights referred to above present fairly, in all material respects, the financial position of each of the funds referred to above at January 31, 2006, the results of their operations for the year then ended, the changes in their net assets for each of the two years in the period then ended, and the financial highlights for each of the indicated years, in conformity with U.S. generally accepted accounting principles.
| | New York, New York
March 10, 2006
|
The Funds 61
IMPORTANT TAX INFORMATION (Unaudited)
In accordance with federal tax law, Dreyfus Tax Exempt Cash Management, Dreyfus Municipal Cash Management Plus and Dreyfus New York Municipal Cash Management hereby makes the following designations regarding the dividends paid from investment income-net during their fiscal year ended January 31, 2006:
- all the dividends paid from investment income-net are “exempt-interest dividends” (not generally subject to regular federal income taxes).
- for individuals who are residents of New York, “exempt-interest dividends” paid by Dreyfus New York Municipal Cash Management are also not sub- ject to New York state and New York city personal income tax.
For state individual income tax purposes, Dreyfus Government Cash Management, Dreyfus Government Prime Cash Management and Dreyfus Treasury Prime Cash Management hereby designate the following percentage of ordinary dividends paid during the fiscal year ended January
31, 2006 as attributable to interest income from direct obligations of the United States. Such dividends are currently exempt from taxation for income tax purposes in most states, including New York, California and the District of Columbia:
| Dreyfus Government Cash Management | | 35.13% |
| Dreyfus Government Prime | | |
| Cash Management | | 100% |
| Dreyfus Treasury Prime Cash Management | | 100% |
The funds below designate the following percentage of ordinary income dividends paid during the fiscal year ended January 31, 2006 as qualifying “interest related dividends”:
| Dreyfus Cash Management | | 83.68% |
| Dreyfus Government Cash Management | | 100% |
| Dreyfus Government Prime | | |
| Cash Management | | 100% |
| Dreyfus Treasury Prime Cash Management | | 100% |
| Dreyfus Cash Management Plus, Inc. | | 85.65% |
| Dreyfus Treasury Cash Management | | 100% |
62
BOARD MEMBERS INFORMATION (Unaudited)
| Joseph S. DiMartino (62) |
| Chairman of the Board (1995) |
| Principal Occupation During Past 5 Years: |
| • Corporate Director and Trustee |
| Other Board Memberships and Affiliations: |
| • The Muscular Dystrophy Association, Director |
| • Levcor International, Inc., an apparel fabric processor, Director |
| • Century Business Services, Inc., a provider of outsourcing |
| functions for small and medium size companies, Director |
| • The Newark Group, a provider of a national market of paper |
| recovery facilities, paperboard mills and paperboard converting |
| plants, Director |
| • Sunair Services Corporation, engages in the design, manufacture |
| and sale of high frequency systems for long-range voice and data |
| communications, as well as providing certain outdoor-related |
| services to homes and businesses, Director |
| No. of Portfolios for which Board Member Serves: 184 |
| |
| ——————— |
| David W. Burke (69) |
| Board Member (1994) |
| Principal Occupation During Past 5 Years: |
| • Corporate Director and Trustee |
| Other Board Memberships and Affiliations: |
| • John F. Kennedy Library Foundation, Director |
| • U.S.S. Constitution Museum, Director |
| No. of Portfolios for which Board Member Serves: 79 |
| |
| ——————— |
| Isabel Dunst (57) |
| Board Member (1991) |
| Principal Occupation During Past 5 Years: |
| • Partner, Hogan & Hartson |
| Other Board Memberships and Affiliations: |
| • Union of Reform Judaism, a religious organization,Trustee |
| No. of Portfolios for which Board Member Serves: 9 |
| Lyle E. Gramley (79) |
| Board Member (1986) |
| Principal Occupation During Past 5 Years: |
| • Consulting economist |
| Other Board Memberships and Affiliations: |
| • IndyMac Bank, Inc., Director |
| No. of Portfolios for which Board Member Serves: 9 |
| |
| ——————— |
| Warren B. Rudman (75) |
| Board Member (1993) |
| Principal Occupation During Past 5 Years: |
| • Of Counsel to (from January 1993 to December 31, 2003, Partner |
| in) the law firm Paul,Weiss, Rifkind,Wharton & Garrison, LLP |
| Other Board Memberships and Affiliations: |
| • Collins & Aikman Corporation, Director |
| • Allied Waste Corporation, Director |
| • Raytheon Company, Director |
| • Boston Scientific, Director |
| No. of Portfolios for which Board Member Serves: 18 |
| |
| ——————— |
| Once elected all Board Members serve for an indefinite term.The address of the Board |
| Members and Officers is in c/o The Dreyfus Corporation, 200 Park Avenue, New |
| York, New York 10166. Additional information about the Board Members is |
| available in the fund’s Statement of Additional Information which can be obtained |
| from Dreyfus free of charge by calling this toll free number: 1-800-554-4611. |
The Funds 63
OFFICERS OF THE FUNDS (Unaudited)
STEPHEN E. CANTER, President since March 2000.
Chairman of the Board, Chief Executive Officer and Chief Operating Officer of the Manager, and an officer of 90 investment companies (comprised of 184 portfolios) managed by the Manager. Mr. Canter also is a Board member and, where applicable, an Executive Committee Member of the other investment management subsidiaries of Mellon Financial Corporation, each of which is an affiliate of the Manager. He is 60 years old and has been an employee of the Manager since May 1995.
STEPHEN R. BYERS, Executive Vice President since November 2002.
Chief Investment Officer,Vice Chairman and a director of the Manager, and an officer of 90 investment companies (comprised of 184 portfolios) managed by the Manager. Mr. Byers also is an officer, director or an Executive Committee Member of certain other investment management subsidiaries of Mellon Financial Corporation, each of which is an affiliate of the Manager. He is 52 years old and has been an employee of the Manager since January 2000.
CHARLES CARDONA, Executive Vice President since November 2001.
Vice Chairman and a Director of the Manager, Executive Vice President of the Distributor, President of Dreyfus Institutional Services Division, and an officer of 12 investment companies (comprised of 16 portfolios) managed by the Manager. He is 48 years old and has been an employee of the Manager since February 1981.
MARK N. JACOBS, Vice President since March 2000.
Executive Vice President, Secretary and General Counsel of the Manager, and an officer of 91 investment companies (comprised of 200 portfolios) managed by the Manager. He is 59 years old and has been an employee of the Manager since June 1977.
MICHAEL A. ROSENBERG, Vice President and Secretary since August 2005.
Associate General Counsel of the Manager, and an officer of 91 investment companies (comprised of 200 portfolios) managed by the Manager. He is 45 years old and has been an employee of the Manager since October 1991.
JAMES BITETTO, Vice President and Assistant Secretary since August 2005.
Assistant General Counsel and Assistant Secretary of the Manager, and an officer of 91 investment companies (comprised of 200 portfolios) managed by the Manager. He is 39 years old and has been an employee of the Manager since December 1996.
JONI LACKS CHARATAN, Vice President and Assistant Secretary since August 2005.
Associate General Counsel of the Manager, and an officer of 91 investment companies (comprised of 200 portfolios) managed by the Manager. She is 50 years old and has been an employee of the Manager since October 1988.
JOSEPH M. CHIOFFI, Vice President and Assistant Secretary since August 2005.
Assistant General Counsel of the Manager, and an officer of 91 investment companies (comprised of 200 portfolios) managed by the Manager. He is 44 years old and has been an employee of the Manager since June 2000.
JANETTE E. FARRAGHER, Vice President and Assistant Secretary since August 2005.
Associate General Counsel of the Manager, and an officer of 91 investment companies (comprised of 200 portfolios) managed by the Manager. She is 43 years old and has been an employee of the Manager since February 1984.
JOHN B. HAMMALIAN, Vice President and Assistant Secretary since August 2005.
Associate General Counsel of the Manager, and an officer of 91 investment companies (comprised of 200 portfolios) managed by the Manager. He is 42 years old and has been an employee of the Manager since February 1991.
ROBERT R. MULLERY, Vice President and Assistant Secretary since August 2005.
Associate General Counsel of the Manager, and an officer of 91 investment companies (comprised of 200 portfolios) managed by the Manager. He is 54 years old and has been an employee of the Manager since May 1986.
JEFF PRUSNOFSKY, Vice President and Assistant Secretary since August 2005.
Associate General Counsel of the Manager, and an officer of 91 investment companies (comprised of 200 portfolios) managed by the Manager. He is 40 years old and has been an employee of the Manager since October 1990.
JAMES WINDELS, Treasurer since November 2001.
Director – Mutual Fund Accounting of the Manager, and an officer of 91 investment companies (comprised of 200 portfolios) managed by the Manager. He is 47 years old and has been an employee of the Manager since April 1985.
64
ERIK D. NAVILOFF, Assistant Treasurer since August 2005.
Senior Accounting Manager – Taxable Fixed Income Funds of the Manager, and an officer of 91 investment companies (comprised of 200 portfolios) managed by the Manager. He is 37 years old and has been an employee of the Manager since November 1992.
ROBERT ROBOL, Assistant Treasurer since August 2003.
Senior Accounting Manager – Money Market and Municipal Bond Funds of the Manager, and an officer of 91 investment companies (comprised of 200 portfolios) managed by the Manager. He is 41 years old and has been an employee of the Manager since October 1988.
ROBERT SVAGNA, Assistant Treasurer since August 2005.
Senior Accounting Manager – Equity Funds of the Manager, and an officer of 91 investment companies (comprised of 200 portfolios) managed by the Manager. He is 38 years old and has been an employee of the Manager since November 1990.
GAVIN C. REILLY, Assistant Treasurer since December 2005.
Tax Manager of the Investment Accounting and Support Department of the Manager, and an officer of 91 investment companies (comprised of 200 portfolios) managed by the Manager. He is 37 years old and has been an employee of the Manager since April 1991.
JOSEPH W. CONNOLLY, Chief Compliance Officer since October 2004.
Chief Compliance Officer of the Manager and The Dreyfus Family of Funds (91 investment companies, comprised of 200 portfolios). From November 2001 through March 2004, Mr. Connolly was first Vice-President, Mutual Fund Servicing for Mellon Global Securities Services. In that capacity, Mr. Connolly was responsible for managing Mellon’s Custody, Fund Accounting and Fund Administration services to third-party mutual fund clients. He is 48 years old and has served in various capacities with the Manager since 1980, including manager of the firm’s Fund Accounting Department from 1997 through October 2001.
WILLIAM GERMENIS, Anti-Money Laundering Compliance Officer since October 2002.
Vice President and Anti-Money Laundering Compliance Officer of the Distributor, and the Anti-Money Laundering Compliance Officer of 87 investment companies (comprised of 196 portfolios) managed by the Manager. He is 35 years old and has been an employee of the Distributor since October 1998.
The Funds 65
NOTES
For More Information
| Dreyfus Cash Management Funds | | Transfer Agent & |
| 200 Park Avenue | | Dividend Disbursing Agent |
| New York, NY 10166 | | Dreyfus Transfer, Inc. |
| Manager | | 200 Park Avenue |
| | | New York, NY 10166 |
| The Dreyfus Corporation | | |
| 200 Park Avenue | | Distributor |
| New York, NY 10166 | | Dreyfus Service Corporation |
| Custodian | | 200 Park Avenue |
| | | New York, NY 10166 |
| The Bank of New York | | |
| One Wall Street | | |
| New York, NY 10286 | | |
| Telephone Call your Dreyfus Investments Division representative or 1-800-346-3621 |
| E-mail Access Dreyfus Investments Division at www.dreyfus.com. |
| You can obtain product information and E-mail requests for information or literature. |
| Mail Dreyfus Investments Division, 144 Glenn Curtiss Boulevard, Uniondale, NY 11556-0144 |
| Each fund files its complete schedule of portfolio holdings with the Securities and Exchange Commission (“SEC”) for the first and |
| third quarters of each fiscal year on Form N-Q. Each fund’s Forms N-Q are available on the SEC’s website at http://www.sec.gov and may be |
| reviewed and copied at the SEC’s Public Reference Room in Washington, DC. Information on the operation of the Public Reference Room may |
| be obtained by calling 1-800-SEC-0330. |
| Information regarding how each fund voted proxies relating to portfolio securities for the 12-month period ended June 30, 2005, is available on |
| the SEC’s website at http://www.sec.gov and without charge, upon request, by calling 1-800-645-6561. |

© 2006 Dreyfus Service Corporation CMGTAR0106
Item 2. Code of Ethics.
The Registrant has adopted a code of ethics that applies to the Registrant's principal executive officer, principal financial officer, principal accounting officer or controller, or persons performing similar functions. There have been no amendments to, or waivers in connection with, the Code of Ethics during the period covered by this Report.
Item 3. Audit Committee Financial Expert.
The Registrant's Board has determined that Joseph S. DiMartino, a member of the Audit Committee of the Board, is an audit committee financial expert as defined by the Securities and Exchange Commission (the "SEC"). Mr. DiMartino is "independent" as defined by the SEC for purposes of audit committee financial expert determinations.
Item 4. Principal Accountant Fees and Services
(a) Audit Fees. The aggregate fees billed for each of the last two fiscal years (the "Reporting Periods") for professional services rendered by the Registrant's principal accountant (the "Auditor") for the audit of the Registrant's annual financial statements, or services that are normally provided by the Auditor in connection with the statutory and regulatory filings or engagements for the Reporting Periods, were $23,561 in 2005 and $24,681 in 2006.
(b) Audit-Related Fees. The aggregate fees billed in the Reporting Periods for assurance and related services by the Auditor that are reasonably related to the performance of the audit of the Registrant's financial statements and are not reported under paragraph (a) of this Item 4 were $ - in 2005 and $ - in 2006.
The aggregate fees billed in the Reporting Periods for non-audit assurance and related services by the Auditor to the Registrant's investment adviser (not including any sub-investment adviser whose role is primarily portfolio management and is subcontracted with or overseen by another investment adviser), and any entity controlling, controlled by or under common control with the investment adviser that provides ongoing services to the Registrant ("Service Affiliates"), that were reasonably related to the performance of the annual audit of the Service Affiliate, which required pre-approval by the Audit Committee were $ - in 2005 and $ - in 2006.
Note: For the second paragraph in each of (b) through (d) of this Item 4, certain of such services were not pre-approved prior to May 6, 2003, when such services were required to be pre-approved. On and after May 6, 2003, 100% of all services provided by the Auditor were pre-approved as required. For comparative purposes, the fees shown assume that all such services were pre-approved, including services that were not pre-approved prior to the compliance date of the pre-approval requirement.
| (c) | Tax Fees. The aggregate fees billed in the Reporting Periods for professional services rendered by the Auditor for tax compliance, tax advice and tax planning ("Tax Services") were $2,568 in 2005 and $3,066 in 2006. These services consisted of (i) review or preparation of U.S. federal, state, local and excise tax returns; (ii) U.S. federal, state and local tax planning, advice and assistance regarding statutory, regulatory or administrative developments, and (iii) tax advice regarding tax qualification matters and/or treatment of various financial instruments held or proposed to be acquired or held. |
| |
The aggregate fees billed in the Reporting Periods for Tax Services by the Auditor to Service Affiliates which required pre-approval by the Audit Committee were $0 in 2005 and $0 in 2006.
(d) All Other Fees. The aggregate fees billed in the Reporting Periods for products and services provided by the Auditor, other than the services reported in paragraphs (a) through (c) of this Item, were $10 in 2005 and $15 in 2006. These services consisted of a review of the Registrant's anti-money laundering program.
The aggregate fees billed in the Reporting Periods for Non-Audit Services by the Auditor to Service Affiliates, other than the services reported in paragraphs (b) through (c) of this Item, which required pre-approval by the Audit Committee were $ - in 2005 and $ - in 2006.
Audit Committee Pre-Approval Policies and Procedures. The Registrant's Audit Committee has established policies and procedures (the "Policy") for pre-approval (within specified fee limits) of the Auditor's engagements for non-audit services to the Registrant and Service Affiliates without specific case-by-case consideration. Pre-approval considerations include whether the proposed services are compatible with maintaining the Auditor's independence. Pre-approvals pursuant to the Policy are considered annually.
Non-Audit Fees. The aggregate non-audit fees billed by the Auditor for services rendered to the Registrant, and rendered to Service Affiliates, for the Reporting Periods were $715,101 in 2005 and $791,626 in 2006.
Auditor Independence. The Registrant's Audit Committee has considered whether the provision of non-audit services that were rendered to Service Affiliates which were not pre-approved (not requiring pre-approval) is compatible with maintaining the Auditor's independence.
| Item 5. | | Audit Committee of Listed Registrants. |
| | | Not applicable. | | [CLOSED-END FUNDS ONLY] |
| Item 6. | | Schedule of Investments. |
| | | Not applicable. | | |
| Item 7. | | Disclosure of Proxy Voting Policies and Procedures for Closed-End Management |
| | | Investment Companies. |
| | | Not applicable. | | [CLOSED-END FUNDS ONLY] |
| Item 8. | | Portfolio Managers of Closed-End Management Investment Companies. |
| | | Not applicable. | | [CLOSED-END FUNDS ONLY, beginning with reports for periods ended |
| | | | | on and after December 31, 2005] |
| Item 9. | | Purchases of Equity Securities by Closed-End Management Investment Companies and |
| | | Affiliated Purchasers. |
| | | Not applicable. | | [CLOSED-END FUNDS ONLY] |
| Item 10. | | Submission of Matters to a Vote of Security Holders. |
The Registrant has a Nominating Committee (the "Committee"), which is responsible for selecting and nominating persons for election or appointment by the Registrant's Board as Board members. The
Committee has adopted a Nominating Committee Charter (the "Charter"). Pursuant to the Charter, the Committee will consider recommendations for nominees from shareholders submitted to the Secretary of the Registrant, c/o The Dreyfus Corporation Legal Department, 200 Park Avenue, 8th Floor East, New York, New York 10166. A nomination submission must include information regarding the recommended nominee as specified in the Charter. This information includes all information relating to a recommended nominee that is required to be disclosed in solicitations or proxy statements for the election of Board members, as well as information sufficient to evaluate the factors to be considered by the Committee, including character and integrity, business and professional experience, and whether the person has the ability to apply sound and independent business judgment and would act in the interests of the Registrant and its shareholders.
Nomination submissions are required to be accompanied by a written consent of the individual to stand for election if nominated by the Board and to serve if elected by the shareholders, and such additional information must be provided regarding the recommended nominee as reasonably requested by the Committee.
Item 11. Controls and Procedures.
(a) The Registrant's principal executive and principal financial officers have concluded, based on their evaluation of the Registrant's disclosure controls and procedures as of a date within 90 days of the filing date of this report, that the Registrant's disclosure controls and procedures are reasonably designed to ensure that information required to be disclosed by the Registrant on Form N-CSR is recorded, processed, summarized and reported within the required time periods and that information required to be disclosed by the Registrant in the reports that it files or submits on Form N-CSR is accumulated and communicated to the Registrant's management, including its principal executive and principal financial officers, as appropriate to allow timely decisions regarding required disclosure.
(b) There were no changes to the Registrant's internal control over financial reporting that occurred during the second fiscal quarter of the period covered by this report that have materially affected, or are reasonably likely to materially affect, the Registrant's internal control over financial reporting.
Item 12. Exhibits.
(a)(1) Code of ethics referred to in Item 2.
(a)(2) Certifications of principal executive and principal financial officers as required by Rule 30a-2(a) under the Investment Company Act of 1940.
(a)(3) Not applicable.
(b) Certification of principal executive and principal financial officers as required by Rule 30a-2(b) under the Investment Company Act of 1940.
Pursuant to the requirements of the Securities Exchange Act of 1934 and the Investment Company Act of 1940, the Registrant has duly caused this Report to be signed on its behalf by the undersigned, thereunto duly authorized.
DREYFUS NEW YORK MUNICIPAL CASH MANAGEMENT
| By: | | /s/ Stephen E. Canter |
| | | Stephen E. Canter |
| | | President |
| |
| Date: | | March 28, 2006 |
Pursuant to the requirements of the Securities Exchange Act of 1934 and the Investment Company Act of 1940, this Report has been signed below by the following persons on behalf of the Registrant and in the capacities and on the dates indicated.
| By: | | /s/ Stephen E. Canter |
| | | Stephen E. Canter |
| | | Chief Executive Officer |
| |
| Date: | | March 28, 2006 |
| By: | | /s/ James Windels |
| | | James Windels |
| | | Chief Financial Officer |
| |
| Date: | | March 28, 2006 |
EXHIBIT INDEX
| (a)(1) | | Code of ethics referred to in Item 2. |
| |
| (a)(2) | | Certifications of principal executive and principal financial officers as required by Rule 30a- |
| 2(a) under the Investment Company Act of 1940. (EX-99.CERT) |
| |
| (b) | | Certification of principal executive and principal financial officers as required by Rule 30a- |
| 2(b) under the Investment Company Act of 1940. (EX-99.906CERT) |