| UNITED STATES |
| SECURITIES AND EXCHANGE COMMISSION |
| Washington, D.C. 20549 |
| FORM N-CSR |
| CERTIFIED SHAREHOLDER REPORT OF REGISTERED MANAGEMENT |
| INVESTMENT COMPANIES |
| Investment Company Act file number 811-6395 |
| DREYFUS NEW YORK MUNICIPAL CASH MANAGEMENT |
| (Exact name of Registrant as specified in charter) |
| c/o The Dreyfus Corporation |
| 200 Park Avenue |
| New York, New York 10166 |
| (Address of principal executive offices) (Zip code) |
| |
| Mark N. Jacobs, Esq. |
| 200 Park Avenue |
| New York, New York 10166 |
| (Name and address of agent for service) |
| |
| Registrant's telephone number, including area code: (212) 922-6000 |
| Date of fiscal year end: | | 1/31 |
| Date of reporting period: | | 7/31/06 |
FORM N-CSR
Item 1. Reports to Stockholders.
| | Dreyfus
Cash Management
Funds
|
| Contents | | |
| |
| The Funds | | |
| |
|
| Letter to Shareholders (Taxable) | | 3 |
| Letter to Shareholders (Tax Exempt) | | 5 |
| Understanding Your Fund's Expenses | | 7 |
| Comparing Your Fund's Expenses | | |
| With Those of Other Funds | | 8 |
| Statements of Investments | | 9 |
| Statements of Assets and Liabilities | | 43 |
| Statements of Operations | | 45 |
| Statements of Changes in Net Assets | | 47 |
| Financial Highlights | | 51 |
| Notes to Financial Statements | | 60 |
| Information About the Review and | | |
| Approval of each Fund's Investment | | |
| Management Agreement | | 64 |
| |
| For More Information | | |
| |
|
| Back cover | | |
The views expressed in this report reflect those of the portfolio manager only through the end of the period covered and do not necessarily represent the views of Dreyfus or any other person in the Dreyfus organization. Any such views are subject to change at any time based upon market or other conditions and Dreyfus disclaims any responsibility to update such views. These views may not be relied on as investment advice and, because investment decisions for a Dreyfus fund are based on numerous factors, may not be relied on as an indication of trading intent on behalf of any Dreyfus fund.
• Not FDIC-Insured • Not Bank-Guaranteed • May Lose Value
Dreyfus Cash Management Funds
The Funds

Dear Shareholder:
We are pleased to present the semiannual report for Dreyfus Cash Management Funds (Taxable). For the six-month period ended July 31, 2006, the six Dreyfus Cash Management Funds listed below produced the following annualized yields and annualized effective yields:1
| | | | | Annualized |
| | | Annualized | | Effective |
| | | Yield (%) | | Yield (%) |
| |
| |
|
| Dreyfus Cash Management | | | | |
| Institutional Shares | | 4.72 | | 4.82 |
| Investor Shares | | 4.47 | | 4.56 |
| Administrative Shares | | 4.62 | | 4.71 |
| Participant Shares | | 4.32 | | 4.40 |
| |
| |
|
| Dreyfus Cash Management Plus, Inc. | | |
| Institutional Shares | | 4.71 | | 4.81 |
| Investor Shares | | 4.46 | | 4.55 |
| Administrative Shares | | 4.61 | | 4.71 |
| Participant Shares | | 4.31 | | 4.39 |
| |
| |
|
| Dreyfus Government Cash Management | | |
| Institutional Shares | | 4.64 | | 4.74 |
| Investor Shares | | 4.39 | | 4.48 |
| Administrative Shares | | 4.54 | | 4.64 |
| Participant Shares | | 4.24 | | 4.33 |
| |
| |
|
| Dreyfus Government Prime Cash Management |
| Institutional Shares | | 4.62 | | 4.72 |
| Investor Shares | | 4.37 | | 4.46 |
| Administrative Shares | | 4.52 | | 4.62 |
| Participant Shares | | 4.22 | | 4.31 |
| |
| |
|
| Dreyfus Treasury Cash Management | | |
| Institutional Shares | | 4.51 | | 4.60 |
| Investor Shares | | 4.26 | | 4.34 |
| Administrative Shares | | 4.41 | | 4.50 |
| Participant Shares | | 4.11 | | 4.19 |
| |
| |
|
| Dreyfus Treasury Prime Cash Management |
| Institutional Shares | | 4.34 | | 4.43 |
| Investor Shares | | 4.09 | | 4.17 |
| Administrative Shares | | 4.24 | | 4.33 |
| Participant Shares | | 3.94 | | 4.01 |
Economic and Market Environment
Despite a series of interest-rate increases that began in June 2004, the U.S. economy continued to show signs
of sustainable growth at the start of the reporting period. In fact, the Federal Reserve Board (the "Fed") implemented its fourteenth consecutive rate hike on January 31, 2006, just one day before the reporting period began. The January meeting also marked a change in leadership at the Fed from Alan Greenspan to Ben Bernanke, and investors looked forward to signs that the new Fed chairman would demonstrate his predecessor's inflation-fighting credibility.
A robust employment report for February helped defuse any remaining expectations that a pause might be imminent in the Fed's tightening campaign.Yet, the Treasury yield curve continued to flatten and, at times during the first quarter of 2006, the yield curve inverted, which in the past has been considered a harbinger of recession.
By the end of March, it had become apparent the inversion of the yield curve was more likely a result of robust demand for U.S.Treasury securities from overseas investors, and not necessarily a sign of impending economic weakness. Accordingly, the Fed increased the federal funds rate to 4.75% in late March. It later was announced that U.S. GDP grew at a robust 5.6% annualized rate during the first quarter.
After a sustained period in which long-term rates remained surprisingly stable in the recovering economy, the U.S. Treasury securities yield curve began to steepen in April as low unemployment, strong consumer confidence and brisk retail sales more than offset reports of a slowing housing market, fuelling renewed inflation concerns. In addition, energy prices surged to new record highs in advance of the summer driving season and amid heightened geopolitical turmoil and ongoing industrial demand in the emerging markets.
Inflation-related worries continued to mount in May, and hawkish comments from Fed members sparked sharp declines in both stocks and U.S. Treasury securities.Although it was later announced that a lower-than-expected number of jobs was created during the month, the unemployment rate fell to 4.6%, stoking additional concerns that wage inflation might accelerate. Hence, the Fed's rate hike in May, to 5%, was widely anticipated. The Fed's post-meeting statement left open the possibility that further rate increases might be needed to address inflation risks.
The Funds 3
LETTER TO SHAREHOLDERS (continued)
June saw a further shift in market sentiment, as investors became increasingly risk-averse due to intensifying inflationary pressures and signs of potential economic weakness. U.S. and global equity markets continued to correct sharply for much of the month, and bond yields across the yield curve moved higher as investors revised upward their inflation and interest-rate expectations.Although investors widely expected the Fed's June 29 rate hike to 5.25%, the outlook for future action became cloudier as investors alternately worried that the Fed might become too aggressive, possibly triggering a recession by choking off economic growth, or too lenient, potentially allowing inflation to take firmer root in the economy. Initial estimates showed that U.S. GDP expanded at a 2.5% annualized rate during the second quarter, confirming earlier indications of slower economic growth.
While there was no scheduled meeting for July, there was considerable debate over the future of Fed policy. After its June meeting, Fed members indicated that they believed U.S. economic growth was moderating, but they were concerned by recent reports of higher levels of core inflation.This left both the Fed and the markets in the position of scrutinizing each bit of new data in an attempt to determine the course of monetary policy.
Portfolio Focus
In this current market environment, most money market investors continued to focus primarily on shorter-term money market instruments. We maintained a similar strategy, generally keeping the fund's weighted average maturity in a range we consider shorter than industry averages. However, we are prepared to adjust our strategies as new economic data become available.
Incoming data could cause the Fed to decide to tighten further, thereby reinforcing its determination to keep prices in check.With three more Fed meetings before year-end, there will be ample opportunity for market participants and the Fed to decide if the tightening process is over or if this is just a pause in a longer process.
Sincerely,

Patricia A. Larkin
Senior Portfolio Manager
|
August 15, 2006
New York, N.Y.
|
An investment in the fund is not insured or guaranteed by the FDIC or
any other government agency. Although the fund seeks to preserve the
value of your investment at $1.00 per share, it is possible to lose money
by investing in the fund.
1 Annualized effective yield is based upon dividends declared daily and
reinvested monthly. Past performance is no guarantee of future results.
Yields fluctuate.
|
4

Dear Shareholder:
We are pleased to present the semiannual report for Dreyfus Cash Management Funds (Tax Exempt). For the six-month period ended July 31, 2006, the three tax-exempt money market portfolios that comprise Dreyfus Cash Management Funds (Tax Exempt) produced the following annualized yields and annualized effective yields:1
| | | | | Annualized |
| | | Annualized | | Effective |
| | | Yield (%) | | Yield (%) |
| |
| |
|
| Dreyfus Municipal Cash Management Plus | | |
| Institutional Shares | | 3.21 | | 3.26 |
| Investor Shares | | 2.96 | | 3.01 |
| Administrative Shares | | 3.11 | | 3.16 |
| Participant Shares | | 2.81 | | 2.85 |
| |
| |
|
| Dreyfus N.Y. Municipal Cash Management | | |
| Institutional Shares | | 3.21 | | 3.26 |
| Investor Shares | | 2.96 | | 3.00 |
| Administrative Shares | | 3.11 | | 3.16 |
| Participant Shares | | 2.81 | | 2.85 |
| |
| |
|
| Dreyfus Tax Exempt Cash Management | | |
| Institutional Shares | | 3.20 | | 3.25 |
| Investor Shares | | 2.95 | | 2.99 |
| Administrative Shares | | 3.10 | | 3.15 |
| Participant Shares | | 2.80 | | 2.84 |
On June 29, 2006, the Dreyfus Tax-Exempt Cash Management Fund obtained a AAA rating from Standard & Poor's, a major credit rating agency.The fund previously was not rated.
Economic and Market Environment
Despite headwinds such as volatile energy prices and rising commodity costs, the U.S. economy remained robust at the start of the reporting period. Labor markets strengthened as the unemployment rate hit multi-year lows, and consumer spending remained strong as homeowners borrowed against rising home values. Accordingly, as it had since June 2004, the Federal Reserve Board (the "Fed") continued to raise short-term interest rates. In fact, the Fed implemented its fourteenth consecutive rate hike on January 31, 2006, just one day before the reporting period began. By the reporting period's end, three additional rate hikes had driven the overnight federal funds rate to 5.25%, its highest level since March 2001.
Yields of tax-exempt money market instruments rose along with interest rates, reaching their highest levels in more than four years. The rise in yields piqued investor interest, and assets in tax-exempt money market funds climbed to record levels. However, yields of shorter-dated municipal money market securities generally rose more sharply than longer-dated securities, causing yield differences along the tax-exempt money market yield spectrum to narrow toward historical lows. By the end of the reporting period there was little difference in the yields of tax-exempt securities with maturities between six months and four years. Investors therefore continued to focus on instruments maturing in six months or less. Even institutional investors who normally favor longer-term securities began to purchase tax-exempt money market securities, adding to demand and putting downward pressure on tax-exempt yields.
Robust investor demand was met by a more limited supply of newly issued municipal money market instruments.The strengthening U.S. economy helped boost tax revenues for most states and municipalities, helping them achieve budget surpluses for their current fiscal years and reducing their need to borrow in order to cover operating shortfalls. In addition, some issuers revised their borrowing programs to rely less heavily on one-year municipal notes and more heavily on variable-rate demand notes on which yields are reset weekly or monthly. A reduced volume of newly issued tax-exempt municipal notes also constrained the rise in tax-exempt money market yields.
The Funds 5
LETTER TO SHAREHOLDERS (continued)
Like most other states, the growing U.S. economy benefited New York's fiscal condition by boosting corporate and personal incomes. In fact, in May 2006, the City of New York received a credit-rating upgrade from one of the major bond rating agencies to AA-, the highest in the city's history.
Portfolio Focus
In an environment characterized by low yields among variable-rate instruments, we found opportunities for incrementally higher yields from tax-exempt commercial paper with maturities in the six-to nine-month range. Otherwise, until the end of the reporting period, we generally maintained a relatively short weighted average maturity. With yield difference so narrow and interest rates rising, it made little sense to us to lock in yields any longer than we deemed necessary. In addition, since variable-rate yields have tended to be more volatile than those of longer-term instruments, we decreased the fund's exposure to variable-rate instruments in an effort to smooth out the fund's yield.
However, we began to lengthen the fund's weighted average maturity during the summer of 2006 toward a range we considered slightly longer than industry averages. Many states and municipalities issue the bulk of their municipal notes in June and July, and we took advantage of opportunities to capture what we believed to be attractive yields from newly issued securities. In addition, a softening housing market,
moderating employment gains and other signs of potential economic slowdown suggested to us that short-term interest rates were unlikely to move much higher. Indeed, after more than two years of steady rate hikes, the Fed left the federal funds rate unchanged at its meeting on August 8, not long after the end of the reporting period. In our view, mone tary policy is now well within the neutral range and, while additional rate hikes are possible, the Fed for now is waiting to assess the effects of its previous moves on inflation and the economy.
Sincerely,

Colleen Meehan
Senior Portfolio Manager
|
| | August 15, 2006
New York, N.Y.
|
An investment in each fund is not insured or guaranteed by the FDIC or any other government agency.Although each fund seeks to preserve the value of your investment at $1.00 per share, it is possible to lose money by investing in the funds.
1 Annualized effective yield is based upon dividends declared daily and reinvested monthly. Past performance is no guarantee of future results. Yields fluctuate. For the national funds, income may be subject to state and local taxes. For the New York fund, income may be subject to state and local taxes for out-of-state residents. For each fund, some income may be subject to the federal alternative minimum tax (AMT).
6
UNDERSTANDING YOUR FUND'S EXPENSES (Unaudited)
As a mutual fund investor, you pay ongoing expenses, such as management fees and other expenses. Using the information below, you can estimate how these expenses affect your investment and compare them with the expenses of other funds.You also may pay one-time transaction expenses, including sales charges (loads) and redemptions fees, which are not shown in this section and would have resulted in higher total expenses. For more information, see your fund's prospectus or talk to your financial adviser.
Review your fund's expenses
The table below shows the expenses you would have paid on a $1,000 investment in each class of each fund from February 1, 2006 to July 31, 2006. It also shows how much a $1,000 investment would be worth at the close of the period, assuming actual returns and expenses.
Expenses and Value of a $1,000 Investment
assuming actual returns for the six months ended July 31, 2006
|

† Expenses are equal to the funds' annualized expense ratio of .20% for Institutional Shares, .45% for Investor Shares, .30% for Administrative Shares and .60% for Participant Shares; multiplied by the average account value over the period, multiplied by 181/365 (to reflect the one-half year period).
The Funds 7
COMPARING YOUR FUND'S EXPENSES WITH THOSE OF OTHER FUNDS (Unaudited)
Using the SEC's method to compare expenses
The Securities and Exchange Commission (SEC) has established guidelines to help investores assess fund expenses. Per these guidelines, the table below shows your fund's expenses based on a $1,000 investment, assuming a hypothetical 5% annualized return.You can use this information to compare the ongoing expenses (but not transaction expenses or total cost) of investing in the fund with those of other funds. All mutual fund shareholder reports will provide this information to help you make this comparison. Please note that you cannot use this information to estimate your actual ending account balance and expenses paid during the period.
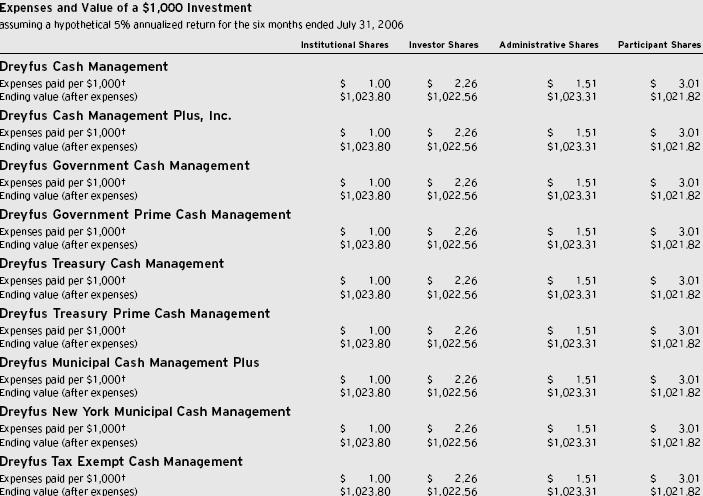
† Expenses are equal to the funds' annualized expense ratio of .20% for Institutional Shares, .45% for Investor Shares, .30% for Administrative Shares and .60% for Participant Shares; multiplied by the average account value over the period, multiplied by 181/365 (to reflect the one-half year period).
| | STATEMENT OF INVESTMENTS
July 31, 2006 (Unaudited)
|
| | | Principal | | |
| Dreyfus Cash Management | | Amount ($) | | Value ($) |
| |
| |
|
| Negotiable Bank Certificates of Deposit—31.2% | | |
| |
|
| Bank of America N.A. | | | | |
| 5.32%, 3/21/07 | | 75,000,000 a | | 75,000,000 |
| Bank of the West | | | | |
| 5.10%, 8/2/06 | | 150,000,000 | | 150,000,000 |
| Barclays Bank PLC (Yankee) | | | | |
| 5.20%—5.47%, 8/29/06—10/20/06 | | 600,000,000 | | 600,000,000 |
| BNP Paribas (Yankee) | | | | |
| 5.47%, 10/24/06 | | 400,000,000 | | 400,000,000 |
| Canadian Imperial Bank of Commerce (Yankee) | | |
| 5.36%, 8/31/06 | | 100,000,000 | | 100,000,000 |
| Credit Suisse (Yankee) | | | | |
| 5.36%—5.47%, 8/30/06—10/20/06 | | 600,000,000 | | 600,000,000 |
| DEPFA BANK PLC (Yankee) | | | | |
| 5.36%—5.46%, 8/31/06—10/20/06 | | 600,000,000 | | 600,000,000 |
| Dresdner Bank AG (Yankee) | | | | |
| 5.30%, 8/11/06 | | 150,000,000 | | 150,000,000 |
| First Tennessee Bank N.A. Memphis | | | | |
| 5.47%, 10/18/06 | | 500,000,000 | | 500,000,000 |
| HSH Nordbank AG (Yankee) | | | | |
| 5.29%, 8/11/06 | | 200,000,000 | | 200,000,000 |
| Societe Generale (Yankee) | | | | |
| 5.32%, 8/21/06 | | 400,000,000 | | 400,000,000 |
| Union Bank of California, N.A. | | | | |
| 5.10%, 8/2/06 | | 325,000,000 | | 325,000,000 |
| Total Negotiable Bank Certificates of Deposit | | |
| (cost $4,100,000,000) | | | | 4,100,000,000 |
| |
| |
|
| |
| Commercial Paper—53.3% | | | | |
| |
| |
|
| Abbey National North America LLC | | | | |
| 5.30%, 8/1/06 | | 150,000,000 | | 150,000,000 |
| Allied Irish Banks N.A. Inc. | | | | |
| 5.37%, 8/31/06 | | 300,000,000 | | 298,670,000 |
| Atlantic Asset Securitization LLC | | | | |
| 5.31%, 8/11/06 | | 49,219,000 b | | 49,146,675 |
| Atlantis One Funding Corp. | | | | |
| 5.47%, 10/20/06 | | 141,976,000 b | | 140,273,866 |
| Bank of America Corp. | | | | |
| 5.33%, 8/21/06 | | 200,000,000 | | 199,413,111 |
| BASF AG | | | | |
| 5.35%, 8/21/06 | | 403,000,000 | | 401,813,389 |
| Beethoven Funding Corp. | | | | |
| 5.32%—5.33%, 8/9/06—8/21/06 | | 328,777,000 b | | 328,199,756 |
| CC (USA) Inc. | | | | |
| 5.44%, 9/28/06 | | 50,000,000 b | | 49,567,417 |
The Funds 9
STATEMENT OF INVESTMENTS (Unaudited) (continued)
| | | Principal | | |
| Dreyfus Cash Management (continued) | | Amount ($) | | Value ($) |
| |
| |
|
| |
| Commercial Paper (continued) | | | | |
| |
| |
|
| Citigroup Funding Inc. | | | | |
| 5.31%—5.49%, 8/10/06—10/20/06 | | 550,000,000 | | 547,639,597 |
| CRC Funding LLC | | | | |
| 5.34%—5.44%, 8/21/06—9/28/06 | | 250,000,000 b | | 248,122,722 |
| Cullinan Finance Ltd. | | | | |
| 5.20%, 8/23/06—8/30/06 | | 100,085,000 b | | 99,713,037 |
| Daimler Chrysler Revolving Auto Conduit LLC | | | | |
| 5.31%, 8/10/06 | | 63,017,000 | | 62,933,660 |
| Deutsche Bank Financial LLC | | | | |
| 5.29%, 8/1/06 | | 550,000,000 | | 550,000,000 |
| Fairway Finance Company LLC | | | | |
| 5.30%, 8/10/06 | | 53,628,000 b | | 53,557,211 |
| FCAR Owner Trust, Ser. I | | | | |
| 5.12%—5.31%, 8/3/06—8/11/06 | | 359,000,000 | | 358,618,703 |
| Gemini Securitization Corp., LLC | | | | |
| 5.11%—5.48%, 8/3/06—10/20/06 | | 345,000,000 b | | 342,650,150 |
| General Electric Capital Corp. | | | | |
| 5.33%, 8/21/06 | | 500,000,000 | | 498,533,333 |
| General Electric Capital Services Inc. | | | | |
| 5.33%, 8/21/06—8/22/06 | | 400,000,000 | | 398,797,333 |
| Harrier Finance Funding Ltd. | | | | |
| 5.20%—5.32%, 8/11/06—8/31/06 | | 350,000,000 b | | 349,064,445 |
| Intesa Funding LLC | | | | |
| 5.36%, 8/31/06 | | 200,000,000 | | 199,114,167 |
| K2 (USA) LLC | | | | |
| 5.20%, 8/31/06 | | 50,000,000 b | | 49,786,250 |
| Kredietbank N.A. Finance Corp. | | | | |
| 5.31%, 8/11/06 | | 520,000,000 | | 519,235,889 |
| Prudential Funding LLC | | | | |
| 5.29%, 8/1/06 | | 150,000,000 | | 150,000,000 |
| Scaldis Capital Ltd. | | | | |
| 5.47%, 10/20/06 | | 30,565,000 b | | 30,198,560 |
| Sigma Finance Inc. | | | | |
| 5.20%—5.45%, 8/31/06—9/29/06 | | 300,000,000 b | | 298,264,097 |
| Spintab AB (Swedmortgage) | | | | |
| 5.45%, 9/29/06 | | 38,150,000 | | 37,813,623 |
| Three Pillars Funding LLC | | | | |
| 5.48%, 10/20/06 | | 30,423,000 b | | 30,057,924 |
| Ticonderoga Master Funding Limited | | | | |
| 5.31%, 8/11/06 | | 50,000,000 b | | 49,926,528 |
| UBS Finance Delaware LLC | | | | |
| 5.29%, 8/1/06 | | 150,000,000 | | 150,000,000 |
| Westpac Banking Corp. | | | | |
| 5.10%, 8/1/06 | | 217,000,000 | | 217,000,000 |
| Westpac Trust Securities NZ Ltd. | | | | |
| 5.10%, 8/2/06 | | 150,000,000 | | 149,979,000 |
| Total Commercial Paper | | | | |
| (cost $7,008,090,443) | | | | 7,008,090,443 |
10
| | | Principal | | |
| Dreyfus Cash Management (continued) | | Amount ($) | | Value ($) |
| |
| |
|
| |
| Corporate Notes—8.0% | | | | |
| |
| |
|
| Bank of America Corp. | | | | |
| 5.31%, 5/25/07 | | 250,000,000 a | | 250,000,000 |
| Fifth Third Bancorp | | | | |
| 5.38%, 8/23/06 | | 200,000,000 a,b | | 200,000,000 |
| General Electric Capital Corp. | | | | |
| 5.36%, 8/24/06 | | 100,000,000 a | | 100,000,000 |
| Harrier Finance Funding Ltd. | | | | |
| 5.32%, 11/15/06—5/18/07 | | 250,000,000 a,b | | 249,993,892 |
| Morgan Stanley | | | | |
| 5.37%, 8/3/06 | | 250,000,000 a | | 250,000,000 |
| Total Corporate Notes | | | | |
| (cost $1,049,993,892) | | | | 1,049,993,892 |
| |
| |
|
| |
| Time Deposits—7.6% | | | | |
| |
| |
|
| HSH Nordbank AG (Grand Cayman) | | | | |
| 5.30%, 8/1/06 | | 300,000,000 | | 300,000,000 |
| Manufacturers & Traders Trust Company (Grand Cayman) | | |
| 5.30%, 8/1/06 | | 250,000,000 | | 250,000,000 |
| National Australia Bank Ltd. (Grand Cayman) | | | | |
| 5.31%, 8/1/06 | | 174,000,000 | | 174,000,000 |
| Regions Bank (Grand Cayman) | | | | |
| 5.30%, 8/1/06 | | 100,000,000 | | 100,000,000 |
| State Street Bank and Trust Co., Boston, MA (Grand Cayman) | | |
| 5.28%, 8/1/06 | | 171,000,000 | | 171,000,000 |
| Total Time Deposits | | | | |
| (cost $995,000,000) | | | | 995,000,000 |
| |
| |
|
| |
| Total Investments (cost $13,153,084,335) | | 100.1% | | 13,153,084,335 |
| Liabilities, Less Cash and Receivables | | (.1%) | | (10,411,603) |
| Net Assets | | 100.0% | | 13,142,672,732 |
| | a Variable rate security—interest rate subject to periodic change.
b Securities exempt from registration under Rule 144A of the Securities Act of 1933.These securities may be resold in transactions exempt from registration, normally to qualified
institutional buyers. At July 31, 2006, these securities amounted to $2,568,522,530 or 19.5% of net assets.
|
| Portfolio Summary (Unaudited) † | | | | | | |
| |
| | | Value (%) | | | | Value (%) |
| |
| |
| |
|
| Banking | | 60.8 | | Chemicals-Fibers & Diversified | | 3.1 |
| Finance | | 11.8 | | Asset-Backed/Certificates-Other | | 1.9 |
| Asset-Backed/Structured Investment Vehicles | | 8.3 | | Brokerage Firms | | 1.9 |
| Asset-Backed/Multi-Seller Programs | | 8.0 | | Insurance | | 1.1 |
| Asset-Backed/Single Seller | | 3.2 | | | | 100.1 |
† Based on net assets.
See notes to financial statements.
|
The Funds 11
| | STATEMENT OF INVESTMENTS
July 31, 2006 (Unaudited)
|
| | | Principal | | |
| Dreyfus Cash Management Plus, Inc. | | Amount ($) | | Value ($) |
| |
| |
|
| Negotiable Bank Certificates of Deposit—24.3% | | |
| |
|
| Barclays Bank PLC (Yankee) | | | | |
| 5.20%, 8/24/06—8/29/06 | | 400,000,000 | | 400,000,000 |
| BNP Paribas (Yankee) | | | | |
| 5.47%, 10/24/06 | | 281,000,000 | | 281,000,000 |
| Credit Suisse (Yankee) | | | | |
| 5.36%—5.47%, 8/30/06—10/20/06 | | 375,000,000 | | 375,000,000 |
| Dresdner Bank AG (Yankee) | | | | |
| 5.30%, 8/11/06 | | 250,000,000 | | 250,000,000 |
| First Tennessee Bank N.A. Memphis | | | | |
| 5.37%, 8/29/06 | | 200,000,000 | | 200,000,000 |
| Fortis Bank (Yankee) | | | | |
| 5.36%, 8/31/06 | | 200,000,000 | | 200,000,000 |
| HSH Nordbank AG (Yankee) | | | | |
| 5.33%, 8/21/06 | | 200,000,000 | | 200,000,000 |
| Societe Generale (Yankee) | | | | |
| 5.32%, 8/21/06 | | 350,000,000 | | 350,000,000 |
| Total Negotiable Bank Certificates of Deposit | | | | |
| (cost $2,256,000,000) | | | | 2,256,000,000 |
| |
| |
|
| |
| Commercial Paper—53.6% | | | | |
| |
| |
|
| Abbey National North America LLC | | | | |
| 5.30%, 8/1/06 | | 150,000,000 | | 150,000,000 |
| Amstel Funding Corp. | | | | |
| 5.20%, 8/31/06 | | 62,645,000 a | | 62,377,193 |
| ANZ National (International) Ltd. | | | | |
| 5.09%, 8/1/06 | | 70,000,000 a | | 70,000,000 |
| Atlantis One Funding Corp. | | | | |
| 5.34%, 8/21/06 | | 23,350,000 a | | 23,281,377 |
| Beethoven Funding Corp. | | | | |
| 5.32%—5.34%, 8/9/06—8/21/06 | | 306,849,000 a | | 306,358,076 |
| Bryant Park Funding LLC | | | | |
| 5.20%—5.30%, 8/9/06—8/31/06 | | 116,977,000 a | | 116,604,011 |
| CHARTA LLC | | | | |
| 5.20%—5.47%, 8/18/06—10/19/06 | | 400,000,000 a | | 397,766,639 |
| Citigroup Funding Inc. | | | | |
| 5.34%, 8/21/06—8/22/06 | | 400,000,000 | | 398,795,055 |
| Concord Minutemen Capital Co. LLC | | | | |
| 5.33%, 8/21/06 | | 390,000,000 a | | 388,856,000 |
| CRC Funding LLC | | | | |
| 5.20%—5.47%, 8/29/06—10/19/06 | | 300,000,000 a | | 298,018,097 |
| Crown Point Capital Co. LLC | | | | |
| 5.47%, 10/17/06 | | 168,305,000 a | | 166,361,077 |
| Cullinan Finance Ltd. | | | | |
| 5.36%, 8/30/06 | | 250,000,000 a | | 248,930,625 |
| Deutsche Bank Financial LLC | | | | |
| 5.29%, 8/1/06 | | 150,000,000 | | 150,000,000 |
| | | Principal | | |
| Dreyfus Cash Management Plus, Inc. (continued) | | Amount ($) | | Value ($) |
| |
| |
|
| |
| Commercial Paper (continued) | | | | |
| |
| |
|
| Falcon Asset Securitization Corp. | | | | |
| 5.31%, 8/10/06 | | 23,692,000 a | | 23,660,667 |
| FCAR Owner Trust, Ser. I | | | | |
| 5.10%, 8/2/06 | | 140,000,000 | | 139,980,420 |
| General Electric Capital Corp. | | | | |
| 5.33%, 8/21/06 | | 250,000,000 | | 249,266,667 |
| Harrier Finance Funding Ltd. | | | | |
| 5.30%, 8/10/06 | | 45,300,000 a | | 45,240,204 |
| ING (US) Funding LLC | | | | |
| 5.36%, 8/29/06 | | 100,000,000 | | 99,586,611 |
| Kredietbank N.A. Finance Corp. | | | | |
| 5.10%, 8/2/06 | | 20,000,000 | | 19,997,203 |
| Nordea North America Inc. | | | | |
| 5.29%, 8/11/06 | | 143,000,000 | | 142,790,664 |
| Prudential Funding LLC | | | | |
| 5.29%, 8/1/06 | | 150,000,000 | | 150,000,000 |
| Scaldis Capital Ltd. | | | | |
| 5.30%, 8/10/06 | | 50,000,000 a | | 49,934,000 |
| Sigma Finance Inc. | | | | |
| 5.20%, 8/31/06 | | 130,000,000 a | | 129,444,250 |
| Spintab AB (Swedmortgage) | | | | |
| 5.37%, 8/29/06 | | 200,000,000 | | 199,172,444 |
| Times Square Funding LLC | | | | |
| 5.31%, 8/1/06—8/7/06 | | 220,000,000 a | | 219,904,486 |
| Total Capital S.A. | | | | |
| 5.30%, 8/1/06 | | 207,057,000 a | | 207,057,000 |
| UBS Finance Delaware LLC | | | | |
| 5.29%, 8/1/06 | | 150,000,000 | | 150,000,000 |
| Westpac Banking Corp. | | | | |
| 5.44%, 9/29/06 | | 200,000,000 | | 198,241,472 |
| Westpac Capital Corp. | | | | |
| 5.09%, 8/2/06 | | 170,000,000 | | 169,976,247 |
| Total Commercial Paper | | | | |
| (cost $4,971,600,485) | | | | 4,971,600,485 |
| |
| |
|
| |
| Corporate Notes—8.7% | | | | |
| |
| |
|
| Bank of America Corp. | | | | |
| 5.31%, 5/25/07 | | 375,000,000 b | | 375,000,000 |
| General Electric Capital Corp. | | | | |
| 5.36%, 8/24/06 | | 100,000,000 b | | 100,000,000 |
| Harrier Finance Funding Ltd. | | | | |
| 5.32%, 5/18/07 | | 75,000,000 a,b | | 74,996,335 |
| Lehman Brothers Holdings Inc. | | | | |
| 5.31%, 12/12/06 | | 250,000,000 b | | 250,000,000 |
| Total Corporate Notes | | | | |
| (cost $799,996,335) | | | | 799,996,335 |
The Funds 13
STATEMENT OF INVESTMENTS (Unaudited) (continued)
| | | Principal | | |
| Dreyfus Cash Management Plus, Inc. (continued) | | Amount ($) | | Value ($) |
| |
| |
|
| |
| Promissory Note—3.5% | | | | |
| |
| |
|
| Goldman Sachs Group Inc. | | | | |
| 5.45%, 8/2/06 | | | | |
| (cost $325,000,000) | | 325,000,000 | | 325,000,000 |
| |
| |
|
| |
| Time Deposits—10.0% | | | | |
| |
| |
|
| Fifth Third Bank (Grand Cayman) | | | | |
| 5.31%, 8/1/06 | | 300,000,000 | | 300,000,000 |
| National Australia Bank Ltd. (Grand Cayman) | | | | |
| 5.31%, 8/1/06 | | 306,000,000 | | 306,000,000 |
| Regions Bank (Grand Cayman) | | | | |
| 5.30%, 8/1/06 | | 100,000,000 | | 100,000,000 |
| State Street Bank and Trust Co., Boston, MA (Grand Cayman) | | | | |
| 5.28%, 8/1/06 | | 221,000,000 | | 221,000,000 |
| Total Time Deposits | | | | |
| (cost $927,000,000) | | | | 927,000,000 |
| |
| |
|
| |
| Total Investments (cost $9,279,596,820) | | 100.1% | | 9,279,596,820 |
| Liabilities, Less Cash and Receivables | | (.1%) | | (5,686,618) |
| Net Assets | | 100.0% | | 9,273,910,202 |
| | a Securities exempt from registration under Rule 144A of the Securities Act of 1933.These securities may be resold in transactions exempt from registration, normally to qualified
institutional buyers. At July 31, 2006, these securities amounted to $2,828,790,037 or 30.5% of net assets.
b Variable rate security—interest rate subject to periodic change.
|
| Portfolio Summary (Unaudited) † | | | | | | |
| |
| | | Value (%) | | | | Value (%) |
| |
| |
| |
|
| Banking | | 49.7 | | Asset-Backed/Structured Investment Vehicles | | 5.4 |
| Asset-Backed/Multi-Seller Programs | | 19.0 | | Asset-Backed/Certificates | | 2.4 |
| Finance | | 8.0 | | Insurance | | 1.6 |
| Asset-Backed/Certificates-Other | | 6.3 | | Asset-Backed/Single Seller | | 1.5 |
| Brokerage Firms | | 6.2 | | | | 100.1 |
| | † Based on net assets.
See notes to financial statements.
|
14
| | STATEMENT OF INVESTMENTS
July 31, 2006 (Unaudited)
|
| | | Annualized | | | | |
| | | Yield on | | | | |
| | | Date of | | Principal | | |
| Dreyfus Government Cash Management | | Purchase (%) | | Amount ($) | | Value ($) |
| |
| |
| |
|
| |
| U.S. Government Agencies—43.0% | | | | | | |
| |
| |
| |
|
| Federal Farm Credit Bank | | | | | | |
| 10/6/06 | | 5.29 | | 125,000,000 a | | 124,993,298 |
| Federal Home Loan Bank System: | | | | | | |
| 8/1/06 | | 5.05 | | 268,300,000 | | 268,300,000 |
| 8/25/06 | | 5.06 | | 425,000,000 | | 423,583,333 |
| 9/29/06 | | 5.34 | | 81,000,000 | | 80,300,702 |
| Federal Home Loan Mortgage Corp.: | | | | | | |
| 10/24/06 | | 5.05 | | 100,000,000 | | 98,849,667 |
| 11/1/06 | | 5.07 | | 100,000,000 | | 98,737,556 |
| Federal National Mortgage Association: | | | | | | |
| 8/16/06 | | 5.00 | | 500,000,000 | | 498,970,833 |
| 9/27/06 | | 5.35 | | 443,368,000 | | 439,661,444 |
| Total U.S. Government Agencies | | | | | | |
| (cost $2,033,396,833) | | | | | | 2,033,396,833 |
| |
| |
| |
|
| |
| Repurchase Agreements—57.2% | | | | | | |
| |
| |
| |
|
| ABN AMRO Bank N.V. | | | | | | |
| dated 7/31/06, due 8/1/06 in the amount of | | | | | | |
| $600,087,000 (fully collateralized by $166,335,000 | | | | | | |
| Federal Farm Credit Bank, Bonds, 4.30%-5.50%, due | | | | | | |
| 2/17/09-9/8/15, value $163,199,153, $172,500,000 | | | | | | |
| Federal Home Loan Bank System, Bonds, 3.73%-6%, due | | | | | | |
| 8/25/06-3/28/16, value $171,409,650, $110,000,000 | | | | | | |
| Federal Home Loan Mortgage Corp., Notes, 3.10%- | | | | | | |
| 6.375%, due 8/25/06-11/9/11, value $110,723,517, | | | | | | |
| $85,000,000 Federal National Mortgage Association, Notes, | | | | | | |
| 0%-6%, due 9/28/10-4/7/23, value $74,975,255 and | | | | | | |
| $92,037,000 U.S. Treasury Notes, 4.375%, due 11/15/08, | | | | | | |
| value $91,693,169) | | 5.22 | | 600,000,000 | | 600,000,000 |
| Banc of America Securities LLC | | | | | | |
| dated 7/31/06, due 8/1/06 in the amount of | | | | | | |
| $600,087,167 (fully collateralized by $594,858,000 | | | | | | |
| U.S. Treasury Notes, 6.125%-6.50%, due | | | | | | |
| 10/15/06-8/15/07, value $612,000,600) | | 5.23 | | 600,000,000 | | 600,000,000 |
| Barclays Financial LLC | | | | | | |
| dated 7/31/06, due 8/1/06 in the amount of | | | | | | |
| $75,010,958 (fully collateralized by $66,104,000 | | | | | | |
| Treasury Inflation Protected Securities, 2%-3.625%, | | | | | | |
| due 1/15/26-4/15/28, value $76,500,059) | | 5.26 | | 75,000,000 | | 75,000,000 |
| Citigroup Global Markets Holdings Inc. | | | | | | |
| dated 7/31/06, due 8/1/06 in the amount of | | | | | | |
| $442,064,704 (fully collateralized by $40,000,000 | | | | | | |
| Federal Farm Credit Bank, Bonds, 4.95%, due 6/27/12, | | | | | | |
| value $38,949,400, $198,745,000 Federal Home Loan | | | | | | |
| Bank System, Bonds, 0%-7%, due 10/25/06-6/15/20, | | | | | | |
| value $198,862,427, $202,200,000 Federal Home Loan | | | | | | |
| Mortgage Corp., Notes, 3.15%-5%, due 11/20/08-11/3/11, | | | | | | |
| value $196,925,669 and $18,100,000 Tennessee Valley | | | | | | |
| Authority, Bonds, 4.70%, due 7/15/33, value $16,103,007) | | 5.27 | | 442,000,000 | | 442,000,000 |
The Funds 15
STATEMENT OF INVESTMENTS (Unaudited) (continued)
| | | Annualized | | | | |
| | | Yield on | | | | |
| | | Date of | | Principal | | |
| Dreyfus Government Cash Management (continued) | | Purchase (%) | | Amount ($) | | Value ($) |
| |
| |
| |
|
| |
| Repurchase Agreements (continued) | | | | | | |
| |
| |
| |
|
| Goldman, Sachs & Co. | | | | | | |
| dated 7/31/06, due 8/1/06 in the amount of | | | | | | |
| $391,056,478 (fully collateralized by $198,865,000 | | | | | | |
| Federal Home Loan Bank System, Bonds, 2.05%-7.075%, | | | | | | |
| due 8/15/06-3/9/26, value $197,029,641, | | | | | | |
| $83,862,000 Federal Home Loan Mortgage Corp., Notes, | | | | | | |
| 2.20%-7.48%, due 8/25/06-6/23/33, value $80,061,946 | | | | | | |
| and $122,375,000 Federal National Mortgage | | | | | | |
| Association, Notes, 0%-7.125%, due 8/14/06-1/30/23, | | | | | | |
| value $121,732,234) | | 5.20 | | 391,000,000 | | 391,000,000 |
| Morgan Stanley | | | | | | |
| dated 7/31/06, due 8/1/06 in the amount of | | | | | | |
| $600,087,167 (fully collateralized by $1,343,234,000 | | | | | | |
| U.S. Treasury Strips, due 8/15/20-11/15/21, value | | | | | | |
| $612,000,212) | | 5.23 | | 600,000,000 | | 600,000,000 |
| Total Repurchase Agreements | | | | | | |
| (cost $2,708,000,000) | | | | | | 2,708,000,000 |
| |
| |
| |
|
| |
| Total Investments (cost $4,741,396,833) | | | | 100.2% | | 4,741,396,833 |
| |
| Liabilities, Less Cash and Receivables | | | | (.2%) | | (9,201,952) |
| |
| Net Assets | | | | 100.0% | | 4,732,194,881 |
a Variable rate security—interest rate subject to periodic change.
| Portfolio Summary (Unaudited) † | | | | | | |
| |
| | | Value (%) | | | | Value (%) |
| |
| |
| |
|
| Repurchase Agreements | | 57.2 | | Federal Home Loan Mortgage Corp | | 4.2 |
| Federal National Mortgage Association | | 19.8 | | Federal Farm Credit Bank | | 2.7 |
| Federal Home Loan Bank System | | 16.3 | | | | 100.2 |
† Based on net assets.
See notes to financial statements.
|
16
| | STATEMENT OF INVESTMENTS
July 31, 2006 (Unaudited)
|
| | | Annualized | | | | |
| | | Yield on | | | | |
| | | Date of | | Principal | | |
| Dreyfus Government Prime Cash Management | | Purchase (%) | | Amount ($) | | Value ($) |
| |
| |
| |
|
| |
| U.S. Government Agencies—99.9% | | | | | | |
| |
| |
| |
|
| Federal Farm Credit Bank: | | | | | | |
| 10/6/06 | | 5.29 | | 50,000,000 a | | 49,997,319 |
| 8/15/07 | | 5.25 | | 50,000,000 a | | 49,989,935 |
| 11/9/07 | | 5.25 | | 50,000,000 a | | 49,987,601 |
| 5/27/08 | | 5.24 | | 100,000,000 a | | 99,962,840 |
| 7/21/08 | | 5.26 | | 50,000,000 a | | 49,981,143 |
| Federal Home Loan Bank System: | | | | | | |
| 8/1/06 | | 5.05 | | 330,000,000 | | 330,000,000 |
| 8/2/06 | | 4.99 | | 51,800,000 | | 51,792,913 |
| 8/4/06 | | 5.04 | | 200,000,000 | | 199,916,667 |
| 8/9/06 | | 5.17 | | 250,000,000 | | 249,713,889 |
| 8/18/06 | | 5.24 | | 150,669,000 | | 150,299,380 |
| 9/27/06 | | 5.33 | | 53,706,000 | | 53,258,719 |
| 9/29/06 | | 5.32 | | 60,382,000 | | 59,862,463 |
| 10/25/06 | | 5.30 | | 200,000,000 | | 197,530,278 |
| 12/20/06 | | 5.40 | | 100,000,000 | | 99,377,490 |
| |
| |
| |
|
| |
| Total Investments (cost $1,691,670,637) | | | | 99.9% | | 1,691,670,637 |
| Cash and Receivables (Net) | | | | .1% | | 1,961,466 |
| Net Assets | | | | 100.0% | | 1,693,632,103 |
a Variable rate security—interest rate subject to periodic change.
| Portfolio Summary (Unaudited) † | | | | | | |
| | | Value (%) | | | | Value (%) |
| |
| |
| |
|
| Federal Home Loan Bank System | | 82.2 | | Federal Farm Credit Bank | | 17.7 |
| | | | | | | 99.9 |
† Based on net assets.
See notes to financial statements.
|
The Funds 17
| | STATEMENT OF INVESTMENTS
July 31, 2006 (Unaudited)
|
| | | Annualized | | | | |
| | | Yield on | | | | |
| | | Date of | | Principal | | |
| Dreyfus Treasury Cash Management | | Purchase (%) | | Amount ($) | | Value ($) |
| |
| |
| |
|
| |
| U.S. Treasury Bill—2.1% | | | | | | |
| |
| |
| |
|
| 12/7/06 | | | | | | |
| (cost $98,282,667) | | 4.95 | | 100,000,000 | | 98,282,667 |
| |
| |
| |
|
| |
| Repurchase Agreements—98.3% | | | | | | |
| |
| |
| |
|
| ABN AMRO Bank N.V. | | | | | | |
| dated 7/31/06, due 8/1/06 in the amount of $650,094,250 | | | | | | |
| (fully collateralized by $188,213,000 U.S. Treasury Bonds, | | | | | | |
| 4.50%-6.375%, due 8/15/27-2/15/36, value $200,963,913 | | | | | | |
| and $465,917,000 U.S. Treasury Notes, 3.125%-5%, | | | | | | |
| due 8/31/07-2/15/16, value $462,036,219) | | 5.22 | | 650,000,000 | | 650,000,000 |
| Banc of America Securities LLC | | | | | | |
| dated 7/31/06, due 8/1/06 in the amount of $650,094,431 | | | | | | |
| (fully collateralized by $219,879,000 Treasury Inflation Protected | | | | | | |
| Securities, 1.875%-3.625%, due 1/15/08-4/15/28, value | | | | | | |
| $237,732,217, $228,710,000 U.S. Treasury Bills, due 8/17/06, | | | | | | |
| value $228,195,402, $64,419,000 U.S. Treasury Bonds, | | | | | | |
| 7.50%-9.875%, due 11/15/15-5/15/21, value $87,001,316 | | | | | | |
| and $108,383,000 U.S. Treasury Notes, 3.625%-5.50%, | | | | | | |
| due 2/15/08- 6/30/11, value $110,071,538) | | 5.23 | | 650,000,000 | | 650,000,000 |
| Barclays Financial LLC | | | | | | |
| dated 7/31/06, due 8/1/06 in the amount of $220,031,900 | | | | | | |
| (fully collateralized by $10,052,000 U.S. Treasury Bills, | | | | | | |
| due 1/4/07, value $9,838,596, $158,346,000 U.S. Treasury Notes, | | | | | | |
| 3.50%-3.875%, due 5/31/07-1/15/09, value $173,065,186 | | | | | | |
| and $54,315,844 U.S. Treasury Strips, due 2/15/12, value $41,496,219) | | 5.22 | | 220,000,000 | | 220,000,000 |
| Bear Stearns Cos. Inc. | | | | | | |
| dated 7/31/06, due 8/1/06 in the amount of $200,028,778 | | | | | | |
| (fully collateralized by $205,479,000 U.S. Treasury Bills, | | | | | | |
| due 8/24/06-1/4/07, value $202,430,481) | | 5.18 | | 200,000,000 | | 200,000,000 |
| Citigroup Global Markets Holdings Inc. | | | | | | |
| dated 7/31/06, due 8/1/06 in the amount of $300,043,583 | | | | | | |
| (fully collateralized by $6,000,000 BEarer Corpora ConversionS, | | | | | | |
| due 11/15/11, value $5,911,380 and $573,060,659 U.S. Treasury Strips, | | | | |
| due 2/15/07-11/15/28, value $300,088,620) | | 5.23 | | 300,000,000 | | 300,000,000 |
| Credit Suisse (USA) Inc. | | | | | | |
| dated 7/31/06, due 8/1/06 in the amount of $500,072,222 | | | | | | |
| (fully collateralized by $190,652,000 U.S. Treasury Bills, | | | | | | |
| due 1/25/07, value $185,985,792 and $325,000,000 U.S. Treasury | | | | | | |
| Notes, 2.625% due 11/15/06, value $324,436,450) | | 5.20 | | 500,000,000 | | 500,000,000 |
| Goldman, Sachs & Co. | | | | | | |
| dated 7/31/06, due 8/1/06 in the amount of $17,002,385 | | | | | | |
| (fully collateralized by $16,407,000 U.S. Treasury Notes, | | | | | | |
| 6%, due 8/15/09, value $17,340,375) | | 5.05 | | 17,000,000 | | 17,000,000 |
| J.P. Morgan Chase & Co. | | | | | | |
| dated 7/31/06, due 8/1/06 in the amount of $277,040,011 | | | | | | |
| (fully collateralized by $287,398,000 U.S. Treasury Bills, | | | | | | |
| due 10/12/06-12/28/06, value $282,540,271) | | 5.20 | | 277,000,000 | | 277,000,000 |
| | | Annualized | | | | |
| | | Yield on | | | | |
| | | Date of | | Principal | | |
| Dreyfus Treasury Cash Management (continued) | | Purchase (%) | | Amount ($) | | Value ($) |
| |
| |
| |
|
| |
| Repurchase Agreements (continued) | | | | | | |
| |
| |
| |
|
| Merrill Lynch & Co. Inc. | | | | | | |
| dated 7/31/06, due 8/1/06 in the amount of | | | | | | |
| $650,094,250 (fully collateralized by $660,566,000 | | | | | | |
| U.S. Treasury Notes, 4.125%, due 8/15/08, value $663,000,678) | | 5.22 | | 650,000,000 | | 650,000,000 |
| Morgan Stanley | | | | | | |
| dated 7/31/06, due 8/1/06 in the amount of | | | | | | |
| $650,094,431 (fully collateralized by $817,450,000 | | | | | | |
| U.S. Treasury Strips, due 5/15/08-8/15/13, value $665,497,274) | | 5.23 | | 650,000,000 | | 650,000,000 |
| UBS Securities LLC | | | | | | |
| dated 7/31/06, due 8/1/06 in the amount of | | | | | | |
| $500,071,944 (fully collateralized by $515,152,000 | | | | | | |
| U.S. Treasury Notes, 3.125%, due 1/31/07, value $510,000,480) | | 5.18 | | 500,000,000 | | 500,000,000 |
| Total Repurchase Agreements | | | | | | |
| (cost $4,614,000,000) | | | | | | 4,614,000,000 |
| |
| |
| |
|
| |
| Total Investments (cost $4,712,282,667) | | | | 100.4% | | 4,712,282,667 |
| |
| Liabilities, Less Cash and Receivables | | | | (.4%) | | (18,921,191) |
| |
| Net Assets | | | | 100.0% | | 4,693,361,476 |
| Portfolio Summary (Unaudited) † | | | | |
| | | Value (%) | | | | Value (%) |
| |
| |
| |
|
| Repurchase Agreements | | 98.3 | | U.S. Treasury Bill | | 2.1 |
| | | | | | | 100.4 |
† Based on net assets.
See notes to financial statements.
|
The Funds 19
| | STATEMENT OF INVESTMENTS
July 31, 2006 (Unaudited)
|
| | | Annualized | | | | |
| | | Yield on | | | | |
| | | Date of | | Principal | | |
| Dreyfus Treasury Prime Cash Management | | Purchase (%) | | Amount ($) | | Value ($) |
| |
| |
| |
|
| U.S. Treasury Bills—100.2% | | | | | | |
| |
| |
| |
|
| 8/3/06 | | 4.76 | | 900,000 | | 899,762 |
| 8/10/06 | | 4.78 | | 24,600,000 | | 24,570,725 |
| 8/17/06 | | 4.76 | | 83,966,000 | | 83,789,998 |
| 8/24/06 | | 4.91 | | 962,278,000 | | 959,271,566 |
| 8/31/06 | | 4.75 | | 376,920,000 | | 375,446,879 |
| 9/7/06 | | 4.77 | | 10,000,000 | | 9,951,489 |
| 9/21/06 | | 4.86 | | 292,000,000 | | 290,015,363 |
| 10/5/06 | | 4.94 | | 27,745,000 | | 27,500,488 |
| 10/12/06 | | 4.86 | | 37,820,000 | | 37,459,954 |
| |
| |
| |
|
| Total Investments (cost $1,808,906,224) | | | | 100.2% | | 1,808,906,224 |
| Liabilities, Less Cash and Receivables | | | | (.2%) | | (4,347,687) |
| Net Assets | | | | 100.0% | | 1,804,558,537 |
| Portfolio Summary (Unaudited)† | | |
| | | Value (%) |
| |
|
| U.S. Treasury Bills | | 100.2 |
† Based on net assets.
See notes to financial statements.
|
20
| | STATEMENT OF INVESTMENTS
July 31, 2006 (Unaudited)
|
| | | Coupon | | Maturity | | Principal | | | | |
| Dreyfus Municipal Cash Management Plus | | Rate (%) | | Date | | Amount ($) | | Value ($) |
| |
| |
| |
| |
|
| |
| Short-Term Investments—104.8% | | | | | | | | | | |
| |
| |
| |
| |
| |
|
| Alabama—2.1% | | | | | | | | | | |
| Columbia Industrial Development Board, PCR, | | | | | | | | | | |
| Refunding (Alabama Power Company Project) | | 3.66 | | 8/1/06 | | 9,850,000 | | a | | 9,850,000 |
| Mobile Industrial Development Board, PCR, | | | | | | | | | | |
| Refunding (Alabama Power Company Project) | | 3.60 | | 8/7/06 | | 12,000,000 | | a | | 12,000,000 |
| Arizona—3.5% | | | | | | | | | | |
| Maricopa County Industrial Development Authority, | | | | | | | | | | |
| MFHR (San Clemente Apartments Project) | | | | | | | | | | |
| (Insured; FNMA and Liquidity Facility; FNMA) | | 3.93 | | 8/7/06 | | 1,010,000 | | a | | 1,010,000 |
| Maricopa County Industrial Development Authority, | | | | | | | | | | |
| MFHR, Refunding (San Martin Apartments Project) | | | | | | | | | | |
| (Insured; FNMA and Liquidity Facility; FNMA) | | 3.67 | | 8/7/06 | | 7,200,000 | | a | | 7,200,000 |
| Phoenix Civic Improvement Corporation, Airport Revenue (Merlots | | | | | | | | | | |
| Program) (Insured; FGIC and Liquidity Facility; Wachovia Bank) | | 3.74 | | 8/7/06 | | 4,630,000 | | a,b | | 4,630,000 |
| Phoenix Civic Improvement Corporation, Water System Revenue | | | | | | | | | | |
| (Insured; MBIA and Liquidity Facility; Merrill Lynch) | | 3.68 | | 8/7/06 | | 14,320,000 | | a,b | | 14,320,000 |
| Roaring Fork Municipal Products LLC (Pima County | | | | | | | | | | |
| Industrial Development Authority) (GIC; Trinity Funding | | | | | | | | | | |
| Corporation and Liquidity Facility; The Bank of New York) | | 3.79 | | 8/7/06 | | 8,775,000 | | a,b | | 8,775,000 |
| California—1.6% | | | | | | | | | | |
| FHLMC Multifamily Certificates, Revenue | | | | | | | | | | |
| (Insured; FHLMC and Liquidity Facility; FHLMC) | | 3.74 | | 8/7/06 | | 16,724,314 | | a,b | | 16,724,314 |
| Colorado—5.2% | | | | | | | | | | |
| Colorado Housing and Finance Authority, EDR | | | | | | | | | | |
| (Wanco Inc. Project) (LOC; U.S. Bank NA) | | 3.80 | | 8/7/06 | | 3,300,000 | | a | | 3,300,000 |
| Erie, COP (LOC; Key Bank) | | 3.69 | | 8/7/06 | | 4,365,000 | | a | | 4,365,000 |
| Lower Colorado River Authority, Revenue, | | | | | | | | | | |
| CP (Liquidity Facility; JPMorgan Chase Bank) | | 3.60 | | 9/7/06 | | 9,300,000 | | | | 9,300,000 |
| Southern Ute Indian Tribe of the Southern | | | | | | | | | | |
| Ute Indian Reservation, Revenue | | 3.68 | | 8/7/06 | | 21,000,000 | | a | | 21,000,000 |
| Vail, MFHR (Liquidity Facility; Merrill Lynch Capital | | | | | | | | | | |
| Services and LOC; Ixis Corporate and Investment Bank) | | 3.77 | | 8/7/06 | | 16,065,000 | | a,b | | 16,065,000 |
| Delaware—.4% | | | | | | | | | | |
| Delaware Economic Development Authority, Revenue (Saint | | | | | | | | | | |
| Anne's Episcopal School Project) (LOC; Wilmington Trust Co.) | | 3.75 | | 8/7/06 | | 4,000,000 | | a | | 4,000,000 |
| District of Columbia—1.5% | | | | | | | | | | |
| Bank of New York Municipal Certificates Trust, | | | | | | | | | | |
| Revenue (GIC; Trinity Funding Corporation | | | | | | | | | | |
| and Liquidity Facility; The Bank of New York) | | 3.77 | | 8/7/06 | | 10,000,000 | | a,b | | 10,000,000 |
| District of Columbia, Revenue, Refunding (American | | | | | | | | | | |
| Association of Homes and Services for the | | | | | | | | | | |
| Aging, Inc. Issue) (LOC; Unicredito Italiano SPA) | | 3.69 | | 8/7/06 | | 5,545,000 | | a | | 5,545,000 |
| Florida—4.6% | | | | | | | | | | |
| Gainesville, Utilities System Revenue (Liquidity Facility; SunTrust Bank) | | 3.70 | | 8/1/06 | | 10,700,000 | | a | | 10,700,000 |
| Miami-Dade County, Aviation Revenue, CP (Miami International | | | | | | | | | | |
| Airport) (LOC: BNP Paribas and Dexia Credit Locale) | | 3.65 | | 8/16/06 | | 15,073,000 | | | | 15,073,000 |
| Miami-Dade County Industrial Development Authority, | | | | | | | | | | |
| IDR (Fine Art Lamps Project) (LOC; SunTrust Bank) | | 3.69 | | 8/7/06 | | 3,850,000 | | a | | 3,850,000 |
The Funds 21
STATEMENT OF INVESTMENTS (Unaudited) (continued)
| Dreyfus Municipal | | Coupon | | Maturity | | Principal | | | | |
| Cash Management Plus (continued) | | Rate (%) | | Date | | Amount ($) | | Value ($) |
| |
| |
| |
| |
|
| Short-Term Investments (continued) | | | | | | | | | | |
| |
| |
| |
| |
| |
|
| Florida (continued) | | | | | | | | | | |
| Orange County Housing Finance Authority, | | | | | | | | | | |
| Homeowner Revenue (Insured: FNMA and GNMA | | | | | | | | | | |
| and Liquidity Facility; Lehman Liquidity LLC) | | 3.75 | | 8/7/06 | | 3,050,000 | | a,b | | 3,050,000 |
| Orange County Industrial Development Authority, IDR | | | | | | | | | | |
| (Central Florida YMCA Project) (LOC; Bank of America) | | 3.68 | | 8/7/06 | | 3,800,000 | | a | | 3,800,000 |
| Sunshine State Governmental Financing Commission, | | | | | | | | | | |
| Revenue, CP (Liquidity Facility; DEPFA Bank PLC) | | 3.68 | | 10/10/06 | | 11,000,000 | | | | 11,000,000 |
| Georgia—.9% | | | | | | | | | | |
| Atlanta, Subordinate Lien Tax Allocation | | | | | | | | | | |
| (Atlantic Station Project) (LOC; Wachovia Bank) | | 3.74 | | 8/7/06 | | 4,000,000 | | a | | 4,000,000 |
| Atlanta Urban Residential Finance Authority, MFHR | | | | | | | | | | |
| (Lindbergh City Center Apartments Project) (LOC; Regions Bank) | | 3.71 | | 8/7/06 | | 5,000,000 | | a | | 5,000,000 |
| Illinois—4.1% | | | | | | | | | | |
| Chicago, IDR (Victoria Limited LLC Project) (LOC; ABN-AMRO) | | 3.73 | | 8/7/06 | | 3,500,000 | | a | | 3,500,000 |
| Chicago, SFMR | | 3.99 | | 7/12/07 | | 10,000,000 | | | | 10,000,000 |
| Illinois (Merlots Program) (Insured; FGIC | | | | | | | | | | |
| and Liquidity Facility; Wachovia Bank) | | 3.69 | | 8/7/06 | | 5,340,000 | | a,b | | 5,340,000 |
| Illinois Finance Authority, Revenue (The Landing at | | | | | | | | | | |
| Plymouth Place Project) (LOC; Lloyds TSB Bank PLC) | | 3.65 | | 8/7/06 | | 5,000,000 | | a | | 5,000,000 |
| Illinois Health Facilities Authority, Revenue, | | | | | | | | | | |
| CP (Evanston Northwestern Corporation) | | 3.55 | | 9/14/06 | | 10,000,000 | | | | 10,000,000 |
| Upper Illinois River Valley Development Authority, | | | | | | | | | | |
| SWDR (Exolon-Esk Co. Project) (LOC; Bank of America) | | 3.71 | | 8/7/06 | | 8,405,000 | | a | | 8,405,000 |
| Indiana—2.3% | | | | | | | | | | |
| Elkhart County, EDR (Four Seasons | | | | | | | | | | |
| Manufacturing Project) (LOC; National City Bank) | | 3.77 | | 8/7/06 | | 4,000,000 | | a | | 4,000,000 |
| Hammond, Sewer and Solid Waste Disposal Revenue, | | | | | | | | | | |
| Refunding (Cargill Inc. Project) | | 3.70 | | 8/7/06 | | 6,500,000 | | a | | 6,500,000 |
| Indiana Finance Authority, EDR (JRL Leasing, Inc. and | | | | | | | | | | |
| LaSarre Co., LLC Project) (LOC; National City Bank) | | 3.77 | | 8/7/06 | | 3,800,000 | | a | | 3,800,000 |
| Indiana Toll Road Commission, Toll Road Revenue | | | | | | | | | | |
| (Merlots Program) (Liquidity Facility; Wachovia Bank) | | 3.69 | | 8/7/06 | | 3,245,000 | | a,b,c | | 3,245,000 |
| Saint Joseph County, Health Care Facility Revenue (South | | | | | | | | | | |
| Bend Medical Foundation Project) (LOC; National City Bank) | | 3.72 | | 8/7/06 | | 2,900,000 | | a | | 2,900,000 |
| Whiting, Industrial Sewage and SWDR, Refunding | | | | | | | | | | |
| (Amoco Oil Company Project) | | 3.72 | | 8/1/06 | | 3,250,000 | | a | | 3,250,000 |
| Iowa—.4% | | | | | | | | | | |
| Iowa Finance Authority, SFMR (Backed Securities Program) | | | | | | | | | | |
| (Liquidity Facility; State Street Bank and Trust Co.) | | 3.70 | | 8/7/06 | | 4,500,000 | | a | | 4,500,000 |
| Kansas—.5% | | | | | | | | | | |
| Junction City, Temporary Notes | | 4.87 | | 8/1/07 | | 2,000,000 | | | | 2,014,482 |
| Mission, MFHR, Refunding (The Falls Apartments Project) (Insured; FNMA) | | 3.74 | | 8/7/06 | | 3,350,000 | | a | | 3,350,000 |
| Kentucky—3.1% | | | | | | | | | | |
| Kenton County Airport Board, Special Facilities Revenue | | | | | | | | | | |
| (Airis Cincinnati LLC Project) (LOC; Deutsche Postbank) | | 3.75 | | 8/7/06 | | 31,800,000 | | a | | 31,800,000 |
| Dreyfus Municipal | | Coupon | | Maturity | | Principal | | | | |
| Cash Management Plus (continued) | | Rate (%) | | Date | | Amount ($) | | Value ($) |
| |
| |
| |
| |
|
| Short-Term Investments (continued) | | | | | | | | | | |
| |
| |
| |
| |
| |
|
| Louisiana—1.0% | | | | | | | | | | |
| Parish of Calcasieu Inc. Industrial Development Board, Environmental | | | | | | | | | | |
| Revenue (Citgo Petroleum Corporation Project) (LOC; BNP Paribas) | | 3.72 | | 8/1/06 | | 10,000,000 | | a | | 10,000,000 |
| Maine—.2% | | | | | | | | | | |
| Auburn, Obligation Securities Revenue (J&A Properties and United | | | | | | | | | | |
| Fabricants Strainrite Project) (LOC; Citizens Bank of Massachusetts) | | 3.70 | | 8/7/06 | | 2,550,000 | | a | | 2,550,000 |
| Maryland—.2% | | | | | | | | | | |
| Maryland Economic Development Corporation, Revenue, | | | | | | | | | | |
| Refunding (United Cerebral Palsy Project) (LOC; M&T Bank) | | 3.76 | | 8/7/06 | | 2,144,500 | | a | | 2,144,500 |
| Massachusetts—3.8% | | | | | | | | | | |
| Everett, GO Notes, BAN | | 3.89 | | 9/8/06 | | 11,000,000 | | | | 11,000,235 |
| Massachusetts Development Finance Agency, | | | | | | | | | | |
| Revenue (Northfield Mount Hermon School Issue) | | | | | | | | | | |
| (Insured; Radian Bank and Liquidity Facility; Bank of America) | | 3.75 | | 8/7/06 | | 5,000,000 | | a | | 5,000,000 |
| Massachusetts Development Finance Agency, Revenue | | | | | | | | | | |
| (Suffolk University Issue) (Insured; Assured Guaranty | | | | | | | | | | |
| and Liquidity Facility; Citizens Bank of Massachusetts) | | 3.72 | | 8/7/06 | | 7,400,000 | | a | | 7,400,000 |
| Massachusetts Health and Educational Facilities Authority, | | | | | | | | | | |
| Revenue (Putters Program) (University of Massachusetts | | | | | | | | | | |
| Project) (Insured; FGIC and Liquidity Facility; PB Finance Inc.) | | 3.70 | | 8/7/06 | | 10,950,000 | | a,b | | 10,950,000 |
| Pembroke, GO Notes, BAN | | 3.95 | | 8/3/06 | | 5,000,000 | | | | 5,000,301 |
| Michigan—5.4% | | | | | | | | | | |
| Michigan, GO Notes | | 4.44 | | 9/29/06 | | 7,600,000 | | | | 7,615,323 |
| Michigan Hospital Finance Authority, HR (Chelsea | | | | | | | | | | |
| Community Hospital) (LOC; National City Bank) | | 3.67 | | 8/7/06 | | 3,620,000 | | a | | 3,620,000 |
| Michigan Hospital Finance Authority, Revenue (Health | | | | | | | | | | |
| Care Equipment Loan Program) (LOC; ABN-AMRO) | | 3.68 | | 8/7/06 | | 5,000,000 | | a | | 5,000,000 |
| Michigan Municipal Bond Authority, Revenue | | | | | | | | | | |
| (LOC; JPMorgan Chase Bank) | | 3.98 | | 8/18/06 | | 10,500,000 | | | | 10,503,597 |
| Michigan Strategic Fund, LOR (HME Inc. Project) (LOC; Fifth Third Bank) | | 3.73 | | 8/7/06 | | 2,235,000 | | a | | 2,235,000 |
| Michigan Strategic Fund, LOR (Kaumagraph | | | | | | | | | | |
| Flint Corp. Project) (LOC; Bank One) | | 3.76 | | 8/7/06 | | 2,600,000 | | a | | 2,600,000 |
| Michigan Strategic Fund, LOR (PFG | | | | | | | | | | |
| Enterprises Inc. Project) (LOC; Huntington NB) | | 3.94 | | 8/7/06 | | 2,875,000 | | a | | 2,875,000 |
| Oakland County Economic Development Corporation, LOR | | | | | | | | | | |
| (Michigan Seamless Tube LLC Project) (LOC; ABM-AMRO) | | 3.80 | | 8/7/06 | | 4,000,000 | | a | | 4,000,000 |
| Roaring Fork Municipal Products LLC (Michigan Higher | | | | | | | | | | |
| Education Student Loan Authority) (Insured; AMBAC | | | | | | | | | | |
| and Liquidity Facility; The Bank of New York) | | 3.77 | | 8/7/06 | | 8,747,000 | | a,b | | 8,747,000 |
| University of Michigan, CP | | 3.55 | | 11/3/06 | | 10,000,000 | | | | 10,000,000 |
| Minnesota—1.9% | | | | | | | | | | |
| Minneapolis-Saint Paul Metropolitan Airports Commission, | | | | | | | | | | |
| Airport Revenue (Insured; FGIC and Liquidity Facility; Merrill Lynch) | | 3.68 | | 8/7/06 | | 9,660,000 | | a,b | | 9,660,000 |
| Southern Minnesota Municipal Power Agency, Power | | | | | | | | | | |
| Supply System Revenue, CP (Liquidity Facility; | | | | | | | | | | |
| Landesbank Hessen-Thuringen Girozentrale) | | 3.65 | | 11/30/06 | | 10,000,000 | | | | 10,000,000 |
The Funds 23
STATEMENT OF INVESTMENTS (Unaudited) (continued)
| Dreyfus Municipal | | Coupon | | Maturity | | Principal | | | | |
| Cash Management Plus (continued) | | Rate (%) | | Date | | Amount ($) | | Value ($) |
| |
| |
| |
| |
|
| Short-Term Investments (continued) | | | | | | | | | | |
| |
| |
| |
| |
| |
|
| Missouri—1.1% | | | | | | | | | | |
| Missouri Health and Educational Facilities Authority, Health Facilities | | | | | | | | | | |
| Revenue (Deaconess Long Term Care of Missouri, Inc.) (LOC; Bank One) | | 3.69 | | 8/7/06 | | 8,145,000 | | a | | 8,145,000 |
| Saint Louis Industrial Development Authority, MFHR | | | | | | | | | | |
| (Windward Estates Project) (GIC; IXIS Corporate and Investment | | | | | | | | | | |
| Bank and Liquidity Facility; Merrill Lynch Capital Services) | | 3.77 | | 8/7/06 | | 3,570,000 | | a,b | | 3,570,000 |
| Nevada—2.5% | | | | | | | | | | |
| Roaring Fork Municipal Products LLC, Revenue (Insured; | | | | | | | | | | |
| FNMA and Liquidity Facility; The Bank of New York) | | 3.79 | | 8/7/06 | | 13,565,000 | | a,b | | 13,565,000 |
| Washoe County, Gas Facilities Revenue (Sierra Pacific Power Co. | | | | | | | | | | |
| Project) (Insured; MBIA and Liquidity Facility; Lehman Liquidity LLC) | | 3.75 | | 8/7/06 | | 11,975,000 | | a,b | | 11,975,000 |
| New Hampshire—.5% | | | | | | | | | | |
| New Hampshire Health and Education Facilities Authority, Revenue | | | | | | | | | | |
| (Currier Museum of Art Issue) (LOC; Royal Bank of Scotland PLC) | | 3.67 | | 8/7/06 | | 4,700,000 | | a | | 4,700,000 |
| New Mexico—.6% | | | | | | | | | | |
| Dona Ana County, IDR (Foamex Products Inc. | | | | | | | | | | |
| Project) (LOC; Bank of Nova Scotia) | | 3.74 | | 8/7/06 | | 5,900,000 | | a | | 5,900,000 |
| New York—3.5% | | | | | | | | | | |
| New York City Industrial Development Agency, Special Facility Revenue | | | | | | | | | | |
| (Korean Air Lines Company Limited Project) (LOC; HSBC Bank USA) | | 3.59 | | 8/7/06 | | 20,000,000 | | a | | 20,000,000 |
| Triborough Bridge and Tunnel Authority, General | | | | | | | | | | |
| Revenue, Refunding (Liquidity Facility; Bank of America) | | 3.66 | | 8/7/06 | | 13,200,000 | | a | | 13,200,000 |
| TSASC Inc. of New York, Tobacco Settlement | | | | | | | | | | |
| Asset-Backed Bonds (Liquidity Facility; Merrill Lynch) | | 3.71 | | 8/7/06 | | 3,280,000 | | a,b | | 3,280,000 |
| North Carolina—2.5% | | | | | | | | | | |
| Burke County Industrial Facilities and Pollution | | | | | | | | | | |
| Control Financing Authority, IDR (Bauer | | | | | | | | | | |
| Industries Inc. Project) (LOC; Bank of Montreal) | | 3.76 | | 8/7/06 | | 1,455,000 | | a | | 1,455,000 |
| Charlotte, Water and Sewer System Revenue | | | | | | | | | | |
| (Liquidity Facility; DEPFA Bank PLC) | | 3.67 | | 8/7/06 | | 15,000,000 | | a | | 15,000,000 |
| Raleigh-Durham Airport Authority, Airport Revenue | | | | | | | | | | |
| (Insured; XLCA and Liquidity Facility; DEPFA Bank PLC) | | 3.70 | | 8/7/06 | | 10,000,000 | | a | | 10,000,000 |
| Ohio—5.3% | | | | | | | | | | |
| Butler County, Capital Funding Revenue (CCAO Low Cost | | | | | | | | | | |
| Capital Pooled Financing Program) (LOC; U.S. Bank NA) | | 3.66 | | 8/7/06 | | 3,255,000 | | a | | 3,255,000 |
| Hamilton County, Health Care Facilities Revenue | | | | | | | | | | |
| (Twin Towers and Twin Lakes Project) (LOC; U.S. Bank NA) | | 3.67 | | 8/7/06 | | 8,000,000 | | a | | 8,000,000 |
| Hamilton County, Hospital Facilities Revenue (Insured; | | | | | | | | | | |
| FSA and Liquidity Facility; Svenska Handelsbanken) | | 3.73 | | 8/7/06 | | 10,000,000 | | a,b | | 10,000,000 |
| Middletown, Hospital Facilities Revenue (Liquidity Facility; | | | | | | | | | | |
| Merrill Lynch Capital Services and LOC; Merrill Lynch) | | 3.73 | | 8/7/06 | | 20,510,000 | | a,b | | 20,510,000 |
| Ohio Water Development Authority, PCR (FirstEnergy Nuclear | | | | | | | | | | |
| Generation Corp. Project) (LOC; Barclays Bank PLC) | | 3.71 | | 8/7/06 | | 9,700,000 | | a | | 9,700,000 |
| University of Cincinnatti, General Receipts, BAN | | 4.44 | | 1/25/07 | | 5,000,000 | | | | 5,028,155 |
| Oklahoma—.5% | | | | | | | | | | |
| Tulsa County Industrial Authority, Capital Improvements | | | | | | | | | | |
| Revenue (Liquidity Facility; Bank of America) | | 3.62 | | 11/15/06 | | 5,000,000 | | | | 5,000,000 |
24
| Dreyfus Municipal | | Coupon | | Maturity | | Principal | | | | |
| Cash Management Plus (continued) | | Rate (%) | | Date | | Amount ($) | | Value ($) |
| |
| |
| |
| |
|
| |
| Short-Term Investments (continued) | | | | | | | | | | |
| |
| |
| |
| |
| |
|
| Oregon—1.4% | | | | | | | | | | |
| Oregon, Homeowner Revenue (Liquidity Facility; Landesbank | | | | | | | | | | |
| Hessen-Thuringen Girozentrale and LOC; Trinity Funding Corporation) | | 3.72 | | 8/7/06 | | 14,450,000 | | a,b | | 14,450,000 |
| Pennsylvania—11.7% | | | | | | | | | | |
| Beaver County Industrial Development Authority, EIR | | | | | | | | | | |
| (BASF Corporation Project) (LOC; BASF AG) | | 3.81 | | 8/1/06 | | 3,700,000 | | a | | 3,700,000 |
| Chartiers Valley Industrial and Commercial Development | | | | | | | | | | |
| Authority (Wesley Hills Project) (LOC; Fifth Third Bank) | | 3.67 | | 8/7/06 | | 8,400,000 | | a | | 8,400,000 |
| Dauphin County General Authority, Revenue (Insured; FSA | | | | | | | | | | |
| and Liquidity Facility: Bank of Nova Scotia and KBC Bank) | | 3.67 | | 8/7/06 | | 15,925,000 | | a | | 15,925,000 |
| Dauphin County General Authority, Revenue (Insured; FSA | | | | | | | | | | |
| and Liquidity Facility: Bank of Nova Scotia and KBC Bank) | | 3.67 | | 8/7/06 | | 15,000,000 | | a | | 15,000,000 |
| Dauphin County General Authority, Revenue | | | | | | | | | | |
| (School District Pooled Financing Program II) | | | | | | | | | | |
| (Insured; AMBAC and Liquidity Facility; Bank of Nova Scotia) | | 3.67 | | 8/7/06 | | 2,250,000 | | a | | 2,250,000 |
| Emmaus General Authority, Local | | | | | | | | | | |
| Government Revenue (LOC; DEPFA Bank PLC) | | 3.69 | | 8/7/06 | | 7,800,000 | | a | | 7,800,000 |
| Emmaus General Authority, Local | | | | | | | | | | |
| Government Revenue (LOC; DEPFA Bank PLC) | | 3.69 | | 8/7/06 | | 5,500,000 | | a | | 5,500,000 |
| Lancaster Municipal Authority, Revenue (Ephrata | | | | | | | | | | |
| Community Hospital Project) (LOC; Fulton Bank) | | 3.75 | | 8/7/06 | | 4,000,000 | | a | | 4,000,000 |
| Lancaster Municipal Authority, Revenue | | | | | | | | | | |
| (Garden Spot Village Project) (LOC; Fulton Bank) | | 3.72 | | 8/7/06 | | 7,435,000 | | a | | 7,435,000 |
| Montgomery County Industrial Development Authority, | | | | | | | | | | |
| Retirement Community Revenue (Adult Communities | | | | | | | | | | |
| Total Services Retirement Life Communities Inc. Obligated | | | | | | | | | | |
| Group) (Insured; Radian and Liquidity Facility; ABN-AMRO) | | 3.70 | | 8/1/06 | | 2,000,000 | | a | | 2,000,000 |
| Montgomery County Industrial Development Authority, Revenue | | | | | | | | | | |
| (Recigno Laboratories, Inc. Project) (LOC; Wachovia Bank) | | 3.81 | | 8/7/06 | | 1,685,000 | | a | | 1,685,000 |
| North Lebanon Township Municipal Authority, Sewer Revenue | | | | | | | | | | |
| (Insured; FSA and Liquidity Facility; Dexia Credit Locale) | | 3.69 | | 8/7/06 | | 3,400,000 | | a | | 3,400,000 |
| Pennsylvania Housing Finance Agency, SFHR | | | | | | | | | | |
| (Liquidity Facility; DEPFA Bank PLC) | | 3.68 | | 8/7/06 | | 24,200,000 | | a | | 24,200,000 |
| Philadelphia, Airport Revenue, Refunding (Insured; MBIA | | | | | | | | | | |
| and Liquidity Facility; JPMorgan Chase Bank) | | 3.73 | | 8/7/06 | | 10,900,000 | | a | | 10,900,000 |
| West Cornwall Township Municipal Authority, | | | | | | | | | | |
| GO Notes, Refunding (Bethlehem Area School District | | | | | | | | | | |
| Project) (Insured; FSA and Liquidity Facility; Dexia Credit Locale) | | 3.67 | | 8/7/06 | | 9,800,000 | | a | | 9,800,000 |
| West Cornwall Township Municipal Authority, Revenue | | | | | | | | | | |
| (Pennsylvania General Government Loan Program) | | | | | | | | | | |
| (Insured; FSA and Liquidity Facility; Dexia Credit Locale) | | 3.67 | | 8/7/06 | | 1,103,000 | | a | | 1,103,000 |
| South Carolina—1.2% | | | | | | | | | | |
| South Carolina Association of Governmental Organizations, COP, TAN | | 4.19 | | 4/13/07 | | 12,000,000 | | | | 12,026,803 |
| Tennessee—1.0% | | | | | | | | | | |
| Sevier County Public Building Authority, Local Government | | | | | | | | | | |
| Public Improvement Revenue (Insured; AMBAC and | | | | | | | | | | |
| Liquidity Facility; Landesbank Hessen-Thuringen Girozentrale) | | 3.66 | | 8/7/06 | | 10,000,000 | | a | | 10,000,000 |
The Funds 25
STATEMENT OF INVESTMENTS (Unaudited) (continued)
| Dreyfus Municipal | | Coupon | | Maturity | | Principal | | | | |
| Cash Management Plus (continued) | | Rate (%) | | Date | | Amount ($) | | Value ($) |
| |
| |
| |
| |
|
| Short-Term Investments (continued) | | | | | | | | | | |
| |
| |
| |
| |
| |
|
| Texas—14.4% | | | | | | | | | | |
| ABN AMRO Munitops Certificates Trust, Water Revenue | | | | | | | | | | |
| (Tarrant Regional Water District) | | | | | | | | | | |
| (Insured; FGIC and Liquidity Facility; ABN-AMRO) | | 3.69 | | 8/7/06 | | 4,800,000 | | a,b | | 4,800,000 |
| Bexar County Housing Finance Corporation, MFHR (Gates | | | | | | | | | | |
| Capernaum Apartments Project) (Liquidity Facility; Merrill Lynch) | | 3.77 | | 8/7/06 | | 3,960,000 | | a,b | | 3,960,000 |
| East Texas Housing Finance Corporation, | | | | | | | | | | |
| MFHR (Liquidity Facility; Merrill Lynch) | | 3.77 | | 8/7/06 | | 4,320,000 | | a,b | | 4,320,000 |
| El Paso County Hospital District, GO Notes (Putters Program) | | | | | | | | | | |
| (Insured; AMBAC and Liquidity Facility; Deutsche Postbank) | | 3.70 | | 8/7/06 | | 3,480,000 | | a,b | | 3,480,000 |
| Fort Bend County, Toll Road Revenue (Putters Program) | | | | | | | | | | |
| (Insured; FGIC and Liquidity Facility; PB Finance Inc.) | | 3.70 | | 8/7/06 | | 2,780,000 | | a,b | | 2,780,000 |
| Harris County, GO, CP (Liquidity Facility: | | | | | | | | | | |
| Bank of Nova Scotia and Lloyds TSB Bank PLC) | | 3.58 | | 8/15/06 | | 5,000,000 | | | | 5,000,000 |
| Harris County Housing Finance Corporation, MFHR | | | | | | | | | | |
| (Liquidity Facility; Merrill Lynch and LOC; Merrill Lynch) | | 3.77 | | 8/7/06 | | 13,145,000 | | a,b | | 13,145,000 |
| Harris County Metropolitan Transportation Authority, | | | | | | | | | | |
| Sales and Use Tax Revenue, CP (LOC; DEPFA Bank PLC) | | 3.60 | | 8/1/06 | | 10,000,000 | | | | 10,000,000 |
| Harris County Metropolitian Transportation Authority, | | | | | | | | | | |
| Sales and Use Tax Revenue, CP (LOC; DEPFA Bank PLC) | | 3.65 | | 9/21/06 | | 2,000,000 | | | | 2,000,000 |
| Houston, CP (Liquidity Facility; DEPFA Bank PLC) | | 3.72 | | 11/16/06 | | 20,000,000 | | | | 20,000,000 |
| Montgomery County Housing Finance Corporation, MFHR | | | | | | | | | | |
| (Park at Woodline Townhomes) (LOC; Citibank NA) | | 3.76 | | 8/7/06 | | 7,500,000 | | a | | 7,500,000 |
| Permian Basin Regional Housing Finance Corporation, | | | | | | | | | | |
| SFMR (Mortgage Backed Securities Program) (GIC; Aegon NV) | | 3.99 | | 6/1/07 | | 5,455,000 | | | | 5,455,000 |
| Revenue Bond Certificate Series Trust Various States, | | | | | | | | | | |
| Housing Revenue (Pebble Brooke) (GIC; AIG Funding Inc.) | | 3.81 | | 8/7/06 | | 7,000,000 | | a,b | | 7,000,000 |
| Revenue Bond Certificate Series Trust Various States, | | | | | | | | | | |
| Revenue (Chimney Project) (GIC; AIG Funding Inc.) | | 3.81 | | 8/7/06 | | 6,200,000 | | a,b | | 6,200,000 |
| Texas, TRAN | | 4.50 | | 8/31/06 | | 27,000,000 | | | | 27,025,358 |
| Texas Affordable Housing Corporation, MFHR | | | | | | | | | | |
| (American Housing Foundation Portfolio) (Insured; MBIA | | | | | | | | | | |
| and Liquidity Facility; Branch Banking and Trust Company) | | 3.68 | | 8/7/06 | | 10,000,000 | | a,b | | 10,000,000 |
| Texas Department of Housing and Community Affairs, | | | | | | | | | | |
| MFHR (Liquidity Facility; Merrill Lynch and LOC; Merrill Lynch) | | 3.77 | | 8/7/06 | | 7,500,000 | | a,b | | 7,500,000 |
| Texas Public Finance Authority, CP | | 3.60 | | 9/6/06 | | 10,900,000 | | | | 10,900,000 |
| Utah—3.5% | | | | | | | | | | |
| Murray City, HR (IHC Health Services Inc.) | | 3.68 | | 8/1/06 | | 36,300,000 | | a | | 36,300,000 |
| Vermont—2.4% | | | | | | | | | | |
| University of Vermont and State Agricultural College, CP | | 3.65 | | 10/10/06 | | 3,015,000 | | | | 3,015,000 |
| University of Vermont and State Agricultural College, CP | | 3.65 | | 10/12/06 | | 8,000,000 | | | | 8,000,000 |
| Vermont Economic Development Authority, Revenue, CP (Economic | | | | | | | | | | |
| Development Capital Program) (LOC; JPMorgan Chase Bank) | | 3.68 | | 10/18/06 | | 13,650,000 | | | | 13,650,000 |
| Dreyfus Municipal | | Coupon | | Maturity | | Principal | | | | |
| Cash Management Plus (continued) | | Rate (%) | | Date | | Amount ($) | | Value ($) |
| |
| |
| |
| |
|
| Short-Term Investments (continued) | | | | | | | | | | |
| |
| |
| |
| |
| |
|
| Virginia—4.3% | | | | | | | | | | |
| Morgan Keegan Municipal Products Inc., Revenue (Virginia Housing | | | | | | | | |
| Development Authority) (Liquidity Facility; BNP Paribas) | | 3.74 | | 8/7/06 | | 20,000,000 | | a,b | | 20,000,000 |
| Norfolk Economic Development Authority, | | | | | | | | | | |
| New Empowerment Zone Facility Revenue (Metropolitan | | | | | | | | | | |
| Machine Corp. Project) (LOC; Wachovia Bank) | | 3.71 | | 8/7/06 | | 6,100,000 | | a | | 6,100,000 |
| Virginia Beach Development Authority, IDR, Refunding (Giant | | | | | | | | | | |
| Square Shopping Center Co. LLP Project) (LOC; Wachovia Bank) | | 3.71 | | 8/7/06 | | 3,500,000 | | a | | 3,500,000 |
| Virginia Housing Development Authority, | | | | | | | | | | |
| Commonwealth Mortgage Revenue | | 3.73 | | 12/12/06 | | 15,000,000 | | | | 15,000,000 |
| Washington—3.6% | | | | | | | | | | |
| Everett Industrial Development Corporation, Exempt | | | | | | | | | | |
| Facilities Revenue (Kimberly Clark Corp. Project) | | 3.71 | | 8/7/06 | | 3,200,000 | | a | | 3,200,000 |
| Port of Bellingham Industrial Development Corporation, | | | | | | | | | | |
| Environmental Facilities Industrial Revenue | | | | | | | | | | |
| (BP West Coast Products LLC Project) | | 3.72 | | 8/1/06 | | 4,750,000 | | a | | 4,750,000 |
| Port of Seattle, Revenue (Insured; FGIC | | | | | | | | | | |
| and Liquidity Facility; BNP Paribas) | | 3.71 | | 8/7/06 | | 2,870,000 | | a,b | | 2,870,000 |
| Seattle Housing Authority, Revenue | | | | | | | | | | |
| (Newholly Project-Phase III) (LOC; Key Bank) | | 3.71 | | 8/7/06 | | 2,450,000 | | a | | 2,450,000 |
| Washington Economic Development Finance Authority, SWDR | | | | | | | | | | |
| (Cedar Grove Composing Project) (LOC; Wells Fargo Bank) | | 3.70 | | 8/7/06 | | 5,000,000 | | a | | 5,000,000 |
| Washington Economic Development Finance Authority, SWDR | | | | | | | | | | |
| (Lemay Enterprises Project) (LOC; Bank of America) | | 3.70 | | 8/7/06 | | 5,660,000 | | a | | 5,660,000 |
| Washington Economic Development Finance Authority, SWDR | | | | | | | | | | |
| (Waste Management Project) (LOC; Bank of America) | | 3.73 | | 8/7/06 | | 5,500,000 | | a | | 5,500,000 |
| Washington Housing Finance Commission, MFHR | | | | | | | | | | |
| (Queen Anne Project) (LOC; Bank of America) | | 3.73 | | 8/7/06 | | 7,500,000 | | a | | 7,500,000 |
| Wisconsin—1.1% | | | | | | | | | | |
| Middleton-Cross Plains Area School District, BAN | | 3.96 | | 12/1/06 | | 1,800,000 | | | | 1,801,522 |
| Onalaska School District, BAN | | 3.63 | | 11/15/06 | | 10,000,000 | | | | 10,001,132 |
| Wyoming—1.0% | | | | | | | | | | |
| Campbell County, IDR (Two Elk Power | | | | | | | | | | |
| Generation Station Project) (LOC; Citibank NA) | | 3.50 | | 11/30/06 | | 10,000,000 | | | | 10,000,000 |
| |
| |
| |
| |
| |
|
| |
| Total Investments (cost $1,090,283,722) | | | | | | 104.8% | | | | 1,090,283,722 |
| Liabilities, Less Cash and Receivables | | | | | | (4.8%) | | (50,412,376) |
| Net Assets | | | | | | 100.0% | | | | 1,039,871,346 |
| | See footnotes on page 42.
See notes to financial statements.
|
The Funds 27
| | STATEMENT OF INVESTMENTS
July 31, 2006 (Unaudited)
|
| Dreyfus New York | | Coupon | | Maturity | | Principal | | | | |
| Municipal Cash Management | | Rate (%) | | Date | | Amount ($) | | Value ($) |
| |
| |
| |
| |
|
| |
| Short-Term Investments—100.7% | | | | | | | | | | |
| |
| |
| |
| |
| |
|
| Albany Industrial Development Agency, | | | | | | | | | | |
| Senior Housing Revenue (South Mall Towers Albany, | | | | | | | | | | |
| L.P. Project) (Insured; FNMA and Liquidity Facility; FNMA) | | 3.65 | | 8/7/06 | | 6,700,000 | | a | | 6,700,000 |
| Allegany County, GO Notes, BAN (LOC; JPMorgan Chase Bank) | | 4.25 | | 9/27/06 | | 2,800,000 | | | | 2,804,260 |
| Chautauqua County Industrial Development Agency, Civic | | | | | | | | | | |
| Facility Revenue (Gerry Homes Project) (LOC; HSBC Bank USA) | | 3.80 | | 8/7/06 | | 13,400,000 | | a | | 13,400,000 |
| Chemung County Industrial Development Agency, IDR | | | | | | | | | | |
| (MMARS 2nd Program) (LOC; HSBC Bank USA) | | 3.80 | | 8/7/06 | | 1,140,000 | | a | | 1,140,000 |
| Dutchess County Industrial Development Agency, | | | | | | | | | | |
| Civic Facility Revenue, Refunding (Lutheran Center | | | | | | | | | | |
| at Poughkeepsie, Inc. Project) (LOC; Key Bank) | | 3.70 | | 8/7/06 | | 3,815,000 | | a | | 3,815,000 |
| Erie County Industrial Development Agency, Civic Facility | | | | | | | | | | |
| Revenue (D'Youville College Project) (LOC; HSBC Bank USA) | | 3.80 | | 8/7/06 | | 7,310,000 | | a | | 7,310,000 |
| Erie County Industrial Development Agency, Civic Facility | | | | | | | | | | |
| Revenue (Heritage Center Project) (LOC; Key Bank) | | 3.71 | | 8/7/06 | | 2,355,000 | | a | | 2,355,000 |
| Erie County Industrial Development Agency, Civic Facility | | | | | | | | | | |
| Revenue (YMCA of Greater Buffalo Project) (LOC; HSBC Bank USA) | | 3.80 | | 8/7/06 | | 1,350,000 | | a | | 1,350,000 |
| Erie County Industrial Development Agency, Civic Facility | | | | | | | | | | |
| Revenue (YMCA of Greater Buffalo Project) (LOC; HSBC Bank USA) | | 3.80 | | 8/7/06 | | 4,000,000 | | a | | 4,000,000 |
| Erie County Industrial Development Agency, School Facility | | | | | | | | | | |
| Revenue (City School District of the City of Buffalo | | | | | | | | | | |
| Project) (Insured; FSA and Liquidity Facility; Goldman Sachs) | | 3.67 | | 8/7/06 | | 3,335,000 | | a,b | | 3,335,000 |
| Erie County Tobacco Asset Securitization Corporation, | | | | | | | | | | |
| Tobacco Settlement Asset-Backed Bonds | | | | | | | | | | |
| (Liquidity Facility; Merrill Lynch and LOC; Merrill Lynch) | | 3.70 | | 8/7/06 | | 3,245,000 | | a,b | | 3,245,000 |
| Herkimer County Industrial Development Agency, IDR | | | | | | | | | | |
| (F.E. Hale Manufacturing Co. Facility) (LOC; HSBC Bank USA) | | 3.80 | | 8/7/06 | | 2,450,000 | | a | | 2,450,000 |
| Metropolitan Transportation Authority, Dedicated Tax Fund, | | | | | | | | | | |
| Refunding (Insured; XLCA and Liquidity Facility; Citibank NA) | | 3.65 | | 8/7/06 | | 7,000,000 | | a | | 7,000,000 |
| Metropolitan Transportation Authority, | | | | | | | | | | |
| Transportation Revenue, CP (LOC; ABN-AMRO) | | 3.65 | | 9/8/06 | | 13,000,000 | | | | 13,000,000 |
| Monroe County Industrial Development Agency, | | | | | | | | | | |
| IDR (Chaney Enterprise) (LOC; M&T Bank) | | 3.84 | | 8/7/06 | | 2,700,000 | | a | | 2,700,000 |
| Monroe County Industrial Development Agency, IDR | | | | | | | | | | |
| (Genesee Metal Stampings Inc. Facility) (LOC; HSBC Bank USA) | | 3.80 | | 8/7/06 | | 810,000 | | a | | 810,000 |
| Monroe County Industrial Development Agency, LR | | | | | | | | | | |
| (Robert Weslayan College Project) (LOC; M&T Bank) | | 3.71 | | 8/7/06 | | 2,900,000 | | a | | 2,900,000 |
| Nassau County Industrial Development Agency, | | | | | | | | | | |
| Civic Facility Revenue (Saint Mary's | | | | | | | | | | |
| Children Project) (LOC; Commerce Bank) | | 3.69 | | 8/7/06 | | 2,015,000 | | a | | 2,015,000 |
| Nassau County Industrial Development Agency, Revenue | | | | | | | | | | |
| (Bryant Landing Project) (Liquidity Facility; | | | | | | | | | | |
| Merrill Lynch and LOC; Merrill Lynch) | | 3.74 | | 8/7/06 | | 5,000,000 | | a,b | | 5,000,000 |
| Nassau County Tobacco Settlement Corporation, | | | | | | | | | | |
| Tobacco Settlement Asset-Backed Bonds (Liquidity Facility; | | | | | | | | | | |
| Merrill Lynch Capital Services and LOC; Merrill Lynch) | | 3.71 | | 8/7/06 | | 10,000,000 | | a,b | | 10,000,000 |
| New York City (Liquidity Facility; Merrill Lynch) | | 3.70 | | 8/7/06 | | 7,000,000 | | a,b | | 7,000,000 |
| Dreyfus New York | | Coupon | | Maturity | | Principal | | | | |
| Municipal Cash Management (continued) | | Rate (%) | | Date | | Amount ($) | | Value ($) |
| |
| |
| |
| |
|
| |
| Short-Term Investments (continued) | | | | | | | | | | |
| |
| |
| |
| |
| |
|
| New York City (LOC; Landesbank Baden-Wurttemberg) | | 3.67 | | 8/1/06 | | 4,000,000 | | a | | 4,000,000 |
| New York City, GO Notes | | 4.97 | | 8/1/06 | | 2,900,000 | | | | 2,900,000 |
| New York City, GO Notes | | 6.96 | | 8/1/06 | | 3,000,000 | | | | 3,000,000 |
| New York City, GO Notes | | 6.11 | | 4/15/07 | | 4,000,000 | | c | | 4,113,139 |
| New York City Industrial Development Agency, Civic Facility Revenue | | | | | | | | | | |
| (Birch Wathen Lenox School Project) (LOC; Allied Irish Bank) | | 3.65 | | 8/7/06 | | 5,250,000 | | a | | 5,250,000 |
| New York City Industrial Development Agency, Civic Facility Revenue | | | | | | | | | | |
| (Brooklyn United Methodist Project) (LOC; The Bank of New York) | | 3.65 | | 8/7/06 | | 3,720,000 | | a | | 3,720,000 |
| New York City Industrial Development Agency, Civic Facility Revenue | | | | | | | | | | |
| (French Institute-Alliance Francaise de New York—Federation | | | | | | | | | | |
| of French Alliances in the United States Project) (LOC; M&T Bank) | | 3.70 | | 8/7/06 | | 2,550,000 | | a | | 2,550,000 |
| New York City Industrial Development Agency, Civic Facility Revenue | | | | | | | | | | |
| (Jewish Community Center on the Upper West Side, | | | | | | | | | | |
| Inc. Project) (LOC; M&T Bank) | | 3.71 | | 8/7/06 | | 5,000,000 | | a | | 5,000,000 |
| New York City Industrial Development Agency, Civic Facility Revenue | | | | | | | | | | |
| (Sephardic Community Youth Center, Inc. Project) (LOC; M&T Bank) | | 3.69 | | 8/7/06 | | 5,000,000 | | a | | 5,000,000 |
| New York City Industrial Development Agency, Civic Facility Revenue | | | | | | | | | | |
| (Village Community School Project) (LOC; M&T Bank) | | 3.70 | | 8/7/06 | | 2,450,000 | | a | | 2,450,000 |
| New York City Industrial Development Agency, Civic Facilty Revenue | | | | | | | | | | |
| (Wartburg Lutheran Home for the Aging and | | | | | | | | | | |
| Wartburg Nursing Home, Inc. Project) (LOC; Key Bank) | | 3.70 | | 8/7/06 | | 9,000,000 | | a | | 9,000,000 |
| New York City Industrial Development Agency, IDR, Refunding | | | | | | | | | | |
| (Plaza Packaging Project) (LOC; The Bank of New York) | | 3.80 | | 8/7/06 | | 1,370,000 | | a | | 1,370,000 |
| New York City Industrial Development Agency, | | | | | | | | | | |
| Liberty Revenue (7 World Trade Center, LLC Project) | | | | | | | | | | |
| (LOC; Citibank NA and Liquidity Facility; Citibank NA) | | 3.69 | | 8/7/06 | | 2,200,000 | | a,b | | 2,200,000 |
| New York City Industrial Development Agency, Liberty Revenue | | | | | | | | | | |
| (FC Hanson Office Associates LLC Project) (LOC; Lloyds TSB Bank PLC) | | 3.65 | | 8/7/06 | | 4,500,000 | | a | | 4,500,000 |
| New York City Industrial Development Agency, | | | | | | | | | | |
| Special Facilities Revenue (Liquidity Facility; Merrill Lynch) | | 3.70 | | 8/7/06 | | 8,200,000 | | a,b | | 8,200,000 |
| New York City Municipal Water Finance Authority, | | | | | | | | | | |
| CP (LOC: Landesbank Baden Wurttemberg | | | | | | | | | | |
| and Landesbank Hessen-Thuringen Girozentrale) | | 3.60 | | 10/12/06 | | 20,000,000 | | | | 20,000,000 |
| New York City Municipal Water Finance Authority, | | | | | | | | | | |
| Water and Sewer System Revenue (Insured; FGIC) | | 3.65 | | 8/1/06 | | 15,000,000 | | a | | 15,000,000 |
| New York City Municipal Water Finance Authority, | | | | | | | | | | |
| Water and Sewer System Revenue (Putters Program) | | | | | | | | | | |
| (Liquidity Facility; JPMorgan Chase Bank) | | 3.68 | | 8/7/06 | | 7,360,000 | | a,b | | 7,360,000 |
| New York Counties Tobacco Trust I, Revenue (Liquidity | | | | | | | | | | |
| Facility; Merrill Lynch and LOC; Merrill Lynch) | | 3.70 | | 8/7/06 | | 2,680,000 | | a,b | | 2,680,000 |
| New York Liberty Development Corporation, Revenue (Goldman | | | | | | | | | | |
| Sachs Headquarters Issue) (Liquidity Facility; Citibank NA) | | 3.68 | | 8/7/06 | | 9,300,000 | | a,b | | 9,300,000 |
| New York State Dormitory Authority, Revenue (Mount Sinai | | | | | | | | | | |
| NYU Health Obligated Group) (Liquidity Facility; Merrill Lynch) | | 3.70 | | 8/7/06 | | 9,335,000 | | a,b | | 9,335,000 |
| New York State Dormitory Authority, Revenue (Oxford University | | | | | | | | | | |
| Press Inc.) (LOC; Landesbank Hessen-Thuringen Girozentrale) | | 3.70 | | 8/1/06 | | 10,300,000 | | a | | 10,300,000 |
The Funds 29
STATEMENT OF INVESTMENTS (Unaudited) (continued)
| Dreyfus New York | | Coupon | | Maturity | | Principal | | | | |
| Municipal Cash Management (continued) | | Rate (%) | | Date | | Amount ($) | | Value ($) |
| |
| |
| |
| |
|
| |
| Short-Term Investments (continued) | | | | | | | | | | |
| |
| |
| |
| |
| |
|
| New York State Dormitory Authority, Revenue | | | | | | | | | | |
| (Park Ridge Hospital Inc.) (LOC; JPMorgan Chase Bank) | | 3.54 | | 8/7/06 | | 10,400,000 | | a | | 10,400,000 |
| New York State Dormitory Authority, Revenue (Pratt Institute) | | | | | | | | | | |
| (Insured; Radian Bank and Liquidity Facility; Citibank NA) | | 3.72 | | 8/7/06 | | 6,400,000 | | a | | 6,400,000 |
| New York State Housing Finance Agency, Housing Revenue | | | | | | | | | | |
| (33 West End Avenue Apartments) (LOC; HSBC Bank USA) | | 3.70 | | 8/7/06 | | 9,000,000 | | a | | 9,000,000 |
| New York State Housing Finance Agency, Housing | | | | | | | | | | |
| Revenue (240 East 39th Street) (LOC; FNMA) | | 3.68 | | 8/7/06 | | 8,100,000 | | a | | 8,100,000 |
| New York State Housing Finance Agency, Housing Revenue | | | | | | | | | | |
| (250 West 93rd Street) (LOC; Bank of America) | | 3.69 | | 8/7/06 | | 5,000,000 | | a | | 5,000,000 |
| New York State Housing Finance Agency, Housing | | | | | | | | | | |
| Revenue (360 West 43rd Street) (LOC; FNMA) | | 3.63 | | 8/7/06 | | 5,050,000 | | a | | 5,050,000 |
| New York State Power Authority, CP (Liquidity Facility: | | | | | | | | | | |
| Bank of Nova Scotia, JPMorgan Chase Bank, Landesbank | | | | | | | | | | |
| Baden-Wurttemberg, State Street Bank and Trust Co., | | | | | | | | | | |
| The Bank of New York and Wachovia Bank) | | 3.58 | | 9/7/06 | | 9,400,000 | | | | 9,400,000 |
| New York State Power Authority, CP (Liquidity Facility: | | | | | | | | | | |
| Bank of Nova Scotia, JPMorgan Chase Bank, | | | | | | | | | | |
| Landesbank Baden-Wurttemberg, State Street Bank | | | | | | | | | | |
| and Trust Co., The Bank of New York and Wachovia Bank) | | 3.59 | | 10/16/06 | | 11,300,000 | | | | 11,300,000 |
| New York State Thruway Authority, Second General | | | | | | | | | | |
| Highway and Bridge Trust Fund Revenue | | 4.06 | | 4/1/07 | | 16,240,000 | | | | 16,299,354 |
| Oneida County Industrial Development Agency, | | | | | | | | | | |
| Civic Facility Revenue (Mohawk Valley Community | | | | | | | | | | |
| College Dormitory Corporation Project) (LOC; Citibank NA) | | 3.67 | | 8/7/06 | | 8,470,000 | | a | | 8,470,000 |
| Ontario County Industrial Development Agency, IDR | | | | | | | | | | |
| (Dixit Enterprises) (LOC; HSBC Bank USA) | | 3.80 | | 8/7/06 | | 3,000,000 | | a | | 3,000,000 |
| Orange County Industrial Development Agency, Civic Facility Revenue | | | | | | | | | | |
| (Saint Luke's Cornwall Hospital Project) (LOC; Key Bank) | | 3.70 | | 8/7/06 | | 4,000,000 | | a | | 4,000,000 |
| Patchogue-Medford Union Free School District, GO Notes, TAN | | 4.43 | | 6/29/07 | | 5,000,000 | | | | 5,028,028 |
| Port Authority of New York and New Jersey, CP (Liquidity | | | | | | | | | | |
| Facility; Landesbank Hessen-Thuringen Girozentrale) | | 3.60 | | 8/17/06 | | 2,870,000 | | | | 2,870,000 |
| Port Authority of New York and New Jersey, CP (Liquidity | | | | | | | | | | |
| Facility; Landesbank Hessen-Thuringen Girozentrale) | | 3.60 | | 8/17/06 | | 9,370,000 | | | | 9,370,000 |
| Poughkeepsie Industrial Development Agency, Senior Living Facility | | | | | | | | | | |
| Revenue (Manor at Woodside Project) (LOC; The Bank of New York) | | 3.70 | | 8/7/06 | | 4,800,000 | | a | | 4,800,000 |
| Rensselaer Industrial Development Agency, IDR | | | | | | | | | | |
| (Capital View Office Park Project) (LOC; M&T Bank) | | 3.72 | | 1/2/07 | | 5,015,000 | | | | 5,015,000 |
| Roaring Fork Municipal Products LLC, Revenue (Ramapo | | | | | | | | | | |
| Housing Authority) (Liquidity Facility; The Bank of New York) | | 3.72 | | 8/7/06 | | 10,385,000 | | a,b | | 10,385,000 |
| Schenectady, GO Notes, BAN (LOC; Bank of America) | | 4.44 | | 5/24/07 | | 3,300,000 | | | | 3,321,414 |
| Shenendehowa Central School District, GO Notes, BAN | | 4.35 | | 6/29/07 | | 4,000,000 | | | | 4,014,638 |
| Dreyfus New York | | Coupon | | Maturity | | Principal | | | | |
| Municipal Cash Management (continued) | | Rate (%) | | Date | | Amount ($) | | Value ($) |
| |
| |
| |
| |
|
| |
| Short-Term Investments (continued) | | | | | | | | | | |
| |
| |
| |
| |
| |
|
| Suffolk County Industrial Development Agency, IDR (Belmont Villas | | | | | | | | | | |
| LLC Facility) (Insured; FNMA and Liquidity Facility; FNMA) | | 3.65 | | 8/7/06 | | 6,000,000 | | a | | 6,000,000 |
| Sullivan County, GO Notes, BAN | | 3.91 | | 9/7/06 | | 4,200,000 | | | | 4,201,127 |
| Syracuse Industrial Development Agency, Civic Facility Revenue | | | | | | | | | | |
| (Community Development Properties-Larned Project) (LOC; M&T Bank) | | 3.71 | | 8/7/06 | | 5,870,000 | | a | | 5,870,000 |
| Tompkins County Industrial Development Agency, Civic Facility | | | | | | | | | | |
| Revenue (Tompkins Cortland Community College Foundation, | | | | | | | | | | |
| Inc. Project) (LOC; Citizens Bank of Massachusetts) | | 3.69 | | 8/7/06 | | 3,525,000 | | a | | 3,525,000 |
| Tompkins County Industrial Development Agency, College and | | | | | | | | | | |
| University Revenue (Cortland College) (LOC; HSBC Bank USA) | | 3.69 | | 8/7/06 | | 4,350,000 | | a | | 4,350,000 |
| Triborough Bridge and Tunnel Authority, General Revenue, | | | | | | | | | | |
| Refunding (Liquidity Facility; Bank of America) | | 3.66 | | 8/7/06 | | 9,300,000 | | a | | 9,300,000 |
| TSASC Inc. of New York, Tobacco Settlement | | | | | | | | | | |
| Asset-Backed Bonds (Liquidity Facility; Merrill Lynch) | | 3.71 | | 8/7/06 | | 19,885,000 | | a,b | | 19,885,000 |
| TSASC Inc. of New York, Tobacco Settlement | | | | | | | | | | |
| Asset-Backed Bonds (Liquidity Facility; Merrill Lynch) | | 3.74 | | 8/7/06 | | 5,000,000 | | a,b | | 5,000,000 |
| Ulster County Industrial Development Agency, IDR | | | | | | | | | | |
| (Selux Corporation Project) (LOC; M&T Bank) | | 3.79 | | 8/7/06 | | 1,910,000 | | a | | 1,910,000 |
| Warren and Washington Counties Industrial Development | | | | | | | | | | |
| Agency, Civic Facility Revenue (Glen at Hiland | | | | | | | | | | |
| Meadows Project) (LOC; PNC Bank) | | 3.65 | | 8/7/06 | | 6,365,000 | | a | | 6,365,000 |
| Westchester County Industrial Development Agency, Civic Facility | | | | | | | | | | |
| Revenue (The Masters School Civic Facility) (LOC; Allied Irish Bank) | | 3.65 | | 8/7/06 | | 3,440,000 | | a | | 3,440,000 |
| Westchester County Industrial Development Agency, Civic Facility | | | | | | | | | | |
| Revenue (The Rye YMCA Project) (LOC; Allied Irish Bank) | | 3.67 | | 8/7/06 | | 3,000,000 | | a | | 3,000,000 |
| Westchester County Industrial Development Agency, | | | | | | | | | | |
| Commercial Facility Revenue (Panorama Flight Service | | | | | | | | | | |
| Inc. Project) (LOC; The Bank of New York) | | 3.70 | | 8/7/06 | | 4,875,000 | | a | | 4,875,000 |
| Westchester Tobacco Asset Securitization Corporation, | | | | | | | | | | |
| Tobacco Settlement Asset-Backed Bonds (Liquidity | | | | | | | | | | |
| Facility; Merrill Lynch and LOC; Merrill Lynch) | | 3.70 | | 8/7/06 | | 4,300,000 | | a,b | | 4,300,000 |
| Yonkers Industrial Development Agency, MFHR (Main Street | | | | | | | | | | |
| Lofts Yonkers LLC Project) (LOC; M&T Bank) | | 3.74 | | 8/7/06 | | 15,000,000 | | a | | 15,000,000 |
| Yonkers Industrial Development Agency, Revenue (Merlots Program) | | | | | | | | | | |
| (Insured; GNMA and Liquidity Facility; Wachovia Bank) | | 3.73 | | 8/7/06 | | 4,215,000 | | a,b | | 4,215,000 |
| |
| |
| |
| |
| |
|
| |
| Total Investments (cost $482,016,960) | | | | | | 100.7% | | | | 482,016,960 |
| Liabilities, Less Cash and Receivables | | | | | | (.7%) | | (3,219,022) |
| Net Assets | | | | | | 100.0% | | | | 478,797,938 |
| | See footnotes on page 42.
See notes to financial statements.
|
The Funds 31
| | STATEMENT OF INVESTMENTS
July 31, 2006 (Unaudited)
|
| Dreyfus Tax Exempt | | Coupon | | Maturity | | Principal | | | | |
| Cash Management | | Rate (%) | | Date | | Amount ($) | | Value ($) |
| |
| |
| |
| |
|
| |
| Short-Term Investments—107.8% | | | | | | | | | | |
| |
| |
| |
| |
| |
|
| Alabama—1.7% | | | | | | | | | | |
| DCH Health Care Authority, Health Care | | | | | | | | | | |
| Facilities Revenue (LOC; Regions Bank) | | 3.65 | | 8/7/06 | | 10,000,000 | | a | | 10,000,000 |
| Jefferson County, Sewer Revenue, Refunding (Insured; | | | | | | | | | | |
| XLCA and Liquidity Facility; Bank of America) | | 3.66 | | 8/7/06 | | 42,600,000 | | a | | 42,600,000 |
| Arizona—2.3% | | | | | | | | | | |
| ABN AMRO Munitops Certificate Trust, Sales Tax | | | | | | | | | | |
| Revenue (Civic Plaza Expansion Project) | | | | | | | | | | |
| (Insured; FGIC and Liquidity Facility; ABN-AMRO) | | 3.68 | | 8/7/06 | | 13,700,000 | | a,b | | 13,700,000 |
| Phoenix Civic Improvement Corporation, | | | | | | | | | | |
| Excise Tax Revenue (Putters Program) (Insured; | | | | | | | | | | |
| FGIC and Liquidity Facility; PB Capital Finance) | | 3.70 | | 8/7/06 | | 8,270,000 | | a,b | | 8,270,000 |
| Phoenix Civic Improvement Corporation, Water System Revenue | | | | | | | | | | |
| (Insured; MBIA and Liquidity Facility; Merrill Lynch) | | 3.68 | | 8/7/06 | | 19,880,000 | | a,b | | 19,880,000 |
| Salt River Project Agricultural Improvement and Power District, | | | | | | | | | | |
| CP (Liquidity Facility: Bank of America, Citibank NA, JPMorgan | | | | | | | | | | |
| Chase Bank, Marshall and Isley Bank and Wells Fargo Bank) | | 3.63 | | 10/10/06 | | 11,000,000 | | | | 11,000,000 |
| Salt River Project Agricultural Improvement and | | | | | | | | | | |
| Power District, CP (Liquidity Facility: Bank of America, | | | | | | | | | | |
| Citibank NA, JPMorgan Chase Bank, Marshall and | | | | | | | | | | |
| Isley Bank and Wells Fargo Bank) | | 3.65 | | 10/12/06 | | 18,000,000 | | | | 18,000,000 |
| Arkansas—.3% | | | | | | | | | | |
| Benton County Public Facilities Board, College Parking Facility Revenue | | | | | | | | | | |
| (NorthWest Arkansas Community College Project) (LOC; Regions Bank) | | 3.66 | | 8/7/06 | | 8,250,000 | | a | | 8,250,000 |
| Colorado—2.7% | | | | | | | | | | |
| ABN AMRO Munitops Certificate Trust, Revenue | | | | | | | | | | |
| (Denver City and County Airport) (Insured; XCLA | | | | | | | | | | |
| and Liquidity Facility; ABN-AMRO) | | 3.69 | | 8/7/06 | | 22,345,000 | | a,b | | 22,345,000 |
| Denver Urban Renewal Authority, Tax Increment | | | | | | | | | | |
| Revenue (Liquidity Facility; Merrill Lynch) | | 3.73 | | 8/7/06 | | 12,495,000 | | a,b | | 12,495,000 |
| Lower Colorado River Authority, Revenue, CP | | | | | | | | | | |
| (Lower Colorado River Authority Transportation | | | | | | | | | | |
| Services Corporation) (Liquidity Facility; JPMorgan Chase Bank) | | 3.60 | | 10/5/06 | | 9,200,000 | | | | 9,200,000 |
| Lower Colorado River Authority, Revenue, CP | | | | | | | | | | |
| (Lower Colorado River Authority Transportation | | | | | | | | | | |
| Services Corporation) (Liquidity Facility; JPMorgan Chase Bank) | | 3.65 | | 10/5/06 | | 25,400,000 | | | | 25,400,000 |
| Lower Colorado River Authority, Transmission Service Corporation | | | | | | | | | | |
| Revenue, CP (Lower Colorado Transportation Services | | | | | | | | | | |
| Corporation) (LOC: JPMorgan Chase Bank, State | | | | | | | | | | |
| Street Bank and Trust Co. and Westdeutsche Landesbank) | | 3.60 | | 9/7/06 | | 11,700,000 | | | | 11,700,000 |
| Delaware—.4% | | | | | | | | | | |
| Delaware Economic Development Authority, MFHR | | | | | | | | | | |
| (School House Project) (LOC; HSBC Bank USA) | | 3.80 | | 8/7/06 | | 13,500,000 | | a | | 13,500,000 |
| District of Columbia—.2% | | | | | | | | | | |
| District of Columbia, GO Notes (Merlots Program) (Insured; | | | | | | | | | | |
| AMBAC and Liquidity Facility; Wachovia Bank) | | 3.69 | | 8/7/06 | | 7,315,000 | | a,b | | 7,315,000 |
| Florida—3.1% | | | | | | | | | | |
| JEA, Electric System Revenue, CP (Liquidity Facility; | | | | | | | | | | |
| Landesbank Hessen-Thuringen Girozentrale) | | 3.65 | | 10/2/06 | | 11,100,000 | | | | 11,100,000 |
32
| Dreyfus Tax Exempt | | Coupon | | Maturity | | Principal | | | | |
| Cash Management (continued) | | Rate (%) | | Date | | Amount ($) | | Value ($) |
| |
| |
| |
| |
|
| Short-Term Investments (continued) | | | | | | | | | | |
| |
| |
| |
| |
| |
|
| Florida (continued) | | | | | | | | | | |
| JEA, Electric System Revenue, CP (Liquidity Facility; | | | | | | | | | | |
| Landesbank Hessen-Thuringen Girozentrale) | | 3.67 | | 11/16/06 | | 20,000,000 | | | | 20,000,000 |
| JEA, Electric System Revenue, CP (Liquidity Facility; | | | | | | | | | | |
| Landesbank Hessen-Thuringen Girozentrale) | | 3.67 | | 11/16/06 | | 5,000,000 | | | | 5,000,000 |
| Orange County Health Facilities Authority; | | | | | | | | | | |
| Revenue, CP (LOC; SunTrust Bank) | | 3.72 | | 10/17/06 | | 10,000,000 | | | | 10,000,000 |
| Sunshine State Governmental Financing Commission, | | | | | | | | | | |
| Revenue, CP (Liquidity Facility; DEPFA Bank PLC | | | | | | | | | | |
| and LOC; DEPFA Bank PLC) | | 3.63 | | 10/10/06 | | 32,700,000 | | | | 32,700,000 |
| Tampa, Educational Facilities Revenue (Trinity | | | | | | | | | | |
| School for Children Project) (LOC; Regions Bank) | | 3.69 | | 8/7/06 | | 5,120,000 | | a | | 5,120,000 |
| Tampa Bay Water, Utility System Revenue (Merlots Program) | | | | | | | | | | |
| (Insured; FGIC and Liquidity Facility; Wachovia Bank) | | 3.69 | | 8/7/06 | | 5,660,000 | | a,b | | 5,660,000 |
| Volusia County Educational Facilities Authority, Educational | | | | | | | | | | |
| Facilities Revenue (Embry-Riddle Aeronautical University, Inc. | | | | | | | | | | |
| Project) (Insured; Radian Bank and Liquidity Facility; Citibank NA) | | 3.69 | | 8/7/06 | | 5,645,000 | | a,b | | 5,645,000 |
| Georgia—4.5% | | | | | | | | | | |
| Atlanta, Airport General Revenue, Refunding | | | | | | | | | | |
| (Hartsfield International Airport) (Insured; MBIA and | | | | | | | | | | |
| Liquidity Facility; Bayerische Landesbank) | | 3.70 | | 8/7/06 | | 65,330,000 | | a | | 65,330,000 |
| Fulton County, GO Notes, TAN | | 3.93 | | 12/29/06 | | 30,000,000 | | | | 30,056,353 |
| Fulton County Housing Authority, MFHR (LOC; | | | | | | | | | | |
| FHLMC and Liquidity Facility; FHLMC) | | 3.69 | | 8/7/06 | | 40,365,000 | | a,b | | 40,365,000 |
| Residential Care Facilities for the Elderly Authority of Fulton | | | | | | | | | | |
| County, Revenue (Canterbury Court Project) (LOC; HSH Nordbank) | | 3.65 | | 8/7/06 | | 995,000 | | a | | 995,000 |
| Hawaii—.5% | | | | | | | | | | |
| Hawaii Department of Budget and Finance, Special Purpose | | | | | | | | | | |
| Revenue (Hawaii Pacific Health Obligated Group) | | | | | | | | | | |
| (Insured; Radian Bank and Liquidity Facility; Bank of Nova Scotia) | | 3.75 | | 8/7/06 | | 14,500,000 | | a | | 14,500,000 |
| Idaho—2.1% | | | | | | | | | | |
| Idaho Health Facilities Authority, Revenue (Saint Lukes | | | | | | | | | | |
| Regional Medical Center Project) (Insured; FSA) | | 3.68 | | 8/1/06 | | 60,280,000 | | a | | 60,280,000 |
| Idaho Housing and Finance Association, Nonprofit Facilities Revenue | | | | | | | | | | |
| (Albertson College of Idaho Project) (LOC; Key Bank) | | 3.66 | | 8/7/06 | | 4,250,000 | | a | | 4,250,000 |
| Illinois—3.6% | | | | | | | | | | |
| Chicago O'hare International Airport, Revenue (Insured; | | | | | | | | | | |
| CIFG and Liquidity Facility; DEPFA Bank PLC) | | 3.65 | | 8/7/06 | | 50,000,000 | | a | | 50,000,000 |
| Illinois, GO Notes (Merlots Program) (Insured; FSA | | | | | | | | | | |
| and Liquidity Facility; Wachovia Bank) | | 3.69 | | 8/7/06 | | 16,890,000 | | a,b | | 16,890,000 |
| Illinois, GO Notes (Merlots Program) (Insured; MBIA | | | | | | | | | | |
| and Liquidity Facility; Wachovia Bank) | | 3.69 | | 8/7/06 | | 9,945,000 | | a,b | | 9,945,000 |
| Illinois Development Finance Authority, Revenue (Evanston | | | | | | | | | | |
| Northwestern Healthcare Corporation) (LOC; Bank One) | | 3.65 | | 8/7/06 | | 6,900,000 | | a | | 6,900,000 |
| Illinois Health Facilities Authority, Revenue, CP | | | | | | | | | | |
| (Evanston Northwestern Corporation) | | 3.55 | | 9/14/06 | | 10,000,000 | | | | 10,000,000 |
| Regional Transportation Authority, GO Notes (Merlots Program) | | | | | | | | | | |
| (Insured; MBIA and Liquidity Facility; Wachovia Bank) | | 3.69 | | 8/7/06 | | 10,100,000 | | a,b | | 10,100,000 |
The Funds 33
STATEMENT OF INVESTMENTS (Unaudited) (continued)
| Dreyfus Tax Exempt | | Coupon | | Maturity | | Principal | | | | |
| Cash Management (continued) | | Rate (%) | | Date | | Amount ($) | | Value ($) |
| |
| |
| |
| |
|
| Short-Term Investments (continued) | | | | | | | | | | |
| |
| |
| |
| |
| |
|
| Illinois (continued) | | | | | | | | | | |
| Roaring Fork Municipal Products LLC (Chicago, Second Lien Water | | | | | | | | | | |
| Revenue) (Insured; AMBAC and Liquidity Facility; The Bank of New York) | | 3.72 | | 8/7/06 | | 6,460,000 | | a,b | | 6,460,000 |
| Indiana—2.7% | | | | | | | | | | |
| Hamilton Southeastern School, Temporary Loan Warrants | | 4.25 | | 12/29/06 | | 16,100,000 | | | | 16,160,960 |
| Indiana Health Facility Financing Authority, | | | | | | | | | | |
| Revenue (Ascension Health Credit Group) | | 3.55 | | 6/1/07 | | 14,000,000 | | | | 14,000,000 |
| Indianapolis Local Public Improvement Bond Bank, Notes | | 4.50 | | 1/4/07 | | 5,850,000 | | | | 5,866,166 |
| Indianapolis Local Public Improvement Bond Bank, Notes | | 4.50 | | 1/4/07 | | 35,000,000 | | | | 35,096,720 |
| Merrillville Community School Corporation, Warrants | | 4.25 | | 12/29/06 | | 12,800,000 | | | | 12,848,339 |
| Iowa—1.7% | | | | | | | | | | |
| Iowa Finance Authority, Wellness Facility Revenue | | | | | | | | | | |
| (Community Y of Marshalltown Project) (LOC; Bank of America) | | 3.68 | | 8/7/06 | | 11,395,000 | | a | | 11,395,000 |
| Louisa County, PCR, Refunding (Midwest Power Systems Inc. Project) | | 3.72 | | 8/7/06 | | 27,900,000 | | a | | 27,900,000 |
| Tobacco Settlement Authority of Iowa, Tobacco Settlement | | | | | | | | | | |
| Asset-Backed Bonds (Liquidity Facility; Citibank NA) | | 3.70 | | 8/7/06 | | 11,810,000 | | a,b | | 11,810,000 |
| Kansas—1.4% | | | | | | | | | | |
| University of Kansas Hospital Authority, Health Facilities | | | | | | | | | | |
| Revenue (KU Health System) (LOC; Bank of Montreal) | | 3.68 | | 8/1/06 | | 11,485,000 | | a | | 11,485,000 |
| Wichita, GO Notes | | 4.48 | | 8/10/06 | | 30,000,000 | | | | 30,009,613 |
| Kentucky—2.5% | | | | | | | | | | |
| Jefferson County, Student Housing Industrial Building Revenue | | | | | | | | | | |
| (University of Louisville Project) (LOC; Wachovia Bank) | | 3.66 | | 8/7/06 | | 19,535,000 | | a | | 19,535,000 |
| Kentucky Public Energy Authority, Gas Supply Revenue | | | | | | | | | | |
| (Liquidity Facility; Societe Generale) | | 3.69 | | 8/1/06 | | 57,200,000 | | a | | 57,200,000 |
| Louisiana—3.1% | | | | | | | | | | |
| Board of Supervisors of Louisiana State University | | | | | | | | | | |
| and Agricultural and Mechanical College, Revenue (Insured; | | | | | | | | | | |
| AMBAC and Liquidity Facility; BNP Paribas) | | 3.65 | | 8/7/06 | | 15,290,000 | | a | | 15,290,000 |
| Louisiana Local Government Environmental Facilities and Community | | | | | | | | | | |
| Development Authority, Revenue (Merlots Program) | | | | | | | | | | |
| (Insured; AMBAC and Liquidity Facility; Wachovia Bank) | | 3.69 | | 8/7/06 | | 8,150,000 | | a,b | | 8,150,000 |
| Louisiana Municipal Natural Gas Purchasing and Distribution Authority, | | | | | | | | | | |
| Revenue (Putters Program) (Gas Project Number 1) (Liquidity Facility; | | | | | | | | | | |
| JPMorgan Chase Bank and LOC; JPMorgan Chase Bank) | | 3.70 | | 8/7/06 | | 29,000,000 | | a,b | | 29,000,000 |
| Louisiana Public Facilities Authority, HR (Liquidity Facility; Merrill Lynch) | | 3.71 | | 8/7/06 | | 34,045,000 | | a,b | | 34,045,000 |
| Tobacco Settlement Financing Corporation of Louisiana, Tobacco | | | | | | | | | | |
| Settlement Asset-Backed Bonds (Liquidity Facility; Merrill Lynch) | | 3.74 | | 8/7/06 | | 9,115,000 | | a,b | | 9,115,000 |
| Maryland—.5% | | | | | | | | | | |
| Frederick County, Revenue, Refunding | | | | | | | | | | |
| (Manekin-Frederick Associates Facility) (LOC; M&T Bank) | | 3.76 | | 8/7/06 | | 2,840,000 | | a | | 2,840,000 |
| Maryland Economic Development Corporation, Revenue | | | | | | | | | | |
| (Legal Aid Bureau Inc. Facility) (LOC; M&T Bank) | | 3.71 | | 8/7/06 | | 2,475,000 | | a | | 2,475,000 |
| Maryland Health and Higher Educational Facility | | | | | | | | | | |
| Authority, LR (John Hopkins Hospital) | | 4.97 | | 8/1/06 | | 2,665,000 | | | | 2,665,000 |
| Montgomery County, EDR (Riderwood Village, Inc. Project) (LOC; M&T Bank) | | 3.67 | | 8/7/06 | | 6,000,000 | | a | | 6,000,000 |
| Massachusetts—2.6% | | | | | | | | | | |
| Massachusetts Development Finance Agency, Revenue | | | | | | | | | | |
| (Lesley University Issue) (LOC; Bank of America) | | 3.72 | | 8/7/06 | | 7,300,000 | | a | | 7,300,000 |
34
| Dreyfus Tax Exempt | | Coupon | | Maturity | | Principal | | | | |
| Cash Management (continued) | | Rate (%) | | Date | | Amount ($) | | Value ($) |
| |
| |
| |
| |
|
| |
| Short-Term Investments (continued) | | | | | | | | | | |
| |
| |
| |
| |
| |
|
| Massachusetts (continued) | | | | | | | | | | |
| Massachusetts Development Finance Agency, Revenue | | | | | | | | | | |
| (Northfield Mount Hermon School Issue) | | | | | | | | | | |
| (Insured; Radian Bank and Liquidity Facility; Bank of America) | | 3.75 | | 8/7/06 | | 15,000,000 | | a | | 15,000,000 |
| Massachusetts Development Finance Agency, Revenue | | | | | | | | | | |
| (Suffolk University Issue) (Insured; Radian Bank and Liquidity | | | | | | | | | | |
| Facility: Bank of America and State Street Bank and Trust Co.) | | 3.75 | | 8/7/06 | | 30,200,000 | | a | | 30,200,000 |
| Massachusetts Development Finance Agency, Revenue | | | | | | | | | | |
| (Wentworth Institute of Technology, Inc. Issue) | | | | | | | | | | |
| (Insured; Radian Bank and Liquidity Facility; Bank of America) | | 3.75 | | 8/7/06 | | 11,300,000 | | a | | 11,300,000 |
| Massachusetts Health and Educational Facilities Authority, | | | | | | | | | | |
| Revenue (Cape Cod Healthcare Obligated | | | | | | | | | | |
| Group Issue) (Insured; Assured Guaranty and | | | | | | | | | | |
| Liquidity Facility; Bank of America) | | 3.69 | | 8/7/06 | | 15,000,000 | | a | | 15,000,000 |
| Michigan—7.0% | | | | | | | | | | |
| Detroit, GO Notes, TAN (LOC; Scotia Bank) | | 4.50 | | 3/1/07 | | 11,945,000 | | | | 11,997,082 |
| Detroit, Sewage Disposal Revenue (Merlots Program) | | | | | | | | | | |
| (Insured; FGIC and Liquidity Facility; Wachovia Bank) | | 3.69 | | 8/7/06 | | 22,030,000 | | a,b | | 22,030,000 |
| Detroit Downtown Development Authority, LR, Refunding | | | | | | | | | | |
| (Millender Center Project) (LOC; HSBC Bank USA) | | 3.75 | | 8/7/06 | | 17,200,000 | | a | | 17,200,000 |
| Detroit Water Supply System, Water Revenue (Merlots Program) | | | | | | | | | | |
| (Insured; MBIA and Liquidity Facility; Wachovia Bank) | | 3.69 | | 8/7/06 | | 10,475,000 | | a,b | | 10,475,000 |
| Eastern Michigan University Board of Regents, General Revenue, | | | | | | | | | | |
| Refunding (Insured; FGIC and Liquidity Facility; Dexia Credit Locale) | | 3.68 | | 8/1/06 | | 12,715,000 | | a | | 12,715,000 |
| Eastern Michigan University Board of Regents, General Revenue, | | | | | | | | | | |
| Refunding (Insured; XLCA and Liquidity Facility; Dexia Credit Locale) | | 3.68 | | 8/1/06 | | 18,680,000 | | a | | 18,680,000 |
| Michigan Higher Education Facilities Authority, Revenue | | | | | | | | | | |
| (Walsh College Project) (LOC; Commerce Bank) | | 3.67 | | 8/7/06 | | 10,195,000 | | a | | 10,195,000 |
| Michigan Hospital Finance Authority, Revenue | | | | | | | | | | |
| (Healthcare Equipment Loan Program) (LOC; Fifth Third Bank) | | 3.68 | | 8/7/06 | | 10,000,000 | | a | | 10,000,000 |
| Michigan Hospital Finance Authority, Revenue | | | | | | | | | | |
| (Healthcare Equipment Loan Program) (LOC; Fifth Third Bank) | | 3.68 | | 8/7/06 | | 15,000,000 | | a | | 15,000,000 |
| Michigan Hospital Finance Authority, Revenue | | | | | | | | | | |
| (Healthcare Equipment Loan Program) (LOC; Fifth Third Bank) | | 3.68 | | 8/7/06 | | 4,500,000 | | a | | 4,500,000 |
| Michigan Hospital Finance Authority, Revenue | | | | | | | | | | |
| (Healthcare Equipment Loan Program) (LOC; Fifth Third Bank) | | 3.68 | | 8/7/06 | | 8,400,000 | | a | | 8,400,000 |
| Michigan Hospital Finance Authority, Revenue | | | | | | | | | | |
| (Healthcare Equipment Loan Program) (LOC; Fifth Third Bank) | | 3.68 | | 8/7/06 | | 7,500,000 | | a | | 7,500,000 |
| Michigan Hospital Finance Authority, Revenue | | | | | | | | | | |
| (Healthcare Equipment Loan Program) (LOC; Fifth Third Bank) | | 3.68 | | 8/7/06 | | 7,500,000 | | a | | 7,500,000 |
| Michigan Municipal Bond Authority, Revenue (LOC; JPMorgan Chase Bank) | | 3.98 | | 8/18/06 | | 45,000,000 | | | | 45,015,313 |
| Michigan Municipal Bond Authority, Revenue (School District | | | | | | | | | | |
| of the City of Detroit) (LOC; JPMorgan Chase Bank) | | 4.15 | | 8/18/06 | | 3,000,000 | | | | 3,000,882 |
| Waterford Township Economic Development Corporation, LOR | | | | | | | | | | |
| (Canterbury Health Care Inc. Project) (LOC; KBC Bank) | | 3.69 | | 8/7/06 | | 11,000,000 | | a | | 11,000,000 |
| Minnesota—2.5% | | | | | | | | | | |
| Oak Park Heights, MFHR, Refunding (Boutwells Landing Project) | | | | | | | | | | |
| (LOC; FHLMC and Liquidity Facility; FHLMC) | | 3.65 | | 8/7/06 | | 12,000,000 | | a | | 12,000,000 |
| Saint Paul Port Authority, Revenue (Amherst H. Wilder | | | | | | | | | | |
| Foundation Project) (LOC; The Bank of New York) | | 3.68 | | 8/1/06 | | 33,310,000 | | a | | 33,310,000 |
The Funds 35
STATEMENT OF INVESTMENTS (Unaudited) (continued)
| Dreyfus Tax Exempt | | Coupon | | Maturity | | Principal | | | | |
| Cash Management (continued) | | Rate (%) | | Date | | Amount ($) | | Value ($) |
| |
| |
| |
| |
|
| Short-Term Investments (continued) | | | | | | | | | | |
| |
| |
| |
| |
| |
|
| Minnesota (continued) | | | | | | | | | | |
| Southern Minnesota Municipal Power Agency, | | | | | | | | | | |
| Power Supply System Revenue, CP (Liquidity Facility; | | | | | | | | | | |
| Landesbank Hessen-Thuringen Girozentrale) | | 3.65 | | 11/30/06 | | 30,000,000 | | | | 30,000,000 |
| Mississippi—1.1% | | | | | | | | | | |
| Medical Center Educational Building Corporation, Revenue | | | | | | | | | | |
| (Pediatric and Research Facilities Project) | | | | | | | | | | |
| (Insured; AMBAC and Liquidity Facility; Bank One) | | 3.65 | | 8/7/06 | | 27,140,000 | | a | | 27,140,000 |
| Mississippi Development Bank, Special Obligation Revenue (Merlots | | | | | | | | | | |
| Program) (Insured; AMBAC and Liquidity Facility; Wachovia Bank) | | 3.69 | | 8/7/06 | | 7,500,000 | | a,b | | 7,500,000 |
| Missouri—1.1% | | | | | | | | | | |
| Kansas City Industrial Development Authority, Revenue | | | | | | | | | | |
| (Ewing Marion Kauffman Foundation Project) | | 3.68 | | 8/1/06 | | 23,600,000 | | a | | 23,600,000 |
| Saint Louis, General Fund Revenue, TRAN | | 4.44 | | 6/29/07 | | 10,000,000 | | | | 10,065,753 |
| Nebraska—.7% | | | | | | | | | | |
| Nebhelp Inc., Revenue (Insured; MBIA and | | | | | | | | | | |
| Liquidity Facility; Lloyds TSB Bank PLC) | | 3.71 | | 8/7/06 | | 11,780,000 | | a | | 11,780,000 |
| Scotts Bluff County Hospital Authority Number 1, HR, Refunding | | | | | | | | | | |
| (Regional West Medical Center) (Insured; Radian | | | | | | | | | | |
| and Liquidity Facility; Key Bank) | | 3.67 | | 8/7/06 | | 10,000,000 | | a | | 10,000,000 |
| Nevada—1.1% | | | | | | | | | | |
| Clark County, Highway Revenue, CP (Motor Vehicle Fuel Tax) | | | | | | | | | | |
| (LOC; Landesbank Hessen-Thuringen Girozentrale) | | 3.65 | | 11/16/06 | | 17,500,000 | | | | 17,500,000 |
| Clark County School District, GO Notes (Merlots Program) | | | | | | | | | | |
| (Insured; FSA and Liquidity Facility; Wachovia Bank) | | 3.58 | | 8/7/06 | | 9,905,000 | | a,b | | 9,905,000 |
| Clark County School District, GO Notes (Putters Program) | | | | | | | | | | |
| (Insured; FSA and Liquidity Facility; PB Capital Finance) | | 3.70 | | 8/7/06 | | 6,945,000 | | a,b | | 6,945,000 |
| New York—2.8% | | | | | | | | | | |
| New York City Municipal Water Finance Authority, CP | | | | | | | | | | |
| (LOC: Landesbank Baden Wurttemberg and | | | | | | | | | | |
| Landesbank Hessen-Thuringen Girozentrale) | | 3.60 | | 10/12/06 | | 50,000,000 | | | | 50,000,000 |
| New York Counties Tobacco Trust I, Revenue | | | | | | | | | | |
| (Liquidity Facility; Merrill Lynch and LOC; Merrill Lynch) | | 3.70 | | 8/7/06 | | 6,930,000 | | a,b | | 6,930,000 |
| Tobacco Settlement Financing Corporation of New York, | | | | | | | | | | |
| Asset Backed Revenue Bonds (State Contingency | | | | | | | | | | |
| Contract Secured) (Liquidity Facility; DEPFA Bank PLC) | | 3.70 | | 8/7/06 | | 17,495,000 | | a,b | | 17,495,000 |
| Tobacco Settlement Financing Corporation of New York, Revenue | | | | | | | | | | |
| (Liquidity Facility: Landesbank Hessen-Thuringen | | | | | | | | | | |
| Girozentrale and Merril Lynch) | | 3.69 | | 8/7/06 | | 10,000,000 | | a,b | | 10,000,000 |
| North Carolina—1.5% | | | | | | | | | | |
| Charlotte, Water and Sewer System Revenue | | | | | | | | | | |
| (Liquidity Facility; DEPFA Bank PLC) | | 3.67 | | 8/7/06 | | 35,000,000 | | a | | 35,000,000 |
| North Carolina Medical Care Commission, Health Care Facilities Revenue | | | | | | | | |
| (Person Memorial Hospital) (LOC; Branch Banking and Trust Co.) | | 3.68 | | 8/1/06 | | 12,000,000 | | a | | 12,000,000 |
| Ohio—3.4% | | | | | | | | | | |
| Akron Bath Copley Joint Township Hospital District, Health Care | | | | | | | | | | |
| Facilities Revenue (Sumner Project) (LOC; KBC Bank) | | 3.66 | | 8/7/06 | | 7,100,000 | | a | | 7,100,000 |
| Cincinnati School District, GO Notes (Putters Program) | | | | | | | | | | |
| (Insured; FSA and Liquidity Facility; PB Capital Finance) | | 3.70 | | 8/7/06 | | 6,845,000 | | a,b | | 6,845,000 |
36
| Dreyfus Tax Exempt | | Coupon | | Maturity | | Principal | | | | |
| Cash Management (continued) | | Rate (%) | | Date | | Amount ($) | | Value ($) |
| |
| |
| |
| |
|
| Short-Term Investments (continued) | | | | | | | | | | |
| |
| |
| |
| |
| |
|
| Ohio (continued) | | | | | | | | | | |
| Cleveland-Cuyahoga County Port Authority, Revenue | | | | | | | | | | |
| (Judson Project) (LOC; National City Bank) | | 3.69 | | 8/7/06 | | 11,505,000 | | a | | 11,505,000 |
| Cuyahoga County, HR (Metrohealth System Project) | | | | | | | | | | |
| (LOC; National City Bank) | | 3.67 | | 8/7/06 | | 10,000,000 | | a | | 10,000,000 |
| Franklin County, Health Care Facilities Refunding and | | | | | | | | | | |
| Improvement Revenue (Ohio Presbyterian Retirement Services) | | | | | | | | | | |
| (Insured; Radian Group and Liquidity Facility; National City Bank) | | 3.67 | | 8/7/06 | | 12,000,000 | | a | | 12,000,000 |
| Franklin County, Health Care Facilities Revenue | | | | | | | | | | |
| (Creekside at the Village Project) (LOC; Key Bank) | | 3.66 | | 8/7/06 | | 7,250,000 | | a | | 7,250,000 |
| Hamilton County, Hospital Facilities Revenue | | | | | | | | | | |
| (Insured; FSA and Liquidity Facility; Svenska Handelsbanken) | | 3.73 | | 8/7/06 | | 45,000,000 | | a,b | | 45,000,000 |
| Ohio Higher Education Facility, Revenue (Ashland | | | | | | | | | | |
| University Project) (LOC; Key Bank) | | 3.69 | | 8/7/06 | | 4,900,000 | | a | | 4,900,000 |
| Oklahoma—.7% | | | | | | | | | | |
| Oklahoma Water Resource Board, State Loan Program | | | | | | | | | | |
| Revenue (Liquidity Facility; Bank of America) | | 3.44 | | 10/1/06 | | 10,000,000 | | | | 10,000,000 |
| Oklahoma Water Resource Board, State Loan Program Revenue | | | | | | | | | | |
| (Liquidity Facility; State Street Bank and Trust Co.) | | 3.44 | | 10/1/06 | | 10,000,000 | | | | 10,000,000 |
| Oregon—.7% | | | | | | | | | | |
| Oregon, Homeowner Revenue (Liquidity Facility; Landesbank | | | | | | | | | | |
| Hessen-Thuringen Girozentrale and LOC; Trinity Funding Group) | | 3.69 | | 8/7/06 | | 11,000,000 | | a,b | | 11,000,000 |
| Salem Hospital Facility Authority, Revenue, Refunding | | | | | | | | | | |
| (Capital Manor Inc. Project) (LOC; Bank of America) | | 3.69 | | 8/7/06 | | 9,150,000 | | a | | 9,150,000 |
| Pennsylvania—18.4% | | | | | | | | | | |
| Bethlehem Area School District, GO Notes (Insured; FSA and | | | | | | | | | | |
| Liquidity Facility; Dexia Credit Locale) | | 3.67 | | 8/7/06 | | 39,995,000 | | a | | 39,995,000 |
| Chester County Health and Educational Facilities Authority, | | | | | | | | | | |
| Retirement Community Revenue (Kendal-Crosslands | | | | | | | | | | |
| Communities Project) (LOC; Allied Irish Bank) | | 3.66 | | 8/7/06 | | 5,605,000 | | a | | 5,605,000 |
| Cumberland County Municipal Authority, Revenue, Refunding | | | | | | | | | | |
| (Wesley Affiliated Services, Inc. Obligated Group) (LOC; KBC Bank) | | 3.66 | | 8/7/06 | | 8,000,000 | | a | | 8,000,000 |
| Dauphin County General Authority, Revenue (Insured; FSA and | | | | | | | | | | |
| Liquidity Facility: Bank of Nova Scotia and KBC Bank) | | 3.67 | | 8/7/06 | | 49,700,000 | | a | | 49,700,000 |
| Dauphin County General Authority, Revenue (Insured; FSA and | | | | | | | | | | |
| Liquidity Facility: Bank of Nova Scotia and KBC Bank) | | 3.67 | | 8/7/06 | | 14,010,000 | | a | | 14,010,000 |
| Dauphin County General Authority, Revenue | | | | | | | | | | |
| (School District Pooled Financing Program II) | | | | | | | | | | |
| (Insured; AMBAC and Liquidity Facility; Bank of Nova Scotia) | | 3.67 | | 8/7/06 | | 90,465,000 | | a | | 90,465,000 |
| Emmaus General Authority, Local Government | | | | | | | | | | |
| Revenue (GIC; Goldman Sachs and Co.) | | 3.69 | | 8/7/06 | | 10,000,000 | | a | | 10,000,000 |
| Emmaus General Authority, Local Government | | | | | | | | | | |
| Revenue (GIC; Goldman Sachs and Co.) | | 3.69 | | 8/7/06 | | 14,500,000 | | a | | 14,500,000 |
| Emmaus General Authority, Local Government | | | | | | | | | | |
| Revenue (LOC; DEPFA Bank PLC) | | 3.69 | | 8/7/06 | | 7,900,000 | | a | | 7,900,000 |
| Emmaus General Authority, Local Government | | | | | | | | | | |
| Revenue (LOC; DEPFA Bank PLC) | | 3.69 | | 8/7/06 | | 8,000,000 | | a | | 8,000,000 |
| Emmaus General Authority, Local Government | | | | | | | | | | |
| Revenue (LOC; DEPFA Bank PLC) | | 3.69 | | 8/7/06 | | 4,800,000 | | a | | 4,800,000 |
The Funds 37
STATEMENT OF INVESTMENTS (Unaudited) (continued)
| Dreyfus Tax Exempt | | Coupon | | Maturity | | Principal | | | | |
| Cash Management (continued) | | Rate (%) | | Date | | Amount ($) | | Value ($) |
| |
| |
| |
| |
|
| |
| Short-Term Investments (continued) | | | | | | | | | | |
| |
| |
| |
| |
| |
|
| Pennsylvania (continued) | | | | | | | | | | |
| Emmaus General Authority, Local Government | | | | | | | | | | |
| Revenue (LOC; DEPFA Bank PLC) | | 3.69 | | 8/7/06 | | 10,600,000 | | a | | 10,600,000 |
| Emmaus General Authority, Local Government | | | | | | | | | | |
| Revenue (LOC; DEPFA Bank PLC) | | 3.69 | | 8/7/06 | | 13,500,000 | | a | | 13,500,000 |
| Emmaus General Authority, Local Government | | | | | | | | | | |
| Revenue (LOC; DEPFA Bank PLC) | | 3.69 | | 8/7/06 | | 5,000,000 | | a | | 5,000,000 |
| Emmaus General Authority, Local Government | | | | | | | | | | |
| Revenue (LOC; DEPFA Bank PLC) | | 3.69 | | 8/7/06 | | 12,000,000 | | a | | 12,000,000 |
| Emmaus General Authority, Local Government | | | | | | | | | | |
| Revenue (LOC; DEPFA Bank PLC) | | 3.69 | | 8/7/06 | | 19,900,000 | | a | | 19,900,000 |
| Emmaus General Authority, Local Government | | | | | | | | | | |
| Revenue (LOC; DEPFA Bank PLC) | | 3.69 | | 8/7/06 | | 17,300,000 | | a | | 17,300,000 |
| Emmaus General Authority, Revenue (LOC; DEPFA Bank PLC) | | 3.69 | | 8/7/06 | | 22,900,000 | | a | | 22,900,000 |
| Emmaus General Authority, Revenue (LOC; DEPFA Bank PLC) | | 3.69 | | 8/7/06 | | 24,900,000 | | a | | 24,900,000 |
| Emmaus General Authority, Revenue (LOC; Goldman Sachs and Co.) | | 3.69 | | 8/7/06 | | 13,075,000 | | a | | 13,075,000 |
| Fayette County Hospital Authority, Revenue, Refunding | | | | | | | | | | |
| (Mount Macrina Manor Project) (LOC; National City Bank) | | 3.68 | | 8/7/06 | | 3,925,000 | | a | | 3,925,000 |
| Harrisburg Authority, Water Revenue, Refunding | | | | | | | | | | |
| (Insured; FGIC and Liquidity Facility; FGIC) | | 3.69 | | 8/7/06 | | 14,405,000 | | a | | 14,405,000 |
| Lancaster County, GO Notes (Insured; FSA and | | | | | | | | | | |
| Liquidity Facility; Royal Bank of Canada) | | 3.67 | | 8/7/06 | | 20,205,000 | | a | | 20,205,000 |
| Lancaster County Hospital Authority, Health Center | | | | | | | | | | |
| Revenue (Luthercare Project) (LOC; M&T Bank) | | 3.69 | | 8/7/06 | | 14,180,000 | | a | | 14,180,000 |
| Langhorne Manor Borough Higher Education and Health | | | | | | | | | | |
| Authority, Retirement Communities Revenue (Wesley Enhanced | | | | | | | | | | |
| Living Obligated Group) (Insured; Radian and Liquidity | | | | | | | | | | |
| Facility; Citizens Bank of Pennsylvania) | | 3.68 | | 8/1/06 | | 4,070,000 | | a | | 4,070,000 |
| Lebanon County Health Facilities Authority, Revenue (Cornwall Manor | | | | | | | | | | |
| Project) (Insured; Radian Bank and Liquidity Facility; Bank of America) | | 3.74 | | 8/7/06 | | 5,510,000 | | a | | 5,510,000 |
| Montgomery County Higher Education and Health Authority, | | | | | | | | | | |
| School Revenue (William Penn Charter School) (LOC; PNC Bank) | | 3.68 | | 8/7/06 | | 10,595,000 | | a | | 10,595,000 |
| Pennsylvania Higher Educational Facilities Authority, Student | | | | | | | | | | |
| Housing Revenue (Washington and Jefferson | | | | | | | | | | |
| Development) (LOC; Unicredito Italiano SPA) | | 3.67 | | 8/7/06 | | 8,000,000 | | a | | 8,000,000 |
| Philadelphia School District, GO Notes, TRAN (LOC; Bank of America) | | 4.44 | | 6/29/07 | | 14,500,000 | | | | 14,591,439 |
| Schuylkill County, GO Notes (Insured; AMBAC and | | | | | | | | | | |
| Liquidity Facility; Wachovia Bank) | | 3.69 | | 8/7/06 | | 6,710,000 | | a | | 6,710,000 |
| Spring Grove Area School District, GO Notes | | | | | | | | | | |
| (Insured; FSA and Liquidity Facility; Dexia Credit Locale) | | 3.67 | | 8/7/06 | | 17,495,000 | | a | | 17,495,000 |
| Spring Grove Area School District, GO Notes (Insured; FSA and | | | | | | | | | | |
| Liquidity Facility; Dexia Credit Locale) | | 3.67 | | 8/7/06 | | 20,000,000 | | a | | 20,000,000 |
| West Cornwall Township Municipal Authority, GO Notes, Refunding | | | | | | | | | | |
| (Bethlehem School District Project) (Insured; FSA and | | | | | | | | | | |
| Liquidity Facility; Dexia Credit Locale) | | 3.67 | | 8/7/06 | | 28,600,000 | | a | | 28,600,000 |
| West Cornwall Township Municipal Authority, Revenue | | | | | | | | | | |
| (Pennsylvania General Government Loan Program) | | | | | | | | | | |
| (Insured; FSA and Liquidity Facility; Dexia Credit Locale) | | 3.67 | | 8/7/06 | | 3,482,000 | | a | | 3,482,000 |
38
| Dreyfus Tax Exempt | | Coupon | | Maturity | | Principal | | | | |
| Cash Management (continued) | | Rate (%) | | Date | | Amount ($) | | Value ($) |
| |
| |
| |
| |
|
| |
| Short-Term Investments (continued) | | | | | | | | | | |
| |
| |
| |
| |
| |
|
| South Carolina—.5% | | | | | | | | | | |
| Greer, Combined Utilities System Revenue (Merlots Program) | | | | | | | | | | |
| (Insured; AMBAC and Liquidity Facility; Wachovia Bank) | | 3.69 | | 8/7/06 | | 8,305,000 | | a,b | | 8,305,000 |
| South Carolina Jobs Economic Development Authority, Health | | | | | | | | | | |
| Facilities Revenue, Refunding (Episcopal Church Home) | | | | | | | | | | |
| (Insured; Radian Bank and Liquidity Facility; Wachovia Bank) | | 3.67 | | 8/7/06 | | 6,920,000 | | a | | 6,920,000 |
| Tennessee—8.3% | | | | | | | | | | |
| Blount County Public Building Authority, Local Government | | | | | | | | | | |
| Public Improvement Revenue (Insured; AMBAC and | | | | | | | | | | |
| Liquidity Facility; Regions Bank) | | 3.66 | | 8/7/06 | | 3,725,000 | | a | | 3,725,000 |
| Blount County Public Building Authority, Local Government | | | | | | | | | | |
| Public Improvement Revenue (Insured; AMBAC and | | | | | | | | | | |
| Liquidity Facility; Regions Bank) | | 3.66 | | 8/7/06 | | 5,000,000 | | a | | 5,000,000 |
| Blount County Public Building Authority, Local Government | | | | | | | | | | |
| Public Improvement Revenue (Insured; AMBAC and | | | | | | | | | | |
| Liquidity Facility; Regions Bank) | | 3.66 | | 8/7/06 | | 6,500,000 | | a | | 6,500,000 |
| Blount County Public Building Authority, Local Government | | | | | | | | | | |
| Public Improvement Revenue (Insured; XLCA and | | | | | | | | | | |
| Liquidity Facility; DEPFA Bank PLC) | | 3.67 | | 8/1/06 | | 10,000,000 | | a | | 10,000,000 |
| Blount County Public Building Authority, Local Government | | | | | | | | | | |
| Public Improvement Revenue (Insured; XLCA and | | | | | | | | | | |
| Liquidity Facility; DEPFA Bank PLC) | | 3.67 | | 8/1/06 | | 8,000,000 | | a | | 8,000,000 |
| Claiborne County Industrial Development Board, Revenue | | | | | | | | | | |
| (Lincoln Memorial University Project) (LOC; Amsouth Bank) | | 3.70 | | 8/7/06 | | 9,000,000 | | a | | 9,000,000 |
| Knoxville, Wastewater Systems Revenue (Putters Program) | | | | | | | | | | |
| (Insured; MBIA and Liquidity Facility; PB Finance Inc.) | | 3.70 | | 8/7/06 | | 8,100,000 | | a,b | | 8,100,000 |
| Sevier County Public Building Authority, Local Government | | | | | | | | | | |
| Public Improvement Revenue (Insured; AMBAC and | | | | | | | | | | |
| Liquidity Facility; DEPFA Bank PLC) | | 3.67 | | 8/1/06 | | 10,000,000 | | a | | 10,000,000 |
| Sevier County Public Building Authority, Local Government | | | | | | | | | | |
| Public Improvement Revenue (Insured; AMBAC and | | | | | | | | | | |
| Liquidity Facility; KBC Bank) | | 3.66 | | 8/7/06 | | 7,395,000 | | a | | 7,395,000 |
| Sevier County Public Building Authority, Local Government | | | | | | | | | | |
| Public Improvement Revenue (Insured; AMBAC and Liquidity | | | | | | | | | | |
| Facility; Landesbank Hessen-Thuringen Girozentrale) | | 3.66 | | 8/7/06 | | 7,485,000 | | a | | 7,485,000 |
| Sevier County Public Building Authority, Local Government | | | | | | | | | | |
| Public Improvement Revenue (Insured; XLCA and | | | | | | | | | | |
| Liquidity Facilty; DEPFA Bank PLC) | | 3.67 | | 8/1/06 | | 11,825,000 | | a | | 11,825,000 |
| Tennergy Corporation, Gas Revenue (Putters Program) | | | | | | | | | | |
| (Liquidity Facility; JPMorgan Chase Bank) | | 3.70 | | 8/7/06 | | 25,000,000 | | a,b | | 25,000,000 |
| Tennergy Corporation, Gas Revenue | | | | | | | | | | |
| (Putters Program) (LOC; BNP Paribas) | | 3.69 | | 8/7/06 | | 92,725,000 | | a,b | | 92,725,000 |
| Tennessee Energy Acquisition Corporation, | | | | | | | | | | |
| Gas Project Revenue (Liquidity Facility; Goldman | | | | | | | | | | |
| Sachs Group and LOC; Goldman Sachs Group) | | 3.71 | | 8/7/06 | | 50,000,000 | | a,b | | 50,000,000 |
| Texas—13.2% | | | | | | | | | | |
| ABN AMRO Munitops Certificates Trust, Water Revenue (Tarrant Regional | | | | | | | | |
| Water District) (Insured; FGIC and Liquidity Facility; ABN-AMRO) | | 3.69 | | 8/7/06 | | 10,260,000 | | a,b | | 10,260,000 |
The Funds 39
STATEMENT OF INVESTMENTS (Unaudited) (continued)
| Dreyfus Tax Exempt | | Coupon | | Maturity | | Principal | | | | |
| Cash Management (continued) | | Rate (%) | | Date | | Amount ($) | | Value ($) |
| |
| |
| |
| |
|
| Short-Term Investments (continued) | | | | | | | | | | |
| |
| |
| |
| |
| |
|
| Texas (continued) | | | | | | | | | | |
| Dallas Area Rapid Transit, Transportation Revenue (Merlots Program) | | | | | | | | | | |
| (Insured: AMBAC and FGIC and Liquidity Facility; Wachovia Bank) | | 3.69 | | 8/7/06 | | 24,060,000 | | a,b | | 24,060,000 |
| Harris County, GO Notes, TAN | | 4.50 | | 2/28/07 | | 7,300,000 | | | | 7,333,190 |
| Harris County Health Facilities Development Corporation, | | | | | | | | | | |
| Revenue (The Methodist Hospital System) | | 3.68 | | 8/1/06 | | 50,000,000 | | a | | 50,000,000 |
| Harris County Metropolitan Transportation Authority, | | | | | | | | | | |
| Sales and Use Tax Revenue, CP (LOC; DEPFA Bank PLC) | | 3.53 | | 8/16/06 | | 15,000,000 | | | | 15,000,000 |
| Harris County Metropolitan Transportation Authority, | | | | | | | | | | |
| Sales and Use Tax Revenue, CP (LOC; DEPFA Bank PLC) | | 3.65 | | 9/7/06 | | 4,000,000 | | | | 4,000,000 |
| Harris County Metropolitian Transportation Authority, | | | | | | | | | | |
| Sales and Use Tax Revenue, CP (LOC; DEPFA Bank PLC) | | 3.65 | | 9/7/06 | | 2,000,000 | | | | 2,000,000 |
| Houston, CP (Liquidity Facility; DEPFA Bank PLC) | | 3.72 | | 11/16/06 | | 35,000,000 | | | | 35,000,000 |
| North Central Texas Health Facilities Development Corporation, HR | | | | | | | | | | |
| (Baylor Health Care System Project) (Liquidity Facility; Wachovia Bank) | | 3.67 | | 8/7/06 | | 21,000,000 | | a | | 21,000,000 |
| San Antonio, Water Revenue (Merlots Program) | | | | | | | | | | |
| (Liquidity Facility; Wachovia Bank) | | 3.69 | | 8/7/06 | | 10,000,000 | | a,b | | 10,000,000 |
| San Antonio, Water System Revenue, CP | | | | | | | | | | |
| (Liquidity Facility; Bank of America) | | 3.60 | | 9/6/06 | | 20,000,000 | | | | 20,000,000 |
| San Antonio, Water System Revenue, Refunding | | | | | | | | | | |
| (Insured; MBIA and Liquidity Facility; JPMorgan Chase Bank) | | 3.68 | | 8/7/06 | | 12,600,000 | | a | | 12,600,000 |
| Texas (Liquidity Facility; Merrill Lynch) | | 3.68 | | 8/7/06 | | 4,165,000 | | a,b | | 4,165,000 |
| Texas, TRAN | | 4.50 | | 8/31/06 | | 67,600,000 | | | | 67,667,481 |
| Texas Affordable Housing Corporation, MFHR | | | | | | | | | | |
| (American Housing Foundation Portfolio) (Insured; MBIA and | | | | | | | | | | |
| Liquidity Facility; Branch Banking and Trust Company) | | 3.68 | | 8/7/06 | | 29,165,000 | | a,b | | 29,165,000 |
| Texas Affordable Housing Corporation, MFHR | | | | | | | | | | |
| (American Housing Foundation Portfolio) (Insured; MBIA | | | | | | | | | | |
| and Liquidity Facility; Goldman Sachs Group) | | 3.68 | | 8/7/06 | | 18,000,000 | | a,b | | 18,000,000 |
| Texas Public Finance Authority, CP | | | | | | | | | | |
| (Liquidity Facility; Texas Public System) | | 3.60 | | 9/6/06 | | 25,000,000 | | | | 25,000,000 |
| University of Texas, University Revenue, CP | | 3.63 | | 8/22/06 | | 25,000,000 | | | | 25,000,000 |
| University of Texas, University Revenue, CP | | 3.68 | | 10/11/06 | | 25,000,000 | | | | 25,000,000 |
| Utah—.3% | | | | | | | | | | |
| Utah Water Finance Agency, Water Revenue | | | | | | | | | | |
| (Insured; AMBAC and Liquidity Facility; JPMorgan Chase Bank) | | 3.71 | | 8/7/06 | | 10,000,000 | | a | | 10,000,000 |
| Vermont—.7% | | | | | | | | | | |
| ABN AMRO Munitops Certificate Trust, Revenue | | | | | | | | | | |
| (University of Vermont and State Agriculture College) | | | | | | | | | | |
| (Insured; MBIA and Liquidity Facility; ABN-AMRO) | | 3.68 | | 8/7/06 | | 14,995,000 | | a,b | | 14,995,000 |
| Vermont Educational and Health Buildings Financing Agency, Revenue | | | | | | | | | | |
| (Rutland Regional Medical Project) (Insured; Radian Bank | | | | | | | | | | |
| and Liquidity Facility; Bank of America) | | 3.70 | | 8/7/06 | | 5,135,000 | | a | | 5,135,000 |
| Virginia—3.5% | | | | | | | | | | |
| Alexandria Industrial Development Authority, Revenue | | | | | | | | | | |
| (Institute for Defense Analyses Project) | | | | | | | | | | |
| (Insured; AMBAC and Liquidity Facility; Wachovia Bank) | | 3.68 | | 8/7/06 | | 14,690,000 | | a | | 14,690,000 |
| Morgan Keegan Municipal Products Inc., Revenue | | | | | | | | | | |
| (Liquidity Facility; BNP Paribas) | | 3.68 | | 8/7/06 | | 40,000,000 | | a,b | | 40,000,000 |
40
| | | | | | | Principal | | | | |
| Dreyfus Tax Exempt Cash Management (continued) | | | | | | Amount ($) | | Value ($) |
| |
| |
| |
| |
|
| |
| Short-Term Investments (continued) | | | | | | | | | | |
| |
| |
| |
| |
| |
|
| Virginia (continued) | | | | | | | | | | |
| Norfolk Redevelopment and Housing Authority, First Mortgage | | | | | | | | | | |
| Revenue (Fort Norfolk Retirement Community, Inc.— | | | | | | | | | | |
| Harbor's Edge Project) (LOC; HSH Nordbank AG) | | 3.65 | | 8/7/06 | | 20,000,000 | | a | | 20,000,000 |
| Tobacco Settlement Financing Corporation of Virginia, Tobacco | | | | | | | | | | |
| Settlement Asset-Backed Bonds (Liquidity Facility; Merrill Lynch) | | 3.70 | | 8/7/06 | | 7,500,000 | | a,b | | 7,500,000 |
| Virginia Housing Development Authority, | | | | | | | | | | |
| Commonwealth Mortgage Revenue | | 3.70 | | 2/13/07 | | 24,000,000 | | | | 24,000,000 |
| Washington—2.0% | | | | | | | | | | |
| Energy Northwest, Electric Revenue, Refunding (Putters Program) | | | | | | | | | | |
| (Insured; AMBAC and Liquidity Facility; PB Finance Inc.) | | 3.70 | | 8/7/06 | | 5,245,000 | | a,b | | 5,245,000 |
| Washington, GO Notes (Merlots Program) (Insured: FGIC and | | | | | | | | | | |
| MBIA and Liquidity Facility; Wachovia Bank) | | 3.69 | | 8/7/06 | | 20,005,000 | | a,b | | 20,005,000 |
| Washington, GO Notes (Merlots Program) (Insured; MBIA and | | | | | | | | | | |
| Liquidity Facility; Wachovia Bank) | | 3.69 | | 8/7/06 | | 5,920,000 | | a,b | | 5,920,000 |
| Washington Health Care Facilities Authority, Revenue | | | | | | | | | | |
| (Seattle Cancer Care Alliance) (LOC; Key Bank) | | 3.66 | | 8/7/06 | | 4,150,000 | | a | | 4,150,000 |
| Washington Higher Education Facilities Authority, Revenue | | | | | | | | | | |
| (Saint Martin's College Project) (LOC; U.S. Bank NA) | | 3.69 | | 8/7/06 | | 6,695,000 | | a | | 6,695,000 |
| Washington Housing Finance Commission, Nonprofit Housing | | | | | | | | | | |
| Revenue (Horizon House Project) (LOC; Bank of America) | | 3.66 | | 8/7/06 | | 20,000,000 | | a | | 20,000,000 |
| Washington Public Power Supply System Project Number 3, | | | | | | | | | | |
| Electric Revenue (Insured; MBIA and Liquidity Facility; | | | | | | | | | | |
| Credit Suisse First Boston) | | 3.65 | | 8/7/06 | | 90,000 | | a | | 90,000 |
| Wisconsin—1.4% | | | | | | | | | | |
| Badger Tobacco Asset Securitization Corporation, Tobacco | | | | | | | | | | |
| Settlement Asset-Backed Bonds (Liquidity Facility: | | | | | | | | | | |
| Lloyds TSB Bank PLC and Merrill Lynch) | | 3.71 | | 8/7/06 | | 5,900,000 | | a,b | | 5,900,000 |
| Wisconsin Health and Educational Facilities Authority, Revenue | | | | | | | | | | |
| (Beloit Memorial Hospital, Inc.) (Insured; XLCA and | | | | | | | | | | |
| Liquidity Facility; Marshall and Ilsley Bank) | | 3.73 | | 8/1/06 | | 10,475,000 | | a | | 10,475,000 |
| Wisconsin Health and Educational Facilities Authority, Revenue | | | | | | | | | | |
| (Reedsburg Area Medical Center Inc.) (LOC; Fifth Third Bank) | | 3.73 | | 8/1/06 | | 9,775,000 | | a | | 9,775,000 |
| Wisconsin Health and Educational Facilities Authority, Revenue | | | | | | | | | | |
| (Saint John's Communities, Inc.) (Insured; Radian Bank and | | | | | | | | | | |
| Liquidity Facility; Marshall and Ilsley Bank) | | 3.67 | | 8/7/06 | | 6,000,000 | | a | | 6,000,000 |
| Wisconsin Public Power Inc., Power Supply System Revenue | | | | | | | | | | |
| (Putters Program) (Insured; AMBAC and Liquidity | | | | | | | | | | |
| Facility; PB Capital Finance) | | 3.70 | | 8/7/06 | | 10,380,000 | | a,b | | 10,380,000 |
| Wyoming—1.0% | | | | | | | | | | |
| Natrona County, HR (Wyoming Medical Center Project) | | | | | | | | | | |
| (Insured; AMBAC and Liquidity Facility; Bank of Nova Scotia) | | 3.67 | | 8/7/06 | | 29,760,000 | | a | | 29,760,000 |
| |
| |
| |
| |
| |
|
| |
| Total Investments (cost $3,297,631,291) | | | | | | 107.8% | | | | 3,297,631,291 |
| Liabilities, Less Cash and Receivables | | | | | | (7.8%) | | (238,387,497) |
| Net Assets | | | | | | 100.0% | | | | 3,059,243,794 |
| | See footnotes on page 42.
See notes to financial statements.
|
The Funds 41
| Summary of Abbreviations | | | | |
| |
| ACA | | American Capital Access | | AGC | | ACE Guaranty Corporation |
| AGIC | | Asset Guaranty Insurance Company | | AMBAC | | American Municipal Bond Assurance Corporation |
| ARRN | | Adjustable Rate Receipt Notes | | BAN | | Bond Anticipation Notes |
| BIGI | | Bond Investors Guaranty Insurance | | BPA | | Bond Purchase Agreement |
| CGIC | | Capital Guaranty Insurance Company | | CIC | | Continental Insurance Company |
| CIFG | | CDC Ixis Financial Guaranty | | CMAC | | Capital Market Assurance Corporation |
| COP | | Certificate of Participation | | CP | | Commercial Paper |
| EDR | | Economic Development Revenue | | EIR | | Environmental Improvement Revenue |
| FGIC | | Financial Guaranty Insurance Company | | FHA | | Federal Housing Administration |
| FHLB | | Federal Home Loan Bank | | FHLMC | | Federal Home Loan Mortgage Corporation |
| FNMA | | Federal National Mortgage Association | | FSA | | Financial Security Assurance |
| GAN | | Grant Anticipation Notes | | GIC | | Guaranteed Investment Contract |
| GNMA | | Government National Mortgage Association | | GO | | General Obligation |
| HR | | Hospital Revenue | | IDB | | Industrial Development Board |
| IDC | | Industrial Development Corporation | | IDR | | Industrial Development Revenue |
| LOC | | Letter of Credit | | LOR | | Limited Obligation Revenue |
| LR | | Lease Revenue | | MBIA | | Municipal Bond Investors |
| | | | | | | Assurance Insurance Corporation |
| MFHR | | Multi-Family Housing Revenue | | MFMR | | Multi-Family Mortgage Revenue |
| PCR | | Pollution Control Revenue | | RAC | | Revenue Anticipation Certificates |
| RAN | | Revenue Anticipation Notes | | RAW | | Revenue Anticipation Warrants |
| RRR | | Resources Recovery Revenue | | SAAN | | State Aid Anticipation Notes |
| SBPA | | Standby Bond Purchase Agreement | | SFHR | | Single Family Housing Revenue |
| SFMR | | Single Family Mortgage Revenue | | SONYMA | | State of New York Mortgage Agency |
| SWDR | | Solid Waste Disposal Revenue | | TAN | | Tax Anticipation Notes |
| TAW | | Tax Anticipation Warrants | | TRAN | | Tax and Revenue Anticipation Notes |
| XLCA | | XL Capital Assurance | | | | |
| Summary of Combined Ratings (Unaudited) | | | | | | | | Value (%) † | | |
| | | | | |
| |
| |
|
| | | | | | | | | | | Dreyfus | | Dreyfus | | Dreyfus |
| | | | | | | | | | | Municipal Cash | | New York | | Tax Exempt |
| | | | | | | | | | | Management | | Municipal Cash | | Cash |
| Fitch | | or | | Moody's | | or | | Standard & Poor's | | Plus | | Management | | Management |
| | | |
| | | |
| |
| |
| |
|
| F1+, F1 | | | | VMIG1, MIG1, P1 | | | | SP1+, SP1, A1+, A1 | | 93.2 | | 89.5 | | 96.5 |
| AAA, AA, A d | | | | Aaa, Aa, A d | | | | AAA, AA, A d | | 1.8 | | 6.5 | | 3.5 |
| Not Rated e | | | | Not Rated e | | | | Not Rated e | | 5.0 | | 4.0 | | .0 |
| | | | | | | | | | | 100.0 | | 100.0 | | 100.0 |
† Based on total investments.
a Securities payable on demand.Variable interest rate—subject to periodic change.
b Securities exempt from registration under Rule 144A of the Securities Act of 1933.These securities may be resold in transactions exempt from registration, normally to qualified
institutional buyers. At July 31, 2006, Dreyfus Municipal Cash Management Plus amounted to $274,911,314 or 26.4%, Dreyfus New York Municipal Cash Management amounted
to $111,440,000 or 23.3% and Dreyfus Tax Exempt Cash Management amounted to $815,040,000 or 26.6% of net assets.
c These securities are prerefunded; the date shown represents the prerefunded date. Bonds which are prerefunded are collateralized by U.S. Government securities which are held in escrow
and are used to pay principal and interest on the municipal issue and to retire the bonds in full at the earliest refunding date.
d Notes which are not F, MIG or SP rated are represented by bond ratings of the issuers.
e Securities which, while not rated by Fitch, Moody's and Standard & Poor's, have been determined by the Manager to be of comparable quality to those rated securities in which the fund
may invest.
See notes to financial statements.
|
STATEMENT OF ASSETS AND LIABILITIES
(amounts in thousands, except Net Asset Value Per Share)
July 31, 2006 (Unaudited)
|
| | | | | Dreyfus | | Dreyfus | | Dreyfus | | Dreyfus | | Dreyfus |
| | | Dreyfus | | Cash | | Government | | Government | | Treasury | | Treasury |
| | | Cash | | Management | | Cash | | Prime Cash | | Cash | | Prime Cash |
| | | Management | | Plus, Inc. | | Management | | Management | | Management | | Management |
| |
| |
| |
| |
| |
| |
|
| Assets ($): | | | | | | | | | | | | |
| Investments at value—Note 1(a,b) † | | 13,153,084 | | 9,279,597 | | 4,741,397a | | 1,691,671 | | 4,712,283a | | 1,808,906 |
| Interest receivable | | 25,820 | | 14,753 | | 868 | | 2,754 | | 668 | | — |
| | | 13,178,904 | | 9,294,350 | | 4,742,265 | | 1,694,425 | | 4,712,951 | | 1,808,906 |
| |
| |
| |
| |
| |
| |
|
| Liabilities ($): | | | | | | | | | | | | |
| Due to The Dreyfus Corporation | | | | | | | | | | | | |
| and affiliates—Note 2(b) | | 2,447 | | 2,210 | | 1,066 | | 488 | | 1,194 | | 453 |
| Cash overdraft due to Custodian | | 33,513 | | 9,056 | | 8,742 | | 305 | | 18,178 | | 3,841 |
| Payable for shares of Beneficial | | | | | | | | | | | | |
| Interest/Common Stock redeemed | | 271 | | 9,174 | | 262 | | — | | 218 | | 53 |
| | | 36,231 | | 20,440 | | 10,070 | | 793 | | 19,590 | | 4,347 |
| |
| |
| |
| |
| |
| |
|
| Net Assets ($) | | 13,142,673 | | 9,273,910 | | 4,732,195 | | 1,693,632 | | 4,693,361 | | 1,804,559 |
| |
| |
| |
| |
| |
| |
|
| Composition of Net Assets ($): | | | | | | | | | | | | |
| Paid-in capital | | 13,144,229 | | 9,282,471 | | 4,734,995 | | 1,693,634 | | 4,693,434 | | 1,805,219 |
| Accumulated net realized | | | | | | | | | | | | |
| gain (loss) on investments | | (1,556) | | (8,561) | | (2,800) | | (2) | | (73) | | (660) |
| |
| |
| |
| |
| |
| |
|
| Net Assets ($) | | 13,142,673 | | 9,273,910 | | 4,732,195 | | 1,693,632 | | 4,693,361 | | 1,804,559 |
| |
| |
| |
| |
| |
| |
|
| Net Asset Value Per Share | | | | | | | | | | | | |
| Institutional Shares | | | | | | | | | | | | |
| Net Assets ($) | | 11,611,732 | | 6,329,722 | | 3,446,773 | | 921,659 | | 2,822,527 | | 1,084,562 |
| Shares Outstanding | | 11,613,066 | | 6,336,449 | | 3,448,629 | | 921,662 | | 2,822,574 | | 1,085,151 |
| Net Asset Value Per Share ($) | | 1.00 | | 1.00 | | 1.00 | | 1.00 | | 1.00 | | 1.00 |
| |
| |
| |
| |
| |
| |
|
| Investor Shares | | | | | | | | | | | | |
| Net Assets ($) | | 1,052,842 | | 1,260,381 | | 825,786 | | 257,437 | | 1,555,460 | | 615,723 |
| Shares Outstanding | | 1,052,994 | | 1,261,339 | | 826,416 | | 257,431 | | 1,555,482 | | 615,805 |
| Net Asset Value Per Share ($) | | 1.00 | | 1.00 | | 1.00 | | 1.00 | | 1.00 | | 1.00 |
| |
| |
| |
| |
| |
| |
|
| Administrative Shares | | | | | | | | | | | | |
| Net Assets ($) | | 247,742 | | 1,023,640 | | 222,490 | | 208,090 | | 87,945 | | 5,371 |
| Shares Outstanding | | 247,786 | | 1,024,103 | | 222,662 | | 208,082 | | 87,946 | | 5,366 |
| Net Asset Value Per Share ($) | | 1.00 | | 1.00 | | 1.00 | | 1.00 | | 1.00 | | 1.00 |
| |
| |
| |
| |
| |
| |
|
| Participant Shares | | | | | | | | | | | | |
| Net Assets ($) | | 230,357 | | 660,167 | | 237,145 | | 306,446 | | 227,429 | | 98,903 |
| Shares Outstanding | | 230,383 | | 660,581 | | 237,288 | | 306,459 | | 227,432 | | 98,897 |
| Net Asset Value Per Share ($) | | 1.00 | | 1.00 | | 1.00 | | 1.00 | | 1.00 | | 1.00 |
| |
| |
| |
| |
| |
| |
|
| † Investments at cost ($) | | 13,153,084 | | 9,279,597 | | 4,741,397 | | 1,691,671 | | 4,712,283 | | 1,808,906 |
| | a Amount includes repurchase agreements of $2,708,000,000 and $4,614,000,000 for Dreyfus Government Cash Management and Dreyfus Treasury Cash Management, respectively,
See Note 1(b).
See notes to financial statements.
|
The Funds 43
STATEMENT OF ASSETS AND LIABILITIES (continued)
(amounts in thousands, except Net Asset Value Per Share)
July 31, 2006 (Unaudited)
|
| | | Dreyfus | | Dreyfus | | Dreyfus |
| | | Municipal Cash | | New York | | Tax Exempt |
| | | Management | | Municipal Cash | | Cash |
| | | Plus | | Management | | Management |
| |
| |
| |
|
| Assets ($): | | | | | | |
| Investments at value—Note 1(a) † | | 1,090,284 | | 482,017 | | 3,297,631 |
| Receivable for investment securites sold | | — | | 6,009 | | — |
| Interest receivable | | 6,806 | | 2,011 | | 18,284 |
| | | 1,097,090 | | 490,037 | | 3,315,915 |
| |
| |
| |
|
| Liabilities ($): | | | | | | |
| Due to The Dreyfus Corporation and affiliates—Note 2(b) | | 196 | | 109 | | 418 |
| Cash overdraft due to Custodian | | 46,965 | | 7,661 | | 227,241 |
| Payable for investment securities purchased | | 10,000 | | — | | 29,000 |
| Payable for shares of Beneficial Interest redeemed | | 58 | | 3,469 | | 12 |
| | | 57,219 | | 11,239 | | 256,671 |
| |
| |
| |
|
| Net Assets ($) | | 1,039,871 | | 478,798 | | 3,059,244 |
| |
| |
| |
|
| Composition of Net Assets ($): | | | | | | |
| Paid-in capital | | 1,039,870 | | 478,718 | | 3,059,236 |
| Accumulated net realized gain (loss) on investments | | 1 | | 80 | | 8 |
| |
| |
| |
|
| Net Assets ($) | | 1,039,871 | | 478,798 | | 3,059,244 |
| |
| |
| |
|
| Net Asset Value Per Share | | | | | | |
| Instititutional Shares | | | | | | |
| Net Assets ($) | | 670,555 | | 305,501 | | 2,597,523 |
| Shares Outstanding | | 670,673 | | 305,446 | | 2,597,573 |
| Net Asset Value Per Share ($) | | 1.00 | | 1.00 | | 1.00 |
| |
| |
| |
|
| Investor Shares | | | | | | |
| Net Assets ($) | | 181,141 | | 131,048 | | 297,206 |
| Shares Outstanding | | 181,125 | | 131,030 | | 297,202 |
| Net Asset Value Per Share ($) | | 1.00 | | 1.00 | | 1.00 |
| |
| |
| |
|
| Administrative Shares | | | | | | |
| Net Assets ($) | | 163,123 | | 39,086 | | 132,867 |
| Shares Outstanding | | 163,108 | | 39,083 | | 132,833 |
| Net Asset Value Per Share ($) | | 1.00 | | 1.00 | | 1.00 |
| |
| |
| |
|
| Participant Shares | | | | | | |
| Net Assets ($) | | 25,052 | | 3,163 | | 31,648 |
| Shares Outstanding | | 25,048 | | 3,163 | | 31,628 |
| Net Asset Value Per Share ($) | | 1.00 | | 1.00 | | 1.00 |
| |
| |
| |
|
| † Investments at cost ($) | | 1,090,284 | | 482,017 | | 3,297,631 |
See notes to financial statements.
| | STATEMENT OF OPERATIONS
(amounts in thousands)
Six Months Ended July 31, 2006 (Unaudited)
|
| | | | | Dreyfus | | Dreyfus | | Dreyfus | | Dreyfus | | Dreyfus |
| | | Dreyfus | | Cash | | Government | | Government | | Treasury | | Treasury |
| | | Cash | | Management | | Cash | | Prime Cash | | Cash | | Prime Cash |
| | | Management | | Plus, Inc. | | Management | | Management | | Management | | Management |
| |
| |
| |
| |
| |
| |
|
| Investment Income ($): | | | | | | | | | | | | |
| Interest Income | | 289,251 | | 214,237 | | 105,653 | | 37,822 | | 100,714 | | 45,329 |
| Expenses: | | | | | | | | | | | | |
| Management fee—Note 2(a) | | 11,757 | | 8,711 | | 4,363 | | 1,565 | | 4,272 | | 2,009 |
| Distribution fees—Note 2(b) | | 2,029 | | 3,213 | | 1,782 | | 930 | | 2,102 | | 1,165 |
| Total Expenses | | 13,786 | | 11,924 | | 6,145 | | 2,495 | | 6,374 | | 3,174 |
| Investment Income—Net | | 275,465 | | 202,313 | | 99,508 | | 35,327 | | 94,340 | | 42,155 |
| |
| |
| |
| |
| |
| |
|
| Net Realized Gain (Loss) on | | | | | | | | | | | | |
| Investments—Note 1(b) ($) | | — | | — | | — | | (1) | | (21) | | (357) |
| Net Increase in Net Assets | | | | | | | | | | | | |
| Resulting from Operations | | 275,465 | | 202,313 | | 99,508 | | 35,326 | | 94,319 | | 41,798 |
See notes to financial statements.
The Funds 45
| | STATEMENT OF OPERATIONS (continued)
(amounts in thousands)
Six Months Ended July 31, 2006 (Unaudited)
|
| | | Dreyfus | | Dreyfus | | Dreyfus |
| | | Municipal Cash | | New York | | Tax Exempt |
| | | Management | | Municipal Cash | | Cash |
| | | Plus | | Management | | Management |
| |
| |
| |
|
| Investment Income ($): | | | | | | |
| Interest Income | | 16,255 | | 7,902 | | 51,042 |
| Expenses: | | | | | | |
| Management fee—Note 2(a) | | 951 | | 464 | | 3,005 |
| Distribution fees—Note 2(b) | | 312 | | 176 | | 457 |
| Total Expenses | | 1,263 | | 640 | | 3,462 |
| Investment Income—Net | | 14,992 | | 7,262 | | 47,580 |
| |
| |
| |
|
| Net Realized Gain (Loss) on Investments—Note 1(b) ($) | | 3 | | 76 | | 83 |
| Net Increase in Net Assets Resulting from Operations | | 14,995 | | 7,338 | | 47,663 |
See notes to financial statements.
| | STATEMENT OF CHANGES IN NET ASSETS
(amounts in thousands)
|
| | | Dreyfus Cash Management | | Dreyfus Cash Management Plus, Inc. |
| |
| |
|
| | | Six Months Ended | | Year Ended | | Six Months Ended | | Year Ended |
| | | July 31, 2006 | | January 31, | | July 31, 2006 | | January 31, |
| | | (Unaudited) | | 2006 | | (Unaudited) | | 2006 |
| |
| |
| |
| |
|
| Operations ($): | | | | | | | | |
| Investment income—net | | 275,465 | | 401,369 | | 202,313 | | 292,369 |
| Net realized gain (loss) on investments | | — | | (154) | | — | | (798) |
| Net Increase (Decrease) in Net Assets | | | | | | | | |
| Resulting from Operations | | 275,465 | | 401,215 | | 202,313 | | 291,571 |
| |
| |
| |
| |
|
| Dividends to Shareholders from ($): | | | | | | | | |
| Investment income—net: | | | | | | | | |
| Institutional Shares | | (238,223) | | (351,357) | | (142,371) | | (223,829) |
| Investor Shares | | (25,105) | | (35,602) | | (27,294) | | (35,763) |
| Administrative Shares | | (7,190) | | (8,404) | | (18,823) | | (19,166) |
| Participant Shares | | (4,947) | | (6,006) | | (13,825) | | (13,611) |
| Total Dividends | | (275,465) | | (401,369) | | (202,313) | | (292,369) |
| |
| |
| |
| |
|
| Beneficial Interest/Capital Stock | | | | | | | | |
| Transactions ($1.00 per share): | | | | | | | | |
| Net proceeds from shares sold: | | | | | | | | |
| Institutional Shares | | 48,528,136 | | 88,227,691 | | 45,528,126 | | 102,606,751 |
| Investor Shares | | 5,237,051 | | 8,207,749 | | 2,850,243 | | 5,299,272 |
| Administrative Shares | | 1,542,340 | | 3,067,374 | | 3,067,316 | | 5,033,982 |
| Participant Shares | | 752,217 | | 1,793,568 | | 1,479,187 | | 2,572,684 |
| Dividends reinvested: | | | | | | | | |
| Institutional Shares | | 73,500 | | 85,179 | | 55,353 | | 86,879 |
| Investor Shares | | 6,764 | | 10,546 | | 24,179 | | 32,664 |
| Administrative Shares | | 2,431 | | 2,320 | | 18,622 | | 19,092 |
| Participant Shares | | 4,115 | | 5,063 | | 13,451 | | 13,140 |
| Cost of shares redeemed: | | | | | | | | |
| Institutional Shares | | (46,474,083) | | (88,111,203) | | (45,161,361) | | (105,251,149) |
| Investor Shares | | (5,428,597) | | (8,048,703) | | (2,889,462) | | (5,114,620) |
| Administrative Shares | | (1,547,698) | | (3,085,440) | | (2,855,635) | | (4,759,710) |
| Participant Shares | | (736,438) | | (1,832,003) | | (1,532,392) | | (2,348,416) |
| Increase (Decrease) in Net Assets from | | | | | | | | |
| Beneficial Interest/Capital Stock Transactions | | 1,959,738 | | 322,141 | | 597,627 | | (1,809,431) |
| Total Increase (Decrease) In Net Assets | | 1,959,738 | | 321,987 | | 597,627 | | (1,810,229) |
| |
| |
| |
| |
|
| Net Assets ($): | | | | | | | | |
| Beginning of Period | | 11,182,935 | | 10,860,948 | | 8,676,283 | | 10,486,512 |
| End of Period | | 13,142,673 | | 11,182,935 | | 9,273,910 | | 8,676,283 |
See notes to financial statements.
The Funds 47
| | STATEMENT OF CHANGES IN NET ASSETS (continued)
(amounts in thousands)
|
| | | Dreyfus Government | | Dreyfus Government |
| | | Cash Management | | Prime Cash Management |
| |
| |
|
| | | Six Months Ended | | Year Ended | | Six Months Ended | | Year Ended |
| | | July 31, 2006 | | January 31, | | July 31, 2006 | | January 31, |
| | | (Unaudited) | | 2006 | | (Unaudited) | | 2006 |
| |
| |
| |
| |
|
| Operations ($): | | | | | | | | |
| Investment income—net | | 99,508 | | 147,524 | | 35,327 | | 38,083 |
| Net realized gain (loss) on investments | | — | | (284) | | (1) | | 51 |
| Net Increase (Decrease) in Net Assets | | | | | | | | |
| Resulting from Operations | | 99,508 | | 147,240 | | 35,326 | | 38,134 |
| |
| |
| |
| |
|
| Dividends to Shareholders from ($): | | | | | | | | |
| Investment income—net: | | | | | | | | |
| Institutional Shares | | (68,020) | | (101,439) | | (19,840) | | (19,681) |
| Investor Shares | | (20,207) | | (31,627) | | (5,509) | | (6,581) |
| Administrative Shares | | (6,053) | | (6,881) | | (4,520) | | (5,413) |
| Participant Shares | | (5,228) | | (7,577) | | (5,458) | | (6,408) |
| Total Dividends | | (99,508) | | (147,524) | | (35,327) | | (38,083) |
| |
| |
| |
| |
|
| Beneficial Interest | | | | | | | | |
| Transactions ($1.00 per share): | | | | | | | | |
| Net proceeds from shares sold: | | | | | | | | |
| Institutional Shares | | 14,784,290 | | 25,264,718 | | 2,422,863 | | 2,989,497 |
| Investor Shares | | 2,900,658 | | 6,351,977 | | 264,704 | | 421,201 |
| Administrative Shares | | 1,038,617 | | 1,451,334 | | 1,969,603 | | 2,090,491 |
| Participant Shares | | 743,726 | | 1,304,455 | | 775,550 | | 1,558,755 |
| Dividends reinvested: | | | | | | | | |
| Institutional Shares | | 29,235 | | 41,829 | | 15,298 | | 16,829 |
| Investor Shares | | 16,124 | | 25,617 | | 5,186 | | 6,059 |
| Administrative Shares | | 5,059 | | 5,866 | | 4,063 | | 5,016 |
| Participant Shares | | 4,483 | | 6,077 | | 4,768 | | 5,580 |
| Cost of shares redeemed: | | | | | | | | |
| Institutional Shares | | (14,209,041) | | (26,035,234) | | (2,289,944) | | (2,769,866) |
| Investor Shares | | (3,141,084) | | (6,614,704) | | (254,634) | | (394,068) |
| Administrative Shares | | (1,060,701) | | (1,530,875) | | (1,975,900) | | (2,085,241) |
| Participant Shares | | (754,983) | | (1,355,837) | | (681,524) | | (1,586,703) |
| Increase (Decrease) in Net Assets from | | | | | | | | |
| Beneficial Interest Transactions | | 356,383 | | (1,084,777) | | 260,033 | | 257,550 |
| Total Increase (Decrease) In Net Assets | | 356,383 | | (1,085,061) | | 260,032 | | 257,601 |
| |
| |
| |
| |
|
| Net Assets ($): | | | | | | | | |
| Beginning of Period | | 4,375,812 | | 5,460,873 | | 1,433,600 | | 1,175,999 |
| End of Period | | 4,732,195 | | 4,375,812 | | 1,693,632 | | 1,433,600 |
See notes to financial statements.
48
| | | Dreyfus Treasury | | Dreyfus Treasury Prime |
| | | Cash Management | | Cash Management | | |
| |
| |
| |
|
| | | Six Months Ended | | Year Ended | | Six Months Ended | | Year Ended |
| | | July 31, 2006 | | January 31, | | July 31, 2006 | | January 31, |
| | | (Unaudited) | | 2006 | | (Unaudited) | | 2006 |
| |
| |
| |
| |
|
| Operations ($): | | | | | | | | |
| Investment income—net | | 94,340 | | 138,913 | | 42,155 | | 68,040 |
| Net realized gain (loss) on investments | | (21) | | (39) | | (357) | | (65) |
| Net Increase (Decrease) in Net Assets | | | | | | | | |
| Resulting from Operations | | 94,319 | | 138,874 | | 41,798 | | 67,975 |
| |
| |
| |
| |
|
| Dividends to Shareholders from ($): | | | | | | | | |
| Investment income—net: | | | | | | | | |
| Institutional Shares | | (60,119) | | (92,357) | | (25,747) | | (44,635) |
| Investor Shares | | (27,817) | | (38,654) | | (12,219) | | (18,263) |
| Administrative Shares | | (1,916) | | (2,274) | | (295) | | (818) |
| Participant Shares | | (4,488) | | (5,628) | | (3,894) | | (4,324) |
| Total Dividends | | (94,340) | | (138,913) | | (42,155) | | (68,040) |
| |
| |
| |
| |
|
| Beneficial Interest | | | | | | | | |
| Transactions ($1.00 per share): | | | | | | | | |
| Net proceeds from shares sold: | | | | | | | | |
| Institutional Shares | | 12,061,871 | | 33,378,971 | | 2,794,009 | | 9,320,877 |
| Investor Shares | | 5,150,681 | | 9,589,674 | | 1,146,624 | | 3,104,509 |
| Administrative Shares | | 650,101 | | 717,102 | | 24,417 | | 121,635 |
| Participant Shares | | 706,927 | | 531,943 | | 335,685 | | 848,315 |
| Dividends reinvested: | | | | | | | | |
| Institutional Shares | | 16,756 | | 25,325 | | 10,378 | | 20,119 |
| Investor Shares | | 1,146 | | 3,982 | | 5,062 | | 9,667 |
| Administrative Shares | | 1,782 | | 2,082 | | 295 | | 797 |
| Participant Shares | | 2,070 | | 2,389 | | 1,104 | | 1,196 |
| Cost of shares redeemed: | | | | | | | | |
| Institutional Shares | | (12,273,135) | | (32,738,634) | | (3,206,903) | | (9,187,163) |
| Investor Shares | | (4,916,682) | | (9,437,450) | | (1,186,801) | | (3,075,940) |
| Administrative Shares | | (650,725) | | (681,475) | | (45,527) | | (134,971) |
| Participant Shares | | (701,024) | | (524,471) | | (590,082) | | (591,166) |
| Increase (Decrease) in Net Assets from | | | | | | | | |
| Beneficial Interest Transactions | | 49,768 | | 869,438 | | (711,739) | | 437,875 |
| Total Increase (Decrease) In Net Assets | | 49,747 | | 869,399 | | (712,096) | | 437,810 |
| |
| |
| |
| |
|
| Net Assets ($): | | | | | | | | |
| Beginning of Period | | 4,643,614 | | 3,774,215 | | 2,516,655 | | 2,078,845 |
| End of Period | | 4,693,361 | | 4,643,614 | | 1,804,559 | | 2,516,655 |
See notes to financial statements.
The Funds 49
| | STATEMENT OF CHANGES IN NET ASSETS (continued)
(amounts in thousands)
|
| | | Dreyfus Municipal Cash | | Dreyfus New York Municipal | | Dreyfus Tax Exempt |
| | | Management Plus | | Cash Management | | Cash Management |
| |
| |
| |
|
| | | Six Months Ended | | Year Ended | | Six Months Ended | | Year Ended | | Six Months Ended | | Year Ended |
| | | July 31, 2006 | | January 31, | | July 31, 2006 | | January 31, | | July 31, 2006 | | January 31, |
| | | (Unaudited) | | 2006 | | (Unaudited) | | 2006 | | (Unaudited) | | 2006 |
| |
| |
| |
| |
| |
| |
|
| Operations ($): | | | | | | | | | | | | |
| Investment income—net | | 14,992 | | 21,037 | | 7,262 | | 10,185 | | 47,580 | | 71,085 |
| Net realized gain (loss) on investments | | 3 | | (2) | | 76 | | 4 | | 83 | | (16) |
| Net unrealized appreciation | | | | | | | | | | | | |
| (depreciation) on investments | | — | | — | | — | | — | | — | | (20) |
| Net Increase (Decrease) in Net Assets | | | | | | | | | | | | |
| Resulting from Operations | | 14,995 | | 21,035 | | 7,338 | | 10,189 | | 47,663 | | 71,049 |
| |
| |
| |
| |
| |
| |
|
| Dividends to Shareholders from ($): | | | | | | | | | | | | |
| Investment income—net: | | | | | | | | | | | | |
| Institutional Shares | | (10,053) | | (14,367) | | (4,988) | | (8,052) | | (41,282) | | (62,218) |
| Investor Shares | | (2,194) | | (3,035) | | (1,888) | | (1,924) | | (3,804) | | (4,769) |
| Administrative Shares | | (2,398) | | (3,133) | | (344) | | (104) | | (2,010) | | (3,333) |
| Participant Shares | | (347) | | (502) | | (42) | | (105) | | (484) | | (765) |
| Total Dividends | | (14,992) | | (21,037) | | (7,262) | | (10,185) | | (47,580) | | (71,085) |
| |
| |
| |
| |
| |
| |
|
| Beneficial Interest | | | | | | | | | | | | |
| Transactions ($1.00 per share): | | | | | | | | | | | | |
| Net proceeds from shares sold: | | | | | | | | | | | | |
| Institutional Shares | | 3,970,218 | | 7,796,226 | | 540,534 | | 1,170,390 | | 9,324,435 | | 21,865,326 |
| Investor Shares | | 371,710 | | 859,699 | | 232,811 | | 473,007 | | 552,089 | | 887,506 |
| Administrative Shares | | 469,603 | | 882,779 | | 96,572 | | 37,565 | | 419,400 | | 689,339 |
| Participant Shares | | 17,062 | | 93,973 | | 7,761 | | 23,299 | | 112,171 | | 253,871 |
| Dividends reinvested: | | | | | | | | | | | | |
| Institutional Shares | | 6,677 | | 9,026 | | 1,741 | | 2,875 | | 18,114 | | 27,380 |
| Investor Shares | | 2,191 | | 3,018 | | 1,888 | | 1,923 | | 2,084 | | 2,610 |
| Administrative Shares | | 2,335 | | 3,002 | | 344 | | 103 | | 1,495 | | 2,163 |
| Participant Shares | | 346 | | 493 | | 41 | | 101 | | 205 | | 374 |
| Cost of shares redeemed: | | | | | | | | | | | | |
| Institutional Shares | | (3,944,650) | | (7,666,537) | | (580,292) | | (1,166,195) | | (9,390,285) (21,757,895) |
| Investor Shares | | (372,465) | | (788,006) | | (228,682) | | (420,813) | | (511,785) | | (875,277) |
| Administrative Shares | | (446,145) | | (877,167) | | (66,084) | | (30,159) | | (393,232) | | (861,639) |
| Participant Shares | | (17,577) | | (89,402) | | (7,111) | | (26,435) | | (122,230) | | (232,067) |
| Increase (Decrease) in Net Assets from | | | | | | | | | | | | |
| Beneficial Interest Transactions | | 59,305 | | 227,104 | | (477) | | 65,661 | | 12,461 | | 1,691 |
| Total Increase (Decrease) In Net Assets | | 59,308 | | 227,102 | | (401) | | 65,665 | | 12,544 | | 1,655 |
| |
| |
| |
| |
| |
| |
|
| Net Assets ($): | | | | | | | | | | | | |
| Beginning of Period | | 980,563 | | 753,461 | | 479,199 | | 413,534 | | 3,046,700 | | 3,045,045 |
| End of Period | | 1,039,871 | | 980,563 | | 478,798 | | 479,199 | | 3,059,244 | | 3,046,700 |
See notes to financial statements.
FINANCIAL HIGHLIGHTS
The following tables describe the performance for each share class for the fiscal periods indicated.All information reflects financial results for a single fund share.Total return shows how much your investment in the fund would have increased (or decreased) during each period, assuming you had reinvested all dividends and distributions.These figures have been derived from the fund's financial statements.
| | | | | Per Share Data ($) | | | | Ratios/Supplemental Data (%) |
| |
| |
| |
| |
|
| | | | | | | | | | | | | | | Ratio of Net | | |
| | | Net Asset | | | | Dividends | | Net Asset | | | | Ratio of | | Investment | | Net Assets |
| | | Value | | Net | | from Net | | Value | | | | Expenses | | Income to | | End of |
| | | Beginning | | Investment | | Investment | | End | | Total | | to Average | | Average | | Period |
| | | of Period | | Income | | Income | | of Period | | Return (%) | | Net Assets | | Net Assets ($ x1,000,000) |
| |
| |
| |
| |
| |
| |
| |
|
| |
| Dreyfus Cash Management | | | | | | | | | | | | | | | | |
| Institutional Shares | | | | | | | | | | | | | | | | |
| Six Months Ended July 31, 2006 (Unaudited) | | 1.00 | | .023 | | (.023) | | 1.00 | | 4.76a | | .20a | | 4.73a | | 11,612 |
| Year Ended January 31, | | | | | | | | | | | | | | | | |
| 2006 | | 1.00 | | .032 | | (.032) | | 1.00 | | 3.28 | | .20 | | 3.24 | | 9,484 |
| 2005 | | 1.00 | | .013 | | (.013) | | 1.00 | | 1.31 | | .20 | | 1.30 | | 9,283 |
| 2004 | | 1.00 | | .010 | | (.010) | | 1.00 | | .99 | | .20 | | .99 | | 9,507 |
| 2003 | | 1.00 | | .016 | | (.016) | | 1.00 | | 1.66 | | .20 | | 1.65 | | 11,410 |
| 2002 | | 1.00 | | .037 | | (.037) | | 1.00 | | 3.77 | | .20 | | 3.64 | | 13,260 |
| Investor Shares | | | | | | | | | | | | | | | | |
| Six Months Ended July 31, 2006 (Unaudited) | | 1.00 | | .022 | | (.022) | | 1.00 | | 4.52a | | .45a | | 4.48a | | 1,053 |
| Year Ended January 31, | | | | | | | | | | | | | | | | |
| 2006 | | 1.00 | | .030 | | (.030) | | 1.00 | | 3.03 | | .45 | | 2.99 | | 1,238 |
| 2005 | | 1.00 | | .011 | | (.011) | | 1.00 | | 1.06 | | .45 | | 1.05 | | 1,068 |
| 2004 | | 1.00 | | .007 | | (.007) | | 1.00 | | .74 | | .45 | | .74 | | 1,254 |
| 2003 | | 1.00 | | .014 | | (.014) | | 1.00 | | 1.41 | | .45 | | 1.40 | | 1,814 |
| 2002 | | 1.00 | | .035 | | (.035) | | 1.00 | | 3.51 | | .45 | | 3.39 | | 1,286 |
| Administrative Shares | | | | | | | | | | | | | | | | |
| Six Months Ended July 31, 2006 (Unaudited) | | 1.00 | | .023 | | (.023) | | 1.00 | | 4.66a | | .30a | | 4.63a | | 248 |
| Year Ended January 31, | | | | | | | | | | | | | | | | |
| 2006 | | 1.00 | | .031 | | (.031) | | 1.00 | | 3.18 | | .30 | | 3.14 | | 251 |
| 2005 | | 1.00 | | .012 | | (.012) | | 1.00 | | 1.21 | | .30 | | 1.20 | | 266 |
| 2004 | | 1.00 | | .009 | | (.009) | | 1.00 | | .89 | | .30 | | .89 | | 255 |
| 2003 | | 1.00 | | .015 | | (.015) | | 1.00 | | 1.56 | | .30 | | 1.55 | | 669 |
| 2002 | | 1.00 | | .036 | | (.036) | | 1.00 | | 3.67 | | .30 | | 3.54 | | 506 |
| Participant Shares | | | | | | | | | | | | | | | | |
| Six Months Ended July 31, 2006 (Unaudited) | | 1.00 | | .021 | | (.021) | | 1.00 | | 4.36a | | .60a | | 4.33a | | 230 |
| Year Ended January 31, | | | | | | | | | | | | | | | | |
| 2006 | | 1.00 | | .028 | | (.028) | | 1.00 | | 2.87 | | .60 | | 2.84 | | 210 |
| 2005 | | 1.00 | | .009 | | (.009) | | 1.00 | | .91 | | .60 | | .90 | | 244 |
| 2004 | | 1.00 | | .006 | | (.006) | | 1.00 | | .59 | | .60 | | .59 | | 132 |
| 2003 | | 1.00 | | .012 | | (.012) | | 1.00 | | 1.26 | | .60 | | 1.25 | | 118 |
| 2002 | | 1.00 | | .033 | | (.033) | | 1.00 | | 3.36 | | .60 | | 3.24 | | 201 |
| | a Annualized.
See notes to financial statements.
|
The Funds 51
F I N A N C I A L H I G H L I G H T S (continued)
| | | | | Per Share Data ($) | | | | Ratios/Supplemental Data (%) |
| |
| |
| |
| |
|
| | | | | | | | | | | | | | | Ratio of Net | | |
| | | Net Asset | | | | Dividends | | Net Asset | | | | Ratio of | | Investment | | Net Assets |
| | | Value | | Net | | from Net | | Value | | | | Expenses | | Income to | | End of |
| | | Beginning | | Investment | | Investment | | End | | Total | | to Average | | Average | | Period |
| | | of Period | | Income | | Income | | of Period | | Return (%) | | Net Assets | | Net Assets ($ x1,000,000) |
| |
| |
| |
| |
| |
| |
| |
|
| |
| Dreyfus Cash Management Plus, Inc. | | | | | | | | | | | | | | | | |
| Institutional Shares | | | | | | | | | | | | | | | | |
| Six Months Ended July 31, 2006 (Unaudited) | | 1.00 | | .023 | | (.023) | | 1.00 | | 4.76a | | .20a | | 4.71a | | 6,330 |
| Year Ended January 31, | | | | | | | | | | | | | | | | |
| 2006 | | 1.00 | | .032 | | (.032) | | 1.00 | | 3.29 | | .20 | | 3.23 | | 5,908 |
| 2005 | | 1.00 | | .013 | | (.013) | | 1.00 | | 1.32 | | .20 | | 1.23 | | 8,466 |
| 2004 | | 1.00 | | .011 | | (.011) | | 1.00 | | 1.06 | | .20 | | 1.07 | | 14,249 |
| 2003 | | 1.00 | | .018 | | (.018) | | 1.00 | | 1.78 | | .20 | | 1.78 | | 24,637 |
| 2002 | | 1.00 | | .038 | | (.038) | | 1.00 | | 3.91 | | .20 | | 3.54 | | 27,179 |
| Investor Shares | | | | | | | | | | | | | | | | |
| Six Months Ended July 31, 2006 (Unaudited) | | 1.00 | | .022 | | (.022) | | 1.00 | | 4.50a | | .45a | | 4.46a | | 1,260 |
| Year Ended January 31, | | | | | | | | | | | | | | | | |
| 2006 | | 1.00 | | .030 | | (.030) | | 1.00 | | 3.03 | | .45 | | 2.98 | | 1,275 |
| 2005 | | 1.00 | | .011 | | (.011) | | 1.00 | | 1.07 | | .45 | | .98 | | 1,058 |
| 2004 | | 1.00 | | .008 | | (.008) | | 1.00 | | .81 | | .45 | | .82 | | 1,203 |
| 2003 | | 1.00 | | .015 | | (.015) | | 1.00 | | 1.53 | | .45 | | 1.53 | | 2,166 |
| 2002 | | 1.00 | | .036 | | (.036) | | 1.00 | | 3.66 | | .45 | | 3.29 | | 1,547 |
| Administrative Shares | | | | | | | | | | | | | | | | |
| Six Months Ended July 31, 2006 (Unaudited) | | 1.00 | | .023 | | (.023) | | 1.00 | | 4.66a | | .30a | | 4.61a | | 1,024 |
| Year Ended January 31, | | | | | | | | | | | | | | | | |
| 2006 | | 1.00 | | .031 | | (.031) | | 1.00 | | 3.19 | | .30 | | 3.13 | | 793 |
| 2005 | | 1.00 | | .012 | | (.012) | | 1.00 | | 1.22 | | .30 | | 1.13 | | 500 |
| 2004 | | 1.00 | | .010 | | (.010) | | 1.00 | | .96 | | .30 | | .97 | | 1,579 |
| 2003 | | 1.00 | | .017 | | (.017) | | 1.00 | | 1.68 | | .30 | | 1.68 | | 2,030 |
| 2002 | | 1.00 | | .037 | | (.037) | | 1.00 | | 3.81 | | .30 | | 3.44 | | 932 |
| Participant Shares | | | | | | | | | | | | | | | | |
| Six Months Ended July 31, 2006 (Unaudited) | | 1.00 | | .021 | | (.021) | | 1.00 | | 4.36a | | .60a | | 4.31a | | 660 |
| Year Ended January 31, | | | | | | | | | | | | | | | | |
| 2006 | | 1.00 | | .028 | | (.028) | | 1.00 | | 2.88 | | .60 | | 2.83 | | 700 |
| 2005 | | 1.00 | | .009 | | (.009) | | 1.00 | | .92 | | .60 | | .83 | | 463 |
| 2004 | | 1.00 | | .007 | | (.007) | | 1.00 | | .65 | | .60 | | .67 | | 957 |
| 2003 | | 1.00 | | .014 | | (.014) | | 1.00 | | 1.38 | | .60 | | 1.38 | | 1,028 |
| 2002 | | 1.00 | | .034 | | (.034) | | 1.00 | | 3.50 | | .60 | | 3.14 | | 491 |
a Annualized.
See notes to financial statements.
52
| | | | | Per Share Data ($) | | | | Ratios/Supplemental Data (%) |
| |
| |
| |
| |
|
| | | | | | | | | | | | | | | Ratio of Net | | |
| | | Net Asset | | | | Dividends | | Net Asset | | | | Ratio of | | Investment | | Net Assets |
| | | Value | | Net | | from Net | | Value | | | | Expenses | | Income to | | End of |
| | | Beginning | | Investment | | Investment | | End | | Total | | to Average | | Average | | Period |
| | | of Period | | Income | | Income | | of Period | | Return (%) | | Net Assets | | Net Assets ($ x1,000,000) |
| |
| |
| |
| |
| |
| |
| |
|
| |
| Dreyfus Goverment Cash Management | | | | | | | | | | | | | | |
| Institutional Shares | | | | | | | | | | | | | | | | |
| Six Months Ended July 31, 2006 (Unaudited) | | 1.00 | | .023 | | (.023) | | 1.00 | | 4.70a | | .20a | | 4.65a | | 3,447 |
| Year Ended January 31, | | | | | | | | | | | | | | | | |
| 2006 | | 1.00 | | .032 | | (.032) | | 1.00 | | 3.23 | | .20 | | 3.15 | | 2,842 |
| 2005 | | 1.00 | | .013 | | (.013) | | 1.00 | | 1.26 | | .20 | | 1.20 | | 3,571 |
| 2004 | | 1.00 | | .010 | | (.010) | | 1.00 | | 1.03 | | .20 | | 1.03 | | 5,409 |
| 2003 | | 1.00 | | .017 | | (.017) | | 1.00 | | 1.75 | | .20 | | 1.74 | | 8,084 |
| 2002 | | 1.00 | | .037 | | (.037) | | 1.00 | | 3.81 | | .20 | | 3.55 | | 7,049 |
| Investor Shares | | | | | | | | | | | | | | | | |
| Six Months Ended July 31, 2006 (Unaudited) | | 1.00 | | .022 | | (.022) | | 1.00 | | 4.44a | | .45a | | 4.40a | | 826 |
| Year Ended January 31, | | | | | | | | | | | | | | | | |
| 2006 | | 1.00 | | .029 | | (.029) | | 1.00 | | 2.97 | | .45 | | 2.90 | | 1,050 |
| 2005 | | 1.00 | | .010 | | (.010) | | 1.00 | | 1.01 | | .45 | | .95 | | 1,287 |
| 2004 | | 1.00 | | .008 | | (.008) | | 1.00 | | .78 | | .45 | | .78 | | 1,307 |
| 2003 | | 1.00 | | .015 | | (.015) | | 1.00 | | 1.50 | | .45 | | 1.49 | | 1,591 |
| 2002 | | 1.00 | | .035 | | (.035) | | 1.00 | | 3.55 | | .45 | | 3.30 | | 1,510 |
| Administrative Shares | | | | | | | | | | | | | | | | |
| Six Months Ended July 31, 2006 (Unaudited) | | 1.00 | | .023 | | (.023) | | 1.00 | | 4.58a | | .30a | | 4.55a | | 222 |
| Year Ended January 31, | | | | | | | | | | | | | | | | |
| 2006 | | 1.00 | | .031 | | (.031) | | 1.00 | | 3.12 | | .30 | | 3.05 | | 240 |
| 2005 | | 1.00 | | .012 | | (.012) | | 1.00 | | 1.16 | | .30 | | 1.10 | | 313 |
| 2004 | | 1.00 | | .009 | | (.009) | | 1.00 | | .93 | | .30 | | .93 | | 900 |
| 2003 | | 1.00 | | .016 | | (.016) | | 1.00 | | 1.65 | | .30 | | 1.64 | | 1,138 |
| 2002 | | 1.00 | | .036 | | (.036) | | 1.00 | | 3.71 | | .30 | | 3.45 | | 623 |
| Participant Shares | | | | | | | | | | | | | | | | |
| Six Months Ended July 31, 2006 (Unaudited) | | 1.00 | | .021 | | (.021) | | 1.00 | | 4.28a | | .60a | | 4.25a | | 237 |
| Year Ended January 31, | | | | | | | | | | | | | | | | |
| 2006 | | 1.00 | | .028 | | (.028) | | 1.00 | | 2.81 | | .60 | | 2.75 | | 244 |
| 2005 | | 1.00 | | .009 | | (.009) | | 1.00 | | .86 | | .60 | | .80 | | 289 |
| 2004 | | 1.00 | | .006 | | (.006) | | 1.00 | | .62 | | .60 | | .63 | | 607 |
| 2003 | | 1.00 | | .013 | | (.013) | | 1.00 | | 1.35 | | .60 | | 1.34 | | 645 |
| 2002 | | 1.00 | | .033 | | (.033) | | 1.00 | | 3.40 | | .60 | | 3.15 | | 523 |
a Annualized.
See notes to financial statements.
|
The Funds 53
F I N A N C I A L H I G H L I G H T S (continued)
| | | | | Per Share Data ($) | | | | Ratios/Supplemental Data (%) |
| |
| |
| |
| |
|
| | | | | | | | | | | | | | | Ratio of Net | | |
| | | Net Asset | | | | Dividends | | Net Asset | | | | Ratio of | | Investment | | Net Assets |
| | | Value | | Net | | from Net | | Value | | | | Expenses | | Income to | | End of |
| | | Beginning | | Investment | | Investment | | End | | Total | | to Average | | Average | | Period |
| | | of Period | | Income | | Income | | of Period | | Return (%) | | Net Assets | | Net Assets ($ x1,000,000) |
| |
| |
| |
| |
| |
| |
| |
|
| |
| Dreyfus Government Prime Cash Management | | | | | | | | | | | | | | |
| Institutional Shares | | | | | | | | | | | | | | | | |
| Six Months Ended July 31, 2006 (Unaudited) | | 1.00 | | .023 | | (.023) | | 1.00 | | 4.68a | | .20a | | 4.64a | | 922 |
| Year Ended January 31, | | | | | | | | | | | | | | | | |
| 2006 | | 1.00 | | .031 | | (.031) | | 1.00 | | 3.18 | | .20 | | 3.21 | | 773 |
| 2005 | | 1.00 | | .012 | | (.012) | | 1.00 | | 1.21 | | .20 | | 1.19 | | 537 |
| 2004 | | 1.00 | | .009 | | (.009) | | 1.00 | | .94 | | .20 | | .91 | | 415 |
| 2003 | | 1.00 | | .016 | | (.016) | | 1.00 | | 1.61 | | .20 | | 1.60 | | 285 |
| 2002 | | 1.00 | | .035 | | (.035) | | 1.00 | | 3.56 | | .20 | | 3.39 | | 360 |
| Investor Shares | | | | | | | | | | | | | | | | |
| Six Months Ended July 31, 2006 (Unaudited) | | 1.00 | | .022 | | (.022) | | 1.00 | | 4.42a | | .45a | | 4.39a | | 257 |
| Year Ended January 31, | | | | | | | | | | | | | | | | |
| 2006 | | 1.00 | | .029 | | (.029) | | 1.00 | | 2.92 | | .45 | | 2.96 | | 242 |
| 2005 | | 1.00 | | .010 | | (.010) | | 1.00 | | .96 | | .45 | | .94 | | 209 |
| 2004 | | 1.00 | | .007 | | (.007) | | 1.00 | | .69 | | .45 | | .66 | | 243 |
| 2003 | | 1.00 | | .014 | | (.014) | | 1.00 | | 1.36 | | .45 | | 1.35 | | 273 |
| 2002 | | 1.00 | | .033 | | (.033) | | 1.00 | | 3.31 | | .45 | | 3.14 | | 196 |
| Administrative Shares | | | | | | | | | | | | | | | | |
| Six Months Ended July 31, 2006 (Unaudited) | | 1.00 | | .022 | | (.022) | | 1.00 | | 4.56a | | .30a | | 4.54a | | 208 |
| Year Ended January 31, | | | | | | | | | | | | | | | | |
| 2006 | | 1.00 | | .030 | | (.030) | | 1.00 | | 3.08 | | .30 | | 3.11 | | 210 |
| 2005 | | 1.00 | | .011 | | (.011) | | 1.00 | | 1.11 | | .30 | | 1.09 | | 200 |
| 2004 | | 1.00 | | .008 | | (.008) | | 1.00 | | .84 | | .30 | | .81 | | 130 |
| 2003 | | 1.00 | | .015 | | (.015) | | 1.00 | | 1.51 | | .30 | | 1.50 | | 216 |
| 2002 | | 1.00 | | .034 | | (.034) | | 1.00 | | 3.46 | | .30 | | 3.29 | | 86 |
| Participant Shares | | | | | | | | | | | | | | | | |
| Six Months Ended July 31, 2006 (Unaudited) | | 1.00 | | .021 | | (.021) | | 1.00 | | 4.25a | | .60a | | 4.24a | | 306 |
| Year Ended January 31, | | | | | | | | | | | | | | | | |
| 2006 | | 1.00 | | .027 | | (.027) | | 1.00 | | 2.77 | | .60 | | 2.81 | | 208 |
| 2005 | | 1.00 | | .008 | | (.008) | | 1.00 | | .81 | | .60 | | .79 | | 230 |
| 2004 | | 1.00 | | .005 | | (.005) | | 1.00 | | .54 | | .60 | | .51 | | 229 |
| 2003 | | 1.00 | | .012 | | (.012) | | 1.00 | | 1.21 | | .60 | | 1.20 | | 325 |
| 2002 | | 1.00 | | .031 | | (.031) | | 1.00 | | 3.15 | | .60 | | 2.99 | | 399 |
a Annualized.
See notes to financial statements.
|
54
| | | | | Per Share Data ($) | | | | Ratios/Supplemental Data (%) |
| |
| |
| |
| |
|
| | | | | | | | | | | | | | | Ratio of Net | | |
| | | Net Asset | | | | Dividends | | Net Asset | | | | Ratio of | | Investment | | Net Assets |
| | | Value | | Net | | from Net | | Value | | | | Expenses | | Income to | | End of |
| | | Beginning | | Investment | | Investment | | End | | Total | | to Average | | Average | | Period |
| | | of Period | | Income | | Income | | of Period | | Return (%) | | Net Assets | | Net Assets ($ x1,000,000) |
| |
| |
| |
| |
| |
| |
| |
|
| |
| Dreyfus Treasury Cash Management | | | | | | | | | | | | | | | | |
| Institutional Shares | | | | | | | | | | | | | | | | |
| Six Months Ended July 31, 2006 (Unaudited) | | 1.00 | | .022 | | (.022) | | 1.00 | | 4.56a | | .20a | | 4.50a | | 2,823 |
| Year Ended January 31, | | | | | | | | | | | | | | | | |
| 2006 | | 1.00 | | .031 | | (.031) | | 1.00 | | 3.10 | | .20 | | 3.08 | | 3,017 |
| 2005 | | 1.00 | | .012 | | (.012) | | 1.00 | | 1.19 | | .20 | | 1.16 | | 2,351 |
| 2004 | | 1.00 | | .009 | | (.009) | | 1.00 | | .93 | | .20 | | .93 | | 3,312 |
| 2003 | | 1.00 | | .016 | | (.016) | | 1.00 | | 1.59 | | .20 | | 1.57 | | 3,397 |
| 2002 | | 1.00 | | .036 | | (.036) | | 1.00 | | 3.62 | | .20 | | 3.42 | | 2,787 |
| Investor Shares | | | | | | | | | | | | | | | | |
| Six Months Ended July 31, 2006 (Unaudited) | | 1.00 | | .021 | | (.021) | | 1.00 | | 4.30a | | .45a | | 4.25a | | 1,555 |
| Year Ended January 31, | | | | | | | | | | | | | | | | |
| 2006 | | 1.00 | | .028 | | (.028) | | 1.00 | | 2.84 | | .45 | | 2.83 | | 1,320 |
| 2005 | | 1.00 | | .009 | | (.009) | | 1.00 | | .94 | | .45 | | .91 | | 1,164 |
| 2004 | | 1.00 | | .007 | | (.007) | | 1.00 | | .68 | | .45 | | .68 | | 1,288 |
| 2003 | | 1.00 | | .013 | | (.013) | | 1.00 | | 1.34 | | .45 | | 1.32 | | 999 |
| 2002 | | 1.00 | | .033 | | (.033) | | 1.00 | | 3.36 | | .45 | | 3.17 | | 1,035 |
| Administrative Shares | | | | | | | | | | | | | | | | |
| Six Months Ended July 31, 2006 (Unaudited) | | 1.00 | | .022 | | (.022) | | 1.00 | | 4.46a | | .30a | | 4.40a | | 88 |
| Year Ended January 31, | | | | | | | | | | | | | | | | |
| 2006 | | 1.00 | | .030 | | (.030) | | 1.00 | | 3.00 | | .30 | | 2.98 | | 87 |
| 2005 | | 1.00 | | .011 | | (.011) | | 1.00 | | 1.09 | | .30 | | 1.06 | | 49 |
| 2004 | | 1.00 | | .008 | | (.008) | | 1.00 | | .83 | | .30 | | .83 | | 20 |
| 2003 | | 1.00 | | .015 | | (.015) | | 1.00 | | 1.49 | | .30 | | 1.47 | | 23 |
| 2002 | | 1.00 | | .035 | | (.035) | | 1.00 | | 3.52 | | .30 | | 3.32 | | 127 |
| Participant Shares | | | | | | | | | | | | | | | | |
| Six Months Ended July 31, 2006 (Unaudited) | | 1.00 | | .020 | | (.020) | | 1.00 | | 4.15a | | .60a | | 4.10a | | 227 |
| Year Ended January 31, | | | | | | | | | | | | | | | | |
| 2006 | | 1.00 | | .027 | | (.027) | | 1.00 | | 2.69 | | .60 | | 2.68 | | 219 |
| 2005 | | 1.00 | | .008 | | (.008) | | 1.00 | | .79 | | .60 | | .76 | | 210 |
| 2004 | | 1.00 | | .005 | | (.005) | | 1.00 | | .52 | | .60 | | .53 | | 123 |
| 2003 | | 1.00 | | .012 | | (.012) | | 1.00 | | 1.19 | | .60 | | 1.17 | | 52 |
| 2002 | | 1.00 | | .032 | | (.032) | | 1.00 | | 3.21 | | .60 | | 3.02 | | 121 |
| | a Annualized.
See notes to financial statements.
|
The Funds 55
F I N A N C I A L H I G H L I G H T S (continued)
| | | | | Per Share Data ($) | | | | Ratios/Supplemental Data (%) |
| |
| |
| |
| |
|
| | | | | | | | | | | | | | | Ratio of Net | | |
| | | Net Asset | | | | Dividends | | Net Asset | | | | Ratio of | | Investment | | Net Assets |
| | | Value | | Net | | from Net | | Value | | | | Expenses | | Income to | | End of |
| | | Beginning | | Investment | | Investment | | End | | Total | | to Average | | Average | | Period |
| | | of Period | | Income | | Income | | of Period | | Return (%) | | Net Assets | | Net Assets ($ x1,000,000) |
| |
| |
| |
| |
| |
| |
| |
|
| |
| Dreyfus Treasury Prime Cash Management | | | | | | | | | | | | | | |
| Institutional Shares | | | | | | | | | | | | | | | | |
| Six Months Ended July 31, 2006 (Unaudited) | | 1.00 | | .022 | | (.022) | | 1.00 | | 4.38a | | .20a | | 4.32a | | 1,085 |
| Year Ended January 31, | | | | | | | | | | | | | | | | |
| 2006 | | 1.00 | | .029 | | (.029) | | 1.00 | | 2.96 | | .20 | | 2.93 | | 1,487 |
| 2005 | | 1.00 | | .012 | | (.012) | | 1.00 | | 1.17 | | .20 | | 1.14 | | 1,333 |
| 2004 | | 1.00 | | .009 | | (.009) | | 1.00 | | .92 | | .20 | | .93 | | 1,785 |
| 2003 | | 1.00 | | .016 | | (.016) | | 1.00 | | 1.58 | | .20 | | 1.56 | | 3,291 |
| 2002 | | 1.00 | | .036 | | (.036) | | 1.00 | | 3.68 | | .20 | | 3.40 | | 3,331 |
| Investor Shares | | | | | | | | | | | | | | | | |
| Six Months Ended July 31, 2006 (Unaudited) | | 1.00 | | .020 | | (.020) | | 1.00 | | 4.13a | | .45a | | 4.07a | | 616 |
| Year Ended January 31, | | | | | | | | | | | | | | | | |
| 2006 | | 1.00 | | .027 | | (.027) | | 1.00 | | 2.70 | | .45 | | 2.68 | | 651 |
| 2005 | | 1.00 | | .009 | | (.009) | | 1.00 | | .92 | | .45 | | .89 | | 613 |
| 2004 | | 1.00 | | .007 | | (.007) | | 1.00 | | .67 | | .45 | | .68 | | 794 |
| 2003 | | 1.00 | | .013 | | (.013) | | 1.00 | | 1.32 | | .45 | | 1.31 | | 1,261 |
| 2002 | | 1.00 | | .034 | | (.034) | | 1.00 | | 3.42 | | .45 | | 3.15 | | 1,300 |
| Administrative Shares | | | | | | | | | | | | | | | | |
| Six Months Ended July 31, 2006 (Unaudited) | | 1.00 | | .021 | | (.021) | | 1.00 | | 4.28a | | .30a | | 4.22a | | 5 |
| Year Ended January 31, | | | | | | | | | | | | | | | | |
| 2006 | | 1.00 | | .028 | | (.028) | | 1.00 | | 2.86 | | .30 | | 2.83 | | 26 |
| 2005 | | 1.00 | | .011 | | (.011) | | 1.00 | | 1.07 | | .30 | | 1.04 | | 39 |
| 2004 | | 1.00 | | .008 | | (.008) | | 1.00 | | .82 | | .30 | | .83 | | 97 |
| 2003 | | 1.00 | | .015 | | (.015) | | 1.00 | | 1.48 | | .30 | | 1.46 | | 205 |
| 2002 | | 1.00 | | .035 | | (.035) | | 1.00 | | 3.57 | | .30 | | 3.30 | | 62 |
| Participant Shares | | | | | | | | | | | | | | | | |
| Six Months Ended July 31, 2006 (Unaudited) | | 1.00 | | .020 | | (.020) | | 1.00 | | 3.97a | | .60a | | 3.92a | | 99 |
| Year Ended January 31, | | | | | | | | | | | | | | | | |
| 2006 | | 1.00 | | .025 | | (.025) | | 1.00 | | 2.55 | | .60 | | 2.53 | | 352 |
| 2005 | | 1.00 | | .008 | | (.008) | | 1.00 | | .76 | | .60 | | .74 | | 94 |
| 2004 | | 1.00 | | .005 | | (.005) | | 1.00 | | .52 | | .60 | | .53 | | 179 |
| 2003 | | 1.00 | | .012 | | (.012) | | 1.00 | | 1.18 | | .60 | | 1.16 | | 321 |
| 2002 | | 1.00 | | .032 | | (.032) | | 1.00 | | 3.26 | | .60 | | 3.00 | | 522 |
a Annualized.
See notes to financial statements.
|
56
| | | | | Per Share Data ($) | | | | Ratios/Supplemental Data (%) |
| |
| |
| |
| |
|
| | | | | | | | | | | | | | | Ratio of Net | | |
| | | Net Asset | | | | Dividends | | Net Asset | | | | Ratio of | | Investment | | Net Assets |
| | | Value | | Net | | from Net | | Value | | | | Expenses | | Income to | | End of |
| | | Beginning | | Investment | | Investment | | End | | Total | | to Average | | Average | | Period |
| | | of Period | | Income | | Income | | of Period | | Return (%) | | Net Assets | | Net Assets ($ x1,000,000) |
| |
| |
| |
| |
| |
| |
| |
|
| |
| Dreyfus Municipal Cash Management Plus | | | | | | | | | | | | | | |
| Institutional Shares | | | | | | | | | | | | | | | | |
| Six Months Ended July 31, 2006 (Unaudited) | | 1.00 | | .016 | | (.016) | | 1.00 | | 3.25a | | .20a | | 3.22a | | 671 |
| Year Ended January 31, | | | | | | | | | | | | | | | | |
| 2006 | | 1.00 | | .024 | | (.024) | | 1.00 | | 2.39 | | .20 | | 2.34 | | 638 |
| 2005 | | 1.00 | | .011 | | (.011) | | 1.00 | | 1.13 | | .20 | | 1.07 | | 500 |
| 2004 | | 1.00 | | .009 | | (.009) | | 1.00 | | .93 | | .20 | | .92 | | 722 |
| 2003 | | 1.00 | | .013 | | (.013) | | 1.00 | | 1.33 | | .20 | | 1.31 | | 224 |
| 2002 | | 1.00 | | .026 | | (.026) | | 1.00 | | 2.59 | | .20 | | 2.52 | | 125 |
| Investor Shares | | | | | | | | | | | | | | | | |
| Six Months Ended July 31, 2006 (Unaudited) | | 1.00 | | .015 | | (.015) | | 1.00 | | 2.98a | | .45a | | 2.97a | | 181 |
| Year Ended January 31, | | | | | | | | | | | | | | | | |
| 2006 | | 1.00 | | .021 | | (.021) | | 1.00 | | 2.13 | | .45 | | 2.09 | | 180 |
| 2005 | | 1.00 | | .009 | | (.009) | | 1.00 | | .88 | | .45 | | .82 | | 105 |
| 2004 | | 1.00 | | .007 | | (.007) | | 1.00 | | .68 | | .45 | | .67 | | 88 |
| 2003 | | 1.00 | | .011 | | (.011) | | 1.00 | | 1.08 | | .45 | | 1.06 | | 92 |
| 2002 | | 1.00 | | .023 | | (.023) | | 1.00 | | 2.34 | | .45 | | 2.27 | | 63 |
| Administrative Shares | | | | | | | | | | | | | | | | |
| Six Months Ended July 31, 2006 (Unaudited) | | 1.00 | | .015 | | (.015) | | 1.00 | | 3.13a | | .30a | | 3.12a | | 163 |
| Year Ended January 31, | | | | | | | | | | | | | | | | |
| 2006 | | 1.00 | | .023 | | (.023) | | 1.00 | | 2.29 | | .30 | | 2.24 | | 137 |
| 2005 | | 1.00 | | .010 | | (.010) | | 1.00 | | 1.03 | | .30 | | .97 | | 129 |
| 2004 | | 1.00 | | .008 | | (.008) | | 1.00 | | .83 | | .30 | | .82 | | 108 |
| 2003 | | 1.00 | | .012 | | (.012) | | 1.00 | | 1.23 | | .30 | | 1.21 | | 110 |
| 2002 | | 1.00 | | .025 | | (.025) | | 1.00 | | 2.48 | | .30 | | 2.42 | | 71 |
| Participant Shares | | | | | | | | | | | | | | | | |
| Six Months Ended July 31, 2006 (Unaudited) | | 1.00 | | .014 | | (.014) | | 1.00 | | 2.82a | | .60a | | 2.82a | | 25 |
| Year Ended January 31, | | | | | | | | | | | | | | | | |
| 2006 | | 1.00 | | .020 | | (.020) | | 1.00 | | 1.98 | | .60 | | 1.94 | | 25 |
| 2005 | | 1.00 | | .007 | | (.007) | | 1.00 | | .73 | | .60 | | .67 | | 20 |
| 2004 | | 1.00 | | .005 | | (.005) | | 1.00 | | .52 | | .60 | | .52 | | 19 |
| 2003 | | 1.00 | | .009 | | (.009) | | 1.00 | | .93 | | .60 | | .91 | | 16 |
| 2002 | | 1.00 | | .022 | | (.022) | | 1.00 | | 2.18 | | .60 | | 2.12 | | 16 |
a Annualized.
See notes to financial statements.
|
The Funds 57
F I N A N C I A L H I G H L I G H T S (continued)
| | | | | Per Share Data ($) | | | | Ratios/Supplemental Data (%) |
| |
| |
| |
| |
|
| | | | | | | | | | | | | | | Ratio of Net | | |
| | | Net Asset | | | | Dividends | | Net Asset | | | | Ratio of | | Investment | | Net Assets |
| | | Value | | Net | | from Net | | Value | | | | Expenses | | Income to | | End of |
| | | Beginning | | Investment | | Investment | | End | | Total | | to Average | | Average | | Period |
| | | of Period | | Income | | Income | | of Period | | Return (%) | | Net Assets | | Net Assets ($ x1,000,000) |
| |
| |
| |
| |
| |
| |
| |
|
| |
| Dreyfus New York Municipal Cash Management | | | | | | | | | | | | | | |
| Institutional Shares | | | | | | | | | | | | | | | | |
| Six Months Ended July 31, 2006 (Unaudited) | | 1.00 | | .016 | | (.016) | | 1.00 | | 3.23a | | .20a | | 3.20a | | 306 |
| Year Ended January 31, | | | | | | | | | | | | | | | | |
| 2006 | | 1.00 | | .023 | | (.023) | | 1.00 | | 2.36 | | .20 | | 2.33 | | 343 |
| 2005 | | 1.00 | | .011 | | (.011) | | 1.00 | | 1.10 | | .20 | | 1.12 | | 336 |
| 2004 | | 1.00 | | .009 | | (.009) | | 1.00 | | .88 | | .20 | | .89 | | 308 |
| 2003 | | 1.00 | | .013 | | (.013) | | 1.00 | | 1.26 | | .20 | | 1.25 | | 417 |
| 2002 | | 1.00 | | .024 | | (.024) | | 1.00 | | 2.41 | | .20 | | 2.24 | | 588 |
| Investor Shares | | | | | | | | | | | | | | | | |
| Six Months Ended July 31, 2006 (Unaudited) | | 1.00 | | .015 | | (.015) | | 1.00 | | 2.98a | | .45a | | 2.95a | | 131 |
| Year Ended January 31, | | | | | | | | | | | | | | | | |
| 2006 | | 1.00 | | .021 | | (.021) | | 1.00 | | 2.11 | | .45 | | 2.08 | | 125 |
| 2005 | | 1.00 | | .008 | | (.008) | | 1.00 | | .85 | | .45 | | .87 | | 71 |
| 2004 | | 1.00 | | .006 | | (.006) | | 1.00 | | .63 | | .45 | | .64 | | 28 |
| 2003 | | 1.00 | | .010 | | (.010) | | 1.00 | | 1.01 | | .45 | | 1.00 | | 21 |
| 2002 | | 1.00 | | .021 | | (.021) | | 1.00 | | 2.15 | | .45 | | 1.99 | | 17 |
| Administrative Shares | | | | | | | | | | | | | | | | |
| Six Months Ended July 31, 2006 (Unaudited) | | 1.00 | | .015 | | (.015) | | 1.00 | | 3.13a | | .30a | | 3.10a | | 39 |
| Year Ended January 31, | | | | | | | | | | | | | | | | |
| 2006 | | 1.00 | | .022 | | (.022) | | 1.00 | | 2.26 | | .30 | | 2.23 | | 8 |
| 2005 | | 1.00 | | .010 | | (.010) | | 1.00 | | 1.00 | | .30 | | 1.02 | | 1 |
| 2004 | | 1.00 | | .008 | | (.008) | | 1.00 | | .79 | | .30 | | .79 | | —b |
| 2003 | | 1.00 | | .011 | | (.011) | | 1.00 | | 1.15 | | .30 | | 1.15 | | 6 |
| 2002 | | 1.00 | | .023 | | (.023) | | 1.00 | | 2.30 | | .30 | | 2.14 | | 3 |
| Participant Shares | | | | | | | | | | | | | | | | |
| Six Months Ended July 31, 2006 (Unaudited) | | 1.00 | | .014 | | (.014) | | 1.00 | | 2.82a | | .60a | | 2.80a | | 3 |
| Year Ended January 31, | | | | | | | | | | | | | | | | |
| 2006 | | 1.00 | | .019 | | (.019) | | 1.00 | | 1.95 | | .60 | | 1.93 | | 3 |
| 2005 | | 1.00 | | .007 | | (.007) | | 1.00 | | .70 | | .60 | | .72 | | 6 |
| 2004 | | 1.00 | | .005 | | (.005) | | 1.00 | | .48 | | .60 | | .49 | | 2 |
| 2003 | | 1.00 | | .009 | | (.009) | | 1.00 | | .86 | | .60 | | .85 | | 2 |
| 2002 | | 1.00 | | .020 | | (.020) | | 1.00 | | 2.04 | | .60 | | 1.84 | | —b |
a Annualized.
b Amount represents less than $1 million.
See notes to financial statements.
|
58
| | | | | Per Share Data ($) | | | | Ratios/Supplemental Data (%) |
| |
| |
| |
| |
|
| | | | | | | | | | | | | | | Ratio of Net | | |
| | | Net Asset | | | | Dividends | | Net Asset | | | | Ratio of | | Investment | | Net Assets |
| | | Value | | Net | | from Net | | Value | | | | Expenses | | Income to | | End of |
| | | Beginning | | Investment | | Investment | | End | | Total | | to Average | | Average | | Period |
| | | of Period | | Income | | Income | | of Period | | Return (%) | | Net Assets | | Net Assets ($ x1,000,000) |
| |
| |
| |
| |
| |
| |
| |
|
| |
| Dreyfus Tax Exempt Cash Management | | | | | | | | | | | | | | |
| Institutional Shares | | | | | | | | | | | | | | | | |
| Six Months Ended July 31, 2006 (Unaudited) | | 1.00 | | .016 | | (.016) | | 1.00 | | 3.23a | | .20a | | 3.20a | | 2,598 |
| Year Ended January 31, | | | | | | | | | | | | | | | | |
| 2006 | | 1.00 | | .023 | | (.023) | | 1.00 | | 2.36 | | .20 | | 2.35 | | 2,645 |
| 2005 | | 1.00 | | .011 | | (.011) | | 1.00 | | 1.12 | | .20 | | 1.14 | | 2,510 |
| 2004 | | 1.00 | | .009 | | (.009) | | 1.00 | | .90 | | .20 | | .89 | | 1,934 |
| 2003 | | 1.00 | | .013 | | (.013) | | 1.00 | | 1.29 | | .20 | | 1.28 | | 2,073 |
| 2002 | | 1.00 | | .025 | | (.025) | | 1.00 | | 2.50 | | .20 | | 2.40 | | 1,880 |
| Investor Shares | | | | | | | | | | | | | | | | |
| Six Months Ended July 31, 2006 (Unaudited) | | 1.00 | | .015 | | (.015) | | 1.00 | | 2.96a | | .45a | | 2.95a | | 297 |
| Year Ended January 31, | | | | | | | | | | | | | | | | |
| 2006 | | 1.00 | | .021 | | (.021) | | 1.00 | | 2.11 | | .45 | | 2.10 | | 255 |
| 2005 | | 1.00 | | .009 | | (.009) | | 1.00 | | .87 | | .45 | | .89 | | 240 |
| 2004 | | 1.00 | | .006 | | (.006) | | 1.00 | | .65 | | .45 | | .64 | | 122 |
| 2003 | | 1.00 | | .010 | | (.010) | | 1.00 | | 1.04 | | .45 | | 1.03 | | 119 |
| 2002 | | 1.00 | | .022 | | (.022) | | 1.00 | | 2.25 | | .45 | | 2.15 | | 195 |
| Administrative Shares | | | | | | | | | | | | | | | | |
| Six Months Ended July 31, 2006 (Unaudited) | | 1.00 | | .015 | | (.015) | | 1.00 | | 3.13a | | .30a | | 3.10a | | 133 |
| Year Ended January 31, | | | | | | | | | | | | | | | | |
| 2006 | | 1.00 | | .022 | | (.022) | | 1.00 | | 2.26 | | .30 | | 2.25 | | 105 |
| 2005 | | 1.00 | | .010 | | (.010) | | 1.00 | | 1.02 | | .30 | | 1.04 | | 275 |
| 2004 | | 1.00 | | .008 | | (.008) | | 1.00 | | .80 | | .30 | | .79 | | 312 |
| 2003 | | 1.00 | | .012 | | (.012) | | 1.00 | | 1.19 | | .30 | | 1.18 | | 185 |
| 2002 | | 1.00 | | .024 | | (.024) | | 1.00 | | 2.40 | | .30 | | 2.30 | | 7 |
| Participant Shares | | | | | | | | | | | | | | | | |
| Six Months Ended July 31, 2006 (Unaudited) | | 1.00 | | .014 | | (.014) | | 1.00 | | 2.82a | | .60a | | 2.80a | | 32 |
| Year Ended January 31, | | | | | | | | | | | | | | | | |
| 2006 | | 1.00 | | .019 | | (.019) | | 1.00 | | 1.96 | | .60 | | 1.95 | | 42 |
| 2005 | | 1.00 | | .007 | | (.007) | | 1.00 | | .72 | | .60 | | .74 | | 19 |
| 2004 | | 1.00 | | .005 | | (.005) | | 1.00 | | .50 | | .60 | | .49 | | 46 |
| 2003 | | 1.00 | | .009 | | (.009) | | 1.00 | | .89 | | .60 | | .88 | | 139 |
| 2002 | | 1.00 | | .021 | | (.021) | | 1.00 | | 2.10 | | .60 | | 2.00 | | 151 |
| | a Annualized.
See notes to financial statements.
|
The Funds 59
NOTES TO FINANCIAL STATEMENTS (Unaudited)
NOTE 1—Significant Accounting Policies:
Dreyfus Cash Management, Dreyfus Cash Management Plus, Inc., Dreyfus Government Cash Management, Dreyfus Government Prime Cash Management, Dreyfus Treasury Cash Management, Dreyfus Treasury Prime Cash Management, Dreyfus Municipal Cash Management Plus, Dreyfus New York Municipal Cash Management and Dreyfus Tax Exempt Cash Management, (each, a "fund" and collectively, the "funds") are open-end management investment companies registered under the Investment Company Act of 1940, as amended (the "Act"). Each fund, other than Dreyfus New York Municipal Cash Management, is diversified. Dreyfus New York Municipal Cash Management is non-diversified. Dreyfus Government Cash Management and Dreyfus Government Prime Cash Management are each a separate series of Dreyfus Government Cash Management Funds (the "Company") which currently offers two series. Each fund's investment objective is to provide investors with as high a level of current income as is consistent with the preservation of capital and the maintenance of liquidity and, in the case of Dreyfus Municipal Cash Management Plus and Dreyfus Tax Exempt Cash Management only, which is exempt from federal income tax, and, in the case of Dreyfus New York Municipal Cash Management only, which is exempt from federal, New York state and New York city personal income taxes. The Dreyfus Corporation (the "Manager" or "Dreyfus") serves as each fund's investment adviser. The Manager is a wholly-owned subsidiary of Mellon Financial Corporation ("Mellon Financial").
Dreyfus Service Corporation (the "Distributor"), a wholly-owned subsidiary of the Manager, is the distributor of the funds' shares, which are sold to the public without a sales charge. Each fund offers the following classes of shares: Institutional Shares, Investor Shares,Administrative Shares and Participant Shares. Investor Shares, Administrative Shares and Participant Shares are subject to a Service Plan adopted pursuant to Rule 12b-1 under the Act. Other differences between the classes include the services offered to and the expenses borne by each class and certain voting rights. Income, expenses (other than expenses attributable to a specific class), and realized and unrealized gains or losses on investments are allocated to each class of shares based on its relative net assets.
It is each fund's policy to maintain a continuous net asset value per share of $1.00; each fund has adopted certain investment, portfolio valuation and dividend and distribution policies to enable it to do so.There is no assurance, however, that any fund will be able to maintain a stable net asset value per share of $1.00.
Each fund's financial statements are prepared in accordance with U.S. generally accepted accounting principles, which may require the use of management estimates and assumptions. Actual results could differ from those estimates.
The funds enter into contracts that contain a variety of indemnifications.The funds' maximum exposure under these arrangements is unknown. The funds do not anticipate recognizing any loss related to these arrangements.
(a) Portfolio valuation: Investments in securities are valued at amortized cost in accordance with Rule 2a-7 of the Act, which has been determined by the Board members to represent the fair value of each fund's investments.
(b) Securities transactions and investment income:Securities transactions are recorded on a trade date basis. Realized gain and loss from securities transactions are recorded on the identified cost basis. Interest income, adjusted for accretion of discount and amortization of premium on investments, is earned from settlement date and recognized on the accrual basis. Cost of investments represents amortized cost.
Dreyfus New York Municipal Cash Management follows an investment policy of investing primarily in municipal obligations of one state. Economic changes affecting the state and certain of its public bodies and municipalities may affect the ability of issuers within the state to pay interest on, or repay principal of, municipal obligations held by the fund.
Dreyfus Cash Management, Dreyfus Cash Management Plus, Inc., Dreyfus Government Cash Management and Dreyfus Treasury Cash Management may enter into repurchase agreements with financial institutions, deemed to be creditworthy by the Manager, subject to the seller's agreement to repurchase and the fund's agreement to resell such securities at a mutually agreed upon price. Securities purchased subject to repurchase agreements are deposited with the funds' custodians and, pur-
60
suant to the terms of the repurchase agreement, must have an aggregate market value greater than or equal to the repurchase price plus accrued interest at all times. If the value of the underlying securities falls below the value of the repurchase price plus accrued interest, the fund will require the seller to deposit additional collateral by the next business day. If the request for additional collateral is not met, or the seller defaults on its repurchase obligation, the fund maintains the right to sell the underlying securities at market value and may claim any resulting loss against the seller.
(c) Expenses:With regards to the Company, expenses directly attributable to each series are charged to that series' operations; expenses which are applicable to both series are allocated between them.
(d) Dividends to shareholders: It is the policy of each fund to declare dividends from investment income-net on each business day. Such dividends are paid monthly. Dividends from net realized capital gain, if any, are normally declared and paid annually, but each fund may make distributions on a more frequent basis to comply with the distribution requirements of the Internal Revenue Code of 1986, as amended (the "Code"). To the extent that net realized capital gain can be offset by capital loss carryovers, it is the policy of each fund not to distribute such gain.
(e) Federal income taxes: It is the policy of each fund (except for Dreyfus Municipal Cash Management Plus, Dreyfus New York Municipal Cash Management and Dreyfus Tax Exempt Cash Management) to continue to qualify as a regulated investment company, if such qualification is in the best interests of its shareholders, by complying with the applicable provisions of the Code and to make distributions of taxable income sufficient to relieve it from substantially all federal income and excise taxes.
On July 13, 2006, the Financial Accounting Standards Board (FASB) released FASB Interpretation No. 48 "Accounting for Uncertainty in Income Taxes" (FIN 48). FIN 48 provides guidance for how uncertain tax positions should be recognized, measured, presented and disclosed in the financial statements. FIN 48 requires the evaluation of tax positions taken or expected to be taken in the course of preparing each fund's tax returns to determine whether the tax positions are "more-likely-than-not" of being sustained by the applicable tax authority.Tax positions not deemed to meet the more-likely-than-not threshold would be recorded as a tax benefit or expense in the current year.Adoption of FIN 48 is required for fiscal years beginning after December 15, 2006 and is to be applied to all open tax years as of the effective date.At this time, management is evaluating the implications of FIN 48 and its impact in the financial statements has not yet been determined.
It is the policy of Dreyfus Municipal Cash Management Plus, Dreyfus New York Municipal Cash Management and Dreyfus Tax Exempt Cash Management to continue to qualify as a regulated investment company, which can distribute tax exempt dividends, by complying with the applicable provisions of the Code and to make distributions of income sufficient to relieve it from substantially all federal income and excise taxes.
Table 1 summarizes each fund's unused capital loss carryover available for federal income tax purposes to be applied against future net securities profits, if any, realized subsequent to January 31, 2006.
| Table 1. | | | | | | | | | | | | | | |
| |
| |
| |
| |
| |
| |
| |
|
| |
| | | | | | | Expiring in fiscal: | | | | ($ x 1,000) |
| |
| |
| |
| |
| |
|
| | | 2008† | | 2009† | | 2011† | | 2012† | | 2013† | | 2014† | | Total |
| Dreyfus Cash Management | | — | | — | | — | | — | | 18 | | 1,538 | | 1,556 |
| Dreyfus Cash Management Plus, Inc. | | — | | — | | — | | — | | 562 | | 7,999 | | 8,561 |
| Dreyfus Government Cash Management | | — | | — | | — | | 172 | | — | | 2,628 | | 2,800 |
| Dreyfus Government Prime Cash Management | | — | | — | | — | | — | | 1 | | — | | 1 |
| Dreyfus Treasury Cash Management | | — | | — | | — | | — | | 13 | | 39 | | 52 |
| Dreyfus Treasury Prime Cash Management | | — | | 61 | | — | | 70 | | 107 | | 65 | | 303 |
| Dreyfus Municipal Cash Management Plus | | — | | — | | — | | — | | — | | 2 | | 2 |
| Dreyfus Tax Exempt Cash Management | | 59 | | — | | — | | — | | — | | 16 | | 75 |
† If not applied, the carryovers expire in the above years.
The Funds 61
NOTES TO FINANCIAL STATEMENTS (Unaudited) (continued)
The tax character of each fund's distributions paid to shareholders (except for Dreyfus Municipal Cash Management Plus, Dreyfus New York Municipal Cash Management and Dreyfus Tax Exempt Cash Management) during the fiscal year ended January 31, 2006, were all ordinary income. The tax character of current year distributions will be determined at the end of the current fiscal year.
The tax character of distributions paid to shareholders of Dreyfus Municipal Cash Management Plus, Dreyfus New York Municipal Cash Management and Dreyfus Tax Exempt Cash Management during the fiscal year ended January 31, 2006, were all tax exempt income.The tax character of current year distributions will be determined at the end of the current fiscal year.
At July 31, 2006, the cost of investments for federal income tax purposes was substantially the same as the cost for financial reporting purposes (see the Statements of Investments).
NOTE 2—Management Fee and Other Transactions with Affiliates:
(a) Pursuant to separate management agreements with the Manager, the management fee of each fund is computed at the annual rate of .20% of the value of such fund's average daily net assets and is payable monthly.
As to each fund, unless the Manager gives a fund's investors 90 days notice to the contrary, the Manager, and not the fund, will be liable for fund expenses (exclusive of taxes, brokerage fees, interest on borrowings and extraordinary expenses) other than the following expenses, which will be borne by the fund: the management fee, and with respect to the fund's Investor Shares, Administrative Shares and Participant Shares, Rule 12b-1 Service Plan expenses.
(b) Under each fund's Service Plan (the "Plan") adopted pursuant to Rule 12b-1 under the Act, relating to its Investor Shares,Administrative Shares and Participant Shares, each fund pays the Distributor for distributing such classes of shares, for advertising and marketing relating to such classes of shares, for providing certain services relating to shareholder accounts in such classes of shares, such as answering shareholder inquiries regarding the fund and providing reports and other information and services related to the maintenance of shareholder accounts ("Servicing"), at an aggregate annual rate of .25%, .10% and .40% of the value of the average daily net assets of Investor Shares, Administrative Shares and Participant Shares, respectively. The Distributor may pay one or more Service Agents (a securities dealer, financial institution or other industry professional) a fee in respect of a fund's Investor Shares, Administrative Shares and Participant Shares owned by shareholders with whom the Service Agent has a Servicing relationship or for whom the Service Agent is the dealer or holder of record.The Distributor determines the amounts, if any, to be paid to Service Agents under the Plan and the basis on which such payments are made.The fees payable under each Plan are payable without regard to actual expenses incurred. Table 2 summarizes the amount each fund was charged pursuant to the Plan during the period ended July 31, 2006.
| Table 2. | | | | | | |
| |
| |
| |
|
| |
| | | Investor | | Administrative | | Participant |
| | | Shares ($) | | Shares ($) | | Shares ($) |
| |
| |
| |
|
| Dreyfus Cash Management | | 1,415,350 | | 156,266 | | 457,439 |
| Dreyfus Cash Management Plus, Inc. | | 1,528,408 | | 404,496 | | 1,279,920 |
| Dreyfus Government Cash Management | | 1,154,183 | | 134,763 | | 492,860 |
| Dreyfus Government Prime Cash Management | | 315,013 | | 100,224 | | 514,701 |
| Dreyfus Treasury Cash Management | | 1,621,495 | | 43,517 | | 436,703 |
| Dreyfus Treasury Prime Cash Management | | 748,200 | | 7,263 | | 409,853 |
| Dreyfus Municipal Cash Management Plus | | 185,769 | | 76,725 | | 49,519 |
| Dreyfus New York Municipal Cash Management | | 159,285 | | 10,958 | | 5,973 |
| Dreyfus Tax Exempt Cash Management | | 323,148 | | 64,241 | | 69,783 |
62
Table 3 summarizes the components of Due to The Dreyfus Corporation and affiliates in the Statements of Assets and Liabilities for each fund.
(c) Each fund (except for Dreyfus New York Municipal Cash Management) pays its Board members an annual fee of $3,000 and an attendance fee of $500 per meeting. Dreyfus New York Municipal Cash Management pays its Board members an annual fee of $1,000 and an attendance fee of $500 per meeting. These amounts are borne by the Manager as to each fund pursuant to the undertakings in effect. See Note 2(a).
NOTE 3—Capital Share Transactions:
Each fund (except for Dreyfus Cash Management Plus, Inc.) is authorized to issue an unlimited number of $.001 par value shares of Beneficial Interest. Dreyfus Cash Management Plus, Inc. is authorized to issue 90 billion shares of $.001 par value Common Stock.
| Table 3. | | | | |
| |
| |
|
| |
| | | Management | | Rule 12b-1 |
| | | Fees ($) | | Service Plan Fees ($) |
| |
| |
|
| Dreyfus Cash Management | | 2,135,396 | | 311,369 |
| Dreyfus Cash Management Plus, Inc. | | 1,624,269 | | 585,286 |
| Dreyfus Government Cash Management | | 787,207 | | 278,449 |
| Dreyfus Government Prime Cash Management | | 317,582 | | 170,026 |
| Dreyfus Treasury Cash Management | | 779,039 | | 414,702 |
| Dreyfus Treasury Prime Cash Management | | 287,414 | | 165,414 |
| Dreyfus Municipal Cash Management Plus | | 139,543 | | 56,123 |
| Dreyfus New York Municipal Cash Management | | 77,652 | | 31,602 |
| Dreyfus Tax Exempt Cash Management | | 332,984 | | 85,048 |
The Funds 63
| | INFORMATION ABOUT THE REVIEW AND APPROVAL
OF EACH FUND'S I N V E S T M E N T M A N A G E M E N T A G R E E M E N T (Unaudited)
|
ALL CASH MANAGEMENT FUNDS
At a Joint Meeting of the Board of each fund held on May 25, 2006, the Board considered the re-approval for an annual period of each fund's Management Agreement, pursuant to which the Manager provides each fund with investment advisory and administrative services. The Board members, none of whom are "interested persons" (as defined in the Investment Company Act of 1940, as amended) of the funds, were assisted in their review by independent legal counsel and met with counsel in executive session separate from representatives of the Manager.
Analysis of Nature, Extent, and Quality of Services Provided to each Fund. The Board members received a presentation from representatives of the Manager regarding services provided to each fund and other funds in the Dreyfus fund complex, and discussed the nature, extent, and quality of the services provided to each fund pursuant to each fund's Management Agreement. The Manager's representatives reviewed each fund's distribution of accounts and the relationships that the Manager has with various intermediaries and the different needs of each. The Manager's representatives noted the sales and servicing support provided by Dreyfus Investments Division to each fund, the diversity of distribution of the funds in the Dreyfus complex generally, and the Manager's need for broad, deep, and diverse resources to be able to provide ongoing shareholder services in each distribution channel. The Board also reviewed the number of shareholder accounts in each fund, as well as each fund's asset size.
The Board members also considered the Manager's research and portfolio management capabilities and that the Manager also provides oversight of day-to-day fund operations, including fund accounting and administration and assistance in meeting legal and regulatory requirements.The Board members also considered the Manager's extensive administrative, accounting, and compliance infrastructure.
Comparative Analysis of Each Fund's Management Fee and Expense Ratio and Performance. The Board members reviewed reports prepared by Lipper, Inc., an independent provider of investment company data, which included information comparing each fund's management fee and expense ratio (based on each fund's Institutional Shares) with a group of comparable funds (the "Expense Group") and with a broader group of funds (the "Expense Universe") that were selected by Lipper. Included in each fund's reports were comparisons of contractual and actual management fee rates and total operating expenses.
The Board members also reviewed the reports prepared by Lipper that presented each fund's performance (based on each fund's Institutional Shares) for various periods ended March 31, 2006, and placed significant emphasis on comparisons of total return performance for each fund to the same group of funds as the fund's Expense Group (the "Performance Group") and to a group of funds that was broader than the fund's Expense Universe (the "Performance Universe") that also were selected by Lipper.The Manager furnished these reports to the Board along with a description of the methodology Lipper used to select each Expense Group and Expense Universe, and Performance Group and Performance Universe.
DREYFUS CASH MANAGEMENT
The Board reviewed the results of the Expense Group and Expense Universe comparisons for various periods ended March 31, 2006. The Board reviewed the range of management fees and expense ratios of the funds in the Expense Group and Expense Universe, and noted that the fund's contractual and actual management fees were lower and higher than the respective Expense Group medians.The Board also noted that the fund's total expense ratio was slightly higher than the Expense Group median and lower than the Expense Universe median.
With respect to the fund's performance, the Board noted that the fund achieved total return results lower than the Performance Group median and higher than the Performance Universe median, for each reported time period up to 10 years. The Board noted the narrow spread in the returns among the fund and the Performance Group funds for each reported time period, the portfolio manager's explanation of how the fund's weighted average maturity was managed over the past two years, and the portfolio manager's historical track record in managing the fund.
Representatives of the Manager reviewed with the Board members the fees paid to the Manager or its affiliates by mutual
64
funds managed by the Manager or its affiliates that were reported in the same Lipper category as the fund (the "Similar Funds"), and explained the nature of the Similar Funds and the differences, from the Manager's perspective, in providing services to the Similar Funds as compared to the fund.The Board members noted that the Similar Funds included funds used primarily as sweep vehicles for asset management accounts as well as funds with investment minimums ranging from $100,000 to $1 billion. The Manager's representatives also reviewed the costs associated with distribution through inter-mediaries.The Board discussed the relationship of the management fees paid in light of the Manager's performance, and the services provided. The Board members considered the relevance of the fee information provided for each Similar Fund to evaluate the appropriateness and reasonableness of the fund's management fee. The Manager's representatives noted that there were no similarly managed separate accounts or wrap fee accounts managed by the Manager or its affiliates with similar investment objectives, policies, and strategies as the fund.
DREYFUS CASH MANAGEMENT PLUS, INC.
The Board reviewed the results of the Expense Group and Expense Universe comparisons for various periods ended March 31, 2006. The Board reviewed the range of management fees and expense ratios of the funds in the Expense Group and Expense Universe, and noted that the fund's contractual and actual management fees were lower and higher than the respective Expense Group medians.The Board also noted that the fund's total expense ratio was slightly higher than the Expense Group median and lower than the Expense Universe median.
With respect to the fund's performance, the Board noted that the fund achieved various total returns generally at or several basis points lower than the Performance Group median, and higher than the Performance Universe median, for each reported time period up to 10 years.The Board noted the narrow spread in the returns among the fund and the Performance Group funds for each reported time period, the portfolio manager's explanation of how the fund's weighted average maturity was managed over the past two years, and the portfolio manager's historical track record in managing the fund.
Representatives of the Manager reviewed with the Board members the fees paid to the Manager or its affiliates by Similar Funds, and explained the nature of the Similar Funds and the differences, from the Manager's perspective, in providing services to the Similar Funds as compared to the fund.The Board members noted that the Similar Funds included funds used primarily as sweep vehicles for asset management accounts as well as funds with investment minimums ranging from $100,000 to $1 billion.The Manager's representatives also reviewed the costs associated with distribution through inter-mediaries.The Board discussed the relationship of the management fees paid in light of the Manager's performance, and the services provided. The Board members considered the relevance of the fee information provided for each Similar Fund to evaluate the appropriateness and reasonableness of the fund's management fee. The Manager's representatives noted that there were no similarly managed separate accounts or wrap fee accounts managed by the Manager or its affiliates with similar investment objectives, policies, and strategies as the fund.
DREYFUS GOVERNMENT CASH MANAGEMENT
The Board reviewed the results of the Expense Group and Expense Universe comparisons for various periods ended March 31, 2006. The Board reviewed the range of management fees and expense ratios of the funds in the Expense Group and Expense Universe, and noted that the fund's contractual and actual management fees were lower and higher than the respective Expense Group medians.The Board also noted that the fund's total expense ratio was at the Expense Group median and lower than the Expense Universe median.
With respect to the fund's performance, the Board noted that the fund achieved various total return results at, or within a few basis points lower or higher than, the Performance Group median, and higher than the Performance Universe median, for each reported time period up to 10 years. The Board noted the narrow spread in the returns among the fund and the Performance Group funds for each reported time period, the portfolio manager's explanation of how the fund's weighted average maturity was managed over the past two years, and the portfolio manager's historical track record in managing the fund.
The Funds 65
| | INFORMATION ABOUT THE REVIEW AND APPROVAL
OF EACH FUND'S INVESTMENT MANAGEMENT AGREEMENT (Unaudited) (continued)
|
Representatives of the Manager reviewed with the Board members the fees paid to the Manager or its affiliates by Similar Fund, and explained the nature of the Similar Funds and the differences, from the Manager's perspective, in providing services to the Similar Funds as compared to the fund.The Manager's representatives also reviewed the costs associated with distribution through intermediaries.The Board discussed the relationship of the management fees paid in light of the Manager's performance, and the services provided.The Board members considered the relevance of the fee information provided for each Similar Fund to evaluate the appropriateness and reasonableness of the fund's management fee. The Manager's representatives noted that there were no similarly managed separate accounts or wrap fee accounts managed by the Manager or its affiliates with similar investment objectives, policies, and strategies as the fund.
DREYFUS GOVERNMENT PRIME CASH MANAGEMENT
The Board reviewed the results of the Expense Group and Expense Universe comparisons for various periods ended March 31, 2006. The Board reviewed the range of management fees and expense ratios of the funds in the Expense Group and Expense Universe, and noted that the fund's contractual and actual management fees were lower and higher than the respective Expense Group medians.The Board also noted that the fund's total expense ratio was at the Expense Group median and lower than the Expense Universe median.
With respect to the fund's performance, the Board noted that the fund achieved various total return results a few basis points lower than the Performance Group median, and above the Performance Universe median, for each reported time period up to 5 years.The Board noted the narrow spread in the returns among the fund and the Performance Group funds for each reported time period, the portfolio manager's explanation of how the fund's weighted average maturity was managed over the past two years, and the portfolio manager's historical track record in managing the fund.
Representatives of the Manager reviewed with the Board members the fees paid to the Manager or its affiliates by Similar Funds, and explained the nature of the Similar Funds and the differences, from the Manager's perspective, in providing services to the Similar Funds as compared to the fund.
The Manager's representatives also reviewed the costs associated with distribution through intermediaries.The Board discussed the relationship of the management fees paid in light of the Manager's performance, and the services provided.The Board members considered the relevance of the fee information provided for each Similar Fund to evaluate the appropriateness and reasonableness of the fund's management fee.The Manager's representatives noted that there were no similarly managed separate accounts or wrap fee accounts managed by the Manager or its affiliates with similar investment objectives, policies, and strategies as the fund.
DREYFUS TREASURY CASH MANAGEMENT
The Board reviewed the results of the Expense Group and Expense Universe comparisons for various periods ended March 31, 2006. The Board reviewed the range of management fees and expense ratios of the funds in the Expense Group and Expense Universe, and noted that the fund's contractual and actual management fees were at and higher than the respective Expense Group medians.The Board also noted that the fund's total expense ratio was at the Expense Group median and lower than the Expense Universe median.
With respect to the fund's performance, the Board noted that the fund achieved various total return results slightly lower than the Performance Group median, and higher than the Performance Universe median, for each reported time period up to 10 years. The Board noted the narrow spread in the returns among the fund and the Performance Group funds for each reported time period, the portfolio manager's explanation of how the fund's weighted average maturity was managed over the past two years, and the portfolio manager's historical track record in managing the fund.
Representatives of the Manager reviewed with the Board members the fees paid to the Manager or its affiliates by Similar Funds, and explained the nature of the Similar Funds and the differences, from the Manager's perspective, in providing services to the Similar Funds as compared to the fund. The Board members noted that the Similar Funds included funds used primarily as a sweep vehicle for asset management accounts as well as funds with investment minimums close to or the same as that of the fund.The Manager's representatives also reviewed the costs associated with distribution through
66
intermediaries. The Board discussed the relationship of the management fees paid in light of the Manager's performance, and the services provided. The Board members considered the relevance of the fee information provided for each Similar Fund to evaluate the appropriateness and reasonableness of the fund's management fee.The Manager's representatives noted that there were no similarly managed separate accounts or wrap fee accounts managed by the Manager or its affiliates with similar investment objectives, policies, and strategies as the fund.
DREYFUS TREASURY PRIME CASH MANAGEMENT
The Board reviewed the results of the Expense Group and Expense Universe comparisons for various periods ended March 31, 2006. The Board reviewed the range of management fees and expense ratios of the funds in the Expense Group and Expense Universe, and noted that the fund's contractual and actual management fees were lower and higher than the respective Expense Group medians.The Board also noted that the fund's total expense ratio was at the Expense Group median and lower than the Expense Universe median.
With respect to the fund's performance, the Board noted that the fund achieved total return results generally at or higher than the Performance Group and Performance Universe median for each reported time period up to 10 years. The Board noted the narrow spread in the returns among the fund and the Performance Group funds for each reported time period, the portfolio manager's explanation of how the fund's maturity was managed over the past two years, and the portfolio manager's historical track record in managing the Fund.
Representatives of the Manager reviewed with the Board members the fees paid to the Manager or its affiliates by Similar Funds, and explained the nature of the Similar Funds and the differences, from the Manager's perspective, in providing services to the Similar Funds as compared to the fund. The Board members noted that the Similar Funds included funds used primarily as a sweep vehicle for asset management accounts as well as funds with investment minimums close to or the same as that of the fund.The Manager's representatives also reviewed the costs associated with distribution through intermediaries. The Board discussed the relationship of the management fees paid in light of the Manager's performance,
and the services provided. The Board members considered the relevance of the fee information provided for each Similar Fund to evaluate the appropriateness and reasonableness of the fund's management fee.The Manager's representatives noted that there were no similarly managed separate accounts or wrap fee accounts managed by the Manager or its affiliates with similar investment objectives, policies, and strategies as the fund.
DREYFUS TAX EXEMPT CASH MANAGEMENT
The Board reviewed the results of the Expense Group and Expense Universe comparisons for various periods ended March 31, 2006. The Board reviewed the range of management fees and expense ratios of the funds in the Expense Group and Expense Universe, and noted that the fund's contractual and actual management fees were lower and higher than the respective Expense Group medians.The Board also noted that the fund's total expense ratio was at the Expense Group median and lower than the Expense Universe median.
With respect to the fund's performance, the Board noted that the fund achieved various first and second quintile (the first quintile reflecting the highest performance ranking group) total return rankings among its Performance Group and Performance Universe for each reported time period up to 10 years.
Representatives of the Manager reviewed with the Board members the fees paid to the Manager or its affiliates by Similar Funds, and explained the nature of the Similar Funds and the differences, from the Manager's perspective, in providing services to the Similar Funds as compared to the fund. The Board members noted that the Similar Funds included one fund used primarily as a sweep vehicle for asset management accounts as well as other funds with investment minimums close to or the same as that of the fund.The Manager's representatives also reviewed the costs associated with distribution through intermediaries.The Board discussed the relationship of the management fees paid in light of the Manager's performance, and the services provided.The Board members considered the relevance of the fee information provided for each Similar Fund to evaluate the appropriateness and reasonableness of the fund's management fee. The Manager's representatives noted that there were no similarly
The Funds 67
| | INFORMATION ABOUT THE REVIEW AND APPROVAL
OF EACH FUND'S INVESTMENT MANAGEMENT AGREEMENT (Unaudited) (continued)
|
managed separate accounts or wrap fee accounts managed by the Manager or its affiliates with similar investment objectives, policies, and strategies as the fund.
DREYFUS MUNICIPAL CASH MANAGEMENT PLUS
The Board reviewed the results of the Expense Group and Expense Universe comparisons for various periods ended March 31, 2006. The Board reviewed the range of management fees and expense ratios of the funds in the Expense Group and Expense Universe, and noted that the fund's contractual and actual management fees were lower and just higher than the respective Expense Group medians. The Board also noted that the fund's total expense ratio was lower than Expense Group and the Expense Universe medians.
With respect to the fund's performance, the Board noted that the fund achieved first quintile total return rankings among its Performance Group and Performance Universe for each reported time period up to 10 years.
Representatives of the Manager reviewed with the Board members the fees paid to the Manager or its affiliates by Similar Funds, and explained the nature of the Similar Funds and the differences, from the Manager's perspective, in providing services to the Similar Funds as compared to the fund.The Board members noted that the Similar Funds included one fund used primarily as a sweep vehicle for asset management accounts as well as other funds with investment minimums close to or the same as that of the fund. The Manager's representatives also reviewed the costs associated with distribution through inter-mediaries.The Board discussed the relationship of the management fees paid in light of the Manager's performance, and the services provided.The Board members considered the relevance of the fee information provided for each Similar Fund to evaluate the appropriateness and reasonableness of the fund's management fee. The Manager's representatives noted that there were no similarly managed separate accounts or wrap fee accounts managed by the Manager or its affiliates with similar investment objectives, policies, and strategies as the fund.
DREYFUS NEW YORK MUNICIPAL CASH MANAGEMENT
The Board reviewed the results of the Expense Group and Expense Universe comparisons for various periods ended March 31, 2006. The Board reviewed the range of management fees and expense ratios of the funds in the Expense Group and Expense Universe, and noted that the fund's contractual and actual management fees were lower than the respective Expense Group medians. The Board also noted that the fund's total expense ratio was lower than the Expense Group and Expense Universe medians.
With respect to the fund's performance, the Board noted that the fund achieved first quintile total return rankings among its Performance Group and Performance Universe for each reported time period up to 10 years.
Representatives of the Manager reviewed with the Board members the fees paid to the Manager or its affiliates by Similar Funds, and explained the nature of the Similar Funds and the differences, from the Manager's perspective, in providing services to the Similar Funds as compared to the fund. The Board members noted that the Similar Funds included one fund used primarily as a sweep vehicle for asset management accounts as well as two other retail funds.The Manager's representatives also reviewed the costs associated with distribution through intermediaries. The Board discussed the relationship of the management fees paid in light of the Manager's performance, and the services provided. The Board members considered the relevance of the fee information provided for each Similar Fund to evaluate the appropriateness and reasonableness of the fund's management fee. The Manager's representatives noted that there were no similarly managed separate accounts or wrap fee accounts managed by the Manager or its affiliates with similar investment objectives, policies, and strategies as the fund.
Analysis of Profitability and Economies of Scale.The Manager's representatives reviewed the dollar amount of expenses allocated and profit received by the Manager for each fund and the method used to determine such expenses and profit.The Board considered information, previously provided and discussed, prepared by an independent consulting firm regarding the Manager's approach to allocating costs to, and determining the profitability of, individual funds and the entire Dreyfus mutual fund complex. The Board members also considered that the methodology had also been reviewed by an independent registered public accounting firm which, like the consultant, found the methodology to be reasonable. The consulting firm also analyzed where any economies of scale might emerge in connection with the management of a fund. The Board members evaluated the profitability analysis in light of the relevant circumstances for each fund, including any decline in fund assets from the prior year, and the extent to which economies of scale would be realized if the fund grows and whether fee levels reflect these economies of scale for the benefit of fund share-holders.The Board members also considered potential benefits to the Manager from acting as investment adviser to each fund and noted that there were no soft dollar arrangements in effect with respect to trading any fund's portfolio.
68
It was noted that the Board members should consider the Manager's profitability with respect to each fund as part of their evaluation of whether the fees under the Management Agreement bear a reasonable relationship to the mix of services provided by the Manager, including the nature, extent, and quality of such services and that a discussion of economies of scale is predicated on increasing assets and that, if a fund's assets had been decreasing, the possibility that the Manager may have realized any economies of scale would be less. It was noted that the profitability percentage for managing the fund was within ranges determined by appropriate court cases to be reasonable given the services rendered and each fund's overall performance and generally superior service levels provided. The Board also noted the Manager's absorption of certain expenses of each fund over the past year and its effect on the profitability of the Manager.
At the conclusion of these discussions, each Board member expressed the opinion that he or she had been furnished with sufficient information to make an informed business decision with respect to continuation of each fund's Management Agreement. Based on their discussions and considerations as described above, each fund's Board made the following conclusions and determinations, as indicated.
- The Board concluded that the nature, extent, and quality of the services provided by the Manager to each fund are adequate and appropriate.
- As to each Taxable Dreyfus Cash Management Fund, the Board was satisfied with each fund's overall performance, noting the narrow spreads in returns among each fund and its respective Expense Group and Performance Group, and the portfolio manager's explanation of each fund's maturity strategy over the past two years and historical track record in managing each fund.
- As to each Tax Exempt Dreyfus Cash Management Fund, the Board was satisfied with each fund's performance.
- The Board concluded that the fee paid to the Manager by each fund was reasonable in light of the services provided, comparative performance and expense and management fee information, including the Manager's undertakings to limit each fund's expense ratio (which reduced the expense ratio of each fund), costs of the services provided and profits to be realized and benefits derived or to be derived by the Manager from its relationship with each fund.
- The Board determined that, given the characteristics of each fund, it was difficult to specifically identify any economies of scale that might be realized merely through increase in the size of a fund. The Board noted that it appeared that the benefits of any economies of scale would be appropriately shared with shareholders through increased investment in fund management and administration resources.
The Board members considered these conclusions and determinations, along with the information received on a routine and regular basis throughout the year, and, without any one factor being dispositive, the Board determined that re-approval of each fund's Management Agreement was in the best interests of the fund and its shareholders.
The Funds 69
NOTES
For More Information
Telephone Call your Dreyfus Investments Division representative or 1-800-346-3621
E-mail Access Dreyfus Investments Division at www.dreyfus.com.
You can obtain product information and E-mail requests for information or literature.
Mail Dreyfus Investments Division, 144 Glenn Curtiss Boulevard, Uniondale, NY 11556-0144
|
The fund files its complete schedule of portfolio holdings with the Securities and Exchange Commission ("SEC") for the first and third quarters of each fiscal year on Form N-Q. The fund's Forms N-Q are available on the SEC's website at http://www.sec.gov and may be reviewed and copied at the SEC's Public Reference Room in Washington, DC. Information on the operation of the Public Reference Room may be obtained by calling 1-202-551-8090.
Information regarding how the fund voted proxies relating to portfolio securities for the 12-month period ended June 30, 2006, is available on the SEC's website at http://www.sec.gov and without charge, upon request, by calling 1-800-645-6561.

© 2006 Dreyfus Service Corporation CMGTSA0706
| Item 2. | | Code of Ethics. |
| | | Not applicable. |
| Item 3. | | Audit Committee Financial Expert. |
| | | Not applicable. |
| Item 4. | | Principal Accountant Fees and Services. |
| | | Not applicable. |
| Item 5. | | Audit Committee of Listed Registrants. |
| | | Not applicable. |
| Item 6. | | Schedule of Investments. |
| | | Not applicable. |
| Item 7. | | Disclosure of Proxy Voting Policies and Procedures for Closed-End Management |
| | | Investment Companies. |
| | | Not applicable. |
| Item 8. | | Portfolio Managers of Closed-End Management Investment Companies. |
| | | Not applicable. |
| Item 9. | | Purchases of Equity Securities by Closed-End Management Investment Companies and |
| | | Affiliated Purchasers. |
| | | Not applicable. [CLOSED-END FUNDS ONLY] |
| Item 10. | | Submission of Matters to a Vote of Security Holders. |
The Registrant has a Nominating Committee (the "Committee"), which is responsible for selecting and nominating persons for election or appointment by the Registrant's Board as Board members. The Committee has adopted a Nominating Committee Charter (the "Charter"). Pursuant to the Charter, the Committee will consider recommendations for nominees from shareholders submitted to the Secretary of the Registrant, c/o The Dreyfus Corporation Legal Department, 200 Park Avenue, 8th Floor East, New York, New York 10166. A nomination submission must include information regarding the recommended nominee as specified in the Charter. This information includes all information relating to a recommended nominee that is required to be disclosed in solicitations or proxy statements for the election of Board members, as well as information sufficient to evaluate the factors to be considered by the Committee, including character and integrity, business and professional experience, and whether the person has the ability to apply sound and independent business judgment and would act in the interests of the Registrant and its shareholders.
Nomination submissions are required to be accompanied by a written consent of the individual to stand for election if nominated by the Board and to serve if elected by the shareholders, and such additional information must be provided regarding the recommended nominee as reasonably requested by the Committee.
Item 11. Controls and Procedures.
(a) The Registrant's principal executive and principal financial officers have concluded, based on their evaluation of the Registrant's disclosure controls and procedures as of a date within 90 days of the filing date of this report, that the Registrant's disclosure controls and procedures are reasonably designed to ensure that information required to be disclosed by the Registrant on Form N-CSR is recorded, processed, summarized and reported within the required time periods and that information required to be disclosed by the Registrant in the reports that it files or submits on Form N-CSR is accumulated and communicated to the Registrant's management, including its principal executive and principal financial officers, as appropriate to allow timely decisions regarding required disclosure.
(b) There were no changes to the Registrant's internal control over financial reporting that occurred during the second fiscal quarter of the period covered by this report that have materially affected, or are reasonably likely to materially affect, the Registrant's internal control over financial reporting.
Item 12. Exhibits.
| (a)(1) | | Not applicable. |
| (a)(2) | | Certifications of principal executive and principal financial officers as required by Rule 30a-2(a) |
| under the Investment Company Act of 1940. |
| (a)(3) | | Not applicable. |
| (b) | | Certification of principal executive and principal financial officers as required by Rule 30a-2(b) |
| under the Investment Company Act of 1940. |
SIGNATURES
Pursuant to the requirements of the Securities Exchange Act of 1934 and the Investment Company Act of 1940, the Registrant has duly caused this Report to be signed on its behalf by the undersigned, thereunto duly authorized.
DREYFUS NEW YORK MUNICIPAL CASH MANAGEMENT
| By: | | /s/ Stephen E. Canter |
| | | Stephen E. Canter |
| | | President |
| |
| Date: | | 9/27/06 |
Pursuant to the requirements of the Securities Exchange Act of 1934 and the Investment Company Act of 1940, this Report has been signed below by the following persons on behalf of the Registrant and in the capacities and on the dates indicated.
| By: | | /s/ Stephen E. Canter |
| | | Stephen E. Canter |
| | | Chief Executive Officer |
| |
| Date: | | 9/27/06 |
| |
| By: | | /s/ James Windels |
| | | James Windels |
| | | Chief Financial Officer |
| |
| Date: | | 9/27/06 |
| |
| EXHIBIT INDEX |
| |
| | | (a)(2) Certifications of principal executive and principal financial officers as required by Rule 30a- |
| | | 2(a) under the Investment Company Act of 1940. (EX-99.CERT) |
| |
| | | (b) Certification of principal executive and principal financial officers as required by Rule 30a- |
| | | 2(b) under the Investment Company Act of 1940. (EX-99.906CERT) |