UNITED STATES
SECURITIES AND EXCHANGE COMMISSION
Washington, D.C. 20549 |
CERTIFIED SHAREHOLDER REPORT OF REGISTERED MANAGEMENT
INVESTMENT COMPANIES |
| |
| Investment Company Act file number | 811 - 6395 |
DREYFUS NEW YORK MUNICIPAL CASH MANAGEMENT
(Exact name of Registrant as specified in charter) |
c/o The Dreyfus Corporation
200 Park Avenue
New York, New York 10166
(Address of principal executive offices) (Zip code) |
Michael A. Rosenberg, Esq.
200 Park Avenue
New York, New York 10166
(Name and address of agent for service) |
| |
| Registrant's telephone number, including area code: | (212) 922-6000 |
| |
| Date of fiscal year end: | 1/31 |
| Date of reporting period: | 7/31/09 |
| |
| Item 1. | Reports to Stockholders. |

| |
| Contents | |
| |
| The Funds | |
| Letter to Shareholders (Taxable) | 3 |
| Letter to Shareholders (Tax Exempt) | 5 |
| Understanding Your Fund s Expenses | 7 |
| Comparing Your Fund s Expenses | |
| With Those of Other Funds | 9 |
| Statements of Investments | 11 |
| Statements of Assets and Liabilities | 67 |
| Statements of Operations | 70 |
| Statements of Changes in Net Assets | 72 |
| Financial Highlights | 78 |
| Notes to Financial Statements | 89 |
| Information About the Review and | |
| Approval of each Fund s Investment | |
| Management Agreement | 99 |
For More Information
Back cover |
The views expressed in this report reflect those of the portfolio manager only through the end of the period covered and do not necessarily represent the views of Dreyfus or any other person in the Dreyfus organization. Any such views are subject to change at any time based upon market or other conditions and Dreyfus disclaims any responsibility to update such views. These views may not be relied on as investment advice and, because investment decisions for a Dreyfus fund are based on numerous factors, may not be relied on as an indication of trading intent on behalf of any Dreyfus fund.

Dreyfus Cash Management Funds
The Funds

Dear Shareholders:
We present to you this semiannual report for Dreyfus Cash Management Funds (Taxable). For the six-month period ended July 31, 2009, the six Dreyfus Cash Management Funds (Taxable) listed below produced the following annualized yields and annualized effective yields.1,2
| | |
| | | Annualized |
| | Annualized | Effective |
| | Yield (%) | Yield (%) |
| Dreyfus Cash Management | | |
| Institutional Shares | 0.67 | 0.68 |
| Investor Shares | 0.42 | 0.43 |
| Administrative Shares | 0.57 | 0.58 |
| Participant Shares | 0.28 | 0.28 |
| Agency Shares | 0.61 | 0.61 |
| Dreyfus Cash Management Plus, Inc. | |
| Institutional Shares | 0.59 | 0.59 |
| Investor Shares | 0.34 | 0.34 |
| Administrative Shares | 0.49 | 0.49 |
| Participant Shares | 0.20 | 0.20 |
| Service Shares | 0.12 | 0.12 |
| Select Shares | 0.03 | 0.03 |
| Agency Shares | 0.53 | 0.53 |
| Dreyfus Government Cash Management | |
| Institutional Shares | 0.29 | 0.29 |
| Investor Shares | 0.07 | 0.07 |
| Administrative Shares | 0.19 | 0.19 |
| Participant Shares | 0.02 | 0.02 |
| Agency Shares | 0.24 | 0.24 |
| Dreyfus Government Prime Cash Management | |
| Institutional Shares | 0.17 | 0.17 |
| Investor Shares | 0.01 | 0.01 |
| Administrative Shares | 0.07 | 0.07 |
| Participant Shares | 0.00 | 0.00 |
| Agency Shares | 0.11 | 0.11 |
| Dreyfus Treasury & Agency Cash Management | |
| Institutional Shares | 0.13 | 0.13 |
| Investor Shares | 0.00 | 0.00 |
| Administrative Shares | 0.04 | 0.04 |
| Participant Shares | 0.00 | 0.00 |
| Service Shares | 0.00 | 0.00 |
| Select Shares | 0.00 | 0.00 |
| Agency Shares | 0.07 | 0.07 |
| Premier Shares | 0.00 | 0.00 |
| | |
| | | Annualized |
| | Annualized | Effective |
| | Yield (%) | Yield (%) |
| Dreyfus Treasury Prime Cash Management | |
| Institutional Shares | 0.04 | 0.04 |
| Investor Shares | 0.00 | 0.00 |
| Administrative Shares | 0.00 | 0.00 |
| Participant Shares | 0.00 | 0.00 |
| Agency Shares | 0.01 | 0.01 |
The Challenges Faced by the Money Markets
The reporting period began in the midst of an ongoing credit crunch that had escalated into a global financial crisis over the second half of 2008.As mortgage foreclosure rates soared and housing values plummeted in the months prior to the reporting period, major financial institutions found themselves unable to obtain short-term funding due to massive losses among mortgage- and asset-backed securities. The U.S.government and Federal Reserve Board (the Fed ) attempted to restore stability by pumping enormous amounts of liquidity into the banking system, including the Troubled Assets Relief Program (TARP) and the Term Asset-Backed Securities Loan Facility ( TALF ). The Fed also eased monetary policy aggressively, driving its target for the overnight federal funds rate to an unprecedented low of 0% to 0.25% by the end of 2008.As short-term interest rates declined, so did yields of money market instruments.
In addition to the Fed s actions, the U.S. Department of the Treasury responded with a number of its own remedial measures in 2008, including the Temporary Guarantee Program for Money Market Funds.
When the reporting period began, the recession continued to gain momentum as job losses mounted and consumer confidence plunged.The U.S.economy lost more than 650,000 jobs per month in February and March, and the Conference Board s Consumer Confidence Index reached the lowest level since its inception in 1967. In an effort to stimulate the economy, in late January the U.S. government passed the $787 billion American Recovery and Reinvestment
The Funds 3
| LETTER TO SHAREHOLDERS (continued) |
Act with the goal of retaining and creating jobs, providing budget relief to states and localities, maintaining social programs and offering tax relief to businesses and individuals.
After hitting multi-year lows in early March, the U.S. stock market and corporate bond market staged impressive rebounds through the reporting period s end. Despite a 6.4% annualized GDP growth rate over the first quarter of 2009, the markets were buoyed by signs that the economic downturn might be decelerating, including lower-than-expected numbers of jobless claims in April and May and a modest increase in retail sales. In addition, a decline in the three-month London Interbank Offered Rate (LIBOR) below 1% provided evidence of improvement in the global credit markets. However, the unemployment rate continued to climb.
The U.S. economy sent mixed signals in June. For example, the National Association of Realtors reported that existing home sales rose 2.4% and the average sale price increased almost 4% in May, but the absolute number of sales and the average sale price remained 15% and 20% below their peaks,respectively. Similarly, the Institute for Supply Management said that its manufacturing index had posted a month-over-month gain in June, but it continued to indicate recessionary conditions among U.S. manufacturers. Perhaps most significant, the U.S. economy lost an additional 467,000 jobs in June, and the unemployment rate rose to 9.5%, its highest level in 26 years.
In July, it was announced that the U.S. economy produced a better-than-expected annualized growth rate of 0.1% during the second quarter, supported by government spending and consumption as the economic stimulus program took hold. Residential construction increased by 0.5% in June, marking the second gain in three months. Perhaps most encouraging, the unemployment rate fell slightly to 9.4% in July when job losses moderated.
Amid Turmoil, a Focus on Quality and Liquidity
As credit conditions stabilized, we maintained the funds weighted average maturities in ranges that were roughly in line with industry averages. However, it is worth noting that the industry s average weighted maturity has been significantly shorter than historical averages as most money market funds remained on a relatively defensive footing.
Despite recent signs of potential economic improvement, we remain concerned regarding liquidity conditions and tighter loan standards. In addition, the Fed again indicated at its June 2009 meeting that economic conditions are likely to warrant exceptionally low levels of the federal funds rate for an extended period. Therefore, until we see more convincing evidence that the Fed is prepared to raise interest rates, we intend to maintain the funds focus on credit quality and liquidity.
| |
| | An investment in the fund is not insured or guaranteed by the FDIC or |
| | any other government agency. Although the fund seeks to preserve the |
| | value of your investment at $1.00 per share, it is possible to lose money |
| | by investing in the fund. |
| 1 | Annualized effective yield is based upon dividends declared daily and |
| | reinvested monthly. Past performance is no guarantee of future results. |
| | Yields fluctuate. |
| 2 | Yields provided reflect the absorption of certain fund expenses by The |
| | Dreyfus Corporation pursuant to an undertaking, which is voluntary |
| | and temporary, not contractual, and can be terminated at any time |
| | without notice. Had these expenses not been absorbed, the following |
| | funds would have produced lower yields: For Cash Management Fund s |
| | Institutional Shares, annualized and annualized effective yields would |
| | have been 0.66% and 0.67%, respectively. For Cash Management Plus |
| | Fund s Institutional, Investor, Administrative, Participant, Select, Service |
| | and Agency Shares, annualized and annualized effective yields would |
| | have been 0.57%, 0.33%, 0.48%, 0.17%, 0.14%, 0.06% and |
| | 4.45%, respectively. For Government Cash Management Fund s |
| | Institutional, Investor, Participant and Agency Shares, annualized and |
| | annualized effective yields would have been 0.28%, 0.04%, 0.09% |
| | and 0.23%, respectively. For Government Cash Management Prime |
| | Fund s Institutional, Investor, Administrative, Participant and Agency |
| | Shares, annualized and annualized effective yields would have been |
| | 0.16%, 0.08%, 0.06%, 0.24% and 0.10%, respectively. For |
| | Treasury Cash Management Prime Fund s Institutional, Investor, |
| | Administrative, Participant and Agency Shares, annualized and |
| | annualized effective yields would have been 0.03%, 0.21%, 0.06%, |
| | 0.37% and 0.01%, respectively. For Treasury & Agency Cash |
| | Management Fund s Institutional, Investor, Administrative, Participant, |
| | Select, Service, Premier and Agency Shares, annualized and annualized |
| | effective yields would have been 0.12%, 0.13, 0.01%, 0.28%, |
| | 0.68%, 0.38%, 0.20% and 0.06%, respectively. |
4

Dear Shareholders:
We are pleased to present the semiannual report for Dreyfus Cash Management Funds (Tax Exempt) For the six-month period ended July 31, 2009, the five tax-exempt money market portfolios that com prise Dreyfus Cash Management Funds (Tax Exempt) produced the following annualized yields and annualized effective yields:1,2
| | |
| | | Annualized |
| | Annualized | Effective |
| | Yield (%) | Yield (%) |
| Dreyfus Municipal Cash Management Plus | |
| Institutional Shares | 0.76 | 0.76 |
| Investor Shares | 0.51 | 0.51 |
| Administrative Shares | 0.66 | 0.66 |
| Participant Shares | 0.36 | 0.36 |
| Agency Shares | 0.70 | 0.70 |
| Dreyfus New York Municipal Cash Management | |
| Institutional Shares | 0.70 | 0.70 |
| Investor Shares | 0.45 | 0.45 |
| Administrative Shares | 0.60 | 0.60 |
| Participant Shares | 0.30 | 0.30 |
| Agency Shares | 0.64 | 0.64 |
| Dreyfus Tax Exempt Cash Management | |
| Institutional Shares | 0.63 | 0.63 |
| Investor Shares | 0.38 | 0.38 |
| Administrative Shares | 0.53 | 0.53 |
| Participant Shares | 0.25 | 0.25 |
| Agency Shares | 0.57 | 0.57 |
| Dreyfus California AMT-Free Municipal Cash Management |
| Institutional Shares | 0.66 | 0.66 |
| Investor Shares | 0.41 | 0.41 |
| Administrative Shares | 0.56 | 0.56 |
| Participant Shares | 0.27 | 0.27 |
| Agency Shares | 0.60 | 0.60 |
| Dreyfus New York AMT-Free Municipal Cash Management |
| Institutional Shares | 0.76 | 0.76 |
| Investor Shares | 0.51 | 0.51 |
| Administrative Shares | 0.66 | 0.66 |
| Participant Shares | 0.36 | 0.36 |
| Classic Shares | 0.26 | 0.26 |
Money Market Yields Plunged During the Downturn
Economic conditions deteriorated sharply in the months prior to the reporting period, as weakness in housing markets, rising unemployment and declining consumer confidence produced the longest and most severe U.S. recession since the 1930s. In response, the Federal Reserve Board (the Fed ) reduced short-term interest rates aggressively, driving the overnight federal funds rate to a record low range of between 0% to 0.25%.As short-term interest rates declined, money market yields also fell to historically low levels.
The recession was exacerbated by a global financial crisis that punished major financial institutions, including dealers and insurers of municipal money market instruments, with severe investment losses.To shore up investor confidence, the U.S. Department of the Treasury initiated the Temporary Guarantee Program for Money Market Funds. The Fed also attempted to restore stability to the credit markets with massive injections of liquidity into the banking system through facilities such as the Troubled Asset Relief Program (TARP) and Term Asset-Backed Securities Loan Facility (TALF).
The recession continued to gain momentum when the reporting period began. The U.S. economy lost more than 650,000 jobs per month in February and March, and the Conference Board s Consumer Confidence Index reached the lowest level since its inception in 1967. However, investor sentiment began to improve in early March.Despite a 6.4% annualized GDP growth rate over the first quarter of 2009, the markets were buoyed by signs that the economic downturn might be decelerating. In fact, the U.S. economy produced a better-than-expected annualized growth rate of 0.1% during the second quarter, supported by government spending and consumption as the economic stimulus program took hold.
Still, the financial crisis and economic downturn put severe pressure on the fiscal conditions of many states and municipalities, which faced weak housing markets, rising unemployment, reduced tax collections and intensifying demands on social services programs. Many state and local governments have struggled to find ways to bridge current and pro-
The Funds 5
| LETTER TO SHAREHOLDERS (continued) |
jected budget deficits. Indeed, just days before the start of the reporting period, the U.S. Congress enacted the $787 billion American Recovery and Reinvestment Act with the goal of creating and retaining jobs, maintaining social programs, offering tax relief to businesses and individuals and providing budget relief to states and localities.
Despite the prospect of federal aid, the state and city of New York have been hard-hit by job losses in the financial services industry, and they face large projected budget deficits. California was hurt during the downturn by job losses and plunging home prices, leading to credit-rating downgrades during the reporting period as the state s elected officials struggled to find ways to bridge a $24 billion budget gap. An agreement was reached and signed into law just days before the reporting period s end.
Focus on Quality and Liquidity
In this environment, investor demand for tax-exempt money market instruments has outpaced supply, putting downward pressure on yields of municipal notes. Yet, bank rating pressure has kept yields on short-term variable rate demand notes (VRDNs) attractive relative to comparable U.S.Treasury securities. Consequently, yield differences along the market s maturity range have remained narrow.
In light of these conditions, we have maintained our focus on direct, high-quality municipal obligations that have been independently approved by our credit analysts, favoring money market instruments backed by pledged tax appropriations or stable revenue streams from essential services facilities. We set the funds weighted average maturities in ranges that were shorter than industry averages. Due to the flat yield curve, this conservative positioning did not detract materially from the funds performance. In addition, given current uncertainty regarding future supply trends and potential regulatory reform, we continue to believe that the more prudent course is to maintain a conservative credit selection strategy with an emphasis on preservation of capital and liquidity.

| |
| | An investment in each fund is not insured or guaranteed by the FDIC |
| | or any other government agency. Although each fund seeks to preserve the |
| | value of your investment at $1.00 per share, it is possible to lose money |
| | by investing in the funds. |
| 1 | Annualized effective yield is based upon dividends declared daily and |
| | reinvested monthly. Past performance is no guarantee of future results. |
| | Yields fluctuate. For the national funds, income may be subject to state |
| | and local taxes. For the NewYork fund, income may be subject to state |
| | and local taxes for out-of-state residents. For each fund, some income |
| | may be subject to the federal alternative minimum tax (AMT). |
| 2 | Yields provided reflect the absorption of certain fund expenses by The |
| | Dreyfus Corporation pursuant to an undertaking, which is voluntary |
| | and temporary, not contractual, and can be terminated at any time |
| | without notice. Had these expenses not been absorbed, the following |
| | funds would have produced lower yields: For Dreyfus California AMT- |
| | Free Municipal Cash Management Fund s Institutional, Investor, |
| | Administrative, Participant and Agency Shares, annualized and |
| | annualized effective yields would have been 0.55%, 0.30%, 0.42%, |
| | 0.15% and 0.49%, respectively. For Dreyfus Municipal Cash |
| | Management Plus Fund s Institutional, Investor, Administrative, |
| | Participant and Agency Shares, annualized and annualized effective |
| | yields would have been 0.72%, 0.47%, 0.62%, 0.32% and 0.66%, |
| | respectively. For Dreyfus Tax Exempt Cash Management Fund s |
| | Institutional, Investor, Administrative, Participant and Agency Shares, |
| | annualized and annualized effective yields would have been 0.61%, |
| | 0.37%, 0.52%, 0.22% and 0.56%, respectively. For NewYork |
| | Municipal Cash Management Fund s Institutional, Investor, |
| | Administrative, Participant and Agency Shares, annualized and |
| | annualized effective yields would have been 0.67%, 0.42%, 0.57%, |
| | 0.28% and 0.61%, respectively. |
6
UNDERSTANDING YOUR FUND S EXPENSES (Unaudited)
As a mutual fund investor, you pay ongoing expenses, such as management fees and other expenses. Using the information below, you can estimate how these expenses affect your investment and compare them with the expenses of other funds.You also may pay one-time transaction expenses, including sales charges (loads) and redemptions fees, which are not shown in this section and would have resulted in higher total expenses. For more information, see your fund s prospectus or talk to your financial adviser.
Review your fund s expenses
The table below shows the expenses you would have paid on a $1,000 investment in each class of each fund from February 1, 2009 to July 31, 2009. It also shows how much a $1,000 investment would be worth at the close of the period, assuming actual returns and expenses.
| | | | | | | | | |
| Expenses and Value of a $1,000 Investment | | | | | | | |
| assuming actual returns for the six months ended July 31, 2009 | | | | | | |
| | Institutional | Investor | Administrative | Participant | Service | Select | Agency | Premier | Classic |
| Dreyfus Cash | | | | | | | | | |
| Management | | | | | | | | | |
| Expenses paid | | | | | | | | | |
| per $1,000 | $ 1.14 | $ 2.38 | $ 1.64 | $ 3.08 | | | $ 1.44 | | |
| Ending value | | | | | | | | | |
| (after expenses) | $1,003.30 | $1,002.10 | $1,002.90 | $1,001.40 | | | $1,003.00 | | |
| Dreyfus Cash | | | | | | | | | |
| Management | | | | | | | | | |
| Plus, Inc. | | | | | | | | | |
| Expenses paid | | | | | | | | | |
| per $1,000 | $ 1.34 | $ 2.58 | $ 1.84 | $ 3.27 | $ 3.62 | $ 4.51 | $ 1.64 | | |
| Ending value | | | | | | | | | |
| (after expenses) | $1,002.90 | $1,001.70 | $1,002.40 | $1,001.00 | $1,000.60 | $1,000.20 | $1,002.60 | | |
| Dreyfus | | | | | | | | | |
| Government Cash | | | | | | | | | |
| Management | | | | | | | | | |
| Expenses paid | | | | | | | | | |
| per $1,000 | $ 1.04 | $ 2.18 | $ 1.59 | $ 2.53 | | | $ 1.34 | | |
| Ending value | | | | | | | | | |
| (after expenses) | $1,001.40 | $1,000.30 | $1,000.90 | $1,000.10 | | | $1,001.20 | | |
| Dreyfus | | | | | | | | | |
| Government Prime | | | | | | | | | |
| Cash Management | | | | | | | | | |
| Expenses paid | | | | | | | | | |
| per $1,000 | $ 1.09 | $ 1.93 | $ 1.59 | $ 1.93 | | | $ 1.39 | | |
| Ending value | | | | | | | | | |
| (after expenses) | $1,000.80 | $1,000.00 | $1,000.30 | $1,000.00 | | | $1,000.50 | | |
| Dreyfus Treasury & | | | | | | | | | |
| Agency Cash | | | | | | | | | |
| Management | | | | | | | | | |
| Expenses paid | | | | | | | | | |
| per $1,000 | $ 1.09 | $ 1.74 | $ 1.54 | $ 1.74 | $ 1.74 | $ 1.74 | $ 1.39 | $ 1.74 | |
| Ending value | | | | | | | | | |
| (after expenses) | $1,000.60 | $1,000.00 | $1,000.20 | $1,000.00 | $1,000.00 | $1,000.00 | $1,000.30 | $1,000.00 | |
| Dreyfus | | | | | | | | | |
| Treasury Prime | | | | | | | | | |
| Cash Management | | | | | | | | | |
| Expenses paid | | | | | | | | | |
| per $1,000 | $ 1.09 | $ 1.29 | $ 1.29 | $ 1.29 | | | $ 1.34 | | |
| Ending value | | | | | | | | | |
| (after expenses) | $1,000.20 | $1,000.00 | $1,000.00 | $1,000.00 | | | $1,000.00 | | |
| Dreyfus | | | | | | | | | |
| Municipal Cash | | | | | | | | | |
| Management Plus | | | | | | | | | |
| Expenses paid | | | | | | | | | |
| per $1,000 | $ 1.14 | $ 2.38 | $ 1.64 | $ 3.13 | | | $ 1.44 | | |
| Ending value | | | | | | | | | |
| (after expenses) | $1,003.80 | $1,002.50 | $1,003.30 | $1,001.80 | | | $1,003.50 | | |
The Funds 7
| | UNDERSTANDING YOUR FUND S EXPENSES (Unaudited) (continued) |
| | | | | | | | | |
| Expenses and Value of a $1,000 Investment (continued) | | | | | | |
| assuming actual returns for the six months ended July 31, 2009 | | | | | | |
| | Institutional | Investor | Administrative | Participant | Service | Select | Agency | Premier | Classic |
| Dreyfus | | | | | | | | | |
| New York | | | | | | | | | |
| Municipal Cash | | | | | | | | | |
| Management | | | | | | | | | |
| Expenses paid | | | | | | | | | |
| per $1,000 | $ 1.19 | $ 2.43 | $ 1.69 | $ 3.18 | | | $ 1.49 | | |
| Ending value | | | | | | | | | |
| (after expenses) | $1,003.50 | $1,002.20 | $1,003.00 | $1,001.50 | | | $1,003.20 | | |
| Dreyfus | | | | | | | | | |
| Tax Exempt Cash | | | | | | | | | |
| Management | | | | | | | | | |
| Expenses paid | | | | | | | | | |
| per $1,000 | $ 1.14 | $ 2.38 | $ 1.64 | $ 3.03 | | | $ 1.44 | | |
| Ending value | | | | | | | | | |
| (after expenses) | $1,003.10 | $1,001.90 | $1,002.60 | $1,001.20 | | | $1,002.90 | | |
| Dreyfus California | | | | | | | | | |
| AMT-Free | | | | | | | | | |
| Municipal Cash | | | | | | | | | |
| Management | | | | | | | | | |
| Expenses paid | | | | | | | | | |
| per $1,000 | $ 1.09 | $ 2.33 | $ 1.59 | $ 3.03 | | | $ 1.39 | | |
| Ending value | | | | | | | | | |
| (after expenses) | $1,003.30 | $1,002.00 | $1,002.80 | $1,001.30 | | | $1,003.00 | | |
| Dreyfus New York | | | | | | | | | |
| AMT-Free | | | | | | | | | |
| Municipal Cash | | | | | | | | | |
| Management | | | | | | | | | |
| Expenses paid | | | | | | | | | |
| per $1,000 | $ 1.19 | $ 2.43 | $ 1.69 | $ 3.18 | | | | | $ 3.67 |
| Ending value | | | | | | | | | |
| (after expenses) | $1,003.80 | $1,002.50 | $1,003.30 | $1,001.80 | | | | | $1,001.30 |
|
| Expenses are equal to Dreyfus Cash Management s annualized expense ratio of .23% for Institutional Shares, .48% for Investor Shares, .33% for Administrative Shares, .62% for |
| Participant Shares and .29% for Agency Shares, Dreyfus Cash Management Plus, Inc 27% for Institutional Shares, .52% for Investor Shares, .37% for Administrative Shares, .66% |
| for Participant Shares, .73% for Service Shares, .91% for Select Shares and .33% for Agency Shares, Dreyfus Government Cash Management .21% for Institutional Shares, .44% for |
| Investor Shares, .32% for Administrative Shares, .51% for Participant Shares and .27% for Agency Shares, Dreyfus Government Prime Cash Management .22% for Institutional |
| Shares, .39% for Investor Shares, .32% for Administrative Shares, .39% for Participant Shares and .28% for Agency Shares, Dreyfus Treasury & Agency Cash Management .22% for |
| Institutional Shares, .35% for Investor Shares, .31% for Administrative Shares, .35% for Participant Shares, 35% for Service Shares, .35% for Select Shares, .28% for Agency Shares |
| and .35% for Premier Shares, Dreyfus Treasury Prime Cash Management .22% for Institutional Shares, .26% for Investor Shares, .26% for Administrative Shares, .26% for |
| Participant Shares and .27% for Agency Shares, Dreyfus Municipal Cash Management Plus .23% for Institutional Shares, .48% for Investor Shares, .33% for Administrative Shares, |
| .63% for Participant Shares and .29% for Agency Shares, Dreyfus NewYork Municipal Cash Management .24% for Institutional Shares, .49% for Investor Shares, .34% for |
| Administrative Shares, .64% for Participant Shares and .30% for Agency Shares, Dreyfus Tax Exempt Cash Management .23% for Institutional Shares, .48% for Investor Shares, |
| .33% for Administrative Shares, .61% for Participant Shares and .29% for Agency Shares, Dreyfus California AMT-Free Municipal Cash Management .22% for Institutional Shares, |
| .47% for Investor Shares, .32% for Administrative Shares, .61% for Participant Shares and .28% for Agency Shares, Dreyfus NewYork AMT-Free Municipal Cash Management |
| .24% for Institutional Shares, .49% for Investor Shares, .34% for Administrative Shares, .64% for Participant Shares and .74% for Classic shares; multiplied by the respective fund s |
| average account value over the period, multiplied by 181/365 (to reflect the one-half year period). |
8
COMPARING YOUR FUND S EXPENSES
WITH THOSE OF OTHER FUNDS (Unaudited) |
Using the SEC s method to compare expenses
The Securities and Exchange Commission (SEC) has established guidelines to help investors assess fund expenses. Per these guidelines, the table below shows your fund's expenses based on a $1,000 investment, assuming a hypothetical 5% annualized return.You can use this information to compare the ongoing expenses (but not transaction expenses or total cost) of investing in the fund with those of other funds. All mutual fund shareholder reports will provide this information to help you make this comparison. Please note that you cannot use this information to estimate your actual ending account balance and expenses paid during the period.
| | | | | | | | | |
| Expenses and Value of a $1,000 Investment | | | | | | | |
| assuming a hypothetical 5% annualized return for the six months ended July 31, 2009 | | | | |
| | Institutional | Investor | Administrative | Participant | Service | Select | Agency | Premier | Classic |
| Dreyfus Cash | | | | | | | | | |
| Management | | | | | | | | | |
| Expenses paid | | | | | | | | | |
| per $1,000 | $ 1.15 | $ 2.41 | $ 1.66 | $ 3.11 | | | $ 1.45 | | |
| Ending value | | | | | | | | | |
| (after expenses) | $1,023.65 | $1,022.41 | $1,023.16 | $1,021.72 | | | $1,023.36 | | |
| Dreyfus Cash | | | | | | | | | |
| Management | | | | | | | | | |
| Plus, Inc. | | | | | | | | | |
| Expenses paid | | | | | | | | | |
| per $1,000 | $ 1.35 | $ 2.61 | $ 1.86 | $ 3.31 | $ 3.66 | $ 4.56 | $ 1.66 | | |
| Ending value | | | | | | | | | |
| (after expenses) | $1,023.46 | $1,022.22 | $1,022.96 | $1,021.52 | $1,021.17 | $1,020.28 | $1,023.16 | | |
| Dreyfus | | | | | | | | | |
| Government Cash | | | | | | | | | |
| Management | | | | | | | | | |
| Expenses paid | | | | | | | | | |
| per $1,000 | $ 1.05 | $ 2.21 | $ 1.61 | $ 2.56 | | | $ 1.35 | | |
| Ending value | | | | | | | | | |
| (after expenses) | $1,023.75 | $1,022.61 | $1,023.21 | $1,022.27 | | | $1,023.46 | | |
| Dreyfus | | | | | | | | | |
| Government Prime | | | | | | | | | |
| Cash Management | | | | | | | | | |
| Expenses paid | | | | | | | | | |
| per $1,000 | $ 1.10 | $ 1.96 | $ 1.61 | $ 1.96 | | | $ 1.40 | | |
| Ending value | | | | | | | | | |
| (after expenses) | $1,023.70 | $1,022.86 | $1,023.21 | $1,022.86 | | | $1,023.41 | | |
| Dreyfus Treasury & | | | | | | | | | |
| Agency Cash | | | | | | | | | |
| Management | | | | | | | | | |
| Expenses paid | | | | | | | | | |
| per $1,000 | $ 1.10 | $ 1.76 | $ 1.56 | $ 1.76 | $ 1.76 | $ 1.76 | $ 1.40 | $ 1.71 | |
| Ending value | | | | | | | | | |
| (after expenses) | $1,023.70 | $1,023.06 | $1,023.26 | $1,023.06 | $1,023.06 | $1,023.06 | $1,023.41 | $1,023.11 | |
| Dreyfus | | | | | | | | | |
| Treasury Prime | | | | | | | | | |
| Cash Management | | | | | | | | | |
| Expenses paid | | | | | | | | | |
| per $1,000 | $ 1.10 | $ 1.30 | $ 1.30 | $ 1.30 | | | $ 1.35 | | |
| Ending value | | | | | | | | | |
| (after expenses) | $1,023.70 | $1,023.51 | $1,023.51 | $1,023.51 | | | $1,023.46 | | |
| Dreyfus | | | | | | | | | |
| Municipal Cash | | | | | | | | | |
| Management Plus | | | | | | | | | |
| Expenses paid | | | | | | | | | |
| per $1,000 | $ 1.15 | $ 2.41 | $ 1.66 | $ 3.16 | | | $ 1.45 | | |
| Ending value | | | | | | | | | |
| (after expenses) | $1,023.65 | $1,022.41 | $1,023.16 | $1,021.67 | | | $1,023.36 | | |
The Funds 9
COMPARING YOUR FUND S EXPENSES WITH THOSE OF OTHER FUNDS (Unaudited) (continued)
| | | | | | | | | |
| Expenses and Value of a $1,000 Investment (continued) | | | | | | |
| assuming a hypothetical 5% annualized return for the six months ended July 31, 2009 | | | | | |
| | Institutional | Investor | Administrative | Participant | Service | Select | Agency | Premier | Classic |
| Dreyfus | | | | | | | | | |
| New York | | | | | | | | | |
| Municipal Cash | | | | | | | | | |
| Management | | | | | | | | | |
| Expenses paid | | | | | | | | | |
| per $1,000 | $ 1.20 | $ 2.46 | $ 1.71 | $ 3.21 | | | $ 1.51 | | |
| Ending value | | | | | | | | | |
| (after expenses) | $1,023.60 | $1,022.36 | $1,023.11 | $1,021.62 | | | $1,023.31 | | |
| Dreyfus | | | | | | | | | |
| Tax Exempt Cash | | | | | | | | | |
| Management | | | | | | | | | |
| Expenses paid | | | | | | | | | |
| per $1,000 | $ 1.15 | $ 2.41 | $ 1.66 | $ 3.06 | | | $ 1.45 | | |
| Ending value | | | | | | | | | |
| (after expenses) | $1,023.65 | $1,022.41 | $1,023.16 | $1,021.77 | | | $1,023.36 | | |
| Dreyfus California | | | | | | | | | |
| AMT-Free | | | | | | | | | |
| Municipal Cash | | | | | | | | | |
| Management | | | | | | | | | |
| Expenses paid | | | | | | | | | |
| per $1,000 | $ 1.10 | $ 2.36 | $ 1.61 | $ 3.06 | �� | | $ 1.40 | | |
| Ending value | | | | | | | | | |
| (after expenses) | $1,023.70 | $1,022.46 | $1,023.21 | $1,021.77 | | | $1,023.41 | | |
| Dreyfus New York | | | | | | | | | |
| AMT-Free | | | | | | | | | |
| Municipal Cash | | | | | | | | | |
| Management | | | | | | | | | |
| Expenses paid | | | | | | | | | |
| per $1,000 | $ 1.20 | $ 2.46 | $ 1.71 | $ 3.21 | | | | | $ 3.71 |
| Ending value | | | | | | | | | |
| (after expenses) | $1,023.60 | $1,022.36 | $1,023.11 | $1,021.62 | | | | | $1,021.12 |
|
| Expenses are equal to Dreyfus Cash Management s annualized expense ratio of .23% for Institutional Shares, .48% for Investor Shares, .33% for Administrative Shares, .62% for |
| Participant Shares and .29% for Agency Shares, Dreyfus Cash Management Plus, Inc 27% for Institutional Shares, .52% for Investor Shares, .37% for Administrative Shares, .66% |
| for Participant Shares, .73% for Service Shares, .91% for Select Shares and .33% for Agency Shares, Dreyfus Government Cash Management .21% for Institutional Shares, .44% for |
| Investor Shares, .32% for Administrative Shares, .51% for Participant Shares and .27% for Agency Shares, Dreyfus Government Prime Cash Management .22% for Institutional |
| Shares, .39% for Investor Shares, .32% for Administrative Shares, .39% for Participant Shares and .28% for Agency Shares, Dreyfus Treasury & Agency Cash Management .22% for |
| Institutional Shares, .35% for Investor Shares, .31% for Administrative Shares, .35% for Participant Shares, .35% for Service Shares, .35% for Select Shares, .28% for Agency Shares |
| and .35% for Premier Shares, Dreyfus Treasury Prime Cash Management 22% for Institutional Shares, .26% for Investor Shares, .26% for Administrative Shares, .26% for Participant |
| Shares and .27% for Agency Shares, Dreyfus Municipal Cash Management Plus .23% for Institutional Shares, .48% for Investor Shares, .33% for Administrative Shares, .63% for |
| Participant Shares and .29% for Agency Shares, Dreyfus NewYork Municipal Cash Management .24% for Institutional Shares, .49% for Investor Shares, .34% for Administrative |
| Shares, .64% for Participant Shares and .30% for Agency Shares, Dreyfus Tax Exempt Cash Management .23% for Institutional Shares, .48% for Investor Shares, .33% for |
| Administrative Shares, .61% for Participant Shares and .29% for Agency Shares, Dreyfus California AMT-Free Municipal Cash Management .22% for Institutional Shares, .47% for |
| Investor Shares, .32% for Administrative Shares, .61% for Participant Shares and .28% for Agency Shares, Dreyfus NewYork AMT-Free Municipal Cash Management .24% for |
| Institutional Shares, .49% for Investor Shares, .34% for Administrative Shares, .64% for Participant Shares and .74% for Classic shares; multiplied by the respective fund s average |
| account value over the period, multiplied by 181/365 (to reflect the one-half year period). |
10
STATEMENT OF INVESTMENTS
July 31, 2009 (Unaudited) |
| | |
| | Principal | |
| Dreyfus Cash Management | Amount ($) | Value ($) |
| |
| Negotiable Bank Certificates of Deposit 59.1% | | |
| Allied Irish Banks (Yankee) | | |
| 1.63% 1.90%, 9/30/09 10/19/09 | 1,175,000,000 | 1,175,014,203 |
| Banco Bilbao Vizcaya Argenteria Puerto Rico (Yankee) | | |
| 0.35% 0.55%, 8/7/09 9/8/09 | 1,275,000,000 | 1,275,002,143 |
| Bank of America N.A. | | |
| 0.71% 0.80%, 11/16/09 12/21/09 | 1,050,000,000 | 1,050,000,000 |
| Bank of Ireland (Yankee) | | |
| 1.90%, 10/6/09 | 330,000,000 a | 330,000,000 |
| Bank of Tokyo-Mitsubishi Ltd. (Yankee) | | |
| 0.40% 0.75%, 8/10/09 10/8/09 | 1,710,000,000 | 1,710,000,000 |
| Barclays Bank PLC (Yankee) | | |
| 0.40% 0.82%, 9/14/09 11/10/09 | 1,630,000,000 | 1,630,000,000 |
| Bayerische Hypo-und Vereinsbank AG (Yankee) | | |
| 0.42%, 8/17/09 | 500,000,000 | 500,000,000 |
| Calyon (Yankee) | | |
| 0.43% 0.67%, 8/3/09 10/9/09 | 1,200,000,000 | 1,200,000,000 |
| Citibank (South Dakota) N.A., Sioux Falls | | |
| 0.41% 0.88%, 8/11/09 10/21/09 | 1,550,000,000 | 1,550,000,000 |
| Credit Industriel et Commercial (Yankee) | | |
| 0.48% 0.93%, 8/3/09 10/28/09 | 1,500,000,000 | 1,500,009,057 |
| DnB NOR Bank ASA (Yankee) | | |
| 0.55%, 8/10/09 | 150,000,000 a | 150,000,000 |
| DZ Bank AG (Yankee) | | |
| 0.42% 0.65%, 8/5/09 8/21/09 | 1,050,000,000 | 1,050,000,000 |
| Fortis Bank (Yankee) | | |
| 0.95% 1.10%, 8/7/09 8/17/09 | 1,850,000,000 | 1,850,000,000 |
| ING Bank N.V. (London) | | |
| 0.93%, 8/7/09 | 700,000,000 | 700,000,000 |
| Intesa Sanpaolo SpA (Yankee) | | |
| 0.35% 1.08%, 8/7/09 5/21/10 | 750,000,000 | 750,000,000 |
| Lloyds TSB Bank PLC (Yankee) | | |
| 0.43% 0.63%, 8/21/09 11/3/09 | 2,070,000,000 | 2,070,000,000 |
| Mizuho Corporate Bank (Yankee) | | |
| 0.40% 0.50%, 8/12/09 9/14/09 | 1,250,000,000 | 1,250,000,000 |
| Natixis (Yankee) | | |
| 0.52% 0.75%, 10/5/09 11/3/09 | 1,125,000,000 | 1,125,000,000 |
| Royal Bank of Scotland PLC (Yankee) | | |
| 0.50% 0.94%, 8/13/09 10/30/09 | 1,560,000,000 | 1,560,000,000 |
| Societe Generale (Yankee) | | |
| 0.57% 0.77%, 8/6/09 9/1/09 | 800,000,000 | 800,000,000 |
| Sumitomo Mitsui Banking Corporation (Yankee) | | |
| 0.38% 0.76%, 8/10/09 10/20/09 | 850,000,000 | 850,000,000 |
| UBS AG (Yankee) | | |
| 0.57% 0.72%, 9/10/09 10/13/09 | 1,700,000,000 | 1,700,000,000 |
| Total Negotiable Bank Certificates of Deposit | | |
| (cost $25,775,025,403) | | 25,775,025,403 |
The Funds 11
STATEMENT OF INVESTMENTS (Unaudited) (continued)
| | |
| | Principal | |
| Dreyfus Cash Management (continued) | Amount ($) | Value ($) |
| |
| Commercial Paper 21.8% | | |
| Abbey National North America LLC | | |
| 0.18%, 8/3/09 | 1,400,000,000 | 1,399,986,000 |
| Atlantis One Funding Corp. | | |
| 0.18% 0.40%, 8/3/09 9/9/09 | 530,000,000 a | 529,867,700 |
| Banco Bilbao Vizcaya Argenteria Puerto Rico | | |
| 0.50%, 8/11/09 | 700,000,000 | 699,902,778 |
| Calyon NA Inc. | | |
| 0.45%, 8/7/09 | 96,490,000 | 96,482,763 |
| Cancara Asset Securitisation Ltd. | | |
| 0.55% 0.82%, 8/11/09 10/13/09 | 750,000,000 a | 749,514,111 |
| CIESCO LLC | | |
| 0.40%, 9/10/09 | 245,000,000 a | 244,891,111 |
| Clipper Receivables Co. | | |
| 1.07%, 8/3/09 | 250,000,000 a | 249,985,139 |
| Danske Corp., Inc. | | |
| 0.37% 0.40%, 8/28/09 9/14/09 | 1,297,000,000 a | 1,296,485,205 |
| General Electric Capital Services Inc. | | |
| 0.38%, 9/21/09 | 350,000,000 | 349,811,583 |
| General Electric Co. | | |
| 0.18%, 8/3/09 | 650,000,000 | 649,993,500 |
| Gotham Funding Corp. | | |
| 0.34% 0.45%, 8/11/09 10/13/09 | 225,000,000 a | 224,864,653 |
| Govco Inc. | | |
| 0.42%, 9/16/09 9/25/09 | 215,000,000 a | 214,875,575 |
| ING (US) Funding LLC | | |
| 0.40% 0.60%, 8/7/09 8/27/09 | 1,350,000,000 | 1,349,776,389 |
| Natexis Banques Populaires US Finance Co. LLC | | |
| 1.09%, 8/5/09 | 300,000,000 | 299,963,667 |
| Societe Generale N.A. Inc. | | |
| 0.60% 0.75%, 8/10/09 9/4/09 | 1,100,000,000 | 1,099,604,167 |
| Victory Receivables Corp. | | |
| 0.48%, 8/7/09 | 33,046,000 a | 33,043,356 |
| Total Commercial Paper | | |
| (cost $9,489,047,697) | | 9,489,047,697 |
| |
| Corporate Note 2.2% | | |
| Bank of America Corp. | | |
| 0.39%, 8/3/09 | | |
| (cost $950,000,000) | 950,000,000 | 950,000,000 |
| |
| U.S. Government Agencies 3.4% | | |
| Federal Home Loan Bank | | |
| 0.64%-0.65%, 5/11/10 | 500,000,000 | 499,970,925 |
| Federal Home Loan Mortgage Corp. | | |
| 0.49%, 10/16/09 | 1,000,000,000 b,c | 1,000,000,000 |
| Total U.S. Government Agencies | | |
| (cost $1,499,970,925) | | 1,499,970,925 |
12
| | |
| | Principal | |
| Dreyfus Cash Management (continued) | Amount ($) | Value ($) |
| |
| Time Deposits 7.3% | | |
| Commerzbank AG (Grand Cayman) | | |
| 0.19%, 8/3/09 | 328,000,000 | 328,000,000 |
| JPMorgan Chase Bank, N.A. (Nassau) | | |
| 0.19%, 8/3/09 | 1,000,000,000 | 1,000,000,000 |
| Landesbank Hessen-Thuringen Girozentrale (Grand Cayman) | | |
| 0.19%, 8/3/09 | 475,000,000 | 475,000,000 |
| Nordea Bank Finland PLC (Grand Cayman) | | |
| 0.18%, 8/3/09 | 1,400,000,000 | 1,400,000,000 |
| Total Time Deposits | | |
| (cost $3,203,000,000) | | 3,203,000,000 |
| |
| |
| Repurchase Agreements 7.1% | | |
| Barclays Financial LLC | | |
| 0.20%, dated 7/31/09, due 8/3/09 in the amount of $1,200,020,000 | | |
| (fully collateralized by $1,168,736,100 U.S. Treasury Notes, 3.125%-4%, | | |
| due 8/31/13-8/15/18, value $1,224,000,033) | 1,200,000,000 | 1,200,000,000 |
| Deutsche Bank Securities | | |
| 0.19%-0.24%, dated 7/31/09, due 8/3/09 in the amount of $1,900,032,167 | | |
| (fully collateralized by $516,560,000 Federal Home Loan Bank, 0.875%-4.625%, | | |
| due 10/9/09-10/10/12, value $523,643,690, $805,799,000 Federal Home Loan | | |
| Mortgage Corp., 0%-3.75%, due 12/31/09-3/27/19, value $805,303,075, | | |
| $150,000,000 Federal National Mortgage Association, 2.25%, due 4/9/12, | | |
| value $150,957,000, and $860,076,775 U.S. Treasury Strips, | | |
| due 5/15/19-8/15/28, value $458,096,235) | 1,900,000,000 | 1,900,000,000 |
| Total Repurchase Agreements | | |
| (cost $3,100,000,000) | | 3,100,000,000 |
| |
| Total Investments (cost $44,017,044,025) | 100.9% | 44,017,044,025 |
| |
| Liabilities, Less Cash and Receivables | (.9%) | (412,638,350) |
| |
| Net Assets | 100.0% | 43,604,405,675 |
|
| a Securities exempt from registration under Rule 144A of the Securities Act of 1933.These securities may be resold in transactions exempt from registration, normally to qualified |
| institutional buyers. At July 31, 2009, these securities amounted to $4,023,526,850 or 9.2% of net assets. |
| b On September 7, 2008, the Federal Housing Finance Agency (FHFA) placed Federal National Mortgage Association and Federal Home Loan Mortgage Corporation into |
| conservatorship with FHFA as the conservator. As such, the FHFA will oversee the continuing affairs of these companies. |
| c Variable rate security interest rate subject to periodic change. |
| | | |
| Portfolio Summary (Unaudited) | | | |
| |
| | Value (%) | | Value (%) |
| Banking | 77.2 | Asset-Backed/Multi-Seller Programs | 2.3 |
| Repurchase Agreements | 7.1 | Finance | 2.3 |
| Foreign/Governmental | 6.4 | Asset-Backed/Certificates-Other | 2.2 |
| U.S. Government Agencies | 3.4 | | 100.9 |
| |
| Based on net assets. | | | |
| See notes to financial statements. | | | |
The Funds 13
STATEMENT OF INVESTMENTS
July 31, 2009 (Unaudited) |
| | |
| | Principal | |
| Dreyfus Cash Management Plus, Inc. | Amount ($) | Value ($) |
| Negotiable Bank Certificates of Deposit 51.4% | | |
| Allied Irish Banks (Yankee) | | |
| 1.63% 1.90%, 9/30/09 10/19/09 | 350,000,000 | 350,006,556 |
| Banco Bilbao Vizcaya Argenteria Puerto Rico (Yankee) | | |
| 0.35% 0.40%, 9/1/09 9/8/09 | 300,000,000 | 300,000,860 |
| Bank of Ireland (Yankee) | | |
| 1.90%, 10/6/09 | 200,000,000 a | 200,000,000 |
| Bank of Tokyo-Mitsubishi Ltd. (Yankee) | | |
| 0.65% 0.75%, 8/10/09 8/13/09 | 50,000,000 | 50,000,000 |
| Bayerische Hypo-und Vereinsbank AG (Yankee) | | |
| 0.40%, 8/24/09 | 200,000,000 | 200,000,000 |
| Citibank (South Dakota) N.A., Sioux Falls | | |
| 0.45% 0.55%, 10/1/09 10/8/09 | 300,000,000 | 300,000,000 |
| Credit Industriel et Commercial (Yankee) | | |
| 0.75%, 8/11/09 | 200,000,000 | 200,000,000 |
| DZ Bank AG (Yankee) | | |
| 0.65%, 8/5/09 | 100,000,000 | 100,000,000 |
| Fortis Bank (Yankee) | | |
| 1.10%, 8/7/09 8/10/09 | 300,000,000 | 300,000,000 |
| ING Bank N.V. (London) | | |
| 0.87%, 8/10/09 | 300,000,000 | 300,000,000 |
| Lloyds TSB Bank PLC (Yankee) | | |
| 0.46% 0.63%, 8/21/09 10/23/09 | 325,000,000 | 325,000,000 |
| Mizuho Corporate Bank (Yankee) | | |
| 0.38% 0.42%, 9/14/09 10/13/09 | 300,000,000 | 300,000,000 |
| Natixis (Yankee) | | |
| 0.75%, 10/5/09 | 300,000,000 | 300,000,000 |
| Royal Bank of Scotland PLC (Yankee) | | |
| 0.52% 0.94%, 8/13/09 10/23/09 | 340,000,000 | 340,000,000 |
| UBS AG (Yankee) | | |
| 0.67% 0.72%, 9/10/09 10/2/09 | 300,000,000 | 300,000,000 |
| Total Negotiable Bank Certificates of Deposit | | |
| (cost $3,865,007,416) | | 3,865,007,416 |
| |
| Commercial Paper 27.5% | | |
| Abbey National North America LLC | | |
| 0.18%, 8/3/09 | 300,000,000 | 299,997,000 |
| ASB Finance Ltd. | | |
| 0.50%, 8/11/09 | 40,000,000 a | 39,994,444 |
| CAFCO LLC | | |
| 0.40%, 9/10/09 | 250,000,000 a | 249,888,889 |
| CHARTA LLC | | |
| 0.65%, 8/14/09 | 50,000,000 a | 49,988,264 |
14
| | |
| | Principal | |
| Dreyfus Cash Management Plus, Inc. (continued) | Amount ($) | Value ($) |
| |
| Commercial Paper (continued) | | |
| CIESCO LLC | | |
| 0.49%, 8/7/09 | 100,000,000 a | 99,991,833 |
| CRC Funding LLC | | |
| 0.40%, 10/15/09 | 200,000,000 a | 199,833,333 |
| Danske Corp., Inc. | | |
| 0.40%, 8/28/09 | 300,000,000 a | 299,910,000 |
| Edison Asset Securitization LLC | | |
| 0.38%, 10/7/09 | 200,000,000 a | 199,858,556 |
| General Electric Co. | | |
| 0.18%, 8/3/09 | 300,000,000 | 299,997,000 |
| Societe Generale N.A. Inc. | | |
| 0.60%-0.65%, 8/10/09 | 325,000,000 | 324,947,500 |
| Total Commercial Paper | | |
| (cost $2,064,406,819) | | 2,064,406,819 |
| |
| Corporate Notes 4.9% | | |
| Bank of America Corp. | | |
| 0.39%, 8/3/09 | 350,000,000 | 350,000,000 |
| Lehman Brothers Holdings Inc. | | |
| 0.00%, 2/22/09 | 97,200,000 b,c,d,e | 17,010,000 |
| Total Corporate Notes | | |
| (cost $447,200,000) | | 367,010,000 |
| |
| Time Deposits 8.0% | | |
| Commerzbank AG (Grand Cayman) | | |
| 0.22%, 8/3/09 | 300,000,000 | 300,000,000 |
| JPMorgan Chase Bank, N.A. (Nassau) | | |
| 0.19%, 8/3/09 | 300,000,000 | 300,000,000 |
| Total Time Deposits | | |
| (cost $600,000,000) | | 600,000,000 |
| |
| Repurchase Agreements 7.6% | | |
| Barclays Financial LLC | | |
| 0.20%, dated 7/31/09, due 8/3/09 in the amount of $172,002,867 | | |
| (fully collateralized by $126,712,800 U.S. Treasury Bonds, 8%, | | |
| due 11/15/21, value $175,440,097) | 172,000,000 | 172,000,000 |
| Credit Suisse (USA) Inc. | | |
| 0.20%, dated 7/31/09, due 8/3/09 in the | | |
| amount of $100,001,667 (fully collateralized by | | |
| $102,033,000 U.S. Treasury Bills, due 8/20/09-11/19/09, | | |
| value $102,003,572) | 100,000,000 | 100,000,000 |
The Funds 15
| STATEMENT OF INVESTMENTS (Unaudited) (continued) |
| | |
| | Principal | |
| Dreyfus Cash Management Plus, Inc. (continued) | Amount ($) | Value ($) |
| |
| Repurchase Agreements (continued) | | |
| Deutsche Bank Securities | | |
| 0.19%, dated 7/31/09, due 8/3/09 in the amount of $300,004,750 | | |
| (fully collateralized by $2,000,000 Asian Development Bank, 4.50%, | | |
| due 9/4/12, value $2,157,030, $160,740,000 Federal Home Loan Bank, | | |
| 0%-4.63%, due 5/18/10-2/4/15, value $168,978,842, $107,257,000 | | |
| Federal Home Loan Mortgage Corp., 1.45%-3.75%, due 7/8/14-7/11/22, | | |
| value $106,196,584, $9,951,000 Federal National Mortgage Association, | | |
| 0%-3.25%, due 4/6/11-6/24/24, value $10,068,055 and $28,559,676 | | |
| U.S. Treasury Strips, due 11/15/19, value $18,599,489) | 300,000,000 | 300,000,000 |
| Total Repurchase Agreements | | |
| (cost $572,000,000) | | 572,000,000 |
| |
| |
| Other .6% | | |
| Capital Support Agreement | | |
| (cost $0) | 0 c | 47,537,936 |
| |
| Total Investments (cost $7,548,614,235) | 100.0% | 7,515,962,171 |
| |
| Cash and Receivables (Net) | .0% | 2,854,518 |
| |
| Net Assets | 100.0% | 7,518,816,689 |
|
| a Securities exempt from registration under Rule 144A of the Securities Act of 1933.These securities may be resold in transactions exempt from registration, normally to qualified |
| institutional buyers. At July 31, 2009, these securities amounted to $1,339,465,319 or 17.8% of net assets. |
| b Bankrupt security matured on February 22, 2009. Security valued at fair value based on similar defaulted securities that have not matured. |
| c The Bank of NewYork Mellon Corporation (BNY Mellon) has entered into a Capital Support Agreement with the fund, which provides that BNY Mellon, at no cost to the fund, will |
| contribute capital to the fund up to 100% of the amortized cost of the security to the extent that the fund maintains a net asset value of $.995 on the sale, final liquidation or other final |
| payment of the security. |
| d Issuer filed for bankruptcy. |
| e Non-income producing security in default. |
| | | |
| Portfolio Summary (Unaudited) | | | |
| |
| | Value (%) | | Value (%) |
| Banking | 60.9 | Finance | 4.0 |
| Foreign/Governmental | 11.3 | Other | .6 |
| Asset-Backed/Multi-Seller Programs | 10.7 | Brokerage Firms | .2 |
| Repurchase Agreements | 7.6 | | |
| Asset-Backed/Certificates-Other | 4.7 | | 100.0 |
| |
| Based on net assets. | | | |
| See notes to financial statements. | | | |
16
STATEMENT OF INVESTMENTS
July 31, 2009 (Unaudited) |
| | | |
| | Annualized | | |
| | Yield on | | |
| | Date of | Principal | |
| Dreyfus Government Cash Management | Purchase (%) | Amount ($) | Value ($) |
| |
| U.S. Government Agencies 60.2% | | | |
| Federal Farm Credit Bank: | | | |
| 8/3/09 | 0.36 | 100,000,000 a | 100,000,000 |
| 9/15/09 | 0.30 | 320,000,000 a | 319,998,104 |
| 3/9/10 | 0.48 | 200,000,000 a | 200,000,000 |
| Federal Home Loan Bank: | | | |
| 8/3/09 | 0.42 | 500,000,000 a | 500,000,000 |
| 8/3/09 | 0.37 | 197,500,000 a | 197,500,000 |
| 8/4/09 | 0.55 | 25,000,000 | 25,004,146 |
| 8/5/09 | 0.55 | 77,095,000 | 77,090,289 |
| 8/11/09 | 0.56 | 295,645,000 | 295,599,011 |
| 8/11/09 | 0.91 | 500,000,000 a | 499,947,722 |
| 8/18/09 | 0.57 | 1,004,355,000 | 1,004,084,661 |
| 8/22/09 | 0.20 | 500,000,000 a | 499,983,490 |
| 8/24/09 | 0.56 | 971,250,000 a | 971,002,510 |
| 9/4/09 | 0.36 | 350,000,000 a | 350,000,000 |
| 9/10/09 | 0.65 | 850,000,000 a | 850,002,381 |
| 9/10/09 | 0.63 | 1,500,000,000 a | 1,500,016,775 |
| 9/30/09 | 0.45 | 457,938,000 | 457,594,546 |
| 10/15/09 | 0.42 | 87,000,000 | 86,923,875 |
| 10/16/09 | 0.30 | 350,000,000 a | 350,057,000 |
| 10/16/09 | 0.42 | 600,000,000 | 599,468,000 |
| 10/16/09 | 0.46 | 1,000,000,000 a | 1,000,000,000 |
| 11/12/09 | 0.55 | 9,790,000 | 9,795,155 |
| 11/20/09 | 0.30 | 201,519,000 | 201,332,595 |
| 11/25/09 | 0.30 | 101,409,000 | 101,310,971 |
| 11/27/09 | 0.30 | 282,100,000 | 281,822,602 |
| 12/1/09 | 0.56 | 500,000,000 | 499,051,111 |
| 12/3/09 | 0.32 | 200,000,000 | 199,993,065 |
| 12/23/09 | 0.35 | 124,750,000 | 124,575,350 |
| 12/23/09 | 0.04 | 25,000,000 | 25,038,483 |
| 12/30/09 | 0.35 | 25,000,000 | 24,963,299 |
| 1/6/10 | 0.30 | 366,000,000 | 365,518,100 |
| 1/11/10 | 0.30 | 254,623,000 | 254,277,137 |
| 1/15/10 | 0.53 | 262,980,000 | 263,370,788 |
| 1/15/10 | 0.58 | 121,650,000 | 123,473,230 |
| 1/20/10 | 0.33 | 500,000,000 | 499,947,638 |
| 2/1/10 | 0.40 | 67,220,000 | 67,082,572 |
| 2/4/10 | 0.40 | 50,000,000 | 49,896,111 |
| 2/5/10 | 0.50 | 402,350,000 | 402,327,915 |
| 2/10/10 | 0.58 | 224,624,000 | 223,925,544 |
| 2/18/10 | 0.42 | 2,300,000 | 2,307,508 |
| 2/26/10 | 0.42 | 22,950,000 | 22,943,523 |
| 4/30/10 | 0.70 | 128,000,000 | 127,992,273 |
The Funds 17
| STATEMENT OF INVESTMENTS (Unaudited) (continued) |
| | | |
| | Annualized | | |
| | Yield on | | |
| | Date of | Principal | |
| Dreyfus Government Cash Management (continued) | Purchase (%) | Amount ($) | Value ($) |
| |
| U.S. Government Agencies (continued) | | | |
| Federal Home Loan Mortgage Corp.: | | | |
| 8/18/09 | 0.21 | 250,000,000 a | 249,976,688 |
| 9/1/09 | 0.55 | 260,950,000 | 260,826,411 |
| 10/5/09 | 0.38 | 38,550,000 | 38,523,550 |
| 10/13/09 | 0.38 | 555,736,000 | 555,304,733 |
| 11/16/09 | 0.30 | 24,029,000 | 24,007,574 |
| 11/16/09 | 0.25 | 281,600,000 | 283,590,485 |
| 11/23/09 | 0.30 | 95,000,000 | 94,909,750 |
| 12/15/09 | 0.35 | 150,000,000 | 152,024,581 |
| 12/21/09 | 0.32 | 279,820,000 | 279,462,982 |
| 12/28/09 | 0.35 | 94,753,000 | 94,615,740 |
| 1/4/10 | 0.30 | 107,902,000 | 107,761,727 |
| 1/19/10 | 0.31 | 771,500,000 | 770,363,966 |
| 2/8/10 | 0.40 | 630,500,000 | 629,161,939 |
| 2/22/10 | 0.40 | 88,079,000 | 87,878,376 |
| Federal National Mortgage Association: | | | |
| 8/3/09 | 0.41 | 800,000,000 a | 800,000,000 |
| 8/3/09 | 0.42 | 420,000,000 a | 419,996,213 |
| 9/30/09 | 0.45 | 100,000,000 | 99,925,000 |
| 10/7/09 | 0.40 | 63,354,000 | 63,306,836 |
| 10/14/09 | 0.38 | 440,220,000 | 439,876,139 |
| 10/19/09 | 0.38 | 19,700,000 | 19,683,572 |
| 11/25/09 | 0.30 | 275,627,000 | 275,360,561 |
| 12/16/09 | 0.33 | 15,000,000 | 14,981,163 |
| 12/22/09 | 0.53 | 250,000,000 | 249,473,681 |
| 12/23/09 | 0.32 | 275,000,000 | 274,646,000 |
| 12/28/09 | 0.33 | 28,420,000 | 28,381,183 |
| 12/29/09 | 0.60 | 100,000,000 | 99,750,000 |
| 2/22/10 | 0.47 | 1,062,752,000 | 1,059,936,910 |
| Total U.S. Government Agencies | | | |
| (cost $21,228,943,240) | | | 21,228,943,240 |
| |
| |
| Repurchase Agreements 39.8% | | | |
| Banc of America Securities LLC | | | |
| dated 7/31/09, due 8/3/09 in the amount of $2,350,035,250 | | | |
| (fully collateralized by $229,296,000 Federal Home Loan Bank, | | | |
| 0%-5.50%, due 8/13/09-7/15/36, value $231,057,980, $202,127,000 | | | |
| Federal Home Loan Mortgage Corp., 0%-5%, due 8/5/11-7/11/22, | | | |
| value $206,889,794, $1,033,560,000 Federal National Mortgage | | | |
| Association, 0%-6.21%, due 8/3/09-6/5/36, value $888,052,712, | | | |
| $262,312,100 Treasury Inflation Protected Securities, 0.875%-2%, | | | |
| due 4/15/10-1/15/15, value $300,423,659 and $1,379,747,573 | | | |
| U.S. Treasury Strips, due 2/15/13-2/15/30, value $770,576,379) | 0.18 | 2,350,000,000 | 2,350,000,000 |
| Barclays Financial LLC | | | |
| dated 7/31/09, due 8/3/09 in the amount of $1,164,019,400 | | | |
| (fully collateralized by $303,287,000 Federal National Mortgage | | | |
| Association, 3.40%, due 3/10/14, value $306,000,407 and | | | |
| $804,536,300 Treasury Inflation Protected Securities, | | | |
| 1.63%-2.50%, due 1/15/15-1/15/29, value $881,280,093) | 0.20 | 1,164,000,000 | 1,164,000,000 |
18
| | | |
| | Annualized | | |
| | Yield on | | |
| | Date of | Principal | |
| Dreyfus Government Cash Management (continued) | Purchase (%) | Amount ($) | Value ($) |
| |
| Repurchase Agreements (continued) | | | |
| BNP Paribas | | | |
| dated 7/31/09, due 8/3/09 in the amount of $2,300,036,417 (fully collateralized | | | |
| by $361,950,000 U.S. Treasury Bills, due 8/20/09, value $361,922,492 and | | | |
| $1,926,759,100 U.S. Treasury Notes, 0.875%-4.50%, due 2/28/10-2/15/16, | | | |
| value $1,984,077,563) | 0.19 | 2,300,000,000 | 2,300,000,000 |
| Calyon Securities (USA) | | | |
| dated 7/31/09, due 8/3/09 in the amount of $1,000,016,667 (fully collateralized by | | | |
| $200,000,000 Treasury Inflation Protected Securities, 3.375%, due 4/15/32, | | | |
| value $298,181,578 and $727,590,100 U.S. Treasury Notes, 1.125%-1.875%, | | | |
| due 1/15/12-6/15/12, value $727,766,082) | 0.20 | 1,000,000,000 | 1,000,000,000 |
| Calyon Securities (USA) | | | |
| dated 7/31/09, due 8/3/09 in the amount of $1,700,029,750 (fully collateralized | | | |
| by $779,025,000 Federal Home Loan Bank, 0.70%-5.648%, due 1/15/10-11/27/37, | | | |
| value $776,726,421, $649,996,000 Federal Home Loan Mortgage Corp., 0%-2.125%, | | | |
| due 9/15/09-3/23/12, value $651,724,757 and $300,000,000 Federal National | | | |
| Mortgage Association, 0%-6.625%, due 9/15/09-2/9/26, value $305,548,889) | 0.21 | 1,700,000,000 | 1,700,000,000 |
| Citigroup Global Markets Holdings Inc. | | | |
| dated 7/31/09, due 8/3/09 in the amount of $200,002,833 (fully collateralized | | | |
| by $42,771,300 Treasury Inflation Protected Securities, 2%, due 1/15/14, | | | |
| value $50,372,592 and $140,005,100 U.S. Treasury Notes, 4.25%, | | | |
| due 8/15/13, value $153,627,449) | 0.17 | 200,000,000 | 200,000,000 |
| Credit Suisse (USA) Inc. | | | |
| dated 7/31/09, due 8/3/09 in the amount of $570,009,975 | | | |
| (fully collateralized by $582,562,000 Federal Home Loan | | | |
| Mortgage Corp., 0%, due 10/26/09-7/12/10, value $581,401,741) | 0.21 | 570,000,000 | 570,000,000 |
| Deutsche Bank Securities | | | |
| dated 7/31/09, due 8/3/09 in the amount of $1,400,021,000 (fully collateralized | | | |
| by $368,504,800 Treasury Inflation Protected Securities, 2%-2.375%, | | | |
| due 1/15/14-1/15/27, value $421,278,856, $205,593,100 U.S. Treasury | | | |
| Bonds, 6.125%-6.875%, due 8/15/25-11/15/27, value $271,370,932, | | | |
| $589,896,000 U.S. Treasury Notes, 3.125%-5.125%, due 6/30/11-7/31/16, | | | |
| value $613,522,085 and $181,531,000 U.S. Treasury Strips, | | | |
| due 5/15/15-2/15/21, value $121,828,189) | 0.18 | 1,400,000,000 | 1,400,000,000 |
| Deutsche Bank Securities | | | |
| dated 7/31/09, due 8/3/09 in the amount of $200,003,167 (fully collateralized | | | |
| by $100,000,000 Federal Home Loan Mortgage Corp., 5.76%, due 8/27/14, | | | |
| value $102,818,861 and $94,910,000 Federal National Mortgage Association, | | | |
| 2.75%-5.375%, due 11/15/11-2/5/14, value $101,181,443) | 0.19 | 200,000,000 | 200,000,000 |
| Goldman, Sachs & Co. | | | |
| dated 7/31/09, due 8/3/09 in the amount of $400,006,333 (fully collateralized | | | |
| by $108,084,400 Treasury Inflation Protected Securities, 3.375%-3.625%, | | | |
| due 4/15/28-4/15/32, value $172,548,855 and $362,528,903 | | | |
| U.S. Treasury Strips, due 2/15/20-2/15/22, value $235,451,167) | 0.19 | 400,000,000 | 400,000,000 |
| HSBC USA Inc. | | | |
| dated 7/31/09, due 8/3/09 in the amount of $1,500,022,500 (fully collateralized | | | |
| by $1,087,434,400 U.S. Treasury Bonds, 4.75%-6.75%, due 8/15/23-2/15/37, | | | |
| value $1,308,438,068 and $216,293,800 U.S. Treasury Notes, 2.88%, | | | |
| due 6/30/10, value $221,565,282) | 0.18 | 1,500,000,000 | 1,500,000,000 |
The Funds 19
| STATEMENT OF INVESTMENTS (Unaudited) (continued) |
| | | |
| | Annualized | | |
| | Yield on | | |
| | Date of | Principal | |
| Dreyfus Government Cash Management (continued) | Purchase (%) | Amount ($) | Value ($) |
| |
| Repurchase Agreements (continued) | | | |
| Morgan Stanley | | | |
| dated 7/31/09, due 8/3/09 in the amount of $500,007,917 (fully collateralized | | | |
| by $267,150,000 Federal Agricultural Mortgage Corp., 5.13%-5.50%, | | | |
| due 7/15/11-4/19/17, value $283,907,341 and $227,050,000 Federal | | | |
| Home Loan Bank, 2.05%-6.38%, due 8/7/09-4/27/29, value $226,325,347) | 0.19 | 500,000,000 | 500,000,000 |
| RBS Securities | | | |
| dated 7/31/09, due 8/3/09 in the amount of $500,008,750 (fully collateralized | | | |
| by $700,000 Inter-American Development Bank, 3%, due 4/22/14, value $706,650, | | | |
| $32,464,000 International Bank for Reconstruction and Development, 1.40%, | | | |
| due 4/14/11, value $33,138,872 and $483,850,000 U.S. Treasury Notes, 3.25%, | | | |
| due 7/31/16, value $476,156,806) | 0.21 | 500,000,000 | 500,000,000 |
| UBS Securities LLC | | | |
| dated 7/31/09, due 8/3/09 in the amount of $250,003,750 (fully | | | |
| collateralized by $2,170,000 Federal Home Loan Mortgage Corp., | | | |
| 5%-5.875%, due 3/21/11-12/14/18, value $2,321,029, $213,505,000 | | | |
| Federal National Mortgage Association, 0%, due 12/2/10-5/27/11, | | | |
| value $213,924,020, $3,295,000 Student Loan Marketing Association, | | | |
| 0%, due 10/3/22, value $1,589,804 and $44,927,000 Tennessee | | | |
| Valley Authority, 0%-8.25%, due 1/18/11-4/15/42, value $37,165,297) | 0.18 | 250,000,000 | 250,000,000 |
| Total Repurchase Agreements | | | |
| (cost $14,034,000,000) | | | 14,034,000,000 |
| |
| Total Investments (cost $35,262,943,240) | | 100.0% | 35,262,943,240 |
| |
| Cash and Receivables (Net) | | .0% | 11,907,850 |
| |
| Net Assets | | 100.0% | 35,274,851,090 |
| |
| a Variable rate security interest rate subject to periodic change. | | | |
| | | |
| Portfolio Summary (Unaudited) | | | |
| |
| | Value (%) | | Value (%) |
| Repurchase Agreements | 39.8 | Federal Home Loan Mortgage Corp | 10.3 |
| Federal Home Loan Bank | 37.2 | Federal Farm Credit Bank | 1.8 |
| Federal National Mortgage Association | 10.9 | | 100.0 |
| |
| Based on net assets. | | | |
| See notes to financial statements. | | | |
20
STATEMENT OF INVESTMENTS
July 31, 2009 (Unaudited) |
| | | |
| | Annualized | | |
| | Yield on | | |
| | Date of | Principal | |
| Dreyfus Government Prime Cash Management | Purchase (%) | Amount ($) | Value ($) |
| |
| U.S. Government Agencies 89.5% | | | |
| Federal Farm Credit Bank: | | | |
| 8/3/09 | 0.36 | 150,000,000 a | 150,000,000 |
| 8/6/09 | 0.36 | 328,000,000 a | 328,180,428 |
| 8/17/09 | 0.16 | 37,000,000 | 36,997,369 |
| 8/28/09 | 0.30 | 412,000,000 a | 411,939,817 |
| 8/28/09 | 0.47 | 100,000,000 a | 100,000,000 |
| 9/15/09 | 2.46 | 31,930,000 | 31,930,000 |
| 9/24/09 | 0.53 | 7,000,000 a | 6,998,243 |
| 12/21/09 | 0.45 | 100,000,000 a | 99,965,150 |
| 3/12/10 | 0.95 | 50,000,000 a | 49,818,237 |
| Federal Home Loan Bank: | | | |
| 8/3/09 | 0.09 | 350,000,000 | 349,998,250 |
| 8/3/09 | 0.42 | 250,000,000 a | 250,000,000 |
| 8/4/09 | 0.55 | 20,000,000 | 19,999,083 |
| 8/6/09 | 0.17 | 500,000,000 | 499,988,194 |
| 8/7/09 | 0.56 | 240,935,000 | 240,912,513 |
| 8/7/09 | 0.34 | 250,000,000 a | 250,000,000 |
| 8/10/09 | 0.55 | 125,000,000 | 124,982,813 |
| 8/14/09 | 0.19 | 277,200,000 | 277,180,981 |
| 8/21/09 | 0.22 | 160,000,000 | 159,980,444 |
| 8/25/09 | 0.22 | 40,475,000 | 40,469,064 |
| 8/28/09 | 0.18 | 91,550,000 | 91,537,641 |
| 9/4/09 | 0.18 | 178,585,000 | 178,554,641 |
| 9/18/09 | 0.44 | 146,000,000 | 145,914,347 |
| 9/18/09 | 0.51 | 8,005,000 | 8,051,621 |
| 9/23/09 | 0.44 | 74,000,000 | 73,952,064 |
| 9/25/09 | 0.43 | 200,000,000 | 199,868,367 |
| 9/30/09 | 0.19 | 200,000,000 | 199,938,333 |
| 10/7/09 | 0.20 | 475,000,000 | 474,823,194 |
| 11/13/09 | 0.29 | 47,000,000 | 46,960,624 |
| 11/18/09 | 0.29 | 17,957,000 | 17,941,233 |
| 11/25/09 | 0.30 | 7,000,000 | 6,993,346 |
| 11/27/09 | 0.29 | 50,000,000 | 49,952,472 |
| 12/4/09 | 0.30 | 23,900,000 | 23,875,104 |
| 12/9/09 | 0.82 | 30,000,000 | 30,000,000 |
| 12/11/09 | 0.83 | 73,250,000 | 74,337,244 |
| 12/14/09 | 0.32 | 114,750,000 | 114,612,300 |
| 12/18/09 | 0.67 | 12,000,000 | 12,121,932 |
| 12/23/09 | 0.67 | 16,250,000 | 16,254,255 |
| 12/28/09 | 0.35 | 200,000,000 | 199,710,278 |
| 12/30/09 | 0.62 | 250,000,000 | 249,349,861 |
| 1/15/10 | 0.30 | 150,000,000 | 149,791,250 |
| 1/22/10 | 0.30 | 200,000,000 | 199,710,000 |
| 3/12/10 | 0.46 | 10,000,000 | 10,127,176 |
| 3/17/10 | 0.45 | 14,070,000 | 14,409,006 |
| Tennessee Valley Authority | | | |
| 9/17/09 | 0.17 | 44,691,000 | 44,680,820 |
| Total U.S. Government Agencies | | | |
| (cost $6,062,807,695) | | | 6,062,807,695 |
The Funds 21
| | STATEMENT OF INVESTMENTS (Unaudited) (continued) |
| | | |
| | Annualized | | |
| | Yield on | | |
| | Date of | Principal | |
| Dreyfus Government Prime Cash Management (continued) | Purchase (%) | Amount ($) | Value ($) |
| U.S. Treasury Bills 2.9% | | | |
| 12/3/09 | | | |
| (cost $199,800,222) | 0.29 | 200,000,000 | 199,800,222 |
| |
| U.S. Treasury Notes 7.4% | | | |
| 8/17/09 | | | |
| (cost $501,013,984) | 0.20 | 500,000,000 | 501,013,984 |
| Total Investments (cost $6,763,621,901) | | 99.8% | 6,763,621,901 |
| Cash and Receivables (Net) | | .2% | 13,352,621 |
| Net Assets | | 100.0% | 6,776,974,522 |
| a Variable rate security interest rate subject to periodic change. | | | |
| | | |
| Portfolio Summary (Unaudited) | | | |
| |
| | Value (%) | | Value (%) |
| Federal Home Loan Bank | 70.9 | U.S. Treasury Bills | 2.9 |
| Federal Farm Credit Bank | 17.9 | Tennessee Valley Authority | .7 |
| U.S. Treasury Notes | 7.4 | | 99.8 |
|
| Based on net assets. |
| See notes to financial statements. |
22
STATEMENT OF INVESTMENTS
July 31, 2009 (Unaudited) |
| | | |
| | Annualized | | |
| | Yield on | | |
| | Date of | Principal | |
| Dreyfus Treasury & Agency Cash Management | Purchase (%) | Amount ($) | Value ($) |
| U.S. Treasury Bills 34.6% | | | |
| 8/6/09 | 0.07 | 150,000,000 | 149,998,542 |
| 9/10/09 | 0.41 | 1,000,000,000 | 999,547,500 |
| 10/22/09 | 0.40 | 350,000,000 | 349,681,111 |
| 11/5/09 | 0.32 | 200,000,000 | 199,829,333 |
| 11/19/09 | 0.37 | 1,000,000,000 | 998,875,555 |
| 11/27/09 | 0.30 | 277,480,000 | 277,207,145 |
| 12/3/09 | 0.27 | 1,000,000,000 | 999,057,083 |
| 12/17/09 | 0.69 | 623,000,000 | 621,352,165 |
| 12/24/09 | 0.34 | 300,000,000 | 299,589,167 |
| 1/28/10 | 0.25 | 750,000,000 | 749,062,500 |
| 4/1/10 | 0.43 | 200,000,000 | 199,426,250 |
| 5/6/10 | 0.52 | 100,000,000 | 99,598,444 |
| Total U.S. Treasury Bills | | | |
| (cost $5,943,224,795) | | | 5,943,224,795 |
| |
| U.S. Treasury Notes 9.5% | | | |
| 8/17/09 | 0.18 | 350,000,000 | 350,496,078 |
| 8/17/09 | 0.18 | 200,000,000 | 200,401,496 |
| 9/15/09 | 0.21 | 200,000,000 | 200,771,909 |
| 2/1/10 | 0.29 | 150,000,000 | 151,356,000 |
| 2/16/10 | 0.32 | 175,000,000 | 179,132,758 |
| 2/16/10 | 0.33 | 238,000,000 | 245,819,049 |
| 3/1/10 | 0.32 | 158,100,000 | 159,617,545 |
| 3/31/10 | 0.35 | 70,000,000 | 70,641,802 |
| 5/17/10 | 0.56 | 75,000,000 | 77,336,276 |
| Total U.S. Treasury Notes | | | |
| (cost $1,635,572,913) | | | 1,635,572,913 |
| |
| Repurchase Agreements 55.8% | | | |
| Banc of America Securities LLC | | | |
| dated 7/31/09, due 8/3/09 in the amount of $1,000,015,000 (fully collateralized | | | |
| by $1,122,887,501 Government National Mortgage Association, 5%-6%, | | | |
| due 6/15/33-7/20/39, value $918,000,000 and $99,002,700 Treasury | | | |
| Inflation Protected Securities, 2.50%, due 1/15/29, value $102,000,012) | 0.18 | 1,000,000,000 | 1,000,000,000 |
| Barclays Financial LLC | | | |
| dated 7/31/09, due 8/3/09 in the amount of $1,572,026,200 (fully collateralized | | | |
| by $653,928,976 Government National Mortgage Association, 4.50%-6.50%, | | | |
| due 1/20/34-7/20/39, value $510,000,001, $384,300 Treasury Inflation | | | |
| Protected Securities, 1.88%, due 7/15/13, value $455,025, $49,288,600 | | | |
| U.S. Treasury Bills, due 4/1/10, value $49,184,108 and $1,067,930,500 | | | |
| U.S. Treasury Notes, 1.38%-4.25%, due 1/15/11-1/31/14, value $1,043,800,948) | 0.20 | 1,572,000,000 | 1,572,000,000 |
The Funds 23
| STATEMENT OF INVESTMENTS (Unaudited) (continued) |
| | | |
| | Annualized | | |
| | Yield on | | |
| | Date of | Principal | |
| Dreyfus Treasury & Agency Cash Management (continued) | Purchase (%) | Amount ($) | Value ($) |
| |
| Repurchase Agreements (continued) | | | |
| BNP Paribas | | | |
| dated 7/31/09, due 8/3/09 in the amount of $1,500,023,750 | | | |
| (fully collateralized by $595,000,000 U.S. Treasury Bills, due 1/14/10, | | | |
| value $594,357,400 and $953,384,100 U.S. Treasury Notes, 0.88%-1.88%, | | | |
| due 3/31/11 4/30/14, value $935,642,631) | 0.19 | 1,500,000,000 | 1,500,000,000 |
| Calyon Securities (USA) | | | |
| dated 7/31/09, due 8/3/09 in the amount of $800,013,333 (fully collateralized | | | |
| by $115,500,000 U.S. Treasury Bonds, 4.25%-8.50%, due 2/15/20-5/15/39, | | | |
| value $164,662,663 and $624,655,400 U.S. Treasury Notes, 1.38%-4.88%, | | | |
| due 8/31/09-9/30/13, value $654,014,334) | 0.20 | 800,000,000 | 800,000,000 |
| Credit Suisse (USA) Inc. | | | |
| dated 7/31/09, due 8/3/09 in the amount of $600,009,500 | | | |
| (fully collateralized by $589,350,200 U.S. Treasury Notes, | | | |
| 3.75%-4%, due 8/15/18-11/15/18, value $612,000,760) | 0.19 | 600,000,000 | 600,000,000 |
| Deutsche Bank Securities | | | |
| dated 7/31/09, due 8/3/09 in the amount of $150,002,250 | | | |
| (fully collateralized by $137,880,000 U.S. Treasury Notes, 2.38%-4.25%, | | | |
| due 8/31/10-1/15/11, value $142,990,354 and $23,393,600 | | | |
| U.S. Treasury Strips, due 11/15/27, value $10,009,654) | 0.18 | 150,000,000 | 150,000,000 |
| Deutsche Bank Securities | | | |
| dated 7/31/09, due 8/3/09 in the amount of $400,006,333 | | | |
| (fully collateralized by $550,476,112 Government National Mortgage | | | |
| Association, 4.50%-7%, due 10/15/38-7/20/39, value $408,000,001) | 0.19 | 400,000,000 | 400,000,000 |
| Goldman, Sachs & Co. | | | |
| dated 7/31/09, due 8/3/09 in the amount of $100,001,583 (fully collateralized | | | |
| by $747,618,690 Government National Mortgage Association, 3%-11%, | | | |
| due 6/15/16-7/20/39, value $102,000,001) | 0.19 | 100,000,000 | 100,000,000 |
| Goldman, Sachs & Co. | | | |
| dated 7/31/09, due 8/3/09 in the amount of $71,000,592 | | | |
| (fully collateralized by $74,018,400 U.S. Treasury Notes, | | | |
| 2.63%, due 2/29/16-4/30/16, value $72,420,020) | 0.10 | 71,000,000 | 71,000,000 |
| HSBC USA Inc. | | | |
| dated 7/31/09, due 8/3/09 in the amount of $800,011,333 | | | |
| (fully collateralized by $183,855,000 U.S. Treasury Bonds, 5.25%, | | | |
| due 2/15/29, value $207,326,769 and $611,581,000 U.S. Treasury | | | |
| Notes, 1%-2.63%, due 7/31/11-7/31/14, value $608,677,743) | 0.17 | 800,000,000 | 800,000,000 |
24
| | | |
| | Annualized | | |
| | Yield on | | |
| | Date of | Principal | |
| Dreyfus Treasury & Agency Cash Management (continued) | Purchase (%) | Amount ($) | Value ($) |
| |
| Repurchase Agreements (continued) | | | |
| JP Morgan Chase & Co. | | | |
| dated 7/31/09, due 8/3/09 in the amount of $200,002,833 (fully collateralized | | | |
| by $252,006,386 U.S. Treasury Strips, due 2/15/15-11/15/16, value $204,002,724) | 0.17 | 200,000,000 | 200,000,000 |
| JP Morgan Chase & Co. | | | |
| dated 7/31/09, due 8/3/09 in the amount of $1,200,018,000 | | | |
| (fully collateralized by $1,575,321,125 Government National Mortgage | | | |
| Association, 3.50%-8.50%, due 2/15/11-5/15/51, value $1,224,000,457) | 0.18 | 1,200,000,000 | 1,200,000,000 |
| Morgan Stanley | | | |
| dated 7/31/09, due 8/3/09 in the amount of $700,010,500 (fully collateralized | | | |
| by $715,820,000 U.S. Treasury Notes, 2.63%, due 7/31/14, value $714,309,620) | 0.18 | 700,000,000 | 700,000,000 |
| RBS Securities | | | |
| dated 7/31/09, due 8/3/09 in the amount of $490,007,758 | | | |
| (fully collateralized by $504,220,500 U.S. Treasury Notes, | | | |
| 1.88%-3.50%, due 2/28/14-2/15/18, value $499,803,940) | 0.19 | 490,000,000 | 490,000,000 |
| Total Repurchase Agreements | | | |
| (cost $9,583,000,000) | | | 9,583,000,000 |
| |
| Total Investments (cost $17,161,797,708) | | 99.9% | 17,161,797,708 |
| |
| Cash and Receivables (Net) | | .1% | 20,750,569 |
| |
| Net Assets | | 100.0% | 17,182,548,277 |
| | | |
| Portfolio Summary (Unaudited) | | | |
| | Value (%) | | Value (%) |
| Repurchase Agreements | 55.8 | U.S. Treasury Notes | 9.5 |
| U.S. Treasury Bills | 34.6 | | 99.9 |
| Based on net assets. | | | |
| See notes to financial statements. | | | |
The Funds 25
| | STATEMENT OF INVESTMENTS
July 31, 2009 (Unaudited) |
| | | |
| | Annualized | | |
| | Yield on | | |
| | Date of | Principal | |
| Dreyfus Treasury Prime Cash Management | Purchase (%) | Amount ($) | Value ($) |
| |
| U.S. Treasury Bills 94.0% | | | |
| 8/6/09 | 0.17 | 2,904,000,000 | 2,903,929,564 |
| 8/13/09 | 0.15 | 3,236,000,000 | 3,235,834,247 |
| 8/20/09 | 0.14 | 3,285,000,000 | 3,284,755,480 |
| 8/27/09 | 0.13 | 3,281,000,000 | 3,280,688,340 |
| 9/3/09 | 0.37 | 550,000,000 | 549,813,229 |
| 9/10/09 | 0.45 | 500,000,000 | 499,750,000 |
| 9/17/09 | 0.26 | 1,180,000,000 | 1,179,602,458 |
| 9/24/09 | 0.17 | 2,750,000,000 | 2,749,281,125 |
| 10/1/09 | 0.17 | 1,750,000,000 | 1,749,495,903 |
| 10/8/09 | 0.28 | 1,150,000,000 | 1,149,392,722 |
| 10/15/09 | 0.19 | 1,300,000,000 | 1,299,498,958 |
| 10/22/09 | 0.17 | 349,000,000 | 348,863,732 |
| 11/5/09 | 0.33 | 500,000,000 | 499,560,000 |
| 11/12/09 | 0.30 | 500,000,000 | 499,570,833 |
| 11/19/09 | 0.30 | 200,000,000 | 199,819,722 |
| 11/27/09 | 0.31 | 300,000,000 | 299,695,167 |
| 12/3/09 | 0.29 | 450,000,000 | 449,550,500 |
| 12/31/09 | 0.30 | 250,000,000 | 249,688,611 |
| 1/7/10 | 0.27 | 760,000,000 | 759,089,283 |
| 1/14/10 | 0.26 | 500,000,000 | 499,400,556 |
| 2/11/10 | 0.41 | 875,000,000 | 873,090,312 |
| 4/1/10 | 0.48 | 250,000,000 | 249,191,688 |
| 4/8/10 | 0.48 | 610,000,000 | 607,966,667 |
| Total U.S. Treasury Bills | | | |
| (cost $27,417,529,097) | | | 27,417,529,097 |
| |
| U.S. Treasury Notes 5.9% | | | |
| 8/17/09 | 0.18 | 250,000,000 | 250,352,644 |
| 8/17/09 | 0.18 | 857,637,000 | 859,339,136 |
| 8/17/09 | 0.18 | 500,000,000 | 501,225,088 |
| 2/16/10 | 0.42 | 100,000,000 | 101,642,609 |
| Total U.S. Treasury Notes | | | |
| (cost $1,712,559,477) | | | 1,712,559,477 |
| |
| Total Investments (cost $29,130,088,574) | | 99.9% | 29,130,088,574 |
| Cash and Receivables (Net) | | .1% | 39,676,093 |
| Net Assets | | 100.0% | 29,169,764,667 |
| | | |
| Portfolio Summary (Unaudited) | | | |
| | Value (%) | | Value (%) |
| U.S. Treasury Bills | 94.0 | U.S. Treasury Notes | 5.9 |
| | | | 99.9 |
| Based on net assets. | | | |
| See notes to financial statements. | | | |
26
STATEMENT OF INVESTMENTS
July 31, 2009 (Unaudited) |
| | | | |
| | Coupon | Maturity | Principal | |
| Dreyfus Municipal Cash Management Plus | Rate (%) | Date | Amount ($) | Value ($) |
| |
| Short-Term Investments 100.3% | | | | |
| Alabama 4.6% | | | | |
| Chatom Industrial Development Board, Gulf Opportunity Zone Revenue | | | | |
| (PowerSouth Energy Cooperative Projects) (Liquidity Facility; National | | | | |
| Rural Utilities Cooperative Finance Corporation and LOC; National | | | | |
| Rural Utilities Cooperative Finance Corporation) | 2.85 | 11/16/09 | 12,000,000 | 12,000,000 |
| Evergreen Industrial Development Board, Industrial Revenue, | | | | |
| Refunding (Tenax Manufacturing Project) (LOC; San Paolo Bank) | 0.54 | 8/7/09 | 2,200,000 a | 2,200,000 |
| Macon Trust Various Certificates (Spanish Fort Redevelopment | | | | |
| Authority Spanish Fort Town Center) (Liquidity Facility; | | | | |
| Bank of America and LOC; Bank of America) | 0.91 | 8/7/09 | 20,750,000 a,b | 20,750,000 |
| Southeast Alabama Gas District, Supply Project | | | | |
| Revenue (Liquidity Facility; Societe Generale) | 0.35 | 8/1/09 | 70,263,000 a | 70,263,000 |
| Arizona 1.8% | | | | |
| Arizona Health Facilities Authority, Revenue | | | | |
| (La Loma Village) (LOC; Citibank NA) | 0.44 | 8/7/09 | 9,700,000 a | 9,700,000 |
| JPMorgan Chase Putters and Drivers Trust (Salt River Project | | | | |
| Agricultural Improvement and Power District, Salt River Project | | | | |
| Electric System Revenue) (Liquidity Facility; JPMorgan Chase Bank) | 0.34 | 8/7/09 | 8,500,000 a,b | 8,500,000 |
| Maricopa County Industrial Development Authority, MFHR (San Clemente | | | | |
| Apartments Project) (Liquidity Facility; FNMA and LOC; FNMA) | 0.44 | 8/7/09 | 1,010,000 a | 1,010,000 |
| Maricopa County Industrial Development Authority, | | | | |
| MFHR, Refunding (San Clemente Apartments | | | | |
| Project) (Liquidity Facility; FNMA and LOC; FNMA) | 0.40 | 8/7/09 | 7,600,000 a | 7,600,000 |
| Phoenix Improvement Corporation, Wastewater | | | | |
| System Revenue, CP (LOC; Bank of America) | 0.40 | 9/14/09 | 14,000,000 | 14,000,000 |
| Arkansas .0% | | | | |
| Morgan Keegan Municipal Products Inc. (Arkansas Development | | | | |
| Finance Authority, SFMR (Warehouse Program)) (Liquidity | | | | |
| Facility; Lloyds TSB Bank PLC and LOC; Lloyds TSB Bank PLC) | 0.61 | 8/7/09 | 185,000 a,b | 185,000 |
| California 3.9% | | | | |
| California Health Facilities Financing Authority, | | | | |
| Revenue (Kaiser Permanente) | 0.24 | 8/7/09 | 28,965,000 a | 28,965,000 |
| California Statewide Communities Development | | | | |
| Authority, Revenue (Kaiser Permanente) | 0.25 | 8/7/09 | 20,000,000 a | 20,000,000 |
| California Statewide Communities Development | | | | |
| Authority, Revenue, CP (Kaiser Permanente) | 0.37 | 12/10/09 | 5,000,000 | 5,000,000 |
| Puttable Floating Option Tax Exempt Receipts (San Jose | | | | |
| Redevelopment Agency, MFHR (101 San Fernando | | | | |
| Apartments)) (Liquidity Facility; FHLMC and LOC; FHLMC) | 0.63 | 8/7/09 | 15,995,000 a,b | 15,995,000 |
| Southern California Public Power Authority, Transmission | | | | |
| Project Revenue, Refunding (Southern Transmission Project) | | | | |
| (Insured; FSA and Liquidity Facility; Westdeutsche Landesbank) | 1.00 | 8/7/09 | 20,000,000 a | 20,000,000 |
| Colorado 1.0% | | | | |
| Colorado Educational and Cultural Facilities Authority, Revenue | | | | |
| (Linfield Christian School Project) (LOC; Wells Fargo Bank) | 0.35 | 8/7/09 | 8,100,000 a | 8,100,000 |
| Colorado Housing and Finance Authority, EDR | | | | |
| (Monaco LLC Project) (LOC; JPMorgan Chase Bank) | 0.76 | 8/7/09 | 2,940,000 a | 2,940,000 |
| Colorado Housing and Finance Authority, EDR | | | | |
| (Popiel Properties, LLC Project) (LOC; Wells Fargo Bank) | 0.71 | 8/7/09 | 3,100,000 a | 3,100,000 |
The Funds 27
| STATEMENT OF INVESTMENTS (Unaudited) (continued) |
| | | | |
| Dreyfus Municipal | Coupon | Maturity | Principal | |
| Cash Management Plus (continued) | Rate (%) | Date | Amount ($) | Value ($) |
| Short-Term Investments (continued) | | | | |
| Colorado (continued) | | | | |
| Colorado Housing and Finance Authority, EDR | | | | |
| (Wanco Inc. Project) (LOC; U.S. Bank NA) | 0.81 | 8/7/09 | 2,635,000 a | 2,635,000 |
| Erie, COP (Lease Purchase Agreement) (LOC; Key Bank) | 3.65 | 8/7/09 | 4,165,000 a | 4,165,000 |
| Southglenn Metropolitan District, Special Revenue (LOC; BNP Paribas) | 0.41 | 8/7/09 | 2,950,000 a | 2,950,000 |
| Connecticut .4% | | | | |
| Connecticut Health and Educational Facilities Authority, Revenue | | | | |
| (Yale University Issue) (Liquidity Facility; Wells Fargo Bank) | 0.31 | 8/7/09 | 5,000,000 a,b | 5,000,000 |
| New Haven, GO Notes, BAN | 1.25 | 2/15/10 | 5,000,000 | 5,010,639 |
| District of Columbia 2.6% | | | | |
| District of Columbia, Revenue (American Public Health | | | | |
| Association Issue) (LOC; Bank of America) | 0.40 | 8/7/09 | 6,765,000 a | 6,765,000 |
| District of Columbia, Revenue, CP (National Academy | | | | |
| of Sciences) (LOC; Bank of America) | 0.50 | 8/18/09 | 13,200,000 | 13,200,000 |
| Metropolitan Washington Airports Authority, Airport System | | | | |
| Revenue (Liquidity Facility; Landesbank Baden-Wurttemberg) | 2.50 | 8/7/09 | 25,000,000 a | 25,000,000 |
| Metropolitan Washington Airports Authority, | | | | |
| Airport System Revenue (LOC; Wachovia Bank) | 0.44 | 8/7/09 | 15,000,000 a | 15,000,000 |
| Florida 5.9% | | | | |
| Broward County Housing Finance Authority, MFHR | | | | |
| (Cypress Grove Apartments Project) (LOC; FNMA) | 0.48 | 8/7/09 | 13,230,000 a | 13,230,000 |
| Escambia County Health Facilities Authority, | | | | |
| Healthcare Facilities Revenue, Refunding (Azalea | | | | |
| Trace, Inc. Obligated Group) (LOC; Bank of America) | 0.43 | 8/1/09 | 7,000,000 a | 7,000,000 |
| Florida Local Government Finance Commission, | | | | |
| Pooled Loan Program Revenue, CP (LOC; Wachovia Bank) | 0.35 | 9/10/09 | 13,275,000 | 13,275,000 |
| Florida Local Government Finance Commission, Pooled Loan | | | | |
| Program Revenue, CP (LOC; Wachovia Bank) | 0.45 | 9/10/09 | 13,474,000 | 13,474,000 |
| Florida Municipal Power Agency, Revenue, CP (LOC; Wachovia Bank) | 0.45 | 10/6/09 | 9,863,000 | 9,863,000 |
| Greater Orlando Aviation Authority, Airport Facilities | | | | |
| Revenue, CP (LOC: Bayerische Landesbank, State Street | | | | |
| Bank and Trust Co. and Westdeutsche Landesbank) | 0.90 | 8/5/09 | 11,105,000 | 11,105,000 |
| Greater Orlando Aviation Authority, Airport Facility Revenue | | | | |
| (FlightSafety International Inc. Project) (LOC; Berkshire | | | | |
| Hathaway Assurance Corporation) | 0.54 | 8/7/09 | 6,700,000 a | 6,700,000 |
| Kissimmee Utility Authority, CP | | | | |
| (Liquidity Facility; JPMorgan Chase Bank) | 0.35 | 8/6/09 | 30,000,000 | 30,000,000 |
| Miami-Dade County Industrial Development Authority, IDR | | | | |
| (Fine Art Lamps Project) (LOC; SunTrust Bank) | 2.05 | 8/7/09 | 4,400,000 a | 4,400,000 |
| Orange County Health Facilities Authority, HR | | | | |
| (Orlando Regional Healthcare System) (Insured; FSA | | | | |
| and Liquidity Facility; Dexia Credit Locale) | 0.75 | 8/1/09 | 5,000,000 a | 5,000,000 |
| Saint Lucie County, PCR, Refunding (Florida Power | | | | |
| and Light Company Project) | 0.35 | 8/1/09 | 5,500,000 a | 5,500,000 |
| Sunshine State Governmental Financing Commission, | | | | |
| Revenue (LOC; Dexia Credit Locale) | 0.70 | 8/7/09 | 18,000,000 a | 18,000,000 |
28
| | | | |
| Dreyfus Municipal | Coupon | Maturity | Principal | |
| Cash Management Plus (continued) | Rate (%) | Date | Amount ($) | Value ($) |
| Short-Term Investments (continued) | | | | |
| Georgia 5.4% | | | | |
| Atlanta, General Fund TAN | 1.75 | 12/31/09 | 10,000,000 | 10,051,639 |
| Atlanta Development Authority, Revenue | | | | |
| (Georgia Aquarium, Inc. Project) (LOC; FHLB) | 0.28 | 8/7/09 | 10,000,000 a | 10,000,000 |
| DeKalb County Hospital Authority, RAC (DeKalb Medical | | | | |
| Center, Inc. Project) (LOC; SunTrust Bank) | 1.85 | 8/7/09 | 34,750,000 a | 34,750,000 |
| Fulton County, General Fund TAN | 1.00 | 12/31/09 | 20,000,000 | 20,056,779 |
| Gwinnett County Development Authority, IDR | | | | |
| (Suzanna's Kitchen, Inc. Project) (LOC; Wachovia Bank) | 0.64 | 8/7/09 | 5,200,000 a | 5,200,000 |
| Metropolitan Atlanta Rapid Transit Authority, | | | | |
| Sales Tax Revenue, CP (Liquidity Facility; Dexia Credit Locale) | 1.10 | 8/4/09 | 25,000,000 | 25,000,000 |
| Monroe County Development Authority, PCR | | | | |
| (Georgia Power Company Plant Scherer Project) | 0.32 | 8/1/09 | 11,000,000 a | 11,000,000 |
| Thomasville Hospital Authority, RAC (John D. Archbold Memorial | | | | |
| Hospital, Inc. Project) (LOC; Branch Banking and Trust Co.) | 0.37 | 8/7/09 | 7,840,000 a | 7,840,000 |
| Idaho .7% | | | | |
| Idaho Health Facilities Authority, Revenue | | | | |
| (Saint Luke's Regional Medical Center Project) | | | | |
| (Insured; FSA and Liquidity Facility; Bank of Montreal) | 0.41 | 8/1/09 | 16,900,000 a | 16,900,000 |
| Illinois 4.8% | | | | |
| Illinois Finance Authority, IDR (Fitzpatrick Brothers, Inc. Project) | | | | |
| (Liquidity Facility; Northern Trust Company) | 0.38 | 8/7/09 | 5,000,000 a | 5,000,000 |
| Illinois Finance Authority, Revenue (Hospice of | | | | |
| Northeastern Illinois Project) (LOC; Harris NA) | 0.37 | 8/7/09 | 8,500,000 a | 8,500,000 |
| Illinois Health Facilities Authority, Revenue (Northwestern | | | | |
| Memorial Hospital) (Liquidity Facility; Northern Trust Company) | 0.33 | 8/1/09 | 26,700,000 a | 26,700,000 |
| Illinois Toll Highway Authority, Toll Highway Senior Priority | | | | |
| Revenue (Liquidity Facility; Dexia Credit Locale) | 0.40 | 8/7/09 | 30,000,000 a | 30,000,000 |
| Lombard, Revenue (Elmhurst Memorial Healthcare | | | | |
| Project) (LOC; Fifth Third Bank) | 3.00 | 8/7/09 | 6,482,000 a | 6,482,000 |
| Oak Forest, Revenue (Homewood Pool South Suburban | | | | |
| Mayors and Managers Association Program) (LOC; Fifth Third Bank) | 3.00 | 8/7/09 | 25,650,000 a | 25,650,000 |
| Upper Illinois River Valley Development Authority, SWDR | | | | |
| (Exolon-ESK Company Project) (LOC; Bank of America) | 0.60 | 8/7/09 | 8,405,000 a | 8,405,000 |
| Indiana 3.0% | | | | |
| Elkhart County, EDR (Four Seasons | | | | |
| Manufacturing Project) (LOC; National City Bank) | 0.65 | 8/7/09 | 3,495,000 a | 3,495,000 |
| Fort Wayne, EDR (Park Center Project) (LOC; National City Bank) | 0.50 | 8/7/09 | 2,375,000 a | 2,375,000 |
| Indiana Finance Authority, EDR (Beford Machine and Tool, Inc., | | | | |
| Metal Technologies, Inc. and Beford Recycling, Inc. Project) | | | | |
| (LOC; Fifth Third Bank) | 3.65 | 8/7/09 | 184,000 a | 184,000 |
| Indiana Finance Authority, EDR (JRL Leasing, Inc. and | | | | |
| LaSarre Co., LLC Project) (LOC; National City Bank) | 0.65 | 8/7/09 | 3,485,000 a | 3,485,000 |
| Indiana Finance Authority, Environmental Revenue, Refunding | | | | |
| (Duke Energy Indiana, Inc. Project) (LOC; Bank of America) | 0.50 | 8/7/09 | 6,000,000 a | 6,000,000 |
The Funds 29
| STATEMENT OF INVESTMENTS (Unaudited) (continued) |
| | | | |
| Dreyfus Municipal | Coupon | Maturity | Principal | |
| Cash Management Plus (continued) | Rate (%) | Date | Amount ($) | Value ($) |
| Short-Term Investments (continued) | | | | |
| Indiana (continued) | | | | |
| Indiana Finance Authority, Environmental Revenue, Refunding | | | | |
| (Duke Energy Indiana, Inc. Project) (LOC; Bank of America) | 0.52 | 8/7/09 | 3,300,000 a | 3,300,000 |
| Indiana Finance Authority, HR (Community Health | | | | |
| Network Project) (LOC; National City Bank) | 0.31 | 8/7/09 | 15,000,000 a | 15,000,000 |
| Indiana Finance Authority, Revenue (Marion | | | | |
| General Hospital Project) (LOC; Regions Bank) | 5.00 | 8/7/09 | 245,000 a | 245,000 |
| Indiana Health and Educational Facility Financing | | | | |
| Authority, Educational Facilities Revenue (University | | | | |
| of Evansville Project) (LOC; Fifth Third Bank) | 3.00 | 8/7/09 | 15,075,000 a | 15,075,000 |
| Indianapolis Local Public Improvement Bond Bank, Revenue | | | | |
| (Insured; FSA and Liquidity Facility; Dexia Credit Locale) | 0.70 | 8/1/09 | 14,000,000 a | 14,000,000 |
| Saint Joseph County, EDR (Logan Community | | | | |
| Resources, Inc. Project) (LOC; Fifth Third Bank) | 3.00 | 8/7/09 | 5,730,000 a | 5,730,000 |
| Kansas .6% | | | | |
| Kansas Development Finance Authority, MFHR | | | | |
| (Tree House Apartments) (LOC; Bank of America) | 0.48 | 8/7/09 | 10,000,000 a | 10,000,000 |
| Mission, MFHR, Refunding | | | | |
| (The Falls Apartments Project) (LOC; FNMA) | 0.41 | 8/7/09 | 3,350,000 a | 3,350,000 |
| Kentucky 1.9% | | | | |
| Kentucky Economic Development Finance Authority, | | | | |
| Hospital Facilities Revenue (The Harrison Memorial | | | | |
| Hospital, Inc. Project) (LOC; Fifth Third Bank) | 3.60 | 8/7/09 | 8,000,000 a | 8,000,000 |
| Kentucky Economic Development Finance Authority, HR | | | | |
| (Baptist Healthcare System Obligated Group) | | | | |
| (LOC; Branch Banking and Trust Co.) | 0.32 | 8/7/09 | 9,000,000 a | 9,000,000 |
| Kentucky Economic Development Finance Authority, HR | | | | |
| (Baptist Healthcare System Obligated Group) | | | | |
| (LOC; Branch Banking and Trust Co.) | 0.37 | 8/7/09 | 7,660,000 a | 7,660,000 |
| Kentucky Economic Development Finance Authority, Industrial | | | | |
| Building Revenue (Republic Services, Inc. Project) (LOC; Bank One) | 0.50 | 8/7/09 | 6,100,000 a | 6,100,000 |
| Warren County, HR, Refunding (Bowling Green-Warren County | | | | |
| Community Hospital Corporation Project) (Insured; Assured | | | | |
| Guaranty and Liquidity Facility; Branch Banking and Trust Co.) | 0.36 | 8/7/09 | 8,450,000 a | 8,450,000 |
| Williamstown, Kentucky League of Cities Funding | | | | |
| Trust Lease Program Revenue (LOC; U.S. Bank NA) | 0.30 | 8/7/09 | 5,000,000 a | 5,000,000 |
| Louisiana .9% | | | | |
| Louisiana, Gasoline and Fuels Tax Second Lien | | | | |
| Revenue (LOC; JPMorgan Chase Bank) | 0.31 | 8/7/09 | 20,000,000 a | 20,000,000 |
| Maine .5% | | | | |
| Maine Finance Authority, Revenue | | | | |
| (Waynflete School Issue) (LOC; JPMorgan Chase Bank) | 0.37 | 8/7/09 | 11,090,000 a | 11,090,000 |
| Maryland 2.8% | | | | |
| Anne Arundel County, EDR (Atlas Container | | | | |
| Corporation Project) (LOC; M&T Bank) | 0.49 | 8/7/09 | 6,875,000 a | 6,875,000 |
| Baltimore County Revenue Authority, | | | | |
| Golf System Revenue (LOC; M&T Bank) | 0.44 | 8/7/09 | 6,345,000 a | 6,345,000 |
| Frederick County, Revenue | | | | |
| (Homewood, Inc. Facility) (LOC; M&T Bank) | 0.37 | 8/7/09 | 2,800,000 a | 2,800,000 |
30
| | | | |
| Dreyfus Municipal | Coupon | Maturity | Principal | |
| Cash Management Plus (continued) | Rate (%) | Date | Amount ($) | Value ($) |
| Short-Term Investments (continued) | | | | |
| Maryland (continued) | | | | |
| Maryland Community Development Administration, Department | | | | |
| of Housing and Community Development, Residential Revenue | | | | |
| (Liquidity Facility; State Street Bank and Trust Co.) | 0.43 | 8/7/09 | 32,500,000 a | 32,500,000 |
| Maryland Economic Development Corporation, Revenue, | | | | |
| Refunding (United Cerebral Palsy Project) (LOC; M&T Bank) | 0.53 | 8/7/09 | 1,859,500 a | 1,859,500 |
| Maryland Health and Higher Educational Facilities Authority, Revenue | | | | |
| (Charles County Nursing Center) (Liquidity Facility; M&T Bank) | 0.46 | 8/7/09 | 3,775,000 a | 3,775,000 |
| Maryland Health and Higher Educational Facilities Authority, | | | | |
| Revenue, CP (Johns Hopkins Health System) | | | | |
| (Liquidity Facility; Bank of America) | 0.50 | 8/25/09 | 10,000,000 | 10,000,000 |
| Massachusetts 1.4% | | | | |
| Macon Trust Various Certificates (Massachusetts Health and Educational | | | | |
| Facilities Authority Harvard Vanguard Medical Associates Issue) | | | | |
| (Liquidity Facility; Bank of America and LOC; Bank of America) | 0.91 | 8/7/09 | 10,500,000 a,b | 10,500,000 |
| Manchester Essex Regional School District, GO Notes, BAN | 1.00 | 10/30/09 | 3,500,000 | 3,504,275 |
| Massachusetts Development Finance Agency, Multifamily Revenue | | | | |
| (Kennedy Lofts Project) (Liquidity Facility; FHLMC and LOC; FHLMC) | 0.52 | 8/7/09 | 4,000,000 a,b | 4,000,000 |
| Massachusetts Health and Educational Facilities Authority, Revenue | | | | |
| (Cape Cod Healthcare Obligated Group Issue) (Insured; | | | | |
| Assured Guaranty and Liquidity Facility; Bank of America) | 0.45 | 8/7/09 | 14,700,000 a | 14,700,000 |
| Michigan 5.3% | | | | |
| Kent Hospital Finance Authority, LOR (Pine Rest Christian | | | | |
| Mental Health Services Project) (LOC; Fifth Third Bank) | 3.00 | 8/7/09 | 45,000 a | 45,000 |
| Michigan Hospital Finance Authority, Revenue (Healthcare | | | | |
| Equipment Loan Program) (LOC; Fifth Third Bank) | 3.75 | 8/7/09 | 6,500,000 a | 6,500,000 |
| Michigan Hospital Finance Authority, Revenue (Healthcare | | | | |
| Equipment Loan Program) (LOC; Standard Federal Bank) | 0.43 | 8/7/09 | 7,925,000 a | 7,925,000 |
| Michigan Hospital Finance Authority, Revenue, CP (Trinity Health System) | 0.30 | 8/5/09 | 15,000,000 | 15,000,000 |
| Michigan Hospital Finance Authority, Revenue, CP (Trinity Health System) | 0.30 | 10/19/09 | 21,470,000 | 21,470,000 |
| Michigan Housing Development Authority, Rental Housing Revenue | | | | |
| (Liquidity Facility; Landesbank Hessen-Thuringen Girozentrale) | 0.45 | 8/7/09 | 6,500,000 a | 6,500,000 |
| Michigan Housing Development Authority, Rental Housing Revenue | | | | |
| (Liquidity Facility; Landesbank Hessen-Thuringen Girozentrale) | 0.45 | 8/7/09 | 25,000,000 a | 25,000,000 |
| Michigan State University Board of Trustees, | | | | |
| General Revenue (LOC; Dexia Credit Locale) | 0.25 | 8/7/09 | 13,615,000 a | 13,615,000 |
| Michigan Strategic Fund, LOR (Diocese of Grand Rapids Educational | | | | |
| and Cathedral Square Project) (LOC; Fifth Third Bank) | 3.00 | 8/7/09 | 8,360,000 a | 8,360,000 |
| Michigan Strategic Fund, LOR, Refunding (Goodwill Industries of | | | | |
| Greater Grand Rapids, Inc. Project) (LOC; Fifth Third Bank) | 3.00 | 8/7/09 | 7,615,000 a | 7,615,000 |
| Oakland County Economic Development Corporation, LOR | | | | |
| (Michigan Seamless Tube LLC Project) (LOC; ABN-AMRO) | 0.85 | 8/7/09 | 2,800,000 a | 2,800,000 |
| Pittsfield Township Economic Development Corporation, LOR, | | | | |
| Refunding (Arbor Project) (LOC; Comerica Bank) | 0.65 | 8/7/09 | 4,520,000 a | 4,520,000 |
| University of Michigan, General Revenue, CP | 0.23 | 8/10/09 | 5,000,000 | 5,000,000 |
| Minnesota 1.0% | | | | |
| Minnesota Housing Finance Agency, Residential Housing | | | | |
| Finance Revenue (Liquidity Facility; FHLB) | 0.40 | 8/7/09 | 7,000,000 a | 7,000,000 |
The Funds 31
| STATEMENT OF INVESTMENTS (Unaudited) (continued) |
| | | | |
| Dreyfus Municipal | Coupon | Maturity | Principal | |
| Cash Management Plus (continued) | Rate (%) | Date | Amount ($) | Value ($) |
| Short-Term Investments (continued) | | | | |
| Minnesota (continued) | | | | |
| Southern Minnesota Municipal Power Agency, | | | | |
| Power Supply System Revenue, CP (Liquidity Facility; | | | | |
| Landesbank Hessen-Thuringen Girozentrale) | 0.75 | 8/5/09 | 10,000,000 | 10,000,000 |
| University of Minnesota, CP | 0.30 | 10/13/09 | 5,175,000 | 5,175,000 |
| Mississippi .4% | | | | |
| Mississippi Business Finance Corporation, Solid Waste Disposal | | | | |
| Facilities Revenue, Refunding (Mississippi Power Company Project) | 0.34 | 8/1/09 | 8,300,000 a | 8,300,000 |
| Missouri 1.0% | | | | |
| Missouri Development Finance Board, LR, CP (LOC; U.S. Bank NA) | 0.40 | 9/3/09 | 23,000,000 | 23,000,000 |
| Nebraska 1.2% | | | | |
| Lancaster County Hospital Authority Number 1, | | | | |
| Health Facilities Revenue (Immanuel Health | | | | |
| Systems-Williamsburg Project) (LOC; Allied Irish Banks) | 0.55 | 8/1/09 | 6,495,000 a | 6,495,000 |
| Public Power Generation Agency, Revenue (Whelan Energy | | | | |
| Center Unit 2) (Insured; Berkshire Hathaway Assurance | | | | |
| Corporation and Liquidity Facility; Citibank NA) | 0.51 | 8/7/09 | 21,910,000 a,b | 21,910,000 |
| Nevada 3.0% | | | | |
| Clark County, Airport System Subordinate Lien Revenue | | | | |
| (LOC; Landesbank Baden-Wurttemberg) | 1.00 | 8/7/09 | 16,100,000 a | 16,100,000 |
| Clark County, Airport System Subordinate Lien Revenue | | | | |
| (LOC; Landesbank Baden-Wurttemberg) | 1.00 | 8/7/09 | 6,600,000 a | 6,600,000 |
| Director of Nevada Department of Business and Industry, Revenue | | | | |
| (Nevada Cancer Institute Project) (LOC; Bank of America) | 0.40 | 8/7/09 | 5,450,000 a | 5,450,000 |
| Las Vegas Convention and Visitors Authority, Revenue, CP (LOC: | | | | |
| Bank of Nova Scotia, Fortis Bank and State Street Bank and Trust Co.) | 0.80 | 8/25/09 | 10,000,000 | 10,000,000 |
| Las Vegas Valley Water District, CP | | | | |
| (Liquidity Facility; JPMorgan Chase Bank) | 0.40 | 9/1/09 | 10,000,000 | 10,000,000 |
| Las Vegas Valley Water District, CP | | | | |
| (Liquidity Facility; JPMorgan Chase Bank) | 0.45 | 10/15/09 | 10,000,000 | 10,000,000 |
| Las Vegas Valley Water District, CP (LOC; BNP Paribas) | 0.25 | 9/8/09 | 10,000,000 | 10,000,000 |
| New Hampshire .2% | | | | |
| New Hampshire Health and Education Facilities Authority, Revenue | | | | |
| (Kimball Union Academy) (LOC; RBS Citizens NA) | 2.25 | 8/7/09 | 5,000,000 a | 5,000,000 |
| New Jersey 3.2% | | | | |
| New Jersey Economic Development Authority, School Facilities | | | | |
| Construction Revenue, Refunding (LOC; Dexia Credit Locale) | 1.00 | 8/7/09 | 21,545,000 a | 21,545,000 |
| New Jersey Turnpike Authority, Turnpike Revenue | | | | |
| (Insured; FSA and Liquidity Facility; Dexia Credit Locale) | 1.00 | 8/7/09 | 52,275,000 a | 52,275,000 |
| New York 2.2% | | | | |
| Metropolitan Transportation Authority, RAN | 2.00 | 12/31/09 | 20,000,000 | 20,133,306 |
| New York City Housing Development Corporation, MFMR | | | | |
| (Beekman Tower) (LOC; RBS Citizens NA) | 1.50 | 8/7/09 | 15,000,000 a | 15,000,000 |
| New York State Housing Finance Agency, Housing Revenue | | | | |
| (316 Eleventh Avenue) (Liquidity Facility; FNMA and LOC; FNMA) | 0.28 | 8/7/09 | 15,000,000 a | 15,000,000 |
| North Carolina 4.9% | | | | |
| Board of Governors of the University of North Carolina, CP | 0.30 | 9/10/09 | 10,000,000 | 10,000,000 |
| Charlotte, COP, CP (Cultural Arts Facility) (LOC; Wachovia Bank) | 0.45 | 9/24/09 | 49,483,000 | 49,483,000 |
32
| | | | |
| Dreyfus Municipal | Coupon | Maturity | Principal | |
| Cash Management Plus (continued) | Rate (%) | Date | Amount ($) | Value ($) |
| Short-Term Investments (continued) | | | | |
| North Carolina (continued) | | | | |
| North Carolina Education Assistance Authority, | | | | |
| Student Loan Revenue, Refunding (LOC; Royal Bank of Canada) | 0.42 | 8/7/09 | 20,000,000 a | 20,000,000 |
| North Carolina Medical Care Commission, Health Care | | | | |
| Facilities Revenue (WakeMed) (LOC; Wachovia Bank) | 0.34 | 8/7/09 | 9,300,000 a | 9,300,000 |
| North Carolina Medical Care Commission, Health Care Facilities | | | | |
| Revenue, Refunding (University Health Systems of Eastern | | | | |
| Carolina) (LOC; Branch Banking and Trust Co.) | 0.33 | 8/7/09 | 5,200,000 a | 5,200,000 |
| Raleigh-Durham Airport Authority, Airport Revenue, | | | | |
| Refunding (LOC; Wachovia Bank) | 0.44 | 8/7/09 | 19,600,000 a | 19,600,000 |
| North Dakota .4% | | | | |
| Mercer County, PCR, CP (Basin Electric Power Cooperative) | 0.50 | 8/10/09 | 10,000,000 | 10,000,000 |
| Ohio 4.8% | | | | |
| Akron, Bath and Copley Joint Township Hospital District, Health Care | | | | |
| Facilities Revenue (Sumner on Ridgewood Project) (LOC; KBC Bank) | 0.50 | 8/7/09 | 5,055,000 a | 5,055,000 |
| Columbus Regional Airport Authority, Revenue, CP (LOC; Calyon) | 0.45 | 8/13/09 | 10,500,000 | 10,500,000 |
| Columbus Regional Airport Authority, Revenue, CP (LOC; Calyon) | 0.55 | 9/10/09 | 8,500,000 | 8,500,000 |
| Edgewood City School District, | | | | |
| School Improvement Unlimited Tax GO Notes, BAN | 2.00 | 12/1/09 | 6,000,000 | 6,022,756 |
| Hamilton County, EDR (Taft Museum Project) (LOC; Fifth Third Bank) | 3.00 | 8/7/09 | 9,070,000 a | 9,070,000 |
| Lakewood, Educational Facilities Revenue | | | | |
| (Saint Edward High School Project) (LOC; Fifth Third Bank) | 3.00 | 8/7/09 | 10,000 a | 10,000 |
| Lorain County, IDR (Cutting Dynamics, Inc. Project) | | | | |
| (LOC; National City Bank) | 1.15 | 8/7/09 | 2,055,000 a | 2,055,000 |
| Middletown, Hospital Facilities Revenue | | | | |
| (Middletown Hospital Group) (LOC; Lloyds TSB Bank PLC) | 0.42 | 8/7/09 | 20,510,000 a,b | 20,510,000 |
| Montgomery County, Revenue, CP (Miami Valley Hospital) | 0.75 | 8/7/09 | 10,000,000 | 10,000,000 |
| Ohio Building Authority, State Facilities Bonds | | | | |
| (Adult Correctional Building Fund Projects) (Prerefunded) | 5.50 | 10/1/09 | 1,550,000 c | 1,578,422 |
| Ohio Higher Educational Facilities, Revenue | | | | |
| (Cedarville University Project) (LOC; Key Bank) | 2.70 | 8/7/09 | 4,900,000 a | 4,900,000 |
| Ohio Higher Educational Facility Commission, | | | | |
| Revenue, CP (Cleveland Clinic Health System) | 0.50 | 1/13/10 | 8,650,000 | 8,650,000 |
| Ohio Water Development Authority, PCR, Refunding (FirstEnergy | | | | |
| Nuclear Generation Corporation Project) (LOC; Bank of Nova Scotia) | 0.55 | 8/7/09 | 15,000,000 a | 15,000,000 |
| Ohio Water Development Authority, PCR, Refunding (FirstEnergy | | | | |
| Nuclear Generation Corporation Project) (LOC; Barclays Bank PLC) | 0.55 | 8/7/09 | 9,700,000 a | 9,700,000 |
| Oklahoma 1.2% | | | | |
| Oklahoma Water Resources Board, State Loan Program | | | | |
| Revenue (Liquidity Facility; State Street Bank and Trust Co.) | 1.63 | 9/1/09 | 7,125,000 | 7,125,000 |
| Tulsa County Industrial Authority, Capital Improvements | | | | |
| Revenue (Liquidity Facility; Bank of America) | 2.00 | 8/17/09 | 20,000,000 | 20,000,000 |
| Oregon .1% | | | | |
| Oregon State Board of Education, GO Notes | 3.00 | 8/1/09 | 1,935,000 | 1,935,000 |
| Pennsylvania 4.6% | | | | |
| Blair County Industrial Development Authority, Revenue | | | | |
| (Hollidaysburg Area YMCA Project) (LOC; | | | | |
| Citizens Bank of Pennsylvania) | 2.25 | 8/7/09 | 3,320,000 a | 3,320,000 |
The Funds 33
| STATEMENT OF INVESTMENTS (Unaudited) (continued) |
| | | | |
| Dreyfus Municipal | Coupon | Maturity | Principal | |
| Cash Management Plus (continued) | Rate (%) | Date | Amount ($) | Value ($) |
| |
| Short-Term Investments (continued) | | | | |
| Pennsylvania (continued) | | | | |
| Chartiers Valley Industrial and Commercial Development Authority, | | | | |
| Revenue (Wesley Hills Project) (LOC; Fifth Third Bank) | 3.00 | 8/7/09 | 190,000 a | 190,000 |
| Chester County Health and Education Facilities | | | | |
| Authority, Mortgage Revenue (Tel Hai Obligated | | | | |
| Group Project) (LOC; M&T Bank) | 0.46 | 8/7/09 | 10,720,000 a | 10,720,000 |
| Haverford Township School District, GO Notes (LOC; TD Bank) | 0.33 | 8/7/09 | 3,500,000 a | 3,500,000 |
| Horizon Hospital System Authority, Senior Health and Housing | | | | |
| Facilities Revenue (Saint Paul Homes Project) (LOC; M&T Bank) | 0.46 | 8/7/09 | 7,400,000 a | 7,400,000 |
| Montgomery County Industrial Development Authority, PCR, CP | | | | |
| (Exelon Project) (LOC; Wachovia Bank) | 0.60 | 8/6/09 | 4,000,000 | 4,000,000 |
| Montgomery County Industrial Development Authority, PCR, CP | | | | |
| (Exelon Project) (LOC; Wachovia Bank) | 0.40 | 8/27/09 | 20,000,000 | 20,000,000 |
| Pennsylvania Economic Development Financing Authority, Revenue | | | | |
| (Evergreen Community Power Facility) (LOC; M&T Bank) | 0.56 | 8/7/09 | 16,000,000 a | 16,000,000 |
| Pennsylvania Housing Finance Agency, SFMR (Liquidity Facility; | | | | |
| Landesbank Hessen-Thuringen Girozentrale) | 0.39 | 8/7/09 | 15,000,000 a | 15,000,000 |
| Philadelphia Authority for Industrial Development, Revenue | | | | |
| (Gift of Life Donor Program Project) (LOC; Commerce Bank NA) | 0.31 | 8/7/09 | 8,000,000 a | 8,000,000 |
| Philadelphia Authority for Industrial Development, | | | | |
| Revenue (The Pennsylvania School for the Deaf) | | | | |
| (LOC; Citizens Bank of Pennsylvania) | 2.25 | 8/7/09 | 2,400,000 a | 2,400,000 |
| University of Pittsburgh of the Commonwealth | | | | |
| System of Higher Education, CP | 0.30 | 8/11/09 | 5,000,000 | 5,000,000 |
| University of Pittsburgh of the Commonwealth | | | | |
| System of Higher Education, CP | 0.40 | 10/5/09 | 10,000,000 | 10,000,000 |
| South Carolina 2.2% | | | | |
| Charleston County School District, GO Notes, TAN | 2.00 | 4/1/10 | 10,000,000 d | 10,102,100 |
| South Carolina Jobs-Economic Development Authority, HR | | | | |
| (Conway Hospital, Inc.) (Insured; Assured Guaranty and | | | | |
| Liquidity Facility; Branch Banking and Trust Co.) | 0.40 | 8/7/09 | 39,825,000 a | 39,825,000 |
| South Dakota .4% | | | | |
| South Dakota Housing Development Authority, Homeownership | | | | |
| Mortgage Revenue (Liquidity Facility; Citigroup) | 0.47 | 8/7/09 | 3,920,000 a,b | 3,920,000 |
| South Dakota Housing Development Authority, Homeownership | | | | |
| Mortgage Revenue (Liquidity Facility; FHLB) | 0.32 | 8/7/09 | 5,000,000 a | 5,000,000 |
| Tennessee 3.2% | | | | |
| Blount County Public Building Authority, Local Government | | | | |
| Public Improvement Revenue (LOC; Branch Banking and Trust Co.) | 0.37 | 8/7/09 | 10,000,000 a | 10,000,000 |
| Cleveland Health and Educational Facilities Board, Revenue | | | | |
| (Lee University Project) (LOC; Branch Banking and Trust Co.) | 0.37 | 8/7/09 | 4,000,000 a | 4,000,000 |
| Hendersonville Industrial Development Board, | | | | |
| Tax Increment Revenue (LOC; Fifth Third Bank) | 3.60 | 8/7/09 | 7,500,000 a | 7,500,000 |
| Metropolitan Government of Nashville and Davidson County | | | | |
| Health and Educational Facilities Board, Health Facilities Revenue, | | | | |
| Refunding (MUC-CI Homes, Inc. Project) (LOC; Fifth Third Bank) | 3.00 | 8/7/09 | 7,750,000 a | 7,750,000 |
| Shelby County Health, Educational and Housing Facility Board, | | | | |
| Revenue (Methodist Le Bonheur Healthcare) (Insured; Assured | | | | |
| Guaranty and Liquidity Facility; U.S. Bank NA) | 0.36 | 8/7/09 | 44,000,000 a | 44,000,000 |
34
| | | | |
| Dreyfus Municipal | Coupon | Maturity | Principal | |
| Cash Management Plus (continued) | Rate (%) | Date | Amount ($) | Value ($) |
| |
| Short-Term Investments (continued) | | | | |
| Texas 13.0% | | | | |
| Calhoun Port Authority, Environmental Facilities Revenue | | | | |
| (Formosa Plastics Corporation, Texas Project) (LOC; Bank of America) | 0.55 | 8/7/09 | 10,000,000 a | 10,000,000 |
| Collin County Housing Finance Corporation, Multifamily | | | | |
| Revenue (Carpenter-Oxford Development Housing) | | | | |
| (Liquidity Facility; FHLMC and LOC; FHLMC) | 0.52 | 8/7/09 | 5,000,000 a,b | 5,000,000 |
| Dallas, Waterworks and Sewer System Revenue, CP | | | | |
| (Liquidity Facility; Bank of America) | 0.40 | 9/21/09 | 28,358,000 | 28,358,000 |
| DeSoto Industrial Development Authority, IDR, Refunding (National | | | | |
| Service Industries Inc. Project) (LOC; Wachovia Bank) | 0.54 | 8/7/09 | 3,660,000 a | 3,660,000 |
| Harris County, CP (Liquidity Facility: | | | | |
| Bank of Nova Scotia and Lloyds TSB Bank PLC) | 0.50 | 8/18/09 | 3,000,000 | 3,000,000 |
| Harris County, GO Notes, TAN | 1.50 | 2/25/10 | 10,000,000 | 10,062,482 |
| Harris County Metropolitan Transit Authority, CP | | | | |
| (Liquidity Facility; JPMorgan Chase Bank) | 0.35 | 11/23/09 | 25,000,000 | 25,000,000 |
| Houston Independent School District, Limited Tax Schoolhouse | | | | |
| Bonds (Liquidity Facility; Bank of America and LOC; | | | | |
| Permanent School Fund Guarantee Program) | 0.37 | 8/7/09 | 17,800,000 a | 17,800,000 |
| Port of Houston Authority of Harris County, CP | | | | |
| (Liquidity Facility; Bank of America) | 0.70 | 12/10/09 | 11,500,000 | 11,500,000 |
| Port of Port Arthur Navigation District of Jefferson County, | | | | |
| Environmental Facilities Revenue (Motiva Enterprises LLC Project) | 0.44 | 8/7/09 | 13,000,000 a | 13,000,000 |
| Port of Port Arthur Navigation District of Jefferson County, | | | | |
| Environmental Facilities Revenue, Refunding | | | | |
| (Motiva Enterprises LLC Project) | 0.60 | 8/1/09 | 26,700,000 a | 26,700,000 |
| Port of Port Arthur Navigation District of | | | | |
| Jefferson County, Revenue, CP (BASF AG) | 0.75 | 9/9/09 | 10,000,000 | 10,000,000 |
| Red River Education Finance Corporation, Higher Education | | | | |
| Revenue (Texas Christian University Project) | 0.25 | 8/7/09 | 10,000,000 a | 10,000,000 |
| San Antonio, Water System Revenue, CP (Liquidity Facility: | | | | |
| Bank of America and State Street Bank and Trust Co.) | 0.43 | 10/5/09 | 10,000,000 | 10,000,000 |
| Texas, GO Notes (Veterans' Housing Assistance Program) | | | | |
| (Liquidity Facility; State Street Bank and Trust Co.) | 0.46 | 8/7/09 | 25,000,000 a | 25,000,000 |
| Texas Department of Housing and Community | | | | |
| Affairs, MFHR, Refunding (Champions Crossing | | | | |
| Apartments) (Liquidity Facility; FNMA and LOC; FNMA) | 0.41 | 8/7/09 | 5,025,000 a | 5,025,000 |
| Texas Department of Housing and Community Affairs, SFMR | 0.40 | 8/7/09 | 30,000,000 a | 30,000,000 |
| University of Texas, University Revenue, CP | 0.20 | 8/17/09 | 5,625,000 | 5,625,000 |
| University of Texas, University Revenue, CP | 0.25 | 8/17/09 | 10,000,000 | 10,000,000 |
| University of Texas, University Revenue, CP | 0.28 | 10/5/09 | 17,885,000 | 17,885,000 |
| University of Texas System Board of Regents, Financing System Revenue | 0.25 | 8/7/09 | 20,000,000 a | 20,000,000 |
| Weslaco Health Facilities Development Corporation, HR, | | | | |
| Refunding (Knapp Medical Center Project) (LOC; Compass Bank) | 0.40 | 8/7/09 | 4,730,000 a | 4,730,000 |
| Utah 1.7% | | | | |
| Intermountain Power Agency, Power Supply Revenue, CP | | | | |
| (Liquidity Facility: Bank of America and Bank of Nova Scotia) | 0.40 | 11/18/09 | 25,000,000 | 25,000,000 |
| Utah Housing Corporation, SFMR (LOC; Royal Bank of Canada) | 0.65 | 8/6/09 | 10,000,000 | 10,000,000 |
| Utah Housing Corporation, SFMR (LOC; Royal Bank of Canada) | 0.60 | 10/1/09 | 3,265,000 | 3,265,000 |
The Funds 35
| STATEMENT OF INVESTMENTS (Unaudited) (continued) |
| | | | |
| Dreyfus Municipal | Coupon | Maturity | Principal | |
| Cash Management Plus (continued) | Rate (%) | Date | Amount ($) | Value ($) |
| Short-Term Investments (continued) | | | | |
| Vermont .4% | | | | |
| Vermont Economic Development Authority, Revenue, CP | | | | |
| (Economic Development Capital Program) (LOC; Calyon) | 0.48 | 8/18/09 | 9,900,000 | 9,900,000 |
| Virginia 1.2% | | | | |
| Lynchburg Redevelopment and Housing Authority, Housing Revenue | | | | |
| (KHM Properties-Lynchburg, LLC Project) (LOC; M&T Bank) | 0.51 | 8/7/09 | 13,520,000 a | 13,520,000 |
| Richmond, CP (Liquidity Facility; Bank of America) | 0.38 | 9/14/09 | 14,000,000 | 14,000,000 |
| Washington .8% | | | | |
| Pierce County Economic Development Corporation, Multi-Mode | | | | |
| Industrial Revenue (SeaTac Packaging Project) (LOC; HSBC Bank USA) | 0.60 | 8/7/09 | 5,280,000 a | 5,280,000 |
| Tacoma Housing Authority, Revenue | | | | |
| (Crown Assisted Living Project) (LOC; Key Bank) | 2.80 | 8/7/09 | 600,000 a | 600,000 |
| Washington Economic Development Finance Authority, SWDR | | | | |
| (CleanScapes, Inc. Project) (LOC; Bank of the West) | 0.46 | 8/7/09 | 7,895,000 a | 7,895,000 |
| Washington Housing Finance Commission, Nonprofit Revenue | | | | |
| (Panorama Project) (LOC; Key Bank) | 2.50 | 8/7/09 | 4,000,000 a | 4,000,000 |
| Wisconsin 1.7% | | | | |
| Wisconsin Health and Educational Facilities Authority, Revenue | | | | |
| (Mequon Jewish Campus, Inc. Project) (LOC; Bank One) | 0.55 | 8/7/09 | 6,365,000 a | 6,365,000 |
| Wisconsin Housing and Economic Development Authority, | | | | |
| Home Ownership Revenue (Liquidity Facility; Fortis Bank) | 0.47 | 8/7/09 | 23,185,000 a | 23,185,000 |
| Wisconsin School Districts, COP, TRAN | | | | |
| (Cash Flow Management Program) (LOC; U.S. Bank NA) | 3.00 | 9/17/09 | 10,000,000 | 10,015,176 |
| |
| Total Investments (cost $2,314,039,074) | | | 100.3% | 2,314,039,074 |
| Liabilities, Less Cash and Receivables | | | (.3%) | (7,506,147) |
| Net Assets | | | 100.0% | 2,306,532,927 |
| |
| See footnotes on page 66 | | | | |
| See notes to financial statements. | | | | |
36
STATEMENT OF INVESTMENTS
July 31, 2009 (Unaudited) |
| | | | |
| Dreyfus New York | Coupon | Maturity | Principal | |
| Municipal Cash Management | Rate (%) | Date | Amount ($) | Value ($) |
| |
| Short-Term Investments 96.4% | | | | |
| Albany County Airport Authority, Airport Revenue, | | | | |
| Refunding (LOC; Bank of America) | 0.50 | 8/7/09 | 8,065,000 a | 8,065,000 |
| Albany Industrial Development Agency, Civic Facility Revenue | | | | |
| (Albany College of Pharmacy Project) (LOC; TD Bank) | 0.27 | 8/7/09 | 1,000,000 a | 1,000,000 |
| Albany Industrial Development Agency, Civic Facility Revenue | | | | |
| (Albany Medical Center Hospital Project) (LOC; Bank of America) | 0.35 | 8/7/09 | 2,800,000 a | 2,800,000 |
| Albany Industrial Development Agency, Civic Facility Revenue | | | | |
| (Albany Medical Center Hospital Project) (LOC; Key Bank) | 2.50 | 8/7/09 | 5,000,000 a | 5,000,000 |
| Arlington Central School District, GO Notes, BAN | 2.75 | 8/21/09 | 3,911,400 | 3,912,763 |
| Avoca Central School District, GO Notes, BAN | 2.75 | 8/26/09 | 6,000,000 | 6,002,211 |
| Cattaraugus County Industrial Development Agency, | | | | |
| Civic Facility Revenue (Young Men's Christian | | | | |
| Association of Olean, N.Y. Project) (LOC; Key Bank) | 2.80 | 8/7/09 | 3,375,000 a | 3,375,000 |
| Chautauqua County Industrial Development Agency, Civic Facility | | | | |
| Revenue (Gerry Homes Project) (LOC; HSBC Bank USA) | 0.50 | 8/7/09 | 11,900,000 a | 11,900,000 |
| Chemung County Industrial Development Agency, IDR | | | | |
| (MMARS 2nd Program) (LOC; HSBC Bank USA) | 0.50 | 8/7/09 | 835,000 a | 835,000 |
| Clinton County Industrial Development Agency, Civic Facility | | | | |
| Revenue (Champlain Valley Physicians Hospital Medical | | | | |
| Center Project) (Liquidity Facility; Key Bank) | 2.50 | 8/7/09 | 7,700,000 a | 7,700,000 |
| Clinton County Industrial Development Agency, Civic Facility | | | | |
| Revenue (Champlain Valley Physicians Hospital Medical | | | | |
| Center Project) (LOC; Key Bank) | 2.50 | 8/7/09 | 10,305,000 a | 10,305,000 |
| Columbia County Industrial Development Agency, Civic Facility | | | | |
| Revenue (The Columbia Memorial Hospital Project) (LOC; Key Bank) | 2.45 | 8/7/09 | 5,570,000 a | 5,570,000 |
| Dutchess County Industrial Development Agency, | | | | |
| Civic Facility Revenue (Anderson Foundation | | | | |
| for Autism, Inc. Project) (LOC; M&T Bank) | 0.46 | 8/7/09 | 8,325,000 a | 8,325,000 |
| Dutchess County Industrial Development Agency, | | | | |
| Civic Facility Revenue (Anderson Foundation | | | | |
| for Autism, Inc. Project) (LOC; M&T Bank) | 0.46 | 8/7/09 | 9,445,000 a | 9,445,000 |
| Dutchess County Industrial Development Agency, Civic Facility | | | | |
| Revenue (Arbor Ridge Brookmeade Inc.) (LOC; M&T Bank) | 0.46 | 8/7/09 | 8,500,000 a | 8,500,000 |
| Dutchess County Industrial Development Agency, | | | | |
| Civic Facility Revenue, Refunding (Lutheran Center | | | | |
| at Poughkeepsie, Inc. Project) (LOC; Key Bank) | 2.45 | 8/7/09 | 3,655,000 a | 3,655,000 |
| East Rochester Housing Authority, Housing Revenue (Park Ridge | | | | |
| Nursing Home, Inc. Project) (LOC; JPMorgan Chase Bank) | 0.39 | 8/7/09 | 5,000,000 a | 5,000,000 |
| Eastchester Union Free School District, GO Notes, TAN | 1.00 | 12/23/09 | 5,000,000 | 5,009,822 |
| Erie County Industrial Development Agency, Civic Facility | | | | |
| Revenue (Heritage Center Project) (LOC; Key Bank) | 2.90 | 8/7/09 | 1,760,000 a | 1,760,000 |
| Erie County Industrial Development Agency, Civic Facility Revenue | | | | |
| (YMCA of Greater Buffalo Project) (LOC; HSBC Bank USA) | 0.50 | 8/7/09 | 675,000 a | 675,000 |
| Erie County Industrial Development Agency, Civic Facility Revenue | | | | |
| (YMCA of Greater Buffalo Project) (LOC; HSBC Bank USA) | 0.50 | 8/7/09 | 3,535,000 a | 3,535,000 |
| Erie County Industrial Development Agency, IDR | | | | |
| (Hydro-Air Components Inc. Project) (LOC; HSBC Bank USA) | 0.60 | 8/7/09 | 3,100,000 a | 3,100,000 |
The Funds 37
| STATEMENT OF INVESTMENTS (Unaudited) (continued) |
| | | | |
| Dreyfus New York | Coupon | Maturity | Principal | |
| Municipal Cash Management (continued) | Rate (%) | Date | Amount ($) | Value ($) |
| |
| Short-Term Investments (continued) | | | | |
| Hempstead Industrial Development Agency, IDR | | | | |
| (FCD Lynbrook LLC Facility) (Liquidity Facility; | | | | |
| Goldman Sachs Group and LOC; Goldman Sachs Group) | 0.37 | 8/7/09 | 6,350,000 a,b | 6,350,000 |
| Herkimer County Industrial Development Agency, IDR | | | | |
| (F.E. Hale Manufacturing Company Facility) (LOC; HSBC Bank USA) | 0.50 | 8/7/09 | 1,950,000 a | 1,950,000 |
| Hudson Yards Infrastructure Corporation, Hudson Yards Senior | | | | |
| Revenue (LOC; Citibank NA and Liquidity Facility; Citibank NA) | 0.65 | 8/7/09 | 52,200,000 a,b | 52,200,000 |
| Lancaster Industrial Development Agency, IDR (Sealing | | | | |
| Devices Inc. Project) (LOC; HSBC Bank USA) | 0.60 | 8/7/09 | 2,335,000 a | 2,335,000 |
| Long Island Power Authority, CP (Long Island Lighting | | | | |
| Company) (LOC; JPMorgan Chase Bank) | 0.48 | 12/3/09 | 29,300,000 | 29,300,000 |
| Long Island Power Authority, CP (Long Island | | | | |
| Lighting Company) (LOC; State Street Bank and Trust Co.) | 0.42 | 8/12/09 | 6,000,000 | 6,000,000 |
| Long Island Power Authority, CP (Long Island Lighting | | | | |
| Company) (LOC; State Street Bank and Trust Co.) | 0.37 | 9/9/09 | 14,000,000 | 14,000,000 |
| Long Island Power Authority, Electric System General | | | | |
| Revenue (Insured; FSA and Liquidity Facility; Dexia Credit Locale) | 0.65 | 8/7/09 | 23,200,000 a | 23,200,000 |
| Long Island Power Authority, Electric System General Revenue | | | | |
| (Insured; FSA and Liquidity Facility; Dexia Credit Locale) | 0.85 | 8/7/09 | 17,000,000 a | 17,000,000 |
| Long Island Power Authority, Electric System | | | | |
| Subordinated Revenue (LOC; Westdeutsche Landesbank) | 0.33 | 8/1/09 | 31,700,000 a | 31,700,000 |
| Metropolitan Transportation Authority, Dedicated Tax Fund Revenue, | | | | |
| Refunding (Insured; FSA and Liquidity Facility; Dexia Credit Locale) | 1.00 | 8/7/09 | 20,000,000 a | 20,000,000 |
| Metropolitan Transportation Authority, RAN | 2.00 | 12/31/09 | 46,765,000 | 47,076,702 |
| Metropolitan Transportation Authority, Transportation | | | | |
| Revenue (LOC; Fortis Bank) | 0.36 | 8/7/09 | 25,000,000 a | 25,000,000 |
| Monroe County Industrial Development Agency, Civic Facility | | | | |
| Revenue (DePaul Properties, Inc. Project) (LOC; Key Bank) | 2.50 | 8/7/09 | 3,000,000 a | 3,000,000 |
| Monroe County Industrial Development Agency, Civic Facility | | | | |
| Revenue (YMCA of Greater Rochester Project) (LOC; M&T Bank) | 0.74 | 8/7/09 | 2,380,000 a | 2,380,000 |
| Monroe County Industrial Development Agency, IDR | | | | |
| (Chaney Enterprise) (LOC; M&T Bank) | 0.61 | 8/7/09 | 2,250,000 a | 2,250,000 |
| Monroe County Industrial Development Agency, IDR | | | | |
| (Genesee Metal Stampings Inc. Facility) (LOC; HSBC Bank USA) | 0.50 | 8/7/09 | 450,000 a | 450,000 |
| Monroe County Industrial Development Agency, | | | | |
| Revenue (HDF-RWC Project 1, LLC Robert | | | | |
| Weslayan College Project) (LOC; M&T Bank) | 0.58 | 8/7/09 | 2,700,000 a | 2,700,000 |
| Nassau County Interim Finance Authority, Sales Tax | | | | |
| Secured Revenue (Liquidity Facility; Bank of America) | 0.35 | 8/7/09 | 25,000,000 a | 25,000,000 |
| New Rochelle City School District, GO Notes, TAN | 1.50 | 12/4/09 | 6,900,000 d | 6,925,461 |
| New York City, GO Notes (Liquidity Facility; Dexia Credit Locale) | 0.50 | 8/1/09 | 7,000,000 a | 7,000,000 |
| New York City, GO Notes (Liquidity Facility; | | | | |
| Landesbank Baden-Wurttemberg) | 0.80 | 8/1/09 | 20,000,000 a | 20,000,000 |
| New York City, GO Notes (LOC; Bank of America) | 0.32 | 8/7/09 | 3,600,000 a | 3,600,000 |
| New York City, GO Notes (LOC; Bank of Nova Scotia) | 0.30 | 8/7/09 | 6,785,000 a | 6,785,000 |
| New York City, GO Notes (LOC; Bayerische Landesbank) | 0.30 | 8/1/09 | 4,850,000 a | 4,850,000 |
| New York City, GO Notes (LOC; JPMorgan Chase Bank) | 0.25 | 8/7/09 | 3,100,000 a | 3,100,000 |
| New York City, GO Notes (LOC; JPMorgan Chase Bank) | 0.30 | 8/7/09 | 4,800,000 a | 4,800,000 |
| New York City, GO Notes (LOC; Landesbank Baden-Wurttemberg) | 0.32 | 8/7/09 | 6,265,000 a | 6,265,000 |
38
| | | | |
| Dreyfus New York | Coupon | Maturity | Principal | |
| Municipal Cash Management (continued) | Rate (%) | Date | Amount ($) | Value ($) |
| |
| Short-Term Investments (continued) | | | | |
| New York City Capital Resource Corporation, Revenue | | | | |
| (Loan Enhanced Assistance Program Cobble Hill | | | | |
| Health Center, Inc.) (LOC; Bank of America) | 0.28 | 8/7/09 | 6,000,000 a | 6,000,000 |
| New York City Housing Development Corporation, MFHR | | | | |
| (Liquidity Facility; Dexia Credit Locale) | 0.40 | 8/1/09 | 10,000,000 a | 10,000,000 |
| New York City Housing Development Corporation, MFHR | | | | |
| (Liquidity Facility; JPMorgan Chase Bank) | 0.35 | 8/7/09 | 17,100,000 a | 17,100,000 |
| New York City Housing Development Corporation, | | | | |
| MFMR (20 Exchange Place) (LOC; | | | | |
| Landesbank Hessen-Thuringen Girozentrale) | 0.33 | 8/7/09 | 5,405,000 a | 5,405,000 |
| New York City Housing Development Corporation, MFMR | | | | |
| (Beekman Tower) (LOC; RBS Citizens NA) | 1.50 | 8/7/09 | 20,345,000 a | 20,345,000 |
| New York City Housing Development Corporation, | | | | |
| Multi-Family Rental Housing Revenue (155 West 21st Street | | | | |
| Development) (Liquidity Facility; FNMA and LOC; FNMA) | 0.28 | 8/7/09 | 10,000,000 a | 10,000,000 |
| New York City Housing Development Corporation, Residential | | | | |
| Revenue (Queens College Residences) (LOC; RBS Citizens NA) | 2.40 | 8/7/09 | 7,000,000 a | 7,000,000 |
| New York City Industrial Development Agency, Civic Facility Revenue | | | | |
| (American Society for Technion Project) (LOC; Allied Irish Banks) | 0.42 | 8/7/09 | 9,545,000 a | 9,545,000 |
| New York City Industrial Development Agency, Civic Facility Revenue | | | | |
| (Birch Wathen Lenox School Project) (LOC; Allied Irish Banks) | 0.66 | 8/7/09 | 7,540,000 a | 7,540,000 |
| New York City Industrial Development Agency, | | | | |
| Civic Facility Revenue (Columbia Grammar and | | | | |
| Preparatory School Project) (LOC; Allied Irish Banks) | 0.66 | 8/7/09 | 5,205,000 a | 5,205,000 |
| New York City Industrial Development Agency, Civic Facility Revenue | | | | |
| (French Institute-Alliance Francaise de New York Federation of | | | | |
| French Alliances in the United States Project) (LOC; M&T Bank) | 0.66 | 8/7/09 | 1,865,000 a | 1,865,000 |
| New York City Industrial Development Agency, | | | | |
| Civic Facility Revenue (Jewish Community Center | | | | |
| on the Upper West Side, Inc. Project) (LOC; M&T Bank) | 0.46 | 8/7/09 | 5,000,000 a | 5,000,000 |
| New York City Industrial Development Agency, Civic Facility Revenue | | | | |
| (New York Psychotherapy Project) (LOC; JPMorgan Chase Bank) | 0.32 | 8/7/09 | 2,820,000 a | 2,820,000 |
| New York City Industrial Development Agency, Civic Facility Revenue | | | | |
| (Sephardic Community Youth Center, Inc. Project) (LOC; M&T Bank) | 0.46 | 8/7/09 | 3,100,000 a | 3,100,000 |
| New York City Industrial Development Agency, | | | | |
| Civic Facility Revenue (Spence-Chapin, Services to | | | | |
| Families and Children Project) (LOC; Allied Irish Banks) | 0.66 | 8/7/09 | 5,690,000 a | 5,690,000 |
| New York City Industrial Development Agency, Civic Facility Revenue | | | | |
| (The Allen-Stevenson School Project) (LOC; Allied Irish Banks) | 0.66 | 8/7/09 | 2,960,000 a | 2,960,000 |
| New York City Industrial Development Agency, Civic Facility Revenue | | | | |
| (Village Community School Project) (LOC; M&T Bank) | 0.66 | 8/7/09 | 2,400,000 a | 2,400,000 |
| New York City Municipal Water Finance Authority, CP (Liquidity | | | | |
| Facility: Bayerische Landesbank and Westdeutsche Landesbank) | 0.50 | 8/3/09 | 7,000,000 | 7,000,000 |
| New York City Municipal Water Finance Authority, | | | | |
| Water and Sewer System Revenue (Putters Program) | | | | |
| (Liquidity Facility; JPMorgan Chase Bank) | 0.32 | 8/7/09 | 2,095,000 a,b | 2,095,000 |
| New York City Transitional Finance Authority, Future Tax Secured | | | | |
| Revenue (Liquidity Facility; JPMorgan Chase Bank) | 0.23 | 8/7/09 | 4,800,000 a | 4,800,000 |
| New York City Transitional Finance Authority, Future Tax Secured | | | | |
| Revenue (Liquidity Facility; Landesbank Baden-Wurttemberg) | 0.30 | 8/1/09 | 5,500,000 a | 5,500,000 |
The Funds 39
| STATEMENT OF INVESTMENTS (Unaudited) (continued) |
| | | | |
| Dreyfus New York | Coupon | Maturity | Principal | |
| Municipal Cash Management (continued) | Rate (%) | Date | Amount ($) | Value ($) |
| |
| Short-Term Investments (continued) | | | | |
| New York City Transitional Finance Authority, | | | | |
| Future Tax Secured Revenue (Prerefunded) | 6.00 | 8/15/09 | 6,000,000 c | 6,072,837 |
| New York Local Government Assistance Corporation, Revenue | | | | |
| (LOC: Bayerische Landesbank and Westdeutshe Landesbank) | 0.40 | 8/7/09 | 23,000,000 a | 23,000,000 |
| New York Local Government Assistance Corporation, Revenue | | | | |
| (LOC; Landesbank Hessen-Thuringen Girozentrale) | 0.25 | 8/7/09 | 3,900,000 a | 3,900,000 |
| New York State Dormitory Authority, Consolidated Fifth General | | | | |
| Resolution Revenue (City University System) (LOC; TD Bank) | 0.25 | 8/7/09 | 6,000,000 a | 6,000,000 |
| New York State Dormitory Authority, Revenue | | | | |
| (Blythedale Children's Hospital) (LOC; TD Bank) | 0.26 | 8/7/09 | 4,500,000 a | 4,500,000 |
| New York State Dormitory Authority, Revenue | | | | |
| (Catholic Health System Obligated Group) (LOC; HSBC Bank USA) | 0.26 | 8/7/09 | 2,470,000 a | 2,470,000 |
| New York State Dormitory Authority, | | | | |
| Revenue (Columbia University) | 0.23 | 8/7/09 | 32,500,000 a | 32,500,000 |
| New York State Dormitory Authority, Revenue | | | | |
| (Cornell University) (Liquidity Facility; JPMorgan Chase Bank) | 0.15 | 8/7/09 | 20,115,000 a | 20,115,000 |
| New York State Dormitory Authority, Revenue | | | | |
| (Long Island University) (LOC; RBS Citizens NA) | 2.50 | 8/7/09 | 6,500,000 a | 6,500,000 |
| New York State Dormitory Authority, Revenue | | | | |
| (New York Law School) (LOC; TD Bank) | 0.25 | 8/7/09 | 4,500,000 a | 4,500,000 |
| New York State Dormitory Authority, Revenue | | | | |
| (Park Ridge Hospital, Inc.) (LOC; JPMorgan Chase Bank) | 0.39 | 8/7/09 | 18,600,000 a | 18,600,000 |
| New York State Dormitory Authority, Revenue | | | | |
| (Samaritan Medical Center) (LOC; HSBC Bank USA) | 0.45 | 8/7/09 | 3,400,000 a | 3,400,000 |
| New York State Dormitory Authority, Revenue | | | | |
| (Samaritan Medical Center) (LOC; Key Bank) | 2.50 | 8/7/09 | 8,000,000 a | 8,000,000 |
| New York State Dormitory Authority, Revenue | | | | |
| (The College of New Rochelle) (LOC; RBS Citizens NA) | 2.40 | 8/7/09 | 4,000,000 a | 4,000,000 |
| New York State Dormitory Authority, | | | | |
| Revenue (The Rockefeller University) | 0.15 | 8/7/09 | 8,300,000 a | 8,300,000 |
| New York State Dormitory Authority, Revenue | | | | |
| (Wagner College) (LOC; TD Bank) | 0.25 | 8/7/09 | 4,000,000 a | 4,000,000 |
| New York State Dormitory Authority, State Personal | | | | |
| Income Tax Revenue (Education) (Liquidity Facility; Citibank NA) | 0.38 | 8/7/09 | 7,095,000 a,b | 7,095,000 |
| New York State Housing Finance Agency, Housing Revenue | | | | |
| (20 River Terrace) (Liquidity Facility; FNMA and LOC; FNMA) | 0.23 | 8/7/09 | 3,300,000 a | 3,300,000 |
| New York State Housing Finance Agency, Housing | | | | |
| Revenue (70 Battery Place) (LOC; FNMA) | 0.37 | 8/7/09 | 20,600,000 a | 20,600,000 |
| New York State Housing Finance Agency, Housing Revenue | | | | |
| (300 East 39 Street) (Liquidity Facility; FNMA and LOC; FNMA) | 0.28 | 8/7/09 | 4,800,000 a | 4,800,000 |
| New York State Housing Finance Agency, Housing Revenue | | | | |
| (316 Eleventh Avenue) (Liquidity Facility; FNMA and LOC; FNMA) | 0.28 | 8/7/09 | 10,500,000 a | 10,500,000 |
| New York State Housing Finance Agency, Housing | | | | |
| Revenue (350 West 37th Street) (LOC; Wachovia Bank) | 0.44 | 8/7/09 | 9,000,000 a | 9,000,000 |
| New York State Housing Finance Agency, Housing | | | | |
| Revenue (Avalon Bowery Place II) (LOC; Bank of America) | 0.52 | 8/7/09 | 12,000,000 a | 12,000,000 |
| New York State Housing Finance Agency, | | | | |
| Housing Revenue (Historic Front Street) | | | | |
| (LOC; Landesbank Hessen-Thuringen Girozentrale) | 0.32 | 8/7/09 | 24,300,000 a | 24,300,000 |
40
| | | | |
| Dreyfus New York | Coupon | Maturity | Principal | |
| Municipal Cash Management (continued) | Rate (%) | Date | Amount ($) | Value ($) |
| |
| Short-Term Investments (continued) | | | | |
| New York State Housing Finance Agency, | | | | |
| Housing Revenue (Normandie Court I Project) | | | | |
| (LOC; Landesbank Hessen-Thuringen Girozentrale) | 0.31 | 8/7/09 | 4,750,000 a | 4,750,000 |
| New York State Housing Finance Agency, Housing Revenue | | | | |
| (North End Avenue) (Liquidity Facility; FNMA and LOC; FNMA) | 0.23 | 8/7/09 | 1,700,000 a | 1,700,000 |
| New York State Housing Finance Agency, | | | | |
| Revenue (Worth Street) (LOC; FNMA) | 0.28 | 8/7/09 | 9,400,000 a | 9,400,000 |
| New York State Urban Development Corporation, | | | | |
| Service Contract Revenue, Refunding (Insured; Assured | | | | |
| Guaranty and Liquidity Facility; JPMorgan Chase Bank) | 0.38 | 8/7/09 | 5,000,000 a | 5,000,000 |
| Newburgh Industrial Development Agency, Civic Facility | | | | |
| Revenue (Community Development Properties | | | | |
| Dubois Street II, Inc. Project) (LOC; Key Bank) | 2.45 | 8/7/09 | 3,300,000 a | 3,300,000 |
| Niagara County Industrial Development Agency, Civic Facility Revenue | | | | |
| (Niagara University Project) (Liquidity Facility; HSBC Bank USA) | 0.26 | 8/7/09 | 5,000,000 a | 5,000,000 |
| Onondaga County Industrial Development Agency, IDR (General Super | | | | |
| Plating Company, Inc. Project) (LOC; Citizens Bank of Pennsylvania) | 3.50 | 8/7/09 | 1,950,000 a | 1,950,000 |
| Onondaga County Industrial Development Agency, IDR | | | | |
| (ICM Controls Corporation Project) (LOC; M&T Bank) | 0.56 | 8/7/09 | 2,380,000 a | 2,380,000 |
| Ontario County Industrial Development Agency, Civic Facility Revenue | | | | |
| (CHF-Finger Lakes, L.L.C. Civic Facility) (LOC; RBS Citizens NA) | 2.40 | 8/7/09 | 4,000,000 a | 4,000,000 |
| Ontario County Industrial Development Agency, | | | | |
| Civic Facility Revenue (Friends of the Finger Lakes | | | | |
| Performing Arts Center, Inc. Civic Facility) (LOC; RBS Citizens NA) | 3.25 | 8/7/09 | 6,565,000 a | 6,565,000 |
| Ontario County Industrial Development Agency, IDR (Dixit Enterprises/ | | | | |
| Newtex Industries, Inc. Facility) (LOC; HSBC Bank USA) | 0.50 | 8/7/09 | 2,670,000 a | 2,670,000 |
| Orange County Industrial Development Agency, Civic Facility | | | | |
| Revenue (Saint Luke's Cornwall Hospital Project) (LOC; Key Bank) | 2.45 | 8/7/09 | 3,800,000 a | 3,800,000 |
| Otsego County Industrial Development Agency, Civic Facility | | | | |
| Revenue (Templeton Foundation Project) (LOC; Key Bank) | 2.70 | 8/7/09 | 3,050,000 a | 3,050,000 |
| Port Authority of New York and New Jersey, CP | | | | |
| (Liquidity Facility; Landesbank Hessen-Thuringen Girozentrale) | 0.50 | 8/6/09 | 13,110,000 | 13,110,000 |
| Port Authority of New York and New Jersey, Equipment Notes | 0.47 | 8/7/09 | 10,500,000 a | 10,500,000 |
| Port Authority of New York and New Jersey, | | | | |
| Special Obligation Revenue (Versatile Structure | | | | |
| Obligations) (Liquidity Facility; Bank of Nova Scotia) | 0.33 | 8/1/09 | 5,000,000 a | 5,000,000 |
| Putnam County Industrial Development Agency, | | | | |
| Civic Facility Revenue (United Cerebral Palsy of Putnam | | | | |
| and Southern Dutchess Project) (LOC; Commerce Bank NA) | 0.27 | 8/7/09 | 3,700,000 a | 3,700,000 |
| Rensselaer Industrial Development Agency, Senior Housing | | | | |
| Revenue (Brunswick Senior Housing Project) (LOC; FHLB) | 0.43 | 8/1/09 | 3,290,000 a | 3,290,000 |
| Rockland County Industrial Development Agency, | | | | |
| Civic Facility Revenue (Rockland Jewish | | | | |
| Community Center Project) (LOC; Wachovia Bank) | 0.31 | 8/7/09 | 6,245,000 a | 6,245,000 |
| Saint Lawrence County Industrial Development Agency, | | | | |
| Civic Facility Revenue, Refunding (Claxton-Hepburn | | | | |
| Medical Center Project) (LOC; Key Bank) | 2.45 | 8/7/09 | 3,600,000 a | 3,600,000 |
| Schenectady Industrial Development Agency, Civic Facility | | | | |
| Revenue (Union Graduate College Project) (LOC; M&T Bank) | 0.46 | 8/7/09 | 5,660,000 a | 5,660,000 |
The Funds 41
| STATEMENT OF INVESTMENTS (Unaudited) (continued) |
| | | | |
| Dreyfus New York | Coupon | Maturity | Principal | |
| Municipal Cash Management (continued) | Rate (%) | Date | Amount ($) | Value ($) |
| |
| Short-Term Investments (continued) | | | | |
| Stillwater Central School District, GO Notes, BAN | 2.75 | 9/24/09 | 4,000,000 | 4,003,474 |
| Suffolk County Industrial Development Agency, IDR | | | | |
| (Wolf Family LLC/Contract Pharmacal Corporation | | | | |
| Facility) (LOC; HSBC Bank USA) | 0.60 | 8/7/09 | 4,080,000 a | 4,080,000 |
| Syracuse Industrial Development Agency, | | | | |
| Civic Facility Revenue (Community Development | | | | |
| Properties-Larned Project) (LOC; M&T Bank) | 0.58 | 8/7/09 | 2,780,000 a | 2,780,000 |
| Syracuse Industrial Development Agency, Civic Facility | | | | |
| Revenue (Crouse Health Hospital, Inc. Project) (LOC; Key Bank) | 2.45 | 8/7/09 | 3,305,000 a | 3,305,000 |
| Syracuse Industrial Development Agency, Civic Facility | | | | |
| Revenue (Crouse Health Hospital, Inc. Project) (LOC; Key Bank) | 2.45 | 8/7/09 | 5,000,000 a | 5,000,000 |
| Syracuse Industrial Development Agency, Housing Revenue | | | | |
| (Masonic Lofts LLC Project) (LOC; Key Bank) | 3.00 | 8/7/09 | 4,050,000 a | 4,050,000 |
| Tompkins County Industrial Development Agency, Civic Facility | | | | |
| Revenue (Cornell University Project) (LOC; JPMorgan Chase Bank) | 0.15 | 8/7/09 | 13,165,000 a | 13,165,000 |
| Ulster County Industrial Development Agency, IDR | | | | |
| (Selux Corporation Project) (LOC; M&T Bank) | 0.56 | 8/7/09 | 1,385,000 a | 1,385,000 |
| Wells Fargo Stage Trust (Metropolitan Transportation | | | | |
| Authority, Dedicated Tax Fund Revenue) (Liquidity | | | | |
| Facility; Wells Fargo Bank and LOC; Wells Fargo Bank) | 0.33 | 8/7/09 | 17,890,000 a,b | 17,890,000 |
| Westchester County Health Care Corporation, CP | | | | |
| (Liquidity Facility; Landesbank Hessen-Thuringen | | | | |
| Girozentrale and LOC; Westchester County) | 1.70 | 8/3/09 | 10,000,000 | 10,000,000 |
| Westchester County Industrial Development Agency, | | | | |
| Civic Facility Revenue (The Masters School Civic | | | | |
| Facility) (LOC; Allied Irish Banks) | 0.66 | 8/7/09 | 15,680,000 a | 15,680,000 |
| Westchester County Industrial Development Agency, Civic Facility | | | | |
| Revenue (The Rye YMCA Project) (LOC; Allied Irish Banks) | 0.66 | 8/7/09 | 2,250,000 a | 2,250,000 |
| Yonkers Industrial Development Agency, MFHR (Main Street | | | | |
| LoftsYonkers LLC Project) (LOC; M&T Bank) | 0.56 | 8/7/09 | 30,000,000 a | 30,000,000 |
| Yonkers Industrial Development Agency, Revenue | | | | |
| (Merlots Program) (11-23 Saint Casimir Avenue, LP | | | | |
| Project) (Liquidity Facility; Wachovia Bank and LOC; GNMA) | 0.43 | 8/7/09 | 4,215,000 a,b | 4,215,000 |
| |
| Total Investments (cost $1,101,983,270) | | | 96.4% | 1,101,983,270 |
| |
| Cash and Receivables (Net) | | | 3.6% | 41,218,617 |
| |
| Net Assets | | | 100.0% | 1,143,201,887 |
| |
| See footnotes on page 66 | | | | |
| See notes to financial statements. | | | | |
42
STATEMENT OF INVESTMENTS
July 31, 2009 (Unaudited) |
| | | | |
| Dreyfus Tax Exempt | Coupon | Maturity | Principal | |
| Cash Management | Rate (%) | Date | Amount ($) | Value ($) |
| |
| Short-Term Investments 100.6% | | | | |
| Alabama .3% | | | | |
| Chatom Industrial Development Board, Gulf Opportunity Zone Revenue | | | | |
| (PowerSouth Energy Cooperative Projects) (Liquidity Facility; | | | | |
| National Rural Utilities Cooperative Finance Corporation and LOC; | | | | |
| National Rural Utilities Cooperative Finance Corporration) | 2.85 | 11/16/09 | 18,000,000 | 18,000,000 |
| Chatom Industrial Development Board, PCR, Refunding | | | | |
| (Alabama Electric Cooperative, Inc. Project) (Liquidity Facility; | | | | |
| National Rural Utilities Cooperative Finance Corporation) | 2.65 | 12/1/09 | 5,000,000 | 5,000,000 |
| Arizona 2.9% | | | | |
| Arizona Health Facilities Authority, HR (Phoenix Children's Hospital) | | | | |
| (Liquidity Facility; BNP Paribas and LOC; BNP Paribas) | 0.57 | 8/7/09 | 12,455,000 a,b | 12,455,000 |
| Arizona Health Facilities Authority, HR (Phoenix Children's Hospital) | | | | |
| (Liquidity Facility; Merrill Lynch Capital Services and LOC; Merrill Lynch) | 1.37 | 8/7/09 | 9,620,000 a,b | 9,620,000 |
| Arizona Health Facilities Authority, HR (Phoenix Children's Hospital) | | | | |
| (Liquidity Facility; Merrill Lynch Capital Services and LOC; Merrill Lynch) | 1.42 | 8/7/09 | 10,000,000 a,b | 10,000,000 |
| Arizona Health Facilities Authority, Revenue | | | | |
| (La Loma Village) (LOC; Citibank NA) | 0.44 | 8/7/09 | 18,300,000 a | 18,300,000 |
| Phoenix Improvement Corporation, Wastewater System | | | | |
| Revenue, CP (LOC; Bank of America) | 0.40 | 9/14/09 | 14,000,000 | 14,000,000 |
| Salt River Project Agricultural Improvement and Power District, CP | | | | |
| (Salt River Project) (Liquidity Facility: Bank of America, Citibank NA, | | | | |
| JPMorgan Chase Bank and Wells Fargo Bank) | 0.57 | 9/16/09 | 36,600,000 | 36,600,000 |
| Salt River Project Agricultural Improvement and Power District, CP | | | | |
| (Salt River Project) (Liquidity Facility: Bank of America, Citibank NA, | | | | |
| JPMorgan Chase Bank and Wells Fargo Bank) | 0.57 | 9/17/09 | 31,000,000 | 31,000,000 |
| Salt River Project Agricultural Improvement and Power District, CP | | | | |
| (Salt River Project) (Liquidity Facility: Bank of America, Citibank NA, | | | | |
| JPMorgan Chase Bank and Wells Fargo Bank) | 0.57 | 9/18/09 | 19,600,000 | 19,600,000 |
| Salt River Project Agricultural Improvement and Power District, CP | | | | |
| (Salt River Project) (Liquidity Facility: Bank of America, Citibank NA, | | | | |
| JPMorgan Chase Bank and Wells Fargo Bank) | 0.45 | 9/21/09 | 25,000,000 | 25,000,000 |
| Salt River Project Agricultural Improvement and Power District, CP | | | | |
| (Salt River Project) (Liquidity Facility: Bank of America, Citibank NA, | | | | |
| JPMorgan Chase Bank and Wells Fargo Bank) | 0.60 | 10/14/09 | 12,900,000 | 12,900,000 |
| California 4.0% | | | | |
| California Health Facilities Financing Authority, | | | | |
| Revenue (Kaiser Permanente) | 0.24 | 8/7/09 | 105,000,000 a | 105,000,000 |
| California Statewide Communities Development Authority, | | | | |
| Revenue (Kaiser Permanente) | 0.25 | 8/7/09 | 50,300,000 a | 50,300,000 |
| California Statewide Communities Development Authority, | | | | |
| Revenue, CP (Kaiser Permanente) | 0.37 | 12/10/09 | 10,000,000 | 10,000,000 |
| Metropolitan Water District of Southern California, | | | | |
| Water Revenue (Liquidity Facility; Bank of America) | 0.30 | 8/7/09 | 49,000,000 a | 49,000,000 |
| Southern California Public Power Authority, Transmission Project | | | | |
| Revenue, Refunding (Southern Transmission Project) | | | | |
| (Insured; FSA and Liquidity Facility; Westdeutsche Landesbank) | 1.00 | 8/7/09 | 50,000,000 a | 50,000,000 |
The Funds 43
| STATEMENT OF INVESTMENTS (Unaudited) (continued) |
| | | | |
| Dreyfus Tax Exempt | Coupon | Maturity | Principal | |
| Cash Management (continued) | Rate (%) | Date | Amount ($) | Value ($) |
| Short-Term Investments (continued) | | | | |
| Colorado 1.4% | | | | |
| Colorado Educational and Cultural Facilities Authority, Revenue | | | | |
| (The Nature Conservancy Project) (Liquidity Facility; Bank of America) | 0.40 | 8/7/09 | 21,200,000 a | 21,200,000 |
| Denver Urban Renewal Authority, Stapleton Senior | | | | |
| Tax Increment Revenue (LOC; U.S. Bank NA) | 0.33 | 8/7/09 | 10,000,000 a | 10,000,000 |
| Mountain Village Housing Authority, Housing Facilities Revenue | | | | |
| (Village Court Apartments Project) (LOC; U.S. Bank NA) | 0.41 | 8/7/09 | 6,500,000 a | 6,500,000 |
| RBC Municipal Products Inc. Trust (Meridian Village Metropolitan | | | | |
| District Number One, Improvement Revenue) (Liquidity Facility; | | | | |
| Royal Bank of Canada and LOC; Royal Bank of Canada) | 0.46 | 8/7/09 | 17,600,000 a,b | 17,600,000 |
| Southern Ute Indian Tribe of the Southern Ute | | | | |
| Indian Reservation, Revenue | 0.23 | 8/7/09 | 26,000,000 a | 26,000,000 |
| Southglenn Metropolitan District, Special Revenue (LOC; BNP Paribas) | 0.41�� | 8/7/09 | 8,000,000 a | 8,000,000 |
| Connecticut .3% | | | | |
| Connecticut Health and Educational Facilities Authority, Revenue | | | | |
| (Westminster School Issue) (LOC; Bank of America) | 0.51 | 8/7/09 | 4,060,000 a | 4,060,000 |
| Connecticut Health and Educational Facilities Authority, Revenue | | | | |
| (Yale University Issue) (Liquidity Facility; Citibank NA) | 0.37 | 8/7/09 | 4,350,000 a,b | 4,350,000 |
| New Haven, GO Notes, BAN | 1.25 | 2/15/10 | 9,000,000 | 9,018,175 |
| Delaware .4% | | | | |
| Delaware Economic Development Authority, MFHR | | | | |
| (School House Project) (LOC; HSBC Bank USA) | 0.50 | 8/7/09 | 12,300,000 a | 12,300,000 |
| Delaware Economic Development Authority, Revenue | | | | |
| (Connections CSP Project) (LOC; PNC Bank NA) | 0.35 | 8/7/09 | 6,790,000 a | 6,790,000 |
| Delaware Health Facilities Authority, Revenue | | | | |
| (Christiana Care Health Services) | 0.33 | 8/7/09 | 8,325,000 a | 8,325,000 |
| District of Columbia 2.8% | | | | |
| Anacostia Waterfront Corporation, PILOT Revenue (Merlots Program) | | | | |
| (Liquidity Facility; Wachovia Bank and LOC; Wachovia Bank) | 0.33 | 8/7/09 | 73,885,000 a,b | 73,885,000 |
| District of Columbia, Multimodal GO (LOC; JPMorgan Chase Bank) | 0.28 | 8/7/09 | 18,630,000 a | 18,630,000 |
| District of Columbia, Revenue (The Washington Center for Internships | | | | |
| and Academic Seminars Issue) (LOC; Branch Banking and Trust Co.) | 0.37 | 8/7/09 | 4,000,000 a | 4,000,000 |
| District of Columbia, Revenue, CP | | | | |
| (National Academy of Sciences) (LOC; Bank of America) | 0.45 | 8/12/09 | 40,000,000 | 40,000,000 |
| District of Columbia, Revenue, CP | | | | |
| (National Academy of Sciences) (LOC; Bank of America) | 0.50 | 9/17/09 | 18,500,000 | 18,500,000 |
| Metropolitan Washington Airports Authority, Airport System | | | | |
| Revenue (Liquidity Facility; Landesbank Baden-Wurttemberg) | 2.50 | 8/7/09 | 26,000,000 a | 26,000,000 |
| Florida 6.1% | | | | |
| Broward County Educational Facilities Authority, | | | | |
| Educational Facilities Revenue (Nova Southeastern | | | | |
| University Project) (LOC; Bank of America) | 0.33 | 8/1/09 | 7,120,000 a | 7,120,000 |
| Broward County Educational Facilities Authority, | | | | |
| Educational Facilities Revenue (Nova Southeastern | | | | |
| University Project) (LOC; Bank of America) | 0.34 | 8/7/09 | 7,725,000 a | 7,725,000 |
| Broward County Health Facilities Authority, Revenue, Refunding | | | | |
| (John Knox Village of Florida, Inc. Project) (LOC; Wachovia Bank) | 0.35 | 8/7/09 | 31,165,000 a | 31,165,000 |
| Cape Coral, CP (LOC; Bank of America) | 0.45 | 8/17/09 | 15,569,000 | 15,569,000 |
44
| | | | |
| Dreyfus Tax Exempt | Coupon | Maturity | Principal | |
| Cash Management (continued) | Rate (%) | Date | Amount ($) | Value ($) |
| |
| Short-Term Investments (continued) | | | | |
| Florida (continued) | | | | |
| Capital Trust Agency, MFHR (Brittany Bay Apartments Waterman's | | | | |
| Crossing) (Liquidity Facility; FHLMC and LOC; FHLMC) | 0.52 | 8/7/09 | 23,350,000 a,b | 23,350,000 |
| Collier County Health Facilities Authority, Health Facility Revenue | | | | |
| (The Moorings, Inc. Project) (LOC; Wachovia Bank) | 0.35 | 8/7/09 | 34,820,000 a | 34,820,000 |
| Collier County Health Facilities Authority, Revenue, CP | | | | |
| (Cleveland Clinic Health System) | 0.40 | 8/12/09 | 41,905,000 | 41,905,000 |
| Escambia County, SWDR (Gulf Power Company Project) | 0.40 | 8/1/09 | 3,150,000 a | 3,150,000 |
| Escambia County Health Facilities Authority, Healthcare | | | | |
| Facilities Revenue, Refunding (Azalea Trace, Inc. | | | | |
| Obligated Group) (LOC; Bank of America) | 0.43 | 8/1/09 | 13,395,000 a | 13,395,000 |
| Florida Local Government Finance Commission, | | | | |
| Pooled Loan Program Revenue, CP (LOC; Wachovia Bank) | 0.35 | 9/10/09 | 30,000,000 | 30,000,000 |
| Highlands County Health Facilities Authority, HR | | | | |
| (Adventist Health System/Sunbelt Obligated Group) | 0.40 | 8/7/09 | 31,500,000 a | 31,500,000 |
| Jacksonville, Transportation Revenue (LOC; Wachovia Bank) | 0.34 | 8/7/09 | 11,000,000 a | 11,000,000 |
| Jacksonville Health Facilities Authority, HR (Baptist Medical | | | | |
| Center Project) (LOC; Branch Banking and Trust Co.) | 0.32 | 8/7/09 | 5,825,000 a | 5,825,000 |
| JEA, Electric System Revenue (Liquidity Facility; Bank of America) | 0.32 | 8/7/09 | 27,400,000 a | 27,400,000 |
| JEA, Electric System Revenue (Liquidity Facility; | | | | |
| State Street Bank and Trust Co.) | 0.25 | 8/7/09 | 9,900,000 a | 9,900,000 |
| JEA, Water and Sewer System Subordinated Revenue | | | | |
| (Liquidity Facility; State Street Corporation) | 0.25 | 8/7/09 | 9,800,000 a | 9,800,000 |
| Miami-Dade County Educational Facilities Authority, Revenue (Florida | | | | |
| International University Foundation Project) (LOC; SunTrust Bank) | 1.85 | 8/7/09 | 200,000 a | 200,000 |
| Orange County Health Facilities Authority, Revenue (Presbyterian | | | | |
| Retirement Communities Project) (LOC; Branch Banking and Trust Co.) | 0.32 | 8/7/09 | 7,715,000 a | 7,715,000 |
| Port Orange, Revenue (Palmer College of | | | | |
| Chiropractic Florida Project) (LOC; ABN-AMRO) | 0.40 | 8/7/09 | 4,075,000 a | 4,075,000 |
| Tohopekaliga Water Authority, Utility System Revenue | | | | |
| (LOC; Landesbank Hessen-Thuringen Girozentrale) | 0.38 | 8/7/09 | 32,050,000 a | 32,050,000 |
| University of South Florida Financing Corporation, COP | | | | |
| (University of South Florida Financing Corporation | | | | |
| Master Lease Program) (LOC; Wachovia Bank) | 0.35 | 8/7/09 | 34,175,000 a | 34,175,000 |
| Volusia County Industrial Development Authority, | | | | |
| Revenue, Refunding (Retirement Housing Foundation | | | | |
| Obligated Group Bishop's Glen) (LOC; KBC Bank) | 0.35 | 8/7/09 | 12,690,000 a | 12,690,000 |
| Wells Fargo Stage Trust (Saint Petersburg Health | | | | |
| Facilities Authority, Health Facilities Revenue, Refunding | | | | |
| (All Children's Hospital, Obligated Group)) (Liquidity Facility; | | | | |
| Wells Fargo Bank and LOC; Wells Fargo Bank) | 0.33 | 8/7/09 | 7,765,000 a,b | 7,765,000 |
| Georgia 4.2% | | | | |
| Burke County Development Authority, PCR | | | | |
| (Georgia Power Company Plant Vogtle Project) | 0.32 | 8/1/09 | 26,000,000 a | 26,000,000 |
| Fulton County, General Fund TAN | 1.00 | 12/31/09 | 75,000,000 | 75,212,921 |
| Fulton County Development Authority, Educational | | | | |
| Facilities Revenue (Catholic Education of North | | | | |
| Georgia, Inc. Project) (LOC; Wachovia Bank) | 0.39 | 8/7/09 | 14,405,000 a | 14,405,000 |
The Funds 45
| STATEMENT OF INVESTMENTS (Unaudited) (continued) |
| | | | |
| Dreyfus Tax Exempt | Coupon | Maturity | Principal | |
| Cash Management (continued) | Rate (%) | Date | Amount ($) | Value ($) |
| Short-Term Investments (continued) | | | | |
| Georgia (continued) | | | | |
| Fulton County Development Authority, Revenue | | | | |
| (Children's Healthcare of Atlanta, Inc. Project) | | | | |
| (Liquidity Facility; Landesbank Hessen-Thuringen Girozentrale) | 0.34 | 8/7/09 | 13,900,000 a | 13,900,000 |
| Fulton County Housing Authority, MFHR | | | | |
| (Liquidity Facility; FHLMC and LOC; FHLMC) | 0.52 | 8/7/09 | 25,365,000 a,b | 25,365,000 |
| Gainesville and Hall County Development Authority, Senior Living Facility | | | | |
| Revenue (Lanier Village Estates, Inc. Project) (LOC; Bank of America) | 0.43 | 8/1/09 | 3,000,000 a | 3,000,000 |
| Georgia, GO Notes (Liquidity Facility; Dexia Credit Locale) | 0.34 | 8/7/09 | 45,483,000 a | 45,483,000 |
| Glynn-Brunswick Memorial Hospital Authority, RAC (Southeast Georgia | | | | |
| Health System Project) (LOC; Branch Banking and Trust Co.) | 0.32 | 8/7/09 | 11,690,000 a | 11,690,000 |
| Metropolitan Atlanta Rapid Transit Authority, | | | | |
| Sales Tax Revenue, CP (Liquidity Facility; Dexia Credit Locale) | 1.10 | 8/4/09 | 20,000,000 | 20,000,000 |
| Metropolitan Atlanta Rapid Transit Authority, | | | | |
| Sales Tax Revenue, CP (LOC; Dexia Credit Locale) | 1.10 | 8/4/09 | 15,000,000 | 15,000,000 |
| Monroe County Development Authority, PCR | | | | |
| (Georgia Power Company Plant Scherer Project) | 0.35 | 8/1/09 | 4,000,000 a | 4,000,000 |
| Private Colleges and Universities Authority, CP | | | | |
| (Emory University Project) | 0.60 | 8/6/09 | 16,296,000 | 16,296,000 |
| Valdosta and Lowndes County Hospital Authority, Revenue | | | | |
| Certificates (South Georgia Medical Center Project) | | | | |
| (LOC; Branch Banking and Trust Co.) | 0.37 | 8/7/09 | 2,800,000 a | 2,800,000 |
| Idaho .6% | | | | |
| Idaho Health Facilities Authority, Health Care Facilities | | | | |
| Revenue (Aces-Pooled Financing Program) (LOC; U.S. Bank NA) | 0.38 | 8/7/09 | 2,250,000 a | 2,250,000 |
| Idaho Health Facilities Authority, Revenue | | | | |
| (Saint Luke's Regional Medical Center Project) | | | | |
| (Insured; FSA and Liquidity Facility; Bank of Montreal) | 0.41 | 8/1/09 | 40,120,000 a | 40,120,000 |
| Illinois 4.6% | | | | |
| Channahon, Revenue, Refunding (Morris Hospital) (LOC; U.S. Bank NA) | 0.33 | 8/7/09 | 3,695,000 a | 3,695,000 |
| Chicago O'Hare International Airport, Revenue | | | | |
| (Insured; Assured Guaranty and Liquidity Facility; Citibank NA) | 0.51 | 8/7/09 | 5,470,000 a,b | 5,470,000 |
| Illinois Development Finance Authority, Revenue (Evanston | | | | |
| Northwestern Healthcare Corporation) (LOC; Bank One) | 0.28 | 8/7/09 | 36,800,000 a | 36,800,000 |
| Illinois Educational Facilities Authority, Revenue, CP | | | | |
| (Field Museum of Natural History) (LOC; Bank of America) | 0.40 | 9/3/09 | 20,000,000 | 20,000,000 |
| Illinois Educational Facilities Authority, Revenue, CP | | | | |
| (Pooled Finance Program) | 0.35 | 9/15/09 | 10,350,000 | 10,350,000 |
| Illinois Educational Facilities Authority, Revenue, CP | | | | |
| (Pooled Finance Program) (LOC; Northern Trust Company) | 0.35 | 10/15/09 | 81,200,000 | 81,200,000 |
| Illinois Finance Authority, Revenue | | | | |
| (OSF Healthcare System) (LOC; National City Bank) | 0.28 | 8/7/09 | 7,100,000 a | 7,100,000 |
| Illinois Finance Authority, Revenue | | | | |
| (Riverside Health System) (LOC; JPMorgan Chase Bank) | 0.40 | 8/7/09 | 5,545,000 a | 5,545,000 |
| Illinois Finance Authority, Revenue, CP | | | | |
| (Loyola University) (LOC; JPMorgan Chase Bank) | 0.40 | 10/14/09 | 20,000,000 | 20,000,000 |
| Illinois Finance Authority, Revenue, Refunding | | | | |
| (Fairview Obligated Group) (LOC; ABN-AMRO) | 0.35 | 8/7/09 | 21,795,000 a | 21,795,000 |
46
| | | | |
| Dreyfus Tax Exempt | Coupon | Maturity | Principal | |
| Cash Management (continued) | Rate (%) | Date | Amount ($) | Value ($) |
| Short-Term Investments (continued) | | | | |
| Illinois (continued) | | | | |
| Illinois Health Facilities Authority, Revenue | | | | |
| (Revolving Fund Pooled Financing Program) | | | | |
| (Insured; FSA and Liquidity Facility; Barclays Bank PLC) | 0.38 | 8/7/09 | 8,950,000 a | 8,950,000 |
| Illinois Housing Development Authority, Homeowner Mortgage Revenue | 1.85 | 8/1/09 | 4,480,000 | 4,480,000 |
| Illinois Toll Highway Authority, Toll Highway Senior Priority | | | | |
| Revenue (Liquidity Facility; Dexia Credit Locale) | 0.40 | 8/7/09 | 50,000,000 a | 50,000,000 |
| Illinois Toll Highway Authority, Toll Highway Senior Revenue, | | | | |
| Refunding (Insured; FSA and Liquidity Facility; Dexia Credit Locale) | 0.62 | 8/7/09 | 23,000,000 a | 23,000,000 |
| Lake County, MFHR (Whispering Oaks Apartments Project) (LOC; FHLMC) | 0.40 | 8/7/09 | 3,250,000 a | 3,250,000 |
| Indiana 3.2% | | | | |
| Indiana Bond Bank, Midyear Funding Program Notes | | | | |
| (Liquidity Facility; JPMorgan Chase Bank) | 2.00 | 1/6/10 | 40,000,000 | 40,248,587 |
| Indiana Educational Facilities Authority, Revenue | | | | |
| (Martin University Project) (LOC; Key Bank) | 2.60 | 8/7/09 | 2,790,000 a | 2,790,000 |
| Indiana Finance Authority, Environmental Revenue, Refunding | | | | |
| (Duke Energy Indiana, Inc. Project) (LOC; Bank of America) | 0.33 | 8/1/09 | 52,500,000 a | 52,500,000 |
| Indiana Finance Authority, Health System Revenue, | | | | |
| Refunding (Sisters of Saint Francis Health Services, Inc. | | | | |
| Obligated Group) (LOC; JPMorgan Chase Bank) | 0.29 | 8/7/09 | 10,900,000 a | 10,900,000 |
| Indiana Finance Authority, HR (Community Health | | | | |
| Network Project) (LOC; Bank of America) | 0.42 | 8/7/09 | 15,000,000 a | 15,000,000 |
| Indiana Finance Authority, Revenue, | | | | |
| Refunding (Trinity Health Credit Group) | 0.25 | 8/7/09 | 14,700,000 a | 14,700,000 |
| Indiana Health and Educational Facility Financing | | | | |
| Authority, Revenue (Ascension Health Senior | | | | |
| Credit Group) (Liquidity Facility; Citibank NA) | 0.39 | 8/7/09 | 59,000,000 a,b | 59,000,000 |
| Indianapolis Local Public Improvement Bond Bank, Notes | 0.45 | 8/31/09 | 16,500,000 | 16,500,000 |
| Kentucky .7% | | | | |
| Fort Mitchell, Kentucky League of Cities Funding Trust, LR | | | | |
| (Trust Lease Program) (LOC; U.S. Bank NA) | 0.30 | 8/7/09 | 6,845,000 a | 6,845,000 |
| Kentucky Property and Buildings Commission, Revenue, | | | | |
| Refunding (Project Number 84) (Liquidity Facility; | | | | |
| Dexia Credit Locale and LOC; Dexia Credit Locale) | 1.42 | 8/7/09 | 16,440,000 a,b | 16,440,000 |
| Madisonville, HR (Trover Clinic Foundation, Inc.) (Insured; Assured | | | | |
| Guaranty and Liquidity Facility; JPMorgan Chase Bank) | 0.44 | 8/7/09 | 6,695,000 a | 6,695,000 |
| Richmond, Lease Program Revenue (Kentucky League of | | | | |
| Cities Funding Trust) (LOC; U.S. Bank NA) | 0.30 | 8/7/09 | 2,000,000 a | 2,000,000 |
| Trimble County, Lease Program Revenue (Kentucky | | | | |
| Association of Counties Leasing Trust) (LOC; U.S. Bank NA) | 0.33 | 8/1/09 | 5,000 a | 5,000 |
| Warren County, HR, Refunding (Bowling Green-Warren County | | | | |
| Community Hospital Corporation Project) (Insured; Assured | | | | |
| Guaranty and Liquidity Facility; Branch Banking and Trust Co.) | 0.36 | 8/7/09 | 16,705,000 a | 16,705,000 |
| Louisiana 1.7% | | | | |
| Louisiana, GO Notes, Refunding (LOC; BNP Paribas) | 0.28 | 8/7/09 | 23,200,000 a | 23,200,000 |
| Louisiana Local Government Environmental Facilities and Community | | | | |
| Development Authority, Healthcare Facilities Revenue, Refunding | | | | |
| (Saint James Place of Baton Rouge Project) (LOC; ABN-AMRO) | 0.44 | 8/7/09 | 11,520,000 a | 11,520,000 |
The Funds 47
| STATEMENT OF INVESTMENTS (Unaudited) (continued) |
| | | | |
| Dreyfus Tax Exempt | Coupon | Maturity | Principal | |
| Cash Management (continued) | Rate (%) | Date | Amount ($) | Value ($) |
| Short-Term Investments (continued) | | | | |
| Louisiana (continued) | | | | |
| Louisiana Municipal Natural Gas Purchasing and Distribution Authority, | | | | |
| Revenue (Putters Program) (Gas Project Number 1) (Liquidity | | | | |
| Facility; JPMorgan Chase Bank and LOC; JPMorgan Chase Bank) | 0.41 | 8/7/09 | 23,914,000 a,b | 23,914,000 |
| Louisiana Public Facilities Authority, HR (Touro Infirmary Project) | | | | |
| (Liquidity Facility; Merrill Lynch Bank and LOC; Merrill Lynch) | 1.42 | 8/7/09 | 34,045,000 a,b | 34,045,000 |
| Tangipahoa Parish Hospital Service District Number 1, HR | | | | |
| (North Oaks Medical Center Project) (LOC; Allied Irish Banks) | 0.45 | 8/7/09 | 18,500,000 a | 18,500,000 |
| Maryland 3.3% | | | | |
| Baltimore County, GO Notes, Refunding (Pension Funding) | 3.00 | 8/1/09 | 7,255,000 | 7,255,000 |
| Baltimore County Revenue Authority, | | | | |
| Golf System Revenue (LOC; M&T Bank) | 0.44 | 8/7/09 | 3,800,000 a | 3,800,000 |
| Frederick County, Revenue (Homewood, Inc. Facility) (LOC; M&T Bank) | 0.37 | 8/7/09 | 13,600,000 a | 13,600,000 |
| Frederick County, Revenue, Refunding (Manekin-Frederick | | | | |
| Associates Facility) (LOC; M&T Bank) | 0.53 | 8/7/09 | 2,395,000 a | 2,395,000 |
| Maryland Economic Development Corporation, | | | | |
| Revenue (Easter Seals Facility) (LOC; M&T Bank) | 0.46 | 8/7/09 | 6,900,000 a | 6,900,000 |
| Maryland Economic Development Corporation, Revenue | | | | |
| (Legal Aid Bureau, Inc. Facility) (LOC; M&T Bank) | 0.48 | 8/7/09 | 2,100,000 a | 2,100,000 |
| Maryland Health and Higher Educational Facilities Authority, | | | | |
| Pooled Loan Program Revenue (LOC; Bank of America) | 0.37 | 8/7/09 | 24,201,000 a | 24,201,000 |
| Maryland Health and Higher Educational Facilities Authority, Revenue | | | | |
| (Dematha Catholic High School) (LOC; Branch Banking and Trust Co.) | 0.37 | 8/7/09 | 9,865,000 a | 9,865,000 |
| Maryland Health and Higher Educational Facilities Authority, | | | | |
| Revenue (Pooled Loan Program Issue) (LOC; Bank One NA) | 0.28 | 8/7/09 | 28,100,000 a | 28,100,000 |
| Maryland Health and Higher Educational Facilities Authority, Revenue | | | | |
| (University of Maryland Medical System Issue) (LOC; PNC Bank NA) | 0.35 | 8/7/09 | 5,000,000 a | 5,000,000 |
| Maryland Health and Higher Educational Facilities | | | | |
| Authority, Revenue (Upper Chesapeake Hospitals Issue) | | | | |
| (LOC; Branch Banking and Trust Co.) | 0.35 | 8/7/09 | 5,800,000 a | 5,800,000 |
| Maryland Health and Higher Educational Facilities Authority, Revenue, | | | | |
| CP (Johns Hopkins Health System) (Liquidity Facility; Bank of America) | 0.50 | 8/25/09 | 39,045,000 | 39,045,000 |
| Maryland Health and Higher Educational Facilities Authority, Revenue, CP | | | | |
| (Johns Hopkins Health System) (Liquidity Facility; Wachovia Bank) | 0.40 | 12/7/09 | 21,940,000 | 21,940,000 |
| Maryland Health and Higher Educational Facility Authority, Revenue, | | | | |
| Refunding (Adventist HealthCare Issue) (LOC; M&T Bank) | 0.45 | 8/7/09 | 23,425,000 a | 23,425,000 |
| Montgomery County, EDR (Riderwood | | | | |
| Village, Inc. Project) (LOC; M&T Bank) | 0.45 | 8/7/09 | 21,775,000 a | 21,775,000 |
| Massachusetts 4.7% | | | | |
| Massachusetts, GO Notes, Refunding (Liquidity Facility; Citibank NA) | 0.37 | 8/7/09 | 92,675,000 a | 92,675,000 |
| Massachusetts, GO Notes, Refunding | | | | |
| (Liquidity Facility; JPMorgan Chase Bank) | 0.35 | 8/7/09 | 65,900,000 a | 65,900,000 |
| Massachusetts, GO Notes, Refunding (Liquidity Facility; | | | | |
| Landesbank Hessen-Thuringen Girozentrale) | 0.30 | 8/7/09 | 20,000,000 a | 20,000,000 |
| Massachusetts Development Finance Agency, First Mortgage | | | | |
| Revenue (Brookhaven at Lexington Project) (LOC; Bank of America) | 0.33 | 8/7/09 | 5,045,000 a | 5,045,000 |
| Massachusetts Development Finance Agency, Revenue | | | | |
| (Brooksby Village, Inc. Project) (LOC; ABN-AMRO) | 0.35 | 8/7/09 | 5,000,000 a | 5,000,000 |
48
| | | | |
| Dreyfus Tax Exempt | Coupon | Maturity | Principal | |
| Cash Management (continued) | Rate (%) | Date | Amount ($) | Value ($) |
| Short-Term Investments (continued) | | | | |
| Massachusetts (continued) | | | | |
| Massachusetts Development Finance Agency, Revenue | | | | |
| (ISO New England Inc. Issue) (LOC; Key Bank) | 2.50 | 8/7/09 | 11,845,000 a | 11,845,000 |
| Massachusetts Development Finance Agency, Revenue | | | | |
| (Suffolk University Issue) (Insured; Assured Guaranty | | | | |
| and Liquidity Facility; JPMorgan Chase Bank) | 0.37 | 8/7/09 | 10,690,000 a | 10,690,000 |
| Massachusetts Development Finance Agency, Revenue, | | | | |
| Refunding (Wentworth Institute of Technology Issue) | | | | |
| (LOC; JPMorgan Chase Bank) | 0.34 | 8/7/09 | 19,600,000 a | 19,600,000 |
| Massachusetts Development Finance Agency, Revenue, | | | | |
| Refunding (Wentworth Institute of Technology Issue) | | | | |
| (LOC; JPMorgan Chase Bank) | 0.34 | 8/7/09 | 14,340,000 a | 14,340,000 |
| Massachusetts Health and Educational Facilities Authority, | | | | |
| Revenue (Cape Cod Healthcare Obligated Group Issue) | | | | |
| (Insured; Assured Guaranty and Liquidity Facility; Bank of America) | 0.45 | 8/7/09 | 4,900,000 a | 4,900,000 |
| Massachusetts Health and Educational Facilities Authority, | | | | |
| Revenue (Partners HealthCare System Issue) | 0.23 | 8/7/09 | 13,000,000 a | 13,000,000 |
| Massachusetts Health and Educational Facilities Authority, Revenue | | | | |
| (Partners HealthCare System, Capital Asset Program Issue) | | | | |
| (Liquidity Facility; JPMorgan Chase Bank) | 0.25 | 8/7/09 | 27,500,000 a | 27,500,000 |
| Massachusetts Health and Educational Facilities Authority, | | | | |
| Revenue, CP (Partners Healthcare System) | 0.30 | 8/5/09 | 9,000,000 | 9,000,000 |
| Massachusetts Health and Educational Facilities Authority, | | | | |
| Revenue, CP (Partners Healthcare System) | 0.23 | 8/10/09 | 9,000,000 | 9,000,000 |
| Massachusetts Water Pollution Abatement Trust (Pool Program) | 5.25 | 8/1/09 | 3,000,000 | 3,000,000 |
| Michigan 5.4% | | | | |
| Board of Trustees of the Michigan State University, CP | 0.25 | 8/5/09 | 12,500,000 | 12,500,000 |
| Board of Trustees of the Michigan State University, CP | 0.25 | 8/5/09 | 12,500,000 | 12,500,000 |
| Board of Trustees of the Michigan State University, CP | 0.30 | 10/19/09 | 15,000,000 | 15,000,000 |
| Board of Trustees of the Michigan State University, CP | 0.30 | 10/19/09 | 14,000,000 | 14,000,000 |
| Board of Trustees of the Michigan State University, | | | | |
| General Revenue (Liquidity Facility; JPMorgan Chase Bank) | 0.23 | 8/7/09 | 16,805,000 a | 16,805,000 |
| Jackson County Hospital Finance Authority, HR | | | | |
| (W.A. Foote Memorial Hospital) (Insured; Assured | | | | |
| Guaranty and Liquidity Facility; JPMorgan Chase Bank) | 0.37 | 8/7/09 | 14,600,000 a | 14,600,000 |
| Jackson County Hospital Finance Authority, HR, Refunding | | | | |
| (W.A. Foote Memorial Hospital) (Insured; Assured | | | | |
| Guaranty and Liquidity Facility; Comerica Bank) | 0.55 | 8/7/09 | 8,000,000 a | 8,000,000 |
| Michigan Building Authority, Multi-Modal Revenue | | | | |
| (Facilities Program) (LOC; JPMorgan Chase Bank) | 0.28 | 8/7/09 | 34,800,000 a | 34,800,000 |
| Michigan Higher Education Facilities Authority, Revenue, | | | | |
| Refunding (Walsh College Project) (LOC; Commerce Bank) | 0.60 | 8/7/09 | 8,135,000 a | 8,135,000 |
| Michigan Hospital Finance Authority, Revenue | | | | |
| (Ascension Health Senior Credit Group) | 0.32 | 8/7/09 | 11,000,000 a | 11,000,000 |
| Michigan Hospital Finance Authority, | | | | |
| Revenue (Trinity Health Credit Group) | 0.25 | 8/7/09 | 8,400,000 a | 8,400,000 |
| Michigan Hospital Finance Authority, Revenue, CP (Trinity Health System) | 0.30 | 8/5/09 | 40,000,000 | 40,000,000 |
| Michigan Hospital Finance Authority, Revenue, CP (Trinity Health System) | 0.60 | 8/11/09 | 25,000,000 | 25,000,000 |
The Funds 49
| STATEMENT OF INVESTMENTS (Unaudited) (continued) |
| | | | |
| Dreyfus Tax Exempt | Coupon | Maturity | Principal | |
| Cash Management (continued) | Rate (%) | Date | Amount ($) | Value ($) |
| Short-Term Investments (continued) | | | | |
| Michigan (continued) | | | | |
| Michigan Hospital Finance Authority, Revenue, CP (Trinity Health System) | 0.37 | 8/5/09 | 20,000,000 | 20,000,000 |
| Michigan Hospital Finance Authority, Revenue, CP (Trinity Health System) | 0.30 | 10/19/09 | 40,000,000 | 40,000,000 |
| Michigan Housing Development Authority, Rental Housing Revenue | | | | |
| (Liquidity Facility; Landesbank Hessen-Thuringen Girozentrale) | 0.45 | 8/7/09 | 18,195,000 a | 18,195,000 |
| University of Michigan, CP | 0.33 | 8/24/09 | 28,525,000 | 28,525,000 |
| University of Michigan, CP | 0.35 | 9/1/09 | 12,880,000 | 12,880,000 |
| University of Michigan, CP | 0.35 | 9/10/09 | 6,930,000 | 6,930,000 |
| Waterford Township Economic Development | | | | |
| Corporation, LOR, Refunding (Canterbury | | | | |
| Health Care, Inc. Project) (LOC; KBC Bank) | 0.44 | 8/7/09 | 10,435,000 a | 10,435,000 |
| Minnesota 2.1% | | | | |
| Minneapolis, GO Notes (Various Purpose) | 2.00 | 12/1/09 | 12,990,000 | 13,060,762 |
| Rochester, Health Care Facilities Revenue, CP (Mayo Foundation) | 0.45 | 8/6/09 | 6,000,000 | 6,000,000 |
| Rochester, Health Care Facilities Revenue, CP (Mayo Foundation) | 0.35 | 9/9/09 | 9,000,000 | 9,000,000 |
| Saint Cloud, Health Care Revenue (CentraCare | | | | |
| Health System Project) (Insured; Assured Guaranty | | | | |
| and Liquidity Facility; Bank of Nova Scotia) | 0.38 | 8/7/09 | 5,300,000 a | 5,300,000 |
| Saint Cloud, Health Care Revenue (CentraCare Health | | | | |
| System Project) (Insured; Assured Guaranty and | | | | |
| Liquidity Facility; Royal Bank of Canada) | 0.35 | 8/7/09 | 5,000,000 a | 5,000,000 |
| University of Minnesota, CP | 0.25 | 8/5/09 | 9,075,000 | 9,075,000 |
| University of Minnesota, CP | 0.30 | 10/2/09 | 23,000,000 | 23,000,000 |
| University of Minnesota, CP | 0.40 | 10/6/09 | 18,000,000 | 18,000,000 |
| University of Minnesota, CP | 0.30 | 10/13/09 | 10,000,000 | 10,000,000 |
| University of Minnesota, CP | 0.30 | 10/19/09 | 3,000,000 | 3,000,000 |
| University of Minnesota, CP | 0.30 | 10/19/09 | 3,000,000 | 3,000,000 |
| University of Minnesota, CP | 0.30 | 10/19/09 | 19,812,000 | 19,812,000 |
| University of Minnesota Regents, GO | | | | |
| (Liquidity Facility; U.S. Bank NA) | 0.25 | 8/7/09 | 12,500,000 a | 12,500,000 |
| Mississippi .6% | | | | |
| Mississippi, GO Notes | 5.00 | 11/1/09 | 5,580,000 | 5,643,947 |
| Mississippi, GO Notes (Capital Improvements) | | | | |
| (Liquidity Facility; Dexia Credit Locale) | 0.45 | 8/7/09 | 33,745,000 a | 33,745,000 |
| Missouri 1.0% | | | | |
| Kansas City Industrial Development Authority, Revenue (Kansas City | | | | |
| Downtown Redevelopment District) (LOC; JPMorgan Chase Bank) | 0.38 | 8/7/09 | 25,800,000 a | 25,800,000 |
| Missouri Health and Educational Facilities Authority, Health Facilities | | | | |
| Revenue (Lutheran Senior Services) (LOC; U.S. Bank NA) | 0.35 | 8/7/09 | 9,000,000 a | 9,000,000 |
| Missouri Health and Educational Facilities Authority, | | | | |
| Health Facilities Revenue (SSM Health Care) | | | | |
| (Insured; FSA and Liquidity Facility; Dexia Credit Locale) | 0.45 | 8/1/09 | 6,105,000 a | 6,105,000 |
| Missouri Health and Educational Facilities Authority, Health Facilities | | | | |
| Revenue (SSM Health Care) (Liquidity Facility; U.S. Bank NA) | 0.25 | 8/7/09 | 8,500,000 a | 8,500,000 |
| Missouri Health and Educational Facilities Authority, Health Facilities | | | | |
| Revenue (The Children's Mercy Hospital) (LOC; UBS AG) | 0.38 | 8/7/09 | 7,300,000 a | 7,300,000 |
| Saint Joseph Industrial Development Authority, Health Facilities | | | | |
| Revenue (Heartland Regional Medical Center) (LOC; U.S. Bank NA) | 0.22 | 8/7/09 | 6,000,000 a | 6,000,000 |
50
| | | | |
| Dreyfus Tax Exempt | Coupon | Maturity | Principal | |
| Cash Management (continued) | Rate (%) | Date | Amount ($) | Value ($) |
| Short-Term Investments (continued) | | | | |
| Nebraska .5% | | | | |
| Lancaster County Hospital Authority Number 1, HR, Refunding | | | | |
| (BryanLGH Medical Center) (LOC; U.S. Bank NA) | 0.38 | 8/7/09 | 24,820,000 a | 24,820,000 |
| Omaha Public Power District, Electric Revenue, CP | | | | |
| (Liquidity Facility; JPMorgan Chase Bank) | 0.42 | 8/12/09 | 5,500,000 | 5,500,000 |
| Nevada 1.8% | | | | |
| Austin Trust (Clark County, GO Bond Bank Bonds) | | | | |
| (Liquidity Facility; Bank of America) | 0.36 | 8/7/09 | 9,770,000 a,b | 9,770,000 |
| Las Vegas Convention and Visitors Authority, Revenue, CP (LOC: Bank | | | | |
| of Nova Scotia, Fortis Bank and State Street Bank and Trust Co.) | 0.80 | 8/25/09 | 33,000,000 | 33,000,000 |
| Las Vegas Valley Water District, CP | | | | |
| (Liquidity Facility; JPMorgan Chase Bank) | 0.35 | 8/25/09 | 10,000,000 | 10,000,000 |
| Las Vegas Valley Water District, CP | | | | |
| (Liquidity Facility; JPMorgan Chase Bank) | 0.40 | 9/1/09 | 20,000,000 | 20,000,000 |
| Las Vegas Valley Water District, CP | | | | |
| (Liquidity Facility; JPMorgan Chase Bank) | 0.45 | 10/15/09 | 20,000,000 | 20,000,000 |
| Las Vegas Valley Water District, CP (LOC; BNP Paribas) | 0.25 | 9/8/09 | 15,000,000 | 15,000,000 |
| Reno, Capital Improvement Revenue, Refunding (LOC; Bank of America) | 0.30 | 8/7/09 | 13,400,000 a | 13,400,000 |
| New Hampshire 1.2% | | | | |
| New Hampshire Business Finance Authority, Revenue | | | | |
| (The Mark H. Wentworth Home Issue) (LOC; TD Bank) | 0.33 | 8/7/09 | 12,000,000 a | 12,000,000 |
| New Hampshire Health and Education Facilities Authority, Revenue | | | | |
| (Dartmouth College Issue) (Liquidity Facility; JPMorgan Chase Bank) | 0.23 | 8/7/09 | 7,060,000 a | 7,060,000 |
| New Hampshire Health and Education Facilities Authority, | | | | |
| Revenue (University System of New Hampshire Issue) | 0.28 | 8/1/09 | 10,165,000 a | 10,165,000 |
| New Hampshire Health and Education Facilities Authority, | | | | |
| Revenue (University System of New Hampshire Issue) | 0.30 | 8/1/09 | 27,175,000 a | 27,175,000 |
| New Hampshire Health and Educational Facilities Authority, | | | | |
| Revenue (University System of New Hampshire Issue) | | | | |
| (Liquidity Facility; JPMorgan Chase Bank) | 0.30 | 8/1/09 | 10,090,000 a | 10,090,000 |
| New Hampshire Higher Educational and Health Facilities Authority, | | | | |
| Revenue (Hunt Community Issue) (LOC; Bank of America) | 0.35 | 8/7/09 | 10,150,000 a | 10,150,000 |
| New Jersey 2.3% | | | | |
| Essex County Improvement Authority, Pooled Governmental | | | | |
| Loan Program Revenue (LOC; Wachovia Bank) | 0.30 | 8/7/09 | 17,650,000 a | 17,650,000 |
| New Jersey Economic Development Authority, School Facilities | | | | |
| Construction Revenue, Refunding (LOC; Dexia Credit Locale) | 1.00 | 8/7/09 | 40,000,000 a | 40,000,000 |
| New Jersey Health Care Facilities Financing Authority, | | | | |
| Revenue (Meridian Health System Obligated Group Issue) | | | | |
| (Insured; Assured Guaranty and Liquidity Facility; Wachovia Bank) | 0.30 | 8/7/09 | 11,400,000 a | 11,400,000 |
| New Jersey Turnpike Authority, Turnpike Revenue | | | | |
| (Insured; FSA and Liquidity Facility; Dexia Credit Locale) | 1.00 | 8/7/09 | 79,100,000 a | 79,100,000 |
| New Mexico .1% | | | | |
| Dona Ana County, Industrial Revenue (Foamex | | | | |
| Products, Inc. Project) (LOC; Bank of Nova Scotia) | 0.49 | 8/7/09 | 6,000,000 a | 6,000,000 |
| New York 6.4% | | | | |
| Babylon Industrial Development Agency, RRR, Refunding | | | | |
| (Ogden Martin Systems of Babylon, Inc. Project) | | | | |
| (Insured; FSA and Liquidity Facility; JPMorgan Chase Bank) | 1.20 | 8/7/09 | 13,190,000 a | 13,190,000 |
The Funds 51
| STATEMENT OF INVESTMENTS (Unaudited) (continued) |
| | | | |
| Dreyfus Tax Exempt | Coupon | Maturity | Principal | |
| Cash Management (continued) | Rate (%) | Date | Amount ($) | Value ($) |
| Short-Term Investments (continued) | | | | |
| New York (continued) | | | | |
| Dutchess County Industrial Development Agency, Civic Facility | | | | |
| Revenue (Arbor Ridge Brookmeade Inc.) (LOC; M&T Bank) | 0.46 | 8/7/09 | 7,480,000 a | 7,480,000 |
| Metropolitan Transportation Authority, Dedicated Tax Fund | | | | |
| Revenue (Insured; FSA and Liquidity Facility; Dexia Credit Locale) | 1.00 | 8/7/09 | 34,305,000 a | 34,305,000 |
| Metropolitan Transportation Authority, Dedicated Tax Fund Revenue, | | | | |
| Refunding (Insured; FSA and Liquidity Facility; Dexia Credit Locale) | 1.00 | 8/7/09 | 50,000,000 a | 50,000,000 |
| Metropolitan Transportation Authority, RAN | 2.00 | 12/31/09 | 55,000,000 | 55,366,591 |
| Metropolitan Transportation Authority, Transportation Revenue, | | | | |
| Refunding (Insured; FSA and Liquidity Facility; Dexia Credit Locale) | 0.65 | 8/7/09 | 15,875,000 a | 15,875,000 |
| Nassau County Industrial Development Agency, Continuing | | | | |
| Care Retirement Community Revenue (Amsterdam at | | | | |
| Harborside Project) (LOC; ABN AMRO) | 0.29 | 8/7/09 | 27,200,000 a | 27,200,000 |
| Nassau County Interim Finance Authority, Sales Tax | | | | |
| Secured Revenue (Liquidity Facility; Bank of America) | 0.35 | 8/7/09 | 35,000,000 a | 35,000,000 |
| New York City, GO Notes (LOC; Bayerische Landesbank) | 0.30 | 8/1/09 | 20,000,000 a | 20,000,000 |
| New York City Housing Development Corporation, MFMR (The Crest | | | | |
| Project) (LOC; Landesbank Hessen-Thuringen Girozentrale) | 0.40 | 8/7/09 | 8,000,000 a | 8,000,000 |
| New York City Transitional Finance Authority, Future Tax Secured | | | | |
| Revenue (Liquidity Facility; Landesbank Baden-Wurttemberg) | 0.30 | 8/1/09 | 28,000,000 a | 28,000,000 |
| New York City Transitional Finance Authority, Revenue (New York | | | | |
| City Recovery) (Liquidity Facility; Bayerische Landesbank) | 0.30 | 8/1/09 | 13,985,000 a | 13,985,000 |
| New York City Transitional Finance Authority, Revenue (New York City | | | | |
| Recovery) (Liquidity Facility; Landesbank Baden-Wurttemberg) | 0.30 | 8/1/09 | 10,000,000 a | 10,000,000 |
| New York City Transitional Finance Authority, Revenue | | | | |
| (New York City Recovery) (Liquidity Facility; | | | | |
| Landesbank Hessen-Thuringen Girozentrale) | 0.28 | 8/7/09 | 21,595,000 a | 21,595,000 |
| New York Local Government Assistance Corporation, GO Notes, | | | | |
| Refunding (Liquidity Facility; JPMorgan Chase Bank) | 0.30 | 8/7/09 | 14,500,000 a | 14,500,000 |
| New York State Dormitory Authority, Insured Revenue | | | | |
| (The Culinary Institute of America) (LOC; TD Bank) | 0.27 | 8/7/09 | 6,925,000 a | 6,925,000 |
| New York State Housing Finance Agency, Service Contract | | | | |
| Revenue, Refunding (LOC; Bank of America) | 0.28 | 8/7/09 | 7,400,000 a | 7,400,000 |
| Oneida County Industrial Development Agency, Civic Facility | | | | |
| Revenue (Preswick Glen Civic Facility) (LOC; Banco Santander) | 0.28 | 8/7/09 | 6,500,000 a | 6,500,000 |
| Tompkins County Industrial Development Agency, | | | | |
| Civic Facility Revenue (Cornell University Project) | | | | |
| (Liquidity Facility; JPMorgan Chase Bank) | 0.30 | 8/1/09 | 3,900,000 a | 3,900,000 |
| Triborough Bridge and Tunnel Authority, | | | | |
| General Revenue (LOC; Dexia Credit Locale) | 0.60 | 8/7/09 | 35,000,000 a | 35,000,000 |
| Westchester County Health Care Corporation, CP | | | | |
| (Liquidity Facility; Landesbank Hessen-Thuringen | | | | |
| Girozentrale and LOC; Westchester County) | 1.70 | 8/3/09 | 10,000,000 | 10,000,000 |
| North Carolina 2.7% | | | | |
| Board of Governors of the University of North Carolina, CP | 0.30 | 9/10/09 | 13,000,000 | 13,000,000 |
| Guilford County, GO Notes (Liquidity Facility; | | | | |
| Branch Banking and Trust Co.) | 0.36 | 8/7/09 | 14,000,000 a | 14,000,000 |
| Mecklenburg County, COP (Installment Financing Agreement) | | | | |
| (Liquidity Facility; Branch Banking and Trust Co.) | 0.35 | 8/7/09 | 9,500,000 a | 9,500,000 |
52
| | | | |
| Dreyfus Tax Exempt | Coupon | Maturity | Principal | |
| Cash Management (continued) | Rate (%) | Date | Amount ($) | Value ($) |
| Short-Term Investments (continued) | | | | |
| North Carolina (continued) | | | | |
| Mecklenburg County, GO (Liquidity Facility; | | | | |
| Landesbank Hessen-Thuringen Girozentrale) | 0.34 | 8/7/09 | 18,200,000 a | 18,200,000 |
| North Carolina Capital Facilities Finance | | | | |
| Agency, CP (Duke University Project) | 0.33 | 12/10/09 | 6,190,000 | 6,190,000 |
| North Carolina Medical Care Commission, Health Care Facilities | | | | |
| First Mortgage Revenue (Deerfield Episcopal Retirement | | | | |
| Community) (LOC; Branch Banking and Trust Co.) | 0.37 | 8/7/09 | 5,000,000 a | 5,000,000 |
| North Carolina Medical Care Commission, Health Care Facilities | | | | |
| Revenue, Refunding (FirstHealth of the Carolinas Project) | | | | |
| (Liquidity Facility; Branch Banking and Trust Co.) | 0.32 | 8/7/09 | 37,515,000 a | 37,515,000 |
| North Carolina Medical Care Commission, Health Care Facilities | | | | |
| Revenue, Refunding (FirstHealth of the Carolinas Project) | | | | |
| (Liquidity Facility; Branch Banking and Trust Co.) | 0.37 | 8/7/09 | 15,240,000 a | 15,240,000 |
| North Carolina Medical Care Commission, HR | | | | |
| (Pooled Equipment Financing Project) (LOC; KBC Bank) | 0.26 | 8/7/09 | 8,500,000 a | 8,500,000 |
| North Carolina Medical Care Commission, HR, Refunding | | | | |
| (North Carolina Baptist Hospital) (LOC; Royal Bank of Canada) | 0.33 | 8/7/09 | 6,700,000 a | 6,700,000 |
| Piedmont Triad Airport Authority, Airport Revenue | | | | |
| (LOC; Branch Banking and Trust Co.) | 0.40 | 8/7/09 | 4,300,000 a | 4,300,000 |
| Wake County, School Bonds (Liquidity Facility; | | | | |
| Landesbank Hessen-Thuringen Girozentrale) | 0.37 | 8/7/09 | 14,795,000 a | 14,795,000 |
| Winston-Salem, Water and Sewer System Revenue | | | | |
| (Liquidity Facility; Branch Banking and Trust Co.) | 0.34 | 8/7/09 | 11,385,000 a | 11,385,000 |
| Winston-Salem, Water and Sewer System Revenue | | | | |
| (Liquidity Facility; Branch Banking and Trust Co.) | 0.34 | 8/7/09 | 11,790,000 a | 11,790,000 |
| North Dakota .3% | | | | |
| Mercer County, PCR, CP (Basin Electric Power Cooperative) | 0.50 | 8/10/09 | 18,000,000 | 18,000,000 |
| Ohio 2.9% | | | | |
| Akron, Bath and Copley Joint Township Hospital | | | | |
| District, Health Care Facilities Revenue | | | | |
| (Sumner on Ridgewood Project) (LOC; KBC Bank) | 0.50 | 8/7/09 | 5,200,000 a | 5,200,000 |
| Allen County, Hospital Facilities Revenue | | | | |
| (Catholic Healthcare Partners) (LOC; Wachovia Bank) | 0.30 | 8/7/09 | 5,000,000 a | 5,000,000 |
| Beavercreek City School District, | | | | |
| School Improvement Unlimited Tax GO Notes, BAN | 2.00 | 8/18/09 | 8,000,000 | 8,005,054 |
| Cleveland, COP, Refunding | | | | |
| (Cleveland Stadium Project) (LOC; Wachovia Bank) | 0.34 | 8/7/09 | 66,280,000 a | 66,280,000 |
| Dayton-Montgomery County Port Authority, | | | | |
| Development Revenue (CareSource Project) (LOC; Fifth Third Bank) | 3.00 | 8/7/09 | 130,000 a | 130,000 |
| Franklin County, Health Care Facilities Revenue | | | | |
| (Creekside at the Village Project) (LOC; Key Bank) | 2.50 | 8/7/09 | 5,435,000 a | 5,435,000 |
| Lakewood, Educational Facilities Revenue | | | | |
| (Saint Edward High School Project) (LOC; Fifth Third Bank) | 3.00 | 8/7/09 | 110,000 a | 110,000 |
| Lucas County, HR (ProMedica Healthcare | | | | |
| Obligated Group) (LOC; UBS AG) | 0.33 | 8/7/09 | 21,955,000 a | 21,955,000 |
| Ohio, HR (Cleveland Clinic Health System Obligated Group) | 0.30 | 8/1/09 | 34,500,000 a | 34,500,000 |
| Ohio Higher Educational Facility Commission, | | | | |
| Revenue, CP (Cleveland Clinic Health System Obligated Group) | 0.30 | 9/16/09 | 13,000,000 | 13,000,000 |
The Funds 53
| STATEMENT OF INVESTMENTS (Unaudited) (continued) |
| | | | |
| Dreyfus Tax Exempt | Coupon | Maturity | Principal | |
| Cash Management (continued) | Rate (%) | Date | Amount ($) | Value ($) |
| |
| Short-Term Investments (continued) | | | | |
| Ohio (continued) | | | | |
| Ohio Higher Educational Facility Commission, | | | | |
| Revenue, CP (Cleveland Clinic Health System Obligated Group) | 0.50 | 1/13/10 | 10,000,000 | 10,000,000 |
| Ohio Higher Educational Facility Commission, | | | | |
| Revenue, CP (Cleveland Clinic Health System Obligated Group) | 0.50 | 2/9/10 | 17,500,000 | 17,500,000 |
| Ohio Higher Educational Facility, Revenue | | | | |
| (Ashland University Project) (LOC; Key Bank) | 1.35 | 8/7/09 | 4,200,000 a | 4,200,000 |
| Oklahoma 1.7% | | | | |
| Oklahoma Development Finance Authority, Continuing | | | | |
| Care Retirement Community Revenue, Refunding | | | | |
| (Inverness Village Project) (LOC; KBC Bank) | 0.33 | 8/7/09 | 22,800,000 a | 22,800,000 |
| Oklahoma Development Finance Authority, Health System Revenue, | | | | |
| Refunding (INTEGRIS Baptist Medical Center, Inc., INTEGRIS | | | | |
| South Olkahoma City Hospital Corportation and INTEGRIS | | | | |
| Rural Health, Inc.) (Insured; Assured Guaranty and | | | | |
| Liquidity Facility; JPMorgan Chase Bank Chase Bank) | 0.30 | 8/7/09 | 16,820,000 a | 16,820,000 |
| Oklahoma Development Finance Authority, | | | | |
| Revenue, CP (Integris Baptist Medical Center) | 0.35 | 8/14/09 | 16,475,000 | 16,475,000 |
| Tulsa County Industrial Authority, Capital Improvements | | | | |
| Revenue (Liquidity Facility; Bank of America) | 2.00 | 8/17/09 | 55,000,000 | 55,000,000 |
| Oregon .3% | | | | |
| Oregon Department of Transportation, | | | | |
| Highway User Tax Senior Lien Revenue | 2.00 | 11/15/09 | 5,925,000 | 5,952,634 |
| Salem Hospital Facility Authority, Revenue | | | | |
| (Capital Manor, Inc. Project) (LOC; Bank of America) | 0.44 | 8/7/09 | 5,585,000 a | 5,585,000 |
| Salem Hospital Facility Authority, Revenue, Refunding | | | | |
| (Capital Manor, Inc. Project) (LOC; Bank of America) | 0.44 | 8/7/09 | 8,680,000 a | 8,680,000 |
| Pennsylvania 8.8% | | | | |
| Allegheny County Industrial Development Authority, | | | | |
| Senior Health and Housing Facilities Revenue | | | | |
| (Longwood at Oakmont, Inc.) (LOC; Allied Irish Banks) | 0.55 | 8/1/09 | 6,430,000 a | 6,430,000 |
| Allegheny County Industrial Development Authority, | | | | |
| Senior Health and Housing Facilities Revenue, Refunding | | | | |
| (Longwood at Oakmont, Inc.) (Liquidity Facility; National City Bank) | 0.43 | 8/1/09 | 4,800,000 a | 4,800,000 |
| Allegheny County Industrial Development Authority, | | | | |
| Senior Health and Housing Facilities Revenue, Refunding | | | | |
| (Longwood at Oakmont, Inc.) (Liquidity Facility; National City Bank) | 0.43 | 8/1/09 | 6,860,000 a | 6,860,000 |
| Beaver County Industrial Development Authority, | | | | |
| PCR, Refunding (FirstEnergy Nuclear Generation | | | | |
| Corporation Project) (LOC; Citibank NA) | 0.34 | 8/7/09 | 7,000,000 a | 7,000,000 |
| Bucks County Industrial Development Authority, HR | | | | |
| (Grand View Hospital) (LOC; TD Bank) | 0.29 | 8/7/09 | 8,800,000 a | 8,800,000 |
| Bucks County Industrial Development Authority, | | | | |
| Revenue (Pennswood Village Project) (LOC; Bank of America) | 0.40 | 8/7/09 | 7,400,000 a | 7,400,000 |
| Butler County Industrial Development Authority, Revenue, Refunding | | | | |
| (Concordia Lutheran Health and Human Care) (LOC; Bank of America) | 0.35 | 8/7/09 | 7,500,000 a | 7,500,000 |
| Chester County Health and Education Facilities Authority, | | | | |
| Retirement Community Revenue (Kendal-Crosslands | | | | |
| Communities Project) (LOC; Wachovia Bank) | 0.35 | 8/7/09 | 21,495,000 a | 21,495,000 |
54
| | | | |
| Dreyfus Tax Exempt | Coupon | Maturity | Principal | |
| Cash Management (continued) | Rate (%) | Date | Amount ($) | Value ($) |
| |
| Short-Term Investments (continued) | | | | |
| Pennsylvania (continued) | | | | |
| Chestnut Ridge School District, GO (Insured; FSA | | | | |
| and Liquidity Facility; Dexia Credit Locale) | 1.45 | 8/7/09 | 10,865,000 a | 10,865,000 |
| Cumberland County Municipal Authority, Revenue (Diakon Lutheran | | | | |
| Social Ministries Project) (LOC; Wachovia Bank) | 0.39 | 8/7/09 | 11,025,000 a | 11,025,000 |
| East Hempfield Township Industrial Development Authority, Revenue | | | | |
| (The Mennonite Home Project) (LOC; M&T Bank) | 0.46 | 8/7/09 | 11,600,000 a | 11,600,000 |
| East Hempfield Township Industrial Development Authority, | | | | |
| Revenue (The Mennonite Home Project) (LOC; M&T Bank) | 0.46 | 8/7/09 | 7,690,000 a | 7,690,000 |
| Emmaus General Authority (Pennsylvania Variable Rate Loan Program) | | | | |
| (Insured; FSA and Liquidity Facility; Wachovia Bank) | 0.54 | 8/7/09 | 20,000,000 a | 20,000,000 |
| Emmaus General Authority, Local Government Revenue | | | | |
| (Bond Pool Program) (LOC; U.S. Bank NA) | 0.37 | 8/7/09 | 8,000,000 a | 8,000,000 |
| Emmaus General Authority, Local Government Revenue | | | | |
| (Bond Pool Program) (LOC; U.S. Bank NA) | 0.37 | 8/7/09 | 9,800,000 a | 9,800,000 |
| Emmaus General Authority, Local Government Revenue | | | | |
| (Bond Pool Program) (LOC; U.S. Bank NA) | 0.37 | 8/7/09 | 10,500,000 a | 10,500,000 |
| Emmaus General Authority, Local Government Revenue | | | | |
| (Bond Pool Program) (LOC; U.S. Bank NA) | 0.37 | 8/7/09 | 11,800,000 a | 11,800,000 |
| Emmaus General Authority, Local Government Revenue | | | | |
| (Bond Pool Program) (LOC; U.S. Bank NA) | 0.37 | 8/7/09 | 5,850,000 a | 5,850,000 |
| Emmaus General Authority, Local Government Revenue | | | | |
| (Bond Pool Program) (LOC; U.S. Bank NA) | 0.37 | 8/7/09 | 13,800,000 a | 13,800,000 |
| Emmaus General Authority, Local Government Revenue | | | | |
| (Bond Pool Program) (LOC; U.S. Bank NA) | 0.37 | 8/7/09 | 17,500,000 a | 17,500,000 |
| Emmaus General Authority, Local Government Revenue | | | | |
| (Bond Pool Program) (LOC; U.S. Bank NA) | 0.37 | 8/7/09 | 13,100,000 a | 13,100,000 |
| Emmaus General Authority, Local Government Revenue | | | | |
| (Bond Pool Program) (LOC; U.S. Bank NA) | 0.37 | 8/7/09 | 9,400,000 a | 9,400,000 |
| Emmaus General Authority, Local Government Revenue | | | | |
| (Bond Pool Program) (LOC; U.S. Bank NA) | 0.37 | 8/7/09 | 12,400,000 a | 12,400,000 |
| Emmaus General Authority, Local Government Revenue | | | | |
| (Bond Pool Program) (LOC; U.S. Bank NA) | 0.37 | 8/7/09 | 10,000,000 a | 10,000,000 |
| Emmaus General Authority, Local Government Revenue | | | | |
| (Bond Pool Program) (LOC; U.S. Bank NA) | 0.37 | 8/7/09 | 9,600,000 a | 9,600,000 |
| Emmaus General Authority, Local Government Revenue | | | | |
| (Bond Pool Program) (LOC; U.S. Bank NA) | 0.37 | 8/7/09 | 6,400,000 a | 6,400,000 |
| Emmaus General Authority, Local Government Revenue | | | | |
| (Bond Pool Program) (LOC; U.S. Bank NA) | 0.37 | 8/7/09 | 4,300,000 a | 4,300,000 |
| Emmaus General Authority, Local Government Revenue | | | | |
| (Bond Pool Program) (LOC; U.S. Bank NA) | 0.37 | 8/7/09 | 10,000,000 a | 10,000,000 |
| Emmaus General Authority, Local Government Revenue | | | | |
| (Bond Pool Program) (LOC; U.S. Bank NA) | 0.37 | 8/7/09 | 3,100,000 a | 3,100,000 |
| General Authority of South Central Pennsylvania, | | | | |
| Revenue (Lutheran Social Services of South Central | | | | |
| Pennsylvania Project) (LOC; M&T Bank) | 0.46 | 8/7/09 | 16,610,000 a | 16,610,000 |
| Lancaster County Hospital Authority, Health Center | | | | |
| Revenue (LUTHERCARE Project) (LOC; M&T Bank) | 0.41 | 8/7/09 | 34,215,000 a | 34,215,000 |
The Funds 55
| STATEMENT OF INVESTMENTS (Unaudited) (continued) |
| | | | |
| Dreyfus Tax Exempt | Coupon | Maturity | Principal | |
| Cash Management (continued) | Rate (%) | Date | Amount ($) | Value ($) |
| |
| Short-Term Investments (continued) | | | | |
| Pennsylvania (continued) | | | | |
| Lancaster County Hospital Authority, Revenue | | | | |
| (Landis Home Retirement Community Project) (LOC; M&T Bank) | 0.46 | 8/7/09 | 7,970,000 a | 7,970,000 |
| Montgomery County Higher Education and Health Authority, | | | | |
| Revenue (Pennsylvania Higher Education and | | | | |
| Health Loan Program) (LOC; M&T Bank) | 0.46 | 8/7/09 | 6,530,000 a | 6,530,000 |
| Montgomery County Industrial Development Authority, PCR, CP | | | | |
| (Exelon Project) (LOC; Wachovia Bank) | 0.40 | 8/27/09 | 25,000,000 | 25,000,000 |
| Montgomery County Industrial Development Authority, Retirement | | | | |
| Community Revenue (Adult Communities Total Services Retirement | | | | |
| Life Communities, Inc. Obligated Group) (LOC; Bank of America) | 0.43 | 8/1/09 | 6,730,000 a | 6,730,000 |
| Montgomery County Industrial Development Authority, Revenue | | | | |
| (Abington Friends School Project) (LOC; Wachovia Bank) | 0.39 | 8/7/09 | 9,030,000 a | 9,030,000 |
| Moon Industrial Development Authority, Community Facilities | | | | |
| Revenue (YMCA Greater Pittsburgh Project) (LOC; PNC Bank NA) | 0.35 | 8/7/09 | 3,565,000 a | 3,565,000 |
| Pennsylvania Intergovernmental Cooperation Authority, | | | | |
| Special Tax Revenue, Refunding (City of Philadelphia Funding | | | | |
| Program) (Insured; FSA and Liquidity Facility; JPMorgan Chase Bank) | 0.45 | 8/7/09 | 30,340,000 a | 30,340,000 |
| Philadelphia, Water and Wastewater Revenue, | | | | |
| Refunding (LOC; Bank of America) | 0.37 | 8/7/09 | 27,900,000 a | 27,900,000 |
| Philadelphia School District, GO Notes, Refunding (LOC; TD Bank) | 0.29 | 8/7/09 | 5,000,000 a | 5,000,000 |
| Philadelphia School District, GO Notes, Refunding (LOC; Wachovia Bank) | 0.34 | 8/7/09 | 38,800,000 a | 38,800,000 |
| Philadelphia School District, GO Notes, Refunding (LOC; Wachovia Bank) | 0.34 | 8/7/09 | 30,400,000 a | 30,400,000 |
| Pottstown Borough Authority, Educational Facilities Revenue | | | | |
| (The Hill School Project) (LOC; M&T Bank) | 0.41 | 8/7/09 | 7,000,000 a | 7,000,000 |
| Ridley School District, GO Notes (LOC; TD Bank) | 0.33 | 8/7/09 | 3,000,000 a | 3,000,000 |
| University of Pittsburgh of the Commonwealth | | | | |
| System of Higher Education, CP | 0.30 | 8/11/09 | 10,000,000 | 10,000,000 |
| University of Pittsburgh of the Commonwealth | | | | |
| System of Higher Education, CP | 0.40 | 10/5/09 | 10,000,000 | 10,000,000 |
| Upper Merion Municipal Utility Authority, Guaranteed Sewer | | | | |
| Revenue (Liquidity Facility; Commerce Bank NA) | 0.33 | 8/7/09 | 6,800,000 a | 6,800,000 |
| Wallingford-Swarthmore School District, GO Notes | | | | |
| (Insured; FSA and Liquidity Facility; Dexia Credit Locale) | 1.45 | 8/7/09 | 10,000,000 a | 10,000,000 |
| Westmoreland County Industrial Development Authority, Health | | | | |
| System Revenue (Excela Health Project) (LOC; Wachovia Bank) | 0.35 | 8/7/09 | 7,815,000 a | 7,815,000 |
| York General Authority, Revenue (Strand-Capitol | | | | |
| Performing Arts Center Project) (LOC; M&T Bank) | 0.46 | 8/7/09 | 4,850,000 a | 4,850,000 |
| South Carolina .8% | | | | |
| Saint Peters Parish/Jasper County Public Facilities Corporation, | | | | |
| Installment Purchase Revenue BAN (County Office Building Projects) | 2.00 | 2/1/10 | 6,500,000 | 6,519,289 |
| South Carolina Jobs-Economic Development Authority, | | | | |
| Health Facilities Revenue, Refunding (The Episcopal | | | | |
| Church Home) (Liquidity Facility; Wachovia Bank) | 0.35 | 8/7/09 | 15,810,000 a | 15,810,000 |
| South Carolina Jobs-Economic Development Authority, HR | | | | |
| (Conway Hospital, Inc.) (Insured; Assured Guaranty and | | | | |
| Liquidity Facility; Branch Banking and Trust Co.) | 0.40 | 8/7/09 | 4,975,000 a | 4,975,000 |
| South Carolina Jobs-Economic Development Authority, HR | | | | |
| (Oconee Memorial Hospital, Inc. Project) (Liquidity Facility; | | | | |
| Wachovia Bank and LOC; Wachovia Bank) | 0.32 | 8/7/09 | 27,000,000 a | 27,000,000 |
56
| | | | |
| Dreyfus Tax Exempt | Coupon | Maturity | Principal | |
| Cash Management (continued) | Rate (%) | Date | Amount ($) | Value ($) |
| |
| Short-Term Investments (continued) | | | | |
| Tennessee 5.2% | | | | |
| Blount County Health and Educational Facilities Board, | | | | |
| Revenue (Maryville College Project) (LOC; Bank of America) | 0.40 | 8/7/09 | 21,400,000 a | 21,400,000 |
| Blount County Public Building Authority, Local Government Public | | | | |
| Improvement Revenue (Liquidity Facility; Branch Banking and Trust Co.) | 0.37 | 8/7/09 | 50,300,000 a | 50,300,000 |
| Blount County Public Building Authority, Local Government Public | | | | |
| Improvement Revenue (LOC; Branch Banking and Trust Co.) | 0.37 | 8/7/09 | 48,875,000 a | 48,875,000 |
| Blount County Public Building Authority, Local Government Public | | | | |
| Improvement Revenue (LOC; Branch Banking and Trust Co.) | 0.37 | 8/7/09 | 10,000,000 a | 10,000,000 |
| Blount County Public Building Authority, Local Government Public | | | | |
| Improvement Revenue (LOC; Branch Banking and Trust Co.) | 0.37 | 8/7/09 | 9,950,000 a | 9,950,000 |
| Blount County Public Building Authority, Local Government Public | | | | |
| Improvement Revenue (LOC; Branch Banking and Trust Co.) | 0.37 | 8/7/09 | 6,000,000 a | 6,000,000 |
| Industrial Development Board of Blount County and the | | | | |
| Cities of Alcoa and Maryville, Local Government | | | | |
| Public Improvement Revenue (Maryville Civic Arts | | | | |
| Center Project) (LOC; Branch Banking and Trust Co.) | 0.37 | 8/7/09 | 6,000,000 a | 6,000,000 |
| Jackson Energy Authority, Gas System | | | | |
| Revenue, Refunding (LOC; FHLB) | 0.28 | 8/7/09 | 4,340,000 a | 4,340,000 |
| Metropolitan Government of Nashville and Davidson County Health | | | | |
| and Educational Facilities Board, Revenue (The Vanderbilt | | | | |
| University) (Liquidity Facility: Bayerische Landesbank and | | | | |
| Landesbank Hessen-Thruingen Girozentrale) | 0.23 | 8/7/09 | 19,370,000 a | 19,370,000 |
| Sevier County Public Building Authority, Local Government | | | | |
| Public Improvement Revenue (LOC; Allied Irish Banks) | 0.42 | 8/7/09 | 25,495,000 a | 25,495,000 |
| Sevier County Public Building Authority, Local Government | | | | |
| Public Improvement Revenue (LOC; Allied Irish Banks) | 0.42 | 8/7/09 | 9,315,000 a | 9,315,000 |
| Shelby County Health, Educational and Housing Facility Board, | | | | |
| Revenue (Methodist Le Bonheur Healthcare) (Insured; Assured | | | | |
| Guaranty and Liquidity Facility; U.S. Bank NA) | 0.33 | 8/7/09 | 15,000,000 a | 15,000,000 |
| Shelby County Health, Educational and Housing Facility Board, Revenue | | | | |
| (Saint George's Independent School Project) (LOC; Regions Bank) | 3.50 | 8/7/09 | 490,000 a | 490,000 |
| Shelby County Health, Educational and Housing Facility Board, | | | | |
| Revenue (Trezevant Manor Project) (LOC; ABN-AMRO) | 0.36 | 8/7/09 | 7,000,000 a | 7,000,000 |
| Tennergy Corporation, Gas Revenue (Putters Program) | | | | |
| (Liquidity Facility; JPMorgan Chase Bank) | 0.41 | 8/7/09 | 17,110,000 a,b | 17,110,000 |
| Tennergy Corporation, Gas Revenue | | | | |
| (Putters Program) (LOC; BNP Paribas) | 0.41 | 8/7/09 | 63,575,000 a,b | 63,575,000 |
| Tennessee, CP (Liquidity Facility; Tennessee | | | | |
| Consolidated Retirement System) | 0.35 | 9/10/09 | 16,500,000 | 16,500,000 |
| Tennessee, CP (Liquidity Facility; Tennessee | | | | |
| Consolidated Retirement System) | 0.40 | 9/15/09 | 8,250,000 | 8,250,000 |
| Tennessee School Bond Authority, CP | | | | |
| (Liquidity Facility; State Street Bank and Trust Co.) | 0.50 | 8/4/09 | 5,105,000 | 5,105,000 |
| Texas 8.8% | | | | |
| Crawford Education Facilities Corporation, Revenue | | | | |
| (Hyde Park Baptist School Project) (LOC; JPMorgan Chase Bank) | 0.35 | 8/7/09 | 12,600,000 a | 12,600,000 |
| Dallas, CP (Liquidity Facility; Bank of America) | 0.40 | 9/21/09 | 14,384,000 | 14,384,000 |
| Dallas, Waterworks and Sewer System Revenue, | | | | |
| CP (Liquidity Facility; Bank of America) | 0.40 | 10/15/09 | 10,500,000 | 10,500,000 |
The Funds 57
| STATEMENT OF INVESTMENTS (Unaudited) (continued) |
| | | | |
| Dreyfus Tax Exempt | Coupon | Maturity | Principal | |
| Cash Management (continued) | Rate (%) | Date | Amount ($) | Value ($) |
| |
| Short-Term Investments (continued) | | | | |
| Texas (continued) | | | | |
| El Paso Independent School District, Unlimited Tax School | | | | |
| Building Bonds (Liquidity Facility; JPMorgan Chase Bank | | | | |
| and LOC; Permanent School Fund Guarantee Program) | 0.45 | 12/8/09 | 17,000,000 | 17,000,000 |
| Harris County, CP (Liquidity Facility: Bank of | | | | |
| Nova Scotia and Lloyds TSB Bank PLC) | 0.42 | 8/12/09 | 9,000,000 | 9,000,000 |
| Harris County, GO Notes, TAN | 2.00 | 2/25/10 | 20,000,000 | 20,185,219 |
| Harris County Cultural Education Facilities Finance | | | | |
| Corporation, Revenue, CP (Methodist Healthcare) | 0.45 | 11/4/09 | 11,000,000 | 11,000,000 |
| Harris County Cultural Education Facilities Finance | | | | |
| Corporation, Revenue, CP (Methodist Healthcare) | 0.48 | 12/2/09 | 22,500,000 | 22,500,000 |
| Harris County Cultural Education Facilities Finance | | | | |
| Corporation, Special Facilities Revenue, Refunding | | | | |
| (Texas Medical Center) (LOC; Compass Bank) | 0.28 | 8/7/09 | 4,065,000 a | 4,065,000 |
| Harris County Metropolitan Transit Authority, CP | | | | |
| (Liquidity Facility; JPMorgan Chase Bank) | 0.45 | 12/8/09 | 13,250,000 | 13,250,000 |
| Harris County Metropolitan Transit Authority, CP | | | | |
| (Liquidity Facility; JPMorgan Chase Bank) | 0.35 | 12/10/09 | 25,000,000 | 25,000,000 |
| Houston, CP (Liquidity Facility; Landesbank Baden-Wurttemberg) | 1.15 | 8/6/09 | 10,800,000 | 10,800,000 |
| Houston, CP (Liquidity Facility; U.S. Bank NA) | 0.30 | 8/18/09 | 10,000,000 | 10,000,000 |
| Houston Higher Education Finance Corporation, | | | | |
| Higher Education Revenue, CP (Rice University) | 0.37 | 9/10/09 | 5,000,000 | 5,000,000 |
| Houston Independent School District, Limited Tax Schoolhouse | | | | |
| Bonds (Liquidity Facility; Bank of America and LOC; | | | | |
| Permanent School Fund Guarantee Program) | 0.37 | 8/7/09 | 15,000,000 a | 15,000,000 |
| Kendall County Health Facilities Development Corporation, Health Care | | | | |
| Revenue (Morningside Ministries Project) (LOC; Allied Irish Banks) | 0.70 | 8/7/09 | 6,460,000 a | 6,460,000 |
| Lower Colorado River Authority, Revenue, CP (LCRA Transportation | | | | |
| Services Corporation) (Liquidity Facility; JPMorgan Chase Bank) | 0.25 | 8/25/09 | 5,000,000 | 5,000,000 |
| Montgomery County, Unlimited Tax Road Bonds | | | | |
| (Liquidity Facility; Bank of America) | 3.00 | 9/1/09 | 14,705,000 | 14,719,674 |
| San Antonio, Electric and Gas Systems | | | | |
| Revenue (LOC; FNMA) (Prerefunded) | 5.75 | 2/1/10 | 8,000,000 c | 8,210,868 |
| San Antonio, Electric and Gas Systems Revenue, CP (Liquidity | | | | |
| Facility: Bank of America and State Street Bank and Trust Co.) | 0.40 | 8/27/09 | 5,500,000 | 5,500,000 |
| San Antonio, Sales Tax Revenue, CP (LOC; Bank of America) | 0.53 | 9/10/09 | 5,500,000 | 5,500,000 |
| San Antonio, Water System Revenue, CP (Liquidity Facility: | | | | |
| Bank of America and State Street Bank and Trust Co.) | 0.43 | 10/5/09 | 10,000,000 | 10,000,000 |
| Sherman Independent School District, Unlimited Tax School | | | | |
| Building Bonds (Liquidity Facility; Banco Bilbao Vizcaya | | | | |
| and LOC; Permament School Fund Guarantee Program) | 3.13 | 8/1/09 | 20,695,000 | 20,695,000 |
| Tarrant County Cultural Education Facilities Finance | | | | |
| Corporation, Revenue (Texas Health Resources System) | 0.23 | 8/7/09 | 5,300,000 a | 5,300,000 |
| Tarrant County Cultural Education Facilities Finance | | | | |
| Corporation, Revenue (Texas Health Resources System) | 0.36 | 8/7/09 | 6,500,000 a | 6,500,000 |
| Tarrant County Cultural Education Facilities Finance | | | | |
| Corporation, Revenue (Texas Health Resources | | | | |
| System) (Liquidity Facility; Compass Bank) | 1.00 | 8/7/09 | 10,775,000 a | 10,775,000 |
58
| | | | |
| Dreyfus Tax Exempt | Coupon | Maturity | Principal | |
| Cash Management (continued) | Rate (%) | Date | Amount ($) | Value ($) |
| Short-Term Investments (continued) | | | | |
| Texas (continued) | | | | |
| Texas, CP | 0.40 | 8/6/09 | 2,500,000 | 2,500,000 |
| Texas, Water Financial Assistance | | | | |
| GO Notes (Water Infrastructure Fund) | 2.00 | 8/1/09 | 16,225,000 | 16,225,000 |
| Texas Water Development Board, State Revolving Fund | | | | |
| Subordinate Lien Revenue (Liquidity Facility; Citibank NA) | 0.41 | 8/7/09 | 10,940,000 a,b | 10,940,000 |
| University of Texas, University Revenue, CP | 0.25 | 8/4/09 | 24,900,000 | 24,900,000 |
| University of Texas, University Revenue, CP | 0.25 | 8/5/09 | 25,000,000 | 25,000,000 |
| University of Texas, University Revenue, CP | 0.25 | 8/10/09 | 25,000,000 | 25,000,000 |
| University of Texas, University Revenue, CP | 0.17 | 8/17/09 | 9,375,000 | 9,375,000 |
| University of Texas, University Revenue, CP | 0.25 | 8/17/09 | 15,000,000 | 15,000,000 |
| University of Texas, University Revenue, CP | 0.40 | 10/7/09 | 35,500,000 | 35,500,000 |
| University of Texas, University Revenue, CP | 0.30 | 10/15/09 | 24,000,000 | 24,000,000 |
| University of Texas, University Revenue, CP | 0.35 | 12/10/09 | 14,700,000 | 14,700,000 |
| University of Texas System Board of Regents, | | | | |
| Financing System Revenue | 0.25 | 8/7/09 | 67,000,000 a | 67,000,000 |
| University of Texas System Board of Regents, | | | | |
| Financing System Revenue, Refunding | 5.00 | 8/15/09 | 2,235,000 | 2,238,903 |
| Weslaco Health Facilities Development Corporation, HR, | | | | |
| Refunding (Knapp Medical Center Project) (LOC; Compass Bank) | 0.40 | 8/7/09 | 4,780,000 a | 4,780,000 |
| Utah 1.7% | | | | |
| Central Utah Water Conservancy District Revenue, Refunding | | | | |
| (Liquidity Facility; Landesbank Hessen-Thuringen Girozentrale) | 0.45 | 8/7/09 | 39,800,000 a | 39,800,000 |
| Intermountain Power Agency, Power Supply Revenue, CP | | | | |
| (Liquidity Facility: Bank of America and Bank of Nova Scotia) | 0.40 | 11/18/09 | 10,000,000 | 10,000,000 |
| Murray City, HR (IHC Health Services, Inc.) | 0.30 | 8/1/09 | 14,000,000 a | 14,000,000 |
| Murray City, HR (IHC Health Services, Inc.) | 0.23 | 8/7/09 | 32,000,000 a | 32,000,000 |
| Utah Housing Corporation, SFMR (LOC; Royal Bank of Canada) | 0.50 | 10/1/09 | 9,395,000 | 9,395,000 |
| Utah Housing Finance Agency, MFHR, Refunding (Candlestick | | | | |
| Apartments Project) (Liquidity Facility; FNMA and LOC; FNMA) | 0.40 | 8/7/09 | 6,400,000 a | 6,400,000 |
| Virginia 2.3% | | | | |
| Albemarle County Economic Development Authority, HR | | | | |
| (Martha Jefferson Hospital) (LOC; Branch Banking and Trust Co.) | 0.30 | 8/7/09 | 6,000,000 a | 6,000,000 |
| Alexandria Industrial Development Authority, Headquarters | | | | |
| Facilities Revenue (American Academy of Otolaryngology-Head | | | | |
| and Neck Surgery Foundation, Inc.) (LOC; Bank of America) | 0.38 | 8/7/09 | 6,310,000 a | 6,310,000 |
| Chesapeake Bay Bridge and Tunnel District, General Resolution | | | | |
| Revenue, Refunding (LOC; Branch Banking and Trust Co.) | 0.32 | 8/7/09 | 6,250,000 a | 6,250,000 |
| Chesterfield County, GO Public Improvement, Refunding | 2.00 | 1/1/10 | 6,200,000 | 6,242,514 |
| Fairfax County Economic Development Authority, Educational Facilities | | | | |
| Revenue (Trinity Christian School Project) (LOC; Wachovia Bank) | 0.54 | 8/7/09 | 9,000,000 a | 9,000,000 |
| Fredericksburg Economic Development Authority, | | | | |
| Revenue (Student Housing and Economic Development | | | | |
| Project-Eagle Village I) (LOC; Bank of America) | 0.41 | 8/7/09 | 40,780,000 a | 40,780,000 |
| Lynchburg Industrial Development Authority, HR | | | | |
| (Centra Health) (LOC; Branch Banking and Trust Co.) | 0.30 | 8/7/09 | 18,525,000 a | 18,525,000 |
The Funds 59
| STATEMENT OF INVESTMENTS (Unaudited) (continued) |
| | | | |
| Dreyfus Tax Exempt | Coupon | Maturity | Principal | |
| Cash Management (continued) | Rate (%) | Date | Amount ($) | Value ($) |
| Short-Term Investments (continued) | | | | |
| Virginia (continued) | | | | |
| Norfolk Redevelopment and Housing Authority, First Mortgage | | | | |
| Revenue (Fort Norfolk Retirement Community, Inc. | | | | |
| Harbor's Edge Project) (LOC; HSH Nordbank AG) | 2.20 | 8/7/09 | 16,300,000 a | 16,300,000 |
| Richmond, CP (Liquidity Facility; Bank of America) | 0.38 | 9/14/09 | 23,000,000 | 23,000,000 |
| University of Virginia, University Revenue, CP | 0.33 | 11/4/09 | 10,000,000 | 10,000,000 |
| University of Virginia, University Revenue, CP | 0.36 | 11/10/09 | 8,000,000 | 8,000,000 |
| Washington .7% | | | | |
| Washington Health Care Facilities Authority, Revenue | | | | |
| (MultiCare Health System) (LOC; Wells Fargo Bank) | 0.23 | 8/7/09 | 6,850,000 a | 6,850,000 |
| Washington Health Care Facilities Authority, Revenue | | | | |
| (Seattle Cancer Care Alliance House) (LOC; Key Bank) | 2.50 | 8/7/09 | 7,000,000 a | 7,000,000 |
| Washington Higher Education Facilities Authority, Revenue, | | | | |
| Refunding (Saint Martins University Project) (LOC; Key Bank) | 2.50 | 8/7/09 | 8,765,000 a | 8,765,000 |
| Washington Housing Finance Commission, Nonprofit Housing | | | | |
| Revenue, Refunding (Emerald Heights Project) (LOC; Bank of America) | 0.45 | 8/1/09 | 25,675,000 a | 25,675,000 |
| West Virginia .3% | | | | |
| West Virginia Hospital Finance Authority, HR, Refunding | | | | |
| (Cabell Huntington Hospital, Inc.) (LOC; Branch Banking and Trust Co.) | 0.32 | 8/7/09 | 10,000,000 a | 10,000,000 |
| West Virginia Hospital Finance Authority, HR, Refunding | | | | |
| (West Virginia United Health System Obligated Group) | | | | |
| (LOC; Branch Banking and Trust Co.) | 0.32 | 8/7/09 | 7,600,000 a | 7,600,000 |
| Wisconsin 1.2% | | | | |
| Byron, IDR, Refunding (Ocean Spray | | | | |
| Cranberries, Inc. Project) (LOC; Wachovia Bank) | 0.54 | 8/7/09 | 5,500,000 a | 5,500,000 |
| Milwaukee Redevelopment Authority, Redevelopment LR (University | | | | |
| of Wisconsin-Milwaukee Kenilworth Project) (LOC; U.S. Bank NA) | 0.41 | 8/7/09 | 6,375,000 a | 6,375,000 |
| Wisconsin, Transportation Revenue, CP (Liquidity Facility: | | | | |
| California State Teachers Retirement System and | | | | |
| State Street Bank and Trust Co.) | 0.43 | 8/12/09 | 22,500,000 | 22,500,000 |
| Wisconsin, Transportation Revenue, CP (Liquidity Facility: | | | | |
| California State Teachers Retirement System and | | | | |
| State Street Bank and Trust Co.) | 0.48 | 8/17/09 | 29,099,000 | 29,099,000 |
| Wisconsin Health and Educational Facilities Authority, Revenue, | | | | |
| Refunding (Marquette University) (LOC; JPMorgan Chase Bank) | 0.41 | 8/7/09 | 4,100,000 a | 4,100,000 |
| Wisconsin Health and Educational Facilities Authority, Revenue, | | | | |
| Refunding (The Medical College of Wisconsin, Inc.) (LOC; U.S. Bank NA) | 0.23 | 8/7/09 | 9,600,000 a | 9,600,000 |
| Wyoming .3% | | | | |
| Sweetwater County, HR (Memorial Hospital Project) (LOC; Key Bank) | 0.55 | 8/7/09 | 20,500,000 a | 20,500,000 |
| |
| Total Investments (cost $6,617,998,138) | | | 100.6% | 6,617,998,138 |
| Liabilities, Less Cash and Receivables | | | (.6%) | (37,404,847) |
| Net Assets | | | 100.0% | 6,580,593,291 |
| |
| See footnotes on page 66 | | | | |
| See notes to financial statements. | | | | |
60
STATEMENT OF INVESTMENTS
July 31, 2009 (Unaudited) |
| | | | |
| Dreyfus California AMT-Free | Coupon | Maturity | Principal | |
| Municipal Cash Management | Rate (%) | Date | Amount ($) | Value ($) |
| |
| Short-Term Investments 96.8% | | | | |
| California 93.5% | | | | |
| ABAG Finance Authority for Nonprofit Corporations, Revenue (Institute | | | | |
| for Defense Analyses Project) (LOC; Branch Banking and Trust Co.) | 0.33 | 8/7/09 | 3,980,000 a | 3,980,000 |
| ABAG Finance Authority for Nonprofit Corporations, | | | | |
| Revenue (Northbay Healthcare Group) (LOC; JPMorgan Chase Bank) | 0.34 | 8/7/09 | 8,000,000 a | 8,000,000 |
| Alameda-Contra Costa Schools Financing Authority, COP | | | | |
| (Capital Improvement Financing Projects) (LOC; KBC Bank) | 0.35 | 8/7/09 | 275,000 a | 275,000 |
| California, Economic Recovery Bonds (Insured; | | | | |
| FSA and Liquidity Facility; Dexia Credit Locale) | 1.05 | 8/5/09 | 6,000,000 a | 6,000,000 |
| California, GO Notes (Kindergarten-University) (LOC: Citibank NA, | | | | |
| National Australia Bank and State Street Bank and Trust Co.) | 0.29 | 8/7/09 | 22,160,000 a | 22,160,000 |
| California, GO Notes (LOC: Bank of America, Bank of Nova Scotia | | | | |
| and Landesbank Hessen-Thuringen Girozentrale) | 0.29 | 8/7/09 | 12,700,000 a | 12,700,000 |
| California, GO Notes (LOC; KBC Bank) | 0.32 | 8/1/09 | 2,590,000 a | 2,590,000 |
| California, GO Notes (LOC; Landesbank Hessen-Thuringen Girozentrale) | 0.33 | 8/1/09 | 3,400,000 a | 3,400,000 |
| California Department of Water Resources, | | | | |
| Power Supply Revenue (Insured; FSA and Liquidity | | | | |
| Facility: Bank of Nova Scotia and Fortis Bank) | 1.90 | 8/7/09 | 1,300,000 a | 1,300,000 |
| California Department of Water Resources, Power Supply Revenue | | | | |
| (Insured; FSA and Liquidity Facility; JPMorgan Chase Bank) | 0.60 | 8/7/09 | 1,300,000 a | 1,300,000 |
| California Department of Water Resources, Power Supply Revenue | | | | |
| (Insured; FSA and Liquidity Facility; Societe Generale) | 0.70 | 8/7/09 | 3,900,000 a | 3,900,000 |
| California Department of Water Resources, | | | | |
| Power Supply Revenue (LOC; Dexia Credit Locale) | 0.55 | 8/7/09 | 1,025,000 a | 1,025,000 |
| California Department of Water Resources, Power Supply Revenue | | | | |
| (LOC: JPMorgan Chase Bank and Societe Generale) | 0.25 | 8/1/09 | 13,670,000 a | 13,670,000 |
| California Educational Facilities Authority, Revenue | | | | |
| (Chapman University) (LOC; Bank of America) | 0.32 | 8/1/09 | 5,500,000 a | 5,500,000 |
| California Educational Facilities Authority, Revenue | | | | |
| (University of San Francisco) (LOC; Allied Irish Banks) | 0.60 | 8/7/09 | 2,260,000 a | 2,260,000 |
| California Educational Facilities Authority, Revenue | | | | |
| (University of San Francisco) (LOC; Allied Irish Banks) | 0.60 | 8/7/09 | 9,525,000 a | 9,525,000 |
| California Educational Facilities Authority, | | | | |
| Revenue, CP (Stanford University) | 0.40 | 2/25/10 | 2,900,000 | 2,900,000 |
| California Housing Finance Agency, MFHR (Liquidity Facility; FNMA) | 0.70 | 8/7/09 | 12,145,000 a | 12,145,000 |
| California Infrastructure and Economic Development Bank, Revenue | | | | |
| (Orange County Performing Arts Center) (LOC; Bank of America) | 0.32 | 8/1/09 | 10,300,000 a | 10,300,000 |
| California Infrastructure and Economic Development Bank, Revenue | | | | |
| (Saint Margaret's Episcopal School) (LOC; Allied Irish Banks) | 0.43 | 8/7/09 | 3,400,000 a | 3,400,000 |
| California Infrastructure and Economic Development Bank, Revenue | | | | |
| (Southern California Public Radio Project) (LOC; Allied Irish Banks) | 0.64 | 8/1/09 | 1,000,000 a | 1,000,000 |
| California Infrastructure and Economic Development Bank, Revenue | | | | |
| (Southern California Public Radio Project) (LOC; Allied Irish Banks) | 0.64 | 8/1/09 | 7,000,000 a | 7,000,000 |
| California Statewide Commission Development | | | | |
| Authority, Revenue, CP (Kaiser Permanente) | 0.37 | 12/10/09 | 11,000,000 | 11,000,000 |
The Funds 61
| STATEMENT OF INVESTMENTS (Unaudited) (continued) |
| | | | |
| Dreyfus California AMT-Free | Coupon | Maturity | Principal | |
| Municipal Cash Management (continued) | Rate (%) | Date | Amount ($) | Value ($) |
| |
| Short-Term Investments (continued) | | | | |
| California (continued) | | | | |
| California Statewide Communities Development Authority, Revenue | | | | |
| (Rady Children's Hospital San Diego) (LOC; Bank of the West) | 0.28 | 8/1/09 | 3,930,000 a | 3,930,000 |
| California Statewide Communities Development Authority, | | | | |
| Revenue, Refunding (University Retirement Community | | | | |
| at Davis Project) (LOC; Bank of America) | 0.30 | 8/1/09 | 5,200,000 a | 5,200,000 |
| Davis Joint Unified School District, GO Notes, TRAN | 3.00 | 8/5/09 | 5,000,000 | 5,000,755 |
| Deutsche Bank Spears/Lifers Trust (Anaheim Redevelopment | | | | |
| Agency, Tax Allocation Revenue, Refunding (Anaheim | | | | |
| Merged Redevelopment Project Area)) (Liquidity Facility; | | | | |
| Deutsche Bank AG and LOC; Deutsche Bank AG) | 0.33 | 8/7/09 | 2,100,000 a,b | 2,100,000 |
| Dos Palos-Oro Loma Joint Unified School District, GO Notes, TRAN | 2.50 | 9/10/09 | 1,600,000 | 1,600,858 |
| Dry Creek Joint Elementary School District, GO Notes, TRAN | 2.00 | 9/9/09 | 3,800,000 | 3,801,514 |
| Eastern Municipal Water District, Water and Sewer Revenue, COP | | | | |
| (Installment Sale Agreement with Eastern Municipal Water | | | | |
| District Facilities Corporation) (Liquidity Facility; Citibank NA) | 0.36 | 8/7/09 | 3,495,000 a,b | 3,495,000 |
| Fremont Public Financing Authority, COP | | | | |
| (Financing Project) (LOC; Allied Irish Banks) | 0.60 | 8/7/09 | 7,500,000 a | 7,500,000 |
| Fresno, Sewer System Revenue (Insured; Assured | | | | |
| Guaranty and Liquidity Facility; Citibank NA) | 0.61 | 8/7/09 | 2,170,000 a,b | 2,170,000 |
| Golden State Tobacco Securitization Corporation, Enhanced Tobacco | | | | |
| Settlement Asset-Backed Bonds (Insured; Berkshire Hathaway | | | | |
| Assurance Corporation and Liquidity Facility; Citibank NA) | 0.61 | 8/7/09 | 14,750,000 a,b | 14,750,000 |
| Hayward Unified School District, GO Notes | 7.00 | 8/1/09 | 4,060,000 | 4,060,000 |
| Kern County Board of Education, TRAN | 2.00 | 9/8/09 | 1,100,000 | 1,100,473 |
| Los Angeles Department of Airports, Airport Revenue, CP | | | | |
| (LOC: Citibank NA and State Street Bank and Trust Co.) | 0.35 | 9/3/09 | 1,800,000 | 1,800,000 |
| Los Angeles Municipal Improvement | | | | |
| Corporation, LR, CP (LOC; Bank of America) | 0.39 | 8/27/09 | 2,000,000 | 2,000,000 |
| Puttable Floating Option Tax Exempt Receipts (California Statewide | | | | |
| Communities Development Authority, MFHR (La Mision Village | | | | |
| Apartments Project)) (Liquidity Facility; FHLMC and LOC; FHLMC) | 0.63 | 8/7/09 | 1,240,000 a,b | 1,240,000 |
| Puttable Floating Option Tax Exempt Receipts (California Statewide | | | | |
| Communities Development Authority, Revenue (Japanese American | | | | |
| National Museum)) (Liquidity Facility; Merrill Lynch Capital | | | | |
| Services and LOC; Merrill Lynch Capital Services) | 1.38 | 8/7/09 | 4,460,000 a,b | 4,460,000 |
| Richmond, Wastewater Revenue, Refunding | | | | |
| (LOC; Union Bank of California) | 0.28 | 8/7/09 | 5,260,000 a | 5,260,000 |
| Riverside, Electric Revenue (Putters Program) (Insured; FSA | | | | |
| and Liquidity Facility; JPMorgan Chase Bank) | 0.30 | 8/7/09 | 1,000,000 a,b | 1,000,000 |
| Rocklin Unified School District, GO Notes, TRAN | 2.00 | 9/9/09 | 4,800,000 | 4,801,913 |
62
| | | | |
| Dreyfus California AMT-Free | Coupon | Maturity | Principal | |
| Municipal Cash Management (continued) | Rate (%) | Date | Amount ($) | Value ($) |
| Short-Term Investments (continued) | | | | |
| California (continued) | | | | |
| Sausalito, MFHR (Rotary Village Senior | | | | |
| Housing Project) (LOC; Bank of the West) | 0.35 | 8/7/09 | 2,230,000 a | 2,230,000 |
| Southern California Public Power Authority, Transmission Project | | | | |
| Revenue, Refunding (Southern Transmission Project) (Insured; | | | | |
| FSA and Liquidity Facility; Westdeutsche Landesbank) | 1.00 | 8/7/09 | 9,000,000 a | 9,000,000 |
| University of California, Revenue, CP | 0.35 | 10/14/09 | 4,000,000 | 4,000,000 |
| Vacaville, MFMR (Quail Run Apartments) | | | | |
| (Liquidity Facility; FNMA and LOC; FNMA) | 0.29 | 8/7/09 | 400,000 a | 400,000 |
| Vacaville Industrial Development Authority, Industrial Revenue, | | | | |
| Refunding (Leggett and Platt, Inc.) (LOC; Wachovia Bank) | 0.54 | 8/7/09 | 1,600,000 a | 1,600,000 |
| Victorville Joint Powers Financing Authority, LR | | | | |
| (Cogeneration Facility Project) (LOC; Fortis Bank) | 1.06 | 8/7/09 | 14,000,000 a | 14,000,000 |
| Wells Fargo Stage Trust (City and County of San Francisco, COP | | | | |
| (Multiple Capital Improvement Projects)) (Liquidity Facility; | | | | |
| Wells Fargo Bank and LOC; Wells Fargo Bank) | 0.31 | 8/7/09 | 3,000,000 a,b | 3,000,000 |
| Wells Fargo Stage Trust (San Diego Public Facilities Financing | | | | |
| Authority, Senior Sewer Revenue) (Liquidity Facility; | | | | |
| Wells Fargo Bank and LOC; Wells Fargo Bank) | 0.31 | 8/7/09 | 5,125,000 a,b | 5,125,000 |
| U.S. Related 3.3% | | | | |
| Puerto Rico Commonwealth, Public Improvement GO, Refunding | | | | |
| (Insured; FSA and Liquidity Facility; Dexia Credit Locale) | 1.20 | 8/7/09 | 3,075,000 a | 3,075,000 |
| Puerto Rico Sales Tax Financing Corporation, | | | | |
| Sales Tax Revenue (Liquidity Facility; Citibank NA) | 0.49 | 8/7/09 | 6,000,000 a,b | 6,000,000 |
| |
| Total Investments (cost $269,030,513) | | | 96.8% | 269,030,513 |
| Cash and Receivables (Net) | | | 3.2% | 9,000,449 |
| Net Assets | | | 100.0% | 278,030,962 |
| |
| See footnotes on page 66 | | | | |
| See notes to financial statements. | | | | |
The Funds 63
STATEMENT OF INVESTMENTS
July 31, 2009 (Unaudited) |
| | | | |
| Dreyfus New York AMT-Free | Coupon | Maturity | Principal | |
| Municipal Cash Management | Rate (%) | Date | Amount ($) | Value ($) |
| Short-Term Investments 96.0% | | | | |
| Avoca Central School District, GO Notes, BAN | 2.75 | 8/26/09 | 2,000,000 | 2,000,737 |
| Broome County Industrial Development Agency, | | | | |
| Continuing Care Retirement Community Revenue | | | | |
| (Good Shepherd Village at Endwell, Inc. Project) (LOC; M&T Bank) | 0.46 | 8/7/09 | 3,250,000 a | 3,250,000 |
| Chautauqua County Industrial Development Agency, Exempt Facility | | | | |
| Revenue (NRG Dunkirk Power Project) (LOC; Bank of America) | 0.28 | 8/7/09 | 3,500,000 a | 3,500,000 |
| Dutchess County Industrial Development Agency, Civic Facility Revenue | | | | |
| (Anderson Foundation for Autism, Inc. Project) (LOC; M&T Bank) | 0.46 | 8/7/09 | 4,700,000 a | 4,700,000 |
| East Farmingdale Volunteer Fire Company Inc., | | | | |
| Volunteer Fire Department Revenue (LOC; Citibank NA) | 0.40 | 8/7/09 | 4,620,000 a | 4,620,000 |
| Eastchester Union Free School District, GO Notes, TAN | 1.00 | 12/23/09 | 1,000,000 | 1,001,964 |
| Edgemont Union Free School District, GO Notes, TAN | 1.00 | 1/15/10 | 1,000,000 | 1,002,483 |
| Lakeland Central School District of Shrub Oak, GO Notes, BAN | 2.75 | 9/4/09 | 3,955,600 | 3,957,944 |
| Long Island Power Authority, CP (Long Island Lighting Company) | | | | |
| (LOC; State Street Bank and Trust Co.) | 0.42 | 8/12/09 | 5,000,000 | 5,000,000 |
| Long Island Power Authority, CP (Long Island Lighting Company) | | | | |
| (LOC; State Street Bank and Trust Co.) | 0.35 | 9/10/09 | 8,000,000 | 8,000,000 |
| Long Island Power Authority, Electric System Subordinated | | | | |
| Revenue (LOC; Westdeutsche Landesbank) | 0.33 | 8/1/09 | 2,500,000 a | 2,500,000 |
| Metropolitan Transportation Authority, RAN | 2.00 | 12/31/09 | 10,625,000 | 10,695,783 |
| Metropolitan Transportation Authority, | | | | |
| Transportation Revenue (LOC; Fortis Bank) | 0.36 | 8/7/09 | 5,000,000 a | 5,000,000 |
| Metropolitan Transportation Authority, Transportation Revenue, | | | | |
| Refunding (Insured; FSA and Liquidity Facility; Dexia Credit Locale) | 0.65 | 8/7/09 | 10,180,000 a | 10,180,000 |
| Monroe County Industrial Development Agency, Civic Facility Revenue | | | | |
| (Association for the Blind and Visually Impaired Goodwill Industries | | | | |
| of Greater Rochester, Inc. Project) (LOC; JPMorgan Chase Bank) | 0.60 | 8/7/09 | 435,000 a | 435,000 |
| New York City, GO Notes | 4.00 | 8/1/09 | 1,000,000 | 1,000,000 |
| New York City, GO Notes (Liquidity Facility; Wachovia Bank) | 0.30 | 8/1/09 | 6,100,000 a | 6,100,000 |
| New York City, GO Notes (LOC; California State | | | | |
| Teachers Retirement System) | 0.30 | 8/1/09 | 1,000,000 a | 1,000,000 |
| New York City Housing Development Corporation, MFMR | | | | |
| (The Crest Project) (LOC; Landesbank Hessen-Thuringen Girozentrale) | 0.40 | 8/7/09 | 3,200,000 a | 3,200,000 |
| New York City Housing Development Corporation, Residential | | | | |
| Revenue (Queens College Residences) (LOC; RBS Citizens NA) | 2.40 | 8/7/09 | 2,200,000 a | 2,200,000 |
| New York City Industrial Development Agency, Civic Facility | | | | |
| Revenue (Ateret Torah Center Project) (LOC; Wachovia Bank) | 0.41 | 8/7/09 | 12,715,000 a | 12,715,000 |
| New York City Industrial Development Agency, Civic Facility Revenue | | | | |
| (The Allen-Stevenson School Project) (LOC; Allied Irish Banks) | 0.66 | 8/7/09 | 16,240,000 a | 16,240,000 |
| New York City Municipal Water Finance Authority, Water and | | | | |
| Sewer System Revenue (Liquidity Facility; Bank of America) | 0.33 | 8/1/09 | 5,000,000 a | 5,000,000 |
| New York City Transitional Finance Authority, | | | | |
| Future Tax Secured Revenue | 6.00 | 2/1/10 | 500,000 | 511,956 |
| New York City Transitional Finance Authority, | | | | |
| Future Tax Secured Revenue (Prerefunded) | 6.00 | 8/15/09 | 3,000,000 c | 3,036,419 |
64
| | | | |
| Dreyfus New York AMT-Free | Coupon | Maturity | Principal | |
| Municipal Cash Management (continued) | Rate (%) | Date | Amount ($) | Value ($) |
| Short-Term Investments (continued) | | | | |
| New York Local Government Assistance Corporation, Revenue | | | | |
| (LOC: Bayerische Landesbank and Westdeutshe Landesbank) | 0.40 | 8/7/09 | 7,500,000 a | 7,500,000 |
| New York State Dormitory Authority, Revenue | | | | |
| (Barnard College) (LOC; RBS Citizens NA) | 2.40 | 8/7/09 | 1,940,000 a | 1,940,000 |
| New York State Dormitory Authority, Revenue | | | | |
| (Catholic Health System Obligated Group) (LOC; HSBC Bank USA) | 0.26 | 8/7/09 | 4,400,000 a,d | 4,400,000 |
| New York State Dormitory Authority, Revenue | | | | |
| (D'Youville College) (LOC; Key Bank) | 2.50 | 8/7/09 | 5,340,000 a | 5,340,000 |
| New York State Dormitory Authority, Revenue | | | | |
| (Ithaca College) (LOC; RBS Citizens NA) | 2.40 | 8/7/09 | 5,900,000 a | 5,900,000 |
| New York State Power Authority, Revenue | 5.00 | 11/15/09 | 1,250,000 | 1,266,619 |
| North Syracuse Central School District, GO Notes, BAN | 2.75 | 8/21/09 | 2,933,542 | 2,934,406 |
| Oneida County Industrial Development Agency, Civic Facility | | | | |
| Revenue (Cedarbrook Village, Inc. Project) (LOC; Key Bank) | 2.45 | 8/7/09 | 3,000,000 a | 3,000,000 |
| Orange County Industrial Development Agency, Civic Facility | | | | |
| Revenue (Tuxedo Park School Project) (LOC; M&T Bank) | 0.46 | 8/7/09 | 1,000,000 a | 1,000,000 |
| Port Authority of New York and New Jersey, Equipment Notes | 0.47 | 8/7/09 | 2,800,000 a | 2,800,000 |
| Port Authority of New York and New Jersey, | | | | |
| Special Obligation Revenue (Versatile Structure | | | | |
| Obligations) (Liquidity Facility; JPMorgan Chase Bank) | 0.35 | 8/1/09 | 2,000,000 a | 2,000,000 |
| Suffolk County Industrial Development Agency, Civic Facility | | | | |
| Revenue (Huntington Hospital Project) (LOC; Bank of America) | 0.36 | 8/7/09 | 6,100,000 a | 6,100,000 |
| Syracuse Industrial Development Agency, | | | | |
| Civic Facility Revenue (Community Development | | | | |
| Properties-Larned Project) (LOC; M&T Bank) | 0.58 | 8/7/09 | 1,900,000 a | 1,900,000 |
| Triborough Bridges and Tunnel Authority, General Revenue | | | | |
| (MTA Bridges and Tunnels) (LOC; Bayerische Landesbank) | 0.90 | 8/7/09 | 13,660,000 a | 13,660,000 |
| Westchester County Industrial Development Agency, | | | | |
| Civic Facility Revenue (Catharine Field Home/The Seabury | | | | |
| at Field Home Civic Facility) (LOC; Comerica Bank) | 0.38 | 8/7/09 | 8,570,000 a | 8,570,000 |
| Yorktown Central School District, GO Notes, TAN | 1.00 | 10/30/09 | 5,000,000 | 5,006,065 |
| |
| Total Investments (cost $190,164,376) | | | 96.0% | 190,164,376 |
| Cash and Receivables (Net) | | | 4.0% | 7,826,439 |
| Net Assets | | | 100.0% | 197,990,815 |
| |
| See footnotes on page 66 | | | | |
| See notes to financial statements. | | | | |
The Funds 65
| STATEMENT OF INVESTMENTS (Unaudited) (continued) |
| | | |
| Summary of Abbreviations | | |
| |
| |
| ABAG | Association of Bay Area Governments | ACA | American Capital Access |
| AGC | ACE Guaranty Corporation | AGIC | Asset Guaranty Insurance Company |
| AMBAC | American Municipal Bond Assurance Corporation | ARRN | Adjustable Rate Receipt Notes |
| BAN | Bond Anticipation Notes | BIGI | Bond Investors Guaranty Insurance |
| BPA | Bond Purchase Agreement | CGIC | Capital Guaranty Insurance Company |
| CIC | Continental Insurance Company | CIFG | CDC Ixis Financial Guaranty |
| CMAC | Capital Markets Assurance Corporation | COP | Certificate of Participation |
| CP | Commercial Paper | EDR | Economic Development Revenue |
| EIR | Environmental Improvement Revenue | FGIC | Financial Guaranty Insurance Company |
| FHA | Federal Housing Administration | FHLB | Federal Home Loan Bank |
| FHLMC | Federal Home Loan Mortgage Corporation | FNMA | Federal National Mortgage Association |
| FSA | Financial Security Assurance | GAN | Grant Anticipation Notes |
| GIC | Guaranteed Investment Contract | GNMA | Government National Mortgage Association |
| GO | General Obligation | HR | Hospital Revenue |
| IDB | Industrial Development Board | IDC | Industrial Development Corporation |
| IDR | Industrial Development Revenue | LOC | Letter of Credit |
| LOR | Limited Obligation Revenue | LR | Lease Revenue |
| MFHR | Multi-Family Housing Revenue | MFMR | Multi-Family Mortgage Revenue |
| PCR | Pollution Control Revenue | PILOT | Payment in Lieu of Taxes |
| RAC | Revenue Anticipation Certificates | RAN | Revenue Anticipation Notes |
| RAW | Revenue Anticipation Warrants | RRR | Resources Recovery Revenue |
| SAAN | State Aid Anticipation Notes | SBPA | Standby Bond Purchase Agreement |
| SFHR | Single Family Housing Revenue | SFMR | Single Family Mortgage Revenue |
| SONYMA | State of New York Mortgage Agency | SWDR | Solid Waste Disposal Revenue |
| TAN | Tax Anticipation Notes | TAW | Tax Anticipation Warrants |
| TRAN | Tax and Revenue Anticipation Notes | XLCA | XL Capital Assurance |
| | | | | | | | | |
| Summary of Combined Ratings (Unaudited) | | | | | |
| | | | | | | | Value (%) | | |
| | | | | | | | | Dreyfus | Dreyfus |
| | | | | | Dreyfus | Dreyfus | Dreyfus | California | New York |
| | | | | | Municipal Cash | New York | Tax Exempt | AMT-Free | AMT-Free |
| | | | | | Management | Municipal Cash | Cash | Municipal Cash Municipal Cash |
| Fitch | or | Moody s | or | Standard & Poor s | Plus | Management | Management | Management | Management |
| F1+, F1 | VMIG1, MIG1, P1 | SP1+, SP1, A1+, A1 | 96.3 | 92.6 | 95.4 | 93.9 | 85.9 |
| AAA, AA, Ae | Aaa, Aa, Ae | | AAA, AA, Ae | .8 | 2.8 | 4.6 | 4.9 | 3.0 |
| Not Ratedf | Not Ratedf | | Not Ratedf | 2.9 | 4.6 | | 1.2 | 11.1 |
| | | | | | 100.0 | 100.0 | 100.0 | 100.0 | 100.0 |
|
| Based on total investments. |
| a Variable rate demand note rate shown is the interest rate in effect at July 31, 2009. Maturity date represents the next demand date, or the ultimate maturity date if earlier. |
| b Securities exempt from registration under Rule 144A of the Securities Act of 1933.These securities may be resold in transactions exempt from registration, normally to qualified |
| institutional buyers. At July 31, 2009, Dreyfus Municipal Cash Management Plus amounted to $116,270,000 or 5.0%, Dreyfus NewYork Municipal Cash Management amounted |
| to $89,845,000 or 7.9%, Dreyfus Tax Exempt Cash Management amounted to $424,654,000 or 6.5% and Dreyfus California AMT-Free Municipal Cash Management amounted |
| to $43,340,000 or 15.6% of net assets. |
| c These securities are prerefunded; the date shown represents the prerefunded date. Bonds which are prerefunded are collateralized by U.S. Government securities which are held in escrow |
| and are used to pay principal and interest on the municipal issue and to retire the bonds in full at the earliest refunding date. |
| d Purchased on delayed delivery basis. |
| e Notes which are not F, MIG or SP rated are represented by bond ratings of the issuers. |
| f Securities which, while not rated by Fitch, Moody's and Standard & Poor's, have been determined by the Manager to be of comparable quality to those rated securities in which the fund |
| may invest. |
| See notes to financial statements. |
66
STATEMENT OF ASSETS AND LIABILITIES
(amounts in thousands, except Net Asset Value Per Share)
July 31, 2009 (Unaudited) |
| | | | | | |
| | | Dreyfus | Dreyfus | Dreyfus | Dreyfus | Dreyfus |
| | Dreyfus | Cash | Government | Government | Treasury & | Treasury |
| | Cash | Management | Cash | Prime Cash | Agency Cash | Prime Cash |
| | Management | Plus, Inc. | Management | Management | Management | Management |
| Assets ($): | | | | | | |
| Investments at value Note 1(a,b) | 44,017,044a | 7,468,424a | 35,262,943a | 6,763,622 | 17,161,798a | 29,130,089 |
| Capital Support Agreement Note 1(f) | | 47,538 | | | | |
| Cash | | 747 | 10,212 | 4,232 | 728 | 32,835 |
| Receivable for investment securites sold | | 28 | | | | |
| Interest receivable | 27,895 | 3,788 | 11,891 | 13,402 | 25,994 | 38,467 |
| Prepaid expenses and other assets | 1,732 | 853 | 256 | 139 | 188 | 291 |
| | 44,046,671 | 7,521,378 | 35,285,302 | 6,781,395 | 17,188,708 | 29,201,682 |
| Liabilities ($): | | | | | | |
| Due to The Dreyfus Corporation | | | | | | |
| and affiliates Note 2(c) | 8,663 | 1,619 | 6,652 | 1,336 | 3,191 | 4,969 |
| Cash overdraft due to Custodian | 4,209 | | | | | |
| Payable for investment securities purchased | 425,000 | | | | | |
| Payable for shares of Beneficial | | | | | | |
| Interest/Common Stock redeemed | 4,358 | 910 | 3,757 | 3,078 | 2,930 | 26,948 |
| Accrued expenses | 35 | 32 | 42 | 6 | 39 | |
| | 442,265 | 2,561 | 10,451 | 4,420 | 6,160 | 31,917 |
| Net Assets ($) | 43,604,406 | 7,518,817 | 35,274,851 | 6,776,975 | 17,182,548 | 29,169,765 |
| Composition of Net Assets ($): | | | | | | |
| Paid-in capital | 43,604,469 | 7,556,421 | 35,274,852 | 6,776,947 | 17,182,619 | 29,169,641 |
| Accumulated net realized gain | | | | | | |
| (loss) on investments | (63) | (4,952) | (1) | 28 | (71) | 124 |
| Accumulated net unrealized appreciation | | | | | | |
| (depreciation) on investments | | (32,652) | | | | |
| Net Assets ($) | 43,604,406 | 7,518,817 | 35,274,851 | 6,776,975 | 17,182,548 | 29,169,765 |
| Net Asset Value Per Share | | | | | | |
| Institutional Shares | | | | | | |
| Net Assets ($) | 35,715,444 | 4,515,413 | 30,647,894 | 4,734,396 | 13,530,201 | 19,875,228 |
| Shares Outstanding | 35,715,496 | 4,536,611 | 30,647,921 | 4,734,377 | 13,530,255 | 19,875,144 |
| Net Asset Value Per Share ($) | 1.00 | 1.00 | 1.00 | 1.00 | 1.00 | 1.00 |
| Investor Shares | | | | | | |
| Net Assets ($) | 4,935,434 | 1,377,981 | 2,831,248 | 659,697 | 2,309,021 | 4,730,870 |
| Shares Outstanding | 4,935,444 | 1,385,327 | 2,831,252 | 659,694 | 2,309,031 | 4,730,852 |
| Net Asset Value Per Share ($) | 1.00 | 1.00 | 1.00 | 1.00 | 1.00 | 1.00 |
The Funds 67
STATEMENT OF ASSETS AND LIABILITIES (continued)
(amounts in thousands, except Net Asset Value Per Share)
July 31, 2009 (Unaudited) |
| | | | | | |
| | | Dreyfus | Dreyfus | Dreyfus | Dreyfus | Dreyfus |
| | Dreyfus | Cash | Government | Government | Treasury & | Treasury |
| | Cash | Management | Cash | Prime Cash | Agency Cash | Prime Cash |
| | Management | Plus, Inc. | Management | Management | Management | Management |
| Net Asset Value Per Share (continued) | | | | | | |
| Administrative Shares | | | | | | |
| Net Assets ($) | 1,516,831 | 1,021,459 | 1,270,192 | 528,193 | 801,673 | 1,679,837 |
| Shares Outstanding | 1,516,836 | 1,027,215 | 1,270,194 | 528,191 | 801,677 | 1,679,829 |
| Net Asset Value Per Share ($) | 1.00 | 1.00 | 1.00 | 1.00 | 1.00 | 1.00 |
| Participant Shares | | | | | | |
| Net Assets ($) | 1,196,401 | 588,843 | 442,733 | 826,037 | 373,601 | 2,789,309 |
| Shares Outstanding | 1,196,398 | 592,237 | 442,732 | 826,033 | 373,602 | 2,789,294 |
| Net Asset Value Per Share ($) | 1.00 | 1.00 | 1.00 | 1.00 | 1.00 | 1.00 |
| Service Shares | | | | | | |
| Net Assets ($) | | 7,138 | | | 5,395 | |
| Shares Outstanding | | 7,167 | | | 5,396 | |
| Net Asset Value Per Share ($) | | 1.00 | | | 1.00 | |
| Select Shares | | | | | | |
| Net Assets ($) | | 7,982 | | | 18,915 | |
| Shares Outstanding | | 8,036 | | | 18,916 | |
| Net Asset Value Per Share ($) | | 1.00 | | | 1.00 | |
| Agency Shares | | | | | | |
| Net Assets ($) | 240,296 | 1 | 82,784 | 28,652 | 104,203 | 94,521 |
| Shares Outstanding | 240,295 | 1 | 82,784 | 28,652 | 104,203 | 94,521 |
| Net Asset Value Per Share ($) | 1.00 | 1.00 | 1.00 | 1.00 | 1.00 | 1.00 |
| Premier Shares | | | | | | |
| Net Assets ($) | | | | | 39,539 | |
| Shares Outstanding | | | | | 39,539 | |
| Net Asset Value Per Share ($) | | | | | 1.00 | |
| Investments at cost ($) | 44,017,044 | 7,548,614 | 35,262,943 | 6,763,622 | 17,161,798 | 29,130,089 |
|
| a Amount includes repurchase agreements of $3,100,000,000, $572,000,000, $14,034,000,000 and $9,583,000,000 for Dreyfus Cash Management, Dreyfus Cash Management |
| Plus, Inc., Dreyfus Government Cash Management and Dreyfus Treasury & Agency Cash Management, respectively, See Note 1(c). |
| See notes to financial statements. |
68
| | | | | |
| | | | | Dreyfus | Dreyfus |
| | Dreyfus | Dreyfus | Dreyfus | California | New York |
| Municipal Cash | New York | Tax Exempt | AMT-Free | AMT-Free |
| Management | Municipal Cash | Cash Municipal Cash | Municipal Cash |
| | Plus | Management | Management | Management | Management |
| Assets ($): | | | | | |
| Investments at value Note 1(a,b) | 2,314,039 | 1,101,983 | 6,617,998 | 269,031 | 190,164 |
| Cash | | | | 5,827 | 142 |
| Receivable for investment securites sold | 20,020 | 49,625 | | 2,402 | 12,147 |
| Interest receivable | 2,495 | 1,364 | 5,249 | 791 | 464 |
| Prepaid expenses and other assets | 281 | 143 | 506 | 52 | 12 |
| | 2,336,835 | 1,153,115 | 6,623,753 | 278,103 | 202,929 |
| Liabilities ($): | | | | | |
| Due to The Dreyfus Corporation and affiliates Note 2(c) | 518 | 256 | 1,372 | 53 | 83 |
| Cash overdraft due to Custodian | 19,654 | 2,607 | 41,596 | | |
| Payable for investment securities purchased | 10,102 | 6,926 | | | 4,400 |
| Payable for shares of Beneficial Interest redeemed | | 103 | 156 | | 455 |
| Accrued expenses | 28 | 21 | 36 | 19 | |
| | 30,302 | 9,913 | 43,160 | 72 | 4,938 |
| Net Assets ($) | 2,306,533 | 1,143,202 | 6,580,593 | 278,031 | 197,991 |
| Composition of Net Assets ($): | | | | | |
| Paid-in capital | 2,306,355 | 1,143,083 | 6,580,138 | 278,016 | 197,983 |
| Accumulated net realized gain (loss) on investments | 178 | 119 | 455 | 15 | 8 |
| Net Assets ($) | 2,306,533 | 1,143,202 | 6,580,593 | 278,031 | 197,991 |
| Net Asset Value Per Share | | | | | |
| Instititutional Shares | | | | | |
| Net Assets ($) | 996,871 | 589,065 | 5,353,103 | 129,339 | 35,657 |
| Shares Outstanding | 996,660 | 589,015 | 5,352,735 | 129,328 | 35,656 |
| Net Asset Value Per Share ($) | 1.00 | 1.00 | 1.00 | 1.00 | 1.00 |
| Investor Shares | | | | | |
| Net Assets ($) | 375,219 | 444,897 | 585,488 | 60,802 | 99,769 |
| Shares Outstanding | 375,142 | 444,840 | 585,448 | 60,797 | 99,765 |
| Net Asset Value Per Share ($) | 1.00 | 1.00 | 1.00 | 1.00 | 1.00 |
| Administrative Shares | | | | | |
| Net Assets ($) | 870,224 | 79,793 | 462,031 | 15,644 | 147 |
| Shares Outstanding | 870,047 | 79,789 | 461,992 | 15,642 | 147 |
| Net Asset Value Per Share ($) | 1.00 | 1.00 | 1.00 | 1.00 | 1.00 |
| Participant Shares | | | | | |
| Net Assets ($) | 50,398 | 29,446 | 174,167 | 72,245 | 10 |
| Shares Outstanding | 50,387 | 29,442 | 174,159 | 72,237 | 10 |
| Net Asset Value Per Share ($) | 1.00 | 1.00 | 1.00 | 1.00 | 1.00 |
| Agency Shares | | | | | |
| Net Assets ($) | 13,821 | 1 | 5,804 | 1 | |
| Shares Outstanding | 13,819 | 1 | 5,804 | 1 | |
| Net Asset Value Per Share ($) | 1.00 | 1.00 | 1.00 | 1.00 | |
| Classic Shares | | | | | |
| Net Assets ($) | | | | | 62,408 |
| Shares Outstanding | | | | | 62,405 |
| Net Asset Value Per Share ($) | | | | | 1.00 |
| Investments at cost ($) | 2,314,039 | 1,101,983 | 6,617,998 | 269,031 | 190,164 |
| |
| See notes to financial statements. | | | | | |
The Funds 69
STATEMENT OF OPERATIONS
(amounts in thousands)
Six Months Ended July 31, 2009 (Unaudited) |
| | | | | | |
| | | Dreyfus | Dreyfus | Dreyfus | Dreyfus | Dreyfus |
| | Dreyfus | Cash | Government | Government | Treasury & | Treasury |
| | Cash | Management | Cash | Prime Cash | Agency Cash | Prime Cash |
| Management | Plus, Inc. | Management | Management | Management | Management |
| Investment Income ($): | | | | | | |
| Interest Income | 177,168 | 31,793 | 94,197 | 14,772 | 33,906 | 46,519 |
| Expenses: | | | | | | |
| Management fee Note 2(a) | 39,559 | 7,372 | 37,329 | 7,541 | 19,256 | 35,848 |
| Distribution fees Note 2(b) | 9,271 | 3,782 | 6,850 | 3,318 | 5,195 | 16,232 |
| Treasury insurance expense Note 1(g) | 5,644 | 2,663 | 2,549 | 732 | 2,191 | 2,880 |
| Registration fees | 468 | 161 | 610 | 194 | 437 | 759 |
| Shareholder servicing costs Note 2(c) | 283 | 109 | 232 | 70 | 167 | 329 |
| Custodian fees Note 2(c) | 139 | 59 | 148 | 52 | 106 | 114 |
| Prospectus and shareholders reports | 80 | 105 | 73 | 38 | 33 | 78 |
| Professional fees | 52 | 48 | 56 | 30 | 53 | 57 |
| Trustees /Directors fees and expenses Note 2(d) | 42 | 6 | 46 | 10 | 22 | 47 |
| Miscellaneous | 198 | 57 | 217 | 83 | 133 | 257 |
| Total Expenses | 55,736 | 14,362 | 48,110 | 12,068 | 27,593 | 56,601 |
| Less reduction in management fees | | | | | | |
| due to yield floor undertaking Note 2(a) | (29) | (37) | (848) | (1,467) | (2,536) | (13,609) |
| Less reduction in management fees due to | | | | | | |
| expense limitations undertaking Note 2(a) | (1,260) | (542) | (1,375) | (472) | (947) | (1,630) |
| Less reduction in fees | | | | | | |
| due to earnings credits Note 1(b) | (12) | (16) | (4) | (7) | (11) | (15) |
| Net Expenses | 54,435 | 13,767 | 45,883 | 10,122 | 24,099 | 41,347 |
| Investment Income Net | 122,733 | 18,026 | 48,314 | 4,650 | 9,807 | 5,172 |
| Realized and Unrealized Gain (Loss) on | | | | | | |
| Investments Note 1(b) ($): | | | | | | |
| Net realized gain (loss) on investments | 170 | 34 | | 9 | 46 | (9) |
| Net unrealized appreciation | | | | | | |
| (depreciation) on investments | | (315) | | | | |
| Net Realized and Unrealized | | | | | | |
| Gain (Loss) on Investments | 170 | (281) | | 9 | 46 | (9) |
| Net Increase in Net Assets | | | | | | |
| Resulting from Operations | 122,903 | 17,745 | 48,314 | 4,659 | 9,853 | 5,163 |
| |
| See notes to financial statements. | | | | | | |
70
| | | | | |
| | | | | Dreyfus | Dreyfus |
| | Dreyfus | Dreyfus | Dreyfus | California | New York |
| | Municipal Cash | New York | Tax Exempt | AMT-Free | AMT-Free |
| | Management | Municipal Cash | Cash | Municipal Cash | Municipal Cash |
| | Plus | Management | Management | Management | Management |
| Investment Income ($): | | | | | |
| Interest Income | 9,913 | 4,693 | 29,904 | 1,068 | 1,064 |
| Expenses: | | | | | |
| Management fee Note 2(a) | 2,055 | 1,021 | 7,008 | 252 | 213 |
| Distribution fees Note 2(b) | 857 | 544 | 1,362 | 229 | 302 |
| Treasury insurance expense Note 1(g) | 314 | 198 | 1,101 | 86 | 43 |
| Registration fees | 198 | 28 | 209 | 11 | |
| Professional fees | 49 | 45 | 58 | 36 | |
| Custodian fees Note 2(c) | 38 | 28 | 55 | 15 | |
| Prospectus and shareholders reports | 35 | 8 | 23 | 2 | |
| Shareholder servicing costs Note 2(c) | 22 | 18 | 197 | 1 | |
| Trustees fees and expenses Note 2(d) | 3 | 2 | 8 | 1 | |
| Miscellaneous | 29 | 24 | 87 | 15 | |
| Total Expenses | 3,600 | 1,916 | 10,108 | 648 | 558 |
| Less reduction in management fee | | | | | |
| due to yield floor undertaking Note 2(a) | | | (16) | (3) | a |
| Less reduction in management fees due to | | | | | |
| expense limitations undertaking Note 2(a) | (373) | (154) | (636) | (81) | |
| Less reduction in management fee | | | | | |
| due to undertaking Note 2(a) | | | | (63) | |
| Less reduction in fees | | | | | |
| due to earnings credits Note 1(b) | (53) | (3) | (69) | (1) | |
| Net Expenses | 3,174 | 1,759 | 9,387 | 500 | 558 |
| Investment Income Net | 6,739 | 2,934 | 20,517 | 568 | 506 |
| Net Realized Gain (Loss) on | | | | | |
| Investments Note 1(b) ($) | 3 | 31 | 315 | | 8 |
| Net Increase in Net Assets | | | | | |
| Resulting from Operations | 6,742 | 2,965 | 20,832 | 568 | 514 |
| |
| a Amount represents less than $1,000. | | | | | |
| See notes to financial statements | | | | | |
The Funds 71
STATEMENT OF CHANGES IN NET ASSETS
(amounts in thousands) |
| | | | |
| | Dreyfus Cash Management | Dreyfus Cash Management Plus, Inc. |
| | Six Months Ended | Year Ended | Six Months Ended | Year Ended |
| | July 31, 2009 | January 31, | July 31, 2009 | January 31, |
| | (Unaudited) | 2009 | (Unaudited) | 2009 |
| Operations ($): | | | | |
| Investment income net | 122,733 | 773,401 | 18,026 | 344,691 |
| Net realized gain (loss) on investments | 170 | (193) | 34 | 1,780 |
| Net unrealized appreciation (depreciation) on investments | | | (315) | (32,337) |
| Net Increase (Decrease) in Net Assets | | | | |
| Resulting from Operations | 122,903 | 773,208 | 17,745 | 314,134 |
| Dividends to Shareholders from ($): | | | | |
| Investment income net: | | | | |
| Institutional Shares | (106,331) | (636,249) | (11,969) | (226,894) |
| Investor Shares | (10,201) | (86,866) | (2,471) | (41,297) |
| Administrative Shares | (3,873) | (35,678) | (2,808) | (46,098) |
| Participant Shares | (1,689) | (12,715) | (770) | (28,385) |
| Service Shares | | | (3) | (1,644) |
| Select Shares | | | (5) | (356) |
| Agency Shares | (639) | (1,893) | a | (17) |
| Total Dividends | (122,733) | (773,401) | (18,026) | (344,691) |
| Beneficial Interest/Capital Stock | | | | |
| Transactions ($1.00 per share): | | | | |
| Net proceeds from shares sold: | | | | |
| Institutional Shares | 121,066,686 | 186,740,823 | 10,316,105 | 71,235,558 |
| Investor Shares | 8,772,262 | 21,517,623 | 1,420,323 | 4,373,540 |
| Administrative Shares | 2,155,265 | 4,931,910 | 1,273,132 | 5,949,446 |
| Participant Shares | 2,500,067 | 4,274,633 | 1,062,501 | 4,863,282 |
| Service Shares | | | 30,645 | 242,535 |
| Select Shares | | | 15,420 | 70,971 |
| Agency Shares | 253,600 | 574,176 | | 38,228 |
| Net assets received in connection | | | | |
| with reorganization Note 1 | | 783,343 | | |
| Dividends reinvested: | | | | |
| Institutional Shares | 27,376 | 168,644 | 5,418 | 77,673 |
| Investor Shares | 1,908 | 20,318 | 2,101 | 36,374 |
| Administrative Shares | 1,096 | 8,814 | 2,381 | 39,392 |
| Participant Shares | 358 | 3,619 | 717 | 27,126 |
| Service Shares | | | a | 157 |
| Select Shares | | | | 20 |
| Agency Shares | 314 | 1 | a | a |
| Cost of shares redeemed: | | | | |
| Institutional Shares | (117,200,162) | (174,070,720) | (9,625,739) | (76,990,767) |
| Investor Shares | (8,731,973) | (19,838,830) | (1,531,368) | (4,718,014) |
| Administrative Shares | (1,815,372) | (5,186,524) | (1,344,469) | (7,171,225) |
| Participant Shares | (2,356,460) | (3,616,149) | (1,510,522) | (5,114,883) |
| Service Shares | | | (30,151) | (306,236) |
| Select Shares | | | (35,508) | (43,293) |
| Agency Shares | (112,291) | (494,498) | | (38,228) |
| Increase (Decrease) in Net Assets from | | | | |
| Beneficial Interest/Capital Stock Transactions | 4,562,674 | 15,817,183 | 50,986 | (7,428,344) |
| Total Increase (Decrease) In Net Assets | 4,562,844 | 15,816,990 | 50,705 | (7,458,901) |
| Net Assets ($): | | | | |
| Beginning of Period | 39,041,562 | 23,224,572 | 7,468,112 | 14,927,013 |
| End of Period | 43,604,406 | 39,041,562 | 7,518,817 | 7,468,112 |
| |
| a Amount represents less than $1,000. | | | | |
| See notes to financial statements. | | | | |
72
| | | | |
| | Dreyfus Government | Dreyfus Government |
| | Cash Management | Prime Cash Management |
| | Six Months Ended | Year Ended | Six Months Ended | Year Ended |
| | July 31, 2009 | January 31, | July 31, 2009 | January 31, |
| | (Unaudited) | 2009 | (Unaudited) | 2009 |
| Operations ($): | | | | |
| Investment income net | 48,314 | 364,171 | 4,650 | 100,451 |
| Net realized gain (loss) on investments | | 2,836 | 9 | 19 |
| Net Increase (Decrease) in Net Assets | | | | |
| Resulting from Operations | 48,314 | 367,007 | 4,659 | 100,470 |
| Dividends to Shareholders from ($): | | | | |
| Investment income net: | | | | |
| Institutional Shares | (45,188) | (281,591) | (4,368) | (67,482) |
| Investor Shares | (1,260) | (44,651) | (28) | (10,951) |
| Administrative Shares | (1,705) | (26,146) | (230) | (9,100) |
| Participant Shares | (56) | (9,680) | (1) | (12,254) |
| Agency Shares | (105) | (2,103) | (23) | (666) |
| Total Dividends | (48,314) | (364,171) | (4,650) | (100,453) |
| Beneficial Interest | | | | |
| Transactions ($1.00 per share): | | | | |
| Net proceeds from shares sold: | | | | |
| Institutional Shares | 93,982,680 | 143,182,998 | 10,508,123 | 24,434,863 |
| Investor Shares | 5,631,923 | 12,562,114 | 931,537 | 2,843,963 |
| Administrative Shares | 2,019,236 | 7,389,922 | 2,400,041 | 5,977,471 |
| Participant Shares | 1,360,913 | 4,126,713 | 846,334 | 3,265,428 |
| Agency Shares | 126,088 | 1,190,425 | 43,265 | 262,921 |
| Dividends reinvested: | | | | |
| Institutional Shares | 13,266 | 105,370 | 1,548 | 35,987 |
| Investor Shares | 735 | 26,359 | 13 | 6,013 |
| Administrative Shares | 1,338 | 19,035 | 204 | 7,663 |
| Participant Shares | 29 | 5,350 | 1 | 10,713 |
| Agency Shares | a | 338 | 1 | a |
| Cost of shares redeemed: | | | | |
| Institutional Shares | (97,063,029) | (118,878,645) | (12,214,337) | (20,358,570) |
| Investor Shares | (6,859,733) | (10,269,095) | (1,450,116) | (2,234,543) |
| Administrative Shares | (3,008,191) | (5,843,987) | (2,565,301) | (5,599,022) |
| Participant Shares | (1,580,228) | (3,915,680) | (1,366,472) | (2,641,115) |
| Agency Shares | (129,224) | (1,106,544) | (55,883) | (231,653) |
| Increase (Decrease) in Net Assets from | | | | |
| Beneficial Interest Transactions | (5,504,197) | 28,594,673 | (2,921,042) | 5,780,119 |
| Total Increase (Decrease) In Net Assets | (5,504,197) | 28,597,509 | (2,921,033) | 5,780,136 |
| Net Assets ($): | | | | |
| Beginning of Period | 40,779,048 | 12,181,539 | 9,698,008 | 3,917,872 |
| End of Period | 35,274,851 | 40,779,048 | 6,776,975 | 9,698,008 |
| |
| a Amount represents less than $1,000. | | | | |
| See notes to financial statements. | | | | |
The Funds 73
STATEMENT OF CHANGES IN NET ASSETS (continued)
(amounts in thousands) |
| | | | |
| | Dreyfus Treasury & | Dreyfus Treasury Prime |
| | Agency Cash Management | Cash Management |
| | Six Months Ended | Year Ended | Six Months Ended | Year Ended |
| | July 31, 2009 | January 31, | July 31, 2009 | January 31, |
| | (Unaudited) | 2009 | (Unaudited) | 2009 |
| Operations ($): | | | | |
| Investment income net | 9,807 | 202,411 | 5,172 | 199,425 |
| Net realized gain (loss) on investments | 46 | 984 | (9) | 668 |
| Net Increase (Decrease) in Net Assets | | | | |
| Resulting from Operations | 9,853 | 203,395 | 5,163 | 200,093 |
| Dividends to Shareholders from ($): | | | | |
| Investment income net: | | | | |
| Institutional Shares | (9,562) | (142,784) | (5,135) | (127,056) |
| Investor Shares | (4) | (33,210) | (8) | (43,949) |
| Administrative Shares | (214) | (19,966) | (10) | (9,190) |
| Participant Shares | (1) | (4,440) | (6) | (15,378) |
| Service Shares | a | (323) | | |
| Select Shares | a | (415) | | |
| Agency Shares | (26) | (947) | (13) | (3,852) |
| Premier Shares | a | (326) | | |
| Total Dividends | (9,807) | (202,411) | (5,172) | (199,425) |
| Beneficial Interest Transactions ($1.00 per share): | | | |
| Net proceeds from shares sold: | | | | |
| Institutional Shares | 34,593,262 | 75,007,689 | 31,038,960 | 94,609,837 |
| Investor Shares | 6,511,569 | 17,741,257 | 4,539,355 | 19,385,467 |
| Administrative Shares | 2,375,296 | 9,506,204 | 3,006,101 | 7,243,860 |
| Participant Shares | 969,764 | 3,422,940 | 5,607,537 | 17,271,629 |
| Service Shares | 4,267 | 544,153 | | |
| Select Shares | 36,318 | 115,831 | | |
| Agency Shares | 176,870 | 545,413 | 291,693 | 1,535,777 |
| Premier Shares | 664,737 | 440,976 | | |
| Dividends reinvested: | | | | |
| Institutional Shares | 2,927 | 58,212 | 2,097 | 71,888 |
| Investor Shares | 1 | 3,880 | 5 | 19,562 |
| Administrative Shares | 135 | 14,282 | 6 | 6,542 |
| Participant Shares | a | 1,188 | 5 | 11,922 |
| Service Shares | a | a | | |
| Select Shares | a | 200 | | |
| Agency Shares | a | a | 10 | 3,377 |
| Premier Shares | | a | | |
| Cost of shares redeemed: | | | | |
| Institutional Shares | (37,527,124) | (71,496,288) | (41,753,162) | (69,468,590) |
| Investor Shares | (7,519,392) | (17,911,593) | (7,330,986) | (14,456,010) |
| Administrative Shares | (2,928,762) | (8,923,463) | (3,851,860) | (5,162,606) |
| Participant Shares | (1,040,156) | (3,268,446) | (8,255,193) | (12,821,119) |
| Service Shares | (4,304) | (594,881) | | |
| Select Shares | (50,114) | (177,501) | | |
| Agency Shares | (135,966) | (482,115) | (606,410) | (1,129,927) |
| Premier Shares | (660,030) | (435,424) | | |
| Increase (Decrease) in Net Assets from | | | | |
| Beneficial Interest Transactions | (4,530,702) | 4,112,514 | (17,311,842) | 37,121,609 |
| Total Increase (Decrease) In Net Assets | (4,530,656) | 4,113,498 | (17,311,851) | 37,122,277 |
| Net Assets ($): | | | | |
| Beginning of Period | 21,713,204 | 17,599,706 | 46,481,616 | 9,359,339 |
| End of Period | 17,182,548 | 21,713,204 | 29,169,765 | 46,481,616 |
| |
| a Amount represents less than $1,000. | | | | |
| See notes to financial statements. | | | | |
74
| | | | |
| | Dreyfus Municipal | Dreyfus New York |
| | Cash Management Plus | Municipal Cash Management |
| | Six Months Ended | Year Ended | Six Months Ended | Year Ended |
| | July 31, 2009 | January 31, | July 31, 2009 | January 31, |
| | (Unaudited) | 2009 | (Unaudited) | 2009 |
| Operations ($): | | | | |
| Investment income net | 6,739 | 33,984 | 2,934 | 16,959 |
| Net realized gain (loss) on investments | 3 | 175 | 31 | 88 |
| Net Increase (Decrease) in Net Assets | | | | |
| Resulting from Operations | 6,742 | 34,159 | 2,965 | 17,047 |
| Dividends to Shareholders from ($): | | | | |
| Investment income net: | | | | |
| Institutional Shares | (3,593) | (17,038) | (1,963) | (9,642) |
| Investor Shares | (762) | (7,833) | (764) | (5,199) |
| Administrative Shares | (2,290) | (8,324) | (156) | (1,297) |
| Participant Shares | (92) | (886) | (51) | (828) |
| Agency Shares | (2) | a | a | a |
| Total Dividends | (6,739) | (34,081) | (2,934) | (16,966) |
| Beneficial Interest Transactions ($1.00 per share): | | | | |
| Net proceeds from shares sold: | | | | |
| Institutional Shares | 3,528,916 | 8,498,054 | 541,582 | 1,346,480 |
| Investor Shares | 352,401 | 942,362 | 413,115 | 746,092 |
| Administrative Shares | 1,028,718 | 1,651,865 | 59,327 | 119,808 |
| Participant Shares | 37,147 | 128,642 | 64,446 | 181,551 |
| Agency Shares | 13,868 | | | |
| Dividends reinvested: | | | | |
| Institutional Shares | 2,217 | 6,404 | 327 | 1,792 |
| Investor Shares | 749 | 7,349 | 695 | 4,676 |
| Administrative Shares | 2,245 | 7,938 | 154 | 1,209 |
| Participant Shares | 92 | 877 | 51 | 827 |
| Agency Shares | 2 | a | a | a |
| Cost of shares redeemed: | | | | |
| Institutional Shares | (3,123,300) | (9,701,968) | (497,045) | (1,262,094) |
| Investor Shares | (270,790) | (1,128,929) | (342,809) | (739,579) |
| Administrative Shares | (785,574) | (1,329,222) | (41,432) | (133,573) |
| Participant Shares | (47,608) | (105,308) | (86,093) | (177,886) |
| Agency Shares | (52) | | | |
| Increase (Decrease) in Net Assets from | | | | |
| Beneficial Interest Transactions | 739,031 | (1,021,936) | 112,318 | 89,303 |
| Total Increase (Decrease) In Net Assets | 739,034 | (1,021,858) | 112,349 | 89,384 |
| Net Assets ($): | | | | |
| Beginning of Period | 1,567,499 | 2,589,357 | 1,030,853 | 941,469 |
| End of Period | 2,306,533 | 1,567,499 | 1,143,202 | 1,030,853 |
| |
| a Amount represents less than $1,000. | | | | |
| See notes to financial statements. | | | | |
The Funds 75
STATEMENT OF CHANGES IN NET ASSETS (continued)
(amounts in thousands) |
| | | | |
| | Dreyfus Tax Exempt | Dreyfus California AMT-Free |
| | Cash Management | Municipal Cash Management |
| | Six Months Ended | Year Ended | Six Months Ended | Year Ended |
| | July 31, 2009 | January 31, | July 31, 2009 | January 31, |
| | (Unaudited) | 2009 | (Unaudited) | 2009 |
| Operations ($): | | | | |
| Investment income net | 20,517 | 118,001 | 568 | 5,530 |
| Net realized gain (loss) on investments | 315 | 140 | | 15 |
| Net Increase (Decrease) in Net Assets | | | | |
| Resulting from Operations | 20,832 | 118,141 | 568 | 5,545 |
| Dividends to Shareholders from ($): | | | | |
| Investment income net: | | | | |
| Institutional Shares | (17,633) | (98,791) | (350) | (2,624) |
| Investor Shares | (1,110) | (8,945) | (83) | (1,074) |
| Administrative Shares | (1,566) | (9,616) | (25) | (25) |
| Participant Shares | (186) | (698) | (110) | (1,828) |
| Agency Shares | (22) | (48) | a | a |
| Total Dividends | (20,517) | (118,098) | (568) | (5,551) |
| Beneficial Interest | | | | |
| Transactions ($1.00 per share): | | | | |
| Net proceeds from shares sold: | | | | |
| Institutional Shares | 9,869,789 | 25,420,986 | 125,968 | 434,112 |
| Investor Shares | 561,860 | 1,561,565 | 119,702 | 312,402 |
| Administrative Shares | 512,541 | 2,917,935 | 56,927 | 7,203 |
| Participant Shares | 176,762 | 372,600 | 40,965 | 197,632 |
| Agency Shares | 26,264 | 4,689 | | a |
| Dividends reinvested: | | | | |
| Institutional Shares | 9,105 | 44,543 | 317 | 2,439 |
| Investor Shares | 883 | 6,525 | 83 | 982 |
| Administrative Shares | 1,340 | 8,442 | 25 | 20 |
| Participant Shares | 1 | 197 | 110 | 1,819 |
| Agency Shares | 20 | 48 | a | a |
| Cost of shares redeemed: | | | | |
| Institutional Shares | (9,716,842) | (24,644,410) | (88,115) | (460,094) |
| Investor Shares | (542,530) | (1,559,021) | (82,777) | (295,483) |
| Administrative Shares | (696,443) | (2,540,898) | (41,360) | (7,230) |
| Participant Shares | (136,766) | (293,178) | (65,440) | (244,762) |
| Agency Shares | (24,818) | (400) | | a |
| Increase (Decrease) in Net Assets from | | | | |
| Beneficial Interest Transactions | 41,166 | 1,299,623 | 66,405 | (50,960) |
| Total Increase (Decrease) In Net Assets | 41,481 | 1,299,666 | 66,405 | (50,966) |
| Net Assets ($): | | | | |
| Beginning of Period | 6,539,112 | 5,239,446 | 211,626 | 262,592 |
| End of Period | 6,580,593 | 6,539,112 | 278,031 | 211,626 |
| |
| a Amount represents less than $1,000. | | | | |
| See notes to financial statements. | | | | |
76
| | | |
| | Dreyfus New York AMT-Free |
| | Municipal Cash Management |
| | Six Months Ended | One Month Ended | Year Ended |
| | July 31, 2009 | January 31, | December 31, |
| | (Unaudited) | 2009a | 2008b,c |
| Operations ($): | | | |
| Investment income net | 506 | 82 | 4,284 |
| Net realized gain (loss) on investments | 8 | | 12 |
| Net Increase (Decrease) in Net Assets Resulting from Operations | 514 | 82 | 4,296 |
| Dividends to Shareholders from ($): | | | |
| Investment income net: | | | |
| Institutional Shares | (182) | (30) | (1,207) |
| Investor Shares | (222) | (39) | (1,914) |
| Administrative Shares | (1) | d | d |
| Participant Shares | d | d | d |
| Classic Shares | (101) | (13) | (1,163) |
| Net realized gain on investments: | | | |
| Institutional Shares | | | (2) |
| Investor Shares | | | (4) |
| Administrative Shares | | | |
| Participant Shares | | | |
| Classic Shares | | | (3) |
| Total Dividends | (506) | (82) | (4,293) |
| Beneficial Interest Transactions ($1.00 per share): | | | |
| Net proceeds from shares sold: | | | |
| Institutional Shares | 65,750 | 29,278 | 172,559 |
| Investor Shares | 97,858 | 24,669 | 384,961 |
| Administrative Shares | 14,894 | | 10 |
| Participant Shares | d | | 10 |
| Classic Shares | 156,870 | 35,258 | 378,913 |
| Dividends reinvested: | | | |
| Institutional Shares | 21 | 2 | 159 |
| Investor Shares | 60 | 8 | 481 |
| Administrative Shares | 1 | | |
| Participant Shares | | | |
| Classic Shares | 101 | 13 | 1,163 |
| Cost of shares redeemed: | | | |
| Institutional Shares | (79,447) | (29,050) | (187,569) |
| Investor Shares | (100,132) | (22,523) | (424,300) |
| Administrative Shares | (14,758) | | |
| Participant Shares | d | | |
| Classic Shares | (170,910) | (31,891) | (386,352) |
| Increase (Decrease) in Net Assets from | | | |
| Beneficial Interest Transactions | (29,692) | 5,764 | (59,965) |
| Total Increase (Decrease) In Net Assets | (29,684) | 5,764 | (59,962) |
| Net Assets ($): | | | |
| Beginning of Period | 227,675 | 221,911 | 281,873 |
| End of Period | 197,991 | 227,675 | 221,911 |
|
| a The fund has changed its fiscal year end from December 31 to January 31. |
| b The fund commenced offering five classes of shares on the close of business September 12, 2008. The existing shares were redesignated and the fund added Administrative and |
| Participant shares. |
| c Represents information for the fund's predecessor, BNY Hamilton NewYork AMT-Free Money Market Fund through September 12, 2008. |
| d Amount represents less than $1,000. |
| See notes to financial statements. |
The Funds 77
FINANCIAL HIGHLIGHTS
The following tables describe the performance for each share class for the fiscal periods indicated.All information reflects financial results for a single fund share. Total return shows how much your investment in the fund would have increased (or decreased) during each period, assuming you had reinvested all dividends and distributions.These figures have been derived from the fund s financial statements. Please note that the financial highlights information in the following tables for Dreyfus New York AMT-Free Municipal Cash Management s Institutional, Investor and Classic shares represents the financial highlights of Dreyfus New York AMT-Free Municipal Cash Management s predecessor, BNY Hamilton NewYork AMT-Free Municipal Money Fund ( NewYork AMT-Free Municipal Money Fund ), before Dreyfus NewYork AMT-Free Municipal Cash Management commenced operations as of the close of business on September 12, 2008, and represents the performance of Dr eyfus New York AMT-Free Municipal Cash Management s Institutional, Investor and Classic shares thereafter. Before Dreyfus New York AMT-Free Municipal Cash Management commenced operations, all of the assets of the New York AMT-Free Municipal Money Fund were transferred to Dreyfus NewYork AMT-Free Municipal Cash Management in exchange for Institutional, Investor and Classic shares of the fund in a tax-free reorganization.Total return shows how much your investment in Dreyfus NewYork AMT-Free Municipal Cash Management would have increased (or decreased) during each period, assuming you had reinvested all dividends and distributions.These figures have been derived from Dreyfus NewYork AMT-Free Municipal Cash Management s predecessor s financial statements.
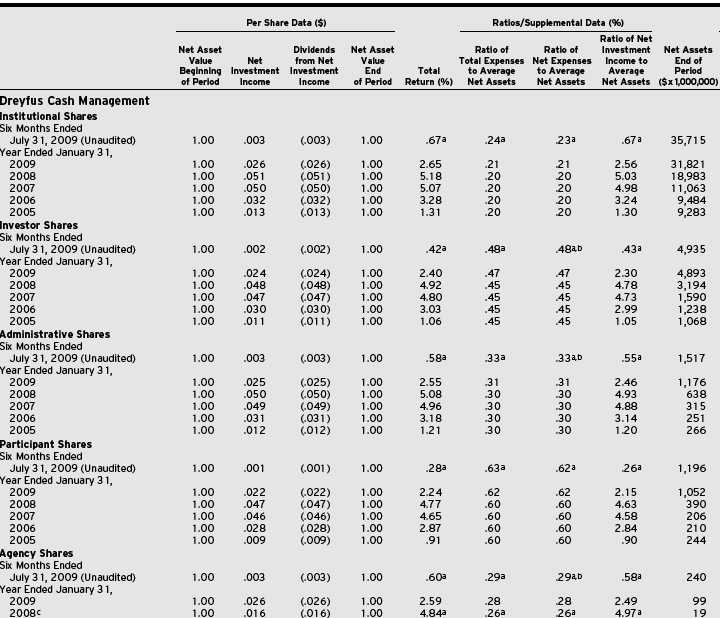
| |
| a | Annualized. |
| b | Expense waivers and/or reimbursements amounted to less than .01%. |
| c | From October 1, 2007 (commencement of initial offering) to January 31, 2008. |
| See notes to financial statements. |
78
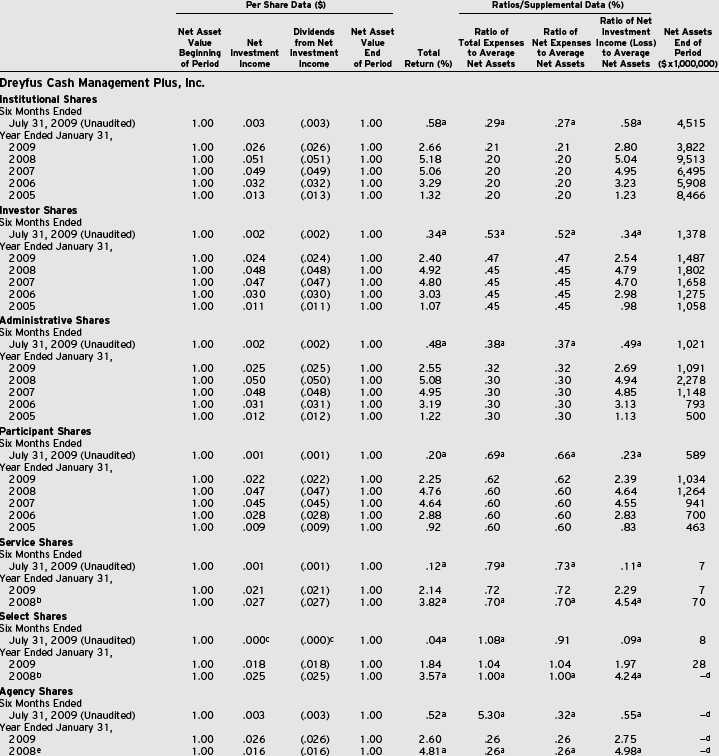
| |
| a | Annualized. |
| b | From June 29, 2007 (commencement of initial offering) to January 31, 2008. |
| c | Amount represents less than $.001 per share. |
| d | Amount represents less than $1 million. |
| e | From October 1, 2007 (commencement of initial offering) to January 31, 2008. |
| See notes to financial statements. |
The Funds 79
| FINANCIAL HIGHLIGHTS (continued) |
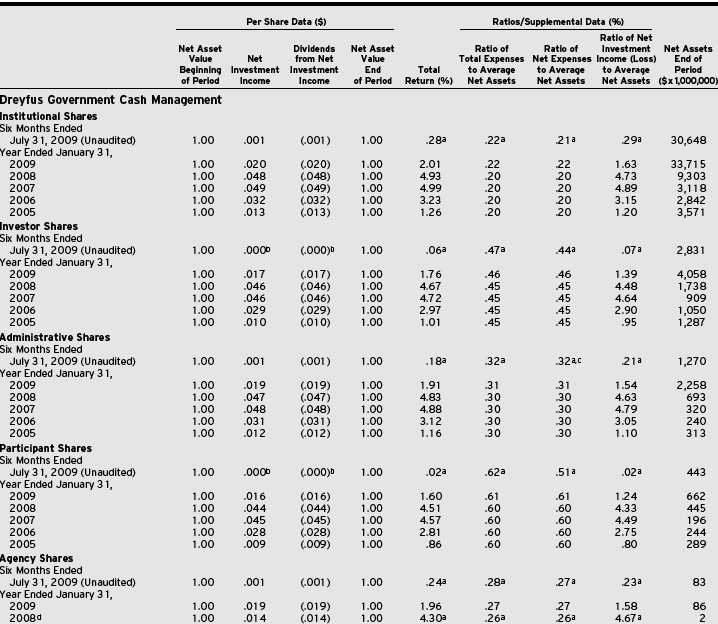
| |
| a | Annualized. |
| b | Amount represents less than $.001 per share. |
| c | Expense waivers and/or reimbursements amounted to less than .01%. |
| d | From October 1, 2007 (commencement of initial offering) to January 31, 2008. |
| See notes to financial statements. |
80
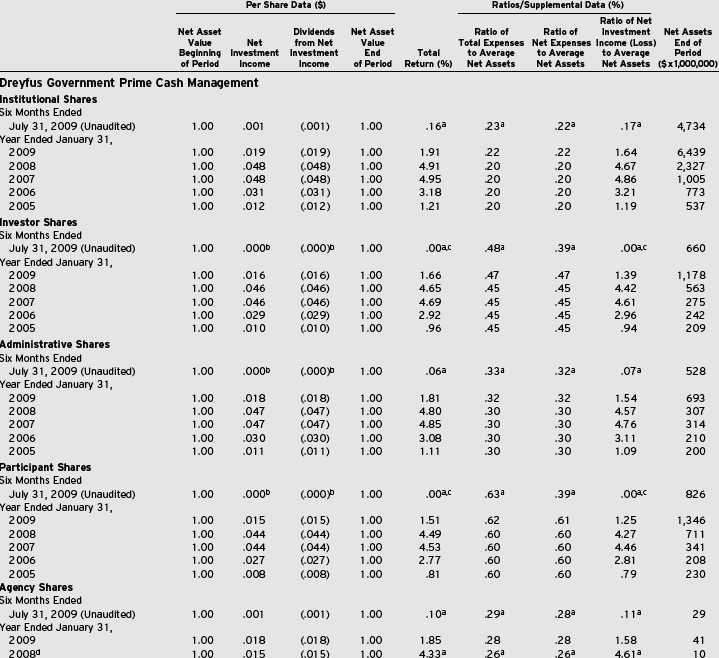
| |
| a | Annualized. |
| b | Amount represents less than $.001 per share. |
| c | Amount represents less than .01%. |
| d | From October 1, 2007 (commencement of initial offering) to January 31, 2008. |
| See notes to financial statements. |
The Funds 81
| FINANCIAL HIGHLIGHTS (continued) |
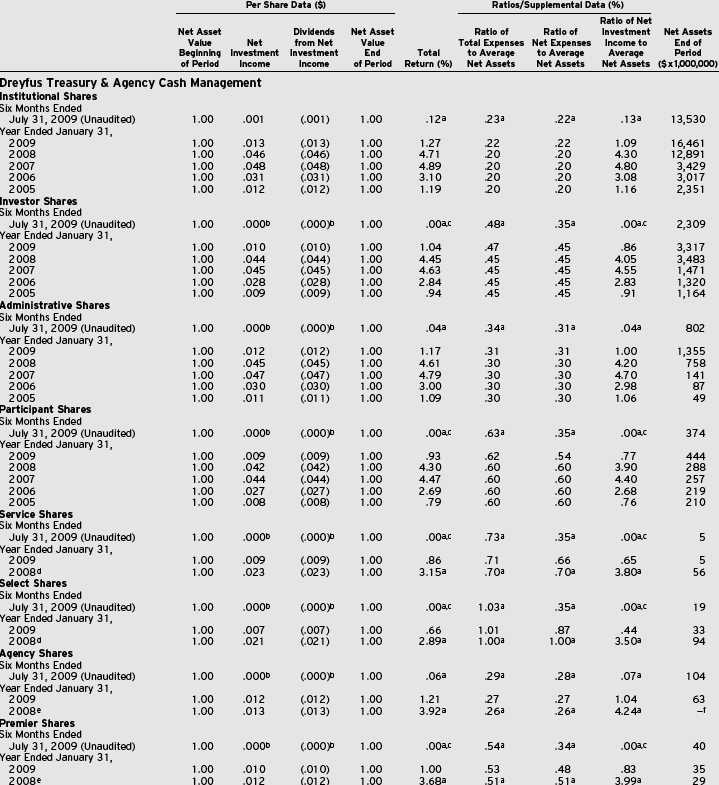
| |
| a | Annualized. |
| b | Amount represents less than $.001 per share. |
| c | Amount represents less than .01%. |
| d | From June 29, 2007 (commencement of initial offering) to January 31, 2008. |
| e | From October 1, 2007 (commencement of initial offering) to January 31, 2008. |
| f | Amount represents less than $1 million. |
| See notes to financial statements. |
82
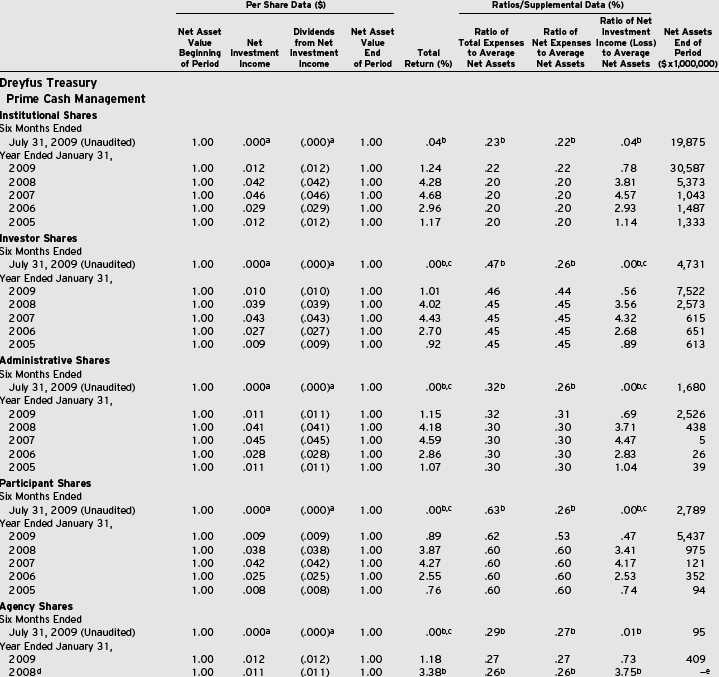
| |
| a | Amount represents less than $.001 per share. |
| b | Annualized. |
| c | Amount represents less than .01%. |
| d | From October 1, 2007 (commencement of initial offering) to January 31, 2008. |
| e | Amount represents less than $1 million. |
| See notes to financial statements. |
The Funds 83
| FINANCIAL HIGHLIGHTS (continued) |

| |
| a | Annualized. |
| b | Amount represents less than $1 million. |
| c | From October 1, 2007 (commencement of initial offering) to January 31, 2008. |
| See notes to financial statements. |
84

| |
| a | Annualized. |
| b | Amount represents less than $1 million. |
| c | From October 1, 2007 (commencement of initial offering) to January 31, 2008. |
| See notes to financial statements. |
The Funds 85
| FINANCIAL HIGHLIGHTS (continued) |
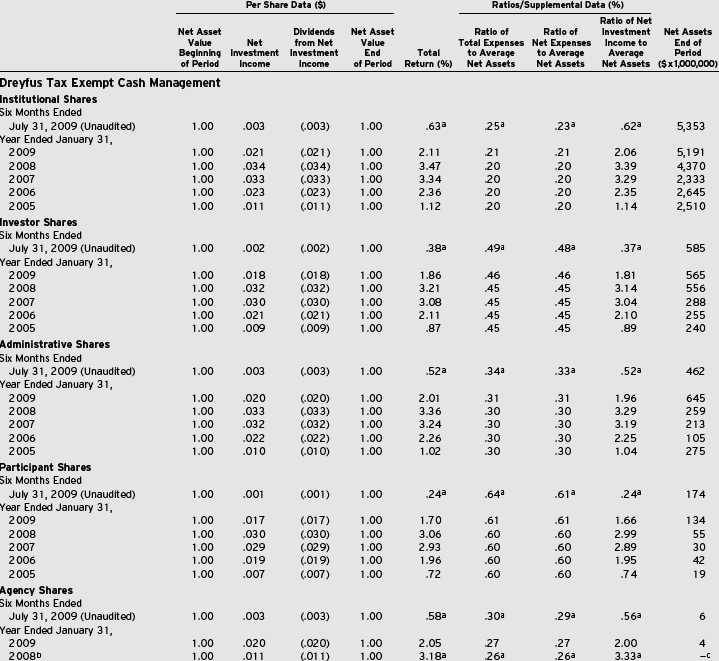
| |
| a | Annualized. |
| b | From October 1, 2007 (commencement of initial offering) to January 31, 2008. |
| c | Amount represents less than $1 million. |
| See notes to financial statements. |
86
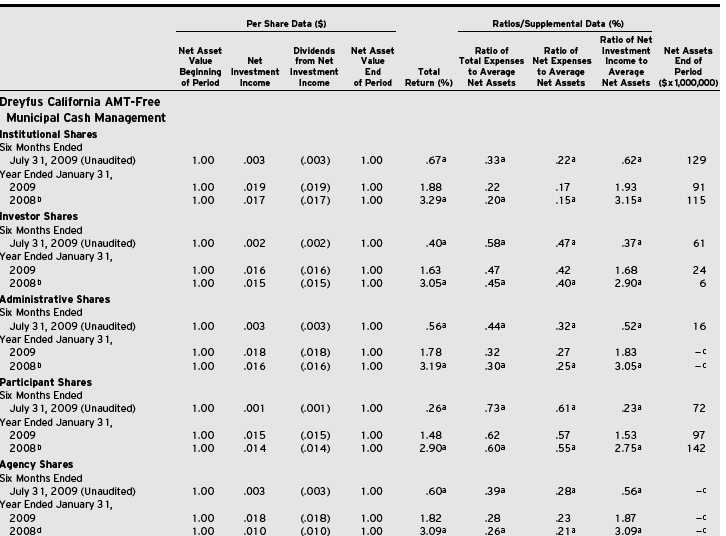
| |
| a | Annualized. |
| b | From August 1, 2007 (commencement of operations) to January 31, 2008. |
| c | Amount represents less than $1 million. |
| d | From October 1, 2007 (commencement of initial offering) to January 31, 2008. |
| See notes to financial statements. |
The Funds 87
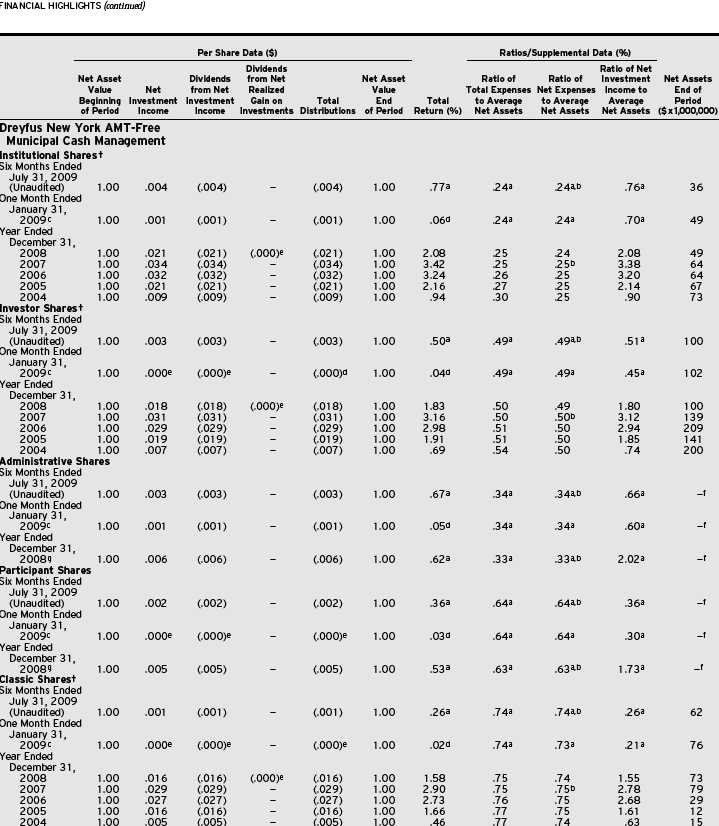
|
| Represents information for the fund s predecessor, BNY Hamilton NewYork AMT-Free Money Market Fund through to September 12, 2008. |
| a Annualized. |
| b Expense waivers and/or reimbursements amounted to less than .01%. |
| c The fund has changed its fiscal year end from December 31 to January 31. |
| d Not annualized. |
| e Amount represents less than $.001 per share. |
| f Amount represents less than $1 million. |
| g From September 13, 2008 (commencement of initial offering) to December 31, 2008. |
| See notes to financial statements. |
88
NOTES TO FINANCIAL STATEMENTS (Unaudited)
NOTE 1 Significant Accounting Policies:
Dreyfus Cash Management, Dreyfus Cash Management Plus, Inc., Dreyfus Government Cash Management, Dreyfus Government Prime Cash Management, Dreyfus Treasury & Agency Cash Management, Dreyfus Treasury Prime Cash Management, Dreyfus Municipal Cash Management Plus, Dreyfus NewYork Municipal Cash Management, Dreyfus Tax Exempt Cash Management, Dreyfus California AMT-Free Municipal Cash Management and Dreyfus New York AMT-Free Municipal Cash Management (each, a fund and collectively, the funds ) are open-end management investment companies registered under the Investment Company Act of 1940, as amended (the Act ). Each fund, other than Dreyfus New York Municipal Cash Management, Dreyfus California AMT-Free Municipal Cash Management and Dreyfus New York AMT-Free Municipal Cash Management is diversified. Dreyfus New York Municipal Cash Management, Dreyfus California AMT-Free Municipal Cash Management and Dreyfus New York AMT-Free Municipal Cash Management are non-diversified. Dreyfus Government Cash Management and Dreyfus Government Prime Cash Management are each a separate series of Dreyfus Government Cash Management Funds (the Company ) and Dreyfus Tax Exempt Cash Management, Dreyfus California AMT-Free Municipal Cash Management and Dreyfus New York AMT-Free Municipal Cash Management are separate series of Dreyfus Tax Exempt Cash Management Funds (the Trust ). Each fund s investment objective is to provide investors with as high a level of current income as is consistent with the preservation of capital and the maintenance of liquidity and, in the case of Dreyfus Municipal Cash Management Plus and Dreyfus Tax Exempt Cash Management only, which are exempt from federal income tax; in the case of Dreyfus NewYork Municipal Cash Management and Dreyfus New York AMT-Free Municipal Cash Management, which is exempt from federal, New York state and NewYork city personal income taxes, and in the case of Dreyfus California AMT-Free Municipal Cash Management only, which is exempt from federal and California state personal income taxes. The Dreyfus Corporation (the Manager or Dreyfus ), a wholly-owned subsidiary of The Bank of New York Mellon Corporation ( BNY Mellon ), serves as each fund s investment adviser.
As of the close of business on August 6, 2008, pursuant to an Agreement and Plan of Reorganization previously approved by Dreyfus Cash Management s Board of Trustees, all of the assets, subject to the liabilities, of Dreyfus Institutional Prime Money Market Fund, were transferred to Dreyfus Cash Management. Shareholders of Dreyfus Institutional Prime Money Market Fund voted affirmatively to approve the reorganization and subsequently received Administrative shares of Dreyfus Cash Management in an amount equal to the aggregate net asset value of the investment in Dreyfus Institutional Prime Money Market Fund at the time of the exchange.The net asset value of Dreyfus Cash Management s Administrative shares at the close of business on August 6, 2008, after the reorganization, was $1.00 per share, and a total of $783,342,509 Administrative shares representing net assets of $783,342,371, were issued to Dreyfus Institutional Prime Money Market Fun d shareholders in the exchange. The exchange was a tax-free event to shareholders.
MBSC Securities Corporation (the Distributor ), a wholly-owned subsidiary of the Manager, is the distributor of the funds shares, which are sold to the public without a sales charge. Each fund offers Institutional Shares, Investor Shares, Administrative Shares, Participant Shares and Agency Shares. In addition, Dreyfus Cash Management Plus and Dreyfus Treasury & Agency Cash Management also offer Service Shares and Select Shares, Dreyfus Treasury & Agency Cash Management also offers Premier Shares and Dreyfus New York AMT-Free Municipal Cash Management also offers Classic Shares. Each share class, except Institutional Shares, are subject to a Service Plan adopted pursuant to Rule 12b-1 under the act. Other differences between the classes include the services offered (by service agents receiving 12b-1 fees) to and the expenses borne by each class and certain voting rights. Income, expenses (other than expenses attributable to a specifi c class), and realized and unrealized gains or losses on investments are allocated to each class of shares based on its relative net assets.
The Funds 89
NOTES TO FINANCIAL STATEMENTS (Unaudited) (continued)
As of July 31, 2009, MBC Investments Corp., an indirect subsidiary of BNY Mellon held the following shares:
| |
| Dreyfus Cash Management Plus, Inc., | |
| Agency shares | 1,045 |
| Dreyfus New York Municipal Cash | |
| Management, Agency shares | 1,032 |
| Dreyfus California AMT-Free | |
| Municipal Cash Management, | |
| Agency shares | 1,031 |
| Dreyfus New York AMT-Free | |
| Municipal Cash Management, | |
| Administrative shares | 10,000 |
| Dreyfus New York AMT-Free | |
| Municipal Cash Management, | |
| Participant shares | 10,000 |
It is each fund s policy to maintain a continuous net asset value per share of $1.00; each fund has adopted certain investment, portfolio valuation and dividend and distribution policies to enable it to do so. There is no assurance, however, that any fund will be able to maintain a stable net asset value per share of $1.00.
The Company and the Trust accounts separately for the assets, liabilities and operations of each series. Expenses directly attributable to each series are charged to that series operations; expenses which are applicable to all series are allocated among them on a pro rata basis.
Each fund s financial statements are prepared in accordance with U.S. generally accepted accounting principles, which may require the use of management estimates and assumptions. Actual results could differ from those estimates.
The funds enter into contracts that contain a variety of indemnifications. The funds maximum exposure under these arrangements is unknown.The funds do not anticipate recognizing any loss related to these arrangements.
(a) Portfolio valuation: Investments in securities are valued at amortized cost (other than those securities covered by a Capital Support Agreement, as described in Note 1(f) below), which are carried at market value based upon valuations provided by an independent pricing service approved by the Board of Trustees/Directors) in accordance with Rule 2a-7 of the Act, which has been determined by the Board members to represent the fair value of each fund s investments.
The funds adopted Statement of Financial Accounting Standards No. 157 Fair Value Measurements ( FAS 157 ). FAS 157 establishes an authoritative definition of fair value, sets out a framework for measuring fair value, and requires additional disclosures about fair value measurements.
Various inputs are used in determining the value of the funds investments relating to FAS 157.These inputs are summarized in the three broad levels listed below.
Level 1 quoted prices in active markets for identical
investments.
Level 2 other significant observable inputs (including
quoted prices for similar investments, interest rates, prepay-
ment speeds, credit risk, etc.).
Level 3 significant unobservable inputs (including the
funds own assumptions in determining the fair value of
investments). |
The inputs or methodology used for valuing securities are not necessarily an indication of the risk associated with investing in those securities. For example, money market securities are valued using amortized cost, in accordance with rules under the Act. Generally, amortized cost approximates the current fair value of a security, but since the value is not obtained from a quoted price in an active market, such securities are reflected as Level 2.
Table 1 is a summary of the inputs used as of July 31, 2009 in valuing the funds investments:
(b) Securities transactions and investment income:
Securities transactions are recorded on a trade date basis. Realized gains and losses from securities transactions are recorded on the identified cost basis. Interest income, adjusted for accretion of discount and amortization of premium on investments, is earned from settlement date and recognized on the accrual basis.Cost of investments represents amortized cost.
The funds have arrangements with the custodian and cash management bank whereby the funds may receive earnings credits when positive cash balances are maintained, which are used to offset custody and cash management fees. For financial reporting purposes, the funds include net earnings credits as an expense offset in the Statement of Operations.
90
Dreyfus New York Municipal Cash Management, Dreyfus California AMT-Free Municipal Cash Management and Dreyfus NewYork AMT-Free Municipal Cash Management follow an investment policy of investing primarily in municipal obligations of one state. Economic changes affecting the state and certain of its public bodies and municipalities may affect the ability of issuers within the state to pay interest on, or repay principal of, municipal obligations held by the fund.
(c) Repurchase Agreements: Dreyfus Cash Management, Dreyfus Cash Management Plus, Inc., Dreyfus Government Cash Management and Dreyfus Treasury & Agency Cash Management may enter into repurchase agreements with financial institutions, deemed to be creditworthy by the Manager, subject to the seller s agreement to repurchase and the fund s agreement to resell such securities at a mutually agreed upon price. Securities purchased subject to repurchase agreements are deposited with the funds custodians and, pursuant to the terms of the repurchase agreement, must have an aggregate market value greater than or equal to the repurchase price plus accrued interest at all times. If the value of the underlying securities falls below the value of the repurchase price plus accrued interest, the fund will require the seller to deposit additional collateral by the next business day. If the request for additional collateral is not met, or the seller defaults on its repurchase obligation, the fund maintains the right to sell the underlying securities at market value and may claim any resulting loss against the seller.
(d) Dividends to shareholders: It is the policy of each fund to declare dividends from investment income-net on each business day. Such dividends are paid monthly. Dividends from net realized capital gains, if any, are normally declared and paid annually, but each fund may make distributions on a more frequent basis to comply with the distribution requirements of the Internal Revenue Code of 1986, as amended (the Code ).To the extent that net realized capital gains can be offset by capital loss carryovers, it is the policy of each fund not to distribute such gains.
(e) Federal income taxes: It is the policy of Dreyfus Cash Management, Dreyfus Cash Management Plus, Inc., Dreyfus Government Cash Management, Dreyfus Government Prime Cash Management, Dreyfus Treasury & Agency Cash Management and Dreyfus Treasury Prime Cash Management to continue to qualify as a regulated investment company if such qualification is in the best interests of its shareholders, by complying with the applicable provisions of the Code and to make distributions of taxable income sufficient to relieve it from substantially all federal income and excise taxes.
It is the policy of Dreyfus Municipal Cash Management Plus, Dreyfus NewYork Municipal Cash Management, Dreyfus Tax Exempt Cash Management, Dreyfus California AMT-Free Municipal Cash Management and Dreyfus NewYork AMT-Free Municipal Cash Management to continue to qualify as a regulated investment company, which can distribute tax
| | | | |
| Table 1. | | | | |
| |
| | | Investments in Securities | |
| | Level 1 Quoted | Level 2 Other Significant | Level 3 Significant | |
| | Prices | Observable Inputs | Unobservable Inputs | Total |
| Dreyfus Cash Management | | 44,017,044,025 | | 44,017,044,025 |
| Dreyfus Cash Management Plus, Inc. | | 7,515,962,171 | | 7,515,962,171 |
| Dreyfus Government Cash Management | | 35,262,943,240 | | 35,262,943,240 |
| Dreyfus Government Prime Cash Management | | 6,763,621,901 | | 6,763,621,901 |
| Dreyfus Treasury & Agency Cash Management | | 17,161,797,708 | | 17,161,797,708 |
| Dreyfus Treasury Prime Cash Management | | 29,130,088,574 | | 29,130,088,574 |
| Dreyfus Municipal Cash Management Plus | | 2,314,039,074 | | 2,314,039,074 |
| Dreyfus New York Municipal Cash Management | | 1,101,983,270 | | 1,101,983,270 |
| Dreyfus Tax Exempt Cash Management | | 6,617,998,138 | | 6,617,998,138 |
| Dreyfus California AMT Tax-Free Municipal Cash Management | | 269,030,513 | | 269,030,513 |
| Dreyfus New York AMT Tax-Free Municipal Cash Management | | 190,164,376 | | 190,164,376 |
The Funds 91
NOTES TO FINANCIAL STATEMENTS (Unaudited) (continued)
exempt dividends, by complying with the applicable provisions of the Code and to make distributions of income and net realized gain sufficient to relieve it from substantially all federal income and excise taxes.
As of and during the period ended July 31, 2009, the funds did not have any liabilities for any uncertain tax positions. The funds recognize interest and penalties, if any, related to uncertain tax positions as income tax expense in the Statement of Operations. During the period, the funds did not incur any interest or penalties.
Each of the tax years in the three-year period ended January 31, 2009 remains subject to examination by the Internal Revenue Service and state taxing authorities.
Table 2 summarizes each relevant fund s unused capital loss carryover available for federal income tax purposes to be applied against future net securities profits, if any, realized subsequent to January 31, 2009.
The tax character of each relevant fund s distributions paid to shareholders (except for Dreyfus Municipal Cash Management Plus, Dreyfus New York Municipal Cash Management, Dreyfus Tax Exempt Cash Management, Dreyfus California AMT-Free Municipal Cash Management and Dreyfus New York AMT-Free Municipal Cash Management) during the fiscal year ended January 31, 2009, were all ordinary income. The tax character of current year distributions will be determined at the end of the current fiscal year.
Table 3 summarizes the tax character of distributions paid to shareholders of Municipal Cash Management Plus, Dreyfus New York Municipal Cash Management, Dreyfus Tax Exempt Cash Management, Dreyfus California AMT-Free Municipal Cash Management and Dreyfus New York AMT-Free Municipal Cash Management during the fiscal year ended January 31, 2009.
At July 31, 2009, for Cash Management Plus, accumulated net unrealized depreciation on investments was $32,652,064, consisting of $47,537,936 gross unrealized appreciation and $80,190,000 gross unrealized depreciation.
At July 31, 2009, the cost of investments for federal income tax purposes was substantially the same as the cost for financial reporting purposes (see the Statements of Investments).
| | | | | | | |
| Table 2. | | | | | | | |
| |
| | | | Expiring in fiscal: | ($ x 1,000) | |
| | 2012 | 2013 | 2014 | 2015 | 2016 | 2017 | Total |
| Dreyfus Cash Management | | | 40 | | | 193 | 233 |
| Dreyfus Cash Management Plus, Inc. | | | 4,986 | | | | 4,986 |
| Dreyfus Government Cash Management | | | | 1 | | | 1 |
| Dreyfus Treasury & Agency Cash Management | | | | | 117 | | 117 |
| |
| If not applied, the carryovers expire in the above years. | | | | | | | |
| | | |
| Table 3. | | | |
| |
| Tax Character of Distributions Paid ($ x 1,000) | | | |
| | | 2009 | |
| | Tax-Exempt | Ordinary | Long-Term |
| | Income | Income | Capital Gain |
| Dreyfus Municipal Cash Management Plus | 33,984 | 73 | 24 |
| Dreyfus New York Municipal Cash Management | 16,959 | a | 7 |
| Dreyfus Tax Exempt Cash Management | 118,001 | 60 | 37 |
| Dreyfus California AMT-Free Municipal Cash Management | 5,530 | 21 | |
| Dreyfus New York AMT-Free Municipal Cash Management | 82 | | |
| |
| a Amount represents less than $1,000. | | | |
92
(f) Capital Support Agreement: Dreyfus Cash Management Plus, Inc. holds notes (the Notes ) issued by Lehman Brothers Holdings, Inc. ( Lehman ). In order to mitigate the negative impact of holding these securities in light of the bankruptcy of Lehman on September 16, 2008, the fund entered into a Capital Support Agreement (the Agree-ment ) with BNY Mellon, the parent company of the fund s adviser. Pursuant to the Agreement, BNY Mellon has agreed to provide capital support to the fund, subject to a maximum amount of $97.2 million (the Maximum Capital Support Payment ), if any of the following events result in the fund s net asset value falling below $0.9950:
(i) Any final sale or other final liquidation of the Notes by the fund for cash in an amount, after deduction of costs, which is less than the amortized cost value of the Notes as of the date such sale or liquidation is consummated;
(ii) Receipt by the fund of final payment on the Notes in cash in an amount less than the amortized cost value of the Notes less costs in respect thereof, as of the date such final payment is received;
(iii) The date upon which a court of competent jurisdiction over the matter discharges Lehman from liability in respect of the Notes, and such discharge results in the receipt of aggregate payments on the Notes in an amount less than the amortized cost value of the Notes, less costs in respect thereof, as of the date such final payment is received; and
(iv) The receipt by the fund of any security or other instrument in exchange for, or as a replacement of, the Notes as a result of an exchange offer, debt restructuring, reorganization or similar transaction pursuant to which the Notes are exchanged for, or replaced with, new securities of Lehman or a third party and such new securities are or become Eligible Securities, as defined in sub-paragraph (a)(10) of Rule 2a-7 promulgated under the Act, and have an aggregate value that is less than the aggregate amortized cost value of the Notes on the date the fund receives such new securities.
The obligations of BNY Mellon to provide capital support shall terminate upon the earliest to occur of (i) the repayment in full of the Notes, (ii) BNY Mellon making payments equal to the Maximum Capital Support Payment, (iii) the date on which the fund no longer holds any Notes, (iv) the mutual agreement of the fund and BNY Mellon to terminate the Agreement and (v) 5:00 p.m. Eastern Time on the date which is 364 days from the date of the Agreement unless the term of the Agreement is extended pursuant to the Agreement s terms.
(g) Treasury s Temporary Guarantee Program: Each fund entered into a Guarantee Agreement with the United States Department of the Treasury (the Treasury ) to participate in the Treasury s Temporary Guarantee Program for Money Market Funds (the Program ).
Under the Program, the Treasury guaranteed the share price of shares of the fund held by shareholders as of September 19, 2008 at $1.00 per share if the fund s net asset value per share fell below $0.995 (a Guarantee Event ) and the fund liquidated. Recovery under the Program was subject to certain conditions and limitations.
Fund shares acquired by investors after September 19, 2008 that increased the number of fund shares the investor held at the close of business on September 19, 2008 were not eligible for protection under the Program. In addition, fund shares acquired by investors who did not hold fund shares at the close of business on September 19, 2008 were not eligible for protection under the Program.
For Dreyfus Cash Management, Dreyfus Cash Management Plus, Inc., Dreyfus Municipal Cash Management Plus, Dreyfus New York Municipal Cash Management, Dreyfus Tax Exempt Cash Management, Dreyfus California AMT-Free Municipal Cash Management and Dreyfus New York AMT-Free Municipal Cash Management, the Program, which was originally set to expire on December 18, 2008, was initially extended by the Treasury until April 30, 2009 and had been further extended by the Treasury until September 18, 2009, at which time the Secretary of the Treasury terminated the Program. Participation in the initial term and the extended periods of the Program required a payment to the Treasury in the amount of .01%, .015% and .015% except for Dreyfus Cash Management Plus, Inc., which was .015%, .022% and .023%, respectively, of the
The Funds 93
NOTES TO FINANCIAL STATEMENTS (Unaudited) (continued)
funds shares outstanding as of September 19, 2008 (valued at $1.00 per share). This expense was borne by the funds without regard to any expense limitation in effect.
For Dreyfus Government Cash Management, Dreyfus Government Prime Cash Management, Dreyfus Treasury & Agency Cash Management and Dreyfus Treasury Prime Cash Management, the Program which was originally set to expire on December 18, 2008, was initially extended by the Treasury until April 30, 2009 and had been further extended by the Treasury until September 18, 2009.The funds participation in the Program expired effective May 1, 2009. As a result, shareholder assets in the funds that were covered under the Program since September 19, 2008 were no longer covered effective May 1, 2009. Participation in the initial term and the April 30, 2009 extension period of the Program required a payment to the Treasury in the amount of .01% and .015%, respectively, of the funds shares outstanding as of September 19, 2008 (valued at $1.00 per share).This expense was borne by the funds without regard to any expense limitation in effect.
NOTE 2 Management Fee and Other Transactions with Affiliates:
(a) Pursuant to separate management agreements with the Manager, the management fee of each fund is computed at the annual rate of .20% of the value of such fund s average daily net assets and is payable monthly.
The Manager has undertaken to reimburse expenses in the event that current yields drop below a certain level. This undertaking is voluntary and not contractual and may be terminated at any time. During the period ended July 31, 2009, the following funds had reimbursements pursuant to the undertaking: Dreyfus Cash Management $29,520, Dreyfus Cash Management Plus, Inc. $37,363; Dreyfus Government Cash Management $847,479, Dreyfus Government Prime Cash Management $1,466,239; Dreyfus Treasury & Agency Cash Management $2,535,968; Dreyfus Treasury Prime Cash Management $13,609,321, Dreyfus Tax Exempt Cash Management $16,237, Dreyfus California AMT-Free Municipal Cash Management $3,283 and Dreyfus NewYork AMT-Free Municipal Cash Management $63.
The Manager currently is limiting the following funds' operating expenses or assuming all or part of the expenses of the funds.These expense limitations and waivers are voluntary, not contractual, and may be terminated at any time. During the period ended July 31, 2009, the following funds had reimbursements pursuant to the limitation: Dreyfus Cash Management $1,259,553, Dreyfus Cash Management Plus, Inc. $541,525, Dreyfus Government Cash Management $1,375,040, Dreyfus Government Prime Cash Management $472,760, Dreyfus Treasury & Agency Cash Management $947,280, Dreyfus Treasury Prime Cash Management $1,629,781, Dreyfus Municipal Cash Management Plus $373,277, Dreyfus New York Municipal Cash Management $153,927, Dreyfus Tax Exempt Cash Management $635, 868 and Dreyfus California AMT-Free Municipal Cash Management $80,608.
As to Dreyfus California AMT-Free Municipal Cash Management, the Manager waived receipt of a portion of the management fee, in the amount of .05% of the value of the fund s average daily net assets from February 1, 2009 through July 31, 2009.The reduction in management fee, pursuant to the undertaking, amounted to $63,073 during the period ended July 31, 2009.This agreement was, and continues to be terminable at any time.
As to Dreyfus New York AMT-Free Municipal Cash Management, the Manager has agreed until September 30, 2010, the Manager, and not the fund, will be liable for fund expenses (exclusive of taxes, brokerage fees, interest on borrowings and extraordinary expenses) other than the following expenses, which will be borne by the fund: the management fee, and with respect to the fund s Investor Shares, Administrative Shares, Participant Shares, and Classic Shares, Rule 12b-1 Service Plan expenses from February 1, 2009 through September 30, 2010. There was no reduction in expenses, pursuant to the undertaking during the period ended July 31, 2009.
94
(b) Under each fund s Service Plan adopted pursuant to Rule 12b-1 under the Act, with respect to each fund s Investor Shares,Administrative Shares, Participant Shares and Agency Shares (with the exception of Dreyfus New York AMT-Free Municipal Cash Management which does not hold Agency Shares), Dreyfus Cash Management Plus , Service Shares and Select Shares, Dreyfus Treasury & Agency Cash Management s, Service Shares, Select Shares and Premier Shares and Dreyfus NewYork AMT-Free Municipal Cash Management s Classic Shares, each fund pays the Distributor for distributing such classes of shares, for advertising and marketing and for providing certain services relating to shareholders of the respective class of shares. These services include answering shareholder inquiries regarding the fund and providing reports and other information and services related to the mai ntenance of shareholder accounts ( Servicing ). Under the Service Plan, as to each relevant class, the Distributor may make payments to Service Agents in respect to these services. Generally, the Service Agent may provide holders of Investor, Administrative, Participant, Agency, Service, Select, Premier and Classic Shares a consolidated statement.The Service Agent generally also will provide the holders of Investor, Participant, Premier, Service and/or Select Shares, automated teller check writing privileges and, in the case of Participant, Premier, Service or Select Shares, automated teller machine access, and bill paying services. The amount paid under the Service Plan for Servicing is intended to be a service fee as defined under the Conduct Rules of the Financial Industry Regulatory Authority ( FINRA ), and at no time will such amount exceed the maximum amount permitted to be paid under the FINRA Conduct Rules as a service fee.The fees payable under the Service Plan are payable without regard to actual expenses incurred. Table 4 summarizes the amount each fund was charged pursuant to the Service Plan during the period ended July 31, 2009.
| | | | | | | | |
| Table 4. | | | | | | | | |
| |
| | Investor | Administrative | Participant | Service | Select | Agency | Premier | Classic |
| | Shares ($) | Shares ($) | Shares ($) | Shares ($) | Shares ($) | Shares ($) | Shares ($) | Shares ($) |
| Dreyfus Cash Management | 5,933,127 | 697,943 | 2,572,943 | | | 66,644 | | |
| Dreyfus Cash | | | | | | | | |
| Management Plus, Inc. | 1,804,211 | 569,490 | 1,349,948 | 13,695 | 44,139 | a | | |
| Dreyfus Government | | | | | | | | |
| Cash Management | 4,694,676 | 833,694 | 1,294,193 | | | 27,044 | | |
| Dreyfus Government Prime | | | | | | | | |
| Cash Management | 945,568 | 333,509 | 2,025,461 | | | 13,266 | | |
| Dreyfus Treasury & Agency | | | | | | | | |
| Cash Management | 3,647,590 | 486,742 | 846,090 | 14,279 | 93,862 | 23,026 | 83,299 | |
| Dreyfus Treasury Prime | | | | | | | | |
| Cash Management | 7,213,123 | 942,123 | 8,014,210 | | | 62,259 | | |
| Dreyfus Municipal | | | | | | | | |
| Cash Management Plus | 391,277 | 360,317 | 105,550 | | | 248 | | |
| Dreyfus New York Municipal | | | | | | | | |
| Cash Management | 443,067 | 27,172 | 73,342 | | | | | |
| Dreyfus Tax Exempt | | | | | | | | |
| Cash Management | 739,184 | 289,605 | 330,330 | | | 2,790 | | |
| Dreyfus California AMT-Free | | | | | | | | |
| Municipal Cash Management | 59,116 | 5,322 | 164,272 | | | | | |
| Dreyfus New York AMT-Free | | | | | | | | |
| Municipal Cash Management | 110,578 | 181 | 20 | | | | | 190,794 |
a Amount represents less than $1.
The Funds 95
NOTES TO FINANCIAL STATEMENTS (Unaudited) (continued)
(c) Each fund (except for Dreyfus New York AMT-Free Municipal Cash Management) has adopted a Shareholder Services Plan (the Plan ), with respect to their Institutional shares. Each fund reimburses the Distributor an amount not to exceed an annual rate of .25% of the value of the fund s average daily net assets attributable to Institutional Shares for certain allocated expenses of providing personal services and/or maintaining shareholder accounts.The services provided may include personal services relating to shareholder accounts, such as answering shareholder inquiries regarding the fund and providing reports and other information, and services related to the maintenance of shareholder accounts. Table 5 summarizes the a mount each fund was charged pursuant to the Plan during the period ended July 31, 2009.
The funds (except for Dreyfus New York AMT-Free Municipal Cash Management) compensate Dreyfus Transfer, Inc., a wholly-owned subsidiary of the Manager, under a transfer agency agreement for providing personnel and facilities to perform transfer agency services for the funds. Table 6 summarizes the amount each fund was charged during the period ended July 31, 2009, pursuant to the transfer agency agreement.
The funds (except for Dreyfus New York AMT-Free Municipal Cash Management) compensate The Bank of NewYork Mellon, a subsidiary of BNY Mellon and an affiliate of Dreyfus, under a cash management agreement for performing cash management services related to fund subscriptions and redemptions. Table 7 summarizes the amount each fund was charged during the period ended July 31, 2009, pursuant to the cash management agreement. These fees were offset by earnings credits pursuant to the cash management agreement.
| |
| Table 5. | |
| |
| | Institutional |
| | Shares ($) |
| Dreyfus Cash Management | 243,394 |
| Dreyfus Cash Management Plus, Inc. | 51,486 |
| Dreyfus Government Cash Management | 178,350 |
| Dreyfus Government Prime Cash Management | 22,892 |
| Dreyfus Treasury & Agency Cash Management | 110,975 |
| Dreyfus Treasury Prime Cash Management | 160,842 |
| Dreyfus Municipal Cash Management Plus | 18,684 |
| Dreyfus New York Municipal Cash Management | 12,404 |
| Dreyfus Tax Exempt Cash Management | 182,865 |
| Dreyfus California AMT-Free Municipal Cash Management | 146 |
| |
| |
| Table 6. | |
| |
| | Transfer Agency |
| | Fees ($) |
| Dreyfus Cash Management | 33,764 |
| Dreyfus Cash Management Plus, Inc. | 38,877 |
| Dreyfus Government Cash Management | 34,682 |
| Dreyfus Government Prime Cash Management | 33,506 |
| Dreyfus Treasury & Agency Cash Management | 38,154 |
| Dreyfus Treasury Prime Cash Management | 121,056 |
| Dreyfus Municipal Cash Management Plus | 2,653 |
| Dreyfus New York Municipal Cash Management | 4,094 |
| Dreyfus Tax Exempt Cash Management | 10,281 |
| Dreyfus California AMT-Free Municipal Cash Management | 839 |
96
The funds (except for Dreyfus New York AMT-Free Municipal Cash Management) also compensate The Bank of New York Mellon under a custody agreement for providing custodial services for each fund. Table 8 summarizes the amount each fund was charged during the period ended July 31, 2009, pursuant to the custody agreement.
During the period ended July 31, 2009, each fund (except for Dreyfus New York AMT-Free Municipal Cash Management) was charged $3,341 for services performed by the Chief Compliance Officer.
Table 9 summarizes the components of Due to The Dreyfus Corporation and affiliates in the Statements of Assets and Liabilities for each fund.
(d) Each Board member also serves as a Board member of other funds within the Dreyfus complex. Annual retainer fees are allocated to each fund based on net assets, and each fund pays its Board members an attendance fee of $500 per meeting. Currently, Board members fees are borne by the Manager as to each fund pursuant to the undertakings in effect. See Note 2(a).
NOTE 3 Capital Share Transactions:
Each fund (except for Dreyfus Cash Management Plus, Inc.) is authorized to issue an unlimited number of $.001 par value shares of Beneficial Interest. Dreyfus Cash Management Plus, Inc. is authorized to issue 120 billion shares of $.001 par value Common Stock.
NOTE 4 Reverse Repurchase Agreements:
Dreyfus Cash Management and Dreyfus Cash Management Plus, Inc. may enter into reverse repurchase agreements with banks, brokers or dealers. This form of borrowing involves the transfer by the fund of an underlying debt
| |
| Table 7. | |
| |
| |
| | Cash Management |
| | Fees ($) |
| Dreyfus Cash Management | 2,900 |
| Dreyfus Cash Management Plus, Inc. | 4,044 |
| Dreyfus Government Cash Management | 3,677 |
| Dreyfus Government Prime Cash Management | 3,514 |
| Dreyfus Treasury & Agency Cash Management | 4,475 |
| Dreyfus Treasury Prime Cash Management | 11,478 |
| Dreyfus Municipal Cash Management Plus | 157 |
| Dreyfus New York Municipal Cash Management | 295 |
| Dreyfus Tax Exempt Cash Management | 728 |
| Dreyfus California AMT-Free Municipal Cash Management | 26 |
| |
| |
| |
| Table 8. | |
| |
| |
| | Custody |
| | Fees ($) |
| Dreyfus Cash Management | 138,551 |
| Dreyfus Cash Management Plus, Inc. | 59,193 |
| Dreyfus Government Cash Management | 148,548 |
| Dreyfus Government Prime Cash Management | 51,539 |
| Dreyfus Treasury & Agency Cash Management | 105,887 |
| Dreyfus Treasury Prime Cash Management | 113,551 |
| Dreyfus Municipal Cash Management Plus | 37,810 |
| Dreyfus New York Municipal Cash Management | 28,419 |
| Dreyfus Tax Exempt Cash Management | 55,154 |
| Dreyfus California AMT-Free Municipal Cash Management | 15,109 |
The Funds 97
| NOTES TO FINANCIAL STATEMENTS (Unaudited) (continued) |
instrument in return for cash proceeds based on a percentage of value of the security. The funds retain the right to receive interest and principal payments on the security. At an agreed upon future date, the funds repurchase the security at principal plus accrued interest. Reverse repurchase agreements may subject the funds to interest rate risk and counterparty credit risk. As of July 31, 2009, there were no open reverse repurchase agreements.
NOTE 5 Subsequent Events Evaluation:
Dreyfus has evaluated the need for disclosures and/or adjustments resulting from subsequent events through the date of issuance of the financial statements.
On September 9, 2009, Dreyfus Cash Management Plus, Inc. sold the Notes it held in Lehman and therefore the payment required by the Capital Support Agreement was made by BNY Mellon to the fund.This payment met the conditions set forth in the Capital Support Agreement and the agreement is now terminated. See Note 1(f). Subsequently, the adviser made an additional capital contribution to the fund.
As of September 19, 2009, theTreasury'sTemporary Guarantee Program was terminated by the Treasury. See Note 1(g). As such, the following funds are no longer eligible for protection under the Program: Dreyfus Cash Management, Dreyfus Cash Management Plus, Inc., Dreyfus Municipal Cash Management Plus, Dreyfus New York Municipal Cash Management, Dreyfus Tax Exempt Cash Management, Dreyfus California AMT-Free Municipal Cash Management and Dreyfus New York AMT-Free Municipal Cash Management.
| | | | | | | |
| Table 9. | | | | | | | |
| |
| | | Rule 12B-1 | | | Chief | | |
| | | Distribution | Shareholder | | Compliance | Transfer | Less Expense |
| | Management | Plan | Services Plan | Custodian | Officer | Agency | Reimbursement |
| | Fees ($) | Fees ($) | Fees ($) | Fees ($) | Fees ($) | Fees ($) | Fees ($) |
| |
| Dreyfus Cash Management | 7,154,506 | 1,544,146 | 39,000 | 108,372 | 557 | 5,627 | 189,647 |
| Dreyfus Cash | | | | | | | |
| Management Plus, Inc. | 1,112,738 | 590,050 | 8,000 | 24,540 | 557 | 6,481 | 123,776 |
| Dreyfus Government | | | | | | | |
| Cash Management | 6,075,403 | 1,096,413 | 30,000 | 97,460 | 557 | 3,061 | 650,417 |
| Dreyfus Government Prime | | | | | | | |
| Cash Management | 1,174,705 | 479,766 | 4,000 | 20,500 | 557 | 3,046 | 346,297 |
| Dreyfus Treasury & Agency | | | | | | | |
| Cash Management | 3,019,093 | 751,535 | 18,000 | 55,235 | 557 | 3,468 | 657,192 |
| Dreyfus Treasury Prime | | | | | | | |
| Cash Management | 5,007,202 | 2,219,417 | 26,000 | 80,638 | 557 | 13,406 | 2,378,368 |
| Dreyfus Municipal | | | | | | | |
| Cash Management Plus | 392,612 | 167,772 | 3,000 | 9,676 | 557 | 442 | 55,625 |
| Dreyfus New York Municipal | | | | | | | |
| Cash Management | 184,883 | 98,029 | 2,000 | 6,719 | 557 | 682 | 36,902 |
| Dreyfus Tax Exempt | | | | | | | |
| Cash Management | 1,205,024 | 233,510 | 29,000 | 22,123 | 557 | 1,777 | 120,086 |
| Dreyfus California AMT-Free | | | | | | | |
| Municipal Cash Management | 49,706 | 40,218 | | 2,884 | 557 | 140 | 40,460 |
| Dreyfus New York AMT-Free | | | | | | | |
| Municipal Cash Management | 35,066 | 48,045 | | | | | 63 |
98
INFORMATION ABOUT THE REVIEW AND APPROVAL
OF EACH FUND S INVESTMENT MANAGEMENT AGREEMENT (Unaudited) |
ALL CASH MANAGEMENT FUNDS
At a Joint Meeting of the Board of each fund held on May 18, 2009, the Board considered the re-approval for an annual period of each fund s Management Agreement, pursuant to which the Manager provides each fund with investment advisory and administrative services. The Board members, none of whom are interested persons (as defined in the Investment Company Act of 1940, as amended) of the funds, were assisted in their review by independent legal counsel and met with counsel in executive session separate from representatives of the Manager.
Analysis of Nature, Extent, and Quality of Services Provided to each Fund. The Board members received a presentation from representatives of the Manager regarding services provided to each fund and other funds in the Dreyfus fund complex, and discussed the nature, extent, and quality of the services provided to each fund pursuant to each fund s Management Agreement.The Manager s representatives noted that the funds serve institutional investors acting for themselves or in a fiduciary capacity, and reviewed the nature of the relationships that the Manager has with various institutions and intermediaries and the different needs of each.The Manager s representatives noted the sales and servicing support provided by the distrib-utor s Dreyfus Cash Investment Services Division to each fund, the diversity of distribution of the funds in the Dreyfus complex generally, and the Manag er s need for broad, deep, and diverse resources to be able to provide ongoing shareholder services among various distribution channels. The Board also reviewed the number of shareholder accounts in each fund, as well as each fund s asset size.
The Board members also considered the Manager s research and portfolio management capabilities and that the Manager also provides oversight of day-to-day fund operations, including fund accounting and administration and assistance in meeting legal and regulatory requirements.The Board members also considered the Manager s extensive administrative, accounting, and compliance infrastructure.
Comparative Analysis of Each Fund s Management Fee and Expense Ratio and Performance. The Board members reviewed reports prepared by Lipper, Inc., an independent provider of investment company data, which included infor-
mation comparing each fund s management fee and expense ratio (based on each fund s Institutional Shares) with a group of comparable funds (the Expense Group ) and with a broader group of funds (the Expense Universe ) that were selected by Lipper.The Board reviewed the results of Expense Group and Expense Universe comparisons that were prepared based on financial statements currently available to Lipper as of March 31, 2009. Included in each fund s reports were comparisons of contractual and actual management fee rates and total operating expenses.
The Board members also reviewed the reports prepared by Lipper that presented each fund s performance (for each fund s Institutional Shares) for various periods ended March 31, 2009, and placed significant emphasis on comparisons of total return performance for each fund to the same group of funds as the fund s Expense Group (the Performance Group ) and to a group of funds that was broader than the fund s Expense Universe (the Performance Universe ) that also were selected by Lipper.
DREYFUS CASH MANAGEMENT
The Board reviewed the range of management fees and expense ratios of the funds in the Expense Group and Expense Universe, and noted that the fund s contractual management fee was at the Expense Group median and that the fund s actual management fee was three basis points higher than the Expense Group median and Expense Universe median.The Board also noted that the fund s total expense ratio was less than two basis points higher than the Expense Group median and lower than the Expense Universe median.
With respect to the fund s performance, the Board noted that the fund achieved total return results variously at, higher, and lower than the Performance Group median, and higher than the Performance Universe median, for each reported time period up to ten years. The Board noted the low absolute returns and the very narrow spreads in the returns among the fund and the Performance Group funds for each reported time period.The Board noted that most of the Performance Group funds that had a lower actual management fee than the fund also had an expense reduction in effect, and the Board consid-
The Funds 99
INFORMATION ABOUT THE REVIEW AND APPROVAL
OF EACH FUND S INVESTMENT MANAGEMENT AGREEMENT (Unaudited) (continued) |
ered the extent to which this may have been reflected in the performance of the fund relative to the Performance Group median. The Board also noted the portfolio manager s presentation of the strategies for managing the fund s average maturity and credit risk profile over the past year.
In addition, a representative of the Manager advised the Board members that money market funds which participated in the U.S. Treasury Department s Temporary Guarantee Program for Money Market Funds (the Program ) made payments to the Treasury Department for participation in the Program in October 2008, December 2008, and April 2009, at a rate of .01%, .015%, and .015% of a fund s assets eligible for coverage under the Program, and that generally the participating funds (including the fund) paid these expenses directly, even if there was an expense limitation in effect. It was noted that the fund s expense information was derived from its January 31, 2009 annual report, which reflected the two payments made by the fund for Program participation. It also was noted that the expense ratio information for one other Expense Group fund was derived from a report dated December 31, 2008, and in the case of each other Expense Group fund from reports dated on or before October 31, 2008, meaning that the total expense ratio reported for those funds reflects only one Program payment or did not reflect any Program payments at all.The Board considered this information and the associated differences in the reported expense ratio of the fund and each Expense Group fund when comparing the fund s total expense ratio to the Expense Group median.
Representatives of the Manager reviewed with the Board members the fees paid to the Manager or its affiliates by mutual funds managed by the Manager or its affiliates that were reported in the same Lipper category as the fund (the Similar Funds ), and explained the nature of the Similar Funds and the differences, from the Manager s perspective, in providing services to the Similar Funds as compared to the fund. The Board members noted that the Similar Funds included funds used primarily as sweep vehicles for asset management accounts as well as funds with investment minimums ranging from $100,000 to $1 billion.The Board analyzed differences in fees paid to the Manager and discussed
the relationship of the management fees paid in light of the services provided. The Board members considered the relevance of the fee information provided for the Similar Funds to evaluate the appropriateness and reasonableness of the fund s management fee.
The Manager s representatives noted that there were no similarly managed institutional separate accounts or wrap fee accounts managed by the Manager or its affiliates with similar investment objectives, policies, and strategies as the fund.
DREYFUS CASH MANAGEMENT PLUS, INC.
The Board reviewed the range of management fees and expense ratios of the funds in the Expense Group and Expense Universe, and noted that the fund s contractual management fee was at the Expense Group median and that the fund s actual management fee was three basis points higher than the Expense Group median and Expense Universe median.The Board also noted that the fund s total expense ratio was three basis points higher than the Expense Group median and lower than the Expense Universe median.
With respect to the fund s performance, the Board noted that the fund achieved total return results at the Performance Group median for the 1-year period, lower than the Performance Group median for each longer-term time period up to ten years and higher than the Performance Universe median for each reported time period up to ten years.The Board noted the low absolute returns and the very narrow spreads in the returns among the fund and the Performance Group funds for each reported time period, including that for each time period of more than one year the fund s performance was no more than five basis points lower than the median for any time period.The Board noted that most of the Performance Group funds that had a lower actual management fee than the fund also had an expense reduction in effect, and the Board considered the extent to which this may have been reflected in the performance of the fund relative to the Performance Group median. The Board also noted the portfolio manager s presentation of the strategies for managing the fund s average maturity and credit risk profile over the past year.
100
In addition, a representative of the Manager advised the Board members that money market funds which participated in the U.S. Treasury Department s Temporary Guarantee Program for Money Market Funds (the Program ) made payments to the Treasury Department for participation in the Program in October 2008, December 2008, and April 2009, at a rate of .01%, .015%, and .015% of a fund s assets eligible for coverage under the Program, and that generally the participating funds (including the fund) paid these expenses directly, even if there was an expense limitation in effect. It was noted that the fund s expense information was derived from its January 31, 2009 annual report, which reflected the two payments made by the fund for Program participation. It also was noted that the expense ratio information for each other Expense Group fund was derived from reports dated on or before November 30, 2008, meaning that the total expense ratio reported for those funds reflect only one Program payment or did not reflect any Program payments at all.The Board considered this information and the associated differences in the reported expense ratio of the fund and each Expense Group fund when comparing the fund s total expense ratio to the Expense Group median.
Representatives of the Manager reviewed with the Board members the fees paid to the Manager or its affiliates by Similar Funds, and explained the nature of the Similar Funds and the differences, from the Manager s perspective, in providing services to the Similar Funds as compared to the fund. The Board members noted that the Similar Funds included funds used primarily as sweep vehicles for asset management accounts as well as funds with investment minimums ranging from $100,000 to $1 billion.The Board analyzed differences in fees paid to the Manager and discussed the relationship of the management fees paid in light of the services provided.The Board members considered the relevance of the fee information provided for the Similar Funds to evaluate the appropriateness and reasonableness of the fund s management fee.
The Manager s representatives noted that there were no similarly managed institutional separate accounts or wrap fee accounts managed by the Manager or its affiliates with similar investment objectives, policies, and strategies as the fund.
DREYFUS GOVERNMENT CASH MANAGEMENT
The Board reviewed the range of management fees and expense ratios of the funds in the Expense Group and Expense Universe, and noted that the fund s contractual management fee approximated the Expense Group median and that the fund s actual management fee was higher (by less than two and three basis points, respectively) than the Expense Group median and Expense Universe median. The Board also noted that the fund s total expense ratio was less than two basis points higher than the Expense Group median and lower than the Expense Universe median.
With respect to the fund s performance, the Board noted that the fund achieved total return results lower than the Performance Group median, and higher than the Performance Universe median, for each reported time period up to ten years. The Board noted the low absolute returns and the very narrow spreads in the returns among the fund and the Performance Group funds for each reported time period, including that the fund s performance was no more than four basis points lower than the median for any time period. The Board noted that most of the Performance Group funds that had a lower actual management fee than the fund also had an expense reduction in effect, and the Board considered the extent to which this may have been reflected in the performance of the fund relative to the Performance Group median. The Board noted the portfolio manager s presentation of the strategy for managing the fund s average maturity over the past year.
In addition, a representative of the Manager advised the Board members that money market funds which participated in the U.S. Treasury Department s Temporary Guarantee Program for Money Market Funds (the Program ) made payments to the Treasury Department for participation in the Program in October 2008, December 2008, and April 2009, at a rate of .01%, .015%, and .015% of a fund s assets eligible for coverage under the Program, and that generally the par-
The Funds 101
INFORMATION ABOUT THE REVIEW AND APPROVAL
OF EACH FUND S INVESTMENT MANAGEMENT AGREEMENT (Unaudited) (continued) |
ticipating funds (including the fund) paid these expenses directly, even if there was an expense limitation in effect. It was noted that the fund s expense information was derived from its January 31, 2009 annual report, which reflected the two payments made by the fund for Program participation. It also was noted that the expense ratio information for one other Expense Group fund was derived from a report dated December 31, 2008, and in the case of each other Expense Group fund from reports dated on or before November 30, 2008, meaning that the total expense ratio reported for those funds reflect only one Program payment or did not reflect any Program payments at all. The Board considered this information and the associated differences in the reported expense ratio of the fund and each Expense Group fund when comparing the fund s total expense ratio to the Expense Group median.
Representatives of the Manager reviewed with the Board members the fees paid to the Manager or its affiliates by Similar Funds, and explained the nature of the Similar Funds and the difference, from the Manager s perspective, in providing services to the Similar Funds as compared to the fund. The Board analyzed differences in fees paid to the Manager and discussed the relationship of the management fees paid in light of the services provided. The Board members considered the relevance of the fee information provided for the Similar Funds to evaluate the appropriateness and reasonableness of the fund s management fee.
The Manager s representatives noted that there were no similarly managed institutional separate accounts or wrap fee accounts managed by the Manager or its affiliates with similar investment objectives, policies, and strategies as the fund.
DREYFUS GOVERNMENT PRIME CASH MANAGEMENT
The Board reviewed the range of management fees and expense ratios of the funds in the Expense Group and Expense Universe, and noted that the fund s contractual management fee was lower than the Expense Group median and that the fund s actual management fee was higher (by one and two basis points, respectively) than the Expense Group median and Expense Universe median.The Board also noted that the fund s total expense ratio was less than two basis points higher than the Expense Group median and lower than the Expense Universe median.
With respect to the fund s performance, the Board noted that the fund achieved total return results lower than the Performance Group median, and higher than the Performance Universe median, for each reported time period up to ten years. The Board noted the low absolute returns and the very narrow spreads in the returns among the fund and the Performance Group funds for each reported time period, including that the fund s performance was no more than five basis points lower than the median for each reported time period of more than one year. The Board noted that most of the Performance Group funds that had a lower actual management fee than the fund also had an expense reduction in effect, and the Board considered the extent to which this may have been reflected in the performance of the fund relative to the Performance Group median. The Board noted the portfolio manager s presentation of the strategy for managing the fund s average maturity over the past year.
In addition, a representative of the Manager advised the Board members that money market funds which participated in the U.S. Treasury Department s Temporary Guarantee Program for Money Market Funds (the Program ) made payments to the Treasury Department for participation in the Program in October 2008, December 2008, and April 2009, at a rate of .01%, .015%, and .015% of a fund s assets eligible for coverage under the Program, and that generally the participating funds (including the fund) paid these expenses directly, even if there was an expense limitation in effect. It was noted that the fund s expense information was derived from its January 31, 2009 annual report, which reflected the two payments made by the fund for Program participation. It also was noted that the expense ratio information for one other Expense Group fund was derived from a report dated December 31, 2008, and in the case of each other Expense Group fund from reports dated on or before November 30, 2008, meaning that the total expense ratio reported for those funds reflect only one Program payment or did not reflect any Program payments at all.The Board considered this information and the associated
102
differences in the reported expense ratio of the fund and each Expense Group fund when comparing the fund s total expense ratio to the Expense Group median.
Representatives of the Manager reviewed with the Board members the fees paid to the Manager or its affiliates by Similar Funds, and explained the nature of the Similar Funds and the difference, from the Manager s perspective, in providing services to the Similar Funds as compared to the fund. The Board analyzed differences in fees paid to the Manager and discussed the relationship of the management fees paid in light of the services provided. The Board members considered the relevance of the fee information provided for the Similar Funds to evaluate the appropriateness and reasonableness of the fund s management fee.
The Manager s representatives noted that there were no similarly managed institutional separate accounts or wrap fee accounts managed by the Manager or its affiliates with similar investment objectives, policies, and strategies as the fund.
DREYFUS TREASURY & AGENCY CASH MANAGEMENT
The Board reviewed the range of management fees and expense ratios of the funds in the Expense Group and Expense Universe, and noted that the fund s contractual management fee was at the Expense Group median and that the fund s actual management fee was higher (by two basis points and three basis points, respectively) that the Expense Group median and Expense Universe median. The Board also noted that the fund s total expense ratio was less than two basis points higher than the Expense Group median and lower than the Expense Universe median.
With respect to the fund s performance, the Board noted that the fund achieved total return results lower than the Performance Group median, and higher than the Performance Universe median, for each reported time period up to ten years. The Board noted the low absolute returns and the very narrow spreads in the returns among the fund and the Performance Group funds for each reported time period, including that the fund s performance was no more than five basis points lower than the median for each reported time period of longer than one year. The Board noted that most of the Performance Group funds that had a lower actual management fee than the fund also had an expense reduction in effect, and the Board considered the extent to which this may have been reflected in the performance of the fund relative to the Performance Group median. The Board noted the portfolio manager s present ation of the strategy for managing the fund s average maturity over the past year.
In addition, a representative of the Manager advised the Board members that money market funds which participated in the U.S. Treasury Department s Temporary Guarantee Program for Money Market Funds (the Program ) made payments to the Treasury Department for participation in the Program in October 2008, December 2008, and April 2009, at a rate of .01%, .015%, and .015% of a fund s assets eligible for coverage under the Program, and that generally the participating funds (including the fund) paid these expenses directly, even if there was an expense limitation in effect. It was noted that the fund s expense information was derived from its January 31, 2009 annual report, which reflected the two payments made by the fund for Program participation. It also was noted that the expense ratio information for one other Expense Group fund was derived from a report dated December 31, 2008, and in the case of each other Expense Group fund from reports dated on or before October 31, 2008, meaning that the total expense ratio reported for those funds reflects only one Program payment or did not reflect any Program payments at all. The Board considered this information and the associated differences in the reported expense ratio of the fund and each Expense Group fund when comparing the fund s total expense ratio to the Expense Group median.
Representatives of the Manager reviewed with the Board members the fees paid to the Manager or its affiliates by Similar Funds, and explained the nature of the Similar Funds and the differences, from the Manager s perspective, in providing services to the Similar Funds as compared to the fund. The Board members noted that the Similar Funds included funds used primarily as a sweep vehicle for asset
The Funds 103
INFORMATION ABOUT THE REVIEW AND APPROVAL
OF EACH FUND S INVESTMENT MANAGEMENT AGREEMENT (Unaudited) (continued) |
management accounts as well as funds with investment minimums close to or the same as that of the fund. The Board analyzed differences in fees paid to the Manager and discussed the relationship of the management fees paid in light of the services provided.The Board members considered the relevance of the fee information provided for the Similar Funds to evaluate the appropriateness and reasonableness of the fund s management fee.
The Manager s representatives noted that there were no similarly managed institutional separate accounts or wrap fee accounts managed by the Manager or its affiliates with similar investment objectives, policies, and strategies as the fund.
DREYFUS TREASURY PRIME CASH MANAGEMENT
The Board reviewed the range of management fees and expense ratios of the funds in the Expense Group and Expense Universe, and noted that the fund s contractual management fee was at the Expense Group median and that the fund s actual management fee was higher (by two basis points and three basis points, respectively) that the Expense Group median and Expense Universe median. The Board also noted that the fund s total expense ratio was less than two basis points higher than the Expense Group median and lower than the Expense Universe median.
With respect to the fund s performance, the Board noted that the fund achieved total return results variously at, higher, and lower than the Performance Group median, and at or higher than the Performance Universe median, for each reported time period up to ten years. The Board noted the low absolute returns and the very narrow spreads in the returns among the fund and the Performance Group funds for each reported time period. The Board noted that each Performance Group fund that had a lower actual management fee than the fund also had an expense reduction in effect, and the Board considered the extent to which this may have been reflected in the performance of the fund relative to the Performance Group median. The Board also noted the portfolio manager s presentation of the strategy for managing the fund s average maturity over the past year.
In addition, a representative of the Manager advised the Board members that money market funds which participated in the U.S. Treasury Department s Temporary Guarantee Program for Money Market Funds (the Program ) made payments to the Treasury Department for participation in the Program in October 2008, December 2008, and April 2009, at a rate of .01%, .015%, and .015% of a fund s assets eligible for coverage under the Program, and that generally the participating funds (including the fund) paid these expenses directly, even if there was an expense limitation in effect. It was noted that the fund s expense information was derived from its January 31, 2009 annual report, which reflected the two payments made by the fund for Program participation. It also was noted that the expense ratio information for several other Expense Group funds was derived from reports dated on or before Nov ember 30, 2008, meaning that the total expense ratio reported for those funds reflect only one Program payment or did not reflect any Program payments at all.The Board considered this information and the associated differences in the reported expense ratio of the fund and each Expense Group fund when comparing the fund s total expense ratio to the Expense Group median.
Representatives of the Manager reviewed with the Board members the fees paid to the Manager or its affiliates by Similar Funds, and explained the nature of the Similar Funds and the differences, from the Manager s perspective, in providing services to the Similar Funds as compared to the fund.The Board members noted that the Similar Funds included funds used primarily as a sweep vehicle for asset management accounts as well as funds with investment minimums close to or the same as that of the fund.The Board analyzed differences in fees paid to the Manager and discussed the relationship of the management fees paid in light of the services provided.The Board members considered the relevance of the fee information provided for the Similar Funds to evaluate the appropriateness and reasonableness of the fund s management fee.
The Manager s representatives noted that there were no similarly managed institutional separate accounts or wrap fee accounts managed by the Manager or its affiliates with similar investment objectives, policies, and strategies as the fund.
DREYFUS TAX EXEMPT CASH MANAGEMENT
The Board reviewed the range of management fees and expense ratios of the funds in the Expense Group and Expense Universe, and noted that the fund s contractual
104
management fee was lower than the Expense Group median and that the fund s actual management fee was higher (by three basis points and two basis points, respectively) that the Expense Group median and Expense Universe median. The Board also noted that the fund s total expense ratio was less than two basis points higher than the Expense Group median and lower than the Expense Universe median.
With respect to the fund s performance, the Board noted that the fund achieved total return results higher than the Performance Group median and Performance Universe median for each reported time period up to ten years. The Board also noted the low absolute returns for the Performance Group funds and the portfolio manager s presentation for managing the fund s average maturity and credit risk profile over the past year.
In addition, a representative of the Manager advised the Board members that money market funds which participated in the U.S. Treasury Department s Temporary Guarantee Program for Money Market Funds (the Program ) made payments to the Treasury Department for participation in the Program in October 2008, December 2008, and April 2009, at a rate of .01%, .015%, and .015% of a fund s assets eligible for coverage under the Program, and that generally the participating funds (including the fund) paid these expenses directly, even if there was an expense limitation in effect. It was noted that the fund s expense information was derived from its January 31, 2009 annual report, which reflected the two payments made by the fund for Program participation. It also was noted that the expense ratio information for each Expense Group fund was derived from reports dated on or before October 31, 2008, meaning that the total expense ratio reported for those funds reflect only one Program payment or did not reflect any Program payments at all. The Board considered this information and the associated differences in the reported expense ratio of the fund and each Expense Group fund when comparing the fund s total expense ratio to the Expense Group median.
Representatives of the Manager reviewed with the Board members the fees paid to the Manager or its affiliates by Similar Funds, and explained the nature of the Similar Funds and the differences, from the Manager s perspective, in pro-
viding services to the Similar Funds as compared to the fund. The Board analyzed differences in fees paid to the Manager and discussed the relationship of the management fees paid in light of the services provided. The Board members considered the relevance of the fee information provided for the Similar Funds to evaluate the appropriateness and reasonableness of the fund s management fee.
The Manager s representatives noted that there were no similarly managed institutional separate accounts or wrap fee accounts managed by the Manager or its affiliates with similar investment objectives, policies, and strategies as the fund.
DREYFUS MUNICIPAL CASH MANAGEMENT PLUS
The Board reviewed the range of management fees and expense ratios of the funds in the Expense Group and Expense Universe, and noted that the fund s contractual management fee was lower than the Expense Group median and that the fund s actual management fee was less than two basis points higher than the Expense Group median and Expense Universe median. The Board also noted that the fund s total expense ratio was less than two basis points higher than the Expense Group median and lower than the Expense Universe median.
With respect to the fund s performance, the Board noted that the fund achieved total return results higher than the Performance Group median and Performance Universe median for each reported time period up to ten years. The Board also noted the low absolute returns for the Performance Group funds and the portfolio manager s presentation for managing the funds average maturity and credit risk profile over the past year.
In addition, a representative of the Manager advised the Board members that money market funds which participated in the U.S. Treasury Department s Temporary Guarantee Program for Money Market Funds (the Program ) made payments to the Treasury Department for participation in the Program in October 2008, December 2008, and April 2009, at a rate of .01%, .015%, and .015% of a fund s assets eligible for coverage under the Program, and that generally the participating funds (including the fund) paid these expenses directly, even if there was an expense limitation in effect. It
The Funds 105
INFORMATION ABOUT THE REVIEW AND APPROVAL
OF EACH FUND S INVESTMENT MANAGEMENT AGREEMENT (Unaudited) (continued) |
was noted that the fund s expense information was derived from its January 31, 2009 annual report, which reflected the two payments made by the fund for Program participation. It also was noted that the expense ratio information for two other Expense Group funds was derived from report dated December 31, 2008, and in the case of each other Expense Group fund from reports dated on or before November 30, 2008, meaning that the total expense ratio reported for those funds reflect only one Program payment or did not reflect any Program payments at all. The Board considered this information and the associated differences in the reported expense ratio of the fund and each Expense Group fund when comparing the fund s total expense ratio to the Expense Group median.
Representatives of the Manager reviewed with the Board members the fees paid to the Manager or its affiliates by Similar Funds, and explained the nature of the Similar Funds and the differences, from the Manager s perspective, in providing services to the Similar Funds as compared to the fund. The Board analyzed differences in fees paid to the Manager and discussed the relationship of the management fees paid in light of the services provided. The Board members considered the relevance of the fee information provided for the Similar Funds to evaluate the appropriateness and reasonableness of the fund s management fee.
The Manager s representatives noted that there were no similarly managed institutional separate accounts or wrap fee accounts managed by the Manager or its affiliates with similar investment objectives, policies, and strategies as the fund.
DREYFUS NEW YORK MUNICIPAL CASH MANAGEMENT
The Board reviewed the range of management fees and expense ratios of the funds in the Expense Group and Expense Universe, and noted that the fund s contractual management fee was lower than the Expense Group median and that the fund s actual management fee was lower than the Expense Group median and higher than the Expense Universe median.The Board also noted that the fund s total expense ratio was lower than the Expense Group median and Expense Universe median.
With respect to the fund s performance, the Board noted that the fund achieved the number one total return ranking among its Performance Group, and the number one or number two total return ranking among its Performance Universe, for each reported time period up to ten 10 years. The Board also noted the low absolute returns for the Performance Group funds and the portfolio manager s presentation for managing the funds average maturity and credit risk profile over the past year.
In addition, a representative of the Manager advised the Board members that money market funds which participated in the U.S. Treasury Department s Temporary Guarantee Program for Money Market Funds (the Program ) made payments to the Treasury Department for participation in the Program in October 2008, December 2008, and April 2009, at a rate of .01%, .015%, and .015% of a fund s assets eligible for coverage under the Program, and that generally the participating funds (including the fund) paid these expenses directly, even if there was an expense limitation in effect. It was noted that the fund s expense information was derived from its January 31, 2009 annual report, which reflected the two payments made by the fund for Program participation. It also was noted that the expense ratio information for two other Expense Group funds was derived from reports dated on or before January 31, 2009, and in the case of each other Expense Group fund f rom reports dated on or before October 31, 2008, meaning that the total expense ratio reported for those funds reflect only one Program payment or did not reflect any Program payments at all. The Board considered this information and the associated differences in the reported expense ratio of the fund and each Expense Group fund when comparing the fund s total expense ratio to the Expense Group median.
Representatives of the Manager reviewed with the Board members the fees paid to the Manager or its affiliates by Similar Funds, and explained the nature of the Similar Funds and the differences, from the Manager s perspective, in providing services to the Similar Funds as compared to the fund. The Board members noted that the Similar Funds included one fund used primarily as a sweep vehicle for asset manage-
106
ment accounts as well as two other retail funds. The Board analyzed differences in fees paid to the Manager and discussed the relationship of the management fees paid in light of the services provided.The Board members considered the relevance of the fee information provided for the Similar Funds to evaluate the appropriateness and reasonableness of the fund s management fee.
The Manager s representatives noted that there were no similarly managed institutional separate accounts or wrap fee accounts managed by the Manager or its affiliates with similar investment objectives, policies, and strategies as the fund.
DREYFUS NEW YORK AMT-FREE MUNICIPAL CASH MANAGEMENT
The Board reviewed the range of management fees and expense ratios of the funds in the Expense Group and Expense Universe, and noted that the fund s contractual management fee was lower than the Expense Group median and that the fund s actual management fee was lower than the Expense Group median and Expense Universe median. The Board also noted that the fund s total expense ratio was lower than the Expense Group median and Expense Universe median.
With respect to the fund s performance, the Board noted that the fund achieved the number one total return ranking among its Performance Group for the one-year period and the number two total return ranking in its Performance Group for each longer-term time period up to ten years, and total return results that were higher than the Performance Universe median for each reported time period up to ten years.The Board also noted the low absolute returns for the Performance Group funds and the portfolio manager s presentation for managing the funds average maturity and credit risk profile over the past year.
In addition, a representative of the Manager advised the Board members that money market funds which participated in the U.S. Treasury Department s Temporary Guarantee
Program for Money Market Funds (the Program ) made payments to the Treasury Department for participation in the Program in October 2008, December 2008, and April 2009, at a rate of .01%, .015%, and .015% of a fund s assets eligible for coverage under the Program, and that generally the participating funds (including the fund) paid these expenses directly, even if there was an expense limitation in effect. It was noted that the fund s expense information was derived from its January 31, 2009 annual report, which reflected the two payments made by the fund for Program participation. It also was noted that the expense ratio information for several other Expense Group funds was derived from reports dated on or before October 31, 2008, meaning that the total expense ratio reported for those funds reflect only one Program payment or did not reflect any Program payments at all.The Board considered this information and the associated differences in the reported expense ratio of the fund and each Expense Group fund when comparing the fund s total expense ratio to the Expense Group median.
Representatives of the Manager reviewed with the Board members the fees paid to the Manager or its affiliates by Similar Funds, and explained the nature of the Similar Funds and the differences, from the Manager s perspective, in providing services to the Similar Funds as compared to the fund. The Board members noted that the Similar Funds included one fund used primarily as a sweep vehicle for asset management accounts as well as two other retail funds. The Board analyzed differences in fees paid to the Manager and discussed the relationship of the management fees paid in light of the services provided.The Board members considered the relevance of the fee information provided for the Similar Funds to evaluate the appropriateness and reasonableness of the fund s management fee.
The Manager s representatives noted that there were no similarly managed institutional separate accounts or wrap fee accounts managed by the Manager or its affiliates with similar investment objectives, policies, and strategies as the fund.
The Funds 107
| | INFORMATION ABOUT THE REVIEW AND APPROVAL
OF EACH FUND S INVESTMENT MANAGEMENT AGREEMENT (Unaudited) (continued) |
DREYFUS CALIFORNIA AMT-FREE MUNICIPAL
CASH MANAGEMENT |
The Board reviewed the range of management fees and expense ratios of the funds in the Expense Group and Expense Universe, and noted that the fund s contractual management fee was lower than the Expense Group median and that the fund s actual management fee was lower than the Expense Group median and Expense Universe median.The Board also noted that the fund s total expense ratio was lower than the Expense Group median and Expense Universe median.
With respect to the fund s performance, the Board noted that the fund achieved the number one total return ranking among its Performance Group, and the number three return ranking among its Performance Universe, for the reported one-year time period.The Board also noted the low absolute returns for the Performance Group funds and the portfolio manager s presentation for managing the funds average maturity and credit risk profile over the past year.
In addition, a representative of the Manager advised the Board members that money market funds which participated in the U.S. Treasury Department s Temporary Guarantee Program for Money Market Funds (the Program ) made payments to the Treasury Department for participation in the Program in October 2008, December 2008, and April 2009, at a rate of .01%, .015%, and .015% of a fund s assets eligible for coverage under the Program, and that generally the participating funds (including the fund) paid these expenses directly, even if there was an expense limitation in effect. It was noted that the fund s expense information was derived from its January 31, 2009 annual report, which reflected the two payments made by the fund for Program participation. It also was noted that the expense ratio information for several other Expense Group funds was derived from reports dated on or before October 31, 2008, meaning that the total expense ratio reported for those funds reflect only one Program payment or did not reflect any Program payments at all.The Board considered this information and the associated differences in the reported expense ratio of the fund and each Expense Group fund when comparing the fund s total expense ratio to the Expense Group median.
Representatives of the Manager reviewed with the Board members the fees paid to the Manager or its affiliates by Similar Funds, and explained the nature of the Similar Funds and the differences, from the Manager s perspective, in providing services to the Similar Funds as compared to the fund. The Board members noted that the Similar Funds included one fund used primarily as a sweep vehicle for asset management accounts as well as two other retail funds. The Board analyzed differences in fees paid to the Manager and discussed the relationship of the management fees paid in light of the services provided.The Board members considered the relevance of the fee information provided for the Similar Funds to evaluate the appropriateness and reasonableness of the fund s management fee.
The Manager s representatives noted that there were no similarly managed institutional separate accounts or wrap fee accounts managed by the Manager or its affiliates with similar investment objectives, policies, and strategies as the fund.
Analysis of Profitability and Economies of Scale. The Manager s representatives reviewed the dollar amount of expenses allocated and profit received by the Manager for each fund and the method used to determine such expenses and profit.The Board considered information, previously provided and discussed, prepared by an independent consulting firm regarding the Manager s approach to allocating costs to, and determining the profitability of, individual funds and the entire Dreyfus mutual fund complex.The Board members also considered that the methodology had also been reviewed by an independent registered public accounting firm which, like the consultant, found the methodology to be reasonable.The consulting firm also analyzed where any economies of scale might emerge in connection with the management of a fund. The Board members evaluated the profitability analysis in light of the relevant circumstances for each fund, including each funds larger asset size from the prior year, and the extent to which economies of scale would be realized if the fund grows and whether fee levels reflect these economies of scale for the benefit of fund shareholders. The Board also considered the Manager s brokerage policies and practices, the standards applied for seeking best execution, and the potential benefits to the Manager from acting as investment adviser to each fund
108
and noted that there were no soft dollar arrangements in effect with respect to trading any fund s portfolio.
It was noted that the Board members should consider the Manager s profitability with respect to each fund as part of their evaluation of whether the fees under the Management Agreement bear a reasonable relationship to the mix of services provided by the Manager, including the nature, extent, and quality of such services and that a discussion of economies of scale is predicated on increasing assets and that, if a fund s assets had been decreasing, the possibility that the Manager may have realized any economies of scale would be less. It was noted that the profitability percentage for managing each fund was within the range determined by appropriate court cases to be reasonable given the services rendered and that the profitability percentage for managing the fund was reasonable given the generally superior service levels provided. The Board also noted the Manager s expense undertaking in effect for each fund over the past year and its effec t on the profitability of the Manager.
At the conclusion of these discussions, the Board agreed that it had been furnished with sufficient information to make an informed business decision with respect to continuation of each fund s Management Agreement. Based on the discussions and considerations as described above, each fund s Board reached the following conclusions and determinations:
- The Board concluded that the nature, extent, and quality of the services provided by the Manager to each fund are adequate and appropriate.
- The Board was satisfied with each fund s performance.The Board noted the low absolute returns for each fund and its respective Performance Group funds and, for the Taxable Funds, the very narrow spreads among the returns for each fund and its Performance Group funds.
- The Board noted that many of each fund s competitors implemented more extensive expense limitations than the respective fund and considered the impact this had on each fund s relative performance results, particularly given the narrow spreads in performance results among the Taxable Funds and their respective Performance Group funds.
- The Board further noted that, as to each fund, the fund s total expense ratio reflected two payments made (in October and December of 2008) to the U.S. Treasury Department for the fund s participation in the U.S.
Treasury Department s Temporary Guarantee Program for Money Market Funds, while the total expense ratio of the substantial majority (if not all) of each fund s respective Expense Group funds reflected only one payment or no payments, and that the multiple payments made by each fund were a material factor in each fund s total expense ratio being up to three basis points higher than the applic- able Expense Group median. - The Board commended the funds portfolio managers and the credit research groups that support them, noting their unwavering commitment to sound investment strategies, to intensive credit research, and to high credit quality.
- The Board concluded that the fee paid to the Manager by each fund was reasonable in light of the services provided, comparative performance and expense and management fee information, including the expense undertakings in effect for each fund, costs of the services provided and profits to be realized and benefits derived or to be derived by the Manager from its relationship with each fund.
- The Board determined that the economies of scale which may accrue to the Manager and its affiliates in connection with the management of each fund had been adequately considered by the Manager in connection with the man- agement fee rate charged to each fund, and that, to the extent in the future it were to be determined that mater- ial economies of scale had not been shared with a fund, the Board would seek to have those economies of scale shared with the fund.
- The Board members considered these conclusions and determinations, along with the information received on a routine and regular basis throughout the year, and, without any one factor being dispositive, the Board determined that re-approval of each fund s Management Agreement was in the best interests of the fund and its respective shareholders.
The Funds 109
NOTES
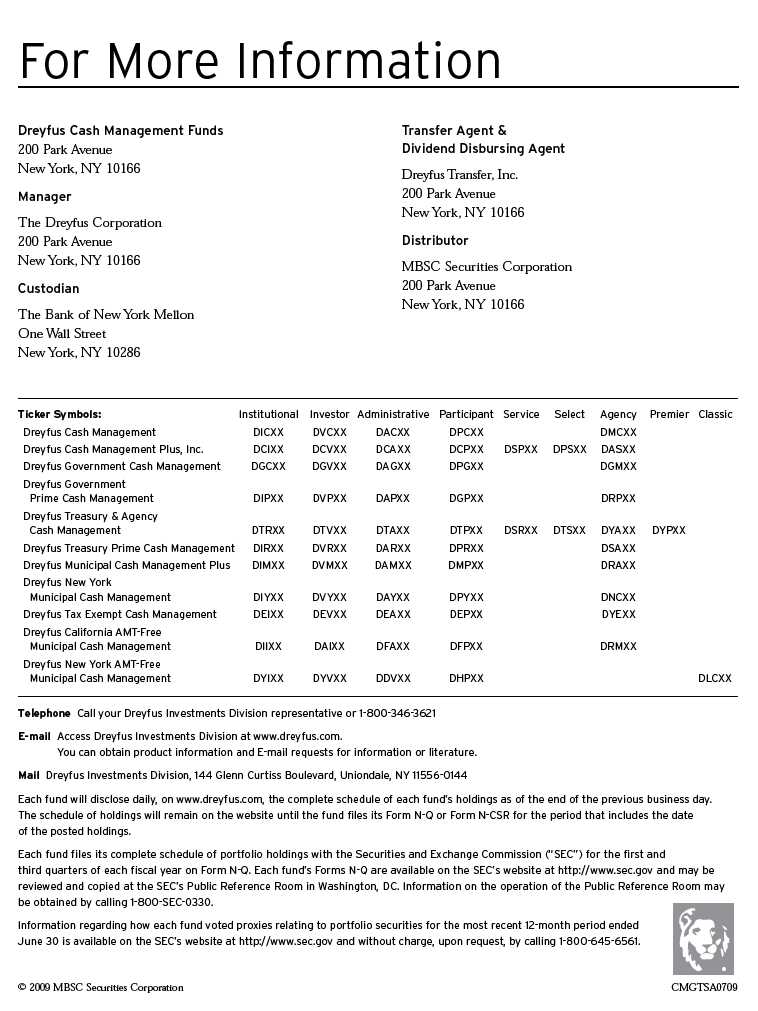
| |
| Item 2. | Code of Ethics. |
| | Not applicable. |
| Item 3. | Audit Committee Financial Expert. |
| | Not applicable. |
| Item 4. | Principal Accountant Fees and Services. |
| | Not applicable. |
| Item 5. | Audit Committee of Listed Registrants. |
| | Not applicable. |
| Item 6. | Investments. |
| (a) | Not applicable. |
| Item 7. | Disclosure of Proxy Voting Policies and Procedures for Closed-End Management |
| | Investment Companies. |
| | Not applicable. |
| Item 8. | Portfolio Managers of Closed-End Management Investment Companies. |
| | Not applicable. |
| Item 9. | Purchases of Equity Securities by Closed-End Management Investment Companies and |
| | Affiliated Purchasers. |
| | Not applicable. [CLOSED END FUNDS ONLY] |
| Item 10. | Submission of Matters to a Vote of Security Holders. |
| | There have been no material changes to the procedures applicable to Item 10. |
| Item 11. | Controls and Procedures. |
(a) The Registrant's principal executive and principal financial officers have concluded, based on their evaluation of the Registrant's disclosure controls and procedures as of a date within 90 days of the filing date of this report, that the Registrant's disclosure controls and procedures are reasonably designed to ensure that information required to be disclosed by the Registrant on Form N-CSR is recorded, processed, summarized and reported within the required time periods and that information required to be disclosed by the Registrant in the reports that it files or submits on Form N-CSR is accumulated and communicated to the Registrant's management, including its principal executive and principal financial officers, as appropriate to allow timely decisions regarding required disclosure.
(b) There were no changes to the Registrant's internal control over financial reporting that occurred during the second fiscal quarter of the period covered by this report that have materially affected, or are reasonably likely to materially affect, the Registrant's internal control over financial reporting.
(a)(1) Not applicable.
(a)(2) Certifications of principal executive and principal financial officers as required by Rule 30a-2(a) under the Investment Company Act of 1940.
(a)(3) Not applicable.
(b) Certification of principal executive and principal financial officers as required by Rule 30a-2(b) under the Investment Company Act of 1940.
Pursuant to the requirements of the Securities Exchange Act of 1934 and the Investment Company Act of 1940, the Registrant has duly caused this Report to be signed on its behalf by the undersigned, thereunto duly
| |
| DREYFUS NEW YORK MUNICIPAL CASH MANAGEMENT |
| |
| By: | /s/ J. David Officer |
| | J. David Officer, |
| | President |
| |
| Date: | September 22, 2009 |
Pursuant to the requirements of the Securities Exchange Act of 1934 and the Investment Company Act of 1940, this Report has been signed below by the following persons on behalf of the Registrant and in the capacities and on the dates indicated.
| |
| By: | /s/ J. David Officer |
| | J. David Officer, |
| | President |
| |
| Date: | September 22, 2009 |
| |
| By: | /s/ James Windels |
| James Windels, |
| | Treasurer |
| |
| Date: | September 22, 2009 |
(a)(2) Certifications of principal executive and principal financial officers as required by Rule 30a-2(a) under the Investment Company Act of 1940. (EX-99.CERT)
(b) Certification of principal executive and principal financial officers as required by Rule 30a-2(b) under the Investment Company Act of 1940. (EX-99.906CERT)