UNITED STATES
SECURITIES AND EXCHANGE COMMISSION
Washington, D.C. 20549
FORM N-CSRS
CERTIFIED SHAREHOLDER REPORT OF REGISTERED
MANAGEMENT INVESTMENT COMPANIES
Investment Company Act file number: 811-06431
MANAGERS TRUST II
(Exact name of registrant as specified in charter)
| | |
| 800 Connecticut Avenue, Norwalk, Connecticut | | 06854 |
| (Address of principal executive offices) | | (Zip code) |
Managers Investment Group LLC
800 Connecticut Avenue, Norwalk, Connecticut 06854
(Name and address of agent for service)
Registrant’s telephone number, including area code: (203) 299-3500
Date of fiscal year end: DECEMBER 31
Date of reporting period: JANUARY 1, 2006 – JUNE 30, 2006 (Semi-Annual Shareholder Report)
| Item 1. | Reports to Shareholders |
SEMI-ANNUAL REPORT
Managers Trust II Funds
June 30, 2006
| • | | Managers High Yield Fund |
| • | | Managers Fixed Income Fund |

Trust II Funds
Semi-Annual Report – June 30, 2006 (unaudited)
Nothing contained herein is to be considered an offer, sale or solicitation of an offer to buy shares of The Managers Funds or Managers AMG Funds. Such offering is made only by Prospectus, which includes details as to offering price and other material information.
Letter to Shareholders
Dear Fellow Shareholder,
The first half of 2006 was characterized by increased volatility in most markets. U.S. and foreign stocks, as well as bonds were all impacted by higher oil prices, unrest in the Middle East, and uncertainty over growth rates and inflation. Times like these challenge investors to remove emotion from decisions and stay the course with their long-term investment plans.
At Managers, regardless of market conditions, we maintain a focus on providing investors with excellent, trusted, and rigorously monitored investment solutions across all major market segments and styles. We encourage our portfolio managers to take a long term view and to invest with a long term horizon. We strive to stay on course even when market volatility causes concern.
Our overriding goal is to hire fund managers that can effectively manage your assets in all types of market conditions. Toward this goal we maintain a team of skilled investment professionals focused solely on understanding the global capital markets and overseeing the managers in our Funds. We hire fund portfolio managers who excel over time, have a strong investment discipline and stick to it. Our investment team oversees the Funds’ managers and portfolios every day so you don’t have to. Once you have selected Managers Funds as part of your asset allocation, you can be assured that we are monitoring that investment every day to help ensure it is delivering on its investment mandate.
We believe we have hired some of the best managers in the market to help our investors navigate complex and volatile markets.
We believe we have hired some of the best managers in the market to help our investors navigate complex and volatile markets. An example is Dan Fuss of Loomis Sayles (Managers Bond Fund) and Bill Gross of PIMCO (Managers Fremont Bond Fund) who have both helped our investors deal with changing market conditions for years. Recently, and for differing reasons, both managers came to the conclusion that the Federal Reserve Board would stop raising short term rates and extended the maturities of their portfolio holdings. These managers made reasoned judgments on the market based on their investment philosophies and backed up by extensive research. Their well thought out and executed investment management strategies let you the investor have confidence that your assets are being managed prudently and proactively.
At Managers we appreciate the opportunity to be a part of your long term investment plan. You can rest assured that under all market conditions our team is focused on delivering you excellent investment management services.
Respectfully,
| | | | |
| | |
 | | | |  |
| Peter M. Lebovitz | | | | Thomas G. Hoffman, CFA |
| President | | | | Executive Vice President |
Managers Funds | | | | Chief Investment Officer |
| | | | Managers Investment Group LLC |
1
About Your Fund’s Expenses (unaudited)
As a shareholder of the Fund, you incur two types of costs: (1) transaction costs, including sales charges (loads) on purchase payments; reinvested dividends or other distributions; redemption fees; and exchange fees; and (2) ongoing costs, including management fees; distribution (12b-1) fees; and other Fund expenses. This Example is intended to help you understand your ongoing costs (in dollars) of investing in the Fund and to compare these costs with the ongoing costs of investing in other mutual funds. The Example is based on an investment of $1,000 invested at the beginning of the period and held for the entire period as indicated below.
Actual Fund Return
The first line of the table below provides information about actual account values and actual expenses. You may use the information in this line, together with the amount you invested, to estimate the expenses that you paid over the period. Simply divide your account value by $1,000 (for example, an $8,600 account value divided by $1,000 = 8.6), then multiply the result by the number in the first line under the heading entitled “Expenses Paid During Period” to estimate the expenses you paid on your account during this period.
Hypothetical Example for Comparison Purposes
The second line of the table below provides information about hypothetical account values and hypothetical expenses based on the Fund’s actual expense ratio and an assumed rate of return of 5% per year before expenses, which is not the Fund’s actual return. The hypothetical account values and expenses may not be used to estimate the actual ending account balance or expenses you paid for the period. You may use this information to compare the ongoing costs of investing in the Fund and other funds. To do so, compare this 5% hypothetical example with the 5% hypothetical examples that appear in the shareholder reports of the other funds.
Please note that the expenses shown in the table are meant to highlight your ongoing costs only and do not reflect any transactional costs, such as sales charges (loads), redemption fees, or exchange fees. Therefore, the second line of the table is useful in comparing ongoing costs only, and will not help you determine the relative total costs of owning different funds. In addition, if these transactional costs were included, your costs would have been higher.
| | | | | | | | | |
Six Months Ended June 30, 2006 | | Beginning Account Value 1/1/2006 | | Ending Account Value 6/30/2006 | | Expenses Paid During Period* |
Managers 20 Fund Class A | | | | | | | | | |
Based on Actual Fund Return | | $ | 1,000 | | $ | 919 | | $ | 7.14 |
Based on Hypothetical 5% Annual Return | | $ | 1,000 | | $ | 1,017 | | $ | 7.50 |
| | | |
Managers 20 Fund Class B | | | | | | | | | |
Based on Actual Fund Return | | $ | 1,000 | | $ | 915 | | $ | 10.68 |
Based on Hypothetical 5% Annual Return | | $ | 1,000 | | $ | 1,014 | | $ | 11.23 |
| | | |
Managers 20 Fund Class C | | | | | | | | | |
Based on Actual Fund Return | | $ | 1,000 | | $ | 915 | | $ | 10.68 |
Based on Hypothetical 5% Annual Return | | $ | 1,000 | | $ | 1,014 | | $ | 11.23 |
| | | |
Managers 20 Fund Institutional Class | | | | | | | | | |
Based on Actual Fund Return | | $ | 1,000 | | $ | 920 | | $ | 5.95 |
Based on Hypothetical 5% Annual Return | | $ | 1,000 | | $ | 1,019 | | $ | 6.26 |
| | | |
Managers Mid-Cap Fund Class A | | | | | | | | | |
Based on Actual Fund Return | | $ | 1,000 | | $ | 1,033 | | $ | 6.30 |
Based on Hypothetical 5% Annual Return | | $ | 1,000 | | $ | 1,019 | | $ | 6.26 |
| | | |
Managers Mid-Cap Fund Class B | | | | | | | | | |
Based on Actual Fund Return | | $ | 1,000 | | $ | 1,029 | | $ | 10.06 |
Based on Hypothetical 5% Annual Return | | $ | 1,000 | | $ | 1,015 | | $ | 9.99 |
| | | |
Managers Mid-Cap Fund Class C | | | | | | | | | |
Based on Actual Fund Return | | $ | 1,000 | | $ | 1,029 | | $ | 10.06 |
Based on Hypothetical 5% Annual Return | | $ | 1,000 | | $ | 1,015 | | $ | 9.99 |
| | | |
Managers Mid-Cap Fund Institutional Class | | | | | | | | | |
Based on Actual Fund Return | | $ | 1,000 | | $ | 1,034 | | $ | 5.04 |
Based on Hypothetical 5% Annual Return | | $ | 1,000 | | $ | 1,020 | | $ | 5.01 |
| | | |
Managers Balanced Fund Class A | | | | | | | | | |
Based on Actual Fund Return | | $ | 1,000 | | $ | 1,028 | | $ | 6.28 |
Based on Hypothetical 5% Annual Return | | $ | 1,000 | | $ | 1,019 | | $ | 6.26 |
| | | |
Managers Balanced Fund Class B | | | | | | | | | |
Based on Actual Fund Return | | $ | 1,000 | | $ | 1,024 | | $ | 10.03 |
Based on Hypothetical 5% Annual Return | | $ | 1,000 | | $ | 1,015 | | $ | 9.99 |
| | | |
Managers Balanced Fund Class C | | | | | | | | | |
Based on Actual Fund Return | | $ | 1,000 | | $ | 1,023 | | $ | 10.03 |
Based on Hypothetical 5% Annual Return | | $ | 1,000 | | $ | 1,015 | | $ | 9.99 |
| | | |
Managers Balanced Fund Institutional Class | | | | | | | | | |
Based on Actual Fund Return | | $ | 1,000 | | $ | 1,028 | | $ | 5.03 |
Based on Hypothetical 5% Annual Return | | $ | 1,000 | | $ | 1,020 | | $ | 5.01 |
2
About Your Fund’s Expenses (continued)
| | | | | | | | | |
Six Months Ended June 30, 2006 | | Beginning Account Value 1/1/2006 | | Ending Account Value 6/30/2006 | | Expenses Paid During Period* |
Managers High Yield Fund Class A | | | | | | | | | |
Based on Actual Fund Return | | $ | 1,000 | | $ | 1,031 | | $ | 5.79 |
Based on Hypothetical 5% Annual Return | | $ | 1,000 | | $ | 1,019 | | $ | 5.76 |
| | | |
Managers High Yield Fund Class B | | | | | | | | | |
Based on Actual Fund Return | | $ | 1,000 | | $ | 1,027 | | $ | 9.55 |
Based on Hypothetical 5% Annual Return | | $ | 1,000 | | $ | 1,015 | | $ | 9.49 |
| | | |
Managers High Yield Fund Class C | | | | | | | | | |
Based on Actual Fund Return | | $ | 1,000 | | $ | 1,027 | | $ | 9.55 |
Based on Hypothetical 5% Annual Return | | $ | 1,000 | | $ | 1,015 | | $ | 9.49 |
| | | |
Managers High Yield Fund Institutional Class | | | | | | | | | |
Based on Actual Fund Return | | $ | 1,000 | | $ | 1,032 | | $ | 4.53 |
Based on Hypothetical 5% Annual Return | | $ | 1,000 | | $ | 1,020 | | $ | 4.51 |
| | | |
Managers Fixed Income Fund Class A | | | | | | | | | |
Based on Actual Fund Return | | $ | 1,000 | | $ | 993 | | $ | 3.66 |
Based on Hypothetical 5% Annual Return | | $ | 1,000 | | $ | 1,021 | | $ | 3.71 |
| | | |
Managers Fixed Income Fund Class B | | | | | | | | | |
Based on Actual Fund Return | | $ | 1,000 | | $ | 989 | | $ | 7.35 |
Based on Hypothetical 5% Annual Return | | $ | 1,000 | | $ | 1,017 | | $ | 7.45 |
| | | |
Managers Fixed Income Fund Class C | | | | | | | | | |
Based on Actual Fund Return | | $ | 1,000 | | $ | 990 | | $ | 7.35 |
Based on Hypothetical 5% Annual Return | | $ | 1,000 | | $ | 1,017 | | $ | 7.45 |
| | | |
Managers Fixed Income Fund Institutional Class | | | | | | | | | |
Based on Actual Fund Return | | $ | 1,000 | | $ | 995 | | $ | 2.42 |
Based on Hypothetical 5% Annual Return | | $ | 1,000 | | $ | 1,022 | | $ | 2.46 |
| * | Expenses are equal to the Fund’s annualized expense ratio multiplied by the average account value over the period, multiplied by the number of days in the most recent fiscal half-year (181), then divided by 365. |
3
Managers Funds Performance
All periods ended June 30, 2006 (unaudited)
| | | | | | | | | | | | | | | | | | | | | |
| | | | | | | Average Annual Total Return1 |
Managers Funds: Equity Funds: | | | | | | Six
Months | | | 1 Year | | | 3 Years | | | 5 Years | | | Since
Inception | | | Inception
Date |
20 Fund3 | | -Class A | | No Load | | (8.11 | )% | | (2.79 | )% | | 0.98 | % | | (10.11 | )% | | (5.37 | )% | | Jan-98 |
| | -Class A | | With Load | | (13.38 | )% | | (8.30 | )% | | (1.01 | )% | | (11.17 | )% | | (6.03 | )% | | Jan-98 |
| | -Class B | | No Load | | (8.53 | )% | | (3.60 | )% | | 0.39 | % | | (10.64 | )% | | (7.27 | )% | | Feb-98 |
| | -Class B | | With Load | | (13.10 | )% | | (8.42 | )% | | (0.61 | )% | | (11.00 | )% | | (7.27 | )% | | Feb-98 |
| | -Class C | | No Load | | (8.49 | )% | | (3.58 | )% | | 0.39 | % | | (10.63 | )% | | (7.86 | )% | | Mar-98 |
| | -Class C | | With Load | | (9.41 | )% | | (4.54 | )% | | 0.08 | % | | (10.82 | )% | | (7.97 | )% | | Mar-98 |
| | -Inst. Class | | No Load | | (7.97 | )% | | (2.74 | )% | | 1.41 | % | | (9.74 | )% | | (7.63 | )% | | Apr-98 |
S&P 500 Index5 | | | | | | 2.71 | % | | 8.63 | % | | 11.22 | % | | 2.49 | % | | 4.77 | % | | |
| | | | | | | | |
Mid-Cap4 | | -Class A | | No Load | | 3.27 | % | | 10.57 | % | | 16.93 | % | | 8.70 | % | | 13.44 | % | | Jan-97 |
| | -Class A | | With Load | | (2.66 | )% | | 4.19 | % | | 14.65 | % | | 7.41 | % | | 12.73 | % | | Jan-97 |
| | -Class B | | No Load | | 2.89 | % | | 9.73 | % | | 16.23 | % | | 8.09 | % | | 11.87 | % | | Jan-98 |
| | -Class B | | With Load | | (2.11 | )% | | 4.73 | % | | 15.49 | % | | 7.80 | % | | 11.87 | % | | Jan-98 |
| | -Class C | | No Load | | 2.88 | % | | 9.82 | % | | 16.21 | % | | 8.11 | % | | 11.01 | % | | Feb-98 |
| | -Class C | | With Load | | 1.88 | % | | 8.82 | % | | 15.85 | % | | 7.89 | % | | 10.88 | % | | Feb-98 |
| | -Inst. Class | | No Load | | 3.39 | % | | 10.89 | % | | 17.36 | % | | 9.17 | % | | 14.00 | % | | Jan-97 |
S&P Mid Cap 400 Index6 | | | | | | 4.24 | % | | 12.98 | % | | 18.14 | % | | 9.30 | % | | 13.72 | % | | |
| | | | | | | | |
Hybrid Fund: | | | | | | | | | | | | | | | | | | | | | |
| | | | | | | | |
Balanced2 | | -Class A | | No Load | | 2.78 | % | | 5.83 | % | | 9.14 | % | | 4.08 | % | | 8.56 | % | | Jan-97 |
| | -Class A | | With Load | | (3.09 | )% | | (0.26 | )% | | 7.00 | % | | 2.86 | % | | 7.88 | % | | Jan-97 |
| | -Class B | | No Load | | 2.35 | % | | 4.95 | % | | 8.45 | % | | 3.53 | % | | 6.52 | % | | Feb-98 |
| | -Class B | | With Load | | (2.65 | )% | | (0.05 | )% | | 7.59 | % | | 3.18 | % | | 6.52 | % | | Feb-98 |
| | -Class C | | No Load | | 2.32 | % | | 4.90 | % | | 8.43 | % | | 3.51 | % | | 6.44 | % | | Feb-98 |
| | -Class C | | With Load | | 1.32 | % | | 3.90 | % | | 8.05 | % | | 3.29 | % | | 6.31 | % | | Feb-98 |
| | -Inst. Class | | No Load | | 2.80 | % | | 5.97 | % | | 9.52 | % | | 4.53 | % | | 9.06 | % | | Jan-97 |
50% S&P 500 Index & 50% Lehman Brothers Aggregate Bond Index7 | | | | | | 1.06 | % | | 3.95 | % | | 6.72 | % | | 4.16 | % | | 7.32 | % | | |
4
Managers Funds Performance
All periods ended June 30, 2006 (continued)
| | | | | | | | | | | | | | | | | | | | | |
| | | | | | | Average Annual Total Returns1 |
Income Funds: | | | | | | Six
Months | | | 1 Year | | | 3 Years | | | 5 Years | | | Since
Inception | | | Inception
Date |
High Yield2,10 | | -Class A | | No Load | | 3.08 | % | | 4.29 | % | | 8.46 | % | | 9.42 | % | | 6.27 | % | | Jan-98 |
| | -Class A | | With Load | | (2.89 | )% | | (1.72 | )% | | 6.34 | % | | 8.13 | % | | 5.53 | % | | Jan-98 |
| | -Class B | | No Load | | 2.72 | % | | 3.43 | % | | 7.77 | % | | 8.82 | % | | 5.18 | % | | Feb-98 |
| | -Class B | | With Load | | (2.27 | )% | | (1.44 | )% | | 6.90 | % | | 8.53 | % | | 5.18 | % | | Feb-98 |
| | -Class C | | No Load | | 2.73 | % | | 3.44 | % | | 7.78 | % | | 8.83 | % | | 5.18 | % | | Feb-98 |
| | -Class C | | With Load | | 1.73 | % | | 2.47 | % | | 7.42 | % | | 8.61 | % | | 5.04 | % | | Feb-98 |
| | -Inst. Class | | No Load | | 3.18 | % | | 4.40 | % | | 8.85 | % | | 9.91 | % | | 6.23 | % | | Mar-98 |
Lehman Brother U.S. Corporate High Yield Bond Index8 | | | | | | 3.14 | % | | 4.80 | % | | 8.63 | % | | 8.69 | % | | N/A | | | |
| | | | | | | | |
Fixed Income2,11 | | -Class A | | No Load | | (0.67 | )% | | 0.01 | % | | 3.34 | % | | 5.19 | % | | 6.06 | % | | Jan-97 |
| | -Class A | | With Load | | (5.67 | )% | | (5.02 | )% | | 1.58 | % | | 4.11 | % | | 5.48 | % | | Jan-97 |
| | -Class B | | No Load | | (1.14 | )% | | (0.84 | )% | | 2.67 | % | | 4.57 | % | | 5.11 | % | | Mar-98 |
| | -Class B | | With Load | | (5.98 | )% | | (5.58 | )% | | 1.76 | % | | 4.24 | % | | 5.11 | % | | Mar-98 |
| | -Class C | | No Load | | (1.04 | )% | | (0.84 | )% | | 2.68 | % | | 4.59 | % | | 5.27 | % | | Mar-98 |
| | -Class C | | With Load | | (2.01 | )% | | (1.79 | )% | | 2.33 | % | | 4.39 | % | | 5.15 | % | | Mar-98 |
| | -Inst. Class | | No Load | | (0.54 | )% | | 0.25 | % | | 3.73 | % | | 5.64 | % | | 6.60 | % | | Jan-97 |
Lehman Brothers Aggregate Bond Index9 | | | | | | (0.72 | )% | | (0.81 | )% | | 2.05 | % | | 4.97 | % | | 6.07 | % | | |
The performance data shown represents past performance. Past performance is not a guarantee of future results. Current performance may be lower or higher than the performance data quoted. The investment return and principal value of an investment will fluctuate so that an investor’s shares, when redeemed, may be worth more or less than their original cost. For performance information through the most recent month end please call 800.835.3879 or visit our web site at www.managersinvest.com.
Performance differences among the share classes are due to differences in sales charge structures and class expenses. Returns shown reflect maximum sales charge of 5.75% on Class A (5.00% maximum for Managers Fixed Income Fund), as well as the applicable contingent deferred sales charge (CDSC) on both Class B and C shares. The Class B shares’ CDSC declines annually between years 1 through 6 according to the following schedule: 5, 4, 3, 3, 2, 1%. No sales charge is assessed after year six. Class C shares held for less than one year are subject to a 1% CDSC.
The Fund share classes differ with regard to sales charges and Fund expenses. In choosing a Fund and class(es), investors should consider the amount they plan to invest, their investment objectives, the Fund’s investment objectives, risks, charges, and expenses carefully before investing, and how long they intend to keep their money invested in the Fund and class(es). Each Fund’s prospectus contains information concerning the Fund’s investment objective, risk, charges, and expenses and other information. Additional risks are associated with investing in high yield securities and such securities may be considered speculative. There are also risks associated with investing in small-cap companies, such as increased volatility, and bonds, such as rising interest rates. More specifically, the value of debt instruments held in bond funds declines when interest rates rise and longer-term bonds are more vulnerable to interest rate risk. To obtain a prospectus, please call 800-835-3879 or visit our website at www.managersinvest.com. Please read the Prospectus carefully before you invest in a Fund or send money. Investors should discuss their goals and choices with a registered financial professional in order to determine which share class is appropriate for them.
Distributed by Managers Distributors, Inc., member NASD.
| 1 | Total return equals income yield plus share price change and assumes reinvestment of all dividends and capital gain distributions. Returns are net of fees and may reflect offsets of Fund expenses as described in the Prospectus. No adjustment has been made for taxes payable by shareholders on their reinvested dividends and capital gain distributions. Returns for periods greater than one year are annualized. |
| 2 | Changing interest rates may adversely affect the value of an investment. An increase in interest rates typically causes the value of bonds and other fixed-income securities to fall. |
| 3 | The Fund is subject to risks associated with investing in a concentrated fund, and the value of the Portfolio will be greatly affected by the fluctuations in the value of a single stock. |
| 4 | The Fund is subject to risks associated with investments in mid-capitalization companies, such as erratic earnings patterns, competitive conditions, limited earnings history, and a reliance on a limited number of products. |
| 5 | The S&P 500 Index is a capitalization-weighted index of 500 stocks. The S&P 500 Index is designed to measure performance of the broad domestic economy through changes in the aggregate market value of these stocks representing all major industries. Unlike the Fund, the S&P 500 Index is unmanaged, is not available for investment, and does not incur expenses. |
| 6 | The S&P MidCap 400 Index is the most widely used index for mid-size companies and covers approximately 7% of the U.S. equities market. Unlike the Fund, the S&P Mid Cap 400 Index is unmanaged, is not available for investment, and does not incur expenses. |
| 7 | The benchmark is composed of 50% S&P 500 Index and 50% Lehman Brothers Aggregate Bond Index. |
| 8 | The Lehman Brothers U.S. Corporate High Yield Bond Index is a total return performance benchmark for fixed income securities having a maximum quality rating of Ba1 (as determined by Moody’s Investors Service). Unlike the Fund, the Lehman Brothers U.S. Corporate High Yield Bond Index is unmanaged, is not available for investment, and does not incur expenses. |
| 9 | The Lehman Brothers Aggregate Bond Index is an index of the U.S. investment-grade fixed-rate bond market, including both government and corporate bonds. Unlike the Fund, the Lehman Brothers Aggregate Bond Index is unmanaged, is not available for investment, and does not incur expenses. |
| 10 | The Fund holds securities in which the issuer of the security may default or otherwise be unable to honor a financial obligation. The Fund holds securities rated below investment grade that are especially susceptible to this risk. These issuers may be involved in bankruptcy proceedings, reorganizations, or financial restructurings, and are not as strong financially as higher rated issuers. |
| 11 | Fixed-income funds are subject to the risks associated with investments in debt securities, such as default risk and fluctuations in the perception of the debtors ability to pay its creditors. |
5
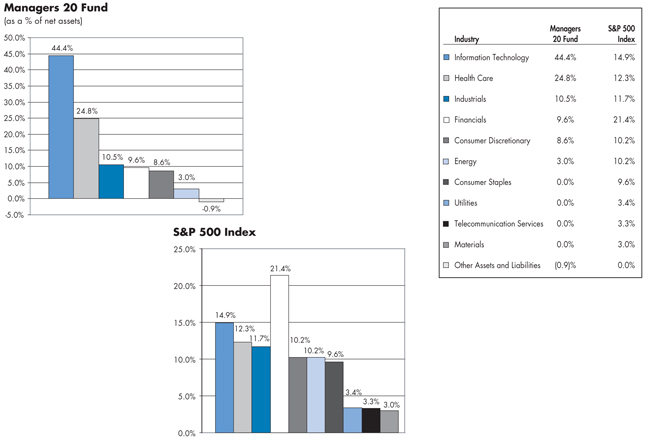
Managers 20 Fund
Fund Snapshots
June 30, 2006 (unaudited)
Portfolio Breakdown
Top Ten Holdings
| | | |
Top Ten Holdings (out of 25 securities) | | % of
Net Assets | |
Cisco Systems, Inc.* | | 5.6 | % |
Google Inc. | | 5.5 | |
Schwab (Charles) Corp.* | | 5.3 | |
Caterpillar, Inc.* | | 5.3 | |
Rockwell Automation, Inc. | | 5.2 | |
Teva Pharmaceutical Industries, Ltd., Sponsored ADR* | | 5.1 | |
QUALCOMM, Inc.* | | 4.9 | |
Amgen, Inc.* | | 4.9 | |
Cognizant Technology Solutions Corp. | | 4.7 | |
Juniper Networks, Inc. | | 4.6 | |
| | | |
Top Ten as a Group | | 51.1 | % |
| | | |
| * | Top Ten Holding at December 31, 2005 |
Any sectors, industries, or securities discussed should not be perceived as investment recommendations. Mention of a specific security should not be considered a recommendation to buy or solicitation to sell that security.
6
Managers 20 Fund
Schedule of Portfolio Investments
June 30, 2006 (unaudited)
| | | | | | | |
| | | Shares | | | Value | |
Common Stocks - 100.9% | | | | | | | |
Consumer Discretionary - 8.6% | | | | | | | |
Amazon.Com, Inc.* | | 16,600 | 2 | | $ | 642,088 | |
eBay, Inc.* | | 22,600 | | | | 661,954 | |
Total Consumer Discretionary | | | | | | 1,304,042 | |
Energy - 3.0% | | | | | | | |
Baker Hughes, Inc. | | 5,500 | | | | 450,175 | |
Financials - 9.6% | | | | | | | |
Citigroup, Inc. | | 13,600 | | | | 656,064 | |
Schwab (Charles) Corp. | | 49,900 | | | | 797,402 | |
Total Financials | | | | | | 1,453,466 | |
Health Care - 24.8% | | | | | | | |
Affymetrix, Inc.* | | 18,4002 | | | | 471,040 | |
Amgen, Inc.* | | 11,300 | | | | 737,099 | |
Medtronic, Inc. | | 12,3002 | | | | 577,116 | |
Pfizer, Inc. | | 28,300 | | | | 664,201 | |
Teva Pharmaceutical Industries, Ltd., Sponsored ADR | | 24,4002 | | | | 770,796 | |
UnitedHealth Group, Inc. | | 12,000 | | | | 537,360 | |
Total Health Care | | | | | | 3,757,612 | |
Industrials - 10.5% | | | | | | | |
Caterpillar, Inc. | | 10,700 | | | | 796,936 | |
Rockwell Automation, Inc. | | 11,000 | | | | 792,110 | |
Total Industrials | | | | | | 1,589,046 | |
Information Technology - 44.4% | | | | | | | |
Applied Materials, Inc. | | 38,0002 | | | | 618,640 | |
Avid Technology, Inc.* | | 14,6002 | | | | 486,618 | |
Cisco Systems, Inc.* | | 43,200 | | | | 843,696 | |
Cognizant Technology Solutions Corp.* | | 10,527 | | | | 709,204 | |
Electronic Arts, Inc.* | | 14,4002 | | | | 619,776 | |
Google Inc.* | | 2,000 | | | | 838,660 | |
Juniper Networks, Inc.* | | 43,1002 | | | | 689,169 | |
Linear Technology Corp. | | 16,3002 | | | | 545,887 | |
Maxim Integrated Products, Inc. | | 19,100 | | | | 613,301 | |
QUALCOMM, Inc. | | 18,600 | | | | 745,302 | |
Total Information Technology | | | | | | 6,710,253 | |
Total Common Stocks (cost $17,028,996) | | | | | | 15,264,594 | |
Other Investment Companies - 26.6%1 | | | | | | | |
Bank of New York Institutional Cash Reserves Fund, 5.22%3 | | 3,982,536 | | | $ | 3,982,536 | |
JPMorgan Prime Money Market Fund, Institutional Class Shares, 4.98% | | 46,652 | | | | 46,652 | |
Total Other Investment Companies
(cost $4,029,188) | | | | | | 4,029,188 | |
Total Investments - 127.5%
(cost $21,058,184) | | | | | | 19,293,782 | |
Other Assets, less Liabilities - (27.5)% | | | | | | (4,163,575 | ) |
Net Assets - 100.0% | | | | | $ | 15,130,207 | |
The accompanying notes are an integral part of these financial statements.
7
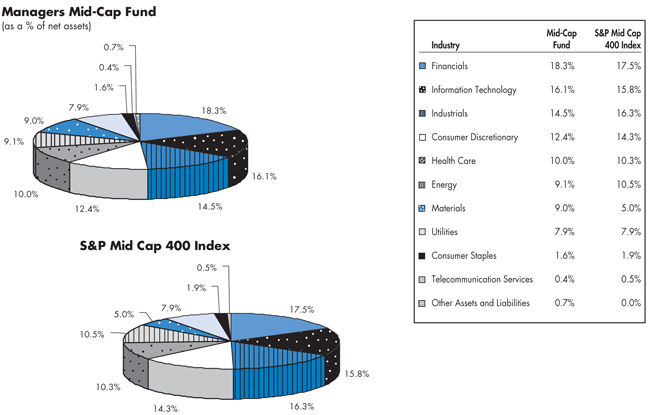
Managers Mid-Cap Fund
Fund Snapshots
June 30, 2006 (unaudited)
Portfolio Breakdown
Top Ten Holdings
| | | |
Top Ten Holdings (out of 120 securities) | | % of
Net Assets | |
Joy Global, Inc.* | | 2.5 | % |
Cummins, Inc. | | 2.2 | |
Patterson-UTI Energy, Inc.* | | 2.2 | |
Questar Corp.* | | 2.1 | |
American Financial Group, Inc.* | | 2.1 | |
Tesoro Corp. | | 1.9 | |
Radian Group, Inc. | | 1.9 | |
Allegheny Energy, Inc. | | 1.7 | |
Martin Marietta Materials, Inc.* | | 1.7 | |
Humana, Inc.* | | 1.7 | |
| | | |
Top Ten as a Group | | 20.0 | % |
| | | |
| * | Top Ten Holding at December 31, 2005 |
Any sectors, industries, or securities discussed should not be perceived as investment recommendations. Mention of a specific security should not be considered a recommendation to buy or solicitation to sell that security.
8
Managers Mid-Cap Fund
Schedule of Portfolio Investments
June 30, 2006 (unaudited)
| | | | | | |
| | | Shares | | | Value |
Common Stocks - 99.3% | | | | | | |
Consumer Discretionary - 12.4% | | | | | | |
Abercrombie & Fitch Co. | | 3,600 | | | $ | 199,548 |
American Eagle Outfitters, Inc. | | 43,600 | 2 | | | 1,484,144 |
AnnTaylor Stores Corp.* | | 26,300 | | | | 1,140,894 |
Autoliv, Inc. | | 11,500 | 2 | | | 650,555 |
Brinker International, Inc. | | 18,600 | 2 | | | 675,180 |
Brunswick Corp. | | 7,500 | | | | 249,375 |
Circuit City Stores, Inc. | | 27,400 | 2 | | | 745,828 |
Darden Restaurants, Inc. | | 29,700 | | | | 1,170,180 |
Dillard’s, Inc., Class A | | 37,300 | 2 | | | 1,188,004 |
Liz Claiborne, Inc. | | 12,100 | 2 | | | 448,426 |
NetFlix, Inc.* | | 20,600 | 2 | | | 560,526 |
Payless ShoeSource, Inc.* | | 39,600 | | | | 1,075,932 |
Rent-A-Center, Inc.* | | 22,000 | 2 | | | 546,920 |
Thor Industries, Inc. | | 9,800 | 2 | | | 474,810 |
Tupperware Corp. | | 19,800 | 2 | | | 389,862 |
Washington Post Co., The | | 410 | | | | 319,804 |
Total Consumer Discretionary | | | | | | 11,319,988 |
Consumer Staples - 1.6% | | | | | | |
Energizer Holdings, Inc.* | | 6,800 | 2 | | | 398,276 |
Hansen Natural Corp.* | | 1,800 | 2 | | | 342,666 |
Hormel Foods Corp. | | 8,900 | 2 | | | 330,546 |
McCormick & Co. | | 12,200 | | | | 409,310 |
Total Consumer Staples | | | | | | 1,480,798 |
Energy- 9.1% | | | | | | |
Cimarex Energy Co. | | 23,600 | | | | 1,014,800 |
ENSCO International, Inc. | | 11,800 | | | | 543,036 |
Helmerich & Payne, Inc. | | 13,400 | | | | 807,484 |
Newfield Exploration Co.* | | 17,700 | | | | 866,238 |
Overseas Shipholding Group, Inc. | | 15,700 | 2 | | | 928,655 |
Patterson-UTI Energy, Inc. | | 70,200 | | | | 1,987,362 |
Tesoro Corp. | | 23,400 | | | | 1,740,024 |
Unit Corp.* | | 7,800 | | | | 443,742 |
Total Energy | | | | | | 8,331,341 |
Financials - 18.3% | | | | | | |
A.G. Edwards, Inc. | | 10,700 | | | | 591,924 |
American Financial Group, Inc. | | 44,000 | 2 | | | 1,887,600 |
AmSouth Bancorporation | | 26,600 | 2 | | | 703,570 |
Assurant, Inc. | | 16,200 | 2 | | | 784,080 |
Camden Property Trust (REIT) | | 9,900 | 2 | | | 728,145 |
CB Richard Ellis Group, Inc.* | | 37,800 | | | | 941,220 |
CBL & Associates Properties, Inc. | | 29,900 | 2 | | | 1,164,007 |
Compass Bancshares, Inc. | | 11,400 | 2 | | | 633,840 |
First American Corp. | | 9,200 | 2 | | | 388,884 |
Highwoods Properties, Inc. | | 37,200 | 2 | | | 1,345,896 |
Indymac Mortgage Holdings, Inc. | | 7,800 | 2 | | | 357,630 |
Jefferies Group, Inc. | | 21,200 | 2 | | | 628,156 |
Leucadia National Corp. | | 13,600 | 2 | | | 396,984 |
Mercantile Bankshares Corp. | | 22,350 | 2 | | | 797,225 |
Nationwide Financial Services, Inc. | | 13,500 | | | | 595,080 |
New Plan Excel Realty Trust, Inc. | | 25,900 | 2 | | | 639,471 |
PMI Group, Inc. | | 16,700 | 2 | | | 744,486 |
Radian Group, Inc. | | 27,500 | | | | 1,698,950 |
Raymond James Financial, Inc. | | 12,100 | | | | 366,267 |
W.R. Berkley Corp. | | 13,900 | | | | 474,407 |
Wilmington Trust Corp. | | 9,200 | | | | 388,056 |
Zions Bancorporation | | 6,300 | | | | 491,022 |
Total Financial | | | | | | 16,746,900 |
HealthCare - 10.0% | | | | | | |
Applera Corp. - Applied Biosystems Group | | 37,500 | | | | 1,213,125 |
C.R. Bard, Inc. | | 11,900 | | | | 871,794 |
Charles River Laboratories International, Inc.* | | 22,100 | | | | 813,280 |
Coventry Health Care, Inc.* | | 21,525 | | | | 1,182,584 |
Hillenbrand Industries, Inc. | | 8,900 | 2 | | | 431,650 |
Humana, Inc.* | | 28,700 | | | | 1,541,190 |
Intuitive Surgical, Inc.* | | 3,100 | 2 | | | 365,707 |
King Pharmaceuticals Inc.* | | 15,000 | | | | 255,000 |
Lifepoint Hospitals, Inc.* | | 24,300 | | | | 780,759 |
Techne Corp.* | | 26,600 | 2 | | | 1,354,472 |
Thermo Electron Corp.* | | 5,400 | | | | 195,696 |
Watson Pharmaceuticals, Inc.* | | 7,200 | | | | 167,616 |
Total Health Care | | | | | | 9,172,873 |
Industrials - 14.5% | | | | | | |
Armor Holdings Inc.* | | 3,200 | | | | 175,456 |
Banta Corp. | | 14,300 | | | | 662,519 |
Con-way, Inc. | | 13,300 | | | | 770,469 |
Corporate Executive Board Co. | | 2,500 | 2 | | | 250,500 |
Cummins, Inc. | | 16,400 | 2 | | | 2,004,900 |
EGL, Inc.* | | 9,900 | | | | 496,980 |
Florida Rock Industries, Inc. | | 9,900 | 2 | | | 491,733 |
ITT Educational Services, Inc.* | | 11,300 | | | | 743,653 |
Joy Global, Inc. | | 44,000 | | | | 2,291,960 |
Precision Castparts Corp. | | 18,000 | | | | 1,075,680 |
The accompanying notes are an integral part of these financial statements.
9
Managers Mid-Cap Fund
Schedule of Portfolio Investments (continued)
| | | | | | | |
| | | Shares | | | Value | |
Industrials - 14.5% (continued) | | | | | | | |
R.R. Donnelley & Sons Co. | | 6,000 | | | $ | 191,700 | |
Republic Services, Inc. | | 22,000 | | | | 887,480 | |
Ryder System, Inc. | | 10,900 | | | | 636,887 | |
Skywest, Inc. | | 22,000 | | | | 545,600 | |
SPX Corp. | | 5,000 | 2 | | | 279,750 | |
Terex Corporation* | | 9,300 | | | | 917,910 | |
Thomas & Betts Corp.* | | 15,700 | | | | 805,410 | |
Total Industrials | | | | | | 13,228,587 | |
Information Technology - 16.1% | | | | | | | |
Akamai Technologies, Inc.* | | 22,200 | 2 | | | 803,418 | |
Arrow Electronics, Inc.* | | 10,200 | | | | 328,440 | |
Avnet, Inc.* | | 30,900 | | | | 618,618 | |
Cadence Design Systems Inc.* | | 33,700 | | | | 577,955 | |
CheckFree Corp.* | | 8,100 | 2 | | | 401,436 | |
Citrix Systems, Inc.* | | 24,200 | | | | 971,388 | |
Cognizant Technology Solutions Corp.* | | 6,100 | | | | 410,957 | |
Factset Research Systems, Inc. | | 24,850 | 2 | | | 1,175,405 | |
Global Payments, Inc. | | 19,600 | | | | 951,580 | |
Imation Corp. | | 13,000 | 2 | | | 533,650 | |
Ingram Micro, Inc., Class A* | | 36,000 | | | | 652,680 | |
Integrated Device Technology, Inc.* | | 33,400 | 2 | | | 473,612 | |
Intersil Corp., Class A | | 33,800 | | | | 785,850 | |
Lam Research Corp.* | | 15,700 | | | | 731,934 | |
MEMC Electronic Materials, Inc.* | | 10,500 | | | | 393,750 | |
Microchip Technology, Inc. | | 12,300 | | | | 412,665 | |
MoneyGram International, Inc. | | 14,200 | | | | 482,090 | |
Omnivision Technologies, Inc.* | | 25,900 | 2 | | | 547,008 | |
Palm, Inc.* | | 58,800 | 2 | | | 946,680 | |
Sabre Holdings Corp. | | 41,600 | | | | 915,200 | |
Sybase, Inc.* | | 30,900 | 2 | | | 599,460 | |
Tellabs, Inc.* | | 24,800 | | | | 330,088 | |
Western Digital Corp.* | | 36,600 | 2 | | | 725,046 | |
Total Information Technology | | | | | | 14,768,910 | |
Materials - 9.0% | | | | | | | |
Airgas, Inc. | | 11,100 | | | | 413,475 | |
Ashland, Inc. | | 11,100 | | | | 740,370 | |
Eagle Materials, Inc. | | 19,700 | 2 | | | 935,750 | |
FMC Corp. | | 22,000 | 2 | | | 1,416,580 | |
Louisana-Pacific Corp. | | 44,900 | 2 | | | 983,310 | |
Martin Marietta Materials, Inc. | | 17,100 | | | | 1,558,665 | |
Steel Dynamics, Inc. | | 18,300 | 2 | | | 1,203,042 | |
United States Steel Corp. | | 13,600 | | | | 953,632 | |
Total Materials | | | | | | 8,204,824 | |
Telecommunication Services - 0.4% | | | | | | | |
NII Holdings, Inc., Class B* | | 6,800 | | | | 383,384 | |
Utilities - 7.9% | | | | | | | |
Allegheny Energy, Inc.* | | 43,100 | | | | 1,597,717 | |
MDU Resources Group, Inc. | | 35,700 | | | | 1,306,977 | |
Nicor, Inc. | | 11,100 | 2 | | | 460,650 | |
OGE Energy Corp. | | 34,700 | 2 | | | 1,215,541 | |
Questar Corp. | | 23,600 | | | | 1,899,564 | |
UniSource Energy Corp. | | 3,100 | | | | 96,565 | |
Wisconsin Energy Corp. | | 17,100 | | | | 689,130 | |
Total Utilities | | | | | | 7,266,144 | |
Total Common Stocks (cost $79,430,438) | | | | | | 90,903,749 | |
Other Investment Companies - 30.3%1 | | | | | | | |
Bank of New York Institutional Cash | | | | | | | |
Reserves Fund, 5.22%3 | | 26,963,712 | | | | 26,963,712 | |
JPMorgan Prime Money Market Fund, Institutional Class Shares, 4.98% | | 766,558 | | | | 766,558 | |
Total Other Investment Companies
(cost $27,730,270) | | | | | | 27,730,270 | |
Total Investments - 129.6%
(cost $107,160,708) | | | | | | 118,634,019 | |
Other Assets, less Liabilities - (29.6)% | | | | | | (27,126,552 | ) |
Net Assets- 100.0% | | | | | $ | 91,507,467 | |
The accompanying notes are an integral part of these financial statements.
10
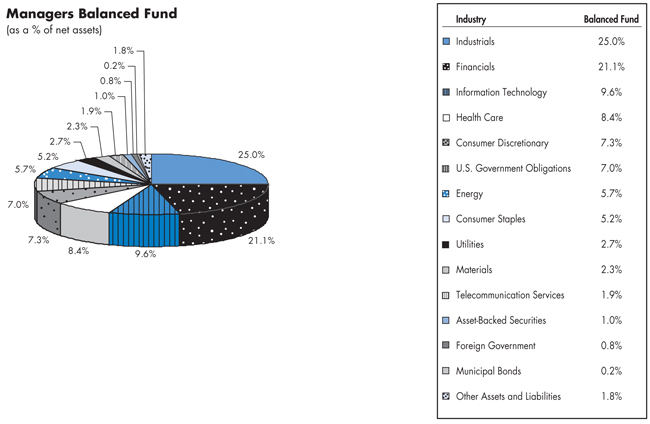
Managers Balanced Fund
Fund Snapshots
June 30, 2006 (unaudited)
Portfolio Breakdown
Top Ten Holdings
| | | |
Top Ten Holdings (out of 181 securities) | | % of Net Assets | |
Bank of America Corp.* | | 2.5 | % |
BellSouth Corp.* | | 1.9 | |
USTN, 2.375%, 08/15/06* | | 1.9 | |
USTN, 2.500%, 10/31/06* | | 1.9 | |
Wachovia Corp. * | | 1.8 | |
Johnson & Johnson* | | 1.8 | |
PG&E Corp. | | 1.5 | |
Marathon Oil Corp. | | 1.5 | |
JPMorgan Chase & Co. | | 1.4 | |
Procter & Gamble Co. | | 1.4 | |
| | | |
Top Ten as a Group | | 17.6 | % |
| | | |
| * | Top Ten Holding at December 31, 2005 |
Any sectors, industries, or securities discussed should not be perceived as investment recommendations. Mention of a specific security should not be considered a recommendation to buy or solicitation to sell that security.
11
Managers Balanced Fund
Schedule of Portfolio Investments
June 30, 2006 (unaudited)
| | | | | | |
Security Description | | Shares | | | Value |
Common Stocks - 65.2% | | | | | | |
Consumer Discretionary - 7.3% | | | | | | |
AnnTaylor Stores Corp.* | | 1,600 | | | $ | 69,408 |
CBS Corp., Class B | | 4,250 | | | | 114,963 |
Coach, Inc.* | | 2,800 | | | | 83,720 |
Dillard’s, Inc., Class A | | 2,200 | 2 | | | 70,070 |
Home Depot, Inc. | | 2,570 | 2 | | | 91,980 |
J.C. Penney Co., Inc. | | 3,500 | 2 | | | 236,284 |
Johnson Controls, Inc. | | 500 | | | | 41,110 |
McDonald’s Corp. | | 7,300 | | | | 245,280 |
McGraw-Hill Companies, Inc., The | | 1,600 | | | | 80,368 |
Office Depot, Inc.* | | 3,300 | | | | 125,400 |
Rent-A-Center, Inc.* | | 4,500 | 2 | | | 111,870 |
Time Warner, Inc. | | 14,860 | 2 | | | 257,078 |
Walt Disney Co., The | | 3,500 | | | | 105,000 |
Total Consumer Discretionary | | | | | | 1,632,531 |
Consumer Staples - 5.2% | | | | | | |
Altria Group, Inc. | | 2,520 | | | | 185,044 |
Archer-Daniels-Midland Co. | | 1,700 | | | | 70,176 |
PepsiCo, Inc. | | 4,900 | | | | 294,196 |
Pilgrim’s Pride Corp., Class B | | 3,400 | 2 | | | 87,720 |
Procter & Gamble Co. | | 5,712 | 2 | | | 317,586 |
Reynolds American, Inc. | | 700 | 2 | | | 80,710 |
SUPERVALU, Inc. | | 4,400 | 2 | | | 135,080 |
Total Consumer Staples | | | | | | 1,170,512 |
Energy - 5.7% | | | | | | |
ConocoPhillips Co. | | 4,200 | | | | 275,226 |
Devon Energy Corp. | | 1,500 | 2 | | | 90,615 |
Exxon Mobil Corp. | | 3,820 | | | | 234,357 |
Marathon Oil Corp. | | 4,000 | | | | 333,200 |
Unit Corp.* | | 2,500 | | | | 142,225 |
Valero Energy Corp. | | 3,100 | | | | 206,212 |
Total Energy | | | | | | 1,281,835 |
Financials - 13.9% | | | | | | |
Allstate Corp., The | | 800 | | | | 43,784 |
Assurant, Inc. | | 2,100 | 2 | | | 101,640 |
AvalonBay Communities, Inc. | | 400 | 2 | | | 44,248 |
Bank of America Corp. | | 11,800 | | | | 567,580 |
Bear, Stearns & Co., Inc. | | 500 | | | | 70,040 |
CBL & Associates Properties, Inc. | | 5,000 | 2 | | | 194,650 |
CIT Group, Inc. | | 4,500 | | | | 235,305 |
Citigroup, Inc. | | 2,500 | | | | 120,600 |
Conseco, Inc.* | | 8,100 | 2 | | | 187,110 |
The accompanying notes are an integral part of these financial statements.
12
Managers Balanced Fund
Schedule of Portfolio Investments (continued)
| | | | | | |
Security Description | | Shares | | | Value |
Financials - 13.9% (continued) | | | | | | |
Goldman Sachs Group, Inc. | | 1,300 | 2 | | $ | 195,559 |
JPMorgan Chase & Co. | | 7,648 | | | | 321,215 |
Lehman Brothers Holdings, Inc. | | 400 | | | | 26,060 |
Merrill Lynch & Co., Inc. | | 900 | | | | 62,604 |
New Century Financial Corp. | | 1,200 | 2 | | | 54,900 |
PMI Group, Inc. | | 800 | 2 | | | 35,664 |
Principal Financial Group | | 2,500 | 2 | | | 139,125 |
Prudential Financial, Inc. | | 2,200 | 2 | | | 170,940 |
Radian Group, Inc. | | 1,000 | | | | 61,780 |
Wachovia Corp. | | 7,500 | | | | 405,600 |
Washington Mutual, Inc. | | 2,108 | 2 | | | 96,083 |
Total Financials | | | | | | 3,134,487 |
Health Care - 8.4% | | | | | | |
AmerisourceBergen Corp. | | 2,400 | 2 | | | 100,608 |
Amgen, Inc.* | | 500 | | | | 32,615 |
Applera Corp. - Applied Biosystems Group | | 2,900 | | | | 93,815 |
Becton, Dickinson & Co. | | 1,800 | | | | 110,034 |
CIGNA Corp. | | 2,100 | | | | 206,870 |
Coventry Health Care, Inc.* | | 2,725 | | | | 149,712 |
Endo Pharmaceuticals Holdings, Inc.* | | 900 | | | | 29,682 |
Gilead Sciences, Inc.* | | 4,200 | | | | 248,472 |
Johnson & Johnson | | 6,680 | | | | 400,265 |
King Pharmaceuticals Inc* | | 6,800 | | | | 115,600 |
Merck & Co., Inc. | | 5,100 | | | | 185,793 |
Pfizer, Inc. | | 8,840 | | | | 207,475 |
Total Health Care | | | | | | 1,880,941 |
Industrials - 8.4% | | | | | | |
CSX Corp. | | 2,800 | | | | 197,232 |
Cummins, Inc. | | 2,000 | | | | 244,500 |
Emerson Electric Co. | | 2,300 | | | | 192,763 |
Florida Rock Industries, Inc. | | 3,100 | 2 | | | 153,977 |
General Electric Co. | | 5,800 | | | | 191,168 |
Northrop Grumman Corp. | | 4,500 | | | | 288,270 |
Oshkosh Truck Corp | | 600 | | | | 28,512 |
Robert Half International, Inc. | | 3,100 | 2 | | | 130,200 |
Ryder System, Inc. | | 1,600 | 2 | | | 93,488 |
Textron, Inc. | | 3,000 | | | | 276,540 |
West Corp.* | | 1,800 | | | | 86,238 |
Total Industrials | | | | | | 1,882,888 |
Information Technology - 9.6% | | | | | | |
Avnet, Inc.* | | 2,100 | | | | 42,042 |
Cisco Systems, Inc.* | | 12,640 | | | | 246,859 |
The accompanying notes are an integral part of these financial statements.
13
Managers Balanced Fund
Schedule of Portfolio Investments (continued)
| | | | | | | | |
Security Description | | | | Shares | | Value |
Information Technology - 9.6% (continued) | | | | | | | | |
Citrix Systems, Inc.* | | | | | 3,400 | | $ | 136,476 |
Computer Sciences Corp.* | | | | | 2,200 | | | 106,568 |
Freescale Semiconductor Inc.* | | | | | 4,900 | | | 142,100 |
Google Inc.* | | | | | 3002 | | | 125,799 |
Hewlett-Packard Co. | | | | | 7,2002 | | | 228,096 |
Intel Corp. | | | | | 6,160 | | | 116,732 |
International Business Machines Corp. | | | | | 2,200 | | | 169,004 |
MEMC Electronic Materials, Inc.* | | | | | 1,500 | | | 56,250 |
Microsoft Corp. | | | | | 12,700 | | | 295,910 |
Motorola, Inc. | | | | | 4,600 | | | 92,690 |
National Semiconductor Corp. | | | | | 3,100 | | | 73,935 |
Oracle Corp.* | | | | | 3,300 | | | 47,817 |
Paychex, Inc. | | | | | 4,000 | | | 155,920 |
Tellabs, Inc.* | | | | | 1,900 | | | 25,289 |
Western Digital Corp.* | | | | | 4,5002 | | | 89,145 |
Total Information Technology | | | | | | | | 2,150,632 |
Materials - 2.3% | | | | | | | | |
Nucor Corp. | | | | | 2,6002 | | | 141,050 |
PPG Industries, Inc. | | | | | 3,700 | | | 244,200 |
United States Steel Corp. | | | | | 1,8002 | | | 126,216 |
Total Materials | | | | | | | | 511,466 |
Telecommunication Services - 1.9% | | | | | | | | |
BellSouth Corp. | | | | | 12,1002 | | | 438,020 |
Utilities - 2.5% | | | | | | | | |
Edison International | | | | | 5,7002 | | | 222,300 |
PG&E Corp. | | | | | 8,6002 | | | 337,808 |
Total Utilities | | | | | | | | 560,108 |
Total Common Stocks (cost $12,883,603) | | | | | | | | 14,643,420 |
| | | |
| | | | | Principal
Amount | | |
Corporate Bonds - 25.0% | | | | | | | | |
Asset-Backed Securities - 1.0% | | | | | | | | |
First Union National Bank Commercial Mortgage, Series 1999-C4, Class A1, 7.184%, 12/15/31 | | | | $ | 36,088 | | | 36,266 |
Greenwich Capital Commercial Funding Corp., Series 2005-GG5, Class A2, 5.117%, 04/10/37 | | | | | 90,000 | | | 87,973 |
GS Mortgage Securities Corp. II Series 2005-GG4, 4.751%, 07/10/39 | | | | | 50,000 | | | 46,242 |
Morgan Stanley Capital I, Series 2005-T19, 4.890%, 06/12/47 | | | | | 75,000 | | | 69,955 |
Total Asset-Backed Securities | | | | | | | | 240,436 |
Finance - 7.2% | | | | | | | | |
Barclays Financial LLC., 4.500%, 03/23/09 5a | | KRW | | | 160,900,000 | | | 170,044 |
BNP Paribas SA, 12.269%, 06/30/11 4a | | IDR | | | 935,500,000 | | | 59,419 |
Boeing Capital Corp., 4.750%, 08/25/08 | | | | | 25,000 | | | 24,580 |
Carramerica Realty Corp., 3.625%, 04/01/09 | | | | | 165,000 | | | 165,292 |
CIT Group Inc., 5.500%, 12/01/14 | | GBP | | | 50,000 | | | 91,424 |
Developers Diversified Realty, 5.375%, 10/15/12 | | | | | 90,000 | | | 86,603 |
The accompanying notes are an integral part of these financial statements.
14
Managers Balanced Fund
Schedule of Portfolio Investments (continued)
| | | | | | | | |
Security Description | | | | Principal
Amount | | Value |
Finance - 7.2% (continued) | | | | | | | | |
General Electric Capital Corp., 6.500%, 09/28/15 | | NZD | | $ | 190,000 | | $ | 114,882 |
Health Care, Inc., 7.500%, 08/15/07 | | | | | 38,000 | | | 38,297 |
Hospitality Properties Trust, 6.750%, 02/15/13 | | | | | 150,000 | | | 153,706 |
iStar Financial Inc., 5.150%, 03/01/12 | | | | | 65,000 | | | 61,876 |
JPMorgan Chase & Co., 12.231%, 03/28/11 4a | | IDR | | | 932,700,000 | | | 60,820 |
Korea Development Bank, 3.875%, 03/02/09 | | | | | 170,000 | | | 161,990 |
Reed Elsevier Capital, Inc., 4.625%, 06/15/12 | | | | | 25,000 | | | 23,189 |
RenaissanceRe Holdings Ltd., 7.000%, 07/15/08 | | | | | 250,000 | | | 254,190 |
Toll Brothers Finance Corp., 5.150%, 05/15/15 | | | | | 15,000 | | | 13,113 |
Union Planters Bank, 6.500%, 03/15/08 | | | | | 30,000 | | | 30,376 |
Wells Fargo Co., 4.899%, 05/01/33 5 | | | | | 105,000 | | | 105,394 |
Total Finance | | | | | | | | 1,615,195 |
Industrials - 16.6% | | | | | | | | |
Affiliated Computer Services, Inc., 5.200%, 06/01/15 | | | | | 25,000 | | | 22,000 |
Albertson’s Inc. | | | | | | | | |
8.000%, 05/01/31 | | | | | 5,000 | | | 4,531 |
7.750%, 06/15/26 | | | | | 125,000 | | | 111,788 |
6.625%, 06/01/28 | | | | | 20,000 | | | 15,987 |
Albertson’s, Inc., 7.450%, 08/01/29 | | | | | 85,000 | | | 73,433 |
American Stores Co., 8.000%, 06/01/26 | | | | | 5,000 | | | 4,833 |
Amerisourcebergen Corp., 5.875%, 09/15/15 a | | | | | 40,000 | | | 37,900 |
AT&T Corp., 8.000%, 11/15/31 | | | | | 205,000 | | | 236,050 |
AT&T Wireless Services, Inc., 8.750%, 03/01/31 | | | | | 105,000 | | | 129,098 |
Avnet Inc., 6.000%, 09/01/15 | | | | | 25,000 | | | 23,708 |
BellSouth Corp., 6.000%, 11/15/34 | | | | | 60,000 | | | 53,487 |
Centex Corp., 5.250%, 06/15/15 | | | | | 20,000 | | | 17,991 |
Chesapeake Energy Corp | | | | | | | | |
6.500%, 08/15/17 | | | | | 75,000 | | | 68,813 |
6.375%, 06/15/15 | | | | | 15,000 | | | 13,988 |
Comcast Corp. | | | | | | | | |
6.500%, 11/15/35 | | | | | 10,000 | | | 9,470 |
6.450%, 03/15/37 | | | | | 20,000 | | | 18,846 |
6.200%, 03/15/16 | | | | | 60,000 | | | 59,713 |
5.650%, 06/15/35 | | | | | 175,000 | | | 149,008 |
CSC Holdings, Inc., 7.875%, 02/15/18 | | | | | 100,000 | | | 100,250 |
CSN Island IX Corp., 10.000%, 01/15/15 a | | | | | 10,000 | | | 11,050 |
DaimlerChrysler North America Holding Corp., 8.500%, 01/18/31 | | | | | 50,000 | | | 56,770 |
Dow Chemical Co., 7.375%, 11/01/29 | | | | | 75,000 | | | 83,542 |
Georgia-Pacific Corp., 7.700%, 06/15/15 | | | | | 125,000 | | | 120,000 |
Hyatt Equities LLC., 6.875%, 06/15/07 a | | | | | 200,000 | | | 201,233 |
K. Hovnanian Enterprises, Inc., 7.500%, 05/15/16 | | | | | 50,000 | | | 46,625 |
KB Home, 5.875%, 01/15/15 | | | | | 130,000 | | | 114,034 |
The accompanying notes are an integral part of these financial statements.
15
Managers Balanced Fund
Schedule of Portfolio Investments (continued)
| | | | | | | | |
Security Description | | | | Principal
Amount | | Value |
Industrials - 16.6% (continued) | | | | | | | | |
Kroger Co., 7.000%, 05/01/18 | | | | $ | 140,000 | | $ | 142,743 |
Lubrizol Corp., The, 5.500%, 10/01/14 | | | | | 75,000 | | | 70,883 |
New England Telephone & Telegraph Co., 7.875%, 11/15/29 | | | | | 15,000 | | | 15,573 |
News America, Inc., 7.280%, 06/30/28 | | | | | 75,000 | | | 76,031 |
Penney (JC) Co., 8.000%, 03/01/10 | | | | | 50,000 | | | 53,312 |
Pioneer Natural Resources USA, Inc., 5.875%, 07/15/16 | | | | | 65,000 | | | 59,511 |
Pulte Homes, Inc. | | | | | | | | |
6.375%, 05/15/33 | | | | | 35,000 | | | 30,329 |
6.000%, 02/15/35 | | | | | 70,000 | | | 58,621 |
5.200%, 02/15/15 | | | | | 30,000 | | | 26,798 |
Qwest Corp., 7.500%, 06/15/23 | | | | | 25,000 | | | 23,563 |
Shaw Communications, Inc., 6.150%, 05/09/16 | | CAD | | | 80,000 | | | 67,570 |
Smithfield Foods, Inc., Series B, 7.750%, 05/15/13 | | | | | 25,000 | | | 24,625 |
Southern Natural Gas Co., 8.875%, 03/15/10 | | | | | 70,000 | | | 74,288 |
Sprint Capital Corp., 6.875%, 11/15/28 | | | | | 135,000 | | | 136,388 |
Time Warner, Inc. | | | | | | | | |
6.950%, 01/15/28 | | | | | 35,000 | | | 34,984 |
6.625%, 05/15/29 | | | | | 75,000 | | | 72,270 |
Transcontinental Gas Pipe Line Corp., 6.400%, 04/15/16 a | | | | | 55,000 | | | 52,938 |
Tyco International Group SA | | | | | | | | |
6.875%, 01/15/29 | | | | | 135,000 | | | 139,560 |
6.000%, 11/15/13 | | | | | 145,000 | | | 143,862 |
US West Communications, Inc., 7.250%, 09/15/25 | | | | | 75,000 | | | 70,500 |
Verizon Global Funding Corp., 5.850%, 09/15/35 | | | | | 80,000 | | | 69,820 |
Verizon New York, Inc., 7.375%, 04/01/32 | | | | | 35,000 | | | 34,601 |
Viacom, Inc., 6.875%, 04/30/36 a | | | | | 30,000 | | | 29,041 |
Walt Disney Co., The, 7.000%, 03/01/32 | | | | | 75,000 | | | 81,275 |
WellPoint Inc. | | | | | | | | |
5.850%, 01/15/36 | | | | | 115,000 | | | 103,100 |
5.000%, 12/15/14 | | | | | 25,000 | | | 23,291 |
Xerox Corp., 6.400%, 03/15/16 | | | | | 162,000 | | | 153,698 |
XTO Energy Inc., 5.300%, 06/30/15 | | | | | 80,000 | | | 74,496 |
Total Industrials | | | | | | | | 3,727,819 |
Utility - 0.2% | | | | | | | | |
Methanex Corp., 6.000%, 08/15/15 | | | | | 45,000 | | | 41,963 |
Total Corporate Bonds (cost $5,734,936) | | | | | | | | 5,625,413 |
Foreign Government and Agency Obligations - 0.8% | | | | | | | | |
Argentina, Republic of, 2.000%, 09/30/14 5 | | ARS | | | 130,000 | | | 40,470 |
Mexico Government, 9.875%, 02/01/10 | | | | | 130,000 | | | 146,575 |
Total Foreign Government and Agency (cost $195,974) | | | | | | | | 187,045 |
Municipal Bonds - 0.2% | | | | | | | | |
MI Tobacco Settlement, 7.309%, 06/01/34 (cost $34,998) | | | | | 35,000 | | | 34,967 |
The accompanying notes are an integral part of these financial statements.
16
Managers Balanced Fund
Schedule of Portfolio Investments (continued)
| | | | | | | |
Security Description | | Principal
Amount | | Value | |
U.S. Government Obligations - 7.0% | | | | | | | |
USTB, 5.250%, 11/15/28 | | $ | 175,000 | | $ | 174,235 | |
USTB, 4.750%, 05/15/14 | | | 165,000 | | | 161,010 | |
USTB, 4.500%, 08/15/14 | | | 25,000 | | | 23,552 | |
USTB, 4.000%, 02/15/15 | | | 85,000 | | | 78,353 | |
USTB, 3.875%, 05/15/09 | | | 300,000 | | | 290,098 | |
USTN, 2.500%, 10/31/06 | | | 420,000 | | | 416,506 | |
USTN, 2.375%, 08/15/06 | | | 425,000 | | | 423,838 | |
Total U.S. Government Obligations (cost $ 1,606,749) | | | | | | 1,567,592 | |
| | |
| | | Shares | | | |
Preferred Stock - 0.2% | | | | | | | |
Newell Financial Trust I, 5.250% (cost $39,878) | | | 925 | | | 40,816 | |
Other Investment Companies - 23.4%1 | | | | | | | |
Bank of New York Institutional Cash Reserves Fund, 5.22%3 | | | 4,970,662 | | | 4,970,662 | |
JPMorgan Prime Money Market Fund, Institutional Class Shares, 4.98% | | | 287,157 | | | 287,157 | |
Total Other Investment Companies (cost $5,257,819) | | | | | | 5,257,819 | |
Total Investments - 121.8% (cost $25,753,957) | | | | | | 27,357,072 | |
Other Assets, less Liabilities - (21.8)% | | | | | | (4,893,042 | ) |
Net Assets-100.0% | | | | | $ | 22,464,030 | |
The accompanying notes are an integral part of these financial statements.
17
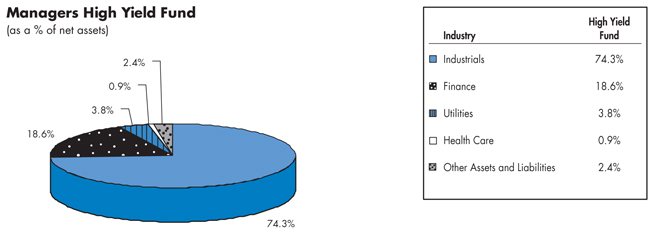
Managers High Yield Fund
Fund Snapshots
June 30, 2006 (unaudited)
Portfolio Breakdown
Top Ten Holdings
| | | |
Top Ten Holdings (out of 171 securities) | | % of Net Assets | |
General Motors Acceptance Corp., 6.875%, 08/28/12* | | 2.1 | % |
MGM Mirage Inc., 6.750%, 04/01/13* | | 1.8 | |
HCA, Inc., 6.750%, 07/15/13 | | 1.7 | |
iPCS, Inc., 11.500%, 05/01/12* | | 1.7 | |
EchoStar DBS Corp., 7.125%, 02/01/16 | | 1.5 | |
Dex Media, Inc., 9.000%, 11/15/13* | | 1.4 | |
DirectTV Holdings/Finance, 6.375%, 06/15/15* | | 1.4 | |
Lyondell Chemical Co., 10.500%, 06/01/13 | | 1.4 | |
Georgia-Pacific Corp., 7.700%, 06/15/15* | | 1.3 | |
Playtex Products, Inc. 9.375%, 06/01/11 | | 1.2 | |
| | | |
Top Ten as a Group | | 15.5 | % |
| | | |
| * | Top Ten Holding at December 31, 2005 |
Any sectors, industries, or securities discussed should not be perceived as investment recommendations. Mention of a specific security should not be considered a recommendation to buy or solicitation to sell that security.
18
Managers High Yield Fund
Schedule of Portfolio Investments
June 30, 2006 (unaudited)
| | | | | | | |
Security Description | | Principal
Amount | | | Value |
Corporate Bonds - 97.6% | | | | | | | |
Finance - 18.6% | | | | | | | |
Alamosa Delaware, Inc., 11.000%, 07/31/10 | | $ | 487,000 | | | $ | 535,700 |
Alliance Laundry Holdings, LLC., 8.500%, 01/15/13 | | | 260,000 | 2 | | | 252,200 |
Arch Western Finance, LLC, 6.750%, 07/01/13 a | | | 580,000 | | | | 558,250 |
El Paso Production Holding, 7.750%, 06/01/13 | | | 90,000 | | | | 91,125 |
Ford Motor Credit Co. | | | | | | | |
7.250%, 10/25/11 | | | 50,000 | | | | 44,401 |
7.077%, 01/15/10 5 | | | 520,000 | | | | 474,139 |
7.000%, 10/01/13 | | | 520,000 | | | | 448,137 |
General Motors Acceptance Corp., 6.875%, 08/28/12 | | | 1,030,000 | | | | 971,618 |
HCA, Inc., 6.750%, 07/15/13 | | | 825,000 | | | | 791,940 |
Inergy LP, 6.875%, 12/15/14 | | | 125,000 | | | | 116,875 |
ITT Corp., 7.375%, 11/15/15 | | | 475,000 | | | | 480,937 |
Jacuzzi Brands, Inc., 9.625%, 07/01/10 | | | 500,000 | | | | 530,625 |
Madison River, 13.250%, 03/01/10 | | | 159,000 | | | | 166,950 |
Nell AF Sarl, 8.375%, 08/15/15 a | | | 235,0002 | | | | 227,069 |
Nexstar Finance Holdings, Inc., 11.375%, 04/01/13 b | | | 200,000 | | | | 163,000 |
Playtex Products, Inc., 9.375%, 06/01/11 | | | 535,000 | 2 | | | 559,743 |
Rainbow National Services LLC, 8.750%, 09/01/12 a | | | 100,0002 | | | | 105,500 |
Rayovac Corp., 8.500%, 10/01/13 | | | 390,0002 | | | | 335,400 |
Reliant Energy Inc., 9.500%, 07/15/13 | | | 85,000 | | | | 85,850 |
Rogers Wireless, Inc., 9.625%, 05/01/11 | | | 270,000 | | | | 297,000 |
Rouse Co., The, 6.750%, 05/01/13 | | | 250,000 | | | | 244,726 |
Service Corp. International, 7.700%, 04/15/09 | | | 95,000 | | | | 95,950 |
Sun Media Corp., 7.625%, 02/15/13 | | | 275,000 | | | | 278,094 |
TRW Automotive, Inc., 9.375%, 02/15/13 | | | 380,000 | | | | 405,650 |
UGS Corp., 10.000%, 06/01/12 | | | 330,000 | | | | 356,400 |
Total Finance | | | | | | | 8,617,279 |
Health Care - 0.9% | | | | | | | |
Extendicare Health Services, Inc., 6.875%, 05/01/14 | | | 400,000 | | | | 420,000 |
Industrials - 74.3% | | | | | | | |
Acco Brands Corp., 7.625%, 08/15/15 | | | 520,0002 | | | | 484,900 |
AEP Industries, Inc., 7.875%, 03/15/13 | | | 65,000 | | | | 65,488 |
AES Corporation, 8.875%, 02/15/11 | | | 280,0002 | | | | 295,400 |
Ainsworth Lumber Co. Ltd. | | | | | | | |
7.250%, 10/01/12 | | | 75,000 | | | | 61,875 |
6.750%, 03/15/14 | | | 240,000 | | | | 183,600 |
AirGate PCS, Inc., 9.257%, 10/15/11 5 | | | 250,000 | | | | 256,874 |
Allied Waste North America, Inc. | | | | | | | |
7.375%, 04/15/14 | | | 100,0002 | | | | 95,500 |
5.750%, 02/15/11 | | | 265,0002 | | | | 248,438 |
The accompanying notes are an integral part of these financial statements.
19
Managers High Yield Fund
Schedule of Portfolio Investments (continued)
| | | | | | | |
Security Description | | Principal Amount | | | Value |
Industrials - 74.3% (continued) | | | | | | | |
ALLTRISTA Corp., 3.750%, 05/01/12 | | $ | 300,000 | 2 | | $ | 307,500 |
Ames True Temper, Inc., 9.507%, 01/15/12 5 | | | 340,000 | | | | 335,750 |
Applied Waste North America, 7.250%, 03/15/15 | | | 150,000 | | | | 144,000 |
ArvinMeritor, Inc., 8.750%, 03/01/12 | | | 200,000 | 2 | | | 196,000 |
Ball Corp., 6.625%, 03/15/18 | | | 210,000 | | | | 196,350 |
Beazer Homes USA, Inc. | | | | | | | |
8.375%, 04/15/12 | | | 180,000 | | | | 180,900 |
6.875%, 07/15/15 | | | 210,000 | | | | 192,150 |
6.500%, 11/15/13 | | | 250,000 | | | | 227,500 |
Brookstone Company, Inc., 12.000%, 10/15/12 a | | | 200,000 | 2 | | | 177,000 |
Cablevision Systems Corp., 8.000%, 04/15/12 | | | 175,000 | 2 | | | 173,469 |
CanWest Media, Inc., 8.000%, 09/15/12 | | | 250,000 | | | | 248,750 |
CCO Holdings, LLC, 8.750%, 11/15/13 | | | 200,000 | 2 | | | 196,000 |
Charter Communications Holdings II, 10.250%, 09/15/10 | | | 500,000 | | | | 503,750 |
Chesapeake Energy Corp. | | | | | | | |
7.000%, 08/15/15 | | | 275,000 | | | | 267,438 |
6.500%, 08/15/17 | | | 445,000 | | | | 408,287 |
Citizens Communications Co., 6.250%, 01/15/13 | | | 380,000 | | | | 361,000 |
Consolidated Communications Holdings, Inc., 9.750%, 04/01/12 | | | 369,000 | | | | 381,915 |
Corrections Corp. of America, 6.250%, 03/15/13 | | | 410,000 | | | | 387,450 |
Covalence Specialty Materials Corp., 10.250%, 03/01 /16 | | | 170,000 | 2 | | | 164,050 |
Crown Americas, 7.750%, 11/15/15 a | | | 290,000 | 2 | | | 287,100 |
D.R. Horton, Inc., 5.250%, 02/15/15 | | | 375,000 | 2 | | | 333,852 |
Dean Foods Co., 7.000%, 06/01/16 | | | 250,000 | | | | 243,125 |
Del Laboratories, Inc. | | | | | | | |
10.149%, 11/01/11 5 | | | 145,000 | 2 | | | 149,350 |
8.000%, 02/01/12 | | | 225,000 | 2 | | | 188,156 |
Denbury Resources, Inc. | | | | | | | |
7.500%, 12/15/15 | | | 155,000 | 2 | | | 155,000 |
7.500%, 04/01/13 | | | 200,000 | | | | 201,000 |
Dex Media, Inc., 9.000%, 11/15/13 b | | | 795,000 | | | | 673,762 |
DirectTV Holdings/Finance, 6.375%, 06/15/15 | | | 720,000 | | | | 667,800 |
Dobson Cellular Systems, Inc., 9.875%, 11/01/12 | | | 115,000 | | | | 121,900 |
Dobson Communications Corp. | | | | | | | |
9.757%, 10/15/12 5 | | | 235,000 | 2 | | | 237,938 |
8.875%, 10/01/13 | | | 210,000 | 2 | | | 207,375 |
EchoStar DBS Corp. | | | | | | | |
7.125%, 02/01/16 a | | | 705,000 | | | | 682,087 |
6.375%, 10/01/11 | | | 45,000 | | | | 43,200 |
Embarq Corp., 7.082%, 06/01/16 | | | 185,000 | | | | 184,307 |
Flextronics International Ltd., 1.000%, 08/01/10 | | | 225,000 | 2 | | | 210,375 |
Fresenius Medical Care Capital Trust II, 7.875%, 02/01/08 | | | 390,000 | | | | 396,825 |
The accompanying notes are an integral part of these financial statements.
20
Managers High Yield Fund
Schedule of Portfolio Investments (continued)
| | | | | | | |
Security Description | | Principal Amount | | | Value |
Industrials - 74.3% (continued) | | | | | | | |
Georgia-Pacific Corp., 7.700%, 06/15/15 | | $ | 610,000 | | | $ | 585,600 |
Goodman Global Holding Company, Inc., 7.875%, 12/15/12 | | | 215,000 | 2 | | | 206,400 |
Graham Packaging Co., LP, 9.875%, 10/15/14 | | | 475,000 | 2 | | | 472,625 |
Graphic Packaging International | | | | | | | |
9.500%, 08/15/13 | | | 45,000 | 2 | | | 44,775 |
8.500%, 08/15/11 | | | 330,000 | 2 | | | 330,825 |
Gregg Appliances Inc., 9.000%, 02/01/13 | | | 385,000 | | | | 357,088 |
Hanover Compressor Co., 9.000%, 06/01/14 | | | 290,000 | | | | 304,500 |
HCA Inc., 6.500%, 02/15/16 | | | 140,000 | | | | 130,148 |
Host Marriott LP., 6.750%, 06/01 /16 | | | 400,000 | | | | 383,500 |
Houghton Mifflin Co., 9.875%, 02/01/13 | | | 220,000 | 2 | | | 229,350 |
Huntsman International LLC., 8.125%, 01/01/15 a | | | 150,000 | 2 | | | 141,375 |
Huntsman LLC, 11.500%, 07/15/12 | | | 145,000 | | | | 162,763 |
Ineos Group Holdings PLC, 8.500%, 02/15/16 | | | 245,000 | 2 | | | 230,606 |
Inergy Finance, 8.250%, 03/01/16 | | | 115,000 | | | | 116,725 |
Intelsat Bermuda Ltd., 11.250%, 06/15/16 | | | 420,000 | | | | 432,600 |
Intelsat Ltd., 10.484%, 01/15/12 5 | | | 215,000 | | | | 218,224 |
Interline Brands, Inc., 8.250%, 06/15/14 | | | 145,000 | | | | 145,363 |
iPCS, Inc., 11.500%, 05/01/12 | | | 700,000 | | | | 784,000 |
Iron Mountain Inc. | | | | | | | |
7.750%, 01/15/15 | | | 300,000 | | | | 288,000 |
6.625%, 01/01/16 | | | 315,000 | | | | 285,075 |
IWO Holdings, Inc., 9.257%, 01/15/12 5 | | | 220,000 | | | | 228,800 |
Jefferson SmurfitCorp., 9.750%, 05/01/12 | | | 255,000 | 2 | | | 229,500 |
L-3 Communications Corp. | | | | | | | |
6.125%, 07/15/13 | | | 175,000 | | | | 167,563 |
5.875%, 01/15/15 | | | 265,000 | | | | 248,438 |
LodgeNet Entertainment Corp., 9.500%, 06/15/13 | | | 150,000 | | | | 160,500 |
Lyondell Chemical Co., 10.500%, 06/01/13 | | | 585,000 | | | | 646,424 |
MGM Mirage Inc. | | | | | | | |
6.750%, 04/01/13 | | | 865,000 | | | | 829,319 |
6.750%, 09/01/12 | | | 210,000 | | | | 203,175 |
5.875%, 02/27/14 | | | 5,000 | 2 | | | 4,506 |
Nalco Company | | | | | | | |
8.875%, 11/15/13 | | | 250,000 | 2 | | | 253,125 |
7.750%, 11/15/11 | | | 100,000 | | | | 100,250 |
Newfield Exploration Co., 6.625%, 04/15/16 | | | 170,000 | | | | 161,075 |
Nordic Telephone Co., Holdings, 8.875%, 05/01/16 | | | 180,000 | 2 | | | 185,850 |
Novelis, Inc., 7.250%, 02/15/15 a | | | 335,000 | | | | 323,274 |
Owens-Brockway Glass Container Inc. | | | | | | | |
8.250%, 05/15/13 | | | 330,000 | 2 | | | 332,475 |
6.750%, 12/01/14 | | | 65,000 | 2 | | | 60,613 |
P.H. Glatfelter Co., 7.125%, 05/01/16 | | | 190,000 | 2 | | | 188,502 |
The accompanying notes are an integral part of these financial statements.
21
Managers High Yield Fund
Schedule of Portfolio Investments (continued)
| | | | | | | |
Security Description | | Principal Amount | | | Value |
Industrials - 74.3% (continued) | | | | | | | |
Packaging Dynamics, Inc., 10.000%, 05/01/16 | | $ | 95,000 | | | $ | 95,475 |
Panamsat Holding Corp., 10.375%, 11/01/14 b | | | 475,000 | | | | 353,490 |
Pogo Producing Co. | | | | | | | |
7.875%, 05/01/13 a | | | 70,000 | 2 | | | 70,525 |
6.875%, 10/01/17 | | | 190,000 | 2 | | | 176,938 |
6.625%, 03/15/15 | | | 90,000 | | | | 83,588 |
PolyOne Corp., 8.875%, 05/01/12 | | | 355,000 | 2 | | | 358,105 |
Quebecor World, Inc., 8.750%, 03/15/16 a | | | 215,000 | | | | 197,263 |
Qwest Communications International, Inc., 8.670%, 02/15/09 5 | | | 400,000 | 2 | | | 409,500 |
Qwest Corp., 8.875%, 03/15/12 | | | 125,000 | | | | 132,500 |
R.H. Donnelley Financial Corp., 10.875%, 12/15/12 a | | | 290,000 | | | | 319,725 |
Rexnord Corp., 10.125%, 12/15/12 | | | 80,000 | | | | 88,587 |
Reynolds American, Inc., 7.250%, 06/01/13 | | | 185,000 | | | | 181,763 |
Rockwood Specialties Grp., 7.500%, 11/15/14 | | | 195,000 | 2 | | | 192,075 |
Rogers Wireless, Inc., 6.375%, 03/01/14 | | | 300,000 | | | | 287,250 |
Rural Cellular Corp. | | | | | | | |
8.250%, 03/15/12 | | | 200,000 | | | | 206,250 |
8.250%, 03/15/12 a | | | 90,000 | | | | 92,813 |
Sealy Mattress Co., 8.250%, 06/15/04 | | | 395,000 | 2 | | | 396,975 |
Serena Software Inc., 10.375%, 03/15/16 | | | 230,000 | | | | 231,725 |
Service Corp. International | | | | | | | |
7.700%, 04/15/09 | | | 65,000 | | | | 65,650 |
7.000%, 06/15/17 a | | | 45,000 | | | | 42,300 |
6.750%, 04/01/16 | | | 520,000 | | | | 481,000 |
Sierra Pacific Resources, 6.750%, 08/15/17 | | | 15,000 | | | | 14,247 |
Simmons Co., 10.000%, 12/15/14 b | | | 480,000 | | | | 321,600 |
Sonat Inc., 7.625%, 07/15/11 | | | 450,000 | 2 | | | 456,750 |
Spectrum Brands, Inc., 7.375%, 02/01/15 | | | 405,000 | 2 | | | 331,088 |
Starwood Hotels & Resorts, 7.875%, 05/01/12 | | | 100,000 | | | | 104,875 |
Steinway Musical Instruments, Inc., 7.000%, 03/01/14 | | | 90,000 | 2 | | | 87,525 |
Stewart Enterprises, Inc., 6.250%, 02/15/13 | | | 315,000 | | | | 288,619 |
Sunstate Equipment Co., 10.500%, 04/01/13 a | | | 290,000 | | | | 300,150 |
Tenet Healthcare Corp., 9.250, 02/01/15 a | | | 390,000 | | | | 384,150 |
Tenneco Automotive Inc., 8.625%, 11/15/14 | | | 400,000 | 2 | | | 401,000 |
TerexCorp., 7.375%, 01/15/14 | | | 380,000 | | | | 380,000 |
Terra Capital, Inc., 12.875%, 10/15/08 | | | 370,000 | | | | 420,875 |
Triad Hospitals, Inc., 7.000%, 11/15/13 | | | 80,000 | 2 | | | 78,200 |
Ubiquitel Opertating Co., 9.875%, 03/01/11 | | | 205,000 | | | | 223,963 |
UGS Capital Corp., 10.380%, 06/01/11 5a | | | 275,000 | | | | 273,625 |
Unisys Corp., 8.000%, 10/15/12 | | | 165,000 | 2 | | | 154,275 |
United Components, Inc., 9.375%, 06/15/13 | | | 205,000 | | | | 202,950 |
United Rentals (North America), Inc., 6.500%, 02/15/12 | | | 315,000 | 2 | | | 299,250 |
Vail Resorts, Inc., 6.750%, 02/15/14 | | | 115,000 | | | | 109,825 |
The accompanying notes are an integral part of these financial statements.
22
Managers High Yield Fund
Schedule of Portfolio Investments (continued)
| | | | | | | | |
Security Description | | Principal Amount | | | Value | |
Industrials - 74.3% (continued) | | | | | | | | |
Vertis Inc., 9.750%, 04/01/09 | | $ | 190,000 | | | $ | 194,275 | |
Videotron Ltee, 6.875%, 01/15/14 | | | 460,000 | | | | 438,150 | |
Visant Holding Corp. | | | | | | | | |
8.750%, 12/01/13a | | | 250,000 | | | | 242,500 | |
10.250%, 12/01/13 b | | | 495,000 | | | | 391,050 | |
Warner Music Group, 7.375%, 04/15/14 | | | 145,000 | | | | 141,375 | |
Whitting Petroleum Corp., 7.000%, 02/01/14 | | | 155,000 | 2 | | | 147,250 | |
Williams Companies, Inc. | | | | | | | | |
8.125%, 03/15/12 | | | 225,000 | | | | 234,563 | |
7.625%, 07/15/19 | | | 65,000 | | | | 66,300 | |
Williams Partners LP, 7.500%, 06/15/11 | | | 100,000 | | | | 100,750 | |
Wind Acquisition Fin SA, 10.750%, 12/01/15 | | | 275,000 | 2 | | | 293,563 | |
Windstream Corp., 8.625%, 08/01/16 | | | 180,000 | | | | 184,950 | |
WMG Holdings Corp., 9.500%, 12/15/14 b | | | 571,000 | | | | 413,975 | |
Xerox Corp., 6.400%, 03/15/16 | | | 400,000 | 2 | | | 379,500 | |
Total Industrials | | | | | | | 34,422,082 | |
Utilities - 3.8% | | | | | | | | |
CMS Energy Corp. | | | | | | | | |
7.500%, 01/15/09 | | | 100,000 | 2 | | | 101,750 | |
6.300%, 02/01/12 | | | 90,000 | | | | 85,500 | |
Hertz Corporation, 8.875%, 01/01/14 | | | 265,000 | | | | 272,950 | |
Midwest Generation, LLC, 8.750%, 05/01/34 | | | 135,000 | | | | 143,775 | |
Select Medical Corp., 7.625%, 02/01/15 | | | 415,000 | 2 | | | 363,125 | |
Sierra Pacific Resources, 8.625%, 03/15/14 | | | 325,000 | | | | 345,912 | |
SunGard Data Systems, Inc. | | | | | | | | |
10.250%, 08/15/15 a | | | 295,000 | 2 | | | 306,431 | |
9.125%, 08/15/13 a | | | 140,000 | 2 | | | 145,950 | |
Total Utilities | | | | | | | 1,765,393 | |
Total Corporate Bonds (cost $46,219,428) | | | | | | | 45,224,754 | |
| | |
| | | Shares | | | | |
Common Stock - 0.5% | | | | | | | | |
Chemicals - 0.5% | | | | | | | | |
Huntsman Corp. (cost $94,073) | | | 12,603 | | | | 218,285 | |
Other Investment Companies - 27.6%1 | | | | | | | | |
Bank of New York Institutional Cash Reserves Fund, 5.22% 3 | | | 12,452,183 | | | | 12,452,183 | |
JPMorgan Prime Money Market Fund, Institutional Class Shares, 4.98% | | | 319,213 | | | | 319,213 | |
Total Other Investment Companies (cost $12,771,396) | | | | | | | 12,771,396 | |
Total Investments - 125.7% (cost $59,084,897) | | | | | | | 58,214,435 | |
Other Assets, less Liabilities - (25.7)% | | | | | | | (11,899,800 | ) |
Net Assets - 100.0% | | | | | | $ | 46,314,635 | |
The accompanying notes are an integral part of these financial statements.
23
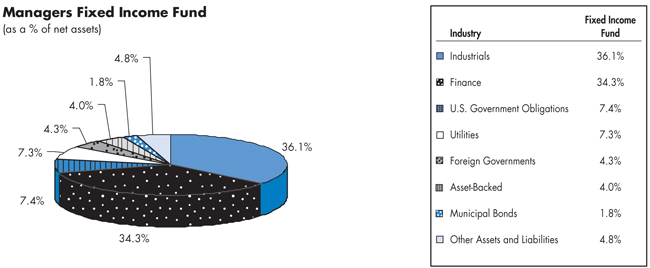
Managers Fixed Income Fund
Fund Snapshots
June 30, 2006 (unaudited)
Portfolio Breakdown
Top Ten Holdings
| | | |
Top Ten Holdings (out of 128 securities) | | % of
Net Assets | |
USTB, 5.375%, 02/15/31* | | 4.1 | % |
Inter-American Development Bank, 6.000%, 12/15/17* | | 3.4 | |
Telefonica Emisiones SAU, 7.045%, 06/20/16 | | 2.5 | |
Qantas Airways Ltd., 6.050%, 04/15/16 | | 2.4 | |
Wells Fargo Co., 4.430%, 05/01/33 | | 2.0 | |
Telus Corp., 8.000%, 06/01/11* | | 2.0 | |
Kraft Foods, Inc., 5.250%, 10/01/13* | | 1.9 | |
Mexican Government, 9.000%, 12/20/12* | | 1.8 | |
Qwest Communications International, Inc., Series B, 7.500%, 11/01/08* | | 1.7 | |
Verizon Global Funding Corp., 5850%, 09/15/35 | | 1.6 | |
| | | |
Top Ten as a Group | | 23.4 | % |
| | | |
| * | Top Ten Holding at December 31, 2005 |
Any sectors, industries or securities discussed should not be perceived as investment recommendations. Mention of a specific security should not be considered a recommendation to buy or solicitation to sell that security.
24
Managers Fixed Income Fund
Schedule of Portfolio Investments
June 30, 2006 (unaudited)
| | | | | | | | |
Security Description | | | | Principal Amount | | Value |
Corporate Bonds - 81.7% | | | | | | | | |
Asset-Backed Security - 4.0% | | | | | | | | |
Centex Home Equity Loan, Series 2004-A, Class AF6, 4.270%, 01/25/34 | | | | $ | 265,000 | | $ | 261,508 |
Community Program Loan Trust, Series 87-A, Class A4, 4.500%, 10/01/18 | | | | | 27,948 | | | 27,295 |
Countrywide Home Loans, Series 2002-S1, Class A5, 6.460%, 11/25/16 5(b) | | | | | 478,527 | | | 483,038 |
First Union National Bank Commercial Mortgage, Series 2001-C3, Class A2, 6.180%, 08/15/33 | | | | | 198,750 | | | 199,592 |
GMAC Commercial Mortgage Securities, Inc., Series 1999-C2, Class A1, 6.570%, 09/15/33 | | | | | 5,705 | | | 5,699 |
LB-UBS Commercial Mortgage Trust, Series 2001-C3, Class A2, 6.365%, 12/15/28 | | | | | 320,000 | | | 328,606 |
Morgan Stanley Dean Witter Capital Inc., Series 2001-PPM, Class A2, 6.400%, 02/15/31 | | | | | 745,521 | | | 756,488 |
Morgan Stanley Dean Witter Capital Inc., Series 2001-TOP3, Class A3, 6.200%, 07/15/33 | | | | | 155,060 | | | 156,410 |
Residential Asset Securities Corp., Series 1999-KS4, Class AJ4, 7.220%, 06/25/28 | | | | | 227,131 | | | 226,805 |
Total Asset-Backed Security | | | | | | | | 2,445,441 |
Finance - 34.3% | | | | | | | | |
ASIF Global Financial, 2.380%, 02/26/09 a | | SGD | | | 1,000,000 | | | 607,715 |
Bank of American Capital Trust, 5.625%, 03/08/35 | | | | | 295,000 | | | 253,538 |
Barclays Capital Corp., 4.160%, 02/22/10 a | | THB | | | 6,000,000 | | | 147,705 |
Boeing Capital Corp., 4.750%, 08/25/08 | | | | | 230,000 | | | 226,133 |
Cardinal Health, Inc., 4.000%, 06/15/15 | | | | | 320,000 | | | 273,305 |
Cendant Corp., 7.375%, 01/15/13 | | | | | 565,000 | | | 618,984 |
Chancellor Media Corp., 8.000%, 11/01/08 | | | | | 414,000 | | | 430,664 |
Citigroup, Inc., 3.500%, 02/01/08 | | | | | 250,000 | | | 242,187 |
Clear Channel Communications, Inc., 6.625%, 06/15/08 | | | | | 191,000 | | | 192,599 |
Coca-Cola HBC Finance BV, 5.125%, 09/17/13 | | | | | 265,000 | | | 252,933 |
Colonial Realty LP | | | | | | | | |
5.500%, 10/01/15 | | | | | 190,0002 | | | 177,904 |
4.800%, 04/01/11 | | | | | 625,000 | | | 587,055 |
Cox Enterprises, Inc., 4.375%, 05/01/08 a | | | | | 410,000 | | | 396,998 |
Developers Divers Realty Corp., 3.875%, 01/30/09 | | | | | 200,000 | | | 190,470 |
Equity One, Inc., 3.875%, 04/15/09 | | | | | 400,000 | | | 378,066 |
Export-Import Bank of Korea, 4.125%, 02/10/09 a | | | | | 485,000 | | | 464,624 |
Ford Motor Credit Co. | | | | | | | | |
9.750%, 09/15/10 a | | | | | 309,000 | | | 301,337 |
7.000%, 10/01/13 | | | | | 125,000 | | | 107,725 |
GMAC | | | | | | | | |
6.125%, 08/28/07 | | | | | 450,000 | | | 445,415 |
6.039%, 03/20/07 5 | | | | | 500,000 | | | 496,671 |
HCA, Inc., 8.750%, 09/01/10 | | | | | 625,000 | | | 662,041 |
Health Care, Inc., 7.500%, 08/15/07 | | | | | 67,000 | | | 67,523 |
Highwoods Properties, Inc., 7.500%, 04/15/18 | | | | | 350,000 | | | 369,326 |
Hospitality Properties Trust, 6.750%, 02/15/13 | | | | | 465,000 | | | 476,494 |
Inter-American Development Bank, 6.000%, 12/15/17 | | NZD | | | 3,500,000 | | | 2,062,299 |
John Hancock Financial Services, Inc., 5.625%, 12/01/08 | | | | | 500,000 | | | 500,875 |
JPMorgan Chase & Co., 4.000%, 02/01/08 | | | | | 350,000 | | | 341,475 |
The accompanying notes are an integral part of these financial statements.
25
Managers Fixed Income Fund
Schedule of Portfolio Investments (continued)
| | | | | | | |
Security Description | | Principal Amount | | | Value |
Finance - 34.3% (continued) | | | | | | | |
Korea Development Bank, 3.875%, 03/02/09 | | $ | 425,000 | | | $ | 404,974 |
Lehman Brothers Holdings, 3.600%, 03/13/09 | | | 150,000 | 2 | | | 142,340 |
Liberty Media Corp., 5.700%, 05/15/13 | | | 190,000 | | | | 173,495 |
Mack-Cali Realty L.P., 7.250%, 03/15/09 | | | 250,000 | | | | 257,001 |
Medco Health Solutions, 7.250%, 08/15/13 | | | 420,000 | | | | 445,313 |
Morgan Stanley & Co., Inc., 3.625%, 04/01/08 | | | 650,000 | 2 | | | 629,314 |
Mutual of Omaha Insurance Co., 6.800%, 06/15/36 a | | | 620,000 | | | | 606,404 |
NCR Corp., 7.125%, 06/15/09 | | | 180,000 | | | | 183,870 |
News America, Inc., 7.625%, 11/30/28 | | | 460,000 | | | | 488,341 |
Protective Life U.S. Funding Trust, 5.875%, 8/15/06 a | | | 375,000 | | | | 375,129 |
Qwest Communications International, Inc., Series B, 7.500%, 11/01/08 | | | 1,000,000 | | | | 1,002,500 |
RenaissanceRe Holdings Ltd., 7.000%, 07/15/08 | | | 750,000 | | | | 762,573 |
Rubbermaid, Inc., 6.600%, 11/15/06 | | | 152,000 | | | | 152,524 |
Sovereign Bank, 5.125%, 03/15/13 | | | 335,000 | | | | 317,348 |
Tele-Communications, Inc., 9.800%, 02/01/12 | | | 350,000 | | | | 404,201 |
Texas Eastern Transmission, 7.000%, 07/15/32 | | | 255,000 | | | | 273,413 |
TGT Pipeline LLC, 5.200%, 06/01/18 | | | 465,000 | | | | 414,871 |
The Ryland Group, Inc., 5.375%, 06/01/08 | | | 440,000 | | | | 433,504 |
Toll Brothers Finance Corp., 5.150%, 05/15/15 | | | 555,000 | 2 | | | 485,178 |
Transamerica Corp., 6.750%, 11/15/06 | | | 85,000 | | | | 85,316 |
Wells Fargo Co., 4.899%, 05/01/33 5 | | | 1,175,000 | 2 | | | 1,179,406 |
XL Capital (Europe) PLC, 6.500%, 01/15/12 | | | 105,000 | 2 | | | 106,681 |
Total Finance | | | | | | | 20,595,757 |
Industrials - 36.1% | | | | | | | |
Albertson’s Inc., 7.750%, 06/15/26 | | | 175,000 | | | | 156,506 |
AOL Time Warner, Inc. | | | | | | | |
7.700%, 05/01/32 | | | 685,000 | 2 | | | 746,674 |
7.625%, 04/15/31 | | | 80,000 | | | | 86,387 |
AT&T Inc. | | | | | | | |
6.500%, 03/15/29 | | | 320,000 | | | | 302,799 |
6.150%, 09/15/34 | | | 185,000 | | | | 170,324 |
AT&T Wireless Services, Inc., 8.750%, 03/01/31 | | | 310,000 | | | | 381,145 |
Avnet Inc., 6.000%, 09/01/15 | | | 415,000 | | | | 393,553 |
BellSouth Corp., 6.000%, 11/15/34 | | | 680,000 | 2 | | | 606,189 |
Bristol-Myers Squibb, 4.829%, 09/15/23 5 | | | 910,000 | | | | 912,848 |
Charter Communications Inc., 8.000%, 04/30/12 a | | | 245,000 | 2 | | | 245,000 |
Chartered Semiconductor, 6.250%, 04/04/13 | | | 715,000 | 2 | | | 694,944 |
Comcast Corp. | | | | | | | |
6.500%, 11/15/35 | | | 405,000 | | | | 383,516 |
6.450%, 03/15/37 | | | 815,000 | | | | 767,975 |
5.650%, 06/15/35 | | | 235,000 | | | | 200,097 |
Corning, Inc., 6.850%, 03/01/29 | | | 600,000 | 2 | | | 612,103 |
The accompanying notes are an integral part of these financial statements.
26
Managers Fixed Income Fund
Schedule of Portfolio Investments (continued)
| | | | | | | |
Security Description | | Principal
Amount | | | Value |
Industrials - 36.1% (continued) | | | | | | | |
D.R. Horton, Inc., 5.250%, 02/15/15 | | $ | 420,000 | 2 | | $ | 373,914 |
Georgia-Pacific Corp., 7.700%, 06/15/15 | | | 315,000 | | | | 302,400 |
HCA, Inc., 7.050%, 12/01/27 | | | 750,000 | | | | 660,596 |
International Paper Co. | | | | | | | |
4.250%, 01/15/09 | | | 300,000 | | | | 288,482 |
4.000%, 04/01/10 | | | 300,000 | | | | 280,923 |
Kraft Foods, Inc., 5.250%, 10/01/13 | | | 1,175,000 | | | | 1,123,761 |
Kroger Co., 7.000%, 05/01/18 | | | 460,0002 | | | | 469,014 |
Lennar Corp. | | | | | | | |
6.500%, 04/15/16 a | | | 280,000 | 2 | | | 271,823 |
5.600%, 05/31/15 | | | 400,000 | 2 | | | 363,978 |
New England Telephone & Telegraph Co., 7.875%, 11/15/29 | | | 95,000 | | | | 98,628 |
News America, Inc. | | | | | | | |
7.280%, 06/30/28 | | | 225,000 | | | | 228,093 |
6.400%, 12/15/35 | | | 425,000 | | | | 394,326 |
6.200%, 12/15/34 | | | 350,000 | | | | 318,624 |
Owens & Minor, Inc., 6.350%, 04/15/16 | | | 125,000 | 2 | | | 122,624 |
Penney (JC) Co., 8.000%, 03/01/10 | | | 125,000 | | | | 133,281 |
Pulte Homes, Inc. | | | | | | | |
6.375%, 05/15/33 | | | 465,000 | | | | 402,940 |
6.000%, 02/15/35 | | | 1,135,000 | 2 | | | 950,499 |
5.200%, 02/15/15 | | | 405,0002 | | | | 361,772 |
Qantas Airways Ltd., 6.050%, 04/15/16 a | | | 1,500,0002 | | | | 1,455,230 |
Qwest Capital Funding, Inc., 7.250%, 02/15/11 | | | 490,0002 | | | | 478,975 |
Samsung Electronics Co., Ltd., 7.700%, 10/01/27 a | | | 600,000 | | | | 616,483 |
Telefonica Emisiones SAU, 7.045%, 06/20/16 | | | 1,475,000 | 2 | | | 1,478,780 |
Telus Corp., 8.000%, 06/01/11 | | | 1,065,000 | | | | 1,154,460 |
Time Warner, Inc. | | | | | | | |
6.950%, 01/15/28 | | | 120,000 | | | | 119,943 |
6.625%, 05/15/29 | | | 270,000 | 2 | | | 260,171 |
Verizon Global Funding Corp., 5.850%, 09/15/35 | | | 1,095,000 | 2 | | | 955,667 |
Verizon New York, Inc., 7.375%, 04/01/32 | | | 195,000 | 2 | | | 192,775 |
Viacom, Inc., 6.875%, 04/30/36 a | | | 920,000 | | | | 890,602 |
Walt Disney Co., The, 7.000%, 03/01/32 | | | 190,000 | 2 | | | 205,896 |
Watson Pharmaceuticals, Inc., 1.750%, 03/15/23 | | | 65,000 | | | | 57,363 |
Total Industrials | | | | | | | 21,672,083 |
Utilities - 7.3% | | | | | | | |
Cilcorp, Inc., 8.700%, 10/15/09 | | | 315,000 | | | | 339,843 |
Commonwealth Edison | | | | | | | |
5.875%, 02/01/33 | | | 620,000 | | | | 573,155 |
4.700%, 04/15/15 | | | 510,000 | 2 | | | 464,777 |
The accompanying notes are an integral part of these financial statements.
27
Managers Fixed Income Fund
Schedule of Portfolio Investments (continued)
| | | | | | | | | | |
Security Description | | | | Principal Amount | | | Value | |
Utilities - 7.3% (continued) | | | | | | | | | | |
Dominion Resources, Inc. | | | | | | | | | | |
5.950%, 06/15/35 | | | | $ | 90,000 | | | $ | 80,953 | |
4.125%, 02/15/08 | | | | | 450,000 | | | | 438,842 | |
Empresa Nacional de Electricidad, Yankee, 7.875%, 02/01/27 | | | | | 900,000 | | | | 937,051 | |
FirstEnergy Corp., Series C, 7.375%, 11/15/31 | | | | | 715,000 | | | | 769,366 | |
Methanex Corp., 6.000%, 08/15/15 | | | | | 320,000 | | | | 298,400 | |
Pacific Gas and Electric Co., 6.050%, 03/01/34 | | | | | 500,000 | | | | 473,440 | |
Total Utilities | | | | | | | | | 4,375,827 | |
Total Corporate Bonds (cost $50,030,742) | | | | | | | | | 49,089,108 | |
Foreign Government Obligations - 4.3% | | | | | | | | | | |
Canadian Government, 4.500%, 09/01/07 | | CAD | | | 1,000,000 | | | | 895,987 | |
Mexican Fixed Rate Bonds, 8.000%, 12/07/23 | | MXN | | | 3,500,000 | | | | 270,649 | |
Mexican Government, 9.000%, 12/20/12 | | MXN | | | 12,000,000 | | | | 1,070,464 | |
Mexico Government, 9.875%, Yankee, 02/01/10 | | | | | 315,000 | | | | 355,163 | |
Total Foreign Government (cost $2,388,782) | | | | | | | | | 2,592,263 | |
U.S. Government and Agency Obligations - 7.4% | | | | | | | | | | |
U.S. Government Agency Obligations- 1.2% | | | | | | | | | | |
FNMA, 2.290%, 02/19/09 | | | | | 700,000 | | | | 425,787 | |
Freddie Mac Corp., 3.220%, 06/20/07 | | | | | 500,002 | | | | 314,215 | |
Total U.S. Government Agency Obligations | | | | | | | | | 740,002 | |
U.S. Treasuries- 6.2% | | | | | | | | | | |
U.S. Treasury Inflation Indexed Bonds, 2.000%, 01/15/14 | | | | | 479,692 | 2 | | | 463,166 | |
USTB, 5.375%, 02/15/31 | | | | | 2,415,000 | 2 | | | 2,457,453 | |
USTB, 4.750%, 05/15/14 | | | | | 835,000 | 2 | | | 814,811 | |
Total U.S. Treasuries | | | | | | | | | 3,735,430 | |
Total U.S. Government and Agency Obligations (cost $4,479,438) | | | | | | | | | 4,475,432 | |
Municipal Bonds - 1.8% | | | | | | | | | | |
Decatur Texas Hospital Authority Hospital Revenue, 7.750%, 09/01/09 | | | | | 185,000 | | | | 191,244 | |
Eufaula Alabama, Series C, 4.000%, 08/15/12 | | | | | 490,000 | | | | 463,663 | |
MI Tobacco Settlement, 7.309%, 06/01/34 | | | | | 405,000 | | | | 404,615 | |
Total Municipal Bonds (cost $1,074,617) | | | | | | | | | 1,059,522 | |
| | | |
| | | | | Shares | | | | |
Preferred Stock - 1.9% | | | | | | | | | | |
Newell Financial Trust I, 5.250% | | | | | 13,455 | | | | 593,702 | |
Travelers Property Casualty Corp., 4.500%, 04/15/32 | | | | | 21,000 | | | | 514,920 | |
Total Preferred Stock (cost $1,049,222) | | | | | | | | | 1,108,622 | |
Other Investment Companies - 30.4%1 | | | | | | | | | | |
Bank of New York Institutional Cash Reserves Fund, 5.22%3 | | | | | 15,776,970 | | | | 15,776,970 | |
JPMorgan Prime Money Market Fund, Institutional Class Shares, 4.98% | | | | | 2,499,780 | | | | 2,499,780 | |
Total Other Investment Companies (cost $18,276,750) | | | | | | | | | 18,276,750 | |
Total Investments - 127.5% (cost $77,299,551) | | | | | | | | | 76,601,697 | |
Other Assets, less Liabilities - (27.5)% | | | | | | | | | (16,539,537 | ) |
Net Assets - 100.0% | | | | | | | | $ | 60,062,160 | |
The accompanying notes are an integral part of these financial statements.
28
Managers Trust II Funds
Notes to Schedules of Portfolio Investments (unaudited)
The following footnotes and abbreviations should be read in conjunction with each of the Schedules of Portfolio Investments previously presented in this report.
At June 30, 2006, the cost of securities for Federal income tax purposes and the gross aggregate unrealized appreciation and/or depreciation based on tax cost were approximately:
| | | | | | | | | | | | |
Fund | | Cost | | Appreciation | | Depreciation | | | Net | |
20 Fund | | $ | 21,058,184 | | $ | 1,331,538 | | ($3,095,940 | ) | | ($1,764,402 | ) |
Mid-Cap | | | 107,160,708 | | | 13,772,746 | | (2,299,435 | ) | | 11,473,311 | |
Balanced | | | 25,753,957 | | | 2,222,199 | | (619,029 | ) | | 1,603,170 | |
High Yield | | | 59,084,897 | | | 641,683 | | (1,512,145 | ) | | (870,462 | ) |
Fixed Income | | | 77,299,551 | | | 1,096,242 | | (1,796,709 | ) | | (700,467 | ) |
| * | Non-income-producing security |
| a | Security exempt from registration under Rule 144A of the Securities Act of 1933. This security may be resold in transactions exempt from registration, normally to qualified buyers. At June 30, 2006, the value of these securities amounted to the following: |
| | | | | | |
Fund | | Value | | % of
Net Assets | |
Balanced | | $ | 399,463 | | 1.8 | % |
High Yield | | | 4,554,025 | | 9.8 | % |
Fixed Income | | | 6,379,050 | | 10.6 | % |
| b | High-yield debt instrument with either deferred interest payments or an interest rate that resets at specific times during its term. |
| 1 | Yield shown for an investment company represents its June 30, 2006, seven-day average yield, which refers to the sum of the previous seven days’ dividends paid, expressed as an annual percentage. |
| 2 | Some or all of these shares were out on loan to various brokers as of June 30, 2006, amounting to: |
| | | | | | |
Fund | | Value | | % of
Net Assets | |
20 Fund | | $ | 3,830,926 | | 25.3 | % |
Mid-Cap | | | 26,338,139 | | 28.8 | % |
Balanced | | | 4,842,061 | | 21.6 | % |
High Yield | | | 12,245,439 | | 26.4 | % |
Fixed Income | | | 15,507,021 | | 25.8 | % |
| 3 | Collateral received from brokers for securities lending was invested in this short-term investment. |
| 4 | Represents yield to maturity at June 30, 2006. |
| 5 | Variable rate security. The rate listed is as of June 30, 2006. |
Investments Definitions and Abbreviations:
| | |
| FNMA: | | Federal National Mortgage Association |
| GMAC: | | General Motors Acceptance Corp. |
| USTB: | | United States Treasury Bond |
| USTN: | | United States Treasury Note |
Registered shares: A security whose owner has been recorded with its issuer or issuer’s registrar.
Abbreviations have been used throughout the portfolios to indicate amounts shown in currencies of par values other than the U.S. dollar (USD):
| | |
| CAD: | | Canadian Dollar |
| NZD: | | New Zealand Dollar |
| GBP: | | British Pound |
| KRW: | | South Korean Won |
| IDR: | | Indonesian Rupiah |
| SGD: | | Singapore Dollar |
| MXN: | | Mexican Peso |
| ARS: | | Argentine Peso |
| THB: | | Thailand Bhat |
29
Statements of Assets and Liabilities
June 30, 2006 (unaudited)
| | | | | | | | | | | | | | | | | | | | |
| | | Managers 20
Fund | | | Managers
Mid-Cap Fund | | | Managers
Balanced Fund | | | Managers High
Yield Fund | | | Managers Fixed
Income Fund | |
Assets: | | | | | | | | | | | | | | | | | | | | |
Investments at value (including securities on loan valued at $3,830,926, $26,338,139, $4,842,061, $12,245,439, and $15,507,021, respectively) | | $ | 19,293,782 | | | $ | 118,634,019 | | | $ | 27,357,072 | | | $ | 58,214,435 | | | $ | 76,601,697 | |
Foreign currency** | | | — | | | | — | | | | 18 | | | | — | | | | 69,188 | |
Receivable for investments sold | | | 139,502 | | | | 64,756 | | | | — | | | | 530,211 | | | | — | |
Receivable for Fund shares sold | | | — | | | | — | | | | 75 | | | | 8,367 | | | | 17,649 | |
Dividends, interest and other receivables | | | 328 | | | | 89,940 | | | | 125,008 | | | | 934,099 | | | | 853,296 | |
Prepaid expenses | | | 34,058 | | | | 33,776 | | | | 31,233 | | | | 35,064 | | | | 29,561 | |
| | | | | | | | | | | | | | | | | | | | |
Total assets | | | 19,467,670 | | | | 118,822,491 | | | | 27,513,406 | | | | 59,722,176 | | | | 77,571,391 | |
| | | | | | | | | | | | | | | | | | | | |
Liabilities: | | | | | | | | | | | | | | | | | | | | |
Payable to Custodian | | | 10,153 | | | | 154,403 | | | | 19,239 | | | | 56,104 | | | | 1,582,919 | |
Payable for Fund shares repurchased | | | 282,482 | | | | 65,993 | | | | 3,928 | | | | 81,624 | | | | 64,238 | |
Payable upon return of securities loaned | | | 3,982,536 | | | | 26,963,712 | | | | 4,970,662 | | | | 12,452,183 | | | | 15,776,970 | |
Payable for investments purchased | | | — | | | | — | | | | — | | | | 728,542 | | | | — | |
Accrued expenses: | | | | | | | | | | | | | | | | | | | | |
Investment advisory and management fees | | | — | | | | 42,150 | | | | 1,672 | | | | 11,772 | | | | 1,671 | |
Administrative fees | | | 2,458 | | | | 14,627 | | | | 3,643 | | | | 7,707 | | | | 10,145 | |
Other | | | 59,834 | | | | 74,139 | | | | 50,232 | | | | 69,609 | | | | 73,288 | |
| | | | | | | | | | | | | | | | | | | | |
Total liabilities | | | 4,337,463 | | | | 27,315,024 | | | | 5,049,376 | | | | 13,407,541 | | | | 17,509,231 | |
| | | | | | | | | | | | | | | | | | | | |
Net Assets | | $ | 15,130,207 | | | $ | 91,507,467 | | | $ | 22,464,030 | | | $ | 46,314,635 | | | $ | 60,062,160 | |
| | | | | | | | | | | | | | | | | | | | |
Net Assets Represent: | | | | | | | | | | | | | | | | | | | | |
Paid-in capital | | $ | 261,248,871 | | | $ | 88,902,161 | | | $ | 39,880,783 | | | $ | 66,840,563 | | | $ | 64,485,964 | |
Undistributed/(overdistributed) net investment income | | | (103,825 | ) | | | (23,221 | ) | | | 21,237 | | | | 8,006 | | | | (32,628 | ) |
Accumulated net realized loss from investments and foreign currency transactions | | | (244,250,437 | ) | | | (8,844,784 | ) | | | (19,041,160 | ) | | | (19,663,472 | ) | | | (3,690,709 | ) |
Net unrealized appreciation (depreciation) of investments and foreign currency translations | | | (1,764,402 | ) | | | 11,473,311 | | | | 1,603,170 | | | | (870,462 | ) | | | (700,467 | ) |
| | | | | | | | | | | | | | | | | | | | |
Net Assets | | $ | 15,130,207 | | | $ | 91,507,467 | | | $ | 22,464,030 | | | $ | 46,314,635 | | | $ | 60,062,160 | |
| | | | | | | | | | | | | | | | | | | | |
Class A Shares - Net Assets | | $ | 2,409,516 | | | $ | 9,313,643 | | | $ | 1,572,400 | | | $ | 20,562,866 | | | $ | 9,128,978 | |
Shares Outstanding | | | 532,231 | | | | 669,421 | | | | 133,629 | | | | 2,484,947 | | | | 908,738 | |
| | | | | | | | | | | | | | | | | | | | |
Net asset value, offering and redemption price per share | | $ | 4.53 | | | $ | 13.91 | | | $ | 11.77 | | | $ | 8.27 | | | $ | 10.05 | |
| | | | | | | | | | | | | | | | | | | | |
Class B Shares - Net Assets | | $ | 5,460,392 | | | $ | 14,046,530 | | | $ | 8,828,501 | | | $ | 14,688,551 | | | $ | 14,694,530 | |
Shares Outstanding | | | 1,272,364 | | | | 1,064,833 | | | | 763,165 | | | | 1,791,465 | | | | 1,472,204 | |
| | | | | | | | | | | | | | | | | | | | |
Net asset value, offering and redemption price per share | | $ | 4.29 | | | $ | 13.19 | | | $ | 11.57 | | | $ | 8.20 | | | $ | 9.98 | |
| | | | | | | | | | | | | | | | | | | | |
Class C Shares - Net Assets | | $ | 4,714,143 | | | $ | 12,830,269 | | | $ | 4,683,693 | | | $ | 7,260,448 | | | $ | 10,773,460 | |
Shares Outstanding | | | 1,094,175 | | | | 971,985 | | | | 401,180 | | | | 887,015 | | | | 1,072,249 | |
| | | | | | | | | | | | | | | | | | | | |
Net asset value, offering and redemption price per share | | $ | 4.31 | | | $ | 13.20 | | | $ | 11.67 | | | $ | 8.19 | | | $ | 10.05 | |
| | | | | | | | | | | | | | | | | | | | |
Institutional Class Shares - Net Assets | | $ | 2,546,156 | | | $ | 55,317,025 | | | $ | 7,379,436 | | | $ | 3,802,770 | | | $ | 25,465,192 | |
Shares Outstanding | | | 550,889 | | | | 3,772,183 | | | | 622,528 | | | | 455,907 | | | | 2,525,224 | |
| | | | | | | | | | | | | | | | | | | | |
Net asset value, offering and redemption price per share | | $ | 4.62 | | | $ | 14.66 | | | $ | 11.85 | | | $ | 8.34 | | | $ | 10.08 | |
| | | | | | | | | | | | | | | | | | | | |
* Investments at cost | | $ | 21,058,184 | | | $ | 107,160,708 | | | $ | 25,753,902 | | | $ | 59,084,897 | | | $ | 77,301,303 | |
| | | | | |
** Foreign currency at cost | | | — | | | | — | | | | 17 | | | | — | | | | 70,049 | |
The accompanying notes are an integral part of these financial statements.
30
Statements of Operations
For the six months ended June 30, 2006 (unaudited)
| | | | | | | | | | | | | | | | | | | | |
| | | Managers 20
Fund | | | Managers
Mid-Cap Fund | | | Managers
Balanced Fund | | | Managers
High Yield
Fund | | | Managers Fixed
Income Fund | |
Investment Income: | | | | | | | | | | | | | | | | | | | | |
Dividend income | | $ | 82,346 | | | $ | 566,349 | | | $ | 134,977 | | | $ | 8,477 | | | $ | 52,077 | |
Interest income | | | — | | | | — | | | | 214,325 | | | | 1,842,237 | | | | 1,625,321 | |
Foreign withholding tax | | | (634 | ) | | | — | | | | — | | | | — | | | | (1,356 | ) |
Securities lending fees | | | 705 | | | | 23,385 | | | | 904 | | | | 15,186 | | | | 9,076 | |
| | | | | | | | | | | | | | | | | | | | |
Total investment income | | | 82,417 | | | | 589,734 | | | | 350,206 | | | | 1,865,900 | | | | 1,685,118 | |
| | | | | | | | | | | | | | | | | | | | |
Expenses: | | | | | | | | | | | | | | | | | | | | |
Investment advisory and management fees | | | 68,056 | | | | 332,967 | | | | 81,045 | | | | 168,152 | | | | 138,070 | |
Administrative fees | | | 19,444 | | | | 95,134 | | | | 23,156 | | | | 48,043 | | | | 61,365 | |
Distribution Fees - Class A Shares | | | 3,848 | | | | 11,564 | | | | 2,019 | | | | 25,631 | | | | 11,316 | |
Distribution Fees - Class B Shares | | | 33,764 | | | | 76,030 | | | | 46,192 | | | | 81,423 | | | | 78,502 | |
Distribution Fees - Class C Shares | | | 28,846 | | | | 67,559 | | | | 24,482 | | | | 38,242 | | | | 55,241 | |
Transfer agent | | | 23,297 | | | | 16,546 | | | | 6,222 | | | | 19,532 | | | | 11,281 | |
Custodian | | | 19,405 | | | | 33,122 | | | | 34,522 | | | | 33,120 | | | | 28,293 | |
Registration fees | | | 16,432 | | | | 16,777 | | | | 16,278 | | | | 16,612 | | | | 13,867 | |
Professional fees | | | 12,237 | | | | 16,935 | | | | 12,950 | | | | 13,716 | | | | 14,616 | |
Reports to shareholders | | | 5,994 | | | | 4,411 | | | | 2,083 | | | | 2,873 | | | | 1,908 | |
Trustees fees and expenses | | | 1,192 | | | | 4,799 | | | | 1,441 | | | | 1,895 | | | | 2,370 | |
Miscellaneous | | | 738 | | | | 1,388 | | | | 3 | | | | 538 | | | | 1,036 | |
| | | | | | | | | | | | | | | | | | | | |
Total expenses before offsets | | | 233,253 | | | | 677,232 | | | | 250,393 | | | | 449,777 | | | | 417,865 | |
| | | | | | | | | | | | | | | | | | | | |
Expense reimbursement | | | (44,394 | ) | | | (45,314 | ) | | | (61,809 | ) | | | (85,585 | ) | | | (122,644 | ) |
Expense reductions | | | (2,617 | ) | | | (17,321 | ) | | | (3,674 | ) | | | (1,935 | ) | | | (17 | ) |
| | | | | | | | | | | | | | | | | | | | |
Net expenses | | | 186,242 | | | | 614,597 | | | | 184,910 | | | | 362,257 | | | | 295,204 | |
| | | | | | | | | | | | | | | | | | | | |
Net investment income (loss) | | | (103,825 | ) | | | (24,863 | ) | | | 165,296 | | | | 1,503,643 | | | | 1,389,914 | |
| | | | | | | | | | | | | | | | | | | | |
Net Realized and Unrealized Gain (Loss): | | | | | | | | | | | | | | | | | | | | |
Net realized gain (loss) on investment transactions | | | (364,175 | ) | | | 8,642,986 | | | | 893,615 | | | | 825,311 | | | | (71,911 | ) |
Net realized loss on foreign currency transactions | | | — | | | | — | | | | (497 | ) | | | — | | | | (1,448 | ) |
Net unrealized depreciation of investments | | | (1,027,338 | ) | | | (5,479,930 | ) | | | (448,890 | ) | | | (909,835 | ) | | | (1,831,434 | ) |
Net unrealized appreciation (depreciation) of foreign currency translations | | | — | | | | — | | | | 56 | | | | — | | | | (4,270 | ) |
| | | | | | | | | | | | | | | | | | | | |
Net realized and unrealized gain (loss) | | | (1,391,513 | ) | | | 3,163,056 | | | | 444,284 | | | | (84,524 | ) | | | (1,909,063 | ) |
| | | | | | | | | | | | | | | | | | | | |
Net Increase (Decrease) in Net Assets Resulting from Operations | | | ($1,495,338 | ) | | $ | 3,138,193 | | | $ | 609,580 | | | $ | 1,419,119 | | | | ($519,149 | ) |
| | | | | | | | | | | | | | | | | | | | |
The accompanying notes are an integral part of these financial statements.
31
Statements of Changes in Net Assets
For the six months ended June 30, 2006 (unaudited) and for the fiscal year ended December 31, 2005
| | | | | | | | | | | | | | | | |
| | | Managers 20 Fund | | | Managers Mid-Cap Fund | |
| | | 2006 | | | 2005 | | | 2006 | | | 2005 | |
Increase (Decrease) in Net Assets From Operations: | | | | | | | | | | | | | | | | |
Net investment income (loss) | | | ($103,825 | ) | | | ($326,049 | ) | | | ($24,863 | ) | | | ($128,063 | ) |
Net realized gain (loss) on investments and foreign currency transactions | | | (364,175 | ) | | | (5,407,020 | ) | | | 8,642,986 | | | | 12,645,244 | |
Net unrealized appreciation (depreciation) of investments and foreign currency translations | | | (1,027,338 | ) | | | 3,312,914 | | | | (5,479,930 | ) | | | (1,958,142 | ) |
| | | | | | | | | | | | | | | | |
Net increase (decrease) in net assets resulting from operations | | | (1,495,338 | ) | | | (2,420,155 | ) | | | 3,138,193 | | | | 10,559,039 | |
| | | | | | | | | | | | | | | | |
Distributions to Shareholders: | | | | | | | | | | | | | | | | |
From net investment income | | | | | | | | | | | | | | | | |
Class A Shares | | | — | | | | — | | | | — | | | | — | |
Class B Shares | | | — | | | | — | | | | — | | | | — | |
Class C Shares | | | — | | | | — | | | | — | | | | — | |
Institutional Class Shares | | | — | | | | — | | | | — | | | | — | |
| | | | | | | | | | | | | | | | |
Total distributions to shareholders | | | — | | | | — | | | | — | | | | — | |
| | | | | | | | | | | | | | | | |
From Capital Share Transactions: | | | | | | | | | | | | | | | | |
Proceeds from sale of shares | | | 228,729 | | | | 893,929 | | | | 3,792,822 | | | | 5,873,404 | |
Reinvestment of dividends and distributions | | | — | | | | — | | | | — | | | | — | |
Cost of shares repurchased | | | (5,820,269 | ) | | | (13,887,282 | ) | | | (13,063,067 | ) | | | (21,235,800 | ) |
| | | | | | | | | | | | | | | | |
Net decrease from capital share transactions | | | (5,591,540 | ) | | | (12,993,353 | ) | | | (9,270,245 | ) | | | (15,362,396 | ) |
| | | | | | | | | | | | | | | | |
Total increase (decrease) in net assets | | | (7,086,878 | ) | | | (15,413,508 | ) | | | (6,132,052 | ) | | | (4,803,357 | ) |
| | | | | | | | | | | | | | | | |
Net Assets: | | | | | | | | | | | | | | | | |
Beginning of period | | | 22,217,085 | | | | 37,630,593 | | | | 97,639,519 | | | | 102,442,876 | |
| | | | | | | | | | | | | | | | |
End of period | | $ | 15,130,207 | | | $ | 22,217,085 | | | $ | 91,507,467 | | | $ | 97,639,519 | |
| | | | | | | | | | | | | | | | |
End of period undistributed (overdistributed) net investment income | | | ($103,825 | ) | | | — | | | | ($23,221 | ) | | $ | 1,642 | |
| | | | | | | | | | | | | | | | |
The accompanying notes are an integral part of these financial statements.
32
| | | | | | | | | | | | | | | | | | | | | | | | |
| | | Managers Balanced Fund | | | Managers High Yield Fund | | | Managers Fixed Income Fund | |
| | | 2006 | | | 2005 | | | 2006 | | | 2005 | | | 2006 | | | 2005 | |
Increase (Decrease) in Net Assets From Operations: | | | | | | | | | | | | | | | | | | | | | | | | |
Net investment income (loss) | | $ | 165,296 | | | $ | 294,823 | | | $ | 1,503,643 | | | $ | 3,316,317 | | | $ | 1,389,914 | | | $ | 2,760,099 | |
Net realized gain (loss) on investments and foreign currency transactions | | | 893,118 | | | | 2,487,347 | | | | 825,311 | | | | 791,823 | | | | (73,359 | ) | | | 389,271 | |
Net unrealized appreciation (depreciation) of investments and foreign currency translations | | | (448,834 | ) | | | (1,822,713 | ) | | | (909,835 | ) | | | (3,087,058 | ) | | | (1,835,704 | ) | | | (1,701,178 | ) |
| | | | | | | | | | | | | | | | | | | | | | | | |
Net increase (decrease) in net assets resulting from operations | | | 609,580 | | | | 959,457 | | | | 1,419,119 | | | | 1,021,082 | | | | (519,149 | ) | | | 1,448,192 | |
| | | | | | | | | | | | | | | | | | | | | | | | |
Distributions to Shareholders: | | | | | | | | | | | | | | | | | | | | | | | | |
From net investment income | | | | | | | | | | | | | | | | | | | | | | | | |
Class A Shares | | | (13,549 | ) | | | (29,028 | ) | | | (674,599 | ) | | | (1,189,279 | ) | | | (216,851 | ) | | | (343,226 | ) |
Class B Shares | | | (44,059 | ) | | | (81,465 | ) | | | (474,394 | ) | | | (1,330,899 | ) | | | (314,274 | ) | | | (813,174 | ) |
Class C Shares | | | (22,869 | ) | | | (41,820 | ) | | | (224,368 | ) | | | (540,473 | ) | | | (221,147 | ) | | | (547,607 | ) |
Institutional Class Shares | | | (71,305 | ) | | | (133,270 | ) | | | (122,276 | ) | | | (272,343 | ) | | | (636,656 | ) | | | (1,347,502 | ) |
| | | | | | | | | | | | | | | | | | | | | | | | |
Total distributions to shareholders | | | (151,782 | ) | | | (285,583 | ) | | | (1,495,637 | ) | | | (3,332,994 | ) | | | (1,388,928 | ) | | | (3,051,509 | ) |
| | | | | | | | | | | | | | | | | | | | | | | | |
From Capital Share Transactions: | | | | | | | | | | | | | | | | | | | | | | | | |
Proceeds from sale of shares | | | 653,593 | | | | 1,751,699 | | | | 4,275,918 | | | | 16,148,558 | | | | 11,625,624 | | | | 12,380,200 | |
Reinvestment of dividends and distributions | | | 89,549 | | | | 124,058 | | | | 805,532 | | | | 1,475,832 | | | | 747,842 | | | | 1,306,176 | |
Cost of shares repurchased | | | (2,688,081 | ) | | | (6,542,450 | ) | | | (8,323,880 | ) | | | (24,777,109 | ) | | | (11,952,535 | ) | | | (14,581,815 | ) |
| | | | | | | | | | | | | | | | | | | | | | | | |
Net decrease from capital share transactions | | | (1,944,939 | ) | | | (4,666,693 | ) | | | (3,242,430 | ) | | | (7,152,719 | ) | | | 420,931 | | | | (895,439 | ) |
| | | | | | | | | | | | | | | | | | | | | | | | |
Total increase (decrease) in net assets | | | (1,487,141 | ) | | | (3,992,819 | ) | | | (3,318,948 | ) | | | (9,464,631 | ) | | | (1,487,146 | ) | | | (2,498,756 | ) |
| | | | | | | | | | | | | | | | | | | | | | | | |
Net Assets: | | | | | | | | | | | | | | | | | | | | | | | | |
Beginning of period | | | 23,951,171 | | | | 27,943,990 | | | | 49,633,583 | | | | 59,098,214 | | | | 61,549,306 | | | | 64,048,062 | |
| | | | | | | | | | | | | | | | | | | | | | | | |
End of period | | $ | 22,464,030 | | | $ | 23,951,171 | | | $ | 46,314,635 | | | $ | 49,633,583 | | | $ | 60,062,160 | | | $ | 61,549,306 | |
| | | | | | | | | | | | | | | | | | | | | | | | |
End of period undistributed (overdistributed) net investment income | | $ | 21,237 | | | $ | 7,723 | | | $ | 8,006 | | | | — | | | | ($32,628 | ) | | | ($33,614 | ) |
| | | | | | | | | | | | | | | | | | | | | | | | |
The accompanying notes are an integral part of these financial statements.
33
Financial Highlights
For a share outstanding throughout the six months ended June 30, 2006 (unaudited) and each year ended December 3 1,
| | | | | | | | | | | | | | | | | | | | | | | | |
| | | Class A Shares | |
20 Fund | | 2006 | | | 2005 | | | 2004 | | | 2003 | | | 2002 | | | 2001 | |
Net Asset Value, Beginning of Period | | $ | 4.93 | | | $ | 5.20 | | | $ | 5.48 | | | $ | 3.51 | | | $ | 6.12 | | | $ | 11.76 | |
| | | | | | | | | | | | | | | | | | | | | | | | |
Income from Investment Operations: | | | | | | | | | | | | | | | | | | | | | | | | |
Net investment loss | | | (0.02 | ) | | | (0.05 | )5 | | | (0.05 | ) | | | (0.05 | ) | | | (0.07 | ) | | | (0.08 | ) |
Net realized and unrealized gain (loss) on investments | | | (0.38 | ) | | | (0.22 | ) | | | (0.23 | ) | | | 2.02 | | | | (2.54 | ) | | | (5.56 | ) |
| | | | | | | | | | | | | | | | | | | | | | | | |
Total from investment operations | | | (0.40 | ) | | | (0.27 | ) | | | (0.28 | ) | | | 1.97 | | | | (2.61 | ) | | | (5.64 | ) |
| | | | | | | | | | | | | | | | | | | | | | | | |
Less Distributions to Shareholders from: | | | | | | | | | | | | | | | | | | | | | | | | |
Net realized gain on investments | | | — | | | | — | | | | — | | | | — | | | | — | | | | — | |
| | | | | | | | | | | | | | | | | | | | | | | | |
Total distributions to shareholders | | | — | | | | — | | | | — | | | | — | | | | — | | | | — | |
| | | | | | | | | | | | | | | | | | | | | | | | |
Net Asset Value, End of Period | | $ | 4.53 | | | $ | 4.93 | | | $ | 5.20 | | | $ | 5.48 | | | $ | 3.51 | | | $ | 6.12 | |
| | | | | | | | | | | | | | | | | | | | | | | | |
Total Return1 | | | (8.11 | )%2 | | | (5.19 | )% | | | (5.11 | )% | | | 56.13 | % | | | (42.65 | )% | | | (47.96 | )% |
| | | | | | | | | | | | | | | | | | | | | | | | |
Ratio of net expenses to average net assets1 | | | 1.48 | %3 | | | 1.58 | % | | | 1.75 | % | | | 1.75 | % | | | 1.75 | % | | | 1.67 | % |
Ratio of total expenses to average net assets1 | | | 1.96 | %3 | | | 1.85 | % | | | 2.07 | % | | | 1.97 | % | | | 1.82 | % | | | 1.67 | % |
Ratio of net investment loss to average net assets | | | (0.62 | )%3 | | | (0.81 | )% | | | (0.74 | )% | | | (1.15 | )% | | | (1.19 | )% | | | (1.19 | )% |
Portfolio turnover | | | 8 | %2 | | | 17 | % | | | 35 | % | | | 9 | % | | | 9 | % | | | 8 | % |
Net assets at end of period (000’s omitted) | | $ | 2,410 | | | $ | 3,499 | | | $ | 5,064 | | | $ | 7,956 | | | $ | 8,778 | | | $ | 23,948 | |
| | | | | | | | | | | | | | | | | | | | | | | | |
| |
| | | Class C Shares | |
20 Fund | | 2006 | | | 2005 | | | 2004 | | | 2003 | | | 2002 | | | 2001 | |
Net Asset Value, Beginning of Period | | $ | 4.71 | | | $ | 5.00 | | | $ | 5.29 | | | $ | 3.40 | | | $ | 5.98 | | | $ | 11.52 | |
| | | | | | | | | | | | | | | | | | | | | | | | |
Income from Investment Operations: | | | | | | | | | | | | | | | | | | | | | | | | |
Net investment loss | | | (0.04 | ) | | | (0.10 | )5 | | | (0.08 | ) | | | (0.07 | ) | | | (0.10 | ) | | | (0.12 | ) |
Net realized and unrealized gain (loss) on investments | | | (0.36 | ) | | | (0.19 | ) | | | (0.21 | ) | | | 1.96 | | | | (2.48 | ) | | | (5.42 | ) |
| | | | | | | | | | | | | | | | | | | | | | | | |
Total from investment operations | | | (0.40 | ) | | | (0.29 | ) | | | (0.29 | ) | | | 1.89 | | | | (2.58 | ) | | | (5.54 | ) |
| | | | | | | | | | | | | | | | | | | | | | | | |
Less Distributions to Shareholders from: | | | | | | | | | | | | | | | | | | | | | | | | |
Net realized gain on investments | | | — | | | | — | | | | — | | | | — | | | | — | | | | — | |
| | | | | | | | | | | | | | | | | | | | | | | | |
Total distributions to shareholders | | | — | | | | — | | | | — | | | | — | | | | — | | | | — | |
| | | | | | | | | | | | | | | | | | | | | | | | |
Net Asset Value, End of Period | | $ | 4.31 | | | $ | 4.71 | | | $ | 5.00 | | | $ | 5.29 | | | $ | 3.40 | | | $ | 5.98 | |
| | | | | | | | | | | | | | | | | | | | | | | | |
Total Return1 | | | (8.49 | )%2 | | | (5.80 | )% | | | (5.48 | )% | | | 55.13 | % | | | (42.98 | )% | | | (48.09 | )% |
| | | | | | | | | | | | | | | | | | | | | | | | |
Ratio of net expenses to average net assets1 | | | 2.22 | %3 | | | 2.24 | % | | | 2.25 | % | | | 2.25 | % | | | 2.25 | % | | | 2.17 | % |
Ratio of total expenses to average net assets1 | | | 2.71 | %3 | | | 2.51 | % | | | 2.57 | % | | | 2.47 | % | | | 2.32 | % | | | 2.17 | % |
Ratio of net investment loss to average net assets | | | (1.38 | )%3 | | | (1.47 | )% | | | (1.24 | )% | | | (1.65 | )% | | | (1.69 | )% | | | (1.69 | )% |
Portfolio turnover | | | 8 | %2 | | | 17 | % | | | 35 | % | | | 9 | % | | | 9 | % | | | 8 | % |
Net assets at end of period (000’s omitted) | | $ | 4,714 | | | $ | 6,605 | | | $ | 11,073 | | | $ | 18,038 | | | $ | 15,359 | | | $ | 40,383 | |
| | | | | | | | | | | | | | | | | | | | | | | | |
34
| | | | | | | | | | | | | | | | | | | | | | | | |
| | | Class B Shares | |
20 Fund | | 2006 | | | 2005 | | | 2004 | | | 2003 | | | 2002 | | | 2001 | |
Net Asset Value, Beginning of Period | | $ | 4.69 | | | $ | 4.98 | | | $ | 5.27 | | | $ | 3.39 | | | $ | 5.95 | | | $ | 11.48 | |
| | | | | | | | | | | | | | | | | | | | | | | | |
Income from Investment Operations: | | | | | | | | | | | | | | | | | | | | | | | | |
Net investment loss | | | (0.04 | ) | | | (0.11 | )5 | | | (0.08 | ) | | | (0.07 | ) | | | (0.10 | ) | | | (0.13 | ) |
Net realized and unrealized gain (loss) on investments | | | (0.36 | ) | | | (0.18 | ) | | | (0.21 | ) | | | 1.95 | | | | (2.46 | ) | | | (5.40 | ) |
| | | | | | | | | | | | | | | | | | | | | | | | |
Total from investment operations | | | (0.40 | ) | | | (0.29 | ) | | | (0.29 | ) | | | 1.88 | | | | (2.56 | ) | | | (5.53 | ) |
| | | | | | | | | | | | | | | | | | | | | | | | |
Less Distributions to Shareholders from: | | | | | | | | | | | | | | | | | | | | | | | | |
Net realized gain on investments | | | — | | | | — | | | | — | | | | — | | | | — | | | | — | |
| | | | | | | | | | | | | | | | | | | | | | | | |
Total distributions to shareholders | | | — | | | | — | | | | — | | | | — | | | | — | | | | — | |
| | | | | | | | | | | | | | | | | | | | | | | | |
Net Asset Value, End of Period | | $ | 4.29 | | | $ | 4.69 | | | $ | 4.98 | | | $ | 5.27 | | | $ | 3.39 | | | $ | 5.95 | |
| | | | | | | | | | | | | | | | | | | | | | | | |
Total Return1 | | | (8.53 | )%2 | | | (5.82 | )% | | | (5.50 | )% | | | 55.46 | % | | | (43.03 | )% | | | (48.17 | )% |
| | | | | | | | | | | | | | | | | | | | | | | | |
Ratio of net expenses to average net assets1 | | | 2.22 | %3 | | | 2.24 | % | | | 2.25 | % | | | 2.25 | % | | | 2.25 | % | | | 2.17 | % |
Ratio of total expenses to average net assets1 | | | 2.71 | %3 | | | 2.51 | % | | | 2.57 | % | | | 2.47 | % | | | 2.32 | % | | | 2.17 | % |
Ratio of net investment loss to average net assets | | | (1.37 | )%3 | | | (1.47 | )% | | | (1.24 | )% | | | (1.65 | )% | | | (1.69 | )% | | | (1.69 | )% |
Portfolio turnover | | | 8 | %2 | | | 17 | % | | | 35 | % | | | 9 | % | | | 9 | % | | | 8 | % |
Net assets at end of period (000’s omitted) | | $ | 5,460 | | | $ | 7,835 | | | $ | 13,007 | | | $ | 19,724 | | | $ | 16,197 | | | $ | 46,136 | |
| | | | | | | | | | | | | | | | | | | | | | | | |
| |
| | | Institutional Class Shares | |
20 Fund | | 2006 | | | 2005 | | | 2004 | | | 2003 | | | 2002 | | | 2001 | |
Net Asset Value, Beginning of Period | | $ | 5.02 | | | $ | 5.28 | | | $ | 5.54 | | | $ | 3.53 | | | $ | 6.13 | | | $ | 11.70 | |
| | | | | | | | | | | | | | | | | | | | | | | | |
Income from Investment Operations: | | | | | | | | | | | | | | | | | | | | | | | | |
Net investment loss | | | (0.01 | ) | | | (0.01 | )5 | | | (0.01 | ) | | | (0.01 | ) | | | (0.04 | ) | | | (0.05 | ) |
Net realized and unrealized gain (loss) on investments | | | (0.39 | ) | | | (0.25 | ) | | | (0.25 | ) | | | 2.02 | | | | (2.56 | ) | | | (5.52 | ) |
| | | | | | | | | | | | | | | | | | | | | | | | |
Total from investment operations | | | (0.40 | ) | | | (0.26 | ) | | | (0.26 | ) | | | 2.01 | | | | (2.60 | ) | | | (5.57 | ) |
| | | | | | | | | | | | | | | | | | | | | | | | |
Less Distributions to Shareholders from: | | | | | | | | | | | | | | | | | | | | | | | | |
Net realized gain on investments | | | — | | | | — | | | | — | | | | — | | | | — | | | | — | |
| | | | | | | | | | | | | | | | | | | | | | | | |
Total distributions to shareholders | | | — | | | | — | | | | — | | | | — | | | | — | | | | — | |
| | | | | | | | | | | | | | | | | | | | | | | | |
Net Asset Value, End of Period | | $ | 4.62 | | | $ | 5.02 | | | $ | 5.28 | | | $ | 5.54 | | | $ | 3.53 | | | $ | 6.13 | |
| | | | | | | | | | | | | | | | | | | | | | | | |
Total Return1 | | | (7.97 | )%2 | | | (4.92 | )% | | | (4.69 | )% | | | 56.94 | % | | | (42.41 | )% | | | (47.61 | )% |
| | | | | | | | | | | | | | | | | | | | | | | | |
Ratio of net expenses to average net assets1 | | | 122 | % | | | 1.24 | % | | | 1.25 | % | | | 1.25 | % | | | 1.25 | % | | | 1.17 | % |
Ratio of total expenses to average net assets1 | | | 1.70 | %3 | | | 1.51 | % | | | 1.59 | % | | | 1.47 | % | | | 1.32 | % | | | 1.17 | % |
Ratio of net investment loss to average net assets | | | (0.37 | )%3 | | | (0.48 | )% | | | (0.19 | )% | | | (0.65 | )% | | | (0.69 | )% | | | (0.69 | )% |
Portfolio turnover | | | 8 | %2 | | | 17 | % | | | 35 | % | | | 9 | % | | | 9 | % | | | 8 | % |
Net assets at end of period (000’s omitted) | | $ | 2,546 | | | $ | 4,278 | | | $ | 8,487 | | | $ | 10,206 | | | $ | 7,988 | | | $ | 20,149 | |
| | | | | | | | | | | | | | | | | | | | | | | | |
35
Financial Highlights
For a share outstanding throughout the six months ended June 30, 2006 (unaudited) and each year ended December 31,
| | | | | | | | | | | | | | | | | | | | | | | | |
| | | Class A Shares | |
Mid-Cap Fund | | 2006 | | | 2005 | | | 2004 | | | 2003 | | | 2002 | | | 2001 | |
Net Asset Value, Beginning of Period | | $ | 13.48 | | | $ | 12.10 | | | $ | 10.36 | | | $ | 7.58 | | | $ | 8.79 | | | $ | 9.86 | |
| | | | | | | | | | | | | | | | | | | | | | | | |
Income from Investment Operations: | | | | | | | | | | | | | | | | | | | | | | | | |
Net investment income (loss) | | | 0.00 | | | | (0.01 | )5 | | | (0.02 | ) | | | (0.01 | ) | | | (0.01 | ) | | | (0.01 | ) |
Net realized and unrealized gain (loss) on investments | | | 0.43 | | | | 1.39 | | | | 1.76 | | | | 2.79 | | | | (1.20 | ) | | | (1.06 | ) |
| | | | | | | | | | | | | | | | | | | | | | | | |
Total from investment operations | | | 0.43 | | | | 1.38 | | | | 1.74 | | | | 2.78 | | | | (1.21 | ) | | | (1.07 | ) |
| | | | | | | | | | | | | | | | | | | | | | | | |
Less Distributions to Shareholders from: | | | | | | | | | | | | | | | | | | | | | | | | |
Net realized gain on investments | | | — | | | | — | | | | — | | | | — | | | | — | | | | (0.00 | )# |
| | | | | | | | | | | | | | | | | | | | | | | | |
Total distributions to shareholders | | | — | | | | — | | | | — | | | | — | | | | — | | | | (0.00 | ) |
| | | | | | | | | | | | | | | | | | | | | | | | |
Net Asset Value, End of Period | | $ | 13.91 | | | $ | 13.48 | | | $ | 12.10 | | | $ | 10.36 | | | $ | 7.58 | | | $ | 8.79 | |
| | | | | | | | | | | | | | | | | | | | | | | | |
Total Return1 | | | 3.27 | %2 | | | 11.32 | % | | | 16.80 | % | | | 36.68 | % | | | (13.77 | )% | | | (10.93 | )% |
| | | | | | | | | | | | | | | | | | | | | | | | |
Ratio of net expenses to average net assets1 | | | 1.21 | %3 | | | 1.33 | % | | | 1.41 | % | | | 1.50 | % | | | 1.50 | % | | | 1.50 | % |
Ratio of total expenses to average net assets1 | | | 1.35 | %3 | | | 1.45 | % | | | 1.68 | % | | | 1.63 | % | | | 1.59 | % | | | 1.60 | % |
Ratio of net investment loss to average net assets | | | 0.03 | %3 | | | (0.13 | )% | | | (0.16 | )% | | | (0.14 | )% | | | (0.09 | )% | | | (0.08 | )% |
Portfolio turnover | | | 47 | %2 | | | 84 | % | | | 90 | % | | | 109 | % | | | 108 | % | | | 120 | % |
Net assets at end of period (000’s omitted) | | $ | 9,314 | | | $ | 8,712 | | | $ | 9,168 | | | $ | 9,741 | | | $ | 7,290 | | | $ | 14,268 | |
| | | | | | | | | | | | | | | | | | | | | | | | |
| |
| | | Class C Shares | |
Mid-Cap Fund | | 2006 | | | 2005 | | | 2004 | | | 2003 | | | 2002 | | | 2001 | |
Net Asset Value, Beginning of Period | | $ | 12.83 | | | $ | 11.60 | | | $ | 9.99 | | | $ | 7.34 | | | $ | 8.55 | | | $ | 9.63 | |
| | | | | | | | | | | | | | | | | | | | | | | | |
Income from Investment Operations: | | | | | | | | | | | | | | | | | | | | | | | | |
Net investment income (loss) | | | (0.05 | ) | | | (0.06 | )5 | | | (0.08 | ) | | | (0.05 | ) | | | (0.06 | ) | | | (0.04 | ) |
Net realized and unrealized gain (loss) on investments | | | 0.42 | | | | 1.29 | | | | 1.69 | | | | 2.70 | | | | (1.15 | ) | | | (1.04 | ) |
| | | | | | | | | | | | | | | | | | | | | | | | |
Total from investment operations | | | 0.37 | | | | 1.23 | | | | 1.61 | | | | 2.65 | | | | (1.21 | ) | | | (1.08 | ) |
| | | | | | | | | | | | | | | | | | | | | | | | |
Less Distributions to Shareholders from: | | | | | | | | | | | | | | | | | | | | | | | | |
Net investment income | | | — | | | | — | | | | — | | | | — | | | | — | | | | — | |
Net realized gain on investments | | | — | | | | — | | | | — | | | | — | | | | — | | | | (0.00 | )# |
| | | | | | | | | | | | | | | | | | | | | | | | |
Total distributions to shareholders | | | — | | | | — | | | | — | | | | — | | | | — | | | | (0.00 | ) |
| | | | | | | | | | | | | | | | | | | | | | | | |
Net Asset Value, End of Period | | $ | 13.20 | | | $ | 12.83 | | | $ | 11.60 | | | $ | 9.99 | | | $ | 7.34 | | | $ | 8.55 | |
| | | | | | | | | | | | | | | | | | | | | | | | |
Total Return1 | | | 2.88 | %2 | | | 10.60 | % | | | 16.12 | % | | | 36.10 | % | | | (14.15 | )% | | | (11.19 | )% |
| | | | | | | | | | | | | | | | | | | | | | | | |
Ratio of net expenses to average net assets1 | | | 1.96 | %3 | | | 1.99 | % | | | 1.91 | % | | | 2.00 | % | | | 2.00 | % | | | 2.00 | % |
Ratio of total expenses to average net assets1 | | | 2.09 | %3 | | | 2.11 | % | | | 2.18 | % | | | 2.13 | % | | | 2.09 | % | | | 2.10 | % |
Ratio of net investment loss to average net assets | | | (0.72 | )%3 | | | (0.79 | )% | | | (0.67 | )% | | | (0.64 | )% | | | (0.59 | )% | | | (0.57 | )% |
Portfolio turnover | | | 47 | %2 | | | 84 | % | | | 90 | % | | | 109 | % | | | 108 | % | | | 120 | % |
Net assets at end of period (000’s omitted) | | $ | 12,830 | | | $ | 13,845 | | | $ | 15,393 | | | $ | 16,576 | | | $ | 16,329 | | | $ | 20,055 | |
| | | | | | | | | | | | | | | | | | | | | | | | |
36
| | | | | | | | | | | | | | | | | | | | | | | | |
| | | Class B Shares | |
Mid-Cap Fund | | 2006 | | | 2005 | | | 2004 | | | 2003 | | | 2002 | | | 2001 | |
Net Asset Value, Beginning of Period | | $ | 12.82 | | | $ | 11.59 | | | $ | 9.98 | | | $ | 7.33 | | | $ | 8.54 | | | $ | 9.63 | |
| | | | | | | | | | | | | | | | | | | | | | | | |
Income from Investment Operations: | | | | | | | | | | | | | | | | | | | | | | | | |
Net investment income (loss) | | | (0.05 | ) | | | (0.06 | )5 | | | (0.07 | ) | | | (0.05 | ) | | | (0.06 | ) | | | (0.05 | ) |
Net realized and unrealized gain (loss) on investments | | | 0.42 | | | | 1.29 | | | | 1.68 | | | | 2.70 | | | | (1.15 | ) | | | (1.04 | ) |
| | | | | | | | | | | | | | | | | | | | | | | | |
Total from investment operations | | | 0.37 | | | | 1.23 | | | | 1.61 | | | | 2.65 | | | | (1.21 | ) | | | (1.09 | ) |
| | | | | | | | | | | | | | | | | | | | | | | | |
Less Distributions to Shareholders from: | | | | | | | | | | | | | | | | | | | | | | | | |
Net realized gain on investments | | | — | | | | — | | | | — | | | | — | | | | — | | | | (0.00 | )# |
| | | | | | | | | | | | | | | | | | | | | | | | |
Total distributions to shareholders | | | — | | | | — | | | | — | | | | — | | | | — | | | | (0.00 | ) |
| | | | | | | | | | | | | | | | | | | | | | | | |
Net Asset Value, End of Period | | $ | 13.19 | | | $ | 12.82 | | | $ | 11.59 | | | $ | 9.98 | | | $ | 7.33 | | | $ | 8.54 | |
| | | | | | | | | | | | | | | | | | | | | | | | |
Total Return1 | | | 2.89 | %2 | | | 10.61 | % | | | 16.13 | % | | | 36.15 | % | | | (14.17 | )% | | | (11.30 | )% |
| | | | | | | | | | | | | | | | | | | | | | | | |
Ratio of net expenses to average net assets1 | | | 1.96 | %3 | | | 1.99 | % | | | 1.90 | % | | | 2.00 | % | | | 2.00 | % | | | 2.00 | % |
Ratio of total expenses to average net assets1 | | | 2.09 | %3 | | | 2.11 | % | | | 2.18 | % | | | 2.13 | % | | | 2.09 | % | | | 2.10 | % |
Ratio of net investment loss to average net assets | | | (0.72 | )%3 | | | (0.79 | )% | | | (0.67 | )% | | | (0.64 | )% | | | (0.59 | )% | | | (0.58 | )% |
Portfolio turnover | | | 47 | %2 | | | 84 | % | | | 90 | % | | | 109 | % | | | 108 | % | | | 120 | % |
Net assets at end of period (000’s omitted) | | $ | 14,047 | | | $ | 15,512 | | | $ | 17,226 | | | $ | 17,052 | | | $ | 15,956 | | | $ | 22,075 | |
| | | | | | | | | | | | | | | | | | | | | | | | |
| |
| | | Institutional Class Shares | |
Mid-Cap Fund | | 2006 | | | 2005 | | | 2004 | | | 2003 | | | 2002 | | | 2001 | |
Net Asset Value, Beginning of Period | | $ | 14.19 | | | $ | 12.70 | | | $ | 10.82 | | | $ | 7.87 | | | $ | 9.09 | | | $ | 10.16 | |
| | | | | | | | | | | | | | | | | | | | | | | | |
Income from Investment Operations: | | | | | | | | | | | | | | | | | | | | | | | | |
Net investment income (loss) | | | 0.02 | | | | 0.10 | 5 | | | 0.04 | | | | 0.03 | | | | 0.04 | | | | 0.03 | |
Net realized and unrealized gain (loss) on investments | | | 0.45 | | | | 1.39 | | | | 1.84 | | | | 2.92 | | | | (1.25 | ) | | | (1.09 | ) |
| | | | | | | | | | | | | | | | | | | | | | | | |
Total from investment operations | | | 0.47 | | | | 1.49 | | | | 1.88 | | | | 2.95 | | | | (1.21 | ) | | | (1.06 | ) |
| | | | | | | | | | | | | | | | | | | | | | | | |
Less Distributions to Shareholders from: | | | | | | | | | | | | | | | | | | | | | | | | |
Net investment income | | | — | | | | — | | | | — | | | | — | | | | (0.01 | ) | | | (0.01 | ) |
Net realized gain on investments | | | — | | | | — | | | | — | | | | — | | | | — | | | | (0.00 | )# |
| | | | | | | | | | | | | | | | | | | | | | | | |
Total distributions to shareholders | | | — | | | | — | | | | — | | | | — | | | | (0.01 | ) | | | (0.01 | ) |
| | | | | | | | | | | | | | | | | | | | | | | | |
Net Asset Value, End of Period | | $ | 14.66 | | | $ | 14.19 | | | $ | 12.70 | | | $ | 10.82 | | | $ | 7.87 | | | $ | 9.09 | |
| | | | | | | | | | | | | | | | | | | | | | | | |
Total Return1 | | | 3.39 | %2 | | | 11.74 | % | | | 17.37 | % | | | 37.51 | % | | | (13.33 | )% | | | (10.38 | )% |
| | | | | | | | | | | | | | | | | | | | | | | | |
Ratio of net expenses to average net assets1 | | | 0.96 | %3 | | | 0.99 | % | | | 0.90 | % | | | 1.00 | % | | | 1.00 | % | | | 1.00 | % |
Ratio of total expenses to average net assets1 | | | 1.09 | %3 | | | 1.11 | % | | | 1.18 | % | | | 1.13 | % | | | 1.09 | % | | | 1.10 | % |
Ratio of net investment loss to average net assets | | | 0.28 | %3 | | | 0.21 | % | | | 0.33 | % | | | 0.36 | % | | | 0.41 | % | | | 0.42 | % |
Portfolio turnover | | | 47 | %2 | | | 84 | % | | | 90 | % | | | 109 | % | | | 108 | % | | | 120 | % |
Net assets at end of period (000’s omitted) | | $ | 55,317 | | | $ | 59,571 | | | $ | 60,656 | | | $ | 64,225 | | | $ | 62,544 | | | $ | 87,671 | |
| | | | | | | | | | | | | | | | | | | | | | | | |
37
Financial Highlights
For a share outstanding throughout the six months ended June 30, 2006 (unaudited) and each year ended December 31,
| | | | | | | | | | | | | | | | | | | | | | | | |
| | | Class A Shares | |
Balanced Fund | | 2006 | | | 2005 | | | 2004 | | | 2003 | | | 2002 | | | 2001 | |
Net Asset Value, Beginning of Period | | $ | 11.55 | | | $ | 11.24 | | | $ | 10.42 | | | $ | 8.62 | | | $ | 10.13 | | | $ | 11.08 | |
| | | | | | | | | | | | | | | | | | | | | | | | |
Income from Investment Operations: | | | | | | | | | | | | | | | | | | | | | | | | |
Net investment income | | | 0.21 | | | | 0.17 | | | | 0.17 | | | | 0.22 | | | | 0.24 | | | | 0.25 | |
Net realized and unrealized gain (loss) on investments | | | 0.11 | | | | 0.30 | | | | 0.81 | | | | 1.81 | | | | (1.49 | ) | | | (0.96 | ) |
| | | | | | | | | | | | | | | | | | | | | | | | |
Total from investment operations | | | 0.32 | | | | 0.47 | | | | 0.98 | | | | 2.03 | | | | (1.25 | ) | | | (0.71 | ) |
| | | | | | | | | | | | | | | | | | | | | | | | |
Less Distributions to Shareholders from: | | | | | | | | | | | | | | | | | | | | | | | | |
Net investment income on investments | | | (0.10 | ) | | | (0.16 | ) | | | (0.16 | ) | | | (0.23 | ) | | | (0.26 | ) | | | (0.24 | ) |
| | | | | | | | | | | | | | | | | | | | | | | | |
Total distributions to shareholders | | | (0.10 | ) | | | (0.16 | ) | | | (0.16 | ) | | | (0.23 | ) | | | (0.26 | ) | | | (0.24 | ) |
| | | | | | | | | | | | | | | | | | | | | | | | |
Net Asset Value, End of Period | | $ | 11.77 | | | $ | 11.55 | | | $ | 11.24 | | | $ | 10.42 | | | $ | 8.62 | | | $ | 10.13 | |
| | | | | | | | | | | | | | | | | | | | | | | | |
Total Return1 | | | 2.78 | %2 | | | 4.24 | % | | | 9.45 | % | | | 23.85 | % | | | (12.47 | )% | | | (6.37 | )% |
| | | | | | | | | | | | | | | | | | | | | | | | |
Ratio of net expenses to average net assets1 | | | 1.22 | %3 | | | 1.31 | % | | | 1.47 | % | | | 1.50 | % | | | 1.50 | % | | | 1.50 | % |
Ratio of total expenses to average net assets1 | | | 1.78 | %3 | | | 1.85 | % | | | 2.05 | % | | | 1.73 | % | | | 1.68 | % | | | 1.68 | % |
Ratio of net investment income to average net assets | | | 1.80 | %3 | | | 1.45 | % | | | 1.46 | % | | | 2.21 | % | | | 2.62 | % | | | 2.43 | % |
Portfolio turnover | | | 26 | %2 | | | 53 | % | | | 85 | % | | | 91 | % | | | 183 | % | | | 226 | % |
Net assets at end of period (000’s omitted) | | $ | 1,572 | | | $ | 1,677 | | | $ | 2,366 | | | $ | 3,448 | | | $ | 4,205 | | | $ | 22,802 | |
| | | | | | | | | | | | | | | | | | | | | | | | |
| |
| | | Class C Shares | |
Balanced Fund | | 2006 | | | 2005 | | | 2004 | | | 2003 | | | 2002 | | | 2001 | |
Net Asset Value, Beginning of Period | | $ | 11.46 | | | $ | 11.16 | | | $ | 10.35 | | | $ | 8.56 | | | $ | 10.06 | | | $ | 11.01 | |
| | | | | | | | | | | | | | | | | | | | | | | | |
Income from Investment Operations: | | | | | | | | | | | | | | | | | | | | | | | | |
Net investment income | | | 0.12 | | | | 0.09 | | | | 0.11 | | | | 0.16 | | | | 0.18 | | | | 0.19 | |
Net realized and unrealized gain (loss) on investments | | | 0.15 | | | | 0.30 | | | | 0.81 | | | | 1.81 | | | | (1.46 | ) | | | (0.94 | ) |
| | | | | | | | | | | | | | | | | | | | | | | | |
Total from investment operations | | | 0.27 | | | | 0.39 | | | | 0.92 | | | | 1.97 | | | | (1.28 | ) | | | (0.75 | ) |
| | | | | | | | | | | | | | | | | | | | | | | | |
Less Distributions to Shareholders from: | | | | | | | | | | | | | | | | | | | | | | | | |
Net realized gain on investments | | | (0.06 | ) | | | (0.09 | ) | | | (0.11 | ) | | | (0.18 | ) | | | (0.22 | ) | | | (0.20 | ) |
| | | | | | | | | | | | | | | | | | | | | | | | |
Total distributions to shareholders | | | (0.06 | ) | | | (0.09 | ) | | | (0.11 | ) | | | (0.18 | ) | | | (0.22 | ) | | | (0.20 | ) |
| | | | | | | | | | | | | | | | | | | | | | | | |
Net Asset Value, End of Period | | $ | 11.67 | | | $ | 11.46 | | | $ | 11.16 | | | $ | 10.35 | | | $ | 8.56 | | | $ | 10.06 | |
| | | | | | | | | | | | | | | | | | | | | | | | |
Total Return1 | | | 2.32 | %2 | | | 3.49 | % | | | 8.88 | % | | | 23.38 | % | | | (12.94 | )% | | | (6.77 | )% |
| | | | | | | | | | | | | | | | | | | | | | | | |
Ratio of net expenses to average net assets1 | | | 1.97 | %3 | | | 1.98 | % | | | 1.97 | % | | | 2.00 | % | | | 2.00 | % | | | 2.00 | % |
Ratio of total expenses to average net assets1 | | | 2.53 | %3 | | | 2.52 | % | | | 2.56 | % | | | 2.23 | % | | | 2.18 | % | | | 2.18 | % |
Ratio of net investment income to average net assets | | | 1.06 | %3 | | | 0.79 | % | | | 0.97 | % | | | 1.71 | % | | | 2.12 | % | | | 1.93 | % |
Portfolio turnover | | | 26 | %2 | | | 53 | % | | | 85 | % | | | 91 | % | | | 183 | % | | | 226 | % |
Net assets at end of period (000’s omitted) | | $ | 4,684 | | | $ | 5,081 | | | $ | 6,377 | | | $ | 8,537 | | | $ | 13,026 | | | $ | 28,946 | |
| | | | | | | | | | | | | | | | | | | | | | | | |
38
| | | | | | | | | | | | | | | | | | | | | | | | |
| | | Class B Shares | |
Balanced Fund | | 2006 | | | 2005 | | | 2004 | | | 2003 | | | 2002 | | | 2001 | |
Net Asset Value, Beginning of Period | | $ | 11.36 | | | $ | 11.06 | | | $ | 10.26 | | | $ | 8.49 | | | $ | 9.98 | | | $ | 10.92 | |
| | | | | | | | | | | | | | | | | | | | | | | | |
Income from Investment Operations: | | | | | | | | | | | | | | | | | | | | | | | | |
Net investment income | | | 0.12 | | | | 0.09 | | | | 0.34 | | | | 0.16 | | | | 0.18 | | | | 0.20 | |
Net realized and unrealized gain (loss) on investments | | | 0.15 | | | | 0.30 | | | | 0.80 | | | | 1.79 | | | | (1.45 | ) | | | (0.94 | ) |
| | | | | | | | | | | | | | | | | | | | | | | | |
Total from investment operations | | | 0.27 | | | | 0.39 | | | | 1.14 | | | | 1.95 | | | | (1.27 | ) | | | (0.74 | ) |
| | | | | | | | | | | | | | | | | | | | | | | | |
Less Distributions to Shareholders from: | | | | | | | | | | | | | | | | | | | | | | | | |
Net investment income on investments | | | (0.06 | ) | | | (0.09 | ) | | | (0.34 | ) | | | (0.18 | ) | | | (0.22 | ) | | | (0.20 | ) |
| | | | | | | | | | | | | | | | | | | | | | | | |
Total distributions to shareholders | | | (0.06 | ) | | | (0.09 | ) | | | (0.34 | ) | | | (0.18 | ) | | | (0.22 | ) | | | (0.20 | ) |
| | | | | | | | | | | | | | | | | | | | | | | | |
Net Asset Value, End of Period | | $ | 11.57 | | | $ | 11.36 | | | $ | 11.06 | | | $ | 10.26 | | | $ | 8.49 | | | $ | 9.98 | |
| | | | | | | | | | | | | | | | | | | | | | | | |
Total Return1 | | | 2.35 | %2 | | | 3.53 | % | | | 11.11 | % | | | 23.42 | % | | | (12.89 | )% | | | (6.79 | )% |
| | | | | | | | | | | | | | | | | | | | | | | | |
Ratio of net expenses to average net assets1 | | | 1.97 | %3 | | | 1.98 | % | | | 1.97 | % | | | 2.00 | % | | | 2.00 | % | | | 2.00 | % |
Ratio of total expenses to average net assets1 | | | 2.53 | %3 | | | 0.79 | % | | | 2.57 | % | | | 2.23 | % | | | 2.18 | % | | | 2.18 | % |
Ratio of net investment income to average net assets | | | 1.05 | %3 | | | 2.52 | % | | | 0.97 | % | | | 1.71 | % | | | 2.12 | % | | | 1.93 | % |
Portfolio turnover | | | 26 | %2 | | | 53 | % | | | 85 | % | | | 91 | % | | | 183 | % | | | 226 | % |
Net assets at end of period (000’s omitted) | | $ | 8,829 | | | $ | 9,692 | | | $ | 11,090 | | | $ | 12,134 | | | $ | 12,345 | | | $ | 20,279 | |
| | | | | | | | | | | | | | | | | | | | | | | | |
| |
| | | Institutional Class Shares | |
Balanced Fund | | 2006 | | | 2005 | | | 2004 | | | 2003 | | | 2002 | | | 2001 | |
Net Asset Value, Beginning of Period | | $ | 11.64 | | | $ | 11.33 | | | $ | 10.50 | | | $ | 8.68 | | | $ | 10.22 | | | $ | 11.17 | |
| | | | | | | | | | | | | | | | | | | | | | | | |
Income from Investment Operations: | | | | | | | | | | | | | | | | | | | | | | | | |
Net investment income | | | 0.23 | | | | 0.18 | | | | 0.21 | | | | 0.27 | | | | 0.28 | | | | 0.31 | |
Net realized and unrealized gain (loss) on investments | | | 0.10 | | | | 0.31 | | | | 0.83 | | | | 1.83 | | | | (1.50 | ) | | | (0.96 | ) |
| | | | | | | | | | | | | | | | | | | | | | | | |
Total from investment operations | | | 0.33 | | | | 0.49 | | | | 1.04 | | | | 2.10 | | | | (1.22 | ) | | | (0.65 | ) |
| | | | | | | | | | | | | | | | | | | | | | | | |
Less Distributions to Shareholders from: | | | | | | | | | | | | | | | | | | | | | | | | |
Net realized gain on investments | | | (0.12 | ) | | | (0.18 | ) | | | (0.21 | ) | | | (0.28 | ) | | | (0.32 | ) | | | (0.30 | ) |
| | | | | | | | | | | | | | | | | | | | | | | | |
Total distributions to shareholders | | | (0.12 | ) | | | (0.18 | ) | | | (0.21 | ) | | | (0.28 | ) | | | (0.32 | ) | | | (0.30 | ) |
| | | | | | | | | | | | | | | | | | | | | | | | |
Net Asset Value, End of Period | | $ | 11.85 | | | $ | 11.64 | | | $ | 11.33 | | | $ | 10.50 | | | $ | 8.68 | | | $ | 10.22 | |
| | | | | | | | | | | | | | | | | | | | | | | | |
Total Return1 | | | 2.80 | %2 | | | 4.57 | % | | | 10.04 | % | | | 24.51 | % | | | (12.06 | )% | | | (5.83 | )% |
| | | | | | | | | | | | | | | | | | | | | | | | |
Ratio of net expenses to average net assets1 | | | 0.97 | %3 | | | 0.98 | % | | | 0.97 | % | | | 1.00 | % | | | 1.00 | % | | | 1.00 | % |
Ratio of total expenses to average net assets1 | | | 1.53 | %3 | | | 1.52 | % | | | 1.57 | % | | | 1.23 | % | | | 1.18 | % | | | 1.18 | % |
Ratio of net investment income to average net assets | | | 2.06 | %3 | | | 1.80 | % | | | 1.98 | % | | | 2.71 | % | | | 3.12 | % | | | 2.93 | % |
Portfolio turnover | | | 26 | %2 | | | 53 | % | | | 85 | % | | | 91 | % | | | 183 | % | | | 226 | % |
Net assets at end of period (000’s omitted) | | $ | 7,379 | | | $ | 7,501 | | | $ | 8,111 | | | $ | 8,104 | | | $ | 8,609 | | | $ | 16,912 | |
| | | | | | | | | | | | | | | | | | | | | | | | |
39
Financial Highlights
For a share outstanding throughout the six months ended June 30, 2006 (unaudited) and each year ended December 31,
| | | | | | | | | | | | | | | | | | | | | | | | |
| | | Class A Shares | |
High Yield Fund | | 2006 | | | 2005 | | | 2004 | | | 2003 | | | 2002 | | | 2001 | |
Net Asset Value, Beginning of Period | | $ | 8.30 | | | $ | 8.67 | | | $ | 8.46 | | | $ | 7.08 | | | $ | 7.76 | | | $ | 8.20 | |
| | | | | | | | | | | | | | | | | | | | | | | | |
Income from Investment Operations: | | | | | | | | | | | | | | | | | | | | | | | | |
Net investment income | | | 0.28 | | | | 0.57 | | | | 0.67 | | | | 0.64 | | | | 0.80 | | | | 0.79 | |
Net realized and unrealized gain (loss) on investments | | | (0.04 | ) | | | (0.37 | ) | | | 0.19 | | | | 1.39 | | | | (0.70 | ) | | | (0.41 | ) |
| | | | | | | | | | | | | | | | | | | | | | | | |
Total from investment operations | | | 0.24 | | | | 0.20 | | | | 0.86 | | | | 2.03 | | | | 0.10 | | | | 0.38 | |
| | | | | | | | | | | | | | | | | | | | | | | | |
Less Distributions to Shareholders from: | | | | | | | | | | | | | | | | | | | | | | | | |
Net investment income | | | (0.27 | ) | | | (0.57 | ) | | | (0.65 | ) | | | (0.65 | ) | | | (0.78 | ) | | | (0.82 | ) |
| | | | | | | | | | | | | | | | | | | | | | | | |
Total distributions to shareholders | | | (0.27 | ) | | | (0.57 | ) | | | (0.65 | ) | | | (0.65 | ) | | | (0.78 | ) | | | (0.82 | ) |
| | | | | | | | | | | | | | | | | | | | | | | | |
Net Asset Value, End of Period | | $ | 8.27 | | | $ | 8.30 | | | $ | 8.67 | | | $ | 8.46 | | | $ | 7.08 | | | $ | 7.76 | |
| | | | | | | | | | | | | | | | | | | | | | | | |
Total Return 1 | | | 3.08 | %2 | | | 2.37 | % | | | 10.62 | % | | | 29.73 | % | | | 1.85 | % | | | 4.78 | % |
| | | | | | | | | | | | | | | | | | | | | | | | |
Ratio of net expenses to average net assets 1 | | | 1.15 | %3 | | | 1.22 | % | | | 1.40 | % | | | 1.40 | % | | | 1.40 | % | | | 1.40 | % |
Ratio of total expenses to average net assets 1 | | | 1.52 | %3 | | | 1.59 | % | | | 1.72 | % | | | 1.63 | % | | | 1.61 | % | | | 1.61 | % |
Ratio of net investment loss to average net assets | | | 6.62 | %3 | | | 6.64 | % | | | 7.68 | % | | | 8.10 | % | | | 10.86 | % | | | 9.95 | % |
Portfolio turnover | | | 33 | %2 | | | 63 | % | | | 74 | % | | | 138 | % | | | 229 | % | | | 197 | % |
Net assets at end of period (000’s omitted) | | $ | 20,563 | | | $ | 20,478 | | | $ | 16,612 | | | $ | 24,693 | | | $ | 44,059 | | | $ | 27,712 | |
| | | | | | | | | | | | | | | | | | | | | | | | |
| |
| | | Class C Shares | |
High Yield Fund | | 2006 | | | 2005 | | | 2004 | | | 2003 | | | 2002 | | | 2001 | |
Net Asset Value, Beginning of Period | | $ | 8.21 | | | $ | 8.59 | | | $ | 8.39 | | | $ | 7.03 | | | $ | 7.70 | | | $ | 8.15 | |
| | | | | | | | | | | | | | | | | | | | | | | | |
Income from Investment Operations: | | | | | | | | | | | | | | | | | | | | | | | | |
Net investment income | | | 0.24 | | | | 0.51 | | | | 0.60 | | | | 0.60 | | | | 0.75 | | | | 0.75 | |
Net realized and unrealized gain (loss) on investments | | | (0.02 | ) | | | (0.38 | ) | | | 0.21 | | | | 1.37 | | | | (0.67 | ) | | | (0.42 | ) |
| | | | | | | | | | | | | | | | | | | | | | | | |
Total from investment operations | | | 0.22 | | | | 0.13 | | | | 0.81 | | | | 1.97 | | | | 0.08 | | | | 0.33 | |
| | | | | | | | | | | | | | | | | | | | | | | | |
Less Distributions to Shareholders from: | | | | | | | | | | | | | | | | | | | | | | | | |
Net investment income | | | (0.24 | ) | | | (0.51 | ) | | | (0.61 | ) | | | (0.61 | ) | | | (0.75 | ) | | | (0.78 | ) |
| | | | | | | | | | | | | | | | | | | | | | | | |
Total distributions to shareholders | | | (0.24 | ) | | | (0.51 | ) | | | (0.61 | ) | | | (0.61 | ) | | | (0.75 | ) | | | (0.78 | ) |
| | | | | | | | | | | | | | | | | | | | | | | | |
Net Asset Value, End of Period | | $ | 8.19 | | | $ | 8.21 | | | $ | 8.59 | | | $ | 8.39 | | | $ | 7.03 | | | $ | 7.70 | |
| | | | | | | | | | | | | | | | | | | | | | | | |
Total Return 1 | | | 2.73 | %2 | | | 1.60 | % | | | 10.08 | % | | | 29.04 | % | | | 1.49 | % | | | 4.18 | % |
| | | | | | | | | | | | | | | | | | | | | | | | |
Ratio of net expenses to average net assets 1 | | | 1.90 | %3 | | | 1.90 | % | | | 1.90 | % | | | 1.90 | % | | | 1.90 | % | | | 1.90 | % |
Ratio of total expenses to average net assets 1 | | | 2.26 | %3 | | | 2.27 | % | | | 2.27 | % | | | 2.13 | % | | | 2.11 | % | | | 2.11 | % |
Ratio of net investment loss to average net assets | | | 5.87 | %3 | | | 5.97 | % | | | 7.17 | % | | | 7.60 | % | | | 10.36 | % | | | 9.45 | % |
Portfolio turnover | | | 33 | %2 | | | 63 | % | | | 74 | % | | | 138 | % | | | 229 | % | | | 197 | % |
Net assets at end of period (000’s omitted) | | $ | 7,260 | | | $ | 7,934 | | | $ | 10,474 | | | $ | 13,833 | | | $ | 16,538 | | | $ | 25,532 | |
| | | | | | | | | | | | | | | | | | | | | | | | |
40
| | | | | | | | | | | | | | | | | | | | | | | | |
| | | Class B Shares | |
High Yield Fund | | 2006 | | | 2005 | | | 2004 | | | 2003 | | | 2002 | | | 2001 | |
Net Asset Value, Beginning of Period | | $ | 8.22 | | | $ | 8.60 | | | $ | 8.40 | | | $ | 7.04 | | | $ | 7.71 | | | $ | 8.16 | |
| | | | | | | | | | | | | | | | | | | | | | | | |
Income from Investment Operations: | | | | | | | | | | | | | | | | | | | | | | | | |
Net investment income | | | 0.24 | | | | 0.51 | | | | 0.60 | | | | 0.60 | | | | 0.75 | | | | 0.76 | |
Net realized and unrealized gain (loss) on investments | | | (0.02 | ) | | | (0.38 | ) | | | 0.21 | | | | 1.38 | | | | (0.67 | ) | | | (0.43 | ) |
| | | | | | | | | | | | | | | | | | | | | | | | |
Total from investment operations | | | 0.22 | | | | 0.13 | | | | 0.81 | | | | 1.98 | | | | 0.08 | | | | 0.33 | |
| | | | | | | | | | | | | | | | | | | | | | | | |
Less Distributions to Shareholders from: | | | | | | | | | | | | | | | | | | | | | | | | |
Net investment income | | | (0.24 | ) | | | (0.51 | ) | | | (0.61 | ) | | | (0.62 | ) | | | (0.75 | ) | | | (0.78 | ) |
| | | | | | | | | | | | | | | | | | | | | | | | |
Total distributions to shareholders | | | (0.24 | ) | | | (0.51 | ) | | | (0.61 | ) | | | (0.62 | ) | | | (0.75 | ) | | | (0.78 | ) |
| | | | | | | | | | | | | | | | | | | | | | | | |
Net Asset Value, End of Period | | $ | 8.20 | | | $ | 8.22 | | | $ | 8.60 | | | $ | 8.40 | | | $ | 7.04 | | | $ | 7.71 | |
| | | | | | | | | | | | | | | | | | | | | | | | |
Total Return 1 | | | 2.72 | %2 | | | 1.59 | % | | | 10.07 | % | | | 29.01 | % | | | 1.49 | % | | | 4.17 | % |
| | | | | | | | | | | | | | | | | | | | | | | | |
Ratio of net expenses to average net assets 1 | | | 1.90 | %3 | | | 1.90 | % | | | 1.90 | % | | | 1.90 | % | | | 1.90 | % | | | 1.90 | % |
Ratio of total expenses to average net assets 1 | | | 2.26 | %3 | | | 2.27 | % | | | 2.27 | % | | | 2.13 | % | | | 2.11 | % | | | 2.11 | % |
Ratio of net investment loss to average net assets | | | 5.86 | %3 | | | 5.96 | % | | | 7.18 | % | | | 7.60 | % | | | 10.36 | % | | | 9.45 | % |
Portfolio turnover | | | 33 | %2 | | | 63 | % | | | 74 | % | | | 138 | % | | | 229 | % | | | 197 | % |
Net assets at end of period (000’s omitted) | | $ | 14,689 | | | $ | 17,782 | | | $ | 27,287 | | | $ | 35,695 | | | $ | 35,654 | | | $ | 48,857 | |
| | | | | | | | | | | | | | | | | | | | | | | | |
| |
| | | Institutional Class Shares | |
High Yield Fund | | 2006 | | | 2005 | | | 2004 | | | 2003 | | | 2002 | | | 2001 | |
Net Asset Value, Beginning of Period | | $ | 8.36 | | | $ | 8.74 | | | $ | 8.52 | | | $ | 7.13 | | | $ | 7.79 | | | $ | 8.24 | |
| | | | | | | | | | | | | | | | | | | | | | | | |
Income from Investment Operations: | | | | | | | | | | | | | | | | | | | | | | | | |
Net investment income | | | 0.28 | | | | 0.60 | | | | 0.73 | | | | 0.68 | | | | 0.84 | | | | 0.82 | |
Net realized and unrealized gain (loss) on investments | | | (0.02 | ) | | | (0.38 | ) | | | 0.18 | | | | 1.40 | | | | (0.68 | ) | | | (0.41 | ) |
| | | | | | | | | | | | | | | | | | | | | | | | |
Total from investment operations | | | 0.26 | | | | 0.22 | | | | 0.91 | | | | 2.08 | | | | 0.16 | | | | 0.41 | |
| | | | | | | | | | | | | | �� | | | | | | | | | | |
Less Distributions to Shareholders from: | | | | | | | | | | | | | | | | | | | | | | | | |
Net investment income | | | (0.28) | | | | (0.60 | ) | | | (0.69 | ) | | | (0.69 | ) | | | (0.82 | ) | | | (0.86 | ) |
| | | | | | | | | | | | | | | | | | | | | | | | |
Total distributions to shareholders | | | (0.28) | | | | (0.60 | ) | | | (0.69 | ) | | | (0.69 | ) | | | (0.82 | ) | | | (0.86 | ) |
| | | | | | | | | | | | | | | | | | | | | | | | |
Net Asset Value, End of Period | | $ | 8.34 | | | $ | 8.36 | | | $ | 8.74 | | | $ | 8.52 | | | $ | 7.13 | | | $ | 7.79 | |
| | | | | | | | | | | | | | | | | | | | | | | | |
Total Return 1 | | | 3.18 | %2 | | | 2.60 | % | | | 10.69 | % | | | 30.30 | % | | | 2.64 | % | | | 5.15 | % |
| | | | | | | | | | | | | | | | | | | | | | | | |
Ratio of net expenses to average net assets 1 | | | 0.90 | %3 | | | 0.90 | % | | | 0.90 | % | | | 0.90 | % | | | 0.90 | % | | | 0.90 | % |
Ratio of total expenses to average net assets 1 | | | 1.27 | %3 | | | 1.27 | % | | | 1.26 | % | | | 1.13 | % | | | 1.11 | % | | | 1.11 | % |
Ratio of net investment loss to average net assets | | | 6.88 | %3 | | | 6.96 | % | | | 8.00 | % | | | 8.60 | % | | | 11.36 | % | | | 10.45 | % |
Portfolio turnover | | | 33 | %2 | | | 63 | % | | | 74 | % | | | 138 | % | | | 229 | % | | | 197 | % |
Net assets at end of period (000’s omitted) | | | $3,803 | | | $ | 3,440 | | | $ | 4,725 | | | $ | 15,469 | | | $ | 9,648 | | | $ | 11,913 | |
| | | | | | | | | | | | | | | | | | | | | | | | |
41
Financial Highlights
For a share outstanding throughout the six months ended June 30, 2006 (unaudited) and each year ended December 31,
| | | | | | | | | | | | | | | | | | | | | | | | |
| | | Class A Shares | |
Fixed Income | | 2006 | | | 2005 | | | 2004 | | | 2003 | | | 2002 | | | 2001 | |
Net Asset Value, Beginning of Period | | $ | 10.36 | | | $ | 10.62 | | | $ | 10.56 | | | $ | 10.05 | | | $ | 10.14 | | | $ | 9.94 | |
| | | | | | | | | | | | | | | | | | | | | | | | |
Income from Investment Operations: | | | | | | | | | | | | | | | | | | | | | | | | |
Net investment income | | | 0.24 | | | | 0.53 | | | | 0.49 | | | | 0.52 | | | | 0.56 | | | | 0.55 | |
Net realized and unrealized gain (loss) on investments | | | (0.28 | ) | | | (0.25 | ) | | | 0.07 | | | | 0.53 | | | | (0.06 | ) | | | 0.30 | |
| | | | | | | | | | | | | | | | | | | | | | | | |
Total from investment operations | | | (0.04 | ) | | | 0.28 | | | | 0.56 | | | | 1.05 | | | | 0.50 | | | | 0.85 | |
| | | | | | | | | | | | | | | | | | | | | | | | |
Less Distributions to Shareholders from: | | | | | | | | | | | | | | | | | | | | | | | | |
Net investment income | | | (0.27 | ) | | | (0.54 | ) | | | (0.50 | ) | | | (0.54 | ) | | | (0.59 | ) | | | (0.55 | ) |
Net realized gain on investments | | | — | | | | — | | | | — | | | | — | | | | — | | | | (0.10 | ) |
| | | | | | | | | | | | | | | | | | | | | | | | |
Total distributions to shareholders | | | (0.27 | ) | | | (0.54 | ) | | | (0.50 | ) | | | (0.54 | ) | | | (0.59 | ) | | | (0.65 | ) |
| | | | | | | | | | | | | | | | | | | | | | | | |
Net Asset Value, End of Period | | $ | 10.05 | | | $ | 10.36 | | | $ | 10.62 | | | $ | 10.56 | | | $ | 10.05 | | | $ | 10.14 | |
| | | | | | | | | | | | | | | | | | | | | | | | |
Total Return 1 | | | (0.67 | )%2 | | | 2.68 | % | | | 5.44 | % | | | 10.67 | % | | | 5.11 | % | | | 8.66 | % |
| | | | | | | | | | | | | | | | | | | | | | | | |
Ratio of net expenses to average net assets 1 | | | 0.74 | %3 | | | 0.81 | % | | | 1.02 | % | | | 1.10 | % | | | 1.10 | % | | | 1.13 | % |
Ratio of total expenses to average net assets 1 | | | 1.14 | %3 | | | 1.27 | % | | | 1.48 | % | | | 1.33 | % | | | 1.32 | % | | | 1.33 | % |
Ratio of net investment income to average net assets | | | 4.80 | %3 | | | 4.65 | % | | | 4.56 | % | | | 5.02 | % | | | 5.73 | % | | | 5.44 | % |
Portfolio turnover | | | 32 | %2 | | | 24 | % | | | 79 | % | | | 315 | % | | | 438 | % | | | 744 | % |
Net assets at end of period (000’s omitted) | | $ | 9,129 | | | $ | 7,591 | | | $ | 5,723 | | | $ | 7,936 | | | $ | 15,455 | | | $ | 65,303 | |
| | | | | | | | | | | | | | | | | | | | | | | | |
| |
| | | Class C Shares | |
Fixed Income | | 2006 | | | 2005 | | | 2004 | | | 2003 | | | 2002 | | | 2001 | |
Net Asset Value, Beginning of Period | | $ | 10.36 | | | $ | 10.63 | | | $ | 10.58 | | | $ | 10.07 | | | $ | 10.15 | | | $ | 9.95 | |
| | | | | | | | | | | | | | | | | | | | | | | | |
Income from Investment Operations: | | | | | | | | | | | | | | | | | | | | | | | | |
Net investment income | | | 0.21 | | | | 0.46 | | | | 0.43 | | | | 0.47 | | | | 0.50 | | | | 0.51 | |
Net realized and unrealized gain (loss) on investments | | | (0.31 | ) | | | (0.26 | ) | | | 0.07 | | | | 0.52 | | | | (0.04 | ) | | | 0.30 | |
| | | | | | | | | | | | | | | | | | | | | | | | |
Total from investment operations | | | (0.10 | ) | | | 0.20 | | | | 0.50 | | | | 0.99 | | | | 0.46 | | | | 0.81 | |
| | | | | | | | | | | | | | | | | | | | | | | | |
Less Distributions to Shareholders from: | | | | | | | | | | | | | | | | | | | | | | | | |
Net investment income | | | (0.21 | ) | | | (0.47 | ) | | | (0.45 | ) | | | (0.48 | ) | | | (0.54 | ) | | | (0.51 | ) |
Net realized gain on investments | | | — | | | | — | | | | — | | | | — | | | | — | | | | (0.10 | ) |
| | | | | | | | | | | | | | | | | | | | | | | | |
Total distributions to shareholders | | | (0.21 | ) | | | (0.47 | ) | | | (0.45 | ) | | | (0.48 | ) | | | (0.54 | ) | | | (0.61 | ) |
| | | | | | | | | | | | | | | | | | | | | | | | |
Net Asset Value, End of Period | | $ | 10.05 | | | $ | 10.36 | | | $ | 10.63 | | | $ | 10.58 | | | $ | 10.07 | | | $ | 10.15 | |
| | | | | | | | | | | | | | | | | | | | | | | | |
Total Return 1 | | | (1.04 | )%2 | | | 1.90 | % | | | 4.85 | % | | | 10.11 | % | | | 4.69 | % | | | 8.26 | % |
| | | | | | | | | | | | | | | | | | | | | | | | |
Ratio of net expenses to average net assets 1 | | | 1.49 | %3 | | | 1.49 | % | | | 1.54 | % | | | 1.60 | % | | | 1.60 | % | | | 1.60 | % |
Ratio of total expenses to average net assets 1 | | | 1.89 | %3 | | | 1.95 | % | | | 1.99 | % | | | 1.84 | % | | | 1.82 | % | | | 1.80 | % |
Ratio of net investment income to average net assets | | | 3.99 | %3 | | | 3.96 | % | | | 4.04 | % | | | 4.52 | % | | | 5.23 | % | | | 4.98 | % |
Portfolio turnover | | | 32 | %2 | | | 24 | % | | | 79 | % | | | 315 | % | | | 438 | % | | | 744 | % |
Net assets at end of period (000’s omitted) | | $ | 10,773 | | | $ | 11,480 | | | $ | 13,703 | | | $ | 20,009 | | | $ | 35,719 | | | $ | 57,239 | |
| | | | | | | | | | | | | | | | | | | | | | | | |
42
| | | | | | | | | | | | | | | | | | | | | | | | |
| | | Class B Shares | |
Fixed Income | | 2006 | | | 2005 | | | 2004 | | | 2003 | | | 2002 | | | 2001 | |
Net Asset Value, Beginning of Period | | $ | 10.30 | | | $ | 10.56 | | | $ | 10.51 | | | $ | 10.02 | | | $ | 10.10 | | | $ | 9.91 | |
| | | | | | | | | | | | | | | | | | | | | | | | |
Income from Investment Operations: | | | | | | | | | | | | | | | | | | | | | | | | |
Net investment income | | | 0.21 | | | | 0.46 | | | | 0.43 | | | | 0.48 | | | | 0.50 | | | | 0.51 | |
Net realized and unrealized gain (loss) on investments | | | (0.32 | ) | | | (0.25 | ) | | | 0.07 | | | | 0.50 | | | | (0.04 | ) | | | 0.29 | |
| | | | | | | | | | | | | | | | | | | | | | | | |
Total from investment operations | | | (0.11 | ) | | | 0.21 | | | | 0.50 | | | | 0.98 | | | | 0.46 | | | | 0.80 | |
| | | | | | | | | | | | | | | | | | | | | | | | |
Less Distributions to Shareholders from: | | | | | | | | | | | | | | | | | | | | | | | | |
Net investment income | | | (0.21 | ) | | | (0.47 | ) | | | (0.45 | ) | | | (0.49 | ) | | | (0.54 | ) | | | (0.51 | ) |
Net realized gain on investments | | | — | | | | — | | | | — | | | | — | | | | — | | | | (0.10 | ) |
| | | | | | | | | | | | | | | | | | | | | | | | |
Total distributions to shareholders | | | (0.21 | ) | | | (0.47 | ) | | | (0.45 | ) | | | (0.49 | ) | | | (0.54 | ) | | | (0.61 | ) |
| | | | | | | | | | | | | | | | | | | | | | | | |
Net Asset Value, End of Period | | $ | 9.98 | | | $ | 10.30 | | | $ | 10.56 | | | $ | 10.51 | | | $ | 10.02 | | | $ | 10.10 | |
| | | | | | | | | | | | | | | | | | | | | | | | |
Total Return1 | | | (1.14 | )%2 | | | 2.01 | % | | | 4.90 | % | | | 10.09 | % | | | 4.64 | % | | | 8.16 | % |
| | | | | | | | | | | | | | | | | | | | | | | | |
Ratio of net expenses to average net assets1 | | | 1.49 | %3 | | | 1.49 | % | | | 1.54 | % | | | 1.60 | % | | | 1.60 | % | | | 1.60 | % |
Ratio of total expenses to average net assets1 | | | 1.89 | %3 | | | 1.95 | % | | | 1.99 | % | | | 1.84 | % | | | 1.82 | % | | | 1.80 | % |
Ratio of net investment income to average net assets | | | 3.99 | %3 | | | 3.96 | % | | | 4.04 | % | | | 4.52 | % | | | 5.23 | % | | | 4.98 | % |
Portfolio turnover | | | 32 | %2 | | | 24 | % | | | 79 | % | | | 315 | % | | | 438 | % | | | 744 | % |
Net assets at end of period (000’s omitted) | | $ | 14,695 | | | $ | 16,837 | | | $ | 20,063 | | | $ | 28,560 | | | $ | 35,087 | | | $ | 38,793 | |
| | | | | | | | | | | | | | | | | | | | | | | | |
| |
| | | Institutional Class Shares | |
Fixed Income | | 2006 | | | 2005 | | | 2004 | | | 2003 | | | 2002 | | | 2001 | |
Net Asset Value, Beginning of Period | | $ | 10.40 | | | $ | 10.66 | | | $ | 10.61 | | | $ | 10.10 | | | $ | 10.17 | | | $ | 9.98 | |
| | | | | | | | | | | | | | | | | | | | | | | | |
Income from Investment Operations: | | | | | | | | | | | | | | | | | | | | | | | | |
Net investment income | | | 0.26 | | | | 0.56 | | | | 0.54 | | | | 0.58 | | | | 0.61 | | | | 0.61 | |
Net realized and unrealized gain (loss) on investments | | | (0.32 | ) | | | (0.25 | ) | | | 0.07 | | | | 0.52 | | | | (0.04 | ) | | | 0.28 | |
| | | | | | | | | | | | | | | | | | | | | | | | |
Total from investment operations | | | (0.06 | ) | | | 0.31 | | | | 0.61 | | | | 1.10 | | | | 0.57 | | | | 0.89 | |
| | | | | | | | | | | | | | | | | | | | | | | | |
Less Distributions to Shareholders from: | | | | | | | | | | | | | | | | | | | | | | | | |
Net investment income | | | (0.26 | ) | | | (0.57 | ) | | | (0.56 | ) | | | (0.59 | ) | | | (0.64 | ) | | | (0.60 | ) |
Net realized gain on investments | | | — | | | | — | | | | — | | | | — | | | | — | | | | (0.10 | ) |
| | | | | | | | | | | | | | | | | | | | | | | | |
Total distributions to shareholders | | | (0.26 | ) | | | (0.57 | ) | | | (0.56 | ) | | | (0.59 | ) | | | (0.64 | ) | | | (0.70 | ) |
| | | | | | | | | | | | | | | | | | | | | | | | |
Net Asset Value, End of Period | | $ | 10.08 | | | $ | 10.40 | | | $ | 10.66 | | | $ | 10.61 | | | $ | 10.10 | | | $ | 10.17 | |
| | | | | | | | | | | | | | | | | | | | | | | | |
Total Return1 | | | (0.54 | )%2 | | | 2.91 | % | | | 5.99 | % | | | 11.17 | % | | | 5.75 | % | | | 9.20 | % |
| | | | | | | | | | | | | | | | | | | | | | | | |
Ratio of net expenses to average net assets1 | | | 0.49 | %3 | | | 0.49 | % | | | 0.50 | % | | | 0.60 | % | | | 0.60 | % | | | 0.60 | % |
Ratio of total expenses to average net assets1 | | | 0.89 | %3 | | | 0.95 | % | | | 0.97 | % | | | 0.84 | % | | | 0.82 | % | | | 0.80 | % |
Ratio of net investment income to average net assets | | | 5.00 | %3 | | | 4.96 | % | | | 5.09 | % | | | 5.52 | % | | | 6.23 | % | | | 5.98 | % |
Portfolio turnover | | | 32 | %2 | | | 24 | % | | | 79 | % | | | 315 | % | | | 438 | % | | | 744 | % |
Net assets at end of period (000’s omitted) | | $ | 25,465 | | | $ | 25,641 | | | $ | 24,559 | | | $ | 23,763 | | | $ | 30,711 | | | $ | 48,376 | |
| | | | | | | | | | | | | | | | | | | | | | | | |
Notes to Financial Highlights
The following notes should be read in conjunction with the Financial Highlights of the Funds presented on the proceeding pages.
| 1 | Total returns and net investment income would have been lower had certain expenses not been reduced. (See Note 1c of Notes to Financial Statements). |
| 4 | Excludes the impact of expense (reimbursement)/recoupment and expense offsets such as brokerage recapture credits, but includes non-reimbursable expenses such as interest and taxes. (See Note 1c of Notes to Financial Statements.) |
| 5 | Per share numbers have been calculated using average shares. |
| # | Rounds to less than $0.01 per share. |
43
Notes to Financial Statements
June 30, 2006 (unaudited)
| 1. | Summary of Significant Accounting Policies |
Managers Trust II (the “Trust”) is an open-end management investment company organized as a Massachusetts business trust and registered under the Investment Company Act of 1940, as amended (the “1940 Act”). Currently, the Trust is comprised of a number of different funds, each having distinct investment management objectives, strategies, risks and policies. Included in this report are; Managers 20 Fund (“20 Fund”), Managers Mid-Cap Fund (“Mid-Cap”), Managers Balanced Fund (“Balanced”), Managers High Yield Fund (“High Yield”), and Managers Fixed Income Fund (“Fixed Income”), collectively the “Funds.”
The Funds each offer four classes of shares: Class A, Class B, Class C and Institutional Class. Sales of Class A shares may be subject to a front-end sales charge. Redemptions of Class B and Class C shares may be subject to a contingent-deferred sales charge (as a percentage of the original offering price or the net asset value at time of sale, whichever is less). Institutional Class shares are available, with no sales charge, to certain institutional investors and qualifying individual investors. Please refer to a current prospectus for additional information on each share class.
The Funds’ financial statements are prepared in accordance with accounting principles generally accepted in the United States of America, which require management to make estimates and assumptions that affect the reported amount of assets and liabilities and disclosure of contingent assets and liabilities at the date of the financial statements and the reported amounts of income and expenses during the reporting periods. Actual results could differ from those estimates. The following is a summary of significant accounting policies followed by the Funds in the preparation of their financial statements:
| a. | Valuation of Investments |
Equity securities traded on a domestic or international securities exchange are generally valued at the last quoted sale price, or, lacking any sales, at the last quoted bid price. Over-the-counter securities are valued at the NASDAQ Official Closing Price, if one is available. Lacking any sales, over-the-counter securities, are valued at the last quoted bid price. The Funds’ investments are generally valued based on market quotations provided by third-party pricing services approved by the Board of Trustees of the Funds. Under certain circumstances, the value of a Fund investment may be based on an evaluation of its fair value, pursuant to procedures established by and under the general supervision of the Board of Trustees of the Fund. A Fund may use the fair value of a portfolio security to calculate its NAV when, for example, (1) market quotations are not readily available because a portfolio security is not traded in a public market or the principal market in which the security trades is closed, (2) trading in a portfolio security is suspended and not resumed prior to the time as of which the Fund calculates its NAV, (3) where a significant event affecting the value of a portfolio security is determined to have occurred between the time of the market quotation provided for a portfolio security and the time as of which the Fund calculates its NAV, (4) a security’s price has remained unchanged over a period of time (often referred to as a “stale price”), or (5) the Investment Manager determines that a market quotation is inaccurate. The Manager monitors intervening events that may affect the value of securities held in the Funds’ portfolios and, in accordance with procedures adopted by the Funds’ Trustees, will adjust the prices of securities traded in foreign markets, as appropriate, to reflect the impact of events occurring subsequent to the close of such markets, but prior to the time each Fund’s NAV is calculated.
Fixed-income securities are valued based on valuations furnished by independent pricing services that reflect the evaluated bid price of such securities, except that for the Balanced, High Yield and Fixed Income Funds, fixed-income securities are valued based on valuations that reflect the mean between bid and asked prices. Some of these pricing services utilize matrix systems, which reflect such factors as security prices, yields, maturities and ratings, and are supplemented by dealer and exchange quotations. Short-term investments having a remaining maturity of 60 days or less are valued at amortized cost, which approximates market value. Investments in other regulated investment companies are valued at their end of day net asset value per share except iShares or other ETFs, which are valued the same as equity securities. Securities (including derivatives) for which market quotations are not readily available are valued at fair value, as determined in good faith, and pursuant to procedures adopted by the Board of Trustees of the Trust. The values assigned to fair value investments are based on available information and do not necessarily represent amounts that might ultimately be realized since such amounts depend on future developments inherent in long-term investments. Further, because of the inherent uncertainty of valuation, those estimated values may differ significantly from the values that would have been used had a ready market of the investments existed, and the differences could be material.
Investments in certain mortgage-backed, stripped mortgage-backed, preferred stocks, convertible securities and other debt securities not traded on an organized market, are valued on the basis of valuations provided by dealers or by a pricing service which uses information with respect to transactions in such securities, various relationships between securities and yield to maturity in determining value.
Security transactions are accounted for as of the trade date. Realized gains and losses on securities sold are determined on the basis of identified cost. The Funds had certain portfolio trades directed to various brokers who paid a portion of such Fund’s expenses. For the six months ended June 30, 2006, under these arrangements the amount by which the Fund’s expenses were reduced and the impact on the expense ratios were as follows: 20 Fund - $2,617 or 0.03%; Mid-Cap -$17,313 or 0.04% and Balanced - $3,662 or 0.03%.
| c. | Investment Income and Expenses |
Dividend income is recorded on the ex-dividend date, except certain dividends from foreign securities where the ex-dividend date may have passed. These dividends are recorded as soon as the Trust is informed of the ex-dividend date. Dividend income on foreign securities is recorded net of any withholding tax. Interest income, which includes amortization of premium and accretion of discount on debt securities, is accrued as earned. Non-cash dividends included in dividend income, if any, are reported at the fair market value of the securities received. Other income and expenses are recorded on an accrual basis. Expenses that cannot be directly attributed to a fund are apportioned among the Funds in the Trust and in some cases other affiliated funds based upon their relative average net assets or number of shareholders.
44
Notes to Financial Statements (continued)
Each of the Funds has a “balance credit” arrangement with The Bank of New York (“BNY”), the Funds’ custodian, whereby each Fund is credited with an interest factor equal to 1% below the effective 90 day T-Bill rate for account balances left uninvested overnight. These credits serve to reduce custody expenses that would otherwise be charged to each Fund. For the six months ended June 30, 2006, the custodian expense was reduced as follows: Mid-Cap - $8; Balanced - $12; High Yield - $1,935; and Fixed Income - $17.
Managers Investment Group LLC (the “Investment Manager”), a subsidiary of Affiliated Managers Group, Inc. (“AMG”) and the Investment Manager for the Funds, has contractually agreed, through at least May 1, 2007 to waive fees and pay or reimburse expenses to the extent that the total operating expenses (exclusive of brokerage, interest, taxes and extraordinary expenses) of the Funds exceed the following percentages of each Fund’s average daily net assets.
| | | | | | | | | | | | |
| | | Class A | | | Class B | | | Class C | | | Institutional Class | |
20 Fund | | 1.50 | %* | | 2.25 | % | | 2.25 | % | | 1.25 | % |
Mid-Cap | | 1.25 | %* | | 2.00 | % | | 2.00 | % | | 1.00 | % |
Balanced | | 1.25 | %* | | 2.00 | % | | 2.00 | % | | 1.00 | % |
High Yield | | 1.15 | %* | | 1.90 | % | | 1.90 | % | | 0.90 | % |
Fixed Income | | 0.74 | %* | | 1.49 | % | | 1.49 | % | | 0.49 | % |
| * | Rate change effective May 1, 2005. Prior to this date the expense caps for Class A shares were 1.75%, 1.50%, 1.50%, 1.40% and 0.99%, respectively. |
Each Fund may be obligated to repay the Investment Manager such amounts waived, paid or reimbursed in future years provided that the repayment occurs within three (3) years after the waiver or reimbursement and that such repayment would not cause the Fund’s expenses in any such year to exceed the above percentages, based on the Fund’s average daily net assets.
For the six months ended June 30, 2006, the cumulative amount of reimbursement for 20 Fund, Mid-Cap, Balanced, High Yield and Fixed Income equaled $253,495, $281,067, $332,597, $468,375 and $676,375, respectively. Total returns and net investment income for the Funds would have been lower had certain expenses not been offset. Total expenses exclude the impact of expense reimbursements and expense offsets such as brokerage recapture credits but includes non-reimbursable expenses such as interest and taxes, if any.
| d. | Dividends and Distributions |
Dividends resulting from net investment income, if any, normally will be declared and paid annually for 20 Fund and Mid-Cap Fund. Dividends resulting from net investment income, if any, normally will be declared and paid monthly for, High Yield and Fixed Income Funds. Dividends resulting from net investment income, if any, normally will be declared and paid quarterly for Balanced Fund. Distributions of capital gains, if any, will be made on an annual basis and when required for Federal excise tax purposes. Income and capital gain distributions are determined in accordance with Federal income tax regulations, which may differ from generally accepted accounting principles. These differences are primarily due to differing treatments for losses deferred due to wash sales, equalization accounting for tax purposes, foreign currency and market discount transactions. Permanent book and tax basis differences, if any, relating to shareholder distributions will result in reclassifications to paid-in-capital.
Each Fund intends to comply with the requirements under Subchapter M of the Internal Revenue Code of 1986, as amended, to distribute substantially all of its taxable income and gains to its shareholders and to meet certain diversification and income requirements with respect to investment companies. Therefore, no provision for Federal income or excise tax is included in the accompanying financial statements.
| f. | Capital Loss Carryovers |
As of June 30, 2006, the following Funds had accumulated net realized capital loss carryovers from securities transactions for Federal income tax purposes as shown in the following chart. These amounts may be used to offset realized capital gains, if any, through the expiration dates listed.
| | | | | |
| | | Capital Loss
Carryover Amount | | Expires Dec. 31, |
20 Fund | | $ | 77,079,380 | | 2008 |
| | | 79,991,018 | | 2009 |
| | | 40,035,261 | | 2010 |
| | | 10,219,945 | | 2011 |
| | | 11,047,284 | | 2012 |
| | | 25,435,421 | | 2013 |
Mid-Cap | | | 7,822,606 | | 2008 |
| | | 9,606,046 | | 2009 |
Balanced | | | 4,643,050 | | 2008 |
| | | 13,683,503 | | 2009 |
| | | 1,575,061 | | 2010 |
High Yield | | | 6,927,868 | | 2007 |
| | | 6,618,233 | | 2008 |
| | | 6,767,059 | | 2009 |
Fixed Income | | | 3,549,175 | | 2009 |
45
Notes to Financial Statements (continued)
The Trust’s Declaration of Trust authorizes for each series the issuance of an unlimited number of shares of beneficial interest, without par value. Each Fund records sales and repurchases of its capital stock on the trade date. Dividends and distributions to shareholders are recorded on the ex-dividend date. For the six months ended June 30, 2006 and the year ended December 31, 2005, the capital stock transactions in the Funds by class were:
| | | | | | | | | | | | | | | | | | | | | | | | | | | | |
| | | 20 Fund | | | Mid-Cap | |
| | | 2006 | | | 2005 | | | 2006 | | | 2005 | |
| | | Shares | | | Amount | | | Shares | | | Amount | | | Shares | | | Amount | | | Shares | | | Amount | |
Class A: | | | | | | | | | | | | | | | | | | | | | | | | | | | | |
Proceeds from sales | | 2,944 | | | $ | 14,626 | | | 27,232 | | | $ | 130,280 | | | 115,143 | | | $ | 1,616,952 | | | 146,988 | | | $ | 1,826,721 | |
Reinvestment of distributions | | — | | | | — | | | — | | | | — | | | — | | | | — | | | — | | | | — | |
Cost of shares repurchased | | (180,773 | ) | | | (866,279 | ) | | (291,714 | ) | | | (1,400,859 | ) | | (92,222 | ) | | | (1,280,839 | ) | | (258,188 | ) | | | (3,283,146 | ) |
Net Increase (Decrease) - Class A | | (177,829 | ) | | | ($851,653 | ) | | (264,482 | ) | | | ($1,270,579 | ) | | 22,921 | | | $ | 336,113 | | | (111,200 | ) | | | ($1,456,425 | ) |
Class B: | | | | | | | | | | | | | | | | | | | | | | | | | | | | |
Proceeds from sales | | 3,101 | | | $ | 14,425 | | | 8,817 | | | $ | 40,332 | | | 9,813 | | | $ | 129,873 | | | 23,971 | | | $ | 282,261 | |
Reinvestment of distributions | | — | | | | — | | | — | | | | — | | | — | | | | — | | | — | | | | — | |
Cost of shares repurchased | | (402,147 | ) | | | (1,857,988 | ) | | (951,327 | ) | | | (4,366,913 | ) | | (154,518 | ) | | | (2,032,144 | ) | | (300,410 | ) | | | (3,563,421 | ) |
Net Decrease - Class B | | (399,046 | ) | | | ($1,843,563 | ) | | (942,510 | ) | | | ($4,326,581 | ) | | (144,705 | ) | | | ($1,902,271 | ) | | (276,439 | ) | | | ($3,281,160 | ) |
Class C: | | | | | | | | | | | | | | | | | | | | | | | | | | | | |
Proceeds from sales | | 12,434 | | | $ | 58,469 | | | 31,705 | | | $ | 144,928 | | | 40,266 | | | $ | 535,606 | | | 68,655 | | | $ | 825,453 | |
Reinvestment of distributions | | — | | | | — | | | — | | | | — | | | — | | | | — | | | — | | | | — | |
Cost of shares repurchased | | (321,822 | ) | | | (1,506,233 | ) | | (844,301 | ) | | | (3,878,459 | ) | | (147,203 | ) | | | (1,954,759 | ) | | (316,626 | ) | | | (3,798,811 | ) |
Net Decrease - Class C | | (309,388 | ) | | | ($1,447,764 | ) | | (812,596 | ) | | | ($3,733,531 | ) | | (106,937 | ) | | | ($1,419,153 | ) | | (247,971 | ) | | | ($2,973,358 | ) |
Institutional Class: | | | | | | | | | | | | | | | | | | | | | | | | | | | | |
Proceeds from sales | | 27,527 | | | $ | 141,209 | | | 117,649 | | | $ | 578,427 | | | 102,692 | | | $ | 1,510,391 | | | 223,648 | | | $ | 2,938,967 | |
Reinvestment of distributions | | — | | | | — | | | — | | | | — | | | — | | | | — | | | — | | | | — | |
Cost of shares repurchased | | (328,229 | ) | | | (1,589,769 | ) | | (873,257 | ) | | | (4,241,089 | ) | | (529,983 | ) | | | (7,795,325 | ) | | (801,950 | ) | | | (10,590,420 | ) |
Net Decrease - Institutional Class | | (300,702 | ) | | | ($1,448,560 | ) | | (755,608 | ) | | | ($3,662,662 | ) | | (427,291 | ) | | | ($6,284,934 | ) | | (578,302 | ) | | | ($7,651,453 | ) |
46
Notes to Financial Statements (continued)
| | | | | | | | | | | | | | | | | | | | | | | | | | | | |
| | | Balanceed | | | High Yield | |
| | | 2006 | | | 2005 | | | 2006 | | | 2005 | |
| | | Shares | | | Amount | | | Shares | | | Amount | | | Shares | | | Amount | | | Shares | | | Amount | |
Class A: | | | | | | | | | | | | | | | | | | | | | | | | | | | | |
Proceeds from sales | | 9,299 | | | $ | 109,210 | | | 20,632 | | | $ | 233,937 | | | 369,761 | | | $ | 3,116,146 | | | 1,503,551 | | | $ | 12,708,992 | |
Reinvestment of distributions | | 664 | | | | 7,778 | | | 986 | | | | 11,199 | | | 69,791 | | | | 585,173 | | | 119,815 | | | | 1,007,568 | |
Cost of shares repurchased | | (21,497 | ) | | | (253,852 | ) | | (86,911 | ) | | | (989,199 | ) | | (423,004 | ) | | | (3,560,726 | ) | | (1,070,529 | ) | | | (9,140,821 | ) |
Net Increase (Decrease) - Class A | | (11,534 | ) | | | ($136,864 | ) | | (65,293 | ) | | | ($744,063 | ) | | 16,548 | | | $ | 140,593 | | | 552,837 | | | $ | 4,575,739 | |
Class B: | | | | | | | | | | | | | | | | | | | | | | | | | | | | |
Proceeds from sales | | 5,242 | | | $ | 61,111 | | | 58,118 | | | $ | 639,490 | | | 17,929 | | | $ | 148,797 | | | 50,636 | | | $ | 424,563 | |
Reinvestment of distributions | | 979 | | | | 11,268 | | | 1,341 | | | | 15,018 | | | 10,353 | | | | 86,060 | | | 25,964 | | | | 216,914 | |
Cost of shares repurchased | | (96,343 | ) | | | (1,121,483 | ) | | (209,009 | ) | | | (2,328,450 | ) | | (399,348 | ) | | | (3,332,341 | ) | | (1,086,845 | ) | | | (9,119,247 | ) |
Net Decrease - Class B | | (90,122 | ) | | | ($1,049,104 | ) | | (149,550 | ) | | | ($1,673,942 | ) | | (371,066 | ) | | | ($3,097,484 | ) | | (1,010,245 | ) | | | ($8,477,770 | ) |
Class C: | | | | | | | | | | | | | | | | | | | | | | | | | | | | |
Proceeds from sales | | 3,998 | | | $ | 46,683 | | | 13,643 | | | $ | 153,333 | | | 26,170 | | | $ | 217,507 | | | 84,882 | | | $ | 710,886 | |
Reinvestment of distributions | | 339 | | | | 3,934 | | | 484 | | | | 5,472 | | | 6,135 | | | | 50,890 | | | 11,918 | | | | 99,327 | |
Cost of shares repurchased | | (46,484 | ) | | | (545,025 | ) | | (142,102 | ) | | | (1,593,340 | ) | | (111,709 | ) | | | (930,046 | ) | | (349,931 | ) | | | (2,938,374 | ) |
Net Decrease - Class C | | (42,147 | ) | | | ($494,408 | ) | | (127,975 | ) | | | ($1,434,535 | ) | | (79,404 | ) | | | ($661,649 | ) | | (253,131 | ) | | | ($2,128,161 | ) |
Institutional Class: | | | | | | | | | | | | | | | | | | | | | | | | | | | | |
Proceeds from sales | | 36,563 | | | $ | 436,588 | | | 63,621 | | | $ | 724,939 | | | 93,499 | | | $ | 793,467 | | | 271,146 | | | $ | 2,304,117 | |
Reinvestment of distributions | | 5,647 | | | | 66,569 | | | 8,066 | | | | 92,369 | | | 9,875 | | | | 83,410 | | | 17,935 | | | | 152,023 | |
Cost of shares repurchased | | (64,172 | ) | | | (767,720 | ) | | (143,110 | ) | | | (1,631,461 | ) | | (58,964 | ) | | | (500,767 | ) | | (418,348 | ) | | | (3,578,667 | ) |
Net Increase (Decrease) - Institutional Class | | (21,962 | ) | | | ($264,563 | ) | | (71,423 | ) | | | ($814,153 | ) | | 44,410 | | | $ | 376,110 | | | (129,267 | ) | | | ($1,122,527 | ) |
47
Notes to Financial Statements (continued)
| | | | | | | | | | | | | | |
| | | Fixed Income | |
| | | 2006 | | | 2005 | |
| | | Shares | | | Amount | | | Shares | | | Amount | |
Class A: | | | | | | | | | | | | | | |
Proceeds from sales | | 585,055 | | | $ | 5,966,792 | | | 417,909 | | | $ | 4,402,019 | |
Reinvestment of distributions | | 12,608 | | | | 127,742 | | | 10,663 | | | | 110,366 | |
Cost of shares repurchased | | (421,798 | ) | | | (4,269,817 | ) | | (234,829 | ) | | | (2,456,835 | ) |
Net Increase - Class A | | 175,865 | | | $ | 1,824,717 | | | 193,743 | | | $ | 2,055,550 | |
Class B: | | | | | | | | | | | | | | |
Proceeds from sales | | 20,570 | | | $ | 208,092 | | | 65,407 | | | $ | 682,333 | |
Reinvestment of distributions | | 6,107 | | | | 61,688 | | | 13,870 | | | | 144,400 | |
Cost of shares repurchased | | (189,807 | ) | | | (1,926,945 | ) | | (343,702 | ) | | | (3,583,035 | ) |
Net Decrease - Class B | | (163,130 | ) | | ($ | 1,657,165 | ) | | (264,425 | ) | | ($ | 2,756,302 | ) |
Class C: | | | | | | | | | | | | | | |
Proceeds from sales | | 133,457 | | | $ | 1,359,353 | | | 134,202 | | | $ | 1,412,102 | |
Reinvestment of distributions | | 2,632 | | | | 26,753 | | | 5,224 | | | | 55,005 | |
Cost of shares repurchased | | (171,748 | ) | | | (1,752,526 | ) | | (320,733 | ) | | | (3,368,435 | ) |
Net Decrease - Class C | | (35,659 | ) | | ($ | 366,420 | ) | | (181,307 | ) | | ($ | 1,901,328 | ) |
Institutional Class: | | | | | | | | | | | | | | |
Proceeds from sales | | 397,142 | | | $ | 4,091,386 | | | 558,692 | | | $ | 5,883,746 | |
Reinvestment of distributions | | 52,088 | | | | 531,659 | | | 94,810 | | | | 996,405 | |
Cost of shares repurchased | | (389,685 | ) | | | (4,003,246 | ) | | (490,814 | ) | | | (5,173,510 | ) |
Net Increase - Institutional Class | | 59,545 | | | $ | 619,799 | | | 162,688 | | | $ | 1,706,641 | |
At June 30, 2006, certain unaffiliated shareholders, specifically omnibus accounts, individually held greater than 10% of the outstanding shares of the following Funds:
| | | | | | | | |
| | | Class A | | Class B | | Class C | | Inst. Class |
20 Fund | | 1 owns 36% | | 1 owns 58% | | 1 owns 55% | | 2 own 35% |
Mid-Cap | | 1 owns 57% | | 1 owns 56% | | 1 owns 78% | | 1 owns 89% |
Balanced | | 2 own 56% | | 1 owns 71% | | 1 owns 80% | | 1 owns 91% |
High Yield | | 1 owns 81 % | | 1 owns 59% | | 1 owns 66% | | 2 own 80% |
Fixed Income | | 3 owns 64% | | 1 owns 67% | | 1 owns 85% | | 2 own 74% |
48
Notes to Financial Statement (continued)
| h. | Foreign Currency Translation |
The books and records of the Funds are maintained in U.S. dollars. The value of investments, assets and liabilities denominated in currencies other than U.S. dollars are translated into U.S. dollars based upon current foreign exchange rates. Purchases and sales of foreign investments, income and expenses are converted into U.S. dollars based on currency exchange rates prevailing on the respective dates of such transactions. Net realized and unrealized gain (loss) on foreign currency transactions represent: (1) foreign exchange gains and losses from the sale and holdings of foreign currencies; (2) gains and losses between trade date and settlement date on investment securities transactions and forward foreign currency exchange contracts; and (3) gains and losses from the difference between amounts of interest and dividends recorded and the amounts actually received.
In addition, the Funds do not isolate the net realized and unrealized gain or loss resulting from changes in exchange rates from the fluctuations resulting from changes in market prices of securities held. Such fluctuations are included with the net realized and unrealized gain or loss on investments.
| 2. | Agreements and Transactions with Affiliates |
The Trust has entered into an Investment Management Agreement with Managers Investment Group LLC (formerly The Managers Funds LLC) under which the Investment Manager provides or oversees investment management services to the Funds. The Investment Manager selects subadvisors for each Fund (subject to Trustee approval), allocates assets among subadvisors and monitors the subadvisors’ investment programs and results. Each Fund’s investment portfolio is managed by one or more portfolio managers who serve pursuant to Subadvisory Agreements with the Investment Manager.
Investment management fees are paid directly by each Fund to the Investment Manager based on average daily net assets. The annual investment management fee rates, as a percentage of average daily net assets for the six months ended June 30, 2006, were as follows:
| | | |
| | | Investment Management Fee | |
20 Fund | | 0.70 | % |
Mid-Cap | | 0.70 | % |
Balanced | | 0.70 | % |
High Yield | | 0.70 | % |
Fixed Income | | 0.45 | % |
The Funds have entered into an Administration and Shareholder Servicing Agreement under which Managers Investment Group LLC serves as each Fund’s administrator (the “Administrator”) and is responsible for all aspects of managing the Funds’ operations, including administration and shareholder services to each Fund, its shareholders, and certain institutions, such as bank trust departments, broker-dealers and registered investment advisers, that advise or act as an intermediary with the Funds’ shareholders.
During the six months ended June 30, 2006, each of the Funds paid an Administration fee at the rate of 0.20% per annum of the Fund’s average daily net assets.
Prior to July, 1, 2005, the aggregate annual retainer paid to each Independent Trustee was $52,000, plus $2,000 for each meeting attended. Effective, July 1, 2005, the aggregate annual retainer paid to each Independent Trustee is $55,000, plus $4,000 or $2,000 for each regular or special meeting attended, respectively. The Trustees’ fees and expenses are allocated amongst all of the Funds for which Managers Investment Group LLC serves as the Advisor based on the relative net assets of such Funds. The Independent Chairman of the Trusts receives an additional payment of $10,000 per year. (Prior to July 1, 2005, the Independent Chairman was paid an additional $5,000 per year). Effective July 1, 2005, the Chairman of the Audit Committee receives an additional $2,000 per year. The “Trustee fees and expenses” shown in the financial statements represents each Fund’s allocated portion of the total fees and expenses paid by the Fund and The Managers Funds.
The Funds are distributed by Managers Distributors, Inc. (the “Distributor”) a wholly-owned subsidiary of Managers Investment Group LLC. Certain Trustees and Officers of the Funds are Officers and/or Directors of the Investment Manager, AMG and/or the Distributor. Managers Distributors, Inc. serves as the principal underwriter for each Fund. The Distributor is a registered broker-dealer and member of the National Association of Securities Dealers, Inc. (“NASD”). Shares of each Fund will be continuously offered and will be sold by brokers, dealers or other financial intermediaries who have executed selling agreements with the Distributor. The Distributor bears all the expenses of providing services pursuant to the Underwriting Agreement, including the payment of the expenses relating to the distribution of Prospectuses for sales purposes and any advertising or sales literature.
The Funds have adopted distribution and service plans with respect to the Class A, Class B and Class C shares of each Fund (the “Plans”), in accordance with the requirements of Rule 12b-1 under the 1940 Act and the requirements of the applicable rules of the NASD regarding asset-based sales charges. Pursuant to the Plans, each Fund may compensate the Distributor for its expenditures in financing any activity primarily intended to result in the sale of each such class of Fund shares and for maintenance and personal service provided to existing shareholders of that class. The Plans authorize payments to the Distributor up to 0.25% (prior to May 1, 2005, 0.50%), 1.00% and 1.00% annually of each Fund’s average daily net assets attributable to its Class A, Class B and Class C shares, respectively.
The Plans further provide for periodic payments by the Distributor to brokers, dealers and other financial intermediaries for providing shareholder services and for promotional and other sales related costs. The portion of payments by Class A, Class B or Class C shares of a Fund for shareholder servicing may not exceed an annual rate of 0.25% of the average daily net asset value of Fund shares of that class owned by clients of such broker, dealer or financial intermediary.
49
Notes to Financial Statements (continued)
The following summarizes the total fees incurred for such services for Class A, Class B and Class C shares for the six months ended June 30, 2006:
| | | |
| | | Amount |
20 Fund | | $ | 66,458 |
Mid-Cap | | | 155,153 |
Balanced | | | 72,693 |
High Yield | | | 145,296 |
Fixed Income | | | 145,059 |
| 3. | Purchases and Sales of Securities |
Purchases and sales of securities, excluding short-term securities, for the six months ended June 30, 2006, were as follows:
| | | | | | | | | | | | |
| | | Long-Term Securities | | U.S. Government Securities |
Fund | | Purchases | | Sales | | Purchases | | Sales |
20 Fund | | $ | 1,515,616 | | $ | 7,338,521 | | | N/A | | | N/A |
Mid-Cap | | | 45,281,300 | | | 54,251,074 | | | N/A | | | N/A |
Balanced | | | 5,937,555 | | | 7,932,885 | | $ | 102,842 | | $ | 1,637,523 |
High Yield | | | 15,607,828 | | | 17,907,567 | | | N/A | | | N/A |
Fixed Income | | | 18,990,582 | | | 19,399,012 | | | 1,874,375 | | | 10,565,755 |
| 4. | Portfolio Securities Loaned |
The Funds may participate in a securities lending program offered by BNY Brokerage providing for the lending of equities, corporate bonds and government securities to qualified brokers. Collateral on all securities loaned is accepted in cash and/or government securities. Collateral is maintained at a minimum level of 102% of the market value, plus interest, if applicable, of investments on loan. Collateral received in the form of cash is invested temporarily in institutional money market funds or other short-term investments by BNY. Securities lending fees include earnings of such temporary cash investments, plus or minus any rebate. These payments are then divided between BNY, as a fee for its services under the program, and the Fund loaning the security, according to agreed-upon rates.
| 5. | Commitments and Contingencies |
In the normal course of business, the Funds may enter into contracts and agreements that contain a variety of representations and warranties, which provide general indemnifications. The maximum exposure to the Funds under these arrangements is unknown, as this would involve future claims that may be against the Funds that have not yet occurred. However, based on experience, the Funds expect the risks of loss to be remote. The Financial Accounting Standards Board (“FASB”) has recently issued Interpretation No. 48, “Accounting for Uncertainty in Income Taxes - an Interpretation of FASB Statement No. 109 (the “Interpretation”), which applies to all registered investment companies and clarifies the accounting for uncertain tax positions. The Interpretation is effective for financial statements for fiscal years beginning after December 15, 2006. Management has not yet completed their analysis of the Interpretation, and is not currently in a position to estimate the significance, if any, that the impact of adoption will have on the financial statements.
| 6. | Risks Associated with Collateralized Mortgage Obligations (“CMOs”) (Balanced and Fixed Income) |
The net asset value of Funds may be sensitive to interest rate fluctuations because the Funds may hold several instruments, including CMOs and other derivatives, whose values can be significantly impacted by interest rate movements. CMOs are obligations collateralized by a portfolio of mortgages or mortgage-related securities. Payments of principal and interest on the mortgage are passed through to the holder of the CMOs on the same schedule as they are received, although certain classes of CMOs have priority over others with respect to the receipt of prepayments on the mortgages. Therefore, the investment in CMOs may be subject to a greater or lesser risk of prepayment than other types of mortgage-related securities. CMOs may have a fixed or variable rate of interest.
50
Notes to Financial Statements (continued)
| 7. | Risks Associated with High Yield Securities (High Yield) |
Investing in high yield securities involves greater risks and considerations not typically associated with U.S. Government and other high quality/investment grade securities. High Yield securities are generally below investment grade securities and do not have an established retail secondary market. Economic downturns may disrupt the high yield market and impair the issuer’s ability to repay principal and interest. Also, an increase in interest rates would likely have an adverse impact on the value of such obligations and could cause the securities to become less liquid.
51
Annual Renewal of Investment Advisory Agreements (unaudited)
On June 2, 2006, the Board of Trustees, including a majority of the Trustees who are not “interested persons” of the Trust (the “Independent Trustees”), approved the Investment Management Agreement with the Investment Manager for each of the Funds identified below and the Subadvisory Agreement for each Fund Subadvisor. The Independent Trustees were separately represented by independent counsel in connection with their consideration of the approval of these agreements. In considering the Investment Management and Subadvisory Agreements, the Trustees reviewed a variety of materials relating to each Fund, the Investment Manager and each Subadvisor, including comparative performance, fee and expense information for an appropriate peer group of similar mutual funds (each, a “Peer Group”), performance information for relevant benchmark indices (each, a “Fund Benchmark”) and other information regarding the nature, extent and quality of services provided by the Investment Manager and the Subadvisors under their respective agreements. The Trustees also took into account performance, fee and expense information regarding each Fund provided to them on a quarterly basis throughout the year. Prior to voting, the Independent Trustees (a) reviewed the foregoing information with their independent legal counsel and with management; (b) received materials from their independent legal counsel discussing the legal standards applicable to their consideration of the Investment Management Agreement and the Subadvisory Agreements; and (c) met with their independent legal counsel in private sessions at which no representatives of management were present.
Nature, extent and quality of services. In considering the nature, extent and quality of the services provided by the Investment Manager, the Trustees reviewed information relating to the Investment Manager’s operations and personnel. Among other things, the Investment Manager provided financial information, biographical information on its supervisory and professional staff and descriptions of its organizational and management structure. The Trustees also took into account information provided periodically throughout the previous year by the Investment Manager relating to the performance of its duties with respect to the Funds and the Trustees’ familiarity with the Investment Manager’s management through Board meetings, discussions and reports. In the course of their deliberations regarding the Investment Management Agreement, the Trustees evaluated, among other things: (a) the quality of the search, selection and monitoring services performed by the Investment Manager in overseeing the portfolio management responsibilities of the Subadvisors; (b) the Investment Manager’s ability to supervise each of the Fund’s other service providers; and (c) the Investment Manager’s compliance programs. The Trustees also took into account the financial condition of the Investment Manager with respect to its ability to provide the services required under the Investment Management Agreement and to maintain contractual expense limitations for the Funds.
For each Fund, the Trustees also reviewed information relating to each Subadvisor’s operations and personnel and the investment philosophy, strategies and techniques (for each Subadvisor, its “Investment Strategy”) used in managing the Fund or the portion of the Fund for which the Subadvisor has portfolio management responsibility. Among other things, the Trustees reviewed biographical information on portfolio management and other professional staff, information regarding each Subadvisor’s organizational and management structure and each Subadvisor’s brokerage policies and practices. The Trustees considered specific information provided regarding the experience of the individual or individuals at each Subadvisor with portfolio management responsibility for the portion of the Fund managed by the Subadvisor, including the information set forth in the Fund’s prospectus and statement of additional information. With respect to those Funds managed with multiple Subadvisors, the Trustees also noted information provided by the Investment Manager regarding the manner in which each Subadvisor’s Investment Strategy complements those utilized by the Fund’s other Subadvisors. In the course of their deliberations, the Trustees evaluated, among other things: (a) the services rendered by each Subadvisor in the past; (b) the qualifications and experience of the Subadvisor’s personnel; and (c) the Subadvisor’s compliance programs. The Trustees also took into account the financial condition of the Subadvisor with respect to its ability to provide the services required under the Subadvisory Agreement.
Performance. As noted above, the Board considered each Fund’s performance during relevant time periods as compared to the Fund’s Peer Group and noted that the Board reviews on a quarterly basis detailed information about the Fund’s performance results, portfolio composition and Investment Strategies, including with respect to the portion of the Fund managed by each Subadvisor. The Board noted the Investment Manager’s expertise and resources in monitoring the performance, investment style and risk adjusted performance of each Subadvisor. The Board also noted each Subadvisor’s performance record with respect to the Fund. The Board was mindful of the Investment Manager’s focus on each Subadvisor’s performance with respect to the Fund and the explanations of management regarding the factors that contributed to the performance of the Fund.
Advisory Fees and Profitability. In considering the reasonableness of the advisory fee charged by the Investment Manager for managing each Fund, the Trustees noted that the Investment Manager, and not the Fund, is responsible for paying the fees charged by the Funds’ Subadvisors and, therefore, that the fees paid to the Investment Manager cover the reasonable cost of providing portfolio management services as well as the reasonable cost of providing search, selection and monitoring services in operating a “manager-of-managers” complex of mutual funds. The Trustees concluded that, in light of the additional high quality supervisory services provided by the Investment Manager and the fact that the subadvisory fees are paid out of the advisory fee, the advisory fee payable by each Fund to the Investment Manager can reasonably be expected to exceed the median advisory fee for the Peer Group, which consists mostly of funds that do not operate with a manager-of-managers structure. In this regard, the Trustees also noted that the Investment Manager has undertaken to implement expense limitations for the Funds.
In considering the reasonableness of the advisory fee payable to the Investment Manager, the Trustees also reviewed information provided by the Investment Manager setting forth all revenues and other benefits, both direct and indirect, received by the Investment Manager and its affiliates attributable to managing each Fund and all the mutual funds in the Managers Family of Funds, the cost
52
Annual Renewal of Investment Advisory Agreements (continued)
of providing such services and the resulting profitability to the Investment Manager and its affiliates from these relationships. The Trustees also noted the current asset levels of each Fund and the willingness of the Investment Manager to waive fees and pay expenses for certain of the Funds from time to time as a means of limiting the total expenses of the smaller Funds. The Trustees also considered the current asset levels of the Funds and the impact on profitability of growth of assets of the Funds. In this regard, the Trustees noted that, unlike the typical mutual fund that is managed by a single investment adviser, the Funds operate in a manager-of-managers structure and, as a Fund grows in size, it is common practice for the Investment Manager to recommend the selection of an additional Subadvisor to manage a portion of the Fund’s portfolio. The Trustees also noted that the subadvisory fees are paid by the Investment Manager out of its advisory fee. The Trustees further noted that, because of this practice, the Investment Manager’s oversight and supervisory responsibilities with respect to the Funds can be expected to increase with the size of the Funds. On this basis, the Trustees concluded that the profitability to the Investment Manager, if any, is reasonable and that the Investment Manager is not realizing material benefits from economies of scale that would warrant adjustments to the fees for the Funds at this time. With respect to economies of scale, the Trustees also noted that as a Fund’s assets increase over time, the Fund may realize other economies of scale to the extent that the increase in assets is proportionally greater than the increase in certain other expenses.
Subadvisory Fees and Profitability. In considering the reasonableness of the fee payable by the Investment Manager to each Subadvisor, the Trustees relied on the ability of the Investment Manager to negotiate the terms of the Subadvisory Agreement at arm’s length as part of the manager-of-managers structure, noting that the Investment Manager is not affiliated with the Subadvisor. In addition, the Trustees noted that the subadvisory fees are paid by the Investment Manager out of its advisory fee. Accordingly, the cost of services to be provided by the Subadvisor and the profitability to the Subadvisor of its relationship with the Fund were not material factors in the Trustees’ deliberations. For similar reasons, and based on the current size of the portion of the Fund managed by the Subadvisor, the Trustees concluded that the effect of any economies of scale being realized by the Subadvisor was not a material factor in the Trustees’ deliberations at this time.
In addition to the foregoing, the Trustees considered the specific factors and related conclusions set forth below with respect to each Fund and each Subadvisor.
MANAGERS 20 FUND
Fund Performance. Among other information relating to the Fund’s performance, the Trustees noted that the Fund’s performance for the 1-year, 3-year and 5-year periods ended March 31, 2006 and for the period from inception of the Fund in April 1998 through March 31, 2006 was below the median performance of the Peer Group and the performance of the Fund Benchmark, which is the S&P 500 Index. The Trustees further noted management’s discussion of the Fund’s performance. The Trustees concluded that, in light of the market environment during the relevant time periods and the Investment Strategy of the Subadvisor used in managing the Fund’s portfolio during such periods, which involve maintaining concentrated positions in aggressive growth companies, the Fund’s performance was reasonable in light of all factors considered. The Trustees noted that the Investment Manager will continue to monitor the performance of the Subadvisor. The Investment Manager indicated that it is considering various alternatives with regard to the Fund, in light of its performance record and small size.
Advisory Fees. The Trustees noted that the Fund’s advisory fee and total expenses (net of applicable expense waivers/reimbursements) as of March 31, 2006 were higher than the average for the Peer Group and that the Investment Manager has contractually agreed through May 1, 2007 to limit the Fund’s net annual operating expenses to 1.50% (Class A Shares). The Trustees concluded that, in light of the nature, extent and quality of the services provided by the Investment Manager and the Subadvisor, the foregoing expense limitation and the considerations noted above with respect to the Subadvisor and the Investment Manager, the Fund’s advisory fees are reasonable.
MANAGERS BALANCED FUND
Fund Performance. Among other information relating to the Fund’s performance, the Trustees noted that the Fund’s performance for the 1-year, 3-year and 5-year periods ended March 31, 2006 and for the period from the Fund’s inception in January 1997 through March 31, 2006 was below, above, above and above the median performance of the Peer Group, respectively, and above the performance of the Fund Benchmark for all such periods. The Fund Benchmark consists of an equal blend of the S&P 500 Index and the Lehman Brothers Aggregate Bond Index. The Trustees concluded that the Fund’s performance has been satisfactory.
Advisory Fees. The Trustees noted that the Fund’s advisory fee and total expenses (net of applicable expense waivers/reimbursements) as of March 31, 2006 were equal to and higher than the average, respectively, for the Peer Group and that the Investment Manager has contractually agreed through May 1, 2007 to limit the Fund’s net annual operating expenses to 1.25% (Class A Shares). The Trustees concluded that, in light of the nature, extent and quality of the services provided by the Investment Manager and the Subadvisors, the Fund’s performance, the foregoing expense limitation and the considerations noted above with respect to the Subadvisors and the Investment Manager, the Fund’s advisory fees are reasonable.
MANAGERS FIXED INCOME FUND
Fund Performance. Among other information relating to the Fund’s performance, the Trustees noted that the Fund’s performance for the 1-year, 3-year and 5-year periods ended March 31, 2006 and for the period from the Fund’s inception in January 1997 through March 31, 2006 was above the median performance of the Peer Group and was above the performance of the Fund Benchmark, which is the Lehman Brothers Aggregate Bond Index, for the 1-year, 3-year and 5-year periods. The Trustees concluded that the Fund’s performance has been satisfactory.
Advisory Fees. The Trustees noted that the Fund’s advisory fee and total expenses (net of applicable expense waivers/reimbursements) as of March 31, 2006 were equal to the average for the Peer Group and that the Investment Manager has contractually agreed through May 1, 2007 to limit the Fund’s net annual operating expenses to 0.74% (Class A Shares). The Trustees concluded that, in light of the nature, extent and quality of the services provided by the Investment
53
Annual Renewal of Investment Advisory Agreements (continued)
Manager and the Subadvisor, the Fund’s performance, the foregoing expense limitation and the considerations noted above with respect to the Subadvisor and the Investment Manager, the Fund’s advisory fees are reasonable.
MANAGERS MID-CAP FUND
Fund Performance. Among other information relating to the Fund’s performance, the Trustees noted that the Fund’s performance for the 1-year, 3-year and 5-year periods ended March 31, 2006 and for the period from its inception in January 1997 through March 31, 2006 was below, below, above and above the median performance of the Peer Group, respectively, and below, above, below and below the performance, respectively, of the Fund Benchmark, which is the S&P Mid Cap 400 Index. The Trustees noted that the Fund’s longer-term performance has exceeded the median of its Peer Group, which has resulted in the Fund performing within the top quartile of its Peer Group for the most recent 5-year period ended March 31, 2006. The Trustees concluded that the Fund’s performance has been reasonable in the light of all factors considered. The Trustees noted that the Investment Manager will continue to monitor the performance of the Subadvisor.
Advisory Fees. The Trustees noted that the Fund’s advisory fee and total expenses (net of applicable expense waivers/reimbursements) as of March 31, 2006 were lower and higher, respectively, than the average for the Peer Group and that the Investment Manager has contractually agreed through May 1, 2007 to limit the Fund’s net annual operating expenses to 1.25% (Class A Shares). The Trustees concluded that, in light of the nature, extent and quality of the services provided by the Investment Manager and the Subadvisor, the Fund’s performance, the foregoing expense limitation and the considerations noted above with respect to the Subadvisor and the Investment Manager, the Fund’s advisory fees are reasonable.
MANAGERS HIGH YIELD FUND
Fund Performance. The Trustees noted that the Fund’s performance for the 1-year, 3-year and 5-year periods ended March 31, 2006 and for the period from the Fund’s inception in January 1998 through March 31, 2006 was above the median performance of the Peer Group for all periods and above the performance of the Fund Benchmark, which is the Lehman Brothers U.S. Corporate High Yield Index. The Trustees concluded that the Fund’s performance has been satisfactory.
Advisory Fees. The Trustees noted that the Fund’s advisory fee and total expenses (net of applicable expense waivers/reimbursements) as of March 31, 2006 were average and above average, respectively, for the Peer Group and that the Investment Manager has contractually agreed through May 1, 2007 to limit the Fund’s net annual operating expenses to 1.15% (Class A Shares). The Trustees concluded that, in light of the nature, extent and quality of the services provided by the Investment Manager and the Subadvisor, the Fund’s performance, the foregoing expense limitation and the considerations noted above with respect to the Subadvisor and the Investment Manager, the Fund’s advisory fees are reasonable.
After consideration of the foregoing, the Trustees also reached the following conclusions regarding the Investment Management Agreement and each Subadvisory Agreement, in addition to those conclusions discussed above: (a) the Investment Manager and each Subadvisor have demonstrated that they possess the capability and resources to perform the duties required of them under the Investment Management Agreement and the applicable Subadvisory Agreements; (b) each Subadvisor’s Investment Strategy is appropriate for pursuing the applicable Fund’s investment objectives; (c) each Subadvisor is reasonably likely to execute its Investment Strategy consistently over time; and (d) the Investment Manager and each Subadvisor maintain appropriate compliance programs.
Based on all of the above-mentioned factors and their related conclusions, with no single factor or conclusion being determinative and with each Trustee not necessarily attributing the same weight to each factor, the Trustees concluded that approval of each Investment Management Agreement and each Subadvisory Agreement would be in the interests of each Fund and its shareholders. Accordingly, on June 2, 2006 the Trustees, including a majority of the Independent Trustees, voted to approve the Investment Management Agreement and the Subadvisory Agreements for each Fund.
54
Investment Manager and Administrator
Managers Investment Group LLC
800 Connecticut Avenue
Norwalk, Connecticut 06854
(203) 299-3500 or (800) 835-3879
Distributor
Managers Distributors, Inc.
800 Connecticut Avenue
Norwalk, Connecticut 06854
(203) 299-3500 or (800) 835-3879
Custodian
The Bank of New York
2 Hanson Place
Brooklyn, New York 11217
Legal Counsel
Ropes & Gray LLP
One International Place
Boston, Massachusetts 02110-2624
Transfer Agent
PFPC, Inc.
attn: Managers
P.O. Box 9769
Providence, Rhode Island 02940
(800) 548-4539
Trustees
Jack W. Aber
William E. Chapman, III
Edward J. Kaier
Peter M. Lebovitz
William J. Nutt
Steven J. Paggioli
Eric Rakowski
Thomas R. Schneeweis

This report is prepared for the Funds’ shareholders. It is authorized for distribution to prospective investors only when preceded or accompanied by an effective prospectus. To receive a free copy of the prospectus or Statement of Additional Information, which includes additional information about Fund Trustees, please contact us by calling 800.835.3879. Distributed by Managers Distributors, Inc., member NASD.
A description of the policies and procedures each Fund uses to vote its proxies is available: (i) without charge, upon request, by calling 800.835.3879, or (ii) on the Securities and Exchange Commission’s (SEC) Web site at www.sec.gov. For information regarding each Fund’s proxy voting record for the 12-month period ended June 30, call 800.835.3879 or visit the SEC Web site at www.sec.gov.
The Funds file their complete schedule of portfolio holdings with the SEC for the first and third quarters of each fiscal year on Form N-Q. The Funds’ Forms N-Q are available on the SEC’s website at www.sec.gov. A Funds’ Forms N-Q may be reviewed and copied at the SEC’s Public Reference Room in Washington, DC. Information on the operation of the Public Reference Room may be obtained by calling 800.SEC.0330. To review a complete list of the Funds’ portfolio holdings, or to view the most recent quarterly holdings report, semiannual report, or annual report, please visit www.managersinvest.com.
MANAGERSAND MANAGERS AMG EQUITY FUNDS
CAPITAL APPRECIATION
Essex Investment Management Co., LLC
EMERGING MARKETS EQUITY
Rexiter Capital Management Limited
ESSEX GROWTH
ESSEX SMALL/MICRO CAP GROWTH
Essex Investment Management Co., LLC
FQ TAX-MANAGED U.S. EQUITY
FQ U.S. EQUITY
First Quadrant, L.P.
INSTITUTIONAL MICRO-CAP
Kern Capital Management LLC
INTERNATIONAL EQUITY
Alliance Bernstein L.P.
Lazard Asset Management, LLC
Wellington Management Company, LLP
INTERNATIONAL GROWTH
Wellington Management Company, LLP
MICRO-CAP
Kern Capital Management LLC
MID-CAP
Chicago Equity Partners, LLC
REAL ESTATE SECURITIES
Urdang Securities Management, Inc.
RORER LARGE-CAP
Rorer Asset Management, LLC
SMALL CAP
TimesSquare Capital Management, LLC
SMALL COMPANY
Epoch Investment Partners, Inc.
Kalmar Investment Advisers, Inc.
SPECIAL EQUITY
Donald Smith & Co., Inc.
Kern Capital Management LLC
Skyline Asset Management, L.P.
Smith Asset Management Group, LP
Veredus Asset Management LLC
Westport Asset Management, Inc.
SYSTEMATIC VALUE
Systematic Financial Management, L.P.
TIMESSQUARE MID CAP GROWTH
TIMESSQUARE SMALL CAP GROWTH
TimesSquare Capital Management, LLC
VALUE
Armstrong Shaw Associates Inc.
Osprey Partners Investment Mgmt., LLC
20
Oak Associates, Ltd.
MANAGERS BALANCED FUNDS
BALANCED
Chicago Equity Partners, LLC
Loomis, Sayles & Company L.P.
GLOBAL
333 Global Advisers*
Armstrong Shaw Associates Inc.
Alliance Bernstein L.P.
First Quadrant, L.P.
Kern Capital Management LLC
Northstar Capital Management, Inc.
Wellington Management Company, LLP
ALTERNATIVE FUNDS
FQ GLOBAL Alternatives
First Quadrant, L.P.
MANAGERS
FIXED INCOME FUNDS
BOND (Managers)
Loomis, Sayles & Company L.P.
BOND (Managers Fremont)
Pacific Investment Management Co. LLC
CALIFORNIA INTERMEDIATE TAX-FREE
Evergreen Investment Management Co., LLC
FIXED INCOME
Loomis, Sayles & Company L.P.
GLOBAL BOND
Loomis, Sayles & Company L.P.
HIGH YIELD
J.P. Morgan Investment Management Inc.
INTERMEDIATE DURATION GOVERNMENT
Smith Breeden Associates, Inc.
MONEY MARKET (MANAGERS)
JPMorgan Investment Advisors Inc.
MONEY MARKET (FREMONT)
333 Global Advisers*
SHORT DURATION Government
Smith Breeden Associates, Inc.
| * | A division of Managers Investment Group LLC |
| | |
| www.managersinvest.com | |  |
Not applicable for the semi-annual shareholder report.
| Item 3. | AUDIT COMMITTEE FINANCIAL EXPERT |
Not applicable for the semi-annual shareholder report.
| Item 4. | PRINCIPAL ACCOUNTANT FEES AND SERVICES |
Not applicable for the semi-annual shareholder report.
| Item 5. | AUDIT COMMITTEE OF LISTED REGISTRANTS |
Not applicable.
| Item 6. | SCHEDULE OF INVESTMENTS |
Not applicable.
| Item 7. | DISCLOSURE OF PROXY VOTING POLICIES AND PROCEDURES FOR CLOSED-END MANAGEMENT INVESTMENT COMPANIES |
Not applicable.
| Item 8. | PORTFOLIO MANAGERS OF CLOSED-END MANAGEMENT INVESTMENT COMPANIES |
Not applicable.
| Item 9. | PURCHASES OF EQUITY SECURITIES BY CLOSED-END MANAGEMENT INVESTMENT COMPANIES AND AFFILIATED PURCHASERS |
Not applicable.
| Item 10. | SUBMISSION OF MATTERS TO A VOTE OF SECURITY HOLDERS |
Not applicable.
| Item 11. | CONTROLS AND PROCEDURES |
| | (a) | The registrant’s principal executive and principal financial officers have concluded, based on their evaluation of the registrant’s disclosure controls and procedures as of a date within 90 days of the filing date of this report, that the registrant’s disclosure controls and procedures are reasonably designed to ensure that information required to be disclosed by the registrant on Form N-CSR is recorded, processed, summarized and reported within the required time periods and that information required to be disclosed by the registrant in the reports that it files or submits on Form N-CSR is accumulated and communicated to the registrant’s management, including its principal executive and principal financial officers, as appropriate to allow timely decisions regarding required disclosure. |
| | (b) | There were no changes in the registrant’s internal control over financial reporting during the registrant’s second fiscal quarter of the period covered by this report that have materially affected, or are reasonably likely to materially affect, the internal control over financial reporting. |
| | | |
| (a | )(1) | | Not applicable. |
| |
| (a | )(2) | | Certifications pursuant to Rule 30a-2(a) under the Investment Company Act of 1940 – Filed herewith. |
| |
| (a | )(3) | | Not applicable. |
| |
| (b | ) | | Certifications pursuant to Rule 30a-2(b) under the Investment Company Act of 1940 – Filed herewith. |
SIGNATURES
Pursuant to the requirements of the Securities Exchange Act of 1934 and the Investment Company Act of 1940, the registrant has duly caused this report to be signed on its behalf by the undersigned, thereunto duly authorized.
| | |
| MANAGERS TRUST II |
| |
By: | | /s/ Peter M. Lebovitz |
| | Peter M. Lebovitz, President |
| |
Date: | | September 7, 2006 |
Pursuant to the requirements of the Securities Exchange Act of 1934 and the Investment Company Act of 1940, this report has been signed below by the following persons on behalf of the registrant and in the capacities and on the dates indicated.
| | |
| |
By: | | /s/ Peter M. Lebovitz |
| | Peter M. Lebovitz, President |
| |
Date: | | September 7, 2006 |
| |
By: | | /s/ Bruce M. Aronow |
| | Bruce M. Aronow, Chief Financial Officer |
| |
Date: | | September 7, 2006 |