UNITED STATES
SECURITIES AND EXCHANGE COMMISSION
Washington, D.C. 20549
FORM N-CSRS
CERTIFIED SHAREHOLDER REPORT OF
REGISTERED MANAGEMENT INVESTMENT COMPANIES
Investment Company Act file number: 811-06431
MANAGERS TRUST II
|
| (Exact name of registrant as specified in charter) |
|
| 800 Connecticut Avenue, Norwalk, Connecticut 06854 |
| (Address of principal executive offices) (Zip code) |
Managers Investment Group LLC
800 Connecticut Avenue, Norwalk, Connecticut 06854
|
| (Name and address of agent for service) |
Registrant’s telephone number, including area code: (203) 299-3500
Date of fiscal year end: MARCH 31
Date of reporting period: APRIL 1, 2006 – SEPTEMBER 30, 2006 (Semi-Annual Shareholder Report)
| Item 1. | Reports to Shareholders |
SEMI-ANNUAL REPORT
Managers Funds
September 30, 2006
| • | | Short Duration Government Fund |
| • | | Intermediate Duration Government Fund |

Managers Short Duration Government Fund
Managers Intermediate Duration Government Fund
Semi-Annual Report—September 30, 2006 (unaudited)
TABLE OF CONTENTS
Nothing contained herein is to be considered an offer, sale or solicitation of an offer to buy shares of The Managers Funds or any fund presented within this report. Such offering is made only by Prospectus, which includes details as to offering price and other material information.
Letter to Shareholders
Dear Fellow Shareholder,
In the months since we last wrote to you, the stock and bond markets have rewarded investors for staying the course. To us, staying the course means creating a plan, selecting investment managers to execute that plan, and sticking with those investments and managers as long as they continue to execute their role in your plan.
It is easy to confuse some aspects of long-term investing with investment complacency. We, at Managers, are anything but complacent. We are vigilant in our portfolio manager monitoring, and diligent in ensuring that each of our managers delivers their investment discipline to you.
We, at Managers, are anything but complacent.
Smith Breeden Associates, Inc., the manager of our Managers Short and Intermediate Duration Government Funds, has done an outstanding job of executing on their high quality, risk controlled, fixed-income strategy. Year after year, they have used their analytical tools to find relative value and manage overall portfolio risk, creating returns in excess of many of their peers. We are pleased to be able to offer these products for use in client portfolios.
As we move through the last calendar quarter of 2006, the interplay of falling oil and commodity prices and a weakening in the housing market will continue to weigh heavily on investors’ decision making, Fed activity, and the bond markets. Smith Breeden will continue to apply the same discipline they have employed successfully in the past to navigate these difficult times.
We appreciate the trust you express by investing with us and look forward to continuing to be a part of your long-term investment plan.
| | | | | | |
| | Respectfully, | | | | |
| | | |
| |  | | | |  |
| | Peter M. Lebovitz | | | | Thomas G. Hoffman, CFA |
| | President | | | | Executive Vice President |
| | Managers Funds | | | | Chief Investment Officer |
| | | | | | Managers Investment Group LLC |
1
About Your Fund’s Expenses (unaudited)
As a shareholder of the Fund, you incur two types of costs: (1) transaction costs, including sales charges (loads) on purchase payments, redemption fees; and exchange fees; and (2) ongoing costs, including management fees and other Fund expenses. These Funds incur only ongoing costs. This Example is intended to help you understand your ongoing costs (in dollars) of investing in the Fund and to compare these costs with the ongoing costs of investing in other mutual funds. The Example is based on an investment of $1,000 invested at the beginning of the period and held for the entire period as indicated below.
Actual Expenses
The first line of the table below provides information about actual account values and actual expenses. You may use the information in this line, together with the amount you invested, to estimate the expenses that you paid over the period. Simply divide your account value by $1,000 (for example, an $8,600 account value divided by $1,000 = 8.6), then multiply the result by the number in the first line under the heading entitled “Expenses Paid During Period” to estimate the expenses you paid on your account during this period.
Hypothetical Example for Comparison Purposes
The second line of the table below provides information about hypothetical account values and hypothetical expenses based on the Fund’s actual expense ratio and an assumed rate of return of 5% per year before expenses, which is not the Fund’s actual return. The hypothetical account values and expenses may not be used to estimate the actual ending account balance or expenses you paid for the period. You may use this information to compare the ongoing costs of investing in the Fund and other funds. To do so, compare this 5% hypothetical example with the 5% hypothetical examples that appear in the shareholder reports of the other funds.
Please note that the expenses shown in the table are meant to highlight your ongoing costs only and do not reflect any transactional costs, such as sales charges (loads), redemption fees, or exchange fees. Therefore, the second line of the table is useful in comparing ongoing costs only, and will not help you determine the relative total costs of owning different funds. In addition, if these transactional costs were included, your costs would have been higher.
| | | | | | | | | |
Six Months Ended September 30, 2006 | | Beginning
Account Value
4/1/2006 | | Ending
Account Value
9/30/2006 | | Expenses
Paid During
the Period* |
Short Duration Government Fund | | | | | | | | | |
Based on Actual Fund Return | | $ | 1,000 | | $ | 1,024 | | $ | 4.21 |
Based on Hypothetical 5% Annual Return | | $ | 1,000 | | $ | 1,021 | | $ | 4.20 |
| | | |
Intermediate Duration Government Fund | | | | | | | | | |
Based on Actual Fund Return | | $ | 1,000 | | $ | 1,035 | | $ | 4.49 |
Based on Hypothetical 5% Annual Return | | $ | 1,000 | | $ | 1,021 | | $ | 4.46 |
| * | Expenses are equal to the Fund’s annualized expense ratio multiplied by the average account value over the period, multiplied by the number of days in the most recent fiscal half-year (183), then divided by 365. |
2
Fund Performance
All Periods ended September 30, 2006 (unaudited)
| | | | | | | | | | | | | | |
| | | Average Annual Total Returns |
| | | Six
Months | | | 1
Year | | | 5
Years | | | 10
Years | | | Inception
Date |
Short Duration Government | | 2.36 | % | | 4.24 | % | | 3.23 | % | | 4.41 | % | | 3/31/92 |
Merrill Lynch Six-Month T-Bill Index | | 2.50 | % | | 4.53 | % | | 2.41 | % | | 4.01 | % | | |
| | | | | |
Intermediate Duration Government | | 3.46 | % | | 3.68 | % | | 4.24 | % | | 5.79 | % | | 3/31/92 |
Citigroup Mortgage Index | | 3.67 | % | | 4.25 | % | | 4.59 | % | | 6.31 | % | | |
The performance data shown represents past performance. Past performance is not a guarantee of future results. Current performance may be lower or higher than the performance data quoted. The investment return and principal value of an investment in the Fund will fluctuate so that an investor’s shares, when redeemed, may be worth more or less than their original cost. For performance information through the most recent month end, please call 800.835.3879 or visit our website at www.managersinvest.com.
The listed returns on the Fund are net of expenses. From time to time the Fund’s advisor has waived fees or reimbursed expenses, which may have resulted in higher returns. Returns for less than one year are not annualized.
Changing interest rates may adversely affect the value of an investment. An increase in interest rates typically causes the value of bonds and other fixed-income securities to fall.
The Fund may use derivative instruments for hedging purposes or as part of its investment strategy. There is also a risk that a derivative intended as a hedge may not perform as expected. The main risk with derivatives is that some types can amplify a gain or loss, potentially earning or losing substantially more money than the actual cost of the derivative or that the counterparty may fail to honor its contract terms, causing a loss for the Fund. Use of these instruments may involve certain costs and risks such as liquidity risk, interest rate risk, market risk, credit risk, management risk and the risk that a fund could not close out a position when it would be most advantageous to do so.
In choosing a Fund, investors should carefully consider the amount they plan to invest, their investment objectives, the Fund’s investment objectives, risks, charges and expenses before investing. For this and other information, please call 800.835.3879 or visit www.managersinvest.com for a free prospectus. Read it carefully before investing or sending money. Distributed by Managers Distributors, Inc., member NASD.
The Merrill Lynch Six-Month T-Bill Index is an unmanaged index that measures returns of six-month Treasury Bills. Unlike the Funds, the Merrill Lynch Six-Month T-Bill Index and the Citigroup Mortgage Index are unmanaged, not available for investment, and do not incur expenses.
Not FDIC insured, nor bank guaranteed. May lose value.
3
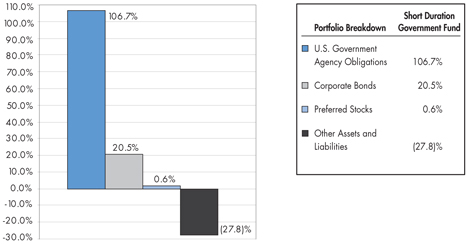
Managers Short Duration Government Fund
Fund Snapshots
September 30, 2006 (unaudited)
Portfolio Breakdown
Managers Short Duration Government Fund
(as a % of net assets)
Top Ten Holdings
| | | |
Top Ten Holdings (out of 192 securities) | | % of
Net Assets | |
FNMA, 6.000%, TBA | | 10.1 | % |
FNMA, 5.500%, TBA | | 6.8 | |
FNMA, 6.500%, TBA | | 5.1 | |
FHLMC, 5.580%, 06/15/35* | | 4.9 | |
GMAC, 7.724%, 03/15/33 | | 3.5 | |
FNMA Whole Loan, 5.530%, 05/25/35 | | 3.5 | |
FNMA, 5.730%, 07/25/44 | | 2.9 | |
USTN, 2.375%, 04/15/11 | | 2.5 | |
GNMA, 3.500%, 07/20/35 | | 2.5 | |
FNMA, 5.730%, 03/25/35 | | 2.3 | |
| | | |
Top Ten as a Group | | 44.1 | % |
| | | |
| * | Top Ten Holding at March 31, 2006. |
Any sectors, industries, or securities discussed should not be perceived as investment recommendations. Mention of a specific security should not be considered a recommendation to buy or solicitation to sell that security.
4
Managers Short Duration Government Fund
Schedule of Portfolio Investments
September 30, 2006 (unaudited)
| | | | | | |
| | | Principal
Amount | | Value |
U.S. Government and Agency Obligations – 106.3%1 | | | | | | |
| | |
Federal Home Association/Veteran’s Association – 0.5% | | | | | | |
FHA/VA, 4.750%, 08/20/23, (10/01/07) 2 | | $ | 160,171 | | $ | 161,245 |
FHA/VA, 5.125%, 10/20/17 to 12/20/25, (01/01/07) 2 | | | 843,908 | | | 848,885 |
Total Federal Home Association/Veteran’s Association | | | | | | 1,010,130 |
| | |
Federal Home Loan Mortgage Corporation – 16.2% | | | | | | |
FHLMC, 2.794%, 07/01/34, (06/01/07) 2,9 | | | 1,895,907 | | | 1,877,046 |
FHLMC, 3.043%, 05/01/34, (06/01/07) 2,9 | | | 989,510 | | | 972,919 |
FHLMC, 5.000%, 06/01/09 to 05/01/18 | | | 5,077,776 | | | 5,001,335 |
FHLMC, 5.500%, 10/15/18 to 09/01/19 | | | 3,942,179 | | | 3,944,758 |
FHLMC, 5.570%, 10/01/35, (10/01/10) 2,9 | | | 1,571,075 | | | 1,574,867 |
FHLMC, 5.580%, 06/15/35, (10/15/06) 2 | | | 11,156,370 | | | 10,934,219 |
FHLMC, 6.000%, 09/01/17 to 05/01/35 | | | 1,798,642 | | | 1,811,924 |
FHLMC, 7.500%, 04/01/15 | | | 749,866 | | | 778,962 |
FHLMC Gold Pool, 4.000%, 12/01/20 | | | 5,384,609 | | | 5,076,036 |
FHLMC Gold Pool, 5.000%, 04/01/19 to 08/01/19 | | | 1,012,920 | | | 996,411 |
FHLMC Gold Pool, 6.000%, 09/01/17 | | | 1,085,666 | | | 1,101,319 |
FHLMC Gold Pool, 7.500%, 04/01/15 to 04/01/29 | | | 333,757 | | | 347,260 |
FHLMC Gold Pool, 8.500%, 12/01/25 9 | | | 95,480 | | | 102,304 |
FHLMC Structured Pass Through Securities, 4.391%, 11/25/38 | | | 692,423 | | | 684,054 |
FHLMC Structured Pass Through Securities, 7.500%, 02/25/42 | | | 207,271 | | | 215,137 |
FHLMC Structured Pass Through Securities, 7.500%, 08/25/42 11 | | | 347,229 | | | 360,576 |
Total Federal Home Loan Mortgage Corporation | | | | | | 35,779,127 |
| | |
Federal National Mortgage Association – 69.3% | | | | | | |
FNMA, 3.180%, 07/25/44 | | | 195,747 | | | 194,398 |
FNMA, 4.280%, 03/25/33 12 | | | 1,865,966 | | | 1,846,965 |
FNMA, 4.540%, 01/01/33, (12/01/07) 2 | | | 739,420 | | | 738,409 |
FNMA, 5.000%, 07/01/18 to 09/01/19 9 | | | 4,827,149 | | | 4,752,439 |
FNMA, 5.000%, TBA | | | 3,200,000 | | | 3,144,000 |
FNMA, 5.250%, 04/15/07 | | | 60,000 | | | 59,983 |
FNMA, 5.430%, 09/25/32, (10/25/06) 2 | | | 74,362 | | | 74,369 |
FNMA, 5.440%, 09/26/33, (10/26/06) 2 | | | 39,523 | | | 39,529 |
FNMA, 5.470%, 10/25/33, (10/25/06) 2 | | | 941,425 | | | 943,845 |
The accompanying notes are an integral part of these financial statements.
5
Managers Short Duration Government Fund
Schedule of Portfolio Investments (continued)
| | | | | | |
| | | Principal
Amount | | Value |
Federal National Mortgage Association (continued) | | | | | | |
FNMA, 5.484%, 01/01/36, (01/01/11) 2 | | $ | 1,461,372 | | $ | 1,463,269 |
FNMA, 5.490%, 06/25/35, (10/25/06) 2,9 | | | 2,784,894 | | | 2,794,729 |
FNMA, 5.500%, 11/01/18 to 07/01/21 9 | | | 23,480,685 | | | 23,471,638 |
FNMA, 5.500%, TBA | | | 20,000,000 | | | 19,915,625 |
FNMA, 5.516%, 05/01/36, (05/01/11) 2 | | | 999,106 | | | 1,000,934 |
FNMA, 5.580%, 05/01/36, (05/01/11) 2 | | | 1,955,807 | | | 1,962,705 |
FNMA, 5.593%, 09/01/33, (09/01/07) 2 | | | 1,478,364 | | | 1,485,188 |
FNMA, 5.650%, 11/25/30, (10/25/06) 2 | | | 4,363,436 | | | 4,392,613 |
FNMA, 5.700%, 07/01/09 | | | 927,697 | | | 926,079 |
FNMA, 5.730%, 11/01/08 | | | 269,115 | | | 269,822 |
FNMA, 5.730%, 03/25/35 to 07/25/44, (10/25/06) 2,9 | | | 14,804,175 | | | 14,867,472 |
FNMA, 6.000%, 03/01/17 to 08/01/17 | | | 1,151,875 | | | 1,169,844 |
FNMA, 6.000%, TBA | | | 22,000,000 | | | 22,330,000 |
FNMA, 6.010%, 12/01/08 9 | | | 4,389,776 | | | 4,423,207 |
FNMA, 6.040%, 10/01/08 | | | 1,156,324 | | | 1,163,909 |
FNMA, 6.220%, 07/01/08 | | | 205,624 | | | 207,012 |
FNMA, 6.230%, 09/01/08 9 | | | 2,513,729 | | | 2,534,983 |
FNMA, 6.305%, 02/01/08 | | | 10,433 | | | 10,447 |
FNMA, 6.473%, 10/25/31 12 | | | 309,860 | | | 308,775 |
FNMA, 6.500%, 04/01/17 | | | 1,210,496 | | | 1,237,507 |
FNMA, 6.500%, TBA | | | 11,000,000 | | | 11,199,375 |
FNMA, 6.510%, 01/01/08 | | | 146,891 | | | 147,551 |
FNMA, 6.620%, 11/01/07 to 01/01/08 9 | | | 1,840,510 | | | 1,846,753 |
FNMA, 6.740%, 06/01/09 | | | 915,793 | | | 913,628 |
FNMA, 6.750%, 08/01/07 9 | | | 1,770,856 | | | 1,772,443 |
FNMA, 6.825%, 09/01/07 9 | | | 2,275,201 | | | 2,280,289 |
FNMA, 7.500%, 10/01/15 to 12/25/42 9 | | | 4,424,487 | | | 4,598,742 |
FNMA, 7.516%, 08/25/31 12 | | | 98,603 | | | 98,271 |
FNMA Grantor Trust, 5.470%, 03/25/33, (10/25/06) 2 | | | 394,826 | | | 394,875 |
FNMA Grantor Trust, 5.480%, 01/25/35, (10/25/06) 2,9 | | | 1,891,365 | | | 1,893,718 |
FNMA Grantor Trust, 5.570%, 05/25/32, (10/25/06) 2 | | | 877,247 | | | 877,402 |
FNMA Whole Loan, 5.530%, 05/25/35, (10/25/06) 2,9 | | | 7,714,748 | | | 7,742,497 |
The accompanying notes are an integral part of these financial statements.
6
Managers Short Duration Government Fund
Schedule of Portfolio Investments (continued)
| | | | | | |
| | | Principal
Amount | | Value |
Federal National Mortgage Association (continued) | | | | | | |
FNMA Whole Loan, 5.780%, 02/25/47 (10/25/06) 2 | | $ | 1,581,623 | | $ | 1,590,668 |
Total Federal National Mortgage Association | | | | | | 153,085,907 |
| | |
Government National Mortgage Association – 15.7% | | | | | | |
GNMA, 3.500%, 09/20/35, (10/01/07) 2 | | | 9,416,629 | | | 9,326,860 |
GNMA, 4.000%, 09/20/35, (10/01/07) 2 | | | 3,461,838 | | | 3,448,907 |
GNMA, 4.500%, 08/20/32 to 10/20/34, (10/01/07) 2 | | | 10,503,561 | | | 10,491,060 |
GNMA, 4.750%, 07/20/18 to 01/20/32, (04/01/07 to 10/01/07) 2 | | | 1,119,774 | | | 1,123,264 |
GNMA, 5.000%, 10/20/32 to 06/20/35, (01/01/07 to 07/01/07) 2 | | | 1,997,578 | | | 2,003,455 |
GNMA, 5.125%, 11/20/17 to 11/20/27, (01/01/07) 2 | | | 1,226,850 | | | 1,233,240 |
GNMA, 5.250%, 01/20/28, (04/01/07) 2 | | | 186,584 | | | 186,958 |
GNMA, 5.375%, 03/20/21 to 05/20/33, (04/01/07 to 07/01/07) 2 | | | 3,735,333 | | | 3,764,882 |
GNMA, 5.500%, 01/20/34, (04/01/07) 2 | | | 2,849,969 | | | 2,855,221 |
GNMA, 6.000%, 07/20/28 9 | | | 240,948 | | | 240,653 |
GNMA, 9.500%, 07/15/09 | | | 36,287 | | | 38,872 |
Total Government National Mortgage Association | | | | | | 34,713,372 |
| | |
Interest Only Strips – 1.6% | | | | | | |
FHLMC IO Strip, 1.770%, 11/15/30, (10/15/06) 2 | | | 448,050 | | | 20,592 |
FHLMC IO Strip, 4.500%, 08/15/35 to 09/15/35 | | | 1,032,198 | | | 248,444 |
FHLMC IO Strip, 5.000%, 05/15/18 to 08/01/35 | | | 2,929,824 | | | 571,781 |
FHLMC IO Strip, 7.500%, 10/01/27 | | | 20,790 | | | 4,953 |
FHLMC IO Strip, 8.000%, 06/01/31 | | | 2,671,184 | | | 651,519 |
FNMA IO Strip, 1.906%, 01/25/24, (10/25/06) 2 | | | 154,231 | | | 8,384 |
FNMA IO Strip, 5.000%, 02/01/35 to 12/01/35 | | | 8,214,530 | | | 1,992,885 |
FNMA IO Strip, 7.500%, 11/18/14 | | | 219,089 | | | 27,669 |
FNMA IO Strip, 8.000%, 08/25/22 to 05/01/30 | | | 321,061 | | | 71,680 |
FNMA IO Strip, 9.000%, 12/15/16 | | | 81,034 | | | 17,081 |
Total Interest Only Strips | | | | | | 3,614,988 |
| | |
U.S. Treasury Notes - 3.0% | | | | | | |
USTN, 2.375%, 04/15/11 9 | | | 5,535,324 | | | 5,541,164 |
The accompanying notes are an integral part of these financial statements.
7
Managers Short Duration Government Fund
Schedule of Portfolio Investments (continued)
| | | | | | |
| | | Principal
Amount | | Value |
U.S. Treasury Notes (continued) | | | | | | |
USTN, 2.625%, 05/15/08 7 | | $ | 1,260,000 | | $ | 1,218,755 |
Total U.S. Treasury Notes | | | | | | 6,759,919 |
Total U.S. Government and Agency Obligations
(cost $235,618,458) | | | | | | 234,963,443 |
| | |
Corporate Bonds – 20.5% | | | | | | |
| | |
Asset-Backed Securities – 20.3% | | | | | | |
Asset Securitization Corp., 7.040%, 11/13/29 | | | 2,391,896 | | | 2,399,613 |
Countrywide Home Loans, 5.830%, 02/25/35, (10/25/06) 2 | | | 3,587,058 | | | 3,613,542 |
Deutsche Alt-A Securities Inc. Mortgage Loan, 6.250%, 07/25/36 11 | | | 1,462,299 | | | 1,463,288 |
DLJ Commercial Mortgage Corp., 6.410%, 06/10/31 | | | 1,294,535 | | | 1,311,896 |
FNMA Grantor Trust Pass Through, Series 2004-T1, Class 1A2, 6.500%, 01/25/44 | | | 1,262,018 | | | 1,289,574 |
First Franklin Mortgage Loan Asset Backed Certificates, Series 2005-FF10, Class A4, 5.650%, 11/25/35, (10/25/06) 2 | | | 1,800,000 | | | 1,804,448 |
GE Capital Commercial Mortgage Corporation, 6.496%, 01/15/33 | | | 525,000 | | | 548,620 |
GMAC, 6.957%, 09/15/35 | | | 1,570,000 | | | 1,666,822 |
GMAC, 7.724%, 03/15/33 7,9 | | | 7,341,000 | | | 7,840,471 |
GMAC, Series 2000-C2, Class A2, 7.455%, 08/16/33 | | | 1,077,461 | | | 1,148,330 |
Greenwich Capital Commercial Funding Corp., Class A2, Series 2005-GG3, 4.305%, 08/10/42 | | | 1,754,000 | | | 1,713,575 |
Harborview Mortgage Loan Trust, 5.740%, 11/19/34, (10/19/06) 2 | | | 3,955,768 | | | 3,974,948 |
Lehman Brothers Mortgage Trust, 6.000%, 08/25/21 | | | 3,125,832 | | | 3,164,742 |
Merrill Lynch Mortgage Investors, Inc., 7.560%, 11/15/31 | | | 2,593,230 | | | 2,717,193 |
PNC Mortgage Acceptance, 7.300%, 10/12/33 | | | 2,351,000 | | | 2,502,276 |
Salomon Brothers Mortgage, 7.455%, 07/18/33 | | | 320,709 | | | 340,019 |
Structured Asset Investment Loan Trust, 5.870%, 12/25/34, (10/25/06) 2,9 | | | 5,000,000 | | | 5,029,292 |
Washington Mutual, Class 2A3, Series 2005-AR2, 5.680%, 01/25/45, (10/25/06) 2 | | | 2,285,721 | | | 2,293,194 |
Total Asset-Backed Securities | | | | | | 44,821,843 |
The accompanying notes are an integral part of these financial statements.
8
Managers Short Duration Government Fund
Schedule of Portfolio Investments (continued)
| | | | | | | |
| | | Principal
Amount | | Value | |
Asset-Backed Interest Only Strips – 0.2% | | | | | | | |
Bank of America-First Union IO Strip, Series 2001-3, Class XC, 0.618%, 04/11/37 2,3 | | $ | 5,153,047 | | $ | 212,534 | |
CS First Boston Mortgage Sec. Corp., IO Strip, Series 1998-C1, Class AX, 1.169%, 05/17/40 2 | | | 3,343,735 | | | 94,342 | |
CS First Boston Mortgage IO Strip, 0.812%, 12/15/35 2,3 | | | 1,689,057 | | | 69,671 | |
GMAC, Series 1999-C1 IO Strip, Class X, 0.777%, 05/15/33 2 | | | 9,948,255 | | | 150,006 | |
Total Asset-Backed Interest Only Strips | | | | | | 526,553 | |
Total Corporate Bonds (cost $46,963,254) | | | | | | 45,348,396 | |
| | |
| | | Shares | | | |
Preferred Stock – 0.6%3 | | | | | | | |
Home Ownership Funding Corp., 13.331% (cost $1,697,505) | | | 7,300 | | | 1,331,571 | |
| | |
Short-Term Investments – 5.0% | | | | | | | |
| | |
Other Investment Companies – 4.6% 4 | | | | | | | |
Bank of New York Institutional Cash Reserves Fund, 5.34% 8 | | | 6,099,804 | | | 6,099,804 | |
JPMorgan Prime Money Market Fund, Institutional Class Shares, 5.18% | | | 3,976,407 | | | 3,976,407 | |
Total Other Investment Companies | | | | | | 10,076,211 | |
| | |
| | | Principal
Amount | | | |
U.S. Government Agency Discount Notes – 0.4% 5,6 | | | | | | | |
FNMA Discount Notes, 0.000%, 02/06/07 to 03/30/07 | | $ | 800,000 | | | 785,190 | |
Total Short-Term Investments (cost $10,860,670) | | | | | | 10,861,401 | |
Total Investments - 132.4% (cost $295,139,887) | | | | | | 292,504,811 | |
Other Assets, less Liabilities - (32.4)% | | | | | | (71,524,262 | ) |
Net Assets - 100.0% | | | | | $ | 220,980,549 | |
The accompanying notes are an integral part of these financial statements.
9
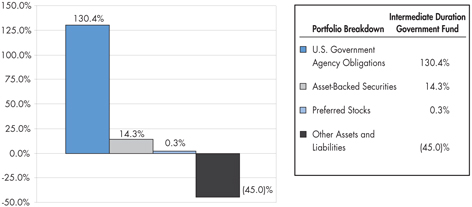
Managers Intermediate Duration Government Fund
Fund Snapshots
September 30, 2006 (unaudited)
Portfolio Breakdown
Managers Intermediate Duration Government Fund
(as a % of net assets)
Top Ten Holdings
| | | |
Top Ten Holdings (out of 156 securities) | | % of
Net Assets | |
FNMA, 5.000%, TBA | | 12.1 | % |
FNMA, 6.500%, TBA | | 9.0 | |
FHLMC Gold Pool, 5.500%, 02/01/35* | | 7.2 | |
FHLMC, 5.631%, 01/01/36* | | 6.8 | |
FHLMC Gold Pool, 5.500%, 06/01/35* | | 6.4 | |
FNMA, 6.000%, TBA | | 6.4 | |
FNMA, 5.500%, TBA | | 6.2 | |
FHLMC Gold Pool, 5.000%, 11/01/33 | | 6.0 | |
FHLMC Gold Pool, 5.500%, 01/01/35* | | 4.9 | |
FNMA, 5.500%, TBA | | 4.6 | |
| | | |
Top Ten as a Group | | 69.6 | % |
| | | |
| * | Top Ten Holding at March 31, 2006. |
Any sectors, industries, or securities discussed should not be perceived as investment recommendations. Mention of a specific security should not be considered a recommendation to buy or solicitation to sell that security.
10
Managers Intermediate Duration Government Fund
Schedule of Portfolio Investments
September 30, 2006 (unaudited)
| | | | | | |
| | | Principal
Amount | | Value |
U.S. Government and Agency Obligations – 130.3%1 | | | | | | |
| | |
Federal Home Mortgage Corporation – 54.4% | | | | | | |
FHLMC, 4.500%, 04/01/35 | | $ | 822,617 | | $ | 770,547 |
FHLMC, 5.000%, 05/01/18 | | | 563,210 | | | 554,868 |
FHLMC, 5.500%, 11/01/17 to 05/01/34 9 | | | 6,422,936 | | | 6,382,254 |
FHLMC, 5.631%, 01/01/36, (01/01/13) 2,9 | | | 11,943,998 | | | 11,957,601 |
FHLMC, 6.000%, 09/01/17 to 07/01/35 | | | 5,127,334 | | | 5,164,569 |
FHLMC, 7.500%, 01/01/31 | | | 96,296 | | | 100,085 |
FHLMC Gold Pool, 4.000%, 12/01/20 | | | 1,134,225 | | | 1,069,226 |
FHLMC Gold Pool, 4.500%, 05/01/34 to 01/01/36 9 | | | 20,749,878 | | | 19,404,683 |
FHLMC Gold Pool, 5.000%, 04/01/19 to 01/01/35 | | | 11,464,936 | | | 11,031,108 |
FHLMC Gold Pool, 5.500%, 10/01/33 to 06/01/35 9 | | | 38,629,687 | | | 38,168,423 |
FHLMC, Series 2186, Class PG, 6.000%, 07/15/28 | | | 89,522 | | | 89,842 |
FHLMC Structured Pass Through Securities, 7.500%, 08/25/42 11 | | | 486,121 | | | 504,806 |
Total Federal Home Loan Mortgage Corporation | | | | | | 95,198,012 |
| | |
Federal National Mortgage Association – 69.4% | | | | | | |
FNMA, 4.500%, 03/01/35 to 10/01/35 9 | | | 12,852,299 | | | 12,011,809 |
FNMA, 5.000%, 06/01/18 to 01/01/20 9 | | | 5,563,457 | | | 5,479,404 |
FNMA, 5.000%, TBA | | | 28,600,000 | | | 27,625,136 |
FNMA, 5.500%, 03/01/17 to 02/01/35 9 | | | 17,644,629 | | | 17,587,940 |
FNMA, 5.500%, TBA | | | 19,000,000 | | | 18,830,000 |
FNMA, 5.612%, 02/01/36, (01/01/11) 2 | | | 549,899 | | | 550,081 |
FNMA, 5.650%, 11/25/30, (10/25/06) 2 | | | 4,363,436 | | | 4,392,613 |
FNMA, 5.730%, 03/25/35, (10/25/06) 2,9 | | | 3,193,329 | | | 3,203,193 |
FNMA, 6.000%, 08/01/17 | | | 644,367 | | | 654,403 |
FNMA, 6.000%, TBA | | | 11,000,000 | | | 11,165,000 |
FNMA, 6.500%, 11/01/28 to 07/01/32 | | | 835,295 | | | 852,638 |
FNMA, 6.500%, TBA | | | 15,500,000 | | | 15,780,938 |
FNMA, 7.000%, 03/25/24 9 | | | 2,750,000 | | | 2,883,455 |
FNMA, 7.500%, 10/25/42 | | | 296,452 | | | 307,999 |
Total Federal National Mortgage Association | | | | | | 121,324,609 |
The accompanying notes are an integral part of these financial statements.
11
Managers Intermediate Duration Government Fund
Schedule of Portfolio Investments (continued)
| | | | | | |
| | | Principal
Amount | | Value |
Government National Mortgage Association – 0.6% | | | | | | |
GNMA, 4.750%, 08/20/17 to 08/20/18, (10/01/07) 2 | | $ | 244,329 | | $ | 245,975 |
GNMA, 5.125%, 11/20/17 to 12/20/17, (01/01/07) 2 | | | 502,338 | | | 504,955 |
GNMA, 5.375%, 03/20/16 to 05/20/21, (04/01/07 to 07/01/07) 2 | | | 204,861 | | | 206,311 |
GNMA, 7.500%, 09/15/28 to 11/15/31 | | | 146,241 | | | 152,346 |
Total Government National Mortgage Association | | | | | | 1,109,587 |
| | |
Interest/Principal Only Strips – 3.8% | | | | | | |
FHLMC IO Strip, 1.370%, 11/15/18, (10/15/06) 2 | | | 1,010,637 | | | 42,812 |
FHLMC IO Strip, 1.770%, 11/15/30, (10/15/06) 2 | | | 363,909 | | | 16,725 |
FHLMC IO Strip, 2.320%, 9/15/16 to 10/15/06, (10/15/06) 2 | | | 851,546 | | | 43,079 |
FHLMC IO Strip, 2.570%, 06/15/31, (10/15/06) 2 | | | 128,991 | | | 9,402 |
FHLMC IO Strip, 4.500%, 04/15/22 to 09/15/35 | | | 2,001,065 | | | 435,841 |
FHLMC IO Strip, 5.000%, 05/15/17 to 09/15/35 9 | | | 10,265,791 | | | 2,337,106 |
FHLMC IO Strip, 6.000%, 05/01/31 | | | 16,197 | | | 3,516 |
FNMA IO Strip, 4.000%, 09/01/33 to 09/01/34 | | | 1,985,292 | | | 280,779 |
FNMA IO Strip, 4.500%, 07/25/19 to 09/01/33 | | | 754,329 | | | 126,053 |
FNMA IO Strip, 5.000%, 11/01/33 to 12/01/35 | | | 11,941,139 | | | 2,814,913 |
FNMA IO Strip, 7.000%, 04/01/23 to 06/01/23 | | | 569,618 | | | 121,774 |
FNMA PO Strip, 4.690%, 07/01/33 5,10 | | | 582,095 | | | 426,021 |
Total Interest/Principal Only Strips | | | | | | 6,658,021 |
| | |
U.S. Treasury Notes – 2.1% | | | | | | |
USTN, 2.375%, 04/15/11 | | | 3,587,710 | | | 3,591,495 |
Total U.S. Government and Agency Obligations
(cost $228,712,673) | | | | | | 227,881,724 |
| | |
Asset-Backed Securities – 14.3% | | | | | | |
AHMA, Series 2005-1, Class 1A1, 4.814%, 11/25/35 11 | | | 1,294,902 | | | 1,312,034 |
American Home Loan Investment Trust, 5.294%, 06/25/45, (03/25/10) 2 | | | 3,693,951 | | | 3,652,556 |
American Home Mortgage Investment Trust, 3.280%, 04/25/44, (02/25/09) 2 | | | 417,157 | | | 404,244 |
American Home Mortgage Investment Trust, 4.390%, 02/25/45, (11/25/09) 2 | | | 1,826,968 | | | 1,776,956 |
The accompanying notes are an integral part of these financial statements.
12
Managers Intermediate Duration Government Fund
Schedule of Portfolio Investments (continued)
| | | | | | |
| | | Principal
Amount | | Value |
Asset-Backed Securities (continued) | | | | | | |
American Home Mortgage Investment Trust, 5.001%, 06/25/45, (03/25/08) 2 | | $ | 487,283 | | $ | 490,546 |
Bank of America Funding Corp., 3.953%, 12/20/34 11 | | | 937,232 | | | 944,350 |
Bear Stearns Alt-A Trust, 4.940%, 04/25/35 11 | | | 693,907 | | | 688,706 |
Countrywide Alternative Loan Trust, 5.500%, 05/25/35, (10/25/06) 2 | | | 1,172,571 | | | 1,162,429 |
Countrywide Alternative Loan Trust, 6.000%, 06/25/34 | | | 872,589 | | | 873,775 |
Countrywide Home Loan, 4.493%, 05/20/35 11 | | | 438,689 | | | 434,304 |
Countrywide Home Loans, Inc., Series 2004-R2, Class 1AF1, 5.750%, 11/25/34, (10/25/06) 2,3 | | | 702,501 | | | 706,891 |
Countrywide Home Loans, Inc., Series 2005-HYB8, Class 1A1, 5.064%, 12/20/35 11 | | | 377,958 | | | 379,262 |
DLJ Commercial Mortgage Corp., 6.410%, 06/10/31 | | | 201,015 | | | 203,710 |
GSMPS Mortgage Loan Trust, 5.680%, 03/25/35, (10/25/06) 2,3 | | | 547,494 | | | 549,579 |
GSR Mortgage Loan Trust, 3.685%, 05/25/34, (02/25/07) 2 | | | 669,224 | | | 664,036 |
Harborview Mortgage Loan Trust, 3.739%, 11/19/34 11 | | | 717,244 | | | 714,445 |
Master Alternative Loans Trust, 6.000%, 01/25/35 9 | | | 1,968,218 | | | 1,967,087 |
Merrill Lynch Mortgage Investors, Inc., 7.560%, 11/15/31 | | | 1,897,944 | | | 1,988,670 |
Morgan Stanley Mortgage Loan Trust, 6.174%, 08/25/35 11 | | | 2,141,063 | | | 2,149,762 |
Structured Asset Securities Corp., Series 2005-RF1, Class A, 5.680%, 03/25/35, (10/25/06) 2,3 | | | 671,045 | | | 669,771 |
Washington Mutual Mortgage Pass-Through Certificates, 6.000%, 10/25/35 | | | 3,332,714 | | | 3,337,285 |
Total Asset-Backed Securities (cost $25,386,284) | | | | | | 25,070,398 |
| | |
| | | Shares | | |
Preferred Stocks - 0.3%3 | | | | | | |
Home Ownership Funding Corp., 13.331% | | | 1,500 | | | 273,611 |
Home Ownership Funding Corp. 2, 13.338% | | | 1,500 | | | 273,657 |
Total Preferred Stocks (cost $501,268) | | | | | | 547,268 |
| | |
Short-Term Investments – 4.8% | | | | | | |
| | |
Other Investment Companies – 4.7% 4 | | | | | | |
Calvert Cash Reserves Institutional Prime Fund, Institutional Class Shares, 4.99% | | | 2,359,842 | | | 2,359,842 |
The accompanying notes are an integral part of these financial statements.
13
Managers Intermediate Duration Government Fund
Schedule of Portfolio Investments (continued)
| | | | | | | |
| | | Shares | | Value | |
Other Investment Companies (continued) | | | | | | | |
JPMorgan Prime Money Market Fund, Institutional Class Shares, 5.18% | | | 5,780,894 | | $ | 5,780,894 | |
Total Other Investment Companies | | | | | | 8,140,736 | |
| | |
| | | Principal
Amount | | | |
U.S. Government Agency Discount Notes - 0.1%5,6 | | | | | | | |
FNMA Discount Notes, 0.000%, 02/06/07 | | $ | 100,000 | | | 98,219 | |
Total Short-Term Investments (cost $8,238,914) | | | | | | 8,238,955 | |
Total Investments - 149.7% (cost $262,839,139) | | | | | | 261,738,345 | |
Other Assets, less Liabilities - (49.7)% | | | | | | (86,884,648 | ) |
Net Assets - 100.0% | | | | | $ | 174,853,697 | |
The accompanying notes are an integral part of these financial statements.
14
The Managers Funds
Notes to Schedules of Portfolio Investments (unaudited)
The following footnotes and abbreviations are to be read in conjunction with the Schedules of Portfolio Investments previously presented in this report.
At September 30, 2006, the cost of securities for Federal income tax purposes and the gross aggregate unrealized appreciation and/or depreciation based on tax cost were approximately as follows:
| | | | | | | | | | | | |
Fund | | Cost | | Appreciation | | Depreciation | | | Net | |
Short Duration | | $ | 295,139,887 | | $ | 1,130,006 | | ($3,765,082 | ) | | ($2,635,076 | ) |
Intermediate Duration | | | 262,839,139 | | | 1,068,711 | | (2,169,502 | ) | | (1,100,791 | ) |
| | 1 | Mortgage-backed obligations and other assets are subject to principal paydowns as a result of prepayments or refinancing of the underlying mortgage instruments. As a result, the average life may be substantially less than the original maturity. The interest rate shown is the rate in effect at September 30, 2006. |
| | 2 | Floating Rate Security. The rate listed is as of September 30, 2006. Date in parenthesis represents the security’s next coupon rate reset. |
| | 3 | Security is exempt from registration under Rule 144A of the Securities Act of 1933, as amended. These securities may be resold in transactions exempt from registration, normally to qualified buyers. At September 30, 2006, the value of these securities amounted to the following: |
| | | | | | |
Fund | | Market Value | | % of Net Assets | |
Short Duration | | $ | 1,613,776 | | 0.7 | % |
Intermediate Duration | | | 2,473,508 | | 1.4 | % |
| | 4 | Yield shown for an investment company represents the September 30, 2006, seven-day average yield, which refers to the sum of the previous seven days’ dividends paid, expressed as an annual percentage. |
| | 6 | Security pledged to cover margin requirements for open futures positions at September 30, 2006. |
| | 7 | Some or all of these securities were out on loan to various brokers as of September 30, 2006, amounting to $5,931,601 representing 2.7% of net assets for Short Duration. |
| | 8 | Collateral received from brokers for securities lending was invested in these short-term investments. |
| | 9 | All or part of security has been segregated for delayed delivery transactions and reverse repurchase agreements. |
| | 10 | Indicates yield to maturity at September 30, 2006. |
| | 11 | Variable Rate Security. The rate listed is as of September 30, 2006 and is periodically reset subject to terms and conditions set forth in the debenture. |
| | 12 | High-yield debt instrument with either deferred interest payments or an interest rate that resets at specific times during its term. |
15
The Managers Funds
Notes to Schedules of Portfolio Investments (continued)
Investments Abbreviations:
| | |
| DLJ: | | Donaldson, Lufkin & Jenrette Securities Corp. |
| FHA/VA: | | Federal Home Association/Veteran’s Association |
| FHLMC: | | Federal Home Loan Mortgage Corp. |
| FNMA: | | Federal National Mortgage Association |
| GMAC: | | General Motors Acceptance Corp. |
| GNMA: | | Government National Mortgage Association |
| GSMPS: | | Goldman Sachs Mortgage Participating Security |
| GSR: | | Goldman Sachs REMIC |
| IO: | | Interest Only |
| LIBOR: | | London Interbank Offering Rate |
| PO: | | Principal Only |
| TBA: | | To Be Announced |
| USTN: | | United States Treasury Note |
| | |
Security Ratings:
The composition of debt holdings as a percentage of portfolio assets is as follows:
| | | | | | | | | | | | | | | | | | |
S&P/Moody’s Ratings | | Gov’t/AAA | | | AA | | | A | | | BBB | | | BB | | | Not Rated | |
Short Duration | | 98.4 | % | | 0.5 | % | | 0.0 | % | | 0.0 | % | | 0.0 | % | | 1.1 | % |
Intermediate Duration | | 99.9 | % | | 0.1 | % | | 0.0 | % | | 0.0 | % | | 0.0 | % | | 0.0 | % |
16
The Managers Funds
Statements of Assets and Liabilities
September 30, 2006 (unaudited)
| | | | | | | | |
| | | Managers
Short Duration
Government Fund | | | Managers
Intermediate Duration
Government Fund | |
Assets: | | | | | | | | |
Investments at value (including securities on loan valued at $5,931,601 and $0, respectively) | | $ | 292,504,811 | | | $ | 261,738,345 | |
Cash | | | 779,115 | | | | — | |
Receivable for investments sold | | | 2,680,808 | | | | 16,483,840 | |
Receivable for TBA sale commitment | | | 16,857,031 | | | | 15,876,563 | |
Receivable for Fund shares sold | | | 243,025 | | | | 1,543,619 | |
Dividends, interest and other receivables | | | 1,076,399 | | | | 1,102,721 | |
Receivable for variation margin on futures | | | 80,188 | | | | 1,481 | |
Prepaid expenses | | | 29,297 | | | | 26,589 | |
| | | | | | | | |
Total assets | | | 314,250,674 | | | | 296,773,158 | |
| | | | | | | | |
Liabilities: | | | | | | | | |
Payable to custodian | | | — | | | | 817,977 | |
Payable upon return of securities loaned | | | 6,099,804 | | | | — | |
Payable for investments purchased | | | 32,709,729 | | | | 65,030,182 | |
Payable for investments purchased on a when-issued basis | | | 27,564,844 | | | | 39,744,375 | |
Payable for Fund shares repurchased | | | 1,010,954 | | | | 224,116 | |
Payable for TBA sale commitment (at value $16,857,031 and $15,876,563, respectively) | | | 16,921,250 | | | | 15,938,750 | |
Reverse repurchase agreements (proceeds $ 8,728,000) | | | 8,740,850 | | | | — | |
Payable for variation margin on futures | | | 21,145 | | | | 5,875 | |
Investment advisory and management fee payable | | | 127,852 | | | | 99,269 | |
Other accrued expenses | | | 73,697 | | | | 58,917 | |
| | | | | | | | |
Total liabilities | | | 93,270,125 | | | | 121,919,461 | |
| | | | | | | | |
Net Assets | | $ | 220,980,549 | | | $ | 174,853,697 | |
| | | | | | | | |
Shares outstanding | | | 22,927,062 | | | | 16,669,120 | |
Net asset value, offering and redemption price per share | | $ | 9.64 | | | $ | 10.49 | |
Net Assets Represent: | | | | | | | | |
Paid-in capital | | $ | 226,854,858 | | | $ | 177,791,588 | |
Undistributed net investment income | | | 999,247 | | | | 57,049 | |
Accumulated net realized loss from investments, options, futures contracts and TBA sale commitment | | | (4,316,394 | ) | | | (1,838,523 | ) |
Net unrealized depreciation of investments, options, futures contracts and TBA sale commitment | | | (2,557,162 | ) | | | (1,156,417 | ) |
| | | | | | | | |
Net Assets | | $ | 220,980,549 | | | $ | 174,853,697 | |
| | | | | | | | |
| | |
* Investments at cost | | $ | 295,139,887 | | | $ | 262,839,139 | |
The accompanying notes are an integral part of these financial statements.
17
The Managers Funds
Statements of Operations
For the six months ended September 30, 2006 (unaudited)
| | | | | | | | |
| | | Managers
Short Duration
Government
Fund | | | Managers
Intermediate
Duration
Government
Fund | |
Investment Income: | | | | | | | | |
Interest income | | $ | 5,570,778 | | | $ | 4,250,422 | |
Dividend income | | | 286,366 | | | | 524,487 | |
Securities lending fees | | | 4,061 | | | | 111 | |
| | | | | | | | |
Total investment income | | | 5,861,205 | | | | 4,775,020 | |
| | | | | | | | |
Expenses: | | | | | | | | |
Investment advisory and management fees | | | 742,807 | | | | 626,289 | |
Interest expense | | | 397,343 | | | | 4,824 | |
Custodian | | | 39,722 | | | | 41,041 | |
Transfer agent | | | 36,164 | | | | 32,778 | |
Professional fees | | | 22,462 | | | | 22,930 | |
Shareholder reports | | | 12,471 | | | | 14,409 | |
Registration fees | | | 10,055 | | | | 11,916 | |
Trustees fees and expenses | | | 6,302 | | | | 4,915 | |
Miscellaneous | | | 5,801 | | | | 8,523 | |
| | | | | | | | |
Total expenses before offsets | | | 1,273,127 | | | | 767,625 | |
| | | | | | | | |
Expense recoupment | | | — | | | | 25,317 | |
Expense reductions | | | (316 | ) | | | (17 | ) |
| | | | | | | | |
Net expenses | | | 1,272,811 | | | | 792,925 | |
| | | | | | | | |
Net investment income | | | 4,588,394 | | | | 3,982,095 | |
| | | | | | | | |
Net Realized and Unrealized Gain (Loss): | | | | | | | | |
Net realized loss on investments | | | (217,131 | ) | | | (533,038 | ) |
Net realized gain (loss) on options and futures contracts | | | 504,021 | | | | (232,683 | ) |
Net unrealized appreciation of investments | | | 1,243,746 | | | | 2,456,931 | |
Net unrealized appreciation (depreciation) of options and futures contracts | | | (1,181,662 | ) | | | 142,479 | |
| | | | | | | | |
Net realized and unrealized gain | | | 348,974 | | | | 1,833,689 | |
| | | | | | | | |
Net Increase in Net Assets Resulting from Operations | | $ | 4,937,368 | | | $ | 5,815,784 | |
| | | | | | | | |
The accompanying notes are an integral part of these financial statements.
18
Managers Short Duration Government Fund
Statement of Changes in Net Assets
| | | | | | | | |
| | | For the six
months ended
September 30, 2006
(unaudited) | | | For the fiscal
year ended
March 31, 2006 | |
Increase (Decrease) in Net Assets From Operations: | | | | | | | | |
Net investment income | | $ | 4,588,394 | | | $ | 8,260,207 | |
Net realized gain on investments, options and futures | | | 286,890 | | | | 437,028 | |
Net unrealized appreciation (depreciation) of investments, options and futures | | | 62,084 | | | | (1,627,812 | ) |
| | | | | | | | |
Net increase in net assets resulting from operations | | | 4,937,368 | | | | 7,069,423 | |
| | | | | | | | |
Distributions to Shareholders: | | | | | | | | |
From net investment income | | | (4,316,223 | ) | | | (8,321,069 | ) |
| | | | | | | | |
Total distributions to shareholders | | | (4,316,223 | ) | | | (8,321,069 | ) |
| | | | | | | | |
From Capital Share Transactions: | | | | | | | | |
Proceeds from sale of shares | | | 77,523,791 | | | | 160,082,951 | |
Net asset value of shares issued in connection with reinvestment of dividends | | | 4,092,114 | | | | 7,882,937 | |
Cost of shares repurchased | | | (67,779,899 | ) | | | (198,090,359 | ) |
| | | | | | | | |
Net increase (decrease) from capital share transactions | | | 13,836,006 | | | | (30,124,471 | ) |
| | | | | | | | |
Total increase (decrease) in net assets | | | 14,457,151 | | | | (31,376,117 | ) |
Net Assets: | | | | | | | | |
Beginning of period | | | 206,523,398 | | | | 237,899,515 | |
| | | | | | | | |
End of period | | $ | 220,980,549 | | | $ | 206,523,398 | |
| | | | | | | | |
End of period undistributed net investment income | | $ | 999,247 | | | $ | 727,076 | |
Share Transactions: | | | | | | | | |
Sale of shares | | | 8,045,050 | | | | 16,712,702 | |
Shares issued in connection with reinvestment of dividends | | | 425,618 | | | | 820,082 | |
Shares repurchased | | | (7,035,387 | ) | | | (20,675,431 | ) |
| | | | | | | | |
Net increase (decrease) in shares | | | 1,435,281 | | | | (3,142,647 | ) |
| | | | | | | | |
The accompanying notes are an integral part of these financial statements.
19
Managers Intermediate Duration Government Fund
Statement of Changes in Net Assets
| | | | | | | | |
| | | For the six
months ended
September 30, 2006
(unaudited) | | | For the fiscal
year ended
March 31, 2006 | |
Increase (Decrease) in Net Assets From Operations: | | | | | | | | |
Net investment income | | $ | 3,982,095 | | | $ | 7,098,787 | |
Net realized loss on investments, options and futures | | | (765,721 | ) | | | (730,620 | ) |
Net unrealized appreciation (depreciation) of investments, options and futures | | | 2,599,410 | | | | (2,548,969 | ) |
| | | | | | | | |
Net increase in net assets resulting from operations | | | 5,815,784 | | | | 3,819,198 | |
| | | | | | | | |
Distributions to Shareholders: | | | | | | | | |
From net investment income | | | (3,979,844 | ) | | | (7,085,544 | ) |
| | | | | | | | |
Total distributions to shareholders | | | (3,979,844 | ) | | | (7,085,544 | ) |
| | | | | | | | |
From Capital Share Transactions: | | | | | | | | |
Proceeds from sale of shares | | | 28,768,365 | | | | 101,429,509 | |
Net asset value of shares issued in connection with reinvestment of dividends and distributions | | | 3,548,444 | | | | 6,437,795 | |
Cost of shares repurchased | | | (53,844,419 | ) | | | (96,081,215 | ) |
| | | | | | | | |
Net increase (decrease) from capital share transactions | | | (21,527,610 | ) | | | 11,786,089 | |
| | | | | | | | |
Total increase (decrease) in net assets | | | (19,691,670 | ) | | | 8,519,743 | |
Net Assets: | | | | | | | | |
Beginning of period | | | 194,545,367 | | | | 186,025,624 | |
| | | | | | | | |
End of period | | $ | 174,853,697 | | | $ | 194,545,367 | |
| | | | | | | | |
End of period undistributed net investment income | | $ | 57,049 | | | $ | 54,798 | |
Share Transactions: | | | | | | | | |
Sale of shares | | | 2,772,250 | | | | 9,591,937 | |
Shares issued in connection with reinvestment of dividends and distributions | | | 343,562 | | | | 611,895 | |
Shares repurchased | | | (5,206,526 | ) | | | (9,109,886 | ) |
| | | | | | | | |
Net increase (decrease) in shares | | | (2,090,714 | ) | | | 1,093,946 | |
| | | | | | | | |
The accompanying notes are an integral part of these financial statements.
20
Managers Short Duration Government Fund
Financial Highlights
For a share outstanding throughout each fiscal period
| | | | | | | | | | | | | | | | | | | | | | | | |
| | | For the six
months ended
Sept 30, 2006 (unaudited) | | | For the fiscal year ended March 31, | |
| | | | 2006 | | | 2005 | | | 2004 | | | 2003 | | | 2002 | |
Net Asset Value, Beginning of Period | | $ | 9.61 | | | $ | 9.66 | | | $ | 9.69 | | | $ | 9.74 | | | $ | 9.72 | | | $ | 9.71 | |
| | | | | | | | | | | | | | | | | | | | | | | | |
Income from Investment Operations: | | | | | | | | | | | | | | | | | | | | | | | | |
Net investment income | | | 0.21 | | | | 0.34 | | | | 0.27 | | | | 0.25 | | | | 0.30 | | | | 0.54 | |
Net realized and unrealized gain (loss) on investments | | | 0.02 | | | | (0.05 | ) | | | (0.02 | ) | | | (0.06 | ) | | | 0.06 | | | | 0.01 | |
| | | | | | | | | | | | | | | | | | | | | | | | |
Total from investment operations | | | 0.23 | | | | 0.29 | | | | 0.25 | | | | 0.19 | | | | 0.36 | | | | 0.55 | |
| | | | | | | | | | | | | | | | | | | | | | | | |
Less Distributions to Shareholders from: | | | | | | | | | | | | | | | | | | | | | | | | |
Net investment income | | | (0.20 | ) | | | (0.34 | ) | | | (0.28 | ) | | | (0.24 | ) | | | (0.32 | ) | | | (0.54 | ) |
Return of capital | | | — | | | | — | | | | — | | | | — | | | | (0.02 | ) | | | — | |
| | | | | | | | | | | | | | | | | | | | | | | | |
Total distributions to shareholders | | | (0.20 | ) | | | (0.34 | ) | | | (0.28 | ) | | | (0.24 | ) | | | (0.34 | ) | | | (0.54 | ) |
| | | | | | | | | | | | | | | | | | | | | | | | |
Net Asset Value, End of Period | | $ | 9.64 | | | $ | 9.61 | | | $ | 9.66 | | | $ | 9.69 | | | $ | 9.74 | | | $ | 9.72 | |
| | | | | | | | | | | | | | | | | | | | | | | | |
Total Return 1 | | | 2.36 | %4 | | | 3.00 | % | | | 2.62 | % | | | 2.00 | % | | | 3.76 | % | | | 6.06 | % |
| | | | | | | | | | | | | | | | | | | | | | | | |
Ratio of net operating expenses to average net assets 2 | | | 0.83 | %5 | | | 0.83 | % | | | 0.78 | % | | | 0.78 | % | | | 0.78 | % | | | 0.78 | % |
Ratio of total expenses to average net assets 3 | | | 1.20 | %5 | | | 1.08 | % | | | 1.00 | % | | | 0.95 | % | | | 0.93 | % | | | 1.67 | % |
Ratio of net investment income to average net assets 2 | | | 4.70 | %5 | | | 3.41 | % | | | 2.90 | % | | | 2.59 | % | | | 2.74 | % | | | 5.71 | % |
Portfolio turnover | | | 100 | %4 | | | 315 | % | | | 341 | % | | | 349 | % | | | 418 | % | | | 683 | % |
Net assets at end of period (000’s omitted) | | $ | 220,981 | | | $ | 206,523 | | | $ | 237,900 | | | $ | 198,726 | | | $ | 160,710 | | | $ | 30,470 | |
| | | | | | | | | | | | | | | | | | | | | | | | |
| 1 | Total returns and net investment income would have been lower had certain expenses not been reduced. |
| 2 | After expense offsets excluding interest expense. (See Note 1(c) of “Notes to Financial Statements.”) |
| 3 | Includes interest expense for the six months ended September 30, 2006 and the fiscal years ended March 31, 2006, 2005, 2004, 2003, and 2002 of 0.37%, 0.23%, 0.16%, 0.03%, 0.01%, and 0.28%, respectively. (See Note 1(c) of “Notes to Financial Statements.”) |
21
Managers Intermediate Duration Government Fund
Financial Highlights
For a share outstanding throughout each fiscal period
| | | | | | | | | | | | | | | | | | | | | | | | |
| | | For the six
months ended
Sept 30, 2006 (unaudited) | | | For the fiscal year ended March 31, | |
| | | | 2006 | | | 2005 | | | 2004 | | | 2003 | | | 2002 | |
Net Asset Value, Beginning of Period | | $ | 10.37 | | | $ | 10.53 | | | $ | 10.74 | | | $ | 10.61 | | | $ | 10.16 | | | $ | 9.94 | |
| | | | | | | | | | | | | | | | | | | | | | | | |
Income from Investment Operations: | | | | | | | | | | | | | | | | | | | | | | | | |
Net investment income | | | 0.23 | | | | 0.37 | | | | 0.26 | | | | 0.23 | | | | 0.40 | | | | 0.41 | |
Net realized and unrealized gain (loss) on investments | | | 0.12 | | | | (0.16 | ) | | | (0.06 | ) | | | 0.20 | | | | 0.45 | | | | 0.26 | |
| | | | | | | | | | | | | | | | | | | | | | | | |
Total from investment operations | | | 0.35 | | | | 0.21 | | | | 0.20 | | | | 0.43 | | | | 0.85 | | | | 0.67 | |
| | | | | | | | | | | | | | | | | | | | | | | | |
Less Distributions to Shareholders from: | | | | | | | | | | | | | | | | | | | | | | | | |
Net investment income | | | (0.23 | ) | | | (0.37 | ) | | | (0.26 | ) | | | (0.23 | ) | | | (0.40 | ) | | | (0.45 | ) |
Net realized gain on investments | | | — | | | | — | | | | (0.15 | ) | | | (0.07 | ) | | | 0.00 | | | | — | |
| | | | | | | | | | | | | | | | | | | | | | | | |
Total distributions to shareholders | | | (0.23 | ) | | | (0.37 | ) | | | (0.41 | ) | | | (0.30 | ) | | | (0.40 | ) | | | (0.45 | ) |
| | | | | | | | | | | | | | | | | | | | | | | | |
Net Asset Value, End of Period | | $ | 10.49 | | | $ | 10.37 | | | $ | 10.53 | | | $ | 10.74 | | | $ | 10.61 | | | $ | 10.16 | |
| | | | | | | | | | | | | | | | | | | | | | | | |
Total Return 1 | | | 3.46 | %4 | | | 2.02 | % | | | 1.78 | % | | | 4.07 | % | | | 8.48 | % | | | 6.78 | % |
| | | | | | | | | | | | | | | | | | | | | | | | |
Ratio of net operating expenses to average net assets 2 | | | 0.88 | %5 | | | 0.88 | % | | | 0.88 | % | | | 0.88 | % | | | 0.88 | % | | | 0.88 | % |
Ratio of total expenses to average net assets 3 | | | 0.88 | %5 | | | 0.88 | % | | | 0.89 | % | | | 0.93 | % | | | 1.06 | % | | | 1.09 | % |
Ratio of net investment income to average net assets 2 | | | 4.40 | %5 | | | 3.53 | % | | | 2.45 | % | | | 2.09 | % | | | 3.75 | % | | | 3.76 | % |
Portfolio turnover | | | 258 | %4 | | | 672 | % | | | 851 | % | | | 667 | % | | | 578 | % | | | 1,106 | % |
Net assets at end of period (000’s omitted) | | $ | 174,854 | | | $ | 194,545 | | | $ | 186,026 | | | $ | 123,826 | | | $ | 71,342 | | | $ | 26,892 | |
| | | | | | | | | | | | | | | | | | | | | | | | |
| 1 | Total returns and net investment income would have been lower had certain expenses not been reduced. |
| 2 | After expense offsets excluding interest expense. (See Note 1(c) of “Notes to Financial Statements.”) |
| 3 | Includes interest expense for the six months ended September 30, 2006 and the fiscal years ended March 31, 2005, 2004 and 2003 of 0.01%, 0.01%, 0.00%, 0.03%, respectively. (See Note 1(c) of “Notes to Financial Statements.”) |
22
The Managers Funds
Notes to Financial Statements
September 30, 2006 (unaudited)
| 1. | Summary of Significant Accounting Policies |
Managers Trust II (“Trust II”) is an open-end management investment company organized as a Massachusetts business trust and registered under the Investment Company Act of 1940, as amended (the “1940 Act”). Included in this report are two series of Trust II: Managers Short Duration Government Fund (“Short Duration”) and Managers Intermediate Duration Government Fund (“Intermediate Duration”). The financial statements of Short Duration and Intermediate Duration (each a “Fund” and collectively, the “Funds”) are prepared in accordance with accounting principles generally accepted in the United States of America which require management to make estimates and assumptions that affect the reported amounts of assets and liabilities and disclosure of contingent assets and liabilities at the date of the financial statements and the reported amounts of income and expenses during the reporting periods. Actual results could differ from those estimates. The following is a summary of significant accounting policies followed by the Funds in the preparation of their financial statements.
| a. | Valuation of Investments |
Equity securities traded on a domestic or international securities exchange are valued at the last quoted sale price, or, lacking any sales, at the last quoted bid price. Over-the-counter securities are valued at the NASDAQ Official Closing Price, if one is available. Lacking any sales, over-the counter securities are valued at the last quoted bid price. Under certain circumstances, the value of each Fund’s investment may be based on an evaluation of its fair value, pursuant to procedures established by and under the general supervision of the Board of Trustees of the Trust. The Fund may use the fair value of a portfolio security to calculate its NAV when, for example, (1) market quotations are not readily available because a portfolio security is not traded in a public market or the principal market in which the security trades is closed, (2) trading in a portfolio security is suspended and has not resumed prior to the time as of which the Fund calculates its NAV, (3) where a significant event affecting the value of a portfolio security is determined to have occurred between the time of the market quotation provided for a portfolio security and the time as of which the Fund calculates its NAV, (4) a security’s price has remained unchanged over a period of time (often referred to as a “stale price”), or (5) the Investment Manager determines that a market quotation is inaccurate. The Investment Manager monitors intervening events that may affect the value of securities held in the Fund’s portfolio and, in accordance with procedures adopted by the Fund’s Trustees, will adjust the prices of securities traded in foreign markets, as appropriate, to reflect the impact of events occurring subsequent to the close of such markets but prior to the time each Fund’s NAV is calculated. Fixed income securities are valued based on valuations furnished by independent pricing services that utilize matrix systems, which reflect such factors as security prices, yields, maturities, and ratings, and are supplemented by dealer and exchange quotations. Futures contracts for which market quotations are readily available are valued at the settlement price as of the close of the futures exchange. Short-term investments having a remaining maturity of 60 days or less are valued at amortized cost, which approximates market. Investments in other regulated investment companies are valued at their end of day net asset value per share. Investments in certain mortgage-backed, stripped mortgage-backed, preferred stocks, convertible securities, derivatives and other debt securities not traded on an organized securities market are valued on the
23
The Managers Funds
Notes to Financial Statements (continued)
basis of valuations provided by dealers or by a pricing service which uses information with respect to transactions in such securities, various relationships between securities and yield to maturity in determining value. Securities (including derivatives) for which market quotations are not readily available are valued at fair value, as determined in good faith, and pursuant to procedures adopted by the Board of Trustees of the Trust. The values assigned to fair value investments are based on available information and do not necessarily represent amounts that might ultimately be realized, since such amounts depend on future developments inherent in long-term investments. Further, because of the inherent uncertainty of valuation, those estimated values may differ significantly from the values that would have been used had a ready market for the investments existed, and the differences could be material.
Security transactions are accounted for as of trade date. Realized gains and losses on securities sold are determined on the basis of identified cost.
| c. | Investment Income and Expenses |
Dividend income is recorded on the ex-dividend date. Interest income, which includes amortization of premium and accretion of discount on debt securities, as required, is accrued as earned. Non-cash dividends included in dividend income, if any, are reported at the fair market value of the securities received. Other income and expenses are recorded on an accrual basis. Expenses that cannot be directly attributed to a fund are apportioned among the Funds in the Trust and in some cases other affiliated funds based upon their relative average net assets or number of shareholders.
The Funds have a “balance credit” arrangement with the Bank of New York (“BNY”), the Funds’ custodian whereby each Fund is credited with an interest factor equal to 1% below the effective 90-day T-Bill rate for account balances left uninvested overnight. These credits serve to reduce custody expenses that would otherwise be charged to each Fund. For the six months ended September 30, 2006, the custodian expense was reduced under the BNY arrangement as follows: Short Duration - $316 and Intermediate Duration - $17.
Managers Investment Group LLC (the “Investment Manager”), a subsidiary of Affiliated Managers Group, Inc. (“AMG”) and the Investment Manager for the Funds, had contractually agreed, through July 31, 2005, to waive its fees and/or bear expenses of each Fund to cause total operating expenses (excluding interest, taxes, brokerage and extraordinary expenses) to not exceed the annual rate of 0.78% for Short Duration and 0.88% for Intermediate Duration. Short Duration Fund is obligated to repay the Investment Manager such amounts waived, paid or reimbursed in future years provided that the repayment occurs within three years after the waiver or reimbursement and that such payment would not cause the Fund’s expenses as a percent of average net assets in any such future year to exceed 0.78%. Intermediate Duration Fund is obligated to repay the Investment Manager such amounts waived, paid or reimbursed in future years provided that the repayment occurs within three years after the waiver or reimbursement and that such repayment would not cause the Fund’s expenses as a percent of average net assets in any such future year to exceed 0.88%. For the six months ended September 30, 2006, Intermediate Duration Fund made such repayments to the Investment Manager in the amount of $25,317. At September 30, 2006, the cumulative amount of unreimbursed expenses from Short Duration and Intermediate Duration were $283,649 and $13,149, respectively.
24
The Managers Funds
Notes to Financial Statements (continued)
| d. | Dividends and Distributions |
Dividends resulting from net investment income, if any, normally will be declared and paid monthly for each Fund. Dividends and distributions to shareholders are recorded on the ex-dividend date. Distributions of capital gains, if any, will be made on an annual basis in December and when required for Federal excise tax purposes. Income and capital gain distributions are determined in accordance with Federal income tax regulations, which may differ from generally accepted accounting principles. These differences are primarily due to differing treatments for losses deferred due to wash sales, equalization accounting for tax purposes, options, futures and market discount transactions. Permanent book and tax basis differences, if any, relating to shareholder distributions will result in reclassifications to paid-in capital.
Each Fund intends to comply with the requirements under Subchapter M of the Internal Revenue Code of 1986, as amended, to distribute substantially all of its taxable income and gains to its shareholders and to meet certain diversification and income requirements with respect to investment companies. Therefore, no provision for Federal income or excise tax is included in the accompanying financial statements.
| f. | Capital Loss Carryovers |
As of September 30, 2006, the following Funds had accumulated net realized capital loss carryovers from securities transactions for Federal income tax purposes as shown in the chart. These amounts may be used to offset realized capital gains, if any, through the expiration dates listed.
| | | | | |
Fund | | Capital Loss
Carryover Amounts | | Expires Mar. 31, |
Short Duration | | $ | 270,758 | | 2008 |
| | | 1,568,229 | | 2009 |
| | | 362,610 | | 2010 |
| | | 213,372 | | 2013 |
| | | | | |
Total: | | $ | 2,414,969 | | |
| | | | | |
| | |
Intermediate Duration | | $ | 260,420 | | 2013 |
| | | 137 | | 2014 |
| | | | | |
Total: | | $ | 260,557 | | |
| | | | | |
The Trust’s Declaration of Trust authorizes the issuance of an unlimited number of shares of beneficial interest, without par value. Each Fund records sales and repurchases of its capital stock on the trade date. Dividends and distributions to shareholders are recorded on the ex-dividend date.
At September 30, 2006, certain unaffiliated shareholders, specifically omnibus accounts, held greater than 10% of the outstanding shares of the following Funds: Short Duration - 2 such accounts held 63%; Intermediate Duration - 2 such accounts held 68%.
25
The Managers Funds
Notes to Financial Statements (continued)
| h. | Reverse Repurchase Agreements |
A reverse repurchase agreement involves the sale of portfolio assets together with an agreement to repurchase the same assets later at a fixed price. Additional assets are maintained in a segregated account with the custodian, and are marked to market daily. The segregated assets may consist of cash, U.S. Government securities, or other liquid securities at least equal in value to the obligations under the reverse repurchase agreements. In the event the buyer of securities under a reverse repurchase agreement files for bankruptcy or becomes insolvent, a fund’s use of the proceeds under the agreement may be restricted pending a determination by the other party, or its trustee or receiver, whether to enforce the obligation to repurchase the securities. Reverse Repurchase agreements outstanding as of September 30, 2006 were as follows:
| | | | | | | | |
Fund | | Principal Amount | | Counterparty | | Value |
Short Duration | | $ | 8,728,000 | | Morgan Stanley, 5.30%, Due 10/23/06 | | $ | 8,740,850 |
| i. | Delayed Delivery Transactions and When-Issued Securities |
The Funds may purchase or sell securities on a delayed delivery or when-issued basis. Payment and delivery may take place after the customary settlement period for that security. The price of the underlying securities and the date when the securities will be delivered and paid for are fixed at the time the transaction is negotiated. During the time a delayed delivery sell is outstanding, the contract is marked to market daily and equivalent deliverable securities are held for the transaction. The value of the securities purchased on a delayed delivery or when-issued basis are identified as such in the Funds’ Schedule of Portfolio Investments. With respect to purchase commitments, the Funds identify securities as segregated in its records with a value at least equal to the amount of the commitment. The payables and receivables associated with the purchases and sales of delayed delivery securities having the same coupon, settlement date and broker are offset. Delayed delivery or when-issued securities that have been purchased from and sold to different brokers are reflected as both payables and receivables in the Funds’ Statement of Assets and Liabilities under the caption when-issued. Losses may arise due to changes in the value of the underlying securities or if the counterparty does not perform under the contract, or if the issuer does not issue the securities due to political, economic, or other factors.
| j. | Dollar Roll and Reverse Dollar Roll Agreements |
A dollar roll is an agreement to sell securities for delivery in the current month and to repurchase substantially similar securities on a specified future date. During the roll period, principal and interest paid on these securities are not received. When a fund invests in a dollar roll, it is compensated by the difference between the current sales price and the forward price for the future purchase as well as by earnings on the cash proceeds of the initial sale. A reverse dollar roll is an agreement to buy securities for delivery in the current month and to sell substantially similar securities on a specified future date, typically at a lower price. During the roll period, the Fund receives the principal and interest on the securities purchased in compensation for the cash invested in the transaction.
26
The Managers Funds
Notes to Financial Statements (continued)
| k. | Securities Transacted on a When Issued Basis |
Each Fund may enter into TBA sale commitments to hedge its portfolio positions or to sell mortgage-backed securities it owns under delayed delivery arrangements. Proceeds of TBA sale commitments are not received until the contractual settlement date. During the time a TBA sale commitment is outstanding, equivalent deliverable securities, or an offsetting TBA purchase commitment deliverable on or before the sale commitment date, are held as “cover” for the transaction. Unsettled TBA sale commitments are valued at the current market value of the underlying securities, generally according to the procedures described under “Valuation of Investments,” in footnote 1a above. Each contract is marked-to-market daily and the change in market value is recorded by the Fund as an unrealized gain or loss. If the TBA sale commitment is closed through the acquisition of an offsetting purchase commitment, the Fund realizes a gain or loss. If the Fund delivers securities under the commitment, the Fund realizes a gain or a loss from the sale of the securities based upon the unit price established at the date the commitment was entered into.
In the normal course of business, the Fund may enter into contracts and agreements that contain a variety of representations and warranties which provide general indemnifications. The maximum exposure to the Fund under these agreements is unknown, as this would involve future claims that may be against the Fund that have not yet occurred. However, based on experience, the Fund expects the risks of loss to be remote.
TBA sale commitments outstanding at September 30, 2006 were as follows:
| | | | | | | | |
Fund | | Principal Amount | | Security | | Current Liability |
Short Duration | | $ | 7,000,000 | | FNMA, 5.00%, 10/15/21 | | $ | 6,877,500 |
| | | 10,000,000 | | FNMA, 6.00%, 10/15/34 | | | 10,043,750 |
| | | | | | | | |
| | | | | Total | | $ | 16,921,250 |
| | | | | | | | |
Intermediate Duration | | $ | 6,000,000 | | FNMA, 5.00%, 10/15/21 | | $ | 5,895,000 |
| | | 10,000,000 | | FNMA, 6.00%, 10/15/36 | | | 10,043,750 |
| | | | | | | | |
| | | | | Total | | $ | 15,938,750 |
| | | | | | �� | | |
Each of the Funds may use interest-rate futures contracts for risk management purposes in order to reduce fluctuations in each Fund’s net asset values relative to each Fund’s targeted option-adjusted duration. On entering into a futures contract, either cash or securities in an amount equal to a certain percentage of the contract value (initial margin) must be deposited with the futures broker. Subsequent payments (variation margin) are made or received each day. The variation margin payments equal the daily changes in the contract value and are recorded as unrealized gains or losses. The Fund recognizes a realized gain or loss when the contract is closed or expires equal to the difference between the value of the contract at the time it was opened and the value at the time it was closed.
27
The Managers Funds
Notes to Financial Statements (continued)
Short Duration had the following open futures contracts as of September 30, 2006:
| | | | | | | | | | |
Type | | Number of
Contracts | | Position | | Expiration Month | | Unrealized
Gain/(Loss) | |
2-Year U.S. Treasury Note | | 224 | | Long | | Dec 2006 | | $ | 103,134 | |
5-Year U.S. Treasury Note | | 309 | | Long | | Dec 2006 | | | (188,882 | ) |
10-Year U.S. Treasury Note | | 95 | | Long | | Dec 2006 | | | 112,301 | |
U.S. Treasury Long Bond | | 58 | | Long | | Dec 2006 | | | 84,731 | |
10-Year Interest Swap | | 212 | | Short | | Dec 2006 | | | (297,052 | ) |
3-Month Eurodollar | | 31 | | Long | | Sep 2006-Dec 2010 | | | 9,663 | |
3-Month Eurodollar | | 843 | | Short | | Sep 2006-Dec 2012 | | | 318,239 | |
| | | | | | | | | | |
| | | | | | Total | | $ | 142,134 | |
| | | | | | | | | | |
Intermediate Duration had the following open futures contracts as of September 30, 2006:
| | | | | | | | | | |
Type | | Number of
Contracts | | Position | | Expiration Month | | Unrealized
Gain/(Loss) | |
2-Year U.S. Treasury Note | | 12 | | Short | | Dec 2006 | | | ($6,002 | ) |
5-Year U.S. Treasury Note | | 15 | | Long | | Dec 2006 | | | 6,677 | |
10-Year U.S. Treasury Note | | 5 | | Short | | Dec 2006 | | | (5,209 | ) |
U.S. Treasury Long Bond | | 1 | | Short | | Dec 2006 | | | (1,893 | ) |
3-Month Eurodollar | | 99 | | Long | | Mar 2007-Dec 2010 | | | 30,138 | |
3-Month Eurodollar | | 18 | | Short | | Jun 2007 | | | (17,150 | ) |
| | | | | | | | | | |
| | | | | | Total | | $ | 6,561 | |
| | | | | | | | | | |
Futures transactions involve additional costs and may result in losses. The effective use of futures depends on the Fund’s ability to close futures positions at times when the Fund’s portfolio managers deem it desirable to do so. The use of futures also involves the risk of imperfect correlation among movements in the values of the securities underlying the futures purchased and sold by the Funds, of the futures contracts themselves, and of the securities that are the subject of a hedge.
| m. | Assets Pledged to Cover Margin Requirements for Open Futures Positions |
The aggregate market value of assets pledged to cover margin requirements for the open futures positions at September 30, 2006 was:
| | | |
Fund | | Assets Pledged |
Short Duration | | $ | 785,190 |
Intermediate Duration | | | 98,178 |
| n. | Interest Rate Caps, Swap Contracts and Options |
Each Fund may enter into over-the-counter transactions involving interest rate caps, swap contracts, or purchase options to enter into such contracts, in order to manage interest rate risk. In an interest rate cap agreement, one party agrees to make payments only
28
The Managers Funds
Notes to Financial Statements (continued)
under specified circumstances, usually in return for payment of a fee by the other party. An interest rate cap entitles the purchaser, to the extent that a specified index exceeds a predetermined interest rate, to receive payments of interest on a notional principal amount from the party selling such interest rate cap. Swap contracts represent an agreement between counter parties to exchange cash flows based on the difference between two rates applied to a notional principal amount for a specified period. The most common type of interest rate swap involves the exchange of fixed-rate cash flows for variable-rate cash flows. Swaps do not involve the exchange of principal between the parties. Purchased options on swap contracts (“swaptions”) give the holder the right, but not the obligation, to enter into a swap contract with the counter party which has written the option on a date, at an interest rate, and with a notional amount as specified in the swaption agreement. If the counter party to the swap transaction defaults, the Fund will be limited to contractual remedies pursuant to the agreements governing the transaction. There is no assurance that swap or swaption contract counter parties will be able to meet their obligations under the contracts or that, in the event of default, the Fund will succeed in pursuing contractual remedies. The Fund may thus assume the risk that payments owed the Fund under a swap or swaption contract will be delayed, or not received at all. During the term of the swap agreement or swaption, unrealized gains or losses are recorded as a result of “marking to market.” When the swap agreement or swaption is terminated, the Fund will record a realized gain or loss equal to the difference between the proceeds from (or cost of) the closing transaction and the Fund’s basis in the contract, if any. Accrued interest and interest paid are recognized as unrealized and realized gain (loss), respectively. In each of the contracts, the Fund pays a premium, to the counter party, in return for the swaption. These swaptions may be exercised by entering into a swap contract with the counter party only on the date specified in each contract.
| 2. | Agreements and Transactions with Affiliates |
The Trust has entered into separate Fund Management Agreements with the Investment Manager with respect to Short Duration and Intermediate Duration. Under these agreements, the Investment Manager provides or oversees investment advisory and management services to the Funds. Investment advisory and management fees of 0.70% per annum are paid directly by each Fund to the Investment Manager based on average daily net assets. The Investment Manager, in turn, pays a portion of this fee to each Fund’s respective subadvisor.
Prior to July 1, 2005, the aggregate annual retainer paid to each Independent Trustee was $52,000, plus $2,000 per meeting attended. Effective July 1, 2005, the aggregate annual retainer paid to each Independent Trustee is $55,000, plus $4,000 or $2,000 for each regular or special meeting attended, respectively. The Trustees’ fees and expenses are allocated amongst all of the Funds for which Managers Investment Group LLC serves as the Advisor (the “Managers Funds”) based on the relative net assets of such Funds. The Independent Chairman of the Trusts receives an additional payment of $10,000 per year. (Prior to July 1, 2005, the Independent Chairman was paid an additional $5,000 per year). Effective July 1, 2005, the Chairman of the Audit Committee receives an additional $2,000 per year. The “Trustee fees and expenses” shown in the financial statements amounting to $6,302 for Short Duration and $4,915 for Intermediate Duration for the six months ended September 30, 2006 represents each Fund’s allocated portion of the total fees and expenses paid by the Fund and other affiliated funds in the Trust and in The Managers Funds complex.
29
The Managers Funds
Notes to Financial Statements (continued)
The Funds are distributed by Managers Distributors, Inc. (the “Distributor”) a wholly-owned subsidiary of Managers Investment Group LLC. Certain Trustees and Officers of the Funds are Officers and/or Directors of the Investment Manager, AMG and/or the Distributor. Managers Distributors, Inc. serves as the principal underwriter for each Fund. The Distributor is a registered broker-dealer and member of the National Association of Securities Dealers, Inc. (“NASD”). Shares of each Fund will be continuously offered and will be sold by brokers, dealers or other financial intermediaries who have executed selling agreements with the Distributor. The Distributor bears all the expenses of providing services pursuant to the Underwriting Agreement, including the payment of the expenses relating to the distribution of Prospectuses for sales purposes and any advertising or sales literature.
The Investment Manager selects subadvisors for each Fund (subject to Trustee approval), and monitors the portfolio managers’ investment programs and results. Each Fund is managed by a subadvisor pursuant to a Subadvisory Agreement by and between the Investment Manager on behalf of each Fund and the respective subadvisor.
| 3. | Purchases and Sales of Securities |
Purchases and sales of securities, excluding short-term securities, for the six months ended September 30, 2006, were as follows:
| | | | | | | | | | | | |
| | | Long-Term Securities | | U.S. Government Securities |
Fund | | Purchases | | Sales | | Purchases | | Sales |
Short Duration | | $ | 271,274,588 | | $ | 249,538,256 | | $ | 271,274,588 | | $ | 248,744,840 |
Intermediate Duration | | | 578,537,207 | | | 569,619,620 | | | 578,537,207 | | | 558,926,190 |
| 4. | Portfolio Securities Loaned |
The Funds may participate in a securities lending program offered by BNY, providing for the lending of corporate bonds, equity and government securities to qualified brokers. Collateral on all securities loaned are accepted in cash and/or government securities. Collateral is maintained at a minimum level of 102% of the market value, plus interest, if applicable, of investments on loan. Collateral received in the form of cash is invested temporarily in institutional money market funds or other short-term investments by BNY. Securities lending fees include earnings of such temporary cash investments, plus or minus any rebate to a borrower. These earnings (after rebate) are then divided between BNY, as a fee for its services under the program, and the Fund loaning the security, according to agreed-upon rates.
| 5. | Risks Associated with Mortgage Related and Asset-Backed Securities |
Asset-backed securities are less effective than other types of securities as a means of “locking in” attractive long-term interest rates. One reason is the need to reinvest prepayments of principal; another is the possibility of significant unscheduled prepayments resulting from declines in interest rates. These prepayments would have to be reinvested at lower rates. As a result, these securities may have less potential for capital appreciation during periods of declining interest rates than other securities of comparable maturities,
30
The Managers Funds
Notes to Financial Statements (continued)
although they may have a similar risk of decline in market value during periods of rising interest rates. Prepayments may also significantly shorten the effective maturities of these securities, especially during periods of declining interest rates. Conversely, during periods of rising interest rates, a reduction in prepayments may increase the effective maturities of these securities, subjecting them to a greater risk of decline in market value in response to rising interest rates than traditional debt securities, and therefore, potentially increasing the volatility of the Funds.
Prepayments may cause losses on securities purchased at a premium. At times, some mortgage-backed and asset-backed securities will have higher than market interest rates and therefore will be purchased at a premium above their par value.
Collateralized mortgage obligations (“CMO’s”) may be issued by a U.S. government agency or instrumentality or by a private issuer. Although payment of the principal of, and interest on, the underlying collateral securing privately issued CMO’s may be guaranteed by the U.S. government or its agencies or instrumentalities, these CMO’s represent obligations solely of the private issuer and are not insured or guaranteed by the U.S. government, its agencies or instrumentalities or any other person or entity.
Prepayments could cause early retirement of CMO’s. CMO’s are designed to reduce the risk of prepayment for investors by issuing multiple classes of securities, each having different maturities, interest rates and payment schedules, and with the principal and interest on the underlying mortgages allocated among the several classes in various ways. Payment of interest or principal on some classes or series of CMO’s may be subject to contingencies or some classes or series may bear some or all of the risk of default on the underlying mortgages. CMO’s of different classes or series are generally retired in sequence as the underlying mortgage loans in the mortgage pool are repaid. If enough mortgages are repaid ahead of schedule, the classes or series of a CMO with the earliest maturities generally will be retired prior to their maturities. Thus, the early retirement of particular classes or series of a CMO would have the same effect as the prepayment of mortgages underlying other mortgage-backed securities. Conversely, slower than anticipated prepayments can extend the effective maturities of CMO’s, subjecting them to a greater risk of decline in market value in response to rising interest rates than traditional debt securities, and therefore, potentially increasing their volatility.
Prepayments could result in losses on stripped mortgage-backed securities. Stripped mortgage-backed securities are usually structured with two classes that receive different portions of interest and principal distributions on a pool of mortgage loans. The yield to maturity on an interest only or “IO” class of stripped mortgage-backed securities is extremely sensitive not only to changes in prevailing interest rates but also to the rate of principal payments (including prepayments) and the underlying assets. A rapid rate of principal prepayments may have a measurable adverse effect on the Fund’s yield to maturity to the extent it invests in IO’s. If the assets underlying the IO experience greater than anticipated prepayments of principal, a Fund may fail to recoup fully its initial investment in these securities. Conversely, principal only or “PO’s” tend to increase in value if prepayments are greater than anticipated and decline if prepayments are slower than anticipated.
31
The Managers Funds
Notes to Financial Statements (continued)
| 6. | Commitments and Contingencies |
The Financial Accounting Standards Board (“FASB”) has recently issued Interpretation No. 48, “Accounting for Uncertainty in Income Taxes – an Interpretation of FASB Statement No. 109 (the “Interpretation”), which applies to all registered investment companies and clarifies the accounting for uncertain tax positions. The Interpretation is effective for financial statements for fiscal years beginning after December 15, 2006. Management has not yet completed their analysis of the Interpretation, and is not currently in a position to estimate the significance, if any, that the impact of adoption will have on the financial statements.
32
Annual Renewal of Investment Advisory Agreements (unaudited)
On June 2, 2006, the Board of Trustees, including a majority of the Trustees who are not “interested persons” of the Trust (the “Independent Trustees”), approved the Investment Management Agreement with the Investment Manager for each of the Managers Short Duration Government Fund and the Managers Intermediate Duration Government Fund (each, a “Fund”) and the Subadvisory Agreement with respect to each Fund. The Independent Trustees were separately represented by independent counsel in connection with their consideration of the approval of these agreements. In considering the Investment Management and Subadvisory Agreements, the Trustees reviewed a variety of materials relating to each Fund, the Investment Manager and the Subadvisor, including comparative performance, fee and expense information for an appropriate peer group of similar mutual funds for each Fund (each, a “Peer Group”), performance information for the benchmark index for each Fund (each, a “Fund Benchmark”) and other information regarding the nature, extent and quality of services provided by the Investment Manager and the Subadvisor under their respective agreements. The Trustees also took into account performance, fee and expense information regarding each Fund provided to them on a quarterly basis throughout the year. Prior to voting, the Independent Trustees: (a) reviewed the foregoing information with their independent legal counsel and with management; (b) received materials from their independent legal counsel discussing the legal standards applicable to their consideration of the Investment Management Agreement and the Subadvisory Agreements; and (c) met with their independent legal counsel in private sessions at which no representatives of management were present.
Nature, extent and quality of services.
In considering the nature, extent and quality of the services provided by the Investment Manager, the Trustees reviewed information relating to the Investment Manager’s operations and personnel. Among other things, the Investment Manager provided financial information, biographical information on its supervisory and professional staff and descriptions of its organizational and management structure. The Trustees also took into account information provided periodically throughout the previous year by the Investment Manager relating to the performance of its duties with respect to the Funds and the Trustees’ familiarity with the Investment Manager’s management through Board meetings, discussions and reports. In the course of their deliberations regarding the Investment Management Agreement, the Trustees evaluated, among other things: (a) the quality of the search, selection and monitoring services performed by the Investment Manager in overseeing the portfolio management responsibilities of the Subadvisor; (b) the Investment Manager’s ability to supervise the Funds’ other service providers; and (c) the Investment Manager’s compliance programs. The Trustees also took into account the financial condition of the Investment Manager with respect to its ability to provide the services required under the Investment Management Agreement.
For each Fund, the Trustees also reviewed information relating to the Subadvisor’s operations and personnel and the investment philosophy, strategies and techniques (the “Investment Strategy”) used in managing each Fund. Among other things, the Trustees reviewed biographical information on portfolio management and other professional staff, information regarding the Subadvisor’s organizational and management structure and the Subadvisor’s brokerage policies and practices. The Trustees considered specific information provided regarding the experience of the individuals at the Subadvisor with portfolio management responsibility for the Funds, including the information set forth in the Funds’ prospectus
33
Annual Renewal of Investment Advisory Agreements (continued)
and statement of additional information. In the course of their deliberations, the Trustees evaluated, among other things: (a) the services rendered by the Subadvisor in the past; (b) the qualifications and experience of the Subadvisor’s personnel; and (c) the Subadvisor’s compliance programs. The Trustees also took into account the financial condition of the Subadvisor with respect to its ability to provide the services required under each Subadvisory Agreement.
Performance.
With respect to the Managers Short Duration Government Fund, among other information relating to the Fund’s performance, the Trustees noted that the Fund’s performance for the 1-year, 3-year, 5-year and 10-year periods ended March 31, 2006 was equal to, above, above and above, respectively, the median of its Peer Group and below, above, above and above the performance of the Merrill Lynch 6-Month T-Bill Index, the Fund Benchmark. The Trustees concluded that the Fund’s performance has been satisfactory.
With respect to the Managers Intermediate Duration Government Fund, among other information relating to the Fund’s performance, the Trustees noted that the Fund’s performance for the 1-year, 3-year, 5-year and 10-year periods ended March 31, 2006 was above the median of its Peer Group and below the performance of the Citigroup Mortgage Index, the Fund Benchmark. The Trustees noted that the Fund Benchmark had enjoyed a performance advantage in recent periods over the Fund, as well as over most other funds in the Peer Group, because of the relative scarcity in the market of certain of the Fund Benchmark’s higher yielding constituent securities. The Trustees concluded that the Fund’s overall performance has been satisfactory.
As noted above, the Board considered each Fund’s performance during relevant time periods as compared to the Fund’s Peer Group and noted that the Board reviews on a quarterly basis detailed information about both the Fund’s performance results and portfolio composition as well as the Subadvisor’s Investment Strategy. The Board also noted the Investment Manager’s expertise and resources in monitoring the performance, investment style and risk adjusted performance of the Subadvisor.
Advisory and Subadvisory Fees and Profitability.
In considering the reasonableness of the advisory fee payable to the Investment Manager and the subadvisory fee payable by the Investment Manager to the Subadvisor, the Trustees reviewed information provided by the Investment Manager setting forth all revenues and other benefits, both direct and indirect, received by the Investment Manager and its affiliates attributable to managing each Fund and all the mutual funds in the Managers Family of Funds (the “Fund Family”) as a group, the cost of providing such services and the resulting profitability to the Investment Manager and its affiliates from these relationships. The Trustees also noted that the Investment Manager, and not the Fund, is responsible for paying the fees charged by the Subadvisor and, therefore, that the fees paid to the Investment Manager cover the reasonable cost of providing portfolio management services as well as the reasonable cost of providing search, selection and monitoring services in operating a “manager-of-managers” complex of mutual funds. The Trustees concluded that, in light of the additional high quality supervisory services provided by the Investment Manager and the fact that the subadvisory fees are paid out of the advisory fee, the advisory fee payable by each Fund to the Investment Manager can reasonably be
34
Annual Renewal of Investment Advisory Agreements (continued)
expected to exceed the median advisory fee for each Fund’s Peer Group, which consists mostly of funds that do not operate using a manager-of-managers structure.
The Trustees also noted the current asset levels of each Fund and the willingness of the Investment Manager to waive fees and pay expenses for funds in the Fund Family from time to time as a means of limiting their total expenses. On this basis, the Trustees concluded that the profitability to the Investment Manager is reasonable and that the Investment Manager is not realizing material benefits from economies of scale that would warrant adjustments to the fees for either Fund at this time. With respect to economies of scale, the Trustees also noted that as a Fund’s assets increase over time, the Fund may realize other economies of scale to the extent that the increase in assets is proportionally greater than the increase in certain other expenses.
In considering the reasonableness of the fee payable by the Investment Manager to the Subadvisor, the Trustees relied on the ability of the Investment Manager to negotiate the terms of the Subadvisory Agreements at arm’s length as part of the manager-of-managers structure, noting that the Investment Manager is not affiliated with the Subadvisor. In addition, the Trustees noted that the subadvisory fees are paid by the Investment Manager out of its advisory fee. Accordingly, the cost of services to be provided by the Subadvisor and the profitability to the Subadvisor of its relationship with the Fund were not material factors in the Trustees’ deliberations. For similar reasons, and based on the current size of the Fund, the Trustees concluded that the effect of any economies of scale being realized by the Subadvisor in managing the Fund was not a material factor at this time.
The Trustees noted that each Fund’s advisory fee and total expenses (net of applicable expense waivers/reimbursements) as of March 31, 2006 were higher than the average for the Fund’s Peer Group. The Trustees concluded that, in light of the nature, extent and quality of the services provided by the Investment Manager and the Subadvisor, each Fund’s performance and the considerations noted above with respect to the Subadvisor and the Investment Manager, the Funds’ advisory fees are reasonable.
* * * * *
After consideration of the foregoing, the Trustees also reached the following conclusions regarding the Investment Management and Subadvisory Agreements in addition to the conclusions discussed above: (a) the Investment Manager has demonstrated that it possesses the resources and capability to perform its duties under the Investment Management Agreement; (b) the Subadvisor has the resources to perform its duties under each of the Subadvisory Agreements and is qualified to manage each Fund’s assets in accordance with its investment objectives and policies; and (c) the Investment Manager and Subadvisor maintain appropriate compliance programs.
Based on all of the above-mentioned factors and their related conclusions, with no single factor or conclusion being determinative and with each Trustee not necessarily attributing the same weight to each factor, the Trustees concluded that approval of the Investment Management and Subadvisory Agreements would be in the interests of each Fund and its shareholders. Accordingly, on June 2, 2006 the Trustees, including a majority of the Independent Trustees, voted to approve the Investment Management and Subadvisory Agreements for each Fund.
35
|
Investment Manager and Administrator |
Managers Investment Group LLC |
800 Connecticut Avenue |
Norwalk, Connecticut 06854 |
(203) 299-3500 or (800) 835-3879 |
|
Distributor |
Managers Distributors, Inc. |
800 Connecticut Avenue |
Norwalk, Connecticut 06854 |
(203) 299-3500 or (800) 835-3879 |
|
Subadvisor |
Smith Breeden Associates, Inc. |
100 Europa Drive |
Chapel Hill, NC 27517 |
|
Custodian |
The Bank of New York |
2 Hanson Place |
Brooklyn, New York 11217 |
|
Legal Counsel |
Ropes & Gray LLP |
One International Place |
Boston, Massachusetts 02110-2624 |
|
Transfer Agent |
PFPC, Inc. attn: Managers |
P.O. Box 9769 |
Providence, Rhode Island 02940 |
(800) 548-4539 |
|
| For Managers Choice Only |
Managers c/o PFPC, Inc |
P.O. Box 61204 |
King of Prussia, Pennsylvania 19406-0851 |
(800) 358-7668 |
|
Trustees |
Jack W. Aber |
William E. Chapman, II |
Edward J. Kaier |
Peter M. Lebovitz |
William J. Nutt |
Steven J. Paggioli |
Eric Rakowski |
Thomas R. Schneeweis |

MANAGERSAND MANAGERS AMG EQUITY FUNDS
EMERGING MARKETS EQUITY
Rexiter Capital Management Limited
ESSEX GROWTH
ESSEX LARGE CAP GROWTH
(Formerly known as Capital Appreciation)
ESSEX SMALL/MICRO CAP GROWTH
Essex Investment Management Co., LLC
FQ TAX-MANAGED U.S. EQUITY
FQ U.S. EQUITY
First Quadrant, L.P.
INSTITUTIONAL MICRO-CAP
MICRO-CAP
Kern Capital Management LLC
INTERNATIONAL EQUITY
Alliance Bernstein L.P.
Lazard Asset Management, LLC
Wellington Management Company, LLP
MID-CAP
Chicago Equity Partners, LLC
REAL ESTATE SECURITIES
Urdang Securities Management, Inc.
RORER LARGE-CAP
Rorer Asset Management, LLC
SMALL CAP
TIMESSQUARE MID CAP GROWTH
TIMESSQUARE SMALL CAP GROWTH
TimesSquare Capital Management, LLC
SMALL COMPANY
Epoch Investment Partners, Inc.
Kalmar Investment Advisers, Inc.
SPECIAL EQUITY
Donald Smith & Co., Inc.
Kern Capital Management LLC
Skyline Asset Management, L.P.
Smith Asset Management Group, LP
Veredus Asset Management LLC
Westport Asset Management, Inc.
SYSTEMATIC VALUE
Systematic Financial Management, L.P.
VALUE
Armstrong Shaw Associates Inc.
Osprey Partners Investment Mgmt., LLC
MANAGERS BALANCED FUNDS
BALANCED
Chicago Equity Partners, LLC
Loomis, Sayles & Company L.P.
GLOBAL
333 Global Advisers*
Armstrong Shaw Associates Inc.
Alliance Bernstein L.P.
First Quadrant, L.P.
Kern Capital Management LLC
Northstar Capital Management, Inc.
Wellington Management Company, LLP
ALTERNATIVE FUNDS
FQ GLOBAL ALTERNATIVES
First Quadrant, L.P.
MANAGERS FIXED INCOME FUNDS
BOND (MANAGERS)
FIXED INCOME
GLOBAL BOND
Loomis, Sayles & Company L.P.
BOND (MANAGERS FREMONT)
Pacific Investment Management Co. LLC
CALIFORNIA INTERMEDIATE TAX-FREE
Evergreen Investment Management Company, LLC
HIGH YIELD
J.P. Morgan Investment Management Inc.
INTERMEDIATE DURATION GOVERNMENT
SHORT DURATION GOVERNMENT
Smith Breeden Associates, Inc.
MONEY MARKET (MANAGERS)
JPMorgan Investment Advisors Inc.
MONEY MARKET (FREMONT)
333 Global Advisers*
| * | A division of Managers Investment Group LLC |
This report is prepared for the Funds’ shareholders. It is authorized for distribution to prospective investors only when preceded or accompanied by an effective prospectus. To receive a free copy of the prospectus or Statement of Additional Information, which includes additional information about Fund Trustees, please contact us by calling 800.835.3879. Distributed by Managers Distributors, Inc., member NASD.
A description of the policies and procedures each Fund uses to vote its proxies is available: (i) without charge, upon request, by calling 800.835.3879, or (ii) on the Securities and Exchange Commission’s (SEC) Web site at www.sec.gov. For information regarding each Fund’s proxy voting record for the 12-month period ended June 30, call 800.835.3879 or visit the SEC Web site at www.sec.gov.
The Funds file their complete schedule of portfolio holdings with the SEC for the first and third quarters of each fiscal year on Form N-Q. The Funds’ Forms N-Q are available on the SEC’s website at www.sec.gov. A Funds’ Forms N-Q may be reviewed and copied at the SEC’s Public Reference Room in Washington, DC. Information on the operation of the Public Reference Room may be obtained by calling 1-800-SEC-0330. To review a complete list of the Funds’ portfolio holdings, or to view the most recent quarterly holdings report, semiannual report, or annual report, please visit www.managersinvest.com.
| | |
| www.managersinvest.com | |  |
Not applicable for the semi-annual shareholder report.
| Item 3. | AUDIT COMMITTEE FINANCIAL EXPERT |
Not applicable for the semi-annual shareholder report.
| Item 4. | PRINCIPAL ACCOUNTANT FEES AND SERVICES |
Not applicable for the semi-annual shareholder report.
| Item 5. | AUDIT COMMITTEE OF LISTED REGISTRANTS |
Not applicable.
| Item 6. | SCHEDULE OF INVESTMENTS |
Not applicable.
| Item 7. | DISCLOSURE OF PROXY VOTING POLICIES AND PROCEDURES FOR CLOSED-END MANAGEMENT INVESTMENT COMPANIES |
Not applicable.
| Item 8. | PORTFOLIO MANAGERS OF CLOSED-END MANAGEMENT INVESTMENT COMPANIES |
Not applicable.
| Item 9. | PURCHASES OF EQUITY SECURITIES BY CLOSED-END MANAGEMENT INVESTMENT COMPANIES AND AFFILIATED PURCHASERS |
Not applicable.
| Item 10. | SUBMISSION OF MATTERS TO A VOTE OF SECURITY HOLDERS |
Not applicable.
| Item 11. | CONTROLS AND PROCEDURES |
| | (a) | The registrant’s principal executive and principal financial officers have concluded, based on their evaluation of the registrant’s disclosure controls and procedures as of a date within 90 days of the filing date of this report, that the registrant’s disclosure controls and procedures are reasonably designed to ensure that information required to be disclosed by the registrant on Form N-CSR is recorded, processed, summarized and reported within the required time periods and that information required to be disclosed by the registrant in the reports that it files or submits on Form N-CSR is accumulated and communicated to the registrant’s management, including its principal executive and principal financial officers, as appropriate to allow timely decisions regarding required disclosure. |
| | (b) | There were no changes in the registrant’s internal control over financial reporting during the registrant’s second fiscal quarter of the period covered by this report that have materially affected, or are reasonably likely to materially affect, the internal control over financial reporting. |
| | |
| (a)(1) | | Not applicable. |
| |
| (a)(2) | | Certifications pursuant to Rule 30a-2(a) under the Investment Company Act of 1940—Filed herewith. |
| |
| (a)(3) | | Not applicable. |
| |
| (b) | | Certifications pursuant to Rule 30a-2(b) under the Investment Company Act of 1940—Filed herewith. |
SIGNATURES
Pursuant to the requirements of the Securities Exchange Act of 1934 and the Investment Company Act of 1940, the registrant has duly caused this report to be signed on its behalf by the undersigned, thereunto duly authorized.
MANAGERS TRUST II
| | |
| |
| By: | | /s/ Peter M. Lebovitz |
| | Peter M. Lebovitz, President |
| |
| Date: | | December 1, 2006 |
Pursuant to the requirements of the Securities Exchange Act of 1934 and the Investment Company Act of 1940, this report has been signed below by the following persons on behalf of the registrant and in the capacities and on the dates indicated.
| | |
| By: | | /s/ Peter M. Lebovitz |
| | Peter M. Lebovitz, President |
| |
| Date: | | December 1, 2006 |
| |
| By: | | /s/ Bruce M. Aronow |
| | Bruce M. Aronow, Chief Financial Officer |
| |
| Date: | | December 1, 2006 |