UNITED STATES
SECURITIES AND EXCHANGE COMMISSION
Washington, D.C. 20549
FORM N-CSRS
CERTIFIED SHAREHOLDER REPORT OF REGISTERED
MANAGEMENT INVESTMENT COMPANIES
Investment Company Act file number: 811-06431
MANAGERS TRUST II
|
| (Exact name of registrant as specified in charter) |
| | |
| 800 Connecticut Avenue, Norwalk, Connecticut | | 06854 |
| (Address of principal executive offices) | | (Zip code) |
Managers Investment Group LLC
800 Connecticut Avenue, Norwalk, Connecticut 06854
|
| (Name and address of agent for service) |
Registrant’s telephone number, including area code: (203) 299-3500
Date of fiscal year end: DECEMBER 31
Date of reporting period: JANUARY 1, 2008 – JUNE 30, 2008
(Semi-Annual Shareholder Report)
| Item 1. | Reports to Shareholders |
SEMI-ANNUAL REPORT
Managers Trust II Funds
June 30, 2008
Managers AMG Chicago Equity Partners Mid-Cap Fund
Managers AMG Chicago Equity Partners Balanced Fund
Managers High Yield Fund
Managers Fixed Income Fund

SAR009-0608
The Managers Funds
Semi-Annual Report — June 30, 2008 (unaudited)
TABLE OF CONTENTS
Nothing contained herein is to be considered an offer, sale or solicitation of an offer to buy shares of The Managers Funds or Managers AMG Funds. Such offering is made only by Prospectus, which includes details as to offering price and other material information.
Letter to Shareholders
Dear Shareholder:
As you are undoubtedly aware, the financial markets were under significant pressure during a majority of the six-month period ending June 30, 2008 (the “period”). The period began with the major U.S. equity markets seeing their worst returns in 5 1/2 years during the first quarter, largely driven by investor concerns over the economic impact of a decline in U.S. home values and the related devaluation of the mortgage-securities market. After the Federal Reserve’s mid-March establishment of the credit facility to extend overnight funds to primary dealers and the bail out of Bear Stearns & Co., the second quarter started with many investors believing that the worst of the credit crunch was over, that economic growth would begin to bounce back later in the year, and that stock prices, in anticipation of future growth, would advance. That’s actually how it played out – until mid-to-late May, that is. Stocks, unfortunately, then sold off during the remainder of the quarter as investors’ concerns over surging energy and food prices, continued fallout from the credit crisis, slow economic growth, and declining corporate profits took center stage. Time will tell if the concerns are completely justified. In the short-term, however, the pain in the financial markets has been all too real.
The resulting impact on equities was widespread. For the period, the Russell 1000® (large cap), Russell 2000® (small cap), and the Russell 3000® (all cap) Indices returned -11.2%, - -9.4% and -11.1%, respectively. Even with the benefit of currencies that were strong relative to the U.S. Dollar for the period, foreign stock markets offered little help in the way of diversification. For the period, the MSCI EAFE Index returned -11.0% (U.S. Dollars), while the MSCI Emerging Markets Index declined by -11.8%.
While many of the media headlines took a negative tone and emphasized inflation, the “housing crisis” and the losses in the stock market, various portions of the bond market provided positive returns. Interest rates fell (and bond prices rose) across the yield curve, although the interest rate declines were most pronounced on the shorter end of the curve. Meanwhile, for the period in aggregate, demand for higher-quality, lower-risk bonds like U.S. Treasuries increased, while investors sold higher-risk, lower-quality bonds in an effort to curtail risk. For the period, the Lehman Brothers U.S. Aggregate Index and the Lehman Brothers Global Aggregate Index returned 1.1% and 3.5% (U.S. Dollars), respectively. Meanwhile, the Lehman Brothers U.S. Credit Bond Index and Lehman U.S. Corporate High Yield Index declined 0.5% and 1.3%, respectively.
Against this backdrop, the Funds in this report have provided the following returns:
| | | | | | | | | | | | | | | | | | | | | | | | |
Periods Ended 06/30/08 | | | | | | 6 Months | | | 1 Year | | | 3 Years | | | 5 Years | | | 10 Years | | | Since
Inception | | | Inception
Date |
Managers AMG Chicago Equity Partners Mid-Cap Fund | | | | | | | | | | | | | | | | | | | | |
| | -Class A | | No Load | | (5.63 | )% | | (15.13 | )% | | 3.46 | % | | 9.87 | % | | 8.99 | % | | 10.99 | % | | 1/2/1997 |
| | -Class A | | With Load | | (11.03 | )% | | (20.02 | )% | | 1.43 | % | | 8.58 | % | | 8.35 | % | | 10.42 | % | | 1/3/1997 |
| | -Class B | | No Load | | (5.94 | )% | | (16.02 | )% | | 2.66 | % | | 9.14 | % | | 8.37 | % | | 9.34 | % | | 1/28/1998 |
| | -Class B | | With Load | | (10.64 | )% | | (19.92 | )% | | 1.70 | % | | 8.85 | % | | 8.37 | % | | 9.34 | % | | 1/29/1998 |
| | -Class C | | No Load | | (5.94 | )% | | (15.98 | )% | | 2.63 | % | | 9.09 | % | | 8.40 | % | | 8.63 | % | | 2/19/1998 |
| | -Class C | | With Load | | (6.88 | )% | | (16.76 | )% | | 2.63 | % | | 9.09 | % | | 8.40 | % | | 8.63 | % | | 2/20/1998 |
| | -Institutional Class | | (5.48 | )% | | (15.15 | )% | | 3.64 | % | | 10.17 | % | | 9.43 | % | | 11.46 | % | | 1/2/1997 |
S&P Mid Cap 400 Index | | (3.90 | )% | | (7.34 | )% | | 7.45 | % | | 12.61 | % | | 9.84 | % | | 12.11 | % | | 1/2/1997 |
Managers AMG Chicago Equity Partners Balanced Fund | | | | | | | | | | | | | | | | | | | | |
| | -Class A | | No Load | | (4.89 | )% | | (4.61 | )% | | 5.23 | % | | 7.44 | % | | 6.15 | % | | 7.92 | % | | 1/2/1997 |
| | -Class A | | With Load | | (10.34 | )% | | (10.09 | )% | | 3.17 | % | | 6.17 | % | | 5.53 | % | | 7.36 | % | | 1/3/1997 |
| | -Class B | | No Load | | (5.26 | )% | | (5.31 | )% | | 4.42 | % | | 6.71 | % | | 5.56 | % | | 6.06 | % | | 2/10/1998 |
| | -Class B | | With Load | | (9.97 | )% | | (9.98 | )% | | 3.49 | % | | 6.40 | % | | 5.56 | % | | 6.06 | % | | 2/11/1998 |
| | -Class C | | No Load | | (5.25 | )% | | (5.27 | )% | | 4.43 | % | | 6.71 | % | | 5.56 | % | | 6.00 | % | | 2/13/1998 |
| | -Class C | | With Load | | (6.19 | )% | | (6.21 | )% | | 4.43 | % | | 6.71 | % | | 5.56 | % | | 6.00 | % | | 2/14/1998 |
| | -Institutional Class | | (4.74 | )% | | (4.34 | )% | | 5.49 | % | | 7.79 | % | | 6.60 | % | | 8.39 | % | | 1/2/1997 |
60% S&P 500/40% Lehman Brothers U.S. Aggregate | | (6.59 | )% | | (4.92 | )% | | 4.59 | % | | 6.35 | % | | 4.47 | % | | 6.92 | % | | 1/2/1997 |
1
Letter to Shareholders (continued)
| | | | | | | | | | | | | | | | | | | | | | | | |
Periods Ended 06/30/08 | | | | | | 6 Months | | | 1 Year | | | 3 Years | | | 5 Years | | | 10 Years | | | Since
Inception | | | Inception
Date |
Managers High Yield Fund | | | | | | | | | | | | | | | | | | | | |
| | -Class A | | No Load | | (1.72 | )% | | (2.22 | )% | | 4.14 | % | | 6.68 | % | | 5.04 | % | | 5.85 | % | | 1/2/1998 |
| | -Class A | | With Load | | (5.95 | )% | | (6.37 | )% | | 2.63 | % | | 5.75 | % | | 4.59 | % | | 5.41 | % | | 1/3/1998 |
| | -Class B | | No Load | | (2.03 | )% | | (3.08 | )% | | 3.27 | % | | 5.91 | % | | 4.41 | % | | 4.80 | % | | 2/19/1998 |
| | -Class B | | With Load | | (6.76 | )% | | (7.61 | )% | | 2.41 | % | | 5.61 | % | | 4.41 | % | | 4.80 | % | | 2/20/1998 |
| | -Class C | | No Load | | (2.16 | )% | | (3.21 | )% | | 3.24 | % | | 5.90 | % | | 4.40 | % | | 4.78 | % | | 2/19/1998 |
| | -Class C | | With Load | | (3.10 | )% | | (4.11 | )% | | 3.24 | % | | 5.90 | % | | 4.40 | % | | 4.78 | % | | 2/20/1998 |
| | -Institutional Class | | (1.68 | )% | | (2.14 | )% | | 4.31 | % | | 6.99 | % | | 5.49 | % | | 5.84 | % | | 3/2/1998 |
Lehman Brothers U.S. Corporate High Yield | | (1.31 | )% | | (2.26 | )% | | 4.54 | % | | 6.92 | % | | 4.91 | % | | | | | 1/2/1998 |
Managers Fixed Income Fund | | | | | | | | | | | | | | | | | | | | |
| | -Class A | | No Load | | (0.02 | )% | | 4.34 | % | | 4.39 | % | | 4.66 | % | | 5.76 | % | | 6.16 | % | | 1/2/1997 |
| | -Class A | | With Load | | (4.29 | )% | | (0.08 | )% | | 2.89 | % | | 3.75 | % | | 5.30 | % | | 5.77 | % | | 1/3/1997 |
| | -Class B | | No Load | | (0.39 | )% | | 3.57 | % | | 3.60 | % | | 3.95 | % | | 5.19 | % | | 5.26 | % | | 3/20/1998 |
| | -Class B | | With Load | | (5.26 | )% | | (1.37 | )% | | 2.69 | % | | 3.61 | % | | 5.19 | % | | 5.26 | % | | 3/21/1998 |
| | -Class C | | No Load | | (0.46 | )% | | 3.50 | % | | 3.56 | % | | 3.93 | % | | 5.19 | % | | 5.38 | % | | 3/5/1998 |
| | -Class C | | With Load | | (1.43 | )% | | 2.51 | % | | 3.56 | % | | 3.93 | % | | 5.19 | % | | 5.38 | % | | 3/6/1998 |
| | -Institutional Class | | 0.05 | % | | 4.59 | % | | 4.64 | % | | 4.99 | % | | 6.24 | % | | 6.66 | % | | 1/2/1997 |
Lehman Brothers U.S. Aggregate Bond Index | | 1.13 | % | | 7.12 | % | | 4.09 | % | | 3.85 | % | | 5.68 | % | | 6.16 | % | | 1/2/1997 |
Note: Returns greater than one year are annualized.
As noted above, for the six months ended June 30, 2008, the Managers AMG Chicago Equity Partners Mid Cap Fund (Institutional class) returned -5.48%, compared to a return of -3.90% for the S&P Mid Cap 400 Index, the Fund’s primary benchmark. Despite the shortfall relative to the benchmark for the period, the Fund performed well relative to peers over the trailing six month period.
Much of the Fund’s relative underperformance during the period was concentrated in the first half of the period. Chicago Equity Partners, LLC (“CEP”), the Fund’s subadvisor, uses a quantitative model to guide stock selection, whereby the top-rated stocks in their model exhibit a combination of growing earnings, positive price momentum, lower valuations, and higher-quality balance sheets. During the second half of 2007 and the first quarter of 2008, the long-term relationship of being positive in the four factor groups did not produce positive returns. During the second quarter, however, CEP began to see the relationship come back into favor. Specifically, as the market was pricing in an extended slowing economy, the higher-quality stocks began outperforming again. CEP also noted that the momentum factors in the model have worked well over the last several quarters, and continued to do so during the second quarter. On a sector basis, stock selection was positive in the information technology, materials and consumer staples sectors. This, however, was offset by negative stock selection within energy, industrials and health care.
Looking forward, CEP remains steadfast in their people, philosophy and process, noting that past periods of underperformance have often led to longer periods of outperformance. The firm believes that dislocations in the current market bring great opportunities for the future.
As noted above, for the six months ended June 30, 2008, the Managers AMG Chicago Equity Partners Balanced Fund (Institutional class) returned -4.74%, compared to a return of -6.59% for the hypothetical index consisting of 60% S&P 500 Index and 40% Lehman Brothers U.S. Aggregate Bond Index, the Fund’s primary benchmark. Not only do these results surpass those of the index, but the Fund compares well to peers during the trailing six months and over all significant time periods.
During the period, both the equity and fixed income portions of the Fund contributed positively to relative performance. The equity portion of the Fund benefited from exposure to CEP’s momentum factors, as has been the case since 2007. Quality factors also added value during the first half of 2008, after being out of favor in 2007. The firm’s model also had good discrimination between the highest-rated stocks and the lowest-rated stocks during the period. Within the fixed income portion of the Fund, relative returns were positively impacted by the bias toward Treasuries and high-quality, investment-grade corporate bonds, particularly in the first half of the period.
As of June 30, 2008, the Fund was underweight in equities, with an allocation of 52% equities and 48% fixed income. The asset-allocation decision to underweight equities has helped the Fund’s overall performance. Similar
2
Letter to Shareholders (continued)
to past experiences, CEP remains extremely confident that the equity market will return to focus on long-term fundamentals, which are the driving factors in their investment process. Meanwhile, CEP expects to continue managing the fixed income portion with caution, and will look to continue to take advantage of the changing conditions currently in play.
As noted above, for the six months ended June 30, 2008, the Managers High Yield Fund (Institutional class) returned -1.68%, compared to a return of -1.31% for its benchmark, the Lehman Brothers U.S. Corporate High Yield Index. Nevertheless, returns have been more favorable over long-term periods and the Fund ranks well above median relative to peers over all significant time periods. For the period, the modest underperformance can be mostly attributed to poor performance within the chemicals, automotive, and retailers sectors. Similarly, abnormally large fund flows during the second quarter hurt performance since the flows occurred during a period of below-average liquidity within the high-yield market, which led to less-than-desirable pricing. These detractors were partly offset by decent relative performance within the telecommunications, financials, and gaming sectors.
Since the middle of 2007, the yield spread between Treasuries and high-yield bonds has widened over 500 basis points, due to strong performance by U.S. Treasuries and falling prices in the high-yield market. While performance during this period has been a little disappointing on a relative and absolute basis, J.P. Morgan Investment Management LLC (“J.P. Morgan”), the Fund’s subadvisor, feels that high yield bonds are currently attractively valued and that prices fell because many are forecasting a significant increase in the default rate as economic growth slows and the credit crunch continues to evolve. J.P. Morgan also believes that the default rate will increase over the next few quarters, but not as drastically as some expect, citing better corporate fundamentals now compared to previous credit crises. Combining these factors, along with high absolute yields, helps support J.P. Morgan’s belief that high-yield investing currently presents a solid opportunity for long-term investors.
As noted above, for the six months ended June 30, 2008, the Managers Fixed Income Fund (Institutional class) returned 0.05%, compared to a return of 1.13% for the Lehman Brothers U.S. Aggregate Index, the Fund’s primary benchmark. While returns for the period are somewhat disappointing, the Fund’s absolute and relative performance is significantly better over three-, five-, and ten-year and since-inception time periods. Furthermore, the Fund ranks in the top ten percent compared to peers over all of those time periods. During the period, the Fund trailed the benchmark primarily due to its greater-than-benchmark allocation to corporate bonds and the related underweight to Treasuries. Much of the underperformance was concentrated during the first quarter, when corporate bonds underperformed Treasuries by nearly 500 basis points. Spreads did narrow somewhat during the second quarter, but corporate bonds still finished the period more than 260 basis points behind Treasuries. Security selection within the industrial sector also detracted from relative returns for the period, while a small allocation to non-U.S. bonds contributed positively.
The widening trend in corporate bond spreads has created what Loomis, Sayles & Co., L.P. (“Loomis”), the Fund’s subadvisor, deems to be attractive buying opportunities. Over the past several quarters, Loomis has been gradually decreasing the Fund’s exposure to Treasuries and using the proceeds to carefully allocate to corporate bonds. As of June 30, 2008, nearly 70% of the Fund’s assets were in corporates, versus roughly 20% for the index. Loomis also believes that security selection will likely prove to be more critical moving forward, as default rates are expected to trend upward and market conditions remain vulnerable to the possibility of further economic deterioration. Loomis has lowered its growth forecast for the balance of 2008, due primarily to rising energy costs. Their forecast is for moderate growth in 2009, as the banks recover, credit improves, and the bulk of the damage from the housing crisis moves behind us. Energy prices remain a significant risk to this forecast. In the near term, Loomis believes bond yields could move lower as the market backs off expectations of potential tightening, with a sustained move higher unlikely to occur until 2009. Assuming the economy begins to recover as they have forecast, Loomis believes rate hikes could begin in the second quarter of 2009.
The following report covers the six month period ended June 30, 2008. Should you have any questions about this report, or if you’d like to receive a prospectus and additional information, including fees and expenses for either of these or any of the other Funds in our family, please feel free to contact us at 1-800-835-3879, or visit our Web site at www.managersinvest.com. As always, please read the prospectus carefully before you invest or send money.
If you are curious about how you can better diversify your investment program, visit the Knowledge Center on our Web site and view our articles in the investment strategies section. You can rest assured that under all market conditions our team is focused on delivering excellent investment management services for your benefit.
We thank you for your continued confidence and investment in The Managers Funds.
|
| Respectfully, |
|
 |
| John H. Streur |
Senior Managing Partner Managers Investment Group LLC |
3
About Your Fund’s Expenses (unaudited)
As a shareholder of the Fund, you incur two types of costs: (1) transaction costs, including sales charges (loads) on purchase payments; reinvested dividends or other distributions; redemption fees; and exchange fees; and (2) ongoing costs, including management fees; distribution (12b-1) fees; and other Fund expenses. This Example is intended to help you understand your ongoing costs (in dollars) of investing in the Fund and to compare these costs with the ongoing costs of investing in other mutual funds. The Example is based on an investment of $1,000 invested at the beginning of the period and held for the entire period as indicated below.
Actual Fund Return
The first line of the table below provides information about actual account values and actual expenses. You may use the information in this line, together with the amount you invested, to estimate the expenses that you paid over the period. Simply divide your account value by $1,000 (for example, an $8,600 account value divided by $1,000 = 8.6), then multiply the result by the number in the first line under the heading entitled “Expenses Paid During Period” to estimate the expenses you paid on your account during this period.
Hypothetical Example for Comparison Purposes
The second line of the table below provides information about hypothetical account values and hypothetical expenses based on the Fund’s actual expense ratio and an assumed rate of return of 5% per year before expenses, which is not the Fund’s actual return. The hypothetical account values and expenses may not be used to estimate the actual ending account balance or expenses you paid for the period. You may use this information to compare the ongoing costs of investing in the Fund and other funds. To do so, compare this 5% hypothetical example with the 5% hypothetical examples that appear in the shareholder reports of the other funds.
Please note that the expenses shown in the table are meant to highlight your ongoing costs only and do not reflect any transactional costs, such as sales charges (loads), redemption fees, or exchange fees. Therefore, the second line of the table is useful in comparing ongoing costs only, and will not help you determine the relative total costs of owning different funds. In addition, if these transactional costs were included, your costs would have been higher.
| | | | | | | | | | | | |
Six Months Ended June 30, 2008 | | Expense
Ratio for
the Period | | | Beginning
Account Value
1/1/2008 | | Ending
Account Value
6/30/2008 | | Expenses
Paid During
Period* |
Managers AMG Chicago Equity Partners Mid-Cap Fund Class A | | | | | | | | | | | | |
Based on Actual Fund Return | | 1.24 | % | | $ | 1,000 | | $ | 944 | | $ | 5.99 |
Based on Hypothetical 5% Annual Return | | 1.24 | % | | $ | 1,000 | | $ | 1,019 | | $ | 6.22 |
Managers AMG Chicago Equity Partners Mid-Cap Fund Class B | | | | | | | | | | | | |
Based on Actual Fund Return | | 1.99 | % | | $ | 1,000 | | $ | 941 | | $ | 9.60 |
Based on Hypothetical 5% Annual Return | | 1.99 | % | | $ | 1,000 | | $ | 1,015 | | $ | 9.97 |
Managers AMG Chicago Equity Partners Mid-Cap Fund Class C | | | | | | | | | | | | |
Based on Actual Fund Return | | 1.99 | % | | $ | 1,000 | | $ | 941 | | $ | 9.59 |
Based on Hypothetical 5% Annual Return | | 1.99 | % | | $ | 1,000 | | $ | 1,015 | | $ | 9.97 |
Managers AMG Chicago Equity Partners Mid-Cap Fund Institutional Class | | | | | | | | | | | | |
Based on Actual Fund Return | | 0.99 | % | | $ | 1,000 | | $ | 945 | | $ | 4.79 |
Based on Hypothetical 5% Annual Return | | 0.99 | % | | $ | 1,000 | | $ | 1,020 | | $ | 4.97 |
| * | Expenses are equal to the Fund’s annualized expense ratio multiplied by the average account value over the period, multiplied by the number of days in the most recent fiscal half-year (182), then divided by 366. |
4
About Your Fund’s Expenses (continued)
| | | | | | | | | | | | |
Six Months Ended June 30, 2008 | | Expense
Ratio for
the Period | | | Beginning
Account Value
6/1/2008 | | Ending
Account Value
6/30/2008 | | Expenses
Paid During
Period* |
Managers AMG Chicago Equity Partners Balanced Fund Class A | | | | | | | | | | | | |
Based on Actual Fund Return | | 1.25 | % | | $ | 1,000 | | $ | 951 | | $ | 6.06 |
Based on Hypothetical 5% Annual Return | | 1.25 | % | | $ | 1,000 | | $ | 1,019 | | $ | 6.27 |
Managers AMG Chicago Equity Partners Balanced Fund Class B | | | | | | | | | | | | |
Based on Actual Fund Return | | 2.00 | % | | $ | 1,000 | | $ | 947 | | $ | 9.68 |
Based on Hypothetical 5% Annual Return | | 2.00 | % | | $ | 1,000 | | $ | 1,015 | | $ | 10.02 |
Managers AMG Chicago Equity Partners Balanced Fund Class C | | | | | | | | | | | | |
Based on Actual Fund Return | | 2.00 | % | | $ | 1,000 | | $ | 948 | | $ | 9.68 |
Based on Hypothetical 5% Annual Return | | 2.00 | % | | $ | 1,000 | | $ | 1,015 | | $ | 10.02 |
Managers AMG Chicago Equity Partners Balanced Fund Institutional Class | | | | | | | | | | | | |
Based on Actual Fund Return | | 1.00 | % | | $ | 1,000 | | $ | 953 | | $ | 4.85 |
Based on Hypothetical 5% Annual Return | | 1.00 | % | | $ | 1,000 | | $ | 1,020 | | $ | 5.02 |
Managers High Yield Fund Class A | | | | | | | | | | | | |
Based on Actual Fund Return | | 1.15 | % | | $ | 1,000 | | $ | 983 | | $ | 5.67 |
Based on Hypothetical 5% Annual Return | | 1.15 | % | | $ | 1,000 | | $ | 1,019 | | $ | 5.77 |
Managers High Yield Fund Class B | | | | | | | | | | | | |
Based on Actual Fund Return | | 1.90 | % | | $ | 1,000 | | $ | 980 | | $ | 9.35 |
Based on Hypothetical 5% Annual Return | | 1.90 | % | | $ | 1,000 | | $ | 1,015 | | $ | 9.52 |
Managers High Yield Fund Class C | | | | | | | | | | | | |
Based on Actual Fund Return | | 1.90 | % | | $ | 1,000 | | $ | 978 | | $ | 9.35 |
Based on Hypothetical 5% Annual Return | | 1.90 | % | | $ | 1,000 | | $ | 1,015 | | $ | 9.52 |
Managers High Yield Fund Institutional Class | | | | | | | | | | | | |
Based on Actual Fund Return | | 0.90 | % | | $ | 1,000 | | $ | 983 | | $ | 4.44 |
Based on Hypothetical 5% Annual Return | | 0.90 | % | | $ | 1,000 | | $ | 1,020 | | $ | 4.52 |
Managers Fixed Income Fund Class A | | | | | | | | | | | | |
Based on Actual Fund Return | | 0.84 | % | | $ | 1,000 | | $ | 1,000 | | $ | 4.18 |
Based on Hypothetical 5% Annual Return | | 0.84 | % | | $ | 1,000 | | $ | 1,021 | | $ | 4.22 |
Managers Fixed Income Fund Class B | | | | | | | | | | | | |
Based on Actual Fund Return | | 1.59 | % | | $ | 1,000 | | $ | 996 | | $ | 7.89 |
Based on Hypothetical 5% Annual Return | | 1.59 | % | | $ | 1,000 | | $ | 1,017 | | $ | 7.97 |
Managers Fixed Income Fund Class C | | | | | | | | | | | | |
Based on Actual Fund Return | | 1.59 | % | | $ | 1,000 | | $ | 995 | | $ | 7.89 |
Based on Hypothetical 5% Annual Return | | 1.59 | % | | $ | 1,000 | | $ | 1,017 | | $ | 7.97 |
Managers Fixed Income Fund Institutional Class | | | | | | | | | | | | |
Based on Actual Fund Return | | 0.59 | % | | $ | 1,000 | | $ | 1,001 | | $ | 2.93 |
Based on Hypothetical 5% Annual Return | | 0.59 | % | | $ | 1,000 | | $ | 1,022 | | $ | 2.97 |
| * | Expenses are equal to the Fund’s annualized expense ratio multiplied by the average account value over the period, multiplied by the number of days in the most recent fiscal half-year (182), then divided by 366. |
5
Funds’ Performance
All periods ended June 30, 2008 (unaudited)
| | | | | | | | | | | | | | | | | | |
Average Annual Total Returns1 | | | | | | Six
Months | | | 1 Year | | | 5 Years | | | 10 Years | | | Inception
Date |
Mid-Cap3 | | -Class A | | No Load | | (5.63 | )% | | (15.13 | )% | | 9.87 | % | | 8.99 | % | | 01/02/97 |
| | -Class A | | With Load | | (11.03 | )% | | (20.02 | )% | | 8.58 | % | | 8.35 | % | | 01/02/97 |
| | -Class B | | No Load | | (5.94 | )% | | (16.02 | )% | | 9.14 | % | | 8.37 | % | | 01/28/98 |
| | -Class B | | With Load | | (10.64 | )% | | (19.92 | )% | | 8.85 | % | | 8.37 | % | | 01/28/98 |
| | -Class C | | No Load | | (5.94 | )% | | (15.98 | )% | | 9.09 | % | | 8.40 | % | | 02/19/98 |
| | -Class C | | With Load | | (6.88 | )% | | (16.76 | )% | | 9.09 | % | | 8.40 | % | | 02/19/98 |
| | -Institutional Class | | No Load | | (5.48 | )% | | (15.15 | )% | | 10.17 | % | | 9.43 | % | | 01/02/97 |
S&P Mid Cap 400 Index4 | | (3.90 | )% | | (7.34 | )% | | 12.61 | % | | 9.84 | % | | |
Balanced2 | | -Class A | | No Load | | (4.89 | )% | | (4.61 | )% | | 7.44 | % | | 6.15 | % | | 01/02/97 |
| | -Class A | | With Load | | (10.34 | )% | | (10.09 | )% | | 6.17 | % | | 5.53 | % | | 01/02/97 |
| | -Class B | | No Load | | (5.26 | )% | | (5.31 | )% | | 6.71 | % | | 5.56 | % | | 02/10/98 |
| | -Class B | | With Load | | (9.97 | )% | | (9.98 | )% | | 6.40 | % | | 5.56 | % | | 02/10/98 |
| | -Class C | | No Load | | (5.25 | )% | | (5.27 | )% | | 6.71 | % | | 5.56 | % | | 02/13/98 |
| | -Class C | | With Load | | (6.19 | )% | | (6.21 | )% | | 6.71 | % | | 5.56 | % | | 02/13/98 |
| | -Institutional Class | | No Load | | (4.74 | )% | | (4.34 | )% | | 7.79 | % | | 6.60 | % | | 01/02/97 |
60% S&P 500 Index & 40% Lehman Brothers Aggregate Bond Index5 | | (6.59 | )% | | (4.92 | )% | | 6.35 | % | | 4.47 | % | | |
High Yield2,8 | | -Class A | | No Load | | (1.72 | )% | | (2.22 | )% | | 6.68 | % | | 5.04 | % | | 01/02/98 |
| | -Class A | | With Load | | (5.95 | )% | | (6.37 | )% | | 5.75 | % | | 4.59 | % | | 01/02/98 |
| | -Class B | | No Load | | (2.03 | )% | | (3.08 | )% | | 5.91 | % | | 4.41 | % | | 02/19/98 |
| | -Class B | | With Load | | (6.76 | )% | | (7.61 | )% | | 5.61 | % | | 4.41 | % | | 02/19/98 |
| | -Class C | | No Load | | (2.16 | )% | | (3.21 | )% | | 5.90 | % | | 4.40 | % | | 02/19/98 |
| | -Class C | | With Load | | (3.10 | )% | | (4.11 | )% | | 5.90 | % | | 4.40 | % | | 02/19/98 |
| | -Institutional Class | | No Load | | (1.68 | )% | | (2.14 | )% | | 6.99 | % | | 5.49 | % | | 03/02/98 |
Lehman Brothers U.S. Corporate High Yield Index6 | | (1.31 | )% | | (2.26 | )% | | 6.92 | % | | 4.91 | % | | |
Fixed Income2,9 | | -Class A | | No Load | | (0.02 | )% | | 4.34 | % | | 4.66 | % | | 5.76 | % | | 01/02/97 |
| | -Class A | | With Load | | (4.29 | )% | | (0.08 | )% | | 3.75 | % | | 5.30 | % | | 01/02/97 |
| | -Class B | | No Load | | (0.39 | )% | | 3.57 | % | | 3.95 | % | | 5.19 | % | | 03/20/98 |
| | -Class B | | With Load | | (5.26 | )% | | (1.37 | )% | | 3.61 | % | | 5.19 | % | | 03/20/98 |
| | -Class C | | No Load | | (0.46 | )% | | 3.50 | % | | 3.93 | % | | 5.19 | % | | 03/05/98 |
| | -Class C | | With Load | | (1.43 | )% | | 2.51 | % | | 3.93 | % | | 5.19 | % | | 03/05/98 |
| | -Institutional Class | | No Load | | (0.05 | )% | | 4.59 | % | | 4.99 | % | | 6.24 | % | | 01/02/97 |
Lehman Brothers U.S. Aggregate Bond Index7 | | | | 1.13 | % | | 7.12 | % | | 3.85 | % | | 5.68 | % | | |
The performance data shown represents past performance. Past performance is not a guarantee of future results. Current performance may be lower or higher than the performance data quoted. The investment return and the principal value of an investment will fluctuate so that an investor’s shares, when redeemed, may be worth more or less than their original cost. For performance information through the most recent month end please call (800) 835-3879 or visit our Web site at www.managersinvest.com.
6
Managers Funds Performance
All periods ended June 30, 2008 (continued)
Performance differences among the share classes are due to differences in sales charge structures and class expenses. Returns shown reflect maximum sales charge of 5.75% on Class A (4.25% maximum for Managers High Yield and Fixed Income Funds), as well as the applicable contingent deferred sales charge (CDSC) on both Class B and C shares. The Class B shares’ CDSC declines annually between years 1 through 6 according to the following schedule: 5, 4, 3, 3, 2, 1%. No sales charge is assessed after year six. Class C shares held for less than one year are subject to a 1% CDSC.
The Fund share classes differ with regard to sales charges and Fund expenses. In choosing a Fund and class(es), investors should consider the amount they plan to invest, their investment objectives, the Fund’s investment objectives, risks, charges, and expenses carefully before investing, and how long they intend to keep their money invested in the Fund and class(es). Each Fund’s prospectus contains information concerning the Fund’s investment objective, risk, charges, and expenses and other information. Additional risks are associated with investing in high yield securities and such securities may be considered speculative. There are also risks associated with investing in small-cap companies, such as increased volatility, and bonds, such as rising interest rates. More specifically, the value of debt instruments held in bond funds declines when interest rates rise and longer-term bonds are more vulnerable to interest rate risk. To obtain a prospectus, please call 800-835-3879 or visit our Web site at www.managersinvest.com. Please read the Prospectus carefully before you invest in a Fund or send money. Investors should discuss their goals and choices with a registered financial professional in order to determine which share class is appropriate for them.
Distributed by Managers Distributors, Inc., member FINRA.
1 | Total return equals income yield plus share price change and assumes reinvestment of all dividends and capital gain distributions. Returns are net of fees and may reflect offsets of Fund expenses as described in the Prospectus. No adjustment has been made for taxes payable by shareholders on their reinvested dividends and capital gain distributions. Returns for periods greater than one year are annualized. The listed returns on the Fund are net of expenses and based on the published NAV as of June 30, 2008. All returns are in U.S. dollars ($). |
2 | Changing interest rates may adversely affect the value of an investment. An increase in interest rates typically causes the value of bonds and other fixed-income securities to fall. |
3 | The Fund is subject to risks associated with investments in mid-capitalization companies, such as erratic earnings patterns, competitive conditions, limited earnings history, and a reliance on a limited number of products. |
4 | The S&P Mid Cap 400 Index is the most widely used index for mid-size companies and covers approximately 7% of the U.S. equities market. Unlike the Fund, the S&P Mid Cap 400 Index is unmanaged, is not available for investment, and does not incur expenses. |
5 | The benchmark is composed of 60% S&P 500 Index and 40% Lehman Brothers Aggregate Bond Index. |
6 | The Lehman Brothers U.S. Corporate High Yield Index is a total return performance benchmark for fixed income securities having a maximum quality rating of Ba1 (as determined by Moody’s Investors Service). Unlike the Fund, the Lehman Brothers U.S. Corporate High Yield Bond Index is unmanaged, is not available for investment, and does not incur expenses. |
7 | The Lehman Brothers Aggregate Bond Index is an index of the U.S. investment-grade fixed-rate bond market, including both government and corporate bonds. Unlike the Fund, the Lehman Brothers Aggregate Bond Index is unmanaged, is not available for investment, and does not incur expenses. |
8 | The Fund holds securities in which the issuer of the security may default or otherwise be unable to honor a financial obligation. The Fund holds securities rated below investment grade that are especially susceptible to this risk. These issuers may be involved in bankruptcy proceedings, reorganizations, or financial restructurings, and are not as strong financially as higher rated issuers. |
9 | Fixed-income funds are subject to the risks associated with investments in debt securities, such as default risk and fluctuations in the perception of the debtors ability to pay its creditors. |
Not FDIC insured, nor bank guaranteed. May lose value.
7
Managers AMG Chicago Equity Partners Mid-Cap Fund
Fund Snapshots
June 30, 2008 (unaudited)
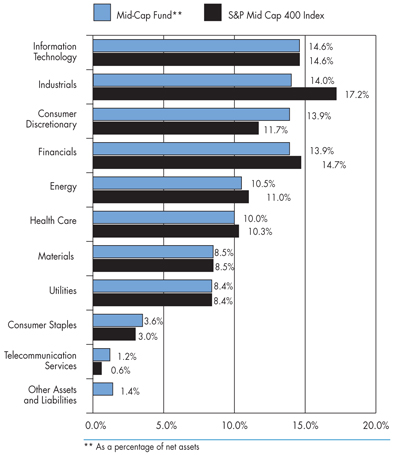
Portfolio Breakdown
| | | | | | |
Industry | | Mid-Cap** | | | S&P Mid Cap
400 Index | |
Information Technology | | 14.6 | % | | 14.6 | % |
Industrials | | 14.0 | % | | 17.2 | % |
Consumer Discretionary | | 13.9 | % | | 11.7 | % |
Financials | | 13.9 | % | | 14.7 | % |
Energy | | 10.5 | % | | 11.0 | % |
Health Care | | 10.0 | % | | 10.3 | % |
Materials | | 8.5 | % | | 8.5 | % |
Utilities | | 8.4 | % | | 8.4 | % |
Consumer Staples | | 3.6 | % | | 3.0 | % |
Telecommunication Services | | 1.2 | % | | 0.6 | % |
Other Assets and Liabilities | | 1.4 | % | | 0.0 | % |
Top Ten Holdings
| | | |
Top Ten Holdings | | % of
Net Assets | |
FMC Technologies, Inc.* | | 3.6 | % |
Cimarex Energy Co. | | 3.0 | |
Flowserve Corp. | | 2.7 | |
Energen Corp. | | 2.6 | |
AMB Property Corp.* | | 2.3 | |
CF Industries Holdings, Inc. | | 2.3 | |
AGCO Corp.* | | 2.1 | |
Noble Energy, Inc.* | | 2.1 | |
Cummins, Inc.* | | 1.9 | |
AK Steel Holding Corp. | | 1.9 | |
| | | |
Top Ten as a Group | | 24.5 | % |
| | | |
| * | Top Ten Holding at December 31, 2007 |
Any sectors, industries, or securities discussed should not be perceived as investment recommendations. Mention of a specific security should not be considered a recommendation to buy or solicitation to sell that security.
8
Managers AMG Chicago Equity Partners Mid-Cap Fund
Schedule of Portfolio Investments
June 30, 2008 (unaudited)
| | | | | | |
| | | Shares | | | Value |
Common Stocks - 98.6% | | | | | | |
Consumer Discretionary - 13.9% | | | | | | |
Aeropostale, Inc.* | | 7,800 | | | $ | 244,374 |
American Greetings Corp., Class A | | 12,300 | | | | 151,782 |
Autoliv, Inc. | | 8,900 | 2 | | | 414,918 |
Barnes & Noble, Inc. | | 21,400 | 2 | | | 531,576 |
Big Lots, Inc.* | | 10,300 | | | | 321,772 |
Blyth, Inc. | | 11,700 | | | | 140,751 |
Bob Evans Farms, Inc. | | 11,100 | 2 | | | 317,460 |
Burger King Holdings, Inc. | | 3,200 | 2 | | | 85,728 |
Callaway Golf Co. | | 7,300 | 2 | | | 86,359 |
Chipotle Mexican Grill, Inc.* | | 1,100 | 2 | | | 90,882 |
DeVry, Inc. | | 18,400 | | | | 986,608 |
Furniture Brands International, Inc. | | 43,000 | 2 | | | 574,480 |
GameStop Corp.* | | 4,000 | 2 | | | 161,600 |
Hanesbrands, Inc.* | | 8,900 | 2 | | | 241,546 |
Hasbro, Inc. | | 8,800 | | | | 314,336 |
Lear Corp.* | | 14,000 | 2 | | | 198,520 |
Netflix, Inc.* | | 9,100 | 2 | | | 237,237 |
NVR, Inc.* | | 300 | 2 | | | 150,024 |
Penske Automotive Group, Inc. | | 11,200 | 2 | | | 165,088 |
Priceline.com, Inc.* | | 3,000 | 2 | | | 346,380 |
Ross Stores, Inc. | | 14,300 | | | | 507,936 |
Scholastic Corp.* | | 12,500 | 2 | | | 358,250 |
Strayer Education, Inc. | | 4,400 | 2 | | | 919,908 |
Tupperware Brands Corp. | | 8,500 | 2 | | | 290,870 |
Warnaco Group, Inc., The* | | 2,400 | 2 | | | 105,768 |
Total Consumer Discretionary | | | | | | 7,944,153 |
Consumer Staples - 3.6% | | | | | | |
BJ’s Wholesale Club, Inc.* | | 21,900 | 2 | | | 847,530 |
Fresh Del Monte Produce, Inc.* | | 10,300 | 2 | | | 242,771 |
Herbalife Ltd. | | 15,100 | 2 | | | 585,125 |
Tyson Foods, Inc., Class A | | 14,700 | | | | 219,618 |
Universal Corp. | | 3,600 | | | | 162,792 |
Total Consumer Staples | | | | | | 2,057,836 |
Energy - 10.5% | | | | | | |
Cimarex Energy Co. | | 24,500 | 2 | | | 1,706,915 |
Encore Acquisition Co.* | | 2,000 | | | | 150,380 |
FMC Technologies, Inc.* | | 26,400 | | | | 2,030,952 |
Frontline, Ltd. | | 4,700 | 2 | | | 327,966 |
Massey Energy Co. | | 2,500 | | | | 234,375 |
Noble Energy, Inc. | | 11,700 | | | | 1,176,552 |
Whiting Petroleum Corp.* | | 3,500 | | | | 371,280 |
Total Energy | | | | | | 5,998,420 |
Financials - 13.9% | | | | | | |
Allied Capital Corp. | | 10,000 | 2 | | | 138,900 |
AMB Property Corp. | | 26,300 | 2 | | | 1,324,994 |
Annaly Capital Management, Inc. | | 38,700 | 2 | | | 600,237 |
Arch Capital Group, Ltd.* | | 11,400 | | | | 756,048 |
Associated Bank Corp. | | 18,700 | 2 | | | 360,723 |
Axis Capital Holdings, Ltd. | | 20,500 | | | | 611,105 |
Bank of Hawaii Corp. | | 8,800 | | | | 420,640 |
Capitol Federal Financial | | 3,100 | 2 | | | 116,591 |
Cullen/Frost Bankers, Inc. | | 3,100 | 2 | | | 154,535 |
First Industrial Realty Trust, Inc. | | 11,200 | | | | 307,664 |
Hospitality Properties Trust | | 20,300 | 2 | | | 496,538 |
HRPT Properties Trust | | 50,100 | | | | 339,177 |
New York Community Bancorp, Inc. | | 6,300 | 2 | | | 112,392 |
PartnerRe Ltd. | | 3,900 | | | | 269,607 |
Potlatch, Corp. | | 15,400 | | | | 694,848 |
Raymond James Financial, Inc. | | 14,000 | 2 | | | 369,460 |
Stancorp Financial Group, Inc. | | 5,400 | | | | 253,584 |
Waddell & Reed Financial, Inc. | | 11,000 | 2 | | | 385,110 |
Webster Financial Corp. | | 6,700 | | | | 124,620 |
Westamerica Bancorporation | | 2,000 | 2 | | | 105,180 |
Total Financials | | | | | | 7,941,953 |
Health Care - 10.0% | | | | | | |
Applera Corp.* | | 32,000 | | | | 1,071,360 |
Edwards Lifesciences Corp.* | | 9,400 | | | | 583,176 |
Endo Pharmaceuticals Holdings, Inc.* | | 9,800 | 2 | | | 237,062 |
Health Net, Inc.* | | 4,800 | | | | 115,488 |
Invitrogen Corp.* | | 12,000 | 2 | | | 471,120 |
Kindred Healthcare, Inc.* | | 22,700 | | | | 652,852 |
Kinetic Concepts, Inc.* | | 3,800 | 2 | | | 151,658 |
King Pharmaceuticals, Inc.* | | 26,700 | 2 | | | 279,549 |
Lifepoint Hospitals, Inc.* | | 23,400 | 2 | | | 662,220 |
Lincare Holdings, Inc.* | | 5,200 | 2 | | | 147,680 |
OSI Pharmaceuticals, Inc.* | | 5,200 | 2 | | | 214,864 |
Par Pharmaceutical Co., Inc.* | | 18,600 | 2 | | | 301,878 |
Patterson Companies, Inc.* | | 12,200 | 2 | | | 358,558 |
The accompanying notes are an integral part of these financial statements.
9
Managers AMG Chicago Equity Partners Mid-Cap Fund
Schedule of Portfolio Investments (continued)
| | | | | | | |
| | | Shares | | | Value | |
Health Care - 10.0% (continued) | | | | | | | |
PDL BioPharma, Inc.* | | 9,900 | 2 | | | 105,138 | |
Techne Corp.* | | 4,500 | | | | 348,255 | |
Total Health Care | | | | | | 5,700,858 | |
Industrials - 14.0% | | | | | | | |
AGCO Corp.* | | 23,300 | | | | 1,221,153 | |
Alliant Techsystems, Inc.* | | 2,600 | 2 | | | 264,368 | |
Brink’s Co., The | | 5,000 | | | | 327,100 | |
ChoicePoint, Inc.* | | 4,400 | | | | 212,080 | |
Cummins, Inc. | | 16,900 | | | | 1,107,288 | |
Flowserve Corp. | | 11,200 | | | | 1,531,040 | |
Gardner Denver, Inc. | | 1,800 | | | | 102,240 | |
Jacobs Engineering Group, Inc.* | | 6,800 | | | | 548,760 | |
Joy Global, Inc. | | 4,000 | | | | 303,320 | |
KBR, Inc. | | 24,900 | | | | 869,259 | |
Lennox International, Inc. | | 2,800 | | | | 81,088 | |
Manpower, Inc. | | 4,800 | | | | 279,552 | |
Rollins, Inc. | | 8,500 | 2 | | | 125,970 | |
Ryder System, Inc. | | 7,800 | 2 | | | 537,264 | |
Shaw Group, Inc., The* | | 1,400 | | | | 86,506 | |
SPX Corp. | | 1,000 | | | | 131,730 | |
UTi Worldwide, Inc. | | 5,500 | | | | 109,725 | |
Walter Industries, Inc. | | 1,200 | | | | 130,524 | |
Total Industrials | | | | | | 7,968,967 | |
Information Technology - 14.6% | | | | | | | |
Activision, Inc.* | | 16,900 | | | | 575,783 | |
ADC Telecommunications, Inc.* | | 16,500 | | | | 243,705 | |
Affiliated Computer Services, Inc.* | | 3,700 | | | | 197,913 | |
Amkor Technology, Inc.* | | 34,000 | 2 | | | 353,940 | |
Avnet, Inc.* | | 16,500 | | | | 450,120 | |
BMC Software, Inc.* | | 22,500 | | | | 810,000 | |
Hewitt Associates, Inc., Class A* | | 22,400 | 2 | | | 858,592 | |
Ingram Micro, Inc., Class A* | | 31,000 | | | | 550,250 | |
Integrated Device Technology, Inc.* | | 25,700 | 2 | | | 255,458 | |
Intersil Corp., Class A | | 12,900 | | | | 313,728 | |
Metavante Technologies, Inc.* | | 7,300 | 2 | | | 165,126 | |
Plantronics, Inc. | | 32,700 | | | | 729,864 | |
Semtech Corp.* | | 14,500 | | | | 204,015 | |
Silicon Laboratories, Inc.* | | 5,500 | | | | 198,495 | |
Sybase, Inc.* | | 6,000 | 2 | | | 176,520 | |
Synopsys, Inc.* | | 10,100 | 2 | | | 241,491 | |
Tech Data Corp.* | | 20,400 | | | | 691,356 | |
Triquint Semiconductor, Inc.* | | 45,400 | 2 | | | 275,124 | |
Western Digital Corp.* | | 30,100 | | | | 1,039,353 | |
Total Information Technology | | | | | | 8,330,833 | |
Materials - 8.5% | | | | | | | |
AK Steel Holding Corp. | | 15,600 | 2 | | | 1,076,400 | |
Celanese Corp. | | 12,900 | | | | 589,014 | |
CF Industries Holdings, Inc. | | 8,600 | | | | 1,314,080 | |
Compass Minerals International, Inc. | | 1,100 | 2 | | | 88,616 | |
Crown Holdings, Inc.* | | 29,600 | | | | 769,304 | |
Terra Industries, Inc.* | | 13,500 | 2 | | | 666,225 | |
Worthington Industries, Inc. | | 16,400 | 2 | | | 336,200 | |
Total Materials | | | | | | 4,839,839 | |
Telecommunication Services - 1.2% | | | | | | | |
CenturyTel, Inc. | | 8,100 | 2 | | | 288,279 | |
Telephone & Data Systems, Inc. | | 8,400 | | | | 397,068 | |
Total Telecommunication Services | | | | | | 685,347 | |
Utilities - 8.4% | | | | | | | |
Alliant Energy Corp. | | 22,100 | | | | 757,146 | |
DPL, Inc. | | 11,100 | 2 | | | 292,818 | |
Energen Corp. | | 19,000 | | | | 1,482,570 | |
Energy East Corp. | | 9,400 | | | | 232,368 | |
Integrys Energy Group, Inc. | | 8,600 | | | | 437,138 | |
MDU Resources Group, Inc. | | 16,650 | 2 | | | 580,419 | |
Reliant Resources, Inc.* | | 8,200 | | | | 174,414 | |
WGL Holdings, Inc. | | 9,300 | 2 | | | 323,082 | |
Wisconsin Energy Corp. | | 10,700 | | | | 483,854 | |
Total Utilities | | | | | | 4,763,809 | |
Total Common Stocks
(cost $55,541,006) | | | | | | 56,232,015 | |
Other Investment Companies - 28.3%1 | | | | | | | |
Bank of New York Institutional Cash Reserves Fund, 2.62%3 | | 15,272,354 | | | | 15,272,354 | |
Dreyfus Cash Management Fund, Institutional Class Shares, 2.66% | | 882,962 | | | | 882,962 | |
Total Other Investment Companies
(cost $16,155,316) | | | | | | 16,155,316 | |
Total Investments - 126.9%
(cost $71,696,322) | | | | | | 72,387,331 | |
Other Assets, less Liabilities - (26.9)% | | | | | | (15,353,398 | ) |
Net Assets - 100.0% | | | | | $ | 57,033,933 | |
The accompanying notes are an integral part of these financial statements.
10
Managers AMG Chicago Equity Partners Balanced Fund
Fund Snapshots
June 30, 2008 (unaudited)
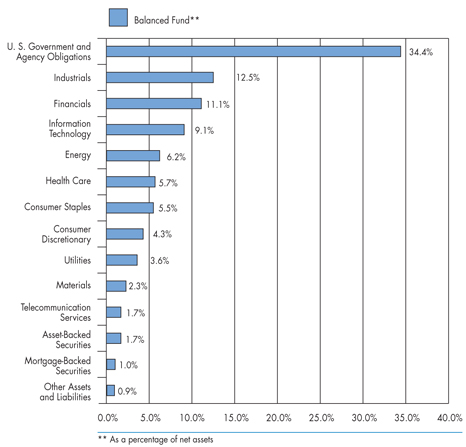
Portfolio Breakdown
| | | |
Industry | | Balanced** | |
U. S. Government and Agency Obligations | | 34.4 | % |
Industrials | | 12.5 | % |
Financials | | 11.1 | % |
Information Technology | | 9.1 | % |
Energy | | 6.2 | % |
Health Care | | 5.7 | % |
Consumer Staples | | 5.5 | % |
Consumer Discretionary | | 4.3 | % |
Utilities | | 3.6 | % |
Materials | | 2.3 | % |
Asset-Backed Securities | | 1.7 | % |
Telecommunication Services | | 1.7 | % |
Mortgage-Backed Securities | | 1.0 | % |
Other Assets and Liabilities | | 0.9 | % |
Top Ten Holdings
| | | |
Top Ten Holdings | | % of
Net Assets | |
FNMA, 5.500%, 02/01/37* | | 7.8 | % |
FNMA, 5.000%, 02/01/36 | | 5.0 | |
FNMA, 6.000%, 03/01/37* | | 4.3 | |
Exxon Mobil Corp.* | | 2.7 | |
FHLB 4.750%, 12/16/16 | | 2.4 | |
FHLMC, 4.375%, 07/17/15 | | 2.4 | |
USTN, 4.750%, 08/15/17 | | 2.1 | |
FNMA, 6.500%, 03/01/37 | | 1.8 | |
FNMA, 4.500%, 09/01/35 | | 1.8 | |
Johnson & Johnson, Co. | | 1.6 | |
| | | |
Top Ten as a Group | | 31.9 | % |
| | | |
| * | Top Ten Holding at December 31, 2007 |
Any sectors, industries, or securities discussed should not be perceived as investment recommendations. Mention of a specific security should not be considered a recommendation to buy or solicitation to sell that security.
11
Managers AMG Chicago Equity Partners Balanced Fund
Schedule of Portfolio Investments
June 30, 2008 (unaudited)
| | | | | | |
Security Description | | Shares | | | Value |
Common Stocks - 51.6% | | | | | | |
Consumer Discretionary - 4.3% | | | | | | |
Best Buy Co., Inc. | | 1,000 | | | $ | 39,600 |
CBS Corp., Class B | | 3,700 | 2 | | | 72,113 |
Goodyear Tire & Rubber Co.* | | 600 | 2 | | | 10,698 |
McDonald’s Corp. | | 3,500 | | | | 196,770 |
Nike, Inc. | | 800 | | | | 47,688 |
Omnicom Group, Inc. | | 1,600 | | | | 71,808 |
RadioShack Corp. | | 3,900 | 2 | | | 47,853 |
TJX Co., Inc. | | 4,900 | 2 | | | 154,203 |
Walt Disney Co., The | | 3,700 | | | | 115,440 |
Total Consumer Discretionary | | | | | | 756,173 |
Consumer Staples - 5.5% | | | | | | |
Altria Group, Inc. | | 1,820 | | | | 37,419 |
Anheuser-Busch Companies, Inc. | | 500 | | | | 31,060 |
Avon Products, Inc. | | 2,600 | | | | 93,652 |
Bunge, Ltd. | | 900 | 2 | | | 96,921 |
Costco Wholesale Corp. | | 1,800 | 2 | | | 126,252 |
Herbalife Ltd. | | 1,700 | 2 | | | 65,875 |
Kroger Co., The | | 5,100 | | | | 147,237 |
Lorillard, Inc.* | | 378 | | | | 26,142 |
PepsiCo, Inc. | | 2,600 | | | | 165,334 |
Philip Morris International, Inc. | | 1,220 | | | | 60,256 |
Procter & Gamble Co., The | | 1,412 | | | | 85,864 |
Tyson Foods, Inc., Class A | | 1,800 | | | | 26,892 |
Total Consumer Staples | | | | | | 962,904 |
Energy - 6.2% | | | | | | |
Chevron Corp. | | 700 | | | | 69,391 |
ConocoPhillips Co. | | 1,300 | | | | 122,707 |
Devon Energy Corp. | | 900 | | | | 108,144 |
Exxon Mobil Corp. | | 5,370 | | | | 473,258 |
FMC Technologies, Inc.* | | 1,500 | 2 | | | 115,395 |
Massey Energy Co. | | 700 | | | | 65,625 |
Murphy Oil Corp. | | 800 | 2 | | | 78,440 |
Valero Energy Corp. | | 1,500 | | | | 61,770 |
Total Energy | | | | | | 1,094,730 |
Financials - 7.4% | | | | | | |
Aflac, Inc. | | 900 | 2 | | | 56,520 |
AMB Property Corp. | | 400 | | | | 20,152 |
Annaly Capital Management, Inc. | | 4,700 | 2 | | | 72,897 |
CBL & Associates Properties, Inc. | | 1,000 | | | | 22,840 |
The accompanying notes are an integral part of these financial statements.
12
Managers AMG Chicago Equity Partners Balanced Fund
Schedule of Portfolio Investments (continued)
| | | | | | |
Security Description | | Shares | | | Value |
Financials - 7.4% (continued) | | | | | | |
Charles Schwab Corp., The | | 1,300 | | | $ | 26,702 |
Chubb Corp., The | | 2,800 | | | | 137,228 |
Goldman Sachs Group, Inc. | | 1,100 | | | | 192,390 |
Hospitality Properties Trust | | 1,000 | 2 | | | 24,460 |
HRPT Properties Trust | | 2,400 | 2 | | | 16,248 |
Hudson City Bancorp, Inc. | | 2,100 | 2 | | | 35,028 |
Janus Capital Group, Inc. | | 1,200 | 2 | | | 31,764 |
JPMorgan Chase & Co. | | 7,248 | | | | 248,679 |
Loews Corp. | | 459 | | | | 21,527 |
Morgan Stanley Co. | | 300 | | | | 10,821 |
Northern Trust Corp. | | 1,700 | | | | 116,569 |
ProLogis | | 500 | 2 | | | 27,175 |
SunTrust Banks, Inc. | | 1,000 | 2 | | | 36,220 |
Travelers Companies, Inc., The | | 3,600 | | | | 156,240 |
U.S. Bancorp | | 2,000 | | | | 55,780 |
Total Financials | | | | | | 1,309,240 |
Health Care - 5.7% | | | | | | |
AmerisourceBergen Corp. | | 2,000 | | | | 79,980 |
Biogen Idec, Inc.* | | 900 | | | | 50,301 |
CIGNA Corp. | | 400 | | | | 14,156 |
Express Scripts, Inc.* | | 1,100 | 2 | | | 68,992 |
Humana, Inc.* | | 1,700 | | | | 67,609 |
Intuitive Surgical, Inc.* | | 300 | 2 | | | 80,820 |
Invitrogen Corp.* | | 3,200 | 2 | | | 125,632 |
Johnson & Johnson, Co. | | 4,480 | | | | 288,243 |
Pfizer, Inc. | | 13,240 | | | | 231,303 |
Total Health Care | | | | | | 1,007,036 |
Industrials - 7.1% | | | | | | |
Boeing Co., The | | 2,200 | | | | 144,584 |
CSX Corp. | | 1,300 | | | | 81,653 |
Cummins, Inc. | | 3,500 | 2 | | | 229,320 |
Emerson Electric Co. | | 3,700 | | | | 182,965 |
Fluor Corp. | | 600 | | | | 111,648 |
Grainger, Inc. | | 1,000 | 2 | | | 81,800 |
Honeywell International, Inc. | | 600 | | | | 30,168 |
Manpower, Inc. | | 400 | | | | 23,296 |
McDermott International, Inc.* | | 3,600 | | | | 222,804 |
Raytheon Co. | | 1,200 | | | | 67,536 |
Southwest Airlines Co. | | 3,200 | 2 | | | 41,728 |
Tyco International Ltd. | | 600 | | | | 24,024 |
Total Industrials | | | | | | 1,241,526 |
The accompanying notes are an integral part of these financial statements.
13
Managers AMG Chicago Equity Partners Balanced Fund
Schedule of Portfolio Investments (continued)
| | | | | | | |
Security Description | | Shares | | | Value |
Information Technology - 9.1% | | | | | | | |
Accenture Ltd. | | | 6,000 | 2 | | $ | 244,320 |
ADC Telecommunications, Inc.* | | | 3,300 | 2 | | | 48,741 |
BMC Software, Inc.* | | | 800 | | | | 28,800 |
Ciena Corp.* | | | 2,300 | 2 | | | 53,291 |
Hewitt Associates, Inc., Class A* | | | 2,000 | | | | 76,660 |
Hewlett-Packard Co. | | | 6,200 | | | | 274,102 |
Intel Corp. | | | 3,000 | 2 | | | 64,440 |
International Business Machines Corp. | | | 1,000 | | | | 118,530 |
Intersil Corp., Class A | | | 1,300 | 2 | | | 31,616 |
Juniper Networks, Inc.* | | | 3,200 | 2 | | | 70,976 |
MasterCard, Inc. | | | 400 | 2 | | | 106,208 |
MEMC Electronic Materials, Inc.* | | | 900 | | | | 55,386 |
Microsoft Corp. | | | 9,200 | | | | 253,092 |
Sanmina-SCI Corp.* | | | 11,300 | | | | 14,464 |
Tech Data Corp.* | | | 2,500 | | | | 84,725 |
Texas Instruments, Inc. | | | 2,000 | | | | 56,320 |
Yahoo!, Inc.* | | | 900 | 2 | | | 18,594 |
Total Information Technology | | | | | | | 1,600,265 |
Materials - 2.3% | | | | | | | |
AK Steel Holding Corp. | | | 2,200 | 2 | | | 151,800 |
Celanese Corp. | | | 1,700 | 2 | | | 77,622 |
Mosaic Co., The,* | | | 1,100 | | | | 159,170 |
Owens-Illinois, Inc.* | | | 600 | | | | 25,014 |
Total Materials | | | | | | | 413,606 |
Telecommunication Services - 1.7% | | | | | | | |
AT&T, Inc. | | | 1,170 | | | | 39,417 |
CenturyTel, Inc. | | | 900 | | | | 32,031 |
Telephone & Data Systems, Inc. | | | 1,200 | | | | 56,724 |
Verizon Communications, Inc. | | | 4,900 | | | | 173,460 |
Total Telecommunication Services | | | | | | | 301,632 |
Utilities - 2.3% | | | | | | | |
Constellation Energy Group, Inc. | | | 700 | 2 | | | 57,471 |
Dominion Resources, Inc. | | | 2,300 | 2 | | | 109,227 |
Edison International | | | 2,800 | | | | 143,864 |
Energen Corp. | | | 1,200 | | | | 93,636 |
Total Utilities | | | | | | | 404,198 |
Total Common Stocks
(cost $8,837,188) | | | | | | | 9,091,310 |
| | |
| | | Principal
Amount | | | |
Mortgage-Backed Securities - 1.0% | | | | | | | |
Bank of America Corp., 4.875%, 06/10/39 | | $ | 51,784 | | | | 51,861 |
GE Capital Commercial Mortgage Corp., 4.970%, 08/11/36 | | | 37,088 | | | | 37,068 |
The accompanying notes are an integral part of these financial statements.
14
Managers AMG Chicago Equity Partners Balanced Fund
Schedule of Portfolio Investments (continued)
| | | | | | | |
Security Description | | Principal
Amount | | | Value |
Mortgage-Backed Securities - 1.0% (continued) | | | | | | | |
Greenwich Capital Commercial Funding Corp., Series 2005-GG5, Class A2, 5.117%, 04/10/37 | | $ | 90,000 | | | $ | 89,873 |
Total Mortgage-Backed Securities
(cost $178,365) | | | | | | | 178,802 |
U.S. Government and Agency Obligations - 34.4% | | | | | | | |
FHLB 4.750%, 12/16/16 | | | 425,000 | 2 | | | 428,150 |
FHLMC, 4.375%, 07/17/15 | | | 425,000 | 2 | | | 422,949 |
FHLMC, 4.500%, 01/15/14 | | | 90,000 | 2 | | | 91,198 |
FHLMC, 5.000%, 12/01/20 to 12/15/22 | | | 277,602 | | | | 278,507 |
FNMA, 3.500%, 10/01/10 | | | 80,049 | | | | 79,658 |
FNMA, 4.000%, 10/01/20 to 12/01/21 | | | 78,725 | | | | 74,060 |
FNMA, 4.375%, 04/15/15 | | | 47,842 | | | | 47,750 |
FNMA, 4.500%, 11/01/19 to 09/01/35 | | | 463,628 | | | | 435,797 |
FNMA, 5.000%, 02/01/36 | | | 919,437 | | | | 884,545 |
FNMA, 5.500%, 02/01/22 to 02/01/37 | | | 1,474,203 | | | | 1,457,536 |
FNMA, 6.000%, 03/01/12 to 08/01/37 | | | 1,037,448 | | | | 1,048,721 |
FNMA, 6.500%, 03/01/37 | | | 315,734 | | | | 325,546 |
USTB, 6.125%, 11/15/27 | | | 95,000 | 2 | | | 113,636 |
USTN, 4.750%, 08/15/17 | | | 355,000 | 2 | | | 376,189 |
Total U.S. Government and Agency Obligations
(cost $6,093,736) | | | | | | | 6,064,242 |
Corporate Bonds - 10.4% | | | | | | | |
Finance - 3.7% | | | | | | | |
Allstate Corp., The, 7.200%, 12/01/09 | | | 75,000 | | | | 78,092 |
Bank of America Corp., 5.750%, 12/01/17 | | | 45,000 | | | | 42,335 |
Berkshire Hathaway Finance Corp., 4.850%, 01/15/15 | | | 95,000 | | | | 93,702 |
Chubb Corp., The, 6.500%, 05/15/38 | | | 25,000 | | | | 23,966 |
Citigroup, Inc., 5.500%, 04/11/13 | | | 50,000 | | | | 48,849 |
General Electric Capital Corp., Series MTNA, 6.750%, 03/15/32 | | | 25,000 | | | | 25,248 |
Goldman Sachs Group, Inc., 5.950%, 01/18/18 | | | 45,000 | | | | 43,275 |
JPMorgan Chase & Co., 6.000%, 01/15/18 | | | 60,000 | | | | 58,553 |
Merrill Lynch & Co., Inc., 5.450%, 02/05/13 | | | 30,000 | | | | 28,324 |
Morgan Stanley, 6.600%, 04/01/12 | | | 45,000 | | | | 45,790 |
Travelers Co., Inc., 5.375%, 06/15/12 | | | 40,000 | | | | 40,171 |
U.S. Bank NA, 4.950%, 10/30/14 | | | 70,000 | | | | 69,106 |
Wachovia Corp., 5.300%, 10/15/11 | | | 60,000 | | | | 58,710 |
Total Finance | | | | | | | 656,121 |
Industrials - 5.4% | | | | | | | |
Abbott Laboratories, 5.875%, 05/15/16 | | | 48,000 | | | | 49,463 |
Archer-Daniels-Midland Co., 5.450%, 03/15/18 | | | 45,000 | | | | 43,986 |
AT&T, Inc., 5.100%, 09/15/14 | | | 65,000 | | | | 63,801 |
Bellsouth Capital Funding Corp., 7.750%, 02/15/10 | | | 75,000 | | | | 78,868 |
Burlington Northern Santa Fe Corp., 5.900%, 07/01/12 | | | 35,000 | | | | 36,019 |
Comcast Corp., 5.875%, 02/15/18 | | | 20,000 | | | | 19,276 |
The accompanying notes are an integral part of these financial statements.
15
Managers AMG Chicago Equity Partners Balanced Fund
Schedule of Portfolio Investments (continued)
| | | | | | | |
Security Description | | Principal
Amount | | Value | |
Industrials - 5.4% (continued) | | | | | | | |
E.I. du Pont de Nemours & Co., 5.000%, 01/15/13 | | $ | 40,000 | | $ | 40,378 | |
Hewlett-Packard Co., 4.500%, 03/01/13 | | | 55,000 | | | 54,530 | |
Honeywell International, Inc., 4.250%, 03/01/13 | | | 55,000 | | | 54,277 | |
IBM Corp., 4.750%, 11/29/12 | | | 60,000 | | | 60,890 | |
Kellogg Co., 7.450%, 04/01/31 | | | 25,000 | | | 28,233 | |
Kimberly-Clark Corp., 6.125%, 08/01/17 | | | 40,000 | | | 41,606 | |
Kraft Foods, Inc., 6.875%, 01/26/39 | | | 25,000 | | | 24,338 | |
Kroger Co., 6.750%, 04/15/12 | | | 40,000 | | | 42,159 | |
Lockheed Martin Corp., 7.650%, 05/01/16 | | | 65,000 | | | 73,928 | |
McDonald’s Corp., 4.300%, 03/01/13 | | | 40,000 | | | 39,629 | |
Merck & Co., Inc., 4.750%, 03/01/15 | | | 65,000 | | | 64,284 | |
TransCanada Pipelines Ltd., 4.875%, 01/15/15 | | | 45,000 | | | 42,335 | |
Verizon Communications, Inc., 6.400%, 02/15/38 | | | 20,000 | | | 18,678 | |
Wal-Mart Stores, Inc., 6.500%, 08/15/37 | | | 25,000 | | | 25,814 | |
Wyeth Co., 5.250%, 03/15/13 | | | 40,000 | | | 40,867 | |
Total Industrials | | | | | | 943,359 | |
Utilities - 1.3% | | | | | | | |
Consolidated Edison, Inc., 5.375%, 12/15/15 | | | 75,000 | | | 74,643 | |
Exelon Generation Co. LLC, 6.200%, 10/01/17 | | | 45,000 | | | 43,906 | |
Florida Power & Light Co., 4.850%, 02/01/13 | | | 95,000 | | | 95,341 | |
Midamerican Energy Co., 5.750%, 11/01/35 | | | 25,000 | | | 23,191 | |
Total Utilities | | | | | | 237,081 | |
Total Corporate Bonds
(cost $1,859,031) | | | | | | 1,836,561 | |
Asset-Backed Securities - 1.7% | | | | | | | |
Harley-Davidson Motorcycle Trust, 5.350%, 03/15/13 | | | 185,000 | | | 188,138 | |
John Deere Corp., 5.070%, 04/15/14 | | | 100,000 | | | 100,599 | |
Total Asset-Backed Securities
(cost $284,855) | | | | | | 288,737 | |
| | |
| | | Shares | | | |
Other Investment Companies - 24.0%1 | | | | | | | |
Bank of New York Institutional Cash Reserves Fund, 2.62%3 | | | 3,906,370 | | | 3,906,370 | |
Dreyfus Cash Management Fund, Institutional Class Shares, 2.66% | | | 314,160 | | | 314,160 | |
Total Other Investment Companies
(cost $4,220,530) | | | | | | 4,220,530 | |
Total Investments - 123.1%
(cost $21,473,705) | | | | | | 21,680,182 | |
Other Assets, less Liabilities - (23.1)% | | | | | | (4,068,609 | ) |
Net Assets - 100.0% | | | | | $ | 17,611,573 | |
The accompanying notes are an integral part of these financial statements.
16
Managers High Yield Fund
Fund Snapshots
June 30, 2008 (unaudited)
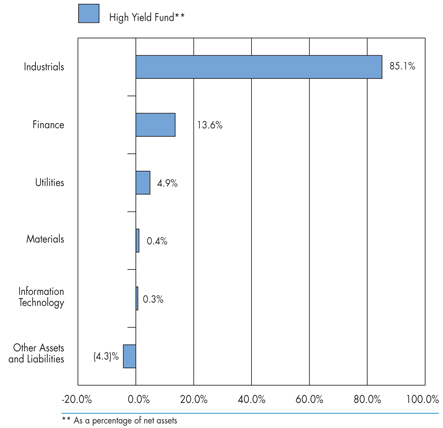
Portfolio Breakdown
| | | |
Industry | | High Yield** | |
Industrials | | 85.1 | % |
Finance | | 13.6 | % |
Utilities | | 4.9 | % |
Materials | | 0.4 | % |
Information Technology | | 0.3 | % |
Other Assets and Liabilities | | (4.3 | )% |
Top Ten Holdings
| | | |
Top Ten Holdings | | % of
Net Assets | |
EchoStar Communications Corp., 7.125%, 02/01/16* | | 1.8 | % |
GMAC LLC, 6.875%, 08/28/12* | | 1.7 | |
DirecTV Holdings LLC, 6.375%, 06/15/15* | | 1.6 | |
Visant Holding Corp., 10.250%, 12/01/13 | | 1.5 | |
HCA, Inc., 9.250%, 11/15/16* | | 1.5 | |
Sprint Capital Corp., 6.900%, 05/01/19 | | 1.3 | |
Tenet Healthcare Corp., 9.250%, 01/01/15 | | 1.3 | |
MetroPCS Wireless, Inc., 9.250%, 11/01/14 | | 1.3 | |
Jarden Corp., 7.500%, 05/01/17 | | 1.2 | |
HCA, Inc., 9.625%, 11/15/16* | | 1.2 | |
| | | |
Top Ten as a Group | | 14.4 | % |
| | | |
| * | Top Ten Holding at December 31, 2007 |
Any sectors, industries, or securities discussed should not be perceived as investment recommendations. Mention of a specific security should not be considered a recommendation to buy or solicitation to sell that security.
17
Managers High Yield Fund
Schedule of Portfolio Investments
June 30, 2008 (unaudited)
| | | | | | | |
Security Description | | Principal
Amount | | | Value |
Corporate Bonds - 103.6% | | | | | | | |
Finance - 13.6% | | | | | | | |
AAC Group Holding Corp., 10.250%, 10/01/12 (b) | | $ | 140,000 | 2 | | $ | 134,400 |
Aeroflex, Inc., Term Loan B1, 5.938%, 08/15/05, (08/16/14) 5 | | | 99,250 | | | | 94,039 |
Allison Transmission, Inc., Term Loan, 5.225%, 07/11/08, (08/07/14) 5 | | | 21,371 | | | | 19,127 |
Allison Transmission, Inc., Term Loan, 5.240%, 07/30/08, (08/07/14) 5 | | | 126,238 | | | | 112,983 |
Allison Transmission, Inc., Term Loan, 5.450%, 09/10/08, (08/07/14) 5 | | | 94,032 | | | | 84,159 |
Allison Transmission, Inc., Term Loan, 5.470%, 08/12/08, (08/07/14) 5 | | | 21,371 | | | | 19,127 |
Arch Western Finance LLC, 6.750%, 07/01/13 | | | 285,000 | | | | 280,725 |
Dresser 2nd Lien Term Loan, 8.469%, 08/18/08, (05/04/14) 5 | | | 195,000 | | | | 188,541 |
First Data Corp., Term Loan B1, 5.231%, 07/24/08, (09/24/14) 5 | | | 217,862 | | | | 200,542 |
First Data Corp., Term Loan, 5.551%, 09/30/08, (09/24/14) 5 | | | 14,976 | | | | 13,786 |
First Data Corp., Term Loan B1, 5.552%, 09/24/08, (09/24/14) (a) 5 | | | 200,000 | 2 | | | 174,250 |
Ford Motor Credit Company LLC, 4.283%, 01/15/10 5 | | | 140,000 | | | | 123,304 |
Ford Motor Credit Company LLC, 7.000%, 10/01/13 | | | 275,000 | | | | 202,718 |
Ford Motor Credit Company LLC, 7.250%, 10/25/11 | | | 75,000 | | | | 58,162 |
Ford Motor Credit Company LLC, 7.800%, 06/01/12 | | | 375,000 | | | | 290,254 |
Ford Motor Credit Company LLC, 8.000%, 12/15/16 | | | 280,000 | | | | 203,774 |
GMAC LLC, 6.625%, 05/15/12 | | | 175,000 | | | | 120,146 |
GMAC LLC, 6.750%, 12/01/14 | | | 25,000 | | | | 16,530 |
GMAC LLC, 6.875%, 08/28/12 | | | 895,000 | | | | 613,377 |
Hawker Beechcraft Acquisition Co., LLC, 8.875%, 04/01/15 6 | | | 275,000 | | | | 277,750 |
Hawker Beechcraft Acquisition Co., LLC, 9.750%, 04/01/17 | | | 30,000 | 2 | | | 30,150 |
Host Hotels & Resorts L.P., 6.875%, 11/01/14 | | | 100,000 | | | | 92,500 |
Host Hotels & Resorts L.P., 7.125%, 11/01/13 | | | 210,000 | | | | 196,350 |
Idearc, Inc., 8.000%, 11/15/16 | | | 180,000 | | | | 114,075 |
KAR Holdings, Inc., 8.750%, 05/01/14 | | | 195,000 | | | | 170,625 |
Nuveen Investments, Inc., 10.500%, 11/15/15 (a) | | | 160,000 | | | | 148,400 |
Petroplus Finance, Ltd., 6.750%, 05/01/14 (a) | | | 75,000 | 2 | | | 68,250 |
Petroplus Finance, Ltd., 7.000%, 05/01/17 (a) | | | 160,000 | 2 | | | 142,000 |
Rainbow National Services LLC, 8.750%, 09/01/12 (a) | | | 100,000 | | | | 102,000 |
Simmons Holding Co., Inc., Term Loan, 8.204%, 08/15/08, (02/15/12) 5 | | | 120,000 | | | | 79,200 |
Texas Competitive Electric Holdings Co. LLC, Term Loan, 5.961%, 08/11/08, (08/07/14) 5 | | | 13,688 | | | | 12,698 |
Texas Competitive Electric Holdings Co. LLC, Term Loan, 6.234%, 08/11/08, (08/07/14) 5 | | | 82,938 | | | | 76,942 |
Texas Competitive Electric Holdings Co. LLC, Term Loan, 6.478%, 08/11/08, (08/07/14) 5 | | | 16,199 | | | | 15,029 |
UCI Holdco, Inc., 10.300%, 12/15/13 6 | | | 125,334 | | | | 107,161 |
Wind Acquisition Finance, S.A., Term Loan, 9.984%, 07/18/08, (12/21/11) 5 | | | 234,296 | | | | 226,681 |
Wind Acquisition Finance, S.A., 10.750%, 12/01/15 (a) | | | 150,000 | | | | 158,250 |
Total Finance | | | | | | | 4,968,005 |
Industrials - 85.1% | | | | | | | |
Acco Brands Corp., 7.625%, 08/15/15 | | | 430,000 | | | | 389,150 |
The accompanying notes are an integral part of these financial statements.
18
Managers High Yield Fund
Schedule of Portfolio Investments (continued)
| | | | | | | |
Security Description | | Principal
Amount | | | Value |
Industrials - 85.1% (continued) | | | | | | | |
Advanced Micro Devices, Inc., 7.750%, 11/01/12 | | $ | 170,000 | 2 | | $ | 147,050 |
Alliance Laundry Corp., 8.500%, 01/15/13 | | | 305,000 | | | | 280,600 |
Allied Waste North America, Inc., 7.250%, 03/15/15 | | | 255,000 | 2 | | | 255,638 |
Allied Waste North America, Inc., 7.375%, 04/15/14 | | | 60,000 | 2 | | | 61,200 |
Alltel Communications, Inc., Term Loan B2, 5.564%, 07/17/08, (05/15/15) 5 | | | 59,849 | | | | 59,550 |
Ames True Temper, Inc., 6.713%, 01/15/12 5 | | | 180,000 | | | | 155,700 |
Ames True Temper, Inc., 10.000%, 07/15/12 | | | 125,000 | 2 | | | 80,625 |
ArvinMeritor, Inc., 8.750%, 03/01/12 | | | 235,000 | 2 | | | 207,975 |
Ashtead Capital, Inc., 9.000%, 08/15/16 (a) | | | 170,000 | 2 | | | 150,450 |
Ashtead Holdings PLC, 8.625%, 08/01/15 (a) | | | 75,000 | | | | 65,625 |
Atlas Energy Resources LLC, 10.750%, 02/01/18 (a) | | | 150,000 | | | | 156,750 |
Baldor Electric Co., 8.625%, 02/15/17 | | | 185,000 | | | | 186,850 |
Beazer Homes USA, Inc., 6.500%, 11/15/13 | | | 115,000 | | | | 82,800 |
Beazer Homes USA, Inc., 8.375%, 04/15/12 | | | 80,000 | | | | 65,200 |
Beazer Homes USA, Inc., 8.625%, 05/15/11 | | | 40,000 | | | | 34,600 |
Biomet, Inc., 10.375%, 10/15/17 6 | | | 415,000 | | | | 441,975 |
Boyd Gaming Corp., 7.125%, 02/01/16 | | | 125,000 | 2 | | | 92,812 |
CCO Holdings LLC, 8.750%, 11/15/13 | | | 365,000 | | | | 337,625 |
Chaparral Energy, Inc., 8.875%, 02/01/17 | | | 125,000 | | | | 109,062 |
Charter Communications, Inc., 10.250%, 09/15/10 | | | 115,000 | 2 | | | 111,838 |
Charter Communications, Inc., 11.000%, 10/01/15 | | | 355,000 | 2 | | | 264,919 |
Chesapeake Energy Corp., 7.000%, 08/15/14 | | | 225,000 | | | | 221,625 |
Chiquita Brands International, Inc., 8.875%, 12/01/15 | | | 125,000 | | | | 110,000 |
Citizens Communications Co., 6.250%, 01/15/13 | | | 100,000 | | | | 93,250 |
Citizens Communications Co., 6.625%, 03/15/15 | | | 50,000 | 2 | | | 45,625 |
Claire’s Stores, Inc., 9.625%, 06/01/15 | | | 205,000 | 2 | | | 88,150 |
Community Health Systems, Inc., 8.875%, 07/15/15 | | | 395,000 | | | | 399,444 |
Constellation Brands, Inc., 7.250%, 09/01/16 | | | 350,000 | | | | 330,750 |
Cooper Companies, Inc., 7.125%, 02/15/15 | | | 235,000 | | | | 226,775 |
Copano Energy LLC, 7.750%, 06/01/18 (a) | | | 100,000 | | | | 98,000 |
Cricket Communications, Inc., 9.375%, 11/01/14 | | | 325,000 | 2 | | | 314,438 |
Cricket Communications, Inc., 10.000%, 07/15/15 (a) | | | 35,000 | | | | 34,475 |
Crown Americas LLC, 7.750%, 11/15/15 | | | 120,000 | | | | 120,600 |
Del Monte Corp., 6.750%, 02/15/15 | | | 235,000 | | | | 225,012 |
Denbury Resources, Inc., 7.500%, 04/01/13 | | | 270,000 | | | | 270,675 |
Dex Media West LLC, 9.875%, 08/15/13 | | | 130,000 | | | | 117,325 |
Dex Media, Inc., 8.000%, 11/15/13 | | | 125,000 | | | | 91,875 |
Dex Media, Inc., 9.000%, 11/15/13 (b) | | | 270,000 | 2 | | | 194,400 |
Digicel Group, Ltd., 8.875%, 01/15/15 (a) | | | 100,000 | 2 | | | 94,625 |
Digicel Group, Ltd., 9.125%, 01/15/15 (a) 6 | | | 104,000 | 2 | | | 98,410 |
Digicel Ltd., 9.250%, 09/01/12 (a) | | | 150,000 | | | | 155,062 |
The accompanying notes are an integral part of these financial statements.
19
Managers High Yield Fund
Schedule of Portfolio Investments (continued)
| | | | | | | |
Security Description | | Principal
Amount | | | Value |
Industrials - 85.1% (continued) | | | | | | | |
DirectTV Holdings LLC, 6.375%, 06/15/15 | | $ | 630,000 | | | $ | 593,775 |
Dynegy Holdings, Inc., 7.500%, 06/01/15 | | | 245,000 | | | | 227,238 |
EchoStar Communications Corp., 7.125%, 02/01/16 | | | 695,000 | | | | 644,612 |
Echostar DBS Corp., 7.750%, 05/31/15 (a) | | | 325,000 | 2 | | | 317,688 |
El Paso Corp., 7.000%, 06/15/17 | | | 55,000 | | | | 54,103 |
El Paso Corp., 7.875%, 06/15/12 | | | 130,000 | 2 | | | 135,932 |
El Paso Natural Gas Co., 7.250%, 06/01/18 | | | 90,000 | | | | 89,100 |
Fairpoint Communications, Inc., 13.125%, 04/01/18 (a) | | | 215,000 | | | | 211,775 |
FMG Finance Property, Ltd., 10.625%, 09/01/16 (a) | | | 225,000 | | | | 263,250 |
Ford Motor Co., 6.500%, 08/01/18 | | | 295,000 | 2 | | | 172,575 |
Forest Oil Corp., 7.250%, 06/15/19 (a) | | | 85,000 | | | | 82,025 |
Forest Oil Corp., 8.000%, 12/15/11 | | | 95,000 | | | | 98,325 |
Freeport-McMoRan Copper & Gold, Inc., 8.250%, 04/01/15 | | | 135,000 | | | | 142,102 |
Freeport-McMoRan Copper & Gold, Inc., 8.375%, 04/01/17 | | | 30,000 | | | | 31,699 |
Freescale Semiconductor, Inc., 8.875%, 12/15/14 | | | 55,000 | | | | 44,962 |
Freescale Semiconductor, Inc., 9.125%, 12/15/14 6 | | | 310,000 | | | | 242,575 |
General Motors Corp., 7.125%, 07/15/13 | | | 300,000 | 2 | | | 191,250 |
General Motors Corp., 8.250%, 07/15/23 | | | 175,000 | | | | 102,812 |
General Motors Corp., 8.375%, 07/15/33 | | | 235,000 | 2 | | | 140,412 |
Georgia-Pacific Corp., 7.000%, 01/15/15 (a) | | | 165,000 | | | | 155,925 |
Georgia-Pacific Corp., 7.700%, 06/15/15 | | | 225,000 | 2 | | | 213,750 |
Graham Packaging Co., L.P., 9.875%, 10/15/14 | | | 275,000 | 2 | | | 244,750 |
Hanesbrands, Inc., 6.508%, 12/15/14 5 | | | 360,000 | 2 | | | 336,600 |
Harrah’s Operating Companies, Inc., 10.750%, 02/01/16 (a) | | | 375,000 | | | | 313,125 |
HCA, Inc., 8.750%, 09/01/10 | | | 14,000 | | | | 14,245 |
HCA, Inc., 9.250%, 11/15/16 | | | 515,000 | | | | 531,738 |
HCA, Inc., 9.625%, 11/15/16 6 | | | 435,000 | | | | 449,138 |
Helix Energy Solutions Group, Inc., 9.500%, 01/15/16 (a) | | | 185,000 | | | | 190,550 |
Hertz Corp., 8.875%, 01/01/14 | | | 310,000 | | | | 285,200 |
Huntsman International LLC, 7.875%, 11/15/14 | | | 155,000 | | | | 142,600 |
Ineos Group Holdings PLC, 8.500%, 02/15/16 (a) | | | 285,000 | 2 | | | 188,812 |
Intelsat Bermuda, Ltd., 11.250%, 06/15/16 | | | 155,000 | | | | 157,712 |
Interline Brands, Inc., 8.125%, 06/15/14 | | | 110,000 | | | | 106,700 |
IPCS, Inc., 4.998%, 05/01/13 5 | | | 90,000 | | | | 81,450 |
IPCS, Inc., 6.123%, 05/01/14 6 | | | 230,000 | | | | 196,650 |
Iron Mountain, Inc., 6.625%, 01/01/16 | | | 90,000 | 2 | | | 84,600 |
Iron Mountain, Inc., 7.750%, 01/15/15 | | | 325,000 | | | | 325,000 |
Jarden Corp., 7.500%, 05/01/17 | | | 520,000 | 2 | | | 455,000 |
K. Hovnanian Enterprises, Inc., 8.625%, 01/15/17 | | | 195,000 | | | | 143,325 |
L-3 Communications Corp., 5.875%, 01/15/15 | | | 165,000 | | | | 153,038 |
L-3 Communications Corp., 6.375%, 10/15/15 | | | 150,000 | | | | 141,000 |
The accompanying notes are an integral part of these financial statements.
20
Managers High Yield Fund
Schedule of Portfolio Investments (continued)
| | | | | | | |
Security Description | | Principal
Amount | | | Value |
Industrials - 85.1% (continued) | | | | | | | |
Level 3 Financing, Inc., 8.750%, 02/15/17 | | $ | 150,000 | 2 | | $ | 129,750 |
Lyondell Chemical Co., Term Loan, 7.000%, 08/11/08, (12/20/14) 5 | | | 150,000 | | | | 131,250 |
MarkWest Energy Finance Corp., 8.750%, 04/15/18 (a) | | | 160,000 | | | | 164,400 |
MetroPCS Wireless, Inc., 9.250%, 11/01/14 | | | 475,000 | | | | 459,562 |
MGM Mirage, Inc., 6.750%, 04/01/13 | | | 405,000 | | | | 351,338 |
MGM Mirage, Inc., 6.875%, 04/01/16 | | | 155,000 | | | | 125,550 |
MGM Mirage, Inc., 7.500%, 06/01/16 | | | 175,000 | | | | 144,812 |
Nalco Company, 7.750%, 11/15/11 | | | 185,000 | | | | 185,925 |
Nalco Company, 8.875%, 11/15/13 | | | 180,000 | | | | 185,400 |
Newfield Exploration Co., 6.625%, 04/15/16 | | | 175,000 | | | | 161,438 |
Noranda Aluminium Acquisition Co., 6.827%, 05/15/15 5 | | | 195,000 | | | | 169,162 |
Nordic Telephone Co., 8.875%, 05/01/16 (a) | | | 315,000 | | | | 310,275 |
Nxp Bv/Nxp Funding LLC, 9.500%, 10/15/15 | | | 485,000 | 2 | | | 423,162 |
Open Solutions, Inc., 9.750%, 02/01/15 (a) | | | 380,000 | | | | 311,600 |
OPTI Canada, Inc., 7.875%, 12/15/14 | | | 30,000 | | | | 29,775 |
OPTI Canada, Inc., 8.250%, 12/15/14 | | | 170,000 | | | | 170,000 |
Packaging Dynamics, Inc., 10.000%, 05/11/16 (a) | | | 160,000 | | | | 107,200 |
Paetec Holding Corp., 9.500%, 07/15/15 | | | 200,000 | 2 | | | 185,500 |
Petrohawk Energy Corp., 7.875%, 06/01/15 (a) | | | 120,000 | | | | 117,750 |
Petrohawk Energy Corp., 9.125%, 07/15/13 | | | 225,000 | | | | 231,750 |
Petroprod Ltd., 10.850%, 05/24/13 (a) | | | 100,000 | | | | 96,000 |
PolyOne Corp., 8.875%, 05/01/12 | | | 195,000 | | | | 195,975 |
PolyOne Corp., 8.875%, 05/01/12 (a) | | | 155,000 | | | | 155,775 |
Quebecor Media, Inc., 7.750%, 03/15/16 | | | 270,000 | | | | 252,450 |
Quebecor World, Inc., 8.750%, 03/15/16* (a) 8 | | | 260,000 | | | | 126,100 |
Quicksilver Resources, Inc., 7.750%, 08/01/15 | | | 160,000 | | | | 159,200 |
Qwest Corp., 7.500%, 10/01/14 | | | 105,000 | | | | 101,588 |
Qwest Corp., 8.875%, 03/15/12 | | | 25,000 | | | | 25,625 |
RBS Global & Rexnord Corp., 8.875%, 09/01/16 | | | 175,000 | | | | 164,500 |
ReAble Therapeutics Finance, 10.875%, 11/15/14 (a) | | | 80,000 | | | | 80,200 |
Reichhold Industries, Inc., 9.000%, 08/15/14 (a) | | | 190,000 | | | | 190,950 |
Rental Service Corp., 9.500%, 12/01/14 | | | 255,000 | 2 | | | 214,200 |
RH Donnelley, Inc., 11.750%, 05/15/15 (a) | | | 71,000 | | | | 64,610 |
Rite Aid Corp., 7.500%, 03/01/17 | | | 50,000 | | | | 40,625 |
Rite Aid Corp., 9.500%, 06/15/17 | | | 150,000 | | | | 99,750 |
Rockwood Specialties Group, Inc., 7.500%, 11/15/14 | | | 25,000 | | | | 24,688 |
Sally Holdings LLC, 10.500%, 11/15/16 | | | 30,000 | 2 | | | 28,725 |
Sally Holdings LLC, 9.250%, 11/15/14 | | | 325,000 | 2 | | | 313,625 |
SandRidge Energy, Inc., 8.000%, 06/01/18 (a) | | | 140,000 | | | | 141,400 |
Sealy Mattress Co., 8.250%, 06/15/04 | | | 440,000 | 2 | | | 363,000 |
SemGroup L.P., 8.750%, 11/15/15 (a) | | | 115,000 | | | | 112,125 |
The accompanying notes are an integral part of these financial statements.
21
Managers High Yield Fund
Schedule of Portfolio Investments (continued)
| | | | | | | |
Security Description | | Principal
Amount | | | Value |
Industrials - 85.1% (continued) | | | | | | | |
Sensata Technologies, B.V., 8.000%, 05/01/14 | | $ | 380,000 | | | $ | 351,500 |
Service Corp. International, 6.750%, 04/01/15 | | | 225,000 | | | | 215,438 |
Service Corp. International, 7.375%, 10/01/14 | | | 105,000 | | | | 105,525 |
Sevan Marine ASA, 9.250%, 12/20/11 (a) | | | 100,000 | | | | 100,500 |
Simmons Co., 10.000%, 12/15/14 (b) | | | 559,000 | | | | 413,660 |
Smurfit-Stone Container Enterprises, Inc., 8.375%, 07/01/12 | | | 230,000 | | | | 202,975 |
Sonat, Inc., 7.625%, 07/15/11 | | | 15,000 | | | | 15,217 |
Spectrum Brands, Inc., 7.375%, 02/01/15 | | | 205,000 | 2 | | | 130,175 |
Sprint Capital Corp., 6.900%, 05/01/19 | | | 555,000 | | | | 487,897 |
Sprint Capital Corp., 8.750%, 03/15/32 | | | 75,000 | | | | 71,610 |
Steel Dynamics, Inc., 7.750%, 04/15/16 (a) | | | 70,000 | | | | 70,000 |
Steinway Musical Instruments, Inc., 7.000%, 03/01/14 (a) | | | 275,000 | | | | 253,000 |
Stewart Enterprises, Inc., 6.250%, 02/15/13 | | | 120,000 | | | | 114,600 |
Sun Media Corp., 7.625%, 02/15/13 | | | 115,000 | | | | 111,838 |
Sungard Data Systems, Inc., 10.250%, 08/15/15 | | | 435,000 | 2 | | | 439,350 |
Sunstate Equipment Co., 10.500%, 04/01/13 (a) | | | 95,000 | 2 | | | 75,525 |
Surgical Care Affiliates, Inc., 8.875%, 07/15/15 (a) 6 | | | 135,000 | | | | 118,800 |
Tenet Healthcare Corp., 9.250%, 01/01/15 | | | 490,000 | 2 | | | 482,650 |
Tenneco Automotive, Inc., 8.625%, 11/15/14 | | | 295,000 | 2 | | | 261,812 |
Tenneco, Inc., 8.125%, 11/15/15 (a) | | | 25,000 | | | | 22,750 |
Terex Corp., 8.000%, 11/15/17 | | | 320,000 | | | | 319,200 |
Terra Capital, Inc., 7.000%, 02/01/17 | | | 270,000 | | | | 265,950 |
Tesoro Corp., 6.625%, 11/01/15 | | | 100,000 | | | | 92,750 |
The Goodyear Tire & Rubber Co., 8.625%, 12/01/11 | | | 83,000 | | | | 84,245 |
The Neiman Marcus Group, Inc., 9.000%, 10/15/15 6 | | | 290,000 | | | | 287,825 |
Titan International, Inc., 8.000%, 01/15/12 | | | 200,000 | | | | 197,000 |
Travelport LLC, 7.307%, 09/01/14 5 | | | 80,000 | | | | 64,400 |
Travelport LLC, 9.875%, 09/01/14 | | | 100,000 | | | | 89,250 |
Travelport LLC, 11.875%, 09/01/16 | | | 110,000 | 2 | | | 90,750 |
TRW Automotive, Inc., 7.000%, 03/15/14 (a) | | | 150,000 | 2 | | | 130,875 |
TRW Automotive, Inc., 7.250%, 03/15/17 (a) | | | 150,000 | | | | 126,750 |
United Components, Inc., 9.375%, 06/15/13 | | | 60,000 | | | | 56,400 |
United Rentals, Inc., 6.500%, 02/15/12 | | | 155,000 | | | | 140,275 |
United Surgical Partners International, Inc., 8.875%, 05/01/17 | | | 55,000 | 2 | | | 51,425 |
United Surgical Partners International, Inc., 9.250%, 05/01/17 6 | | | 185,000 | 2 | | | 171,125 |
Vail Resorts, Inc., 6.750%, 02/15/14 | | | 270,000 | | | | 256,500 |
Vedanta Resources PLC, 9.500%, 07/18/18 (a) | | | 120,000 | | | | 120,000 |
Venoco, Inc., 8.750%, 12/15/11 | | | 190,000 | | | | 186,675 |
Videotron, Ltd., 6.875%, 01/15/14 | | | 148,000 | | | | 143,560 |
Videotron, Ltd., 9.125%, 04/15/18 (a) | | | 30,000 | | | | 31,500 |
Visant Holding Corp., 10.250%, 12/01/13 (b) | | | 555,000 | 2 | | | 541,125 |
The accompanying notes are an integral part of these financial statements.
22
Managers High Yield Fund
Schedule of Portfolio Investments (continued)
| | | | | | | | |
Security Description | | Principal
Amount | | | Value | |
Industrials - 85.1% (continued) | | | | | | | | |
Vitro, S.A.B. de C.V., 9.125%, 02/01/17 | | $ | 405,000 | | | $ | 322,988 | |
West Corp., 9.500%, 10/15/14 | | | 175,000 | | | | 158,375 | |
Windstream Corp., 8.125%, 08/01/13 | | | 60,000 | | | | 60,150 | |
Windstream Corp., 8.625%, 08/01/16 | | | 165,000 | | | | 165,412 | |
Total Industrial | | | | | | | 31,011,665 | |
Utilities - 4.9% | | | | | | | | |
AES Corp., The, 8.875%, 2/15/11 | | | 230,000 | | | | 239,200 | |
Edison Mission Energy, 7.000%, 05/15/17 | | | 185,000 | | | | 173,900 | |
Energy Future Holdings Corp., 10.875%, 11/01/17 (a) | | | 325,000 | 2 | | | 329,875 | |
IPALCO Enterprises, Inc., 7.250%, 04/01/16 (a) | | | 50,000 | | | | 49,500 | |
Mirant North America LLC, 7.375%, 12/31/13 | | | 175,000 | | | | 174,344 | |
NRG Energy, Inc., 7.250%, 02/01/14 | | | 210,000 | | | | 201,075 | |
NRG Energy, Inc., 7.375%, 01/15/17 | | | 95,000 | 2 | | | 90,012 | |
NRG Energy, Inc., 7.375%, 02/01/16 | | | 120,000 | | | | 113,250 | |
Texas Competitive Electric Holdings Company LLC, 10.250%, 11/01/15 (a) | | | 415,000 | | | | 408,775 | |
Total Utilities | | | | | | | 1,779,931 | |
Total Corporate Bonds
(cost $41,070,159) | | | | | | | 37,759,601 | |
| | |
| | | Shares | | | | |
Common Stocks - 0.7% | | | | | | | | |
Information Technology - 0.3% | | | | | | | | |
Flextronics International, Ltd.* | | | 13,000 | | | | 122,200 | |
Materials - 0.4% | | | | | | | | |
Huntsman Corp. | | | 12,603 | | | | 143,675 | |
Total Common Stocks (cost $216,202) | | | | | | | 265,875 | |
Other Investment Companies - 25.7%1 | | | | | | | | |
Bank of New York Institutional Cash Reserves Fund, 2.62%3 (cost $9,350,278) | | | 9,350,278 | | | | 9,350,278 | |
Total Investments - 130.0%
(cost $50,636,639) | | | | | | | 47,375,754 | |
Other Assets, less Liabilities - (30.0)% | | | | | | | (10,919,233 | ) |
Net Assets - 100.0% | | | | | | $ | 36,456,521 | |
The accompanying notes are an integral part of these financial statements.
23
Managers Fixed Income Fund
Fund Snapshots
June 30, 2008 (unaudited)
Portfolio Breakdown
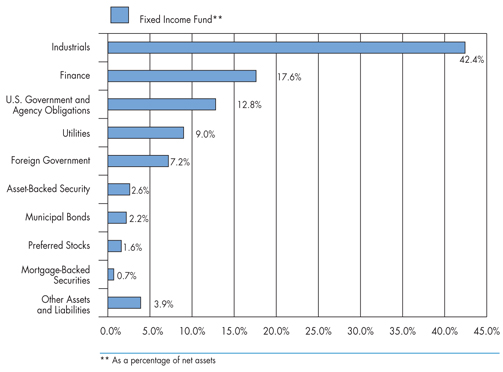
| | | |
Industry | | Fixed
Income** | |
Industrials | | 42.4 | % |
Finance | | 17.6 | % |
U.S. Government and Agency Obligations | | 12.8 | % |
Utilities | | 9.0 | % |
Foreign Government | | 7.2 | % |
Asset-Backed Securities | | 2.6 | % |
Municipal Bonds | | 2.2 | % |
Preferred Stocks | | 1.6 | % |
Mortgage-Backed Securities | | 0.7 | % |
Other Assets and Liabilities | | 3.9 | % |
Top Ten Holdings
| | | |
Top Ten Holdings | | % of
Net Assets | |
USTN, 4.875%, 05/31/09* | | 8.2 | % |
USTN, 4.750%, 02/15/37* | | 2.5 | |
CIT Group, Inc., 7.625%, 11/30/12* | | 2.3 | |
Inter-American Development Bank, 6.000%, 12/15/17* | | 2.0 | |
American General Finance Corp., Series MTN, 6.900%, 12/15/17* | | 1.9 | |
Merrill Lynch & Co., Inc., 6.110%, 01/29/37 | | 1.9 | |
Kinder Morgan Energy Partners, L.P., 5.950%, 02/15/18 | | 1.8 | |
PPG Industries, Inc., 6.650%, 03/15/18 | | 1.6 | |
Equitable Resources, Inc., 6.500%, 04/01/18 | | 1.4 | |
Nisource Finance Corp., 6.400%, 03/15/18* | | 1.3 | |
| | | |
Top Ten as a Group | | 24.9 | % |
| | | |
| * | Top Ten Holding at December 31, 2007 |
Any sectors, industries, or securities discussed should not be perceived as investment recommendations. Mention of a specific security should not be considered a recommendation to buy or solicitation to sell that security.
24
Managers Fixed Income Fund
Schedule of Portfolio Investments
June 30, 2008 (unaudited)
| | | | | | |
Security Description | | Principal
Amount | | Value |
Corporate Bonds - 68.9% | | | | | | |
Finance - 17.6% | | | | | | |
American General Finance Corp., Series MTN, 6.900%, 12/15/17 | | $ | 2,770,000 | | $ | 2,418,229 |
ASIF Global Financial, 2.380%, 02/26/09 (a) | | SGD | 1,000,000 | | | 734,265 |
Bank of America Capital Trust VI, 5.625%, 03/08/35 | | | 295,000 | | | 240,948 |
Barclays Capital Corp., 4.160%, 02/22/10 (a) | | THB | 6,000,000 | | | 178,571 |
Bear Stearns Companies, Inc., The, 4.650%, 07/02/18 | | | 10,000 | | | 8,436 |
Bear Stearns Companies, Inc., The, 5.300%, 10/30/15 | | | 25,000 | | | 23,435 |
Bear Stearns Companies, Inc., The, 6.400%, 10/02/17 | | | 65,000 | | | 64,343 |
Bear Stearns Companies, Inc., The, 7.250%, 02/01/18 | | | 470,000 | | | 491,322 |
Boeing Capital Corp., 4.750%, 08/25/08 | | | 230,000 | | | 230,884 |
CIGNA Corp., 6.150%, 11/15/36 | | | 240,000 | | | 212,068 |
CIT Group, Inc., 7.625%, 11/30/12 | | | 3,450,000 | | | 2,870,100 |
Colonial Realty, L.P., 4.800%, 04/01/11 | | | 625,000 | | | 589,929 |
Colonial Realty, L.P., 5.500%, 10/01/15 | | | 190,000 | | | 167,568 |
Developers Divers Realty Corp., 3.875%, 01/30/09 | | | 200,000 | | | 197,650 |
Duke Realty, L.P., 5.950%, 02/15/17 | | | 35,000 | | | 32,378 |
Equity One, Inc., 3.875%, 04/15/09 | | | 150,000 | | | 147,023 |
ERAC USA Finance Co., 6.375%, 10/15/17 (a) | | | 235,000 | | | 210,350 |
ERAC USA Finance Co., 6.700%, 06/01/34 (a) | | | 65,000 | | | 53,379 |
ERAC USA Finance Co., 7.000%, 10/15/37 (a) | | | 915,000 | | | 763,178 |
ERP Operating, L.P., 5.125%, 03/15/16 | | | 15,000 | | | 13,547 |
ERP Operating, L.P., 5.750%, 06/15/17 | | | 70,000 | | | 64,722 |
Ford Motor Credit Company LLC, 5.700%, 01/15/10 | | | 15,000 | | | 12,802 |
Ford Motor Credit Company LLC, 7.000%, 10/01/13 | | | 135,000 | | | 99,516 |
Ford Motor Credit Company LLC, 9.750%, 09/15/10 | | | 309,000 | | | 269,538 |
Highwoods Realty, L.P., 5.850%, 03/15/17 | | | 30,000 | | | 25,952 |
Highwoods Realty, L.P., 7.500%, 04/15/18 | | | 350,000 | | | 333,116 |
Hospitality Properties Trust, 6.750%, 02/15/13 | | | 465,000 | | | 442,138 |
HSBC Bank USA, N.A., 1.959%, 04/18/12 (a) 4 | | MYR | 665,000 | | | 188,988 |
iStar Financial, Inc., 3.291%, 10/01/12, (10/01/08) 5 | | | 325,000 | | | 255,125 |
Kinder Morgan Finance Co., 5.150%, 03/01/15 | | | 75,000 | | | 66,562 |
Kinder Morgan Finance Co., 5.700%, 01/05/16 | | | 165,000 | | | 147,675 |
Lehman Brothers Holdings, Inc., 3.600%, 03/13/09 | | | 150,000 | | | 147,602 |
Lehman Brothers Holdings, Inc., 6.000%, 05/03/32 7 | | | 30,000 | | | 22,994 |
Lehman Brothers Holdings, Inc., 6.875%, 07/17/37 | | | 715,000 | | | 617,227 |
Mack-Cali Realty, L.P., 7.250%, 03/15/09 | | | 250,000 | | | 252,816 |
Marsh & McLennan Companies, Inc., 5.375%, 07/15/14 | | | 410,000 | | | 398,545 |
Marsh & McLennan Companies, Inc., 5.750%, 09/15/15 | | | 652,000 | | | 647,371 |
Marsh & McLennan Companies, Inc., 5.875%, 08/01/33 | | | 730,000 | | | 614,342 |
Merrill Lynch & Co., Inc., 6.110%, 01/29/37 | | | 2,900,000 | | | 2,309,975 |
Morgan Stanley, 6.625%, 04/01/18 | | | 1,220,000 | | | 1,158,006 |
The accompanying notes are an integral part of these financial statements.
25
Managers Fixed Income Fund
Schedule of Portfolio Investments (continued)
| | | | | | | |
Security Description | | Principal
Amount | | | Value |
Finance - 17.6% (continued) | | | | | | | |
Mutual of Omaha Insurance Co., 6.800%, 06/15/36 (a) | | $ | 620,000 | | | $ | 593,517 |
PNC Bank, N.A., 6.875%, 04/01/18 | | | 395,000 | | | | 392,525 |
ProLogis Trust, 5.625%, 11/15/15 | | | 15,000 | | | | 14,113 |
ProLogis Trust, 5.750%, 04/01/16 | | | 15,000 | | | | 14,149 |
Rabobank Nederland, 12.500%, 02/17/09 | | ISK | 20,000,000 | | | | 255,747 |
Rabobank Nederland, 14.000%, 01/28/09 (a) | | ISK | 16,000,000 | | | | 204,108 |
SLM Corp., 8.450%, 06/15/18 | | | 845,000 | | | | 811,968 |
Sovereign Bank, 5.125%, 03/15/13 | | | 335,000 | | | | 267,331 |
Toll Brothers Finance Corp., 5.150%, 05/15/15 | | | 555,000 | | | | 481,302 |
Travelers Co., Inc., 6.250%, 06/15/37 | | | 755,000 | | | | 704,059 |
Travelers Property Casualty Corp., 6.375%, 03/15/33 | | | 330,000 | | | | 316,136 |
XL Capital PLC, 6.500%, 01/15/12 | | | 105,000 | | | | 102,819 |
Total Finance | | | | | | | 21,880,389 |
Industrials - 42.4% | | | | | | | |
Anadarko Petroleum Corp., 5.950%, 09/15/16 | | | 485,000 | | | | 486,040 |
Anadarko Petroleum Corp., 6.450%, 09/15/36 | | | 360,000 | | | | 356,494 |
Anheuser-Busch Companies, Inc., 5.950%, 01/15/33 | | | 330,000 | | | | 292,272 |
Anheuser-Busch Companies, Inc., 6.450%, 09/01/37 | | | 420,000 | | | | 402,690 |
Apache Corp., 6.000%, 01/15/37 | | | 630,000 | | | | 620,259 |
AstraZeneca PLC, 6.450%, 09/15/37 | | | 905,000 | | | | 924,383 |
AT&T, Inc., 6.150%, 09/15/34 | | | 185,000 | | | | 173,400 |
AT&T, Inc., 6.500%, 03/15/29 | | | 775,000 | | | | 737,894 |
AT&T Wireless Services, Inc., 8.750%, 03/01/31 | | | 310,000 | | | | 368,832 |
Avnet, Inc., 2.000%, 03/15/34 | | | 100,000 | | | | 103,875 |
Avnet, Inc., 6.000%, 09/01/15 | | | 720,000 | | | | 698,976 |
Avnet, Inc., 6.625%, 09/15/16 | | | 140,000 | | | | 140,157 |
BellSouth Corp., 6.000%, 11/15/34 | | | 990,000 | 2 | | | 909,464 |
Bowater, Inc., 6.500%, 06/15/13 | | | 170,000 | | | | 107,950 |
Camden Property Trust, 5.700%, 05/15/17 | | | 255,000 | | | | 223,381 |
Canadian Pacific Railway Co., 5.950%, 05/15/37 | | | 410,000 | | | | 341,247 |
Cardinal Health, Inc., 4.000%, 06/15/15 | | | 320,000 | | | | 289,692 |
Charter Communications, Inc., 8.000%, 04/30/12 (a) | | | 245,000 | | | | 232,750 |
Chartered Semiconductor Manufacturing, Ltd., 6.250%, 04/04/13 | | | 715,000 | | | | 681,599 |
Coca-Cola HBC Finance, B.V., 5.125%, 09/17/13 | | | 265,000 | | | | 265,810 |
Comcast Corp., 5.650%, 06/15/35 | | | 265,000 | | | | 225,894 |
Comcast Corp., 6.450%, 03/15/37 | | | 795,000 | | | | 742,212 |
Comcast Corp., 6.500%, 11/15/35 | | | 460,000 | | | | 438,643 |
Comcast Corp., 6.950%, 08/15/37 | | | 240,000 | | | | 236,789 |
Continental Airlines, Inc., 5.983%, 04/19/22 | | | 85,000 | | | | 70,339 |
Continental Airlines, Inc., Series B, 6.903%, 04/19/22 | | | 94,000 | | | | 75,435 |
Corning, Inc., 6.850%, 03/01/29 | | | 600,000 | | | | 588,565 |
Covidien International Finance, S.A., 6.000%, 10/15/17 | | | 295,000 | | | | 299,095 |
The accompanying notes are an integral part of these financial statements.
26
Managers Fixed Income Fund
Schedule of Portfolio Investments (continued)
| | | | | | | |
Security Description | | Principal
Amount | | | Value |
Industrials - 42.4% (continued) | | | | | | | |
Covidien International Finance, S.A., 6.550%, 10/15/37 | | $ | 300,000 | | | $ | 303,570 |
CSX Corp., 6.000%, 10/01/36 | | | 570,000 | 2 | | | 495,471 |
Cummins Engine Co., Inc., 6.750%, 02/15/27 | | | 153,000 | | | | 134,292 |
D.R. Horton, Inc., 5.250%, 02/15/15 | | | 420,000 | | | | 336,000 |
Delta Air Lines, Inc., 8.021%, 08/10/22 | | | 780,394 | | | | 710,158 |
Desarrolladora Homex, S.A. de C.V., 7.500%, 09/28/15 | | | 245,000 | | | | 247,450 |
DP World, Ltd., 6.850%, 07/02/37 (a) | | | 1,120,000 | | | | 963,782 |
Dun & Bradstreet Corp., The, 6.000%, 04/01/13 | | | 790,000 | | | | 787,822 |
El Paso Corp., 6.950%, 06/01/28 | | | 165,000 | 2 | | | 152,790 |
Energy Transfer Partners, L.P., 6.125%, 02/15/17 | | | 65,000 | | | | 63,052 |
Energy Transfer Partners, L.P., 6.625%, 10/15/36 | | | 145,000 | | | | 135,378 |
Equifax, Inc., 7.000%, 07/01/37 | | | 280,000 | | | | 258,448 |
Equitable Resources, Inc., 6.500%, 04/01/18 | | | 1,730,000 | | | | 1,735,591 |
Federated Retail Holdings, Inc., 6.375%, 03/15/37 | | | 820,000 | | | | 633,316 |
General Motors Corp., 8.250%, 07/15/23 | | | 35,000 | | | | 20,562 |
Georgia-Pacific Corp., 7.250%, 06/01/28 | | | 70,000 | | | | 58,800 |
HCA, Inc., 6.250%, 02/15/13 | | | 5,000 | | | | 4,363 |
HCA, Inc., 6.375%, 01/15/15 | | | 5,000 | | | | 4,176 |
HCA, Inc., 6.750%, 07/15/13 | | | 5,000 | | | | 4,413 |
HCA, Inc., 7.050%, 12/01/27 | | | 750,000 | | | | 571,719 |
HCA, Inc., 7.190%, 11/15/15 | | | 5,000 | | | | 4,333 |
HCA, Inc., 7.500%, 12/15/23 | | | 5,000 | | | | 4,092 |
HCA, Inc., 7.500%, 11/06/33 | | | 75,000 | 2 | | | 58,125 |
HCA, Inc., 7.690%, 06/15/25 | | | 315,000 | 2 | | | 259,172 |
HCA, Inc., 7.750%, 07/15/36 | | | 5,000 | | | | 3,980 |
HCA, Inc., 8.360%, 04/15/24 | | | 40,000 | | | | 34,246 |
HCA, Inc., 8.750%, 09/01/10 | | | 625,000 | | | | 635,938 |
International Paper Co., 4.000%, 04/01/10 | | | 300,000 | | | | 290,558 |
International Paper Co., 4.250%, 01/15/09 | | | 300,000 | | | | 299,057 |
International Paper Co., 5.500%, 01/15/14 | | | 635,000 | | | | 584,186 |
Intuit, Inc., 5.750%, 03/15/17 | | | 210,000 | | | | 197,576 |
J.C. Penney Co., Inc., 5.750%, 02/15/18 | | | 25,000 | | | | 22,345 |
J.C. Penney Co., Inc., 6.375%, 10/15/36 | | | 580,000 | 2 | | | 485,835 |
J.C. Penney Co., Inc., 7.400%, 04/01/37 | | | 20,000 | | | | 18,007 |
J.C. Penney Co., Inc., 7.625%, 03/01/97 | | | 25,000 | | | | 20,483 |
Johnson & Johnson Co., 5.950%, 08/15/37 | | | 810,000 | | | | 843,863 |
Kinder Morgan Energy Partners, L.P., 5.950%, 02/15/18 | | | 2,335,000 | | | | 2,278,979 |
KLA Instruments Corp., 6.900%, 05/01/18 | | | 1,135,000 | | | | 1,114,670 |
Koninklijke Philips Electronics NV, 6.875%, 03/11/38 | | | 1,090,000 | | | | 1,128,958 |
Kraft Foods, Inc., 6.500%, 11/01/31 | | | 310,000 | | | | 287,747 |
Kroger Co., 7.000%, 05/01/18 | | | 460,000 | | | | 488,989 |
Lennar Corp., 5.600%, 05/31/15 | | | 400,000 | | | | 294,500 |
The accompanying notes are an integral part of these financial statements.
27
Managers Fixed Income Fund
Schedule of Portfolio Investments (continued)
| | | | | | | |
Security Description | | Principal
Amount | | | Value |
Industrials - 42.4% (continued) | | | | | | | |
Lennar Corp., 6.500%, 04/15/16 | | $ | 280,000 | | | $ | 215,950 |
Liberty Media Corp., 5.700%, 05/15/13 | | | 190,000 | | | | 171,223 |
Lubrizol Corp., 6.500%, 10/01/34 | | | 880,000 | | | | 802,404 |
Macy’s Retail Holdings, Inc., 6.790%, 07/15/27 | | | 40,000 | | | | 32,873 |
Macy’s Retail Holdings, Inc., 6.900%, 04/01/29 | | | 70,000 | | | | 59,304 |
Marks & Spencer Group PLC, 7.125%, 12/01/37 (a) | | | 300,000 | | | | 262,178 |
Masco Corp., 5.850%, 03/15/17 | | | 350,000 | | | | 317,760 |
Medco Health Solutions, Inc., 7.125%, 03/15/18 | | | 1,260,000 | | | | 1,310,792 |
Medco Health Solutions, Inc., 7.250%, 08/15/13 | | | 420,000 | | | | 446,378 |
Missouri Pacific Railroad Co., 5.000%, 01/01/45 | | | 200,000 | | | | 124,000 |
Motorola, Inc., 5.220% 10/01/97 | | | 40,000 | | | | 22,312 |
Motorola, Inc., 6.500%, 11/15/28 | | | 70,000 | | | | 54,818 |
Motorola, Inc., 6.625%, 11/15/37 | | | 95,000 | | | | 74,944 |
New England Telephone & Telegraph Co., 7.875%, 11/15/29 | | | 95,000 | | | | 101,842 |
News America, Inc., 6.200%, 12/15/34 | | | 350,000 | | | | 323,765 |
News America, Inc., 6.400%, 12/15/35 | | | 425,000 | | | | 403,442 |
News America, Inc., 7.280%, 06/30/28 | | | 225,000 | | | | 231,846 |
News America, Inc., 7.625%, 11/30/28 | | | 460,000 | | | | 490,217 |
Nextel Communications, Inc., 5.950%, 03/15/14 | | | 710,000 | | | | 570,426 |
Nextel Communications, Inc., 6.875%, 10/31/13 | | | 5,000 | | | | 4,229 |
Nextel Communications, Inc., 7.375%, 08/01/15 | | | 20,000 | | | | 16,611 |
Northwest Airlines, Inc., 8.028%, 11/01/17 | | | 475,000 | | | | 451,250 |
Owens & Minor, Inc., 6.350%, 04/15/16 | | | 125,000 | | | | 122,959 |
PPG Industries, Inc., 6.650%, 03/15/18 | | | 1,935,000 | | | | 1,975,635 |
Pulte Homes, Inc., 5.200%, 02/15/15 | | | 405,000 | | | | 332,100 |
Pulte Homes, Inc., 6.000%, 02/15/35 | | | 1,265,000 | 2 | | | 993,025 |
Pulte Homes, Inc., 6.375%, 05/15/33 | | | 465,000 | | | | 362,700 |
Qantas Airways, Ltd., 6.050%, 04/15/16 (a) | | | 1,500,000 | | | | 1,361,806 |
Questar Market Resources, Inc., 6.800%, 04/01/18 | | | 1,365,000 | | | | 1,336,055 |
Qwest Corp., 6.875%, 09/15/33 | | | 20,000 | | | | 16,600 |
Safeway, Inc., 6.350%, 08/15/17 | | | 400,000 | | | | 412,378 |
Samsung Electronics Co., Ltd., 7.700%, 10/01/27 (a) | | | 600,000 | | | | 648,064 |
Simon Property Group, L.P., 5.750%, 12/01/15 | | | 20,000 | | | | 19,439 |
Sprint Capital Corp., 6.875%, 11/15/28 | | | 30,000 | | | | 25,037 |
Sprint Capital Corp., 6.900%, 05/01/19 | | | 20,000 | | | | 17,582 |
Telecom Italia Capital S.p.A., 6.000%, 09/30/34 | | | 40,000 | | | | 34,336 |
Telecom Italia Capital S.p.A., 6.375%, 11/15/33 | | | 105,000 | | | | 93,754 |
Tele-Communications, Inc., 9.800%, 02/01/12 | | | 350,000 | | | | 394,827 |
Telefonica Emisiones SAU, 7.045%, 06/20/36 | | | 1,475,000 | | | | 1,518,394 |
Tennessee Gas Pipeline Co., 7.000%, 10/15/28 | | | 240,000 | 2 | | | 235,262 |
Texas Eastern Transmission, L.P., 7.000%, 07/15/32 | | | 255,000 | 2 | | | 256,321 |
TGT Pipeline LLC, 5.200%, 06/01/18 | | | 465,000 | | | | 417,377 |
The accompanying notes are an integral part of these financial statements.
28
Managers Fixed Income Fund
Schedule of Portfolio Investments (continued)
| | | | | | | |
Security Description | | Principal
Amount | | | Value |
Industrials - 42.4% (continued) | | | | | | | |
Time Warner Cable, Inc., 6.750%, 7/01/18 | | $ | 1,500,000 | | | $ | 1,512,668 |
Time Warner, Inc., 6.625%, 05/15/29 | | | 270,000 | | | | 246,355 |
Time Warner, Inc., 6.950%, 01/15/28 | | | 120,000 | | | | 115,443 |
Time Warner, Inc., 7.625%, 04/15/31 | | | 80,000 | | | | 81,440 |
Time Warner, Inc., 7.700%, 05/01/32 | | | 685,000 | | | | 703,235 |
Toro Co., The, 6.625%, 05/01/37 | | | 365,000 | | | | 374,483 |
Union Pacific Corp., 5.375%, 06/01/33 | | | 50,000 | | | | 43,006 |
V.F. Corp., 6.450%, 11/01/37 | | | 412,000 | | | | 390,980 |
Verizon Global Funding Corp., 5.850%, 09/15/35 | | | 1,095,000 | | | | 968,181 |
Verizon Maryland, Inc., 5.125%, 06/15/33 | | | 295,000 | | | | 228,510 |
Verizon New York, Inc., Series B, 7.375%, 04/01/32 | | | 195,000 | | | | 198,645 |
Viacom, Inc., 6.875%, 04/30/36 | | | 470,000 | | | | 442,685 |
Vondafone Group PLC, 6.150%, 02/27/37 | | | 650,000 | | | | 596,335 |
Walt Disney Co., The, 7.000%, 03/01/32 | | | 190,000 | | | | 217,651 |
Watson Pharmaceuticals, Inc., 1.750%, 03/15/23 | | | 65,000 | | | | 62,238 |
Western Union Co., 6.200%, 11/17/36 | | | 635,000 | | | | 594,475 |
Weyerhaeuser Co., 6.875%, 12/15/33 | | | 645,000 | | | | 600,590 |
XTO Energy, Inc., 6.750%, 08/01/37 | | | 300,000 | | | | 305,178 |
Total Industrials | | | | | | | 52,755,242 |
Utilities - 8.9% | | | | | | | |
Ameren Energy Generating Co., 7.000%, 04/15/18 (a) | | | 1,200,000 | | | | 1,203,779 |
Bruce Mansfield Unit, 6.850%, 06/01/34 | | | 285,000 | | | | 288,432 |
CILCORP, Inc., 8.700%, 10/15/09 | | | 315,000 | | | | 323,586 |
Cleveland Electric Illuminating Co., The, 5.950%, 12/15/36 | | | 715,000 | | | | 607,578 |
Commonwealth Edison Co., 4.700%, 04/15/15 | | | 510,000 | | | | 474,447 |
Commonwealth Edison Co., 5.875%, 02/01/33 | | | 620,000 | | | | 562,318 |
Dominion Resources, Inc., 5.950%, 06/15/35 | | | 90,000 | | | | 81,030 |
Empresa Nacional de Electricidad, Yankee, 7.875%, 02/01/27 | | | 900,000 | | | | 983,260 |
Illinois Power Co., 6.250%, 04/01/18 (a) | | | 1,370,000 | | | | 1,321,201 |
ITC Holdings Corp., 5.875%, 09/30/16 (a) | | | 225,000 | | | | 218,857 |
ITC Holdings Corp., 6.375%, 09/30/36 (a) | | | 300,000 | | | | 273,325 |
Methanex Corp., 6.000%, 08/15/15 | | | 320,000 | | | | 298,151 |
MidAmerican Energy Holdings Co., 6.500%, 09/15/37 | | | 340,000 | 2 | | | 344,517 |
NiSource Finance Corp., 6.400%, 03/15/18 | | | 1,645,000 | | | | 1,590,462 |
NiSource Finance Corp., 6.800%, 01/15/19 | | | 900,000 | | | | 884,219 |
Pacific Gas and Electric Co., 6.050%, 03/01/34 | | | 500,000 | | | | 483,654 |
Southwestern Electric Power Co., 6.450%, 01/15/19 | | | 1,225,000 | | | | 1,220,064 |
Total Utilities | | | | | | | 11,158,880 |
Total Corporate Bonds
(cost $88,813,710) | | | | | | | 85,794,511 |
U.S. Government and Agency Obligations - 12.9% | | | | | | | |
FNMA, 2.290%, 02/19/09 | | | 700,000 | | | | 516,256 |
USTN, 4.500%, 09/30/11 | | | 750,000 | 2 | | | 784,102 |
The accompanying notes are an integral part of these financial statements.
29
Managers Fixed Income Fund
Schedule of Portfolio Investments (continued)
| | | | | | | |
Security Description | | Principal
Amount | | | Value |
U.S. Government and Agency Obligations - 12.9% (continued) | | | | | | | |
USTN, 4.750%, 02/15/37 | | $ | 3,000,000 | | | $ | 3,098,907 |
USTN, 4.750%, 05/15/14 | | | 835,000 | 2 | | | 895,407 |
USTN, 4.875%, 05/31/09 | | | 9,940,000 | 2 | | | 10,166,761 |
U.S. Treasury Inflation Indexed Bonds, 2.000%, 01/15/14 | | | 511,452 | | | | 543,138 |
Total U.S. Government and Agency Obligations
(cost $15,449,504) | | | | | | | 16,004,571 |
Foreign Government Obligations - 7.2% | | | | | | | |
Brazil, Republic of, 10.250%, 01/10/28 | | BRL | 750,000 | | | | 397,667 |
Canadian Government, 3.750%, 06/01/12 | | CAD | 135,000 | | | | 133,917 |
Canadian Government, 4.250%, 09/01/09 | | CAD | 1,000,000 | | | | 991,802 |
Canadian Government, 5.250%, 06/01/12 | | CAD | 390,000 | | | | 407,781 |
Export-Import Bank of Korea, 4.125%, 02/10/09 (a) | | | 485,000 | | | | 483,727 |
Inter-American Development Bank, 6.000%, 12/15/17 | | NZD | 3,500,000 | | | | 2,457,375 |
International Bank for Reconstruction & Development, 9.500%, 05/27/10 | | ISK | 3,300,000 | | | | 42,138 |
Korea Development Bank, 3.875%, 03/02/09 | | | 425,000 | | | | 424,348 |
Mexican Fixed Rate Bonds, 8.000%, 12/07/23 | | MXN | 3,500,000 | | | | 303,774 |
Mexican Government, 9.000%, 12/20/12 | | MXN | 12,000,000 | | | | 1,170,700 |
New South Wales Treasury Corp., Series 12RG, 6.000%, 05/01/12 | | AUD | 520,000 | | | | 476,917 |
New South Wales Treasury Corp., Series 10RG, 7.000%, 12/01/10 | | AUD | 995,000 | | | | 947,005 |
Nordic Investment Bank, 13.000%, 09/12/08 | | ISK | 5,700,000 | | | | 72,675 |
Queensland Treasury Corp., Series 11G, 6.000%, 06/14/11 | | AUD | 665,000 | | | | 616,680 |
Total Foreign Government Obligations
(cost $8,510,320) | | | | | | | 8,926,506 |
Municipal Bonds - 2.2% | | | | | | | |
Alabama Public School & College Authority, Capital Improvement Bond, 4.500%, 12/01/26 | | | 30,000 | | | | 29,014 |
Buckeye Tobacco Settlement Financing Authority, Asset-A-2, 5.875%, 06/01/47 | | | 250,000 | | | | 208,605 |
Chicago Illinois Board of Education, Dedicated-Series B, 4.750%, 12/01/31 | | | 50,000 | | | | 49,028 |
Chicago Illinois O’Hare International Airport Revenue Bond, Series A, 4.500%, 01/01/38 | | | 15,000 | | | | 13,457 |
Decatur Texas Hospital Authority Hospital Revenue, 7.750%, 09/01/09 | | | 90,000 | | | | 92,460 |
District of Columbia, Series A, 4.750%, 06/01/36 | | | 30,000 | | | | 28,106 |
Eufaula Alabama, Series C, 4.000%, 08/15/12 | | | 345,000 | | | | 340,111 |
Florida State Turnpike Authority, Revenue Bond, Department of Transportation, Series A, 3.500%, 07/01/27 | | | 30,000 | | | | 24,214 |
Green Bay Wisconsin, Water System Revenue Refunding Bonds, 3.500%, 11/01/26 (FSA Insured) | | | 20,000 | | | | 16,745 |
Green Bay Wisconsin, Water System Revenue Refunding Bonds, 3.500%, 11/01/29 (FSA Insured) | | | 20,000 | | | | 16,114 |
Grosse Pointe Michigan Public School System, 3.000%, 05/01/27 | | | 15,000 | | | | 10,955 |
Harris County Texas, Road Bonds, Series B, 4.500%, 10/01/31 | | | 85,000 | | | | 80,307 |
JEA Florida Water & Sewer System Revenue Bond, Series B, 4.750%, 10/01/41 | | | 45,000 | | | | 42,146 |
Louisianna State, Series C, 3.250%, 05/01/26 (FSA Insured) | | | 30,000 | | | | 23,800 |
Massachusetts State School Building Authority Sales Tax Revenue Bond, Series A, 4.750%, 08/15/32 | | | 30,000 | | | | 29,324 |
Michigan Tobacco Settlement Financial Authority, Series A, 7.309%, 06/01/34 | | | 395,000 | | | | 361,654 |
Omaha Public Power District, Electric System Subordinated Revenue Bonds, Series AA, 4.500%, 02/01/34 | | | 70,000 | | | | 63,304 |
San Diego California Unified School District, Refunding Bonds, Election 1998, Series F-1, 4.500%, 07/01/29 | | | 30,000 | | | | 27,836 |
San Jose California Redevelopment Agency Tax Allocation, Series C, 3.750%, 08/01/28 | | | 35,000 | | | | 28,517 |
The accompanying notes are an integral part of these financial statements.
30
Managers Fixed Income Fund
Schedule of Portfolio Investments (continued)
| | | | | | | |
Security Description | | Principal
Amount | | Value | |
Municipal Bonds - 2.2% (continued) | | | | | | | |
San Jose Redevelopment Agency, 3.750%, 08/01/28 | | $ | 15,000 | | $ | 12,133 | |
State of California, 4.500%, 08/01/27 (AMBAC Insured) | | | 45,000 | | | 42,570 | |
State of California, 4.500%, 08/01/30 (AMBAC Insured) | | | 35,000 | | | 32,029 | |
State of California, 4.500%, 10/01/29 | | | 130,000 | | | 119,662 | |
State of California, 4.500%, 08/01/30 | | | 30,000 | | | 27,495 | |
State of California, Variable Purpose Bond, 3.250%, 12/01/27 | | | 25,000 | | | 19,084 | |
State of California, Variable Purpose Bond, 4.500%, 12/01/33 | | | 110,000 | | | 98,938 | |
Tobacco Settlement Financing Corp., 6.706%, 06/01/46 | | | 1,075,000 | | | 906,139 | |
University of California Regents Medical Center, Series A, 4.750%, 05/15/31 | | | 10,000 | | | 9,570 | |
Wisconsin Housing & Economic Development Authority, Revenue Bonds, Series E, 4.900%, 11/01/35 | | | 10,000 | | | 9,495 | |
Total Municipal Bonds
(cost $2,978,066) | | | | | | 2,762,812 | |
Mortgage-Backed Securities - 0.7% | | | | | | | |
CS First Boston Mortgage Securities Corp., Series 2005-7, Class 3A1, 5.000%, 08/25/20 | | | 334,093 | | | 297,299 | |
LB-UBS Commercial Mortgage Trust, Series 2001-C3, Class A2, 6.365%, 12/15/28 | | | 320,000 | | | 328,730 | |
Morgan Stanley Dean Witter Capital, Inc., Series 2001-PPM, Class A2, 6.400%, 02/15/31 | | | 233,560 | | | 238,844 | |
Total Mortgage-Backed Securities
(cost $903,121) | | | | | | 864,873 | |
Asset-Backed Securities - 2.6% | | | | | | | |
ARGF, Series 2005-2A, Class A5, 2.642%, 05/20/11, (07/21/08) (a) 5 | | | 100,000 | | | 91,676 | |
Capital One Auto Finance Trust 2006-C A4, 2.501%, 05/15/13, (07/15/08) 5 | | | 735,000 | | | 653,218 | |
CCCIT, Series 2008-C6, Class C6, 6.300%, 06/20/14 | | | 780,000 | | | 745,875 | |
Centex Home Equity Loan, Series 2004-A, Class AF6, 4.270%, 01/25/34 7 | | | 262,613 | | | 245,808 | |
CHAIT, Series 2007-B1, Class B1, 2.721%, 04/15/19, (07/15/08) 5 | | | 845,000 | | | 676,414 | |
Community Program Loan Trust, Series 87-A, Class A4, 4.500%, 10/01/18 | | | 18,011 | | | 17,817 | |
Countrywide Home Loans, Series 2002-S1, Class A5, 6.460%, 05/25/32 (b) | | | 313,613 | | | 296,809 | |
MBNAS, Series 2005-B2, Class B, 2.651%, 12/17/12, (07/15/08) 5 | | | 535,000 | | | 515,530 | |
Total Asset-Backed Securities
(cost $3,246,949) | | | | | | 3,243,147 | |
| | |
| | | Shares | | | |
Preferred Stocks - 1.6% | | | | | | | |
CIT Group, Inc., 6.350% | | | 2,540 | | $ | 32,385 | |
FHLMC, 8.375% | | | 18,499 | | | 449,526 | |
FNMA, 8.250% | | | 35,000 | | | 803,249 | |
Lehman Brothers Holdings, Inc., 7.250% | | | 225 | | | 180,997 | |
Newell Financial Trust I, 5.250% | | | 13,455 | | | 608,839 | |
Total Preferred Stocks
(cost $2,151,845) | | | | | | 2,074,996 | |
Other Investment Companies - 14.7%1 | | | | | | | |
Bank of New York Institutional Cash Reserves Fund, 2.62%3 | | | 15,645,485 | | | 15,645,485 | |
Dreyfus Cash Management Fund, Institutional Class Shares, 2.66% | | | 1,072,344 | | | 1,072,345 | |
JPMorgan Liquid Assets Money Market Fund, Capital Shares, 2.68% | | | 1,533,838 | | | 1,533,838 | |
Total Other Investment Companies
(cost $18,251,668) | | | | | | 18,251,668 | |
Total Investments - 110.8%
(cost $140,305,183) | | | | | | 137,923,084 | |
Other Assets, less Liabilities - (10.8)% | | | | | | (13,492,400 | ) |
Net Assets - 100.0% | | | | | $ | 124,430,684 | |
The accompanying notes are an integral part of these financial statements.
31
Managers Trust II Funds
Notes to Schedules of Portfolio Investments (unaudited)
The following footnotes and abbreviations should be read in conjunction with each of the Schedules of Portfolio Investments previously presented in this report.
At June 30, 2008, the cost of securities for Federal income tax purposes and the gross aggregate unrealized appreciation and/or depreciation based on tax cost were:
| | | | | | | | | | | | | |
Fund | | Cost | | Appreciation | | Depreciation | | | Net | |
Managers AMG Chicago Equity Partners Mid-Cap Fund | | $ | 71,834,259 | | $ | 5,816,449 | | ($5,263,377 | ) | | $ | 553,072 | |
Managers AMG Chicago Equity Partners Balanced Fund | | | 21,478,924 | | | 1,196,434 | | (995,176 | ) | | | 201,258 | |
Managers High Yield Fund | | | 50,662,378 | | | 294,734 | | (3,581,358 | ) | | | (3,286,624 | ) |
Managers Fixed Income Fund | | | 140,437,421 | | | 2,221,389 | | (4,735,726 | ) | | | (2,514,337 | ) |
| * | Non-income-producing security |
| (a) | Security exempt from registration under Rule 144A of the Securities Act of 1933. This security may be resold in transactions exempt from registration, normally to qualified buyers. At June 30, 2008, the value of these securities amounted to the following: |
| | | | | | |
Fund | | Value | | % of Net Assets | |
Managers High Yield Fund | | $ | 9,987,501 | | 8.0 | % |
Managers Fixed Income Fund | | | 7,185,932 | | 19.7 | % |
| (b) | Step Bond. A debt instrument with either deferred interest payments or an interest rate that resets at specific times during its term. |
1 | Yield shown for an investment company represents its June 30, 2008, seven-day average yield, which refers to the sum of the previous seven days’ dividends paid, expressed as an annual percentage. |
2 | Some or all of these securities were out on loan to various brokers as of June 30, 2008, amounting to: |
| | | | | | |
Fund | | Value | | % of Net Assets | |
Managers AMG Chicago Equity Partners Mid-Cap Fund | | $ | 14,697,998 | | 25.8 | % |
Managers AMG Chicago Equity Partners Balanced Fund | | | 3,804,140 | | 21.6 | % |
Managers High Yield Fund | | | 8,952,938 | | 24.6 | % |
Managers Fixed Income Fund | | | 15,242,908 | | 12.3 | % |
3 | Collateral received from brokers for securities lending was invested in this short-term investment. |
4 | Represents yield to maturity at June 30, 2008. |
5 | Floating rate security. The rate listed is as of June 30, 2008. Date in parenthesis represents the securities next coupon rate reset. |
6 | Payment-in-kind security. A type of high yield debt instrument whose issuer has the option of making interest payments in either cash or additional debt securities. |
7 | Variable Rate Security. The rate listed is as of June 30, 2008 and is periodically reset subject to terms and conditions set forth in the debenture. |
8 | Security is in default. Issuer has failed to make a timely payment of either principal or interest or has failed to comply with some provision of the bond indenture. |
Investments Definitions and Abbreviations:
| | |
| FHLB: | | Federal Home Loan Bank |
| FHLMC: | | Federal Home Loan Mortgage Corp. |
| FNMA: | | Federal National Mortgage Association |
| USTB: | | United States Treasury Bond |
| USTN: | | United States Treasury Note |
Registered shares: A security whose owner has been recorded with its issuer or issuer’s registrar.
Abbreviations have been used throughout the portfolios to indicate amounts shown in currencies of par values other than the U.S. dollar (USD):
| | |
| AUD: | | Australian Dollar |
| BRL: | | Brazilian Real |
| CAD: | | Canadian Dollar |
| ISK: | | Iceland Krona |
| MXN: | | Mexican Peso |
| MYR: | | Malaysian Ringgit |
| NZD: | | New Zealand Dollar |
| SGD: | | Singapore Dollar |
| THB: | | Thailand Bhat |
32
Statements of Assets and Liabilities
June 30, 2008 (unaudited)
| | | | | | | | | | | | | | | | |
| | | Managers AMG
Chicago Equity
Partners
Mid-Cap Fund | | | Managers AMG
Chicago Equity
Partners
Balanced Fund | | | Managers
High Yield
Fund | | | Managers
Fixed Income
Fund | |
Assets: | | | | | | | | | | | | | | | | |
Investments at value* (including securities on loan valued at $14,697,998, $3,804,140, $8,952,938, and $15,242,908 respectively) | | $ | 72,387,331 | | | $ | 21,680,182 | | | $ | 47,375,754 | | | $ | 137,923,084 | |
Foreign currency** | | | — | | | | — | | | | — | | | | 109 | |
Receivable for investments sold | | | 101,523 | | | | 411,627 | | | | 767,473 | | | | — | |
Receivable for Fund shares sold | | | 25,253 | | | | 28,388 | | | | 118,614 | | | | 883,246 | |
Dividends, interest and other receivables | | | 54,274 | | | | 86,118 | | | | 835,920 | | | | 1,787,090 | |
Prepaid expenses | | | 15,104 | | | | 18,885 | | | | 18,142 | | | | 33,734 | |
| | | | | | | | | | | | | | | | |
Total assets | | | 72,583,485 | | | | 22,225,200 | | | | 49,115,903 | | | | 140,627,263 | |
| | | | | | | | | | | | | | | | |
Liabilities: | | | | | | | | | | | | | | | | |
Payable to Custodian | | | — | | | | — | | | | 2,819,811 | | | | 98,615 | |
Payable for Fund shares repurchased | | | 10,921 | | | | 123 | | | | 322,239 | | | | — | |
Payable upon return of securities loaned | | | 15,272,354 | | | | 3,906,370 | | | | 9,350,278 | | | | 15,645,485 | |
Payable for investments purchased | | | 182,488 | | | | 673,193 | | | | 124,269 | | | | 337,758 | |
Accrued expenses: | | | | | | | | | | | | | | | | |
Investment advisory and management fees | | | 24,128 | | | | 342 | | | | 8,031 | | | | 24,532 | |
Administrative fees | | | 9,909 | | | | 2,964 | | | | 6,978 | | | | 20,304 | |
Other | | | 49,752 | | | | 30,635 | | | | 27,776 | | | | 69,885 | |
| | | | | | | | | | | | | | | | |
Total liabilities | | | 15,549,552 | | | | 4,613,627 | | | | 12,659,382 | | | | 16,196,579 | |
| | | | | | | | | | | | | | | | |
Net Assets | | $ | 57,033,933 | | | $ | 17,611,573 | | | $ | 36,456,521 | | | $ | 124,430,684 | |
| | | | | | | | | | | | | | | | |
Net Assets Represent: | | | | | | | | | | | | | | | | |
Paid-in capital | | $ | 58,631,486 | | | $ | 33,590,703 | | | $ | 53,283,425 | | | $ | 128,941,757 | |
Undistributed net investment income (loss) | | | 126,660 | | | | 21,047 | | | | 27,520 | | | | (8,619 | ) |
Accumulated net realized loss from investments and foreign currency transactions | | | (2,415,222 | ) | | | (16,206,654 | ) | | | (13,593,539 | ) | | | (2,120,566 | ) |
Net unrealized appreciation (depreciation) of investments and foreign currency translations | | | 691,009 | | | | 206,477 | | | | (3,260,885 | ) | | | (2,381,888 | ) |
| | | | | | | | | | | | | | | | |
Net Assets | | $ | 57,033,933 | | | $ | 17,611,573 | | | $ | 36,456,521 | | | $ | 124,430,684 | |
| | | | | | | | | | | | | | | | |
Class A Shares - Net Assets | | $ | 5,849,971 | | | $ | 2,652,400 | | | $ | 22,622,633 | | | $ | 38,461,245 | |
Shares Outstanding | | | 453,459 | | | | 213,773 | | | | 2,905,331 | | | | 3,742,546 | |
| | | | | | | | | | | | | | | | |
Net asset value and redemption price per share | | $ | 12.90 | | | $ | 12.41 | | | $ | 7.79 | | | $ | 10.28 | |
| | | | | | | | | | | | | | | | |
Offering price per share based on a maximum sales charge of 5.75% (NAV per share/(100%-5.75%) | | $ | 13.69 | | | $ | 13.17 | | | | n/a | | | | n/a | |
Offering price per share based on a maximum sales charge of 4.25% (NAV per share/(100%-4.25%) | | | n/a | | | | n/a | | | $ | 8.14 | | | $ | 10.74 | |
Class B Shares - Net Assets | | $ | 4,821,080 | | | $ | 4,193,452 | | | $ | 5,052,921 | | | $ | 8,583,719 | |
Shares Outstanding | | | 400,323 | | | | 343,532 | | | | 656,513 | | | | 841,910 | |
| | | | | | | | | | | | | | | | |
Net asset value and offering price per share | | $ | 12.04 | | | $ | 12.21 | | | $ | 7.70 | | | $ | 10.20 | |
| | | | | | | | | | | | | | | | |
Class C Shares - Net Assets | | $ | 6,916,593 | | | $ | 3,549,337 | | | $ | 5,768,897 | | | $ | 44,314,788 | |
Shares Outstanding | | | 574,967 | | | | 288,160 | | | | 750,835 | | | | 4,318,786 | |
| | | | | | | | | | | | | | | | |
Net asset value and offering price per share | | $ | 12.03 | | | $ | 12.32 | | | $ | 7.68 | | | $ | 10.26 | |
| | | | | | | | | | | | | | | | |
Institutional Class Shares - Net Assets | | $ | 39,446,289 | | | $ | 7,216,384 | | | $ | 3,012,070 | | | $ | 33,070,932 | |
Shares Outstanding | | | 2,894,359 | | | | 577,109 | | | | 384,046 | | | | 3,207,562 | |
| | | | | | | | | | | | | | | | |
Net asset value, offering and redemption price per share | | $ | 13.63 | | | $ | 12.50 | | | $ | 7.84 | | | $ | 10.31 | |
| | | | | | | | | | | | | | | | |
* Investments at cost | | $ | 71,696,322 | | | $ | 21,473,705 | | | $ | 50,636,639 | | | $ | 140,305,183 | |
** Foreign currency at cost | | | — | | | | — | | | | — | | | $ | 109 | |
The accompanying notes are an integral part of these financial statements.
33
Statements of Operations
For the six months ended June 30, 2008 (unaudited)
| | | | | | | | | | | | | | | | |
| | | Managers AMG
Chicago Equity
Partners
Mid-Cap Fund | | | Managers AMG
Chicago Equity
Partners
Balanced Fund | | | Managers
High Yield
Fund | | | Managers
Fixed Income
Fund | |
Investment Income: | | | | | | | | | | | | | | | | |
Dividend income | | $ | 449,478 | | | $ | 94,650 | | | $ | 46,405 | | | $ | 221,831 | |
Interest income | | | — | | | | 209,352 | | | | 1,655,069 | | | | 3,171,666 | |
Securities lending fees | | | 39,836 | | | | 9,468 | | | | 18,239 | | | | 50,845 | |
| | | | | | | | | | | | | | | | |
Total investment income | | | 489,314 | | | | 313,470 | | | | 1,719,713 | | | | 3,444,342 | |
| | | | | | | | | | | | | | | | |
Expenses: | | | | | | | | | | | | | | | | |
Investment advisory and management fees | | | 215,948 | | | | 65,245 | | | | 138,390 | | | | 250,927 | |
Administrative fees | | | 61,699 | | | | 18,642 | | | | 39,540 | | | | 111,523 | |
Distribution Fees - Class A | | | 7,432 | | | | 2,852 | | | | 30,731 | | | | 39,940 | |
Distribution Fees - Class B | | | 27,968 | | | | 25,732 | | | | 28,641 | | | | 44,078 | |
Distribution Fees - Class C | | | 36,974 | | | | 18,987 | | | | 29,800 | | | | 192,125 | |
Registration fees | | | 40,358 | | | | 34,588 | | | | 35,763 | | | | 22,471 | |
Professional fees | | | 17,231 | | | | 13,909 | | | | 15,547 | | | | 20,835 | |
Custodian | | | 11,770 | | | | 8,950 | | | | 8,413 | | | | 9,352 | |
Reports to shareholders | | | 10,599 | | | | 3,449 | | | | 7,992 | | | | 8,865 | |
Transfer agent | | | 10,243 | | | | 3,354 | | | | 10,651 | | | | 12,836 | |
Trustees fees and expenses | | | 2,312 | | | | 595 | | | | 1,230 | | | | 3,452 | |
Miscellaneous | | | 4,628 | | | | 2,196 | | | | 9,988 | | | | 2,341 | |
| | | | | | | | | | | | | | | | |
Total expenses before offsets | | | 447,162 | | | | 198,499 | | | | 356,686 | | | | 718,745 | |
| | | | | | | | | | | | | | | | |
Expense reimbursement | | | (67,075 | ) | | | (56,725 | ) | | | (80,932 | ) | | | (113,255 | ) |
Expense reductions | | | (17,433 | ) | | | (1,587 | ) | | | (325 | ) | | | (1,088 | ) |
| | | | | | | | | | | | | | | | |
Net expenses | | | 362,654 | | | | 140,187 | | | | 275,429 | | | | 604,402 | |
| | | | | | | | | | | | | | | | |
Net investment income | | | 126,660 | | | | 173,283 | | | | 1,444,284 | | | | 2,839,940 | |
| | | | | | | | | | | | | | | | |
Net Realized and Unrealized Gain (Loss): | | | | | | | | | | | | | | | | |
Net realized gain (loss) on investment transactions | | | (1,439,494 | ) | | | 236,438 | | | | (182,508 | ) | | | 755,107 | |
Net realized loss on foreign currency transactions | | | — | | | | — | | | | — | | | | (4,547 | ) |
Net unrealized depreciation of investments | | | (2,873,712 | ) | | | (1,389,079 | ) | | | (1,964,129 | ) | | | (3,982,668 | ) |
Net unrealized appreciation of foreign currency translations | | | — | | | | — | | | | — | | | | 2,281 | |
| | | | | | | | | | | | | | | | |
Net realized and unrealized loss | | | (4,313,206 | ) | | | (1,152,641 | ) | | | (2,146,637 | ) | | | (3,229,827 | ) |
| | | | | | | | | | | | | | | | |
Net decrease in net assets resulting from operations | | | ($4,186,546 | ) | | | ($979,358 | ) | | | ($702,353 | ) | | | ($389,887 | ) |
| | | | | | | | | | | | | | | | |
The accompanying notes are an integral part of these financial statements.
34
Statements of Changes in Net Assets
For the six months ended June 30, 2008 (unaudited) and for the year ended December 31, 2007
| | | | | | | | | | | | | | | | |
| | | Managers AMG Chicago Equity
Partners Mid-Cap Fund | | | Managers AMG Chicago Equity
Partners Balanced Fund | |
| | | 2008 | | | 2007 | | | 2008 | | | 2007 | |
Increase (Decrease) in Net Assets From Operations: | | | | | | | | | | | | | | | | |
Net investment income (loss) | | $ | 126,660 | | | | ($95,181 | ) | | $ | 173,283 | | | $ | 347,759 | |
Net realized gain (loss) on investments and foreign currency transactions | | | (1,439,494 | ) | | | 9,759,495 | | | | 236,438 | | | | 1,622,090 | |
Net unrealized appreciation (depreciation) of investments and foreign currency translations | | | (2,873,712 | ) | | | (8,462,133 | ) | | | (1,389,079 | ) | | | (1,021,872 | ) |
| | | | | | | | | | | | | | | | |
Net increase (decrease) in net assets resulting from operations | | | (4,186,546 | ) | | | 1,202,181 | | | | (979,358 | ) | | | 947,977 | |
| | | | | | | | | | | | | | | | |
Distributions to Shareholders: | | | | | | | | | | | | | | | | |
From net investment income: | | | | | | | | | | | | | | | | |
Class A | | | — | | | | — | | | | (24,931 | ) | | | (41,572 | ) |
Class B | | | — | | | | — | | | | (26,110 | ) | | | (91,395 | ) |
Class C | | | — | | | | — | | | | (21,854 | ) | | | (54,519 | ) |
Institutional Class | | | — | | | | — | | | | (81,438 | ) | | | (182,482 | ) |
From realized capital gain: | | | | | | | | | | | | | | | | |
Class A | | | — | | | | (543,259 | ) | | | — | | | | — | |
Class B | | | — | | | | (535,307 | ) | | | — | | | | — | |
Class C | | | — | | | | (641,479 | ) | | | — | | | | — | |
Institutional Class | | | — | | | | (3,769,867 | ) | | | — | | | | — | |
| | | | | | | | | | | | | | | | |
Total distributions to shareholders | | | — | | | | (5,489,912 | ) | | | (154,333 | ) | | | (369,968 | ) |
| | | | | | | | | | | | | | | | |
From Capital Share Transactions: | | | | | | | | | | | | | | | | |
Proceeds from sale of shares | | | 2,786,114 | | | | 8,549,376 | | | | 1,693,846 | | | | 2,248,776 | |
Reinvestment of dividends and distributions | | | — | | | | 4,213,056 | | | | 106,228 | | | | 236,946 | |
Cost of shares repurchased | | | (14,619,217 | ) | | | (23,552,407 | ) | | | (2,923,709 | ) | | | (5,768,240 | ) |
| | | | | | | | | | | | | | | | |
Net increase (decrease) from capital share transactions | | | (11,833,103 | ) | | | (10,789,975 | ) | | | (1,123,635 | ) | | | (3,282,518 | ) |
| | | | | | | | | | | | | | | | |
Total increase (decrease) in net assets | | | (16,019,649 | ) | | | (15,077,706 | ) | | | (2,257,326 | ) | | | (2,704,509 | ) |
| | | | | | | | | | | | | | | | |
Net Assets: | | | | | | | | | | | | | | | | |
Beginning of period | | | 73,053,582 | | | | 88,131,288 | | | | 19,868,899 | | | | 22,573,408 | |
| | | | | | | | | | | | | | | | |
End of period | | $ | 57,033,933 | | | $ | 73,053,582 | | | $ | 17,611,573 | | | $ | 19,868,899 | |
| | | | | | | | | | | | | | | | |
End of period undistributed net investment income (loss) | | $ | 126,660 | | | | — | | | $ | 21,047 | | | $ | 2,097 | |
| | | | | | | | | | | | | | | | |
The accompanying notes are an integral part of these financial statements.
35
| | | | | | | | | | | | | | |
Managers
High Yield Fund | | | Managers
Fixed Income Fund | |
| 2008 | | | 2007 | | | 2008 | | | 2007 | |
| | | | | | | | | | | | | | |
| $ | 1,444,284 | | | $ | 3,096,302 | | | $ | 2,839,940 | | | $ | 3,794,418 | |
| | (182,508 | ) | | | 517,236 | | | | 750,560 | | | | 379,470 | |
| | (1,964,129 | ) | | | (2,479,264 | ) | | | (3,980,387 | ) | | | 87,612 | |
| | | | | | | | | | | | | | | |
| | (702,353 | ) | | | 1,134,274 | | | | (389,887 | ) | | | 4,261,500 | |
| | | | | | | | | | | | | | | |
| | | | | | | | | | | | | | |
| | | | | | | | | | | | | | |
| | (901,561 | ) | | | (1,827,273 | ) | | | (809,144 | ) | | | (928,844 | ) |
| | (192,462 | ) | | | (540,529 | ) | | | (195,401 | ) | | | (500,146 | ) |
| | (202,648 | ) | | | (430,397 | ) | | | (881,567 | ) | | | (1,155,466 | ) |
| | (124,014 | ) | | | (307,268 | ) | | | (881,108 | ) | | | (1,576,517 | ) |
| | | | | | | | | | | | | | |
| | — | | | | — | | | | — | | | | — | |
| | — | | | | — | | | | — | | | | — | |
| | — | | | | — | | | | — | | | | — | |
| | — | | | | — | | | | — | | | | — | |
| | | | | | | | | | | | | | | |
| | (1,420,685 | ) | | | (3,105,467 | ) | | | (2,767,220 | ) | | | (4,160,973 | ) |
| | | | | | | | | | | | | | | |
| | | | | | | | | | | | | | |
| | 16,777,094 | | | | 23,125,690 | | | | 42,655,620 | | | | 52,824,061 | |
| | 962,286 | | | | 1,914,562 | | | | 1,634,956 | | | | 2,372,039 | |
| | (19,455,979 | ) | | | (36,750,191 | ) | | | (15,420,330 | ) | | | (22,759,542 | ) |
| | | | | | | | | | | | | | | |
| | (1,716,599 | ) | | | (11,709,939 | ) | | | 28,870,246 | | | | 32,436,558 | |
| | | | | | | | | | | | | | | |
| | (3,839,637 | ) | | | (13,691,132 | ) | | | 25,713,139 | | | | 32,537,085 | |
| | | | | | | | | | | | | | | |
| | | | | | | | | | | | | | |
| | 40,296,158 | | | | 53,977,290 | | | | 98,717,545 | | | | 66,180,460 | |
| | | | | | | | | | | | | | | |
| $ | 36,456,521 | | | $ | 40,296,158 | | | $ | 124,430,684 | | | $ | 98,717,545 | |
| | | | | | | | | | | | | | | |
| $ | 27,520 | | | $ | 3,921 | | | | ($8,619 | ) | | | ($81,339 | ) |
| | | | | | | | | | | | | | | |
The accompanying notes are an integral part of these financial statements.
36
Financial Highlights
For a share outstanding throughout each of the six months ended June 30, 2008 (unaudited) and each year ended December 31,
| | | | | | | | | | | | | | | | | | | | | | | | |
| | | For the six
months ended
June 30, 2008
(unaudited) | | | Class A | |
Managers AMG Chicago Equity Partners Mid-Cap Fund | | | 2007 | | | 2006 | | | 2005 | | | 2004 | | | 2003 | |
Net Asset Value, Beginning of Period | | $ | 13.67 | | | $ | 14.60 | | | $ | 13.48 | | | $ | 12.10 | | | $ | 10.36 | | | $ | 7.58 | |
| | | | | | | | | | | | | | | | | | | | | | | | |
Income from Investment Operations: | | | | | | | | | | | | | | | | | | | | | | | | |
Net investment income (loss) | | | 0.03 | | | | (0.02 | )2 | | | 0.05 | | | | (0.01 | )2 | | | (0.02 | ) | | | (0.01 | ) |
Net realized and unrealized gain (loss) on investments | | | (0.80 | ) | | | 0.17 | 2 | | | 1.11 | | | | 1.39 | 2 | | | 1.76 | | | | 2.79 | |
| | | | | | | | | | | | | | | | | | | | | | | | |
Total from investment operations | | | (0.77 | ) | | | 0.15 | | | | 1.16 | | | | 1.38 | | | | 1.74 | | | | 2.78 | |
| | | | | | | | | | | | | | | | | | | | | | | | |
Less Distributions to Shareholders from: | | | | | | | | | | | | | | | | | | | | | | | | |
Net investment income | | | — | | | | — | | | | (0.04 | ) | | | — | | | | — | | | | — | |
Net realized gain on investments | | | — | | | | (1.08 | ) | | | — | | | | — | | | | — | | | | — | |
| | | | | | | | | | | | | | | | | | | | | | | | |
Total distributions to shareholders | | | — | | | | (1.08 | ) | | | (0.04 | ) | | | — | | | | — | | | | — | |
| | | | | | | | | | | | | | | | | | | | | | | | |
Net Asset Value, End of Period | | $ | 12.90 | | | $ | 13.67 | | | $ | 14.60 | | | $ | 13.48 | | | $ | 12.10 | | | $ | 10.36 | |
| | | | | | | | | | | | | | | | | | | | | | | | |
Total Return 1 | | | (5.63 | )%4 | | | 0.84 | % | | | 8.69 | % | | | 11.32 | % | | | 16.80 | % | | | 36.68 | % |
| | | | | | | | | | | | | | | | | | | | | | | | |
Ratio of net expenses to average net assets | | | 1.18 | %3 | | | 1.21 | % | | | 1.23 | % | | | 1.33 | % | | | 1.41 | % | | | 1.50 | % |
Ratio of net investment income (loss) to average net assets 1 | | | 0.42 | %3 | | | (0.10 | )% | | | 0.34 | % | | | (0.13 | )% | | | (0.16 | )% | | | (0.14 | )% |
Portfolio turnover | | | 52 | %4 | | | 125 | % | | | 85 | % | | | 84 | % | | | 90 | % | | | 109 | % |
Net assets at end of period (000’s omitted) | | $ | 5,850 | | | $ | 6,464 | | | $ | 9,178 | | | $ | 8,712 | | | $ | 9,168 | | | $ | 9,741 | |
| | | | | | | | | | | | | | | | | | | | | | | | �� |
Ratios absent expense offsets: 5 | | | | | | | | | | | | | | | | | | | | | | | | |
Ratio of total expenses to average net assets | | | 1.45 | %3 | | | 1.37 | % | | | 1.36 | % | | | 1.45 | % | | | 1.68 | % | | | 1.63 | % |
Ratio of net investment income (loss) to average net assets | | | 0.12 | %3 | | | (0.25 | )% | | | 0.22 | % | | | (0.24 | )% | | | (0.43 | )% | | | (0.27 | )% |
| | | | | | | | | | | | | | | | | | | | | | | | |
| | |
| | | For the six
months ended
June 30, 2008
(unaudited) | | | Class C | |
Managers AMG Chicago Equity Partners Mid-Cap Fund | | | 2007 | | | 2006 | | | 2005 | | | 2004 | | | 2003 | |
Net Asset Value, Beginning of Period | | $ | 12.79 | | | $ | 13.80 | | | $ | 12.83 | | | $ | 11.60 | | | $ | 9.99 | | | $ | 7.34 | |
| | | | | | | | | | | | | | | | | | | | | | | | |
Income from Investment Operations: | | | | | | | | | | | | | | | | | | | | | | | | |
Net investment income (loss) | | | (0.02 | ) | | | (0.12 | )2 | | | (0.06 | ) | | | (0.06 | )2 | | | (0.08 | ) | | | (0.05 | ) |
Net realized and unrealized gain (loss) on investments | | | (0.74 | ) | | | 0.12 | 2 | | | 1.07 | | | | 1.29 | 2 | | | 1.69 | | | | 2.70 | |
| | | | | | | | | | | | | | | | | | | | | | | | |
Total from investment operations | | | (0.76 | ) | | | — | | | | 1.01 | | | | 1.23 | | | | 1.61 | | | | 2.65 | |
| | | | | | | | | | | | | | | | | | | | | | | | |
Less Distributions to Shareholders from: | | | | | | | | | | | | | | | | | | | | | | | | |
Net investment income | | | — | | | | — | | | | (0.04 | ) | | | — | | | | — | | | | — | |
Net realized gain on investments | | | — | | | | (1.01 | ) | | | — | | | | — | | | | — | | | | — | |
| | | | | | | | | | | | | | | | | | | | | | | | |
Total distributions to shareholders | | | — | | | | (1.01 | ) | | | (0.04 | ) | | | — | | | | — | | | | — | |
| | | | | | | | | | | | | | | | | | | | | | | | |
Net Asset Value, End of Period | | $ | 12.03 | | | $ | 12.79 | | | $ | 13.80 | | | $ | 12.83 | | | $ | 11.60 | | | $ | 9.99 | |
| | | | | | | | | | | | | | | | | | | | | | | | |
Total Return 1 | | | (5.94 | )%4 | | | (0.19 | )% | | | 7.87 | % | | | 10.60 | % | | | 16.12 | % | | | 36.10 | % |
| | | | | | | | | | | | | | | | | | | | | | | | |
Ratio of net expenses to average net assets | | | 1.93 | %3 | | | 1.96 | % | | | 1.98 | % | | | 1.99 | % | | | 1.91 | % | | | 2.00 | % |
Ratio of net investment income (loss) to average net assets 1 | | | (0.34 | )%3 | | | (0.85 | )% | | | (0.41 | )% | | | (0.79 | )% | | | (0.67 | )% | | | (0.64 | )% |
Portfolio turnover | | | 52 | %4 | | | 125 | % | | | 85 | % | | | 84 | % | | | 90 | % | | | 109 | % |
Net assets at end of period (000’s omitted) | | $ | 6,917 | | | $ | 8,651 | | | $ | 11,748 | | | $ | 13,845 | | | $ | 15,393 | | | $ | 16,576 | |
| | | | | | | | | | | | | | | | | | | | | | | | |
Ratios absent expense offsets: 5 | | | | | | | | | | | | | | | | | | | | | | | | |
Ratio of total expenses to average net assets | | | 2.21 | %3 | | | 2.12 | % | | | 2.11 | % | | | 2.11 | % | | | 2.18 | % | | | 2.13 | % |
Ratio of net investment income (loss) to average net assets | | | (0.63 | )%3 | | | (1.02 | )% | | | (0.56 | )% | | | (0.91 | )% | | | (0.94 | )% | | | (0.77 | )% |
| | | | | | | | | | | | | | | | | | | | | | | | |
37
| | | | | | | | | | | | | | | | | | | | | | |
For the six
months ended
June 30, 2008 (unaudited) | | | Class B | |
| | 2007 | | | 2006 | | | 2005 | | | 2004 | | | 2003 | |
| $ | 12.80 | | | $ | 13.79 | | | $ | 12.82 | | | $ | 11.59 | | | $ | 9.98 | | | $ | 7.33 | |
| | | | | | | | | | | | | | | | | | | | | | | |
| | | | | | | | | | | | | | | | | | | | | | |
| | (0.02 | ) | | | (0.13 | )2 | | | (0.08 | ) | | | (0.06 | )2 | | | (0.07 | ) | | | (0.05 | ) |
| | (0.74 | ) | | | 0.15 | 2 | | | 1.09 | | | | 1.29 | 2 | | | 1.68 | | | | 2.70 | |
| | | | | | | | | | | | | | | | | | | | | | | |
| | (0.76 | ) | | | 0.02 | | | | 1.01 | | | | 1.23 | | | | 1.61 | | | | 2.65 | |
| | | | | | | | | | | | | | | | | | | | | | | |
| | | | | | | | | | | | | | | | | | | | | | |
| | — | | | | — | | | | (0.04 | ) | | | — | | | | — | | | | — | |
| | — | | | | (1.01 | ) | | | — | | | | — | | | | — | | | | — | |
| | | | | | | | | | | | | | | | | | | | | | | |
| | — | | | | (1.01 | ) | | | (0.04 | ) | | | — | | | | — | | | | — | |
| | | | | | | | | | | | | | | | | | | | | | | |
| $ | 12.04 | | | $ | 12.80 | | | $ | 13.79 | | | $ | 12.82 | | | $ | 11.59 | | | $ | 9.98 | |
| | | | | | | | | | | | | | | | | | | | | | | |
| | (5.94 | )%4 | | | (0.03 | )% | | | 7.88 | % | | | 10.61 | % | | | 16.13 | % | | | 36.15 | % |
| | | | | | | | | | | | | | | | | | | | | | | |
| | 1.93 | %3 | | | 1.96 | % | | | 1.98 | % | | | 1.99 | % | | | 1.90 | % | | | 2.00 | % |
| | (0.34 | )%3 | | | (0.86 | )% | | | (0.41 | )% | | | (0.79 | )% | | | (0.67 | )% | | | (0.64 | )% |
| | 52 | %4 | | | 125 | % | | | 85 | % | | | 84 | % | | | 90 | % | | | 109 | % |
| $ | 4,821 | | | $ | 6,909 | | | $ | 11,197 | | | $ | 15,512 | | | $ | 17,226 | | | $ | 17,052 | |
| | | | | | | | | | | | | | | | | | | | | | | |
| | | | | | | | | | | | | | | | | | | | | | |
| | 2.21 | %3 | | | 2.12 | % | | | 2.11 | % | | | 2.11 | % | | | 2.18 | % | | | 2.13 | % |
| | (0.63 | )%3 | | | (1.02 | )% | | | (0.59 | )% | | | (0.91 | )% | | | (0.95 | )% | | | (0.77 | )% |
| | | | | | | | | | | | | | | | | | | | | | | |
| |
For the six
months ended
June 30, 2008 (unaudited) | | | Institutional Class | |
| | 2007 | | | 2006 | | | 2005 | | | 2004 | | | 2003 | |
| $ | 14.42 | | | $ | 15.41 | | | $ | 14.19 | | | $ | 12.70 | | | $ | 10.82 | | | $ | 7.87 | |
| | | | | | | | | | | | | | | | | | | | | | | |
| | | | | | | | | | | | | | | | | | | | | | |
| | 0.05 | | | | 0.03 | 2 | | | 0.09 | | | | 0.10 | 2 | | | 0.04 | | | | 0.03 | |
| | (0.84 | ) | | | 0.11 | 2 | | | 1.17 | | | | 1.39 | 2 | | | 1.84 | | | | 2.92 | |
| | | | | | | | | | | | | | | | | | | | | | | |
| | (0.79 | ) | | | 0.14 | | | | 1.26 | | | | 1.49 | | | | 1.88 | | | | 2.95 | |
| | | | | | | | | | | | | | | | | | | | | | | |
| | | | | | | | | | | | | | | | | | | | | | |
| | — | | | | — | | | | (0.04 | ) | | | — | | | | — | | | | — | |
| | — | | | | (1.13 | ) | | | — | | | | — | | | | — | | | | — | |
| | | | | | | | | | | | | | | | | | | | | | | |
| | — | | | | (1.13 | ) | | | (0.04 | ) | | | — | | | | — | | | | — | |
| | | | | | | | | | | | | | | | | | | | | | | |
| $ | 13.63 | | | $ | 14.42 | | | $ | 15.41 | | | $ | 14.19 | | | $ | 12.70 | | | $ | 10.82 | |
| | | | | | | | | | | | | | | | | | | | | | | |
| | (5.48 | )%4 | | | 0.78 | % | | | 8.96 | % | | | 11.74 | % | | | 17.37 | % | | | 37.51 | % |
| | | | | | | | | | | | | | | | | | | | | | | |
| | 0.93 | %3 | | | 0.96 | % | | | 0.98 | % | | | 0.99 | % | | | 0.90 | % | | | 1.00 | % |
| | 0.65 | %3 | | | 0.16 | % | | | 0.59 | % | | | 0.21 | % | | | 0.33 | % | | | 0.36 | % |
| | 52 | %4 | | | 125 | % | | | 85 | % | | | 84 | % | | | 90 | % | | | 109 | % |
| $ | 39,446 | | | $ | 51,029 | | | $ | 56,008 | | | $ | 59,571 | | | $ | 60,656 | | | $ | 64,225 | |
| | | | | | | | | | | | | | | | | | | | | | | |
| | | | | | | | | | | | | | | | | | | | | | |
| | 1.21 | %3 | | | 1.12 | % | | | 1.11 | % | | | 1.11 | % | | | 1.18 | % | | | 1.13 | % |
| | 0.37 | %3 | | | 0.01 | % | | | 0.47 | % | | | 0.09 | % | | | 0.06 | % | | | 0.23 | % |
| | | | | | | | | | | | | | | | | | | | | | | |
38
Financial Highlights
For a share outstanding throughout each of the six months ended June 30, 2008 (unaudited) and each year ended December 31,
| | | | | | | | | | | | | | | | | | | | | | | | |
| | | For the six
months ended
June 30, 2008
(unaudited) | | | Class A | |
Managers AMG Chicago Equity Partners Balanced Fund | | | 2007 | | | 2006 | | | 2005 | | | 2004 | | | 2003 | |
Net Asset Value, Beginning of Period | | $ | 13.18 | | | $ | 12.86 | | | $ | 11.55 | | | $ | 11.24 | | | $ | 10.42 | | | $ | 8.62 | |
| | | | | | | | | | | | | | | | | | | | | | | | |
Income from Investment Operations: | | | | | | | | | | | | | | | | | | | | | | | | |
Net investment income | | | 0.12 | | | | 0.25 | | | | 0.25 | | | | 0.17 | | | | 0.17 | | | | 0.22 | |
Net realized and unrealized gain (loss) on investments | | | (0.76 | ) | | | 0.34 | | | | 1.32 | | | | 0.30 | | | | 0.81 | | | | 1.81 | |
| | | | | | | | | | | | | | | | | | | | | | | | |
Total from investment operations | | | (0.64 | ) | | | 0.59 | | | | 1.57 | | | | 0.47 | | | | 0.98 | | | | 2.03 | |
| | | | | | | | | | | | | | | | | | | | | | | | |
Less Distributions to Shareholders from: | | | | | | | | | | | | | | | | | | | | | | | | |
Net investment income | | | (0.13 | ) | | | (0.27 | ) | | | (0.26 | ) | | | (0.16 | ) | | | (0.16 | ) | | | (0.23 | ) |
| | | | | | | | | | | | | | | | | | | | | | | | |
Total distributions to shareholders | | | (0.13 | ) | | | (0.27 | ) | | | (0.26 | ) | | | (0.16 | ) | | | (0.16 | ) | | | (0.23 | ) |
| | | | | | | | | | | | | | | | | | | | | | | | |
Net Asset Value, End of Period | | $ | 12.41 | | | $ | 13.18 | | | $ | 12.86 | | | $ | 11.55 | | | $ | 11.24 | | | $ | 10.42 | |
| | | | | | | | | | | | | | | | | | | | | | | | |
Total Return 1 | | | (4.89 | )%4 | | | 4.63 | % | | | 13.73 | % | | | 4.24 | % | | | 9.45 | % | | | 23.85 | % |
| | | | | | | | | | | | | | | | | | | | | | | | |
Ratio of net expenses to average net assets | | | 1.23 | %3 | | | 1.23 | % | | | 1.23 | % | | | 1.31 | % | | | 1.47 | % | | | 1.50 | % |
Ratio of net investment income to average net assets 1 | | | 2.14 | %3 | | | 1.93 | % | | | 2.05 | % | | | 1.45 | % | | | 1.46 | % | | | 2.21 | % |
Portfolio turnover | | | 54 | %4 | | | 206 | % | | | 66 | % | | | 53 | % | | | 85 | % | | | 91 | % |
Net assets at end of period (000’s omitted) | | $ | 2,652 | | | $ | 2,076 | | | $ | 1,933 | | | $ | 1,677 | | | $ | 2,366 | | | $ | 3,448 | |
| | | | | | | | | | | | | | | | | | | | | | | | |
Ratios absent expense offsets: 5 | | | | | | | | | | | | | | | | | | | | | | | | |
Ratio of total expenses to average net assets | | | 1.87 | %3 | | | 1.78 | % | | | 1.81 | % | | | 1.85 | % | | | 2.05 | % | | | 1.73 | % |
Ratio of net investment income to average net assets | | | 1.50 | %3 | | | 1.38 | % | | | 1.49 | % | | | 0.89 | % | | | 0.88 | % | | | 1.98 | % |
| | | | | | | | | | | | | | | | | | | | | | | | |
| | | For the six
months ended
June 30, 2008
(unaudited) | | | Class C | |
Managers AMG Chicago Equity Partners Balanced Fund | | | 2007 | | | 2006 | | | 2005 | | | 2004 | | | 2003 | |
Net Asset Value, Beginning of Period | | $ | 13.08 | | | $ | 12.76 | | | $ | 11.46 | | | $ | 11.16 | | | $ | 10.35 | | | $ | 8.56 | |
| | | | | | | | | | | | | | | | | | | | | | | | |
Income from Investment Operations: | | | | | | | | | | | | | | | | | | | | | | | | |
Net investment income | | | 0.09 | | | | 0.16 | | | | 0.16 | | | | 0.09 | | | | 0.11 | | | | 0.16 | |
Net realized and unrealized gain (loss) on investments | | | (0.78 | ) | | | 0.33 | | | | 1.31 | | | | 0.30 | | | | 0.81 | | | | 1.81 | |
| | | | | | | | | | | | | | | | | | | | | | | | |
Total from investment operations | | | (0.69 | ) | | | 0.49 | | | | 1.47 | | | | 0.39 | | | | 0.92 | | | | 1.97 | |
| | | | | | | | | | | | | | | | | | | | | | | | |
Less Distributions to Shareholders from: | | | | | | | | | | | | | | | | | | | | | | | | |
Net investment income | | | (0.07 | ) | | | (0.17 | ) | | | (0.17 | ) | | | (0.09 | ) | | | (0.11 | ) | | | (0.18 | ) |
| | | | | | | | | | | | | | | | | | | | | | | | |
Total distributions to shareholders | | | (0.07 | ) | | | (0.17 | ) | | | (0.17 | ) | | | (0.09 | ) | | | (0.11 | ) | | | (0.18 | ) |
| | | | | | | | | | | | | | | | | | | | | | | | |
Net Asset Value, End of Period | | $ | 12.32 | | | $ | 13.08 | | | $ | 12.76 | | | $ | 11.46 | | | $ | 11.16 | | | $ | 10.35 | |
| | | | | | | | | | | | | | | | | | | | | | | | |
Total Return 1 | | | (5.25 | )%4 | | | 3.86 | % | | | 12.88 | % | | | 3.49 | % | | | 8.88 | % | | | 23.38 | % |
| | | | | | | | | | | | | | | | | | | | | | | | |
Ratio of net expenses to average net assets | | | 1.98 | %3 | | | 1.98 | % | | | 1.98 | % | | | 1.98 | % | | | 1.97 | % | | | 2.00 | % |
Ratio of net investment income to average net assets 1 | | | 1.38 | %3 | | | 1.17 | % | | | 1.30 | % | | | 0.79 | % | | | 0.97 | % | | | 1.71 | % |
Portfolio turnover | | | 54 | %4 | | | 206 | % | | | 66 | % | | | 53 | % | | | 85 | % | | | 91 | % |
Net assets at end of period (000’s omitted) | | $ | 3,549 | | | $ | 4,013 | | | $ | 4,479 | | | $ | 5,081 | | | $ | 6,377 | | | $ | 8,537 | |
| | | | | | | | | | | | | | | | | | | | | | | | |
Ratios absent expense offsets: 5 | | | | | | | | | | | | | | | | | | | | | | | | |
Ratio of total expenses to average net assets | | | 2.62 | %3 | | | 2.53 | % | | | 2.56 | % | | | 2.52 | % | | | 2.56 | % | | | 2.23 | % |
Ratio of net investment income to average net assets | | | 0.74 | %3 | | | 0.62 | % | | | 0.71 | % | | | 0.24 | % | | | 0.38 | % | | | 1.48 | % |
| | | | | | | | | | | | | | | | | | | | | | | | |
39
| | | | | | | | | | | | | | | | | | | | | | |
For the six months ended
June 30, 2008
(unaudited) | | | Class B | |
| | 2007 | | | 2006 | | | 2005 | | | 2004 | | | 2003 | |
| $ | 12.96 | | | $ | 12.64 | | | $ | 11.36 | | | $ | 11.06 | | | $ | 10.26 | | | $ | 8.49 | |
| | | | | | | | | | | | | | | | | | | | | | | |
| | | | | | | | | | | | | | | | | | | | | | |
| | 0.11 | | | | 0.16 | | | | 0.18 | | | | 0.09 | | | | 0.34 | | | | 0.16 | |
| | (0.79 | ) | | | 0.33 | | | | 1.29 | | | | 0.30 | | | | 0.80 | | | | 1.79 | |
| | | | | | | | | | | | | | | | | | | | | | | |
| | (0.68 | ) | | | 0.49 | | | | 1.47 | | | | 0.39 | | | | 1.14 | | | | 1.95 | |
| | | | | | | | | | | | | | | | | | | | | | | |
| | | | | | | | | | | | | | | | | | | | | | |
| | (0.07 | ) | | | (0.17 | ) | | | (0.19 | ) | | | (0.09 | ) | | | (0.34 | ) | | | (0.18 | ) |
| | | | | | | | | | | | | | | | | | | | | | | |
| | (0.07 | ) | | | (0.17 | ) | | | (0.19 | ) | | | (0.09 | ) | | | (0.34 | ) | | | (0.18 | ) |
| | | | | | | | | | | | | | | | | | | | | | | |
| $ | 12.21 | | | $ | 12.96 | | | $ | 12.64 | | | $ | 11.36 | | | $ | 11.06 | | | $ | 10.26 | |
| | | | | | | | | | | | | | | | | | | | | | | |
| | (5.26 | )%4 | | | 3.86 | % | | | 12.83 | % | | | 3.53 | % | | | 11.11 | % | | | 23.42 | % |
| | | | | | | | | | | | | | | | | | | | | | | |
| | 1.98 | %3 | | | 1.98 | % | | | 1.98 | % | | | 1.98 | % | | | 1.97 | % | | | 2.00 | % |
| | 1.38 | %3 | | | 1.16 | % | | | 1.30 | % | | | 0.79 | % | | | 0.97 | % | | | 1.71 | % |
| | 54 | %4 | | | 206 | % | | | 66 | % | | | 53 | % | | | 85 | % | | | 91 | % |
| $ | 4,193 | | | $ | 6,026 | | | $ | 8,485 | | | $ | 9,692 | | | $ | 11,090 | | | $ | 12,134 | |
| | | | | | | | | | | | | | | | | | | | | | | |
| | | | | | | | | | | | | | | | | | | | | | |
| | 2.62 | %3 | | | 2.53 | % | | | 2.56 | % | | | 2.52 | % | | | 2.57 | % | | | 2.23 | % |
| | 0.74 | %3 | | | 0.61 | % | | | 0.71 | % | | | 0.25 | % | | | 0.37 | % | | | 1.48 | % |
| | | | | | | | | | | | | | | | | | | | | | | |
For the six months ended
June 30, 2008
(unaudited) | | | Institutional Class | |
| | 2007 | | | 2006 | | | 2005 | | | 2004 | | | 2003 | |
| $ | 13.28 | | | $ | 12.96 | | | $ | 11.64 | | | $ | 11.33 | | | $ | 10.50 | | | $ | 8.68 | |
| | | | | | | | | | | | | | | | | | | | | | | |
| | | | | | | | | | | | | | | | | | | | | | |
| | 0.15 | | | | 0.29 | | | | 0.29 | | | | 0.18 | | | | 0.21 | | | | 0.27 | |
| | (0.79 | ) | | | 0.34 | | | | 1.32 | | | | 0.31 | | | | 0.83 | | | | 1.83 | |
| | | | | | | | | | | | | | | | | | | | | | | |
| | (0.64 | ) | | | 0.63 | | | | 1.61 | | | | 0.49 | | | | 1.04 | | | | 2.10 | |
| | | | | | | | | | | | | | | | | | | | | | | |
| | | | | | | | | | | | | | | | | | | | | | |
| | (0.14 | ) | | | (0.31 | ) | | | (0.29 | ) | | | (0.18 | ) | | | (0.21 | ) | | | (0.28 | ) |
| | | | | | | | | | | | | | | | | | | | | | | |
| | (0.14 | ) | | | (0.31 | ) | | | (0.29 | ) | | | (0.18 | ) | | | (0.21 | ) | | | (0.28 | ) |
| | | | | | | | | | | | | | | | | | | | | | | |
| $ | 12.50 | | | $ | 13.28 | | | $ | 12.96 | | | $ | 11.64 | | | $ | 11.33 | | | $ | 10.50 | |
| | | | | | | | | | | | | | | | | | | | | | | |
| | (4.82 | )%4,6 | | | 4.87 | % | | | 13.98 | % | | | 4.57 | % | | | 10.04 | % | | | 24.51 | % |
| | | | | | | | | | | | | | | | | | | | | | | |
| | 0.98 | %3 | | | 0.98 | % | | | 0.98 | % | | | 0.98 | % | | | 0.97 | % | | | 1.00 | % |
| | 2.38 | %3 | | | 2.18 | % | | | 2.30 | % | | | 1.80 | % | | | 1.98 | % | | | 2.71 | % |
| | 54 | %4 | | | 206 | % | | | 66 | % | | | 53 | % | | | 85 | % | | | 91 | % |
| $ | 7,216 | | | $ | 7,754 | | | $ | 7,676 | | | $ | 7,501 | | | $ | 8,111 | | | $ | 8,104 | |
| | | | | | | | | | | | | | | | | | | | | | | |
| | | | | | | | | | | | | | | | | | | | | | |
| | 1.62 | %3 | | | 1.53 | % | | | 1.56 | % | | | 1.52 | % | | | 1.57 | % | | | 1.23 | % |
| | 1.74 | %3 | | | 1.63 | % | | | 1.73 | % | | | 1.26 | % | | | 1.37 | % | | | 2.48 | % |
| | | | | | | | | | | | | | | | | | | | | | | |
40
Financial Highlights
For a share outstanding throughout each of the six months ended June 30, 2008 (unaudited) and each year ended December 31,
| | | | | | | | | | | | | | | | | | | | | | | | |
| | | For the six
months ended
June 30, 2008
(unaudited) | | | Class A | |
Managers High Yield Fund | | | 2007 | | | 2006 | | | 2005 | | | 2004 | | | 2003 | |
Net Asset Value, Beginning of Period | | $ | 8.23 | | | $ | 8.63 | | | $ | 8.30 | | | $ | 8.67 | | | $ | 8.46 | | | $ | 7.08 | |
| | | | | | | | | | | | | | | | | | | | | | | | |
Income from Investment Operations: | | | | | | | | | | | | | | | | | | | | | | | | |
Net investment income | | | 0.31 | | | | 0.59 | | | | 0.55 | | | | 0.57 | | | | 0.67 | | | | 0.64 | |
Net realized and unrealized gain (loss) on investments | | | (0.45 | ) | | | (0.40 | ) | | | 0.33 | | | | (0.37 | ) | | | 0.19 | | | | 1.39 | |
| | | | | | | | | | | | | | | | | | | | | | | | |
Total from investment operations | | | (0.14 | ) | | | 0.19 | | | | 0.88 | | | | 0.20 | | | | 0.86 | | | | 2.03 | |
| | | | | | | | | | | | | | | | | | | | | | | | |
Less Distributions to Shareholders from: | | | | | | | | | | | | | | | | | | | | | | | | |
Net investment income | | | (0.30 | ) | | | (0.59 | ) | | | (0.55 | ) | | | (0.57 | ) | | | (0.65 | ) | | | (0.65 | ) |
| | | | | | | | | | | | | | | | | | | | | | | | |
Total distributions to shareholders | | | (0.30 | ) | | | (0.59 | ) | | | (0.55 | ) | | | (0.57 | ) | | | (0.65 | ) | | | (0.65 | ) |
| | | | | | | | | | | | | | | | | | | | | | | | |
Net Asset Value, End of Period | | $ | 7.79 | | | $ | 8.23 | | | $ | 8.63 | | | $ | 8.30 | | | $ | 8.67 | | | $ | 8.46 | |
| | | | | | | | | | | | | | | | | | | | | | | | |
Total Return 1 | | | (1.72 | )%4 | | | 2.25 | % | | | 11.07 | % | | | 2.37 | % | | | 10.62 | % | | | 29.73 | % |
| | | | | | | | | | | | | | | | | | | | | | | | |
Ratio of net expenses to average net assets | | | 1.15 | %3 | | | 1.15 | % | | | 1.15 | % | | | 1.22 | % | | | 1.40 | % | | | 1.40 | % |
Ratio of net investment income to average net assets 1 | | | 7.48 | %3 | | | 6.92 | % | | | 6.65 | % | | | 6.64 | % | | | 7.68 | % | | | 8.10 | % |
Portfolio turnover | | | 24 | %4 | | | 51 | % | | | 65 | % | | | 63 | % | | | 74 | % | | | 138 | % |
Net assets at end of period (000’s omitted) | | $ | 22,623 | | | $ | 24,151 | | | $ | 26,953 | | | $ | 20,478 | | | $ | 16,612 | | | $ | 24,693 | |
| | | | | | | | | | | | | | | | | | | | | | | | |
Ratios absent expense offsets: 5 | | | | | | | | | | | | | | | | | | | | | | | | |
Ratio of total expenses to average net assets | | | 1.60 | %3,7 | | | 1.55 | % | | | 1.54 | % | | | 1.59 | % | | | 1.72 | % | | | 1.63 | % |
Ratio of net investment income to average net assets | | | 7.03 | %3,7 | | | 6.52 | % | | | 6.26 | % | | | 6.28 | % | | | 7.37 | % | | | 7.87 | % |
| | | | | | | | | | | | | | | | | | | | | | | | |
| | |
| | | For the six
months ended
June 30, 2008
(unaudited) | | | Class C | |
Managers High Yield Fund | | | 2007 | | | 2006 | | | 2005 | | | 2004 | | | 2003 | |
Net Asset Value, Beginning of Period | | $ | 8.12 | | | $ | 8.53 | | | $ | 8.21 | | | $ | 8.59 | | | $ | 8.39 | | | $ | 7.03 | |
| | | | | | | | | | | | | | | | | | | | | | | | |
Income from Investment Operations: | | | | | | | | | | | | | | | | | | | | | | | | |
Net investment income | | | 0.27 | | | | 0.53 | | | | 0.49 | | | | 0.51 | | | | 0.60 | | | | 0.60 | |
Net realized and unrealized gain (loss) on investments | | | (0.44 | ) | | | (0.41 | ) | | | 0.32 | | | | (0.38 | ) | | | 0.21 | | | | 1.37 | |
| | | | | | | | | | | | | | | | | | | | | | | | |
Total from investment operations | | | (0.17 | ) | | | 0.12 | | | | 0.81 | | | | 0.13 | | | | 0.81 | | | | 1.97 | |
| | | | | | | | | | | | | | | | | | | | | | | | |
Less Distributions to Shareholders from: | | | | | | | | | | | | | | | | | | | | | | | | |
Net investment income | | | (0.27 | ) | | | (0.53 | ) | | | (0.49 | ) | | | (0.51 | ) | | | (0.61 | ) | | | (0.61 | ) |
| | | | | | | | | | | | | | | | | | | | | | | | |
Total distributions to shareholders | | | (0.27 | ) | | | (0.53 | ) | | | (0.49 | ) | | | (0.51 | ) | | | (0.61 | ) | | | (0.61 | ) |
| | | | | | | | | | | | | | | | | | | | | | | | |
Net Asset Value, End of Period | | $ | 7.68 | | | $ | 8.12 | | | $ | 8.53 | | | $ | 8.21 | | | $ | 8.59 | | | $ | 8.39 | |
| | | | | | | | | | | | | | | | | | | | | | | | |
Total Return 1 | | | (2.16 | )%4 | | | 1.32 | % | | | 10.24 | % | | | 1.60 | % | | | 10.08 | % | | | 29.04 | % |
| | | | | | | | | | | | | | | | | | | | | | | | |
Ratio of net expenses to average net assets | | | 1.90 | %3 | | | 1.90 | % | | | 1.90 | % | | | 1.90 | % | | | 1.90 | % | | | 1.90 | % |
Ratio of net investment income to average net assets 1 | | | 6.91 | %3 | | | 6.18 | % | | | 5.89 | % | | | 5.97 | % | | | 7.17 | % | | | 7.60 | % |
Portfolio turnover | | | 24 | %4 | | | 51 | % | | | 65 | % | | | 63 | % | | | 74 | % | | | 138 | % |
Net assets at end of period (000’s omitted) | | $ | 5,769 | | | $ | 6,186 | | | $ | 7,653 | | | $ | 7,934 | | | $ | 10,474 | | | $ | 13,833 | |
| | | | | | | | | | | | | | | | | | | | | | | | |
Ratios absent expense offsets: 5 | | | | | | | | | | | | | | | | | | | | | | | | |
Ratio of total expenses to average net assets | | | 2.36 | %3,7 | | | 2.30 | % | | | 2.29 | % | | | 2.27 | % | | | 2.27 | % | | | 2.13 | % |
Ratio of net investment income to average net assets | | | 6.45 | %3,7 | | | 5.78 | % | | | 5.50 | % | | | 5.60 | % | | | 6.80 | % | | | 7.37 | % |
| | | | | | | | | | | | | | | | | | | | | | | | |
41
| | | | | | | | | | | | | | | | | | | | | | |
For the six months ended
June 30, 2008
(unaudited) | | | Class B | |
| | 2007 | | | 2006 | | | 2005 | | | 2004 | | | 2003 | |
| $ | 8.13 | | | $ | 8.54 | | | $ | 8.22 | | | $ | 8.60 | | | $ | 8.40 | | | $ | 7.04 | |
| | | | | | | | | | | | | | | | | | | | | | | |
| | | | | | | | | | | | | | | | | | | | | | |
| | 0.28 | | | | 0.54 | | | | 0.50 | | | | 0.51 | | | | 0.60 | | | | 0.60 | |
| | (0.44 | ) | | | (0.43 | ) | | | 0.31 | | | | (0.38 | ) | | | 0.21 | | | | 1.38 | |
| | | | | | | | | | | | | | | | | | | | | | | |
| | (0.16 | ) | | | 0.11 | | | | 0.81 | | | | 0.13 | | | | 0.81 | | | | 1.98 | |
| | | | | | | | | | | | | | | | | | | | | | | |
| | | | | | | | | | | | | | | | | | | | | | |
| | (0.27 | ) | | | (0.52 | ) | | | (0.49 | ) | | | (0.51 | ) | | | (0.61 | ) | | | (0.62 | ) |
| | | | | | | | | | | | | | | | | | | | | | | |
| | (0.27 | ) | | | (0.52 | ) | | | (0.49 | ) | | | (0.51 | ) | | | (0.61 | ) | | | (0.62 | ) |
| | | | | | | | | | | | | | | | | | | | | | | |
| $ | 7.70 | | | $ | 8.13 | | | $ | 8.54 | | | $ | 8.22 | | | $ | 8.60 | | | $ | 8.40 | |
| | | | | | | | | | | | | | | | | | | | | | | |
| | (2.03 | )%4 | | | 1.30 | % | | | 10.21 | % | | | 1.59 | % | | | 10.07 | % | | | 29.01 | % |
| | | | | | | | | | | | | | | | | | | | | | | |
| | 1.90 | %3 | | | 1.90 | % | | | 1.90 | % | | | 1.90 | % | | | 1.90 | % | | | 1.90 | % |
| | 6.95 | %3 | | | 6.14 | % | | | 5.88 | % | | | 5.96 | % | | | 7.18 | % | | | 7.60 | % |
| | 24 | %4 | | | 51 | % | | | 65 | % | | | 63 | % | | | 74 | % | | | 138 | % |
| $ | 5,053 | | | $ | 6,536 | | | $ | 12,318 | | | $ | 17,782 | | | $ | 27,287 | | | $ | 35,695 | |
| | | | | | | | | | | | | | | | | | | | | | | |
| | | | | | | | | | | | | | | | | | | | | | |
| | 2.36 | %3,7 | | | 2.30 | % | | | 2.28 | % | | | 2.27 | % | | | 2.27 | % | | | 2.13 | % |
| | 6.49 | %3,7 | | | 5.74 | % | | | 5.50 | % | | | 5.59 | % | | | 6.81 | % | | | 7.37 | % |
| | | | | | | | | | | | | | | | | | | | | | | |
For the six months ended
June 30, 2008
(unaudited) | | | Institutional Class | |
| | 2007 | | | 2006 | | | 2005 | | | 2004 | | | 2003 | |
| $ | 8.29 | | | $ | 8.70 | | | $ | 8.36 | | | $ | 8.74 | | | $ | 8.52 | | | $ | 7.13 | |
| | | | | | | | | | | | | | | | | | | | | | | |
| | | | | | | | | | | | | | | | | | | | | | |
| | 0.32 | | | | 0.64 | | | | 0.58 | | | | 0.60 | | | | 0.73 | | | | 0.68 | |
| | (0.46 | ) | | | (0.43 | ) | | | 0.34 | | | | (0.38 | ) | | | 0.18 | | | | 1.40 | |
| | | | | | | | | | | | | | | | | | | | | | | |
| | (0.14 | ) | | | 0.21 | | | | 0.92 | | | | 0.22 | | | | 0.91 | | | | 2.08 | |
| | | | | | | | | | | | | | | | | | | | | | | |
| | | | | | | | | | | | | | | | | | | | | | |
| | (0.31 | ) | | | (0.62 | ) | | | (0.58 | ) | | | (0.60 | ) | | | (0.69 | ) | | | (0.69 | ) |
| | | | | | | | | | | | | | | | | | | | | | | |
| | (0.31 | ) | | | (0.62 | ) | | | (0.58 | ) | | | (0.60 | ) | | | (0.69 | ) | | | (0.69 | ) |
| | | | | | | | | | | | | | | | | | | | | | | |
| $ | 7.84 | | | $ | 8.29 | | | $ | 8.70 | | | $ | 8.36 | | | $ | 8.74 | | | $ | 8.52 | |
| | | | | | | | | | | | | | | | | | | | | | | |
| | (1.68 | )%4 | | | 2.40 | % | | | 11.38 | % | | | 2.60 | % | | | 10.69 | % | | | 30.30 | % |
| | | | | | | | | | | | | | | | | | | | | | | |
| | 0.90 | %3 | | | 0.90 | % | | | 0.90 | % | | | 0.90 | % | | | 0.90 | % | | | 0.90 | % |
| | 7.85 | %3 | | | 7.16 | % | | | 6.91 | % | | | 6.96 | % | | | 8.00 | % | | | 8.60 | % |
| | 24 | %4 | | | 51 | % | | | 65 | % | | | 63 | % | | | 74 | % | | | 138 | % |
| $ | 3,012 | | | $ | 3,423 | | | $ | 7,053 | | | $ | 3,440 | | | $ | 4,725 | | | $ | 15,469 | |
| | | | | | | | | | | | | | | | | | | | | | | |
| | | | | | | | | | | | | | | | | | | | | | |
| | 1.36 | %3,7 | | | 1.30 | % | | | 1.29 | % | | | 1.27 | % | | | 1.26 | % | | | 1.13 | % |
| | 7.39 | %3,7 | | | 6.77 | % | | | 5.50 | % | | | 6.59 | % | | | 7.64 | % | | | 8.37 | % |
| | | | | | | | | | | | | | | | | | | | | | | |
42
Financial Highlights
For a share outstanding throughout each of the six months ended June 30, 2008 (unaudited) and each year ended December 31,
| | | | | | | | | | | | | | | | | | | | | | | | |
| | | For the six
months ended
June 30, 2008
(unaudited) | | | Class A | |
Managers Fixed Income Fund | | | 2007 | | | 2006 | | | 2005 | | | 2004 | | | 2003 | |
Net Asset Value, Beginning of Period | | $ | 10.54 | | | $ | 10.55 | | | $ | 10.36 | | | $ | 10.62 | | | $ | 10.56 | | | $ | 10.05 | |
| | | | | | | | | | | | | | | | | | | | | | | | |
Income from Investment Operations: | | | | | | | | | | | | | | | | | | | | | | | | |
Net investment income | | | 0.28 | | | | 0.56 | | | | 0.52 | | | | 0.53 | | | | 0.49 | | | | 0.52 | |
Net realized and unrealized gain (loss) on investments | | | (0.28 | ) | | | 0.01 | | | | 0.19 | | | | (0.25 | ) | | | 0.07 | | | | 0.53 | |
| | | | | | | | | | | | | | | | | | | | | | | | |
Total from investment operations | | | 0.00 | | | | 0.57 | | | | 0.71 | | | | 0.28 | | | | 0.56 | | | | 1.05 | |
| | | | | | | | | | | | | | | | | | | | | | | | |
Less Distributions to Shareholders from: | | | | | | | | | | | | | | | | | | | | | | | | |
Net investment income | | | (0.26 | ) | | | (0.58 | ) | | | (0.52 | ) | | | (0.54 | ) | | | (0.50 | ) | | | (0.54 | ) |
| | | | | | | | | | | | | | | | | | | | | | | | |
Total distributions to shareholders | | | (0.26 | ) | | | (0.58 | ) | | | (0.52 | ) | | | (0.54 | ) | | | (0.50 | ) | | | (0.54 | ) |
| | | | | | | | | | | | | | | | | | | | | | | | |
Net Asset Value, End of Period | | $ | 10.28 | | | $ | 10.54 | | | $ | 10.55 | | | $ | 10.36 | | | $ | 10.62 | | | $ | 10.56 | |
| | | | | | | | | | | | | | | | | | | | | | | | |
Total Return 1 | | | (0.02 | )%4 | | | 5.53 | % | | | 7.10 | % | | | 2.68 | % | | | 5.44 | % | | | 10.67 | % |
| | | | | | | | | | | | | | | | | | | | | | | | |
Ratio of net expenses to average net assets | | | 0.84 | %3 | | | 0.82 | % | | | 0.74 | % | | | 0.81 | % | | | 1.02 | % | | | 1.10 | % |
Ratio of net investment income to average net assets 1 | | | 5.35 | %3 | | | 5.12 | % | | | 4.98 | % | | | 4.65 | % | | | 4.56 | % | | | 5.02 | % |
Portfolio turnover | | | 9 | %4 | | | 17 | % | | | 55 | % | | | 24 | % | | | 79 | % | | | 315 | % |
Net assets at end of period (000’s omitted) | | $ | 38,461 | | | $ | 24,122 | | | $ | 11,776 | | | $ | 7,591 | | | $ | 5,723 | | | $ | 7,936 | |
| | | | | | | | | | | | | | | | | | | | | | | | |
Ratios absent expense offsets: 5 | | | | | | | | | | | | | | | | | | | | | | | | |
Ratio of total expenses to average net assets | | | 1.04 | %3 | | | 1.12 | % | | | 1.15 | % | | | 1.27 | % | | | 1.48 | % | | | 1.33 | % |
Ratio of net investment income to average net assets | | | 5.14 | %3 | | | 4.84 | % | | | 4.60 | % | | | 4.19 | % | | | 4.11 | % | | | 4.79 | % |
| | | | | | | | | | | | | | | | | | | | | | | | |
| | |
| | | For the six
months ended
June 30, 2008
(unaudited) | | | Class C | |
Managers Fixed Income Fund | | | 2007 | | | 2006 | | | 2005 | | | 2004 | | | 2003 | |
Net Asset Value, Beginning of Period | | $ | 10.54 | | | $ | 10.55 | | | $ | 10.36 | | | $ | 10.63 | | | $ | 10.58 | | | $ | 10.07 | |
| | | | | | | | | | | | | | | | | | | | | | | | |
Income from Investment Operations: | | | | | | | | | | | | | | | | | | | | | | | | |
Net investment income | | | 0.24 | | | | 0.48 | | | | 0.43 | | | | 0.46 | | | | 0.43 | | | | 0.47 | |
Net realized and unrealized gain (loss) on investments | | | (0.29 | ) | | | 0.01 | | | | 0.20 | | | | (0.26 | ) | | | 0.07 | | | | 0.52 | |
| | | | | | | | | | | | | | | | | | | | | | | | |
Total from investment operations | | | (0.05 | ) | | | 0.49 | | | | 0.63 | | | | 0.20 | | | | 0.50 | | | | 0.99 | |
| | | | | | | | | | | | | | | | | | | | | | | | |
Less Distributions to Shareholders from: | | | | | | | | | | | | | | | | | | | | | | | | |
Net investment income | | | (0.23 | ) | | | (0.50 | ) | | | (0.44 | ) | | | (0.47 | ) | | | (0.45 | ) | | | (0.48 | ) |
| | | | | | | | | | | | | | | | | | | | | | | | |
Total distributions to shareholders | | | (0.23 | ) | | | (0.50 | ) | | | (0.44 | ) | | | (0.47 | ) | | | (0.45 | ) | | | (0.48 | ) |
| | | | | | | | | | | | | | | | | | | | | | | | |
Net Asset Value, End of Period | | $ | 10.26 | | | $ | 10.54 | | | $ | 10.55 | | | $ | 10.36 | | | $ | 10.63 | | | $ | 10.58 | |
| | | | | | | | | | | | | | | | | | | | | | | | |
Total Return 1 | | | (0.46 | )%4 | | | 4.75 | % | | | 6.31 | % | | | 1.90 | % | | | 4.85 | % | | | 10.11 | % |
| | | | | | | | | | | | | | | | | | | | | | | | |
Ratio of net expenses to average net assets | | | 1.59 | %3 | | | 1.56 | % | | | 1.49 | % | | | 1.49 | % | | | 1.54 | % | | | 1.60 | % |
Ratio of net investment income to average net assets 1 | | | 4.59 | %3 | | | 4.38 | % | | | 4.23 | % | | | 3.96 | % | | | 4.04 | % | | | 4.52 | % |
Portfolio turnover | | | 9 | %4 | | | 17 | % | | | 55 | % | | | 24 | % | | | 79 | % | | | 315 | % |
Net assets at end of period (000’s omitted) | | $ | 44,315 | | | $ | 32,154 | | | $ | 15,454 | | | $ | 11,480 | | | $ | 13,703 | | | $ | 20,009 | |
| | | | | | | | | | | | | | | | | | | | | | | | |
Ratios absent expense offsets: 5 | | | | | | | | | | | | | | | | | | | | | | | | |
Ratio of total expenses to average net assets | | | 1.79 | %3 | | | 1.86 | % | | | 1.90 | % | | | 1.95 | % | | | 1.99 | % | | | 1.84 | % |
Ratio of net investment income to average net assets | | | 4.39 | %3 | | | 4.08 | % | | | 3.82 | % | | | 3.50 | % | | | 3.59 | % | | | 4.28 | % |
| | | | | | | | | | | | | | | | | | | | | | | | |
43
| | | | | | | | | | | | | | | | | | | | | | |
For the
six months ended
June 30, 2008
(unaudited) | | | Class B | |
| | 2007 | | | 2006 | | | 2005 | | | 2004 | | | 2003 | |
| $ | 10.47 | | | $ | 10.48 | | | $ | 10.30 | | | $ | 10.56 | | | $ | 10.51 | | | $ | 10.02 | |
| | | | | | | | | | | | | | | | | | | | | | | |
| | | | | | | | | | | | | | | | | | | | | | |
| | 0.24 | | | | 0.51 | | | | 0.43 | | | | 0.46 | | | | 0.43 | | | | 0.48 | |
| | (0.28 | ) | | | (0.03 | ) | | | 0.19 | | | | (0.25 | ) | | | 0.07 | | | | 0.50 | |
| | | | | | | | | | | | | | | | | | | | | | | |
| | (0.04 | ) | | | 0.48 | | | | 0.62 | | | | 0.21 | | | | 0.50 | | | | 0.98 | |
| | | | | | | | | | | | | | | | | | | | | | | |
| | | | | | | | | | | | | | | | | | | | | | |
| | (0.23 | ) | | | (0.49 | ) | | | (0.44 | ) | | | (0.47 | ) | | | (0.45 | ) | | | (0.49 | ) |
| | | | | | | | | | | | | | | | | | | | | | | |
| | (0.23 | ) | | | (0.49 | ) | | | (0.44 | ) | | | (0.47 | ) | | | (0.45 | ) | | | (0.49 | ) |
| | | | | | | | | | | | | | | | | | | | | | | |
| $ | 10.20 | | | $ | 10.47 | | | $ | 10.48 | | | $ | 10.30 | | | $ | 10.56 | | | $ | 10.51 | |
| | | | | | | | | | | | | | | | | | | | | | | |
| | (0.39 | )%4 | | | 4.74 | % | | | 6.25 | % | | | 2.01 | % | | | 4.90 | % | | | 10.09 | % |
| | | | | | | | | | | | | | | | | | | | | | | |
| | 1.59 | %3 | | | 1.55 | % | | | 1.49 | % | | | 1.49 | % | | | 1.54 | % | | | 1.60 | % |
| | 4.58 | %3 | | | 4.37 | % | | | 4.23 | % | | | 3.96 | % | | | 4.04 | % | | | 4.52 | % |
| | 9 | %4 | | | 17 | % | | | 55 | % | | | 24 | % | | | 79 | % | | | 315 | % |
| $ | 8,584 | | | $ | 9,029 | | | $ | 13,089 | | | $ | 16,837 | | | $ | 20,063 | | | $ | 28,560 | |
| | | | | | | | | | | | | | | | | | | | | | | |
| | | | | | | | | | | | | | | | | | | | | | |
| | 1.79 | %3 | | | 1.85 | % | | | 1.90 | % | | | 1.95 | % | | | 1.99 | % | | | 1.84 | % |
| | 4.37 | %3 | | | 4.05 | % | | | 3.80 | % | | | 3.50 | % | | | 3.59 | % | | | 4.28 | % |
| | | | | | | | | | | | | | | | | | | | | | | |
| |
For the
six months ended
June 30, 2008
(unaudited) | | | Institutional Class | |
| | 2007 | | | 2006 | | | 2005 | | | 2004 | | | 2003 | |
| $ | 10.59 | | | $ | 10.59 | | | $ | 10.40 | | | $ | 10.66 | | | $ | 10.61 | | | $ | 10.10 | |
| | | | | | | | | | | | | | | | | | | | | | | |
| | | | | | | | | | | | | | | | | | | | | | |
| | 0.29 | | | | 0.59 | | | | 0.54 | | | | 0.56 | | | | 0.54 | | | | 0.58 | |
| | (0.28 | ) | | | 0.01 | | | | 0.19 | | | | (0.25 | ) | | | 0.07 | | | | 0.52 | |
| | | | | | | | | | | | | | | | | | | | | | | |
| | 0.01 | | | | 0.60 | | | | 0.73 | | | | 0.31 | | | | 0.61 | | | | 1.10 | |
| | | | | | | | | | | | | | | | | | | | | | | |
| | | | | | | | | | | | | | | | | | | | | | |
| | (0.29 | ) | | | (0.60 | ) | | | (0.54 | ) | | | (0.57 | ) | | | (0.56 | ) | | | (0.59 | ) |
| | | | | | | | | | | | | | | | | | | | | | | |
| | (0.29 | ) | | | (0.60 | ) | | | (0.54 | ) | | | (0.57 | ) | | | (0.56 | ) | | | (0.59 | ) |
| | | | | | | | | | | | | | | | | | | | | | | |
| $ | 10.31 | | | $ | 10.59 | | | $ | 10.59 | | | $ | 10.40 | | | $ | 10.66 | | | $ | 10.61 | |
| | | | | | | | | | | | | | | | | | | | | | | |
| | 0.05 | %4 | | | 5.84 | % | | | 7.34 | % | | | 2.91 | % | | | 5.99 | % | | | 11.17 | % |
| | | | | | | | | | | | | | | | | | | | | | | |
| | 0.59 | %3 | | | 0.56 | % | | | 0.49 | % | | | 0.49 | % | | | 0.50 | % | | | 0.60 | % |
| | 5.58 | %3 | | | 5.37 | % | | | 5.23 | % | | | 4.96 | % | | | 5.09 | % | | | 5.52 | % |
| | 9 | %4 | | | 17 | % | | | 55 | % | | | 24 | % | | | 79 | % | | | 315 | % |
| $ | 33,071 | | | $ | 33,412 | | | $ | 25,861 | | | $ | 25,641 | | | $ | 24,559 | | | $ | 23,763 | |
| | | | | | | | | | | | | | | | | | | | | | | |
| | | | | | | | | | | | | | | | | | | | | | |
| | 0.79 | %3 | | | 0.86 | % | | | 0.90 | % | | | 0.95 | % | | | 0.97 | % | | | 0.84 | % |
| | 5.37 | %3 | | | 5.07 | % | | | 4.82 | % | | | 4.50 | % | | | 4.63 | % | | | 5.28 | % |
| | | | | | | | | | | | | | | | | | | | | | | |
The following notes should be read in conjunction with the Financial Highlights of the Funds presented on the previous pages.
1 | Total returns and net investment income would have been lower had certain expenses not been reduced. (See Note 1(c) of Notes to Financial Statements.) |
2 | Per share numbers have been calculated using average shares. |
5 | Excludes the impact of expense reimbursements or fee waivers and expense reductions such as brokerage credits, but includes non-reimbursable expenses, if any, such as interest and taxes. (See Note 1(c) of Notes to Financial Statements.) |
6 | The total return is based on the Financial Statements Net Asset Values as shown. |
7 | Includes interest expense for the period ended June 30, 2008, of 0.02%. (See Note 1(c) of Notes to Financial Statements.) |
44
Notes to Financial Statements
June 30, 2008 (unaudited)
| 1. | Summary of Significant Accounting Policies |
Managers Trust II (the “Trust”) is an open-end management investment company organized as a Massachusetts business trust and registered under the Investment Company Act of 1940, as amended (the “1940 Act”). Currently, the Trust is comprised of a number of different funds, each having distinct investment management objectives, strategies, risks and policies. Included in this report are: Managers AMG Chicago Equity Partners Mid-Cap Fund (“Mid-Cap”) (formerly Managers Mid-Cap Fund), Managers AMG Chicago Equity Partners Balanced Fund (“Balanced”) (formerly Managers Balanced Fund), Managers High Yield Fund (“High Yield”), and Managers Fixed Income Fund (“Fixed Income”), collectively the “Funds.” The Funds each offer four classes of shares: Class A, Class B, Class C and Institutional Class. Sales of Class A shares may be subject to a front-end sales charge. Redemptions of Class A, Class B and Class C shares may be subject to a contingent-deferred sales charge (as a percentage of the original offering price or the net asset value at time of sale, whichever is less). Institutional Class shares are available, with no sales charge, to certain institutional investors and qualifying individual investors. Please refer to a current prospectus for additional information on each share class.
The Funds’ financial statements are prepared in accordance with accounting principles generally accepted in the United States of America, which require management to make estimates and assumptions that affect the reported amount of assets and liabilities and disclosure of contingent assets and liabilities at the date of the financial statements and the reported amounts of income and expenses during the reporting periods. Actual results could differ from those estimates and such differences may be material. The following is a summary of significant accounting policies followed by the Funds in the preparation of their financial statements:
| a. | Valuation of Investments |
Equity securities traded on a domestic or international securities exchange are valued at the last quoted sale price, or, lacking any sales, at the last quoted bid price. Over-the-counter securities are valued at the Nasdaq Official Closing Price, if one is available. Lacking any sales, over-the counter securities are valued at the last quoted bid price. The Funds’ investments are generally valued based on market quotations provided by third party pricing services approved by the Board of Trustees of the Funds. Under certain circumstances, the value of each Fund’s investment may be based on an evaluation of its fair value, pursuant to procedures established by and under the general supervision of the Board of Trustees of the Trust. A Fund may use the fair value of a portfolio security to calculate its NAV when, for example, (1) market quotations are not readily available because a portfolio security is not traded in a public market or the principal market in which the security trades is closed, (2) trading in a portfolio security is suspended and has not resumed before the Fund calculates its NAV, (3) a significant event affecting the value of a portfolio security is determined to have occurred between the time of the market quotation provided for a portfolio security and the time as of which the Fund calculates its NAV, (4) a security’s price has remained unchanged over a period of time (often referred to as a “stale price”), or (5) the Investment Manager determines that a market quotation is inaccurate. The Investment Manager monitors intervening events that may affect the value of securities held in a Fund’s portfolio and, in accordance with procedures adopted by the Fund’s Trustees, will adjust the prices of securities traded in foreign markets, as appropriate, to reflect the impact of events occurring subsequent to the close of such markets but prior to the time each Fund’s NAV is calculated.
Fixed-income securities are valued based on valuations furnished by independent pricing services that reflect the mean between bid and asked prices for the Balanced, High Yield and Fixed Income Funds. Some of these pricing services utilize matrix systems, which reflect such factors as security prices, yields, maturities and ratings, and are supplemented by dealer and exchange quotations. Short-term investments having a remaining maturity of 60 days or less are valued at amortized cost, which approximates market value. Investments in other regulated investment companies are valued at their end of day net asset value per share except iShares or other ETFs, which are valued the same as equity securities. Securities (including derivatives) for which market quotations are not readily available are valued at fair value, as determined in good faith, and pursuant to procedures adopted by the Board of Trustees of the Trust. The values assigned to fair value investments are based on available information and do not necessarily represent amounts that might ultimately be realized since such amounts depend on future developments inherent in long-term investments. Further, because of the inherent uncertainty of valuation, those estimated values may differ significantly from the values that would have been used had a ready market of the investments existed, and the differences could be material.
Investments in certain mortgage-backed, stripped mortgage-backed, preferred stocks, convertible securities and other debt securities not traded on an organized market, are valued on the basis of valuations provided by dealers or by a pricing service which uses information with respect to transactions in such securities, various relationships between securities and yield to maturity in determining value.
The Funds adopted Financial Accounting Standards Board Statement of Financial Accounting Standards No. 157, Fair Value Measurements (“FAS 157”), effective January 1, 2008. In accordance with FAS 157, fair value is defined as the price that a Fund would receive to sell an asset or pay to transfer a liability in an orderly transaction between market participants at the measurement date. FAS 157 also establishes a framework for measuring fair value, and a three-level hierarchy for fair value measurements based upon the transparency of inputs to the valuation of an asset or liability. Inputs may be observable or unobservable and refer broadly to the assumptions that market participants would use in pricing the asset or liability. Observable inputs reflect the assumptions market participants would use in pricing the asset or liability based on market data obtained from sources independent of the Funds. Unobservable inputs reflect the Funds’ own assumptions about the assumptions that market participants would use in pricing the asset or liability developed based on the best information available in the circumstances. Each investment is assigned a level based upon the observability of the inputs which are significant to the overall valuation. The three-tier hierarchy of inputs is summarized below:
Level 1 – quoted prices in active markets for identical investments
Level 2 – other significant observable inputs (including quoted prices for similar investments, interest rates, prepayment speeds, credit risk)
Level 3 –significant unobservable inputs (including the Funds’ own assumptions in determining the fair value of investments)
45
Notes to Financial Statements (continued)
The inputs or methodologies used for valuing investments are not necessarily an indication of the risk associated with investing in those investments. The following table summarizes the inputs used to value the Funds’ net assets by the above fair value hierarchy levels as of June 30, 2008:
| | | | | |
Level | | Investments in
Securities | | Other
Financial
Instruments* |
Mid-Cap | | | | | |
Level 1 | | $ | 72,387,331 | | — |
Level 2 | | | — | | — |
Level 3 | | | — | | — |
| | | | | |
Total | | $ | 72,387,331 | | — |
| | | | | |
Balanced | | | | | |
Level 1 | | $ | 13,311,840 | | — |
Level 2 | | | 8,368,342 | | — |
Level 3 | | | — | | — |
| | | | | |
Total | | $ | 21,680,182 | | — |
| | | | | |
High Yield | | | | | |
Level 1 | | $ | 9,616,153 | | — |
Level 2 | | | 37,759,600 | | — |
Level 3 | | | — | | — |
| | | | | |
Total | | $ | 47,375,754 | | — |
| | | | | |
Fixed Income | | | | | |
Level 1 | | $ | 20,326,664 | | — |
Level 2 | | | 117,596,420 | | — |
Level 3 | | | — | | — |
| | | | | |
Total | | $ | 137,923,084 | | — |
| | | | | |
| * | Other financial instruments are derivative instruments not reflected in the Schedule of Portfolio Investments, such as futures, forwards and swap contracts, which are valued at the unrealized appreciation/depreciation of the instrument. |
The following table is a reconciliation of investments in which significant unobservable inputs (Level 3) were used in determining fair value:
| | | | | | |
Balance as of June 30, 2008 | | Investments in
Securities | | Other
Financial
Instruments |
Mid-Cap | | $ | 0 | | $ | 0 |
Balanced | | | 0 | | | 0 |
High Yield | | | 0 | | | 0 |
Fixed Income | | | 0 | | | 0 |
Security transactions are accounted for as of the trade date. Realized gains and losses on securities sold are determined on the basis of identified cost.
| c. | Investment Income and Expenses |
Dividend income is recorded on the ex-dividend date, except certain dividends from foreign securities where the ex-dividend date may have passed. These dividends are recorded as soon as the Trust is informed of the ex-dividend date. Dividend income on foreign securities is recorded net of any withholding tax. Interest income, which includes amortization of premium and accretion of discount on debt securities, is accrued as earned. Non-cash dividends included in dividend income, if any, are reported at the fair market value of the securities received. Other income and expenses are recorded on an accrual basis. Expenses that cannot be directly attributed to a fund are apportioned among the Funds in the Trust and in some cases other affiliated funds based upon their relative average net assets or number of shareholders.
The following Funds had certain portfolio trades directed to various brokers who paid a portion of such Fund’s expenses. For the six months ended June 30, 2008, under these arrangements, the amount by which the Funds’ expenses were reduced and the impact on the expense ratios were: Mid-Cap - $17,244 or 0.06%, and Balanced - $1,537 or 0.02%.
The Funds have a “balance credit” arrangement with The Bank of New York Mellon (“BNYM”), the Funds’ custodian, whereby each Fund is credited with an interest factor equal to 0.75% below the effective 90-day T-Bill rate for account balances left uninvested overnight. These credits serve to reduce custody expenses that would otherwise be charged to each Fund. For the six months ended June 30, 2008, the custodian expense was reduced as follows: Mid-Cap - $28, Balanced - $0, High Yield - $2, and Fixed Income - $3.
Overdrafts will cause a reduction of any earnings credits, computed at 2% above the effective Federal Funds rate on the day of the overdraft. For the six months ended June 30, 2008, overdraft fees for Mid-Cap, Balanced, High Yield, and Fixed Income equaled $2,111, $946, $8,547, and $0, respectively.
The Trust also has a balance credit arrangement with its Transfer Agent, PNC Global Investment Servicing (U.S.) Inc., whereby earnings credits are used to offset banking charges and other out-of-pocket expenses. For the six months ended June 30, 2008, the transfer agent expense was reduced as follows: Mid-Cap - $161, Balanced - $50, High Yield - $103, and Fixed Income - $351. The Investment Manager has agreed to waive a portion of its management fee in consideration of shareholder servicing fees that it has received from JPMorgan Distribution Services, Inc., with respect to short-term cash investments each Fund may have made in the JPMorgan Liquid Assets Portfolio – Capital Shares. For the six months ended June 30, 2008, the management fee was reduced as follows: Mid-Cap - $0, Balanced - $0, High Yield - $220, Fixed Income - $734.
| d. | Dividends and Distributions |
Dividends resulting from net investment, if any, normally will be declared and paid annually for the Mid-Cap Fund, monthly for the Fixed Income and High Yield Funds, and quarterly for the Balanced Fund. Distributions of capital gains, if any, will be made on an annual basis and when required for Federal excise tax purposes. Income and capital gain distributions are determined in accordance with Federal income tax regulations, which may differ from generally accepted accounting principles. These differences are primarily due to differing treatments for losses deferred due to wash sales, equalization accounting for tax purposes, foreign currency and market discount transactions. Permanent book and tax basis differences, if any, relating to shareholder distributions will result in reclassifications to paid-in-capital.
46
Notes to Financial Statements (continued)
Each Fund intends to comply with the requirements under Subchapter M of the Internal Revenue Code of 1986, as amended, to distribute substantially all of its taxable income and gains to its shareholders and to meet certain diversification and income requirements with respect to investment companies. Therefore, no provision for Federal income or excise tax is included in the accompanying financial statements.
Additionally, based on each Fund’s understanding of the tax rules and rates related to income, gains and transactions for the foreign jurisdictions in which it invests, each Fund will provide for foreign taxes, and where appropriate, deferred foreign taxes.
The Trust’s Declaration of Trust authorizes for each series the issuance of an unlimited number of shares of beneficial interest, without par value. Each Fund records sales and repurchases of its capital stock on the trade date.
Dividends and distributions to shareholders are recorded on the ex-dividend date. For the six months ended June 30, 2008 and the year ended December 31, 2007, the capital stock transactions in the Funds by class were:
| | | | | | | | | | | | | | | | | | | | | | | | | | | | |
| | | Mid-Cap | | | Balanced | |
| | | 2008 | | | 2007 | | | 2008 | | | 2007 | |
| | | Shares | | | Amount | | | Shares | | | Amount | | | Shares | | | Amount | | | Shares | | | Amount | |
Class A: | | | | | | | | | | | | | | | | | | | | | | | | | | | | |
Proceeds from sales | | 76,275 | | | $ | 990,174 | | | 174,624 | | | $ | 2,677,409 | | | 72,570 | | | $ | 921,058 | | | 56,145 | | | $ | 732,763 | |
Reinvestment of distributions | | — | | | | — | | | 17,545 | | | | 245,106 | | | 1,094 | | | | 13,739 | | | 1,923 | | | | 25,329 | |
Cost of shares repurchased | | (95,844 | ) | | | (1,252,167 | ) | | (347,741 | ) | | | (5,297,263 | ) | | (17,422 | ) | | | (221,126 | ) | | (50,851 | ) | | | (680,836 | ) |
| | | | | | | | | | | | | | | | | | | | | | | | | | | | |
Net Increase (Decrease) - Class A | | (19,569 | ) | | | ($261,993 | ) | | (155,572 | ) | | | ($2,374,748 | ) | | 56,242 | | | $ | 713,671 | | | 7,217 | | | $ | 77,256 | |
| | | | | | | | | | | | | | | | | | | | | | | | | | | | |
Class B: | | | | | | | | | | | | | | | | | | | | | | | | | | | | |
Proceeds from sales | | 903 | | | $ | 10,600 | | | 33,150 | | | $ | 458,765 | | | 12,270 | | | $ | 153,682 | | | 9,773 | | | $ | 125,376 | |
Reinvestment of distributions | | — | | | | — | | | 13,109 | | | | 171,594 | | | 664 | | | | 8,207 | | | 1,954 | | | | 25,272 | |
Cost of shares repurchased | | (140,181 | ) | | | (1,689,707 | ) | | (318,832 | ) | | | (4,596,519 | ) | | (134,366 | ) | | | (1,679,001 | ) | | (217,938 | ) | | | (2,810,029 | ) |
| | | | | | | | | | | | | | | | | | | | | | | | | | | | |
Net Decrease - Class B | | (139,278 | ) | | | ($1,679,107 | ) | | (272,573 | ) | | | ($3,966,160 | ) | | (121,432 | ) | | ($ | 1,517,112 | ) | | (206,211 | ) | | ($ | 2,659,381 | ) |
| | | | | | | | | | | | | | | | | | | | | | | | | | | | |
Class C: | | | | | | | | | | | | | | | | | | | | | | | | | | | | |
Proceeds from sales | | 7,119 | | | $ | 86,462 | | | 50,160 | | | $ | 688,679 | | | 14,176 | | | $ | 181,403 | | | 9,119 | | | $ | 119,367 | |
Reinvestment of distributions | | — | | | | — | | | 10,655 | | | | 139,371 | | | 380 | | | | 4,737 | | | 730 | | | | 9,536 | |
Cost of shares repurchased | | (108,500 | ) | | | (1,293,045 | ) | | (235,928 | ) | | | (3,427,065 | ) | | (33,189 | ) | | | (419,794 | ) | | (54,020 | ) | | | (705,519 | ) |
| | | | | | | | | | | | | | | | | | | | | | | | | | | | |
Net Decrease - Class C | | (101,381 | ) | | | ($1,206,583 | ) | | (175,113 | ) | | | ($2,599,015 | ) | | (18,633 | ) | | | ($233,654 | ) | | (44,171 | ) | | | ($576,616 | ) |
| | | | | | | | | | | | | | | | | | | | | | | | | | | | |
Institutional Class: | | | | | | | | | | | | | | | | | | | | | | | | | | | | |
Proceeds from sales | | 125,766 | | | $ | 1,698,878 | | | 290,909 | | | $ | 4,724,523 | | | 34,374 | | | $ | 437,703 | | | 96,331 | | | $ | 1,271,270 | |
Reinvestment of distributions | | — | | | | — | | | 248,099 | | | | 3,656,985 | | | 6,281 | | | | 79,545 | | | 13,330 | | | | 176,809 | |
Cost of shares repurchased | | (770,583 | ) | | | (10,384,298 | ) | | (634,275 | ) | | | (10,231,560 | ) | | (47,302 | ) | | | (603,788 | ) | | (118,166 | ) | | | (1,571,856 | ) |
| | | | | | | | | | | | | | | | | | | | | | | | | | | | |
Net Decrease - Institutional Class | | (644,817 | ) | | | ($8,685,420 | ) | | (95,267 | ) | | | ($1,850,052 | ) | | (6,647 | ) | | | ($86,540 | ) | | (8,505 | ) | | | ($123,777 | ) |
| | | | | | | | | | | | | | | | | | | | | | | | | | | | |
47
Notes to Financial Statements (continued)
| | | | | | | | | | | | | | | | | | | | | | | | | | | | |
| | | High Yield | | | Fixed Income | |
| | | 2008 | | | 2007 | | | 2008 | | | 2007 | |
| | | Shares | | | Amount | | | Shares | | | Amount | | | Shares | | | Amount | | | Shares | | | Amount | |
Class A: | | | | | | | | | | | | | | | | | | | | | | | | | | | | |
Proceeds from sales | | 1,889,335 | | | $ | 15,291,991 | | | 2,321,944 | | | $ | 19,882,916 | | | 1,859,062 | | | $ | 19,516,787 | | | 1,696,074 | | | $ | 17,826,303 | |
Reinvestment of distributions | | 90,897 | | | | 724,522 | | | 181,714 | | | | 1,545,504 | | | 42,212 | | | | 439,742 | | | 48,605 | | | | 506,986 | |
Cost of shares repurchased | | (2,009,796 | ) | | | (16,255,609 | ) | | (2,693,687 | ) | | | (23,063,355 | ) | | (447,480 | ) | | | (4,694,569 | ) | | (572,203 | ) | | | (6,036,138 | ) |
| | | | | | | | | | | | | | | | | | | | | | | | | | | | |
Net Increase (Decrease)- Class A | | (29,564 | ) | | | ($239,096 | ) | | (190,029 | ) | | | ($1,634,935 | ) | | 1,453,794 | | | $ | 15,261,960 | | | 1,172,476 | | | $ | 12,297,151 | |
| | | | | | | | | | | | | | | | | | | | | | | | | | | | |
Class B: | | | | | | | | | | | | | | | | | | | | | | | | | | | | |
Proceeds from sales | | 6,774 | | | $ | 53,242 | | | 26,725 | | | $ | 227,385 | | | 137,621 | | | $ | 1,429,805 | | | 63,279 | | | $ | 660,314 | |
Reinvestment of distributions | | 8,039 | | | | 63,393 | | | 11,860 | | | | 99,730 | | | 6,530 | | | | 67,584 | | | 13,190 | | | | 137,318 | |
Cost of shares repurchased | | (162,080 | ) | | | (1,282,189 | ) | | (677,011 | ) | | | (5,779,918 | ) | | (164,685 | ) | | | (1,705,918 | ) | | (463,226 | ) | | | (4,837,057 | ) |
| | | | | | | | | | | | | | | | | | | | | | | | | | | | |
Net Decrease - Class B | | (147,267 | ) | | | ($1,165,554 | ) | | (638,426 | ) | | | ($5,452,803 | ) | | (20,534 | ) | | | ($208,529 | ) | | (386,757 | ) | | | ($4,039,425 | ) |
| | | | | | | | | | | | | | | | | | | | | | | | | | | | |
Class C: | | | | | | | | | | | | | | | | | | | | | | | | | | | | |
Proceeds from sales | | 48,830 | | | $ | 384,561 | | | 104,832 | | | $ | 881,044 | | | 1,551,709 | | | $ | 16,272,170 | | | 1,884,490 | | | $ | 19,847,157 | |
Reinvestment of distributions | | 9,040 | | | | 71,073 | | | 13,456 | | | | 112,711 | | | 33,184 | | | | 345,418 | | | 33,978 | | | | 354,851 | |
Cost of shares repurchased | | (68,919 | ) | | | (540,521 | ) | | (253,818 | ) | | | (2,137,953 | ) | | (317,190 | ) | | | (3,328,302 | ) | | (332,155 | ) | | | (3,488,168 | ) |
| | | | | | | | | | | | | | | | | | | | | | | | | | | | |
Net Increase (Decrease) - Class C | | (11,049 | ) | | | ($84,887 | ) | | (135,530 | ) | | | ($1,144,198 | ) | | 1,267,703 | | | $ | 13,289,286 | | | 1,586,313 | | | $ | 16,713,840 | |
| | | | | | | | | | | | | | | | | | | | | | | | | | | | |
Institutional Class: | | | | | | | | | | | | | | | | | | | | | | | | | | | | |
Proceeds from sales | | 129,677 | | | $ | 1,047,300 | | | 237,475 | | | $ | 2,055,697 | | | 514,641 | | | $ | 5,436,285 | | | 1,377,200 | | | $ | 14,490,100 | |
Reinvestment of distributions | | 12,861 | | | | 103,298 | | | 27,420 | | | | 235,265 | | | 74,719 | | | | 782,212 | | | 130,502 | | | | 1,373,072 | |
Cost of shares repurchased | | (171,524 | ) | | | (1,377,660 | ) | | (662,798 | ) | | | (5,768,965 | ) | | (537,554 | ) | | | (5,691,541 | ) | | (793,501 | ) | | | (8,398,180 | ) |
| | | | | | | | | | | | | | | | | | | | | | | | | | | | |
Net Increase (Decrease) - Institutional Class | | (28,986 | ) | | | ($227,062 | ) | | (397,903 | ) | | | ($3,478,003 | ) | | 51,806 | | | $ | 526,956 | | | 714,201 | | | $ | 7,464,992 | |
| | | | | | | | | | | | | | | | | | | | | | | | | | | | |
At June 30, 2008, certain unaffiliated shareholders, specifically omnibus accounts, individually held greater than 10% of the outstanding shares of the following Funds:
| | | | | | | | |
| | | Class A | | Class B | | Class C | | Inst. Class |
Mid-Cap | | 1 owns 43% | | 1 owns 59% | | 1 owns 78% | | 2 own 96% |
Balanced | | 3 own 65% | | 1 owns 61% | | 1 owns 77% | | 1 owns 94% |
High Yield | | 1 owns 64% | | 2 own 60% | | 2 own 61% | | 3 own 84% |
Fixed Income | | 2 own 60% | | 1 owns 54% | | 2 own 69% | | 3 own 77% |
| g. | Capital Loss Carryovers |
As of June 30, 2008, the following Funds had accumulated net realized capital loss carryovers from securities transactions for Federal income tax purposes as shown in the following chart. These amounts may be used to offset realized capital gains, if any, through the expiration dates listed.
| | | | | |
| | | Capital Loss
Carryover Amount | | Expires
Dec. 31, |
Balanced | | $ | 1,179,034 | | 2008 |
| | $ | 13,683,503 | | 2009 |
| | $ | 1,575,061 | | 2010 |
High Yield | | $ | 6,618,233 | | 2008 |
| | $ | 6,767,059 | | 2009 |
Fixed Income | | $ | 2,814,977 | | 2009 |
| h. | Foreign Currency Translation |
The books and records of the Funds are maintained in U.S. dollars. The value of investments, assets and liabilities denominated in currencies other than U.S. dollars are translated into U.S. dollars based upon current foreign exchange rates. Purchases and sales of foreign investments, income, and expenses are converted into U.S. dollars based on currency exchange rates prevailing on the
48
Notes to Financial Statements (continued)
respective dates of such transactions. Net realized and unrealized gain (loss) on foreign currency transactions represent: (1) foreign exchange gains and losses from the sale and holdings of foreign currencies; (2) gains and losses between trade date and settlement date on investment securities transactions and forward foreign currency exchange contracts; and (3) gains and losses from the difference between amounts of interest and dividends recorded and the amounts actually received.
In addition, the Funds do not isolate the net realized and unrealized gain or loss resulting from changes in exchange rates from the fluctuations resulting from changes in market prices of securities held. Such fluctuations are included with the net realized and unrealized gain or loss on investments.
| 2. | Agreements and Transactions with Affiliates |
The Trust has entered into an Investment Management Agreement under which Managers Investment Group LLC (the “Investment Manager”), an independently managed subsidiary of Affiliated Managers Group, Inc. (“AMG”), provides or oversees investment management services to the Funds. The Investment Manager selects subadvisors for each Fund (subject to Trustee approval), allocates assets among subadvisors and monitors the subadvisors’ investment programs and results. Each Fund’s investment portfolio is managed by a portfolio manager who serves pursuant to Subadvisory Agreements with the Investment Manager.
Investment management fees are paid directly by each Fund to the Investment Manager based on average daily net assets. The annual investment management fee rates, as a percentage of average daily net assets for the six months ended June 30, 2008, were as follows:
| | | |
| | | Investment
Management Fee | |
Mid-Cap | | 0.70 | % |
Balanced | | 0.70 | % |
High Yield | | 0.70 | % |
Fixed Income | | 0.45 | % |
The Investment Manager has contractually agreed, through at least May 1, 2009 to waive fees and pay or reimburse expenses to the extent that the total operating expenses (exclusive of brokerage costs, interest, taxes, acquired fund fees and extraordinary expenses) exceed the following percentages of each Fund’s average daily net assets.
| | | | | | | | | | | | |
| | | Class A | | | Class B | | | Class C | | | Institutional
Class | |
Mid-Cap | | 1.24 | % | | 1.99 | % | | 1.99 | % | | 0.99 | %* |
Balanced | | 1.25 | % | | 2.00 | % | | 2.00 | % | | 1.00 | % |
High Yield | | 1.15 | % | | 1.90 | % | | 1.90 | % | | 0.90 | % |
Fixed Income | | 0.84 | % | | 1.59 | % | | 1.59 | % | | 0.59 | %* |
| * | Rate change effective May 1, 2007. Prior to this date the expense caps for Institutional Class shares were 1.00% and 0.49% for Mid-Cap and Fixed Income, respectively. |
Each Fund may be obligated to repay the Investment Manager such amounts waived, paid or reimbursed in future years provided that the repayment occurs within thirty-six (36) months after the waiver or reimbursement and that such repayment would not cause the Fund’s expenses in any such year to exceed the above percentages, based on the Fund’s average daily net assets.
For the six months ended June 30, 2008, the cumulative amount of expense reimbursement by the Investment Manager subject to the repayment by Mid-Cap, Balanced, High Yield and Fixed Income equaled $330,201, $349,143, $534,947 and $730,496, respectively. Total returns and net investment income for the Funds would have been lower had certain expenses not been offset. Total expenses exclude the impact of expense reimbursements and expense offsets such as brokerage recapture credits but includes non-reimbursable expenses such as interest and taxes, if any.
The Funds have entered into an Administration and Shareholder Servicing Agreement under which Managers Investment Group LLC serves as each Fund’s administrator (the “Administrator”) and is responsible for all aspects of managing the Funds’ operations, including administration and shareholder services to each Fund, its shareholders, and certain institutions, such as bank trust departments, broker-dealers and registered investment advisers, that advise or act as an intermediary with the Funds’ shareholders.
During the six months ended June 30, 2008, each of the Funds paid an Administration fee at the rate of 0.20% per annum of the Fund’s average daily net assets.
Prior to July 1, 2007, the aggregate annual retainer paid to each Independent Trustee was $55,000, plus $4,000 or $2,000 for each regular or special meeting attended, respectively. Effective July 1, 2007, the aggregate annual retainer paid to each Independent Trustee is $65,000, plus $4,000 or $2,500 for each regular or special meeting attended, respectively. The Trustees’ fees and expenses are allocated amongst all of the Funds for which the Investment Manager serves as the advisor (the “Managers Funds”) based on the relative net assets of such Funds. The Independent Chairman of the Trusts receives an additional payment of $15,000 per year. (Prior to July 1, 2007, the Independent Chairman received an additional payment of $10,000 per year). The Chairman of the Audit Committee receives an additional payment of $5,000 per year. (Prior to July 1, 2007, the Chairman of the Audit Committee received an additional payment of $2,000 per year). The “Trustees fees and expenses” shown in the financial statements represents the Fund’s allocated portion of the total fees and expenses paid by the Managers Funds.
The Funds are distributed by Managers Distributors, Inc. (the “MDI”), a wholly-owned subsidiary of the Investment Manager. MDI serves as the principal underwriter for each Fund and is a registered broker-dealer and member of the Financial Industry Regulatory Authority, Inc. (“FINRA”). Shares of each Fund will be continuously offered and will be sold by brokers, dealers or other financial intermediaries who have executed selling agreements with MDI. MDI bears all the expenses of providing services pursuant to the Underwriting Agreement, including the payment of the expenses relating to the distribution of Prospectuses for sales purposes and any advertising or sales literature. Certain Trustees and Officers of the Funds are Officers and/or Directors of the Investment Manager, AMG and/or MDI.
The Funds have adopted distribution and service plans with respect to the Class A, Class B and Class C shares of each Fund (the “Plans”), in accordance with the requirements of Rule 12b-1 under the 1940 Act and the requirements of the applicable rules of the
49
Notes to Financial Statements (continued)
FINRA regarding asset-based sales charges. Pursuant to the Plans, each Fund may compensate MDI for its expenditures in financing any activity primarily intended to result in the sale of each such class of Fund shares and for maintenance and personal service provided to existing shareholders of that class. The Plans authorize payments to MDI up to 0.25%, 1.00% and 1.00% annually of each Fund’s average daily net assets attributable to its Class A, Class B and Class C shares, respectively.
The Plans further provide for periodic payments by MDI to brokers, dealers and other financial intermediaries for providing shareholder services and for promotional and other sales related costs. The portion of payments by Class A, Class B or Class C shares of a Fund for shareholder servicing may not exceed an annual rate of 0.25% of the average daily net asset value of Fund shares of that class owned by clients of such broker, dealer or financial intermediary.
The following summarizes the total fees incurred under the plans for Class A, Class B and Class C shares for the six months ended June 30, 2008:
| | | |
| | | Amount |
Mid-Cap | | $ | 72,374 |
Balanced | | | 47,571 |
High Yield | | | 89,172 |
Fixed Income | | | 276,143 |
| 3. | Purchases and Sales of Securities |
Purchases and sales of securities, excluding short-term securities, for the six months ended June 30, 2008, were as follows:
| | | | | | | | | | | | |
| | | Long-Term Securities | | U.S. Government Securities |
Fund | | Purchases | | Sales | | Purchases | | Sales |
Mid-Cap | | $ | 31,959,620 | | $ | 45,139,688 | | | n/a | | | n/a |
Balanced | | | 4,355,503 | | | 4,893,383 | | $ | 5,688,924 | | $ | 6,076,012 |
High Yield | | | 10,365,935 | | | 8,623,206 | | | n/a | | | n/a |
Fixed Income | | | 33,469,442 | | | 2,814,972 | | | 3,847,239 | | | 6,104,338 |
| 4. | Portfolio Securities Loaned |
The Funds may participate in a securities lending program offered by BNYM providing for the lending of equities, corporate bonds and government securities to qualified brokers. Collateral on all securities loaned is accepted in cash and/or government securities. Collateral is maintained at a minimum level of 102% (105% in the case of certain foreign securities) of the market value, plus interest, if applicable, of investments on loan. Collateral received in the form of cash is invested temporarily in institutional money market funds or other short-term investments by BNYM. Securities lending fees include earnings of such temporary cash investments, plus or minus any rebate to a borrower. These earnings (after rebate) are then divided between BNYM, as a fee for its services under the program, and the Fund loaning the security, according to agreed-upon rates.
| 5. | Commitments and Contingencies |
In the normal course of business, the Funds may enter into contracts and agreements that contain a variety of representations and warranties, which provide general indemnifications. The maximum exposure to the Funds under these arrangements is unknown, as this would involve future claims that may be against the Funds that have not yet occurred. However, based on experience, the Funds expect the risks of loss to be remote.
| 6. | Risks Associated with Collateralized Mortgage Obligations (“CMOs”) (Balanced and Fixed Income) |
The net asset value of Funds may be sensitive to interest rate fluctuations because the Funds may hold several instruments, including CMOs and other derivatives, whose values can be significantly impacted by interest rate movements. CMOs are obligations collateralized by a portfolio of mortgages or mortgage-related securities. Payments of principal and interest on the mortgages are passed through to the holder of the CMOs on the same schedule as they are received, although certain classes of CMOs have priority over others with respect to the receipt of prepayments on the mortgages. Therefore, the investment in CMOs may be subject to a greater or lesser risk of prepayment than other types of mortgage-related securities. CMOs may have a fixed or variable rate of interest.
| 7. | Risks Associated with High Yield Securities (High Yield) |
Investing in high yield securities involves greater risks and considerations not typically associated with U.S. Government and other high quality/investment grade securities. High Yield securities are generally below investment grade securities and do not have an established retail secondary market. Economic downturns may disrupt the high yield market and impair the issuer’s ability to repay principal and interest. Also, an increase in interest rates would likely have an adverse impact on the value of such obligations and could cause the securities to become less liquid.
| 8. | New Accounting Pronouncement |
In June 2006, the Financial Accounting Standards Board (“FASB”) issued Interpretation No. 48, “Accounting for Uncertainty in Income Taxes - an Interpretation of FASB Statement No. 109 (“FIN 48”).” FIN 48 applies to all registered investment companies and establishes the minimum threshold for recognizing, and a system for measuring, the benefits of tax-return positions in the financial statements. FIN 48 is effective for fiscal years beginning after December 15, 2006. The Investment Manager has analyzed the Funds’ tax positions taken on federal income tax returns for all open tax years (tax years ended December 31, 2004-2007) and has concluded that as of June 30, 2008, no provision for income tax is required in the Funds’ financial statements. Additionally, the Investment Manager is not aware of any events that are reasonably possible to occur in the next twelve months that would result in the amounts of any unrecognized tax benefits significantly increasing or decreasing for the Funds. However, the Investment Manager’s conclusion regarding FIN 48 may be subject to review and adjustment at a later date based on factors including, but not limited to, further implementation guidance expected from FASB, and ongoing analysis of tax laws, regulations, and interpretations thereof.
50
Annual Renewal of Investment Advisory Agreements (unaudited)
On June 6, 2008, the Board of Trustees, including a majority of the Trustees who are not “interested persons” of the Trust (the “Independent Trustees”), approved the Investment Management Agreement with the Investment Manager for each of the Funds identified below and the Subadvisory Agreement for each Fund Subadvisor. The Independent Trustees were separately represented by independent counsel in connection with their consideration of the approval of these agreements. In considering the Investment Management and Subadvisory Agreements, the Trustees reviewed a variety of materials relating to each Fund, the Investment Manager and each Subadvisor, including comparative performance, fee and expense information for an appropriate peer group of similar mutual funds (each a “Peer Group”), performance information for relevant benchmark indices (each a “Fund Benchmark”) and other information regarding the nature, extent and quality of services provided by the Investment Manager and the Subadvisors under their respective agreements. The Trustees also took into account information on the services provided by the Investment Manager and each Subadvisor (including information provided at meetings held on May 15-16 and June 5-6, 2008), as well as performance, fee and expense information regarding each Fund provided to them on a quarterly basis throughout the year. Prior to voting, the Independent Trustees: (a) reviewed the foregoing information with their independent legal counsel and with management; (b) received materials from their independent legal counsel discussing the legal standards applicable to their consideration of the Investment Management Agreement and the Subadvisory Agreements; and (c) met with their independent legal counsel in private sessions at which no representatives of management were present.
Nature, extent and quality of services.
In considering the nature, extent and quality of the services provided by the Investment Manager, the Trustees reviewed information relating to the Investment Manager’s operations and personnel. Among other things, the Investment Manager provided financial information, biographical information on its supervisory and professional staff and descriptions of its organizational and management structure. The Trustees also took into account information provided periodically throughout the previous year by the Investment Manager relating to the performance of its duties with respect to the Funds and the Trustees’ familiarity with the Investment Manager’s management through Board meetings, discussions and reports. In the course of their deliberations regarding the Investment Management Agreement, the Trustees evaluated, among other things: (a) the extent and quality of the Investment Manager’s oversight of the operation and management of the Funds; (b) the quality of the search, selection and monitoring services performed by the Investment Manager in overseeing the portfolio management responsibilities of the Subadvisors; (c) the Investment Manager’s ability to supervise the Funds’ other service providers; and (d) the Investment Manager’s compliance programs. The Trustees also took into account the financial condition of the Investment Manager with respect to its ability to provide the services required under the Investment Management Agreement and to maintain contractual expense limitations for the Funds.
For each Fund, the Trustees also reviewed information relating to each Subadvisor’s operations and personnel and the investment philosophy, strategies and techniques (for each Subadvisor, its “Investment Strategy”) used in managing the Fund or the portion of the Fund for which the Subadvisor has portfolio management responsibility. Among other things, the Trustees reviewed biographical information on portfolio management and other professional staff, information regarding each Subadvisor’s organizational and management structure and each Subadvisor’s brokerage policies and practices. The Trustees considered specific information provided regarding the experience of the individual or individuals at each Subadvisor with portfolio management responsibility for the portion of the Fund managed by the Subadvisor, including the information set forth in the Fund’s prospectus and statement of additional information. With respect to those Funds managed with multiple Subadvisors, the Trustees also noted information provided by the Investment Manager regarding the manner in which each Subadvisor’s Investment Strategy complements those utilized by a Fund’s other Subadvisors. In the course of their deliberations, the Trustees evaluated, among other things: (a) the services rendered by each Subadvisor in the past; (b) the qualifications and experience of the Subadvisor’s personnel; and (c) the Subadvisor’s compliance programs. The Trustees also took into account the financial condition of each Subadvisor with respect to its ability to provide the services required under its Subadvisory Agreement.
Performance.
As noted above, the Board considered each Fund’s performance during relevant time periods as compared to the Fund’s Peer Group and noted that the Board reviews on a quarterly basis detailed information about the Fund’s performance results, portfolio composition and Investment Strategies, including with respect to the portion of the Fund managed by each Subadvisor. The Board noted the Investment Manager’s expertise and resources in monitoring the performance, investment style and risk-adjusted performance of each Subadvisor. The Board also noted each Subadvisor’s performance record with respect to the Fund. The Board was mindful of the Investment Manager’s attention to monitoring each Subadvisor’s performance with respect to the Funds and its discussions with management regarding the factors that contributed to the performance of the Funds.
Advisory Fees and Profitability.
In considering the reasonableness of the advisory fee charged by the Investment Manager for managing each Fund, the Trustees noted that the Investment Manager, and not the Fund, is responsible for paying the fees charged by the Fund’s Subadvisors and, therefore, that the fees paid to the Investment Manager cover the cost of providing portfolio management services as well as the cost of providing search, selection and monitoring services in operating a “manager-of-managers” complex of mutual funds. The Trustees concluded that, in light of the additional high quality supervisory services provided by the Investment Manager and the fact that the subadvisory fees are paid out of the advisory fee, the advisory fee payable by each Fund to the Investment Manager can reasonably be expected to exceed the median advisory fee for the Peer Group, which consists of many funds that do not operate with a manager-of-managers structure. In this regard, the Trustees also noted that the Investment Manager has undertaken to maintain expense limitations for the Funds.
51
Annual Renewal of Investment Advisory Agreements (continued)
In considering the reasonableness of the advisory fee payable to the Investment Manager, the Trustees also reviewed information provided by the Investment Manager setting forth all revenues and other benefits, both direct and indirect, received by the Investment Manager and its affiliates attributable to managing each Fund and all the mutual funds in the Managers Family of Funds, the cost of providing such services and the resulting profitability to the Investment Manager and its affiliates from these relationships. The Trustees also noted the current asset levels of each Fund and the willingness of the Investment Manager to waive fees and pay expenses for certain of the Funds from time to time as a means of limiting the total expenses of the smaller Funds. The Trustees also noted that the subadvisory fees are paid by the Investment Manager out of its advisory fee. The Trustees also considered the current asset levels of the Funds and the impact on profitability of growth of assets of the Funds. The Board took into account management’s discussion of the current advisory fee structure. In this regard, the Trustees noted that, unlike a mutual fund that is managed by a single investment adviser, the Funds operate in a manager-of-managers structure and, as a Fund grows in size, it is common practice for the Investment Manager to recommend the selection of an additional Subadvisor to manage a portion of the Fund’s portfolio. The Trustees further noted that, because of this practice, the Investment Manager’s oversight and supervisory responsibilities with respect to the Funds can be expected to increase with the size of the Funds. Based on the foregoing, the Trustees concluded that the profitability to the Investment Manager is reasonable and that the Investment Manager is not realizing material benefits from economies of scale that would warrant adjustments to the fees for any Fund at this time. With respect to economies of scale, the Trustees also noted that as a Fund’s assets increase over time, the Fund may realize other economies of scale to the extent that the increase in assets is proportionally greater than the increase in certain other expenses.
Subadvisory Fees and Profitability.
In considering the reasonableness of the fee payable by the Investment Manager to each Subadvisor (other than Chicago Equity Partners, LLC (“CEP”), which is an affiliate of the Investment Manager), the Trustees relied on the ability of the Investment Manager to negotiate the terms of the Subadvisory Agreement at arm’s length as part of the manager-of-managers structure, noting that the Investment Manager is not affiliated with the Subadvisors (other than CEP). In addition, the Trustees noted that the subadvisory fees are paid by the Investment Manager out of its advisory fee. Accordingly, the cost of services to be provided by each unaffiliated Subadvisor and the profitability to the Subadvisor of its relationship with a Fund were not material factors in the Trustees’ deliberations. For similar reasons, and based on the current size of the portion of a Fund managed by each Subadvisor, the Trustees concluded that the effect of any economies of scale being realized by each unaffiliated Subadvisor was not a material factor in the Trustees’ deliberations at this time.
In considering the reasonableness of the fees payable by the Investment Manager to CEP, the Trustees noted that CEP is an affiliate of the Investment Manager and reviewed information provided by CEP regarding the cost to CEP of providing subadvisory services to a Fund and the resulting profitability from such relationship. The Trustees also noted that the subadvisory fees are paid by the Investment Manager out of its advisory fee. Accordingly, the cost of services to be provided by CEP and the profitability to CEP of its relationship with a Fund were not material factors in the Trustees’ deliberations. For similar reasons, and based on the current size of the portion of a Fund managed by CEP, the Trustees concluded that the effect of any economies of scale being realized by CEP was not a material factor in the Trustees’ deliberations at this time.
In addition to the foregoing, the Trustees considered the specific factors and related conclusions set forth below with respect to each Fund and each Subadvisor.
MANAGERS AMG CHICAGO EQUITY PARTNERS BALANCED FUND
Fund Performance.
Among other information relating to the Fund’s performance, the Trustees noted that the Fund’s performance for Class A shares for the 1-year, 3-year, 5-year and 10-year periods ended March 31, 2008 was above the median performance of the Peer Group for each period and below, below, above and above, respectively, the performance of the Fund Benchmark, a Composite Index (60% S&P 500 Index and 40% Lehman Brothers Aggregate Bond Index). The Trustees concluded that the Fund’s performance has been satisfactory.
Advisory Fees.
The Trustees noted that the Fund’s advisory fee and total expenses (net of applicable expense waivers/reimbursements) as of March 31, 2008 were both higher than the average for the Peer Group. The Trustees took into account the fact that the Investment Manager has contractually agreed, through May 1, 2009, to limit the Fund’s net annual operating expenses to 1.25%, 2.00%, 2.00% and 1.00% for Class A shares, Class B shares, Class C shares and Institutional Class shares, respectively. The Trustees concluded that, in light of the nature, extent and quality of the services provided by the Investment Manager and the Subadvisor, the Fund’s performance, the foregoing expense limitation and the considerations noted above with respect to the Subadvisor and the Investment Manager, the Fund’s advisory fees are reasonable.
MANAGERS FIXED INCOME FUND
Fund Performance.
Among other information relating to the Fund’s performance, the Trustees noted that the Fund’s performance for Class A shares for the 1-year, 3-year, 5-year and 10-year periods ended March 31, 2008 was below, above, above and above, respectively, the median performance of the Peer Group and below, above, above and below, respectively, the performance of the Fund Benchmark, the Lehman Brothers Aggregate Bond Index. The Board also noted management’s discussion of the Fund’s more recent performance. The Trustees concluded that the Fund’s performance has been satisfactory.
Advisory Fees.
The Trustees noted that the Fund’s advisory fee and total expenses (net of applicable expense waivers/reimbursements) as of March 31, 2008 were both higher than the average for the Peer Group. The Trustees took into account the fact that the Investment Manager has contractually agreed, through May 1, 2009, to limit the Fund’s net
52
Annual Renewal of Investment Advisory Agreements (continued)
annual operating expenses to 0.84%, 1.59%, 1.59% and 0.59% for Class A shares, Class B shares, Class C shares and Institutional Class shares, respectively. The Trustees concluded that, in light of the nature, extent and quality of the services provided by the Investment Manager and the Subadvisor, the Fund’s performance, the foregoing expense limitation and the considerations noted above with respect to the Subadvisor and the Investment Manager, the Fund’s advisory fees are reasonable.
MANAGERS AMG CHICAGO EQUITY PARTNERS MID-CAP FUND
Fund Performance.
Among other information relating to the Fund’s performance, the Trustees noted that the Fund’s performance for Class A shares for the 1-year, 3-year, 5-year and 10-year periods ended March 31, 2008 was below, below, below and above, respectively, the median performance of the Peer Group and below the performance of the Fund Benchmark, the S&P MidCap 400 Index, for each period. The Board took into account management’s discussion of the Fund’s performance. The Trustees noted that the Fund’s 10-year performance has exceeded the median of its Peer Group, which has resulted in the Fund performing within the top quartile of its Peer Group (Institutional Class Shares) since inception of the Fund (January 2, 1997) through the period ended March 31, 2008. The Trustees concluded that the Fund’s performance has been satisfactory in light of all factors considered.
Advisory Fees.
The Trustees noted that the Fund’s advisory fee and total expenses (net of applicable expense waivers/reimbursements) as of March 31, 2008 were both lower than the average for the Peer Group. The Trustees also took into account the fact that the Investment Manager has contractually agreed, through May 1, 2009, to limit the Fund’s net annual operating expenses to 1.24%, 1.99%, 1.99% and 0.99% for Class A shares, Class B shares, Class C shares and Institutional Class shares, respectively. The Trustees concluded that, in light of the nature, extent and quality of the services provided by the Investment Manager and the Subadvisor, the Fund’s performance, the foregoing expense limitation and the considerations noted above with respect to the Subadvisor and the Investment Manager, the Fund’s advisory fees are reasonable.
MANAGERS HIGH YIELD FUND
Fund Performance.
The Trustees noted that the Fund’s performance for Class A shares for the 1-year, 3-year, 5-year and 10-year periods ended March 31, 2008 was above the median performance of the Peer Group for each period and above, below, below and above, respectively, the performance of the Fund Benchmark, the Lehman Brothers U.S. Corporate High Yield Index. The Trustees concluded that the Fund’s performance has been satisfactory.
Advisory Fees.
The Trustees noted that the Fund’s advisory fee and total expenses (net of applicable expense waivers/reimbursements) as of March 31, 2008 were both higher than the average for the Peer Group. The Trustees took into account the fact that the Investment Manager has contractually agreed, through May 1, 2009, to limit the Fund’s net annual operating expenses to 1.15%, 1.90%, 1.90% and 0.90% for Class A shares, Class B shares, Class C shares and Institutional Class shares, respectively. The Trustees concluded that, in light of the nature, extent and quality of the services provided by the Investment Manager and the Subadvisor, the foregoing expense limitation and the considerations noted above with respect to the Subadvisor and the Investment Manager, the Fund’s advisory fees are reasonable.
* * * * *
After consideration of the foregoing, the Trustees also reached the following conclusions regarding the Investment Management Agreement and each Subadvisory Agreement, in addition to those conclusions discussed above: (a) the Investment Manager and each Subadvisor have demonstrated that they possess the capability and resources to perform the duties required of them under the Investment Management Agreement and the applicable Subadvisory Agreement; (b) each Subadvisor’s Investment Strategy is appropriate for pursuing the applicable Fund’s investment objectives; (c) each Subadvisor is reasonably likely to execute its Investment Strategy consistently over time; and (d) the Investment Manager and each Subadvisor maintain appropriate compliance programs.
Based on all of the above-mentioned factors and their related conclusions, with no single factor or conclusion being determinative and with each Trustee not necessarily attributing the same weight to each factor, the Trustees concluded that approval of each Investment Management Agreement and each Subadvisory Agreement (as applicable) would be in the best interests of each Fund and its shareholders. Accordingly, on June 6, 2008, the Trustees, including a majority of the Independent Trustees, voted to approve the Investment Management Agreement and the Subadvisory Agreements (as applicable) for each Fund.
53
THIS PAGE INTENTIONALLY LEFT BLANK
THIS PAGE INTENTIONALLY LEFT BLANK
Investment Manager and Administrator
Managers Investment Group LLC
800 Connecticut Avenue
Norwalk, Connecticut 06854
(203) 299-3500 or (800) 835-3879
Distributor
Managers Distributors, Inc.
800 Connecticut Avenue
Norwalk, Connecticut 06854
(203) 299-3500 or (800) 835-3879
Custodian
The Bank of New York Mellon
2 Hanson Place
Brooklyn, New York 11217
Legal Counsel
Ropes & Gray LLP
One International Place
Boston, Massachusetts 02110-2624
Transfer Agent
PNC Global Investment Servicing (U.S.) Inc.
Attn: Managers
P.O. Box 9769
Providence, Rhode Island 02940
(800) 548-4539
Trustees
Jack W. Aber
William E. Chapman, II
Nathaniel Dalton
Edward J. Kaier
Steven J. Paggioli
Eric Rakowski
Thomas R. Schneeweis
John H. Streur
For Managers Choice Only
Managers
c/o PNC Global Investment Servicing (U.S.) Inc.
P.O. Box 61204
King of Prussia, Pennsylvania 19406-0851
(800) 358-7668
MANAGERSAND MANAGERS AMG EQUITY FUNDS
EMERGING MARKETS EQUITY
Rexiter Capital Management Limited
ESSEX GROWTH
ESSEX LARGE CAP GROWTH
ESSEX SMALL/MICRO CAP GROWTH
Essex Investment Management Co., LLC
FQ TAX-MANAGED U.S. EQUITY
FQ U.S. EQUITY
First Quadrant, L.P.
INSTITUTIONAL MICRO-CAP
MICRO-CAP
Lord, Abbett & Co. LLC
WEDGE Capital Management L.L.P.
OFI Institutional Asset Management, Inc.
Next Century Growth Investors LLC
INTERNATIONAL EQUITY
AllianceBernstein L.P.
Lazard Asset Management, LLC
Wellington Management Company, LLP
CHICAGO EQUITY PARTNERS
MID-CAP
Chicago Equity Partners, LLC
REAL ESTATE SECURITIES
Urdang Securities Management, Inc.
SKYLINE SPECIAL EQUITIES PORTFOLIO
Skyline Asset Management, L.P.
SMALL CAP
TIMESSQUARE MID CAP GROWTH
TIMESSQUARE SMALL CAP GROWTH
TimesSquare Capital Management, LLC
SMALL COMPANY
Epoch Investment Partners, Inc.
Kalmar Investment Advisers
SPECIAL EQUITY
Donald Smith & Co., Inc.
Lord, Abbett & Co. LLC
Skyline Asset Management, L.P.
Smith Asset Management Group, L.P.
Veredus Asset Management LLC
Westport Asset Management, Inc.
SYSTEMATIC VALUE
SYSTEMATIC MID CAP VALUE
Systematic Financial Management, L.P.
VALUE
Armstrong Shaw Associates Inc.
Osprey Partners Investment Management, LLC
MANAGERSAND MANAGERS AMG BALANCED FUNDS
CHICAGO EQUITY PARTNERS BALANCED
Chicago Equity Partners, LLC
GLOBAL
AllianceBernstein L.P.
First Quadrant, L.P.
Wellington Management Company, LLP
ALTERNATIVE FUNDS
FQ GLOBAL ALTERNATIVES
First Quadrant, L.P.
MANAGERS FIXED INCOME FUNDS
BOND (MANAGERS)
FIXED INCOME
GLOBAL BOND
Loomis, Sayles & Co., L.P.
BOND (MANAGERS FREMONT)
Pacific Investment Management Co. LLC
CALIFORNIA INTERMEDIATE TAX-FREE
Evergreen Investment Management Co., LLC
HIGH YIELD
J.P. Morgan Investment Management LLC
INTERMEDIATE DURATION GOVERNMENT
SHORT DURATION GOVERNMENT
Smith Breeden Associates, Inc.
MONEY MARKET
JPMorgan Investment Advisors Inc.
This report is prepared for the Funds’ shareholders. It is authorized for distribution to prospective investors only when preceded or accompanied by an effective prospectus. To receive a free copy of the prospectus or Statement of Additional Information, which includes additional information about Fund Trustees, please contact us by calling 800.835.3879. Distributed by Managers Distributors, Inc., member FINRA.
A description of the policies and procedures each Fund uses to vote its proxies is available: (i) without charge, upon request, by calling 800.835.3879, or (ii) on the Securities and Exchange Commission’s (SEC) Web site at www.sec.gov. For information regarding each Fund’s proxy voting record for the 12-month period ended June 30, call 800.835.3879 or visit the SEC Web site at www.sec.gov.
The Funds file their complete schedule of portfolio holdings with the SEC for the first and third quarters of each fiscal year on Form N-Q. The Funds’ Forms N-Q are available on the SEC’s website at www.sec.gov. A Fund’s Forms N-Q may be reviewed and copied at the SEC’s Public Reference Room in Washington, DC. Information on the operation of the Public Reference Room may be obtained by calling 800.SEC.0330. To review a complete list of the Funds’ portfolio holdings, or to view the most recent quarterly holdings report, semiannual report, or annual report, please visit www.managersinvest.com.
www.managersinvest.com


SEMI-ANNUAL REPORT
Managers Trust II Funds
June 30, 2008
Managers Short Duration Government Fund
Managers Intermediate Duration Government Fund
SAROO5-0608
Managers Short Duration Government Fund
Managers Intermediate Duration Government Fund
Semi-Annual Report – June 30, 2008 (unaudited)
TABLE OF CONTENTS
Nothing contained herein is to be considered an offer, sale or solicitation of an offer to buy shares of The Managers Funds or Managers AMG Funds. Such offering is made only by Prospectus, which includes details as to offering price and other material information.
Letter to Shareholders
Dear Fellow Shareholder:
As you are undoubtedly aware, the financial markets were under significant pressure during a majority of the six-month period ending June 30, 2008 (the “period”). The period began with the major U.S. equity markets seeing their worst returns in 5 1/2 years during the first quarter, largely driven by investor concerns over the economic impact of a decline in U.S. home values and the related devaluation of the mortgage-securities market. After the Federal Reserve’s mid-March establishment of the credit facility to extend overnight funds to primary dealers and the bail out of Bear Stearns, the second quarter started with many investors believing that the worst of the credit crunch was over, that economic growth would begin to bounce back later in the year, and that stock prices, in anticipation of future growth, would advance. That’s actually how it played out – until mid-to-late May, that is. Stocks, unfortunately, then sold off during the remainder of the quarter as investors’ concerns over surging energy and food prices, continued fallout from the credit crisis, slow economic growth, and declining corporate profits took center stage. Time will tell if the concerns are completely justified. In the short term, however, the pain in the financial markets has been all too real.
The resulting impact on equities was widespread. For the period, the Russell 1000® (large cap), Russell 2000® (small cap), and the Russell 3000® (all cap) Indices returned -11.2%, - -9.4% and -11.1%, respectively. Even with the benefit of currencies that were strong relative to the U.S. Dollar for the period, foreign stock markets offered little help in the way of diversification. For the period, the MSCI EAFE Index returned -11.0% (U.S. Dollars), while the MSCI Emerging Markets Index declined by -11.8%.
While many of the media headlines took a negative tone and emphasized inflation, the “housing crisis” and the losses in the stock market, various portions of the bond market provided positive returns. Interest rates fell (and bond prices rose) across the yield curve, although the interest rate declines were most pronounced on the shorter end of the curve. Meanwhile, for the period in aggregate, demand for higher-quality, lower-risk bonds like U.S. Treasuries increased, while investors sold higher-risk, lower-quality bonds in an effort to curtail risk. For the period, the Lehman Brothers U.S. Aggregate Index and the Lehman Brothers Global Aggregate Index returned 1.1% and 3.5% (U.S. Dollars), respectively. Meanwhile, the Citigroup Mortgage Index advanced 1.9%.
Against this backdrop, the Managers Short Duration Government Fund and the Managers Intermediate Duration Government Fund (each a “Fund,” and collectively the “Funds”) advanced, as detailed below:
| | | | | | | | | | | | | | | | | | | | |
Periods Ended 06/30/08 | | 6 Months | | | 1 Year | | | 3 Years | | | 5 Years | | | 10 Years | | | Since
Inception | | | Inception
Date |
Short Duration Government Fund | | 1.10 | % | | 3.61 | % | | 4.02 | % | | 3.27 | % | | 4.06 | % | | 4.64 | % | | 3/31/1992 |
Merrill Lynch Six-Month T-Bill Index | | 1.62 | % | | 4.62 | % | | 4.60 | % | | 3.38 | % | | 3.88 | % | | 4.28 | % | | 3/31/1992 |
Intermediate Duration Government Fund | | 0.03 | % | | 5.66 | % | | 3.67 | % | | 3.59 | % | | 5.04 | % | | 6.33 | % | | 3/31/1992 |
Citigroup Mortgage Index | | 1.86 | % | | 8.05 | % | | 4.85 | % | | 4.60 | % | | 5.80 | % | | 6.49 | % | | 3/31/1992 |
Note: Returns greater than one year are annualized.
For the six-month period ended June 30, 2008, the Managers Short Duration Government Fund (the “Short Duration Fund”) returned 1.10%, underperforming its benchmark, the Merrill Lynch Six-Month U.S. Treasury Bill Index, which returned 1.62%. Despite the shortfall relative to the benchmark, the Fund performed well relative to its peers during the period. The Fund has also fared very well versus its peers over the past one-, three-, five-, and ten-year periods, ended June 30, 2008.
During the period, the Fund’s underperformance relative to the benchmark was driven mostly by first-quarter results, when returns were hindered primarily by the Fund’s exposure to agency mortgages, which underperformed Treasuries significantly during the quarter. Agency mortgages did, however, manage to outpace sectors with higher credit risks during that same period. The large exposure to agency mortgages in the Fund is consistent with the investment process used by the team at Smith Breeden Associates, Inc. (“Smith Breeden”), the Fund’s subadvisor, to manage this Portfolio. Partially
1
Letter to Shareholders (continued)
offsetting the lower results generated by the agency mortgages was the Fund’s yield-curve positioning, which benefitted results primarily during the first quarter when short-term rates fell and the yield curve steepened.
For the six-month period ended June 30, 2008, the Managers Intermediate Duration Government Fund (the “Intermediate Duration Fund”) returned 0.03%, underperforming its benchmark, the Citigroup Mortgage Index, which returned 1.86%. Despite falling short of the benchmark during the period, the Fund has still generated solid results over the past three-, five-, and ten-year time periods relative to its peers.
Similar to the performance of the Short Duration Fund, the Intermediate Duration Fund’s underperformance relative to the benchmark was driven mostly by its results in the first quarter. The primary driver of the shortfall was the Fund’s exposure to agency mortgages, which, as noted above, underperformed Treasuries significantly during the first quarter. Agency mortgages did, however, manage to outpace sectors with higher credit risk during that same period. Partially offsetting the lower returns of the agency mortgages, and once again consistent with the Short Duration Fund, was the Intermediation Duration Fund’s yield-curve positioning, which modestly augmented results, especially during the first quarter.
Looking ahead, Smith Breeden is optimistic about the mortgage-backed securities market, as management believes that current economic conditions will prevent the Federal Reserve from raising interest rates in the near term, which should benefit returns in both Funds. Further, Smith Breeden believes that mortgage spreads, which are at levels not seen since the demise of Long Term Capital Management in 1998, are unjustifiably wide and will tighten as these markets settle down.
The following report covers the six-month period ended June 30, 2008. Should you have any questions about this report, or if you’d like to receive a prospectus and additional information, including fees and expenses for either of these or any of the other Funds in our family, please feel free to contact us at 1-800-835-3879, or visit our Web site at www.managersinvest.com. As always, please read the prospectus carefully before you invest or send money.
If you are curious about how you can better diversify your investment program, visit the Knowledge Center on our Web site and view our articles in the investment strategies section. You can rest assured that under all market conditions our team is focused on delivering excellent investment management services for your benefit.
We thank you for your continued confidence and investment in The Managers Funds.
|
| Sincerely, |
|
|
John H. Streur Senior Managing Partner Managers Investment Group LLC |
2
About Your Fund’s Expenses (unaudited)
As a shareholder of a Fund, you may incur two types of costs: (1) transaction costs, which may include sales charges (loads) on purchase payments; redemption fees; and exchange fees; and (2) ongoing costs, including management fees and other Fund expenses. This example is intended to help you understand your ongoing costs (in dollars) of investing in the Fund and to compare these costs with the ongoing costs of investing in other mutual funds. The example is based on an investment of $1,000 invested at the beginning of the period and held for the entire period as indicated below.
Actual Expenses
The first line of the table below provides information about the actual account values and actual expenses. You may use the information in this line, together with the amount you invested, to estimate the expenses that you paid over the period. Simply divide your account value by $1,000 (for example, an $8,600 account value divided by $1,000 = 8.6), then multiply the result by the number in the first line under the heading entitled “Expenses Paid During Period” to estimate the expenses you paid on your account during this period.
Hypothetical Example for Comparison Purposes
The second line of the table below provides information about hypothetical account values and hypothetical expenses based on the Fund’s actual expense ratio and an assumed annual rate of return of 5% before expenses, which is not the Fund’s actual return. The hypothetical account values and expenses may not be used to estimate the actual ending account balance or expenses you paid for the period. You may use this information to compare the ongoing costs of investing in the Fund and other funds by comparing this 5% hypothetical example with the 5% hypothetical examples that appear in the shareholder reports of other funds.
Please note that the expenses shown in the table are meant to highlight your on-going costs only and do not reflect any transactional costs, such as sales charges (loads), redemption fees, or exchange fees. Therefore, the second line of the table is useful in comparing ongoing costs only, and will not help you determine the relative total costs of owning different funds.
| | | | | | | | | | | | |
Six Months Ended June 30, 2008 | | Expense
Ratio for the
Period | | | Beginning
Account
Value
1/1/2008 | | Ending
Account
Value
6/30/2008 | | Expenses
Paid During
the Period* |
Short Duration Government Fund | | | | | | | | | | | | |
Based on Actual Fund Return | | 0.82 | % | | $ | 1,000 | | $ | 1,011 | | $ | 4.10 |
Based on Hypothetical 5% Annual Return | | 0.82 | % | | $ | 1,000 | | $ | 1,021 | | $ | 4.12 |
Intermediate Duration Government Fund | | | | | | | | | | | | |
Based on Actual Fund Return | | 0.89 | % | | $ | 1,000 | | $ | 1,000 | | $ | 4.43 |
Based on Hypothetical 5% Annual Return | | 0.89 | % | | $ | 1,000 | | $ | 1,020 | | $ | 4.47 |
| * | Expenses are equal to the Fund’s annualized expense ratio multiplied by the average account value over the period, multiplied by the number of days in the most recent fiscal half-year (182), then divided by 366. |
3
Fund Performance
All periods ended June 30, 2008 (unaudited)
| | | | | | | | | | | | | | |
| | | Average Annual Total Returns* |
| | | Six
Months | | | One
Year | | | Five
Years | | | Ten
Years | | | Inception
Date |
Short Duration Government Fund | | 1.10 | % | | 3.61 | % | | 3.27 | % | | 4.06 | % | | 3/31/1992 |
Merrill Lynch Six-Month T-Bill Index | | 1.62 | % | | 4.62 | % | | 3.38 | % | | 3.88 | % | | |
Intermediate Duration Government Fund | | 0.03 | % | | 5.66 | % | | 3.59 | % | | 5.04 | % | | 3/31/1992 |
Citigroup Mortgage Index | | 1.86 | % | | 8.05 | % | | 4.60 | % | | 5.80 | % | | |
| * | Performance based on published NAV as of 6/30/08. |
The performance data shown represents past performance. Past performance is not a guarantee of future results. Current performance may be lower or higher than the performance data quoted. The investment return and principal value of an investment in the Fund will fluctuate so that an investor’s shares, when redeemed, may be worth more or less than their original cost. For performance information through the most recent month end, please call 800.835.3879 or visit our Web site at www.managersinvest.com.
Total return equals income yield plus share price change and assumes reinvestment of all dividends and capital gain distributions. Returns are net of fees and may reflect offsets of Fund expenses as described in the Prospectus. No adjustment has been made for taxes payable by shareholders on their reinvested dividends and capital gain distributions. Returns for periods greater than one year are annualized. The listed returns on the Fund are net of expenses. All returns are in U.S. dollars($). Changing interest rates may adversely affect the value of an investment. An increase in interest rates typically causes the value of bonds and other fixed-income securities to fall.
Fixed-income funds are subject to the risks associated with investments in debt securities, such as default risk, fluctuations in the debtor’s perceived ability to pay its creditors, and changing interest rate risk. An increase in interest rates typically causes the value of bonds and other fixed-income securities to fall.
The Funds’ may use derivative instruments for hedging purposes or as part of its investment strategy. There is also a risk that a derivative intended as a hedge may not perform as expected. The main risk with derivatives is that some types can amplify a gain or loss, potentially earning or losing substantially more money than the actual cost of the derivative or that the counterparty may fail to honor its contract terms, causing a loss for the Fund. Use of these instruments may involve certain costs and risks such as liquidity risk, interest rate risk, market risk, credit risk, management risk and the risk that a fund could not close out a position when it would be most advantageous to do so.
Many bonds have call provisions which allow the debtors to pay them back before maturity. This is especially true with mortgage securities, which can be paid back anytime. Typically debtors prepay their debt when it is to their advantage (when interest rates drop making a new loan at current rates more attractive), and thus likely to the disadvantage of bondholders, who may have to reinvest prepayment proceeds in securities with lower yields. Prepayment risk will vary depending on the provisions of the security and current interest rates relative to the interest rate of the debt.
Investors should carefully consider the amount they plan to invest, their investment objectives, the Fund’s investment objectives, risks, charges and expenses before investing. For this and other information, please call 800.835.3879 or visit www.managersinvest. com for a free prospectus. Read it carefully before investing or sending money. Distributed by Managers Distributors, Inc., member FINRA.
The Merrill Lynch Six-Month T-Bill Index is an unmanaged index that measures returns of six-month Treasury Bills. Unlike the Short Duration Government Fund, the Merrill Lynch Six-Month T-Bill Index is unmanaged, is not available for investment, and does not incur expenses.
The Citigroup Mortgage Index includes all outstanding government sponsored fixed-rate mortgage-backed securities, weighted in proportion to their current market capitalization. The Index reflects no deductions for fees, expenses, or taxes. Unlike the Intermediate Duration Government Fund, the Citigroup Mortgage Index is unmanaged, is not available for investment, and does not incur expenses.
Not FDIC insured, nor bank guaranteed. May lose value.
4
Managers Short Duration Government Fund
Fund Snapshots
June 30, 2008 (unaudited)
Portfolio Breakdown
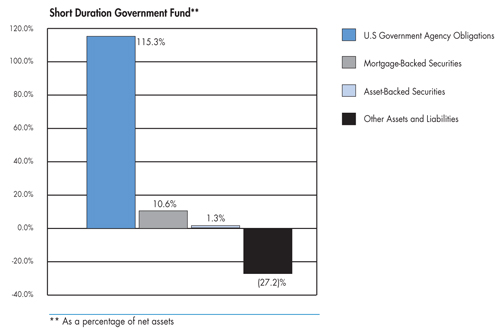
| | | |
Portfolio Breakdown | | Short Duration
Government Fund** | |
U.S Government Agency Obligations | | 115.3 | % |
Mortgage-Backed Securities | | 10.6 | % |
Asset-Backed Securities | | 1.3 | % |
Other Assets and Liabilities | | (27.2 | )% |
Top Ten Holdings
| | | |
Top Ten Holdings | | Percentage
of Net
Assets | |
FNMA, 6.000%, TBA | | 9.2 | % |
FNMA, 5.500%, TBA | | 8.1 | |
FHLMC Gold Pool, 6.000%, TBA | | 5.7 | |
FHLMC, 5.934%, 02/01/37* | | 4.9 | |
FHLMC Gold Pool, 6.000%, 03/01/23 | | 4.4 | |
FNMA, 5.000%, TBA | | 3.4 | |
FHLMC Gold Pool, 2.721%, 06/15/35* | | 3.1 | |
GMAC Commercial Mortgage Securities, Inc., Series 2000-C1, Class A2, 7.724%, 03/15/33* | | 3.1 | |
FNMA, 6.000%, TBA | | 2.6 | |
FNMA Whole Loan, Series 2005-W2, Class A1, 2.683%, 05/25/35* | | 2.4 | |
| | | |
Top Ten as a Group | | 46.9 | % |
| | | |
| * | Top Ten Holding at December 31, 2007 |
Any sectors, industries, or securities discussed should not be perceived as investment recommendations. Mention of a specific security should not be considered a recommendation to buy or solicitation to sell that security.
5
Managers Short Duration Government Fund
Schedule of Portfolio Investments
June 30, 2008 (unaudited)
| | | | | | |
Security Description | | Principal
Amount | | Value |
U.S. Government and Agency Obligations - 115.3%1 | | | | | | |
Federal Home Loan Mortgage Corporation - 44.5% | | | | | | |
FHLMC, 3.808%, 05/01/34, (06/01/09) 2,7 | | $ | 497,121 | | $ | 497,448 |
FHLMC, 3.964%, 10/01/33, (10/01/08) 2,7 | | | 3,892,486 | | | 3,930,211 |
FHLMC, 4.184%, 07/01/34, (02/01/09) 2,7 | | | 833,727 | | | 837,260 |
FHLMC, 4.677%, 03/01/38, (04/01/13) 2 | | | 1,990,162 | | | 1,966,952 |
FHLMC, 4.898%, 12/01/35, (10/01/10) 2 | | | 1,888,252 | | | 1,906,306 |
FHLMC, 5.934%, 02/01/37, (02/01/12) 2,7 | | | 11,290,092 | | | 11,500,278 |
FHLMC Gold Pool, 2.721%, 06/15/35, (07/15/08) 2,7 | | | 7,480,845 | | | 7,352,305 |
FHLMC Gold Pool, 3.750%, 11/15/25 7 | | | 4,096,023 | | | 4,086,346 |
FHLMC Gold Pool, 4.000%, 09/15/15 to 12/01/20 7 | | | 5,322,447 | | | 5,072,675 |
FHLMC Gold Pool, 5.000%, 05/01/18 to 06/15/27 7 | | | 13,748,103 | | | 13,824,912 |
FHLMC Gold Pool, 5.500%, 11/01/17 to 09/01/19 7 | | | 2,076,569 | | | 2,103,987 |
FHLMC Gold Pool, 6.000%, 09/01/17 to 09/01/37 7 | | | 31,028,252 | | | 31,779,953 |
FHLMC Gold Pool, 6.000%, TBA | | | 13,000,000 | | | 13,304,694 |
FHLMC Gold Pool, 6.500%, TBA | | | 3,000,000 | | | 3,091,875 |
FHLMC Gold Pool, 7.500%, 04/01/15 to 03/01/33 | | | 1,798,829 | | | 1,923,142 |
FHLMC Gold Pool, 8.500%, 12/01/25 7 | | | 90,885 | | | 100,478 |
FHLMC Structured Pass Through Securities, Series T-58, Class 1A3, 4.391%, 11/25/38 | | | 125,214 | | | 125,034 |
FHLMC Structured Pass Through Securities, Series T-42, Class A5, 7.500%, 02/25/42 | | | 146,232 | | | 156,240 |
FHLMC Structured Pass Through Securities, Series T-51, Class 2A, 7.500%, 08/25/42 9 | | | 239,536 | | | 253,160 |
Total Federal Home Loan Mortgage Corporation | | | | | | 103,813,256 |
Federal National Mortgage Association - 59.7% | | | | | | |
FNMA, 2.803%, 11/25/30, (07/25/08) 2,7 | | | 3,044,497 | | | 2,997,235 |
FNMA, 2.882%, 03/25/35, (07/25/08) 2,7 | | | 3,279,759 | | | 3,132,835 |
FNMA, 3.779%, 06/01/34, (06/01/09) 2 | | | 3,100,974 | | | 3,106,757 |
FNMA, 4.277%, 06/01/34, (04/01/09) 2,7 | | | 3,817,500 | | | 3,852,292 |
FNMA, 4.396%, 08/01/34, (02/01/09) 2 | | | 1,479,704 | | | 1,482,215 |
FNMA, 4.425%, 08/01/34, (04/01/09) 2 | | | 1,920,881 | | | 1,935,556 |
FNMA, 5.000%, 07/01/18 to 03/25/24 7 | | | 3,396,244 | | | 3,398,840 |
FNMA, 5.000%, TBA | | | 8,000,000 | | | 7,910,000 |
FNMA, 5.310%, 06/01/37, (05/01/10) 2 | | | 1,769,056 | | | 1,796,726 |
FNMA, 5.341%, 08/01/36, (05/01/11) 2 | | | 1,371,311 | | | 1,397,556 |
FNMA, 5.356%, 02/01/37, (12/01/09) 2 | | | 2,306,307 | | | 2,349,945 |
FNMA, 5.485%, 05/01/36, (05/01/11) 2 | | | 842,917 | | | 857,347 |
FNMA, 5.500%, 11/01/18 to 01/01/21 7 | | | 3,087,908 | | | 3,114,623 |
FNMA, 5.500%, TBA | | | 18,750,000 | | | 18,873,038 |
FNMA, 5.631%, 10/01/36, (04/01/11) 2 | | | 3,502,806 | | | 3,567,408 |
FNMA, 5.730%, 11/01/08 | | | 259,789 | | | 259,170 |
FNMA, 5.771%, 01/01/37, (01/01/12) 2,7 | | | 4,247,988 | | | 4,344,736 |
FNMA, 5.889%, 09/01/37, (08/01/12) 2 | | | 1,860,447 | | | 1,893,262 |
FNMA, 5.892%, 09/01/37, (09/01/12) 2 | | | 1,947,075 | | | 1,979,529 |
FNMA, 6.000%, 03/01/17 to 09/01/22 7 | | | 6,227,286 | | | 6,392,214 |
FNMA, 6.000%, TBA | | | 27,000,000 | | | 27,577,500 |
The accompanying notes are an integral part of these financial statements.
6
Managers Short Duration Government Fund
Schedule of Portfolio Investments (continued)
| | | | | | |
Security Description | | Principal
Amount | | Value |
Federal National Mortgage Association - 59.7% (continued) | | | | | | |
FNMA, 6.010%, 12/01/08 7 | | $ | 4,242,864 | | $ | 4,232,702 |
FNMA, 6.032%, 11/01/37, (10/01/12) 2 | | | 2,784,249 | | | 2,838,628 |
FNMA, 6.040%, 10/01/08 7 | | | 1,090,498 | | | 1,087,949 |
FNMA, 6.500%, 04/01/17 7 | | | 840,994 | | | 877,332 |
FNMA, 6.500%, TBA | | | 5,000,000 | | | 5,146,875 |
FNMA, 6.516%, 01/01/33, (12/01/08) 2 | | | 126,128 | | | 127,486 |
FNMA, 6.740%, 06/01/09 | | | 887,557 | | | 904,348 |
FNMA, 6.831%, 09/01/33, (09/01/08) 2,7 | | | 784,945 | | | 787,546 |
FNMA, 7.000%, 09/01/14 | | | 1,389,045 | | | 1,457,436 |
FNMA, 7.500%, 08/01/33 to 09/01/33 | | | 312,134 | | | 329,687 |
FNMA, Series 2008-22, Class KA, 5.500%, 06/25/21 | | | 1,030,457 | | | 1,041,100 |
FNMA, Series 2002-33, Class A2, 7.500%, 06/25/32 | | | 146,683 | | | 157,035 |
FNMA Grantor Trust, Series 2002-T5, Class A1, 2.723%, 05/25/32, (07/25/08) 2 | | | 686,259 | | | 624,454 |
FNMA Grantor Trust Pass Through, Series 2004-T1, Class 1A2, 6.500%, 01/25/44 | | | 940,361 | | | 980,230 |
FNMA Whole Loan, Series 2005-W2, Class A1, 2.683%, 05/25/35, (07/25/08) 2,7 | | | 5,973,326 | | | 5,644,819 |
FNMA Whole Loan, Series 2003-W8, Class 3F1, 2.882%, 05/25/42, (07/25/08) 2,7 | | | 2,336,178 | | | 2,270,329 |
FNMA Whole Loan, Series 2004-W14, Class 1AF, 2.882%, 07/25/44, (07/25/08) 2,7 | | | 4,730,439 | | | 4,735,054 |
FNMA Whole Loan, Series 2004-W5, Class F1, 2.933%, 02/25/47, (07/25/08) 2 | | | 1,152,819 | | | 1,151,227 |
FNMA Whole Loan, Series 2002-W1, Class 2A, 7.500%, 02/25/42 7,9 | | | 703,416 | | | 739,604 |
FNMA Whole Loan, Series 2002-W6, Class 2A, 7.500%, 06/25/42 | | | 604,335 | | | 645,717 |
FNMA Whole Loan, Series 2003-W4, Class 4A, 7.500%, 10/25/42 7 | | | 1,219,165 | | | 1,281,501 |
FNMA Whole Loan, Series 2003-W1, Class 2A, 7.500%, 12/25/42 | | | 38,609 | | | 40,051 |
Total Federal National Mortgage Association | | | | | | 139,319,894 |
Government National Mortgage Association - 8.9% | | | | | | |
GNMA, 3.625%, 03/20/37, (04/01/09) 2 | | | 1,072,986 | | | 1,045,515 |
GNMA, 4.750%, 01/20/32, (04/01/09) 2 | | | 207,476 | | | 207,749 |
GNMA, 4.750%, 10/20/34, (01/01/09) 2 | | | 629,398 | | | 630,633 |
GNMA, 5.000%, 10/20/32, (01/01/09) 2 | | | 436,853 | | | 438,243 |
GNMA, 5.000%, 03/20/35, (04/01/09) 2 | | | 160,399 | | | 160,268 |
GNMA, 5.125%, 11/20/17 to 11/20/27, (01/01/09) 2,7 | | | 2,155,217 | | | 2,166,092 |
GNMA, 5.250%, 01/20/28, (04/01/09) 2 | | | 103,084 | | | 103,474 |
GNMA, 5.375%, 03/20/21 to 03/20/23, (04/01/09) 2 | | | 194,672 | | | 195,656 |
GNMA, 5.500%, 01/20/34, (04/01/09) 2 | | | 969,649 | | | 973,212 |
GNMA, 5.500%, 07/20/35 to 09/20/35, (10/01/08) 2,7 | | | 6,002,369 | | | 6,029,227 |
GNMA, 5.625%, 07/20/18 to 09/20/35, (10/01/08) 2 | | | 6,494,010 | | | 6,559,347 |
GNMA, 6.000%, 06/20/35, (07/01/09) 2 | | | 206,059 | | | 209,487 |
GNMA, 6.375%, 06/20/22 to 05/20/33, (07/01/09) 2,7 | | | 1,260,733 | | | 1,283,032 |
GNMA, 6.375%, 05/20/27, (01/01/09) 2,7 | | | 723,866 | | | 737,346 |
GNMA, 9.500%, 07/15/09 to 12/15/17 | | | 19,376 | | | 21,051 |
GNMA, Series 2001-65, Class PG, 6.000%, 07/20/28 7 | | | 19,104 | | | 19,077 |
Total Government National Mortgage Association | | | | | | 20,779,409 |
Interest Only Strips - 1.6% | | | | | | |
FHLMC IO Strip, 4.500%, 08/15/35 to 09/15/35 | | | 903,456 | | | 217,510 |
The accompanying notes are an integral part of these financial statements.
7
Managers Short Duration Government Fund
Schedule of Portfolio Investments (continued)
| | | | | | |
Security Description | | Principal
Amount | | Value |
Interest Only Strips - 1.6% (continued) | | | | | | |
FHLMC IO Strip, 4.629%, 11/15/30, (07/15/08) 2,10 | | $ | 324,781 | | $ | 23,553 |
FHLMC IO Strip, 5.000%, 05/15/18 to 08/01/35 | | | 6,996,747 | | | 1,633,785 |
FHLMC IO Strip, 7.500%, 10/01/27 | | | 58,896 | | | 16,612 |
FHLMC IO Strip, 8.000%, 06/01/31 | | | 13,613 | | | 2,852 |
FNMA IO Strip, 4.750%, 01/25/24, (07/25/08) 2 | | | 114,660 | | | 10,946 |
FNMA IO Strip, 5.000%, 03/01/35 to 04/01/36 | | | 7,382,400 | | | 1,857,028 |
FNMA IO Strip, 7.500%, 11/18/14 | | | 103,044 | | | 8,318 |
FNMA IO Strip, 8.000%, 08/25/22 to 05/01/30 | | | 224,960 | | | 52,411 |
FNMA IO Strip, 9.000%, 12/15/16 | | | 53,097 | | | 10,852 |
Total Interest Only Strips | | | | | | 3,833,867 |
U.S. Treasury Notes - 0.6% | | | | | | |
U.S. Treasury Inflation Linked Notes, 2.375%, 04/15/11 | | | 1,261,717 | | | 1,336,927 |
Total U.S. Government and Agency Obligations
(cost $268,736,657) | | | | | | 269,083,353 |
Mortgage-Backed Securities and Interest Only Strips - 10.6%1 | | | | | | |
Mortgage-Backed Securities - 10.5% | | | | | | |
Countrywide Home Loans, Inc., 2.982%, 02/25/35, (07/25/08) 2,7,10 | | | 1,664,438 | | | 1,094,478 |
Deutsche Alt-A Securities, Inc. Mortgage Loan, 6.250%, 07/25/36 9,10 | | | 549,524 | | | 506,195 |
GE Capital Commercial Mortgage Corporation, 6.496%, 01/15/33 | | | 502,122 | | | 514,601 |
GMAC Commercial Mortgage Securities, Inc., Series 2000-C1, Class A2, 7.724%, 03/15/33 7,9 | | | 7,028,735 | | | 7,260,864 |
GMAC Commercial Mortgage Securities, Inc., Series 2000-C3, Class A2, 6.957%, 09/15/35 | | | 1,563,233 | | | 1,615,568 |
Greenwich Capital Commercial Funding Corp., Class A2, Series 2005-GG3, 4.305%, 08/10/42 | | | 1,754,000 | | | 1,741,399 |
Harborview Mortgage Loan Trust, 2.893%, 11/19/34, (07/21/08) 2,10 | | | 1,524,862 | | | 1,177,369 |
Lehman Brothers Mortgage Trust, 6.000%, 08/25/21 10 | | | 2,305,654 | | | 2,132,730 |
Merrill Lynch Mortgage Investors, Inc., 7.560%, 11/15/31 | | | 2,160,077 | | | 2,210,836 |
PNC Mortgage Acceptance, 7.300%, 10/12/33 9 | | | 2,124,605 | | | 2,196,987 |
Salomon Brothers Mortgage, 7.455%, 07/18/33 | | | 291,903 | | | 300,948 |
Structured Adjustable Rate Mortgage Loan Trust, Series 2007-7, Class 2AS2, 5.717%, 08/25/47 9 | | | 2,455,096 | | | 2,103,759 |
Structured Adjustable Rate Mortgage Loan Trust, Series 2007-9, Class 2A1, 5.996%, 10/25/47 2 | | | 1,098,414 | | | 875,029 |
Washington Mutual, Class 2A3, Series 2005-AR2, 2.833%, 01/25/45, (07/25/08) 2,10 | | | 1,016,123 | | | 716,995 |
Total Mortgage-Backed Securities | | | | | | 24,447,758 |
Mortgage-Backed Interest Only Strips - 0.1% | | | | | | |
Bank of America-First Union IO Strip, Series 2001-3, Class XC, 0.502%, 04/11/37 3,9 | | | 4,873,552 | | | 179,901 |
CS First Boston Mortgage IO Strip, 1.515%, 12/15/35 3,9 | | | 1,406,168 | | | 44,431 |
CS First Boston Mortgage Securities Corp. IO Strip, Series 1998-C1, Class AX, 1.196%, 05/17/40 9 | | | 853,798 | | | 36,964 |
GMAC, Series 1999-C1 IO Strip, Class X, 0.770%, 05/15/33 9 | | | 7,487,960 | | | 70,159 |
Total Mortgage-Backed Interest Only Strips | | | | | | 331,455 |
Total Mortgage-Backed Securities and Interest Only Strips
(cost $28,383,965) | | | | | | 24,779,213 |
Asset-Backed Securities - 1.3%1 | | | | | | |
First Franklin Mortgage Loan Asset Backed Certificates, Series 2005-FF10, Class A4, 2.803%, 11/25/35, (07/25/08) 2 | | | 1,800,000 | | | 1,645,548 |
FNMA Grantor Trust, Series 2003-T4, Class A1, 2.592%, 09/26/33, (07/28/08) 2 | | | 20,466 | | | 19,251 |
FNMA Grantor Trust, Series 2004-T10, Class 1AV1, 2.643%, 06/25/35, (07/25/08) 2,7 | | | 254,891 | | | 248,338 |
FNMA Grantor Trust, Series 2003-T2, Class A1, 2.763%, 03/25/33, (07/25/08) 2 | | | 394,826 | | | 380,100 |
The accompanying notes are an integral part of these financial statements.
8
Managers Short Duration Government Fund
Schedule of Portfolio Investments (continued)
| | | | | | | |
Security Description | | Principal
Amount | | Value | |
Asset-Backed Securities - 1.3% (continued) | | | | | | | |
FNMA Whole Loan, Series 2003-W13, Class AV2, 2.763%, 10/25/33, (07/25/08) 2 | | $ | 187,613 | | $ | 176,141 | |
FNMA Whole Loan, Series 2001-W2, Class AS5, 6.473%, 10/25/31 8 | | | 161,878 | | | 156,221 | |
Structured Asset Investment Loan Trust, 3.022%, 12/25/34, (07/25/08) 2,7 | | | 585,866 | | | 534,801 | |
Total Asset-Backed Securities
(cost $3,407,531) | | | | | | 3,160,400 | |
Short-Term Investments - 4.5% | | | | | | | |
U.S. Government and Agency Discount Notes - 0.3%5,6 | | | | | | | |
FHLMC Discount Notes, 2.219%, 08/18/08 | | | 50,000 | | | 49,851 | |
FHLMC Discount Notes, 2.516%, 11/03/08 | | | 156,000 | | | 154,657 | |
FNMA Discount Notes, 2.212%, 08/13/08 | | | 19,000 | | | 18,949 | |
FNMA Discount Notes, 2.356%, 09/24/08 | | | 100,000 | | | 99,448 | |
FNMA Discount Notes, 2.437%, 12/03/08 | | | 75,000 | | | 74,227 | |
FNMA Discount Notes, 2.450%, 10/15/08 | | | 150,000 | | | 148,931 | |
FNMA Discount Notes, 2.557%, 12/04/08 to 12/10/08 | | | 150,000 | | | 148,337 | |
Total U.S. Government and Agency Discount Notes | | | | | | 694,400 | |
| | |
| | | Shares | | | |
Other Investment Companies - 4.2%4,7 | | | | | | | |
Dreyfus Cash Management Fund, Institutional Class Shares, 2.66% | | | 6,404,734 | | | 6,404,734 | |
JPMorgan Money Market Fund, Institutional Class Shares, 2.68% | | | 3,439,355 | | | 3,439,355 | |
Total Other Investment Companies | | | | | | 9,844,089 | |
Total Short-Term Investments
(cost $10,538,902) | | | | | | 10,538,489 | |
Total Investments - 131.7%
(cost $311,067,055) | | | | | | 307,561,455 | |
Other Assets, less Liabilities - (31.7)% | | | | | | (74,048,545 | ) |
Net Assets - 100.0% | | | | | $ | 233,512,910 | |
The accompanying notes are an integral part of these financial statements.
9
Managers Intermediate Duration Government Fund
Fund Snapshots
June 30, 2008 (unaudited)
Portfolio Breakdown
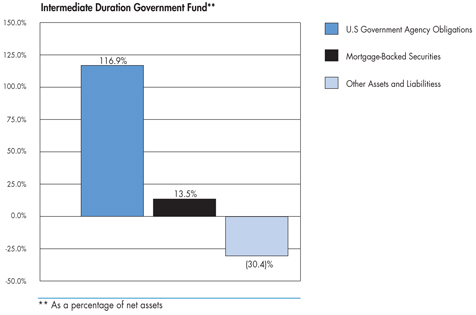
| | | |
Portfolio Breakdown | | Intermediate Duration
Government Fund** | |
U.S. Government Agency Obligations | | 116.9 | % |
Mortgage-Backed Securities | | 13.5 | % |
Other Assets and Liabilities | | (30.4 | )% |
Top Ten Holdings
| | | |
Top Ten Holdings | | Percentage
of Net Assets | |
FNMA, 6.000%, TBA | | 11.0 | % |
FHLMC Gold Pool, 5.500%, TBA | | 8.9 | |
FNMA, 6.500%, TBA | | 6.3 | |
FNMA, 5.000%, 10/01/35 | | 6.0 | |
FHLMC Gold Pool, 5.500%, 02/01/35* | | 5.3 | |
FHLMC Gold Pool, 5.623%, 01/01/36* | | 4.9 | |
FHLMC Gold Pool, 5.500%, 06/01/35 | | 4.7 | |
FNMA, 5.500%, 07/17/18 | | 3.7 | |
FHLMC Gold Pool, 5.500%, 01/01/35* | | 3.6 | |
FHLMC Gold Pool, 6.000%, 10/01/21* | | 3.5 | |
| | | |
Top Ten as a Group | | 57.9 | % |
| | | |
| * | Top Ten Holding at December 31, 2007 |
Any sectors, industries, or securities discussed should not be perceived as investment recommendations. Mention of a specific security should not be considered a recommendation to buy or solicitation to sell that security.
10
Managers Intermediate Duration Government Fund
Schedule of Portfolio Investments
June 30, 2008 (unaudited)
| | | | | | |
Security Description | | Principal
Amount | | Value |
U.S. Government and Agency Obligations - 116.9%1 | | | | | | |
Federal Home Loan Mortgage Corporation - 60.7% | | | | | | |
FHLMC, 4.150%, 11/01/33, (12/01/08) 2 | | $ | 2,823,808 | | $ | 2,851,137 |
FHLMC, 4.500%, 04/01/35 | | | 714,671 | | | 665,105 |
FHLMC, 5.934%, 02/01/37, (02/01/12) 2 | | | 945,343 | | | 962,942 |
FHLMC Gold Pool, 3.750%, 11/15/25 | | | 3,271,634 | | | 3,263,904 |
FHLMC Gold Pool, 4.000%, 12/01/20 | | | 898,370 | | | 845,703 |
FHLMC Gold Pool, 4.500%, 05/01/34 to 01/01/36 7 | | | 18,441,574 | | | 17,128,266 |
FHLMC Gold Pool, 5.000%, 05/01/18 to 12/01/35 | | | 9,792,824 | | | 9,497,922 |
FHLMC Gold Pool, 5.000%, TBA | | | 3,000,000 | | | 2,874,375 |
FHLMC Gold Pool, 5.500%, 01/01/18 to 06/01/35 7 | | | 35,841,261 | | | 35,490,249 |
FHLMC Gold Pool, 5.500%, TBA | | | 17,000,000 | | | 16,745,000 |
FHLMC Gold Pool, 5.623%, 01/01/36, (01/01/13) 2,7 | | | 9,229,720 | | | 9,322,174 |
FHLMC Gold Pool, 6.000%, 09/01/17 to 05/01/22 | | | 12,982,091 | | | 13,303,870 |
FHLMC Gold Pool, 6.500%, TBA | | | 1,000,000 | | | 1,030,625 |
FHLMC Gold Pool, 7.500%, 01/01/31 | | | 92,069 | | | 99,633 |
FHLMC Structured Pass Through Securities, Series T-51, Class 2A, 7.500%, 08/25/42 9 | | | 335,351 | | | 354,424 |
Total Federal Home Loan Mortgage Corporation | | | | | | 114,435,329 |
Federal National Mortgage Association - 52.0% | | | | | | |
FNMA, 2.803%, 11/25/30, (07/25/08) 2,7 | | | 3,044,497 | | | 2,997,235 |
FNMA, 2.882%, 03/25/35, (07/25/08) 2,7 | | | 2,037,675 | | | 1,946,393 |
FNMA, 3.779%, 06/01/34, (06/01/09) 2 | | | 2,513,983 | | | 2,518,671 |
FNMA, 4.250%, 07/01/33, (12/01/08) 2 | | | 892,377 | | | 907,505 |
FNMA, 4.277%, 06/01/34, (04/01/09) 2 | | | 3,042,819 | | | 3,070,551 |
FNMA, 4.425%, 08/01/34, (04/01/09) 2 | | | 1,536,704 | | | 1,548,445 |
FNMA, 4.500%, TBA | | | 5,000,000 | | | 4,632,810 |
FNMA, 5.000%, 06/01/18 to 10/01/35 7 | | | 16,267,804 | | | 15,819,174 |
FNMA, 5.000%, TBA | | | 1,000,000 | | | 988,750 |
FNMA, 5.310%, 06/01/37, (05/01/10) 2 | | | 1,405,975 | | | 1,427,966 |
FNMA, 5.500%, 03/01/17 to 12/01/37 7 | | | 13,918,714 | | | 13,933,498 |
FNMA, 5.500%, TBA | | | 11,200,000 | | | 11,185,559 |
FNMA, 5.544%, 02/01/36, (01/01/11) 2 | | | 384,205 | | | 390,379 |
FNMA, 6.000%, 08/01/17 | | | 439,527 | | | 452,081 |
FNMA, 6.000%, TBA | | | 20,500,000 | | | 20,679,375 |
FNMA, 6.500%, 11/01/28 to 07/01/32 | | | 640,667 | | | 661,353 |
FNMA, 6.500%, TBA | | | 11,500,000 | | | 11,837,812 |
FNMA, Series 1994-55, Class H, 7.000%, 03/25/24 7 | | | 2,750,000 | | | 2,904,497 |
FNMA Whole Loan, Series 2003-W4, Class 4A, 7.500%, 10/25/42 | | | 203,194 | | | 213,584 |
Total Federal National Mortgage Association | | | | | | 98,115,638 |
Government National Mortgage Association - 0.4% | | | | | | |
GNMA, 5.125%, 11/20/17 to 12/20/17, (01/01/09) 2 | | | 331,889 | | | 334,347 |
GNMA, 5.375%, 03/20/16, (04/01/09) 2 | | | 35,785 | | | 36,074 |
GNMA, 5.625%, 08/20/17 to 08/20/18, (10/01/08) 2 | | | 166,780 | | | 168,862 |
The accompanying notes are an integral part of these financial statements.
11
Managers Intermediate Duration Government Fund
Schedule of Portfolio Investments (continued)
| | | | | | |
Security Description | | Principal
Amount | | Value |
Government National Mortgage Association - 0.4% (continued) | | | | | | |
GNMA, 6.375%, 06/20/16 to 05/20/21, (07/01/09) 2 | | $ | 91,568 | | $ | 93,374 |
GNMA, 7.500%, 09/15/28 to 11/15/31 | | | 114,948 | | | 123,729 |
Total Government National Mortgage Association | | | | | | 756,386 |
Interest and Principal Only Strips - 3.2% | | | | | | |
FHLMC IO Strip, 4.229%, 11/15/18, (07/15/08) 2,10 | | | 702,103 | | | 46,389 |
FHLMC IO Strip, 4.500%, 04/15/22 to 09/15/35 | | | 1,729,887 | | | 404,457 |
FHLMC IO Strip, 4.629%, 11/15/30, (07/15/08) 2,10 | | | 263,789 | | | 19,130 |
FHLMC IO Strip, 5.000%, 05/15/17 to 09/15/35 7 | | | 9,745,938 | | | 2,339,606 |
FHLMC IO Strip, 5.179%, 09/15/16 to 10/15/16, (07/15/08) 2,10 | | | 525,220 | | | 32,818 |
FHLMC IO Strip, 5.429%, 06/15/31, (07/15/08) 2 | | | 95,840 | | | 12,534 |
FHLMC IO Strip, 6.000%, 05/01/31 | | | 11,502 | | | 2,951 |
FNMA IO Strip, 4.000%, 09/01/18 to 11/01/18 | | | 1,506,444 | | | 185,436 |
FNMA IO Strip, 4.500%, 02/25/22 to 10/01/33 | | | 512,229 | | | 105,878 |
FNMA IO Strip, 5.000%, 09/01/33 to 04/01/36 | | | 9,857,055 | | | 2,472,809 |
FNMA IO Strip, 7.000%, 04/01/23 to 06/01/23 | | | 400,178 | | | 88,362 |
FNMA PO Strip, 5.482%, 07/01/33 5 | | | 479,471 | | | 343,010 |
Total Interest and Principal Only Strips | | | | | | 6,053,380 |
U.S. Treasury Notes - 0.6% | | | | | | |
U.S. Treasury Inflation Linked Note, 2.375%, 04/15/11 | | | 1,126,456 | | | 1,193,603 |
Total U.S. Government and Agency Obligations
(cost $29,598,548) | | | | | | 220,554,336 |
Mortgage-Backed Securities - 13.5%1 | | | | | | |
American Home Loan Investment Trust, 5.294%, 06/25/45, (08/01/08) 2,10 | | | 2,405,931 | | | 2,023,675 |
American Home Mortgage Assets, Series 2005-1, Class 1A1, 7.312%, 11/25/35 9 | | | 206,877 | | | 173,708 |
American Home Mortgage Investment Trust, 3.280%, 04/25/44, (08/01/08) 2,10 | | | 248,681 | | | 226,446 |
American Home Mortgage Investment Trust, 4.390%, 02/25/45, (08/01/08) 2,10 | | | 1,182,024 | | | 1,056,078 |
American Home Mortgage Investment Trust, 4.809%, 06/25/45, (08/01/08) 2,10 | | | 175,790 | | | 156,141 |
Bank of America Funding Corp., 6.612%, 12/20/34 9 | | | 315,791 | | | 255,471 |
Bear Stearns Alt-A Trust, 6.514%, 04/25/35 2,10 | | | 253,386 | | | 218,124 |
Citigroup Mortgage Loan Trust, Series 2007-AR5, Class 1A2A, 5.610%, 04/25/37 9 | | | 1,654,396 | | | 1,353,070 |
Countrywide Alternative Loan Trust, 2.783%, 05/25/35, (07/25/08) 2,10 | | | 1,273,568 | | | 1,094,167 |
Countrywide Alternative Loan Trust, 6.000%, 06/25/34 | | | 682,631 | | | 606,689 |
Countrywide Alternative Loan Trust, Series 2007-25, Class 2A1, 6.000%, 11/25/22 10 | | | 893,618 | | | 781,916 |
Countrywide Home Loan Mortgage Pass Through Trust, Series 2007-HYB2, Class 3A1, 5.454%, 02/25/47 9,10 | | | 442,286 | | | 328,002 |
Countrywide Home Loans, Inc., 6.424%, 05/20/35 9,10 | | | 216,995 | | | 188,540 |
Countrywide Home Loans, Inc., Series 2004-R2, Class 1AF1, 2.902%, 11/25/34,
(07/25/08) 2,3 | | | 491,083 | | | 394,815 |
Countrywide Home Loans, Inc., Series 2005-HYB8, Class 1A1, 5.545%, 12/20/35 9,10 | | | 195,218 | | | 170,958 |
Deutsche Alt-A Securities, Inc., Series 2006-AR6, Class A6, 2.672%, 02/25/37,
(07/25/08) 2,10 | | | 1,795,447 | | | 1,236,729 |
GSMPS Mortgage Loan Trust, 2.833%, 03/25/35, (07/25/08) 2,3,10 | | | 394,036 | | | 360,873 |
GSR Mortgage Loan Trust, 3.940%, 05/25/34, (08/01/08) 2,10 | | | 99,734 | | | 87,824 |
Harborview Mortgage Loan Trust, 6.564%, 11/19/34 9 | | | 197,392 | | | 172,564 |
Master Alternative Loans Trust, 6.000%, 01/25/35 7,10 | | | 1,379,797 | | | 1,088,315 |
Merrill Lynch Mortgage Investors, Inc., 7.560%, 11/15/31 | | | 1,580,926 | | | 1,618,076 |
Morgan Stanley Mortgage Loan Trust, 6.066%, 08/25/35 9,10 | | | 1,780,664 | | | 1,618,178 |
The accompanying notes are an integral part of these financial statements.
12
Managers Intermediate Duration Government Fund
Schedule of Portfolio Investments (continued)
| | | | | | | |
Security Description | | Principal
Amount | | Value | |
Mortgage-Backed Securities - 13.5% (continued) | | | | | | | |
Morgan Stanley Mortgage Loan Trust, Series 2007-11AR, Class 2A5, 5.986%, 06/25/37 9,10 | | $ | 542,405 | | $ | 412,815 | |
Morgan Stanley Mortgage Loan Trust, Series 2007-14AR, Class 6A1, 6.470%, 11/25/37 9,10 | | | 1,518,031 | | | 1,413,560 | |
Structured Adjustable Rate Mortgage Loan Trust, Series 2007-7, Class 2AS2, 5.717%, 08/25/47 9 | | | 2,000,448 | | | 1,714,174 | |
Structured Adjustable Rate Mortgage Loan Trust, Series 2007-9, Class 2A1, 5.996%, 10/25/479 | | | 1,739,155 | | | 1,385,463 | |
Structured Asset Securities Corp., Series 2005-RF1, Class A, 2.833%, 03/25/35,
(07/25/08) 2,3,10 | | | 483,861 | | | 432,190 | |
Washington Mutual Mortgage Pass-Through Certificates, 6.000%, 10/25/35 | | | 2,457,051 | | | 2,183,704 | |
Wells Fargo Mortgage Backed Securities Trust, Series 2007-16, Class 1A1, 6.000%, 12/28/37 | | | 2,901,703 | | | 2,811,025 | |
Total Mortgage-Backed Securities
(cost $221,219,811) | | | | | | 25,563,290 | |
Short-Term Investments - 8.2% | | | | | | | |
U.S. Government and Agency Discount Notes - 0.1%5,6 | | | | | | | |
FHLMC Discount Notes, 2.516%, 11/03/08 | | | 178,000 | | | 176,467 | |
FNMA Discount Notes, 2.212%, 08/13/08 | | | 22,000 | | | 21,941 | |
Total U.S. Government and Agency Discount Notes | | | | | | 198,408 | |
| | |
| | | Shares | | | |
Other Investment Companies - 8.1%4,7 | | | | | | | |
Dreyfus Cash Management Fund, Institutional Class Shares, 2.66% | | | 6,989,822 | | | 6,989,822 | |
JPMorgan Money Market Fund, Institutional Class Shares, 2.68% | | | 8,204,247 | | | 8,204,247 | |
Total Other Investment Companies | | | | | | 15,194,069 | |
Total Short-Term Investments
(cost $15,392,730) | | | | | | 15,392,477 | |
Total Investments - 138.6%
(cost $266,211,089) | | | | | | 261,510,103 | |
Other Assets, less Liabilities - (38.6)% | | | | | | (72,813,648 | ) |
Net Assets - 100.0% | | | | | $ | 188,696,455 | |
The accompanying notes are an integral part of these financial statements.
13
Notes to Schedules of Portfolio Investments
The following footnotes and abbreviations are to be read in conjunction with the Schedules of Portfolio Investments previously presented in this report.
At June 30, 2008, the cost of securities for Federal income tax purposes and the gross aggregate unrealized appreciation and/or depreciation based on tax cost were approximately as follows:
| | | | | | | | | | | | |
Fund | | Cost | | Appreciation | | Depreciation | | | Net | |
Short Duration | | $ | 311,071,153 | | $ | 1,708,923 | | ($5,218,621 | ) | | ($3,509,698 | ) |
Intermediate Duration | | | 266,223,450 | | | 1,564,761 | | (6,278,108 | ) | | (4,713,347 | ) |
1 | Mortgage-backed obligations and other assets are subject to principal paydowns as a result of prepayments or refinancing of the underlying mortgage instruments. As a result, the average life may be substantially less than the original maturity. The interest rate shown is the rate in effect at June 30, 2008. |
2 | Floating Rate Security. The rate listed is as of June 30, 2008. Date in parenthesis represents the security’s next coupon rate reset. |
3 | Security is exempt from registration under Rule 144A of the Securities Act of 1933, as amended. These securities may be resold in transactions exempt from registration, normally to qualified buyers. At June 30, 2008, the value of these securities amounted to the following: |
| | | | | | |
Fund | | Market Value | | % of Net Assets | |
Short Duration | | $ | 224,332 | | 0.1 | % |
Intermediate Duration | | | 1,187,878 | | 0.6 | % |
4 | Yield shown for an investment company represents the June 30, 2008, seven-day average yield, which refers to the sum of the previous seven days’ dividends paid, expressed as an annual percentage. |
5 | The rate listed indicates yield to maturity at June 30, 2008. |
6 | Security pledged to cover margin requirements for open futures positions at June 30, 2008. |
7 | All or part of this security has been segregated for delayed delivery transactions. |
8 | Step Bond. A debt instrument with either deferred interest payments or an interest rate that resets at specific times during its term. |
9 | Variable Rate Security. The rate listed is as of June 30, 2008 and is periodically reset subject to terms and conditions set forth in the debenture. |
10 | Illiquid security. A security not readily convertible into cash such as a stock, bond or commodity that is not actively traded and would be difficult to sell in a current sale. The Funds may not invest more than 15% of their net assets in illiquid securities. All securities are valued by an independent pricing agent. |
Investments Abbreviations:
| | |
| DLJ: | | Donaldson, Lufkin & Jenrette Securities Corp. |
| FHLMC: | | Federal Home Loan Mortgage Corp. |
| FNMA: | | Federal National Mortgage Association |
| GMAC: | | General Motors Acceptance Corp. |
| GNMA: | | Government National Mortgage Association |
| GSMPS: | | Goldman Sachs Mortgage Participating Security |
| GSR: | | Goldman Sachs REMIC |
| IO: | | Interest Only |
| PO: | | Principal Only |
| TBA: | | To Be Announced |
| USTN: | | United States Treasury Note |
Security Ratings:
The composition of debt holdings as a percentage of portfolio assets is as follows:
| | | | | | | | | | | | | | | | | | |
S&P/Moody’s Ratings | | Gov’t/AAA | | | AA | | | A | | | BBB | | | BB | | | Not Rated | |
Short Duration | | 99.6 | % | | 0.0 | % | | 0.0 | % | | 0.0 | % | | 0.0 | % | | 0.4 | % |
Intermediate Duration | | 100.0 | % | | 0.0 | % | | 0.0 | % | | 0.0 | % | | 0.0 | % | | 0.0 | % |
14
Statements of Assets and Liabilities
June 30, 2008 (unaudited)
| | | | | | | | |
| | | Managers Short
Duration
Government Fund | | | Managers
Intermediate Duration
Government Fund | |
Assets: | | | | | | | | |
Investments at value* | | $ | 307,561,455 | | | $ | 261,510,103 | |
Receivable for investments sold | | | 38,814,250 | | | | 16,738,281 | |
Receivable for TBA sale commitments | | | 19,304,688 | | | | 3,029,063 | |
Receivable for Fund shares sold | | | 1,704,595 | | | | 542,569 | |
Dividends, interest and other receivables | | | 1,399,357 | | | | 1,557,588 | |
Receivable for variation margin on futures | | | 44,546 | | | | 18,686 | |
Prepaid expenses | | | 18,050 | | | | 2,406 | |
| | | | | | | | |
Total assets | | | 368,846,941 | | | | 283,398,696 | |
| | | | | | | | |
Liabilities: | | | | | | | | |
Payable for investments purchased | | | 100,275,995 | | | | 87,386,048 | |
Payable for Fund shares repurchased | | | 925,006 | | | | 4,126,382 | |
Payable for TBA sale commitments, at value (proceeds $33,860,031 and $3,029,063, respectively) | | | 33,841,742 | | | | 3,033,438 | |
Payable for variation margin on futures | | | 113,346 | | | | 9,000 | |
Investment advisory and management fee payable | | | 137,450 | | | | 101,440 | |
Other accrued expenses | | | 40,492 | | | | 45,933 | |
| | | | | | | | |
Total liabilities | | | 135,334,031 | | | | 94,702,241 | |
| | | | | | | | |
Net Assets | | $ | 233,512,910 | | | $ | 188,696,455 | |
| | | | | | | | |
Shares outstanding | | | 24,337,685 | | | | 18,050,892 | |
| | | | | | | | |
Net asset value, offering and redemption price per share | | $ | 9.59 | | | $ | 10.45 | |
| | | | | | | | |
Net Assets Represent: | | | | | | | | |
Paid-in capital | | $ | 240,364,841 | | | $ | 192,690,440 | |
Undistributed net investment income | | | 821,465 | | | | 62,471 | |
Accumulated net realized gain (loss) from investments, options, futures contracts and TBA sale commitments | | | (4,181,930 | ) | | | 358,335 | |
Net unrealized depreciation of investments, options, futures contracts and TBA sale commitments | | | (3,491,466 | ) | | | (4,414,791 | ) |
| | | | | | | | |
Net Assets | | $ | 233,512,910 | | | $ | 188,696,455 | |
| | | | | | | | |
* Investments at cost | | $ | 311,067,055 | | | $ | 266,211,089 | |
The accompanying notes are an integral part of these financial statements.
15
Statements of Operations
For the six months ended June 30, 2008 (unaudited)
| | | | | | | | |
| | | Managers Short
Duration
Government Fund | | | Managers
Intermediate Duration
Government Fund | |
Investment Income: | | | | | | | | |
Interest income | | $ | 5,128,271 | | | $ | 4,702,280 | |
Dividend income | | | 657,040 | | | | 357,835 | |
Securities lending fees | | | 6,913 | | | | 3,400 | |
| | | | | | | | |
Total investment income | | | 5,792,224 | | | | 5,063,515 | |
| | | | | | | | |
Expenses: | | | | | | | | |
Investment advisory and management fees | | | 852,057 | | | | 684,418 | |
Professional fees | | | 45,471 | | | | 33,086 | |
Custodian | | | 29,363 | | | | 21,628 | |
Transfer agent | | | 27,734 | | | | 123,094 | |
Registration fees | | | 22,417 | | | | 18,478 | |
Reports to shareholders | | | 16,062 | | | | 18,747 | |
Trustees fees and expenses | | | 8,057 | | | | 5,389 | |
Miscellaneous | | | 4,233 | | | | 3,959 | |
| | | | | | | | |
Total expenses before offsets | | | 1,005,394 | | | | 908,799 | |
| | | | | | | | |
Expense waiver | | | (6,960 | ) | | | (3,200 | ) |
Expense reimbursement | | | — | | | | (37,957 | ) |
Expense reductions | | | (934 | ) | | | (653 | ) |
| | | | | | | | |
Net expenses | | | 997,500 | | | | 866,989 | |
| | | | | | | | |
Net investment income | | | 4,794,724 | | | | 4,196,526 | |
| | | | | | | | |
Net Realized and Unrealized Gain (Loss): | | | | | | | | |
Net realized gain on investments and TBA sale commitments | | | 817,644 | | | | 1,245,054 | |
Net realized gain (loss) on options and futures contracts | | | (774,708 | ) | | | 236,939 | |
Net unrealized depreciation of investments and TBA sale commitments | | | (2,583,263 | ) | | | (5,576,930 | ) |
Net unrealized appreciation (depreciation) of options and futures contracts | | | 165,846 | | | | (117,914 | ) |
| | | | | | | | |
Net realized and unrealized loss | | | (2,374,481 | ) | | | (4,212,851 | ) |
| | | | | | | | |
Net increase (decrease) in net assets resulting from operations | | $ | 2,420,243 | | | ($ | 16,325 | ) |
| | | | | | | | |
The accompanying notes are an integral part of these financial statements.
16
Statements of Changes in Net Assets
| | | | | | | | | | | | | | | | | | | | | | | | |
| | | Managers Short Duration Government Fund | | | Managers Intermediate Duration Government Fund | |
| | | For the six
months ended
June 30, 2008
(unaudited) | | | For the period
from April 1, 2007 to
December 31, 2007 | | | For the fiscal
year ended
March 31, 2007 | | | For the six
months ended
June 30, 2008
(unaudited) | | | For the period
from April 1, 2007 to
December 31, 2007 | | | For the fiscal
year ended
March 31, 2007 | |
Increase (Decrease) in Net Assets From Operations: | | | | | | | | | | | | | | | | | | | | | | | | |
Net investment income | | $ | 4,794,724 | | | $ | 6,675,804 | | | $ | 8,483,687 | | | $ | 4,196,526 | | | $ | 6,388,790 | | | $ | 7,934,407 | |
Net realized gain (loss) on investments, options and futures | | | 42,936 | | | | (614,286 | ) | | | 721,946 | | | | 1,481,993 | | | | 297,557 | | | | (348,413 | ) |
Net unrealized appreciation (depreciation) of investments, options and futures | | | (2,417,417 | ) | | | 763,188 | | | | 782,009 | | | | (5,694,844 | ) | | | 2,054,940 | | | | 2,980,940 | |
| | | | | | | | | | | | | | | | | | | | | | | | |
Net increase (decrease) in net assets resulting from operations | | | 2,420,243 | | | | 6,824,706 | | | | 9,987,642 | | | | (16,325 | ) | | | 8,741,287 | | | | 10,566,934 | |
| | | | | | | | | | | | | | | | | | | | | | | | |
Distributions to Shareholders: | | | | | | | | | | | | | | | | | | | | | | | | |
From net investment income | | | (4,705,750 | ) | | | (6,670,389 | ) | | | (8,566,062 | ) | | | (4,134,843 | ) | | | (6,439,350 | ) | | | (7,937,857 | ) |
| | | | | | | | | | | | | | | | | | | | | | | | |
From Capital Share Transactions: | | | | | | | | | | | | | | | | | | | | | | | | |
Proceeds from sale of shares | | | 78,826,289 | | | | 122,092,292 | | | | 123,190,502 | | | | 38,821,009 | | | | 54,398,859 | | | | 66,087,961 | |
Reinvestment of dividends and distributions | | | 4,518,472 | | | | 6,371,801 | | | | 8,136,268 | | | | 3,740,734 | | | | 5,657,461 | | | | 7,038,492 | |
Cost of shares repurchased | | | (82,663,387 | ) | | | (73,485,510 | ) | | | (159,287,605 | ) | | | (43,154,041 | ) | | | (51,689,803 | ) | | | (87,529,430 | ) |
| | | | | | | | | | | | | | | | | | | | | | | | |
Net increase (decrease) from capital share transactions | | | 681,374 | | | | 54,978,583 | | | | (27,960,835 | ) | | | (592,298 | ) | | | 8,366,517 | | | | (14,402,977 | ) |
| | | | | | | | | | | | | | | | | | | | | | | | |
Total increase (decrease) in net assets | | | (1,604,133 | ) | | | 55,132,900 | | | | (26,539,255 | ) | | | (4,743,466 | ) | | | 10,668,454 | | | | (11,773,900 | ) |
| | | | | | | | | | | | | | | | | | | | | | | | |
Net Assets: | | | | | | | | | | | | | | | | | | | | | | | | |
Beginning of period | | | 235,117,043 | | | | 179,984,143 | | | | 206,523,398 | | | | 193,439,921 | | | | 182,771,467 | | | | 194,545,367 | |
| | | | | | | | | | | | | | | | | | | | | | | | |
End of period | | $ | 233,512,910 | | | $ | 235,117,043 | | | $ | 179,984,143 | | | $ | 188,696,455 | | | | 193,439,921 | | | $ | 182,771,467 | |
| | | | | | | | | | | | | | | | | | | | | | | | |
End of period undistributed net investment income | | $ | 821,465 | | | $ | 732,491 | | | $ | 727,076 | | | $ | 62,471 | | | $ | 788 | | | $ | 51,348 | |
| | | | | | | | | | | | | | | | | | | | | | | | |
Share Transactions: | | | | | | | | | | | | | | | | | | | | | | | | |
Sale of shares | | | 8,162,336 | | | | 12,626,197 | | | | 12,771,423 | | | | 3,636,076 | | | | 5,177,651 | | | | 6,314,692 | |
Reinvestment of dividends and distributions | | | 469,943 | | | | 659,682 | | | | 844,943 | | | | 353,273 | | | | 539,286 | | | | 675,812 | |
Shares repurchased | | | (8,581,432 | ) | | | (7,593,562 | ) | | | (16,513,626 | ) | | | (4,064,469 | ) | | | (4,935,351 | ) | | | (8,405,912 | ) |
| | | | | | | | | | | | | | | | | | | | | | | | |
Net increase (decrease) in shares | | | 50,847 | | | | 5,692,317 | | | | (2,897,260 | ) | | | (75,120 | ) | | | 781,586 | | | | (1,415,408 | ) |
| | | | | | | | | | | | | | | | | | | | | | | | |
The accompanying notes are an integral part of these financial statements.
17
Financial Highlights
For a share outstanding throughout each fiscal period
| | | | | | | | | | | | | | | | | | | | | | | | | | | | |
| | | For the six
months ended
June 30, 2008
(unaudited) | | | For the period
from April 1, 2007 to
December 31, 2007 | | | For the fiscal year ended March 31, | |
Short Duration Government Fund | | | | 2007 | | | 2006 | | | 2005 | | | 2004 | | | 2003 | |
Net Asset Value, Beginning of Period | | $ | 9.68 | | | $ | 9.68 | | | $ | 9.61 | | | $ | 9.66 | | | $ | 9.69 | | | $ | 9.74 | | | $ | 9.72 | |
| | | | | | | | | | | | | | | | | | | | | | | | | | | | |
Income from Investment Operations: | | | | | | | | | | | | | | | | | | | | | | | | | | | | |
Net investment income | | | 0.19 | | | | 0.31 | | | | 0.42 | | | | 0.34 | | | | 0.27 | | | | 0.25 | | | | 0.30 | |
Net realized and unrealized gain (loss) on investments | | | (0.09 | ) | | | 0.01 | | | | 0.06 | | | | (0.05 | ) | | | (0.02 | ) | | | (0.06 | ) | | | 0.06 | |
| | | | | | | | | | | | | | | | | | | | | | | | | | | | |
Total from investment operations | | | 0.10 | | | | 0.32 | | | | 0.48 | | | | 0.29 | | | | 0.25 | | | | 0.19 | | | | 0.36 | |
| | | | | | | | | | | | | | | | | | | | | | | | | | | | |
Less Distributions to Shareholders from: | | | | | | | | | | | | | | | | | | | | | | | | | | | | |
Net investment income | | | (0.19 | ) | | | (0.32 | ) | | | (0.41 | ) | | | (0.34 | ) | | | (0.28 | ) | | | (0.24 | ) | | | (0.32 | ) |
Return of capital | | | — | | | | — | | | | — | | | | — | | | | — | | | | — | | | | (0.02 | ) |
| | | | | | | | | | | | | | | | | | | | | | | | | | | | |
Total distributions to shareholders | | | (0.19 | ) | | | (0.32 | ) | | | (0.41 | ) | | | (0.34 | ) | | | (0.28 | ) | | | (0.24 | ) | | | (0.34 | ) |
| | | | | | | | | | | | | | | | | | | | | | | | | | | | |
Net Asset Value, End of Period | | $ | 9.59 | | | $ | 9.68 | | | $ | 9.68 | | | $ | 9.61 | | | $ | 9.66 | | | $ | 9.69 | | | $ | 9.74 | |
| | | | | | | | | | | | | | | | | | | | | | | | | | | | |
Total Return1 | | | 0.99 | %4,7 | | | 3.41 | %4 | | | 5.05 | % | | | 3.00 | % | | | 2.62 | % | | | 2.00 | % | | | 3.76 | % |
| | | | | | | | | | | | | | | | | | | | | | | | | | | | |
Ratio of net expenses to average net assets2 | | | 0.82 | %5 | | | 0.84 | %5 | | | 0.83 | % | | | 0.83 | % | | | 0.78 | % | | | 0.78 | % | | | 0.78 | % |
Ratio of net investment income to average net assets 1,2 | | | 3.94 | %5 | | | 4.49 | %5 | | | 4.15 | % | | | 3.41 | % | | | 2.90 | % | | | 2.59 | % | | | 2.74 | % |
Portfolio turnover | | | 139 | %4 | | | 199 | %4 | | | 230 | % | | | 315 | % | | | 341 | % | | | 349 | % | | | 418 | % |
Net assets at end of period (000’s omitted) | | $ | 233,513 | | | $ | 235,117 | | | $ | 179,984 | | | $ | 206,523 | | | $ | 237,900 | | | $ | 198,726 | | | $ | 160,710 | |
| | | | | | | | | | | | | | | | | | | | | | | | | | | | |
Ratios absent expense offsets:6 | | | | | | | | | | | | | | | | | | | | | | | | | | | | |
Ratio of total expenses to average net assets | | | 0.83 | %5 | | | 1.22 | %3,5 | | | 1.36 | %3 | | | 1.08 | %3 | | | 1.00 | %3 | | | 0.95 | %3 | | | 0.93 | %3 |
Ratio of net investment income to average net assets | | | 3.93 | %5 | | | 4.11 | %3,5 | | | 3.62 | %3 | | | 3.16 | %3 | | | 2.68 | %3 | | | 2.42 | %3 | | | 2.59 | %3 |
| | | | | | | | | | | | | | | | | | | | | | | | | | | | |
1 | Total returns and net investment income would have been lower had certain expenses not been reduced. (See Note 1(c) of “Notes to Financial Statements.”) |
2 | After expense offsets, excluding interest expense. (See Note 1(h) of “Notes to Financial Statements.”) |
3 | Includes interest expense for the period ended December 31, 2007 and the fiscal years ended March 31, 2007, 2006, 2005, 2004 and 2003 of 0.38%, 0.53%, 0.23%, 0.16%, 0.03% and 0.01%, respectively. (See Note 1(h) of “Notes to Financial Statements.”) |
6 | Excludes the impact of expense reimbursements or fee waivers and expense reductions such as brokerage recapture credits, but includes non-reimbursable expenses, if any, such as interest and taxes. (See Note 1(c) of “Notes to Financial Statements.”) |
7 | The Total Return is based on the Financial Statement Net Asset Values as shown above. |
18
Financial Highlights
For a share outstanding throughout each fiscal period
| | | | | | | | | | | | | | | | | | | | | | | | | | | | |
| | | For the six
months ended
June 30, 2008
(unaudited) | | | For the period
from April 1, 2007
to
December 31, 2007 | | | For the fiscal year ended March 31, | |
Intermediate Duration Government Fund | | | | 2007 | | | 2006 | | | 2005 | | | 2004 | | | 2003 | |
Net Asset Value, Beginning of Period | | $ | 10.67 | | | $ | 10.54 | | | $ | 10.37 | | | $ | 10.53 | | | $ | 10.74 | | | $ | 10.61 | | | $ | 10.16 | |
| | | | | | | | | | | | | | | | | | | | | | | | | | | | |
Income from Investment Operations: | | | | | | | | | | | | | | | | | | | | | | | | | | | | |
Net investment income | | | 0.22 | | | | 0.37 | | | | 0.47 | | | | 0.37 | | | | 0.26 | | | | 0.23 | | | | 0.40 | |
Net realized and unrealized gain (loss) on investments | | | (0.22 | ) | | | 0.13 | | | | 0.17 | | | | (0.16 | ) | | | (0.06 | ) | | | 0.20 | | | | 0.45 | |
| | | | | | | | | | | | | | | | | | | | | | | | | | | | |
Total from investment operations | | | 0.00 | | | | 0.50 | | | | 0.64 | | | | 0.21 | | | | 0.20 | | | | 0.43 | | | | 0.85 | |
| | | | | | | | | | | | | | | | | | | | | | | | | | | | |
Less Distributions to Shareholders from: | | | | | | | | | | | | | | | | | | | | | | | | | | | | |
Net investment income | | | (0.22 | ) | | | (0.37 | ) | | | (0.47 | ) | | | (0.37 | ) | | | (0.26 | ) | | | (0.23 | ) | | | (0.40 | ) |
Net realized gain on investments | | | — | | | | — | | | | — | | | | — | | | | (0.15 | ) | | | (0.07 | ) | | | 0.00 | |
| | | | | | | | | | | | | | | | | | | | | | | | | | | | |
Total distributions to shareholders | | | (0.22 | ) | | | (0.37 | ) | | | (0.47 | ) | | | (0.37 | ) | | | (0.41 | ) | | | (0.30 | ) | | | (0.40 | ) |
| | | | | | | | | | | | | | | | | | | | | | | | | | | | |
Net Asset Value, End of Period | | $ | 10.45 | | | $ | 10.67 | | | $ | 10.54 | | | $ | 10.37 | | | $ | 10.53 | | | $ | 10.74 | | | $ | 10.61 | |
| | | | | | | | | | | | | | | | | | | | | | | | | | | | |
Total Return1 | | | 0.03 | %4 | | | 4.85 | %4 | | | 6.30 | % | | | 2.02 | % | | | 1.78 | % | | | 4.07 | % | | | 8.48 | % |
| | | | | | | | | | | | | | | | | | | | | | | | | | | | |
Ratio of net expenses to average net assets2 | | | 0.89 | %5 | | | 0.83 | %5 | | | 0.87 | % | | | 0.88 | % | | | 0.88 | % | | | 0.88 | % | | | 0.88 | % |
Ratio of net investment income to average net assets 1,2 | | | 4.29 | %5 | | | 4.62 | %5 | | | 4.46 | % | | | 3.53 | % | | | 2.45 | % | | | 2.09 | % | | | 3.75 | % |
Portfolio turnover | | | 206 | %4 | | | 240 | %4 | | | 445 | % | | | 672 | % | | | 851 | % | | | 667 | % | | | 578 | % |
Net assets at end of period (000’s omitted) | | $ | 188,696 | | | $ | 193,440 | | | $ | 182,771 | | | $ | 194,545 | | | $ | 186,026 | | | $ | 123,826 | | | $ | 71,342 | |
| | | | | | | | | | | | | | | | | | | | | | | | | | | | |
Ratios absent expense offsets:6 | | | | | | | | | | | | | | | | | | | | | | | | | | | | |
Ratio of total expenses to average net assets | | | 0.93 | %5 | | | 0.84 | %3,5 | | | 0.89 | %3 | | | 0.88 | %3 | | | 0.89 | %3 | | | 0.93 | %3 | | | 1.06 | %3 |
Ratio of net investment income to average net assets | | | 4.25 | %5 | | | 4.61 | %3,5 | | | 4.44 | %3 | | | 3.53 | % | | | 2.44 | %3 | | | 2.04 | %3 | | | 3.57 | %3 |
| | | | | | | | | | | | | | | | | | | | | | | | | | | | |
1 | Total returns and net investment income would have been lower had certain expenses not been reduced. (See Note 1(c) of “Notes to Financial Statements.”) |
2 | After expense offsets, excluding interest expense. (See Note 1(h) of “Notes to Financial Statements.”) |
3 | Includes interest expense for the period ended December 31, 2007 and the fiscal years ended March 31, 2007, 2005, 2004 and 2003 of 0.01%, 0.04%, 0.01%, 0.00%, 0.03%, respectively. (See Note 1(h) of “Notes to Financial Statements.”) |
6 | Excludes the impact of expense reimbursements or fee waivers and expense reductions such as brokerage recapture credits, but includes non-reimbursable expenses, if any, such as interest and taxes. (See Note 1(c) of “Notes to Financial Statements.”) |
19
Notes to Financial Statements
June 30, 2008 (unaudited)
| 1. | Summary of Significant Accounting Policies |
Managers Trust II (the “Trust”) is an open-end management investment company organized as a Massachusetts business trust and registered under the Investment Company Act of 1940, as amended (the “1940 Act”). Currently, the Trust is comprised of a number of different funds, each having distinct investment management objectives, strategies, risks and policies. Included in this report are two series of Trust II: Managers Short Duration Government Fund (“Short Duration”) and Managers Intermediate Duration Government Fund (“Intermediate Duration”) (each a “Fund” and collectively the “Funds”).
The Funds’ financial statements are prepared in accordance with accounting principles generally accepted in the United States of America, which require management to make estimates and assumptions that affect the reported amounts of assets and liabilities and disclosure of contingent assets and liabilities at the date of the financial statements and the reported amounts of income and expenses during the reporting periods. Actual results could differ from those estimates and such differences could be material. The following is a summary of significant accounting policies followed by the Funds in the preparation of their financial statements:
| a. | Valuation of Investments |
Equity securities traded on a domestic or international securities exchange are valued at the last quoted sale price, or, lacking any sales, at the last quoted bid price. Over-the-counter securities are valued at the Nasdaq Official Closing Price, if one is available. Lacking any sales, over-the counter securities are valued at the last quoted bid price. The Funds’ investments are generally valued based on market quotations provided by the third party pricing services approved by the Board of Trustees of the Funds. Under certain circumstances, the value of a specific investment may be based on an evaluation of its fair value, pursuant to procedures established by and under the general supervision of the Board of Trustees of the Trust. A Fund may use the fair value of a portfolio security to calculate its NAV when, for example, (1) market quotations are not readily available because a portfolio security is not traded in a public market or the principal market in which the security trades is closed, (2) trading in a portfolio security is suspended and has not resumed before the Fund calculates its NAV, (3) where a significant event affecting the value of a portfolio security is determined to have occurred between the time of the market quotation provided for a portfolio security and the time as of which the Fund calculates its NAV, (4) a security’s price has remained unchanged over a period of time (often referred to as a “stale price”), or (5) Managers Investment Group LLC (the “Investment Manager”) determines that a market quotation is inaccurate. Portfolio investments that trade primarily on foreign markets are priced based upon the market quotation of such securities as of the close of their respective principal markets, as adjusted to reflect the Investment Manager’s determination of the impact of events occurring subsequent to the close of such markets but prior to the time as of which the Fund calculates their NAV. In accordance with procedures approved by the Board of Trustees, the Investment Manager relies upon recommendations of a third-party fair valuation service in adjusting the prices of such foreign portfolio investments. The Funds may invest in securities that may be thinly traded. The Board of Trustees has adopted procedures to adjust prices when thinly traded securities are judged to be stale so that they reflect fair value. An investment valued on the basis of its fair value may be valued at a price higher or lower than available market quotations. An investment’s valuation may differ depending on the method used and the factors considered in determining value according to the Funds’ fair value procedures.
Fixed-income securities are valued based on valuations furnished by independent pricing services that utilize matrix systems, which reflect such factors as security prices, yields, maturities, and ratings, and are supplemented by dealer and exchange quotations. Futures contracts for which market quotations are readily available are valued at the settlement price as of the close of the futures exchange. Short-term investments having a remaining maturity of 60 days or less are valued at amortized cost, which approximates market value. Investments in other regulated investment companies are valued at their end of day net asset value per share except iShares or other ETF’s, which are valued the same as equity securities. Investments in certain mortgage-backed, stripped mortgage-backed, preferred stocks, convertible securities, derivatives and other debt securities not traded on an organized securities market are valued on the basis of valuations provided by dealers or by a pricing service which uses information with respect to transactions in such securities and various relationships between securities and yield to maturity in determining value. Securities (including derivatives) for which market quotations are not readily available are valued at fair value, as determined in good faith, and pursuant to procedures adopted by the Board of Trustees of the Trust. The values assigned to fair value investments are based on available information and do not necessarily represent amounts that might ultimately be realized, since such amounts depend on future developments inherent in long-term investments. Further, because of the inherent uncertainty of valuation, those estimated values may differ significantly from the values that would have been used had a ready market for the investments existed, and the differences could be material.
The Funds adopted Financial Accounting Standards Board Statement of Financial Accounting Standards No. 157, Fair Value Measurements (“FAS 157”), effective January 1, 2008. In accordance with FAS 157, fair value is defined as the price that a Fund would receive to sell an asset or pay to transfer a liability in an orderly transaction between market participants at the measurement date. FAS 157 also establishes a framework for measuring fair value, and a three-level hierarchy for fair value measurements based upon the transparency of inputs to the valuation of an asset or liability. Inputs may be observable or unobservable and refer broadly to the assumptions that market participants would use in pricing the asset or liability. Observable inputs reflect the assumptions market participants would use in pricing the asset or liability based on market data obtained from sources independent of the Funds. Unobservable inputs reflect the Funds’ own assumptions about the assumptions that market participants would use in pricing the asset or liability developed based on the best information available in the circumstances. Each investment is assigned a level based upon the observability of the inputs which are significant to the overall valuation. The three-tier hierarchy of inputs is summarized below:
Level 1 – quoted prices in active markets for identical investments
Level 2 – other significant observable inputs (including quoted prices for similar investments, interest rates, prepayment speeds, credit risk)
Level 3 –significant unobservable inputs (including the Funds’ own assumptions in determining the fair value of investments)
20
Notes to Financial Statements (continued)
The inputs or methodologies used for valuing investments are not necessarily an indication of the risk associated with investing in those investments. The following table summarizes the valuation of the Funds’ net assets by the above fair value hierarchy levels as of June 30, 2008:
| | | | | | | |
Level | | Investments in
Securities | | Other Financial
Instruments* | |
Short Duration | | | | | | | |
Level 1 | | $ | 9,844,090 | | ($ | 4,156 | ) |
Level 2 | | | 297,717,365 | | | — | |
Level 3 | | | — | | | — | |
| | | | | | | |
Total | | $ | 307,561,455 | | ($ | 4,156 | ) |
| | | | | | | |
Intermediate Duration | | | | | | | |
Level 1 | | $ | 15,194,069 | | ($ | 290,570 | ) |
Level 2 | | | 246,316,034 | | | — | |
Level 3 | | | — | | | — | |
| | | | | | | |
Total | | $ | 261,510,103 | | ($ | 290,570 | ) |
| | | | | | | |
| * | Other financial instruments are derivative instruments not reflected in the Schedule of Portfolio Investments, such as futures, forwards and swap contracts, which are valued at the unrealized appreciation/depreciation of the instrument. |
The following table is a reconciliation of investments in which significant unobservable inputs (Level 3) were used in determining fair value:
| | | | | | |
Balance as of June 30, 2008 | | Investments
in Securities | | Other Financial
Instruments |
Short Duration | | $ | 0 | | $ | 0 |
Intermediate Duration | | $ | 0 | | $ | 0 |
Security transactions are accounted for as of trade date. Realized gains and losses on securities sold are determined on the basis of identified cost.
| c. | Investment Income and Expenses |
Dividend income is recorded on the ex-dividend date except certain dividends from foreign securities where the ex-dividend date may have passed. These dividends are recorded as soon as the Trust is informed of the ex-dividend date. Dividend Income on foreign securities is recorded net of any withholding tax. Interest income, which includes amortization of premium and accretion of discount on debt securities, is accrued as earned. Non-cash dividends included in dividend income, if any, are reported at the fair market value of the securities received. Other income and expenses are recorded on an accrual basis. Expenses that cannot be directly attributed to a fund are apportioned among the Funds in the Trust and in some cases other affiliated funds based upon their relative average net assets or number of shareholders.
The Funds have a “balance credit” arrangement with The Bank of New York Mellon (“BNYM”), formerly the Bank of New York, the Funds’ custodian, whereby each Fund is credited with an interest factor equal to 0.75% below the effective 90-day T-Bill rate for account balances left uninvested overnight. These credits serve to reduce custody expenses that would otherwise be charged to each Fund. For the six months ended June 30, 2008, the custodian expense was reduced as follows: Short Duration - $278 and Intermediate Duration - $121.
Overdrafts will cause a reduction of any earnings credits and are computed at 2% above the effective Federal Funds rate on the day of the overdraft. For the six months ended June 30, 2008, the Funds’ had no overdraft fees.
The Trust also has a balance credit arrangement with its Transfer Agent, PNC Global Investment Servicing (U.S.) Inc. (formerly PFPC Inc.), whereby earnings credits are used to offset banking charges and other out-of-pocket expenses. For the six months ended June 30, 2008, the transfer agent expense was reduced as follows: Short Duration - $656 and Intermediate Duration - $532.
The Investment Manager has agreed to waive a portion of its management fee in consideration of shareholder servicing fees that it has received from JPMorgan Distribution Services, Inc., with respect to short-term cash investments the Fund has made in the JPMorgan Liquid Assets Portfolio. For six months ended June 30, 2008, the management fee was reduced as follows: Short Duration - $6,960, Intermediate Duration - $3,200.
Total returns and net investment income for the Funds would have been lower had certain expenses not been offset. Total expenses before offsets exclude the impact of expense reimbursements or fee waivers and expense offsets such as brokerage recapture credits, but include non-reimburseable expenses such as interest and taxes, if any.
| d. | Dividends and Distributions |
Dividends resulting from net investment income, if any, normally will be declared and paid monthly for each Fund. Distributions of capital gains, if any, will be made annually in December and when required for Federal excise tax purposes. Income and capital gain distributions are determined in accordance with Federal income tax regulations, which may differ from generally accepted accounting principles. These differences are primarily due to differing treatments for losses deferred due to wash sales, REITS, equalization accounting for tax purposes, foreign currency, options, futures and market discount transactions. Permanent book and tax basis differences, if any, relating to shareholder distributions will result in reclassifications to paid-in capital.
The Funds intend to comply with the requirements under Subchapter M of the Internal Revenue Code of 1986, as amended, to distribute substantially all of its taxable income and gains to its shareholders and to meet certain diversification and income requirements with respect to investment companies. Therefore, no provision for Federal income or excise tax is included in the accompanying financial statements.
21
Notes to Financial Statements (continued)
| f. | Capital Loss Carryovers |
As of June 30, 2008, the Funds had accumulated net realized capital loss carryovers from securities transactions for Federal income tax purposes as shown in the chart. These amounts may be used for Federal income tax purposes to offset future realized capital gains, if any, through the expiration dates listed.
| | | | | |
Fund | | Capital Loss
Carryover Amounts | | Expires Dec. 31, |
Short Duration | | $ | 1,568,229 | | 2008 |
| | | 362,610 | | 2009 |
| | | 213,372 | | 2012 |
| | | 285,554 | | 2014 |
| | | 704,384 | | 2016 |
| | | | | |
Total: | | $ | 3,134,149 | | |
| | | | | |
Intermediate Duration | | $ | 591,542 | | 2014 |
The Trust’s Declaration of Trust authorizes for each series the issuance of an unlimited number of shares of beneficial interest, without par value, for each Fund. Each Fund records sales and repurchases of its capital stock on the trade date. Dividends and distributions to shareholders are recorded on the ex-dividend date.
At June 30, 2008, certain unaffiliated shareholders, specifically omnibus accounts, individually held greater than 10% of the outstanding shares of the Funds as follows: Short Duration - 2 collectively own 64%; and Intermediate Duration—2 collectively own 64%. Transactions by these shareholders may have a material impact on the Funds.
| h. | Reverse Repurchase Agreements |
A reverse repurchase agreement involves the sale of portfolio assets together with an agreement to repurchase the same or substantially the same assets later at a fixed price. An interest expense is charged to the Fund for the duration of the sale. Additional assets are maintained in a segregated account with the custodian, and are marked to market daily. The segregated assets may consist of cash, U.S. Government securities, or other liquid securities at least equal in value to the obligations under the reverse repurchase agreements. In the event the buyer of securities under a reverse repurchase agreement files for bankruptcy or becomes insolvent, a fund’s use of the proceeds under the agreement may be restricted pending a determination by the other party, or its trustee or receiver, whether to enforce the obligation to repurchase the securities. As of June 30, 2008, there were no reverse repurchase agreements outstanding.
| i. | Delayed Delivery Transactions and When-Issued Securities |
The Funds may purchase or sell securities on a delayed delivery or when-issued basis. Payment and delivery may take place after the customary settlement period for that security. The price of the underlying securities and the date when the securities will be delivered and paid for are fixed at the time the transaction is negotiated. During the time a delayed delivery sell is outstanding, the contract is marked to market daily and equivalent deliverable securities are held for the transaction. The value of the securities purchased on a delayed delivery or when-issued basis are identified as such in the Funds’ Schedules of Portfolio Investments. With respect to purchase commitments, the Funds identify securities as segregated in its records with a value at least equal to the amount of the commitment. The payables and receivables associated with the purchases and sales of delayed delivery securities having the same coupon, settlement date and broker are offset. Delayed delivery or when-issued securities that have been purchased from and sold to different brokers are reflected as both payables and receivables in the Funds’ Statement of Assets and Liabilities under the caption when-issued. Losses may arise due to changes in the value of the underlying securities or if the counterparty does not perform under the contract, or if the issuer does not issue the securities due to political, economic, or other factors.
| j. | Dollar Roll and Reverse Dollar Roll Agreements |
The Funds may enter into dollar rolls in which they sell debt securities for delivery currently and simultaneously contract to repurchase similar, but not identical, securities at the same price or a lower price on an agreed date. The Funds receive compensation as consideration for entering into the commitment to repurchase. The compensation is the difference between the current sale price and the forward price for the future price (often referred to as the “drop”) as well as by the interest earned on the cash proceeds of the initial sale. The Funds may also be compensated by the receipt of a commitment fee. As the holder, the counterparty receives all principal and interest payments, including prepayments, made with respect to the similar security. Dollar rolls may be renewed with a new sale and repurchase price with a cash settlement mad at renewal without physical delivery of the securities subject to the contract.
Certain risks may arise upon entering into dollar rolls from the potential inability of counterparties to meet the terms of their commitments. Additionally, the value of such securities may change adversely before the Funds are able to repurchase them. There can be no assurance that the Funds use of the cash that they receive from a dollar roll will provide a return that exceeds its cost.
| k. | Securities Transacted on a When Issued Basis |
The Funds may enter into To Be Announced (“TBA”) sale commitments to hedge its portfolio positions or to sell mortgage-backed securities it owns under delayed delivery arrangements. Proceeds of TBA sale commitments are not received until the contractual settlement date. During the time a TBA sale commitment is outstanding, equivalent deliverable securities, or an offsetting TBA purchase commitment deliverable on or before the sale commitment date, are held as “cover” for the transaction. Unsettled TBA sale commitments are valued at the current market value of the underlying securities, according to the procedures described under “Valuation of Investments,” in footnote 1a above. Each contract is marked-to-market daily and the change in market value is recorded by the Funds as an unrealized gain or loss. If the TBA sale commitment is closed through the acquisition of an offsetting purchase commitment, the Fund realizes a gain or loss. If the Fund delivers securities under the commitment, the Fund realizes a gain or a loss from the sale of the securities based upon the unit price established at the date the commitment was entered into.
22
Notes to Financial Statements (continued)
TBA sale commitments outstanding at June 30, 2008 were as follows:
| | | | | | | | |
Fund | | Principal/Share
Amount | | Security | | Current Liability |
Short Duration | | $ | 16,800,000 | | FNMA, 5.000%, 7/15/22 | | $ | 16,574,242 |
| | | 4,000,000 | | FNMA, 5.500%, 7/15/38 | | | 3,942,500 |
| | | 13,000,000 | | FNMA, 6.000%, 7/15/23 | | | 13,325,000 |
| | | | | | | | |
Total | | | | | | | $ | 33,841,742 |
| | | | | | | | |
Intermediate Duration | | $ | 2,000,000 | | FHLMC, 6.000%, 7/15/23 | | $ | 2,046,876 |
| | | 1,000,000 | | FNMA, 5.000%, 7/15/22 | | | 986,562 |
| | | | | | | | |
Total | | | | | | | $ | 3,033,438 |
| | | | | | | | |
The Funds may use interest rate futures contracts for risk management purposes in order to reduce fluctuations in the Fund’s net asset value relative to the Fund’s targeted option-adjusted duration. On entering into a futures contract, either cash or securities in an amount equal to a certain percentage of the contract value (initial margin) must be deposited with the futures broker. Subsequent payments (variation margin) are made or received each day. The variation margin payments equal the daily changes in the contract value and are recorded as unrealized gains or losses. The Fund recognizes a realized gain or loss when the contract is closed or expires equal to the difference between the value of the contract at the time it was opened and the value at the time it was closed.
Short Duration had the following open futures contracts as of June 30, 2008:
| | | | | | | | | | |
Type | | Number of
Contracts | | Position | | Expiration Month | | Unrealized
Gain/(Loss) | |
2-Year U.S. Commodity | | 221 | | Long | | September 2008 | | | ($22,335 | ) |
5-Year Treasury Note | | 419 | | Short | | September 2008 | | | 30,246 | |
10-Year U.S. Treasury Note | | 31 | | Short | | September 2008 | | | (35,109 | ) |
U.S. Treasury Long Bond | | 84 | | Long | | September 2008 | | | 148,759 | |
10-Year Swap | | 218 | | Short | | September 2008 | | | (36,218 | ) |
3-Month Eurodollar | | 195 | | Long | | March 2008 -September 2011 | | | 34,506 | |
3-Month Eurodollar | | 138 | | Short | | March 2008 -December 2012 | | | (124,006 | ) |
| | | | | | | | | | |
Total | | | | | | | | | ($4,157 | ) |
| | | | | | | | | | |
|
Intermediate Duration had the following open futures contracts as of June 30, 2008: | |
| | | | |
Type | | Number of
Contracts | | Position | | Expiration Month | | Unrealized
Gain/(Loss) | |
2-Year U.S. Commodity | | 12 | | Short | | September 2008 | | | ($5,280 | ) |
5-Year U.S. Treasury Note | | 33 | | Long | | September 2008 | | | 3,838 | |
10-Year U.S. Treasury Note | | 22 | | Short | | September 2008 | | | (33,000 | ) |
U.S. Treasury Long Bond | | 3 | | Long | | September 2008 | | | 5,313 | |
10-Year Swap | | 7 | | Long | | September 2008 | | | (2,096 | ) |
3-Month Eurodollar | | 175 | | Long | | September 2008 -September 2012 | | | 523,159 | |
3-Month Eurodollar | | 78 | | Short | | December 2008 - June 2010 | | | (201,364 | ) |
| | | | | | | | | | |
Total | | | | | | | | $ | 290,570 | |
| | | | | | | | | | |
Futures transactions involve additional costs and may result in losses. The effective use of futures depends on the Fund’s ability to close futures positions at times when the Fund’s portfolio managers deem it desirable to do so. The use of futures also involves the risk of imperfect correlation among movements in the values of the securities underlying the futures purchased and sold by the Funds, of the futures contracts themselves, and of the securities that are the subject of a hedge.
23
Notes to Financial Statements (continued)
| m. | Assets Pledged to Cover Margin Requirements for Open Futures Positions |
The aggregate market value of assets pledged to cover margin requirements for the open futures positions at June 30, 2008 was:
| | | |
Fund | | Assets Pledged |
Short Duration | | $ | 793,817 |
Intermediate Duration | | | 198,410 |
A written option contract is a contract in which the writer of the option grants the buyer of the option the right to purchase from (call option) or sell to (put option) the writer a designated instrument at a specified price within a specified period of time. Options written (sold) are recorded as liabilities. When an option expires, the premium (original option value) is realized as a gain if the option was written or as a loss if the option was purchased. When the exercise of an option results in a cash settlement, the difference between the premium and the settlement proceeds is recognized as realized gain or loss. When securities are acquired or delivered upon exercise of an option, the acquisition cost or sale proceeds are adjusted by the amount of the premium. When an option is closed, the difference between the premium and the cost to close the position is realized as a gain or loss. At June 30, 2008, there were no written options outstanding.
| o. | Commitments and Contingencies |
In the normal course of business, the Funds may enter into contracts and agreements that contain a variety of representations and warranties which provide general indemnifications. The maximum exposure to the Funds under these agreements is unknown, as this would involve future claims that may be against the Funds that have not yet occurred. However, based on experience, the Funds expect the risks of loss to be remote.
| 2. | Agreements and Transactions with Affiliates |
The Trust has entered into an Investment Management Agreement under which Managers Investment Group LLC (the “Investment Manager”), an independently managed subsidiary of Affiliated Managers Group, Inc. (“AMG”), serves as investment manager to the Funds. The Investment Manager selects subadvisors for the Funds (subject to Trustee approval) and monitors each subadvisor’s investment programs and results. Each Fund’s investment portfolio is managed by a portfolio manager who serves pursuant to a Subadvisory Agreement with the Investment Manager.
Investment management fees are paid directly by each Fund to the Investment Manager based on average daily net assets. For the six months ended June 30, 2008, the annual investment management fee rates, as a percentage of average daily net assets were as follows: Short Duration – 0.70% and Intermediate Duration – 0.70%.
The Investment Manager had contractually agreed, through July 31, 2005, to waive its fees and/or bear expenses of the Short Duration Fund to cause total operating expenses (exclusive of taxes, interest, brokerage costs, acquired fund fees and extraordinary expenses) to not exceed the annual rate of 0.78%. Short Duration Fund is obligated to repay the Investment Manager such amounts waived, paid or reimbursed in future years provided that the repayment occurs within (36) months after the waiver or reimbursement and that such payment would not cause the Fund’s total operating expenses as a percent of average net assets in any such future year to exceed 0.78%. Effective January 1, 2008, Managers has contractually agreed, through at least May 1, 2009, to limit the Intermediate Duration Fund’s annual fund operating expenses (exclusive of taxes, interest, brokerage costs, acquired fund fees and extraordinary expenses) to 0.89% of average daily net assets. Intermediate Duration Fund was obligated to repay the Investment Manager such amounts waived, paid or reimbursed in future years provided that the repayment occurred within (36) months after the waiver or reimbursement and that such payment would not cause the Fund’s expenses as a percent of average net assets in any such future year to exceed 0.88%. For the six months ended June 30, 2008, the Funds made no such repayments to the Investment Manager. For the six months ended June 30, 2008, the cumulative amount of reimbursement by the Investment Manager subject to repayment by Short Duration and Intermediate Duration was $7,073 and $37,957, respectively.
Prior to July 1, 2007, the aggregate annual retainer paid to each Independent Trustee was $55,000, plus $4,000 or $2,000 for each regular or special meeting attended, respectively. Effective July 1, 2007, the aggregate annual retainer paid to each Independent Trustee is $65,000, plus $4,000 or $2,500 for each regular or special meeting attended, respectively. The Trustees’ fees and expenses are allocated amongst all of the Funds for which the Investment Manager serves as the advisor (the “Managers Funds”) based on the relative net assets of such Funds. The Independent Chairman of the Trusts receives an additional payment of $15,000 per year. (Prior to July 1, 2007, the Independent Chairman received an additional payment of $10,000 per year). The Chairman of the Audit Committee receives an additional payment of $5,000 per year. (Prior to July 1, 2007, the Chairman of the Audit Committee received an additional payment of $2,000 per year). The “Trustee fees and expenses” shown in the financial statements represent each Fund’s allocated portion of the total fees and expenses paid by the Fund and other affiliated funds in the Managers Funds.
The Funds are distributed by Managers Distributors, Inc. (the “Distributor” or “MDI”), a wholly-owned subsidiary of the Investment Manager. The MDI serves as the principal underwriter for each Fund in the Trust. MDI is a registered broker-dealer and member of the Financial Industry Regulatory Authority, Inc. (“FINRA”). Shares of each Fund will be continuously offered and will be sold by brokers, dealers or other financial intermediaries who have executed selling agreements with the Distributor. MDI bears all the expenses of providing services pursuant to the Underwriting Agreement, including the payment of the expenses relating to the distribution of Prospectuses for sales purposes and any advertising or sales literature. Certain Trustees and Officers of the Funds are Officers and/or Directors of the Investment Manager, AMG and/or the Distributor.
24
Notes to Financial Statements (continued)
| 3. | Purchases and Sales of Securities |
Purchases and sales of securities, excluding short-term securities, for the six months ended June 30, 2008 were as follows:
| | | | | | | | | | | | |
| | | Long-Term Securities | | U.S. Government Securities |
Fund | | Purchases | | Sales | | Purchases | | Sales |
Short Duration | | $ | 3,464,987 | | $ | 5,845,237 | | $ | 417,412,406 | | $ | 384,646,297 |
Intermediate Duration | | | 50,302 | | | 42,081,854 | | | 537,559,451 | | | 466,268,858 |
| 4. | Portfolio Securities Loaned |
The Funds may participate in a securities lending program offered by BNYM providing for the lending of equities, corporate bonds and government securities to qualified brokers. Collateral on all securities loaned is accepted in cash and/or government securities. Collateral is maintained at a minimum level of 102% (105% in the case of certain foreign securities) of the market value, plus interest, if applicable, of investments on loan. Collateral received in the form of cash is invested temporarily in institutional money market funds or other short-term investments by BNYM.
Securities lending fees include earnings of such temporary cash investments, plus or minus any rebate. These earnings (after rebate) are then divided between BNYM, as a fee for its services under the program, and the Fund loaning the security, according to agreed-upon rates.
| 5. | Risks Associated with Mortgage Related and Asset-Backed Securities |
Asset-backed securities are less effective than other types of securities as a means of “locking in” attractive long-term interest rates. One reason is the need to reinvest prepayments of principal; another is the possibility of significant unscheduled prepayments resulting from declines in interest rates. These prepayments would have to be reinvested at lower rates. As a result, these securities may have less potential for capital appreciation during periods of declining interest rates than other securities of comparable maturities, although they may have a similar risk of decline in market value during periods of rising interest rates. Prepayments may also significantly shorten the effective maturities of these securities, especially during periods of declining interest rates. Conversely, during periods of rising interest rates, a reduction in prepayments may increase the effective maturities of these securities, subjecting them to a greater risk of decline in market value in response to rising interest rates than traditional debt securities, and therefore, potentially increasing the volatility of the Funds.
Prepayments may cause losses on securities purchased at a premium. At times, some mortgage- backed and asset-backed securities will have higher than market interest rates and therefore will be purchased at a premium above their par value.
Collateralized mortgage obligations (“CMO’s”) may be issued by a U.S. government agency or instrumentality or by a private issuer. Although payment of the principal of, and interest on, the underlying collateral securing privately issued CMO’s may be guaranteed by the U.S. government or its agencies or instrumentalities, these CMO’s represent obligations solely of the private issuer and are not insured or guaranteed by the U.S. government, its agencies or instrumentalities or any other person or entity.
Prepayments could cause early retirement of CMO’s. CMO’s are designed to reduce the risk of prepayment for investors by issuing multiple classes of securities, each having different maturities, interest rates and payment schedules, and with the principal and interest on the underlying mortgages allocated among the several classes in various ways. Payment of interest or principal on some classes or series of CMO’s may be subject to contingencies or some classes or series may bear some or all of the risk of default on the underlying mortgages. CMO’s of different classes or series are generally retired in sequence as the underlying mortgage loans in the mortgage pool are repaid. If enough mortgages are repaid ahead of schedule, the classes or series of a CMO with the earliest maturities generally will be retired prior to their maturities. Thus, the early retirement of particular classes or series of a CMO would have the same effect as the prepayment of mortgages underlying other mortgage-backed securities. Conversely, slower than anticipated prepayments can extend the effective maturities of CMO’s, subjecting them to a greater risk of decline in market value in response to rising interest rates than traditional debt securities, and therefore, potentially increasing their volatility.
25
Notes to Financial Statements (continued)
Prepayments could result in losses on stripped mortgage-backed securities. Stripped mortgage-backed securities are usually structured with two classes that receive different portions of interest and principal distributions on a pool of mortgage loans. The yield to maturity on an interest only or “IO” class of stripped mortgage-backed securities is extremely sensitive not only to changes in prevailing interest rates but also to the rate of principal payments (including prepayments) and the underlying assets. A rapid rate of principal prepayments may have a measurable adverse effect on the Fund’s yield to maturity to the extent it invests in IO’s. If the assets underlying the IO experience greater than anticipated prepayments of principal, a Fund may fail to recoup fully its initial investment in these securities. Conversely, principal only or “PO’s” tend to increase in value if prepayments are greater than anticipated and decline if prepayments are slower than anticipated.
| 6. | New Accounting Pronouncement |
In June 2006, the Financial Accounting Standards Board (“FASB”) issued Interpretation No. 48, “Accounting for Uncertainty in Income Taxes - an Interpretation of FASB Statement No. 109 (“FIN 48”).” FIN 48 applies to all registered investment companies and establishes the minimum threshold for recognizing, and a system for measuring, the benefits of tax-return positions in the financial statements. FIN 48 is effective for fiscal years beginning after December 15, 2006. The Investment Manager has analyzed the Funds’ tax positions taken on federal income tax returns for all open tax years (tax years ended March 31, 2005 – 2007 and December 31, 2007) and has concluded that as of June 30, 2008, no provision for income tax is required in the Funds’ financial statements. Additionally, the Investment Manager is not aware of any events that are reasonably possible to occur in the next twelve months that would result in the amounts of any unrecognized tax benefits significantly increasing or decreasing for the Funds. However, the Investment Manager’s conclusion regarding FIN 48 may be subject to review and adjustment at a later date based on factors including, but not limited to, further implementation guidance expected from FASB, and ongoing analysis of tax laws, regulations, and interpretations thereof.
| 7. | Change in Fiscal Year Ends |
Short Duration and Intermediate Duration have changed their fiscal year ends from March 31 to December 31, effective December 31, 2007.
26
Annual Renewal of Investment Advisory Agreements (unaudited)
On June 6, 2008, the Board of Trustees, including a majority of the Trustees who are not “interested persons” of the Trust (the “Independent Trustees”), approved the Investment Management Agreement with the Investment Manager for each of the Managers Short Duration Government Fund and the Managers Intermediate Duration Government Fund (each a “Fund”) and the Subadvisory Agreement with respect to each Fund. The Independent Trustees were separately represented by independent counsel in connection with their consideration of the approval of these agreements. In considering the Investment Management and Subadvisory Agreements, the Trustees reviewed a variety of materials relating to each Fund, the Investment Manager and the Subadvisor, including comparative performance, fee and expense information for an appropriate peer group of similar mutual funds for each Fund (each a “Peer Group”), performance information for the benchmark index for each Fund (each a “Fund Benchmark”) and other information regarding the nature, extent and quality of services provided by the Investment Manager and the Subadvisor under their respective agreements. The Trustees also took into account information on the services provided by the Investment Manager and the Subadvisor (including information provided at meetings held on May 15-16 and June 5-6, 2008), as well as performance, fee and expense information regarding each Fund provided to them on a quarterly basis throughout the year. Prior to voting, the Independent Trustees: (a) reviewed the foregoing information with their independent legal counsel and with management; (b) received materials from their independent legal counsel discussing the legal standards applicable to their consideration of the Investment Management Agreement and the Subadvisory Agreements; and (c) met with their independent legal counsel in private sessions at which no representatives of management were present.
Nature, extent and quality of services.
In considering the nature, extent and quality of the services provided by the Investment Manager, the Trustees reviewed information relating to the Investment Manager’s operations and personnel. Among other things, the Investment Manager provided financial information, biographical information on its supervisory and professional staff and descriptions of its organizational and management structure. The Trustees also took into account information provided periodically throughout the previous year by the Investment Manager relating to the performance of its duties with respect to the Funds and the Trustees’ familiarity with the Investment Manager’s management through Board meetings, discussions and reports. In the course of their deliberations regarding the Investment Management Agreement, the Trustees evaluated, among other things: (a) the extent and quality of the Investment Manager’s oversight of the operation and management of the Funds; (b) the quality of the search, selection and monitoring services performed by the Investment Manager in overseeing the portfolio management responsibilities of the Subadvisor; (c) the Investment Manager’s ability to supervise the Funds’ other service providers; and (d) the Investment Manager’s compliance programs. The Trustees also took into account the financial condition of the Investment Manager with respect to its ability to provide the services required under the Investment Management Agreement and to maintain a contractual expense limitation for the Intermediate Duration Government Fund.
For each Fund, the Trustees also reviewed information relating to the Subadvisor’s operations and personnel and the investment philosophy, strategies and techniques (the “Investment Strategy”) used in managing each Fund. Among other things, the Trustees reviewed biographical information on portfolio management and other professional staff, information regarding the Subadvisor’s organizational and management structure and the Subadvisor’s brokerage policies and practices. The Trustees considered specific information provided regarding the experience of the individuals at the Subadvisor with portfolio management responsibility for the Funds, including the information set forth in the Funds’ prospectus and statement of additional information. In the course of their deliberations, the Trustees evaluated, among other things: (a) the services rendered by the Subadvisor in the past; (b) the qualifications and experience of the Subadvisor’s personnel; and (c) the Subadvisor’s compliance programs. The Trustees also took into account the financial condition of the Subadvisor with respect to its ability to provide the services required under each Subadvisory Agreement.
Performance.
With respect to the Managers Short Duration Government Fund, among other information relating to the Fund’s performance, the Trustees noted that the Fund’s performance for the 1-year, 3-year, 5-year and 10-year periods ended March 31, 2008 was above the median performance of its Peer Group for each period and below, below, below and above, respectively, the performance of the Fund Benchmark, the Merrill Lynch 6-Month U.S. T-Bill Index. The Trustees concluded that the Fund’s performance has been satisfactory.
With respect to the Managers Intermediate Duration Government Fund, among other information relating to the Fund’s performance, the Trustees noted that the Fund’s performance for the 1-year, 3-year, 5-year and 10-year periods ended March 31, 2008 was below, below, above and above, respectively, the median performance of its Peer Group and below the performance of the Fund Benchmark, the Citigroup Mortgage Index, for each period. The Trustees took into account management’s discussion of the Fund’s performance, including the effect of current mortgage market conditions on short-term performance. The Trustees also noted the Fund’s strong long-term performance relative to its Peer Group. The Trustees concluded that the Fund’s overall performance has been satisfactory in light of all factors considered.
As noted above, the Board considered each Fund’s performance during relevant time periods as compared to the Fund’s Peer Group and noted that the Board reviews on a quarterly basis detailed information about both the Fund’s performance results and portfolio composition as well as the Subadvisor’s Investment Strategy. The Board also noted the Investment Manager’s expertise and resources in monitoring the performance, investment style and risk-adjusted performance of the Subadvisor. The Board was mindful of the Investment Manager’s attention to monitoring the Subadvisor’s performance with respect to the Funds and its discussions with management regarding the factors that contributed to the performance of the Funds.
Advisory and Subadvisory Fees and Profitability.
In considering the reasonableness of the advisory fee payable to the Investment Manager and the subadvisory fee payable by the Investment Manager to the Subadvisor, the Trustees reviewed information provided by the Investment Manager setting forth all revenues and other benefits, both direct and indirect, received by the Investment Manager and its affiliates attributable to managing each Fund and all the mutual funds in the Managers Family of Funds, the cost of providing such services and the resulting profitability to the
27
Annual Renewal of Investment Advisory Agreements (continued)
Investment Manager and its affiliates from these relationships. The Trustees also noted that the Investment Manager, and not the Funds, is responsible for paying the fees charged by the Subadvisor and, therefore, that the fees paid to the Investment Manager cover the cost of providing portfolio management services as well as the cost of providing search, selection and monitoring services in operating a “manager-of-managers” complex of mutual funds. The Trustees concluded that, in light of the additional high quality supervisory services provided by the Investment Manager and the fact that the subadvisory fees are paid out of the advisory fee, the advisory fee payable by each Fund to the Investment Manager can reasonably be expected to exceed the median advisory fee for each Fund’s Peer Group, which consists of many funds that do not operate using a manager-of-managers structure. In this regard, the Trustees also noted that the Investment Manager has undertaken to maintain an expense limitation for the Intermediate Duration Government Fund.
The Trustees also noted the current asset levels of each Fund and the willingness of the Investment Manager to waive fees and pay expenses for the Intermediate Duration Government Fund from time to time as a means of limiting its total expenses. The Board took into account management’s discussion of the current advisory fee structure of the Funds. On this basis, the Trustees concluded that the profitability to the Investment Manager and its affiliates of their relationships with the Funds is reasonable and that the Investment Manager is not realizing material benefits from economies of scale that would warrant adjustments to the fees for either Fund at this time. With respect to economies of scale, the Trustees also noted that as a Fund’s assets increase over time, the Fund may realize other economies of scale to the extent that the increase in assets is proportionally greater than the increase in certain other expenses.
In considering the reasonableness of the fee payable by the Investment Manager to the Subadvisor, the Trustees relied on the ability of the Investment Manager to negotiate the terms of the Subadvisory Agreements at arm’s length as part of the manager-of-managers structure, noting that the Investment Manager is not affiliated with the Subadvisor. Accordingly, the cost of services to be provided by the Subadvisor and the profitability to the Subadvisor of its relationship with each Fund were not material factors in the Trustees’ deliberations. For similar reasons, and based on the current size of each Fund, the Trustees concluded that the effect of any economies of scale being realized by the Subadvisor in managing the Fund was not a material factor at this time.
The Trustees noted that each Fund’s advisory fee and total expenses (net of applicable expense waivers/reimbursements) as of March 31, 2008 were both higher than the average for the Fund’s Peer Group. The Trustees took into account the fact that the Investment Manager has contractually agreed, through May 1, 2009, to limit the Intermediate Duration Government Fund’s net annual operating expenses to 0.89%. The Trustees concluded that, in light of the nature, extent and quality of the services provided by the Investment Manager and the Subadvisor, each Fund’s performance and the considerations noted above with respect to the Subadvisor and the Investment Manager, the Funds’ advisory fees are reasonable.
* * * * *
After consideration of the foregoing, the Trustees also reached the following conclusions regarding the Investment Management and Subadvisory Agreements in addition to the conclusions discussed above: (a) the Investment Manager has demonstrated that it possesses the resources and capability to perform its duties under the Investment Management Agreement; (b) the Subadvisor has the resources to perform its duties under each of the Subadvisory Agreements and is qualified to manage each Fund’s assets in accordance with its investment objectives and policies; and (c) the Investment Manager and Subadvisor maintain appropriate compliance programs.
Based on all of the above-mentioned factors and their related conclusions, with no single factor or conclusion being determinative and with each Trustee not necessarily attributing the same weight to each factor, the Trustees concluded that approval of the Investment Management Agreement and each Subadvisory Agreement (as applicable) would be in the best interests of each Fund and its shareholders. Accordingly, on June 6, 2008, the Trustees, including a majority of the Independent Trustees, voted to approve the Investment Management and Subadvisory Agreements for each Fund.
Administrator
Managers Investment Group LLC
800 Connecticut Avenue
Norwalk, Connecticut 06854
(203) 299-3500 or (800) 835-3879
Distributor
Managers Distributors, Inc.
800 Connecticut Avenue
Norwalk, Connecticut 06854
(203) 299-3500 or (800) 835-3879
Subadvisor
Smith Breeden Associates, Inc.
280 South Magnum Street, Suite 301
Durham, North Carolina 27701
Custodian
The Bank of New York Mellon
2 Hanson Place
Brooklyn, New York 11217
Legal Counsel
Ropes & Gray LLP
One International Place
Boston, Massachusetts 02110-2624
Transfer Agent
PNC Global Investment Servicing (U.S.) Inc.
Attn: Managers
P.O. Box 9769
Providence, Rhode Island 02940
(800) 548-4539
Trustees
Jack W. Aber
William E. Chapman, II
Nathaniel Dalton
Edward J. Kaier
Steven J. Paggioli
Eric Rakowski
Thomas R. Schneeweis
John H. Streur
For Managers Choice Only
Managers
c/o PNC Global Investment Servicing (U.S.) Inc.
P.O. Box 61204
King of Prussia, Pennslyvania 19406-0851
(800) 358-7668
28
MANAGERS AND MANAGERS AMG EQUITY FUNDS
EMERGING MARKETS EQUITY
Rexiter Capital Management Limited
ESSEX GROWTH
ESSEX LARGE CAP GROWTH
ESSEX SMALL/MICRO CAP GROWTH
Essex Investment Management Co., LLC
FQ TAX-MANAGED U.S. EQUITY
FQ U.S. EQUITY
First Quadrant, L.P.
INSTITUTIONAL MICRO-CAP MICRO-CAP
Lord, Abbett & Co. LLC
WEDGE Capital Management L.L.P.
OFI Institutional Asset Management, Inc.
Next Century Growth Investors LLC
INTERNATIONAL EQUITY
AllianceBernstein L.P.
Lazard Asset Management, LLC
Wellington Management Company, LLP
CHICAGO EQUITY PARTNERS
MID-CAP
Chicago Equity Partners, LLC
REAL ESTATE SECURITIES
Urdang Securities Management, Inc.
SKYLINE SPECIAL EQUITIES
PORTFOLIO
Skyline Asset Management, L.P.
SMALL CAP
TIMESSQUARE MID CAP GROWTH
TIMESSQUARE SMALL CAP GROWTH
TimesSquare Capital Management, LLC
SMALL COMPANY
Epoch Investment Partners, Inc.
Kalmar Investment Advisers
SPECIAL EQUITY
Donald Smith & Co., Inc.
Lord, Abbett & Co. LLC
Skyline Asset Management, L.P.
Smith Asset Management Group, L.P.
Veredus Asset Management LLC
Westport Asset Management, Inc.
SYSTEMATIC VALUE
SYSTEMATIC MID CAP VALUE
Systematic Financial Management, L.P.
VALUE
Armstrong Shaw Associates Inc.
Osprey Partners Investment Management, LLC
MANAGERSAND MANAGERS AMG BALANCED FUNDS
CHICAGO EQUITY PARTNERS BALANCED
Chicago Equity Partners, LLC
GLOBAL
AllianceBernstein L.P.
First Quadrant, L.P.
Wellington Management Company, LLP
ALTERNATIVE FUNDS
FQ GLOBAL ALTERNATIVES
First Quadrant, L.P.
MANAGERS FIXED INCOME FUNDS
BOND (MANAGERS)
FIXED INCOME
GLOBAL BOND
Loomis, Sayles & Co., L.P.
BOND (MANAGERS FREMONT)
Pacific Investment Management Co. LLC
CALIFORNIA INTERMEDIATE TAX-FREE
Evergreen Investment Management Co., LLC
HIGH YIELD
J.P. Morgan Investment Management LLC
INTERMEDIATE DURATION GOVERNMENT
SHORT DURATION GOVERNMENT
Smith Breeden Associates, Inc.
MONEY MARKET
JPMorgan Investment Advisors Inc.
This report is prepared for the Funds’ shareholders. It is authorized for distribution to prospective investors only when preceded or accompanied by an effective prospectus. To receive a free copy of the prospectus or Statement of Additional Information, which includes additional information about Fund Trustees, please contact us by calling 800.835.3879. Distributed by Managers Distributors, Inc., member FINRA.
A description of the policies and procedures each Fund uses to vote its proxies is available: (i) without charge, upon request, by calling 800.835.3879, or (ii) on the Securities and Exchange Commission’s (SEC) Web site at www.sec.gov. For information regarding each Fund’s proxy voting record for the 12-month period ended June 30, call 800.835.3879 or visit the SEC Web site at www.sec.gov.
The Funds file their complete schedule of portfolio holdings with the SEC for the first and third quarters of each fiscal year on Form N-Q. The Funds’ Forms N-Q are available on the SEC’s website at www.sec.gov. A Fund’s Forms N-Q may be reviewed and copied at the SEC’s Public Reference Room in Washington, DC. Information on the operation of the Public Reference Room may be obtained by calling 800.SEC.0330. To review a complete list of the Funds’ portfolio holdings, or to view the most recent quarterly holdings report, semiannual report, or annual report, please visit www.managersinvest.com.
www.managersinvest.com

Not applicable for the semi-annual shareholder report.
| Item 3. | AUDIT COMMITTEE FINANCIAL EXPERT |
Not applicable for the semi-annual shareholder report.
| Item 4. | PRINCIPAL ACCOUNTANT FEES AND SERVICES |
Not applicable for the semi-annual shareholder report.
| Item 5. | AUDIT COMMITTEE OF LISTED REGISTRANTS |
Not applicable.
| Item 6. | SCHEDULE OF INVESTMENTS |
The schedule of investments in unaffiliated issuers as of the close of the reporting period is included as part of the shareholder report contained in Item 1 hereof.
| Item 7. | DISCLOSURE OF PROXY VOTING POLICIES AND PROCEDURES FOR CLOSED-END MANAGEMENT INVESTMENT COMPANIES |
Not applicable.
| Item 8. | PORTFOLIO MANAGERS OF CLOSED-END MANAGEMENT INVESTMENT COMPANIES |
Not applicable.
| Item 9. | PURCHASES OF EQUITY SECURITIES BY CLOSED-END MANAGEMENT INVESTMENT COMPANIES AND AFFILIATED PURCHASERS |
Not applicable.
| Item 10. | SUBMISSION OF MATTERS TO A VOTE OF SECURITY HOLDERS |
Not applicable.
| Item 11. | CONTROLS AND PROCEDURES |
| | (a) | The registrant’s principal executive and principal financial officers have concluded, based on their evaluation of the registrant’s disclosure controls and procedures as of a date within 90 days of the filing date of this report, that the registrant’s disclosure controls and procedures are reasonably designed to ensure that information required to be disclosed by the registrant on Form N-CSR is recorded, processed, summarized and reported within the required time periods and that information required to be disclosed by the registrant in the reports that it files or submits on Form N-CSR is accumulated and communicated to the registrant’s management, including its principal executive and principal financial officers, as appropriate to allow timely decisions regarding required disclosure. |
| | (b) | There were no changes in the registrant’s internal control over financial reporting during the registrant’s second fiscal quarter of the period covered by this report that have materially affected, or are reasonably likely to materially affect, the internal control over financial reporting. |
| | | | |
| (a) | | (1) | | Not applicable. |
| (a) | | (2) | | Certifications pursuant to Rule 30a-2(a) under the Investment Company Act of 1940 – Filed herewith. |
| (a) | | (3) | | Not applicable. |
| | |
| (b) | | | | Certifications pursuant to Rule 30a-2(b) under the Investment Company Act of 1940 – Filed herewith. |
SIGNATURES
Pursuant to the requirements of the Securities Exchange Act of 1934 and the Investment Company Act of 1940, the registrant has duly caused this report to be signed on its behalf by the undersigned, thereunto duly authorized.
MANAGERS TRUST II
| | |
| |
| By: | | /s/ John H. Streur |
| | John H. Streur, President |
| |
| Date: | | August 29, 2008 |
Pursuant to the requirements of the Securities Exchange Act of 1934 and the Investment Company Act of 1940, this report has been signed below by the following persons on behalf of the registrant and in the capacities and on the dates indicated.
| | |
| By: | | /s/ John H. Streur |
| | John H. Streur, President |
| |
| Date: | | August 29, 2008 |
| |
| By: | | /s/ Donald S. Rumery |
| | Donald S. Rumery, Chief Financial Officer |
| |
| Date: | | August 29, 2008 |