UNITED STATES
SECURITIES AND EXCHANGE COMMISSION
Washington, D.C. 20549
FORM N-CSRS
CERTIFIED SHAREHOLDER REPORT OF
REGISTERED MANAGEMENT INVESTMENT COMPANIES
Investment Company Act file number: 811-06431
MANAGERS TRUST II
(Exact name of registrant as specified in charter)
800 Connecticut Avenue, Norwalk, Connecticut 06854
(Address of principal executive offices) (Zip code)
Managers Investment Group LLC
800 Connecticut Avenue, Norwalk, Connecticut 06854
(Name and address of agent for service)
Registrant’s telephone number, including area code: (203) 299-3500
Date of fiscal year end: DECEMBER 31
Date of reporting period: JANUARY 1, 2009 – JUNE 30, 2009
(Semi-Annual Shareholder Report)
| Item 1. | Reports to Shareholders |
SEMI-ANNUAL REPORT
Managers Trust II Funds
June 30, 2009
Managers AMG Chicago Equity Partners Mid-Cap Fund
Managers AMG Chicago Equity Partners Balanced Fund
Managers High Yield Fund
Managers Fixed Income Fund
Managers Short Duration Government Fund
Managers Intermediate Duration Government Fund

The Managers Funds
Semi-Annual Report — June 30, 2009 (unaudited)
TABLE OF CONTENTS
Nothing contained herein is to be considered an offer, sale or solicitation of an offer to buy shares of any series of the Managers Family of Funds. Such offering is made only by Prospectus, which includes details as to offering price and other material information.
About Your Fund’s Expenses (unaudited)
As a shareholder of a Fund, you may incur two types of costs: (1) transaction costs, which may include sales charges (loads) on purchase payments; redemption fees; and exchange fees; and (2) ongoing costs, including management fees; distribution (12b-1) fees; and other Fund expenses. This example is intended to help you understand your ongoing costs (in dollars) of investing in the Fund and to compare these costs with the ongoing costs of investing in other mutual funds. The example is based on $1,000 invested at the beginning of the period and held for the entire period as indicated below.
Actual Expenses
The first line of the following table provides information about the actual account values and actual expenses. You may use the information in this line, together with the amount you invested, to estimate the expenses that you paid over the period. Simply divide your account value by $1,000 (for example, an $8,600 account value divided by $1,000 = 8.6), then multiply the result by the number in the first line under the heading entitled “Expenses Paid During Period” to estimate the expenses you paid on your account during this period.
Hypothetical Example for Comparison Purposes
The second line of the following table provides information about hypothetical account values and hypothetical expenses based on the Fund’s actual expense ratio and an assumed annual rate of return of 5% before expenses, which is not the Fund’s actual return. The hypothetical account values and expenses may not be used to estimate the actual ending account balance or expenses you paid for the period. You may use this information to compare the ongoing costs of investing in the Fund and other funds by comparing this 5% hypothetical example with the 5% hypothetical examples that appear in the shareholder reports of other funds.
Please note that the expenses shown in the table are meant to highlight your ongoing costs only and do not reflect any transactional costs, such as sales charges (loads), redemption fees, or exchange fees. Therefore, the second line of the table is useful in comparing ongoing costs only, and will not help you determine the relative total costs of owning different funds.
| | | | | | | | | | | | |
Six Months Ended June 30, 2009 | | Expense
Ratio for
the Period | | | Beginning
Account Value
01/01/2009 | | Ending
Account Value
06/30/2009 | | Expenses
Paid During
Period* |
Managers AMG Chicago Equity Partners Mid-Cap Fund Class A | | | | | | | | | | | | |
Based on Actual Fund Return | | 1.24 | % | | $ | 1,000 | | $ | 1,101 | | $ | 6.46 |
Based on Hypothetical 5% Annual Return | | 1.24 | % | | $ | 1,000 | | $ | 1,019 | | $ | 6.21 |
Managers AMG Chicago Equity Partners Mid-Cap Fund Class B | | | | | | | | | | | | |
Based on Actual Fund Return | | 1.99 | % | | $ | 1,000 | | $ | 1,097 | | $ | 10.35 |
Based on Hypothetical 5% Annual Return | | 1.99 | % | | $ | 1,000 | | $ | 1,015 | | $ | 9.94 |
Managers AMG Chicago Equity Partners Mid-Cap Fund Class C | | | | | | | | | | | | |
Based on Actual Fund Return | | 1.99 | % | | $ | 1,000 | | $ | 1,097 | | $ | 10.35 |
Based on Hypothetical 5% Annual Return | | 1.99 | % | | $ | 1,000 | | $ | 1,015 | | $ | 9.94 |
Managers AMG Chicago Equity Partners Mid-Cap Fund Institutional Class | | | | | | | | | | | | |
Based on Actual Fund Return | | 0.99 | % | | $ | 1,000 | | $ | 1,103 | | $ | 5.16 |
Based on Hypothetical 5% Annual Return | | 0.99 | % | | $ | 1,000 | | $ | 1,020 | | $ | 4.96 |
Managers AMG Chicago Equity Partners Balanced Fund Class A | | | | | | | | | | | | |
Based on Actual Fund Return | | 1.25 | % | | $ | 1,000 | | $ | 1,055 | | $ | 6.37 |
Based on Hypothetical 5% Annual Return | | 1.25 | % | | $ | 1,000 | | $ | 1,019 | | $ | 6.26 |
Managers AMG Chicago Equity Partners Balanced Fund Class B | | | | | | | | | | | | |
Based on Actual Fund Return | | 2.00 | % | | $ | 1,000 | | $ | 1,053 | | $ | 10.18 |
Based on Hypothetical 5% Annual Return | | 2.00 | % | | $ | 1,000 | | $ | 1,015 | | $ | 9.99 |
Managers AMG Chicago Equity Partners Balanced Fund Class C | | | | | | | | | | | | |
Based on Actual Fund Return | | 2.00 | % | | $ | 1,000 | | $ | 1,052 | | $ | 10.18 |
Based on Hypothetical 5% Annual Return | | 2.00 | % | | $ | 1,000 | | $ | 1,015 | | $ | 9.99 |
Managers AMG Chicago Equity Partners Balanced Fund Institutional Class | | | | | | | | | | | | |
Based on Actual Fund Return | | 1.00 | % | | $ | 1,000 | | $ | 1,057 | | $ | 5.10 |
Based on Hypothetical 5% Annual Return | | 1.00 | % | | $ | 1,000 | | $ | 1,020 | | $ | 5.01 |
| * | Expenses are equal to the Fund’s annualized expense ratio multiplied by the average account value over the period, multiplied by the number of days in the most recent fiscal half-year (181), then divided by 365. |
1
About Your Fund’s Expenses (continued)
| | | | | | | | | | | | |
Six Months Ended June 30, 2009 | | Expense
Ratio for
the Period | | | Beginning
Account Value
01/01/2009 | | Ending
Account Value
06/30/2009 | | Expenses
Paid During
Period* |
Managers High Yield Fund Class A | | | | | | | | | | | | |
Based on Actual Fund Return | | 1.15 | % | | $ | 1,000 | | $ | 1,264 | | $ | 6.45 |
Based on Hypothetical 5% Annual Return | | 1.15 | % | | $ | 1,000 | | $ | 1,019 | | $ | 5.76 |
Managers High Yield Fund Class B | | | | | | | | | | | | |
Based on Actual Fund Return | | 1.90 | % | | $ | 1,000 | | $ | 1,255 | | $ | 10.62 |
Based on Hypothetical 5% Annual Return | | 1.90 | % | | $ | 1,000 | | $ | 1,015 | | $ | 9.49 |
Managers High Yield Fund Class C | | | | | | | | | | | | |
Based on Actual Fund Return | | 1.90 | % | | $ | 1,000 | | $ | 1,258 | | $ | 10.64 |
Based on Hypothetical 5% Annual Return | | 1.90 | % | | $ | 1,000 | | $ | 1,015 | | $ | 9.49 |
Managers High Yield Fund Institutional Class | | | | | | | | | | | | |
Based on Actual Fund Return | | 0.90 | % | | $ | 1,000 | | $ | 1,270 | | $ | 5.06 |
Based on Hypothetical 5% Annual Return | | 0.90 | % | | $ | 1,000 | | $ | 1,020 | | $ | 4.51 |
Managers Fixed Income Fund Class A | | | | | | | | | | | | |
Based on Actual Fund Return | | 0.84 | % | | $ | 1,000 | | $ | 1,108 | | $ | 4.39 |
Based on Hypothetical 5% Annual Return | | 0.84 | % | | $ | 1,000 | | $ | 1,021 | | $ | 4.21 |
Managers Fixed Income Fund Class B | | | | | | | | | | | | |
Based on Actual Fund Return | | 1.59 | % | | $ | 1,000 | | $ | 1,103 | | $ | 8.29 |
Based on Hypothetical 5% Annual Return | | 1.59 | % | | $ | 1,000 | | $ | 1,017 | | $ | 7.95 |
Managers Fixed Income Fund Class C | | | | | | | | | | | | |
Based on Actual Fund Return | | 1.59 | % | | $ | 1,000 | | $ | 1,102 | | $ | 8.29 |
Based on Hypothetical 5% Annual Return | | 1.59 | % | | $ | 1,000 | | $ | 1,017 | | $ | 7.95 |
Managers Fixed Income Fund Institutional Class | | | | | | | | | | | | |
Based on Actual Fund Return | | 0.59 | % | | $ | 1,000 | | $ | 1,108 | | $ | 3.08 |
Based on Hypothetical 5% Annual Return | | 0.59 | % | | $ | 1,000 | | $ | 1,022 | | $ | 2.96 |
Managers Short Duration Government Fund | | | | | | | | | | | | |
Based on Actual Fund Return | | 0.83 | % | | $ | 1,000 | | $ | 1,040 | | $ | 4.20 |
Based on Hypothetical 5% Annual Return | | 0.83 | % | | $ | 1,000 | | $ | 1,021 | | $ | 4.16 |
Managers Intermediate Duration Government Fund | | | | | | | | | | | | |
Based on Actual Fund Return | | 0.89 | % | | $ | 1,000 | | $ | 1,056 | | $ | 4.54 |
Based on Hypothetical 5% Annual Return | | 0.89 | % | | $ | 1,000 | | $ | 1,020 | | $ | 4.46 |
| * | Expenses are equal to the Fund’s annualized expense ratio multiplied by the average account value over the period, multiplied by the number of days in the most recent fiscal half-year (181), then divided by 365. |
2
Funds’ Performance
All periods ended June 30, 2009 (unaudited)
| | | | | | | | | | | | | | | | | | |
Average Annual Total Returns1 | | | | | | Six
Months | | | 1 Year | | | 5 Years | | | 10 Years | | | Inception
Date |
Mid-Cap 3,12 | | Class A | | No Load | | 10.10 | % | | (32.65 | )% | | (3.01 | )% | | 3.55 | % | | 01/02/97 |
| | Class A | | With Load | | 3.73 | % | | (36.54 | )% | | (4.15 | )% | | 2.94 | % | | 01/02/97 |
| | Class B | | No Load | | 9.69 | % | | (33.15 | )% | | (3.69 | )% | | 2.94 | % | | 01/28/98 |
| | Class B | | With Load | | 4.69 | % | | (36.49 | )% | | (4.05 | )% | | 2.94 | % | | 01/28/98 |
| | Class C | | No Load | | 9.70 | % | | (33.18 | )% | | (3.73 | )% | | 2.93 | % | | 02/19/98 |
| | Class C | | With Load | | 8.70 | % | | (33.84 | )% | | (3.73 | )% | | 2.93 | % | | 02/19/98 |
| | Institutional Class | | No Load | | 10.32 | % | | (32.46 | )% | | (2.77 | )% | | 3.95 | % | | 01/02/97 |
S&P Mid Cap 400 Index 4 | | | | | | 8.47 | % | | (28.02 | )% | | 0.36 | % | | 4.62 | % | | |
Balanced 2,5,11,12 | | Class A | | No Load | | 5.46 | % | | (9.83 | )% | | 2.55 | % | | 4.35 | % | | 01/02/97 |
| | Class A | | With Load | | (0.62 | )% | | (15.03 | )% | | 1.34 | % | | 3.73 | % | | 01/02/97 |
| | Class B | | No Load | | 5.28 | % | | (10.41 | )% | | 1.84 | % | | 3.75 | % | | 02/10/98 |
| | Class B | | With Load | | 0.28 | % | | (14.82 | )% | | 1.47 | % | | 3.75 | % | | 02/10/98 |
| | Class C | | No Load | | 5.20 | % | | (10.47 | )% | | 1.83 | % | | 3.74 | % | | 02/13/98 |
| | Class C | | With Load | | 4.20 | % | | (11.35 | )% | | 1.83 | % | | 3.74 | % | | 02/13/98 |
| | Institutional Class | | No Load | | 5.65 | % | | (9.61 | )% | | 2.85 | % | | 4.78 | % | | 01/02/97 |
60% S&P 500 Index & 40% Barclays Capital U.S. Aggregate Bond Index 6 | | | | | | 3.47 | % | | (12.40 | )% | | 1.35 | % | | 1.64 | % | | |
High Yield 2,5,7,12 | | Class A | | No Load | | 26.36 | % | | (9.69 | )% | | 2.37 | % | | 3.88 | % | | 01/02/98 |
| | Class A | | With Load | | 21.08 | % | | (13.57 | )% | | 1.48 | % | | 3.43 | % | | 01/02/98 |
| | Class B | | No Load | | 25.50 | % | | (10.61 | )% | | 1.56 | % | | 3.19 | % | | 02/19/98 |
| | Class B | | With Load | | 20.50 | % | | (14.67 | )% | | 1.27 | % | | 3.19 | % | | 02/19/98 |
| | Class C | | No Load | | 25.77 | % | | (10.37 | )% | | 1.60 | % | | 3.22 | % | | 02/19/98 |
| | Class C | | With Load | | 24.77 | % | | (11.18 | )% | | 1.60 | % | | 3.22 | % | | 02/19/98 |
| | Institutional Class | | No Load | | 26.95 | % | | (9.03 | )% | | 2.73 | % | | 4.35 | % | | 03/02/98 |
Barclays Capital U.S. Corporate High Yield Bond Index 8 | | | | | | 30.43 | % | | (2.40 | )% | | 4.33 | % | | 4.69 | % | | |
Fixed Income 2,5,11,12 | | Class A | | No Load | | 10.75 | % | | (0.80 | )% | | 3.97 | % | | 5.49 | % | | 01/02/97 |
| | Class A | | With Load | | 6.00 | % | | (5.05 | )% | | 3.07 | % | | 5.02 | % | | 01/02/97 |
| | Class B | | No Load | | 10.28 | % | | (1.62 | )% | | 3.20 | % | | 4.85 | % | | 03/20/98 |
| | Class B | | With Load | | 5.28 | % | | (6.29 | )% | | 2.87 | % | | 4.85 | % | | 03/20/98 |
| | Class C | | No Load | | 10.24 | % | | (1.56 | )% | | 3.20 | % | | 4.86 | % | | 03/05/98 |
| | Class C | | With Load | | 9.24 | % | | (2.50 | )% | | 3.20 | % | | 4.86 | % | | 03/05/98 |
| | Institutional Class | | No Load | | 10.75 | % | | (0.63 | )% | | 4.22 | % | | 5.91 | % | | 01/02/97 |
Barclays Capital U.S. Aggregate Bond Index 9 | | | | | | 1.90 | % | | 6.05 | % | | 5.01 | % | | 5.98 | % | | |
Short Duration Government 2,5,10,11 | | | | | | 3.99 | % | | 1.64 | % | | 3.35 | % | | 3.85 | % | | 03/31/92 |
Merrill Lynch Six-Month T-Bill Index 13 | | | | | | 0.30 | % | | 2.24 | % | | 3.63 | % | | 3.61 | % | | |
Intermediate Duration Government 2,5,10,11,12 | | | | | | 5.57 | % | | 6.43 | % | | 4.55 | % | | 5.38 | % | | 03/31/92 |
Citigroup Mortgage Index 14 | | | | | | 2.70 | % | | 9.38 | % | | 6.03 | % | | 6.32 | % | | |
The performance data shown represents past performance. Past performance is not a guarantee of future results. Current performance may be lower or higher than the performance data quoted. The investment return and the principal value of an investment will fluctuate so that an investor’s shares, when redeemed, may be worth more or less than their original cost. For performance information through the most recent month end please call (800) 835-3879 or visit our Web site at www.managersinvest.com.
3
Funds’ Performance (continued)
Performance differences among the share classes are due to differences in sales charge structures and class expenses. Returns shown reflect maximum sales charge of 5.75% on Class A (4.25% maximum for Managers High Yield and Fixed Income Funds), as well as the applicable contingent deferred sales charge (CDSC) on both Class B and C shares. The Class B shares’ CDSC declines annually between years 1 through 6 according to the following schedule: 5, 4, 3, 3, 2, 1%. No sales charge is assessed after year six. Class C shares held for less than one year are subject to a 1% CDSC.
In choosing a Fund and class(es), investors should consider the amount they plan to invest, their investment objectives, the Fund’s investment objectives, risks, charges, and expenses before investing. For this and other information, please call (800) 835-3879 or visit www.managersinvest.com for a free prospectus. Read it carefully before investing or sending money. Distributed by Managers Distributors, Inc., member FINRA.
| 1 | Total return equals income yield plus share price change and assumes reinvestment of all dividends and capital gain distributions. Returns are net of fees and may reflect offsets of Fund expenses as described in the Prospectus. No adjustment has been made for taxes payable by shareholders on their reinvested dividends and capital gain distributions. Returns for periods greater than one year are annualized. The listed returns on the Fund are net of expenses and based on the published NAV as of June 30, 2009. All returns are in U.S. dollars ($). |
| 2 | Changing interest rates may adversely affect the value of an investment. An increase in interest rates typically causes the value of bonds and other fixed-income securities to fall. |
| 3 | The Fund or strategy is subject to risks associated with investments in mid-capitalization companies, such as erratic earnings patterns, competitive conditions, limited earnings history, and a reliance on a limited number of products. |
| 4 | The S&P Mid Cap 400 Index is the most widely used index for mid-size companies and covers approximately 7% of the U.S. equities market. Unlike the Fund, the S&P Mid Cap 400 Index is unmanaged, is not available for investment, and does not incur expenses. |
| 5 | The Fund is subject to the risks associated with investments in debt securities, such as default risk and fluctuations in the perception of the debtor’s ability to pay its creditors. |
| 6 | The benchmark is composed of 60% S&P 500 Index and 40% Barclays Capital U.S. Aggregate Bond Index. The S&P 500 Index is proprietary data of Standard & Poor’s, a division of McGraw-Hill Companies, Inc. |
| 7 | The Fund holds securities in which the issuer of the security may default or otherwise be unable to honor a financial obligation. The Fund holds securities rated below investment grade that are especially susceptible to this risk. These issuers may be involved in bankruptcy proceedings, reorganizations, or financial restructurings, and are not as strong financially as higher-rated issuers. |
| 8 | The Barclays Capital U.S. Corporate High Yield Bond Index is a total return performance benchmark for fixed income securities having a maximum quality rating of Ba1 (as determined by Moody’s Investors Service). Unlike the Fund, the Barclays Capital U.S. Corporate High Yield Bond Index is unmanaged, is not available for investment, and does not incur expenses. |
| 9 | The Barclays Capital U.S. Aggregate Bond Index is an index of the U.S. investment-grade fixed-rate bond market, including both government and corporate bonds. Unlike the Fund, the Barclays Capital U.S. Aggregate Bond Index is unmanaged, is not available for investment, and does not incur expenses. |
| 10 | The Fund may use derivative instruments for hedging purposes or as part of its investment strategy. There is also a risk that a derivative intended as a hedge may not perform as expected. The main risk with derivatives is that some types can amplify a gain or loss, potentially earning or losing substantially more money than the actual cost of the derivative or that the counterparty may fail to honor its contract terms, causing a loss for the Fund. Use of these instruments may involve certain costs and risks such as liquidity risk, interest rate risk, market risk, credit risk, management risk and the risk that a fund could not close out a position when it would be most advantageous to do so. |
| 11 | Many bonds have call provisions which allow the debtors to pay them back before maturity. This is especially true with mortgage securities, which can be paid back anytime. Typically debtors prepay their debt when it is to their advantage (when interest rates drop making a new loan at current rates more attractive), and thus likely to the disadvantage of bondholders, who may have to reinvest prepayment proceeds in securities with lower yields. Prepayment risk will vary depending on the provisions of the security and current interest rates relative to the interest rate of the debt. |
| 12 | From time to time, the Fund’s advisor has waived its fees and/or absorbed Fund expenses, which has resulted in higher returns. |
| 13 | The Merrill Lynch Six-Month T-Bill Index is an unmanaged index that measures returns of six-month Treasury Bills. Unlike the Short Duration Government Fund, the Merrill Lynch Six-Month T-Bill Index is unmanaged, is not available for investment, and does not incur expenses. |
| 14 | The Citigroup Mortgage Index includes all outstanding government sponsored fixed-rate mortgage-backed securities, weighted in proportion to their current market capitalization. The Index reflects no deductions for fees, expenses, or taxes. Unlike the Intermediate Duration Government Fund, the Citigroup Mortgage Index is unmanaged, is not available for investment, and does not incur expenses. |
Not FDIC insured, nor bank guaranteed. May lose value.
4
Managers AMG Chicago Equity Partners Mid-Cap Fund
Fund Snapshots
June 30, 2009 (unaudited)
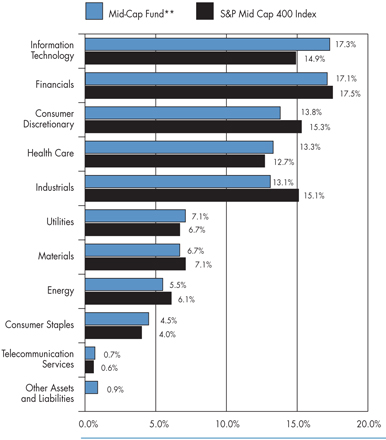
Portfolio Breakdown
| | | | | | |
Industry | | Mid-Cap** | | | S&P Mid Cap
400 Index | |
Information Technology | | 17.3 | % | | 14.9 | % |
Financials | | 17.1 | % | | 17.5 | % |
Consumer Discretionary | | 13.8 | % | | 15.3 | % |
Health Care | | 13.3 | % | | 12.7 | % |
Industrials | | 13.1 | % | | 15.1 | % |
Utilities | | 7.1 | % | | 6.7 | % |
Materials | | 6.7 | % | | 7.1 | % |
Energy | | 5.5 | % | | 6.1 | % |
Consumer Staples | | 4.5 | % | | 4.0 | % |
Telecommunication Services | | 0.7 | % | | 0.6 | % |
Other Assets and Liabilities | | 0.9 | % | | 0.0 | % |
| ** | As a percentage of net assets |
Top Ten Holdings
| | | |
Top Ten Holdings | | % of
Net Assets | |
Ingram Micro, Inc., Class A | | 1.9 | % |
Ross Stores, Inc.* | | 1.8 | |
Joy Global, Inc. | | 1.5 | |
Sybase, Inc.* | | 1.4 | |
Hewitt Associates, Inc., Class A | | 1.4 | |
Owens & Minor, Inc.* | | 1.3 | |
Health Net, Inc. | | 1.3 | |
Valeant Pharmaceuticals International | | 1.3 | |
BJ’s Wholesale Club, Inc.* | | 1.2 | |
Charles River Laboratories International, Inc. | | 1.2 | |
| | | |
Top Ten as a Group | | 14.3 | % |
| | | |
| * | Top Ten Holding at December 31, 2008 |
Any sectors, industries, or securities discussed should not be perceived as investment recommendations. Mention of a specific security should not be considered a recommendation to buy or solicitation to sell that security. Specific securities mentioned in this report may have been sold from the Fund’s portfolio of investments by the time you receive this report.
5
Managers AMG Chicago Equity Partners Mid-Cap Fund
Schedule of Portfolio Investments
June 30, 2009 (unaudited)
| | | | | | |
| | | Shares | | | Value |
Common Stocks - 99.1% | | | | | | |
Consumer Discretionary - 13.8% | | | | | | |
Aeropostale, Inc.* | | 5,300 | | | $ | 181,631 |
Autonation, Inc.* | | 9,200 | 2 | | | 159,620 |
Bob Evans Farms, Inc. | | 6,600 | | | | 189,684 |
Borg Warner, Inc. | | 6,200 | | | | 211,730 |
Brinker International, Inc. | | 9,700 | | | | 165,191 |
Chipotle Mexican Grill, Inc.* | | 2,200 | 2 | | | 176,000 |
DeVry, Inc. | | 2,300 | | | | 115,092 |
Dollar Tree, Inc.* | | 8,900 | | | | 374,690 |
Foot Locker, Inc. | | 14,500 | | | | 151,815 |
ITT Educational Services, Inc.* | | 1,700 | | | | 171,122 |
Leggett & Platt, Inc. | | 10,200 | | | | 155,346 |
M. D. C. Holdings, Inc. | | 8,500 | | | | 255,935 |
Marvel Entertainment, Inc.* | | 6,600 | | | | 234,894 |
Netflix, Inc.* | | 2,200 | 2 | | | 90,948 |
NVR, Inc.* | | 500 | | | | 251,195 |
Panera Bread Co., Class A* | | 3,400 | 2 | | | 169,524 |
priceline.com, Inc.* | | 1,300 | | | | 145,015 |
Ross Stores, Inc. | | 15,400 | | | | 594,440 |
Strayer Education, Inc. | | 900 | 2 | | | 196,299 |
Warnaco Group, Inc., The* | | 10,000 | | | | 324,000 |
Whirlpool Corp. | | 3,100 | | | | 131,936 |
Total Consumer Discretionary | | | | | | 4,446,107 |
Consumer Staples - 4.5% | | | | | | |
BJ’s Wholesale Club, Inc.* | | 12,100 | | | | 389,983 |
Hansen Natural Corp.* | | 3,500 | | | | 107,870 |
Hormel Foods Corp. | | 8,400 | | | | 290,136 |
Lancaster Colony Corp. | | 8,100 | | | | 356,967 |
Ralcorp Holdings, Inc.* | | 5,100 | | | | 310,692 |
Total Consumer Staples | | | | | | 1,455,648 |
Energy - 5.5% | | | | | | |
Bill Barrett Corp.* | | 5,000 | | | | 137,300 |
Cimarex Energy Co. | | 8,700 | | | | 246,558 |
FMC Technologies, Inc.* | | 8,200 | | | | 308,156 |
Frontier Oil Corp. | | 10,300 | | | | 135,033 |
Helmerich & Payne, Inc. | | 5,300 | 2 | | | 163,611 |
Mariner Energy, Inc.* | | 7,100 | | | | 83,425 |
Newfield Exploration Co.* | | 7,600 | | | | 248,292 |
Oil States International, Inc.* | | 6,300 | | | | 152,523 |
Overseas Shipholding Group, Inc. | | 2,800 | | | | 95,312 |
Tidewater, Inc. | | 4,900 | | | | 210,063 |
Total Energy | | | | | | 1,780,273 |
Financials - 17.1% | | | | | | |
American Financial Group, Inc. | | 15,800 | | | | 340,964 |
AmeriCredit Corp.* | | 8,400 | 2 | | | 113,820 |
Annaly Capital Management, Inc. | | 12,800 | | | | 193,792 |
Arch Capital Group, Ltd.* | | 4,200 | | | | 246,036 |
Associated Bank Corp. | | 18,100 | | | | 226,250 |
Bank of Hawaii Corp. | | 8,600 | 2 | | | 308,138 |
Cullen/Frost Bankers, Inc. | | 4,000 | | | | 184,480 |
Duke Realty Corp. | | 34,200 | | | | 299,934 |
Eaton Vance Corp. | | 7,700 | | | | 205,975 |
Equity One, Inc. | | 15,800 | 2 | | | 209,508 |
Federal Realty Investment Trust | | 3,800 | | | | 195,776 |
Fidelity National Financial, Inc., Class C | | 12,600 | | | | 170,478 |
First American Corp. | | 6,600 | | | | 171,006 |
Hospitality Properties Trust | | 17,700 | | | | 210,453 |
HRPT Properties Trust | | 45,800 | | | | 185,948 |
Jefferies Group, Inc. | | 13,500 | | | | 287,955 |
Mack-Cali Realty Corp. | | 13,500 | | | | 307,800 |
Nationwide Health Properties, Inc. | | 6,300 | | | | 162,162 |
Platinum Underwriter Holdings, Ltd. | | 4,200 | | | | 120,078 |
Potlatch Corp. | | 11,300 | | | | 274,477 |
Protective Life Corp. | | 14,100 | | | | 161,304 |
Raymond James Financial, Inc. | | 10,400 | | | | 178,984 |
Reinsurance Group of America, Inc. | | 4,800 | | | | 167,568 |
Unitrin, Inc. | | 19,800 | | | | 237,996 |
Westamerica Bancorporation | | 3,100 | 2 | | | 153,791 |
Wilmington Trust Corp. | | 13,000 | 2 | | | 177,580 |
Total Financials | | | | | | 5,492,253 |
Health Care - 13.3% | | | | | | |
Cerner Corp.* | | 4,500 | | | | 280,305 |
Charles River Laboratories International, Inc.* | | 11,500 | | | | 388,125 |
Gen-Probe, Inc.* | | 3,800 | | | | 163,324 |
Health Management Associates, Inc.* | | 24,000 | | | | 118,560 |
Health Net, Inc.* | | 27,000 | | | | 419,850 |
Henry Schein, Inc.* | | 5,900 | | | | 282,905 |
Hill-Rom Holdings, Inc. | | 18,500 | | | | 300,070 |
Kindred Healthcare, Inc.* | | 11,600 | | | | 143,492 |
Life Technologies Corp. | | 4,506 | | | | 187,990 |
Omnicare, Inc. | | 4,400 | | | | 113,344 |
The accompanying notes are an integral part of these financial statements.
6
Managers AMG Chicago Equity Partners Mid-Cap Fund
Schedule of Portfolio Investments (continued)
| | | | | | |
| | | Shares | | | Value |
Health Care - 13.3% (continued) | | | | | | |
Owens & Minor, Inc. | | 9,800 | | | $ | 429,436 |
PDL BioPharma, Inc. | | 6,400 | | | | 50,560 |
Pharmaceutical Product Development, Inc. | | 8,200 | | | | 190,404 |
ResMed, Inc.* | | 6,000 | | | | 244,380 |
Steris Corp. | | 12,100 | | | | 315,568 |
Techne Corp. | | 3,900 | | | | 248,859 |
Valeant Pharmaceuticals International* | | 15,900 | 2 | | | 408,948 |
Total Health Care | | | | | | 4,286,120 |
Industrials - 13.1% | | | | | | |
Aecom Technology Corp.* | | 3,700 | | | | 118,400 |
AGCO Corp.* | | 4,000 | | | | 116,280 |
Alaska Airgroup, Inc.* | | 5,800 | | | | 105,908 |
Alliant Techsystems, Inc.* | | 2,900 | | | | 238,844 |
BE Aerospace, Inc.* | | 4,500 | | | | 64,620 |
Brink’s Co., The | | 7,900 | | | | 229,337 |
Bucyrus International, Inc. | | 6,100 | | | | 174,216 |
Dycom Industries, Inc.* | | 12,600 | | | | 139,482 |
Federal Signal Corp. | | 14,900 | | | | 113,985 |
Flowserve Corp. | | 3,500 | | | | 244,335 |
GrafTech International, Ltd.* | | 13,400 | | | | 151,554 |
Harsco Corp. | | 12,300 | | | | 348,090 |
J.B. Hunt Transport Services, Inc. | | 4,400 | | | | 134,332 |
Joy Global, Inc. | | 13,300 | | | | 475,076 |
KBR, Inc. | | 11,000 | | | | 202,840 |
Knight Transportation, Inc. | | 7,700 | | | | 127,435 |
Lincoln Electric Holdings, Inc. | | 4,100 | | | | 147,764 |
Nordson Corp. | | 9,700 | | | | 375,002 |
Oshkosh Truck Corp. | | 12,900 | | | | 187,566 |
R.R. Donnelley & Sons Co. | | 9,700 | | | | 112,714 |
Shaw Group, Inc., The* | | 6,000 | | | | 164,460 |
Werner Enterprises, Inc. | | 13,700 | | | | 248,244 |
Total Industrials | | | | | | 4,220,484 |
Information Technology - 17.3% | | | | | | |
3Com Corp.* | | 55,200 | | | | 259,992 |
Acxiom Corp. | | 14,500 | | | | 128,035 |
ADC Telecommunications, Inc.* | | 11,900 | | | | 94,724 |
Alliance Data Systems Corp.* | | 6,100 | 2 | | | 251,259 |
Atmel Corp.* | | 29,400 | | | | 109,662 |
Broadridge Financial Solutions, Inc. | | 9,000 | | | | 149,220 |
Convergys Corp.* | | 15,800 | | | | 146,624 |
Factset Research Systems, Inc. | | 4,200 | 2 | | | 209,454 |
Fairchild Semiconductor International, Inc.* | | 30,900 | | | | 215,991 |
Gartner, Inc.* | | 12,500 | | | | 190,750 |
Global Payments, Inc. | | 3,800 | | | | 142,348 |
Hewitt Associates, Inc., Class A* | | 15,100 | | | | 449,678 |
Ingram Micro, Inc., Class A* | | 34,000 | | | | 595,000 |
Lender Processing Services, Inc. | | 4,800 | | | | 133,296 |
Macrovision Solutions Corp.* | | 7,800 | | | | 170,118 |
Metavante Technologies, Inc.* | | 4,800 | | | | 124,128 |
NCR Corp.* | | 13,800 | | | | 163,254 |
NeuStar, Inc., Class A* | | 4,000 | | | | 88,640 |
Novellus Systems, Inc.* | | 12,300 | | | | 205,410 |
SAIC, Inc.* | | 8,400 | | | | 155,820 |
Silicon Laboratories, Inc.* | | 7,800 | | | | 295,932 |
Sybase, Inc.* | | 14,800 | | | | 463,832 |
Tech Data Corp.* | | 11,700 | | | | 382,707 |
Tellabs, Inc.* | | 24,300 | | | | 139,239 |
Western Digital Corp.* | | 11,000 | | | | 291,500 |
Total Information Technology | | | | | | 5,556,613 |
Materials - 6.7% | | | | | | |
Ashland, Inc. | | 8,600 | | | | 241,230 |
CF Industries Holdings, Inc. | | 1,400 | | | | 103,796 |
Commercial Metals Co. | | 6,200 | | | | 99,386 |
Cytec Industries, Inc. | | 7,300 | | | | 135,926 |
Louisana-Pacific Corp. | | 30,200 | | | | 103,284 |
Lubrizol Corp. | | 4,800 | | | | 227,088 |
MeadWestvaco Corp. | | 17,000 | | | | 278,970 |
Scotts Co., The, Class A | | 5,400 | | | | 189,270 |
Terra Industries, Inc. | | 4,200 | | | | 101,724 |
The Valspar Corp. | | 7,800 | | | | 175,734 |
Westlake Chemical Corp. | | 7,800 | | | | 159,042 |
Worthington Industries, Inc. | | 26,900 | | | | 344,051 |
Total Materials | | | | | | 2,159,501 |
Telecommunication Services - 0.7% | | | | | | |
CenturyTel, Inc. | | 4,300 | 2 | | | 132,010 |
NII Holdings, Inc., Class B* | | 5,100 | | | | 97,257 |
Total Telecommunication Services | | | | | | 229,267 |
Utilities - 7.1% | | | | | | |
Alliant Energy Corp. | | 14,400 | | | | 376,272 |
Energen Corp. | | 2,300 | | | | 91,770 |
Hawaiian Electric Industries, Inc. | | 15,000 | 2 | | | 285,900 |
The accompanying notes are an integral part of these financial statements.
7
Managers AMG Chicago Equity Partners Mid-Cap Fund
Schedule of Portfolio Investments (continued)
| | | | | | |
| | | Shares | | Value | |
Utilities - 7.1% (continued) | | | | | | |
Mirant Corp.* | | 11,600 | | $ | 182,584 | |
New Jersey Resources Corp. | | 4,100 | | | 151,864 | |
NiSource, Inc. | | 21,600 | | | 251,856 | |
NSTAR | | 5,200 | | | 166,972 | |
PNM Resources, Inc. | | 21,800 | | | 233,478 | |
UGI Corp. | | 12,100 | | | 308,429 | |
Vectren Corp. | | 9,200 | | | 215,556 | |
Total Utilities | | | | | 2,264,681 | |
Total Common Stocks (cost $33,904,707) | | | | | 31,890,947 | |
Short-Term Investments - 11.4% 1 | | | | | | |
BNY Institutional Cash Reserves Fund,
Series A, 0.06% 3 | | 3,082,893 | | | 3,082,893 | |
BNY Institutional Cash Reserves Fund,
Series B *3,10 | | 159,721 | | | 23,559 | |
Dreyfus Cash Management Fund, Institutional
Class Shares, 0.44% 11 | | 558,278 | | | 558,278 | |
Total Short-Term Investments
(cost $3,800,892) | | | | | 3,664,730 | |
Total Investments - 110.5%
(cost $37,705,599) | | | | | 35,555,677 | |
Other Assets, less Liabilities - (10.5)% | | | | | (3,374,748 | ) |
Net Assets - 100.0% | | | | $ | 32,180,929 | |
The accompanying notes are an integral part of these financial statements.
8
Managers AMG Chicago Equity Partners Balanced Fund
Fund Snapshots
June 30, 2009 (unaudited)
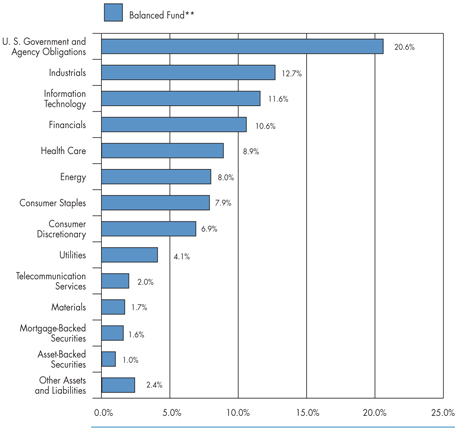
Portfolio Breakdown
| | | |
Industry | | Balanced** | |
U. S. Government and Agency Obligations | | 20.6 | % |
Industrials | | 12.7 | % |
Information Technology | | 11.6 | % |
Financials | | 10.6 | % |
Health Care | | 8.9 | % |
Energy | | 8.0 | % |
Consumer Staples | | 7.9 | % |
Consumer Discretionary | | 6.9 | % |
Utilities | | 4.1 | % |
Telecommunication Services | | 2.0 | % |
Materials | | 1.7 | % |
Mortgage-Backed Securities | | 1.6 | % |
Asset-Backed Securities | | 1.0 | % |
Other Assets and Liabilities | | 2.4 | % |
| ** | As a percentage of net assets |
Top Ten Holdings
| | | |
Top Ten Holdings | | % of
Net Assets | |
Exxon Mobil Corp.* | | 2.8 | % |
Johnson & Johnson* | | 2.1 | |
FNMA, 5.500%, 02/01/37* | | 1.8 | |
FNMA, 4.625%, 10/15/13 | | 1.8 | |
FHLMC, 5.750%, 05/15/12 | | 1.6 | |
FHLMC, 4.750%, 11/17/15 | | 1.5 | |
FNMA, 4.375%, 09/15/12 | | 1.5 | |
FNMA, 4.750%, 11/19/12 | | 1.4 | |
Pfizer, Inc.* | | 1.4 | |
Wal-Mart Stores, Inc. | | 1.4 | |
| | | |
Top Ten as a Group | | 17.3 | % |
| | | |
| * | Top Ten Holding at December 31, 2008 |
Any sectors, industries, or securities discussed should not be perceived as investment recommendations. Mention of a specific security should not be considered a recommendation to buy or solicitation to sell that security. Specific securities mentioned in this report may have been sold from the Fund’s portfolio of investments by the time you receive this report.
9
Managers AMG Chicago Equity Partners Balanced Fund
Schedule of Portfolio Investments
June 30, 2009 (unaudited)
| | | | | | |
Security Description | | Shares | | | Value |
Common Stocks - 64.1% | | | | | | |
Consumer Discretionary - 6.9% | | | | | | |
Amazon.com, Inc.* | | 1,500 | | | $ | 125,490 |
Apollo Group, Inc., Class A* | | 2,800 | | | | 199,136 |
Comcast Corp., Class A | | 10,200 | | | | 147,798 |
Family Dollar Stores, Inc. | | 1,500 | | | | 42,450 |
Johnson Controls, Inc. | | 3,500 | | | | 76,020 |
Leggett & Platt, Inc. | | 5,500 | | | | 83,765 |
Macy’s, Inc. | | 11,200 | | | | 131,712 |
McDonald’s Corp. | | 4,250 | | | | 244,332 |
Omnicom Group, Inc. | | 2,600 | | | | 82,108 |
Polo Ralph Lauren Corp. | | 900 | | | | 48,186 |
Ross Stores, Inc. | | 3,900 | | | | 150,540 |
Walt Disney Co., The | | 5,750 | | | | 134,148 |
Total Consumer Discretionary | | | | | | 1,465,685 |
Consumer Staples - 7.9% | | | | | | |
Altria Group, Inc. | | 4,520 | | | | 74,083 |
Archer-Daniels-Midland Co. | | 2,600 | | | | 69,602 |
Avon Products, Inc. | | 5,450 | | | | 140,501 |
Bunge, Ltd. | | 1,400 | 2 | | | 84,350 |
Coca-Cola Enterprises, Inc. | | 7,300 | | | | 121,545 |
Colgate-Palmolive Co. | | 1,100 | | | | 77,814 |
Herbalife, Ltd. | | 1,700 | | | | 53,618 |
Kimberly-Clark Corp. | | 800 | | | | 41,944 |
Kroger Co., The | | 5,250 | | | | 115,762 |
Lorillard, Inc. | | 900 | | | | 60,993 |
PepsiCo, Inc. | | 3,950 | | | | 217,092 |
Philip Morris International, Inc. | | 2,320 | | | | 101,198 |
Procter & Gamble Co., The | | 2,514 | | | | 128,465 |
Sysco Corp. | | 4,400 | | | | 98,912 |
Wal-Mart Stores, Inc. | | 6,100 | | | | 295,484 |
Total Consumer Staples | | | | | | 1,681,363 |
Energy - 8.0% | | | | | | |
Chevron Corp. | | 2,250 | | | | 149,062 |
ConocoPhillips Co. | | 6,000 | | | | 252,360 |
Devon Energy Corp. | | 3,100 | | | | 168,950 |
Ensco International, Inc. | | 2,500 | | | | 87,175 |
Exxon Mobil Corp. | | 8,420 | | | | 588,642 |
FMC Technologies, Inc.* | | 3,000 | | | | 112,740 |
Foundation Coal Holdings, Inc. | | 4,900 | | | | 137,739 |
Global Industries, Ltd.* | | 13,500 | 2 | | | 76,410 |
The accompanying notes are an integral part of these financial statements.
10
Managers AMG Chicago Equity Partners Balanced Fund
Schedule of Portfolio Investments (continued)
| | | | | |
Security Description | | Shares | | Value |
Energy - 8.0% (continued) | | | | | |
Tesoro Corp. | | 3,200 | | $ | 40,736 |
Valero Energy Corp. | | 5,800 | | | 97,962 |
Total Energy | | | | | 1,711,776 |
Financials - 8.4% | | | | | |
American Financial Group, Inc. | | 5,100 | | | 110,058 |
Bank of America Corp. | | 13,283 | | | 175,336 |
Bank of Hawaii Corp. | | 1,300 | | | 46,579 |
Boston Properties, Inc. | | 2,100 | | | 100,170 |
First American Corp. | | 1,500 | | | 38,865 |
Goldman Sachs Group, Inc. | | 1,950 | | | 287,508 |
Hanover Insurance Group, Inc. | | 1,000 | | | 38,110 |
JPMorgan Chase & Co. | | 6,548 | | | 223,352 |
Northern Trust Corp. | | 1,300 | | | 69,784 |
Prudential Financial, Inc. | | 4,800 | | | 178,656 |
Raymond James Financial, Inc. | | 5,400 | | | 92,934 |
SL Green Realty Corp. | | 4,600 | | | 105,524 |
U.S. Bancorp | | 7,200 | | | 129,024 |
Wells Fargo & Co. | | 7,600 | | | 184,376 |
Total Financials | | | | | 1,780,276 |
Health Care - 8.9% | | | | | |
Abbott Laboratories Co. | | 3,300 | | | 155,232 |
AmerisourceBergen Corp. | | 10,200 | | | 180,948 |
Amgen, Inc.* | | 2,100 | | | 111,174 |
Baxter International, Inc. | | 1,350 | | | 71,496 |
CR Bard, Inc. | | 700 | | | 52,115 |
Express Scripts, Inc.* | | 2,500 | | | 171,875 |
Gilead Sciences, Inc.* | | 3,000 | | | 140,520 |
Humana, Inc.* | | 2,800 | | | 90,328 |
Johnson & Johnson | | 7,780 | | | 441,904 |
Pfizer, Inc. | | 20,190 | | | 302,850 |
Schering-Plough Corp. | | 2,400 | | | 60,288 |
Wyeth | | 2,600 | | | 118,014 |
Total Health Care | | | | | 1,896,744 |
Industrials - 6.0% | | | | | |
CH Robinson Worldwide, Inc. | | 2,000 | | | 104,300 |
Cooper Industries, Ltd., Class A | | 3,600 | | | 111,780 |
CSX Corp. | | 1,700 | | | 58,871 |
Emerson Electric Co. | | 3,750 | | | 121,500 |
Expeditors International of Washington, Inc. | | 2,200 | | | 73,348 |
Fluor Corp. | | 2,000 | | | 102,580 |
General Dynamics Corp. | | 2,300 | | | 127,397 |
The accompanying notes are an integral part of these financial statements.
11
Managers AMG Chicago Equity Partners Balanced Fund
Schedule of Portfolio Investments (continued)
| | | | | | |
Security Description | | Shares | | | Value |
Industrials - 6.0% (continued) | | | | | | |
General Electric Co. | | 20,700 | | | $ | 242,604 |
Grainger (W.W.), Inc. | | 700 | | | | 57,316 |
Joy Global, Inc. | | 2,100 | | | | 75,012 |
Northrop Grumman Corp. | | 2,200 | | | | 100,496 |
Raytheon Co. | | 2,500 | | | | 111,075 |
Total Industrials | | | | | | 1,286,279 |
Information Technology - 11.6% | | | | | | |
Adobe Systems, Inc.* | | 6,200 | | | | 175,460 |
Apple, Inc.* | | 1,300 | | | | 185,159 |
Cisco Systems, Inc.* | | 8,700 | | | | 162,168 |
Computer Sciences Corp.* | | 4,200 | | | | 186,060 |
F5 Networks, Inc.* | | 2,400 | | | | 83,016 |
Hewitt Associates, Inc., Class A* | | 2,700 | | | | 80,406 |
Hewlett-Packard Co. | | 5,800 | | | | 224,170 |
Ingram Micro, Inc., Class A* | | 8,600 | | | | 150,500 |
Intel Corp. | | 12,200 | | | | 201,910 |
International Business Machines Corp. | | 2,350 | | | | 245,387 |
Microsoft Corp. | | 8,950 | | | | 212,742 |
NCR Corp.* | | 5,850 | | | | 69,206 |
Novellus Systems, Inc.* | | 6,000 | | | | 100,200 |
QUALCOMM, Inc. | | 2,200 | | | | 99,440 |
Symantec Corp.* | | 9,200 | | | | 143,152 |
Texas Instruments, Inc. | | 7,200 | | | | 153,360 |
Total Information Technology | | | | | | 2,472,336 |
Materials - 1.7% | | | | | | |
FMC Corp. | | 2,800 | | | | 132,440 |
Lubrizol Corp. | | 3,100 | | | | 146,661 |
Owens-Illinois, Inc.* | | 2,800 | | | | 78,428 |
Total Materials | | | | | | 357,529 |
Telecommunication Services - 2.0% | | | | | | |
CenturyTel, Inc. | | 4,800 | 2 | | | 147,360 |
Sprint Corp.* | | 21,500 | | | | 103,415 |
Verizon Communications, Inc. | | 5,750 | | | | 176,698 |
Total Telecommunication Services | | | | | | 427,473 |
Utilities - 2.7% | | | | | | |
Alliant Energy Corp. | | 10,500 | | | | 274,365 |
PG&E Corp. | | 5,400 | | | | 207,576 |
UGI Corp. | | 3,800 | | | | 96,862 |
Total Utilities | | | | | | 578,803 |
Total Common Stocks (cost $13,667,685) | | | | | | 13,658,264 |
The accompanying notes are an integral part of these financial statements.
12
Managers AMG Chicago Equity Partners Balanced Fund
Schedule of Portfolio Investments (continued)
| | | | | | |
Security Description | | Principal Amount | | Value |
Corporate Bonds - 10.3% | | | | | | |
Financials - 2.2% | | | | | | |
American Express Co., 7.250%, 05/20/14 | | $ | 35,000 | | $ | 36,242 |
Bank of America Corp., 5.750%, 12/01/17 | | | 55,000 | | | 49,052 |
Berkshire Hathaway Finance Corp., 4.850%, 01/15/15 | | | 50,000 | | | 52,104 |
Chubb Corp., The, 6.500%, 05/15/38 | | | 25,000 | | | 27,194 |
Citigroup, Inc., 5.500%, 04/11/13 | | | 50,000 | | | 46,901 |
CME Group, Inc., 5.750%, 02/15/14 | | | 20,000 | | | 21,350 |
General Electric Capital Corp., Series MTNA, 6.750%, 03/15/32 | | | 20,000 | | | 18,003 |
Goldman Sachs Group, Inc., 5.950%, 01/18/18 | | | 45,000 | | | 43,720 |
JPMorgan Chase & Co., 6.000%, 01/15/18 | | | 30,000 | | | 29,851 |
Marsh & McLennan Companies, Inc., 5.375%, 07/15/14 | | | 20,000 | | | 19,491 |
Morgan Stanley, 5.950%, 12/28/17 | | | 20,000 | | | 19,223 |
National Rural Utilities Cooperative Finance Corp., 10.375%, 11/01/18 | | | 35,000 | | | 43,953 |
Travelers Cos., Inc., 5.375%, 06/15/12 | | | 40,000 | | | 40,706 |
Wachovia Bank, N.A., 5.850%, 02/01/37 | | | 25,000 | | | 22,124 |
Total Financials | | | | | | 469,914 |
Industrials - 6.7% | | | | | | |
Abbott Laboratories, 5.875%, 05/15/16 | | | 48,000 | | | 52,424 |
Altria Group, Inc., 8.500%, 11/10/13 | | | 15,000 | | | 17,067 |
Altria Group, Inc., 9.700%, 11/10/18 | | | 13,000 | | | 14,927 |
Archer-Daniels-Midland Co., 5.450%, 03/15/18 | | | 45,000 | | | 47,399 |
AT&T, Inc., 5.100%, 09/15/14 | | | 65,000 | | | 67,598 |
Burlington Northern Santa Fe Corp., 5.900%, 07/01/12 | | | 35,000 | | | 37,090 |
Cardinal Health, Inc., 5.500%, 06/15/13 | | | 25,000 | | | 24,851 |
Cisco Systems, Inc., 5.900%, 02/15/39 | | | 25,000 | | | 24,705 |
Coca-Cola Enterprises, Inc., 7.375%, 03/03/14 | | | 30,000 | | | 34,351 |
Comcast Corp., 5.875%, 02/15/18 | | | 20,000 | | | 20,308 |
Devon Energy Corp., 6.300%, 01/15/19 | | | 60,000 | | | 64,233 |
E.I. du Pont de Nemours & Co., 5.000%, 01/15/13 | | | 40,000 | | | 42,086 |
General Mills, Inc., 5.200%, 03/17/15 | | | 65,000 | | | 68,621 |
GlaxoSmithKline Capital, Inc., 6.380%, 05/15/38 | | | 25,000 | | | 27,279 |
Hess Corp., 8.125%, 02/15/19 | | | 30,000 | | | 34,212 |
Hewlett-Packard Co., 4.500%, 03/01/13 | | | 55,000 | | | 57,229 |
Honeywell International, Inc., 4.250%, 03/01/13 | | | 55,000 | | | 57,164 |
IBM Corp., 4.750%, 11/29/12 | | | 60,000 | | | 64,386 |
Kellogg Co., 7.450%, 04/01/31 | | | 25,000 | | | 30,109 |
Kimberly-Clark Corp., 6.125%, 08/01/17 | | | 40,000 | | | 43,945 |
Kraft Foods, Inc., 6.875%, 01/26/39 | | | 25,000 | | | 26,549 |
Kroger Co., 6.750%, 04/15/12 | | | 40,000 | | | 43,274 |
Lockheed Martin Corp., 7.650%, 05/01/16 | | | 65,000 | | | 76,321 |
McDonald’s Corp., 4.300%, 03/01/13 | | | 40,000 | | | 41,642 |
The accompanying notes are an integral part of these financial statements.
13
Managers AMG Chicago Equity Partners Balanced Fund
Schedule of Portfolio Investments (continued)
| | | | | | |
Security Description | | Principal Amount | | Value |
Industrials - 6.7% (continued) | | | | | | |
McDonald’s Corp., 6.300%, 10/15/37 | | $ | 25,000 | | $ | 27,073 |
McKesson Corp., 7.500%, 02/15/19 | | | 30,000 | | | 33,844 |
Norfolk Southern Corp., 5.640%, 05/17/29 | | | 25,000 | | | 22,924 |
Northrop Grumman Corp., 7.750%, 02/15/31 | | | 25,000 | | | 31,374 |
PACCAR, Inc., 6.875%, 02/15/14 | | | 50,000 | | | 54,813 |
Spectra Energy Capital LLC, 6.200%, 04/15/18 | | | 40,000 | | | 39,347 |
Time Warner Cable, Inc., 5.850%, 05/01/17 | | | 25,000 | | | 25,004 |
TransCanada Pipelines, Ltd., 4.875%, 01/15/15 | | | 45,000 | | | 45,279 |
Union Pacific Corp., 6.250%, 05/01/34 | | | 23,000 | | | 21,940 |
United Parcel Service, Inc., 6.200%, 01/15/38 | | | 25,000 | | | 27,447 |
Verizon Communications, Inc., 6.400%, 02/15/38 | | | 20,000 | | | 19,643 |
Wal-Mart Stores, Inc., 6.500%, 08/15/37 | | | 25,000 | | | 28,030 |
Wyeth Co., 5.250%, 03/15/13 | | | 40,000 | | | 42,800 |
Total Industrials | | | | | | 1,437,288 |
Utilities - 1.4% | | | | | | |
Consolidated Edison, Inc., 5.375%, 12/15/15 | | | 75,000 | | | 78,223 |
Exelon Generation Co., LLC, 6.200%, 10/01/17 | | | 45,000 | | | 44,863 |
Florida Power & Light Co., 4.850%, 02/01/13 | | | 45,000 | | | 46,817 |
Midamerican Energy Co., 5.750%, 11/01/35 | | | 25,000 | | | 24,870 |
Pacific Gas & Electric, 8.250%, 10/15/18 | | | 55,000 | | | 67,232 |
Virginia Electric and Power Co., 8.875%, 11/15/38 | | | 25,000 | | | 33,612 |
Total Utilities | | | | | | 295,617 |
Total Corporate Bonds (cost $2,089,277) | | | | | | 2,202,819 |
Asset-Backed Securities - 1.0% | | | | | | |
Harley-Davidson Motorcycle Trust 2006-2, Class A2, 5.350%, 03/15/13 | | | 114,679 | | | 118,063 |
John Deere Owner Trust 2007, Class A4, 5.070%, 04/15/14 | | | 100,000 | | | 102,218 |
Total Asset-Backed Securities (cost $214,587) | | | | | | 220,281 |
Mortgage-Backed Securities - 1.6% | | | | | | |
Bank of America Commercial Mortgage, Inc., Series 2004-3, Class A3, 4.875%, 06/10/39 | | | 4,624 | | | 4,619 |
Bank of America Commercial Mortgage, Inc., Series 2005-6, Class A4, 5.351%, 09/10/47 7 | | | 66,000 | | | 57,498 |
GE Capital Commercial Mortgage Corp., 4.970%, 08/11/36 | | | 19,549 | | | 19,727 |
Greenwich Capital Commercial Funding Corp., Series 2004-GG1, Class A7, 5.317%, 06/10/36 7 | | | 80,000 | | | 74,069 |
Greenwich Capital Commercial Funding Corp., Series 2005-GG5, Class A2, 5.117%, 04/10/37 | | | 90,000 | | | 86,785 |
Wachovia Bank Commercial Mortgage Trust, Series 2005-C16, Class A4, 4.847%, 10/15/41 7 | | | 70,000 | | | 61,685 |
Wachovia Bank Commercial Mortgage Trust, Series 2005-C19, Class A2, 4.516%, 05/15/44 | | | 35,000 | | | 33,225 |
Total Mortgage-Backed Securities (cost $334,950) | | | | | | 337,608 |
U.S. Government and Agency Obligations - 20.6% | | | | | | |
Federal Home Loan Mortgage Corporation - 8.9% | | | | | | |
FHLMC, 3.375%, 02/27/13 | | | 285,000 | | | 295,210 |
FHLMC, 4.375%, 07/17/15 | | | 245,000 | | | 261,798 |
FHLMC, 4.500%, 09/16/13 | | | 255,000 | | | 273,550 |
The accompanying notes are an integral part of these financial statements.
14
Managers AMG Chicago Equity Partners Balanced Fund
Schedule of Portfolio Investments (continued)
| | | | | | | |
Security Description | | Principal Amount | | Value | |
Federal Home Loan Mortgage Corporation - 8.9% (continued) | | | | | | | |
FHLMC, 4.750%, 11/17/15 | | $ | 300,000 | | $ | 324,242 | |
FHLMC, 5.000%, 12/01/20 | | | 104,958 | | | 109,231 | |
FHLMC, 5.250%, 06/18/14 | | | 260,000 | | | 287,276 | |
FHLMC, 5.750%, 05/15/12 | | | 300,000 | | | 333,779 | |
Total Federal Home Loan Mortgage Corporation | | | | | | 1,885,086 | |
Federal National Mortgage Association - 10.5% | | | | | | | |
FNMA, 4.000%, 10/01/20 to 12/01/21 | | | 64,860 | | | 65,034 | |
FNMA, 4.375%, 09/15/12 | | | 300,000 | | | 321,674 | |
FNMA, 4.500%, 11/01/19 to 09/01/35 | | | 136,268 | | | 139,774 | |
FNMA, 4.625%, 10/15/13 | | | 351,000 | | | 379,303 | |
FNMA, 4.750%, 11/19/12 | | | 280,000 | | | 304,756 | |
FNMA, 5.000%, 02/01/36 | �� | | 164,704 | | | 168,300 | |
FNMA, 5.500%, 02/01/22 to 02/01/37 | | | 439,079 | | | 455,127 | |
FNMA, 6.000%, 03/01/37 to 08/01/37 | | | 270,044 | | | 282,795 | |
FNMA, 6.500%, 03/01/37 | | | 107,844 | | | 115,058 | |
Total Federal National Mortgage Association | | | | | | 2,231,821 | |
United States Treasury Securities - 1.2% | | | | | | | |
U.S. Treasury Bonds, 4.250%, 05/15/39 | | | 150,000 | | | 148,523 | |
U.S. Treasury Notes, 5.250%, 02/15/29 | | | 100,000 | | | 112,500 | |
Total United States Treasury Securities | | | | | | 261,023 | |
Total U.S. Government and Agency Obligations (cost $4,361,260) | | | | | | 4,377,930 | |
| | |
| | | Shares | | | |
Short-Term Investments - 3.5%1 | | | | | | | |
BNY Institutional Cash Reserves Fund, Series A, 0.06% 3 | | | 294,004 | | | 294,004 | |
BNY Institutional Cash Reserves Fund, Series B *3,10 | | | 28,392 | | | 4,188 | |
Dreyfus Cash Management Fund, Institutional Class Shares, 0.44% 11 | | | 448,420 | | | 448,420 | |
Total Short-Term Investments (cost $770,816) | | | | | | 746,612 | |
Total Investments - 101.1% (cost $21,438,575) | | | | | | 21,543,514 | |
Other Assets, less Liabilities - (1.1)% | | | | | | (241,867 | ) |
Net Assets - 100.0% | | | | | $ | 21,301,647 | |
The accompanying notes are an integral part of these financial statements.
15
Managers High Yield Fund
Fund Snapshots
June 30, 2009 (unaudited)
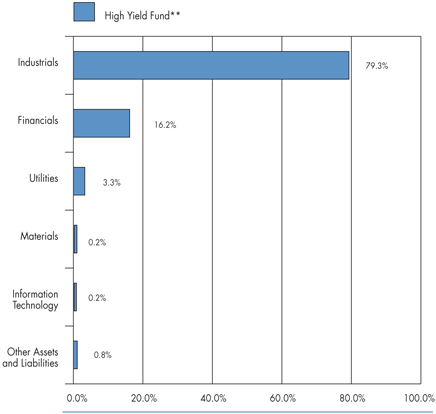
Portfolio Breakdown
| | | |
Industry | | High Yield** | |
Industrials | | 79.3 | % |
Financials | | 16.2 | % |
Utilities | | 3.3 | % |
Materials | | 0.2 | % |
Information Technology | | 0.2 | % |
Other Assets and Liabilities | | 0.8 | % |
| ** | As a percentage of net assets |
Top Ten Holdings
| | | |
Top Ten Holdings | | % of
Net Assets | |
HCA, Inc., 9.625%, 11/15/16* | | 3.0 | % |
Biomet, Inc., 10.375%, 10/15/17* | | 1.6 | |
Sprint Capital Corp., 6.900%, 05/01/19* | | 1.6 | |
GMAC LLC, 6.875%, 08/28/12* | | 1.5 | |
Sungard Data Systems, Inc., 10.250%, 08/15/15* | | 1.4 | |
EchoStar Communications Corp., 7.125%, 02/01/16* | | 1.3 | |
EchoStar DBS Corp., 7.750%, 05/31/15 | | 1.3 | |
Visant Holding Corp., 10.250%, 12/01/13* | | 1.2 | |
Sealy Mattress Co., 8.250%, 06/15/04 | | 1.1 | |
DirecTV Holdings LLC, 6.375%, 06/15/15* | | 1.1 | |
| | | |
Top Ten as a Group | | 15.1 | % |
| | | |
| * | Top Ten Holding at December 31, 2008 |
Any sectors, industries, or securities discussed should not be perceived as investment recommendations. Mention of a specific security should not be considered a recommendation to buy or solicitation to sell that security. Specific securities mentioned in this report may have been sold from the Fund’s portfolio of investments by the time you receive this report.
16
Managers High Yield Fund
Schedule of Portfolio Investments
June 30, 2009 (unaudited)
| | | | | | | |
Security Description | | Principal Amount | | | Value |
Corporate Bonds - 98.8% | | | | | | | |
Financials - 16.2% | | | | | | | |
ACCO Brands Corp., 7.750%, 08/17/12, (07/20/09) 5 | | $ | 14,837 | | | $ | 12,414 |
ACCO Brands Corp., 7.750%, 08/17/12, (08/26/09) 5 | | | 30,007 | | | | 25,107 |
Aeroflex, Inc., Term Loan B1, 3.625%, 08/15/14, (07/20/09) 5 | | | 11,178 | | | | 9,054 |
Aeroflex, Inc., Term Loan B1, 4.125%, 08/15/14, (08/17/09) 5 | | | 222,286 | | | | 180,052 |
Arch Western Finance, LLC, 6.750%, 07/01/13 | | | 270,000 | | | | 247,725 |
Ashland, Inc., Term Loan B, 7.650%, 05/13/14, (06/30/09) 5 | | | 68,501 | | | | 69,041 |
Bank of America Corp., 5.750%, 08/15/16 | | | 40,000 | | | | 34,756 |
CIT Group, Inc., 5.600%, 04/27/11 | | | 135,000 | 2 | | | 101,268 |
CIT Group, Inc., 5.650%, 02/13/17 | | | 125,000 | | | | 70,622 |
CIT Group, Inc., 5.800%, 07/28/11 | | | 125,000 | | | | 93,760 |
Claire’s Stores, Inc., 3.338%, 05/29/14 | | | 160,000 | | | | 89,667 |
DJO Finance LLC, 10.875% 11/15/14 | | | 150,000 | | | | 132,000 |
Dresser, Inc., 2nd Lien Term Loan, 6.068%, 05/04/15, (07/20/09) 5 | | | 195,000 | | | | 138,572 |
Dutch Revolving Credit Loans, 3.815%, 12/20/13, (07/22/09) 5 | | | 6,051 | | | | 2,666 |
First Data Corp., 3.060%, 09/24/14, (07/31/09) 5 | | | 13,953 | | | | 10,492 |
First Data Corp., Term Loan B2, 3.060%, 09/24/14, (07/31/09) 5 | | | 3,423 | | | | 2,576 |
First Data Corp., Term Loan B1, 3.065%, 09/24/14, (07/24/09) 5 | | | 286,424 | | | | 215,406 |
Ford Motor Credit Company LLC, 2.701%, 01/15/10, (07/15/09) 5 | | | 140,000 | | | | 133,525 |
Ford Motor Credit Company LLC, 7.000%, 10/01/13 | | | 93,000 | | | | 74,839 |
Ford Motor Credit Company LLC, 7.250%, 10/25/11 | | | 195,000 | | | | 168,748 |
Ford Motor Credit Company LLC, 7.800%, 06/01/12 | | | 235,000 | | | | 202,323 |
Ford Motor Credit Company LLC, 8.000%, 12/15/16 | | | 100,000 | | | | 76,551 |
Freescale Semiconductor, 0.713%, 12/15/14 | | | 221,977 | | | | 195,895 |
German Tranche B-1 Euro Term Loans, 4.065%, 12/20/14, (07/22/09) 5 | | | 5,181 | | | | 2,283 |
German Tranche B-2 Euro Term Loans, 4.065%, 12/20/14, (07/22/09) 5 | | | 5,181 | | | | 2,283 |
German Tranche B-3 Euro Term Loans, 4.065%, 12/20/14, (07/22/09) 5 | | | 5,181 | | | | 2,283 |
GMAC LLC, 6.625%, 05/15/12 (a) | | | 110,000 | | | | 92,950 |
GMAC LLC, 6.750%, 12/01/14 (a) | | | 17,000 | | | | 13,515 |
GMAC LLC, 6.875%, 08/28/12 (a) | | | 561,000 | 2 | | | 474,045 |
Harrah’s Operating Co., Term Loan B-3, 3.302%, 01/28/15, (09/30/09) 5 | | | 347 | | | | 257 |
Harrah’s Operating Co., Term Loan B-3, 3.319%, 01/25/15, (06/30/09) 5 | | | 331 | | | | 244 |
Harrah’s Operating Co., Term Loan B-3, 3.459%, 01/28/15, (07/27/09) 5 | | | 14,857 | | | | 10,968 |
Harrah’s Operating Co., Term Loan B-3, 3.487%, 01/28/15, (09/30/09) 5 | | | 25,861 | | | | 19,092 |
Harrah’s Operating Co., Term Loan B-3, 3.598%, 01/28/15, (09/30/09) 5 | | | 2,318 | | | | 1,711 |
Harrah’s Operating Co., Term Loan B-3, 4.092%, 01/28/15, (07/27/09) 5 | | | 87,428 | | | | 64,547 |
Harrah’s Operating Co., Inc., 10.000%, 12/15/18 (a) | | | 262,000 | | | | 151,960 |
Host Hotels & Resorts, L.P., 6.375%, 03/15/15 | | | 275,000 | | | | 239,250 |
Host Hotels & Resorts, L.P., 6.875%, 11/01/14 | | | 50,000 | | | | 45,250 |
Host Hotels & Resorts, L.P., 7.125%, 11/01/13 | | | 45,000 | | | | 42,525 |
The accompanying notes are an integral part of these financial statements.
17
Managers High Yield Fund
Schedule of Portfolio Investments (continued)
| | | | | | | |
Security Description | | Principal Amount | | | Value |
Financials - 16.2% (continued) | | | | | | | |
Ineos Group Holdings, Term Loan B, 7.501%, 12/14/13, (09/28/09) 5 | | $ | 204,235 | | | $ | 151,814 |
Ineos Group Holdings, Term Loan C, 8.001%, 12/14/14, (09/28/09) 5 | | | 204,235 | | | | 151,814 |
KAR Holdings, Inc., 8.750%, 05/01/14 | | | 115,000 | | | | 99,188 |
Lyondell Chemical, B2 Term Loan, 7.000%, 12/20/14, (07/01/09) 5 | | | 22,482 | | | | 9,908 |
Lyondell Chemical, New Money Dip Term Loan, 1.500%, 12/15/09, (07/03/09) 5 | | | 51,691 | | | | 53,416 |
Lyondell Chemical, New Money Dip Term Loan, 13.000%, 12/15/09, (06/30/09) 5 | | | 103,430 | | | | 106,882 |
Lyondell Chemical, Roll-Up Dip Term Loan, 5.940%, 12/15/09, (06/30/09) 5 | | | 85,102 | | | | 71,113 |
Neiman Marcus Group, Inc., The, Term Loan, 2.318%, 04/26/13, (07/06/09) 5 | | | 36,538 | | | | 27,683 |
Neiman Marcus Group, Inc., The, Term Loan, 2.630%, 04/26/13, (09/08/09) 5 | | | 58,462 | | | | 44,293 |
Nuveen Investments, Term Loan B, 3.075%, 11/07/14, (07/27/09) 5 | | | 65,449 | | | | 51,078 |
Nuveen Investments, Term Loan B, 3.308%, 11/07/14, (07/27/09) 5 | | | 26,180 | | | | 20,431 |
Nuveen Investments, Term Loan B, 3.319%, 11/07/14, (06/30/09) 5 | | | 104,719 | | | | 81,724 |
Nuveen Investments, Inc., 3.338%, 11/07/14 | | | 3,652 | | | | 2,850 |
Primary Revolving Credit Loans, 3.815%, 12/20/13, (07/22/09) 5 | | | 6,767 | | | | 2,982 |
Sensata Technologies Finance Co., LLC, 2.603%, 04/27/13, (06/30/09) 5 | | | 832 | | | | 641 |
Sensata Technologies Finance Co., LLC, Term B Loan Floater, 2.804%, 04/27/13, (07/29/09) 5 | | | 322,964 | | | | 248,683 |
Simmons Bedding Co., Term Loan D, 10.500%, 12/19/11, (07/31/09) 5 | | | 85,000 | | | | 77,669 |
Simmons Holding Co., Inc., 8.224%, 02/15/12, (08/17/09) 5 | | | 125,642 | | | | 3,769 |
Texas Competitive Electric Holdings, 3.819%, 10/10/14, (06/30/09) 5 | | | 3,159 | | | | 2,265 |
Texas Competitive Electric Holdings, 3.821%, 10/10/14, (07/09/09) 5 | | | 308,026 | | | | 220,874 |
UCI Holdco, Inc., 8.629%, 12/15/13 | | | 138,313 | | | | 31,120 |
U.S. Tranche A Dollar Term Loans, 3.815%, 12/20/13, (07/22/09) 5 | | | 12,894 | | | | 5,682 |
U.S. Tranche B-1 Dollar Term Loans, 7.000%, 12/20/14, (07/01/09) 5 | | | 44,964 | | | | 19,816 |
Wind Acquisition Loan, 8.357%, 12/07/11, (07/20/09) 5 | | | 259,234 | | | | 261,178 |
Total Financials | | | | | | | 5,197,095 |
Industrials - 79.3% | | | | | | | |
ACCO Brands Corp., 7.625%, 08/15/15 | | | 430,000 | | | | 227,900 |
Advanced Micro Devices, Inc., 7.750%, 11/01/12 | | | 85,000 | | | | 56,738 |
Alliance Laundry Corp., 8.500%, 01/15/13 | | | 275,000 | | | | 242,000 |
Ames True Temper, Inc., 5.131%, 01/15/12, (07/15/09) 5 | | | 180,000 | | | | 149,400 |
Ames True Temper, Inc., 10.000%, 07/15/12 | | | 85,000 | 2 | | | 62,475 |
Amkor Tech, Inc., 7.750%, 05/15/13 | | | 220,000 | | | | 202,675 |
Anixter International, Inc., 10.000%, 03/15/14 | | | 100,000 | | | | 100,000 |
Ashland, Inc., 9.125%, 06/01/17 (a) | | | 15,000 | | | | 15,638 |
Ashtead Capital, Inc., 9.000%, 08/15/16 (a) | | | 270,000 | | | | 230,175 |
Atlas Energy Resources LLC, 10.750%, 02/01/18 (a) | | | 150,000 | | | | 142,125 |
Baldor Electric Co., 8.625%, 02/15/17 | | | 165,000 | | | | 153,450 |
Beazer Homes USA, Inc., 6.500%, 11/15/13 | | | 115,000 | 2 | | | 57,500 |
Belden, Inc., 9.250%, 06/15/19 (a) | | | 30,000 | | | | 29,212 |
Biomet, Inc., 10.375%, 10/15/17 6 | | | 535,000 | | | | 520,288 |
Boyd Gaming Corp., 7.125%, 02/01/16 | | | 200,000 | | | | 149,250 |
The accompanying notes are an integral part of these financial statements.
18
Managers High Yield Fund
Schedule of Portfolio Investments (continued)
| | | | | | | |
Security Description | | Principal Amount | | | Value |
Industrials - 79.3% (continued) | | | | | | | |
BWAY Corp, 10.000%, 04/15/14 (a) | | $ | 95,000 | | | $ | 95,238 |
CC Holdings GS V LLC, 7.750%, 05/01/17 (a) | | | 35,000 | | | | 34,300 |
CCH II Capital Corp., 10.250%, 10/01/13 (a) 8 | | | 123,000 | | | | 122,385 |
CCO Holdings LLC, 8.750%, 11/15/13 8 | | | 365,000 | 2 | | | 348,575 |
Central Garden and Pet Co., 9.125%, 02/01/13 | | | 130,000 | | | | 124,962 |
Charter Communications Operating LLC, 10.375%, 04/30/14 (a) 8 | | | 50,000 | | | | 48,125 |
Chesapeake Energy Corp., 6.500%, 08/15/17 | | | 200,000 | | | | 169,000 |
Chesapeake Energy Corp., 7.000%, 08/15/14 | | | 200,000 | | | | 186,000 |
Chiquita Brands International, Inc., 8.875%, 12/01/15 | | | 165,000 | 2 | | | 143,138 |
Citizens Communications Co., 6.625%, 03/15/15 | | | 100,000 | | | | 88,500 |
Claire’s Stores, Inc., 9.625%, 06/01/15 6 | | | 226,634 | | | | 73,656 |
Clearwater Paper Corp., 10.625%, 06/15/16 (a) | | | 85,000 | | | | 87,125 |
Community Health Systems, Inc., 8.875%, 07/15/15 | | | 185,000 | | | | 182,225 |
Constellation Brands, Inc., 7.125%, 09/01/16 | | | 155,000 | | | | 144,150 |
Cooper Companies, Inc., 7.125%, 02/15/15 | | | 120,000 | | | | 112,500 |
Corrections Corp. of America, 6.250%, 03/15/13 | | | 50,000 | | | | 47,625 |
Corrections Corp. of America, 7.750%, 06/01/17 | | | 90,000 | | | | 89,100 |
Cricket Communications, Inc., 9.375%, 11/01/14 | | | 260,000 | | | | 257,400 |
Crown Americas LLC, 7.625%, 11/15/13 | | | 50,000 | | | | 49,000 |
Crown Americas LLC, 7.625%, 05/15/17 (a) | | | 50,000 | | | | 48,500 |
Crown Castle International Corp., 9.000%, 01/15/15 | | | 155,000 | | | | 158,488 |
CSC Holdings, Inc., 8.500%, 04/15/14 (a) | | | 25,000 | | | | 24,906 |
CSC Holdings, Inc., 8.625%, 02/15/19 (a) | | | 20,000 | | | | 19,550 |
Del Monte Corp., 6.750%, 02/15/15 | | | 70,000 | | | | 66,675 |
Denbury Resources, Inc., 7.500%, 04/01/13 | | | 145,000 | | | | 139,200 |
Dex Media West LLC, 9.875%, 08/15/13 8 | | | 130,000 | | | | 20,150 |
Dex Media, Inc., 8.000%, 11/15/13 8 | | | 125,000 | | | | 19,375 |
Dex Media, Inc., 9.000%, 11/15/13 8 | | | 270,000 | | | | 41,850 |
Digicel Group, Ltd., 8.875%, 01/15/15 (a) | | | 100,000 | | | | 83,500 |
Digicel Group, Ltd., 9.125%, 01/15/15 (a) 6 | | | 104,000 | | | | 86,840 |
Digicel Group, Ltd., 12.000%, 04/01/14 (a) | | | 100,000 | | | | 99,500 |
DirecTV Holdings LLC, 6.375%, 06/15/15 | | | 380,000 | | | | 353,400 |
DirecTV Holdings LLC, 7.625%, 05/15/16 | | | 35,000 | | | | 34,212 |
Dole Food Co., Inc., 13.875%, 03/15/14 (a) | | | 55,000 | | | | 60,775 |
Dow Chemical Co., The, 8.550%, 05/15/19 | | | 180,000 | | | | 180,617 |
Dynegy Holdings, Inc., 7.500%, 06/01/15 | | | 185,000 | | | | 155,169 |
EchoStar Communications Corp., 7.125%, 02/01/16 | | | 445,000 | | | | 417,188 |
EchoStar DBS Corp., 7.750%, 05/31/15 | | | 430,000 | | | | 411,725 |
El Paso Corp., 7.000%, 06/15/17 | | | 55,000 | | | | 50,366 |
El Paso Corp., 8.250%, 02/15/16 | | | 45,000 | | | | 43,988 |
El Paso Natural Gas Co., 7.250%, 06/01/18 | | | 90,000 | | | | 83,546 |
The accompanying notes are an integral part of these financial statements.
19
Managers High Yield Fund
Schedule of Portfolio Investments (continued)
| | | | | | | |
Security Description | | Principal Amount | | | Value |
Industrials - 79.3% (continued) | | | | | | | |
Fairpoint Communications, Inc., 13.125%, 04/01/18 | | $ | 190,000 | | | $ | 38,000 |
First Data Corp., 9.880%, 09/24/15 | | | 350,000 | 2 | | | 250,250 |
Flextronics International, Ltd., 6.250%, 11/15/14 | | | 150,000 | | | | 141,000 |
FMG Finance Property, Ltd., 10.625%, 09/01/16 (a) | | | 180,000 | | | | 173,700 |
Forest Oil Corp., 7.250%, 06/15/19 | | | 75,000 | | | | 67,500 |
Forest Oil Corp., 7.750%, 05/01/14 | | | 40,000 | | | | 38,600 |
Freeport-McMoRan Copper & Gold, Inc., 8.250%, 04/01/15 | | | 125,000 | | | | 126,392 |
Freeport-McMoRan Copper & Gold, Inc., 8.375%, 04/01/17 | | | 110,000 | | | | 110,981 |
General Cable Corp., 7.125%, 04/01/17 | | | 100,000 | | | | 91,250 |
Georgia-Pacific Corp., 7.000%, 01/15/15 (a) | | | 115,000 | | | | 108,100 |
Georgia-Pacific Corp., 7.700%, 06/15/15 | | | 225,000 | | | | 211,500 |
Georgia-Pacific Corp., 8.250%, 05/01/16 (a) | | | 20,000 | | | | 19,500 |
Goodyear Tire & Rubber Co., The, 9.000%, 07/01/15 | | | 10,000 | 2 | | | 9,950 |
Goodyear Tire & Rubber Co., The, 10.500%, 05/15/16 | | | 60,000 | | | | 60,900 |
Graham Packaging Co., L.P., 8.500%, 10/15/12 | | | 70,000 | | | | 67,900 |
Graham Packaging Co., L.P., 9.875%, 10/15/14 | | | 240,000 | | | | 224,400 |
Hanesbrands, Inc., 4.593%, 12/15/14, (12/15/09) 5 | | | 295,000 | | | | 238,950 |
Harrahs Operating Escrow LLC, 11.250%, 06/01/17 (a) | | | 140,000 | | | | 133,000 |
HCA, Inc., 8.500%, 04/15/19 (a) | | | 55,000 | | | | 54,175 |
HCA, Inc., 9.625%, 11/15/16 6 | | | 978,000 | | | | 970,665 |
Health Management Associates, Inc., 6.125%, 04/15/16 | | | 245,000 | | | | 211,312 |
Helix Energy Solutions Group, Inc., 9.500%, 01/15/16 (a) | | | 80,000 | | | | 73,400 |
Hertz Corp., 8.875%, 01/01/14 | | | 265,000 | | | | 245,125 |
Host Hotels & Resorts, L.P., 6.750%, 06/01/16 | | | 75,000 | | | | 65,438 |
Huntsman LLC, 11.500%, 07/15/12 | | | 100,000 | | | | 101,750 |
Huntsman International LLC, 7.875%, 11/15/14 | | | 120,000 | | | | 95,700 |
Ineos Group Holdings PLC, 8.500%, 02/15/16 (a) | | | 45,000 | | | | 14,175 |
Intelsat Bermuda, Ltd., 11.250%, 06/15/16 | | | 190,000 | | | | 194,750 |
Intelsat Jackson Holdings, 9.500%, 06/15/16, (a) | | | 270,000 | | | | 272,700 |
Intelsat Subsidiary Holding Co., Ltd., 8.875%, 01/15/15 (a) | | | 85,000 | | | | 82,275 |
Interline Brands, Inc., 8.125%, 06/15/14 | | | 55,000 | | | | 54,450 |
IPCS, Inc., 3.152%, 05/01/13, (08/03/09) 5 | | | 90,000 | | | | 71,550 |
IPCS, Inc., 8.161%, 05/01/14, (08/01/09) 5,6 | | | 230,000 | | | | 152,950 |
Iron Mountain, Inc., 8.750%, 07/15/18 | | | 240,000 | 2 | | | 237,600 |
Jarden Corp., 7.500%, 05/01/17 | | | 215,000 | 2 | | | 189,200 |
Jarden Corp., 8.000%, 05/01/16 | | | 100,000 | | | | 95,750 |
K. Hovnanian Enterprises, Inc., 8.625%, 01/15/17 | | | 195,000 | | | | 92,625 |
L-3 Communications Corp., 5.875%, 01/15/15 | | | 255,000 | | | | 227,588 |
L-3 Communications Corp., 6.375%, 10/15/15 | | | 50,000 | | | | 45,625 |
Levi Strauss & Co., 9.750%, 01/15/15 | | | 75,000 | | | | 74,062 |
Macy’s Retail Holdings, Inc., 5.900%, 12/01/16 | | | 105,000 | | | | 85,663 |
The accompanying notes are an integral part of these financial statements.
20
Managers High Yield Fund
Schedule of Portfolio Investments (continued)
| | | | | | | |
Security Description | | Principal Amount | | | Value |
Industrials - 79.3% (continued) | | | | | | | |
Macy’s Retail Holdings, Inc., 7.875%, 07/15/15 | | $ | 185,000 | | | $ | 179,230 |
MarkWest Energy Partners LP, 8.750%, 04/15/18 | | | 210,000 | | | | 182,700 |
MetroPCS Wireless, Inc., 9.250%, 11/01/14 | | | 280,000 | | | | 279,650 |
MGM Mirage, Inc., 6.750%, 04/01/13 | | | 405,000 | | | | 272,362 |
MGM Mirage, Inc., 6.875%, 04/01/16 | | | 155,000 | 2 | | | 101,912 |
MGM Mirage, Inc., 7.500%, 06/01/16 | | | 175,000 | 2 | | | 114,406 |
MGM Mirage, Inc., 10.375%, 05/15/14 (a) | | | 40,000 | | | | 41,700 |
MGM Mirage, Inc., 11.125%, 11/15/17 (a) | | | 55,000 | | | | 58,575 |
Nalco Co., 8.250%, 05/15/17 (a) | | | 130,000 | | | | 131,300 |
Newell Rubbermaid, Inc., 10.600%, 04/15/19 | | | 135,000 | | | | 155,500 |
Newfield Exploration Co., 6.625%, 04/15/16 | | | 150,000 | | | | 136,125 |
Noranda Aluminium Acquisition Co., 5.412%, 05/15/15, (11/15/09) 5,6 | | | 202,161 | | | | 112,452 |
Nordic Telephone Co., 8.875%, 05/01/16 (a) | | | 190,000 | | | | 184,300 |
Nustar Logistics, 7.650%, 04/15/18 | | | 185,000 | | | | 179,864 |
NXP B.V. Funding LLC, 7.875%, 10/15/14 | | | 180,000 | | | | 82,800 |
Open Solutions, Inc., 9.750%, 02/01/15 (a) | | | 280,000 | | | | 116,200 |
OPTI Canada, Inc., 7.875%, 12/15/14 | | | 30,000 | | | | 19,575 |
OPTI Canada, Inc., 8.250%, 12/15/14 | | | 35,000 | | | | 23,275 |
P.H. Glatfelter, 7.125%, 05/01/16 | | | 95,000 | | | | 87,756 |
Packaging Dynamics, Inc., 10.000%, 05/11/16 (a) | | | 160,000 | | | | 53,600 |
Paetec Holding Corp., 8.875%, 06/30/17 (a) | | | 130,000 | 2 | | | 122,850 |
Paetec Holding Corp., 9.500%, 07/15/15 | | | 200,000 | 2 | | | 174,500 |
Petrohawk Energy Corp., 7.875%, 06/01/15 | | | 200,000 | | | | 186,000 |
Petrohawk Energy Corp., 9.125%, 07/15/13 | | | 75,000 | | | | 75,000 |
PolyOne Corp., 8.875%, 05/01/12 | | | 320,000 | | | | 270,400 |
Pride International, Inc., 8.500%, 06/15/19 | | | 155,000 | | | | 153,838 |
Quebecor Media, Inc., 7.750%, 03/15/16 | | | 270,000 | | | | 246,038 |
Quebecor World, Inc., 8.750%, 03/15/16* (a) 8 | | | 165,000 | | | | 15,675 |
Quicksilver Resources, Inc., 8.250%, 08/01/15 | | | 160,000 | | | | 143,200 |
Qwest Communications International, Inc., 7.500%, 02/15/14 | | | 70,000 | | | | 64,225 |
Qwest Corp., 7.500%, 10/01/14 | | | 105,000 | | | | 100,669 |
Qwest Corp., 8.875%, 03/15/12 | | | 215,000 | | | | 217,688 |
RailAmerica, Inc., 9.250%, 07/01/17 (a) | | | 105,000 | | | | 101,850 |
RBS Global, Inc., 9.500%, 08/01/14 (a) | | | 262,000 | | | | 225,320 |
Reichhold Industries, Inc., 9.000%, 08/15/14 (a) | | | 235,000 | | | | 83,425 |
Rental Service Corp., 9.500%, 12/01/14 | | | 255,000 | | | | 205,912 |
RH Donnelley, Inc., 11.750%, 05/15/15 (a) 8 | | | 71,000 | | | | 33,015 |
Rite Aid Corp., 7.500%, 03/01/17 | | | 70,000 | | | | 55,125 |
Rite Aid Corp., 9.500%, 06/01/15 | | | 105,000 | | | | 104,825 |
Rite Aid Corp., 9.500%, 06/15/17 | | | 150,000 | | | | 98,250 |
Royal Caribbean Cruises, Ltd., 6.875%, 12/01/13 | | | 80,000 | 2 | | | 67,200 |
The accompanying notes are an integral part of these financial statements.
21
Managers High Yield Fund
Schedule of Portfolio Investments (continued)
| | | | | | | |
Security Description | | Principal Amount | | | Value |
Industrials - 79.3% (continued) | | | | | | | |
Royal Caribbean Cruises, Ltd., 7.000%, 06/15/13 | | $ | 110,000 | | | $ | 96,662 |
Royal Caribbean Cruises, Ltd., 7.250%, 06/15/16 | | | 105,000 | | | | 83,475 |
Sally Holdings LLC, 9.250%, 11/15/14 | | | 160,000 | 2 | | | 160,000 |
Sealy Mattress Co., 8.250%, 06/15/04 | | | 435,000 | | | | 359,962 |
Sensata Technologies, B.V., 8.000%, 05/01/14 | | | 190,000 | | | | 94,288 |
Service Corp. International, 6.750%, 04/01/15 | | | 225,000 | | | | 204,750 |
Simmons Co., 7.875%, 01/15/14 | | | 380,000 | | | | 212,800 |
Simmons Co., 10.000%, 12/15/14 (b) | | | 559,000 | | | | 81,055 |
Smurfit-Stone Container Enterprises, Inc., 8.375%, 07/01/12 8 | | | 230,000 | 2 | | | 89,125 |
Solo Cup Co., 10.500%, 11/01/13 (a) | | | 100,000 | | | | 100,750 |
Spectrum Brands, Inc., 7.375%, 02/01/15 8 | | | 205,000 | | | | 138,375 |
Sprint Capital Corp., 6.900%, 05/01/19 | | | 595,000 | | | | 495,338 |
Sprint Capital Corp., 8.750%, 03/15/32 | | | 75,000 | | | | 60,750 |
Starwood Hotels & Resorts Worldwide, Inc., 6.750%, 05/15/18 | | | 160,000 | | | | 137,418 |
Starwood Hotels & Resorts Worldwide, Inc., 7.875%, 05/01/12 | | | 100,000 | | | | 92,056 |
Steinway Musical Instruments, Inc., 7.000%, 03/01/14 (a) | | | 225,000 | | | | 176,625 |
Sun Media Corp., 7.625%, 02/15/13 | | | 75,000 | | | | 49,688 |
Sungard Data Systems, Inc., 10.250%, 08/15/15 | | | 470,000 | | | | 436,512 |
Supervalu, Inc., 8.000%, 05/01/16 | | | 235,000 | | | | 229,125 |
Surgical Care Affiliates, Inc., 8.875%, 07/15/15 (a) 6 | | | 145,000 | | | | 112,376 |
Swift Energy Co., 7.125%, 06/01/17 | | | 55,000 | | | | 39,050 |
Tenet Healthcare Corp., 8.875%, 07/01/19 (a) | | | 45,000 | | | | 45,450 |
Tenet Healthcare Corp., 9.250%, 01/01/15 | | | 290,000 | 2 | | | 266,800 |
Tenneco, Inc., 8.125%, 11/15/15 | | | 180,000 | | | | 143,100 |
Terex Corp., 8.000%, 11/15/17 | | | 290,000 | 2 | | | 224,388 |
Terra Capital, Inc., 7.000%, 02/01/17 | | | 100,000 | | | | 91,875 |
Tesoro Corp., 6.625%, 11/01/15 | | | 130,000 | | | | 117,325 |
TGT Pipeline LLC, 5.200%, 06/01/18 | | | 115,000 | | | | 98,068 |
The Goodyear Tire & Rubber Co., 8.625%, 12/01/11 | | | 83,000 | | | | 82,170 |
The Neiman Marcus Group, Inc., 9.000%, 10/15/15 6 | | | 297,069 | | | | 176,756 |
Titan International, Inc., 8.000%, 01/15/12 | | | 200,000 | | | | 182,000 |
Travelport LLC, 5.293%, 09/01/14, (09/01/09) 5 | | | 80,000 | | | | 44,000 |
Travelport LLC, 9.875%, 09/01/14 | | | 100,000 | | | | 67,000 |
Travelport LLC, 11.875%, 09/01/16 | | | 110,000 | 2 | | | 65,450 |
TRW Automotive, Inc., 7.000%, 03/15/14 | | | 150,000 | 2 | | | 108,750 |
TRW Automotive, Inc., 7.250%, 03/15/17 | | | 150,000 | | | | 104,250 |
United Components, Inc., 9.375%, 06/15/13 | | | 60,000 | | | | 38,400 |
United Surgical Partners International, Inc., 8.875%, 05/01/17 | | | 55,000 | | | | 50,325 |
United Surgical Partners International, Inc., 9.250%, 05/01/17 6 | | | 185,000 | | | | 151,700 |
Vail Resorts, Inc., 6.750%, 02/15/14 | | | 155,000 | | | | 150,350 |
Vedanta Resources PLC, 9.500%, 07/18/18 (a) | | | 120,000 | | | | 100,200 |
The accompanying notes are an integral part of these financial statements.
22
Managers High Yield Fund
Schedule of Portfolio Investments (continued)
| | | | | | | | |
Security Description | | Principal Amount | | | Value | |
Industrials - 79.3% (continued) | | | | | | | | |
Venoco, Inc., 8.750%, 12/15/11 | | $ | 130,000 | | | $ | 118,625 | |
Videotron, Ltd., 6.875%, 01/15/14 | | | 123,000 | | | | 114,390 | |
Visant Holding Corp., 10.250%, 12/01/13 (b) | | | 380,000 | | | | 379,050 | |
Vitro, S.A.B. de C.V., 9.125%, 02/01/17 8 | | | 380,000 | | | | 148,200 | |
West Corp, 9.500%, 10/15/14 | | | 125,000 | | | | 110,000 | |
Wind Acquisition Finance, S.A., 10.750%, 12/01/15 (a) | | | 75,000 | | | | 75,375 | |
Windstream Corp., 8.125%, 08/01/13 | | | 60,000 | | | | 58,350 | |
Windstream Corp., 8.625%, 08/01/16 | | | 165,000 | | | | 158,813 | |
WMG Acquisition, 9.500%, 06/15/16 (a) | | | 95,000 | | | | 95,000 | |
Total Industrials | | | | | | | 25,436,378 | |
Utilities - 3.3% | | | | | | | | |
AES Corp., The, 8.000%, 10/15/17 | | | 35,000 | | | | 32,725 | |
AES Corp., The, 9.750%, 04/15/16 (a) | | | 200,000 | | | | 203,501 | |
Calpine Construction Finance Co., 8.000%, 06/01/16 (a) | | | 85,000 | | | | 81,812 | |
Edison Mission Energy, 7.000%, 05/15/17 | | | 110,000 | | | | 84,975 | |
Energy Future Holdings Corp., 10.875%, 11/01/17 | | | 180,000 | | | | 132,300 | |
Energy Future Holdings Corp., 11.250%, 11/01/17 6 | | | 700 | | | | 430 | |
Mirant North America LLC, 7.375%, 12/31/13 | | | 115,000 | | | | 110,975 | |
NRG Energy, Inc., 7.250% 02/01/14 | | | 145,000 | | | | 141,012 | |
NRG Energy, Inc., 7.375%, 02/01/16 | | | 80,000 | | | | 75,900 | |
NRG Energy, Inc., 7.375%, 01/15/17 | | | 20,000 | | | | 18,900 | |
Texas Competitive Electric Holdings Co., LLC, 10.250%, 11/01/15 | | | 265,000 | 2 | | | 166,288 | |
Total Utilities | | | | | | | 1,048,818 | |
Total Corporate Bonds (cost $36,050,647) | | | | | | | 31,682,291 | |
| | |
| | | Shares | | | | |
Common Stocks - 0.4% | | | | | | | | |
Information Technology - 0.2% | | | | | | | | |
Flextronics International, Ltd.* | | | 13,000 | | | | 53,430 | |
Materials - 0.2% | | | | | | | | |
Huntsman Corp. | | | 12,603 | | | | 63,394 | |
Total Common Stocks (cost $216,202) | | | | | | | 116,824 | |
Short-Term Investments - 16.4% 1 | | | | | | | | |
BNY Institutional Cash Reserves Fund, Series A, 0.06% 3 | | | 3,107,045 | | | | 3,107,045 | |
BNY Institutional Cash Reserves Fund, Series B*3,10 | | | 87,750 | | | | 12,943 | |
Dreyfus Cash Management Fund, Institutional Class Shares, 0.44% 11 | | | 2,132,449 | | | | 2,132,449 | |
Total Short-Term Investments (cost $5,327,244) | | | | | | | 5,252,437 | |
Total Investments - 115.6% (cost $41,594,093) | | | | | | | 37,051,552 | |
Other Assets, less Liabilities - (15.6)% | | | | | | | (4,995,440 | ) |
Net Assets - 100.0% | | | | | | $ | 32,056,112 | |
The accompanying notes are an integral part of these financial statements.
23
Managers Fixed Income Fund
Fund Snapshots
June 30, 2009 (unaudited)
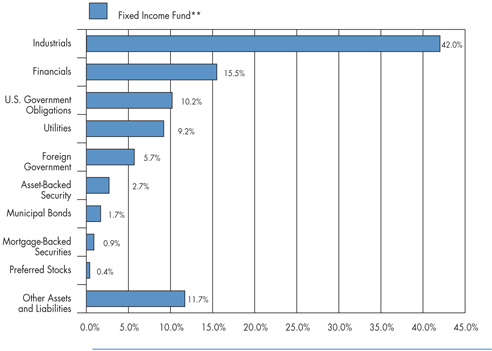
Portfolio Breakdown
| | | |
Industry | | Fixed
Income** | |
Industrials | | 42.0 | % |
Financials | | 15.5 | % |
U.S. Government Obligations | | 10.2 | % |
Utilities | | 9.2 | % |
Foreign Government | | 5.7 | % |
Asset-Backed Securities | | 2.7 | % |
Municipal Bonds | | 1.7 | % |
Mortgage-Backed Securities | | 0.9 | % |
Preferred Stocks | | 0.4 | % |
Other Assets and Liabilities | | 11.7 | % |
| ** | As a percentage of net assets |
Top Ten Holdings
| | | |
Top Ten Holdings | | % of Net Assets | |
U.S. Treasury Notes, 3.125%, 05/15/19 | | 4.5 | % |
U.S. Treasury Notes, 3.500%, 02/15/39 | | 4.0 | |
Kinder Morgan Energy Partners, LP, 5.950%, 02/15/18* | | 1.8 | |
Merrill Lynch & Co., Inc., 6.110%, 01/29/37* | | 1.7 | |
Inter-American Development Bank, 6.000%, 12/15/17* | | 1.7 | |
PPG Industries, Inc., 6.650%, 03/15/18* | | 1.6 | |
Equitable Resources, Inc., 6.500%, 04/01/18* | | 1.3 | |
Time Warner Cable, Inc., 6.750%, 07/01/18* | | 1.2 | |
NiSource Finance Corp., 6.400%, 03/15/18 | | 1.2 | |
American General Finance Corp., Series J, 6.900%, 12/15/17 | | 1.2 | |
| | | |
Top Ten as a Group | | 20.2 | % |
| | | |
| * | Top Ten Holding at December 31, 2008 |
Any sectors, industries, or securities discussed should not be perceived as investment recommendations. Mention of a specific security should not be considered a recommendation to buy or solicitation to sell that security. Specific securities mentioned in this report may have been sold from the Fund’s portfolio of investments by the time you receive this report.
24
Managers Fixed Income Fund
Schedule of Portfolio Investments
June 30, 2009 (unaudited)
| | | | | | | | |
Security Description | | | | Principal Amount | | Value |
Corporate Bonds - 66.7% | | | | | | | | |
Financials - 15.5% | | | | | | | | |
American General Finance Corp., Series J, 6.900%, 12/15/17 | | | | $ | 2,770,000 | | $ | 1,501,880 |
Associates Corp. of North America, 6.950%, 11/01/18 | | | | | 305,000 | | | 273,330 |
Bank of America Capital Trust VI, 5.625%, 03/08/35 | | | | | 295,000 | | | 192,553 |
Barclays Capital Corp., 4.160%, 02/22/10 (a) | | THB | | | 6,000,000 | | | 176,872 |
Bear Stearns Companies, Inc., The, 4.650%, 07/02/18 | | | | | 480,000 | | | 425,206 |
Bear Stearns Companies, Inc., The, 5.300%, 10/30/15 | | | | | 25,000 | | | 24,593 |
Bear Stearns Companies, Inc., The, 6.400%, 10/02/17 | | | | | 65,000 | | | 65,219 |
Caterpillar Financial Services Corp., Series MTN, 5.450%, 04/15/18 | | | | | 30,000 | | | 28,610 |
Caterpillar Financial Services Corp., 6.125%, 02/17/14 | | | | | 615,000 | | | 656,675 |
CIGNA Corp., 6.150%, 11/15/36 | | | | | 240,000 | | | 172,307 |
CIT Group, Inc., 7.625%, 11/30/12 | | | | | 1,043,000 | | | 714,671 |
CIT Group, Inc., 12.000%, 12/18/18 (a) | | | | | 1,604,000 | | | 754,268 |
Citigroup, Inc., 5.850%, 12/11/34 | | | | | 75,000 | | | 58,414 |
Citigroup, Inc., 5.875%, 05/29/37 | | | | | 100,000 | | | 78,370 |
Colonial Realty, L.P., 4.800%, 04/01/11 | | | | | 181,000 | | | 169,588 |
Colonial Realty, L.P., 5.500%, 10/01/15 | | | | | 190,000 | | | 149,935 |
Duke Realty, L.P., 5.950%, 02/15/17 | | | | | 35,000 | | | 27,170 |
ERAC USA Finance Co., 6.375%, 10/15/17 (a) | | | | | 240,000 | | | 217,034 |
ERAC USA Finance Co., 6.700%, 06/01/34 (a) | | | | | 65,000 | | | 48,892 |
ERAC USA Finance Co., 7.000%, 10/15/37 (a) | | | | | 925,000 | | | 737,590 |
ERP Operating, L.P., 5.125%, 03/15/16 | | | | | 15,000 | | | 13,775 |
ERP Operating, L.P., 5.750%, 06/15/17 | | | | | 70,000 | | | 65,403 |
Ford Motor Credit Company LLC, 5.700%, 01/15/10 | | | | | 15,000 | | | 14,479 |
Ford Motor Credit Company LLC, 7.000%, 10/01/13 | | | | | 135,000 | | | 108,638 |
Ford Motor Credit Company LLC, 9.750%, 09/15/10 | | | | | 309,000 | | | 296,070 |
GE Capital Australia Funding Pty., Ltd., 8.000%, 02/13/12 | | AUD | | | 260,000 | | | 209,639 |
General Electric Capital Corp., Series A, 1.431%, 05/13/24, (07/14/09) 5 | | | | | 180,000 | | | 110,881 |
Highwoods Realty, L.P., 5.850%, 03/15/17 | | | | | 30,000 | | | 23,927 |
Highwoods Realty, L.P., 7.500%, 04/15/18 | | | | | 350,000 | | | 303,319 |
iStar Financial, Inc., 1.097%, 10/01/12, (10/01/09) 5 | | | | | 325,000 | | | 124,540 |
Kinder Morgan Finance Co., 5.150%, 03/01/15 | | | | | 75,000 | | | 65,438 |
Kinder Morgan Finance Co., 5.700%, 01/05/16 | | | | | 165,000 | | | 142,312 |
Marsh & McLennan Companies, Inc., 5.375%, 07/15/14 | | | | | 410,000 | | | 399,571 |
Marsh & McLennan Companies, Inc., 5.750%, 09/15/15 | | | | | 652,000 | | | 621,972 |
Marsh & McLennan Companies, Inc., 5.875%, 08/01/33 | | | | | 1,230,000 | | | 976,155 |
Marsh & McLennan Companies, Inc., 9.250%, 04/15/19 | | | | | 435,000 | | | 490,322 |
MBIA Insurance Corp., 14.000%, 01/15/33 7 | | | | | 25,000 | | | 9,506 |
Merrill Lynch & Co., Inc., 6.110%, 01/29/37 | | | | | 2,900,000 | | | 2,246,241 |
Morgan Stanley, 4.750%, 04/01/14 | | | | | 540,000 | | | 510,609 |
The accompanying notes are an integral part of these financial statements.
25
Managers Fixed Income Fund
Schedule of Portfolio Investments (continued)
| | | | | | | |
Security Description | | Principal Amount | | | Value |
Financials - 15.5% (continued) | | | | | | | |
Morgan Stanley, 5.550%, 04/27/17 | | $ | 520,000 | | | $ | 484,805 |
Morgan Stanley, 5.950%, 12/28/17 | | | 300,000 | | | | 288,338 |
Morgan Stanley, 6.625%, 04/01/18 | | | 160,000 | | | | 159,766 |
Morgan Stanley, 6.750%, 04/15/11 | | | 65,000 | | | | 68,120 |
Morgan Stanley, 7.300%, 05/13/19 | | | 300,000 | | | | 311,631 |
Mutual of Omaha Insurance Co., 6.800%, 06/15/36 (a) | | | 620,000 | | | | 426,001 |
National City Bank of Indiana, 4.250%, 07/01/18 | | | 395,000 | | | | 332,216 |
ProLogis Trust, 5.625%, 11/15/15 | | | 15,000 | | | | 11,909 |
ProLogis Trust, 5.750%, 04/01/16 | | | 15,000 | | | | 11,839 |
Simon Property Group, LP, 5.250%, 12/01/16 | | | 25,000 | | | | 22,240 |
Simon Property Group, LP, 5.875%, 03/01/17 | | | 40,000 | | | | 36,781 |
Simon Property Group, LP, 6.750%, 05/15/14 | | | 1,200,000 | 2 | | | 1,206,998 |
Simon Property Group, LP, 10.350%, 04/01/19 | | | 385,000 | | | | 438,143 |
SLM Corp., 8.450%, 06/15/18 | | | 845,000 | | | | 723,952 |
Sovereign Bank, 5.125%, 03/15/13 | | | 335,000 | | | | 311,926 |
Standard Chartered Bank, 6.400%, 09/29/17 (a) | | | 100,000 | | | | 90,500 |
Standard Chartered PLC, 5.500%, 11/18/14 (a) | | | 750,000 | | | | 766,244 |
Toll Brothers Finance Corp., 5.150%, 05/15/15 | | | 555,000 | | | | 491,986 |
Travelers Cos., Inc., 6.250%, 06/15/37 | | | 345,000 | | | | 358,494 |
Travelers Property Casualty Corp., 6.375%, 03/15/33 | | | 330,000 | | | | 347,137 |
XL Capital PLC, 6.500%, 01/15/12 | | | 105,000 | | | | 97,849 |
Total Financials | | | | | | | 20,192,849 |
Industrials - 42.0% | | | | | | | |
Alltel Corp., 7.875%, 07/01/32 | | | 210,000 | | | | 244,544 |
Anadarko Petroleum Corp., 5.950%, 09/15/16 | | | 450,000 | | | | 444,622 |
Anadarko Petroleum Corp., 6.450%, 09/15/36 | | | 395,000 | | | | 356,141 |
Anheuser-Busch Companies, Inc., 5.950%, 01/15/33 | | | 330,000 | | | | 272,759 |
Anheuser-Busch Companies, Inc., 6.450%, 09/01/37 | | | 420,000 | | | | 392,438 |
Anheuser-Busch InBev Worldwide, Inc., 5.375%, 11/15/14 (a) | | | 975,000 | | | | 984,831 |
AstraZeneca PLC, 6.450%, 09/15/37 | | | 500,000 | | | | 556,178 |
AT&T Corp., 6.500%, 03/15/29 | | | 775,000 | | | | 742,748 |
AT&T Wireless Services, Inc., 8.750%, 03/01/31 | | | 310,000 | | | | 378,845 |
AT&T, Inc., 6.150%, 09/15/34 | | | 840,000 | | | | 799,910 |
AT&T, Inc., 6.700%, 11/15/13 | | | 855,000 | | | | 939,873 |
Avnet, Inc., 6.000%, 09/01/15 | | | 720,000 | | | | 662,920 |
Avnet, Inc., 6.625%, 09/15/16 | | | 140,000 | | | | 131,446 |
BellSouth Corp., 6.000%, 11/15/34 | | | 280,000 | | | | 264,743 |
BellSouth Corp., 6.550%, 06/15/34 | | | 55,000 | | | | 54,082 |
Camden Property Trust, 5.700%, 05/15/17 | | | 255,000 | | | | 230,725 |
Canadian Pacific Railway Co., 5.950%, 05/15/37 | | | 410,000 | | | | 336,606 |
Cardinal Health, Inc., 4.000%, 06/15/15 | | | 320,000 | | | | 279,044 |
The accompanying notes are an integral part of these financial statements.
26
Managers Fixed Income Fund
Schedule of Portfolio Investments (continued)
| | | | | | |
Security Description | | Principal Amount | | Value |
Industrials - 42.0% (continued) | | | | | | |
Charter Communications Operating LLC, 8.000%, 04/30/12 (a) 8 | | $ | 245,000 | | $ | 237,038 |
Chartered Semiconductor Manufacturing, Ltd., 6.250%, 04/04/13 | | | 715,000 | | | 648,101 |
Chevron Phillips Chemical Co., LLC, 8.250%, 06/15/19 (a) | | | 1,205,000 | | | 1,259,208 |
Coca-Cola HBC Finance, B.V., 5.125%, 09/17/13 | | | 265,000 | | | 268,874 |
Comcast Corp., 5.650%, 06/15/35 | | | 505,000 | | | 464,021 |
Comcast Corp., 6.450%, 03/15/37 | | | 795,000 | | | 786,004 |
Comcast Corp., 6.500%, 11/15/35 | | | 460,000 | | | 466,480 |
Continental Airlines, Inc., 5.983%, 04/19/22 | | | 85,000 | | | 70,125 |
Continental Airlines, Inc., Series B, 6.903%, 04/19/22 | | | 94,000 | | | 58,280 |
Corning, Inc., 6.850%, 03/01/29 | | | 600,000 | | | 558,122 |
Covidien International Finance, S.A., 6.000%, 10/15/17 | | | 295,000 | | | 314,230 |
CSX Corp., 6.000%, 10/01/36 | | | 570,000 | | | 517,964 |
Cummins Engine Co., Inc., 6.750%, 02/15/27 | | | 153,000 | | | 120,208 |
D.R. Horton, Inc., 5.250%, 02/15/15 | | | 420,000 | | | 350,700 |
Delta Air Lines, Inc., 8.021%, 08/10/22 | | | 739,610 | | | 480,746 |
Desarrolladora Homex, S.A. de C.V., 7.500%, 09/28/15 | | | 245,000 | | | 211,925 |
DP World, Ltd., 6.850%, 07/02/37 (a) | | | 1,420,000 | | | 948,767 |
Dun & Bradstreet Corp., The, 6.000%, 04/01/13 | | | 790,000 | | | 792,642 |
El Paso Corp., 6.950%, 06/01/28 | | | 165,000 | | | 124,968 |
Energy Transfer Partners, L.P., 6.125%, 02/15/17 | | | 65,000 | | | 64,672 |
Energy Transfer Partners, L.P., 6.625%, 10/15/36 | | | 145,000 | | | 142,115 |
Equifax, Inc., 7.000%, 07/01/37 | | | 228,000 | | | 221,603 |
Equitable Resources, Inc., 6.500%, 04/01/18 | | | 1,730,000 | | | 1,674,370 |
Express Scripts, Inc., 6.250%, 06/15/14 | | | 305,000 | | | 323,065 |
Express Scripts, Inc., 7.250%, 06/15/19 | | | 185,000 | | | 204,375 |
Georgia-Pacific Corp., 7.250%, 06/01/28 | | | 70,000 | | | 52,675 |
HCA, Inc., 6.250%, 02/15/13 | | | 5,000 | | | 4,400 |
HCA, Inc., 6.375%, 01/15/15 | | | 5,000 | | | 4,088 |
HCA, Inc., 6.750%, 07/15/13 | | | 5,000 | | | 4,425 |
HCA, Inc., 7.050%, 12/01/27 | | | 750,000 | | | 460,545 |
HCA, Inc., 7.190%, 11/15/15 | | | 5,000 | | | 3,866 |
HCA, Inc., 7.500%, 12/15/23 | | | 5,000 | | | 3,282 |
HCA, Inc., 7.500%, 11/06/33 | | | 75,000 | | | 43,125 |
HCA, Inc., 7.690%, 06/15/25 | | | 315,000 | | | 195,019 |
HCA, Inc., 7.750%, 07/15/36 | | | 5,000 | | | 2,997 |
HCA, Inc., 8.360%, 04/15/24 | | | 40,000 | | | 26,608 |
HCA, Inc., 8.750%, 09/01/10 | | | 625,000 | | | 629,688 |
Home Depot, Inc., The, 5.875%, 12/16/36 | | | 1,035,000 | | | 916,045 |
Intel Corp., 2.950%, 12/15/35 | | | 25,000 | | | 21,125 |
International Paper Co., 5.500%, 01/15/14 | | | 635,000 | | | 583,924 |
International Paper Co., 7.950%, 06/15/18 | | | 625,000 | | | 603,906 |
The accompanying notes are an integral part of these financial statements.
27
Managers Fixed Income Fund
Schedule of Portfolio Investments (continued)
| | | | | | |
Security Description | | Principal Amount | | Value |
Industrials - 42.0% (continued) | | | | | | |
Intuit, Inc., 5.750%, 03/15/17 | | $ | 210,000 | | $ | 199,829 |
J.C. Penney Co., Inc., 5.750%, 02/15/18 | | | 25,000 | | | 21,978 |
J.C. Penney Co., Inc., 6.375%, 10/15/36 | | | 580,000 | | | 430,424 |
J.C. Penney Co., Inc., 7.400%, 04/01/37 | | | 20,000 | | | 15,824 |
J.C. Penney Co., Inc., 7.625%, 03/01/97 | | | 25,000 | | | 16,783 |
Kinder Morgan Energy Partners, LP, 5.950%, 02/15/18 | | | 2,335,000 | | | 2,289,482 |
KLA Instruments Corp., 6.900%, 05/01/18 | | | 1,135,000 | | | 1,022,071 |
Koninklijke Philips Electronics, N.V., 6.875%, 03/11/38 | | | 1,090,000 | | | 1,171,339 |
Kraft Foods, Inc., 6.500%, 11/01/31 | | | 310,000 | | | 308,698 |
Kroger Co., 7.000%, 05/01/18 | | | 460,000 | | | 496,157 |
Lennar Corp., 5.600%, 05/31/15 | | | 400,000 | | | 317,000 |
Lennar Corp., 6.500%, 04/15/16 | | | 280,000 | | | 225,400 |
Liberty Media Corp., 5.700%, 05/15/13 | | | 190,000 | | | 165,300 |
Lubrizol Corp., 6.500%, 10/01/34 | | | 880,000 | | | 782,192 |
Macy’s Retail Holdings, Inc., 6.790%, 07/15/27 | | | 80,000 | | | 55,541 |
Macy’s Retail Holdings, Inc., 6.900%, 04/01/29 | | | 30,000 | | | 21,101 |
Marks & Spencer Group PLC, 7.125%, 12/01/37 (a) | | | 300,000 | | | 222,638 |
Masco Corp., 5.850%, 03/15/17 | | | 350,000 | | | 279,988 |
Medco Health Solutions, Inc., 7.125%, 03/15/18 | | | 1,260,000 | | | 1,329,029 |
Medco Health Solutions, Inc., 7.250%, 08/15/13 | | | 420,000 | | | 450,889 |
Missouri Pacific Railroad Co., 5.000%, 01/01/45 9 | | | 200,000 | | | 100,000 |
Motorola, Inc., 5.220%, 10/01/97 | | | 40,000 | | | 17,858 |
Motorola, Inc., 6.500%, 09/01/25 | | | 15,000 | | | 10,523 |
Motorola, Inc., 6.500%, 11/15/28 | | | 70,000 | | | 47,708 |
New England Telephone & Telegraph Co., 7.875%, 11/15/29 | | | 95,000 | | | 97,790 |
News America, Inc., 6.200%, 12/15/34 | | | 350,000 | | | 299,670 |
News America, Inc., 6.400%, 12/15/35 | | | 425,000 | | | 373,073 |
News America, Inc., 7.280%, 06/30/28 | | | 225,000 | | | 207,569 |
News America, Inc., 7.625%, 11/30/28 | | | 460,000 | | | 441,606 |
Nextel Communications, Inc., 5.950%, 03/15/14 | | | 710,000 | | | 562,675 |
Nextel Communications, Inc., 6.875%, 10/31/13 | | | 5,000 | | | 4,162 |
Nextel Communications, Inc., 7.375%, 08/01/15 | | | 20,000 | | | 16,050 |
NGPL Pipeline LLC, 7.768%, 12/15/37 (a) | | | 940,000 | | | 1,029,983 |
Northwest Airlines, Inc., 8.028%, 11/01/17 | | | 446,872 | | | 285,998 |
Owens & Minor, Inc., 6.350%, 04/15/16 9 | | | 125,000 | | | 109,522 |
PPG Industries, Inc., 6.650%, 03/15/18 | | | 1,935,000 | | | 2,060,585 |
Pulte Homes, Inc., 6.000%, 02/15/35 | | | 1,265,000 | | | 828,575 |
Pulte Homes, Inc., 6.375%, 05/15/33 | | | 465,000 | | | 309,225 |
Pulte Homes, Inc., Senior Notes, 5.200%, 02/15/15 | | | 405,000 | | | 340,200 |
Qantas Airways, Ltd., 6.050%, 04/15/16 (a) | | | 1,500,000 | | | 1,356,852 |
Questar Market Resources, Inc., 6.800%, 04/01/18 | | | 1,365,000 | | | 1,288,201 |
The accompanying notes are an integral part of these financial statements.
28
Managers Fixed Income Fund
Schedule of Portfolio Investments (continued)
| | | | | | |
Security Description | | Principal Amount | | Value |
Industrials - 42.0% (continued) | | | | | | |
Qwest Corp., 6.875%, 09/15/33 | | $ | 20,000 | | $ | 14,700 |
Safeway, Inc., 6.350%, 08/15/17 | | | 400,000 | | | 423,380 |
Samsung Electronics Co., Ltd., 7.700%, 10/01/27 (a) | | | 570,000 | | | 580,390 |
Simon Property Group, LP, 5.750%, 12/01/15 | | | 85,000 | | | 78,386 |
Sprint Capital Corp., 6.875%, 11/15/28 | | | 30,000 | | | 21,450 |
Sprint Capital Corp., 6.900%, 05/01/19 | | | 15,000 | | | 12,488 |
Sprint Capital Corp., 8.750%, 03/15/32 | | | 5,000 | | | 4,050 |
Telecom Italia Capital S.p.A., 6.000%, 09/30/34 | | | 40,000 | | | 33,885 |
Telecom Italia Capital S.p.A., 6.375%, 11/15/33 | | | 105,000 | | | 93,590 |
Tele-Communications, Inc., 9.800%, 02/01/12 | | | 350,000 | | | 394,223 |
Telefonica Emisiones SAU, 5.877%, 07/15/19 | | | 265,000 | | | 273,729 |
Telefonica Emisiones SAU, 7.045%, 06/20/36 | | | 1,210,000 | | | 1,345,107 |
Tennessee Gas Pipeline Co., 7.000%, 10/15/28 | | | 240,000 | | | 229,899 |
Texas Eastern Transmission, LP, 7.000%, 07/15/32 | | | 255,000 | | | 269,010 |
TGT Pipeline LLC, 5.200%, 06/01/18 | | | 465,000 | | | 396,536 |
Time Warner Cable, Inc., 6.750%, 07/01/18 | | | 1,500,000 | | | 1,564,982 |
Time Warner, Inc., 6.625%, 05/15/29 | | | 270,000 | | | 244,788 |
Time Warner, Inc., 6.950%, 01/15/28 | | | 120,000 | | | 113,013 |
Time Warner, Inc., 7.625%, 04/15/31 | | | 80,000 | | | 77,975 |
Time Warner, Inc., 7.700%, 05/01/32 | | | 685,000 | | | 674,909 |
Toro Co., The, 6.625%, 05/01/37 9 | | | 365,000 | | | 265,964 |
Union Pacific Corp., 5.375%, 06/01/33 | | | 50,000 | | | 43,890 |
V.F. Corp., 6.450%, 11/01/37 | | | 412,000 | | | 392,201 |
Verizon Global Funding Corp., 5.850%, 09/15/35 | | | 1,095,000 | | | 1,021,738 |
Verizon Maryland, Inc., 5.125%, 06/15/33 | | | 295,000 | | | 219,215 |
Verizon New England, Inc., 4.750%, 10/01/13 | | | 300,000 | | | 297,903 |
Verizon New England, Inc., 6.500%, 09/15/11 | | | 530,000 | | | 564,431 |
Verizon New York, Inc., Series B, 7.375%, 04/01/32 | | | 195,000 | | | 190,500 |
Viacom, Inc., 6.875%, 04/30/36 | | | 470,000 | | | 434,275 |
Vondafone Group PLC, 6.150%, 02/27/37 | | | 650,000 | | | 641,603 |
Walt Disney Co., The, 7.000%, 03/01/32 | | | 190,000 | | | 221,674 |
Watson Pharmaceuticals, Inc., Convertible 1.750%, 03/15/23 | | | 65,000 | | | 64,431 |
Western Union Co., 6.200%, 11/17/36 | | | 635,000 | | | 600,283 |
Weyerhaeuser Co., 6.875%, 12/15/33 | | | 645,000 | | | 440,535 |
Total Industrials | | | | | | 54,791,397 |
Utilities - 9.2% | | | | | | |
Abu Dhabi National Energy Co., 7.250%, 08/01/18 (a) | | | 1,040,000 | | | 1,041,901 |
Ameren Energy Generating Co., 7.000%, 04/15/18 | | | 1,200,000 | | | 1,083,437 |
Bruce Mansfield Unit, 6.850%, 06/01/34 9 | | | 281,000 | | | 247,433 |
CILCORP, Inc., 8.700%, 10/15/09 | | | 315,000 | | | 310,275 |
Cleveland Electric Illuminating Co., The, 5.950%, 12/15/36 | | | 715,000 | | | 624,884 |
The accompanying notes are an integral part of these financial statements.
29
Managers Fixed Income Fund
Schedule of Portfolio Investments (continued)
| | | | | | | | | |
Security Description | | | | Principal Amount | | | Value |
Utilities - 9.2% (continued) | | | | | | | | | |
Commonwealth Edison Co., 4.700%, 04/15/15 | | | | $ | 510,000 | | | $ | 504,055 |
Commonwealth Edison Co., 5.875%, 02/01/33 | | | | | 620,000 | | | | 596,063 |
Dominion Resources, Inc., 5.950%, 06/15/35 | | | | | 90,000 | | | | 86,129 |
Empresa Nacional de Electricidad, 7.875%, 02/01/27 | | | | | 900,000 | | | | 955,031 |
Illinois Power Co., 6.250%, 04/01/18 | | | | | 1,370,000 | | | | 1,299,564 |
ITC Holdings Corp., 5.875%, 09/30/16 (a) | | | | | 225,000 | | | | 213,284 |
ITC Holdings Corp., 6.375%, 09/30/36 (a) | | | | | 300,000 | | | | 252,320 |
Methanex Corp., 6.000%, 08/15/15 | | | | | 320,000 | | | | 246,604 |
MidAmerican Energy Holdings Co., 6.500%, 09/15/37 | | | | | 340,000 | | | | 354,027 |
NiSource Finance Corp., 6.400%, 03/15/18 | | | | | 1,645,000 | | | | 1,511,714 |
NiSource Finance Corp., 6.800%, 01/15/19 | | | | | 900,000 | | | | 844,821 |
Pacific Gas and Electric Co., 6.050%, 03/01/34 | | | | | 500,000 | | | | 520,402 |
Southwestern Electric Power Co., 6.450%, 01/15/19 | | | | | 1,225,000 | | | | 1,251,523 |
Total Utilities | | | | | | | | | 11,943,467 |
Total Corporate Bonds (cost $92,132,182) | | | | | | | | | 86,927,713 |
U.S. Government Obligations - 10.2% | | | | | | | | | |
U.S. Treasury Notes, 3.125%, 05/15/19 | | | | | 6,000,000 | 2 | | | 5,805,018 |
U.S. Treasury Notes, 3.500%, 02/15/39 | | | | | 6,000,000 | 2 | | | 5,190,018 |
U.S. Treasury Notes, 4.500%, 09/30/11 | | | | | 750,000 | 2 | | | 804,024 |
U.S. Treasury Notes, 4.750%, 05/15/14 | | | | | 835,000 | 2 | | | 920,849 |
U.S. Treasury Inflation Indexed Bonds, 2.000%, 01/15/14 | | | | | 507,742 | | | | 519,960 |
Total U.S. Government Obligations (cost $13,057,561) | | | | | | | | | 13,239,869 |
Foreign Government Obligations - 5.7% | | | | | | | | | |
Brazil, Republic of, 10.250%, 01/10/28 | | BRL | | | 750,000 | | | | 378,923 |
Canadian Government, 3.750%, 06/01/12 | | CAD | | | 135,000 | | | | 122,321 |
Canadian Government, 4.250%, 09/01/09 | | CAD | | | 1,000,000 | | | | 865,271 |
Canadian Government, 5.250%, 06/01/12 | | CAD | | | 390,000 | | | | 367,592 |
Inter-American Development Bank, 6.000%, 12/15/17 | | NZD | | | 3,500,000 | | | | 2,199,756 |
International Bank for Reconstruction & Development, Series GDIF, 1.430%, 03/05/14 | | SGD | | | 1,000,000 | | | | 666,988 |
International Bank for Reconstruction & Development, 9.500%, 05/27/10 | | ISK | | | 3,300,000 | | | | 25,959 |
Mexican Bonos, Series M, 7.250%, 12/15/16 | | MXN | | | 6,850,000 | | | | 500,814 |
Mexican Fixed Rate Bonds, 8.000%, 12/07/23 | | MXN | | | 3,500,000 | | | | 255,943 |
Mexican Government, 9.000%, 12/20/12 | | MXN | | | 5,950,000 | | | | 486,465 |
New South Wales Treasury Corp., Series 12RG, 6.000%, 05/01/12 | | AUD | | | 260,000 | | | | 214,784 |
New South Wales Treasury Corp., Series 10RG, 7.000%, 12/01/10 | | AUD | | | 995,000 | | | | 836,676 |
Queensland Treasury Corp., Series 11G, 6.000%, 06/14/11 | | AUD | | | 665,000 | | | | 553,255 |
Total Foreign Government Obligations (cost $7,941,617) | | | | | | | | | 7,474,747 |
Municipal Bonds - 1.7% | | | | | | | | | |
Alabama Public School & College Authority, Capital Improvement Bond, 4.500%, 12/01/26 | | | | | 30,000 | | | | 28,774 |
Buckeye Ohio Tobacco Settlement Financing Authority, Asset-A-2, 5.875%, 06/01/47 9 | | | | | 250,000 | | | | 141,125 |
Chicago Illinois Board of Education, Dedicated-Series B, 4.750%, 12/01/31 (FSA Insured) | | | | | 50,000 | | | | 47,025 |
The accompanying notes are an integral part of these financial statements.
30
Managers Fixed Income Fund
Schedule of Portfolio Investments (continued)
| | | | | | |
Security Description | | Principal Amount | | Value |
Municipal Bonds - 1.7% (continued) | | | | | | |
Chicago Illinois O’Hare International Airport Revenue Bond, Series A, 4.500%, 01/01/38 (FSA Insured) | | $ | 15,000 | | $ | 13,233 |
Decatur Texas Hospital Authority Hospital Revenue, 7.750%, 09/01/09 | | | 60,000 | | | 60,508 |
District of Columbia, Series A, 4.750%, 06/01/36 (National Insured) | | | 30,000 | | | 26,749 |
Eufaula Alabama, Series C, 4.000%, 08/15/12 (AMBAC Insured) | | | 285,000 | | | 284,484 |
Florida State Turnpike Authority, Revenue Bond, Department of Transportation, Series A, 3.500%, 07/01/27 (National Insured) | | | 30,000 | | | 23,512 |
Green Bay Wisconsin, Water System Revenue Refunding Bonds, 3.500%, 11/01/26 (FSA Insured) | | | 20,000 | | | 17,113 |
Green Bay Wisconsin, Water System Revenue Refunding Bonds, 3.500%, 11/01/29 (FSA Insured) | | | 20,000 | | | 16,221 |
Grosse Pointe Michigan Public School System, 3.000%, 05/01/27 (National Insured) | | | 15,000 | | | 11,516 |
Harris County Texas, Road Bonds, Series B, 4.500%, 10/01/31 | | | 85,000 | | | 81,532 |
JEA Florida Water & Sewer System Revenue Bond, Series B, 4.750%, 10/01/41 (National Insured) | | | 45,000 | | | 40,238 |
Louisianna State, Series C, 3.250%, 05/01/26 (FSA Insured) | | | 30,000 | | | 22,206 |
Massachusetts State School Building Authority Sales Tax Revenue Bond, Series A, 4.750%, 08/15/32 | | | 30,000 | | | 29,058 |
Michigan Tobacco Settlement Financial Authority, Series A, 7.309%, 06/01/34 9 | | | 390,000 | | | 259,869 |
Omaha Nebraska Public Power District, Electric System Subordinated Revenue Bonds, Series AA, 4.500%, 02/01/34 (National Insured) | | | 70,000 | | | 65,440 |
San Diego California Unified School District, Refunding Bonds, Election 1998, Series F-1, 4.500%, 07/01/29 (FSA Insured) | | | 30,000 | | | 27,357 |
San Jose California Redevelopment Agency Tax Allocation, Series C, 3.750%, 08/01/28 (National Insured) | | | 35,000 | | | 24,191 |
San Jose Redevelopment Agency, 3.750%, 08/01/28 (BHAC Insured) | | | 15,000 | | | 11,213 |
State of California, 4.500%, 08/01/27 (AMBAC Insured) | | | 45,000 | | | 36,417 |
State of California, 4.500%, 10/01/29 | | | 130,000 | | | 102,540 |
State of California, 4.500%, 08/01/30 (AMBAC Insured) | | | 35,000 | | | 27,353 |
State of California, 4.500%, 08/01/30 | | | 30,000 | | | 23,446 |
State of California, Variable Purpose Bond, 3.250%, 12/01/27 (National Insured) | | | 25,000 | | | 16,072 |
State of California, Variable Purpose Bond, 4.500%, 12/01/33 (AMBAC Insured) | | | 110,000 | | | 83,499 |
University of California Regents Medical Center, Series A, 4.750%, 05/15/31 (National Insured) | | | 10,000 | | | 9,516 |
Virginia Tobacco Settlement Financing Corp., 6.706%, 06/01/46 9 | | | 1,055,000 | | | 652,760 |
Wisconsin Housing & Economic Development Authority, Revenue Bonds, Series E, 4.900%, 11/01/35 | | | 10,000 | | | 8,945 |
Total Municipal Bonds (cost $2,866,922) | | | | | | 2,191,912 |
Asset-Backed Securities - 2.7% | | | | | | |
ARG Funding Corp., Series 2005-2A, Class A5, 2.639%, 05/20/11, (07/20/09) (a) 5 | | | 385,000 | | | 360,237 |
Capital One Auto Finance Trust 2006-C A4, 0.349%, 05/15/13, (07/15/09) 5 | | | 735,000 | | | 673,224 |
Centex Home Equity Loan, Series 2004-A, Class AF6, 4.270%, 01/25/34 7 | | | 258,319 | | | 204,752 |
Chase Issuance Trust, Series 2007-B1, Class B1, 0.569%, 04/15/19, (07/15/09) 5 | | | 845,000 | | | 590,106 |
Chase Issuance Trust, Series 2005-C1, Class C1, 0.689%, 11/15/12, (07/15/09) 5 | | | 56,000 | | | 54,081 |
Citibank Credit Card Issuance Trust, Series 2008-C6, Class C6, 6.300%, 06/20/14 | | | 780,000 | | | 738,462 |
Community Program Loan Trust, Series 87-A, Class A4, 4.500%, 10/01/18 | | | 13,408 | | | 13,409 |
Countrywide Home Loans, Series 2002-S1, Class A5, 5.960%, 11/25/16 (b) | | | 221,457 | | | 158,795 |
MBNA Credit Card Master Note Trust, Series 2005-B2, Class B, 2.694%, 12/17/12 5 | | | 535,000 | | | 521,868 |
Merrill Auto Trust Securitization, Series 2008-1, Class B, 6.750%, 04/15/15 | | | 200,000 | | | 171,744 |
Total Asset-Backed Securities (cost $3,705,952) | | | | | | 3,486,678 |
The accompanying notes are an integral part of these financial statements.
31
Managers Fixed Income Fund
Schedule of Portfolio Investments (continued)
| | | | | | | | |
Security Description | | Principal Amount | | | Value | |
Mortgage-Backed Securities - 0.9% | | | | | | | | |
Credit Suisse Mortgage Capital, Series 2007-C5, Class A4, 5.695%, 09/15/40 7 | | $ | 300,000 | | | $ | 206,868 | |
CS First Boston Mortgage Securities Corp., Series 2005-7, Class 3A1, 5.000%, 08/25/20 | | | 301,246 | | | | 254,911 | |
JPMorgan Chase Commercial Mortgage Securities Corp., Series 2007-LDPX, Class A3, 5.420%, 01/15/49 | | | 110,000 | | | | 81,273 | |
JPMorgan Chase Commercial Mortgage Securities Corp., Series 2007-LD11, Class A4, 6.007%, 06/15/49 5 | | | 220,000 | | | | 168,619 | |
Morgan Stanley Dean Witter Capital Inc., Series 2001-PPM, Class A2, 6.400%, 02/15/31 | | | 193,026 | | | | 196,095 | |
LB-UBS Commercial Mortgage Trust, Series 2001-C3, Class A2, 6.365%, 12/15/28 | | | 320,000 | | | | 327,398 | |
Total Mortgage-Backed Securities (cost $1,157,060) | | | | | | | 1,235,164 | |
| | |
| | | Shares | | | | |
Preferred Stocks - 0.4% | | | | | | | | |
CIT Group, Inc., Series A, 6.350% | | | 5,365 | 2 | | | 38,360 | |
FHLMC, Series F, 5.000%* | | | 750 | | | | 1,050 | |
FHLMC, Series K, 5.790%* | | | 2,250 | | | | 2,812 | |
FHLMC, Series O, 5.810%* | | | 750 | | | | 1,275 | |
FHLMC, Series P, 6.000%* | | | 1,000 | | | | 1,340 | |
FHLMC, Series R, 5.700%* | | | 1,200 | | | | 1,620 | |
FHLMC, Series T, 6.420%* | | | 700 | | | | 1,120 | |
FHLMC, Series U, 5.900%* | | | 1,700 | | | | 1,360 | |
FHLMC, Series V, 5.570%* | | | 11,750 | | | | 10,810 | |
FHLMC, Series W, 5.660%* | | | 3,450 | | | | 3,105 | |
FHLMC, Series Y, 6.550%* | | | 3,300 | | | | 2,706 | |
FHLMC, Series Z, 8.375%* 5 | | | 29,524 | | | | 36,019 | |
FNMA, Series H, 5.810%* | | | 450 | | | | 688 | |
FNMA, Series I, 5.375%* | | | 1,050 | | | | 1,806 | |
FNMA, Series L, 5.125%* | | | 550 | | | | 808 | |
FNMA, Series M, 4.750%* | | | 1,500 | | | | 2,280 | |
FNMA, Series Q, 6.750%* | | | 700 | | | | 840 | |
FNMA, Series S, 8.250%* 5 | | | 52,775 | | | | 70,719 | |
Newell Financial Trust I, 5.250% | | | 13,455 | | | | 359,081 | |
Total Preferred Stocks (cost $2,942,956) | | | | | | | 537,799 | |
Short-Term Investments - 21.2%1 | | | | | | | | |
BNY Institutional Cash Reserves Fund, Series A, 0.06%3 | | | 14,136,203 | | | | 14,136,203 | |
BNY Institutional Cash Reserves Fund, Series B *3,10 | | | 247,573 | | | | 36,517 | |
Dreyfus Cash Management Fund, Institutional Class Shares, 0.44%11 | | | 12,019,648 | | | | 12,019,648 | |
JPMorgan Liquid Assets Money Market Fund, Capital Shares, 0.48%12 | | | 1,517,578 | | | | 1,517,578 | |
Total Short-Term Investments (cost $27,921,002) | | | | | | | 27,709,946 | |
Total Investments - 109.5% (cost $151,725,252) | | | | | | | 142,803,828 | |
Other Assets, less Liabilities - (9.5)% | | | | | | | (12,394,918 | ) |
Net Assets - 100.0% | | | | | | $ | 130,408,910 | |
The accompanying notes are an integral part of these financial statements.
32
Managers Short Duration Government Fund
Fund Snapshots
June 30, 2009 (unaudited)
Portfolio Breakdown
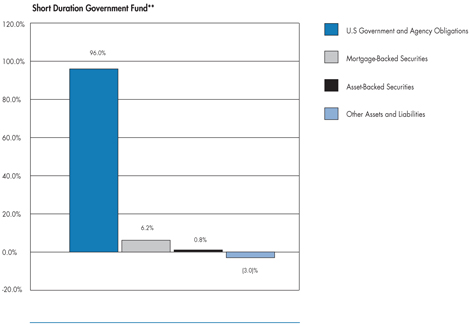
| | | |
Portfolio Breakdown | | Short Duration
Government Fund** | |
U.S Government and Agency Obligations | | 96.0 | % |
Mortgage-Backed Securities | | 6.2 | % |
Asset-Backed Securities | | 0.8 | % |
Other Assets and Liabilities | | (3.0 | )% |
| ** | As a percentage of net assets |
Top Ten Holdings
| | | |
Top Ten Holdings | | % of
Net Assets | |
FHLMC, 4.500%, TBA | | 9.7 | % |
FNMA, 6.000%, 12/01/23 | | 4.4 | |
FHLMC, 5.929%, 02/01/37* | | 4.0 | |
FHLMC Gold Pool, 6.000%, 03/01/23 | | 3.0 | |
FHLMC Gold Pool, 0.569%, 06/15/35* | | 2.7 | |
GMAC Commercial Mortgage Securities, Inc., Series 2000-C1, Class A2, 7.724%, 03/15/33* | | 2.3 | |
FNMA Whole Loan, Series 2005-W2, Class A1, 0.514%, 05/25/35* | | 2.0 | |
FNMA, 6.000%, 09/01/22 | | 1.9 | |
FHLMC REMICS, Series 3059, Class PA, 5.500%, 10/15/26 | | 1.8 | |
FNMA Whole Loan, Series 2004-W14, Class 1AF, 0.714%, 07/25/44 | | 1.7 | |
| | | |
Top Ten as a Group | | 33.5 | % |
| | | |
| * | Top Ten Holding at December 31, 2008 |
Any sectors, industries, or securities discussed should not be perceived as investment recommendations. Mention of a specific security should not be considered a recommendation to buy or solicitation to sell that security. Specific securities mentioned in this report may have been sold from the Fund’s portfolio of investments by the time you receive this report.
33
Managers Short Duration Government Fund
Schedule of Portfolio Investments
June 30, 2009 (unaudited)
| | | | | | |
Security Description | | Principal Amount | | Value |
U.S. Government and Agency Obligations - 96.0%1 | | | | | | |
Federal Home Loan Mortgage Corporation - 44.5% | | | | | | |
FHLMC Gold Pool, 0.569%, 06/15/35, (07/15/09) 5 | | $ | 6,525,593 | | $ | 6,490,988 |
FHLMC Gold Pool, 3.750%, 11/15/25 | | | 2,384,557 | | | 2,417,181 |
FHLMC Gold Pool, 4.000%, 12/01/20 | | | 3,592,830 | | | 3,601,064 |
FHLMC Gold Pool, 5.000%, 05/01/18 to 08/01/19 | | | 3,379,326 | | | 3,534,874 |
FHLMC Gold Pool, 5.500%, 11/01/17 to 12/01/17 | | | 806,282 | | | 851,838 |
FHLMC Gold Pool, 5.500%, 08/01/19 to 09/01/19 | | | 898,160 | | | 944,977 |
FHLMC Gold Pool, 6.000%, 03/01/23 | | | 6,943,655 | | | 7,352,246 |
FHLMC Gold Pool, 7.000%, 06/01/17 | | | 2,725,288 | | | 2,900,553 |
FHLMC Gold Pool, 7.500%, 04/01/15 to 03/01/33 | | | 1,493,311 | | | 1,609,608 |
FHLMC REMICS, Series 2003-86, Class OX, 4.500%, 09/15/26 | | | 711,007 | | | 725,745 |
FHLMC REMICS, Series 2870, Class CN, 4.000%, 10/15/27 | | | 524,802 | | | 536,362 |
FHLMC REMICS, Series 2769, Class BX, 4.500%, 07/15/27 | | | 696,774 | | | 713,968 |
FHLMC REMICS, Series 2885, Class DE, 4.500%, 12/15/17 | | | 439,923 | | | 455,064 |
FHLMC REMICS, Series 3059, Class PA, 5.500%, 10/15/26 | | | 4,220,435 | | | 4,320,638 |
FHLMC REMICS, Series 3153, Class NB, 5.500%, 02/15/27 | | | 1,077,034 | | | 1,106,761 |
FHLMC Structured Pass Through Securities, 7.500%, 02/25/42 | | | 131,763 | | | 141,068 |
FHLMC Structured Pass Through Securities, Series T-51, Class 2A, 7.500%, 08/25/42 7 | | | 212,492 | | | 227,499 |
FHLMC, 2.954%, 05/01/34, (06/01/10) 5 | | | 428,609 | | | 434,152 |
FHLMC, 3.321%, 07/01/34, (02/01/10) 5 | | | 729,750 | | | 740,237 |
FHLMC, 4.000%, 09/15/15 | | | 583,128 | | | 592,321 |
FHLMC, 4.500%, TBA | | | 24,000,000 | | | 23,797,488 |
FHLMC, 4.512%, 10/01/33, (10/01/09) 5 | | | 2,680,634 | | | 2,739,238 |
FHLMC, 4.669%, 03/01/38, (04/01/13) 5 | | | 1,901,220 | | | 1,960,758 |
FHLMC, 4.901%, 12/01/35, (10/01/10) 5 | | | 1,552,142 | | | 1,605,399 |
FHLMC, 5.000%, 05/01/18 to 06/15/27 | | | 7,724,759 | | | 7,989,602 |
FHLMC, 5.929%, 02/01/37, (02/01/12) 5 | | | 9,309,302 | | | 9,819,128 |
FHLMC, Series 2628, Class PV, 3.750%, 10/15/16 | | | 560,686 | | | 567,261 |
FHLMC, Series 2697, Class LP, 4.500%, 10/15/19 | | | 669,787 | | | 685,250 |
FHLMC, Series 2963, Class WL, 4.500%, 07/15/25 | | | 606,751 | | | 614,734 |
FHLMC, Series 2691, Class TC, 4.500%, 07/15/26 | | | 3,220,000 | | | 3,275,236 |
FHLMC, Series 2725, Class PC, 4.500%, 05/15/28 | | | 3,720,165 | | | 3,801,090 |
FHLMC, Series 2958, Class NB, 5.000%, 05/15/25 | | | 3,687,794 | | | 3,736,563 |
FHLMC, Series 2964, Class NA, 5.500%, 02/15/26 | | | 1,242,925 | | | 1,269,087 |
FHLMC, Series 3165, Class JA, 5.500%, 04/15/26 | | | 623,174 | | | 643,269 |
FHLMC, Series 2984, Class NA, 5.500%, 04/15/26 | | | 2,795,386 | | | 2,863,534 |
FHLMC, Series 3138, Class PA, 5.500%, 02/15/27 | | | 2,808,537 | | | 2,897,430 |
FHLMC, Series 2637, Class SI, 5.681%, 06/15/18, (07/15/09) 5 | | | 853,357 | | | 56,362 |
FHLMC, Series 3167, Class QA, 6.000%, 10/15/26 | | | 848,253 | | | 861,234 |
The accompanying notes are an integral part of these financial statements.
34
Managers Short Duration Government Fund
Schedule of Portfolio Investments (continued)
| | | | | | |
Security Description | | Principal Amount | | Value |
Federal Home Loan Mortgage Corporation - 44.5% (continued) | | | | | | |
FHLMC, Series 2608, Class SJ, 6.781%, 03/15/17, (07/15/09) 5 | | $ | 1,285,393 | | $ | 69,159 |
FHLMC, Series 2772, Class KS, 6.861%, 06/15/22, (07/15/09) 5 | | | 802,550 | | | 63,277 |
Total Federal Home Loan Mortgage Corporation | | | | | | 109,012,243 |
Federal National Mortgage Association - 43.0% | | | | | | |
FNMA, 0.634%, 11/25/30, (07/25/09) 5 | | | 2,669,023 | | | 2,586,871 |
FNMA, 0.714%, 03/25/35, (07/25/09) 5 | | | 2,741,057 | | | 2,664,322 |
FNMA, 3.529%, 06/01/34, (06/01/10) 5 | | | 2,237,893 | | | 2,266,862 |
FNMA, 3.602%, 08/01/34, (10/01/09) 5 | | | 1,041,296 | | | 1,066,327 |
FNMA, 3.729%, 06/01/34, (11/01/09) 5 | | | 2,844,314 | | | 2,861,731 |
FNMA, 4.067%, 08/01/33, (08/01/09) 5 | | | 746,639 | | | 760,569 |
FNMA, 4.159%, 02/01/33, (09/01/09) 5 | | | 962,508 | | | 986,900 |
FNMA, 4.408%, 04/01/35, (03/01/10) 5 | | | 1,571,636 | | | 1,628,472 |
FNMA, 4.412%, 08/01/34, (02/01/10) 5 | | | 1,543,379 | | | 1,592,747 |
FNMA, 4.672%, 11/01/34, (10/01/09) 5 | | | 916,988 | | | 946,759 |
FNMA, 4.826%, 01/01/35, (11/01/09) 5 | | | 695,987 | | | 711,309 |
FNMA, 4.851%, 01/01/35, (12/01/09) 5 | | | 977,231 | | | 1,002,538 |
FNMA, 4.862%, 09/01/33, (09/01/09) 5 | | | 1,157,033 | | | 1,181,544 |
FNMA, 4.880%, 01/01/33, (01/01/10) 5 | | | 4,014,939 | | | 4,156,277 |
FNMA, 4.897%, 06/01/35, (06/01/10) 5 | | | 714,901 | | | 740,134 |
FNMA, 4.947%, 01/01/33, (12/01/09) 5 | | | 122,933 | | | 127,123 |
FNMA, 4.954%, 06/01/35, (06/01/10) 5 | | | 738,676 | | | 766,059 |
FNMA, 4.991%, 01/01/36, (11/01/10) 5 | | | 542,648 | | | 563,958 |
FNMA, 5.000%, 03/01/18 to 03/25/24 | | | 4,935,233 | | | 5,138,704 |
FNMA, 5.150%, 01/01/36, (12/01/10) 5 | | | 221,471 | | | 229,263 |
FNMA, 5.305%, 06/01/37, (05/01/10) 5 | | | 1,552,228 | | | 1,615,244 |
FNMA, 5.344%, 02/01/37, (12/01/09) 5 | | | 2,038,869 | | | 2,074,219 |
FNMA, 5.348%, 08/01/36, (05/01/11) 5 | | | 992,625 | | | 1,033,966 |
FNMA, 5.491%, 05/01/36, (05/01/11) 5 | | | 723,807 | | | 756,955 |
FNMA, 5.500%, 12/01/18 to 01/01/21 | | | 2,549,234 | | | 2,673,106 |
FNMA, 5.624%, 10/01/36, (04/01/11) 5 | | | 2,992,380 | | | 3,129,625 |
FNMA, 5.755%, 01/01/37, (01/01/12) 5 | | | 3,870,532 | | | 4,068,095 |
FNMA, 5.852%, 09/01/37, (08/01/12) 5 | | | 1,663,782 | | | 1,746,294 |
FNMA, 5.886%, 09/01/37, (09/01/12) 5 | | | 1,769,077 | | | 1,857,754 |
FNMA, 5.980%, 11/01/37, (10/01/12) 5 | | | 2,543,147 | | | 2,682,630 |
FNMA, 6.000%, 03/01/17 to 12/01/23 | | | 15,102,022 | | | 16,000,199 |
FNMA, 6.500%, 04/01/17 to 08/01/32 | | | 2,053,081 | | | 2,199,007 |
FNMA, 7.000%, 09/01/14 | | | 1,042,936 | | | 1,101,791 |
FNMA, 7.500%, 12/01/33 to 01/01/34 | | | 267,345 | | | 290,270 |
FNMA, Series 2003-86, Class OX, 4.500%, 09/25/26 | | | 508,915 | | | 517,578 |
FNMA, Series 2005-86, Class WH, 5.000%, 11/25/25 | | | 2,039,510 | | | 2,084,635 |
FNMA, Series 2005-33, Class QA, 5.000%, 06/25/27 | | | 847,418 | | | 867,257 |
The accompanying notes are an integral part of these financial statements.
35
Managers Short Duration Government Fund
Schedule of Portfolio Investments (continued)
| | | | | | |
Security Description | | Principal Amount | | Value |
Federal National Mortgage Association - 43.0% (continued) | | | | | | |
FNMA, Series 2008-22, Class KA, 5.500%, 06/25/21 | | $ | 882,313 | | $ | 891,540 |
FNMA, Series 2005-16, Class LY, 5.500%, 09/25/25 | | | 747,271 | | | 757,872 |
FNMA, Series 2006-57, Class PA, 5.500%, 08/25/27 | | | 3,997,522 | | | 4,120,660 |
FNMA, Series 2006-48, Class TA, 5.500%, 04/25/28 | | | 3,033,117 | | | 3,132,136 |
FNMA, Series 2003-73, Class SM, 6.286%, 04/25/18, (07/25/09) 5 | | | 1,150,092 | | | 94,336 |
FNMA, Series 2003-26, Class QS, 6.786%, 10/25/17, (07/25/09) 5 | | | 1,076,456 | | | 77,307 |
FNMA, Series 1993-139, Class GA, 7.000%, 08/25/23 | | | 3,446,301 | | | 3,558,547 |
FNMA Grantor Trust, Series 2002-T5, Class A1, 0.554%, 05/25/32, (07/27/09) 5 | | | 593,833 | | | 500,520 |
FNMA Grantor Trust Pass Through, Series 2004-T1, Class 1A2, 6.500%, 01/25/44 | | | 847,954 | | | 902,939 |
FNMA Pass Through Securities, Series 2002-33, Class A2, 7.500%, 06/25/32 | | | 131,169 | | | 141,744 |
FNMA Whole Loan, Series 2005-W2, Class A1, 0.514%, 05/25/35, (07/25/09) 5 | | | 5,119,007 | | | 4,944,686 |
FNMA Whole Loan, Series 2003-W8, Class 3F1, 0.714%, 05/25/42, (07/25/09) 5 | | | 2,050,208 | | | 1,929,913 |
FNMA Whole Loan, Series 2004-W14, Class 1AF, 0.714%, 07/25/44, (07/25/09) 5 | | | 4,284,487 | | | 4,238,257 |
FNMA Whole Loan, Series 2004-W5, Class F1, 0.764%, 02/25/47, (07/25/09) 5 | | | 1,021,428 | | | 989,203 |
FNMA Whole Loan, Series 2002-W1, Class 2A, 7.500%, 02/25/42 7 | | | 628,808 | | | 679,506 |
FNMA Whole Loan, Series 2002-W6, Class 2A, 7.500%, 06/25/42 | | | 534,644 | | | 577,750 |
FNMA Whole Loan, Series 2003-W4, Class 4A, 7.500%, 10/25/42 | | | 1,076,705 | | | 1,163,514 |
FNMA Whole Loan, Series 2003-W1, Class 2A, 7.500%, 12/25/42 | | | 35,076 | | | 37,904 |
Total Federal National Mortgage Association | | | | | | 105,415,428 |
Government National Mortgage Association - 7.3% | | | | | | |
GNMA, 2.625%, 03/20/37, (04/01/10) 5 | | | 828,864 | | | 824,940 |
GNMA, 3.750%, 01/20/32, (04/01/10) 5 | | | 178,664 | | | 180,628 |
GNMA, 3.750%, 10/20/34, (01/01/10) 5 | | | 519,599 | | | 522,971 |
GNMA, 4.000%, 10/20/32, (01/01/10) 5 | | | 359,214 | | | 363,736 |
GNMA, 4.000%, 03/20/35, (04/01/10) 5 | | | 130,011 | | | 131,820 |
GNMA, 4.125%, 10/20/17 to 11/20/27, (01/01/10) 5 | | | 1,906,632 | | | 1,937,522 |
GNMA, 4.250%, 01/20/28, (04/01/10) 5 | | | 87,682 | | | 89,079 |
GNMA, 4.375%, 03/20/21, (04/01/10) 5 | | | 62,847 | | | 64,918 |
GNMA, 4.375%, 03/20/23, (04/01/10) 5 | | | 110,478 | | | 112,802 |
GNMA, 4.500%, 01/20/34, (04/01/10) 5 | | | 740,318 | | | 754,511 |
GNMA, 4.500%, 07/20/35 to 09/20/35, (10/01/09) 5 | | | 4,337,031 | | | 4,408,045 |
GNMA, 4.625%, 07/20/18 to 09/20/35, (10/01/09) 5 | | | 5,129,415 | | | 5,242,033 |
GNMA, 5.000%, 06/20/35, (07/01/10) 5 | | | 162,309 | | | 166,244 |
GNMA, 5.375%, 06/20/22 to 05/20/33, (07/01/10) 5 | | | 1,681,364 | | | 1,733,513 |
GNMA, 9.500%, 12/15/17 | | | 13,190 | | | 14,403 |
GNMA, Series 2005-58, Class NJ, 4.500%, 08/20/35 | | | 1,208,327 | | | 1,253,508 |
Total Government National Mortgage Association | | | | | | 17,800,673 |
Interest Only Strips - 0.9% | | | | | | |
FHLMC IO Strip, 4.500%, 08/15/35 to 09/15/35 | | | 808,681 | | | 138,995 |
FHLMC IO Strip, 6.381%, 11/15/18 (07/15/09) 5 | | | 1,463,907 | | | 98,914 |
FHLMC IO Strip, 6.781%, 11/15/30, (07/15/09) 5 | | | 517,655 | | | 40,501 |
The accompanying notes are an integral part of these financial statements.
36
Managers Short Duration Government Fund
Schedule of Portfolio Investments (continued)
| | | | | | | |
Security Description | | Principal Amount | | | Value |
Interest Only Strips - 0.9% (continued) | | | | | | | |
FHLMC IO Strip, 5.000%, 05/15/18 to 08/01/35 | | $ | 6,011,792 | | | $ | 896,354 |
FHLMC IO Strip, 7.500%, 10/01/27 9 | | | 51,615 | | | | 10,099 |
FHLMC IO Strip, 8.000%, 06/01/31 9 | | | 11,887 | | | | 2,593 |
FNMA IO Strip, 5.000%, 02/01/35 to 12/01/35 | | | 6,467,032 | | | | 1,016,153 |
FNMA IO Strip, 6.906%, 01/25/24, (07/25/09) 5 | | | 99,390 | | | | 13,962 |
FNMA IO Strip, 7.500%, 11/18/14 | | | 58,497 | | | | 3,457 |
FNMA IO Strip, 8.000%, 08/25/22 9 | | | 86,847 | | | | 17,364 |
FNMA IO Strip, 8.000%, 03/18/27 to 05/18/27 | | | 79,417 | | | | 15,378 |
FNMA IO Strip, 8.000%, 05/01/30 9 | | | 28,033 | | | | 5,313 |
FNMA IO Strip, 9.000%, 12/15/16 9 | | | 43,054 | | | | 7,227 |
Total Interest Only Strips | | | | | | | 2,266,310 |
U.S. Treasury Notes - 0.3% | | | | | | | |
U.S. Treasury Inflation Linked Notes, 2.375%, 04/15/11 | | | 788,492 | 2 | | | 811,901 |
Total U.S. Government and Agency Obligations ( cost $233,189,868) | | | | | | | 235,306,555 |
Mortgage-Backed Securities and Interest Only Strips - 6.2%1 | | | | | | | |
Mortgage-Backed Securities - 6.1% | | | | | | | |
Countrywide Home Loans, Inc., 0.814%, 02/25/35, (07/27/09) 5,9 | | | 1,497,899 | | | | 323,550 |
Deutsche Alt-A Securities, Inc., Mortgage Loan, 6.250%, 07/25/36 9 | | | 387,964 | | | | 266,480 |
Fannie Mae Remic Trust, Series 2005-30, Class BU, 5.000%, 03/25/24 | | | 275,314 | | | | 276,562 |
Freddie Mac Multiclass Certificates, Series 3113, Class QA, 5.000%, 11/15/25 | | | 1,407,122 | | | | 1,446,786 |
GE Capital Commercial Mortgage Corporation, 6.496%, 01/15/33 | | | 487,514 | | | | 492,319 |
GMAC Commercial Mortgage Securities, Inc., Series 2000-C3, Class A2, 6.957%, 09/15/35 | | | 1,531,286 | | | | 1,581,620 |
GMAC Commercial Mortgage Securities, Inc., Series 2000-C1, Class A2, 7.724%, 03/15/33 7 | | | 5,582,504 | | | | 5,633,436 |
Greenwich Capital Commercial Funding Corp., Class A2, Series 2005-GG3, 4.305%, 08/10/42 | | | 1,645,691 | | | | 1,606,687 |
Merrill Lynch Mortgage Investors, Inc., 7.560%, 11/15/31 | | | 911,779 | | | | 911,626 |
PNC Mortgage Acceptance Corp., Series 2000-C2, Class A2, 7.300%, 10/12/33 | | | 1,818,210 | | | | 1,863,758 |
Salomon Brothers Mortgage Securities VII, Series 2000-C2, Class A2, 7.455%, 07/18/33 | | | 241,616 | | | | 245,162 |
Washington Mutual, Class 2A3, Series 2005-AR2, 0.664%, 01/25/45, (07/25/09) 5,9 | | | 912,460 | | | | 380,276 |
Total Mortgage-Backed Securities | | | | | | | 15,028,262 |
Mortgage-Backed Interest Only Strips - 0.1% | | | | | | | |
Bank of America-First Union IO Strip, Series 2001-3, Class XC, 1.917%, 04/11/37 (a) 7 | | | 4,708,098 | | | | 129,790 |
CS First Boston Mortgage Securities Corp., IO Strip, Series 1998-C1, Class AX, 1.046%, 05/17/40 7 | | | 669,926 | | | | 29,672 |
CS First Boston Mortgage Securities Corp., IO Strip, Series 2001-CP4, Class AX, 1.511%, 12/15/35 (a) 7 | | | 1,381,108 | | | | 28,347 |
GMAC, Series 1999-C1 IO Strip, Class X, 0.782%, 05/15/33 7 | | | 2,043,983 | | | | 28,194 |
Total Mortgage-Backed Interest Only Strips | | | | | | | 216,003 |
Total Mortgage- Backed Securities and Interest Only Strips (cost $18,615,350) | | | | | | | 15,244,265 |
Asset-Backed Securities - 0.8% | | | | | | | |
First Franklin Mortgage Loan Asset Backed Certificates, Series 2005-FF10, Class A4, 0.634%, 11/25/35, (07/27/09) 5,9 | | | 1,565,297 | | | | 955,301 |
FNMA Grantor Trust, Series 2003-T4, Class A1, 0.531%, 09/26/33, (07/27/09) 5,9 | | | 18,401 | | | | 12,026 |
FNMA Grantor Trust, Series 2003-T2, Class A1, 0.594%, 03/25/33, (07/27/09) 5 | | | 394,826 | | | | 325,784 |
FNMA Whole Loan, Series 2003-W13, Class AV2, 0.594%, 10/25/33, (07/27/09) 5,9 | | | 152,310 | | | | 133,019 |
The accompanying notes are an integral part of these financial statements.
37
Managers Short Duration Government Fund
Schedule of Portfolio Investments (continued)
| | | | | | | |
Security Description | | Principal Amount | | Value | |
Asset-Backed Securities - 0.8% (continued) | | | | | | | |
FNMA Whole Loan, Series 2001-W2, Class AS5, 6.473%, 10/25/31 (b) | | $ | 119,317 | | $ | 110,456 | |
Structured Asset Investment Loan Trust, 0.854%, 12/25/34, (07/27/09) 5 | | | 392,925 | | | 329,316 | |
Total Asset-Backed Securities (cost $2,644,398) | | | | | | 1,865,902 | |
Short-Term Investments - 7.1% | | | | | | | |
U.S. Government and Agency Discount Notes - 0.3% | | | | | | | |
FHLMC Discount Notes, 0.151%, 09/08/09 13 | | | 750,000 | | $ | 749,785 | |
| | |
| | | Shares | | | |
Other Investment Companies - 6.8%1 | | | | | | | |
BNY Institutional Cash Reserves Fund, Series A, 0.06% 3 | | | 15,000 | | | 15,000 | |
BNY Institutional Cash Reserves Fund, Series B*3,10 | | | 15,506 | | | 2,287 | |
Dreyfus Cash Management Fund, Institutional Class Shares, 0.44% 11 | | | 15,632,417 | | | 15,632,417 | |
JPMorgan Liquid Assets Money Market Fund, Capital Shares, 0.48% | | | 1,036,410 | | | 1,036,410 | |
Total Other Investment Companies | | | | | | 16,686,114 | |
Total Short-Term Investments (cost $17,448,467) | | | | | | 17,435,899 | |
Total Investments - 110.1% (cost $271,898,083) | | | | | | 269,852,621 | |
Other Assets, less Liabilities - (10.1)% | | | | | | (24,736,029 | ) |
Net Assets - 100.0% | | | | | $ | 245,116,592 | |
The accompanying notes are an integral part of these financial statements.
38
Managers Intermediate Duration Government Fund
Fund Snapshots
June 30, 2009 (unaudited)
Portfolio Breakdown
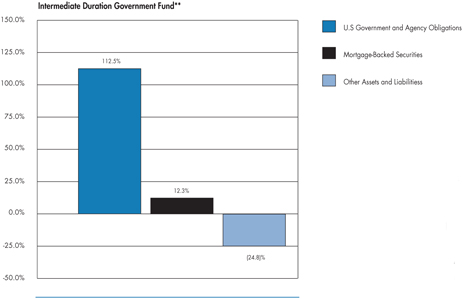
| | | |
Portfolio Breakdown | | Intermediate Duration
Government Fund** | |
U.S. Government and Agency Obligations | | 112.5 | % |
Mortgage-Backed Securities | | 12.3 | % |
Other Assets and Liabilities | | (24.8 | )% |
| ** | As a percentage of net assets |
Top Ten Holdings
| | | |
Top Ten Holdings | | % of
Net Assets | |
GNMA, 5.500%, TBA | | 7.6 | % |
GNMA, 4.500%, TBA | | 6.3 | |
FNMA, 5.500%, TBA | | 6.0 | |
FHLMC, 5.500%, 07/14/33 | | 5.7 | |
FNMA, 5.000%, 10/01/35* | | 5.6 | |
FNMA, 5.000%, 07/17/18 | | 5.5 | |
FHLMC Gold Pool, 5.500%, 02/01/35* | | 4.7 | |
FHLMC, 5.628%, 01/01/36 | | 4.3 | |
FHLMC Gold Pool, 5.500%, 06/01/35* | | 4.1 | |
FHLMC Gold Pool, 5.500%, 01/01/35* | | 3.2 | |
| | | |
Top Ten as a Group | | 53.0 | % |
| | | |
| * | Top Ten Holding at December 31, 2008 |
Any sectors, industries, or securities discussed should not be perceived as investment recommendations. Mention of a specific security should not be considered a recommendation to buy or solicitation to sell that security. Specific securities mentioned in this report may have been sold from the Fund’s portfolio of investments by the time you receive this report.
39
Managers Intermediate Duration Government Fund
Schedule of Portfolio Investments
June 30, 2009 (unaudited)
| | | | | | |
Security Description | | Principal Amount | | Value |
U.S. Government and Agency Obligations - 112.5% | | | | | | |
Federal Home Loan Mortgage Corporation - 54.9% | | | | | | |
FHLMC, 4.316%, 11/01/33, (12/01/09) 5 | | $ | 2,232,447 | | $ | 2,282,799 |
FHLMC, 4.500%, 04/01/35 | | | 642,418 | | | 642,110 |
FHLMC, 4.500%, TBA | | | 1,000,000 | | | 995,312 |
FHLMC, 5.000%, 05/01/18 to 12/01/35 | | | 7,666,111 | | | 7,833,152 |
FHLMC, 5.000%, TBA | | | 5,000,000 | | | 5,064,060 |
FHLMC, 5.500%, 11/01/17 to 05/01/34 | | | 4,097,240 | | | 4,276,130 |
FHLMC, 5.500%, TBA | | | 10,500,000 | | | 10,837,974 |
FHLMC, 5.628%, 01/01/36, (01/01/13) 5 | | | 7,920,054 | | | 8,235,598 |
FHLMC, 5.929%, 02/01/37, (02/01/12) 5 | | | 779,487 | | | 822,176 |
FHLMC, 6.000%, 02/01/22 to 03/01/22 | | | 1,567,962 | | | 1,660,196 |
FHLMC, 7.500%, 07/01/34 | | | 3,007,683 | | | 3,282,291 |
FHLMC Gold Pool, 3.750%, 11/15/25 | | | 1,904,627 | | | 1,930,685 |
FHLMC Gold Pool, 4.000%, 12/01/20 | | | 756,801 | | | 758,536 |
FHLMC Gold Pool, 4.500%, 05/01/34 to 01/01/36 | | | 16,583,068 | | | 16,561,959 |
FHLMC Gold Pool, 5.000%, 04/01/19 to 08/01/19 | | | 296,851 | | | 309,728 |
FHLMC Gold Pool, 5.500%, 01/01/35 to 12/01/38 | | | 30,118,682 | | | 31,210,591 |
FHLMC Gold Pool, 6.000%, 09/01/17 to 05/01/22 | | | 6,451,782 | | | 6,832,038 |
FHLMC, Series 2637, Class SI, 5.681%, 06/15/18, (07/15/09) 5 | | | 653,281 | | | 43,147 |
FHLMC, Series 2608, Class SJ, 6.781%, 03/15/17, (07/15/09) 5 | | | 1,968,044 | | | 105,888 |
FHLMC, Series 2772, Class KS, 6.861%, 06/15/22, (07/15/09) 5 | | | 614,386 | | | 48,441 |
FHLMC Structured Pass Through Securities, Series T-51, Class 2A, 7.500%, 08/25/42 | | | 297,489 | | | 318,499 |
Total Federal Home Loan Mortgage Corporation | | | | | | 104,051,310 |
Federal National Mortgage Association - 40.1% | | | | | | |
FNMA, 0.634%, 11/25/30, (07/25/09) 5 | | | 2,669,023 | | | 2,586,870 |
FNMA, 0.714%, 03/25/35, (07/25/09) 5 | | | 1,702,986 | | | 1,655,312 |
FNMA, 3.529%, 06/01/34, (06/01/10) 5 | | | 1,814,277 | | | 1,837,762 |
FNMA, 3.729%, 06/01/34, (11/01/09) 5 | | | 2,267,120 | | | 2,281,003 |
FNMA, 4.000%, TBA | | | 6,000,000 | | | 6,000,000 |
FNMA, 4.412%, 08/01/34, (02/01/10) 5 | | | 1,234,703 | | | 1,274,198 |
FNMA, 4.545%, 07/01/33, (12/01/09) 5 | | | 705,151 | | | 715,621 |
FNMA, 5.000%, 06/01/18 to 10/01/35 | | | 13,913,939 | | | 14,280,395 |
FNMA, 5.000%, TBA | | | 10,000,000 | | | 10,346,880 |
FNMA, 5.305%, 06/01/37, (05/01/10) 5 | | | 1,233,649 | | | 1,283,731 |
FNMA, 5.500%, 03/01/17 to 12/01/37 | | | 13,209,441 | | | 13,773,924 |
FNMA, 5.500%, TBA | | | 15,000,000 | | | 15,485,318 |
FNMA, 5.521%, 02/01/36, (01/01/11) 5 | | | 358,614 | | | 376,230 |
FNMA, 6.000%, 08/01/17 | | | 337,663 | | | 359,801 |
FNMA, 6.500%, 11/01/28 to 07/01/32 | | | 595,438 | | | 636,677 |
FNMA, Series 1994-55, Class H, 7.000%, 03/25/24 | | | 2,750,000 | | | 2,960,946 |
The accompanying notes are an integral part of these financial statements.
40
Managers Intermediate Duration Government Fund
Schedule of Portfolio Investments (continued)
| | | | | | | |
Security Description | | Principal Amount | | | Value |
Federal National Mortgage Association - 40.1% (continued) | | | | | | | |
FNMA, Series 2003-73, Class SM, 6.286%, 04/25/18, (07/25/09) 5 | | $ | 880,444 | | | $ | 72,219 |
FNMA Whole Loan, Series 2003-W4, Class 4A, 7.500%, 10/25/42 | | | 179,451 | | | | 193,919 |
Total Federal National Mortgage Association | | | | | | | 73,533,936 |
Government National Mortgage Association - 15.9% | | | | | | | |
GNMA, 4.125%, 11/20/17 to 12/20/17, (01/01/10) 5 | | | 282,204 | | | | 289,511 |
GNMA, 4.375%, 03/20/16, (04/01/10) 5 | | | 27,790 | | | | 28,531 |
GNMA, 4.500%, TBA | | | 12,000,000 | | | | 11,977,500 |
GNMA, 4.625%, 08/20/17 to 08/20/18, (10/01/09) 5 | | | 135,434 | | | | 139,859 |
GNMA, 5.000%, TBA | | | 3,000,000 | | | | 3,058,126 |
GNMA, 5.375%, 06/20/16 to 05/20/21, (07/01/10) 5 | | | 79,330 | | | | 81,991 |
GNMA, 5.500%, TBA | | | 14,000,000 | | | | 14,455,000 |
GNMA, 7.500%, 09/15/28 to 11/15/31 | | | 71,943 | | | | 78,924 |
Total Government National Mortgage Association | | | | | | | 30,109,442 |
Interest and Principal Only Strips - 1.2% | | | | | | | |
FHLMC IO Strip, 4.500%, 08/15/35 to 09/15/35 | | | 1,525,970 | | | | 257,170 |
FHLMC IO Strip, 5.000%, 05/15/17 to 09/15/35 | | | 6,917,922 | | | | 1,040,261 |
FHLMC IO Strip, 6.000%, 05/01/31 | | | 9,045 | | | | 1,675 |
FHLMC IO Strip, 6.381%, 11/15/18, (07/15/09) 5 | | | 1,163,619 | | | | 78,624 |
FHLMC IO Strip, 6.781%, 11/15/30, (07/15/09) 5 | | | 210,448 | | | | 16,465 |
FHLMC IO Strip, 7.331%, 09/15/16 to 10/15/16, (07/15/09) 5 | | | 324,793 | | | | 16,162 |
FHLMC IO Strip, 7.581%, 06/15/31, (07/15/09) 5 | | | 76,265 | | | | 8,521 |
FNMA IO Strip, 4.000%, 09/01/33 to 09/01/34 | | | 1,245,571 | | | | 119,588 |
FNMA IO Strip, 4.500%, 09/01/33 | | | 396,424 | | | | 46,882 |
FNMA IO Strip, 5.000%, 05/01/34 to 12/01/35 | | | 2,706,123 | | | | 380,533 |
FNMA IO Strip, 7.000%, 04/01/23 9 | | | 305,575 | | | | 52,712 |
FNMA IO Strip, 7.000%, 06/01/23 9 | | | 34,100 | | | | 4,650 |
FNMA PO Strip, 3.715%, 07/01/33 | | | 407,081 | | | | 347,510 |
Total Interest and Principal Only Strips | | | | | | | 2,370,753 |
U.S. Treasury Notes - 0.4% | | | | | | | |
U.S. Treasury Inflation Linked Notes, 2.375%, 04/15/11 | | | 705,776 | 2 | | | 726,729 |
Total U.S. Government and Agency Obligations (cost $209,091,095) | | | | | | | 210,792,170 |
Mortgage-Backed Securities - 12.3% | | | | | | | |
American Home Loan Investment Trust, 5.294%, 06/25/45, (03/25/10) 5,9 | | | 2,056,543 | | | | 1,121,576 |
American Home Mortgage Assets, Series 2005-1, Class 1A1, 5.333%, 11/25/35 9 | | | 158,856 | | | | 64,629 |
American Home Mortgage Investment Trust, 3.149%, 06/25/45, (08/01/09) 5,9 | | | 146,199 | | | | 81,295 |
American Home Mortgage Investment Trust, 3.170%, 04/25/44, (08/01/09) 5,9 | | | 208,142 | | | | 148,768 |
American Home Mortgage Investment Trust, 4.390%, 02/25/45, (11/25/09) 5,9 | | | 986,427 | | | | 775,929 |
Bank of America Commercial Mortgage Inc., Series 2006-2, Class A3, 5.901%, 05/10/45 7 | | | 3,015,000 | | | | 2,567,872 |
Bank of America Commercial Mortgage Inc., Series 2006-5, Class A3, 5.390%, 09/10/47 | | | 1,340,000 | | | | 1,094,242 |
Bank of America Funding Corp., 4.072%, 12/20/34 7,9 | | | 263,831 | | | | 167,065 |
Bear Stearns Alt-A Trust, 4.691%, 04/25/35 7,9 | | | 228,642 | | | | 105,984 |
The accompanying notes are an integral part of these financial statements.
41
Managers Intermediate Duration Government Fund
Schedule of Portfolio Investments (continued)
| | | | | | | |
Security Description | | Principal Amount | | Value | |
Mortgage-Backed Securities - 12.3% (continued) | | | | | | | |
Bear Stearns Commercial Mortgage Securities, Series 2005-PWR9, Class A3, 4.868%, 09/11/42 | | $ | 1,000,000 | | $ | 841,030 | |
Citigroup Commercial Mortgage Trust, Series 2008-C7, Class A3, 6.299%, 12/10/49 7 | | | 1,148,000 | | | 885,116 | |
Citigroup/Deutsche Bank Commercial Mortgage Trust, Series 2006-CD3, Class A4, 5.658%, 10/15/48 | | | 2,000,000 | | | 1,614,769 | |
Countrywide Alternative Loan Trust, 0.614%, 05/25/35, (07/25/09) 5,9 | | | 1,064,596 | | | 722,308 | |
Countrywide Alternative Loan Trust, Series 2007-25, Class 2A1, 6.000%, 11/25/22 9 | | | 749,055 | | | 560,621 | |
Countrywide Home Loans, Inc., 5.003%, 05/20/35 7,9 | | | 176,340 | | | 92,889 | |
Countrywide Home Loans, Inc., Series 2004-R2, Class 1AF1, 0.734%, 11/25/34, (07/25/09) (a) 5,9 | | | 438,366 | | | 302,747 | |
Countrywide Home Loans, Inc., Series 2005-HYB8, Class 1A1, 4.495%, 12/20/35 7,9 | | | 172,836 | | | 107,294 | |
Deutsche Alt-A Securities, Inc., Series 2006-AR6, Class A6, 0.504%, 02/25/37, (07/27/09)5,9 | | | 1,579,424 | | | 593,923 | |
Goldman Sachs Mortgage Loan Trust, Series 2005-RP2, Class 1AF, 0.664%, 03/25/35, (07/25/09) (a) 5,9 | | | 356,386 | | | 323,800 | |
GSR Mortgage Loan Trust, Series 2004-5, Class 1A3, 2.250%, 05/25/34, (08/01/09) 5,9 | | | 80,690 | | | 58,593 | |
Harborview Mortgage Loan Trust, 4.788%, 11/19/34 7,9 | | | 148,046 | | | 91,619 | |
JP Morgan Chase Commercial Mortgage Securities Trust, Series 2006-LDP6, Class A3B, 5.559%, 04/15/43 7 | | | 1,900,000 | | | 1,445,980 | |
Master Alternative Loans Trust, 6.000%, 01/25/35 9 | | | 1,165,246 | | | 856,274 | |
Merrill Lynch Mortgage Investors, Inc., 7.560%, 11/15/31 | | | 667,317 | | | 667,204 | |
Morgan Stanley Mortgage Loan Trust, 6.087%, 08/25/35 7,9 | | | 1,677,880 | | | 1,165,865 | |
Structured Asset Securities Corp., Series 2005-RF1, Class A, 0.664%, 03/25/35, (07/25/09) (a) 5,9 | | | 425,468 | | | 350,556 | |
Washington Mutual Mortgage Pass-Through Certificates, 6.000%, 10/25/359 | | | 2,241,656 | | | 1,557,601 | |
Wachovia Bank Commercial Mortgage Trust, Series 2006-C28, Class A3, 5.679%, 10/15/48 | | | 2,206,000 | | | 1,754,854 | |
Wachovia Bank Commercial Mortgage Trust, Series 2007-C33, Class A3, 6.100%, 02/15/51 | | | 1,200,000 | | | 908,247 | |
Wells Fargo Mortgage Backed Securities Trust, Series 2007-16, Class 1A1, 6.000%, 12/28/37 | | | 2,513,293 | | | 2,223,872 | |
Total Mortgage-Backed Securities (cost $28,238,743) | | | | | | 23,252,522 | |
Short-Term Investments - 15.6% | | | | | | | |
U.S. Government and Agency Discount Notes - 0.1% | | | | | | | |
FHLMC Discount Notes, 0.151%, 09/08/09 13 | | | 100,000 | | | 99,971 | |
FHLMC Discount Notes, 0.169%, 10/05/09 13 | | | 178,000 | | | 177,920 | |
Total U.S. Government and Agency Discount Notes | | | | | | 277,891 | |
| | |
| | | Shares | | | |
Other Investment Companies - 15.5% 1 | | | | | | | |
BNY Institutional Cash Reserves Fund, Series A, 0.06% 3 | | | 3,000 | | | 3,000 | |
BNY Institutional Cash Reserves Fund, Series B *3,10 | | | 13,850 | | | 2,043 | |
Dreyfus Cash Management Fund, Institutional Class Shares, 0.44% 11 | | | 27,282,594 | | | 27,282,594 | |
JPMorgan Liquid Assets Money Market Fund, Capital Shares, 0.48% 12 | | | 2,041,292 | | | 2,041,292 | |
Total Other Investment Companies | | | | | | 29,328,929 | |
Total Short-Term Investments (cost $29,618,426) | | | | | | 29,606,820 | |
Total Investments - 140.4% (cost $266,948,264) | | | | | | 263,651,512 | |
Other Assets, less Liabilities - (40.4)% | | | | | | (74,024,875 | ) |
Net Assets - 100.0% | | | | | $ | 189,626,637 | |
The accompanying notes are an integral part of these financial statements.
42
Managers Trust II Funds
Notes to Schedules of Portfolio Investments (unaudited)
The following footnotes and abbreviations should be read in conjunction with each of the Schedules of Portfolio Investments previously presented in this report.
At June 30, 2009, the cost of securities for Federal income tax purposes and the gross aggregate unrealized appreciation and/or depreciation based on tax cost were approximately:
| | | | | | | | | | | | |
Fund | | Cost | | Appreciation | | Depreciation | | | Net | |
Managers AMG Chicago Equity Partners Mid-Cap Fund | | $ | 38,069,301 | | $ | 2,497,268 | | ($5,010,892 | ) | | ($2,513,624 | ) |
Managers AMG Chicago Equity Partners Balanced Fund | | | 21,596,658 | | | 1,064,635 | | (1,117,779 | ) | | (53,144 | ) |
Managers High Yield Fund | | | 41,635,662 | | | 1,226,475 | | (5,810,585 | ) | | (4,584,110 | ) |
Managers Fixed Income Fund | | | 151,832,882 | | | 2,823,510 | | (11,852,564 | ) | | (9,029,054 | ) |
Managers Short Duration Government Fund | | | 271,898,083 | | | 3,625,876 | | (5,671,338 | ) | | (2,045,462 | ) |
Managers Intermediate Duration Government Fund | | | 266,962,723 | | | 5,666,080 | | (6,390,421 | ) | | (724,341 | ) |
| * | Non-income-producing security |
| (a) | Security exempt from registration under Rule 144A of the Securities Act of 1933. This security may be resold in transactions exempt from registration, normally to qualified buyers. At June 30, 2009, the value of these securities amounted to the following: |
| | | | | | |
Fund | | Value | | % of Net Assets | |
Managers High Yield Fund | | $ | 5,263,288 | | 16.4 | % |
Managers Fixed Income Fund | | | 11,704,850 | | 9.0 | % |
Managers Short Duration Government Fund | | | 158,137 | | 0.1 | % |
Managers Intermediate Duration Government Fund | | | 977,103 | | 0.5 | % |
| (b) | Step Bond. A debt instrument with either deferred interest payments or an interest rate that resets at specific times during its term. |
| 1 | Yield shown for an investment company represents its June 30, 2009, seven-day average yield, which refers to the sum of the previous seven days’ dividends paid, expressed as an annual percentage. |
| 2 | Some or all of these securities were out on loan to various brokers as of June 30, 2009, amounting to: |
| | | | | | |
Fund | | Value | | % of Net Assets | |
Managers AMG Chicago Equity Partners Mid-Cap Fund | | $ | 3,082,893 | | 9.6 | % |
Managers AMG Chicago Equity Partners Balanced Fund | | | 305,039 | | 1.4 | % |
Managers High Yield Fund | | | 3,078,698 | | 9.6 | % |
Managers Fixed Income Fund | | | 13,957,652 | | 10.7 | % |
Managers Short Duration Government Fund | | | 27,802 | | 0.0 | %# |
Managers Intermediate Duration Government Fund | | | 15,445 | | 0.0 | %# |
| # | Rounds to less than 0.1% |
| 3 | Collateral received from brokers for securities lending was invested in this short-term investment. |
| 4 | Percentage rate listed represents yield to maturity at June 30, 2009. |
| 5 | Floating rate security. The rate listed is as of June 30, 2009. Date in parentheses represents the securities next coupon rate reset. |
| 6 | Payment-in-kind security. A type of high yield debt instrument whose issuer has the option of making interest payments in either cash or additional debt securities. |
| 7 | Variable Rate Security. The rate listed is as of June 30, 2009 and is periodically reset subject to terms and conditions set forth in the debenture. |
| 8 | Security is in default. Issuer has failed to make a timely payment of either principal or interest or has failed to comply with some provision of the bond indenture. |
43
Notes to Schedules of Portfolio Investments (continued)
| 9 | Illiquid Security. A security not readily convertible into cash such as a stock, bond or commodity that is not actively traded and would be difficult to sell in a current sale. The Funds may not invest more than 15% of their net assets in illiquid securities. All securities are valued on the basis of valuations provided by dealers or independent pricing services. Illiquid securities at June 30, 2009, amounted to the following: |
| | | | | | |
Fund | | Value | | % of Net Assets | |
Managers Fixed Income Fund | | $ | 1,776,673 | | 1.4 | % |
Managers Short Duration Government Fund | | | 2,113,248 | | 0.9 | % |
Managers Intermediate Duration Government Fund | | | 9,306,698 | | 4.9 | % |
| 10 | On September 12, 2008, The Bank of New York Mellon (“BNYM”) established a separate sleeve of the BNY Institutional Cash Reserves Fund (“ICRF”) (Series B) to hold certain Lehman Brothers floating rate notes. The Fund’s position in Series B is being marked to market daily. |
| 11 | Under the U.S. Treasury Temporary Money Market Fund Guarantee Program, the maximum amount covered for each Fund’s investment in the Dreyfus Cash Management Fund is: |
| | | |
Fund | | Market Value |
Managers AMG Chicago Equity Partners Mid-Cap Fund | | $ | 669,850 |
Managers AMG Chicago Equity Partners Balanced Fund | | | 1,690,163 |
Managers High Yield Fund | | | 535,122 |
Managers Fixed Income Fund | | | 6,475,984 |
Managers Short Duration Government Fund | | | 3,259,504 |
Managers Intermediate Duration Government Fund | | | 6,150,779 |
| 12 | Under the U.S. Treasury Temporary Money Market Fund Guarantee Program, the maximum amount covered for each Fund’s investment in the JPMorgan Liquid Assets Money Market Fund is: |
| | | |
Fund | | Market Value |
Managers Fixed Income Fund | | $ | 1,550,100 |
Managers Intermediate Duration Government Fund | | | 8,258,106 |
| 13 | Security pledged to cover margin requirements for open futures positions at June 30, 2009. |
Investments Definitions and Abbreviations:
| | |
| AMBAC: | | American Municipal Bond Assurance Corp. |
| BHAC: | | Berkshire Hathaway Assurance Corp. |
| FHLB: | | Federal Home Loan Bank |
| FHLMC: | | Federal Home Loan Mortgage Corp. |
| REIT: | | Real Estate Investment Trust |
| FNMA: | | Federal National Mortgage Association |
| FSA: | | FSA Capital, Inc. |
| GMAC: | | General Motors Acceptance Corporation |
| GNMA: | | Government National Mortgage Association |
Abbreviations have been used throughout the portfolios to indicate amounts shown in currencies of par values other than the U.S. dollar (USD):
| | |
| AUD: | | Australian Dollar |
| BRL: | | Brazilian Real |
| CAD: | | Canadian Dollar |
| ISK: | | Iceland Krona |
| MXN: | | Mexican Peso |
| NZD: | | New Zealand Dollar |
| SGD: | | Singapore Dollar |
| THB: | | Thailand Baht |
44
THIS PAGE INTENTIONALLY LEFT BLANK
Statements of Assets and Liabilities
June 30, 2009 (unaudited)
| | | | | | | | | | | | | | | | |
| | | Managers AMG
Chicago Equity
Partners
Mid-Cap Fund | | | Managers AMG
Chicago Equity
Partners
Balanced Fund | | | Managers
High Yield
Fund | | | Managers
Fixed Income
Fund | |
Assets: | | | | | | | | | | | | | | | | |
Investments at value* (including securities on loan valued at $3,082,893, $305,039, $3,078,698, and $13,957,652, respectively) | | $ | 35,555,677 | | | $ | 21,543,514 | | | $ | 37,051,552 | | | $ | 142,803,828 | |
Foreign currency** | | | — | | | | — | | | | — | | | | (28,999 | ) |
Receivable for investments sold | | | 231,422 | | | | — | | | | 88,750 | | | | 103,415 | |
Receivable for Fund shares sold | | | 503 | | | | 4,816 | | | | 805,119 | | | | 761,067 | |
Dividends, interest and other receivables | | | 28,099 | | | | 88,412 | | | | 645,748 | | | | 1,755,689 | |
Prepaid expenses | | | 36,166 | | | | 37,808 | | | | 41,712 | | | | 46,830 | |
Total assets | | | 35,851,867 | | | | 21,674,550 | | | | 38,632,881 | | | | 145,441,830 | |
Liabilities: | | | | | | | | | | | | | | | | |
Payable for Fund shares repurchased | | | 71,708 | | | | 16,191 | | | | 2,849,976 | | | | 255,775 | |
Payable upon return of securities loaned | | | 3,242,614 | | | | 322,396 | | | | 3,194,795 | | | | 14,383,776 | |
Payable for investments purchased | | | 302,408 | | | | — | | | | 477,864 | | | | 270,567 | |
Accrued expenses: | | | | | | | | | | | | | | | | |
Investment advisory and management fees | | | 10,007 | | | | 2,388 | | | | 5,181 | | | | 20,467 | |
Administrative fees | | | 5,385 | | | | 3,526 | | | | 5,598 | | | | 20,696 | |
Other | | | 38,816 | | | | 28,403 | | | | 43,355 | | | | 81,639 | |
Total liabilities | | | 3,670,938 | | | | 372,904 | | | | 6,576,769 | | | | 15,032,920 | |
Net Assets | | $ | 32,180,929 | | | $ | 21,301,647 | | | $ | 32,056,112 | | | $ | 130,408,910 | |
Net Assets Represent: | | | | | | | | | | | | | | | | |
Paid-in capital | | $ | 52,607,305 | | | $ | 38,398,008 | | | $ | 48,348,099 | | | $ | 142,912,619 | |
Undistributed net investment income (loss) | | | 178,751 | | | | 18,511 | | | | 26,008 | | | | (65,781 | ) |
Accumulated net realized loss from investments and foreign currency transactions | | | (18,455,205 | ) | | | (17,219,811 | ) | | | (11,775,454 | ) | | | (3,520,827 | ) |
Net unrealized appreciation (depreciation) of investments and foreign currency translations | | | (2,149,922 | ) | | | 104,939 | | | | (4,542,541 | ) | | | (8,917,101 | ) |
Net Assets | | $ | 32,180,929 | | | $ | 21,301,647 | | | $ | 32,056,112 | | | $ | 130,408,910 | |
Class A Shares - Net Assets | | $ | 4,521,557 | | | $ | 10,618,205 | | | $ | 23,090,407 | | | $ | 39,545,242 | |
Shares Outstanding | | | 525,057 | | | | 971,760 | | | | 3,645,542 | | | | 4,116,680 | |
Net asset value and redemption price per share | | $ | 8.61 | | | $ | 10.93 | | | $ | 6.33 | | | $ | 9.61 | |
Offering price per share based on a maximum sales charge of 5.75% (NAV per share/(100% - 5.75%) | | $ | 9.14 | | | $ | 11.60 | | | | n/a | | | | n/a | |
Offering price per share based on a maximum sales charge of 4.25% (NAV per share/(100% - 4.25%) | | | n/a | | | | n/a | | | $ | 6.61 | | | $ | 10.04 | |
Class B Shares - Net Assets | | $ | 1,044,314 | | | $ | 1,579,386 | | | $ | 1,730,737 | | | $ | 5,630,429 | |
Shares Outstanding | | | 129,905 | | | | 146,565 | | | | 277,466 | | | | 590,796 | |
Net asset value and offering price per share | | $ | 8.04 | | | $ | 10.78 | | | $ | 6.24 | | | $ | 9.53 | |
Class C Shares - Net Assets | | $ | 3,468,555 | | | $ | 2,819,726 | | | $ | 4,157,491 | | | $ | 51,534,048 | |
Shares Outstanding | | | 431,836 | | | | 259,653 | | | | 666,005 | | | | 5,374,476 | |
Net asset value and offering price per share | | $ | 8.03 | | | $ | 10.86 | | | $ | 6.24 | | | $ | 9.59 | |
Institutional Class Shares - Net Assets | | $ | 23,146,503 | | | $ | 6,284,330 | | | $ | 3,077,477 | | | $ | 33,699,191 | |
Shares Outstanding | | | 2,547,707 | | | | 570,252 | | | | 481,073 | | | | 3,497,641 | |
Net asset value, offering and redemption price per share | | $ | 9.09 | | | $ | 11.02 | | | $ | 6.40 | | | $ | 9.63 | |
* Investments at cost | | $ | 37,705,599 | | | $ | 21,438,575 | | | $ | 41,594,093 | | | $ | 151,725,252 | |
** Foreign currency at cost | | | — | | | | — | | | | — | | | | ($28,999 | ) |
The accompanying notes are an integral part of these financial statements.
46
Statements of Assets and Liabilities
June 30, 2009 (unaudited)
| | | | | | | | |
| | | Managers Short
Duration Government
Fund | | | Managers Intermediate
Duration Government
Fund | |
Assets: | | | | | | | | |
Investments at value* (including securities on loan valued at $27,802 and $15,445, respectively) | | $ | 269,852,621 | | | $ | 266,238,382 | |
Receivable for delayed delivery investments sold | | | 28,909,531 | | | | 37,367,793 | |
Receivable for Fund shares sold | | | 1,385,489 | | | | 573,049 | |
Dividends, interest and other receivables | | | 1,161,909 | | | | 983,229 | |
Receivable for variation margin on futures | | | 95,972 | | | | 20,069 | |
Prepaid expenses | | | 42,317 | | | | 28,086 | |
Total assets | | | 301,447,839 | | | | 305,210,608 | |
Liabilities: | | | | | | | | |
Payable upon return of securities loaned | | | 30,506 | | | | 16,850 | |
Payable for delayed delivery investments purchased | | | 55,315,583 | | | | 99,178,489 | |
Payable for Fund shares repurchased | | | 795,944 | | | | 419,759 | |
Payable for TBA sale commitments | | | — | | | | 15,808,274 | |
Payable for variation margin on futures | | | 14,341 | | | | 8,916 | |
Investment advisory and management fee payable | | | 140,078 | | | | 97,452 | |
Other accrued expenses | | | 34,795 | | | | 54,231 | |
Total liabilities | | | 56,331,247 | | | | 115,583,971 | |
Net Assets | | $ | 245,116,592 | | | $ | 189,626,637 | |
Shares outstanding | | | 25,976,380 | | | | 18,001,152 | |
Net asset value, offering and redemption price per share | | $ | 9.44 | | | $ | 10.53 | |
Net Assets Represent: | | | | | | | | |
Paid-in capital | | $ | 255,406,988 | | | $ | 192,359,761 | |
Undistributed net investment income | | | 74,561 | | | | 46,358 | |
Accumulated net realized loss from investments and futures contracts | | | (7,597,299 | ) | | | (2,513,549 | ) |
Net unrealized depreciation of investments, futures contracts and TBA sale commitments | | | (2,767,658 | ) | | | (265,933 | ) |
Net Assets | | $ | 245,116,592 | | | $ | 189,626,637 | |
* Investments at cost | | $ | 271,898,083 | | | $ | 266,948,264 | |
The accompanying notes are an integral part of these financial statements.
47
Statements of Operations
For the six months ended June 30, 2009 (unaudited)
| | | | | | | | | | | | | | | | | | | | | | | | |
| | | Managers AMG
Chicago Equity
Partners
Mid-Cap Fund | | | Managers AMG
Chicago Equity
Partners
Balanced Fund | | | Managers
High Yield
Fund | | | Managers
Fixed Income
Fund | | | Managers Short
Duration
Government Fund | | | Managers
Intermediate
Duration
Government Fund | |
Investment Income: | | | | | | | | | | | | | | | | | | | | | | | | |
Dividend income | | $ | 332,399 | | | $ | 171,178 | | | $ | 32,746 | | | $ | 61,677 | | | $ | 109,511 | | | $ | 61,487 | |
Interest income | | | — | | | | 159,997 | | | | 1,582,536 | | | | 3,866,881 | | | | 4,336,218 | | | | 4,186,456 | |
Securities lending fees | | | 11,133 | | | | 539 | | | | 2,171 | | | | 968 | | | | 468 | | | | — | |
Total investment income | | | 343,532 | | | | 331,714 | | | | 1,617,453 | | | | 3,929,526 | | | | 4,446,197 | | | | 4,247,943 | |
Expenses: | | | | | | | | | | | | | | | | | | | | | | | | |
Investment advisory and management fees | | | 104,254 | | | | 70,786 | | | | 101,001 | | | | 260,597 | | | | 865,705 | | | | 614,243 | |
Administrative fees | | | 29,787 | | | | 20,225 | | | | 28,857 | | | | 115,821 | | | | — | | | | — | |
Distribution Fees - Class A | | | 4,865 | | | | 12,209 | | | | 24,613 | | | | 44,483 | | | | — | | | | — | |
Distribution Fees - Class B | | | 6,945 | | | | 9,790 | | | | 10,517 | | | | 28,797 | | | | — | | | | — | |
Distribution Fees - Class C | | | 16,398 | | | | 13,378 | | | | 18,375 | | | | 227,142 | | | | — | | | | — | |
Registration fees | | | 18,092 | | | | 19,488 | | | | 20,585 | | | | 24,997 | | | | 22,790 | | | | 10,815 | |
Professional fees | | | 15,281 | | | | 13,808 | | | | 14,535 | | | | 27,048 | | | | 42,842 | | | | 34,438 | |
Custodian | | | 8,762 | | | | 19,278 | | | | 17,098 | | | | 12,730 | | | | 29,096 | | | | 25,614 | |
Transfer agent | | | 8,479 | | | | 3,612 | | | | 8,527 | | | | 18,890 | | | | 38,325 | | | | 121,362 | |
Reports to shareholders | | | 3,701 | | | | 2,345 | | | | 7,935 | | | | 11,159 | | | | 9,410 | | | | 16,930 | |
Trustees fees and expenses | | | 2,015 | | | | 854 | | | | 1,274 | | | | 5,044 | | | | 13,816 | | | | 7,724 | |
Miscellaneous | | | 2,266 | | | | 1,704 | | | | 3,025 | | | | 4,759 | | | | 8,315 | | | | 5,474 | |
Total expenses before offsets | | | 220,845 | | | | 187,477 | | | | 256,342 | | | | 781,467 | | | | 1,030,299 | | | | 836,600 | |
Expense reimbursement | | | (45,102 | ) | | | (50,903 | ) | | | (71,813 | ) | | | (139,040 | ) | | | — | | | | (55,127 | ) |
Expense reductions | | | (8,372 | ) | | | (3,426 | ) | | | (79 | ) | | | (710 | ) | | | (2,757 | ) | | | (1,012 | ) |
Net expenses | | | 167,371 | | | | 133,148 | | | | 184,450 | | | | 641,717 | | | | 1,027,542 | | | | 780,461 | |
Net investment income | | | 176,161 | | | | 198,566 | | | | 1,433,003 | | | | 3,287,809 | | | | 3,418,655 | | | | 3,467,482 | |
Net Realized and Unrealized Gain (Loss): | | | | | | | | | | | | | | | | | | | | | | | | |
Net realized loss on investment transactions | | | (5,949,395 | ) | | | (1,098,394 | ) | | | (3,507,237 | ) | | | (1,272,945 | ) | | | (864,833 | ) | | | (413,480 | ) |
Net realized gain on options and futures contracts | | | — | | | | — | | | | — | | | | — | | | | 611,190 | | | | 261,331 | |
Net realized loss on foreign currency transactions | | | — | | | | — | | | | — | | | | (66,755 | ) | | | — | | | | — | |
Net unrealized appreciation of investments | | | 8,658,509 | | | | 1,882,103 | | | | 8,889,374 | | | | 10,072,162 | | | | 6,091,669 | | | | 6,322,871 | |
Net unrealized appreciation of futures contracts | | | — | | | | — | | | | — | | | | — | | | | 452,177 | | | | 1,336 | |
Net unrealized appreciation of foreign currency translations | | | — | | | | — | | | | — | | | | 23,047 | | | | — | | | | — | |
Net realized and unrealized gain | | | 2,709,114 | | | | 783,709 | | | | 5,382,137 | | | | 8,755,509 | | | | 6,290,203 | | | | 6,172,058 | |
Net increase in net assets resulting from operations | | $ | 2,885,275 | | | $ | 982,275 | | | $ | 6,815,140 | | | $ | 12,043,318 | | | $ | 9,708,858 | | | $ | 9,639,540 | |
The accompanying notes are an integral part of these financial statements.
48
Statements of Changes in Net Assets
For the six months ended June 30, 2009 (unaudited) and for the year ended December 31, 2008
| | | | | | | | | | | | | | | | |
| | | Managers AMG Chicago Equity
Partners Mid-Cap Fund | | | Managers AMG Chicago Equity
Partners Balanced Fund | |
| | | 2009 | | | 2008 | | | 2009 | | | 2008 | |
Increase (Decrease) in Net Assets From Operations: | | | | | | | | | | | | | | | | |
Net investment income | | $ | 176,161 | | | $ | 280,442 | | | $ | 198,566 | | | $ | 400,727 | |
Net realized gain (loss) on investments and foreign currency transactions | | | (5,949,395 | ) | | | (11,493,243 | ) | | | (1,098,394 | ) | | | (863,028 | ) |
Net unrealized appreciation (depreciation) of investments and foreign currency translations | | | 8,658,509 | | | | (14,400,228 | ) | | | 1,882,103 | | | | (3,372,720 | ) |
Net increase (decrease) in net assets resulting from operations | | | 2,885,275 | | | | (25,613,029 | ) | | | 982,275 | | | | (3,835,021 | ) |
Distributions to Shareholders: | | | | | | | | | | | | | | | | |
From net investment income: | | | | | | | | | | | | | | | | |
Class A | | | — | | | | (29,318 | ) | | | (93,196 | ) | | | (128,430 | ) |
Class B | | | — | | | | — | | | | (9,020 | ) | | | (48,453 | ) |
Class C | | | — | | | | — | | | | (14,868 | ) | | | (49,264 | ) |
Institutional Class | | | — | | | | (245,740 | ) | | | (62,971 | ) | | | (170,512 | ) |
From net realized gain on investments: | | | | | | | | | | | | | | | | |
Class A | | | — | | | | (4,013 | ) | | | — | | | | — | |
Class B | | | — | | | | (1,900 | ) | | | — | | | | — | |
Class C | | | — | | | | (3,738 | ) | | | — | | | | — | |
Institutional Class | | | — | | | | (23,113 | ) | | | — | | | | — | |
Return of capital: | | | | | | | | | | | | | | | | |
Class A | | | — | | | | — | | | | — | | | | (11,286 | ) |
Class B | | | — | | | | — | | | | — | | | | (2,780 | ) |
Class C | | | — | | | | — | | | | — | | | | (3,360 | ) |
Institutional Class | | | — | | | | — | | | | — | | | | (6,852 | ) |
Total distributions to shareholders | | | — | | | | (307,822 | ) | | | (180,055 | ) | | | (420,937 | ) |
From Capital Share Transactions: | | | | | | | | | | | | | | | | |
Proceeds from sale of shares | | | 1,584,852 | | | | 4,850,028 | | | | 2,333,823 | | | | 11,344,962 | |
Reinvestment of dividends and distributions | | | — | | | | 252,585 | | | | 90,186 | | | | 240,711 | |
Cost of shares repurchased | | | (3,605,082 | ) | | | (20,919,460 | ) | | | (3,282,628 | ) | | | (5,840,568 | ) |
Net increase (decrease) from capital share transactions | | | (2,020,230 | ) | | | (15,816,847 | ) | | | (858,619 | ) | | | 5,745,105 | |
Total increase (decrease) in net assets | | | 865,045 | | | | (41,737,698 | ) | | | (56,399 | ) | | | 1,489,147 | |
Net Assets: | | | | | | | | | | | | | | | | |
Beginning of period | | | 31,315,884 | | | | 73,053,582 | | | | 21,358,046 | | | | 19,868,899 | |
End of period | | $ | 32,180,929 | | | $ | 31,315,884 | | | $ | 21,301,647 | | | $ | 21,358,046 | |
End of period undistributed net investment income (loss) | | $ | 178,751 | | | $ | 2,590 | | | $ | 18,511 | | | | — | |
| | | | | | | | | | | | | | | | |
The accompanying notes are an integral part of these financial statements.
49
| | | | | | | | | | | | | | |
Managers
High Yield Fund | | | Managers
Fixed Income Fund | |
| 2009 | | | 2008 | | | 2009 | | | 2008 | |
| | | | | | | | | | | | | | |
| $ | 1,433,003 | | | $ | 2,899,783 | | | $ | 3,287,809 | | | $ | 6,213,046 | |
| | (3,507,237 | ) | | | (1,475,419 | ) | | | (1,339,700 | ) | | | 552,575 | |
| | 8,889,374 | | | | (12,135,159 | ) | | | 10,095,209 | | | | (20,610,809 | ) |
| | 6,815,140 | | | | (10,710,795 | ) | | | 12,043,318 | | | | (13,845,188 | ) |
| | | | | | | | | | | | | | |
| | | | | | | | | | | | | | |
| | (976,856 | ) | | | (1,870,572 | ) | | | (1,046,608 | ) | | | (1,887,389 | ) |
| | (95,729 | ) | | | (361,874 | ) | | | (143,208 | ) | | | (384,003 | ) |
| | (172,518 | ) | | | (419,878 | ) | | | (1,166,965 | ) | | | (1,992,311 | ) |
| | (161,892 | ) | | | (256,424 | ) | | | (883,785 | ) | | | (1,843,604 | ) |
| | | | | | | | | | | | | | |
| | — | | | | — | | | | — | | | | — | |
| | — | | | | — | | | | — | | | | — | |
| | — | | | | — | | | | — | | | | — | |
| | — | | | | — | | | | — | | | | — | |
| | | | | | | | | | | | | | |
| | — | | | | — | | | | — | | | | — | |
| | — | | | | — | | | | — | | | | — | |
| | — | | | | — | | | | — | | | | — | |
| | — | | | | — | | | | — | | | | — | |
| | (1,406,995 | ) | | | (2,908,748 | ) | | | (3,240,566 | ) | | | (6,107,307 | ) |
| | | | | | | | | | | | | | |
| | 17,173,152 | | | | 23,364,772 | | | | 28,309,426 | | | | 69,659,067 | |
| | 1,058,101 | | | | 2,090,161 | | | | 2,199,743 | | | | 3,710,771 | |
| | (17,671,497 | ) | | | (26,043,337 | ) | | | (18,617,058 | ) | | | (42,420,841 | ) |
| | 559,756 | | | | (588,404 | ) | | | 11,892,111 | | | | 30,948,997 | |
| | 5,967,901 | | | | (14,207,947 | ) | | | 20,694,863 | | | | 10,996,502 | |
| | | | | | | | | | | | | | |
| | 26,088,211 | | | | 40,296,158 | | | | 109,714,047 | | | | 98,717,545 | |
| $ | 32,056,112 | | | $ | 26,088,211 | | | $ | 130,408,910 | | | $ | 109,714,047 | |
| $ | 26,008 | | | | — | | | | ($65,781 | ) | | | ($113,024 | ) |
| | | | | | | | | | | | | | | |
The accompanying notes are an integral part of these financial statements.
50
Statements of Changes in Net Assets
For the six months ended June 30, 2009 (unaudited) and for the year ended December 31, 2008
| | | | | | | | | | | | | | | | |
| | | Managers Short Duration Government Fund | | | Managers Intermediate Duration Government Fund | |
| | | 2009 | | | 2008 | | | 2009 | | | 2008 | |
Increase (Decrease) in Net Assets From Operations: | | | | | | | | | | | | | | | | |
Net investment income | | $ | 3,418,655 | | | $ | 9,732,459 | | | $ | 3,467,482 | | | $ | 8,113,649 | |
Net realized gain (loss) on investments, options and futures | | | (253,643 | ) | | | (5,391,403 | ) | | | (152,149 | ) | | | 974,502 | |
Net unrealized appreciation (depreciation) of investments, options and futures | | | 6,543,846 | | | | (8,237,454 | ) | | | 6,324,207 | | | | (7,870,193 | ) |
Net increase (decrease) in net assets resulting from operations | | | 9,708,858 | | | | (3,896,398 | ) | | | 9,639,540 | | | | 1,217,958 | |
Distributions to Shareholders: | | | | | | | | | | | | | | | | |
From net investment income | | | (3,346,809 | ) | | | (9,735,159 | ) | | | (3,451,285 | ) | | | (8,103,541 | ) |
From net realized gain on investments | | | — | | | | — | | | | — | | | | (2,192,978 | ) |
Total distributions to shareholders | | | (3,346,809 | ) | | | (9,735,159 | ) | | | (3,451,285 | ) | | | (10,296,519 | ) |
From Capital Share Transactions: | | | | | | | | | | | | | | | | |
Proceeds from sale of shares | | | 88,566,266 | | | | 211,840,428 | | | | 52,981,536 | | | | 69,809,959 | |
Reinvestment of dividends and distributions | | | 3,245,984 | | | | 9,362,027 | | | | 3,139,755 | | | | 9,362,400 | |
Cost of shares repurchased | | | (96,606,187 | ) | | | (199,139,461 | ) | | | (42,863,482 | ) | | | (93,353,146 | ) |
Net increase (decrease) from capital share transactions | | | (4,793,937 | ) | | | 22,062,994 | | | | 13,257,809 | | | | (14,180,787 | ) |
Total increase (decrease) in net assets | | | 1,568,112 | | | | 8,431,437 | | | | 19,446,064 | | | | (23,259,348 | ) |
Net Assets: | | | | | | | | | | | | | | | | |
Beginning of period | | | 243,548,480 | | | | 235,117,043 | | | | 170,180,573 | | | | 193,439,921 | |
End of period | | $ | 245,116,592 | | | $ | 243,548,480 | | | $ | 189,626,637 | | | $ | 170,180,573 | |
End of period undistributed net investment income | | $ | 74,561 | | | $ | 2,715 | | | $ | 46,358 | | | $ | 30,161 | |
| | | | | | | | | | | | | | | | |
Share Transactions: | | | | | | | | | | | | | | | | |
Sale of shares | | | 9,501,332 | | | | 22,203,945 | | | | 5,098,828 | | | | 6,633,814 | |
Reinvestment of dividends and distributions | | | 348,408 | | | | 985,459 | | | | 301,990 | | | | 903,908 | |
Shares repurchased | | | (10,350,569 | ) | | | (20,999,033 | ) | | | (4,135,034 | ) | | | (8,928,366 | ) |
Net increase (decrease) in shares | | | (500,829 | ) | | | 2,190,371 | | | | 1,265,784 | | | | (1,390,644 | ) |
The accompanying notes are an integral part of these financial statements.
51
Financial Highlights
For a share outstanding throughout each of the six months ended June 30, 2009 (unaudited) and each year ended December 31,
| | | | | | | | | | | | | | | | | | | | | | | | |
Managers AMG Chicago Equity Partners Mid-Cap Fund | | For the six
months ended
June 30, 2009
(unaudited) | | | Class A | |
| | | 2008 | | | 2007 | | | 2006 | | | 2005 | | | 2004 | |
Net Asset Value, Beginning of Period | | $ | 7.82 | | | $ | 13.67 | | | $ | 14.60 | | | $ | 13.48 | | | $ | 12.10 | | | $ | 10.36 | |
Income from Investment Operations: | | | | | | | | | | | | | | | | | | | | | | | | |
Net investment income (loss) | | | 0.04 | | | | 0.06 | | | | (0.02 | )2 | | | 0.05 | | | | (0.01 | )2 | | | (0.02 | ) |
Net realized and unrealized gain (loss) on investments | | | 0.75 | | | | (5.84 | ) | | | 0.17 | 2 | | | 1.11 | | | | 1.39 | 2 | | | 1.76 | |
Total from investment operations | | | 0.79 | | | | (5.78 | ) | | | 0.15 | | | | 1.16 | | | | 1.38 | | | | 1.74 | |
Less Distributions to Shareholders from: | | | | | | | | | | | | | | | | | | | | | | | | |
Net investment income | | | — | | | | (0.06 | ) | | | — | | | | (0.04 | ) | | | — | | | | — | |
Net realized gain on investments | | | — | | | | (0.01 | ) | | | (1.08 | ) | | | — | | | | — | | | | — | |
Total distributions to shareholders | | | — | | | | (0.07 | ) | | | (1.08 | ) | | | (0.04 | ) | | | — | | | | — | |
Net Asset Value, End of Period | | $ | 8.61 | | | $ | 7.82 | | | $ | 13.67 | | | $ | 14.60 | | | $ | 13.48 | | | $ | 12.10 | |
Total Return 1 | | | 10.10 | %8 | | | (42.28 | )% | | | 0.84 | % | | | 8.69 | % | | | 11.32 | % | | | 16.80 | % |
Ratio of net expenses to average net assets | | | 1.18 | %9 | | | 1.18 | % | | | 1.21 | % | | | 1.23 | % | | | 1.33 | % | | | 1.41 | % |
Ratio of net investment income (loss) to average net assets 1 | | | 1.11 | %9 | | | 0.57 | % | | | (0.10 | )% | | | 0.34 | % | | | (0.13 | )% | | | (0.16 | )% |
Portfolio turnover | | | 58 | %8 | | | 107 | % | | | 125 | % | | | 85 | % | | | 84 | % | | | 90 | % |
Net assets at end of period (000’s omitted) | | $ | 4,522 | | | $ | 3,863 | | | $ | 6,464 | | | $ | 9,178 | | | $ | 8,712 | | | $ | 9,168 | |
| | | | | | | | | | | | | | | | | | | | | | | | |
Ratios absent expense offsets: 3 | | | | | | | | | | | | | | | | | | | | | | | | |
Ratio of total expenses to average net assets | | | 1.54 | %9 | | | 1.44 | % | | | 1.37 | % | | | 1.36 | % | | | 1.45 | % | | | 1.68 | % |
Ratio of net investment income (loss) to average net assets | | | 0.75 | %9 | | | 0.31 | % | | | (0.25 | )% | | | 0.22 | % | | | (0.24 | )% | | | (0.43 | )% |
| | | | | | | | | | | | | | | | | | | | | | | | |
| | |
Managers AMG Chicago Equity Partners Mid-Cap Fund | | For the six
months ended
June 30, 2009
(unaudited) | | | Class B | |
| | | 2008 | | | 2007 | | | 2006 | | | 2005 | | | 2004 | |
Net Asset Value, Beginning of Period | | $ | 7.33 | | | $ | 12.80 | | | $ | 13.79 | | | $ | 12.82 | | | $ | 11.59 | | | $ | 9.98 | |
Income from Investment Operations: | | | | | | | | | | | | | | | | | | | | | | | | |
Net investment loss | | | (0.01 | ) | | | (0.06 | ) | | | (0.13 | )2 | | | (0.08 | ) | | | (0.06 | )2 | | | (0.07 | ) |
Net realized and unrealized gain (loss) on investments | | | 0.72 | | | | (5.40 | ) | | | 0.15 | 2 | | | 1.09 | | | | 1.29 | 2 | | | 1.68 | |
Total from investment operations | | | 0.71 | | | | (5.46 | ) | | | 0.02 | | | | 1.01 | | | | 1.23 | | | | 1.61 | |
Less Distributions to Shareholders from: | | | | | | | | | | | | | | | | | | | | | | | | |
Net investment income | | | — | | | | — | | | | — | | | | (0.04 | ) | | | — | | | | — | |
Net realized gain on investments | | | — | | | | (0.01 | ) | | | (1.01 | ) | | | — | | | | — | | | | — | |
Total distributions to shareholders | | | — | | | | (0.01 | ) | | | (1.01 | ) | | | (0.04 | ) | | | — | | | | — | |
Net Asset Value, End of Period | | $ | 8.04 | | | $ | 7.33 | | | $ | 12.80 | | | $ | 13.79 | | | $ | 12.82 | | | $ | 11.59 | |
Total Return 1 | | | 9.69 | %8 | | | (42.67 | )% | | | (0.03 | )% | | | 7.88 | % | | | 10.61 | % | | | 16.13 | % |
Ratio of net expenses to average net assets | | | 1.92 | %9 | | | 1.94 | % | | | 1.96 | % | | | 1.98 | % | | | 1.99 | % | | | 1.90 | % |
Ratio of net investment income (loss) to average net assets 1 | | | 0.38 | %9 | | | (0.30 | )% | | | (0.86 | )% | | | (0.41 | )% | | | (0.79 | )% | | | (0.67 | )% |
Portfolio turnover | | | 58 | %8 | | | 107 | % | | | 125 | % | | | 85 | % | | | 84 | % | | | 90 | % |
Net assets at end of period (000’s omitted) | | $ | 1,044 | | | $ | 1,742 | | | $ | 6,909 | | | $ | 11,197 | | | $ | 15,512 | | | $ | 17,226 | |
| | | | | | | | | | | | | | | | | | | | | | | | |
Ratios absent expense offsets: 3 | | | | | | | | | | | | | | | | | | | | | | | | |
Ratio of total expenses to average net assets | | | 2.27 | %9 | | | 2.20 | % | | | 2.12 | % | | | 2.11 | % | | | 2.11 | % | | | 2.18 | % |
Ratio of net investment income (loss) to average net assets | | | 0.04 | %9 | | | (0.56 | )% | | | (1.02 | )% | | | (0.59 | )% | | | (0.91 | )% | | | (0.95 | )% |
| | | | | | | | | | | | | | | | | | | | | | | | |
52
Financial Highlights
For a share outstanding throughout each of the six months ended June 30, 2009 (unaudited) and each year ended December 31,
| | | | | | | | | | | | | | | | | | | | | | | | |
Managers AMG Chicago Equity Partners Mid-Cap Fund | | For the six
months ended
June 30, 2009
(unaudited) | | | Class C | |
| | | 2008 | | | 2007 | | | 2006 | | | 2005 | | | 2004 | |
Net Asset Value, Beginning of Period | | $ | 7.32 | | | $ | 12.79 | | | $ | 13.80 | | | $ | 12.83 | | | $ | 11.60 | | | $ | 9.99 | |
Income from Investment Operations: | | | | | | | | | | | | | | | | | | | | | | | | |
Net investment income (loss) | | | 0.01 | | | | (0.03 | ) | | | (0.12 | )2 | | | (0.06 | ) | | | (0.06 | )2 | | | (0.08 | ) |
Net realized and unrealized gain (loss) on investments | | | 0.70 | | | | (5.43 | ) | | | 0.12 | 2 | | | 1.07 | | | | 1.29 | 2 | | | 1.69 | |
Total from investment operations | | | 0.71 | | | | (5.46 | ) | | | — | | | | 1.01 | | | | 1.23 | | | | 1.61 | |
Less Distributions to Shareholders from: | | | | | | | | | | | | | | | | | | | | | | | | |
Net investment income | | | — | | | | — | | | | — | | | | (0.04 | ) | | | — | | | | — | |
Net realized gain on investments | | | — | | | | (0.01 | ) | | | (1.01 | ) | | | — | | | | — | | | | — | |
Total distributions to shareholders | | | — | | | | (0.01 | ) | | | (1.01 | ) | | | (0.04 | ) | | | — | | | | — | |
Net Asset Value, End of Period | | $ | 8.03 | | | $ | 7.32 | | | $ | 12.79 | | | $ | 13.80 | | | $ | 12.83 | | | $ | 11.60 | |
Total Return 1 | | | 9.70 | %8 | | | (42.71 | )% | | | (0.19 | )% | | | 7.87 | % | | | 10.60 | % | | | 16.12 | % |
Ratio of net expenses to average net assets | | | 1.94 | %9 | | | 1.94 | % | | | 1.96 | % | | | 1.98 | % | | | 1.99 | % | | | 1.91 | % |
Ratio of net investment income (loss) to average net assets 1 | | | 0.39 | %9 | | | (0.23 | )% | | | (0.85 | )% | | | (0.41 | )% | | | (0.79 | )% | | | (0.67 | )% |
Portfolio turnover | | | 58 | %8 | | | 107 | % | | | 125 | % | | | 85 | % | | | 84 | % | | | 90 | % |
Net assets at end of period (000’s omitted) | | $ | 3,469 | | | $ | 3,558 | | | $ | 8,651 | | | $ | 11,748 | | | $ | 13,845 | | | $ | 15,393 | |
| | | | | | | | | | | | | | | | | | | | | | | | |
Ratios absent expense offsets: 3 | | | | | | | | | | | | | | | | | | | | | | | | |
Ratio of total expenses to average net assets | | | 2.30 | %9 | | | 2.19 | % | | | 2.12 | % | | | 2.11 | % | | | 2.11 | % | | | 2.18 | % |
Ratio of net investment income (loss) to average net assets | | | 0.03 | %9 | | | (0.49 | )% | | | (1.02 | )% | | | (0.56 | )% | | | (0.91 | )% | | | (0.94 | )% |
| | | | | | | | | | | | | | | | | | | | | | | | |
| | |
Managers AMG Chicago Equity Partners Mid-Cap Fund | | For the six
months ended
June 30, 2009
(unaudited) | | | Institutional Class | |
| | | 2008 | | | 2007 | | | 2006 | | | 2005 | | | 2004 | |
Net Asset Value, Beginning of Period | | $ | 8.24 | | | $ | 14.42 | | | $ | 15.41 | | | $ | 14.19 | | | $ | 12.70 | | | $ | 10.82 | |
Income from Investment Operations: | | | | | | | | | | | | | | | | | | | | | | | | |
Net investment income | | | 0.06 | | | | 0.10 | | | | 0.03 | 2 | | | 0.09 | | | | 0.10 | 2 | | | 0.04 | |
Net realized and unrealized gain (loss) on investments | | | 0.79 | | | | (6.18 | ) | | | 0.11 | 2 | | | 1.17 | | | | 1.39 | 2 | | | 1.84 | |
Total from investment operations | | | 0.85 | | | | (6.08 | ) | | | 0.14 | | | | 1.26 | | | | 1.49 | | | | 1.88 | |
Less Distributions to Shareholders from: | | | | | | | | | | | | | | | | | | | | | | | | |
Net investment income | | | — | | | | (0.09 | ) | | | — | | | | (0.04 | ) | | | — | | | | — | |
Net realized gain on investments | | | — | | | | (0.01 | ) | | | (1.13 | ) | | | — | | | | — | | | | — | |
Total distributions to shareholders | | | — | | | | (0.10 | ) | | | (1.13 | ) | | | (0.04 | ) | | | — | | | | — | |
Net Asset Value, End of Period | | $ | 9.09 | | | $ | 8.24 | | | $ | 14.42 | | | $ | 15.41 | | | $ | 14.19 | | | $ | 12.70 | |
Total Return 1 | | | 10.32 | %8 | | | (42.13 | )% | | | 0.78 | % | | | 8.96 | % | | | 11.74 | % | | | 17.37 | % |
Ratio of net expenses to average net assets | | | 0.93 | %9 | | | 0.94 | % | | | 0.96 | % | | | 0.98 | % | | | 0.99 | % | | | 0.90 | % |
Ratio of net investment income to average net assets 1 | | | 1.37 | %9 | | | 0.77 | % | | | 0.16 | % | | | 0.59 | % | | | 0.21 | % | | | 0.33 | % |
Portfolio turnover | | | 58 | %8 | | | 107 | % | | | 125 | % | | | 85 | % | | | 84 | % | | | 90 | % |
Net assets at end of period (000’s omitted) | | $ | 23,147 | | | $ | 22,152 | | | $ | 51,029 | | | $ | 56,008 | | | $ | 59,571 | | | $ | 60,656 | |
| | | | | | | | | | | | | | | | | | | | | | | | |
Ratios absent expense offsets: 3 | | | | | | | | | | | | | | | | | | | | | | | | |
Ratio of total expenses to average net assets | | | 1.29 | %9 | | | 1.19 | % | | | 1.12 | % | | | 1.11 | % | | | 1.11 | % | | | 1.18 | % |
Ratio of net investment income to average net assets | | | 1.01 | %9 | | | 0.51 | % | | | 0.01 | % | | | 0.47 | % | | | 0.09 | % | | | 0.06 | % |
| | | | | | | | | | | | | | | | | | | | | | | | |
53
Financial Highlights
For a share outstanding throughout each of the six months ended June 30, 2009 (unaudited) and each year ended December 31,
| | | | | | | | | | | | | | | | | | | | | | | | |
Managers AMG Chicago Equity Partners Balanced Fund | | For the six
months ended
June 30, 2009
(unaudited) | | | Class A | |
| | | 2008 | | | 2007 | | | 2006 | | | 2005 | | | 2004 | |
Net Asset Value, Beginning of Period | | $ | 10.45 | | | $ | 13.18 | | | $ | 12.86 | | | $ | 11.55 | | | $ | 11.24 | | | $ | 10.42 | |
Income from Investment Operations: | | | | | | | | | | | | | | | | | | | | | | | | |
Net investment income | | | 0.06 | | | | 0.29 | | | | 0.25 | | | | 0.25 | | | | 0.17 | | | | 0.17 | |
Net realized and unrealized gain (loss) on investments | | | 0.47 | | | | (2.74 | ) | | | 0.34 | | | | 1.32 | | | | 0.30 | | | | 0.81 | |
Total from investment operations | | | 0.53 | | | | (2.45 | ) | | | 0.59 | | | | 1.57 | | | | 0.47 | | | | 0.98 | |
Less Distributions to Shareholders from: | | | | | | | | | | | | | | | | | | | | | | | | |
Net investment income | | | (0.05 | ) | | | (0.27 | ) | | | (0.27 | ) | | | (0.26 | ) | | | (0.16 | ) | | | (0.16 | ) |
Return of capital | | | — | | | | (0.01 | ) | | | — | | | | — | | | | — | | | | — | |
Total distributions to shareholders | | | (0.05 | ) | | | (0.28 | ) | | | (0.27 | ) | | | (0.26 | ) | | | (0.16 | ) | | | (0.16 | ) |
Net Asset Value, End of Period | | $ | 10.93 | | | $ | 10.45 | | | $ | 13.18 | | | $ | 12.86 | | | $ | 11.55 | | | $ | 11.24 | |
Total Return 1 | | | 5.46 | %8 | | | (18.68 | )% | | | 4.63 | % | | | 13.73 | % | | | 4.24 | % | | | 9.45 | % |
Ratio of net expenses to average net assets | | | 1.22 | %9 | | | 1.17 | % | | | 1.23 | % | | | 1.23 | % | | | 1.31 | % | | | 1.47 | % |
Ratio of net investment income to average net assets 1 | | | 2.07 | %9 | | | 2.53 | % | | | 1.93 | % | | | 2.05 | % | | | 1.45 | % | | | 1.46 | % |
Portfolio turnover | | | 70 | %8 | | | 99 | % | | | 206 | % | | | 66 | % | | | 53 | % | | | 85 | % |
Net assets at end of period (000’s omitted) | | $ | 2,820 | | | $ | 9,932 | | | $ | 2,076 | | | $ | 1,933 | | | $ | 1,677 | | | $ | 2,366 | |
| | | | | | | | | | | | | | | | | | | | | | | | |
Ratios absent expense offsets: 3 | | | | | | | | | | | | | | | | | | | | | | | | |
Ratio of total expenses to average net assets | | | 1.76 | %9 | | | 1.68 | % | | | 1.78 | % | | | 1.81 | % | | | 1.85 | % | | | 2.05 | % |
Ratio of net investment income to average net assets | | | 1.53 | %9 | | | 2.03 | % | | | 1.38 | % | | | 1.49 | % | | | 0.89 | % | | | 0.88 | % |
| | | | | | | | | | | | | | | | | | | | | | | | |
| | |
Managers AMG Chicago Equity Partners Balanced Fund | | For the six
months ended
June 30, 2009
(unaudited) | | | Class B | |
| | | 2008 | | | 2007 | | | 2006 | | | 2005 | | | 2004 | |
Net Asset Value, Beginning of Period | | $ | 10.29 | | | $ | 12.96 | | | $ | 12.64 | | | $ | 11.36 | | | $ | 11.06 | | | $ | 10.26 | |
Income from Investment Operations: | | | | | | | | | | | | | | | | | | | | | | | | |
Net investment income | | | 0.06 | | | | 0.16 | | | | 0.16 | | | | 0.18 | | | | 0.09 | | | | 0.34 | |
Net realized and unrealized gain (loss) on investments | | | 0.46 | | | | (2.66 | ) | | | 0.33 | | | | 1.29 | | | | 0.30 | | | | 0.80 | |
Total from investment operations | | | 0.52 | | | | (2.50 | ) | | | 0.49 | | | | 1.47 | | | | 0.39 | | | | 1.14 | |
Less Distributions to Shareholders from: | | | | | | | | | | | | | | | | | | | | | | | | |
Net investment income | | | (0.03 | ) | | | (0.16 | ) | | | (0.17 | ) | | | (0.19 | ) | | | (0.09 | ) | | | (0.34 | ) |
Return of capital | | | — | | | | (0.01 | ) | | | — | | | | — | | | | — | | | | — | |
Total distributions to shareholders | | | (0.03 | ) | | | (0.17 | ) | | | (0.17 | ) | | | (0.19 | ) | | | (0.09 | ) | | | (0.34 | ) |
Net Asset Value, End of Period | | $ | 10.78 | | | $ | 10.29 | | | $ | 12.96 | | | $ | 12.64 | | | $ | 11.36 | | | $ | 11.06 | |
Total Return 1 | | | 5.28 | %8 | | | (19.38 | )% | | | 3.86 | % | | | 12.83 | % | | | 3.53 | % | | | 11.11 | % |
Ratio of net expenses to average net assets | | | 1.97 | %9 | | | 1.97 | % | | | 1.98 | % | | | 1.98 | % | | | 1.98 | % | | | 1.97 | % |
Ratio of net investment income to average net assets 1 | | | 1.34 | %9 | | | 1.53 | % | | | 1.16 | % | | | 1.30 | % | | | 0.79 | % | | | 0.97 | % |
Portfolio turnover | | | 70 | %8 | | | 99 | % | | | 206 | % | | | 66 | % | | | 53 | % | | | 85 | % |
Net assets at end of period (000’s omitted) | | $ | 6,284 | | | $ | 2,434 | | | $ | 6,026 | | | $ | 8,485 | | | $ | 9,692 | | | $ | 11,090 | |
| | | | | | | | | | | | | | | | | | | | | | | | |
Ratios absent expense offsets: 3 | | | | | | | | | | | | | | | | | | | | | | | | |
Ratio of total expenses to average net assets | | | 2.51 | %9 | | | 2.55 | % | | | 2.53 | % | | | 2.56 | % | | | 2.52 | % | | | 2.57 | % |
Ratio of net investment income to average net assets | | | 0.80 | %9 | | | 0.95 | % | | | 0.61 | % | | | 0.71 | % | | | 0.25 | % | | | 0.37 | % |
| | | | | | | | | | | | | | | | | | | | | | | | |
54
Financial Highlights
For a share outstanding throughout each of the six months ended June 30, 2009 (unaudited) and each year ended December 31,
| | | | | | | | | | | | | | | | | | | | | | | | |
Managers AMG Chicago Equity Partners Balanced Fund | | For the six
months ended
June 30, 2009
(unaudited) | | | Class C | |
| | | 2008 | | | 2007 | | | 2006 | | | 2005 | | | 2004 | |
Net Asset Value, Beginning of Period | | $ | 10.38 | | | $ | 13.08 | | | $ | 12.76 | | | $ | 11.46 | | | $ | 11.16 | | | $ | 10.35 | |
Income from Investment Operations: | | | | | | | | | | | | | | | | | | | | | | | | |
Net investment income | | | 0.04 | | | | 0.18 | | | | 0.16 | | | | 0.16 | | | | 0.09 | | | | 0.11 | |
Net realized and unrealized gain (loss) on investments | | | 0.47 | | | | (2.70 | ) | | | 0.33 | | | | 1.31 | | | | 0.30 | | | | 0.81 | |
Total from investment operations | | | 0.51 | | | | (2.52 | ) | | | 0.49 | | | | 1.47 | | | | 0.39 | | | | 0.92 | |
Less Distributions to Shareholders from: | | | | | | | | | | | | | | | | | | | | | | | | |
Net investment income | | | (0.03 | ) | | | (0.17 | ) | | | (0.17 | ) | | | (0.17 | ) | | | (0.09 | ) | | | (0.11 | ) |
Return of capital | | | — | | | | (0.01 | ) | | | — | | | | — | | | | — | | | | — | |
Total distributions to shareholders | | | (0.03 | ) | | | (0.18 | ) | | | (0.17 | ) | | | (0.17 | ) | | | (0.09 | ) | | | (0.11 | ) |
Net Asset Value, End of Period | | $ | 10.86 | | | $ | 10.38 | | | $ | 13.08 | | | $ | 12.76 | | | $ | 11.46 | | | $ | 11.16 | |
Total Return 1 | | | 5.20 | %8 | | | (19.36 | )% | | | 3.86 | % | | | 12.88 | % | | | 3.49 | % | | | 8.88 | % |
Ratio of net expenses to average net assets | | | 1.97 | %9 | | | 1.96 | % | | | 1.98 | % | | | 1.98 | % | | | 1.98 | % | | | 1.97 | % |
Ratio of net investment income to average net assets 1 | | | 1.31 | %9 | | | 1.57 | % | | | 1.17 | % | | | 1.30 | % | | | 0.79 | % | | | 0.97 | % |
Portfolio turnover | | | 70 | %8 | | | 99 | % | | | 206 | % | | | 66 | % | | | 53 | % | | | 85 | % |
Net assets at end of period (000’s omitted) | | $ | 3,549 | | | $ | 2,926 | | | $ | 4,013 | | | $ | 4,479 | | | $ | 5,081 | | | $ | 6,377 | |
| | | | | | | | | | | | | | | | | | | | | | | | |
Ratios absent expense offsets: 3 | | | | | | | | | | | | | | | | | | | | | | | | |
Ratio of total expenses to average net assets | | | 2.51 | %9 | | | 2.52 | % | | | 2.53 | % | | | 2.56 | % | | | 2.52 | % | | | 2.56 | % |
Ratio of net investment income to average net assets | | | 0.77 | %9 | | | 1.01 | % | | | 0.62 | % | | | 0.71 | % | | | 0.24 | % | | | 0.38 | % |
| | | | | | | | | | | | | | | | | | | | | | | | |
| | |
Managers AMG Chicago Equity Partners Balanced Fund | | For the six
months ended
June 30, 2009
(unaudited) | | | Institutional Class | |
| | | 2008 | | | 2007 | | | 2006 | | | 2005 | | | 2004 | |
Net Asset Value, Beginning of Period | | $ | 10.54 | | | $ | 13.28 | | | $ | 12.96 | | | $ | 11.64 | | | $ | 11.33 | | | $ | 10.50 | |
Income from Investment Operations: | | | | | | | | | | | | | | | | | | | | | | | | |
Net investment income | | | 0.06 | | | | 0.31 | | | | 0.29 | | | | 0.29 | | | | 0.18 | | | | 0.21 | |
Net realized and unrealized gain (loss) on investments | | | 0.48 | | | | (2.74 | ) | | | 0.34 | | | | 1.32 | | | | 0.31 | | | | 0.83 | |
Total from investment operations | | | 0.54 | | | | (2.43 | ) | | | 0.63 | | | | 1.61 | | | | 0.49 | | | | 1.04 | |
Less Distributions to Shareholders from: | | | | | | | | | | | | | | | | | | | | | | | | |
Net investment income | | | (0.06 | ) | | | (0.30 | ) | | | (0.31 | ) | | | (0.29 | ) | | | (0.18 | ) | | | (0.21 | ) |
Return of capital | | | — | | | | (0.01 | ) | | | — | | | | — | | | | — | | | | — | |
Total distributions to shareholders | | | (0.06 | ) | | | (0.31 | ) | | | (0.31 | ) | | | (0.29 | ) | | | (0.18 | ) | | | (0.21 | ) |
Net Asset Value, End of Period | | $ | 11.02 | | | $ | 10.54 | | | $ | 13.28 | | | $ | 12.96 | | | $ | 11.64 | | | $ | 11.33 | |
Total Return 1 | | | 5.65 | %8 | | | (18.51 | )% | | | 4.87 | % | | | 13.98 | % | | | 4.57 | % | | | 10.04 | % |
Ratio of net expenses to average net assets | | | 0.97 | %9 | | | 0.96 | % | | | 0.98 | % | | | 0.98 | % | | | 0.98 | % | | | 0.97 | % |
Ratio of net investment income to average net assets 1 | | | 2.31 | %9 | | | 2.58 | % | | | 2.18 | % | | | 2.30 | % | | | 1.80 | % | | | 1.98 | % |
Portfolio turnover | | | 70 | %8 | | | 99 | % | | | 206 | % | | | 66 | % | | | 53 | % | | | 85 | % |
Net assets at end of period (000’s omitted) | | $ | 7,216 | | | $ | 6,065 | | | $ | 7,754 | | | $ | 7,676 | | | $ | 7,501 | | | $ | 8,111 | |
| | | | | | | | | | | | | | | | | | | | | | | | |
Ratios absent expense offsets: 3 | | | | | | | | | | | | | | | | | | | | | | | | |
Ratio of total expenses to average net assets | | | 1.51 | %9 | | | 1.52 | % | | | 1.53 | % | | | 1.56 | % | | | 1.52 | % | | | 1.57 | % |
Ratio of net investment income to average net assets | | | 1.77 | %9 | | | 2.02 | % | | | 1.63 | % | | | 1.73 | % | | | 1.26 | % | | | 1.37 | % |
| | | | | | | | | | | | | | | | | | | | | | | | |
55
Financial Highlights
For a share outstanding throughout each of the six months ended June 30, 2009 (unaudited) and each year ended December 31,
| | | | | | | | | | | | | | | | | | | | | | | | |
Managers High Yield Fund | | For the six
months ended
June 30, 2009
(unaudited) | | | Class A | |
| | | 2008 | | | 2007 | | | 2006 | | | 2005 | | | 2004 | |
Net Asset Value, Beginning of Period | | $ | 5.25 | | | $ | 8.23 | | | $ | 8.63 | | | $ | 8.30 | | | $ | 8.67 | | | $ | 8.46 | |
Income from Investment Operations: | | | | | | | | | | | | | | | | | | | | | | | | |
Net investment income | | | 0.29 | | | | 0.64 | | | | 0.59 | | | | 0.55 | | | | 0.57 | | | | 0.67 | |
Net realized and unrealized gain (loss) on investments | | | 1.08 | | | | (2.99 | ) | | | (0.40 | ) | | | 0.33 | | | | (0.37 | ) | | | 0.19 | |
Total from investment operations | | | 1.37 | | | | (2.35 | ) | | | 0.19 | | | | 0.88 | | | | 0.20 | | | | 0.86 | |
Less Distributions to Shareholders from: | | | | | | | | | | | | | | | | | | | | | | | | |
Net investment income | | | (0.29 | ) | | | (0.63 | ) | | | (0.59 | ) | | | (0.55 | ) | | | (0.57 | ) | | | (0.65 | ) |
Total distributions to shareholders | | | (0.29 | ) | | | (0.63 | ) | | | (0.59 | ) | | | (0.55 | ) | | | (0.57 | ) | | | (0.65 | ) |
Net Asset Value, End of Period | | $ | 6.33 | | | $ | 5.25 | | | $ | 8.23 | | | $ | 8.63 | | | $ | 8.30 | | | $ | 8.67 | |
Total Return 1 | | | 26.36 | %8 | | | (30.02 | )%4 | | | 2.25 | % | | | 11.07 | % | | | 2.37 | % | | | 10.62 | % |
Ratio of net expenses to average net assets | | | 1.15 | %9 | | | 1.15 | %7 | | | 1.15 | % | | | 1.15 | % | | | 1.22 | % | | | 1.40 | % |
Ratio of net investment income to average net assets 1 | | | 10.05 | %9 | | | 8.57 | %7 | | | 6.92 | % | | | 6.65 | % | | | 6.64 | % | | | 7.68 | % |
Portfolio turnover | | | 29 | %8 | | | 41 | % | | | 51 | % | | | 65 | % | | | 63 | % | | | 74 | % |
Net assets at end of period (000’s omitted) | | $ | 23,090 | | | $ | 17,105 | | | $ | 24,151 | | | $ | 26,953 | | | $ | 20,478 | | | $ | 16,612 | |
| | | | | | | | | | | | | | | | | | | | | | | | |
Ratios absent expense offsets: 3 | | | | | | | | | | | | | | | | | | | | | | | | |
Ratio of total expenses to average net assets | | | 1.66 | %9 | | | 1.70 | % | | | 1.55 | % | | | 1.54 | % | | | 1.59 | % | | | 1.72 | % |
Ratio of net investment income to average net assets | | | 9.54 | %9 | | | 8.01 | % | | | 6.52 | % | | | 6.26 | % | | | 6.28 | % | | | 7.37 | % |
| | | | | | | | | | | | | | | | | | | | | | | | |
| | |
Managers High Yield Fund | | For the six
months ended
June 30, 2009
(unaudited) | | | Class B | |
| | | 2008 | | | 2007 | | | 2006 | | | 2005 | | | 2004 | |
Net Asset Value, Beginning of Period | | $ | 5.18 | | | $ | 8.13 | | | $ | 8.54 | | | $ | 8.22 | | | $ | 8.60 | | | $ | 8.40 | |
Income from Investment Operations: | | | | | | | | | | | | | | | | | | | | | | | | |
Net investment income | | | 0.27 | | | | 0.56 | | | | 0.54 | | | | 0.50 | | | | 0.51 | | | | 0.60 | |
Net realized and unrealized gain (loss) on investments | | | 1.05 | | | | (2.94 | ) | | | (0.43 | ) | | | 0.31 | | | | (0.38 | ) | | | 0.21 | |
Total from investment operations | | | 1.32 | | | | (2.38 | ) | | | 0.11 | | | | 0.81 | | | | 0.13 | | | | 0.81 | |
Less Distributions to Shareholders from: | | | | | | | | | | | | | | | | | | | | | | | | |
Net investment income | | | (0.26 | ) | | | (0.57 | ) | | | (0.52 | ) | | | (0.49 | ) | | | (0.51 | ) | | | (0.61 | ) |
Total distributions to shareholders | | | (0.26 | ) | | | (0.57 | ) | | | (0.52 | ) | | | (0.49 | ) | | | (0.51 | ) | | | (0.61 | ) |
Net Asset Value, End of Period | | $ | 6.24 | | | $ | 5.18 | | | $ | 8.13 | | | $ | 8.54 | | | $ | 8.22 | | | $ | 8.60 | |
Total Return 1 | | | 25.50 | %8 | | | (30.62 | )%4 | | | 1.30 | % | | | 10.21 | % | | | 1.59 | % | | | 10.07 | % |
Ratio of net expenses to average net assets | | | 1.90 | %9 | | | 1.90 | %7 | | | 1.90 | % | | | 1.90 | % | | | 1.90 | % | | | 1.90 | % |
Ratio of net investment income to average net assets 1 | | | 9.53 | %9 | | | 7.80 | %7 | | | 6.14 | % | | | 5.88 | % | | | 5.96 | % | | | 7.18 | % |
Portfolio turnover | | | 29 | %8 | | | 41 | % | | | 51 | % | | | 65 | % | | | 63 | % | | | 74 | % |
Net assets at end of period (000’s omitted) | | $ | 1,731 | | | $ | 2,577 | | | $ | 6,536 | | | $ | 12,318 | | | $ | 17,782 | | | $ | 27,287 | |
| | | | | | | | | | | | | | | | | | | | | | | | |
Ratios absent expense offsets: 3 | | | | | | | | | | | | | | | | | | | | | | | | |
Ratio of total expenses to average net assets | | | 2.41 | %9 | | | 2.45 | % | | | 2.30 | % | | | 2.28 | % | | | 2.27 | % | | | 2.27 | % |
Ratio of net investment income to average net assets | | | 9.02 | %9 | | | 7.25 | % | | | 5.74 | % | | | 5.50 | % | | | 5.59 | % | | | 6.81 | % |
| | | | | | | | | | | | | | | | | | | | | | | | |
56
Financial Highlights
For a share outstanding throughout each of the six months ended June 30, 2009 (unaudited) and each year ended December 31,
| | | | | | | | | | | | | | | | | | | | | | | | |
Managers High Yield Fund | | For the six
months ended
June 30, 2009
(unaudited) | | | Class C | |
| | | 2008 | | | 2007 | | | 2006 | | | 2005 | | | 2004 | |
Net Asset Value, Beginning of Period | | $ | 5.18 | | | $ | 8.12 | | | $ | 8.53 | | | $ | 8.21 | | | $ | 8.59 | | | $ | 8.39 | |
Income from Investment Operations: | | | | | | | | | | | | | | | | | | | | | | | | |
Net investment income | | | 0.26 | | | | 0.57 | | | | 0.53 | | | | 0.49 | | | | 0.51 | | | | 0.60 | |
Net realized and unrealized gain (loss) on investments | | | 1.06 | | | | (2.94 | ) | | | (0.41 | ) | | | 0.32 | | | | (0.38 | ) | | | 0.21 | |
Total from investment operations | | | 1.32 | | | | (2.37 | ) | | | 0.12 | | | | 0.81 | | | | 0.13 | | | | 0.81 | |
Less Distributions to Shareholders from: | | | | | | | | | | | | | | | | | | | | | | | | |
Net investment income | | | (0.26 | ) | | | (0.57 | ) | | | (0.53 | ) | | | (0.49 | ) | | | (0.51 | ) | | | (0.61 | ) |
Total distributions to shareholders | | | (0.26 | ) | | | (0.57 | ) | | | (0.53 | ) | | | (0.49 | ) | | | (0.51 | ) | | | (0.61 | ) |
Net Asset Value, End of Period | | $ | 6.24 | | | $ | 5.18 | | | $ | 8.12 | | | $ | 8.53 | | | $ | 8.21 | | | $ | 8.59 | |
Total Return 1 | | | 25.77 | %8 | | | (30.54 | )%4 | | | 1.32 | % | | | 10.24 | % | | | 1.60 | % | | | 10.08 | % |
Ratio of net expenses to average net assets | | | 1.90 | %9 | | | 1.90 | %7 | | | 1.90 | % | | | 1.90 | % | | | 1.90 | % | | | 1.90 | % |
Ratio of net investment income to average net assets 1 | | | 9.42 | %9 | | | 7.91 | %7 | | | 6.18 | % | | | 5.89 | % | | | 5.97 | % | | | 7.17 | % |
Portfolio turnover | | | 29 | %8 | | | 41 | % | | | 51 | % | | | 65 | % | | | 63 | % | | | 74 | % |
Net assets at end of period (000’s omitted) | | $ | 4,157 | | | $ | 3,516 | | | $ | 6,186 | | | $ | 7,653 | | | $ | 7,934 | | | $ | 10,474 | |
| | | | | | | | | | | | | | | | | | | | | | | | |
Ratios absent expense offsets: 3 | | | | | | | | | | | | | | | | | | | | | | | | |
Ratio of total expenses to average net assets | | | 2.42 | %9 | | | 2.46 | % | | | 2.30 | % | | | 2.29 | % | | | 2.27 | % | | | 2.27 | % |
Ratio of net investment income to average net assets | | | 8.91 | %9 | | | 7.36 | % | | | 5.78 | % | | | 5.50 | % | | | 5.60 | % | | | 6.80 | % |
| | | | | | | | | | | | | | | | | | | | | | | | |
| | |
Managers High Yield Fund | | For the six
months ended
June 30, 2009
(unaudited) | | | Institutional Class | |
| | | 2008 | | | 2007 | | | 2006 | | | 2005 | | | 2004 | |
Net Asset Value, Beginning of Period | | $ | 5.29 | | | $ | 8.29 | | | $ | 8.70 | | | $ | 8.36 | | | $ | 8.74 | | | $ | 8.52 | |
Income from Investment Operations: | | | | | | | | | | | | | | | | | | | | | | | | |
Net investment income | | | 0.32 | | | | 0.64 | | | | 0.64 | | | | 0.58 | | | | 0.60 | | | | 0.73 | |
Net realized and unrealized gain (loss) on investments | | | 1.08 | | | | (2.98 | ) | | | (0.43 | ) | | | 0.34 | | | | (0.38 | ) | | | 0.18 | |
Total from investment operations | | | 1.40 | | | | (2.34 | ) | | | 0.21 | | | | 0.92 | | | | 0.22 | | | | 0.91 | |
Less Distributions to Shareholders from: | | | | | | | | | | | | | | | | | | | | | | | | |
Net investment income | | | (0.29 | ) | | | (0.66 | ) | | | (0.62 | ) | | | (0.58 | ) | | | (0.60 | ) | | | (0.69 | ) |
Total distributions to shareholders | | | (0.29 | ) | | | (0.66 | ) | | | (0.62 | ) | | | (0.58 | ) | | | (0.60 | ) | | | (0.69 | ) |
Net Asset Value, End of Period | | $ | 6.40 | | | $ | 5.29 | | | $ | 8.29 | | | $ | 8.70 | | | $ | 8.36 | | | $ | 8.74 | |
Total Return 1 | | | 26.95 | %8 | | | (29.80 | )%4 | | | 2.40 | % | | | 11.38 | % | | | 2.60 | % | | | 10.69 | % |
Ratio of net expenses to average net assets | | | 0.90 | %9 | | | 0.90 | %7 | | | 0.90 | % | | | 0.90 | % | | | 0.90 | % | | | 0.90 | % |
Ratio of net investment income to average net assets 1 | | | 10.32 | %9 | | | 8.90 | %7 | | | 7.16 | % | | | 6.91 | % | | | 6.96 | % | | | 8.00 | % |
Portfolio turnover | | | 29 | %8 | | | 41 | % | | | 51 | % | | | 65 | % | | | 63 | % | | | 74 | % |
Net assets at end of period (000’s omitted) | | $ | 3,077 | | | $ | 2,890 | | | $ | 3,423 | | | $ | 7,053 | | | $ | 3,440 | | | $ | 4,725 | |
| | | | | | | | | | | | | | | | | | | | | | | | |
Ratios absent expense offsets: 3 | | | | | | | | | | | | | | | | | | | | | | | | |
Ratio of total expenses to average net assets | | | 1.39 | %9 | | | 1.46 | % | | | 1.30 | % | | | 1.29 | % | | | 1.27 | % | | | 1.26 | % |
Ratio of net investment income to average net assets | | | 9.84 | %9 | | | 8.34 | % | | | 6.77 | % | | | 6.51 | % | | | 6.59 | % | | | 7.64 | % |
| | | | | | | | | | | | | | | | | | | | | | | | |
57
Financial Highlights
For a share outstanding throughout each of the six months ended June 30, 2009 (unaudited) and each year ended December 31,
| | | | | | | | | | | | | | | | | | | | | | | | |
Managers Fixed Income Fund | | For the six
months ended
June 30, 2009
(unaudited) | | | Class A | |
| | | 2008 | | | 2007 | | | 2006 | | | 2005 | | | 2004 | |
Net Asset Value, Beginning of Period | | $ | 8.93 | | | $ | 10.54 | | | $ | 10.55 | | | $ | 10.36 | | | $ | 10.62 | | | $ | 10.56 | |
Income from Investment Operations: | | | | | | | | | | | | | | | | | | | | | | | | |
Net investment income | | | 0.26 | | | | 0.55 | | | | 0.56 | | | | 0.52 | | | | 0.53 | | | | 0.49 | |
Net realized and unrealized gain (loss) on investments | | | 0.68 | | | | (1.62 | ) | | | 0.01 | | | | 0.19 | | | | (0.25 | ) | | | 0.07 | |
Total from investment operations | | | 0.94 | | | | (1.07 | ) | | | 0.57 | | | | 0.71 | | | | 0.28 | | | | 0.56 | |
Less Distributions to Shareholders from: | | | | | | | | | | | | | | | | | | | | | | | | |
Net investment income | | | (0.26 | ) | | | (0.54 | ) | | | (0.58 | ) | | | (0.52 | ) | | | (0.54 | ) | | | (0.50 | ) |
Total distributions to shareholders | | | (0.26 | ) | | | (0.54 | ) | | | (0.58 | ) | | | (0.52 | ) | | | (0.54 | ) | | | (0.50 | ) |
Net Asset Value, End of Period | | $ | 9.61 | | | $ | 8.93 | | | $ | 10.54 | | | $ | 10.55 | | | $ | 10.36 | | | $ | 10.62 | |
Total Return 1 | | | 10.75 | %8 | | | (10.45 | )% | | | 5.53 | % | | | 7.10 | % | | | 2.68 | % | | | 5.44 | % |
Ratio of net expenses to average net assets | | | 0.84 | %9 | | | 0.84 | % | | | 0.82 | % | | | 0.74 | % | | | 0.81 | % | | | 1.02 | % |
Ratio of net investment income to average net assets 1 | | | 5.96 | %9 | | | 5.72 | % | | | 5.12 | % | | | 4.98 | % | | | 4.65 | % | | | 4.56 | % |
Portfolio turnover | | | 20 | %8 | | | 16 | % | | | 17 | % | | | 55 | % | | | 24 | % | | | 79 | % |
Net assets at end of period (000’s omitted) | | $ | 38,461 | | | $ | 33,417 | | | $ | 24,122 | | | $ | 11,776 | | | $ | 7,591 | | | $ | 5,723 | |
| | | | | | | | | | | | | | | | | | | | | | | | |
Ratios absent expense offsets: 3 | | | | | | | | | | | | | | | | | | | | | | | | |
Ratio of total expenses to average net assets | | | 1.08 | %9 | | | 1.08 | % | | | 1.12 | % | | | 1.15 | % | | | 1.27 | % | | | 1.48 | % |
Ratio of net investment income to average net assets | | | 5.72 | %9 | | | 5.48 | % | | | 4.84 | % | | | 4.60 | % | | | 4.19 | % | | | 4.11 | % |
| | | | | | | | | | | | | | | | | | | | | | | | |
| | |
Managers Fixed Income Fund | | For the six
months ended
June 30, 2009
(unaudited) | | | Class B | |
| | | 2008 | | | 2007 | | | 2006 | | | 2005 | | | 2004 | |
Net Asset Value, Beginning of Period | | $ | 8.86 | | | $ | 10.47 | | | $ | 10.48 | | | $ | 10.30 | | | $ | 10.56 | | | $ | 10.51 | |
Income from Investment Operations: | | | | | | | | | | | | | | | | | | | | | | | | |
Net investment income | | | 0.24 | | | | 0.48 | | | | 0.51 | | | | 0.43 | | | | 0.46 | | | | 0.43 | |
Net realized and unrealized gain (loss) on investments | | | 0.66 | | | | (1.62 | ) | | | (0.03 | ) | | | 0.19 | | | | (0.25 | ) | | | 0.07 | |
Total from investment operations | | | 0.90 | | | | (1.14 | ) | | | 0.48 | | | | 0.62 | | | | 0.21 | | | | 0.50 | |
Less Distributions to Shareholders from: | | | | | | | | | | | | | | | | | | | | | | | | |
Net investment income | | | (0.23 | ) | | | (0.47 | ) | | | (0.49 | ) | | | (0.44 | ) | | | (0.47 | ) | | | (0.45 | ) |
Total distributions to shareholders | | | (0.23 | ) | | | (0.47 | ) | | | (0.49 | ) | | | (0.44 | ) | | | (0.47 | ) | | | (0.45 | ) |
Net Asset Value, End of Period | | $ | 9.53 | | | $ | 8.86 | | | $ | 10.47 | | | $ | 10.48 | | | $ | 10.30 | | | $ | 10.56 | |
Total Return 1 | | | 10.28 | %8 | | | (11.13 | )% | | | 4.74 | % | | | 6.25 | % | | | 2.01 | % | | | 4.90 | % |
Ratio of net expenses to average net assets | | | 1.59 | %9 | | | 1.59 | % | | | 1.55 | % | | | 1.49 | % | | | 1.49 | % | | | 1.54 | % |
Ratio of net investment income to average net assets 1 | | | 5.22 | %9 | | | 4.90 | % | | | 4.37 | % | | | 4.23 | % | | | 3.96 | % | | | 4.04 | % |
Portfolio turnover | | | 20 | %8 | | | 16 | % | | | 17 | % | | | 55 | % | | | 24 | % | | | 79 | % |
Net assets at end of period (000’s omitted) | | $ | 8,584 | | | $ | 6,349 | | | $ | 9,029 | | | $ | 13,089 | | | $ | 16,837 | | | $ | 20,063 | |
| | | | | | | | | | | | | | | | | | | | | | | | |
Ratios absent expense offsets: 3 | | | | | | | | | | | | | | | | | | | | | | | | |
Ratio of total expenses to average net assets | | | 1.84 | %9 | | | 1.82 | % | | | 1.85 | % | | | 1.90 | % | | | 1.95 | % | | | 1.99 | % |
Ratio of net investment income to average net assets | | | 4.98 | %9 | | | 4.66 | % | | | 4.05 | % | | | 3.80 | % | | | 3.50 | % | | | 3.59 | % |
| | | | | | | | | | | | | | | | | | | | | | | | |
58
Financial Highlights
For a share outstanding throughout each of the six months ended June 30, 2009 (unaudited) and each year ended December 31,
| | | | | | | | | | | | | | | | | | | | | | | | |
Managers Fixed Income Fund | | For the six
months ended
June 30, 2009
(unaudited) | | | Class C | |
| | | 2008 | | | 2007 | | | 2006 | | | 2005 | | | 2004 | |
Net Asset Value, Beginning of Period | | $ | 8.92 | | | $ | 10.54 | | | $ | 10.55 | | | $ | 10.36 | | | $ | 10.63 | | | $ | 10.58 | |
Income from Investment Operations: | | | | | | | | | | | | | | | | | | | | | | | | |
Net investment income | | | 0.23 | | | | 0.48 | | | | 0.48 | | | | 0.43 | | | | 0.46 | | | | 0.43 | |
Net realized and unrealized gain (loss) on investments | | | 0.67 | | | | (1.62 | ) | | | 0.01 | | | | 0.20 | | | | (0.26 | ) | | | 0.07 | |
Total from investment operations | | | 0.90 | | | | (1.14 | ) | | | 0.49 | | | | 0.63 | | | | 0.20 | | | | 0.50 | |
Less Distributions to Shareholders from: | | | | | | | | | | | | | | | | | | | | | | | | |
Net investment income | | | (0.23 | ) | | | (0.48 | ) | | | (0.50 | ) | | | (0.44 | ) | | | (0.47 | ) | | | (0.45 | ) |
Total distributions to shareholders | | | (0.23 | ) | | | (0.48 | ) | | | (0.50 | ) | | | (0.44 | ) | | | (0.47 | ) | | | (0.45 | ) |
Net Asset Value, End of Period | | $ | 9.59 | | | $ | 8.92 | | | $ | 10.54 | | | $ | 10.55 | | | $ | 10.36 | | | $ | 10.63 | |
Total Return 1 | | | 10.24 | %8 | | | (11.11 | )% | | | 4.75 | % | | | 6.31 | % | | | 1.90 | % | | | 4.85 | % |
Ratio of net expenses to average net assets | | | 1.59 | %9 | | | 1.59 | % | | | 1.56 | % | | | 1.49 | % | | | 1.49 | % | | | 1.54 | % |
Ratio of net investment income to average net assets 1 | | | 5.21 | %9 | | | 4.96 | % | | | 4.38 | % | | | 4.23 | % | | | 3.96 | % | | | 4.04 | % |
Portfolio turnover | | | 20 | %8 | | | 16 | % | | | 17 | % | | | 55 | % | | | 24 | % | | | 79 | % |
Net assets at end of period (000’s omitted) | | $ | 44,315 | | | $ | 41,387 | | | $ | 32,154 | | | $ | 15,454 | | | $ | 11,480 | | | $ | 13,703 | |
| | | | | | | | | | | | | | | | | | | | | | | | |
Ratios absent expense offsets: 3 | | | | | | | | | | | | | | | | | | | | | | | | |
Ratio of total expenses to average net assets | | | 1.84 | %9 | | | 1.83 | % | | | 1.86 | % | | | 1.90 | % | | | 1.95 | % | | | 1.99 | % |
Ratio of net investment income to average net assets | | | 4.97 | %9 | | | 4.73 | % | | | 4.08 | % | | | 3.82 | % | | | 3.50 | % | | | 3.59 | % |
| | | | | | | | | | | | | | | | | | | | | | | | |
| | |
Managers Fixed Income Fund | | For the six
months ended
June 30, 2009
(unaudited) | | | Institutional Class | |
| | | 2008 | | | 2007 | | | 2006 | | | 2005 | | | 2004 | |
Net Asset Value, Beginning of Period | | $ | 8.96 | | | $ | 10.59 | | | $ | 10.59 | | | $ | 10.40 | | | $ | 10.66 | | | $ | 10.61 | |
Income from Investment Operations: | | | | | | | | | | | | | | | | | | | | | | | | |
Net investment income | | | 0.28 | | | | 0.58 | | | | 0.59 | | | | 0.54 | | | | 0.56 | | | | 0.54 | |
Net realized and unrealized gain (loss) on investments | | | 0.66 | | | | (1.63 | ) | | | 0.01 | | | | 0.19 | | | | (0.25 | ) | | | 0.07 | |
Total from investment operations | | | 0.94 | | | | (1.05 | ) | | | 0.60 | | | | 0.73 | | | | 0.31 | | | | 0.61 | |
Less Distributions to Shareholders from: | | | | | | | | | | | | | | | | | | | | | | | | |
Net investment income | | | (0.27 | ) | | | (0.58 | ) | | | (0.60 | ) | | | (0.54 | ) | | | (0.57 | ) | | | (0.56 | ) |
Total distributions to shareholders | | | (0.27 | ) | | | (0.58 | ) | | | (0.60 | ) | | | (0.54 | ) | | | (0.57 | ) | | | (0.56 | ) |
Net Asset Value, End of Period | | $ | 9.63 | | | $ | 8.96 | | | $ | 10.59 | | | $ | 10.59 | | | $ | 10.40 | | | $ | 10.66 | |
Total Return 1 | | | 10.75 | %8 | | | (10.23 | )% | | | 5.84 | % | | | 7.34 | % | | | 2.91 | % | | | 5.99 | % |
Ratio of net expenses to average net assets | | | 0.59 | %9 | | | 0.59 | % | | | 0.56 | % | | | 0.49 | % | | | 0.49 | % | | | 0.50 | % |
Ratio of net investment income to average net assets 1 | | | 6.21 | %9 | | | 5.93 | % | | | 5.37 | % | | | 5.23 | % | | | 4.96 | % | | | 5.09 | % |
Portfolio turnover | | | 20 | %8 | | | 16 | % | | | 17 | % | | | 55 | % | | | 24 | % | | | 79 | % |
Net assets at end of period (000’s omitted) | | $ | 33,071 | | | $ | 28,561 | | | $ | 33,412 | | | $ | 25,861 | | | $ | 25,641 | | | $ | 24,559 | |
| | | | | | | | | | | | | | | | | | | | | | | | |
Ratios absent expense offsets: 3 | | | | | | | | | | | | | | | | | | | | | | | | |
Ratio of total expenses to average net assets | | | 0.83 | %9 | | | 0.83 | % | | | 0.86 | % | | | 0.90 | % | | | 0.95 | % | | | 0.97 | % |
Ratio of net investment income to average net assets | | | 5.97 | %9 | | | 5.69 | % | | | 5.07 | % | | | 4.82 | % | | | 4.50 | % | | | 4.63 | % |
| | | | | | | | | | | | | | | | | | | | | | | | |
59
Financial Highlights
For a share outstanding throughout each of the six months ended June 30, 2009 (unaudited) and each year ended
| | | | | | | | | | | | | | | | | | | | | | | | | | | | |
Short Duration Government Fund | | For the six
months ended
June 30, 2009
(unaudited) | | | For the year
ended
December 31,
2008 | | | For the period from
April 1, 2007 to
December 31, 2007 | | | For the fiscal year ended March 31, | |
| | | | | 2007 | | | 2006 | | | 2005 | | | 2004 | |
Net Asset Value, Beginning of Period | | $ | 9.20 | | | $ | 9.68 | | | $ | 9.68 | | | $ | 9.61 | | | $ | 9.66 | | | $ | 9.69 | | | $ | 9.74 | |
Income from Investment Operations: | | | | | | | | | | | | | | | | | | | | | | | | | | | | |
Net investment income | | | 0.13 | | | | 0.37 | | | | 0.31 | | | | 0.42 | | | | 0.34 | | | | 0.27 | | | | 0.25 | |
Net realized and unrealized gain (loss) on investments | | | 0.24 | | | | (0.48 | ) | | | 0.01 | | | | 0.06 | | | | (0.05 | ) | | | (0.02 | ) | | | (0.06 | ) |
Total from investment operations | | | 0.37 | | | | (0.11 | ) | | | 0.32 | | | | 0.48 | | | | 0.29 | | | | 0.25 | | | | 0.19 | |
Less Distributions to Shareholders from: | | | | | | | | | | | | | | | | | | | | | | | | | | | | |
Net investment income | | | (0.13 | ) | | | (0.37 | ) | | | (0.32 | ) | | | (0.41 | ) | | | (0.34 | ) | | | (0.28 | ) | | | (0.24 | ) |
Total distributions to shareholders | | | (0.13 | ) | | | (0.37 | ) | | | (0.32 | ) | | | (0.41 | ) | | | (0.34 | ) | | | (0.28 | ) | | | (0.24 | ) |
Net Asset Value, End of Period | | $ | 9.44 | | | $ | 9.20 | | | $ | 9.68 | | | $ | 9.68 | | | $ | 9.61 | | | $ | 9.66 | | | $ | 9.69 | |
Total Return 1 | | | 3.99 | %4,8 | | | (1.19 | )% | | | 3.41 | %8 | | | 5.05 | % | | | 3.00 | % | | | 2.62 | % | | | 2.00 | % |
Ratio of net expenses to average net assets 5 | | | 0.83 | %9 | | | 0.83 | % | | | 0.84 | %9 | | | 0.83 | % | | | 0.83 | % | | | 0.78 | % | | | 0.78 | % |
Ratio of net investment income to average net assets 1,5 | | | 2.76 | %9 | | | 3.88 | % | | | 4.49 | %9 | | | 4.15 | % | | | 3.41 | % | | | 2.90 | % | | | 2.59 | % |
Portfolio turnover | | | 108 | %8 | | | 282 | % | | | 199 | %8 | | | 230 | % | | | 315 | % | | | 341 | % | | | 349 | % |
Net assets at end of period (000’s omitted) | | $ | 245,117 | | | $ | 243,548 | | | $ | 235,117 | | | $ | 179,984 | | | $ | 206,523 | | | $ | 237,900 | | | $ | 198,726 | |
| | | | | | | | | | | | | | | | | | | | | | | | | | | | |
Ratios absent expense offsets: 3 | | | | | | | | | | | | | | | | | | | | | | | | | | | | |
Ratio of total expenses to average net assets | | | 0.83 | %9 | | | 0.84 | % | | | 1.22 | %9 | | | 1.36 | % | | | 1.08 | % | | | 1.00 | % | | | 0.95 | % |
Ratio of net investment income to average net assets | | | 2.76 | %9 | | | 3.87 | % | | | 4.11 | %9 | | | 3.62 | % | | | 3.16 | % | | | 2.68 | % | | | 2.42 | % |
| | | | | | | | | | | | | | | | | | | | | | | | | | | | |
60
Financial Highlights
For a share outstanding throughout each of the six months ended June 30, 2009 (unaudited) and each year ended
| | | | | | | | | | | | | | | | | | | | | | | | | | | | |
Intermediate Duration Government
Fund | | For the six
months ended
June 30, 2009
(unaudited) | | | For the year ended
December 31, 2008 | | | For the period from
April 1, 2007 to
December 31, 2007 | | | For the fiscal year ended March 31, | |
| | | | | 2007 | | | 2006 | | | 2005 | | | 2004 | |
Net Asset Value, Beginning of Period | | $ | 10.17 | | | $ | 10.67 | | | $ | 10.54 | | | $ | 10.37 | | | $ | 10.53 | | | $ | 10.74 | | | $ | 10.61 | |
Income from Investment Operations: | | | | | | | | | | | | | | | | | | | | | | | | | | | | |
Net investment income | | | 0.20 | | | | 0.32 | | | | 0.37 | | | | 0.47 | | | | 0.37 | | | | 0.26 | | | | 0.23 | |
Net realized and unrealized gain (loss) on investments | | | 0.36 | | | | (0.24 | ) | | | 0.13 | | | | 0.17 | | | | (0.16 | ) | | | (0.06 | ) | | | 0.20 | |
Total from investment operations | | | 0.56 | | | | 0.08 | | | | 0.50 | | | | 0.64 | | | | 0.21 | | | | 0.20 | | | | 0.43 | |
Less Distributions to Shareholders from: | | | | | | | | | | | | | | | | | | | | | | | | | | | | |
Net investment income | | | (0.20 | ) | | | (0.45 | ) | | | (0.37 | ) | | | (0.47 | ) | | | (0.37 | ) | | | (0.26 | ) | | | (0.23 | ) |
Net realized gain on investments | | | — | | | | (0.13 | ) | | | — | | | | — | | | | — | | | | (0.15 | ) | | | (0.07 | ) |
Total distributions to shareholders | | | (0.20 | ) | | | (0.58 | ) | | | (0.37 | ) | | | (0.47 | ) | | | (0.37 | ) | | | (0.41 | ) | | | (0.30 | ) |
Net Asset Value, End of Period | | $ | 10.53 | | | $ | 10.17 | | | $ | 10.67 | | | $ | 10.54 | | | $ | 10.37 | | | $ | 10.53 | | | $ | 10.74 | |
Total Return 1 | | | 5.57 | %8 | | | 0.85 | % | | | 4.85 | %8 | | | 6.30 | % | | | 2.02 | % | | | 1.78 | % | | | 4.07 | % |
Ratio of net expenses to average net assets 6 | | | 0.89 | %9 | | | 0.89 | % | | | 0.83 | %9 | | | 0.87 | % | | | 0.88 | % | | | 0.88 | % | | | 0.88 | % |
Ratio of net investment income to average net assets 1,6 | | | 3.95 | %9 | | | 4.32 | % | | | 4.62 | %9 | | | 4.46 | % | | | 3.53 | % | | | 2.45 | % | | | 2.09 | % |
Portfolio turnover | | | 201 | %8 | | | 429 | % | | | 240.00 | %8 | | | 445 | % | | | 672 | % | | | 851 | % | | | 667 | % |
Net assets at end of period (000’s omitted) | | $ | 189,627 | | | $ | 170,181 | | | $ | 193,440 | | | $ | 182,771 | | | $ | 194,545 | | | $ | 186,026 | | | $ | 123,826 | |
| | | | | | | | | | | | | | | | | | | | | | | | | | | | |
Ratios absent expense offsets: 3 | | | | | | | | | | | | | | | | | | | | | | | | | | | | |
Ratio of total expenses to average net assets | | | 0.95 | %9 | | | 0.95 | % | | | 0.84 | %9 | | | 0.89 | % | | | 0.88 | % | | | 0.89 | % | | | 0.93 | % |
Ratio of net investment income to average net assets | | | 3.89 | %9 | | | 4.26 | % | | | 4.61 | %9 | | | 4.44 | % | | | 3.53 | % | | | 2.44 | % | | | 2.04 | % |
| | | | | | | | | | | | | | | | | | | | | | | | | | | | |
Notes to Financial Highlights
The following notes should be read in conjunction with the Financial Highlights of the Funds presented on the previous pages.
| 1 | Total returns and net investment income would have been lower had certain expenses not been reduced. (See Note 1(c) of Notes to Financial Statements.) |
| 2 | Per share numbers have been calculated using average shares. |
| 3 | Excludes the impact of expense reimbursements or fee waivers and expense reductions such as brokerage credits, but includes non-reimbursable expenses, if any, such as interest and taxes. (See Note 1(c) of Notes to Financial Statements.) |
| 4 | The total return is based on the Financial Statements Net Asset Values as shown. |
| 5 | Excludes interest expense for the six months ended June 30, 2009, the year ended December 31, 2008, the period ended December 31, 2007 and the fiscal years ended March 31, 2007, 2006, 2005 and 2004 of 0.00%, 0.00%, 0.38%, 0.53%, 0.23%, 0.16% and 0.03%, respectively. (See Note 1(c) of Notes to Financial Statements.) |
| 6 | Excludes interest expense for the six months ended June 30, 2009, the year ended December 31, 2008, the period ended December 31, 2007 and the fiscal years ended March 31, 2007, 2006, 2005 and 2004 of 0.00%, 0.00%, 0.01%, 0.04%, 0.00%, 0.01% and 0.00%, respectively. (See Note 1(c) of Notes to Financial Statements.) |
| 7 | Excludes interest expense for the year ended December 31, 2008, of 0.06%. (See Note 1(c) of Notes to Financial Statements.) |
61
Notes to Financial Statements
June 30, 2009 (unaudited)
| 1. | Summary of Significant Accounting Policies |
Managers Trust II (the “Trust”) is an open-end management investment company organized as a Massachusetts business trust and registered under the Investment Company Act of 1940, as amended (the “1940 Act”). Currently, the Trust is comprised of a number of different funds, each having distinct investment management objectives, strategies, risks and policies. Included in this report are: Managers AMG Chicago Equity Partners Mid-Cap Fund (“Mid-Cap”), Managers AMG Chicago Equity Partners Balanced Fund (“Balanced”), Managers High Yield Fund (“High Yield”), Managers Fixed Income Fund (“Fixed Income”), Managers Short Duration Government Fund (“Short Duration”), and Managers Intermediate Duration Government Fund (“Intermediate Duration”), collectively the “Funds.”
Mid-Cap, Balanced, High Yield, and Fixed Income each offer four classes of shares: Class A, Class B, Class C and Institutional Class. Sales of Class A shares may be subject to a front-end sales charge. Redemptions of Class A, Class B and Class C shares may be subject to a contingent-deferred sales charge (as a percentage of the original offering price or the net asset value at time of sale, whichever is less). Institutional Class shares are available, with no sales charge, to certain institutional investors and qualifying individual investors. Each class represents interest in the same assets of the Fund and the classes are identical except for class specific expenses related to shareholder activity. Each class has equal voting privileges except that each class has exclusive voting rights with respect to its services and/or distribution plan. Please refer to a current prospectus for additional information on each share class.
The Funds’ financial statements are prepared in accordance with accounting principles generally accepted in the United States of America, which require management to make estimates and assumptions that affect the reported amounts of assets and liabilities and disclosure of contingent assets and liabilities at the date of the financial statements and the reported amounts of income and expenses during the reporting periods. Actual results could differ from those estimates and such differences may be material. The following is a summary of significant accounting policies followed by the Funds in the preparation of their financial statements:
| a. | Valuation of Investments |
Equity securities traded on a domestic or international securities exchange are valued at the last quoted sale price, or, lacking any sales, at the last quoted bid price. Over-the-counter securities are valued at the Nasdaq Official Closing Price, if one is available. Lacking any sales, over-the counter securities are valued at the last quoted bid price. The Funds’ investments are generally valued based on market quotations provided by third party pricing services approved by the Board of Trustees of the Funds. Under certain circumstances, the value of each Fund’s investment may be based on an evaluation of its fair value, pursuant to procedures established by and under the general supervision of the Board of Trustees of the Trust. Each Fund may use the fair value of a portfolio security to calculate its NAV when, for example, (1) market quotations are not readily available because a portfolio security is not traded in a public market or the principal market in which the security trades is closed, (2) trading in a portfolio security is suspended and has not resumed before the Fund calculates its NAV, (3) a significant event affecting the value of a portfolio security is determined to have occurred between the time of the market quotation provided for a portfolio security and the time as of which the Fund calculates its NAV, (4) a security’s price has remained unchanged over a period of time (often referred to as a “stale price”), or (5) Managers Investment Group LLC (the “Investment Manager”) determines that a market quotation is inaccurate. Portfolio investments that trade primarily on foreign markets are priced based upon the market quotation of such securities as of the close of their respective principal markets, as adjusted to reflect the Investment Manager’s determination of the impact of events occurring subsequent to the close of such markets but prior to the time as of which the Funds calculate its NAV. In accordance with procedures approved by the Board of Trustees, the Investment Manager relies upon recommendations of a third-party fair valuation service in adjusting the prices of such foreign portfolio investments. The Funds may invest in securities that may be thinly traded. The Board of Trustees has adopted procedures to adjust prices when thinly traded securities are judged to be stale so that they reflect fair value. An investment valued on the basis of its fair value may be valued at a price higher or lower than available market quotations. An investment’s valuation may differ depending on the method used and the factors considered in determining value according to the Fund’s fair value procedures.
Fixed income securities are valued based on valuations furnished by independent pricing services that utilize matrix systems, which reflect such factors as security prices, yields, maturities, and ratings, and are supplemented by dealer and exchange quotations. Futures contracts for which market quotations are readily available are valued at the settlement price as of the close of the futures exchange. Short-term investments having a remaining maturity of 60 days or less are valued at amortized cost, which approximates market value. Investments in other regulated investment companies are valued at their end of day net asset value per share except iShares or other ETF’s, which are valued the same as equity securities. Investments in certain mortgage-backed and stripped mortgage-backed securities, preferred stocks, convertible securities, derivatives and other debt securities not traded on an organized securities market are valued on the basis of valuations provided by dealers or by a pricing service which uses information with respect to transactions in such securities and various relationships between securities and yield to maturity in determining value. Securities (including derivatives) for which market quotations are not readily available are fair valued, as determined in good faith, and pursuant to procedures adopted by the Board of Trustees of the Trust. The values assigned to fair value investments are based on available information and do not necessarily represent amounts that might ultimately be realized, since such amounts depend on future developments inherent in long-term investments. Further, because of the inherent uncertainty of valuation, those estimated values may differ significantly from the values that would have been used had a ready market for the investments existed, and the differences could be material.
The Funds adopted Financial Accounting Standards Board Statement of Financial Accounting Standards No. 157, Fair Value Measurements (“FAS 157”), effective January 1, 2008. In accordance with FAS 157, fair value is defined as the price that a Fund would
62
Notes to Financial Statements (continued)
receive to sell an asset or pay to transfer a liability in an orderly transaction between market participants at the measurement date. FAS 157 also establishes a framework for measuring fair value, and a three-level hierarchy for fair value measurements based upon the transparency of inputs to the valuation of an asset or liability. Inputs may be observable or unobservable and refer broadly to the assumptions that market participants would use in pricing the asset or liability. Observable inputs reflect the assumptions market participants would use in pricing the asset or liability based on market data obtained from sources independent of the Funds. Unobservable inputs reflect the Funds’ own assumptions about the assumptions that market participants would use in pricing the asset or liability developed based on the best information available in the circumstances. Each investment is assigned a level based upon the observability of the inputs which are significant to the overall valuation.
In April 2009, Statement of Financial Accounting Standards Staff Position No. 157-4, “Determining Fair Value When the Volume and Level of Activity for the Asset or Liability Have Significantly Decreased and Identifying Transactions that are not Orderly” (“FSP FAS 157-4”) was issued and is effective for interim and annual reporting periods ending after June 15, 2009. FSP FAS 157-4 provides additional guidance for estimating fair value in accordance with FAS 157 when the volume and level of activity for the asset or liability have significantly decreased. Additionally, FSP FAS 157-4 requires quantitative disclosures about fair value measurements separately for each major category of assets and liabilities.
The three-tier hierarchy of inputs is summarized below:
Level 1 – quoted prices in active markets for identical investments
Level 2 – other significant observable inputs (including quoted prices for similar investments, interest rates, prepayment speeds, credit risk)
Level 3 – significant unobservable inputs (including the Funds’ own assumptions in determining the fair value of investments)
The inputs or methodologies used for valuing investments are not necessarily an indication of the risk associated with investing in those investments. The following table summarizes the inputs used to value the Funds’ net assets by the above fair value hierarchy levels as of June 30, 2009:
| | | | | | | | | | | |
| | | Level 1 | | Level 2 | | Level 3 | | Total |
Mid-Cap | | | | | | | | | | | |
Investments in Securities | | | | | | | | | | | |
Common Stocks | | | | | | | | | | | |
Consumer Discretionary | | $ | 4,446,107 | | | — | | — | | $ | 4,446,107 |
Consumer Staples | | | 1,455,648 | | | — | | — | | | 1,455,648 |
Energy | | | 1,780,273 | | | — | | — | | | 1,780,273 |
Financials | | | 5,492,253 | | | — | | — | | | 5,492,253 |
Health Care | | | 4,286,120 | | | — | | — | | | 4,286,120 |
Industrials | | | 4,220,484 | | | — | | — | | | 4,220,484 |
Information Technology | | | 5,556,613 | | | — | | — | | | 5,556,613 |
Materials | | | 2,159,501 | | | — | | — | | | 2,159,501 |
Telecommunication Services | | | 229,267 | | | — | | — | | | 229,267 |
Utilities | | | 2,264,681 | | | — | | — | | | 2,264,681 |
Short-Term Investments | | | 3,641,171 | | $ | 23,559 | | — | | | 3,664,730 |
| | | | | | | | | | | |
Total Investments in Securities | | | 35,532,118 | | | 23,559 | | — | | | 35,555,677 |
Other Financial Instruments* | | | — | | | — | | — | | | — |
| | | | | | | | | | | |
Totals | | $ | 35,532,118 | | $ | 23,559 | | — | | $ | 35,555,677 |
| | | | | | | | | | | |
63
Notes to Financial Statements (continued)
| | | | | | | | | | | |
| | | Level 1 | | Level 2 | | Level 3 | | Total |
Balanced | | | | | | | | | | | |
Investments in Securities | | | | | | | | | | | |
Common Stocks | | | | | | | | | | | |
Consumer Discretionary | | $ | 1,465,685 | | | — | | — | | $ | 1,465,685 |
Consumer Staples | | | 1,681,363 | | | — | | — | | | 1,681,363 |
Energy | | | 1,711,776 | | | — | | — | | | 1,711,776 |
Financials | | | 1,780,276 | | | — | | — | | | 1,780,276 |
Health Care | | | 1,896,744 | | | — | | — | | | 1,896,744 |
Industrials | | | 1,286,279 | | | — | | — | | | 1,286,279 |
Information Technology | | | 2,472,336 | | | — | | — | | | 2,472,336 |
Materials | | | 357,529 | | | — | | — | | | 357,529 |
Telecommunication Services | | | 427,473 | | | — | | — | | | 427,473 |
Utilities | | | 578,803 | | | — | | — | | | 578,803 |
Asset-Backed Securities | | | — | | $ | 220,281 | | — | | | 220,281 |
Mortgage-Backed Securities | | | — | | | 337,608 | | — | | | 337,608 |
U.S. Government and Agency Obligations | | | — | | | — | | — | | | — |
Federal Home Loan Mortgage Corporation | | | — | | | 1,885,086 | | — | | | 1,885,086 |
Federal National Mortgage Association | | | — | | | 2,231,821 | | — | | | 2,231,821 |
U.S. Government | | | — | | | 261,023 | | — | | | 261,023 |
Corporate Bonds | | | | | | — | | — | | | — |
Financials | | | — | | | 469,914 | | — | | | 469,914 |
Industrials | | | — | | | 1,437,288 | | — | | | 1,437,288 |
Utilities | | | — | | | 295,617 | | — | | | 295,617 |
Short-Term Investments | | | 742,424 | | | 4,188 | | — | | | 746,612 |
| | | | | | | | | | | |
Total Investments in Securities | | | 14,400,688 | | | 7,142,826 | | — | | | 21,543,514 |
Other Financial Instruments* | | | — | | | — | | — | | | — |
| | | | | | | | | | | |
Totals | | $ | 14,400,688 | | $ | 7,142,826 | | — | | $ | 21,543,514 |
| | | | | | | | | | | |
| | | | |
| | | Level 1 | | Level 2 | | Level 3 | | Total |
High Yield | | | | | | | | | | | |
Investments in Securities | | | | | | | | | | | |
Corporate Bonds | | | | | | | | | | | |
Financials | | | — | | $ | 5,197,095 | | — | | $ | 5,197,095 |
Industrials | | | — | | | 25,436,378 | | — | | | 25,436,378 |
Utilities | | | — | | | 1,048,818 | | — | | | 1,048,818 |
Common Stocks | | | | | | | | | | | |
Information Technology | | $ | 53,430 | | | — | | — | | | 53,430 |
Materials | | | 63,394 | | | — | | — | | | 63,394 |
Short-Term Investments | | | 5,239,494 | | | 12,943 | | — | | | 5,252,437 |
| | | | | | | | | | | |
Total Investments in Securities | | | 5,356,318 | | | 31,695,234 | | — | | | 37,051,552 |
Other Financial Instruments* | | | — | | | — | | — | | | — |
| | | | | | | | | | | |
Totals | | $ | 5,356,318 | | $ | 31,695,234 | | — | | $ | 37,051,552 |
| | | | | | | | | | | |
64
Notes to Financial Statements (continued)
| | | | | | | | | | | | | |
| | | Level 1 | | | Level 2 | | Level 3 | | Total | |
Fixed Income | | | | | | | | | | | | | |
Investments in Securities | | | | | | | | | | | | | |
Corporate Bonds | | | | | | | | | | | | | |
Financials | | | — | | | $ | 20,192,849 | | — | | $ | 20,192,849 | |
Industrials | | | — | | | | 11,943,467 | | — | | | 11,943,467 | |
Utilities | | | — | | | | 54,791,397 | | — | | | 54,791,397 | |
U.S. Government and Agency Obligations | | | — | | | | 13,239,869 | | — | | | 13,239,869 | |
Foreign Government Obligations | | | — | | | | 7,474,747 | | — | | | 7,474,747 | |
Municipal Bonds | | | — | | | | 2,191,912 | | — | | | 2,191,912 | |
Asset-Backed Securities | | | — | | | | 3,486,678 | | — | | | 3,486,678 | |
Mortgage-Backed Securities | | | — | | | | 1,235,164 | | — | | | 1,235,164 | |
Preferred Stocks | | $ | 537,799 | | | | — | | — | | | 537,799 | |
Short-Term Investments | | | 27,673,429 | | | | 36,517 | | — | | | 27,709,946 | |
| | | | | | | | | | | | | |
Total Investments in Securities | | | 28,211,228 | | | | 114,592,600 | | — | | | 142,803,828 | |
Other Financial Instruments* | | | — | | | | — | | — | | | — | |
| | | | | | | | | | | | | |
Totals | | $ | 28,211,228 | | | $ | 114,592,600 | | — | | $ | 142,803,828 | |
| | | | | | | | | | | | | |
| | | | |
| | | Level 1 | | | Level 2 | | Level 3 | | Total | |
Short Duration | | | | | | | | | | | | | |
Investments in Securities | | | | | | | | | | | | | |
U.S. Government and Agency Obligations | | | | | | | | | | | | | |
Federal Home Loan Mortgage Corporation | | | — | | | $ | 109,012,243 | | — | | $ | 109,012,243 | |
Federal National Mortgage Association | | | — | | | | 105,415,428 | | — | | | 105,415,428 | |
Government National Mortgage Association | | | — | | | | 17,800,673 | | — | | | 17,800,673 | |
Interest Only Strips | | | — | | | | 2,266,310 | | — | | | 2,266,310 | |
U.S. Treasury Notes | | | — | | | | 811,901 | | — | | | 811,901 | |
Mortgage-Backed Securities and Interest Only Strips | | | | | | | | | | | | | |
Mortgage-Backed Securities | | | — | | | | 15,028,262 | | — | | | 15,028,262 | |
Mortgage-Backed Interest Only Strips | | | — | | | | 216,003 | | — | | | 216,003 | |
Asset-Backed Securities | | | — | | | | 1,865,902 | | — | | | 1,865,902 | |
U.S. Government and Agency Discount Notes | | | — | | | | 749,785 | | — | | | 749,785 | |
Short-Term Investments | | $ | 16,683,827 | | | | 2,287 | | — | | | 16,686,114 | |
| | | | | | | | | | | | | |
Total Investments in Securities | | | 16,683,827 | | | | 253,168,794 | | — | | $ | 269,852,621 | |
Other Financial Instruments* | | | (722,194 | ) | | | — | | — | | | (722,194 | ) |
| | | | | | | | | | | | | |
Totals | | $ | 15,961,633 | | | $ | 253,168,794 | | — | | $ | 269,130,427 | |
| | | | | | | | | | | | | |
65
Notes to Financial Statements (continued)
| | | | | | | | | | | |
| | | Level 1 | | Level 2 | | Level 3 | | Total |
Intermediate Duration | | | | | | | | | | | |
Investments in Securities | | | | | | | | | | | |
U.S. Government and Agency Obligations | | | | | | | | | | | |
Federal Home Loan Mortgage Corporation | | | — | | $ | 104,051,310 | | — | | $ | 104,051,310 |
Federal National Mortgage Association | | | — | | | 76,120,806 | | — | | | 76,120,806 |
Government National Mortgage Association | | | — | | | 30,109,442 | | — | | | 30,109,442 |
Interest Only Strips | | | — | | | 2,370,753 | | — | | | 2,370,753 |
U.S. Treasury Notes | | | — | | | 726,729 | | — | | | 726,729 |
Mortgage-Backed Securities | | | — | | | 23,252,522 | | — | | | 23,252,522 |
U.S. Government and Agency Discount Notes | | | — | | | 277,891 | | — | | | 277,891 |
Short-Term Investments | | $ | 29,326,886 | | | 2,043 | | — | | | 29,328,929 |
| | | | | | | | | | | |
Total Investments in Securities | | | 29,326,886 | | | 236,911,496 | | — | | | 266,238,382 |
Other Financial Instruments* | | | 457,869 | | | — | | — | | | 457,869 |
| | | | | | | | | | | |
Totals | | $ | 29,784,755 | | $ | 236,911,496 | | — | | $ | 266,696,251 |
| | | | | | | | | | | |
| * | Other financial instruments are derivative instruments not reflected in the Schedule of Portfolio Investments, such as futures, forwards and swap contracts, which are valued at the unrealized appreciation/depreciation of the instrument. |
In March 2008, Statement of Financial Accounting Standards No. 161, “Disclosures about Derivative Instruments and Hedging Activities” (“SFAS 161”) was issued and is effective for fiscal years and interim periods beginning after November 15, 2008. SFAS 161 is intended to improve financial reporting for derivative instruments by requiring enhanced disclosure that enables investors to understand how and why a fund uses derivatives, how derivatives are accounted for, and how derivative instruments affect a fund’s results of operations and financial position. The fair values of derivative instruments as of June 30, 2009 for Short Duration and Intermediate Duration were as follows:
| | | | | | | | | | | | |
| | | Derivatives not accounted for as
hedging instruments under
Statement 133 | | Asset Derivatives | | Liability Derivatives |
Fund | | | Statement of Assets and
Liabilities Location | | Fair Value | | Statement of Assets and
Liabilities Location | | Fair Value |
Short Duration | | Interest rate contracts | | Receivables | | $ | 95,972 | | Payables | | $ | 14,341 |
| | | | | | | | | | | | |
Intermediate Duration | | Interest rate contracts | | Receivables | | $ | 20,069 | | Payables | | $ | 8,916 |
| | | | | | | | | | | | |
The amount of realized gain/(loss) on derivatives recognized in income for Short Duration and Intermediate Duration as of June 30, 2009, were as follows:
| | | | | |
Fund | | Derivatives not accounted for as hedging instruments under Statement 133 | | Futures |
Short Duration | | Interest rate contracts | | $ | 611,190 |
| | | | | |
Intermediate Duration | | Interest rate contracts | | $ | 261,331 |
| | | | | |
The change in unrealized gain/(loss) on derivatives recognized in income for Short Duration and Intermediate Duration as of June 30, 2009, were as follows:
| | | | | |
Fund | | Derivatives not accounted for as hedging instruments under Statement 133 | | Futures |
Short Duration | | Interest rate contracts | | $ | 452,177 |
| | | | | |
Intermediate Duration | | Interest rate contracts | | $ | 1,336 |
| | | | | |
66
Notes to Financial Statements (continued)
Security transactions are accounted for as of the trade date. Realized gains and losses on securities sold are determined on the basis of identified cost.
| c. | Investment Income and Expenses |
Dividend income is recorded on the ex-dividend date, except certain dividends from foreign securities where the ex-dividend date may have passed. These dividends are recorded as soon as the Trust is informed of the ex-dividend date. Dividend income on foreign securities is recorded net of any withholding tax. Interest income, which includes amortization of premium and accretion of discount on debt securities, is accrued as earned. Non-cash dividends included in dividend income, if any, are reported at the fair market value of the securities received. Other income and expenses are recorded on an accrual basis. Expenses that cannot be directly attributed to a fund are apportioned among the Funds in the Trust and in some cases other affiliated funds based upon their relative average net assets or number of shareholders. Investment income, realized and unrealized capital gains and losses, the common expenses of each Fund and certain Fund level expense reductions, if any, are allocated on a pro rata basis to each class based on the relative net assets of each class to the total net assets of each Fund.
The following Funds had certain portfolio trades directed to various brokers who paid a portion of such Fund’s expenses. For the six months ended June 30, 2009, under these arrangements, the amount by which the Funds’ expenses were reduced and the impact on the expense ratios were: Mid-Cap - $8,287 or 0.06%, and Balanced - $3,368 or 0.03%.
The Funds have a “balance credit” arrangement with The Bank of New York Mellon (formerly The Bank of New York) (“BNYM”), the Funds’ custodian, whereby each Fund is credited with an interest factor equal to 0.75% below the effective 90-day T-Bill rate for account balances left uninvested overnight. If the T-Bill rate falls below 0.75%, no credits will be earned. These credits serve to reduce custody expenses that would otherwise be charged to each Fund. For the six months ended June 30, 2009, the custodian expense was reduced for any of the Funds.
Overdrafts will cause a reduction of any earnings credits, computed at 2% above the effective Federal Funds rate on the day of the overdraft. For the six months ended June 30, 2009, overdraft fees and the impact on the expense ratios, if any, for Mid-Cap, Balanced, High Yield, Fixed Income, Short Duration, and Intermediate Duration equaled $5, $15, $1,088, $0, $0, and $0, respectively.
The Trust also has a balance credit arrangement with its Transfer Agent, PNC Global Investment Servicing (U.S.) Inc. (formerly PFPC, Inc.), whereby earnings credits are used to offset banking charges and other out-of-pocket expenses. For the six months ended June 30, 2009, the transfer agent expense was reduced as follows: Mid-Cap - $84, Balanced - $58, High Yield - $79, Fixed Income - $334, Short Duration - $730, and Intermediate Duration - $508.
The Investment Manager has agreed to waive a portion of its management fee in consideration of shareholder servicing fees that it has received from JPMorgan Distribution Services, Inc., with respect to short-term cash investments each Fund may have made in the JPMorgan Liquid Assets Portfolio – Capital. For the six months ended June 30, 2009, the management fee was reduced as follows: Mid-Cap - $0, Balanced - $0, High Yield - $0, Fixed Income - $376, Short Duration - $2,027, and Intermediate Duration - $505.
Total returns and net investment income for the Funds would have been lower had certain expenses not been offset. Total expenses before offsets exclude the impact of expense reimbursements or fee waivers and expense offsets such as brokerage recapture credits, but include non-reimburseable expenses, if any, such as interest and taxes.
| d. | Dividends and Distributions |
Dividends resulting from net investment income, if any, normally will be declared and paid annually for the Mid-Cap Fund, monthly for the Fixed Income, High Yield, Short Duration and Intermediate Duration and quarterly for the Balanced Fund. Distributions of capital gains, if any, will be made on an annual basis and when required for Federal excise tax purposes. Income and capital gain distributions are determined in accordance with Federal income tax regulations, which may differ from generally accepted accounting principles. These differences are primarily due to differing treatments for losses deferred due to wash sales, REITS, equalization accounting for tax purposes, foreign currency, options, futures, and market discount transactions. Permanent book and tax basis differences, if any, relating to shareholder distributions will result in reclassifications to paid-in-capital.
Each Fund intends to comply with the requirements under Subchapter M of the Internal Revenue Code of 1986, as amended, to distribute substantially all of its taxable income and gains to its shareholders and to meet certain diversification and income requirements with respect to investment companies. Therefore, no provision for Federal income or excise tax is included in the accompanying financial statements.
Additionally, based on each Fund’s understanding of the tax rules and rates related to income, gains and transactions for the foreign jurisdictions in which it invests, each Fund will provide for foreign taxes, and where appropriate, deferred foreign taxes.
Management has analyzed the Funds’ tax positions taken on federal income tax returns for all open tax years (tax years ended December 31, 2005-2008), and has concluded that no provision for federal income tax is required in the Funds’ financial statements. Additionally, the Funds are not aware of any tax position for which it is reasonably possible that the total amounts of unrecognized tax benefits will change materially in the next twelve months.
67
Notes to Financial Statements (continued)
The Trust’s Declaration of Trust authorizes for each series the issuance of an unlimited number of shares of beneficial interest, without par value. Each Fund records sales and repurchases of its capital stock on the trade date. Dividends and distributions to shareholders are recorded on the ex-dividend date. For the six months ended June 30, 2009, and the year ended December 31, 2008, the capital stock transactions by class for Mid-Cap, Balanced, High Yield, and Fixed Income were:
| | | | | | | | | | | | | | | | | | | | | | | | | | | | |
| | | Mid-Cap | | | Balanced | |
| | | 2009 | | | 2008 | | | 2009 | | | 2008 | |
| | | Shares | | | Amount | | | Shares | | | Amount | | | Shares | | | Amount | | | Shares | | | Amount | |
Class A: | | | | | | | | | | | | | | | | | | | | | | | | | | | | |
Proceeds from sales | | 90,152 | | | $ | 710,542 | | | 193,100 | | | $ | 2,186,766 | | | 156,213 | | | $ | 1,618,817 | | | 887,710 | | | $ | 9,935,110 | |
Reinvestment of distributions | | — | | | | — | | | 2,277 | | | | 17,119 | | | 1,937 | | | | 20,344 | | | 3,175 | | | | 36,148 | |
Cost of shares repurchased | | (59,042 | ) | | | (447,192 | ) | | (174,458 | ) | | | (1,997,426 | ) | | (136,356 | ) | | | (1,324,612 | ) | | (98,450 | ) | | | (1,068,697 | ) |
| | | | | | | | | | | | | | | | | | | | | | | | | | | | |
Net Increase - Class A | | 31,110 | | | $ | 263,350 | | | 20,919 | | | $ | 206,459 | | | 21,794 | | | $ | 314,549 | | | 792,435 | | | $ | 8,902,561 | |
| | | | | | | | | | | | | | | | | | | | | | | | | | | | |
Class B: | | | | | | | | | | | | | | | | | | | | | | | | | | | | |
Proceeds from sales | | 105 | | | $ | 555 | | | 5,625 | | | $ | 56,961 | | | 6,078 | | | $ | 60,570 | | | 19,896 | | | $ | 233,307 | |
Reinvestment of distributions | | — | | | | — | | | 122 | | | | 860 | | | 376 | | | | 3,855 | | | 1,609 | | | | 18,325 | |
Cost of shares repurchased | | (107,787 | ) | | | (794,087 | ) | | (307,761 | ) | | | (3,310,412 | ) | | (96,395 | ) | | | (978,472 | ) | | (249,963 | ) | | | (2,999,626 | ) |
| | | | | | | | | | | | | | | | | | | | | | | | | | | | |
Net Decrease - Class B | | (107,682 | ) | | | ($793,532 | ) | | (302,014 | ) | | | ($3,252,591 | ) | | (89,941 | ) | | | ($914,047 | ) | | (228,458 | ) | | | ($2,747,994 | ) |
| | | | | | | | | | | | | | | | | | | | | | | | | | | | |
Class C: | | | | | | | | | | | | | | | | | | | | | | | | | | | | |
Proceeds from sales | | 9,180 | | | $ | 69,316 | | | 12,546 | | | $ | 135,835 | | | 10,090 | | | $ | 102,692 | | | 34,838 | | | $ | 413,646 | |
Reinvestment of distributions | | — | | | | — | | | 129 | | | | 910 | | | 353 | | | | 3,674 | | | 1,068 | | | | 12,081 | |
Cost of shares repurchased | | (63,257 | ) | | | (461,247 | ) | | (203,110 | ) | | | (2,045,048 | ) | | (32,603 | ) | | | (323,891 | ) | | (60,886 | ) | | | (715,503 | ) |
| | | | | | | | | | | | | | | | | | | | | | | | | | | | |
Net Decrease - Class C | | (54,077 | ) | | | ($391,931 | ) | | (190,435 | ) | | | ($1,908,303 | ) | | (22,160 | ) | | | ($217,525 | ) | | (24,980 | ) | | | ($289,776 | ) |
| | | | | | | | | | | | | | | | | | | | | | | | | | | | |
Institutional Class: | | | | | | | | | | | | | | | | | | | | | | | | | | | | |
Proceeds from sales | | 99,035 | | | $ | 804,439 | | | 199,679 | | | $ | 2,470,466 | | | 53,539 | | | $ | 551,744 | | | 63,486 | | | $ | 762,899 | |
Reinvestment of distributions | | — | | | | — | | | 29,469 | | | | 233,696 | | | 5,891 | | | | 62,313 | | | 14,878 | | | | 174,157 | |
Cost of shares repurchased | | (238,924 | ) | | | (1,902,556 | ) | | (1,080,728 | ) | | | (13,566,574 | ) | | (64,691 | ) | | | (655,653 | ) | | (86,606 | ) | | | (1,056,742 | ) |
| | | | | | | | | | | | | | | | | | | | | | | | | | | | |
Net Decrease - Institutional Class | | (139,889 | ) | | | ($1,098,117 | ) | | (851,580 | ) | | | ($10,862,412 | ) | | (5,261 | ) | | | ($41,596 | ) | | (8,242 | ) | | | ($119,686 | ) |
| | | | | | | | | | | | | | | | | | | | | | | | | | | | |
68
Notes to Financial Statements (continued)
| | | | | | | | | | | | | | | | | | | | | | | | | | | | |
| | | High Yield | | | Fixed Income | |
| | | 2009 | | | 2008 | | | 2009 | | | 2008 | |
| | | Shares | | | Amount | | | Shares | | | Amount | | | Shares | | | Amount | | | Shares | | | Amount | |
Class A: | | | | | | | | | | | | | | | | | | | | | | | | | | | | |
Proceeds from sales | | 2,008,595 | | | $ | 11,399,577 | | | 2,801,422 | | | $ | 20,561,791 | | | 1,269,848 | | | $ | 11,442,472 | | | 3,327,108 | | | $ | 32,869,031 | |
Reinvestment of distributions | | 144,576 | | | | 809,833 | | | 230,576 | | | | 1,572,459 | | | 75,851 | | | | 689,093 | | | 111,756 | | | | 1,075,961 | |
Cost of shares repurchased | | (1,767,924 | ) | | | (9,970,662 | ) | | (2,706,598 | ) | | | (20,623,729 | ) | | (970,124 | ) | | | (8,691,931 | ) | | (1,986,511 | ) | | | (18,515,373 | ) |
| | | | | | | | | | | | | | | | | | | | | | | | | | | | |
Net Increase - Class A | | 385,247 | | | $ | 2,238,748 | | | 325,400 | | | $ | 1,510,521 | | | 375,575 | | | $ | 3,439,634 | | | 1,452,353 | | | $ | 15,429,619 | |
| | | | | | | | | | | | | | | | | | | | | | | | | | | | |
Class B: | | | | | | | | | | | | | | | | | | | | | | | | | | | | |
Proceeds from sales | | 4,396 | | | $ | 22,780 | | | 14,993 | | | $ | 109,348 | | | 44,601 | | | $ | 403,459 | | | 177,579 | | | $ | 1,818,362 | |
Reinvestment of distributions | | 8,413 | | | | 45,592 | | | 21,065 | | | | 141,495 | | | 7,045 | | | | 63,475 | | | 15,233 | | | | 147,128 | |
Cost of shares repurchased | | (232,352 | ) | | | (1,289,848 | ) | | (342,829 | ) | | | (2,470,946 | ) | | (177,291 | ) | | | (1,592,912 | ) | | (338,815 | ) | | | (3,309,389 | ) |
| | | | | | | | | | | | | | | | | | | | | | | | | | | | |
Net Decrease - Class B | | (219,543 | ) | | | ($1,221,476 | ) | | (306,771 | ) | | | ($2,220,103 | ) | | (125,645 | ) | | | ($1,125,978 | ) | | (146,003 | ) | | | ($1,343,899 | ) |
| | | | | | | | | | | | | | | | | | | | | | | | | | | | |
Class C: | | | | | | | | | | | | | | | | | | | | | | | | | | | | |
Proceeds from sales | | 72,306 | | | $ | 384,006 | | | 77,051 | | | $ | 547,383 | | | 1,245,275 | | | $ | 11,250,763 | | | 2,518,847 | | | $ | 25,245,989 | |
Reinvestment of distributions | | 14,371 | | | | 79,073 | | | 24,296 | | | | 161,751 | | | 69,535 | | | | 631,407 | | | 86,932 | | | | 836,530 | |
Cost of shares repurchased | | (99,904 | ) | | | (551,676 | ) | | (183,999 | ) | | | (1,222,428 | ) | | (581,227 | ) | | | (5,228,505 | ) | | (1,015,969 | ) | | | (9,644,130 | ) |
| | | | | | | | | | | | | | | | | | | | | | | | | | | | |
Net Increase (Decrease) - Class C | | (13,227 | ) | | | ($88,597 | ) | | (82,652 | ) | | | ($513,294 | ) | | 733,583 | | | $ | 6,653,665 | | | 1,589,810 | | | $ | 16,438,389 | |
| | | | | | | | | | | | | | | | | | | | | | | | | | | | |
Institutional Class: | | | | | | | | | | | | | | | | | | | | | | | | | | | | |
Proceeds from sales | | 987,115 | | | $ | 5,366,789 | | | 326,591 | | | $ | 2,146,250 | | | 564,567 | | | $ | 5,212,732 | | | 983,478 | | | $ | 9,725,685 | |
Reinvestment of distributions | | 21,979 | | | | 123,603 | | | 31,126 | | | | 214,456 | | | 89,536 | | | | 815,768 | | | 169,130 | | | | 1,651,152 | |
Cost of shares repurchased | | (1,074,278 | ) | | | (5,859,311 | ) | | (224,492 | ) | | | (1,726,234 | ) | | (343,910 | ) | | | (3,103,710 | ) | | (1,120,916 | ) | | | (10,951,949 | ) |
| | | | | | | | | | | | | | | | | | | | | | | | | | | | |
Net Increase (Decrease) - Institutional Class | | (65,184 | ) | | | ($368,919 | ) | | 133,225 | | | $ | 634,472 | | | 310,193 | | | $ | 2,924,790 | | | 31,692 | | | $ | 424,888 | |
| | | | | | | | | | | | | | | | | | | | | | | | | | | | |
At June 30, 2009, certain unaffiliated shareholders, specifically omnibus accounts, individually held greater than 10% of the outstanding shares of the following Funds:
| | | | | | |
Mid-Cap | | | | Balanced | | |
1 owns 46% | | Class A | | 1 owns 77% | | Class A |
1 owns 48% | | Class B | | 1 owns 51% | | Class B |
2 own 82% | | Class C | | 1 owns 74% | | Class C |
2 own 98% | | Inst. Class | | 1 owns 94% | | Inst. Class |
| | | |
High Yield | | | | Fixed Income | | |
1 owns 46% | | Class A | | 3 own 54% | | Class A |
2 own 53% | | Class B | | 2 own 60% | | Class B |
3 own 67% | | Class C | | 3 own 59% | | Class C |
3 own 86% | | Inst. Class | | 3 own 79% | | Inst. Class |
| | | |
Short Duration | | | | Intermediate Duration | | |
2 own 67% | | | | 1 owns 38% | | |
| g. | Capital Loss Carryovers |
As of June 30, 2009, the following Funds had accumulated net realized capital loss carryovers from securities transactions for Federal income tax purposes as shown in the following chart. These amounts may be used to offset realized capital gains, if any, through the expiration dates listed.
| | | | | |
| | | Capital Loss
Carryover Amount | | Expires Dec. 31, |
Mid-Cap | | $ | 2,458,446 | | 2016 |
| | | | | |
Balanced | | $ | 13,683,503 | | 2009 |
| | | 1,575,061 | | 2010 |
| | | 72,153 | | 2016 |
| | | | | |
Total | | $ | 15,330,717 | | |
| | | | | |
High Yield | | $ | 6,767,059 | | 2009 |
| | | 744,082 | | 2016 |
| | | | | |
Total | | $ | 7,511,141 | | |
| | | | | |
Fixed Income | | $ | 1,790,459 | | 2009 |
| | | | | |
Short Duration | | $ | 362,610 | | 2009 |
| | | 213,372 | | 2012 |
| | | 285,554 | | 2014 |
| | | 1,518,156 | | 2016 |
| | | | | |
Total | | $ | 2,379,692 | | |
| | | | | |
69
Notes to Financial Statements (continued)
| h. | Reverse Repurchase Agreements |
A reverse repurchase agreement involves the sale of portfolio assets together with an agreement to repurchase the same or substantially the same assets later at a fixed price. An interest expense is charged to the Fund for the duration of the sale. Additional assets are maintained in a segregated account with the custodian, and are marked to market daily. The segregated assets may consist of cash, U. S. Government securities, or other liquid securities at least equal in value to the obligations under the reverse repurchase agreements. In the event the buyer of securities under a reverse repurchase agreement files for bankruptcy or becomes insolvent, a fund’s use of the proceeds under the agreement may be restricted pending a determination by the other party, or its trustee or receiver, whether to enforce the obligation to repurchase the securities. For the six months ended June 30, 2009, there were no reverse repurchase agreements, and therefore no interest expense.
| i. | Delayed Delivery Transactions and When-Issued Securities |
The Funds may purchase or sell securities on a delayed delivery or when-issued basis. Payment and delivery may take place after the customary settlement period for that security. The price of the underlying securities and the date when the securities will be delivered and paid for are fixed at the time the transaction is negotiated. During the time a delayed delivery sell is outstanding, the contract is marked to market daily and equivalent deliverable securities are held for the transaction. The value of the securities purchased on a delayed delivery or when-issued basis are identified as such in the Funds’ Schedules of Portfolio Investments. With respect to purchase commitments, the Funds identify securities as segregated in its records with a value at least equal to the amount of the commitment. The payables and receivables associated with the purchases and sales of delayed delivery securities having the same coupon, settlement date and broker are offset. Delayed delivery or when-issued securities that have been purchased from and sold to different brokers are reflected as both payables and receivables in the Funds’ Statement of Assets and Liabilities. Losses may arise due to changes in the value of the underlying securities or if the counterparty does not perform under the contract, or if the issuer does not issue the securities due to political, economic, or other factors.
| j. | Dollar Roll and Reverse Dollar Roll Agreements |
The Funds may enter into dollar rolls in which they sell debt securities for delivery currently and simultaneously contract to repurchase similar, but not identical, securities at the same price or a lower price on an agreed date. The Funds receive compensation as consideration for entering into the commitment to repurchase. The compensation is the difference between the current sale price and the forward price for the future purchase (often referred to as the “drop”) as well as by the interest earned on the cash proceeds of the initial sale. The Funds may also be compensated by the receipt of a commitment fee. As the holder, the counterparty receives all principal and interest payments, including prepayments, made with respect to the similar security. Dollar rolls may be renewed with a new sale and repurchase price with a cash settlement made at renewal without physical delivery of the securities subject to the contract.
Certain risks may arise upon entering into dollar rolls from the potential inability of counterparties to meet the terms of their commitments. Additionally, the value of such securities may change adversely before the Funds are able to repurchase them. There can be no assurance that the Funds’ use of the cash that they receive from a dollar roll will provide a return that exceeds its cost.
| k. | Securities Transacted on a When Issued Basis |
The Funds may enter into To Be Announced (“TBA”) sale commitments to hedge its portfolio positions or to sell mortgage-backed securities it owns under delayed delivery arrangements. Proceeds of TBA sale commitments are not received until the contractual settlement date. During the time a TBA sale commitment is outstanding, equivalent deliverable securities, or an offsetting TBA purchase commitment deliverable on or before the sale commitment date, are held as “cover” for the transaction. Unsettled TBA sale commitments are valued at the current market value of the underlying securities, according to the procedures described under “Valuation of Investments,” in footnote 1a above. Each contract is marked-to-market daily and the change in market value is recorded by the Funds as an unrealized gain or loss. If the TBA sale commitment is closed through the acquisition of an offsetting purchase commitment, the Fund realizes a gain or loss. If the Fund delivers securities under the commitment, the Fund realizes a gain or a loss from the sale of the securities based upon the unit price established at the date the commitment was entered into.
TBA sale commitments outstanding at June 30, 2009 were as follows:
| | | | | | | | |
Fund | | Principal/Share
Amount | | Security | | Current Liability |
Intermediate Duration | | | | | | | | |
| | $ | 10,000,000 | | FNMA, 5.000%, 07/15/22 | | $ | 10,315,620 |
| | | 5,000,000 | | FHLMC, 4.500%, 07/15/39 | | | 4,976,560 |
| | | 500,000 | | FHLMC, 5.500%, 07/15/36 | | | 516,094 |
| | | | | | | | |
| | | | | Total | | $ | 15,808,274 |
| | | | | | | | |
The Funds may use interest rate futures contracts for risk management purposes in order to reduce the interest rate risk of fixed income securities. The Funds are subject to interest rate risk in the normal course of pursuing its investment objectives. With futures, there is minimal counterparty credit risk to the Funds since futures are exchange traded and the exchange’s clearinghouse, as counterparty to all exchange traded futures, guarantees the futures against default. On entering into a futures contract, either cash or securities in an amount equal to a certain percentage of the contract value (initial margin) must be deposited with the futures broker. Subsequent payments (variation margin) are made or received each day. The variation margin payments equal the daily changes in the contract value and are recorded as unrealized gains or losses. The Fund recognizes a realized gain or loss when the contract is closed or expires equal to the difference between the value of the contract at the time it was opened and the value at the time it was closed.
70
Notes to Financial Statements (continued)
Short Duration had the following open futures contracts as of June 30, 2009:
| | | | | | | | | |
Type | | Number of
Contracts | | Position | | Expiration Month | | Unrealized
Gain/(Loss) | |
2-Year U.S. Treasury Note | | 104 | | Long | | September 2009 | | ($40,886 | ) |
5-Year U.S. Treasury Note | | 8 | | Short | | September 2009 | | 9,230 | |
10-Year U.S. Treasury Note | | 20 | | Short | | September 2009 | | 27,763 | |
U.S. Treasury Long Bond | | 29 | | Long | | September 2009 | | 78,318 | |
5-Year Swap | | 15 | | Short | | September 2009 | | (18,905 | ) |
10-Year Swap | | 127 | | Short | | September 2009 | | (130,294 | ) |
3-Month Eurodollar (IMM) | | 1 | | Long | | March 2008 | | 497 | |
3-Month Eurodollar (IMM) | | 26 | | Short | | March 2008 - December 2009 | | (123,240 | ) |
3-Month Eurodollar | | 26 | | Long | | March 2008 - September 2011 | | 142,548 | |
3-Month Eurodollar | | 147 | | Short | | March 2010 - December 2012 | | (667,225 | ) |
| | | | | | | | | |
| | | | | | Total | | ($722,194 | ) |
| | | | | | | | | |
Intermediate Duration had the following open futures contracts as of June 30, 2009:
| | | | | | | | | | |
Type | | Number of
Contracts | | Position | | Expiration Month | | Unrealized
Gain/(Loss) | |
2-Year U.S. Treasury Note | | 7 | | Short | | September 2009 | | $ | 2,826 | |
5-Year U.S. Treasury Note | | 44 | | Short | | September 2009 | | | 50,765 | |
10-Year U.S. Treasury Note | | 30 | | Short | | September 2009 | | | 41,644 | |
U.S. Treasury Long Bond | | 3 | | Long | | September 2009 | | | 8,102 | |
5-Year Swap | | 20 | | Short | | September 2009 | | | (27,433 | ) |
10-Year Swap | | 6 | | Long | | September 2009 | | | 6,126 | |
3-Month Eurodollar (IMM) | | 23 | | Long | | September 2009 - December 2009 | | | 237,685 | |
3-Month Eurodollar | | 30 | | Long | | March 2010 - September 2012 | | | 201,438 | |
3-Month Eurodollar | | 8 | | Short | | June 2010 | | | (63,284 | ) |
| | | | | | | | | | |
| | | | | | Total | | $ | 457,869 | |
| | | | | | | | | | |
Futures transactions involve additional costs and may result in losses. The effective use of futures depends on the Fund’s ability to close futures positions at times when the Fund’s portfolio managers deem it desirable to do so. The use of futures also involves the risk of imperfect correlation among movements in the values of the securities underlying the futures purchased and sold by the Funds, of the futures contracts themselves, and of the securities that are the subject of a hedge.
| m. | Assets Pledged to Cover Margin Requirements for Open Futures Positions |
The aggregate market value of assets pledged to cover margin requirements for the open futures positions at June 30, 2009 was:
| | | |
Fund | | Assets Pledged |
Short Duration | | $ | 749,785 |
Intermediate Duration | | | 277,891 |
A written option contract is a contract in which the writer of the option grants the buyer of the option the right to purchase from (call option) or sell to (put option) the writer a designated instrument at a specified price within a specified period of time. Options written (sold) are recorded as liabilities. When an option expires, the premium (original option value) is realized
71
Notes to Financial Statements (continued)
as a gain if the option was written or as a loss if the option was purchased. When the exercise of an option results in a cash settlement, the difference between the premium and the settlement proceeds is recognized as realized gain or loss. When securities are acquired or delivered upon exercise of an option, the acquisition cost or sale proceeds are adjusted by the amount of the premium. When an option is closed, the difference between the premium and the cost to close the position is realized as a gain or loss. For the six months ended June 30, 2009, there were no options written or outstanding.
The Funds expect that interest-only STRIPS will be purchased for their hedging characteristics. Stripped Securities (“STRIPS”) are usually structured with two classes that receive different proportions of the interest and principal distributions from a pool of underlying assets. A common type of STRIP will have one class receiving all of the interest from the underlying assets (“interest-only” or “IO” class), while the other class will receive all of the principal (“principal only” or “PO” class). However, in some instances, one class will receive some of the interest and most of the principal while the other class will receive most of the interest and the remainder of the principal. STRIPS are unusually volatile in response to changes in interest rates. The yield to maturity on an IO class of STRIPS is extremely sensitive not only to changes in prevailing interest rates but also to the rate of principal payments (including prepayments) on the underlying assets. A rapid rate of principal prepayments may have a measurably adverse effect on a Fund’s yield to maturity to the extent it invests in IOs. Conversely, POs tend to increase in value if prepayments are greater than anticipated and decline if prepayments are slower than anticipated. Thus, if the underlying assets experience greater than anticipated prepayments of principal, a Fund may fail to fully recover its initial investment in these securities, even if the STRIPS were rated of the highest credit quality by Standard & Poor’s Corporation or Moody’s. These risks will be managed by investing in a variety of such securities and by using certain hedging techniques. In addition the secondary market for STRIPS may be less liquid that that of other mortgage-backed or asset-backed securities, potentially limiting a Fund’s ability to buy of sell those securities at any particular time.
| p. | Commitments and Contingencies |
In the normal course of business, the Funds may enter into contracts and agreements that contain a variety of representations and warranties which provide general indemnifications. The maximum exposure to the Funds under these agreements is unknown, as this would involve future claims that may be made against the Funds that have not yet occurred. However, based on experience, the Funds expect the risks of loss to be remote.
| q. | Foreign Currency Translation |
The books and records of the Funds are maintained in U.S. dollars. The value of investments, assets and liabilities denominated in currencies other than U.S. dollars are translated into U.S. dollars based upon current foreign exchange rates. Purchases and sales of foreign investments, income, and expenses are converted into U.S. dollars based on currency exchange rates prevailing on the respective dates of such transactions. Net realized and unrealized gain (loss) on foreign currency transactions represent: (1) foreign exchange gains and losses from the sale and holdings of foreign currencies; (2) gains and losses between trade date and settlement date on investment securities transactions and forward foreign currency exchange contracts; and (3) gains and losses from the difference between amounts of interest and dividends recorded and the amounts actually received.
In addition, the Funds do not isolate the net realized and unrealized gain or loss resulting from changes in exchange rates from the fluctuations resulting from changes in market prices of securities held. Such fluctuations are included with the net realized and unrealized gain or loss on investments.
| 2. | Agreements and Transactions with Affiliates |
The Trust has entered into an Investment Management Agreement under which the Investment Manager, an independently managed subsidiary of Affiliated Managers Group, Inc. (“AMG”), provides or oversees investment management services to the Funds. The Investment Manager selects subadvisors for each Fund (subject to Trustee approval), allocates assets among subadvisors and monitors the subadvisors’ investment programs and results. Each Fund’s investment portfolio is managed by a portfolio manager who serves pursuant to Subadvisory Agreements with the Investment Manager.
Investment management fees are paid directly by each Fund to the Investment Manager based on average daily net assets. The annual investment management fee rates, as a percentage of average daily net assets for the six months ended June 30, 2009, were as follows:
| | | |
| | | Investment
Management Fee | |
Mid-Cap | | 0.70 | % |
Balanced | | 0.70 | % |
High Yield | | 0.70 | % |
Fixed Income | | 0.45 | % |
Short Duration | | 0.70 | % |
Intermediate Duration | | 0.70 | % |
The Investment Manager has contractually agreed, through at least May 1, 2010 to waive fees and pay or reimburse expenses to the extent that the total operating expenses (exclusive of brokerage costs, interest, taxes, acquired fund fees and extraordinary expenses) exceed the following percentages of the following Fund’s average daily net assets.
| | | | | | |
Mid-Cap | | | | Balanced | | |
| 1.24% | | Class A | | 1.25% | | Class A |
| 1.99% | | Class B | | 2.00% | | Class B |
| 1.99% | | Class C | | 2.00% | | Class C |
| 0.99% | | Institutional Class | | 1.00% | | Inst. Class |
| | | |
High Yield | | | | Fixed Income | | |
| 1.15% | | Class A | | 0.84% | | Class A |
| 1.90% | | Class B | | 1.59% | | Class B |
| 1.90% | | Class C | | 1.59% | | Class C |
| 0.90% | | Institutional Class | | 0.59% | | Inst. Class |
| |
Intermediate Duration | | |
| 0.89% | | | | | | |
72
Notes to Financial Statements (continued)
Each Fund may be obligated to repay the Investment Manager such amounts waived, paid or reimbursed in future years provided that the repayment occurs within thirty-six (36) months after the waiver or reimbursement and that such repayment would not cause the Fund’s expenses in any such year to exceed the above percentages, based on the Fund’s average daily net assets. For the six months ended June 30, 2009, the Funds made no such repayments to the Investment Manager.
For the six months ended June 30, 2009, the cumulative amount of expense reimbursement by the Investment Manager subject to the repayment by Mid-Cap, Balanced, High Yield, Fixed Income, and Intermediate Duration equaled $318,250, $326,204, $530,428, $772,410, and $162,529, respectively. Total returns and net investment income for the Funds would have been lower had certain expenses not been offset. Total expenses exclude the impact of expense reimbursements and expense offsets such as brokerage recapture credits but include non-reimbursable expenses such as interest and taxes, if any.
Mid-Cap, Balanced, High Yield, and Fixed Income have entered into an Administration and Shareholder Servicing Agreement under which Managers Investment Group LLC serves as each Fund’s administrator (the “Administrator”) and is responsible for all aspects of managing the Funds’ operations, including administration and shareholder services to each Fund, its shareholders, and certain institutions, such as bank trust departments, broker-dealers and registered investment advisers, that advise or act as an intermediary with the Funds’ shareholders. During the six months ended June 30, 2009, each of these Funds paid an Administration fee at the rate of 0.20% per annum of the Fund’s average daily net assets.
The aggregate annual retainer paid to each Independent Trustee is $65,000, plus $4,000 or $2,500 for each regular or special meeting attended, respectively. The Trustees’ fees and expenses are allocated amongst all of the Funds for which the Investment Manager serves as the advisor (the “Managers Funds”) based on the relative net assets of such Funds. The Independent Chairman of the Trusts receives an additional payment of $15,000 per year. The Chairman of the Audit Committee receives an additional payment of $5,000 per year. The “Trustees fees and expenses” shown in the financial statements represents the Funds’ allocated portion of the total fees and expenses paid by the Managers Funds.
The Funds are distributed by Managers Distributors, Inc. (the “Distributor” or “MDI”), a wholly-owned subsidiary of the Investment Manager. The MDI serves as the principal underwriter for each Fund in the Trust. MDI is a registered broker-dealer and member of the Financial Industry Regulatory Authority, Inc. (“FINRA”). Shares of each Fund will be continuously offered and will be sold by brokers, dealers or other financial intermediaries who have executed selling agreements with the Distributor. MDI bears all the expenses of providing services pursuant to the Underwriting Agreement, including the payment of the expenses relating to the distribution of Prospectuses for sales purposes and any advertising or sales literature. Certain Trustees and Officers of the Funds are Officers and/or Directors of the Investment Manager, AMG and/or the Distributor.
Mid-Cap, Balanced, High Yield, and Fixed Income have adopted distribution and service plans with respect to the Class A, Class B and Class C shares of each Fund (the “Plans”), in accordance with the requirements of Rule 12b-1 under the 1940 Act and the requirements of the applicable rules of the FINRA regarding asset-based sales charges. Pursuant to the Plans, each Fund may compensate MDI for its expenditures in financing any activity primarily intended to result in the sale of each such class of Fund shares and for maintenance and personal service provided to existing shareholders of that class.
The Plans authorize payments to MDI up to 0.25%, 1.00% and 1.00% annually of each Fund’s average daily net assets attributable to its Class A, Class B and Class C shares, respectively. The Plans further provide for periodic payments by MDI to brokers, dealers and other financial intermediaries for providing shareholder services and for promotional and other sales related costs.
The portion of payments by Class A, Class B or Class C shares of a Fund for shareholder servicing may not exceed an annual rate of 0.25% of the average daily net asset value of Fund shares of that class owned by clients of such broker, dealer or financial intermediary.
The following summarizes the total fees incurred under the plans for Class A, Class B and Class C shares for the six months ended June 30, 2009:
| | | |
| | | Amount |
Mid-Cap | | $ | 119,557 |
Balanced | | | 86,209 |
High Yield | | | 155,027 |
Fixed Income | | | 569,539 |
| 3. | Purchases and Sales of Securities |
Purchases and sales of securities, excluding short-term securities, for the six months ended June 30, 2009, were as follows:
| | | | | | | | | | | | |
| | | Long-Term Securities | | U.S. Government Securities |
Fund | | Purchases | | Sales | | Purchases | | Sales |
Mid-Cap | | $ | 17,344,054 | | $ | 19,447,829 | | | n/a | | | n/a |
Balanced | | | 12,567,470 | | | 13,215,958 | | $ | 1,475,193 | | $ | 1,221,162 |
High Yield | | | 11,433,705 | | | 7,541,469 | | | n/a | | | n/a |
Fixed Income | | | 11,911,964 | | | 11,026,564 | | | 10,963,506 | | | 9,980,206 |
Short Duration | | | 4,906,843 | | | 9,987,103 | | | 799,207,127 | | | 776,033,078 |
Intermediate Duration | | | 136,309 | | | 3,173,825 | | | 1,060,435,805 | | | 1,038,902,965 |
73
Notes to Financial Statements (continued)
| 4. | Portfolio Securities Loaned |
The Funds may participate in a securities lending program offered by BNYM, providing for the lending of securities to qualified brokers. Securities lending fees include earnings of such temporary cash investments, plus or minus any rebate to a borrower. These earnings (after any rebate) are then divided between BNYM, as a fee for its services under the program, and the Fund, according to agreed-upon rates. Collateral on all securities loaned is accepted in cash and/or government securities and is maintained at a minimum level of 102% (105% in the case of certain foreign securities) of the market value, plus interest, if applicable, of investments on loan. It is the Funds’ policy to obtain additional collateral from or return excess collateral to the borrower by the end of the next business day, following the valuation date of the securities loaned. Therefore, the value of the collateral held may be temporarily less than the value of the securities on loan. Lending securities entails a risk of loss to the Funds if and to the extent that the market value of the securities loaned were to increase and the borrower did not increase the collateral accordingly, and the borrower fails to return the securities. The Funds bear the risk of any deficiency in the amount of the collateral available for return to the borrower due to any loss on the collateral invested. Collateral received in the form of cash is invested temporarily in the BNY Institutional Cash Reserves Fund (the “ICRF”), or other short-term investments as defined in the Securities Lending Agreement with BNYM.
In September of 2008, BNYM advised the Investment Manager that the ICRF had exposure to certain defaulted debt obligations, and that BNYM had established a separate sleeve of the ICRF to hold these securities. The net impact of these positions is not material to each Fund. Each Fund’s position in the separate sleeve of the ICRF is included in the Schedule of Investments and the unrealized loss on such investment is included in Net Unrealized Depreciation on the Statement of Assets and Liabilities and Statement of Operations.
| 5. | Risks Associated with Collateralized Mortgage Obligations (“CMOs”) |
The net asset value of the Funds may be sensitive to interest rate fluctuations because the Funds may hold several instruments, including CMOs and other derivatives, whose values can be significantly impacted by interest rate movements. CMOs are obligations collateralized by a portfolio of mortgages or mortgage-related securities. Payments of principal and interest on the mortgages are passed through to the holder of the CMOs on the same schedule as they are received, although certain classes of CMOs have priority over others with respect to the receipt of prepayments on the mortgages. Therefore, the investment in CMOs may be subject to a greater or lesser risk of prepayment than other types of mortgage-related securities. CMOs may have a fixed or variable rate of interest.
| 6. | Risks Associated with High Yield Securities |
Investing in high yield securities involves greater risks and considerations not typically associated with U.S. Government and other high quality/investment grade securities. High Yield securities are generally below investment grade securities and do not have an established retail secondary market. Economic downturns may disrupt the high yield market and impair the issuer’s ability to repay principal and interest. Also, an increase in interest rates would likely have an adverse impact on the value of such obligations and could cause the securities to become less liquid.
74
Annual Renewal of Investment Advisory Agreements (unaudited)
On June 4-5, 2009, the Board of Trustees, including a majority of the Trustees who are not “interested persons” of the Trust (the “Independent Trustees”), approved the Investment Management Agreement with the Investment Manager for each of the Funds identified below and the Subadvisory Agreement for each Fund Subadvisor. The Independent Trustees were separately represented by independent counsel in connection with their consideration of the approval of these agreements. In considering the Investment Management and Subadvisory Agreements, the Trustees reviewed a variety of materials relating to each Fund, the Investment Manager and each Subadvisor, including comparative performance, fee and expense information for an appropriate peer group of similar mutual funds (each a “Peer Group”), performance information for relevant benchmark indices (each a “Fund Benchmark”) and, with respect to each Subadvisor, comparative performance information for an appropriate peer group of managed accounts, and, as to all other matters, other information provided to them on a periodic basis throughout the year, as well as information provided in connection with the meetings of June 4-5, 2009, regarding the nature, extent and quality of services provided by the Investment Manager and the Subadvisors under their respective agreements. Prior to voting, the Independent Trustees: (a) reviewed the foregoing information with their independent legal counsel and with management; (b) received materials from their independent legal counsel discussing the legal standards applicable to their consideration of the Investment Management Agreement and the Subadvisory Agreements; and (c) met with their independent legal counsel in private sessions at which no representatives of management were present.
Nature, extent and quality of services.
In considering the nature, extent and quality of the services provided by the Investment Manager, the Trustees reviewed information relating to the Investment Manager’s operations and personnel. Among other things, the Investment Manager provided financial information, biographical information on its supervisory and professional staff and descriptions of its organizational and management structure. The Trustees also took into account information provided periodically throughout the previous year by the Investment Manager relating to the performance of its duties with respect to the Funds and the Trustees’ familiarity with the Investment Manager’s management through Board meetings, discussions and reports. In the course of their deliberations regarding the Investment Management Agreement, the Trustees evaluated, among other things: (a) the extent and quality of the Investment Manager’s oversight of the operation and management of the Funds; (b) the quality of the search, selection and monitoring services performed by the Investment Manager in overseeing the portfolio management responsibilities of the Subadvisors; (c) the Investment Manager’s ability to supervise the Funds’ other service providers; and (d) the Investment Manager’s compliance programs. The Trustees also took into account the financial condition of the Investment Manager with respect to its ability to provide the services required under the Investment Management Agreement and to maintain contractual expense limitations for the Funds.
For each Fund, the Trustees also reviewed information relating to each Subadvisor’s operations and personnel and the investment philosophy, strategies and techniques (for each Subadvisor, its “Investment Strategy”) used in managing the Fund or the portion of the Fund for which the Subadvisor has portfolio management responsibility.
Among other things, the Trustees reviewed biographical information on portfolio management and other professional staff, information regarding each Subadvisor’s organizational and management structure and each Subadvisor’s brokerage policies and practices. The Trustees considered specific information provided regarding the experience of the individual or individuals at each Subadvisor with portfolio management responsibility for the portion of the Fund managed by the Subadvisor, including the information set forth in the Fund’s prospectus and statement of additional information. With respect to those Funds managed with multiple Subadvisors, the Trustees also noted information provided by the Investment Manager regarding the manner in which each Subadvisor’s Investment Strategy complements those utilized by a Fund’s other Subadvisors. In the course of their deliberations, the Trustees evaluated, among other things: (a) the services rendered by each Subadvisor in the past; (b) the qualifications and experience of the Subadvisor’s personnel; and (c) the Subadvisor’s compliance programs. The Trustees also took into account the financial condition of each Subadvisor with respect to its ability to provide the services required under its Subadvisory Agreement.
Performance.
As noted above, the Board considered each Fund’s performance during relevant time periods as compared to the Fund’s Peer Group and considered each Subadvisor’s performance as compared to an appropriate peer group of managed accounts and noted that the Board reviews on a quarterly basis detailed information about the Fund’s performance results, portfolio composition and Investment Strategies, including with respect to the portion of the Fund managed by each Subadvisor. The Board noted the Investment Manager’s expertise and resources in monitoring the performance, investment style and risk-adjusted performance of each Subadvisor. The Board also noted each Subadvisor’s performance record with respect to the Fund. The Board was mindful of the Investment Manager’s attention to monitoring each Subadvisor’s performance with respect to the Funds and its discussions with management regarding the factors that contributed to the performance of the Funds.
Advisory Fees and Profitability.
In considering the reasonableness of the advisory fee charged by the Investment Manager for managing each Fund, the Trustees noted that the Investment Manager, and not the Fund, is responsible for paying the fees charged by the Fund’s Subadvisors and, therefore, that the fees paid to the Investment Manager cover the cost of providing portfolio management services as well as the cost of providing search, selection and monitoring services in operating a “manager-of-managers” complex of mutual funds. The Trustees concluded that, in light of the additional high quality supervisory services provided by the Investment Manager and the fact that the subadvisory fees are paid out of the advisory fee, the advisory fee payable by each Fund to the Investment Manager can reasonably be expected to exceed the median advisory fee for the Peer Group, which consists of many funds that do not operate with a manager-of-managers structure. In this regard, the Trustees also noted that the Investment Manager has undertaken to maintain expense limitations for the Funds.
In considering the reasonableness of the advisory fee payable to the Investment Manager, the Trustees also reviewed information provided by the Investment Manager setting forth all revenues and other benefits, both direct and indirect, received by the Investment
75
Annual Renewal of Investment Advisory Agreements (continued)
Manager and its affiliates attributable to managing each Fund and all the mutual funds in the Managers Family of Funds, the cost of providing such services and the resulting profitability to the Investment Manager and its affiliates from these relationships. The Trustees also noted the current asset levels of each Fund and the willingness of the Investment Manager to waive fees and pay expenses for certain of the Funds from time to time as a means of limiting total expenses. The Trustees also noted that the subadvisory fees are paid by the Investment Manager out of its advisory fee. The Trustees also considered the current asset levels of the Funds, including the effect on assets attributable to the economic and market conditions over the past year, and considered the impact on profitability of the current asset levels and any future growth of assets of the Funds. The Board took into account management’s discussion of the current advisory fee structure. Based on the foregoing, the Trustees concluded that the profitability to the Investment Manager is reasonable and that the Investment Manager is not realizing material benefits from economies of scale that would warrant adjustments to the fees for any Fund at this time. With respect to economies of scale, the Trustees also noted that as a Fund’s assets increase over time, the Fund may realize other economies of scale to the extent that the increase in assets is proportionally greater than the increase in certain other expenses.
Subadvisory Fees and Profitability.
In considering the reasonableness of the fee payable by the Investment Manager to each Subadvisor (other than Chicago Equity Partners, LLC (“CEP”), which is an affiliate of the Investment Manager), the Trustees relied on the ability of the Investment Manager to negotiate the terms of the Subadvisory Agreement at arm’s length as part of the manager-of-managers structure, noting that the Investment Manager is not affiliated with the Subadvisors (other than CEP). In addition, the Trustees noted that the subadvisory fees are paid by the Investment Manager out of its advisory fee. Accordingly, the cost of services to be provided by each unaffiliated Subadvisor and the profitability to the Subadvisor of its relationship with a Fund were not material factors in the Trustees’ deliberations. For similar reasons, and based on the current size of the portion of a Fund managed by each Subadvisor, the Trustees concluded that the effect of any economies of scale being realized by each unaffiliated Subadvisor was not a material factor in the Trustees’ deliberations at this time.
In considering the reasonableness of the fees payable by the Investment Manager to CEP, the Trustees noted that CEP is an affiliate of the Investment Manager and reviewed information provided by CEP regarding the cost to CEP of providing subadvisory services to a Fund and the resulting profitability from such relationship. The Trustees also noted that the subadvisory fees are paid by the Investment Manager out of its advisory fee. Accordingly, the cost of services to be provided by CEP and the profitability to CEP of its relationship with a Fund were not material factors in the Trustees’ deliberations. For similar reasons, and based on the current size of the portion of a Fund managed by CEP, the Trustees concluded that the effect of any economies of scale being realized by CEP was not a material factor in the Trustees’ deliberations at this time.
In addition to the foregoing, the Trustees considered the specific factors and related conclusions set forth below with respect to each Fund and each Subadvisor.
MANAGERS AMG CHICAGO EQUITY PARTNERS MID-CAP FUND
Fund Performance.
Among other information relating to the Fund’s performance, the Trustees noted that the Fund’s performance for the 1-year, 3-year, 5-year and 10-year periods ended March 31, 2009 was below, below, below and above, respectively, the median performance of the Peer Group and below the performance of the Fund Benchmark, the S&P MidCap 400 Index, for each period. The Board took into account management’s discussion of the Fund’s performance over longer periods, including the fact that the Fund’s 10-year performance has exceeded the median of the Peer Group. The Trustees concluded that the Fund’s performance has been satisfactory in light of all factors considered.
Advisory Fees.
The Trustees noted that the Fund’s advisory fee and total expenses (net of applicable expense waivers/reimbursements) as of March 31, 2009 were both lower than the average for the Peer Group. The Trustees also took into account the fact that the Investment Manager has contractually agreed, through May 1, 2010, to limit the Fund’s net annual operating expenses to 1.24%, 1.99%, 1.99% and 0.99% for Class A shares, Class B shares, Class C shares and Institutional Class shares, respectively. The Trustees concluded that, in light of the nature, extent and quality of the services provided by the Investment Manager and the Subadvisor, the foregoing expense limitation and the considerations noted above with respect to the Subadvisor and the Investment Manager, the Fund’s advisory fees are reasonable.
MANAGERS AMG CHICAGO EQUITY PARTNERS BALANCED FUND
Fund Performance.
Among other information relating to the Fund’s performance, the Trustees noted that the Fund’s performance for the 1-year, 3-year, 5-year and 10-year periods ended March 31, 2009 was above the median performance of the Peer Group and above the performance of the Fund Benchmark, a Composite Index (60% S&P 500 Index and 40% Barclays Capital U.S. Aggregate Bond Index), for each period. The Trustees concluded that the Fund’s performance has been satisfactory.
Advisory Fees.
The Trustees noted that the Fund’s advisory fee and total expenses (net of applicable expense waivers/reimbursements) as of March 31, 2009 were both higher than the average for the Peer Group. The Trustees took into account the fact that the Investment Manager has contractually agreed, through May 1, 2010, to limit the Fund’s net annual operating expenses to 1.25%, 2.00%, 2.00% and 1.00% for Class A shares, Class B shares, Class C shares and Institutional Class shares, respectively. The Trustees concluded that, in light of the nature, extent and quality of the services provided by the
76
Annual Renewal of Investment Advisory Agreements (continued)
Investment Manager and the Subadvisor, the Fund’s performance, the foregoing expense limitation and the considerations noted above with respect to the Subadvisor and the Investment Manager, the Fund’s advisory fees are reasonable.
MANAGERS HIGH YIELD FUND
Fund Performance.
Among other information relating to the Fund’s performance, the Trustees noted that the Fund’s performance for Institutional Class shares for the 1-year, 3-year, 5-year and 10-year periods ended March 31, 2009 was below, below, below and above, respectively, the median performance of the Peer Group and below the performance of the Fund Benchmark, the Barclays Capital U.S. Corporate High Yield Index, for each period. The Board took into account management’s discussion of the Fund’s performance, including the fact that the Fund’s 10-year performance has exceeded the median of the Peer Group. The Board also noted certain anticipated changes in the Fund’s investment process that the Investment Manager indicated may affect performance going forward. The Trustees concluded that the Fund’s performance has been satisfactory in light of all factors considered.
Advisory Fees.
The Trustees noted that the Fund’s advisory fee and total expenses (net of applicable expense waivers/reimbursements) as of March 31, 2009 were both higher than the average for the Peer Group. The Trustees took into account the fact that the Investment Manager has contractually agreed, through May 1, 2010, to limit the Fund’s net annual operating expenses to 1.15%, 1.90%, 1.90% and 0.90% for Class A shares, Class B shares, Class C shares and Institutional Class shares, respectively. The Trustees concluded that, in light of the nature, extent and quality of the services provided by the Investment Manager and the Subadvisor, the foregoing expense limitation and the considerations noted above with respect to the Subadvisor and the Investment Manager, the Fund’s advisory fees are reasonable.
MANAGERS FIXED INCOME FUND
Fund Performance.
Among other information relating to the Fund’s performance, the Trustees noted that the Fund’s performance for Class A shares for the 1-year, 3-year, 5-year and 10-year periods ended March 31, 2009 was below, below, below and above, respectively, the median performance of the Peer Group and below the performance of the Fund Benchmark, the Barclays Capital U.S. Aggregate Bond Index, for each period. The Board took into account the fact that the Fund’s 10-year performance has exceeded the median of the Peer Group. The Board also noted management’s discussion of the Fund’s more recent performance, including the fact that the Fund outpaced the Fund Benchmark in the first quarter of 2009 and continued to perform well into the second quarter. The Trustees concluded that the Fund’s performance has been satisfactory in light of all factors considered.
Advisory Fees.
The Trustees noted that the Fund’s advisory fee and total expenses (net of applicable expense waivers/reimbursements) as of March 31, 2009 were both higher than the average for the Peer Group. The Trustees took into account the fact that the Investment Manager has contractually agreed, through May 1, 2010, to limit the Fund’s net annual operating expenses to 0.84%, 1.59%, 1.59% and 0.59% for Class A shares, Class B shares, Class C shares and Institutional Class shares, respectively. The Trustees concluded that, in light of the nature, extent and quality of the services provided by the Investment Manager and the Subadvisor, the foregoing expense limitation and the considerations noted above with respect to the Subadvisor and the Investment Manager, the Fund’s advisory fees are reasonable.
* * * * *
After consideration of the foregoing, the Trustees also reached the following conclusions regarding the Investment Management Agreement and each Subadvisory Agreement, in addition to those conclusions discussed above: (a) the Investment Manager and each Subadvisor have demonstrated that they possess the capability and resources to perform the duties required of them under the Investment Management Agreement and the applicable Subadvisory Agreement; (b) each Subadvisor’s Investment Strategy is appropriate for pursuing the applicable Fund’s investment objectives; (c) each Subadvisor is reasonably likely to execute its Investment Strategy consistently over time; and (d) the Investment Manager and each Subadvisor maintain appropriate compliance programs.
Based on all of the above-mentioned factors and their related conclusions, with no single factor or conclusion being determinative and with each Trustee not necessarily attributing the same weight to each factor, the Trustees concluded that approval of each Investment Management Agreement and each Subadvisory Agreement (as applicable) would be in the best interests of each Fund and its shareholders. Accordingly, on June 4-5, 2009, the Trustees, including a majority of the Independent Trustees, voted to approve the Investment Management Agreement and the Subadvisory Agreements (as applicable) for each Fund.
SHORT DURATION FUND AND INTERMEDIATE DURATION FUND
On June 4-5, 2009, the Board of Trustees, including a majority of the Trustees who are not “interested persons” of the Trust (the “Independent Trustees”), approved the Investment Management Agreement with the Investment Manager for each of the Managers Short Duration Government Fund and the Managers Intermediate Duration Government Fund (each a “Fund”) and the Subadvisory Agreement with respect to each Fund. The Independent Trustees were separately represented by independent counsel in connection with their consideration of the approval of these agreements. In considering the Investment Management and Subadvisory Agreements, the Trustees reviewed a variety of materials relating to each Fund, the Investment Manager and the Subadvisor, including comparative performance, fee and expense information for an
77
Annual Renewal of Investment Advisory Agreements (continued)
appropriate peer group of similar mutual funds for each Fund (each a “Peer Group”), performance information for the benchmark index for each Fund (each a “Fund Benchmark”) and, with respect to the Subadvisor, comparative performance information for an appropriate peer group of managed accounts, and, as to all other matters, other information provided to them on a periodic basis throughout the year, as well as information provided in connection with the meetings of June 4-5, 2009, regarding the nature, extent and quality of services provided by the Investment Manager and the Subadvisor under their respective agreements. Prior to voting, the Independent Trustees: (a) reviewed the foregoing information with their independent legal counsel and with management; (b) received materials from their independent legal counsel discussing the legal standards applicable to their consideration of the Investment Management Agreement and the Subadvisory Agreements; and (c) met with their independent legal counsel in private sessions at which no representatives of management were present.
Nature, extent and quality of services.
In considering the nature, extent and quality of the services provided by the Investment Manager, the Trustees reviewed information relating to the Investment Manager’s operations and personnel. Among other things, the Investment Manager provided financial information, biographical information on its supervisory and professional staff and descriptions of its organizational and management structure. The Trustees also took into account information provided periodically throughout the previous year by the Investment Manager relating to the performance of its duties with respect to the Funds and the Trustees’ familiarity with the Investment Manager’s management through Board meetings, discussions and reports. In the course of their deliberations regarding the Investment Management Agreement, the Trustees evaluated, among other things: (a) the extent and quality of the Investment Manager’s oversight of the operation and management of the Funds; (b) the quality of the search, selection and monitoring services performed by the Investment Manager in overseeing the portfolio management responsibilities of the Subadvisor; (c) the Investment Manager’s ability to supervise the Funds’ other service providers; and (d) the Investment Manager’s compliance programs. The Trustees also took into account the financial condition of the Investment Manager with respect to its ability to provide the services required under the Investment Management Agreement and to maintain a contractual expense limitation for the Managers Intermediate Duration Government Fund.
For each Fund, the Trustees also reviewed information relating to the Subadvisor’s operations and personnel and the investment philosophy, strategies and techniques (the “Investment Strategy”) used in managing each Fund. Among other things, the Trustees reviewed biographical information on portfolio management and other professional staff, information regarding the Subadvisor’s organizational and management structure and the Subadvisor’s brokerage policies and practices. The Trustees considered specific information provided regarding the experience of the individuals at the Subadvisor with portfolio management responsibility for the Funds, including the information set forth in the Funds’ prospectus and statement of additional information. In the course of their deliberations, the Trustees evaluated, among other things: (a) the services rendered by the Subadvisor in the past; (b) the qualifications and experience of the Subadvisor’s personnel; and (c) the Subadvisor’s compliance programs. The Trustees also took into account the financial condition of the Subadvisor with respect to its ability to provide the services required under each Subadvisory Agreement.
Performance.
With respect to the Managers Short Duration Government Fund, among other information relating to the Fund’s performance, the Trustees noted that the Fund’s performance for the 1-year, 3-year, 5-year and 10-year periods ended March 31, 2009 was above the median performance of the Peer Group and below the performance of the Fund Benchmark, the Merrill Lynch Six Month U.S. T-Bill Index, for each period. The Board also took into account management’s discussion of the Fund’s performance. The Trustees concluded that the Fund’s performance has been satisfactory in light of all factors considered.
With respect to the Managers Intermediate Duration Government Fund, among other information relating to the Fund’s performance, the Trustees noted that the Fund’s performance for the 1-year, 3-year, 5-year and 10-year periods ended March 31, 2009 was below, below, below and above, respectively, the median performance of the Peer Group and below the performance of the Fund Benchmark, the Citigroup Mortgage Index, for each period. The Trustees took into account management’s discussion of the Fund’s performance, including the effect of mortgage-backed securities on short-term performance. The Trustees also noted the Fund’s strong long-term performance relative to the Peer Group for the 10-year period as well as the Fund’s more recent performance year-to-date. The Trustees concluded that the Fund’s overall performance has been satisfactory in light of all factors considered.
As noted above, the Board considered each Fund’s performance during relevant time periods as compared to the Fund’s Peer Group and considered the Subadvisor’s performance as compared to an appropriate peer group of managed accounts and noted that the Board reviews on a quarterly basis detailed information about both the Fund’s performance results and portfolio composition as well as the Subadvisor’s Investment Strategy. The Board also noted the Investment Manager’s expertise and resources in monitoring the performance, investment style and risk-adjusted performance of the Subadvisor. The Board was mindful of the Investment Manager’s attention to monitoring the Subadvisor’s performance with respect to the Funds and its discussions with management regarding the factors that contributed to the performance of the Funds.
Advisory and Subadvisory Fees and Profitability.
In considering the reasonableness of the advisory fee payable to the Investment Manager and the subadvisory fee payable by the Investment Manager to the Subadvisor, the Trustees reviewed information provided by the Investment Manager setting forth all revenues and other benefits, both direct and indirect, received by the
78
Annual Renewal of Investment Advisory Agreements (continued)
Investment Manager and its affiliates attributable to managing each Fund and all the mutual funds in the Managers Family of Funds, the cost of providing such services and the resulting profitability to the Investment Manager and its affiliates from these relationships. The Trustees also noted that the Investment Manager, and not the Funds, is responsible for paying the fees charged by the Subadvisor and, therefore, that the fees paid to the Investment Manager cover the cost of providing portfolio management services as well as the cost of providing search, selection and monitoring services in operating a “manager-of-managers” complex of mutual funds. The Trustees concluded that, in light of the additional high quality supervisory services provided by the Investment Manager and the fact that the subadvisory fees are paid out of the advisory fee, the advisory fee payable by each Fund to the Investment Manager can reasonably be expected to exceed the median advisory fee for each Fund’s Peer Group, which consists of many funds that do not operate using a manager-of-managers structure. In this regard, the Trustees also noted that the Investment Manager has undertaken to maintain an expense limitation for the Managers Intermediate Duration Government Fund.
The Trustees also noted the current asset levels of each Fund and the willingness of the Investment Manager to waive fees and pay expenses for the Managers Intermediate Duration Government Fund from time to time as a means of limiting its total expenses. The Trustees also considered the current asset levels of the Funds, including the effect on assets attributable to the economic and market conditions over the past year, and considered the impact on profitability of the current asset levels and any future growth of assets of the Funds. The Board took into account management’s discussion of the current advisory fee structure of the Funds. On this basis, the Trustees concluded that the profitability to the Investment Manager and its affiliates of their relationships with the Funds is reasonable and that the Investment Manager is not realizing material benefits from economies of scale that would warrant adjustments to the fees for either Fund at this time. With respect to economies of scale, the Trustees also noted that as a Fund’s assets increase over time, the Fund may realize other economies of scale to the extent that the increase in assets is proportionally greater than the increase in certain other expenses.
In considering the reasonableness of the fee payable by the Investment Manager to the Subadvisor, the Trustees relied on the ability of the Investment Manager to negotiate the terms of the Subadvisory Agreements at arm’s length as part of the manager- of-managers structure, noting that the Investment Manager is not affiliated with the Subadvisor. Accordingly, the cost of services to be provided by the Subadvisor and the profitability to the Subadvisor of its relationship with each Fund were not material factors in the Trustees’ deliberations. For similar reasons, and based on the current size of each Fund, the Trustees concluded that the effect of any economies of scale being realized by the Subadvisor in managing the Fund was not a material factor at this time.
The Trustees noted that each Fund’s advisory fee and total expenses (net of applicable expense waivers/reimbursements) as of March 31, 2009 were both higher than the average for the Fund’s Peer Group. The Trustees took into account the fact that the Investment Manager has contractually agreed, through May 1, 2010, to limit the Managers Intermediate Duration Government Fund’s net annual operating expenses to 0.89% . The Trustees concluded that, in light of the nature, extent and quality of the services provided by the Investment Manager and the Subadvisor and the considerations noted above with respect to the Subadvisor and the Investment Manager, the Funds’ advisory fees are reasonable.
* * * * *
After consideration of the foregoing, the Trustees also reached the following conclusions regarding the Investment Management and Subadvisory Agreements in addition to the conclusions discussed above: (a) the Investment Manager has demonstrated that it possesses the resources and capability to perform its duties under the Investment Management Agreement; (b) the Subadvisor has the resources to perform its duties under each of the Subadvisory Agreements and is qualified to manage each Fund’s assets in accordance with its investment objectives and policies; and (c) the Investment Manager and Subadvisor maintain appropriate compliance programs.
Based on all of the above-mentioned factors and their related conclusions, with no single factor or conclusion being determinative and with each Trustee not necessarily attributing the same weight to each factor, the Trustees concluded that approval of the Investment Management Agreement and each Subadvisory Agreement (as applicable) would be in the best interests of each Fund and its shareholders. Accordingly, on June 4-5, 2009, the Trustees, including a majority of the Independent Trustees, voted to approve the Investment Management and Subadvisory Agreements (as applicable) for each Fund.
79
Investment Manager and Administrator
Managers Investment Group LLC
333 W. Wacker Drive
Suite 1200
Chicago, IL 60606
(800) 835-3879
Distributor
Managers Investment Group LLC
333 W. Wacker Drive
Suite 1200
Chicago, IL 60606
(800) 835-3879
Custodian
The Bank of New York Mellon
2 Hanson Place
Brooklyn, New York 11217
Legal Counsel
Ropes & Gray LLP
One International Place
Boston, Massachusetts 02110-2624
Transfer Agent
PNC Global Investment Servicing (U.S.) Inc.
Attn: Managers
P.O. Box 9769
Providence, Rhode Island 02940
(800) 548-4539
Trustees
Jack W. Aber
William E. Chapman, II
Nathaniel Dalton
Edward J. Kaier
Steven J. Paggioli
Eric Rakowski
Thomas R. Schneeweis
John H. Streur
For Managers Choice Only
Managers
c/o PNC Global Investment Servicing (U.S.) Inc.
P.O. Box 61204
King of Prussia, Pennsylvania 19406-0851
(800) 358-7668

MANAGERSAND MANAGERS AMG FUNDS
EQUITY FUNDS
EMERGING MARKETS EQUITY
Rexiter Capital Management Limited
Schroder Investment Management North America Inc.
ESSEX GROWTH
ESSEX LARGE CAP GROWTH
ESSEX SMALL/MICRO CAP GROWTH
Essex Investment Management Co., LLC
FQ TAX-MANAGED U.S. EQUITY
FQ U.S. EQUITY
First Quadrant, L.P.
GW&K SMALL CAP EQUITY
Gannett Welsh & Kotler, LLC
INSTITUTIONAL MICRO-CAP
MICRO-CAP
Lord, Abbett & Co. LLC
WEDGE Capital Management L.L.P.
OFI Institutional Asset Management, Inc.
Next Century Growth Investors LLC
INTERNATIONAL EQUITY
AllianceBernstein L.P.
Lazard Asset Management, LLC
Martin Currie Inc.
CHICAGO EQUITY PARTNERS
MID-CAP
Chicago Equity Partners, LLC
REAL ESTATE SECURITIES
Urdang Securities Management, Inc.
RENAISSANCE LARGE CAP GROWTH
Renaissance Group LLC
SKYLINE SPECIAL EQUITIES PORTFOLIO
Skyline Asset Management, L.P.
SMALL CAP
TIMESSQUARE MID CAP GROWTH
TIMESSQUARE SMALL CAP GROWTH
TimesSquare Capital Management, LLC
SPECIAL EQUITY
Ranger Investment Management, L.P.
Lord, Abbett & Co. LLC
Smith Asset Management Group, L.P.
Federated MDTA LLC
SYSTEMATIC VALUE
SYSTEMATIC MID CAP VALUE
Systematic Financial Management, L.P.
BALANCED FUNDS
CHICAGO EQUITY PARTNERS BALANCED
Chicago Equity Partners, LLC
GLOBAL
AllianceBernstein L.P.
First Quadrant, L.P.
Wellington Management Company, LLP
ALTERNATIVE FUNDS
FQ GLOBAL ALTERNATIVES
First Quadrant, L.P.
INCOME FUNDS
BOND (MANAGERS)
FIXED INCOME
GLOBAL BOND
Loomis, Sayles & Co., L.P.
BOND (MANAGERS FREMONT)
Pacific Investment Management Co. LLC
CALIFORNIA INTERMEDIATE TAX-FREE
Miller Tabak Asset Management LLC
GW&K MUNICIPAL BOND
GW&K MUNICIPAL ENHANCED YIELD
Gannett Welsh & Kotler, LLC
HIGH YIELD
J.P. Morgan Investment Management LLC
INTERMEDIATE DURATION GOVERNMENT
SHORT DURATION GOVERNMENT
Smith Breeden Associates, Inc.
MONEY MARKET
JPMorgan Investment Advisors Inc.
This report is prepared for the Funds’ shareholders. It is authorized for distribution to prospective investors only when preceded or accompanied by an effective prospectus. To receive a free copy of the prospectus or Statement of Additional Information, which includes additional information about Fund Trustees, please contact us by calling 800.835.3879. Distributed by Managers Distributors, Inc., member FINRA.
A description of the policies and procedures each Fund uses to vote its proxies is available: (i) without charge, upon request, by calling 800.835.3879, or (ii) on the Securities and Exchange Commission’s (SEC) Web site at www.sec.gov. For information regarding each Fund’s proxy voting record for the 12-month period ended June 30, call 800.835.3879 or visit the SEC Web site at www.sec.gov.
The Funds file their complete schedule of portfolio holdings with the SEC for the first and third quarters of each fiscal year on Form N-Q. The Funds’ Forms N-Q are available on the SEC’s website at www.sec.gov. A Fund’s Forms N-Q may be reviewed and copied at the SEC’s Public Reference Room in Washington, DC. Information on the operation of the Public Reference Room may be obtained by calling 800.SEC.0330. To review a complete list of the Funds’ portfolio holdings, or to view the most recent quarterly holdings report, semiannual report, or annual report, please visit www.managersinvest.com.

www.managersinvest.com

Not applicable for the semi-annual shareholder report.
| Item 3. | AUDIT COMMITTEE FINANCIAL EXPERT |
Not applicable for the semi-annual shareholder report.
| Item 4. | PRINCIPAL ACCOUNTANT FEES AND SERVICES |
Not applicable for the semi-annual shareholder report.
| Item 5. | AUDIT COMMITTEE OF LISTED REGISTRANTS |
Not applicable.
| Item 6. | SCHEDULE OF INVESTMENTS |
The schedule of investments in unaffiliated issuers as of the close of the reporting period is included as part of the shareholder report contained in Item 1 hereof.
| Item 7. | DISCLOSURE OF PROXY VOTING POLICIES AND PROCEDURES FOR CLOSED-END MANAGEMENT INVESTMENT COMPANIES |
Not applicable.
| Item 8. | PORTFOLIO MANAGERS OF CLOSED-END MANAGEMENT INVESTMENT COMPANIES |
Not applicable.
| Item 9. | PURCHASES OF EQUITY SECURITIES BY CLOSED-END MANAGEMENT INVESTMENT COMPANIES AND AFFILIATED PURCHASERS |
Not applicable.
| Item 10. | SUBMISSION OF MATTERS TO A VOTE OF SECURITY HOLDERS |
Not applicable.
| Item 11. | Controls and Procedures |
| | (a) | The registrant’s principal executive and principal financial officers have concluded, based on their evaluation of the registrant’s disclosure controls and procedures as of a date within 90 days of the filing date of this report, that the registrant’s disclosure controls and procedures are reasonably designed to ensure that information required to be disclosed by the registrant on Form N-CSR is recorded, processed, summarized and reported within the required time periods and that information required to be disclosed by the registrant in the reports that it files or submits on Form N-CSR is accumulated and communicated to the registrant’s management, including its principal executive and principal financial officers, as appropriate to allow timely decisions regarding required disclosure. |
| | (b) | There were no changes in the registrant’s internal control over financial reporting during the registrant’s second fiscal quarter of the period covered by this report that have materially affected, or are reasonably likely to materially affect, the internal control over financial reporting. |
| | |
| (a)(1) | | Not applicable. |
| |
| (a)(2) | | Certifications pursuant to Rule 30a-2(a) under the Investment Company Act of 1940 - Filed herewith. |
| |
| (a)(3) | | Not applicable. |
| |
| (b) | | Certifications pursuant to Rule 30a-2(b) under the Investment Company Act of 1940 - Filed herewith. |
SIGNATURES
Pursuant to the requirements of the Securities Exchange Act of 1934 and the Investment Company Act of 1940, the registrant has duly caused this report to be signed on its behalf by the undersigned, thereunto duly authorized.
| | |
| MANAGERS TRUST II |
| |
| By: | | /s/ John H. Streur |
| | John H. Streur, President |
| |
| Date: | | September 3, 2009 |
Pursuant to the requirements of the Securities Exchange Act of 1934 and the Investment Company Act of 1940, this report has been signed below by the following persons on behalf of the registrant and in the capacities and on the dates indicated.
| | |
| |
| By: | | /s/ John H. Streur |
| | John H. Streur, President |
| |
| Date: | | September 3, 2009 |
| |
| By: | | /s/ Donald S. Rumery |
| | Donald S. Rumery, Chief Financial Officer |
| |
| Date: | | September 3, 2009 |