UNITED STATES
SECURITIES AND EXCHANGE COMMISSION
Washington, D.C. 20549
FORM N-CSRS
CERTIFIED SHAREHOLDER REPORT OF REGISTERED
MANAGEMENT INVESTMENT COMPANIES
Investment Company Act file number: 811-06431
MANAGERS TRUST II
|
| (Exact name of registrant as specified in charter) |
| | |
| 800 Connecticut Avenue, Norwalk, Connecticut | | 06854 |
| (Address of principal executive offices) | | (Zip code) |
Managers Investment Group LLC
800 Connecticut Avenue, Norwalk, Connecticut 06854
|
| (Name and address of agent for service) |
Registrant’s telephone number, including area code: (203) 299-3500
Date of fiscal year end: DECEMBER 31
Date of reporting period: JANUARY 1, 2007 – JUNE 30, 2007 (Semi-Annual Shareholder Report)
| Item 1. | Reports to Shareholders |
SEMI-ANNUAL REPORT
Managers Trust II Funds
June 30, 2007
| | • | | Managers AMG Chicago Equity Partners Mid-Cap Fund |
| | • | | Managers AMG Chicago Equity Partners Balanced Fund |
| | • | | Managers High Yield Fund |
| | • | | Managers Fixed Income Fund |

The Managers Funds
Semi-Annual Report — June 30, 2007 (unaudited)
TABLE OF CONTENTS
Nothing contained herein is to be considered an offer, sale or solicitation of an offer to buy shares of The Managers Funds or Managers AMG Funds. Such offering is made only by Prospectus, which includes details as to offering price and other material information.
Letter to Shareholders
Dear Fellow Shareholder:
As most investors expected, the U.S. economy slowed over the course of the past six months and the rest of the world continued on a generally stable growth trajectory. Underpinned by a global economy performing generally within expectations, and, aside from a sharp and short-lived market correction beginning in late February, the domestic and foreign stock markets climbed steadily, providing strong gains for the period. For example, most domestic equity indices rose 7% or more during the period and international stocks provided stronger returns. Meanwhile, the bond market became increasingly volatile as the melt-down in the sub-prime lending sector caused a liquidity squeeze across other higher-risk sectors. This led investors to balance the perception that the growing global economy is putting pressure on inflation against the extent to which the liquidity squeeze will impede investment spending, acquisition activity and ultimately the U.S. and global economies.
Against this backdrop, your Funds produced positive results during the six-month period, as shown in the accompanying semiannual report.
While the strong equity market return may seem counterintuitive in the face of slowing earnings, a significantly deteriorating housing market and the stress fractures among the mortgage lending industry, there are several positive trends that lead to these results. First, because of widespread belief that the economy would be slowing, investors’ expectations for earnings growth were relatively conservative, and most companies exceeded these modest expectations during the period. Furthermore, although the U.S. economy is slowing, we believe the global economy is healthy, and global growth is a significant contributor to U.S. companies’ earnings. Another important factor has been the relatively high amount of liquidity searching for return in a relatively low interest rate environment. A clear illustration of this is the enormous amount of money committed to private equity pools that are searching for and buying up public companies on a regular basis. Low volatility and low interest rates have encouraged investors to increase leverage, which has thus far been rewarding.
Speaking of interest rates, at the beginning of the year investors were confidently predicting and wishing that the Fed would reduce rates in the near future—consistent with the expectations for a real slowdown in the economy. Over the course of the first half of 2007, however, expectations for a near-term rate cut evolved into uncertainty over the outlook for any rate cut at all, as the Fed has been satisfied to stand pat and communicate concerns balanced between too much inflation risk versus a slowing economy. Again, while the economy has slowed, we believe it does not appear to be falling into recession, and in fact improved during the second quarter. Although credit spreads remained tight into late May because of a high demand for yield and historically low default rates, spreads have widened significantly since then as the domino effect started by sub-prime lending defaults has prompted investors to rapidly reduce their risk exposure. Prices of high-yield bonds across all sectors have declined, the yield premium for credit default swaps (CDS) has expanded, and prices for investment grade corporate bonds have suffered, even without a deterioration in fundamental quality.
The extent and duration of this recent liquidity squeeze will be the key to the direction of the financial markets over the second half of the year. If this sharp sell off of risk is brief, as it was in February, and markets reach equilibrium within the third quarter, then we think the relatively sound fundamentals of the U.S. and global economies should only be mildly affected. Equity markets, which appear to us to be fairly valued under that scenario, will be free to move higher, default rates will remain low, and bond prices will recover. However, price declines in a leveraged marketplace have an ability to create a viscous cycle. If dominos continue to fall, forcing more investors to sell or hedge risky assets, even relatively liquid and high quality debt securities will trade lower. If the ample liquidity that has been driving profitability, acquisitions, and the equity markets higher is restricted, the rise in cost of capital will hinder profitability, increase default rates and significantly deter investment spending which will, in our opinion, in time, weaken the U.S. economy.
Noting these risks and known stresses, we believe that the current strength of many foreign economies, the continued full U.S. employment picture, and the continued high levels of corporate free cash flow will all help to pull the U.S. economy through this technical liquidity squeeze. In addition, if the credit markets continue to deteriorate, we expect that the Fed will be inclined to add liquidity by reducing rates to mitigate the problem. Hence, we continue to believe that investors should maintain their portfolios with allocations near their long-run targets, rebalance if necessary and take full advantage of opportunities to participate in the growth of the global economy. In any event, investors will be well served by an appropriately balanced and globally diversified portfolio.
1
Letter to Shareholders (continued)
One of our foremost goals at Managers Investment Group is to structure and manage mutual funds that will help our shareholders and clients become more successful in reaching their investment goals and objectives. Each of our Funds is geared to provide you with exposure to a specific asset class or segment of the market. Investors tend to use our Funds as part of their overall asset allocation in order to structure a well-diversified portfolio intended to meet individual needs. Most of our Funds, like the Managers Money Market Fund, are therefore designed to be building blocks.
The following report contains details for each of the Funds and covers the six-month period ended June 30, 2007. Should you have any questions about this report, or if you’d like to receive a Prospectus and additional information, including fees and expenses, for these or any of the other Funds in our family, please feel free to contact us at 1-800-835-3879, or visit our website at www.managersinvest.com. As always, please read the Prospectus carefully before you invest or send money.
If you are curious about how you can better diversify your investment program, visit the Knowledge Center on our Web site and view our articles in the investment strategies section. You can rest assured that under all market conditions our team is focused on delivering excellent investment management services for your benefit.
We thank you for your continued confidence and investment in The Managers Funds.
Sincerely,
| | |
 | |  |
| John Streur | | Thomas G. Hoffman, CFA |
| Senior Managing Partner | | Executive Vice President |
| Managers Investment Group LLC | | Chief Investment Officer |
| | Managers Investment Group LLC |
2
About Your Fund's Expenses (unaudited)
As a shareholder of the Fund, you incur two types of costs: (1) transaction costs, including sales charges (loads) on purchase payments; reinvested dividends or other distributions; redemption fees; and exchange fees; and (2) ongoing costs, including management fees; distribution (12b-1) fees; and other Fund expenses. This Example is intended to help you understand your ongoing costs (in dollars) of investing in the Fund and to compare these costs with the ongoing costs of investing in other mutual funds. The Example is based on an investment of $1,000 invested at the beginning of the period and held for the entire period as indicated below.
Actual Fund Return
The first line of the table below provides information about actual account values and actual expenses. You may use the information in this line, together with the amount you invested, to estimate the expenses that you paid over the period. Simply divide your account value by $1,000 (for example, an $8,600 account value divided by $1,000 = 8.6), then multiply the result by the number in the first line under the heading entitled “Expenses Paid During Period” to estimate the expenses you paid on your account during this period.
Hypothetical Example for Comparison Purposes
The second line of the table below provides information about hypothetical account values and hypothetical expenses based on the Fund’s actual expense ratio and an assumed rate of return of 5% per year before expenses, which is not the Fund’s actual return. The hypothetical account values and expenses may not be used to estimate the actual ending account balance or expenses you paid for the period. You may use this information to compare the ongoing costs of investing in the Fund and other funds. To do so, compare this 5% hypothetical example with the 5% hypothetical examples that appear in the shareholder reports of the other funds.
Please note that the expenses shown in the table are meant to highlight your ongoing costs only and do not reflect any transactional costs, such as sales charges (loads), redemption fees, or exchange fees. Therefore, the second line of the table is useful in comparing ongoing costs only, and will not help you determine the relative total costs of owning different funds. In addition, if these transactional costs were included, your costs would have been higher.
| | | | | | | | | |
Six Months Ended June 30, 2007 | | Beginning
Account Value
1/1/2007 | | Ending
Account Value
6/30/2007 | | Expenses
Paid During
Period* |
Mid-Cap Fund Class A | | | | | | | | | |
Based on Actual Fund Return | | $ | 1,000 | | $ | 1,121 | | $ | 6.52 |
Based on Hypothetical 5% Annual Return | | $ | 1,000 | | $ | 1,019 | | $ | 6.21 |
Mid-Cap Fund Class B | | | | | | | | | |
Based on Actual Fund Return | | $ | 1,000 | | $ | 1,120 | | $ | 10.46 |
Based on Hypothetical 5% Annual Return | | $ | 1,000 | | $ | 1,015 | | $ | 9.94 |
Mid-Cap Fund Class C | | | | | | | | | |
Based on Actual Fund Return | | $ | 1,000 | | $ | 1,117 | | $ | 10.45 |
Based on Hypothetical 5% Annual Return | | $ | 1,000 | | $ | 1,015 | | $ | 9.94 |
Mid-Cap Fund Institutional Class | | | | | | | | | |
Based on Actual Fund Return | | $ | 1,000 | | $ | 1,123 | | $ | 5.21 |
Based on Hypothetical 5% Annual Return | | $ | 1,000 | | $ | 1,020 | | $ | 4.96 |
Balanced Fund Class A | | | | | | | | | |
Based on Actual Fund Return | | $ | 1,000 | | $ | 1,043 | | $ | 6.33 |
Based on Hypothetical 5% Annual Return | | $ | 1,000 | | $ | 1,019 | | $ | 6.26 |
Balanced Fund Class B | | | | | | | | | |
Based on Actual Fund Return | | $ | 1,000 | | $ | 1,039 | | $ | 10.11 |
Based on Hypothetical 5% Annual Return | | $ | 1,000 | | $ | 1,015 | | $ | 9.99 |
Balanced Fund Class C | | | | | | | | | |
Based on Actual Fund Return | | $ | 1,000 | | $ | 1,039 | | $ | 10.11 |
Based on Hypothetical 5% Annual Return | | $ | 1,000 | | $ | 1,015 | | $ | 9.99 |
Balanced Fund Institutional Class | | | | | | | | | |
Based on Actual Fund Return | | $ | 1,000 | | $ | 1,044 | | $ | 5.07 |
Based on Hypothetical 5% Annual Return | | $ | 1,000 | | $ | 1,020 | | $ | 5.01 |
High Yield Fund Class A | | | | | | | | | |
Based on Actual Fund Return | | $ | 1,000 | | $ | 1,028 | | $ | 5.78 |
Based on Hypothetical 5% Annual Return | | $ | 1,000 | | $ | 1,019 | | $ | 5.76 |
High Yield Fund Class B | | | | | | | | | |
Based on Actual Fund Return | | $ | 1,000 | | $ | 1,024 | | $ | 9.54 |
Based on Hypothetical 5% Annual Return | | $ | 1,000 | | $ | 1,015 | | $ | 9.49 |
High Yield Fund Class C | | | | | | | | | |
Based on Actual Fund Return | | $ | 1,000 | | $ | 1,024 | | $ | 9.54 |
Based on Hypothetical 5% Annual Return | | $ | 1,000 | | $ | 1,015 | | $ | 9.49 |
High Yield Fund Institutional Class | | | | | | | | | |
Based on Actual Fund Return | | $ | 1,000 | | $ | 1,029 | | $ | 4.53 |
Based on Hypothetical 5% Annual Return | | $ | 1,000 | | $ | 1,020 | | $ | 4.51 |
Fixed Income Fund Class A | | | | | | | | | |
Based on Actual Fund Return | | $ | 1,000 | | $ | 1,011 | | $ | 4.19 |
Based on Hypothetical 5% Annual Return | | $ | 1,000 | | $ | 1,021 | | $ | 4.21 |
Fixed Income Fund Class B | | | | | | | | | |
Based on Actual Fund Return | | $ | 1,000 | | $ | 1,007 | | $ | 7.91 |
Based on Hypothetical 5% Annual Return | | $ | 1,000 | | $ | 1,017 | | $ | 7.95 |
Fixed Income Fund Class C | | | | | | | | | |
Based on Actual Fund Return | | $ | 1,000 | | $ | 1,008 | | $ | 7.91 |
Based on Hypothetical 5% Annual Return | | $ | 1,000 | | $ | 1,017 | | $ | 7.95 |
Fixed Income Fund Institutional Class | | | | | | | | | |
Based on Actual Fund Return | | $ | 1,000 | | $ | 1,012 | | $ | 2.94 |
Based on Hypothetical 5% Annual Return | | $ | 1,000 | | $ | 1,022 | | $ | 2.96 |
| * | Expenses are equal to the Fund’s annualized expense ratio multiplied by the average account value over the period, multiplied by the number of days in the most recent fiscal half-year (181), then divided by 365. |
3
Funds Performance
All periods ended June 30, 2007 (unaudited)
| | | | | | | | | | | | | | | | | | |
Average Annual Total Returns 1 | | | | | | Six
Months | | | 1
Year | | | 5
Years | | | Since
Inception | | | Inception
Date |
Mid-Cap 3 | | -Class A | | No Load | | 12.12 | % | | 18.01 | % | | 13.62 | % | | 13.87 | % | | 01/02/97 |
| | -Class A | | With Load | | 5.68 | % | | 11.21 | % | | 12.28 | % | | 13.23 | % | | 01/02/97 |
| | -Class B | | No Load | | 11.96 | % | | 17.40 | % | | 13.01 | % | | 12.45 | % | | 01/28/98 |
| | -Class B | | With Load | | 6.96 | % | | 12.40 | % | | 12.77 | % | | 12.45 | % | | 01/28/98 |
| | -Class C | | No Load | | 11.74 | % | | 17.16 | % | | 12.96 | % | | 11.65 | % | | 02/19/98 |
| | -Class C | | With Load | | 10.74 | % | | 16.16 | % | | 12.96 | % | | 11.65 | % | | 02/19/98 |
| | -Institutional Class | | No Load | | 12.26 | % | | 18.32 | % | | 14.07 | % | | 14.40 | % | | 01/02/97 |
S&P Mid Cap 400 Index 4 | | | | | | 11.98 | % | | 18.51 | % | | 14.17 | % | | 14.17 | %a | | |
| | | | | | | |
Balanced 2 | | -Class A | | No Load | | 4.32 | % | | 15.43 | % | | 9.66 | % | | 9.19 | % | | 01/02/97 |
| | -Class A | | With Load | | (1.64 | )% | | 8.78 | % | | 8.37 | % | | 8.58 | % | | 01/02/97 |
| | -Class B | | No Load | | 3.92 | % | | 14.56 | % | | 9.01 | % | | 7.35 | % | | 02/10/98 |
| | -Class B | | With Load | | (1.08 | )% | | 9.56 | % | | 8.72 | % | | 7.35 | % | | 02/10/98 |
| | -Class C | | No Load | | 3.88 | % | | 14.60 | % | | 8.99 | % | | 7.28 | % | | 02/13/98 |
| | -Class C | | With Load | | 2.88 | % | | 13.60 | % | | 8.99 | % | | 7.28 | % | | 02/13/98 |
| | -Institutional Class | | No Load | | 4.42 | % | | 15.79 | % | | 10.09 | % | | 9.69 | % | | 01/02/97 |
60% S&P 500 Index & 40% Lehman Brothers Aggregate Bond Index 5 | | | | | | 4.61 | % | | 14.72 | % | | 8.53 | % | | 8.13 | %b | | |
| | | | | | | |
High Yield 2,8 | | -Class A | | No Load | | 2.78 | % | | 10.75 | % | | 12.51 | % | | 6.73 | % | | 01/02/98 |
| | -Class A | | With Load | | (1.55 | )% | | 6.02 | % | | 11.54 | % | | 6.25 | % | | 01/02/98 |
| | -Class B | | No Load | | 2.40 | % | | 9.87 | % | | 11.80 | % | | 5.67 | % | | 02/19/98 |
| | -Class B | | With Load | | (2.57 | )% | | 4.87 | % | | 11.54 | % | | 5.67 | % | | 02/19/98 |
| | -Class C | | No Load | | 2.42 | % | | 9.91 | % | | 11.81 | % | | 5.67 | % | | 02/19/98 |
| | -Class C | | With Load | | 1.42 | % | | 8.91 | % | | 11.81 | % | | 5.67 | % | | 02/19/98 |
| | -Institutional Class | | No Load | | 2.89 | % | | 11.08 | % | | 12.96 | % | | 6.74 | % | | 03/02/98 |
Lehman Brothers U.S. Corporate High Yield Bond Index 6 | | | | | | 2.87 | % | | 11.55 | % | | 11.91 | % | | 5.92 | %c | | |
| | | | | | | |
Fixed Income 2,9 | | -Class A | | No Load | | 1.12 | % | | 9.02 | % | | 6.18 | % | | 6.34 | % | | 01/02/97 |
| | -Class A | | With Load | | (3.20 | )% | | 4.35 | % | | 5.27 | % | | 5.90 | % | | 01/02/97 |
| | -Class B | | No Load | | 0.74 | % | | 8.27 | % | | 5.52 | % | | 5.45 | % | | 03/20/98 |
| | -Class B | | With Load | | (4.19 | )% | | 3.27 | % | | 5.20 | % | | 5.45 | % | | 03/20/98 |
| | -Class C | | No Load | | 0.75 | % | | 8.23 | % | | 5.52 | % | | 5.58 | % | | 03/05/98 |
| | -Class C | | With Load | | (0.24 | )% | | 7.23 | % | | 5.52 | % | | 5.58 | % | | 03/05/98 |
| | -Institutional Class | | No Load | | 1.24 | % | | 9.26 | % | | 6.58 | % | | 6.85 | % | | 01/02/97 |
Lehman Brothers Aggregate Bond Index 7 | | | | | | 0.98 | % | | 6.12 | % | | 4.48 | % | | 6.07 | %d | | |
a | Performance for the S&P Mid Cap 400 Index reflects an inception date of January 2, 1997. |
b | Performance for the 60% S&P 500 Index & 40% Lehman Brothers Aggregate Bond Index reflects an inception date of January 2, 1997. |
c | Performance for the Lehman Brothers U.S. Corporate High Yield Bond Index reflects an inception date of December 31, 1997. |
d | Performance for the Lehman Brothers Aggregate Bond Index reflects an inception date of January 2, 1997. |
The performance data shown represents past performance. Past performance is not a guarantee of future results. Current performance may be lower or higher than the performance data quoted. The investment return and the principal value of an investment will fluctuate so that an investor’s shares, when redeemed, may be worth more or less than their original cost. For performance information through the most recent month end please call (800) 835-3879 or visit our Web site at www.managersinvest.com.
4
Managers Funds Performance
All periods ended June 30, 2007 (continued)
Performance differences among the share classes are due to differences in sales charge structures and class expenses. Returns shown reflect maximum sales charge of 5.75% on Class A (4.25% maximum for Managers High Yield and Fixed Income Funds), as well as the applicable contingent deferred sales charge (CDSC) on both Class B and C shares. The Class B shares’ CDSC declines annually between years 1 through 6 according to the following schedule: 5, 4, 3, 3, 2, 1%. No sales charge is assessed after year six. Class C shares held for less than one year are subject to a 1% CDSC.
The Fund share classes differ with regard to sales charges and Fund expenses. In choosing a Fund and class(es), investors should consider the amount they plan to invest, their investment objectives, the Fund’s investment objectives, risks, charges, and expenses carefully before investing, and how long they intend to keep their money invested in the Fund and class(es). Each Fund’s prospectus contains information concerning the Fund’s investment objective, risk, charges, and expenses and other information. Additional risks are associated with investing in high yield securities and such securities may be considered speculative. There are also risks associated with investing in small-cap companies, such as increased volatility, and bonds, such as rising interest rates. More specifically, the value of debt instruments held in bond funds declines when interest rates rise and longer-term bonds are more vulnerable to interest rate risk. To obtain a prospectus, please call 800-835-3879 or visit our website at www.managersinvest.com. Please read the Prospectus carefully before you invest in a Fund or send money. Investors should discuss their goals and choices with a registered financial professional in order to determine which share class is appropriate for them.
Distributed by Managers Distributors, Inc., member FINRA.
1 | Total return equals income yield plus share price change and assumes reinvestment of all dividends and capital gain distributions. Returns are net of fees and may reflect offsets of Fund expenses as described in the Prospectus. No adjustment has been made for taxes payable by shareholders on their reinvested dividends and capital gain distributions. Returns for periods greater than one year are annualized. |
2 | Changing interest rates may adversely affect the value of an investment. An increase in interest rates typically causes the value of bonds and other fixed-income securities to fall. |
3 | The Fund is subject to risks associated with investments in mid-capitalization companies, such as erratic earnings patterns, competitive conditions, limited earnings history, and a reliance on a limited number of products. |
4 | The S&P MidCap 400 Index is the most widely used index for mid-size companies and covers approximately 7% of the U.S. equities market. Unlike the Fund, the S&P Mid Cap 400 Index is unmanaged, is not available for investment, and does not incur expenses. |
5 | The benchmark is composed of 60% S&P 500 Index and 40% Lehman Brothers Aggregate Bond Index. |
6 | The Lehman Brothers U.S. Corporate High Yield Bond Index is a total return performance benchmark for fixed income securities having a maximum quality rating of Ba1 (as determined by Moody’s Investors Service). Unlike the Fund, the Lehman Brothers U.S. Corporate High Yield Bond Index is unmanaged, is not available for investment, and does not incur expenses. |
7 | The Lehman Brothers Aggregate Bond Index is an index of the U.S. investment-grade fixed-rate bond market, including both government and corporate bonds. Unlike the Fund, the Lehman Brothers Aggregate Bond Index is unmanaged, is not available for investment, and does not incur expenses. |
8 | The Fund holds securities in which the issuer of the security may default or otherwise be unable to honor a financial obligation. The Fund holds securities rated below investment grade that are especially susceptible to this risk. These issuers may be involved in bankruptcy proceedings, reorganizations, or financial restructurings, and are not as strong financially as higher rated issuers. |
9 | Fixed-income funds are subject to the risks associated with investments in debt securities, such as default risk and fluctuations in the perception of the debtors ability to pay its creditors. |
5
Mid-Cap
Fund Snapshots
June 30, 2007 (unaudited)
Portfolio Breakdown
| | | | | | | | |
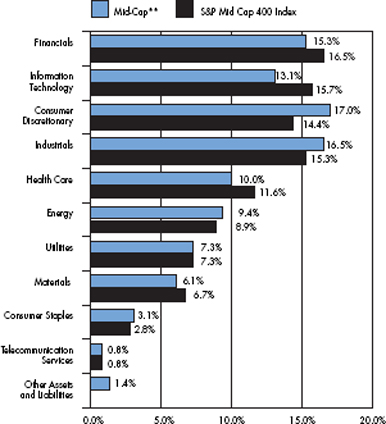 | | Industry | | Mid-Cap** | | | S&P Mid Cap
400 Index | |
| | Financials | | 15.3 | % | | 16.5 | % |
| | Information Technology | | 13.1 | % | | 15.7 | % |
| | Consumer Discretionary | | 17.0 | % | | 14.4 | % |
| | Industrials | | 16.5 | % | | 15.3 | % |
| | Health Care | | 10.0 | % | | 11.6 | % |
| | Energy | | 9.4 | % | | 8.9 | % |
| | Utilities | | 7.3 | % | | 7.3 | % |
| | Materials | | 6.1 | % | | 6.7 | % |
| | Consumer Staples | | 3.1 | % | | 2.8 | % |
| | Telecommunication Services | | 0.8 | % | | 0.8 | % |
| | Other Assets and Liabilities | | 1.4 | % | | 0.0 | % |
| ** | As a percentage of net assets |
Top Ten Holdings
| | | |
Top Ten Holdings | | % of
Net Assets | |
Cummins, Inc.* | | 2.7 | % |
Everest Re Group Ltd. | | 2.6 | |
Tidewater, Inc. | | 2.5 | |
Family Dollar Stores, Inc. | | 2.0 | |
Terex Corp.* | | 1.9 | |
ITT Educational Services, Inc. | | 1.8 | |
Tesoro Corp.* | | 1.8 | |
American Financial Group, Inc. | | 1.8 | |
Ross Stores, Inc. | | 1.7 | |
Alliant Energy Corp. | | 1.6 | |
| | | |
Top Ten as a Group | | 20.4 | % |
| | | |
| * | Top Ten Holding at December 31, 2006 |
Any sectors, industries, or securities discussed should not be perceived as investment recommendations. Mention of a specific security should not be considered a recommendation to buy or solicitation to sell that security.
6
Mid-Cap
Schedule of Portfolio Investments
June 30, 2007 (unaudited)
| | | | | | |
| | | Shares | | | Value |
Common Stocks—98.6% | | | | | | |
Consumer Discretionary—17.0% | | | | | | |
Aeropostale, Inc.* | | 27,800 | | | $ | 1,158,704 |
American Greetings Corp., Class A | | 18,500 | | | | 524,105 |
AnnTaylor Stores Corp.* | | 7,700 | | | | 272,734 |
ArvinMeritor, Inc. | | 38,700 | 2 | | | 859,140 |
Big Lots, Inc.* | | 12,600 | 2 | | | 370,692 |
Blyth, Inc. | | 9,900 | | | | 263,142 |
Brinker International, Inc. | | 16,700 | 2 | | | 488,809 |
Darden Restaurants, Inc. | | 5,600 | 2 | | | 246,344 |
DeVry, Inc. | | 17,400 | 2 | | | 591,948 |
Dollar Tree Stores, Inc.* | | 10,000 | | | | 435,500 |
Expedia, Inc.* | | 12,900 | | | | 377,841 |
Family Dollar Stores, Inc. | | 52,100 | 2 | | | 1,788,072 |
Goodyear Tire & Rubber Co.* | | 11,900 | 2 | | | 413,644 |
Hasbro, Inc. | | 30,000 | | | | 942,300 |
ITT Educational Services, Inc.* | | 14,400 | | | | 1,690,272 |
Jack in the Box, Inc.* | | 3,200 | | | | 227,008 |
Marvel Entertainment, Inc.* | | 19,200 | 2 | | | 489,216 |
NVR, Inc.* | | 900 | 2 | | | 611,775 |
Polo Ralph Lauren Corp. | | 1,600 | | | | 156,976 |
RadioShack Corp. | | 5,300 | 2 | | | 175,642 |
Ross Stores, Inc. | | 49,700 | | | | 1,530,760 |
Service Corp. International | | 15,100 | | | | 192,978 |
Sherwin-Williams Co., The | | 17,400 | | | | 1,156,578 |
Whirlpool Corp. | | 5,000 | 2 | | | 556,000 |
Total Consumer Discretionary | | | | | | 15,520,180 |
Consumer Staples—3.1% | | | | | | |
Energizer Holdings, Inc.* | | 9,100 | 2 | | | 906,360 |
Estee Lauder Co., Class A | | 4,500 | 2 | | | 204,795 |
McCormick & Co., Inc. | | 3,700 | 2 | | | 141,266 |
NBTY, Inc.* | | 12,300 | | | | 531,360 |
Tyson Foods, Inc., Class A | | 47,500 | 2 | | | 1,094,400 |
Total Consumer Staples | | | | | | 2,878,181 |
Energy—9.4% | | | | | | |
Frontier Oil Corp. | | 16,400 | | | | 717,828 |
Holly Corp. | | 11,700 | 2 | | | 868,023 |
Noble Energy, Inc. | | 14,600 | | | | 910,894 |
Overseas Shipholding Group, Inc. | | 15,700 | | | | 1,277,980 |
Patterson-UTI Energy, Inc. | | 16,000 | | | | 419,360 |
Tesoro Corp. | | 29,400 | 2 | | | 1,680,210 |
Tidewater, Inc. | | 32,100 | 2 | | | 2,275,248 |
Unit Corp.* | | 7,800 | 2 | | | 490,698 |
Total Energy | | | | | | 8,640,241 |
Financials—15.3% | | | | | | |
AG Edwards, Inc. | | 7,600 | | | | 642,580 |
American Financial Group, Inc. | | 47,300 | | | | 1,615,295 |
AmeriCredit Corp.* | | 6,100 | 2 | | | 161,955 |
Associates Bank Corp. | | 19,900 | 2 | | | 650,730 |
CB Richard Ellis Group, Inc.* | | 3,300 | | | | 120,450 |
City National Corp. | | 8,300 | 2 | | | 631,547 |
Eaton Vance Corp. | | 4,600 | 2 | | | 203,228 |
Everest Re Group Ltd. | | 21,800 | | | | 2,368,352 |
First Industrial Realty Trust, Inc. | | 11,900 | | | | 461,244 |
First Marblehead Corp., The | | 4,450 | 2 | | | 171,948 |
Highwoods Properties, Inc. | | 22,500 | | | | 843,750 |
Hospitality Properties Trust | | 22,600 | 2 | | | 937,674 |
HRPT Properties Trust | | 20,300 | | | | 211,120 |
Investors Financial Services Corp. | | 4,100 | | | | 252,847 |
Leucadia National Corp. | | 4,500 | | | | 158,625 |
PMI Group, Inc. | | 32,400 | | | | 1,447,308 |
Potlatch Corp. | | 16,500 | | | | 710,325 |
Radian Group, Inc. | | 21,500 | | | | 1,161,000 |
Raymond James Financial, Inc. | | 15,700 | 2 | | | 485,130 |
Wilmington Trust Corp. | | 18,500 | | | | 767,935 |
Total Financials | | | | | | 14,003,043 |
Health Care—10.0% | | | | | | |
Applera Corp—Applied Biosystems Group | | 37,900 | | | | 1,157,466 |
Charles River Laboratories International, Inc.* | | 12,400 | | | | 640,088 |
Coventry Health Care, Inc.* | | 18,425 | | | | 1,062,201 |
CR Bard, Inc. | | 2,200 | 2 | | | 181,786 |
Health Net, Inc.* | | 18,900 | | | | 997,920 |
Hillenbrand Industries, Inc. | | 11,100 | | | | 721,500 |
ImClone Systems, Inc.* | | 9,700 | | | | 342,992 |
Invitrogen Corp.* | | 1,900 | 2 | | | 140,125 |
Kinetic Concepts, Inc.* | | 7,900 | | | | 410,563 |
King Pharmaceuticals, Inc.* | | 26,100 | 2 | | | 534,006 |
Manor Care, Inc. | | 7,600 | | | | 496,204 |
Millennium Pharmaceuticals, Inc.* | | 43,500 | | | | 459,795 |
Pediatrix Medical Group, Inc.* | | 3,000 | | | | 165,450 |
Steris Corp. | | 9,400 | | | | 287,640 |
Techne Corp.* | | 14,800 | | | | 846,708 |
Universal Health Services, Inc., Class B | | 4,600 | | | | 282,900 |
The accompanying notes are an integral part of these financial statements.
7
Mid-Cap
Schedule of Portfolio Investments (continued)
| | | | | | | |
| | | Shares | | | Value | |
Health Care—10.0% (continued) | | | | | | | |
WellCare Health Plans, Inc.* | | 4,800 | | | $ | 434,448 | |
Total Health Care | | | | | | 9,161,792 | |
Industrials—16.5% | | | | | | | |
Acuity Brands, Inc. | | 8,000 | 2 | | | 482,240 | |
Belden CDT, Inc. | | 12,100 | | | | 669,735 | |
Continental Airlines, Inc.* | | 16,900 | | | | 572,403 | |
Cummins, Inc. | | 24,600 | | | | 2,489,767 | |
Deluxe Corp. | | 17,400 | 2 | | | 706,614 | |
Dun & Bradstreet Corp. | | 6,700 | | | | 689,966 | |
Equifax, Inc. | | 24,800 | 2 | | | 1,101,616 | |
Granite Construction, Inc. | | 11,300 | | | | 725,234 | |
IKON Office Solutions, Inc. | | 22,900 | 2 | | | 357,469 | |
Jacobs Engineering Group, Inc.* | | 8,500 | 2 | | | 488,835 | |
Korn/Ferry International* | | 9,800 | | | | 257,348 | |
Lennox International, Inc. | | 15,000 | | | | 513,450 | |
Manitowoc Co., The | | 5,400 | | | | 434,052 | |
Manpower, Inc. | | 9,200 | 2 | | | 848,608 | |
Precision Castparts Corp. | | 2,000 | | | | 242,720 | |
R.R. Donnelley & Sons Co. | | 6,000 | | | | 261,060 | |
Republic Services, Inc. | | 18,750 | | | | 574,500 | |
Rollins, Inc. | | 6,000 | | | | 136,620 | |
SPX Corp. | | 5,000 | | | | 439,050 | |
Teleflex, Inc. | | 3,700 | | | | 302,586 | |
Terex Corp.* | | 21,600 | | | | 1,756,080 | |
US Airways Group, Inc.* | | 25,200 | 2 | | | 762,804 | |
YRC Worldwide, Inc.* | | 7,100 | | | | 261,280 | |
Total Industrials | | | | | | 15,074,037 | |
Information Technology—13.1% | | | | | | | |
Avnet, Inc.* | | 28,900 | 2 | | | 1,145,596 | |
BMC Software, Inc.* | | 24,900 | | | | 754,470 | |
Cadence Design Systems, Inc.* | | 16,000 | | | | 351,360 | |
CommScope, Inc.* | | 11,700 | | | | 682,695 | |
Compuware Corp.* | | 26,000 | | | | 308,360 | |
CSG Systems International, Inc.* | | 13,200 | | | | 349,932 | |
Factset Research Systems, Inc. | | 11,350 | | | | 775,772 | |
Gartner, Inc.* | | 21,600 | 2 | | | 531,144 | |
Ingram Micro, Inc., Class A* | | 46,800 | | | | 1,016,028 | |
International Rectifier Corp* | | 19,400 | 2 | | | 722,844 | |
Intersil Corp., Class A | | 37,300 | | | | 1,173,458 | |
Lexmark International, Inc.* | | 6,200 | | | | 305,722 | |
McAfee, Inc.* | | 24,900 | | | | 876,480 | |
Polycom, Inc.* | | 28,900 | | | | 971,040 | |
Semtech Corp.* | | 31,500 | | | | 545,895 | |
Teradyne, Inc.* | | 19,800 | 2 | | | 348,084 | |
Vishay Intertechnology, Inc.* | | 48,600 | | | | 768,852 | |
Western Digital Corp.* | | 17,700 | 2 | | | 342,495 | |
Total Information Technology | | | | | | 11,970,227 | |
Materials—6.1% | | | | | | | |
Ashland, Inc. | | 11,900 | | | | 761,005 | |
Celanese Corp. | | 26,300 | | | | 1,019,914 | |
CF Industries Holdings, Inc. | | 16,100 | | | | 964,229 | |
Chaparral Steel Co. | | 19,200 | | | | 1,379,904 | |
Lubrizol Corp. | | 2,600 | | | | 167,830 | |
Olin Corp. | | 29,800 | 2 | | | 625,800 | |
Pactiv Corp.* | | 6,100 | | | | 194,529 | |
Sonoco Products Co. | | 10,300 | | | | 440,943 | |
Total Materials | | | | | | 5,554,154 | |
Telecommunication Services—0.8% | | | | | | | |
Centurytel, Inc. | | 11,300 | 2 | | | 554,265 | |
Telephone & Data Systems, Inc. | | 2,200 | | | | 137,654 | |
Total Telecommunication Services | | | | | | 691,919 | |
Utilities—7.3% | | | | | | | |
Alliant Energy Corp. | | 38,600 | | | | 1,499,610 | |
Energy East Corp | | 17,200 | | | | 448,748 | |
MDU Resources Group, Inc. | | 42,950 | 2 | | | 1,204,318 | |
Nicor, Inc. | | 6,700 | | | | 287,564 | |
OGE Energy Corp. | | 34,100 | | | | 1,249,765 | |
Oneok, Inc. | | 9,900 | | | | 499,059 | |
Reliant Resources, Inc.* | | 38,400 | | | | 1,034,880 | |
WGL Holdings, Inc. | | 14,600 | 2 | | | 476,544 | |
Total Utilities | | | | | | 6,700,488 | |
Total Common Stocks (cost $78,203,600) | | | | | | 90,194,262 | |
Other Investment Companies—23.2%1 | | | | | | | |
Bank of New York Institutional Cash Reserves Fund, 5.33%3 | | 19,577,790 | | | | 19,577,790 | |
JPMorgan Prime Money Market Fund, Institutional Class Shares, 5.19% | | 1,668,215 | | | | 1,668,215 | |
Total Other Investment Companies (cost $21,246,005) | | | | | | 21,246,005 | |
Total Investments—121.8% (cost $99,449,605) | | | | | | 111,440,267 | |
Other Assets, less Liabilities—(21.8)% | | | | | | (19,942,947 | ) |
Net Assets—100% | | | | | $ | 91,497,320 | |
The accompanying notes are an integral part of these financial statements.
8
Balanced
Fund Snapshots
June 30, 2007 (unaudited)
Portfolio Breakdown
| | | | | |
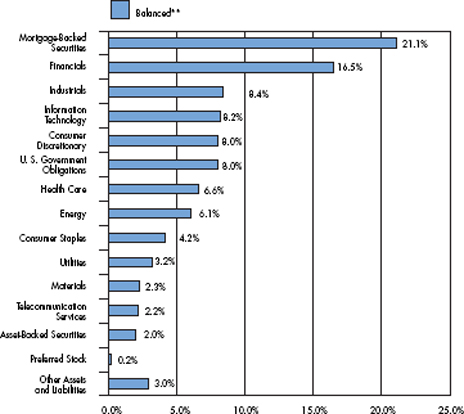 | | Industry | | Balanced** | |
| | Mortgage-Backed Securities | | 21.1 | % |
| | Financials | | 16.5 | % |
| | Industrials | | 8.4 | % |
| | Information Technology | | 8.2 | % |
| | Consumer Discretionary | | 8.0 | % |
| | U. S. Government Obligations | | 8.0 | % |
| | Health Care | | 6.6 | % |
| | Energy | | 6.1 | % |
| | Consumer Staples | | 4.2 | % |
| | Utilities | | 3.2 | % |
| | Materials | | 2.3 | % |
| | Telecommunication Services | | 2.2 | % |
| | Asset-Backed Securities | | 2.0 | % |
| | Preferred Stock | | 0.2 | % |
| | Other Assets and Liabilities | | 3.0 | % |
| ** | As a percentage of net assets |
Top Ten Holdings
| | | |
Top Ten Holdings | | % of
Net Assets | |
FNMA, 5.000%, 02/01/22 to 06/01/37 | | 4.8 | % |
FNMA, 5.500%, 02/01/22 to 06/01/37 | | 4.8 | |
FNMA, 6.000%, 03/01/12 to 04/01/37 | | 3.4 | |
FNMA, 4.500%, 07/01/18 to 09/01/35 | | 3.0 | |
USTB, 5.250%, 11/15/28 | | 2.5 | |
AT&T, Inc. | | 2.2 | |
FNMA, 5.375%, 11/15/11 | | 2.1 | |
Bank of America Corp.* | | 1.9 | |
JPMorgan Chase & Co.* | | 1.9 | |
Johnson & Johnson Co.* | | 1.7 | |
| | | |
Top Ten as a Group | | 28.3 | % |
| | | |
| * | Top Ten Holding at December 31, 2006 |
Any sectors, industries, or securities discussed should not be perceived as investment recommendations. Mention of a specific security should not be considered a recommendation to buy or solicitation to sell that security.
9
Balanced
Schedule of Portfolio Investments
June 30, 2007 (unaudited)
| | | | | | |
Security Description | | Shares | | | Value |
Common Stocks—58.4% | | | | | | |
Consumer Discretionary—8.0% | | | | | | |
CBS Corp., Class B | | 6,300 | 2 | | $ | 209,916 |
Citadel Broadcasting Corp. | | 176 | 2 | | | 1,135 |
Expedia, Inc.* | | 1,000 | 2 | | | 29,290 |
Family Dollar Stores, Inc. | | 2,700 | | | | 92,664 |
Goodyear Tire & Rubber Co.* | | 700 | 2 | | | 24,332 |
IAC/InterActive Corp.* | | 4,600 | | | | 159,206 |
ITT Educational Services, Inc.* | | 200 | | | | 23,476 |
J.C. Penney Co., Inc. | | 1,200 | 2 | | | 86,856 |
Kohl’s Corp.* | | 700 | | | | 49,721 |
Mattel, Inc. | | 1,500 | | | | 37,935 |
McDonald’s Corp. | | 5,100 | | | | 258,876 |
McGraw-Hill Companies, Inc., The | | 600 | 2 | | | 40,848 |
Nike, Inc. | | 400 | | | | 23,316 |
Omnicom Group, Inc. | | 3,200 | | | | 169,344 |
RadioShack Corp. | | 7,900 | 2 | | | 261,806 |
Ross Stores, Inc. | | 2,400 | | | | 73,920 |
Sherwin-Williams Co., The | | 2,100 | | | | 139,587 |
Walt Disney Co., The | | 2,100 | | | | 71,694 |
Total Consumer Discretionary | | | | | | 1,753,922 |
Consumer Staples—4.2% | | | | | | |
Altria Group, Inc. | | 2,020 | | | | 141,683 |
Avon Products, Inc. | | 3,100 | | | | 113,925 |
Kraft Foods, Inc. | | 4,836 | 2 | | | 170,469 |
Kroger Co. | | 6,200 | | | | 174,406 |
PepsiCo, Inc. | | 3,200 | | | | 207,520 |
Procter & Gamble Co. | | 2,112 | | | | 129,233 |
Total Consumer Staples | | | | | | 937,236 |
Energy—6.1% | | | | | | |
ConocoPhillips Co. | | 1,000 | | | | 78,500 |
Devon Energy Corp. | | 1,200 | | | | 93,948 |
Exxon Mobil Corp. | | 3,820 | | | | 320,422 |
Global Industries, Ltd.* | | 1,500 | | | | 40,230 |
Marathon Oil Corp. | | 4,700 | | | | 281,812 |
Overseas Shipholding Group, Inc. | | 800 | 2 | | | 65,120 |
Tesoro Corp. | | 2,800 | 2 | | | 160,020 |
Tidewater, Inc. | | 3,900 | 2 | | | 276,432 |
Valero Energy Corp. | | 400 | | | | 29,544 |
Total Energy | | | | | | 1,346,028 |
Financials—12.0% | | | | | | |
Assurant, Inc. | | 1,900 | | | | 111,948 |
Bank of America Corp. | | 8,600 | | | | 420,454 |
The accompanying notes are an integral part of these financial statements.
10
Balanced
Schedule of Portfolio Investments (continued)
| | | | | | |
Security Description | | Shares | | | Value |
Financials—12.0% (continued) | | | | | | |
CBL & Associates Properties, Inc. | | 3,700 | 2 | | $ | 133,385 |
Chubb Corp. | | 3,800 | | | | 205,732 |
Citigroup, Inc. | | 2,300 | | | | 117,967 |
Goldman Sachs Group, Inc. | | 1,650 | 2 | | | 357,637 |
Hospitality Properties Trust | | 1,000 | 2 | | | 41,490 |
JPMorgan Chase & Co. | | 8,448 | | | | 409,306 |
Lehman Brothers Holdings, Inc. | | 400 | 2 | | | 29,808 |
Loews Corp. | | 1,000 | | | | 50,980 |
Merrill Lynch & Co., Inc. | | 2,600 | | | | 217,308 |
PMI Group, Inc. | | 2,600 | 2 | | | 116,142 |
Radian Group, Inc. | | 900 | 2 | | | 48,600 |
SunTrust Banks, Inc. | | 1,800 | | | | 154,332 |
Travelers Companies, Inc., The | | 4,100 | | | | 219,350 |
Total Financials | | | | | | 2,634,439 |
Health Care—6.6% | | | | | | |
AmerisourceBergen Corp. | | 2,200 | 2 | | | 108,834 |
Baxter International, Inc. | | 1,500 | | | | 84,510 |
Biogen Idec, Inc.* | | 3,200 | | | | 171,200 |
CIGNA Corp. | | 4,500 | | | | 234,990 |
Johnson & Johnson Co. | | 6,180 | | | | 380,812 |
McKesson Corp. | | 4,500 | | | | 268,380 |
Medco Health Solutions, Inc.* | | 800 | | | | 62,392 |
Pfizer, Inc. | | 5,540 | | | | 141,658 |
Total Health Care | | | | | | 1,452,776 |
Industrials—6.3% | | | | | | |
American Standard Companies, Inc. | | 800 | | | | 47,184 |
Continental Airlines, Inc.* | | 3,800 | | | | 128,706 |
Con-Way, Inc. | | 1,000 | 2 | | | 50,240 |
CSX Corp. | | 800 | | | | 36,064 |
Cummins, Inc. | | 2,450 | | | | 247,964 |
Dun & Bradstreet Corp. | | 700 | | | | 72,086 |
Emerson Electric Co. | | 4,100 | | | | 191,880 |
General Electric Co. | | 3,800 | | | | 145,464 |
Manpower, Inc. | | 600 | 2 | | | 55,344 |
Northrop Grumman Corp. | | 3,100 | | | | 241,397 |
Terex Corp.* | | 600 | | | | 48,780 |
Textron, Inc. | | 1,200 | | | | 132,132 |
Total Industrials | | | | | | 1,397,241 |
Information Technology—8.2% | | | | | | |
Applied Materials, Inc. | | 1,000 | 2 | | | 19,870 |
Avnet, Inc.* | | 1,900 | 2 | | | 75,316 |
BEA Systems, Inc.* | | 2,300 | 2 | | | 31,487 |
The accompanying notes are an integral part of these financial statements.
11
Balanced
Schedule of Portfolio Investments (continued)
| | | | | | | |
Security Description | | Shares | | | Value |
Information Technology—8.2% (continued) | | | | | | | |
BMC Software, Inc.* | | | 1,400 | | | $ | 42,420 |
Cisco Systems, Inc.* | | | 9,240 | | | | 257,334 |
CommScope, Inc.* | | | 1,000 | | | | 58,350 |
Computer Sciences Corp.* | | | 2,000 | | | | 118,300 |
Hewlett-Packard Co. | | | 8,000 | | | | 356,960 |
International Business Machines Corp. | | | 1,400 | 2 | | | 147,350 |
International Rectifier Corp.* | | | 3,100 | 2 | | | 115,506 |
Intersil Corp., Class A | | | 700 | 2 | | | 22,022 |
LSI Logic Corp.* | | | 2,100 | 2 | | | 15,771 |
Mastercard, Inc. | | | 200 | | | | 33,174 |
McAfee, Inc.* | | | 1,800 | | | | 63,360 |
Microsoft Corp. | | | 9,500 | | | | 279,965 |
Nvidia Corp.* | | | 3,200 | | | | 132,192 |
Vishay Intertechnology, Inc.* | | | 1,700 | | | | 26,894 |
Total Information Technology | | | | | | | 1,796,271 |
Materials—2.3% | | | | | | | |
Celanese Corp. | | | 6,100 | | | | 236,558 |
International Paper Co. | | | 1,000 | | | | 39,050 |
Lubrizol Corp. | | | 700 | | | | 45,185 |
Nucor Corp. | | | 1,200 | 2 | | | 70,380 |
Pactiv Corp.* | | | 1,400 | 2 | | | 44,646 |
United States Steel Corp. | | | 700 | 2 | | | 76,125 |
Total Materials | | | | | | | 511,944 |
Telecommunication Services—2.2% | | | | | | | |
AT&T, Inc. | | | 11,770 | | | | 488,455 |
Utilities—2.5% | | | | | | | |
Constellation Energy Group, Inc. | | | 2,300 | 2 | | | 200,491 |
Edison International | | | 3,700 | 2 | | | 207,644 |
Northeast Utilities | | | 2,200 | | | | 62,392 |
Reliant Resources, Inc.* | | | 900 | | | | 24,255 |
Sempra Energy | | | 1,100 | 2 | | | 65,153 |
Total Utilities | | | | | | | 559,935 |
Total Common Stocks (cost $10,673,818) | | | | | | | 12,878,247 |
| | |
| | | Principal
Amount | | | |
Mortgage-Backed Securities—21.1% | | | | | | | |
Bank of America Corp., 4.875%, 06/10/39 | | $ | 100,000 | | | | 98,615 |
FHLMC, 5.000%, 12/15/22 | | | 188,691 | | | | 185,537 |
FNMA, 3.500%, 10/01/10 | | | 94,846 | | | | 90,852 |
FNMA, 4.000%, 10/01/20 to 12/01/21 | | | 83,634 | | | | 77,403 |
FNMA, 4.375%, 04/15/15 | | | 62,013 | | | | 60,278 |
FNMA, 4.500%, 07/01/18 to 09/01/35 | | | 704,862 | | | | 658,504 |
FNMA, 5.000%, 02/01/22 to 06/01/37 | | | 1,122,212 | | | | 1,065,093 |
FNMA, 5.500%, 02/01/22 to 06/01/37 | | | 1,086,678 | | | | 1,052,926 |
The accompanying notes are an integral part of these financial statements.
12
Balanced
Schedule of Portfolio Investments (continued)
| | | | | | | |
Security Description | | Principal
Amount | | | Value |
Mortgage-Backed Securities—21.1% (continued) | | | | | | | |
FNMA, 6.000%, 03/01/12 to 04/01/37 | | $ | 744,305 | | | $ | 737,845 |
FNMA, 6.500%, 11/01/36 to 12/01/36 | | | 359,621 | | | | 363,174 |
GE Capital Commercial Mortgage Corp., 4.970%, 08/11/36 | | | 42,425 | | | | 41,991 |
Greenwich Capital Commercial Funding Corp., Series 2005-GG5, Class A2, 5.117%, 04/10/37 | | | 90,000 | | | | 89,057 |
GS Mortgage Securities Corp. II Series 2005-GG4, 4.751%, 07/10/39 | | | 50,000 | | | | 46,767 |
Morgan Stanley Capital I, Series 2005-T19, 4.890%, 06/12/47 | | | 75,000 | | | | 70,664 |
Total Mortgage-Backed Securities (cost $4,719,991) | | | | | | | 4,638,706 |
U.S. Government and Agency Obligations—8.0% | | | | | | | |
FHLB, 3.875%, 01/15/10 | | | 150,000 | 2 | | | 145,453 |
FHLMC, 5.625%, 03/15/11 | | | 300,000 | | | | 304,259 |
FNMA, 4.250%, 08/15/10 | | | 300,000 | 2 | | | 292,085 |
FNMA, 5.375%, 11/15/11 | | | 450,000 | 2 | | | 452,702 |
USTB, 5.250%, 11/15/28 | | | 555,000 | 2 | | | 558,989 |
Total U.S. Government and Agency Obligations (cost $1,769,212) | | | | | | | 1,753,488 |
Corporate Bonds—7.3% | | | | | | | |
Finance—4.5% | | | | | | | |
Allstate Corp., The, 7.200%, 12/01/09 | | | 75,000 | | | | 77,981 |
American International Group, Inc., 6.250%, 05/01/36 (a) | | | 35,000 | | | | 35,442 |
Bank of America Corp., 5.625%, 10/14/16 | | | 95,000 | | | | 93,686 |
Berkshire Hathaway Finance Corp., 4.850%, 01/15/15 | | | 150,000 | | | | 142,722 |
Citigroup, Inc., 6.500%, 01/18/11 | | | 95,000 | | | | 98,048 |
JPMorgan Chase & Co., 4.750%, 03/01/15 | | | 95,000 | | | | 88,848 |
Marshall & Ilsley Corp., 4.375%, 08/01/09 | | | 75,000 | | | | 73,713 |
Travelers Companies, Inc. (The), 5.375%, 06/15/12 | | | 95,000 | | | | 94,065 |
U.S. Bank NA, 4.950%, 10/30/14 | | | 95,000 | | | | 90,857 |
Wachovia Corp., 5.300%, 10/15/11 | | | 95,000 | | | | 94,105 |
Wells Fargo Co., 4.200%, 01/15/10 | | | 95,000 | | | | 92,649 |
Total Finance | | | | | | | 982,116 |
Industrials—2.1% | | | | | | | |
Bellsouth Capital Funding Corp., 7.750%, 02/15/10 | | | 75,000 | | | | 79,050 |
IBM Corp., 4.750%, 11/29/12 | | | 95,000 | | | | 91,935 |
Lockheed Martin Corp., 7.650%, 05/01/16 | | | 75,000 | | | | 84,594 |
Merck & Co., Inc., 4.750%, 03/01/15 | | | 90,000 | | | | 84,808 |
Wal-Mart Stores, Inc., 5.250%, 09/01/35 | | | 40,000 | | | | 35,086 |
Walt Disney Co., The, 6.375%, 03/01/12 | | | 95,000 | | | | 98,503 |
Total Industrials | | | | | | | 473,976 |
Utilities—0.7% | | | | | | | |
Consolidated Edison, Inc., 5.375%, 12/15/15 | | | 75,000 | 2 | | | 72,844 |
Florida Power & Light Co., 4.850%, 02/01/13 | | | 95,000 | | | | 91,362 |
Total Utilities | | | | | | | 164,206 |
Total Corporate Bonds (cost $1,634,670) | | | | | | | 1,620,298 |
The accompanying notes are an integral part of these financial statements.
13
Balanced
Schedule of Portfolio Investments (continued)
| | | | | | | | |
Security Description | | Principal
Amount | | | Value | |
Asset-Backed Securities—2.0% | | | | | | | | |
Capital One Multi-Asset Execution Trust, 5.300%, 02/18/14 | | $ | 150,000 | 2 | | $ | 149,702 | |
Harley-Davidson Motorcycle Trust, 5.350%, 03/15/13 | | | 185,000 | | | | 185,209 | |
John Deere Corp., 5.070%, 04/15/14 | | | 100,000 | | | | 98,905 | |
Total Asset-Backed Securities (cost $436,477) | | | | | | | 433,816 | |
| | |
| | | Shares | | | | |
Preferred Stock—0.2% | | | | | | | | |
Newell Financial Trust I, 5.250% (cost $39,878) | | | 925 | | | | 45,788 | |
Other Investment Companies—21.2%1 | | | | | | | | |
Bank of New York Institutional Cash Reserves Fund, 5.33%3 | | | 4,074,205 | | | | 4,074,205 | |
JPMorgan Prime Money Market Fund, Institutional Class Shares, 5.19% | | | 597,731 | | | | 597,731 | |
Total Other Investment Companies (cost $4,671,936) | | | | | | | 4,671,936 | |
Total Investments—118.2% (cost $23,945,982) | | | | | | | 26,042,279 | |
Other Assets, less Liabilities—(18.2)% | | | | | | | (4,018,971 | ) |
Net Assets—100% | | | | | | $ | 22,023,308 | |
The accompanying notes are an integral part of these financial statements.
14
High Yield
Fund Snapshots
June 30, 2007 (unaudited)
Portfolio Breakdown
| | | | | |
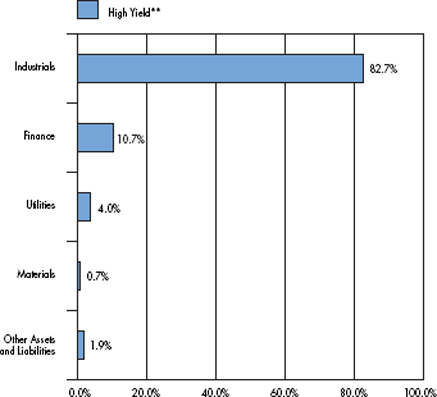 | | Industry | | High Yield** | |
| | Industrials | | 82.7 | % |
| | Finance | | 10.7 | % |
| | Utilities | | 4.0 | % |
| | Materials | | 0.7 | % |
| | Other Assets and Liabilities | | 1.9 | % |
| ** | As a percentage of net assets |
Top Ten Holdings
| | | |
Top Ten Holdings | | % of
Net Assets | |
General Motors Acceptance Corp., 6.875%, 08/28/12* | | 1.8 | % |
DirecTV Holdings LLC, 6.375%, 06/15/15* | | 1.6 | |
Dex Media, Inc., 7.754%, 11/15/13* | | 1.4 | |
EchoStar Communications Corp., 7.125%, 02/01/16* | | 1.3 | |
Visant Holding Corp., 9.071%, 12/01/13* | | 1.3 | |
Arch Western Finance, LLC, 6.750%, 07/01/13* | | 1.3 | |
HCA, Inc., 9.250%, 11/15/16* | | 1.3 | |
Playtex Products, Inc., 9.375%, 06/01/11 | | 1.2 | |
HCA, Inc., 9.625%, 11/15/16 | | 1.1 | |
MetroPCS Wireless, Inc., 9.250%, 11/01/14 | | 1.1 | |
| | | |
Top Ten as a Group | | 13.4 | % |
| | | |
| * | Top Ten Holding at December 31, 2006 |
Any sectors, industries, or securities discussed should not be perceived as investment recommendations. Mention of a specific security should not be considered a recommendation to buy or solicitation to sell that security.
15
High Yield
Schedule of Portfolio Investments
June 30, 2007 (unaudited)
| | | | | | | |
Security Description | | Principal
Amount | | | Value |
Corporate Bonds—97.4% | | | | | | | |
Finance—10.7% | | | | | | | |
AAC Group Holding Corp., 9.669%, 10/01/12 (b) 4 | | $ | 140,000 | 2 | | $ | 126,700 |
Arch Western Finance, LLC, 6.750%, 07/01/13 | | | 610,000 | | | | 588,650 |
Consolidated Communications Holdings, Inc., 9.750%, 04/01/12 | | | 384,000 | | | | 404,160 |
Dresser, Inc., 1st Lien Term Loan, 5.385%, 05/04/14 | | | 100,000 | | | | 100,552 |
Dresser, Inc., 2nd Lien Term Loan, 6.110%, 05/04/15 | | | 100,000 | | | | 101,463 |
Ford Motor Credit Co., | | | | | | | |
6.930%, 01/15/10, (10/15/07) 5 | | | 320,000 | | | | 315,964 |
7.000%, 10/01/13 | | | 400,000 | | | | 371,053 |
7.800%, 06/01/12 | | | 215,000 | | | | 209,948 |
8.000%, 12/15/16 | | | 280,000 | | | | 268,631 |
General Motors Acceptance Corp., 6.875%, 08/28/12 | | | 845,000 | | | | 826,717 |
GMAC, | | | | | | | |
6.625%, 05/15/12 | | | 175,000 | | | | 169,166 |
6.750%, 12/01/14 | | | 25,000 | 2 | | | 23,976 |
Hawker Beechcraft Acquisition Co., 8.500%, 04/01/15 (a) | | | 40,000 | | | | 41,400 |
Idearc, Inc., 8.000%, 11/15/16 | | | 180,000 | | | | 182,700 |
KAR Holdings, Inc., 8.750%, 05/01/14 (a) | | | 115,000 | | | | 113,275 |
Petroplus Finance Ltd., | | | | | | | |
6.750%, 05/01/14 (a) | | | 75,000 | 2 | | | 72,562 |
7.000%, 05/01/17 (a) | | | 85,000 | | | | 82,238 |
Pilgrim’s Pride Corp., 7.625%, 05/01/15 | | | 65,000 | | | | 65,162 |
Rainbow National Services LLC, 8.750%, 09/01/12 (a) | | | 100,000 | | | | 104,500 |
Sally Holdings LLC, | | | | | | | |
9.250%, 11/15/14 (a) | | | 225,000 | 2 | | | 226,688 |
10.500%, 11/15/16 (a) | | | 30,000 | | | | 30,300 |
Simmons Holdco., Inc. 5.398%, 02/15/12, (08/15/07) 5,6 | | | 120,000 | | | | 118,300 |
UCI Holdco, Inc., 12.360%, 12/15/13, (09/17/07) (a) 5 | | | 111,402 | | | | 113,630 |
Wind Acquisition Loan, 12.620%, 12/07/11 6 | | | 207,313 | | | | 213,273 |
Total Finance | | | | | | | 4,871,008 |
Industrials—82.7% | | | | | | | |
Acco Brands Corp., 7.625%, 08/15/15 | | | 480,000 | | | | 474,000 |
Actuant Corp., 6.875%, 06/15/17 (a) | | | 80,000 | | | | 79,600 |
Advanced Micro Devices, Inc., 7.750%, 11/01/12 | | | 170,000 | 2 | | | 160,650 |
Alliance Laundry Corp., 8.500%, 01/15/13 | | | 235,000 | | | | 234,412 |
Allied Waste North America, Inc., | | | | | | | |
7.250%, 03/15/15 | | | 165,000 | 2 | | | 164,175 |
7.375%, 04/15/14 | | | 245,000 | 2 | | | 243,162 |
Ames True Temper, Inc., | | | | | | | |
9.360%, 01/15/12, (10/15/07) 5 | | | 240,000 | | | | 243,000 |
10.000%, 07/15/12 | | | 150,000 | 2 | | | 142,500 |
ArvinMeritor, Inc., 8.750%, 03/01/12 | | | 235,000 | 2 | | | 238,525 |
The accompanying notes are an integral part of these financial statements.
16
High Yield
Schedule of Portfolio Investments (continued)
| | | | | | | |
Security Description | | Principal
Amount | | | Value |
Industrials—82.7% (continued) | | | | | | | |
Ashtead Capital, Inc., 9.000%, 08/15/16 (a) | | $ | 170,000 | | | $ | 178,925 |
Axtel SAB de CV, 7.625%, 02/01/17 (a) | | | 255,000 | | | | 253,089 |
Beazer Homes USA, | | | | | | | |
6.500%, 11/15/13 | | | 165,000 | 2 | | | 142,725 |
8.375%, 04/15/12 | | | 180,000 | | | | 171,000 |
8.675%, 05/15/11 | | | 40,000 | | | | 38,600 |
Bristow Group, Inc., 7.500%, 09/15/17 (a) | | | 80,000 | | | | 80,600 |
Brookstone Co., Inc., 12.000%, 10/15/12 | | | 200,000 | 2 | | | 206,000 |
CCO Holdings LLC, 8.750%, 11/15/13 | | | 315,000 | | | | 322,088 |
Charter Communications, Inc., 11.000%, 10/01/15 | | | 355,000 | | | | 372,306 |
Chesapeake Energy Corp., | | | | | | | |
6.500%, 08/15/17 | | | 80,000 | | | | 76,200 |
7.000%, 08/15/14 | | | 275,000 | | | | 274,312 |
Citizens Communications Co., 6.625%, 03/15/15 | | | 50,000 | | | | 47,750 |
Claire’s Stores, Inc., 9.625%, 06/01/15 (a) | | | 205,000 | 2 | | | 190,650 |
Clarke American Corp., | | | | | | | |
9.500%, 05/15/15 (a) | | | 25,000 | | | | 24,062 |
10.106%, 05/15/15, (08/15/07) (a) 5 | | | 25,000 | 2 | | | 24,188 |
Community Health Systems, 8.875%, 07/15/15 (a) | | | 145,000 | | | | 147,719 |
Constellation Brands, Inc., 7.125%, 09/01/16 | | | 460,000 | | | | 450,800 |
The Cooper Companies, Inc., 7.125%, 02/15/15 (a) | | | 140,000 | | | | 139,300 |
Corrections Corp. of America, 6.250%, 03/15/13 | | | 160,000 | | | | 154,400 |
Cricket Communications I, 9.375%, 11/01/14 | | | 415,000 | | | | 430,562 |
Crown Americas LLC, 7.750%, 11/15/15 | | | 120,000 | | | | 121,200 |
Del Laboratories, Inc., | | | | | | | |
8.000%, 02/01/12 | | | 270,000 | 2 | | | 260,550 |
10.356%, 11/01/11, (08/01/07) 5 | | | 145,000 | | | | 149,350 |
Del Monte Corp., 6.750%, 02/15/15 | | | 145,000 | | | | 138,838 |
Denbury Resources, Inc., 7.500%, 04/01/13 | | | 370,000 | | | | 371,850 |
Dex Media East, LLC, 12.125%, 11/15/12 | | | 125,000 | | | | 134,844 |
Dex Media West LLC, 9.875%, 08/15/13 | | | 60,000 | | | | 64,500 |
Dex Media, Inc., 7.754%, 11/15/13 (b) 4 | | | 670,000 | | | | 633,989 |
Digicel Group, Ltd., | | | | | | | |
8.875%, 01/15/15 (a) | | | 100,000 | 2 | | | 98,250 |
9.125%, 01/15/15 (a) | | | 100,000 | 2 | | | 98,875 |
9.250%, 09/01/12 (a) | | | 250,000 | | | | 264,688 |
DirecTV Holdings LLC, | | | | | | | |
6.375%, 06/15/15 | | | 780,000 | | | | 735,150 |
8.375%, 03/15/13 | | | 30,000 | | | | 31,538 |
Dobson Cellular Systems, Inc., 9.875%, 11/01/12 | | | 115,000 | | | | 124,488 |
Dobson Communications Corp., | | | | | | | |
8.875%, 10/01/13 | | | 220,000 | 2 | | | 231,000 |
9.610%,10/15/12, (10/15/07) 5 | | | 235,000 | | | | 240,875 |
The accompanying notes are an integral part of these financial statements.
17
High Yield
Schedule of Portfolio Investments (continued)
| | | | | | | |
Security Description | | Principal
Amount | | | Value |
Industrials—82.7% (continued) | | | | | | | |
EchoStar Communications Corp., 7.125%, 02/01/16 | | $ | 615,000 | | | $ | 604,238 |
El Paso Corp., 7.000%, 06/15/17 | | | 200,000 | | | | 198,809 |
Energy XXI Gulf Coast Inc., 10.000%, 06/15/13 (a) | | | 115,000 | | | | 112,412 |
Esco Corp, 8.625%, 12/15/13 (a) | | | 140,000 | | | | 147,700 |
Flextronics International Ltd., 1.000%, 08/01/10 | | | 225,000 | | | | 210,375 |
FMC Finance III SA, 6.875%, 07/15/17 (a) | | | 150,000 | | | | 147,750 |
FMG Finance Pty, Ltd., 10.625%, 09/01/16 (a) | | | 225,000 | | | | 268,875 |
Ford Motor Co., 6.500%, 08/01/18 | | | 255,000 | 2 | | | 207,825 |
Forest Oil Corp., 7.250%, 06/15/19 (a) | | | 70,000 | | | | 68,250 |
Freescale Semiconductor, | | | | | | | |
9.125%, 12/15/14 (a) | | | 320,000 | | | | 302,400 |
10.125%, 12/15/16 (a) | | | 100,000 | 2 | | | 94,500 |
Fresenius Medical Care Capital Trust II, 7.875%, 02/01/08 | | | 220,000 | | | | 221,650 |
Fresenius Medical Core Capital Trust IV, 7.875%, 06/15/11 (a) | | | 120,000 | | | | 124,800 |
Frigstad Discoverer Invest, Ltd., 11.500%, 02/21/12 (a) | | | 100,000 | | | | 101,343 |
General Cable Corp., 7.125%, 04/01/17 (a) | | | 60,000 | 2 | | | 59,700 |
General Motors Corp., | | | | | | | |
7.125%, 07/15/13 | | | 225,000 | 2 | | | 211,781 |
8.375%, 07/15/33 | | | 235,000 | 2 | | | 215,612 |
Georgia-Pacifi c Corp., | | | | | | | |
7.000%, 01/15/15 (a) | | | 140,000 | | | | 135,450 |
7.125%, 01/15/17 (a) | | | 100,000 | | | | 96,500 |
7.700%, 06/15/15 | | | 325,000 | | | | 323,375 |
Goodman Global Holdings Co., Inc., 7.875%, 12/15/12 | | | 135,000 | 2 | | | 134,325 |
Goodyear Tire & Rubber Co., 8.625%, 12/01/11 (a) | | | 83,000 | | | | 87,772 |
Graham Packaging Co., L.P., 9.875%, 10/15/14 | | | 375,000 | 2 | | | 381,094 |
Gregg Appliances Inc., 9.000%, 02/01/13 | | | 330,000 | | | | 353,100 |
Hanesbrands, Inc., 8.784%, 12/15/14, (12/17/07) 5 | | | 295,000 | 2 | | | 300,900 |
Hanover Compressor Co., 9.000%, 06/01/14 | | | 140,000 | | | | 148,750 |
HCA, Inc., | | | | | | | |
8.750%, 09/01/10 | | | 35,000 | | | | 36,619 |
9.250%, 11/15/16 (a) | | | 550,000 | | | | 587,125 |
9.625%, 11/15/16 (a) | | | 480,000 | | | | 517,200 |
Host Marriott LP, 6.750%, 06/01/16 | | | 335,000 | | | | 329,975 |
Huntsman International LLC, 7.875%, 11/15/14 | | | 155,000 | 2 | | | 166,819 |
Ineos Group Holdings PLC, 8.500%, 02/15/16 (a) | | | 365,000 | 2 | |
|
358,612 |
Insight Communications Co., Inc., 12.250%, 02/15/11 (b) | | | 10,000 | | | | 10,475 |
Intelsat Bermuda, Ltd., | | | | | | | |
8.886%, 01/15/15, (01/15/08) 5 | | | 150,000 | | | | 153,938 |
11.250%, 06/15/16 | | | 380,000 | | | | 427,500 |
Interline Brands Inc., 8.125%, 06/15/14 | | | 145,000 | | | | 146,812 |
The accompanying notes are an integral part of these financial statements.
18
High Yield
Schedule of Portfolio Investments (continued)
| | | | | | | |
Security Description | | Principal
Amount | | | Value |
Industrials—82.% (continued) | | | | | | | |
IPCS, Inc., | | | | | | | |
7.480%, 05/01/13, (08/01/07) 5 | | $ | 90,000 | | | $ | 90,562 |
8.605%, 05/01/14, (08/01/07) 5 | | | 145,000 | | | | 146,088 |
Iron Mountain Inc., | | | | | | | |
6.625%, 01/01/16 | | | 315,000 | | | | 290,588 |
7.750%, 01/15/15 | | | 175,000 | | | | 171,500 |
Jarden Corp., 7.500%, 05/01/17 | | | 325,000 | | | | 322,562 |
K. Hovnanian Enterprises, Inc., 8.625%, 01/15/17 | | | 250,000 | 2 | | | 241,250 |
L-3 Communications Corp., | | | | | | | |
5.875%, 01/15/15 | | | 265,000 | 2 | | | 247,112 |
6.125%, 07/15/13 | | | 50,000 | | | | 47,500 |
6.375%, 10/15/15 | | | 100,000 | | | | 95,000 |
Level 3 Financing, Inc., | | | | | | | |
8.750%, 02/15/17 (a) | | | 150,000 | 2 | | | 149,062 |
9.250%, 11/01/14 | | | 240,000 | 2 | | | 243,600 |
MetroPCS Wireless, Inc., 9.250%, 11/01/14 (a) | | | 500,000 | 2 | | | 518,750 |
MGM Mirage, Inc., | | | | | | | |
6.750%, 04/01/13 (a) | | | 305,000 | | | | 291,275 |
6.875%, 04/01/16 (a) | | | 155,000 | | | | 143,375 |
7.500%, 06/01/16 | | | 360,000 | | | | 343,350 |
Nalco Company, | | | | | | | |
7.750%, 11/15/11 | | | 185,000 | | | | 187,312 |
8.875%, 11/15/13 | | | 125,000 | | | | 130,312 |
Newfield Exploration Co., 6.625%, 04/15/16 | | | 215,000 | 2 | | | 208,012 |
Nexstar Finance Holdings, Inc., 9.791%, 04/01/13 (b) 4 | | | 200,000 | | | | 197,500 |
Nordic Telephone Co., 8.875%, 05/01/16 (a) | | | 315,000 | | | | 335,475 |
NXP BV, 9.500%, 10/15/15 | | | 505,000 | 2 | | | 499,950 |
Open Solutions, Inc., 9.750%, 02/01/15 (a) | | | 420,000 | | | | 426,300 |
OPTI Canada, Inc., | | | | | | | |
7.875%, 12/15/14 (a) | | | 90,000 | | | | 90,450 |
8.250%, 12/15/14 (a) | | | 155,000 | | | | 158,100 |
Owens-Brockway Glass Container, Inc., | | | | | | | |
6.750%, 12/01/14 | | | 65,000 | | | | 63,700 |
8.250%, 05/15/13 | | | 225,000 | | | | 234,000 |
P.H. Glatfelter, 7.125%, 05/01/16 | | | 215,000 | | | | 217,688 |
Packaging Dynamics, Inc., 10.000%, 05/11/16 (a) | | | 185,000 | | | | 185,925 |
Paetec Holding Corp., 9.500%, 07/15/15 (a) | | | 125,000 | | | | 125,000 |
Penhall International, 12.000%, 08/01/14 (a) | | | 75,000 | | | | 81,375 |
Petrohawk Energy Corp., 9.125%, 07/15/13 | | | 225,000 | | | | 239,062 |
Petroprod Ltd., 10.850%, 05/24/13 (a) | | | 100,000 | | | | 102,250 |
Playtex Products, Inc., 9.375%, 06/01/11 | | | 535,000 | 2 | | | 552,388 |
PolyOne Corp., 8.875%, 05/01/12 | | | 400,000 | 2 | | | 399,000 |
The accompanying notes are an integral part of these financial statements.
19
High Yield
Schedule of Portfolio Investments (continued)
| | | | | | | |
Security Description | | Principal
Amount | | | Value |
Industrials—82.7% (continued) | | | | | | | |
Quebecor World, Inc., 8.750%, 03/15/16 (a) | | $ | 425,000 | | | $ | 420,750 |
Qwest Communications International, Inc., 8.860%, 02/15/09, (08/15/07) 5 | | | 400,000 | | | | 406,000 |
Qwest Corp., 7.500%, 10/01/14 | | | 105,000 | | | | 108,150 |
R.H. Donnelley Corp., 6.875%, 01/15/13 | | | 85,000 | | | | 80,962 |
R.H. Donnelley Financial Corp., 10.875%, 12/15/12 (a) | | | 290,000 | | | | 310,662 |
RBS Global & Rexnord Corp., 8.875%, 09/01/16 | | | 160,000 | 2 | | | 161,200 |
Reichhold Industries, Inc., 9.000%, 08/15/14 (a) | | | 175,000 | | | | 181,125 |
Rental Services Corp., 9.500%, 02/01/14 (a) | | | 145,000 | | | | 148,625 |
Rite Aid Escrow Corp., 9.500%, 06/15/17 (a) | | | 150,000 | | | | 144,750 |
Rockwood Specialties GRP., 7.500%, 11/15/14 | | | 155,000 | | | | 156,550 |
Rural Cellular Corp., | | | | | | | |
8.250%, 03/15/12 | | | 305,000 | | | | 313,388 |
8.360%, 06/01/13, (09/04/07) (a) 5 | | | 110,000 | | | | 110,000 |
Sealy Mattress Co., 8.250%, 06/15/04 | | | 360,000 | | | | 370,800 |
Select Medical Corp., 7.625%, 02/01/15 | | | 130,000 | 2 | | | 117,000 |
SemGroup LP, 8.750%, 11/15/15 (a) | | | 125,000 | 2 | | | 126,250 |
Sensata Technologies BV, 8.000%, 05/01/14 | | | 260,000 | | | | 252,200 |
Service Corp. International, | | | | | | | |
6.750%, 04/01/15 (a) | | | 125,000 | | | | 121,094 |
7.375%, 10/01/14 | | | 195,000 | | | | 196,950 |
Simmons Co., 10.000%, 12/15/14 (b) | | | 545,000 | | | | 460,525 |
Spectrum Brands, Inc., 7.375%, 02/01/15 | | | 245,000 | 2 | | | 198,144 |
Steinway Musical Instruments, Inc., 7.000%, 03/01/14 (a) | | | 275,000 | | | | 269,500 |
Sun Media Corp., 7.625%, 02/15/13 | | | 315,000 | | | | 318,150 |
Sungard Data Systems, Inc., 10.250%, 08/15/15 | | | 430,000 | 2 | | | 456,875 |
Sunstate Equipment Co., 10.500%, 04/01/13 (a) | | | 95,000 | | | | 98,325 |
Surgical Care Affiliates, Inc., 8.875%, 07/15/15 (a) | | | 100,000 | | | | 100,000 |
Tenet Healthcare Corp., 9.250%, 02/01/15 | | | 515,000 | | | | 491,825 |
Tenneco Automotive, Inc., 8.625%, 11/15/14 | | | 295,000 | 2 | | | 305,325 |
Terex Corp., 7.375%, 01/15/14 | | | 185,000 | | | | 185,925 |
Terra Capital, Inc., 7.000%, 02/01/17 | | | 400,000 | | | | 388,000 |
Titan International, Inc., 8.000%, 01/15/12 | | | 200,000 | | | | 206,500 |
Travelport LLC, | | | | | | | |
9.875%, 09/01/14 | | | 100,000 | | | | 106,500 |
9.985%, 09/01/14, (09/04/07) 5 | | | 65,000 | | | | 66,950 |
11.875%, 09/01/16 | | | 165,000 | 2 | | | 182,944 |
Triad Hospitals, Inc., 7.000%, 11/15/13 | | | 405,000 | | | | 426,748 |
TRW Automotive, Inc., | | | | | | | |
7.000%, 03/15/14 (a) | | | 150,000 | | | | 143,625 |
7.250%, 03/15/17 (a) | | | 250,000 | | | | 239,375 |
United Components, Inc., 9.375%, 06/15/13 | | | 60,000 | | | | 62,250 |
United Rentals (North America), Inc., 6.500%, 02/15/12 | | | 355,000 | | | | 350,562 |
The accompanying notes are an integral part of these financial statements.
20
High Yield
Schedule of Portfolio Investments (continued)
| | | | | | | | |
Security Description | | Principal
Amount | | | Value | |
Industrials—82.7% (continued) | | | | | | | | |
United Surgical Partners, | | | | | | | | |
8.875%, 05/01/17 (a) | | $ | 55,000 | 2 | | $ | 55,412 | |
9.250%, 05/01/17 (a) | | | 185,000 | | | | 186,388 | |
Vail Resorts, Inc., 6.750%, 02/15/14 | | | 325,000 | | | | 318,094 | |
Venoco, Inc., 8.750%, 12/15/11 (a) | | | 190,000 | | | | 197,125 | |
Videotron Ltee, 6.875%, 01/15/14 (a) | | | 148,000 | | | | 145,780 | |
Visant Holding Corp., 9.071%, 12/01/13 (b) 4 | | | 655,000 | | | | 604,238 | |
Vitro S.A., 9.125%, 02/01/17 (a) | | | 225,000 | | | | 231,750 | |
Warner Music Group, 7.375%, 04/15/14 | | | 230,000 | | | | 215,050 | |
West Corp., 9.500%, 10/15/14 | | | 430,000 | | | | 442,900 | |
Whiting Petroleum Corp. 7.000%, 02/01/14 | | | 110,000 | | | | 103,950 | |
Williams Partners L.P., 7.250%, 02/01/17 | | | 235,000 | | | | 237,350 | |
Wind Acquisition Fin SA, 10.750%, 12/01/15 (a) | | | 150,000 | | | | 172,875 | |
Windstream Corp, | | | | | | | | |
7.000%, 03/15/19 | | | 50,000 | | | | 48,000 | |
8.125%, 08/01/13 | | | 60,000 | | | | 63,000 | |
8.625%, 08/01/16 | | | 245,000 | | | | 260,312 | |
WMG Holdings Corp., 10.132%, 12/15/14 (b) 4 | | | 266,000 | | | | 203,490 | |
Total Industrials | | | | | | | 37,445,237 | |
Utilities—4.0% | | | | | | | | |
AES Corp., 8.875%, 2/15/11 | | | 230,000 | | | | 243,512 | |
Dynegy Holdings, Inc., | | | | | | | | |
7.500%, 06/01/15 (a) | | | 50,000 | | | | 47,312 | |
7.750%, 06/01/19 (a) | | | 145,000 | | | | 135,575 | |
Edison Mission Energy, 7.000%, 05/15/17 (a) | | | 310,000 | | | | 293,725 | |
Mirant North America LLC, 7.375%, 12/31/13 | | | 275,000 | | | | 282,562 | |
NRG Energy, Inc., | | | | | | | | |
7.250% 02/01/14 | | | 245,000 | | | | 246,225 | |
7.375%, 02/01/16 | | | 45,000 | | | | 45,225 | |
7.375%, 01/15/17 | | | 235,000 | | | | 236,469 | |
Reliant Energy, Inc., 7.625%, 06/15/14 | | | 300,000 | 2 | | | 294,000 | |
Total Utilities | | | | | | | 1,824,605 | |
Total Corporate Bonds (cost $43,807,055) | | | | | | | 44,140,850 | |
| | |
| | | Shares | | | | |
Common Stock—0.7% | | | | | | | | |
Materials—0.7% | | | | | | | | |
Huntsman Corp. (cost $94,073) | | | 12,603 | | | | 306,381 | |
Other Investment Companies—18.7%1 | | | | | | | | |
Bank of New York Institutional Cash Reserves Fund, 5.33% (cost $8,457,501) 3 | | | 8,457,501 | | | | 8,457,501 | |
Total Investments—116.8% (cost $52,358,629) | | | | | | | 52,904,732 | |
Other Assets, less Liabilities—(16.8)% | | | | | | | (7,610,567 | ) |
Net Assets—100% | | | | | | $ | 45,294,165 | |
The accompanying notes are an integral part of these financial statements.
21
Fixed Income
Fund Snapshots
June 30, 2007 (unaudited)
Portfolio Breakdown
| | | | | |
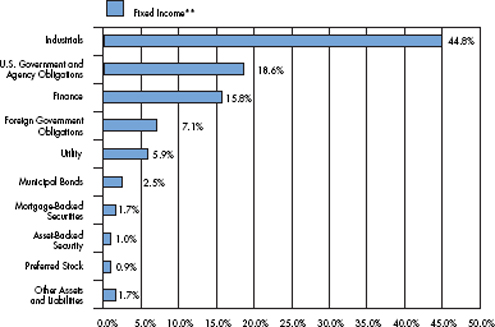 | | Industry | | Fixed
Income** | |
| | Industrials | | 44.8 | % |
| | U.S. Government and Agency Obligations | | 18.6 | % |
| | Finance | | 15.8 | % |
| | Foreign Government Obligations | | 7.1 | % |
| | Utility | | 5.9 | % |
| | Municipal Bonds | | 2.5 | % |
| | Mortgage-Backed Securities | | 1.7 | % |
| | Asset-Backed Securities | | 1.0 | % |
| | Preferred Stock | | 0.9 | % |
| | Other Assets and Liabilities | | 1.7 | % |
** As a percentage of net assets
Top Ten Holdings
| | | |
Top Ten Holdings | | % of
Net Assets | |
USTN, 4.875%, 05/31/09 | | 13.3 | % |
Inter-American Development Bank, 6.000%, 12/15/17* | | 3.3 | |
Telefonica Emisiones SAU, 7.045%, 06/20/36* | | 2.0 | |
USTB, 5.375%, 02/15/31* | | 2.0 | |
Qantas Airways, Ltd., 6.050%, 04/15/16* | | 2.0 | |
Wells Fargo Co., 5.106%, 05/01/33* | | 1.6 | |
Mexican Government, 9.000%, 12/20/12* | | 1.6 | |
Pulte Homes, Inc., 6.000%, 02/15/35* | | 1.4 | |
Verizon Global Funding Corp., 5.850%, 09/15/35* | | 1.3 | |
Empresa Nacional de Electricidad, Yankee, 7.875%, 02/01/27* | | 1.3 | |
| | | |
Top Ten as a Group | | 29.8 | % |
| | | |
| * | Top Ten Holding at December 31, 2006 |
Any sectors, industries, or securities discussed should not be perceived as investment recommendations. Mention of a specific security should not be considered a recommendation to buy or solicitation to sell that security.
22
Fixed Income
Schedule of Portfolio Investments
June 30, 2007 (unaudited)
| | | | | | | | | |
Security Description | | | | Principal
Amount | | | Value |
Corporate Bonds—66.5% | | | | | | | | | |
Finance—15.8% | | | | | | | | | |
ASIF Global Financial, 2.380%, 02/26/09 (a) | | SGD | | $ | 1,000,000 | | | $ | 646,903 |
Bank of America Capital Trust VI, 5.625%, 03/08/35 | | | | | 295,000 | | | | 264,139 |
Barclays Capital Corp., 4.160%, 02/22/10 (a) | | THB | | | 6,000,000 | | | | 176,793 |
Boeing Capital Corp., 4.750%, 08/25/08 | | | | | 230,000 | | | | 228,484 |
Cigna Corp., 6.150%, 11/15/36 | | | | | 240,000 | | | | 229,366 |
Colonial Realty LP, | | | | | | | | | |
4.800%, 04/01/11 | | | | | 625,000 | | | | 602,996 |
5.500%, 10/01/15 | | | | | 190,000 | | | | 182,912 |
Developers Divers Realty Corp., 3.875%, 01/30/09 | | | | | 200,000 | | | | 194,906 |
Equity One, Inc., 3.875%, 04/15/09 | | | | | 150,000 | | | | 145,363 |
Ford Motor Credit Co., | | | | | | | | | |
7.000%, 10/01/13 | | | | | 125,000 | | | | 115,954 |
9.750%, 09/15/10 | | | | | 309,000 | | | | 322,873 |
GMAC, 6.125%, 08/28/07 | | | | | 450,000 | | | | 450,323 |
Health Care, Inc., 7.500%, 08/15/07 | | | | | 67,000 | | | | 67,129 |
Highwoods Properties, Inc., 7.500%, 04/15/18 | | | | | 350,000 | | | | 379,688 |
Hospitality Properties Trust, 6.750%, 02/15/13 | | | | | 465,000 | | | | 480,142 |
HSBC Bank, 3.626%, 04/18/12 (a) 4 | | MYR | | | 665,000 | | | | 162,085 |
JPMorgan Chase & Co., 4.000%, 02/01/08 | | | | | 350,000 | | | | 347,077 |
Kinder Morgan Finance Co., | | | | | | | | | |
5.150%, 03/01/15 | | | | | 75,000 | 2 | | | 68,474 |
5.700%, 01/05/16 | | | | | 165,000 | | | | 152,326 |
6.400%, 01/05/36 | | | | | 110,000 | | | | 97,505 |
Korea Development Bank, 3.875%, 03/02/09 | | | | | 425,000 | | | | 414,400 |
Lehman Brothers Holdings, 3.600%, 03/13/09 | | | | | 150,000 | | | | 145,427 |
Mack-Cali Realty L.P., 7.250%, 03/15/09 | | | | | 250,000 | | | | 256,815 |
Marsh & McLennan Companies, Inc., | | | | | | | | | |
5.375%, 07/15/14 | | | | | 410,000 | | | | 384,129 |
5.750%, 09/15/15 | | | | | 200,000 | | | | 189,289 |
5.875%, 08/01/33 | | | | | 730,000 | | | | 616,484 |
Morgan Stanley & Co., Inc., 3.625%, 04/01/08 | | | | | 650,000 | | | | 641,230 |
Mutual of Omaha Insurance Co., 6.800%, 06/15/36 (a) | | | | | 620,000 | | | | 643,675 |
Sovereign Bank, 5.125%, 03/15/13 | | | | | 335,000 | | | | 323,507 |
Toll Brothers Finance Corp., 5.150%, 05/15/15 | | | | | 555,000 | 2 | | | 501,539 |
Travelers Companies, Inc., 6.250%, 06/15/37 | | | | | 755,000 | | | | 733,532 |
Travelers Property Casualty Corp., 6.375%, 03/15/33 | | | | | 330,000 | | | | 328,428 |
Wells Fargo Co., 5.106%, 05/01/33, (08/01/07) 5 | | | | | 1,175,000 | 2 | | | 1,180,758 |
XL Capital (Europe) PLC, 6.500%, 01/15/12 | | | | | 105,000 | | | | 107,928 |
Total Finance | | | | | | | | | 11,782,579 |
The accompanying notes are an integral part of these financial statements.
23
Fixed Income
Schedule of Portfolio Investments (continued)
| | | | | | | |
Security Description | | Principal
Amount | | | Value |
Industrials—44.8% | | | | | | | |
Anadarko Petroleum Corp., | | | | | | | |
5.950%, 09/15/06 | | $ | 485,000 | | | $ | 474,391 |
6.450%, 09/15/36 | | | 360,000 | | | | 347,368 |
Apache Corp., 6.000%, 01/15/37 | | | 630,000 | | | | 602,763 |
AT&T, Inc., | | | | | | | |
6.150%, 09/15/34 | | | 185,000 | | | | 177,951 |
6.500%, 03/15/29 | | | 775,000 | | | | 748,043 |
AT&T Wireless Services, Inc., 8.750%, 03/01/31 | | | 310,000 | | | | 387,540 |
Avnet, Inc., | | | | | | | |
2.000%, 03/15/34 | | | 100,000 | | | | 127,000 |
6.000%, 09/01/15 | | | 720,000 | | | | 694,989 |
6.625%, 09/15/16 | | | 140,000 | | | | 142,098 |
BellSouth Corp., 6.000%, 11/15/34 | | | 990,000 | 2 | | | 929,621 |
Bowater, Inc., 6.500%, 06/15/13 | | | 170,000 | 2 | | | 148,538 |
Bristol-Myers Squibb, 4.860%, 09/15/23, (09/17/07) 5 | | | 910,000 | | | | 925,925 |
Canadian Pacific RR & Co., 5.950%, 05/15/37 | | | 410,000 | | | | 386,669 |
Cardinal Health, Inc., 4.000%, 06/15/15 | | | 320,000 | | | | 278,308 |
Charter Communications, Inc., 8.000%, 04/30/12 (a) | | | 245,000 | | | | 249,288 |
Chartered Semiconductor Manufacturing, 6.250%, 04/04/13 | | | 715,000 | | | | 719,878 |
Clear Channel Communications, Inc., 6.625%, 06/15/08 | | | 191,000 | | | | 191,785 |
Coca-Cola HBC Finance BV, 5.125%, 09/17/13 | | | 265,000 | | | | 257,270 |
Comcast Corp., | | | | | | | |
5.650%, 06/15/35 | | | 235,000 | | | | 205,117 |
6.450%, 03/15/37 | | | 815,000 | | | | 787,970 |
6.500%, 11/15/35 | | | 405,000 | 2 | | | 393,832 |
Corning, Inc., 6.850%, 03/01/29 | | | 600,000 | | | | 606,362 |
Cox Enterprises, Inc., 4.375%, 05/01/08 (a) | | | 410,000 | | | | 405,971 |
CSX Corp., 6.000%, 10/01/36 | | | 570,000 | | | | 533,899 |
Cummins, Inc., 6.750%, 02/15/27 | | | 153,000 | | | | 149,336 |
D.R. Horton, Inc., 5.250%, 02/15/15 | | | 420,000 | | | | 376,408 |
Desarrolladora Homex SA de C.V., 7.500%, 09/28/15 | | | 245,000 | 2 | | | 254,800 |
El Paso Corp., 6.950%, 06/01/28 | | | 165,000 | 2 | | | 154,128 |
Energy Transfer Partners LP, | | | | | | | |
6.125%, 02/15/17 | | | 65,000 | | | | 64,299 |
6.625%, 10/15/36 | | | 145,000 | | | | 142,046 |
Equifax, Inc., 7.000%, 07/01/37 | | | 115,000 | | | | 116,371 |
Federated Retail Holdings, 6.375%, 03/15/37 | | | 760,000 | | | | 733,453 |
Georgia-Pacific Corp., 7.250%, 06/01/28 | | | 70,000 | | | | 64,750 |
HCA, Inc., | | | | | | | |
7.050%, 12/01/27 | | | 750,000 | | | | 613,193 |
7.500%, 11/06/33 | | | 75,000 | 2 | | | 63,938 |
7.690%, 06/15/25 | | | 300,000 | | | | 262,438 |
8.750%, 09/01/10 | | | 625,000 | | | | 653,906 |
The accompanying notes are an integral part of these financial statements.
24
Fixed Income
Schedule of Portfolio Investments (continued)
| | | | | | | |
Security Description | | Principal
Amount | | | Value |
Industrials—44.8% (continued) | | | | | | | |
International Paper Co., | | | | | | | |
4.000%, 04/01/10 | | $ | 300,000 | | | $ | 288,136 |
4.250%, 01/15/09 | | | 300,000 | | | | 294,092 |
Intuit, Inc., 5.750%, 03/15/17 | | | 210,000 | | | | 202,502 |
JC Penney Corp., Inc., 6.375%, 10/15/36 | | | 310,000 | | | | 296,164 |
KN Capital Trust III, 7.630%, 04/15/28 | | | 10,000 | | | | 9,426 |
Kraft Foods, Inc., 6.500%, 11/01/31 | | | 270,000 | | | | 261,800 |
Kroger Co., 7.000%, 05/01/18 | | | 460,000 | | | | 472,402 |
Lennar Corp., | | | | | | | |
5.600%, 05/31/15 | | | 400,000 | | | | 375,410 |
6.500%, 04/15/16 | | | 280,000 | 2 | | | 271,606 |
Liberty Media Corp., 5.700%, 05/15/13 | | | 190,000 | 2 | | | 179,534 |
Lubrizol Corp., 6.500%, 10/01/34 | | | 750,000 | 2 | | | 726,222 |
Masco Corp., 5.850%, 03/15/17 | | | 350,000 | | | | 337,069 |
Medco Health Solutions, 7.250%, 08/15/13 | | | 420,000 | | | | 442,486 |
Missouri Pacific Railroad, 5.000%, 01/01/45 | | | 200,000 | | | | 152,502 |
New England Telephone & Telegraph Co., 7.875%, 11/15/29 | | | 95,000 | | | | 104,221 |
News America, Inc., | | | | | | | |
6.200%, 12/15/34 | | | 350,000 | | | | 327,299 |
6.400%, 12/15/35 | | | 425,000 | | | | 406,018 |
7.280%, 06/30/28 | | | 225,000 | | | | 236,299 |
7.625%, 11/30/28 | | | 460,000 | | | | 499,322 |
Nextel Communications, Inc., 5.950%, 03/15/14 | | | 695,000 | | | | 662,850 |
Owens & Minor, Inc., 6.350%, 04/15/16 | | | 125,000 | | | | 123,294 |
Pulte Homes, Inc., | | | | | | | |
5.200%, 02/15/15 | | | 405,000 | | | | 364,485 |
6.000%, 02/15/35 | | | 1,265,000 | 2 | | | 1,081,245 |
6.375%, 05/15/33 | | | 465,000 | | | | 410,851 |
Qantas Airways, Ltd., 6.050%, 04/15/16 (a) | | | 1,500,000 | 2 | | | 1,458,616 |
Qwest Corp., 6.875%, 09/15/33 | | | 20,000 | 2 | | | 18,850 |
Samsung Electronics Co., Ltd., 7.700%, 10/01/27 (a) | | | 600,000 | | | | 660,343 |
Telecom Italia Capital, | | | | | | | |
6.000%, 09/30/34 | | | 40,000 | | | | 36,151 |
6.375%, 11/15/33 | | | 105,000 | | | | 99,209 |
Tele-Communications, Inc., 9.800%, 02/01/12 | | | 350,000 | | | | 404,367 |
Telefonica Emisiones SAU, 7.045%, 06/20/36 | | | 1,475,000 | | | | 1,532,276 |
Tennessee Gas Pipeline Co., 7.000%, 10/15/28 | | | 240,000 | 2 | | | 248,357 |
Texas Eastern Transmission, 7.000%, 07/15/32 | | | 255,000 | | | | 280,585 |
TGT Pipeline LLC, 5.200%, 06/01/18 | | | 465,000 | | | | 424,888 |
The Ryland Group, Inc., 5.375%, 06/01/08 | | | 440,000 | | | | 439,055 |
The accompanying notes are an integral part of these financial statements.
25
Fixed Income
Schedule of Portfolio Investments (continued)
| | | | | | | | | |
Security Description | | | | Principal Amount | | | Value |
Industrials—44.8% (continued) | | | | | | | | | |
Time Warner, Inc., | | | | | | | | | |
6.625%, 05/15/29 | | | | $ | 270,000 | | | $ | 262,897 |
6.950%, 01/15/28 | | | | | 120,000 | | | | 121,203 |
7.625%, 04/15/31 | | | | | 80,000 | | | | 85,953 |
7.700%, 05/01/32 | | | | | 685,000 | | | | 742,858 |
Toro Co., 6.625%, 05/01/37 | | | | | 365,000 | | | | 352,099 |
Union Pacific Corp., 5.375%, 06/01/33 | | | | | 50,000 | | | | 43,737 |
Verizon Global Funding Corp., 5.850%, 09/15/35 | | | | | 1,095,000 | 2 | | | 1,007,640 |
Verizon Maryland, Inc., 5.125%, 06/15/33 | | | | | 295,000 | 2 | | | 239,482 |
Verizon New York, Inc., Series B, 7.375%, 04/01/32 | | | | | 195,000 | | | | 205,696 |
Viacom, Inc., 6.875%, 04/30/36 | | | | | 470,000 | | | | 455,469 |
Vondafone Group PLC, 6.150%, 02/27/37 | | | | | 650,000 | | | | 606,662 |
Walt Disney Co., The, 7.000%, 03/01/32 | | | | | 190,000 | | | | 211,770 |
Watson Pharmaceuticals, Inc., 1.750%, 03/15/23 | | | | | 65,000 | | | | 63,294 |
Western Union Co., 6.200%, 11/17/36 | | | | | 635,000 | | | | 609,709 |
Total Industrials | | | | | | | | | 33,508,043 |
Utilities—5.9% | | | | | | | | | |
Cilcorp, Inc., 8.700%, 10/15/09 | | | | | 315,000 | | | | 327,093 |
Cleveland Electric Illuminating Co., The, 5.950%, 12/15/36 | | | | | 715,000 | | | | 661,209 |
Commonwealth Edison, | | | | | | | | | |
4.700%, 04/15/15 | | | | | 510,000 | | | | 466,552 |
5.875%, 02/01/33 | | | | | 620,000 | | | | 575,011 |
Dominion Resources, Inc., 5.950%, 06/15/35 | | | | | 90,000 | | | | 84,667 |
Empresa Nacional de Electricidad, Yankee, 7.875%, 02/01/27 | | | | | 900,000 | | | | 1,001,889 |
ITC Holdings Corp., | | | | | | | | | |
5.875%, 09/30/16 (a) | | | | | 225,000 | | | | 219,737 |
6.375%, 09/30/36 (a) | | | | | 300,000 | | | | 289,088 |
Methanex Corp., 6.000%, 08/15/15 | | | | | 320,000 | | | | 308,450 |
Pacific Gas and Electric Co., 6.050%, 03/01/34 | | | | | 500,000 | | | | 485,916 |
Total Utilities | | | | | | | | | 4,419,612 |
Total Corporate Bonds (cost $49,832,635) | | | | | | | | | 49,710,234 |
U.S. Government and Agency Obligations—18.6% | | | | | | | | | |
FNMA, 2.290%, 02/19/09 | | SGD | | | 700,000 | | | | 452,955 |
USTB, 5.375%, 02/15/31 | | | | | 1,430,000 | 2 | | | 1,468,879 |
USTN, 4.500%, 09/30/11 | | | | | 750,000 | 2 | | | 737,930 |
USTN, 4.750%, 05/15/14 | | | | | 835,000 | 2 | | | 824,824 |
USTN, 4.875%, 05/31/09 | | | | | 9,940,000 | | | | 9,940,010 |
U.S. Treasury Inflation Indexed Bonds, 2.000%, 01/15/14 | | | | | 491,968 | | | | 472,943 |
Total U.S. Government and Agency Obligations (cost $13,953,330) | | | | | | | | | 13,897,541 |
Foreign Government—7.1% | | | | | | | | | |
Canadian Government, 4.500%, 09/01/07 | | CAD | | | 1,000,000 | | | | 938,352 |
Export-Import Bank of Korea, 4.125%, 02/10/09 (a) | | | | | 485,000 | | | | 474,733 |
The accompanying notes are an integral part of these financial statements.
26
Fixed Income
Schedule of Portfolio Investments (continued)
| | | | | | | | | |
Security Description | | | | Principal Amount | | Value | |
Foreign Government—7.1% (continued) | | | | | | | | | |
Inter-American Development Bank, 6.000%, 12/15/17 | | NZD | | $ | 3,500,000 | | $ | 2,432,753 | |
Mexican Fixed Rate Bonds, 8.000%, 12/07/23 | | MXN | | | 3,500,000 | | | 333,332 | |
Mexican Government, 9.000%, 12/20/12 | | MXN | | | 12,000,000 | | | 1,176,508 | |
Total Foreign Government (cost $4,897,665) | | | | | | | | 5,355,678 | |
Municipal Bonds—2.5% | | | | | | | | | |
Decatur Texas Hospital Authority Hospital Revenue, 7.750%, 09/01/09 | | | | | 125,000 | | | 125,892 | |
Eufaula Alabama, Series C, 4.000%, 08/15/12 | | | | | 410,000 | | | 395,006 | |
MI Tobacco Settlement, 7.309%, 06/01/34 | | | | | 405,000 | | | 412,910 | |
Tobacco Settlement Corp., 6.706%, 06/01/46 | | | | | 980,000 | | | 940,359 | |
Total Municipal Bonds (cost $1,917,014) | | | | | | | | 1,874,167 | |
Mortgage-Backed Securities—1.7% | | | | | | | | | |
CS First Boston Mortgage Securities Corp., Series 2005-7, Class 3A1, 5.000%, 08/25/20 | | | | | 393,891 | | | 385,711 | |
LB-UBS Commercial Mortgage Trust, Series 2001-C3, Class A2, 6.365%, 12/15/28 | | | | | 320,000 | | | 328,612 | |
Morgan Stanley Dean Witter Capital, Inc., Series 2001-PPM, Class A2, 6.400%, 02/15/31 | | | | | 505,773 | | | 513,696 | |
Morgan Stanley Dean Witter Capital, Inc., Series 2001-TOP3, Class A3, 6.200%, 07/15/33 | | | | | 58,528 | | | 58,595 | |
Total Mortgage-Backed Securities (cost $1,301,172) | | | | | | | | 1,286,614 | |
Asset-Backed Securities—1.0% | | | | | | | | | |
Centex Home Equity Loan, Series 2004-A, Class AF6, 4.270%, 01/25/34 | | | | | 265,000 | | | 259,104 | |
Community Program Loan Trust, Series 87-A, Class A4, 4.500%, 10/01/18 | | | | | 23,202 | | | 22,852 | |
Countrywide Home Loans, Series 2002-S1, Class A5, 6.460%, 11/25/16 (b) | | | | | 451,645 | | | 455,486 | |
Total Asset-Backed Securities (cost $739,181) | | | | | | | | 737,442 | |
| | | |
| | | | | Shares | | | |
Preferred Stocks—0.9% | | | | | | | | | |
Newell Financial Trust I, 5.250% (cost $578,039) | | | | | 13,455 | | | 666,022 | |
Other Investment Companies—13.5%1 | | | | | | | | | |
Bank of New York Institutional Cash Reserves Fund, 5.33%3 | | | | | 9,500,810 | | | 9,500,810 | |
JPMorgan Prime Money Market Fund, Institutional Class Shares, 5.19% | | | | | 576,107 | | | 576,107 | |
Total Other Investment Companies (cost $10,076,917) | | | | | | | | 10,076,917 | |
Total Investments—111.8% (cost $83,295,953) | | | | | | | | 83,604,615 | |
Other Assets, less Liabilities—(11.8)% | | | | | | | | (8,853,604 | ) |
Net Assets—100% | | | | | | | $ | 74,751,011 | |
The accompanying notes are an integral part of these financial statements.
27
Managers Trust II Funds
Notes to Schedules of Portfolio Investments (unaudited)
The following footnotes and abbreviations should be read in conjunction with each of the Schedules of Portfolio Investments previously presented in this report.
At June 30, 2007, the cost of securities for Federal income tax purposes and the gross aggregate unrealized appreciation and/or depreciation based on tax cost were approximately:
| | | | | | | | | | | | | |
Fund | | Cost | | Appreciation | | Depreciation | | | Net |
Mid-Cap | | $ | 99,423,760 | | $ | 13,922,266 | | $ | (1,905,759 | ) | | $ | 12,016,507 |
| | | | |
Balanced | | | 23,955,125 | | | 2,359,716 | | | (272,562 | ) | | | 2,087,154 |
| | | | |
High Yield | | | 52,392,119 | | | 1,178,736 | | | (666,123 | ) | | | 512,613 |
| | | | |
Fixed Income | | | 83,350,822 | | | 1,505,966 | | | (1,252,173 | ) | | | 253,793 |
| * | Non-income-producing security |
| (a) | Security exempt from registration under Rule 144A of the Securities Act of 1933. This security may be resold in transactions exempt from registration, normally to qualified buyers. At June 30, 2007, the value of these securities amounted to the following: |
| | | | | | |
Fund | | Value | | % of Net Assets | |
High Yield | | $ | 5,387,232 | | 11.9 | % |
| | |
Fixed Income | | | 11,396,583 | | 15.2 | % |
| (b) | Step Bond. High-yield debt instrument with either deferred interest payments or an interest rate that resets at specific times during its term. |
1 | Yield shown for an investment company represents its June 30, 2007, seven-day average yield, which refers to the sum of the previous seven days’ dividends paid, expressed as an annual percentage. |
2 | Some or all of these shares were out on loan to various brokers as of June 30, 2007, amounting to: |
| | | | | | |
Fund | | Value | | % of Net Assets | |
Mid-Cap | | $ | 19,075,585 | | 20.8 | % |
| | |
Balanced | | | 3,967,920 | | 18.0 | % |
| | |
High Yield | | | 8,291,029 | | 18.3 | % |
| | |
Fixed Income | | | 9,360,277 | | 12.5 | % |
3 | Collateral received from brokers for securities lending was invested in this short-term investment. |
4 | Represents yield to maturity at June 30, 2007. |
5 | Floating rate security. The rate listed is as of June 30, 2007. Date in parenthesis represents the securities next coupon rate reset. |
6 | Payment-in-kind security. A type of high yield debt instrument whose issuer has the option of making interest payments either in cash or in additional debt securities. |
Investments Definitions and Abbreviations:
| | | | | | |
FNMA: | | Federal National Mortgage Association | | USTB: | | United States Treasury Bond |
GMAC: | | General Motors Acceptance Corp. | | USTN: | | United States Treasury Note |
|
Registered shares: A security whose owner has been recorded with its issuer or issuer’s registrar. |
|
| Abbreviations have been used throughout the portfolios to indicate amounts shown in currencies of par values other than the U.S. dollar (USD): |
| | | |
CAD: | | Canadian Dollar | | SGD: | | Singapore Dollar |
NZD: | | New Zealand Dollar | | MXN: | | Mexican Peso |
THB: | | Thailand Bhat | | MYR: | | Malaysian Ringgit |
28
Statements of Assets and Liabilities
June 30, 2007 (unaudited)
| | | | | | | | | | | | | | | | |
| | | Mid-Cap | | | Balanced | | | High Yield | | | Fixed Income | |
Assets: | | | | | | | | | | | | | | | | |
Investments at value (including securities on loan valued at $19,075,585, $3,967,920, $8,291,029, and $9,360,277, respectively) | | $ | 111,440,267 | | | $ | 26,042,279 | | | $ | 52,904,732 | | | $ | 83,604,615 | |
Cash | | | — | | | | 379 | | | | — | | | | — | |
Foreign currency** | | | — | | | | — | | | | — | | | | 38 | |
Receivable for investments sold | | | 514,198 | | | | — | | | | 521,525 | | | | — | |
Receivable for Fund shares sold | | | 135 | | | | 2,316 | | | | 114,631 | | | | 240,782 | |
Dividends, interest and other receivables | | | 44,576 | | | | 83,765 | | | | 844,408 | | | | 968,289 | |
Prepaid expenses | | | 36,100 | | | | 32,849 | | | | 33,829 | | | | 34,302 | |
| | | | | | | | | | | | | | | | |
Total assets | | | 112,035,276 | | | | 26,161,588 | | | | 54,419,125 | | | | 84,848,026 | |
| | | | | | | | | | | | | | | | |
Liabilities: | | | | | | | | | | | | | | | | |
Payable to Custodian | | | 28,988 | | | | — | | | | 38,198 | | | | 17,322 | |
Payable for Fund shares repurchased | | | 7,347 | | | | 13,246 | | | | 42,099 | | | | 486,430 | |
Payable upon return of securities loaned | | | 19,577,790 | | | | 4,074,205 | | | | 8,457,501 | | | | 9,500,810 | |
Payable for investments purchased | | | 798,119 | | | | — | | | | 506,038 | | | | — | |
Accrued expenses: | | | | | | | | | | | | | | | | |
Investment advisory and management fees | | | 41,760 | | | | 1,604 | | | | 8,448 | | | | 7,245 | |
Administrative fees | | | 15,168 | | | | 3,648 | | | | 7,740 | | | | 11,988 | |
Other | | | 68,784 | | | | 45,577 | | | | 64,936 | | | | 73,220 | |
| | | | | | | | | | | | | | | | |
Total liabilities | | | 20,537,956 | | | | 4,138,280 | | | | 9,124,960 | | | | 10,097,015 | |
| | | | | | | | | | | | | | | | |
Net Assets | | $ | 91,497,320 | | | $ | 22,023,308 | | | $ | 45,294,165 | | | $ | 74,751,011 | |
| | | | | | | | | | | | | | | | |
Net Assets Represent: | | | | | | | | | | | | | | | | |
Paid-in capital | | $ | 74,338,088 | | | $ | 36,702,253 | | | $ | 63,878,870 | | | $ | 77,298,597 | |
Undistributed net investment income (loss) | | | (45,622 | ) | | | 9,351 | | | | 20,081 | | | | (15,087 | ) |
Accumulated net realized gain (loss) from investments and foreign currency transactions | | | 5,214,192 | | | | (16,784,593 | ) | | | (19,150,889 | ) | | | (2,842,513 | ) |
Net unrealized appreciation of investments and foreign currency translations | | | 11,990,662 | | | | 2,096,297 | | | | 546,103 | | | | 310,014 | |
| | | | | | | | | | | | | | | | |
Net Assets | | $ | 91,497,320 | | | $ | 22,023,308 | | | $ | 45,294,165 | | | $ | 74,751,011 | |
| | | | | | | | | | | | | | | | |
Class A Shares—Net Assets | | $ | 8,948,230 | | | $ | 1,825,351 | | | $ | 25,524,812 | | | $ | 16,151,817 | |
Shares Outstanding | | | 546,565 | | | | 137,373 | | | | 2,976,722 | | | | 1,553,693 | |
| | | | | | | | | | | | | | | | |
Net asset value, offering and redemption price per share | | $ | 16.37 | | | $ | 13.29 | | | $ | 8.57 | | | $ | 10.40 | |
| | | | | | | | | | | | | | | | |
Class B Shares—Net Assets | | $ | 10,591,728 | | | $ | 7,854,827 | | | $ | 8,777,582 | | | $ | 10,755,262 | |
Shares Outstanding | | | 686,004 | | | | 601,497 | | | | 1,033,910 | | | | 1,041,814 | |
| | | | | | | | | | | | | | | | |
Net asset value, offering and redemption price per share | | $ | 15.44 | | | $ | 13.06 | | | $ | 8.49 | | | $ | 10.32 | |
| | | | | | | | | | | | | | | | |
Class C Shares—Net Assets | | $ | 11,277,221 | | | $ | 4,260,900 | | | $ | 7,075,409 | | | $ | 23,802,112 | |
Shares Outstanding | | | 731,225 | | | | 323,177 | | | | 834,750 | | | | 2,289,854 | |
| | | | | | | | | | | | | | | | |
Net asset value, offering and redemption price per share | | $ | 15.42 | | | $ | 13.18 | | | $ | 8.48 | | | $ | 10.39 | |
| | | | | | | | | | | | | | | | |
Institutional Class Shares—Net Assets | | $ | 60,680,141 | | | $ | 8,082,230 | | | $ | 3,916,362 | | | $ | 24,041,820 | |
Shares Outstanding | | | 3,508,109 | | | | 603,678 | | | | 452,881 | | | | 2,303,437 | |
| | | | | | | | | | | | | | | | |
Net asset value, offering and redemption price per share | | $ | 17.30 | | | $ | 13.39 | | | $ | 8.65 | | | $ | 10.44 | |
| | | | | | | | | | | | | | | | |
* Investments at cost | | $ | 99,449,605 | | | $ | 23,945,982 | | | $ | 52,358,629 | | | $ | 83,295,953 | |
** Foreign currency at cost | | | — | | | | — | | | | — | | | $ | 37 | |
The accompanying notes are an integral part of these financial statements.
29
Statements of Operations
For the six months ended June 30, 2007 (unaudited)
| | | | | | | | | | | | | | | | |
| | | Mid-Cap | | | Balanced | | | High Yield | | | Fixed Income | |
Investment Income: | | | | | | | | | | | | | | | | |
Dividend income | | $ | 476,727 | | | $ | 133,867 | | | $ | 28,803 | | | $ | 83,690 | |
Interest income | | | — | | | | 199,492 | | | | 1,920,987 | | | | 1,898,626 | |
Securities lending fees | | | 6,988 | | | | 1,789 | | | | 10,348 | | | | 6,495 | |
| | | | | | | | | | | | | | | | |
Total investment income | | | 483,715 | | | | 335,148 | | | | 1,960,138 | | | | 1,988,811 | |
| | | | | | | | | | | | | | | | |
Expenses: | | | | | | | | | | | | | | | | |
Investment advisory and management fees | | | 314,352 | | | | 78,131 | | | | 174,305 | | | | 152,195 | |
Administrative fees | | | 89,815 | | | | 22,323 | | | | 49,801 | | | | 67,642 | |
Distribution Fees—Class A Shares | | | 11,565 | | | | 2,543 | | | | 33,587 | | | | 14,911 | |
Distribution Fees—Class B Shares | | | 54,305 | | | | 21,682 | | | | 52,743 | | | | 58,814 | |
Distribution Fees—Class C Shares | | | 57,426 | | | | 40,309 | | | | 36,938 | | | | 95,655 | |
Custodian | | | 31,914 | | | | 28,709 | | | | 35,829 | | | | 28,863 | |
Registration fees | | | 17,393 | | | | 16,451 | | | | 16,858 | | | | 17,534 | |
Professional fees | | | 18,683 | | | | 13,377 | | | | 17,540 | | | | 18,392 | |
Transfer agent | | | 14,546 | | | | 4,745 | | | | 15,587 | | | | 9,346 | |
Reports to shareholders | | | 14,156 | | | | 5,322 | | | | 8,509 | | | | 8,380 | |
Trustees fees and expenses | | | 1,043 | | | | 349 | | | | 1,010 | | | | 1,595 | |
Miscellaneous | | | 3,114 | | | | 891 | | | | 2,239 | | | | 1,337 | |
| | | | | | | | | | | | | | | | |
Total expenses before offsets | | | 628,312 | | | | 234,832 | | | | 444,946 | | | | 474,664 | |
| | | | | | | | | | | | | | | | |
Expense reimbursement | | | (57,035 | ) | | | (58,512 | ) | | | (96,954 | ) | | | (127,658 | ) |
Expense reductions | | | (11,216 | ) | | | (2,048 | ) | | | (297 | ) | | | (214 | ) |
| | | | | | | | | | | | | | | | |
Net expenses | | | 560,061 | | | | 174,272 | | | | 347,695 | | | | 346,792 | |
| | | | | | | | | | | | | | | | |
Net investment income (loss) | | | (76,346 | ) | | | 160,876 | | | | 1,612,443 | | | | 1,642,019 | |
| | | | | | | | | | | | | | | | |
Net Realized and Unrealized Gain (Loss): | | | | | | | | | | | | | | | | |
Net realized gain on investment transactions | | | 10,493,652 | | | | 1,278,802 | | | | 411,209 | | | | 120,607 | |
Net realized gain on foreign currency transactions | | | — | | | | — | | | | — | | | | 3,005 | |
Net unrealized depreciation of investments | | | (63,268 | ) | | | (521,131 | ) | | | (636,405 | ) | | | (1,201,184 | ) |
Net unrealized appreciation of foreign currency translations | | | — | | | | — | | | | — | | | | 311 | |
| | | | | | | | | | | | | | | | |
Net realized and unrealized gain (loss) | | | 10,430,384 | | | | 757,671 | | | | (225,196 | ) | | | (1,077,261 | ) |
| | | | | | | | | | | | | | | | |
Net Increase in Net Assets Resulting from Operations | | $ | 10,354,038 | | | $ | 918,547 | | | $ | 1,387,247 | | | $ | 564,758 | |
| | | | | | | | | | | | | | | | |
The accompanying notes are an integral part of these financial statements.
30
Statements of Changes in Net Assets
For the six months ended June 30, 2007 (unaudited) and for the year ended December 31, 2006
| | | | | | | | | | | | | | | | |
| | | Mid-Cap | | | Balanced | |
| | | 2007 | | | 2006 | | | 2007 | | | 2006 | |
Increase (Decrease) in Net Assets From Operations: | | | | | | | | | | | | | | | | |
Net investment income (loss) | | $ | (76,346 | ) | | $ | 256,737 | | | $ | 160,876 | | | $ | 384,956 | |
Net realized gain on investments and foreign currency transactions | | | 10,493,652 | | | | 12,117,996 | | | | 1,278,802 | | | | 1,890,604 | |
Net unrealized appreciation (depreciation) of investments and foreign currency translations | | | (63,268 | ) | | | (4,899,311 | ) | | | (521,131 | ) | | | 565,424 | |
| | | | | | | | | | | | | | | | |
Net increase in net assets resulting from operations | | | 10,354,038 | | | | 7,475,422 | | | | 918,547 | | | | 2,840,984 | |
| | | | | | | | | | | | | | | | |
Distributions to Shareholders: | | | | | | | | | | | | | | | | |
From net investment income: | | | | | | | | | | | | | | | | |
Class A Shares | | | — | | | | (25,327 | ) | | | (18,717 | ) | | | (36,816 | ) |
Class B Shares | | | — | | | | (32,741 | ) | | | (45,816 | ) | | | (121,169 | ) |
Class C Shares | | | — | | | | (34,369 | ) | | | (24,474 | ) | | | (63,310 | ) |
Institutional Class Shares | | | — | | | | (146,506 | ) | | | (85,037 | ) | | | (174,540 | ) |
| | | | | | | | | | | | | | | | |
Total distributions to shareholders | | | — | | | | (238,943 | ) | | | (174,044 | ) | | | (395,835 | ) |
| | | | | | | | | | | | | | | | |
From Capital Share Transactions: | | | | | | | | | | | | | | | | |
Proceeds from sale of shares | | | 3,855,083 | | | | 6,822,273 | | | | 923,256 | | | | 1,503,313 | |
Reinvestment of dividends and distributions | | | — | | | | 167,331 | | | | 107,870 | | | | 228,114 | |
Cost of shares repurchased | | | (10,843,089 | ) | | | (23,734,314 | ) | | | (2,325,729 | ) | | | (5,554,339 | ) |
| | | | | | | | | | | | | | | | |
Net increase (decrease) from capital share transactions | | | (6,988,006 | ) | | | (16,744,710 | ) | | | (1,294,603 | ) | | | (3,822,912 | ) |
| | | | | | | | | | | | | | | | |
Total increase (decrease) in net assets | | | 3,366,032 | | | | (9,508,231 | ) | | | (550,100 | ) | | | (1,377,763 | ) |
| | | | | | | | | | | | | | | | |
Net Assets: | | | | | | | | | | | | | | | | |
Beginning of period | | | 88,131,288 | | | | 97,639,519 | | | | 22,573,408 | | | | 23,951,171 | |
| | | | | | | | | | | | | | | | |
End of period | | $ | 91,497,320 | | | $ | 88,131,288 | | | $ | 22,023,308 | | | $ | 22,573,408 | |
| | | | | | | | | | | | | | | | |
End of period undistributed net investment income (loss) | | $ | (45,622 | ) | | $ | 30,724 | | | $ | 9,351 | | | $ | 22,519 | |
| | | | | | | | | | | | | | | | |
The accompanying notes are an integral part of these financial statements.
31
| | | | | | | | | | | | | | |
| High Yield | | | Fixed Income | |
| 2007 | | | 2006 | | | 2007 | | | 2006 | |
| $ | 1,612,443 | | | $ | 3,171,541 | | | $ | 1,642,019 | | | $ | 2,954,343 | |
| | 411,209 | | | | 926,685 | | | | 123,612 | | | | 738,076 | |
| | (636,405 | ) | | | 1,143,135 | | | | (1,200,873 | ) | | | 375,650 | |
| | | | | | | | | | | | | | | |
| | 1,387,247 | | | | 5,241,361 | | | | 564,758 | | | | 4,068,069 | |
| | | | | | | | | | | | | | | |
| | (908,535 | ) | | | (1,527,984 | ) | | | (316,922 | ) | | | (491,190 | ) |
| | (306,239 | ) | | | (868,633 | ) | | | (256,248 | ) | | | (635,983 | ) |
| | (220,302 | ) | | | (443,807 | ) | | | (434,299 | ) | | | (512,279 | ) |
| | (170,372 | ) | | | (318,031 | ) | | | (650,382 | ) | | | (1,354,183 | ) |
| | | | | | | | | | | | | | | |
| | (1,605,448 | ) | | | (3,158,455 | ) | | | (1,657,851 | ) | | | (2,993,635 | ) |
| | | | | | | | | | | | | | | |
| | 9,721,460 | | | | 16,283,760 | | | | 22,114,184 | | | | 24,882,296 | |
| | 956,903 | | | | 1,750,704 | | | | 908,364 | | | | 1,506,078 | |
| | (19,143,287 | ) | | | (15,773,663 | ) | | | (13,358,904 | ) | | | (22,831,654 | ) |
| | | | | | | | | | | | | | | |
| | (8,464,924 | ) | | | 2,260,801 | | | | 9,663,644 | | | | 3,556,720 | |
| | | | | | | | | | | | | | | |
| | (8,683,125 | ) | | | 4,343,707 | | | | 8,570,551 | | | | 4,631,154 | |
| | | | | | | | | | | | | | | |
| | 53,977,290 | | | | 49,633,583 | | | | 66,180,460 | | | | 61,549,306 | |
| | | | | | | | | | | | | | | |
| $ | 45,294,165 | | | $ | 53,977,290 | | | $ | 74,751,011 | | | $ | 66,180,460 | |
| | | | | | | | | | | | | | | |
| | $20,081 | | | $ | 13,086 | | | $ | (15,087 | ) | | $ | 745 | |
| | | | | | | | | | | | | | | |
The accompanying notes are an integral part of these financial statements.
32
Financial Highlights
For a share outstanding throughout each of the six months ended June 30, 2007 (unaudited) and each year ended December 31,
| | | | | | | | | | | | | | | | | | | | | | | | |
| | | Class A Shares | |
Mid-Cap | | 2007 | | | 2006 | | | 2005 | | | 2004 | | | 2003 | | | 2002 | |
Net Asset Value, Beginning of Period | | $ | 14.60 | | | $ | 13.48 | | | $ | 12.10 | | | $ | 10.36 | | | $ | 7.58 | | | $ | 8.79 | |
| | | | | | | | | | | | | | | | | | | | | | | | |
Income from Investment Operations: | | | | | | | | | | | | | | | | | | | | | | | | |
Net investment income (loss) | | | — | | | | 0.05 | | | | (0.01 | )2 | | | (0.02 | ) | | | (0.01 | ) | | | (0.01 | ) |
Net realized and unrealized gain (loss) on investments | | | 1.77 | | | | 1.11 | | | | 1.39 | | | | 1.76 | | | | 2.79 | | | | (1.20 | ) |
| | | | | | | | | | | | | | | | | | | | | | | | |
Total from investment operations | | | 1.77 | | | | 1.16 | | | | 1.38 | | | | 1.74 | | | | 2.78 | | | | (1.21 | ) |
| | | | | | | | | | | | | | | | | | | | | | | | |
Less Distributions to Shareholders from: | | | | | | | | | | | | | | | | | | | | | | | | |
Net investment income | | | — | | | | (0.04 | ) | | | — | | | | — | | | | — | | | | — | |
| | | | | | | | | | | | | | | | | | | | | | | | |
Total distributions to shareholders | | | — | | | | (0.04 | ) | | | — | | | | — | | | | — | | | | — | |
| | | | | | | | | | | | | | | | | | | | | | | | |
Net Asset Value, End of Period | | $ | 16.37 | | | $ | 14.60 | | | $ | 13.48 | | | $ | 12.10 | | | $ | 10.36 | | | $ | 7.58 | |
| | | | | | | | | | | | | | | | | | | | | | | | |
Total Return 1 | | | 12.12 | %4 | | | 8.69 | % | | | 11.32 | % | | | 16.80 | % | | | 36.68 | % | | | (13.77 | )% |
| | | | | | | | | | | | | | | | | | | | | | | | |
Ratio of net expenses to average net assets 1 | | | 1.22 | %3 | | | 1.23 | % | | | 1.33 | % | | | 1.41 | % | | | 1.50 | % | | | 1.50 | % |
Ratio of total expenses to average net assets 1 | | | 1.37 | %3 | | | 1.36 | % | | | 1.45 | % | | | 1.68 | % | | | 1.63 | % | | | 1.59 | % |
Ratio of net investment income (loss) to average net assets | | | (0.15 | )%3 | | | 0.34 | % | | | (0.13 | )% | | | (0.16 | )% | | | (0.14 | )% | | | (0.09 | )% |
Portfolio turnover | | | 59 | %4 | | | 85 | % | | | 84 | % | | | 90 | % | | | 109 | % | | | 108 | % |
Net assets at end of period (000’s omitted) | | $ | 8,948 | | | $ | 9,178 | | | $ | 8,712 | | | $ | 9,168 | | | $ | 9,741 | | | $ | 7,290 | |
| | | | | | | | | | | | | | | | | | | | | | | | |
| |
| | | Class C Shares | |
Mid-Cap | | 2007 | | | 2006 | | | 2005 | | | 2004 | | | 2003 | | | 2002 | |
Net Asset Value, Beginning of Period | | $ | 13.80 | | | $ | 12.83 | | | $ | 11.60 | | | $ | 9.99 | | | $ | 7.34 | | | $ | 8.55 | |
| | | | | | | | | | | | | | | | | | | | | | | | |
Income from Investment Operations: | | | | | | | | | | | | | | | | | | | | | | | | |
Net investment loss | | | (0.07 | ) | | | (0.06 | ) | | | (0.06 | )2 | | | (0.08 | ) | | | (0.05 | ) | | | (0.06 | ) |
Net realized and unrealized gain (loss) on investments | | | 1.69 | | | | 1.07 | | | | 1.29 | | | | 1.69 | | | | 2.70 | | | | (1.15 | ) |
| | | | | | | | | | | | | | | | | | | | | | | | |
Total from investment operations | | | 1.62 | | | | 1.01 | | | | 1.23 | | | | 1.61 | | | | 2.65 | | | | (1.21 | ) |
| | | | | | | | | | | | | | | | | | | | | | | | |
Less Distributions to Shareholders from: | | | | | | | | | | | | | | | | | | | | | | | | |
Net investment income | | | — | | | | (0.04 | ) | | | — | | | | — | | | | — | | | | — | |
| | | | | | | | | | | | | | | | | | | | | | | | |
Total distributions to shareholders | | | — | | | | (0.04 | ) | | | — | | | | — | | | | — | | | | — | |
| | | | | | | | | | | | | | | | | | | | | | | | |
Net Asset Value, End of Period | | $ | 15.42 | | | $ | 13.80 | | | $ | 12.83 | | | $ | 11.60 | | | $ | 9.99 | | | $ | 7.34 | |
| | | | | | | | | | | | | | | | | | | | | | | | |
Total Return 1 | | | 11.74 | %4 | | | 7.87 | % | | | 10.60 | % | | | 16.12 | % | | | 36.10 | % | | | (14.15 | )% |
| | | | | | | | | | | | | | | | | | | | | | | | |
Ratio of net expenses to average net assets 1 | | | 1.97 | %3 | | | 1.98 | % | | | 1.99 | % | | | 1.91 | % | | | 2.00 | % | | | 2.00 | % |
Ratio of total expenses to average net assets 1 | | | 2.12 | %3 | | | 2.11 | % | | | 2.11 | % | | | 2.18 | % | | | 2.13 | % | | | 2.09 | % |
Ratio of net investment income (loss) to average net assets | | | (0.89 | )%3 | | | (0.41 | )% | | | (0.79 | )% | | | (0.67 | )% | | | (0.64 | )% | | | (0.59 | )% |
Portfolio turnover | | | 59 | %4 | | | 85 | % | | | 84 | % | | | 90 | % | | | 109 | % | | | 108 | % |
Net assets at end of period (000’s omitted) | | $ | 11,277 | | | $ | 11,748 | | | $ | 13,845 | | | $ | 15,393 | | | $ | 16,576 | | | $ | 16,329 | |
| | | | | | | | | | | | | | | | | | | | | | | | |
33
| | | | | | | | | | | | | | | | | | | | | | |
| Class B Shares | |
| 2007 | | | 2006 | | | 2005 | | | 2004 | | | 2003 | | | 2002 | |
| $ | 13.79 | | | $ | 12.82 | | | $ | 11.59 | | | $ | 9.98 | | | $ | 7.33 | | | $ | 8.54 | |
| | | | | | | | | | | | | | | | | | | | | | | |
| | (0.07 | ) | | | (0.08 | ) | | | (0.06 | )2 | | | (0.07 | ) | | | (0.05 | ) | | | (0.06 | ) |
| | 1.72 | | | | 1.09 | | | | 1.29 | | | | 1.68 | | | | 2.70 | | | | (1.15 | ) |
| | | | | | | | | | | | | | | | | | | | | | | |
| | 1.65 | | | | 1.01 | | | | 1.23 | | | | 1.61 | | | | 2.65 | | | | (1.21 | ) |
| | | | | | | | | | | | | | | | | | | | | | | |
| | — | | | | (0.04 | ) | | | — | | | | — | | | | — | | | | — | |
| | | | | | | | | | | | | | | | | | | | | | | |
| | — | | | | (0.04 | ) | | | — | | | | — | | | | — | | | | — | |
| | | | | | | | | | | | | | | | | | | | | | | |
| $ | 15.44 | | | $ | 13.79 | | | $ | 12.82 | | | $ | 11.59 | | | $ | 9.98 | | | $ | 7.33 | |
| | | | | | | | | | | | | | | | | | | | | | | |
| | 11.96 | %4 | | | 7.88 | % | | | 10.61 | % | | | 16.13 | % | | | 36.15 | % | | | (14.17 | )% |
| | | | | | | | | | | | | | | | | | | | | | | |
| | 1.97 | %3 | | | 1.98 | % | | | 1.99 | % | | | 1.90 | % | | | 2.00 | % | | | 2.00 | % |
| | 2.12 | %3 | | | 2.11 | % | | | 2.11 | % | | | 2.18 | % | | | 2.13 | % | | | 2.09 | % |
| | (0.90 | )%3 | | | (0.41 | )% | | | (0.79 | )% | | | (0.67 | )% | | | (0.64 | )% | | | (0.59 | )% |
| | 59 | %4 | | | 85 | % | | | 84 | % | | | 90 | % | | | 109 | % | | | 108 | % |
| $ | 10,592 | | | $ | 11,197 | | | $ | 15,512 | | | $ | 17,226 | | | $ | 17,052 | | | $ | 15,956 | |
| | | | | | | | | | | | | | | | | | | | | | | |
|
| Institutional Class Shares | |
| 2007 | | | 2006 | | | 2005 | | | 2004 | | | 2003 | | | 2002 | |
| $ | 15.41 | | | $ | 14.19 | | | $ | 12.70 | | | $ | 10.82 | | | $ | 7.87 | | | $ | 9.09 | |
| | | | | | | | | | | | | | | | | | | | | | | |
| | 0.01 | | | | 0.09 | | | | 0.10 | 2 | | | 0.04 | | | | 0.03 | | | | 0.04 | |
| | 1.88 | | | | 1.17 | | | | 1.39 | | | | 1.84 | | | | 2.92 | | | | (1.25 | ) |
| | | | | | | | | | | | | | | | | | | | | | | |
| | 1.89 | | | | 1.26 | | | | 1.49 | | | | 1.88 | | | | 2.95 | | | | (1.21 | ) |
| | | | | | | | | | | | | | | | | | | | | | | |
| | — | | | | (0.04 | ) | | | — | | | | — | | | | — | | | | (0.01 | ) |
| | | | | | | | | | | | | | | | | | | | | | | |
| | — | | | | (0.04 | ) | | | — | | | | — | | | | — | | | | (0.01 | ) |
| | | | | | | | | | | | | | | | | | | | | | | |
| $ | 17.30 | | | $ | 15.41 | | | $ | 14.19 | | | $ | 12.70 | | | $ | 10.82 | | | $ | 7.87 | |
| | | | | | | | | | | | | | | | | | | | | | | |
| | 12.26 | %4 | | | 8.96 | % | | | 11.74 | % | | | 17.37 | % | | | 37.51 | % | | | (13.33 | )% |
| | | | | | | | | | | | | | | | | | | | | | | |
| | 0.97 | %3 | | | 0.98 | % | | | 0.99 | % | | | 0.90 | % | | | 1.00 | % | | | 1.00 | % |
| | 1.12 | %3 | | | 1.11 | % | | | 1.11 | % | | | 1.18 | % | | | 1.13 | % | | | 1.09 | % |
| | 0.11 | %3 | | | 0.59 | % | | | 0.21 | % | | | 0.33 | % | | | 0.36 | % | | | 0.41 | % |
| | 59 | %4 | | | 85 | % | | | 84 | % | | | 90 | % | | | 109 | % | | | 108 | % |
| $ | 60,680 | | | $ | 56,008 | | | $ | 59,571 | | | $ | 60,656 | | | $ | 64,225 | | | $ | 62,544 | |
| | | | | | | | | | | | | | | | | | | | | | | |
34
Financial Highlights
For a share outstanding throughout each of the six months ended June 30, 2007 (unaudited) and each year ended December 31,
| | | | | | | | | | | | | | | | | | | | | | | | |
| | | Class A Shares | |
Balanced | | 2007 | | | 2006 | | | 2005 | | | 2004 | | | 2003 | | | 2002 | |
Net Asset Value, Beginning of Period | | $ | 12.86 | | | $ | 11.55 | | | $ | 11.24 | | | $ | 10.42 | | | $ | 8.62 | | | $ | 10.13 | |
| | | | | | | | | | | | | | | | | | | | | | | | |
Income from Investment Operations: | | | | | | | | | | | | | | | | | | | | | | | | |
Net investment income | | | 0.12 | | | | 0.25 | | | | 0.17 | | | | 0.17 | | | | 0.22 | | | | 0.24 | |
Net realized and unrealized gain (loss) on investments | | | 0.43 | | | | 1.32 | | | | 0.30 | | | | 0.81 | | | | 1.81 | | | | (1.49 | ) |
| | | | | | | | | | | | | | | | | | | | | | | | |
Total from investment operations | | | 0.55 | | | | 1.57 | | | | 0.47 | | | | 0.98 | | | | 2.03 | | | | (1.25 | ) |
| | | | | | | | | | | | | | | | | | | | | | | | |
Less Distributions to Shareholders from: | | | | | | | | | | | | | | | | | | | | | | | | |
Net investment income | | | (0.12 | ) | | | (0.26 | ) | | | (0.16 | ) | | | (0.16 | ) | | | (0.23 | ) | | | (0.26 | ) |
| | | | | | | | | | | | | | | | | | | | | | | | |
Total distributions to shareholders | | | (0.12 | ) | | | (0.26 | ) | | | (0.16 | ) | | | (0.16 | ) | | | (0.23 | ) | | | (0.26 | ) |
| | | | | | | | | | | | | | | | | | | | | | | | |
Net Asset Value, End of Period | | $ | 13.29 | | | $ | 12.86 | | | $ | 11.55 | | | $ | 11.24 | | | $ | 10.42 | | | $ | 8.62 | |
| | | | | | | | | | | | | | | | | | | | | | | | |
Total Return 1 | | | 4.32 | %4 | | | 13.73 | % | | | 4.24 | % | | | 9.45 | % | | | 23.85 | % | | | (12.47 | )% |
| | | | | | | | | | | | | | | | | | | | | | | | |
Ratio of net expenses to average net assets 1 | | | 1.23 | %3 | | | 1.23 | % | | | 1.31 | % | | | 1.47 | % | | | 1.50 | % | | | 1.50 | % |
Ratio of total expenses to average net assets 1 | | | 1.77 | %3 | | | 1.81 | % | | | 1.85 | % | | | 2.05 | % | | | 1.73 | % | | | 1.68 | % |
Ratio of net investment income to average net assets | | | 1.77 | %3 | | | 2.05 | % | | | 1.45 | % | | | 1.46 | % | | | 2.21 | % | | | 2.62 | % |
Portfolio turnover | | | 141 | %4 | | | 66 | % | | | 53 | % | | | 85 | % | | | 91 | % | | | 183 | % |
Net assets at end of period (000’s omitted) | | $ | 1,825 | | | $ | 1,933 | | | $ | 1,677 | | | $ | 2,366 | | | $ | 3,448 | | | $ | 4,205 | |
| | | | | | | | | | | | | | | | | | | | | | | | |
| |
| | | Class C Shares | |
Balanced | | 2007 | | | 2006 | | | 2005 | | | 2004 | | | 2003 | | | 2002 | |
Net Asset Value, Beginning of Period | | $ | 12.76 | | | $ | 11.46 | | | $ | 11.16 | | | $ | 10.35 | | | $ | 8.56 | | | $ | 10.06 | |
| | | | | | | | | | | | | | | | | | | | | | | | |
Income from Investment Operations: | | | | | | | | | | | | | | | | | | | | | | | | |
Net investment income | | | 0.07 | | | | 0.16 | | | | 0.09 | | | | 0.11 | | | | 0.16 | | | | 0.18 | |
Net realized and unrealized gain (loss) on investments | | | 0.42 | | | | 1.31 | | | | 0.30 | | | | 0.81 | | | | 1.81 | | | | (1.46 | ) |
| | | | | | | | | | | | | | | | | | | | | | | | |
Total from investment operations | | | 0.49 | | | | 1.47 | | | | 0.39 | | | | 0.92 | | | | 1.97 | | | | (1.28 | ) |
| | | | | | | | | | | | | | | | | | | | | | | | |
Less Distributions to Shareholders from: | | | | | | | | | | | | | | | | | | | | | | | | |
Net investment income | | | (0.07 | ) | | | (0.17 | ) | | | (0.09 | ) | | | (0.11 | ) | | | (0.18 | ) | | | (0.22 | ) |
| | | | | | | | | | | | | | | | | | | | | | | | |
Total distributions to shareholders | | | (0.07 | ) | | | (0.17 | ) | | | (0.09 | ) | | | (0.11 | ) | | | (0.18 | ) | | | (0.22 | ) |
| | | | | | | | | | | | | | | | | | | | | | | | |
Net Asset Value, End of Period | | $ | 13.18 | | | $ | 12.76 | | | $ | 11.46 | | | $ | 11.16 | | | $ | 10.35 | | | $ | 8.56 | |
| | | | | | | | | | | | | | | | | | | | | | | | |
Total Return 1 | | | 3.88 | %4 | | | 12.88 | % | | | 3.49 | % | | | 8.88 | % | | | 23.38 | % | | | (12.94 | )% |
| | | | | | | | | | | | | | | | | | | | | | | | |
Ratio of net expenses to average net assets 1 | | | 1.98 | %3 | | | 1.98 | % | | | 1.98 | % | | | 1.97 | % | | | 2.00 | % | | | 2.00 | % |
Ratio of total expenses to average net assets 1 | | | 2.52 | %3 | | | 2.56 | % | | | 2.52 | % | | | 2.56 | % | | | 2.23 | % | | | 2.18 | % |
Ratio of net investment income to average net assets | | | 1.02 | %3 | | | 1.30 | % | | | 0.79 | % | | | 0.97 | % | | | 1.71 | % | | | 2.12 | % |
Portfolio turnover | | | 141 | %4 | | | 66 | % | | | 53 | % | | | 85 | % | | | 91 | % | | | 183 | % |
Net assets at end of period (000’s omitted) | | $ | 4,261 | | | $ | 4,479 | | | $ | 5,081 | | | $ | 6,377 | | | $ | 8,537 | | | $ | 13,026 | |
| | | | | | | | | | | | | | | | | | | | | | | | |
35
| | | | | | | | | | | | | | | | | | | | | | |
| Class B Shares | |
| 2007 | | | 2006 | | | 2005 | | | 2004 | | | 2003 | | | 2002 | |
| $ | 12.64 | | | $ | 11.36 | | | $ | 11.06 | | | $ | 10.26 | | | $ | 8.49 | | | $ | 9.98 | |
| | 0.07 | | | | 0.18 | | | | 0.09 | | | | 0.34 | | | | 0.16 | | | | 0.18 | |
| | 0.42 | | | | 1.29 | | | | 0.30 | | | | 0.80 | | | | 1.79 | | | | (1.45 | ) |
| | | | | | | | | | | | | | | | | | | | | | | |
| | 0.49 | | | | 1.47 | | | | 0.39 | | | | 1.14 | | | | 1.95 | | | | (1.27 | ) |
| | | | | | | | | | | | | | | | | | | | | | | |
| | (0.07 | ) | | | (0.19 | ) | | | (0.09 | ) | | | (0.34 | ) | | | (0.18 | ) | | | (0.22 | ) |
| | | | | | | | | | | | | | | | | | | | | | | |
| | (0.07 | ) | | | (0.19 | ) | | | (0.09 | ) | | | (0.34 | ) | | | (0.18 | ) | | | (0.22 | ) |
| | | | | | | | | | | | | | | | | | | | | | | |
| $ | 13.06 | | | $ | 12.64 | | | $ | 11.36 | | | $ | 11.06 | | | $ | 10.26 | | | $ | 8.49 | |
| | | | | | | | | | | | | | | | | | | | | | | |
| | 3.92 | %4 | | | 12.83 | % | | | 3.53 | % | | | 11.11 | % | | | 23.42 | % | | | (12.89 | )% |
| | | | | | | | | | | | | | | | | | | | | | | |
| | 1.98 | %3 | | | 1.98 | % | | | 1.98 | % | | | 1.97 | % | | | 2.00 | % | | | 2.00 | % |
| | 2.52 | %3 | | | 2.56 | % | | | 2.52 | % | | | 2.57 | % | | | 2.23 | % | | | 2.18 | % |
| | 1.02 | %3 | | | 1.30 | % | | | 0.79 | % | | | 0.97 | % | | | 1.71 | % | | | 2.12 | % |
| | 141 | %4 | | | 66 | % | | | 53 | % | | | 85 | % | | | 91 | % | | | 183 | % |
| $ | 7,855 | | | $ | 8,485 | | | $ | 9,692 | | | $ | 11,090 | | | $ | 12,134 | | | $ | 12,345 | |
| | | | | | | | | | | | | | | | | | | | | | | |
|
| Institutional Class Shares | |
| 2007 | | | 2006 | | | 2005 | | | 2004 | | | 2003 | | | 2002 | |
| $ | 12.96 | | | $ | 11.64 | | | $ | 11.33 | | | $ | 10.50 | | | $ | 8.68 | | | $ | 10.22 | |
| | | | | | | | | | | | | | | | | | | | | | | |
| | 0.13 | | | | 0.29 | | | | 0.18 | | | | 0.21 | | | | 0.27 | | | | 0.28 | |
| | 0.44 | | | | 1.32 | | | | 0.31 | | | | 0.83 | | | | 1.83 | | | | (1.50 | ) |
| | | | | | | | | | | | | | | | | | | | | | | |
| | 0.57 | | | | 1.61 | | | | 0.49 | | | | 1.04 | | | | 2.10 | | | | (1.22 | ) |
| | | | | | | | | | | | | | | | | | | | | | | |
| | (0.14 | ) | | | (0.29 | ) | | | (0.18 | ) | | | (0.21 | ) | | | (0.28 | ) | | | (0.32 | ) |
| | | | | | | | | | | | | | | | | | | | | | | |
| | (0.14 | ) | | | (0.29 | ) | | | (0.18 | ) | | | (0.21 | ) | | | (0.28 | ) | | | (0.32 | ) |
| | | | | | | | | | | | | | | | | | | | | | | |
| $ | 13.39 | | | $ | 12.96 | | | $ | 11.64 | | | $ | 11.33 | | | $ | 10.50 | | | $ | 8.68 | |
| | | | | | | | | | | | | | | | | | | | | | | |
| | 4.42 | %4 | | | 13.98 | % | | | 4.57 | % | | | 10.04 | % | | | 24.51 | % | | | (12.06 | )% |
| | | | | | | | | | | | | | | | | | | | | | | |
| | 0.98 | %3 | | | 0.98 | % | | | 0.98 | % | | | 0.97 | % | | | 1.00 | % | | | 1.00 | % |
| | 1.53 | %3 | | | 1.56 | % | | | 1.52 | % | | | 1.57 | % | | | 1.23 | % | | | 1.18 | % |
| | 2.02 | %3 | | | 2.30 | % | | | 1.80 | % | | | 1.98 | % | | | 2.71 | % | | | 3.12 | % |
| | 141 | %4 | | | 66 | % | | | 53 | % | | | 85 | % | | | 91 | % | | | 183 | % |
| $ | 8,082 | | | $ | 7,676 | | | $ | 7,501 | | | $ | 8,111 | | | $ | 8,104 | | | $ | 8,609 | |
| | | | | | | | | | | | | | | | | | | | | | | |
36
Financial Highlights
For a share outstanding throughout each of the six months ended June 30, 2007 (unaudited) and each year ended December 31,
| | | | | | | | | | | | | | | | | | | | | | | | |
| | | Class A Shares | |
High Yield | | 2007 | | | 2006 | | | 2005 | | | 2004 | | | 2003 | | | 2002 | |
Net Asset Value, Beginning of Period | | $ | 8.63 | | | $ | 8.30 | | | $ | 8.67 | | | $ | 8.46 | | | $ | 7.08 | | | $ | 7.76 | |
| | | | | | | | | | | | | | | | | | | | | | | | |
Income from Investment Operations: | | | | | | | | | | | | | | | | | | | | | | | | |
Net investment income | | | 0.29 | | | | 0.55 | | | | 0.57 | | | | 0.67 | | | | 0.64 | | | | 0.80 | |
Net realized and unrealized gain (loss) on investments | | | (0.06 | ) | | | 0.33 | | | | (0.37 | ) | | | 0.19 | | | | 1.39 | | | | (0.70 | ) |
| | | | | | | | | | | | | | | | | | | | | | | | |
Total from investment operations | | | 0.23 | | | | 0.88 | | | | 0.20 | | | | 0.86 | | | | 2.03 | | | | 0.10 | |
| | | | | | | | | | | | | | | | | | | | | | | | |
Less Distributions to Shareholders from: | | | | | | | | | | | | | | | | | | | | | | | | |
Net investment income | | | (0.29 | ) | | | (0.55 | ) | | | (0.57 | ) | | | (0.65 | ) | | | (0.65 | ) | | | (0.78 | ) |
| | | | | | | | | | | | | | | | | | | | | | | | |
Total distributions to shareholders | | | (0.29 | ) | | | (0.55 | ) | | | (0.57 | ) | | | (0.65 | ) | | | (0.65 | ) | | | (0.78 | ) |
| | | | | | | | | | | | | | | | | | | | | | | | |
Net Asset Value, End of Period | | $ | 8.57 | | | $ | 8.63 | | | $ | 8.30 | | | $ | 8.67 | | | $ | 8.46 | | | $ | 7.08 | |
| | | | | | | | | | | | | | | | | | | | | | | | |
Total Return 1 | | | 2.78 | %4 | | | 11.07 | % | | | 2.37 | % | | | 10.62 | % | | | 29.73 | % | | | 1.85 | % |
| | | | | | | | | | | | | | | | | | | | | | | | |
Ratio of net expenses to average net assets 1 | | | 1.15 | %3 | | | 1.15 | % | | | 1.22 | % | | | 1.40 | % | | | 1.40 | % | | | 1.40 | % |
Ratio of total expenses to average net assets 1 | | | 1.54 | %3 | | | 1.54 | % | | | 1.59 | % | | | 1.72 | % | | | 1.63 | % | | | 1.61 | % |
Ratio of net investment income to average net assets | | | 6.72 | %3 | | | 6.65 | % | | | 6.64 | % | | | 7.68 | % | | | 8.10 | % | | | 10.86 | % |
Portfolio turnover | | | 32 | %4 | | | 65 | % | | | 63 | % | | | 74 | % | | | 138 | % | | | 229 | % |
Net assets at end of period (000’s omitted) | | $ | 25,525 | | | $ | 26,953 | | | $ | 20,478 | | | $ | 16,612 | | | $ | 24,693 | | | $ | 44,059 | |
| | | | | | | | | | | | | | | | | | | | | | | | |
| |
| | | Class C Shares | |
High Yield | | 2007 | | | 2006 | | | 2005 | | | 2004 | | | 2003 | | | 2002 | |
Net Asset Value, Beginning of Period | | $ | 8.53 | | | $ | 8.21 | | | $ | 8.59 | | | $ | 8.39 | | | $ | 7.03 | | | $ | 7.70 | |
| | | | | | | | | | | | | | | | | | | | | | | | |
Income from Investment Operations: | | | | | | | | | | | | | | | | | | | | | | | | |
Net investment income | | | 0.26 | | | | 0.49 | | | | 0.51 | | | | 0.60 | | | | 0.60 | | | | 0.75 | |
Net realized and unrealized gain (loss) on investments | | | (0.05 | ) | | | 0.32 | | | | (0.38 | ) | | | 0.21 | | | | 1.37 | | | | (0.67 | ) |
| | | | | | | | | | | | | | | | | | | | | | | | |
Total from investment operations | | | 0.21 | | | | 0.81 | | | | 0.13 | | | | 0.81 | | | | 1.97 | | | | 0.08 | |
| | | | | | | | | | | | | | | | | | | | | | | | |
Less Distributions to Shareholders from: | | | | | | | | | | | | | | | | | | | | | | | | |
Net investment income | | | (0.26 | ) | | | (0.49 | ) | | | (0.51 | ) | | | (0.61 | ) | | | (0.61 | ) | | | (0.75 | ) |
| | | | | | | | | | | | | | | | | | | | | | | | |
Total distributions to shareholders | | | (0.26 | ) | | | (0.49 | ) | | | (0.51 | ) | | | (0.61 | ) | | | (0.61 | ) | | | (0.75 | ) |
| | | | | | | | | | | | | | | | | | | | | | | | |
Net Asset Value, End of Period | | $ | 8.48 | | | $ | 8.53 | | | $ | 8.21 | | | $ | 8.59 | | | $ | 8.39 | | | $ | 7.03 | |
| | | | | | | | | | | | | | | | | | | | | | | | |
Total Return 1 | | | 2.42 | %4 | | | 10.24 | % | | | 1.60 | % | | | 10.08 | % | | | 29.04 | % | | | 1.49 | % |
| | | | | | | | | | | | | | | | | | | | | | | | |
Ratio of net expenses to average net assets 1 | | | 1.90 | %3 | | | 1.90 | % | | | 1.90 | % | | | 1.90 | % | | | 1.90 | % | | | 1.90 | % |
Ratio of total expenses to average net assets 1 | | | 2.29 | %3 | | | 2.29 | % | | | 2.27 | % | | | 2.27 | % | | | 2.13 | % | | | 2.11 | % |
Ratio of net investment income to average net assets | | | 5.98 | %3 | | | 5.89 | % | | | 5.97 | % | | | 7.17 | % | | | 7.60 | % | | | 10.36 | % |
Portfolio turnover | | | 32 | %4 | | | 65 | % | | | 63 | % | | | 74 | % | | | 138 | % | | | 229 | % |
Net assets at end of period (000’s omitted) | | $ | 7,075 | | | $ | 7,653 | | | $ | 7,934 | | | $ | 10,474 | | | $ | 13,833 | | | $ | 16,538 | |
| | | | | | | | | | | | | | | | | | | | | | | | |
37
| | | | | | | | | | | | | | | | | | | | | | |
| Class B Shares | |
| 2007 | | | 2006 | | | 2005 | | | 2004 | | | 2003 | | | 2002 | |
| $ | 8.54 | | | $ | 8.22 | | | $ | 8.60 | | | $ | 8.40 | | | $ | 7.04 | | | $ | 7.71 | |
| | | | | | | | | | | | | | | | | | | | | | | |
| | 0.26 | | | | 0.50 | | | | 0.51 | | | | 0.60 | | | | 0.60 | | | | 0.75 | |
| | (0.05 | ) | | | 0.31 | | | | (0.38 | ) | | | 0.21 | | | | 1.38 | | | | (0.67 | ) |
| | | | | | | | | | | | | | | | | | | | | | | |
| | 0.21 | | | | 0.81 | | | | 0.13 | | | | 0.81 | | | | 1.98 | | | | 0.08 | |
| | | | | | | | | | | | | | | | | | | | | | | |
| | (0.26 | ) | | | (0.49 | ) | | | (0.51 | ) | | | (0.61 | ) | | | (0.62 | ) | | | (0.75 | ) |
| | | | | | | | | | | | | | | | | | | | | | | |
| | (0.26 | ) | | | (0.49 | ) | | | (0.51 | ) | | | (0.61 | ) | | | (0.62 | ) | | | (0.75 | ) |
| | | | | | | | | | | | | | | | | | | | | | | |
| $ | 8.49 | | | $ | 8.54 | | | $ | 8.22 | | | $ | 8.60 | | | $ | 8.40 | | | $ | 7.04 | |
| | | | | | | | | | | | | | | | | | | | | | | |
| | 2.40 | %4 | | | 10.21 | % | | | 1.59 | % | | | 10.07 | % | | | 29.01 | % | | | 1.49 | % |
| | | | | | | | | | | | | | | | | | | | | | | |
| | 1.90 | %3 | | | 1.90 | % | | | 1.90 | % | | | 1.90 | % | | | 1.90 | % | | | 1.90 | % |
| | 2.29 | %3 | | | 2.28 | % | | | 2.27 | % | | | 2.27 | % | | | 2.13 | % | | | 2.11 | % |
| | 5.96 | %3 | | | 5.88 | % | | | 5.96 | % | | | 7.18 | % | | | 7.60 | % | | | 10.36 | % |
| | 32 | %4 | | | 65 | % | | | 63 | % | | | 74 | % | | | 138 | % | | | 229 | % |
| $ | 8,778 | | | $ | 12,318 | | | $ | 17,782 | | | $ | 27,287 | | | $ | 35,695 | | | $ | 35,654 | |
| | | | | | | | | | | | | | | | | | | | | | | |
|
| Institutional Class Shares | |
| 2007 | | | 2006 | | | 2005 | | | 2004 | | | 2003 | | | 2002 | |
| $ | 8.70 | | | $ | 8.36 | | | $ | 8.74 | | | $ | 8.52 | | | $ | 7.13 | | | $ | 7.79 | |
| | | | | | | | | | | | | | | | | | | | | | | |
| | 0.31 | | | | 0.58 | | | | 0.60 | | | | 0.73 | | | | 0.68 | | | | 0.84 | |
| | (0.06 | ) | | | 0.34 | | | | (0.38 | ) | | | 0.18 | | | | 1.40 | | | | (0.68 | ) |
| | | | | | | | | | | | | | | | | | | | | | | |
| | 0.25 | | | | 0.92 | | | | 0.22 | | | | 0.91 | | | | 2.08 | | | | 0.16 | |
| | | | | | | | | | | | | | | | | | | | | | | |
| | (0.30 | ) | | | (0.58 | ) | | | (0.60 | ) | | | (0.69 | ) | | | (0.69 | ) | | | (0.82 | ) |
| | | | | | | | | | | | | | | | | | | | | | | |
| | (0.30 | ) | | | (0.58 | ) | | | (0.60 | ) | | | (0.69 | ) | | | (0.69 | ) | | | (0.82 | ) |
| | | | | | | | | | | | | | | | | | | | | | | |
| $ | 8.65 | | | $ | 8.70 | | | $ | 8.36 | | | $ | 8.74 | | | $ | 8.52 | | | $ | 7.13 | |
| | | | | | | | | | | | | | | | | | | | | | | |
| | 2.89 | %4 | | | 11.38 | % | | | 2.60 | % | | | 10.69 | % | | | 30.30 | % | | | 2.64 | % |
| | | | | | | | | | | | | | | | | | | | | | | |
| | 0.90 | %3 | | | 0.90 | % | | | 0.90 | % | | | 0.90 | % | | | 0.90 | % | | | 0.90 | % |
| | 1.28 | %3 | | | 1.29 | % | | | 1.27 | % | | | 1.26 | % | | | 1.13 | % | | | 1.11 | % |
| | 6.99 | %3 | | | 6.91 | % | | | 6.96 | % | | | 8.00 | % | | | 8.60 | % | | | 11.36 | % |
| | 32 | %4 | | | 65 | % | | | 63 | % | | | 74 | % | | | 138 | % | | | 229 | % |
| $ | 3,916 | | | $ | 7,053 | | | $ | 3,440 | | | $ | 4,725 | | | $ | 15,469 | | | $ | 9,648 | |
| | | | | | | | | | | | | | | | | | | | | | | |
38
Financial Highlights
For a share outstanding throughout each of the six months ended June 30, 2007 (unaudited) and each year ended December 31,
| | | | | | | | | | | | | | | | | | | | | | | | |
| | | Class A Shares | |
Fixed Income | | 2007 | | | 2006 | | | 2005 | | | 2004 | | | 2003 | | | 2002 | |
Net Asset Value, Beginning of Period | | $ | 10.55 | | | $ | 10.36 | | | $ | 10.62 | | | $ | 10.56 | | | $ | 10.05 | | | $ | 10.14 | |
| | | | | | | | | | | | | | | | | | | | | | | | |
Income from Investment Operations: | | | | | | | | | | | | | | | | | | | | | | | | |
Net investment income | | | 0.26 | | | | 0.52 | | | | 0.53 | | | | 0.49 | | | | 0.52 | | | | 0.56 | |
Net realized and unrealized gain (loss) on investments | | | (0.14 | ) | | | 0.19 | | | | (0.25 | ) | | | 0.07 | | | | 0.53 | | | | (0.06 | ) |
| | | | | | | | | | | | | | | | | | | | | | | | |
Total from investment operations | | | 0.12 | | | | 0.71 | | | | 0.28 | | | | 0.56 | | | | 1.05 | | | | 0.50 | |
| | | | | | | | | | | | | | | | | | | | | | | | |
Less Distributions to Shareholders from: | | | | | | | | | | | | | | | | | | | | | | | | |
Net investment income | | | (0.27 | ) | | | (0.52 | ) | | | (0.54 | ) | | | (0.50 | ) | | | (0.54 | ) | | | (0.59 | ) |
| | | | | | | | | | | | | | | | | | | | | | | | |
Total distributions to shareholders | | | (0.27 | ) | | | (0.52 | ) | | | (0.54 | ) | | | (0.50 | ) | | | (0.54 | ) | | | (0.59 | ) |
| | | | | | | | | | | | | | | | | | | | | | | | |
Net Asset Value, End of Period | | $ | 10.40 | | | $ | 10.55 | | | $ | 10.36 | | | $ | 10.62 | | | $ | 10.56 | | | $ | 10.05 | |
| | | | | | | | | | | | | | | | | | | | | | | | |
Total Return 1 | | | 1.12 | %4 | | | 7.10 | % | | | 2.68 | % | | | 5.44 | % | | | 10.67 | % | | | 5.11 | % |
| | | | | | | | | | | | | | | | | | | | | | | | |
Ratio of net expenses to average net assets 1 | | | 0.78 | %3 | | | 0.74 | % | | | 0.81 | % | | | 1.02 | % | | | 1.10 | % | | | 1.10 | % |
Ratio of total expenses to average net assets 1 | | | 1.15 | %3 | | | 1.15 | % | | | 1.27 | % | | | 1.48 | % | | | 1.33 | % | | | 1.32 | % |
Ratio of net investment income to average net assets | | | 5.11 | %3 | | | 4.98 | % | | | 4.65 | % | | | 4.56 | % | | | 5.02 | % | | | 5.73 | % |
Portfolio turnover | | | 12 | %4 | | | 55 | % | | | 24 | % | | | 79 | % | | | 315 | % | | | 438 | % |
Net assets at end of period (000’s omitted) | | $ | 16,152 | | | $ | 11,776 | | | $ | 7,591 | | | $ | 5,723 | | | $ | 7,936 | | | $ | 15,455 | |
| | | | | | | | | | | | | | | | | | | | | | | | |
| |
| | | Class C Shares | |
Fixed Income | | 2007 | | | 2006 | | | 2005 | | | 2004 | | | 2003 | | | 2002 | |
Net Asset Value, Beginning of Period | | $ | 10.55 | | | $ | 10.36 | | | $ | 10.63 | | | $ | 10.58 | | | $ | 10.07 | | | $ | 10.15 | |
| | | | | | | | | | | | | | | | | | | | | | | | |
Income from Investment Operations: | | | | | | | | | | | | | | | | | | | | | | | | |
Net investment income | | | 0.22 | | | | 0.43 | | | | 0.46 | | | | 0.43 | | | | 0.47 | | | | 0.50 | |
Net realized and unrealized gain (loss) on investments | | | (0.15 | ) | | | 0.20 | | | | (0.26 | ) | | | 0.07 | | | | 0.52 | | | | (0.04 | ) |
| | | | | | | | | | | | | | | | | | | | | | | | |
Total from investment operations | | | 0.07 | | | | 0.63 | | | | 0.20 | | | | 0.50 | | | | 0.99 | | | | 0.46 | |
| | | | | | | | | | | | | | | | | | | | | | | | |
Less Distributions to Shareholders from: | | | | | | | | | | | | | | | | | | | | | | | | |
Net investment income | | | (0.23 | ) | | | (0.44 | ) | | | (0.47 | ) | | | (0.45 | ) | | | (0.48 | ) | | | (0.54 | ) |
| | | | | | | | | | | | | | | | | | | | | | | | |
Total distributions to shareholders | | | (0.23 | ) | | | (0.44 | ) | | | (0.47 | ) | | | (0.45 | ) | | | (0.48 | ) | | | (0.54 | ) |
| | | | | | | | | | | | | | | | | | | | | | | | |
Net Asset Value, End of Period | | $ | 10.39 | | | $ | 10.55 | | | $ | 10.36 | | | $ | 10.63 | | | $ | 10.58 | | | $ | 10.07 | |
| | | | | | | | | | | | | | | | | | | | | | | | |
Total Return 1 | | | 0.75 | %4 | | | 6.31 | % | | | 1.90 | % | | | 4.85 | % | | | 10.11 | % | | | 4.69 | % |
| | | | | | | | | | | | | | | | | | | | | | | | |
Ratio of net expenses to average net assets 1 | | | 1.52 | %3 | | | 1.49 | % | | | 1.49 | % | | | 1.54 | % | | | 1.60 | % | | | 1.60 | % |
Ratio of total expenses to average net assets 1 | | | 1.90 | %3 | | | 1.90 | % | | | 1.95 | % | | | 1.99 | % | | | 1.84 | % | | | 1.82 | % |
Ratio of net investment income to average net assets | | | 4.37 | %3 | | | 4.23 | % | | | 3.96 | % | | | 4.04 | % | | | 4.52 | % | | | 5.23 | % |
Portfolio turnover | | | 12 | %4 | | | 55 | % | | | 24 | % | | | 79 | % | | | 315 | % | | | 438 | % |
Net assets at end of period (000’s omitted) | | $ | 23,802 | | | $ | 15,454 | | | $ | 11,480 | | | $ | 13,703 | | | $ | 20,009 | | | $ | 35,719 | |
| | | | | | | | | | | | | | | | | | | | | | | | |
39
| | | | | | | | | | | | | | | | | | | | | | |
| Class B Shares | |
| 2007 | | | 2006 | | | 2005 | | | 2004 | | | 2003 | | | 2002 | |
| $ | 10.48 | | | $ | 10.30 | | | $ | 10.56 | | | $ | 10.51 | | | $ | 10.02 | | | $ | 10.10 | |
| | | | | | | | | | | | | | | | | | | | | | | |
| | 0.23 | | | | 0.43 | | | | 0.46 | | | | 0.43 | | | | 0.48 | | | | 0.50 | |
| | (0.16 | ) | | | 0.19 | | | | (0.25 | ) | | | 0.07 | | | | 0.50 | | | | (0.04 | ) |
| | | | | | | | | | | | | | | | | | | | | | | |
| | 0.07 | | | | 0.62 | | | | 0.21 | | | | 0.50 | | | | 0.98 | | | | 0.46 | |
| | | | | | | | | | | | | | | | | | | | | | | |
| | (0.23 | ) | | | (0.44 | ) | | | (0.47 | ) | | | (0.45 | ) | | | (0.49 | ) | | | (0.54 | ) |
| | | | | | | | | | | | | | | | | | | | | | | |
| | (0.23 | ) | | | (0.44 | ) | | | (0.47 | ) | | | (0.45 | ) | | | (0.49 | ) | | | (0.54 | ) |
| | | | | | | | | | | | | | | | | | | | | | | |
| $ | 10.32 | | | $ | 10.48 | | | $ | 10.30 | | | $ | 10.56 | | | $ | 10.51 | | | $ | 10.02 | |
| | | | | | | | | | | | | | | | | | | | | | | |
| | 0.74 | %4 | | | 6.25 | % | | | 2.01 | % | | | 4.90 | % | | | 10.09 | % | | | 4.64 | % |
| | | | | | | | | | | | | | | | | | | | | | | |
| | 1.51 | %3 | | | 1.49 | % | | | 1.49 | % | | | 1.54 | % | | | 1.60 | % | | | 1.60 | % |
| | 1.89 | %3 | | | 1.90 | % | | | 1.95 | % | | | 1.99 | % | | | 1.84 | % | | | 1.82 | % |
| | 4.36 | %3 | | | 4.23 | % | | | 3.96 | % | | | 4.04 | % | | | 4.52 | % | | | 5.23 | % |
| | 12 | %4 | | | 55 | % | | | 24 | % | | | 79 | % | | | 315 | % | | | 438 | % |
| $ | 10,755 | | | $ | 13,089 | | | $ | 16,837 | | | $ | 20,063 | | | $ | 28,560 | | | $ | 35,087 | |
| | | | | | | | | | | | | | | | | | | | | | | |
|
| Institutional Class Shares | |
| 2007 | | | 2006 | | | 2005 | | | 2004 | | | 2003 | | | 2002 | |
| $ | 10.59 | | | $ | 10.40 | | | $ | 10.66 | | | $ | 10.61 | | | $ | 10.10 | | | $ | 10.17 | |
| | | | | | | | | | | | | | | | | | | | | | | |
| | 0.28 | | | | 0.54 | | | | 0.56 | | | | 0.54 | | | | 0.58 | | | | 0.61 | |
| | (0.15 | ) | | | 0.19 | | | | (0.25 | ) | | | 0.07 | | | | 0.52 | | | | (0.04 | ) |
| | | | | | | | | | | | | | | | | | | | | | | |
| | 0.13 | | | | 0.73 | | | | 0.31 | | | | 0.61 | | | | 1.10 | | | | 0.57 | |
| | | | | | | | | | | | | | | | | | | | | | | |
| | (0.28 | ) | | | (0.54 | ) | | | (0.57 | ) | | | (0.56 | ) | | | (0.59 | ) | | | (0.64 | ) |
| | | | | | | | | | | | | | | | | | | | | | | |
| | (0.28 | ) | | | (0.54 | ) | | | (0.57 | ) | | | (0.56 | ) | | | (0.59 | ) | | | (0.64 | ) |
| | | | | | | | | | | | | | | | | | | | | | | |
| $ | 10.44 | | | $ | 10.59 | | | $ | 10.40 | | | $ | 10.66 | | | $ | 10.61 | | | $ | 10.10 | |
| | | | | | | | | | | | | | | | | | | | | | | |
| | 1.24 | %4 | | | 7.34 | % | | | 2.91 | % | | | 5.99 | % | | | 11.17 | % | | | 5.75 | % |
| | | | | | | | | | | | | | | | | | | | | | | |
| | 0.52 | %3 | | | 0.49 | % | | | 0.49 | % | | | 0.50 | % | | | 0.60 | % | | | 0.60 | % |
| | 0.90 | %3 | | | 0.90 | % | | | 0.95 | % | | | 0.97 | % | | | 0.84 | % | | | 0.82 | % |
| | 5.35 | %3 | | | 5.23 | % | | | 4.96 | % | | | 5.09 | % | | | 5.52 | % | | | 6.23 | % |
| | 12 | %4 | | | 55 | % | | | 24 | % | | | 79 | % | | | 315 | % | | | 438 | % |
| $ | 24,042 | | | $ | 25,861 | | | $ | 25,641 | | | $ | 24,559 | | | $ | 23,763 | | | $ | 30,711 | |
| | | | | | | | | | | | | | | | | | | | | | | |
The following notes should be read in conjunction with the Financial Highlights of the Funds presented on the proceeding pages.
1 | Total returns and net investment income would have been lower had certain expenses not been reduced. (See Note 1c of Notes to Financial Statements.) |
2 | Per share numbers have been calculated using average shares. |
40
Notes to Financial Statements
June 30, 2007 (unaudited)
| 1. | Summary of Significant Accounting Policies |
Managers Trust II (the “Trust”) is an open-end management investment company organized as a Massachusetts business trust and registered under the Investment Company Act of 1940, as amended (the “1940 Act”). Currently, the Trust is comprised of a number of different funds, each having distinct investment management objectives, strategies, risks and policies. Included in this report are; Managers AMG Chicago Equity Partners Mid-Cap Fund (“Mid-Cap”)(formerly Managers Mid-Cap Fund), Managers AMG Chicago Equity Partners Balanced Fund (“Balanced”)(formerly Managers Balanced Fund), Managers High Yield Fund (“High Yield”), and Managers Fixed Income Fund (“Fixed Income”), collectively the “Funds.”
The Funds each offer four classes of shares: Class A, Class B, Class C and Institutional Class. Sales of Class A shares may be subject to a front-end sales charge. Redemptions of Class B and Class C shares may be subject to a contingent-deferred sales charge (as a percentage of the original offering price or the net asset value at time of sale, whichever is less). Institutional Class shares are available, with no sales charge, to certain institutional investors and qualifying individual investors. Please refer to a current prospectus for additional information on each share class.
The Funds’ financial statements are prepared in accordance with accounting principles generally accepted in the United States of America, which require management to make estimates and assumptions that affect the reported amount of assets and liabilities and disclosure of contingent assets and liabilities at the date of the financial statements and the reported amounts of income and expenses during the reporting periods. Actual results could differ from those estimates. The following is a summary of significant accounting policies followed by the Funds in the preparation of their financial statements:
| a. | Valuation of Investments |
Equity securities traded on a domestic or international securities exchange are generally valued at the last quoted sale price, or, lacking any sales, at the last quoted bid price. Over-the-counter securities are valued at the Nasdaq Official Closing Price, if one is available. Lacking any sales, over-the-counter securities, are valued at the last quoted bid price. The Funds’ investments are generally valued based on market quotations provided by third-party pricing services approved by the Board of Trustees of the Trust. Under certain circumstances, the value of a specific investment may be based on an evaluation of its fair value, pursuant to procedures established by and under the general supervision of the Board of Trustees of the Fund. Each Fund may use the fair value of a portfolio security to calculate its NAV when, for example, (1) market quotations are not readily available because a portfolio security is not traded in a public market or the principal market in which the security trades is closed, (2) trading in a portfolio security is suspended and has not resumed prior to the time as of which the Fund calculates its NAV, (3) where a significant event affecting the value of a portfolio security is determined to have occurred between the time of the market quotation provided for a portfolio security and the time as of which the Fund calculates its NAV, (4) a security’s price has remained unchanged over a period of time (often referred to as a “stale price”), or (5) the Investment Manager determines that a market quotation is inaccurate. The Manager monitors intervening events that may affect the value of securities held in each Funds’ portfolios and, in accordance with procedures adopted by the Funds’ Trustees, will adjust the prices of securities traded in foreign markets, as appropriate, to reflect the impact of events occurring subsequent to the close of such markets, but prior to the time each Fund’s NAV is calculated.
Fixed-income securities are valued based on valuations furnished by independent pricing services that reflect the evaluated bid price of such securities, except that for the Balanced, High Yield and Fixed Income Funds, fixed-income securities are valued based on valuations that reflect the mean between bid and asked prices. Some of these pricing services utilize matrix systems, which reflect such factors as security prices, yields, maturities and ratings, and are supplemented by dealer and exchange quotations. Short-term investments having a remaining maturity of 60 days or less are valued at amortized cost, which approximates market value. Investments in other regulated investment companies are valued at their end of day net asset value per share except iShares or other ETFs, which are valued the same as equity securities. Securities (including derivatives) for which market quotations are not readily available are valued at fair value, as determined in good faith, and pursuant to procedures adopted by the Board of Trustees of the Trust. The values assigned to fair value investments are based on available information and do not necessarily represent amounts that might ultimately be realized since such amounts depend on future developments inherent in long-term investments. Further, because of the inherent uncertainty of valuation, those estimated values may differ significantly from the values that would have been used had a ready market of the investments existed, and the differences could be material.
Investments in certain mortgage-backed, stripped mortgage-backed, preferred stocks, convertible securities and other debt securities not traded on an organized market, are valued on the basis of valuations provided by dealers or by a pricing service which uses information with respect to transactions in such securities, various relationships between securities and yield to maturity in determining value.
Security transactions are accounted for as of the trade date. Realized gains and losses on securities sold are determined on the basis of identified cost. The Funds had certain portfolio trades directed to various brokers who paid a portion of such Fund’s expenses. For the six months ended June 30, 2007, under these arrangements the amount by which each Fund’s expenses were reduced and the impact on the expense ratios were as follows: Mid-Cap -$10,901 or 0.02% and Balanced—$1,952 or 0.02%.
| c. | Investment Income and Expenses |
Dividend income is recorded on the ex-dividend date, except certain dividends from foreign securities where the ex-dividend date may have passed. These dividends are recorded as soon as the Trust is informed of the ex-dividend date. Dividend income on foreign securities is recorded net of any withholding tax. Interest income, which includes amortization of premium and accretion of discount on debt securities, is accrued as earned. Non-cash dividends included in dividend income, if any, are reported at the fair market value of the securities received. Other income and expenses are recorded on an accrual basis. Expenses that cannot be directly attributed to a fund are apportioned among the Funds in the Trust and in some cases other affiliated funds based upon their relative average net assets or number of shareholders.
41
Notes to Financial Statements (continued)
Each of the Funds has a “balance credit” arrangement with The Bank of New York Mellon (“BNY”), the Funds’ custodian, whereby each Fund is credited with an interest factor equal to 1% below the effective 90 day T-Bill rate for account balances left uninvested overnight. These credits serve to reduce custody expenses that would otherwise be charged to each Fund. For the six months ended June 30, 2007, the custodian expense was reduced as follows: Mid-Cap—$28; Balanced—$25; and High Yield—$134. Each of the Funds also has a balance credit arrangement with its transfer agent, PFPC, Inc., whereby earnings credits are used to offset banking charges. For the six months ended June 30, 2007, the transfer agent expense was reduced as follows: Mid-Cap—$287; Balanced—$72; High Yield—$163; and Fixed Income—$214.
Managers Investment Group LLC (the “Investment Manager”), an indirect wholly-owned subsidiary of Affiliated Managers Group, Inc. (“AMG”) and the Investment Manager for the Funds, has contractually agreed, through at least May 1, 2008 to waive fees and pay or reimburse expenses to the extent that the total operating expenses (exclusive of brokerage, interest, taxes, acquired fund fees and extraordinary expenses) of the Funds exceed the following percentages of each Fund’s average daily net assets.
| | | | | | | | | | | | |
| | | Class A | | | Class B | | | Class C | | | Institutional Class | |
Mid-Cap | | 1.24 | %* | | 1.99 | % | | 1.99 | % | | 0.99 | % |
| | | | |
Balanced | | 1.25 | % | | 2.00 | % | | 2.00 | % | | 1.00 | % |
| | | | |
High Yield | | 1.15 | % | | 1.90 | % | | 1.90 | % | | 0.90 | % |
| | | | |
Fixed Income | | 0.84 | %* | | 1.59 | % | | 1.59 | % | | 0.59 | % |
| * | Rate change effective May 1, 2007. Prior to this date the expense caps for Class A shares were 1.25%, and 0.74%, respectively. |
Each Fund may be obligated to repay the Investment Manager such amounts waived, paid or reimbursed in future years provided that the repayment occurs within three (3) years after the waiver or reimbursement and that such repayment would not cause the Fund’s expenses in any such year to exceed the above percentages, based on the Fund’s average daily net assets.
For the six months ended June 30, 2007, the cumulative amount of reimbursement for Mid-Cap, Balanced, High Yield and Fixed Income equaled $369,131, $432,854, $624,310 and $877,044, respectively. Total returns and net investment income for the Funds would have been lower had certain expenses not been offset. Total expenses exclude the impact of expense reimbursements and expense offsets such as brokerage recapture credits but includes non-reimbursable expenses such as interest and taxes, if any.
| d. | Dividends and Distributions |
Dividends resulting from net investment income, if any, normally will be declared and paid annually for the Mid-Cap Fund. Dividends resulting from net investment income, if any, normally will be declared and paid monthly for High Yield and Fixed Income Funds. Dividends resulting from net investment income, if any, normally will be declared and paid quarterly for Balanced Fund. Distributions of capital gains, if any, will be made on an annual basis and when required for Federal excise tax purposes. Income and capital gain distributions are determined in accordance with Federal income tax regulations, which may differ from generally accepted accounting principles. These differences are primarily due to differing treatments for losses deferred due to wash sales, equalization accounting for tax purposes, foreign currency and market discount transactions. Permanent book and tax basis differences, if any, relating to shareholder distributions will result in reclassifications to paid-in-capital.
Each Fund intends to comply with the requirements under Subchapter M of the Internal Revenue Code of 1986, as amended, to distribute substantially all of its taxable income and gains to its shareholders and to meet certain diversification and income requirements with respect to investment companies. Therefore, no provision for Federal income or excise tax is included in the accompanying financial statements.
| f. | Capital Loss Carryovers |
As of June 30, 2007, the following Funds had accumulated net realized capital loss carryovers from securities transactions for Federal income tax purposes as shown in the following chart. These amounts may be used to offset realized capital gains, if any, through the expiration dates listed.
| | | | | |
| | | Capital Loss Carryover Amount | | Expires Dec. 31, |
Mid-Cap | | $ | 5,274,581 | | 2009 |
Balanced | | $ | 2,793,871 | | 2008 |
| | $ | 13,683,503 | | 2009 |
| | $ | 1,575,061 | | 2010 |
High Yield | | $ | 6,143,316 | | 2007 |
| | $ | 6,618,233 | | 2008 |
| | $ | 6,767,059 | | 2009 |
Fixed Income | | $ | 2,911,256 | | 2009 |
The Trust’s Declaration of Trust authorizes for each series the issuance of an unlimited number of shares of beneficial interest, without par value. Each Fund records sales and repurchases of its capital stock on the trade date. Dividends and distributions to shareholders are recorded on the ex-dividend date. For the six months ended June 30, 2007 and the year ended December 31, 2006, the capital stock transactions in the Funds by class were:
42
Notes to Financial Statements (continued)
| | | | | | | | | | | | | | | | | | | | | | | | | | | | |
| | | Mid-Cap | | | Balanced | |
| | | 2007 | | | 2006 | | | 2007 | | | 2006 | |
| | | Shares | | | Amount | | | Shares | | | Amount | | | Shares | | | Amount | | | Shares | | | Amount | |
Class A: | | | | | | | | | | | | | | | | | | | | | | | | | | | | |
Proceeds from sales | | 70,692 | | | $ | 1,097,374 | | | 176,313 | | | $ | 2,451,625 | | | 24,515 | | | $ | 318,863 | | | 36,387 | | | $ | 444,288 | |
| | | | | | | | | | | �� | | | | | | | | | | | | | | | | | |
Reinvestment of distributions | | — | | | | — | | | 639 | | | | 9,337 | | | 832 | | | | 10,878 | | | 1,641 | | | | 20,091 | |
| | | | | | | | | | | | | | | | | | | | | | | | | | | | |
Cost of shares repurchased | | (152,727 | ) | | | (2,404,483 | ) | | (194,852 | ) | | | (2,689,231 | ) | | (38,288 | ) | | | (513,899 | ) | | (32,877 | ) | | | (393,885 | ) |
| | | | | | | | | | | | | | | | | | | | | | | | | | | | |
Net Increase (Decrease)—Class A | | (82,035 | ) | | ($ | 1,307,109 | ) | | (17,900 | ) | | ($ | 228,269 | ) | | (12,941 | ) | | ($ | 184,158 | ) | | 5,151 | | | $ | 70,494 | |
| | | | | | | | | | | | | | | | | | | | | | | | | | | | |
Class B: | | | | | | | | | | | | | | | | | | | | | | | | | | | | |
Proceeds from sales | | 12,485 | | | $ | 186,266 | | | 12,282 | | | $ | 162,495 | | | 6,399 | | | $ | 81,877 | | | 13,482 | | | $ | 161,914 | |
| | | | | | | | | | | | | | | | | | | | | | | | | | | | |
Reinvestment of distributions | | — | | | | — | | | 728 | | | | 10,050 | | | 930 | | | | 11,932 | | | 2,559 | | | | 30,832 | |
| | | | | | | | | | | | | | | | | | | | | | | | | | | | |
Cost of shares repurchased | | (138,655 | ) | | | (2,037,008 | ) | | (410,374 | ) | | | (5,340,340 | ) | | (77,007 | ) | | | (988,178 | ) | | (198,153 | ) | | | (2,344,153 | ) |
| | | | | | | | | | | | | | | | | | | | | | | | | | | | |
Net Decrease—Class B | | (126,170 | ) | | ($ | 1,850,742 | ) | | (397,364 | ) | | ($ | 5,167,795 | ) | | (69,678 | ) | | ($ | 894,369 | ) | | (182,112 | ) | | ($ | 2,151,407 | ) |
| | | | | | | | | | | | | | | | | | | | | | | | | | | | |
Class C: | | | | | | | | | | | | | | | | | | | | | | | | | | | | |
Proceeds from sales | | 10,111 | | | $ | 149,189 | | | 59,755 | | | $ | 788,637 | | | 3,646 | | | $ | 47,295 | | | 8,701 | | | $ | 104,843 | |
| | | | | | | | | | | | | | | | | | | | | | | | | | | | |
Reinvestment of distributions | | — | | | | — | | | 469 | | | | 6,487 | | | 221 | | | | 2,839 | | | 945 | | | | 11,513 | |
| | | | | | | | | | | | | | | | | | | | | | | | | | | | |
Cost of shares repurchased | | (130,347 | ) | | | (1,913,694 | ) | | (287,685 | ) | | | (3,793,773 | ) | | (31,654 | ) | | | (412,085 | ) | | (102,009 | ) | | | (1,229,283 | ) |
| | | | | | | | | | | | | | | | | | | | | | | | | | | | |
Net Decrease—Class C | | (120,236 | ) | | ($ | 1,764,505 | ) | | (227,461 | ) | | ($ | 2,998,649 | ) | | (27,787 | ) | | ($ | 361,951 | ) | | (92,363 | ) | | ($ | 1,112,927 | ) |
| �� | | | | | | | | | | | | | | | | | | | | | | | | | | | |
Institutional Class: | | | | | | | | | | | | | | | | | | | | | | | | | | | | |
Proceeds from sales | | 149,810 | | | $ | 2,422,254 | | | 237,398 | | | $ | 3,419,516 | | | 36,159 | | | $ | 475,221 | | | 65,134 | | | $ | 792,268 | |
| | | | | | | | | | | | | | | | | | | | | | | | | | | | |
Reinvestment of distributions | | — | | | | — | | | 9,168 | | | | 141,457 | | | 6,243 | | | | 82,221 | | | 13,452 | | | | 165,678 | |
| | | | | | | | | | | | | | | | | | | | | | | | | | | | |
Cost of shares repurchased | | (276,144 | ) | | | (4,487,904 | ) | | (811,597 | ) | | | (11,910,970 | ) | | (30,984 | ) | | | (411,567 | ) | | (130,816 | ) | | | (1,587,018 | ) |
| | | | | | | | | | | | | | | | | | | | | | | | | | | | |
Net Increase (Decrease)—Institutional Class | | (126,334 | ) | | ($ | 2,065,650 | ) | | (565,031 | ) | | ($ | 8,349,997 | ) | | 11,418 | | | $ | 145,875 | | | (52,230 | ) | | ($ | 629,072 | ) |
| | | | | | | | | | | | | | | | | | | | | | | | | | | | |
43
Notes to Financial Statements (continued)
| | | | | | | | | | | | | | | | | | | | | | | | | | | | |
| | | High Yield | | | Fixed Income | |
| | | 2007 | | | 2006 | | | 2007 | | | 2006 | |
| | | Shares | | | Amount | | | Shares | | | Amount | | | Shares | | | Amount | | | Shares | | | Amount | |
Class A: | | | | | | | | | | | | | | | | | | | | | | | | | | | | |
Proceeds from sales | | 903,156 | | | $ | 7,903,806 | | | 1,268,606 | | | $ | 10,631,261 | | | 829,772 | | | $ | 8,757,494 | | | 978,639 | | | $ | 10,062,790 | |
Reinvestment of distributions | | 89,230 | | | | 777,847 | | | 154,809 | | | | 1,301,994 | | | 15,851 | | | | 166,029 | | | 26,164 | | | | 269,325 | |
Cost of shares repurchased | | (1,140,588 | ) | | | (9,932,274 | ) | | (766,890 | ) | | | (6,464,627 | ) | | (408,206 | ) | | | (4,317,486 | ) | | (621,400 | ) | | | (6,331,138 | ) |
| | | | | | | | | | | | | | | | | | | | | | | | | | | | |
Net Increase (Decrease)—Class A | | (148,202 | ) | | $ | (1,250,621 | ) | | 656,525 | | | $ | 5,468,628 | | | 437,417 | | | $ | 4,606,037 | | | 383,403 | | | $ | 4,000,977 | |
| | | | | | | | | | | | | | | | | | | | | | | | | | | | |
Class B: | | | | | | | | | | | | | | | | | | | | | | | | | | | | |
Proceeds from sales | | 18,400 | | | $ | 158,859 | | | 29,046 | | | $ | 241,336 | | | 25,868 | | | $ | 271,494 | | | 48,307 | | | $ | 495,841 | |
Reinvestment of distributions | | 5,534 | | | | 47,802 | | | 18,575 | | | | 154,611 | | | 6,251 | | | | 65,341 | | | 11,761 | | | | 120,301 | |
Cost of shares repurchased | | (432,230 | ) | | | (3,739,447 | ) | | (767,946 | ) | | | (6,415,073 | ) | | (239,506 | ) | | | (2,517,496 | ) | | (446,201 | ) | | | (4,568,602 | ) |
| | | | | | | | | | | | | | | | | | | | | | | | | | | | |
Net Decrease—Class B | | (408,296 | ) | | $ | (3,532,786 | ) | | (720,325 | ) | | $ | (6,019,126 | ) | | (207,387 | ) | | $ | (2,180,661 | ) | | (386,133 | ) | | $ | (3,952,460 | ) |
| | | | | | | | | | | | | | | | | | | | | | | | | | | | |
Class C: | | | | | | | | | | | | | | | | | | | | | | | | | | | | |
Proceeds from sales | | 48,154 | | | $ | 414,299 | | | 127,970 | | | $ | 1,071,642 | | | 950,894 | | | $ | 10,051,044 | | | 701,564 | | | $ | 7,294,815 | |
Reinvestment of distributions | | 5,678 | | | | 48,963 | | | 12,459 | | | | 103,445 | | | 11,567 | | | | 121,204 | | | 7,830 | | | | 81,210 | |
Cost of shares repurchased | | (116,496 | ) | | | (1,005,022 | ) | | (209,434 | ) | | | (1,745,503 | ) | | (137,377 | ) | | | (1,450,454 | ) | | (352,532 | ) | | | (3,627,740 | ) |
| | | | | | | | | | | | | | | | | | | | | | | | | | | | |
Net Increase (Decrease)—Class C | | (62,664 | ) | | $ | (541,760 | ) | | (69,005 | ) | | $ | (570,416 | ) | | 825,084 | | | $ | 8,721,794 | | | 356,862 | | | $ | 3,748,285 | |
| | | | | | | | | | | | | | | | | | | | | | | | | | | | |
Institutional Class: | | | | | | | | | | | | | | | | | | | | | | | | | | | | |
Proceeds from sales | | 141,763 | | | $ | 1,244,496 | | | 512,003 | | | $ | 4,339,606 | | | 286,193 | | | $ | 3,034,152 | | | 680,641 | | | $ | 7,028,850 | |
Reinvestment of distributions | | 9,376 | | | | 82,291 | | | 22,496 | | | | 190,654 | | | 52,607 | | | | 555,790 | | | 100,168 | | | | 1,035,242 | |
Cost of shares repurchased | | (509,193 | ) | | | (4,466,544 | ) | | (135,061 | ) | | | (1,148,460 | ) | | (476,918 | ) | | | (5,073,468 | ) | | (804,932 | ) | | | (8,304,174 | ) |
| | | | | | | | | | | | | | | | | | | | | | | | | | | | |
Net Increase (Decrease)—Institutional Class | | (358,054 | ) | | $ | (3,139,757 | ) | | 399,438 | | | $ | 3,381,800 | | | (138,118 | ) | | $ | (1,483,526 | ) | | (24,123 | ) | | $ | (240,082 | ) |
| | | | | | | | | | | | | | | | | | | | | | | | | | | | |
At June 30, 2007, certain unaffiliated shareholders, specifically omnibus accounts, individually held greater than 10% of the outstanding shares of the following Funds:
| | | | | | | | | | | | |
| | | Class A | | | Class B | | | Class C | | | Inst. Class | |
Mid-Cap | | 1 owns 57 | % | | 1 owns 56 | % | | 1 owns 81 | % | | 1 owns 87 | % |
| | | | |
Balanced | | 3 own 57 | % | | 1 owns 69 | % | | 1 owns 79 | % | | 1 owns 94 | % |
| | | | |
High Yield | | 1 owns 74 | % | | 1 owns 55 | % | | 1 owns 58 | % | | 3 own 88 | % |
| | | | |
Fixed Income | | 2 own 60 | % | | 1 owns 60 | % | | 1 owns 67 | % | | 3 own 84 | % |
| h. | Foreign Currency Translation |
The books and records of the Funds are maintained in U.S. dollars. The value of investments, assets and liabilities denominated in currencies other than U.S. dollars are translated into U.S. dollars based upon current foreign exchange rates. Purchases and sales of foreign investments, income and expenses are converted into U.S. dollars based on currency exchange rates prevailing on the respective dates of such transactions. Net realized and unrealized gain (loss) on foreign currency transactions represent: (1) foreign exchange gains and losses from the sale and holdings of foreign currencies; (2) gains and losses between trade date and settlement date on investment securities transactions and forward foreign currency exchange contracts; and (3) gains and losses from the difference between amounts of interest and dividends recorded and the amounts actually received.
44
Notes to Financial Statements (continued)
In addition, the Funds do not isolate the net realized and unrealized gain or loss resulting from changes in exchange rates from the fluctuations resulting from changes in market prices of securities held. Such fluctuations are included with the net realized and unrealized gain or loss on investments.
| 2. | Agreements and Transactions with Affiliates |
The Trust has entered into an Investment Management Agreement with Managers Investment Group LLC under which the Investment Manager provides or oversees investment management services to the Funds. The Investment Manager selects subadvisors for each Fund (subject to Trustee approval), allocates assets among subadvisors and monitors the subadvisors’ investment programs and results. Each Fund’s investment portfolio is managed by a portfolio manager who serves pursuant to Subadvisory Agreements with the Investment Manager.
Investment management fees are paid directly by each Fund to the Investment Manager based on average daily net assets. The annual investment management fee rates, as a percentage of average daily net assets for the six months ended June 30, 2007, were as follows:
| | | |
| | | Investment
Management Fee | |
Mid-Cap | | 0.70 | % |
| |
Balanced | | 0.70 | % |
| |
High Yield | | 0.70 | % |
| |
Fixed Income | | 0.45 | % |
The Funds have entered into an Administration and Shareholder Servicing Agreement under which Managers Investment Group LLC serves as each Fund’s administrator (the “Administrator”) and is responsible for all aspects of managing the Funds’ operations, including administration and shareholder services to each Fund, its shareholders, and certain institutions, such as bank trust departments, broker-dealers and registered investment advisers, that advise or act as an intermediary with the Funds’ shareholders.
During the six months ended June 30, 2007, each of the Funds paid an Administration fee at the rate of 0.20% per annum of the Fund’s average daily net assets.
The aggregate annual retainer paid to each Independent Trustee is $55,000, plus $4,000 or $2,000 for each regular or special meeting attended, respectively. The Trustees’ fees and expenses are allocated amongst all of the Funds for which Managers Investment Group LLC serves as the Advisor based on the relative net assets of such Funds. The Independent Chairman of the Trusts receives an additional payment of $10,000 per year and the Chairman of the Audit Committee receives an additional $2,000 per year. The “Trustee fees and expenses” shown in the financial statements represents each Fund’s allocated portion of the total fees and expenses paid by the Fund and The Managers Funds.
The Funds are distributed by Managers Distributors, Inc. (the “Distributor”) a wholly-owned subsidiary of Managers Investment Group LLC. Managers Distributors, Inc. serves as the principal underwriter for each Fund. The Distributor is a registered broker-dealer and member of the Financial Industry Regulatory Authority (“FINRA”). Shares of each Fund will be continuously offered and will be sold by brokers, dealers or other financial intermediaries who have executed selling agreements with the Distributor. The Distributor bears all the expenses of providing services pursuant to the Underwriting Agreement, including the payment of the expenses relating to the distribution of Prospectuses for sales purposes and any advertising or sales literature. Certain Trustees and Officers of the Funds are Officers and/or Directors of the Investment Manager, AMG and/or the Distributor.
The Funds have adopted distribution and service plans with respect to the Class A, Class B and Class C shares of each Fund (the “Plans”), in accordance with the requirements of Rule 12b-1 under the 1940 Act and the requirements of the applicable rules of the FINRA regarding asset-based sales charges. Pursuant to the Plans, each Fund may compensate the Distributor for its expenditures in financing any activity primarily intended to result in the sale of each such class of Fund shares and for maintenance and personal service provided to existing shareholders of that class. The Plans authorize payments to the Distributor up to 0.25%, 1.00% and 1.00% annually of each Fund’s average daily net assets attributable to its Class A, Class B and Class C shares, respectively.
The Plans further provide for periodic payments by the Distributor to brokers, dealers and other financial intermediaries for providing shareholder services and for promotional and other sales related costs. The portion of payments by Class A, Class B or Class C shares of a Fund for shareholder servicing may not exceed an annual rate of 0.25% of the average daily net asset value of Fund shares of that class owned by clients of such broker, dealer or financial intermediary.
The following summarizes the total fees incurred under the plans for Class A, Class B and Class C shares for the six months ended June 30, 2007:
| | | |
| | | Amount |
Mid-Cap | | $ | 123,296 |
| |
Balanced | | | 64,534 |
| |
High Yield | | | 1,232,678 |
| |
Fixed Income | | | 169,380 |
| 3. | Purchases and Sales of Securities |
Purchases and sales of securities, excluding short-term securities, for the six months ended December 31, 2007, were as follows:
45
Notes to Financial Statements (continued)
| | | | | | | | | | | | |
| | | Long-Term Securities | | U.S. Government Securities |
Fund | | Purchases | | Sales | | Purchases | | Sales |
Mid-Cap | | $ | 52,727,744 | | $ | 60,423,218 | | | N/A | | | N/A |
| | | | |
Balanced | | | 31,174,051 | | | 31,015,748 | | $ | 7,416,453 | | $ | 6,020,550 |
| | | | |
High Yield | | | 15,593,319 | | | 23,799,286 | | | N/A | | | N/A |
| | | | |
Fixed Income | | | 20,058,245 | | | 7,770,413 | | | 12,001,268 | | | 3,209,152 |
| 4. | Portfolio Securities Loaned |
The Funds may participate in a securities lending program offered by BNY Brokerage providing for the lending of equities, corporate bonds and government securities to qualified brokers. Collateral on all securities loaned is accepted in cash and/or government securities. Collateral is maintained at a minimum level of 102% of the market value, plus interest, if applicable, of investments on loan. Collateral received in the form of cash is invested temporarily in institutional money market funds or other short-term investments by BNY. Securities lending fees include earnings of such temporary cash investments, plus or minus any rebate. These payments are then divided between BNY, as a fee for its services under the program, and the Fund loaning the security, according to agreed-upon rates.
| 5. | Commitments and Contingencies |
In the normal course of business, the Funds may enter into contracts and agreements that contain a variety of representations and warranties, which provide general indemnifications. The maximum exposure to the Funds under these arrangements is unknown, as this would involve future claims that may be against the Funds that have not yet occurred. However, based on experience, the Funds expect the risks of loss to be remote.
| 6. | Risks Associated with Collateralized Mortgage Obligations (“CMOs”) (Balanced and Fixed Income) |
The net asset value of Funds may be sensitive to interest rate fluctuations because the Funds may hold several instruments, including CMOs and other derivatives, whose values can be significantly impacted by interest rate movements. CMOs are obligations collateralized by a portfolio of mortgages or mortgage-related securities. Payments of principal and interest on the mortgage are passed through to the holder of the CMOs on the same schedule as they are received, although certain classes of CMOs have priority over others with respect to the receipt of prepayments on the mortgages. Therefore, the investment in CMOs may be subject to a greater or lesser risk of prepayment than other types of mortgage-related securities. CMOs may have a fixed or variable rate of interest.
| 7. | Risks Associated with High Yield Securities (High Yield) |
Investing in high yield securities involves greater risks and considerations not typically associated with U.S. Government and other high quality/investment grade securities. High Yield securities are generally below investment grade securities and do not have an established retail secondary market. Economic downturns may disrupt the high yield market and impair the issuer’s ability to repay principal and interest. Also, an increase in interest rates would likely have an adverse impact on the value of such obligations and could cause the securities to become less liquid.
| 8. | New Accounting Pronouncements |
The Financial Accounting Standards Board (“FASB”) has recently issued Interpretation No. 48, “Accounting for Uncertainty in Income Taxes – an Interpretation of FASB Statement No. 109 (the “Interpretation”) (“FIN 48”), which applies to all registered investment companies and clarifies the accounting for uncertain tax positions. The Interpretation is effective for financial statements for fiscal years beginning after December 15, 2006. FIN 48 will be effective for the Funds’ fiscal year ended December 31, 2007. Based on analysis computed to date, management does not believe the adoption of FIN 48 will result in any material impact to the Funds’ financial statements.
In addition, in September 2006, Statement of Financial Accounting Standards No. 157, Fair Value Measurements (“SFAS 157”), was issued and is effective for fiscal years beginning after November 15, 2007. SFAS 157 defines fair value, establishes a framework for measuring fair value and expands disclosures about fair value measurements. Management is currently evaluating the impact, if any, the adoption of SFAS 157 will have on the Funds’ financial statements.
46
Notes to Financial Statements (continued)
Proxy Result Information (unaudited)
At a Special Meeting of Shareholders of the Trust held on February 26, 2007, the following votes were recorded for Managers Mid-Cap Fund (“Mid-Cap Fund”) and Managers Balanced Fund (“Balanced Fund”). The proposals, which shareholders were asked to vote on, are explained in further detail in the proxy statement dated January 8, 2007:
Proposal 1 – To approve the Subadvisory Agreement between Managers Investment Group LLC and Chicago Equity Partners with respect to Managers Mid-Cap Fund.
| | | | | | |
Fund | | Shares For | | Shares Against | | Shares Abstained |
Mid-Cap Fund | | 3,908,619 | | 17,695 | | 33,574 |
Proposal 2– To approve the Subadvisory Agreement between Managers Investment Group LLC and Chicago Equity Partners with respect to Managers Balance Fund.
| | | | | | |
Fund | | Shares For | | Shares Against | | Shares Abstained |
Balanced Fund | | 948,514 | | 12,808 | | 18,154 |
Pursuant to Article III, Section 1 of the By-Laws of the Trust and the Securities Exchange Act of 1940, such total votes on each proposal represented a quorum of the outstanding shares of the Funds.
47
Annual Renewal of Investment Advisory Agreements (unaudited)
On June 8, 2007, the Board of Trustees, including a majority of the Trustees who are not “interested persons” of the Trust (the “Independent Trustees”), approved the Investment Management Agreement with the Investment Manager for each of the Funds identified below and the Subadvisory Agreement for each Fund Subadvisor. The Independent Trustees were separately represented by independent counsel in connection with their consideration of the approval of these agreements. In considering the Investment Management and Subadvisory Agreements, the Trustees reviewed a variety of materials relating to each Fund, the Investment Manager and each Subadvisor, including comparative performance, fee and expense information for an appropriate peer group of similar mutual funds (each, a “Peer Group”), performance information for relevant benchmark indices (each, a “Fund Benchmark”) and other information regarding the nature, extent and quality of services provided by the Investment Manager and the Subadvisors under their respective agreements. The Trustees also took into account performance, fee and expense information regarding each Fund provided to them on a quarterly basis throughout the year. Prior to voting, the Independent Trustees: (a) reviewed the foregoing information with their independent legal counsel and with management; (b) received materials from their independent legal counsel discussing the legal standards applicable to their consideration of the Investment Management Agreement and the Subadvisory Agreements; and (c) met with their independent legal counsel in private sessions at which no representatives of management were present.
Nature, extent and quality of services. In considering the nature, extent and quality of the services provided by the Investment Manager, the Trustees reviewed information relating to the Investment Manager’s operations and personnel. Among other things, the Investment Manager provided financial information, biographical information on its supervisory and professional staff and descriptions of its organizational and management structure. The Trustees also took into account information provided periodically throughout the previous year by the Investment Manager relating to the performance of its duties with respect to the Funds and the Trustees’ familiarity with the Investment Manager’s management through Board meetings, discussions and reports. In the course of their deliberations regarding the Investment Management Agreement, the Trustees evaluated, among other things: (a) the quality of the search, selection and monitoring services performed by the Investment Manager in overseeing the portfolio management responsibilities of the Subadvisors; (b) the Investment Manager’s ability to supervise the Funds’ other service providers; and (c) the Investment Manager’s compliance programs. The Trustees also took into account the financial condition of the Investment Manager with respect to its ability to provide the services required under the Investment Management Agreement and to maintain contractual expense limitations for the Funds.
For each Fund, the Trustees also reviewed information relating to each Subadvisor’s operations and personnel and the investment philosophy, strategies and techniques (for each Subadvisor, its “Investment Strategy”) used in managing the Fund or the portion of the Fund for which the Subadvisor has portfolio management responsibility. Among other things, the Trustees reviewed biographical information on portfolio management and other professional staff, information regarding each Subadvisor’s organizational and management structure and each Subadvisor’s brokerage policies and practices. The Trustees considered specific information provided regarding the experience of the individual or individuals at each Subadvisor with portfolio management responsibility for the portion of the Fund managed by the Subadvisor, including the information set forth in the Fund’s prospectus and statement of additional information. With respect to those Funds managed with multiple Subadvisors, the Trustees also noted information provided by the Investment Manager regarding the manner in which each Subadvisor’s Investment Strategy complements those utilized by a Fund’s other Subadvisors. In the course of their deliberations, the Trustees evaluated, among other things: (a) the services rendered by each Subadvisor in the past; (b) the qualifications and experience of the Subadvisor’s personnel; and (c) the Subadvisor’s compliance programs. The Trustees also took into account the financial condition of each Subadvisor with respect to its ability to provide the services required under its Subadvisory Agreement.
Performance. As noted above, the Board considered each Fund’s performance during relevant time periods as compared to the Fund’s Peer Group and noted that the Board reviews on a quarterly basis detailed information about the Fund’s performance results, portfolio composition and Investment Strategies, including with respect to the portion of the Fund managed by each Subadvisor. The Board noted the Investment Manager’s expertise and resources in monitoring the performance, investment style and risk adjusted performance of each Subadvisor. The Board also noted each Subadvisor’s performance record with respect to the Fund. The Board was mindful of the Investment Manager’s focus on each Subadvisor’s performance with respect to the Fund and the explanations of management regarding the factors that contributed to the performance of the Fund.
Advisory Fees and Profitability. In considering the reasonableness of the advisory fee charged by the Investment Manager for managing each Fund, the Trustees noted that the Investment Manager, and not the Fund, is responsible for paying the fees charged by the Fund’s Subadvisors and, therefore, that the fees paid to the Investment Manager cover the cost of providing portfolio management services as well as the cost of providing search, selection and monitoring services in operating a “manager-of-managers” complex of mutual funds. The Trustees concluded that, in light of the additional high quality supervisory services provided by the Investment Manager and the fact that the subadvisory fees are paid out of the advisory fee, the advisory fee payable by each Fund to the Investment Manager can reasonably be expected to exceed the median advisory fee for the Peer Group, which consists mostly of funds that do not operate with a manager-of-managers structure. In this regard, the Trustees also noted that the Investment Manager has undertaken to implement expense limitations for the Funds.
In considering the reasonableness of the advisory fee payable to the Investment Manager, the Trustees also reviewed information provided by the Investment Manager setting forth all revenues and other benefits, both direct and indirect, received by the Investment Manager and its affiliates attributable to managing each Fund and all the mutual funds in the Managers Family of Funds, the cost of providing such services and the resulting profitability to the Investment Manager and its affiliates from these relationships. The Trustees also noted the current asset levels of each Fund and the willingness of the Investment Manager to waive fees and pay expenses for certain of the Funds from time to time as a means of limiting the total expenses of the smaller Funds. The Trustees also considered the current asset levels of the Funds and the impact
48
Annual Renewal of Investment Advisory Agreements (continued)
on profitability of growth of assets of the Funds. In this regard, the Trustees noted that, unlike a mutual fund that is managed by a single investment adviser, the Funds operate in a manager-of-managers structure and, as a Fund grows in size, it is common practice for the Investment Manager to recommend the selection of an additional Subadvisor to manage a portion of the Fund’s portfolio. The Trustees also noted that the subadvisory fees are paid by the Investment Manager out of its advisory fee. The Trustees further noted that, because of this practice, the Investment Manager’s oversight and supervisory responsibilities with respect to the Funds can be expected to increase with the size of the Funds. Based on the foregoing, the Trustees concluded that the profitability to the Investment Manager is reasonable and that the Investment Manager is not realizing material benefits from economies of scale that would warrant adjustments to the fees for any Fund at this time. With respect to economies of scale, the Trustees also noted that as a Fund’s assets increase over time, the Fund may realize other economies of scale to the extent that the increase in assets is proportionally greater than the increase in certain other expenses.
Subadvisory Fees and Profitability. In considering the reasonableness of the fee payable by the Investment Manager to each Subadvisor (other than Chicago Equity Partners, LLC (“CEP”), which is an affiliate of the Investment Manager), the Trustees relied on the ability of the Investment Manager to negotiate the terms of the Subadvisory Agreement at arm’s length as part of the manager-of-managers structure, noting that the Investment Manager is not affiliated with the Subadvisor. In addition, the Trustees noted that the subadvisory fees are paid by the Investment Manager out of its advisory fee. Accordingly, the cost of services to be provided by each Subadvisor and the profitability to the Subadvisor of its relationship with a Fund were not material factors in the Trustees’ deliberations. For similar reasons, and based on the current size of the portion of a Fund managed by each Subadvisor, the Trustees concluded that the effect of any economies of scale being realized by each Subadvisor was not a material factor in the Trustees’ deliberations at this time.
In considering the reasonableness of the fees payable by the Investment Manager to CEP, the Trustees noted that CEP is an affiliate of the Investment Manager and reviewed information provided by CEP regarding the cost to CEP of providing subadvisory services to a Fund and the resulting profitability from such relationship. The Trustees also noted that the subadvisory fees are paid by the Investment Manager out of its advisory fee. Accordingly, the cost of services to be provided by CEP and the profitability to CEP of its relationship with a Fund were not material factors in the Trustees’ deliberations. For similar reasons, and based on the current size of the portion of a Fund managed by CEP, the Trustees concluded that the effect of any economies of scale being realized by CEP was not a material factor in the Trustees’ deliberations at this time.
In addition to the foregoing, the Trustees considered the specific factors and related conclusions set forth below with respect to each Fund and each Subadvisor.
MANAGERS AMG CHICAGO EQUITY PARTNERS BALANCED FUND
Fund Performance. Among other information relating to the Fund’s performance, the Trustees noted that the Fund’s performance for the 1-year, 3-year and 5-year periods ended March 31, 2007 and for the period from the Fund’s inception in January 1997 through March 31, 2007 was above the median performance of the Peer Group and above the performance of the Fund Benchmark for all such periods. The Fund Benchmark consists of an equal blend of the S&P 500 Index and the Lehman Brothers Aggregate Bond Index. The Trustees concluded that the Fund’s performance has been satisfactory.
Advisory Fees. The Trustees noted that the Fund’s advisory fee and total expenses (net of applicable expense waivers/reimbursements) as of December 31, 2006 were higher than the average for the Peer Group. The Trustees took into account the fact that the Investment Manager has contractually agreed through May 1, 2008 to limit the Fund’s net annual operating expenses to 1.00%, 1.25%, 2.00%, and 2.00% for Institutional Shares, Class A Shares, Class B Shares, and Class C Shares, respectively. The Trustees concluded that, in light of the nature, extent and quality of the services provided by the Investment Manager and the Subadvisor, the Fund’s performance, the foregoing expense limitation and the considerations noted above with respect to the Subadvisor and the Investment Manager, the Fund’s advisory fees are reasonable.
MANAGERS FIXED INCOME FUND
Fund Performance. Among other information relating to the Fund’s performance, the Trustees noted that the Fund’s performance for the 1-year, 3-year, 5-year and 10-year periods ended March 31, 2007 was above the median performance of the Peer Group and above the performance of the Fund Benchmark, the Lehman Brothers Aggregate Bond Index, for all such periods. The Trustees concluded that the Fund’s performance has been satisfactory.
Advisory Fees. The Trustees noted that the Fund’s advisory fee and total expenses (net of applicable expense waivers/reimbursements) as of May 1, 2007 were both higher than the average for the Peer Group. The Trustees took into account the fact that the Investment Manager has contractually agreed through May 1, 2008 to limit the Fund’s net annual operating expenses to 0.59%, 0.84%, 1.59%, and 1.59% for Institutional Class Shares, Class A Shares, Class B Shares, and Class C Shares, respectively. The Trustees concluded that, in light of the nature, extent and quality of the services provided by the Investment Manager and the Subadvisor, the Fund’s performance, the foregoing expense limitation and the considerations noted above with respect to the Subadvisor and the Investment Manager, the Fund’s advisory fees are reasonable.
MANAGERS AMG CHICAGO EQUITY PARTNERS MID-CAP FUND
Fund Performance. Among other information relating to the Fund’s performance, the Trustees noted that the Fund’s performance for the 1-year, 3-year and 5-year periods ended March 31, 2007 and for the period from its inception in January 1997 through March 31, 2007 was below, below, above and above, respectively, the median performance of the Peer Group and below the performance of the Fund Benchmark, the S&P Mid Cap 400 Index, for each period. The Trustees noted that the Fund’s longer-term performance has exceeded the median of its Peer Group, which has resulted in the Fund performing within the top third of its Peer Group (Institutional Class Shares) for the most recent 5-year period ended March 31, 2007. The Trustees concluded that the Fund’s performance has been satisfactory.
Advisory Fees. The Trustees noted that the Fund’s advisory fee and total expenses (net of applicable expense waivers/reimbursements) as of December 31, 2006 were both lower than the average for the Peer Group. The Trustees took into account the fact that the
49
Annual Renewal of Investment Advisory Agreements (continued)
Investment Manager has contractually agreed through May 1, 2008 to limit the Fund’s net annual operating expenses to 0.99%, 1.24%, 1.99%, and 1.99% for Institutional Class Shares, Class A Shares, Class B Shares, and Class C Shares, respectively. The Trustees concluded that, in light of the nature, extent and quality of the services provided by the Investment Manager and the Subadvisor, the Fund’s performance, the foregoing expense limitation and the considerations noted above with respect to the Subadvisor and the Investment Manager, the Fund’s advisory fees are reasonable.
MANAGERS HIGH YIELD FUND
Fund Performance. The Trustees noted that the Fund’s performance for the 1-year, 3-year and 5-year periods ended March 31, 2007 and for the period from the Fund’s inception in January 1998 through March 31, 2007 was below, above, above and above, respectively, the median performance of the Peer Group and below, below, above and above, respectively, the performance of the Fund Benchmark, the Lehman Brothers U.S. Corporate High Yield Index. The Trustees took into account management’s discussion of the reasons for the Fund’s performance.
Advisory Fees. The Trustees noted that the Fund’s advisory fee and total expenses (net of applicable expense waivers/reimbursements) as of December 31, 2006 were both higher than the average for the Peer Group. The Trustees took into account the fact that the Investment Manager has contractually agreed through May 1, 2008 to limit the Fund’s net annual operating expenses to 0.90%, 1.15%, 1.90%, and 1.90% for Institutional Class Shares, Class A Shares, Class B Shares, and Class C Shares, respectively. The Trustees concluded that, in light of the nature, extent and quality of the services provided by the Investment Manager and the Subadvisor, the foregoing expense limitation and the considerations noted above with respect to the Subadvisor and the Investment Manager, the Fund’s advisory fees are reasonable.
* * * * *
After consideration of the foregoing, the Trustees also reached the following conclusions regarding the Investment Management Agreement and each Subadvisory Agreement, in addition to those conclusions discussed above: (a) the Investment Manager and each Subadvisor have demonstrated that they possess the capability and resources to perform the duties required of them under the Investment Management Agreement and the applicable Subadvisory Agreement; (b) each Subadvisor’s Investment Strategy is appropriate for pursuing the applicable Fund’s investment objectives; (c) each Subadvisor is reasonably likely to execute its Investment Strategy consistently over time; and (d) the Investment Manager and each Subadvisor maintain appropriate compliance programs.
Based on all of the above-mentioned factors and their related conclusions, with no single factor or conclusion being determinative and with each Trustee not necessarily attributing the same weight to each factor, the Trustees concluded that approval of each Investment Management Agreement and each Subadvisory Agreement (as applicable) would be in the interests of each Fund and its shareholders. Accordingly, on June 8, 2007, the Trustees, including a majority of the Independent Trustees, voted to approve the Investment Management Agreement and the Subadvisory Agreements (as applicable) for each Fund.
50
Investment Manager and Administrator
Managers Investment Group LLC
800 Connecticut Avenue
Norwalk, Connecticut 06854
(203) 299-3500 or (800) 835-3879
Distributor
Managers Distributors, Inc.
800 Connecticut Avenue
Norwalk, Connecticut 06854
(203) 299-3500 or (800) 835-3879
Custodian
The Bank of New York
2 Hanson Place
Brooklyn, New York 11217
Legal Counsel
Ropes & Gray LLP
One International Place
Boston, Massachusetts 02110-2624
Transfer Agent
PFPC, Inc.
Attn: Managers
P.O. Box 9769
Providence, Rhode Island 02940
(800) 548-4539
Trustees
Jack W. Aber
William E. Chapman, II
Edward J. Kaier
William J. Nutt
Steven J. Paggioli
Eric Rakowski
Thomas R. Schneeweis
For Managers Choice Only
Managers
c/o PFPC, Inc.
P.O. Box 61204
King of Prussia, Pennsylvania 19406-0851
(800) 358-7668

MANAGERS AND MANAGERS AMG EQUITY FUNDS
| | |
| EMERGING MARKETS EQUITY | | SMALL CAP |
Rexiter Capital Management Limited | | TIMESSQUARE MID CAP GROWTH |
| | TIMESSQUARE SMALL CAP GROWTH |
| ESSEX GROWTH | | TimesSquare Capital Management, LLC |
ESSEX LARGE CAP GROWTH | | |
| ESSEX SMALL/MICRO CAP GROWTH | | SMALL COMPANY |
Essex Investment Management Co., LLC | | Epoch Investment Partners, Inc. |
| | Kalmar Investment Advisers, Inc. |
| FQ TAX-MANAGED U.S. EQUITY | | |
| FQ U.S. EQUITY | | SPECIAL EQUITY |
First Quadrant, L.P. | | Donald Smith & Co., Inc. |
| | Kern Capital Management LLC |
| INSTITUTIONAL MICRO-CAP | | Skyline Asset Management, L.P. |
| MICRO-CAP | | Smith Asset Management Group, LP |
Kern Capital Management LLC | | Veredus Asset Management LLC |
| | Westport Asset Management, Inc. |
| INTERNATIONAL EQUITY | | |
Alliance Bernstein L.P. | | SYSTEMATIC VALUE |
Lazard Asset Management, LLC | | SYSTEMATIC MID CAP VALUE |
Wellington Management Company, LLP | | Systematic Financial Management, L.P. |
| |
| CHICAGO EQUITY PARTNERS | | VALUE |
| MID-CAP | | Armstrong Shaw Associates Inc. |
Chicago Equity Partners, LLC | | Osprey Partners Investment Mgmt., LLC |
| |
| REAL ESTATE SECURITIES | | |
Urdang Securities Management, Inc. | | |
This report is prepared for the Funds’ shareholders. It is authorized for distribution to prospective investors only when preceded or accompanied by an effective prospectus. To receive a free copy of the prospectus or Statement of Additional Information, which includes additional information about Fund Trustees, please contact us by calling 800.835.3879. Distributed by Managers Distributors, Inc., member FINRA.
A description of the policies and procedures each Fund uses to vote its proxies is available: (i) without charge, upon request, by calling 800.835.3879, or (ii) on the Securities and Exchange Commission’s (SEC) Web site at www.sec.gov. For information regarding each Fund’s proxy voting record for the 12-month period ended June 30, call 800.835.3879 or visit the SEC Web site at www.sec.gov.
The Funds file their complete schedule of portfolio holdings with the SEC for the first and third quarters of each fiscal year on Form N-Q. The Funds’ Forms N-Q are available on the SEC’s website at www.sec.gov. A Fund’s Forms N-Q may be reviewed and copied at the SEC’s Public Reference Room in Washington, DC. Information on the operation of the Public Reference Room may be obtained by calling 800.SEC.0330. To review a complete list of the Funds’ portfolio holdings, or to view the most recent quarterly holdings report, semiannual report, or annual report, please visit www.managersinvest.com.
MANAGERS AND MANAGERS AMG
BALANCED FUNDS
CHICAGO EQUITY PARTNERS BALANCED
Chicago Equity Partners, LLC
GLOBAL
Armstrong Shaw Associates Inc.
Alliance Bernstein L.P.
First Quadrant, L.P.
Kern Capital Management LLC
Northstar Capital Management, Inc.
Wellington Management Company, LLP
ALTERNATIVE FUNDS
FQ GLOBAL ALTERNATIVES
First Quadrant, L.P.
MANAGERS
FIXED INCOME FUNDS
BOND (MANAGERS)
FIXED INCOME
GLOBAL BOND
Loomis, Sayles & Company L.P.
BOND (MANAGERS FREMONT)
Pacific Investment Management Co. LLC
CALIFORNIA INTERMEDIATE TAX-FREE
Evergreen Investment Management Co., LLC
HIGH YIELD
J.P. Morgan Investment Management Inc.
INTERMEDIATE DURATION GOVERNMENT SHORT DURATION GOVERNMENT
Smith Breeden Associates, Inc.
MONEY MARKET
JPMorgan Investment Advisors Inc.
| | |
| www.managersinvest.com | |  |
Not applicable for the semi-annual shareholder report.
| Item 3. | AUDIT COMMITTEE FINANCIAL EXPERT |
Not applicable for the semi-annual shareholder report.
| Item 4. | PRINCIPAL ACCOUNTANT FEES AND SERVICES |
Not applicable for the semi-annual shareholder report.
| Item 5. | AUDIT COMMITTEE OF LISTED REGISTRANTS |
Not applicable.
| Item 6. | SCHEDULE OF INVESTMENTS |
The schedule of investments in unaffiliated issuers as of the close of the reporting period is included as part of the shareholder report contained in Item 1 hereof.
| Item 7. | DISCLOSURE OF PROXY VOTING POLICIES AND PROCEDURES FOR CLOSED-END MANAGEMENT INVESTMENT COMPANIES |
Not applicable.
| Item 8. | PORTFOLIO MANAGERS OF CLOSED-END MANAGEMENT INVESTMENT COMPANIES |
Not applicable.
| Item 9. | PURCHASES OF EQUITY SECURITIES BY CLOSED-END MANAGEMENT INVESTMENT COMPANIES AND AFFILIATED PURCHASERS |
Not applicable.
| Item 10. | SUBMISSION OF MATTERS TO A VOTE OF SECURITY HOLDERS |
Not applicable.
| Item 11. | CONTROLS AND PROCEDURES |
| | (a) | The registrant’s principal executive and principal financial officers have concluded, based on their evaluation of the registrant’s disclosure controls and procedures as of a date within 90 days of the filing date of this report, that the registrant’s disclosure controls and procedures are reasonably designed to ensure that information required to be disclosed by the registrant on Form N-CSR is recorded, processed, summarized and reported within the required time periods and that information required to be disclosed by the registrant in the reports that it files or submits on Form N-CSR is accumulated and communicated to the registrant’s management, including its principal executive and principal financial officers, as appropriate to allow timely decisions regarding required disclosure. |
| | (b) | There were no changes in the registrant’s internal control over financial reporting during the registrant’s second fiscal quarter of the period covered by this report that have materially affected, or are reasonably likely to materially affect, the internal control over financial reporting. |
| | |
(a)(1) | | Not applicable. |
| |
(a)(2) | | Certifications pursuant to Rule 30a-2(a) under the Investment Company Act of 1940 - Filed herewith. |
| |
(a)(3) | | Not applicable. |
| |
(b) | | Certifications pursuant to Rule 30a-2(b) under the Investment Company Act of 1940 - Filed herewith. |
SIGNATURES
Pursuant to the requirements of the Securities Exchange Act of 1934 and the Investment Company Act of 1940, the registrant has duly caused this report to be signed on its behalf by the undersigned, thereunto duly authorized.
| | |
| MANAGERS TRUST II |
| |
| By: | | /s/ William J. Nutt |
| | William J. Nutt, President |
| |
| Date: | | September 4, 2007 |
Pursuant to the requirements of the Securities Exchange Act of 1934 and the Investment Company Act of 1940, this report has been signed below by the following persons on behalf of the registrant and in the capacities and on the dates indicated.
| | |
| By: | | /s/ William J. Nutt |
| | William J. Nutt, President |
| |
| Date: | | September 4, 2007 |
| |
| By: | | /s/ Bruce M. Aronow |
| | Bruce M. Aronow, Chief Financial Officer |
| |
| Date: | | September 4, 2007 |