UNITED STATES
SECURITIES AND EXCHANGE COMMISSION
Washington, D.C. 20549
FORM N-CSR
CERTIFIED SHAREHOLDER REPORT OF REGISTERED
MANAGEMENT INVESTMENT COMPANIES
Investment Company Act file number 811-6440
Fidelity Aberdeen Street Trust
(Exact name of registrant as specified in charter)
82 Devonshire St., Boston, Massachusetts 02109
(Address of principal executive offices) (Zip code)
Eric D. Roiter, Secretary
82 Devonshire St.
Boston, Massachusetts 02109
(Name and address of agent for service)
Registrant's telephone number, including area code: 617-563-7000
Date of fiscal year end: | March 31 |
| |
Date of reporting period: | March 31, 2004 |
Item 1. Reports to Stockholders
Fidelity Advisor
Freedom FundsSM -
Income, 2005, 2010, 2015, 2020, 2025, 2030, 2035, 2040 -
Class A, Class T, Class B
and Class C
Annual Report
March 31, 2004
(2_fidelity_logos) (Registered_Trademark)
Contents
For a free copy of the funds' proxy voting guidelines call 1-877-208-0098 or visit the Securities and Exchange Commission (SEC)'s web site at www.sec.gov.
Standard & Poor's, S&P and S&P 500 are registered service marks of The McGraw-Hill Companies, Inc. and have been licensed for use by Fidelity Distributors Corporation.
Other third party marks appearing herein are the property of their respective owners.
All other marks appearing herein are registered or unregistered trademarks or service marks of FMR Corp. or an affiliated company.
(Recycle graphic) This report is printed on recycled paper using soy-based inks.
This report and the financial statements contained herein are submitted for the general information of the shareholders of the fund. This report is not authorized for distribution to prospective investors in the fund unless preceded or accompanied by an effective prospectus.
Mutual fund shares are not deposits or obligations of, or guaranteed by, any depository institution. Shares are not insured by the FDIC, Federal Reserve Board or any other agency, and are subject to investment risks, including possible loss of principal amount invested.
Neither the funds nor Fidelity Distributors Corporation is a bank.
For more information on any Fidelity fund, including charges and expenses, call 1-800-544-6666 for a free prospectus. Read it carefully before you invest or send money.
Annual Report
Chairman's Message
(photo_of_Edward_C_Johnson_3d)
Dear Shareholder:
Many of you have read or heard news stories recently that were critical of mutual funds and made allegations that the mutual fund industry has been less than forthright. I find these reports unsettling and not necessarily an accurate picture of the overall industry, and I would like you to know where we at Fidelity stand.
With specific regard to allegations that certain mutual fund companies were violating the Securities and Exchange Commission's forward pricing rules or were involved in so-called "market timing" activities, I want to say two things:
First, Fidelity does not have agreements that permit customers who buy fund shares after 4 p.m. to obtain the 4 p.m. price. This is not to say that someone could not deceive the company through fraudulent acts. But I underscore that we have no so-called "agreements" which would permit this illegal practice.
Second, Fidelity has been on record for years opposing predatory short-term trading which adversely affects other shareholders in a mutual fund. In fact, in the 1980s, we began charging a fee - which is returned to the fund and, therefore, to investors - to discourage this activity. What's more, several years ago we took the industry lead in developing a Fair Value Pricing Policy to prevent market timing on foreign securities in our funds. It is reasonable to assume that another structure can be developed that would alter the system to make it much more difficult for predatory traders to operate. This, however, will only be achieved through close cooperation among regulators, legislators and the industry.
Certainly no industry is perfect, and there have been instances of unethical and illegal activity from time to time within the mutual fund industry. When this occurs, confessed or convicted offenders should be dealt with appropriately. Clearly, every system can be improved. We applaud well thought out improvements by regulators, legislators and industry representatives that achieve the common goal of building and protecting the value of investors' holdings. But we remain concerned about the risk of over-regulation and the quick application of simplistic solutions to intricate problems.
For more than 57 years, Fidelity Investments has worked very hard to improve its products and service to justify your trust. When our family founded this company in 1946, we had only a few hundred customers. Many of them were family and friends. Today, we serve more than 18 million customers including individual investors and participants in retirement plans across America.
Let me close by saying that we do not take your trust in us for granted, and we realize that we must always work to improve all aspects of our service to you. In turn, we urge you to continue your active participation with your financial matters, so that your interests can be well served.
Best regards,
/s/Edward C. Johnson 3d
Edward C. Johnson 3d
Annual Report
Fidelity Advisor Freedom Income Fund SM - Class A, T, B, and C
Performance: The Bottom Line
Average annual total return reflects the change in the value of an investment, assuming reinvestment of the fund's dividend income and capital gains (the profits earned upon the sale of securities that have grown in value) and assuming a constant rate of performance each year. During periods of reimbursement by Fidelity, a fund's total return will be greater than it would be had the reimbursement not occurred. The $10,000 table and each class's returns do not reflect the deduction of taxes that a shareholder would pay on fund distributions or the redemption of fund shares. How a fund did yesterday is no guarantee of how it will do tomorrow. Returns may reflect the conversion of Class B shares to Class A shares after a maximum of seven years.
Average Annual Total Returns
Average annual total returns take Fidelity Advisor Freedom Income FundSM - Class T cumulative total return and show you what would have happened if Fidelity Advisor Freedom Income Fund shares had performed at a constant rate each year. These numbers will be reported once the fund is a year old.
$10,000 Over Life of Fund
Let's say hypothetically that $10,000 was invested in Fidelity Advisor Freedom Income - Class T on July 24, 2003, when the fund started, and the current 3.50% sales charge was paid. The chart shows how the value of the investment would have grown, and also shows how the Lehman Brothers® Aggregate Bond Index did over the same period.
Annual Report
Fidelity Advisor Freedom 2005 Fund SM - Class A, T, B, and C
Performance: The Bottom Line
Average annual total return reflects the change in the value of an investment, assuming reinvestment of the fund's dividend income and capital gains (the profits earned upon the sale of securities that have grown in value) and assuming a constant rate of performance each year. During the periods of reimbursement by Fidelity, a fund's total return will be greater than it would be had the reimbursement not occurred.
Average Annual Total Returns
Average annual total returns take Fidelity Advisor Freedom 2005 FundSM - Class T cumulative total return and show you what would have happened if Fidelity Advisor Freedom 2005 Fund shares had performed at a constant rate each year. These numbers will be reported once the fund is a year old. In addition, the growth of the hypothetical $10,000 investment in the fund will appear in the fund's next report.
Annual Report
Fidelity Advisor Freedom 2010 Fund SM - Class A, T, B, and C
Performance: The Bottom Line
Average annual total return reflects the change in the value of an investment, assuming reinvestment of the fund's dividend income and capital gains (the profits earned upon the sale of securities that have grown in value) and assuming a constant rate of performance each year. During periods of reimbursement by Fidelity, a fund's total return will be greater than it would be had the reimbursement not occurred. The $10,000 table and each class's returns do not reflect the deduction of taxes that a shareholder would pay on fund distributions or the redemption of fund shares. How a fund did yesterday is no guarantee of how it will do tomorrow. Returns may reflect the conversion of Class B shares to Class A shares after a maximum of seven years.
Average Annual Total Returns
Average annual total returns take Fidelity Advisor Freedom 2010 FundSM - Class T cumulative total return and show you what would have happened if Fidelity Advisor Freedom 2010 Fund shares had performed at a constant rate each year. These numbers will be reported once the fund is a year old.
$10,000 Over Life of Fund
Let's say hypothetically that $10,000 was invested in Fidelity Advisor Freedom 2010 - Class T on July 24, 2003, when the fund started, and the current 3.50% sales charge was paid. The chart shows how the value of the investment would have grown, and also shows how the Standard & Poor's 500SM Index did over the same period.
Annual Report
Fidelity Advisor Freedom 2015 Fund SM - Class A, T, B, and C
Performance: The Bottom Line
Average annual total return reflects the change in the value of an investment, assuming reinvestment of the fund's dividend income and capital gains (the profits earned upon the sale of securities that have grown in value) and assuming a constant rate of performance each year. During the periods of reimbursement by Fidelity, a fund's total return will be greater than it would be had the reimbursement not occurred.
Average Annual Total Returns
Average annual total returns take Fidelity Advisor Freedom 2015 FundSM - Class T cumulative total return and show you what would have happened if Fidelity Advisor Freedom 2015 Fund shares had performed at a constant rate each year. These numbers will be reported once the fund is a year old. In addition, the growth of the hypothetical $10,000 investment in the fund will appear in the fund's next report.
Annual Report
Fidelity Advisor Freedom 2020 Fund SM - Class A, T, B, and C
Performance: The Bottom Line
Average annual total return reflects the change in the value of an investment, assuming reinvestment of the fund's dividend income and capital gains (the profits earned upon the sale of securities that have grown in value) and assuming a constant rate of performance each year. During periods of reimbursement by Fidelity, a fund's total return will be greater than it would be had the reimbursement not occurred. The $10,000 table and each class's returns do not reflect the deduction of taxes that a shareholder would pay on fund distributions or the redemption of fund shares. How a fund did yesterday is no guarantee of how it will do tomorrow. Returns may reflect the conversion of Class B shares to Class A shares after a maximum of seven years.
Average Annual Total Returns
Average annual total returns take Fidelity Advisor Freedom 2020 FundSM - Class T cumulative total return and show you what would have happened if Fidelity Advisor Freedom 2020 Fund shares had performed at a constant rate each year. These numbers will be reported once the fund is a year old.
$10,000 Over Life of Fund
Let's say hypothetically that $10,000 was invested in Fidelity Advisor Freedom 2020 - Class T on July 24, 2003, when the fund started, and the current 3.50% sales charge was paid. The chart shows how the value of the investment would have grown, and also shows how the Standard & Poor's® 500 Index did over the same period.
Annual Report
Fidelity Advisor Freedom 2025 Fund SM - Class A, T, B, and C
Performance: The Bottom Line
Average annual total return reflects the change in the value of an investment, assuming reinvestment of the fund's dividend income and capital gains (the profits earned upon the sale of securities that have grown in value) and assuming a constant rate of performance each year. During the periods of reimbursement by Fidelity, a fund's total return will be greater than it would be had the reimbursement not occurred.
Average Annual Total Returns
Average annual total returns take Fidelity Advisor Freedom 2025 FundSM - Class T cumulative total return and show you what would have happened if Fidelity Advisor Freedom 2025 Fund shares had performed at a constant rate each year. These numbers will be reported once the fund is a year old. In addition, the growth of the hypothetical $10,000 investment in the fund will appear in the fund's next report.
Annual Report
Fidelity Advisor Freedom 2030 Fund SM - Class A, T, B, and C
Performance: The Bottom Line
Average annual total return reflects the change in the value of an investment, assuming reinvestment of the fund's dividend income and capital gains (the profits earned upon the sale of securities that have grown in value) and assuming a constant rate of performance each year. During periods of reimbursement by Fidelity, a fund's total return will be greater than it would be had the reimbursement not occurred. The $10,000 table and each class's returns do not reflect the deduction of taxes that a shareholder would pay on fund distributions or the redemption of fund shares. How a fund did yesterday is no guarantee of how it will do tomorrow. Returns may reflect the conversion of Class B shares to Class A shares after a maximum of seven years.
Average Annual Total Returns
Average annual total returns take Fidelity Advisor Freedom 2030 FundSM - Class T cumulative total return and show you what would have happened if Fidelity Advisor Freedom 2030 Fund shares had performed at a constant rate each year. These numbers will be reported once the fund is a year old.
$10,000 Over Life of Fund
Let's say hypothetically that $10,000 was invested in Fidelity Advisor Freedom 2030 - Class T on July 24, 2003, when the fund started, and the current 3.50% sales charge was paid. The chart shows how the value of the investment would have grown, and also shows how the Standard & Poor's® 500 Index did over the same period.
Annual Report
Fidelity Advisor Freedom 2035 Fund SM - Class A, T, B, and C
Performance: The Bottom Line
Average annual total return reflects the change in the value of an investment, assuming reinvestment of the fund's dividend income and capital gains (the profits earned upon the sale of securities that have grown in value) and assuming a constant rate of performance each year. During the periods of reimbursement by Fidelity, a fund's total return will be greater than it would be had the reimbursement not occurred.
Average Annual Total Returns
Average annual total returns take Fidelity Advisor Freedom 2035 FundSM - Class T cumulative total return and show you what would have happened if Fidelity Advisor Freedom 2035 Fund shares had performed at a constant rate each year. These numbers will be reported once the fund is a year old. In addition, the growth of the hypothetical $10,000 investment in the fund will appear in the fund's next report.
Annual Report
Fidelity Advisor Freedom 2040 Fund SM - Class A, T, B, and C
Performance: The Bottom Line
Average annual total return reflects the change in the value of an investment, assuming reinvestment of the fund's dividend income and capital gains (the profits earned upon the sale of securities that have grown in value) and assuming a constant rate of performance each year. During periods of reimbursement by Fidelity, a fund's total return will be greater than it would be had the reimbursement not occurred. The $10,000 table and each class's returns do not reflect the deduction of taxes that a shareholder would pay on fund distributions or the redemption of fund shares. How a fund did yesterday is no guarantee of how it will do tomorrow. Returns may reflect the conversion of Class B shares to Class A shares after a maximum of seven years.
Average Annual Total Returns
Average annual total returns take Fidelity Advisor Freedom 2040 FundSM - Class T cumulative total return and show you what would have happened if Fidelity Advisor Freedom 2040 Fund shares had performed at a constant rate each year. These numbers will be reported once the fund is a year old.
$10,000 Over Life of Fund
Let's say hypothetically that $10,000 was invested in Fidelity Advisor Freedom 2040 - Class T on July 24, 2003, when the fund started, and the current 3.50% sales charge was paid. The chart shows how the value of the investment would have grown, and also shows how the Standard & Poor's® 500 Index did over the same period.
Annual Report
Management's Discussion of Fund Performance
Comments from Ren Cheng, Portfolio Manager of Fidelity Advisor Freedom FundsSM
Robust economic growth and rising corporate profitability helped fuel a broad-based rally in the U.S. equity markets during the 12-month period ending March 31, 2004. Most notably, the Russell 2000® Index, a benchmark for small-cap stock returns, soared 63.83%. The NASDAQ Composite® Index gained 49.38%, driven by strong returns from technology and telecommunications stocks. Elsewhere, the large-cap-oriented Standard & Poor's 500SM Index rose 35.12%, while the blue-chips' Dow Jones Industrial AverageSM advanced 32.39%. Overseas equity markets also performed well based on improving economic data around the world. The Morgan Stanley Capital InternationalSM Europe, Australasia, Far East (MSCI® EAFE®) Index, a proxy for the performance of the overseas equity markets, rose 57.93%. Turning to fixed-income results, the Lehman Brothers® Aggregate Bond Index, a broad measure of the U.S. taxable bond market, returned 5.41% during the past year. Buoyed by an improving business climate, corporate bonds were the top-performing fixed-income category, as evidenced by the 8.61% gain for the Lehman Brothers Credit Bond Index.
The Advisor Freedom Funds performed well from their inception dates through the end of the period on March 31, 2004, delivering a range of returns appropriate to portfolios with different asset allocations. On a relative basis, the Advisor Freedom Funds trailed their respective benchmarks by small margins due primarily to weakness in their underlying domestic equity holdings. More specifically, the individual returns of Fidelity® Advisor Growth & Income Fund, Fidelity Advisor Dividend Growth Fund, Fidelity Advisor Large Cap Fund and Fidelity Advisor Equity Growth Fund trailed the return of the Wilshire 5000® Total Market Index since the inception of the original Advisor Freedom Funds - Income, 2010, 2020, 2030 and 2040 - on July 24, 2003. On the positive side of the ledger, the diversified international portfolios - Fidelity Advisor Diversified International Fund and Fidelity Advisor Overseas Fund - both outperformed the MSCI EAFE index. Elsewhere, Fidelity Advisor High Income Advantage Fund outperformed the Merrill Lynch® U.S. High Yield Master II Index, providing a boost to the total return of those Advisor Freedom Funds with an allocation to high-yield bonds.
The views expressed in this statement reflect those of the portfolio manager only through the end of the period of the report as stated on the cover and do not necessarily represent the views of Fidelity or any other person in the Fidelity organization. Any such views are subject to change at any time based upon market or other conditions and Fidelity disclaims any responsibility to update such views. These views may not be relied on as investment advice and, because investment decisions for a Fidelity fund are based on numerous factors, may not be relied on as an indication of trading intent on behalf of any Fidelity fund.
Annual Report
Fidelity Advisor Freedom Income Fund
Investment Changes
Fund Holdings as of March 31, 2004 |
| % of fund's
investments | % of fund's investments
6 months ago |
Domestic Equity Funds | | |
Fidelity Advisor Dividend Growth Fund
Institutional Class | 4.0% | 3.8% |
Fidelity Advisor Equity Growth Fund
Institutional Class | 2.0 | 1.9 |
Fidelity Advisor Equity Income Fund
Institutional Class | 4.2 | 3.9 |
Fidelity Advisor Growth & Income Fund
Institutional Class | 3.9 | 3.8 |
Fidelity Advisor Large Cap Fund
Institutional Class | 4.0 | 3.8 |
Fidelity Advisor Mid-Cap Fund
Institutional Class | 1.2 | 1.2 |
Fidelity Advisor Small Cap Fund
Institutional Class | 1.3 | 1.1 |
| 20.6 | 19.5 |
Investment Grade Fixed-Income Funds | | |
Fidelity Advisor Government Investment Fund
Institutional Class | 20.1 | 20.4 |
Fidelity Advisor Intermediate Bond Fund
Institutional Class | 20.1 | 20.3 |
| 40.2 | 40.7 |
Short-Term Fixed-Income Funds | | |
Fidelity Advisor Short-Fixed Income Fund
Institutional Class | 15.8 | 16.0 |
Money Market Fund | | |
Fidelity Cash Reserves Fund | 23.4 | 23.8 |
| 100.0% | 100.0% |
Annual Report
Fidelity Advisor Freedom Income Fund
Investment Changes - continued
Asset Allocation (% of fund's investments)
The fund invests according to an asset allocation strategy that becomes increasingly conservative over time. The six months ago allocation is based on the fund's holdings as of September 30, 2003. The current allocation is based on the fund's holdings as of March 31, 2004. The expected allocation represents the fund's anticipated target asset allocation at September 30, 2004.
Annual Report
Fidelity Advisor Freedom Income Fund
Investments March 31, 2004
Showing Percentage of Total Value of Investment in Securities
Equity Funds - 20.6% |
| Shares | | Value (Note 1) |
Domestic Equity Funds - 20.6% |
Fidelity Advisor Dividend Growth Fund Institutional Class | 113,981 | | $ 1,314,205 |
Fidelity Advisor Equity Growth Fund Institutional Class | 14,003 | | 660,125 |
Fidelity Advisor Equity Income Fund Institutional Class | 50,288 | | 1,356,262 |
Fidelity Advisor Growth & Income Fund Institutional Class | 79,602 | | 1,284,771 |
Fidelity Advisor Large Cap Fund Institutional Class | 88,368 | | 1,305,192 |
Fidelity Advisor Mid-Cap Fund Institutional Class | 17,464 | | 403,059 |
Fidelity Advisor Small Cap Fund Institutional Class | 19,188 | | 422,133 |
TOTAL EQUITY FUNDS (Cost $6,396,725) | 6,745,747 |
Fixed-Income Funds - 56.0% |
| | | |
Investment Grade Fixed-Income Funds - 40.2% |
Fidelity Advisor Government Investment Fund Institutional Class | 646,411 | | 6,586,927 |
Fidelity Advisor Intermediate Bond Fund Institutional Class | 573,880 | | 6,588,140 |
TOTAL INVESTMENT GRADE FIXED-INCOME FUNDS | | 13,175,067 |
Short-Term Fixed-Income Funds - 15.8% |
Fidelity Advisor Short-Fixed Income Fund Institutional Class | 538,122 | | 5,203,638 |
TOTAL FIXED-INCOME FUNDS (Cost $18,162,636) | 18,378,705 |
Money Market Fund - 23.4% |
| | | |
Fidelity Cash Reserves Fund
(Cost $7,676,434) | 7,676,434 | | 7,676,434 |
TOTAL INVESTMENT IN SECURITIES - 100% (Cost $32,235,795) | $ 32,800,886 |
Other Information |
Purchases and redemptions of the underlying fund shares aggregated $37,483,614 and $5,218,740, respectively. |
See accompanying notes which are an integral part of the financial statements.
Annual Report
Fidelity Advisor Freedom Income Fund
Financial Statements
Statement of Assets and Liabilities
| March 31, 2004 |
| | |
Assets | | |
Investment in securities, at value (cost $32,235,795) - See accompanying schedule | | $ 32,800,886 |
Cash | | 243,642 |
Receivable for investments sold | | 37,442 |
Total assets | | 33,081,970 |
| | |
Liabilities | | |
Payable for investments purchased | $ 97,412 | |
Payable for fund shares redeemed | 164,149 | |
Accrued management fee | 3,781 | |
Distribution fees payable | 17,073 | |
Total liabilities | | 282,415 |
| | |
Net Assets | | $ 32,799,555 |
Net Assets consist of: | | |
Paid in capital | | $ 32,198,302 |
Undistributed net investment income | | 1,120 |
Accumulated undistributed net realized gain (loss) on investments | | 35,042 |
Net unrealized appreciation (depreciation) on investments | | 565,091 |
Net Assets | | $ 32,799,555 |
See accompanying notes which are an integral part of the financial statements.
Annual Report
Fidelity Advisor Freedom Income Fund
Financial Statements - continued
Statement of Assets and Liabilities - continued
| March 31, 2004 |
Calculation of Maximum Offering Price | | |
Class A:
Net Asset Value and redemption price per share ($5,008,636 ÷ 481,450 shares) | | $ 10.40 |
| | |
Maximum offering price per share (100/94.25 of $10.40) | | $ 11.03 |
Class T:
Net Asset Value and redemption price per share ($14,535,367 ÷ 1,398,681 shares) | | $ 10.39 |
| | |
Maximum offering price per share (100/96.50 of $10.39) | | $ 10.77 |
Class B:
Net Asset Value and offering price per share ($3,648,581 ÷ 351,631 shares) A | | $ 10.38 |
| | |
Class C:
Net Asset Value and offering price per share ($9,247,896 ÷ 891,493 shares) A | | $ 10.37 |
| | |
Institutional Class:
Net Asset Value, offering price and redemption price per share ($359,075 ÷ 34,492 shares) | | $ 10.41 |
A Redemption price per share is equal to net asset value less any applicable contingent deferred sales charge.
See accompanying notes which are an integral part of the financial statements.
Annual Report
Statement of Operations
| July 24, 2003 (commencement of operations) to March 31, 2004 |
| | |
Investment Income | | |
Income distributions from underlying funds | | $ 235,721 |
| | |
Expenses | | |
Management fee | $ 11,067 | |
Distribution fees | 73,426 | |
Non-interested trustees' compensation | 40 | |
Total expenses before reductions | 84,533 | |
Expense reductions | (2,717) | 81,816 |
Net investment income (loss) | | 153,905 |
Realized and Unrealized Gain (Loss) | | |
Realized gain (loss) on sale of underlying fund shares | (29,080) | |
Capital gain distributions from underlying funds | 67,705 | 38,625 |
Change in net unrealized appreciation (depreciation) on investment securities | | 565,091 |
Net gain (loss) | | 603,716 |
Net increase (decrease) in net assets resulting from operations | | $ 757,621 |
See accompanying notes which are an integral part of the financial statements.
Annual Report
Fidelity Advisor Freedom Income Fund
Financial Statements - continued
Statement of Changes in Net Assets
| July 24, 2003
(commencement of
operations) to
March 31, 2004 |
Increase (Decrease) in Net Assets | |
Operations | |
Net investment income (loss) | $ 153,905 |
Net realized gain (loss) | 38,625 |
Change in net unrealized appreciation (depreciation) | 565,091 |
Net increase (decrease) in net assets resulting from operations | 757,621 |
Distributions to shareholders from net investment income | (156,368) |
Share transactions - net increase (decrease) | 32,198,302 |
Total increase (decrease) in net assets | 32,799,555 |
| |
Net Assets | |
Beginning of period | - |
End of period (including undistributed net investment income of $1,120) | $ 32,799,555 |
See accompanying notes which are an integral part of the financial statements.
Annual Report
Financial Highlights - Class A
Year ended March 31, | 2004F |
Selected Per-Share Data | |
Net asset value, beginning of period | $ 10.00 |
Income from Investment Operations | |
Net investment income (loss)E | .13 |
Net realized and unrealized gain (loss) | .36 |
Total from investment operations | .49 |
Distributions from net investment income | (.09) |
Net asset value, end of period | $ 10.40 |
Total ReturnB,C,D | 4.95% |
Ratios to Average Net AssetsG | |
Expenses before expense reductions | .35%A |
Expenses net of voluntary waivers, if any | .33%A |
Expenses net of all reductions | .33%A |
Net investment income (loss) | 1.81%A |
Supplemental Data | |
Net assets, end of period (000 omitted) | $ 5,009 |
Portfolio turnover rate | 46%A |
A Annualized
B Total returns for periods of less than one year are not annualized.
C Total returns would have been lower had certain expenses not been reduced during the periods shown.
D Total returns do not include the effect of the sales charges.
E Calculated based on average shares outstanding during the period.
F For the period July 24, 2003 (commencement of operations) to March 31, 2004.
G Expense ratios reflect operating expenses of the class. Expenses before reductions do not reflect amounts reimbursed by the investment adviser or reductions from brokerage service arrangements or other expense offset arrangements and do not represent the amount paid by the class during periods when reimbursements or reductions occur. Expenses net of any voluntary waivers reflect expenses after reimbursement by the investment adviser but prior to reductions from brokerage service arrangements or other expense offset arrangements. Expenses net of all reductions represent the net expenses paid by the class.
See accompanying notes which are an integral part of the financial statements.
Annual Report
Financial Highlights - Class T
Year ended March 31, | 2004F |
Selected Per-Share Data | |
Net asset value, beginning of period | $ 10.00 |
Income from Investment Operations | |
Net investment income (loss)E | .11 |
Net realized and unrealized gain (loss) | .37 |
Total from investment operations | .48 |
Distributions from net investment income | (.09) |
Net asset value, end of period | $ 10.39 |
Total ReturnB,C,D | 4.78% |
Ratios to Average Net AssetsG | |
Expenses before expense reductions | .60%A |
Expenses net of voluntary waivers, if any | .58%A |
Expenses net of all reductions | .58%A |
Net investment income (loss) | 1.56%A |
Supplemental Data | |
Net assets, end of period (000 omitted) | $ 14,535 |
Portfolio turnover rate | 46%A |
A Annualized
B Total returns for periods of less than one year are not annualized.
C Total returns would have been lower had certain expenses not been reduced during the periods shown.
D Total returns do not include the effect of the sales charges.
E Calculated based on average shares outstanding during the period.
F For the period July 24, 2003 (commencement of operations) to March 31, 2004.
G Expense ratios reflect operating expenses of the class. Expenses before reductions do not reflect amounts reimbursed by the investment adviser or reductions from brokerage service arrangements or other expense offset arrangements and do not represent the amount paid by the class during periods when reimbursements or reductions occur. Expenses net of any voluntary waivers reflect expenses after reimbursement by the investment adviser but prior to reductions from brokerage service arrangements or other expense offset arrangements. Expenses net of all reductions represent the net expenses paid by the class.
See accompanying notes which are an integral part of the financial statements.
Annual Report
Financial Highlights - Class B
Year ended March 31, | 2004F |
Selected Per-Share Data | |
Net asset value, beginning of period | $ 10.00 |
Income from Investment Operations | |
Net investment income (loss)E | .07 |
Net realized and unrealized gain (loss) | .37 |
Total from investment operations | .44 |
Distributions from net investment income | (.06) |
Net asset value, end of period | $ 10.38 |
Total ReturnB,C,D | 4.45% |
Ratios to Average Net AssetsG | |
Expenses before expense reductions | 1.10%A |
Expenses net of voluntary waivers, if any | 1.08%A |
Expenses net of all reductions | 1.08%A |
Net investment income (loss) | 1.06%A |
Supplemental Data | |
Net assets, end of period (000 omitted) | $ 3,649 |
Portfolio turnover rate | 46%A |
A Annualized
B Total returns for periods of less than one year are not annualized.
C Total returns would have been lower had certain expenses not been reduced during the periods shown.
D Total returns do not include the effect of the contingent deferred sales charge.
E Calculated based on average shares outstanding during the period.
F For the period July 24, 2003 (commencement of operations) to March 31, 2004.
G Expense ratios reflect operating expenses of the class. Expenses before reductions do not reflect amounts reimbursed by the investment adviser or reductions from brokerage service arrangements or other expense offset arrangements and do not represent the amount paid by the class during periods when reimbursements or reductions occur. Expenses net of any voluntary waivers reflect expenses after reimbursement by the investment adviser but prior to reductions from brokerage service arrangements or other expense offset arrangements. Expenses net of all reductions represent the net expenses paid by the class.
See accompanying notes which are an integral part of the financial statements.
Annual Report
Financial Highlights - Class C
Year ended March 31, | 2004F |
Selected Per-Share Data | |
Net asset value, beginning of period | $ 10.00 |
Income from Investment Operations | |
Net investment income (loss)E | .07 |
Net realized and unrealized gain (loss) | .37 |
Total from investment operations | .44 |
Distributions from net investment income | (.07) |
Net asset value, end of period | $ 10.37 |
Total ReturnB,C,D | 4.39% |
Ratios to Average Net AssetsG | |
Expenses before expense reductions | 1.10%A |
Expenses net of voluntary waivers, if any | 1.08%A |
Expenses net of all reductions | 1.08%A |
Net investment income (loss) | 1.06%A |
Supplemental Data | |
Net assets, end of period (000 omitted) | $ 9,248 |
Portfolio turnover rate | 46%A |
A Annualized
B Total returns for periods of less than one year are not annualized.
C Total returns would have been lower had certain expenses not been reduced during the periods shown.
D Total returns do not include the effect of the contingent deferred sales charge.
E Calculated based on average shares outstanding during the period.
F For the period July 24, 2003 (commencement of operations) to March 31, 2004.
G Expense ratios reflect operating expenses of the class. Expenses before reductions do not reflect amounts reimbursed by the investment adviser or reductions from brokerage service arrangements or other expense offset arrangements and do not represent the amount paid by the class during periods when reimbursements or reductions occur. Expenses net of any voluntary waivers reflect expenses after reimbursement by the investment adviser but prior to reductions from brokerage service arrangements or other expense offset arrangements. Expenses net of all reductions represent the net expenses paid by the class.
See accompanying notes which are an integral part of the financial statements.
Annual Report
Financial Highlights - Institutional Class
Year ended March 31, | 2004E |
Selected Per-Share Data | |
Net asset value, beginning of period | $ 10.00 |
Income from Investment Operations | |
Net investment income (loss)D | .14 |
Net realized and unrealized gain (loss) | .37 |
Total from investment operations | .51 |
Distributions from net investment income | (.10) |
Net asset value, end of period | $ 10.41 |
Total ReturnB,C | 5.16% |
Ratios to Average Net AssetsF | |
Expenses before expense reductions | .10%A |
Expenses net of voluntary waivers, if any | .08%A |
Expenses net of all reductions | .08%A |
Net investment income (loss) | 2.05%A |
Supplemental Data | |
Net assets, end of period (000 omitted) | $ 359 |
Portfolio turnover rate | 46%A |
A Annualized
B Total returns for periods of less than one year are not annualized.
C Total returns would have been lower had certain expenses not been reduced during the periods shown.
D Calculated based on average shares outstanding during the period.
E For the period July 24, 2003 (commencement of operations) to March 31, 2004.
F Expense ratios reflect operating expenses of the class. Expenses before reductions do not reflect amounts reimbursed by the investment adviser or reductions from brokerage service arrangements or other expense offset arrangements and do not represent the amount paid by the class during periods when reimbursements or reductions occur. Expenses net of any voluntary waivers reflect expenses after reimbursement by the investment adviser but prior to reductions from brokerage service arrangements or other expense offset arrangements. Expenses net of all reductions represent the net expenses paid by the class.
See accompanying notes which are an integral part of the financial statements.
Annual Report
Fidelity Advisor Freedom 2005 Fund
Investment Summary
Fund Holdings as of March 31, 2004 |
| % of fund's
investments |
Domestic Equity Funds | |
Fidelity Advisor Dividend Growth Fund Institutional Class | 7.8% |
Fidelity Advisor Equity Growth Fund Institutional Class | 3.9 |
Fidelity Advisor Equity Income Fund Institutional Class | 7.9 |
Fidelity Advisor Growth & Income Fund Institutional Class | 7.7 |
Fidelity Advisor Large Cap Fund Institutional Class | 7.8 |
Fidelity Advisor Mid-Cap Fund Institutional Class | 2.4 |
Fidelity Advisor Small Cap Fund Institutional Class | 2.5 |
| 40.0 |
International Equity Funds | |
Fidelity Advisor Diversified International Fund Institutional Class | 2.6 |
Fidelity Advisor Overseas Fund Institutional Class | 2.6 |
| 5.2 |
High Yield Fixed-Income Funds | |
Fidelity Advisor High Income Advantage Fund Institutional Class | 5.0 |
Investment Grade Fixed-Income Funds | |
Fidelity Advisor Government Investment Fund Institutional Class | 20.0 |
Fidelity Advisor Intermediate Bond Fund Institutional Class | 20.1 |
| 40.1 |
Short-Term Fixed-Income Funds | |
Fidelity Advisor Short-Fixed Income Fund Institutional Class | 4.0 |
Money Market Fund | |
Fidelity Cash Reserves Fund | 5.7 |
| 100.0% |
Annual Report
Fidelity Advisor Freedom 2005 Fund
Investment Summary - continued
Asset Allocation (% of fund's investments)

The fund invests according to an asset allocation strategy that becomes increasingly conservative over time. The initial allocation represents the target asset allocation at inception. The current allocation is based on the fund's holdings as of March 31, 2004. The expected allocation represents the fund's anticipated target asset allocation at September 30, 2004.
Annual Report
Fidelity Advisor Freedom 2005 Fund
Investments March 31, 2004
Showing Percentage of Total Value of Investment in Securities
Equity Funds - 45.2% |
| Shares | | Value (Note 1) |
Domestic Equity Funds - 40.0% |
Fidelity Advisor Dividend Growth Fund Institutional Class | 41,237 | | $ 475,461 |
Fidelity Advisor Equity Growth Fund Institutional Class | 5,076 | | 239,271 |
Fidelity Advisor Equity Income Fund Institutional Class | 17,904 | | 482,871 |
Fidelity Advisor Growth & Income Fund Institutional Class | 29,168 | | 470,768 |
Fidelity Advisor Large Cap Fund Institutional Class | 32,030 | | 473,086 |
Fidelity Advisor Mid-Cap Fund Institutional Class | 6,232 | | 143,842 |
Fidelity Advisor Small Cap Fund Institutional Class | 6,768 | | 148,891 |
TOTAL DOMESTIC EQUITY FUNDS | | 2,434,190 |
International Equity Funds - 5.2% |
Fidelity Advisor Diversified International Fund Institutional Class | 9,312 | | 158,405 |
Fidelity Advisor Overseas Fund Institutional Class | 9,485 | | 157,736 |
TOTAL INTERNATIONAL EQUITY FUNDS | | 316,141 |
TOTAL EQUITY FUNDS (Cost $2,705,141) | 2,750,331 |
Fixed-Income Funds - 49.1% |
| | | |
High Yield Fixed-Income Funds - 5.0% |
Fidelity Advisor High Income Advantage Fund Institutional Class | 32,890 | | 303,905 |
Investment Grade Fixed-Income Funds - 40.1% |
Fidelity Advisor Government Investment Fund Institutional Class | 119,533 | | 1,218,042 |
Fidelity Advisor Intermediate Bond Fund Institutional Class | 106,125 | | 1,218,318 |
TOTAL INVESTMENT GRADE FIXED-INCOME FUNDS | | 2,436,360 |
Short-Term Fixed-Income Funds - 4.0% |
Fidelity Advisor Short-Fixed Income Fund Institutional Class | 25,047 | | 242,202 |
TOTAL FIXED-INCOME FUNDS (Cost $2,966,809) | 2,982,467 |
Money Market Fund - 5.7% |
| Shares | | Value (Note 1) |
Fidelity Cash Reserves Fund
(Cost $346,307) | 346,307 | | $ 346,307 |
TOTAL INVESTMENT IN SECURITIES - 100% (Cost $6,018,257) | $ 6,079,105 |
Other Information |
Purchases and redemptions of the underlying fund shares aggregated $6,105,267 and $86,233, respectively. |
See accompanying notes which are an integral part of the financial statements.
Annual Report
Fidelity Advisor Freedom 2005 Fund
Financial Statements
Statement of Assets and Liabilities
| March 31, 2004 |
| | |
Assets | | |
Investment in securities, at value (cost $6,018,257) - See accompanying schedule | | $ 6,079,105 |
Cash | | 28 |
Receivable for fund shares sold | | 314,739 |
Total assets | | 6,393,872 |
| | |
Liabilities | | |
Payable for investments purchased | $ 300,196 | |
Accrued management fee | 586 | |
Distribution fees payable | 2,343 | |
Total liabilities | | 303,125 |
| | |
Net Assets | | $ 6,090,747 |
Net Assets consist of: | | |
Paid in capital | | $ 6,016,499 |
Undistributed net investment income | | 10,206 |
Accumulated undistributed net realized gain (loss) on investments | | 3,194 |
Net unrealized appreciation (depreciation) on investments | | 60,848 |
Net Assets | | $ 6,090,747 |
See accompanying notes which are an integral part of the financial statements.
Annual Report
Fidelity Advisor Freedom 2005 Fund
Financial Statements - continued
Statement of Assets and Liabilities - continued
| March 31, 2004 |
Calculation of Maximum Offering Price | | |
Class A:
Net Asset Value and redemption price per share ($1,386,469 ÷ 132,211 shares) | | $ 10.49 |
| | |
Maximum offering price per share (100/94.25 of $10.49) | | $ 11.13 |
Class T:
Net Asset Value and redemption price per share ($2,031,359 ÷ 193,801 shares) | | $ 10.48 |
| | |
Maximum offering price per share (100/96.50 of $10.48) | | $ 10.86 |
Class B:
Net Asset Value and offering price per share ($1,202,573 ÷ 114,894 shares) A | | $ 10.47 |
| | |
Class C:
Net Asset Value and offering price per share ($1,073,273 ÷ 102,503 shares) A | | $ 10.47 |
| | |
Institutional Class:
Net Asset Value, offering price and redemption price per share ($397,073 ÷ 37,835 shares) | | $ 10.49 |
A Redemption price per share is equal to net asset value less any applicable contingent deferred sales charge.
See accompanying notes which are an integral part of the financial statements.
Annual Report
Statement of Operations
| November 6, 2003 (commencement of operations) to March 31, 2004 |
| | |
Investment Income | | |
Income distributions from underlying funds | | $ 25,035 |
Interest | | 28 |
Total income | | 25,063 |
| | |
Expenses | | |
Management fee | $ 975 | |
Distribution fees | 5,704 | |
Non-interested trustees' compensation | 3 | |
Total expenses before reductions | 6,682 | |
Expense reductions | (170) | 6,512 |
Net investment income (loss) | | 18,551 |
Realized and Unrealized Gain (Loss) Realized gain (loss) on sale of underlying fund shares | (777) | |
Capital gain distributions from underlying funds | 4,194 | 3,417 |
Change in net unrealized appreciation (depreciation) on investment securities | | 60,848 |
Net gain (loss) | | 64,265 |
Net increase (decrease) in net assets resulting from operations | | $ 82,816 |
See accompanying notes which are an integral part of the financial statements.
Annual Report
Fidelity Advisor Freedom 2005 Fund
Financial Statements - continued
Statement of Changes in Net Assets
| November 6, 2003
(commencement of
operations) to
March 31, 2004 |
Increase (Decrease) in Net Assets | |
Operations | |
Net investment income (loss) | $ 18,551 |
Net realized gain (loss) | 3,417 |
Change in net unrealized appreciation (depreciation) | 60,848 |
Net increase (decrease) in net assets resulting from operations | 82,816 |
Distributions to shareholders from net investment income | (8,568) |
Share transactions - net increase (decrease) | 6,016,499 |
Total increase (decrease) in net assets | 6,090,747 |
| |
Net Assets | |
Beginning of period | - |
End of period (including undistributed net investment income of $10,206) | $ 6,090,747 |
See accompanying notes which are an integral part of the financial statements.
Annual Report
Financial Highlights - Class A
Year ended March 31, | 2004F |
Selected Per-Share Data | |
Net asset value, beginning of period | $ 10.00 |
Income from Investment Operations | |
Net investment income (loss)E | .09 |
Net realized and unrealized gain (loss) | .46 |
Total from investment operations | .55 |
Distributions from net investment income | (.06) |
Net asset value, end of period | $ 10.49 |
Total ReturnB,C,D | 5.52% |
Ratios to Average Net AssetsG | |
Expenses before expense reductions | .35%A |
Expenses net of voluntary waivers, if any | .33%A |
Expenses net of all reductions | .33%A |
Net investment income (loss) | 2.21%A |
Supplemental Data | |
Net assets, end of period (000 omitted) | $ 1,386 |
Portfolio turnover rate | 9%A |
A Annualized
B Total returns for periods of less than one year are not annualized.
C Total returns would have been lower had certain expenses not been reduced during the periods shown.
D Total returns do not include the effect of the sales charges.
E Calculated based on average shares outstanding during the period.
F For the period November 6, 2003 (commencement of operations) to March 31, 2004.
G Expense ratios reflect operating expenses of the class. Expenses before reductions do not reflect amounts reimbursed by the investment adviser or reductions from brokerage service arrangements or other expense offset arrangements and do not represent the amount paid by the class during periods when reimbursements or reductions occur. Expenses net of any voluntary waivers reflect expenses after reimbursement by the investment adviser but prior to reductions from brokerage service arrangements or other expense offset arrangements. Expenses net of all reductions represent the net expenses paid by the class.
See accompanying notes which are an integral part of the financial statements.
Annual Report
Financial Highlights - Class T
Year ended March 31, | 2004F |
Selected Per-Share Data | |
Net asset value, beginning of period | $ 10.00 |
Income from Investment Operations | |
Net investment income (loss)E | .08 |
Net realized and unrealized gain (loss) | .46 |
Total from investment operations | .54 |
Distributions from net investment income | (.06) |
Net asset value, end of period | $ 10.48 |
Total ReturnB,C,D | 5.36% |
Ratios to Average Net AssetsG | |
Expenses before expense reductions | .60%A |
Expenses net of voluntary waivers, if any | .58%A |
Expenses net of all reductions | .58%A |
Net investment income (loss) | 1.97%A |
Supplemental Data | |
Net assets, end of period (000 omitted) | $ 2,031 |
Portfolio turnover rate | 9%A |
A Annualized
B Total returns for periods of less than one year are not annualized.
C Total returns would have been lower had certain expenses not been reduced during the periods shown.
D Total returns do not include the effect of the sales charges.
E Calculated based on average shares outstanding during the period.
F For the period November 6, 2003 (commencement of operations) to March 31, 2004.
G Expense ratios reflect operating expenses of the class. Expenses before reductions do not reflect amounts reimbursed by the investment adviser or reductions from brokerage service arrangements or other expense offset arrangements and do not represent the amount paid by the class during periods when reimbursements or reductions occur. Expenses net of any voluntary waivers reflect expenses after reimbursement by the investment adviser but prior to reductions from brokerage service arrangements or other expense offset arrangements. Expenses net of all reductions represent the net expenses paid by the class.
See accompanying notes which are an integral part of the financial statements.
Annual Report
Financial Highlights - Class B
Year ended March 31, | 2004F |
Selected Per-Share Data | |
Net asset value, beginning of period | $ 10.00 |
Income from Investment Operations | |
Net investment income (loss)E | .06 |
Net realized and unrealized gain (loss) | .46 |
Total from investment operations | .52 |
Distributions from net investment income | (.05) |
Net asset value, end of period | $ 10.47 |
Total ReturnB,C,D | 5.21% |
Ratios to Average Net AssetsG | |
Expenses before expense reductions | 1.10%A |
Expenses net of voluntary waivers, if any | 1.08%A |
Expenses net of all reductions | 1.08%A |
Net investment income (loss) | 1.47%A |
Supplemental Data | |
Net assets, end of period (000 omitted) | $ 1,203 |
Portfolio turnover rate | 9%A |
A Annualized
B Total returns for periods of less than one year are not annualized.
C Total returns would have been lower had certain expenses not been reduced during the periods shown.
D Total returns do not include the effect of the contingent deferred sales charge.
E Calculated based on average shares outstanding during the period.
F For the period November 6, 2003 (commencement of operations) to March 31, 2004.
G Expense ratios reflect operating expenses of the class. Expenses before reductions do not reflect amounts reimbursed by the investment adviser or reductions from brokerage service arrangements or other expense offset arrangements and do not represent the amount paid by the class during periods when reimbursements or reductions occur. Expenses net of any voluntary waivers reflect expenses after reimbursement by the investment adviser but prior to reductions from brokerage service arrangements or other expense offset arrangements. Expenses net of all reductions represent the net expenses paid by the class.
See accompanying notes which are an integral part of the financial statements.
Annual Report
Financial Highlights - Class C
Year ended March 31, | 2004F |
Selected Per-Share Data | |
Net asset value, beginning of period | $ 10.00 |
Income from Investment Operations | |
Net investment income (loss)E | .06 |
Net realized and unrealized gain (loss) | .46 |
Total from investment operations | .52 |
Distributions from net investment income | (.05) |
Net asset value, end of period | $ 10.47 |
Total ReturnB,C,D | 5.21% |
Ratios to Average Net AssetsG | |
Expenses before expense reductions | 1.10%A |
Expenses net of voluntary waivers, if any | 1.08%A |
Expenses net of all reductions | 1.08%A |
Net investment income (loss) | 1.47%A |
Supplemental Data | |
Net assets, end of period (000 omitted) | $ 1,073 |
Portfolio turnover rate | 9%A |
A Annualized
B Total returns for periods of less than one year are not annualized.
C Total returns would have been lower had certain expenses not been reduced during the periods shown.
D Total returns do not include the effect of the contingent deferred sales charge.
E Calculated based on average shares outstanding during the period.
F For the period November 6, 2003 (commencement of operations) to March 31, 2004.
G Expense ratios reflect operating expenses of the class. Expenses before reductions do not reflect amounts reimbursed by the investment adviser or reductions from brokerage service arrangements or other expense offset arrangements and do not represent the amount paid by the class during periods when reimbursements or reductions occur. Expenses net of any voluntary waivers reflect expenses after reimbursement by the investment adviser but prior to reductions from brokerage service arrangements or other expense offset arrangements. Expenses net of all reductions represent the net expenses paid by the class.
See accompanying notes which are an integral part of the financial statements.
Annual Report
Financial Highlights - Institutional Class
Year ended March 31, | 2004E |
Selected Per-Share Data | |
Net asset value, beginning of period | $ 10.00 |
Income from Investment Operations | |
Net investment income (loss)D | .10 |
Net realized and unrealized gain (loss) | .45 |
Total from investment operations | .55 |
Distributions from net investment income | (.06) |
Net asset value, end of period | $ 10.49 |
Total ReturnB,C | 5.52% |
Ratios to Average Net AssetsF | |
Expenses before expense reductions | .10%A |
Expenses net of voluntary waivers, if any | .08%A |
Expenses net of all reductions | .08%A |
Net investment income (loss) | 2.46%A |
Supplemental Data | |
Net assets, end of period (000 omitted) | $ 397 |
Portfolio turnover rate | 9%A |
A Annualized
B Total returns for periods of less than one year are not annualized.
C Total returns would have been lower had certain expenses not been reduced during the periods shown.
D Calculated based on average shares outstanding during the period.
E For the period November 6, 2003 (commencement of operations) to March 31, 2004.
F Expense ratios reflect operating expenses of the class. Expenses before reductions do not reflect amounts reimbursed by the investment adviser or reductions from brokerage service arrangements or other expense offset arrangements and do not represent the amount paid by the class during periods when reimbursements or reductions occur. Expenses net of any voluntary waivers reflect expenses after reimbursement by the investment adviser but prior to reductions from brokerage service arrangements or other expense offset arrangements. Expenses net of all reductions represent the net expenses paid by the class.
See accompanying notes which are an integral part of the financial statements.
Annual Report
Fidelity Advisor Freedom 2010 Fund
Investment Changes
Fund Holdings as of March 31, 2004 |
| % of fund's investments | % of fund's investments
6 months ago |
Domestic Equity Funds | | |
Fidelity Advisor Dividend Growth Fund Institutional Class | 7.9% | 7.8% |
Fidelity Advisor Equity Growth Fund
Institutional Class | 4.0 | 3.9 |
Fidelity Advisor Equity Income Fund
Institutional Class | 8.1 | 7.8 |
Fidelity Advisor Growth & Income Fund Institutional Class | 7.7 | 7.7 |
Fidelity Advisor Large Cap Fund
Institutional Class | 7.8 | 7.7 |
Fidelity Advisor Mid-Cap Fund Institutional Class | 2.4 | 2.4 |
Fidelity Advisor Small Cap Fund
Institutional Class | 2.5 | 2.4 |
| 40.4 | 39.7 |
International Equity Funds | | |
Fidelity Advisor Diversified International Fund Institutional Class | 2.7 | 2.6 |
Fidelity Advisor Overseas Fund Institutional Class | 2.6 | 2.5 |
| 5.3 | 5.1 |
High Yield Fixed-Income Funds | | |
Fidelity Advisor High Income Advantage Fund Institutional Class | 5.1 | 5.2 |
Investment Grade Fixed-Income Funds | | |
Fidelity Advisor Government Investment Fund Institutional Class | 19.8 | 20.3 |
Fidelity Advisor Intermediate Bond Fund Institutional Class | 19.9 | 20.2 |
| 39.7 | 40.5 |
Short-Term Fixed-Income Funds | | |
Fidelity Advisor Short-Fixed Income Fund Institutional Class | 3.8 | 3.9 |
Money Market Fund | | |
Fidelity Cash Reserves Fund | 5.7 | 5.6 |
| 100.0% | 100.0% |
Annual Report
Fidelity Advisor Freedom 2010 Fund
Investment Changes - continued
Asset Allocation (% of fund's investments)
The fund invests according to an asset allocation strategy that becomes increasingly conservative over time. The six months ago allocation is based on the fund's holdings as of September 30, 2003. The current allocation is based on the fund's holdings as of March 31, 2004. The expected allocation represents the fund's anticipated target asset allocation at September 30, 2004.
Annual Report
Fidelity Advisor Freedom 2010 Fund
Investments March 31, 2004
Showing Percentage of Total Value of Investment in Securities
Equity Funds - 45.7% |
| Shares | | Value (Note 1) |
Domestic Equity Funds - 40.4% |
Fidelity Advisor Dividend Growth Fund Institutional Class | 618,583 | | $ 7,132,259 |
Fidelity Advisor Equity Growth Fund Institutional Class | 76,594 | | 3,610,646 |
Fidelity Advisor Equity Income Fund Institutional Class | 270,982 | | 7,308,373 |
Fidelity Advisor Growth & Income Fund Institutional Class | 435,150 | | 7,023,318 |
Fidelity Advisor Large Cap Fund Institutional Class | 480,906 | | 7,102,984 |
Fidelity Advisor Mid-Cap Fund Institutional Class | 94,251 | | 2,175,309 |
Fidelity Advisor Small Cap Fund Institutional Class | 104,079 | | 2,289,734 |
TOTAL DOMESTIC EQUITY FUNDS | | 36,642,623 |
International Equity Funds - 5.3% |
Fidelity Advisor Diversified International Fund Institutional Class | 143,285 | | 2,437,269 |
Fidelity Advisor Overseas Fund Institutional Class | 145,772 | | 2,424,190 |
TOTAL INTERNATIONAL EQUITY FUNDS | | 4,861,459 |
TOTAL EQUITY FUNDS (Cost $40,014,308) | 41,504,082 |
Fixed-Income Funds - 48.6% |
| | | |
High Yield Fixed-Income Funds - 5.1% |
Fidelity Advisor High Income Advantage Fund Institutional Class | 499,305 | | 4,613,579 |
Investment Grade Fixed-Income Funds - 39.7% |
Fidelity Advisor Government Investment Fund Institutional Class | 1,767,624 | | 18,012,091 |
Fidelity Advisor Intermediate Bond Fund Institutional Class | 1,569,315 | | 18,015,735 |
TOTAL INVESTMENT GRADE FIXED-INCOME FUNDS | | 36,027,826 |
Short-Term Fixed-Income Funds - 3.8% |
Fidelity Advisor Short-Fixed Income Fund Institutional Class | 358,666 | | 3,468,296 |
TOTAL FIXED-INCOME FUNDS (Cost $43,664,601) | 44,109,701 |
Money Market Fund - 5.7% |
| Shares | | Value (Note 1) |
Fidelity Cash Reserves Fund
(Cost $5,122,359) | 5,122,359 | | $ 5,122,359 |
TOTAL INVESTMENT IN SECURITIES - 100% (Cost $88,801,268) | $ 90,736,142 |
Other Information |
Purchases and redemptions of the underlying fund shares aggregated $117,747,651 and $28,871,201, respectively. |
See accompanying notes which are an integral part of the financial statements.
Annual Report
Fidelity Advisor Freedom 2010 Fund
Financial Statements
Statement of Assets and Liabilities
| March 31, 2004 |
| | |
Assets | | |
Investment in securities, at value (cost $88,801,268) - See accompanying schedule | | $ 90,736,142 |
Cash | | 1 |
Receivable for investments sold | | 138,498 |
Receivable for fund shares sold | | 793,759 |
Total assets | | 91,668,400 |
| | |
Liabilities | | |
Payable for investments purchased | $ 692,653 | |
Payable for fund shares redeemed | 207,138 | |
Accrued management fee | 9,934 | |
Distribution fees payable | 38,020 | |
Total liabilities | | 947,745 |
| | |
Net Assets | | $ 90,720,655 |
Net Assets consist of: | | |
Paid in capital | | $ 88,531,370 |
Undistributed net investment income | | 239,489 |
Accumulated undistributed net realized gain (loss) on investments | | 14,922 |
Net unrealized appreciation (depreciation) on investments | | 1,934,874 |
Net Assets | | $ 90,720,655 |
See accompanying notes which are an integral part of the financial statements.
Annual Report
Fidelity Advisor Freedom 2010 Fund
Financial Statements - continued
Statement of Assets and Liabilities - continued
| March 31, 2004 |
Calculation of Maximum Offering Price | | |
Class A:
Net Asset Value and redemption price per share ($32,615,485 ÷ 2,987,854 shares) | | $ 10.92 |
| | |
Maximum offering price per share (100/94.25 of $10.92) | | $ 11.59 |
Class T:
Net Asset Value and redemption price per share ($29,964,180 ÷ 2,749,143 shares) | | $ 10.90 |
| | |
Maximum offering price per share (100/96.50 of $10.90) | | $ 11.30 |
Class B:
Net Asset Value and offering price per share ($14,897,169 ÷ 1,370,178 shares) A | | $ 10.87 |
| | |
Class C:
Net Asset Value and offering price per share ($11,552,383 ÷ 1,062,688 shares) A | | $ 10.87 |
| | |
Institutional Class:
Net Asset Value, offering price and redemption price per share ($1,691,438 ÷ 154,687 shares) | | $ 10.93 |
A Redemption price per share is equal to net asset value less any applicable contingent deferred sales charge.
See accompanying notes which are an integral part of the financial statements.
Annual Report
Statement of Operations
| July 24, 2003 (commencement of operations) to March 31, 2004 |
| | |
Investment Income | | |
Income distributions from underlying funds | | $ 585,312 |
| | |
Expenses | | |
Management fee | $ 23,831 | |
Distribution fees | 136,410 | |
Non-interested trustees' compensation | 78 | |
Total expenses before reductions | 160,319 | |
Expense reductions | (5,772) | 154,547 |
Net investment income (loss) | | 430,765 |
Realized and Unrealized Gain (Loss) Realized gain (loss) on sale of underlying fund shares | (75,182) | |
Capital gain distributions from underlying fund shares | 95,140 | 19,958 |
Change in net unrealized appreciation (depreciation) on investment securities | | 1,934,874 |
Net gain (loss) | | 1,954,832 |
Net increase (decrease) in net assets resulting from operations | | $ 2,385,597 |
See accompanying notes which are an integral part of the financial statements.
Annual Report
Fidelity Advisor Freedom 2010 Fund
Financial Statements - continued
Statement of Changes in Net Assets
| July 24, 2003
(commencement of
operations) to
March 31, 2004 |
Increase (Decrease) in Net Assets | |
Operations | |
Net investment income (loss) | $ 430,765 |
Net realized gain (loss) | 19,958 |
Change in net unrealized appreciation (depreciation) | 1,934,874 |
Net increase (decrease) in net assets resulting from operations | 2,385,597 |
Distributions to shareholders from net investment income | (196,312) |
Share transactions - net increase (decrease) | 88,531,370 |
Total increase (decrease) in net assets | 90,720,655 |
| |
Net Assets | |
Beginning of period | - |
End of period (including undistributed net investment income of $239,489) | $ 90,720,655 |
See accompanying notes which are an integral part of the financial statements.
Annual Report
Financial Highlights - Class A
Year ended March 31, | 2004F |
Selected Per-Share Data | |
Net asset value, beginning of period | $ 10.00 |
Income from Investment Operations | |
Net investment income (loss)E | .16 |
Net realized and unrealized gain (loss) | .83 |
Total from investment operations | .99 |
Distributions from net investment income | (.07) |
Net asset value, end of period | $ 10.92 |
Total ReturnB,C,D | 9.92% |
Ratios to Average Net AssetsG | |
Expenses before expense reductions | .35%A |
Expenses net of voluntary waivers, if any | .33%A |
Expenses net of all reductions | .33%A |
Net investment income (loss) | 2.14%A |
Supplemental Data | |
Net assets, end of period (000 omitted) | $ 32,615 |
Portfolio turnover rate | 103%A |
A Annualized
B Total returns for periods of less than one year are not annualized.
C Total returns would have been lower had certain expenses not been reduced during the periods shown.
D Total returns do not include the effect of the sales charges.
E Calculated based on average shares outstanding during the period.
F For the period July 24, 2003 (commencement of operations) to March 31, 2004.
G Expense ratios reflect operating expenses of the class. Expenses before reductions do not reflect amounts reimbursed by the investment adviser or reductions from brokerage service arrangements or other expense offset arrangements and do not represent the amount paid by the class during periods when reimbursements or reductions occur. Expenses net of any voluntary waivers reflect expenses after reimbursement by the investment adviser but prior to reductions from brokerage service arrangements or other expense offset arrangements. Expenses net of all reductions represent the net expenses paid by the class.
See accompanying notes which are an integral part of the financial statements.
Annual Report
Financial Highlights - Class T
Year ended March 31, | 2004F |
Selected Per-Share Data | |
Net asset value, beginning of period | $ 10.00 |
Income from Investment Operations | |
Net investment income (loss)E | .14 |
Net realized and unrealized gain (loss) | .83 |
Total from investment operations | .97 |
Distributions from net investment income | (.07) |
Net asset value, end of period | $ 10.90 |
Total ReturnB,C,D | 9.72% |
Ratios to Average Net AssetsG | |
Expenses before expense reductions | .60%A |
Expenses net of voluntary waivers, if any | .58%A |
Expenses net of all reductions | .58%A |
Net investment income (loss) | 1.89%A |
Supplemental Data | |
Net assets, end of period (000 omitted) | $ 29,964 |
Portfolio turnover rate | 103%A |
A Annualized
B Total returns for periods of less than one year are not annualized.
C Total returns would have been lower had certain expenses not been reduced during the periods shown.
D Total returns do not include the effect of the sales charges.
E Calculated based on average shares outstanding during the period.
F For the period July 24, 2003 (commencement of operations) to March 31, 2004.
G Expense ratios reflect operating expenses of the class. Expenses before reductions do not reflect amounts reimbursed by the investment adviser or reductions from brokerage service arrangements or other expense offset arrangements and do not represent the amount paid by the class during periods when reimbursements or reductions occur. Expenses net of any voluntary waivers reflect expenses after reimbursement by the investment adviser but prior to reductions from brokerage service arrangements or other expense offset arrangements. Expenses net of all reductions represent the net expenses paid by the class.
See accompanying notes which are an integral part of the financial statements.
Annual Report
Financial Highlights - Class B
Year ended March 31, | 2004F |
Selected Per-Share Data | |
Net asset value, beginning of period | $ 10.00 |
Income from Investment Operations | |
Net investment income (loss)E | .10 |
Net realized and unrealized gain (loss) | .83 |
Total from investment operations | .93 |
Distributions from net investment income | (.06) |
Net asset value, end of period | $ 10.87 |
Total ReturnB,C,D | 9.32% |
Ratios to Average Net AssetsG | |
Expenses before expense reductions | 1.10%A |
Expenses net of voluntary waivers, if any | 1.08%A |
Expenses net of all reductions | 1.08%A |
Net investment income (loss) | 1.39%A |
Supplemental Data | |
Net assets, end of period (000 omitted) | $ 14,897 |
Portfolio turnover rate | 103%A |
A Annualized
B Total returns for periods of less than one year are not annualized.
C Total returns would have been lower had certain expenses not been reduced during the periods shown.
D Total returns do not include the effect of the contingent deferred sales charge.
E Calculated based on average shares outstanding during the period.
F For the period July 24, 2003 (commencement of operations) to March 31, 2004.
G Expense ratios reflect operating expenses of the class. Expenses before reductions do not reflect amounts reimbursed by the investment adviser or reductions from brokerage service arrangements or other expense offset arrangements and do not represent the amount paid by the class during periods when reimbursements or reductions occur. Expenses net of any voluntary waivers reflect expenses after reimbursement by the investment adviser but prior to reductions from brokerage service arrangements or other expense offset arrangements. Expenses net of all reductions represent the net expenses paid by the class.
See accompanying notes which are an integral part of the financial statements.
Annual Report
Financial Highlights - Class C
Year ended March 31, | 2004F |
Selected Per-Share Data | |
Net asset value, beginning of period | $ 10.00 |
Income from Investment Operations | |
Net investment income (loss)E | .10 |
Net realized and unrealized gain (loss) | .83 |
Total from investment operations | .93 |
Distributions from net investment income | (.06) |
Net asset value, end of period | $ 10.87 |
Total ReturnB,C,D | 9.32% |
Ratios to Average Net AssetsG | |
Expenses before expense reductions | 1.10%A |
Expenses net of voluntary waivers, if any | 1.08%A |
Expenses net of all reductions | 1.08%A |
Net investment income (loss) | 1.39%A |
Supplemental Data | |
Net assets, end of period (000 omitted) | $ 11,552 |
Portfolio turnover rate | 103%A |
A Annualized
B Total returns for periods of less than one year are not annualized.
C Total returns would have been lower had certain expenses not been reduced during the periods shown.
D Total returns do not include the effect of the contingent deferred sales charge.
E Calculated based on average shares outstanding during the period.
F For the period July 24, 2003 (commencement of operations) to March 31, 2004.
G Expense ratios reflect operating expenses of the class. Expenses before reductions do not reflect amounts reimbursed by the investment adviser or reductions from brokerage service arrangements or other expense offset arrangements and do not represent the amount paid by the class during periods when reimbursements or reductions occur. Expenses net of any voluntary waivers reflect expenses after reimbursement by the investment adviser but prior to reductions from brokerage service arrangements or other expense offset arrangements. Expenses net of all reductions represent the net expenses paid by the class.
See accompanying notes which are an integral part of the financial statements.
Annual Report
Financial Highlights - Institutional Class
Year ended March 31, | 2004E |
Selected Per-Share Data | |
Net asset value, beginning of period | $ 10.00 |
Income from Investment Operations | |
Net investment income (loss)D | .17 |
Net realized and unrealized gain (loss) | .83 |
Total from investment operations | 1.00 |
Distributions from net investment income | (.07) |
Net asset value, end of period | $ 10.93 |
Total ReturnB,C | 10.02% |
Ratios to Average Net AssetsF | |
Expenses before expense reductions | .10%A |
Expenses net of voluntary waivers, if any | .08%A |
Expenses net of all reductions | .08%A |
Net investment income (loss) | 2.38%A |
Supplemental Data | |
Net assets, end of period (000 omitted) | $ 1,691 |
Portfolio turnover rate | 103%A |
A Annualized
B Total returns for periods of less than one year are not annualized.
C Total returns would have been lower had certain expenses not been reduced during the periods shown.
D Calculated based on average shares outstanding during the period.
E For the period July 24, 2003 (commencement of operations) to March 31, 2004.
F Expense ratios reflect operating expenses of the class. Expenses before reductions do not reflect amounts reimbursed by the investment adviser or reductions from brokerage service arrangements or other expense offset arrangements and do not represent the amount paid by the class during periods when reimbursements or reductions occur. Expenses net of any voluntary waivers reflect expenses after reimbursement by the investment adviser but prior to reductions from brokerage service arrangements or other expense offset arrangements. Expenses net of all reductions represent the net expenses paid by the class.
See accompanying notes which are an integral part of the financial statements.
Annual Report
Fidelity Advisor Freedom 2015 Fund
Investment Summary
Fund Holdings as of March 31, 2004 |
| % of fund's
investments |
Domestic Equity Funds | |
Fidelity Advisor Dividend Growth Fund Institutional Class | 10.2% |
Fidelity Advisor Equity Growth Fund Institutional Class | 5.2 |
Fidelity Advisor Equity Income Fund Institutional Class | 10.4 |
Fidelity Advisor Growth & Income Fund Institutional Class | 10.1 |
Fidelity Advisor Large Cap Fund Institutional Class | 10.2 |
Fidelity Advisor Mid-Cap Fund Institutional Class | 3.1 |
Fidelity Advisor Small Cap Fund Institutional Class | 3.2 |
| 52.4 |
International Equity Funds | |
Fidelity Advisor Diversified International Fund Institutional Class | 4.3 |
Fidelity Advisor Overseas Fund Institutional Class | 4.2 |
| 8.5 |
High Yield Fixed-Income Funds | |
Fidelity Advisor High Income Advantage Fund Institutional Class | 6.5 |
Investment Grade Fixed-Income Funds | |
Fidelity Advisor Government Investment Fund Institutional Class | 14.4 |
Fidelity Advisor Intermediate Bond Fund Institutional Class | 14.5 |
| 28.9 |
Short-Term Fixed-Income Funds | |
Fidelity Advisor Short-Fixed Income Fund Institutional Class | 1.5 |
Money Market Fund | |
Fidelity Cash Reserves Fund | 2.2 |
| 100.0% |
Annual Report
Fidelity Advisor Freedom 2015 Fund
Investment Summary - continued
Asset Allocation (% of fund's investments)

The fund invests according to an asset allocation strategy that becomes increasingly conservative over time. The initial allocation represents the target asset allocation at inception. The current allocation is based on the fund's holdings as of March 31, 2004. The expected allocation represents the fund's anticipated target asset allocation at September 30, 2004.
Annual Report
Fidelity Advisor Freedom 2015 Fund
Investments March 31, 2004
Showing Percentage of Total Value of Investment in Securities
Equity Funds - 60.9% |
| Shares | | Value (Note 1) |
Domestic Equity Funds - 52.4% |
Fidelity Advisor Dividend Growth Fund Institutional Class | 159,024 | | $ 1,833,544 |
Fidelity Advisor Equity Growth Fund Institutional Class | 19,627 | | 925,213 |
Fidelity Advisor Equity Income Fund Institutional Class | 69,029 | | 1,861,707 |
Fidelity Advisor Growth & Income Fund Institutional Class | 112,805 | | 1,820,677 |
Fidelity Advisor Large Cap Fund Institutional Class | 123,704 | | 1,827,109 |
Fidelity Advisor Mid-Cap Fund Institutional Class | 24,006 | | 554,058 |
Fidelity Advisor Small Cap Fund Institutional Class | 26,211 | | 576,653 |
TOTAL DOMESTIC EQUITY FUNDS | | 9,398,961 |
International Equity Funds - 8.5% |
Fidelity Advisor Diversified International Fund Institutional Class | 45,055 | | 766,383 |
Fidelity Advisor Overseas Fund Institutional Class | 45,917 | | 763,603 |
TOTAL INTERNATIONAL EQUITY FUNDS | | 1,529,986 |
TOTAL EQUITY FUNDS (Cost $10,783,427) | 10,928,947 |
Fixed-Income Funds - 36.9% |
| | | |
High Yield Fixed-Income Funds - 6.5% |
Fidelity Advisor High Income Advantage Fund Institutional Class | 126,943 | | 1,172,950 |
Investment Grade Fixed-Income Funds - 28.9% |
Fidelity Advisor Government Investment Fund Institutional Class | 254,504 | | 2,593,394 |
Fidelity Advisor Intermediate Bond Fund Institutional Class | 225,943 | | 2,593,826 |
TOTAL INVESTMENT GRADE FIXED-INCOME FUNDS | | 5,187,220 |
Short-Term Fixed-Income Funds - 1.5% |
Fidelity Advisor Short-Fixed Income Fund Institutional Class | 27,694 | | 267,800 |
TOTAL FIXED-INCOME FUNDS (Cost $6,604,115) | 6,627,970 |
Money Market Fund - 2.2% |
| Shares | | Value (Note 1) |
Fidelity Cash Reserves Fund
(Cost $392,584) | 392,584 | | $ 392,584 |
TOTAL INVESTMENT IN SECURITIES - 100% (Cost $17,780,126) | $ 17,949,501 |
Other Information |
Purchases and redemptions of the underlying fund shares aggregated $17,920,164 and $140,216, respectively. |
See accompanying notes which are an integral part of the financial statements.
Annual Report
Fidelity Advisor Freedom 2015 Fund
Financial Statements
Statement of Assets and Liabilities
| March 31, 2004 |
| | |
Assets | | |
Investment in securities, at value (cost $17,780,126) - See accompanying schedule | | $ 17,949,501 |
Cash | | 29 |
Receivable for fund shares sold | | 474,623 |
Total assets | | 18,424,153 |
| | |
Liabilities | | |
Payable for investments purchased | $ 468,932 | |
Payable for fund shares redeemed | 400 | |
Accrued management fee | 1,907 | |
Distribution fees payable | 7,883 | |
Total liabilities | | 479,122 |
| | |
Net Assets | | $ 17,945,031 |
Net Assets consist of: | | |
Paid in capital | | $ 17,749,398 |
Undistributed net investment income | | 20,910 |
Accumulated undistributed net realized gain (loss) on investments | | 5,348 |
Net unrealized appreciation (depreciation) on investments | | 169,375 |
Net Assets | | $ 17,945,031 |
See accompanying notes which are an integral part of the financial statements.
Annual Report
Fidelity Advisor Freedom 2015 Fund
Financial Statements - continued
Statement of Assets and Liabilities - continued
| March 31, 2004 |
Calculation of Maximum Offering Price | | |
Class A:
Net Asset Value and redemption price per share ($4,772,547 ÷ 451,330 shares) | | $ 10.57 |
| | |
Maximum offering price per share (100/94.25 of $10.57) | | $ 11.21 |
Class T:
Net Asset Value and redemption price per share ($5,038,301 ÷ 476,613 shares) | | $ 10.57 |
| | |
Maximum offering price per share (100/96.50 of $10.57) | | $ 10.95 |
Class B:
Net Asset Value and offering price per share ($4,259,439 ÷ 403,349 shares) A | | $ 10.56 |
| | |
Class C:
Net Asset Value and offering price per share ($3,593,171 ÷ 340,273 shares) A | | $ 10.56 |
| | |
Institutional Class:
Net Asset Value, offering price and redemption price per share ($281,573 ÷ 26,585 shares) | | $ 10.59 |
A Redemption price per share is equal to net asset value less any applicable contingent deferred sales charge.
See accompanying notes which are an integral part of the financial statements.
Annual Report
Statement of Operations
| November 6, 2003 (commencement of operations) to March 31, 2004 |
| | |
Investment Income | | |
Income distributions from underlying funds | | $ 58,556 |
Interest | | 29 |
Total income | | 58,585 |
| | |
Expenses | | |
Management fee | $ 2,662 | |
Distribution fees | 17,204 | |
Non-interested trustees' compensation | 6 | |
Total expenses before reductions | 19,872 | |
Expense reductions | (429) | 19,443 |
Net investment income (loss) | | 39,142 |
Realized and Unrealized Gain (Loss) Realized gain (loss) on sale of underlying fund shares | 179 | |
Capital gain distributions from underlying funds | 5,458 | 5,637 |
Change in net unrealized appreciation (depreciation) on investment securities | | 169,375 |
Net gain (loss) | | 175,012 |
Net increase (decrease) in net assets resulting from operations | | $ 214,154 |
See accompanying notes which are an integral part of the financial statements.
Annual Report
Fidelity Advisor Freedom 2015 Fund
Financial Statements - continued
Statement of Changes in Net Assets
| November 6, 2003
(commencement of
operations) to
March 31, 2004 |
Increase (Decrease) in Net Assets | |
Operations | |
Net investment income (loss) | $ 39,142 |
Net realized gain (loss) | 5,637 |
Change in net unrealized appreciation (depreciation) | 169,375 |
Net increase (decrease) in net assets resulting from operations | 214,154 |
Distributions to shareholders from net investment income | (18,521) |
Share transactions - net increase (decrease) | 17,749,398 |
Total increase (decrease) in net assets | 17,945,031 |
| |
Net Assets | |
Beginning of period | - |
End of period (including undistributed net investment income of $20,910) | $ 17,945,031 |
See accompanying notes which are an integral part of the financial statements.
Annual Report
Financial Highlights - Class A
Year ended March 31, | 2004F |
Selected Per-Share Data | |
Net asset value, beginning of period | $ 10.00 |
Income from Investment Operations | |
Net investment income (loss)E | .07 |
Net realized and unrealized gain (loss) | .56 |
Total from investment operations | .63 |
Distributions from net investment income | (.06) |
Net asset value, end of period | $ 10.57 |
Total ReturnB,C,D | 6.32% |
Ratios to Average Net AssetsG | |
Expenses before expense reductions | .35%A |
Expenses net of voluntary waivers, if any | .33%A |
Expenses net of all reductions | .33%A |
Net investment income (loss) | 1.84%A |
Supplemental Data | |
Net assets, end of period (000 omitted) | $ 4,773 |
Portfolio turnover rate | 5%A |
A Annualized
B Total returns for periods of less than one year are not annualized.
C Total returns would have been lower had certain expenses not been reduced during the periods shown.
D Total returns do not include the effect of the sales charges.
E Calculated based on average shares outstanding during the period.
F For the period November 6, 2003 (commencement of operations) to March 31, 2004.
G Expense ratios reflect operating expenses of the class. Expenses before reductions do not reflect amounts reimbursed by the investment adviser or reductions from brokerage service arrangements or other expense offset arrangements and do not represent the amount paid by the class during periods when reimbursements or reductions occur. Expenses net of any voluntary waivers reflect expenses after reimbursement by the investment adviser but prior to reductions from brokerage service arrangements or other expense offset arrangements. Expenses net of all reductions represent the net expenses paid by the class.
See accompanying notes which are an integral part of the financial statements.
Annual Report
Financial Highlights - Class T
Year ended March 31, | 2004F |
Selected Per-Share Data | |
Net asset value, beginning of period | $ 10.00 |
Income from Investment Operations | |
Net investment income (loss)E | .06 |
Net realized and unrealized gain (loss) | .57 |
Total from investment operations | .63 |
Distributions from net investment income | (.06) |
Net asset value, end of period | $ 10.57 |
Total ReturnB,C,D | 6.27% |
Ratios to Average Net AssetsG | |
Expenses before expense reductions | .60%A |
Expenses net of voluntary waivers, if any | .58%A |
Expenses net of all reductions | .58%A |
Net investment income (loss) | 1.59%A |
Supplemental Data | |
Net assets, end of period (000 omitted) | $ 5,038 |
Portfolio turnover rate | 5%A |
A Annualized
B Total returns for periods of less than one year are not annualized.
C Total returns would have been lower had certain expenses not been reduced during the periods shown.
D Total returns do not include the effect of the sales charges.
E Calculated based on average shares outstanding during the period.
F For the period November 6, 2003 (commencement of operations) to March 31, 2004.
G Expense ratios reflect operating expenses of the class. Expenses before reductions do not reflect amounts reimbursed by the investment adviser or reductions from brokerage service arrangements or other expense offset arrangements and do not represent the amount paid by the class during periods when reimbursements or reductions occur. Expenses net of any voluntary waivers reflect expenses after reimbursement by the investment adviser but prior to reductions from brokerage service arrangements or other expense offset arrangements. Expenses net of all reductions represent the net expenses paid by the class.
See accompanying notes which are an integral part of the financial statements.
Annual Report
Financial Highlights - Class B
Year ended March 31, | 2004F |
Selected Per-Share Data | |
Net asset value, beginning of period | $ 10.00 |
Income from Investment Operations | |
Net investment income (loss)E | .04 |
Net realized and unrealized gain (loss) | .58 |
Total from investment operations | .62 |
Distributions from net investment income | (.06) |
Net asset value, end of period | $ 10.56 |
Total ReturnB,C,D | 6.17% |
Ratios to Average Net AssetsG | |
Expenses before expense reductions | 1.10%A |
Expenses net of voluntary waivers, if any | 1.08%A |
Expenses net of all reductions | 1.08%A |
Net investment income (loss) | 1.09%A |
Supplemental Data | |
Net assets, end of period (000 omitted) | $ 4,259 |
Portfolio turnover rate | 5%A |
A Annualized
B Total returns for periods of less than one year are not annualized.
C Total returns would have been lower had certain expenses not been reduced during the periods shown.
D Total returns do not include the effect of the contingent deferred sales charge.
E Calculated based on average shares outstanding during the period.
F For the period November 6, 2003 (commencement of operations) to March 31, 2004.
G Expense ratios reflect operating expenses of the class. Expenses before reductions do not reflect amounts reimbursed by the investment adviser or reductions from brokerage service arrangements or other expense offset arrangements and do not represent the amount paid by the class during periods when reimbursements or reductions occur. Expenses net of any voluntary waivers reflect expenses after reimbursement by the investment adviser but prior to reductions from brokerage service arrangements or other expense offset arrangements. Expenses net of all reductions represent the net expenses paid by the class.
See accompanying notes which are an integral part of the financial statements.
Annual Report
Financial Highlights - Class C
Year ended March 31, | 2004F |
Selected Per-Share Data | |
Net asset value, beginning of period | $ 10.00 |
Income from Investment Operations | |
Net investment income (loss)E | .04 |
Net realized and unrealized gain (loss) | .57 |
Total from investment operations | .61 |
Distributions from net investment income | (.05) |
Net asset value, end of period | $ 10.56 |
Total ReturnB,C,D | 6.12% |
Ratios to Average Net AssetsG | |
Expenses before expense reductions | 1.10%A |
Expenses net of voluntary waivers, if any | 1.08%A |
Expenses net of all reductions | 1.08%A |
Net investment income (loss) | 1.09%A |
Supplemental Data | |
Net assets, end of period (000 omitted) | $ 3,593 |
Portfolio turnover rate | 5%A |
A Annualized
B Total returns for periods of less than one year are not annualized.
C Total returns would have been lower had certain expenses not been reduced during the periods shown.
D Total returns do not include the effect of the contingent deferred sales charge.
E Calculated based on average shares outstanding during the period.
F For the period November 6, 2003 (commencement of operations) to March 31, 2004.
G Expense ratios reflect operating expenses of the class. Expenses before reductions do not reflect amounts reimbursed by the investment adviser or reductions from brokerage service arrangements or other expense offset arrangements and do not represent the amount paid by the class during periods when reimbursements or reductions occur. Expenses net of any voluntary waivers reflect expenses after reimbursement by the investment adviser but prior to reductions from brokerage service arrangements or other expense offset arrangements. Expenses net of all reductions represent the net expenses paid by the class.
See accompanying notes which are an integral part of the financial statements.
Annual Report
Financial Highlights - Institutional Class
Year ended March 31, | 2004 E |
Selected Per-Share Data | |
Net asset value, beginning of period | $ 10.00 |
Income from Investment Operations | |
Net investment income (loss)D | .09 |
Net realized and unrealized gain (loss) | .56 |
Total from investment operations | .65 |
Distributions from net investment income | (.06) |
Net asset value, end of period | $ 10.59 |
Total ReturnB,C | 6.52% |
Ratios to Average Net AssetsF | |
Expenses before expense reductions | .10%A |
Expenses net of voluntary waivers, if any | .08%A |
Expenses net of all reductions | .08%A |
Net investment income (loss) | 2.09%A |
Supplemental Data | |
Net assets, end of period (000 omitted) | $ 282 |
Portfolio turnover rate | 5%A |
A Annualized
B Total returns for periods of less than one year are not annualized.
C Total returns would have been lower had certain expenses not been reduced during the periods shown.
D Calculated based on average shares outstanding during the period.
E For the period November 6, 2003 (commencement of operations) to March 31, 2004.
F Expense ratios reflect operating expenses of the class. Expenses before reductions do not reflect amounts reimbursed by the investment adviser or reductions from brokerage service arrangements or other expense offset arrangements and do not represent the amount paid by the class during periods when reimbursements or reductions occur. Expenses net of any voluntary waivers reflect expenses after reimbursement by the investment adviser but prior to reductions from brokerage service arrangements or other expense offset arrangements. Expenses net of all reductions represent the net expenses paid by the class.
See accompanying notes which are an integral part of the financial statements.
Annual Report
Fidelity Advisor Freedom 2020 Fund
Investment Changes
Fund Holdings as of March 31, 2004 |
| % of fund's
investments | % of fund's investments
6 months ago |
Domestic Equity Funds | | |
Fidelity Advisor Dividend Growth Fund Institutional Class | 11.7% | 11.6% |
Fidelity Advisor Equity Growth Fund
Institutional Class | 5.9 | 5.9 |
Fidelity Advisor Equity Income Fund
Institutional Class | 12.0 | 11.6 |
Fidelity Advisor Growth & Income Fund Institutional Class | 11.5 | 11.5 |
Fidelity Advisor Large Cap Fund
Institutional Class | 11.6 | 11.6 |
Fidelity Advisor Mid-Cap Fund Institutional Class | 3.5 | 3.6 |
Fidelity Advisor Small Cap Fund
Institutional Class | 3.7 | 3.5 |
| 59.9 | 59.3 |
International Equity Funds | | |
Fidelity Advisor Diversified International Fund Institutional Class | 5.2 | 5.1 |
Fidelity Advisor Overseas Fund Institutional Class | 5.2 | 5.1 |
| 10.4 | 10.2 |
High Yield Fixed-Income Funds | | |
Fidelity Advisor High Income Advantage Fund Institutional Class | 7.5 | 7.7 |
Investment Grade Fixed-Income Funds | | |
Fidelity Advisor Government Investment Fund Institutional Class | 11.1 | 11.4 |
Fidelity Advisor Intermediate Bond Fund Institutional Class | 11.1 | 11.4 |
| 22.2 | 22.8 |
| 100.0% | 100.0% |
Annual Report
Fidelity Advisor Freedom 2020 Fund
Investment Changes - continued
Asset Allocation (% of fund's investments)
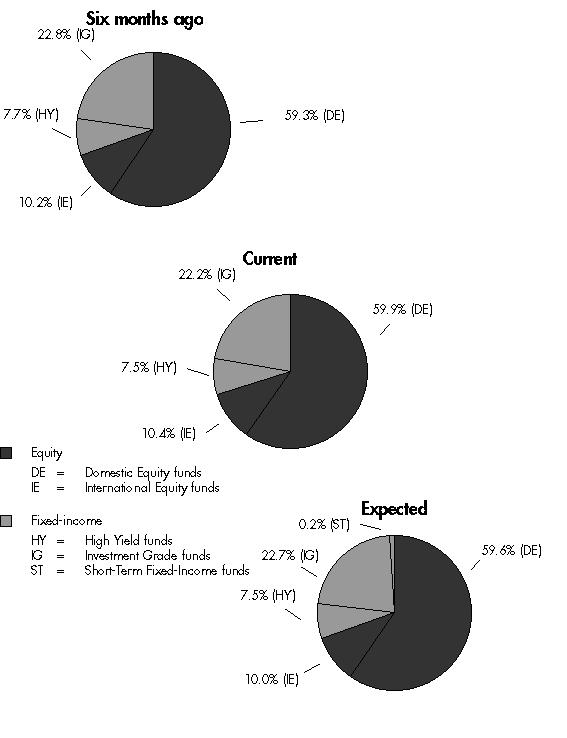
The fund invests according to an asset allocation strategy that becomes increasingly conservative over time. The six months ago allocation is based on the fund's holdings as of September 30, 2003. The current allocation is based on the fund's holdings as of March 31, 2004. The expected allocation represents the fund's anticipated target asset allocation at September 30, 2004.
Annual Report
Fidelity Advisor Freedom 2020 Fund
Investments March 31, 2004
Showing Percentage of Total Value of Investment in Securities
Equity Funds - 70.3% |
| Shares | | Value (Note 1) |
Domestic Equity Funds - 59.9% |
Fidelity Advisor Dividend Growth Fund Institutional Class | 1,682,100 | | $ 19,394,618 |
Fidelity Advisor Equity Growth Fund Institutional Class | 207,811 | | 9,796,200 |
Fidelity Advisor Equity Income Fund Institutional Class | 736,376 | | 19,860,067 |
Fidelity Advisor Growth & Income Fund Institutional Class | 1,185,392 | | 19,132,229 |
Fidelity Advisor Large Cap Fund Institutional Class | 1,306,286 | | 19,293,850 |
Fidelity Advisor Mid-Cap Fund Institutional Class | 254,480 | | 5,873,406 |
Fidelity Advisor Small Cap Fund Institutional Class | 280,928 | | 6,180,406 |
TOTAL DOMESTIC EQUITY FUNDS | | 99,530,776 |
International Equity Funds - 10.4% |
Fidelity Advisor Diversified International Fund Institutional Class | 511,541 | | 8,701,305 |
Fidelity Advisor Overseas Fund Institutional Class | 519,927 | | 8,646,392 |
TOTAL INTERNATIONAL EQUITY FUNDS | | 17,347,697 |
TOTAL EQUITY FUNDS (Cost $112,906,046) | 116,878,473 |
Fixed-Income Funds - 29.7% |
| | | |
High Yield Fixed-Income Funds - 7.5% |
Fidelity Advisor High Income Advantage Fund Institutional Class | 1,341,726 | | 12,397,549 |
Investment Grade Fixed-Income Funds - 22.2% |
Fidelity Advisor Government Investment Fund Institutional Class | 1,810,034 | | 18,444,242 |
Fidelity Advisor Intermediate Bond Fund Institutional Class | 1,605,383 | | 18,429,802 |
TOTAL INVESTMENT GRADE FIXED-INCOME FUNDS | | 36,874,044 |
TOTAL FIXED-INCOME FUNDS (Cost $48,798,720) | 49,271,593 |
TOTAL INVESTMENT IN SECURITIES - 100% (Cost $161,704,766) | $ 166,150,066 |
Other Information |
Purchases and redemptions of the underlying fund shares aggregated $163,374,072 and $1,656,921, respectively. |
See accompanying notes which are an integral part of the financial statements.
Annual Report
Fidelity Advisor Freedom 2020 Fund
Financial Statements
Statement of Assets and Liabilities
| March 31, 2004 |
| | |
Assets | | |
Investment in securities, at value (cost $161,704,766) - See accompanying schedule | | $ 166,150,066 |
Receivable for fund shares sold | | 946,853 |
Total assets | | 167,096,919 |
| | |
Liabilities | | |
Payable for investments purchased | $ 617,750 | |
Payable for fund shares redeemed | 328,459 | |
Accrued management fee | 18,085 | |
Distribution fees payable | 65,044 | |
Total liabilities | | 1,029,338 |
| | |
Net Assets | | $ 166,067,581 |
Net Assets consist of: | | |
Paid in capital | | $ 161,281,476 |
Undistributed net investment income | | 278,597 |
Accumulated undistributed net realized gain (loss) on investments | | 62,208 |
Net unrealized appreciation (depreciation) on investments | | 4,445,300 |
Net Assets | | $ 166,067,581 |
See accompanying notes which are an integral part of the financial statements.
Annual Report
Fidelity Advisor Freedom 2020 Fund
Financial Statements - continued
Statement of Assets and Liabilities - continued
| March 31, 2004 |
Calculation of Maximum Offering Price | | |
Class A:
Net Asset Value and redemption price per share ($72,334,246 ÷ 6,405,508 shares) | | $ 11.29 |
| | |
Maximum offering price per share (100/94.25 of $11.29) | | $ 11.98 |
Class T:
Net Asset Value and redemption price per share ($52,309,807 ÷ 4,633,377 shares) | | $ 11.29 |
| | |
Maximum offering price per share (100/96.50 of $11.29) | | $ 11.70 |
Class B:
Net Asset Value and offering price per share ($23,274,067 ÷ 2,065,411 shares) A | | $ 11.27 |
| | |
Class C:
Net Asset Value and offering price per share ($15,871,331 ÷ 1,409,016 shares) A | | $ 11.26 |
| | |
Institutional Class:
Net Asset Value, offering price and redemption price per share ($2,278,130 ÷ 201,341 shares) | | $ 11.31 |
A Redemption price per share is equal to net asset value less any applicable contingent deferred sales charge.
See accompanying notes which are an integral part of the financial statements.
Annual Report
Statement of Operations
| July 24, 2003 (commencement of operations) to March 31, 2004 |
| | |
Investment Income | | |
Income distributions from underlying funds | | $ 879,011 |
| | |
Expenses | | |
Management fee | $ 42,754 | |
Distribution fees | 225,097 | |
Non-interested trustees' compensation | 137 | |
Total expenses before reductions | 267,988 | |
Expense reductions | (10,339) | 257,649 |
Net investment income (loss) | | 621,362 |
Realized and Unrealized Gain (Loss) Realized gain (loss) on sale of underlying fund shares | (12,385) | |
Capital gain distributions from underlying funds | 78,762 | 66,377 |
Change in net unrealized appreciation (depreciation) on investment securities | | 4,445,300 |
Net gain (loss) | | 4,511,677 |
Net increase (decrease) in net assets resulting from operations | | $ 5,133,039 |
See accompanying notes which are an integral part of the financial statements.
Annual Report
Fidelity Advisor Freedom 2020 Fund
Financial Statements - continued
Statement of Changes in Net Assets
| July 24, 2003
(commencement of
operations) to
March 31, 2004 |
Increase (Decrease) in Net Assets | |
Operations | |
Net investment income (loss) | $ 621,362 |
Net realized gain (loss) | 66,377 |
Change in net unrealized appreciation (depreciation) | 4,445,300 |
Net increase (decrease) in net assets resulting from operations | 5,133,039 |
Distributions to shareholders from net investment income | (346,934) |
Share transactions - net increase (decrease) | 161,281,476 |
Total increase (decrease) in net assets | 166,067,581 |
| |
Net Assets | |
Beginning of period | - |
End of period (including undistributed net investment income of $278,597) | $ 166,067,581 |
See accompanying notes which are an integral part of the financial statements.
Annual Report
Financial Highlights - Class A
Year ended March 31, | 2004F |
Selected Per-Share Data | |
Net asset value, beginning of period | $ 10.00 |
Income from Investment Operations | |
Net investment income (loss)E | .13 |
Net realized and unrealized gain (loss) | 1.25 |
Total from investment operations | 1.38 |
Distributions from net investment income | (.09) |
Net asset value, end of period | $ 11.29 |
Total ReturnB,C,D | 13.78% |
Ratios to Average Net AssetsG | |
Expenses before expense reductions | .35%A |
Expenses net of voluntary waivers, if any | .33%A |
Expenses net of all reductions | .33%A |
Net investment income (loss) | 1.74%A |
Supplemental Data | |
Net assets, end of period (000 omitted) | $ 72,334 |
Portfolio turnover rate | 4%A |
A Annualized
B Total returns for periods of less than one year are not annualized.
C Total returns would have been lower had certain expenses not been reduced during the periods shown.
D Total returns do not include the effect of the sales charges.
E Calculated based on average shares outstanding during the period.
F For the period July 24, 2003 (commencement of operations) to March 31, 2004.
G Expense ratios reflect operating expenses of the class. Expenses before reductions do not reflect amounts reimbursed by the investment adviser or reductions from brokerage service arrangements or other expense offset arrangements and do not represent the amount paid by the class during periods when reimbursements or reductions occur. Expenses net of any voluntary waivers reflect expenses after reimbursement by the investment adviser but prior to reductions from brokerage service arrangements or other expense offset arrangements. Expenses net of all reductions represent the net expenses paid by the class.
See accompanying notes which are an integral part of the financial statements.
Annual Report
Financial Highlights - Class T
Year ended March 31, | 2004F |
Selected Per-Share Data | |
Net asset value, beginning of period | $ 10.00 |
Income from Investment Operations | |
Net investment income (loss)E | .11 |
Net realized and unrealized gain (loss) | 1.26 |
Total from investment operations | 1.37 |
Distributions from net investment income | (.08) |
Net asset value, end of period | $ 11.29 |
Total ReturnB,C,D | 13.73% |
Ratios to Average Net AssetsG | |
Expenses before expense reductions | .60%A |
Expenses net of voluntary waivers, if any | .58%A |
Expenses net of all reductions | .58%A |
Net investment income (loss) | 1.49%A |
Supplemental Data | |
Net assets, end of period (000 omitted) | $ 52,310 |
Portfolio turnover rate | 4%A |
A Annualized
B Total returns for periods of less than one year are not annualized.
C Total returns would have been lower had certain expenses not been reduced during the periods shown.
D Total returns do not include the effect of the sales charges.
E Calculated based on average shares outstanding during the period.
F For the period July 24, 2003 (commencement of operations) to March 31, 2004.
G Expense ratios reflect operating expenses of the class. Expenses before reductions do not reflect amounts reimbursed by the investment adviser or reductions from brokerage service arrangements or other expense offset arrangements and do not represent the amount paid by the class during periods when reimbursements or reductions occur. Expenses net of any voluntary waivers reflect expenses after reimbursement by the investment adviser but prior to reductions from brokerage service arrangements or other expense offset arrangements. Expenses net of all reductions represent the net expenses paid by the class.
See accompanying notes which are an integral part of the financial statements.
Annual Report
Financial Highlights - Class B
Year ended March 31, | 2004F |
Selected Per-Share Data | |
Net asset value, beginning of period | $ 10.00 |
Income from Investment Operations | |
Net investment income (loss)E | .07 |
Net realized and unrealized gain (loss) | 1.27 |
Total from investment operations | 1.34 |
Distributions from net investment income | (.07) |
Net asset value, end of period | $ 11.27 |
Total ReturnB,C,D | 13.37% |
Ratios to Average Net AssetsG | |
Expenses before expense reductions | 1.10%A |
Expenses net of voluntary waivers, if any | 1.08%A |
Expenses net of all reductions | 1.08%A |
Net investment income (loss) | .99%A |
Supplemental Data | |
Net assets, end of period (000 omitted) | $ 23,274 |
Portfolio turnover rate | 4%A |
A Annualized
B Total returns for periods of less than one year are not annualized.
C Total returns would have been lower had certain expenses not been reduced during the periods shown.
D Total returns do not include the effect of the contingent deferred sales charge.
E Calculated based on average shares outstanding during the period.
F For the period July 24, 2003 (commencement of operations) to March 31, 2004.
G Expense ratios reflect operating expenses of the class. Expenses before reductions do not reflect amounts reimbursed by the investment adviser or reductions from brokerage service arrangements or other expense offset arrangements and do not represent the amount paid by the class during periods when reimbursements or reductions occur. Expenses net of any voluntary waivers reflect expenses after reimbursement by the investment adviser but prior to reductions from brokerage service arrangements or other expense offset arrangements. Expenses net of all reductions represent the net expenses paid by the class.
See accompanying notes which are an integral part of the financial statements.
Annual Report
Financial Highlights - Class C
Year ended March 31, | 2004F |
Selected Per-Share Data | |
Net asset value, beginning of period | $ 10.00 |
Income from Investment Operations | |
Net investment income (loss)E | .07 |
Net realized and unrealized gain (loss) | 1.26 |
Total from investment operations | 1.33 |
Distributions from net investment income | (.07) |
Net asset value, end of period | $ 11.26 |
Total ReturnB,C,D | 13.32% |
Ratios to Average Net AssetsG | |
Expenses before expense reductions | 1.10%A |
Expenses net of voluntary waivers, if any | 1.08%A |
Expenses net of all reductions | 1.08%A |
Net investment income (loss) | .99%A |
Supplemental Data | |
Net assets, end of period (000 omitted) | $ 15,871 |
Portfolio turnover rate | 4%A |
A Annualized
B Total returns for periods of less than one year are not annualized.
C Total returns would have been lower had certain expenses not been reduced during the periods shown.
D Total returns do not include the effect of the contingent deferred sales charge.
E Calculated based on average shares outstanding during the period.
F For the period July 24, 2003 (commencement of operations) to March 31, 2004.
G Expense ratios reflect operating expenses of the class. Expenses before reductions do not reflect amounts reimbursed by the investment adviser or reductions from brokerage service arrangements or other expense offset arrangements and do not represent the amount paid by the class during periods when reimbursements or reductions occur. Expenses net of any voluntary waivers reflect expenses after reimbursement by the investment adviser but prior to reductions from brokerage service arrangements or other expense offset arrangements. Expenses net of all reductions represent the net expenses paid by the class.
See accompanying notes which are an integral part of the financial statements.
Annual Report
Financial Highlights - Institutional Class
Year ended March 31, | 2004E |
Selected Per-Share Data | |
Net asset value, beginning of period | $ 10.00 |
Income from Investment Operations | |
Net investment income (loss)D | .15 |
Net realized and unrealized gain (loss) | 1.25 |
Total from investment operations | 1.40 |
Distributions from net investment income | (.09) |
Net asset value, end of period | $ 11.31 |
Total ReturnB,C | 14.03% |
Ratios to Average Net AssetsF | |
Expenses before expense reductions | .10%A |
Expenses net of voluntary waivers, if any | .08%A |
Expenses net of all reductions | .08%A |
Net investment income (loss) | 1.98%A |
Supplemental Data | |
Net assets, end of period (000 omitted) | $ 2,278 |
Portfolio turnover rate | 4%A |
A Annualized
B Total returns for periods of less than one year are not annualized.
C Total returns would have been lower had certain expenses not been reduced during the periods shown.
D Calculated based on average shares outstanding during the period.
E For the period July 24, 2003 (commencement of operations) to March 31, 2004.
F Expense ratios reflect operating expenses of the class. Expenses before reductions do not reflect amounts reimbursed by the investment adviser or reductions from brokerage service arrangements or other expense offset arrangements and do not represent the amount paid by the class during periods when reimbursements or reductions occur. Expenses net of any voluntary waivers reflect expenses after reimbursement by the investment adviser but prior to reductions from brokerage service arrangements or other expense offset arrangements. Expenses net of all reductions represent the net expenses paid by the class.
See accompanying notes which are an integral part of the financial statements.
Annual Report
Fidelity Advisor Freedom 2025 Fund
Investment Summary
Fund Holdings as of March 31, 2004 |
| % of fund's
investments |
Domestic Equity Funds | |
Fidelity Advisor Dividend Growth Fund Institutional Class | 12.9% |
Fidelity Advisor Equity Growth Fund Institutional Class | 6.5 |
Fidelity Advisor Equity Income Fund Institutional Class | 13.1 |
Fidelity Advisor Growth & Income Fund Institutional Class | 12.8 |
Fidelity Advisor Large Cap Fund Institutional Class | 12.8 |
Fidelity Advisor Mid-Cap Fund Institutional Class | 3.9 |
Fidelity Advisor Small Cap Fund Institutional Class | 4.0 |
| 66.0 |
International Equity Funds | |
Fidelity Advisor Diversified International Fund Institutional Class | 6.0 |
Fidelity Advisor Overseas Fund Institutional Class | 5.9 |
| 11.9 |
High Yield Fixed-Income Funds | |
Fidelity Advisor High Income Advantage Fund Institutional Class | 7.5 |
Investment Grade Fixed-Income Funds | |
Fidelity Advisor Government Investment Fund Institutional Class | 7.3 |
Fidelity Advisor Intermediate Bond Fund Institutional Class | 7.3 |
| 14.6 |
| 100.0% |
Annual Report
Fidelity Advisor Freedom 2025 Fund
Investment Changes - continued
Asset Allocation (% of fund's investments)

The fund invests according to an asset allocation strategy that becomes increasingly conservative over time. The initial allocation represents the target asset allocation at inception. The current allocation is based on the fund's holdings as of March 31, 2004. The expected allocation represents the fund's anticipated target asset allocation at September 30, 2004.
Annual Report
Fidelity Advisor Freedom 2025 Fund
Investments March 31, 2004
Showing Percentage of Total Value of Investment in Securities
Equity Funds - 77.9% |
| Shares | | Value (Note 1) |
Domestic Equity Funds - 66.0% |
Fidelity Advisor Dividend Growth Fund Institutional Class | 111,425 | | $ 1,284,731 |
Fidelity Advisor Equity Growth Fund Institutional Class | 13,770 | | 649,100 |
Fidelity Advisor Equity Income Fund Institutional Class | 48,357 | | 1,304,189 |
Fidelity Advisor Growth & Income Fund Institutional Class | 78,945 | | 1,274,168 |
Fidelity Advisor Large Cap Fund Institutional Class | 86,629 | | 1,279,506 |
Fidelity Advisor Mid-Cap Fund Institutional Class | 16,814 | | 388,065 |
Fidelity Advisor Small Cap Fund Institutional Class | 18,341 | | 403,510 |
TOTAL DOMESTIC EQUITY FUNDS | | 6,583,269 |
International Equity Funds - 11.9% |
Fidelity Advisor Diversified International Fund Institutional Class | 35,057 | | 596,314 |
Fidelity Advisor Overseas Fund Institutional Class | 35,691 | | 593,543 |
TOTAL INTERNATIONAL EQUITY FUNDS | | 1,189,857 |
TOTAL EQUITY FUNDS (Cost $7,634,525) | 7,773,126 |
Fixed-Income Funds - 22.1% |
| | | |
High Yield Fixed-Income Funds - 7.5% |
Fidelity Advisor High Income Advantage Fund Institutional Class | 80,327 | | 742,223 |
Investment Grade Fixed-Income Funds - 14.6% |
Fidelity Advisor Government Investment Fund Institutional Class | 71,638 | | 729,987 |
Fidelity Advisor Intermediate Bond Fund Institutional Class | 63,602 | | 730,151 |
TOTAL INVESTMENT GRADE FIXED-INCOME FUNDS | | 1,460,138 |
TOTAL FIXED-INCOME FUNDS (Cost $2,199,510) | 2,202,361 |
TOTAL INVESTMENT IN SECURITIES - 100% (Cost $9,834,035) | $ 9,975,487 |
Other Information |
Purchases and redemptions of the underlying fund shares aggregated $9,935,720 and $100,386, respectively. |
See accompanying notes which are an integral part of the financial statements.
Annual Report
Fidelity Advisor Freedom 2025 Fund
Financial Statements
Statement of Assets and Liabilities
| March 31, 2004 |
| | |
Assets | | |
Investment in securities, at value (cost $9,834,035) - See accompanying schedule | | $ 9,975,487 |
Cash | | 27 |
Receivable for fund shares sold | | 279,029 |
Total assets | | 10,254,543 |
| | |
Liabilities | | |
Payable for investments purchased | $ 260,496 | |
Payable for fund shares redeemed | 18,384 | |
Accrued management fee | 1,048 | |
Distribution fees payable | 4,475 | |
Total liabilities | | 284,403 |
| | |
Net Assets | | $ 9,970,140 |
Net Assets consist of: | | |
Paid in capital | | $ 9,822,177 |
Undistributed net investment income | | 6,118 |
Accumulated undistributed net realized gain (loss) on investments | | 393 |
Net unrealized appreciation (depreciation) on investments | | 141,452 |
Net Assets | | $ 9,970,140 |
See accompanying notes which are an integral part of the financial statements.
Annual Report
Fidelity Advisor Freedom 2025 Fund
Financial Statements - continued
Statement of Assets and Liabilities - continued
| March 31, 2004 |
Calculation of Maximum Offering Price | | |
Class A:
Net Asset Value and redemption price per share ($2,284,181 ÷ 214,120 shares) | | $ 10.67 |
| | |
Maximum offering price per share (100/94.25 of $10.67) | | $ 11.32 |
Class T:
Net Asset Value and redemption price per share ($2,556,091 ÷ 239,031 shares) | | $ 10.69 |
| | |
Maximum offering price per share (100/96.50 of $10.69) | | $ 11.08 |
Class B:
Net Asset Value and offering price per share ($2,771,032 ÷ 260,386 shares) A | | $ 10.64 |
| | |
Class C:
Net Asset Value and offering price per share ($2,137,113 ÷ 200,760 shares) A | | $ 10.65 |
| | |
Institutional Class:
Net Asset Value, offering price and redemption price per share ($221,723 ÷ 20,760 shares) | | $ 10.68 |
A Redemption price per share is equal to net asset value less any applicable contingent deferred sales charge.
See accompanying notes which are an integral part of the financial statements.
Annual Report
Statement of Operations
| November 6, 2003 (commencement of operations) to March 31, 2004 |
| | |
Investment Income | | |
Income distributions from underlying funds | | $ 29,359 |
Interest | | 27 |
Total income | | 29,386 |
| | |
Expenses | | |
Management fee | $ 1,516 | |
Distribution fees | 10,271 | |
Non-interested trustees' compensation | 4 | |
Total expenses before reductions | 11,791 | |
Expense reductions | (261) | 11,530 |
Net investment income (loss) | | 17,856 |
Realized and Unrealized Gain (Loss) Realized gain (loss) on sale of underlying fund shares | (1,299) | |
Capital gain distributions from underlying funds | 1,787 | 488 |
Change in net unrealized appreciation (depreciation) on investment securities | | 141,452 |
Net gain (loss) | | 141,940 |
Net increase (decrease) in net assets resulting from operations | | $ 159,796 |
See accompanying notes which are an integral part of the financial statements.
Annual Report
Fidelity Advisor Freedom 2025 Fund
Financial Statements - continued
Statement of Changes in Net Assets
| November 6, 2003
(commencement of
operations) to
March 31, 2004 |
Increase (Decrease) in Net Assets | |
Operations | |
Net investment income (loss) | $ 17,856 |
Net realized gain (loss) | 488 |
Change in net unrealized appreciation (depreciation) | 141,452 |
Net increase (decrease) in net assets resulting from operations | 159,796 |
Distributions to shareholders from net investment income | (11,834) |
Share transactions - net increase (decrease) | 9,822,178 |
Total increase (decrease) in net assets | 9,970,140 |
| |
Net Assets | |
Beginning of period | - |
End of period (including undistributed net investment income of $6,118) | $ 9,970,140 |
See accompanying notes which are an integral part of the financial statements.
Annual Report
Financial Highlights - Class A
Year ended March 31, | 2004F |
Selected Per-Share Data | |
Net asset value, beginning of period | $ 10.00 |
Income from Investment Operations | |
Net investment income (loss) E | .06 |
Net realized and unrealized gain (loss) | .67 |
Total from investment operations | .73 |
Distributions from net investment income | (.06) |
Net asset value, end of period | $ 10.67 |
Total ReturnB,C,D | 7.32% |
Ratios to Average Net AssetsG | |
Expenses before expense reductions | .35%A |
Expenses net of voluntary waivers, if any | .33%A |
Expenses net of all reductions | .33%A |
Net investment income (loss) | 1.59%A |
Supplemental Data | |
Net assets, end of period (000 omitted) | $ 2,284 |
Portfolio turnover rate | 6%A |
A Annualized
B Total returns for periods of less than one year are not annualized.
C Total returns would have been lower had certain expenses not been reduced during the periods shown.
D Total returns do not include the effect of the sales charges.
E Calculated based on average shares outstanding during the period.
F For the period November 6, 2003 (commencement of operations) to March 31, 2004.
G Expense ratios reflect operating expenses of the class. Expenses before reductions do not reflect amounts reimbursed by the investment adviser or reductions from brokerage service arrangements or other expense offset arrangements and do not represent the amount paid by the class during periods when reimbursements or reductions occur. Expenses net of any voluntary waivers reflect expenses after reimbursement by the investment adviser but prior to reductions from brokerage service arrangements or other expense offset arrangements. Expenses net of all reductions represent the net expenses paid by the class.
See accompanying notes which are an integral part of the financial statements.
Annual Report
Financial Highlights - Class T
Year ended March 31, | 2004F |
Selected Per-Share Data | |
Net asset value, beginning of period | $ 10.00 |
Income from Investment Operations | |
Net investment income (loss)E | .05 |
Net realized and unrealized gain (loss) | .70 |
Total from investment operations | .75 |
Distributions from net investment income | (.06) |
Net asset value, end of period | $ 10.69 |
Total ReturnB,C,D | 7.52% |
Ratios to Average Net AssetsG | |
Expenses before expense reductions | .60%A |
Expenses net of voluntary waivers, if any | .58%A |
Expenses net of all reductions | .58%A |
Net investment income (loss) | 1.34%A |
Supplemental Data | |
Net assets, end of period (000 omitted) | $ 2,556 |
Portfolio turnover rate | 6%A |
A Annualized
B Total returns for periods of less than one year are not annualized.
C Total returns would have been lower had certain expenses not been reduced during the periods shown.
D Total returns do not include the effect of the sales charges.
E Calculated based on average shares outstanding during the period.
F For the period November 6, 2003 (commencement of operations) to March 31, 2004.
G Expense ratios reflect operating expenses of the class. Expenses before reductions do not reflect amounts reimbursed by the investment adviser or reductions from brokerage service arrangements or other expense offset arrangements and do not represent the amount paid by the class during periods when reimbursements or reductions occur. Expenses net of any voluntary waivers reflect expenses after reimbursement by the investment adviser but prior to reductions from brokerage service arrangements or other expense offset arrangements. Expenses net of all reductions represent the net expenses paid by the class.
See accompanying notes which are an integral part of the financial statements.
Annual Report
Financial Highlights - Class B
Year ended March 31, | 2004F |
Selected Per-Share Data | |
Net asset value, beginning of period | $ 10.00 |
Income from Investment Operations | |
Net investment income (loss)E | .03 |
Net realized and unrealized gain (loss) | .67 |
Total from investment operations | .70 |
Distributions from net investment income | (.06) |
Net asset value, end of period | $ 10.64 |
Total ReturnB,C,D | 6.97% |
Ratios to Average Net AssetsG | |
Expenses before expense reductions | 1.10%A |
Expenses net of voluntary waivers, if any | 1.08%A |
Expenses net of all reductions | 1.08%A |
Net investment income (loss) | .84%A |
Supplemental Data | |
Net assets, end of period (000 omitted) | $ 2,771 |
Portfolio turnover rate | 6%A |
A Annualized
B Total returns for periods of less than one year are not annualized.
C Total returns would have been lower had certain expenses not been reduced during the periods shown.
D Total returns do not include the effect of the contingent deferred sales charge.
E Calculated based on average shares outstanding during the period.
F For the period November 6, 2003 (commencement of operations) to March 31, 2004.
G Expense ratios reflect operating expenses of the class. Expenses before reductions do not reflect amounts reimbursed by the investment adviser or reductions from brokerage service arrangements or other expense offset arrangements and do not represent the amount paid by the class during periods when reimbursements or reductions occur. Expenses net of any voluntary waivers reflect expenses after reimbursement by the investment adviser but prior to reductions from brokerage service arrangements or other expense offset arrangements. Expenses net of all reductions represent the net expenses paid by the class.
See accompanying notes which are an integral part of the financial statements.
Annual Report
Financial Highlights - Class C
Year ended March 31, | 2004F |
Selected Per-Share Data | |
Net asset value, beginning of period | $ 10.00 |
Income from Investment Operations | |
Net investment income (loss)E | .03 |
Net realized and unrealized gain (loss) | .67 |
Total from investment operations | .70 |
Distributions from net investment income | (.05) |
Net asset value, end of period | $ 10.65 |
Total ReturnB,C,D | 7.02% |
Ratios to Average Net AssetsG | |
Expenses before expense reductions | 1.10%A |
Expenses net of voluntary waivers, if any | 1.08%A |
Expenses net of all reductions | 1.08%A |
Net investment income (loss) | .84%A |
Supplemental Data | |
Net assets, end of period (000 omitted) | $ 2,137 |
Portfolio turnover rate | 6%A |
A Annualized
B Total returns for periods of less than one year are not annualized.
C Total returns would have been lower had certain expenses not been reduced during the periods shown.
D Total returns do not include the effect of the contingent deferred sales charge.
E Calculated based on average shares outstanding during the period.
F For the period November 6, 2003 (commencement of operations) to March 31, 2004.
G Expense ratios reflect operating expenses of the class. Expenses before reductions do not reflect amounts reimbursed by the investment adviser or reductions from brokerage service arrangements or other expense offset arrangements and do not represent the amount paid by the class during periods when reimbursements or reductions occur. Expenses net of any voluntary waivers reflect expenses after reimbursement by the investment adviser but prior to reductions from brokerage service arrangements or other expense offset arrangements. Expenses net of all reductions represent the net expenses paid by the class.
See accompanying notes which are an integral part of the financial statements.
Annual Report
Financial Highlights - Institutional Class
Year ended March 31, | 2004E |
Selected Per-Share Data | |
Net asset value, beginning of period | $ 10.00 |
Income from Investment Operations | |
Net investment income (loss)D | .08 |
Net realized and unrealized gain (loss) | .66 |
Total from investment operations | .74 |
Distributions from net investment income | (.06) |
Net asset value, end of period | $ 10.68 |
Total ReturnB,C | 7.42% |
Ratios to Average Net AssetsF | |
Expenses before expense reductions | .10%A |
Expenses net of voluntary waivers, if any | .08%A |
Expenses net of all reductions | .08%A |
Net investment income (loss) | 1.84%A |
Supplemental Data | |
Net assets, end of period (000 omitted) | $ 222 |
Portfolio turnover rate | 6%A |
A Annualized
B Total returns for periods of less than one year are not annualized.
C Total returns would have been lower had certain expenses not been reduced during the periods shown.
D Calculated based on average shares outstanding during the period.
E For the period November 6, 2003 (commencement of operations) to March 31, 2004.
F Expense ratios reflect operating expenses of the class. Expenses before reductions do not reflect amounts reimbursed by the investment adviser or reductions from brokerage service arrangements or other expense offset arrangements and do not represent the amount paid by the class during periods when reimbursements or reductions occur. Expenses net of any voluntary waivers reflect expenses after reimbursement by the investment adviser but prior to reductions from brokerage service arrangements or other expense offset arrangements. Expenses net of all reductions represent the net expenses paid by the class.
See accompanying notes which are an integral part of the financial statements.
Annual Report
Fidelity Advisor Freedom 2030 Fund
Investment Changes
Fund Holdings as of March 31, 2004 |
| % of fund's
investments | % of fund's investments
6 months ago |
Domestic Equity Funds | | |
Fidelity Advisor Dividend Growth Fund Institutional Class | 13.6% | 13.5% |
Fidelity Advisor Equity Growth Fund Institutional Class | 6.8 | 6.9 |
Fidelity Advisor Equity Income Fund Institutional Class | 13.9 | 13.6 |
Fidelity Advisor Growth & Income Fund Institutional Class | 13.4 | 13.5 |
Fidelity Advisor Large Cap Fund Institutional Class | 13.5 | 13.5 |
Fidelity Advisor Mid-Cap Fund Institutional Class | 4.1 | 4.1 |
Fidelity Advisor Small Cap Fund Institutional Class | 4.3 | 4.1 |
| 69.6 | 69.2 |
International Equity Funds | | |
Fidelity Advisor Diversified International Fund Institutional Class | 6.6 | 6.4 |
Fidelity Advisor Overseas Fund Institutional Class | 6.5 | 6.4 |
| 13.1 | 12.8 |
High Yield Fixed-Income Funds | | |
Fidelity Advisor High Income Advantage Fund Institutional Class | 7.5 | 7.8 |
Investment Grade Fixed-Income Funds | | |
Fidelity Advisor Government Investment Fund Institutional Class | 4.9 | 5.1 |
Fidelity Advisor Intermediate Bond Fund Institutional Class | 4.9 | 5.1 |
| 9.8 | 10.2 |
| 100.0% | 100.0% |
Annual Report
Fidelity Advisor Freedom 2030 Fund
Investment Changes - continued
Asset Allocation (% of fund's investments)

The fund invests according to an asset allocation strategy that becomes increasingly conservative over time. The six months ago allocation is based on the fund's holdings as of September 30, 2003. The current allocation is based on the fund's holdings as of March 31, 2004. The expected allocation represents the fund's anticipated target asset allocation at September 30, 2004.
Annual Report
Fidelity Advisor Freedom 2030 Fund
Investments March 31, 2004
Showing Percentage of Total Value of Investment in Securities
Equity Funds - 82.7% |
| Shares | | Value (Note 1) |
Domestic Equity Funds - 69.6% |
Fidelity Advisor Dividend Growth Fund Institutional Class | 919,234 | | $ 10,598,772 |
Fidelity Advisor Equity Growth Fund Institutional Class | 113,487 | | 5,349,755 |
Fidelity Advisor Equity Income Fund Institutional Class | 402,676 | | 10,860,171 |
Fidelity Advisor Growth & Income Fund Institutional Class | 647,426 | | 10,449,450 |
Fidelity Advisor Large Cap Fund Institutional Class | 713,870 | | 10,543,856 |
Fidelity Advisor Mid-Cap Fund Institutional Class | 139,283 | | 3,214,649 |
Fidelity Advisor Small Cap Fund Institutional Class | 153,805 | | 3,383,706 |
TOTAL DOMESTIC EQUITY FUNDS | | 54,400,359 |
International Equity Funds - 13.1% |
Fidelity Advisor Diversified International Fund Institutional Class | 300,642 | | 5,113,918 |
Fidelity Advisor Overseas Fund Institutional Class | 305,609 | | 5,082,282 |
TOTAL INTERNATIONAL EQUITY FUNDS | | 10,196,200 |
TOTAL EQUITY FUNDS (Cost $62,368,035) | 64,596,559 |
Fixed-Income Funds - 17.3% |
| | | |
High Yield Fixed-Income Funds - 7.5% |
Fidelity Advisor High Income Advantage Fund Institutional Class | 632,629 | | 5,845,489 |
Investment Grade Fixed-Income Funds - 9.8% |
Fidelity Advisor Government Investment Fund Institutional Class | 375,937 | | 3,830,801 |
Fidelity Advisor Intermediate Bond Fund Institutional Class | 333,564 | | 3,829,311 |
TOTAL INVESTMENT GRADE FIXED-INCOME FUNDS | | 7,660,112 |
TOTAL FIXED-INCOME FUNDS (Cost $13,424,513) | 13,505,601 |
TOTAL INVESTMENT IN SECURITIES - 100% (Cost $75,792,548) | $ 78,102,160 |
Other Information |
Purchases and redemptions of the underlying fund shares aggregated $76,243,182 and $445,498, respectively. |
See accompanying notes which are an integral part of the financial statements.
Annual Report
Fidelity Advisor Freedom 2030 Fund
Financial Statements
Statement of Assets and Liabilities
| March 31, 2004 |
| | |
Assets | | |
Investment in securities, at value (cost $75,792,548) - See accompanying schedule | | $ 78,102,160 |
Receivable for fund shares sold | | 639,732 |
Total assets | | 78,741,892 |
| | |
Liabilities | | |
Payable to custodian bank | $ 4,713 | |
Payable for investments purchased | 470,046 | |
Payable for fund shares redeemed | 164,677 | |
Accrued management fee | 8,575 | |
Distribution fees payable | 32,762 | |
Total liabilities | | 680,773 |
| | |
Net Assets | | $ 78,061,119 |
Net Assets consist of: | | |
Paid in capital | | $ 75,684,175 |
Undistributed net investment income | | 54,472 |
Accumulated undistributed net realized gain (loss) on investments | | 12,860 |
Net unrealized appreciation (depreciation) on investments | | 2,309,612 |
Net Assets | | $ 78,061,119 |
See accompanying notes which are an integral part of the financial statements.
Annual Report
Fidelity Advisor Freedom 2030 Fund
Financial Statements - continued
Statement of Assets and Liabilities - continued
| March 31, 2004 |
Calculation of Maximum Offering Price | | |
Class A:
Net Asset Value and redemption price per share ($27,878,657 ÷ 2,428,458 shares) | | $ 11.48 |
| | |
Maximum offering price per share (100/94.25 of $11.48) | | $ 12.18 |
Class T:
Net Asset Value and redemption price per share ($27,201,115 ÷ 2,372,489 shares) | | $ 11.47 |
| | |
Maximum offering price per share (100/96.50 of $11.47) | | $ 11.89 |
Class B:
Net Asset Value and offering price per share ($12,229,031 ÷ 1,069,001 shares) A | | $ 11.44 |
| | |
Class C:
Net Asset Value and offering price per share ($9,722,086 ÷ 849,827 shares) A | | $ 11.44 |
| | |
Institutional Class:
Net Asset Value, offering price and redemption price per share ($1,030,230 ÷ 89,646 shares) | | $ 11.49 |
A Redemption price per share is equal to net asset value less any applicable contingent deferred sales charge.
See accompanying notes which are an integral part of the financial statements.
Annual Report
Statement of Operations
| July 24, 2003 (commencement of operations) to March 31, 2004 |
| | |
Investment Income | | |
Income distributions from underlying funds | | $ 359,719 |
| | |
Expenses | | |
Management fee | $ 20,439 | |
Distribution fees | 115,823 | |
Non-interested trustees' compensation | 67 | |
Total expenses before reductions | 136,329 | |
Expense reductions | (4,980) | 131,349 |
Net investment income (loss) | | 228,370 |
Realized and Unrealized Gain (Loss) Realized gain (loss) on sale of underlying fund shares | (5,135) | |
Capital gain distributions from underlying funds | 19,000 | 13,865 |
Change in net unrealized appreciation (depreciation) on investment securities | | 2,309,612 |
Net gain (loss) | | 2,323,477 |
Net increase (decrease) in net assets resulting from operations | | $ 2,551,847 |
See accompanying notes which are an integral part of the financial statements.
Annual Report
Fidelity Advisor Freedom 2030 Fund
Financial Statements - continued
Statement of Changes in Net Assets
| July 24, 2003
(commencement of
operations) to
March 31, 2004 |
Increase (Decrease) in Net Assets | |
Operations | |
Net investment income (loss) | $ 228,370 |
Net realized gain (loss) | 13,865 |
Change in net unrealized appreciation (depreciation) | 2,309,612 |
Net increase (decrease) in net assets resulting from operations | 2,551,847 |
Distributions to shareholders from net investment income | (174,903) |
Share transactions - net increase (decrease) | 75,684,175 |
Total increase (decrease) in net assets | 78,061,119 |
| |
Net Assets | |
Beginning of period | - |
End of period (including undistributed net investment income of $54,472) | $ 78,061,119 |
See accompanying notes which are an integral part of the financial statements.
Annual Report
Financial Highlights - Class A
Year ended March 31, | 2004F |
Selected Per-Share Data | |
Net asset value, beginning of period | $ 10.00 |
Income from Investment Operations | |
Net investment income (loss)E | .11 |
Net realized and unrealized gain (loss) | 1.46 |
Total from investment operations | 1.57 |
Distributions from net investment income | (.09) |
Net asset value, end of period | $ 11.48 |
Total ReturnB,C,D | 15.68% |
Ratios to Average Net AssetsG | |
Expenses before expense reductions | .35%A |
Expenses net of voluntary waivers, if any | .33%A |
Expenses net of all reductions | .33%A |
Net investment income (loss) | 1.44%A |
Supplemental Data | |
Net assets, end of period (000 omitted) | $ 27,879 |
Portfolio turnover rate | 2%A |
A Annualized
B Total returns for periods of less than one year are not annualized.
C Total returns would have been lower had certain expenses not been reduced during the periods shown.
D Total returns do not include the effect of the sales charges.
E Calculated based on average shares outstanding during the period.
F For the period July 24, 2003 (commencement of operations) to March 31, 2004.
G Expense ratios reflect operating expenses of the class. Expenses before reductions do not reflect amounts reimbursed by the investment adviser or reductions from brokerage service arrangements or other expense offset arrangements and do not represent the amount paid by the class during periods when reimbursements or reductions occur. Expenses net of any voluntary waivers reflect expenses after reimbursement by the investment adviser but prior to reductions from brokerage service arrangements or other expense offset arrangements. Expenses net of all reductions represent the net expenses paid by the class.
See accompanying notes which are an integral part of the financial statements.
Annual Report
Financial Highlights - Class T
Year ended March 31, | 2004F |
Selected Per-Share Data | |
Net asset value, beginning of period | $ 10.00 |
Income from Investment Operations | |
Net investment income (loss)E | .09 |
Net realized and unrealized gain (loss) | 1.46 |
Total from investment operations | 1.55 |
Distributions from net investment income | (.08) |
Net asset value, end of period | $ 11.47 |
Total ReturnB,C,D | 15.53% |
Ratios to Average Net AssetsG | |
Expenses before expense reductions | .60%A |
Expenses net of voluntary waivers, if any | .58%A |
Expenses net of all reductions | .58%A |
Net investment income (loss) | 1.19%A |
Supplemental Data | |
Net assets, end of period (000 omitted) | $ 27,201 |
Portfolio turnover rate | 2%A |
A Annualized
B Total returns for periods of less than one year are not annualized.
C Total returns would have been lower had certain expenses not been reduced during the periods shown.
D Total returns do not include the effect of the sales charges.
E Calculated based on average shares outstanding during the period.
F For the period July 24, 2003 (commencement of operations) to March 31, 2004.
G Expense ratios reflect operating expenses of the class. Expenses before reductions do not reflect amounts reimbursed by the investment adviser or reductions from brokerage service arrangements or other expense offset arrangements and do not represent the amount paid by the class during periods when reimbursements or reductions occur. Expenses net of any voluntary waivers reflect expenses after reimbursement by the investment adviser but prior to reductions from brokerage service arrangements or other expense offset arrangements. Expenses net of all reductions represent the net expenses paid by the class.
See accompanying notes which are an integral part of the financial statements.
Annual Report
Financial Highlights - Class B
Year ended March 31, | 2004F |
Selected Per-Share Data | |
Net asset value, beginning of period | $ 10.00 |
Income from Investment Operations | |
Net investment income (loss)E | .05 |
Net realized and unrealized gain (loss) | 1.46 |
Total from investment operations | 1.51 |
Distributions from net investment income | (.07) |
Net asset value, end of period | $ 11.44 |
Total ReturnB,C,D | 15.12% |
Ratios to Average Net AssetsG | |
Expenses before expense reductions | 1.10%A |
Expenses net of voluntary waivers, if any | 1.08%A |
Expenses net of all reductions | 1.08%A |
Net investment income (loss) | .69%A |
Supplemental Data | |
Net assets, end of period (000 omitted) | $ 12,229 |
Portfolio turnover rate | 2%A |
A Annualized
B Total returns for periods of less than one year are not annualized.
C Total returns would have been lower had certain expenses not been reduced during the periods shown.
D Total returns do not include the effect of the contingent deferred sales charge.
E Calculated based on average shares outstanding during the period.
F For the period July 24, 2003 (commencement of operations) to March 31, 2004.
G Expense ratios reflect operating expenses of the class. Expenses before reductions do not reflect amounts reimbursed by the investment adviser or reductions from brokerage service arrangements or other expense offset arrangements and do not represent the amount paid by the class during periods when reimbursements or reductions occur. Expenses net of any voluntary waivers reflect expenses after reimbursement by the investment adviser but prior to reductions from brokerage service arrangements or other expense offset arrangements. Expenses net of all reductions represent the net expenses paid by the class.
See accompanying notes which are an integral part of the financial statements.
Annual Report
Financial Highlights - Class C
Year ended March 31, | 2004F |
Selected Per-Share Data | |
Net asset value, beginning of period | $ 10.00 |
Income from Investment Operations | |
Net investment income (loss)E | .05 |
Net realized and unrealized gain (loss) | 1.46 |
Total from investment operations | 1.51 |
Distributions from net investment income | (.07) |
Net asset value, end of period | $ 11.44 |
Total ReturnB,C,D | 15.12% |
Ratios to Average Net AssetsG | |
Expenses before expense reductions | 1.10%A |
Expenses net of voluntary waivers, if any | 1.08%A |
Expenses net of all reductions | 1.08%A |
Net investment income (loss) | .69%A |
Supplemental Data | |
Net assets, end of period (000 omitted) | $ 9,722 |
Portfolio turnover rate | 2%A |
A Annualized
B Total returns for periods of less than one year are not annualized.
C Total returns would have been lower had certain expenses not been reduced during the periods shown.
D Total returns do not include the effect of the contingent deferred sales charge.
E Calculated based on average shares outstanding during the period.
F For the period July 24, 2003 (commencement of operations) to March 31, 2004.
G Expense ratios reflect operating expenses of the class. Expenses before reductions do not reflect amounts reimbursed by the investment adviser or reductions from brokerage service arrangements or other expense offset arrangements and do not represent the amount paid by the class during periods when reimbursements or reductions occur. Expenses net of any voluntary waivers reflect expenses after reimbursement by the investment adviser but prior to reductions from brokerage service arrangements or other expense offset arrangements. Expenses net of all reductions represent the net expenses paid by the class.
See accompanying notes which are an integral part of the financial statements.
Annual Report
Financial Highlights - Institutional Class
Year ended March 31, | 2004E |
Selected Per-Share Data | |
Net asset value, beginning of period | $ 10.00 |
Income from Investment Operations | |
Net investment income (loss)D | .13 |
Net realized and unrealized gain (loss) | 1.45 |
Total from investment operations | 1.58 |
Distributions from net investment income | (.09) |
Net asset value, end of period | $ 11.49 |
Total ReturnB,C | 15.83% |
Ratios to Average Net AssetsF | |
Expenses before expense reductions | .10%A |
Expenses net of voluntary waivers, if any | .08%A |
Expenses net of all reductions | .07%A |
Net investment income (loss) | 1.69%A |
Supplemental Data | |
Net assets, end of period (000 omitted) | $ 1,030 |
Portfolio turnover rate | 2%A |
A Annualized
B Total returns for periods of less than one year are not annualized.
C Total returns would have been lower had certain expenses not been reduced during the periods shown.
D Calculated based on average shares outstanding during the period.
E For the period July 24, 2003 (commencement of operations) to March 31, 2004.
F Expense ratios reflect operating expenses of the class. Expenses before reductions do not reflect amounts reimbursed by the investment adviser or reductions from brokerage service arrangements or other expense offset arrangements and do not represent the amount paid by the class during periods when reimbursements or reductions occur. Expenses net of any voluntary waivers reflect expenses after reimbursement by the investment adviser but prior to reductions from brokerage service arrangements or other expense offset arrangements. Expenses net of all reductions represent the net expenses paid by the class.
See accompanying notes which are an integral part of the financial statements.
Annual Report
Fidelity Advisor Freedom 2035 Fund
Investment Summary
Fund Holdings as of March 31, 2004 |
| % of fund's
investments |
Domestic Equity Funds | |
Fidelity Advisor Dividend Growth Fund Institutional Class | 13.6% |
Fidelity Advisor Equity Growth Fund Institutional Class | 6.8 |
Fidelity Advisor Equity Income Fund Institutional Class | 13.8 |
Fidelity Advisor Growth & Income Fund Institutional Class | 13.5 |
Fidelity Advisor Large Cap Fund Institutional Class | 13.5 |
Fidelity Advisor Mid-Cap Fund Institutional Class | 4.1 |
Fidelity Advisor Small Cap Fund Institutional Class | 4.3 |
| 69.6 |
International Equity Funds | |
Fidelity Advisor Diversified International Fund Institutional Class | 7.8 |
Fidelity Advisor Overseas Fund Institutional Class | 7.7 |
| 15.5 |
High Yield Fixed-Income Funds | |
Fidelity Advisor High Income Advantage Fund Institutional Class | 9.9 |
Investment Grade Fixed-Income Funds | |
Fidelity Advisor Government Investment Fund Institutional Class | 2.5 |
Fidelity Advisor Intermediate Bond Fund Institutional Class | 2.5 |
| 5.0 |
| 100.0% |
Annual Report
Fidelity Advisor Freedom 2035 Fund
Investment Changes - continued
Asset Allocation (% of fund's investments)
The fund invests according to an asset allocation strategy that becomes increasingly conservative over time. The initial allocation represents the target asset allocation at inception. The current allocation is based on the fund's holdings as of March 31, 2004. The expected allocation represents the fund's anticipated target asset allocation at September 30, 2004.
Annual Report
Fidelity Advisor Freedom 2035 Fund
Investments March 31, 2004
Showing Percentage of Total Value of Investment in Securities
Equity Funds - 85.1% |
| Shares | | Value (Note 1) |
Domestic Equity Funds - 69.6% |
Fidelity Advisor Dividend Growth Fund Institutional Class | 60,850 | | $ 701,603 |
Fidelity Advisor Equity Growth Fund Institutional Class | 7,479 | | 352,577 |
Fidelity Advisor Equity Income Fund Institutional Class | 26,457 | | 713,534 |
Fidelity Advisor Growth & Income Fund Institutional Class | 42,972 | | 693,563 |
Fidelity Advisor Large Cap Fund Institutional Class | 47,181 | | 696,861 |
Fidelity Advisor Mid-Cap Fund Institutional Class | 9,170 | | 211,643 |
Fidelity Advisor Small Cap Fund Institutional Class | 10,037 | | 220,807 |
TOTAL DOMESTIC EQUITY FUNDS | | 3,590,588 |
International Equity Funds - 15.5% |
Fidelity Advisor Diversified International Fund Institutional Class | 23,633 | | 402,001 |
Fidelity Advisor Overseas Fund Institutional Class | 24,039 | | 399,772 |
TOTAL INTERNATIONAL EQUITY FUNDS | | 801,773 |
TOTAL EQUITY FUNDS (Cost $4,289,120) | 4,392,361 |
Fixed-Income Funds - 14.9% |
| | | |
High Yield Fixed-Income Funds - 9.9% |
Fidelity Advisor High Income Advantage Fund Institutional Class | 55,312 | | 511,085 |
Investment Grade Fixed-Income Funds - 5.0% |
Fidelity Advisor Government Investment Fund Institutional Class | 12,617 | | 128,564 |
Fidelity Advisor Intermediate Bond Fund Institutional Class | 11,201 | | 128,583 |
TOTAL INVESTMENT GRADE FIXED-INCOME FUNDS | | 257,147 |
TOTAL FIXED-INCOME FUNDS (Cost $771,091) | 768,232 |
TOTAL INVESTMENT IN SECURITIES - 100% (Cost $5,060,211) | $ 5,160,593 |
Other Information |
Purchases and redemptions of the underlying fund shares aggregated $5,065,639 and $5,329, respectively. |
See accompanying notes which are an integral part of the financial statements.
Annual Report
Fidelity Advisor Freedom 2035 Fund
Financial Statements
Statement of Assets and Liabilities
| March 31, 2004 |
| | |
Assets | | |
Investment in securities, at value (cost $5,060,211) - See accompanying schedule | | $ 5,160,593 |
Cash | | 27 |
Receivable for investments sold | | 374 |
Receivable for fund shares sold | | 138,020 |
Total assets | | 5,299,014 |
| | |
Liabilities | | |
Payable for investments purchased | $ 128,150 | |
Payable for fund shares redeemed | 9,000 | |
Accrued management fee | 526 | |
Distribution fees payable | 2,121 | |
Total liabilities | | 139,797 |
| | |
Net Assets | | $ 5,159,217 |
Net Assets consist of: | | |
Paid in capital | | $ 5,056,671 |
Undistributed net investment income | | 1,743 |
Accumulated undistributed net realized gain (loss) on investments | | 421 |
Net unrealized appreciation (depreciation) on investments | | 100,382 |
Net Assets | | $ 5,159,217 |
See accompanying notes which are an integral part of the financial statements.
Annual Report
Fidelity Advisor Freedom 2035 Fund
Financial Statements - continued
Statement of Assets and Liabilities - continued
| March 31, 2004 |
Calculation of Maximum Offering Price | | |
Class A:
Net Asset Value and redemption price per share ($1,884,289 ÷ 176,144 shares) | | $ 10.70 |
| | |
Maximum offering price per share (100/94.25 of $10.70) | | $ 11.35 |
Class T:
Net Asset Value and redemption price per share ($1,046,553 ÷ 97,907 shares) | | $ 10.69 |
| | |
Maximum offering price per share (100/96.50 of $10.69) | | $ 11.08 |
Class B:
Net Asset Value and offering price per share ($1,122,566 ÷ 105,247 shares) A | | $ 10.67 |
| | |
Class C:
Net Asset Value and offering price per share ($889,881 ÷ 83,353 shares) A | | $ 10.68 |
| | |
Institutional Class:
Net Asset Value, offering price and redemption price per share ($215,928 ÷ 20,166 shares) | | $ 10.71 |
A Redemption price per share is equal to net asset value less any applicable contingent deferred sales charge.
See accompanying notes which are an integral part of the financial statements.
Annual Report
Statement of Operations
| November 6, 2003 (commencement of operations) to March 31, 2004 |
| | |
Investment Income | | |
Income distributions from underlying funds | | $ 20,247 |
Interest | | 27 |
Total income | | 20,274 |
| | |
Expenses | | |
Management fee | $ 950 | |
Distribution fees | 5,805 | |
Non-interested trustees' compensation | 3 | |
Total expenses before reductions | 6,758 | |
Expense reductions | (194) | 6,564 |
Net investment income (loss) | | 13,710 |
Realized and Unrealized Gain (Loss) Realized gain (loss) on sale of underlying fund shares | (99) | |
Capital gain distributions from underlying funds | 549 | 450 |
Change in net unrealized appreciation (depreciation) on investment securities | | 100,382 |
Net gain (loss) | | 100,832 |
Net increase (decrease) in net assets resulting from operations | | $ 114,542 |
See accompanying notes which are an integral part of the financial statements.
Annual Report
Fidelity Advisor Freedom 2035 Fund
Financial Statements - continued
Statement of Changes in Net Assets
| November 6, 2003
(commencement of
operations) to
March 31, 2004 |
Increase (Decrease) in Net Assets | |
Operations | |
Net investment income (loss) | $ 13,710 |
Net realized gain (loss) | 450 |
Change in net unrealized appreciation (depreciation) | 100,382 |
Net increase (decrease) in net assets resulting from operations | 114,542 |
Distributions to shareholders from net investment income | (11,997) |
Share transactions - net increase (decrease) | 5,056,672 |
Total increase (decrease) in net assets | 5,159,217 |
| |
Net Assets | |
Beginning of period | - |
End of period (including undistributed net investment income of $1,743) | $ 5,159,217 |
See accompanying notes which are an integral part of the financial statements.
Annual Report
Financial Highlights - Class A
Year ended March 31, | 2004F |
Selected Per-Share Data | |
Net asset value, beginning of period | $ 10.00 |
Income from Investment Operations | |
Net investment income (loss)E | .07 |
Net realized and unrealized gain (loss) | .72 |
Total from investment operations | .79 |
Distributions from net investment income | (.09) |
Net asset value, end of period | $ 10.70 |
Total ReturnB,C,D | 7.88% |
Ratios to Average Net AssetsG | |
Expenses before expense reductions | .35%A |
Expenses net of voluntary waivers, if any | .33%A |
Expenses net of all reductions | .33%A |
Net investment income (loss) | 1.80%A |
Supplemental Data | |
Net assets, end of period (000 omitted) | $ 1,884 |
Portfolio turnover rate | 1%A |
A Annualized
B Total returns for periods of less than one year are not annualized.
C Total returns would have been lower had certain expenses not been reduced during the periods shown.
D Total returns do not include the effect of the sales charges.
E Calculated based on average shares outstanding during the period.
F For the period November 6, 2003 (commencement of sale of shares) to March 31, 2004.
G Expense ratios reflect operating expenses of the class. Expenses before reductions do not reflect amounts reimbursed by the investment adviser or reductions from brokerage service arrangements or other expense offset arrangements and do not represent the amount paid by the class during periods when reimbursements or reductions occur. Expenses net of any voluntary waivers reflect expenses after reimbursement by the investment adviser but prior to reductions from brokerage service arrangements or other expense offset arrangements. Expenses net of all reductions represent the net expenses paid by the class.
See accompanying notes which are an integral part of the financial statements.
Annual Report
Financial Highlights - Class T
Year ended March 31, | 2004F |
Selected Per-Share Data | |
Net asset value, beginning of period | $ 10.00 |
Income from Investment Operations | |
Net investment income (loss)E | .06 |
Net realized and unrealized gain (loss) | .71 |
Total from investment operations | .77 |
Distributions from net investment income | (.08) |
Net asset value, end of period | $ 10.69 |
Total ReturnB,C,D | 7.73% |
Ratios to Average Net AssetsG | |
Expenses before expense reductions | .60%A |
Expenses net of voluntary waivers, if any | .58%A |
Expenses net of all reductions | .58%A |
Net investment income (loss) | 1.55%A |
Supplemental Data | |
Net assets, end of period (000 omitted) | $ 1,047 |
Portfolio turnover rate | 1%A |
A Annualized
B Total returns for periods of less than one year are not annualized.
C Total returns would have been lower had certain expenses not been reduced during the periods shown.
D Total returns do not include the effect of the sales charges.
E Calculated based on average shares outstanding during the period.
F For the period November 6, 2003 (commencement of sale of shares) to March 31, 2004.
G Expense ratios reflect operating expenses of the class. Expenses before reductions do not reflect amounts reimbursed by the investment adviser or reductions from brokerage service arrangements or other expense offset arrangements and do not represent the amount paid by the class during periods when reimbursements or reductions occur. Expenses net of any voluntary waivers reflect expenses after reimbursement by the investment adviser but prior to reductions from brokerage service arrangements or other expense offset arrangements. Expenses net of all reductions represent the net expenses paid by the class.
See accompanying notes which are an integral part of the financial statements.
Annual Report
Financial Highlights - Class B
Year ended March 31, | 2004F |
Selected Per-Share Data | |
Net asset value, beginning of period | $ 10.00 |
Income from Investment Operations | |
Net investment income (loss)E | .04 |
Net realized and unrealized gain (loss) | .71 |
Total from investment operations | .75 |
Distributions from net investment income | (.08) |
Net asset value, end of period | $ 10.67 |
Total ReturnB,C,D | 7.48% |
Ratios to Average Net AssetsG | |
Expenses before expense reductions | 1.10%A |
Expenses net of voluntary waivers, if any | 1.08%A |
Expenses net of all reductions | 1.08%A |
Net investment income (loss) | 1.05%A |
Supplemental Data | |
Net assets, end of period (000 omitted) | $ 1,123 |
Portfolio turnover rate | 1%A |
A Annualized
B Total returns for periods of less than one year are not annualized.
C Total returns would have been lower had certain expenses not been reduced during the periods shown.
D Total returns do not include the effect of the contingent deferred sales charge.
E Calculated based on average shares outstanding during the period.
F For the period November 6, 2003 (commencement of sale of shares) to March 31, 2004.
G Expense ratios reflect operating expenses of the class. Expenses before reductions do not reflect amounts reimbursed by the investment adviser or reductions from brokerage service arrangements or other expense offset arrangements and do not represent the amount paid by the class during periods when reimbursements or reductions occur. Expenses net of any voluntary waivers reflect expenses after reimbursement by the investment adviser but prior to reductions from brokerage service arrangements or other expense offset arrangements. Expenses net of all reductions represent the net expenses paid by the class.
See accompanying notes which are an integral part of the financial statements.
Annual Report
Financial Highlights - Class C
Year ended March 31, | 2004F |
Selected Per-Share Data | |
Net asset value, beginning of period | $ 10.00 |
Income from Investment Operations | |
Net investment income (loss)E | .04 |
Net realized and unrealized gain (loss) | .72 |
Total from investment operations | .76 |
Distributions from net investment income | (.08) |
Net asset value, end of period | $ 10.68 |
Total ReturnB,C,D | 7.58% |
Ratios to Average Net AssetsG | |
Expenses before expense reductions | 1.10%A |
Expenses net of voluntary waivers, if any | 1.08%A |
Expenses net of all reductions | 1.08%A |
Net investment income (loss) | 1.05%A |
Supplemental Data | |
Net assets, end of period (000 omitted) | $ 890 |
Portfolio turnover rate | 1%A |
A Annualized
B Total returns for periods of less than one year are not annualized.
C Total returns would have been lower had certain expenses not been reduced during the periods shown.
D Total returns do not include the effect of the contingent deferred sales charge.
E Calculated based on average shares outstanding during the period.
F For the period November 6, 2003 (commencement of sale of shares) to March 31, 2004.
G Expense ratios reflect operating expenses of the class. Expenses before reductions do not reflect amounts reimbursed by the investment adviser or reductions from brokerage service arrangements or other expense offset arrangements and do not represent the amount paid by the class during periods when reimbursements or reductions occur. Expenses net of any voluntary waivers reflect expenses after reimbursement by the investment adviser but prior to reductions from brokerage service arrangements or other expense offset arrangements. Expenses net of all reductions represent the net expenses paid by the class.
See accompanying notes which are an integral part of the financial statements.
Annual Report
Financial Highlights - Institutional Class
Year ended March 31, | 2004 E |
Selected Per-Share Data | |
Net asset value, beginning of period | $ 10.00 |
Income from Investment Operations | |
Net investment income (loss)D | .08 |
Net realized and unrealized gain (loss) | .72 |
Total from investment operations | .80 |
Distributions from net investment income | (.09) |
Net asset value, end of period | $ 10.71 |
Total ReturnB,C | 7.98% |
Ratios to Average Net AssetsF | |
Expenses before expense reductions | .10%A |
Expenses net of voluntary waivers, if any | .08%A |
Expenses net of all reductions | .08%A |
Net investment income (loss) | 2.04%A |
Supplemental Data | |
Net assets, end of period (000 omitted) | $ 216 |
Portfolio turnover rate | 1%A |
A Annualized
B Total returns for periods of less than one year are not annualized.
C Total returns would have been lower had certain expenses not been reduced during the periods shown.
D Calculated based on average shares outstanding during the period.
E For the period November 6, 2003 (commencement of sale of shares) to March 31, 2004.
F Expense ratios reflect operating expenses of the class. Expenses before reductions do not reflect amounts reimbursed by the investment adviser or reductions from brokerage service arrangements or other expense offset arrangements and do not represent the amount paid by the class during periods when reimbursements or reductions occur. Expenses net of any voluntary waivers reflect expenses after reimbursement by the investment adviser but prior to reductions from brokerage service arrangements or other expense offset arrangements. Expenses net of all reductions represent the net expenses paid by the class.
See accompanying notes which are an integral part of the financial statements.
Annual Report
Fidelity Advisor Freedom 2040 Fund
Investment Changes
Fund Holdings as of March 31, 2004 |
| % of fund's
investments | % of fund's investments
6 months ago |
Domestic Equity Funds | | |
Fidelity Advisor Dividend Growth Fund Institutional Class | 14.5% | 14.5% |
Fidelity Advisor Equity Growth Fund
Institutional Class | 7.3 | 7.4 |
Fidelity Advisor Equity Income Fund
Institutional Class | 14.9 | 14.6 |
Fidelity Advisor Growth & Income Fund Institutional Class | 14.3 | 14.4 |
Fidelity Advisor Large Cap Fund Institutional Class | 14.5 | 14.6 |
Fidelity Advisor Mid-Cap Fund Institutional Class | 4.4 | 4.4 |
Fidelity Advisor Small Cap Fund
Institutional Class | 4.6 | 4.4 |
| 74.5 | 74.3 |
International Equity Funds | | |
Fidelity Advisor Diversified International Fund Institutional Class | 7.8 | 7.7 |
Fidelity Advisor Overseas Fund Institutional Class | 7.8 | 7.7 |
| 15.6 | 15.4 |
High Yield Fixed-Income Funds | | |
Fidelity Advisor High Income Advantage Fund Institutional Class | 9.9 | 10.3 |
| 100.0% | 100.0% |
Annual Report
Fidelity Advisor Freedom 2040 Fund
Investment Changes - continued
Asset Allocation (% of fund's investments)

The fund invests according to an asset allocation strategy that becomes increasingly conservative over time. The six months ago allocation is based on the fund's holdings as of September 30, 2003. The current allocation is based on the fund's holdings as of March 31, 2004. The expected allocation represents the fund's anticipated target asset allocation at September 30, 2004.
Annual Report
Fidelity Advisor Freedom 2040 Fund
Investments March 31, 2004
Showing Percentage of Total Value of Investment in Securities
Equity Funds - 90.1% |
| Shares | | Value (Note 1) |
Domestic Equity Funds - 74.5% |
Fidelity Advisor Dividend Growth Fund Institutional Class | 545,249 | | $ 6,286,718 |
Fidelity Advisor Equity Growth Fund Institutional Class | 67,379 | | 3,176,241 |
Fidelity Advisor Equity Income Fund Institutional Class | 238,782 | | 6,439,950 |
Fidelity Advisor Growth & Income Fund Institutional Class | 384,273 | | 6,202,165 |
Fidelity Advisor Large Cap Fund Institutional Class | 423,943 | | 6,261,631 |
Fidelity Advisor Mid-Cap Fund Institutional Class | 83,050 | | 1,916,794 |
Fidelity Advisor Small Cap Fund Institutional Class | 91,091 | | 2,003,995 |
TOTAL DOMESTIC EQUITY FUNDS | | 32,287,494 |
International Equity Funds - 15.6% |
Fidelity Advisor Diversified International Fund Institutional Class | 199,615 | | 3,395,446 |
Fidelity Advisor Overseas Fund Institutional Class | 203,215 | | 3,379,473 |
TOTAL INTERNATIONAL EQUITY FUNDS | | 6,774,919 |
TOTAL EQUITY FUNDS (Cost $37,671,959) | 39,062,413 |
Fixed-Income Funds - 9.9% |
| | | |
High Yield Fixed-Income Funds - 9.9% |
Fidelity Advisor High Income Advantage Fund Institutional Class
(Cost $4,306,944) | 465,715 | | 4,303,207 |
TOTAL INVESTMENT IN SECURITIES - 100% (Cost $41,978,903) | $ 43,365,620 |
Other Information |
Purchases and redemptions of the underlying fund shares aggregated $42,306,185 and $324,541, respectively. |
Income Tax Information |
At March 31, 2004, the fund had a capital loss carryforward of approximately $105, all of which will expire on March 31, 2012. |
See accompanying notes which are an integral part of the financial statements.
Annual Report
Fidelity Advisor Freedom 2040 Fund
Financial Statements
Statement of Assets and Liabilities
| March 31, 2004 |
| | |
Assets | | |
Investment in securities, at value (cost $41,978,903) - See accompanying schedule | | $ 43,365,620 |
Cash | | 1 |
Receivable for fund shares sold | | 464,373 |
Total assets | | 43,829,994 |
| | |
Liabilities | | |
Payable for investments purchased | $ 446,882 | |
Payable for fund shares redeemed | 17,353 | |
Accrued management fee | 4,788 | |
Distribution fees payable | 19,579 | |
Total liabilities | | 488,602 |
| | |
Net Assets | | $ 43,341,392 |
Net Assets consist of: | | |
Paid in capital | | $ 41,946,553 |
Undistributed net investment income | | 10,863 |
Accumulated undistributed net realized gain (loss) on investments | | (2,741) |
Net unrealized appreciation (depreciation) on investments | | 1,386,717 |
Net Assets | | $ 43,341,392 |
See accompanying notes which are an integral part of the financial statements.
Annual Report
Fidelity Advisor Freedom 2040 Fund
Financial Statements - continued
Statement of Assets and Liabilities - continued
| March 31, 2004 |
Calculation of Maximum Offering Price | | |
Class A:
Net Asset Value and redemption price per share ($9,666,308 ÷ 831,851 shares) | | $ 11.62 |
| | |
Maximum offering price per share (100/94.25 of $11.62) | | $ 12.33 |
Class T:
Net Asset Value and redemption price per share ($19,191,014 ÷ 1,654,260 shares) | | $ 11.60 |
| | |
Maximum offering price per share (100/96.50 of $11.60) | | $ 12.02 |
Class B:
Net Asset Value and offering price per share ($7,232,039 ÷ 624,906 shares) A | | $ 11.57 |
| | |
Class C:
Net Asset Value and offering price per share ($6,957,977 ÷ 601,355 shares) A | | $ 11.57 |
| | |
Institutional Class:
Net Asset Value, offering price and redemption price per share ($294,054 ÷ 25,280 shares) | | $ 11.63 |
A Redemption price per share is equal to net asset value less any applicable contingent deferred sales charge.
See accompanying notes which are an integral part of the financial statements.
Annual Report
Statement of Operations
| July 24, 2003 (commencement of operations) to March 31, 2004 |
| | |
Investment Income | | |
Income distributions from underlying funds | | $ 202,027 |
| | |
Expenses | | |
Management fee | $ 10,840 | |
Distribution fees | 66,143 | |
Non-interested trustees' compensation | 35 | |
Total expenses before reductions | 77,018 | |
Expense reductions | (2,314) | 74,704 |
Net investment income (loss) | | 127,323 |
Realized and Unrealized Gain (Loss) Realized gain (loss) on sale of underlying fund shares | | (2,741) |
Change in net unrealized appreciation (depreciation) on investment securities | | 1,386,717 |
Net gain (loss) | | 1,383,976 |
Net increase (decrease) in net assets resulting from operations | | $ 1,511,299 |
See accompanying notes which are an integral part of the financial statements.
Annual Report
Fidelity Advisor Freedom 2040 Fund
Financial Statements - continued
Statement of Changes in Net Assets
| July 24, 2003
(commencement of
operations) to
March 31, 2004 |
Increase (Decrease) in Net Assets | |
Operations | |
Net investment income (loss) | $ 127,323 |
Net realized gain (loss) | (2,741) |
Change in net unrealized appreciation (depreciation) | 1,386,717 |
Net increase (decrease) in net assets resulting from operations | 1,511,299 |
Distributions to shareholders from net investment income | (116,460) |
Share transactions - net increase (decrease) | 41,946,553 |
Total increase (decrease) in net assets | 43,341,392 |
| |
Net Assets | |
Beginning of period | - |
End of period (including undistributed net investment income of $10,863 | $ 43,341,392 |
See accompanying notes which are an integral part of the financial statements.
Annual Report
Financial Highlights - Class A
Year ended March 31, | 2004F |
Selected Per-Share Data | |
Net asset value, beginning of period | $ 10.00 |
Income from Investment Operations | |
Net investment income (loss)E | .12 |
Net realized and unrealized gain (loss) | 1.60 |
Total from investment operations | 1.72 |
Distributions from net investment income | (.10) |
Net asset value, end of period | $ 11.62 |
Total ReturnB,C,D | 17.19% |
Ratios to Average Net AssetsG | |
Expenses before expense reductions | .35%A |
Expenses net of voluntary waivers, if any | .33%A |
Expenses net of all reductions | .33%A |
Net investment income (loss) | 1.53%A |
Supplemental Data | |
Net assets, end of period (000 omitted) | $ 9,666 |
Portfolio turnover rate | 3%A |
A Annualized
B Total returns for periods of less than one year are not annualized.
C Total returns would have been lower had certain expenses not been reduced during the periods shown.
D Total returns do not include the effect of the sales charges.
E Calculated based on average shares outstanding during the period.
F For the period July 24, 2003 (commencement of operations) to March 31, 2004.
G Expense ratios reflect operating expenses of the class. Expenses before reductions do not reflect amounts reimbursed by the investment adviser or reductions from brokerage service arrangements or other expense offset arrangements and do not represent the amount paid by the class during periods when reimbursements or reductions occur. Expenses net of any voluntary waivers reflect expenses after reimbursement by the investment adviser but prior to reductions from brokerage service arrangements or other expense offset arrangements. Expenses net of all reductions represent the net expenses paid by the class.
See accompanying notes which are an integral part of the financial statements.
Annual Report
Financial Highlights - Class T
Year ended March 31, | 2004F |
Selected Per-Share Data | |
Net asset value, beginning of period | $ 10.00 |
Income from Investment Operations | |
Net investment income (loss)E | .10 |
Net realized and unrealized gain (loss) | 1.59 |
Total from investment operations | 1.69 |
Distributions from net investment income | (.09) |
Net asset value, end of period | $ 11.60 |
Total ReturnB,C,D | 16.93% |
Ratios to Average Net AssetsG | |
Expenses before expense reductions | .60%A |
Expenses net of voluntary waivers, if any | .58%A |
Expenses net of all reductions | .58%A |
Net investment income (loss) | 1.28%A |
Supplemental Data | |
Net assets, end of period (000 omitted) | $ 19,191 |
Portfolio turnover rate | 3%A |
A Annualized
B Total returns for periods of less than one year are not annualized.
C Total returns would have been lower had certain expenses not been reduced during the periods shown.
D Total returns do not include the effect of the sales charges.
E Calculated based on average shares outstanding during the period.
F For the period July 24, 2003 (commencement of operations) to March 31, 2004.
G Expense ratios reflect operating expenses of the class. Expenses before reductions do not reflect amounts reimbursed by the investment adviser or reductions from brokerage service arrangements or other expense offset arrangements and do not represent the amount paid by the class during periods when reimbursements or reductions occur. Expenses net of any voluntary waivers reflect expenses after reimbursement by the investment adviser but prior to reductions from brokerage service arrangements or other expense offset arrangements. Expenses net of all reductions represent the net expenses paid by the class.
See accompanying notes which are an integral part of the financial statements.
Annual Report
Financial Highlights - Class B
Year ended March 31, | 2004F |
Selected Per-Share Data | |
Net asset value, beginning of period | $ 10.00 |
Income from Investment Operations | |
Net investment income (loss)E | .06 |
Net realized and unrealized gain (loss) | 1.60 |
Total from investment operations | 1.66 |
Distributions from net investment income | (.09) |
Net asset value, end of period | $ 11.57 |
Total ReturnB,C,D | 16.58% |
Ratios to Average Net AssetsG | |
Expenses before expense reductions | 1.10%A |
Expenses net of voluntary waivers, if any | 1.08%A |
Expenses net of all reductions | 1.08%A |
Net investment income (loss) | .78%A |
Supplemental Data | |
Net assets, end of period (000 omitted) | $ 7,232 |
Portfolio turnover rate | 3%A |
A Annualized
B Total returns for periods of less than one year are not annualized.
C Total returns would have been lower had certain expenses not been reduced during the periods shown.
D Total returns do not include the effect of the contingent deferred sales charge.
E Calculated based on average shares outstanding during the period.
F For the period July 24, 2003 (commencement of operations) to March 31, 2004.
G Expense ratios reflect operating expenses of the class. Expenses before reductions do not reflect amounts reimbursed by the investment adviser or reductions from brokerage service arrangements or other expense offset arrangements and do not represent the amount paid by the class during periods when reimbursements or reductions occur. Expenses net of any voluntary waivers reflect expenses after reimbursement by the investment adviser but prior to reductions from brokerage service arrangements or other expense offset arrangements. Expenses net of all reductions represent the net expenses paid by the class.
See accompanying notes which are an integral part of the financial statements.
Annual Report
Financial Highlights - Class C
Year ended March 31, | 2004F |
Selected Per-Share Data | |
Net asset value, beginning of period | $ 10.00 |
Income from Investment Operations | |
Net investment income (loss)E | .06 |
Net realized and unrealized gain (loss) | 1.59 |
Total from investment operations | 1.65 |
Distributions from net investment income | (.08) |
Net asset value, end of period | $ 11.57 |
Total ReturnB,C,D | 16.53% |
Ratios to Average Net AssetsG | |
Expenses before expense reductions | 1.10%A |
Expenses net of voluntary waivers, if any | 1.08%A |
Expenses net of all reductions | 1.08%A |
Net investment income (loss) | .78%A |
Supplemental Data | |
Net assets, end of period (000 omitted) | $ 6,958 |
Portfolio turnover rate | 3%A |
A Annualized
B Total returns for periods of less than one year are not annualized.
C Total returns would have been lower had certain expenses not been reduced during the periods shown.
D Total returns do not include the effect of the contingent deferred sales charge.
E Calculated based on average shares outstanding during the period.
F For the period July 24, 2003 (commencement of operations) to March 31, 2004.
G Expense ratios reflect operating expenses of the class. Expenses before reductions do not reflect amounts reimbursed by the investment adviser or reductions from brokerage service arrangements or other expense offset arrangements and do not represent the amount paid by the class during periods when reimbursements or reductions occur. Expenses net of any voluntary waivers reflect expenses after reimbursement by the investment adviser but prior to reductions from brokerage service arrangements or other expense offset arrangements. Expenses net of all reductions represent the net expenses paid by the class.
See accompanying notes which are an integral part of the financial statements.
Annual Report
Financial Highlights - Institutional Class
Year ended March 31, | 2004 E |
Selected Per-Share Data | |
Net asset value, beginning of period | $ 10.00 |
Income from Investment Operations | |
Net investment income (loss)D | .13 |
Net realized and unrealized gain (loss) | 1.60 |
Total from investment operations | 1.73 |
Distributions from net investment income | (.10) |
Net asset value, end of period | $ 11.63 |
Total ReturnB,C | 17.34% |
Ratios to Average Net AssetsF | |
Expenses before expense reductions | .10%A |
Expenses net of voluntary waivers, if any | .08%A |
Expenses net of all reductions | .08%A |
Net investment income (loss) | 1.78%A |
Supplemental Data | |
Net assets, end of period (000 omitted) | $ 294 |
Portfolio turnover rate | 3%A |
A Annualized
B Total returns for periods of less than one year are not annualized.
C Total returns would have been lower had certain expenses not been reduced during the periods shown.
D Calculated based on average shares outstanding during the period.
E For the period July 24, 2003 (commencement of operations) to March 31, 2004.
F Expense ratios reflect operating expenses of the class. Expenses before reductions do not reflect amounts reimbursed by the investment adviser or reductions from brokerage service arrangements or other expense offset arrangements and do not represent the amount paid by the class during periods when reimbursements or reductions occur. Expenses net of any voluntary waivers reflect expenses after reimbursement by the investment adviser but prior to reductions from brokerage service arrangements or other expense offset arrangements. Expenses net of all reductions represent the net expenses paid by the class.
See accompanying notes which are an integral part of the financial statements.
Annual Report
Notes to Financial Statements
For the period ended March 31, 2004
1. Significant Accounting Policies.
Fidelity Advisor Freedom Income Fund, Fidelity Advisor Freedom 2005 Fund, Fidelity Advisor Freedom 2010 Fund, Fidelity Advisor Freedom 2015 Fund, Fidelity Advisor Freedom 2020 Fund, Fidelity Advisor Freedom 2025 Fund, Fidelity Advisor Freedom 2030 Fund, Fidelity Advisor Freedom 2035 Fund and Fidelity Advisor Freedom 2040 Fund (the funds) are funds of Fidelity Aberdeen Street Trust (the trust). The trust is registered under the Investment Company Act of 1940, as amended (the 1940 Act), as an open-end management investment company organized as a Delaware statutory trust. Each fund is authorized to issue an unlimited number of shares. The funds primarily invest in a combination of other Fidelity equity, fixed income, and money market funds (the Underlying Funds) managed by Fidelity Management & Research Company (FMR). Each fund offers Class A, Class T, Class B, Class C, and Institutional Class shares, each of which has equal rights as to assets and voting privileges. Each class has exclusive voting rights with respect to matters that affect that class. Class B shares will automatically convert to Class A shares after a holding period of seven years from the initial date of purchase. Investment income, realized and unrealized capital gains and losses, the common expenses of the fund, and certain fund-level expense reductions, if any, are allocated on a pro rata basis to each class based on the relative net assets of each class to the total net assets of the fund. Each class differs with respect to distribution and service plan fees incurred. Certain expense reductions also differ by class. The financial statements have been prepared in conformity with accounting principles generally accepted in the United States of America, which require management to make certain estimates and assumptions at the date of the financial statements. The following summarizes the significant accounting policies of the funds:
Security Valuation. Net asset value per share is calculated as of the close of business of the New York Stock Exchange, normally 4:00 p.m. Eastern time. Investments in the Underlying Funds are valued at their net asset value each business day. Short-term securities with remaining maturities of sixty days or less for which quotations are not readily available are valued on the basis of amortized cost.
Investment Transactions and Income. Security transactions, normally shares of the Underlying Funds, are accounted for as of trade date. Gains and losses on securities sold are determined on the basis of identified cost. Income and capital gain distributions from the Underlying Funds, if any, are recorded on the ex-dividend date. Interest income is accrued as earned.
Expenses. Most expenses of the trust can be directly attributed to a fund. Expenses which cannot be directly attributed are apportioned between the funds in the trust. Expenses included in the accompanying financial statements reflect the expenses of each fund and do not include any expenses associated with the Underlying Funds.
Annual Report
Notes to Financial Statements - continued
1. Significant Accounting Policies - continued
Income Tax Information and Distributions to Shareholders. Each year, the funds intend to qualify as regulated investment companies by distributing all of their taxable income and realized gains under Subchapter M of the Internal Revenue Code. As a result, no provision for income taxes is required in the accompanying financial statements. Distributions are recorded on the ex-dividend date.
Income and capital gain distributions are determined in accordance with income tax regulations, which may differ from generally accepted accounting principles. Capital accounts within the financial statements are adjusted for permanent and temporary book and tax differences. These adjustments have no impact on net assets or the results of operations. Temporary differences will reverse in a subsequent period. These differences are primarily due to short-term gain distributions from the Underlying Funds and losses deferred due to wash sales.
The tax-basis components of distributable earnings and the federal tax cost as of period end were as follows for each fund:
| Cost for
Federal Income
Tax Purposes | Unrealized
Appreciation | Unrealized
Depreciation | Net Unrealized
Appreciation/
(Depreciation) |
Advisor Freedom Income | $ 32,235,897 | $ 585,961 | $ (20,972) | $ 564,989 |
Advisor Freedom 2005 | 6,018,261 | 84,012 | (23,168) | 60,844 |
Advisor Freedom 2010 | 88,803,932 | 2,105,030 | (172,820) | 1,932,210 |
Advisor Freedom 2015 | 17,780,149 | 262,359 | (93,007) | 169,352 |
Advisor Freedom 2020 | 161,705,252 | 4,915,639 | (470,825) | 4,444,814 |
Advisor Freedom 2025 | 9,834,033 | 197,036 | (55,582) | 141,454 |
Advisor Freedom 2030 | 75,792,563 | 2,617,940 | (308,343) | 2,309,597 |
Advisor Freedom 2035 | 5,060,207 | 128,333 | (27,947) | 100,386 |
Advisor Freedom 2040 | 41,978,956 | 1,615,448 | (228,784) | 1,386,664 |
| Undistributed
Ordinary Income | Undistributed
Long-term
Capital Gain | Capital Loss
Carryforward |
Advisor Freedom Income | $ 1,120 | $ 35,147 | $ - |
Advisor Freedom 2005 | 10,206 | 3,194 | - |
Advisor Freedom 2010 | 239,489 | 17,590 | - |
Advisor Freedom 2015 | 21,111 | 5,169 | - |
Advisor Freedom 2020 | 278,597 | 62,696 | - |
Advisor Freedom 2025 | 6,117 | 394 | - |
Advisor Freedom 2030 | 54,472 | 12,872 | - |
Advisor Freedom 2035 | 1,743 | 421 | - |
Advisor Freedom 2040 | 10,863 | - | (105) |
Annual Report
1. Significant Accounting Policies - continued
Income Tax Information and Distributions to Shareholders - continued
The tax character of distributions paid was as follows:
Year ended March 31, 2004 | |
| Ordinary Income |
Advisor Freedom Income | $ 156,368 |
Advisor Freedom 2005 | 8,568 |
Advisor Freedom 2010 | 196,312 |
Advisor Freedom 2015 | 18,521 |
Advisor Freedom 2020 | 346,934 |
Advisor Freedom 2025 | 11,834 |
Advisor Freedom 2030 | 174,903 |
Advisor Freedom 2035 | 11,997 |
Advisor Freedom 2040 | 116,460 |
2. Operating Policies.
Repurchase Agreements. FMR has received an Exemptive Order from the Securities and Exchange Commission (the SEC) which permits the funds and other affiliated entities of FMR to transfer uninvested cash balances into joint trading accounts. These accounts are then invested in repurchase agreements that are collateralized by U.S. Treasury or Government obligations. Certain funds may also invest directly with institutions, in repurchase agreements that are collateralized by commercial paper obligations and corporate obligations. Collateral is held in segregated accounts with custodian banks and may be obtained in the event of a default of the counterparty. Collateral is marked-to-market daily and maintained at a value at least equal to the principal amount of the repurchase agreement (including accrued interest).
3. Purchases and Sales of Investments.
Information regarding purchases and redemptions of the Underlying Funds' shares is included under the caption "Other Information" at the end of each applicable fund's Schedule of Investments.
4. Fees and Other Transactions with Affiliates.
Management Fee. Strategic Advisers, Inc. (Strategic Advisers), an affiliate of FMR, provides the funds with investment management related services. For these services the funds pay a monthly management fee to Strategic Advisers. The management fee is computed at an annual rate of .10% of the funds' average net assets. The management fee is reduced by an amount equal to the fees and expenses paid by the funds to the non-interested Trustees.
Annual Report
Notes to Financial Statements - continued
4. Fees and Other Transactions with Affiliates - continued
Other Transactions. Strategic Advisers has entered into an administration agreement with FMR under which FMR provides management and administrative services (other than investment advisory services) necessary for the operation of each fund. Pursuant to this agreement, FMR pays all expenses of each fund, except the compensation of the non-interested trustees and certain exceptions such as interest expense. FMR also contracts with other Fidelity companies to perform the services necessary for the operation of each fund. For the services under the agreement, Strategic Advisers pays FMR a monthly administration fee equal to the management fee received by Strategic Advisers, minus an amount equal to an annual rate of .02% of each fund's average net assets. The funds do not pay any fees for these services.
Distribution and Service Plan. In accordance with Rule 12b-1 of the 1940 Act, the funds have adopted separate Distribution and Service Plans for each class of shares. Certain classes pay Fidelity Distributors Corporation (FDC), an affiliate of FMR, separate Distribution and Service Fees, each of which is based on an annual percentage of each class' average net assets. In addition, FDC may pay financial intermediaries for selling shares of the fund and providing shareholder support services. For the period, the Distribution and Service Fee rates and the total amounts paid to and retained by FDC were as follows:
Advisor Freedom Income | Distribution
Fee | Service
Fee | Paid to
FDC | Retained
by FDC |
Class A | 0% | .25% | $ 3,442 | $ 208 |
Class T | .25% | .25% | 25,254 | 276 |
Class B | .75% | .25% | 16,559 | 12,615 |
Class C | .75% | .25% | 28,171 | 23,105 |
| | | $ 73,426 | $ 36,204 |
Advisor Freedom 2005 | | | | |
Class A | 0% | .25% | $ 464 | $ 195 |
Class T | .25% | .25% | 1,370 | 414 |
Class B | .75% | .25% | 1,941 | 1,654 |
Class C | .75% | .25% | 1,929 | 1,834 |
| | | $ 5,704 | $ 4,097 |
Advisor Freedom 2010 | | | | |
Class A | 0% | .25% | $ 20,867 | $ 269 |
Class T | .25% | .25% | 37,214 | 312 |
Class B | .75% | .25% | 45,717 | 34,400 |
Class C | .75% | .25% | 32,612 | 26,238 |
| | | $ 136,410 | $ 61,219 |
Annual Report
4. Fees and Other Transactions with Affiliates - continued
Distribution and Service Plan - continued
| Distribution
Fee | Service
Fee | Paid to
FDC | Retained
by FDC |
Advisor Freedom 2015 | | | | |
Class A | 0% | .25% | $ 1,615 | $ 174 |
Class T | .25% | .25% | 3,878 | 342 |
Class B | .75% | .25% | 6,114 | 4,769 |
Class C | .75% | .25% | 5,597 | 4,481 |
| | | $ 17,204 | $ 9,766 |
Advisor Freedom 2020 | | | | |
Class A | 0% | .25% | $ 45,184 | $ 85 |
Class T | .25% | .25% | 64,286 | - |
Class B | .75% | .25% | 71,689 | 53,825 |
Class C | .75% | .25% | 43,938 | 35,758 |
| | | $ 225,097 | $ 89,668 |
Advisor Freedom 2025 | | | | |
Class A | 0% | .25% | $ 904 | $ 199 |
Class T | .25% | .25% | 1,441 | 406 |
Class B | .75% | .25% | 4,240 | 3,371 |
Class C | .75% | .25% | 3,686 | 3,477 |
| | | $ 10,271 | $ 7,453 |
Advisor Freedom 2030 | | | | |
Class A | 0% | .25% | $ 17,610 | $ 203 |
Class T | .25% | .25% | 34,064 | 184 |
Class B | .75% | .25% | 34,833 | 26,277 |
Class C | .75% | .25% | 29,316 | 17,895 |
| | | $ 115,823 | $ 44,559 |
Advisor Freedom 2035 | | | | |
Class A | 0% | .25% | $ 634 | $ 203 |
Class T | .25% | .25% | 964 | 412 |
Class B | .75% | .25% | 2,265 | 1,902 |
Class C | .75% | .25% | 1,942 | 1,833 |
| | | $ 5,805 | $ 4,350 |
Advisor Freedom 2040 | | | | |
Class A | 0% | .25% | $ 5,458 | $ 191 |
Class T | .25% | .25% | 24,598 | 264 |
Class B | .75% | .25% | 17,969 | 13,666 |
Class C | .75% | .25% | 18,118 | 13,474 |
| | | $ 66,143 | $ 27,595 |
Annual Report
Notes to Financial Statements - continued
4. Fees and Other Transactions with Affiliates - continued
Sales Load. FDC receives a front-end sales charge of up to 5.75% for selling Class A shares, and 3.50% for selling Class T shares of the fund. FDC receives the proceeds of contingent deferred sales charges levied on Class A, Class T, Class B, and Class C redemptions. These charges depend on the holding period. The deferred sales charges range from 5% to 1% for Class B, 1% for Class C, and .25% for certain purchases of Class A and Class T shares.
For the period, sales charge amounts retained by FDC were as follows:
| Retained
by FDC | |
Advisor Freedom Income | | |
Class A | $ 15,614 | |
Class T | 5,012 | |
Class B* | 9,135 | |
Class C* | 380 | |
| $ 30,141 | |
Advisor Freedom 2005 | | |
Class A | $ 5,969 | |
Class T | 1,616 | |
Class B* | 400 | |
Class C* | 216 | |
| $ 8,201 | |
Advisor Freedom 2010 | | |
Class A | $ 81,127 | |
Class T | 20,792 | |
Class B* | 14,478 | |
Class C* | 740 | |
| $ 117,137 | |
Advisor Freedom 2015 | | |
Class A | $ 27,638 | |
Class T | 6,243 | |
Class B* | 58 | |
Class C* | 77 | |
| $ 34,016 | |
Advisor Freedom 2020 | | |
Class A | $ 121,889 | |
Class T | 27,280 | |
Class B* | 13,621 | |
Class C* | 748 | |
| $ 163,538 | |
Annual Report
4. Fees and Other Transactions with Affiliates - continued
Sales Load - continued
Advisor Freedom 2025 | Retained
by FDC | |
Class A | $ 12,893 | |
Class T | 2,454 | |
Class B* | 813 | |
Class C* | - | |
| $ 16,160 | |
Advisor Freedom 2030 | | |
Class A | $ 54,156 | |
Class T | 14,128 | |
Class B* | 5,292 | |
Class C* | 1,423 | |
| $ 74,999 | |
Advisor Freedom 2035 | | |
Class A | $ 6,529 | |
Class T | 1,659 | |
Class B* | 158 | |
Class C* | - | |
| $ 8,346 | |
Advisor Freedom 2040 | | |
Class A | $ 35,107 | |
Class T | 13,422 | |
Class B* | 3,837 | |
Class C* | 637 | |
| $ 53,003 | |
* When Class B and Class C shares are initially sold, FDC pays commissions from its own resources to financial intermediaries through which the sales are made.
Annual Report
Notes to Financial Statements - continued
5. Expense Reductions.
FMR agreed to reimburse certain funds to the extent operating expenses exceeded certain levels of average net assets as noted in the table below. Some expenses, for example interest expense, are excluded from this reimbursement.
| Expense
Limitations | Reimbursement
from adviser |
Advisor Freedom Income | | |
Class A | .33% | $ 313 |
Class T | .58% | 1,204 |
Class B | 1.08% | 412 |
Class C | 1.08% | 707 |
Institutional Class | .08% | 49 |
Advisor Freedom 2005 | | |
Class A | .33% | 27 |
Class T | .58% | 48 |
Class B | 1.08% | 33 |
Class C | 1.08% | 33 |
Institutional Class | .08% | 29 |
Advisor Freedom 2010 | | |
Class A | .33% | 1,956 |
Class T | .58% | 1,777 |
Class B | 1.08% | 1,116 |
Class C | 1.08% | 762 |
Institutional Class | .08% | 52 |
Advisor Freedom 2015 | | |
Class A | .33% | 98 |
Class T | .58% | 122 |
Class B | 1.08% | 99 |
Class C | 1.08% | 91 |
Institutional Class | .08% | 19 |
Advisor Freedom 2020 | | |
Class A | .33% | 4,432 |
Class T | .58% | 3,049 |
Class B | 1.08% | 1,676 |
Class C | 1.08% | 1,028 |
Institutional Class | .08% | 72 |
Advisor Freedom 2025 | | |
Class A | .33% | 68 |
Class T | .58% | 42 |
Class B | 1.08% | 66 |
Class C | 1.08% | 67 |
Institutional Class | .08% | 18 |
Annual Report
5. Expense reductions - continued
| Expense
Limitations | Reimbursement
from adviser |
Advisor Freedom 2030 | | |
Class A | .33% | 1,651 |
Class T | .58% | 1,501 |
Class B | 1.08% | 844 |
Class C | 1.08% | 715 |
Institutional Class | .08% | 55 |
Advisor Freedom 2035 | | |
Class A | .33% | 36 |
Class T | .58% | 36 |
Class B | 1.08% | 55 |
Class C | 1.08% | 49 |
Institutional Class | .08% | 18 |
Advisor Freedom 2040 | | |
Class A | .33% | 479 |
Class T | .58% | 1,033 |
Class B | 1.08% | 379 |
Class C | 1.08% | 376 |
Institutional Class | .08% | 38 |
In addition, through arrangements with each applicable fund's custodian, credits realized as a result of uninvested cash balances were used to reduce the fund's expenses. All of the applicable expense reductions are noted in the table below.
| Custody
expense
reduction |
Advisor Freedom Income | $ 32 |
Advisor Freedom 2010 | 109 |
Advisor Freedom 2020 | 82 |
Advisor Freedom 2030 | 214 |
Advisor Freedom 2040 | 9 |
6. Other Information.
At the end of the period, FMR or its affiliates and certain unaffiliated shareholders each were owners of record of more than 10% of the outstanding shares of the following funds:
| Affiliated % | Number of Unaffiliated
Shareholders | Unaffiliated
Shareholders % |
Advisor Freedom 2005 | 17% | 1 | 10% |
Advisor Freedom 2010 | - | 1 | 19% |
Advisor Freedom 2015 | - | 1 | 12% |
Advisor Freedom 2020 | - | 1 | 25% |
Advisor Freedom 2025 | 11% | - | - |
Advisor Freedom 2030 | - | 1 | 15% |
Advisor Freedom 2035 | 21% | - | - |
Advisor Freedom 2040 | - | 2 | 23% |
Annual Report
Notes to Financial Statements - continued
7. Distributions to Shareholders.
Distributions to shareholders of each class were as follows:
| Year ended March 31, |
Advisor Freedom IncomeA | 2004 |
From net investment income | |
Class A | $ 19,649 |
Class T | 79,678 |
Class B | 18,877 |
Class C | 34,941 |
Institutional Class | 3,223 |
Total | $ 156,368 |
Advisor Freedom 2005B | |
From net investment income | |
Class A | $ 1,826 |
Class T | 1,280 |
Class B | 1,542 |
Class C | 1,663 |
Institutional Class | 2,257 |
Total | $ 8,568 |
Advisor Freedom 2010A | |
From net investment income | |
Class A | $ 43,977 |
Class T | 66,548 |
Class B | 49,040 |
Class C | 34,840 |
Institutional Class | 1,907 |
Total | $ 196,312 |
Advisor Freedom 2015B | |
From net investment income | |
Class A | $ 5,218 |
Class T | 5,119 |
Class B | 4,459 |
Class C | 2,525 |
Institutional Class | 1,200 |
Total | $ 18,521 |
Advisor Freedom 2020A | |
From net investment income | |
Class A | $ 89,794 |
Class T | 125,405 |
Class B | 78,799 |
Class C | 50,035 |
Institutional Class | 2,901 |
Total | $ 346,934 |
Annual Report
7. Distributions to Shareholders - continued
| Year ended March 31, |
Advisor Freedom 2025B | 2004 |
From net investment income | |
Class A | $ 2,746 |
Class T | 1,859 |
Class B | 3,827 |
Class C | 2,202 |
Institutional Class | 1,200 |
Total | $ 11,834 |
Advisor Freedom 2030A | |
From net investment income | |
Class A | $ 35,680 |
Class T | 69,540 |
Class B | 38,645 |
Class C | 29,038 |
Institutional Class | 2,000 |
Total | $ 174,903 |
Advisor Freedom 2035B | |
From net investment income | |
Class A | $ 3,119 |
Class T | 1,638 |
Class B | 3,169 |
Class C | 2,371 |
Institutional Class | 1,700 |
Total | $ 11,997 |
Advisor Freedom 2040 A | |
From net investment income | |
Class A | $ 17,994 |
Class T | 50,760 |
Class B | 23,869 |
Class C | 21,670 |
Institutional Class | 2,167 |
Total | $ 116,460 |
A July 24, 2003 (commencement of operations) to March 31, 2004
B November 6, 2003 (commencement of operations) to March 31, 2004
Annual Report
Notes to Financial Statements - continued
8. Share Transactions.
Transactions for each class of shares were as follows:
| Shares | Dollars |
| Year ended March 31, |
Advisor Freedom Income A | 2004 | 2004 |
Class A | | |
Shares sold | 556,120 | $ 5,708,669 |
Reinvestment of distributions | 1,560 | 16,075 |
Shares redeemed | (76,230) | (789,030) |
Net increase (decrease) | 481,450 | $ 4,935,714 |
Class T | | |
Shares sold | 1,803,899 | $ 18,395,637 |
Reinvestment of distributions | 7,538 | 77,485 |
Shares redeemed | (412,756) | (4,222,818) |
Net increase (decrease) | 1,398,681 | $ 14,250,304 |
Class B | | |
Shares sold | 406,170 | $ 4,116,167 |
Reinvestment of distributions | 1,783 | 18,299 |
Shares redeemed | (56,322) | (578,381) |
Net increase (decrease) | 351,631 | $ 3,556,085 |
Class C | | |
Shares sold | 968,910 | $ 9,906,406 |
Reinvestment of distributions | 2,293 | 23,551 |
Shares redeemed | (79,710) | (821,157) |
Net increase (decrease) | 891,493 | $ 9,108,800 |
Institutional Class | | |
Shares sold | 34,289 | $ 345,318 |
Reinvestment of distributions | 204 | 2,087 |
Shares redeemed | (1) | (6) |
Net increase (decrease) | 34,492 | $ 347,399 |
Advisor Freedom 2005 B | | |
Class A | | |
Shares sold | 132,035 | $ 1,369,748 |
Reinvestment of distributions | 177 | 1,810 |
Shares redeemed | (1) | (15) |
Net increase (decrease) | 132,211 | $ 1,371,543 |
Class T | | |
Shares sold | 194,308 | $ 2,020,332 |
Reinvestment of distributions | 125 | 1,280 |
Shares redeemed | (632) | (6,663) |
Net increase (decrease) | 193,801 | $ 2,014,949 |
Annual Report
8. Share Transactions - continued
| Shares | Dollars |
| Year ended March 31, |
| 2004 | 2004 |
Class B | | |
Shares sold | 119,966 | $ 1,241,061 |
Reinvestment of distributions | 141 | 1,444 |
Shares redeemed | (5,213) | (54,663) |
Net increase(decrease) | 114,894 | $ 1,187,842 |
Class C | | |
Shares sold | 104,471 | $ 1,080,313 |
Reinvestment of distributions | 163 | 1,663 |
Shares redeemed | (2,131) | (22,078) |
Net increase(decrease) | 102,503 | $ 1,059,898 |
Institutional Class | | |
Shares sold | 37,614 | $ 380,010 |
Reinvestment of distributions | 221 | 2,257 |
Net increase(decrease) | 37,835 | $ 382,267 |
Advisor Freedom 2010 A | | |
Class A | | |
Shares sold | 6,011,846 | $ 64,179,052 |
Reinvestment of distributions | 3,950 | 41,954 |
Shares redeemed | (3,027,942) | (32,337,081) |
Net increase(decrease) | 2,987,854 | $ 31,883,925 |
Class T | | |
Shares sold | 3,031,245 | $ 32,349,186 |
Reinvestment of distributions | 6,169 | 65,456 |
Shares redeemed | (288,271) | (3,097,922) |
Net increase(decrease) | 2,749,143 | $ 29,316,720 |
Class B | | |
Shares sold | 1,431,674 | $ 15,072,786 |
Reinvestment of distributions | 4,375 | 46,370 |
Shares redeemed | (65,871) | (697,008) |
Net increase(decrease) | 1,370,178 | $ 14,422,148 |
Class C | | |
Shares sold | 1,108,463 | $ 11,728,611 |
Reinvestment of distributions | 2,998 | 31,779 |
Shares redeemed | (48,773) | (528,477) |
Net increase(decrease) | 1,062,688 | $ 11,231,913 |
Institutional Class | | |
Shares sold | 161,267 | $ 1,748,838 |
Reinvestment of distributions | 143 | 1,516 |
Shares redeemed | (6,723) | (73,690) |
Net increase(decrease) | 154,687 | $ 1,676,664 |
Annual Report
Notes to Financial Statements - continued
8. Share Transactions - continued
| Shares | Dollars |
| Year ended March 31, |
| 2004 | 2004 |
Advisor Freedom 2015 B | | |
Class A | | |
Shares sold | 453,543 | $ 4,740,621 |
Reinvestment of distributions | 503 | 5,159 |
Shares redeemed | (2,716) | (28,286) |
Net increase(decrease) | 451,330 | $ 4,717,494 |
Class T | | |
Shares sold | 478,142 | $ 5,005,957 |
Reinvestment of distributions | 498 | 5,107 |
Shares redeemed | (2,027) | (21,269) |
Net increase(decrease) | 476,613 | $ 4,989,795 |
Class B | | |
Shares sold | 403,545 | $ 4,213,233 |
Reinvestment of distributions | 434 | 4,450 |
Shares redeemed | (630) | (6,636) |
Net increase(decrease) | 403,349 | $ 4,211,047 |
Class C | | |
Shares sold | 343,634 | $ 3,596,889 |
Reinvestment of distributions | 237 | 2,428 |
Shares redeemed | (3,598) | (38,127) |
Net increase(decrease) | 340,273 | $ 3,561,190 |
Institutional Class | | |
Shares sold | 26,468 | $ 268,672 |
Reinvestment of distributions | 117 | 1,200 |
Net increase(decrease) | 26,585 | $ 269,872 |
Advisor Freedom 2020 A | | |
Class A | | |
Shares sold | 7,039,702 | $ 77,494,120 |
Reinvestment of distributions | 7,871 | 85,955 |
Shares redeemed | (642,065) | (7,227,956) |
Net increase(decrease) | 6,405,508 | $ 70,352,119 |
Class T | | |
Shares sold | 4,882,894 | $ 53,798,538 |
Reinvestment of distributions | 11,313 | 123,537 |
Shares redeemed | (260,830) | (2,914,264) |
Net increase(decrease) | 4,633,377 | $ 51,007,811 |
Annual Report
8. Share Transactions - continued
| Shares | Dollars |
| Year ended March 31, |
| 2004 | 2004 |
Class B | | |
Shares sold | 2,121,988 | $ 22,935,276 |
Reinvestment of distributions | 6,931 | 75,615 |
Shares redeemed | (63,508) | (709,002) |
Net increase(decrease) | 2,065,411 | $ 22,301,889 |
Class C | | |
Shares sold | 1,436,597 | $ 15,662,940 |
Reinvestment of distributions | 3,975 | 43,369 |
Shares redeemed | (31,556) | (351,618) |
Net increase(decrease) | 1,409,016 | $ 15,354,691 |
Institutional Class | | |
Shares sold | 213,708 | $ 2,403,565 |
Reinvestment of distributions | 165 | 1,800 |
Shares redeemed | (12,532) | (140,399) |
Net increase(decrease) | 201,341 | $ 2,264,966 |
Advisor Freedom 2025 B | | |
Class A | | |
Shares sold | 214,014 | $ 2,244,093 |
Reinvestment of distributions | 267 | 2,746 |
Shares redeemed | (161) | (1,730) |
Net increase(decrease) | 214,120 | $ 2,245,109 |
Class T | | |
Shares sold | 243,313 | $ 2,566,782 |
Reinvestment of distributions | 168 | 1,733 |
Shares redeemed | (4,450) | (47,326) |
Net increase(decrease) | 239,031 | $ 2,521,189 |
Class B | | |
Shares sold | 261,803 | $ 2,752,450 |
Reinvestment of distributions | 362 | 3,722 |
Shares redeemed | (1,779) | (19,098) |
Net increase(decrease) | 260,386 | $ 2,737,074 |
Class C | | |
Shares sold | 205,102 | $ 2,156,679 |
Reinvestment of distributions | 195 | 2,008 |
Shares redeemed | (4,537) | (48,091) |
Net increase(decrease) | 200,760 | $ 2,110,596 |
Institutional Class | | |
Shares sold | 20,644 | $ 207,010 |
Reinvestment of distributions | 116 | 1,200 |
Net increase(decrease) | 20,760 | $ 208,210 |
Annual Report
Notes to Financial Statements - continued
8. Share Transactions - continued
| Shares | Dollars |
| Year ended March 31, |
Advisor Freedom 2030A | 2004 | 2004 |
Class A | | |
Shares sold | 2,657,168 | $ 29,782,835 |
Reinvestment of distributions | 3,132 | 34,676 |
Shares redeemed | (231,842) | (2,650,316) |
Net increase(decrease) | 2,428,458 | $ 27,167,195 |
Class T | | |
Shares sold | 2,514,746 | $ 28,024,586 |
Reinvestment of distributions | 6,254 | 69,167 |
Shares redeemed | (148,511) | (1,683,269) |
Net increase(decrease) | 2,372,489 | $ 26,410,484 |
Class B | | |
Shares sold | 1,105,667 | $ 12,159,059 |
Reinvestment of distributions | 3,296 | 36,421 |
Shares redeemed | (39,962) | (454,012) |
Net increase(decrease) | 1,069,001 | $ 11,741,468 |
Class C | | |
Shares sold | 892,318 | $ 9,844,674 |
Reinvestment of distributions | 2,197 | 24,276 |
Shares redeemed | (44,688) | (510,933) |
Net increase(decrease) | 849,827 | $ 9,358,017 |
Institutional Class | | |
Shares sold | 95,905 | $ 1,079,123 |
Reinvestment of distributions | 173 | 1,916 |
Shares redeemed | (6,432) | (74,028) |
Net increase(decrease) | 89,646 | $ 1,007,011 |
Advisor Freedom 2035 B | | |
Class A | | |
Shares sold | 177,071 | $ 1,865,742 |
Reinvestment of distributions | 299 | 3,084 |
Shares redeemed | (1,226) | (13,000) |
Net increase(decrease) | 176,144 | $ 1,855,826 |
Class T | | |
Shares sold | 97,843 | $ 1,031,539 |
Reinvestment of distributions | 159 | 1,638 |
Shares redeemed | (95) | (1,015) |
Net increase(decrease) | 97,907 | $ 1,032,162 |
Class B | | |
Shares sold | 105,253 | $ 1,097,083 |
Reinvestment of distributions | 308 | 3,169 |
Shares redeemed | (314) | (3,293) |
Net increase(decrease) | 105,247 | $ 1,096,959 |
Annual Report
8. Share Transactions - continued
| Shares | Dollars |
| Year ended March 31, |
| 2004 | 2004 |
Class C | | |
Shares sold | 83,351 | $ 870,026 |
Reinvestment of distributions | 220 | 2,265 |
Shares redeemed | (218) | (2,276) |
Net increase(decrease) | 83,353 | $ 870,015 |
Institutional Class | | |
Shares sold | 20,001 | $ 200,010 |
Reinvestment of distributions | 165 | 1,700 |
Net increase(decrease) | 20,166 | $ 201,710 |
Advisor Freedom 2040A | | |
Class A | | |
Shares sold | 937,469 | $ 10,645,307 |
Reinvestment of distributions | 1,597 | 17,851 |
Shares redeemed | (107,215) | (1,237,201) |
Net increase(decrease) | 831,851 | $ 9,425,957 |
Class T | | |
Shares sold | 1,768,005 | $ 19,891,891 |
Reinvestment of distributions | 4,509 | 50,369 |
Shares redeemed | (118,254) | (1,362,835) |
Net increase(decrease) | 1,654,260 | $ 18,579,425 |
Class B | | |
Shares sold | 653,746 | $ 7,321,660 |
Reinvestment of distributions | 2,047 | 22,842 |
Shares redeemed | (30,887) | (356,280) |
Net increase(decrease) | 624,906 | $ 6,988,222 |
Class C | | |
Shares sold | 634,471 | $ 7,073,358 |
Reinvestment of distributions | 1,860 | 20,761 |
Shares redeemed | (34,976) | (401,419) |
Net increase(decrease) | 601,355 | $ 6,692,700 |
Institutional Class | | |
Shares sold | 25,651 | $ 264,662 |
Reinvestment of distributions | 183 | 2,044 |
Shares redeemed | (554) | (6,457) |
Net increase(decrease) | 25,280 | $ 260,249 |
A July 24, 2003 (commencement of operations) to March 31, 2004
B November 6, 2003 (commencement of operations) to March 31, 2004
Annual Report
Report of Independent Registered Public Accounting Firm
To the Trustees of Fidelity Aberdeen Street Trust and the Shareholders of Fidelity Advisor Freedom Income Fund, Fidelity Advisor Freedom 2005 Fund, Fidelity Advisor Freedom 2010 Fund, Fidelity Advisor Freedom 2015 Fund, Fidelity Advisor Freedom 2020 Fund, Fidelity Advisor Freedom 2025 Fund, Fidelity Advisor Freedom 2030 Fund, Fidelity Advisor Freedom 2035 Fund and Fidelity Advisor Freedom 2040 Fund:
We have audited the accompanying statements of assets and liabilities of Fidelity Advisor Freedom Income Fund, Fidelity Advisor Freedom 2005 Fund, Fidelity Advisor Freedom 2010 Fund, Fidelity Advisor Freedom 2015 Fund, Fidelity Advisor Freedom 2020 Fund, Fidelity Advisor Freedom 2025 Fund, Fidelity Advisor Freedom 2030 Fund, Fidelity Advisor Freedom 2035 Fund and Fidelity Advisor Freedom 2040 Fund (the Funds), each a fund of the Fidelity Aberdeen Street Trust, including the portfolios of investments, as of March 31, 2004, and the related statements of operations, changes in net assets, and financial highlights from commencement of operations through March 21, 2004. These financial statements and financial highlights are the responsibility of the Funds' management. Our responsibility is to express an opinion on these financial statements and financial highlights based on our audits.
We conducted our audits in accordance with the Standards of the Public Company Accounting Oversight Board (United States). Those standards require that we plan and perform the audit to obtain reasonable assurance about whether the financial statements and financial highlights are free of material misstatement. An audit includes examining, on a test basis, evidence supporting the amounts and disclosures in the financial statements. Our procedures included confirmation of securities owned as of March 31, 2004, by correspondence with the custodian and brokers; where replies were not received from brokers, we performed other auditing procedures. An audit also includes assessing the accounting principles used and significant estimates made by management, as well as evaluating the overall financial statement presentation. We believe that our audits provide a reasonable basis for our opinion.
In our opinion, the financial statements and financial highlights referred to above present fairly, in all material respects, the financial position of the Funds as of March 31, 2004, and the results of their operations, the changes in their net assets, and their financial highlights from commencement of operations through March 31, 2004, in conformity with accounting principles generally accepted in the United States of America.
/s/ Deloitte & Touche LLP
DELOITTE & TOUCHE LLP
Boston, Massachusetts
May 21, 2004
Annual Report
Trustees and Officers
The Trustees, Members of the Advisory Board, and executive officers of the trust and funds, as applicable, are listed below. The Board of Trustees governs each Advisor Freedom Fund and is responsible for protecting the interests of shareholders. The Trustees are experienced executives who meet periodically throughout the year to oversee each Advisor Freedom Fund's activities, review contractual arrangements with companies that provide services to each Advisor Freedom Fund, and review each Advisor Freedom Fund's performance. If the interests of an Advisor Freedom Fund and an underlying Fidelity fund were to diverge, a conflict of interest could arise and affect how the Trustees and Members of the Advisory Board fulfill their fiduciary duties to the affected funds. Strategic Advisers has structured the Advisor Freedom Funds to avoid these potential conflicts, although there may be situations where a conflict of interest is unavoidable. In such instances, Strategic Advisers, the Trustees, and Members of the Advisory Board would take reasonable steps to minimize and, if possible, eliminate the conflict. Except for William O. McCoy, each of the Trustees oversees 292 funds advised by FMR or an affiliate. Mr. McCoy oversees 294 funds advised by FMR or an affiliate.
The Trustees hold office without limit in time except that (a) any Trustee may resign; (b) any Trustee may be removed by written instrument, signed by at least two-thirds of the number of Trustees prior to such removal; (c) any Trustee who requests to be retired or who has become incapacitated by illness or injury may be retired by written instrument signed by a majority of the other Trustees; and (d) any Trustee may be removed at any special meeting of shareholders by a two-thirds vote of the outstanding voting securities of the trust. In any event, each non-interested Trustee shall retire not later than the last day of the calendar year in which his or her 72nd birthday occurs. The executive officers and Advisory Board Members hold office without limit in time, except that any officer and Advisory Board Member may resign or may be removed by a vote of a majority of the Trustees at any regular meeting or any special meeting of the Trustees. Except as indicated, each individual has held the office shown or other offices in the same company for the past five years.
The funds' Statement of Additional Information (SAI) includes more information about the Trustees. To request a free copy, call Fidelity at 1-877-208-0098.
Interested Trustees*:
Correspondence intended for each Trustee who is an "interested person" (as defined in the 1940 Act) may be sent to Fidelity Investments, 82 Devonshire Street, Boston, Massachusetts 02109.
Name, Age; Principal Occupation |
Edward C. Johnson 3d (73)** |
| Year of Election or Appointment: 1991 Mr. Johnson is Chairman of the Board of Trustees. Mr. Johnson serves as Chief Executive Officer, Chairman, and a Director of FMR Corp.; a Director and Chairman of the Board and of the Executive Committee of FMR; Chairman and a Director of Fidelity Management & Research (Far East) Inc.; Chairman (1998) and a Director of Fidelity Investments Money Management, Inc.; and Chairman (2001) and a Director (2000) of FMR Co., Inc. |
Abigail P. Johnson (42)** |
| Year of Election or Appointment: 2001 Senior Vice President of Advisor Freedom Income (2003), Advisor Freedom 2005 (2003), Advisor Freedom 2010 (2003), Advisor Freedom 2015 (2003), Advisor Freedom 2020 (2003), Advisor Freedom 2025 (2003), Advisor Freedom 2030 (2003), Advisor Freedom 2035 (2003), and Advisor Freedom 2040 (2003). Ms. Johnson also serves as Senior Vice President of other Fidelity funds (2001). She is President and a Director of FMR (2001), Fidelity Investments Money Management, Inc. (2001), FMR Co., Inc. (2001), and a Director of FMR Corp. Previously, Ms. Johnson managed a number of Fidelity funds. |
Laura B. Cronin (49) |
| Year of Election or Appointment: 2003 Ms. Cronin is an Executive Vice President (2002) and Chief Financial Officer (2002) of FMR Corp. and is a member of the Fidelity Management Committee (2003). Previously, Ms. Cronin served as Vice President of Finance of FMR (1997-1999), and Chief Financial Officer of FMR (1999-2001), Fidelity Personal Investments (2001), and Fidelity Brokerage Company (2001-2002). |
Robert L. Reynolds (52) |
| Year of Election or Appointment: 2003 Mr. Reynolds is a Director (2003) and Chief Operating Officer (2002) of FMR Corp. and is the head of the Fidelity Management Committee (2003). He also serves on the Board at Fidelity Investments Canada, Ltd. (2000). Previously, Mr. Reynolds served as President of Fidelity Investments Institutional Retirement Group (1996-2000). |
* Trustees have been determined to be "Interested Trustees" by virtue of, among other things, their affiliation with the trust or various entities under common control with FMR.
** Edward C. Johnson 3d, Trustee, is Abigail P. Johnson's father.
Annual Report
Non-Interested Trustees:
Correspondence intended for each non-interested Trustee (that is, the Trustees other than the Interested Trustees) may be sent to Fidelity Investments, P.O. Box 55235, Boston, Massachusetts 02205-5235.
Name, Age; Principal Occupation |
J. Michael Cook (61) |
| Year of Election or Appointment: 2001 Prior to Mr. Cook's retirement in May 1999, he served as Chairman and Chief Executive Officer of Deloitte & Touche LLP (accounting/consulting), Chairman of the Deloitte & Touche Foundation, and a member of the Board of Deloitte Touche Tohmatsu. He currently serves as a Director of Comcast (telecommunications, 2002), International Flavors & Fragrances, Inc. (2000), The Dow Chemical Company (2000), and Northrop Grumman Corporation (global defense technology, 2003). He is a Member of the Diversity Advisory Council of Marakon (2003) and the Advisory Board of the Directorship Search Group, Chairman Emeritus of the Board of Catalyst (a leading organization for the advancement of women in business), and is Chairman of the Accountability Advisory Council to the Comptroller General of the United States. He also serves as a Member of the Advisory Board of the Graduate School of Business of the University of Florida, his alma mater. |
Ralph F. Cox (71) |
| Year of Election or Appointment: 1991 Mr. Cox is President of RABAR Enterprises (management consulting for the petroleum industry). Prior to February 1994, he was President of Greenhill Petroleum Corporation (petroleum exploration and production). Until March 1990, Mr. Cox was President and Chief Operating Officer of Union Pacific Resources Company (exploration and production). He is a Director of CH2M Hill Companies (engineering), and Abraxas Petroleum (petroleum exploration and production, 1999). In addition, he is a member of advisory boards of Texas A&M University and the University of Texas at Austin. |
Robert M. Gates (60) |
| Year of Election or Appointment: 1997 Dr. Gates is President of Texas A&M University (2002). He was Director of the Central Intelligence Agency (CIA) from 1991 to 1993. From 1989 to 1991, Dr. Gates served as Assistant to the President of the United States and Deputy National Security Advisor. Dr. Gates is a Director of NACCO Industries, Inc. (mining and manufacturing), Parker Drilling Co., Inc. (drilling and rental tools for the energy industry, 2001), and Brinker International (restaurant management, 2003). He also serves as a member of the Advisory Board of VoteHere.net (secure internet voting, 2001). Previously, Dr. Gates served as a Director of LucasVarity PLC (automotive components and diesel engines), a Director of TRW Inc. (automotive, space, defense, and information technology), and Dean of the George Bush School of Government and Public Service at Texas A&M University (1999-2001). Dr. Gates also is a Trustee of the Forum for International Policy. |
George H. Heilmeier (67) |
| Year of Election or Appointment: 2004 Dr. Heilmeier is Chairman Emeritus of Telcordia Technologies (communication software and systems), where prior to his retirement, he served as company Chairman and Chief Executive Officer. He currently serves on the Boards of Directors of The Mitre Corporation (systems engineering and information technology support for the government), INET Technologies Inc. (telecommunications network surveillance, 2001) and Teletech Holdings (customer management services, 1998). He is Chairman of the General Motors Technology Advisory Committee and a Life Fellow of the IEEE (2000). Dr. Heilmeier is a member of the Defense Science Board and the National Security Agency Advisory Board. He is also a member of the National Academy of Engineering, the American Academy of Arts and Sciences and The Board of Overseers of the School of Engineering and Applied Science of the University of Pennsylvania. Previously, Dr. Heilmeier served as a Director of TRW Inc. (automotive, space, defense, and information technology, 1992-2002) and Compaq (1994-2002). |
Donald J. Kirk (71) |
| Year of Election or Appointment: 1991 Mr. Kirk is a Governor of the American Stock Exchange (2001), a Trustee and former Chairman of the Board of Trustees of the Greenwich Hospital Association, a Director of the Yale-New Haven Health Services Corp. (1998), and a Director Emeritus and former Chairman of the Board of Directors of National Arts Strategies Inc. Mr. Kirk was an Executive-in-Residence (1995-2000) and a Professor (1987-1995) at Columbia University Graduate School of Business. Prior to 1987, he was Chairman of the Financial Accounting Standards Board. Previously, Mr. Kirk served as a Governor of the National Association of Securities Dealers, Inc. (1996-2002), a member and Vice Chairman of the Public Oversight Board of the American Institute of Certified Public Accountants' SEC Practice Section (1995-2002), a Director of General Re Corporation (reinsurance, 1987-1998) and as a Director of Valuation Research Corp. (appraisals and valuations). |
Marie L. Knowles (57) |
| Year of Election or Appointment: 2001 Prior to Ms. Knowles' retirement in June 2000, she served as Executive Vice President and Chief Financial Officer of Atlantic Richfield Company (ARCO) (diversified energy, 1996-2000). From 1993 to 1996, she was a Senior Vice President of ARCO and President of ARCO Transportation Company. She served as a Director of ARCO from 1996 to 1998. She currently serves as a Director of Phelps Dodge Corporation (copper mining and manufacturing) and McKesson Corporation (healthcare service, 2002). Ms. Knowles is a Trustee of the Brookings Institution and the Catalina Island Conservancy and also serves as a member of the Advisory Board for the School of Engineering of the University of Southern California. |
Ned C. Lautenbach (60) |
| Year of Election or Appointment: 2000 Mr. Lautenbach has been a partner of Clayton, Dubilier & Rice, Inc. (private equity investment firm) since September 1998. Previously, Mr. Lautenbach was with the International Business Machines Corporation (IBM) from 1968 until his retirement in 1998. He was most recently Senior Vice President and Group Executive of Worldwide Sales and Services. From 1993 to 1995, he was Chairman of IBM World Trade Corporation, and from 1994 to 1998 was a member of IBM's Corporate Executive Committee. Mr. Lautenbach serves as Co-Chairman and a Director of Covansys, Inc. (global provider of business and technology solutions, 2000). In addition, he is a Director of Eaton Corporation (diversified industrial) and the Philharmonic Center for the Arts in Naples, Florida (1999). He also is a member of the Council on Foreign Relations. |
Marvin L. Mann (70) |
| Year of Election or Appointment: 1993 Mr. Mann is Chairman of the non-interested Trustees (2001). He is Chairman Emeritus of Lexmark International, Inc. (computer peripherals) where he served as CEO until April 1998 and retired as Chairman May 1999, and remains a member of the Board. Prior to 1991, he held the positions of Vice President of International Business Machines Corporation (IBM) and President and General Manager of various IBM divisions and subsidiaries. He is also a member of the Director Services Committee of the Investment Company Institute. In addition, Mr. Mann is a member of the President's Cabinet at the University of Alabama and the Board of Visitors of the Culverhouse College of Commerce and Business Administration at the University of Alabama. |
William O. McCoy (70) |
| Year of Election or Appointment: 1997 Prior to his retirement in December 1994, Mr. McCoy was Vice Chairman of the Board of BellSouth Corporation (telecommunications) and President of BellSouth Enterprises. He is currently a Director of Liberty Corporation (holding company), Duke Realty Corporation (real estate), and Progress Energy, Inc. (electric utility). He is also a partner of Franklin Street Partners (private investment management firm) and a member of the Research Triangle Foundation Board. In addition, Mr. McCoy served as the Interim Chancellor (1999-2000) and a member of the Board of Visitors (1994-1998) for the University of North Carolina at Chapel Hill and currently serves on the Board of Directors of the University of North Carolina Health Care System and the Board of Visitors of the Kenan-Flagler Business School (University of North Carolina at Chapel Hill). He also served as Vice President of Finance for the University of North Carolina (16-school system, 1995-1998). |
William S. Stavropoulos (64) |
| Year of Election or Appointment: 2001 Mr. Stavropoulos is Chairman of the Board (2000), CEO (2002), a position he previously held from 1995-2000, Chairman of the Executive Committee (2000), and a Member of the Board of Directors of The Dow Chemical Company. Since joining The Dow Chemical Company in 1967, Mr. Stavropoulos served in numerous senior management positions, including President (1993-2000; 2002-2003). Currently, he is a Director of NCR Corporation (data warehousing and technology solutions), BellSouth Corporation (telecommunications), Chemical Financial Corporation, and Maersk Inc. (industrial conglomerate, 2002). He also serves as a member of the Board of Trustees of the American Enterprise Institute for Public Policy Research. In addition, Mr. Stavropoulos is a member of The Business Council, J.P. Morgan International Council and the University of Notre Dame Advisory Council for the College of Science. |
Annual Report
Advisory Board Members and Executive Officers:
Correspondence intended for Ms. Small may be sent to Fidelity Investments, P.O. Box 55235, Boston, Massachusetts 02205-5235. Correspondence intended for each executive officer and Mr. Lynch may be sent to Fidelity Investments, 82 Devonshire Street, Boston, Massachusetts 02109.
Name, Age; Principal Occupation |
Peter S. Lynch (61) |
| Year of Election or Appointment: 2003 Member of the Advisory Board of Fidelity Aberdeen Street Trust. Vice Chairman and a Director of FMR, and Vice Chairman (2001) and a Director (2000) of FMR Co., Inc. Previously, Mr. Lynch served as a Trustee of the Fidelity funds (1990-2003). Prior to May 31, 1990, he was a Director of FMR and Executive Vice President of FMR (a position he held until March 31, 1991), Vice President of Fidelity® Magellan® Fund and FMR Growth Group Leader, and Managing Director of FMR Corp. Mr. Lynch was also Vice President of Fidelity Investments Corporate Services. In addition, he serves as a Trustee of Boston College, Massachusetts Eye & Ear Infirmary, Historic Deerfield, John F. Kennedy Library, and the Museum of Fine Arts of Boston. |
Cornelia M. Small (59) |
| Year of Election or Appointment: 2004 Member of the Advisory Board of Fidelity Aberdeen Street Trust. Ms. Small is a member (2000) and Chairperson (2002) of the Investment Committee, and a member (2002) of the Board of Trustees of Smith College. Previously, she served as Chief Investment Officer (1999-2000), Director of Global Equity Investments (1996-1999), and a member of the Board of Directors of Scudder, Stevens & Clark (1990-1997) and Scudder Kemper Investments (1997-1998). In addition, Ms. Small served as Co-Chair (2000-2003) of the Annual Fund for the Fletcher School of Law and Diplomacy. |
Bart A. Grenier (45) |
| Year of Election or Appointment: 2003 Vice President of Advisor Freedom Income, Advisor Freedom 2005, Advisor Freedom 2010, Advisor Freedom 2015, Advisor Freedom 2020, Advisor Freedom 2025, Advisor Freedom 2030, Advisor Freedom 2035, and Advisor Freedom 2040. Mr. Grenier also serves as Vice President of certain Equity Funds (2001), a position he previously held from 1999 to 2000, and Vice President of certain High Income Funds (2002). He is Senior Vice President of FMR (1999) and FMR Co., Inc. (2001), and President and Director of Strategic Advisers, Inc. (2002). He also heads Fidelity's Asset Allocation Group (2000), Fidelity's Growth and Income Group (2001), Fidelity's Value Group (2001), and Fidelity's High Income Division (2001). Previously, Mr. Grenier served as President of Fidelity Ventures (2000), Vice President of certain High Income Funds (1997-2000), High Income Division Head (1997-2000), Group Leader of the Income-Growth and Asset Allocation-Income Groups (1996-2000), and Assistant Equity Division Head (1997-2000). |
Ren Y. Cheng (47) |
| Year of Election or Appointment: 2003 Vice President of Advisor Freedom Income, Advisor Freedom 2005, Advisor Freedom 2010, Advisor Freedom 2015, Advisor Freedom 2020, Advisor Freedom 2025, Advisor Freedom 2030, Advisor Freedom 2035, and Advisor Freedom 2040. Mr. Cheng also serves as Vice President of other funds advised by Strategic Advisers, Inc. including the Fidelity Freedom Funds®. Prior to assuming his current responsibilities, Mr. Cheng managed a variety of Fidelity funds. Mr. Cheng also serves as Vice President of FMR (2002), FMR Co., Inc. (2002) and Strategic Advisers, Inc. (2003). |
Eric D. Roiter (55) |
| Year of Election or Appointment: 2003 Secretary of Advisor Freedom Income, Advisor Freedom 2005, Advisor Freedom 2010, Advisor Freedom 2015, Advisor Freedom 2020, Advisor Freedom 2025, Advisor Freedom 2030, Advisor Freedom 2035, and Advisor Freedom 2040. He also serves as Secretary of other Fidelity funds (1998); Vice President, General Counsel, and Clerk of FMR Co., Inc. (2001) and FMR (1998); Vice President and Clerk of FDC (1998); Assistant Clerk of Fidelity Management & Research (U.K.) Inc. (2001) and Fidelity Management & Research (Far East) Inc. (2001); and Assistant Secretary of Fidelity Investments Money Management, Inc. (2001). Prior to joining Fidelity, Mr. Roiter was with the law firm of Debevoise & Plimpton, as an associate (1981-1984) and as a partner (1985-1997), and served as an Assistant General Counsel of the U.S. Securities and Exchange Commission (1979-1981). Mr. Roiter is an Adjunct Member, Faculty of Law, at Boston College Law School (2003). |
Stuart Fross (44) |
| Year of Election or Appointment: 2003 Assistant Secretary of Advisor Freedom Income, Advisor Freedom 2005, Advisor Freedom 2010, Advisor Freedom 2015, Advisor Freedom 2020, Advisor Freedom 2025, Advisor Freedom 2030, Advisor Freedom 2035, and Advisor Freedom 2040. Mr. Fross also serves as Assistant Secretary of other Fidelity funds (2003) and is an employee of FMR. |
Christine Reynolds (45) |
| Year of Election or Appointment: 2004 President, Treasurer, and Anti-Money Laundering (AML) officer of Advisor Freedom Income, Advisor Freedom 2005, Advisor Freedom 2010, Advisor Freedom 2015, Advisor Freedom 2020, Advisor Freedom 2025, Advisor Freedom 2030, Advisor Freedom 2035, and Advisor Freedom 2040. Ms. Reynolds also serves as President, Treasurer, and AML officer of other Fidelity funds (2004) and is a Vice President (2003) and an employee (2002) of FMR. Before joining Fidelity Investments, Ms. Reynolds worked at PricewaterhouseCoopers LLP (PwC) (1980-2002), where she was most recently an audit partner with PwC's investment management practice. |
Timothy F. Hayes (53) |
| Year of Election or Appointment: 2003 Chief Financial Officer of Advisor Freedom Income, Advisor Freedom 2005, Advisor Freedom 2010, Advisor Freedom 2015, Advisor Freedom 2020, Advisor Freedom 2025, Advisor Freedom 2030, Advisor Freedom 2035, and Advisor Freedom 2040. Mr. Hayes also serves as Chief Financial Officer of other Fidelity funds (2002). Recently he was appointed President of Fidelity Service Company (2003) where he also serves as a Director. Mr. Hayes also serves as President of Fidelity Investments Operations Group (FIOG, 2002), which includes Fidelity Pricing and Cash Management Services Group (FPCMS), where he was appointed President in 1998. Previously, Mr. Hayes served as Chief Financial Officer of Fidelity Investments Corporate Systems and Service Group (1998) and Fidelity Systems Company (1997-1998). |
John R. Hebble (45) |
| Year of Election or Appointment: 2003 Deputy Treasurer of Advisor Freedom Income, Advisor Freedom 2005, Advisor Freedom 2010, Advisor Freedom 2015, Advisor Freedom 2020, Advisor Freedom 2025, Advisor Freedom 2030, Advisor Freedom 2035, and Advisor Freedom 2040. Mr. Hebble also serves as Deputy Treasurer of other Fidelity funds (2003), and is an employee of FMR. Before joining Fidelity Investments, Mr. Hebble worked at Deutsche Asset Management where he served as Director of Fund Accounting (2002-2003) and Assistant Treasurer of the Scudder Funds (1998-2003). |
Kimberley H. Monasterio (40) |
| Year of Election or Appointment: 2004 Deputy Treasurer of Advisor Freedom Income, Advisor Freedom 2005, Advisor Freedom 2010, Advisor Freedom 2015, Advisor Freedom 2020, Advisor Freedom 2025, Advisor Freedom 2030, Advisor Freedom 2035, and Advisor Freedom 2040. Ms. Monasterio also serves as Deputy Treasurer of other Fidelity funds (2004) and is an employee of FMR (2004). Before joining Fidelity Investments, Ms. Monasterio served as Treasurer (2000-2004) and Chief Financial Officer (2002-2004) of the Franklin Templeton Funds and Senior Vice President of Franklin Templeton Services, LLC (2000-2004). |
John H. Costello (57) |
| Year of Election or Appointment: 2003 Assistant Treasurer of Advisor Freedom Income, Advisor Freedom 2005, Advisor Freedom 2010, Advisor Freedom 2015, Advisor Freedom 2020, Advisor Freedom 2025, Advisor Freedom 2030, Advisor Freedom 2035, and Advisor Freedom 2040. Mr. Costello also serves as Assistant Treasurer of other Fidelity funds and is an employee of FMR. |
Francis V. Knox, Jr. (56) |
| Year of Election or Appointment: 2003 Assistant Treasurer of Advisor Freedom Income, Advisor Freedom 2005, Advisor Freedom 2010, Advisor Freedom 2015, Advisor Freedom 2020, Advisor Freedom 2025, Advisor Freedom 2030, Advisor Freedom 2035, and Advisor Freedom 2040. Mr. Knox also serves as Assistant Treasurer of other Fidelity funds (2002), and is a Vice President and an employee of FMR. Previously, Mr. Knox served as Vice President of Investment & Advisor Compliance (1990-2001), and Compliance Officer of Fidelity Management & Research (U.K.) Inc. (1992-2002), Fidelity Management & Research (Far East) Inc. (1991-2002), and FMR Corp. (1995-2002). |
Peter L. Lydecker (50) |
| Year of Election or Appointment: 2004 Assistant Treasurer of Advisor Freedom Income, Advisor Freedom 2005, Advisor Freedom 2010, Advisor Freedom 2015, Advisor Freedom 2020, Advisor Freedom 2025, Advisor Freedom 2030, Advisor Freedom 2035, and Advisor Freedom 2040. Mr. Lydecker also serves as Assistant Treasurer of other Fidelity funds (2004) and is an employee of FMR. |
Mark Osterheld (48) |
| Year of Election or Appointment: 2003 Assistant Treasurer of Advisor Freedom Income, Advisor Freedom 2005, Advisor Freedom 2010, Advisor Freedom 2015, Advisor Freedom 2020, Advisor Freedom 2025, Advisor Freedom 2030, Advisor Freedom 2035, and Advisor Freedom 2040. Mr. Osterheld also serves as Assistant Treasurer of other Fidelity funds (2002) and is an employee of FMR. |
Thomas J. Simpson (45) |
| Year of Election or Appointment: 2003 Assistant Treasurer of Advisor Freedom Income, Advisor Freedom 2005, Advisor Freedom 2010, Advisor Freedom 2015, Advisor Freedom 2020, Advisor Freedom 2025, Advisor Freedom 2030, Advisor Freedom 2035, and Advisor Freedom 2040. Mr. Simpson is Assistant Treasurer of other Fidelity funds (2000) and an employee of FMR (1996). Prior to joining FMR, Mr. Simpson was Vice President and Fund Controller of Liberty Investment Services (1987-1995). |
Annual Report
Distributions
The Board of Trustees of each fund voted to pay to shareholders of record at the opening of business on record date, the following distributions per share derived from capital gains realized from sales of portfolio securities, and dividends derived from net investment income:
Advisor Freedom Income | Pay Date | Record Date | Dividends | Capital
Gains |
Class A | 05/10/04 | 05/07/04 | $.019 | $.010 |
Class T | 05/10/04 | 05/07/04 | $.013 | $.010 |
Class B | 05/10/04 | 05/07/04 | $.002 | $.010 |
Class C | 05/10/04 | 05/07/04 | $.003 | $.010 |
Advisor Freedom 2005 | Pay Date | Record Date | Dividends | Capital
Gains |
Class A | 05/10/04 | 05/07/04 | $.017 | $.004 |
Class T | 05/10/04 | 05/07/04 | $.014 | $.004 |
Class B | 05/10/04 | 05/07/04 | $.009 | $.004 |
Class C | 05/10/04 | 05/07/04 | $.009 | $.004 |
Advisor Freedom 2010 | Pay Date | Record Date | Dividends | Capital
Gains |
Class A | 05/10/04 | 05/07/04 | $.029 | $.002 |
Class T | 05/10/04 | 05/07/04 | $.026 | $.002 |
Class B | 05/10/04 | 05/07/04 | $.016 | $.002 |
Class C | 05/10/04 | 05/07/04 | $.016 | $.002 |
Advisor Freedom 2015 | Pay Date | Record Date | Dividends | Capital
Gains |
Class A | 05/10/04 | 05/07/04 | $.010 | $.002 |
Class T | 05/10/04 | 05/07/04 | $.008 | $.002 |
Class B | 05/10/04 | 05/07/04 | $.002 | $.002 |
Class C | 05/10/04 | 05/07/04 | $- | $.002 |
Advisor Freedom 2020 | Pay Date | Record Date | Dividends | Capital
Gains |
Class A | 05/10/04 | 05/07/04 | $.021 | $.004 |
Class T | 05/10/04 | 05/07/04 | $.018 | $.004 |
Class B | 05/10/04 | 05/07/04 | $.008 | $.004 |
Class C | 05/10/04 | 05/07/04 | $.008 | $.004 |
Advisor Freedom 2025 | Pay Date | Record Date | Dividends | Capital
Gains |
Class A | 05/17/04 | 05/14/04 | $.008 | $.001 |
Class T | 05/17/04 | 05/14/04 | $.007 | $.001 |
Class B | 05/17/04 | 05/14/04 | $.001 | $.001 |
Class C | 05/17/04 | 05/14/04 | $- | $.001 |
Advisor Freedom 2030 | Pay Date | Record Date | Dividends | Capital
Gains |
Class A | 05/17/04 | 05/14/04 | $.011 | $.002 |
Class T | 05/17/04 | 05/14/04 | $.008 | $.002 |
Class B | 05/17/04 | 05/14/04 | $- | $.002 |
Class C | 05/17/04 | 05/14/04 | $- | $.002 |
Advisor Freedom 2035 | Pay Date | Record Date | Dividends | Capital
Gains |
Class A | 05/17/04 | 05/14/04 | $.006 | $.001 |
Class T | 05/17/04 | 05/14/04 | $.004 | $.001 |
Class B | 05/17/04 | 05/14/04 | $- | $.001 |
Class C | 05/17/04 | 05/14/04 | $- | $.001 |
A percentage of the dividends distributed during the fiscal year for the following funds was derived from interest on U.S. Government securities which is generally exempt from state income tax:
Advisor Freedom Income | Class A | Class T | Class B | Class C |
| 1.38% | 1.38% | 1.38% | 1.38% |
A percentage of the dividends distributed during the fiscal year for the following funds may be taken into account as a dividend for purposes of the maximum rate under section 1(h)(11) of the Internal Revenue Code.
Advisor Freedom Income | Class A | Class T | Class B | Class C |
10/03/03 | 19% | 19% | 19% | 19% |
11/07/03 | 19% | 19% | 19% | 19% |
12/26/03 | 19% | 19% | 19% | 19% |
02/06/04 | 0% | 0% | 0% | 0% |
Distributions Paid 12/26/2003 | Class A | Class T | Class B | Class C |
Advisor Freedom 2005 | 31% | 34% | 38% | 38% |
Advisor Freedom 2010 | 29% | 29% | 34% | 34% |
Advisor Freedom 2015 | 39% | 42% | 42% | 46% |
Advisor Freedom 2020 | 40% | 42% | 52% | 48% |
Advisor Freedom 2025 | 47% | 47% | 52% | 57% |
Advisor Freedom 2030 | 49% | 52% | 59% | 59% |
Advisor Freedom 2035 | 45% | 48% | 51% | 51% |
Advisor Freedom 2040 | 49% | 52% | 55% | 58% |
Annual Report
A percentage of the dividends distributed during the fiscal year for the following funds qualifies for the dividends-received deduction for corporate shareholders:
Advisor Freedom Income | Class A | Class T | Class B | Class C |
10/03/03 | 18% | 16% | 24% | 25% |
11/07/03 | 18% | 16% | 24% | 25% |
12/26/03 | 18% | 16% | 24% | 25% |
02/06/04 | 0% | 0% | 0% | 0% |
Distributions Paid 12/26/2003 | Class A | Class T | Class B | Class C |
Advisor Freedom 2005 | 30% | 32% | 27% | 35% |
Advisor Freedom 2010 | 24% | 21% | 27% | 26% |
Advisor Freedom 2015 | 33% | 26% | 33% | 36% |
Advisor Freedom 2020 | 29% | 30% | 38% | 34% |
Advisor Freedom 2025 | 42% | 29% | 32% | 43% |
Advisor Freedom 2030 | 34% | 37% | 42% | 42% |
Advisor Freedom 2035 | 29% | 34% | 35% | 33% |
Advisor Freedom 2040 | 33% | 36% | 36% | 41% |
The funds will notify shareholders in January 2005 of amounts for use in preparing 2004 income tax returns.
Annual Report
Annual Report
Annual Report
Annual Report
Annual Report
Annual Report
Investment Adviser
Strategic Advisers, Inc.
Boston, MA
General Distributor
Fidelity Distributors Corporation
Boston, MA
Transfer and Shareholder
Servicing Agent
Fidelity Investments Institutional Operations Company, Inc.
Boston, MA
Custodian
The Bank of New York
New York, NY
Annual Report
Fidelity Advisor Aggressive Growth Fund |
Fidelity Advisor Asset Allocation Fund |
Fidelity Advisor Balanced Fund |
Fidelity Advisor Biotechnology Fund |
Fidelity Advisor California Municipal Income Fund |
Fidelity Advisor Consumer Industries Fund |
Fidelity Advisor Cyclical Industries Fund |
Fidelity Advisor Developing Communications Fund |
Fidelity Advisor Diversified International Fund |
Fidelity Advisor Dividend Growth Fund |
Fidelity Advisor Dynamic Capital Appreciation Fund |
Fidelity Advisor Electronics Fund |
Fidelity Advisor Emerging Asia Fund |
Fidelity Advisor Emerging Markets Income Fund |
Fidelity Advisor Equity Growth Fund |
Fidelity Advisor Equity Income Fund |
Fidelity Advisor Equity Value Fund |
Fidelity Advisor Europe Capital Appreciation Fund |
Fidelity Advisor Fifty Fund |
Fidelity Advisor Financial Services Fund |
Fidelity Advisor Floating Rate High Income Fund |
Fidelity Advisor Freedom Income, 2005, 2010, 2015, 2020, 2025, 2030, 2035, 2040 FundsSM |
Fidelity Advisor Global Equity Fund |
Fidelity Advisor Government Investment Fund |
Fidelity Advisor Growth & Income Fund |
Fidelity Advisor Growth Opportunities |
Fidelity Advisor Health Care Fund |
Fidelity Advisor High Income Advantage Fund |
Fidelity Advisor High Income Fund |
Fidelity Advisor Inflation-Protected Bond Fund |
Fidelity Advisor Intermediate Bond Fund |
Fidelity Advisor International Capital Appreciation Fund |
Fidelity Advisor International Small Cap Fund |
Fidelity Advisor Investment Grade Bond Fund |
Fidelity Advisor Japan Fund |
Fidelity Advisor Korea Fund |
Fidelity Advisor Large Cap Fund |
Fidelity Advisor Latin America Fund |
Fidelity Advisor Leveraged Company Stock Fund |
Fidelity Advisor Mid Cap Fund |
Fidelity Advisor Mortgage Securities Fund |
Fidelity Advisor Municipal Income Fund |
Fidelity Advisor Natural Resources Fund |
Fidelity Advisor New Insights Fund |
Fidelity Advisor New York
Municipal Income Fund |
Fidelity Advisor Overseas Fund |
Fidelity Advisor Real Estate Fund |
Fidelity Advisor Short Fixed-Income Fund |
Fidelity Advisor Short Intermediate Municipal Income Fund |
Fidelity Advisor Small Cap Fund |
Fidelity Advisor Strategic Dividend & Income Fund |
Fidelity Advisor Strategic Growth Fund |
Fidelity Advisor Strategic Income Fund |
Fidelity Advisor Tax Managed
Stock Fund |
Fidelity Advisor Technology Fund |
Fidelity Advisor Telecommunications & Utilities Growth Fund |
Fidelity Advisor Value Fund |
Fidelity Advisor Value Leaders Fund |
Fidelity Advisor Value Strategies Fund |
Prime Fund |
Tax-Exempt Fund |
Treasury Fund |
AFF-UANN-0504
1.792134.100
(Fidelity Investment logo)(registered trademark)
Fidelity Advisor
Freedom FundsSM -
Income, 2005, 2010, 2015, 2020, 2025, 2030, 2035, 2040 -
Institutional Class
Annual Report
March 31, 2004
(2_fidelity_logos) (Registered_Trademark)
Contents
For a free copy of the funds' proxy voting guidelines call 1-877-208-0098 or visit the Securities and Exchange Commission (SEC)'s web site at www.sec.gov.
Standard & Poor's, S&P and S&P 500 are registered service marks of The McGraw-Hill Companies, Inc. and have been licensed for use by Fidelity Distributors Corporation.
Other third party marks appearing herein are the property of their respective owners.
All other marks appearing herein are registered or unregistered trademarks or service marks of FMR Corp. or an affiliated company.
(Recycle graphic) This report is printed on recycled paper using soy-based inks.
This report and the financial statements contained herein are submitted for the general information of the shareholders of the fund. This report is not authorized for distribution to prospective investors in the fund unless preceded or accompanied by an effective prospectus.
Mutual fund shares are not deposits or obligations of, or guaranteed by, any depository institution. Shares are not insured by the FDIC, Federal Reserve Board or any other agency, and are subject to investment risks, including possible loss of principal amount invested.
Neither the funds nor Fidelity Distributors Corporation is a bank.
For more information on any Fidelity fund, including charges and expenses, call 1-800-544-6666 for a free prospectus. Read it carefully before you invest or send money.
Annual Report
Chairman's Message
(photo_of_Edward_C_Johnson_3d)
Dear Shareholder:
Many of you have read or heard news stories recently that were critical of mutual funds and made allegations that the mutual fund industry has been less than forthright. I find these reports unsettling and not necessarily an accurate picture of the overall industry, and I would like you to know where we at Fidelity stand.
With specific regard to allegations that certain mutual fund companies were violating the Securities and Exchange Commission's forward pricing rules or were involved in so-called "market timing" activities, I want to say two things:
First, Fidelity does not have agreements that permit customers who buy fund shares after 4 p.m. to obtain the 4 p.m. price. This is not to say that someone could not deceive the company through fraudulent acts. But I underscore that we have no so-called "agreements" which would permit this illegal practice.
Second, Fidelity has been on record for years opposing predatory short-term trading which adversely affects other shareholders in a mutual fund. In fact, in the 1980s, we began charging a fee - which is returned to the fund and, therefore, to investors - to discourage this activity. What's more, several years ago we took the industry lead in developing a Fair Value Pricing Policy to prevent market timing on foreign securities in our funds. It is reasonable to assume that another structure can be developed that would alter the system to make it much more difficult for predatory traders to operate. This, however, will only be achieved through close cooperation among regulators, legislators and the industry.
Certainly no industry is perfect, and there have been instances of unethical and illegal activity from time to time within the mutual fund industry. When this occurs, confessed or convicted offenders should be dealt with appropriately. Clearly, every system can be improved. We applaud well thought out improvements by regulators, legislators and industry representatives that achieve the common goal of building and protecting the value of investors' holdings. But we remain concerned about the risk of over-regulation and the quick application of simplistic solutions to intricate problems.
For more than 57 years, Fidelity Investments has worked very hard to improve its products and service to justify your trust. When our family founded this company in 1946, we had only a few hundred customers. Many of them were family and friends. Today, we serve more than 18 million customers including individual investors and participants in retirement plans across America.
Let me close by saying that we do not take your trust in us for granted, and we realize that we must always work to improve all aspects of our service to you. In turn, we urge you to continue your active participation with your financial matters, so that your interests can be well served.
Best regards,
/s/Edward C. Johnson 3d
Edward C. Johnson 3d
Annual Report
Fidelity Advisor Freedom Income FundSM - Institutional Class
Performance: The Bottom Line
Average annual total return reflects the change in the value of an investment, assuming reinvestment of the class' dividend income and capital gains (the profits earned upon the sale of securities that have grown in value) and assuming a constant rate of performance each year. During periods of reimbursement by Fidelity, a fund's total return will be greater than it would be had the reimbursement not occurred. The $10,000 table and the class's returns do not reflect the deduction of taxes that a shareholder would pay on fund distributions or the redemption of fund shares. How a fund did yesterday is no guarantee of how it will do tomorrow.
Average Annual Total Returns
Average annual total returns take Fidelity Advisor Freedom Income FundSM - Institutional Class cumulative total return and show you what would have happened if Fidelity Advisor Freedom Income Fund - Insitutional Class shares had performed at a constant rate each year. These numbers will be reported once the fund is a year old.
$10,000 Over Life of Fund
Let's say hypothetically that $10,000 was invested in Fidelity Advisor Freedom Income - Institutional Class on July 24, 2003, when the fund started. The chart shows how the value of the investment would have grown, and also shows how the Lehman Brothers® Aggregate Bond Index did over the same period.

Annual Report
Fidelity Advisor Freedom 2005 Fund SM - Institutional Class
Performance: The Bottom Line
Average annual total return reflects the change in the value of an investment, assuming reinvestment of the fund's dividend income and capital gains (the profits earned upon the sale of securities that have grown in value) and assuming a constant rate of performance each year. During periods of reimbursement by Fidelity, a fund's total return will be greater than it would be had the reimbursement not occurred. How a fund did yesterday is no guarantee of how it will do tomorrow.
Average Annual Total Returns
Average annual total returns take Fidelity Advisor Freedom 2005 FundSM - Institutional Class cumulative total return and show you what would have happened if Fidelity Advisor Freedom 2005 Fund - Institutional Class shares had performed at a constant rate each year. These numbers will be reported once the fund is a year old. In addition, the growth of the hypothetical $10,000 investment in the fund will appear in the fund's next report.
Annual Report
Fidelity Advisor Freedom 2010 Fund SM - Institutional Class
Performance: The Bottom Line
Average annual total return reflects the change in the value of an investment, assuming reinvestment of the class' dividend income and capital gains (the profits earned upon the sale of securities that have grown in value) and assuming a constant rate of performance each year. During periods of reimbursement by Fidelity, a fund's total return will be greater than it would be had the reimbursement not occurred. The $10,000 table and the class's returns do not reflect the deduction of taxes that a shareholder would pay on fund distributions or the redemption of fund shares. How a fund did yesterday is no guarantee of how it will do tomorrow.
Average Annual Total Returns
Average annual total returns take Fidelity Advisor Freedom 2010 FundSM - Institutional Class cumulative total return and show you what would have happened if Fidelity Advisor Freedom 2010 Fund - Institutional Class shares had performed at a constant rate each year. These numbers will be reported once the fund is a year old.
$10,000 Over Life of Fund
Let's say hypothetically that $10,000 was invested in Fidelity Advisor Freedom 2010 - Institutional Class on July 24, 2003, when the fund started. The chart shows how the value of the investment would have grown, and also shows how the Standard & Poor's 500SM Index did over the same period.
Annual Report
Fidelity Advisor Freedom 2015 Fund SM - Institutional Class
Performance: The Bottom Line
Average annual total return reflects the change in the value of an investment, assuming reinvestment of the fund's dividend income and capital gains (the profits earned upon the sale of securities that have grown in value) and assuming a constant rate of performance each year. During periods of reimbursement by Fidelity, a fund's total return will be greater than it would be had the reimbursement not occurred. How a fund did yesterday is no guarantee of how it will do tomorrow.
Average Annual Total Returns
Average annual total returns take Fidelity Advisor Freedom 2015 FundSM - Institutional Class cumulative total return and show you what would have happened if Fidelity Advisor Freedom 2015 Fund - Institutional Class shares had performed at a constant rate each year. These numbers will be reported once the fund is a year old. In addition, the growth of the hypothetical $10,000 investment in the fund will appear in the fund's next report.
Annual Report
Fidelity Advisor Freedom 2020 Fund SM - Institutional Class
Performance: The Bottom Line
Average annual total return reflects the change in the value of an investment, assuming reinvestment of the class' dividend income and capital gains (the profits earned upon the sale of securities that have grown in value) and assuming a constant rate of performance each year. During periods of reimbursement by Fidelity, a fund's total return will be greater than it would be had the reimbursement not occurred. The $10,000 table and the class's returns do not reflect the deduction of taxes that a shareholder would pay on fund distributions or the redemption of fund shares. How a fund did yesterday is no guarantee of how it will do tomorrow.
Average Annual Total Returns
Average annual total returns take Fidelity Advisor Freedom 2020 FundSM - Institutional Class cumulative total return and show you what would have happened if Fidelity Advisor Freedom 2020 Fund - Institutional Class shares had performed at a constant rate each year. These numbers will be reported once the fund is a year old.
$10,000 Over Life of Fund
Let's say hypothetically that $10,000 was invested in Fidelity Advisor Freedom 2020 - Institutional Class on July 24, 2003, when the fund started. The chart shows how the value of the investment would have grown, and also shows how the Standard & Poor's 500SM Index did over the same period.
Annual Report
Fidelity Advisor Freedom 2025 Fund SM - Institutional Class
Performance: The Bottom Line
Average annual total return reflects the change in the value of an investment, assuming reinvestment of the fund's dividend income and capital gains (the profits earned upon the sale of securities that have grown in value) and assuming a constant rate of performance each year. During periods of reimbursement by Fidelity, a fund's total return will be greater than it would be had the reimbursement not occurred. How a fund did yesterday is no guarantee of how it will do tomorrow.
Average Annual Total Returns
Average annual total returns take Fidelity Advisor Freedom 2025 FundSM - Institutional Class cumulative total return and show you what would have happened if Fidelity Advisor Freedom 2025 Fund - Institutional Class shares had performed at a constant rate each year. These numbers will be reported once the fund is a year old. In addition, the growth of the hypothetical $10,000 investment in the fund will appear in the fund's next report.
Annual Report
Fidelity Advisor Freedom 2030 Fund SM - Institutional Class
Performance: The Bottom Line
Average annual total return reflects the change in the value of an investment, assuming reinvestment of the class' dividend income and capital gains (the profits earned upon the sale of securities that have grown in value) and assuming a constant rate of performance each year. During periods of reimbursement by Fidelity, a fund's total return will be greater than it would be had the reimbursement not occurred. The $10,000 table and the class's returns do not reflect the deduction of taxes that a shareholder would pay on fund distributions or the redemption of fund shares. How a fund did yesterday is no guarantee of how it will do tomorrow.
Average Annual Total Returns
Average annual total returns take Fidelity Advisor Freedom 2030 FundSM - Institutional Class cumulative total return and show you what would have happened if Fidelity Advisor Freedom 2030 Fund - Institutional Class shares had performed at a constant rate each year. These numbers will be reported once the fund is a year old.
$10,000 Over Life of Fund
Let's say hypothetically that $10,000 was invested in Fidelity Advisor Freedom 2030 - Institutional Class on July 24, 2003, when the fund started. The chart shows how the value of the investment would have grown, and also shows how the Standard & Poor's 500 Index did over the same period.
Annual Report
Fidelity Advisor Freedom 2035 Fund SM - Institutional Class
Performance: The Bottom Line
Average annual total return reflects the change in the value of an investment, assuming reinvestment of the fund's dividend income and capital gains (the profits earned upon the sale of securities that have grown in value) and assuming a constant rate of performance each year. During periods of reimbursement by Fidelity, a fund's total return will be greater than it would be had the reimbursement not occurred. How a fund did yesterday is no guarantee of how it will do tomorrow.
Average Annual Total Returns
Average annual total returns take Fidelity Advisor Freedom 2035 FundSM - Institutional Class cumulative total return and show you what would have happened if Fidelity Advisor Freedom 2035 Fund - Institutional Class shares had performed at a constant rate each year. These numbers will be reported once the fund is a year old. In addition, the growth of the hypothetical $10,000 investment in the fund will appear in the fund's next report.
Annual Report
Fidelity Advisor Freedom 2040 FundSM - Institutional Class
Performance: The Bottom Line
Average annual total return reflects the change in the value of an investment, assuming reinvestment of the class' dividend income and capital gains (the profits earned upon the sale of securities that have grown in value) and assuming a constant rate of performance each year. During periods of reimbursement by Fidelity, a fund's total return will be greater than it would be had the reimbursement not occurred. The $10,000 table and the class's returns do not reflect the deduction of taxes that a shareholder would pay on fund distributions or the redemption of fund shares. How a fund did yesterday is no guarantee of how it will do tomorrow.
Average Annual Total Returns
Average annual total returns take Fidelity Advisor Freedom 2040 FundSM - Institutional Class cumulative total return and show you what would have happened if Fidelity Advisor Freedom 2040 Fund - Institutional Class shares had performed at a constant rate each year. These numbers will be reported once the fund is a year old.
$10,000 Over Life of Fund
Let's say hypothetically that $10,000 was invested in Fidelity Advisor Freedom 2040 - Institutional Class on July 24, 2003, when the fund started. The chart shows how the value of the investment would have grown, and also shows how the Standard & Poor's 500 Index did over the same period.

Annual Report
Management's Discussion of Fund Performance
Comments from Ren Cheng, Portfolio Manager of Fidelity Advisor Freedom FundsSM
Robust economic growth and rising corporate profitability helped fuel a broad-based rally in the U.S. equity markets during the 12-month period ending March 31, 2004. Most notably, the Russell 2000® Index, a benchmark for small-cap stock returns, soared 63.83%. The NASDAQ Composite® Index gained 49.38%, driven by strong returns from technology and telecommunications stocks. Elsewhere, the large-cap-oriented Standard & Poor's 500SM Index rose 35.12%, while the blue-chips' Dow Jones Industrial AverageSM advanced 32.39%. Overseas equity markets also performed well based on improving economic data around the world. The Morgan Stanley Capital InternationalSM Europe, Australasia, Far East (MSCI® EAFE®) Index, a proxy for the performance of the overseas equity markets, rose 57.93%. Turning to fixed-income results, the Lehman Brothers® Aggregate Bond Index, a broad measure of the U.S. taxable bond market, returned 5.41% during the past year. Buoyed by an improving business climate, corporate bonds were the top-performing fixed-income category, as evidenced by the 8.61% gain for the Lehman Brothers Credit Bond Index.
The Advisor Freedom Funds performed well from their inception dates through the end of the period on March 31, 2004, delivering a range of returns appropriate to portfolios with different asset allocations. On a relative basis, the Advisor Freedom Funds trailed their respective benchmarks by small margins due primarily to weakness in their underlying domestic equity holdings. More specifically, the individual returns of Fidelity® Advisor Growth & Income Fund, Fidelity Advisor Dividend Growth Fund, Fidelity Advisor Large Cap Fund and Fidelity Advisor Equity Growth Fund trailed the return of the Wilshire 5000® Total Market Index since the inception of the original Advisor Freedom Funds - Income, 2010, 2020, 2030 and 2040 - on July 24, 2003. On the positive side of the ledger, the diversified international portfolios - Fidelity Advisor Diversified International Fund and Fidelity Advisor Overseas Fund - both outperformed the MSCI EAFE index. Elsewhere, Fidelity Advisor High Income Advantage Fund outperformed the Merrill Lynch® U.S. High Yield Master II Index, providing a boost to the total return of those Advisor Freedom Funds with an allocation to high-yield bonds.
The views expressed in this statement reflect those of the portfolio manager only through the end of the period of the report as stated on the cover and do not necessarily represent the views of Fidelity or any other person in the Fidelity organization. Any such views are subject to change at any time based upon market or other conditions and Fidelity disclaims any responsibility to update such views. These views may not be relied on as investment advice and, because investment decisions for a Fidelity fund are based on numerous factors, may not be relied on as an indication of trading intent on behalf of any Fidelity fund.
Annual Report
Fidelity Advisor Freedom Income Fund
Investment Changes
Fund Holdings as of March 31, 2004 |
| % of fund's
investments | % of fund's investments
6 months ago |
Domestic Equity Funds | | |
Fidelity Advisor Dividend Growth Fund
Institutional Class | 4.0% | 3.8% |
Fidelity Advisor Equity Growth Fund
Institutional Class | 2.0 | 1.9 |
Fidelity Advisor Equity Income Fund
Institutional Class | 4.2 | 3.9 |
Fidelity Advisor Growth & Income Fund
Institutional Class | 3.9 | 3.8 |
Fidelity Advisor Large Cap Fund
Institutional Class | 4.0 | 3.8 |
Fidelity Advisor Mid-Cap Fund
Institutional Class | 1.2 | 1.2 |
Fidelity Advisor Small Cap Fund
Institutional Class | 1.3 | 1.1 |
| 20.6 | 19.5 |
Investment Grade Fixed-Income Funds | | |
Fidelity Advisor Government Investment Fund
Institutional Class | 20.1 | 20.4 |
Fidelity Advisor Intermediate Bond Fund
Institutional Class | 20.1 | 20.3 |
| 40.2 | 40.7 |
Short-Term Fixed-Income Funds | | |
Fidelity Advisor Short-Fixed Income Fund
Institutional Class | 15.8 | 16.0 |
Money Market Fund | | |
Fidelity Cash Reserves Fund | 23.4 | 23.8 |
| 100.0% | 100.0% |
Annual Report
Fidelity Advisor Freedom Income Fund
Investment Changes - continued
Asset Allocation (% of fund's investments)

The fund invests according to an asset allocation strategy that becomes increasingly conservative over time. The six months ago allocation is based on the fund's holdings as of September 30, 2003. The current allocation is based on the fund's holdings as of March 31, 2004. The expected allocation represents the fund's anticipated target asset allocation at September 30, 2004.
Annual Report
Fidelity Advisor Freedom Income Fund
Investments March 31, 2004
Showing Percentage of Total Value of Investment in Securities
Equity Funds - 20.6% |
| Shares | | Value (Note 1) |
Domestic Equity Funds - 20.6% |
Fidelity Advisor Dividend Growth Fund Institutional Class | 113,981 | | $ 1,314,205 |
Fidelity Advisor Equity Growth Fund Institutional Class | 14,003 | | 660,125 |
Fidelity Advisor Equity Income Fund Institutional Class | 50,288 | | 1,356,262 |
Fidelity Advisor Growth & Income Fund Institutional Class | 79,602 | | 1,284,771 |
Fidelity Advisor Large Cap Fund Institutional Class | 88,368 | | 1,305,192 |
Fidelity Advisor Mid-Cap Fund Institutional Class | 17,464 | | 403,059 |
Fidelity Advisor Small Cap Fund Institutional Class | 19,188 | | 422,133 |
TOTAL EQUITY FUNDS (Cost $6,396,725) | 6,745,747 |
Fixed-Income Funds - 56.0% |
| | | |
Investment Grade Fixed-Income Funds - 40.2% |
Fidelity Advisor Government Investment Fund Institutional Class | 646,411 | | 6,586,927 |
Fidelity Advisor Intermediate Bond Fund Institutional Class | 573,880 | | 6,588,140 |
TOTAL INVESTMENT GRADE FIXED-INCOME FUNDS | | 13,175,067 |
Short-Term Fixed-Income Funds - 15.8% |
Fidelity Advisor Short-Fixed Income Fund Institutional Class | 538,122 | | 5,203,638 |
TOTAL FIXED-INCOME FUNDS (Cost $18,162,636) | 18,378,705 |
Money Market Fund - 23.4% |
| | | |
Fidelity Cash Reserves Fund
(Cost $7,676,434) | 7,676,434 | | 7,676,434 |
TOTAL INVESTMENT IN SECURITIES - 100% (Cost $32,235,795) | $ 32,800,886 |
Other Information |
Purchases and redemptions of the underlying fund shares aggregated $37,483,614 and $5,218,740, respectively. |
See accompanying notes which are an integral part of the financial statements.
Annual Report
Fidelity Advisor Freedom Income Fund
Financial Statements
Statement of Assets and Liabilities
| March 31, 2004 |
| | |
Assets | | |
Investment in securities, at value (cost $32,235,795) - See accompanying schedule | | $ 32,800,886 |
Cash | | 243,642 |
Receivable for investments sold | | 37,442 |
Total assets | | 33,081,970 |
| | |
Liabilities | | |
Payable for investments purchased | $ 97,412 | |
Payable for fund shares redeemed | 164,149 | |
Accrued management fee | 3,781 | |
Distribution fees payable | 17,073 | |
Total liabilities | | 282,415 |
| | |
Net Assets | | $ 32,799,555 |
Net Assets consist of: | | |
Paid in capital | | $ 32,198,302 |
Undistributed net investment income | | 1,120 |
Accumulated undistributed net realized gain (loss) on investments | | 35,042 |
Net unrealized appreciation (depreciation) on investments | | 565,091 |
Net Assets | | $ 32,799,555 |
See accompanying notes which are an integral part of the financial statements.
Annual Report
Fidelity Advisor Freedom Income Fund
Financial Statements - continued
Statement of Assets and Liabilities - continued
| March 31, 2004 |
Calculation of Maximum Offering Price | | |
Class A:
Net Asset Value and redemption price per share ($5,008,636 ÷ 481,450 shares) | | $ 10.40 |
| | |
Maximum offering price per share (100/94.25 of $10.40) | | $ 11.03 |
Class T:
Net Asset Value and redemption price per share ($14,535,367 ÷ 1,398,681 shares) | | $ 10.39 |
| | |
Maximum offering price per share (100/96.50 of $10.39) | | $ 10.77 |
Class B:
Net Asset Value and offering price per share ($3,648,581 ÷ 351,631 shares) A | | $ 10.38 |
| | |
Class C:
Net Asset Value and offering price per share ($9,247,896 ÷ 891,493 shares) A | | $ 10.37 |
| | |
Institutional Class:
Net Asset Value, offering price and redemption price per share ($359,075 ÷ 34,492 shares) | | $ 10.41 |
A Redemption price per share is equal to net asset value less any applicable contingent deferred sales charge.
See accompanying notes which are an integral part of the financial statements.
Annual Report
Statement of Operations
| July 24, 2003 (commencement of operations) to March 31, 2004 |
| | |
Investment Income | | |
Income distributions from underlying funds | | $ 235,721 |
| | |
Expenses | | |
Management fee | $ 11,067 | |
Distribution fees | 73,426 | |
Non-interested trustees' compensation | 40 | |
Total expenses before reductions | 84,533 | |
Expense reductions | (2,717) | 81,816 |
Net investment income (loss) | | 153,905 |
Realized and Unrealized Gain (Loss) | | |
Realized gain (loss) on sale of underlying fund shares | (29,080) | |
Capital gain distributions from underlying funds | 67,705 | 38,625 |
Change in net unrealized appreciation (depreciation) on investment securities | | 565,091 |
Net gain (loss) | | 603,716 |
Net increase (decrease) in net assets resulting from operations | | $ 757,621 |
See accompanying notes which are an integral part of the financial statements.
Annual Report
Fidelity Advisor Freedom Income Fund
Financial Statements - continued
Statement of Changes in Net Assets
| July 24, 2003
(commencement of
operations) to
March 31, 2004 |
Increase (Decrease) in Net Assets | |
Operations | |
Net investment income (loss) | $ 153,905 |
Net realized gain (loss) | 38,625 |
Change in net unrealized appreciation (depreciation) | 565,091 |
Net increase (decrease) in net assets resulting from operations | 757,621 |
Distributions to shareholders from net investment income | (156,368) |
Share transactions - net increase (decrease) | 32,198,302 |
Total increase (decrease) in net assets | 32,799,555 |
| |
Net Assets | |
Beginning of period | - |
End of period (including undistributed net investment income of $1,120) | $ 32,799,555 |
See accompanying notes which are an integral part of the financial statements.
Annual Report
Financial Highlights - Class A
Year ended March 31, | 2004F |
Selected Per-Share Data | |
Net asset value, beginning of period | $ 10.00 |
Income from Investment Operations | |
Net investment income (loss)E | .13 |
Net realized and unrealized gain (loss) | .36 |
Total from investment operations | .49 |
Distributions from net investment income | (.09) |
Net asset value, end of period | $ 10.40 |
Total ReturnB,C,D | 4.95% |
Ratios to Average Net AssetsG | |
Expenses before expense reductions | .35%A |
Expenses net of voluntary waivers, if any | .33%A |
Expenses net of all reductions | .33%A |
Net investment income (loss) | 1.81%A |
Supplemental Data | |
Net assets, end of period (000 omitted) | $ 5,009 |
Portfolio turnover rate | 46%A |
A Annualized
B Total returns for periods of less than one year are not annualized.
C Total returns would have been lower had certain expenses not been reduced during the periods shown.
D Total returns do not include the effect of the sales charges.
E Calculated based on average shares outstanding during the period.
F For the period July 24, 2003 (commencement of operations) to March 31, 2004.
G Expense ratios reflect operating expenses of the class. Expenses before reductions do not reflect amounts reimbursed by the investment adviser or reductions from brokerage service arrangements or other expense offset arrangements and do not represent the amount paid by the class during periods when reimbursements or reductions occur. Expenses net of any voluntary waivers reflect expenses after reimbursement by the investment adviser but prior to reductions from brokerage service arrangements or other expense offset arrangements. Expenses net of all reductions represent the net expenses paid by the class.
See accompanying notes which are an integral part of the financial statements.
Annual Report
Financial Highlights - Class T
Year ended March 31, | 2004F |
Selected Per-Share Data | |
Net asset value, beginning of period | $ 10.00 |
Income from Investment Operations | |
Net investment income (loss)E | .11 |
Net realized and unrealized gain (loss) | .37 |
Total from investment operations | .48 |
Distributions from net investment income | (.09) |
Net asset value, end of period | $ 10.39 |
Total ReturnB,C,D | 4.78% |
Ratios to Average Net AssetsG | |
Expenses before expense reductions | .60%A |
Expenses net of voluntary waivers, if any | .58%A |
Expenses net of all reductions | .58%A |
Net investment income (loss) | 1.56%A |
Supplemental Data | |
Net assets, end of period (000 omitted) | $ 14,535 |
Portfolio turnover rate | 46%A |
A Annualized
B Total returns for periods of less than one year are not annualized.
C Total returns would have been lower had certain expenses not been reduced during the periods shown.
D Total returns do not include the effect of the sales charges.
E Calculated based on average shares outstanding during the period.
F For the period July 24, 2003 (commencement of operations) to March 31, 2004.
G Expense ratios reflect operating expenses of the class. Expenses before reductions do not reflect amounts reimbursed by the investment adviser or reductions from brokerage service arrangements or other expense offset arrangements and do not represent the amount paid by the class during periods when reimbursements or reductions occur. Expenses net of any voluntary waivers reflect expenses after reimbursement by the investment adviser but prior to reductions from brokerage service arrangements or other expense offset arrangements. Expenses net of all reductions represent the net expenses paid by the class.
See accompanying notes which are an integral part of the financial statements.
Annual Report
Financial Highlights - Class B
Year ended March 31, | 2004F |
Selected Per-Share Data | |
Net asset value, beginning of period | $ 10.00 |
Income from Investment Operations | |
Net investment income (loss)E | .07 |
Net realized and unrealized gain (loss) | .37 |
Total from investment operations | .44 |
Distributions from net investment income | (.06) |
Net asset value, end of period | $ 10.38 |
Total ReturnB,C,D | 4.45% |
Ratios to Average Net AssetsG | |
Expenses before expense reductions | 1.10%A |
Expenses net of voluntary waivers, if any | 1.08%A |
Expenses net of all reductions | 1.08%A |
Net investment income (loss) | 1.06%A |
Supplemental Data | |
Net assets, end of period (000 omitted) | $ 3,649 |
Portfolio turnover rate | 46%A |
A Annualized
B Total returns for periods of less than one year are not annualized.
C Total returns would have been lower had certain expenses not been reduced during the periods shown.
D Total returns do not include the effect of the contingent deferred sales charge.
E Calculated based on average shares outstanding during the period.
F For the period July 24, 2003 (commencement of operations) to March 31, 2004.
G Expense ratios reflect operating expenses of the class. Expenses before reductions do not reflect amounts reimbursed by the investment adviser or reductions from brokerage service arrangements or other expense offset arrangements and do not represent the amount paid by the class during periods when reimbursements or reductions occur. Expenses net of any voluntary waivers reflect expenses after reimbursement by the investment adviser but prior to reductions from brokerage service arrangements or other expense offset arrangements. Expenses net of all reductions represent the net expenses paid by the class.
See accompanying notes which are an integral part of the financial statements.
Annual Report
Financial Highlights - Class C
Year ended March 31, | 2004F |
Selected Per-Share Data | |
Net asset value, beginning of period | $ 10.00 |
Income from Investment Operations | |
Net investment income (loss)E | .07 |
Net realized and unrealized gain (loss) | .37 |
Total from investment operations | .44 |
Distributions from net investment income | (.07) |
Net asset value, end of period | $ 10.37 |
Total ReturnB,C,D | 4.39% |
Ratios to Average Net AssetsG | |
Expenses before expense reductions | 1.10%A |
Expenses net of voluntary waivers, if any | 1.08%A |
Expenses net of all reductions | 1.08%A |
Net investment income (loss) | 1.06%A |
Supplemental Data | |
Net assets, end of period (000 omitted) | $ 9,248 |
Portfolio turnover rate | 46%A |
A Annualized
B Total returns for periods of less than one year are not annualized.
C Total returns would have been lower had certain expenses not been reduced during the periods shown.
D Total returns do not include the effect of the contingent deferred sales charge.
E Calculated based on average shares outstanding during the period.
F For the period July 24, 2003 (commencement of operations) to March 31, 2004.
G Expense ratios reflect operating expenses of the class. Expenses before reductions do not reflect amounts reimbursed by the investment adviser or reductions from brokerage service arrangements or other expense offset arrangements and do not represent the amount paid by the class during periods when reimbursements or reductions occur. Expenses net of any voluntary waivers reflect expenses after reimbursement by the investment adviser but prior to reductions from brokerage service arrangements or other expense offset arrangements. Expenses net of all reductions represent the net expenses paid by the class.
See accompanying notes which are an integral part of the financial statements.
Annual Report
Financial Highlights - Institutional Class
Year ended March 31, | 2004E |
Selected Per-Share Data | |
Net asset value, beginning of period | $ 10.00 |
Income from Investment Operations | |
Net investment income (loss)D | .14 |
Net realized and unrealized gain (loss) | .37 |
Total from investment operations | .51 |
Distributions from net investment income | (.10) |
Net asset value, end of period | $ 10.41 |
Total ReturnB,C | 5.16% |
Ratios to Average Net AssetsF | |
Expenses before expense reductions | .10%A |
Expenses net of voluntary waivers, if any | .08%A |
Expenses net of all reductions | .08%A |
Net investment income (loss) | 2.05%A |
Supplemental Data | |
Net assets, end of period (000 omitted) | $ 359 |
Portfolio turnover rate | 46%A |
A Annualized
B Total returns for periods of less than one year are not annualized.
C Total returns would have been lower had certain expenses not been reduced during the periods shown.
D Calculated based on average shares outstanding during the period.
E For the period July 24, 2003 (commencement of operations) to March 31, 2004.
F Expense ratios reflect operating expenses of the class. Expenses before reductions do not reflect amounts reimbursed by the investment adviser or reductions from brokerage service arrangements or other expense offset arrangements and do not represent the amount paid by the class during periods when reimbursements or reductions occur. Expenses net of any voluntary waivers reflect expenses after reimbursement by the investment adviser but prior to reductions from brokerage service arrangements or other expense offset arrangements. Expenses net of all reductions represent the net expenses paid by the class.
See accompanying notes which are an integral part of the financial statements.
Annual Report
Fidelity Advisor Freedom 2005 Fund
Investment Summary
Fund Holdings as of March 31, 2004 |
| % of fund's
investments |
Domestic Equity Funds | |
Fidelity Advisor Dividend Growth Fund Institutional Class | 7.8% |
Fidelity Advisor Equity Growth Fund Institutional Class | 3.9 |
Fidelity Advisor Equity Income Fund Institutional Class | 7.9 |
Fidelity Advisor Growth & Income Fund Institutional Class | 7.7 |
Fidelity Advisor Large Cap Fund Institutional Class | 7.8 |
Fidelity Advisor Mid-Cap Fund Institutional Class | 2.4 |
Fidelity Advisor Small Cap Fund Institutional Class | 2.5 |
| 40.0 |
International Equity Funds | |
Fidelity Advisor Diversified International Fund Institutional Class | 2.6 |
Fidelity Advisor Overseas Fund Institutional Class | 2.6 |
| 5.2 |
High Yield Fixed-Income Funds | |
Fidelity Advisor High Income Advantage Fund Institutional Class | 5.0 |
Investment Grade Fixed-Income Funds | |
Fidelity Advisor Government Investment Fund Institutional Class | 20.0 |
Fidelity Advisor Intermediate Bond Fund Institutional Class | 20.1 |
| 40.1 |
Short-Term Fixed-Income Funds | |
Fidelity Advisor Short-Fixed Income Fund Institutional Class | 4.0 |
Money Market Fund | |
Fidelity Cash Reserves Fund | 5.7 |
| 100.0% |
Annual Report
Fidelity Advisor Freedom 2005 Fund
Investment Summary - continued
Asset Allocation (% of fund's investments)
The fund invests according to an asset allocation strategy that becomes increasingly conservative over time. The initial allocation represents the target asset allocation at inception. The current allocation is based on the fund's holdings as of March 31, 2004. The expected allocation represents the fund's anticipated target asset allocation at September 30, 2004.
Annual Report
Fidelity Advisor Freedom 2005 Fund
Investments March 31, 2004
Showing Percentage of Total Value of Investment in Securities
Equity Funds - 45.2% |
| Shares | | Value (Note 1) |
Domestic Equity Funds - 40.0% |
Fidelity Advisor Dividend Growth Fund Institutional Class | 41,237 | | $ 475,461 |
Fidelity Advisor Equity Growth Fund Institutional Class | 5,076 | | 239,271 |
Fidelity Advisor Equity Income Fund Institutional Class | 17,904 | | 482,871 |
Fidelity Advisor Growth & Income Fund Institutional Class | 29,168 | | 470,768 |
Fidelity Advisor Large Cap Fund Institutional Class | 32,030 | | 473,086 |
Fidelity Advisor Mid-Cap Fund Institutional Class | 6,232 | | 143,842 |
Fidelity Advisor Small Cap Fund Institutional Class | 6,768 | | 148,891 |
TOTAL DOMESTIC EQUITY FUNDS | | 2,434,190 |
International Equity Funds - 5.2% |
Fidelity Advisor Diversified International Fund Institutional Class | 9,312 | | 158,405 |
Fidelity Advisor Overseas Fund Institutional Class | 9,485 | | 157,736 |
TOTAL INTERNATIONAL EQUITY FUNDS | | 316,141 |
TOTAL EQUITY FUNDS (Cost $2,705,141) | 2,750,331 |
Fixed-Income Funds - 49.1% |
| | | |
High Yield Fixed-Income Funds - 5.0% |
Fidelity Advisor High Income Advantage Fund Institutional Class | 32,890 | | 303,905 |
Investment Grade Fixed-Income Funds - 40.1% |
Fidelity Advisor Government Investment Fund Institutional Class | 119,533 | | 1,218,042 |
Fidelity Advisor Intermediate Bond Fund Institutional Class | 106,125 | | 1,218,318 |
TOTAL INVESTMENT GRADE FIXED-INCOME FUNDS | | 2,436,360 |
Short-Term Fixed-Income Funds - 4.0% |
Fidelity Advisor Short-Fixed Income Fund Institutional Class | 25,047 | | 242,202 |
TOTAL FIXED-INCOME FUNDS (Cost $2,966,809) | 2,982,467 |
Money Market Fund - 5.7% |
| Shares | | Value (Note 1) |
Fidelity Cash Reserves Fund
(Cost $346,307) | 346,307 | | $ 346,307 |
TOTAL INVESTMENT IN SECURITIES - 100% (Cost $6,018,257) | $ 6,079,105 |
Other Information |
Purchases and redemptions of the underlying fund shares aggregated $6,105,267 and $86,233, respectively. |
See accompanying notes which are an integral part of the financial statements.
Annual Report
Fidelity Advisor Freedom 2005 Fund
Financial Statements
Statement of Assets and Liabilities
| March 31, 2004 |
| | |
Assets | | |
Investment in securities, at value (cost $6,018,257) - See accompanying schedule | | $ 6,079,105 |
Cash | | 28 |
Receivable for fund shares sold | | 314,739 |
Total assets | | 6,393,872 |
| | |
Liabilities | | |
Payable for investments purchased | $ 300,196 | |
Accrued management fee | 586 | |
Distribution fees payable | 2,343 | |
Total liabilities | | 303,125 |
| | |
Net Assets | | $ 6,090,747 |
Net Assets consist of: | | |
Paid in capital | | $ 6,016,499 |
Undistributed net investment income | | 10,206 |
Accumulated undistributed net realized gain (loss) on investments | | 3,194 |
Net unrealized appreciation (depreciation) on investments | | 60,848 |
Net Assets | | $ 6,090,747 |
See accompanying notes which are an integral part of the financial statements.
Annual Report
Fidelity Advisor Freedom 2005 Fund
Financial Statements - continued
Statement of Assets and Liabilities - continued
| March 31, 2004 |
Calculation of Maximum Offering Price | | |
Class A:
Net Asset Value and redemption price per share ($1,386,469 ÷ 132,211 shares) | | $ 10.49 |
| | |
Maximum offering price per share (100/94.25 of $10.49) | | $ 11.13 |
Class T:
Net Asset Value and redemption price per share ($2,031,359 ÷ 193,801 shares) | | $ 10.48 |
| | |
Maximum offering price per share (100/96.50 of $10.48) | | $ 10.86 |
Class B:
Net Asset Value and offering price per share ($1,202,573 ÷ 114,894 shares) A | | $ 10.47 |
| | |
Class C:
Net Asset Value and offering price per share ($1,073,273 ÷ 102,503 shares) A | | $ 10.47 |
| | |
Institutional Class:
Net Asset Value, offering price and redemption price per share ($397,073 ÷ 37,835 shares) | | $ 10.49 |
A Redemption price per share is equal to net asset value less any applicable contingent deferred sales charge.
See accompanying notes which are an integral part of the financial statements.
Annual Report
Statement of Operations
| November 6, 2003 (commencement of operations) to March 31, 2004 |
| | |
Investment Income | | |
Income distributions from underlying funds | | $ 25,035 |
Interest | | 28 |
Total income | | 25,063 |
| | |
Expenses | | |
Management fee | $ 975 | |
Distribution fees | 5,704 | |
Non-interested trustees' compensation | 3 | |
Total expenses before reductions | 6,682 | |
Expense reductions | (170) | 6,512 |
Net investment income (loss) | | 18,551 |
Realized and Unrealized Gain (Loss) Realized gain (loss) on sale of underlying fund shares | (777) | |
Capital gain distributions from underlying funds | 4,194 | 3,417 |
Change in net unrealized appreciation (depreciation) on investment securities | | 60,848 |
Net gain (loss) | | 64,265 |
Net increase (decrease) in net assets resulting from operations | | $ 82,816 |
See accompanying notes which are an integral part of the financial statements.
Annual Report
Fidelity Advisor Freedom 2005 Fund
Financial Statements - continued
Statement of Changes in Net Assets
| November 6, 2003
(commencement of
operations) to
March 31, 2004 |
Increase (Decrease) in Net Assets | |
Operations | |
Net investment income (loss) | $ 18,551 |
Net realized gain (loss) | 3,417 |
Change in net unrealized appreciation (depreciation) | 60,848 |
Net increase (decrease) in net assets resulting from operations | 82,816 |
Distributions to shareholders from net investment income | (8,568) |
Share transactions - net increase (decrease) | 6,016,499 |
Total increase (decrease) in net assets | 6,090,747 |
| |
Net Assets | |
Beginning of period | - |
End of period (including undistributed net investment income of $10,206) | $ 6,090,747 |
See accompanying notes which are an integral part of the financial statements.
Annual Report
Financial Highlights - Class A
Year ended March 31, | 2004F |
Selected Per-Share Data | |
Net asset value, beginning of period | $ 10.00 |
Income from Investment Operations | |
Net investment income (loss)E | .09 |
Net realized and unrealized gain (loss) | .46 |
Total from investment operations | .55 |
Distributions from net investment income | (.06) |
Net asset value, end of period | $ 10.49 |
Total ReturnB,C,D | 5.52% |
Ratios to Average Net AssetsG | |
Expenses before expense reductions | .35%A |
Expenses net of voluntary waivers, if any | .33%A |
Expenses net of all reductions | .33%A |
Net investment income (loss) | 2.21%A |
Supplemental Data | |
Net assets, end of period (000 omitted) | $ 1,386 |
Portfolio turnover rate | 9%A |
A Annualized
B Total returns for periods of less than one year are not annualized.
C Total returns would have been lower had certain expenses not been reduced during the periods shown.
D Total returns do not include the effect of the sales charges.
E Calculated based on average shares outstanding during the period.
F For the period November 6, 2003 (commencement of operations) to March 31, 2004.
G Expense ratios reflect operating expenses of the class. Expenses before reductions do not reflect amounts reimbursed by the investment adviser or reductions from brokerage service arrangements or other expense offset arrangements and do not represent the amount paid by the class during periods when reimbursements or reductions occur. Expenses net of any voluntary waivers reflect expenses after reimbursement by the investment adviser but prior to reductions from brokerage service arrangements or other expense offset arrangements. Expenses net of all reductions represent the net expenses paid by the class.
See accompanying notes which are an integral part of the financial statements.
Annual Report
Financial Highlights - Class T
Year ended March 31, | 2004F |
Selected Per-Share Data | |
Net asset value, beginning of period | $ 10.00 |
Income from Investment Operations | |
Net investment income (loss)E | .08 |
Net realized and unrealized gain (loss) | .46 |
Total from investment operations | .54 |
Distributions from net investment income | (.06) |
Net asset value, end of period | $ 10.48 |
Total ReturnB,C,D | 5.36% |
Ratios to Average Net AssetsG | |
Expenses before expense reductions | .60%A |
Expenses net of voluntary waivers, if any | .58%A |
Expenses net of all reductions | .58%A |
Net investment income (loss) | 1.97%A |
Supplemental Data | |
Net assets, end of period (000 omitted) | $ 2,031 |
Portfolio turnover rate | 9%A |
A Annualized
B Total returns for periods of less than one year are not annualized.
C Total returns would have been lower had certain expenses not been reduced during the periods shown.
D Total returns do not include the effect of the sales charges.
E Calculated based on average shares outstanding during the period.
F For the period November 6, 2003 (commencement of operations) to March 31, 2004.
G Expense ratios reflect operating expenses of the class. Expenses before reductions do not reflect amounts reimbursed by the investment adviser or reductions from brokerage service arrangements or other expense offset arrangements and do not represent the amount paid by the class during periods when reimbursements or reductions occur. Expenses net of any voluntary waivers reflect expenses after reimbursement by the investment adviser but prior to reductions from brokerage service arrangements or other expense offset arrangements. Expenses net of all reductions represent the net expenses paid by the class.
See accompanying notes which are an integral part of the financial statements.
Annual Report
Financial Highlights - Class B
Year ended March 31, | 2004F |
Selected Per-Share Data | |
Net asset value, beginning of period | $ 10.00 |
Income from Investment Operations | |
Net investment income (loss)E | .06 |
Net realized and unrealized gain (loss) | .46 |
Total from investment operations | .52 |
Distributions from net investment income | (.05) |
Net asset value, end of period | $ 10.47 |
Total ReturnB,C,D | 5.21% |
Ratios to Average Net AssetsG | |
Expenses before expense reductions | 1.10%A |
Expenses net of voluntary waivers, if any | 1.08%A |
Expenses net of all reductions | 1.08%A |
Net investment income (loss) | 1.47%A |
Supplemental Data | |
Net assets, end of period (000 omitted) | $ 1,203 |
Portfolio turnover rate | 9%A |
A Annualized
B Total returns for periods of less than one year are not annualized.
C Total returns would have been lower had certain expenses not been reduced during the periods shown.
D Total returns do not include the effect of the contingent deferred sales charge.
E Calculated based on average shares outstanding during the period.
F For the period November 6, 2003 (commencement of operations) to March 31, 2004.
G Expense ratios reflect operating expenses of the class. Expenses before reductions do not reflect amounts reimbursed by the investment adviser or reductions from brokerage service arrangements or other expense offset arrangements and do not represent the amount paid by the class during periods when reimbursements or reductions occur. Expenses net of any voluntary waivers reflect expenses after reimbursement by the investment adviser but prior to reductions from brokerage service arrangements or other expense offset arrangements. Expenses net of all reductions represent the net expenses paid by the class.
See accompanying notes which are an integral part of the financial statements.
Annual Report
Financial Highlights - Class C
Year ended March 31, | 2004F |
Selected Per-Share Data | |
Net asset value, beginning of period | $ 10.00 |
Income from Investment Operations | |
Net investment income (loss)E | .06 |
Net realized and unrealized gain (loss) | .46 |
Total from investment operations | .52 |
Distributions from net investment income | (.05) |
Net asset value, end of period | $ 10.47 |
Total ReturnB,C,D | 5.21% |
Ratios to Average Net AssetsG | |
Expenses before expense reductions | 1.10%A |
Expenses net of voluntary waivers, if any | 1.08%A |
Expenses net of all reductions | 1.08%A |
Net investment income (loss) | 1.47%A |
Supplemental Data | |
Net assets, end of period (000 omitted) | $ 1,073 |
Portfolio turnover rate | 9%A |
A Annualized
B Total returns for periods of less than one year are not annualized.
C Total returns would have been lower had certain expenses not been reduced during the periods shown.
D Total returns do not include the effect of the contingent deferred sales charge.
E Calculated based on average shares outstanding during the period.
F For the period November 6, 2003 (commencement of operations) to March 31, 2004.
G Expense ratios reflect operating expenses of the class. Expenses before reductions do not reflect amounts reimbursed by the investment adviser or reductions from brokerage service arrangements or other expense offset arrangements and do not represent the amount paid by the class during periods when reimbursements or reductions occur. Expenses net of any voluntary waivers reflect expenses after reimbursement by the investment adviser but prior to reductions from brokerage service arrangements or other expense offset arrangements. Expenses net of all reductions represent the net expenses paid by the class.
See accompanying notes which are an integral part of the financial statements.
Annual Report
Financial Highlights - Institutional Class
Year ended March 31, | 2004E |
Selected Per-Share Data | |
Net asset value, beginning of period | $ 10.00 |
Income from Investment Operations | |
Net investment income (loss)D | .10 |
Net realized and unrealized gain (loss) | .45 |
Total from investment operations | .55 |
Distributions from net investment income | (.06) |
Net asset value, end of period | $ 10.49 |
Total ReturnB,C | 5.52% |
Ratios to Average Net AssetsF | |
Expenses before expense reductions | .10%A |
Expenses net of voluntary waivers, if any | .08%A |
Expenses net of all reductions | .08%A |
Net investment income (loss) | 2.46%A |
Supplemental Data | |
Net assets, end of period (000 omitted) | $ 397 |
Portfolio turnover rate | 9%A |
A Annualized
B Total returns for periods of less than one year are not annualized.
C Total returns would have been lower had certain expenses not been reduced during the periods shown.
D Calculated based on average shares outstanding during the period.
E For the period November 6, 2003 (commencement of operations) to March 31, 2004.
F Expense ratios reflect operating expenses of the class. Expenses before reductions do not reflect amounts reimbursed by the investment adviser or reductions from brokerage service arrangements or other expense offset arrangements and do not represent the amount paid by the class during periods when reimbursements or reductions occur. Expenses net of any voluntary waivers reflect expenses after reimbursement by the investment adviser but prior to reductions from brokerage service arrangements or other expense offset arrangements. Expenses net of all reductions represent the net expenses paid by the class.
See accompanying notes which are an integral part of the financial statements.
Annual Report
Fidelity Advisor Freedom 2010 Fund
Investment Changes
Fund Holdings as of March 31, 2004 |
| % of fund's investments | % of fund's investments
6 months ago |
Domestic Equity Funds | | |
Fidelity Advisor Dividend Growth Fund Institutional Class | 7.9% | 7.8% |
Fidelity Advisor Equity Growth Fund
Institutional Class | 4.0 | 3.9 |
Fidelity Advisor Equity Income Fund
Institutional Class | 8.1 | 7.8 |
Fidelity Advisor Growth & Income Fund Institutional Class | 7.7 | 7.7 |
Fidelity Advisor Large Cap Fund
Institutional Class | 7.8 | 7.7 |
Fidelity Advisor Mid-Cap Fund Institutional Class | 2.4 | 2.4 |
Fidelity Advisor Small Cap Fund
Institutional Class | 2.5 | 2.4 |
| 40.4 | 39.7 |
International Equity Funds | | |
Fidelity Advisor Diversified International Fund Institutional Class | 2.7 | 2.6 |
Fidelity Advisor Overseas Fund Institutional Class | 2.6 | 2.5 |
| 5.3 | 5.1 |
High Yield Fixed-Income Funds | | |
Fidelity Advisor High Income Advantage Fund Institutional Class | 5.1 | 5.2 |
Investment Grade Fixed-Income Funds | | |
Fidelity Advisor Government Investment Fund Institutional Class | 19.8 | 20.3 |
Fidelity Advisor Intermediate Bond Fund Institutional Class | 19.9 | 20.2 |
| 39.7 | 40.5 |
Short-Term Fixed-Income Funds | | |
Fidelity Advisor Short-Fixed Income Fund Institutional Class | 3.8 | 3.9 |
Money Market Fund | | |
Fidelity Cash Reserves Fund | 5.7 | 5.6 |
| 100.0% | 100.0% |
Annual Report
Fidelity Advisor Freedom 2010 Fund
Investment Changes - continued
Asset Allocation (% of fund's investments)

The fund invests according to an asset allocation strategy that becomes increasingly conservative over time. The six months ago allocation is based on the fund's holdings as of September 30, 2003. The current allocation is based on the fund's holdings as of March 31, 2004. The expected allocation represents the fund's anticipated target asset allocation at September 30, 2004.
Annual Report
Fidelity Advisor Freedom 2010 Fund
Investments March 31, 2004
Showing Percentage of Total Value of Investment in Securities
Equity Funds - 45.7% |
| Shares | | Value (Note 1) |
Domestic Equity Funds - 40.4% |
Fidelity Advisor Dividend Growth Fund Institutional Class | 618,583 | | $ 7,132,259 |
Fidelity Advisor Equity Growth Fund Institutional Class | 76,594 | | 3,610,646 |
Fidelity Advisor Equity Income Fund Institutional Class | 270,982 | | 7,308,373 |
Fidelity Advisor Growth & Income Fund Institutional Class | 435,150 | | 7,023,318 |
Fidelity Advisor Large Cap Fund Institutional Class | 480,906 | | 7,102,984 |
Fidelity Advisor Mid-Cap Fund Institutional Class | 94,251 | | 2,175,309 |
Fidelity Advisor Small Cap Fund Institutional Class | 104,079 | | 2,289,734 |
TOTAL DOMESTIC EQUITY FUNDS | | 36,642,623 |
International Equity Funds - 5.3% |
Fidelity Advisor Diversified International Fund Institutional Class | 143,285 | | 2,437,269 |
Fidelity Advisor Overseas Fund Institutional Class | 145,772 | | 2,424,190 |
TOTAL INTERNATIONAL EQUITY FUNDS | | 4,861,459 |
TOTAL EQUITY FUNDS (Cost $40,014,308) | 41,504,082 |
Fixed-Income Funds - 48.6% |
| | | |
High Yield Fixed-Income Funds - 5.1% |
Fidelity Advisor High Income Advantage Fund Institutional Class | 499,305 | | 4,613,579 |
Investment Grade Fixed-Income Funds - 39.7% |
Fidelity Advisor Government Investment Fund Institutional Class | 1,767,624 | | 18,012,091 |
Fidelity Advisor Intermediate Bond Fund Institutional Class | 1,569,315 | | 18,015,735 |
TOTAL INVESTMENT GRADE FIXED-INCOME FUNDS | | 36,027,826 |
Short-Term Fixed-Income Funds - 3.8% |
Fidelity Advisor Short-Fixed Income Fund Institutional Class | 358,666 | | 3,468,296 |
TOTAL FIXED-INCOME FUNDS (Cost $43,664,601) | 44,109,701 |
Money Market Fund - 5.7% |
| Shares | | Value (Note 1) |
Fidelity Cash Reserves Fund
(Cost $5,122,359) | 5,122,359 | | $ 5,122,359 |
TOTAL INVESTMENT IN SECURITIES - 100% (Cost $88,801,268) | $ 90,736,142 |
Other Information |
Purchases and redemptions of the underlying fund shares aggregated $117,747,651 and $28,871,201, respectively. |
See accompanying notes which are an integral part of the financial statements.
Annual Report
Fidelity Advisor Freedom 2010 Fund
Financial Statements
Statement of Assets and Liabilities
| March 31, 2004 |
| | |
Assets | | |
Investment in securities, at value (cost $88,801,268) - See accompanying schedule | | $ 90,736,142 |
Cash | | 1 |
Receivable for investments sold | | 138,498 |
Receivable for fund shares sold | | 793,759 |
Total assets | | 91,668,400 |
| | |
Liabilities | | |
Payable for investments purchased | $ 692,653 | |
Payable for fund shares redeemed | 207,138 | |
Accrued management fee | 9,934 | |
Distribution fees payable | 38,020 | |
Total liabilities | | 947,745 |
| | |
Net Assets | | $ 90,720,655 |
Net Assets consist of: | | |
Paid in capital | | $ 88,531,370 |
Undistributed net investment income | | 239,489 |
Accumulated undistributed net realized gain (loss) on investments | | 14,922 |
Net unrealized appreciation (depreciation) on investments | | 1,934,874 |
Net Assets | | $ 90,720,655 |
See accompanying notes which are an integral part of the financial statements.
Annual Report
Fidelity Advisor Freedom 2010 Fund
Financial Statements - continued
Statement of Assets and Liabilities - continued
| March 31, 2004 |
Calculation of Maximum Offering Price | | |
Class A:
Net Asset Value and redemption price per share ($32,615,485 ÷ 2,987,854 shares) | | $ 10.92 |
| | |
Maximum offering price per share (100/94.25 of $10.92) | | $ 11.59 |
Class T:
Net Asset Value and redemption price per share ($29,964,180 ÷ 2,749,143 shares) | | $ 10.90 |
| | |
Maximum offering price per share (100/96.50 of $10.90) | | $ 11.30 |
Class B:
Net Asset Value and offering price per share ($14,897,169 ÷ 1,370,178 shares) A | | $ 10.87 |
| | |
Class C:
Net Asset Value and offering price per share ($11,552,383 ÷ 1,062,688 shares) A | | $ 10.87 |
| | |
Institutional Class:
Net Asset Value, offering price and redemption price per share ($1,691,438 ÷ 154,687 shares) | | $ 10.93 |
A Redemption price per share is equal to net asset value less any applicable contingent deferred sales charge.
See accompanying notes which are an integral part of the financial statements.
Annual Report
Statement of Operations
| July 24, 2003 (commencement of operations) to March 31, 2004 |
| | |
Investment Income | | |
Income distributions from underlying funds | | $ 585,312 |
| | |
Expenses | | |
Management fee | $ 23,831 | |
Distribution fees | 136,410 | |
Non-interested trustees' compensation | 78 | |
Total expenses before reductions | 160,319 | |
Expense reductions | (5,772) | 154,547 |
Net investment income (loss) | | 430,765 |
Realized and Unrealized Gain (Loss) Realized gain (loss) on sale of underlying fund shares | (75,182) | |
Capital gain distributions from underlying fund shares | 95,140 | 19,958 |
Change in net unrealized appreciation (depreciation) on investment securities | | 1,934,874 |
Net gain (loss) | | 1,954,832 |
Net increase (decrease) in net assets resulting from operations | | $ 2,385,597 |
See accompanying notes which are an integral part of the financial statements.
Annual Report
Fidelity Advisor Freedom 2010 Fund
Financial Statements - continued
Statement of Changes in Net Assets
| July 24, 2003
(commencement of
operations) to
March 31, 2004 |
Increase (Decrease) in Net Assets | |
Operations | |
Net investment income (loss) | $ 430,765 |
Net realized gain (loss) | 19,958 |
Change in net unrealized appreciation (depreciation) | 1,934,874 |
Net increase (decrease) in net assets resulting from operations | 2,385,597 |
Distributions to shareholders from net investment income | (196,312) |
Share transactions - net increase (decrease) | 88,531,370 |
Total increase (decrease) in net assets | 90,720,655 |
| |
Net Assets | |
Beginning of period | - |
End of period (including undistributed net investment income of $239,489) | $ 90,720,655 |
See accompanying notes which are an integral part of the financial statements.
Annual Report
Financial Highlights - Class A
Year ended March 31, | 2004F |
Selected Per-Share Data | |
Net asset value, beginning of period | $ 10.00 |
Income from Investment Operations | |
Net investment income (loss)E | .16 |
Net realized and unrealized gain (loss) | .83 |
Total from investment operations | .99 |
Distributions from net investment income | (.07) |
Net asset value, end of period | $ 10.92 |
Total ReturnB,C,D | 9.92% |
Ratios to Average Net AssetsG | |
Expenses before expense reductions | .35%A |
Expenses net of voluntary waivers, if any | .33%A |
Expenses net of all reductions | .33%A |
Net investment income (loss) | 2.14%A |
Supplemental Data | |
Net assets, end of period (000 omitted) | $ 32,615 |
Portfolio turnover rate | 103%A |
A Annualized
B Total returns for periods of less than one year are not annualized.
C Total returns would have been lower had certain expenses not been reduced during the periods shown.
D Total returns do not include the effect of the sales charges.
E Calculated based on average shares outstanding during the period.
F For the period July 24, 2003 (commencement of operations) to March 31, 2004.
G Expense ratios reflect operating expenses of the class. Expenses before reductions do not reflect amounts reimbursed by the investment adviser or reductions from brokerage service arrangements or other expense offset arrangements and do not represent the amount paid by the class during periods when reimbursements or reductions occur. Expenses net of any voluntary waivers reflect expenses after reimbursement by the investment adviser but prior to reductions from brokerage service arrangements or other expense offset arrangements. Expenses net of all reductions represent the net expenses paid by the class.
See accompanying notes which are an integral part of the financial statements.
Annual Report
Financial Highlights - Class T
Year ended March 31, | 2004F |
Selected Per-Share Data | |
Net asset value, beginning of period | $ 10.00 |
Income from Investment Operations | |
Net investment income (loss)E | .14 |
Net realized and unrealized gain (loss) | .83 |
Total from investment operations | .97 |
Distributions from net investment income | (.07) |
Net asset value, end of period | $ 10.90 |
Total ReturnB,C,D | 9.72% |
Ratios to Average Net AssetsG | |
Expenses before expense reductions | .60%A |
Expenses net of voluntary waivers, if any | .58%A |
Expenses net of all reductions | .58%A |
Net investment income (loss) | 1.89%A |
Supplemental Data | |
Net assets, end of period (000 omitted) | $ 29,964 |
Portfolio turnover rate | 103%A |
A Annualized
B Total returns for periods of less than one year are not annualized.
C Total returns would have been lower had certain expenses not been reduced during the periods shown.
D Total returns do not include the effect of the sales charges.
E Calculated based on average shares outstanding during the period.
F For the period July 24, 2003 (commencement of operations) to March 31, 2004.
G Expense ratios reflect operating expenses of the class. Expenses before reductions do not reflect amounts reimbursed by the investment adviser or reductions from brokerage service arrangements or other expense offset arrangements and do not represent the amount paid by the class during periods when reimbursements or reductions occur. Expenses net of any voluntary waivers reflect expenses after reimbursement by the investment adviser but prior to reductions from brokerage service arrangements or other expense offset arrangements. Expenses net of all reductions represent the net expenses paid by the class.
See accompanying notes which are an integral part of the financial statements.
Annual Report
Financial Highlights - Class B
Year ended March 31, | 2004F |
Selected Per-Share Data | |
Net asset value, beginning of period | $ 10.00 |
Income from Investment Operations | |
Net investment income (loss)E | .10 |
Net realized and unrealized gain (loss) | .83 |
Total from investment operations | .93 |
Distributions from net investment income | (.06) |
Net asset value, end of period | $ 10.87 |
Total ReturnB,C,D | 9.32% |
Ratios to Average Net AssetsG | |
Expenses before expense reductions | 1.10%A |
Expenses net of voluntary waivers, if any | 1.08%A |
Expenses net of all reductions | 1.08%A |
Net investment income (loss) | 1.39%A |
Supplemental Data | |
Net assets, end of period (000 omitted) | $ 14,897 |
Portfolio turnover rate | 103%A |
A Annualized
B Total returns for periods of less than one year are not annualized.
C Total returns would have been lower had certain expenses not been reduced during the periods shown.
D Total returns do not include the effect of the contingent deferred sales charge.
E Calculated based on average shares outstanding during the period.
F For the period July 24, 2003 (commencement of operations) to March 31, 2004.
G Expense ratios reflect operating expenses of the class. Expenses before reductions do not reflect amounts reimbursed by the investment adviser or reductions from brokerage service arrangements or other expense offset arrangements and do not represent the amount paid by the class during periods when reimbursements or reductions occur. Expenses net of any voluntary waivers reflect expenses after reimbursement by the investment adviser but prior to reductions from brokerage service arrangements or other expense offset arrangements. Expenses net of all reductions represent the net expenses paid by the class.
See accompanying notes which are an integral part of the financial statements.
Annual Report
Financial Highlights - Class C
Year ended March 31, | 2004F |
Selected Per-Share Data | |
Net asset value, beginning of period | $ 10.00 |
Income from Investment Operations | |
Net investment income (loss)E | .10 |
Net realized and unrealized gain (loss) | .83 |
Total from investment operations | .93 |
Distributions from net investment income | (.06) |
Net asset value, end of period | $ 10.87 |
Total ReturnB,C,D | 9.32% |
Ratios to Average Net AssetsG | |
Expenses before expense reductions | 1.10%A |
Expenses net of voluntary waivers, if any | 1.08%A |
Expenses net of all reductions | 1.08%A |
Net investment income (loss) | 1.39%A |
Supplemental Data | |
Net assets, end of period (000 omitted) | $ 11,552 |
Portfolio turnover rate | 103%A |
A Annualized
B Total returns for periods of less than one year are not annualized.
C Total returns would have been lower had certain expenses not been reduced during the periods shown.
D Total returns do not include the effect of the contingent deferred sales charge.
E Calculated based on average shares outstanding during the period.
F For the period July 24, 2003 (commencement of operations) to March 31, 2004.
G Expense ratios reflect operating expenses of the class. Expenses before reductions do not reflect amounts reimbursed by the investment adviser or reductions from brokerage service arrangements or other expense offset arrangements and do not represent the amount paid by the class during periods when reimbursements or reductions occur. Expenses net of any voluntary waivers reflect expenses after reimbursement by the investment adviser but prior to reductions from brokerage service arrangements or other expense offset arrangements. Expenses net of all reductions represent the net expenses paid by the class.
See accompanying notes which are an integral part of the financial statements.
Annual Report
Financial Highlights - Institutional Class
Year ended March 31, | 2004E |
Selected Per-Share Data | |
Net asset value, beginning of period | $ 10.00 |
Income from Investment Operations | |
Net investment income (loss)D | .17 |
Net realized and unrealized gain (loss) | .83 |
Total from investment operations | 1.00 |
Distributions from net investment income | (.07) |
Net asset value, end of period | $ 10.93 |
Total ReturnB,C | 10.02% |
Ratios to Average Net AssetsF | |
Expenses before expense reductions | .10%A |
Expenses net of voluntary waivers, if any | .08%A |
Expenses net of all reductions | .08%A |
Net investment income (loss) | 2.38%A |
Supplemental Data | |
Net assets, end of period (000 omitted) | $ 1,691 |
Portfolio turnover rate | 103%A |
A Annualized
B Total returns for periods of less than one year are not annualized.
C Total returns would have been lower had certain expenses not been reduced during the periods shown.
D Calculated based on average shares outstanding during the period.
E For the period July 24, 2003 (commencement of operations) to March 31, 2004.
F Expense ratios reflect operating expenses of the class. Expenses before reductions do not reflect amounts reimbursed by the investment adviser or reductions from brokerage service arrangements or other expense offset arrangements and do not represent the amount paid by the class during periods when reimbursements or reductions occur. Expenses net of any voluntary waivers reflect expenses after reimbursement by the investment adviser but prior to reductions from brokerage service arrangements or other expense offset arrangements. Expenses net of all reductions represent the net expenses paid by the class.
See accompanying notes which are an integral part of the financial statements.
Annual Report
Fidelity Advisor Freedom 2015 Fund
Investment Summary
Fund Holdings as of March 31, 2004 |
| % of fund's
investments |
Domestic Equity Funds | |
Fidelity Advisor Dividend Growth Fund Institutional Class | 10.2% |
Fidelity Advisor Equity Growth Fund Institutional Class | 5.2 |
Fidelity Advisor Equity Income Fund Institutional Class | 10.4 |
Fidelity Advisor Growth & Income Fund Institutional Class | 10.1 |
Fidelity Advisor Large Cap Fund Institutional Class | 10.2 |
Fidelity Advisor Mid-Cap Fund Institutional Class | 3.1 |
Fidelity Advisor Small Cap Fund Institutional Class | 3.2 |
| 52.4 |
International Equity Funds | |
Fidelity Advisor Diversified International Fund Institutional Class | 4.3 |
Fidelity Advisor Overseas Fund Institutional Class | 4.2 |
| 8.5 |
High Yield Fixed-Income Funds | |
Fidelity Advisor High Income Advantage Fund Institutional Class | 6.5 |
Investment Grade Fixed-Income Funds | |
Fidelity Advisor Government Investment Fund Institutional Class | 14.4 |
Fidelity Advisor Intermediate Bond Fund Institutional Class | 14.5 |
| 28.9 |
Short-Term Fixed-Income Funds | |
Fidelity Advisor Short-Fixed Income Fund Institutional Class | 1.5 |
Money Market Fund | |
Fidelity Cash Reserves Fund | 2.2 |
| 100.0% |
Annual Report
Fidelity Advisor Freedom 2015 Fund
Investment Summary - continued
Asset Allocation (% of fund's investments)
The fund invests according to an asset allocation strategy that becomes increasingly conservative over time. The initial allocation represents the target asset allocation at inception. The current allocation is based on the fund's holdings as of March 31, 2004. The expected allocation represents the fund's anticipated target asset allocation at September 30, 2004.
Annual Report
Fidelity Advisor Freedom 2015 Fund
Investments March 31, 2004
Showing Percentage of Total Value of Investment in Securities
Equity Funds - 60.9% |
| Shares | | Value (Note 1) |
Domestic Equity Funds - 52.4% |
Fidelity Advisor Dividend Growth Fund Institutional Class | 159,024 | | $ 1,833,544 |
Fidelity Advisor Equity Growth Fund Institutional Class | 19,627 | | 925,213 |
Fidelity Advisor Equity Income Fund Institutional Class | 69,029 | | 1,861,707 |
Fidelity Advisor Growth & Income Fund Institutional Class | 112,805 | | 1,820,677 |
Fidelity Advisor Large Cap Fund Institutional Class | 123,704 | | 1,827,109 |
Fidelity Advisor Mid-Cap Fund Institutional Class | 24,006 | | 554,058 |
Fidelity Advisor Small Cap Fund Institutional Class | 26,211 | | 576,653 |
TOTAL DOMESTIC EQUITY FUNDS | | 9,398,961 |
International Equity Funds - 8.5% |
Fidelity Advisor Diversified International Fund Institutional Class | 45,055 | | 766,383 |
Fidelity Advisor Overseas Fund Institutional Class | 45,917 | | 763,603 |
TOTAL INTERNATIONAL EQUITY FUNDS | | 1,529,986 |
TOTAL EQUITY FUNDS (Cost $10,783,427) | 10,928,947 |
Fixed-Income Funds - 36.9% |
| | | |
High Yield Fixed-Income Funds - 6.5% |
Fidelity Advisor High Income Advantage Fund Institutional Class | 126,943 | | 1,172,950 |
Investment Grade Fixed-Income Funds - 28.9% |
Fidelity Advisor Government Investment Fund Institutional Class | 254,504 | | 2,593,394 |
Fidelity Advisor Intermediate Bond Fund Institutional Class | 225,943 | | 2,593,826 |
TOTAL INVESTMENT GRADE FIXED-INCOME FUNDS | | 5,187,220 |
Short-Term Fixed-Income Funds - 1.5% |
Fidelity Advisor Short-Fixed Income Fund Institutional Class | 27,694 | | 267,800 |
TOTAL FIXED-INCOME FUNDS (Cost $6,604,115) | 6,627,970 |
Money Market Fund - 2.2% |
| Shares | | Value (Note 1) |
Fidelity Cash Reserves Fund
(Cost $392,584) | 392,584 | | $ 392,584 |
TOTAL INVESTMENT IN SECURITIES - 100% (Cost $17,780,126) | $ 17,949,501 |
Other Information |
Purchases and redemptions of the underlying fund shares aggregated $17,920,164 and $140,216, respectively. |
See accompanying notes which are an integral part of the financial statements.
Annual Report
Fidelity Advisor Freedom 2015 Fund
Financial Statements
Statement of Assets and Liabilities
| March 31, 2004 |
| | |
Assets | | |
Investment in securities, at value (cost $17,780,126) - See accompanying schedule | | $ 17,949,501 |
Cash | | 29 |
Receivable for fund shares sold | | 474,623 |
Total assets | | 18,424,153 |
| | |
Liabilities | | |
Payable for investments purchased | $ 468,932 | |
Payable for fund shares redeemed | 400 | |
Accrued management fee | 1,907 | |
Distribution fees payable | 7,883 | |
Total liabilities | | 479,122 |
| | |
Net Assets | | $ 17,945,031 |
Net Assets consist of: | | |
Paid in capital | | $ 17,749,398 |
Undistributed net investment income | | 20,910 |
Accumulated undistributed net realized gain (loss) on investments | | 5,348 |
Net unrealized appreciation (depreciation) on investments | | 169,375 |
Net Assets | | $ 17,945,031 |
See accompanying notes which are an integral part of the financial statements.
Annual Report
Fidelity Advisor Freedom 2015 Fund
Financial Statements - continued
Statement of Assets and Liabilities - continued
| March 31, 2004 |
Calculation of Maximum Offering Price | | |
Class A:
Net Asset Value and redemption price per share ($4,772,547 ÷ 451,330 shares) | | $ 10.57 |
| | |
Maximum offering price per share (100/94.25 of $10.57) | | $ 11.21 |
Class T:
Net Asset Value and redemption price per share ($5,038,301 ÷ 476,613 shares) | | $ 10.57 |
| | |
Maximum offering price per share (100/96.50 of $10.57) | | $ 10.95 |
Class B:
Net Asset Value and offering price per share ($4,259,439 ÷ 403,349 shares) A | | $ 10.56 |
| | |
Class C:
Net Asset Value and offering price per share ($3,593,171 ÷ 340,273 shares) A | | $ 10.56 |
| | |
Institutional Class:
Net Asset Value, offering price and redemption price per share ($281,573 ÷ 26,585 shares) | | $ 10.59 |
A Redemption price per share is equal to net asset value less any applicable contingent deferred sales charge.
See accompanying notes which are an integral part of the financial statements.
Annual Report
Statement of Operations
| November 6, 2003 (commencement of operations) to March 31, 2004 |
| | |
Investment Income | | |
Income distributions from underlying funds | | $ 58,556 |
Interest | | 29 |
Total income | | 58,585 |
| | |
Expenses | | |
Management fee | $ 2,662 | |
Distribution fees | 17,204 | |
Non-interested trustees' compensation | 6 | |
Total expenses before reductions | 19,872 | |
Expense reductions | (429) | 19,443 |
Net investment income (loss) | | 39,142 |
Realized and Unrealized Gain (Loss) Realized gain (loss) on sale of underlying fund shares | 179 | |
Capital gain distributions from underlying funds | 5,458 | 5,637 |
Change in net unrealized appreciation (depreciation) on investment securities | | 169,375 |
Net gain (loss) | | 175,012 |
Net increase (decrease) in net assets resulting from operations | | $ 214,154 |
See accompanying notes which are an integral part of the financial statements.
Annual Report
Fidelity Advisor Freedom 2015 Fund
Financial Statements - continued
Statement of Changes in Net Assets
| November 6, 2003
(commencement of
operations) to
March 31, 2004 |
Increase (Decrease) in Net Assets | |
Operations | |
Net investment income (loss) | $ 39,142 |
Net realized gain (loss) | 5,637 |
Change in net unrealized appreciation (depreciation) | 169,375 |
Net increase (decrease) in net assets resulting from operations | 214,154 |
Distributions to shareholders from net investment income | (18,521) |
Share transactions - net increase (decrease) | 17,749,398 |
Total increase (decrease) in net assets | 17,945,031 |
| |
Net Assets | |
Beginning of period | - |
End of period (including undistributed net investment income of $20,910) | $ 17,945,031 |
See accompanying notes which are an integral part of the financial statements.
Annual Report
Financial Highlights - Class A
Year ended March 31, | 2004F |
Selected Per-Share Data | |
Net asset value, beginning of period | $ 10.00 |
Income from Investment Operations | |
Net investment income (loss)E | .07 |
Net realized and unrealized gain (loss) | .56 |
Total from investment operations | .63 |
Distributions from net investment income | (.06) |
Net asset value, end of period | $ 10.57 |
Total ReturnB,C,D | 6.32% |
Ratios to Average Net AssetsG | |
Expenses before expense reductions | .35%A |
Expenses net of voluntary waivers, if any | .33%A |
Expenses net of all reductions | .33%A |
Net investment income (loss) | 1.84%A |
Supplemental Data | |
Net assets, end of period (000 omitted) | $ 4,773 |
Portfolio turnover rate | 5%A |
A Annualized
B Total returns for periods of less than one year are not annualized.
C Total returns would have been lower had certain expenses not been reduced during the periods shown.
D Total returns do not include the effect of the sales charges.
E Calculated based on average shares outstanding during the period.
F For the period November 6, 2003 (commencement of operations) to March 31, 2004.
G Expense ratios reflect operating expenses of the class. Expenses before reductions do not reflect amounts reimbursed by the investment adviser or reductions from brokerage service arrangements or other expense offset arrangements and do not represent the amount paid by the class during periods when reimbursements or reductions occur. Expenses net of any voluntary waivers reflect expenses after reimbursement by the investment adviser but prior to reductions from brokerage service arrangements or other expense offset arrangements. Expenses net of all reductions represent the net expenses paid by the class.
See accompanying notes which are an integral part of the financial statements.
Annual Report
Financial Highlights - Class T
Year ended March 31, | 2004F |
Selected Per-Share Data | |
Net asset value, beginning of period | $ 10.00 |
Income from Investment Operations | |
Net investment income (loss)E | .06 |
Net realized and unrealized gain (loss) | .57 |
Total from investment operations | .63 |
Distributions from net investment income | (.06) |
Net asset value, end of period | $ 10.57 |
Total ReturnB,C,D | 6.27% |
Ratios to Average Net AssetsG | |
Expenses before expense reductions | .60%A |
Expenses net of voluntary waivers, if any | .58%A |
Expenses net of all reductions | .58%A |
Net investment income (loss) | 1.59%A |
Supplemental Data | |
Net assets, end of period (000 omitted) | $ 5,038 |
Portfolio turnover rate | 5%A |
A Annualized
B Total returns for periods of less than one year are not annualized.
C Total returns would have been lower had certain expenses not been reduced during the periods shown.
D Total returns do not include the effect of the sales charges.
E Calculated based on average shares outstanding during the period.
F For the period November 6, 2003 (commencement of operations) to March 31, 2004.
G Expense ratios reflect operating expenses of the class. Expenses before reductions do not reflect amounts reimbursed by the investment adviser or reductions from brokerage service arrangements or other expense offset arrangements and do not represent the amount paid by the class during periods when reimbursements or reductions occur. Expenses net of any voluntary waivers reflect expenses after reimbursement by the investment adviser but prior to reductions from brokerage service arrangements or other expense offset arrangements. Expenses net of all reductions represent the net expenses paid by the class.
See accompanying notes which are an integral part of the financial statements.
Annual Report
Financial Highlights - Class B
Year ended March 31, | 2004F |
Selected Per-Share Data | |
Net asset value, beginning of period | $ 10.00 |
Income from Investment Operations | |
Net investment income (loss)E | .04 |
Net realized and unrealized gain (loss) | .58 |
Total from investment operations | .62 |
Distributions from net investment income | (.06) |
Net asset value, end of period | $ 10.56 |
Total ReturnB,C,D | 6.17% |
Ratios to Average Net AssetsG | |
Expenses before expense reductions | 1.10%A |
Expenses net of voluntary waivers, if any | 1.08%A |
Expenses net of all reductions | 1.08%A |
Net investment income (loss) | 1.09%A |
Supplemental Data | |
Net assets, end of period (000 omitted) | $ 4,259 |
Portfolio turnover rate | 5%A |
A Annualized
B Total returns for periods of less than one year are not annualized.
C Total returns would have been lower had certain expenses not been reduced during the periods shown.
D Total returns do not include the effect of the contingent deferred sales charge.
E Calculated based on average shares outstanding during the period.
F For the period November 6, 2003 (commencement of operations) to March 31, 2004.
G Expense ratios reflect operating expenses of the class. Expenses before reductions do not reflect amounts reimbursed by the investment adviser or reductions from brokerage service arrangements or other expense offset arrangements and do not represent the amount paid by the class during periods when reimbursements or reductions occur. Expenses net of any voluntary waivers reflect expenses after reimbursement by the investment adviser but prior to reductions from brokerage service arrangements or other expense offset arrangements. Expenses net of all reductions represent the net expenses paid by the class.
See accompanying notes which are an integral part of the financial statements.
Annual Report
Financial Highlights - Class C
Year ended March 31, | 2004F |
Selected Per-Share Data | |
Net asset value, beginning of period | $ 10.00 |
Income from Investment Operations | |
Net investment income (loss)E | .04 |
Net realized and unrealized gain (loss) | .57 |
Total from investment operations | .61 |
Distributions from net investment income | (.05) |
Net asset value, end of period | $ 10.56 |
Total ReturnB,C,D | 6.12% |
Ratios to Average Net AssetsG | |
Expenses before expense reductions | 1.10%A |
Expenses net of voluntary waivers, if any | 1.08%A |
Expenses net of all reductions | 1.08%A |
Net investment income (loss) | 1.09%A |
Supplemental Data | |
Net assets, end of period (000 omitted) | $ 3,593 |
Portfolio turnover rate | 5%A |
A Annualized
B Total returns for periods of less than one year are not annualized.
C Total returns would have been lower had certain expenses not been reduced during the periods shown.
D Total returns do not include the effect of the contingent deferred sales charge.
E Calculated based on average shares outstanding during the period.
F For the period November 6, 2003 (commencement of operations) to March 31, 2004.
G Expense ratios reflect operating expenses of the class. Expenses before reductions do not reflect amounts reimbursed by the investment adviser or reductions from brokerage service arrangements or other expense offset arrangements and do not represent the amount paid by the class during periods when reimbursements or reductions occur. Expenses net of any voluntary waivers reflect expenses after reimbursement by the investment adviser but prior to reductions from brokerage service arrangements or other expense offset arrangements. Expenses net of all reductions represent the net expenses paid by the class.
See accompanying notes which are an integral part of the financial statements.
Annual Report
Financial Highlights - Institutional Class
Year ended March 31, | 2004 E |
Selected Per-Share Data | |
Net asset value, beginning of period | $ 10.00 |
Income from Investment Operations | |
Net investment income (loss)D | .09 |
Net realized and unrealized gain (loss) | .56 |
Total from investment operations | .65 |
Distributions from net investment income | (.06) |
Net asset value, end of period | $ 10.59 |
Total ReturnB,C | 6.52% |
Ratios to Average Net AssetsF | |
Expenses before expense reductions | .10%A |
Expenses net of voluntary waivers, if any | .08%A |
Expenses net of all reductions | .08%A |
Net investment income (loss) | 2.09%A |
Supplemental Data | |
Net assets, end of period (000 omitted) | $ 282 |
Portfolio turnover rate | 5%A |
A Annualized
B Total returns for periods of less than one year are not annualized.
C Total returns would have been lower had certain expenses not been reduced during the periods shown.
D Calculated based on average shares outstanding during the period.
E For the period November 6, 2003 (commencement of operations) to March 31, 2004.
F Expense ratios reflect operating expenses of the class. Expenses before reductions do not reflect amounts reimbursed by the investment adviser or reductions from brokerage service arrangements or other expense offset arrangements and do not represent the amount paid by the class during periods when reimbursements or reductions occur. Expenses net of any voluntary waivers reflect expenses after reimbursement by the investment adviser but prior to reductions from brokerage service arrangements or other expense offset arrangements. Expenses net of all reductions represent the net expenses paid by the class.
See accompanying notes which are an integral part of the financial statements.
Annual Report
Fidelity Advisor Freedom 2020 Fund
Investment Changes
Fund Holdings as of March 31, 2004 |
| % of fund's
investments | % of fund's investments
6 months ago |
Domestic Equity Funds | | |
Fidelity Advisor Dividend Growth Fund Institutional Class | 11.7% | 11.6% |
Fidelity Advisor Equity Growth Fund
Institutional Class | 5.9 | 5.9 |
Fidelity Advisor Equity Income Fund
Institutional Class | 12.0 | 11.6 |
Fidelity Advisor Growth & Income Fund Institutional Class | 11.5 | 11.5 |
Fidelity Advisor Large Cap Fund
Institutional Class | 11.6 | 11.6 |
Fidelity Advisor Mid-Cap Fund Institutional Class | 3.5 | 3.6 |
Fidelity Advisor Small Cap Fund
Institutional Class | 3.7 | 3.5 |
| 59.9 | 59.3 |
International Equity Funds | | |
Fidelity Advisor Diversified International Fund Institutional Class | 5.2 | 5.1 |
Fidelity Advisor Overseas Fund Institutional Class | 5.2 | 5.1 |
| 10.4 | 10.2 |
High Yield Fixed-Income Funds | | |
Fidelity Advisor High Income Advantage Fund Institutional Class | 7.5 | 7.7 |
Investment Grade Fixed-Income Funds | | |
Fidelity Advisor Government Investment Fund Institutional Class | 11.1 | 11.4 |
Fidelity Advisor Intermediate Bond Fund Institutional Class | 11.1 | 11.4 |
| 22.2 | 22.8 |
| 100.0% | 100.0% |
Annual Report
Fidelity Advisor Freedom 2020 Fund
Investment Changes - continued
Asset Allocation (% of fund's investments)
The fund invests according to an asset allocation strategy that becomes increasingly conservative over time. The six months ago allocation is based on the fund's holdings as of September 30, 2003. The current allocation is based on the fund's holdings as of March 31, 2004. The expected allocation represents the fund's anticipated target asset allocation at September 30, 2004.
Annual Report
Fidelity Advisor Freedom 2020 Fund
Investments March 31, 2004
Showing Percentage of Total Value of Investment in Securities
Equity Funds - 70.3% |
| Shares | | Value (Note 1) |
Domestic Equity Funds - 59.9% |
Fidelity Advisor Dividend Growth Fund Institutional Class | 1,682,100 | | $ 19,394,618 |
Fidelity Advisor Equity Growth Fund Institutional Class | 207,811 | | 9,796,200 |
Fidelity Advisor Equity Income Fund Institutional Class | 736,376 | | 19,860,067 |
Fidelity Advisor Growth & Income Fund Institutional Class | 1,185,392 | | 19,132,229 |
Fidelity Advisor Large Cap Fund Institutional Class | 1,306,286 | | 19,293,850 |
Fidelity Advisor Mid-Cap Fund Institutional Class | 254,480 | | 5,873,406 |
Fidelity Advisor Small Cap Fund Institutional Class | 280,928 | | 6,180,406 |
TOTAL DOMESTIC EQUITY FUNDS | | 99,530,776 |
International Equity Funds - 10.4% |
Fidelity Advisor Diversified International Fund Institutional Class | 511,541 | | 8,701,305 |
Fidelity Advisor Overseas Fund Institutional Class | 519,927 | | 8,646,392 |
TOTAL INTERNATIONAL EQUITY FUNDS | | 17,347,697 |
TOTAL EQUITY FUNDS (Cost $112,906,046) | 116,878,473 |
Fixed-Income Funds - 29.7% |
| | | |
High Yield Fixed-Income Funds - 7.5% |
Fidelity Advisor High Income Advantage Fund Institutional Class | 1,341,726 | | 12,397,549 |
Investment Grade Fixed-Income Funds - 22.2% |
Fidelity Advisor Government Investment Fund Institutional Class | 1,810,034 | | 18,444,242 |
Fidelity Advisor Intermediate Bond Fund Institutional Class | 1,605,383 | | 18,429,802 |
TOTAL INVESTMENT GRADE FIXED-INCOME FUNDS | | 36,874,044 |
TOTAL FIXED-INCOME FUNDS (Cost $48,798,720) | 49,271,593 |
TOTAL INVESTMENT IN SECURITIES - 100% (Cost $161,704,766) | $ 166,150,066 |
Other Information |
Purchases and redemptions of the underlying fund shares aggregated $163,374,072 and $1,656,921, respectively. |
See accompanying notes which are an integral part of the financial statements.
Annual Report
Fidelity Advisor Freedom 2020 Fund
Financial Statements
Statement of Assets and Liabilities
| March 31, 2004 |
| | |
Assets | | |
Investment in securities, at value (cost $161,704,766) - See accompanying schedule | | $ 166,150,066 |
Receivable for fund shares sold | | 946,853 |
Total assets | | 167,096,919 |
| | |
Liabilities | | |
Payable for investments purchased | $ 617,750 | |
Payable for fund shares redeemed | 328,459 | |
Accrued management fee | 18,085 | |
Distribution fees payable | 65,044 | |
Total liabilities | | 1,029,338 |
| | |
Net Assets | | $ 166,067,581 |
Net Assets consist of: | | |
Paid in capital | | $ 161,281,476 |
Undistributed net investment income | | 278,597 |
Accumulated undistributed net realized gain (loss) on investments | | 62,208 |
Net unrealized appreciation (depreciation) on investments | | 4,445,300 |
Net Assets | | $ 166,067,581 |
See accompanying notes which are an integral part of the financial statements.
Annual Report
Fidelity Advisor Freedom 2020 Fund
Financial Statements - continued
Statement of Assets and Liabilities - continued
| March 31, 2004 |
Calculation of Maximum Offering Price | | |
Class A:
Net Asset Value and redemption price per share ($72,334,246 ÷ 6,405,508 shares) | | $ 11.29 |
| | |
Maximum offering price per share (100/94.25 of $11.29) | | $ 11.98 |
Class T:
Net Asset Value and redemption price per share ($52,309,807 ÷ 4,633,377 shares) | | $ 11.29 |
| | |
Maximum offering price per share (100/96.50 of $11.29) | | $ 11.70 |
Class B:
Net Asset Value and offering price per share ($23,274,067 ÷ 2,065,411 shares) A | | $ 11.27 |
| | |
Class C:
Net Asset Value and offering price per share ($15,871,331 ÷ 1,409,016 shares) A | | $ 11.26 |
| | |
Institutional Class:
Net Asset Value, offering price and redemption price per share ($2,278,130 ÷ 201,341 shares) | | $ 11.31 |
A Redemption price per share is equal to net asset value less any applicable contingent deferred sales charge.
See accompanying notes which are an integral part of the financial statements.
Annual Report
Statement of Operations
| July 24, 2003 (commencement of operations) to March 31, 2004 |
| | |
Investment Income | | |
Income distributions from underlying funds | | $ 879,011 |
| | |
Expenses | | |
Management fee | $ 42,754 | |
Distribution fees | 225,097 | |
Non-interested trustees' compensation | 137 | |
Total expenses before reductions | 267,988 | |
Expense reductions | (10,339) | 257,649 |
Net investment income (loss) | | 621,362 |
Realized and Unrealized Gain (Loss) Realized gain (loss) on sale of underlying fund shares | (12,385) | |
Capital gain distributions from underlying funds | 78,762 | 66,377 |
Change in net unrealized appreciation (depreciation) on investment securities | | 4,445,300 |
Net gain (loss) | | 4,511,677 |
Net increase (decrease) in net assets resulting from operations | | $ 5,133,039 |
See accompanying notes which are an integral part of the financial statements.
Annual Report
Fidelity Advisor Freedom 2020 Fund
Financial Statements - continued
Statement of Changes in Net Assets
| July 24, 2003
(commencement of
operations) to
March 31, 2004 |
Increase (Decrease) in Net Assets | |
Operations | |
Net investment income (loss) | $ 621,362 |
Net realized gain (loss) | 66,377 |
Change in net unrealized appreciation (depreciation) | 4,445,300 |
Net increase (decrease) in net assets resulting from operations | 5,133,039 |
Distributions to shareholders from net investment income | (346,934) |
Share transactions - net increase (decrease) | 161,281,476 |
Total increase (decrease) in net assets | 166,067,581 |
| |
Net Assets | |
Beginning of period | - |
End of period (including undistributed net investment income of $278,597) | $ 166,067,581 |
See accompanying notes which are an integral part of the financial statements.
Annual Report
Financial Highlights - Class A
Year ended March 31, | 2004F |
Selected Per-Share Data | |
Net asset value, beginning of period | $ 10.00 |
Income from Investment Operations | |
Net investment income (loss)E | .13 |
Net realized and unrealized gain (loss) | 1.25 |
Total from investment operations | 1.38 |
Distributions from net investment income | (.09) |
Net asset value, end of period | $ 11.29 |
Total ReturnB,C,D | 13.78% |
Ratios to Average Net AssetsG | |
Expenses before expense reductions | .35%A |
Expenses net of voluntary waivers, if any | .33%A |
Expenses net of all reductions | .33%A |
Net investment income (loss) | 1.74%A |
Supplemental Data | |
Net assets, end of period (000 omitted) | $ 72,334 |
Portfolio turnover rate | 4%A |
A Annualized
B Total returns for periods of less than one year are not annualized.
C Total returns would have been lower had certain expenses not been reduced during the periods shown.
D Total returns do not include the effect of the sales charges.
E Calculated based on average shares outstanding during the period.
F For the period July 24, 2003 (commencement of operations) to March 31, 2004.
G Expense ratios reflect operating expenses of the class. Expenses before reductions do not reflect amounts reimbursed by the investment adviser or reductions from brokerage service arrangements or other expense offset arrangements and do not represent the amount paid by the class during periods when reimbursements or reductions occur. Expenses net of any voluntary waivers reflect expenses after reimbursement by the investment adviser but prior to reductions from brokerage service arrangements or other expense offset arrangements. Expenses net of all reductions represent the net expenses paid by the class.
See accompanying notes which are an integral part of the financial statements.
Annual Report
Financial Highlights - Class T
Year ended March 31, | 2004F |
Selected Per-Share Data | |
Net asset value, beginning of period | $ 10.00 |
Income from Investment Operations | |
Net investment income (loss)E | .11 |
Net realized and unrealized gain (loss) | 1.26 |
Total from investment operations | 1.37 |
Distributions from net investment income | (.08) |
Net asset value, end of period | $ 11.29 |
Total ReturnB,C,D | 13.73% |
Ratios to Average Net AssetsG | |
Expenses before expense reductions | .60%A |
Expenses net of voluntary waivers, if any | .58%A |
Expenses net of all reductions | .58%A |
Net investment income (loss) | 1.49%A |
Supplemental Data | |
Net assets, end of period (000 omitted) | $ 52,310 |
Portfolio turnover rate | 4%A |
A Annualized
B Total returns for periods of less than one year are not annualized.
C Total returns would have been lower had certain expenses not been reduced during the periods shown.
D Total returns do not include the effect of the sales charges.
E Calculated based on average shares outstanding during the period.
F For the period July 24, 2003 (commencement of operations) to March 31, 2004.
G Expense ratios reflect operating expenses of the class. Expenses before reductions do not reflect amounts reimbursed by the investment adviser or reductions from brokerage service arrangements or other expense offset arrangements and do not represent the amount paid by the class during periods when reimbursements or reductions occur. Expenses net of any voluntary waivers reflect expenses after reimbursement by the investment adviser but prior to reductions from brokerage service arrangements or other expense offset arrangements. Expenses net of all reductions represent the net expenses paid by the class.
See accompanying notes which are an integral part of the financial statements.
Annual Report
Financial Highlights - Class B
Year ended March 31, | 2004F |
Selected Per-Share Data | |
Net asset value, beginning of period | $ 10.00 |
Income from Investment Operations | |
Net investment income (loss)E | .07 |
Net realized and unrealized gain (loss) | 1.27 |
Total from investment operations | 1.34 |
Distributions from net investment income | (.07) |
Net asset value, end of period | $ 11.27 |
Total ReturnB,C,D | 13.37% |
Ratios to Average Net AssetsG | |
Expenses before expense reductions | 1.10%A |
Expenses net of voluntary waivers, if any | 1.08%A |
Expenses net of all reductions | 1.08%A |
Net investment income (loss) | .99%A |
Supplemental Data | |
Net assets, end of period (000 omitted) | $ 23,274 |
Portfolio turnover rate | 4%A |
A Annualized
B Total returns for periods of less than one year are not annualized.
C Total returns would have been lower had certain expenses not been reduced during the periods shown.
D Total returns do not include the effect of the contingent deferred sales charge.
E Calculated based on average shares outstanding during the period.
F For the period July 24, 2003 (commencement of operations) to March 31, 2004.
G Expense ratios reflect operating expenses of the class. Expenses before reductions do not reflect amounts reimbursed by the investment adviser or reductions from brokerage service arrangements or other expense offset arrangements and do not represent the amount paid by the class during periods when reimbursements or reductions occur. Expenses net of any voluntary waivers reflect expenses after reimbursement by the investment adviser but prior to reductions from brokerage service arrangements or other expense offset arrangements. Expenses net of all reductions represent the net expenses paid by the class.
See accompanying notes which are an integral part of the financial statements.
Annual Report
Financial Highlights - Class C
Year ended March 31, | 2004F |
Selected Per-Share Data | |
Net asset value, beginning of period | $ 10.00 |
Income from Investment Operations | |
Net investment income (loss)E | .07 |
Net realized and unrealized gain (loss) | 1.26 |
Total from investment operations | 1.33 |
Distributions from net investment income | (.07) |
Net asset value, end of period | $ 11.26 |
Total ReturnB,C,D | 13.32% |
Ratios to Average Net AssetsG | |
Expenses before expense reductions | 1.10%A |
Expenses net of voluntary waivers, if any | 1.08%A |
Expenses net of all reductions | 1.08%A |
Net investment income (loss) | .99%A |
Supplemental Data | |
Net assets, end of period (000 omitted) | $ 15,871 |
Portfolio turnover rate | 4%A |
A Annualized
B Total returns for periods of less than one year are not annualized.
C Total returns would have been lower had certain expenses not been reduced during the periods shown.
D Total returns do not include the effect of the contingent deferred sales charge.
E Calculated based on average shares outstanding during the period.
F For the period July 24, 2003 (commencement of operations) to March 31, 2004.
G Expense ratios reflect operating expenses of the class. Expenses before reductions do not reflect amounts reimbursed by the investment adviser or reductions from brokerage service arrangements or other expense offset arrangements and do not represent the amount paid by the class during periods when reimbursements or reductions occur. Expenses net of any voluntary waivers reflect expenses after reimbursement by the investment adviser but prior to reductions from brokerage service arrangements or other expense offset arrangements. Expenses net of all reductions represent the net expenses paid by the class.
See accompanying notes which are an integral part of the financial statements.
Annual Report
Financial Highlights - Institutional Class
Year ended March 31, | 2004E |
Selected Per-Share Data | |
Net asset value, beginning of period | $ 10.00 |
Income from Investment Operations | |
Net investment income (loss)D | .15 |
Net realized and unrealized gain (loss) | 1.25 |
Total from investment operations | 1.40 |
Distributions from net investment income | (.09) |
Net asset value, end of period | $ 11.31 |
Total ReturnB,C | 14.03% |
Ratios to Average Net AssetsF | |
Expenses before expense reductions | .10%A |
Expenses net of voluntary waivers, if any | .08%A |
Expenses net of all reductions | .08%A |
Net investment income (loss) | 1.98%A |
Supplemental Data | |
Net assets, end of period (000 omitted) | $ 2,278 |
Portfolio turnover rate | 4%A |
A Annualized
B Total returns for periods of less than one year are not annualized.
C Total returns would have been lower had certain expenses not been reduced during the periods shown.
D Calculated based on average shares outstanding during the period.
E For the period July 24, 2003 (commencement of operations) to March 31, 2004.
F Expense ratios reflect operating expenses of the class. Expenses before reductions do not reflect amounts reimbursed by the investment adviser or reductions from brokerage service arrangements or other expense offset arrangements and do not represent the amount paid by the class during periods when reimbursements or reductions occur. Expenses net of any voluntary waivers reflect expenses after reimbursement by the investment adviser but prior to reductions from brokerage service arrangements or other expense offset arrangements. Expenses net of all reductions represent the net expenses paid by the class.
See accompanying notes which are an integral part of the financial statements.
Annual Report
Fidelity Advisor Freedom 2025 Fund
Investment Summary
Fund Holdings as of March 31, 2004 |
| % of fund's
investments |
Domestic Equity Funds | |
Fidelity Advisor Dividend Growth Fund Institutional Class | 12.9% |
Fidelity Advisor Equity Growth Fund Institutional Class | 6.5 |
Fidelity Advisor Equity Income Fund Institutional Class | 13.1 |
Fidelity Advisor Growth & Income Fund Institutional Class | 12.8 |
Fidelity Advisor Large Cap Fund Institutional Class | 12.8 |
Fidelity Advisor Mid-Cap Fund Institutional Class | 3.9 |
Fidelity Advisor Small Cap Fund Institutional Class | 4.0 |
| 66.0 |
International Equity Funds | |
Fidelity Advisor Diversified International Fund Institutional Class | 6.0 |
Fidelity Advisor Overseas Fund Institutional Class | 5.9 |
| 11.9 |
High Yield Fixed-Income Funds | |
Fidelity Advisor High Income Advantage Fund Institutional Class | 7.5 |
Investment Grade Fixed-Income Funds | |
Fidelity Advisor Government Investment Fund Institutional Class | 7.3 |
Fidelity Advisor Intermediate Bond Fund Institutional Class | 7.3 |
| 14.6 |
| 100.0% |
Annual Report
Fidelity Advisor Freedom 2025 Fund
Investment Changes - continued
Asset Allocation (% of fund's investments)

The fund invests according to an asset allocation strategy that becomes increasingly conservative over time. The initial allocation represents the target asset allocation at inception. The current allocation is based on the fund's holdings as of March 31, 2004. The expected allocation represents the fund's anticipated target asset allocation at September 30, 2004.
Annual Report
Fidelity Advisor Freedom 2025 Fund
Investments March 31, 2004
Showing Percentage of Total Value of Investment in Securities
Equity Funds - 77.9% |
| Shares | | Value (Note 1) |
Domestic Equity Funds - 66.0% |
Fidelity Advisor Dividend Growth Fund Institutional Class | 111,425 | | $ 1,284,731 |
Fidelity Advisor Equity Growth Fund Institutional Class | 13,770 | | 649,100 |
Fidelity Advisor Equity Income Fund Institutional Class | 48,357 | | 1,304,189 |
Fidelity Advisor Growth & Income Fund Institutional Class | 78,945 | | 1,274,168 |
Fidelity Advisor Large Cap Fund Institutional Class | 86,629 | | 1,279,506 |
Fidelity Advisor Mid-Cap Fund Institutional Class | 16,814 | | 388,065 |
Fidelity Advisor Small Cap Fund Institutional Class | 18,341 | | 403,510 |
TOTAL DOMESTIC EQUITY FUNDS | | 6,583,269 |
International Equity Funds - 11.9% |
Fidelity Advisor Diversified International Fund Institutional Class | 35,057 | | 596,314 |
Fidelity Advisor Overseas Fund Institutional Class | 35,691 | | 593,543 |
TOTAL INTERNATIONAL EQUITY FUNDS | | 1,189,857 |
TOTAL EQUITY FUNDS (Cost $7,634,525) | 7,773,126 |
Fixed-Income Funds - 22.1% |
| | | |
High Yield Fixed-Income Funds - 7.5% |
Fidelity Advisor High Income Advantage Fund Institutional Class | 80,327 | | 742,223 |
Investment Grade Fixed-Income Funds - 14.6% |
Fidelity Advisor Government Investment Fund Institutional Class | 71,638 | | 729,987 |
Fidelity Advisor Intermediate Bond Fund Institutional Class | 63,602 | | 730,151 |
TOTAL INVESTMENT GRADE FIXED-INCOME FUNDS | | 1,460,138 |
TOTAL FIXED-INCOME FUNDS (Cost $2,199,510) | 2,202,361 |
TOTAL INVESTMENT IN SECURITIES - 100% (Cost $9,834,035) | $ 9,975,487 |
Other Information |
Purchases and redemptions of the underlying fund shares aggregated $9,935,720 and $100,386, respectively. |
See accompanying notes which are an integral part of the financial statements.
Annual Report
Fidelity Advisor Freedom 2025 Fund
Financial Statements
Statement of Assets and Liabilities
| March 31, 2004 |
| | |
Assets | | |
Investment in securities, at value (cost $9,834,035) - See accompanying schedule | | $ 9,975,487 |
Cash | | 27 |
Receivable for fund shares sold | | 279,029 |
Total assets | | 10,254,543 |
| | |
Liabilities | | |
Payable for investments purchased | $ 260,496 | |
Payable for fund shares redeemed | 18,384 | |
Accrued management fee | 1,048 | |
Distribution fees payable | 4,475 | |
Total liabilities | | 284,403 |
| | |
Net Assets | | $ 9,970,140 |
Net Assets consist of: | | |
Paid in capital | | $ 9,822,177 |
Undistributed net investment income | | 6,118 |
Accumulated undistributed net realized gain (loss) on investments | | 393 |
Net unrealized appreciation (depreciation) on investments | | 141,452 |
Net Assets | | $ 9,970,140 |
See accompanying notes which are an integral part of the financial statements.
Annual Report
Fidelity Advisor Freedom 2025 Fund
Financial Statements - continued
Statement of Assets and Liabilities - continued
| March 31, 2004 |
Calculation of Maximum Offering Price | | |
Class A:
Net Asset Value and redemption price per share ($2,284,181 ÷ 214,120 shares) | | $ 10.67 |
| | |
Maximum offering price per share (100/94.25 of $10.67) | | $ 11.32 |
Class T:
Net Asset Value and redemption price per share ($2,556,091 ÷ 239,031 shares) | | $ 10.69 |
| | |
Maximum offering price per share (100/96.50 of $10.69) | | $ 11.08 |
Class B:
Net Asset Value and offering price per share ($2,771,032 ÷ 260,386 shares) A | | $ 10.64 |
| | |
Class C:
Net Asset Value and offering price per share ($2,137,113 ÷ 200,760 shares) A | | $ 10.65 |
| | |
Institutional Class:
Net Asset Value, offering price and redemption price per share ($221,723 ÷ 20,760 shares) | | $ 10.68 |
A Redemption price per share is equal to net asset value less any applicable contingent deferred sales charge.
See accompanying notes which are an integral part of the financial statements.
Annual Report
Statement of Operations
| November 6, 2003 (commencement of operations) to March 31, 2004 |
| | |
Investment Income | | |
Income distributions from underlying funds | | $ 29,359 |
Interest | | 27 |
Total income | | 29,386 |
| | |
Expenses | | |
Management fee | $ 1,516 | |
Distribution fees | 10,271 | |
Non-interested trustees' compensation | 4 | |
Total expenses before reductions | 11,791 | |
Expense reductions | (261) | 11,530 |
Net investment income (loss) | | 17,856 |
Realized and Unrealized Gain (Loss) Realized gain (loss) on sale of underlying fund shares | (1,299) | |
Capital gain distributions from underlying funds | 1,787 | 488 |
Change in net unrealized appreciation (depreciation) on investment securities | | 141,452 |
Net gain (loss) | | 141,940 |
Net increase (decrease) in net assets resulting from operations | | $ 159,796 |
See accompanying notes which are an integral part of the financial statements.
Annual Report
Fidelity Advisor Freedom 2025 Fund
Financial Statements - continued
Statement of Changes in Net Assets
| November 6, 2003
(commencement of
operations) to
March 31, 2004 |
Increase (Decrease) in Net Assets | |
Operations | |
Net investment income (loss) | $ 17,856 |
Net realized gain (loss) | 488 |
Change in net unrealized appreciation (depreciation) | 141,452 |
Net increase (decrease) in net assets resulting from operations | 159,796 |
Distributions to shareholders from net investment income | (11,834) |
Share transactions - net increase (decrease) | 9,822,178 |
Total increase (decrease) in net assets | 9,970,140 |
| |
Net Assets | |
Beginning of period | - |
End of period (including undistributed net investment income of $6,118) | $ 9,970,140 |
See accompanying notes which are an integral part of the financial statements.
Annual Report
Financial Highlights - Class A
Year ended March 31, | 2004F |
Selected Per-Share Data | |
Net asset value, beginning of period | $ 10.00 |
Income from Investment Operations | |
Net investment income (loss) E | .06 |
Net realized and unrealized gain (loss) | .67 |
Total from investment operations | .73 |
Distributions from net investment income | (.06) |
Net asset value, end of period | $ 10.67 |
Total ReturnB,C,D | 7.32% |
Ratios to Average Net AssetsG | |
Expenses before expense reductions | .35%A |
Expenses net of voluntary waivers, if any | .33%A |
Expenses net of all reductions | .33%A |
Net investment income (loss) | 1.59%A |
Supplemental Data | |
Net assets, end of period (000 omitted) | $ 2,284 |
Portfolio turnover rate | 6%A |
A Annualized
B Total returns for periods of less than one year are not annualized.
C Total returns would have been lower had certain expenses not been reduced during the periods shown.
D Total returns do not include the effect of the sales charges.
E Calculated based on average shares outstanding during the period.
F For the period November 6, 2003 (commencement of operations) to March 31, 2004.
G Expense ratios reflect operating expenses of the class. Expenses before reductions do not reflect amounts reimbursed by the investment adviser or reductions from brokerage service arrangements or other expense offset arrangements and do not represent the amount paid by the class during periods when reimbursements or reductions occur. Expenses net of any voluntary waivers reflect expenses after reimbursement by the investment adviser but prior to reductions from brokerage service arrangements or other expense offset arrangements. Expenses net of all reductions represent the net expenses paid by the class.
See accompanying notes which are an integral part of the financial statements.
Annual Report
Financial Highlights - Class T
Year ended March 31, | 2004F |
Selected Per-Share Data | |
Net asset value, beginning of period | $ 10.00 |
Income from Investment Operations | |
Net investment income (loss)E | .05 |
Net realized and unrealized gain (loss) | .70 |
Total from investment operations | .75 |
Distributions from net investment income | (.06) |
Net asset value, end of period | $ 10.69 |
Total ReturnB,C,D | 7.52% |
Ratios to Average Net AssetsG | |
Expenses before expense reductions | .60%A |
Expenses net of voluntary waivers, if any | .58%A |
Expenses net of all reductions | .58%A |
Net investment income (loss) | 1.34%A |
Supplemental Data | |
Net assets, end of period (000 omitted) | $ 2,556 |
Portfolio turnover rate | 6%A |
A Annualized
B Total returns for periods of less than one year are not annualized.
C Total returns would have been lower had certain expenses not been reduced during the periods shown.
D Total returns do not include the effect of the sales charges.
E Calculated based on average shares outstanding during the period.
F For the period November 6, 2003 (commencement of operations) to March 31, 2004.
G Expense ratios reflect operating expenses of the class. Expenses before reductions do not reflect amounts reimbursed by the investment adviser or reductions from brokerage service arrangements or other expense offset arrangements and do not represent the amount paid by the class during periods when reimbursements or reductions occur. Expenses net of any voluntary waivers reflect expenses after reimbursement by the investment adviser but prior to reductions from brokerage service arrangements or other expense offset arrangements. Expenses net of all reductions represent the net expenses paid by the class.
See accompanying notes which are an integral part of the financial statements.
Annual Report
Financial Highlights - Class B
Year ended March 31, | 2004F |
Selected Per-Share Data | |
Net asset value, beginning of period | $ 10.00 |
Income from Investment Operations | |
Net investment income (loss)E | .03 |
Net realized and unrealized gain (loss) | .67 |
Total from investment operations | .70 |
Distributions from net investment income | (.06) |
Net asset value, end of period | $ 10.64 |
Total ReturnB,C,D | 6.97% |
Ratios to Average Net AssetsG | |
Expenses before expense reductions | 1.10%A |
Expenses net of voluntary waivers, if any | 1.08%A |
Expenses net of all reductions | 1.08%A |
Net investment income (loss) | .84%A |
Supplemental Data | |
Net assets, end of period (000 omitted) | $ 2,771 |
Portfolio turnover rate | 6%A |
A Annualized
B Total returns for periods of less than one year are not annualized.
C Total returns would have been lower had certain expenses not been reduced during the periods shown.
D Total returns do not include the effect of the contingent deferred sales charge.
E Calculated based on average shares outstanding during the period.
F For the period November 6, 2003 (commencement of operations) to March 31, 2004.
G Expense ratios reflect operating expenses of the class. Expenses before reductions do not reflect amounts reimbursed by the investment adviser or reductions from brokerage service arrangements or other expense offset arrangements and do not represent the amount paid by the class during periods when reimbursements or reductions occur. Expenses net of any voluntary waivers reflect expenses after reimbursement by the investment adviser but prior to reductions from brokerage service arrangements or other expense offset arrangements. Expenses net of all reductions represent the net expenses paid by the class.
See accompanying notes which are an integral part of the financial statements.
Annual Report
Financial Highlights - Class C
Year ended March 31, | 2004F |
Selected Per-Share Data | |
Net asset value, beginning of period | $ 10.00 |
Income from Investment Operations | |
Net investment income (loss)E | .03 |
Net realized and unrealized gain (loss) | .67 |
Total from investment operations | .70 |
Distributions from net investment income | (.05) |
Net asset value, end of period | $ 10.65 |
Total ReturnB,C,D | 7.02% |
Ratios to Average Net AssetsG | |
Expenses before expense reductions | 1.10%A |
Expenses net of voluntary waivers, if any | 1.08%A |
Expenses net of all reductions | 1.08%A |
Net investment income (loss) | .84%A |
Supplemental Data | |
Net assets, end of period (000 omitted) | $ 2,137 |
Portfolio turnover rate | 6%A |
A Annualized
B Total returns for periods of less than one year are not annualized.
C Total returns would have been lower had certain expenses not been reduced during the periods shown.
D Total returns do not include the effect of the contingent deferred sales charge.
E Calculated based on average shares outstanding during the period.
F For the period November 6, 2003 (commencement of operations) to March 31, 2004.
G Expense ratios reflect operating expenses of the class. Expenses before reductions do not reflect amounts reimbursed by the investment adviser or reductions from brokerage service arrangements or other expense offset arrangements and do not represent the amount paid by the class during periods when reimbursements or reductions occur. Expenses net of any voluntary waivers reflect expenses after reimbursement by the investment adviser but prior to reductions from brokerage service arrangements or other expense offset arrangements. Expenses net of all reductions represent the net expenses paid by the class.
See accompanying notes which are an integral part of the financial statements.
Annual Report
Financial Highlights - Institutional Class
Year ended March 31, | 2004E |
Selected Per-Share Data | |
Net asset value, beginning of period | $ 10.00 |
Income from Investment Operations | |
Net investment income (loss)D | .08 |
Net realized and unrealized gain (loss) | .66 |
Total from investment operations | .74 |
Distributions from net investment income | (.06) |
Net asset value, end of period | $ 10.68 |
Total ReturnB,C | 7.42% |
Ratios to Average Net AssetsF | |
Expenses before expense reductions | .10%A |
Expenses net of voluntary waivers, if any | .08%A |
Expenses net of all reductions | .08%A |
Net investment income (loss) | 1.84%A |
Supplemental Data | |
Net assets, end of period (000 omitted) | $ 222 |
Portfolio turnover rate | 6%A |
A Annualized
B Total returns for periods of less than one year are not annualized.
C Total returns would have been lower had certain expenses not been reduced during the periods shown.
D Calculated based on average shares outstanding during the period.
E For the period November 6, 2003 (commencement of operations) to March 31, 2004.
F Expense ratios reflect operating expenses of the class. Expenses before reductions do not reflect amounts reimbursed by the investment adviser or reductions from brokerage service arrangements or other expense offset arrangements and do not represent the amount paid by the class during periods when reimbursements or reductions occur. Expenses net of any voluntary waivers reflect expenses after reimbursement by the investment adviser but prior to reductions from brokerage service arrangements or other expense offset arrangements. Expenses net of all reductions represent the net expenses paid by the class.
See accompanying notes which are an integral part of the financial statements.
Annual Report
Fidelity Advisor Freedom 2030 Fund
Investment Changes
Fund Holdings as of March 31, 2004 |
| % of fund's
investments | % of fund's investments
6 months ago |
Domestic Equity Funds | | |
Fidelity Advisor Dividend Growth Fund Institutional Class | 13.6% | 13.5% |
Fidelity Advisor Equity Growth Fund Institutional Class | 6.8 | 6.9 |
Fidelity Advisor Equity Income Fund Institutional Class | 13.9 | 13.6 |
Fidelity Advisor Growth & Income Fund Institutional Class | 13.4 | 13.5 |
Fidelity Advisor Large Cap Fund Institutional Class | 13.5 | 13.5 |
Fidelity Advisor Mid-Cap Fund Institutional Class | 4.1 | 4.1 |
Fidelity Advisor Small Cap Fund Institutional Class | 4.3 | 4.1 |
| 69.6 | 69.2 |
International Equity Funds | | |
Fidelity Advisor Diversified International Fund Institutional Class | 6.6 | 6.4 |
Fidelity Advisor Overseas Fund Institutional Class | 6.5 | 6.4 |
| 13.1 | 12.8 |
High Yield Fixed-Income Funds | | |
Fidelity Advisor High Income Advantage Fund Institutional Class | 7.5 | 7.8 |
Investment Grade Fixed-Income Funds | | |
Fidelity Advisor Government Investment Fund Institutional Class | 4.9 | 5.1 |
Fidelity Advisor Intermediate Bond Fund Institutional Class | 4.9 | 5.1 |
| 9.8 | 10.2 |
| 100.0% | 100.0% |
Annual Report
Fidelity Advisor Freedom 2030 Fund
Investment Changes - continued
Asset Allocation (% of fund's investments)

The fund invests according to an asset allocation strategy that becomes increasingly conservative over time. The six months ago allocation is based on the fund's holdings as of September 30, 2003. The current allocation is based on the fund's holdings as of March 31, 2004. The expected allocation represents the fund's anticipated target asset allocation at September 30, 2004.
Annual Report
Fidelity Advisor Freedom 2030 Fund
Investments March 31, 2004
Showing Percentage of Total Value of Investment in Securities
Equity Funds - 82.7% |
| Shares | | Value (Note 1) |
Domestic Equity Funds - 69.6% |
Fidelity Advisor Dividend Growth Fund Institutional Class | 919,234 | | $ 10,598,772 |
Fidelity Advisor Equity Growth Fund Institutional Class | 113,487 | | 5,349,755 |
Fidelity Advisor Equity Income Fund Institutional Class | 402,676 | | 10,860,171 |
Fidelity Advisor Growth & Income Fund Institutional Class | 647,426 | | 10,449,450 |
Fidelity Advisor Large Cap Fund Institutional Class | 713,870 | | 10,543,856 |
Fidelity Advisor Mid-Cap Fund Institutional Class | 139,283 | | 3,214,649 |
Fidelity Advisor Small Cap Fund Institutional Class | 153,805 | | 3,383,706 |
TOTAL DOMESTIC EQUITY FUNDS | | 54,400,359 |
International Equity Funds - 13.1% |
Fidelity Advisor Diversified International Fund Institutional Class | 300,642 | | 5,113,918 |
Fidelity Advisor Overseas Fund Institutional Class | 305,609 | | 5,082,282 |
TOTAL INTERNATIONAL EQUITY FUNDS | | 10,196,200 |
TOTAL EQUITY FUNDS (Cost $62,368,035) | 64,596,559 |
Fixed-Income Funds - 17.3% |
| | | |
High Yield Fixed-Income Funds - 7.5% |
Fidelity Advisor High Income Advantage Fund Institutional Class | 632,629 | | 5,845,489 |
Investment Grade Fixed-Income Funds - 9.8% |
Fidelity Advisor Government Investment Fund Institutional Class | 375,937 | | 3,830,801 |
Fidelity Advisor Intermediate Bond Fund Institutional Class | 333,564 | | 3,829,311 |
TOTAL INVESTMENT GRADE FIXED-INCOME FUNDS | | 7,660,112 |
TOTAL FIXED-INCOME FUNDS (Cost $13,424,513) | 13,505,601 |
TOTAL INVESTMENT IN SECURITIES - 100% (Cost $75,792,548) | $ 78,102,160 |
Other Information |
Purchases and redemptions of the underlying fund shares aggregated $76,243,182 and $445,498, respectively. |
See accompanying notes which are an integral part of the financial statements.
Annual Report
Fidelity Advisor Freedom 2030 Fund
Financial Statements
Statement of Assets and Liabilities
| March 31, 2004 |
| | |
Assets | | |
Investment in securities, at value (cost $75,792,548) - See accompanying schedule | | $ 78,102,160 |
Receivable for fund shares sold | | 639,732 |
Total assets | | 78,741,892 |
| | |
Liabilities | | |
Payable to custodian bank | $ 4,713 | |
Payable for investments purchased | 470,046 | |
Payable for fund shares redeemed | 164,677 | |
Accrued management fee | 8,575 | |
Distribution fees payable | 32,762 | |
Total liabilities | | 680,773 |
| | |
Net Assets | | $ 78,061,119 |
Net Assets consist of: | | |
Paid in capital | | $ 75,684,175 |
Undistributed net investment income | | 54,472 |
Accumulated undistributed net realized gain (loss) on investments | | 12,860 |
Net unrealized appreciation (depreciation) on investments | | 2,309,612 |
Net Assets | | $ 78,061,119 |
See accompanying notes which are an integral part of the financial statements.
Annual Report
Fidelity Advisor Freedom 2030 Fund
Financial Statements - continued
Statement of Assets and Liabilities - continued
| March 31, 2004 |
Calculation of Maximum Offering Price | | |
Class A:
Net Asset Value and redemption price per share ($27,878,657 ÷ 2,428,458 shares) | | $ 11.48 |
| | |
Maximum offering price per share (100/94.25 of $11.48) | | $ 12.18 |
Class T:
Net Asset Value and redemption price per share ($27,201,115 ÷ 2,372,489 shares) | | $ 11.47 |
| | |
Maximum offering price per share (100/96.50 of $11.47) | | $ 11.89 |
Class B:
Net Asset Value and offering price per share ($12,229,031 ÷ 1,069,001 shares) A | | $ 11.44 |
| | |
Class C:
Net Asset Value and offering price per share ($9,722,086 ÷ 849,827 shares) A | | $ 11.44 |
| | |
Institutional Class:
Net Asset Value, offering price and redemption price per share ($1,030,230 ÷ 89,646 shares) | | $ 11.49 |
A Redemption price per share is equal to net asset value less any applicable contingent deferred sales charge.
See accompanying notes which are an integral part of the financial statements.
Annual Report
Statement of Operations
| July 24, 2003 (commencement of operations) to March 31, 2004 |
| | |
Investment Income | | |
Income distributions from underlying funds | | $ 359,719 |
| | |
Expenses | | |
Management fee | $ 20,439 | |
Distribution fees | 115,823 | |
Non-interested trustees' compensation | 67 | |
Total expenses before reductions | 136,329 | |
Expense reductions | (4,980) | 131,349 |
Net investment income (loss) | | 228,370 |
Realized and Unrealized Gain (Loss) Realized gain (loss) on sale of underlying fund shares | (5,135) | |
Capital gain distributions from underlying funds | 19,000 | 13,865 |
Change in net unrealized appreciation (depreciation) on investment securities | | 2,309,612 |
Net gain (loss) | | 2,323,477 |
Net increase (decrease) in net assets resulting from operations | | $ 2,551,847 |
See accompanying notes which are an integral part of the financial statements.
Annual Report
Fidelity Advisor Freedom 2030 Fund
Financial Statements - continued
Statement of Changes in Net Assets
| July 24, 2003
(commencement of
operations) to
March 31, 2004 |
Increase (Decrease) in Net Assets | |
Operations | |
Net investment income (loss) | $ 228,370 |
Net realized gain (loss) | 13,865 |
Change in net unrealized appreciation (depreciation) | 2,309,612 |
Net increase (decrease) in net assets resulting from operations | 2,551,847 |
Distributions to shareholders from net investment income | (174,903) |
Share transactions - net increase (decrease) | 75,684,175 |
Total increase (decrease) in net assets | 78,061,119 |
| |
Net Assets | |
Beginning of period | - |
End of period (including undistributed net investment income of $54,472) | $ 78,061,119 |
See accompanying notes which are an integral part of the financial statements.
Annual Report
Financial Highlights - Class A
Year ended March 31, | 2004F |
Selected Per-Share Data | |
Net asset value, beginning of period | $ 10.00 |
Income from Investment Operations | |
Net investment income (loss)E | .11 |
Net realized and unrealized gain (loss) | 1.46 |
Total from investment operations | 1.57 |
Distributions from net investment income | (.09) |
Net asset value, end of period | $ 11.48 |
Total ReturnB,C,D | 15.68% |
Ratios to Average Net AssetsG | |
Expenses before expense reductions | .35%A |
Expenses net of voluntary waivers, if any | .33%A |
Expenses net of all reductions | .33%A |
Net investment income (loss) | 1.44%A |
Supplemental Data | |
Net assets, end of period (000 omitted) | $ 27,879 |
Portfolio turnover rate | 2%A |
A Annualized
B Total returns for periods of less than one year are not annualized.
C Total returns would have been lower had certain expenses not been reduced during the periods shown.
D Total returns do not include the effect of the sales charges.
E Calculated based on average shares outstanding during the period.
F For the period July 24, 2003 (commencement of operations) to March 31, 2004.
G Expense ratios reflect operating expenses of the class. Expenses before reductions do not reflect amounts reimbursed by the investment adviser or reductions from brokerage service arrangements or other expense offset arrangements and do not represent the amount paid by the class during periods when reimbursements or reductions occur. Expenses net of any voluntary waivers reflect expenses after reimbursement by the investment adviser but prior to reductions from brokerage service arrangements or other expense offset arrangements. Expenses net of all reductions represent the net expenses paid by the class.
See accompanying notes which are an integral part of the financial statements.
Annual Report
Financial Highlights - Class T
Year ended March 31, | 2004F |
Selected Per-Share Data | |
Net asset value, beginning of period | $ 10.00 |
Income from Investment Operations | |
Net investment income (loss)E | .09 |
Net realized and unrealized gain (loss) | 1.46 |
Total from investment operations | 1.55 |
Distributions from net investment income | (.08) |
Net asset value, end of period | $ 11.47 |
Total ReturnB,C,D | 15.53% |
Ratios to Average Net AssetsG | |
Expenses before expense reductions | .60%A |
Expenses net of voluntary waivers, if any | .58%A |
Expenses net of all reductions | .58%A |
Net investment income (loss) | 1.19%A |
Supplemental Data | |
Net assets, end of period (000 omitted) | $ 27,201 |
Portfolio turnover rate | 2%A |
A Annualized
B Total returns for periods of less than one year are not annualized.
C Total returns would have been lower had certain expenses not been reduced during the periods shown.
D Total returns do not include the effect of the sales charges.
E Calculated based on average shares outstanding during the period.
F For the period July 24, 2003 (commencement of operations) to March 31, 2004.
G Expense ratios reflect operating expenses of the class. Expenses before reductions do not reflect amounts reimbursed by the investment adviser or reductions from brokerage service arrangements or other expense offset arrangements and do not represent the amount paid by the class during periods when reimbursements or reductions occur. Expenses net of any voluntary waivers reflect expenses after reimbursement by the investment adviser but prior to reductions from brokerage service arrangements or other expense offset arrangements. Expenses net of all reductions represent the net expenses paid by the class.
See accompanying notes which are an integral part of the financial statements.
Annual Report
Financial Highlights - Class B
Year ended March 31, | 2004F |
Selected Per-Share Data | |
Net asset value, beginning of period | $ 10.00 |
Income from Investment Operations | |
Net investment income (loss)E | .05 |
Net realized and unrealized gain (loss) | 1.46 |
Total from investment operations | 1.51 |
Distributions from net investment income | (.07) |
Net asset value, end of period | $ 11.44 |
Total ReturnB,C,D | 15.12% |
Ratios to Average Net AssetsG | |
Expenses before expense reductions | 1.10%A |
Expenses net of voluntary waivers, if any | 1.08%A |
Expenses net of all reductions | 1.08%A |
Net investment income (loss) | .69%A |
Supplemental Data | |
Net assets, end of period (000 omitted) | $ 12,229 |
Portfolio turnover rate | 2%A |
A Annualized
B Total returns for periods of less than one year are not annualized.
C Total returns would have been lower had certain expenses not been reduced during the periods shown.
D Total returns do not include the effect of the contingent deferred sales charge.
E Calculated based on average shares outstanding during the period.
F For the period July 24, 2003 (commencement of operations) to March 31, 2004.
G Expense ratios reflect operating expenses of the class. Expenses before reductions do not reflect amounts reimbursed by the investment adviser or reductions from brokerage service arrangements or other expense offset arrangements and do not represent the amount paid by the class during periods when reimbursements or reductions occur. Expenses net of any voluntary waivers reflect expenses after reimbursement by the investment adviser but prior to reductions from brokerage service arrangements or other expense offset arrangements. Expenses net of all reductions represent the net expenses paid by the class.
See accompanying notes which are an integral part of the financial statements.
Annual Report
Financial Highlights - Class C
Year ended March 31, | 2004F |
Selected Per-Share Data | |
Net asset value, beginning of period | $ 10.00 |
Income from Investment Operations | |
Net investment income (loss)E | .05 |
Net realized and unrealized gain (loss) | 1.46 |
Total from investment operations | 1.51 |
Distributions from net investment income | (.07) |
Net asset value, end of period | $ 11.44 |
Total ReturnB,C,D | 15.12% |
Ratios to Average Net AssetsG | |
Expenses before expense reductions | 1.10%A |
Expenses net of voluntary waivers, if any | 1.08%A |
Expenses net of all reductions | 1.08%A |
Net investment income (loss) | .69%A |
Supplemental Data | |
Net assets, end of period (000 omitted) | $ 9,722 |
Portfolio turnover rate | 2%A |
A Annualized
B Total returns for periods of less than one year are not annualized.
C Total returns would have been lower had certain expenses not been reduced during the periods shown.
D Total returns do not include the effect of the contingent deferred sales charge.
E Calculated based on average shares outstanding during the period.
F For the period July 24, 2003 (commencement of operations) to March 31, 2004.
G Expense ratios reflect operating expenses of the class. Expenses before reductions do not reflect amounts reimbursed by the investment adviser or reductions from brokerage service arrangements or other expense offset arrangements and do not represent the amount paid by the class during periods when reimbursements or reductions occur. Expenses net of any voluntary waivers reflect expenses after reimbursement by the investment adviser but prior to reductions from brokerage service arrangements or other expense offset arrangements. Expenses net of all reductions represent the net expenses paid by the class.
See accompanying notes which are an integral part of the financial statements.
Annual Report
Financial Highlights - Institutional Class
Year ended March 31, | 2004E |
Selected Per-Share Data | |
Net asset value, beginning of period | $ 10.00 |
Income from Investment Operations | |
Net investment income (loss)D | .13 |
Net realized and unrealized gain (loss) | 1.45 |
Total from investment operations | 1.58 |
Distributions from net investment income | (.09) |
Net asset value, end of period | $ 11.49 |
Total ReturnB,C | 15.83% |
Ratios to Average Net AssetsF | |
Expenses before expense reductions | .10%A |
Expenses net of voluntary waivers, if any | .08%A |
Expenses net of all reductions | .07%A |
Net investment income (loss) | 1.69%A |
Supplemental Data | |
Net assets, end of period (000 omitted) | $ 1,030 |
Portfolio turnover rate | 2%A |
A Annualized
B Total returns for periods of less than one year are not annualized.
C Total returns would have been lower had certain expenses not been reduced during the periods shown.
D Calculated based on average shares outstanding during the period.
E For the period July 24, 2003 (commencement of operations) to March 31, 2004.
F Expense ratios reflect operating expenses of the class. Expenses before reductions do not reflect amounts reimbursed by the investment adviser or reductions from brokerage service arrangements or other expense offset arrangements and do not represent the amount paid by the class during periods when reimbursements or reductions occur. Expenses net of any voluntary waivers reflect expenses after reimbursement by the investment adviser but prior to reductions from brokerage service arrangements or other expense offset arrangements. Expenses net of all reductions represent the net expenses paid by the class.
See accompanying notes which are an integral part of the financial statements.
Annual Report
Fidelity Advisor Freedom 2035 Fund
Investment Summary
Fund Holdings as of March 31, 2004 |
| % of fund's
investments |
Domestic Equity Funds | |
Fidelity Advisor Dividend Growth Fund Institutional Class | 13.6% |
Fidelity Advisor Equity Growth Fund Institutional Class | 6.8 |
Fidelity Advisor Equity Income Fund Institutional Class | 13.8 |
Fidelity Advisor Growth & Income Fund Institutional Class | 13.5 |
Fidelity Advisor Large Cap Fund Institutional Class | 13.5 |
Fidelity Advisor Mid-Cap Fund Institutional Class | 4.1 |
Fidelity Advisor Small Cap Fund Institutional Class | 4.3 |
| 69.6 |
International Equity Funds | |
Fidelity Advisor Diversified International Fund Institutional Class | 7.8 |
Fidelity Advisor Overseas Fund Institutional Class | 7.7 |
| 15.5 |
High Yield Fixed-Income Funds | |
Fidelity Advisor High Income Advantage Fund Institutional Class | 9.9 |
Investment Grade Fixed-Income Funds | |
Fidelity Advisor Government Investment Fund Institutional Class | 2.5 |
Fidelity Advisor Intermediate Bond Fund Institutional Class | 2.5 |
| 5.0 |
| 100.0% |
Annual Report
Fidelity Advisor Freedom 2035 Fund
Investment Changes - continued
Asset Allocation (% of fund's investments)

The fund invests according to an asset allocation strategy that becomes increasingly conservative over time. The initial allocation represents the target asset allocation at inception. The current allocation is based on the fund's holdings as of March 31, 2004. The expected allocation represents the fund's anticipated target asset allocation at September 30, 2004.
Annual Report
Fidelity Advisor Freedom 2035 Fund
Investments March 31, 2004
Showing Percentage of Total Value of Investment in Securities
Equity Funds - 85.1% |
| Shares | | Value (Note 1) |
Domestic Equity Funds - 69.6% |
Fidelity Advisor Dividend Growth Fund Institutional Class | 60,850 | | $ 701,603 |
Fidelity Advisor Equity Growth Fund Institutional Class | 7,479 | | 352,577 |
Fidelity Advisor Equity Income Fund Institutional Class | 26,457 | | 713,534 |
Fidelity Advisor Growth & Income Fund Institutional Class | 42,972 | | 693,563 |
Fidelity Advisor Large Cap Fund Institutional Class | 47,181 | | 696,861 |
Fidelity Advisor Mid-Cap Fund Institutional Class | 9,170 | | 211,643 |
Fidelity Advisor Small Cap Fund Institutional Class | 10,037 | | 220,807 |
TOTAL DOMESTIC EQUITY FUNDS | | 3,590,588 |
International Equity Funds - 15.5% |
Fidelity Advisor Diversified International Fund Institutional Class | 23,633 | | 402,001 |
Fidelity Advisor Overseas Fund Institutional Class | 24,039 | | 399,772 |
TOTAL INTERNATIONAL EQUITY FUNDS | | 801,773 |
TOTAL EQUITY FUNDS (Cost $4,289,120) | 4,392,361 |
Fixed-Income Funds - 14.9% |
| | | |
High Yield Fixed-Income Funds - 9.9% |
Fidelity Advisor High Income Advantage Fund Institutional Class | 55,312 | | 511,085 |
Investment Grade Fixed-Income Funds - 5.0% |
Fidelity Advisor Government Investment Fund Institutional Class | 12,617 | | 128,564 |
Fidelity Advisor Intermediate Bond Fund Institutional Class | 11,201 | | 128,583 |
TOTAL INVESTMENT GRADE FIXED-INCOME FUNDS | | 257,147 |
TOTAL FIXED-INCOME FUNDS (Cost $771,091) | 768,232 |
TOTAL INVESTMENT IN SECURITIES - 100% (Cost $5,060,211) | $ 5,160,593 |
Other Information |
Purchases and redemptions of the underlying fund shares aggregated $5,065,639 and $5,329, respectively. |
See accompanying notes which are an integral part of the financial statements.
Annual Report
Fidelity Advisor Freedom 2035 Fund
Financial Statements
Statement of Assets and Liabilities
| March 31, 2004 |
| | |
Assets | | |
Investment in securities, at value (cost $5,060,211) - See accompanying schedule | | $ 5,160,593 |
Cash | | 27 |
Receivable for investments sold | | 374 |
Receivable for fund shares sold | | 138,020 |
Total assets | | 5,299,014 |
| | |
Liabilities | | |
Payable for investments purchased | $ 128,150 | |
Payable for fund shares redeemed | 9,000 | |
Accrued management fee | 526 | |
Distribution fees payable | 2,121 | |
Total liabilities | | 139,797 |
| | |
Net Assets | | $ 5,159,217 |
Net Assets consist of: | | |
Paid in capital | | $ 5,056,671 |
Undistributed net investment income | | 1,743 |
Accumulated undistributed net realized gain (loss) on investments | | 421 |
Net unrealized appreciation (depreciation) on investments | | 100,382 |
Net Assets | | $ 5,159,217 |
See accompanying notes which are an integral part of the financial statements.
Annual Report
Fidelity Advisor Freedom 2035 Fund
Financial Statements - continued
Statement of Assets and Liabilities - continued
| March 31, 2004 |
Calculation of Maximum Offering Price | | |
Class A:
Net Asset Value and redemption price per share ($1,884,289 ÷ 176,144 shares) | | $ 10.70 |
| | |
Maximum offering price per share (100/94.25 of $10.70) | | $ 11.35 |
Class T:
Net Asset Value and redemption price per share ($1,046,553 ÷ 97,907 shares) | | $ 10.69 |
| | |
Maximum offering price per share (100/96.50 of $10.69) | | $ 11.08 |
Class B:
Net Asset Value and offering price per share ($1,122,566 ÷ 105,247 shares) A | | $ 10.67 |
| | |
Class C:
Net Asset Value and offering price per share ($889,881 ÷ 83,353 shares) A | | $ 10.68 |
| | |
Institutional Class:
Net Asset Value, offering price and redemption price per share ($215,928 ÷ 20,166 shares) | | $ 10.71 |
A Redemption price per share is equal to net asset value less any applicable contingent deferred sales charge.
See accompanying notes which are an integral part of the financial statements.
Annual Report
Statement of Operations
| November 6, 2003 (commencement of operations) to March 31, 2004 |
| | |
Investment Income | | |
Income distributions from underlying funds | | $ 20,247 |
Interest | | 27 |
Total income | | 20,274 |
| | |
Expenses | | |
Management fee | $ 950 | |
Distribution fees | 5,805 | |
Non-interested trustees' compensation | 3 | |
Total expenses before reductions | 6,758 | |
Expense reductions | (194) | 6,564 |
Net investment income (loss) | | 13,710 |
Realized and Unrealized Gain (Loss) Realized gain (loss) on sale of underlying fund shares | (99) | |
Capital gain distributions from underlying funds | 549 | 450 |
Change in net unrealized appreciation (depreciation) on investment securities | | 100,382 |
Net gain (loss) | | 100,832 |
Net increase (decrease) in net assets resulting from operations | | $ 114,542 |
See accompanying notes which are an integral part of the financial statements.
Annual Report
Fidelity Advisor Freedom 2035 Fund
Financial Statements - continued
Statement of Changes in Net Assets
| November 6, 2003
(commencement of
operations) to
March 31, 2004 |
Increase (Decrease) in Net Assets | |
Operations | |
Net investment income (loss) | $ 13,710 |
Net realized gain (loss) | 450 |
Change in net unrealized appreciation (depreciation) | 100,382 |
Net increase (decrease) in net assets resulting from operations | 114,542 |
Distributions to shareholders from net investment income | (11,997) |
Share transactions - net increase (decrease) | 5,056,672 |
Total increase (decrease) in net assets | 5,159,217 |
| |
Net Assets | |
Beginning of period | - |
End of period (including undistributed net investment income of $1,743) | $ 5,159,217 |
See accompanying notes which are an integral part of the financial statements.
Annual Report
Financial Highlights - Class A
Year ended March 31, | 2004F |
Selected Per-Share Data | |
Net asset value, beginning of period | $ 10.00 |
Income from Investment Operations | |
Net investment income (loss)E | .07 |
Net realized and unrealized gain (loss) | .72 |
Total from investment operations | .79 |
Distributions from net investment income | (.09) |
Net asset value, end of period | $ 10.70 |
Total ReturnB,C,D | 7.88% |
Ratios to Average Net AssetsG | |
Expenses before expense reductions | .35%A |
Expenses net of voluntary waivers, if any | .33%A |
Expenses net of all reductions | .33%A |
Net investment income (loss) | 1.80%A |
Supplemental Data | |
Net assets, end of period (000 omitted) | $ 1,884 |
Portfolio turnover rate | 1%A |
A Annualized
B Total returns for periods of less than one year are not annualized.
C Total returns would have been lower had certain expenses not been reduced during the periods shown.
D Total returns do not include the effect of the sales charges.
E Calculated based on average shares outstanding during the period.
F For the period November 6, 2003 (commencement of sale of shares) to March 31, 2004.
G Expense ratios reflect operating expenses of the class. Expenses before reductions do not reflect amounts reimbursed by the investment adviser or reductions from brokerage service arrangements or other expense offset arrangements and do not represent the amount paid by the class during periods when reimbursements or reductions occur. Expenses net of any voluntary waivers reflect expenses after reimbursement by the investment adviser but prior to reductions from brokerage service arrangements or other expense offset arrangements. Expenses net of all reductions represent the net expenses paid by the class.
See accompanying notes which are an integral part of the financial statements.
Annual Report
Financial Highlights - Class T
Year ended March 31, | 2004F |
Selected Per-Share Data | |
Net asset value, beginning of period | $ 10.00 |
Income from Investment Operations | |
Net investment income (loss)E | .06 |
Net realized and unrealized gain (loss) | .71 |
Total from investment operations | .77 |
Distributions from net investment income | (.08) |
Net asset value, end of period | $ 10.69 |
Total ReturnB,C,D | 7.73% |
Ratios to Average Net AssetsG | |
Expenses before expense reductions | .60%A |
Expenses net of voluntary waivers, if any | .58%A |
Expenses net of all reductions | .58%A |
Net investment income (loss) | 1.55%A |
Supplemental Data | |
Net assets, end of period (000 omitted) | $ 1,047 |
Portfolio turnover rate | 1%A |
A Annualized
B Total returns for periods of less than one year are not annualized.
C Total returns would have been lower had certain expenses not been reduced during the periods shown.
D Total returns do not include the effect of the sales charges.
E Calculated based on average shares outstanding during the period.
F For the period November 6, 2003 (commencement of sale of shares) to March 31, 2004.
G Expense ratios reflect operating expenses of the class. Expenses before reductions do not reflect amounts reimbursed by the investment adviser or reductions from brokerage service arrangements or other expense offset arrangements and do not represent the amount paid by the class during periods when reimbursements or reductions occur. Expenses net of any voluntary waivers reflect expenses after reimbursement by the investment adviser but prior to reductions from brokerage service arrangements or other expense offset arrangements. Expenses net of all reductions represent the net expenses paid by the class.
See accompanying notes which are an integral part of the financial statements.
Annual Report
Financial Highlights - Class B
Year ended March 31, | 2004F |
Selected Per-Share Data | |
Net asset value, beginning of period | $ 10.00 |
Income from Investment Operations | |
Net investment income (loss)E | .04 |
Net realized and unrealized gain (loss) | .71 |
Total from investment operations | .75 |
Distributions from net investment income | (.08) |
Net asset value, end of period | $ 10.67 |
Total ReturnB,C,D | 7.48% |
Ratios to Average Net AssetsG | |
Expenses before expense reductions | 1.10%A |
Expenses net of voluntary waivers, if any | 1.08%A |
Expenses net of all reductions | 1.08%A |
Net investment income (loss) | 1.05%A |
Supplemental Data | |
Net assets, end of period (000 omitted) | $ 1,123 |
Portfolio turnover rate | 1%A |
A Annualized
B Total returns for periods of less than one year are not annualized.
C Total returns would have been lower had certain expenses not been reduced during the periods shown.
D Total returns do not include the effect of the contingent deferred sales charge.
E Calculated based on average shares outstanding during the period.
F For the period November 6, 2003 (commencement of sale of shares) to March 31, 2004.
G Expense ratios reflect operating expenses of the class. Expenses before reductions do not reflect amounts reimbursed by the investment adviser or reductions from brokerage service arrangements or other expense offset arrangements and do not represent the amount paid by the class during periods when reimbursements or reductions occur. Expenses net of any voluntary waivers reflect expenses after reimbursement by the investment adviser but prior to reductions from brokerage service arrangements or other expense offset arrangements. Expenses net of all reductions represent the net expenses paid by the class.
See accompanying notes which are an integral part of the financial statements.
Annual Report
Financial Highlights - Class C
Year ended March 31, | 2004F |
Selected Per-Share Data | |
Net asset value, beginning of period | $ 10.00 |
Income from Investment Operations | |
Net investment income (loss)E | .04 |
Net realized and unrealized gain (loss) | .72 |
Total from investment operations | .76 |
Distributions from net investment income | (.08) |
Net asset value, end of period | $ 10.68 |
Total ReturnB,C,D | 7.58% |
Ratios to Average Net AssetsG | |
Expenses before expense reductions | 1.10%A |
Expenses net of voluntary waivers, if any | 1.08%A |
Expenses net of all reductions | 1.08%A |
Net investment income (loss) | 1.05%A |
Supplemental Data | |
Net assets, end of period (000 omitted) | $ 890 |
Portfolio turnover rate | 1%A |
A Annualized
B Total returns for periods of less than one year are not annualized.
C Total returns would have been lower had certain expenses not been reduced during the periods shown.
D Total returns do not include the effect of the contingent deferred sales charge.
E Calculated based on average shares outstanding during the period.
F For the period November 6, 2003 (commencement of sale of shares) to March 31, 2004.
G Expense ratios reflect operating expenses of the class. Expenses before reductions do not reflect amounts reimbursed by the investment adviser or reductions from brokerage service arrangements or other expense offset arrangements and do not represent the amount paid by the class during periods when reimbursements or reductions occur. Expenses net of any voluntary waivers reflect expenses after reimbursement by the investment adviser but prior to reductions from brokerage service arrangements or other expense offset arrangements. Expenses net of all reductions represent the net expenses paid by the class.
See accompanying notes which are an integral part of the financial statements.
Annual Report
Financial Highlights - Institutional Class
Year ended March 31, | 2004 E |
Selected Per-Share Data | |
Net asset value, beginning of period | $ 10.00 |
Income from Investment Operations | |
Net investment income (loss)D | .08 |
Net realized and unrealized gain (loss) | .72 |
Total from investment operations | .80 |
Distributions from net investment income | (.09) |
Net asset value, end of period | $ 10.71 |
Total ReturnB,C | 7.98% |
Ratios to Average Net AssetsF | |
Expenses before expense reductions | .10%A |
Expenses net of voluntary waivers, if any | .08%A |
Expenses net of all reductions | .08%A |
Net investment income (loss) | 2.04%A |
Supplemental Data | |
Net assets, end of period (000 omitted) | $ 216 |
Portfolio turnover rate | 1%A |
A Annualized
B Total returns for periods of less than one year are not annualized.
C Total returns would have been lower had certain expenses not been reduced during the periods shown.
D Calculated based on average shares outstanding during the period.
E For the period November 6, 2003 (commencement of sale of shares) to March 31, 2004.
F Expense ratios reflect operating expenses of the class. Expenses before reductions do not reflect amounts reimbursed by the investment adviser or reductions from brokerage service arrangements or other expense offset arrangements and do not represent the amount paid by the class during periods when reimbursements or reductions occur. Expenses net of any voluntary waivers reflect expenses after reimbursement by the investment adviser but prior to reductions from brokerage service arrangements or other expense offset arrangements. Expenses net of all reductions represent the net expenses paid by the class.
See accompanying notes which are an integral part of the financial statements.
Annual Report
Fidelity Advisor Freedom 2040 Fund
Investment Changes
Fund Holdings as of March 31, 2004 |
| % of fund's
investments | % of fund's investments
6 months ago |
Domestic Equity Funds | | |
Fidelity Advisor Dividend Growth Fund Institutional Class | 14.5% | 14.5% |
Fidelity Advisor Equity Growth Fund
Institutional Class | 7.3 | 7.4 |
Fidelity Advisor Equity Income Fund
Institutional Class | 14.9 | 14.6 |
Fidelity Advisor Growth & Income Fund Institutional Class | 14.3 | 14.4 |
Fidelity Advisor Large Cap Fund Institutional Class | 14.5 | 14.6 |
Fidelity Advisor Mid-Cap Fund Institutional Class | 4.4 | 4.4 |
Fidelity Advisor Small Cap Fund
Institutional Class | 4.6 | 4.4 |
| 74.5 | 74.3 |
International Equity Funds | | |
Fidelity Advisor Diversified International Fund Institutional Class | 7.8 | 7.7 |
Fidelity Advisor Overseas Fund Institutional Class | 7.8 | 7.7 |
| 15.6 | 15.4 |
High Yield Fixed-Income Funds | | |
Fidelity Advisor High Income Advantage Fund Institutional Class | 9.9 | 10.3 |
| 100.0% | 100.0% |
Annual Report
Fidelity Advisor Freedom 2040 Fund
Investment Changes - continued
Asset Allocation (% of fund's investments)

The fund invests according to an asset allocation strategy that becomes increasingly conservative over time. The six months ago allocation is based on the fund's holdings as of September 30, 2003. The current allocation is based on the fund's holdings as of March 31, 2004. The expected allocation represents the fund's anticipated target asset allocation at September 30, 2004.
Annual Report
Fidelity Advisor Freedom 2040 Fund
Investments March 31, 2004
Showing Percentage of Total Value of Investment in Securities
Equity Funds - 90.1% |
| Shares | | Value (Note 1) |
Domestic Equity Funds - 74.5% |
Fidelity Advisor Dividend Growth Fund Institutional Class | 545,249 | | $ 6,286,718 |
Fidelity Advisor Equity Growth Fund Institutional Class | 67,379 | | 3,176,241 |
Fidelity Advisor Equity Income Fund Institutional Class | 238,782 | | 6,439,950 |
Fidelity Advisor Growth & Income Fund Institutional Class | 384,273 | | 6,202,165 |
Fidelity Advisor Large Cap Fund Institutional Class | 423,943 | | 6,261,631 |
Fidelity Advisor Mid-Cap Fund Institutional Class | 83,050 | | 1,916,794 |
Fidelity Advisor Small Cap Fund Institutional Class | 91,091 | | 2,003,995 |
TOTAL DOMESTIC EQUITY FUNDS | | 32,287,494 |
International Equity Funds - 15.6% |
Fidelity Advisor Diversified International Fund Institutional Class | 199,615 | | 3,395,446 |
Fidelity Advisor Overseas Fund Institutional Class | 203,215 | | 3,379,473 |
TOTAL INTERNATIONAL EQUITY FUNDS | | 6,774,919 |
TOTAL EQUITY FUNDS (Cost $37,671,959) | 39,062,413 |
Fixed-Income Funds - 9.9% |
| | | |
High Yield Fixed-Income Funds - 9.9% |
Fidelity Advisor High Income Advantage Fund Institutional Class
(Cost $4,306,944) | 465,715 | | 4,303,207 |
TOTAL INVESTMENT IN SECURITIES - 100% (Cost $41,978,903) | $ 43,365,620 |
Other Information |
Purchases and redemptions of the underlying fund shares aggregated $42,306,185 and $324,541, respectively. |
Income Tax Information |
At March 31, 2004, the fund had a capital loss carryforward of approximately $105, all of which will expire on March 31, 2012. |
See accompanying notes which are an integral part of the financial statements.
Annual Report
Fidelity Advisor Freedom 2040 Fund
Financial Statements
Statement of Assets and Liabilities
| March 31, 2004 |
| | |
Assets | | |
Investment in securities, at value (cost $41,978,903) - See accompanying schedule | | $ 43,365,620 |
Cash | | 1 |
Receivable for fund shares sold | | 464,373 |
Total assets | | 43,829,994 |
| | |
Liabilities | | |
Payable for investments purchased | $ 446,882 | |
Payable for fund shares redeemed | 17,353 | |
Accrued management fee | 4,788 | |
Distribution fees payable | 19,579 | |
Total liabilities | | 488,602 |
| | |
Net Assets | | $ 43,341,392 |
Net Assets consist of: | | |
Paid in capital | | $ 41,946,553 |
Undistributed net investment income | | 10,863 |
Accumulated undistributed net realized gain (loss) on investments | | (2,741) |
Net unrealized appreciation (depreciation) on investments | | 1,386,717 |
Net Assets | | $ 43,341,392 |
See accompanying notes which are an integral part of the financial statements.
Annual Report
Fidelity Advisor Freedom 2040 Fund
Financial Statements - continued
Statement of Assets and Liabilities - continued
| March 31, 2004 |
Calculation of Maximum Offering Price | | |
Class A:
Net Asset Value and redemption price per share ($9,666,308 ÷ 831,851 shares) | | $ 11.62 |
| | |
Maximum offering price per share (100/94.25 of $11.62) | | $ 12.33 |
Class T:
Net Asset Value and redemption price per share ($19,191,014 ÷ 1,654,260 shares) | | $ 11.60 |
| | |
Maximum offering price per share (100/96.50 of $11.60) | | $ 12.02 |
Class B:
Net Asset Value and offering price per share ($7,232,039 ÷ 624,906 shares) A | | $ 11.57 |
| | |
Class C:
Net Asset Value and offering price per share ($6,957,977 ÷ 601,355 shares) A | | $ 11.57 |
| | |
Institutional Class:
Net Asset Value, offering price and redemption price per share ($294,054 ÷ 25,280 shares) | | $ 11.63 |
A Redemption price per share is equal to net asset value less any applicable contingent deferred sales charge.
See accompanying notes which are an integral part of the financial statements.
Annual Report
Statement of Operations
| July 24, 2003 (commencement of operations) to March 31, 2004 |
| | |
Investment Income | | |
Income distributions from underlying funds | | $ 202,027 |
| | |
Expenses | | |
Management fee | $ 10,840 | |
Distribution fees | 66,143 | |
Non-interested trustees' compensation | 35 | |
Total expenses before reductions | 77,018 | |
Expense reductions | (2,314) | 74,704 |
Net investment income (loss) | | 127,323 |
Realized and Unrealized Gain (Loss) Realized gain (loss) on sale of underlying fund shares | | (2,741) |
Change in net unrealized appreciation (depreciation) on investment securities | | 1,386,717 |
Net gain (loss) | | 1,383,976 |
Net increase (decrease) in net assets resulting from operations | | $ 1,511,299 |
See accompanying notes which are an integral part of the financial statements.
Annual Report
Fidelity Advisor Freedom 2040 Fund
Financial Statements - continued
Statement of Changes in Net Assets
| July 24, 2003
(commencement of
operations) to
March 31, 2004 |
Increase (Decrease) in Net Assets | |
Operations | |
Net investment income (loss) | $ 127,323 |
Net realized gain (loss) | (2,741) |
Change in net unrealized appreciation (depreciation) | 1,386,717 |
Net increase (decrease) in net assets resulting from operations | 1,511,299 |
Distributions to shareholders from net investment income | (116,460) |
Share transactions - net increase (decrease) | 41,946,553 |
Total increase (decrease) in net assets | 43,341,392 |
| |
Net Assets | |
Beginning of period | - |
End of period (including undistributed net investment income of $10,863 | $ 43,341,392 |
See accompanying notes which are an integral part of the financial statements.
Annual Report
Financial Highlights - Class A
Year ended March 31, | 2004F |
Selected Per-Share Data | |
Net asset value, beginning of period | $ 10.00 |
Income from Investment Operations | |
Net investment income (loss)E | .12 |
Net realized and unrealized gain (loss) | 1.60 |
Total from investment operations | 1.72 |
Distributions from net investment income | (.10) |
Net asset value, end of period | $ 11.62 |
Total ReturnB,C,D | 17.19% |
Ratios to Average Net AssetsG | |
Expenses before expense reductions | .35%A |
Expenses net of voluntary waivers, if any | .33%A |
Expenses net of all reductions | .33%A |
Net investment income (loss) | 1.53%A |
Supplemental Data | |
Net assets, end of period (000 omitted) | $ 9,666 |
Portfolio turnover rate | 3%A |
A Annualized
B Total returns for periods of less than one year are not annualized.
C Total returns would have been lower had certain expenses not been reduced during the periods shown.
D Total returns do not include the effect of the sales charges.
E Calculated based on average shares outstanding during the period.
F For the period July 24, 2003 (commencement of operations) to March 31, 2004.
G Expense ratios reflect operating expenses of the class. Expenses before reductions do not reflect amounts reimbursed by the investment adviser or reductions from brokerage service arrangements or other expense offset arrangements and do not represent the amount paid by the class during periods when reimbursements or reductions occur. Expenses net of any voluntary waivers reflect expenses after reimbursement by the investment adviser but prior to reductions from brokerage service arrangements or other expense offset arrangements. Expenses net of all reductions represent the net expenses paid by the class.
See accompanying notes which are an integral part of the financial statements.
Annual Report
Financial Highlights - Class T
Year ended March 31, | 2004F |
Selected Per-Share Data | |
Net asset value, beginning of period | $ 10.00 |
Income from Investment Operations | |
Net investment income (loss)E | .10 |
Net realized and unrealized gain (loss) | 1.59 |
Total from investment operations | 1.69 |
Distributions from net investment income | (.09) |
Net asset value, end of period | $ 11.60 |
Total ReturnB,C,D | 16.93% |
Ratios to Average Net AssetsG | |
Expenses before expense reductions | .60%A |
Expenses net of voluntary waivers, if any | .58%A |
Expenses net of all reductions | .58%A |
Net investment income (loss) | 1.28%A |
Supplemental Data | |
Net assets, end of period (000 omitted) | $ 19,191 |
Portfolio turnover rate | 3%A |
A Annualized
B Total returns for periods of less than one year are not annualized.
C Total returns would have been lower had certain expenses not been reduced during the periods shown.
D Total returns do not include the effect of the sales charges.
E Calculated based on average shares outstanding during the period.
F For the period July 24, 2003 (commencement of operations) to March 31, 2004.
G Expense ratios reflect operating expenses of the class. Expenses before reductions do not reflect amounts reimbursed by the investment adviser or reductions from brokerage service arrangements or other expense offset arrangements and do not represent the amount paid by the class during periods when reimbursements or reductions occur. Expenses net of any voluntary waivers reflect expenses after reimbursement by the investment adviser but prior to reductions from brokerage service arrangements or other expense offset arrangements. Expenses net of all reductions represent the net expenses paid by the class.
See accompanying notes which are an integral part of the financial statements.
Annual Report
Financial Highlights - Class B
Year ended March 31, | 2004F |
Selected Per-Share Data | |
Net asset value, beginning of period | $ 10.00 |
Income from Investment Operations | |
Net investment income (loss)E | .06 |
Net realized and unrealized gain (loss) | 1.60 |
Total from investment operations | 1.66 |
Distributions from net investment income | (.09) |
Net asset value, end of period | $ 11.57 |
Total ReturnB,C,D | 16.58% |
Ratios to Average Net AssetsG | |
Expenses before expense reductions | 1.10%A |
Expenses net of voluntary waivers, if any | 1.08%A |
Expenses net of all reductions | 1.08%A |
Net investment income (loss) | .78%A |
Supplemental Data | |
Net assets, end of period (000 omitted) | $ 7,232 |
Portfolio turnover rate | 3%A |
A Annualized
B Total returns for periods of less than one year are not annualized.
C Total returns would have been lower had certain expenses not been reduced during the periods shown.
D Total returns do not include the effect of the contingent deferred sales charge.
E Calculated based on average shares outstanding during the period.
F For the period July 24, 2003 (commencement of operations) to March 31, 2004.
G Expense ratios reflect operating expenses of the class. Expenses before reductions do not reflect amounts reimbursed by the investment adviser or reductions from brokerage service arrangements or other expense offset arrangements and do not represent the amount paid by the class during periods when reimbursements or reductions occur. Expenses net of any voluntary waivers reflect expenses after reimbursement by the investment adviser but prior to reductions from brokerage service arrangements or other expense offset arrangements. Expenses net of all reductions represent the net expenses paid by the class.
See accompanying notes which are an integral part of the financial statements.
Annual Report
Financial Highlights - Class C
Year ended March 31, | 2004F |
Selected Per-Share Data | |
Net asset value, beginning of period | $ 10.00 |
Income from Investment Operations | |
Net investment income (loss)E | .06 |
Net realized and unrealized gain (loss) | 1.59 |
Total from investment operations | 1.65 |
Distributions from net investment income | (.08) |
Net asset value, end of period | $ 11.57 |
Total ReturnB,C,D | 16.53% |
Ratios to Average Net AssetsG | |
Expenses before expense reductions | 1.10%A |
Expenses net of voluntary waivers, if any | 1.08%A |
Expenses net of all reductions | 1.08%A |
Net investment income (loss) | .78%A |
Supplemental Data | |
Net assets, end of period (000 omitted) | $ 6,958 |
Portfolio turnover rate | 3%A |
A Annualized
B Total returns for periods of less than one year are not annualized.
C Total returns would have been lower had certain expenses not been reduced during the periods shown.
D Total returns do not include the effect of the contingent deferred sales charge.
E Calculated based on average shares outstanding during the period.
F For the period July 24, 2003 (commencement of operations) to March 31, 2004.
G Expense ratios reflect operating expenses of the class. Expenses before reductions do not reflect amounts reimbursed by the investment adviser or reductions from brokerage service arrangements or other expense offset arrangements and do not represent the amount paid by the class during periods when reimbursements or reductions occur. Expenses net of any voluntary waivers reflect expenses after reimbursement by the investment adviser but prior to reductions from brokerage service arrangements or other expense offset arrangements. Expenses net of all reductions represent the net expenses paid by the class.
See accompanying notes which are an integral part of the financial statements.
Annual Report
Financial Highlights - Institutional Class
Year ended March 31, | 2004 E |
Selected Per-Share Data | |
Net asset value, beginning of period | $ 10.00 |
Income from Investment Operations | |
Net investment income (loss)D | .13 |
Net realized and unrealized gain (loss) | 1.60 |
Total from investment operations | 1.73 |
Distributions from net investment income | (.10) |
Net asset value, end of period | $ 11.63 |
Total ReturnB,C | 17.34% |
Ratios to Average Net AssetsF | |
Expenses before expense reductions | .10%A |
Expenses net of voluntary waivers, if any | .08%A |
Expenses net of all reductions | .08%A |
Net investment income (loss) | 1.78%A |
Supplemental Data | |
Net assets, end of period (000 omitted) | $ 294 |
Portfolio turnover rate | 3%A |
A Annualized
B Total returns for periods of less than one year are not annualized.
C Total returns would have been lower had certain expenses not been reduced during the periods shown.
D Calculated based on average shares outstanding during the period.
E For the period July 24, 2003 (commencement of operations) to March 31, 2004.
F Expense ratios reflect operating expenses of the class. Expenses before reductions do not reflect amounts reimbursed by the investment adviser or reductions from brokerage service arrangements or other expense offset arrangements and do not represent the amount paid by the class during periods when reimbursements or reductions occur. Expenses net of any voluntary waivers reflect expenses after reimbursement by the investment adviser but prior to reductions from brokerage service arrangements or other expense offset arrangements. Expenses net of all reductions represent the net expenses paid by the class.
See accompanying notes which are an integral part of the financial statements.
Annual Report
Notes to Financial Statements
For the period ended March 31, 2004
1. Significant Accounting Policies.
Fidelity Advisor Freedom Income Fund, Fidelity Advisor Freedom 2005 Fund, Fidelity Advisor Freedom 2010 Fund, Fidelity Advisor Freedom 2015 Fund, Fidelity Advisor Freedom 2020 Fund, Fidelity Advisor Freedom 2025 Fund, Fidelity Advisor Freedom 2030 Fund, Fidelity Advisor Freedom 2035 Fund and Fidelity Advisor Freedom 2040 Fund (the funds) are funds of Fidelity Aberdeen Street Trust (the trust). The trust is registered under the Investment Company Act of 1940, as amended (the 1940 Act), as an open-end management investment company organized as a Delaware statutory trust. Each fund is authorized to issue an unlimited number of shares. The funds primarily invest in a combination of other Fidelity equity, fixed income, and money market funds (the Underlying Funds) managed by Fidelity Management & Research Company (FMR). Each fund offers Class A, Class T, Class B, Class C, and Institutional Class shares, each of which has equal rights as to assets and voting privileges. Each class has exclusive voting rights with respect to matters that affect that class. Class B shares will automatically convert to Class A shares after a holding period of seven years from the initial date of purchase. Investment income, realized and unrealized capital gains and losses, the common expenses of the fund, and certain fund-level expense reductions, if any, are allocated on a pro rata basis to each class based on the relative net assets of each class to the total net assets of the fund. Each class differs with respect to distribution and service plan fees incurred. Certain expense reductions also differ by class. The financial statements have been prepared in conformity with accounting principles generally accepted in the United States of America, which require management to make certain estimates and assumptions at the date of the financial statements. The following summarizes the significant accounting policies of the funds:
Security Valuation. Net asset value per share is calculated as of the close of business of the New York Stock Exchange, normally 4:00 p.m. Eastern time. Investments in the Underlying Funds are valued at their net asset value each business day. Short-term securities with remaining maturities of sixty days or less for which quotations are not readily available are valued on the basis of amortized cost.
Investment Transactions and Income. Security transactions, normally shares of the Underlying Funds, are accounted for as of trade date. Gains and losses on securities sold are determined on the basis of identified cost. Income and capital gain distributions from the Underlying Funds, if any, are recorded on the ex-dividend date. Interest income is accrued as earned.
Expenses. Most expenses of the trust can be directly attributed to a fund. Expenses which cannot be directly attributed are apportioned between the funds in the trust. Expenses included in the accompanying financial statements reflect the expenses of each fund and do not include any expenses associated with the Underlying Funds.
Annual Report
Notes to Financial Statements - continued
1. Significant Accounting Policies - continued
Income Tax Information and Distributions to Shareholders. Each year, the funds intend to qualify as regulated investment companies by distributing all of their taxable income and realized gains under Subchapter M of the Internal Revenue Code. As a result, no provision for income taxes is required in the accompanying financial statements. Distributions are recorded on the ex-dividend date.
Income and capital gain distributions are determined in accordance with income tax regulations, which may differ from generally accepted accounting principles. Capital accounts within the financial statements are adjusted for permanent and temporary book and tax differences. These adjustments have no impact on net assets or the results of operations. Temporary differences will reverse in a subsequent period. These differences are primarily due to short-term gain distributions from the Underlying Funds and losses deferred due to wash sales.
The tax-basis components of distributable earnings and the federal tax cost as of period end were as follows for each fund:
| Cost for
Federal Income
Tax Purposes | Unrealized
Appreciation | Unrealized
Depreciation | Net Unrealized
Appreciation/
(Depreciation) |
Advisor Freedom Income | $ 32,235,897 | $ 585,961 | $ (20,972) | $ 564,989 |
Advisor Freedom 2005 | 6,018,261 | 84,012 | (23,168) | 60,844 |
Advisor Freedom 2010 | 88,803,932 | 2,105,030 | (172,820) | 1,932,210 |
Advisor Freedom 2015 | 17,780,149 | 262,359 | (93,007) | 169,352 |
Advisor Freedom 2020 | 161,705,252 | 4,915,639 | (470,825) | 4,444,814 |
Advisor Freedom 2025 | 9,834,033 | 197,036 | (55,582) | 141,454 |
Advisor Freedom 2030 | 75,792,563 | 2,617,940 | (308,343) | 2,309,597 |
Advisor Freedom 2035 | 5,060,207 | 128,333 | (27,947) | 100,386 |
Advisor Freedom 2040 | 41,978,956 | 1,615,448 | (228,784) | 1,386,664 |
| Undistributed
Ordinary Income | Undistributed
Long-term
Capital Gain | Capital Loss
Carryforward |
Advisor Freedom Income | $ 1,120 | $ 35,147 | $ - |
Advisor Freedom 2005 | 10,206 | 3,194 | - |
Advisor Freedom 2010 | 239,489 | 17,590 | - |
Advisor Freedom 2015 | 21,111 | 5,169 | - |
Advisor Freedom 2020 | 278,597 | 62,696 | - |
Advisor Freedom 2025 | 6,117 | 394 | - |
Advisor Freedom 2030 | 54,472 | 12,872 | - |
Advisor Freedom 2035 | 1,743 | 421 | - |
Advisor Freedom 2040 | 10,863 | - | (105) |
Annual Report
1. Significant Accounting Policies - continued
Income Tax Information and Distributions to Shareholders - continued
The tax character of distributions paid was as follows:
Year ended March 31, 2004 | |
| Ordinary Income |
Advisor Freedom Income | $ 156,368 |
Advisor Freedom 2005 | 8,568 |
Advisor Freedom 2010 | 196,312 |
Advisor Freedom 2015 | 18,521 |
Advisor Freedom 2020 | 346,934 |
Advisor Freedom 2025 | 11,834 |
Advisor Freedom 2030 | 174,903 |
Advisor Freedom 2035 | 11,997 |
Advisor Freedom 2040 | 116,460 |
2. Operating Policies.
Repurchase Agreements. FMR has received an Exemptive Order from the Securities and Exchange Commission (the SEC) which permits the funds and other affiliated entities of FMR to transfer uninvested cash balances into joint trading accounts. These accounts are then invested in repurchase agreements that are collateralized by U.S. Treasury or Government obligations. Certain funds may also invest directly with institutions, in repurchase agreements that are collateralized by commercial paper obligations and corporate obligations. Collateral is held in segregated accounts with custodian banks and may be obtained in the event of a default of the counterparty. Collateral is marked-to-market daily and maintained at a value at least equal to the principal amount of the repurchase agreement (including accrued interest).
3. Purchases and Sales of Investments.
Information regarding purchases and redemptions of the Underlying Funds' shares is included under the caption "Other Information" at the end of each applicable fund's Schedule of Investments.
4. Fees and Other Transactions with Affiliates.
Management Fee. Strategic Advisers, Inc. (Strategic Advisers), an affiliate of FMR, provides the funds with investment management related services. For these services the funds pay a monthly management fee to Strategic Advisers. The management fee is computed at an annual rate of .10% of the funds' average net assets. The management fee is reduced by an amount equal to the fees and expenses paid by the funds to the non-interested Trustees.
Annual Report
Notes to Financial Statements - continued
4. Fees and Other Transactions with Affiliates - continued
Other Transactions. Strategic Advisers has entered into an administration agreement with FMR under which FMR provides management and administrative services (other than investment advisory services) necessary for the operation of each fund. Pursuant to this agreement, FMR pays all expenses of each fund, except the compensation of the non-interested trustees and certain exceptions such as interest expense. FMR also contracts with other Fidelity companies to perform the services necessary for the operation of each fund. For the services under the agreement, Strategic Advisers pays FMR a monthly administration fee equal to the management fee received by Strategic Advisers, minus an amount equal to an annual rate of .02% of each fund's average net assets. The funds do not pay any fees for these services.
Distribution and Service Plan. In accordance with Rule 12b-1 of the 1940 Act, the funds have adopted separate Distribution and Service Plans for each class of shares. Certain classes pay Fidelity Distributors Corporation (FDC), an affiliate of FMR, separate Distribution and Service Fees, each of which is based on an annual percentage of each class' average net assets. In addition, FDC may pay financial intermediaries for selling shares of the fund and providing shareholder support services. For the period, the Distribution and Service Fee rates and the total amounts paid to and retained by FDC were as follows:
Advisor Freedom Income | Distribution
Fee | Service
Fee | Paid to
FDC | Retained
by FDC |
Class A | 0% | .25% | $ 3,442 | $ 208 |
Class T | .25% | .25% | 25,254 | 276 |
Class B | .75% | .25% | 16,559 | 12,615 |
Class C | .75% | .25% | 28,171 | 23,105 |
| | | $ 73,426 | $ 36,204 |
Advisor Freedom 2005 | | | | |
Class A | 0% | .25% | $ 464 | $ 195 |
Class T | .25% | .25% | 1,370 | 414 |
Class B | .75% | .25% | 1,941 | 1,654 |
Class C | .75% | .25% | 1,929 | 1,834 |
| | | $ 5,704 | $ 4,097 |
Advisor Freedom 2010 | | | | |
Class A | 0% | .25% | $ 20,867 | $ 269 |
Class T | .25% | .25% | 37,214 | 312 |
Class B | .75% | .25% | 45,717 | 34,400 |
Class C | .75% | .25% | 32,612 | 26,238 |
| | | $ 136,410 | $ 61,219 |
Annual Report
4. Fees and Other Transactions with Affiliates - continued
Distribution and Service Plan - continued
| Distribution
Fee | Service
Fee | Paid to
FDC | Retained
by FDC |
Advisor Freedom 2015 | | | | |
Class A | 0% | .25% | $ 1,615 | $ 174 |
Class T | .25% | .25% | 3,878 | 342 |
Class B | .75% | .25% | 6,114 | 4,769 |
Class C | .75% | .25% | 5,597 | 4,481 |
| | | $ 17,204 | $ 9,766 |
Advisor Freedom 2020 | | | | |
Class A | 0% | .25% | $ 45,184 | $ 85 |
Class T | .25% | .25% | 64,286 | - |
Class B | .75% | .25% | 71,689 | 53,825 |
Class C | .75% | .25% | 43,938 | 35,758 |
| | | $ 225,097 | $ 89,668 |
Advisor Freedom 2025 | | | | |
Class A | 0% | .25% | $ 904 | $ 199 |
Class T | .25% | .25% | 1,441 | 406 |
Class B | .75% | .25% | 4,240 | 3,371 |
Class C | .75% | .25% | 3,686 | 3,477 |
| | | $ 10,271 | $ 7,453 |
Advisor Freedom 2030 | | | | |
Class A | 0% | .25% | $ 17,610 | $ 203 |
Class T | .25% | .25% | 34,064 | 184 |
Class B | .75% | .25% | 34,833 | 26,277 |
Class C | .75% | .25% | 29,316 | 17,895 |
| | | $ 115,823 | $ 44,559 |
Advisor Freedom 2035 | | | | |
Class A | 0% | .25% | $ 634 | $ 203 |
Class T | .25% | .25% | 964 | 412 |
Class B | .75% | .25% | 2,265 | 1,902 |
Class C | .75% | .25% | 1,942 | 1,833 |
| | | $ 5,805 | $ 4,350 |
Advisor Freedom 2040 | | | | |
Class A | 0% | .25% | $ 5,458 | $ 191 |
Class T | .25% | .25% | 24,598 | 264 |
Class B | .75% | .25% | 17,969 | 13,666 |
Class C | .75% | .25% | 18,118 | 13,474 |
| | | $ 66,143 | $ 27,595 |
Annual Report
Notes to Financial Statements - continued
4. Fees and Other Transactions with Affiliates - continued
Sales Load. FDC receives a front-end sales charge of up to 5.75% for selling Class A shares, and 3.50% for selling Class T shares of the fund. FDC receives the proceeds of contingent deferred sales charges levied on Class A, Class T, Class B, and Class C redemptions. These charges depend on the holding period. The deferred sales charges range from 5% to 1% for Class B, 1% for Class C, and .25% for certain purchases of Class A and Class T shares.
For the period, sales charge amounts retained by FDC were as follows:
| Retained
by FDC | |
Advisor Freedom Income | | |
Class A | $ 15,614 | |
Class T | 5,012 | |
Class B* | 9,135 | |
Class C* | 380 | |
| $ 30,141 | |
Advisor Freedom 2005 | | |
Class A | $ 5,969 | |
Class T | 1,616 | |
Class B* | 400 | |
Class C* | 216 | |
| $ 8,201 | |
Advisor Freedom 2010 | | |
Class A | $ 81,127 | |
Class T | 20,792 | |
Class B* | 14,478 | |
Class C* | 740 | |
| $ 117,137 | |
Advisor Freedom 2015 | | |
Class A | $ 27,638 | |
Class T | 6,243 | |
Class B* | 58 | |
Class C* | 77 | |
| $ 34,016 | |
Advisor Freedom 2020 | | |
Class A | $ 121,889 | |
Class T | 27,280 | |
Class B* | 13,621 | |
Class C* | 748 | |
| $ 163,538 | |
Annual Report
4. Fees and Other Transactions with Affiliates - continued
Sales Load - continued
Advisor Freedom 2025 | Retained
by FDC | |
Class A | $ 12,893 | |
Class T | 2,454 | |
Class B* | 813 | |
Class C* | - | |
| $ 16,160 | |
Advisor Freedom 2030 | | |
Class A | $ 54,156 | |
Class T | 14,128 | |
Class B* | 5,292 | |
Class C* | 1,423 | |
| $ 74,999 | |
Advisor Freedom 2035 | | |
Class A | $ 6,529 | |
Class T | 1,659 | |
Class B* | 158 | |
Class C* | - | |
| $ 8,346 | |
Advisor Freedom 2040 | | |
Class A | $ 35,107 | |
Class T | 13,422 | |
Class B* | 3,837 | |
Class C* | 637 | |
| $ 53,003 | |
* When Class B and Class C shares are initially sold, FDC pays commissions from its own resources to financial intermediaries through which the sales are made.
Annual Report
Notes to Financial Statements - continued
5. Expense Reductions.
FMR agreed to reimburse certain funds to the extent operating expenses exceeded certain levels of average net assets as noted in the table below. Some expenses, for example interest expense, are excluded from this reimbursement.
| Expense
Limitations | Reimbursement
from adviser |
Advisor Freedom Income | | |
Class A | .33% | $ 313 |
Class T | .58% | 1,204 |
Class B | 1.08% | 412 |
Class C | 1.08% | 707 |
Institutional Class | .08% | 49 |
Advisor Freedom 2005 | | |
Class A | .33% | 27 |
Class T | .58% | 48 |
Class B | 1.08% | 33 |
Class C | 1.08% | 33 |
Institutional Class | .08% | 29 |
Advisor Freedom 2010 | | |
Class A | .33% | 1,956 |
Class T | .58% | 1,777 |
Class B | 1.08% | 1,116 |
Class C | 1.08% | 762 |
Institutional Class | .08% | 52 |
Advisor Freedom 2015 | | |
Class A | .33% | 98 |
Class T | .58% | 122 |
Class B | 1.08% | 99 |
Class C | 1.08% | 91 |
Institutional Class | .08% | 19 |
Advisor Freedom 2020 | | |
Class A | .33% | 4,432 |
Class T | .58% | 3,049 |
Class B | 1.08% | 1,676 |
Class C | 1.08% | 1,028 |
Institutional Class | .08% | 72 |
Advisor Freedom 2025 | | |
Class A | .33% | 68 |
Class T | .58% | 42 |
Class B | 1.08% | 66 |
Class C | 1.08% | 67 |
Institutional Class | .08% | 18 |
Annual Report
5. Expense reductions - continued
| Expense
Limitations | Reimbursement
from adviser |
Advisor Freedom 2030 | | |
Class A | .33% | 1,651 |
Class T | .58% | 1,501 |
Class B | 1.08% | 844 |
Class C | 1.08% | 715 |
Institutional Class | .08% | 55 |
Advisor Freedom 2035 | | |
Class A | .33% | 36 |
Class T | .58% | 36 |
Class B | 1.08% | 55 |
Class C | 1.08% | 49 |
Institutional Class | .08% | 18 |
Advisor Freedom 2040 | | |
Class A | .33% | 479 |
Class T | .58% | 1,033 |
Class B | 1.08% | 379 |
Class C | 1.08% | 376 |
Institutional Class | .08% | 38 |
In addition, through arrangements with each applicable fund's custodian, credits realized as a result of uninvested cash balances were used to reduce the fund's expenses. All of the applicable expense reductions are noted in the table below.
| Custody
expense
reduction |
Advisor Freedom Income | $ 32 |
Advisor Freedom 2010 | 109 |
Advisor Freedom 2020 | 82 |
Advisor Freedom 2030 | 214 |
Advisor Freedom 2040 | 9 |
6. Other Information.
At the end of the period, FMR or its affiliates and certain unaffiliated shareholders each were owners of record of more than 10% of the outstanding shares of the following funds:
| Affiliated % | Number of Unaffiliated
Shareholders | Unaffiliated
Shareholders % |
Advisor Freedom 2005 | 17% | 1 | 10% |
Advisor Freedom 2010 | - | 1 | 19% |
Advisor Freedom 2015 | - | 1 | 12% |
Advisor Freedom 2020 | - | 1 | 25% |
Advisor Freedom 2025 | 11% | - | - |
Advisor Freedom 2030 | - | 1 | 15% |
Advisor Freedom 2035 | 21% | - | - |
Advisor Freedom 2040 | - | 2 | 23% |
Annual Report
Notes to Financial Statements - continued
7. Distributions to Shareholders.
Distributions to shareholders of each class were as follows:
| Year ended March 31, |
Advisor Freedom IncomeA | 2004 |
From net investment income | |
Class A | $ 19,649 |
Class T | 79,678 |
Class B | 18,877 |
Class C | 34,941 |
Institutional Class | 3,223 |
Total | $ 156,368 |
Advisor Freedom 2005B | |
From net investment income | |
Class A | $ 1,826 |
Class T | 1,280 |
Class B | 1,542 |
Class C | 1,663 |
Institutional Class | 2,257 |
Total | $ 8,568 |
Advisor Freedom 2010A | |
From net investment income | |
Class A | $ 43,977 |
Class T | 66,548 |
Class B | 49,040 |
Class C | 34,840 |
Institutional Class | 1,907 |
Total | $ 196,312 |
Advisor Freedom 2015B | |
From net investment income | |
Class A | $ 5,218 |
Class T | 5,119 |
Class B | 4,459 |
Class C | 2,525 |
Institutional Class | 1,200 |
Total | $ 18,521 |
Advisor Freedom 2020A | |
From net investment income | |
Class A | $ 89,794 |
Class T | 125,405 |
Class B | 78,799 |
Class C | 50,035 |
Institutional Class | 2,901 |
Total | $ 346,934 |
Annual Report
7. Distributions to Shareholders - continued
| Year ended March 31, |
Advisor Freedom 2025B | 2004 |
From net investment income | |
Class A | $ 2,746 |
Class T | 1,859 |
Class B | 3,827 |
Class C | 2,202 |
Institutional Class | 1,200 |
Total | $ 11,834 |
Advisor Freedom 2030A | |
From net investment income | |
Class A | $ 35,680 |
Class T | 69,540 |
Class B | 38,645 |
Class C | 29,038 |
Institutional Class | 2,000 |
Total | $ 174,903 |
Advisor Freedom 2035B | |
From net investment income | |
Class A | $ 3,119 |
Class T | 1,638 |
Class B | 3,169 |
Class C | 2,371 |
Institutional Class | 1,700 |
Total | $ 11,997 |
Advisor Freedom 2040 A | |
From net investment income | |
Class A | $ 17,994 |
Class T | 50,760 |
Class B | 23,869 |
Class C | 21,670 |
Institutional Class | 2,167 |
Total | $ 116,460 |
A July 24, 2003 (commencement of operations) to March 31, 2004
B November 6, 2003 (commencement of operations) to March 31, 2004
Annual Report
Notes to Financial Statements - continued
8. Share Transactions.
Transactions for each class of shares were as follows:
| Shares | Dollars |
| Year ended March 31, |
Advisor Freedom Income A | 2004 | 2004 |
Class A | | |
Shares sold | 556,120 | $ 5,708,669 |
Reinvestment of distributions | 1,560 | 16,075 |
Shares redeemed | (76,230) | (789,030) |
Net increase (decrease) | 481,450 | $ 4,935,714 |
Class T | | |
Shares sold | 1,803,899 | $ 18,395,637 |
Reinvestment of distributions | 7,538 | 77,485 |
Shares redeemed | (412,756) | (4,222,818) |
Net increase (decrease) | 1,398,681 | $ 14,250,304 |
Class B | | |
Shares sold | 406,170 | $ 4,116,167 |
Reinvestment of distributions | 1,783 | 18,299 |
Shares redeemed | (56,322) | (578,381) |
Net increase (decrease) | 351,631 | $ 3,556,085 |
Class C | | |
Shares sold | 968,910 | $ 9,906,406 |
Reinvestment of distributions | 2,293 | 23,551 |
Shares redeemed | (79,710) | (821,157) |
Net increase (decrease) | 891,493 | $ 9,108,800 |
Institutional Class | | |
Shares sold | 34,289 | $ 345,318 |
Reinvestment of distributions | 204 | 2,087 |
Shares redeemed | (1) | (6) |
Net increase (decrease) | 34,492 | $ 347,399 |
Advisor Freedom 2005 B | | |
Class A | | |
Shares sold | 132,035 | $ 1,369,748 |
Reinvestment of distributions | 177 | 1,810 |
Shares redeemed | (1) | (15) |
Net increase (decrease) | 132,211 | $ 1,371,543 |
Class T | | |
Shares sold | 194,308 | $ 2,020,332 |
Reinvestment of distributions | 125 | 1,280 |
Shares redeemed | (632) | (6,663) |
Net increase (decrease) | 193,801 | $ 2,014,949 |
Annual Report
8. Share Transactions - continued
| Shares | Dollars |
| Year ended March 31, |
| 2004 | 2004 |
Class B | | |
Shares sold | 119,966 | $ 1,241,061 |
Reinvestment of distributions | 141 | 1,444 |
Shares redeemed | (5,213) | (54,663) |
Net increase(decrease) | 114,894 | $ 1,187,842 |
Class C | | |
Shares sold | 104,471 | $ 1,080,313 |
Reinvestment of distributions | 163 | 1,663 |
Shares redeemed | (2,131) | (22,078) |
Net increase(decrease) | 102,503 | $ 1,059,898 |
Institutional Class | | |
Shares sold | 37,614 | $ 380,010 |
Reinvestment of distributions | 221 | 2,257 |
Net increase(decrease) | 37,835 | $ 382,267 |
Advisor Freedom 2010 A | | |
Class A | | |
Shares sold | 6,011,846 | $ 64,179,052 |
Reinvestment of distributions | 3,950 | 41,954 |
Shares redeemed | (3,027,942) | (32,337,081) |
Net increase(decrease) | 2,987,854 | $ 31,883,925 |
Class T | | |
Shares sold | 3,031,245 | $ 32,349,186 |
Reinvestment of distributions | 6,169 | 65,456 |
Shares redeemed | (288,271) | (3,097,922) |
Net increase(decrease) | 2,749,143 | $ 29,316,720 |
Class B | | |
Shares sold | 1,431,674 | $ 15,072,786 |
Reinvestment of distributions | 4,375 | 46,370 |
Shares redeemed | (65,871) | (697,008) |
Net increase(decrease) | 1,370,178 | $ 14,422,148 |
Class C | | |
Shares sold | 1,108,463 | $ 11,728,611 |
Reinvestment of distributions | 2,998 | 31,779 |
Shares redeemed | (48,773) | (528,477) |
Net increase(decrease) | 1,062,688 | $ 11,231,913 |
Institutional Class | | |
Shares sold | 161,267 | $ 1,748,838 |
Reinvestment of distributions | 143 | 1,516 |
Shares redeemed | (6,723) | (73,690) |
Net increase(decrease) | 154,687 | $ 1,676,664 |
Annual Report
Notes to Financial Statements - continued
8. Share Transactions - continued
| Shares | Dollars |
| Year ended March 31, |
| 2004 | 2004 |
Advisor Freedom 2015 B | | |
Class A | | |
Shares sold | 453,543 | $ 4,740,621 |
Reinvestment of distributions | 503 | 5,159 |
Shares redeemed | (2,716) | (28,286) |
Net increase(decrease) | 451,330 | $ 4,717,494 |
Class T | | |
Shares sold | 478,142 | $ 5,005,957 |
Reinvestment of distributions | 498 | 5,107 |
Shares redeemed | (2,027) | (21,269) |
Net increase(decrease) | 476,613 | $ 4,989,795 |
Class B | | |
Shares sold | 403,545 | $ 4,213,233 |
Reinvestment of distributions | 434 | 4,450 |
Shares redeemed | (630) | (6,636) |
Net increase(decrease) | 403,349 | $ 4,211,047 |
Class C | | |
Shares sold | 343,634 | $ 3,596,889 |
Reinvestment of distributions | 237 | 2,428 |
Shares redeemed | (3,598) | (38,127) |
Net increase(decrease) | 340,273 | $ 3,561,190 |
Institutional Class | | |
Shares sold | 26,468 | $ 268,672 |
Reinvestment of distributions | 117 | 1,200 |
Net increase(decrease) | 26,585 | $ 269,872 |
Advisor Freedom 2020 A | | |
Class A | | |
Shares sold | 7,039,702 | $ 77,494,120 |
Reinvestment of distributions | 7,871 | 85,955 |
Shares redeemed | (642,065) | (7,227,956) |
Net increase(decrease) | 6,405,508 | $ 70,352,119 |
Class T | | |
Shares sold | 4,882,894 | $ 53,798,538 |
Reinvestment of distributions | 11,313 | 123,537 |
Shares redeemed | (260,830) | (2,914,264) |
Net increase(decrease) | 4,633,377 | $ 51,007,811 |
Annual Report
8. Share Transactions - continued
| Shares | Dollars |
| Year ended March 31, |
| 2004 | 2004 |
Class B | | |
Shares sold | 2,121,988 | $ 22,935,276 |
Reinvestment of distributions | 6,931 | 75,615 |
Shares redeemed | (63,508) | (709,002) |
Net increase(decrease) | 2,065,411 | $ 22,301,889 |
Class C | | |
Shares sold | 1,436,597 | $ 15,662,940 |
Reinvestment of distributions | 3,975 | 43,369 |
Shares redeemed | (31,556) | (351,618) |
Net increase(decrease) | 1,409,016 | $ 15,354,691 |
Institutional Class | | |
Shares sold | 213,708 | $ 2,403,565 |
Reinvestment of distributions | 165 | 1,800 |
Shares redeemed | (12,532) | (140,399) |
Net increase(decrease) | 201,341 | $ 2,264,966 |
Advisor Freedom 2025 B | | |
Class A | | |
Shares sold | 214,014 | $ 2,244,093 |
Reinvestment of distributions | 267 | 2,746 |
Shares redeemed | (161) | (1,730) |
Net increase(decrease) | 214,120 | $ 2,245,109 |
Class T | | |
Shares sold | 243,313 | $ 2,566,782 |
Reinvestment of distributions | 168 | 1,733 |
Shares redeemed | (4,450) | (47,326) |
Net increase(decrease) | 239,031 | $ 2,521,189 |
Class B | | |
Shares sold | 261,803 | $ 2,752,450 |
Reinvestment of distributions | 362 | 3,722 |
Shares redeemed | (1,779) | (19,098) |
Net increase(decrease) | 260,386 | $ 2,737,074 |
Class C | | |
Shares sold | 205,102 | $ 2,156,679 |
Reinvestment of distributions | 195 | 2,008 |
Shares redeemed | (4,537) | (48,091) |
Net increase(decrease) | 200,760 | $ 2,110,596 |
Institutional Class | | |
Shares sold | 20,644 | $ 207,010 |
Reinvestment of distributions | 116 | 1,200 |
Net increase(decrease) | 20,760 | $ 208,210 |
Annual Report
Notes to Financial Statements - continued
8. Share Transactions - continued
| Shares | Dollars |
| Year ended March 31, |
Advisor Freedom 2030A | 2004 | 2004 |
Class A | | |
Shares sold | 2,657,168 | $ 29,782,835 |
Reinvestment of distributions | 3,132 | 34,676 |
Shares redeemed | (231,842) | (2,650,316) |
Net increase(decrease) | 2,428,458 | $ 27,167,195 |
Class T | | |
Shares sold | 2,514,746 | $ 28,024,586 |
Reinvestment of distributions | 6,254 | 69,167 |
Shares redeemed | (148,511) | (1,683,269) |
Net increase(decrease) | 2,372,489 | $ 26,410,484 |
Class B | | |
Shares sold | 1,105,667 | $ 12,159,059 |
Reinvestment of distributions | 3,296 | 36,421 |
Shares redeemed | (39,962) | (454,012) |
Net increase(decrease) | 1,069,001 | $ 11,741,468 |
Class C | | |
Shares sold | 892,318 | $ 9,844,674 |
Reinvestment of distributions | 2,197 | 24,276 |
Shares redeemed | (44,688) | (510,933) |
Net increase(decrease) | 849,827 | $ 9,358,017 |
Institutional Class | | |
Shares sold | 95,905 | $ 1,079,123 |
Reinvestment of distributions | 173 | 1,916 |
Shares redeemed | (6,432) | (74,028) |
Net increase(decrease) | 89,646 | $ 1,007,011 |
Advisor Freedom 2035 B | | |
Class A | | |
Shares sold | 177,071 | $ 1,865,742 |
Reinvestment of distributions | 299 | 3,084 |
Shares redeemed | (1,226) | (13,000) |
Net increase(decrease) | 176,144 | $ 1,855,826 |
Class T | | |
Shares sold | 97,843 | $ 1,031,539 |
Reinvestment of distributions | 159 | 1,638 |
Shares redeemed | (95) | (1,015) |
Net increase(decrease) | 97,907 | $ 1,032,162 |
Class B | | |
Shares sold | 105,253 | $ 1,097,083 |
Reinvestment of distributions | 308 | 3,169 |
Shares redeemed | (314) | (3,293) |
Net increase(decrease) | 105,247 | $ 1,096,959 |
Annual Report
8. Share Transactions - continued
| Shares | Dollars |
| Year ended March 31, |
| 2004 | 2004 |
Class C | | |
Shares sold | 83,351 | $ 870,026 |
Reinvestment of distributions | 220 | 2,265 |
Shares redeemed | (218) | (2,276) |
Net increase(decrease) | 83,353 | $ 870,015 |
Institutional Class | | |
Shares sold | 20,001 | $ 200,010 |
Reinvestment of distributions | 165 | 1,700 |
Net increase(decrease) | 20,166 | $ 201,710 |
Advisor Freedom 2040A | | |
Class A | | |
Shares sold | 937,469 | $ 10,645,307 |
Reinvestment of distributions | 1,597 | 17,851 |
Shares redeemed | (107,215) | (1,237,201) |
Net increase(decrease) | 831,851 | $ 9,425,957 |
Class T | | |
Shares sold | 1,768,005 | $ 19,891,891 |
Reinvestment of distributions | 4,509 | 50,369 |
Shares redeemed | (118,254) | (1,362,835) |
Net increase(decrease) | 1,654,260 | $ 18,579,425 |
Class B | | |
Shares sold | 653,746 | $ 7,321,660 |
Reinvestment of distributions | 2,047 | 22,842 |
Shares redeemed | (30,887) | (356,280) |
Net increase(decrease) | 624,906 | $ 6,988,222 |
Class C | | |
Shares sold | 634,471 | $ 7,073,358 |
Reinvestment of distributions | 1,860 | 20,761 |
Shares redeemed | (34,976) | (401,419) |
Net increase(decrease) | 601,355 | $ 6,692,700 |
Institutional Class | | |
Shares sold | 25,651 | $ 264,662 |
Reinvestment of distributions | 183 | 2,044 |
Shares redeemed | (554) | (6,457) |
Net increase(decrease) | 25,280 | $ 260,249 |
A July 24, 2003 (commencement of operations) to March 31, 2004
B November 6, 2003 (commencement of operations) to March 31, 2004
Annual Report
Report of Independent Registered Public Accounting Firm
To the Trustees of Fidelity Aberdeen Street Trust and the Shareholders of Fidelity Advisor Freedom Income Fund, Fidelity Advisor Freedom 2005 Fund, Fidelity Advisor Freedom 2010 Fund, Fidelity Advisor Freedom 2015 Fund, Fidelity Advisor Freedom 2020 Fund, Fidelity Advisor Freedom 2025 Fund, Fidelity Advisor Freedom 2030 Fund, Fidelity Advisor Freedom 2035 Fund and Fidelity Advisor Freedom 2040 Fund:
We have audited the accompanying statements of assets and liabilities of Fidelity Advisor Freedom Income Fund, Fidelity Advisor Freedom 2005 Fund, Fidelity Advisor Freedom 2010 Fund, Fidelity Advisor Freedom 2015 Fund, Fidelity Advisor Freedom 2020 Fund, Fidelity Advisor Freedom 2025 Fund, Fidelity Advisor Freedom 2030 Fund, Fidelity Advisor Freedom 2035 Fund and Fidelity Advisor Freedom 2040 Fund (the Funds), each a fund of the Fidelity Aberdeen Street Trust, including the portfolios of investments, as of March 31, 2004, and the related statements of operations, changes in net assets, and financial highlights from commencement of operations through March 21, 2004. These financial statements and financial highlights are the responsibility of the Funds' management. Our responsibility is to express an opinion on these financial statements and financial highlights based on our audits.
We conducted our audits in accordance with the Standards of the Public Company Accounting Oversight Board (United States). Those standards require that we plan and perform the audit to obtain reasonable assurance about whether the financial statements and financial highlights are free of material misstatement. An audit includes examining, on a test basis, evidence supporting the amounts and disclosures in the financial statements. Our procedures included confirmation of securities owned as of March 31, 2004, by correspondence with the custodian and brokers; where replies were not received from brokers, we performed other auditing procedures. An audit also includes assessing the accounting principles used and significant estimates made by management, as well as evaluating the overall financial statement presentation. We believe that our audits provide a reasonable basis for our opinion.
In our opinion, the financial statements and financial highlights referred to above present fairly, in all material respects, the financial position of the Funds as of March 31, 2004, and the results of their operations, the changes in their net assets, and their financial highlights from commencement of operations through March 31, 2004, in conformity with accounting principles generally accepted in the United States of America.
/s/ Deloitte & Touche LLP
DELOITTE & TOUCHE LLP
Boston, Massachusetts
May 21, 2004
Annual Report
Trustees and Officers
The Trustees, Members of the Advisory Board, and executive officers of the trust and funds, as applicable, are listed below. The Board of Trustees governs each Advisor Freedom Fund and is responsible for protecting the interests of shareholders. The Trustees are experienced executives who meet periodically throughout the year to oversee each Advisor Freedom Fund's activities, review contractual arrangements with companies that provide services to each Advisor Freedom Fund, and review each Advisor Freedom Fund's performance. If the interests of an Advisor Freedom Fund and an underlying Fidelity fund were to diverge, a conflict of interest could arise and affect how the Trustees and Members of the Advisory Board fulfill their fiduciary duties to the affected funds. Strategic Advisers has structured the Advisor Freedom Funds to avoid these potential conflicts, although there may be situations where a conflict of interest is unavoidable. In such instances, Strategic Advisers, the Trustees, and Members of the Advisory Board would take reasonable steps to minimize and, if possible, eliminate the conflict. Except for William O. McCoy, each of the Trustees oversees 292 funds advised by FMR or an affiliate. Mr. McCoy oversees 294 funds advised by FMR or an affiliate.
The Trustees hold office without limit in time except that (a) any Trustee may resign; (b) any Trustee may be removed by written instrument, signed by at least two-thirds of the number of Trustees prior to such removal; (c) any Trustee who requests to be retired or who has become incapacitated by illness or injury may be retired by written instrument signed by a majority of the other Trustees; and (d) any Trustee may be removed at any special meeting of shareholders by a two-thirds vote of the outstanding voting securities of the trust. In any event, each non-interested Trustee shall retire not later than the last day of the calendar year in which his or her 72nd birthday occurs. The executive officers and Advisory Board Members hold office without limit in time, except that any officer and Advisory Board Member may resign or may be removed by a vote of a majority of the Trustees at any regular meeting or any special meeting of the Trustees. Except as indicated, each individual has held the office shown or other offices in the same company for the past five years.
The funds' Statement of Additional Information (SAI) includes more information about the Trustees. To request a free copy, call Fidelity at 1-877-208-0098.
Interested Trustees*:
Correspondence intended for each Trustee who is an "interested person" (as defined in the 1940 Act) may be sent to Fidelity Investments, 82 Devonshire Street, Boston, Massachusetts 02109.
Name, Age; Principal Occupation |
Edward C. Johnson 3d (73)** |
| Year of Election or Appointment: 1991 Mr. Johnson is Chairman of the Board of Trustees. Mr. Johnson serves as Chief Executive Officer, Chairman, and a Director of FMR Corp.; a Director and Chairman of the Board and of the Executive Committee of FMR; Chairman and a Director of Fidelity Management & Research (Far East) Inc.; Chairman (1998) and a Director of Fidelity Investments Money Management, Inc.; and Chairman (2001) and a Director (2000) of FMR Co., Inc. |
Abigail P. Johnson (42)** |
| Year of Election or Appointment: 2001 Senior Vice President of Advisor Freedom Income (2003), Advisor Freedom 2005 (2003), Advisor Freedom 2010 (2003), Advisor Freedom 2015 (2003), Advisor Freedom 2020 (2003), Advisor Freedom 2025 (2003), Advisor Freedom 2030 (2003), Advisor Freedom 2035 (2003), and Advisor Freedom 2040 (2003). Ms. Johnson also serves as Senior Vice President of other Fidelity funds (2001). She is President and a Director of FMR (2001), Fidelity Investments Money Management, Inc. (2001), FMR Co., Inc. (2001), and a Director of FMR Corp. Previously, Ms. Johnson managed a number of Fidelity funds. |
Laura B. Cronin (49) |
| Year of Election or Appointment: 2003 Ms. Cronin is an Executive Vice President (2002) and Chief Financial Officer (2002) of FMR Corp. and is a member of the Fidelity Management Committee (2003). Previously, Ms. Cronin served as Vice President of Finance of FMR (1997-1999), and Chief Financial Officer of FMR (1999-2001), Fidelity Personal Investments (2001), and Fidelity Brokerage Company (2001-2002). |
Robert L. Reynolds (52) |
| Year of Election or Appointment: 2003 Mr. Reynolds is a Director (2003) and Chief Operating Officer (2002) of FMR Corp. and is the head of the Fidelity Management Committee (2003). He also serves on the Board at Fidelity Investments Canada, Ltd. (2000). Previously, Mr. Reynolds served as President of Fidelity Investments Institutional Retirement Group (1996-2000). |
* Trustees have been determined to be "Interested Trustees" by virtue of, among other things, their affiliation with the trust or various entities under common control with FMR.
** Edward C. Johnson 3d, Trustee, is Abigail P. Johnson's father.
Annual Report
Non-Interested Trustees:
Correspondence intended for each non-interested Trustee (that is, the Trustees other than the Interested Trustees) may be sent to Fidelity Investments, P.O. Box 55235, Boston, Massachusetts 02205-5235.
Name, Age; Principal Occupation |
J. Michael Cook (61) |
| Year of Election or Appointment: 2001 Prior to Mr. Cook's retirement in May 1999, he served as Chairman and Chief Executive Officer of Deloitte & Touche LLP (accounting/consulting), Chairman of the Deloitte & Touche Foundation, and a member of the Board of Deloitte Touche Tohmatsu. He currently serves as a Director of Comcast (telecommunications, 2002), International Flavors & Fragrances, Inc. (2000), The Dow Chemical Company (2000), and Northrop Grumman Corporation (global defense technology, 2003). He is a Member of the Diversity Advisory Council of Marakon (2003) and the Advisory Board of the Directorship Search Group, Chairman Emeritus of the Board of Catalyst (a leading organization for the advancement of women in business), and is Chairman of the Accountability Advisory Council to the Comptroller General of the United States. He also serves as a Member of the Advisory Board of the Graduate School of Business of the University of Florida, his alma mater. |
Ralph F. Cox (71) |
| Year of Election or Appointment: 1991 Mr. Cox is President of RABAR Enterprises (management consulting for the petroleum industry). Prior to February 1994, he was President of Greenhill Petroleum Corporation (petroleum exploration and production). Until March 1990, Mr. Cox was President and Chief Operating Officer of Union Pacific Resources Company (exploration and production). He is a Director of CH2M Hill Companies (engineering), and Abraxas Petroleum (petroleum exploration and production, 1999). In addition, he is a member of advisory boards of Texas A&M University and the University of Texas at Austin. |
Robert M. Gates (60) |
| Year of Election or Appointment: 1997 Dr. Gates is President of Texas A&M University (2002). He was Director of the Central Intelligence Agency (CIA) from 1991 to 1993. From 1989 to 1991, Dr. Gates served as Assistant to the President of the United States and Deputy National Security Advisor. Dr. Gates is a Director of NACCO Industries, Inc. (mining and manufacturing), Parker Drilling Co., Inc. (drilling and rental tools for the energy industry, 2001), and Brinker International (restaurant management, 2003). He also serves as a member of the Advisory Board of VoteHere.net (secure internet voting, 2001). Previously, Dr. Gates served as a Director of LucasVarity PLC (automotive components and diesel engines), a Director of TRW Inc. (automotive, space, defense, and information technology), and Dean of the George Bush School of Government and Public Service at Texas A&M University (1999-2001). Dr. Gates also is a Trustee of the Forum for International Policy. |
George H. Heilmeier (67) |
| Year of Election or Appointment: 2004 Dr. Heilmeier is Chairman Emeritus of Telcordia Technologies (communication software and systems), where prior to his retirement, he served as company Chairman and Chief Executive Officer. He currently serves on the Boards of Directors of The Mitre Corporation (systems engineering and information technology support for the government), INET Technologies Inc. (telecommunications network surveillance, 2001) and Teletech Holdings (customer management services, 1998). He is Chairman of the General Motors Technology Advisory Committee and a Life Fellow of the IEEE (2000). Dr. Heilmeier is a member of the Defense Science Board and the National Security Agency Advisory Board. He is also a member of the National Academy of Engineering, the American Academy of Arts and Sciences and The Board of Overseers of the School of Engineering and Applied Science of the University of Pennsylvania. Previously, Dr. Heilmeier served as a Director of TRW Inc. (automotive, space, defense, and information technology, 1992-2002) and Compaq (1994-2002). |
Donald J. Kirk (71) |
| Year of Election or Appointment: 1991 Mr. Kirk is a Governor of the American Stock Exchange (2001), a Trustee and former Chairman of the Board of Trustees of the Greenwich Hospital Association, a Director of the Yale-New Haven Health Services Corp. (1998), and a Director Emeritus and former Chairman of the Board of Directors of National Arts Strategies Inc. Mr. Kirk was an Executive-in-Residence (1995-2000) and a Professor (1987-1995) at Columbia University Graduate School of Business. Prior to 1987, he was Chairman of the Financial Accounting Standards Board. Previously, Mr. Kirk served as a Governor of the National Association of Securities Dealers, Inc. (1996-2002), a member and Vice Chairman of the Public Oversight Board of the American Institute of Certified Public Accountants' SEC Practice Section (1995-2002), a Director of General Re Corporation (reinsurance, 1987-1998) and as a Director of Valuation Research Corp. (appraisals and valuations). |
Marie L. Knowles (57) |
| Year of Election or Appointment: 2001 Prior to Ms. Knowles' retirement in June 2000, she served as Executive Vice President and Chief Financial Officer of Atlantic Richfield Company (ARCO) (diversified energy, 1996-2000). From 1993 to 1996, she was a Senior Vice President of ARCO and President of ARCO Transportation Company. She served as a Director of ARCO from 1996 to 1998. She currently serves as a Director of Phelps Dodge Corporation (copper mining and manufacturing) and McKesson Corporation (healthcare service, 2002). Ms. Knowles is a Trustee of the Brookings Institution and the Catalina Island Conservancy and also serves as a member of the Advisory Board for the School of Engineering of the University of Southern California. |
Ned C. Lautenbach (60) |
| Year of Election or Appointment: 2000 Mr. Lautenbach has been a partner of Clayton, Dubilier & Rice, Inc. (private equity investment firm) since September 1998. Previously, Mr. Lautenbach was with the International Business Machines Corporation (IBM) from 1968 until his retirement in 1998. He was most recently Senior Vice President and Group Executive of Worldwide Sales and Services. From 1993 to 1995, he was Chairman of IBM World Trade Corporation, and from 1994 to 1998 was a member of IBM's Corporate Executive Committee. Mr. Lautenbach serves as Co-Chairman and a Director of Covansys, Inc. (global provider of business and technology solutions, 2000). In addition, he is a Director of Eaton Corporation (diversified industrial) and the Philharmonic Center for the Arts in Naples, Florida (1999). He also is a member of the Council on Foreign Relations. |
Marvin L. Mann (70) |
| Year of Election or Appointment: 1993 Mr. Mann is Chairman of the non-interested Trustees (2001). He is Chairman Emeritus of Lexmark International, Inc. (computer peripherals) where he served as CEO until April 1998 and retired as Chairman May 1999, and remains a member of the Board. Prior to 1991, he held the positions of Vice President of International Business Machines Corporation (IBM) and President and General Manager of various IBM divisions and subsidiaries. He is also a member of the Director Services Committee of the Investment Company Institute. In addition, Mr. Mann is a member of the President's Cabinet at the University of Alabama and the Board of Visitors of the Culverhouse College of Commerce and Business Administration at the University of Alabama. |
William O. McCoy (70) |
| Year of Election or Appointment: 1997 Prior to his retirement in December 1994, Mr. McCoy was Vice Chairman of the Board of BellSouth Corporation (telecommunications) and President of BellSouth Enterprises. He is currently a Director of Liberty Corporation (holding company), Duke Realty Corporation (real estate), and Progress Energy, Inc. (electric utility). He is also a partner of Franklin Street Partners (private investment management firm) and a member of the Research Triangle Foundation Board. In addition, Mr. McCoy served as the Interim Chancellor (1999-2000) and a member of the Board of Visitors (1994-1998) for the University of North Carolina at Chapel Hill and currently serves on the Board of Directors of the University of North Carolina Health Care System and the Board of Visitors of the Kenan-Flagler Business School (University of North Carolina at Chapel Hill). He also served as Vice President of Finance for the University of North Carolina (16-school system, 1995-1998). |
William S. Stavropoulos (64) |
| Year of Election or Appointment: 2001 Mr. Stavropoulos is Chairman of the Board (2000), CEO (2002), a position he previously held from 1995-2000, Chairman of the Executive Committee (2000), and a Member of the Board of Directors of The Dow Chemical Company. Since joining The Dow Chemical Company in 1967, Mr. Stavropoulos served in numerous senior management positions, including President (1993-2000; 2002-2003). Currently, he is a Director of NCR Corporation (data warehousing and technology solutions), BellSouth Corporation (telecommunications), Chemical Financial Corporation, and Maersk Inc. (industrial conglomerate, 2002). He also serves as a member of the Board of Trustees of the American Enterprise Institute for Public Policy Research. In addition, Mr. Stavropoulos is a member of The Business Council, J.P. Morgan International Council and the University of Notre Dame Advisory Council for the College of Science. |
Annual Report
Advisory Board Members and Executive Officers:
Correspondence intended for Ms. Small may be sent to Fidelity Investments, P.O. Box 55235, Boston, Massachusetts 02205-5235. Correspondence intended for each executive officer and Mr. Lynch may be sent to Fidelity Investments, 82 Devonshire Street, Boston, Massachusetts 02109.
Name, Age; Principal Occupation |
Peter S. Lynch (61) |
| Year of Election or Appointment: 2003 Member of the Advisory Board of Fidelity Aberdeen Street Trust. Vice Chairman and a Director of FMR, and Vice Chairman (2001) and a Director (2000) of FMR Co., Inc. Previously, Mr. Lynch served as a Trustee of the Fidelity funds (1990-2003). Prior to May 31, 1990, he was a Director of FMR and Executive Vice President of FMR (a position he held until March 31, 1991), Vice President of Fidelity® Magellan® Fund and FMR Growth Group Leader, and Managing Director of FMR Corp. Mr. Lynch was also Vice President of Fidelity Investments Corporate Services. In addition, he serves as a Trustee of Boston College, Massachusetts Eye & Ear Infirmary, Historic Deerfield, John F. Kennedy Library, and the Museum of Fine Arts of Boston. |
Cornelia M. Small (59) |
| Year of Election or Appointment: 2004 Member of the Advisory Board of Fidelity Aberdeen Street Trust. Ms. Small is a member (2000) and Chairperson (2002) of the Investment Committee, and a member (2002) of the Board of Trustees of Smith College. Previously, she served as Chief Investment Officer (1999-2000), Director of Global Equity Investments (1996-1999), and a member of the Board of Directors of Scudder, Stevens & Clark (1990-1997) and Scudder Kemper Investments (1997-1998). In addition, Ms. Small served as Co-Chair (2000-2003) of the Annual Fund for the Fletcher School of Law and Diplomacy. |
Bart A. Grenier (45) |
| Year of Election or Appointment: 2003 Vice President of Advisor Freedom Income, Advisor Freedom 2005, Advisor Freedom 2010, Advisor Freedom 2015, Advisor Freedom 2020, Advisor Freedom 2025, Advisor Freedom 2030, Advisor Freedom 2035, and Advisor Freedom 2040. Mr. Grenier also serves as Vice President of certain Equity Funds (2001), a position he previously held from 1999 to 2000, and Vice President of certain High Income Funds (2002). He is Senior Vice President of FMR (1999) and FMR Co., Inc. (2001), and President and Director of Strategic Advisers, Inc. (2002). He also heads Fidelity's Asset Allocation Group (2000), Fidelity's Growth and Income Group (2001), Fidelity's Value Group (2001), and Fidelity's High Income Division (2001). Previously, Mr. Grenier served as President of Fidelity Ventures (2000), Vice President of certain High Income Funds (1997-2000), High Income Division Head (1997-2000), Group Leader of the Income-Growth and Asset Allocation-Income Groups (1996-2000), and Assistant Equity Division Head (1997-2000). |
Ren Y. Cheng (47) |
| Year of Election or Appointment: 2003 Vice President of Advisor Freedom Income, Advisor Freedom 2005, Advisor Freedom 2010, Advisor Freedom 2015, Advisor Freedom 2020, Advisor Freedom 2025, Advisor Freedom 2030, Advisor Freedom 2035, and Advisor Freedom 2040. Mr. Cheng also serves as Vice President of other funds advised by Strategic Advisers, Inc. including the Fidelity Freedom Funds®. Prior to assuming his current responsibilities, Mr. Cheng managed a variety of Fidelity funds. Mr. Cheng also serves as Vice President of FMR (2002), FMR Co., Inc. (2002) and Strategic Advisers, Inc. (2003). |
Eric D. Roiter (55) |
| Year of Election or Appointment: 2003 Secretary of Advisor Freedom Income, Advisor Freedom 2005, Advisor Freedom 2010, Advisor Freedom 2015, Advisor Freedom 2020, Advisor Freedom 2025, Advisor Freedom 2030, Advisor Freedom 2035, and Advisor Freedom 2040. He also serves as Secretary of other Fidelity funds (1998); Vice President, General Counsel, and Clerk of FMR Co., Inc. (2001) and FMR (1998); Vice President and Clerk of FDC (1998); Assistant Clerk of Fidelity Management & Research (U.K.) Inc. (2001) and Fidelity Management & Research (Far East) Inc. (2001); and Assistant Secretary of Fidelity Investments Money Management, Inc. (2001). Prior to joining Fidelity, Mr. Roiter was with the law firm of Debevoise & Plimpton, as an associate (1981-1984) and as a partner (1985-1997), and served as an Assistant General Counsel of the U.S. Securities and Exchange Commission (1979-1981). Mr. Roiter is an Adjunct Member, Faculty of Law, at Boston College Law School (2003). |
Stuart Fross (44) |
| Year of Election or Appointment: 2003 Assistant Secretary of Advisor Freedom Income, Advisor Freedom 2005, Advisor Freedom 2010, Advisor Freedom 2015, Advisor Freedom 2020, Advisor Freedom 2025, Advisor Freedom 2030, Advisor Freedom 2035, and Advisor Freedom 2040. Mr. Fross also serves as Assistant Secretary of other Fidelity funds (2003) and is an employee of FMR. |
Christine Reynolds (45) |
| Year of Election or Appointment: 2004 President, Treasurer, and Anti-Money Laundering (AML) officer of Advisor Freedom Income, Advisor Freedom 2005, Advisor Freedom 2010, Advisor Freedom 2015, Advisor Freedom 2020, Advisor Freedom 2025, Advisor Freedom 2030, Advisor Freedom 2035, and Advisor Freedom 2040. Ms. Reynolds also serves as President, Treasurer, and AML officer of other Fidelity funds (2004) and is a Vice President (2003) and an employee (2002) of FMR. Before joining Fidelity Investments, Ms. Reynolds worked at PricewaterhouseCoopers LLP (PwC) (1980-2002), where she was most recently an audit partner with PwC's investment management practice. |
Timothy F. Hayes (53) |
| Year of Election or Appointment: 2003 Chief Financial Officer of Advisor Freedom Income, Advisor Freedom 2005, Advisor Freedom 2010, Advisor Freedom 2015, Advisor Freedom 2020, Advisor Freedom 2025, Advisor Freedom 2030, Advisor Freedom 2035, and Advisor Freedom 2040. Mr. Hayes also serves as Chief Financial Officer of other Fidelity funds (2002). Recently he was appointed President of Fidelity Service Company (2003) where he also serves as a Director. Mr. Hayes also serves as President of Fidelity Investments Operations Group (FIOG, 2002), which includes Fidelity Pricing and Cash Management Services Group (FPCMS), where he was appointed President in 1998. Previously, Mr. Hayes served as Chief Financial Officer of Fidelity Investments Corporate Systems and Service Group (1998) and Fidelity Systems Company (1997-1998). |
John R. Hebble (45) |
| Year of Election or Appointment: 2003 Deputy Treasurer of Advisor Freedom Income, Advisor Freedom 2005, Advisor Freedom 2010, Advisor Freedom 2015, Advisor Freedom 2020, Advisor Freedom 2025, Advisor Freedom 2030, Advisor Freedom 2035, and Advisor Freedom 2040. Mr. Hebble also serves as Deputy Treasurer of other Fidelity funds (2003), and is an employee of FMR. Before joining Fidelity Investments, Mr. Hebble worked at Deutsche Asset Management where he served as Director of Fund Accounting (2002-2003) and Assistant Treasurer of the Scudder Funds (1998-2003). |
Kimberley H. Monasterio (40) |
| Year of Election or Appointment: 2004 Deputy Treasurer of Advisor Freedom Income, Advisor Freedom 2005, Advisor Freedom 2010, Advisor Freedom 2015, Advisor Freedom 2020, Advisor Freedom 2025, Advisor Freedom 2030, Advisor Freedom 2035, and Advisor Freedom 2040. Ms. Monasterio also serves as Deputy Treasurer of other Fidelity funds (2004) and is an employee of FMR (2004). Before joining Fidelity Investments, Ms. Monasterio served as Treasurer (2000-2004) and Chief Financial Officer (2002-2004) of the Franklin Templeton Funds and Senior Vice President of Franklin Templeton Services, LLC (2000-2004). |
John H. Costello (57) |
| Year of Election or Appointment: 2003 Assistant Treasurer of Advisor Freedom Income, Advisor Freedom 2005, Advisor Freedom 2010, Advisor Freedom 2015, Advisor Freedom 2020, Advisor Freedom 2025, Advisor Freedom 2030, Advisor Freedom 2035, and Advisor Freedom 2040. Mr. Costello also serves as Assistant Treasurer of other Fidelity funds and is an employee of FMR. |
Francis V. Knox, Jr. (56) |
| Year of Election or Appointment: 2003 Assistant Treasurer of Advisor Freedom Income, Advisor Freedom 2005, Advisor Freedom 2010, Advisor Freedom 2015, Advisor Freedom 2020, Advisor Freedom 2025, Advisor Freedom 2030, Advisor Freedom 2035, and Advisor Freedom 2040. Mr. Knox also serves as Assistant Treasurer of other Fidelity funds (2002), and is a Vice President and an employee of FMR. Previously, Mr. Knox served as Vice President of Investment & Advisor Compliance (1990-2001), and Compliance Officer of Fidelity Management & Research (U.K.) Inc. (1992-2002), Fidelity Management & Research (Far East) Inc. (1991-2002), and FMR Corp. (1995-2002). |
Peter L. Lydecker (50) |
| Year of Election or Appointment: 2004 Assistant Treasurer of Advisor Freedom Income, Advisor Freedom 2005, Advisor Freedom 2010, Advisor Freedom 2015, Advisor Freedom 2020, Advisor Freedom 2025, Advisor Freedom 2030, Advisor Freedom 2035, and Advisor Freedom 2040. Mr. Lydecker also serves as Assistant Treasurer of other Fidelity funds (2004) and is an employee of FMR. |
Mark Osterheld (48) |
| Year of Election or Appointment: 2003 Assistant Treasurer of Advisor Freedom Income, Advisor Freedom 2005, Advisor Freedom 2010, Advisor Freedom 2015, Advisor Freedom 2020, Advisor Freedom 2025, Advisor Freedom 2030, Advisor Freedom 2035, and Advisor Freedom 2040. Mr. Osterheld also serves as Assistant Treasurer of other Fidelity funds (2002) and is an employee of FMR. |
Thomas J. Simpson (45) |
| Year of Election or Appointment: 2003 Assistant Treasurer of Advisor Freedom Income, Advisor Freedom 2005, Advisor Freedom 2010, Advisor Freedom 2015, Advisor Freedom 2020, Advisor Freedom 2025, Advisor Freedom 2030, Advisor Freedom 2035, and Advisor Freedom 2040. Mr. Simpson is Assistant Treasurer of other Fidelity funds (2000) and an employee of FMR (1996). Prior to joining FMR, Mr. Simpson was Vice President and Fund Controller of Liberty Investment Services (1987-1995). |
Annual Report
Distributions
The Board of Trustees of each fund voted to pay to shareholders of record at the opening of business on record date, the following distributions per share derived from capital gains realized from sales of portfolio securities, and dividends derived from net investment income:
Institutional Class | Pay Date | Record Date | Dividends | Capital Gains |
Advisor Freedom Income | 05/10/04 | 05/07/04 | $.024 | $.010 |
Advisor Freedom 2005 | 05/10/04 | 05/07/04 | $.019 | $.004 |
Advisor Freedom 2010 | 05/10/04 | 05/07/04 | $.034 | $.002 |
Advisor Freedom 2015 | 05/10/04 | 05/07/04 | $.012 | $.002 |
Advisor Freedom 2020 | 05/10/04 | 05/07/04 | $.026 | $.004 |
Advisor Freedom 2025 | 05/17/04 | 05/14/04 | $.010 | $.001 |
Advisor Freedom 2030 | 05/17/04 | 05/14/04 | $.016 | $.002 |
Advisor Freedom 2035 | 05/17/04 | 05/14/04 | $.008 | $.001 |
A percentage of the dividends distributed during the fiscal year for the following funds was derived from interest on U.S. Government securities which is generally exempt from state income tax:
Advisor Freedom Income | Institutional Class |
| 1.38% |
A percentage of the dividends distributed during the fiscal year for the following funds may be taken into account as a dividend for purposes of the maximum rate under section 1(h)(11) of the Internal Revenue Code.
Advisor Freedom Income | Institutional Class |
10/03/03 | 19% |
11/07/03 | 19% |
12/26/03 | 19% |
02/06/04 | 0% |
Distributions Paid 12/26/2003 | Institutional Class |
Advisor Freedom 2005 | 31% |
Advisor Freedom 2010 | 29% |
Advisor Freedom 2015 | 39% |
Advisor Freedom 2020 | 37% |
Advisor Freedom 2025 | 47% |
Advisor Freedom 2030 | 46% |
Advisor Freedom 2035 | 45% |
Advisor Freedom 2040 | 47% |
Annual Report
Distributions - continued
A percentage of the dividends distributed during the fiscal year for the following funds qualifies for the dividends-received deduction for corporate shareholders:
Advisor Freedom Income | Institutional Class |
10/03/03 | 13% |
11/07/03 | 13% |
12/26/03 | 13% |
02/06/04 | 0% |
Distributions Paid 12/26/2003 | Institutional Class |
Advisor Freedom 2005 | 16% |
Advisor Freedom 2010 | 24% |
Advisor Freedom 2015 | 34% |
Advisor Freedom 2020 | 29% |
Advisor Freedom 2025 | 46% |
Advisor Freedom 2030 | 35% |
Advisor Freedom 2035 | 32% |
Advisor Freedom 2040 | 34% |
The funds will notify shareholders in January 2005 of amounts for use in preparing 2004 income tax returns.
Annual Report
Annual Report
Annual Report
Annual Report
Annual Report
Annual Report
Annual Report
Investment Adviser
Strategic Advisers, Inc.
Boston, MA
General Distributor
Fidelity Distributors Corporation
Boston, MA
Transfer and Shareholder
Servicing Agent
Fidelity Investments Institutional Operations Company, Inc.
Boston, MA
Custodian
The Bank of New York
New York, NY
Annual Report
Fidelity Advisor Aggressive Growth Fund |
Fidelity Advisor Asset Allocation Fund |
Fidelity Advisor Balanced Fund |
Fidelity Advisor Biotechnology Fund |
Fidelity Advisor California Municipal Income Fund |
Fidelity Advisor Consumer Industries Fund |
Fidelity Advisor Cyclical Industries Fund |
Fidelity Advisor Developing Communications Fund |
Fidelity Advisor Diversified International Fund |
Fidelity Advisor Dividend Growth Fund |
Fidelity Advisor Dynamic Capital Appreciation Fund |
Fidelity Advisor Electronics Fund |
Fidelity Advisor Emerging Asia Fund |
Fidelity Advisor Emerging Markets Income Fund |
Fidelity Advisor Equity Growth Fund |
Fidelity Advisor Equity Income Fund |
Fidelity Advisor Equity Value Fund |
Fidelity Advisor Europe Capital Appreciation Fund |
Fidelity Advisor Fifty Fund |
Fidelity Advisor Financial Services Fund |
Fidelity Advisor Floating Rate High Income Fund |
Fidelity Advisor Freedom Income, 2005, 2010, 2015, 2020, 2025, 2030, 2035, 2040 FundsSM |
Fidelity Advisor Global Equity Fund |
Fidelity Advisor Government Investment Fund |
Fidelity Advisor Growth & Income Fund |
Fidelity Advisor Growth Opportunities |
Fidelity Advisor Health Care Fund |
Fidelity Advisor High Income Advantage Fund |
Fidelity Advisor High Income Fund |
Fidelity Advisor Inflation-Protected Bond Fund |
Fidelity Advisor Intermediate Bond Fund |
Fidelity Advisor International Capital Appreciation Fund |
Fidelity Advisor International Small Cap Fund |
Fidelity Advisor Investment Grade Bond Fund |
Fidelity Advisor Japan Fund |
Fidelity Advisor Korea Fund |
Fidelity Advisor Large Cap Fund |
Fidelity Advisor Latin America Fund |
Fidelity Advisor Leveraged Company Stock Fund |
Fidelity Advisor Mid Cap Fund |
Fidelity Advisor Mortgage Securities Fund |
Fidelity Advisor Municipal Income Fund |
Fidelity Advisor Natural Resources Fund |
Fidelity Advisor New Insights Fund |
Fidelity Advisor New York
Municipal Income Fund |
Fidelity Advisor Overseas Fund |
Fidelity Advisor Real Estate Fund |
Fidelity Advisor Short Fixed-Income Fund |
Fidelity Advisor Short Intermediate Municipal Income Fund |
Fidelity Advisor Small Cap Fund |
Fidelity Advisor Strategic Dividend & Income Fund |
Fidelity Advisor Strategic Growth Fund |
Fidelity Advisor Strategic Income Fund |
Fidelity Advisor Tax Managed
Stock Fund |
Fidelity Advisor Technology Fund |
Fidelity Advisor Telecommunications & Utilities Growth Fund |
Fidelity Advisor Value Fund |
Fidelity Advisor Value Leaders Fund |
Fidelity Advisor Value Strategies Fund |
Prime Fund |
Tax-Exempt Fund |
Treasury Fund |
AFFI-UANN-0504
1.792135.100
(Fidelity Investment logo)(registered trademark)
Fidelity Freedom Funds® -
Income, 2000, 2005, 2010, 2015,
2020, 2025, 2030, 2035, 2040
Annual Report
March 31, 2004
(2_fidelity_logos) (Registered_Trademark)
Contents
For a free copy of the fund's proxy voting guidelines visit www.fidelity.com/goto/proxyguidelines, call 1-800-544-8544, or visit the Securities and Exchange Commission (SEC)'s web site at www.sec.gov.
Standard & Poor's, S&P and S&P 500 are registered service marks of The McGraw-Hill Companies, Inc. and have been licensed for use by Fidelity Distributors Corporation.
Other third party marks appearing herein are the property of their respective owners.
All other marks appearing herein are registered or unregistered trademarks or service marks of FMR Corp. or an affiliated company.
(Recycle graphic) This report is printed on recycled paper using soy-based inks.
This report and the financial statements contained herein are submitted for the general information of the shareholders of the fund. This report is not authorized for distribution to prospective investors in the fund unless preceded or accompanied by an effective prospectus.
Mutual fund shares are not deposits or obligations of, or guaranteed by, any depository institution. Shares are not insured by the FDIC, Federal Reserve Board or any other agency, and are subject to investment risks, including possible loss of principal amount invested.
Neither the funds nor Fidelity Distributors Corporation is a bank.
For more information on any Fidelity fund, including charges and expenses, call 1-800-544-6666 for a free prospectus. Read it carefully before you invest or send money.
Annual Report
Chairman's Message
(photo_of_Edward_C_Johnson_3d)
Dear Shareholder:
Many of you have read or heard news stories recently that were critical of mutual funds and made allegations that the mutual fund industry has been less than forthright. I find these reports unsettling and not necessarily an accurate picture of the overall industry, and I would like you to know where we at Fidelity stand.
With specific regard to allegations that certain mutual fund companies were violating the Securities and Exchange Commission's forward pricing rules or were involved in so-called "market timing" activities, I want to say two things:
First, Fidelity does not have agreements that permit customers who buy fund shares after 4 p.m. to obtain the 4 p.m. price. This is not to say that someone could not deceive the company through fraudulent acts. But I underscore that we have no so-called "agreements" which would permit this illegal practice.
Second, Fidelity has been on record for years opposing predatory short-term trading which adversely affects other shareholders in a mutual fund. In fact, in the 1980s, we began charging a fee - which is returned to the fund and, therefore, to investors - to discourage this activity. What's more, several years ago we took the industry lead in developing a Fair Value Pricing Policy to prevent market timing on foreign securities in our funds. It is reasonable to assume that another structure can be developed that would alter the system to make it much more difficult for predatory traders to operate. This, however, will only be achieved through close cooperation among regulators, legislators and the industry.
Certainly no industry is perfect, and there have been instances of unethical and illegal activity from time to time within the mutual fund industry. When this occurs, confessed or convicted offenders should be dealt with appropriately. Clearly, every system can be improved. We applaud well thought out improvements by regulators, legislators and industry representatives that achieve the common goal of building and protecting the value of investors' holdings. But we remain concerned about the risk of over-regulation and the quick application of simplistic solutions to intricate problems.
For more than 57 years, Fidelity Investments has worked very hard to improve its products and service to justify your trust. When our family founded this company in 1946, we had only a few hundred customers. Many of them were family and friends. Today, we serve more than 18 million customers including individual investors and participants in retirement plans across America.
Let me close by saying that we do not take your trust in us for granted, and we realize that we must always work to improve all aspects of our service to you. In turn, we urge you to continue your active participation with your financial matters, so that your interests can be well served.
Best regards,
/s/Edward C. Johnson 3d
Edward C. Johnson 3d
Annual Report
Fidelity Freedom Income Fund®
Performance: The Bottom Line
Average annual total return reflects the change in the value of an investment, assuming reinvestment of the fund's dividend income and capital gains (the profits earned upon the sale of securities that have grown in value) and assuming a constant rate of performance each year. The $10,000 table and the fund's returns do not reflect the deduction of taxes that a shareholder would pay on fund distributions or the redemption of fund shares. During periods of reimbursement by Fidelity, a fund's total return will be greater than it would be had the reimbursement not occurred. How a fund did yesterday is no guarantee of how it will do tomorrow.
Average Annual Total Returns
Periods ended March 31, 2004 | Past 1
year | Past 5
years | Life of
fundA |
Fidelity Freedom Income Fund | 8.87% | 4.56% | 6.39% |
A From October 17, 1996.
$10,000 Over Life of Fund
Let's say hypothetically that $10,000 was invested in Fidelity Freedom Income Fund® on October 17, 1996, when the fund started. The chart shows how the value of your investment would have grown, and also shows how the Lehman Brothers® Aggregate Bond Index did over the same period.
Annual Report
Fidelity Freedom 2000 Fund®
Performance: The Bottom Line
Average annual total return reflects the change in the value of an investment, assuming reinvestment of the fund's dividend income and capital gains (the profits earned upon the sale of securities that have grown in value) and assuming a constant rate of performance each year. The $10,000 table and the fund's returns do not reflect the deduction of taxes that a shareholder would pay on fund distributions or the redemption of fund shares. During periods of reimbursement by Fidelity, a fund's total return will be greater than it would be had the reimbursement not occurred. How a fund did yesterday is no guarantee of how it will do tomorrow.
Average Annual Total Returns
Periods ended March 31, 2004 | Past 1
year | Past 5
years | Life of
fundA |
Fidelity Freedom 2000 Fund | 10.97% | 4.43% | 7.60% |
A From October 17, 1996.
$10,000 Over Life of Fund
Let's say hypothetically that $10,000 was invested in Fidelity Freedom 2000 Fund® on October 17, 1996, when the fund started. The chart shows how the value of your investment would have grown, and also shows how the Lehman Brothers Aggregate Bond Index did over the same period.
Annual Report
Fidelity Freedom 2005 FundSM
Performance: The Bottom Line
Average annual total return reflects the change in the value of an investment, assuming reinvestment of the fund's dividend income and capital gains (the profits earned upon the sale of securities that have grown in value) and assuming a constant rate of performance each year. During periods of reimbursement by Fidelity, a fund's total return will be greater than it would be had the reimbursement not occurred. How a fund did yesterday is no guarantee of how it will do tomorrow.
Average Annual Total Returns
Average annual total returns take Fidelity Freedom 2005 Fund'sSM cumulative total return and show you what would have happened if Fidelity Freedom 2005 Fund shares had performed at a constant rate each year. These numbers will be reported once the fund is a year old. In addition, the growth of the hypothetical $10,000 investment in the fund will appear in the fund's next report.
Annual Report
Fidelity Freedom 2010 Fund®
Performance: The Bottom Line
Average annual total return reflects the change in the value of an investment, assuming reinvestment of the fund's dividend income and capital gains (the profits earned upon the sale of securities that have grown in value) and assuming a constant rate of performance each year. The $10,000 table and the fund's returns do not reflect the deduction of taxes that a shareholder would pay on fund distributions or the redemption of fund shares. During periods of reimbursement by Fidelity, a fund's total return will be greater than it would be had the reimbursement not occurred. How a fund did yesterday is no guarantee of how it will do tomorrow.
Average Annual Total Returns
Periods ended March 31, 2004 | Past 1
year | Past 5
years | Life of
fundA |
Fidelity Freedom 2010 Fund | 20.15% | 4.33% | 8.80% |
A From October 17, 1996.
$10,000 Over Life of Fund
Let's say hypothetically that $10,000 was invested in Fidelity Freedom 2010 Fund® on October 17, 1996, when the fund started. The chart shows how the value of your investment would have grown, and also shows how the S&P 500® Index did over the same period.
Annual Report
Fidelity Freedom 2015 FundSM
Performance: The Bottom Line
Average annual total return reflects the change in the value of an investment, assuming reinvestment of the fund's dividend income and capital gains (the profits earned upon the sale of securities that have grown in value) and assuming a constant rate of performance each year. During periods of reimbursement by Fidelity, a fund's total return will be greater than it would be had the reimbursement not occurred. How a fund did yesterday is no guarantee of how it will do tomorrow.
Average Annual Total Returns
Average annual total returns take Fidelity Freedom 2015 Fund'sSM cumulative total return and show you what would have happened if Fidelity Freedom 2015 Fund shares had performed at a constant rate each year. These numbers will be reported once the fund is a year old. In addition, the growth of the hypothetical $10,000 investment in the fund will appear in the fund's next report.
Annual Report
Fidelity Freedom 2020 Fund®
Performance: The Bottom Line
Average annual total return reflects the change in the value of an investment, assuming reinvestment of the fund's dividend income and capital gains (the profits earned upon the sale of securities that have grown in value) and assuming a constant rate of performance each year. The $10,000 table and the fund's returns do not reflect the deduction of taxes that a shareholder would pay on fund distributions or the redemption of fund shares. During periods of reimbursement by Fidelity, a fund's total return will be greater than it would be had the reimbursement not occurred. How a fund did yesterday is no guarantee of how it will do tomorrow.
Average Annual Total Returns
Periods ended March 31, 2004 | Past 1
year | Past 5
years | Life of
fundA |
Fidelity Freedom 2020 Fund | 29.68% | 3.19% | 8.67% |
A From October 17, 1996.
$10,000 Over Life of Fund
Let's say hypothetically that $10,000 was invested in Fidelity Freedom 2020 Fund® on October 17, 1996, when the fund started. The chart shows how the value of your investment would have grown, and also shows how the S&P 500 Index did over the same period.
Annual Report
Fidelity Freedom 2025 FundSM
Performance: The Bottom Line
Average annual total return reflects the change in the value of an investment, assuming reinvestment of the fund's dividend income and capital gains (the profits earned upon the sale of securities that have grown in value) and assuming a constant rate of performance each year. During periods of reimbursement by Fidelity, a fund's total return will be greater than it would be had the reimbursement not occurred. How a fund did yesterday is no guarantee of how it will do tomorrow.
Average Annual Total Returns
Average annual total returns take Fidelity Freedom 2025 Fund'sSM cumulative total return and show you what would have happened if Fidelity Freedom 2025 Fund shares had performed at a constant rate each year. These numbers will be reported once the fund is a year old. In addition, the growth of the hypothetical $10,000 investment in the fund will appear in the fund's next report.
Annual Report
Fidelity Freedom 2030 Fund®
Performance: The Bottom Line
Average annual total return reflects the change in the value of an investment, assuming reinvestment of the fund's dividend income and capital gains (the profits earned upon the sale of securities that have grown in value) and assuming a constant rate of performance each year. The $10,000 table and the fund's returns do not reflect the deduction of taxes that a shareholder would pay on fund distributions or the redemption of fund shares. During periods of reimbursement by Fidelity, a fund's total return will be greater than it would be had the reimbursement not occurred. How a fund did yesterday is no guarantee of how it will do tomorrow.
Average Annual Total Returns
Periods ended March 31, 2004 | Past 1
year | Past 5
years | Life of
fundA |
Fidelity Freedom 2030 Fund | 34.22% | 2.27% | 8.16% |
A From October 17, 1996.
$10,000 Over Life of Fund
Let's say hypothetically that $10,000 was invested in Fidelity Freedom 2030 Fund® on October 17, 1996, when the fund started. The chart shows how the value of your investment would have grown, and also shows how the S&P 500 Index did over the same period.
Annual Report
Fidelity Freedom 2035 FundSM
Performance: The Bottom Line
Average annual total return reflects the change in the value of an investment, assuming reinvestment of the fund's dividend income and capital gains (the profits earned upon the sale of securities that have grown in value) and assuming a constant rate of performance each year. During periods of reimbursement by Fidelity, a fund's total return will be greater than it would be had the reimbursement not occurred. How a fund did yesterday is no guarantee of how it will do tomorrow.
Average Annual Total Returns
Average annual total returns take Fidelity Freedom 2035 Fund'sSM cumulative total return and show you what would have happened if Fidelity Freedom 2035 Fund shares had performed at a constant rate each year. These numbers will be reported once the fund is a year old. In addition, the growth of the hypothetical $10,000 investment in the fund will appear in the fund's next report.
Annual Report
Fidelity Freedom 2040 Fund®
Performance: The Bottom Line
Average annual total return reflects the change in the value of an investment, assuming reinvestment of the fund's dividend income and capital gains (the profits earned upon the sale of securities that have grown in value) and assuming a constant rate of performance each year. The $10,000 table and the fund's returns do not reflect the deduction of taxes that a shareholder would pay on fund distributions or the redemption of fund shares. During periods of reimbursement by Fidelity, a fund's total return will be greater than it would be had the reimbursement not occurred. How a fund did yesterday is no guarantee of how it will do tomorrow.
Average Annual Total Returns
Periods ended March 31, 2004 | Past 1
year | Life of
fundA |
Fidelity Freedom 2040 Fund | 37.75% | -5.31% |
A From September 6, 2000
$10,000 Over Life of Fund
Let's say hypothetically that $10,000 was invested in Fidelity Freedom 2040 Fund® on September 6, 2000, when the fund started. The chart shows what the value of your investment would have been, and also shows how the S&P 500 Index did over the same period.
Annual Report
Management's Discussion of Fund Performance
Comments from Ren Cheng, Portfolio Manager of Fidelity Freedom Funds®
Robust economic growth and rising corporate profitability helped fuel a broad-based rally in the U.S. equity markets during the 12-month period ending March 31, 2004. Most notably, the Russell 2000® Index, a benchmark for small-cap stock returns, soared 63.83%. The NASDAQ Composite® Index gained 49.38%, driven by strong returns from technology and telecommunications stocks. Elsewhere, the large-cap-oriented Standard & Poor's 500SM Index rose 35.12%, while the blue-chips' Dow Jones Industrial AverageSM advanced 32.39%. Overseas equity markets also performed well based on improving economic data around the world. The Morgan Stanley Capital InternationalSM Europe, Australasia, Far East (MSCI® EAFE®) Index, a proxy for the performance of the overseas equity markets, rose 57.93%. Turning to fixed-income results, the Lehman Brothers® Aggregate Bond Index, a broad measure of the U.S. taxable bond market, returned 5.41% during the past year. Buoyed by an improving business climate, corporate bonds were the top-performing fixed-income category, as evidenced by the 8.61% gain for the Lehman Brothers Credit Bond Index.
The Freedom Funds performed well during the year ending March 31, 2004, delivering a range of returns appropriate to a series of portfolios with different asset allocations. (For specific performance results, please see the portfolio performance section of this report.) On a relative basis, the Freedom Funds trailed their respective benchmarks by small margins due primarily to weakness in their underlying domestic equity holdings, which collectively underperformed the 39.37% return for the Wilshire 5000® Total Market Index. More specifically, the individual returns of Fidelity® Disciplined Equity Fund, Fidelity Blue Chip Growth Fund, Fidelity Growth & Income Portfolio and Fidelity Fund trailed the Wilshire index. On the positive side of the ledger, the more diversified of the international portfolios - Fidelity Diversified International Fund, Fidelity Overseas Fund and Fidelity Europe Fund, which together represent the bulk of the Freedom Funds' international component - all outperformed the MSCI EAFE index. Elsewhere, Fidelity Capital & Income Fund outperformed the Merrill Lynch® U.S. High Yield Master II Index by nearly five percentage points, providing a boost to the total return of those Freedom Funds with an allocation to high-yield bonds.
The views expressed in this statement reflect those of the portfolio manager only through the end of the period of the report as stated on the cover and do not necessarily represent the views of Fidelity or any other person in the Fidelity organization. Any such views are subject to change at any time based upon market or other conditions and Fidelity disclaims any responsibility to update such views. These views may not be relied on as investment advice and, because investment decisions for a Fidelity fund are based on numerous factors, may not be relied on as an indication of trading intent on behalf of any Fidelity fund.
Annual Report
Fidelity Freedom Income Fund
Investment Changes
Fund Holdings as of March 31, 2004 |
| % of fund's investments | % of fund's investments
6 months ago |
Domestic Equity Funds | | |
Fidelity Blue Chip Growth Fund | 3.2 | 3.1 |
Fidelity Disciplined Equity Fund | 3.3 | 3.3 |
Fidelity Equity-Income Fund | 3.4 | 3.3 |
Fidelity Fund | 3.2 | 3.2 |
Fidelity Growth & Income Portfolio | 3.2 | 3.2 |
Fidelity Growth Company Fund | 1.9 | 2.0 |
Fidelity Mid-Cap Stock Fund | 2.0 | 1.9 |
Fidelity OTC Portfolio | 1.5 | 1.6 |
| 21.7 | 21.6 |
Investment Grade Fixed-Income Funds | | |
Fidelity Government Income Fund | 15.1 | 15.0 |
Fidelity Intermediate Bond Fund | 9.8 | 10.0 |
Fidelity Investment Grade Bond Fund | 15.1 | 15.2 |
| 40.0 | 40.2 |
Money Market Fund | | |
Fidelity Retirement Government Money Market Portfolio | 38.3 | 38.2 |
| 100.0 | 100.0 |
Annual Report
Investment Changes - continued
Asset Allocation (% of fund's investments)
The six months ago allocation is based on the fund's holdings as of September 30, 2003. The current allocation is based on the fund's holdings as of March 31, 2004. The expected allocation represents the fund's anticipated target asset allocation at September 30, 2004.
Annual Report
Fidelity Freedom Income Fund
Investments March 31, 2004
Showing Percentage of Total Value of Investment in Securities
Equity Funds - 21.7% |
| Shares | | Value (Note 1) |
Domestic Equity Funds - 21.7% |
Fidelity Blue Chip Growth Fund | 1,379,086 | | $ 55,191,041 |
Fidelity Disciplined Equity Fund | 2,472,142 | | 57,650,362 |
Fidelity Equity-Income Fund | 1,186,891 | | 59,261,452 |
Fidelity Fund | 2,006,164 | | 56,814,560 |
Fidelity Growth & Income Portfolio | 1,554,011 | | 55,959,929 |
Fidelity Growth Company Fund | 658,692 | | 33,988,524 |
Fidelity Mid-Cap Stock Fund | 1,544,409 | | 34,363,108 |
Fidelity OTC Portfolio | 806,084 | | 26,608,820 |
TOTAL EQUITY FUNDS (Cost $366,430,578) | 379,837,796 |
Fixed-Income Funds - 40.0% |
| | | |
Investment Grade Fixed-Income Funds - 40.0% |
Fidelity Government Income Fund | 25,320,688 | | 264,094,777 |
Fidelity Intermediate Bond Fund | 15,969,848 | | 172,793,753 |
Fidelity Investment Grade Bond Fund | 34,521,855 | | 265,127,849 |
TOTAL FIXED-INCOME FUNDS (Cost $676,514,350) | 702,016,379 |
Money Market Fund - 38.3% |
| | |
Fidelity Retirement Government Money Market Portfolio
(Cost $671,411,128) | 671,411,128 | 671,411,128 |
TOTAL INVESTMENT IN SECURITIES - 100% (Cost $1,714,356,056) | $ 1,753,265,303 |
Other Information |
Purchases and redemptions of the underlying fund shares aggregated $510,075,841 and $85,954,137, respectively. |
Income Tax Information |
The fund hereby designates approximately $8,610,000 as a capital gain dividend for the purpose of the dividend paid deduction. |
See accompanying notes which are an integral part of the financial statements.
Annual Report
Fidelity Freedom Income Fund
Financial Statements
Statement of Assets and Liabilities
| March 31, 2004 |
| | |
Assets | | |
Investment in securities, at value (cost $1,714,356,056) - See accompanying schedule | | $ 1,753,265,303 |
Receivable for investments sold | | 590,191 |
Receivable for fund shares sold | | 3,866,393 |
Receivable from investment adviser for expense reductions | | 27,340 |
Total assets | | 1,757,749,227 |
| | |
Liabilities | | |
Payable for investments purchased | $ 2,118,829 | |
Payable for fund shares redeemed | 2,201,063 | |
Accrued management fee | 143,632 | |
Total liabilities | | 4,463,524 |
| | |
Net Assets | | $ 1,753,285,703 |
Net Assets consist of: | | |
Paid in capital | | $ 1,710,651,734 |
Undistributed net investment income | | 4,504,251 |
Accumulated undistributed net realized gain (loss) on investments | | (779,529) |
Net unrealized appreciation (depreciation) on investments | | 38,909,247 |
Net Assets, for 156,032,058 shares outstanding | | $ 1,753,285,703 |
Net Asset Value, offering price and redemption price per share ($1,753,285,703 ÷ 156,032,058 shares) | | $ 11.24 |
See accompanying notes which are an integral part of the financial statements.
Annual Report
Fidelity Freedom Income Fund
Financial Statements - continued
Statement of Operations
| Year ended March 31, 2004 |
| | |
Investment Income | | |
Income distributions from underlying funds | | $ 26,424,571 |
Interest | | 27 |
Total income | | 26,424,598 |
| | |
Expenses | | |
Management fee | $ 1,496,860 | |
Non-interested trustees' compensation | 6,546 | |
Total expenses before reductions | 1,503,406 | |
Expense reductions | (301,846) | 1,201,560 |
Net investment income (loss) | | 25,223,038 |
Realized and Unrealized Gain (Loss) Realized gain (loss) on sale of underlying fund shares | 8,888,967 | |
Capital gain distributions from underlying funds | 11,220,000 | 20,108,967 |
Change in net unrealized appreciation (depreciation) on investment securities | | 77,459,245 |
Net gain (loss) | | 97,568,212 |
Net increase (decrease) in net assets resulting from operations | | $ 122,791,250 |
See accompanying notes which are an integral part of the financial statements.
Annual Report
Statement of Changes in Net Assets
| Year ended
March 31,
2004 | Year ended
March 31,
2003 |
Increase (Decrease) in Net Assets | | |
Operations | | |
Net investment income (loss) | $ 25,223,038 | $ 23,807,916 |
Net realized gain (loss) | 20,108,967 | 4,077,551 |
Change in net unrealized appreciation (depreciation) | 77,459,245 | (28,910,173) |
Net increase (decrease) in net assets resulting
from operations | 122,791,250 | (1,024,706) |
Distributions to shareholders from net investment income | (29,935,758) | (26,214,990) |
Distributions to shareholders from net realized gain | (8,680,228) | - |
Total distributions | (38,615,986) | (26,214,990) |
Share transactions
Net proceeds from sales of shares | 1,036,318,179 | 707,261,513 |
Reinvestment of distributions | 37,978,019 | 25,742,209 |
Cost of shares redeemed | (648,001,570) | (423,924,099) |
Net increase (decrease) in net assets resulting from share transactions | 426,294,628 | 309,079,623 |
Total increase (decrease) in net assets | 510,469,892 | 281,839,927 |
| | |
Net Assets | | |
Beginning of period | 1,242,815,811 | 960,975,884 |
End of period (including undistributed net investment income of $4,504,251 and undistributed net investment income of $2,735,597, respectively) | $ 1,753,285,703 | $ 1,242,815,811 |
Other Information Shares | | |
Sold | 94,086,862 | 66,528,847 |
Issued in reinvestment of distributions | 3,451,194 | 2,423,943 |
Redeemed | (58,840,442) | (39,888,498) |
Net increase (decrease) | 38,697,614 | 29,064,292 |
See accompanying notes which are an integral part of the financial statements.
Annual Report
Financial Highlights
Years ended March 31, | 2004 | 2003 | 2002 | 2001 | 2000 |
Selected Per-Share Data | | | | | |
Net asset value, beginning of period | $ 10.59 | $ 10.89 | $ 10.93 | $ 11.58 | $ 11.25 |
Income from Investment Operations | | | | | |
Net investment income (loss)B | .18 | .24 | .36 | .57 | .52 |
Net realized and unrealized gain (loss) | .75 | (.27) | .05 | (.37) | .45 |
Total from investment operations | .93 | (.03) | .41 | .20 | .97 |
Distributions from net investment income | (.22) | (.27) | (.38) | (.59) | (.52) |
Distributions from net realized gain | (.06) | - | (.07) | (.26) | (.12) |
Total distributions | (.28) | (.27) | (.45) | (.85) | (.64) |
Net asset value, end of period | $ 11.24 | $ 10.59 | $ 10.89 | $ 10.93 | $ 11.58 |
Total ReturnA | 8.87% | (.23)% | 3.78% | 1.77% | 8.96% |
Ratios to Average Net AssetsC,D | | | | |
Expenses before expense reductions | .10% | .10% | .10% | .10% | .10% |
Expenses net of voluntary waivers, if any | .08% | .08% | .08% | .08% | .08% |
Expenses net of all reductions | .08% | .08% | .07% | .06% | .07% |
Net investment income (loss) | 1.68% | 2.28% | 3.27% | 5.07% | 4.59% |
Supplemental Data | | | | | |
Net assets, end of period (000 omitted) | $ 1,753,286 | $ 1,242,816 | $ 960,976 | $ 618,169 | $ 306,834 |
Portfolio turnover rate | 6% | 7% | 9% | 40% | 37% |
A Total returns would have been lower had certain expenses not been reduced during the periods shown.
B Calculated based on average shares outstanding during the period.
C Amounts do not include the activity of the underlying funds.
D Expense ratios reflect operating expenses of the fund. Expenses before reductions do not reflect amounts reimbursed by the investment adviser or reductions from brokerage service arrangements or other expense offset arrangements and do not represent the amount paid by the fund during periods when reimbursements or reductions occur. Expenses net of any voluntary waivers reflect expenses after reimbursement by the investment adviser but prior to reductions from brokerage service arrangements or other expense offset arrangements. Expenses net of all reductions represent the net expenses paid by the fund.
See accompanying notes which are an integral part of the financial statements.
Annual Report
Fidelity Freedom 2000 Fund
Investment Changes
Fund Holdings as of March 31, 2004 |
| % of fund's
investments | % of fund's investments
6 months ago |
Domestic Equity Funds | | |
Fidelity Blue Chip Growth Fund | 3.6 | 3.7 |
Fidelity Disciplined Equity Fund | 3.8 | 3.9 |
Fidelity Equity-Income Fund | 3.9 | 4.0 |
Fidelity Fund | 3.8 | 3.7 |
Fidelity Growth & Income Portfolio | 3.7 | 3.8 |
Fidelity Growth Company Fund | 2.2 | 2.4 |
Fidelity Mid-Cap Stock Fund | 2.3 | 2.2 |
Fidelity OTC Portfolio | 1.8 | 1.9 |
| 25.1 | 25.6 |
International Equity Funds | | |
Fidelity Diversified International Fund | 0.2 | 0.3 |
Fidelity Europe Fund | 0.3 | 0.4 |
Fidelity Japan Fund | 0.1 | 0.1 |
Fidelity Overseas Fund | 0.2 | 0.3 |
Fidelity Southeast Asia Fund | 0.1 | 0.1 |
| 0.9 | 1.2 |
High Yield Fixed-Income Funds | | |
Fidelity Capital & Income Fund | 0.7 | 1.1 |
Fidelity High Income Fund | 0.5 | 0.5 |
| 1.2 | 1.6 |
Investment Grade Fixed-Income Funds | | |
Fidelity Government Income Fund | 15.3 | 15.3 |
Fidelity Intermediate Bond Fund | 10.1 | 10.2 |
Fidelity Investment Grade Bond Fund | 15.4 | 15.6 |
| 40.8 | 41.1 |
Money Market Fund | | |
Fidelity Retirement Government Money Market Portfolio | 32.0 | 30.5 |
| 100.0 | 100.0 |
Asset Allocation (% of fund's investments) |
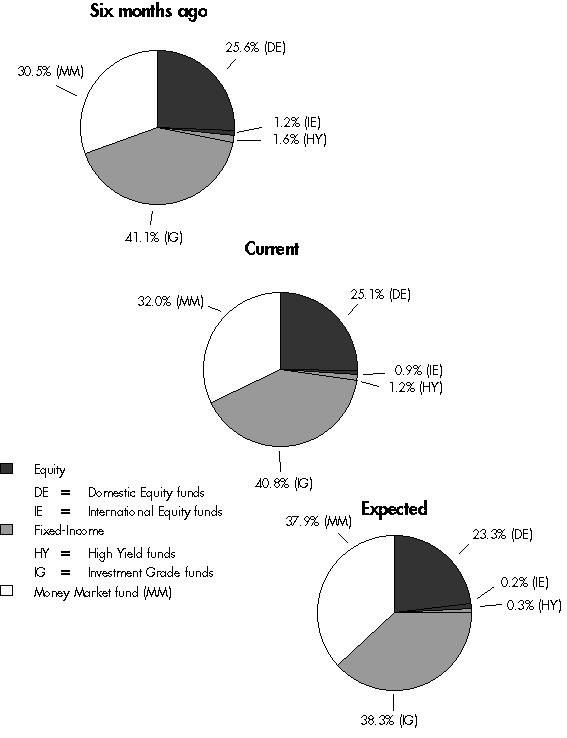
The fund invests according to an asset allocation strategy that becomes increasingly conservative over time. The six months ago allocation is based on the fund's holdings as of September 30, 2003. The current allocation is based on the fund's holdings as of March 31, 2004. The expected allocation represents the fund's anticipated target asset allocation at September 30, 2004.
Annual Report
Fidelity Freedom 2000 Fund
Investments March 31, 2004
Showing Percentage of Total Value of Investment in Securities
Equity Funds - 26.0% |
| Shares | | Value (Note 1) |
Domestic Equity Funds - 25.1% |
Fidelity Blue Chip Growth Fund | 1,444,162 | | $ 57,795,376 |
Fidelity Disciplined Equity Fund | 2,601,102 | | 60,657,695 |
Fidelity Equity-Income Fund | 1,252,503 | | 62,537,470 |
Fidelity Fund | 2,104,984 | | 59,613,137 |
Fidelity Growth & Income Portfolio | 1,631,537 | | 58,751,641 |
Fidelity Growth Company Fund | 689,635 | | 35,585,188 |
Fidelity Mid-Cap Stock Fund | 1,620,389 | | 36,053,656 |
Fidelity OTC Portfolio | 846,624 | | 27,947,054 |
TOTAL DOMESTIC EQUITY FUNDS | | 398,941,217 |
International Equity Funds - 0.9% |
Fidelity Diversified International Fund | 151,896 | | 3,909,812 |
Fidelity Europe Fund | 188,664 | | 5,301,454 |
Fidelity Japan Fund | 110,509 | | 1,445,462 |
Fidelity Overseas Fund | 110,564 | | 3,677,352 |
Fidelity Southeast Asia Fund | 51,490 | | 807,365 |
TOTAL INTERNATIONAL EQUITY FUNDS | | 15,141,445 |
TOTAL EQUITY FUNDS (Cost $412,276,196) | 414,082,662 |
Fixed-Income Funds - 42.0% |
| | | |
High Yield Fixed-Income Funds - 1.2% |
Fidelity Capital & Income Fund | 1,310,283 | | 10,534,673 |
Fidelity High Income Fund | 952,509 | | 8,486,859 |
TOTAL HIGH YIELD FIXED-INCOME FUNDS | | 19,021,532 |
Investment Grade Fixed-Income Funds - 40.8% |
Fidelity Government Income Fund | 23,390,127 | | 243,959,028 |
Fidelity Intermediate Bond Fund | 14,758,381 | | 159,685,679 |
Fidelity Investment Grade Bond Fund | 31,919,645 | | 245,142,876 |
TOTAL INVESTMENT GRADE FIXED-INCOME FUNDS | | 648,787,583 |
TOTAL FIXED-INCOME FUNDS (Cost $637,138,141) | 667,809,115 |
Money Market Fund - 32.0% |
| Shares | Value (Note 1) |
Fidelity Retirement Government Money Market Portfolio
(Cost $510,156,514) | 510,156,514 | $ 510,156,513 |
TOTAL INVESTMENT IN SECURITIES - 100% (Cost $1,559,570,851) | $ 1,592,048,290 |
Other Information |
Purchases and redemptions of the underlying fund shares aggregated $323,329,886 and $105,886,007, respectively. |
Income Tax Information |
At March 31, 2004, the fund had a capital loss carryforward of approximately $437,000 all of which will expire on March 31, 2011. |
See accompanying notes which are an integral part of the financial statements.
Annual Report
Fidelity Freedom 2000 Fund
Financial Statements
Statement of Assets and Liabilities
| March 31, 2004 |
| | |
Assets | | |
Investment in securities, at value (cost $1,559,570,851) - See accompanying schedule | | $ 1,592,048,290 |
Receivable for fund shares sold | | 3,832,480 |
Receivable from investment adviser for expense reductions | | 25,391 |
Total assets | | 1,595,906,161 |
| | |
Liabilities | | |
Payable for investments purchased | $ 2,719,156 | |
Payable for fund shares redeemed | 988,312 | |
Accrued management fee | 131,099 | |
Total liabilities | | 3,838,567 |
| | |
Net Assets | | $ 1,592,067,594 |
Net Assets consist of: | | |
Paid in capital | | $ 1,556,547,460 |
Undistributed net investment income | | 9,033,441 |
Accumulated undistributed net realized gain (loss) on investments | | (5,990,746) |
Net unrealized appreciation (depreciation) on investments | | 32,477,439 |
Net Assets, for 132,993,574 shares outstanding | | $ 1,592,067,594 |
Net Asset Value, offering price and redemption price per share ($1,592,067,594 ÷ 132,993,574 shares) | | $ 11.97 |
See accompanying notes which are an integral part of the financial statements.
Annual Report
Fidelity Freedom 2000 Fund
Financial Statements - continued
Statement of Operations
| Year ended March 31, 2004 |
| | |
Investment Income | | |
Income distributions from underlying funds | | $ 27,078,206 |
Interest | | 22 |
Total income | | 27,078,228 |
| | |
Expenses | | |
Management fee | $ 1,440,357 | |
Non-interested trustees' compensation | 6,364 | |
Total expenses before reductions | 1,446,721 | |
Expense reductions | (290,071) | 1,156,650 |
Net investment income (loss) | | 25,921,578 |
Realized and Unrealized Gain (Loss) Realized gain (loss) on sale of underlying fund shares | 11,742,211 | |
Capital gain distributions from underlying funds | 11,403,678 | 23,145,889 |
Change in net unrealized appreciation (depreciation) on investment securities | | 97,696,438 |
Net gain (loss) | | 120,842,327 |
Net increase (decrease) in net assets resulting from operations | | $ 146,763,905 |
See accompanying notes which are an integral part of the financial statements.
Annual Report
Statement of Changes in Net Assets
| Year ended
March 31,
2004 | Year ended
March 31,
2003 |
Increase (Decrease) in Net Assets | | |
Operations | | |
Net investment income (loss) | $ 25,921,578 | $ 27,365,697 |
Net realized gain (loss) | 23,145,889 | 550,809 |
Change in net unrealized appreciation (depreciation) | 97,696,438 | (47,509,567) |
Net increase (decrease) in net assets resulting
from operations | 146,763,905 | (19,593,061) |
Distributions to shareholders from net investment income | (29,821,507) | (31,262,029) |
Share transactions
Net proceeds from sales of shares | 677,171,698 | 570,971,934 |
Reinvestment of distributions | 29,685,123 | 31,164,497 |
Cost of shares redeemed | (496,912,877) | (397,643,480) |
Net increase (decrease) in net assets resulting from share transactions | 209,943,944 | 204,492,951 |
Total increase (decrease) in net assets | 326,886,342 | 153,637,861 |
| | |
Net Assets | | |
Beginning of period | 1,265,181,252 | 1,111,543,391 |
End of period (including undistributed net investment income of $9,033,441 and undistributed net investment income of $6,669,332, respectively) | $ 1,592,067,594 | $ 1,265,181,252 |
Other Information Shares | | |
Sold | 58,221,202 | 51,362,656 |
Issued in reinvestment of distributions | 2,553,873 | 2,813,006 |
Redeemed | (42,674,105) | (35,789,862) |
Net increase (decrease) | 18,100,970 | 18,385,800 |
See accompanying notes which are an integral part of the financial statements.
Annual Report
Financial Highlights
Years ended March 31, | 2004 | 2003 | 2002 | 2001 | 2000 |
Selected Per-Share Data | | | | | |
Net asset value, beginning of period | $ 11.01 | $ 11.52 | $ 11.43 | $ 13.47 | $ 12.60 |
Income from Investment Operations | | | | | |
Net investment income (loss)B | .21 | .26 | .37 | .55 | .50 |
Net realized and unrealized gain (loss) | .99 | (.47) | - E | (.91) | 1.18 |
Total from investment
operations | 1.20 | (.21) | .37 | (.36) | 1.68 |
Distributions from net investment income | (.24) | (.30) | (.28) | (.75) | (.52) |
Distributions from net realized gain | - | - | - | (.93) | (.29) |
Total distributions | (.24) | (.30) | (.28) | (1.68) | (.81) |
Net asset value, end of period | $ 11.97 | $ 11.01 | $ 11.52 | $ 11.43 | $ 13.47 |
Total ReturnA | 10.97% | (1.81)% | 3.21% | (2.95)% | 13.81% |
Ratios to Average Net AssetsC,D | | | | |
Expenses before expense
reductions | .10% | .10% | .10% | .10% | .10% |
Expenses net of voluntary waivers, if any | .08% | .08% | .08% | .08% | .08% |
Expenses net of all
reductions | .08% | .08% | .07% | .06% | .07% |
Net investment income (loss) | 1.79% | 2.37% | 3.19% | 4.41% | 3.88% |
Supplemental Data | | | | | |
Net assets, end of period (000 omitted) | $ 1,592,068 | $ 1,265,181 | $ 1,111,543 | $ 900,651 | $ 743,948 |
Portfolio turnover rate | 7% | 7% | 13% | 51% | 37% |
A Total returns would have been lower had certain expenses not been reduced during the periods shown.
B Calculated based on average shares outstanding during the period.
C Amounts do not include the activity of the underlying funds.
D Expense ratios reflect operating expenses of the fund. Expenses before reductions do not reflect amounts reimbursed by the investment adviser or reductions from brokerage service arrangements or other expense offset arrangements and do not represent the amount paid by the fund during periods when reimbursements or reductions occur. Expenses net of any voluntary waivers reflect expenses after reimbursement by the investment adviser but prior to reductions from brokerage service arrangements or other expense offset arrangements. Expenses net of all reductions represent the net expenses paid by the fund.
E Amount represents less than $.01 per share.
See accompanying notes which are an integral part of the financial statements.
Annual Report
Fidelity Freedom 2005 Fund
Investment Summary
Fund Holdings as of March 31, 2004 |
| % of fund's
investments |
Domestic Equity Funds | |
Fidelity Blue Chip Growth Fund | 5.9 |
Fidelity Disciplined Equity Fund | 6.0 |
Fidelity Equity-Income Fund | 6.0 |
Fidelity Fund | 6.0 |
Fidelity Growth & Income Portfolio | 6.0 |
Fidelity Growth Company Fund | 3.6 |
Fidelity Mid-Cap Stock Fund | 3.6 |
Fidelity OTC Portfolio | 2.8 |
| 39.9 |
International Equity Funds | |
Fidelity Diversified International Fund | 1.3 |
Fidelity Europe Fund | 1.8 |
Fidelity Japan Fund | 0.6 |
Fidelity Overseas Fund | 1.3 |
Fidelity Southeast Asia Fund | 0.2 |
| 5.2 |
High Yield Fixed-Income Funds | |
Fidelity Capital & Income Fund | 2.5 |
Fidelity High Income Fund | 2.4 |
| 4.9 |
Investment Grade Fixed-Income Funds | |
Fidelity Government Income Fund | 15.1 |
Fidelity Intermediate Bond Fund | 9.9 |
Fidelity Investment Grade Bond Fund | 15.1 |
| 40.1 |
Money Market Fund | |
Fidelity Retirement Government Money Market Portfolio | 9.9 |
| 100.0 |
Asset Allocation (% of fund's investments) |
The fund invests according to an asset allocation strategy that becomes increasingly conservative over time. The initial allocation represents the target asset allocation at inception. The current allocation is based on the fund's holdings as of March 31, 2004. The expected allocation represents the fund's anticipated target asset allocation at September 30, 2004.
Annual Report
Fidelity Freedom 2005 Fund
Investments March 31, 2004
Showing Percentage of Total Value of Investment in Securities
Equity Funds - 45.1% |
| Shares | | Value (Note 1) |
Domestic Equity Funds - 39.9% |
Fidelity Blue Chip Growth Fund | 54,141 | | $ 2,166,709 |
Fidelity Disciplined Equity Fund | 94,193 | | 2,196,580 |
Fidelity Equity-Income Fund | 43,984 | | 2,196,134 |
Fidelity Fund | 76,877 | | 2,177,157 |
Fidelity Growth & Income Portfolio | 60,559 | | 2,180,718 |
Fidelity Growth Company Fund | 25,473 | | 1,314,384 |
Fidelity Mid-Cap Stock Fund | 59,213 | | 1,317,487 |
Fidelity OTC Portfolio | 30,556 | | 1,008,645 |
TOTAL DOMESTIC EQUITY FUNDS | | 14,557,814 |
International Equity Funds - 5.2% |
Fidelity Diversified International Fund | 18,344 | | 472,172 |
Fidelity Europe Fund | 23,072 | | 648,316 |
Fidelity Japan Fund | 15,568 | | 203,636 |
Fidelity Overseas Fund | 14,102 | | 469,022 |
Fidelity Southeast Asia Fund | 5,960 | | 93,455 |
TOTAL INTERNATIONAL EQUITY FUNDS | | 1,886,601 |
TOTAL EQUITY FUNDS (Cost $16,196,736) | 16,444,415 |
Fixed-Income Funds - 45.0% |
| | | |
High Yield Fixed-Income Funds - 4.9% |
Fidelity Capital & Income Fund | 112,686 | | 905,997 |
Fidelity High Income Fund | 101,657 | | 905,767 |
TOTAL HIGH YIELD FIXED-INCOME FUNDS | | 1,811,764 |
Investment Grade Fixed-Income Funds - 40.1% |
Fidelity Government Income Fund | 528,925 | | 5,516,689 |
Fidelity Intermediate Bond Fund | 332,822 | | 3,601,136 |
Fidelity Investment Grade Bond Fund | 717,063 | | 5,507,044 |
TOTAL INVESTMENT GRADE FIXED-INCOME FUNDS | | 14,624,869 |
TOTAL FIXED-INCOME FUNDS (Cost $16,299,995) | 16,436,633 |
Money Market Fund - 9.9% |
| Shares | | Value (Note 1) |
Fidelity Retirement Government Money Market Portfolio
(Cost $3,601,929) | 3,601,929 | | $ 3,601,929 |
TOTAL INVESTMENT IN SECURITIES - 100% (Cost $36,098,660) | $ 36,482,977 |
Other Information |
Purchases and redemptions of the underlying fund shares aggregated $37,509,823 and $1,373,417, respectively. |
See accompanying notes which are an integral part of the financial statements.
Annual Report
Fidelity Freedom 2005 Fund
Financial Statements
Statement of Assets and Liabilities
| March 31, 2004 |
| | |
Assets | | |
Investment in securities, at value (cost $36,098,660) - See accompanying schedule | | $ 36,482,977 |
Receivable for fund shares sold | | 1,314,887 |
Receivable from investment adviser for expense reductions | | 295 |
Total assets | | 37,798,159 |
| | |
Liabilities | | |
Payable for investments purchased | $ 1,308,352 | |
Payable for fund shares redeemed | 4,167 | |
Accrued management fee | 2,503 | |
Total liabilities | | 1,315,022 |
| | |
Net Assets | | $ 36,483,137 |
Net Assets consist of: | | |
Paid in capital | | $ 36,005,029 |
Undistributed net investment income | | 111,038 |
Accumulated undistributed net realized gain (loss) on investments | | (17,247) |
Net unrealized appreciation (depreciation) on investments | | 384,317 |
Net Assets, for 3,479,846 shares outstanding | | $ 36,483,137 |
Net Asset Value, offering price and redemption price per share ($36,483,137 ÷ 3,479,846 shares) | | $ 10.48 |
See accompanying notes which are an integral part of the financial statements.
Annual Report
Fidelity Freedom 2005 Fund
Financial Statements - continued
Statement of Operations
| For the period November 6, 2003 (commencement of operations) to March 31, 2004 |
| | |
Investment Income | | |
Income distributions from underlying funds | | $ 134,957 |
Interest | | 27 |
Total income | | 134,984 |
| | |
Expenses | | |
Management fee | $ 6,233 | |
Non-interested trustees' compensation | 16 | |
Total expenses before reductions | 6,249 | |
Expense reductions | (1,244) | 5,005 |
Net investment income (loss) | | 129,979 |
Realized and Unrealized Gain (Loss) Realized gain (loss) on sale of underlying fund shares | (37,746) | |
Capital gain distributions from underlying funds | 31,031 | (6,715) |
Change in net unrealized appreciation (depreciation) on investment securities | | 384,317 |
Net gain (loss) | | 377,602 |
Net increase (decrease) in net assets resulting from operations | | $ 507,581 |
See accompanying notes which are an integral part of the financial statements.
Annual Report
Statement of Changes in Net Assets
| For the period
November 6, 2003
(commencement
of operations) to
March 31, 2004 |
Increase (Decrease) in Net Assets | |
Operations | |
Net investment income (loss) | $ 129,979 |
Net realized gain (loss) | (6,715) |
Change in net unrealized appreciation (depreciation) | 384,317 |
Net increase (decrease) in net assets resulting
from operations | 507,581 |
Distributions to shareholders from net investment income | (29,473) |
Share transactions
Net proceeds from sales of shares | 40,964,747 |
Reinvestment of distributions | 29,049 |
Cost of shares redeemed | (4,988,767) |
Net increase (decrease) in net assets resulting from share transactions | 36,005,029 |
Total increase (decrease) in net assets | 36,483,137 |
| |
Net Assets | |
Beginning of period | - |
End of period (including undistributed net investment income of $111,038) | $ 36,483,137 |
Other Information Shares | |
Sold | 3,957,673 |
Issued in reinvestment of distributions | 2,848 |
Redeemed | (480,675) |
Net increase (decrease) | 3,479,846 |
See accompanying notes which are an integral part of the financial statements.
Annual Report
Financial Highlights
Period ended March 31, | 2004 F |
Selected Per-Share Data | |
Net asset value, beginning of period | $ 10.00 |
Income from Investment Operations | |
Net investment income (loss) D | .08 |
Net realized and unrealized gain (loss) | .44 |
Total from investment operations | .52 |
Distributions from net investment income | (.04) |
Net asset value, end of period | $ 10.48 |
Total Return B, C | 5.21% |
Ratios to Average Net Assets E, G | |
Expenses before expense reductions | .10% A |
Expenses net of voluntary waivers, if any | .08% A |
Expenses net of all reductions | .08% A |
Net investment income (loss) | 2.03% A |
Supplemental Data | |
Net assets, end of period (000 omitted) | $ 36,483 |
Portfolio turnover rate | 22% A |
A Annualized
B Total returns for periods of less than one year are not annualized.
C Total returns would have been lower had certain expenses not been reduced during the periods shown.
D Calculated based on average shares outstanding during the period.
E Amounts do not include the activity of the underlying funds.
F For the period November 6, 2003 (commencement of operations) to March 31, 2004.
G Expense ratios reflect operating expenses of the fund. Expenses before reductions do not reflect amounts reimbursed by the investment adviser or reductions from brokerage service arrangements or other expense offset arrangements and do not represent the amount paid by the fund during periods when reimbursements or reductions occur. Expenses net of any voluntary waivers reflect expenses after reimbursement by the investment adviser but prior to reductions from brokerage service arrangements or other expense offset arrangements. Expenses net of all reductions represent the net expenses paid by the fund.
See accompanying notes which are an integral part of the financial statements.
Annual Report
Fidelity Freedom 2010 Fund
Investment Changes
Fund Holdings as of March 31, 2004 |
| % of fund's
investments | % of fund's investments
6 months ago |
Domestic Equity Funds | | |
Fidelity Blue Chip Growth Fund | 6.1 | 6.0 |
Fidelity Disciplined Equity Fund | 6.3 | 6.4 |
Fidelity Equity-Income Fund | 6.5 | 6.5 |
Fidelity Fund | 6.3 | 6.1 |
Fidelity Growth & Income Portfolio | 6.2 | 6.2 |
Fidelity Growth Company Fund | 3.7 | 3.9 |
Fidelity Mid-Cap Stock Fund | 3.8 | 3.7 |
Fidelity OTC Portfolio | 2.9 | 3.2 |
| 41.8 | 42.0 |
International Equity Funds | | |
Fidelity Diversified International Fund | 1.4 | 1.5 |
Fidelity Europe Fund | 2.0 | 1.9 |
Fidelity Japan Fund | 0.6 | 0.6 |
Fidelity Overseas Fund | 1.4 | 1.4 |
Fidelity Southeast Asia Fund | 0.3 | 0.3 |
| 5.7 | 5.7 |
High Yield Fixed-Income Funds | | |
Fidelity Capital & Income Fund | 3.7 | 4.8 |
Fidelity High Income Fund | 2.0 | 1.6 |
| 5.7 | 6.4 |
Investment Grade Fixed-Income Funds | | |
Fidelity Government Income Fund | 14.4 | 14.1 |
Fidelity Intermediate Bond Fund | 9.4 | 9.3 |
Fidelity Investment Grade Bond Fund | 14.4 | 14.3 |
| 38.2 | 37.7 |
Money Market Fund | | |
Fidelity Retirement Government Money Market Portfolio | 8.6 | 8.2 |
| 100.0 | 100.0 |
Asset Allocation (% of fund's investments) |

The fund invests according to an asset allocation strategy that becomes increasingly conservative over time. The six months ago allocation is based on the fund's holdings as of September 30, 2003. The current allocation is based on the fund's holdings as of March 31, 2004. The expected allocation represents the fund's anticipated target asset allocation at September 30, 2004.
Annual Report
Fidelity Freedom 2010 Fund
Investments March 31, 2004
Showing Percentage of Total Value of Investment in Securities
Equity Funds - 47.5% |
| Shares | | Value (Note 1) |
Domestic Equity Funds - 41.8% |
Fidelity Blue Chip Growth Fund | 11,205,416 | | $ 448,440,746 |
Fidelity Disciplined Equity Fund | 20,086,642 | | 468,420,487 |
Fidelity Equity-Income Fund | 9,638,280 | | 481,239,310 |
Fidelity Fund | 16,306,713 | | 461,806,110 |
Fidelity Growth & Income Portfolio | 12,638,996 | | 455,130,234 |
Fidelity Growth Company Fund | 5,339,265 | | 275,506,058 |
Fidelity Mid-Cap Stock Fund | 12,529,684 | | 278,785,479 |
Fidelity OTC Portfolio | 6,526,097 | | 215,426,471 |
TOTAL DOMESTIC EQUITY FUNDS | | 3,084,754,895 |
International Equity Funds - 5.7% |
Fidelity Diversified International Fund | 4,203,234 | | 108,191,231 |
Fidelity Europe Fund | 5,281,251 | | 148,403,158 |
Fidelity Japan Fund | 3,197,187 | | 41,819,209 |
Fidelity Overseas Fund | 3,120,597 | | 103,791,059 |
Fidelity Southeast Asia Fund | 1,421,851 | | 22,294,623 |
TOTAL INTERNATIONAL EQUITY FUNDS | | 424,499,280 |
TOTAL EQUITY FUNDS (Cost $3,433,170,417) | 3,509,254,175 |
Fixed-Income Funds - 43.9% |
| | | |
High Yield Fixed-Income Funds - 5.7% |
Fidelity Capital & Income Fund | 33,787,130 | | 271,648,525 |
Fidelity High Income Fund | 16,632,057 | | 148,191,627 |
TOTAL HIGH YIELD FIXED-INCOME FUNDS | | 419,840,152 |
Investment Grade Fixed-Income Funds - 38.2% |
Fidelity Government Income Fund | 101,825,755 | | 1,062,042,627 |
Fidelity Intermediate Bond Fund | 64,163,548 | | 694,249,585 |
Fidelity Investment Grade Bond Fund | 138,745,394 | | 1,065,564,627 |
TOTAL INVESTMENT GRADE FIXED-INCOME FUNDS | | 2,821,856,839 |
TOTAL FIXED-INCOME FUNDS (Cost $3,111,179,287) | 3,241,696,991 |
Money Market Fund - 8.6% |
| Shares | | Value (Note 1) |
Fidelity Retirement Government Money Market Portfolio
(Cost $636,825,886) | 636,825,886 | | $ 636,825,886 |
TOTAL INVESTMENT IN SECURITIES - 100% (Cost $7,181,175,590) | $ 7,387,777,052 |
Other Information |
Purchases and redemptions of the underlying fund shares aggregated $2,073,921,577 and $252,427,362, respectively. |
Income Tax Information |
The fund hereby designates approximately $38,960,000 as a capital gain dividend for the purpose of the dividend paid deduction. |
See accompanying notes which are an integral part of the financial statements.
Annual Report
Fidelity Freedom 2010 Fund
Financial Statements
Statement of Assets and Liabilities
| March 31, 2004 |
| | |
Assets | | |
Investment in securities, at value (cost $7,181,175,590) - See accompanying schedule | | $ 7,387,777,052 |
Receivable for investments sold | | 2,504,640 |
Receivable for fund shares sold | | 18,281,449 |
Receivable from investment adviser for expense reductions | | 113,700 |
Total assets | | 7,408,676,841 |
| | |
Liabilities | | |
Payable for investments purchased | $ 14,092,632 | |
Payable for fund shares redeemed | 6,114,675 | |
Accrued management fee | 606,484 | |
Total liabilities | | 20,813,791 |
| | |
Net Assets | | $ 7,387,863,050 |
Net Assets consist of: | | |
Paid in capital | | $ 7,177,434,739 |
Undistributed net investment income | | 39,579,230 |
Accumulated undistributed net realized gain (loss) on investments | | (35,752,381) |
Net unrealized appreciation (depreciation) on investments | | 206,601,462 |
Net Assets, for 555,138,705 shares outstanding | | $ 7,387,863,050 |
Net Asset Value, offering price and redemption price per share ($7,387,863,050 ÷ 555,138,705 shares) | | $ 13.31 |
See accompanying notes which are an integral part of the financial statements.
Annual Report
Fidelity Freedom 2010 Fund
Financial Statements - continued
Statement of Operations
| Year ended March 31, 2004 |
| | |
Investment Income | | |
Income distributions from underlying funds | | $ 131,986,582 |
Interest | | 24 |
Total income | | 131,986,606 |
| | |
Expenses | | |
Management fee | $ 6,102,155 | |
Non-interested trustees' compensation | 26,531 | |
Total expenses before reductions | 6,128,686 | |
Expense reductions | (1,232,500) | 4,896,186 |
Net investment income (loss) | | 127,090,420 |
Realized and Unrealized Gain (Loss) Realized gain (loss) on sale of underlying fund shares | 53,324,662 | |
Capital gain distributions from underlying funds | 49,929,690 | 103,254,352 |
Change in net unrealized appreciation (depreciation) on investment securities | | 830,502,101 |
Net gain (loss) | | 933,756,453 |
Net increase (decrease) in net assets resulting from operations | | $ 1,060,846,873 |
See accompanying notes which are an integral part of the financial statements.
Annual Report
Statement of Changes in Net Assets
| Year ended
March 31,
2004 | Year ended
March 31,
2003 |
Increase (Decrease) in Net Assets | | |
Operations | | |
Net investment income (loss) | $ 127,090,420 | $ 102,952,701 |
Net realized gain (loss) | 103,254,352 | 12,376,942 |
Change in net unrealized appreciation (depreciation) | 830,502,101 | (428,586,155) |
Net increase (decrease) in net assets resulting
from operations | 1,060,846,873 | (313,256,512) |
Distributions to shareholders from net investment income | (137,172,581) | (112,169,818) |
Distributions to shareholders from net realized gain | (45,734,256) | - |
Total distributions | (182,906,837) | (112,169,818) |
Share transactions
Net proceeds from sales of shares | 2,848,469,702 | 1,979,230,766 |
Reinvestment of distributions | 182,406,439 | 111,936,699 |
Cost of shares redeemed | (1,203,465,830) | (1,046,927,312) |
Net increase (decrease) in net assets resulting from share transactions | 1,827,410,311 | 1,044,240,153 |
Total increase (decrease) in net assets | 2,705,350,347 | 618,813,823 |
| | |
Net Assets | | |
Beginning of period | 4,682,512,703 | 4,063,698,880 |
End of period (including undistributed net investment income of $39,579,230 and undistributed net investment income of $27,197,526, respectively) | $ 7,387,863,050 | $ 4,682,512,703 |
Other Information Shares | | |
Sold | 224,495,492 | 169,212,178 |
Issued in reinvestment of distributions | 14,269,108 | 9,649,447 |
Redeemed | (94,459,409) | (90,195,379) |
Net increase (decrease) | 144,305,191 | 88,666,246 |
See accompanying notes which are an integral part of the financial statements.
Annual Report
Financial Highlights
Years ended March 31, | 2004 | 2003 | 2002 | 2001 | 2000 |
Selected Per-Share Data | | | | | |
Net asset value, beginning of period | $ 11.40 | $ 12.61 | $ 12.94 | $ 15.55 | $ 13.76 |
Income from Investment Operations | | | | | |
Net investment income (loss) B | .26 | .28 | .36 | .49 | .43 |
Net realized and unrealized gain (loss) | 2.02 | (1.18) | (.05) | (1.97) | 2.27 |
Total from investment operations | 2.28 | (.90) | .31 | (1.48) | 2.70 |
Distributions from net investment income | (.28) | (.31) | (.37) | (.46) | (.49) |
Distributions from net realized gain | (.09) | - | (.27) | (.67) | (.42) |
Total distributions | (.37) | (.31) | (.64) | (1.13) | (.91) |
Net asset value, end of period | $ 13.31 | $ 11.40 | $ 12.61 | $ 12.94 | $ 15.55 |
Total Return A | 20.15% | (7.17)% | 2.31% | (10.00)% | 20.32% |
Ratios to Average Net Assets C, D | | | | |
Expenses before expense reductions | .10% | .10% | .10% | .10% | .10% |
Expenses net of voluntary waivers, if any | .08% | .08% | .08% | .08% | .08% |
Expenses net of all reductions | .08% | .08% | .07% | .06% | .07% |
Net investment income (loss) | 2.07% | 2.44% | 2.84% | 3.43% | 2.98% |
Supplemental Data | | | | | |
Net assets, end of period (000 omitted) | $ 7,387,863 | $ 4,682,513 | $ 4,063,699 | $ 2,813,123 | $ 2,013,087 |
Portfolio turnover rate | 4% | 8% | 10% | 42% | 33% |
A Total returns would have been lower had certain expenses not been reduced during the periods shown.
B Calculated based on average shares outstanding during the period.
C Amounts do not include the activity of the underlying funds.
D Expense ratios reflect operating expenses of the fund. Expenses before reductions do not reflect amounts reimbursed by the investment adviser or reductions from brokerage service arrangements or other expense offset arrangements and do not represent the amount paid by the fund during periods when reimbursements or reductions occur. Expenses net of any voluntary waivers reflect expenses after reimbursement by the investment adviser but prior to reductions from brokerage service arrangements or other expense offset arrangements. Expenses net of all reductions represent the net expenses paid by the fund.
See accompanying notes which are an integral part of the financial statements.
Annual Report
Fidelity Freedom 2015 Fund
Investment Summary
Fund Holdings as of March 31, 2004 |
| % of fund's investments |
Domestic Equity Funds | |
Fidelity Blue Chip Growth Fund | 7.8 |
Fidelity Disciplined Equity Fund | 7.9 |
Fidelity Equity-Income Fund | 7.9 |
Fidelity Fund | 7.8 |
Fidelity Growth & Income Portfolio | 7.9 |
Fidelity Growth Company Fund | 4.7 |
Fidelity Mid-Cap Stock Fund | 4.7 |
Fidelity OTC Portfolio | 3.6 |
| 52.3 |
International Equity Funds | |
Fidelity Diversified International Fund | 2.1 |
Fidelity Europe Fund | 2.9 |
Fidelity Japan Fund | 1.0 |
Fidelity Overseas Fund | 2.1 |
Fidelity Southeast Asia Fund | 0.4 |
| 8.5 |
High Yield Fixed-Income Funds | |
Fidelity Capital & Income Fund | 3.2 |
Fidelity High Income Fund | 3.3 |
| 6.5 |
Investment Grade Fixed-Income Funds | |
Fidelity Government Income Fund | 11.0 |
Fidelity Intermediate Bond Fund | 7.1 |
Fidelity Investment Grade Bond Fund | 10.9 |
| 29.0 |
Money Market Fund | |
Fidelity Retirement Government Money Market Portfolio | 3.7 |
| 100.0 |
Asset Allocation (% of fund's investments) |
The fund invests according to an asset allocation strategy that becomes increasingly conservative over time. The initial allocation represents the target asset allocation at inception. The current allocation is based on the fund's holdings as of March 31, 2004. The expected allocation represents the fund's anticipated target asset allocation at September 30, 2004.
Annual Report
Fidelity Freedom 2015 Fund
Investments March 31, 2004
Showing Percentage of Total Value of Investment in Securities
Equity Funds - 60.8% |
| Shares | | Value (Note 1) |
Domestic Equity Funds - 52.3% |
Fidelity Blue Chip Growth Fund | 222,449 | | $ 8,902,421 |
Fidelity Disciplined Equity Fund | 387,088 | | 9,026,889 |
Fidelity Equity-Income Fund | 180,379 | | 9,006,305 |
Fidelity Fund | 315,710 | | 8,940,907 |
Fidelity Growth & Income Portfolio | 248,773 | | 8,958,326 |
Fidelity Growth Company Fund | 104,559 | | 5,395,222 |
Fidelity Mid-Cap Stock Fund | 243,019 | | 5,407,168 |
Fidelity OTC Portfolio | 125,581 | | 4,145,425 |
TOTAL DOMESTIC EQUITY FUNDS | | 59,782,663 |
International Equity Funds - 8.5% |
Fidelity Diversified International Fund | 94,246 | | 2,425,900 |
Fidelity Europe Fund | 118,751 | | 3,336,906 |
Fidelity Japan Fund | 80,852 | | 1,057,538 |
Fidelity Overseas Fund | 72,448 | | 2,409,634 |
Fidelity Southeast Asia Fund | 30,350 | | 475,895 |
TOTAL INTERNATIONAL EQUITY FUNDS | | 9,705,873 |
TOTAL EQUITY FUNDS (Cost $68,800,861) | 69,488,536 |
Fixed-Income Funds - 35.5% |
| | | |
High Yield Fixed-Income Funds - 6.5% |
Fidelity Capital & Income Fund | 462,712 | | 3,720,204 |
Fidelity High Income Fund | 417,677 | | 3,721,505 |
TOTAL HIGH YIELD FIXED-INCOME FUNDS | | 7,441,709 |
Investment Grade Fixed-Income Funds - 29.0% |
Fidelity Government Income Fund | 1,199,825 | | 12,514,177 |
Fidelity Intermediate Bond Fund | 754,852 | | 8,167,494 |
Fidelity Investment Grade Bond Fund | 1,626,565 | | 12,492,020 |
TOTAL INVESTMENT GRADE FIXED-INCOME FUNDS | | 33,173,691 |
TOTAL FIXED-INCOME FUNDS (Cost $40,361,960) | 40,615,400 |
Money Market Fund - 3.7% |
| Shares | | Value (Note 1) |
Fidelity Retirement Government Money Market Portfolio
(Cost $4,230,198) | 4,230,198 | | $ 4,230,198 |
TOTAL INVESTMENT IN SECURITIES - 100% (Cost $113,393,019) | $ 114,334,134 |
Other Information |
Purchases and redemptions of the underlying fund shares aggregated $113,800,065 and $395,403, respectively. |
See accompanying notes which are an integral part of the financial statements.
Annual Report
Fidelity Freedom 2015 Fund
Financial Statements
Statement of Assets and Liabilities
| March 31, 2004 |
| | |
Assets | | |
Investment in securities, at value (cost $113,393,019) - See accompanying schedule | | $ 114,334,134 |
Receivable for fund shares sold | | 7,533,758 |
Receivable from investment adviser for expense reductions | | 898 |
Total assets | | 121,868,790 |
| | |
Liabilities | | |
Payable for investments purchased | $ 7,522,630 | |
Payable for fund shares redeemed | 3,779 | |
Accrued management fee | 7,722 | |
Total liabilities | | 7,534,131 |
| | |
Net Assets | | $ 114,334,659 |
Net Assets consist of: | | |
Paid in capital | | $ 113,044,449 |
Undistributed net investment income | | 299,550 |
Accumulated undistributed net realized gain (loss) on investments | | 49,545 |
Net unrealized appreciation (depreciation) on investments | | 941,115 |
Net Assets, for 10,814,605 shares outstanding | | $ 114,334,659 |
Net Asset Value, offering price and redemption price per share ($114,334,659 ÷ 10,814,605 shares) | | $ 10.57 |
See accompanying notes which are an integral part of the financial statements.
Annual Report
Fidelity Freedom 2015 Fund
Financial Statements - continued
Statement of Operations
| For the period November 6, 2003 (commencement of operations) to March 31, 2004 |
| | |
Investment Income | | |
Income distributions from underlying funds | | $ 344,410 |
Interest | | 27 |
Total income | | 344,437 |
| | |
Expenses | | |
Management fee | $ 17,959 | |
Non-interested trustees' compensation | 45 | |
Total expenses before reductions | 18,004 | |
Expense reductions | (3,567) | 14,437 |
Net investment income (loss) | | 330,000 |
Realized and Unrealized Gain (Loss) Realized gain (loss) on sale of underlying fund shares | (11,643) | |
Capital gain distributions from underlying funds | 94,402 | 82,759 |
Change in net unrealized appreciation (depreciation) on investment securities | | 941,115 |
Net gain (loss) | | 1,023,874 |
Net increase (decrease) in net assets resulting from operations | | $ 1,353,874 |
See accompanying notes which are an integral part of the financial statements.
Annual Report
Statement of Changes in Net Assets
| For the period
November 6, 2003
(commencement
of operations) to
March 31, 2004 |
Increase (Decrease) in Net Assets | |
Operations | |
Net investment income (loss) | $ 330,000 |
Net realized gain (loss) | 82,759 |
Change in net unrealized appreciation (depreciation) | 941,115 |
Net increase (decrease) in net assets resulting from operations | 1,353,874 |
Distributions to shareholders from net investment income | (63,664) |
Share transactions
Net proceeds from sales of shares | 119,563,790 |
Reinvestment of distributions | 63,367 |
Cost of shares redeemed | (6,582,708) |
Net increase (decrease) in net assets resulting from share transactions | 113,044,449 |
Total increase (decrease) in net assets | 114,334,659 |
| |
Net Assets | |
Beginning of period | - |
End of period (including undistributed net investment income
of $299,550) | $ 114,334,659 |
Other Information Shares | |
Sold | 11,437,447 |
Issued in reinvestment of distributions | 6,188 |
Redeemed | (629,030) |
Net increase (decrease) | 10,814,605 |
See accompanying notes which are an integral part of the financial statements.
Annual Report
Financial Highlights
Period ended March 31, | 2004F |
Selected Per-Share Data | |
Net asset value, beginning of period | $ 10.00 |
Income from Investment Operations | |
Net investment income (loss)D | .07 |
Net realized and unrealized gain (loss) | .54 |
Total from investment operations | .61 |
Distributions from net investment income | (.04) |
Net asset value, end of period | $ 10.57 |
Total ReturnB,C | 6.11% |
Ratios to Average Net AssetsE,G | |
Expenses before expense reductions | .10%A |
Expenses net of voluntary waivers, if any | .08%A |
Expenses net of all reductions | .08%A |
Net investment income (loss) | 1.79%A |
Supplemental Data | |
Net assets, end of period (000 omitted) | $ 114,335 |
Portfolio turnover rate | 2%A |
A Annualized
B Total returns for periods of less than one year are not annualized.
C Total returns would have been lower had certain expenses not been reduced during the periods shown.
D Calculated based on average shares outstanding during the period.
E Amounts do not include the activity of the underlying funds.
F For the period November 6, 2003 (commencement of operations) to March 31, 2004.
G Expense ratios reflect operating expenses of the fund. Expenses before reductions do not reflect amounts reimbursed by the investment adviser or reductions from brokerage service arrangements or other expense offset arrangements and do not represent the amount paid by the fund during periods when reimbursements or reductions occur. Expenses net of any voluntary waivers reflect expenses after reimbursement by the investment adviser but prior to reductions from brokerage service arrangements or other expense offset arrangements. Expenses net of all reductions represent the net expenses paid by the fund.
See accompanying notes which are an integral part of the financial statements.
Annual Report
Fidelity Freedom 2020 Fund
Investment Changes
Fund Holdings as of March 31, 2004 |
| % of fund's
investments | % of fund's investments
6 months ago |
Domestic Equity Funds | | |
Fidelity Blue Chip Growth Fund | 8.8 | 8.7 |
Fidelity Disciplined Equity Fund | 9.1 | 9.1 |
Fidelity Equity-Income Fund | 9.4 | 9.3 |
Fidelity Fund | 9.0 | 8.8 |
Fidelity Growth & Income Portfolio | 8.9 | 8.8 |
Fidelity Growth Company Fund | 5.4 | 5.6 |
Fidelity Mid-Cap Stock Fund | 5.5 | 5.3 |
Fidelity OTC Portfolio | 4.2 | 4.6 |
| 60.3 | 60.2 |
International Equity Funds | | |
Fidelity Diversified International Fund | 2.7 | 2.8 |
Fidelity Europe Fund | 3.8 | 3.6 |
Fidelity Japan Fund | 1.1 | 1.0 |
Fidelity Overseas Fund | 2.6 | 2.5 |
Fidelity Southeast Asia Fund | 0.6 | 0.6 |
| 10.8 | 10.5 |
High Yield Fixed-Income Funds | | |
Fidelity Capital & Income Fund | 4.4 | 5.9 |
Fidelity High Income Fund | 3.5 | 2.9 |
| 7.9 | 8.8 |
Investment Grade Fixed-Income Funds | | |
Fidelity Government Income Fund | 7.9 | 7.6 |
Fidelity Intermediate Bond Fund | 5.2 | 5.1 |
Fidelity Investment Grade Bond Fund | 7.9 | 7.8 |
| 21.0 | 20.5 |
| 100.0 | 100.0 |
Asset Allocation (% of fund's investments) |
The fund invests according to an asset allocation strategy that becomes increasingly conservative over time. The six months ago allocation is based on the fund's holdings as of September 30, 2003. The current allocation is based on the fund's holdings as of March 31, 2004. The expected allocation represents the fund's anticipated target asset allocation at September 30, 2004.
Annual Report
Fidelity Freedom 2020 Fund
Investments March 31, 2004
Showing Percentage of Total Value of Investment in Securities
Equity Funds - 71.1% |
| Shares | | Value (Note 1) |
Domestic Equity Funds - 60.3% |
Fidelity Blue Chip Growth Fund | 16,560,506 | | $ 662,751,433 |
Fidelity Disciplined Equity Fund | 29,554,389 | | 689,208,342 |
Fidelity Equity-Income Fund | 14,145,893 | | 706,304,435 |
Fidelity Fund | 24,041,304 | | 680,849,738 |
Fidelity Growth & Income Portfolio | 18,623,891 | | 670,646,332 |
Fidelity Growth Company Fund | 7,887,345 | | 406,987,025 |
Fidelity Mid-Cap Stock Fund | 18,496,788 | | 411,553,533 |
Fidelity OTC Portfolio | 9,587,997 | | 316,499,767 |
TOTAL DOMESTIC EQUITY FUNDS | | 4,544,800,605 |
International Equity Funds - 10.8% |
Fidelity Diversified International Fund | 8,061,082 | | 207,492,249 |
Fidelity Europe Fund | 10,183,399 | | 286,153,501 |
Fidelity Japan Fund | 6,211,747 | | 81,249,655 |
Fidelity Overseas Fund | 6,024,551 | | 200,376,579 |
Fidelity Southeast Asia Fund | 2,716,716 | | 42,598,102 |
TOTAL INTERNATIONAL EQUITY FUNDS | | 817,870,086 |
TOTAL EQUITY FUNDS (Cost $5,109,742,674) | 5,362,670,691 |
Fixed-Income Funds - 28.9% |
| | | |
High Yield Fixed-Income Funds - 7.9% |
Fidelity Capital & Income Fund | 41,492,035 | | 333,595,957 |
Fidelity High Income Fund | 29,726,871 | | 264,866,420 |
TOTAL HIGH YIELD FIXED-INCOME FUNDS | | 598,462,377 |
Investment Grade Fixed-Income Funds - 21.0% |
Fidelity Government Income Fund | 57,033,527 | | 594,859,682 |
Fixed-Income Funds - continued |
| Shares | | Value (Note 1) |
Investment Grade Fixed-Income Funds - continued |
Fidelity Intermediate Bond Fund | 35,932,346 | | $ 388,787,984 |
Fidelity Investment Grade Bond Fund | 77,677,788 | | 596,565,411 |
TOTAL INVESTMENT GRADE FIXED-INCOME FUNDS | | 1,580,213,077 |
TOTAL FIXED-INCOME FUNDS (Cost $2,093,981,446) | 2,178,675,454 |
TOTAL INVESTMENT IN SECURITIES - 100% (Cost $7,203,724,120) | $ 7,541,346,145 |
Other Information |
Purchases and redemptions of the underlying fund shares aggregated $2,366,569,450 and $159,604,466, respectively. |
Income Tax Information |
The fund hereby designates approximately $22,528,000 as a capital gain dividend for the purpose of the dividend paid deduction. |
See accompanying notes which are an integral part of the financial statements.
Annual Report
Fidelity Freedom 2020 Fund
Financial Statements
Statement of Assets and Liabilities
| March 31, 2004 |
| | |
Assets | | |
Investment in securities, at value (cost $7,203,724,120) - See accompanying schedule | | $ 7,541,346,145 |
Receivable for investments sold | | 3,398,758 |
Receivable for fund shares sold | | 24,504,837 |
Receivable from investment adviser for expense reductions | | 113,073 |
Total assets | | 7,569,362,813 |
| | |
Liabilities | | |
Payable for investments purchased | $ 22,945,434 | |
Payable for fund shares redeemed | 4,369,458 | |
Accrued management fee | 616,305 | |
Total liabilities | | 27,931,197 |
| | |
Net Assets | | $ 7,541,431,616 |
Net Assets consist of: | | |
Paid in capital | | $ 7,189,483,065 |
Undistributed net investment income | | 31,958,994 |
Accumulated undistributed net realized gain (loss) on investments | | (17,632,468) |
Net unrealized appreciation (depreciation) on investments | | 337,622,025 |
Net Assets, for 565,351,949 shares outstanding | | $ 7,541,431,616 |
Net Asset Value, offering price and redemption price per share ($7,541,431,616 ÷ 565,351,949 shares) | | $ 13.34 |
See accompanying notes which are an integral part of the financial statements.
Annual Report
Fidelity Freedom 2020 Fund
Financial Statements - continued
Statement of Operations
| Year ended March 31, 2004 |
| | |
Investment Income | | |
Income distributions from underlying funds | | $ 113,101,017 |
Interest | | 130 |
Total income | | 113,101,147 |
| | |
Expenses | | |
Management fee | $ 5,839,995 | |
Non-interested trustees' compensation | 25,114 | |
Total expenses before reductions | 5,865,109 | |
Expense reductions | (1,182,452) | 4,682,657 |
Net investment income (loss) | | 108,418,490 |
Realized and Unrealized Gain (Loss) Realized gain (loss) on sale of underlying fund shares | 36,304,240 | |
Capital gain distributions from underlying funds | 37,679,940 | 73,984,180 |
Change in net unrealized appreciation (depreciation) on investment securities | | 1,210,523,965 |
Net gain (loss) | | 1,284,508,145 |
Net increase (decrease) in net assets resulting from operations | | $ 1,392,926,635 |
See accompanying notes which are an integral part of the financial statements.
Annual Report
Statement of Changes in Net Assets
| Year ended
March 31,
2004 | Year ended
March 31,
2003 |
Increase (Decrease) in Net Assets | | |
Operations | | |
Net investment income (loss) | $ 108,418,490 | $ 69,103,005 |
Net realized gain (loss) | 73,984,180 | (6,966,202) |
Change in net unrealized appreciation (depreciation) | 1,210,523,965 | (622,128,692) |
Net increase (decrease) in net assets resulting
from operations | 1,392,926,635 | (559,991,889) |
Distributions to shareholders from net investment income | (107,292,278) | (72,675,960) |
Distributions to shareholders from net realized gain | (20,270,970) | - |
Total distributions | (127,563,248) | (72,675,960) |
Share transactions
Net proceeds from sales of shares | 3,024,604,608 | 2,141,628,123 |
Reinvestment of distributions | 127,344,836 | 72,560,999 |
Cost of shares redeemed | (963,483,193) | (779,213,077) |
Net increase (decrease) in net assets resulting from share transactions | 2,188,466,251 | 1,434,976,045 |
Total increase (decrease) in net assets | 3,453,829,638 | 802,308,196 |
| | |
Net Assets | | |
Beginning of period | 4,087,601,978 | 3,285,293,782 |
End of period (including undistributed net investment income of $31,958,994 and undistributed net investment income of $14,735,168, respectively) | $ 7,541,431,616 | $ 4,087,601,978 |
Other Information Shares | | |
Sold | 243,258,376 | 193,201,583 |
Issued in reinvestment of distributions | 10,065,943 | 6,670,255 |
Redeemed | (77,230,607) | (71,432,595) |
Net increase (decrease) | 176,093,712 | 128,439,243 |
See accompanying notes which are an integral part of the financial statements.
Annual Report
Financial Highlights
Years ended March 31, | 2004 | 2003 | 2002 | 2001 | 2000 |
Selected Per-Share Data | | | | | |
Net asset value, beginning of period | $ 10.50 | $ 12.60 | $ 13.11 | $ 17.28 | $ 14.55 |
Income from Investment Operations | | | | | |
Net investment income (loss) B | .23 | .21 | .26 | .35 | .32 |
Net realized and unrealized gain (loss) | 2.87 | (2.09) | (.08) | (3.17) | 3.43 |
Total from investment operations | 3.10 | (1.88) | .18 | (2.82) | 3.75 |
Distributions from net investment income | (.22) | (.22) | (.26) | (.39) | (.35) |
Distributions in excess of net investment income | - | - | - | - | (.10) |
Distributions from net realized gain | (.04) | - | (.43) | (.96) | (.57) |
Total distributions | (.26) | (.22) | (.69) | (1.35) | (1.02) |
Net asset value, end of period | $ 13.34 | $ 10.50 | $ 12.60 | $ 13.11 | $ 17.28 |
Total Return A | 29.68% | (14.96)% | 1.12% | (17.23)% | 26.74% |
Ratios to Average Net Assets C, D | | | | |
Expenses before expense reductions | .10% | .10% | .10% | .10% | .10% |
Expenses net of voluntary waivers, if any | .08% | .08% | .08% | .08% | .08% |
Expenses net of all reductions | .08% | .08% | .07% | .06% | .07% |
Net investment income (loss) | 1.85% | 1.96% | 2.03% | 2.29% | 2.07% |
Supplemental Data | | | | | |
Net assets, end of period (000 omitted) | $ 7,541,432 | $ 4,087,602 | $ 3,285,294 | $ 2,189,361 | $ 1,964,178 |
Portfolio turnover rate | 3% | 6% | 10% | 50% | 28% |
A Total returns would have been lower had certain expenses not been reduced during the periods shown.
B Calculated based on average shares outstanding during the period.
C Amounts do not include the activity of the underlying funds.
D Expense ratios reflect operating expenses of the fund. Expenses before reductions do not reflect amounts reimbursed by the investment adviser or reductions from brokerage service arrangements or other expense offset arrangements and do not represent the amount paid by the fund during periods when reimbursements or reductions occur. Expenses net of any voluntary waivers reflect expenses after reimbursement by the investment adviser but prior to reductions from brokerage service arrangements or other expense offset arrangements. Expenses net of all reductions represent the net expenses paid by the fund.
See accompanying notes which are an integral part of the financial statements.
Annual Report
Fidelity Freedom 2025 Fund
Investment Summary
Fund Holdings as of March 31, 2004 |
| % of fund's
investments |
Domestic Equity Funds | |
Fidelity Blue Chip Growth Fund | 9.8 |
Fidelity Disciplined Equity Fund | 9.9 |
Fidelity Equity-Income Fund | 9.9 |
Fidelity Fund | 9.9 |
Fidelity Growth & Income Portfolio | 9.9 |
Fidelity Growth Company Fund | 5.9 |
Fidelity Mid-Cap Stock Fund | 6.0 |
Fidelity OTC Portfolio | 4.6 |
| 65.9 |
International Equity Funds | |
Fidelity Diversified International Fund | 3.0 |
Fidelity Europe Fund | 4.1 |
Fidelity Japan Fund | 1.3 |
Fidelity Overseas Fund | 2.9 |
Fidelity Southeast Asia Fund | 0.6 |
| 11.9 |
High Yield Fixed-Income Funds | |
Fidelity Capital & Income Fund | 3.8 |
Fidelity High Income Fund | 3.7 |
| 7.5 |
Investment Grade Fixed-Income Funds | |
Fidelity Government Income Fund | 5.6 |
Fidelity Intermediate Bond Fund | 3.6 |
Fidelity Investment Grade Bond Fund | 5.5 |
| 14.7 |
| 100.0 |
Asset Allocation (% of fund's investments) |

The fund invests according to an asset allocation strategy that becomes increasingly conservative over time. The initial allocation represents the target asset allocation at inception. The current allocation is based on the fund's holdings as of March 31, 2004. The expected allocation represents the fund's anticipated target asset allocation at September 30, 2004.
Annual Report
Fidelity Freedom 2025 Fund
Investments March 31, 2004
Showing Percentage of Total Value of Investment in Securities
Equity Funds - 77.8% |
| Shares | | Value (Note 1) |
Domestic Equity Funds - 65.9% |
Fidelity Blue Chip Growth Fund | 163,031 | | $ 6,524,494 |
Fidelity Disciplined Equity Fund | 283,567 | | 6,612,783 |
Fidelity Equity-Income Fund | 132,185 | | 6,599,999 |
Fidelity Fund | 231,326 | | 6,551,158 |
Fidelity Growth & Income Portfolio | 182,242 | | 6,562,524 |
Fidelity Growth Company Fund | 76,606 | | 3,952,855 |
Fidelity Mid-Cap Stock Fund | 177,974 | | 3,959,918 |
Fidelity OTC Portfolio | 92,086 | | 3,039,760 |
TOTAL DOMESTIC EQUITY FUNDS | | 43,803,491 |
International Equity Funds - 11.9% |
Fidelity Diversified International Fund | 76,822 | | 1,977,396 |
Fidelity Europe Fund | 96,841 | | 2,721,226 |
Fidelity Japan Fund | 64,825 | | 847,907 |
Fidelity Overseas Fund | 59,082 | | 1,965,064 |
Fidelity Southeast Asia Fund | 25,009 | | 392,136 |
TOTAL INTERNATIONAL EQUITY FUNDS | | 7,903,729 |
TOTAL EQUITY FUNDS (Cost $51,021,689) | 51,707,220 |
Fixed-Income Funds - 22.2% |
| | | |
High Yield Fixed-Income Funds - 7.5% |
Fidelity Capital & Income Fund | 307,176 | | 2,469,697 |
Fidelity High Income Fund | 277,165 | | 2,469,536 |
TOTAL HIGH YIELD FIXED-INCOME FUNDS | | 4,939,233 |
Investment Grade Fixed-Income Funds - 14.7% |
Fidelity Government Income Fund | 353,681 | | 3,688,890 |
Fidelity Intermediate Bond Fund | 222,255 | | 2,404,798 |
Fidelity Investment Grade Bond Fund | 479,482 | | 3,682,418 |
TOTAL INVESTMENT GRADE FIXED-INCOME FUNDS | | 9,776,106 |
TOTAL FIXED-INCOME FUNDS (Cost $14,651,000) | 14,715,339 |
TOTAL INVESTMENT IN SECURITIES - 100% (Cost $65,672,689) | $ 66,422,559 |
Other Information |
Purchases and redemptions of the underlying fund shares aggregated $66,457,242 and $745,887, respectively. |
See accompanying notes which are an integral part of the financial statements.
Annual Report
Fidelity Freedom 2025 Fund
Financial Statements
Statement of Assets and Liabilities
| March 31, 2004 |
| | |
Assets | | |
Investment in securities, at value (cost $65,672,689) - See accompanying schedule | | $ 66,422,559 |
Receivable for fund shares sold | | 3,989,107 |
Receivable from investment adviser for expense reductions | | 517 |
Total assets | | 70,412,183 |
| | |
Liabilities | | |
Payable for investments purchased | $ 3,900,381 | |
Payable for fund shares redeemed | 84,493 | |
Accrued management fee | 4,429 | |
Total liabilities | | 3,989,303 |
| | |
Net Assets | | $ 66,422,880 |
Net Assets consist of: | | |
Paid in capital | | $ 65,526,214 |
Undistributed net investment income | | 140,453 |
Accumulated undistributed net realized gain (loss) on investments | | 6,343 |
Net unrealized appreciation (depreciation) on investments | | 749,870 |
Net Assets, for 6,241,657 shares outstanding | | $ 66,422,880 |
Net Asset Value, offering price and redemption price per share ($66,422,880 ÷ 6,241,657 shares) | | $ 10.64 |
See accompanying notes which are an integral part of the financial statements.
Annual Report
Fidelity Freedom 2025 Fund
Financial Statements - continued
Statement of Operations
| For the period November 6, 2003 (commencement of operations) to March 31, 2004 |
| | |
Investment Income | | |
Income distributions from underlying funds | | $ 176,315 |
Interest | | 27 |
Total income | | 176,342 |
| | |
Expenses | | |
Management fee | $ 10,718 | |
Non-interested trustees' compensation | 28 | |
Total expenses before reductions | 10,746 | |
Expense reductions | (2,139) | 8,607 |
Net investment income (loss) | | 167,735 |
Realized and Unrealized Gain (Loss) Realized gain (loss) on sale of underlying fund shares | (38,667) | |
Capital gain distributions from underlying funds | 68,778 | 30,111 |
Change in net unrealized appreciation (depreciation) on investment securities | | 749,870 |
Net gain (loss) | | 779,981 |
Net increase (decrease) in net assets resulting from operations | | $ 947,716 |
See accompanying notes which are an integral part of the financial statements.
Annual Report
Statement of Changes in Net Assets
| For the period
November 6, 2003
(commencement
of operations) to
March 31, 2004 |
Increase (Decrease) in Net Assets | |
Operations | |
Net investment income (loss) | $ 167,735 |
Net realized gain (loss) | 30,111 |
Change in net unrealized appreciation (depreciation) | 749,870 |
Net increase (decrease) in net assets resulting
from operations | 947,716 |
Distributions to shareholders from net investment income | (51,049) |
Share transactions
Net proceeds from sales of shares | 70,184,741 |
Reinvestment of distributions | 50,972 |
Cost of shares redeemed | (4,709,500) |
Net increase (decrease) in net assets resulting from share transactions | 65,526,213 |
Total increase (decrease) in net assets | 66,422,880 |
| |
Net Assets | |
Beginning of period | - |
End of period (including undistributed net investment income
of $140,453) | $ 66,422,880 |
Other Information Shares | |
Sold | 6,683,071 |
Issued in reinvestment of distributions | 4,963 |
Redeemed | (446,377) |
Net increase (decrease) | 6,241,657 |
See accompanying notes which are an integral part of the financial statements.
Annual Report
Financial Highlights
Period ended March 31, | 2004 F |
Selected Per-Share Data | |
Net asset value, beginning of period | $ 10.00 |
Income from Investment Operations | |
Net investment income (loss) D | .06 |
Net realized and unrealized gain (loss) | .63 |
Total from investment operations | .69 |
Distributions from net investment income | (.05) |
Net asset value, end of period | $ 10.64 |
Total Return B, C | 6.92% |
Ratios to Average Net Assets E, G | |
Expenses before expense reductions | .10% A |
Expenses net of voluntary waivers, if any | .08% A |
Expenses net of all reductions | .08% A |
Net investment income (loss) | 1.53% A |
Supplemental Data | |
Net assets, end of period (000 omitted) | $ 66,423 |
Portfolio turnover rate | 7% A |
A Annualized
B Total returns for periods of less than one year are not annualized.
C Total returns would have been lower had certain expenses not been reduced during the periods shown.
D Calculated based on average shares outstanding during the period.
E Amounts do not include the activity of the underlying funds.
F For the period November 6, 2003 (commencement of operations) to March 31, 2004.
G Expense ratios reflect operating expenses of the fund. Expenses before reductions do not reflect amounts reimbursed by the investment adviser or reductions from brokerage service arrangements or other expense offset arrangements and do not represent the amount paid by the fund during periods when reimbursements or reductions occur. Expenses net of any voluntary waivers reflect expenses after reimbursement by the investment adviser but prior to reductions from brokerage service arrangements or other expense offset arrangements. Expenses net of all reductions represent the net expenses paid by the fund.
See accompanying notes which are an integral part of the financial statements.
Annual Report
Fidelity Freedom 2030 Fund
Investment Changes
Fund Holdings as of March 31, 2004 |
| % of fund's investments | % of fund's investments
6 months ago |
Domestic Equity Funds | | |
Fidelity Blue Chip Growth Fund | 10.1 | 10.0 |
Fidelity Disciplined Equity Fund | 10.5 | 10.4 |
Fidelity Equity-Income Fund | 10.8 | 10.6 |
Fidelity Fund | 10.4 | 10.1 |
Fidelity Growth & Income Portfolio | 10.2 | 10.1 |
Fidelity Growth Company Fund | 6.2 | 6.4 |
Fidelity Mid-Cap Stock Fund | 6.3 | 6.1 |
Fidelity OTC Portfolio | 4.8 | 5.2 |
| 69.3 | 68.9 |
International Equity Funds | | |
Fidelity Diversified International Fund | 3.4 | 3.5 |
Fidelity Europe Fund | 4.7 | 4.5 |
Fidelity Japan Fund | 1.4 | 1.3 |
Fidelity Overseas Fund | 3.3 | 3.2 |
Fidelity Southeast Asia Fund | 0.7 | 0.7 |
| 13.5 | 13.2 |
High Yield Fixed-Income Funds | | |
Fidelity Capital & Income Fund | 4.5 | 6.0 |
Fidelity High Income Fund | 3.5 | 2.9 |
| 8.0 | 8.9 |
Investment Grade Fixed-Income Funds | | |
Fidelity Government Income Fund | 3.5 | 3.4 |
Fidelity Intermediate Bond Fund | 2.2 | 2.2 |
Fidelity Investment Grade Bond Fund | 3.5 | 3.4 |
| 9.2 | 9.0 |
| 100.0 | 100.0 |
Asset Allocation (% of fund's investments) |

The fund invests according to an asset allocation strategy that becomes increasingly conservative over time. The six months ago allocation is based on the fund's holdings as of September 30, 2003. The current allocation is based on the fund's holdings as of March 31, 2004. The expected allocation represents the fund's anticipated target asset allocation at September 30, 2004.
Annual Report
Fidelity Freedom 2030 Fund
Investments March 31, 2004
Showing Percentage of Total Value of Investment in Securities
Equity Funds - 82.8% |
| Shares | | Value (Note 1) |
Domestic Equity Funds - 69.3% |
Fidelity Blue Chip Growth Fund | 11,014,259 | | $ 440,790,658 |
Fidelity Disciplined Equity Fund | 19,656,975 | | 458,400,662 |
Fidelity Equity-Income Fund | 9,409,173 | | 469,800,008 |
Fidelity Fund | 15,986,209 | | 452,729,433 |
Fidelity Growth & Income Portfolio | 12,386,648 | | 446,043,208 |
Fidelity Growth Company Fund | 5,245,929 | | 270,689,956 |
Fidelity Mid-Cap Stock Fund | 12,303,388 | | 273,750,377 |
Fidelity OTC Portfolio | 6,375,008 | | 210,439,003 |
TOTAL DOMESTIC EQUITY FUNDS | | 3,022,643,305 |
International Equity Funds - 13.5% |
Fidelity Diversified International Fund | 5,815,944 | | 149,702,396 |
Fidelity Europe Fund | 7,354,673 | | 206,666,320 |
Fidelity Japan Fund | 4,476,090 | | 58,547,256 |
Fidelity Overseas Fund | 4,347,860 | | 144,609,811 |
Fidelity Southeast Asia Fund | 1,957,589 | | 30,694,999 |
TOTAL INTERNATIONAL EQUITY FUNDS | | 590,220,782 |
TOTAL EQUITY FUNDS (Cost $3,527,508,472) | 3,612,864,087 |
Fixed-Income Funds - 17.2% |
| | | |
High Yield Fixed-Income Funds - 8.0% |
Fidelity Capital & Income Fund | 24,283,336 | | 195,238,024 |
Fidelity High Income Fund | 17,083,479 | | 152,213,796 |
TOTAL HIGH YIELD FIXED-INCOME FUNDS | | 347,451,820 |
Investment Grade Fixed-Income Funds - 9.2% |
Fidelity Government Income Fund | 14,550,781 | | 151,764,650 |
Fidelity Intermediate Bond Fund | 9,174,204 | | 99,264,891 |
Fidelity Investment Grade Bond Fund | 19,818,509 | | 152,206,152 |
TOTAL INVESTMENT GRADE FIXED-INCOME FUNDS | | 403,235,693 |
TOTAL FIXED-INCOME FUNDS (Cost $726,408,773) | 750,687,513 |
TOTAL INVESTMENT IN SECURITIES - 100% (Cost $4,253,917,245) | $ 4,363,551,600 |
Other Information |
Purchases and redemptions of the underlying fund shares aggregated $1,272,818,121 and $84,117,056, respectively. |
Income Tax Information |
At March 31, 2004, the fund had a capital loss carryforward of approximately $2,372,000 all of which will expire on March 31, 2011. |
See accompanying notes which are an integral part of the financial statements.
Annual Report
Fidelity Freedom 2030 Fund
Financial Statements
Statement of Assets and Liabilities
| March 31, 2004 |
| | |
Assets | | |
Investment in securities, at value (cost $4,253,917,245) - See accompanying schedule | | $ 4,363,551,600 |
Receivable for fund shares sold | | 13,114,544 |
Receivable from investment adviser for expense reductions | | 65,279 |
Total assets | | 4,376,731,423 |
| | |
Liabilities | | |
Payable for investments purchased | $ 10,264,106 | |
Payable for fund shares redeemed | 2,510,904 | |
Accrued management fee | 355,335 | |
Total liabilities | | 13,130,345 |
| | |
Net Assets | | $ 4,363,601,078 |
Net Assets consist of: | | |
Paid in capital | | $ 4,256,210,564 |
Undistributed net investment income | | 13,119,744 |
Accumulated undistributed net realized gain (loss) on investments | | (15,363,585) |
Net unrealized appreciation (depreciation) on investments | | 109,634,355 |
Net Assets, for 328,833,557 shares outstanding | | $ 4,363,601,078 |
Net Asset Value, offering price and redemption price per share ($4,363,601,078 ÷ 328,833,557 shares) | | $ 13.27 |
See accompanying notes which are an integral part of the financial statements.
Annual Report
Fidelity Freedom 2030 Fund
Financial Statements - continued
Statement of Operations
| Year ended March 31, 2004 |
| | |
Investment Income | | |
Income distributions from underlying funds | | $ 56,220,213 |
Interest | | 72 |
Total income | | 56,220,285 |
| | |
Expenses | | |
Management fee | $ 3,382,618 | |
Non-interested trustees' compensation | 14,533 | |
Total expenses before reductions | 3,397,151 | |
Expense reductions | (684,751) | 2,712,400 |
Net investment income (loss) | | 53,507,885 |
Realized and Unrealized Gain (Loss) Realized gain (loss) on sale of underlying fund shares | 17,061,608 | |
Capital gain distributions from underlying funds | 17,308,349 | 34,369,957 |
Change in net unrealized appreciation (depreciation) on investment securities | | 822,607,092 |
Net gain (loss) | | 856,977,049 |
Net increase (decrease) in net assets resulting from operations | | $ 910,484,934 |
See accompanying notes which are an integral part of the financial statements.
Annual Report
Statement of Changes in Net Assets
| Year ended
March 31,
2004 | Year ended
March 31,
2003 |
Increase (Decrease) in Net Assets | | |
Operations | | |
Net investment income (loss) | $ 53,507,885 | $ 30,791,451 |
Net realized gain (loss) | 34,369,957 | (17,949,498) |
Change in net unrealized appreciation (depreciation) | 822,607,092 | (435,761,003) |
Net increase (decrease) in net assets resulting
from operations | 910,484,934 | (422,919,050) |
Distributions to shareholders from net investment income | (54,155,489) | (29,196,488) |
Share transactions
Net proceeds from sales of shares | 1,741,268,563 | 1,215,615,046 |
Reinvestment of distributions | 54,098,665 | 29,167,188 |
Cost of shares redeemed | (623,305,522) | (452,758,840) |
Net increase (decrease) in net assets resulting from share transactions | 1,172,061,706 | 792,023,394 |
Total increase (decrease) in net assets | 2,028,391,151 | 339,907,856 |
| | |
Net Assets | | |
Beginning of period | 2,335,209,927 | 1,995,302,071 |
End of period (including undistributed net investment income of $13,119,744 and undistributed net investment income of $7,463,941, respectively) | $ 4,363,601,078 | $ 2,335,209,927 |
Other Information Shares | | |
Sold | 142,532,558 | 114,050,607 |
Issued in reinvestment of distributions | 4,366,371 | 2,780,758 |
Redeemed | (50,732,438) | (42,741,782) |
Net increase (decrease) | 96,166,491 | 74,089,583 |
See accompanying notes which are an integral part of the financial statements.
Annual Report
Financial Highlights
Years ended March 31, | 2004 | 2003 | 2002 | 2001 | 2000 |
Selected Per-Share Data | | | | | |
Net asset value, beginning of period | $ 10.04 | $ 12.58 | $ 13.23 | $ 17.84 | $ 14.55 |
Income from Investment Operations | | | | | |
Net investment income (loss)B | .19 | .16 | .19 | .28 | .27 |
Net realized and
unrealized gain (loss) | 3.23 | (2.55) | (.11) | (3.84) | 3.91 |
Total from investment operations | 3.42 | (2.39) | .08 | (3.56) | 4.18 |
Distributions from net investment income | (.19) | (.15) | (.20) | (.34) | (.28) |
Distributions in excess of net investment income | - | - | - | - | (.13) |
Distributions from net realized gain | - | - | (.53) | (.71) | (.48) |
Total distributions | (.19) | (.15) | (.73) | (1.05) | (.89) |
Net asset value, end of period | $ 13.27 | $ 10.04 | $ 12.58 | $ 13.23 | $ 17.84 |
Total ReturnA | 34.22% | (19.05)% | .28% | (20.78)% | 29.64% |
Ratios to Average Net AssetsC,D | | | | |
Expenses before expense reductions | .10% | .10% | .10% | .10% | .10% |
Expenses net of voluntary waivers, if any | .08% | .08% | .08% | .08% | .08% |
Expenses net of all
reductions | .08% | .08% | .07% | .06% | .07% |
Net investment income (loss) | 1.58% | 1.52% | 1.50% | 1.75% | 1.71% |
Supplemental Data | | | | | |
Net assets, end of
period (000 omitted) | $ 4,363,601 | $ 2,335,210 | $ 1,995,302 | $ 1,376,774 | $ 1,216,369 |
Portfolio turnover rate | 2% | 4% | 5% | 37% | 26% |
A Total returns would have been lower had certain expenses not been reduced during the periods shown.
B Calculated based on average shares outstanding during the period.
C Amounts do not include the activity of the underlying funds.
D Expense ratios reflect operating expenses of the fund. Expenses before reductions do not reflect amounts reimbursed by the investment adviser or reductions from brokerage service arrangements or other expense offset arrangements and do not represent the amount paid by the fund during periods when reimbursements or reductions occur. Expenses net of any voluntary waivers reflect expenses after reimbursement by the investment adviser but prior to reductions from brokerage service arrangements or other expense offset arrangements. Expenses net of all reductions represent the net expenses paid by the fund.
See accompanying notes which are an integral part of the financial statements.
Annual Report
Fidelity Freedom 2035 Fund
Investment Summary
Fund Holdings as of March 31, 2004 |
| % of fund's
investments |
Domestic Equity Funds | |
Fidelity Blue Chip Growth Fund | 10.4 |
Fidelity Disciplined Equity Fund | 10.5 |
Fidelity Equity-Income Fund | 10.5 |
Fidelity Fund | 10.4 |
Fidelity Growth & Income Portfolio | 10.5 |
Fidelity Growth Company Fund | 6.3 |
Fidelity Mid-Cap Stock Fund | 6.3 |
Fidelity OTC Portfolio | 4.8 |
| 69.7 |
International Equity Funds | |
Fidelity Diversified International Fund | 3.9 |
Fidelity Europe Fund | 5.3 |
Fidelity Japan Fund | 1.6 |
Fidelity Overseas Fund | 3.8 |
Fidelity Southeast Asia Fund | 0.8 |
| 15.4 |
High Yield Fixed-Income Funds | |
Fidelity Capital & Income Fund | 5.0 |
Fidelity High Income Fund | 4.9 |
| 9.9 |
Investment Grade Fixed-Income Funds | |
Fidelity Government Income Fund | 1.9 |
Fidelity Intermediate Bond Fund | 1.2 |
Fidelity Investment Grade Bond Fund | 1.9 |
| 5.0 |
| 100.0 |
Asset Allocation (% of fund's investments) |
The fund invests according to an asset allocation strategy that becomes increasingly conservative over time. The initial allocation represents the target asset allocation at inception. The current allocation is based on the fund's holdings as of March 31, 2004. The expected allocation represents the fund's anticipated target asset allocation at September 30, 2004.
Annual Report
Fidelity Freedom 2035 Fund
Investments March 31, 2004
Showing Percentage of Total Value of Investment in Securities
Equity Funds - 85.1% |
| Shares | | Value (Note 1) |
Domestic Equity Funds - 69.7% |
Fidelity Blue Chip Growth Fund | 72,444 | | $ 2,899,203 |
Fidelity Disciplined Equity Fund | 125,887 | | 2,935,698 |
Fidelity Equity-Income Fund | 58,724 | | 2,932,096 |
Fidelity Fund | 102,792 | | 2,911,072 |
Fidelity Growth & Income Portfolio | 80,966 | | 2,915,570 |
Fidelity Growth Company Fund | 34,022 | | 1,755,526 |
Fidelity Mid-Cap Stock Fund | 79,050 | | 1,758,857 |
Fidelity OTC Portfolio | 40,904 | | 1,350,254 |
TOTAL DOMESTIC EQUITY FUNDS | | 19,458,276 |
International Equity Funds - 15.4% |
Fidelity Diversified International Fund | 41,886 | | 1,078,157 |
Fidelity Europe Fund | 52,814 | | 1,484,062 |
Fidelity Japan Fund | 35,406 | | 463,110 |
Fidelity Overseas Fund | 32,216 | | 1,071,502 |
Fidelity Southeast Asia Fund | 13,593 | | 213,133 |
TOTAL INTERNATIONAL EQUITY FUNDS | | 4,309,964 |
TOTAL EQUITY FUNDS (Cost $23,422,611) | 23,768,240 |
Fixed-Income Funds - 14.9% |
| | | |
High Yield Fixed-Income Funds - 9.9% |
Fidelity Capital & Income Fund | 172,366 | | 1,385,825 |
Fidelity High Income Fund | 155,489 | | 1,385,403 |
TOTAL HIGH YIELD FIXED-INCOME FUNDS | | 2,771,228 |
Investment Grade Fixed-Income Funds - 5.0% |
Fidelity Government Income Fund | 50,733 | | 529,143 |
Fidelity Intermediate Bond Fund | 32,016 | | 346,416 |
Fidelity Investment Grade Bond Fund | 68,789 | | 528,301 |
TOTAL INVESTMENT GRADE FIXED-INCOME FUNDS | | 1,403,860 |
TOTAL FIXED-INCOME FUNDS (Cost $4,178,155) | 4,175,088 |
TOTAL INVESTMENT IN SECURITIES - 100% (Cost $27,600,766) | $ 27,943,328 |
Other Information |
Purchases and redemptions of the underlying fund shares aggregated $28,449,846 and $805,112, respectively. |
See accompanying notes which are an integral part of the financial statements.
Annual Report
Fidelity Freedom 2035 Fund
Financial Statements
Statement of Assets and Liabilities
| March 31, 2004 |
| | |
Assets | | |
Investment in securities, at value (cost $27,600,766) - See accompanying schedule | | $ 27,943,328 |
Receivable for fund shares sold | | 1,926,896 |
Receivable from investment adviser for expense reductions | | 208 |
Total assets | | 29,870,432 |
| | |
Liabilities | | |
Payable for investments purchased | $ 1,904,849 | |
Payable for fund shares redeemed | 20,336 | |
Accrued management fee | 1,790 | |
Total liabilities | | 1,926,975 |
| | |
Net Assets | | $ 27,943,457 |
Net Assets consist of: | | |
Paid in capital | | $ 27,572,078 |
Undistributed net investment income | | 54,094 |
Accumulated undistributed net realized gain (loss) on investments | | (25,277) |
Net unrealized appreciation (depreciation) on investments | | 342,562 |
Net Assets, for 2,613,261 shares outstanding | | $ 27,943,457 |
Net Asset Value, offering price and redemption price per share ($27,943,457 ÷ 2,613,261 shares) | | $ 10.69 |
See accompanying notes which are an integral part of the financial statements.
Annual Report
Fidelity Freedom 2035 Fund
Financial Statements - continued
Statement of Operations
| For the period November 6, 2003 (commencement of operations) to March 31, 2004 |
| | |
Investment Income | | |
Income distributions from underlying funds | | $ 68,907 |
Interest | | 27 |
Total income | | 68,934 |
| | |
Expenses | | |
Management fee | $ 4,285 | |
Non-interested trustees' compensation | 11 | |
Total expenses before reductions | 4,296 | |
Expense reductions | (848) | 3,448 |
Net investment income (loss) | | 65,486 |
Realized and Unrealized Gain (Loss) Realized gain (loss) on sale of underlying fund shares | (43,969) | |
Capital gain distributions from underlying funds | 28,415 | (15,554) |
Change in net unrealized appreciation (depreciation) on investment securities | | 342,562 |
Net gain (loss) | | 327,008 |
Net increase (decrease) in net assets resulting from operations | | $ 392,494 |
See accompanying notes which are an integral part of the financial statements.
Annual Report
Statement of Changes in Net Assets
| For the period
November 6, 2003
(commencement
of operations) to
March 31, 2004 |
Increase (Decrease) in Net Assets | |
Operations | |
Net investment income (loss) | $ 65,486 |
Net realized gain (loss) | (15,554) |
Change in net unrealized appreciation (depreciation) | 342,562 |
Net increase (decrease) in net assets resulting
from operations | 392,494 |
Distributions to shareholders from net investment income | (21,115) |
Share transactions
Net proceeds from sales of shares | 29,915,978 |
Reinvestment of distributions | 21,115 |
Cost of shares redeemed | (2,365,015) |
Net increase (decrease) in net assets resulting from share transactions | 27,572,078 |
Total increase (decrease) in net assets | 27,943,457 |
| |
Net Assets | |
Beginning of period | - |
End of period (including undistributed net investment income of $54,094) | $ 27,943,457 |
Other Information Shares | |
Sold | 2,836,707 |
Issued in reinvestment of distributions | 2,052 |
Redeemed | (225,498) |
Net increase (decrease) | 2,613,261 |
See accompanying notes which are an integral part of the financial statements.
Annual Report
Financial Highlights
Period ended March 31, | 2004 F |
Selected Per-Share Data | |
Net asset value, beginning of period | $ 10.00 |
Income from Investment Operations | |
Net investment income (loss) D | .06 |
Net realized and unrealized gain (loss) | .68 |
Total from investment operations | .74 |
Distributions from net investment income | (.05) |
Net asset value, end of period | $ 10.69 |
Total Return B, C | 7.42% |
Ratios to Average Net Assets E, G | |
Expenses before expense reductions | .10% A |
Expenses net of voluntary waivers, if any | .08% A |
Expenses net of all reductions | .08% A |
Net investment income (loss) | 1.49% A |
Supplemental Data | |
Net assets, end of period (000 omitted) | $ 27,943 |
Portfolio turnover rate | 18% A |
A Annualized
B Total returns for periods of less than one year are not annualized.
C Total returns would have been lower had certain expenses not been reduced during the periods shown.
D Calculated based on average shares outstanding during the period.
E Amounts do not include the activity of the underlying funds.
F For the period November 6, 2003 (commencement of operations) to March 31, 2004.
G Expense ratios reflect operating expenses of the fund. Expenses before reductions do not reflect amounts reimbursed by the investment adviser or reductions from brokerage service arrangements or other expense offset arrangements and do not represent the amount paid by the fund during periods when reimbursements or reductions occur. Expenses net of any voluntary waivers reflect expenses after reimbursement by the investment adviser but prior to reductions from brokerage service arrangements or other expense offset arrangements. Expenses net of all reductions represent the net expenses paid by the fund.
See accompanying notes which are an integral part of the financial statements.
Annual Report
Fidelity Freedom 2040 Fund
Investment Changes
Fund Holdings as of March 31, 2004 |
| % of fund's
investments | % of fund's investments
6 months ago |
Domestic Equity Funds | | |
Fidelity Blue Chip Growth Fund | 10.8 | 10.7 |
Fidelity Disciplined Equity Fund | 11.1 | 11.0 |
Fidelity Equity-Income Fund | 11.4 | 11.2 |
Fidelity Fund | 11.0 | 10.8 |
Fidelity Growth & Income Portfolio | 10.9 | 10.6 |
Fidelity Growth Company Fund | 6.8 | 7.1 |
Fidelity Mid-Cap Stock Fund | 6.7 | 6.6 |
Fidelity OTC Portfolio | 5.1 | 5.6 |
| 73.8 | 73.6 |
International Equity Funds | | |
Fidelity Diversified International Fund | 4.0 | 4.0 |
Fidelity Europe Fund | 5.5 | 5.3 |
Fidelity Japan Fund | 1.6 | 1.6 |
Fidelity Overseas Fund | 3.9 | 3.8 |
Fidelity Southeast Asia Fund | 0.8 | 0.8 |
| 15.8 | 15.5 |
High Yield Fixed-Income Funds | | |
Fidelity Capital & Income Fund | 5.0 | 5.4 |
Fidelity High Income Fund | 5.1 | 5.5 |
| 10.1 | 10.9 |
Investment Grade Fixed-Income Funds | | |
Fidelity Government Income Fund | 0.1 | 0.0 |
Fidelity Intermediate Bond Fund | 0.1 | 0.0 |
Fidelity Investment Grade Bond Fund | 0.1 | 0.0 |
| 0.3 | 0.0 |
| 100.0 | 100.0 |
Asset Allocation (% of fund's investments) |
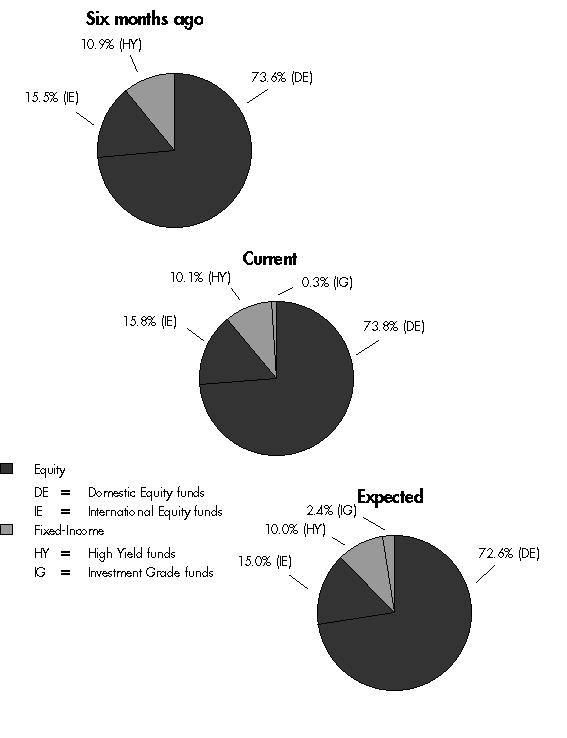
The fund invests according to an asset allocation strategy that becomes increasingly conservative over time. The six months ago allocation is based on the fund's holdings as of September 30, 2003. The current allocation is based on the fund's holdings as of March 31, 2004. The expected allocation represents the fund's anticipated target asset allocation at September 30, 2004.
Annual Report
Fidelity Freedom 2040 Fund
Investments March 31, 2004
Showing Percentage of Total Value of Investment in Securities
Equity Funds - 89.6% |
| Shares | | Value (Note 1) |
Domestic Equity Funds - 73.8% |
Fidelity Blue Chip Growth Fund | 3,495,587 | | $ 139,893,402 |
Fidelity Disciplined Equity Fund | 6,181,080 | | 144,142,797 |
Fidelity Equity-Income Fund | 2,942,940 | | 146,941,010 |
Fidelity Fund | 5,048,637 | | 142,977,396 |
Fidelity Growth & Income Portfolio | 3,908,798 | | 140,755,808 |
Fidelity Growth Company Fund | 1,708,953 | | 88,181,982 |
Fidelity Mid-Cap Stock Fund | 3,900,480 | | 86,785,678 |
Fidelity OTC Portfolio | 2,008,497 | | 66,300,493 |
TOTAL DOMESTIC EQUITY FUNDS | | 955,978,566 |
International Equity Funds - 15.8% |
Fidelity Diversified International Fund | 1,992,636 | | 51,290,459 |
Fidelity Europe Fund | 2,541,797 | | 71,424,492 |
Fidelity Japan Fund | 1,583,376 | | 20,710,559 |
Fidelity Overseas Fund | 1,512,417 | | 50,302,991 |
Fidelity Southeast Asia Fund | 664,857 | | 10,424,960 |
TOTAL INTERNATIONAL EQUITY FUNDS | | 204,153,461 |
TOTAL EQUITY FUNDS (Cost $1,043,976,866) | 1,160,132,027 |
Fixed-Income Funds - 10.4% |
| | | |
High Yield Fixed-Income Funds - 10.1% |
Fidelity Capital & Income Fund | 8,040,568 | | 64,646,164 |
Fidelity High Income Fund | 7,439,750 | | 66,288,176 |
TOTAL HIGH YIELD FIXED-INCOME FUNDS | | 130,934,340 |
Investment Grade Fixed-Income Funds - 0.3% |
Fidelity Government Income Fund | 153,378 | | 1,599,731 |
Fidelity Intermediate Bond Fund | 94,887 | | 1,026,680 |
Fidelity Investment Grade Bond Fund | 207,777 | | 1,595,730 |
TOTAL INVESTMENT GRADE FIXED-INCOME FUNDS | | 4,222,141 |
TOTAL FIXED-INCOME FUNDS (Cost $125,494,308) | 135,156,481 |
TOTAL INVESTMENT IN SECURITIES - 100% (Cost $1,169,471,174) | $ 1,295,288,508 |
Other Information |
Purchases and redemptions of the underlying fund shares aggregated $624,295,713 and $27,776,796, respectively. |
Income Tax Information |
The fund hereby designates approximately $1,340,000 as a capital gain dividend for the purpose of the dividend paid deduction. |
See accompanying notes which are an integral part of the financial statements.
Annual Report
Fidelity Freedom 2040 Fund
Financial Statements
Statement of Assets and Liabilities
| March 31, 2004 |
| | |
Assets | | |
Investment in securities, at value (cost $1,169,471,174) - See accompanying schedule | | $ 1,295,288,508 |
Receivable for investments sold | | 14,768 |
Receivable for fund shares sold | | 5,071,833 |
Receivable from investment adviser for expense reductions | | 18,156 |
Total assets | | 1,300,393,265 |
| | |
Liabilities | | |
Payable for investments purchased | $ 3,780,905 | |
Payable for fund shares redeemed | 1,206,634 | |
Accrued management fee | 103,670 | |
Total liabilities | | 5,091,209 |
| | |
Net Assets | | $ 1,295,302,056 |
Net Assets consist of: | | |
Paid in capital | | $ 1,165,109,035 |
Undistributed net investment income | | 3,848,676 |
Accumulated undistributed net realized gain (loss) on investments | | 527,011 |
Net unrealized appreciation (depreciation) on investments | | 125,817,334 |
Net Assets, for 167,090,499 shares outstanding | | $ 1,295,302,056 |
Net Asset Value, offering price and redemption price per share ($1,295,302,056 ÷ 167,090,499 shares) | | $ 7.75 |
See accompanying notes which are an integral part of the financial statements.
Annual Report
Fidelity Freedom 2040 Fund
Financial Statements - continued
Statement of Operations
| Year ended March 31, 2004 |
| | |
Investment Income | | |
Income distributions from underlying funds | | $ 13,803,963 |
| | |
Expenses | | |
Management fee | $ 847,180 | |
Non-interested trustees' compensation | 3,540 | |
Total expenses before reductions | 850,720 | |
Expense reductions | (172,538) | 678,182 |
Net investment income (loss) | | 13,125,781 |
Realized and Unrealized Gain (Loss) Realized gain (loss) on sale of underlying fund shares | 5,218,431 | |
Capital gain distributions from underlying funds | 3,584,561 | 8,802,992 |
Change in net unrealized appreciation (depreciation) on investment securities | | 210,847,160 |
Net gain (loss) | | 219,650,152 |
Net increase (decrease) in net assets resulting from operations | | $ 232,775,933 |
See accompanying notes which are an integral part of the financial statements.
Annual Report
Statement of Changes in Net Assets
| Year ended
March 31,
2004 | Year ended
March 31,
2003 |
Increase (Decrease) in Net Assets | | |
Operations | | |
Net investment income (loss) | $ 13,125,781 | $ 4,383,057 |
Net realized gain (loss) | 8,802,992 | (2,232,836) |
Change in net unrealized appreciation (depreciation) | 210,847,160 | (72,981,951) |
Net increase (decrease) in net assets resulting
from operations | 232,775,933 | (70,831,730) |
Distributions to shareholders from net investment income | (11,153,888) | (3,821,127) |
Distributions to shareholders from net realized gain | (4,018,883) | (374,581) |
Total distributions | (15,172,771) | (4,195,708) |
Share transactions
Net proceeds from sales of shares | 945,253,767 | 442,697,287 |
Reinvestment of distributions | 15,153,948 | 4,187,253 |
Cost of shares redeemed | (365,417,074) | (145,261,494) |
Net increase (decrease) in net assets resulting from share transactions | 594,990,641 | 301,623,046 |
Total increase (decrease) in net assets | 812,593,803 | 226,595,608 |
| | |
Net Assets | | |
Beginning of period | 482,708,253 | 256,112,645 |
End of period (including undistributed net investment income of $3,848,676 and undistributed net investment income of $905,955, respectively) | $ 1,295,302,056 | $ 482,708,253 |
Other Information Shares | | |
Sold | 131,314,763 | 73,155,671 |
Issued in reinvestment of distributions | 2,078,771 | 694,723 |
Redeemed | (50,681,969) | (24,046,080) |
Net increase (decrease) | 82,711,565 | 49,804,314 |
See accompanying notes which are an integral part of the financial statements.
Annual Report
Financial Highlights
Years ended March 31, | 2004 | 2003 | 2002 | 2001 F |
Selected Per-Share Data | | | | |
Net asset value, beginning of period | $ 5.72 | $ 7.41 | $ 7.62 | $ 10.00 |
Income from Investment Operations | | | | |
Net investment income (loss) D | .11 | .08 | .09 | .07 |
Net realized and unrealized gain (loss) | 2.04 | (1.69) | (.11) | (2.39) |
Total from investment operations | 2.15 | (1.61) | (.02) | (2.32) |
Distributions from net investment income | (.09) | (.07) | (.07) | (.06) |
Distributions from net realized gain | (.03) | (.01) | (.12) | - |
Total distributions | (.12) | (.08) | (.19) | (.06) |
Net asset value, end of period | $ 7.75 | $ 5.72 | $ 7.41 | $ 7.62 |
Total Return B,C | 37.75% | (21.79)% | (.40)% | (23.28)% |
Ratios to Average Net Assets E,G | | | | |
Expenses before expense reductions | .10% | .10% | .10% | .10% A |
Expenses net of voluntary waivers, if any | .08% | .08% | .08% | .08% A |
Expenses net of all reductions | .08% | .08% | .08% | .08% A |
Net investment income (loss) | 1.55% | 1.38% | 1.24% | 1.46% A |
Supplemental Data | | | | |
Net assets, end of period (000 omitted) | $ 1,295,302 | $ 482,708 | $ 256,113 | $ 72,621 |
Portfolio turnover rate | 3% | 4% | 5% | 38% A |
A Annualized
B Total returns for periods of less than one year are not annualized.
C Total returns would have been lower had certain expenses not been reduced during the periods shown.
D Calculated based on average shares outstanding during the period.
E Amounts do not include the activity of the underlying funds.
F For the period September 6, 2000 (commencement of operations) to March 31, 2001.
G Expense ratios reflect operating expenses of the fund. Expenses before reductions do not reflect amounts reimbursed by the investment adviser or reductions from brokerage service arrangements or other expense offset arrangements and do not represent the amount paid by the fund during periods when reimbursements or reductions occur. Expenses net of any voluntary waivers reflect expenses after reimbursement by the investment adviser but prior to reductions from brokerage service arrangements or other expense offset arrangements. Expenses net of all reductions represent the net expenses paid by the fund.
See accompanying notes which are an integral part of the financial statements.
Annual Report
Notes to Financial Statements
For the period ended March 31, 2004
1. Significant Accounting Policies.
Freedom Income Fund, Freedom 2000 Fund, Freedom 2005 Fund, Freedom 2010 Fund, Freedom 2015 Fund, Freedom 2020 Fund, Freedom 2025 Fund, Freedom 2030 Fund, Freedom 2035 Fund and Freedom 2040 Fund (the funds) are funds of Fidelity Aberdeen Street Trust (the trust). The trust is registered under the Investment Company Act of 1940, as amended (the 1940 Act), as an open-end management investment company organized as a Delaware statutory trust. Each fund is authorized to issue an unlimited number of shares. The funds primarily invest in a combination of other Fidelity equity, fixed income, and money market funds (the Underlying Funds) managed by Fidelity Management & Research Company (FMR). The financial statements have been prepared in conformity with accounting principles generally accepted in the United States of America, which require management to make certain estimates and assumptions at the date of the financial statements. The following summarizes the significant accounting policies of the funds:
Security Valuation. Net asset value per share is calculated as of the close of business of the New York Stock Exchange, normally 4:00 p.m. Eastern time. Investments in the Underlying Funds are valued at their net asset value each business day. Short-term securities with remaining maturities of sixty days or less for which quotations are not readily available are valued on the basis of amortized cost.
Investment Transactions and Income. Security transactions, normally shares of the Underlying Funds, are accounted for as of trade date. Gains and losses on securities sold are determined on the basis of identified cost. Income and capital gain distributions from the Underlying Funds, if any, are recorded on the ex-dividend date. Interest income is accrued as earned.
Expenses. Most expenses of the trust can be directly attributed to a fund. Expenses which cannot be directly attributed are apportioned between the funds in the trust. Expenses included in the accompanying financial statements reflect the expenses of each fund and do not include any expenses associated with the Underlying Funds.
Income Tax Information and Distributions to Shareholders. Each year, the funds intend to qualify as regulated investment companies by distributing all of their taxable income and realized gains under Subchapter M of the Internal Revenue Code. As a result, no provision for income taxes is required in the accompanying financial statements. Income and capital gain distributions are recorded on the ex-dividend date.
Annual Report
Notes to Financial Statements - continued
1. Significant Accounting Policies - continued
Income Tax Information and Distributions to Shareholders - continued
Income and capital gain distributions are determined in accordance with income tax regulations, which may differ from generally accepted accounting principles. In addition, certain funds will treat a portion of the proceeds from shares redeemed as a distribution from net investment income and realized gain for income tax purposes. Capital accounts within the financial statements are adjusted for permanent and temporary book and tax differences. These adjustments have no impact on net assets or the results of operations. Temporary differences will reverse in a subsequent period. These differences are primarily due to the short-term gain distributions from the Underlying Funds and losses deferred due to wash sales and excise tax regulations.
The tax-basis components of distributable earnings and the federal tax cost as of period end were as follows for each fund:
| Cost for Federal Income Tax
Purposes | Unrealized
Appreciation | Unrealized
Depreciation | Net Unrealized
Appreciation/
(Depreciation) |
Freedom Income | $ 1,719,198,733 | $ 55,929,172 | $ (21,862,602) | $ 34,066,570 |
Freedom 2000 | 1,565,125,011 | 54,860,628 | (27,937,349) | 26,923,279 |
Freedom 2005 | 36,098,660 | 488,435 | (104,118) | 384,317 |
Freedom 2010 | 7,233,955,060 | 418,956,001 | (265,134,009) | 153,821,992 |
Freedom 2015 | 113,393,019 | 1,465,899 | (524,784) | 941,115 |
Freedom 2020 | 7,236,524,909 | 588,406,073 | (283,584,837) | 304,821,236 |
Freedom 2025 | 65,672,691 | 1,070,114 | (320,246) | 749,868 |
Freedom 2030 | 4,266,908,631 | 362,251,294 | (265,608,325) | 96,642,969 |
Freedom 2035 | 27,600,807 | 468,932 | (126,411) | 342,521 |
Freedom 2040 | 1,171,378,360 | 140,012,172 | (16,102,024) | 123,910,148 |
| Undistributed
Ordinary Income | Undistributed Long-term
Capital Gain | Capital Loss
Carryforward |
Freedom Income | $ 4,504,251 | $ 950,954 | $ - |
Freedom 2000 | 3,735,785 | - | (436,587) |
Freedom 2005 | 111,038 | - | - |
Freedom 2010 | 31,701,754 | 13,638,181 | - |
Freedom 2015 | 299,550 | 49,545 | - |
Freedom 2020 | 27,205,551 | 12,912,251 | - |
Freedom 2025 | 140,453 | 6,343 | - |
Freedom 2030 | 9,319,319 | - | (2,372,198) |
Freedom 2035 | 54,094 | - | - |
Freedom 2040 | 3,848,676 | 2,434,195 | - |
Annual Report
1. Significant Accounting Policies - continued
Income Tax Information and Distributions to Shareholders - continued
The tax character of distributions paid was as follows:
March 31, 2004 | Ordinary
Income | Long-term
Capital Gains | Total |
Freedom Income | $ 31,382,463 | $ 7,233,523 | $ 38,615,986 |
Freedom 2000 | 29,821,507 | - | 29,821,507 |
Freedom 2005 | 29,473 | - | 29,473 |
Freedom 2010 | 147,335,749 | 35,571,088 | 182,906,837 |
Freedom 2015 | 63,664 | - | 63,664 |
Freedom 2020 | 107,292,278 | 20,270,970 | 127,563,248 |
Freedom 2025 | 51,049 | - | 51,049 |
Freedom 2030 | 54,155,489 | - | 54,155,489 |
Freedom 2035 | 21,115 | - | 21,115 |
Freedom 2040 | 13,833,144 | 1,339,627 | 15,172,771 |
March 31, 2003 | Ordinary
Income | Long-term
Capital Gains | Total |
Freedom Income | $ 26,214,990 | $ - | $ 26,214,990 |
Freedom 2000 | 31,262,029 | - | 31,262,029 |
Freedom 2010 | 112,169,818 | - | 112,169,818 |
Freedom 2020 | 72,675,960 | - | 72,675,960 |
Freedom 2030 | 29,196,488 | - | 29,196,488 |
Freedom 2040 | 3,928,506 | 267,202 | 4,195,708 |
2. Operating Policies.
Repurchase Agreements. FMR has received an Exemptive Order from the Securities and Exchange Commission (the SEC) which permits the funds and other affiliated entities of FMR to transfer uninvested cash balances into joint trading accounts. These accounts are then invested in repurchase agreements that are collateralized by U.S. Treasury or Government obligations. Certain funds may also invest directly with institutions, in repurchase agreements that are collateralized by commercial paper obligations and corporate obligations. Collateral is held in segregated accounts with custodian banks and may be obtained in the event of a default of the counterparty. Collateral is marked-to-market daily and maintained at a value at least equal to the principal amount of the repurchase agreement (including accrued interest).
3. Purchases and Sales of Investments.
Information regarding purchases and redemptions of the Underlying Funds' shares is included under the caption "Other Information" at the end of each applicable fund's Schedule of Investments.
Annual Report
Notes to Financial Statements - continued
4. Fees and Other Transactions with Affiliates.
Management Fee. Strategic Advisers, Inc. (Strategic Advisers), an affiliate of FMR, provides the funds with investment management related services. For these services the funds pay a monthly management fee to Strategic Advisers. The management fee is computed at an annual rate of .10% of the funds' average net assets. The management fee is reduced by an amount equal to the fees and expenses paid by the funds to the non-interested Trustees.
Other Transactions. Strategic Advisers has entered into an administration agreement with FMR under which FMR provides management and administrative services (other than investment advisory services) necessary for the operation of each fund. Pursuant to this agreement, FMR pays all expenses of each fund, except the compensation of the non-interested trustees and certain exceptions such as interest expense. FMR also contracts with other Fidelity companies to perform the services necessary for the operation of each fund. For the services under the agreement, Strategic Advisers pays FMR a monthly administration fee equal to the management fee received by Strategic Advisers, minus an amount equal to an annual rate of .02% of each fund's average net assets. The funds do not pay any fees for these services.
5. Expense Reductions.
FMR agreed to reimburse certain funds to the extent operating expenses exceeded certain levels of average net assets as noted in the table below. Some expenses, for example interest expense, are excluded from this reimbursement.
| Expense
Limitations | Reimbursement
from adviser |
Freedom Income | .08% | $ 301,834 |
Freedom 2000 | .08% | 290,055 |
Freedom 2005 | .08% | 1,244 |
Freedom 2010 | .08% | 1,232,472 |
Freedom 2015 | .08% | 3,567 |
Freedom 2020 | .08% | 1,182,436 |
Freedom 2025 | .08% | 2,139 |
Freedom 2030 | .08% | 684,751 |
Freedom 2035 | .08% | 848 |
Freedom 2040 | .08% | 172,538 |
Annual Report
5. Expense Reductions - continued
In addition, through arrangements with each applicable fund's custodian, credits realized as a result of uninvested cash balances were used to reduce each applicable fund's expenses. During the period, these credits reduced expenses by the following amounts:
Freedom Income | $ 12 | | |
Freedom 2000 | 16 | |
Freedom 2010 | 28 | |
Freedom 2020 | 16 | |
6. Other Information.
The funds do not invest in the Underlying Funds for the purpose of exercising management or control; however, investments by the funds within their principal investment strategies may represent a significant portion of the Underlying Fund's net assets. At the end of the period, Freedom 2010 was the owner of record of approximately 10%, 11%, 18% and 25% of the total outstanding shares of Fidelity Intermediate Bond Fund, Fidelity Disciplined Equity Fund, Fidelity Investment Grade Bond Fund and Fidelity Government Income Fund, respectively. Freedom 2020 was the owner of record of approximately 10%, 12%, 14%, 16% and 18% of the total outstanding shares of Fidelity Investment Grade Bond Fund, Fidelity Japan Fund, Fidelity Government Income Fund, Fidelity Disciplined Equity Fund and Fidelity Europe Fund, respectively. Freedom 2030 was the owner of record of approximately 11% and 13% of the total outstanding shares of Fidelity Disciplined Equity Fund and Fidelity Europe Fund, respectively. The funds, in aggregate, were the owners of record of more than 20% of the total outstanding shares of the following Underlying Funds.
Fund | % of shares held | |
Fidelity Government Income Fund | 56% | |
Fidelity Europe Fund | 45% | |
Fidelity Disciplined Equity Fund | 45% | |
Fidelity Investment Grade Bond Fund | 40% | |
Fidelity Japan Fund | 31% | |
Fidelity High Income Fund | 22% | |
Fidelity Intermediate Bond Fund | 22% | |
Fidelity Capital & Income Fund | 20% | |
At the end of the period, one unaffiliated shareholder was the owner of record of 11% and 11% of the total outstanding shares of the Freedom 2025 Fund and the Freedom 2035 Fund, respectively.
Annual Report
Report of Independent Registered Public Accounting Firm
To the Trustees of Fidelity Aberdeen Street Trust and the Shareholders of Fidelity Freedom Income Fund, Fidelity Freedom 2000 Fund, Fidelity Freedom 2005 Fund, Fidelity Freedom 2010 Fund, Fidelity Freedom 2015 Fund, Fidelity Freedom 2020 Fund, Fidelity Freedom 2025 Fund, Fidelity Freedom 2030 Fund, Fidelity Freedom 2035 Fund and Fidelity Freedom 2040 Fund:
In our opinion, the accompanying statements of assets and liabilities, including the schedules of investments, and the related statements of operations and of changes in net assets and the financial highlights present fairly, in all material respects, the financial position of Fidelity Freedom Income Fund, Fidelity Freedom 2000 Fund, Fidelity Freedom 2005 Fund, Fidelity Freedom 2010 Fund, Fidelity Freedom 2015 Fund, Fidelity Freedom 2020 Fund, Fidelity Freedom 2025 Fund, Fidelity Freedom 2030 Fund, Fidelity Freedom 2035 Fund and Fidelity Freedom 2040 Fund (funds of Fidelity Aberdeen Street Trust) at March 31, 2004, and the results of their operations, the changes in their net assets and the financial highlights for the periods indicated, in conformity with accounting principles generally accepted in the United States of America. These financial statements and financial highlights (hereafter referred to as "financial statements") are the responsibility of the Fidelity Aberdeen Street Trust's management; our responsibility is to express an opinion on these financial statements based on our audits. We conducted our audits of these financial statements in accordance with the standards of the Public Company Accounting Oversight Board (United States). Those standards require that we plan and perform the audit to obtain reasonable assurance about whether the financial statements are free of material misstatement. An audit includes examining, on a test basis, evidence supporting the amounts and disclosures in the financial statements, assessing the accounting principles used and significant estimates made by management, and evaluating the overall financial statement presentation. We believe that our audits, which included confirmation of securities at March 31, 2004 by correspondence with the custodian, provide a reasonable basis for our opinion.
/s/PricewaterhouseCoopers LLP
PricewaterhouseCoopers LLP
Boston, Massachusetts
May 18, 2004
Annual Report
Trustees and Officers
The Trustees, Members of the Advisory Board, and executive officers of the trust and funds, as applicable, are listed below. The Board of Trustees governs each Freedom Fund and is responsible for protecting the interests of shareholders. The Trustees are experienced executives who meet periodically throughout the year to oversee each Freedom Fund's activities, review contractual arrangements with companies that provide services to each Freedom Fund, and review each Freedom Fund's performance. If the interests of a Freedom Fund and an underlying Fidelity fund were to diverge, a conflict of interest could arise and affect how the Trustees and Members of the Advisory Board fulfill their fiduciary duties to the affected funds. Strategic Advisers has structured the Freedom Funds to avoid these potential conflicts, although there may be situations where a conflict of interest is unavoidable. In such instances, Strategic Advisers, the Trustees, and Members of the Advisory Board would take reasonable steps to minimize and, if possible, eliminate the conflict. Except for William O. McCoy, each of the Trustees oversees 292 funds advised by FMR or an affiliate. Mr. McCoy oversees 294 funds advised by FMR or an affiliate.
The Trustees hold office without limit in time except that (a) any Trustee may resign; (b) any Trustee may be removed by written instrument, signed by at least two-thirds of the number of Trustees prior to such removal; (c) any Trustee who requests to be retired or who has become incapacitated by illness or injury may be retired by written instrument signed by a majority of the other Trustees; and (d) any Trustee may be removed at any special meeting of shareholders by a two-thirds vote of the outstanding voting securities of the trust. In any event, each non-interested Trustee shall retire not later than the last day of the calendar year in which his or her 72nd birthday occurs. The executive officers and Advisory Board Members hold office without limit in time, except that any officer and Advisory Board Member may resign or may be removed by a vote of a majority of the Trustees at any regular meeting or any special meeting of the Trustees. Except as indicated, each individual has held the office shown or other offices in the same company for the past five years.
The funds' Statement of Additional Information (SAI) includes more information about the Trustees. To request a free copy, call Fidelity at 1-800-544-8544.
Annual Report
Trustees and Officers - continued
Interested Trustees*:
Correspondence intended for each Trustee who is an "interested person" (as defined in the 1940 Act) may be sent to Fidelity Investments, 82 Devonshire Street, Boston, Massachusetts 02109.
Name, Age; Principal Occupation |
Edward C. Johnson 3d (73)** |
| Year of Election or Appointment: 1991 Mr. Johnson is Chairman of the Board of Trustees. Mr. Johnson serves as Chief Executive Officer, Chairman, and a Director of FMR Corp.; a Director and Chairman of the Board and of the Executive Committee of FMR; Chairman and a Director of Fidelity Management & Research (Far East) Inc.; Chairman (1998) and a Director of Fidelity Investments Money Management, Inc.; and Chairman (2001) and a Director (2000) of FMR Co., Inc. |
Abigail P. Johnson (42)** |
| Year of Election or Appointment: 2001 Senior Vice President of Freedom Income (2001), Freedom 2000 (2001), Freedom 2005 (2003), Freedom 2010 (2001), Freedom 2015 (2003), Freedom 2020 (2001), Freedom 2025 (2003), Freedom 2030 (2001), Freedom 2035 (2003), and Freedom 2040 (2001). Ms. Johnson also serves as Senior Vice President of other Fidelity funds (2001). She is President and a Director of FMR (2001), Fidelity Investments Money Management, Inc. (2001), FMR Co., Inc. (2001), and a Director of FMR Corp. Previously, Ms. Johnson managed a number of Fidelity funds. |
Laura B. Cronin (49) |
| Year of Election or Appointment: 2003 Ms. Cronin is an Executive Vice President (2002) and Chief Financial Officer (2002) of FMR Corp. and is a member of the Fidelity Management Committee (2003). Previously, Ms. Cronin served as Vice President of Finance of FMR (1997-1999), and Chief Financial Officer of FMR (1999-2001), Fidelity Personal Investments (2001), and Fidelity Brokerage Company (2001-2002). |
Robert L. Reynolds (52) |
| Year of Election or Appointment: 2003 Mr. Reynolds is a Director (2003) and Chief Operating Officer (2002) of FMR Corp. and is the head of the Fidelity Management Committee (2003). He also serves on the Board at Fidelity Investments Canada, Ltd. (2000). Previously, Mr. Reynolds served as President of Fidelity Investments Institutional Retirement Group (1996-2000). |
Annual Report
* Trustees have been determined to be "Interested Trustees" by virtue of, among other things, their affiliation with the trust or various entities under common control with FMR.
** Edward C. Johnson 3d, Trustee, is Abigail P. Johnson's father.
Non-Interested Trustees:
Correspondence intended for each non-interested Trustee (that is, the Trustees other than the Interested Trustees) may be sent to Fidelity Investments, P.O. Box 55235, Boston, Massachusetts 02205-5235.
Name, Age; Principal Occupation |
J. Michael Cook (61) |
| Year of Election or Appointment: 2001 Prior to Mr. Cook's retirement in May 1999, he served as Chairman and Chief Executive Officer of Deloitte & Touche LLP (accounting/consulting), Chairman of the Deloitte & Touche Foundation, and a member of the Board of Deloitte Touche Tohmatsu. He currently serves as a Director of Comcast (telecommunications, 2002), International Flavors & Fragrances, Inc. (2000), The Dow Chemical Company (2000), and Northrop Grumman Corporation (global defense technology, 2003). He is a Member of the Diversity Advisory Council of Marakon (2003) and the Advisory Board of the Directorship Search Group, Chairman Emeritus of the Board of Catalyst (a leading organization for the advancement of women in business), and is Chairman of the Accountability Advisory Council to the Comptroller General of the United States. He also serves as a Member of the Advisory Board of the Graduate School of Business of the University of Florida, his alma mater. |
Ralph F. Cox (71) |
| Year of Election or Appointment: 1991 Mr. Cox is President of RABAR Enterprises (management consulting for the petroleum industry). Prior to February 1994, he was President of Greenhill Petroleum Corporation (petroleum exploration and production). Until March 1990, Mr. Cox was President and Chief Operating Officer of Union Pacific Resources Company (exploration and production). He is a Director of CH2M Hill Companies (engineering), and Abraxas Petroleum (petroleum exploration and production, 1999). In addition, he is a member of advisory boards of Texas A&M University and the University of Texas at Austin. |
Robert M. Gates (60) |
| Year of Election or Appointment: 1997 Dr. Gates is President of Texas A&M University (2002). He was Director of the Central Intelligence Agency (CIA) from 1991 to 1993. From 1989 to 1991, Dr. Gates served as Assistant to the President of the United States and Deputy National Security Advisor. Dr. Gates is a Director of NACCO Industries, Inc. (mining and manufacturing), Parker Drilling Co., Inc. (drilling and rental tools for the energy industry, 2001), and Brinker International (restaurant management, 2003). He also serves as a member of the Advisory Board of VoteHere.net (secure internet voting, 2001). Previously, Dr. Gates served as a Director of LucasVarity PLC (automotive components and diesel engines), a Director of TRW Inc. (automotive, space, defense, and information technology), and Dean of the George Bush School of Government and Public Service at Texas A&M University (1999-2001). Dr. Gates also is a Trustee of the Forum for International Policy. |
George H. Heilmeier (67) |
| Year of Election or Appointment: 2004 Dr. Heilmeier is Chairman Emeritus of Telcordia Technologies (communication software and systems), where prior to his retirement, he served as company Chairman and Chief Executive Officer. He currently serves on the Boards of Directors of The Mitre Corporation (systems engineering and information technology support for the government), INET Technologies Inc. (telecommunications network surveillance, 2001) and Teletech Holdings (customer management services, 1998). He is Chairman of the General Motors Technology Advisory Committee and a Life Fellow of the IEEE (2000). Dr. Heilmeier is a member of the Defense Science Board and the National Security Agency Advisory Board. He is also a member of the National Academy of Engineering, the American Academy of Arts and Sciences and The Board of Overseers of the School of Engineering and Applied Science of the University of Pennsylvania. Previously, Dr. Heilmeier served as a Director of TRW Inc. (automotive, space, defense, and information technology, 1992-2002) and Compaq (1994-2002). |
Donald J. Kirk (71) |
| Year of Election or Appointment: 1991 Mr. Kirk is a Governor of the American Stock Exchange (2001), a Trustee and former Chairman of the Board of Trustees of the Greenwich Hospital Association, a Director of the Yale-New Haven Health Services Corp. (1998), and a Director Emeritus and former Chairman of the Board of Directors of National Arts Strategies Inc. Mr. Kirk was an Executive-in-Residence (1995-2000) and a Professor (1987-1995) at Columbia University Graduate School of Business. Prior to 1987, he was Chairman of the Financial Accounting Standards Board. Previously, Mr. Kirk served as a Governor of the National Association of Securities Dealers, Inc. (1996-2002), a member and Vice Chairman of the Public Oversight Board of the American Institute of Certified Public Accountants' SEC Practice Section (1995-2002), a Director of General Re Corporation (reinsurance, 1987-1998) and as a Director of Valuation Research Corp. (appraisals and valuations). |
Marie L. Knowles (57) |
| Year of Election or Appointment: 2001 Prior to Ms. Knowles' retirement in June 2000, she served as Executive Vice President and Chief Financial Officer of Atlantic Richfield Company (ARCO) (diversified energy, 1996-2000). From 1993 to 1996, she was a Senior Vice President of ARCO and President of ARCO Transportation Company. She served as a Director of ARCO from 1996 to 1998. She currently serves as a Director of Phelps Dodge Corporation (copper mining and manufacturing) and McKesson Corporation (healthcare service, 2002). Ms. Knowles is a Trustee of the Brookings Institution and the Catalina Island Conservancy and also serves as a member of the Advisory Board for the School of Engineering of the University of Southern California. |
Ned C. Lautenbach (60) |
| Year of Election or Appointment: 2000 Mr. Lautenbach has been a partner of Clayton, Dubilier & Rice, Inc. (private equity investment firm) since September 1998. Previously, Mr. Lautenbach was with the International Business Machines Corporation (IBM) from 1968 until his retirement in 1998. He was most recently Senior Vice President and Group Executive of Worldwide Sales and Services. From 1993 to 1995, he was Chairman of IBM World Trade Corporation, and from 1994 to 1998 was a member of IBM's Corporate Executive Committee. Mr. Lautenbach serves as Co-Chairman and a Director of Covansys, Inc. (global provider of business and technology solutions, 2000). In addition, he is a Director of Eaton Corporation (diversified industrial) and the Philharmonic Center for the Arts in Naples, Florida (1999). He also is a member of the Council on Foreign Relations. |
Marvin L. Mann (70) |
| Year of Election or Appointment: 1993 Mr. Mann is Chairman of the non-interested Trustees (2001). He is Chairman Emeritus of Lexmark International, Inc. (computer peripherals) where he served as CEO until April 1998 and retired as Chairman May 1999, and remains a member of the Board. Prior to 1991, he held the positions of Vice President of International Business Machines Corporation (IBM) and President and General Manager of various IBM divisions and subsidiaries. He is also a member of the Director Services Committee of the Investment Company Institute. In addition, Mr. Mann is a member of the President's Cabinet at the University of Alabama and the Board of Visitors of the Culverhouse College of Commerce and Business Administration at the University of Alabama. |
William O. McCoy (70) |
| Year of Election or Appointment: 1997 Prior to his retirement in December 1994, Mr. McCoy was Vice Chairman of the Board of BellSouth Corporation (telecommunications) and President of BellSouth Enterprises. He is currently a Director of Liberty Corporation (holding company), Duke Realty Corporation (real estate), and Progress Energy, Inc. (electric utility). He is also a partner of Franklin Street Partners (private investment management firm) and a member of the Research Triangle Foundation Board. In addition, Mr. McCoy served as the Interim Chancellor (1999-2000) and a member of the Board of Visitors (1994-1998) for the University of North Carolina at Chapel Hill and currently serves on the Board of Directors of the University of North Carolina Health Care System and the Board of Visitors of the Kenan-Flagler Business School (University of North Carolina at Chapel Hill). He also served as Vice President of Finance for the University of North Carolina (16-school system, 1995-1998). |
William S. Stavropoulos (64) |
| Year of Election or Appointment: 2001 Mr. Stavropoulos is Chairman of the Board (2000), CEO (2002), a position he previously held from 1995-2000, Chairman of the Executive Committee (2000), and a Member of the Board of Directors of The Dow Chemical Company. Since joining The Dow Chemical Company in 1967, Mr. Stavropoulos served in numerous senior management positions, including President (1993-2000; 2002-2003). Currently, he is a Director of NCR Corporation (data warehousing and technology solutions), BellSouth Corporation (telecommunications), Chemical Financial Corporation, and Maersk Inc. (industrial conglomerate, 2002). He also serves as a member of the Board of Trustees of the American Enterprise Institute for Public Policy Research. In addition, Mr. Stavropoulos is a member of The Business Council, J.P. Morgan International Council and the University of Notre Dame Advisory Council for the College of Science. |
Advisory Board Members and Executive Officers:
Correspondence intended for Ms. Small may be sent to Fidelity Investments, P.O. Box 55235, Boston, Massachusetts 02205-5235. Correspondence intended for each executive officer and Mr. Lynch may be sent to Fidelity Investments, 82 Devonshire Street, Boston, Massachusetts 02109.
Name, Age; Principal Occupation |
Peter S. Lynch (61) |
| Year of Election or Appointment: 2003 Member of the Advisory Board of Fidelity Aberdeen Street Trust. Vice Chairman and a Director of FMR, and Vice Chairman (2001) and a Director (2000) of FMR Co., Inc. Previously, Mr. Lynch served as a Trustee of the Fidelity funds (1990-2003). Prior to May 31, 1990, he was a Director of FMR and Executive Vice President of FMR (a position he held until March 31, 1991), Vice President of Fidelity® Magellan® Fund and FMR Growth Group Leader, and Managing Director of FMR Corp. Mr. Lynch was also Vice President of Fidelity Investments Corporate Services. In addition, he serves as a Trustee of Boston College, Massachusetts Eye & Ear Infirmary, Historic Deerfield, John F. Kennedy Library, and the Museum of Fine Arts of Boston. |
Cornelia M. Small (59) |
| Year of Election or Appointment: 2004 Member of the Advisory Board of Fidelity Aberdeen Street Trust. Ms. Small is a member (2000) and Chairperson (2002) of the Investment Committee, and a member (2002) of the Board of Trustees of Smith College. Previously, she served as Chief Investment Officer (1999-
2000), Director of Global Equity Investments (1996-1999), and a member of the Board of Directors of Scudder, Stevens & Clark (1990-1997) and Scudder Kemper Investments (1997-1998). In addition, Ms. Small served as Co-Chair (2000-2003) of the Annual Fund for the Fletcher School of Law and Diplomacy. |
Bart A. Grenier (45) |
| Year of Election or Appointment: 2001 or 2003 Vice President of Freedom Income (2001), Freedom 2000 (2001), Freedom 2005 (2003), Freedom 2010 (2001), Freedom 2015 (2003), Freedom 2020 (2001), Freedom 2025 (2003), Freedom 2030 (2001), Freedom 2035 (2003), and Freedom 2040 (2001). Mr. Grenier also serves as Vice President of certain Equity Funds (2001), a position he previously held from 1999 to 2000, and Vice President of certain High Income Funds (2002). He is Senior Vice President of FMR (1999) and FMR Co., Inc. (2001), and President and Director of Strategic Advisers, Inc. (2002). He also heads Fidelity's Asset Allocation Group (2000), Fidelity's Growth and Income Group (2001), Fidelity's Value Group (2001), and Fidelity's High Income Division (2001). Previously, Mr. Grenier served as President of Fidelity Ventures (2000), Vice President of certain High Income Funds (1997-2000), High Income Division Head (1997-2000), Group Leader of the Income-Growth and Asset Allocation-Income Groups (1996-2000), and Assistant Equity Division Head (1997-2000). |
Ren Y. Cheng (47) |
| Year of Election or Appointment: 1998, 2000, or 2003 Vice President of Freedom Income (1998), Freedom 2000 (1998), Freedom 2005 (2003), Freedom 2010 (1998), Freedom 2015 (2003), Freedom 2020 (1998), Freedom 2025 (2003), Freedom 2030 (1998), Freedom 2035 (2003), and Freedom 2040 (2000). Mr. Cheng is also Vice President of the Fidelity Advisor Freedom FundsSM, which are also advised by Strategic Advisers, Inc. Prior to assuming his current responsibilities, Mr. Cheng managed a variety of Fidelity funds. |
Eric D. Roiter (55) |
| Year of Election or Appointment: 1998, 2000, or 2003 Secretary of Freedom Income (1998), Freedom 2000 (1998), Freedom 2005 (2003), Freedom 2010 (1998), Freedom 2015 (2003), Freedom 2020 (1998), Freedom 2025 (2003), Freedom 2030 (1998), Freedom 2035 (2003), and Freedom 2040 (2000). He also serves as Secretary of other Fidelity funds (1998); Vice President, General Counsel, and Clerk of FMR Co., Inc. (2001) and FMR (1998); Vice President and Clerk of FDC (1998); Assistant Clerk of Fidelity Management & Research (U.K.) Inc. (2001) and Fidelity Management & Research (Far East) Inc. (2001); and Assistant Secretary of Fidelity Investments Money Management, Inc. (2001). Prior to joining Fidelity, Mr. Roiter was with the law firm of Debevoise & Plimpton, as an associate (1981-1984) and as a partner (1985-1997), and served as an Assistant General Counsel of the U.S. Securities and Exchange Commission (1979-1981). Mr. Roiter is an Adjunct Member, Faculty of Law, at Boston College Law School (2003). |
Stuart Fross (44) |
| Year of Election or Appointment: 2003 Assistant Secretary of Freedom Income, Freedom 2000, Freedom 2005, Freedom 2010, Freedom 2015, Freedom 2020, Freedom 2025, Freedom 2030, Freedom 2035, and Freedom 2040. Mr. Fross also serves as Assistant Secretary of other Fidelity funds (2003) and is an employee of FMR. |
Christine Reynolds (45) |
| Year of Election or Appointment: 2004 President, Treasurer, and Anti-Money Laundering (AML) officer of Freedom Income, Freedom 2000, Freedom 2005, Freedom 2010, Freedom 2015, Freedom 2020, Freedom 2025, Freedom 2030, Freedom 2035, and Freedom 2040. Ms. Reynolds also serves as President, Treasurer, and AML officer of other Fidelity funds (2004) and is a Vice President (2003) and an employee (2002) of FMR. Before joining Fidelity Investments, Ms. Reynolds worked at PricewaterhouseCoopers LLP (PwC) (1980-2002), where she was most recently an audit partner with PwC's investment management practice. |
Timothy F. Hayes (53) |
| Year of Election or Appointment: 2002 or 2003 Chief Financial Officer of Freedom Income (2002), Freedom 2000 (2002), Freedom 2005 (2003), Freedom 2010 (2002), Freedom 2015 (2003), Freedom 2020 (2002), Freedom 2025 (2003), Freedom 2030 (2002), Freedom 2035 (2003), and Freedom 2040 (2002). Mr. Hayes also serves as Chief Financial Officer of other Fidelity funds (2002). Recently he was appointed President of Fidelity Service Company (2003) where he also serves as a Director. Mr. Hayes also serves as President of Fidelity Investments Operations Group (FIOG, 2002), which includes Fidelity Pricing and Cash Management Services Group (FPCMS), where he was appointed President in 1998. Previously, Mr. Hayes served as Chief Financial Officer of Fidelity Investments Corporate Systems and Service Group (1998) and Fidelity Systems Company (1997-1998). |
John R. Hebble (45) |
| Year of Election or Appointment: 2003 Deputy Treasurer of Freedom Income, Freedom 2000, Freedom 2005, Freedom 2010, Freedom 2015, Freedom 2020, Freedom 2025, Freedom 2030, Freedom 2035, and Freedom 2040. Mr. Hebble also serves as Deputy Treasurer of other Fidelity funds (2003), and is an employee of FMR. Before joining Fidelity Investments, Mr. Hebble worked at Deutsche Asset Management where he served as Director of Fund Accounting (2002-2003) and Assistant Treasurer of the Scudder Funds (1998-2003). |
Kimberley H. Monasterio (40) |
| Year of Election or Appointment: 2004 Deputy Treasurer of Freedom Income, Freedom 2000, Freedom 2005, Freedom 2010, Freedom 2015, Freedom 2020, Freedom 2025, Freedom 2030, Freedom 2035, and Freedom 2040. Ms. Monasterio also serves as Deputy Treasurer of other Fidelity funds (2004) and is an employee of FMR (2004). Before joining Fidelity Investments, Ms. Monasterio served as Treasurer (2000-2004) and Chief Financial Officer (2002-2004) of the Franklin Templeton Funds and Senior Vice President of Franklin Templeton Services, LLC (2000-2004). |
John H. Costello (57) |
| Year of Election or Appointment: 1996, 2000, or 2003 Assistant Treasurer of Freedom Income (1996), Freedom 2000 (1996), Freedom 2005 (2003), Freedom 2010 (1996), Freedom 2015 (2003), Freedom 2020 (1996), Freedom 2025 (2003), Freedom 2030 (1996), Freedom 2035 (2003), and Freedom 2040 (2000). Mr. Costello also serves as Assistant Treasurer of other Fidelity funds and is an employee of FMR. |
Francis V. Knox, Jr. (56) |
| Year of Election or Appointment: 2002 or 2003 Assistant Treasurer of Freedom Income (2002), Freedom 2000 (2002), Freedom 2005 (2003), Freedom 2010 (2002), Freedom 2015 (2003), Freedom 2020 (2002), Freedom 2025 (2003), Freedom 2030 (2002), Freedom 2035 (2003), and Freedom 2040 (2002). Mr. Knox also serves as Assistant Treasurer of other Fidelity funds (2002), and is a Vice President and an employee of FMR. Previously, Mr. Knox served as Vice President of Investment & Advisor Compliance (1990-2001), and Compliance Officer of Fidelity Management & Research (U.K.) Inc. (1992-2002), Fidelity Management & Research (Far East) Inc. (1991-2002), and FMR Corp. (1995-2002). |
Peter L. Lydecker (50) |
| Year of Election or Appointment: 2004 Assistant Treasurer of Freedom Income, Freedom 2000, Freedom 2005, Freedom 2010, Freedom 2015, Freedom 2020, Freedom 2025, Freedom 2030, Freedom 2035, and Freedom 2040. Mr. Lydecker also serves as Assistant Treasurer of other Fidelity funds (2004) and is an employee of FMR. |
Mark Osterheld (48) |
| Year of Election or Appointment: 2002 or 2003 Assistant Treasurer of Freedom Income (2002), Freedom 2000 (2002), Freedom 2005 (2003), Freedom 2010 (2002), Freedom 2015 (2003), Freedom 2020 (2002), Freedom 2025 (2003), Freedom 2030 (2002), Freedom 2035 (2003), and Freedom 2040 (2002). Mr. Osterheld also serves as Assistant Treasurer of other Fidelity funds (2002) and is an employee of FMR. |
Thomas J. Simpson (45) |
| Year of Election or Appointment: 2000 or 2003 Assistant Treasurer of Freedom Income (2000), Freedom 2000 (2000), Freedom 2005 (2003), Freedom 2010 (2000), Freedom 2015 (2003), Freedom 2020 (2000), Freedom 2025 (2003), Freedom 2030 (2000), Freedom 2035 (2003), and Freedom 2040 (2000). Mr. Simpson is Assistant Treasurer of other Fidelity funds (2000) and an employee of FMR (1996). Prior to joining FMR, Mr. Simpson was Vice President and Fund Controller of Liberty Investment Services (1987-1995). |
Annual Report
Distributions
The Board of Trustees of each fund voted to pay to shareholders of record at the opening of business on record date, the following distributions per share derived from capital gains realized from sales of portfolio securities, and dividends derived from net investment income:
Fund | Pay Date | Record Date | Dividends | Capital Gains |
Freedom Income | 05/10/04 | 05/07/04 | $0.02 | $0.006 |
Freedom 2000 | 05/10/04 | 05/07/04 | $0.03 | - |
Freedom 2005 | 05/10/04 | 05/07/04 | $0.03 | - |
Freedom 2010 | 05/10/04 | 05/07/04 | $0.06 | $0.025 |
Freedom 2015 | 05/10/04 | 05/07/04 | $0.02 | $0.005 |
Freedom 2020 | 05/17/04 | 05/14/04 | $0.05 | $0.025 |
Freedom 2025 | 05/17/04 | 05/14/04 | $0.017 | $0.001 |
Freedom 2030 | 05/17/04 | 05/14/04 | $0.03 | - |
Freedom 2035 | 05/17/04 | 05/14/04 | $0.015 | - |
Freedom 2040 | 05/17/04 | 05/14/04 | $0.025 | $0.015 |
A percentage of the dividends distributed during the fiscal year for the following funds was derived from interest on U.S. Government securities which is generally exempt from state income tax:
Freedom Income | 14.16% |
Freedom 2000 | 14.78% |
Freedom 2010 | 11.66% |
Freedom 2020 | 7.44% |
Freedom 2030 | 4.30% |
A percentage of the dividends distributed during the fiscal year for the following funds may be taken into account as a dividend for purposes of the maximum rate under section 1(h)(11) of the Internal Revenue Code.
Freedom Income | |
04/04/03 | 0% |
05/02/03 | 7% |
06/06/03 | 7% |
07/03/03 | 7% |
08/01/03 | 7% |
09/05/03 | 7% |
10/03/03 | 7% |
11/07/03 | 7% |
12/05/03 | 7% |
12/26/03 | 7% |
02/06/04 | 15% |
03/05/04 | 15% |
| 05/02/03 | 12/26/03 |
Freedom 2000 | 0% | 12% |
Freedom 2005 | - | 33% |
Freedom 2010 | 0% | 17% |
Freedom 2015 | - | 40% |
Freedom 2020 | 0% | 32% |
Freedom 2025 | - | 45% |
Freedom 2030 | 0% | 45% |
Freedom 2035 | - | 55% |
Freedom 2040 | 0% | 45% |
A percentage of the dividends distributed during the fiscal year for the following funds qualifies for the dividends-received deduction for corporate shareholders:
Freedom Income | |
04/04/03 | 9% |
05/02/03 | 9% |
06/06/03 | 9% |
07/03/03 | 9% |
08/01/03 | 9% |
09/05/03 | 9% |
10/03/03 | 9% |
11/07/03 | 9% |
12/05/03 | 9% |
12/26/03 | 9% |
02/06/04 | 11% |
03/05/04 | 11% |
| 05/02/03 | 12/26/03 |
Freedom 2000 | 6% | 11% |
Freedom 2005 | - | 26% |
Freedom 2010 | 11% | 14% |
Freedom 2015 | - | 31% |
Freedom 2020 | 22% | 26% |
Freedom 2025 | - | 33% |
Freedom 2030 | 24% | 35% |
Freedom 2035 | - | 38% |
Freedom 2040 | 28% | 34% |
The funds will notify shareholders in January 2005 of amounts for use in preparing 2004 income tax returns.
Annual Report
Managing Your Investments
Fidelity offers several ways to conveniently manage your personal investments via your telephone or PC. You can access your account information, conduct trades and research your investments 24 hours a day.
By Phone
Fidelity Automated Service Telephone provides a single toll-free number to access account balances, positions, quotes and trading. It's easy to navigate the service, and on your first call, the system will help you create a personal identification number (PIN) for security.
(phone_graphic)
Fidelity Automated
Service Telephone (FAST®)
1-800-544-5555
Press
1 For mutual fund and brokerage trading.
2 For quotes.*
3 For account balances and holdings.
4 To review orders and mutual
fund activity.
5 To change your PIN.
*0 To speak to a Fidelity representative.
By PC
Fidelity's web site on the Internet provides a wide range of information, including daily financial news, fund performance, interactive planning tools and news about Fidelity products and services.
(computer_graphic)
Fidelity's Web Site
www.fidelity.com
* When you call the quotes line, please remember that a fund's yield and return will vary and, except for money market funds, share price will also vary. This means that you may have a gain or loss when you sell your shares. There is no assurance that money market funds will be able to maintain a stable $1 share price; an investment in a money market fund is not insured or guaranteed by the U.S. government. Total returns are historical and include changes in share price, reinvestment of dividends and capital gains, and the effects of any sales charges.
Annual Report
To Write Fidelity
We'll give your correspondence immediate attention and send you written confirmation upon completion of your request.
(letter_graphic)
Making Changes
To Your Account
(such as changing name, address, bank, etc.)
Fidelity Investments
P.O. Box 770001
Cincinnati, OH 45277-0002
(letter_graphic)
For Non-Retirement
Accounts
Buying shares
Fidelity Investments
P.O. Box 770001
Cincinnati, OH 45277-0003
Overnight Express
Fidelity Investments
Attn: Distribution Services
100 Crosby Parkway - KC1H
Covington, KY 41015
Selling shares
Fidelity Investments
P.O. Box 770001
Cincinnati, OH 45277-0035
Overnight Express
Fidelity Investments
Attn: Distribution Services
100 Crosby Parkway - KC1H
Covington, KY 41015
General Correspondence
Fidelity Investments
P.O. Box 500
Merrimack, NH 03054-0500
(letter_graphic)
For Retirement
Accounts
Buying shares
Fidelity Investments
P.O. Box 770001
Cincinnati, OH 45277-0003
Selling shares
Fidelity Investments
P.O. Box 770001
Cincinnati, OH 45277-0035
Overnight Express
Fidelity Investments
Attn: Distribution Services
100 Crosby Parkway - KC1H
Covington, KY 41015
General Correspondence
Fidelity Investments
P.O. Box 500
Merrimack, NH 03054-0500
Annual Report
Investment Adviser
Strategic Advisers, Inc.
Boston, MA
General Distributor
Fidelity Distributors Corporation
Boston, MA
Transfer and Shareholder
Servicing Agent
Fidelity Investments Institutional
Operations Company, Inc.
Boston, MA
Custodian
The Bank of New York
New York, NY
Fidelity's Asset Allocation Funds
Asset ManagerSM
Asset Manager: Aggressive®
Asset Manager: Growth®
Asset Manager: Income®
Fidelity Freedom Funds ® -
Income, 2000, 2005, 2010, 2015, 2020, 2025, 2030, 2035, 2040
The Fidelity Telephone Connection
Mutual Fund 24-Hour Service
Exchanges/Redemptions
and Account Assistance 1-800-544-6666
Product Information 1-800-544-6666
Retirement Accounts 1-800-544-4774
(8 a.m. - 9 p.m.)
TDD Service 1-800-544-0118
for the deaf and hearing impaired
(9 a.m. - 9 p.m. Eastern time)
Fidelity Automated Service
Telephone (FAST®) (automated graphic) 1-800-544-5555
(automated graphic) Automated line for quickest service
FF-UANN-0504
1.792136.100
(Fidelity Investment logo)(registered trademark)
Corporate Headquarters
82 Devonshire St., Boston, MA 02109
www.fidelity.com
Item 2. Code of Ethics
As of the end of the period, March 31, 2004, Fidelity Aberdeen Street Trust (the trust) has adopted a code of ethics, as defined in Item 2 of Form N-CSR, that applies to its President and Treasurer and its Chief Financial Officer. A copy of the code of ethics is filed as an exhibit to this Form N-CSR.
Item 3. Audit Committee Financial Expert
The Board of Trustees of the trust has determined that Marie L. Knowles and Donald J. Kirk are each audit committee financial experts, as defined in Item 3 of Form N-CSR. Ms. Knowles and Mr. Kirk are each independent for purposes of Item 3 of Form N-CSR.
Item 4. Principal Accountant Fees and Services
(a) Audit Fees.
For the fiscal years ended March 31, 2004 and March 31, 2003, the aggregate Audit Fees billed by PricewaterhouseCoopers LLP (PwC) for professional services rendered for the audits of the financial statements, or services that are normally provided in connection with statutory and regulatory filings or engagements for those fiscal years, for Fidelity Freedom Income Fund, Fidelity Freedom 2000 Fund, Fidelity Freedom 2005 Fund, Fidelity Freedom 2010 Fund, Fidelity Freedom 2015 Fund, Fidelity Freedom 2020 Fund, Fidelity Freedom 2025 Fund, Fidelity Freedom 2030 Fund, Fidelity Freedom 2035 Fund, and Fidelity Freedom 2040 Fund (the funds) and for all funds in the Fidelity Group of Funds are shown in the table below.
Fund | 2004A | 2003A,B |
Fidelity Freedom Income Fund | $17,000 | $15,000 |
Fidelity Freedom 2000 Fund | $17,000 | $15,000 |
Fidelity Freedom 2005 Fund | $11,000 | $0 |
Fidelity Freedom 2010 Fund | $29,000 | $22,000 |
Fidelity Freedom 2015 Fund | $11,000 | $0 |
Fidelity Freedom 2020 Fund | $28,000 | $20,000 |
Fidelity Freedom 2025 Fund | $11,000 | $0 |
Fidelity Freedom 2030 Fund | $22,000 | $17,000 |
Fidelity Freedom 2035 Fund | $11,000 | $0 |
Fidelity Freedom 2040 Fund | $15,000 | $13,000 |
All funds in the Fidelity Group of Funds audited by PwC | $10,600,000 | $8,600,000 |
A | Aggregate amounts may reflect rounding. |
B | No Audit Fees were billed by PwC for professional services rendered for the audit of the annual financial statements, or services that are normally provided in connection with statutory and regulatory filings or engagements, to Fidelity Freedom 2005 Fund, Fidelity Freedom 2015 Fund, Fidelity Freedom 2025 Fund, and Fidelity Freedom 2035 Fund, as the funds did not commence operations until November 6, 2003. |
For the fiscal years ended March 31, 2004 and March 31, 2003, the aggregate Audit Fees billed by Deloitte & Touche LLP, the member firms of Deloitte Touche Tohmatsu, and their respective affiliates (collectively, "Deloitte Entities") for professional services rendered for the audits of the financial statements, or services that are normally provided in connection with statutory and regulatory filings or engagements for those fiscal years, for Fidelity Advisor Freedom Income Fund, Fidelity Advisor Freedom 2005 Fund, Fidelity Advisor Freedom 2010 Fund, Fidelity Advisor Freedom 2015 Fund, Fidelity Advisor Freedom 2020 Fund, Fidelity Advisor Freedom 2025 Fund, Fidelity Advisor Freedom 2030 Fund, Fidelity Advisor Freedom 2035 Fund, and Fidelity Advisor Freedom 2040 Fund (the funds) and for all funds in the Fidelity Group of Funds are shown in the table below.
Fund | 2004A | 2003A, B |
Fidelity Advisor Freedom Income Fund | $11,000 | $0 |
Fidelity Advisor Freedom 2005 Fund | $10,000 | $0 |
Fidelity Advisor Freedom 2010 Fund | $10,000 | $0 |
Fidelity Advisor Freedom 2015 Fund | $10,000 | $0 |
Fidelity Advisor Freedom 2020 Fund | $10,000 | $0 |
Fidelity Advisor Freedom 2025 Fund | $10,000 | $0 |
Fidelity Advisor Freedom 2030 Fund | $10,000 | $0 |
Fidelity Advisor Freedom 2035 Fund | $10,000 | $0 |
Fidelity Advisor Freedom 2040 Fund | $10,000 | $0 |
All funds in the Fidelity Group of Funds audited by Deloitte Entities | $4,200,000 | $2,500,000 |
A | Aggregate amounts may reflect rounding. |
B | No Audit Fees were billed by Deloitte Entities for professional services rendered for the audit of the financial statements, or services that are normally provided in connection with statutory and regulatory filings or engagements, to Fidelity Advisor Freedom Income Fund (July 24, 2003), Fidelity Advisor Freedom 2005 Fund (November 6, 2003), Fidelity Advisor Freedom 2010 Fund (July 24, 2003), Fidelity Advisor Freedom 2015 Fund (November 6, 2003), Fidelity Advisor Freedom 2020 Fund (July 24, 2003), Fidelity Advisor Freedom 2025 Fund (November 6, 2003), Fidelity Advisor Freedom 2030 Fund (July 24, 2003), Fidelity Advisor Freedom 2035 Fund (November 6, 2003), and Fidelity Advisor Freedom 2040 Fund (July 24, 2003), as the funds did not commence operations until July 24, 2003 or November 6, 2003, as noted above. |
(b) Audit-Related Fees.
In each of the fiscal years ended March 31, 2004 and March 31, 2003, the aggregate Audit-Related Fees billed by PwC for services rendered for assurance and related services to each fund that are reasonably related to the performance of the audit or review of the fund's financial statements, but not reported as Audit Fees, are shown in the table below.
Fund | 2004A, B | 2003 A, B, C |
Fidelity Freedom Income Fund | $0 | $0 |
Fidelity Freedom 2000 Fund | $0 | $0 |
Fidelity Freedom 2005 Fund | $0 | $0 |
Fidelity Freedom 2010 Fund | $0 | $0 |
Fidelity Freedom 2015 Fund | $0 | $0 |
Fidelity Freedom 2020 Fund | $0 | $0 |
Fidelity Freedom 2025 Fund | $0 | $0 |
Fidelity Freedom 2030 Fund | $0 | $0 |
Fidelity Freedom 2035 Fund | $0 | $0 |
Fidelity Freedom 2040 Fund | $0 | $0 |
A | Aggregate amounts may reflect rounding. |
B | Includes amounts related to non-audit services prior to May 6, 2003 that would have been subject to pre-approval if the SEC rules relating to the pre-approval of non-audit services had been in effect at that time. |
C | No Audit-Related Fees were billed by PwC for services rendered for assurance and related services to Fidelity Freedom 2005 Fund, Fidelity Freedom 2015 Fund, Fidelity Freedom 2025 Fund, and Fidelity Freedom 2035 Fund by PwC that are reasonably related to the performance of the audit or review of the funds' financial statements, but not reported as Audit Fees, as the funds did not commence operations until November 6, 2003. |
In each of the fiscal years ended March 31, 2004 and March 31, 2003, the aggregate Audit-Related Fees billed by Deloitte Entities for services rendered for assurance and related services to each fund that are reasonably related to the performance of the audit or review of the fund's financial statements, but not reported as Audit Fees, are shown in the table below.
Fund | 2004A, B | 2003 A, B,C |
Fidelity Advisor Freedom Income Fund | $0 | $0 |
Fidelity Advisor Freedom 2005 Fund | $0 | $0 |
Fidelity Advisor Freedom 2010 Fund | $0 | $0 |
Fidelity Advisor Freedom 2015 Fund | $0 | $0 |
Fidelity Advisor Freedom 2020 Fund | $0 | $0 |
Fidelity Advisor Freedom 2025 Fund | $0 | $0 |
Fidelity Advisor Freedom 2030 Fund | $0 | $0 |
Fidelity Advisor Freedom 2035 Fund | $0 | $0 |
Fidelity Advisor Freedom 2040 Fund | $0 | $0 |
A | Aggregate amounts may reflect rounding. |
B | Includes amounts related to non-audit services prior to May 6, 2003 that would have been subject to pre-approval if the SEC rules relating to the pre-approval of non-audit services had been in effect at that time. |
C | No Audit-Related Fees were billed by Deloitte Entities for services rendered for assurance and related services to Fidelity Advisor Freedom Income Fund (July 24, 2003), Fidelity Advisor Freedom 2005 Fund (November 6, 2003), Fidelity Advisor Freedom 2010 Fund (July 24, 2003), Fidelity Advisor Freedom 2015 Fund (November 6, 2003), Fidelity Advisor Freedom 2020 Fund (July 24, 2003), Fidelity Advisor Freedom 2025 Fund (November 6, 2003), Fidelity Advisor Freedom 2030 Fund (July 24, 2003), Fidelity Advisor Freedom 2035 Fund (November 6, 2003), and Fidelity Advisor Freedom 2040 Fund (July 24, 2003) by Deloitte Entities that are reasonably related to the performance of the audit or review of the funds' financial statements, but not reported as Audit Fees, as the funds did not commence operations until July 24, 2003 or November 6, 2003, as noted above. |
In each of the fiscal years ended March 31, 2004 and March 31, 2003, the aggregate Audit-Related Fees that were billed by PwC and Deloitte Entities that were required to be approved by the Audit Committee for services rendered on behalf of Fidelity Management & Research Company (FMR) and entities controlling, controlled by, or under common control with FMR (not including any sub-adviser whose role is primarily portfolio management and is subcontracted with or overseen by another investment adviser) that provide ongoing services to the funds ("Fund Service Providers") for assurance and related services that relate directly to the operations and financial reporting of each fund that are reasonably related to the performance of the audit or review of the fund's financial statements, but not reported as Audit Fees, are shown in the table below.
Billed By | 2004 A, B, C | 2003A, B, C |
PwC | $50,000 | $0 |
Deloitte Entities | $0 | $0 |
A | Aggregate amounts may reflect rounding. |
B | Includes amounts related to non-audit services prior to May 6, 2003 that would have been subject to pre-approval if the SEC rules relating to the pre-approval of non-audit services had been in effect at that time. |
C | May include amounts billed prior to the funds' commencement of operations. |
Fees included in the audit-related category comprise assurance and related services (e.g., due diligence services) that are traditionally performed by the independent accountant. These audit-related services include due diligence related to mergers and acquisitions, accounting consultations and audits in connection with acquisitions, internal control reviews, attest services that are not required by statute or regulation and consultation concerning financial accounting and reporting standards.
(c) Tax Fees.
In each of the fiscal years ended March 31, 2004 and March 31, 2003, the aggregate Tax Fees billed by PwC for professional services rendered for tax compliance, tax advice, and tax planning for each fund is shown in the table below.
Fund | 2004A, B | 2003A, B, C |
Fidelity Freedom Income Fund | $1,400 | $1,200 |
Fidelity Freedom 2000 Fund | $1,400 | $1,200 |
Fidelity Freedom 2005 Fund | $1,300 | $0 |
Fidelity Freedom 2010 Fund | $1,400 | $1,200 |
Fidelity Freedom 2015 Fund | $1,300 | $0 |
Fidelity Freedom 2020 Fund | $1,400 | $1,200 |
Fidelity Freedom 2025 Fund | $1,300 | $0 |
Fidelity Freedom 2030 Fund | $1,400 | $1,200 |
Fidelity Freedom 2035 Fund | $1,300 | $0 |
Fidelity Freedom 2040 Fund | $1,400 | $1,200 |
A | Aggregate amounts may reflect rounding. |
B | Includes amounts related to non-audit services prior to May 6, 2003 that would have been subject to pre-approval if the SEC rules relating to the pre-approval of non-audit services had been in effect at that time. |
C | No Tax Fees were billed by PwC for services rendered for tax compliance, tax advice, and tax planning for Fidelity Freedom 2005 Fund, Fidelity Freedom 2015 Fund, Fidelity Freedom 2025 Fund, and Fidelity Freedom 2035 Fund by PwC, as the funds did not commence operations until November 6, 2003. |
In each of the fiscal years ended March 31, 2004 and March 31, 2003, the aggregate Tax Fees billed by Deloitte Entities for professional services rendered for tax compliance, tax advice, and tax planning for each fund is shown in the table below.
Fund | 2004A, B | 2003A, B, C |
Fidelity Advisor Freedom Income Fund | $1,600 | $0 |
Fidelity Advisor Freedom 2005 Fund | $1,500 | $0 |
Fidelity Advisor Freedom 2010 Fund | $1,500 | $0 |
Fidelity Advisor Freedom 2015 Fund | $1,500 | $0 |
Fidelity Advisor Freedom 2020 Fund | $1,500 | $0 |
Fidelity Advisor Freedom 2025 Fund | $1,500 | $0 |
Fidelity Advisor Freedom 2030 Fund | $1,500 | $0 |
Fidelity Advisor Freedom 2035 Fund | $1,500 | $0 |
Fidelity Advisor Freedom 2040 Fund | $1,500 | $0 |
A | Aggregate amounts may reflect rounding. |
B | Includes amounts related to non-audit services prior to May 6, 2003 that would have been subject to pre-approval if the SEC rules relating to the pre-approval of non-audit services had been in effect at that time. |
C | No Tax Fees were billed by Deloitte Entities for services rendered for tax compliance, tax advice, and tax planning for Fidelity Advisor Freedom Income Fund (July 24, 2003), Fidelity Advisor Freedom 2005 Fund (November 6, 2003), Fidelity Advisor Freedom 2010 Fund (July 24, 2003), Fidelity Advisor Freedom 2015 Fund (November 6, 2003), Fidelity Advisor Freedom 2020 Fund (July 24, 2003), Fidelity Advisor Freedom 2025 Fund (November 6, 2003), Fidelity Advisor Freedom 2030 Fund (July 24, 2003), Fidelity Advisor Freedom 2035 Fund (November 6, 2003), and Fidelity Advisor Freedom 2040 Fund (July 24, 2003) by Deloitte Entities, as the funds did not commence operations until July 24, 2003 or November 6, 2003, as noted above. |
In each of the fiscal years ended March 31, 2004 and March 31, 2003, the aggregate Tax Fees billed by PwC and Deloitte Entities that were required to be approved by the Audit Committee for professional services rendered on behalf of the Fund Service Providers for tax compliance, tax advice, and tax planning that relate directly to the operations and financial reporting of each fund is shown in the table below.
Billed By | 2004A, B, C | 2003A, B, C |
PwC | $0 | $0 |
Deloitte Entities | $0 | $0 |
A | Aggregate amounts may reflect rounding. |
B | Includes amounts related to non-audit services prior to May 6, 2003 that would have been subject to pre-approval if the SEC rules relating to the pre-approval of non-audit services had been in effect at that time. |
C | May include amounts billed prior to the funds' commencement of operations. |
Fees included in the Tax Fees category comprise all services performed by professional staff in the independent accountant's tax division except those services related to the audit. Typically, this category would include fees for tax compliance, tax planning, and tax advice. Tax compliance, tax advice, and tax planning services include preparation of original and amended tax returns, claims for refund and tax payment-planning services, assistance with tax audits and appeals, tax advice related to mergers and acquisitions and requests for rulings or technical advice from taxing authorities.
(d) All Other Fees.
In each of the fiscal years ended March 31, 2004 and March 31, 2003, the aggregate Other Fees billed by PwC for all other non-audit services rendered to the funds is shown in the table below.
Fund | 2004A, B | 2003A, B, C |
Fidelity Freedom Income Fund | $1,800 | $1,900 |
Fidelity Freedom 2000 Fund | $1,800 | $2,000 |
Fidelity Freedom 2005 Fund | $500 | $0 |
Fidelity Freedom 2010 Fund | $4,700 | $4,300 |
Fidelity Freedom 2015 Fund | $500 | $0 |
Fidelity Freedom 2020 Fund | $4,600 | $3,800 |
Fidelity Freedom 2025 Fund | $500 | $0 |
Fidelity Freedom 2030 Fund | $3,000 | $2,700 |
Fidelity Freedom 2035 Fund | $500 | $0 |
Fidelity Freedom 2040 Fund | $1,400 | $1,300 |
A | Aggregate amounts may reflect rounding. |
B | Includes amounts related to non-audit services prior to May 6, 2003 that would have been subject to pre-approval if the SEC rules relating to the pre-approval of non-audit services had been in effect at that time. |
C | No Other Fees were billed by PwC for all other non-audit services rendered to Fidelity Freedom 2005 Fund, Fidelity Freedom 2015 Fund, Fidelity Freedom 2025 Fund, and Fidelity Freedom 2035 Fund as the funds did not commence operations until November 6, 2003. |
In each of the fiscal years ended March 31, 2004 and March 31, 2003, the aggregate Other Fees billed by Deloitte Entities for all other non-audit services rendered to the funds is shown in the table below.
Fund | 2004A, B | 2003A, B, C |
Fidelity Advisor Freedom Income Fund | $0 | $0 |
Fidelity Advisor Freedom 2005 Fund | $0 | $0 |
Fidelity Advisor Freedom 2010 Fund | $0 | $0 |
Fidelity Advisor Freedom 2015 Fund | $0 | $0 |
Fidelity Advisor Freedom 2020 Fund | $0 | $0 |
Fidelity Advisor Freedom 2025 Fund | $0 | $0 |
Fidelity Advisor Freedom 2030 Fund | $0 | $0 |
Fidelity Advisor Freedom 2035 Fund | $0 | $0 |
Fidelity Advisor Freedom 2040 Fund | $0 | $0 |
A | Aggregate amounts may reflect rounding. |
B | Includes amounts related to non-audit services prior to May 6, 2003 that would have been subject to pre-approval if the SEC rules relating to the pre-approval of non-audit services had been in effect at that time. |
C | No Other Fees were billed by Deloitte Entities for all other non-audit services rendered to Fidelity Advisor Freedom Income Fund (July 24, 2003), Fidelity Advisor Freedom 2005 Fund (November 6, 2003), Fidelity Advisor Freedom 2010 Fund (July 24, 2003), Fidelity Advisor Freedom 2015 Fund (November 6, 2003), Fidelity Advisor Freedom 2020 Fund (July 24, 2003), Fidelity Advisor Freedom 2025 Fund (November 6, 2003), Fidelity Advisor Freedom 2030 Fund (July 24, 2003), Fidelity Advisor Freedom 2035 Fund (November 6, 2003), and Fidelity Advisor Freedom 2040 Fund (July 24, 2003) as the funds did not commence operations until July 24, 2003 or November 6, 2003, as noted above. |
In each of the fiscal years ended March 31, 2004 and March 31, 2003, the aggregate Other Fees billed by PwC and Deloitte Entities that were required to be approved by the Audit Committee for all other non-audit services rendered on behalf of the Fund Service Providers that relate directly to the operations and financial reporting of each fund is shown in the table below.
Billed By | 2004A, B, C | 2003A, B, C |
PwC | $210,000 | $210,000 |
Deloitte Entities | $550,000 | $650,000 |
A | Aggregate amounts may reflect rounding. |
B | Includes amounts related to non-audit services prior to May 6, 2003 that would have been subject to pre-approval if the SEC rules relating to the pre-approval of non-audit services had been in effect at that time. |
C | May include amounts billed prior to the funds' commencement of operations. |
Fees included in the All Other Fees category include services related to internal control reviews, strategy and other consulting, financial information systems design and implementation, consulting on other information systems, and other tax services unrelated to the fund.
(e) (1) | Audit Committee Pre-Approval Policies and Procedures: |
The trust's Audit Committee must pre-approve all audit and non-audit services provided by the independent accountants relating to the operations or financial reporting of the funds. Prior to the commencement of any audit or non-audit services to a fund, the Audit Committee reviews the services to determine whether they are appropriate and permissible under applicable law.
The trust's Audit Committee has adopted policies and procedures to, among other purposes, provide a framework for the Committee's consideration of non-audit services by the audit firms that audit the Fidelity funds. The policies and procedures require that any non-audit service provided by a fund audit firm to a Fidelity Fund and any non-audit service provided by a fund auditor to a Fund Service Provider that relates directly to the operations and financial reporting of a Fidelity fund (Covered Service) are subject to approval by the Audit Committee before such service is provided. Non-audit services provided by a fund audit firm for a Fund Service Provider that do not relate directly to the operations and financial reporting of a Fidelity fund (Non-Covered Service) but that are expected to exceed $50,000 are also subject to pre-approval by the Audit Committee.
All Covered Services, as well as Non-Covered Services that are expected to exceed $50,000, must be approved in advance of provision of the service either: (i) by formal resolution of the Audit Committee, or (ii) by oral or written approval of the service by the Chair of the Audit Committee (or if the Chair is unavailable, such other member of the Audit Committee as may be designated by the Audit Committee to act in the Chair's absence). The approval contemplated by (ii) above is permitted where the Treasurer determines that action on such an engagement is necessary before the next meeting of the Audit Committee. Neither pre-approval nor advance notice of Non-Covered Service engagements for which fees are not expected to exceed $50,000 is required; such engagements are to be reported to the Audit Committee monthly.
(e) (2) | Services approved pursuant to paragraph (c)(7)(i)(C) of Rule 2-01 of Regulation S-X: |
Audit-Related Fees:
There were no amounts, including amounts related to non-audit services prior to May 6, 2003 that would have been subject to pre-approval if the SEC rules relating to the pre-approval of non-audit services had been in effect at that time, that were approved by the Audit Committee pursuant to the de minimis exception for the fiscal years ended March 31, 2004 and March 31, 2003 on behalf of each fund.
There were no amounts, including amounts related to non-audit services prior to May 6, 2003 that would have been subject to pre-approval if the SEC rules relating to the pre-approval of non-audit services had been in effect at that time, that were required to be approved by the Audit Committee pursuant to the de minimis exception for the fiscal years ended March 31, 2004 and March 31, 2003 on behalf of the Fund Service Providers that relate directly to the operations and financial reporting of each fund.
Tax Fees:
There were no amounts, including amounts related to non-audit services prior to May 6, 2003 that would have been subject to pre-approval if the SEC rules relating to the pre-approval of non-audit services had been in effect at that time, that were approved by the Audit Committee pursuant to the de minimis exception for the fiscal years ended March 31, 2004 and March 31, 2003 on behalf of each fund.
There were no amounts, including amounts related to non-audit services prior to May 6, 2003 that would have been subject to pre-approval if the SEC rules relating to the pre-approval of non-audit services had been in effect at that time, that were required to be approved by the Audit Committee pursuant to the de minimis exception for the fiscal years ended March 31, 2004 and March 31, 2003 on behalf of the Fund Service Providers that relate directly to the operations and financial reporting of each fund.
All Other Fees:
There were no amounts, including amounts related to non-audit services prior to May 6, 2003 that would have been subject to pre-approval if the SEC rules relating to the pre-approval of non-audit services had been in effect at that time, that were approved by the Audit Committee pursuant to the de minimis exception for the fiscal years ended March 31, 2004 and March 31, 2003 on behalf of each fund.
There were no amounts, including amounts related to non-audit services prior to May 6, 2003 that would have been subject to pre-approval if the SEC rules relating to the pre-approval of non-audit services had been in effect at that time, that were required to be approved by the Audit Committee pursuant to the de minimis exception for the fiscal years ended March 31, 2004 and March 31, 2003 on behalf of the Fund Service Providers that relate directly to the operations and financial reporting of each fund.
(f) According to PwC for the fiscal year ended March 31, 2004, the percentage of hours spent on the audit of each fund's financial statements for the most recent fiscal year that were attributed to work performed by persons who are not full-time, permanent employees of PwC is as follows:
Fund | 2004 |
Fidelity Freedom Income Fund | 0% |
Fidelity Freedom 2000 Fund | 0% |
Fidelity Freedom 2005 Fund | 0% |
Fidelity Freedom 2010 Fund | 0% |
Fidelity Freedom 2015 Fund | 0% |
Fidelity Freedom 2020 Fund | 0% |
Fidelity Freedom 2025 Fund | 0% |
Fidelity Freedom 2030 Fund | 0% |
Fidelity Freedom 2035 Fund | 0% |
Fidelity Freedom 2040 Fund | 0% |
According to Deloitte Entities for the fiscal year ended March 31, 2004, the percentage of hours spent on the audit of each fund's financial statements for the most recent fiscal year that were attributed to work performed by persons who are not full-time, permanent employees of Deloitte Entities is as follows:
Fund | 2004 |
Fidelity Advisor Freedom Income Fund | 0% |
Fidelity Advisor Freedom 2005 Fund | 0% |
Fidelity Advisor Freedom 2010 Fund | 0% |
Fidelity Advisor Freedom 2015 Fund | 0% |
Fidelity Advisor Freedom 2020 Fund | 0% |
Fidelity Advisor Freedom 2025 Fund | 0% |
Fidelity Advisor Freedom 2030 Fund | 0% |
Fidelity Advisor Freedom 2035 Fund | 0% |
Fidelity Advisor Freedom 2040 Fund | 0% |
(g) For the fiscal years ended March 31, 2004 and March 31, 2003, the aggregate fees billed by PwC of $2,200,000A,B,C and $1,550,000A,B,C for non-audit services rendered on behalf of the funds, FMR (not including any sub-adviser whose role is primarily portfolio management and is subcontracted with or overseen by another investment adviser) and Fund Service Providers relating to Covered Services and Non-Covered Services are shown in the table below.
| 2004A,B,C | 2003A,B,C |
Covered Services | $300,000 | $200,000 |
Non-Covered Services | $1,900,000 | $1,350,000 |
A | Aggregate amounts may reflect rounding. |
B | Includes amounts related to non-audit services prior to May 6, 2003 that would have been subject to pre-approval if the SEC rules relating to the pre-approval of non-audit services had been in effect at that time. |
C | May include amounts billed prior to the funds' commencement of operations. |
For the fiscal years ended March 31, 2004 and March 31, 2003, the aggregate fees billed by Deloitte Entities of $1,750,000A,B,C and $1,600,000A,B,C for non-audit services rendered on behalf of the funds, FMR (not including any sub-adviser whose role is primarily portfolio management and is subcontracted with or overseen by another investment adviser) and Fund Service Providers relating to Covered Services and Non-Covered Services are shown in the table below.
| 2004A,B,C | 2003A,B,C |
Covered Services | $550,000 | $650,000 |
Non-Covered Services | $1,200,000 | $950,000 |
A | Aggregate amounts may reflect rounding. |
B | Includes amounts related to non-audit services prior to May 6, 2003 that would have been subject to pre-approval if the SEC rules relating to the pre-approval of non-audit services had been in effect at that time. |
C | May include amounts billed prior to the funds' commencement of operations. |
(h) The trust's Audit Committee has considered Non-Covered Services that were not pre-approved that were provided by PwC and Deloitte Entities to Fund Service Providers to be compatible with maintaining the independence of PwC and Deloitte Entities in their audit of the funds, taking into account representations from PwC and Deloitte Entities, in accordance with Independence Standards Board Standard No.1, regarding their independence from the funds and their related entities.
Item 5. Audit Committee of Listed Registrants
Not applicable.
Item 6. Schedule of Investments
Not applicable.
Item 7. Disclosure of Proxy Voting Policies and Procedures for Closed-End Management Investment Companies
Not applicable.
Item 8. Purchase of Equity Securities by Closed-End Management Investment Company and Affiliated Purchasers
Not applicable.
Item 9. Submission of Matters to a Vote of Security Holders
There were no material changes to the procedures by which shareholders may recommend nominees to the trust's Board of Trustees.
Item 10. Controls and Procedures
(a)(i) The President and Treasurer and the Chief Financial Officer have concluded that the trust's disclosure controls and procedures (as defined in Rule 30a-3(c) under the Investment Company Act) provide reasonable assurances that material information relating to the trust is made known to them by the appropriate persons, based on their evaluation of these controls and procedures as of a date within 90 days of the filing date of this report.
(a)(ii) There was no change in the trust's internal control over financial reporting (as defined in Rule 30a-3(d) under the Investment Company Act) that occurred during the trust's second fiscal half-year that has materially affected, or is reasonably likely to materially affect, the trust's internal control over financial reporting.
Item 11. Exhibits
(a) | (1) | Code of Ethics pursuant to Item 2 of Form N-CSR is filed and attached hereto as EX-99.CODE ETH. |
(a) | (2) | Certification pursuant to Rule 30a-2(a) under the Investment Company Act of 1940 (17 CFR 270.30a-2(a)) is filed and attached hereto as Exhibit 99.CERT. |
(a) | (3) | Not applicable. |
(b) | | Certification pursuant to Rule 30a-2(b) under the Investment Company Act of 1940 (17 CFR 270.30a-2(b)) is furnished and attached hereto as Exhibit 99.906CERT. |
SIGNATURES
Pursuant to the requirements of the Securities Exchange Act of 1934 and the Investment Company Act of 1940, the registrant has duly caused this report to be signed on its behalf by the undersigned, thereunto duly authorized.
Fidelity Aberdeen Street Trust
By: | /s/Christine Reynolds |
| Christine Reynolds |
| President and Treasurer |
| |
Date: | May 27, 2004 |
Pursuant to the requirements of the Securities Exchange Act of 1934 and the Investment Company Act of 1940, this report has been signed below by the following persons on behalf of the registrant and in the capacities and on the dates indicated.
By: | /s/Christine Reynolds |
| Christine Reynolds |
| President and Treasurer |
| |
Date: | May 27, 2004 |
By: | /s/Timothy F. Hayes |
| Timothy F. Hayes |
| Chief Financial Officer |
| |
Date: | May 27, 2004 |