UNITED STATES
SECURITIES AND EXCHANGE COMMISSION
Washington, D.C. 20549
FORM N-CSR
CERTIFIED SHAREHOLDER REPORT OF REGISTERED
MANAGEMENT INVESTMENT COMPANIES
Investment Company Act file number 811-6440
Fidelity Aberdeen Street Trust
(Exact name of registrant as specified in charter)
82 Devonshire St., Boston, Massachusetts 02109
(Address of principal executive offices) (Zip code)
Eric D. Roiter, Secretary
82 Devonshire St.
Boston, Massachusetts 02109
(Name and address of agent for service)
Registrant's telephone number, including area code: 617-563-7000
Date of fiscal year end: | March 31 |
| |
Date of reporting period: | March 31, 2006 |
Item 1. Reports to Stockholders
Fidelity Advisor Freedom Funds®
Income, 2005, 2010, 2015, 2020, 2025, 2030,
2035, 2040 - Class A, Class T, Class B and Class C
|

Annual Report
March 31, 2006
|

| Contents | | | | | | |
| |
| |
| Chairman’s Message | | 3 | | Ned Johnson’s message to shareholders. |
| Performance | | | | 4 | | How the funds have done over time. |
| Management’s Discussion | | 13 | | The managers’ review of fund performance, strategy and outlook. |
| Shareholder Expense Example | | 14 | | An example of shareholder expenses. |
| Advisor Freedom Income | | 18 | | Investment Changes |
| | | | | 19 | | Investments |
| | | | | 20 | | Financial Statements |
| Advisor Freedom 2005 | | 24 | | Investment Changes |
| | | | | 25 | | Investments |
| | | | | 26 | | Financial Statements |
| Advisor Freedom 2010 | | 30 | | Investment Changes |
| | | | | 31 | | Investments |
| | | | | 32 | | Financial Statements |
| Advisor Freedom 2015 | | 36 | | Investment Changes |
| | | | | 37 | | Investments |
| | | | | 38 | | Financial Statements |
| Advisor Freedom 2020 | | 42 | | Investment Changes |
| | | | | 43 | | Investments |
| | | | | 44 | | Financial Statements |
| Advisor Freedom 2025 | | 48 | | Investment Changes |
| | | | | 49 | | Investments |
| | | | | 50 | | Financial Statements |
| Advisor Freedom 2030 | | 54 | | Investment Changes |
| | | | | 55 | | Investments |
| | | | | 56 | | Financial Statements |
| Advisor Freedom 2035 | | 60 | | Investment Changes |
| | | | | 61 | | Investments |
| | | | | 62 | | Financial Statements |
| Advisor Freedom 2040 | | 66 | | Investment Changes |
| | | | | 67 | | Investments |
| | | | | 68 | | Financial Statements |
| Notes | | | | 72 | | Notes to the financial statements. |
| Report of Independent Registered Public | | 87 | | |
| Accounting Firm | | | | | | |
| Trustees and Officers | | 88 | | |
| Distributions | | | | 95 | | |
| Proxy Voting Results | | 99 | | |
| | To view a fund’s proxy voting guidelines and proxy voting record for the 12 month period ended June 30, visit www.fidelity.com/proxyvotingresults or visit the
Securities and Exchange Commission’s (SEC) web site at www.sec.gov. You may also call 1-877-208-0098 to request a free copy of the proxy voting guidelines.
Standard & Poor’s, S&P and S&P 500 are registered service marks of The McGraw Hill Companies, Inc. and have been licensed for use by Fidelity Distributors Corporation.
Other third party marks appearing herein are the property of their respective owners.
All other marks appearing herein are registered or unregistered trademarks or service marks of FMR Corp. or an affiliated company.
|
| | This report and the financial statements contained herein are submitted for the general information of the shareholders of the funds. This report is not authorized for
distribution to prospective investors in the funds unless preceded or accompanied by an effective prospectus.
A fund files its complete schedule of portfolio holdings with the SEC for the first and third quarters of each fiscal year on Form N Q. Forms N Q are available on the
SEC’s web site at http://www.sec.gov. A fund’s Forms N Q may be reviewed and copied at the SEC’s Public Reference Room in Washington, DC. Information regarding
the operation of the SEC’s Public Reference Room may be obtained by calling 1-800-SEC-0330. For a complete list of a fund’s portfolio holdings, view the most recent
quarterly holdings report, semiannual report, or annual report on Fidelity’s web site at http://www.advisor.fidelity.com.
NOT FDIC INSURED · MAY LOSE VALUE · NO BANK GUARANTEE
Neither the funds nor Fidelity Distributors Corporation is a bank.
|
Annual Report 2
Chairman’s Message
(photograph of Edward C. Johnson 3d)
Dear Shareholder:
Although many securities markets made gains in early 2006, there is only one certainty when it comes to investing: There is no sure thing. There are, however, a number of time tested, fundamental investment principles that can put the historical odds in your favor.
One of the basic tenets is to invest for the long term. Over time, riding out the markets’ inevitable ups and downs has proven much more effective than selling into panic or chasing the hottest trend. Even missing only a few of the markets’ best days can significantly diminish investor returns. Patience also affords the benefits of compounding of earning interest on additional income or reinvested dividends and capital gains. There are tax advantages and cost benefits to consider as well. The more you sell, the more taxes you pay, and the more you trade, the higher the costs. While staying the course doesn’t eliminate risk, it can considerably lessen the effect of short term declines.
You can further manage your investing risk through diversification. And today, more than ever, geographic diversification should be taken into account. Studies indicate that asset allocation is the single most important determinant of a portfolio’s long term success. The right mix of stocks, bonds and cash aligned to your particular risk tolerance and investment objective is very import ant. Age appropriate rebalancing is also an essential aspect of asset allocation. For younger investors, an emphasis on equities which historically have been the best perform ing asset class over time is encouraged. As investors near their specific goal, such as retirement or sending a child to college, consideration may be given to replacing volatile assets (e.g. common stocks) with more stable fixed investments (bonds or savings plans).
A third investment principle investing regularly can help lower the average cost of your purchases. Investing a certain amount of money each month or quarter helps ensure you won’t pay for all your shares at market highs. This strategy known as dollar cost averaging also reduces unconstructive “emotion” from investing, helping shareholders avoid selling weak performers just prior to an upswing, or chasing a hot performer just before a correction.
We invite you to contact us via the Internet, through our Investor Centers or over the phone. It is our privilege to provide you the information you need to make the invest ments that are right for you.
Sincerely,
/s/ Edward C. Johnson 3d
Edward C. Johnson 3d
3 Annual Report
Fidelity Advisor Freedom Income Fund® — Class A, T, B, and C
Performance: The Bottom Line
|
Average annual total return reflects the change in the value of an investment, assuming reinvestment of each class’ dividend income and capital gains (the profits earned upon the sale of securities that have grown in value) and assuming a constant rate of performance each year. The $10,000 table and each class’ returns do not reflect the deduction of taxes that a shareholder would pay on fund distributions or the redemption of fund shares. During periods of reimbursement by Fidelity, a fund’s total return will be greater than it would be had the reimbursement not occurred. How a fund did yesterday is no guarantee of how it will do tomorrow.
| Average Annual Total Returns | | | | |
Periods ended March 31, 2006 | | Past 1 | | Life of |
| | | year | | fundA |
| Class A | | 5.12% | | 4.10% |
| Class A (incl. 5.75% sales charge) | | 0.92% | | 1.83% |
| Class T | | 4.78% | | 3.84% |
| Class T (incl. 3.50% sales charge) | | 1.12% | | 2.48% |
| Class B | | 4.27% | | 3.31% |
| Class B (incl. contingent deferred sales charge)B | | 0.73% | | 2.25% |
| Class C | | 4.37% | | 3.33% |
| Class C (incl. contingent deferred sales charge)C | | 3.37% | | 3.33% |
A From July 24, 2003.
B Class B shares’ contingent deferred sales charges included in the past one year and life of fund total return figures are 5% and 3%, respectively.
C Class C shares’ contingent deferred sales charges included in the past one year and life of fund total return figures are 1% and 0%, respectively.
|
$10,000 Over Life of Fund
Let’s say hypothetically that $10,000 was invested in Fidelity Advisor Freedom Income Class T on July 24, 2003, when the fund started, and the current 3.50% sales charge was paid. The chart shows how the value of your investment would have changed, and also shows how the Lehman Brothers® Aggregate Bond Index performed over the same period.
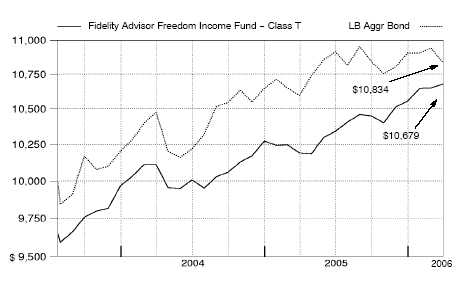
Annual Report 4
Fidelity Advisor Freedom 2005 Fund® — Class A, T, B, and C
Performance: The Bottom Line
|
Average annual total return reflects the change in the value of an investment, assuming reinvestment of each class’ dividend income and capital gains (the profits earned upon the sale of securities that have grown in value) and assuming a constant rate of performance each year. The $10,000 table and each class’ returns do not reflect the deduction of taxes that a shareholder would pay on fund distributions or the redemption of fund shares. During periods of reimbursement by Fidelity, a fund’s total return will be greater than it would be had the reimbursement not occurred. How a fund did yesterday is no guarantee of how it will do tomorrow.
| Average Annual Total Returns | | | | |
| |
| Periods ended March 31, 2006 | | Past 1 | | Life of |
| | | year | | fundA |
| Class A | | 9.63% | | 7.31% |
| Class A (incl. 5.75% sales charge) | | 3.33% | | 4.69% |
| Class T | | 9.31% | | 7.02% |
| Class T (incl. 3.50% sales charge) | | 5.48% | | 5.44% |
| Class B | | 8.80% | | 6.51% |
| Class B (incl. contingent deferred sales charge)B | | 3.80% | | 5.36% |
| Class C | | 8.74% | | 6.53% |
| Class C (incl. contingent deferred sales charge)C | | 7.74% | | 6.53% |
A From November 6, 2003.
B Class B shares’ contingent deferred sales charges included in the past one year and life of fund total return figures are 5% and 3%, respectively.
C Class C shares’ contingent deferred sales charges included in the past one year and life of fund total return figures are 1% and 0%, respectively.
|
$10,000 Over Life of Fund
Let’s say hypothetically that $10,000 was invested in Fidelity Advisor Freedom 2005 Class T on November 6, 2003, when the fund started, and the current 3.50% sales charge was paid. The chart shows how the value of your investment would have changed, and also shows how the Lehman Brothers Aggregate Bond Index performed over the same period.
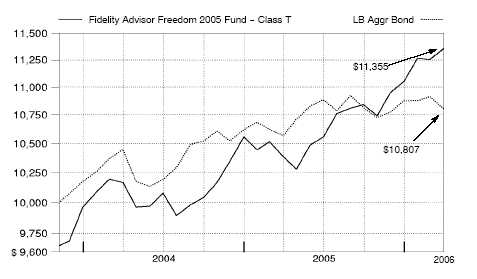
5 Annual Report
Fidelity Advisor Freedom 2010 Fund® — Class A, T, B, and C
Performance: The Bottom Line
|
Average annual total return reflects the change in the value of an investment, assuming reinvestment of each class’ dividend income and capital gains (the profits earned upon the sale of securities that have grown in value) and assuming a constant rate of performance each year. The $10,000 table and each class’ returns do not reflect the deduction of taxes that a shareholder would pay on fund distributions or the redemption of fund shares. During periods of reimbursement by Fidelity, a fund’s total return will be greater than it would be had the reimbursement not occurred. How a fund did yesterday is no guarantee of how it will do tomorrow.
| Average Annual Total Returns | | | | |
Periods ended March 31, 2006 | | Past 1 | | Life of |
| | | year | | fundA |
| Class A | | 9.65% | | 8.18% |
| Class A (incl. 5.75% sales charge) | | 3.35% | | 5.82% |
| Class T | | 9.42% | | 7.90% |
| Class T (incl. 3.50% sales charge) | | 5.59% | | 6.48% |
| Class B | | 8.83% | | 7.36% |
| Class B (incl. contingent deferred sales charge)B | | 3.83% | | 6.36% |
| Class C | | 8.78% | | 7.34% |
| Class C (incl. contingent deferred sales charge)C | | 7.78% | | 7.34% |
A From July 24, 2003.
B Class B shares’ contingent deferred sales charges included in the past one year and life of fund total return figures are 5% and 3%, respectively.
C Class C shares’ contingent deferred sales charges included in the past one year and life of fund total return figures are 1% and 0%, respectively.
|
$10,000 Over Life of Fund
Let’s say hypothetically that $10,000 was invested in Fidelity Advisor Freedom 2010 Class T on July 24, 2003, when the fund started, and the current 3.50% sales charge was paid. The chart shows how the value of your investment would have changed, and also shows how the Lehman Brothers Aggregate Bond Index performed over the same period.
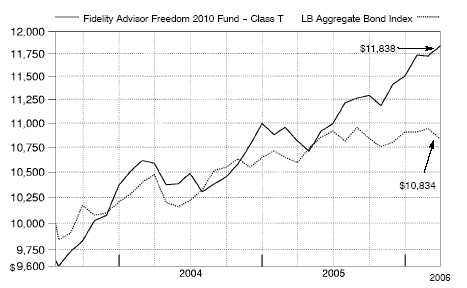
Annual Report 6
Fidelity Advisor Freedom 2015 Fund® — Class A, T, B, and C
Performance: The Bottom Line
|
Average annual total return reflects the change in the value of an investment, assuming reinvestment of each class’ dividend income and capital gains (the profits earned upon the sale of securities that have grown in value) and assuming a constant rate of performance each year. The $10,000 table and each class’ returns do not reflect the deduction of taxes that a shareholder would pay on fund distributions or the redemption of fund shares. During periods of reimbursement by Fidelity, a fund’s total return will be greater than it would be had the reimbursement not occurred. How a fund did yesterday is no guarantee of how it will do tomorrow.
| Average Annual Total Returns | | | | |
Periods ended March 31, 2006 | | Past 1 | | Life of |
| | | year | | fundA |
| Class A | | 12.12% | | 9.02% |
| Class A (incl. 5.75% sales charge) | | 5.67% | | 6.37% |
| Class T | | 11.71% | | 8.75% |
| Class T (incl. 3.50% sales charge) | | 7.80% | | 7.14% |
| Class B | | 11.17% | | 8.25% |
| Class B (incl. contingent deferred sales charge)B | | 6.17% | | 7.12% |
| Class C | | 11.19% | | 8.23% |
| Class C (incl. contingent deferred sales charge)C | | 10.19% | | 8.23% |
A From November 6, 2003.
B Class B shares’ contingent deferred sales charges included in the past one year and life of fund total return figures are 5% and 3%, respectively.
C Class C shares’ contingent deferred sales charges included in the past one year and life of fund total return figures are 1% and 0%, respectively.
|
$10,000 Over Life of Fund
Let’s say hypothetically that $10,000 was invested in Fidelity Advisor Freedom 2015 Class T on November 6, 2003, when the fund started, and the current 3.50% sales charge was paid. The chart shows how the value of your investment would have changed, and also shows how the Standard & Poor’s 500SM Index (S&P 500®) performed over the same period.
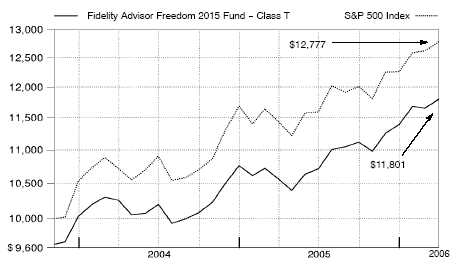
7 Annual Report
Fidelity Advisor Freedom 2020 Fund® — Class A, T, B, and C
Performance: The Bottom Line
|
Average annual total return reflects the change in the value of an investment, assuming reinvestment of each class’ dividend income and capital gains (the profits earned upon the sale of securities that have grown in value) and assuming a constant rate of performance each year. The $10,000 table and each class’ returns do not reflect the deduction of taxes that a shareholder would pay on fund distributions or the redemption of fund shares. During periods of reimbursement by Fidelity, a fund’s total return will be greater than it would be had the reimbursement not occurred. How a fund did yesterday is no guarantee of how it will do tomorrow.
| Average Annual Total Returns | | | | |
Periods ended March 31, 2006 | | Past 1 | | Life of |
| | | year | | fundA |
| Class A | | 13.62% | | 11.54% |
| Class A (incl. 5.75% sales charge) | | 7.08% | | 9.11% |
| Class T | | 13.28% | | 11.28% |
| Class T (incl. 3.50% sales charge) | | 9.31% | | 9.82% |
| Class B | | 12.71% | | 10.73% |
| Class B (incl. contingent deferred sales charge)B | | 7.71% | | 9.79% |
| Class C | | 12.66% | | 10.74% |
| Class C (incl. contingent deferred sales charge)C | | 11.66% | | 10.74% |
A From July 24, 2003.
B Class B shares’ contingent deferred sales charges included in the past one year and life of fund total return figures are 5% and 3%, respectively.
C Class C shares’ contingent deferred sales charges included in the past one year and life of fund total return figures are 1% and 0%, respectively.
|
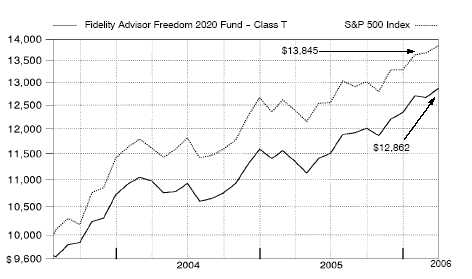
$10,000 Over Life of Fund
Let’s say hypothetically that $10,000 was invested in Fidelity Advisor Freedom 2020 Class T on July 24, 2003, when the fund started, and the current 3.50% sales charge was paid. The chart shows how the value of your investment would have changed, and also shows how the S&P 500 performed over the same period.
Annual Report 8
Fidelity Advisor Freedom 2025 Fund® — Class A, T, B, and C
Performance: The Bottom Line
|
Average annual total return reflects the change in the value of an investment, assuming reinvestment of each class’ dividend income and capital gains (the profits earned upon the sale of securities that have grown in value) and assuming a constant rate of performance each year. The $10,000 table and each class’ returns do not reflect the deduction of taxes that a shareholder would pay on fund distributions or the redemption of fund shares. During periods of reimbursement by Fidelity, a fund’s total return will be greater than it would be had the reimbursement not occurred. How a fund did yesterday is no guarantee of how it will do tomorrow.
| Average Annual Total Returns | | | | |
Periods ended March 31, 2006 | | Past 1 | | Life of |
| | | year | | fundA |
| Class A | | 14.35% | | 10.68% |
| Class A (incl. 5.75% sales charge) | | 7.78% | | 7.98% |
| Class T | | 14.07% | | 10.56% |
| Class T (incl. 3.50% sales charge) | | 10.08% | | 8.94% |
| Class B | | 13.46% | | 9.88% |
| Class B (incl. contingent deferred sales charge)B | | 8.46% | | 8.78% |
| Class C | | 13.46% | | 9.85% |
| Class C (incl. contingent deferred sales charge)C | | 12.46% | | 9.85% |
A From November 6, 2003.
B Class B shares’ contingent deferred sales charges included in the past one year and life of fund total return figures are 5% and 3%, respectively.
C Class C shares’ contingent deferred sales charges included in the past one year and life of fund total return figures are 1% and 0%, respectively.
|
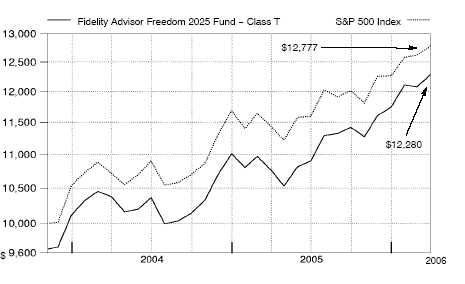
$10,000 Over Life of Fund
Let’s say hypothetically that $10,000 was invested in Fidelity Advisor Freedom 2025 Class T on November 6, 2003, when the fund started, and the current 3.50% sales charge was paid. The chart shows how the value of your investment would have changed, and also shows how the S&P 500 performed over the same period.
9 Annual Report
Fidelity Advisor Freedom 2030 Fund® — Class A, T, B, and C
Performance: The Bottom Line
|
Average annual total return reflects the change in the value of an investment, assuming reinvestment of each class’ dividend income and capital gains (the profits earned upon the sale of securities that have grown in value) and assuming a constant rate of performance each year. The $10,000 table and each class’ returns do not reflect the deduction of taxes that a shareholder would pay on fund distributions or the redemption of fund shares. During periods of reimbursement by Fidelity, a fund’s total return will be greater than it would be had the reimbursement not occurred. How a fund did yesterday is no guarantee of how it will do tomorrow.
| Average Annual Total Returns | | | | |
Periods ended March 31, 2006 | | Past 1 | | Life of |
| | | year | | fundA |
| Class A | | 15.84% | | 13.22% |
| Class A (incl. 5.75% sales charge) | | 9.18% | | 10.75% |
| Class T | | 15.52% | | 12.93% |
| Class T (incl. 3.50% sales charge) | | 11.48% | | 11.45% |
| Class B | | 14.96% | | 12.38% |
| Class B (incl. contingent deferred sales charge)B | | 9.96% | | 11.46% |
| Class C | | 14.99% | | 12.39% |
| Class C (incl. contingent deferred sales charge)C | | 13.99% | | 12.39% |
A From July 24, 2003.
B Class B shares’ contingent deferred sales charges included in the past one year and life of fund total return figures are 5% and 3%, respectively.
C Class C shares’ contingent deferred sales charges included in the past one year and life of fund total return figures are 1% and 0%, respectively.
|
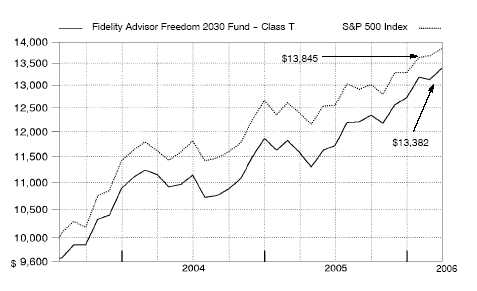
$10,000 Over Life of Fund
Let’s say hypothetically that $10,000 was invested in Fidelity Advisor Freedom 2030 Class T on July 24, 2003, when the fund started, and the current 3.50% sales charge was paid. The chart shows how the value of your investment would have changed, and also shows how the S&P 500 performed over the same period.
Annual Report 10
Fidelity Advisor Freedom 2035 Fund® — Class A, T, B, and C
Performance: The Bottom Line
|
Average annual total return reflects the change in the value of an investment, assuming reinvestment of each class’ dividend income and capital gains (the profits earned upon the sale of securities that have grown in value) and assuming a constant rate of performance each year. The $10,000 table and each class’ returns do not reflect the deduction of taxes that a shareholder would pay on fund distributions or the redemption of fund shares. During periods of reimbursement by Fidelity, a fund’s total return will be greater than it would be had the reimbursement not occurred. How a fund did yesterday is no guarantee of how it will do tomorrow.
| Average Annual Total Returns | | | | |
Periods ended March 31, 2006 | | Past 1 | | Life of |
| | | year | | fundA |
| Class A | | 16.03% | | 11.96% |
| Class A (incl. 5.75% sales charge) | | 9.36% | | 9.23% |
| Class T | | 15.84% | | 11.64% |
| Class T (incl. 3.50% sales charge) | | 11.79% | | 10.00% |
| Class B | | 15.17% | | 11.04% |
| Class B (incl. contingent deferred sales charge)B | | 10.17% | | 9.95% |
| Class C | | 15.15% | | 11.08% |
| Class C (incl. contingent deferred sales charge)C | | 14.15% | | 11.08% |
A From November 6, 2003.
B Class B shares’ contingent deferred sales charges included in the past one year and life of fund total return figures are 5% and 3%, respectively.
C Class C shares’ contingent deferred sales charges included in the past one year and life of fund total return figures are 1% and 0%, respectively.
|
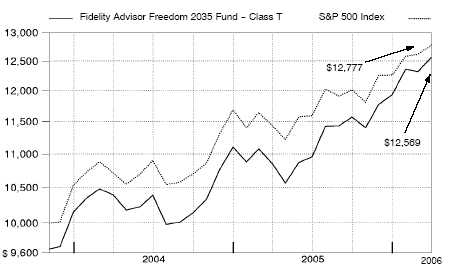
$10,000 Over Life of Fund
Let’s say hypothetically that $10,000 was invested in Fidelity Advisor Freedom 2035 Class T on November 6, 2003, when the fund started, and the current 3.50% sales charge was paid. The chart shows how the value of your investment would have changed, and also shows how the S&P 500 performed over the same period.
11 Annual Report
Fidelity Advisor Freedom 2040 Fund® — Class A, T, B, and C
Performance: The Bottom Line
|
Average annual total return reflects the change in the value of an investment, assuming reinvestment of each class’ dividend income and capital gains (the profits earned upon the sale of securities that have grown in value) and assuming a constant rate of performance each year. The $10,000 table and each class’ returns do not reflect the deduction of taxes that a shareholder would pay on fund distributions or the redemption of fund shares. During periods of reimbursement by Fidelity, a fund’s total return will be greater than it would be had the reimbursement not occurred. How a fund did yesterday is no guarantee of how it will do tomorrow.
| Average Annual Total Returns | | | | |
Periods ended March 31, 2006 | | Past 1 | | Life of |
| | | year | | fundA |
| Class A | | 16.65% | | 14.34% |
| Class A (incl. 5.75% sales charge) | | 9.94% | | 11.85% |
| Class T | | 16.35% | | 14.01% |
| Class T (incl. 3.50% sales charge) | | 12.27% | | 12.51% |
| Class B | | 15.81% | | 13.47% |
| Class B (incl. contingent deferred sales charge)B | | 10.81% | | 12.57% |
| Class C | | 15.82% | | 13.46% |
| Class C (incl. contingent deferred sales charge)C | | 14.82% | | 13.46% |
A From July 24, 2003.
B Class B shares’ contingent deferred sales charges included in the past one year and life of fund total return figures are 5% and 3%, respectively.
C Class C shares’ contingent deferred sales charges included in the past one year and life of fund total return figures are 1% and 0%, respectively.
|
$10,000 Over Life of Fund
Let’s say hypothetically that $10,000 was invested in Fidelity Advisor Freedom 2040 Class T on July 24, 2003, when the fund started, and the current 3.50% sales charge was paid. The chart shows how the value of your investment would have changed, and also shows how the S&P 500 performed over the same period.
Annual Report 12
Management’s Discussion of Fund Performance
Comments from Ren Cheng and Jonathan Shelon, Co Portfolio Managers of Fidelity Advisor Freedom Funds®
Stocks registered widespread gains for the 12 months ending March 31, 2006, as most major equity market benchmarks turned in double digit returns. Strong corporate earnings and healthy economic growth helped fuel U.S. equities in spite of mounting concerns about inflation, a softening of the housing market and higher short term interest rates. Of the 10 broad market sectors measured by the Standard & Poor’s 500SM Index, energy had the best performance, followed by financials and telecommunication services, which also did well. Consumer discretionary had the weakest results, held back by poor performing automobile and traditional media stocks. For the 12 month period overall, the S&P 500® gained 11.73%; the NASDAQ Composite® Index, benefiting from more exposure to better performing mid and small cap stocks, was up 18.03%; and the Morgan Stanley Capital InternationalSM Europe, Australasia, Far East (MSCI® EAFE®) Index a broad benchmark of the international equity markets was up 24.62% . Turning to fixed income results, continued short term interest hikes by the Federal Reserve Board contributed to mixed returns for many sectors of the taxable, investment grade bond market during the period. The Lehman Brothers® Aggregate Bond Index a broad measure of the investment grade bond market returned 2.26% . High yield bonds represented the best performing debt category, bolstered by improving issuer fundamentals and low default rates, with the Merrill Lynch® U.S. High Yield Master II Index returning 7.23% ..
During the 12 months ending March 31, 2006, the Advisor Freedom Funds performed in line with our expectations, with each of the funds in the series producing consistent results, as determined by its age appropriate asset allocation. On a relative basis, most of the Funds outperformed their respective composite benchmarks during the period. The biggest factor in the Funds’ relative results was a continuation of the strong absolute performance in both the domestic and international equity markets. The Dow Jones Wilshire 5000 Composite IndexSM the broad market index the Advisor Freedom Funds use to measure the performance of U.S. equities in their composite benchmarks gained 14.72%, while the MSCI EAFE index’s hefty gain reflected the especially strong performance of foreign equities during the period. Performance within the fixed income asset classes was less pro nounced during the period, as rising short term interest rates and gathering inflation fears continued to put pressure on bond prices. An exception to this overall trend was the performance of high yield bonds, where the lower rated sectors of that category produced the strongest results, driving the underlying high yield fund to outperform its benchmark index. The Funds’ investment grade bond allocation performed slightly ahead of the 2.26% rise in its benchmark. Meanwhile, the short term asset class’s return was slightly behind the 3.55% gain of its benchmark index, but still provided a better absolute return than investment grade bonds during this period of rapidly rising short term interest rates.
The views expressed above reflect those of the portfolio manager(s) only through the end of the period as stated on the cover of this report and do not necessarily represent the views of Fidelity or any other person in the Fidelity organization. Any such views are subject to change at any time based upon market or other conditions and Fidelity disclaims any responsibility to update such views. These views may not be relied on as investment advice and, because investment decisions for a Fidelity fund are based on numerous factors, may not be relied on as an indication of trading intent on behalf of any Fidelity fund.
13 13 Annual Report
Shareholder Expense Example
|
As a shareholder of a Fund, you incur two types of costs: (1) transaction costs, including sales charges (loads) on purchase payments or redemption proceeds, and (2) ongoing costs, including distribution and/or service (12b 1) fees and other Fund expenses. This Example is intended to help you understand your ongoing costs (in dollars) of investing in the Funds and to compare these costs with the ongoing costs of investing in other mutual funds.
The Example is based on an investment of $1,000 invested at the beginning of the period and held for the entire period (October 1, 2005 to March 31, 2006).
The first line of the table below for each class of each fund provides information about actual account values and actual expenses. You may use the information in this line, together with the amount you invested, to estimate the expenses that you paid over the period. Simply divide your account value by $1,000.00 (for example, an $8,600 account value divided by $1,000.00 = 8.6), then multiply the result by the number in the first line for a class of the fund under the heading entitled “Expenses Paid During Period” to estimate the expenses you paid on your account during this period. In addi tion, each fund, as a shareholder in underlying Fidelity funds, will indirectly bear its pro rata share of the fees and expenses incurred by the underlying Fidelity funds. These fees and expenses are not included in each fund’s annualized expense ratio used to calculate the expense estimates in the table below.
Hypothetical Example for Comparison Purposes
|
The second line of the table below for each class of each fund provides information about hypothetical account values and hypothetical expenses based on a Class’ actual expense ratio and an assumed rate of return of 5% per year before expenses, which is not the Class’ actual return. The hypothetical account values and expenses may not be used to estimate the actual ending account balance or expenses you paid for the period. You may use this information to compare the ongoing costs of investing in the Fund and other funds. To do so, compare this 5% hypothetical example with the 5% hypothetical examples that appear in the shareholder reports of the other funds. In addition, each fund, as a shareholder in underlying Fidelity funds, will indirectly bear its pro rata share of the fees and expenses incurred by the underlying Fidelity funds. These fees and expenses are not included in each fund’s annualized expense ratio used to calculate the expense estimates in the table below.
Please note that the expenses shown in the table are meant to highlight your ongoing costs only and do not reflect any transaction costs. Therefore, the second line of the table is useful in comparing ongoing costs only, and will not help you determine the relative total costs of owning different funds. In addition, if these transactional costs were included, your costs would have been higher.
| | | | | | | | | Expenses Paid |
| | | Beginning | | | | Ending | | During Period* |
| | | Account Value | | | | Account Value | | October 1, 2005 |
| | | October 1, 2005 | | | | March 31, 2006 | | to March 31, 2006 |
| Advisor Freedom Income | | | | | | | | | | |
| Class A | | | | | | | | | | |
| Actual | | $ 1,000.00 | | | | $ 1,024.10 | | | | $ 1.26 |
| HypotheticalA | | $ 1,000.00 | | | | $ 1,023.68 | | | | $ 1.26 |
| Class T | | | | | | | | | | |
| Actual | | $ 1,000.00 | | | | $ 1,022.00 | | | | $ 2.52 |
| HypotheticalA | | $ 1,000.00 | | | | $ 1,022.44 | | | | $ 2.52 |
| Class B | | | | | | | | | | |
| Actual | | $ 1,000.00 | | | | $ 1,019.20 | | | | $ 5.03 |
| HypotheticalA | | $ 1,000.00 | | | | $ 1,019.95 | | | | $ 5.04 |
| Class C | | | | | | | | | | |
| Actual | | $ 1,000.00 | | | | $ 1,020.30 | | | | $ 5.04 |
| HypotheticalA | | $ 1,000.00 | | | | $ 1,019.95 | | | | $ 5.04 |
| Institutional Class | | | | | | | | | | |
| Actual | | $ 1,000.00 | | | | $ 1,024.50 | | | | $ .00 |
| HypotheticalA | | $ 1,000.00 | | | | $ 1,024.93 | | | | $ .00 |
| Advisor Freedom 2005 | | | | | | | | | | |
| Class A | | | | | | | | | | |
| Actual | | $ 1,000.00 | | | | $ 1,048.50 | | | | $ 1.28 |
| HypotheticalA | | $ 1,000.00 | | | | $ 1,023.68 | | | | $ 1.26 |
| Class T | | | | | | | | | | |
| Actual | | $ 1,000.00 | | | | $ 1,047.40 | | | | $ 2.55 |
| HypotheticalA | | $ 1,000.00 | | | | $ 1,022.44 | | | | $ 2.52 |
| Class B | | | | | | | | | | |
| Actual | | $ 1,000.00 | | | | $ 1,044.90 | | | | $ 5.10 |
| HypotheticalA | | $ 1,000.00 | | | | $ 1,019.95 | | | | $ 5.04 |
| Class C | | | | | | | | | | |
| Actual | | $ 1,000.00 | | | | $ 1,044.40 | | | | $ 5.10 |
| HypotheticalA | | $ 1,000.00 | | | | $ 1,019.95 | | | | $ 5.04 |
| Institutional Class | | | | | | | | | | |
| Actual | | $ 1,000.00 | | | | $ 1,050.70 | | | | $ .00 |
| HypotheticalA | | $ 1,000.00 | | | | $ 1,024.93 | | | | $ .00 |
| | | | | | | | | Expenses Paid |
| | | Beginning | | | | Ending | | During Period* |
| | | Account Value | | | | Account Value | | October 1, 2005 |
| | | October 1, 2005 | | | | March 31, 2006 | | to March 31, 2006 |
| Advisor Freedom 2010 | | | | | | | | | | |
| Class A | | | | | | | | | | |
| Actual | | $ 1,000.00 | | | | $ 1,049.90 | | | | $ 1.28 |
| HypotheticalA | | $ 1,000.00 | | | | $ 1,023.68 | | | | $ 1.26 |
| Class T | | | | | | | | | | |
| Actual | | $ 1,000.00 | | | | $ 1,048.20 | | | | $ 2.55 |
| HypotheticalA | | $ 1,000.00 | | | | $ 1,022.44 | | | | $ 2.52 |
| Class B | | | | | | | | | | |
| Actual | | $ 1,000.00 | | | | $ 1,045.50 | | | | $ 5.10 |
| HypotheticalA | | $ 1,000.00 | | | | $ 1,019.95 | | | | $ 5.04 |
| Class C | | | | | | | | | | |
| Actual | | $ 1,000.00 | | | | $ 1,044.90 | | | | $ 5.10 |
| HypotheticalA | | $ 1,000.00 | | | | $ 1,019.95 | | | | $ 5.04 |
| Institutional Class | | | | | | | | | | |
| Actual | | $ 1,000.00 | | | | $ 1,051.30 | | | | $ .00 |
| HypotheticalA | | $ 1,000.00 | | | | $ 1,024.93 | | | | $ .00 |
| Advisor Freedom 2015 | | | | | | | | | | |
| Class A | | | | | | | | | | |
| Actual | | $ 1,000.00 | | | | $ 1,063.90 | | | | $ 1.29 |
| HypotheticalA | | $ 1,000.00 | | | | $ 1,023.68 | | | | $ 1.26 |
| Class T | | | | | | | | | | |
| Actual | | $ 1,000.00 | | | | $ 1,061.50 | | | | $ 2.57 |
| HypotheticalA | | $ 1,000.00 | | | | $ 1,022.44 | | | | $ 2.52 |
| Class B | | | | | | | | | | |
| Actual | | $ 1,000.00 | | | | $ 1,059.10 | | | | $ 5.13 |
| HypotheticalA | | $ 1,000.00 | | | | $ 1,019.95 | | | | $ 5.04 |
| Class C | | | | | | | | | | |
| Actual | | $ 1,000.00 | | | | $ 1,059.30 | | | | $ 5.13 |
| HypotheticalA | | $ 1,000.00 | | | | $ 1,019.95 | | | | $ 5.04 |
| Institutional Class | | | | | | | | | | |
| Actual | | $ 1,000.00 | | | | $ 1,065.00 | | | | $ .00 |
| HypotheticalA | | $ 1,000.00 | | | | $ 1,024.93 | | | | $ .00 |
| Advisor Freedom 2020 | | | | | | | | | | |
| Class A | | | | | | | | | | |
| Actual | | $ 1,000.00 | | | | $ 1,072.50 | | | | $ 1.29 |
| HypotheticalA | | $ 1,000.00 | | | | $ 1,023.68 | | | | $ 1.26 |
| Class T | | | | | | | | | | |
| Actual | | $ 1,000.00 | | | | $ 1,070.80 | | | | $ 2.58 |
| HypotheticalA | | $ 1,000.00 | | | | $ 1,022.44 | | | | $ 2.52 |
| Class B | | | | | | | | | | |
| Actual | | $ 1,000.00 | | | | $ 1,068.30 | | | | $ 5.16 |
| HypotheticalA | | $ 1,000.00 | | | | $ 1,019.95 | | | | $ 5.04 |
| Class C | | | | | | | | | | |
| Actual | | $ 1,000.00 | | | | $ 1,067.60 | | | | $ 5.15 |
| HypotheticalA | | $ 1,000.00 | | | | $ 1,019.95 | | | | $ 5.04 |
| Institutional Class | | | | | | | | | | |
| Actual | | $ 1,000.00 | | | | $ 1,073.80 | | | | $ .00 |
| HypotheticalA | | $ 1,000.00 | | | | $ 1,024.93 | | | | $ .00 |
| Advisor Freedom 2025 | | | | | | | | | | |
| Class A | | | | | | | | | | |
| Actual | | $ 1,000.00 | | | | $ 1,076.10 | | | | $ 1.29 |
| HypotheticalA | | $ 1,000.00 | | | | $ 1,023.68 | | | | $ 1.26 |
| Class T | | | | | | | | | | |
| Actual | | $ 1,000.00 | | | | $ 1,075.20 | | | | $ 2.59 |
| HypotheticalA | | $ 1,000.00 | | | | $ 1,022.44 | | | | $ 2.52 |
| Class B | | | | | | | | | | |
| Actual | | $ 1,000.00 | | | | $ 1,072.50 | | | | $ 5.17 |
| HypotheticalA | | $ 1,000.00 | | | | $ 1,019.95 | | | | $ 5.04 |
15 15 Annual Report
| Shareholder Expense Example continued | | | | | | | | | | | | |
| |
| |
| | | | | | | | | | | | | Expenses Paid |
| | | | | | | Beginning | | | | Ending | | During Period* |
| | | | | | | Account Value | | | | Account Value | | October 1, 2005 |
| | | | | | | October 1, 2005 | | | | March 31, 2006 | | to March 31, 2006 |
| Class C | | | | | | | | | | | | | | |
| Actual | | | | | | $ 1,000.00 | | | | $ 1,072.50 | | | | $ 5.17 |
| HypotheticalA | | | | | | $ 1,000.00 | | | | $ 1,019.95 | | | | $ 5.04 |
| Institutional Class | | | | | | | | | | | | | | |
| Actual | | | | | | $ 1,000.00 | | | | $ 1,078.20 | | | | $ .00 |
| HypotheticalA | | | | | | $ 1,000.00 | | | | $ 1,024.93 | | | | $ .00 |
| Advisor Freedom 2030 | | | | | | | | | | | | | | |
| Class A | | | | | | | | | | | | | | |
| Actual | | | | | | $ 1,000.00 | | | | $ 1,085.90 | | | | $ 1.30 |
| HypotheticalA | | | | | | $ 1,000.00 | | | | $ 1,023.68 | | | | $ 1.26 |
| Class T | | | | | | | | | | | | | | |
| Actual | | | | | | $ 1,000.00 | | | | $ 1,084.20 | | | | $ 2.60 |
| HypotheticalA | | | | | | $ 1,000.00 | | | | $ 1,022.44 | | | | $ 2.52 |
| Class B | | | | | | | | | | | | | | |
| Actual | | | | | | $ 1,000.00 | | | | $ 1,081.10 | | | | $ 5.19 |
| HypotheticalA | | | | | | $ 1,000.00 | | | | $ 1,019.95 | | | | $ 5.04 |
| Class C | | | | | | | | | | | | | | |
| Actual | | | | | | $ 1,000.00 | | | | $ 1,081.40 | | | | $ 5.19 |
| HypotheticalA | | | | | | $ 1,000.00 | | | | $ 1,019.95 | | | | $ 5.04 |
| Institutional Class | | | | | | | | | | | | | | |
| Actual | | | | | | $ 1,000.00 | | | | $ 1,087.10 | | | | $ .00 |
| HypotheticalA | | | | | | $ 1,000.00 | | | | $ 1,024.93 | | | | $ .00 |
| Advisor Freedom 2035 | | | | | | | | | | | | | | |
| Class A | | | | | | | | | | | | | | |
| Actual | | | | | | $ 1,000.00 | | | | $ 1,087.40 | | | | $ 1.30 |
| HypotheticalA | | | | | | $ 1,000.00 | | | | $ 1,023.68 | | | | $ 1.26 |
| Class T | | | | | | | | | | | | | | |
| Actual | | | | | | $ 1,000.00 | | | | $ 1,086.20 | | | | $ 2.60 |
| HypotheticalA | | | | | | $ 1,000.00 | | | | $ 1,022.44 | | | | $ 2.52 |
| Class B | | | | | | | | | | | | | | |
| Actual | | | | | | $ 1,000.00 | | | | $ 1,083.40 | | | | $ 5.19 |
| HypotheticalA | | | | | | $ 1,000.00 | | | | $ 1,019.95 | | | | $ 5.04 |
| Class C | | | | | | | | | | | | | | |
| Actual | | | | | | $ 1,000.00 | | | | $ 1,083.30 | | | | $ 5.19 |
| HypotheticalA | | | | | | $ 1,000.00 | | | | $ 1,019.95 | | | | $ 5.04 |
| Institutional Class | | | | | | | | | | | | | | |
| Actual | | | | | | $ 1,000.00 | | | | $ 1,089.50 | | | | $ .00 |
| HypotheticalA | | | | | | $ 1,000.00 | | | | $ 1,024.93 | | | | $ .00 |
| Advisor Freedom 2040 | | | | | | | | | | | | | | |
| Class A | | | | | | | | | | | | | | |
| Actual | | | | | | $ 1,000.00 | | | | $ 1,091.30 | | | | $ 1.30 |
| HypotheticalA | | | | | | $ 1,000.00 | | | | $ 1,023.68 | | | | $ 1.26 |
| Class T | | | | | | | | | | | | | | |
| Actual | | | | | | $ 1,000.00 | | | | $ 1,089.60 | | | | $ 2.60 |
| HypotheticalA | | | | | | $ 1,000.00 | | | | $ 1,022.44 | | | �� | $ 2.52 |
| Class B | | | | | | | | | | | | | | |
| Actual | | | | | | $ 1,000.00 | | | | $ 1,086.80 | | | | $ 5.20 |
| HypotheticalA | | | | | | $ 1,000.00 | | | | $ 1,019.95 | | | | $ 5.04 |
| Class C | | | | | | | | | | | | | | |
| Actual | | | | | | $ 1,000.00 | | | | $ 1,087.00 | | | | $ 5.20 |
| HypotheticalA | | | | | | $ 1,000.00 | | | | $ 1,019.95 | | | | $ 5.04 |
| Institutional Class | | | | | | | | | | | | | | |
| Actual | | | | | | $ 1,000.00 | | | | $ 1,092.40 | | | | $ .00 |
| HypotheticalA | | | | | | $ 1,000.00 | | | | $ 1,024.93 | | | | $ .00 |
| |
| A 5% return per year before expenses | | | | | | | | | | | | | | |
* Expenses are equal to each Class’ annualized expense ratio (shown in the table below); multiplied by the average account value over the period, multiplied by 182/ 365 (to reflect the one-half year period). The fees and expenses of the underlying Fidelity funds in which the fund invests are not included in each class’ annualized expense ratio.
| | | Annualized |
| | | Expense Ratio |
| Advisor Freedom Income | | |
| Class A | | .25% |
| Class T | | .50% |
| Class B | | 1.00% |
| Class C | | 1.00% |
| Institutional Class | | .00% |
| Advisor Freedom 2005 | | |
| Class A | | .25% |
| Class T | | .50% |
| Class B | | 1.00% |
| Class C | | 1.00% |
| Institutional Class | | .00% |
| Advisor Freedom 2010 | | |
| Class A | | .25% |
| Class T | | .50% |
| Class B | | 1.00% |
| Class C | | 1.00% |
| Institutional Class | | .00% |
| Advisor Freedom 2015 | | |
| Class A | | .25% |
| Class T | | .50% |
| Class B | | 1.00% |
| Class C | | 1.00% |
| Institutional Class | | .00% |
| Advisor Freedom 2020 | | |
| Class A | | .25% |
| Class T | | .50% |
| Class B | | 1.00% |
| Class C | | 1.00% |
| Institutional Class | | .00% |
| Advisor Freedom 2025 | | |
| Class A | | .25% |
| Class T | | .50% |
| Class B | | 1.00% |
| Class C | | 1.00% |
| Institutional Class | | .00% |
| Advisor Freedom 2030 | | |
| Class A | | .25% |
| Class T | | .50% |
| Class B | | 1.00% |
| Class C | | 1.00% |
| Institutional Class | | .00% |
| Advisor Freedom 2035 | | |
| Class A | | .25% |
| Class T | | .50% |
| Class B | | 1.00% |
| Class C | | 1.00% |
| Institutional Class | | .00% |
| Advisor Freedom 2040 | | |
| Class A | | .25% |
| Class T | | .50% |
| Class B | | 1.00% |
| Class C | | 1.00% |
| Institutional Class | | .00% |
17 17 Annual Report
| Fidelity Advisor Freedom Income Fund |
| Investment Changes | | |
| |
| |
| Fund Holdings as of March 31, 2006 | | |
| | | % of fund’s | | % of fund’s investments |
| | | investments | | 6 months ago |
| Domestic Equity Funds | | | | |
| Fidelity Advisor Dividend Growth | | | | |
| Fund Institutional Class | | 4.4 | | 4.0 |
| Fidelity Advisor Equity Growth | | | | |
| Fund Institutional Class | | 2.5 | | 2.0 |
| Fidelity Advisor Equity Income | | | | |
| Fund Institutional Class | | 4.3 | | 4.0 |
| Fidelity Advisor Growth & Income | | | | |
| Fund Institutional Class | | 3.3 | | 4.0 |
| Fidelity Advisor Large Cap Fund | | | | |
| Institutional Class | | 3.3 | | 4.0 |
| Fidelity Advisor Mid Cap Fund | | | | |
| Institutional Class | | 1.7 | | 1.3 |
| Fidelity Advisor Small Cap Fund | | | | |
| Institutional Class | | 1.3 | | 1.3 |
| | | 20.8 | | 20.6 |
| High Yield Fixed Income Funds | | | | |
| Fidelity Advisor High Income | | | | |
| Advantage Fund Institutional | | | | |
| Class | | 2.0 | | 0.6 |
| Investment Grade Fixed-Income Funds | | | | |
| Fidelity Advisor Government | | | | |
| Investment Fund Institutional | | | | |
| Class | | 17.7 | | 19.0 |
| Fidelity Advisor Intermediate Bond | | | | |
| Fund Institutional Class | | 18.2 | | 19.5 |
| Fidelity Advisor Strategic Real | | | | |
| Return Fund Institutional Class | | 0.5 | | 0.0 |
| | | 36.4 | | 38.5 |
| Short Term Funds | | | | |
| Fidelity Advisor Short Fixed | | | | |
| Income Fund Institutional Class | | 20.4 | | 20.1 |
| Fidelity Cash Reserves Fund | | 20.4 | | 20.2 |
| | | 40.8 | | 40.3 |
| | | 100.0 | | 100.0 |
The “six months ago” allocation is based on the fund’s holdings as of Septem ber 30, 2005. The current allocation is based on the fund’s holdings as of March 31, 2006.
Annual Report 18
| Fidelity Advisor Freedom Income Fund | | |
| Investments March 31, 2006 |
| Showing Percentage of Total Value of Investment in Securities |
| |
| Equity Funds 20.8% | | |
| | | Shares | | Value (Note 1) |
| Domestic Equity Funds 20.8% | | | | |
| Fidelity Advisor Dividend Growth Fund | | | | |
| Institutional Class | | 239,409 | | $ 3,064,429 |
| Fidelity Advisor Equity Growth Fund | | | | |
| Institutional Class (a) | | 33,331 | | 1,766,565 |
| Fidelity Advisor Equity Income Fund | | | | |
| Institutional Class | | 102,461 | | 3,061,541 |
| Fidelity Advisor Growth & Income Fund | | | | |
| Institutional Class | | 123,801 | | 2,327,451 |
| Fidelity Advisor Large Cap Fund | | | | |
| Institutional Class | | 130,560 | | 2,350,089 |
| Fidelity Advisor Mid Cap Fund | | | | |
| Institutional Class | | 45,341 | | 1,197,917 |
| Fidelity Advisor Small Cap Fund | | | | |
| Institutional Class | | 36,272 | | 896,273 |
| TOTAL EQUITY FUNDS | | | | |
| (Cost $12,596,228) | | | | 14,664,265 |
| |
| Fixed Income Funds 38.4% | | | | |
| |
| High Yield Fixed-Income Funds – 2.0% | | | | |
| Fidelity Advisor High Income Advantage | | | | |
| Fund Institutional Class | | 146,488 | | 1,422,402 |
| Investment Grade Fixed Income Funds 36.4% | | | | |
| Fidelity Advisor Government Investment | | | | |
| Fund Institutional Class | | 1,285,510 | | 12,520,864 |
| Fidelity Advisor Intermediate Bond Fund | | | | |
| Institutional Class | | 1,196,286 | | 12,824,182 |
| Fidelity Advisor Strategic Real Return | | | | |
| Fund Institutional Class | | 37,043 | | 369,315 |
| |
| TOTAL INVESTMENT GRADE FIXED-INCOME FUNDS | | | | 25,714,361 |
| |
| TOTAL FIXED-INCOME FUNDS | | | | |
| (Cost $27,990,737) | | | | 27,136,763 |
| |
| Short Term Funds 40.8% | | | | |
| |
| Fidelity Advisor Short Fixed Income Fund | | | | |
| Institutional Class | | 1,542,636 | | 14,439,071 |
| Fidelity Cash Reserves Fund | | 14,429,670 | | 14,429,670 |
| TOTAL SHORT TERM FUNDS | | | | |
| (Cost $29,113,697) | | | | 28,868,741 |
| TOTAL INVESTMENT IN SECURITIES 100% | | | | |
| (Cost $69,700,662) | | | | $ 70,669,769 |
| | Legend
(a) Non-income producing
|
See accompanying notes which are an integral part of the financial statements.
19 Annual Report
| Fidelity Advisor Freedom Income Fund | | | | | | |
| |
| Financial Statements | | | | | | |
| |
| |
| Statement of Assets and Liabilities | | | | | | |
| | | | | | | March 31, 2006 |
| Assets | | | | | | |
| Investment in securities, at value (cost $69,700,662) — See accompanying schedule | | | | | | $ 70,669,769 |
| Cash | | | | | | 2 |
| Receivable for investments sold | | | | | | 143,909 |
| Receivable for fund shares sold | | | | | | 331,044 |
| Total assets | | | | | | 71,144,724 |
| |
| Liabilities | | | | | | |
| Payable for investments purchased | | | | $ 167,704 | | |
| Payable for fund shares redeemed | | | | 265,927 | | |
| Distribution fees payable | | | | 32,838 | | |
| Other affiliated payables | | | | 383 | | |
| Total liabilities | | | | | | 466,852 |
| |
| Net Assets | | | | | | $ 70,677,872 |
| Net Assets consist of: | | | | | | |
| Paid in capital | | | | | | $ 69,020,272 |
| Undistributed net investment income | | | | | | 192,880 |
| Accumulated undistributed net realized gain (loss) on investments | | | | | | 495,613 |
| Net unrealized appreciation (depreciation) on investments | | | | | | 969,107 |
| Net Assets | | | | | | $ 70,677,872 |
| Calculation of Maximum Offering Price | | | | | | |
| Class A: | | | | | | |
| Net Asset Value and redemption price per share ($18,523,716 ÷ 1,760,877 shares) | | | | | | $ 10.52 |
| Maximum offering price per share (100/94.25 of $10.52) | | | | | | $ 11.16 |
| Class T: | | | | | | |
| Net Asset Value and redemption price per share ($32,469,043 ÷ 3,088,635 shares) | | | | | | $ 10.51 |
| Maximum offering price per share (100/96.50 of $10.51) | | | | | | $ 10.89 |
| Class B: | | | | | | |
| Net Asset Value and offering price per share ($4,872,829 ÷ 464,048 shares)A | | | | | | $ 10.50 |
| Class C: | | | | | | |
| Net Asset Value and offering price per share ($13,678,370 ÷ 1,303,092 shares)A | | | | | | $ 10.50 |
| Institutional Class: | | | | | | |
| Net Asset Value, offering price and redemption price per share ($1,133,914 ÷ 107,691 shares) | | | | | | $ 10.53 |
| A Redemption price per share is equal to net asset value less any applicable contingent deferred sales charge. | | | | | | |
| |
| Statement of Operations | | | | | | |
| | | | | Year ended March 31, 2006 |
| Investment Income | | | | | | |
| Income distributions from underlying funds | | | | | | $ 2,004,168 |
| |
| Expenses | | | | | | |
| Management fee | | | | $ 4,883 | | |
| Distribution fees | | | | 380,439 | | |
| Independent trustees’ compensation | | | | 274 | | |
| Total expenses before reductions | | | | 385,596 | | |
| Expense reductions | | | | (1,266) | | 384,330 |
| |
| Net investment income (loss) | | | | | | 1,619,838 |
| Realized and Unrealized Gain (Loss) | | | | | | |
| Realized gain (loss) on sale of underlying fund shares | | | | 31,071 | | |
| Capital gain distributions from underlying funds | | | | 477,388 | | 508,459 |
| Change in net unrealized appreciation (depreciation) on underlying funds | | | | | | 864,314 |
| Net gain (loss) | | | | | | 1,372,773 |
| Net increase (decrease) in net assets resulting from operations | | | | | | $ 2,992,611 |
See accompanying notes which are an integral part of the financial statements.
| | |
| Annual Report | | 20 |
| Statement of Changes in Net Assets | | | | | | | | | | | | |
| | | | | | | Year ended | | | | Year ended |
| | | | | | | March 31, | | | | March 31, |
| | | | | | | 2006 | | | | 2005 |
| Increase (Decrease) in Net Assets | | | | | | | | | | | | |
| Operations | | | | | | | | | | | | |
| Net investment income (loss) | | | | | | $ 1,619,838 | | | | $ 739,057 |
| Net realized gain (loss) | | | | | | 508,459 | | | | 181,655 |
| Change in net unrealized appreciation (depreciation) | | | | | | 864,314 | | | | (460,298) |
| Net increase (decrease) in net assets resulting from operations | | | | | | 2,992,611 | | | | 460,414 |
| Distributions to shareholders from net investment income | | | | | | (1,455,415) | | | | (704,650) |
| Distributions to shareholders from net realized gain | | | | | | (201,782) | | | | (34,829) |
| Total distributions | | | | | | (1,657,197) | | | | (739,479) |
| Share transactions - net increase (decrease) | | | | | | 11,032,548 | | | | 25,789,420 |
| Total increase (decrease) in net assets | | | | | | 12,367,962 | | | | 25,510,355 |
| |
| Net Assets | | | | | | | | | | | | |
| Beginning of period | | | | | | 58,309,910 | | | | 32,799,555 |
| End of period (including undistributed net investment income of $192,880 and undistributed net investment income of | | | | | | | | | | | | |
| $86,109, respectively) | | | | | | $ 70,677,872 | | | | $ 58,309,910 |
| |
| Financial Highlights Class A | | | | | | | | | | | | |
| Years ended March 31, | | | | 2006 | | | | 2005 | | | | 2004G |
| Selected Per-Share Data | | | | | | | | | | | | |
| Net asset value, beginning of period | | | | $ 10.30 | | | | $ 10.40 | | | | $ 10.00 |
| Income from Investment Operations | | | | | | | | | | | | |
| Net investment income (loss)E | | | | .29 | | | | .20 | | | | .13 |
| Net realized and unrealized gain (loss) | | | | .23 | | | | (.10) | | | | .36 |
| Total from investment operations | | | | .52 | | | | .10 | | | | .49 |
| Distributions from net investment income | | | | (.27) | | | | (.19) | | | | (.09) |
| Distributions from net realized gain | | | | (.04) | | | | (.01) | | | | — |
| Total distributions | | | | (.30)I | | | | (.20) | | | | (.09) |
| Net asset value, end of period | | | | $ 10.52 | | | | $ 10.30 | | | | $ 10.40 |
| Total ReturnB,C,D | | | | 5.12% | | | | .99% | | | | 4.95% |
| Ratios to Average Net AssetsF,H | | | | | | | | | | | | |
| Expenses before reductions | | | | .26% | | | | .35% | | | | .35%A |
| Expenses net of fee waivers, if any | | | | .26% | | | | .33% | | | | .33%A |
| Expenses net of all reductions | | | | .26% | | | | .33% | | | | .33%A |
| Net investment income (loss) | | | | 2.83% | | | | 1.96% | | | | 1.81%A |
| Supplemental Data | | | | | | | | | | | | |
| Net assets, end of period (000 omitted) | | | | $ 18,524 | | | | $ 10,120 | | | | $ 5,009 |
| Portfolio turnover rate | | | | 21% | | | | 18% | | | | 46%A |
A Annualized
B Total returns for periods of less than one year are not annualized.
C Total returns would have been lower had certain expenses not been reduced during the periods shown.
D Total returns do not include the effect of the sales charges.
E Calculated based on average shares outstanding during the period.
F Amounts do not include the activity of the underlying funds.
G For the period July 24, 2003 (commencement of operations) to March 31, 2004.
H Expense ratios reflect operating expenses of the class. Expenses before reductions do not reflect amounts reimbursed by the investment adviser or expense offset arrangements and do not represent the amount paid by the class during periods when
reimbursements or reductions occur. Expense ratios before reductions for start up periods may not be representative of longer term operating periods. Expenses net of fee waivers reflect expenses after reimbursement by the investment adviser but prior to
reductions from expense offset arrangements. Expenses net of all reductions represent the net expenses paid by the class but do not include expenses of the investment companies in which the fund invests.
I Total distribution of $.300 per share is comprised of distributions from net investment income of $.265 and distributions from net realized gain of $.035 per share.
|
See accompanying notes which are an integral part of the financial statements.
|
21 Annual Report
| Financial Highlights Class T | | | | | | | | | | |
| Years ended March 31, | | 2006 | | | | 2005 | | | | 2004G |
| Selected Per-Share Data | | | | | | | | | | |
| Net asset value, beginning of period | | $ 10.30 | | | | $ 10.39 | | | | $ 10.00 |
| Income from Investment Operations | | | | | | | | | | |
| Net investment income (loss)E | | .27 | | | | .18 | | | | .11 |
| Net realized and unrealized gain (loss) | | .22 | | | | (.10) | | | | .37 |
| Total from investment operations | | .49 | | | | .08 | | | | .48 |
| Distributions from net investment income | | (.24) | | | | (.16) | | | | (.09) |
| Distributions from net realized gain | | (.04) | | | | (.01) | | | | — |
| Total distributions | | (.28) | | | | (.17) | | | | (.09) |
| Net asset value, end of period | | $ 10.51 | | | | $ 10.30 | | | | $ 10.39 |
| Total ReturnB,C,D | | 4.78% | | | | .79% | | | | 4.78% |
| Ratios to Average Net AssetsF,H | | | | | | | | | | |
| Expenses before reductions | | .51% | | | | .60% | | | | .60%A |
| Expenses net of fee waivers, if any | | .51% | | | | .58% | | | | .58%A |
| Expenses net of all reductions | | .51% | | | | .58% | | | | .58%A |
| Net investment income (loss) | | 2.58% | | | | 1.71% | | | | 1.56%A |
| Supplemental Data | | | | | | | | | | |
| Net assets, end of period (000 omitted) | | $ 32,469 | | | | $ 29,013 | | | | $ 14,535 |
| Portfolio turnover rate | | 21% | | | | 18% | | | | 46%A |
A Annualized
B Total returns for periods of less than one year are not annualized.
C Total returns would have been lower had certain expenses not been reduced during the periods shown.
D Total returns do not include the effect of the sales charges.
E Calculated based on average shares outstanding during the period.
F Amounts do not include the activity of the underlying funds.
G For the period July 24, 2003 (commencement of operations) to March 31, 2004.
H Expense ratios reflect operating expenses of the class. Expenses before reductions do not reflect amounts reimbursed by the investment adviser or expense offset arrangements and do not represent the amount paid by the class during periods when
reimbursements or reductions occur. Expense ratios before reductions for start up periods may not be representative of longer term operating periods. Expenses net of fee waivers reflect expenses after reimbursement by the investment adviser but
prior to reductions from expense offset arrangements. Expenses net of all reductions represent the net expenses paid by the class but do not include expenses of the investment companies in which the fund invests.
|
| Financial Highlights Class B | | | | | | | | | | |
| Years ended March 31, | | 2006 | | | | 2005 | | | | 2004G |
| Selected Per-Share Data | | | | | | | | | | |
| Net asset value, beginning of period | | $ 10.29 | | | | $ 10.38 | | | | $ 10.00 |
| Income from Investment Operations | | | | | | | | | | |
| Net investment income (loss)E | | 22 | | | | .12 | | | | .07 |
| Net realized and unrealized gain (loss) | | 21 | | | | (.10) | | | | .37 |
| Total from investment operations | | 43 | | | | .02 | | | | .44 |
| Distributions from net investment income | | (.19) | | | | (.10) | | | | (.06) |
| Distributions from net realized gain | | (.04) | | | | (.01) | | | | — |
| Total distributions | | (.22)I | | | | (.11) | | | | (.06) |
| Net asset value, end of period | | $ 10.50 | | | | $ 10.29 | | | | $ 10.38 |
| Total ReturnB,C,D | | 4.27% | | | | .23% | | | | 4.45% |
| Ratios to Average Net AssetsF,H | | | | | | | | | | |
| Expenses before reductions | | 1.01% | | | | 1.10% | | | | 1.10%A |
| Expenses net of fee waivers, if any | | 1.01% | | | | 1.08% | | | | 1.08%A |
| Expenses net of all reductions | | 1.01% | | | | 1.08% | | | | 1.08%A |
| Net investment income (loss) | | 2.08% | | | | 1.21% | | | | 1.06%A |
| Supplemental Data | | | | | | | | | | |
| Net assets, end of period (000 omitted) | | $ 4,873 | | | | $ 4,454 | | | | $ 3,649 |
| Portfolio turnover rate | | 21% | | | | 18% | | | | 46%A |
A Annualized
B Total returns for periods of less than one year are not annualized.
C Total returns would have been lower had certain expenses not been reduced during the periods shown.
D Total returns do not include the effect of the contingent deferred sales charge.
E Calculated based on average shares outstanding during the period.
F Amounts do not include the activity of the underlying funds.
G For the period July 24, 2003 (commencement of operations) to March 31, 2004.
H Expense ratios reflect operating expenses of the class. Expenses before reductions do not reflect amounts reimbursed by the investment adviser or expense offset arrangements and do not represent the amount paid by the class during periods when
reimbursements or reductions occur. Expense ratios before reductions for start up periods may not be representative of longer term operating periods. Expenses net of fee waivers reflect expenses after reimbursement by the investment adviser but
prior to reductions from expense offset arrangements. Expenses net of all reductions represent the net expenses paid by the class but do not include expenses of the investment companies in which the fund invests.
I Total distribution of $.224 per share is comprised of distributions from net investment income of $.189 and distributions from net realized gain of $.035 per share.
|
See accompanying notes which are an integral part of the financial statements.
| | |
| Annual Report | | 22 |
| Financial Highlights Class C | | | | | | | | | | |
| Years ended March 31, | | 2006 | | | | 2005 | | | | 2004G |
| Selected Per-Share Data | | | | | | | | | | |
| Net asset value, beginning of period | | $ 10.28 | | | | $ 10.37 | | | | $ 10.00 |
| Income from Investment Operations | | | | | | | | | | |
| Net investment income (loss)E | | .22 | | | | .12 | | | | .07 |
| Net realized and unrealized gain (loss) | | .22 | | | | (.09) | | | | .37 |
| Total from investment operations | | .44 | | | | .03 | | | | .44 |
| Distributions from net investment income | | (.19) | | | | (.11) | | | | (.07) |
| Distributions from net realized gain | | (.04) | | | | (.01) | | | | — |
| Total distributions | | (.22)I | | | | (.12) | | | | (.07) |
| Net asset value, end of period | | $ 10.50 | | | | $ 10.28 | | | | $ 10.37 |
| Total ReturnB,C,D | | 4.37% | | | | .24% | | | | 4.39% |
| Ratios to Average Net AssetsF,H | | | | | | | | | | |
| Expenses before reductions | | 1.01% | | | | 1.10% | | | | 1.10%A |
| Expenses net of fee waivers, if any | | 1.01% | | | | 1.08% | | | | 1.08%A |
| Expenses net of all reductions | | 1.01% | | | | 1.08% | | | | 1.08%A |
| Net investment income (loss) | | 2.08% | | | | 1.21% | | | | 1.06%A |
| Supplemental Data | | | | | | | | | | |
| Net assets, end of period (000 omitted) | | $ 13,678 | | | | $ 14,097 | | | | $ 9,248 |
| Portfolio turnover rate | | 21% | | | | 18% | | | | 46%A |
A Annualized
B Total returns for periods of less than one year are not annualized.
C Total returns would have been lower had certain expenses not been reduced during the periods shown.
D Total returns do not include the effect of the contingent deferred sales charge.
E Calculated based on average shares outstanding during the period.
F Amounts do not include the activity of the underlying funds.
G For the period July 24, 2003 (commencement of operations) to March 31, 2004.
H Expense ratios reflect operating expenses of the class. Expenses before reductions do not reflect amounts reimbursed by the investment adviser or expense offset arrangements and do not represent the amount paid by the class during periods when
reimbursements or reductions occur. Expense ratios before reductions for start up periods may not be representative of longer term operating periods. Expenses net of fee waivers reflect expenses after reimbursement by the investment adviser but
prior to reductions from expense offset arrangements. Expenses net of all reductions represent the net expenses paid by the class but do not include expenses of the investment companies in which the fund invests.
I Total distribution of $.224 per share is comprised of distributions from net investment income of $.189 and distributions from net realized gain of $.035 per share.
|
| Financial Highlights Institutional Class | | | | | | | | | | |
| Years ended March 31, | | 2006 | | | | 2005 | | | | 2004F |
| Selected Per-Share Data | | | | | | | | | | |
| Net asset value, beginning of period | | $ 10.31 | | | | $ 10.41 | | | | $ 10.00 |
| Income from Investment Operations | | | | | | | | | | |
| Net investment income (loss)D | | .32 | | | | .23 | | | | .14 |
| Net realized and unrealized gain (loss) | | .23 | | | | (.11) | | | | .37 |
| Total from investment operations | | .55 | | | | .12 | | | | .51 |
| Distributions from net investment income | | (.29) | | | | (.21) | | | | (.10) |
| Distributions from net realized gain | | (.04) | | | | (.01) | | | | — |
| Total distributions | | (.33) | | | | (.22) | | | | (.10) |
| Net asset value, end of period | | $ 10.53 | | | | $ 10.31 | | | | $ 10.41 |
| Total ReturnB,C | | 5.39% | | | | 1.21% | | | | 5.16% |
| Ratios to Average Net AssetsE,G | | | | | | | | | | |
| Expenses before reductions | | .01% | | | | .10% | | | | .10%A |
| Expenses net of fee waivers, if any | | .01% | | | | .08% | | | | .08%A |
| Expenses net of all reductions | | .01% | | | | .08% | | | | .08%A |
| Net investment income (loss) | | 3.08% | | | | 2.21% | | | | 2.05%A |
| Supplemental Data | | | | | | | | | | |
| Net assets, end of period (000 omitted) | | $ 1,134 | | | | $ 626 | | | | $ 359 |
| Portfolio turnover rate | | 21% | | | | 18% | | | | 46%A |
A Annualized
B Total returns for periods of less than one year are not annualized.
C Total returns would have been lower had certain expenses not been reduced during the periods shown.
D Calculated based on average shares outstanding during the period.
E Amounts do not include the activity of the underlying funds.
F For the period July 24, 2003 (commencement of operations) to March 31, 2004.
G Expense ratios reflect operating expenses of the class. Expenses before reductions do not reflect amounts reimbursed by the investment adviser or expense offset arrangements and do not represent the amount paid by the class during periods when
reimbursements or reductions occur. Expense ratios before reductions for start up periods may not be representative of longer term operating periods. Expenses net of fee waivers reflect expenses after reimbursement by the investment adviser but
prior to reductions from expense offset arrangements. Expenses net of all reductions represent the net expenses paid by the class but do not include expenses of the investment companies in which the fund invests.
|
See accompanying notes which are an integral part of the financial statements.
|
23 Annual Report
| Fidelity Advisor Freedom 2005 Fund | | |
| Investment Changes | | |
| |
| |
| Fund Holdings as of March 31, 2006 | | |
| | | % of fund’s | | % of fund’s investments |
| | | investments | | 6 months ago |
| Domestic Equity Funds | | | | |
| Fidelity Advisor Dividend Growth | | | | |
| Fund Institutional Class | | 8.3 | | 7.9 |
| Fidelity Advisor Equity Growth | | | | |
| Fund Institutional Class | | 5.0 | | 4.1 |
| Fidelity Advisor Equity Income | | | | |
| Fund Institutional Class | | 8.3 | | 8.0 |
| Fidelity Advisor Growth & Income | | | | |
| Fund Institutional Class | | 6.7 | | 7.9 |
| Fidelity Advisor Large Cap Fund | | | | |
| Institutional Class | | 6.7 | | 7.8 |
| Fidelity Advisor Mid Cap Fund | | | | |
| Institutional Class | | 3.3 | | 2.5 |
| Fidelity Advisor Small Cap Fund | | | | |
| Institutional Class | | 2.5 | | 2.5 |
| | | 40.8 | | 40.7 |
| International Equity Funds | | | | |
| Fidelity Advisor Diversified | | | | |
| International Fund Institutional | | | | |
| Class | | 4.0 | | 2.6 |
| Fidelity Advisor Overseas Fund | | | | |
| Institutional Class | | 4.0 | | 2.5 |
| | | 8.0 | | 5.1 |
| High Yield Fixed-Income Funds | | | | |
| Fidelity Advisor High Income | | | | |
| Advantage Fund Institutional | | | | |
| Class | | 5.2 | | 5.0 |
| Investment Grade Fixed-Income | | | | |
| Funds | | | | |
| Fidelity Advisor Government | | | | |
| Investment Fund Institutional | | | | |
| Class | | 16.5 | | 18.8 |
| Fidelity Advisor Intermediate Bond | | | | |
| Fund Institutional Class | | 16.6 | | 18.5 |
| Fidelity Advisor Strategic Real | | | | |
| Return Fund Institutional Class | | 0.9 | | 0.0 |
| | | 34.0 | | 37.3 |
| Short-Term Funds | | | | |
| Fidelity Advisor Short Fixed | | | | |
| Income Fund Institutional Class | | 6.0 | | 5.9 |
| Fidelity Cash Reserves Fund | | 6.0 | | 6.0 |
| | | 12.0 | | 11.9 |
| | | 100.0 | | 100.0 |

The ”current” allocation is based on the fund’s holdings as of March 31, 2006. The ”expected” allocation represents the fund’s anticipated allocation at September 30, 2006. In March 2006, the target date for combining the fund with the Advisor Freedom Income Fund was extended by approximately five years resulting in a greater allocation to equity funds. Also, beginning in March 2006, the fund increased its allocation to international equity. The ”six months ago” allocation is based on the fund’s holdings as of September 30, 2005, reflecting the prior allocation.
Annual Report 24
| Fidelity Advisor Freedom 2005 Fund | | |
| Investments March 31, 2006 |
| Showing Percentage of Total Value of Investment in Securities |
| |
| Equity Funds 48.8% | | | | |
| | | Shares | | Value (Note 1) |
| Domestic Equity Funds 40.8% | | | | |
| Fidelity Advisor Dividend Growth Fund | | | | |
| Institutional Class | | 278,762 | | $ 3,568,148 |
| Fidelity Advisor Equity Growth Fund | | | | |
| Institutional Class (a) | | 40,183 | | 2,129,680 |
| Fidelity Advisor Equity Income Fund | | | | |
| Institutional Class | | 119,587 | | 3,573,248 |
| Fidelity Advisor Growth & Income Fund | | | | |
| Institutional Class | | 152,521 | | 2,867,398 |
| Fidelity Advisor Large Cap Fund | | | | |
| Institutional Class | | 160,212 | | 2,883,817 |
| Fidelity Advisor Mid Cap Fund | | | | |
| Institutional Class | | 54,182 | | 1,431,480 |
| Fidelity Advisor Small Cap Fund | | | | |
| Institutional Class | | 43,531 | | 1,075,653 |
| |
| TOTAL DOMESTIC EQUITY FUNDS | | | | 17,529,424 |
| International Equity Funds 8.0% | | | | |
| Fidelity Advisor Diversified International | | | | |
| Fund Institutional Class | | 73,921 | | 1,733,449 |
| Fidelity Advisor Overseas Fund | | | | |
| Institutional Class | | 80,386 | | 1,723,474 |
| |
| TOTAL INTERNATIONAL EQUITY FUNDS | | | | 3,456,923 |
| |
| TOTAL EQUITY FUNDS | | | | |
| (Cost $18,584,839) | | | | 20,986,347 |
| |
| Fixed Income Funds 39.2% | | | | |
| |
| High Yield Fixed-Income Funds – 5.2% | | | | |
| Fidelity Advisor High Income Advantage | | | | |
| Fund Institutional Class | | 228,972 | | 2,223,320 |
| Investment Grade Fixed Income Funds 34.0% | | | | |
| Fidelity Advisor Government Investment | | | | |
| Fund Institutional Class | | 730,083 | | 7,111,013 |
| Fidelity Advisor Intermediate Bond Fund | | | | |
| Institutional Class | | 664,068 | | 7,118,808 |
| Fidelity Advisor Strategic Real Return | | | | |
| Fund Institutional Class | | 38,032 | | 379,179 |
| |
| TOTAL INVESTMENT GRADE FIXED-INCOME FUNDS | | | | 14,609,000 |
| |
| TOTAL FIXED-INCOME FUNDS | | | | |
| (Cost $17,120,285) | | | | 16,832,320 |
| Short Term Funds 12.0% | | | | |
| | | Shares | | Value (Note 1) |
| Fidelity Advisor Short Fixed Income Fund | | | | |
| Institutional Class | | 274,136 | | $ 2,565,909 |
| Fidelity Cash Reserves Fund | | 2,583,136 | | 2,583,136 |
| TOTAL SHORT TERM FUNDS | | | | |
| (Cost $5,182,795) | | | | 5,149,045 |
| TOTAL INVESTMENT IN SECURITIES 100% | | | | |
| (Cost $40,887,919) | | | | $ 42,967,712 |
| | Legend
(a) Non-income producing
|
See accompanying notes which are an integral part of the financial statements.
25 Annual Report
| Fidelity Advisor Freedom 2005 Fund | | | | | | |
| |
| Financial Statements | | | | | | |
| |
| |
| Statement of Assets and Liabilities | | | | | | |
| | | | | | | March 31, 2006 |
| Assets | | | | | | |
| Investment in securities, at value (cost $40,887,919) — See accompanying schedule | | | | | | $ 42,967,712 |
| Cash | | | | | | 65 |
| Receivable for investments sold | | | | | | 500 |
| Receivable for fund shares sold | | | | | | 20,265 |
| Total assets | | | | | | 42,988,542 |
| |
| Liabilities | | | | | | |
| Payable for investments purchased | | | | $ 18,929 | | |
| Payable for fund shares redeemed | | | | 1,829 | | |
| Distribution fees payable | | | | 18,509 | | |
| Other affiliated payables | | | | 565 | | |
| Total liabilities | | | | | | 39,832 |
| |
| Net Assets | | | | | | $ 42,948,710 |
| Net Assets consist of: | | | | | | |
| Paid in capital | | | | | | $ 40,187,444 |
| Undistributed net investment income | | | | | | 142,110 |
| Accumulated undistributed net realized gain (loss) on investments | | | | | | 539,363 |
| Net unrealized appreciation (depreciation) on investments | | | | | | 2,079,793 |
| Net Assets | | | | | | $ 42,948,710 |
| Calculation of Maximum Offering Price | | | | | | |
| Class A: | | | | | | |
| Net Asset Value and redemption price per share ($16,193,759 ÷ 1,429,081 shares) | | | | | | $ 11.33 |
| Maximum offering price per share (100/94.25 of $11.33) | | | | | | $ 12.02 |
| Class T: | | | | | | |
| Net Asset Value and redemption price per share ($13,906,390 ÷ 1,229,053 shares) | | | | | | $ 11.31 |
| Maximum offering price per share (100/96.50 of $11.31) | | | | | | $ 11.72 |
| Class B: | | | | | | |
| Net Asset Value and offering price per share ($3,835,243 ÷ 339,929 shares)A | | | | | | $ 11.28 |
| Class C: | | | | | | |
| Net Asset Value and offering price per share ($7,637,011 ÷ 677,533 shares)A | | | | | | $ 11.27 |
| Institutional Class: | | | | | | |
| Net Asset Value, offering price and redemption price per share ($1,376,307 ÷ 121,099 shares) | | | | | | $ 11.37 |
| |
| A Redemption price per share is equal to net asset value less any applicable contingent deferred sales charge. | | | | | | |
| |
| Statement of Operations | | | | | | |
| | | | | Year ended March 31, 2006 |
| Investment Income | | | | | | |
| Income distributions from underlying funds | | | | | | $ 851,792 |
| Interest | | | | | | 61 |
| Total income | | | | | | 851,853 |
| |
| Expenses | | | | | | |
| Management fee | | | | $ 1,981 | | |
| Distribution fees | | | | 187,332 | | |
| Independent trustees’ compensation | | | | 138 | | |
| Total expenses before reductions | | | | 189,451 | | |
| Expense reductions | | | | (531) | | 188,920 |
| |
| Net investment income (loss) | | | | | | 662,933 |
| Realized and Unrealized Gain (Loss) | | | | | | |
| Realized gain (loss) on sale of underlying fund shares | | | | 61,071 | | |
| Capital gain distributions from underlying funds | | | | 555,775 | | 616,846 |
| Change in net unrealized appreciation (depreciation) on underlying funds | | | | | | 1,887,861 |
| Net gain (loss) | | | | | | 2,504,707 |
| Net increase (decrease) in net assets resulting from operations | | | | | | $ 3,167,640 |
See accompanying notes which are an integral part of the financial statements.
| | |
| Annual Report | | 26 |
| Statement of Changes in Net Assets | | | | | | | | | | | | |
| | | | | | | Year ended | | | | Year ended |
| | | | | | | March 31, | | | | March 31, |
| | | | | | | 2006 | | | | 2005 |
| Increase (Decrease) in Net Assets | | | | | | | | | | |
| Operations | | | | | | | | | | |
| Net investment income (loss) | | | | | | $ 662,933 | | | | $ 266,970 |
| Net realized gain (loss) | | | | | | 616,846 | | | | 66,761 |
| Change in net unrealized appreciation (depreciation) | | | | | | 1,887,861 | | | | 131,084 |
| Net increase (decrease) in net assets resulting from operations | | | | | | 3,167,640 | | | | 464,815 |
| Distributions to shareholders from net investment income | | | | | | (559,364) | | | | (231,296) |
| Distributions to shareholders from net realized gain | | | | | | (151,533) | | | | (3,243) |
| Total distributions | | | | | | (710,897) | | | | (234,539) |
| Share transactions - net increase (decrease) | | | | | | 17,491,701 | | | | 16,679,243 |
| Total increase (decrease) in net assets | | | | | | 19,948,444 | | | | 16,909,519 |
| |
| Net Assets | | | | | | | | | | |
| Beginning of period | | | | | | 23,000,266 | | | | 6,090,747 |
| End of period (including undistributed net investment income of $142,110 and undistributed net investment income of | | | | | | | | | | |
| $66,592, respectively) | | | | | | $ 42,948,710 | | | | $ 23,000,266 |
| |
| Financial Highlights Class A | | | | | | | | | | | | |
| Years ended March 31, | | | | 2006 | | | | 2005 | | | | 2004 G |
| Selected Per-Share Data | | | | | | | | | | | | |
| Net asset value, beginning of period | | | | $ 10.57 | | | | $ 10.49 | | | | $ 10.00 |
| Income from Investment Operations | | | | | | | | | | | | |
| Net investment income (loss) E | | | | .25 | | | | .22 | | | | .09 |
| Net realized and unrealized gain (loss) | | | | .76 | | | | .03 | | | | .46 |
| Total from investment operations | | | | 1.01 | | | | .25 | | | | .55 |
| Distributions from net investment income | | | | (.20) | | | | (.17) | | | | (.06) |
| Distributions from net realized gain | | | | (.05) | | | | — I | | | | — |
| Total distributions | | | | (.25) | | | | (.17) | | | | (.06) |
| Net asset value, end of period | | | | $ 11.33 | | | | $ 10.57 | | | | $ 10.49 |
| Total Return B,C,D | | | | 9.63% | | | | 2.38% | | | | 5.52% |
| Ratios to Average Net Assets F,H | | | | | | | | | | | | |
| Expenses before reductions | | | | .26% | | | | .35% | | | | .35% A |
| Expenses net of fee waivers, if any | | | | .26% | | | | .33% | | | | .33% A |
| Expenses net of all reductions | | | | .26% | | | | .33% | | | | .33% A |
| Net investment income (loss) | | | | 2.25% | | | | 2.13% | | | | 2.21% A |
| Supplemental Data | | | | | | | | | | | | |
| Net assets, end of period (000 omitted) | | | | $ 16,194 | | | | $ 5,970 | | | | $ 1,386 |
| Portfolio turnover rate | | | | 34% | | | | 24% | | | | 9% A |
A Annualized
B Total returns for periods of less than one year are not annualized.
C Total returns would have been lower had certain expenses not been reduced during the periods shown.
D Total returns do not include the effect of the sales charges.
E Calculated based on average shares outstanding during the period.
F Amounts do not include the activity of the underlying funds.
G For the period November 6, 2003 (commencement of operations) to March 31, 2004.
H Expense ratios reflect operating expenses of the class. Expenses before reductions do not reflect amounts reimbursed by the investment adviser or expense offset arrangements and do not represent the amount paid by the class during periods when
reimbursements or reductions occur. Expense ratios before reductions for start up periods may not be representative of longer term operating periods. Expenses net of fee waivers reflect expenses after reimbursement by the investment adviser but prior to
reductions from expense offset arrangements. Expenses net of all reductions represent the net expenses paid by the class but do not include expenses of the investment companies in which the fund invests.
I Amount represents less than $.01 per share.
|
See accompanying notes which are an integral part of the financial statements.
|
27 Annual Report
| Financial Highlights Class T | | | | | | | | | | |
| Years ended March 31, | | 2006 | | | | 2005 | | | | 2004 G |
| Selected Per Share Data | | | | | | | | | | |
| Net asset value, beginning of period | | $ 10.56 | | | | $ 10.48 | | | | $ 10.00 |
| Income from Investment Operations | | | | | | | | | | |
| Net investment income (loss) E | | .22 | | | | .20 | | | | .08 |
| Net realized and unrealized gain (loss) | | .75 | | | | .03 | | | | .46 |
| Total from investment operations | | .97 | | | | .23 | | | | .54 |
| Distributions from net investment income | | (.17) | | | | (.14) | | | | (.06) |
| Distributions from net realized gain | | (.05) | | | | — I | | | | — |
| Total distributions | | (.22) | | | | (.15) J | | | | (.06) |
| Net asset value, end of period | | $ 11.31 | | | | $ 10.56 | | | | $ 10.48 |
| Total Return B,C,D | | 9.31% | | | | 2.17% | | | | 5.36% |
| Ratios to Average Net Assets F,H | | | | | | | | | | |
| Expenses before reductions | | .51% | | | | .60% | | | | .60% A |
| Expenses net of fee waivers, if any | | .50% | | | | .58% | | | | .58% A |
| Expenses net of all reductions | | .50% | | | | .58% | | | | .58% A |
| Net investment income (loss) | | 2.00% | | | | 1.88% | | | | 1.97% A |
| Supplemental Data | | | | | | | | | | |
| Net assets, end of period (000 omitted) | | $ 13,906 | | | | $ 7,977 | | | | $ 2,031 |
| Portfolio turnover rate | | 34% | | | | 24% | | | | 9% A |
A Annualized
B Total returns for periods of less than one year are not annualized.
C Total returns would have been lower had certain expenses not been reduced during the periods shown.
D Total returns do not include the effect of the sales charges.
E Calculated based on average shares outstanding during the period.
F Amounts do not include the activity of the underlying funds.
G For the period November 6, 2003 (commencement of operations) to March 31, 2004.
H Expense ratios reflect operating expenses of the class. Expenses before reductions do not reflect amounts reimbursed by the investment adviser or expense offset arrangements and do not represent the amount paid by the class during periods when
reimbursements or reductions occur. Expense ratios before reductions for start up periods may not be representative of longer term operating periods. Expenses net of fee waivers reflect expenses after reimbursement by the investment adviser but
prior to reductions from expense offset arrangements. Expenses net of all reductions represent the net expenses paid by the class but do not include expenses of the investment companies in which the fund invests.
I Amount represents less than $.01 per share.
J Total distribution of $.148 per share is comprised of distributions from net investment income of $.144 and distributions from net realized gain of $.004 per share.
|
| Financial Highlights Class B | | | | | | | | | | |
| Years ended March 31, | | 2006 | | | | 2005 | | | | 2004 G |
| Selected Per Share Data | | | | | | | | | | |
| Net asset value, beginning of period | | $ 10.53 | | | | $ 10.47 | | | | $ 10.00 |
| Income from Investment Operations | | | | | | | | | | |
| Net investment income (loss) E | | .16 | | | | .14 | | | | .06 |
| Net realized and unrealized gain (loss) | | .76 | | | | .03 | | | | .46 |
| Total from investment operations | | .92 | | | | .17 | | | | .52 |
| Distributions from net investment income | | (.12) | | | | (.11) | | | | (.05) |
| Distributions from net realized gain | | (.05) | | | | — I | | | | — |
| Total distributions | | (.17) | | | | (.11) | | | | (.05) |
| Net asset value, end of period | | $ 11.28 | | | | $ 10.53 | | | | $ 10.47 |
| Total Return B,C,D | | 8.80% | | | | 1.64% | | | | 5.21% |
| Ratios to Average Net Assets F,H | | | | | | | | | | |
| Expenses before reductions | | 1.01% | | | | 1.10% | | | | 1.10% A |
| Expenses net of fee waivers, if any | | 1.00% | | | | 1.08% | | | | 1.08% A |
| Expenses net of all reductions | | 1.00% | | | | 1.08% | | | | 1.08% A |
| Net investment income (loss) | | 1.50% | | | | 1.38% | | | | 1.47% A |
| Supplemental Data | | | | | | | | | | |
| Net assets, end of period (000 omitted) | | $ 3,835 | | | | $ 2,747 | | | | $ 1,203 |
| Portfolio turnover rate | | 34% | | | | 24% | | | | 9% A |
A Annualized
B Total returns for periods of less than one year are not annualized.
C Total returns would have been lower had certain expenses not been reduced during the periods shown.
D Total returns do not include the effect of the contingent deferred sales charge.
E Calculated based on average shares outstanding during the period.
F Amounts do not include the activity of the underlying funds.
G For the period November 6, 2003 (commencement of operations) to March 31, 2004.
H Expense ratios reflect operating expenses of the class. Expenses before reductions do not reflect amounts reimbursed by the investment adviser or expense offset arrangements and do not represent the amount paid by the class during periods when
reimbursements or reductions occur. Expense ratios before reductions for start up periods may not be representative of longer term operating periods. Expenses net of fee waivers reflect expenses after reimbursement by the investment adviser but
prior to reductions from expense offset arrangements. Expenses net of all reductions represent the net expenses paid by the class but do not include expenses of the investment companies in which the fund invests.
I Amount represents less than $.01 per share.
|
See accompanying notes which are an integral part of the financial statements.
| | |
| Annual Report | | 28 |
| Financial Highlights Class C | | | | | | | | | | |
| Years ended March 31, | | 2006 | | | | 2005 | | | | 2004 G |
| Selected Per Share Data | | | | | | | | | | |
| Net asset value, beginning of period | | $ 10.53 | | | | $ 10.47 | | | | $ 10.00 |
| Income from Investment Operations | | | | | | | | | | |
| Net investment income (loss) E | | .16 | | | | .14 | | | | .06 |
| Net realized and unrealized gain (loss) | | .75 | | | | .04 | | | | .46 |
| Total from investment operations | | .91 | | | | .18 | | | | .52 |
| Distributions from net investment income | | (.12) | | | | (.12) | | | | (.05) |
| Distributions from net realized gain | | (.05) | | | | — I | | | | — |
| Total distributions | | (.17) | | | | (.12) | | | | (.05) |
| Net asset value, end of period | | $ 11.27 | | | | $ 10.53 | | | | $ 10.47 |
| Total Return B,C ,D | | 8.74% | | | | 1.74% | | | | 5.21% |
| Ratios to Average Net Assets F,H | | | | | | | | | | |
| Expenses before reductions | | 1.01% | | | | 1.10% | | | | 1.10% A |
| Expenses net of fee waivers, if any | | 1.01% | | | | 1.08% | | | | 1.08% A |
| Expenses net of all reductions | | 1.01% | | | | 1.08% | | | | 1.08% A |
| Net investment income (loss) | | 1.50% | | | | 1.38% | | | | 1.47% A |
| Supplemental Data | | | | | | | | | | |
| Net assets, end of period (000 omitted) | | $ 7,637 | | | | $ 5,655 | | | | $ 1,073 |
| Portfolio turnover rate | | 34% | | | | 24% | | | | 9% A |
A Annualized
B Total returns for periods of less than one year are not annualized.
C Total returns would have been lower had certain expenses not been reduced during the periods shown.
D Total returns do not include the effect of the contingent deferred sales charge.
E Calculated based on average shares outstanding during the period.
F Amounts do not include the activity of the underlying funds.
G For the period November 6, 2003 (commencement of operations) to March 31, 2004.
H Expense ratios reflect operating expenses of the class. Expenses before reductions do not reflect amounts reimbursed by the investment adviser or expense offset arrangements and do not represent the amount paid by the class during periods when
reimbursements or reductions occur. Expense ratios before reductions for start up periods may not be representative of longer term operating periods. Expenses net of fee waivers reflect expenses after reimbursement by the investment adviser but
prior to reductions from expense offset arrangements. Expenses net of all reductions represent the net expenses paid by the class but do not include expenses of the investment companies in which the fund invests.
I Amount represents less than $.01 per share.
|
| Financial Highlights Institutional Class | | | | | | | | | | |
| Years ended March 31, | | 2006 | | | | 2005 | | | | 2004 F |
| Selected Per Share Data | | | | | | | | | | |
| Net asset value, beginning of period | | $ 10.60 | | | | $ 10.49 | | | | $ 10.00 |
| Income from Investment Operations | | | | | | | | | | |
| Net investment income (loss) D | | .28 | | | | .25 | | | | .10 |
| Net realized and unrealized gain (loss) | | .76 | | | | .04 | | | | .45 |
| Total from investment operations | | 1.04 | | | | .29 | | | | .55 |
| Distributions from net investment income | | (.22) | | | | (.18) | | | | (.06) |
| Distributions from net realized gain | | (.05) | | | | — H | | | | — |
| Total distributions | | (.27) | | | | (.18) | | | | (.06) |
| Net asset value, end of period | | $ 11.37 | | | | $ 10.60 | | | | $ 10.49 |
| Total Return B,,C | | 9.92% | | | | 2.79% | | | | 5.52% |
| Ratios to Average Net Assets E,G | | | | | | | | | | |
| Expenses before reductions | | .01% | | | | .10% | | | | .10% A |
| Expenses net of fee waivers, if any | | .00% | | | | .08% | | | | .08% A |
| Expenses net of all reductions | | .00% | | | | .08% | | | | .08% A |
| Net investment income (loss) | | 2.50% | | | | 2.38% | | | | 2.46% A |
| Supplemental Data | | | | | | | | | | |
| Net assets, end of period (000 omitted) | | $ 1,376 | | | | $ 651 | | | | $ 397 |
| Portfolio turnover rate | | 34% | | | | 24% | | | | 9% A |
A Annualized
B Total returns for periods of less than one year are not annualized.
C Total returns would have been lower had certain expenses not been reduced during the periods shown.
D Calculated based on average shares outstanding during the period.
E Amounts do not include the activity of the underlying funds.
F For the period November 6, 2003 (commencement of operations) to March 31, 2004.
G Expense ratios reflect operating expenses of the class. Expenses before reductions do not reflect amounts reimbursed by the investment adviser or expense offset arrangements and do not represent the amount paid by the class during periods when
reimbursements or reductions occur. Expense ratios before reductions for start up periods may not be representative of longer term operating periods. Expenses net of fee waivers reflect expenses after reimbursement by the investment adviser but
prior to reductions from expense offset arrangements. Expenses net of all reductions represent the net expenses paid by the class but do not include expenses of the investment companies in which the fund invests.
H Amount represents less than $.01 per share.
|
See accompanying notes which are an integral part of the financial statements.
|
29 Annual Report
| Fidelity Advisor Freedom 2010 Fund | | |
| Investment Changes | | |
| |
| |
| Fund Holdings as of March 31, 2006 | | |
| | | % of fund’s | | % of fund’s investments |
| | | investments | | 6 months ago |
| Domestic Equity Funds | | | | |
| Fidelity Advisor Dividend Growth | | | | |
| Fund Institutional Class | | 8.6 | | 8.1 |
| Fidelity Advisor Equity Growth | | | | |
| Fund Institutional Class | | 5.0 | | 4.2 |
| Fidelity Advisor Equity Income | | | | |
| Fund Institutional Class | | 8.6 | | 8.1 |
| Fidelity Advisor Growth & Income | | | | |
| Fund Institutional Class | | 6.4 | | 7.9 |
| Fidelity Advisor Large Cap Fund | | | | |
| Institutional Class | | 6.4 | | 7.9 |
| Fidelity Advisor Mid Cap Fund | | | | |
| Institutional Class | | 3.4 | | 2.5 |
| Fidelity Advisor Small Cap Fund | | | | |
| Institutional Class | | 2.5 | | 2.5 |
| | | 40.9 | | 41.2 |
| International Equity Funds | | | | |
| Fidelity Advisor Diversified | | | | |
| International Fund Institutional | | | | |
| Class | | 4.2 | | 2.7 |
| Fidelity Advisor Overseas Fund | | | | |
| Institutional Class | | 4.2 | | 2.6 |
| | | 8.4 | | 5.3 |
| High Yield Fixed-Income Funds | | | | |
| Fidelity Advisor High Income | | | | |
| Advantage Fund Institutional | | | | |
| Class | | 5.0 | | 5.1 |
| Investment Grade Fixed-Income | | | | |
| Funds | | | | |
| Fidelity Advisor Government | | | | |
| Investment Fund Institutional | | | | |
| Class | | 17.6 | | 19.6 |
| Fidelity Advisor Intermediate Bond | | | | |
| Fund Institutional Class | | 17.6 | | 19.5 |
| Fidelity Advisor Strategic Real | | | | |
| Return Fund Institutional Class | | 0.9 | | 0.0 |
| | | 36.1 | | 39.1 |
| Short-Term Funds | | | | |
| Fidelity Advisor Short Fixed | | | | |
| Income Fund Institutional Class | | 4.8 | | 4.6 |
| Fidelity Cash Reserves Fund | | 4.8 | | 4.7 |
| | | 9.6 | | 9.3 |
| | | 100.0 | | 100.0 |

The ”current” allocation is based on the fund’s holdings as of March 31, 2006. The ”expected” allocation represents the fund’s anticipated allocation at September 30, 2006. In March 2006, the target date for combining the fund with the Advisor Freedom Income Fund was extended by approximately five years resulting in a greater allocation to equity funds. Also, beginning in March 2006, the fund increased its allocation to international equity. The ”six months ago” allocation is based on the fund’s holdings as of September 30, 2005, reflecting the prior allocation.
Annual Report 30
| Fidelity Advisor Freedom 2010 Fund | | |
| Investments March 31, 2006 |
| Showing Percentage of Total Value of Investment in Securities |
| |
| Equity Funds 49.3% | | | | |
| | | Shares | | Value (Note 1) |
| Domestic Equity Funds 40.9% | | | | |
| Fidelity Advisor Dividend Growth Fund | | | | |
| Institutional Class | | 2,500,502 | | $ 32,006,424 |
| Fidelity Advisor Equity Growth Fund | | | | |
| Institutional Class (a) | | 353,013 | | 18,709,689 |
| Fidelity Advisor Equity Income Fund | | | | |
| Institutional Class | | 1,069,158 | | 31,946,449 |
| Fidelity Advisor Growth & Income Fund | | | | |
| Institutional Class | | 1,264,236 | | 23,767,634 |
| Fidelity Advisor Large Cap Fund | | | | |
| Institutional Class | | 1,337,927 | | 24,082,678 |
| Fidelity Advisor Mid Cap Fund | | | | |
| Institutional Class | | 475,144 | | 12,553,315 |
| Fidelity Advisor Small Cap Fund | | | | |
| Institutional Class | | 376,861 | | 9,312,230 |
| |
| TOTAL DOMESTIC EQUITY FUNDS | | | | 152,378,419 |
| International Equity Funds 8.4% | | | | |
| Fidelity Advisor Diversified International | | | | |
| Fund Institutional Class | | 666,718 | | 15,634,526 |
| Fidelity Advisor Overseas Fund | | | | |
| Institutional Class | | 724,219 | | 15,527,245 |
| |
| TOTAL INTERNATIONAL EQUITY FUNDS | | | | 31,161,771 |
| |
| TOTAL EQUITY FUNDS | | | | |
| (Cost $161,238,163) | | | | 183,540,190 |
| |
| Fixed Income Funds 41.1% | | | | |
| |
| High Yield Fixed-Income Funds – 5.0% | | | | |
| Fidelity Advisor High Income Advantage | | | | |
| Fund Institutional Class | | 1,944,145 | | 18,877,647 |
| Investment Grade Fixed Income Funds 36.1% | | | | |
| Fidelity Advisor Government Investment | | | | |
| Fund Institutional Class | | 6,728,153 | | 65,532,209 |
| Fidelity Advisor Intermediate Bond Fund | | | | |
| Institutional Class | | 6,127,970 | | 65,691,844 |
| Fidelity Advisor Strategic Real Return | | | | |
| Fund Institutional Class | | 359,201 | | 3,581,231 |
| |
| TOTAL INVESTMENT GRADE FIXED-INCOME FUNDS | | | | 134,805,284 |
| |
| TOTAL FIXED-INCOME FUNDS | | | | |
| (Cost $157,409,552) | | | | 153,682,931 |
| Short Term Funds 9.6% | | | | |
| | | Shares | | Value (Note 1) |
| Fidelity Advisor Short Fixed Income | | | | |
| Fund Institutional Class | | 1,915,167 | | $ 17,925,964 |
| Fidelity Cash Reserves Fund | | 17,920,008 | | 17,920,008 |
| TOTAL SHORT TERM FUNDS | | | | |
| (Cost $36,112,247) | | | | 35,845,972 |
| TOTAL INVESTMENT IN SECURITIES 100% | | | | |
| (Cost $354,759,962) | | | | $373,069,093 |
Legend
(a) Non-income producing
|
See accompanying notes which are an integral part of the financial statements.
31 Annual Report
| Fidelity Advisor Freedom 2010 Fund | | | | | | |
| |
| Financial Statements | | | | | | |
| |
| |
| Statement of Assets and Liabilities | | | | | | |
| | | | | | | March 31, 2006 |
| Assets | | | | | | |
| Investment in securities, at value (cost $354,759,962) — See accompanying schedule | | | | | | $ 373,069,093 |
| Cash | | | | | | 8 |
| Receivable for investments sold | | | | | | 198,447 |
| Receivable for fund shares sold | | | | | | 986,236 |
| Other affiliated receivables | | | | | | 1,406 |
| Total assets | | | | | | 374,255,190 |
| |
| Liabilities | | | | | | |
| Payable for investments purchased | | | | $ 275,784 | | |
| Payable for fund shares redeemed | | | | 898,078 | | |
| Distribution fees payable | | | | 148,103 | | |
| Other affiliated payables | | | | 4,974 | | |
| Total liabilities | | | | | | $ 1,326,939 |
| |
| Net Assets | | | | | | $ 372,928,251 |
| Net Assets consist of: | | | | | | |
| Paid in capital | | | | | | $ 348,411,924 |
| Undistributed net investment income | | | | | | 1,256,073 |
| Accumulated undistributed net realized gain (loss) on investments | | | | | | 4,951,123 |
| Net unrealized appreciation (depreciation) on investments | | | | | | 18,309,131 |
| Net Assets | | | | | | $ 372,928,251 |
| |
| Calculation of Maximum Offering Price | | | | | | |
| Class A: | | | | | | |
| Net Asset Value and redemption price per share ($146,592,737 ÷ 12,437,518 shares) | | | | | | $ 11.79 |
| Maximum offering price per share (100/94.25 of $11.79) | | | | | | $ 12.51 |
| Class T: | | | | | | |
| Net Asset Value and redemption price per share ($143,011,737 ÷ 12,173,138 shares) | | | | | | $ 11.75 |
| Maximum offering price per share (100/96.50 of $11.75) | | | | | | $ 12.18 |
| Class B: | | | | | | |
| Net Asset Value and offering price per share ($33,403,916 ÷ 2,852,590 shares)A | | | | | | $ 11.71 |
| Class C: | | | | | | |
| Net Asset Value and offering price per share ($38,881,657 ÷ 3,325,046 shares)A | | | | | | $ 11.69 |
| Institutional Class: | | | | | | |
| Net Asset Value, offering price and redemption price per share ($11,038,204 ÷ 933,893 shares) | | | | | | $ 11.82 |
A Redemption price per share is equal to net asset value less any applicable contingent deferred sales charge. | | | | | | |
| |
| Statement of Operations | | | | | | |
| | | | | Year ended March 31, 2006 |
| Investment Income | | | | | | |
| Income distributions from underlying funds | | | | | | $ 7,408,150 |
| |
| Expenses | | | | | | |
| Management fee | | | | $ 19,560 | | |
| Distribution fees | | | | 1,497,104 | | |
| Independent trustees’ compensation | | | | 1,220 | | |
| Total expenses before reductions | | | | 1,517,884 | | |
| Expense reductions | | | | (5,249) | | 1,512,635 |
| |
| Net investment income (loss) | | | | | | 5,895,515 |
| Realized and Unrealized Gain (Loss) | | | | | | |
| Realized gain (loss) on sale of underlying fund shares | | | | 325,634 | | |
| Capital gain distributions from underlying funds | | | | 4,940,697 | | 5,266,331 |
| Change in net unrealized appreciation (depreciation) on underlying funds | | | | | | 15,956,793 |
| Net gain (loss) | | | | | | 21,223,124 |
| Net increase (decrease) in net assets resulting from operations | | | | | | $ 27,118,639 |
See accompanying notes which are an integral part of the financial statements.
| | |
| Annual Report | | 32 |
| Statement of Changes in Net Assets | | | | | | | | | | | | |
| | | | | | | Year ended | | | | Year ended |
| | | | | | | March 31, | | | | March 31, |
| | | | | | | 2006 | | | | 2005 |
| Increase (Decrease) in Net Assets | | | | | | | | | | |
| Operations | | | | | | | | | | |
| Net investment income (loss) | | | | | | $ 5,895,515 | | | | $ 2,856,146 |
| Net realized gain (loss) | | | | | | 5,266,331 | | | | 949,461 |
| Change in net unrealized appreciation (depreciation) | | | | | | 15,956,793 | | | | 417,464 |
| Net increase (decrease) in net assets resulting from operations | | | | | | 27,118,639 | | | | 4,223,071 |
| Distributions to shareholders from net investment income | | | | | | (5,136,102) | | | | (2,579,243) |
| Distributions to shareholders from net realized gain | | | | | | (1,279,124) | | | | (20,201) |
| Total distributions | | | | | | (6,415,226) | | | | (2,599,444) |
| Share transactions - net increase (decrease) | | | | | | 123,162,830 | | | | 136,717,726 |
| Total increase (decrease) in net assets | | | | | | 143,866,243 | | | | 138,341,353 |
| |
| Net Assets | | | | | | | | | | |
| Beginning of period | | | | | | 229,062,008 | | | | 90,720,655 |
| End of period (including undistributed net investment income of $1,256,073 and undistributed net investment income of | | | | | | | | | | |
| $718,326, respectively) | | | | | | $ 372,928,251 | | | | $ 229,062,008 |
| |
| Financial Highlights Class A | | | | | | | | | | | | |
| Years ended March 31, | | | | 2006 | | | | 2005 | | | | 2004G |
| Selected Per-Share Data | | | | | | | | | | | | |
| Net asset value, beginning of period | | | | $ 11.01 | | | | $ 10.92 | | | | $ 10.00 |
| Income from Investment Operations | | | | | | | | | | | | |
| Net investment income (loss)E | | | | .25 | | | | .23 | | | | .16 |
| Net realized and unrealized gain (loss) | | | | .80 | | | | .04 | | | | .83 |
| Total from investment operations | | | | 1.05 | | | | .27 | | | | .99 |
| Distributions from net investment income | | | | (.22) | | | | (.18) | | | | (.07) |
| Distributions from net realized gain | | | | (.06) | | | | —I | | | | — |
| Total distributions | | | | (.27)J | | | | (.18) | | | | (.07) |
| Net asset value, end of period | | | | $ 11.79 | | | | $ 11.01 | | | | $ 10.92 |
| Total ReturnB,C,D | | | | 9.65% | | | | 2.48% | | | | 9.92% |
| Ratios to Average Net AssetsF,H | | | | | | | | | | | | |
| Expenses before reductions | | | | .26% | | | | .35% | | | | .35%A |
| Expenses net of fee waivers, if any | | | | .26% | | | | .33% | | | | .33%A |
| Expenses net of all reductions | | | | .26% | | | | .33% | | | | .33%A |
| Net investment income (loss) | | | | 2.23% | | | | 2.10% | | | | 2.14%A |
| Supplemental Data | | | | | | | | | | | | |
| Net assets, end of period (000 omitted) | | | | $ 146,593 | | | | $ 74,013 | | | | $ 32,615 |
| Portfolio turnover rate | | | | 7% | | | | 5% | | | | 103%A |
A Annualized
B Total returns for periods of less than one year are not annualized.
C Total returns would have been lower had certain expenses not been reduced during the periods shown.
D Total returns do not include the effect of the sales charges.
E Calculated based on average shares outstanding during the period.
F Amounts do not include the activity of the underlying funds.
G For the period July 24, 2003 (commencement of operations) to March 31, 2004.
H Expense ratios reflect operating expenses of the class. Expenses before reductions do not reflect amounts reimbursed by the investment adviser or expense offset arrangements and do not represent the amount paid by the class during periods when
reimbursements or reductions occur. Expense ratios before reductions for start up periods may not be representative of longer term operating periods. Expenses net of fee waivers reflect expenses after reimbursement by the investment adviser but prior to
reductions from expense offset arrangements. Expenses net of all reductions represent the net expenses paid by the class but do not include expenses of the investment companies in which the fund invests.
I Amount represents less than $.01 per share.
J Total distribution of $.27 per share is comprised of distributions from net investment income of $.215 and distributions from net realized gain of $.055 per share.
|
See accompanying notes which are an integral part of the financial statements.
|
33 Annual Report
| Financial Highlights Class T | | | | | | | | | | |
| Years ended March 31, | | 2006 | | | | 2005 | | | | 2004G |
| Selected Per Share Data | | | | | | | | | | |
| Net asset value, beginning of period | | $ 10.97 | | | | $ 10.90 | | | | $ 10.00 |
| Income from Investment Operations | | | | | | | | | | |
| Net investment income (loss)E | | .22 | | | | .20 | | | | .14 |
| Net realized and unrealized gain (loss) | | .80 | | | | .04 | | | | .83 |
| Total from investment operations | | 1.02 | | | | .24 | | | | .97 |
| Distributions from net investment income | | (.19) | | | | (.17) | | | | (.07) |
| Distributions from net realized gain | | (.06) | | | | —I | | | | — |
| Total distributions | | (.24)J | | | | (.17) | | | | (.07) |
| Net asset value, end of period | | $ 11.75 | | | | $ 10.97 | | | | $ 10.90 |
| Total ReturnB,C,D | | 9.42% | | | | 2.18% | | | | 9.72% |
| Ratios to Average Net AssetsF,H | | | | | | | | | | |
| Expenses before reductions | | .51% | | | | .60% | | | | .60%A |
| Expenses net of fee waivers, if any | | .51% | | | | .58% | | | | .58%A |
| Expenses net of all reductions | | .51% | | | | .58% | | | | .58%A |
| Net investment income (loss) | | 1.98% | | | | 1.86% | | | | 1.89%A |
| Supplemental Data | | | | | | | | | | |
| Net assets, end of period (000 omitted) | | $ 143,012 | | | | $ 94,744 | | | | $ 29,964 |
| Portfolio turnover rate | | 7% | | | | 5% | | | | 103%A |
A Annualized
B Total returns for periods of less than one year are not annualized.
C Total returns would have been lower had certain expenses not been reduced during the periods shown.
D Total returns do not include the effect of the sales charges.
E Calculated based on average shares outstanding during the period.
F Amounts do not include the activity of the underlying funds.
G For the period July 24, 2003 (commencement of operations) to March 31, 2004.
H Expense ratios reflect operating expenses of the class. Expenses before reductions do not reflect amounts reimbursed by the investment adviser or expense offset arrangements and do not represent the amount paid by the class during periods when
reimbursements or reductions occur. Expense ratios before reductions for start up periods may not be representative of longer term operating periods. Expenses net of fee waivers reflect expenses after reimbursement by the investment adviser but
prior to reductions from expense offset arrangements. Expenses net of all reductions represent the net expenses paid by the class but do not include expenses of the investment companies in which the fund invests.
I Amount represents less than $.01 per share.
J Total distribution of $.242 per share is comprised of distributions from net investment income of $.187 and distributions from net realized gain of $.055 per share.
|
| Financial Highlights Class B | | | | | | | | | | |
| Years ended March 31, | | 2006 | | | | 2005 | | | | 2004G |
| Selected Per Share Data | | | | | | | | | | |
| Net asset value, beginning of period | | $ 10.94 | | | | $ 10.87 | | | | $ 10.00 |
| Income from Investment Operations | | | | | | | | | | |
| Net investment income (loss)E | | .17 | | | | .15 | | | | .10 |
| Net realized and unrealized gain (loss) | | .79 | | | | .04 | | | | .83 |
| Total from investment operations | | .96 | | | | .19 | | | | .93 |
| Distributions from net investment income | | (.13) | | | | (.12) | | | | (.06) |
| Distributions from net realized gain | | (.06) | | | | —I | | | | — |
| Total distributions | | (.19) | | | | (.12) | | | | (.06) |
| Net asset value, end of period | | $ 11.71 | | | | $ 10.94 | | | | $ 10.87 |
| Total ReturnB,C,D | | 8.83% | | | | 1.72% | | | | 9.32% |
| Ratios to Average Net AssetsF,H | | | | | | | | | | |
| Expenses before reductions | �� | 1.01% | | | | 1.10% | | | | 1.10%A |
| Expenses net of fee waivers, if any | | 1.01% | | | | 1.08% | | | | 1.08%A |
| Expenses net of all reductions | | 1.01% | | | | 1.08% | | | | 1.08%A |
| Net investment income (loss) | | 1.48% | | | | 1.35% | | | | 1.39%A |
| Supplemental Data | | | | | | | | | | |
| Net assets, end of period (000 omitted) | | $ 33,404 | | | | $ 27,098 | | | | $ 14,897 |
| Portfolio turnover rate | | 7% | | | | 5% | | | | 103%A |
A Annualized
B Total returns for periods of less than one year are not annualized.
C Total returns would have been lower had certain expenses not been reduced during the periods shown.
D Total returns do not include the effect of the contingent deferred sales charge.
E Calculated based on average shares outstanding during the period.
F Amounts do not include the activity of the underlying funds.
G For the period July 24, 2003 (commencement of operations) to March 31, 2004.
H Expense ratios reflect operating expenses of the class. Expenses before reductions do not reflect amounts reimbursed by the investment adviser or expense offset arrangements and do not represent the amount paid by the class during periods when
reimbursements or reductions occur. Expense ratios before reductions for start up periods may not be representative of longer term operating periods. Expenses net of fee waivers reflect expenses after reimbursement by the investment adviser but
prior to reductions from expense offset arrangements. Expenses net of all reductions represent the net expenses paid by the class but do not include expenses of the investment companies in which the fund invests.
I Amount represents less than $.01 per share.
|
See accompanying notes which are an integral part of the financial statements.
| | |
| Annual Report | | 34 |
| Financial Highlights Class C | | | | | | | | | | |
| Years ended March 31, | | 2006 | | | | 2005 | | | | 2004G |
| Selected Per Share Data | | | | | | | | | | |
| Net asset value, beginning of period | | $ 10.93 | | | | $ 10.87 | | | | $ 10.00 |
| Income from Investment Operations | | | | | | | | | | |
| Net investment income (loss)E | | .17 | | | | .15 | | | | .10 |
| Net realized and unrealized gain (loss) | | .78 | | | | .04 | | | | .83 |
| Total from investment operations | | .95 | | | | .19 | | | | .93 |
| Distributions from net investment income | | (.14) | | | | (.13) | | | | (.06) |
| Distributions from net realized gain | | (.06) | | | | —I | | | | — |
| Total distributions | | (.19)J | | | | (.13) | | | | (.06) |
| Net asset value, end of period | | $ 11.69 | | | | $ 10.93 | | | | $ 10.87 |
| Total ReturnB,C,D | | 8.78% | | | | 1.72% | | | | 9.32% |
| Ratios to Average Net AssetsF,H | | | | | | | | | | |
| Expenses before reductions | | 1.01% | | | | 1.10% | | | | 1.10%A |
| Expenses net of fee waivers, if any | | 1.01% | | | | 1.08% | | | | 1.08%A |
| Expenses net of all reductions | | 1.01% | | | | 1.08% | | | | 1.08%A |
| Net investment income (loss) | | 1.48% | | | | 1.36% | | | | 1.39%A |
| Supplemental Data | | | | | | | | | | |
| Net assets, end of period (000 omitted) | | $ 38,882 | | | | $ 27,668 | | | | $ 11,552 |
| Portfolio turnover rate | | 7% | | | | 5% | | | | 103%A |
A Annualized
B Total returns for periods of less than one year are not annualized.
C Total returns would have been lower had certain expenses not been reduced during the periods shown.
D Total returns do not include the effect of the contingent deferred sales charge.
E Calculated based on average shares outstanding during the period.
F Amounts do not include the activity of the underlying funds.
G For the period July 24, 2003 (commencement of operations) to March 31, 2004.
H Expense ratios reflect operating expenses of the class. Expenses before reductions do not reflect amounts reimbursed by the investment adviser or expense offset arrangements and do not represent the amount paid by the class during periods when
reimbursements or reductions occur. Expense ratios before reductions for start up periods may not be representative of longer term operating periods. Expenses net of fee waivers reflect expenses after reimbursement by the investment adviser but
prior to reductions from expense offset arrangements. Expenses net of all reductions represent the net expenses paid by the class but do not include expenses of the investment companies in which the fund invests.
I Amount represents less than $.01 per share.
J Total distribution of $.191 per share is comprised of distributions from net investment income of $.136 and distributions from net realized gain of $.055 per share.
|
| Financial Highlights Institutional Class | | | | | | | | | | |
| Years ended March 31, | | 2006 | | | | 2005 | | | | 2004F |
| Selected Per Share Data | | | | | | | | | | |
| Net asset value, beginning of period | | $ 11.03 | | | | $ 10.93 | | | | $ 10.00 |
| Income from Investment Operations | | | | | | | | | | |
| Net investment income (loss)D | | .28 | | | | .26 | | | | .17 |
| Net realized and unrealized gain (loss) | | .80 | | | | .05 | | | | .83 |
| Total from investment operations | | 1.08 | | | | .31 | | | | 1.00 |
| Distributions from net investment income | | (.24) | | | | (.20) | | | | (.07) |
| Distributions from net realized gain | | (.06) | | | | —H | | | | — |
| Total distributions | | (.29)J | | | | (.21)I | | | | (.07) |
| Net asset value, end of period | | $ 11.82 | | | | $ 11.03 | | | | $ 10.93 |
| Total ReturnB,C | | 9.94% | | | | 2.80% | | | | 10.02% |
| Ratios to Average Net AssetsE,G | | | | | | | | | | |
| Expenses before reductions | | .01% | | | | .10% | | | | .10%A |
| Expenses net of fee waivers, if any | | .01% | | | | .08% | | | | .08%A |
| Expenses net of all reductions | | .01% | | | | .08% | | | | .08%A |
| Net investment income (loss) | | 2.48% | | | | 2.35% | | | | 2.38%A |
| Supplemental Data | | | | | | | | | | |
| Net assets, end of period (000 omitted) | | $ 11,038 | | | | $ 5,538 | | | | $ 1,691 |
| Portfolio turnover rate | | 7% | | | | 5% | | | | 103%A |
A Annualized
B Total returns for periods of less than one year are not annualized.
C Total returns would have been lower had certain expenses not been reduced during the periods shown.
D Calculated based on average shares outstanding during the period.
E Amounts do not include the activity of the underlying funds.
F For the period July 24, 2003 (commencement of operations) to March 31, 2004.
G Expense ratios reflect operating expenses of the class. Expenses before reductions do not reflect amounts reimbursed by the investment adviser or expense offset arrangements and do not represent the amount paid by the class during periods when
reimbursements or reductions occur. Expense ratios before reductions for start up periods may not be representative of longer term operating periods. Expenses net of fee waivers reflect expenses after reimbursement by the investment adviser but
prior to reductions from expense offset arrangements. Expenses net of all reductions represent the net expenses paid by the class but do not include expenses of the investment companies in which the fund invests.
H Amount represents less than $.01 per share.
I Total distribution of $.206 per share is comprised of distributions from net investment income of $.204 and distributions from net realized gain of $.002 per share.
J Total distribution of $.292 per share is comprised of distributions from net investment income of $.237 and distributions from net realized gain of $.055 per share.
|
See accompanying notes which are an integral part of the financial statements.
|
35 Annual Report
| Fidelity Advisor Freedom 2015 Fund | | |
| Investment Changes | | |
| |
| |
| Fund Holdings as of March 31, 2006 | | |
| | | % of fund’s | | % of fund’s investments |
| | | investments | | 6 months ago |
| Domestic Equity Funds | | | | |
| Fidelity Advisor Dividend Growth | | | | |
| Fund Institutional Class | | 9.9 | | 10.1 |
| Fidelity Advisor Equity Growth | | | | |
| Fund Institutional Class | | 5.8 | | 5.2 |
| Fidelity Advisor Equity Income | | | | |
| Fund Institutional Class | | 10.0 | | 10.0 |
| Fidelity Advisor Growth & Income | | | | |
| Fund Institutional Class | | 7.7 | | 9.9 |
| Fidelity Advisor Large Cap Fund | | | | |
| Institutional Class | | 7.7 | | 9.8 |
| Fidelity Advisor Mid Cap Fund | | | | |
| Institutional Class | | 4.0 | | 3.2 |
| Fidelity Advisor Small Cap Fund | | | | |
| Institutional Class | | 3.0 | | 3.1 |
| | | 48.1 | | 51.3 |
| International Equity Funds | | | | |
| Fidelity Advisor Diversified | | | | |
| International Fund Institutional | | | | |
| Class | | 5.5 | | 4.3 |
| Fidelity Advisor Overseas Fund | | | | |
| Institutional Class | | 5.4 | | 4.3 |
| | | 10.9 | | 8.6 |
| High Yield Fixed-Income Funds | | | | |
| Fidelity Advisor High Income | | | | |
| Advantage Fund Institutional | | | | |
| Class | | 6.7 | | 6.7 |
| Investment Grade Fixed-Income | | | | |
| Funds | | | | |
| Fidelity Advisor Government | | | | |
| Investment Fund Institutional | | | | |
| Class | | 14.5 | | 15.0 |
| Fidelity Advisor Intermediate Bond | | | | |
| Fund Institutional Class | | 14.6 | | 14.9 |
| Fidelity Advisor Strategic Real | | | | |
| Return Fund Institutional Class | | 1.0 | | 0.0 |
| | | 30.1 | | 29.9 |
| Short-Term Funds | | | | |
| Fidelity Advisor Short Fixed | | | | |
| Income Fund Institutional Class | | 2.1 | | 1.6 |
| Fidelity Cash Reserves Fund | | 2.1 | | 1.9 |
| | | 4.2 | | 3.5 |
| | | 100.0 | | 100.0 |

The fund invests according to an asset allocation strategy that becomes increasingly conservative over time. The ”six months ago” allocation is based on the fund’s holdings as of September 30, 2005. The ”current” allocation is based on the fund’s holdings as of March 31, 2006. The ”expected” allocation represents the fund’s anticipated allocation at September 30, 2006. Beginning in March 2006, the fund changed its asset allocation strategy, resulting in an increased emphasis on international equity.
Annual Report 36
| Fidelity Advisor Freedom 2015 Fund | | |
| Investments March 31, 2006 |
| Showing Percentage of Total Value of Investment in Securities |
| |
| Equity Funds 59.0% | | | | |
| | | Shares | | Value (Note 1) |
| Domestic Equity Funds 48.1% | | | | |
| Fidelity Advisor Dividend Growth Fund | | | | |
| Institutional Class | | 2,692,299 | | $ 34,461,421 |
| Fidelity Advisor Equity Growth Fund | | | | |
| Institutional Class (a) | | 382,080 | | 20,250,241 |
| Fidelity Advisor Equity Income Fund | | | | |
| Institutional Class | | 1,170,091 | | 34,962,328 |
| Fidelity Advisor Growth & Income Fund | | | | |
| Institutional Class | | 1,434,668 | | 26,971,753 |
| Fidelity Advisor Large Cap Fund | | | | |
| Institutional Class | | 1,501,407 | | 27,025,320 |
| Fidelity Advisor Mid Cap Fund | | | | |
| Institutional Class | | 532,282 | | 14,062,889 |
| Fidelity Advisor Small Cap Fund | | | | |
| Institutional Class | | 430,479 | | 10,637,144 |
| |
| TOTAL DOMESTIC EQUITY FUNDS | | | | 168,371,096 |
| International Equity Funds 10.9% | | | | |
| Fidelity Advisor Diversified International | | | | |
| Fund Institutional Class | | 822,079 | | 19,277,757 |
| Fidelity Advisor Overseas Fund | | | | |
| Institutional Class | | 879,836 | | 18,863,675 |
| |
| TOTAL INTERNATIONAL EQUITY FUNDS | | | | 38,141,432 |
| |
| TOTAL EQUITY FUNDS | | | | |
| (Cost $184,765,295) | | | | 206,512,528 |
| |
| Fixed Income Funds 36.8% | | | | |
| |
| High Yield Fixed-Income Funds – 6.7% | | | | |
| Fidelity Advisor High Income Advantage | | | | |
| Fund Institutional Class | | 2,404,362 | | 23,346,356 |
| Investment Grade Fixed Income Funds 30.1% | | | | |
| Fidelity Advisor Government Investment | | | | |
| Fund Institutional Class | | 5,210,025 | | 50,745,642 |
| Fidelity Advisor Intermediate Bond Fund | | | | |
| Institutional Class | | 4,782,154 | | 51,264,687 |
| Fidelity Advisor Strategic Real Return | | | | |
| Fund Institutional Class | | 346,294 | | 3,452,551 |
| |
| TOTAL INVESTMENT GRADE FIXED-INCOME FUNDS | | | | 105,462,880 |
| |
| TOTAL FIXED-INCOME FUNDS | | | | |
| (Cost $130,918,888) | | | | 128,809,236 |
| Short Term Funds 4.2% | | | | |
| | | Shares | | Value (Note 1) |
| Fidelity Advisor Short Fixed Income | | | | |
| Fund Institutional Class | | 776,735 | | $ 7,270,237 |
| Fidelity Cash Reserves Fund | | 7,282,020 | | 7,282,020 |
| TOTAL SHORT TERM FUNDS | | | | |
| (Cost $14,628,666) | | | | 14,552,257 |
| TOTAL INVESTMENT IN SECURITIES 100% | | | | |
| (Cost $330,312,849) | | | | $349,874,021 |
Legend
(a) Non-income producing
|
See accompanying notes which are an integral part of the financial statements.
37 Annual Report
| Fidelity Advisor Freedom 2015 Fund | | | | | | |
| |
| Financial Statements | | | | | | |
| |
| |
| Statement of Assets and Liabilities | | | | | | |
| | | | | | | March 31, 2006 |
| Assets | | | | | | |
| Investment in securities, at value (cost $330,312,849) — See accompanying schedule | | | | | | $ 349,874,021 |
| Cash | | | | | | 4 |
| Receivable for investments sold | | | | | | 91,039 |
| Receivable for fund shares sold | | | | | | 1,139,780 |
| Total assets | | | | | | 351,104,844 |
| |
| Liabilities | | | | | | |
| Payable for investments purchased | | | | $ 716,846 | | |
| Payable for fund shares redeemed | | | | 508,947 | | |
| Distribution fees payable | | | | 133,189 | | |
| Other affiliated payables | | | | 6,987 | | |
| Total liabilities | | | | | | 1,365,969 |
| |
| Net Assets | | | | | | $ 349,738,875 |
| Net Assets consist of: | | | | | | |
| Paid in capital | | | | | | $ 324,459,687 |
| Undistributed net investment income | | | | | | 874,617 |
| Accumulated undistributed net realized gain (loss) on investments | | | | | | 4,843,399 |
| Net unrealized appreciation (depreciation) on investments | | | | | | 19,561,172 |
| Net Assets | | | | | | $ 349,738,875 |
| |
| Calculation of Maximum Offering Price | | | | | | |
| Class A: | | | | | | |
| Net Asset Value and redemption price per share ($128,240,739 ÷ 10,834,960 shares) | | | | | | $ 11.84 |
| Maximum offering price per share (100/94.25 of $11.84) | | | | | | $ 12.56 |
| Class T: | | | | | | |
| Net Asset Value and redemption price per share ($125,323,367 ÷ 10,609,770 shares) | | | | | | $ 11.81 |
| Maximum offering price per share (100/96.50 of $11.81) | | | | | | $ 12.24 |
| Class B: | | | | | | |
| Net Asset Value and offering price per share ($33,633,115 ÷ 2,857,206 shares)A | | | | | | $ 11.77 |
| Class C: | | | | | | |
| Net Asset Value and offering price per share ($35,656,103 ÷ 3,029,333 shares)A | | | | | | $ 11.77 |
| Institutional Class: | | | | | | |
| Net Asset Value, offering price and redemption price per share ($26,885,551 ÷ 2,262,113 shares) | | | | | | $ 11.89 |
A Redemption price per share is equal to net asset value less any applicable contingent deferred sales charge. | | | | | | |
| |
| Statement of Operations | | | | | | |
| | | | | Year ended March 31, 2006 |
| Investment Income | | | | | | |
| Income distributions from underlying funds | | | | | | $ 5,245,300 |
| Interest | | | | | | 371 |
| Total income | | | | | | 5,245,671 |
| |
| Expenses | | | | | | |
| Management fee | | | | $ 13,329 | | |
| Distribution fees | | | | 1,182,507 | | |
| Independent trustees’ compensation | | | | 948 | | |
| Total expenses before reductions | | | | 1,196,784 | | |
| Expense reductions | | | | (3,711) | | 1,193,073 |
| |
| Net investment income (loss) | | | | | | 4,052,598 |
| Realized and Unrealized Gain (Loss) | | | | | | |
| Realized gain (loss) on sale of underlying fund shares | | | | 66,664 | | |
| Capital gain distributions from underlying funds | | | | 5,299,202 | | 5,365,866 |
| Change in net unrealized appreciation (depreciation) on underlying funds | | | | | | 18,399,382 |
| Net gain (loss) | | | | | | 23,765,248 |
| Net increase (decrease) in net assets resulting from operations | | | | | | $ 27,817,846 |
See accompanying notes which are an integral part of the financial statements.
| | |
| Annual Report | | 38 |
| Statement of Changes in Net Assets | | | | | | | | | | | | |
| | | | | | | Year ended | | | | Year ended |
| | | | | | | March 31, | | | | March 31, |
| | | | | | | 2006 | | | | 2005 |
| Increase (Decrease) in Net Assets | | | | | | | | | | |
| Operations | | | | | | | | | | |
| Net investment income (loss) | | | | | | $ 4,052,598 | | | | $ 1,395,893 |
| Net realized gain (loss) | | | | | | 5,365,866 | | | | 568,476 |
| Change in net unrealized appreciation (depreciation) | | | | | | 18,399,382 | | | | 992,415 |
| Net increase (decrease) in net assets resulting from operations | | | | | | 27,817,846 | | | | 2,956,784 |
| Distributions to shareholders from net investment income | | | | | | (3,337,676) | | | | (1,216,011) |
| Distributions to shareholders from net realized gain | | | | | | (1,130,850) | | | | (6,537) |
| Total distributions | | | | | | (4,468,526) | | | | (1,222,548) |
| Share transactions - net increase (decrease) | | | | | | 174,816,071 | | | | 131,894,217 |
| Total increase (decrease) in net assets | | | | | | 198,165,391 | | | | 133,628,453 |
| |
| Net Assets | | | | | | | | | | |
| Beginning of period | | | | | | 151,573,484 | | | | 17,945,031 |
| End of period (including undistributed net investment income of $874,617 and undistributed net investment income of | | | | | | | | | | |
| $318,954, respectively) | | | | | | $ 349,738,875 | | | | $ 151,573,484 |
| |
| Financial Highlights Class A | | | | | | | | | | | | |
| Years ended March 31, | | 2006 | | | | 2005 | | | | 2004G |
| Selected Per-Share Data | | | | | | | | | | | | |
| Net asset value, beginning of period | | | | $ 10.77 | | | | $ 10.57 | | | | $ 10.00 |
| Income from Investment Operations | | | | | | | | | | | | |
| Net investment income (loss)E | | | | .22 | | | | .21 | | | | .07 |
| Net realized and unrealized gain (loss) | | | | 1.07 | | | | .13 | | | | .56 |
| Total from investment operations | | | | 1.29 | | | | .34 | | | | .63 |
| Distributions from net investment income | | | | (.16) | | | | (.14) | | | | (.06) |
| Distributions from net realized gain | | | | (.06) | | | | —I | | | | — |
| Total distributions | | | | (.22) | | | | (.14) | | | | (.06) |
| Net asset value, end of period | | | | $ 11.84 | | | | $ 10.77 | | | | $ 10.57 |
| Total ReturnB,C,D | | | | 12.12% | | | | 3.22% | | | | 6.32% |
| Ratios to Average Net AssetsF,H | | | | | | | | | | | | |
| Expenses before reductions | | | | .26% | | | | .35% | | | | .35%A |
| Expenses net of fee waivers, if any | | | | .26% | | | | .33% | | | | .33%A |
| Expenses net of all reductions | | | | .26% | | | | .33% | | | | .33%A |
| Net investment income (loss) | | | | 1.93% | | | | 2.02% | | | | 1.84%A |
| Supplemental Data | | | | | | | | | | | | |
| Net assets, end of period (000 omitted) | | | | $ 128,241 | | | | $ 45,028 | | | | $ 4,773 |
| Portfolio turnover rate | | | | 4% | | | | 3% | | | | 5%A |
A Annualized
B Total returns for periods of less than one year are not annualized.
C Total returns would have been lower had certain expenses not been reduced during the periods shown.
D Total returns do not include the effect of the sales charges.
E Calculated based on average shares outstanding during the period.
F Amounts do not include the activity of the underlying funds.
G For the period November 6, 2003 (commencement of operations) to March 31, 2004.
H Expense ratios reflect operating expenses of the class. Expenses before reductions do not reflect amounts reimbursed by the investment adviser or expense offset arrangements and do not represent the amount paid by the class during periods when
reimbursements or reductions occur. Expense ratios before reductions for start up periods may not be representative of longer term operating periods. Expenses net of fee waivers reflect expenses after reimbursement by the investment adviser but prior to
reductions from expense offset arrangements. Expenses net of all reductions represent the net expenses paid by the class but do not include expenses of the investment companies in which the fund invests.
I Amount represents less than $.01 per share.
|
See accompanying notes which are an integral part of the financial statements.
|
39 Annual Report
| Financial Highlights Class T | | | | | | | | | | |
| Years ended March 31, | | 2006 | | | | 2005 | | | | 2004G |
| Selected Per Share Data | | | | | | | | | | |
| Net asset value, beginning of period | | $ 10.76 | | | | $ 10.57 | | | | $ 10.00 |
| Income from Investment Operations | | | | | | | | | | |
| Net investment income (loss)E | | .19 | | | | .19 | | | | .06 |
| Net realized and unrealized gain (loss) | | 1.06 | | | | .13 | | | | .57 |
| Total from investment operations | | 1.25 | | | | .32 | | | | .63 |
| Distributions from net investment income | | (.14) | | | | (.13) | | | | (.06) |
| Distributions from net realized gain | | (.06) | | | | —I | | | | — |
| Total distributions | | (.20) | | | | (.13) | | | | (.06) |
| Net asset value, end of period | | $ 11.81 | | | | $ 10.76 | | | | $ 10.57 |
| Total ReturnB,C,D | | 11.71% | | | | 3.01% | | | | 6.27% |
| Ratios to Average Net AssetsF,H | | | | | | | | | | |
| Expenses before reductions | | .51% | | | | .60% | | | | .60%A |
| Expenses net of fee waivers, if any | | .51% | | | | .58% | | | | .58%A |
| Expenses net of all reductions | | .51% | | | | .58% | | | | .58%A |
| Net investment income (loss) | | 1.68% | | | | 1.77% | | | | 1.59%A |
| Supplemental Data | | | | | | | | | | |
| Net assets, end of period (000 omitted) | | $ 125,323 | | | | $ 55,945 | | | | $ 5,038 |
| Portfolio turnover rate | | 4% | | | | 3% | | | | 5%A |
A Annualized
B Total returns for periods of less than one year are not annualized.
C Total returns would have been lower had certain expenses not been reduced during the periods shown.
D Total returns do not include the effect of the sales charges.
E Calculated based on average shares outstanding during the period.
F Amounts do not include the activity of the underlying funds.
G For the period November 6, 2003 (commencement of operations) to March 31, 2004.
H Expense ratios reflect operating expenses of the class. Expenses before reductions do not reflect amounts reimbursed by the investment adviser or expense offset arrangements and do not represent the amount paid by the class during periods when
reimbursements or reductions occur. Expense ratios before reductions for start up periods may not be representative of longer term operating periods. Expenses net of fee waivers reflect expenses after reimbursement by the investment adviser but
prior to reductions from expense offset arrangements. Expenses net of all reductions represent the net expenses paid by the class but do not include expenses of the investment companies in which the fund invests.
I Amount represents less than $.01 per share.
|
| Financial Highlights Class B | | | | | | | | | | |
| Years ended March 31, | | 2006 | | | | 2005 | | | | 2004G |
| Selected Per Share Data | | | | | | | | | | |
| Net asset value, beginning of period | | $ 10.73 | | | | $ 10.56 | | | | $ 10.00 |
| Income from Investment Operations | | | | | | | | | | |
| Net investment income (loss)E | | .13 | | | | .13 | | | | .04 |
| Net realized and unrealized gain (loss) | | 1.06 | | | | .13 | | | | .58 |
| Total from investment operations | | 1.19 | | | | .26 | | | | .62 |
| Distributions from net investment income | | (.09) | | | | (.09) | | | | (.06) |
| Distributions from net realized gain | | (.06) | | | | —I | | | | — |
| Total distributions | | (.15) | | | | (.09) | | | | (.06) |
| Net asset value, end of period | | $ 11.77 | | | | $ 10.73 | | | | $ 10.56 |
| Total ReturnB,C,D | | 11.17% | | | | 2.49% | | | | 6.17% |
| Ratios to Average Net AssetsF,H | | | | | | | | | | |
| Expenses before reductions | | 1.01% | | | | 1.10% | | | | 1.10%A |
| Expenses net of fee waivers, if any | | 1.01% | | | | 1.08% | | | | 1.08%A |
| Expenses net of all reductions | | 1.01% | | | | 1.08% | | | | 1.08%A |
| Net investment income (loss) | | 1.18% | | | | 1.28% | | | | 1.09%A |
| Supplemental Data | | | | | | | | | | |
| Net assets, end of period (000 omitted) | | $ 33,633 | | | | $ 18,813 | | | | $ 4,259 |
| Portfolio turnover rate | | 4% | | | | 3% | | | | 5%A |
A Annualized
B Total returns for periods of less than one year are not annualized.
C Total returns would have been lower had certain expenses not been reduced during the periods shown.
D Total returns do not include the effect of the contingent deferred sales charge.
E Calculated based on average shares outstanding during the period.
F Amounts do not include the activity of the underlying funds.
G For the period November 6, 2003 (commencement of operations) to March 31, 2004.
H Expense ratios reflect operating expenses of the class. Expenses before reductions do not reflect amounts reimbursed by the investment adviser or expense offset arrangements and do not represent the amount paid by the class during periods when
reimbursements or reductions occur. Expense ratios before reductions for start up periods may not be representative of longer term operating periods. Expenses net of fee waivers reflect expenses after reimbursement by the investment adviser but
prior to reductions from expense offset arrangements. Expenses net of all reductions represent the net expenses paid by the class but do not include expenses of the investment companies in which the fund invests.
I Amount represents less than $.01 per share.
|
See accompanying notes which are an integral part of the financial statements.
| | |
| Annual Report | | 40 |
| Financial Highlights Class C | | | | | | | | | | |
| Years ended March 31, | | 2006 | | | | 2005 | | | | 2004G |
| Selected Per Share Data | | | | | | | | | | |
| Net asset value, beginning of period | | $ 10.73 | | | | $ 10.56 | | | | $ 10.00 |
| Income from Investment Operations | | | | | | | | | | |
| Net investment income (loss)E | | .13 | | | | .13 | | | | .04 |
| Net realized and unrealized gain (loss) | | 1.06 | | | | .13 | | | | .57 |
| Total from investment operations | | 1.19 | | | | .26 | | | | .61 |
| Distributions from net investment income | | (.09) | | | | (.09) | | | | (.05) |
| Distributions from net realized gain | | (.06) | | | | —I | | | | — |
| Total distributions | | (.15) | | | | (.09) | | | | (.05) |
| Net asset value, end of period | | $ 11.77 | | | | $ 10.73 | | | | $ 10.56 |
| Total ReturnB,C,D | | 11.19% | | | | 2.47% | | | | 6.12% |
| Ratios to Average Net AssetsF,H | | | | | | | | | | |
| Expenses before reductions | | 1.01% | | | | 1.10% | | | | 1.10%A |
| Expenses net of fee waivers, if any | | 1.01% | | | | 1.08% | | | | 1.08%A |
| Expenses net of all reductions | | 1.01% | | | | 1.08% | | | | 1.08%A |
| Net investment income (loss) | | 1.18% | | | | 1.28% | | | | 1.09%A |
| Supplemental Data | | | | | | | | | | |
| Net assets, end of period (000 omitted) | | $ 35,656 | | | | $ 18,926 | | | | $ 3,593 |
| Portfolio turnover rate | | 4% | | | | 3% | | | | 5%A |
A Annualized
B Total returns for periods of less than one year are not annualized.
C Total returns would have been lower had certain expenses not been reduced during the periods shown.
D Total returns do not include the effect of the contingent deferred sales charge.
E Calculated based on average shares outstanding during the period.
F Amounts do not include the activity of the underlying funds.
G For the period November 6, 2003 (commencement of operations) to March 31, 2004.
H Expense ratios reflect operating expenses of the class. Expenses before reductions do not reflect amounts reimbursed by the investment adviser or expense offset arrangements and do not represent the amount paid by the class during periods when
reimbursements or reductions occur. Expense ratios before reductions for start up periods may not be representative of longer term operating periods. Expenses net of fee waivers reflect expenses after reimbursement by the investment adviser but
prior to reductions from expense offset arrangements. Expenses net of all reductions represent the net expenses paid by the class but do not include expenses of the investment companies in which the fund invests.
I Amount represents less than $.01 per share.
|
| Financial Highlights Institutional Class | | | | | | | | | | |
| Years ended March 31, | | 2006 | | | | 2005 | | | | 2004F |
| Selected Per Share Data | | | | | | | | | | |
| Net asset value, beginning of period | | $ 10.81 | | | | $ 10.59 | | | | $ 10.00 |
| Income from Investment Operations | | | | | | | | | | |
| Net investment income (loss)D | | .25 | | | | .24 | | | | .09 |
| Net realized and unrealized gain (loss) | | 1.07 | | | | .13 | | | | .56 |
| Total from investment operations | | 1.32 | | | | .37 | | | | .65 |
| Distributions from net investment income | | (.18) | | | | (.15) | | | | (.06) |
| Distributions from net realized gain | | (.06) | | | | —H | | | | — |
| Total distributions | | (.24) | | | | (.15) | | | | (.06) |
| Net asset value, end of period | | $ 11.89 | | | | $ 10.81 | | | | $ 10.59 |
| Total ReturnB,C | | 12.36% | | | | 3.52% | | | | 6.52% |
| Ratios to Average Net AssetsE,G | | | | | | | | | | |
| Expenses before reductions | | .01% | | | | .10% | | | | .10%A |
| Expenses net of fee waivers, if any | | .00% | | | | .08% | | | | .08%A |
| Expenses net of all reductions | | .00% | | | | .08% | | | | .08%A |
| Net investment income (loss) | | 2.18% | | | | 2.27% | | | | 2.09%A |
| Supplemental Data | | | | | | | | | | |
| Net assets, end of period (000 omitted) | | $ 26,886 | | | | $ 12,861 | | | | $ 282 |
| Portfolio turnover rate | | 4% | | | | 3% | | | | 5%A |
A Annualized
B Total returns for periods of less than one year are not annualized.
C Total returns would have been lower had certain expenses not been reduced during the periods shown.
D Calculated based on average shares outstanding during the period.
E Amounts do not include the activity of the underlying funds.
F For the period November 6, 2003 (commencement of operations) to March 31, 2004.
G Expense ratios reflect operating expenses of the class. Expenses before reductions do not reflect amounts reimbursed by the investment adviser or expense offset arrangements and do not represent the amount paid by the class during periods when
reimbursements or reductions occur. Expense ratios before reductions for start up periods may not be representative of longer term operating periods. Expenses net of fee waivers reflect expenses after reimbursement by the investment adviser but
prior to reductions from expense offset arrangements. Expenses net of all reductions represent the net expenses paid by the class but do not include expenses of the investment companies in which the fund invests.
H Amount represents less than $.01 per share.
|
See accompanying notes which are an integral part of the financial statements.
|
41 Annual Report
| Fidelity Advisor Freedom 2020 Fund | | |
| Investment Changes | | |
| |
| |
| Fund Holdings as of March 31, 2006 | | |
| | | % of fund’s | | % of fund’s investments |
| | | investments | | 6 months ago |
| Domestic Equity Funds | | | | |
| Fidelity Advisor Dividend Growth | | | | |
| Fund Institutional Class | | 11.8 | | 11.7 |
| Fidelity Advisor Equity Growth | | | | |
| Fund Institutional Class | | 7.0 | | 6.0 |
| Fidelity Advisor Equity Income | | | | |
| Fund Institutional Class | | 11.9 | | 11.7 |
| Fidelity Advisor Growth & Income | | | | |
| Fund Institutional Class | | 8.7 | | 11.6 |
| Fidelity Advisor Large Cap Fund | | | | |
| Institutional Class | | 8.7 | | 11.5 |
| Fidelity Advisor Mid Cap Fund | | | | |
| Institutional Class | | 4.7 | | 3.6 |
| Fidelity Advisor Small Cap Fund | | | | |
| Institutional Class | | 3.5 | | 3.6 |
| | | 56.3 | | 59.7 |
| International Equity Funds | | | | |
| Fidelity Advisor Diversified | | | | |
| International Fund Institutional | | | | |
| Class | | 6.4 | | 5.1 |
| Fidelity Advisor Overseas Fund | | | | |
| Institutional Class | | 6.4 | | 5.0 |
| | | 12.8 | | 10.1 |
| High Yield Fixed-Income Funds | | | | |
| Fidelity Advisor High Income | | | | |
| Advantage Fund Institutional | | | | |
| Class | | 7.6 | | 7.4 |
| Investment Grade Fixed-Income | | | | |
| Funds | | | | |
| Fidelity Advisor Government | | | | |
| Investment Fund Institutional | | | | |
| Class | | 11.2 | | 11.3 |
| Fidelity Advisor Intermediate Bond | | | | |
| Fund Institutional Class | | 11.3 | | 11.4 |
| Fidelity Advisor Strategic Real | | | | |
| Return Fund Institutional Class | | 0.7 | | 0.0 |
| | | 23.2 | | 22.7 |
| Short-Term Funds | | | | |
| Fidelity Advisor Short Fixed | | | | |
| Income Fund Institutional Class | | 0.1 | | 0.0 |
| Fidelity Cash Reserves Fund | | 0.0 | | 0.1 |
| | | 0.1 | | 0.1 |
| | | 100.0 | | 100.0 |
The fund invests according to an asset allocation strategy that becomes increasingly conservative over time. The ”six months ago” allocation is based on the fund’s holdings as of September 30, 2005. The ”current” allocation is based on the fund’s holdings as of March 31, 2006. The ”expected” allocation represents the fund’s anticipated allocation at September 30, 2006. Beginning in March 2006, the fund changed its asset allocation strategy, resulting in an increased emphasis on international equity.
Annual Report 42
| Fidelity Advisor Freedom 2020 Fund | | |
| Investments March 31, 2006 |
| Showing Percentage of Total Value of Investment in Securities |
| |
| Equity Funds 69.1% | | | | |
| | | Shares | | Value (Note 1) |
| Domestic Equity Funds 56.3% | | | | |
| Fidelity Advisor Dividend Growth Fund | | | | |
| Institutional Class | | 6,773,478 | | $ 86,700,513 |
| Fidelity Advisor Equity Growth Fund | | | | |
| Institutional Class (a) | | 975,499 | | 51,701,464 |
| Fidelity Advisor Equity Income Fund | | | | |
| Institutional Class | | 2,925,664 | | 87,418,850 |
| Fidelity Advisor Growth & Income Fund | | | | |
| Institutional Class | | 3,381,211 | | 63,566,768 |
| Fidelity Advisor Large Cap Fund | | | | |
| Institutional Class | | 3,559,036 | | 64,062,648 |
| Fidelity Advisor Mid Cap Fund | | | | |
| Institutional Class | | 1,316,114 | | 34,771,726 |
| Fidelity Advisor Small Cap Fund | | | | |
| Institutional Class | | 1,046,126 | | 25,849,780 |
| |
| TOTAL DOMESTIC EQUITY FUNDS | | | | 414,071,749 |
| International Equity Funds 12.8% | | | | |
| Fidelity Advisor Diversified International | | | | |
| Fund Institutional Class | | 2,015,574 | | 47,265,201 |
| Fidelity Advisor Overseas Fund | | | | |
| Institutional Class | | 2,189,034 | | 46,932,890 |
| |
| TOTAL INTERNATIONAL EQUITY FUNDS | | | | 94,198,091 |
| |
| TOTAL EQUITY FUNDS | | | | |
| (Cost $444,940,095) | | | | 508,269,840 |
| |
| Fixed Income Funds 30.8% | | | | |
| |
| High Yield Fixed-Income Funds – 7.6% | | | | |
| Fidelity Advisor High Income Advantage | | | | |
| Fund Institutional Class | | 5,714,870 | | 55,491,387 |
| Investment Grade Fixed Income Funds 23.2% | | | | |
| Fidelity Advisor Government Investment | | | | |
| Fund Institutional Class | | 8,473,883 | | 82,535,624 |
| Fidelity Advisor Intermediate Bond Fund | | | | |
| Institutional Class | | 7,742,317 | | 82,997,643 |
| Fidelity Advisor Strategic Real Return | | | | |
| Fund Institutional Class | | 471,036 | | 4,696,233 |
| |
| TOTAL INVESTMENT GRADE FIXED-INCOME FUNDS | | | | 170,229,500 |
| |
| TOTAL FIXED-INCOME FUNDS | | | | |
| (Cost $228,769,601) | | | | 225,720,887 |
| Short Term Funds 0.1% | | | | | | |
| | | Shares | | Value (Note 1) |
| Fidelity Advisor Short Fixed Income | | | | | | |
| Fund Institutional Class | | 62,269 | | | | $ 582,834 |
| Fidelity Cash Reserves Fund | | 552,985 | | | | 552,985 |
| TOTAL SHORT TERM FUNDS | | | | | | |
| (Cost $1,140,219) | | | | | | 1,135,819 |
| TOTAL INVESTMENT IN SECURITIES 100% | | | | | | |
| (Cost $674,849,915) | | | | $735,126,546 |
Legend
(a) Non-income producing
|
See accompanying notes which are an integral part of the financial statements.
43 Annual Report
| Fidelity Advisor Freedom 2020 Fund | | | | | | |
| |
| Financial Statements | | | | | | |
| |
| |
| Statement of Assets and Liabilities | | | | | | |
| | | | | | | March 31, 2006 |
| Assets | | | | | | |
| Investment in securities, at value (cost $674,849,915) — See accompanying schedule | | | | | | $ 735,126,546 |
| Cash | | | | | | 33,698 |
| Receivable for investments sold | | | | | | 1,884 |
| Receivable for fund shares sold | | | | | | 2,262,939 |
| Total assets | | | | | | 737,425,067 |
| |
| Liabilities | | | | | | |
| Payable for investments purchased | | | | $ 1,705,367 | | |
| Payable for fund shares redeemed | | | | 591,683 | | |
| Distribution fees payable | | | | 287,182 | | |
| Other affiliated payables | | | | 11,564 | | |
| Total liabilities | | | | | | 2,595,796 |
| |
| Net Assets | | | | | | $ 734,829,271 |
| Net Assets consist of: | | | | | | |
| Paid in capital | | | | | | $ 659,302,138 |
| Undistributed net investment income | | | | | | 1,350,482 |
| Accumulated undistributed net realized gain (loss) on investments | | | | | | 13,900,020 |
| Net unrealized appreciation (depreciation) on investments | | | | | | 60,276,631 |
| Net Assets | | | | | | $ 734,829,271 |
| Calculation of Maximum Offering Price | | | | | | |
| Class A: | | | | | | |
| Net Asset Value and redemption price per share ($284,466,094 ÷ 22,145,156 shares) | | | | | | $ 12.85 |
| Maximum offering price per share (100/94.25 of $12.85) | | | | | | $ 13.63 |
| Class T: | | | | | | |
| Net Asset Value and redemption price per share ($296,476,535 ÷ 23,104,171 shares) | | | | | | $ 12.83 |
| Maximum offering price per share (100/96.50 of $12.83) | | | | | | $ 13.30 |
| Class B: | | | | | | |
| Net Asset Value and offering price per share ($71,232,374 ÷ 5,572,397 shares)A | | | | | | $ 12.78 |
| Class C: | | | | | | |
| Net Asset Value and offering price per share ($61,442,380 ÷ 4,809,746 shares)A | | | | | | $ 12.77 |
| Institutional Class: | | | | | | |
| Net Asset Value, offering price and redemption price per share ($21,211,888 ÷ 1,644,670 shares) | | | | | | $ 12.90 |
| A Redemption price per share is equal to net asset value less any applicable contingent deferred sales charge. | | | | | | |
| |
| Statement of Operations | | | | | | |
| | | | | Year ended March 31, 2006 |
| Investment Income | | | | | | |
| Income distributions from underlying funds | | | | | | $ 10,385,569 |
| Interest | | | | | | 16 |
| Total income | | | | | | 10,385,585 |
| |
| Expenses | | | | | | |
| Management fee | | | | $ 34,940 | | |
| Distribution fees | | | | 2,766,278 | | |
| Independent trustees’ compensation | | | | 2,268 | | |
| Total expenses before reductions | | | | 2,803,486 | | |
| Expense reductions | | | | (9,616) | | 2,793,870 |
| |
| Net investment income (loss) | | | | | | 7,591,715 |
| Realized and Unrealized Gain (Loss) | | | | | | |
| Realized gain (loss) on sale of underlying fund shares | | | | 1,603,801 | | |
| Capital gain distributions from underlying funds | | | | 13,453,299 | | 15,057,100 |
| Change in net unrealized appreciation (depreciation) on underlying funds | | | | | | 49,835,325 |
| Net gain (loss) | | | | | | 64,892,425 |
| Net increase (decrease) in net assets resulting from operations | | | | | | $ 72,484,140 |
See accompanying notes which are an integral part of the financial statements.
| | |
| Annual Report | | 44 |
| Statement of Changes in Net Assets | | | | | | | | | | | | |
| | | | | | | Year ended | | | | Year ended |
| | | | | | | March 31, | | | | March 31, |
| | | | | | | 2006 | | | | 2005 |
| Increase (Decrease) in Net Assets | | | | | | | | | | |
| Operations | | | | | | | | | | |
| Net investment income (loss) | | | | | | $ 7,591,715 | | | | $ 4,402,724 |
| Net realized gain (loss) | | | | | | 15,057,100 | | | | 1,965,370 |
| Change in net unrealized appreciation (depreciation) | | | | | | 49,835,325 | | | | 5,996,006 |
| Net increase (decrease) in net assets resulting from operations | | | | | | 72,484,140 | | | | 12,364,100 |
| Distributions to shareholders from net investment income | | | | | | (6,539,824) | | | | (4,439,939) |
| Distributions to shareholders from net realized gain | | | | | | (3,059,372) | | | | (68,080) |
| Total distributions | | | | | | (9,599,196) | | | | (4,508,019) |
| Share transactions - net increase (decrease) | | | | | | 258,660,731 | | | | 239,359,934 |
| Total increase (decrease) in net assets | | | | | | 321,545,675 | | | | 247,216,015 |
| |
| Net Assets | | | | | | | | | | |
| Beginning of period | | | | | | 413,283,596 | | | | 166,067,581 |
| End of period (including undistributed net investment income of $1,350,482 and undistributed net investment income of | | | | | | | | | | |
| $637,463, respectively) | | | | | | $ 734,829,271 | | | | $ 413,283,596 |
| |
| Financial Highlights Class A | | | | | | | | | | | | |
| Years ended March 31, | | | | 2006 | | | | 2005 | | | | 2004G |
| Selected Per-Share Data | | | | | | | | | | | | |
| Net asset value, beginning of period | | | | $ 11.53 | | | | $ 11.29 | | | | $ 10.00 |
| Income from Investment Operations | | | | | | | | | | | | |
| Net investment income (loss)E | | | | .19 | | | | .20 | | | | .13 |
| Net realized and unrealized gain (loss) | | | | 1.36 | | | | .23 | | | | 1.25 |
| Total from investment operations | | | | 1.55 | | | | .43 | | | | 1.38 |
| Distributions from net investment income | | | | (.16) | | | | (.18) | | | | (.09) |
| Distributions from net realized gain | | | | (.08) | | | | —I | | | | — |
| Total distributions | | | | (.23)K | | | | (.19)J | | | | (.09) |
| Net asset value, end of period | | | | $ 12.85 | | | | $ 11.53 | | | | $ 11.29 |
| Total ReturnB,C,D | | | | 13.62% | | | | 3.75% | | | | 13.78% |
| Ratios to Average Net AssetsF,H | | | | | | | | | | | | |
| Expenses before reductions | | | | .26% | | | | .35% | | | | .35%A |
| Expenses net of fee waivers, if any | | | | .26% | | | | .33% | | | | .33%A |
| Expenses net of all reductions | | | | .26% | | | | .33% | | | | .33%A |
| Net investment income (loss) | | | | 1.60% | | | | 1.80% | | | | 1.74%A |
| Supplemental Data | | | | | | | | | | | | |
| Net assets, end of period (000 omitted) | | | | $ 284,466 | | | | $ 135,306 | | | | $ 72,334 |
| Portfolio turnover rate | | | | 6% | | | | 1% | | | | 4%A |
A Annualized
B Total returns for periods of less than one year are not annualized.
C Total returns would have been lower had certain expenses not been reduced during the periods shown.
D Total returns do not include the effect of the sales charges.
E Calculated based on average shares outstanding during the period.
F Amounts do not include the activity of the underlying funds.
G For the period July 24, 2003 (commencement of operations) to March 31, 2004.
H Expense ratios reflect operating expenses of the class. Expenses before reductions do not reflect amounts reimbursed by the investment adviser or expense offset arrangements and do not represent the amount paid by the class during periods when
reimbursements or reductions occur. Expense ratios before reductions for start up periods may not be representative of longer term operating periods. Expenses net of fee waivers reflect expenses after reimbursement by the investment adviser but prior to
reductions from expense offset arrangements. Expenses net of all reductions represent the net expenses paid by the class but do not include expenses of the investment companies in which the fund invests.
I Amount represents less than $.01 per share.
J Total distribution of $.185 per share is comprised of distributions from net investment income of $.181 and distributions from net realized gain of $.004 per share.
K Total distribution of $.233 per share is comprised of distributions from net investment income of $.158 and distributions from net realized gain of $.075 per share.
|
See accompanying notes which are an integral part of the financial statements.
|
45 Annual Report
| Financial Highlights Class T | | | | | | | | | | |
| Years ended March 31, | | 2006 | | | | 2005 | | | | 2004G |
| Selected Per Share Data | | | | | | | | | | |
| Net asset value, beginning of period | | $ 11.52 | | | | $ 11.29 | | | | $ 10.00 |
| Income from Investment Operations | | | | | | | | | | |
| Net investment income (loss)E | | .16 | | | | .18 | | | | .11 |
| Net realized and unrealized gain (loss) | | 1.36 | | | | .21 | | | | 1.26 |
| Total from investment operations | | 1.52 | | | | .39 | | | | 1.37 |
| Distributions from net investment income | | (.13) | | | | (.16) | | | | (.08) |
| Distributions from net realized gain | | (.08) | | | | —I | | | | — |
| Total distributions | | (.21) | | | | (.16) | | | | (.08) |
| Net asset value, end of period | | $ 12.83 | | | | $ 11.52 | | | | $ 11.29 |
| Total ReturnB,C,D | | 13.28% | | | | 3.46% | | | | 13.73% |
| Ratios to Average Net AssetsF,H | | | | | | | | | | |
| Expenses before reductions | | .51% | | | | .60% | | | | .60%A |
| Expenses net of fee waivers, if any | | .51% | | | | .58% | | | | .58%A |
| Expenses net of all reductions | | .51% | | | | .58% | | | | .58%A |
| Net investment income (loss) | | 1.35% | | | | 1.55% | | | | 1.49%A |
| Supplemental Data | | | | | | | | | | |
| Net assets, end of period (000 omitted) | | $ 296,477 | | | | $ 177,336 | | | | $ 52,310 |
| Portfolio turnover rate | | 6% | | | | 1% | | | | 4%A |
A Annualized
B Total returns for periods of less than one year are not annualized.
C Total returns would have been lower had certain expenses not been reduced during the periods shown.
D Total returns do not include the effect of the sales charges.
E Calculated based on average shares outstanding during the period.
F Amounts do not include the activity of the underlying funds.
G For the period July 24, 2003 (commencement of operations) to March 31, 2004.
H Expense ratios reflect operating expenses of the class. Expenses before reductions do not reflect amounts reimbursed by the investment adviser or expense offset arrangements and do not represent the amount paid by the class during periods when
reimbursements or reductions occur. Expense ratios before reductions for start up periods may not be representative of longer term operating periods. Expenses net of fee waivers reflect expenses after reimbursement by the investment adviser but
prior to reductions from expense offset arrangements. Expenses net of all reductions represent the net expenses paid by the class but do not include expenses of the investment companies in which the fund invests.
I Amount represents less than $.01 per share.
|
| Financial Highlights Class B | | | | | | | | | | |
| Years ended March 31, | | 2006 | | | | 2005 | | | | 2004G |
| Selected Per Share Data | | | | | | | | | | |
| Net asset value, beginning of period | | $ 11.48 | | | | $ 11.27 | | | | $ 10.00 |
| Income from Investment Operations | | | | | | | | | | |
| Net investment income (loss)E | | .10 | | | | .12 | | | | .07 |
| Net realized and unrealized gain (loss) | | 1.35 | | | | .21 | | | | 1.27 |
| Total from investment operations | | 1.45 | | | | .33 | | | | 1.34 |
| Distributions from net investment income | | (.08) | | | | (.12) | | | | (.07) |
| Distributions from net realized gain | | (.07) | | | | —I | | | | — |
| Total distributions | | (.15) | | | | (.12) | | | | (.07) |
| Net asset value, end of period | | $ 12.78 | | | | $ 11.48 | | | | $ 11.27 |
| Total ReturnB,C,D | | 12.71% | | | | 2.93% | | | | 13.37% |
| Ratios to Average Net AssetsF,H | | | | | | | | | | |
| Expenses before reductions | | 1.01% | | | | 1.10% | | | | 1.10%A |
| Expenses net of fee waivers, if any | | 1.01% | | | | 1.08% | | | | 1.08%A |
| Expenses net of all reductions | | 1.01% | | | | 1.08% | | | | 1.08%A |
| Net investment income (loss) | | .85% | | | | 1.05% | | | | .99%A |
| Supplemental Data | | | | | | | | | | |
| Net assets, end of period (000 omitted) | | $ 71,232 | | | | $ 49,398 | | | | $ 23,274 |
| Portfolio turnover rate | | 6% | | | | 1% | | | | 4%A |
A Annualized
B Total returns for periods of less than one year are not annualized.
C Total returns would have been lower had certain expenses not been reduced during the periods shown.
D Total returns do not include the effect of the contingent deferred sales charge.
E Calculated based on average shares outstanding during the period.
F Amounts do not include the activity of the underlying funds.
G For the period July 24, 2003 (commencement of operations) to March 31, 2004.
H Expense ratios reflect operating expenses of the class. Expenses before reductions do not reflect amounts reimbursed by the investment adviser or expense offset arrangements and do not represent the amount paid by the class during periods when
reimbursements or reductions occur. Expense ratios before reductions for start up periods may not be representative of longer term operating periods. Expenses net of fee waivers reflect expenses after reimbursement by the investment adviser but
prior to reductions from expense offset arrangements. Expenses net of all reductions represent the net expenses paid by the class but do not include expenses of the investment companies in which the fund invests.
I Amount represents less than $.01 per share.
|
See accompanying notes which are an integral part of the financial statements.
| | |
| Annual Report | | 46 |
| Financial Highlights Class C | | | | | | | | | | |
| Years ended March 31, | | 2006 | | | | 2005 | | | | 2004G |
| Selected Per Share Data | | | | | | | | | | |
| Net asset value, beginning of period | | $ 11.48 | | | | $ 11.26 | | | | $ 10.00 |
| Income from Investment Operations | | | | | | | | | | |
| Net investment income (loss)E | | .10 | | | | .12 | | | | .07 |
| Net realized and unrealized gain (loss) | | 1.34 | | | | .22 | | | | 1.26 |
| Total from investment operations | | 1.44 | | | | .34 | | | | 1.33 |
| Distributions from net investment income | | (.08) | | | | (.12) | | | | (.07) |
| Distributions from net realized gain | | (.07) | | | | —I | | | | — |
| Total distributions | | (.15) | | | | (.12) | | | | (.07) |
| Net asset value, end of period | | $ 12.77 | | | | $ 11.48 | | | | $ 11.26 |
| Total ReturnB,C,D | | 12.66% | | | | 3.02% | | | | 13.32% |
| Ratios to Average Net AssetsF,H | | | | | | | | | | |
| Expenses before reductions | | 1.01% | | | | 1.10% | | | | 1.10%A |
| Expenses net of fee waivers, if any | | 1.01% | | | | 1.08% | | | | 1.08%A |
| Expenses net of all reductions | | 1.01% | | | | 1.08% | | | | 1.08%A |
| Net investment income (loss) | | .85% | | | | 1.05% | | | | .99%A |
| Supplemental Data | | | | | | | | | | |
| Net assets, end of period (000 omitted) | | $ 61,442 | | | | $ 39,310 | | | | $ 15,871 |
| Portfolio turnover rate | | 6% | | | | 1% | | | | 4%A |
A Annualized
B Total returns for periods of less than one year are not annualized.
C Total returns would have been lower had certain expenses not been reduced during the periods shown.
D Total returns do not include the effect of the contingent deferred sales charge.
E Calculated based on average shares outstanding during the period.
F Amounts do not include the activity of the underlying funds.
G For the period July 24, 2003 (commencement of operations) to March 31, 2004.
H Expense ratios reflect operating expenses of the class. Expenses before reductions do not reflect amounts reimbursed by the investment adviser or expense offset arrangements and do not represent the amount paid by the class during periods when
reimbursements or reductions occur. Expense ratios before reductions for start up periods may not be representative of longer term operating periods. Expenses net of fee waivers reflect expenses after reimbursement by the investment adviser but
prior to reductions from expense offset arrangements. Expenses net of all reductions represent the net expenses paid by the class but do not include expenses of the investment companies in which the fund invests.
I Amount represents less than $.01 per share.
|
| Financial Highlights Institutional Class | | | | | | | | | | |
| Years ended March 31, | | 2006 | | | | 2005 | | | | 2004F |
| Selected Per Share Data | | | | | | | | | | |
| Net asset value, beginning of period | | $ 11.57 | | | | $ 11.31 | | | | $ 10.00 |
| Income from Investment Operations | | | | | | | | | | |
| Net investment income (loss)D | | .23 | | | | .23 | | | | .15 |
| Net realized and unrealized gain (loss) | | 1.36 | | | | .23 | | | | 1.25 |
| Total from investment operations | | 1.59 | | | | .46 | | | | 1.40 |
| Distributions from net investment income | | (.18) | | | | (.20) | | | | (.09) |
| Distributions from net realized gain | | (.08) | | | | —H | | | | — |
| Total distributions | | (.26) | | | | (.20) | | | | (.09) |
| Net asset value, end of period | | $ 12.90 | | | | $ 11.57 | | | | $ 11.31 |
| Total ReturnB,C | | 13.88% | | | | 4.06% | | | | 14.03% |
| Ratios to Average Net AssetsE,G | | | | | | | | | | |
| Expenses before reductions | | .01% | | | | .10% | | | | .10%A |
| Expenses net of fee waivers, if any | | .00% | | | | .08% | | | | .08%A |
| Expenses net of all reductions | | .00% | | | | .08% | | | | .08%A |
| Net investment income (loss) | | 1.85% | | | | 2.05% | | | | 1.98%A |
| Supplemental Data | | | | | | | | | | |
| Net assets, end of period (000 omitted) | | $ 21,212 | | | | $ 11,932 | | | | $ 2,278 |
| Portfolio turnover rate | | 6% | | | | 1% | | | | 4%A |
A Annualized
B Total returns for periods of less than one year are not annualized.
C Total returns would have been lower had certain expenses not been reduced during the periods shown.
D Calculated based on average shares outstanding during the period.
E Amounts do not include the activity of the underlying funds.
F For the period July 24, 2003 (commencement of operations) to March 31, 2004.
G Expense ratios reflect operating expenses of the class. Expenses before reductions do not reflect amounts reimbursed by the investment adviser or expense offset arrangements and do not represent the amount paid by the class during periods when
reimbursements or reductions occur. Expense ratios before reductions for start up periods may not be representative of longer term operating periods. Expenses net of fee waivers reflect expenses after reimbursement by the investment adviser but
prior to reductions from expense offset arrangements. Expenses net of all reductions represent the net expenses paid by the class but do not include expenses of the investment companies in which the fund invests.
H Amount represents less than $.01 per share.
|
See accompanying notes which are an integral part of the financial statements.
|
47 Annual Report
| Fidelity Advisor Freedom 2025 Fund | | |
| Investment Changes | | |
| |
| |
| Fund Holdings as of March 31, 2006 | | |
| | | % of fund’s | | % of fund’s investments |
| | | investments | | 6 months ago |
| Domestic Equity Funds | | | | |
| Fidelity Advisor Dividend Growth | | | | |
| Fund Institutional Class | | 12.4 | | 12.5 |
| Fidelity Advisor Equity Growth | | | | |
| Fund Institutional Class | | 7.2 | | 6.4 |
| Fidelity Advisor Equity Income | | | | |
| Fund Institutional Class | | 12.5 | | 12.5 |
| Fidelity Advisor Growth & Income | | | | |
| Fund Institutional Class | | 9.6 | | 12.6 |
| Fidelity Advisor Large Cap Fund | | | | |
| Institutional Class | | 9.7 | | 12.4 |
| Fidelity Advisor Mid Cap Fund | | | | |
| Institutional Class | | 5.0 | | 3.9 |
| Fidelity Advisor Small Cap Fund | | | | |
| Institutional Class | | 3.7 | | 3.8 |
| | | 60.1 | | 64.1 |
| International Equity Funds | | | | |
| Fidelity Advisor Diversified | | | | |
| International Fund Institutional | | | | |
| Class | | 6.7 | | 5.5 |
| Fidelity Advisor Overseas Fund | | | | |
| Institutional Class | | 6.6 | | 5.5 |
| | | 13.3 | | 11.0 |
| High Yield Fixed-Income Funds | | | | |
| Fidelity Advisor High Income | | | | |
| Advantage Fund Institutional | | | | |
| Class | | 7.5 | | 7.4 |
| Investment Grade Fixed-Income | | | | |
| Funds | | | | |
| Fidelity Advisor Government | | | | |
| Investment Fund Institutional | | | | |
| Class | | 9.3 | | 8.7 |
| Fidelity Advisor Intermediate Bond | | | | |
| Fund Institutional Class | | 9.3 | | 8.8 |
| Fidelity Advisor Strategic Real | | | | |
| Return Fund Institutional Class | | 0.5 | | 0.0 |
| | | 19.1 | | 17.5 |
| | | 100.0 | | 100.0 |
The fund invests according to an asset allocation strategy that becomes increasingly conservative over time. The ”six months ago” allocation is based on the fund’s holdings as of September 30, 2005. The ”current” allocation is based on the fund’s holdings as of March 31, 2006. The ”expected” allocation represents the fund’s anticipated allocation at September 30, 2006. Beginning in March 2006, the fund changed its asset allocation strategy, resulting in an increased emphasis on international equity.
Annual Report 48
| Fidelity Advisor Freedom 2025 Fund | | |
| Investments March 31, 2006 |
| Showing Percentage of Total Value of Investment in Securities |
| |
| Equity Funds 73.4% | | | | |
| | | Shares | | Value (Note 1) |
| Domestic Equity Funds 60.1% | | | | |
| Fidelity Advisor Dividend Growth Fund | | | | |
| Institutional Class | | 2,577,319 | | $ 32,989,689 |
| Fidelity Advisor Equity Growth Fund | | | | |
| Institutional Class (a) | | 362,723 | | 19,224,329 |
| Fidelity Advisor Equity Income Fund | | | | |
| Institutional Class | | 1,111,656 | | 33,216,271 |
| Fidelity Advisor Growth & Income Fund | | | | |
| Institutional Class | | 1,353,621 | | 25,448,071 |
| Fidelity Advisor Large Cap Fund | | | | |
| Institutional Class | | 1,423,742 | | 25,627,360 |
| Fidelity Advisor Mid Cap Fund | | | | |
| Institutional Class | | 496,812 | | 13,125,785 |
| Fidelity Advisor Small Cap Fund | | | | |
| Institutional Class | | 399,192 | | 9,864,023 |
| |
| TOTAL DOMESTIC EQUITY FUNDS | | | | 159,495,528 |
| International Equity Funds 13.3% | | | | |
| Fidelity Advisor Diversified International | | | | |
| Fund Institutional Class | | 755,743 | | 17,722,168 |
| Fidelity Advisor Overseas Fund | | | | |
| Institutional Class | | 815,402 | | 17,482,208 |
| |
| TOTAL INTERNATIONAL EQUITY FUNDS | | | | 35,204,376 |
| |
| TOTAL EQUITY FUNDS | | | | |
| (Cost $173,908,183) | | | | 194,699,904 |
| |
| Fixed Income Funds 26.6% | | | | |
| |
| High Yield Fixed-Income Funds – 7.5% | | | | |
| Fidelity Advisor High Income Advantage | | | | |
| Fund Institutional Class | | 2,054,482 | | 19,949,023 |
| Investment Grade Fixed Income Funds 19.1% | | | | |
| Fidelity Advisor Government Investment | | | | |
| Fund Institutional Class | | 2,517,353 | | 24,519,016 |
| Fidelity Advisor Intermediate Bond Fund | | | | |
| Institutional Class | | 2,298,061 | | 24,635,210 |
| Fidelity Advisor Strategic Real Return | | | | |
| Fund Institutional Class | | 136,363 | | 1,359,537 |
| |
| TOTAL INVESTMENT GRADE FIXED-INCOME FUNDS | | | | 50,513,763 |
| |
| TOTAL FIXED-INCOME FUNDS | | | | |
| (Cost $71,127,176) | | | | 70,462,786 |
| TOTAL INVESTMENT IN SECURITIES 100% | | | | |
| (Cost $245,035,359) | | | | $265,162,690 |
Legend
(a) Non-income producing
|
See accompanying notes which are an integral part of the financial statements.
49 Annual Report
| Fidelity Advisor Freedom 2025 Fund | | | | | | |
| |
| Financial Statements | | | | | | |
| |
| |
| Statement of Assets and Liabilities | | | | | | |
| | | | | | | March 31, 2006 |
| Assets | | | | | | |
| Investment in securities, at value (cost $245,035,359) — See accompanying schedule | | | | | | $ 265,162,690 |
| Cash | | | | | | 51 |
| Receivable for investments sold | | | | | | 23,322 |
| Receivable for fund shares sold | | | | | | 1,136,815 |
| Total assets | | | | | | 266,322,878 |
| |
| Liabilities | | | | | | |
| Payable for investments purchased | | | | $ 925,018 | | |
| Payable for fund shares redeemed | | | | 234,946 | | |
| Distribution fees payable | | | | 98,133 | | |
| Other affiliated payables | | | | 4,656 | | |
| Total liabilities | | | | | | 1,262,753 |
| |
| Net Assets | | | | | | $ 265,060,125 |
| Net Assets consist of: | | | | | | |
| Paid in capital | | | | | | $ 240,012,588 |
| Undistributed net investment income | | | | | | 285,056 |
| Accumulated undistributed net realized gain (loss) on investments | | | | | | 4,635,150 |
| Net unrealized appreciation (depreciation) on investments | | | | | | 20,127,331 |
| Net Assets | | | | | | $ 265,060,125 |
| |
| Calculation of Maximum Offering Price | | | | | | |
| Class A: | | | | | | |
| Net Asset Value and redemption price per share ($128,503,677 ÷ 10,411,344 shares) | | | | | | $ 12.34 |
| Maximum offering price per share (100/94.25 of $12.34) | | | | | | $ 13.09 |
| Class T: | | | | | | |
| Net Asset Value and redemption price per share ($83,955,271 ÷ 6,795,348 shares) | | | | | | $ 12.35 |
| Maximum offering price per share (100/96.50 of $12.35) | | | | | | $ 12.80 |
| Class B: | | | | | | |
| Net Asset Value and offering price per share ($27,110,965 ÷ 2,210,721 shares)A | | | | | | $ 12.26 |
| Class C: | | | | | | |
| Net Asset Value and offering price per share ($20,322,897 ÷ 1,657,110 shares)A | | | | | | $ 12.26 |
| Institutional Class: | | | | | | |
| Net Asset Value, offering price and redemption price per share ($5,167,315 ÷ 417,098 shares) | | | | | | $ 12.39 |
A Redemption price per share is equal to net asset value less any applicable contingent deferred sales charge. | | | | | | |
| |
| Statement of Operations | | | | | | |
| | | | | Year ended March 31, 2006 |
| Investment Income | | | | | | |
| Income distributions from underlying funds | | | | | | $ 3,160,771 |
| Interest | | | | | | 218 |
| Total income | | | | | | 3,160,989 |
| |
| Expenses | | | | | | |
| Management fee | | | | $ 10,421 | | |
| Distribution fees | | | | 873,364 | | |
| Independent trustees’ compensation | | | | 730 | | |
| Total expenses before reductions | | | | 884,515 | | |
| Expense reductions | | | | (2,875) | | 881,640 |
| |
| Net investment income (loss) | | | | | | 2,279,349 |
| Realized and Unrealized Gain (Loss) | | | | | | |
| Realized gain (loss) on sale of underlying fund shares | | | | 158,296 | | |
| Capital gain distributions from underlying funds | | | | 4,838,876 | | 4,997,172 |
| Change in net unrealized appreciation (depreciation) on underlying funds | | | | | | 18,627,272 |
| Net gain (loss) | | | | | | 23,624,444 |
| Net increase (decrease) in net assets resulting from operations | | | | | | $ 25,903,793 |
See accompanying notes which are an integral part of the financial statements.
| | |
| Annual Report | | 50 |
| Statement of Changes in Net Assets | | | | | | | | | | | | |
| | | | | | | Year ended | | | | Year ended |
| | | | | | | March 31, | | | | March 31, |
| | | | | | | 2006 | | | | 2005 |
| Increase (Decrease) in Net Assets | | | | | | | | | | |
| Operations | | | | | | | | | | |
| Net investment income (loss) | | | | | | $ 2,279,349 | | | | $ 661,992 |
| Net realized gain (loss) | | | | | | 4,997,172 | | | | 319,501 |
| Change in net unrealized appreciation (depreciation) | | | | | | 18,627,272 | | | | 1,358,607 |
| Net increase (decrease) in net assets resulting from operations | | | | | | 25,903,793 | | | | 2,340,100 |
| Distributions to shareholders from net investment income | | | | | | (2,006,218) | | | | (647,465) |
| Distributions to shareholders from net realized gain | | | | | | (689,007) | | | | (1,629) |
| Total distributions | | | | | | (2,695,225) | | | | (649,094) |
| Share transactions - net increase (decrease) | | | | | | 119,342,923 | | | | 110,847,488 |
| Total increase (decrease) in net assets | | | | | | 142,551,491 | | | | 112,538,494 |
| |
| Net Assets | | | | | | | | | | |
| Beginning of period | | | | | | 122,508,634 | | | | 9,970,140 |
| End of period (including undistributed net investment income of $285,056 and undistributed net investment income of | | | | | | | | | | |
| $95,450, respectively) | | | | | | $ 265,060,125 | | | | $ 122,508,634 |
| |
| Financial Highlights Class A | | | | | | | | | | | | |
| Years ended March 31, | | 2006 | | | | 2005 | | | | 2004G |
| Selected Per-Share Data | | | | | | | | | | | | |
| Net asset value, beginning of period | | | | $ 10.96 | | | | $ 10.67 | | | | $ 10.00 |
| Income from Investment Operations | | | | | | | | | | | | |
| Net investment income (loss)E | | | | .17 | | | | .19 | | | | .06 |
| Net realized and unrealized gain (loss) | | | | 1.39 | | | | .23 | | | | .67 |
| Total from investment operations | | | | 1.56 | | | | .42 | | | | .73 |
| Distributions from net investment income | | | | (.13) | | | | (.13) | | | | (.06) |
| Distributions from net realized gain | | | | (.05) | | | | —I | | | | — |
| Total distributions | | | | (.18) | | | | (.13) | | | | (.06) |
| Net asset value, end of period | | | | $ 12.34 | | | | $ 10.96 | | | | $ 10.67 |
| Total ReturnB,C,D | | | | 14.35% | | | | 3.96% | | | | 7.32% |
| Ratios to Average Net AssetsF,H | | | | | | | | | | | | |
| Expenses before reductions | | | | .26% | | | | .35% | | | | .35%A |
| Expenses net of fee waivers, if any | | | | .25% | | | | .33% | | | | .33%A |
| Expenses net of all reductions | | | | .25% | | | | .33% | | | | .33%A |
| Net investment income (loss) | | | | 1.44% | | | | 1.76% | | | | 1.59%A |
| Supplemental Data | | | | | | | | | | | | |
| Net assets, end of period (000 omitted) | | | | $ 128,504 | | | | $ 59,347 | | | | $ 2,284 |
| Portfolio turnover rate | | | | 5% | | | | 10% | | | | 6%A |
A Annualized
B Total returns for periods of less than one year are not annualized.
C Total returns would have been lower had certain expenses not been reduced during the periods shown.
D Total returns do not include the effect of the sales charges.
E Calculated based on average shares outstanding during the period.
F Amounts do not include the activity of the underlying funds.
G For the period November 6, 2003 (commencement of operations) to March 31, 2004.
H Expense ratios reflect operating expenses of the class. Expenses before reductions do not reflect amounts reimbursed by the investment adviser or expense offset arrangements and do not represent the amount paid by the class during periods when
reimbursements or reductions occur. Expense ratios before reductions for start up periods may not be representative of longer term operating periods. Expenses net of fee waivers reflect expenses after reimbursement by the investment adviser but prior to
reductions from expense offset arrangements. Expenses net of all reductions represent the net expenses paid by the class but do not include expenses of the investment companies in which the fund invests.
I Amount represents less than $.01 per share.
|
See accompanying notes which are an integral part of the financial statements.
|
51 Annual Report
| Financial Highlights Class T | | | | | | | | | | | | |
| Years ended March 31, | | | | 2006 | | | | 2005 | | | | 2004G |
| Selected Per Share Data | | | | | | | | | | | | |
| Net asset value, beginning of period | | | | $ 10.97 | | | | $ 10.69 | | | | $ 10.00 |
| Income from Investment Operations | | | | | | | | | | | | |
| Net investment income (loss)E | | | | .14 | | | | .16 | | | | .05 |
| Net realized and unrealized gain (loss) | | | | 1.39 | | | | .24 | | | | .70 |
| Total from investment operations | | | | 1.53 | | | | .40 | | | | .75 |
| Distributions from net investment income | | | | (.11) | | | | (.12) | | | | (.06) |
| Distributions from net realized gain | | | | (.05) | | | | —I | | | | — |
| Total distributions | | | | (.15)J | | | | (.12) | | | | (.06) |
| Net asset value, end of period | | | | $ 12.35 | | | | $ 10.97 | | | | $ 10.69 |
| Total ReturnB,C,D | | | | 14.07% | | | | 3.75% | | | | 7.52% |
| Ratios to Average Net AssetsF,H | | | | | | | | | | | | |
| Expenses before reductions | | | | .51% | | | | .60% | | | | .60%A |
| Expenses net of fee waivers, if any | | | | .50% | | | | .58% | | | | .58%A |
| Expenses net of all reductions | | | | .50% | | | | .58% | | | | .58%A |
| Net investment income (loss) | | | | 1.19% | | | | 1.51% | | | | 1.34%A |
| Supplemental Data | | | | | | | | | | | | |
| Net assets, end of period (000 omitted) | | | | $ 83,955 | | | | $ 36,966 | | | | $ 2,556 |
| Portfolio turnover rate | | | | 5% | | | | 10% | | | | 6%A |
A Annualized
B Total returns for periods of less than one year are not annualized.
C Total returns would have been lower had certain expenses not been reduced during the periods shown.
D Total returns do not include the effect of the sales charges.
E Calculated based on average shares outstanding during the period.
F Amounts do not include the activity of the underlying funds.
G For the period November 6, 2003 (commencement of operations) to March 31, 2004.
H Expense ratios reflect operating expenses of the class. Expenses before reductions do not reflect amounts reimbursed by the investment adviser or expense offset arrangements and do not represent the amount paid by the class during periods when
reimbursements or reductions occur. Expense ratios before reductions for start up periods may not be representative of longer term operating periods. Expenses net of fee waivers reflect expenses after reimbursement by the investment adviser but
prior to reductions from expense offset arrangements. Expenses net of all reductions represent the net expenses paid by the class but do not include expenses of the investment companies in which the fund invests.
I Amount represents less than $.01 per share.
J Total distribution of $.154 per share is comprised of distributions from net investment income of $.108 and distributions from net realized gain of $.046 per share.
|
| Financial Highlights Class B | | | | | | | | | | | | |
| Years ended March 31, | | | | 2006 | | | | 2005 | | | | 2004G |
| Selected Per Share Data | | | | | | | | | | | | |
| Net asset value, beginning of period | | | | $ 10.91 | | | | $ 10.64 | | | | $ 10.00 |
| Income from Investment Operations | | | | | | | | | | | | |
| Net investment income (loss)E | | | | .08 | | | | .11 | | | | .03 |
| Net realized and unrealized gain (loss) | | | | 1.38 | | | | .24 | | | | .67 |
| Total from investment operations | | | | 1.46 | | | | .35 | | | | .70 |
| Distributions from net investment income | | | | (.07) | | | | (.08) | | | | (.06) |
| Distributions from net realized gain | | | | (.04) | | | | —I | | | | — |
| Total distributions | | | | (.11) | | | | (.08) | | | | (.06) |
| Net asset value, end of period | | | | $ 12.26 | | | | $ 10.91 | | | | $ 10.64 |
| Total ReturnB,C,D | | | | 13.46% | | | | 3.29% | | | | 6.97% |
| Ratios to Average Net AssetsF,H | | | | | | | | | | | | |
| Expenses before reductions | | | | 1.01% | | | | 1.10% | | | | 1.10%A |
| Expenses net of fee waivers, if any | | | | 1.01% | | | | 1.08% | | | | 1.08%A |
| Expenses net of all reductions | | | | 1.01% | | | | 1.08% | | | | 1.08%A |
| Net investment income (loss) | | | | .69% | | | | 1.01% | | | | .84%A |
| Supplemental Data | | | | | | | | | | | | |
| Net assets, end of period (000 omitted) | | | | $ 27,111 | | | | $ 13,415 | | | | $ 2,771 |
| Portfolio turnover rate | | | | 5% | | | | 10% | | | | 6%A |
A Annualized
B Total returns for periods of less than one year are not annualized.
C Total returns would have been lower had certain expenses not been reduced during the periods shown.
D Total returns do not include the effect of the contingent deferred sales charge.
E Calculated based on average shares outstanding during the period.
F Amounts do not include the activity of the underlying funds.
G For the period November 6, 2003 (commencement of operations) to March 31, 2004.
H Expense ratios reflect operating expenses of the class. Expenses before reductions do not reflect amounts reimbursed by the investment adviser or expense offset arrangements and do not represent the amount paid by the class during periods when
reimbursements or reductions occur. Expense ratios before reductions for start up periods may not be representative of longer term operating periods. Expenses net of fee waivers reflect expenses after reimbursement by the investment adviser but
prior to reductions from expense offset arrangements. Expenses net of all reductions represent the net expenses paid by the class but do not include expenses of the investment companies in which the fund invests.
I Amount represents less than $.01 per share.
|
See accompanying notes which are an integral part of the financial statements.
| | |
| Annual Report | | 52 |
| Financial Highlights Class C | | | | | | | | | | | | |
| Years ended March 31, | | | | 2006 | | | | 2005 | | | | 2004G |
| Selected Per Share Data | | | | | | | | | | | | |
| Net asset value, beginning of period | | | | $ 10.91 | | | | $ 10.65 | | | | $ 10.00 |
| Income from Investment Operations | | | | | | | | | | | | |
| Net investment income (loss)E | | | | .08 | | | | .11 | | | | .03 |
| Net realized and unrealized gain (loss) | | | | 1.38 | | | | .23 | | | | .67 |
| Total from investment operations | | | | 1.46 | | | | .34 | | | | .70 |
| Distributions from net investment income | | | | (.07) | | | | (.08) | | | | (.05) |
| Distributions from net realized gain | | | | (.04) | | | | —I | | | | — |
| Total distributions | | | | (.11) | | | | (.08) | | | | (.05) |
| Net asset value, end of period | | | | $ 12.26 | | | | $ 10.91 | | | | $ 10.65 |
| Total ReturnB,C,D | | | | 13.46% | | | | 3.19% | | | | 7.02% |
| Ratios to Average Net AssetsF,H | | | | | | | | | | | | |
| Expenses before reductions | | | | 1.01% | | | | 1.10% | | | | 1.10%A |
| Expenses net of fee waivers, if any | | | | 1.01% | | | | 1.08% | | | | 1.08%A |
| Expenses net of all reductions | | | | 1.01% | | | | 1.08% | | | | 1.08%A |
| Net investment income (loss) | | | | .69% | | | | 1.01% | | | | .84%A |
| Supplemental Data | | | | | | | | | | | | |
| Net assets, end of period (000 omitted) | | | | $ 20,323 | | | | $ 10,859 | | | | $ 2,137 |
| Portfolio turnover rate | | | | 5% | | | | 10% | | | | 6%A |
A Annualized
B Total returns for periods of less than one year are not annualized.
C Total returns would have been lower had certain expenses not been reduced during the periods shown.
D Total returns do not include the effect of the contingent deferred sales charge.
E Calculated based on average shares outstanding during the period.
F Amounts do not include the activity of the underlying funds.
G For the period November 6, 2003 (commencement of operations) to March 31, 2004.
H Expense ratios reflect operating expenses of the class. Expenses before reductions do not reflect amounts reimbursed by the investment adviser or expense offset arrangements and do not represent the amount paid by the class during periods when
reimbursements or reductions occur. Expense ratios before reductions for start up periods may not be representative of longer term operating periods. Expenses net of fee waivers reflect expenses after reimbursement by the investment adviser but
prior to reductions from expense offset arrangements. Expenses net of all reductions represent the net expenses paid by the class but do not include expenses of the investment companies in which the fund invests.
I Amount represents less than $.01 per share.
|
| Financial Highlights Institutional Class | | | | | | | | | | | | |
| Years ended March 31, | | | | 2006 | | | | 2005 | | | | 2004F |
| Selected Per Share Data | | | | | | | | | | | | |
| Net asset value, beginning of period | | | | $ 10.99 | | | | $ 10.68 | | | | $ 10.00 |
| Income from Investment Operations | | | | | | | | | | | | |
| Net investment income (loss)D | | | | .20 | | | | .22 | | | | .08 |
| Net realized and unrealized gain (loss) | | | | 1.40 | | | | .24 | | | | .66 |
| Total from investment operations | | | | 1.60 | | | | .46 | | | | .74 |
| Distributions from net investment income | | | | (.15) | | | | (.15) | | | | (.06) |
| Distributions from net realized gain | | | | (.05) | | | | —H | | | | — |
| Total distributions | | | | (.20) | | | | (.15) | | | | (.06) |
| Net asset value, end of period | | | | $ 12.39 | | | | $ 10.99 | | | | $ 10.68 |
| Total ReturnB,C | | | | 14.69% | | | | 4.25% | | | | 7.42% |
| Ratios to Average Net AssetsE,G | | | | | | | | | | | | |
| Expenses before reductions | | | | .01% | | | | .10% | | | | .10%A |
| Expenses net of fee waivers, if any | | | | .00% | | | | .08% | | | | .08%A |
| Expenses net of all reductions | | | | .00% | | | | .08% | | | | .08%A |
| Net investment income (loss) | | | | 1.69% | | | | 2.01% | | | | 1.84%A |
| Supplemental Data | | | | | | | | | | | | |
| Net assets, end of period (000 omitted) | | | | $ 5,167 | | | | $ 1,921 | | | | $ 222 |
| Portfolio turnover rate | | | | 5% | | | | 10% | | | | 6%A |
A Annualized
B Total returns for periods of less than one year are not annualized.
C Total returns would have been lower had certain expenses not been reduced during the periods shown.
D Calculated based on average shares outstanding during the period.
E Amounts do not include the activity of the underlying funds.
F For the period November 6, 2003 (commencement of operations) to March 31, 2004.
G Expense ratios reflect operating expenses of the class. Expenses before reductions do not reflect amounts reimbursed by the investment adviser or expense offset arrangements and do not represent the amount paid by the class during periods when
reimbursements or reductions occur. Expense ratios before reductions for start up periods may not be representative of longer term operating periods. Expenses net of fee waivers reflect expenses after reimbursement by the investment adviser but
prior to reductions from expense offset arrangements. Expenses net of all reductions represent the net expenses paid by the class but do not include expenses of the investment companies in which the fund invests.
H Amount represents less than $.01 per share.
|
See accompanying notes which are an integral part of the financial statements.
|
53 Annual Report
| Fidelity Advisor Freedom 2030 Fund | | |
| Investment Changes | | |
| |
| |
| Fund Holdings as of March 31, 2006 | | |
| | | % of fund’s | | % of fund’s investments |
| | | investments | | 6 months ago |
| Domestic Equity Funds | | | | |
| Fidelity Advisor Dividend Growth | | | | |
| Fund Institutional Class | | 13.8 | | 13.7 |
| Fidelity Advisor Equity Growth | | | | |
| Fund Institutional Class | | 8.1 | | 7.1 |
| Fidelity Advisor Equity Income | | | | |
| Fund Institutional Class | | 14.0 | | 13.7 |
| Fidelity Advisor Growth & Income | | | | |
| Fund Institutional Class | | 10.7 | | 13.6 |
| Fidelity Advisor Large Cap Fund | | | | |
| Institutional Class | | 10.8 | | 13.5 |
| Fidelity Advisor Mid Cap Fund | | | | |
| Institutional Class | | 5.6 | | 4.3 |
| Fidelity Advisor Small Cap Fund | | | | |
| Institutional Class | | 4.1 | | 4.2 |
| | | 67.1 | | 70.1 |
| International Equity Funds | | | | |
| Fidelity Advisor Diversified | | | | |
| International Fund Institutional | | | | |
| Class | | 7.7 | | 6.3 |
| Fidelity Advisor Overseas Fund | | | | |
| Institutional Class | | 7.7 | | 6.3 |
| | | 15.4 | | 12.6 |
| High Yield Fixed-Income Funds | | | | |
| Fidelity Advisor High Income | | | | |
| Advantage Fund Institutional | | | | |
| Class | | 7.6 | | 7.4 |
| Investment Grade Fixed-Income | | | | |
| Funds | | | | |
| Fidelity Advisor Government | | | | |
| Investment Fund Institutional | | | | |
| Class | | 4.8 | | 5.0 |
| Fidelity Advisor Intermediate Bond | | | | |
| Fund Institutional Class | | 4.8 | | 4.9 |
| Fidelity Advisor Strategic Real | | | | |
| Return Fund Institutional Class | | 0.3 | | 0.0 |
| | | 9.9 | | 9.9 |
| | | 100.0 | | 100.0 |
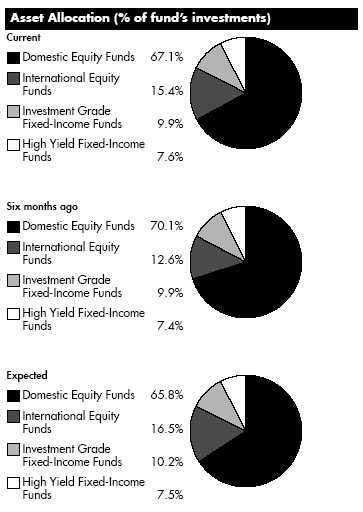
The fund invests according to an asset allocation strategy that becomes increasingly conservative over time. The ”six months ago” allocation is based on the fund’s holdings as of September 30, 2005. The ”current” allocation is based on the fund’s holdings as of March 31, 2006. The ”expected” allocation represents the fund’s anticipated allocation at September 30, 2006. Beginning in March 2006, the fund changed its asset allocation strategy, resulting in an increased emphasis on international equity.
Annual Report 54
| Fidelity Advisor Freedom 2030 Fund | | |
| Investments March 31, 2006 |
| Showing Percentage of Total Value of Investment in Securities |
| |
| Equity Funds 82.5% | | | | |
| | | Shares | | Value (Note 1) |
| Domestic Equity Funds 67.1% | | | | |
| Fidelity Advisor Dividend Growth Fund | | | | |
| Institutional Class | | 4,666,280 | | $ 59,728,389 |
| Fidelity Advisor Equity Growth Fund | | | | |
| Institutional Class (a) | | 665,684 | | 35,281,273 |
| Fidelity Advisor Equity Income Fund | | | | |
| Institutional Class | | 2,025,273 | | 60,515,162 |
| Fidelity Advisor Growth & Income Fund | | | | |
| Institutional Class | | 2,464,415 | | 46,330,996 |
| Fidelity Advisor Large Cap Fund | | | | |
| Institutional Class | | 2,600,007 | | 46,800,127 |
| Fidelity Advisor Mid Cap Fund | | | | |
| Institutional Class | | 911,045 | | 24,069,801 |
| Fidelity Advisor Small Cap Fund | | | | |
| Institutional Class | | 725,606 | | 17,929,726 |
| |
| TOTAL DOMESTIC EQUITY FUNDS | | | | 290,655,474 |
| International Equity Funds 15.4% | | | | |
| Fidelity Advisor Diversified International | | | | |
| Fund Institutional Class | | 1,431,393 | | 33,566,155 |
| Fidelity Advisor Overseas Fund | | | | |
| Institutional Class | | 1,546,937 | | 33,166,325 |
| |
| TOTAL INTERNATIONAL EQUITY FUNDS | | | | 66,732,480 |
| |
| TOTAL EQUITY FUNDS | | | | |
| (Cost $315,034,675) | | | | 357,387,954 |
| |
| Fixed Income Funds 17.5% | | | | |
| |
| High Yield Fixed-Income Funds – 7.6% | | | | |
| Fidelity Advisor High Income Advantage | | | | |
| Fund Institutional Class | | 3,363,189 | | 32,656,563 |
| Investment Grade Fixed Income Funds 9.9% | | | | |
| Fidelity Advisor Government Investment | | | | |
| Fund Institutional Class | | 2,132,153 | | 20,767,172 |
| Fidelity Advisor Intermediate Bond Fund | | | | |
| Institutional Class | | 1,957,058 | | 20,979,658 |
| Fidelity Advisor Strategic Real Return | | | | |
| Fund Institutional Class | | 129,274 | | 1,288,865 |
| |
| TOTAL INVESTMENT GRADE FIXED-INCOME FUNDS | | | | 43,035,695 |
| |
| TOTAL FIXED-INCOME FUNDS | | | | |
| (Cost $75,853,547) | | | | 75,692,258 |
| TOTAL INVESTMENT IN SECURITIES 100% | | | | |
| (Cost $390,888,222) | | | | $433,080,212 |
Legend
(a) Non-income producing
|
See accompanying notes which are an integral part of the financial statements.
55 Annual Report
| Fidelity Advisor Freedom 2030 Fund | | | | | | |
| |
| Financial Statements | | | | | | |
| |
| |
| Statement of Assets and Liabilities | | | | | | |
| | | | | | | March 31, 2006 |
| Assets | | | | | | |
| Investment in securities, at value (cost $390,888,222) — See accompanying schedule | | | | | | $ 433,080,212 |
| Cash | | | | | | 4,015 |
| Receivable for investments sold | | | | | | 36,085 |
| Receivable for fund shares sold | | | | | | 1,087,282 |
| Total assets | | | | | | 434,207,594 |
| |
| Liabilities | | | | | | |
| Payable for investments purchased | | | | $ 551,561 | | |
| Payable for fund shares redeemed | | | | 575,784 | | |
| Distribution fees payable | | | | 171,816 | | |
| Other affiliated payables | | | | 7,864 | | |
| Total liabilities | | | | | | 1,307,025 |
| |
| Net Assets | | | | | | $ 432,900,569 |
| Net Assets consist of: | | | | | | |
| Paid in capital | | | | | | $ 382,298,843 |
| Undistributed net investment income | | | | | | 475,086 |
| Accumulated undistributed net realized gain (loss) on investments | | | | | | 7,934,650 |
| Net unrealized appreciation (depreciation) on investments | | | | | | 42,191,990 |
| Net Assets | | | | | | $ 432,900,569 |
| |
| Calculation of Maximum Offering Price | | | | | | |
| Class A: | | | | | | |
| Net Asset Value and redemption price per share ($156,915,518 ÷ 11,648,988 shares) | | | | | | $ 13.47 |
| Maximum offering price per share (100/94.25 of $13.47) | | | | | | $ 14.29 |
| Class T: | | | | | | |
| Net Asset Value and redemption price per share ($184,028,584 ÷ 13,700,912 shares) | | | | | | $ 13.43 |
| Maximum offering price per share (100/96.50 of $13.43) | | | | | | $ 13.92 |
| Class B: | | | | | | |
| Net Asset Value and offering price per share ($43,098,850 ÷ 3,223,215 shares)A | | | | | | $ 13.37 |
| Class C: | | | | | | |
| Net Asset Value and offering price per share ($37,939,562 ÷ 2,837,837 shares)A | | | | | | $ 13.37 |
| Institutional Class: | | | | | | |
| Net Asset Value, offering price and redemption price per share ($10,918,055 ÷ 808,239 shares) | | | | | | $ 13.51 |
| A Redemption price per share is equal to net asset value less any applicable contingent deferred sales charge. | | | | | | |
| |
| Statement of Operations | | | | | | |
| | | | | Year ended March 31, 2006 |
| Investment Income | | | | | | |
| Income distributions from underlying funds | | | | | | $ 4,443,085 |
| Interest | | | | | | 15 |
| Total income | | | | | | 4,443,100 |
| |
| Expenses | | | | | | |
| Management fee | | | | $ 19,176 | | |
| Distribution fees | | | | 1,575,564 | | |
| Independent trustees’ compensation | | | | 1,259 | | |
| Total expenses before reductions | | | | 1,595,999 | | |
| Expense reductions | | | | (5,324) | | 1,590,675 |
| |
| Net investment income (loss) | | | | | | 2,852,425 |
| Realized and Unrealized Gain (Loss) | | | | | | |
| Realized gain (loss) on sale of underlying fund shares | | | | 92,053 | | |
| Capital gain distributions from underlying funds | | | | 8,711,513 | | 8,803,566 |
| Change in net unrealized appreciation (depreciation) on underlying funds | | | | | | 35,545,698 |
| Net gain (loss) | | | | | | 44,349,264 |
| Net increase (decrease) in net assets resulting from operations | | | | | | $ 47,201,689 |
See accompanying notes which are an integral part of the financial statements.
| | |
| Annual Report | | 56 |
| Statement of Changes in Net Assets | | | | | | | | | | | | |
| | | | | | | Year ended | | | | Year ended |
| | | | | | | March 31, | | | | March 31, |
| | | | | | | 2006 | | | | 2005 |
| Increase (Decrease) in Net Assets | | | | | | | | | | |
| Operations | | | | | | | | | | |
| Net investment income (loss) | | | | | | $ 2,852,425 | | | | $ 1,851,071 |
| Net realized gain (loss) | | | | | | 8,803,566 | | | | 1,016,872 |
| Change in net unrealized appreciation (depreciation) | | | | | | 35,545,698 | | | | 4,336,680 |
| Net increase (decrease) in net assets resulting from operations | | | | | | 47,201,689 | | | | 7,204,623 |
| Distributions to shareholders from net investment income | | | | | | (2,377,341) | | | | (1,985,403) |
| Distributions to shareholders from net realized gain | | | | | | (1,802,422) | | | | (16,365) |
| Total distributions | | | | | | (4,179,763) | | | | (2,001,768) |
| Share transactions - net increase (decrease) | | | | | | 164,372,570 | | | | 142,242,099 |
| Total increase (decrease) in net assets | | | | | | 207,394,496 | | | | 147,444,954 |
| |
| Net Assets | | | | | | | | | | |
| Beginning of period | | | | | | 225,506,073 | | | | 78,061,119 |
| End of period (including undistributed net investment income of $475,086 and undistributed net investment income of | | | | | | | | | | |
| $131,528, respectively) | | | | | | $ 432,900,569 | | | | $ 225,506,073 |
| |
| Financial Highlights Class A | | | | | | | | | | | | |
| Years ended March 31, | | 2006 | | | | 2005 | | | | 2004G |
| Selected Per-Share Data | | | | | | | | | | | | |
| Net asset value, beginning of period | | | | $ 11.81 | | | | $ 11.48 | | | | $ 10.00 |
| Income from Investment Operations | | | | | | | | | | | | |
| Net investment income (loss)E | | | | .15 | | | | .18 | | | | .11 |
| Net realized and unrealized gain (loss) | | | | 1.70 | | | | .30 | | | | 1.46 |
| Total from investment operations | | | | 1.85 | | | | .48 | | | | 1.57 |
| Distributions from net investment income | | | | (.11) | | | | (.15) | | | | (.09) |
| Distributions from net realized gain | | | | (.08) | | | | —I | | | | — |
| Total distributions | | | | (.19) | | | | (.15) | | | | (.09) |
| Net asset value, end of period | | | | $ 13.47 | | | | $ 11.81 | | | | $ 11.48 |
| Total ReturnB,C,D | | | | 15.84% | | | | 4.19% | | | | 15.68% |
| Ratios to Average Net AssetsF,H | | | | | | | | | | | | |
| Expenses before reductions | | | | .26% | | | | .35% | | | | .35%A |
| Expenses net of fee waivers, if any | | | | .26% | | | | .33% | | | | .33%A |
| Expenses net of all reductions | | | | .26% | | | | .33% | | | | .33%A |
| Net investment income (loss) | | | | 1.17% | | | | 1.55% | | | | 1.44%A |
| Supplemental Data | | | | | | | | | | | | |
| Net assets, end of period (000 omitted) | | | | $ 156,916 | | | | $ 65,593 | | | | $ 27,879 |
| Portfolio turnover rate | | | | 4% | | | | 2% | | | | 2%A |
A Annualized
B Total returns for periods of less than one year are not annualized.
C Total returns would have been lower had certain expenses not been reduced during the periods shown.
D Total returns do not include the effect of the sales charges.
E Calculated based on average shares outstanding during the period.
F Amounts do not include the activity of the underlying funds.
G For the period July 24, 2003 (commencement of operations) to March 31, 2004.
H Expense ratios reflect operating expenses of the class. Expenses before reductions do not reflect amounts reimbursed by the investment adviser or expense offset arrangements and do not represent the amount paid by the class during periods when
reimbursements or reductions occur. Expense ratios before reductions for start up periods may not be representative of longer term operating periods. Expenses net of fee waivers reflect expenses after reimbursement by the investment adviser but prior to
reductions from expense offset arrangements. Expenses net of all reductions represent the net expenses paid by the class but do not include expenses of the investment companies in which the fund invests.
I Amount represents less than $.01 per share.
|
See accompanying notes which are an integral part of the financial statements.
|
57 Annual Report
| Financial Highlights Class T | | | | | | | | | | |
| Years ended March 31, | | 2006 | | | | 2005 | | | | 2004G |
| Selected Per Share Data | | | | | | | | | | |
| Net asset value, beginning of period | | $ 11.78 | | | | $ 11.47 | | | | $ 10.00 |
| Income from Investment Operations | | | | | | | | | | |
| Net investment income (loss)E | | .11 | | | | .15 | | | | .09 |
| Net realized and unrealized gain (loss) | | 1.70 | | | | .30 | | | | 1.46 |
| Total from investment operations | | 1.81 | | | | .45 | | | | 1.55 |
| Distributions from net investment income | | (.09) | | | | (.14) | | | | (.08) |
| Distributions from net realized gain | | (.08) | | | | —I | | | | — |
| Total distributions | | (.16)J | | | | (.14) | | | | (.08) |
| Net asset value, end of period | | $ 13.43 | | | | $ 11.78 | | | | $ 11.47 |
| Total ReturnB,C,D | | 15.52% | | | | 3.91% | | | | 15.53% |
| Ratios to Average Net AssetsF,H | | | | | | | | | | |
| Expenses before reductions | | .51% | | | | .60% | | | | .60%A |
| Expenses net of fee waivers, if any | | .51% | | | | .58% | | | | .58%A |
| Expenses net of all reductions | | .51% | | | | .58% | | | | .58%A |
| Net investment income (loss) | | .92% | | | | 1.30% | | | | 1.19%A |
| Supplemental Data | | | | | | | | | | |
| Net assets, end of period (000 omitted) | | $ 184,029 | | | | $ 102,153 | | | | $ 27,201 |
| Portfolio turnover rate | | 4% | | | | 2% | | | | 2%A |
A Annualized
B Total returns for periods of less than one year are not annualized.
C Total returns would have been lower had certain expenses not been reduced during the periods shown.
D Total returns do not include the effect of the sales charges.
E Calculated based on average shares outstanding during the period.
F Amounts do not include the activity of the underlying funds.
G For the period July 24, 2003 (commencement of operations) to March 31, 2004.
H Expense ratios reflect operating expenses of the class. Expenses before reductions do not reflect amounts reimbursed by the investment adviser or expense offset arrangements and do not represent the amount paid by the class during periods when
reimbursements or reductions occur. Expense ratios before reductions for start up periods may not be representative of longer term operating periods. Expenses net of fee waivers reflect expenses after reimbursement by the investment adviser but
prior to reductions from expense offset arrangements. Expenses net of all reductions represent the net expenses paid by the class but do not include expenses of the investment companies in which the fund invests.
I Amount represents less than $.01 per share.
J Total distribution of $.164 per share is comprised of distributions from net investment income of $.087 and distributions from net realized gain of $.077 per share.
|
| Financial Highlights Class B | | | | | | | | | | | | |
| Years ended March 31, | | | | 2006 | | | | 2005 | | | | 2004G |
| Selected Per Share Data | | | | | | | | | | | | |
| Net asset value, beginning of period | | | | $ 11.74 | | | | $ 11.44 | | | | $ 10.00 |
| Income from Investment Operations | | | | | | | | | | | | |
| Net investment income (loss)E | | | | .05 | | | | .09 | | | | .05 |
| Net realized and unrealized gain (loss) | | | | 1.70 | | | | .30 | | | | 1.46 |
| Total from investment operations | | | | 1.75 | | | | .39 | | | | 1.51 |
| Distributions from net investment income | | | | (.05) | | | | (.09) | | | | (.07) |
| Distributions from net realized gain | | | | (.07) | | | | —I | | | | — |
| Total distributions | | | | (.12) | | | | (.09) | | | | (.07) |
| Net asset value, end of period | | | | $ 13.37 | | | | $ 11.74 | | | | $ 11.44 |
| Total ReturnB,C,D | | | | 14.96% | | | | 3.41% | | | | 15.12% |
| Ratios to Average Net AssetsF,H | | | | | | | | | | | | |
| Expenses before reductions | | | | 1.01% | | | | 1.10% | | | | 1.10%A |
| Expenses net of fee waivers, if any | | | | 1.01% | | | | 1.08% | | | | 1.08%A |
| Expenses net of all reductions | | | | 1.01% | | | | 1.08% | | | | 1.08%A |
| Net investment income (loss) | | | | .42% | | | | .80% | | | | .69%A |
| Supplemental Data | | | | | | | | | | | | |
| Net assets, end of period (000 omitted) | | | | $ 43,099 | | | | $ 27,653 | | | | $ 12,229 |
| Portfolio turnover rate | | | | 4% | | | | 2% | | | | 2%A |
A Annualized
B Total returns for periods of less than one year are not annualized.
C Total returns would have been lower had certain expenses not been reduced during the periods shown.
D Total returns do not include the effect of the contingent deferred sales charge.
E Calculated based on average shares outstanding during the period.
F Amounts do not include the activity of the underlying funds.
G For the period July 24, 2003 (commencement of operations) to March 31, 2004.
H Expense ratios reflect operating expenses of the class. Expenses before reductions do not reflect amounts reimbursed by the investment adviser or expense offset arrangements and do not represent the amount paid by the class during periods when
reimbursements or reductions occur. Expense ratios before reductions for start up periods may not be representative of longer term operating periods. Expenses net of fee waivers reflect expenses after reimbursement by the investment adviser but
prior to reductions from expense offset arrangements. Expenses net of all reductions represent the net expenses paid by the class but do not include expenses of the investment companies in which the fund invests.
I Amount represents less than $.01 per share.
|
See accompanying notes which are an integral part of the financial statements.
| | |
| Annual Report | | 58 |
| Financial Highlights Class C | | | | | | | | | | | | |
| Years ended March 31, | | | | 2006 | | | | 2005 | | | | 2004G |
| Selected Per Share Data | | | | | | | | | | | | |
| Net asset value, beginning of period | | | | $ 11.74 | | | | $ 11.44 | | | | $ 10.00 |
| Income from Investment Operations | | | | | | | | | | | | |
| Net investment income (loss)E | | | | .05 | | | | .09 | | | | .05 |
| Net realized and unrealized gain (loss) | | | | 1.70 | | | | .30 | | | | 1.46 |
| Total from investment operations | | | | 1.75 | | | | .39 | | | | 1.51 |
| Distributions from net investment income | | | | (.05) | | | | (.09) | | | | (.07) |
| Distributions from net realized gain | | | | (.07) | | | | —I | | | | — |
| Total distributions | | | | (.12) | | | | (.09) | | | | (.07) |
| Net asset value, end of period | | | | $ 13.37 | | | | $ 11.74 | | | | $ 11.44 |
| Total ReturnB,C,D | | | | 14.99% | | | | 3.41% | | | | 15.12% |
| Ratios to Average Net AssetsF,H | | | | | | | | | | | | |
| Expenses before reductions | | | | 1.01% | | | | 1.10% | | | | 1.10%A |
| Expenses net of fee waivers, if any | | | | 1.01% | | | | 1.08% | | | | 1.08%A |
| Expenses net of all reductions | | | | 1.01% | | | | 1.08% | | | | 1.08%A |
| Net investment income (loss) | | | | .42% | | | | .80% | | | | .69%A |
| Supplemental Data | | | | | | | | | | | | |
| Net assets, end of period (000 omitted) | | | | $ 37,940 | | | | $ 22,265 | | | | $ 9,722 |
| Portfolio turnover rate | | | | 4% | | | | 2% | | | | 2%A |
A Annualized
B Total returns for periods of less than one year are not annualized.
C Total returns would have been lower had certain expenses not been reduced during the periods shown.
D Total returns do not include the effect of the contingent deferred sales charge.
E Calculated based on average shares outstanding during the period.
F Amounts do not include the activity of the underlying funds.
G For the period July 24, 2003 (commencement of operations) to March 31, 2004.
H Expense ratios reflect operating expenses of the class. Expenses before reductions do not reflect amounts reimbursed by the investment adviser or expense offset arrangements and do not represent the amount paid by the class during periods when
reimbursements or reductions occur. Expense ratios before reductions for start up periods may not be representative of longer term operating periods. Expenses net of fee waivers reflect expenses after reimbursement by the investment adviser but
prior to reductions from expense offset arrangements. Expenses net of all reductions represent the net expenses paid by the class but do not include expenses of the investment companies in which the fund invests.
I Amount represents less than $.01 per share.
|
| Financial Highlights Institutional Class | | | | | | | | | | | | |
| Years ended March 31, | | | | 2006 | | | | 2005 | | | | 2004F |
| Selected Per Share Data | | | | | | | | | | | | |
| Net asset value, beginning of period | | | | $ 11.84 | | | | $ 11.49 | | | | $ 10.00 |
| Income from Investment Operations | | | | | | | | | | | | |
| Net investment income (loss)D | | | | .18 | | | | .21 | | | | .13 |
| Net realized and unrealized gain (loss) | | | | 1.71 | | | | .31 | | | | 1.45 |
| Total from investment operations | | | | 1.89 | | | | .52 | | | | 1.58 |
| Distributions from net investment income | | | | (.13) | | | | (.17) | | | | (.09) |
| Distributions from net realized gain | | | | (.09) | | | | —H | | | | — |
| Total distributions | | | | (.22) | | | | (.17) | | | | (.09) |
| Net asset value, end of period | | | | $ 13.51 | | | | $ 11.84 | | | | $ 11.49 |
| Total ReturnB,C | | | | 16.10% | | | | 4.50% | | | | 15.83% |
| Ratios to Average Net AssetsE,G | | | | | | | | | | | | |
| Expenses before reductions | | | | .01% | | | | .10% | | | | .10%A |
| Expenses net of fee waivers, if any | | | | .00% | | | | .08% | | | | .08%A |
| Expenses net of all reductions | | | | .00% | | | | .08% | | | | .07%A |
| Net investment income (loss) | | | | 1.42% | | | | 1.80% | | | | 1.69%A |
| Supplemental Data | | | | | | | | | | | | |
| Net assets, end of period (000 omitted) | | | | $ 10,918 | | | | $ 7,841 | | | | $ 1,030 |
| Portfolio turnover rate | | | | 4% | | | | 2% | | | | 2%A |
A Annualized
B Total returns for periods of less than one year are not annualized.
C Total returns would have been lower had certain expenses not been reduced during the periods shown.
D Calculated based on average shares outstanding during the period.
E Amounts do not include the activity of the underlying funds.
F For the period July 24, 2003 (commencement of operations) to March 31, 2004.
G Expense ratios reflect operating expenses of the class. Expenses before reductions do not reflect amounts reimbursed by the investment adviser or expense offset arrangements and do not represent the amount paid by the class during periods when
reimbursements or reductions occur. Expense ratios before reductions for start up periods may not be representative of longer term operating periods. Expenses net of fee waivers reflect expenses after reimbursement by the investment adviser but
prior to reductions from expense offset arrangements. Expenses net of all reductions represent the net expenses paid by the class but do not include expenses of the investment companies in which the fund invests.
H Amount represents less than $.01 per share.
|
See accompanying notes which are an integral part of the financial statements.
|
59 Annual Report
| Fidelity Advisor Freedom 2035 Fund | | |
| Investment Changes | | |
| |
| |
| Fund Holdings as of March 31, 2006 | | |
| | | % of fund’s | | % of fund’s investments |
| | | investments | | 6 months ago |
| Domestic Equity Funds | | | | |
| Fidelity Advisor Dividend Growth | | | | |
| Fund Institutional Class | | 14.0 | | 13.9 |
| Fidelity Advisor Equity Growth | | | | |
| Fund Institutional Class | | 8.3 | | 7.2 |
| Fidelity Advisor Equity Income | | | | |
| Fund Institutional Class | | 14.4 | | 13.9 |
| Fidelity Advisor Growth & Income | | | | |
| Fund Institutional Class | | 10.6 | | 13.0 |
| Fidelity Advisor Large Cap Fund | | | | |
| Institutional Class | | 10.6 | | 13.0 |
| Fidelity Advisor Mid Cap Fund | | | | |
| Institutional Class | | 5.4 | | 4.4 |
| Fidelity Advisor Small Cap Fund | | | | |
| Institutional Class | | 4.2 | | 4.1 |
| | | 67.5 | | 69.5 |
| International Equity Funds | | | | |
| Fidelity Advisor Diversified | | | | |
| International Fund Institutional | | | | |
| Class | | 7.9 | | 7.0 |
| Fidelity Advisor Overseas Fund | | | | |
| Institutional Class | | 7.6 | | 6.9 |
| | | 15.5 | | 13.9 |
| High Yield Fixed-Income Funds | | | | |
| Fidelity Advisor High Income | | | | |
| Advantage Fund Institutional | | | | |
| Class | | 8.3 | | 8.6 |
| Investment Grade Fixed-Income | | | | |
| Funds | | | | |
| Fidelity Advisor Government | | | | |
| Investment Fund Institutional | | | | |
| Class | | 4.1 | | 4.0 |
| Fidelity Advisor Intermediate Bond | | | | |
| Fund Institutional Class | | 4.2 | | 4.0 |
| Fidelity Advisor Strategic Real | | | | |
| Return Fund Institutional Class | | 0.4 | | 0.0 |
| | | 8.7 | | 8.0 |
| | | 100.0 | | 100.0 |
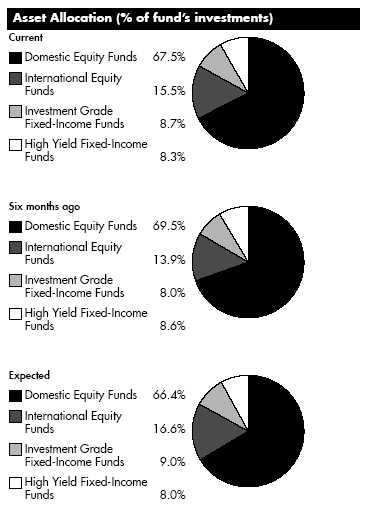
The fund invests according to an asset allocation strategy that becomes increasingly conservative over time. The ”six months ago” allocation is based on the fund’s holdings as of September 30, 2005. The ”current” allocation is based on the fund’s holdings as of March 31, 2006. The ”expected” allocation represents the fund’s anticipated allocation at September 30, 2006. Beginning in March 2006, the fund changed its asset allocation strategy, resulting in an increased emphasis on international equity.
Annual Report 60
| Fidelity Advisor Freedom 2035 Fund | | |
| Investments March 31, 2006 |
| Showing Percentage of Total Value of Investment in Securities |
| |
| Equity Funds 83.0% | | | | | | |
| | | | | Shares | | Value (Note 1) |
| Domestic Equity Funds 67.5% | | | | | | |
| Fidelity Advisor Dividend Growth Fund | | | | | | |
| Institutional Class | | | | 1,365,036 | | $ 17,472,464 |
| Fidelity Advisor Equity Growth Fund | | | | | | |
| Institutional Class (a) | | | | 195,291 | | 10,350,429 |
| Fidelity Advisor Equity Income Fund | | | | | | |
| Institutional Class | | | | 600,725 | | 17,949,649 |
| Fidelity Advisor Growth & Income Fund | | | | | | |
| Institutional Class | | | | 705,459 | | 13,262,624 |
| Fidelity Advisor Large Cap Fund | | | | | | |
| Institutional Class | | | | 734,960 | | 13,229,280 |
| Fidelity Advisor Mid Cap Fund | | | | | | |
| Institutional Class | | | | 253,680 | | 6,702,233 |
| Fidelity Advisor Small Cap Fund | | | | | | |
| Institutional Class | | | | 213,700 | | 5,280,534 |
| |
| TOTAL DOMESTIC EQUITY FUNDS | | | | | | 84,247,213 |
| International Equity Funds 15.5% | | | | | | |
| Fidelity Advisor Diversified International | | | | | | |
| Fund Institutional Class | | | | 423,144 | | 9,922,727 |
| Fidelity Advisor Overseas Fund | | | | | | |
| Institutional Class | | | | 441,714 | | 9,470,349 |
| |
| TOTAL INTERNATIONAL EQUITY FUNDS | | | | | | 19,393,076 |
| |
| TOTAL EQUITY FUNDS | | | | | | |
| (Cost $93,493,516) | | | | 1,073,833 | | 103,640,289 |
| |
| Fixed Income Funds 17.0% | | | | | | |
| |
| High Yield Fixed-Income Funds – 8.3% | | | | | | |
| Fidelity Advisor High Income | | | | | | |
| Advantage Fund Institutional Class | | | | | | 10,426,918 |
| Investment Grade Fixed Income Funds 8.7% | | | | | | |
| Fidelity Advisor Government Investment | | | | | | |
| Fund Institutional Class | | | | 527,499 | | 5,137,842 |
| Fidelity Advisor Intermediate Bond Fund | | | | | | |
| Institutional Class | | | | 488,486 | | 5,236,570 |
| Fidelity Advisor Strategic Real Return | | | | | | |
| Fund Institutional Class | | | | 49,261 | | 491,135 |
| |
| TOTAL INVESTMENT GRADE FIXED-INCOME FUNDS | | | | | | 10,865,547 |
| |
| TOTAL FIXED-INCOME FUNDS | | | | | | |
| (Cost $21,277,759) | | | | | | 21,292,465 |
| TOTAL INVESTMENT IN SECURITIES 100% | | | | | | |
| (Cost $114,771,275) | | | | | | $ 124,932,754 |
Legend
(a) Non-income producing
|
See accompanying notes which are an integral part of the financial statements.
61 Annual Report
| Fidelity Advisor Freedom 2035 Fund | | | | | | |
| |
| Financial Statements | | | | | | |
| |
| |
| Statement of Assets and Liabilities | | | | | | |
| | | | | | | March 31, 2006 |
| |
| Assets | | | | | | |
| Investment in securities, at value (cost $114,771,275) — See accompanying schedule | | | | | | $ 124,932,754 |
| Cash | | | | | | 58 |
| Receivable for fund shares sold | | | | | | 371,323 |
| Total assets | | | | | | 125,304,135 |
| |
| Liabilities | | | | | | |
| Payable for investments purchased | | | | $ 291,929 | | |
| Payable for fund shares redeemed | | | | 79,299 | | |
| Distribution fees payable | | | | 50,183 | | |
| Other affiliated payables | | | | 2,891 | | |
| Total liabilities | | | | | | 424,302 |
| |
| Net Assets | | | | | | $ 124,879,833 |
| Net Assets consist of: | | | | | | |
| Paid in capital | | | | | | $ 112,473,106 |
| Undistributed net investment income | | | | | | 2,651 |
| Accumulated undistributed net realized gain (loss) on investments | | | | | | 2,242,597 |
| Net unrealized appreciation (depreciation) on investments | | | | | | 10,161,479 |
| Net Assets | | | | | | $ 124,879,833 |
| Calculation of Maximum Offering Price | | | | | | |
| Class A: | | | | | | |
| Net Asset Value and redemption price per share ($49,877,180 ÷ 3,936,072 shares) | | | | | | $ 12.67 |
| Maximum offering price per share (100/94.25 of $12.67) | | | | | | $ 13.44 |
| Class T: | | | | | | |
| Net Asset Value and redemption price per share ($45,421,394 ÷ 3,600,372 shares) | | | | | | $ 12.62 |
| Maximum offering price per share (100/96.50 of $12.62) | | | | | | $ 13.08 |
| Class B: | | | | | | |
| Net Asset Value and offering price per share ($15,351,127 ÷ 1,223,863 shares)A | | | | | | $ 12.54 |
| Class C: | | | | | | |
| Net Asset Value and offering price per share ($12,023,217 ÷ 957,712 shares)A | | | | | | $ 12.55 |
| Institutional Class: | | | | | | |
| Net Asset Value, offering price and redemption price per share ($2,206,915 ÷ 173,699 shares) | | | | | | $ 12.71 |
A Redemption price per share is equal to net asset value less any applicable contingent deferred sales charge. | | | | | | |
| |
| Statement of Operations | | | | | | |
| | | | | Year ended March 31, 2006 |
| |
| Investment Income | | | | | | |
| Income distributions from underlying funds | | | | | | $ 1,152,372 |
| Interest | | | | | | 52 |
| Total income | | | | | | 1,152,424 |
| |
| Expenses | | | | | | |
| Management fee | | | | $ 3,848 | | |
| Distribution fees | | | | 413,377 | | |
| Independent trustees’ compensation | | | | 307 | | |
| Total expenses before reductions | | | | 417,532 | | |
| Expense reductions | | | | (1,125) | | 416,407 |
| |
| Net investment income (loss) | | | | | | 736,017 |
| Realized and Unrealized Gain (Loss) | | | | | | |
| Realized gain (loss) on sale of underlying fund shares | | | | 38,288 | | |
| Capital gain distributions from underlying funds | | | | 2,378,113 | | 2,416,401 |
| Change in net unrealized appreciation (depreciation) on underlying funds | | | | | | 9,386,127 |
| Net gain (loss) | | | | | | 11,802,528 |
| Net increase (decrease) in net assets resulting from operations | | | | | | $ 12,538,545 |
See accompanying notes which are an integral part of the financial statements.
| | |
| Annual Report | | 62 |
| Statement of Changes in Net Assets | | | | | | | | | | |
| | | | | | | Year ended | | Year ended |
| | | | | | | March 31, | | March 31, |
| | | | | | | 2006 | | 2005 |
| Increase (Decrease) in Net Assets | | | | | | | | |
| Operations | | | | | | | | |
| Net investment income (loss) | | | | | | $ 736,017 | | $ 295,234 |
| Net realized gain (loss) | | | | | | 2,416,401 | | 130,957 |
| Change in net unrealized appreciation (depreciation) | | | | | | 9,386,127 | | 674,970 |
| Net increase (decrease) in net assets resulting from operations | | | | | | 12,538,545 | | 1,101,161 |
| Distributions to shareholders from net investment income | | | | | | (733,367) | | (351,658) |
| Distributions to shareholders from net realized gain | | | | | | (249,712) | | (788) |
| Total distributions | | | | | | (983,079) | | (352,446) |
| Share transactions - net increase (decrease) | | | | | | 69,137,683 | | 38,278,752 |
| Total increase (decrease) in net assets | | | | | | 80,693,149 | | 39,027,467 |
| |
| Net Assets | | | | | | | | |
| Beginning of period | | | | | | 44,186,684 | | 5,159,217 |
| End of period (including undistributed net investment income of $2,651 and undistributed net investment income of $0, | | | | | | | | |
| respectively) | | | | | | $ 124,879,833 | | $ 44,186,684 |
| |
| Financial Highlights Class A | | | | | | | | | | |
| Years ended March 31, | | | | 2006 | | | | 2005 | | 2004G |
| Selected Per-Share Data | | | | | | | | | | |
| Net asset value, beginning of period | | | | $ 11.06 | | | | $ 10.70 | | $ 10.00 |
| Income from Investment Operations | | | | | | | | | | |
| Net investment income (loss)E | | | | .14 | | | | .19 | | .07 |
| Net realized and unrealized gain (loss) | | | | 1.62 | | | | .32 | | .72 |
| Total from investment operations | | | | 1.76 | | | | .51 | | .79 |
| Distributions from net investment income | | | | (.11) | | | | (.15) | | (.09) |
| Distributions from net realized gain | | | | (.04) | | | | —I | | — |
| Total distributions | | | | (.15) | | | | (.15) | | (.09) |
| Net asset value, end of period | | | | $ 12.67 | | | | $ 11.06 | | $ 10.70 |
| Total Return B,C,D | | | | 16.03% | | | | 4.76% | | 7.88% |
| Ratios to Average Net Assets F,H | | | | | | | | | | |
| Expenses before reductions | | | | .26% | | | | .35% | | .35%A |
| Expenses net of fee waivers, if any | | | | .25% | | | | .33% | | .33%A |
| Expenses net of all reductions | | | | .25% | | | | .33% | | .33%A |
| Net investment income (loss) | | | | 1.20% | | | | 1.71% | | 1.80%A |
| Supplemental Data | | | | | | | | | | |
| Net assets, end of period (000 omitted) | | | | $ 49,877 | | | | $ 15,281 | | $ 1,884 |
| Portfolio turnover rate | | | | 4% | | | | 5% | | 1%A |
A Annualized
B Total returns for periods of less than one year are not annualized.
C Total returns would have been lower had certain expenses not been reduced during the periods shown.
D Total returns do not include the effect of the sales charges.
E Calculated based on average shares outstanding during the period.
F Amounts do not include the activity of the underlying funds.
G For the period November 6, 2003 (commencement of operations) to March 31, 2004.
H Expense ratios reflect operating expenses of the class. Expenses before reductions do not reflect amounts reimbursed by the investment adviser or expense offset arrangements and do not represent the amount paid by the class during periods when
reimbursements or reductions occur. Expense ratios before reductions for start up periods may not be representative of longer term operating periods. Expenses net of fee waivers reflect expenses after reimbursement by the investment adviser but prior to
reductions from expense offset arrangements. Expenses net of all reductions represent the net expenses paid by the class but do not include expenses of the investment companies in which the fund invests.
I Amount represents less than $.01 per share.
|
See accompanying notes which are an integral part of the financial statements.
|
63 Annual Report
| Financial Highlights Class T | | | | | | |
| Years ended March 31, | | 2006 | | 2005 | | 2004G |
| Selected Per-Share Data | | | | | | |
| Net asset value, beginning of period | | $ 11.02 | | $ 10.69 | | $ 10.00 |
| Income from Investment Operations | | | | | | |
| Net investment income (loss)E | | .11 | | .16 | | .06 |
| Net realized and unrealized gain (loss) | | 1.63 | | .31 | | .71 |
| Total from investment operations | | 1.74 | | .47 | | .77 |
| Distributions from net investment income | | (.10) | | (.14) | | (.08) |
| Distributions from net realized gain | | (.04) | | —I | | — |
| Total distributions | | (.14) | | (.14) | | (.08) |
| Net asset value, end of period | | $ 12.62 | | $ 11.02 | | $ 10.69 |
| Total Return B,,C,D | | 15.84% | | 4.37% | | 7.73% |
| Ratios to Average Net Assets F,H | | | | | | |
| Expenses before reductions | | .51% | | .60% | | .60%A |
| Expenses net of fee waivers, if any | | .50% | | .58% | | .58%A |
| Expenses net of all reductions | | .50% | | .58% | | .58%A |
| Net investment income (loss) | | .95% | | 1.46% | | 1.55%A |
| Supplemental Data | | | | | | |
| Net assets, end of period (000 omitted) | | $ 45,421 | | $ 16,432 | | $ 1,047 |
| Portfolio turnover rate | | 4% | | 5% | | 1%A |
A Annualized
B Total returns for periods of less than one year are not annualized.
C Total returns would have been lower had certain expenses not been reduced during the periods shown.
D Total returns do not include the effect of the sales charges.
E Calculated based on average shares outstanding during the period.
F Amounts do not include the activity of the underlying funds.
G For the period November 6, 2003 (commencement of operations) to March 31, 2004.
H Expense ratios reflect operating expenses of the class. Expenses before reductions do not reflect amounts reimbursed by the investment adviser or expense offset arrangements and do not represent the amount paid by the class during periods when
reimbursements or reductions occur. Expense ratios before reductions for start up periods may not be representative of longer term operating periods. Expenses net of fee waivers reflect expenses after reimbursement by the investment adviser but
prior to reductions from expense offset arrangements. Expenses net of all reductions represent the net expenses paid by the class but do not include expenses of the investment companies in which the fund invests.
I Amount represents less than $.01 per share.
|
| Financial Highlights Class B | | | | | | |
| Years ended March 31, | | 2006 | | 2005 | | 2004G |
| Selected Per-Share Data | | | | | | |
| Net asset value, beginning of period | | $ 10.98 | | $ 10.67 | | $ 10.00 |
| Income from Investment Operations | | | | | | |
| Net investment income (loss)E | | .05 | | .10 | | .04 |
| Net realized and unrealized gain (loss) | | 1.61 | | .32 | | .71 |
| Total from investment operations | | 1.66 | | .42 | | .75 |
| Distributions from net investment income | | (.06) | | (.11) | | (.08) |
| Distributions from net realized gain | | (.04) | | —I | | — |
| Total distributions | | (.10) | | (.11) | | (.08) |
| Net asset value, end of period | | $ 12.54 | | $ 10.98 | | $ 10.67 |
| Total Return B,C,D | | 15.17% | | 3.88% | | 7.48% |
| Ratios to Average Net Assets F,H | | | | | | |
| Expenses before reductions | | 1.01% | | 1.10% | | 1.10%A |
| Expenses net of fee waivers, if any | | 1.00% | | 1.08% | | 1.08%A |
| Expenses net of all reductions | | 1.00% | | 1.08% | | 1.08%A |
| Net investment income (loss) | | .45% | | .96% | | 1.05%A |
| Supplemental Data | | | | | | |
| Net assets, end of period (000 omitted) | | $ 15,351 | | $ 6,917 | | $ 1,123 |
| Portfolio turnover rate | | 4% | | 5% | | 1%A |
A Annualized
B Total returns for periods of less than one year are not annualized.
C Total returns would have been lower had certain expenses not been reduced during the periods shown.
D Total returns do not include the effect of the contingent deferred sales charge.
E Calculated based on average shares outstanding during the period.
F Amounts do not include the activity of the underlying funds.
G For the period November 6, 2003 (commencement of operations) to March 31, 2004.
H Expense ratios reflect operating expenses of the class. Expenses before reductions do not reflect amounts reimbursed by the investment adviser or expense offset arrangements and do not represent the amount paid by the class during periods when
reimbursements or reductions occur. Expense ratios before reductions for start up periods may not be representative of longer term operating periods. Expenses net of fee waivers reflect expenses after reimbursement by the investment adviser but
prior to reductions from expense offset arrangements. Expenses net of all reductions represent the net expenses paid by the class but do not include expenses of the investment companies in which the fund invests.
I Amount represents less than $.01 per share.
|
See accompanying notes which are an integral part of the financial statements.
| | |
| Annual Report | | 64 |
| Financial Highlights Class C | | | | | | |
| Years ended March 31, | | 2006 | | 2005 | | 2004G |
| Selected Per-Share Data | | | | | | |
| Net asset value, beginning of period | | $ 10.99 | | $ 10.68 | | $ 10.00 |
| Income from Investment Operations | | | | | | |
| Net investment income (loss)E | | .05 | | .10 | | .04 |
| Net realized and unrealized gain (loss) | | 1.61 | | .32 | | .72 |
| Total from investment operations | | 1.66 | | .42 | | .76 |
| Distributions from net investment income | | (.06) | | (.11) | | (.08) |
| Distributions from net realized gain | | (.04) | | —I | | — |
| Total distributions | | (.10) | | (.11) | | (.08) |
| Net asset value, end of period | | $ 12.55 | | $ 10.99 | | $ 10.68 |
| Total Return B,C,D | | 15.15% | | 3.87% | | 7.58% |
| Ratios to Average Net Assets F,H | | | | | | |
| Expenses before reductions | | 1.01% | | 1.10% | | 1.10%A |
| Expenses net of fee waivers, if any | | 1.00% | | 1.08% | | 1.08%A |
| Expenses net of all reductions | | 1.00% | | 1.08% | | 1.08%A |
| Net investment income (loss) | | .45% | | .96% | | 1.05%A |
| Supplemental Data | | | | | | |
| Net assets, end of period (000 omitted) | | $ 12,023 | | $ 5,089 | | $ 890 |
| Portfolio turnover rate | | 4% | | 5% | | 1%A |
A Annualized
B Total returns for periods of less than one year are not annualized.
C Total returns would have been lower had certain expenses not been reduced during the periods shown.
D Total returns do not include the effect of the contingent deferred sales charge.
E Calculated based on average shares outstanding during the period.
F Amounts do not include the activity of the underlying funds.
G For the period November 6, 2003 (commencement of operations) to March 31, 2004.
H Expense ratios reflect operating expenses of the class. Expenses before reductions do not reflect amounts reimbursed by the investment adviser or expense offset arrangements and do not represent the amount paid by the class during periods when
reimbursements or reductions occur. Expense ratios before reductions for start up periods may not be representative of longer term operating periods. Expenses net of fee waivers reflect expenses after reimbursement by the investment adviser but
prior to reductions from expense offset arrangements. Expenses net of all reductions represent the net expenses paid by the class but do not include expenses of the investment companies in which the fund invests.
I Amount represents less than $.01 per share.
|
| Financial Highlights Institutional Class | | | | | | |
| Years ended March 31, | | 2006 | | 2005 | | 2004F |
| Selected Per-Share Data | | | | | | |
| Net asset value, beginning of period | | $ 11.07 | | $ 10.71 | | $ 10.00 |
| Income from Investment Operations | | | | | | |
| Net investment income (loss)D | | 17 | | .21 | | .08 |
| Net realized and unrealized gain (loss) | | 1.64 | | .31 | | .72 |
| Total from investment operations | | 1.81 | | .52 | | .80 |
| Distributions from net investment income | | (.13) | | (.16) | | (.09) |
| Distributions from net realized gain | | (.04) | | —H | | — |
| Total distributions | | (.17) | | (.16) | | (.09) |
| Net asset value, end of period | | $ 12.71 | | $ 11.07 | | $ 10.71 |
| Total Return B,C | | 16.45% | | 4.87% | | 7.98% |
| Ratios to Average Net Assets E,G | | | | | | |
| Expenses before reductions | | 01% | | .10% | | .10%A |
| Expenses net of fee waivers, if any | | 00% | | .08% | | .08%A |
| Expenses net of all reductions | | 00% | | .08% | | .08%A |
| Net investment income (loss) | | 1.45% | | 1.96% | | 2.04%A |
| Supplemental Data | | | | | | |
| Net assets, end of period (000 omitted) | | $ 2,207 | | $ 467 | | $ 216 |
| Portfolio turnover rate | | 4% | | 5% | | 1%A |
A Annualized
B Total returns for periods of less than one year are not annualized.
C Total returns would have been lower had certain expenses not been reduced during the periods shown.
D Calculated based on average shares outstanding during the period.
E Amounts do not include the activity of the underlying funds.
F For the period November 6, 2003 (commencement of operations) to March 31, 2004.
G Expense ratios reflect operating expenses of the class. Expenses before reductions do not reflect amounts reimbursed by the investment adviser or expense offset arrangements and do not represent the amount paid by the class during periods when
reimbursements or reductions occur. Expense ratios before reductions for start up periods may not be representative of longer term operating periods. Expenses net of fee waivers reflect expenses after reimbursement by the investment adviser but
prior to reductions from expense offset arrangements. Expenses net of all reductions represent the net expenses paid by the class but do not include expenses of the investment companies in which the fund invests.
H Amount represents less than $.01 per share.
|
See accompanying notes which are an integral part of the financial statements.
|
65 Annual Report
| Fidelity Advisor Freedom 2040 Fund | | |
| Investment Changes | | |
| |
| |
| Fund Holdings as of March 31, 2006 | | |
| | | % of fund’s | | % of fund’s investments |
| | | investments | | 6 months ago |
| Domestic Equity Funds | | | | |
| Fidelity Advisor Dividend Growth | | | | |
| Fund Institutional Class | | 14.4 | | 13.7 |
| Fidelity Advisor Equity Growth | | | | |
| Fund Institutional Class | | 8.4 | | 7.1 |
| Fidelity Advisor Equity Income | | | | |
| Fund Institutional Class | | 14.3 | | 13.6 |
| Fidelity Advisor Growth & Income | | | | |
| Fund Institutional Class | | 10.7 | | 13.6 |
| Fidelity Advisor Large Cap Fund | | | | |
| Institutional Class | | 10.6 | | 13.5 |
| Fidelity Advisor Mid Cap Fund | | | | |
| Institutional Class | | 5.6 | | 4.3 |
| Fidelity Advisor Small Cap Fund | | | | |
| Institutional Class | | 4.1 | | 4.2 |
| | | 68.1 | | 70.0 |
| International Equity Funds | | | | |
| Fidelity Advisor Diversified | | | | |
| International Fund Institutional | | | | |
| Class | | 8.6 | | 7.6 |
| Fidelity Advisor Overseas Fund | | | | |
| Institutional Class | | 8.4 | | 7.5 |
| | | 17.0 | | 15.1 |
| High Yield Fixed-Income Funds | | | | |
| Fidelity Advisor High Income | | | | |
| Advantage Fund Institutional | | | | |
| Class | | 9.9 | | 9.9 |
| Investment Grade Fixed-Income | | | | |
| Funds | | | | |
| Fidelity Advisor Government | | | | |
| Investment Fund Institutional | | | | |
| Class | | 2.4 | | 2.5 |
| Fidelity Advisor Intermediate Bond | | | | |
| Fund Institutional Class | | 2.4 | | 2.5 |
| Fidelity Advisor Strategic Real | | | | |
| Return Fund Institutional Class | | 0.2 | | 0.0 |
| | | 5.0 | | 5.0 |
| | | 100.0 | | 100.0 |
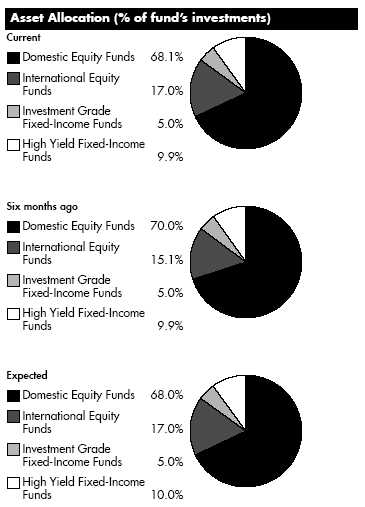
The fund invests according to an asset allocation strategy that becomes increasingly conservative over time. The ”six months ago” allocation is based on the fund’s holdings as of September 30, 2005. The ”current” allocation is based on the fund’s holdings as of March 31, 2006. The ”expected” allocation represents the fund’s anticipated allocation at September 30, 2006. Beginning in March 2006, the fund changed its asset allocation strategy, resulting in an increased emphasis on international equity.
Annual Report 66
| Fidelity Advisor Freedom 2040 Fund | | |
| Investments March 31, 2006 |
| Showing Percentage of Total Value of Investment in Securities |
| |
| Equity Funds 85.1% | | | | | | |
| | | | | Shares | | Value (Note 1) |
| Domestic Equity Funds 68.1% | | | | | | |
| Fidelity Advisor Dividend Growth Fund | | | | | | |
| Institutional Class | | | | 3,923,946 | | $ 50,226,515 |
| Fidelity Advisor Equity Growth Fund | | | | | | |
| Institutional Class (a) | | | | 554,402 | | 29,383,301 |
| Fidelity Advisor Equity Income Fund | | | | | | |
| Institutional Class | | | | 1,671,589 | | 49,947,084 |
| Fidelity Advisor Growth & Income Fund | | | | | | |
| Institutional Class | | | | 1,993,266 | | 37,473,410 |
| Fidelity Advisor Large Cap Fund | | | | | | |
| Institutional Class | | | | 2,065,366 | | 37,176,582 |
| Fidelity Advisor Mid Cap Fund | | | | | | |
| Institutional Class | | | | 745,462 | | 19,695,112 |
| Fidelity Advisor Small Cap Fund | | | | | | |
| Institutional Class | | | | 574,334 | | 14,191,794 |
| |
| TOTAL DOMESTIC EQUITY FUNDS | | | | | | 238,093,798 |
| International Equity Funds 17.0% | | | | | | |
| Fidelity Advisor Diversified International | | | | | | |
| Fund Institutional Class | | | | 1,273,123 | | 29,854,743 |
| Fidelity Advisor Overseas Fund | | | | | | |
| Institutional Class | | | | 1,375,942 | | 29,500,193 |
| |
| TOTAL INTERNATIONAL EQUITY FUNDS | | | | | | 59,354,936 |
| |
| TOTAL EQUITY FUNDS | | | | | | |
| (Cost $264,001,949) | | | | 3,555,889 | | 297,448,734 |
| |
| Fixed Income Funds 14.9% | | | | | | |
| |
| High Yield Fixed-Income Funds – 9.9% | | | | | | |
| Fidelity Advisor High Income | | | | | | |
| Advantage Fund Institutional Class | | | | | | 34,527,678 |
| Investment Grade Fixed Income Funds 5.0% | | | | | | |
| Fidelity Advisor Government Investment | | | | | | |
| Fund Institutional Class | | | | 868,325 | | 8,457,481 |
| Fidelity Advisor Intermediate Bond Fund | | | | | | |
| Institutional Class | | | | 791,274 | | 8,482,452 |
| Fidelity Advisor Strategic Real Return | | | | | | |
| Fund Institutional Class | | | | 55,974 | | 558,057 |
| |
| TOTAL INVESTMENT GRADE FIXED-INCOME FUNDS | | | | | | 17,497,990 |
| |
| TOTAL FIXED-INCOME FUNDS | | | | | | |
| (Cost $51,377,683) | | | | | | 52,025,668 |
| TOTAL INVESTMENT IN SECURITIES 100% | | | | | | |
| (Cost $315,379,632) | | | | | | $ 349,474,402 |
Legend
(a) Non-income producing
|
See accompanying notes which are an integral part of the financial statements.
67 Annual Report
| Fidelity Advisor Freedom 2040 Fund | | | | | | |
| |
| Financial Statements | | | | | | |
| |
| |
| Statement of Assets and Liabilities | | | | | | |
| | | | | March 31, 2006 |
| |
| Assets | | | | | | |
| Investment in securities, at value (cost $315,379,632) — See accompanying schedule | | | | | | $ 349,474,402 |
| Cash | | | | | | 6 |
| Receivable for investments sold | | | | | | 9,500 |
| Receivable for fund shares sold | | | | | | 1,532,115 |
| Total assets | | | | | | 351,016,023 |
| |
| Liabilities | | | | | | |
| Payable for investments purchased | | | | $ 1,027,751 | | |
| Payable for fund shares redeemed | | | | 513,902 | | |
| Distribution fees payable | | | | 139,763 | | |
| Other affiliated payables | | | | 6,912 | | |
| Total liabilities | | | | | | 1,688,328 |
| |
| Net Assets | | | | | | $ 349,327,695 |
| Net Assets consist of: | | | | | | |
| Paid in capital | | | | | | $ 308,584,162 |
| Undistributed net investment income | | | | | | 155,872 |
| Accumulated undistributed net realized gain (loss) on investments | | | | | | 6,492,891 |
| Net unrealized appreciation (depreciation) on investments | | | | | | 34,094,770 |
| Net Assets | | | | | | $ 349,327,695 |
| Calculation of Maximum Offering Price | | | | | | |
| Class A: | | | | | | |
| Net Asset Value and redemption price per share ($133,817,369 ÷ 9,677,102 shares) | | | | | | $ 13.83 |
| Maximum offering price per share (100/94.25 of $13.83) | | | | | | $ 14.67 |
| Class T: | | | | | | |
| Net Asset Value and redemption price per share ($136,678,653 ÷ 9,909,900 shares) | | | | | | $ 13.79 |
| Maximum offering price per share (100/96.50 of $13.79) | | | | | | $ 14.29 |
| Class B: | | | | | | |
| Net Asset Value and offering price per share ($32,658,207 ÷ 2,383,695 shares)A | | | | | | $ 13.70 |
| Class C: | | | | | | |
| Net Asset Value and offering price per share ($38,946,608 ÷ 2,843,691 shares)A | | | | | | $ 13.70 |
| Institutional Class: | | | | | | |
| Net Asset Value, offering price and redemption price per share ($7,226,858 ÷ 521,117 shares) | | | | | | $ 13.87 |
| A Redemption price per share is equal to net asset value less any applicable contingent deferred sales charge. | | | | | | |
| |
| Statement of Operations | | | | | | |
| | | | | Year ended March 31, 2006 |
| |
| Investment Income | | | | | | |
| Income distributions from underlying funds | | | | | | $ 3,482,841 |
| |
| Expenses | | | | | | |
| Management fee | | | | $ 13,998 | | |
| Distribution fees | | | | 1,240,320 | | |
| Independent trustees’ compensation | | | | 959 | | |
| Total expenses before reductions | | | | 1,255,277 | | |
| Expense reductions | | | | (4,008) | | 1,251,269 |
| |
| Net investment income (loss) | | | | | | 2,231,572 |
| Realized and Unrealized Gain (Loss) | | | | | | |
| Realized gain (loss) on sale of underlying fund shares | | | | 18,879 | | |
| Capital gain distributions from underlying funds | | | | 7,157,905 | | 7,176,784 |
| Change in net unrealized appreciation (depreciation) on underlying funds | | | | | | 29,421,318 |
| Net gain (loss) | | | | | | 36,598,102 |
| Net increase (decrease) in net assets resulting from operations | | | | | | $ 38,829,674 |
See accompanying notes which are an integral part of the financial statements.
| | |
| Annual Report | | 68 |
| Statement of Changes in Net Assets | | | | | | | | | | |
| | | | | Year ended | | | | Year ended |
| | | | | March 31, | | | | March 31, |
| | | | | 2006 | | | | 2005 |
| Increase (Decrease) in Net Assets | | | | | | | | |
| Operations | | | | | | | | |
| Net investment income (loss) | | | | $ 2,231,572 | | | | $ 1,078,538 |
| Net realized gain (loss) | | | | 7,176,784 | | | | 530,762 |
| Change in net unrealized appreciation (depreciation) | | | | 29,421,318 | | | | 3,286,735 |
| Net increase (decrease) in net assets resulting from operations | | | | 38,829,674 | | | | 4,896,035 |
| Distributions to shareholders from net investment income | | | | (2,075,700) | | | | (1,190,067) |
| Distributions to shareholders from net realized gain | | | | (1,111,246) | | | | — |
| Total distributions | | | | (3,186,946) | | | | (1,190,067) |
| Share transactions - net increase (decrease) | | | | 151,023,971 | | | | 115,613,636 |
| Total increase (decrease) in net assets | | | | 186,666,699 | | | | 119,319,604 |
| |
| Net Assets | | | | | | | | |
| Beginning of period | | | | 162,660,996 | | | | 43,341,392 |
| End of period (including undistributed net investment income of $155,872 and undistributed net investment income of | | | | | | | | |
| $26,420, respectively) | | | | $ 349,327,695 | | | | $ 162,660,996 |
| |
| Financial Highlights Class A | | | | | | | | | | |
| Years ended March 31, | | 2006 | | | | 2005 | | | | 2004G |
| Selected Per-Share Data | | | | | | | | | | |
| Net asset value, beginning of period | | $ 12.03 | | | | $ 11.62 | | | | $ 10.00 |
| Income from Investment Operations | | | | | | | | | | |
| Net investment income (loss)E | | .15 | | | | .18 | | | | .12 |
| Net realized and unrealized gain (loss) | | 1.84 | | | | .39 | | | | 1.60 |
| Total from investment operations | | 1.99 | | | | .57 | | | | 1.72 |
| Distributions from net investment income | | (.12) | | | | (.16) | | | | (.10) |
| Distributions from net realized gain | | (.07) | | | | — | | | | — |
| Total distributions | | (.19) | | | | (.16) | | | | (.10) |
| Net asset value, end of period | | $ 13.83 | | | | $ 12.03 | | | | $ 11.62 |
| Total Return B,C,D | | 16.65% | | | | 4.87% | | | | 17.19% |
| Ratios to Average Net Assets F,H | | | | | | | | | | |
| Expenses before reductions | | .26% | | | | .35% | | | | .35%A |
| Expenses net of fee waivers, if any | | .26% | | | | .33% | | | | .33%A |
| Expenses net of all reductions | | .26% | | | | .33% | | | | .33%A |
| Net investment income (loss) | | 1.18% | | | | 1.50% | | | | 1.53%A |
| Supplemental Data | | | | | | | | | | |
| Net assets, end of period (000 omitted) | | $133,817 | | | | $ 51,718 | | | | $ 9,666 |
| Portfolio turnover rate | | 4% | | | | 3% | | | | 3%A |
A Annualized
B Total returns for periods of less than one year are not annualized.
C Total returns would have been lower had certain expenses not been reduced during the periods shown.
D Total returns do not include the effect of the sales charges.
E Calculated based on average shares outstanding during the period.
F Amounts do not include the activity of the underlying funds.
G For the period July 24, 2003 (commencement of operations) to March 31, 2004.
H Expense ratios reflect operating expenses of the class. Expenses before reductions do not reflect amounts reimbursed by the investment adviser or expense offset arrangements and do not represent the amount paid by the class during periods when
reimbursements or reductions occur. Expense ratios before reductions for start up periods may not be representative of longer term operating periods. Expenses net of fee waivers reflect expenses after reimbursement by the investment adviser but prior to
reductions from expense offset arrangements. Expenses net of all reductions represent the net expenses paid by the class but do not include expenses of the investment companies in which the fund invests.
|
See accompanying notes which are an integral part of the financial statements.
|
69 Annual Report
| Financial Highlights Class T | | | | | | |
| Years ended March 31, | | 2006 | | 2005 | | 2004G |
| Selected Per-Share Data | | | | | | |
| Net asset value, beginning of period | | $ 12.00 | | $ 11.60 | | $ 10.00 |
| Income from Investment Operations | | | | | | |
| Net investment income (loss)E | | .12 | | .15 | | .10 |
| Net realized and unrealized gain (loss) | | 1.83 | | .38 | | 1.59 |
| Total from investment operations | | 1.95 | | .53 | | 1.69 |
| Distributions from net investment income | | (.10) | | (.13) | | (.09) |
| Distributions from net realized gain | | (.06) | | — | | — |
| Total distributions | | (.16) | | (.13) | | (.09) |
| Net asset value, end of period | | $ 13.79 | | $ 12.00 | | $ 11.60 |
| Total Return B,C,D | | 16.35% | | 4.57% | | 16.93% |
| Ratios to Average Net Assets F,H | | | | | | |
| Expenses before reductions | | .51% | | .60% | | .60%A |
| Expenses net of fee waivers, if any | | .51% | | .58% | | .58%A |
| Expenses net of all reductions | | .51% | | .58% | | .58%A |
| Net investment income (loss) | | .93% | | 1.25% | | 1.28%A |
| Supplemental Data | | | | | | |
| Net assets, end of period (000 omitted) | | $ 136,679 | | $ 66,136 | | $ 19,191 |
| Portfolio turnover rate | | 4% | | 3% | | 3%A |
A Annualized
B Total returns for periods of less than one year are not annualized.
C Total returns would have been lower had certain expenses not been reduced during the periods shown.
D Total returns do not include the effect of the sales charges.
E Calculated based on average shares outstanding during the period.
F Amounts do not include the activity of the underlying funds.
G For the period July 24, 2003 (commencement of operations) to March 31, 2004.
H Expense ratios reflect operating expenses of the class. Expenses before reductions do not reflect amounts reimbursed by the investment adviser or expense offset arrangements and do not represent the amount paid by the class during periods when
reimbursements or reductions occur. Expense ratios before reductions for start up periods may not be representative of longer term operating periods. Expenses net of fee waivers reflect expenses after reimbursement by the investment adviser but
prior to reductions from expense offset arrangements. Expenses net of all reductions represent the net expenses paid by the class but do not include expenses of the investment companies in which the fund invests.
|
| Financial Highlights Class B | | | | | | |
| Years ended March 31, | | 2006 | | 2005 | | 2004G |
| Selected Per-Share Data | | | | | | |
| Net asset value, beginning of period | | $ 11.94 | | $ 11.57 | | $ 10.00 |
| Income from Investment Operations | | | | | | |
| Net investment income (loss)E | | .05 | | .09 | | .06 |
| Net realized and unrealized gain (loss) | | 1.83 | | .38 | | 1.60 |
| Total from investment operations | | 1.88 | | .47 | | 1.66 |
| Distributions from net investment income | | (.06) | | (.10) | | (.09) |
| Distributions from net realized gain | | (.06) | | — | | — |
| Total distributions | | (.12) | | (.10) | | (.09) |
| Net asset value, end of period | | $ 13.70 | | $ 11.94 | | $ 11.57 |
| Total Return B,C,D | | 15.81% | | 4.04% | | 16.58% |
| Ratios to Average Net Assets F,H | | | | | | |
| Expenses before reductions | | 1.01% | | 1.10% | | 1.10%A |
| Expenses net of fee waivers, if any | | 1.01% | | 1.08% | | 1.08%A |
| Expenses net of all reductions | | 1.01% | | 1.08% | | 1.08%A |
| Net investment income (loss) | | .43% | | .75% | | .78%A |
| Supplemental Data | | | | | | |
| Net assets, end of period (000 omitted) | | $ 32,658 | | $ 18,541 | | $ 7,232 |
| Portfolio turnover rate | | 4% | | 3% | | 3%A |
A Annualized
B Total returns for periods of less than one year are not annualized.
C Total returns would have been lower had certain expenses not been reduced during the periods shown.
D Total returns do not include the effect of the contingent deferred sales charge.
E Calculated based on average shares outstanding during the period.
F Amounts do not include the activity of the underlying funds.
G For the period July 24, 2003 (commencement of operations) to March 31, 2004.
H Expense ratios reflect operating expenses of the class. Expenses before reductions do not reflect amounts reimbursed by the investment adviser or expense offset arrangements and do not represent the amount paid by the class during periods when
reimbursements or reductions occur. Expense ratios before reductions for start up periods may not be representative of longer term operating periods. Expenses net of fee waivers reflect expenses after reimbursement by the investment adviser but
prior to reductions from expense offset arrangements. Expenses net of all reductions represent the net expenses paid by the class but do not include expenses of the investment companies in which the fund invests.
|
See accompanying notes which are an integral part of the financial statements.
| | |
| Annual Report | | 70 |
| Financial Highlights Class C | | | | | | |
| Years ended March 31, | | 2006 | | 2005 | | 2004G |
| Selected Per-Share Data | | | | | | |
| Net asset value, beginning of period | | $ 11.94 | | $ 11.57 | | $ 10.00 |
| Income from Investment Operations | | | | | | |
| Net investment income (loss)E | | .05 | | .09 | | .06 |
| Net realized and unrealized gain (loss) | | 1.83 | | .38 | | 1.59 |
| Total from investment operations | | 1.88 | | .47 | | 1.65 |
| Distributions from net investment income | | (.06) | | (.10) | | (.08) |
| Distributions from net realized gain | | (.06) | | — | | — |
| Total distributions | | (.12) | | (.10) | | (.08) |
| Net asset value, end of period | | $ 13.70 | | $ 11.94 | | $ 11.57 |
| Total Return B,C,D | | 15.82% | | 4.04% | | 16.53% |
| Ratios to Average Net Assets F,H | | | | | | |
| Expenses before reductions | | 1.01% | | 1.10% | | 1.10%A |
| Expenses net of fee waivers, if any | | 1.01% | | 1.08% | | 1.08%A |
| Expenses net of all reductions | | 1.01% | | 1.08% | | 1.08%A |
| Net investment income (loss) | | .43% | | .75% | | .78%A |
| Supplemental Data | | | | | | |
| Net assets, end of period (000 omitted) | | $ 38,947 | | $ 21,792 | | $ 6,958 |
| Portfolio turnover rate | | 4% | | 3% | | 3%A |
A Annualized
B Total returns for periods of less than one year are not annualized.
C Total returns would have been lower had certain expenses not been reduced during the periods shown.
D Total returns do not include the effect of the contingent deferred sales charge.
E Calculated based on average shares outstanding during the period.
F Amounts do not include the activity of the underlying funds.
G For the period July 24, 2003 (commencement of operations) to March 31, 2004.
H Expense ratios reflect operating expenses of the class. Expenses before reductions do not reflect amounts reimbursed by the investment adviser or expense offset arrangements and do not represent the amount paid by the class during periods when
reimbursements or reductions occur. Expense ratios before reductions for start up periods may not be representative of longer term operating periods. Expenses net of fee waivers reflect expenses after reimbursement by the investment adviser but
prior to reductions from expense offset arrangements. Expenses net of all reductions represent the net expenses paid by the class but do not include expenses of the investment companies in which the fund invests.
|
| Financial Highlights Institutional Class | | | | | | |
| Years ended March 31, | | 2006 | | 2005 | | 2004F |
| Selected Per-Share Data | | | | | | |
| Net asset value, beginning of period | | $ 12.05 | | $ 11.63 | | $ 10.00 |
| Income from Investment Operations | | | | | | |
| Net investment income (loss)D | | .18 | | .21 | | .13 |
| Net realized and unrealized gain (loss) | | 1.85 | | .38 | | 1.60 |
| Total from investment operations | | 2.03 | | .59 | | 1.73 |
| Distributions from net investment income | | (.14) | | (.17) | | (.10) |
| Distributions from net realized gain | | (.07) | | — | | — |
| Total distributions | | (.21) | | (.17) | | (.10) |
| Net asset value, end of period | | $ 13.87 | | $ 12.05 | | $ 11.63 |
| Total Return B,C | | 16.99% | | 5.07% | | 17.34% |
| Ratios to Average Net Assets E,G | | | | | | |
| Expenses before reductions | | .01% | | .10% | | .10%A |
| Expenses net of fee waivers, if any | | .00% | | .08% | | .08%A |
| Expenses net of all reductions | | .00% | | .08% | | .08%A |
| Net investment income (loss) | | 1.43% | | 1.75% | | 1.78%A |
| Supplemental Data | | | | | | |
| Net assets, end of period (000 omitted) | | $ 7,227 | | $ 4,474 | | $ 294 |
| Portfolio turnover rate | | 4% | | 3% | | 3%A |
A Annualized
B Total returns for periods of less than one year are not annualized.
C Total returns would have been lower had certain expenses not been reduced during the periods shown.
D Calculated based on average shares outstanding during the period.
E Amounts do not include the activity of the underlying funds.
F For the period July 24, 2003 (commencement of operations) to March 31, 2004.
G Expense ratios reflect operating expenses of the class. Expenses before reductions do not reflect amounts reimbursed by the investment adviser or expense offset arrangements and do not represent the amount paid by the class during periods when
reimbursements or reductions occur. Expense ratios before reductions for start up periods may not be representative of longer term operating periods. Expenses net of fee waivers reflect expenses after reimbursement by the investment adviser but
prior to reductions from expense offset arrangements. Expenses net of all reductions represent the net expenses paid by the class but do not include expenses of the investment companies in which the fund invests.
|
See accompanying notes which are an integral part of the financial statements.
|
71 Annual Report
Notes to Financial Statements
For the period ended March 31, 2006
|
1. Significant Accounting Policies.
|
Fidelity Advisor Freedom Income Fund, Advisor Freedom 2005 Fund, Advisor Freedom 2010 Fund, Advisor Freedom 2015 Fund, Advisor Freedom 2020 Fund, Advisor Freedom 2025 Fund, Advisor Freedom 2030 Fund, Advisor Freedom 2035 Fund and Advisor Freedom 2040 Fund (the funds) are funds of Fidelity Aberdeen Street Trust (the trust). The trust is registered under the Investment Company Act of 1940, as amended (the 1940 Act), as an open end management investment company organized as a Delaware statutory trust. Each fund is authorized to issue an unlimited number of shares. The funds invest primarily in a combination of other Fidelity equity, fixed income, and money market funds (the Underlying Funds) managed by Fidelity Management & Research Company (FMR). Each fund offers Class A, Class T, Class B, Class C, and Institutional Class shares, each of which has equal rights as to assets and voting privileges. Each class has exclusive voting rights with respect to matters that affect that class. Class B shares will automatically convert to Class A shares after a holding period of seven years from the initial date of purchase. Investment income, realized and unrealized capital gains and losses, the common expenses of the fund, and certain fund level expense reductions, if any, are allocated on a pro rata basis to each class based on the relative net assets of each class to the total net assets of the fund. Each class differs with respect to distribution and service plan fees incurred. Certain expense reductions also differ by class. The financial statements have been prepared in conformity with accounting principles generally accepted in the United States of America, which require management to make certain estimates and assumptions at the date of the financial statements. The following summarizes the significant accounting policies of the funds:
Security Valuation. Net asset value per share is calculated as of the close of business of the New York Stock Exchange, normally 4:00 p.m. Eastern time. Investments in the Underlying Funds are valued at their net asset value each business day. Short term securities with remaining maturities of sixty days or less for which quotations are not readily available are valued on the basis of amortized cost.
Investment Transactions and Income. Security transactions, normally shares of the Underlying Funds, are accounted for as of trade date. Gains and losses on securities sold are determined on the basis of identified cost. Income and capital gain distributions from the Underlying Funds, if any, are recorded on the ex dividend date. Interest income is accrued as earned. Interest income includes coupon interest and amortization of premium and accretion of discount on debt securities.
Expenses. Most expenses of the trust can be directly attributed to a fund. Expenses which cannot be directly attributed are apportioned among each fund in the trust. Expenses included in the accompanying financial statements reflect the expenses of each fund and do not include any expenses associated with the Underlying Funds.
Income Tax Information and Distributions to Shareholders. Each year, each fund intends to qualify as a regulated investment company by distributing all of its taxable income and realized gains under Subchapter M of the Internal Revenue Code. As a result, no provision for income taxes is required in the accompanying financial statements.
Distributions are recorded on the ex dividend date. Income dividends and capital gain distributions are declared separately for each class. Income and capital gain distributions are determined in accordance with income tax regulations, which may differ from generally accepted accounting principles. In addition, certain funds will claim a portion of the payment made to redeeming shareholders as a distribution for income tax purposes.
Capital accounts within the financial statements are adjusted for permanent book tax differences. These adjustments have no impact on net assets or the results of operations. Temporary book tax differences will reverse in a subsequent period.
Book tax differences are primarily due to short term capital gain distributions from Underlying Funds and losses deferred due to wash sales and excise tax regulations.
| The tax basis components of distributable earnings and the federal tax cost as of period end were as follows for each fund: | | | | |
| |
| | | | | | | | | | | | | | | Net Unrealized |
| | | Cost for Federal | | | | Unrealized | | | | Unrealized | | | | Appreciation/ |
| | | Income Tax Purposes | | | | Appreciation | | | | Depreciation | | | | (Depreciation) |
| Advisor Freedom Income | | $ 69,700,308 | | | | $ 2,099,665 | | | | $ (1,130,204) | | | | $ 969,461 |
| Advisor Freedom 2005 | | 40,887,918 | | | | 2,510,537 | | | | (430,743) | | | | 2,079,794 |
| Advisor Freedom 2010 | | 354,761,350 | | | | 23,151,864 | | | | (4,844,121) | | | | 18,307,743 |
| Advisor Freedom 2015 | | 330,312,966 | | | | 22,699,974 | | | | (3,138,919) | | | | 19,561,055 |
| Advisor Freedom 2020 | | 674,851,445 | | | | 65,715,328 | | | | (5,440,227) | | | | 60,275,101 |
| Advisor Freedom 2025 | | 245,036,083 | | | | 21,565,559 | | | | (1,438,952) | | | | 20,126,607 |
| Advisor Freedom 2030 | | 390,888,878 | | | | 43,757,852 | | | | (1,566,518) | | | | 42,191,334 |
| Advisor Freedom 2035 | | 114,771,413 | | | | 10,557,946 | | | | (396,605) | | | | 10,161,341 |
| Advisor Freedom 2040 | | 315,380,054 | | | | 34,832,513 | | | | (738,165) | | | | 34,094,348 |
| 1. Significant Accounting Policies continued | | | | | | | | | | | | | | |
| |
| Income Tax Information and Distributions to Shareholders continued | | | | | | | | | | | | |
| |
| | | | | | | | | | | | | | | Undistributed |
| | | | | | | | | | | Undistributed | | | | Long-term |
| | | | | | | | | | | Ordinary Income | | | | Capital Gain |
| Advisor Freedom Income | | | | | | | | | | $ 219,609 | | | | $ 442,156 |
| Advisor Freedom 2005 | | | | | | | | | | 162,644 | | | | 518,830 |
| Advisor Freedom 2010 | | | | | | | | | | 1,447,647 | | | | 4,760,938 |
| Advisor Freedom 2015 | | | | | | | | | | 984,245 | | | | 4,733,886 |
| Advisor Freedom 2020 | | | | | | | | | | 1,867,050 | | | | 13,384,984 |
| Advisor Freedom 2025 | | | | | | | | | | 443,575 | | | | 4,477,357 |
| Advisor Freedom 2030 | | | | | | | | | | 565,464 | | | | 7,844,928 |
| Advisor Freedom 2035 | | | | | | | | | | 111,066 | | | | 2,134,322 |
| Advisor Freedom 2040 | | | | | | | | | | 356,945 | | | | 6,292,237 |
| |
| The tax character of distributions paid was as follows: | | | | | | | | | | | | | | |
| |
| March 31, 2006 | | | | | | | | | | | | | | |
| | | | | | | Ordinary | | | | Long-term | | | | |
| | | | | | | Income | | | | Capital Gains | | | | Total |
| Advisor Freedom Income | | | | | | $ 1,513,067 | | | | $ 144,130 | | | | $ 1,657,197 |
| Advisor Freedom 2005 | | | | | | 621,106 | | | | 89,791 | | | | 710,897 |
| Advisor Freedom 2010 | | | | | | 5,639,391 | | | | 775,835 | | | | 6,415,226 |
| Advisor Freedom 2015 | | | | | | 3,990,749 | | | | 477,777 | | | | 4,468,526 |
| Advisor Freedom 2020 | | | | | | 7,886,283 | | | | 1,712,913 | | | | 9,599,196 |
| Advisor Freedom 2025 | | | | | | 2,446,690 | | | | 248,535 | | | | 2,695,225 |
| Advisor Freedom 2030 | | | | | | 3,352,916 | | | | 826,847 | | | | 4,179,763 |
| Advisor Freedom 2035 | | | | | | 889,584 | | | | 93,495 | | | | 983,079 |
| Advisor Freedom 2040 | | | | | | 2,735,694 | | | | 451,252 | | | | 3,186,946 |
| |
| March 31, 2005 | | | | | | | | | | | | | | |
| | | | | | | Ordinary | | | | Long-term | | | | |
| | | | | | | Income | | | | Capital Gains | | | | Total |
| Advisor Freedom Income | | | | | | $ 704,332 | | | | $ 35,147 | | | | $ 739,479 |
| Advisor Freedom 2005 | | | | | | 231,296 | | | | 3,243 | | | | 234,539 |
| Advisor Freedom 2010 | | | | | | 2,581,854 | | | | 17,590 | | | | 2,599,444 |
| Advisor Freedom 2015 | | | | | | 1,216,211 | | | | 6,337 | | | | 1,222,548 |
| Advisor Freedom 2020 | | | | | | 4,439,939 | | | | 68,080 | | | | 4,508,019 |
| Advisor Freedom 2025 | | | | | | 647,465 | | | | 1,629 | | | | 649,094 |
| Advisor Freedom 2030 | | | | | | 1,985,403 | | | | 16,365 | | | | 2,001,768 |
| Advisor Freedom 2035 | | | | | | 330,752 | | | | 21,694 | | | | 352,446 |
| Advisor Freedom 2040 | | | | | | 1,190,067 | | | | — | | | | 1,190,067 |
| |
| 2. Operating Policies. | | | | | | | | | | | | | | |
Repurchase Agreements. FMR has received an Exemptive Order from the Securities and Exchange Commission (the SEC) which permits certain funds and other affiliated entities of FMR to transfer uninvested cash balances into joint trading accounts which are then invested in repurchase agreements. Certain funds may also invest directly with institutions in repurchase agreements. Repurchase agreements are collateralized by government or non government securities. Upon settlement date, collateral is held in segregated accounts with custodian banks and may be obtained in the event of a default of the counterparty. Each applicable fund monitors, on a daily basis, the value of the collateral to ensure it is at least equal to the principal amount of the repurchase agreement (including accrued interest). In the event of a default by the counterparty, realization of the collateral proceeds could be delayed, during which time the value of the collateral may decline.
73 Annual Report
| Notes to Financial Statements continued | | | | |
| |
| |
| |
| 3. Purchases and Sales of Investments. | | | | |
| |
Purchases and redemptions of the underlying fund shares are noted in the table below.
| | | | |
| | | | | Purchases ($) | | Redemptions ($) |
| Advisor Freedom Income | | | | 24,713,712 | | 13,299,690 |
| Advisor Freedom 2005 | | | | 29,342,440 | | 11,337,422 |
| Advisor Freedom 2010 | | | | 148,806,647 | | 21,225,849 |
| Advisor Freedom 2015 | | | | 188,651,266 | | 8,880,461 |
| Advisor Freedom 2020 | | | | 304,380,004 | | 34,179,267 |
| Advisor Freedom 2025 | | | | 132,628,269 | | 8,807,768 |
| Advisor Freedom 2030 | | | | 182,902,917 | | 11,088,376 |
| Advisor Freedom 2035 | | | | 74,728,399 | | 3,429,443 |
| Advisor Freedom 2040 | | | | 166,901,729 | | 9,607,568 |
| |
| 4. Fees and Other Transactions with Affiliates. | | | | |
Management Fee. Strategic Advisers, Inc. (Strategic Advisers), an affiliate of FMR, provides the funds with investment management related ser vices. As of May 1, 2005, Strategic Advisers contractually agreed to eliminate the .10% management fee. On May 19, 2005, the Board of Trustees ap proved amendments to the management contracts. Under the amended contracts the funds no longer pay management fees.
Prior to May 19, 2005, the funds paid a monthly management fee to Strategic Advisers. The management fee was computed at an annual rate of .10% of the funds’ average net assets. The management fee was reduced by an amount equal to the fees and expenses paid by the funds to the independent Trustees.
Other Transactions. Strategic Advisers has entered into an administration agreement with FMR under which FMR provides management and admin istrative services (other than investment advisory services) necessary for the operation of each fund. Pursuant to this agreement, FMR pays all ex penses of each fund, excluding the compensation of the independent Trustees and certain other expenses such as interest expense. FMR also contracts with other Fidelity companies to perform the services necessary for the operation of each fund. The funds do not pay any fees for these services. Effec tive May 19, 2005, FMR no longer received fees for services under the administration agreement.
Distribution and Service Plan. In accordance with Rule 12b 1 of the 1940 Act, the fund has adopted separate Distribution and Service Plans for each class of shares. Certain classes pay Fidelity Distributors Corporation (FDC), an affiliate of FMR, separate Distribution and Service Fees, each of which is based on an annual percentage of each class’ average net assets. In addition, FDC may pay financial intermediaries for selling shares of the fund and providing shareholder support services. For the period, the Distribution and Service Fee rates and the total amounts paid to and retained by FDC were as follows:
| | | Distribution | | Service | | | | Paid to | | | | Retained |
| Advisor Freedom Income | | Fee | | Fee | | | | FDC | | | | by FDC |
| Class A | | 0% | | .25% | | | | $ 34,548 | | | | $ 56 |
| Class T | | .25% | | .25% | | | | 155,124 | | | | — |
| Class B | | .75% | | .25% | | | | 46,860 | | | | 35,147 |
| Class C | | .75% | | .25% | | | | 143,907 | | | | 36,856 |
| | | | | | | | | $ 380,439 | | | | $ 72,059 |
| Advisor Freedom 2005 | | | | | | | | | | | | |
| Class A | | 0% | | .25% | | | | $ 25,895 | | | | $ 559 |
| Class T | | .25% | | .25% | | | | 63,139 | | | | 842 |
| Class B | | .75% | | .25% | | | | 33,541 | | | | 25,712 |
| Class C | | .75% | | .25% | | | | 64,757 | | | | 27,171 |
| | | | | | | | | $ 187,332 | | | | $ 54,284 |
| Advisor Freedom 2010 | | | | | | | | | | | | |
| Class A | | 0% | | .25% | | | | $ 269,607 | | | | $ 816 |
| Class T | | .25% | | .25% | | | | 593,381 | | | | 369 |
| Class B | | .75% | | .25% | | | | 305,776 | | | | 229,333 |
| Class C | | .75% | | .25% | | | | 328,340 | | | | 108,873 |
| | | | | | | | | $ 1,497,104 | | | | $ 339,391 |
| Advisor Freedom 2015 | | | | | | | | | | | | |
| Class A | | 0% | | .25% | | | | $ 204,082 | | | | $ 488 |
| Class T | | .25% | | .25% | | | | 448,360 | | | | — |
| Class B | | .75% | | .25% | | | | 263,580 | | | | 197,685 |
| Class C | | .75% | | .25% | | | | 266,485 | | | | 134,804 |
| | | | | | | | | $ 1,182,507 | | | | $ 332,977 |
| 4. Fees and Other Transactions with Affiliates continued | | | | | | | | | | | | |
| |
| Distribution and Service Plan continued | | | | | | | | | | | | | | |
| | | | | Distribution | | Service | | | | Paid to | | | | Retained |
| Advisor Freedom 2020 | | | | Fee | | Fee | | | | FDC | | | | by FDC |
| Class A | | | | 0% | | .25% | | | | $ 503,132 | | | | $ 1,026 |
| Class T | | | | .25% | | .25% | | | | 1,162,864 | | | | — |
| Class B | | | | .75% | | .25% | | | | 600,717 | | | | 450,537 |
| Class C | | | | .75% | | .25% | | | | 499,565 | | | | 164,969 |
| | | | | | | | | | | $ 2,766,278 | | | | $ 616,532 |
| Advisor Freedom 2025 | | | | | | | | | | | | | | |
| Class A | | | | 0% | | .25% | | | | $ 221,027 | | | | $ 452 |
| Class T | | | | .25% | | .25% | | | | 293,934 | | | | — |
| Class B | | | | .75% | | .25% | | | | 204,351 | | | | 153,263 |
| Class C | | | | .75% | | .25% | | | | 154,052 | | | | 65,008 |
| | | | | | | | | | | $ 873,364 | | | | $ 218,723 |
| Advisor Freedom 2030 | | | | | | | | | | | | | | |
| Class A | | | | 0% | | .25% | | | | $ 263,620 | | | | $ 273 |
| Class T | | | | .25% | | .25% | | | | 670,634 | | | | 732 |
| Class B | | | | .75% | | .25% | | | | 349,300 | | | | 261,976 |
| Class C | | | | .75% | | .25% | | | | 292,010 | | | | 91,580 |
| | | | | | | | | | | $ 1,575,564 | | | | $ 354,561 |
| Advisor Freedom 2035 | | | | | | | | | | | | | | |
| Class A | | | | 0% | | .25% | | | | $ 74,063 | | | | $ 329 |
| Class T | | | | .25% | | .25% | | | | 144,640 | | | | — |
| Class B | | | | .75% | | .25% | | | | 111,658 | | | | 83,744 |
| Class C | | | | .75% | | .25% | | | | 83,016 | | | | 45,501 |
| | | | | | | | | | | $ 413,377 | | | | $ 129,574 |
| Advisor Freedom 2040 | | | | | | | | | | | | | | |
| Class A | | | | 0% | | .25% | | | | $ 216,852 | | | | $ 149 |
| Class T | | | | .25% | | .25% | | | | 477,308 | | | | — |
| Class B | | | | .75% | | .25% | | | | 252,659 | | | | 189,495 |
| Class C | | | | .75% | | .25% | | | | 293,501 | | | | 112,270 |
| | | | | | | | | | | $ 1,240,320 | | | | $ 301,914 |
Sales Load. FDC receives a front end sales charge of up to 5.75% for selling Class A shares, and 3.50% for selling Class T shares, some of which is paid to financial intermediaries for selling shares of the fund. FDC receives the proceeds of contingent deferred sales charges levied on Class A, Class T, Class B, and Class C redemptions. These charges depend on the holding period. The deferred sales charges range from 5% to 1% for Class B, 1% for Class C, 1.00% to .50% for certain purchases of Class A shares (.25% prior to February 24, 2006) and .25% for certain purchases of Class T shares.
| For the period, sales charge amounts retained by FDC were as follows: | | | | |
| |
| | | | | Retained |
| Advisor Freedom Income | | | | by FDC |
| Class A | | | | $ 19,148 |
| Class T | | | | 6,026 |
| Class B* | | | | 15,880 |
| Class C* | | | | 2,141 |
| | | | | $ 43,195 |
| Advisor Freedom 2005 | | | | |
| Class A | | | | $ 25,187 |
| Class T | | | | 6,041 |
| Class B* | | | | 5,814 |
| Class C* | | | | 1,760 |
| | | | | $ 38,802 |
75 Annual Report
| Notes to Financial Statements continued | | | | | | |
| |
| |
| |
| 4. Fees and Other Transactions with Affiliates continued | | | | |
| |
| Sales Load continued | | | | | | |
| |
| | | | | | | Retained |
| Advisor Freedom 2010 | | | | | | by FDC |
| Class A | | | | | | $ 110,780 |
| Class T | | | | | | 28,167 |
| Class B* | | | | | | 88,191 |
| Class C* | | | | | | 6,243 |
| | | | | | | $ 233,381 |
| Advisor Freedom 2015 | | | | | | |
| Class A | | | | | | $ 169,873 |
| Class T | | | | | | 33,577 |
| Class B* | | | | | | 43,281 |
| Class C* | | | | | | 7,170 |
| | | | | | | $ 253,901 |
| Advisor Freedom 2020 | | | | | | |
| Class A | | | | | | $ 238,254 |
| Class T | | | | | | 46,834 |
| Class B* | | | | | | 139,225 |
| Class C* | | | | | | 9,106 |
| | | | | | | $ 433,419 |
| Advisor Freedom 2025 | | | | | | |
| Class A | | | | | | $ 145,000 |
| Class T | | | | | | 22,639 |
| Class B* | | | | | | 53,085 |
| Class C* | | | | | | 4,097 |
| | | | | | | $ 224,821 |
| Advisor Freedom 2030 | | | | | | |
| Class A | | | | | | $ 139,670 |
| Class T | | | | | | 29,995 |
| Class B* | | | | | | 90,562 |
| Class C* | | | | | | 5,622 |
| | | | | | | $ 265,849 |
| Advisor Freedom 2035 | | | | | | |
| Class A | | | | | | $ 77,413 |
| Class T | | | | | | 12,495 |
| Class B* | | | | | | 28,435 |
| Class C* | | | | | | 2,020 |
| | | | | | | $ 120,363 |
| Advisor Freedom 2040 | | | | | | |
| Class A | | | | | | $ 128,065 |
| Class T | | | | | | 20,786 |
| Class B* | | | | | | 65,798 |
| Class C* | | | | | | 6,512 |
| | | | | | | $ 221,161 |
| |
| * When Class B and Class C shares are initially sold, FDC pays commissions from its own resources to financial intermediaries through which the sales are made. | | | | |
FMR voluntarily agreed to reimburse funds to the extent annual operating expenses exceeded certain levels of average net assets as noted in the table below. Some expenses, for example interest expense, are excluded from this reimbursement.
The following classes of each applicable fund were in reimbursement during the period:
| | | Expense | | Reimbursement |
| | | Limitations | | from adviser |
| Advisor Freedom Income | | | | | | | | |
| Class A | | .33% - .25%* | | | | $ 243 |
| Class T | | .58% - .50%* | | | | 617 |
| Class B | | 1.08% - 1.00%* | | | | 89 |
| Class C | | 1.08% - 1.00%* | | | | 300 |
| Institutional Class | | .08% - .00%* | | | | 14 |
| Advisor Freedom 2005 | | | | | | |
| Class A | | .33% - .25%* | | | | 156 |
| Class T | | .58% - .50%* | | | | 184 |
| Class B | | 1.08% - 1.00%* | | | | 56 |
| Class C | | 1.08% - 1.00%* | | | | 116 |
| Institutional Class | | .08% - .00%* | | | | 15 |
| Advisor Freedom 2010 | | | | | | |
| Class A | | .33% - .25%* | | | | 1,803 |
| Class T | | .58% - .50%* | | | | 2,047 |
| Class B | | 1.08% - 1.00%* | | | | 580 |
| Class C | | 1.08% - 1.00%* | | | | 608 |
| Institutional Class | | .08% - .00%* | | | | 130 |
| Advisor Freedom 2015 | | | | | | |
| Class A | | .33% - .25%* | | | | 1,146 |
| Class T | | .58% - .50%* | | | | 1,372 |
| Class B | | 1.08% - 1.00%* | | | | 443 |
| Class C | | 1.08% - 1.00%* | | | | 449 |
| Institutional Class | | .08% - .00%* | | | | 288 |
| Advisor Freedom 2020 | | | | | | | | |
| Class A | | .33% - .25%* | | | | 3,180 |
| Class T | | .58% - .50%* | | | | 3,941 |
| Class B | | 1.08% - 1.00%* | | | | 1,073 |
| Class C | | 1.08% - 1.00%* | | | | 887 |
| Institutional Class | | .08% - .00%* | | | | 268 |
| Advisor Freedom 2025 | | | | | | | | |
| Class A | | .33% - .25%* | | | | 1,364 |
| Class T | | .58% - .50%* | | | | 887 |
| Class B | | 1.08% - 1.00%* | | | | 323 |
| Class C | | 1.08% - 1.00%* | | | | 246 |
| Institutional Class | | .08% - .00%* | | | | 51 |
| Advisor Freedom 2030 | | | | | | | | |
| Class A | | .33% - .25%* | | | | 1,605 |
| Class T | | .58% - .50%* | | | | 2,251 |
| Class B | | 1.08% - 1.00%* | | | | 618 |
| Class C | | 1.08% - 1.00%* | | | | 496 |
| Institutional Class | | .08% - .00%* | | | | 164 |
77 Annual Report
| Notes to Financial Statements continued | | | | | | |
| |
| |
| 5. Expense Reductions - continued | | | | | | |
| |
| | | | | Expense | | Reimbursement |
| | | | | Limitations | | from adviser |
| Advisor Freedom 2035 | | | | | | | | |
| Class A | | | | .33% - .25%* | | 397 |
| Class T | | | | .58% - .50%* | | 405 |
| Class B | | | | 1.08% - 1.00%* | | 162 |
| Class C | | | | 1.08% - 1.00%* | | 131 |
| Institutional Class | | | | .08% - .00%* | | 13 |
| Advisor Freedom 2040 | | | | | | | | |
| Class A | | | | .33% - .25%* | | 1,278 |
| Class T | | | | .58% - .50%* | | 1,549 |
| Class B | | | | 1.08% - 1.00%* | | 427 |
| Class C | | | | 1.08% - 1.00%* | | 504 |
| Institutional Class | | | | .08% - .00%* | | 96 |
* Expense limitation in effect at period end. | | | | | | | | |
In addition, through arrangements with each applicable fund’s custodian, credits realized as a result of uninvested cash balances were used to reduce each applicable fund’s management fee. During the period, these credits reduced management fee by the following amounts:
| Advisor Freedom Income | | $ 3 |
| Advisor Freedom 2005 | | 4 |
| Advisor Freedom 2010 | | 81 |
| Advisor Freedom 2015 | | 13 |
| Advisor Freedom 2020 | | 267 |
| Advisor Freedom 2025 | | 4 |
| Advisor Freedom 2030 | | 190 |
| Advisor Freedom 2035 | | 17 |
| Advisor Freedom 2040 | | 154 |
| |
| 6. Other. | | |
The funds’ organizational documents provide former and current trustees and officers with a limited indemnification against liabilities arising in connection with the performance of their duties to the funds. In the normal course of business, the funds may also enter into contracts that provide general indemnifications. The funds’ maximum exposure under these arrangements is unknown as this would be dependent on future claims that may be made against the funds. The risk of material loss from such claims is considered remote.
The funds do not invest in the Underlying Funds for the purpose of exercising management or control; however, investments by the funds within their principal investment strategies may represent a significant portion of the Underlying Fund’s net assets. The funds, in aggregate, were the owners of record of more than 20% of the total outstanding shares of the following Underlying Funds.
| Fund | | % of shares held |
| |
| Fidelity Advisor Large Cap Fund | | 25% |
| Fidelity Advisor Government Investment Fund | | 28% |
| 7. Distributions to Shareholders. | | | | | | |
| |
| Distributions to shareholders of each class were as follows: | | | | | | |
| | | Years ended March 31, |
| | | 2006 | | | | 2005 |
| Advisor Freedom Income | | | | | | |
| From net investment income | | | | | | |
| Class A | | $ 360,423 | | | | $ 156,915 |
| Class T | | 716,147 | | | | 358,648 |
| Class B | | 85,800 | | | | 44,872 |
| Class C | | 263,465 | | | | 134,067 |
| Institutional Class | | 29,580 | | | | 10,148 |
| Total | | $ 1,455,415 | | | | $ 704,650 |
| From net realized gain | | | | | | |
| Class A | | $ 35,475 | | | | $ 5,263 |
| Class T | | 101,688 | | | | 15,048 |
| Class B | | 15,014 | | | | 3,971 |
| Class C | | 47,334 | | | | 10,183 |
| Institutional Class | | 2,271 | | | | 364 |
| Total | | $ 201,782 | | | | $ 34,829 |
| Advisor Freedom 2005 | | | | | | |
| From net investment income | | | | | | |
| Class A | | $ 206,518 | | | | $ 72,744 |
| Class T | | 208,572 | | | | 71,074 |
| Class B | | 38,357 | | | | 23,488 |
| Class C | | 78,865 | | | | 54,062 |
| Institutional Class | | 27,052 | | | | 9,928 |
| Total | | $ 559,364 | | | | $ 231,296 |
| From net realized gain | | | | | | |
| Class A | | $ 40,250 | | | | $ 817 |
| Class T | | 62,014 | | | | 951 |
| Class B | | 14,837 | | | | 646 |
| Class C | | 29,953 | | | | 641 |
| Institutional Class | | 4,479 | | | | 188 |
| Total | | $ 151,533 | | | | $ 3,243 |
| Advisor Freedom 2010 | | | | | | |
| From net investment income | | | | | | |
| Class A | | $ 2,171,009 | | | | $ 896,266 |
| Class T | | 2,009,465 | | | | 1,070,938 |
| Class B | | 367,156 | | | | 244,225 |
| Class C | | 407,816 | | | | 262,890 |
| Institutional Class | | 180,656 | | | | 104,924 |
| Total | | $ 5,136,102 | | | | $ 2,579,243 |
| From net realized gain | | | | | | |
| Class A | | $ 441,149 | | | | $ 6,722 |
| Class T | | 514,332 | | | | 7,134 |
| Class B | | 144,772 | | | | 3,175 |
| Class C | | 147,544 | | | | 2,556 |
| Institutional Class | | 31,327 | | | | 614 |
| Total | | $ 1,279,124 | | | | $ 20,201 |
79 Annual Report
| Notes to Financial Statements continued | | | | | | | | |
| |
| |
| |
| 7. Distributions to Shareholders - continued | | | | | | | | |
| | | | | | | Years ended March 31, |
| | | | | | | 2006 | | | | 2005 |
| Advisor Freedom 2015 | | | | | | | | | | |
| From net investment income | | | | | | | | | | |
| Class A | | | | | | $ 1,356,176 | | | | $ 362,175 |
| Class T | | | | | | 1,245,899 | | | | 450,450 |
| Class B | | | | | | 232,461 | | | | 125,071 |
| Class C | | | | | | 245,384 | | | | 117,958 |
| Institutional Class | | | | | | 257,756 | | | | 160,357 |
| Total | | | | | | $ 3,337,676 | | | | $ 1,216,011 |
| From net realized gain | | | | | | | | | | |
| Class A | | | | | | $ 361,841 | | | | $ 1,578 |
| Class T | | | | | | 431,884 | | | | 1,718 |
| Class B | | | | | | 129,149 | | | | 1,172 |
| Class C | | | | | | 130,303 | | | | 898 |
| Institutional Class | | | | | | 77,673 | | | | 1,171 |
| Total | | | | | | $ 1,130,850 | | | | $ 6,537 |
| Advisor Freedom 2020 | | | | | | | | | | |
| From net investment income | | | | | | | | | | |
| Class A | | | | | | $ 2,883,663 | | | | $ 1,730,029 |
| Class T | | | | | | 2,628,309 | | | | 1,789,888 |
| Class B | | | | | | 420,463 | | | | 435,029 |
| Class C | | | | | | 364,285 | | | | 327,289 |
| Institutional Class | | | | | | 243,104 | | | | 157,704 |
| Total | | | | | | $ 6,539,824 | | | | $ 4,439,939 |
| From net realized gain | | | | | | | | | | |
| Class A | | | | | | $ 1,061,003 | | | | $ 27,378 |
| Class T | | | | | | 1,308,678 | | | | 23,535 |
| Class B | | | | | | 326,977 | | | | 9,581 |
| Class C | | | | | | 276,300 | | | | 6,642 |
| Institutional Class | | | | | | 86,414 | | | | 944 |
| Total | | | | | | $ 3,059,372 | | | | $ 68,080 |
| Advisor Freedom 2025 | | | | | | | | | | |
| From net investment income | | | | | | | | | | |
| Class A | | | | | | $ 1,121,310 | | | | $ 224,481 |
| Class T | | | | | | 596,908 | | | | 274,089 |
| Class B | | | | | | 141,241 | | | | 77,176 |
| Class C | | | | | | 106,449 | | | | 61,009 |
| Institutional Class | | | | | | 40,310 | | | | 10,710 |
| Total | | | | | | $ 2,006,218 | | | | $ 647,465 |
| From net realized gain | | | | | | | | | | |
| Class A | | | | | | $ 347,287 | | | | $ 430 |
| Class T | | | | | | 210,648 | | | | 395 |
| Class B | | | | | | 67,889 | | | | 443 |
| Class C | | | | | | 51,620 | | | | 333 |
| Institutional Class | | | | | | 11,563 | | | | 28 |
| Total | | | | | | $ 689,007 | | | | $ 1,629 |
| 7. Distributions to Shareholders - continued | | | | | | |
| | | Years ended March 31, |
| | | 2006 | | | | 2005 |
| Advisor Freedom 2030 | | | | | | |
| From net investment income | | | | | | |
| Class A | | $ 1,047,937 | | | | $ 638,944 |
| Class T | | 974,321 | | | | 938,314 |
| Class B | | 133,986 | | | | 178,105 |
| Class C | | 126,130 | | | | 146,090 |
| Institutional Class | | 94,967 | | | | 83,950 |
| Total | | $ 2,377,341 | | | | $ 1,985,403 |
| From net realized gain | | | | | | |
| Class A | | $ 622,840 | | | | $ 5,495 |
| Class T | | 768,934 | | | | 5,920 |
| Class B | | 191,018 | | | | 2,610 |
| Class C | | 157,380 | | | | 1,897 |
| Institutional Class | | 62,250 | | | | 443 |
| Total | | $ 1,802,422 | | | | $ 16,365 |
| Advisor Freedom 2035 | | | | | | |
| From net investment income | | | | | | |
| Class A | | $ 336,621 | | | | $ 138,492 |
| Class T | | 271,292 | | | | 124,168 |
| Class B | | 62,536 | | | | 48,334 |
| Class C | | 46,277 | | | | 34,996 |
| Institutional Class | | 16,641 | | | | 5,668 |
| Total | | $ 733,367 | | | | $ 351,658 |
| From net realized gain | | | | | | |
| Class A | | $ 92,405 | | | | $ 272 |
| Class T | | 90,299 | | | | 213 |
| Class B | | 36,328 | | | | 175 |
| Class C | | 27,177 | | | | 105 |
| Institutional Class | | 3,503 | | | | 23 |
| Total | | $ 249,712 | | | | $ 788 |
| Advisor Freedom 2040 | | | | | | |
| From net investment income | | | | | | |
| Class A | | $ 950,126 | | | | $ 357,270 |
| Class T | | 792,429 | | | | 516,094 |
| Class B | | 121,700 | | | | 124,906 |
| Class C | | 148,642 | | | | 140,661 |
| Institutional Class | | 62,803 | | | | 51,136 |
| Total | | $ 2,075,700 | | | | $ 1,190,067 |
| From net realized gain | | | | | | |
| Class A | | $ 407,878 | | | | $ — |
| Class T | | 422,998 | | | | — |
| Class B | | 116,257 | | | | — |
| Class C | | 134,587 | | | | — |
| Institutional Class | | 29,526 | | | | — |
| Total | | $ 1,111,246 | | | | $ — |
81 Annual Report
| Notes to Financial Statements continued | | | | | | | | | | | | |
| |
| |
| |
| 8. Share Transactions. | | | | | | | | | | | | | | |
| |
| Transactions for each class of shares were as follows: | | | | | | | | | | | | |
| |
| | | | | Shares | | | | Dollars |
| | | | | Years ended March 31, | | | | Years ended March 31, |
| | | | | 2006 | | 2005 | | | | 2006 | | | | 2005 |
| Advisor Freedom Income | | | | | | | | | | | | | | |
| Class A | | | | | | | | | | | | | | |
| Shares sold | | | | 1,248,334 | | 728,210 | | | | $ 13,023,137 | | | | $ 7,481,125 |
| Reinvestment of distributions | | | | 34,742 | | 13,977 | | | | 361,381 | | | | 144,254 |
| Shares redeemed | | | | (504,418) | | (241,418) | | | | (5,262,926) | | | | (2,487,639) |
| Net increase (decrease) | | | | 778,658 | | 500,769 | | | | $ 8,121,592 | | | | $ 5,137,740 |
| Class T | | | | | | | | | | | | | | |
| Shares sold | | | | 1,413,853 | | 2,252,617 | | | | $ 14,717,233 | | | | $ 23,261,446 |
| Reinvestment of distributions | | | | 74,755 | | 34,674 | | | | 776,259 | | | | 358,020 |
| Shares redeemed | | | | (1,217,170) | | 868,775) | | | | (12,681,876) | | | | (8,962,920) |
| Net increase (decrease) | | | | 271,438 | | 1,418,516 | | | | $ 2,811,616 | | | | $ 14,656,546 |
| Class B | | | | | | | | | | | | | | |
| Shares sold | | | | 151,645 | | 202,570 | | | | $ 1,576,981 | | | | $ 2,078,692 |
| Reinvestment of distributions | | | | 8,915 | | 4,403 | | | | 92,494 | | | | 45,378 |
| Shares redeemed | | | | (129,511) | | (125,605) | | | | (1,343,127) | | | | (1,287,886) |
| Net increase (decrease) | | | | 31,049 | | 81,368 | | | | $ 326,348 | | | | $ 836,184 |
| Class C | | | | | | | | | | | | | | |
| Shares sold | | | | 424,993 | | 888,712 | | | | $ 4,420,146 | | | | $ 9,098,996 |
| Reinvestment of distributions | | | | 22,295 | | 10,052 | | | | 231,247 | | | | 103,577 |
| Shares redeemed | | | | (514,989) | | (419,464) | | | | (5,366,087) | | | | (4,313,437) |
| Net increase (decrease) | | | | (67,701) | | 479,300 | | | | $ (714,694) | | | | $ 4,889,136 |
| Institutional Class | | | | | | | | | | | | | | |
| Shares sold | | | | 110,433 | | 42,061 | | | | $ 1,154,968 | | | | $ 432,907 |
| Reinvestment of distributions | | | | 2,279 | | 760 | | | | 23,731 | | | | 7,846 |
| Shares redeemed | | | | (65,692) | | (16,642) | | | | (691,013) | | | | (170,939) |
| Net increase (decrease) | | | | 47,020 | | 26,179 | | | | $ 487,686 | | | | $ 269,814 |
| Advisor Freedom 2005 | | | | | | | | | | | | | | |
| Class A | | | | | | | | | | | | | | |
| Shares sold | | | | 1,045,087 | | 585,329 | | | | $ 11,488,136 | | | | $ 6,132,477 |
| Reinvestment of distributions | | | | 20,715 | | 6,487 | | | | 227,182 | | | | 69,326 |
| Shares redeemed | | | | (201,347) | | (159,401) | | | | (2,219,234) | | | | (1,685,117) |
| Net increase (decrease) | | | | 864,455 | | 432,415 | | | | $ 9,496,084 | | | | $ 4,516,686 |
| Class T | | | | | | | | | | | | | | |
| Shares sold | | | | 1,419,295 | | 772,833 | | | | $ 15,260,795 | | | | $ 8,098,797 |
| Reinvestment of distributions | | | | 24,717 | | 6,710 | | | | 269,302 | | | | 71,635 |
| Shares redeemed | | | | (970,234) | | (218,069) | | | | (10,565,587) | | | | (2,293,607) |
| Net increase (decrease) | | | | 473,778 | | 561,474 | | | | $ 4,964,510 | | | | $ 5,876,825 |
| Class B | | | | | | | | | | | | | | |
| Shares sold | | | | 122,820 | | 192,162 | | | | $ 1,330,376 | | | | $ 2,010,191 |
| Reinvestment of distributions | | | | 4,304 | | 1,998 | | | | 46,985 | | | | 21,257 |
| Shares redeemed | | | | (48,057) | | (48,192) | | | | (526,073) | | | | (503,088) |
| Net increase (decrease) | | | | 79,067 | | 145,968 | | | | $ 851,288 | | | | $ 1,528,360 |
| Class C | | | | | | | | | | | | | | |
| Shares sold | | | | 316,798 | | 478,945 | | | | $ 3,462,176 | | | | $ 4,977,613 |
| Reinvestment of distributions | | | | 8,537 | | 4,388 | | | | 93,176 | | | | 46,808 |
| Shares redeemed | | | | (185,035) | | (48,603) | | | | (2,016,625) | | | | (512,104) |
| Net increase (decrease) | | | | 140,300 | | 434,730 | | | | $ 1,538,727 | | | | $ 4,512,317 |
| Institutional Class | | | | | | | | | | | | | | |
| Shares sold | | | | 89,143 | | 34,319 | | | | $ 967,402 | | | | $ 360,945 |
| Reinvestment of distributions | | | | 2,817 | | 860 | | | | 31,000 | | | | 9,166 |
| Shares redeemed | | | | (32,274) | | (11,601) | | | | (357,310) | | | | (125,056) |
| Net increase (decrease) | | | | 59,686 | | 23,578 | | | | $ 641,092 | | | | $ 245,055 |
| 8. Share Transactions - continued | | | | | | | | | | | | |
| |
| | | Shares | | | | Dollars |
| | | Years ended March 31, | | | | Years ended March 31, |
| | | 2006 | | 2005 | | | | 2006 | | | | 2005 |
| Advisor Freedom 2010 | | | | | | | | | | | | |
| Class A | | | | | | | | | | | | |
| Shares sold | | 7,739,808 | | 4,608,995 | | | | $ 88,298,046 | | | | $ 50,250,054 |
| Reinvestment of distributions | | 223,520 | | 78,688 | | | | 2,536,606 | | | | 872,410 |
| Shares redeemed | | (2,250,375) | | (950,972) | | | | (25,763,889) | | | | (10,395,541) |
| Net increase (decrease) | | 5,712,953 | | 3,736,711 | | | | $ 65,070,763 | | | | $ 40,726,923 |
| Class T | | | | | | | | | | | | |
| Shares sold | | 7,216,617 | | 7,487,847 | | | | $ 81,687,336 | | | | $ 81,779,426 |
| Reinvestment of distributions | | 222,039 | | 96,564 | | | | 2,509,373 | | | | 1,069,348 |
| Shares redeemed | | (3,900,266) | | (1,698,806) | | | | (44,179,760) | | | | (18,462,716) |
| Net increase (decrease) | | 3,538,390 | | 5,885,605 | | | | $ 40,016,949 | | | | $ 64,386,058 |
| Class B | | | | | | | | | | | | |
| Shares sold | | 834,087 | | 1,378,429 | | | | $ 9,388,818 | | | | $ 14,897,988 |
| Reinvestment of distributions | | 40,955 | | 20,499 | | | | 460,771 | | | | 226,286 |
| Shares redeemed | | (499,400) | | (292,158) | | | | (5,655,011) | | | | (3,159,106) |
| Net increase (decrease) | | 375,642 | | 1,106,770 | | | | $ 4,194,578 | | | | $ 11,965,168 |
| Class C | | | | | | | | | | | | |
| Shares sold | | 1,335,196 | | 1,743,474 | | | | $ 15,082,752 | | | | $ 18,868,200 |
| Reinvestment of distributions | | 43,770 | | 20,727 | | | | 492,426 | | | | 228,983 |
| Shares redeemed | | (585,637) | | (295,172) | | | | (6,617,347) | | | | (3,194,192) |
| Net increase (decrease) | | 793,329 | | 1,469,029 | | | | $ 8,957,831 | | | | $ 15,902,991 |
| Institutional Class | | | | | | | | | | | | |
| Shares sold | | 700,184 | | 496,890 | | | | $ 8,032,090 | | | | $ 5,380,233 |
| Reinvestment of distributions | | 14,123 | | 6,067 | | | | 160,978 | | | | 67,159 |
| Shares redeemed | | (282,482) | | (155,576) | | | | (3,270,359) | | | | (1,710,806) |
| Net increase (decrease) | | 431,825 | | 347,381 | | | | $ 4,922,709 | | | | $ 3,736,586 |
| Advisor Freedom 2015 | | | | | | | | | | | | |
| Class A | | | | | | | | | | | | |
| Shares sold | | 7,755,416 | | 4,003,451 | | | | $ 87,784,785 | | | | $ 42,707,661 |
| Reinvestment of distributions | | 148,528 | | 31,923 | | | | 1,681,279 | | | | 349,281 |
| Shares redeemed | | (1,248,688) | | (307,000) | | | | (14,243,836) | | | | (3,266,298) |
| Net increase (decrease) | | 6,655,256 | | 3,728,374 | | | | $ 75,222,228 | | | | $ 39,790,644 |
| Class T | | | | | | | | | | | | |
| Shares sold | | 7,331,499 | | 5,141,514 | | | | $ 82,443,787 | | | | $ 54,603,890 |
| Reinvestment of distributions | | 146,891 | | 40,873 | | | | 1,655,344 | | | | 446,960 |
| Shares redeemed | | (2,069,563) | | (458,057) | | | | (23,392,515) | | | | (4,861,368) |
| Net increase (decrease) | | 5,408,827 | | 4,724,330 | | | | $ 60,706,616 | | | | $ 50,189,482 |
| Class B | | | | | | | | | | | | |
| Shares sold | | 1,320,734 | | 1,449,464 | | | | $ 14,714,003 | | | | $ 15,307,338 |
| Reinvestment of distributions | | 29,554 | | 10,737 | | | | 331,712 | | | | 117,212 |
| Shares redeemed | | (246,964) | | (109,668) | | | | (2,776,985) | | | | (1,158,377) |
| Net increase(decrease) | | 1,103,324 | | 1,350,533 | | | | $ 12,268,730 | | | | $ 14,266,173 |
| Class C | | | | | | | | | | | | |
| Shares sold | | 1,634,319 | | 1,505,221 | | | | $ 18,295,083 | | | | $ 15,938,225 |
| Reinvestment of distributions | | 29,172 | | 8,911 | | | | 327,542 | | | | 97,350 |
| Shares redeemed | | (398,401) | | (90,162) | | | | (4,467,845) | | | | (956,104) |
| Net increase (decrease) | | 1,265,090 | | 1,423,970 | | | | $ 14,154,780 | | | | $ 15,079,471 |
| Institutional Class | | | | | | | | | | | | |
| Shares sold | | 1,374,943 | | 1,325,729 | | | | $ 15,910,190 | | | | $ 14,281,479 |
| Reinvestment of distributions | | 27,882 | | 14,118 | | | | 315,005 | | | | 154,581 |
| Shares redeemed | | (330,682) | | (176,462) | | | | (3,761,478) | | | | (1,867,613) |
| Net increase (decrease) | | 1,072,143 | | 1,163,385 | | | | $ 12,463,717 | | | | $ 12,568,447 |
83 Annual Report
| Notes to Financial Statements continued | | | | | | | | | | | | |
| |
| |
| |
| 8. Share Transactions - continued | | | | | | | | | | | | |
| |
| | | | | Shares | | | | Dollars |
| | | | | Years ended March 31, | | | | Years ended March 31, |
| | | | | 2006 | | 2005 | | | | 2006 | | | | 2005 |
| Advisor Freedom 2020 | | | | | | | | | | | | | | |
| Class A | | | | | | | | | | | | | | |
| Shares sold | | | | 14,590,446 | | 6,713,038 | | | | $ 177,880,434 | | | | $ 76,292,402 |
| Reinvestment of distributions | | | | 318,258 | | 146,966 | | | | 3,855,895 | | | | 1,714,049 |
| Shares redeemed | | | | (4,501,371) | | (1,527,689) | | | | (55,311,034) | | | | (17,327,477) |
| Net increase (decrease) | | | | 10,407,333 | | 5,332,315 | | | | $ 126,425,295 | | | | $ 60,678,974 |
| Class T | | | | | | | | | | | | | | |
| Shares sold | | | | 13,438,162 | | 12,699,220 | | | | $ 162,737,119 | | | | $ 143,541,530 |
| Reinvestment of distributions | | | | 323,423 | | 153,474 | | | | 3,903,406 | | | | 1,793,543 |
| Shares redeemed | | | | (6,053,700) | | (2,089,785) | | | | (73,680,929) | | | | (23,854,402) |
| Net increase (decrease) | | | | 7,707,885 | | 10,762,909 | | | | $ 92,959,596 | | | | $ 121,480,671 |
| Class B | | | | | | | | | | | | | | |
| Shares sold | | | | 1,799,544 | | 2,516,778 | | | | $ 21,593,687 | | | | $ 28,294,743 |
| Reinvestment of distributions | | | | 59,314 | | 36,057 | | | | 711,860 | | | | 420,877 |
| Shares redeemed | | | | (589,847) | | (314,860) | | | | (7,123,757) | | | | (3,560,956) |
| Net increase (decrease) | | | | 1,269,011 | | 2,237,975 | | | | $ 15,181,790 | | | | $ 25,154,664 |
| Class C | | | | | | | | | | | | | | |
| Shares sold | | | | 2,110,159 | | 2,324,713 | | | | $ 25,285,625 | | | | $ 26,225,111 |
| Reinvestment of distributions | | | | 47,015 | | 24,834 | | | | 564,041 | | | | 289,805 |
| Shares redeemed | | | | (773,044) | | (332,947) | | | | (9,282,747) | | | | (3,727,954) |
| Net increase (decrease) | | | | 1,384,130 | | 2,016,600 | | | | $ 16,566,919 | | | | $ 22,786,962 |
| Institutional Class | | | | | | | | | | | | | | |
| Shares sold | | | | 845,222 | | 926,868 | | | | $ 10,376,829 | | | | $ 10,370,986 |
| Reinvestment of distributions | | | | 22,706 | | 10,712 | | | | 275,559 | | | | 125,784 |
| Shares redeemed | | | | (254,821) | | (107,358) | | | | (3,125,257) | | | | (1,238,107) |
| Net increase (decrease) | | | | 613,107 | | 830,222 | | | | $ 7,527,131 | | | | $ 9,258,663 |
| Advisor Freedom 2025 | | | | | | | | | | | | | | |
| Class A | | | | | | | | | | | | | | |
| Shares sold | | | | 6,210,144 | | 5,276,780 | | | | $ 72,280,640 | | | | $ 57,517,460 |
| Reinvestment of distributions | | | | 124,720 | | 19,938 | | | | 1,454,965 | | | | 222,747 |
| Shares redeemed | | | | (1,339,389) | | (94,969) | | | | (15,549,227) | | | | (1,026,036) |
| Net increase(decrease) | | | | 4,995,475 | | 5,201,749 | | | | $ 58,186,378 | | | | $ 56,714,171 |
| Class T | | | | | | | | | | | | | | |
| Shares sold | | | | 4,779,347 | | 3,762,442 | | | | $ 55,329,806 | | | | $ 40,548,861 |
| Reinvestment of distributions | | | | 68,757 | | 24,426 | | | | 804,360 | | | | 273,522 |
| Shares redeemed | | | | (1,422,431) | | (656,224) | | | | (16,584,794) | | | | (7,186,110) |
| Net increase (decrease) | | | | 3,425,673 | | 3,130,644 | | | | $ 39,549,372 | | | | $ 33,636,273 |
| Class B | | | | | | | | | | | | | | |
| Shares sold | | | | 1,133,308 | | 1,071,244 | | | | $ 12,946,544 | | | | $ 11,424,918 |
| Reinvestment of distributions | | | | 17,249 | | 6,592 | | | | 200,192 | | | | 73,482 |
| Shares redeemed | | | | (169,943) | | (108,115) | | | | (1,979,347) | | | | (1,143,060) |
| Net increase (decrease) | | | | 980,614 | | 969,721 | | | | $ 11,167,389 | | | | $ 10,355,340 |
| Class C | | | | | | | | | | | | | | |
| Shares sold | | | | 835,184 | | 854,961 | | | | $ 9,579,811 | | | | $ 9,116,240 |
| Reinvestment of distributions | | | | 11,884 | | 4,495 | | | | 137,922 | | | | 50,136 |
| Shares redeemed | | | | (185,560) | | (64,614) | | | | (2,143,096) | | | | (685,152) |
| Net increase (decrease) | | | | 661,508 | | 794,842 | | | | $ 7,574,637 | | | | $ 8,481,224 |
| Institutional Class | | | | | | | | | | | | | | |
| Shares sold | | | | 395,871 | | 190,349 | | | | $ 4,647,168 | | | | $ 2,059,061 |
| Reinvestment of distributions | | | | 4,061 | | 854 | | | | 47,460 | | | | 9,558 |
| Shares redeemed | | | | (157,588) | | (37,209) | | | | (1,829,481) | | | | (408,139) |
| Net increase (decrease) | | | | 242,344 | | 153,994 | | | | $ 2,865,147 | | | | $ 1,660,480 |
| 8. Share Transactions - continued | | | | | | | | | | | | |
| |
| | | Shares | | | | Dollars |
| | | Years ended March 31, | | | | Years ended March 31, |
| | | 2006 | | 2005 | | | | 2006 | | | | 2005 |
| Advisor Freedom 2030 | | | | | | | | | | | | |
| Class A | | | | | | | | | | | | |
| Shares sold | | 7,622,210 | | 3,725,720 | | | | $ 95,830,636 | | | | $ 43,285,155 |
| Reinvestment of distributions | | 131,003 | | 52,499 | | | | 1,642,629 | | | | 630,708 |
| Shares redeemed | | (1,657,097) | | (653,805) | | | | (20,896,249) | | | | (7,592,923) |
| Net increase (decrease) | | 6,096,116 | | 3,124,414 | | | | $ 76,577,016 | | | | $ 36,322,940 |
| Class T | | | | | | | | | | | | |
| Shares sold | | 8,271,712 | | 7,556,712 | | | | $ 103,937,897 | | | | $ 87,295,265 |
| Reinvestment of distributions | | 138,114 | | 76,945 | | | | 1,718,369 | | | | 924,403 |
| Shares redeemed | | (3,379,705) | | (1,335,355) | | | | (42,137,889) | | | | (15,591,463) |
| Net increase (decrease) | | 5,030,121 | | 6,298,302 | | | | $ 63,518,377 | | | | $ 72,628,205 |
| Class B | | | | | | | | | | | | |
| Shares sold | | 1,157,095 | | 1,441,453 | | | | $ 14,320,376 | | | | $ 16,551,682 |
| Reinvestment of distributions | | 25,279 | | 14,367 | | | | 311,100 | | | | 172,589 |
| Shares redeemed | | (314,426) | | (169,554) | | | | (3,917,552) | | | | (1,953,216) |
| Net increase (decrease) | | 867,948 | | 1,286,266 | | | | $ 10,713,924 | | | | $ 14,771,055 |
| Class C | | | | | | | | | | | | |
| Shares sold | | 1,235,865 | | 1,214,477 | | | | $ 15,380,567 | | | | $ 13,923,553 |
| Reinvestment of distributions | | 20,600 | | 10,905 | | | | 254,461 | | | | 131,015 |
| Shares redeemed | | (314,678) | | (179,159) | | | | (3,929,603) | | | | (2,091,102) |
| Net increase (decrease) | | 941,787 | | 1,046,223 | | | | $ 11,705,425 | | | | $ 11,963,466 |
| Institutional Class | | | | | | | | | | | | |
| Shares sold | | 327,266 | | 648,019 | | | | $ 4,137,340 | | | | $ 7,437,369 |
| Reinvestment of distributions | | 9,043 | | 4,103 | | | | 113,199 | | | | 49,211 |
| Shares redeemed | | (190,476) | | (79,362) | | | | (2,392,711) | | | | (930,147) |
| Net increase (decrease) | | 145,833 | | 572,760 | | | | $ 1,857,828 | | | | $ 6,556,433 |
| Advisor Freedom 2035 | | | | | | | | | | | | |
| Class A | | | | | | | | | | | | |
| Shares sold | | 2,810,083 | | 1,306,403 | | | | $ 33,259,729 | | | | $ 14,223,336 |
| Reinvestment of distributions | | 34,961 | | 12,002 | | | | 418,335 | | | | 135,434 |
| Shares redeemed | | (291,205) | | (112,316) | | | | (3,451,031) | | | | (1,200,215) |
| Net increase (decrease) | | 2,553,839 | | 1,206,089 | | | | $ 30,227,033 | | | | $ 13,158,555 |
| Class T | | | | | | | | | | | | |
| Shares sold | | 2,779,197 | | 1,582,067 | | | | $ 32,690,026 | | | | $ 17,237,692 |
| Reinvestment of distributions | | 30,222 | | 10,972 | | | | 359,343 | | | | 123,545 |
| Shares redeemed | | (700,210) | | (199,783) | | | | (8,256,703) | | | | (2,193,255) |
| Net increase (decrease) | | 2,109,209 | | 1,393,256 | | | | $ 24,792,666 | | | | $ 15,167,982 |
| Class B | | | | | | | | | | | | |
| Shares sold | | 677,778 | | 567,399 | | | | $ 7,827,768 | | | | $ 6,107,462 |
| Reinvestment of distributions | | 8,197 | | 4,279 | | | | 96,381 | | | | 48,075 |
| Shares redeemed | | (92,314) | | (46,723) | | | | (1,090,117) | | | | (510,531) |
| Net increase (decrease) | | 593,661 | | 524,955 | | | | $ 6,834,032 | | | | $ 5,645,006 |
| Class C | | | | | | | | | | | | |
| Shares sold | | 594,915 | | 394,064 | | | | $ 6,913,576 | | | | $ 4,222,523 |
| Reinvestment of distributions | | 5,735 | | 2,802 | | | | 67,452 | | | | 31,509 |
| Shares redeemed | | (106,161) | | (16,996) | | | | (1,246,975) | | | | (184,466) |
| Net increase (decrease) | | 494,489 | | 379,870 | | | | $ 5,734,053 | | | | $ 4,069,566 |
| Institutional Class | | | | | | | | | | | | |
| Shares sold | | 153,700 | | 23,012 | | | | $ 1,815,954 | | | | $ 248,080 |
| Reinvestment of distributions | | 1,611 | | 480 | | | | 19,381 | | | | 5,406 |
| Shares redeemed | | (23,805) | | (1,465) | | | | (285,436) | | | | (15,843) |
| Net increase (decrease) | | 131,506 | | 22,027 | | | | $ 1,549,899 | | | | $ 237,643 |
85 Annual Report
| Notes to Financial Statements continued | | | | | | | | | | | | |
| |
| |
| |
| 8. Share Transactions - continued | | | | | | | | | | | | |
| |
| | | | | Shares | | | | Dollars |
| | | | | Years ended March 31, | | | | Years ended March 31, |
| | | | | 2006 | | 2005 | | | | 2006 | | | | 2005 |
| Advisor Freedom 2040 | | | | | | | | | | | | | | |
| Class A | | | | | | | | | | | | | | |
| Shares sold | | | | 6,594,125 | | 3,857,042 | | | | $ 84,779,212 | | | | $ 45,930,304 |
| Reinvestment of distributions | | | | 103,322 | | 28,564 | | | | 1,336,258 | | | | 350,714 |
| Shares redeemed | | | | (1,319,831) | | (417,971) | | | | (17,027,651) | | | | (4,959,405) |
| Net increase (decrease) | | | | 5,377,616 | | 3,467,635 | | | | $ 69,087,819 | | | | $ 41,321,613 |
| Class T | | | | | | | | | | | | | | |
| Shares sold | | | | 6,934,246 | | 4,878,040 | | | | $ 88,873,959 | | | | $ 57,327,142 |
| Reinvestment of distributions | | | | 94,278 | | 41,907 | | | | 1,212,995 | | | | 514,396 |
| Shares redeemed | | | | (2,629,297) | | (1,063,534) | | | | (33,492,621) | | | | (12,602,134) |
| Net increase (decrease) | | | | 4,399,227 | | 3,856,413 | | | | $ 56,594,333 | | | | $ 45,239,404 |
| Class B | | | | | | | | | | | | | | |
| Shares sold | | | | 1,066,326 | | 1,020,115 | | | | $ 13,457,885 | | | | $ 11,904,851 |
| Reinvestment of distributions | | | | 18,114 | | 9,751 | | | | 229,826 | | | �� | 119,452 |
| Shares redeemed | | | | (252,957) | | (102,560) | | | | (3,223,373) | | | | (1,209,741) |
| Net increase (decrease) | | | | 831,483 | | 927,306 | | | | $ 10,464,338 | | | | $ 10,814,562 |
| Class C | | | | | | | | | | | | | | |
| Shares sold | | | | 1,277,719 | | 1,473,064 | | | | $ 16,223,875 | | | | $ 17,144,955 |
| Reinvestment of distributions | | | | 20,564 | | 10,547 | | | | 261,225 | | | | 129,196 |
| Shares redeemed | | | | (279,598) | | (259,960) | | | | (3,548,799) | | | | (3,017,274) |
| Net increase (decrease) | | | | 1,018,685 | | 1,223,651 | | | | $ 12,936,301 | | | | $ 14,256,877 |
| Institutional Class | | | | | | | | | | | | | | |
| Shares sold | | | | 291,937 | | 384,780 | | | | $ 3,766,408 | | | | $ 4,445,168 |
| Reinvestment of distributions | | | | 5,062 | | 2,257 | | | | 65,359 | | | | 27,746 |
| Shares redeemed | | | | (147,050) | | (41,149) | | | | (1,890,587) | | | | (491,734) |
| Net increase (decrease) | | | | 149,949 | | 345,888 | | | | $ 1,941,180 | | | | $ 3,981,180 |
Report of Independent Registered Public Accounting Firm
To the Trustees of Fidelity Aberdeen Street Trust and the Shareholders of Fidelity Advisor Freedom Income Fund, Fidelity Advisor Freedom 2005 Fund, Fidelity Advisor Freedom 2010 Fund, Fidelity Advisor Freedom 2015 Fund, Fidelity Advisor Freedom 2020 Fund, Fidelity Advisor Freedom 2025 Fund, Fidelity Advisor Freedom 2030 Fund, Fidelity Advisor Freedom 2035 Fund and Fidelity Advisor Freedom 2040 Fund:
We have audited the accompanying statements of assets and liabilities of Fidelity Advisor Freedom Income Fund, Fidelity Advisor Freedom 2005 Fund, Fidelity Advisor Freedom 2010 Fund, Fidelity Advisor Freedom 2015 Fund, Fidelity Advisor Freedom 2020 Fund, Fidelity Advisor Freedom 2025 Fund, Fidelity Advisor Freedom 2030 Fund, Fidelity Advisor Freedom 2035 Fund and Fidelity Advisor Freedom 2040 Fund (the Funds) each a fund of Fidelity Aberdeen Street Trust, including the schedules of investments, as of March 31, 2006, and the related statements of operations for the year then ended, the statements of changes in net assets for each of the two years in the period then ended, and the financial highlights for each of the periods pre sented. These financial statements and financial highlights are the responsibility of the Funds’ management. Our responsibility is to express an opinion on these financial statements and financial highlights based on our audits.
We conducted our audits in accordance with standards of the Public Company Accounting Oversight Board (United States). Those standards require that we plan and perform the audit to obtain reasonable assurance about whether the financial statements and financial highlights are free of material misstatement. The Funds are not required to have, nor were we engaged to perform, an audit of their internal control over financial reporting. Our audits included consideration of internal control over financial reporting as a basis for designing audit procedures that are appropriate in the circum stances, but not for the purpose of expressing an opinion on the effectiveness of the Fund’s internal control over financial reporting. Accordingly, we express no such opinion. An audit also includes examining, on a test basis, evidence supporting the amounts and disclosures in the financial state ments, assessing the accounting principles used and significant estimates made by management, as well as evaluating the overall financial statement presentation. Our procedures included confirmation of securities owned as of March 31, 2006, by correspondence with the custodians and brokers; where replies were not received from brokers, we performed other auditing procedures. We believe that our audits provide a reasonable basis for our opinion.
In our opinion, the financial statements and financial highlights referred to above present fairly, in all material respects, the financial positions of Fidelity Advisor Freedom Income Fund, Fidelity Advisor Freedom 2005 Fund, Fidelity Advisor Freedom 2010 Fund, Fidelity Advisor Freedom 2015 Fund, Fidelity Advisor Freedom 2020 Fund, Fidelity Advisor Freedom 2025 Fund, Fidelity Advisor Freedom 2030 Fund, Fidelity Advisor Freedom 2035 Fund and Fidelity Advisor Freedom 2040 Fund as of March 31, 2006, the results of their operations for the year then ended, the changes in their net assets for each of the two years in the period then ended, and their financial highlights for each of the respective stated periods ended, in conformity with accounting principles generally accepted in the United States of America.
/s/ Deloitte & Touche LLP
|
DELOITTE & TOUCHE LLP
Boston, Massachusetts
May 16, 2006
|
87 Annual Report
The Trustees, Members of the Advisory Board, and executive officers of the trust and funds, as applicable, are listed below. The Board of Trustees governs each Advisor Freedom Fund and is responsible for protecting the interests of shareholders. The Trustees are experienced executives who meet periodically throughout the year to oversee each Advisor Freedom Fund’s activities, review contractual arrangements with companies that provide services to each Advisor Freedom Fund, and review each Advisor Freedom Fund’s performance. If the interests of an Advisor Freedom Fund and an underlying Fidelity fund were to diverge, a conflict of interest could arise and affect how the Trustees and Members of the Advisory Board fulfill their fiduciary duties to the affected funds. Strategic Advisers has structured the Advisor Freedom Funds to avoid these potential conflicts, although there may be situations where a conflict of interest is unavoidable. In such instances, Strategic Advisers, the Trustees, and Members of the Advisory Board would take reasonable steps to minimize and, if possible, eliminate the conflict. Except for William O. McCoy and Albert R. Gamper, Jr., each of the Trustees oversees 330 funds advised by FMR or an affiliate. Mr. McCoy oversees 332 funds advised by FMR or an affiliate. Mr. Gamper oversees 262 funds advised by FMR or an affiliate.
The Trustees hold office without limit in time except that (a) any Trustee may resign; (b) any Trustee may be removed by written instrument, signed by at least two thirds of the number of Trustees prior to such removal; (c) any Trustee who requests to be retired or who has become incapac itated by illness or injury may be retired by written instrument signed by a majority of the other Trustees; and (d) any Trustee may be removed at any special meeting of shareholders by a two thirds vote of the outstanding voting securities of the trust. Each Trustee who is not an interested person (as defined in the 1940 Act) (Independent Trustee), shall retire not later than the last day of the calendar year in which his or her 72nd birthday occurs. The Independent Trustees may waive this mandatory retirement age policy with respect to individual Trustees. The executive officers and Advisory Board Members hold office without limit in time, except that any officer and Advisory Board Member may resign or may be removed by a vote of a majority of the Trustees at any regular meeting or any special meeting of the Trustees. Except as indicated, each individual has held the office shown or other offices in the same company for the past five years.
The funds’ Statement of Additional Information (SAI) includes more information about the Trustees. To request a free copy, call Fidelity at 1-877-208-0098.
Correspondence intended for each Trustee who is an interested person may be sent to Fidelity Investments, 82 Devonshire Street, Boston, Massachusetts 02109.
| | Name, Age; Principal Occupation
Edward C. Johnson 3d (75)
|
Year of Election or Appointment: 1991
Mr. Johnson is Chairman of the Board of Trustees. Mr. Johnson serves as Chief Executive Officer, Chairman, and a Director of FMR Corp.; a Director and Chairman of the Board and of the Executive Committee of FMR; Chairman and a Director of Fidelity Management & Research (Far East) Inc.; Chairman and a Director of Fidelity Investments Money Management, Inc.; and Chairman (2001 present) and a Director (2000 present) of FMR Co., Inc.
Year of Election or Appointment: 2005
Mr. Jonas is Senior Vice President of Advisor Freedom Income (2005 present), Advisor Freedom 2005 (2005 present), Advisor Freedom 2010 (2005 present), Advisor Freedom 2015 (2005 present), Advisor Freedom 2020 (2005 present), Advisor Freedom 2025 (2005 present), Advisor Freedom 2030 (2005 present), Advisor Freedom 2035 (2005 present), Advisor Freedom 2040 (2005 present), Advisor Freedom 2045 (2006 present), and Advisor Freedom 2050 (2006 present). He also serves as Senior Vice President of other Fidelity funds (2005 present). Mr. Jonas is Executive Director of FMR (2005 present). Previously, Mr. Jonas served as President of Fidelity Enterprise Operations and Risk Services (2004 2005), Chief Administrative Officer (2002 2004), and Chief Financial Officer of FMR Co. (1998 2000). Mr. Jonas has been with Fidelity Investments since 1987 and has held various financial and management positions including Chief Financial Officer of FMR. In addition, he serves on the Boards of Boston Ballet (2003 present) and Simmons College (2003 present).
Year of Election or Appointment: 2003
Mr. Reynolds is a Director (2003 present) and Chief Operating Officer (2002 present) of FMR Corp. He also serves on the Board at Fidelity Investments Canada, Ltd. (2000 present). Previously, Mr. Reynolds served as President of Fidelity Investments Institutional Retirement Group (1996 2000).
* Trustees have been determined to be “Interested Trustees” by virtue of, among other things, their affiliation with the trust or various entities under common control with FMR.
Correspondence intended for each Independent Trustee (that is, the Trustees other than the Interested Trustees) may be sent to Fidelity Investments, P.O. Box 55235, Boston, Massachusetts 02205-5235.
| | Name, Age; Principal Occupation
Dennis J. Dirks (57)
|
Year of Election or Appointment: 2005
Prior to his retirement in May 2003, Mr. Dirks was Chief Operating Officer and a member of the Board of The Depository Trust & Clearing Corporation (DTCC) (1999 2003). He also served as President, Chief Operating Officer, and Board member of The Depository Trust Company (DTC) (1999 2003) and President and Board member of the National Securities Clearing Corporation (NSCC) (1999 2003). In addition, Mr. Dirks served as Chief Executive Officer and Board member of the Government Securities Clearing Corporation (2001 2003) and Chief Executive Officer and Board member of the Mortgage Backed Securities Clearing Corporation (2001 2003). Mr. Dirks also serves as a Trustee and a member of the Finance Committee of Manhattan College (2005 present) and a Trustee and a member of the Finance Committee of AHRC of Nassau County (2006 present).
| | Albert R. Gamper, Jr. (64)
|
Year of Election or Appointment: 2006
Mr. Gamper also serves as a Trustee (2006 present) or Member of the Advisory Board (2005 present) of other investment companies advised by FMR. Prior to his retirement in December 2004, Mr. Gamper served as Chairman of the Board of CIT Group Inc. (commercial finance). During his tenure with CIT Group Inc. Mr. Gamper served in numerous senior management positions, includ ing Chairman (1987 1989; 1999 2001; 2002 2004), Chief Executive Officer (1987 2004), and President (1989 2002). He currently serves as a member of the Board of Directors of Public Service Enterprise Group (utilities, 2001 present), Chairman of the Board of Governors, Rutgers University (2004 present), and Chairman of the Board of Saint Barnabas Health Care System.
Year of Election or Appointment: 1997
Dr. Gates is Chairman of the Independent Trustees (2006 present). Dr. Gates is President of Texas A&M University (2002 present). He was Director of the Central Intelligence Agency (CIA) from 1991 to 1993. From 1989 to 1991, Dr. Gates served as Assistant to the President of the United States and Deputy National Security Advisor. Dr. Gates is a Director of NACCO Industries, Inc. (mining and manufacturing), Parker Drilling Co., Inc. (drilling and rental tools for the energy industry, 2001 present), and Brinker International (restaurant management, 2003 present). Previously, Dr. Gates served as a Director of LucasVarity PLC (automotive components and diesel engines), a Director of TRW Inc. (automotive, space, defense, and information technology), and Dean of the George Bush School of Government and Public Service at Texas A&M University (1999 2001).
Year of Election or Appointment: 2004
Dr. Heilmeier is Chairman Emeritus of Telcordia Technologies (communication software and systems), where prior to his retirement, he served as company Chairman and Chief Executive Officer. He currently serves on the Boards of Directors of The Mitre Corpo ration (systems engineering and information technology support for the government), and HRL Laboratories (private research and development, 2004 present). He is Chairman of the General Motors Science & Technology Advisory Board and a Life Fellow of the Institute of Electrical and Electronics Engineers (IEEE). Dr. Heilmeier is a member of the Defense Science Board and the National Security Agency Advisory Board. He is also a member of the National Academy of Engineering, the American Academy of Arts and Sciences, and the Board of Overseers of the School of Engineering and Applied Science of the University of Pennsylvania. Previously, Dr. Heilmeier served as a Director of TRW Inc. (automotive, space, defense, and information technology, 1992 2002), Compaq (1994 2002), Automatic Data Processing, Inc. (ADP) (technology based business outsourcing, 1995 2002), INET Technologies Inc. (telecommunications network surveillance, 2001 2004), and Teletech Holdings (customer management services). He is the recipient of the 2005 Kyoto Prize in Advanced Technology for his invention of the liquid crystal display.
Year of Election or Appointment: 2001
Prior to Ms. Knowles’ retirement in June 2000, she served as Executive Vice President and Chief Financial Officer of Atlantic Richfield Company (ARCO) (diversified energy, 1996 2000). From 1993 to 1996, she was a Senior Vice President of ARCO and President of ARCO Transportation Company. She served as a Director of ARCO from 1996 to 1998. She currently serves as a Director of Phelps Dodge Corporation (copper mining and manufacturing) and McKesson Corporation (healthcare service, 2002 present). Ms. Knowles is a Trustee of the Brookings Institution and the Catalina Island Conservancy and also serves as a member of the Advisory Board for the School of Engineering of the University of Southern California.
89 Annual Report
Trustees and Officers - continued
|
| | Name, Age; Principal Occupation
Ned C. Lautenbach (62)
|
Year of Election or Appointment: 2000
Mr. Lautenbach has been a partner of Clayton, Dubilier & Rice, Inc. (private equity investment firm) since September 1998. Previously, Mr. Lautenbach was with the International Business Machines Corporation (IBM) from 1968 until his retirement in 1998. Mr. Lautenbach serves as a Director of Italtel Holding S.p.A. (telecommunications (Milan, Italy), 2004 present) and Eaton Corpora tion (diversified industrial) as well as the Philharmonic Center for the Arts in Naples, Florida. He also is a member of the Board of Trustees of Fairfield University (2005 present), as well as a member of the Council on Foreign Relations.
Year of Election or Appointment: 1997
Prior to his retirement in December 1994, Mr. McCoy was Vice Chairman of the Board of BellSouth Corporation (telecommunications) and President of BellSouth Enterprises. He is currently a Director of Duke Realty Corporation (real estate) and Progress Energy, Inc. (electric utility). He is also a partner of Franklin Street Partners (private investment management firm) and a member of the Research Triangle Foundation Board. In addition, Mr. McCoy served as the Interim Chancellor (1999 2000) and a member of the Board of Visitors for the University of North Carolina at Chapel Hill and currently serves as Chairman of the Board of Directors of the Uni versity of North Carolina Health Care System and the Board of Visitors of the Kenan Flagler Business School (University of North Carolina at Chapel Hill). He also served as Vice President of Finance for the University of North Carolina (16 school system).
Year of Election or Appointment: 2005
Ms. Small is a member (2000 present) and Chairperson (2002 present) of the Investment Committee, and a member (2002 present) of the Board of Trustees of Smith College. Previously, she served as Chief Investment Officer (1999 2000), Director of Global Equity Investments (1996 1999), and a member of the Board of Directors of Scudder, Stevens & Clark (1990 1997) and Scudder Kemper Investments (1997 1999). In addition, Ms. Small served as Co Chair (2000 2003) of the Annual Fund for the Fletcher School of Law and Diplomacy.
| | William S. Stavropoulos (66)
|
Year of Election or Appointment: 2001
Mr. Stavropoulos is Chairman of the Board (2000 present) and a Member of the Board of Directors of The Dow Chemical Company. Since joining The Dow Chemical Company in 1967, Mr. Stavropoulos served in numerous senior management positions, including President (1993 2000; 2002 2003), CEO (1995 2000; 2002 2004), and Chairman of the Executive Committee (2000 2004). Currently, he is a Director of NCR Corporation (data warehousing and technology solutions), BellSouth Corporation (telecommunications), Chemical Financial Corporation, Maersk Inc. (industrial conglomerate, 2002 present), and Metalmark Capital (private equity investment firm, 2005 present). He also serves as a member of the Board of Trustees of the American Enterprise Institute for Public Policy Research. In addition, Mr. Stavropoulos is a member of The Business Council, J.P. Morgan International Council and the University of Notre Dame Advisory Council for the College of Science.
Year of Election or Appointment: 2005
Prior to his retirement in 2001, Mr. Wolfe was Chairman and Chief Executive Officer of Hershey Foods Corporation (1993 2001). He currently serves as a member of the boards of Adelphia Communications Corporation (2003 present), Bausch & Lomb, Inc., and Revlon Inc. (2004 present).
Advisory Board Members and Executive Officers:
|
Correspondence intended for Mr. Keyes may be sent to Fidelity Investments, P.O. Box 55235, Boston, Massachusetts 02205-5235. Correspondence intended for each executive officer and Mr. Lynch may be sent to Fidelity Investments, 82 Devonshire Street, Boston, Massachusetts 02109.
| | Name, Age; Principal Occupation
James H. Keyes (65)
|
Year of Election or Appointment: 2006
Member of the Advisory Board of Fidelity Aberdeen Street Trust. Prior to his retirement in 2003, Mr. Keyes was Chairman, Presi dent, and Chief Executive Officer of Johnson Controls, Inc. (automotive supplier, 1993 2003). He currently serves as a member of the boards of LSI Logic Corporation (semiconductor technologies, 1984 present), Navistar International Corporation (manufacture and sale of trucks, buses, and diesel engines, 2002 present), and Pitney Bowes, Inc. (integrated mail, messaging, and document management solutions, 1998 present).
Year of Election or Appointment: 2003
Member of the Advisory Board of Fidelity Aberdeen Street Trust. Vice Chairman and a Director of FMR, and Vice Chairman (2001 present) and a Director (2000 present) of FMR Co., Inc. Previously, Mr. Lynch served as a Trustee of the Fidelity funds (1990 2003). In addition, he serves as a Trustee of Boston College, Massachusetts Eye & Ear Infirmary, Historic Deerfield, John F. Kennedy Library, and the Museum of Fine Arts of Boston.
Year of Election or Appointment: 2005 or 2006
Vice President of Advisor Freedom Income (2005 present), Advisor Freedom 2005 (2005 present), Advisor Freedom 2010 (2005 present), Advisor Freedom 2015 (2005 present), Advisor Freedom 2020 (2005 present), Advisor Freedom 2025 (2005 present), Advisor Freedom 2030 (2005 present), Advisor Freedom 2035 (2005 present), Advisor Freedom 2040 (2005 present), Advisor Freedom 2045 (2006 present), and Advisor Freedom 2050 (2006 present). Mr. Greer also serves as Vice President of certain Equity Funds (2005 present), certain Asset Allocation Funds (2005 present), and a Trustee of other investment companies advised by FMR (2003 present). He is an Executive Vice President of FMR (2005 present) and FMR Co., Inc. (2005 present). Previously, Mr. Greer served as a Director and Managing Director of Strategic Advisers, Inc. (2002 2005), and Executive Vice President (2000 2002) and Money Market Group Leader (1997 2002) of the Fidelity Investments Fixed Income Division. He also served as Vice President of Fidelity’s Money Market Funds (1997 2002), Senior Vice President of FMR
(1997 2002), and Vice President of FIMM (1998 2002).
Year of Election or Appointment: 2003 or 2006
Vice President of Advisor Freedom Income (2003 present), Advisor Freedom 2005 (2003 present), Advisor Freedom 2010 (2003 present), Advisor Freedom 2015 (2003 present), Advisor Freedom 2020 (2003 present), Advisor Freedom 2025 (2003 present), Advisor Freedom 2030 (2003 present), Advisor Freedom 2035 (2003 present), Advisor Freedom 2040 (2003 present), Advisor Freedom 2045 (2006 present), and Advisor Freedom 2050 (2006 present). Mr. Cheng also serves as Vice President of other funds advised by Strategic Advisers Inc., including the Fidelity Freedom Funds®. Prior to assuming his current responsibilities, Mr. Cheng worked as a portfolio manager. Mr. Cheng also serves as Vice President of FMR (2002) and FMR Co., Inc. (2002).
Year of Election or Appointment: 2003 or 2006
Secretary of Advisor Freedom Income (2003 present), Advisor Freedom 2005 (2003 present), Advisor Freedom 2010 (2003 present), Advisor Freedom 2015 (2003 present), Advisor Freedom 2020 (2003 present), Advisor Freedom 2025 (2003 present), Advisor Freedom 2030 (2003 present), Advisor Freedom 2035 (2003 present), Advisor Freedom 2040 (2003 present), Advisor Freedom 2045 (2006 present), and Advisor Freedom 2050 (2006 present). He also serves as Secretary of other Fidelity funds; Vice President, General Counsel, and Secretary of FMR Co., Inc. (2001 present) and FMR; Assistant Secretary of Fidelity Management & Research (U.K.) Inc. (2001 present), Fidelity Research & Analysis Company (2001 present), and Fidelity Investments Money Management, Inc. (2001 present). Mr. Roiter is an Adjunct Member, Faculty of Law, at Boston College Law School (2003 present). Previously, Mr. Roiter served as Vice President and Secretary of Fidelity Distributors Corporation (FDC) (1998 2005).
91 Annual Report
Trustees and Officers - continued
|
| | Name, Age; Principal Occupation
|
Year of Election or Appointment: 2003 or 2006
Assistant Secretary of Advisor Freedom Income (2003 present), Advisor Freedom 2005 (2003 present), Advisor Freedom 2010 (2003 present), Advisor Freedom 2015 (2003 present), Advisor Freedom 2020 (2003 present), Advisor Freedom 2025 (2003 present), Advisor Freedom 2030 (2003 present), Advisor Freedom 2035 (2003 present), Advisor Freedom 2040 (2003 present), Advisor Freedom 2045 (2006 present), and Advisor Freedom 2050 (2006 present). Mr. Fross also serves as Assistant Secretary of other Fidelity funds (2003 present), Vice President and Secretary of FDC (2005 present), and is an employee of FMR.
Year of Election or Appointment: 2004 or 2006
President and Treasurer of Advisor Freedom Income (2004 present), Advisor Freedom 2005 (2004 present), Advisor Freedom 2010 (2004 present), Advisor Freedom 2015 (2004 present), Advisor Freedom 2020 (2004 present), Advisor Freedom 2025 (2004 present), Advisor Freedom 2030 (2004 present), Advisor Freedom 2035 (2004 present), Advisor Freedom 2040 (2004 present), Advisor Freedom 2045 (2006 present), and Advisor Freedom 2050 (2006 present). Ms. Reynolds also serves as President and Treasurer of other Fidelity funds (2004 present) and is a Vice President (2003 present) and an employee (2002 present) of FMR. Before joining Fidelity Investments, Ms. Reynolds worked at PricewaterhouseCoopers LLP (PwC) (1980 2002), where she was most recently an audit partner with PwC’s investment management practice.
Year of Election or Appointment: 2006
Anti Money Laundering (AML) officer of Advisor Freedom Income, Advisor Freedom 2005, Advisor Freedom 2010, Advisor Freedom 2015, Advisor Freedom 2020, Advisor Freedom 2025, Advisor Freedom 2030, Advisor Freedom 2035, Advisor Freedom 2040, Advisor Freedom 2045, and Advisor Freedom 2050. Mr. Ganis also serves as AML officer of other Fidelity funds (2006 present) and FMR Corp. (2003 present). Before joining Fidelity Investments, Mr. Ganis practiced law at Goodwin Procter, LLP (2000 2002).
Year of Election or Appointment: 2005 or 2006
Chief Financial Officer of Advisor Freedom Income (2005 present), Advisor Freedom 2005 (2005 present), Advisor Freedom 2010 (2005 present), Advisor Freedom 2015 (2005 present), Advisor Freedom 2020 (2005 present), Advisor Freedom 2025 (2005 present), Advisor Freedom 2030 (2005 present), Advisor Freedom 2035 (2005 present), Advisor Freedom 2040 (2005 present), Advisor Freedom 2045 (2006 present), and Advisor Freedom 2050 (2006 present). Mr. Murphy also serves as Chief Financial Officer of other Fidelity funds (2005 present). He also serves as Senior Vice President of Fidelity Pricing and Cash Management Services Group (FPCMS).
| | Kenneth A. Rathgeber (58)
|
Year of Election or Appointment: 2004 or 2006
Chief Compliance Officer of Advisor Freedom Income (2004 present), Advisor Freedom 2005 (2004 present), Advisor Freedom 2010 (2004 present), Advisor Freedom 2015 (2004 present), Advisor Freedom 2020 (2004 present), Advisor Freedom 2025 (2004 present), Advisor Freedom 2030 (2004 present), Advisor Freedom 2035 (2004 present), Advisor Freedom 2040 (2004 present), Advisor Freedom 2045 (2006 present), and Advisor Freedom 2050 (2006 present). Mr. Rathgeber also serves as Chief Compliance Officer of other Fidelity funds (2004 present) and Executive Vice President of Risk Oversight for Fidelity Investments (2002 present). He is Chief Compliance Officer of FMR (2005 present), FMR Co., Inc. (2005 present), Fidelity Management & Research (U.K.) Inc. (2005 present), Fidelity Research & Analysis Company (2005 present), Fidelity Investments Money Management, Inc. (2005 present), and Strategic Advisers, Inc. (2005 present). Previously, Mr. Rathgeber served as Executive Vice President and Chief Operating Officer for Fidelity Investments Institutional Services Company, Inc. (1998 2002).
Year of Election or Appointment: 2005 or 2006
Deputy Treasurer of Advisor Freedom Income (2005 present), Advisor Freedom 2005 (2005 present), Advisor Freedom 2010 (2005 present), Advisor Freedom 2015 (2005 present), Advisor Freedom 2020 (2005 present), Advisor Freedom 2025 (2005 present), Advisor Freedom 2030 (2005 present), Advisor Freedom 2035 (2005 present), Advisor Freedom 2040 (2005 present), Advisor Freedom 2045 (2006 present), and Advisor Freedom 2050 (2006 present). Mr. Mehrmann also serves as Deputy Treasurer of other Fidelity funds (2005 present) and is an employee of FMR. Previously, Mr. Mehrmann served as Vice President of Fidelity Investments Institutional Services Group (FIIS)/Fidelity Investments Institutional Operations Corporation, Inc. (FIIOC) Client Services (1998 2004).
Name, Age; Principal Occupation
Kimberley H. Monasterio (42)
|
Year of Election or Appointment: 2004 or 2006
Deputy Treasurer ofAdvisor Freedom Income (2004 present), Advisor Freedom 2005 (2004 present), Advisor Freedom 2010 (2004 present), Advisor Freedom 2015 (2004 present), Advisor Freedom 2020 (2004 present), Advisor Freedom 2025 (2004 present), Advisor Freedom 2030 (2004 present), Advisor Freedom 2035 (2004 present), Advisor Freedom 2040 (2004 present), Advisor Freedom 2045 (2006 present), and Advisor Freedom 2050 (2006 present). Ms. Monasterio also serves as Deputy Treasurer of other Fidelity funds (2004) and is an employee of FMR (2004). Before joining Fidelity Investments, Ms. Monasterio served as Treasurer (2000 2004) and Chief Financial Officer (2002 2004) of the Franklin Templeton Funds and Senior Vice President of Franklin Templeton Services, LLC (2000 2004).
Year of Election or Appointment: 2005 or 2006
Deputy Treasurer of Advisor Freedom Income (2005 present), Advisor Freedom 2005 (2005 present), Advisor Freedom 2010 (2005 present), Advisor Freedom 2015 (2005 present), Advisor Freedom 2020 (2005 present), Advisor Freedom 2025 (2005 present), Advisor Freedom 2030 (2005 present), Advisor Freedom 2035 (2005 present), Advisor Freedom 2040 (2005 present), Advisor Freedom 2045 (2006 present), and Advisor Freedom 2050 (2006 present). Mr. Robins also serves as Deputy Treasurer of other Fidelity funds (2005 present) and is an employee of FMR (2004 present). Before joining Fidelity Invest ments, Mr. Robins worked at KPMG LLP, where he was a partner in KPMG’s department of professional practice (2002 2004) and a Senior Manager (1999 2000). In addition, Mr. Robins served as Assistant Chief Accountant, United States Securities and Exchange Commission (2000 2002).
Year of Election or Appointment: 2005 or 2006
Assistant Treasurer of Advisor Freedom Income (2005 present), Advisor Freedom 2005 (2005 present), Advisor Freedom 2010 (2005 present), Advisor Freedom 2015 (2005 present), Advisor Freedom 2020 (2005 present), Advisor Freedom 2025 (2005 present), Advisor Freedom 2030 (2005 present), Advisor Freedom 2035 (2005 present), Advisor Freedom 2040 (2005 present), Advisor Freedom 2045 (2006 present), and Advisor Freedom 2050 (2006 present). Mr. Byrnes also serves as Assistant Treasurer of other Fidelity funds (2005 present) and is an employee of FMR (2005 present). Previously, Mr. Byrnes served as Vice President of FPCMS (2003 2005). Before joining Fidelity Investments, Mr. Byrnes worked at Deutsche Asset Management where he served as Vice President of the Investment Operations Group (2000 2003).
Year of Election or Appointment: 2003 or 2006
Assistant Treasurer of Advisor Freedom Income (2003 present), Advisor Freedom 2005 (2003 present), Advisor Freedom 2010 (2003 present), Advisor Freedom 2015 (2003 present), Advisor Freedom 2020 (2003 present), Advisor Freedom 2025 (2003 present), Advisor Freedom 2030 (2003 present), Advisor Freedom 2035 (2003 present), Advisor Freedom 2040 (2003 present), Advisor Freedom 2045 (2006 present), and Advisor Freedom 2050 (2006 present). Mr. Costello also serves as Assistant Treasurer of other Fidelity funds and is an employee of FMR.
Year of Election or Appointment: 2004 or 2006
Assistant Treasurer of Advisor Freedom Income (2004 present), Advisor Freedom 2005 (2004 present), Advisor Freedom 2010 (2004 present), Advisor Freedom 2015 (2004 present), Advisor Freedom 2020 (2004 present), Advisor Freedom 2025 (2004 present), Advisor Freedom 2030 (2004 present), Advisor Freedom 2035 (2004 present), Advisor Freedom 2040 (2004 present), Advisor Freedom 2045 (2006 present), and Advisor Freedom 2050 (2006 present). Mr. Lydecker also serves as Assistant Treasurer of other Fidelity funds (2004) and is an employee of FMR.
Year of Election or Appointment: 2003 or 2006
Assistant Treasurer of Advisor Freedom Income (2003 present), Advisor Freedom 2005 (2003 present), Advisor Freedom 2010 (2003 present), Advisor Freedom 2015 (2003 present), Advisor Freedom 2020 (2003 present), Advisor Freedom 2025 (2003 present), Advisor Freedom 2030 (2003 present), Advisor Freedom 2035 (2003 present), Advisor Freedom 2040 (2003 present), Advisor Freedom 2045 (2006 present), and Advisor Freedom 2050 (2006 present). Mr. Osterheld also serves as Assistant Treasurer of other Fidelity funds (2002) and is an employee of FMR.
93 Annual Report
Trustees and Officers - continued
|
| | Name, Age; Principal Occupation
Gary W. Ryan (47)
|
Year of Election or Appointment: 2005 or 2006
Assistant Treasurer of Advisor Freedom Income (2005 present), Advisor Freedom 2005 (2005 present), Advisor Freedom 2010 (2005 present), Advisor Freedom 2015 (2005 present), Advisor Freedom 2020 (2005 present), Advisor Freedom 2025 (2005 present), Advisor Freedom 2030 (2005 present), Advisor Freedom 2035 (2005 present), Advisor Freedom 2040 (2005 present), Advisor Freedom 2045 (2006 present), and Advisor Freedom 2050 (2006 present). Mr. Ryan also serves as Assistant Treasurer of other Fidelity funds (2005 present) and is an employee of FMR (2005 present). Previously, Mr. Ryan served as Vice President of Fund Reporting in FPCMS (1999 2005).
Year of Election or Appointment: 2005 or 2006
Assistant Treasurer of Advisor Freedom Income (2005 present), Advisor Freedom 2005 (2005 present), Advisor Freedom 2010 (2005 present), Advisor Freedom 2015 (2005 present), Advisor Freedom 2020 (2005 present), Advisor Freedom 2025 (2005 present), Advisor Freedom 2030 (2005 present), Advisor Freedom 2035 (2005 present), Advisor Freedom 2040 (2005 present), Advisor Freedom 2045 (2006 present), and Advisor Freedom 2050 (2006 present). Mr. Schiavone also serves as Assistant Treasurer of other Fidelity funds (2005 present) and is an employee of FMR (2005 present). Before joining Fidelity Investments, Mr. Schiavone worked at Deutsche Asset Management, where he most recently served as Assistant Treasurer (2003 2005) of the Scudder Funds and Vice President and Head of Fund Reporting (1996 2003).
The Board of Trustees of each fund voted to pay to shareholders of record at the opening of business on record date, the following distributions per share derived from capital gains realized from sales of portfolio securities, and dividends derived from net investment income:
| Advisor Freedom Income | | Pay Date | | Record Date | | Dividends | | Capital Gains |
| Class A | | 5/08/06 | | 5/05/06 | | $.026 | | $.070 |
| Class T | | 5/08/06 | | 5/05/06 | | $.024 | | $.070 |
| Class B | | 5/08/06 | | 5/05/06 | | $.019 | | $.070 |
| Class C | | 5/08/06 | | 5/05/06 | | $.019 | | $.070 |
| Advisor Freedom 2005 | | Pay Date | | Record Date | | Dividends | | Capital Gains |
| Class A | | 5/08/06 | | 5/05/06 | | $.044 | | $.140 |
| Class T | | 5/08/06 | | 5/05/06 | | $.037 | | $.140 |
| Class B | | 5/08/06 | | 5/05/06 | | $.023 | | $.140 |
| Class C | | 5/08/06 | | 5/05/06 | | $.023 | | $.140 |
| Advisor Freedom 2010 | | Pay Date | | Record Date | | Dividends | | Capital Gains |
| Class A | | 5/08/06 | | 5/05/06 | | $.045 | | $.160 |
| Class T | | 5/08/06 | | 5/05/06 | | $.038 | | $.160 |
| Class B | | 5/08/06 | | 5/05/06 | | $.023 | | $.160 |
| Class C | | 5/08/06 | | 5/05/06 | | $.024 | | $.160 |
| Advisor Freedom 2015 | | Pay Date | | Record Date | | Dividends | | Capital Gains |
| Class A | | 5/08/06 | | 5/05/06 | | $.035 | | $.155 |
| Class T | | 5/08/06 | | 5/05/06 | | $.028 | | $.155 |
| Class B | | 5/08/06 | | 5/05/06 | | $.014 | | $.155 |
| Class C | | 5/08/06 | | 5/05/06 | | $.015 | | $.155 |
| Advisor Freedom 2020 | | Pay Date | | Record Date | | Dividends | | Capital Gains |
| Class A | | 5/08/06 | | 5/05/06 | | $.029 | | $.235 |
| Class T | | 5/08/06 | | 5/05/06 | | $.021 | | $.235 |
| Class B | | 5/08/06 | | 5/05/06 | | $.006 | | $.235 |
| Class C | | 5/08/06 | | 5/05/06 | | $.007 | | $.235 |
| Advisor Freedom 2025 | | Pay Date | | Record Date | | Dividends | | Capital Gains |
| Class A | | 5/15/06 | | 5/12/06 | | $.018 | | $.203 |
| Class T | | 5/15/06 | | 5/12/06 | | $.011 | | $.203 |
| Class B | | 5/15/06 | | 5/12/06 | | __ | | $.199 |
| Class C | | 5/15/06 | | 5/12/06 | | __ | | $.200 |
| Advisor Freedom 2030 | | Pay Date | | Record Date | | Dividends | | Capital Gains |
| Class A | | 5/15/06 | | 5/12/06 | | $.024 | | $.230 |
| Class T | | 5/15/06 | | 5/12/06 | | $.016 | | $.230 |
| Class B | | 5/15/06 | | 5/12/06 | | $.001 | | $.230 |
| Class C | | 5/15/06 | | 5/12/06 | | $.002 | | $.230 |
| Advisor Freedom 2035 | | Pay Date | | Record Date | | Dividends | | Capital Gains |
| Class A | | 5/15/06 | | 5/12/06 | | __ | | $.217 |
| Class T | | 5/15/06 | | 5/12/06 | | __ | | $.210 |
| Class B | | 5/15/06 | | 5/12/06 | | __ | | $.200 |
| Class C | | 5/15/06 | | 5/12/06 | | __ | | $.200 |
| Advisor Freedom 2040 | | Pay Date | | Record Date | | Dividends | | Capital Gains |
| Class A | | 5/15/06 | | 5/12/06 | | $.011 | | $.245 |
| Class T | | 5/15/06 | | 5/12/06 | | $.003 | | $.245 |
| Class B | | 5/15/06 | | 5/12/06 | | __ | | $.235 |
| Class C | | 5/15/06 | | 5/12/06 | | __ | | $.235 |
95 Annual Report
Distributions - continued
|
The funds hereby designate as capital gain dividends the amounts noted below for the taxable year indicated or for dividends for the taxable year ended 2006, or, if subsequently determined to be different, the net capital gain of such year.
| Fund | | |
| Advisor Freedom Income | | 454,893 |
| Advisor Freedom 2005 | | 562,544 |
| Advisor Freedom 2010 | | 4,792,513 |
| Advisor Freedom 2015 | | 4,761,838 |
| Advisor Freedom 2020 | | 13,533,685 |
| Advisor Freedom 2025 | | 4,482,425 |
| Advisor Freedom 2030 | | 7,869,781 |
| Advisor Freedom 2035 | | 2,151,852 |
| Advisor Freedom 2040 | | 6,342,520 |
A percentage of the dividends distributed during the fiscal year for the following funds was derived from interest on U.S. Government securities which is generally exempt from state income tax:
| | | Class A | | Class T | | Class B | | Class C |
| Advisor Freedom Income | | 18.12% | | 18.12% | | 18.12% | | 18.12% |
| Advisor Freedom 2005 | | 14.61% | | 14.61% | | 14.61% | | 14.61% |
| Advisor Freedom 2010 | | 14.87% | | 14.87% | | 14.87% | | 14.87% |
| Advisor Freedom 2015 | | 10.86% | | 10.86% | | 10.86% | | 10.86% |
| Advisor Freedom 2020 | | 8.26% | | 8.26% | | 8.26% | | 8.26% |
| Advisor Freedom 2025 | | 6.50% | | 6.50% | | 6.50% | | 6.50% |
A percentage of the dividends distributed during the fiscal year for the following funds qualifies for the dividends received deduction for corporate shareholders:
| Fund | | Class A | | Class T | | Class B | | Class C |
| |
| Advisor Freedom Income | | | | | | | | |
| April 2005 | | 4% | | 5% | | 7% | | 7% |
| May 2005 | | 5% | | 5% | | 7% | | 7% |
| June 2005 | | 5% | | 5% | | 7% | | 7% |
| July 2005 | | 5% | | 5% | | 6% | | 7% |
| August 2005 | | 5% | | 5% | | 7% | | 7% |
| September 2005 | | 5% | | 5% | | 7% | | 7% |
| October 2005 | | 5% | | 5% | | 7% | | 7% |
| November 2005 | | 5% | | 5% | | 6% | | 6% |
| December 2005 (ex date 12/02) | | 5% | | 5% | | 7% | | 6% |
| December 2005 (ex date 12/29) | | 5% | | 5% | | 6% | | 6% |
| February 2006 | | 1% | | 1% | | 1% | | 1% |
| March 2006 | | 1% | | 1% | | 1% | | 1% |
| |
| Advisor Freedom 2005 | | | | | | | | |
| May 2005 | | 8% | | 8% | | 20% | | 20% |
| December 2005 | | 11% | | 12% | | 16% | | 15% |
| |
| Advisor Freedom 2010 | | | | | | | | |
| May 2005 | | 8% | | 9% | | 14% | | 14% |
| December 2005 | | 12% | | 13% | | 17% | | 17% |
| |
| Advisor Freedom 2015 | | | | | | | | |
| May 2005 | | 12% | | 15% | | 31% | | 31% |
| December 2005 | | 15% | | 17% | | 23% | | 23% |
| Fund | | Class A | | Class T | | Class B | | Class C |
| |
| Advisor Freedom 2020 | | | | | | | | |
| May 2005 | | 20% | | 27% | | 100% | | 81% |
| December 2005 | | 21% | | 24% | | 34% | | 33% |
| |
| Advisor Freedom 2025 | | | | | | | | |
| May 2005 | | 29% | | 69% | | — | | — |
| December 2005 | | 23% | | 27% | | 37% | | 37% |
| |
| Advisor Freedom 2030 | | | | | | | | |
| May 2005 | | 57% | | 100% | | — | | — |
| December 2005 | | 29% | | 35% | | 55% | | 52% |
| |
| Advisor Freedom 2035 | | | | | | | | |
| May 2005 | | — | | — | | — | | — |
| December 2005 | | 28% | | 32% | | 48% | | 48% |
| |
| Advisor Freedom 2040 | | | | | | | | |
| May 2005 | | 91% | | — | | — | | — |
| December 2005 | | 27% | | 32% | | 48% | | 47% |
A percentage of the dividends distributed during the fiscal year for the following funds may be taken into account as a dividend for purposes of the maximum rate under section 1(h)(11) of the Internal Revenue Code.
| Fund | | Class A | | Class T | | Class B | | Class C |
| |
| Advisor Freedom Income | | | | | | | | |
| April 2005 | | — | | — | | — | | — |
| May 2005 | | 5% | | 6% | | 8% | | 8% |
| June 2005 | | 6% | | 7% | | 8% | | 8% |
| July 2005 | | 6% | | 7% | | 8% | | 9% |
| August 2005 | | 6% | | 7% | | 8% | | 8% |
| September 2005 | | 6% | | 7% | | 8% | | 8% |
| October 2005 | | 6% | | 7% | | 9% | | 9% |
| November 2005 | | 6% | | 7% | | 8% | | 8% |
| December 2005 (ex date 12/02) | | 6% | | 7% | | 8% | | 8% |
| December 2005 (ex date 12/29) | | 7% | | 7% | | 8% | | 8% |
| February 2006 | | 1% | | 1% | | 1% | | 1% |
| March 2006 | | 1% | | 1% | | 1% | | 1% |
| |
| Advisor Freedom 2005 | | | | | | | | |
| May 2005 | | 8% | | 8% | | 20% | | 20% |
| December 2005 | | 16% | | 18% | | 23% | | 22% |
| |
| Advisor Freedom 2010 | | | | | | | | |
| May 2005 | | 8% | | 10% | | 15% | | 15% |
| December 2005 | | 17% | | 19% | | 25% | | 24% |
| |
| Advisor Freedom 2015 | | | | | | | | |
| May 2005 | | 13% | | 16% | | 32% | | 32% |
| December 2005 | | 25% | | 28% | | 38% | | 37% |
| |
| Advisor Freedom 2020 | | | | | | | | |
| May 2005 | | 21% | | 28% | | 100% | | 83% |
| December 2005 | | 32% | | 37% | | 52% | | 51% |
97 Annual Report
Distributions - continued
|
| Fund | | Class A | | Class T | | Class B | | Class C |
| |
| Advisor Freedom 2025 | | | | | | | | |
| May 2005 | | 31% | | 72% | | — | | — |
| December 2005 | | 36% | | 41% | | 57% | | 57% |
| |
| Advisor Freedom 2030 | | | | | | | | |
| May 2005 | | 63% | | 100% | | — | | — |
| December 2005 | | 45% | | 54% | | 84% | | 80% |
| |
| Advisor Freedom 2035 | | | | | | | | |
| May 2005 | | — | | — | | — | | — |
| December 2005 | | 45% | | 52% | | 77% | | 77% |
| |
| Advisor Freedom 2040 | | | | | | | | |
| May 2005 | | 96% | | — | | — | | — |
| December 2005 | | 45% | | 53% | | 78% | | 76% |
Fidelity Advisor Income designates $1,570,562 of distributions paid during the fiscal year ended March 31, 2006 as qualifying to be taxed as interest-related dividends for nonresident alien shareholders.
The funds will notify shareholders in January 2007 of amounts for use in preparing 2006 income tax returns.
Proxy Voting Results
A special meeting of the funds’ shareholders was held on May 11, 2005. The results of votes taken among shareholders on proposals before them are reported below. Each vote reported represents one dollar of net asset value held on the record date for the meeting.
| PROPOSAL 1 | | | | |
| To elect a Board of Trustees.A | | | | |
| | | # of | | % of |
| | | Votes | | Votes |
| |
| Laura B. Cronin | | | | |
| Affirmative | | 14,239,751,820.01 | | 94.148 |
| Withheld | | 885,124,580.88 | | 5.852 |
| TOTAL | | 15,124,876,400.89 | | 100.000 |
| Dennis J. Dirks | | | | |
| Affirmative | | 14,214,711,536.39 | | 93.982 |
| Withheld | | 910,164,864.50 | | 6.018 |
| TOTAL | | 15,124,876,400.89 | | 100.000 |
| Robert M. Gates | | | | |
| Affirmative | | 14,201,606,421.24 | | 93.896 |
| Withheld | | 923,269,979.65 | | 6.104 |
| TOTAL | | 15,124,876,400.89 | | 100.000 |
| George H. Heilmeier | | | | |
| Affirmative | | 14,204,274,887.85 | | 93.913 |
| Withheld | | 920,601,513.04 | | 6.087 |
| TOTAL | | 15,124,876,400.89 | | 100.000 |
| Abigail P. Johnson | | | | |
| Affirmative | | 14,182,349,317.20 | | 93.768 |
| Withheld | | 942,527,083.69 | | 6.232 |
| TOTAL | | 15,124,876,400.89 | | 100.000 |
| Edward C. Johnson 3d | | | | |
| Affirmative | | 14,170,946,355.46 | | 93.693 |
| Withheld | | 953,930,045.43 | | 6.307 |
| TOTAL | | 15,124,876,400.89 | | 100.000 |
| Marie L. Knowles | | | | |
| Affirmative | | 14,215,316,094.83 | | 93.986 |
| Withheld | | 909,560,306.06 | | 6.014 |
| TOTAL | | 15,124,876,400.89 | | 100.000 |
| Ned C. Lautenbach | | | | |
| Affirmative | | 14,218,303,274.43 | | 94.006 |
| Withheld | | 906,573,126.46 | | 5.994 |
| TOTAL | | 15,124,876,400.89 | | 100.000 |
| Marvin L. Mann | | | | |
| Affirmative | | 14,204,487,663.39 | | 93.915 |
| Withheld | | 920,388,737.50 | | 6.085 |
| TOTAL | | 15,124,876,400.89 | | 100.000 |
| William O. McCoy | | | | |
| Affirmative | | 14,207,936,637.38 | | 93.938 |
| Withheld | | 916,939,763.51 | | 6.062 |
| TOTAL | | 15,124,876,400.89 | | 100.000 |
| Robert L. Reynolds | | | | |
| Affirmative | | 14,217,076,502.23 | | 93.998 |
| Withheld | | 907,799,898.66 | | 6.002 |
| TOTAL | | 15,124,876,400.89 | | 100.000 |
| | | # of | | % of |
| | | Votes | | Votes |
| |
| Cornelia M. Small | | | | |
| Affirmative | | 14,218,030,163.22 | | 94.004 |
| Withheld | | 906,846,237.67 | | 5.996 |
| TOTAL | | 15,124,876,400.89 | | 100.000 |
| |
| William S. Stavropoulos | | | | |
| Affirmative | | 14,211,272,772.82 | | 93.960 |
| Withheld | | 913,603,628.07 | | 6.040 |
| TOTAL | | 15,124,876,400.89 | | 100.000 |
| |
| Kenneth L. Wolfe | | | | |
| Affirmative | | 14,212,093,506.53 | | 93.965 |
| Withheld | | 912,782,894.36 | | 6.035 |
| TOTAL | | 15,124,876,400.89 | | 100.000 |
A Denotes trust-wide proposals and voting results.
99 Annual Report
Investment Adviser
Strategic Advisers, Inc.
Boston, MA
General Distributor
Fidelity Distributors Corporation
Boston, MA
Transfer and Service Agents
Fidelity Investments Institutional Operations Company, Inc.
Boston, MA
Fidelity Service Company, Inc.
Boston, MA
Custodian
The Bank of New York
New York, NY
|
AFF UANN-0506
1.792134.102
|

Fidelity Advisor Freedom Funds®
Income, 2005, 2010, 2015, 2020, 2025, 2030,
2035, 2040 - Institutional Class
|

Annual Report
March 31, 2006
|

| Contents | | | | | | |
| |
| |
| Chairman’s Message | | 3 | | Ned Johnson’s message to shareholders. |
| Performance | | | | 4 | | How the funds have done over time. |
| Management’s Discussion | | 13 | | The managers’ review of fund performance, strategy and outlook. |
| Shareholder Expense Example | | 14 | | An example of shareholder expenses. |
| Advisor Freedom Income | | 18 | | Investment Changes |
| | | | | 19 | | Investments |
| | | | | 20 | | Financial Statements |
| Advisor Freedom 2005 | | 24 | | Investment Changes |
| | | | | 25 | | Investments |
| | | | | 26 | | Financial Statements |
| Advisor Freedom 2010 | | 30 | | Investment Changes |
| | | | | 31 | | Investments |
| | | | | 32 | | Financial Statements |
| Advisor Freedom 2015 | | 36 | | Investment Changes |
| | | | | 37 | | Investments |
| | | | | 38 | | Financial Statements |
| Advisor Freedom 2020 | | 42 | | Investment Changes |
| | | | | 43 | | Investments |
| | | | | 44 | | Financial Statements |
| Advisor Freedom 2025 | | 48 | | Investment Changes |
| | | | | 49 | | Investments |
| | | | | 50 | | Financial Statements |
| Advisor Freedom 2030 | | 54 | | Investment Changes |
| | | | | 55 | | Investments |
| | | | | 56 | | Financial Statements |
| Advisor Freedom 2035 | | 60 | | Investment Changes |
| | | | | 61 | | Investments |
| | | | | 62 | | Financial Statements |
| Advisor Freedom 2040 | | 66 | | Investment Changes |
| | | | | 67 | | Investments |
| | | | | 68 | | Financial Statements |
| Notes | | | | 72 | | Notes to the financial statements. |
| Report of Independent Registered Public | | 87 | | |
| Accounting Firm | | | | | | |
| Trustees and Officers | | 88 | | |
| Distributions | | | | 95 | | |
| Proxy Voting Results | | 98 | | |
To view a fund’s proxy voting guidelines and proxy voting record for the 12 month period ended June 30, visit www.fidelity.com/proxyvotingresults or visit the
Securities and Exchange Commission’s (SEC) web site at www.sec.gov. You may also call 1-877-208-0098 to request a free copy of the proxy voting guidelines.
Standard & Poor’s, S&P and S&P 500 are registered service marks of The McGraw Hill Companies, Inc. and have been licensed for use by Fidelity Distributors Corporation.
Other third party marks appearing herein are the property of their respective owners.
All other marks appearing herein are registered or unregistered trademarks or service marks of FMR Corp. or an affiliated company.
|
This report and the financial statements contained herein are submitted for the general information of the shareholders of the funds. This report is not authorized for
distribution to prospective investors in the funds unless preceded or accompanied by an effective prospectus.
A fund files its complete schedule of portfolio holdings with the SEC for the first and third quarters of each fiscal year on Form N Q. Forms N Q are available on the
SEC’s web site at http://www.sec.gov. A fund’s Forms N Q may be reviewed and copied at the SEC’s Public Reference Room in Washington, DC. Information regarding
the operation of the SEC’s Public Reference Room may be obtained by calling 1-800-SEC-0330. For a complete list of a fund’s portfolio holdings, view the most recent
quarterly holdings report, semiannual report, or annual report on Fidelity’s web site at http://www.advisor.fidelity.com.
NOT FDIC INSURED · MAY LOSE VALUE · NO BANK GUARANTEE
Neither the funds nor Fidelity Distributors Corporation is a bank.
|
Annual Report 2
Chairman’s Message
(photograph of Edward C. Johnson 3d)
Dear Shareholder:
Although many securities markets made gains in early 2006, there is only one certainty when it comes to investing: There is no sure thing. There are, however, a number of time tested, fundamental investment principles that can put the historical odds in your favor.
One of the basic tenets is to invest for the long term. Over time, riding out the markets’ inevitable ups and downs has proven much more effective than selling into panic or chasing the hottest trend. Even missing only a few of the markets’ best days can significantly diminish investor returns. Patience also affords the benefits of compounding of earning interest on additional income or reinvested dividends and capital gains. There are tax advantages and cost benefits to consider as well. The more you sell, the more taxes you pay, and the more you trade, the higher the costs. While staying the course doesn’t eliminate risk, it can considerably lessen the effect of short term declines.
You can further manage your investing risk through diversification. And today, more than ever, geographic diversification should be taken into account. Studies indicate that asset allocation is the single most important determinant of a portfolio’s long term success. The right mix of stocks, bonds and cash aligned to your particular risk tolerance and investment objective is very import ant. Age appropriate rebalancing is also an essential aspect of asset allocation. For younger investors, an emphasis on equities which historically have been the best perform ing asset class over time is encouraged. As investors near their specific goal, such as retirement or sending a child to college, consideration may be given to replacing volatile assets (e.g. common stocks) with more stable fixed investments (bonds or savings plans).
A third investment principle investing regularly can help lower the average cost of your purchases. Investing a certain amount of money each month or quarter helps ensure you won’t pay for all your shares at market highs. This strategy known as dollar cost averaging also reduces unconstructive “emotion” from investing, helping shareholders avoid selling weak performers just prior to an upswing, or chasing a hot performer just before a correction.
We invite you to contact us via the Internet, through our Investor Centers or over the phone. It is our privilege to provide you the information you need to make the invest ments that are right for you.
Sincerely,
/s/ Edward C. Johnson 3d
Edward C. Johnson 3d
3 Annual Report
Fidelity Advisor Freedom Income Fund® Institutional Class
Performance: The Bottom Line
|
Average annual total return reflects the change in the value of an investment, assuming reinvestment of the class’ dividend income and capital gains (the profits earned upon the sale of securities that have grown in value) and assuming a constant rate of performance each year. The $10,000 table and the class’ returns do not reflect the deduction of taxes that a shareholder would pay on fund distributions or the redemption of fund shares. During periods of reimbursement by Fidelity, a fund’s total return will be greater than it would be had the reimbursement not occurred. How a fund did yesterday is no guarantee of how it will do tomorrow.
| Average Annual Total Returns | | | | |
| Periods ended March 31, 2006 | | Past 1 | | Life of |
| | | year | | fundA |
| Institutional Class | | 5.39% | | 4.37% |
A From July 24, 2003.
$10,000 Over Life of Fund
Let’s say hypothetically that $10,000 was invested in Fidelity Advisor Freedom Income Institutional Class on July 24, 2003, when the fund started. The chart shows how the value of your investment would have changed, and also shows how the Lehman Brothers® Aggregate Bond Index performed over the same period.

Annual Report 4
Fidelity Advisor Freedom 2005 Fund® Institutional Class
Performance: The Bottom Line
|
Average annual total return reflects the change in the value of an investment, assuming reinvestment of the class’ dividend income and capital gains (the profits earned upon the sale of securities that have grown in value) and assuming a constant rate of performance each year. The $10,000 table and the class’ returns do not reflect the deduction of taxes that a shareholder would pay on fund distributions or the redemption of fund shares. During periods of reimbursement by Fidelity, a fund’s total return will be greater than it would be had the reimbursement not oc curred. How a fund did yesterday is no guarantee of how it will do tomorrow.
| Average Annual Total Returns | | | | |
| Periods ended March 31, 2006 | | Past 1 | | Life of |
| | | year | | fundA |
| Institutional Class | | 9.92% | | 7.60% |
A From November 6, 2003.
$10,000 Over Life of Fund
Let’s say hypothetically that $10,000 was invested in Fidelity Advisor Freedom 2005 Institutional Class on November 6, 2003, when the fund started. The chart shows how the value of your investment would have changed, and also shows how the Lehman Brothers Aggregate Bond Index performed over the same period.
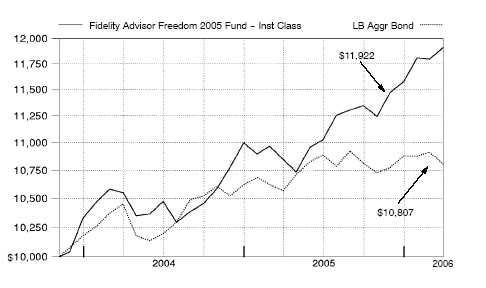
5 Annual Report
Fidelity Advisor Freedom 2010 Fund® Institutional Class
Performance: The Bottom Line
|
Average annual total return reflects the change in the value of an investment, assuming reinvestment of the class’ dividend income and capital gains (the profits earned upon the sale of securities that have grown in value) and assuming a constant rate of performance each year. The $10,000 table and the class’ returns do not reflect the deduction of taxes that a shareholder would pay on fund distributions or the redemption of fund shares. During periods of reimbursement by Fidelity, a fund’s total return will be greater than it would be had the reimbursement not occurred. How a fund did yesterday is no guarantee of how it will do tomorrow.
| Average Annual Total Returns | | | | |
| Periods ended March 31, 2006 | | Past 1 | | Life of |
| | | year | | fundA |
| Institutional Class | | 9.94% | | 8.44% |
A From July 24, 2003.
$10,000 Over Life of Fund
Let’s say hypothetically that $10,000 was invested in Fidelity Advisor Freedom 2010 Institutional Class on July 24, 2003, when the fund started. The chart shows how the value of your investment would have changed, and also shows how the Lehman Brothers Aggregate Bond Index performed over the same period.
Annual Report 6
Fidelity Advisor Freedom 2015 Fund® Institutional Class
Performance: The Bottom Line
|
Average annual total return reflects the change in the value of an investment, assuming reinvestment of the class’ dividend income and capital gains (the profits earned upon the sale of securities that have grown in value) and assuming a constant rate of performance each year. The $10,000 table and the class’ returns do not reflect the deduction of taxes that a shareholder would pay on fund distributions or the redemption of fund shares. During periods of reimbursement by Fidelity, a fund’s total return will be greater than it would be had the reimbursement not occurred. How a fund did yesterday is no guarantee of how it will do tomorrow.
| Average Annual Total Returns | | | | |
| Periods ended March 31, 2006 | | Past 1 | | Life of |
| | | year | | fundA |
| Institutional Class | | 12.36% | | 9.34% |
A From November 6, 2003.
$10,000 Over Life of Fund
Let’s say hypothetically that $10,000 was invested in Fidelity Advisor Freedom 2015 Institutional Class on November 6, 2003, when the fund started. The chart shows how the value of your investment would have changed, and also shows how the Standard & Poor’s 500SM Index (S&P 500®) performed over the same period.
7 Annual Report
Fidelity Advisor Freedom 2020 Fund® Institutional Class
Performance: The Bottom Line
|
Average annual total return reflects the change in the value of an investment, assuming reinvestment of the class’ dividend income and capital gains (the profits earned upon the sale of securities that have grown in value) and assuming a constant rate of performance each year. The $10,000 table and the class’ returns do not reflect the deduction of taxes that a shareholder would pay on fund distributions or the redemption of fund shares. During periods of reimbursement by Fidelity, a fund’s total return will be greater than it would be had the reimbursement not occurred. How a fund did yesterday is no guarantee of how it will do tomorrow.
| Average Annual Total Returns | | | | |
| Periods ended March 31, 2006 | | Past 1 | | Life of |
| | | year | | fundA |
| Institutional Class | | 13.88% | | 11.85% |
A From July 24, 2003.
$10,000 Over Life of Fund
Let’s say hypothetically that $10,000 was invested in Fidelity Advisor Freedom 2020 Institutional Class on July 24, 2003, when the fund started. The chart shows how the value of your investment would have changed, and also shows how the S&P 500 performed over the same period.
Annual Report 8
Fidelity Advisor Freedom 2025 Fund® Institutional Class
Performance: The Bottom Line
|
Average annual total return reflects the change in the value of an investment, assuming reinvestment of the class’ dividend income and capital gains (the profits earned upon the sale of securities that have grown in value) and assuming a constant rate of performance each year. The $10,000 table and the class’ returns do not reflect the deduction of taxes that a shareholder would pay on fund distributions or the redemption of fund shares. During periods of reimbursement by Fidelity, a fund’s total return will be greater than it would be had the reimbursement not occurred. How a fund did yesterday is no guarantee of how it will do tomorrow.
| Average Annual Total Returns | | | | |
| Periods ended March 31, 2006 | | Past 1 | | Life of |
| | | year | | fundA |
| Institutional Class | | 14.69% | | 10.99% |
A From November 6, 2003.
$10,000 Over Life of Fund
Let’s say hypothetically that $10,000 was invested in Fidelity Advisor Freedom 2025 Institutional Class on November 6, 2003, when the fund started. The chart shows how the value of your investment would have changed, and also shows how the S&P 500 performed over the same period.
9 Annual Report
Fidelity Advisor Freedom 2030 Fund® Institutional Class
Performance: The Bottom Line
|
Average annual total return reflects the change in the value of an investment, assuming reinvestment of the class’ dividend income and capital gains (the profits earned upon the sale of securities that have grown in value) and assuming a constant rate of performance each year. The $10,000 table and the class’ returns do not reflect the deduction of taxes that a shareholder would pay on fund distributions or the redemption of fund shares. During periods of reimbursement by Fidelity, a fund’s total return will be greater than it would be had the reimbursement not occurred. How a fund did yesterday is no guarantee of how it will do tomorrow.
| Average Annual Total Returns | | | | |
| Periods ended March 31, 2006 | | Past 1 | | Life of |
| | | year | | fundA |
| Institutional Class | | 16.10% | | 13.49% |
A From July 24, 2003.
$10,000 Over Life of Fund
Let’s say hypothetically that $10,000 was invested in Fidelity Advisor Freedom 2030 Institutional Class on July 24, 2003, when the fund started. The chart shows how the value of your investment would have changed, and also shows how the S&P 500 performed over the same period.
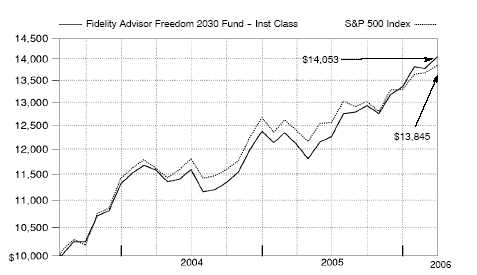
Annual Report 10
Fidelity Advisor Freedom 2035 Fund® Institutional Class
Performance: The Bottom Line
|
Average annual total return reflects the change in the value of an investment, assuming reinvestment of the class’ dividend income and capital gains (the profits earned upon the sale of securities that have grown in value) and assuming a constant rate of performance each year. The $10,000 table and the class’ returns do not reflect the deduction of taxes that a shareholder would pay on fund distributions or the redemption of fund shares. During periods of reimbursement by Fidelity, a fund’s total return will be greater than it would be had the reimbursement not oc curred. How a fund did yesterday is no guarantee of how it will do tomorrow.
| Average Annual Total Returns | | | | |
| Periods ended March 31, 2006 | | Past 1 | | Life of |
| | | year | | fundA |
| Institutional Class | | 16.45% | | 12.22% |
A From November 6, 2003.
$10,000 Over Life of Fund
Let’s say hypothetically that $10,000 was invested in Fidelity Advisor Freedom 2035 Institutional Class on November 6, 2003, when the fund started. The chart shows how the value of your investment would have changed, and also shows how the S&P 500 performed over the same period.
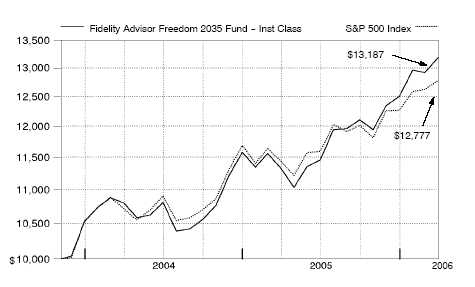
11 Annual Report
Fidelity Advisor Freedom 2040 Fund® Institutional Class
Performance: The Bottom Line
|
Average annual total return reflects the change in the value of an investment, assuming reinvestment of the class’ dividend income and capital gains (the profits earned upon the sale of securities that have grown in value) and assuming a constant rate of performance each year. The $10,000 table and the class’ returns do not reflect the deduction of taxes that a shareholder would pay on fund distributions or the redemption of fund shares. During periods of reimbursement by Fidelity, a fund’s total return will be greater than it would be had the reimbursement not occurred. How a fund did yesterday is no guarantee of how it will do tomorrow.
| Average Annual Total Returns | | | | |
| Periods ended March 31, 2006 | | Past 1 | | Life of |
| | | year | | fundA |
| Institutional Class | | 16.99% | | 14.60% |
A From July 24, 2003.
$10,000 Over Life of Fund
Let’s say hypothetically that $10,000 was invested in Fidelity Advisor Freedom 2040 Institutional Class on July 24, 2003, when the fund started. The chart shows how the value of your investment would have changed, and also shows how the S&P 500 performed over the same period.
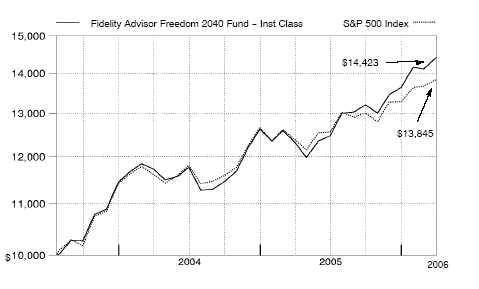
Annual Report 12
Management’s Discussion of Fund Performance
Comments from Ren Cheng and Jonathan Shelon, Co Portfolio Managers of Fidelity Advisor Freedom Funds®
Stocks registered widespread gains for the 12 months ending March 31, 2006, as most major equity market benchmarks turned in double digit returns. Strong corporate earnings and healthy economic growth helped fuel U.S. equities in spite of mounting concerns about inflation, a softening of the housing market and higher short term interest rates. Of the 10 broad market sectors measured by the Standard & Poor’s 500SM Index, energy had the best performance, followed by financials and telecommunication services, which also did well. Consumer discretionary had the weakest results, held back by poor performing automobile and traditional media stocks. For the 12 month period overall, the S&P 500® gained 11.73%; the NASDAQ Composite® Index, benefiting from more exposure to better performing mid and small cap stocks, was up 18.03%; and the Morgan Stanley Capital InternationalSM Europe, Australasia, Far East (MSCI® EAFE®) Index a broad benchmark of the international equity markets was up 24.62% . Turning to fixed income results, continued short term interest hikes by the Federal Reserve Board contributed to mixed returns for many sectors of the taxable, investment grade bond market during the period. The Lehman Brothers® Aggregate Bond Index a broad measure of the investment grade bond market returned 2.26% . High yield bonds represented the best performing debt category, bolstered by improving issuer fundamentals and low default rates, with the Merrill Lynch® U.S. High Yield Master II Index returning 7.23% ..
During the 12 months ending March 31, 2006, the Advisor Freedom Funds performed in line with our expectations, with each of the funds in the series producing consistent results, as determined by its age appropriate asset allocation. On a relative basis, most of the Funds outperformed their respective composite benchmarks during the period. The biggest factor in the Funds’ relative results was a continuation of the strong absolute performance in both the domestic and international equity markets. The Dow Jones Wilshire 5000 Composite IndexSM the broad market index the Advisor Freedom Funds use to measure the performance of U.S. equities in their composite benchmarks gained 14.72%, while the MSCI EAFE index’s hefty gain reflected the especially strong performance of foreign equities during the period. Performance within the fixed income asset classes was less pro nounced during the period, as rising short term interest rates and gathering inflation fears continued to put pressure on bond prices. An exception to this overall trend was the performance of high yield bonds, where the lower rated sectors of that category produced the strongest results, driving the underlying high yield fund to outperform its benchmark index. The Funds’ investment grade bond allocation performed slightly ahead of the 2.26% rise in its benchmark. Meanwhile, the short term asset class’s return was slightly behind the 3.55% gain of its benchmark index, but still provided a better absolute return than investment grade bonds during this period of rapidly rising short term interest rates.
The views expressed above reflect those of the portfolio manager(s) only through the end of the period as stated on the cover of this report and do not necessarily represent the views of Fidelity or any other person in the Fidelity organization. Any such views are subject to change at any time based upon market or other conditions and Fidelity disclaims any responsibility to update such views. These views may not be relied on as investment advice and, because investment decisions for a Fidelity fund are based on numerous factors, may not be relied on as an indication of trading intent on behalf of any Fidelity fund.
13 13 Annual Report
Shareholder Expense Example
|
As a shareholder of a Fund, you incur two types of costs: (1) transaction costs, including sales charges (loads) on purchase payments or redemption proceeds, and (2) ongoing costs, including distribution and/or service (12b 1) fees and other Fund expenses. This Example is intended to help you understand your ongoing costs (in dollars) of investing in the Funds and to compare these costs with the ongoing costs of investing in other mutual funds.
The Example is based on an investment of $1,000 invested at the beginning of the period and held for the entire period (October 1, 2005 to March 31, 2006).
The first line of the table below for each class of each fund provides information about actual account values and actual expenses. You may use the information in this line, together with the amount you invested, to estimate the expenses that you paid over the period. Simply divide your account value by $1,000.00 (for example, an $8,600 account value divided by $1,000.00 = 8.6), then multiply the result by the number in the first line for a class of the fund under the heading entitled “Expenses Paid During Period” to estimate the expenses you paid on your account during this period. In addi tion, each fund, as a shareholder in underlying Fidelity funds, will indirectly bear its pro rata share of the fees and expenses incurred by the underlying Fidelity funds. These fees and expenses are not included in each fund’s annualized expense ratio used to calculate the expense estimates in the table below.
Hypothetical Example for Comparison Purposes
|
The second line of the table below for each class of each fund provides information about hypothetical account values and hypothetical expenses based on a Class’ actual expense ratio and an assumed rate of return of 5% per year before expenses, which is not the Class’ actual return. The hypothetical account values and expenses may not be used to estimate the actual ending account balance or expenses you paid for the period. You may use this information to compare the ongoing costs of investing in the Fund and other funds. To do so, compare this 5% hypothetical example with the 5% hypothetical examples that appear in the shareholder reports of the other funds. In addition, each fund, as a shareholder in underlying Fidelity funds, will indirectly bear its pro rata share of the fees and expenses incurred by the underlying Fidelity funds. These fees and expenses are not included in each fund’s annualized expense ratio used to calculate the expense estimates in the table below.
Please note that the expenses shown in the table are meant to highlight your ongoing costs only and do not reflect any transaction costs. Therefore, the second line of the table is useful in comparing ongoing costs only, and will not help you determine the relative total costs of owning different funds. In addition, if these transactional costs were included, your costs would have been higher.
| | | | | | | | | Expenses Paid |
| | | Beginning | | | | Ending | | During Period* |
| | | Account Value | | | | Account Value | | October 1, 2005 |
| | | October 1, 2005 | | | | March 31, 2006 | | to March 31, 2006 |
| Advisor Freedom Income | | | | | | | | | | |
| Class A | | | | | | | | | | |
| Actual | | $ 1,000.00 | | | | $ 1,024.10 | | | | $ 1.26 |
| HypotheticalA | | $ 1,000.00 | | | | $ 1,023.68 | | | | $ 1.26 |
| Class T | | | | | | | | | | |
| Actual | | $ 1,000.00 | | | | $ 1,022.00 | | | | $ 2.52 |
| HypotheticalA | | $ 1,000.00 | | | | $ 1,022.44 | | | | $ 2.52 |
| Class B | | | | | | | | | | |
| Actual | | $ 1,000.00 | | | | $ 1,019.20 | | | | $ 5.03 |
| HypotheticalA | | $ 1,000.00 | | | | $ 1,019.95 | | | | $ 5.04 |
| Class C | | | | | | | | | | |
| Actual | | $ 1,000.00 | | | | $ 1,020.30 | | | | $ 5.04 |
| HypotheticalA | | $ 1,000.00 | | | | $ 1,019.95 | | | | $ 5.04 |
| Institutional Class | | | | | | | | | | |
| Actual | | $ 1,000.00 | | | | $ 1,024.50 | | | | $ .00 |
| HypotheticalA | | $ 1,000.00 | | | | $ 1,024.93 | | | | $ .00 |
| Advisor Freedom 2005 | | | | | | | | | | |
| Class A | | | | | | | | | | |
| Actual | | $ 1,000.00 | | | | $ 1,048.50 | | | | $ 1.28 |
| HypotheticalA | | $ 1,000.00 | | | | $ 1,023.68 | | | | $ 1.26 |
| Class T | | | | | | | | | | |
| Actual | | $ 1,000.00 | | | | $ 1,047.40 | | | | $ 2.55 |
| HypotheticalA | | $ 1,000.00 | | | | $ 1,022.44 | | | | $ 2.52 |
| Class B | | | | | | | | | | |
| Actual | | $ 1,000.00 | | | | $ 1,044.90 | | | | $ 5.10 |
| HypotheticalA | | $ 1,000.00 | | | | $ 1,019.95 | | | | $ 5.04 |
| Class C | | | | | | | | | | |
| Actual | | $ 1,000.00 | | | | $ 1,044.40 | | | | $ 5.10 |
| HypotheticalA | | $ 1,000.00 | | | | $ 1,019.95 | | | | $ 5.04 |
| Institutional Class | | | | | | | | | | |
| Actual | | $ 1,000.00 | | | | $ 1,050.70 | | | | $ .00 |
| HypotheticalA | | $ 1,000.00 | | | | $ 1,024.93 | | | | $ .00 |
| | | | | | | | | Expenses Paid |
| | | Beginning | | | | Ending | | During Period* |
| | | Account Value | | | | Account Value | | October 1, 2005 |
| | | October 1, 2005 | | | | March 31, 2006 | | to March 31, 2006 |
| Advisor Freedom 2010 | | | | | | | | | | |
| Class A | | | | | | | | | | |
| Actual | | $ 1,000.00 | | | | $ 1,049.90 | | | | $ 1.28 |
| HypotheticalA | | $ 1,000.00 | | | | $ 1,023.68 | | | | $ 1.26 |
| Class T | | | | | | | | | | |
| Actual | | $ 1,000.00 | | | | $ 1,048.20 | | | | $ 2.55 |
| HypotheticalA | | $ 1,000.00 | | | | $ 1,022.44 | | | | $ 2.52 |
| Class B | | | | | | | | | | |
| Actual | | $ 1,000.00 | | | | $ 1,045.50 | | | | $ 5.10 |
| HypotheticalA | | $ 1,000.00 | | | | $ 1,019.95 | | | | $ 5.04 |
| Class C | | | | | | | | | | |
| Actual | | $ 1,000.00 | | | | $ 1,044.90 | | | | $ 5.10 |
| HypotheticalA | | $ 1,000.00 | | | | $ 1,019.95 | | | | $ 5.04 |
| Institutional Class | | | | | | | | | | |
| Actual | | $ 1,000.00 | | | | $ 1,051.30 | | | | $ .00 |
| HypotheticalA | | $ 1,000.00 | | | | $ 1,024.93 | | | | $ .00 |
| Advisor Freedom 2015 | | | | | | | | | | |
| Class A | | | | | | | | | | |
| Actual | | $ 1,000.00 | | | | $ 1,063.90 | | | | $ 1.29 |
| HypotheticalA | | $ 1,000.00 | | | | $ 1,023.68 | | | | $ 1.26 |
| Class T | | | | | | | | | | |
| Actual | | $ 1,000.00 | | | | $ 1,061.50 | | | | $ 2.57 |
| HypotheticalA | | $ 1,000.00 | | | | $ 1,022.44 | | | | $ 2.52 |
| Class B | | | | | | | | | | |
| Actual | | $ 1,000.00 | | | | $ 1,059.10 | | | | $ 5.13 |
| HypotheticalA | | $ 1,000.00 | | | | $ 1,019.95 | | | | $ 5.04 |
| Class C | | | | | | | | | | |
| Actual | | $ 1,000.00 | | | | $ 1,059.30 | | | | $ 5.13 |
| HypotheticalA | | $ 1,000.00 | | | | $ 1,019.95 | | | | $ 5.04 |
| Institutional Class | | | | | | | | | | |
| Actual | | $ 1,000.00 | | | | $ 1,065.00 | | | | $ .00 |
| HypotheticalA | | $ 1,000.00 | | | | $ 1,024.93 | | | | $ .00 |
| Advisor Freedom 2020 | | | | | | | | | | |
| Class A | | | | | | | | | | |
| Actual | | $ 1,000.00 | | | | $ 1,072.50 | | | | $ 1.29 |
| HypotheticalA | | $ 1,000.00 | | | | $ 1,023.68 | | | | $ 1.26 |
| Class T | | | | | | | | | | |
| Actual | | $ 1,000.00 | | | | $ 1,070.80 | | | | $ 2.58 |
| HypotheticalA | | $ 1,000.00 | | | | $ 1,022.44 | | | | $ 2.52 |
| Class B | | | | | | | | | | |
| Actual | | $ 1,000.00 | | | | $ 1,068.30 | | | | $ 5.16 |
| HypotheticalA | | $ 1,000.00 | | | | $ 1,019.95 | | | | $ 5.04 |
| Class C | | | | | | | | | | |
| Actual | | $ 1,000.00 | | | | $ 1,067.60 | | | | $ 5.15 |
| HypotheticalA | | $ 1,000.00 | | | | $ 1,019.95 | | | | $ 5.04 |
| Institutional Class | | | | | | | | | | |
| Actual | | $ 1,000.00 | | | | $ 1,073.80 | | | | $ .00 |
| HypotheticalA | | $ 1,000.00 | | | | $ 1,024.93 | | | | $ .00 |
| Advisor Freedom 2025 | | | | | | | | | | |
| Class A | | | | | | | | | | |
| Actual | | $ 1,000.00 | | | | $ 1,076.10 | | | | $ 1.29 |
| HypotheticalA | | $ 1,000.00 | | | | $ 1,023.68 | | | | $ 1.26 |
| Class T | | | | | | | | | | |
| Actual | | $ 1,000.00 | | | | $ 1,075.20 | | | | $ 2.59 |
| HypotheticalA | | $ 1,000.00 | | | | $ 1,022.44 | | | | $ 2.52 |
| Class B | | | | | | | | | | |
| Actual | | $ 1,000.00 | | | | $ 1,072.50 | | | | $ 5.17 |
| HypotheticalA | | $ 1,000.00 | | | | $ 1,019.95 | | | | $ 5.04 |
15 15 Annual Report
| Shareholder Expense Example continued | | | | | | | | | | | | |
| |
| |
| | | | | | | | | | | | | Expenses Paid |
| | | | | | | Beginning | | | | Ending | | During Period* |
| | | | | | | Account Value | | | | Account Value | | October 1, 2005 |
| | | | | | | October 1, 2005 | | | | March 31, 2006 | | to March 31, 2006 |
| Class C | | | | | | | | | | | | | | |
| Actual | | | | | | $ 1,000.00 | | | | $ 1,072.50 | | | | $ 5.17 |
| HypotheticalA | | | | | | $ 1,000.00 | | | | $ 1,019.95 | | | | $ 5.04 |
| Institutional Class | | | | | | | | | | | | | | |
| Actual | | | | | | $ 1,000.00 | | | | $ 1,078.20 | | | | $ .00 |
| HypotheticalA | | | | | | $ 1,000.00 | | | | $ 1,024.93 | | | | $ .00 |
| Advisor Freedom 2030 | | | | | | | | | | | | | | |
| Class A | | | | | | | | | | | | | | |
| Actual | | | | | | $ 1,000.00 | | | | $ 1,085.90 | | | | $ 1.30 |
| HypotheticalA | | | | | | $ 1,000.00 | | | | $ 1,023.68 | | | | $ 1.26 |
| Class T | | | | | | | | | | | | | | |
| Actual | | | | | | $ 1,000.00 | | | | $ 1,084.20 | | | | $ 2.60 |
| HypotheticalA | | | | | | $ 1,000.00 | | | | $ 1,022.44 | | | | $ 2.52 |
| Class B | | | | | | | | | | | | | | |
| Actual | | | | | | $ 1,000.00 | | | | $ 1,081.10 | | | | $ 5.19 |
| HypotheticalA | | | | | | $ 1,000.00 | | | | $ 1,019.95 | | | | $ 5.04 |
| Class C | | | | | | | | | | | | | | |
| Actual | | | | | | $ 1,000.00 | | | | $ 1,081.40 | | | | $ 5.19 |
| HypotheticalA | | | | | | $ 1,000.00 | | | | $ 1,019.95 | | | | $ 5.04 |
| Institutional Class | | | | | | | | | | | | | | |
| Actual | | | | | | $ 1,000.00 | | | | $ 1,087.10 | | | | $ .00 |
| HypotheticalA | | | | | | $ 1,000.00 | | | | $ 1,024.93 | | | | $ .00 |
| Advisor Freedom 2035 | | | | | | | | | | | | | | |
| Class A | | | | | | | | | | | | | | |
| Actual | | | | | | $ 1,000.00 | | | | $ 1,087.40 | | | | $ 1.30 |
| HypotheticalA | | | | | | $ 1,000.00 | | | | $ 1,023.68 | | | | $ 1.26 |
| Class T | | | | | | | | | | | | | | |
| Actual | | | | | | $ 1,000.00 | | | | $ 1,086.20 | | | | $ 2.60 |
| HypotheticalA | | | | | | $ 1,000.00 | | | | $ 1,022.44 | | | | $ 2.52 |
| Class B | | | | | | | | | | | | | | |
| Actual | | | | | | $ 1,000.00 | | | | $ 1,083.40 | | | | $ 5.19 |
| HypotheticalA | | | | | | $ 1,000.00 | | | | $ 1,019.95 | | | | $ 5.04 |
| Class C | | | | | | | | | | | | | | |
| Actual | | | | | | $ 1,000.00 | | | | $ 1,083.30 | | | | $ 5.19 |
| HypotheticalA | | | | | | $ 1,000.00 | | | | $ 1,019.95 | | | | $ 5.04 |
| Institutional Class | | | | | | | | | | | | | | |
| Actual | | | | | | $ 1,000.00 | | | | $ 1,089.50 | | | | $ .00 |
| HypotheticalA | | | | | | $ 1,000.00 | | | | $ 1,024.93 | | | | $ .00 |
| Advisor Freedom 2040 | | | | | | | | | | | | | | |
| Class A | | | | | | | | | | | | | | |
| Actual | | | | | | $ 1,000.00 | | | | $ 1,091.30 | | | | $ 1.30 |
| HypotheticalA | | | | | | $ 1,000.00 | | | | $ 1,023.68 | | | | $ 1.26 |
| Class T | | | | | | | | | | | | | | |
| Actual | | | | | | $ 1,000.00 | | | | $ 1,089.60 | | | | $ 2.60 |
| HypotheticalA | | | | | | $ 1,000.00 | | | | $ 1,022.44 | | | | $ 2.52 |
| Class B | | | | | | | | | | | | | | |
| Actual | | | | | | $ 1,000.00 | | | | $ 1,086.80 | | | | $ 5.20 |
| HypotheticalA | | | | | | $ 1,000.00 | | | | $ 1,019.95 | | | | $ 5.04 |
| Class C | | | | | | | | | | | | | | |
| Actual | | | | | | $ 1,000.00 | | | | $ 1,087.00 | | | | $ 5.20 |
| HypotheticalA | | | | | | $ 1,000.00 | | | | $ 1,019.95 | | | | $ 5.04 |
| Institutional Class | | | | | | | | | | | | | | |
| Actual | | | | | | $ 1,000.00 | | | | $ 1,092.40 | | | | $ .00 |
| HypotheticalA | | | | | | $ 1,000.00 | | | | $ 1,024.93 | | | | $ .00 |
| |
| A 5% return per year before expenses | | | | | | | | | | | | | | |
* Expenses are equal to each Class’ annualized expense ratio (shown in the table below); multiplied by the average account value over the period, multiplied by 182/ 365 (to reflect the one-half year period). The fees and expenses of the underlying Fidelity funds in which the fund invests are not included in each class’ annualized expense ratio.
| | | Annualized |
| | | Expense Ratio |
| Advisor Freedom Income | | |
| Class A | | .25% |
| Class T | | .50% |
| Class B | | 1.00% |
| Class C | | 1.00% |
| Institutional Class | | .00% |
| Advisor Freedom 2005 | | |
| Class A | | .25% |
| Class T | | .50% |
| Class B | | 1.00% |
| Class C | | 1.00% |
| Institutional Class | | .00% |
| Advisor Freedom 2010 | | |
| Class A | | .25% |
| Class T | | .50% |
| Class B | | 1.00% |
| Class C | | 1.00% |
| Institutional Class | | .00% |
| Advisor Freedom 2015 | | |
| Class A | | .25% |
| Class T | | .50% |
| Class B | | 1.00% |
| Class C | | 1.00% |
| Institutional Class | | .00% |
| Advisor Freedom 2020 | | |
| Class A | | .25% |
| Class T | | .50% |
| Class B | | 1.00% |
| Class C | | 1.00% |
| Institutional Class | | .00% |
| Advisor Freedom 2025 | | |
| Class A | | .25% |
| Class T | | .50% |
| Class B | | 1.00% |
| Class C | | 1.00% |
| Institutional Class | | .00% |
| Advisor Freedom 2030 | | |
| Class A | | .25% |
| Class T | | .50% |
| Class B | | 1.00% |
| Class C | | 1.00% |
| Institutional Class | | .00% |
| Advisor Freedom 2035 | | |
| Class A | | .25% |
| Class T | | .50% |
| Class B | | 1.00% |
| Class C | | 1.00% |
| Institutional Class | | .00% |
| Advisor Freedom 2040 | | |
| Class A | | .25% |
| Class T | | .50% |
| Class B | | 1.00% |
| Class C | | 1.00% |
| Institutional Class | | .00% |
17 17 Annual Report
| Fidelity Advisor Freedom Income Fund |
| Investment Changes | | |
| |
| |
| Fund Holdings as of March 31, 2006 | | |
| | | % of fund’s | | % of fund’s investments |
| | | investments | | 6 months ago |
| Domestic Equity Funds | | | | |
| Fidelity Advisor Dividend Growth | | | | |
| Fund Institutional Class | | 4.4 | | 4.0 |
| Fidelity Advisor Equity Growth | | | | |
| Fund Institutional Class | | 2.5 | | 2.0 |
| Fidelity Advisor Equity Income | | | | |
| Fund Institutional Class | | 4.3 | | 4.0 |
| Fidelity Advisor Growth & Income | | | | |
| Fund Institutional Class | | 3.3 | | 4.0 |
| Fidelity Advisor Large Cap Fund | | | | |
| Institutional Class | | 3.3 | | 4.0 |
| Fidelity Advisor Mid Cap Fund | | | | |
| Institutional Class | | 1.7 | | 1.3 |
| Fidelity Advisor Small Cap Fund | | | | |
| Institutional Class | | 1.3 | | 1.3 |
| | | 20.8 | | 20.6 |
| High Yield Fixed Income Funds | | | | |
| Fidelity Advisor High Income | | | | |
| Advantage Fund Institutional | | | | |
| Class | | 2.0 | | 0.6 |
| Investment Grade Fixed-Income Funds | | | | |
| Fidelity Advisor Government | | | | |
| Investment Fund Institutional | | | | |
| Class | | 17.7 | | 19.0 |
| Fidelity Advisor Intermediate Bond | | | | |
| Fund Institutional Class | | 18.2 | | 19.5 |
| Fidelity Advisor Strategic Real | | | | |
| Return Fund Institutional Class | | 0.5 | | 0.0 |
| | | 36.4 | | 38.5 |
| Short Term Funds | | | | |
| Fidelity Advisor Short Fixed | | | | |
| Income Fund Institutional Class | | 20.4 | | 20.1 |
| Fidelity Cash Reserves Fund | | 20.4 | | 20.2 |
| | | 40.8 | | 40.3 |
| | | 100.0 | | 100.0 |
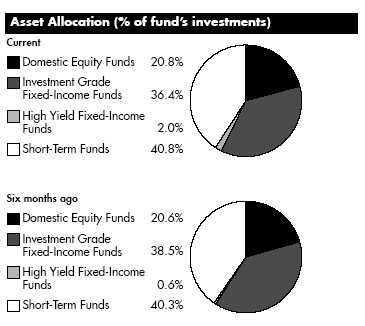
The “six months ago” allocation is based on the fund’s holdings as of September 30, 2005. The current allocation is based on the fund’s holdings as of March 31, 2006.
Annual Report 18
| Fidelity Advisor Freedom Income Fund | | |
| Investments March 31, 2006 |
| Showing Percentage of Total Value of Investment in Securities |
| |
| Equity Funds 20.8% | | |
| | | Shares | | Value (Note 1) |
| Domestic Equity Funds 20.8% | | | | |
| Fidelity Advisor Dividend Growth Fund | | | | |
| Institutional Class | | 239,409 | | $ 3,064,429 |
| Fidelity Advisor Equity Growth Fund | | | | |
| Institutional Class (a) | | 33,331 | | 1,766,565 |
| Fidelity Advisor Equity Income Fund | | | | |
| Institutional Class | | 102,461 | | 3,061,541 |
| Fidelity Advisor Growth & Income Fund | | | | |
| Institutional Class | | 123,801 | | 2,327,451 |
| Fidelity Advisor Large Cap Fund | | | | |
| Institutional Class | | 130,560 | | 2,350,089 |
| Fidelity Advisor Mid Cap Fund | | | | |
| Institutional Class | | 45,341 | | 1,197,917 |
| Fidelity Advisor Small Cap Fund | | | | |
| Institutional Class | | 36,272 | | 896,273 |
| TOTAL EQUITY FUNDS | | | | |
| (Cost $12,596,228) | | | | 14,664,265 |
| |
| Fixed Income Funds 38.4% | | | | |
| |
| High Yield Fixed-Income Funds – 2.0% | | | | |
| Fidelity Advisor High Income Advantage | | | | |
| Fund Institutional Class | | 146,488 | | 1,422,402 |
| Investment Grade Fixed Income Funds 36.4% | | | | |
| Fidelity Advisor Government Investment | | | | |
| Fund Institutional Class | | 1,285,510 | | 12,520,864 |
| Fidelity Advisor Intermediate Bond Fund | | | | |
| Institutional Class | | 1,196,286 | | 12,824,182 |
| Fidelity Advisor Strategic Real Return | | | | |
| Fund Institutional Class | | 37,043 | | 369,315 |
| |
| TOTAL INVESTMENT GRADE FIXED-INCOME FUNDS | | | | 25,714,361 |
| |
| TOTAL FIXED-INCOME FUNDS | | | | |
| (Cost $27,990,737) | | | | 27,136,763 |
| |
| Short Term Funds 40.8% | | | | |
| |
| Fidelity Advisor Short Fixed Income Fund | | | | |
| Institutional Class | | 1,542,636 | | 14,439,071 |
| Fidelity Cash Reserves Fund | | 14,429,670 | | 14,429,670 |
| TOTAL SHORT TERM FUNDS | | | | |
| (Cost $29,113,697) | | | | 28,868,741 |
| TOTAL INVESTMENT IN SECURITIES 100% | | | | |
| (Cost $69,700,662) | | | | $ 70,669,769 |
| | Legend
(a) Non-income producing
|
See accompanying notes which are an integral part of the financial statements.
19 Annual Report
| Fidelity Advisor Freedom Income Fund | | | | | | |
| |
| Financial Statements | | | | | | |
| |
| |
| Statement of Assets and Liabilities | | | | | | |
| | | | | | | March 31, 2006 |
| Assets | | | | | | |
| Investment in securities, at value (cost $69,700,662) — See accompanying schedule | | | | | | $ 70,669,769 |
| Cash | | | | | | 2 |
| Receivable for investments sold | | | | | | 143,909 |
| Receivable for fund shares sold | | | | | | 331,044 |
| Total assets | | | | | | 71,144,724 |
| |
| Liabilities | | | | | | |
| Payable for investments purchased | | | | $ 167,704 | | |
| Payable for fund shares redeemed | | | | 265,927 | | |
| Distribution fees payable | | | | 32,838 | | |
| Other affiliated payables | | | | 383 | | |
| Total liabilities | | | | | | 466,852 |
| |
| Net Assets | | | | | | $ 70,677,872 |
| Net Assets consist of: | | | | | | |
| Paid in capital | | | | | | $ 69,020,272 |
| Undistributed net investment income | | | | | | 192,880 |
| Accumulated undistributed net realized gain (loss) on investments | | | | | | 495,613 |
| Net unrealized appreciation (depreciation) on investments | | | | | | 969,107 |
| Net Assets | | | | | | $ 70,677,872 |
| Calculation of Maximum Offering Price | | | | | | |
| Class A: | | | | | | |
| Net Asset Value and redemption price per share ($18,523,716 ÷ 1,760,877 shares) | | | | | | $ 10.52 |
| Maximum offering price per share (100/94.25 of $10.52) | | | | | | $ 11.16 |
| Class T: | | | | | | |
| Net Asset Value and redemption price per share ($32,469,043 ÷ 3,088,635 shares) | | | | | | $ 10.51 |
| Maximum offering price per share (100/96.50 of $10.51) | | | | | | $ 10.89 |
| Class B: | | | | | | |
| Net Asset Value and offering price per share ($4,872,829 ÷ 464,048 shares)A | | | | | | $ 10.50 |
| Class C: | | | | | | |
| Net Asset Value and offering price per share ($13,678,370 ÷ 1,303,092 shares)A | | | | | | $ 10.50 |
| Institutional Class: | | | | | | |
| Net Asset Value, offering price and redemption price per share ($1,133,914 ÷ 107,691 shares) | | | | | | $ 10.53 |
| A Redemption price per share is equal to net asset value less any applicable contingent deferred sales charge. | | | | | | |
| |
| Statement of Operations | | | | | | |
| | | | | Year ended March 31, 2006 |
| Investment Income | | | | | | |
| Income distributions from underlying funds | | | | | | $ 2,004,168 |
| |
| Expenses | | | | | | |
| Management fee | | | | $ 4,883 | | |
| Distribution fees | | | | 380,439 | | |
| Independent trustees’ compensation | | | | 274 | | |
| Total expenses before reductions | | | | 385,596 | | |
| Expense reductions | | | | (1,266) | | 384,330 |
| |
| Net investment income (loss) | | | | | | 1,619,838 |
| Realized and Unrealized Gain (Loss) | | | | | | |
| Realized gain (loss) on sale of underlying fund shares | | | | 31,071 | | |
| Capital gain distributions from underlying funds | | | | 477,388 | | 508,459 |
| Change in net unrealized appreciation (depreciation) on underlying funds | | | | | | 864,314 |
| Net gain (loss) | | | | | | 1,372,773 |
| Net increase (decrease) in net assets resulting from operations | | | | | | $ 2,992,611 |
See accompanying notes which are an integral part of the financial statements.
| | |
| Annual Report | | 20 |
| Statement of Changes in Net Assets | | | | | | | | | | | | |
| | | | | | | Year ended | | | | Year ended |
| | | | | | | March 31, | | | | March 31, |
| | | | | | | 2006 | | | | 2005 |
| Increase (Decrease) in Net Assets | | | | | | | | | | |
| Operations | | | | | | | | | | |
| Net investment income (loss) | | | | | | $ 1,619,838 | | | | $ 739,057 |
| Net realized gain (loss) | | | | | | | | 508,459 | | | | 181,655 |
| Change in net unrealized appreciation (depreciation) | | | | | | | | 864,314 | | | | (460,298) |
| Net increase (decrease) in net assets resulting from operations | | | | | | 2,992,611 | | | | 460,414 |
| Distributions to shareholders from net investment income | | | | | | (1,455,415) | | | | (704,650) |
| Distributions to shareholders from net realized gain | | | | | | (201,782) | | | | (34,829) |
| Total distributions | | | | | | (1,657,197) | | | | (739,479) |
| Share transactions - net increase (decrease) | | | | | | 11,032,548 | | | | 25,789,420 |
| Total increase (decrease) in net assets | | | | | | 12,367,962 | | | | 25,510,355 |
| |
| Net Assets | | | | | | | | | | |
| Beginning of period | | | | | | 58,309,910 | | | | 32,799,555 |
| End of period (including undistributed net investment income of $192,880 and undistributed net investment income of | | | | | | | | | | |
| $86,109, respectively) | | | | | | $ 70,677,872 | | | | $ 58,309,910 |
| |
| Financial Highlights Class A | | | | | | | | | | | | |
| Years ended March 31, | | | | 2006 | | | | 2005 | | | | 2004G |
| Selected Per-Share Data | | | | | | | | | | | | |
| Net asset value, beginning of period | | | | $ 10.30 | | | | $ 10.40 | | | | $ 10.00 |
| Income from Investment Operations | | | | | | | | | | | | |
| Net investment income (loss)E | | | | .29 | | | | .20 | | | | .13 |
| Net realized and unrealized gain (loss) | | | | .23 | | | | (.10) | | | | .36 |
| Total from investment operations | | | | .52 | | | | .10 | | | | .49 |
| Distributions from net investment income | | | | (.27) | | | | (.19) | | | | (.09) |
| Distributions from net realized gain | | | | (.04) | | | | (.01) | | | | — |
| Total distributions | | | | (.30)I | | | | (.20) | | | | (.09) |
| Net asset value, end of period | | | | $ 10.52 | | | | $ 10.30 | | | | $ 10.40 |
| Total ReturnB,C,D | | | | 5.12% | | | | .99% | | | | 4.95% |
| Ratios to Average Net AssetsF,H | | | | | | | | | | | | |
| Expenses before reductions | | | | .26% | | | | .35% | | | | .35%A |
| Expenses net of fee waivers, if any | | | | .26% | | | | .33% | | | | .33%A |
| Expenses net of all reductions | | | | .26% | | | | .33% | | | | .33%A |
| Net investment income (loss) | | | | 2.83% | | | | 1.96% | | | | 1.81%A |
| Supplemental Data | | | | | | | | | | | | |
| Net assets, end of period (000 omitted) | | | | $ 18,524 | | | | $ 10,120 | | | | $ 5,009 |
| Portfolio turnover rate | | | | 21% | | | | 18% | | | | 46%A |
A Annualized
B Total returns for periods of less than one year are not annualized.
C Total returns would have been lower had certain expenses not been reduced during the periods shown.
D Total returns do not include the effect of the sales charges.
E Calculated based on average shares outstanding during the period.
F Amounts do not include the activity of the underlying funds.
G For the period July 24, 2003 (commencement of operations) to March 31, 2004.
H Expense ratios reflect operating expenses of the class. Expenses before reductions do not reflect amounts reimbursed by the investment adviser or expense offset arrangements and do not represent the amount paid by the class during periods when
reimbursements or reductions occur. Expense ratios before reductions for start up periods may not be representative of longer term operating periods. Expenses net of fee waivers reflect expenses after reimbursement by the investment adviser but prior to
reductions from expense offset arrangements. Expenses net of all reductions represent the net expenses paid by the class but do not include expenses of the investment companies in which the fund invests.
I Total distribution of $.300 per share is comprised of distributions from net investment income of $.265 and distributions from net realized gain of $.035 per share.
|
See accompanying notes which are an integral part of the financial statements.
|
21 Annual Report
| Financial Highlights Class T | | | | | | | | | | |
| Years ended March 31, | | 2006 | | | | 2005 | | | | 2004G |
| Selected Per-Share Data | | | | | | | | | | |
| Net asset value, beginning of period | | $ 10.30 | | | | $ 10.39 | | | | $ 10.00 |
| Income from Investment Operations | | | | | | | | | | |
| Net investment income (loss)E | | .27 | | | | .18 | | | | .11 |
| Net realized and unrealized gain (loss) | | .22 | | | | (.10) | | | | .37 |
| Total from investment operations | | .49 | | | | .08 | | | | .48 |
| Distributions from net investment income | | (.24) | | | | (.16) | | | | (.09) |
| Distributions from net realized gain | | (.04) | | | | (.01) | | | | — |
| Total distributions | | (.28) | | | | (.17) | | | | (.09) |
| Net asset value, end of period | | $ 10.51 | | | | $ 10.30 | | | | $ 10.39 |
| Total ReturnB,C,D | | 4.78% | | | | .79% | | | | 4.78% |
| Ratios to Average Net AssetsF,H | | | | | | | | | | |
| Expenses before reductions | | .51% | | | | .60% | | | | .60%A |
| Expenses net of fee waivers, if any | | .51% | | | | .58% | | | | .58%A |
| Expenses net of all reductions | | .51% | | | | .58% | | | | .58%A |
| Net investment income (loss) | | 2.58% | | | | 1.71% | | | | 1.56%A |
| Supplemental Data | | | | | | | | | | |
| Net assets, end of period (000 omitted) | | $ 32,469 | | | | $ 29,013 | | | | $ 14,535 |
| Portfolio turnover rate | | 21% | | | | 18% | | | | 46%A |
A Annualized
B Total returns for periods of less than one year are not annualized.
C Total returns would have been lower had certain expenses not been reduced during the periods shown.
D Total returns do not include the effect of the sales charges.
E Calculated based on average shares outstanding during the period.
F Amounts do not include the activity of the underlying funds.
G For the period July 24, 2003 (commencement of operations) to March 31, 2004.
H Expense ratios reflect operating expenses of the class. Expenses before reductions do not reflect amounts reimbursed by the investment adviser or expense offset arrangements and do not represent the amount paid by the class during periods when
reimbursements or reductions occur. Expense ratios before reductions for start up periods may not be representative of longer term operating periods. Expenses net of fee waivers reflect expenses after reimbursement by the investment adviser but
prior to reductions from expense offset arrangements. Expenses net of all reductions represent the net expenses paid by the class but do not include expenses of the investment companies in which the fund invests.
|
| Financial Highlights Class B | | | | | | | | | | |
| Years ended March 31, | | 2006 | | | | 2005 | | | | 2004G |
| Selected Per-Share Data | | | | | | | | | | |
| Net asset value, beginning of period | | $ 10.29 | | | | $ 10.38 | | | | $ 10.00 |
| Income from Investment Operations | | | | | | | | | | |
| Net investment income (loss)E | | .22 | | | | .12 | | | | .07 |
| Net realized and unrealized gain (loss) | | .21 | | | | (.10) | | | | .37 |
| Total from investment operations | | .43 | | | | .02 | | | | .44 |
| Distributions from net investment income | | (.19) | | | | (.10) | | | | (.06) |
| Distributions from net realized gain | | (.04) | | | | (.01) | | | | — |
| Total distributions | | (.22)I | | | | (.11) | | | | (.06) |
| Net asset value, end of period | | $ 10.50 | | | | $ 10.29 | | | | $ 10.38 |
| Total ReturnB,C,D | | 4.27% | | | | .23% | | | | 4.45% |
| Ratios to Average Net AssetsF,H | | | | | | | | | | |
| Expenses before reductions | | 1.01% | | | | 1.10% | | | | 1.10%A |
| Expenses net of fee waivers, if any | | 1.01% | | | | 1.08% | | | | 1.08%A |
| Expenses net of all reductions | | 1.01% | | | | 1.08% | | | | 1.08%A |
| Net investment income (loss) | | 2.08% | | | | 1.21% | | | | 1.06%A |
| Supplemental Data | | | | | | | | | | |
| Net assets, end of period (000 omitted) | | $ 4,873 | | | | $ 4,454 | | | | $ 3,649 |
| Portfolio turnover rate | | 21% | | | | 18% | | | | 46%A |
A Annualized
B Total returns for periods of less than one year are not annualized.
C Total returns would have been lower had certain expenses not been reduced during the periods shown.
D Total returns do not include the effect of the contingent deferred sales charge.
E Calculated based on average shares outstanding during the period.
F Amounts do not include the activity of the underlying funds.
G For the period July 24, 2003 (commencement of operations) to March 31, 2004.
H Expense ratios reflect operating expenses of the class. Expenses before reductions do not reflect amounts reimbursed by the investment adviser or expense offset arrangements and do not represent the amount paid by the class during periods when
reimbursements or reductions occur. Expense ratios before reductions for start up periods may not be representative of longer term operating periods. Expenses net of fee waivers reflect expenses after reimbursement by the investment adviser but
prior to reductions from expense offset arrangements. Expenses net of all reductions represent the net expenses paid by the class but do not include expenses of the investment companies in which the fund invests.
I Total distribution of $.224 per share is comprised of distributions from net investment income of $.189 and distributions from net realized gain of $.035 per share.
|
See accompanying notes which are an integral part of the financial statements.
| | |
| Annual Report | | 22 |
| Financial Highlights Class C | | | | | | | | | | |
| Years ended March 31, | | 2006 | | | | 2005 | | | | 2004G |
| Selected Per-Share Data | | | | | | | | | | |
| Net asset value, beginning of period | | $ 10.28 | | | | $ 10.37 | | | | $ 10.00 |
| Income from Investment Operations | | | | | | | | | | |
| Net investment income (loss)E | | .22 | | | | .12 | | | | .07 |
| Net realized and unrealized gain (loss) | | .22 | | | | (.09) | | | | .37 |
| Total from investment operations | | .44 | | | | .03 | | | | .44 |
| Distributions from net investment income | | (.19) | | | | (.11) | | | | (.07) |
| Distributions from net realized gain | | (.04) | | | | (.01) | | | | — |
| Total distributions | | (.22)I | | | | (.12) | | | | (.07) |
| Net asset value, end of period | | $ 10.50 | | | | $ 10.28 | | | | $ 10.37 |
| Total ReturnB,C,D | | 4.37% | | | | .24% | | | | 4.39% |
| Ratios to Average Net AssetsF,H | | | | | | | | | | |
| Expenses before reductions | | 1.01% | | | | 1.10% | | | | 1.10%A |
| Expenses net of fee waivers, if any | | 1.01% | | | | 1.08% | | | | 1.08%A |
| Expenses net of all reductions | | 1.01% | | | | 1.08% | | | | 1.08%A |
| Net investment income (loss) | | 2.08% | | | | 1.21% | | | | 1.06%A |
| Supplemental Data | | | | | | | | | | |
| Net assets, end of period (000 omitted) | | $ 13,678 | | | | $ 14,097 | | | | $ 9,248 |
| Portfolio turnover rate | | 21% | | | | 18% | | | | 46%A |
A Annualized
B Total returns for periods of less than one year are not annualized.
C Total returns would have been lower had certain expenses not been reduced during the periods shown.
D Total returns do not include the effect of the contingent deferred sales charge.
E Calculated based on average shares outstanding during the period.
F Amounts do not include the activity of the underlying funds.
G For the period July 24, 2003 (commencement of operations) to March 31, 2004.
H Expense ratios reflect operating expenses of the class. Expenses before reductions do not reflect amounts reimbursed by the investment adviser or expense offset arrangements and do not represent the amount paid by the class during periods when
reimbursements or reductions occur. Expense ratios before reductions for start up periods may not be representative of longer term operating periods. Expenses net of fee waivers reflect expenses after reimbursement by the investment adviser but
prior to reductions from expense offset arrangements. Expenses net of all reductions represent the net expenses paid by the class but do not include expenses of the investment companies in which the fund invests.
I Total distribution of $.224 per share is comprised of distributions from net investment income of $.189 and distributions from net realized gain of $.035 per share.
|
| Financial Highlights Institutional Class | | | | | | | | | | |
| Years ended March 31, | | 2006 | | | | 2005 | | | | 2004F |
| Selected Per-Share Data | | | | | | | | | | |
| Net asset value, beginning of period | | $ 10.31 | | | | $ 10.41 | | | | $ 10.00 |
| Income from Investment Operations | | | | | | | | | | |
| Net investment income (loss)D | | .32 | | | | .23 | | | | .14 |
| Net realized and unrealized gain (loss) | | .23 | | | | (.11) | | | | .37 |
| Total from investment operations | | .55 | | | | .12 | | | | .51 |
| Distributions from net investment income | | (.29) | | | | (.21) | | | | (.10) |
| Distributions from net realized gain | | (.04) | | | | (.01) | | | | — |
| Total distributions | | (.33) | | | | (.22) | | | | (.10) |
| Net asset value, end of period | | $ 10.53 | | | | $ 10.31 | | | | $ 10.41 |
| Total ReturnB,C | | 5.39% | | | | 1.21% | | | | 5.16% |
| Ratios to Average Net AssetsE,G | | | | | | | | | | |
| Expenses before reductions | | .01% | | | | .10% | | | | .10%A |
| Expenses net of fee waivers, if any | | .01% | | | | .08% | | | | .08%A |
| Expenses net of all reductions | | .01% | | | | .08% | | | | .08%A |
| Net investment income (loss) | | 3.08% | | | | 2.21% | | | | 2.05%A |
| Supplemental Data | | | | | | | | | | |
| Net assets, end of period (000 omitted) | | $ 1,134 | | | | $ 626 | | | | $ 359 |
| Portfolio turnover rate | | 21% | | | | 18% | | | | 46%A |
A Annualized
B Total returns for periods of less than one year are not annualized.
C Total returns would have been lower had certain expenses not been reduced during the periods shown.
D Calculated based on average shares outstanding during the period.
E Amounts do not include the activity of the underlying funds.
F For the period July 24, 2003 (commencement of operations) to March 31, 2004.
G Expense ratios reflect operating expenses of the class. Expenses before reductions do not reflect amounts reimbursed by the investment adviser or expense offset arrangements and do not represent the amount paid by the class during periods when
reimbursements or reductions occur. Expense ratios before reductions for start up periods may not be representative of longer term operating periods. Expenses net of fee waivers reflect expenses after reimbursement by the investment adviser but
prior to reductions from expense offset arrangements. Expenses net of all reductions represent the net expenses paid by the class but do not include expenses of the investment companies in which the fund invests.
|
See accompanying notes which are an integral part of the financial statements.
|
23 Annual Report
| Fidelity Advisor Freedom 2005 Fund | | |
| Investment Changes | | |
| |
| |
| Fund Holdings as of March 31, 2006 | | |
| | | % of fund’s | | % of fund’s investments |
| | | investments | | 6 months ago |
| Domestic Equity Funds | | | | |
| Fidelity Advisor Dividend Growth | | | | |
| Fund Institutional Class | | 8.3 | | 7.9 |
| Fidelity Advisor Equity Growth | | | | |
| Fund Institutional Class | | 5.0 | | 4.1 |
| Fidelity Advisor Equity Income | | | | |
| Fund Institutional Class | | 8.3 | | 8.0 |
| Fidelity Advisor Growth & Income | | | | |
| Fund Institutional Class | | 6.7 | | 7.9 |
| Fidelity Advisor Large Cap Fund | | | | |
| Institutional Class | | 6.7 | | 7.8 |
| Fidelity Advisor Mid Cap Fund | | | | |
| Institutional Class | | 3.3 | | 2.5 |
| Fidelity Advisor Small Cap Fund | | | | |
| Institutional Class | | 2.5 | | 2.5 |
| | | 40.8 | | 40.7 |
| International Equity Funds | | | | |
| Fidelity Advisor Diversified | | | | |
| International Fund Institutional | | | | |
| Class | | 4.0 | | 2.6 |
| Fidelity Advisor Overseas Fund | | | | |
| Institutional Class | | 4.0 | | 2.5 |
| | | 8.0 | | 5.1 |
| High Yield Fixed-Income Funds | | | | |
| Fidelity Advisor High Income | | | | |
| Advantage Fund Institutional | | | | |
| Class | | 5.2 | | 5.0 |
| Investment Grade Fixed-Income | | | | |
| Funds | | | | |
| Fidelity Advisor Government | | | | |
| Investment Fund Institutional | | | | |
| Class | | 16.5 | | 18.8 |
| Fidelity Advisor Intermediate Bond | | | | |
| Fund Institutional Class | | 16.6 | | 18.5 |
| Fidelity Advisor Strategic Real | | | | |
| Return Fund Institutional Class | | 0.9 | | 0.0 |
| | | 34.0 | | 37.3 |
| Short-Term Funds | | | | |
| Fidelity Advisor Short Fixed | | | | |
| Income Fund Institutional Class | | 6.0 | | 5.9 |
| Fidelity Cash Reserves Fund | | 6.0 | | 6.0 |
| | | 12.0 | | 11.9 |
| | | 100.0 | | 100.0 |
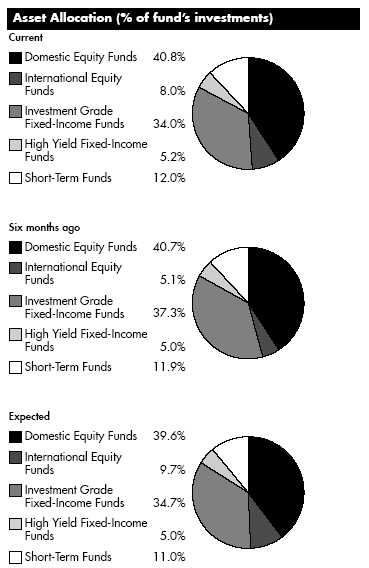
The ”current” allocation is based on the fund’s holdings as of March 31, 2006. The ”expected” allocation represents the fund’s anticipated allocation at September 30, 2006. In March 2006, the target date for combining the fund with the Advisor Freedom Income Fund was extended by approximately five years resulting in a greater allocation to equity funds. Also, beginning in March 2006, the fund increased its allocation to international equity. The ”six months ago” allocation is based on the fund’s holdings as of September 30, 2005, reflecting the prior allocation.
Annual Report 24
| Fidelity Advisor Freedom 2005 Fund | | |
| Investments March 31, 2006 |
| Showing Percentage of Total Value of Investment in Securities |
| |
| Equity Funds 48.8% | | | | |
| | | Shares | | Value (Note 1) |
| Domestic Equity Funds 40.8% | | | | |
| Fidelity Advisor Dividend Growth Fund | | | | |
| Institutional Class | | 278,762 | | $ 3,568,148 |
| Fidelity Advisor Equity Growth Fund | | | | |
| Institutional Class (a) | | 40,183 | | 2,129,680 |
| Fidelity Advisor Equity Income Fund | | | | |
| Institutional Class | | 119,587 | | 3,573,248 |
| Fidelity Advisor Growth & Income Fund | | | | |
| Institutional Class | | 152,521 | | 2,867,398 |
| Fidelity Advisor Large Cap Fund | | | | |
| Institutional Class | | 160,212 | | 2,883,817 |
| Fidelity Advisor Mid Cap Fund | | | | |
| Institutional Class | | 54,182 | | 1,431,480 |
| Fidelity Advisor Small Cap Fund | | | | |
| Institutional Class | | 43,531 | | 1,075,653 |
| |
| TOTAL DOMESTIC EQUITY FUNDS | | | | 17,529,424 |
| International Equity Funds 8.0% | | | | |
| Fidelity Advisor Diversified International | | | | |
| Fund Institutional Class | | 73,921 | | 1,733,449 |
| Fidelity Advisor Overseas Fund | | | | |
| Institutional Class | | 80,386 | | 1,723,474 |
| |
| TOTAL INTERNATIONAL EQUITY FUNDS | | | | 3,456,923 |
| |
| TOTAL EQUITY FUNDS | | | | |
| (Cost $18,584,839) | | | | 20,986,347 |
| |
| Fixed Income Funds 39.2% | | | | |
| |
| High Yield Fixed-Income Funds – 5.2% | | | | |
| Fidelity Advisor High Income Advantage | | | | |
| Fund Institutional Class | | 228,972 | | 2,223,320 |
| Investment Grade Fixed Income Funds 34.0% | | | | |
| Fidelity Advisor Government Investment | | | | |
| Fund Institutional Class | | 730,083 | | 7,111,013 |
| Fidelity Advisor Intermediate Bond Fund | | | | |
| Institutional Class | | 664,068 | | 7,118,808 |
| Fidelity Advisor Strategic Real Return | | | | |
| Fund Institutional Class | | 38,032 | | 379,179 |
| |
| TOTAL INVESTMENT GRADE FIXED-INCOME FUNDS | | | | 14,609,000 |
| |
| TOTAL FIXED-INCOME FUNDS | | | | |
| (Cost $17,120,285) | | | | 16,832,320 |
| Short Term Funds 12.0% | | | | |
| | | Shares | | Value (Note 1) |
| Fidelity Advisor Short Fixed Income Fund | | | | |
| Institutional Class | | 274,136 | | $ 2,565,909 |
| Fidelity Cash Reserves Fund | | 2,583,136 | | 2,583,136 |
| TOTAL SHORT TERM FUNDS | | | | |
| (Cost $5,182,795) | | | | 5,149,045 |
| TOTAL INVESTMENT IN SECURITIES 100% | | | | |
| (Cost $40,887,919) | | | | $ 42,967,712 |
Legend
(a) Non-income producing
|
See accompanying notes which are an integral part of the financial statements.
25 Annual Report
| Fidelity Advisor Freedom 2005 Fund | | | | | | |
| |
| Financial Statements | | | | | | |
| |
| |
| Statement of Assets and Liabilities | | | | | | |
| | | | | | | March 31, 2006 |
| Assets | | | | | | |
| Investment in securities, at value (cost $40,887,919) — See accompanying schedule | | | | | | $ 42,967,712 |
| Cash | | | | | | 65 |
| Receivable for investments sold | | | | | | 500 |
| Receivable for fund shares sold | | | | | | 20,265 |
| Total assets | | | | | | 42,988,542 |
| |
| Liabilities | | | | | | |
| Payable for investments purchased | | | | $ 18,929 | | |
| Payable for fund shares redeemed | | | | 1,829 | | |
| Distribution fees payable | | | | 18,509 | | |
| Other affiliated payables | | | | 565 | | |
| Total liabilities | | | | | | 39,832 |
| |
| Net Assets | | | | | | $ 42,948,710 |
| Net Assets consist of: | | | | | | |
| Paid in capital | | | | | | $ 40,187,444 |
| Undistributed net investment income | | | | | | 142,110 |
| Accumulated undistributed net realized gain (loss) on investments | | | | | | 539,363 |
| Net unrealized appreciation (depreciation) on investments | | | | | | 2,079,793 |
| Net Assets | | | | | | $ 42,948,710 |
| Calculation of Maximum Offering Price | | | | | | |
| Class A: | | | | | | |
| Net Asset Value and redemption price per share ($16,193,759 ÷ 1,429,081 shares) | | | | | | $ 11.33 |
| Maximum offering price per share (100/94.25 of $11.33) | | | | | | $ 12.02 |
| Class T: | | | | | | |
| Net Asset Value and redemption price per share ($13,906,390 ÷ 1,229,053 shares) | | | | | | $ 11.31 |
| Maximum offering price per share (100/96.50 of $11.31) | | | | | | $ 11.72 |
| Class B: | | | | | | |
| Net Asset Value and offering price per share ($3,835,243 ÷ 339,929 shares)A | | | | | | $ 11.28 |
| Class C: | | | | | | |
| Net Asset Value and offering price per share ($7,637,011 ÷ 677,533 shares)A | | | | | | $ 11.27 |
| Institutional Class: | | | | | | |
| Net Asset Value, offering price and redemption price per share ($1,376,307 ÷ 121,099 shares) | | | | | | $ 11.37 |
| |
| A Redemption price per share is equal to net asset value less any applicable contingent deferred sales charge. | | | | | | |
| |
| Statement of Operations | | | | | | |
| | | | | Year ended March 31, 2006 |
| Investment Income | | | | | | |
| Income distributions from underlying funds | | | | | | $ 851,792 |
| Interest | | | | | | 61 |
| Total income | | | | | | 851,853 |
| |
| Expenses | | | | | | |
| Management fee | | | | $ 1,981 | | |
| Distribution fees | | | | 187,332 | | |
| Independent trustees’ compensation | | | | 138 | | |
| Total expenses before reductions | | | | 189,451 | | |
| Expense reductions | | | | (531) | | 188,920 |
| |
| Net investment income (loss) | | | | | | 662,933 |
| Realized and Unrealized Gain (Loss) | | | | | | |
| Realized gain (loss) on sale of underlying fund shares | | | | 61,071 | | |
| Capital gain distributions from underlying funds | | | | 555,775 | | 616,846 |
| Change in net unrealized appreciation (depreciation) on underlying funds | | | | | | 1,887,861 |
| Net gain (loss) | | | | | | 2,504,707 |
| Net increase (decrease) in net assets resulting from operations | | | | | | $ 3,167,640 |
See accompanying notes which are an integral part of the financial statements.
| | |
| Annual Report | | 26 |
| Statement of Changes in Net Assets | | | | | | | | | | | | |
| | | | | | | Year ended | | | | Year ended |
| | | | | | | March 31, | | | | March 31, |
| | | | | | | 2006 | | | | 2005 |
| Increase (Decrease) in Net Assets | | | | | | | | | | |
| Operations | | | | | | | | | | |
| Net investment income (loss) | | | | | | $ 662,933 | | | | $ 266,970 |
| Net realized gain (loss) | | | | | | 616,846 | | | | 66,761 |
| Change in net unrealized appreciation (depreciation) | | | | | | 1,887,861 | | | | 131,084 |
| Net increase (decrease) in net assets resulting from operations | | | | | | 3,167,640 | | | | 464,815 |
| Distributions to shareholders from net investment income | | | | | | (559,364) | | | | (231,296) |
| Distributions to shareholders from net realized gain | | | | | | (151,533) | | | | (3,243) |
| Total distributions | | | | | | (710,897) | | | | (234,539) |
| Share transactions - net increase (decrease) | | | | | | 17,491,701 | | | | 16,679,243 |
| Total increase (decrease) in net assets | | | | | | 19,948,444 | | | | 16,909,519 |
| |
| Net Assets | | | | | | | | | | |
| Beginning of period | | | | | | 23,000,266 | | | | 6,090,747 |
| End of period (including undistributed net investment income of $142,110 and undistributed net investment income of | | | | | | | | | | | | |
| $66,592, respectively) | | | | | | $ 42,948,710 | | | | $ 23,000,266 |
| |
| Financial Highlights Class A | | | | | | | | | | | | |
| Years ended March 31, | | | | 2006 | | | | 2005 | | | | 2004 G |
| Selected Per-Share Data | | | | | | | | | | | | |
| Net asset value, beginning of period | | | | $ 10.57 | | | | $ 10.49 | | | | $ 10.00 |
| Income from Investment Operations | | | | | | | | | | | | |
| Net investment income (loss) E | | | | .25 | | | | .22 | | | | .09 |
| Net realized and unrealized gain (loss) | | | | .76 | | | | .03 | | | | .46 |
| Total from investment operations | | | | 1.01 | | | | .25 | | | | .55 |
| Distributions from net investment income | | | | (.20) | | | | (.17) | | | | (.06) |
| Distributions from net realized gain | | | | (.05) | | | | — I | | | | — |
| Total distributions | | | | (.25) | | | | (.17) | | | | (.06) |
| Net asset value, end of period | | | | $ 11.33 | | | | $ 10.57 | | | | $ 10.49 |
| Total Return B,C,D | | | | 9.63% | | | | 2.38% | | | | 5.52% |
| Ratios to Average Net Assets F,H | | | | | | | | | | | | |
| Expenses before reductions | | | | .26% | | | | .35% | | | | .35% A |
| Expenses net of fee waivers, if any | | | | .26% | | | | .33% | | | | .33% A |
| Expenses net of all reductions | | | | .26% | | | | .33% | | | | .33% A |
| Net investment income (loss) | | | | 2.25% | | | | 2.13% | | | | 2.21% A |
| Supplemental Data | | | | | | | | | | | | |
| Net assets, end of period (000 omitted) | | | | $ 16,194 | | | | $ 5,970 | | | | $ 1,386 |
| Portfolio turnover rate | | | | 34% | | | | 24% | | | | 9% A |
A Annualized
B Total returns for periods of less than one year are not annualized.
C Total returns would have been lower had certain expenses not been reduced during the periods shown.
D Total returns do not include the effect of the sales charges.
E Calculated based on average shares outstanding during the period.
F Amounts do not include the activity of the underlying funds.
G For the period November 6, 2003 (commencement of operations) to March 31, 2004.
H Expense ratios reflect operating expenses of the class. Expenses before reductions do not reflect amounts reimbursed by the investment adviser or expense offset arrangements and do not represent the amount paid by the class during periods when
reimbursements or reductions occur. Expense ratios before reductions for start up periods may not be representative of longer term operating periods. Expenses net of fee waivers reflect expenses after reimbursement by the investment adviser but prior to
reductions from expense offset arrangements. Expenses net of all reductions represent the net expenses paid by the class but do not include expenses of the investment companies in which the fund invests.
I Amount represents less than $.01 per share.
|
See accompanying notes which are an integral part of the financial statements.
|
27 Annual Report
| Financial Highlights Class T | | | | | | | | | | |
| Years ended March 31, | | 2006 | | | | 2005 | | | | 2004 G |
| Selected Per Share Data | | | | | | | | | | |
| Net asset value, beginning of period | | $ 10.56 | | | | $ 10.48 | | | | $ 10.00 |
| Income from Investment Operations | | | | | | | | | | |
| Net investment income (loss) E | | .22 | | | | .20 | | | | .08 |
| Net realized and unrealized gain (loss) | | .75 | | | | .03 | | | | .46 |
| Total from investment operations | | .97 | | | | .23 | | | | .54 |
| Distributions from net investment income | | (.17) | | | | (.14) | | | | (.06) |
| Distributions from net realized gain | | (.05) | | | | — I | | | | — |
| Total distributions | | (.22) | | | | (.15) J | | | | (.06) |
| Net asset value, end of period | | $ 11.31 | | | | $ 10.56 | | | | $ 10.48 |
| Total Return B,C,D | | 9.31% | | | | 2.17% | | | | 5.36% |
| Ratios to Average Net Assets F,H | | | | | | | | | | |
| Expenses before reductions | | .51% | | | | .60% | | | | .60% A |
| Expenses net of fee waivers, if any | | .50% | | | | .58% | | | | .58% A |
| Expenses net of all reductions | | .50% | | | | .58% | | | | .58% A |
| Net investment income (loss) | | 2.00% | | | | 1.88% | | | | 1.97% A |
| Supplemental Data | | | | | | | | | | |
| Net assets, end of period (000 omitted) | | $ 13,906 | | | | $ 7,977 | | | | $ 2,031 |
| Portfolio turnover rate | | 34% | | | | 24% | | | | 9% A |
A Annualized
B Total returns for periods of less than one year are not annualized.
C Total returns would have been lower had certain expenses not been reduced during the periods shown.
D Total returns do not include the effect of the sales charges.
E Calculated based on average shares outstanding during the period.
F Amounts do not include the activity of the underlying funds.
G For the period November 6, 2003 (commencement of operations) to March 31, 2004.
H Expense ratios reflect operating expenses of the class. Expenses before reductions do not reflect amounts reimbursed by the investment adviser or expense offset arrangements and do not represent the amount paid by the class during periods when
reimbursements or reductions occur. Expense ratios before reductions for start up periods may not be representative of longer term operating periods. Expenses net of fee waivers reflect expenses after reimbursement by the investment adviser but
prior to reductions from expense offset arrangements. Expenses net of all reductions represent the net expenses paid by the class but do not include expenses of the investment companies in which the fund invests.
I Amount represents less than $.01 per share.
J Total distribution of $.148 per share is comprised of distributions from net investment income of $.144 and distributions from net realized gain of $.004 per share.
|
| Financial Highlights Class B | | | | | | | | | | |
| Years ended March 31, | | 2006 | | | | 2005 | | | | 2004 G |
| Selected Per Share Data | | | | | | | | | | |
| Net asset value, beginning of period | | $ 10.53 | | | | $ 10.47 | | | | $ 10.00 |
| Income from Investment Operations | | | | | | | | | | |
| Net investment income (loss) E | | .16 | | | | .14 | | | | .06 |
| Net realized and unrealized gain (loss) | | .76 | | | | .03 | | | | .46 |
| Total from investment operations | | .92 | | | | .17 | | | | .52 |
| Distributions from net investment income | | (.12) | | | | (.11) | | | | (.05) |
| Distributions from net realized gain | | (.05) | | | | — I | | | | — |
| Total distributions | | (.17) | | | | (.11) | | | | (.05) |
| Net asset value, end of period | | $ 11.28 | | | | $ 10.53 | | | | $ 10.47 |
| Total Return B,C,D | | 8.80% | | | | 1.64% | | | | 5.21% |
| Ratios to Average Net Assets F,H | | | | | | | | | | |
| Expenses before reductions | | 1.01% | | | | 1.10% | | | | 1.10% A |
| Expenses net of fee waivers, if any | | 1.00% | | | | 1.08% | | | | 1.08% A |
| Expenses net of all reductions | | 1.00% | | | | 1.08% | | | | 1.08% A |
| Net investment income (loss) | | 1.50% | | | | 1.38% | | | | 1.47% A |
| Supplemental Data | | | | | | | | | | |
| Net assets, end of period (000 omitted) | | $ 3,835 | | | | $ 2,747 | | | | $ 1,203 |
| Portfolio turnover rate | | 34% | | | | 24% | | | | 9% A |
A Annualized
B Total returns for periods of less than one year are not annualized.
C Total returns would have been lower had certain expenses not been reduced during the periods shown.
D Total returns do not include the effect of the contingent deferred sales charge.
E Calculated based on average shares outstanding during the period.
F Amounts do not include the activity of the underlying funds.
G For the period November 6, 2003 (commencement of operations) to March 31, 2004.
H Expense ratios reflect operating expenses of the class. Expenses before reductions do not reflect amounts reimbursed by the investment adviser or expense offset arrangements and do not represent the amount paid by the class during periods when
reimbursements or reductions occur. Expense ratios before reductions for start up periods may not be representative of longer term operating periods. Expenses net of fee waivers reflect expenses after reimbursement by the investment adviser but
prior to reductions from expense offset arrangements. Expenses net of all reductions represent the net expenses paid by the class but do not include expenses of the investment companies in which the fund invests.
I Amount represents less than $.01 per share.
|
See accompanying notes which are an integral part of the financial statements.
| | |
| Annual Report | | 28 |
| Financial Highlights Class C | | | | | | | | | | |
| Years ended March 31, | | 2006 | | | | 2005 | | | | 2004 G |
| Selected Per Share Data | | | | | | | | | | |
| Net asset value, beginning of period | | $ 10.53 | | | | $ 10.47 | | | | $ 10.00 |
| Income from Investment Operations | | | | | | | | | | |
| Net investment income (loss) E | | .16 | | | | .14 | | | | .06 |
| Net realized and unrealized gain (loss) | | .75 | | | | .04 | | | | .46 |
| Total from investment operations | | .91 | | | | .18 | | | | .52 |
| Distributions from net investment income | | (.12) | | | | (.12) | | | | (.05) |
| Distributions from net realized gain | | (.05) | | | | — I | | | | — |
| Total distributions | | (.17) | | | | (.12) | | | | (.05) |
| Net asset value, end of period | | $ 11.27 | | | | $ 10.53 | | | | $ 10.47 |
| Total Return B,C,D | | 8.74% | | | | 1.74% | | | | 5.21% |
| Ratios to Average Net Assets F,H | | | | | | | | | | |
| Expenses before reductions | | 1.01% | | | | 1.10% | | | | 1.10% A |
| Expenses net of fee waivers, if any | | 1.01% | | | | 1.08% | | | | 1.08% A |
| Expenses net of all reductions | | 1.01% | | | | 1.08% | | | | 1.08% A |
| Net investment income (loss) | | 1.50% | | | | 1.38% | | | | 1.47% A |
| Supplemental Data | | | | | | | | | | |
| Net assets, end of period (000 omitted) | | $ 7,637 | | | | $ 5,655 | | | | $ 1,073 |
| Portfolio turnover rate | | 34% | | | | 24% | | | | 9% A |
A Annualized
B Total returns for periods of less than one year are not annualized.
C Total returns would have been lower had certain expenses not been reduced during the periods shown.
D Total returns do not include the effect of the contingent deferred sales charge.
E Calculated based on average shares outstanding during the period.
F Amounts do not include the activity of the underlying funds.
G For the period November 6, 2003 (commencement of operations) to March 31, 2004.
H Expense ratios reflect operating expenses of the class. Expenses before reductions do not reflect amounts reimbursed by the investment adviser or expense offset arrangements and do not represent the amount paid by the class during periods when
reimbursements or reductions occur. Expense ratios before reductions for start up periods may not be representative of longer term operating periods. Expenses net of fee waivers reflect expenses after reimbursement by the investment adviser but
prior to reductions from expense offset arrangements. Expenses net of all reductions represent the net expenses paid by the class but do not include expenses of the investment companies in which the fund invests.
I Amount represents less than $.01 per share.
|
| Financial Highlights Institutional Class | | | | | | | | | | |
| Years ended March 31, | | 2006 | | | | 2005 | | | | 2004 F |
| Selected Per Share Data | | | | | | | | | | |
| Net asset value, beginning of period | | $ 10.60 | | | | $ 10.49 | | | | $ 10.00 |
| Income from Investment Operations | | | | | | | | | | |
| Net investment income (loss) D | | .28 | | | | .25 | | | | .10 |
| Net realized and unrealized gain (loss) | | .76 | | | | .04 | | | | .45 |
| Total from investment operations | | 1.04 | | | | .29 | | | | .55 |
| Distributions from net investment income | | (.22) | | | | (.18) | | | | (.06) |
| Distributions from net realized gain | | (.05) | | | | — H | | | | — |
| Total distributions | | (.27) | | | | (.18) | | | | (.06) |
| Net asset value, end of period | | $ 11.37 | | | | $ 10.60 | | | | $ 10.49 |
| Total Return B,C | | 9.92% | | | | 2.79% | | | | 5.52% |
| Ratios to Average Net Assets E,G | | | | | | | | | | |
| Expenses before reductions | | .01% | | | | .10% | | | | .10% A |
| Expenses net of fee waivers, if any | | .00% | | | | .08% | | | | .08% A |
| Expenses net of all reductions | | .00% | | | | .08% | | | | .08% A |
| Net investment income (loss) | | 2.50% | | | | 2.38% | | | | 2.46% A |
| Supplemental Data | | | | | | | | | | |
| Net assets, end of period (000 omitted) | | $ 1,376 | | | | $ 651 | | | | $ 397 |
| Portfolio turnover rate | | 34% | | | | 24% | | | | 9% A |
A Annualized
B Total returns for periods of less than one year are not annualized.
C Total returns would have been lower had certain expenses not been reduced during the periods shown.
D Calculated based on average shares outstanding during the period.
E Amounts do not include the activity of the underlying funds.
F For the period November 6, 2003 (commencement of operations) to March 31, 2004.
G Expense ratios reflect operating expenses of the class. Expenses before reductions do not reflect amounts reimbursed by the investment adviser or expense offset arrangements and do not represent the amount paid by the class during periods when
reimbursements or reductions occur. Expense ratios before reductions for start up periods may not be representative of longer term operating periods. Expenses net of fee waivers reflect expenses after reimbursement by the investment adviser but
prior to reductions from expense offset arrangements. Expenses net of all reductions represent the net expenses paid by the class but do not include expenses of the investment companies in which the fund invests.
H Amount represents less than $.01 per share.
|
See accompanying notes which are an integral part of the financial statements.
|
29 Annual Report
| Fidelity Advisor Freedom 2010 Fund | | |
| Investment Changes | | |
| |
| |
| Fund Holdings as of March 31, 2006 | | |
| | | % of fund’s | | % of fund’s investments |
| | | investments | | 6 months ago |
| Domestic Equity Funds | | | | |
| Fidelity Advisor Dividend Growth | | | | |
| Fund Institutional Class | | 8.6 | | 8.1 |
| Fidelity Advisor Equity Growth | | | | |
| Fund Institutional Class | | 5.0 | | 4.2 |
| Fidelity Advisor Equity Income | | | | |
| Fund Institutional Class | | 8.6 | | 8.1 |
| Fidelity Advisor Growth & Income | | | | |
| Fund Institutional Class | | 6.4 | | 7.9 |
| Fidelity Advisor Large Cap Fund | | | | |
| Institutional Class | | 6.4 | | 7.9 |
| Fidelity Advisor Mid Cap Fund | | | | |
| Institutional Class | | 3.4 | | 2.5 |
| Fidelity Advisor Small Cap Fund | | | | |
| Institutional Class | | 2.5 | | 2.5 |
| | | 40.9 | | 41.2 |
| International Equity Funds | | | | |
| Fidelity Advisor Diversified | | | | |
| International Fund Institutional | | | | |
| Class | | 4.2 | | 2.7 |
| Fidelity Advisor Overseas Fund | | | | |
| Institutional Class | | 4.2 | | 2.6 |
| | | 8.4 | | 5.3 |
| High Yield Fixed-Income Funds | | | | |
| Fidelity Advisor High Income | | | | |
| Advantage Fund Institutional | | | | |
| Class | | 5.0 | | 5.1 |
| Investment Grade Fixed-Income | | | | |
| Funds | | | | |
| Fidelity Advisor Government | | | | |
| Investment Fund Institutional | | | | |
| Class | | 17.6 | | 19.6 |
| Fidelity Advisor Intermediate Bond | | | | |
| Fund Institutional Class | | 17.6 | | 19.5 |
| Fidelity Advisor Strategic Real | | | | |
| Return Fund Institutional Class | | 0.9 | | 0.0 |
| | | 36.1 | | 39.1 |
| Short-Term Funds | | | | |
| Fidelity Advisor Short Fixed | | | | |
| Income Fund Institutional Class | | 4.8 | | 4.6 |
| Fidelity Cash Reserves Fund | | 4.8 | | 4.7 |
| | | 9.6 | | 9.3 |
| | | 100.0 | | 100.0 |
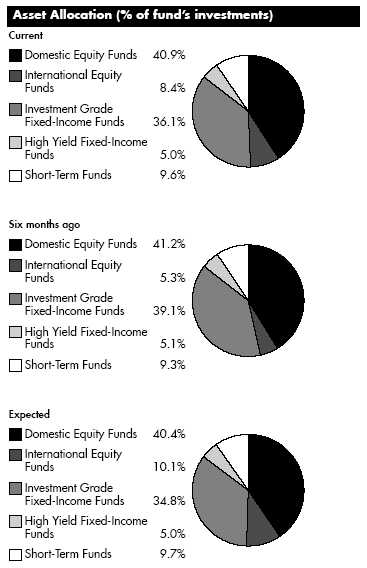
The ”current” allocation is based on the fund’s holdings as of March 31, 2006. The ”expected” allocation represents the fund’s anticipated allocation at September 30, 2006. In March 2006, the target date for combining the fund with the Advisor Freedom Income Fund was extended by approximately five years resulting in a greater allocation to equity funds. Also, beginning in March 2006, the fund increased its allocation to international equity. The ”six months ago” allocation is based on the fund’s holdings as of September 30, 2005, reflecting the prior allocation.
Annual Report 30
| Fidelity Advisor Freedom 2010 Fund | | |
| Investments March 31, 2006 |
| Showing Percentage of Total Value of Investment in Securities |
| |
| Equity Funds 49.3% | | | | |
| | | Shares | | Value (Note 1) |
| Domestic Equity Funds 40.9% | | | | |
| Fidelity Advisor Dividend Growth Fund | | | | |
| Institutional Class | | 2,500,502 | | $ 32,006,424 |
| Fidelity Advisor Equity Growth Fund | | | | |
| Institutional Class (a) | | 353,013 | | 18,709,689 |
| Fidelity Advisor Equity Income Fund | | | | |
| Institutional Class | | 1,069,158 | | 31,946,449 |
| Fidelity Advisor Growth & Income Fund | | | | |
| Institutional Class | | 1,264,236 | | 23,767,634 |
| Fidelity Advisor Large Cap Fund | | | | |
| Institutional Class | | 1,337,927 | | 24,082,678 |
| Fidelity Advisor Mid Cap Fund | | | | |
| Institutional Class | | 475,144 | | 12,553,315 |
| Fidelity Advisor Small Cap Fund | | | | |
| Institutional Class | | 376,861 | | 9,312,230 |
| |
| TOTAL DOMESTIC EQUITY FUNDS | | | | 152,378,419 |
| International Equity Funds 8.4% | | | | |
| Fidelity Advisor Diversified International | | | | |
| Fund Institutional Class | | 666,718 | | 15,634,526 |
| Fidelity Advisor Overseas Fund | | | | |
| Institutional Class | | 724,219 | | 15,527,245 |
| |
| TOTAL INTERNATIONAL EQUITY FUNDS | | | | 31,161,771 |
| |
| TOTAL EQUITY FUNDS | | | | |
| (Cost $161,238,163) | | | | 183,540,190 |
| |
| Fixed Income Funds 41.1% | | | | |
| |
| High Yield Fixed-Income Funds – 5.0% | | | | |
| Fidelity Advisor High Income Advantage | | | | |
| Fund Institutional Class | | 1,944,145 | | 18,877,647 |
| Investment Grade Fixed Income Funds 36.1% | | | | |
| Fidelity Advisor Government Investment | | | | |
| Fund Institutional Class | | 6,728,153 | | 65,532,209 |
| Fidelity Advisor Intermediate Bond Fund | | | | |
| Institutional Class | | 6,127,970 | | 65,691,844 |
| Fidelity Advisor Strategic Real Return | | | | |
| Fund Institutional Class | | 359,201 | | 3,581,231 |
| |
| TOTAL INVESTMENT GRADE FIXED-INCOME FUNDS | | | | 134,805,284 |
| |
| TOTAL FIXED-INCOME FUNDS | | | | |
| (Cost $157,409,552) | | | | 153,682,931 |
| Short Term Funds 9.6% | | | | |
| | | Shares | | Value (Note 1) |
| Fidelity Advisor Short Fixed Income | | | | |
| Fund Institutional Class | | 1,915,167 | | $ 17,925,964 |
| Fidelity Cash Reserves Fund | | 17,920,008 | | 17,920,008 |
| TOTAL SHORT TERM FUNDS | | | | |
| (Cost $36,112,247) | | | | 35,845,972 |
| TOTAL INVESTMENT IN SECURITIES 100% | | | | |
| (Cost $354,759,962) | | | | $373,069,093 |
Legend
(a) Non-income producing
|
See accompanying notes which are an integral part of the financial statements.
31 Annual Report
| Fidelity Advisor Freedom 2010 Fund | | | | | | |
| |
| Financial Statements | | | | | | |
| |
| |
| Statement of Assets and Liabilities | | | | | | |
| | | | | | | March 31, 2006 |
| Assets | | | | | | |
| Investment in securities, at value (cost $354,759,962) — See accompanying schedule | | | | | | $ 373,069,093 |
| Cash | | | | | | 8 |
| Receivable for investments sold | | | | | | 198,447 |
| Receivable for fund shares sold | | | | | | 986,236 |
| Other affiliated receivables | | | | | | 1,406 |
| Total assets | | | | | | 374,255,190 |
| |
| Liabilities | | | | | | |
| Payable for investments purchased | | | | $ 275,784 | | |
| Payable for fund shares redeemed | | | | 898,078 | | |
| Distribution fees payable | | | | 148,103 | | |
| Other affiliated payables | | | | 4,974 | | |
| Total liabilities | | | | | | 1,326,939 |
| |
| Net Assets | | | | | | $ 372,928,251 |
| Net Assets consist of: | | | | | | |
| Paid in capital | | | | | | $ 348,411,924 |
| Undistributed net investment income | | | | | | 1,256,073 |
| Accumulated undistributed net realized gain (loss) on investments | | | | | | 4,951,123 |
| Net unrealized appreciation (depreciation) on investments | | | | | | 18,309,131 |
| Net Assets | | | | | | $ 372,928,251 |
| |
| Calculation of Maximum Offering Price | | | | | | |
| Class A: | | | | | | |
| Net Asset Value and redemption price per share ($146,592,737 ÷ 12,437,518 shares) | | | | | | $ 11.79 |
| Maximum offering price per share (100/94.25 of $11.79) | | | | | | $ 12.51 |
| Class T: | | | | | | |
| Net Asset Value and redemption price per share ($143,011,737 ÷ 12,173,138 shares) | | | | | | $ 11.75 |
| Maximum offering price per share (100/96.50 of $11.75) | | | | | | $ 12.18 |
| Class B: | | | | | | |
| Net Asset Value and offering price per share ($33,403,916 ÷ 2,852,590 shares)A | | | | | | $ 11.71 |
| Class C: | | | | | | |
| Net Asset Value and offering price per share ($38,881,657 ÷ 3,325,046 shares)A | | | | | | $ 11.69 |
| Institutional Class: | | | | | | |
| Net Asset Value, offering price and redemption price per share ($11,038,204 ÷ 933,893 shares) | | | | | | $ 11.82 |
| A Redemption price per share is equal to net asset value less any applicable contingent deferred sales charge. | | | | | | |
| |
| Statement of Operations | | | | | | |
| | | | | Year ended March 31, 2006 |
| Investment Income | | | | | | |
| Income distributions from underlying funds | | | | | | $ 7,408,150 |
| |
| Expenses | | | | | | |
| Management fee | | | | $ 19,560 | | |
| Distribution fees | | | | 1,497,104 | | |
| Independent trustees’ compensation | | | | 1,220 | | |
| Total expenses before reductions | | | | 1,517,884 | | |
| Expense reductions | | | | (5,249) | | 1,512,635 |
| |
| Net investment income (loss) | | | | | | 5,895,515 |
| Realized and Unrealized Gain (Loss) | | | | | | |
| Realized gain (loss) on sale of underlying fund shares | | | | 325,634 | | |
| Capital gain distributions from underlying funds | | | | 4,940,697 | | 5,266,331 |
| Change in net unrealized appreciation (depreciation) on underlying funds | | | | | | 15,956,793 |
| Net gain (loss) | | | | | | 21,223,124 |
| Net increase (decrease) in net assets resulting from operations | | | | | | $ 27,118,639 |
See accompanying notes which are an integral part of the financial statements.
| | |
| Annual Report | | 32 |
| Statement of Changes in Net Assets | | | | | | | | | | | | |
| | | | | | | Year ended | | | | Year ended |
| | | | | | | March 31, | | | | March 31, |
| | | | | | | 2006 | | | | 2005 |
| Increase (Decrease) in Net Assets | | | | | | | | | | |
| Operations | | | | | | | | | | |
| Net investment income (loss) | | | | | | $ 5,895,515 | | | | $ 2,856,146 |
| Net realized gain (loss) | | | | | | 5,266,331 | | | | 949,461 |
| Change in net unrealized appreciation (depreciation) | | | | | | 15,956,793 | | | | 417,464 |
| Net increase (decrease) in net assets resulting from operations | | | | | | 27,118,639 | | | | 4,223,071 |
| Distributions to shareholders from net investment income | | | | | | (5,136,102) | | | | (2,579,243) |
| Distributions to shareholders from net realized gain | | | | | | (1,279,124) | | | | (20,201) |
| Total distributions | | | | | | (6,415,226) | | | | (2,599,444) |
| Share transactions - net increase (decrease) | | | | | | 123,162,830 | | | | 136,717,726 |
| Total increase (decrease) in net assets | | | | | | 143,866,243 | | | | 138,341,353 |
| |
| Net Assets | | | | | | | | | | |
| Beginning of period | | | | | | 229,062,008 | | | | 90,720,655 |
| End of period (including undistributed net investment income of $1,256,073 and undistributed net investment income of | | | | | | | | | | |
| $718,326, respectively) | | | | | | $ 372,928,251 | | | | $ 229,062,008 |
| |
| Financial Highlights Class A | | | | | | | | | | | | |
| Years ended March 31, | | | | 2006 | | | | 2005 | | | | 2004G |
| Selected Per-Share Data | | | | | | | | | | | | |
| Net asset value, beginning of period | | | | $ 11.01 | | | | $ 10.92 | | | | $ 10.00 |
| Income from Investment Operations | | | | | | | | | | | | |
| Net investment income (loss)E | | | | .25 | | | | .23 | | | | .16 |
| Net realized and unrealized gain (loss) | | | | .80 | | | | .04 | | | | .83 |
| Total from investment operations | | | | 1.05 | | | | .27 | | | | .99 |
| Distributions from net investment income | | | | (.22) | | | | (.18) | | | | (.07) |
| Distributions from net realized gain | | | | (.06) | | | | —I | | | | — |
| Total distributions | | | | (.27)J | | | | (.18) | | | | (.07) |
| Net asset value, end of period | | | | $ 11.79 | | | | $ 11.01 | | | | $ 10.92 |
| Total ReturnB,C,D | | | | 9.65% | | | | 2.48% | | | | 9.92% |
| Ratios to Average Net AssetsF,H | | | | | | | | | | | | |
| Expenses before reductions | | | | .26% | | | | .35% | | | | .35%A |
| Expenses net of fee waivers, if any | | | | .26% | | | | .33% | | | | .33%A |
| Expenses net of all reductions | | | | .26% | | | | .33% | | | | .33%A |
| Net investment income (loss) | | | | 2.23% | | | | 2.10% | | | | 2.14%A |
| Supplemental Data | | | | | | | | | | | | |
| Net assets, end of period (000 omitted) | | | | $ 146,593 | | | | $ 74,013 | | | | $ 32,615 |
| Portfolio turnover rate | | | | 7% | | | | 5% | | | | 103%A |
A Annualized
B Total returns for periods of less than one year are not annualized.
C Total returns would have been lower had certain expenses not been reduced during the periods shown.
D Total returns do not include the effect of the sales charges.
E Calculated based on average shares outstanding during the period.
F Amounts do not include the activity of the underlying funds.
G For the period July 24, 2003 (commencement of operations) to March 31, 2004.
H Expense ratios reflect operating expenses of the class. Expenses before reductions do not reflect amounts reimbursed by the investment adviser or expense offset arrangements and do not represent the amount paid by the class during periods when
reimbursements or reductions occur. Expense ratios before reductions for start up periods may not be representative of longer term operating periods. Expenses net of fee waivers reflect expenses after reimbursement by the investment adviser but prior to
reductions from expense offset arrangements. Expenses net of all reductions represent the net expenses paid by the class but do not include expenses of the investment companies in which the fund invests.
I Amount represents less than $.01 per share.
J Total distribution of $.27 per share is comprised of distributions from net investment income of $.215 and distributions from net realized gain of $.055 per share.
|
See accompanying notes which are an integral part of the financial statements.
|
33 Annual Report
| Financial Highlights Class T | | | | | | | | | | |
| Years ended March 31, | | 2006 | | | | 2005 | | | | 2004G |
| Selected Per Share Data | | | | | | | | | | |
| Net asset value, beginning of period | | $ 10.97 | | | | $ 10.90 | | | | $ 10.00 |
| Income from Investment Operations | | | | | | | | | | |
| Net investment income (loss)E | | .22 | | | | .20 | | | | .14 |
| Net realized and unrealized gain (loss) | | .80 | | | | .04 | | | | .83 |
| Total from investment operations | | 1.02 | | | | .24 | | | | .97 |
| Distributions from net investment income | | (.19) | | | | (.17) | | | | (.07) |
| Distributions from net realized gain | | (.06) | | | | —I | | | | — |
| Total distributions | | (.24)J | | | | (.17) | | | | (.07) |
| Net asset value, end of period | | $ 11.75 | | | | $ 10.97 | | | | $ 10.90 |
| Total ReturnB,C,D | | 9.42% | | | | 2.18% | | | | 9.72% |
| Ratios to Average Net AssetsF,H | | | | | | | | | | |
| Expenses before reductions | | .51% | | | | .60% | | | | .60%A |
| Expenses net of fee waivers, if any | | .51% | | | | .58% | | | | .58%A |
| Expenses net of all reductions | | .51% | | | | .58% | | | | .58%A |
| Net investment income (loss) | | 1.98% | | | | 1.86% | | | | 1.89%A |
| Supplemental Data | | | | | | | | | | |
| Net assets, end of period (000 omitted) | | $ 143,012 | | | | $ 94,744 | | | | $ 29,964 |
| Portfolio turnover rate | | 7% | | | | 5% | | | | 103%A |
A Annualized
B Total returns for periods of less than one year are not annualized.
C Total returns would have been lower had certain expenses not been reduced during the periods shown.
D Total returns do not include the effect of the sales charges.
E Calculated based on average shares outstanding during the period.
F Amounts do not include the activity of the underlying funds.
G For the period July 24, 2003 (commencement of operations) to March 31, 2004.
H Expense ratios reflect operating expenses of the class. Expenses before reductions do not reflect amounts reimbursed by the investment adviser or expense offset arrangements and do not represent the amount paid by the class during periods when
reimbursements or reductions occur. Expense ratios before reductions for start up periods may not be representative of longer term operating periods. Expenses net of fee waivers reflect expenses after reimbursement by the investment adviser but
prior to reductions from expense offset arrangements. Expenses net of all reductions represent the net expenses paid by the class but do not include expenses of the investment companies in which the fund invests.
I Amount represents less than $.01 per share.
J Total distribution of $.242 per share is comprised of distributions from net investment income of $.187 and distributions from net realized gain of $.055 per share.
|
| Financial Highlights Class B | | | | | | | | | | |
| Years ended March 31, | | 2006 | | | | 2005 | | | | 2004G |
| Selected Per Share Data | | | | | | | | | | |
| Net asset value, beginning of period | | $ 10.94 | | | | $ 10.87 | | | | $ 10.00 |
| Income from Investment Operations | | | | | | | | | | |
| Net investment income (loss)E | | .17 | | | | .15 | | | | .10 |
| Net realized and unrealized gain (loss) | | .79 | | | | .04 | | | | .83 |
| Total from investment operations | | .96 | | | | .19 | | | | .93 |
| Distributions from net investment income | | (.13) | | | | (.12) | | | | (.06) |
| Distributions from net realized gain | | (.06) | | | | —I | | | | — |
| Total distributions | | (.19) | | | | (.12) | | | | (.06) |
| Net asset value, end of period | | $ 11.71 | | | | $ 10.94 | | | | $ 10.87 |
| Total ReturnB,C,D | | 8.83% | | | | 1.72% | | | | 9.32% |
| Ratios to Average Net AssetsF,H | | | | | | | | | | |
| Expenses before reductions | | 1.01% | | | | 1.10% | | | | 1.10%A |
| Expenses net of fee waivers, if any | | 1.01% | | | | 1.08% | | | | 1.08%A |
| Expenses net of all reductions | | 1.01% | | | | 1.08% | | | | 1.08%A |
| Net investment income (loss) | | 1.48% | | | | 1.35% | | | | 1.39%A |
| Supplemental Data | | | | | | | | | | |
| Net assets, end of period (000 omitted) | | $ 33,404 | | | | $ 27,098 | | | | $ 14,897 |
| Portfolio turnover rate | | 7% | | | | 5% | | | | 103%A |
A Annualized
B Total returns for periods of less than one year are not annualized.
C Total returns would have been lower had certain expenses not been reduced during the periods shown.
D Total returns do not include the effect of the contingent deferred sales charge.
E Calculated based on average shares outstanding during the period.
F Amounts do not include the activity of the underlying funds.
G For the period July 24, 2003 (commencement of operations) to March 31, 2004.
H Expense ratios reflect operating expenses of the class. Expenses before reductions do not reflect amounts reimbursed by the investment adviser or expense offset arrangements and do not represent the amount paid by the class during periods when
reimbursements or reductions occur. Expense ratios before reductions for start up periods may not be representative of longer term operating periods. Expenses net of fee waivers reflect expenses after reimbursement by the investment adviser but
prior to reductions from expense offset arrangements. Expenses net of all reductions represent the net expenses paid by the class but do not include expenses of the investment companies in which the fund invests.
I Amount represents less than $.01 per share.
|
See accompanying notes which are an integral part of the financial statements.
| | |
| Annual Report | | 34 |
| Financial Highlights Class C | | | | | | | | | | |
| Years ended March 31, | | 2006 | | | | 2005 | | | | 2004G |
| Selected Per Share Data | | | | | | | | | | |
| Net asset value, beginning of period | | $ 10.93 | | | | $ 10.87 | | | | $ 10.00 |
| Income from Investment Operations | | | | | | | | | | |
| Net investment income (loss)E | | .17 | | | | .15 | | | | .10 |
| Net realized and unrealized gain (loss) | | .78 | | | | .04 | | | | .83 |
| Total from investment operations | | .95 | | | | .19 | | | | .93 |
| Distributions from net investment income | | (.14) | | | | (.13) | | | | (.06) |
| Distributions from net realized gain | | (.06) | | | | —I | | | | — |
| Total distributions | | (.19)J | | | | (.13) | | | | (.06) |
| Net asset value, end of period | | $ 11.69 | | | | $ 10.93 | | | | $ 10.87 |
| Total ReturnB,C,D | | 8.78% | | | | 1.72% | | | | 9.32% |
| Ratios to Average Net AssetsF,H | | | | | | | | | | |
| Expenses before reductions | | 1.01% | | | | 1.10% | | | | 1.10%A |
| Expenses net of fee waivers, if any | | 1.01% | | | | 1.08% | | | | 1.08%A |
| Expenses net of all reductions | | 1.01% | | | | 1.08% | | | | 1.08%A |
| Net investment income (loss) | | 1.48% | | | | 1.36% | | | | 1.39%A |
| Supplemental Data | | | | | | | | | | |
| Net assets, end of period (000 omitted) | | $ 38,882 | | | | $ 27,668 | | | | $ 11,552 |
| Portfolio turnover rate | | 7% | | | | 5% | | | | 103%A |
A Annualized
B Total returns for periods of less than one year are not annualized.
C Total returns would have been lower had certain expenses not been reduced during the periods shown.
D Total returns do not include the effect of the contingent deferred sales charge.
E Calculated based on average shares outstanding during the period.
F Amounts do not include the activity of the underlying funds.
G For the period July 24, 2003 (commencement of operations) to March 31, 2004.
H Expense ratios reflect operating expenses of the class. Expenses before reductions do not reflect amounts reimbursed by the investment adviser or expense offset arrangements and do not represent the amount paid by the class during periods when
reimbursements or reductions occur. Expense ratios before reductions for start up periods may not be representative of longer term operating periods. Expenses net of fee waivers reflect expenses after reimbursement by the investment adviser but
prior to reductions from expense offset arrangements. Expenses net of all reductions represent the net expenses paid by the class but do not include expenses of the investment companies in which the fund invests.
I Amount represents less than $.01 per share.
J Total distribution of $.191 per share is comprised of distributions from net investment income of $.136 and distributions from net realized gain of $.055 per share.
|
| Financial Highlights Institutional Class | | | | | | | | | | |
| Years ended March 31, | | 2006 | | | | 2005 | | | | 2004F |
| Selected Per Share Data | | | | | | | | | | |
| Net asset value, beginning of period | | $ 11.03 | | | | $ 10.93 | | | | $ 10.00 |
| Income from Investment Operations | | | | | | | | | | |
| Net investment income (loss)D | | 28 | | | | .26 | | | | .17 |
| Net realized and unrealized gain (loss) | | 80 | | | | .05 | | | | .83 |
| Total from investment operations | | 1.08 | | | | .31 | | | | 1.00 |
| Distributions from net investment income | | (.24) | | | | (.20) | | | | (.07) |
| Distributions from net realized gain | | (.06) | | | | —H | | | | — |
| Total distributions | | (.29)J | | | | (.21)I | | | | (.07) |
| Net asset value, end of period | | $ 11.82 | | | | $ 11.03 | | | | $ 10.93 |
| Total ReturnB,C | | 9.94% | | | | 2.80% | | | | 10.02% |
| Ratios to Average Net AssetsE,G | | | | | | | | | | |
| Expenses before reductions | | 01% | | | | .10% | | | | .10%A |
| Expenses net of fee waivers, if any | | 01% | | | | .08% | | | | .08%A |
| Expenses net of all reductions | | 01% | | | | .08% | | | | .08%A |
| Net investment income (loss) | | 2.48% | | | | 2.35% | | | | 2.38%A |
| Supplemental Data | | | | | | | | | | |
| Net assets, end of period (000 omitted) | | $ 11,038 | | | | $ 5,538 | | | | $ 1,691 |
| Portfolio turnover rate | | 7% | | | | 5% | | | | 103%A |
A Annualized
B Total returns for periods of less than one year are not annualized.
C Total returns would have been lower had certain expenses not been reduced during the periods shown.
D Calculated based on average shares outstanding during the period.
E Amounts do not include the activity of the underlying funds.
F For the period July 24, 2003 (commencement of operations) to March 31, 2004.
G Expense ratios reflect operating expenses of the class. Expenses before reductions do not reflect amounts reimbursed by the investment adviser or expense offset arrangements and do not represent the amount paid by the class during periods when
reimbursements or reductions occur. Expense ratios before reductions for start up periods may not be representative of longer term operating periods. Expenses net of fee waivers reflect expenses after reimbursement by the investment adviser but
prior to reductions from expense offset arrangements. Expenses net of all reductions represent the net expenses paid by the class but do not include expenses of the investment companies in which the fund invests.
H Amount represents less than $.01 per share.
I Total distribution of $.206 per share is comprised of distributions from net investment income of $.204 and distributions from net realized gain of $.002 per share.
J Total distribution of $.292 per share is comprised of distributions from net investment income of $.237 and distributions from net realized gain of $.055 per share.
|
See accompanying notes which are an integral part of the financial statements.
|
35 Annual Report
| Fidelity Advisor Freedom 2015 Fund | | |
| Investment Changes | | |
| |
| |
| Fund Holdings as of March 31, 2006 | | |
| | | % of fund’s | | % of fund’s investments |
| | | investments | | 6 months ago |
| Domestic Equity Funds | | | | |
| Fidelity Advisor Dividend Growth | | | | |
| Fund Institutional Class | | 9.9 | | 10.1 |
| Fidelity Advisor Equity Growth | | | | |
| Fund Institutional Class | | 5.8 | | 5.2 |
| Fidelity Advisor Equity Income | | | | |
| Fund Institutional Class | | 10.0 | | 10.0 |
| Fidelity Advisor Growth & Income | | | | |
| Fund Institutional Class | | 7.7 | | 9.9 |
| Fidelity Advisor Large Cap Fund | | | | |
| Institutional Class | | 7.7 | | 9.8 |
| Fidelity Advisor Mid Cap Fund | | | | |
| Institutional Class | | 4.0 | | 3.2 |
| Fidelity Advisor Small Cap Fund | | | | |
| Institutional Class | | 3.0 | | 3.1 |
| | | 48.1 | | 51.3 |
| International Equity Funds | | | | |
| Fidelity Advisor Diversified | | | | |
| International Fund Institutional | | | | |
| Class | | 5.5 | | 4.3 |
| Fidelity Advisor Overseas Fund | | | | |
| Institutional Class | | 5.4 | | 4.3 |
| | | 10.9 | | 8.6 |
| High Yield Fixed-Income Funds | | | | |
| Fidelity Advisor High Income | | | | |
| Advantage Fund Institutional | | | | |
| Class | | 6.7 | | 6.7 |
| Investment Grade Fixed-Income | | | | |
| Funds | | | | |
| Fidelity Advisor Government | | | | |
| Investment Fund Institutional | | | | |
| Class | | 14.5 | | 15.0 |
| Fidelity Advisor Intermediate Bond | | | | |
| Fund Institutional Class | | 14.6 | | 14.9 |
| Fidelity Advisor Strategic Real | | | | |
| Return Fund Institutional Class | | 1.0 | | 0.0 |
| | | 30.1 | | 29.9 |
| Short-Term Funds | | | | |
| Fidelity Advisor Short Fixed | | | | |
| Income Fund Institutional Class | | 2.1 | | 1.6 |
| Fidelity Cash Reserves Fund | | 2.1 | | 1.9 |
| | | 4.2 | | 3.5 |
| | | 100.0 | | 100.0 |
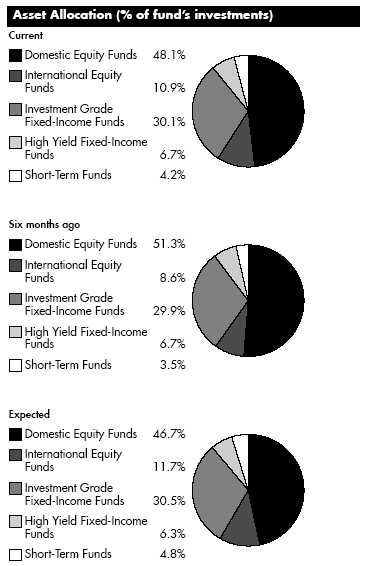
The fund invests according to an asset allocation strategy that becomes increasingly conservative over time. The ”six months ago” allocation is based on the fund’s holdings as of September 30, 2005. The ”current” allocation is based on the fund’s holdings as of March 31, 2006. The ”expected” allocation represents the fund’s anticipated allocation at September 30, 2006. Beginning in March 2006, the fund changed its asset allocation strategy, resulting in an increased emphasis on international equity.
Annual Report 36
| Fidelity Advisor Freedom 2015 Fund | | |
| Investments March 31, 2006 |
| Showing Percentage of Total Value of Investment in Securities |
| |
| Equity Funds 59.0% | | | | |
| | | Shares | | Value (Note 1) |
| Domestic Equity Funds 48.1% | | | | |
| Fidelity Advisor Dividend Growth Fund | | | | |
| Institutional Class | | 2,692,299 | | $ 34,461,421 |
| Fidelity Advisor Equity Growth Fund | | | | |
| Institutional Class (a) | | 382,080 | | 20,250,241 |
| Fidelity Advisor Equity Income Fund | | | | |
| Institutional Class | | 1,170,091 | | 34,962,328 |
| Fidelity Advisor Growth & Income Fund | | | | |
| Institutional Class | | 1,434,668 | | 26,971,753 |
| Fidelity Advisor Large Cap Fund | | | | |
| Institutional Class | | 1,501,407 | | 27,025,320 |
| Fidelity Advisor Mid Cap Fund | | | | |
| Institutional Class | | 532,282 | | 14,062,889 |
| Fidelity Advisor Small Cap Fund | | | | |
| Institutional Class | | 430,479 | | 10,637,144 |
| |
| TOTAL DOMESTIC EQUITY FUNDS | | | | 168,371,096 |
| International Equity Funds 10.9% | | | | |
| Fidelity Advisor Diversified International | | | | |
| Fund Institutional Class | | 822,079 | | 19,277,757 |
| Fidelity Advisor Overseas Fund | | | | |
| Institutional Class | | 879,836 | | 18,863,675 |
| |
| TOTAL INTERNATIONAL EQUITY FUNDS | | | | 38,141,432 |
| |
| TOTAL EQUITY FUNDS | | | | |
| (Cost $184,765,295) | | | | 206,512,528 |
| |
| Fixed Income Funds 36.8% | | | | |
| |
| High Yield Fixed-Income Funds – 6.7% | | | | |
| Fidelity Advisor High Income Advantage | | | | |
| Fund Institutional Class | | 2,404,362 | | 23,346,356 |
| Investment Grade Fixed Income Funds 30.1% | | | | |
| Fidelity Advisor Government Investment | | | | |
| Fund Institutional Class | | 5,210,025 | | 50,745,642 |
| Fidelity Advisor Intermediate Bond Fund | | | | |
| Institutional Class | | 4,782,154 | | 51,264,687 |
| Fidelity Advisor Strategic Real Return | | | | |
| Fund Institutional Class | | 346,294 | | 3,452,551 |
| |
| TOTAL INVESTMENT GRADE FIXED-INCOME FUNDS | | | | 105,462,880 |
| |
| TOTAL FIXED-INCOME FUNDS | | | | |
| (Cost $130,918,888) | | | | 128,809,236 |
| Short Term Funds 4.2% | | | | |
| | | Shares | | Value (Note 1) |
| Fidelity Advisor Short Fixed Income | | | | |
| Fund Institutional Class | | 776,735 | | $ 7,270,237 |
| Fidelity Cash Reserves Fund | | 7,282,020 | | 7,282,020 |
| TOTAL SHORT TERM FUNDS | | | | |
| (Cost $14,628,666) | | | | 14,552,257 |
| TOTAL INVESTMENT IN SECURITIES 100% | | | | |
| (Cost $330,312,849) | | | | $349,874,021 |
Legend
(a) Non-income producing
|
See accompanying notes which are an integral part of the financial statements.
37 Annual Report
| Fidelity Advisor Freedom 2015 Fund | | | | | | |
| |
| Financial Statements | | | | | | |
| |
| |
| Statement of Assets and Liabilities | | | | | | |
| | | | | | | March 31, 2006 |
| Assets | | | | | | |
| Investment in securities, at value (cost $330,312,849) — See accompanying schedule | | | | | | $ 349,874,021 |
| Cash | | | | | | 4 |
| Receivable for investments sold | | | | | | 91,039 |
| Receivable for fund shares sold | | | | | | 1,139,780 |
| Total assets | | | | | | 351,104,844 |
| |
| Liabilities | | | | | | |
| Payable for investments purchased | | | | $ 716,846 | | |
| Payable for fund shares redeemed | | | | 508,947 | | |
| Distribution fees payable | | | | 133,189 | | |
| Other affiliated payables | | | | 6,987 | | |
| Total liabilities | | | | | | 1,365,969 |
| |
| Net Assets | | | | | | $ 349,738,875 |
| Net Assets consist of: | | | | | | |
| Paid in capital | | | | | | $ 324,459,687 |
| Undistributed net investment income | | | | | | 874,617 |
| Accumulated undistributed net realized gain (loss) on investments | | | | | | 4,843,399 |
| Net unrealized appreciation (depreciation) on investments | | | | | | 19,561,172 |
| Net Assets | | | | | | $ 349,738,875 |
| |
| Calculation of Maximum Offering Price | | | | | | |
| Class A: | | | | | | |
| Net Asset Value and redemption price per share ($128,240,739 ÷ 10,834,960 shares) | | | | �� | | $ 11.84 |
| Maximum offering price per share (100/94.25 of $11.84) | | | | | | $ 12.56 |
| Class T: | | | | | | |
| Net Asset Value and redemption price per share ($125,323,367 ÷ 10,609,770 shares) | | | | | | $ 11.81 |
| Maximum offering price per share (100/96.50 of $11.81) | | | | | | $ 12.24 |
| Class B: | | | | | | |
| Net Asset Value and offering price per share ($33,633,115 ÷ 2,857,206 shares)A | | | | | | $ 11.77 |
| Class C: | | | | | | |
| Net Asset Value and offering price per share ($35,656,103 ÷ 3,029,333 shares)A | | | | | | $ 11.77 |
| Institutional Class: | | | | | | |
| Net Asset Value, offering price and redemption price per share ($26,885,551 ÷ 2,262,113 shares) | | | | | | $ 11.89 |
| A Redemption price per share is equal to net asset value less any applicable contingent deferred sales charge. | | | | | | |
| |
| Statement of Operations | | | | | | |
| | | | | Year ended March 31, 2006 |
| Investment Income | | | | | | |
| Income distributions from underlying funds | | | | | | $ 5,245,300 |
| Interest | | | | | | 371 |
| Total income | | | | | | 5,245,671 |
| |
| Expenses | | | | | | |
| Management fee | | | | $ 13,329 | | |
| Distribution fees | | | | 1,182,507 | | |
| Independent trustees’ compensation | | | | 948 | | |
| Total expenses before reductions | | | | 1,196,784 | | |
| Expense reductions | | | | (3,711) | | 1,193,073 |
| |
| Net investment income (loss) | | | | | | 4,052,598 |
| Realized and Unrealized Gain (Loss) | | | | | | |
| Realized gain (loss) on sale of underlying fund shares | | | | 66,664 | | |
| Capital gain distributions from underlying funds | | | | 5,299,202 | | 5,365,866 |
| Change in net unrealized appreciation (depreciation) on underlying funds | | | | | | 18,399,382 |
| Net gain (loss) | | | | | | 23,765,248 |
| Net increase (decrease) in net assets resulting from operations | | | | | | $ 27,817,846 |
See accompanying notes which are an integral part of the financial statements.
| | |
| Annual Report | | 38 |
| Statement of Changes in Net Assets | | | | | | | | | | | | |
| | | | | | | Year ended | | | | Year ended |
| | | | | | | March 31, | | | | March 31, |
| | | | | | | 2006 | | | | 2005 |
| Increase (Decrease) in Net Assets | | | | | | | | | | |
| Operations | | | | | | | | | | |
| Net investment income (loss) | | | | | | $ 4,052,598 | | | | $ 1,395,893 |
| Net realized gain (loss) | | | | | | 5,365,866 | | | | 568,476 |
| Change in net unrealized appreciation (depreciation) | | | | | | 18,399,382 | | | | 992,415 |
| Net increase (decrease) in net assets resulting from operations | | | | | | 27,817,846 | | | | 2,956,784 |
| Distributions to shareholders from net investment income | | | | | | (3,337,676) | | | | (1,216,011) |
| Distributions to shareholders from net realized gain | | | | | | (1,130,850) | | | | (6,537) |
| Total distributions | | | | | | (4,468,526) | | | | (1,222,548) |
| Share transactions - net increase (decrease) | | | | | | 174,816,071 | | | | 131,894,217 |
| Total increase (decrease) in net assets | | | | | | 198,165,391 | | | | 133,628,453 |
| |
| Net Assets | | | | | | | | | | |
| Beginning of period | | | | | | 151,573,484 | | | | 17,945,031 |
| End of period (including undistributed net investment income of $874,617 and undistributed net investment income of | | | | | | | | | | |
| $318,954, respectively) | | | | | | $ 349,738,875 | | | | $ 151,573,484 |
| |
| Financial Highlights Class A | | | | | | | | | | | | |
| Years ended March 31, | | | | 2006 | | | | 2005 | | | | 2004G |
| Selected Per-Share Data | | | | | | | | | | | | |
| Net asset value, beginning of period | | | | $ 10.77 | | | | $ 10.57 | | | | $ 10.00 |
| Income from Investment Operations | | | | | | | | | | | | |
| Net investment income (loss)E | | | | .22 | | | | .21 | | | | .07 |
| Net realized and unrealized gain (loss) | | | | 1.07 | | | | .13 | | | | .56 |
| Total from investment operations | | | | 1.29 | | | | .34 | | | | .63 |
| Distributions from net investment income | | | | (.16) | | | | (.14) | | | | (.06) |
| Distributions from net realized gain | | | | (.06) | | | | —I | | | | — |
| Total distributions | | | | (.22) | | | | (.14) | | | | (.06) |
| Net asset value, end of period | | | | $ 11.84 | | | | $ 10.77 | | | | $ 10.57 |
| Total ReturnB,C,D | | | | 12.12% | | | | 3.22% | | | | 6.32% |
| Ratios to Average Net AssetsF,H | | | | | | | | | | | | |
| Expenses before reductions | | | | .26% | | | | .35% | | | | .35%A |
| Expenses net of fee waivers, if any | | | | .26% | | | | .33% | | | | .33%A |
| Expenses net of all reductions | | | | .26% | | | | .33% | | | | .33%A |
| Net investment income (loss) | | | | 1.93% | | | | 2.02% | | | | 1.84%A |
| Supplemental Data | | | | | | | | | | | | |
| Net assets, end of period (000 omitted) | | | | $ 128,241 | | | | $ 45,028 | | | | $ 4,773 |
| Portfolio turnover rate | | | | 4% | | | | 3% | | | | 5%A |
A Annualized
B Total returns for periods of less than one year are not annualized.
C Total returns would have been lower had certain expenses not been reduced during the periods shown.
D Total returns do not include the effect of the sales charges.
E Calculated based on average shares outstanding during the period.
F Amounts do not include the activity of the underlying funds.
G For the period November 6, 2003 (commencement of operations) to March 31, 2004.
H Expense ratios reflect operating expenses of the class. Expenses before reductions do not reflect amounts reimbursed by the investment adviser or expense offset arrangements and do not represent the amount paid by the class during periods when
reimbursements or reductions occur. Expense ratios before reductions for start up periods may not be representative of longer term operating periods. Expenses net of fee waivers reflect expenses after reimbursement by the investment adviser but prior to
reductions from expense offset arrangements. Expenses net of all reductions represent the net expenses paid by the class but do not include expenses of the investment companies in which the fund invests.
I Amount represents less than $.01 per share.
|
See accompanying notes which are an integral part of the financial statements.
|
39 Annual Report
| Financial Highlights Class T | | | | | | | | | | |
| Years ended March 31, | | 2006 | | | | 2005 | | | | 2004G |
| Selected Per Share Data | | | | | | | | | | |
| Net asset value, beginning of period | | $ 10.76 | | | | $ 10.57 | | | | $ 10.00 |
| Income from Investment Operations | | | | | | | | | | |
| Net investment income (loss)E | | .19 | | | | .19 | | | | .06 |
| Net realized and unrealized gain (loss) | | 1.06 | | | | .13 | | | | .57 |
| Total from investment operations | | 1.25 | | | | .32 | | | | .63 |
| Distributions from net investment income | | (.14) | | | | (.13) | | | | (.06) |
| Distributions from net realized gain | | (.06) | | | | —I | | | | — |
| Total distributions | | (.20) | | | | (.13) | | | | (.06) |
| Net asset value, end of period | | $ 11.81 | | | | $ 10.76 | | | | $ 10.57 |
| Total ReturnB,C,D | | 11.71% | | | | 3.01% | | | | 6.27% |
| Ratios to Average Net AssetsF,H | | | | | | | | | | |
| Expenses before reductions | | .51% | | | | .60% | | | | .60%A |
| Expenses net of fee waivers, if any | | .51% | | | | .58% | | | | .58%A |
| Expenses net of all reductions | | .51% | | | | .58% | | | | .58%A |
| Net investment income (loss) | | 1.68% | | | | 1.77% | | | | 1.59%A |
| Supplemental Data | | | | | | | | | | |
| Net assets, end of period (000 omitted) | | $ 125,323 | | | | $ 55,945 | | | | $ 5,038 |
| Portfolio turnover rate | | 4% | | | | 3% | | | | 5%A |
A Annualized
B Total returns for periods of less than one year are not annualized.
C Total returns would have been lower had certain expenses not been reduced during the periods shown.
D Total returns do not include the effect of the sales charges.
E Calculated based on average shares outstanding during the period.
F Amounts do not include the activity of the underlying funds.
G For the period November 6, 2003 (commencement of operations) to March 31, 2004.
H Expense ratios reflect operating expenses of the class. Expenses before reductions do not reflect amounts reimbursed by the investment adviser or expense offset arrangements and do not represent the amount paid by the class during periods when
reimbursements or reductions occur. Expense ratios before reductions for start up periods may not be representative of longer term operating periods. Expenses net of fee waivers reflect expenses after reimbursement by the investment adviser but
prior to reductions from expense offset arrangements. Expenses net of all reductions represent the net expenses paid by the class but do not include expenses of the investment companies in which the fund invests.
I Amount represents less than $.01 per share.
|
| Financial Highlights Class B | | | | | | | | | | |
| Years ended March 31, | | 2006 | | | | 2005 | | | | 2004G |
| Selected Per Share Data | | | | | | | | | | |
| Net asset value, beginning of period | | $ 10.73 | | | | $ 10.56 | | | | $ 10.00 |
| Income from Investment Operations | | | | | | | | | | |
| Net investment income (loss)E | | .13 | | | | .13 | | | | .04 |
| Net realized and unrealized gain (loss) | | 1.06 | | | | .13 | | | | .58 |
| Total from investment operations | | 1.19 | | | | .26 | | | | .62 |
| Distributions from net investment income | | (.09) | | | | (.09) | | | | (.06) |
| Distributions from net realized gain | | (.06) | | | | —I | | | | — |
| Total distributions | | (.15) | | | | (.09) | | | | (.06) |
| Net asset value, end of period | | $ 11.77 | | | | $ 10.73 | | | | $ 10.56 |
| Total ReturnB,C,D | | 11.17% | | | | 2.49% | | | | 6.17% |
| Ratios to Average Net AssetsF,H | | | | | | | | | | |
| Expenses before reductions | | 1.01% | | | | 1.10% | | | | 1.10%A |
| Expenses net of fee waivers, if any | | 1.01% | | | | 1.08% | | | | 1.08%A |
| Expenses net of all reductions | | 1.01% | | | | 1.08% | | | | 1.08%A |
| Net investment income (loss) | | 1.18% | | | | 1.28% | | | | 1.09%A |
| Supplemental Data | | | | | | | | | | |
| Net assets, end of period (000 omitted) | | $ 33,633 | | | | $ 18,813 | | | | $ 4,259 |
| Portfolio turnover rate | | 4% | | | | 3% | | | | 5%A |
A Annualized
B Total returns for periods of less than one year are not annualized.
C Total returns would have been lower had certain expenses not been reduced during the periods shown.
D Total returns do not include the effect of the contingent deferred sales charge.
E Calculated based on average shares outstanding during the period.
F Amounts do not include the activity of the underlying funds.
G For the period November 6, 2003 (commencement of operations) to March 31, 2004.
H Expense ratios reflect operating expenses of the class. Expenses before reductions do not reflect amounts reimbursed by the investment adviser or expense offset arrangements and do not represent the amount paid by the class during periods when
reimbursements or reductions occur. Expense ratios before reductions for start up periods may not be representative of longer term operating periods. Expenses net of fee waivers reflect expenses after reimbursement by the investment adviser but
prior to reductions from expense offset arrangements. Expenses net of all reductions represent the net expenses paid by the class but do not include expenses of the investment companies in which the fund invests.
I Amount represents less than $.01 per share.
|
See accompanying notes which are an integral part of the financial statements.
| | |
| Annual Report | | 40 |
| Financial Highlights Class C | | | | | | | | | | |
| Years ended March 31, | | 2006 | | | | 2005 | | | | 2004G |
| Selected Per Share Data | | | | | | | | | | |
| Net asset value, beginning of period | | $ 10.73 | | | | $ 10.56 | | | | $ 10.00 |
| Income from Investment Operations | | | | | | | | | | |
| Net investment income (loss)E | | .13 | | | | .13 | | | | .04 |
| Net realized and unrealized gain (loss) | | 1.06 | | | | .13 | | | | .57 |
| Total from investment operations | | 1.19 | | | | .26 | | | | .61 |
| Distributions from net investment income | | (.09) | | | | (.09) | | | | (.05) |
| Distributions from net realized gain | | (.06) | | | | —I | | | | — |
| Total distributions | | (.15) | | | | (.09) | | | | (.05) |
| Net asset value, end of period | | $ 11.77 | | | | $ 10.73 | | | | $ 10.56 |
| Total ReturnB,C,D | | 11.19% | | | | 2.47% | | | | 6.12% |
| Ratios to Average Net AssetsF,H | | | | | | | | | | |
| Expenses before reductions | | 1.01% | | | | 1.10% | | | | 1.10%A |
| Expenses net of fee waivers, if any | | 1.01% | | | | 1.08% | | | | 1.08%A |
| Expenses net of all reductions | | 1.01% | | | | 1.08% | | | | 1.08%A |
| Net investment income (loss) | | 1.18% | | | | 1.28% | | | | 1.09%A |
| Supplemental Data | | | | | | | | | | |
| Net assets, end of period (000 omitted) | | $ 35,656 | | | | $ 18,926 | | | | $ 3,593 |
| Portfolio turnover rate | | 4% | | | | 3% | | | | 5%A |
A Annualized
B Total returns for periods of less than one year are not annualized.
C Total returns would have been lower had certain expenses not been reduced during the periods shown.
D Total returns do not include the effect of the contingent deferred sales charge.
E Calculated based on average shares outstanding during the period.
F Amounts do not include the activity of the underlying funds.
G For the period November 6, 2003 (commencement of operations) to March 31, 2004.
H Expense ratios reflect operating expenses of the class. Expenses before reductions do not reflect amounts reimbursed by the investment adviser or expense offset arrangements and do not represent the amount paid by the class during periods when
reimbursements or reductions occur. Expense ratios before reductions for start up periods may not be representative of longer term operating periods. Expenses net of fee waivers reflect expenses after reimbursement by the investment adviser but
prior to reductions from expense offset arrangements. Expenses net of all reductions represent the net expenses paid by the class but do not include expenses of the investment companies in which the fund invests.
I Amount represents less than $.01 per share.
|
| Financial Highlights Institutional Class | | | | | | | | | | |
| Years ended March 31, | | 2006 | | | | 2005 | | | | 2004F |
| Selected Per Share Data | | | | | | | | | | |
| Net asset value, beginning of period | | $ 10.81 | | | | $ 10.59 | | | | $ 10.00 |
| Income from Investment Operations | | | | | | | | | | |
| Net investment income (loss)D | | .25 | | | | .24 | | | | .09 |
| Net realized and unrealized gain (loss) | | 1.07 | | | | .13 | | | | .56 |
| Total from investment operations | | 1.32 | | | | .37 | | | | .65 |
| Distributions from net investment income | | (.18) | | | | (.15) | | | | (.06) |
| Distributions from net realized gain | | (.06) | | | | —H | | | | — |
| Total distributions | | (.24) | | | | (.15) | | | | (.06) |
| Net asset value, end of period | | $ 11.89 | | | | $ 10.81 | | | | $ 10.59 |
| Total ReturnB,C | | 12.36% | | | | 3.52% | | | | 6.52% |
| Ratios to Average Net AssetsE,G | | | | | | | | | | |
| Expenses before reductions | | .01% | | | | .10% | | | | .10%A |
| Expenses net of fee waivers, if any | | .00% | | | | .08% | | | | .08%A |
| Expenses net of all reductions | | .00% | | | | .08% | | | | .08%A |
| Net investment income (loss) | | 2.18% | | | | 2.27% | | | | 2.09%A |
| Supplemental Data | | | | | | | | | | |
| Net assets, end of period (000 omitted) | | $ 26,886 | | | | $ 12,861 | | | | $ 282 |
| Portfolio turnover rate | | 4% | | | | 3% | | | | 5%A |
A Annualized
B Total returns for periods of less than one year are not annualized.
C Total returns would have been lower had certain expenses not been reduced during the periods shown.
D Calculated based on average shares outstanding during the period.
E Amounts do not include the activity of the underlying funds.
F For the period November 6, 2003 (commencement of operations) to March 31, 2004.
G Expense ratios reflect operating expenses of the class. Expenses before reductions do not reflect amounts reimbursed by the investment adviser or expense offset arrangements and do not represent the amount paid by the class during periods when
reimbursements or reductions occur. Expense ratios before reductions for start up periods may not be representative of longer term operating periods. Expenses net of fee waivers reflect expenses after reimbursement by the investment adviser but
prior to reductions from expense offset arrangements. Expenses net of all reductions represent the net expenses paid by the class but do not include expenses of the investment companies in which the fund invests.
H Amount represents less than $.01 per share.
|
See accompanying notes which are an integral part of the financial statements.
|
41 Annual Report
| Fidelity Advisor Freedom 2020 Fund | | |
| Investment Changes | | |
| |
| |
| Fund Holdings as of March 31, 2006 | | |
| | | % of fund’s | | % of fund’s investments |
| | | investments | | 6 months ago |
| Domestic Equity Funds | | | | |
| Fidelity Advisor Dividend Growth | | | | |
| Fund Institutional Class | | 11.8 | | 11.7 |
| Fidelity Advisor Equity Growth | | | | |
| Fund Institutional Class | | 7.0 | | 6.0 |
| Fidelity Advisor Equity Income | | | | |
| Fund Institutional Class | | 11.9 | | 11.7 |
| Fidelity Advisor Growth & Income | | | | |
| Fund Institutional Class | | 8.7 | | 11.6 |
| Fidelity Advisor Large Cap Fund | | | | |
| Institutional Class | | 8.7 | | 11.5 |
| Fidelity Advisor Mid Cap Fund | | | | |
| Institutional Class | | 4.7 | | 3.6 |
| Fidelity Advisor Small Cap Fund | | | | |
| Institutional Class | | 3.5 | | 3.6 |
| | | 56.3 | | 59.7 |
| International Equity Funds | | | | |
| Fidelity Advisor Diversified | | | | |
| International Fund Institutional | | | | |
| Class | | 6.4 | | 5.1 |
| Fidelity Advisor Overseas Fund | | | | |
| Institutional Class | | 6.4 | | 5.0 |
| | | 12.8 | | 10.1 |
| High Yield Fixed-Income Funds | | | | |
| Fidelity Advisor High Income | | | | |
| Advantage Fund Institutional | | | | |
| Class | | 7.6 | | 7.4 |
| Investment Grade Fixed-Income | | | | |
| Funds | | | | |
| Fidelity Advisor Government | | | | |
| Investment Fund Institutional | | | | |
| Class | | 11.2 | | 11.3 |
| Fidelity Advisor Intermediate Bond | | | | |
| Fund Institutional Class | | 11.3 | | 11.4 |
| Fidelity Advisor Strategic Real | | | | |
| Return Fund Institutional Class | | 0.7 | | 0.0 |
| | | 23.2 | | 22.7 |
| Short-Term Funds | | | | |
| Fidelity Advisor Short Fixed | | | | |
| Income Fund Institutional Class | | 0.1 | | 0.0 |
| Fidelity Cash Reserves Fund | | 0.0 | | 0.1 |
| | | 0.1 | | 0.1 |
| | | 100.0 | | 100.0 |
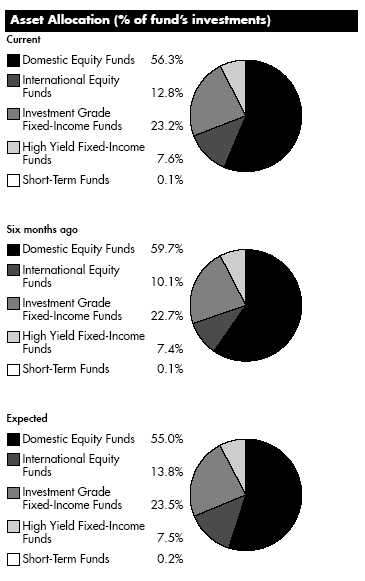
The fund invests according to an asset allocation strategy that becomes increasingly conservative over time. The ”six months ago” allocation is based on the fund’s holdings as of September 30, 2005. The ”current” allocation is based on the fund’s holdings as of March 31, 2006. The ”expected” allocation represents the fund’s anticipated allocation at September 30, 2006. Beginning in March 2006, the fund changed its asset allocation strategy, resulting in an increased emphasis on international equity.
Annual Report 42
| Fidelity Advisor Freedom 2020 Fund | | |
| Investments March 31, 2006 |
| Showing Percentage of Total Value of Investment in Securities |
| |
| Equity Funds 69.1% | | | | |
| | | Shares | | Value (Note 1) |
| Domestic Equity Funds 56.3% | | | | |
| Fidelity Advisor Dividend Growth Fund | | | | |
| Institutional Class | | 6,773,478 | | $ 86,700,513 |
| Fidelity Advisor Equity Growth Fund | | | | |
| Institutional Class (a) | | 975,499 | | 51,701,464 |
| Fidelity Advisor Equity Income Fund | | | | |
| Institutional Class | | 2,925,664 | | 87,418,850 |
| Fidelity Advisor Growth & Income Fund | | | | |
| Institutional Class | | 3,381,211 | | 63,566,768 |
| Fidelity Advisor Large Cap Fund | | | | |
| Institutional Class | | 3,559,036 | | 64,062,648 |
| Fidelity Advisor Mid Cap Fund | | | | |
| Institutional Class | | 1,316,114 | | 34,771,726 |
| Fidelity Advisor Small Cap Fund | | | | |
| Institutional Class | | 1,046,126 | | 25,849,780 |
| |
| TOTAL DOMESTIC EQUITY FUNDS | | | | 414,071,749 |
| International Equity Funds 12.8% | | | | |
| Fidelity Advisor Diversified International | | | | |
| Fund Institutional Class | | 2,015,574 | | 47,265,201 |
| Fidelity Advisor Overseas Fund | | | | |
| Institutional Class | | 2,189,034 | | 46,932,890 |
| |
| TOTAL INTERNATIONAL EQUITY FUNDS | | | | 94,198,091 |
| |
| TOTAL EQUITY FUNDS | | | | |
| (Cost $444,940,095) | | | | 508,269,840 |
| |
| Fixed Income Funds 30.8% | | | | |
| |
| High Yield Fixed-Income Funds – 7.6% | | | | |
| Fidelity Advisor High Income Advantage | | | | |
| Fund Institutional Class | | 5,714,870 | | 55,491,387 |
| Investment Grade Fixed Income Funds 23.2% | | | | |
| Fidelity Advisor Government Investment | | | | |
| Fund Institutional Class | | 8,473,883 | | 82,535,624 |
| Fidelity Advisor Intermediate Bond Fund | | | | |
| Institutional Class | | 7,742,317 | | 82,997,643 |
| Fidelity Advisor Strategic Real Return | | | | |
| Fund Institutional Class | | 471,036 | | 4,696,233 |
| |
| TOTAL INVESTMENT GRADE FIXED-INCOME FUNDS | | | | 170,229,500 |
| |
| TOTAL FIXED-INCOME FUNDS | | | | |
| (Cost $228,769,601) | | | | 225,720,887 |
| Short Term Funds 0.1% | | | | | | |
| | | Shares | | Value (Note 1) |
| Fidelity Advisor Short Fixed Income | | | | | | |
| Fund Institutional Class | | 62,269 | | | | $582,834 |
| Fidelity Cash Reserves Fund | | 552,985 | | | | 552,985 |
| TOTAL SHORT TERM FUNDS | | | | | | |
| (Cost $1,140,219) | | | | | | 1,135,819 |
| TOTAL INVESTMENT IN SECURITIES 100% | | | | | | |
| (Cost $674,849,915) | | | | $735,126,546 |
Legend
(a) Non-income producing
|
See accompanying notes which are an integral part of the financial statements.
43 Annual Report
| Fidelity Advisor Freedom 2020 Fund | | | | | | |
| |
| Financial Statements | | | | | | |
| |
| |
| Statement of Assets and Liabilities | | | | | | |
| | | | | | | March 31, 2006 |
| Assets | | | | | | |
| Investment in securities, at value (cost $674,849,915) — See accompanying schedule | | | | | | $ 735,126,546 |
| Cash | | | | | | 33,698 |
| Receivable for investments sold | | | | | | 1,884 |
| Receivable for fund shares sold | | | | | | 2,262,939 |
| Total assets | | | | | | 737,425,067 |
| |
| Liabilities | | | | | | |
| Payable for investments purchased | | | | $ 1,705,367 | | |
| Payable for fund shares redeemed | | | | 591,683 | | |
| Distribution fees payable | | | | 287,182 | | |
| Other affiliated payables | | | | 11,564 | | |
| Total liabilities | | | | | | 2,595,796 |
| |
| Net Assets | | | | | | $ 734,829,271 |
| Net Assets consist of: | | | | | | |
| Paid in capital | | | | | | $ 659,302,138 |
| Undistributed net investment income | | | | | | 1,350,482 |
| Accumulated undistributed net realized gain (loss) on investments | | | | | | 13,900,020 |
| Net unrealized appreciation (depreciation) on investments | | | | | | 60,276,631 |
| Net Assets | | | | | | $ 734,829,271 |
| Calculation of Maximum Offering Price | | | | | | |
| Class A: | | | | | | |
| Net Asset Value and redemption price per share ($284,466,094 ÷ 22,145,156 shares) | | | | | | $ 12.85 |
| Maximum offering price per share (100/94.25 of $12.85) | | | | | | $ 13.63 |
| Class T: | | | | | | |
| Net Asset Value and redemption price per share ($296,476,535 ÷ 23,104,171 shares) | | | | | | $ 12.83 |
| Maximum offering price per share (100/96.50 of $12.83) | | | | | | $ 13.30 |
| Class B: | | | | | | |
| Net Asset Value and offering price per share ($71,232,374 ÷ 5,572,397 shares)A | | | | | | $ 12.78 |
| Class C: | | | | | | |
| Net Asset Value and offering price per share ($61,442,380 ÷ 4,809,746 shares)A | | | | | | $ 12.77 |
| Institutional Class: | | | | | | |
| Net Asset Value, offering price and redemption price per share ($21,211,888 ÷ 1,644,670 shares) | | | | | | $ 12.90 |
| A Redemption price per share is equal to net asset value less any applicable contingent deferred sales charge. | | | | | | |
| |
| Statement of Operations | | | | | | |
| | | | | Year ended March 31, 2006 |
| Investment Income | | | | | | |
| Income distributions from underlying funds | | | | | | $ 10,385,569 |
| Interest | | | | | | 16 |
| Total income | | | | | | 10,385,585 |
| |
| Expenses | | | | | | |
| Management fee | | | | $ 34,940 | | |
| Distribution fees | | | | 2,766,278 | | |
| Independent trustees’ compensation | | | | 2,268 | | |
| Total expenses before reductions | | | | 2,803,486 | | |
| Expense reductions | | | | (9,616) | | 2,793,870 |
| |
| Net investment income (loss) | | | | | | 7,591,715 |
| Realized and Unrealized Gain (Loss) | | | | | | |
| Realized gain (loss) on sale of underlying fund shares | | | | 1,603,801 | | |
| Capital gain distributions from underlying funds | | | | 13,453,299 | | 15,057,100 |
| Change in net unrealized appreciation (depreciation) on underlying funds | | | | | | 49,835,325 |
| Net gain (loss) | | | | | | 64,892,425 |
| Net increase (decrease) in net assets resulting from operations | | | | | | $ 72,484,140 |
See accompanying notes which are an integral part of the financial statements.
| | |
| Annual Report | | 44 |
| Statement of Changes in Net Assets | | | | | | | | | | | | |
| | | | | | | Year ended | | | | Year ended |
| | | | | | | March 31, | | | | March 31, |
| | | | | | | 2006 | | | | 2005 |
| Increase (Decrease) in Net Assets | | | | | | | | | | | | |
| Operations | | | | | | | | | | | | |
| Net investment income (loss) | | | | | | $ 7,591,715 | | | | $ 4,402,724 |
| Net realized gain (loss) | | | | | | 15,057,100 | | | | 1,965,370 |
| Change in net unrealized appreciation (depreciation) | | | | | | 49,835,325 | | | | 5,996,006 |
| Net increase (decrease) in net assets resulting from operations | | | | | | 72,484,140 | | | | 12,364,100 |
| Distributions to shareholders from net investment income | | | | | | (6,539,824) | | | | (4,439,939) |
| Distributions to shareholders from net realized gain | | | | | | (3,059,372) | | | | (68,080) |
| Total distributions | | | | | | (9,599,196) | | | | (4,508,019) |
| Share transactions - net increase (decrease) | | | | | | 258,660,731 | | | | 239,359,934 |
| Total increase (decrease) in net assets | | | | | | 321,545,675 | | | | 247,216,015 |
| |
| Net Assets | | | | | | | | | | | | |
| Beginning of period | | | | | | 413,283,596 | | | | 166,067,581 |
| End of period (including undistributed net investment income of $1,350,482 and undistributed net investment income of | | | | | | | | | | | | |
| $637,463, respectively) | | | | | | $ 734,829,271 | | | | $ 413,283,596 |
| |
| Financial Highlights Class A | | | | | | | | | | | | |
| Years ended March 31, | | | | 2006 | | | | 2005 | | | | 2004G |
| Selected Per-Share Data | | | | | | | | | | | | |
| Net asset value, beginning of period | | | | $ 11.53 | | | | $ 11.29 | | | | $ 10.00 |
| Income from Investment Operations | | | | | | | | | | | | |
| Net investment income (loss)E | | | | .19 | | | | .20 | | | | .13 |
| Net realized and unrealized gain (loss) | | | | 1.36 | | | | .23 | | | | 1.25 |
| Total from investment operations | | | | 1.55 | | | | .43 | | | | 1.38 |
| Distributions from net investment income | | | | (.16) | | | | (.18) | | | | (.09) |
| Distributions from net realized gain | | | | (.08) | | | | —I | | | | — |
| Total distributions | | | | (.23)K | | | | (.19)J | | | | (.09) |
| Net asset value, end of period | | | | $ 12.85 | | | | $ 11.53 | | | | $ 11.29 |
| Total ReturnB,C,D | | | | 13.62% | | | | 3.75% | | | | 13.78% |
| Ratios to Average Net AssetsF,H | | | | | | | | | | | | |
| Expenses before reductions | | | | .26% | | | | .35% | | | | .35%A |
| Expenses net of fee waivers, if any | | | | .26% | | | | .33% | | | | .33%A |
| Expenses net of all reductions | | | | .26% | | | | .33% | | | | .33%A |
| Net investment income (loss) | | | | 1.60% | | | | 1.80% | | | | 1.74%A |
| Supplemental Data | | | | | | | | | | | | |
| Net assets, end of period (000 omitted) | | | | $ 284,466 | | | | $ 135,306 | | | | $ 72,334 |
| Portfolio turnover rate | | | | 6% | | | | 1% | | | | 4%A |
A Annualized
B Total returns for periods of less than one year are not annualized.
C Total returns would have been lower had certain expenses not been reduced during the periods shown.
D Total returns do not include the effect of the sales charges.
E Calculated based on average shares outstanding during the period.
F Amounts do not include the activity of the underlying funds.
G For the period July 24, 2003 (commencement of operations) to March 31, 2004.
H Expense ratios reflect operating expenses of the class. Expenses before reductions do not reflect amounts reimbursed by the investment adviser or expense offset arrangements and do not represent the amount paid by the class during periods when
reimbursements or reductions occur. Expense ratios before reductions for start up periods may not be representative of longer term operating periods. Expenses net of fee waivers reflect expenses after reimbursement by the investment adviser but prior to
reductions from expense offset arrangements. Expenses net of all reductions represent the net expenses paid by the class but do not include expenses of the investment companies in which the fund invests.
I Amount represents less than $.01 per share.
J Total distribution of $.185 per share is comprised of distributions from net investment income of $.181 and distributions from net realized gain of $.004 per share.
K Total distribution of $.233 per share is comprised of distributions from net investment income of $.158 and distributions from net realized gain of $.075 per share.
|
See accompanying notes which are an integral part of the financial statements.
|
45 Annual Report
| Financial Highlights Class T | | | | | | | | | | |
| Years ended March 31, | | 2006 | | | | 2005 | | | | 2004G |
| Selected Per Share Data | | | | | | | | | | |
| Net asset value, beginning of period | | $ 11.52 | | | | $ 11.29 | | | | $ 10.00 |
| Income from Investment Operations | | | | | | | | | | |
| Net investment income (loss)E | | .16 | | | | .18 | | | | .11 |
| Net realized and unrealized gain (loss) | | 1.36 | | | | .21 | | | | 1.26 |
| Total from investment operations | | 1.52 | | | | .39 | | | | 1.37 |
| Distributions from net investment income | | (.13) | | | | (.16) | | | | (.08) |
| Distributions from net realized gain | | (.08) | | | | —I | | | | — |
| Total distributions | | (.21) | | | | (.16) | | | | (.08) |
| Net asset value, end of period | | $ 12.83 | | | | $ 11.52 | | | | $ 11.29 |
| Total ReturnB,C,D | | 13.28% | | | | 3.46% | | | | 13.73% |
| Ratios to Average Net AssetsF,H | | | | | | | | | | |
| Expenses before reductions | | .51% | | | | .60% | | | | .60%A |
| Expenses net of fee waivers, if any | | .51% | | | | .58% | | | | .58%A |
| Expenses net of all reductions | | .51% | | | | .58% | | | | .58%A |
| Net investment income (loss) | | 1.35% | | | | 1.55% | | | | 1.49%A |
| Supplemental Data | | | | | | | | | | |
| Net assets, end of period (000 omitted) | | $ 296,477 | | | | $ 177,336 | | | | $ 52,310 |
| Portfolio turnover rate | | 6% | | | | 1% | | | | 4%A |
A Annualized
B Total returns for periods of less than one year are not annualized.
C Total returns would have been lower had certain expenses not been reduced during the periods shown.
D Total returns do not include the effect of the sales charges.
E Calculated based on average shares outstanding during the period.
F Amounts do not include the activity of the underlying funds.
G For the period July 24, 2003 (commencement of operations) to March 31, 2004.
H Expense ratios reflect operating expenses of the class. Expenses before reductions do not reflect amounts reimbursed by the investment adviser or expense offset arrangements and do not represent the amount paid by the class during periods when
reimbursements or reductions occur. Expense ratios before reductions for start up periods may not be representative of longer term operating periods. Expenses net of fee waivers reflect expenses after reimbursement by the investment adviser but
prior to reductions from expense offset arrangements. Expenses net of all reductions represent the net expenses paid by the class but do not include expenses of the investment companies in which the fund invests.
I Amount represents less than $.01 per share.
|
| Financial Highlights Class B | | | | | | | | | | |
| Years ended March 31, | | 2006 | | | | 2005 | | | | 2004G |
| Selected Per Share Data | | | | | | | | | | |
| Net asset value, beginning of period | | $ 11.48 | | | | $ 11.27 | | | | $ 10.00 |
| Income from Investment Operations | | | | | | | | | | |
| Net investment income (loss)E | | .10 | | | | .12 | | | | .07 |
| Net realized and unrealized gain (loss) | | 1.35 | | | | .21 | | | | 1.27 |
| Total from investment operations | | 1.45 | | | | .33 | | | | 1.34 |
| Distributions from net investment income | | (.08) | | | | (.12) | | | | (.07) |
| Distributions from net realized gain | | (.07) | | | | —I | | | | — |
| Total distributions | | (.15) | | | | (.12) | | | | (.07) |
| Net asset value, end of period | | $ 12.78 | | | | $ 11.48 | | | | $ 11.27 |
| Total ReturnB,C,D | | 12.71% | | | | 2.93% | | | | 13.37% |
| Ratios to Average Net AssetsF,H | | | | | | | | | | |
| Expenses before reductions | | 1.01% | | | | 1.10% | | | | 1.10%A |
| Expenses net of fee waivers, if any | | 1.01% | | | | 1.08% | | | | 1.08%A |
| Expenses net of all reductions | | 1.01% | | | | 1.08% | | | | 1.08%A |
| Net investment income (loss) | | .85% | | | | 1.05% | | | | .99%A |
| Supplemental Data | | | | | | | | | | |
| Net assets, end of period (000 omitted) | | $ 71,232 | | | | $ 49,398 | | | | $ 23,274 |
| Portfolio turnover rate | | 6% | | | | 1% | | | | 4%A |
A Annualized
B Total returns for periods of less than one year are not annualized.
C Total returns would have been lower had certain expenses not been reduced during the periods shown.
D Total returns do not include the effect of the contingent deferred sales charge.
E Calculated based on average shares outstanding during the period.
F Amounts do not include the activity of the underlying funds.
G For the period July 24, 2003 (commencement of operations) to March 31, 2004.
H Expense ratios reflect operating expenses of the class. Expenses before reductions do not reflect amounts reimbursed by the investment adviser or expense offset arrangements and do not represent the amount paid by the class during periods when
reimbursements or reductions occur. Expense ratios before reductions for start up periods may not be representative of longer term operating periods. Expenses net of fee waivers reflect expenses after reimbursement by the investment adviser but
prior to reductions from expense offset arrangements. Expenses net of all reductions represent the net expenses paid by the class but do not include expenses of the investment companies in which the fund invests.
I Amount represents less than $.01 per share.
|
See accompanying notes which are an integral part of the financial statements.
| | |
| Annual Report | | 46 |
| Financial Highlights Class C | | | | | | | | | | |
| Years ended March 31, | | 2006 | | | | 2005 | | | | 2004G |
| Selected Per Share Data | | | | | | | | | | |
| Net asset value, beginning of period | | $ 11.48 | | | | $ 11.26 | | | | $ 10.00 |
| Income from Investment Operations | | | | | | | | | | |
| Net investment income (loss)E | | .10 | | | | .12 | | | | .07 |
| Net realized and unrealized gain (loss) | | 1.34 | | | | .22 | | | | 1.26 |
| Total from investment operations | | 1.44 | | | | .34 | | | | 1.33 |
| Distributions from net investment income | | (.08) | | | | (.12) | | | | (.07) |
| Distributions from net realized gain | | (.07) | | | | —I | | | | — |
| Total distributions | | (.15) | | | | (.12) | | | | (.07) |
| Net asset value, end of period | | $ 12.77 | | | | $ 11.48 | | | | $ 11.26 |
| Total ReturnB,C,D | | 12.66% | | | | 3.02% | | | | 13.32% |
| Ratios to Average Net AssetsF,H | | | | | | | | | | |
| Expenses before reductions | | 1.01% | | | | 1.10% | | | | 1.10%A |
| Expenses net of fee waivers, if any | | 1.01% | | | | 1.08% | | | | 1.08%A |
| Expenses net of all reductions | | 1.01% | | | | 1.08% | | | | 1.08%A |
| Net investment income (loss) | | .85% | | | | 1.05% | | | | .99%A |
| Supplemental Data | | | | | | | | | | |
| Net assets, end of period (000 omitted) | | $ 61,442 | | | | $ 39,310 | | | | $ 15,871 |
| Portfolio turnover rate | | 6% | | | | 1% | | | | 4%A |
A Annualized
B Total returns for periods of less than one year are not annualized.
C Total returns would have been lower had certain expenses not been reduced during the periods shown.
D Total returns do not include the effect of the contingent deferred sales charge.
E Calculated based on average shares outstanding during the period.
F Amounts do not include the activity of the underlying funds.
G For the period July 24, 2003 (commencement of operations) to March 31, 2004.
H Expense ratios reflect operating expenses of the class. Expenses before reductions do not reflect amounts reimbursed by the investment adviser or expense offset arrangements and do not represent the amount paid by the class during periods when
reimbursements or reductions occur. Expense ratios before reductions for start up periods may not be representative of longer term operating periods. Expenses net of fee waivers reflect expenses after reimbursement by the investment adviser but
prior to reductions from expense offset arrangements. Expenses net of all reductions represent the net expenses paid by the class but do not include expenses of the investment companies in which the fund invests.
I Amount represents less than $.01 per share.
|
| Financial Highlights Institutional Class | | | | | | | | | | |
| Years ended March 31, | | 2006 | | | | 2005 | | | | 2004F |
| Selected Per Share Data | | | | | | | | | | |
| Net asset value, beginning of period | | $ 11.57 | | | | $ 11.31 | | | | $ 10.00 |
| Income from Investment Operations | | | | | | | | | | |
| Net investment income (loss)D | | .23 | | | | .23 | | | | .15 |
| Net realized and unrealized gain (loss) | | 1.36 | | | | .23 | | | | 1.25 |
| Total from investment operations | | 1.59 | | | | .46 | | | | 1.40 |
| Distributions from net investment income | | (.18) | | | | (.20) | | | | (.09) |
| Distributions from net realized gain | | (.08) | | | | —H | | | | — |
| Total distributions | | (.26) | | | | (.20) | | | | (.09) |
| Net asset value, end of period | | $ 12.90 | | | | $ 11.57 | | | | $ 11.31 |
| Total ReturnB,C | | 13.88% | | | | 4.06% | | | | 14.03% |
| Ratios to Average Net AssetsE,G | | | | | | | | | | |
| Expenses before reductions | | .01% | | | | .10% | | | | .10%A |
| Expenses net of fee waivers, if any | | .00% | | | | .08% | | | | .08%A |
| Expenses net of all reductions | | .00% | | | | .08% | | | | .08%A |
| Net investment income (loss) | | 1.85% | | | | 2.05% | | | | 1.98%A |
| Supplemental Data | | | | | | | | | | |
| Net assets, end of period (000 omitted) | | $ 21,212 | | | | $ 11,932 | | | | $ 2,278 |
| Portfolio turnover rate | | 6% | | | | 1% | | | | 4%A |
A Annualized
B Total returns for periods of less than one year are not annualized.
C Total returns would have been lower had certain expenses not been reduced during the periods shown.
D Calculated based on average shares outstanding during the period.
E Amounts do not include the activity of the underlying funds.
F For the period July 24, 2003 (commencement of operations) to March 31, 2004.
G Expense ratios reflect operating expenses of the class. Expenses before reductions do not reflect amounts reimbursed by the investment adviser or expense offset arrangements and do not represent the amount paid by the class during periods when
reimbursements or reductions occur. Expense ratios before reductions for start up periods may not be representative of longer term operating periods. Expenses net of fee waivers reflect expenses after reimbursement by the investment adviser but
prior to reductions from expense offset arrangements. Expenses net of all reductions represent the net expenses paid by the class but do not include expenses of the investment companies in which the fund invests.
H Amount represents less than $.01 per share.
|
See accompanying notes which are an integral part of the financial statements.
|
47 Annual Report
| Fidelity Advisor Freedom 2025 Fund | | |
| Investment Changes | | |
| |
| |
| Fund Holdings as of March 31, 2006 | | |
| | | % of fund’s | | % of fund’s investments |
| | | investments | | 6 months ago |
| Domestic Equity Funds | | | | |
| Fidelity Advisor Dividend Growth | | | | |
| Fund Institutional Class | | 12.4 | | 12.5 |
| Fidelity Advisor Equity Growth | | | | |
| Fund Institutional Class | | 7.2 | | 6.4 |
| Fidelity Advisor Equity Income | | | | |
| Fund Institutional Class | | 12.5 | | 12.5 |
| Fidelity Advisor Growth & Income | | | | |
| Fund Institutional Class | | 9.6 | | 12.6 |
| Fidelity Advisor Large Cap Fund | | | | |
| Institutional Class | | 9.7 | | 12.4 |
| Fidelity Advisor Mid Cap Fund | | | | |
| Institutional Class | | 5.0 | | 3.9 |
| Fidelity Advisor Small Cap Fund | | | | |
| Institutional Class | | 3.7 | | 3.8 |
| | | 60.1 | | 64.1 |
| International Equity Funds | | | | |
| Fidelity Advisor Diversified | | | | |
| International Fund Institutional | | | | |
| Class | | 6.7 | | 5.5 |
| Fidelity Advisor Overseas Fund | | | | |
| Institutional Class | | 6.6 | | 5.5 |
| | | 13.3 | | 11.0 |
| High Yield Fixed-Income Funds | | | | |
| Fidelity Advisor High Income | | | | |
| Advantage Fund Institutional | | | | |
| Class | | 7.5 | | 7.4 |
| Investment Grade Fixed-Income | | | | |
| Funds | | | | |
| Fidelity Advisor Government | | | | |
| Investment Fund Institutional | | | | |
| Class | | 9.3 | | 8.7 |
| Fidelity Advisor Intermediate Bond | | | | |
| Fund Institutional Class | | 9.3 | | 8.8 |
| Fidelity Advisor Strategic Real | | | | |
| Return Fund Institutional Class | | 0.5 | | 0.0 |
| | | 19.1 | | 17.5 |
| | | 100.0 | | 100.0 |
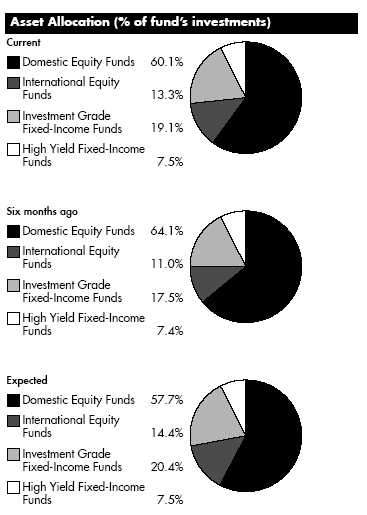
The fund invests according to an asset allocation strategy that becomes increasingly conservative over time. The ”six months ago” allocation is based on the fund’s holdings as of September 30, 2005. The ”current” allocation is based on the fund’s holdings as of March 31, 2006. The ”expected” allocation represents the fund’s anticipated allocation at September 30, 2006. Beginning in March 2006, the fund changed its asset allocation strategy, resulting in an increased emphasis on international equity.
Annual Report 48
| Fidelity Advisor Freedom 2025 Fund | | |
| Investments March 31, 2006 |
| Showing Percentage of Total Value of Investment in Securities |
| |
| Equity Funds 73.4% | | | | |
| | | Shares | | Value (Note 1) |
| Domestic Equity Funds 60.1% | | | | |
| Fidelity Advisor Dividend Growth Fund | | | | |
| Institutional Class | | 2,577,319 | | $ 32,989,689 |
| Fidelity Advisor Equity Growth Fund | | | | |
| Institutional Class (a) | | 362,723 | | 19,224,329 |
| Fidelity Advisor Equity Income Fund | | | | |
| Institutional Class | | 1,111,656 | | 33,216,271 |
| Fidelity Advisor Growth & Income Fund | | | | |
| Institutional Class | | 1,353,621 | | 25,448,071 |
| Fidelity Advisor Large Cap Fund | | | | |
| Institutional Class | | 1,423,742 | | 25,627,360 |
| Fidelity Advisor Mid Cap Fund | | | | |
| Institutional Class | | 496,812 | | 13,125,785 |
| Fidelity Advisor Small Cap Fund | | | | |
| Institutional Class | | 399,192 | | 9,864,023 |
| |
| TOTAL DOMESTIC EQUITY FUNDS | | | | 159,495,528 |
| International Equity Funds 13.3% | | | | |
| Fidelity Advisor Diversified International | | | | |
| Fund Institutional Class | | 755,743 | | 17,722,168 |
| Fidelity Advisor Overseas Fund | | | | |
| Institutional Class | | 815,402 | | 17,482,208 |
| |
| TOTAL INTERNATIONAL EQUITY FUNDS | | | | 35,204,376 |
| |
| TOTAL EQUITY FUNDS | | | | |
| (Cost $173,908,183) | | | | 194,699,904 |
| |
| Fixed Income Funds 26.6% | | | | |
| |
| High Yield Fixed-Income Funds – 7.5% | | | | |
| Fidelity Advisor High Income Advantage | | | | |
| Fund Institutional Class | | 2,054,482 | | 19,949,023 |
| Investment Grade Fixed Income Funds 19.1% | | | | |
| Fidelity Advisor Government Investment | | | | |
| Fund Institutional Class | | 2,517,353 | | 24,519,016 |
| Fidelity Advisor Intermediate Bond Fund | | | | |
| Institutional Class | | 2,298,061 | | 24,635,210 |
| Fidelity Advisor Strategic Real Return | | | | |
| Fund Institutional Class | | 136,363 | | 1,359,537 |
| |
| TOTAL INVESTMENT GRADE FIXED-INCOME FUNDS | | | | 50,513,763 |
| |
| TOTAL FIXED-INCOME FUNDS | | | | |
| (Cost $71,127,176) | | | | 70,462,786 |
| TOTAL INVESTMENT IN SECURITIES 100% | | | | |
| (Cost $245,035,359) | | | | $265,162,690 |
Legend
(a) Non-income producing
|
See accompanying notes which are an integral part of the financial statements.
49 Annual Report
| Fidelity Advisor Freedom 2025 Fund | | | | | | |
| |
| Financial Statements | | | | | | |
| |
| |
| Statement of Assets and Liabilities | | | | | | |
| | | | | | | March 31, 2006 |
| Assets | | | | | | |
| Investment in securities, at value (cost $245,035,359) — See accompanying schedule | | | | | | $ 265,162,690 |
| Cash | | | | | | 51 |
| Receivable for investments sold | | | | | | 23,322 |
| Receivable for fund shares sold | | | | | | 1,136,815 |
| Total assets | | | | | | 266,322,878 |
| |
| Liabilities | | | | | | |
| Payable for investments purchased | | | | $ 925,018 | | |
| Payable for fund shares redeemed | | | | 234,946 | | |
| Distribution fees payable | | | | 98,133 | | |
| Other affiliated payables | | | | 4,656 | | |
| Total liabilities | | | | | | 1,262,753 |
| |
| Net Assets | | | | | | $ 265,060,125 |
| Net Assets consist of: | | | | | | |
| Paid in capital | | | | | | $ 240,012,588 |
| Undistributed net investment income | | | | | | 285,056 |
| Accumulated undistributed net realized gain (loss) on investments | | | | | | 4,635,150 |
| Net unrealized appreciation (depreciation) on investments | | | | | | 20,127,331 |
| Net Assets | | | | | | $ 265,060,125 |
| |
| Calculation of Maximum Offering Price | | | | | | |
| Class A: | | | | | | |
| Net Asset Value and redemption price per share ($128,503,677 ÷ 10,411,344 shares) | | | | | | $ 12.34 |
| Maximum offering price per share (100/94.25 of $12.34) | | | | | | $ 13.09 |
| Class T: | | | | | | |
| Net Asset Value and redemption price per share ($83,955,271 ÷ 6,795,348 shares) | | | | | | $ 12.35 |
| Maximum offering price per share (100/96.50 of $12.35) | | | | | | $ 12.80 |
| Class B: | | | | | | |
| Net Asset Value and offering price per share ($27,110,965 ÷ 2,210,721 shares)A | | | | | | $ 12.26 |
| Class C: | | | | | | |
| Net Asset Value and offering price per share ($20,322,897 ÷ 1,657,110 shares)A | | | | | | $ 12.26 |
| Institutional Class: | | | | | | |
| Net Asset Value, offering price and redemption price per share ($5,167,315 ÷ 417,098 shares) | | | | | | $ 12.39 |
| A Redemption price per share is equal to net asset value less any applicable contingent deferred sales charge. | | | | | | |
| |
| Statement of Operations | | | | | | |
| | | | | Year ended March 31, 2006 |
| Investment Income | | | | | | |
| Income distributions from underlying funds | | | | | | $ 3,160,771 |
| Interest | | | | | | 218 |
| Total income | | | | | | 3,160,989 |
| |
| Expenses | | | | | | |
| Management fee | | | | $ 10,421 | | |
| Distribution fees | | | | 873,364 | | |
| Independent trustees’ compensation | | | | 730 | | |
| Total expenses before reductions | | | | 884,515 | | |
| Expense reductions | | | | (2,875) | | 881,640 |
| |
| Net investment income (loss) | | | | | | 2,279,349 |
| Realized and Unrealized Gain (Loss) | | | | | | |
| Realized gain (loss) on sale of underlying fund shares | | | | 158,296 | | |
| Capital gain distributions from underlying funds | | | | 4,838,876 | | 4,997,172 |
| Change in net unrealized appreciation (depreciation) on underlying funds | | | | | | 18,627,272 |
| Net gain (loss) | | | | | | 23,624,444 |
| Net increase (decrease) in net assets resulting from operations | | | | | | $ 25,903,793 |
See accompanying notes which are an integral part of the financial statements.
| | |
| Annual Report | | 50 |
| Statement of Changes in Net Assets | | | | | | | | | | | | |
| | | | | | | Year ended | | | | Year ended |
| | | | | | | March 31, | | | | March 31, |
| | | | | | | 2006 | | | | 2005 |
| Increase (Decrease) in Net Assets | | | | | | | | | | |
| Operations | | | | | | | | | | |
| Net investment income (loss) | | | | | | $ 2,279,349 | | | | $ 661,992 |
| Net realized gain (loss) | | | | | | 4,997,172 | | | | 319,501 |
| Change in net unrealized appreciation (depreciation) | | | | | | 18,627,272 | | | | 1,358,607 |
| Net increase (decrease) in net assets resulting from operations | | | | | | 25,903,793 | | | | 2,340,100 |
| Distributions to shareholders from net investment income | | | | | | (2,006,218) | | | | (647,465) |
| Distributions to shareholders from net realized gain | | | | | | (689,007) | | | | (1,629) |
| Total distributions | | | | | | (2,695,225) | | | | (649,094) |
| Share transactions - net increase (decrease) | | | | | | 119,342,923 | | | | 110,847,488 |
| Total increase (decrease) in net assets | | | | | | 142,551,491 | | | | 112,538,494 |
| |
| Net Assets | | | | | | | | | | |
| Beginning of period | | | | | | 122,508,634 | | | | 9,970,140 |
| End of period (including undistributed net investment income of $285,056 and undistributed net investment income of | | | | | | | | | | |
| $95,450, respectively) | | | | | | $ 265,060,125 | | | | $ 122,508,634 |
| |
| Financial Highlights Class A | | | | | | | | | | | | |
| Years ended March 31, | | | | 2006 | | | | 2005 | | | | 2004G |
| Selected Per-Share Data | | | | | | | | | | | | |
| Net asset value, beginning of period | | | | $ 10.96 | | | | $ 10.67 | | | | $ 10.00 |
| Income from Investment Operations | | | | | | | | | | | | |
| Net investment income (loss)E | | | | .17 | | | | .19 | | | | .06 |
| Net realized and unrealized gain (loss) | | | | 1.39 | | | | .23 | | | | .67 |
| Total from investment operations | | | | 1.56 | | | | .42 | | | | .73 |
| Distributions from net investment income | | | | (.13) | | | | (.13) | | | | (.06) |
| Distributions from net realized gain | | | | (.05) | | | | —I | | | | — |
| Total distributions | | | | (.18) | | | | (.13) | | | | (.06) |
| Net asset value, end of period | | | | $ 12.34 | | | | $ 10.96 | | | | $ 10.67 |
| Total ReturnB,C,D | | | | 14.35% | | | | 3.96% | | | | 7.32% |
| Ratios to Average Net AssetsF,H | | | | | | | | | | | | |
| Expenses before reductions | | | | .26% | | | | .35% | | | | .35%A |
| Expenses net of fee waivers, if any | | | | .25% | | | | .33% | | | | .33%A |
| Expenses net of all reductions | | | | .25% | | | | .33% | | | | .33%A |
| Net investment income (loss) | | | | 1.44% | | | | 1.76% | | | | 1.59%A |
| Supplemental Data | | | | | | | | | | | | |
| Net assets, end of period (000 omitted) | | | | $ 128,504 | | | | $ 59,347 | | | | $ 2,284 |
| Portfolio turnover rate | | | | 5% | | | | 10% | | | | 6%A |
A Annualized
B Total returns for periods of less than one year are not annualized.
C Total returns would have been lower had certain expenses not been reduced during the periods shown.
D Total returns do not include the effect of the sales charges.
E Calculated based on average shares outstanding during the period.
F Amounts do not include the activity of the underlying funds.
G For the period November 6, 2003 (commencement of operations) to March 31, 2004.
H Expense ratios reflect operating expenses of the class. Expenses before reductions do not reflect amounts reimbursed by the investment adviser or expense offset arrangements and do not represent the amount paid by the class during periods when
reimbursements or reductions occur. Expense ratios before reductions for start up periods may not be representative of longer term operating periods. Expenses net of fee waivers reflect expenses after reimbursement by the investment adviser but prior to
reductions from expense offset arrangements. Expenses net of all reductions represent the net expenses paid by the class but do not include expenses of the investment companies in which the fund invests.
I Amount represents less than $.01 per share.
|
See accompanying notes which are an integral part of the financial statements.
|
51 Annual Report
| Financial Highlights Class T | | | | | | | | | | | | |
| Years ended March 31, | | | | 2006 | | | | 2005 | | | | 2004G |
| Selected Per Share Data | | | | | | | | | | | | |
| Net asset value, beginning of period | | | | $ 10.97 | | | | $ 10.69 | | | | $ 10.00 |
| Income from Investment Operations | | | | | | | | | | | | |
| Net investment income (loss)E | | | | .14 | | | | .16 | | | | .05 |
| Net realized and unrealized gain (loss) | | | | 1.39 | | | | .24 | | | | .70 |
| Total from investment operations | | | | 1.53 | | | | .40 | | | | .75 |
| Distributions from net investment income | | | | (.11) | | | | (.12) | | | | (.06) |
| Distributions from net realized gain | | | | (.05) | | | | —I | | | | — |
| Total distributions | | | | (.15)J | | | | (.12) | | | | (.06) |
| Net asset value, end of period | | | | $ 12.35 | | | | $ 10.97 | | | | $ 10.69 |
| Total ReturnB,C,D | | | | 14.07% | | | | 3.75% | | | | 7.52% |
| Ratios to Average Net AssetsF,H | | | | | | | | | | | | |
| Expenses before reductions | | | | .51% | | | | .60% | | | | .60%A |
| Expenses net of fee waivers, if any | | | | .50% | | | | .58% | | | | .58%A |
| Expenses net of all reductions | | | | .50% | | | | .58% | | | | .58%A |
| Net investment income (loss) | | | | 1.19% | | | | 1.51% | | | | 1.34%A |
| Supplemental Data | | | | | | | | | | | | |
| Net assets, end of period (000 omitted) | | | | $ 83,955 | | | | $ 36,966 | | | | $ 2,556 |
| Portfolio turnover rate | | | | 5% | | | | 10% | | | | 6%A |
A Annualized
B Total returns for periods of less than one year are not annualized.
C Total returns would have been lower had certain expenses not been reduced during the periods shown.
D Total returns do not include the effect of the sales charges.
E Calculated based on average shares outstanding during the period.
F Amounts do not include the activity of the underlying funds.
G For the period November 6, 2003 (commencement of operations) to March 31, 2004.
H Expense ratios reflect operating expenses of the class. Expenses before reductions do not reflect amounts reimbursed by the investment adviser or expense offset arrangements and do not represent the amount paid by the class during periods when
reimbursements or reductions occur. Expense ratios before reductions for start up periods may not be representative of longer term operating periods. Expenses net of fee waivers reflect expenses after reimbursement by the investment adviser but
prior to reductions from expense offset arrangements. Expenses net of all reductions represent the net expenses paid by the class but do not include expenses of the investment companies in which the fund invests.
I Amount represents less than $.01 per share.
J Total distribution of $.154 per share is comprised of distributions from net investment income of $.108 and distributions from net realized gain of $.046 per share.
|
| Financial Highlights Class B | | | | | | | | | | | | |
| Years ended March 31, | | | | 2006 | | | | 2005 | | | | 2004G |
| Selected Per Share Data | | | | | | | | | | | | |
| Net asset value, beginning of period | | | | $ 10.91 | | | | $ 10.64 | | | | $ 10.00 |
| Income from Investment Operations | | | | | | | | | | | | |
| Net investment income (loss)E | | | | .08 | | | | .11 | | | | .03 |
| Net realized and unrealized gain (loss) | | | | 1.38 | | | | .24 | | | | .67 |
| Total from investment operations | | | | 1.46 | | | | .35 | | | | .70 |
| Distributions from net investment income | | | | (.07) | | | | (.08) | | | | (.06) |
| Distributions from net realized gain | | | | (.04) | | | | —I | | | | — |
| Total distributions | | | | (.11) | | | | (.08) | | | | (.06) |
| Net asset value, end of period | | | | $ 12.26 | | | | $ 10.91 | | | | $ 10.64 |
| Total ReturnB,C,D | | | | 13.46% | | | | 3.29% | | | | 6.97% |
| Ratios to Average Net AssetsF,H | | | | | | | | | | | | |
| Expenses before reductions | | | | 1.01% | | | | 1.10% | | | | 1.10%A |
| Expenses net of fee waivers, if any | | | | 1.01% | | | | 1.08% | | | | 1.08%A |
| Expenses net of all reductions | | | | 1.01% | | | | 1.08% | | | | 1.08%A |
| Net investment income (loss) | | | | .69% | | | | 1.01% | | | | .84%A |
| Supplemental Data | | | | | | | | | | | | |
| Net assets, end of period (000 omitted) | | | | $ 27,111 | | | | $ 13,415 | | | | $ 2,771 |
| Portfolio turnover rate | | | | 5% | | | | 10% | | | | 6%A |
A Annualized
B Total returns for periods of less than one year are not annualized.
C Total returns would have been lower had certain expenses not been reduced during the periods shown.
D Total returns do not include the effect of the contingent deferred sales charge.
E Calculated based on average shares outstanding during the period.
F Amounts do not include the activity of the underlying funds.
G For the period November 6, 2003 (commencement of operations) to March 31, 2004.
H Expense ratios reflect operating expenses of the class. Expenses before reductions do not reflect amounts reimbursed by the investment adviser or expense offset arrangements and do not represent the amount paid by the class during periods when
reimbursements or reductions occur. Expense ratios before reductions for start up periods may not be representative of longer term operating periods. Expenses net of fee waivers reflect expenses after reimbursement by the investment adviser but
prior to reductions from expense offset arrangements. Expenses net of all reductions represent the net expenses paid by the class but do not include expenses of the investment companies in which the fund invests.
I Amount represents less than $.01 per share.
|
See accompanying notes which are an integral part of the financial statements.
| | |
| Annual Report | | 52 |
| Financial Highlights Class C | | | | | | | | | | | | |
| Years ended March 31, | | | | 2006 | | | | 2005 | | | | 2004G |
| Selected Per Share Data | | | | | | | | | | | | |
| Net asset value, beginning of period | | | | $ 10.91 | | | | $ 10.65 | | | | $ 10.00 |
| Income from Investment Operations | | | | | | | | | | | | |
| Net investment income (loss)E | | | | .08 | | | | .11 | | | | .03 |
| Net realized and unrealized gain (loss) | | | | 1.38 | | | | .23 | | | | .67 |
| Total from investment operations | | | | 1.46 | | | | .34 | | | | .70 |
| Distributions from net investment income | | | | (.07) | | | | (.08) | | | | (.05) |
| Distributions from net realized gain | | | | (.04) | | | | —I | | | | — |
| Total distributions | | | | (.11) | | | | (.08) | | | | (.05) |
| Net asset value, end of period | | | | $ 12.26 | | | | $ 10.91 | | | | $ 10.65 |
| Total ReturnB,C,D | | | | 13.46% | | | | 3.19% | | | | 7.02% |
| Ratios to Average Net AssetsF,H | | | | | | | | | | | | |
| Expenses before reductions | | | | 1.01% | | | | 1.10% | | | | 1.10%A |
| Expenses net of fee waivers, if any | | | | 1.01% | | | | 1.08% | | | | 1.08%A |
| Expenses net of all reductions | | | | 1.01% | | | | 1.08% | | | | 1.08%A |
| Net investment income (loss) | | | | .69% | | | | 1.01% | | | | .84%A |
| Supplemental Data | | | | | | | | | | | | |
| Net assets, end of period (000 omitted) | | | | $ 20,323 | | | | $ 10,859 | | | | $ 2,137 |
| Portfolio turnover rate | | | | 5% | | | | 10% | | | | 6%A |
A Annualized
B Total returns for periods of less than one year are not annualized.
C Total returns would have been lower had certain expenses not been reduced during the periods shown.
D Total returns do not include the effect of the contingent deferred sales charge.
E Calculated based on average shares outstanding during the period.
F Amounts do not include the activity of the underlying funds.
G For the period November 6, 2003 (commencement of operations) to March 31, 2004.
H Expense ratios reflect operating expenses of the class. Expenses before reductions do not reflect amounts reimbursed by the investment adviser or expense offset arrangements and do not represent the amount paid by the class during periods when
reimbursements or reductions occur. Expense ratios before reductions for start up periods may not be representative of longer term operating periods. Expenses net of fee waivers reflect expenses after reimbursement by the investment adviser but
prior to reductions from expense offset arrangements. Expenses net of all reductions represent the net expenses paid by the class but do not include expenses of the investment companies in which the fund invests.
I Amount represents less than $.01 per share.
|
| Financial Highlights Institutional Class | | | | | | | | | | | | |
| Years ended March 31, | | | | 2006 | | | | 2005 | | | | 2004F |
| Selected Per Share Data | | | | | | | | | | | | |
| Net asset value, beginning of period | | | | $ 10.99 | | | | $ 10.68 | | | | $ 10.00 |
| Income from Investment Operations | | | | | | | | | | | | |
| Net investment income (loss)D | | | | .20 | | | | .22 | | | | .08 |
| Net realized and unrealized gain (loss) | | | | 1.40 | | | | .24 | | | | .66 |
| Total from investment operations | | | | 1.60 | | | | .46 | | | | .74 |
| Distributions from net investment income | | | | (.15) | | | | (.15) | | | | (.06) |
| Distributions from net realized gain | | | | (.05) | | | | —H | | | | — |
| Total distributions | | | | (.20) | | | | (.15) | | | | (.06) |
| Net asset value, end of period | | | | $ 12.39 | | | | $ 10.99 | | | | $ 10.68 |
| Total ReturnB,C | | | | 14.69% | | | | 4.25% | | | | 7.42% |
| Ratios to Average Net AssetsE,G | | | | | | | | | | | | |
| Expenses before reductions | | | | .01% | | | | .10% | | | | .10%A |
| Expenses net of fee waivers, if any | | | | .00% | | | | .08% | | | | .08%A |
| Expenses net of all reductions | | | | .00% | | | | .08% | | | | .08%A |
| Net investment income (loss) | | | | 1.69% | | | | 2.01% | | | | 1.84%A |
| Supplemental Data | | | | | | | | | | | | |
| Net assets, end of period (000 omitted) | | | | $ 5,167 | | | | $ 1,921 | | | | $ 222 |
| Portfolio turnover rate | | | | 5% | | | | 10% | | | | 6%A |
A Annualized
B Total returns for periods of less than one year are not annualized.
C Total returns would have been lower had certain expenses not been reduced during the periods shown.
D Calculated based on average shares outstanding during the period.
E Amounts do not include the activity of the underlying funds.
F For the period November 6, 2003 (commencement of operations) to March 31, 2004.
G Expense ratios reflect operating expenses of the class. Expenses before reductions do not reflect amounts reimbursed by the investment adviser or expense offset arrangements and do not represent the amount paid by the class during periods when
reimbursements or reductions occur. Expense ratios before reductions for start up periods may not be representative of longer term operating periods. Expenses net of fee waivers reflect expenses after reimbursement by the investment adviser but
prior to reductions from expense offset arrangements. Expenses net of all reductions represent the net expenses paid by the class but do not include expenses of the investment companies in which the fund invests.
H Amount represents less than $.01 per share.
|
See accompanying notes which are an integral part of the financial statements.
|
53 Annual Report
| Fidelity Advisor Freedom 2030 Fund | | |
| Investment Changes | | |
| |
| |
| Fund Holdings as of March 31, 2006 | | |
| | | % of fund’s | | % of fund’s investments |
| | | investments | | 6 months ago |
| Domestic Equity Funds | | | | |
| Fidelity Advisor Dividend Growth | | | | |
| Fund Institutional Class | | 13.8 | | 13.7 |
| Fidelity Advisor Equity Growth | | | | |
| Fund Institutional Class | | 8.1 | | 7.1 |
| Fidelity Advisor Equity Income | | | | |
| Fund Institutional Class | | 14.0 | | 13.7 |
| Fidelity Advisor Growth & Income | | | | |
| Fund Institutional Class | | 10.7 | | 13.6 |
| Fidelity Advisor Large Cap Fund | | | | |
| Institutional Class | | 10.8 | | 13.5 |
| Fidelity Advisor Mid Cap Fund | | | | |
| Institutional Class | | 5.6 | | 4.3 |
| Fidelity Advisor Small Cap Fund | | | | |
| Institutional Class | | 4.1 | | 4.2 |
| | | 67.1 | | 70.1 |
| International Equity Funds | | | | |
| Fidelity Advisor Diversified | | | | |
| International Fund Institutional | | | | |
| Class | | 7.7 | | 6.3 |
| Fidelity Advisor Overseas Fund | | | | |
| Institutional Class | | 7.7 | | 6.3 |
| | | 15.4 | | 12.6 |
| High Yield Fixed-Income Funds | | | | |
| Fidelity Advisor High Income | | | | |
| Advantage Fund Institutional | | | | |
| Class | | 7.6 | | 7.4 |
| Investment Grade Fixed-Income | | | | |
| Funds | | | | |
| Fidelity Advisor Government | | | | |
| Investment Fund Institutional | | | | |
| Class | | 4.8 | | 5.0 |
| Fidelity Advisor Intermediate Bond | | | | |
| Fund Institutional Class | | 4.8 | | 4.9 |
| Fidelity Advisor Strategic Real | | | | |
| Return Fund Institutional Class | | 0.3 | | 0.0 |
| | | 9.9 | | 9.9 |
| | | 100.0 | | 100.0 |
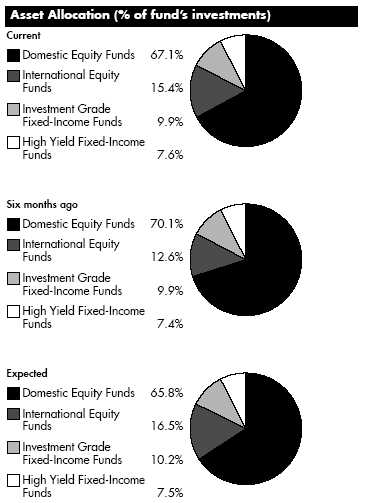
The fund invests according to an asset allocation strategy that becomes increasingly conservative over time. The ”six months ago” allocation is based on the fund’s holdings as of September 30, 2005. The ”current” allocation is based on the fund’s holdings as of March 31, 2006. The ”expected” allocation represents the fund’s anticipated allocation at September 30, 2006. Beginning in March 2006, the fund changed its asset allocation strategy, resulting in an increased emphasis on international equity.
Annual Report 54
| Fidelity Advisor Freedom 2030 Fund | | |
| Investments March 31, 2006 |
| Showing Percentage of Total Value of Investment in Securities |
| |
| Equity Funds 82.5% | | | | |
| | | Shares | | Value (Note 1) |
| Domestic Equity Funds 67.1% | | | | |
| Fidelity Advisor Dividend Growth Fund | | | | |
| Institutional Class | | 4,666,280 | | $ 59,728,389 |
| Fidelity Advisor Equity Growth Fund | | | | |
| Institutional Class (a) | | 665,684 | | 35,281,273 |
| Fidelity Advisor Equity Income Fund | | | | |
| Institutional Class | | 2,025,273 | | 60,515,162 |
| Fidelity Advisor Growth & Income Fund | | | | |
| Institutional Class | | 2,464,415 | | 46,330,996 |
| Fidelity Advisor Large Cap Fund | | | | |
| Institutional Class | | 2,600,007 | | 46,800,127 |
| Fidelity Advisor Mid Cap Fund | | | | |
| Institutional Class | | 911,045 | | 24,069,801 |
| Fidelity Advisor Small Cap Fund | | | | |
| Institutional Class | | 725,606 | | 17,929,726 |
| |
| TOTAL DOMESTIC EQUITY FUNDS | | | | 290,655,474 |
| International Equity Funds 15.4% | | | | |
| Fidelity Advisor Diversified International | | | | |
| Fund Institutional Class | | 1,431,393 | | 33,566,155 |
| Fidelity Advisor Overseas Fund | | | | |
| Institutional Class | | 1,546,937 | | 33,166,325 |
| |
| TOTAL INTERNATIONAL EQUITY FUNDS | | | | 66,732,480 |
| |
| TOTAL EQUITY FUNDS | | | | |
| (Cost $315,034,675) | | | | 357,387,954 |
| |
| Fixed Income Funds 17.5% | | | | |
| |
| High Yield Fixed-Income Funds – 7.6% | | | | |
| Fidelity Advisor High Income Advantage | | | | |
| Fund Institutional Class | | 3,363,189 | | 32,656,563 |
| Investment Grade Fixed Income Funds 9.9% | | | | |
| Fidelity Advisor Government Investment | | | | |
| Fund Institutional Class | | 2,132,153 | | 20,767,172 |
| Fidelity Advisor Intermediate Bond Fund | | | | |
| Institutional Class | | 1,957,058 | | 20,979,658 |
| Fidelity Advisor Strategic Real Return | | | | |
| Fund Institutional Class | | 129,274 | | 1,288,865 |
| |
| TOTAL INVESTMENT GRADE FIXED-INCOME FUNDS | | | | 43,035,695 |
| |
| TOTAL FIXED-INCOME FUNDS | | | | |
| (Cost $75,853,547) | | | | 75,692,258 |
| TOTAL INVESTMENT IN SECURITIES 100% | | | | |
| (Cost $390,888,222) | | | | $433,080,212 |
Legend
(a) Non-income producing
|
See accompanying notes which are an integral part of the financial statements.
55 Annual Report
| Fidelity Advisor Freedom 2030 Fund | | | | | | |
| |
| Financial Statements | | | | | | |
| |
| |
| Statement of Assets and Liabilities | | | | | | |
| | | | | | | March 31, 2006 |
| Assets | | | | | | |
| Investment in securities, at value (cost $390,888,222) — See accompanying schedule | | | | | | $ 433,080,212 |
| Cash | | | | | | 4,015 |
| Receivable for investments sold | | | | | | 36,085 |
| Receivable for fund shares sold | | | | | | 1,087,282 |
| Total assets | | | | | | 434,207,594 |
| |
| Liabilities | | | | | | |
| Payable for investments purchased | | | | $ 551,561 | | |
| Payable for fund shares redeemed | | | | 575,784 | | |
| Distribution fees payable | | | | 171,816 | | |
| Other affiliated payables | | | | 7,864 | | |
| Total liabilities | | | | | | 1,307,025 |
| |
| Net Assets | | | | | | $ 432,900,569 |
| Net Assets consist of: | | | | | | |
| Paid in capital | | | | | | $ 382,298,843 |
| Undistributed net investment income | | | | | | 475,086 |
| Accumulated undistributed net realized gain (loss) on investments | | | | | | 7,934,650 |
| Net unrealized appreciation (depreciation) on investments | | | | | | 42,191,990 |
| Net Assets | | | | | | $ 432,900,569 |
| |
| Calculation of Maximum Offering Price | | | | | | |
| Class A: | | | | | | |
| Net Asset Value and redemption price per share ($156,915,518 ÷ 11,648,988 shares) | | | | | | $ 13.47 |
| Maximum offering price per share (100/94.25 of $13.47) | | | | | | $ 14.29 |
| Class T: | | | | | | |
| Net Asset Value and redemption price per share ($184,028,584 ÷ 13,700,912 shares) | | | | | | $ 13.43 |
| Maximum offering price per share (100/96.50 of $13.43) | | | | | | $ 13.92 |
| Class B: | | | | | | |
| Net Asset Value and offering price per share ($43,098,850 ÷ 3,223,215 shares)A | | | | | | $ 13.37 |
| Class C: | | | | | | |
| Net Asset Value and offering price per share ($37,939,562 ÷ 2,837,837 shares)A | | | | | | $ 13.37 |
| Institutional Class: | | | | | | |
| Net Asset Value, offering price and redemption price per share ($10,918,055 ÷ 808,239 shares) | | | | | | $ 13.51 |
| A Redemption price per share is equal to net asset value less any applicable contingent deferred sales charge. | | | | | | |
| |
| Statement of Operations | | | | | | |
| | | | | Year ended March 31, 2006 |
| Investment Income | | | | | | |
| Income distributions from underlying funds | | | | | | $ 4,443,085 |
| Interest | | | | | | 15 |
| Total income | | | | | | 4,443,100 |
| |
| Expenses | | | | | | |
| Management fee | | | | $ 19,176 | | |
| Distribution fees | | | | 1,575,564 | | |
| Independent trustees’ compensation | | | | 1,259 | | |
| Total expenses before reductions | | | | 1,595,999 | | |
| Expense reductions | | | | (5,324) | | 1,590,675 |
| |
| Net investment income (loss) | | | | | | 2,852,425 |
| Realized and Unrealized Gain (Loss) | | | | | | |
| Realized gain (loss) on sale of underlying fund shares | | | | 92,053 | | |
| Capital gain distributions from underlying funds | | | | 8,711,513 | | 8,803,566 |
| Change in net unrealized appreciation (depreciation) on underlying funds | | | | | | 35,545,698 |
| Net gain (loss) | | | | | | 44,349,264 |
| Net increase (decrease) in net assets resulting from operations | | | | | | $ 47,201,689 |
See accompanying notes which are an integral part of the financial statements.
| | |
| Annual Report | | 56 |
| Statement of Changes in Net Assets | | | | | | | | | | | | |
| | | | | | | Year ended | | | | Year ended |
| | | | | | | March 31, | | | | March 31, |
| | | | | | | 2006 | | | | 2005 |
| Increase (Decrease) in Net Assets | | | | | | | | | | |
| Operations | | | | | | | | | | |
| Net investment income (loss) | | | | | | $ 2,852,425 | | | | $ 1,851,071 |
| Net realized gain (loss) | | | | | | 8,803,566 | | | | 1,016,872 |
| Change in net unrealized appreciation (depreciation) | | | | | | 35,545,698 | | | | 4,336,680 |
| Net increase (decrease) in net assets resulting from operations | | | | | | 47,201,689 | | | | 7,204,623 |
| Distributions to shareholders from net investment income | | | | | | (2,377,341) | | | | (1,985,403) |
| Distributions to shareholders from net realized gain | | | | | | (1,802,422) | | | | (16,365) |
| Total distributions | | | | | | (4,179,763) | | | | (2,001,768) |
| Share transactions - net increase (decrease) | | | | | | 164,372,570 | | | | 142,242,099 |
| Total increase (decrease) in net assets | | | | | | 207,394,496 | | | | 147,444,954 |
| |
| Net Assets | | | | | | | | | | |
| Beginning of period | | | | | | 225,506,073 | | | | 78,061,119 |
| End of period (including undistributed net investment income of $475,086 and undistributed net investment income of | | | | | | | | | | |
| $131,528, respectively) | | | | | | $ 432,900,569 | | | | $ 225,506,073 |
| |
| Financial Highlights Class A | | | | | | | | | | | | |
| Years ended March 31, | | | | 2006 | | | | 2005 | | | | 2004G |
| Selected Per-Share Data | | | | | | | | | | | | |
| Net asset value, beginning of period | | | | $ 11.81 | | | | $ 11.48 | | | | $ 10.00 |
| Income from Investment Operations | | | | | | | | | | | | |
| Net investment income (loss)E | | | | .15 | | | | .18 | | | | .11 |
| Net realized and unrealized gain (loss) | | | | 1.70 | | | | .30 | | | | 1.46 |
| Total from investment operations | | | | 1.85 | | | | .48 | | | | 1.57 |
| Distributions from net investment income | | | | (.11) | | | | (.15) | | | | (.09) |
| Distributions from net realized gain | | | | (.08) | | | | —I | | | | — |
| Total distributions | | | | (.19) | | | | (.15) | | | | (.09) |
| Net asset value, end of period | | | | $ 13.47 | | | | $ 11.81 | | | | $ 11.48 |
| Total ReturnB,C,D | | | | 15.84% | | | | 4.19% | | | | 15.68% |
| Ratios to Average Net AssetsF,H | | | | | | | | | | | | |
| Expenses before reductions | | | | .26% | | | | .35% | | | | .35%A |
| Expenses net of fee waivers, if any | | | | .26% | | | | .33% | | | | .33%A |
| Expenses net of all reductions | | | | .26% | | | | .33% | | | | .33%A |
| Net investment income (loss) | | | | 1.17% | | | | 1.55% | | | | 1.44%A |
| Supplemental Data | | | | | | | | | | | | |
| Net assets, end of period (000 omitted) | | | | $ 156,916 | | | | $ 65,593 | | | | $ 27,879 |
| Portfolio turnover rate | | | | 4% | | | | 2% | | | | 2%A |
A Annualized
B Total returns for periods of less than one year are not annualized.
C Total returns would have been lower had certain expenses not been reduced during the periods shown.
D Total returns do not include the effect of the sales charges.
E Calculated based on average shares outstanding during the period.
F Amounts do not include the activity of the underlying funds.
G For the period July 24, 2003 (commencement of operations) to March 31, 2004.
H Expense ratios reflect operating expenses of the class. Expenses before reductions do not reflect amounts reimbursed by the investment adviser or expense offset arrangements and do not represent the amount paid by the class during periods when
reimbursements or reductions occur. Expense ratios before reductions for start up periods may not be representative of longer term operating periods. Expenses net of fee waivers reflect expenses after reimbursement by the investment adviser but prior to
reductions from expense offset arrangements. Expenses net of all reductions represent the net expenses paid by the class but do not include expenses of the investment companies in which the fund invests.
I Amount represents less than $.01 per share.
|
See accompanying notes which are an integral part of the financial statements.
|
57 Annual Report
| Financial Highlights Class T | | | | | | | | | | |
| Years ended March 31, | | 2006 | | | | 2005 | | | | 2004G |
| Selected Per Share Data | | | | | | | | | | |
| Net asset value, beginning of period | | $ 11.78 | | | | $ 11.47 | | | | $ 10.00 |
| Income from Investment Operations | | | | | | | | | | |
| Net investment income (loss)E | | .11 | | | | .15 | | | | .09 |
| Net realized and unrealized gain (loss) | | 1.70 | | | | .30 | | | | 1.46 |
| Total from investment operations | | 1.81 | | | | .45 | | | | 1.55 |
| Distributions from net investment income | | (.09) | | | | (.14) | | | | (.08) |
| Distributions from net realized gain | | (.08) | | | | —I | | | | — |
| Total distributions | | (.16)J | | | | (.14) | | | | (.08) |
| Net asset value, end of period | | $ 13.43 | | | | $ 11.78 | | | | $ 11.47 |
| Total ReturnB,C,D | | 15.52% | | | | 3.91% | | | | 15.53% |
| Ratios to Average Net AssetsF,H | | | | | | | | | | |
| Expenses before reductions | | .51% | | | | .60% | | | | .60%A |
| Expenses net of fee waivers, if any | | .51% | | | | .58% | | | | .58%A |
| Expenses net of all reductions | | .51% | | | | .58% | | | | .58%A |
| Net investment income (loss) | | 92% | | | | 1.30% | | | | 1.19%A |
| Supplemental Data | | | | | | | | | | |
| Net assets, end of period (000 omitted) | | $ 184,029 | | | | $ 102,153 | | | | $ 27,201 |
| Portfolio turnover rate | | 4% | | | | 2% | | | | 2%A |
A Annualized
B Total returns for periods of less than one year are not annualized.
C Total returns would have been lower had certain expenses not been reduced during the periods shown.
D Total returns do not include the effect of the sales charges.
E Calculated based on average shares outstanding during the period.
F Amounts do not include the activity of the underlying funds.
G For the period July 24, 2003 (commencement of operations) to March 31, 2004.
H Expense ratios reflect operating expenses of the class. Expenses before reductions do not reflect amounts reimbursed by the investment adviser or expense offset arrangements and do not represent the amount paid by the class during periods when
reimbursements or reductions occur. Expense ratios before reductions for start up periods may not be representative of longer term operating periods. Expenses net of fee waivers reflect expenses after reimbursement by the investment adviser but
prior to reductions from expense offset arrangements. Expenses net of all reductions represent the net expenses paid by the class but do not include expenses of the investment companies in which the fund invests.
I Amount represents less than $.01 per share.
J Total distribution of $.164 per share is comprised of distributions from net investment income of $.087 and distributions from net realized gain of $.077 per share.
|
| Financial Highlights Class B | | | | | | | | | | | | |
| Years ended March 31, | | | | 2006 | | | | 2005 | | | | 2004G |
| Selected Per Share Data | | | | | | | | | | | | |
| Net asset value, beginning of period | | | | $ 11.74 | | | | $ 11.44 | | | | $ 10.00 |
| Income from Investment Operations | | | | | | | | | | | | |
| Net investment income (loss)E | | | | .05 | | | | .09 | | | | .05 |
| Net realized and unrealized gain (loss) | | | | 1.70 | | | | .30 | | | | 1.46 |
| Total from investment operations | | | | 1.75 | | | | .39 | | | | 1.51 |
| Distributions from net investment income | | | | (.05) | | | | (.09) | | | | (.07) |
| Distributions from net realized gain | | | | (.07) | | | | —I | | | | — |
| Total distributions | | | | (.12) | | | | (.09) | | | | (.07) |
| Net asset value, end of period | | | | $ 13.37 | | | | $ 11.74 | | | | $ 11.44 |
| Total ReturnB,C,D | | | | 14.96% | | | | 3.41% | | | | 15.12% |
| Ratios to Average Net AssetsF,H | | | | | | | | | | | | |
| Expenses before reductions | | | | 1.01% | | | | 1.10% | | | | 1.10%A |
| Expenses net of fee waivers, if any | | | | 1.01% | | | | 1.08% | | | | 1.08%A |
| Expenses net of all reductions | | | | 1.01% | | | | 1.08% | | | | 1.08%A |
| Net investment income (loss) | | | | .42% | | | | .80% | | | | .69%A |
| Supplemental Data | | | | | | | | | | | | |
| Net assets, end of period (000 omitted) | | | | $ 43,099 | | | | $ 27,653 | | | | $ 12,229 |
| Portfolio turnover rate | | | | 4% | | | | 2% | | | | 2%A |
A Annualized
B Total returns for periods of less than one year are not annualized.
C Total returns would have been lower had certain expenses not been reduced during the periods shown.
D Total returns do not include the effect of the contingent deferred sales charge.
E Calculated based on average shares outstanding during the period.
F Amounts do not include the activity of the underlying funds.
G For the period July 24, 2003 (commencement of operations) to March 31, 2004.
H Expense ratios reflect operating expenses of the class. Expenses before reductions do not reflect amounts reimbursed by the investment adviser or expense offset arrangements and do not represent the amount paid by the class during periods when
reimbursements or reductions occur. Expense ratios before reductions for start up periods may not be representative of longer term operating periods. Expenses net of fee waivers reflect expenses after reimbursement by the investment adviser but
prior to reductions from expense offset arrangements. Expenses net of all reductions represent the net expenses paid by the class but do not include expenses of the investment companies in which the fund invests.
I Amount represents less than $.01 per share.
|
See accompanying notes which are an integral part of the financial statements.
| | |
| Annual Report | | 58 |
| Financial Highlights Class C | | | | | | | | | | | | |
| Years ended March 31, | | | | 2006 | | | | 2005 | | | | 2004G |
| Selected Per Share Data | | | | | | | | | | | | |
| Net asset value, beginning of period | | | | $ 11.74 | | | | $ 11.44 | | | | $ 10.00 |
| Income from Investment Operations | | | | | | | | | | | | |
| Net investment income (loss)E | | | | .05 | | | | .09 | | | | .05 |
| Net realized and unrealized gain (loss) | | | | 1.70 | | | | .30 | | | | 1.46 |
| Total from investment operations | | | | 1.75 | | | | .39 | | | | 1.51 |
| Distributions from net investment income | | | | (.05) | | | | (.09) | | | | (.07) |
| Distributions from net realized gain | | | | (.07) | | | | —I | | | | — |
| Total distributions | | | | (.12) | | | | (.09) | | | | (.07) |
| Net asset value, end of period | | | | $ 13.37 | | | | $ 11.74 | | | | $ 11.44 |
| Total ReturnB,C,D | | | | 14.99% | | | | 3.41% | | | | 15.12% |
| Ratios to Average Net AssetsF,H | | | | | | | | | | | | |
| Expenses before reductions | | | | 1.01% | | | | 1.10% | | | | 1.10%A |
| Expenses net of fee waivers, if any | | | | 1.01% | | | | 1.08% | | | | 1.08%A |
| Expenses net of all reductions | | | | 1.01% | | | | 1.08% | | | | 1.08%A |
| Net investment income (loss) | | | | .42% | | | | .80% | | | | .69%A |
| Supplemental Data | | | | | | | | | | | | |
| Net assets, end of period (000 omitted) | | | | $ 37,940 | | | | $ 22,265 | | | | $ 9,722 |
| Portfolio turnover rate | | | | 4% | | | | 2% | | | | 2%A |
A Annualized
B Total returns for periods of less than one year are not annualized.
C Total returns would have been lower had certain expenses not been reduced during the periods shown.
D Total returns do not include the effect of the contingent deferred sales charge.
E Calculated based on average shares outstanding during the period.
F Amounts do not include the activity of the underlying funds.
G For the period July 24, 2003 (commencement of operations) to March 31, 2004.
H Expense ratios reflect operating expenses of the class. Expenses before reductions do not reflect amounts reimbursed by the investment adviser or expense offset arrangements and do not represent the amount paid by the class during periods when
reimbursements or reductions occur. Expense ratios before reductions for start up periods may not be representative of longer term operating periods. Expenses net of fee waivers reflect expenses after reimbursement by the investment adviser but
prior to reductions from expense offset arrangements. Expenses net of all reductions represent the net expenses paid by the class but do not include expenses of the investment companies in which the fund invests.
I Amount represents less than $.01 per share.
|
| Financial Highlights Institutional Class | | | | | | | | | | | | |
| Years ended March 31, | | | | 2006 | | | | 2005 | | | | 2004F |
| Selected Per Share Data | | | | | | | | | | | | |
| Net asset value, beginning of period | | | | $ 11.84 | | | | $ 11.49 | | | | $ 10.00 |
| Income from Investment Operations | | | | | | | | | | | | |
| Net investment income (loss)D | | | | .18 | | | | .21 | | | | .13 |
| Net realized and unrealized gain (loss) | | | | 1.71 | | | | .31 | | | | 1.45 |
| Total from investment operations | | | | 1.89 | | | | .52 | | | | 1.58 |
| Distributions from net investment income | | | | (.13) | | | | (.17) | | | | (.09) |
| Distributions from net realized gain | | | | (.09) | | | | —H | | | | — |
| Total distributions | | | | (.22) | | | | (.17) | | | | (.09) |
| Net asset value, end of period | | | | $ 13.51 | | | | $ 11.84 | | | | $ 11.49 |
| Total ReturnB,C | | | | 16.10% | | | | 4.50% | | | | 15.83% |
| Ratios to Average Net AssetsE,G | | | | | | | | | | | | |
| Expenses before reductions | | | | .01% | | | | .10% | | | | .10%A |
| Expenses net of fee waivers, if any | | | | .00% | | | | .08% | | | | .08%A |
| Expenses net of all reductions | | | | .00% | | | | .08% | | | | .07%A |
| Net investment income (loss) | | | | 1.42% | | | | 1.80% | | | | 1.69%A |
| Supplemental Data | | | | | | | | | | | | |
| Net assets, end of period (000 omitted) | | | | $ 10,918 | | | | $ 7,841 | | | | $ 1,030 |
| Portfolio turnover rate | | | | 4% | | | | 2% | | | | 2%A |
A Annualized
B Total returns for periods of less than one year are not annualized.
C Total returns would have been lower had certain expenses not been reduced during the periods shown.
D Calculated based on average shares outstanding during the period.
E Amounts do not include the activity of the underlying funds.
F For the period July 24, 2003 (commencement of operations) to March 31, 2004.
G Expense ratios reflect operating expenses of the class. Expenses before reductions do not reflect amounts reimbursed by the investment adviser or expense offset arrangements and do not represent the amount paid by the class during periods when
reimbursements or reductions occur. Expense ratios before reductions for start up periods may not be representative of longer term operating periods. Expenses net of fee waivers reflect expenses after reimbursement by the investment adviser but
prior to reductions from expense offset arrangements. Expenses net of all reductions represent the net expenses paid by the class but do not include expenses of the investment companies in which the fund invests.
H Amount represents less than $.01 per share.
|
See accompanying notes which are an integral part of the financial statements.
|
59 Annual Report
| Fidelity Advisor Freedom 2035 Fund | | |
| Investment Changes | | |
| |
| |
| Fund Holdings as of March 31, 2006 | | |
| | | % of fund’s | | % of fund’s investments |
| | | investments | | 6 months ago |
| Domestic Equity Funds | | | | |
| Fidelity Advisor Dividend Growth | | | | |
| Fund Institutional Class | | 14.0 | | 13.9 |
| Fidelity Advisor Equity Growth | | | | |
| Fund Institutional Class | | 8.3 | | 7.2 |
| Fidelity Advisor Equity Income | | | | |
| Fund Institutional Class | | 14.4 | | 13.9 |
| Fidelity Advisor Growth & Income | | | | |
| Fund Institutional Class | | 10.6 | | 13.0 |
| Fidelity Advisor Large Cap Fund | | | | |
| Institutional Class | | 10.6 | | 13.0 |
| Fidelity Advisor Mid Cap Fund | | | | |
| Institutional Class | | 5.4 | | 4.4 |
| Fidelity Advisor Small Cap Fund | | | | |
| Institutional Class | | 4.2 | | 4.1 |
| | | 67.5 | | 69.5 |
| International Equity Funds | | | | |
| Fidelity Advisor Diversified | | | | |
| International Fund Institutional | | | | |
| Class | | 7.9 | | 7.0 |
| Fidelity Advisor Overseas Fund | | | | |
| Institutional Class | | 7.6 | | 6.9 |
| | | 15.5 | | 13.9 |
| High Yield Fixed-Income Funds | | | | |
| Fidelity Advisor High Income | | | | |
| Advantage Fund Institutional | | | | |
| Class | | 8.3 | | 8.6 |
| Investment Grade Fixed-Income | | | | |
| Funds | | | | |
| Fidelity Advisor Government | | | | |
| Investment Fund Institutional | | | | |
| Class | | 4.1 | | 4.0 |
| Fidelity Advisor Intermediate Bond | | | | |
| Fund Institutional Class | | 4.2 | | 4.0 |
| Fidelity Advisor Strategic Real | | | | |
| Return Fund Institutional Class | | 0.4 | | 0.0 |
| | | 8.7 | | 8.0 |
| | | 100.0 | | 100.0 |
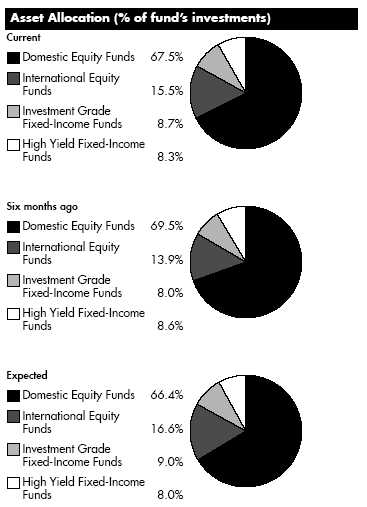
The fund invests according to an asset allocation strategy that becomes increasingly conservative over time. The ”six months ago” allocation is based on the fund’s holdings as of September 30, 2005. The ”current” allocation is based on the fund’s holdings as of March 31, 2006. The ”expected” allocation represents the fund’s anticipated allocation at September 30, 2006. Beginning in March 2006, the fund changed its asset allocation strategy, resulting in an increased emphasis on international equity.
Annual Report 60
| Fidelity Advisor Freedom 2035 Fund | | |
| Investments March 31, 2006 |
| Showing Percentage of Total Value of Investment in Securities |
| |
| Equity Funds 83.0% | | | | | | |
| | | | | Shares | | Value (Note 1) |
| Domestic Equity Funds 67.5% | | | | | | |
| Fidelity Advisor Dividend Growth Fund | | | | | | |
| Institutional Class | | | | 1,365,036 | | $ 17,472,464 |
| Fidelity Advisor Equity Growth Fund | | | | | | |
| Institutional Class (a) | | | | 195,291 | | 10,350,429 |
| Fidelity Advisor Equity Income Fund | | | | | | |
| Institutional Class | | | | 600,725 | | 17,949,649 |
| Fidelity Advisor Growth & Income Fund | | | | | | |
| Institutional Class | | | | 705,459 | | 13,262,624 |
| Fidelity Advisor Large Cap Fund | | | | | | |
| Institutional Class | | | | 734,960 | | 13,229,280 |
| Fidelity Advisor Mid Cap Fund | | | | | | |
| Institutional Class | | | | 253,680 | | 6,702,233 |
| Fidelity Advisor Small Cap Fund | | | | | | |
| Institutional Class | | | | 213,700 | | 5,280,534 |
| |
| TOTAL DOMESTIC EQUITY FUNDS | | | | | | 84,247,213 |
| International Equity Funds 15.5% | | | | | | |
| Fidelity Advisor Diversified International | | | | | | |
| Fund Institutional Class | | | | 423,144 | | 9,922,727 |
| Fidelity Advisor Overseas Fund | | | | | | |
| Institutional Class | | | | 441,714 | | 9,470,349 |
| |
| TOTAL INTERNATIONAL EQUITY FUNDS | | | | | | 19,393,076 |
| |
| TOTAL EQUITY FUNDS | | | | | | |
| (Cost $93,493,516) | | | | | | 103,640,289 |
| |
| Fixed Income Funds 17.0% | | | | | | |
| |
| High Yield Fixed-Income Funds – 8.3% | | | | | | |
| Fidelity Advisor High Income | | | | | | |
| Advantage Fund Institutional Class | | | | 1,073,833 | | 10,426,918 |
| Investment Grade Fixed Income Funds 8.7% | | | | | | |
| Fidelity Advisor Government Investment | | | | | | |
| Fund Institutional Class | | | | 527,499 | | 5,137,842 |
| Fidelity Advisor Intermediate Bond Fund | | | | | | |
| Institutional Class | | | | 488,486 | | 5,236,570 |
| Fidelity Advisor Strategic Real Return | | | | | | |
| Fund Institutional Class | | | | 49,261 | | 491,135 |
| |
| TOTAL INVESTMENT GRADE FIXED-INCOME FUNDS | | | | | | 10,865,547 |
| |
| TOTAL FIXED-INCOME FUNDS | | | | | | |
| (Cost $21,277,759) | | | | | | 21,292,465 |
| TOTAL INVESTMENT IN SECURITIES 100% | | | | | | |
| (Cost $114,771,275) | | | | | | $ 124,932,754 |
Legend
(a) Non-income producing
|
See accompanying notes which are an integral part of the financial statements.
61 Annual Report
| Fidelity Advisor Freedom 2035 Fund | | | | | | |
| |
| Financial Statements | | | | | | |
| |
| |
| Statement of Assets and Liabilities | | | | | | |
| | | | | March 31, 2006 |
| |
| Assets | | | | | | |
| Investment in securities, at value (cost $114,771,275) — See accompanying schedule | | | | | | $ 124,932,754 |
| Cash | | | | | | 58 |
| Receivable for fund shares sold | | | | | | 371,323 |
| Total assets | | | | | | 125,304,135 |
| |
| Liabilities | | | | | | |
| Payable for investments purchased | | | | $ 291,929 | | |
| Payable for fund shares redeemed | | | | 79,299 | | |
| Distribution fees payable | | | | 50,183 | | |
| Other affiliated payables | | | | 2,891 | | |
| Total liabilities | | | | | | 424,302 |
| |
| Net Assets | | | | | | $ 124,879,833 |
| Net Assets consist of: | | | | | | |
| Paid in capital | | | | | | $ 112,473,106 |
| Undistributed net investment income | | | | | | 2,651 |
| Accumulated undistributed net realized gain (loss) on investments | | | | | | 2,242,597 |
| Net unrealized appreciation (depreciation) on investments | | | | | | 10,161,479 |
| Net Assets | | | | | | $ 124,879,833 |
| Calculation of Maximum Offering Price | | | | | | |
| Class A: | | | | | | |
| Net Asset Value and redemption price per share ($49,877,180 ÷ 3,936,072 shares) | | | | | | $ 12.67 |
| Maximum offering price per share (100/94.25 of $12.67) | | | | | | $ 13.44 |
| Class T: | | | | | | |
| Net Asset Value and redemption price per share ($45,421,394 ÷ 3,600,372 shares) | | | | | | $ 12.62 |
| Maximum offering price per share (100/96.50 of $12.62) | | | | | | $ 13.08 |
| Class B: | | | | | | |
| Net Asset Value and offering price per share ($15,351,127 ÷ 1,223,863 shares)A | | | | | | $ 12.54 |
| Class C: | | | | | | |
| Net Asset Value and offering price per share ($12,023,217 ÷ 957,712 shares)A | | | | | | $ 12.55 |
| Institutional Class: | | | | | | |
| Net Asset Value, offering price and redemption price per share ($2,206,915 ÷ 173,699 shares) | | | | | | $ 12.71 |
| A Redemption price per share is equal to net asset value less any applicable contingent deferred sales charge. | | | | | | |
| |
| Statement of Operations | | | | | | |
| | | | | Year ended March 31, 2006 |
| |
| Investment Income | | | | | | |
| Income distributions from underlying funds | | | | | | $ 1,152,372 |
| Interest | | | | | | 52 |
| Total income | | | | | | 1,152,424 |
| |
| Expenses | | | | | | |
| Management fee | | | | $ 3,848 | | |
| Distribution fees | | | | 413,377 | | |
| Independent trustees’ compensation | | | | 307 | | |
| Total expenses before reductions | | | | 417,532 | | |
| Expense reductions | | | | (1,125) | | 416,407 |
| |
| Net investment income (loss) | | | | | | 736,017 |
| Realized and Unrealized Gain (Loss) | | | | | | |
| Realized gain (loss) on sale of underlying fund shares | | | | 38,288 | | |
| Capital gain distributions from underlying funds | | | | 2,378,113 | | 2,416,401 |
| Change in net unrealized appreciation (depreciation) on underlying funds | | | | | | 9,386,127 |
| Net gain (loss) | | | | | | 11,802,528 |
| Net increase (decrease) in net assets resulting from operations | | | | | | $ 12,538,545 |
See accompanying notes which are an integral part of the financial statements.
| | |
| Annual Report | | 62 |
| Statement of Changes in Net Assets | | | | | | | | | | |
| | | | | | | Year ended | | Year ended |
| | | | | | | March 31, | | March 31, |
| | | | | | | 2006 | | 2005 |
| Increase (Decrease) in Net Assets | | | | | | | | | | |
| Operations | | | | | | | | | | |
| Net investment income (loss) | | | | | | $ 736,017 | | $ 295,234 |
| Net realized gain (loss) | | | | | | 2,416,401 | | 130,957 |
| Change in net unrealized appreciation (depreciation) | | | | | | 9,386,127 | | 674,970 |
| Net increase (decrease) in net assets resulting from operations | | | | | | 12,538,545 | | 1,101,161 |
| Distributions to shareholders from net investment income | | | | | | (733,367) | | (351,658) |
| Distributions to shareholders from net realized gain | | | | | | (249,712) | | (788) |
| Total distributions | | | | | | (983,079) | | (352,446) |
| Share transactions - net increase (decrease) | | | | | | 69,137,683 | | 38,278,752 |
| Total increase (decrease) in net assets | | | | | | 80,693,149 | | 39,027,467 |
| |
| Net Assets | | | | | | | | |
| Beginning of period | | | | | | 44,186,684 | | 5,159,217 |
| End of period (including undistributed net investment income of $2,651 and undistributed net investment income of $0, | | | | | | | | |
| respectively) | | | | | | $ 124,879,833 | | $ 44,186,684 |
| |
| Financial Highlights Class A | | | | | | | | | | |
| Years ended March 31, | | | | 2006 | | | | 2005 | | 2004G |
| Selected Per-Share Data | | | | | | | | | | |
| Net asset value, beginning of period | | | | $ 11.06 | | | | $ 10.70 | | $ 10.00 |
| Income from Investment Operations | | | | | | | | | | |
| Net investment income (loss)E | | | | .14 | | | | .19 | | .07 |
| Net realized and unrealized gain (loss) | | | | 1.62 | | | | .32 | | .72 |
| Total from investment operations | | | | 1.76 | | | | .51 | | .79 |
| Distributions from net investment income | | | | (.11) | | | | (.15) | | (.09) |
| Distributions from net realized gain | | | | (.04) | �� | | | —I | | — |
| Total distributions | | | | (.15) | | | | (.15) | | (.09) |
| Net asset value, end of period | | | | $ 12.67 | | | | $ 11.06 | | $ 10.70 |
| Total Return B,C,D | | | | 16.03% | | | | 4.76% | | 7.88% |
| Ratios to Average Net Assets F,H | | | | | | | | | | |
| Expenses before reductions | | | | .26% | | | | .35% | | .35%A |
| Expenses net of fee waivers, if any | | | | .25% | | | | .33% | | .33%A |
| Expenses net of all reductions | | | | .25% | | | | .33% | | .33%A |
| Net investment income (loss) | | | | 1.20% | | | | 1.71% | | 1.80%A |
| Supplemental Data | | | | | | | | | | |
| Net assets, end of period (000 omitted) | | | | $ 49,877 | | | | $ 15,281 | | $ 1,884 |
| Portfolio turnover rate | | | | 4% | | | | 5% | | 1%A |
A Annualized
B Total returns for periods of less than one year are not annualized.
C Total returns would have been lower had certain expenses not been reduced during the periods shown.
D Total returns do not include the effect of the sales charges.
E Calculated based on average shares outstanding during the period.
F Amounts do not include the activity of the underlying funds.
G For the period November 6, 2003 (commencement of operations) to March 31, 2004.
H Expense ratios reflect operating expenses of the class. Expenses before reductions do not reflect amounts reimbursed by the investment adviser or expense offset arrangements and do not represent the amount paid by the class during periods when
reimbursements or reductions occur. Expense ratios before reductions for start up periods may not be representative of longer term operating periods. Expenses net of fee waivers reflect expenses after reimbursement by the investment adviser but prior to
reductions from expense offset arrangements. Expenses net of all reductions represent the net expenses paid by the class but do not include expenses of the investment companies in which the fund invests.
I Amount represents less than $.01 per share.
|
See accompanying notes which are an integral part of the financial statements.
|
63 Annual Report
| Financial Highlights Class T | | | | | | |
| Years ended March 31, | | 2006 | | 2005 | | 2004G |
| Selected Per-Share Data | | | | | | |
| Net asset value, beginning of period | | $ 11.02 | | $ 10.69 | | $ 10.00 |
| Income from Investment Operations | | | | | | |
| Net investment income (loss)E | | .11 | | .16 | | .06 |
| Net realized and unrealized gain (loss) | | 1.63 | | .31 | | .71 |
| Total from investment operations | | 1.74 | | .47 | | .77 |
| Distributions from net investment income | | (.10) | | (.14) | | (.08) |
| Distributions from net realized gain | | (.04) | | —I | | — |
| Total distributions | | (.14) | | (.14) | | (.08) |
| Net asset value, end of period | | $ 12.62 | | $ 11.02 | | $ 10.69 |
| Total Return B,C,D | | 15.84% | | 4.37% | | 7.73% |
| Ratios to Average Net Assets F,H | | | | | | |
| Expenses before reductions | | .51% | | .60% | | .60%A |
| Expenses net of fee waivers, if any | | .50% | | .58% | | .58%A |
| Expenses net of all reductions | | .50% | | .58% | | .58%A |
| Net investment income (loss) | | .95% | | 1.46% | | 1.55%A |
| Supplemental Data | | | | | | |
| Net assets, end of period (000 omitted) | | $ 45,421 | | $ 16,432 | | $ 1,047 |
| Portfolio turnover rate | | 4% | | 5% | | 1%A |
A Annualized
B Total returns for periods of less than one year are not annualized.
C Total returns would have been lower had certain expenses not been reduced during the periods shown.
D Total returns do not include the effect of the sales charges.
E Calculated based on average shares outstanding during the period.
F Amounts do not include the activity of the underlying funds.
G For the period November 6, 2003 (commencement of operations) to March 31, 2004.
H Expense ratios reflect operating expenses of the class. Expenses before reductions do not reflect amounts reimbursed by the investment adviser or expense offset arrangements and do not represent the amount paid by the class during periods when
reimbursements or reductions occur. Expense ratios before reductions for start up periods may not be representative of longer term operating periods. Expenses net of fee waivers reflect expenses after reimbursement by the investment adviser but
prior to reductions from expense offset arrangements. Expenses net of all reductions represent the net expenses paid by the class but do not include expenses of the investment companies in which the fund invests.
I Amount represents less than $.01 per share.
|
| Financial Highlights Class B | | | | | | |
| Years ended March 31, | | 2006 | | 2005 | | 2004G |
| Selected Per-Share Data | | | | | | |
| Net asset value, beginning of period | | $ 10.98 | | $ 10.67 | | $ 10.00 |
| Income from Investment Operations | | | | | | |
| Net investment income (loss)E | | .05 | | .10 | | .04 |
| Net realized and unrealized gain (loss) | | 1.61 | | .32 | | .71 |
| Total from investment operations | | 1.66 | | .42 | | .75 |
| Distributions from net investment income | | (.06) | | (.11) | | (.08) |
| Distributions from net realized gain | | (.04) | | —I | | — |
| Total distributions | | (.10) | | (.11) | | (.08) |
| Net asset value, end of period | | $ 12.54 | | $ 10.98 | | $ 10.67 |
| Total Return B,C,D | | 15.17% | | 3.88% | | 7.48% |
| Ratios to Average Net Assets F,H | | | | | | |
| Expenses before reductions | | 1.01% | | 1.10% | | 1.10%A |
| Expenses net of fee waivers, if any | | 1.00% | | 1.08% | | 1.08%A |
| Expenses net of all reductions | | 1.00% | | 1.08% | | 1.08%A |
| Net investment income (loss) | | .45% | | .96% | | 1.05%A |
| Supplemental Data | | | | | | |
| Net assets, end of period (000 omitted) | | $ 15,351 | | $ 6,917 | | $ 1,123 |
| Portfolio turnover rate | | 4% | | 5% | | 1%A |
A Annualized
B Total returns for periods of less than one year are not annualized.
C Total returns would have been lower had certain expenses not been reduced during the periods shown.
D Total returns do not include the effect of the contingent deferred sales charge.
E Calculated based on average shares outstanding during the period.
F Amounts do not include the activity of the underlying funds.
G For the period November 6, 2003 (commencement of operations) to March 31, 2004.
H Expense ratios reflect operating expenses of the class. Expenses before reductions do not reflect amounts reimbursed by the investment adviser or expense offset arrangements and do not represent the amount paid by the class during periods when
reimbursements or reductions occur. Expense ratios before reductions for start up periods may not be representative of longer term operating periods. Expenses net of fee waivers reflect expenses after reimbursement by the investment adviser but
prior to reductions from expense offset arrangements. Expenses net of all reductions represent the net expenses paid by the class but do not include expenses of the investment companies in which the fund invests.
I Amount represents less than $.01 per share.
|
See accompanying notes which are an integral part of the financial statements.
| | |
| Annual Report | | 64 |
| Financial Highlights Class C | | | | | | |
| Years ended March 31, | | 2006 | | 2005 | | 2004G |
| Selected Per-Share Data | | | | | | |
| Net asset value, beginning of period | | $ 10.99 | | $ 10.68 | | $ 10.00 |
| Income from Investment Operations | | | | | | |
| Net investment income (loss)E | | .05 | | .10 | | .04 |
| Net realized and unrealized gain (loss) | | 1.61 | | .32 | | .72 |
| Total from investment operations | | 1.66 | | .42 | | .76 |
| Distributions from net investment income | | (.06) | | (.11) | | (.08) |
| Distributions from net realized gain | | (.04) | | —I | | — |
| Total distributions | | (.10) | | (.11) | | (.08) |
| Net asset value, end of period | | $ 12.55 | | $ 10.99 | | $ 10.68 |
| Total Return B,C,D | | 15.15% | | 3.87% | | 7.58% |
| Ratios to Average Net Assets F,H | | | | | | |
| Expenses before reductions | | 1.01% | | 1.10% | | 1.10%A |
| Expenses net of fee waivers, if any | | 1.00% | | 1.08% | | 1.08%A |
| Expenses net of all reductions | | 1.00% | | 1.08% | | 1.08%A |
| Net investment income (loss) | | .45% | | .96% | | 1.05%A |
| Supplemental Data | | | | | | |
| Net assets, end of period (000 omitted) | | $ 12,023 | | $ 5,089 | | $ 890 |
| Portfolio turnover rate | | 4% | | 5% | | 1%A |
A Annualized
B Total returns for periods of less than one year are not annualized.
C Total returns would have been lower had certain expenses not been reduced during the periods shown.
D Total returns do not include the effect of the contingent deferred sales charge.
E Calculated based on average shares outstanding during the period.
F Amounts do not include the activity of the underlying funds.
G For the period November 6, 2003 (commencement of operations) to March 31, 2004.
H Expense ratios reflect operating expenses of the class. Expenses before reductions do not reflect amounts reimbursed by the investment adviser or expense offset arrangements and do not represent the amount paid by the class during periods when
reimbursements or reductions occur. Expense ratios before reductions for start up periods may not be representative of longer term operating periods. Expenses net of fee waivers reflect expenses after reimbursement by the investment adviser but
prior to reductions from expense offset arrangements. Expenses net of all reductions represent the net expenses paid by the class but do not include expenses of the investment companies in which the fund invests.
I Amount represents less than $.01 per share.
|
| Financial Highlights Institutional Class | | | | | | |
| Years ended March 31, | | 2006 | | 2005 | | 2004F |
| Selected Per-Share Data | | | | | | |
| Net asset value, beginning of period | | $ 11.07 | | $ 10.71 | | $ 10.00 |
| Income from Investment Operations | | | | | | |
| Net investment income (loss)D | | .17 | | .21 | | .08 |
| Net realized and unrealized gain (loss) | | 1.64 | | .31 | | .72 |
| Total from investment operations | | 1.81 | | .52 | | .80 |
| Distributions from net investment income | | (.13) | | (.16) | | (.09) |
| Distributions from net realized gain | | (.04) | | —H | | — |
| Total distributions | | (.17) | | (.16) | | (.09) |
| Net asset value, end of period | | $ 12.71 | | $ 11.07 | | $ 10.71 |
| Total Return B,C | | 16.45% | | 4.87% | | 7.98% |
| Ratios to Average Net Assets E,G | | | | | | |
| Expenses before reductions | | .01% | | .10% | | .10%A |
| Expenses net of fee waivers, if any | | .00% | | .08% | | .08%A |
| Expenses net of all reductions | | .00% | | .08% | | .08%A |
| Net investment income (loss) | | 1.45% | | 1.96% | | 2.04%A |
| Supplemental Data | | | | | | |
| Net assets, end of period (000 omitted) | | $ 2,207 | | $ 467 | | $ 216 |
| Portfolio turnover rate | | 4% | | 5% | | 1%A |
A Annualized
B Total returns for periods of less than one year are not annualized.
C Total returns would have been lower had certain expenses not been reduced during the periods shown.
D Calculated based on average shares outstanding during the period.
E Amounts do not include the activity of the underlying funds.
F For the period November 6, 2003 (commencement of operations) to March 31, 2004.
G Expense ratios reflect operating expenses of the class. Expenses before reductions do not reflect amounts reimbursed by the investment adviser or expense offset arrangements and do not represent the amount paid by the class during periods when
reimbursements or reductions occur. Expense ratios before reductions for start up periods may not be representative of longer term operating periods. Expenses net of fee waivers reflect expenses after reimbursement by the investment adviser but
prior to reductions from expense offset arrangements. Expenses net of all reductions represent the net expenses paid by the class but do not include expenses of the investment companies in which the fund invests.
H Amount represents less than $.01 per share.
|
See accompanying notes which are an integral part of the financial statements.
|
65 Annual Report
| Fidelity Advisor Freedom 2040 Fund | | |
| Investment Changes | | |
| |
| |
| Fund Holdings as of March 31, 2006 | | |
| | | % of fund’s | | % of fund’s investments |
| | | investments | | 6 months ago |
| Domestic Equity Funds | | | | |
| Fidelity Advisor Dividend Growth | | | | |
| Fund Institutional Class | | 14.4 | | 13.7 |
| Fidelity Advisor Equity Growth | | | | |
| Fund Institutional Class | | 8.4 | | 7.1 |
| Fidelity Advisor Equity Income | | | | |
| Fund Institutional Class | | 14.3 | | 13.6 |
| Fidelity Advisor Growth & Income | | | | |
| Fund Institutional Class | | 10.7 | | 13.6 |
| Fidelity Advisor Large Cap Fund | | | | |
| Institutional Class | | 10.6 | | 13.5 |
| Fidelity Advisor Mid Cap Fund | | | | |
| Institutional Class | | 5.6 | | 4.3 |
| Fidelity Advisor Small Cap Fund | | | | |
| Institutional Class | | 4.1 | | 4.2 |
| | | 68.1 | | 70.0 |
| International Equity Funds | | | | |
| Fidelity Advisor Diversified | | | | |
| International Fund Institutional | | | | |
| Class | | 8.6 | | 7.6 |
| Fidelity Advisor Overseas Fund | | | | |
| Institutional Class | | 8.4 | | 7.5 |
| | | 17.0 | | 15.1 |
| High Yield Fixed-Income Funds | | | | |
| Fidelity Advisor High Income | | | | |
| Advantage Fund Institutional | | | | |
| Class | | 9.9 | | 9.9 |
| Investment Grade Fixed-Income | | | | |
| Funds | | | | |
| Fidelity Advisor Government | | | | |
| Investment Fund Institutional | | | | |
| Class | | 2.4 | | 2.5 |
| Fidelity Advisor Intermediate Bond | | | | |
| Fund Institutional Class | | 2.4 | | 2.5 |
| Fidelity Advisor Strategic Real | | | | |
| Return Fund Institutional Class | | 0.2 | | 0.0 |
| | | 5.0 | | 5.0 |
| | | 100.0 | | 100.0 |
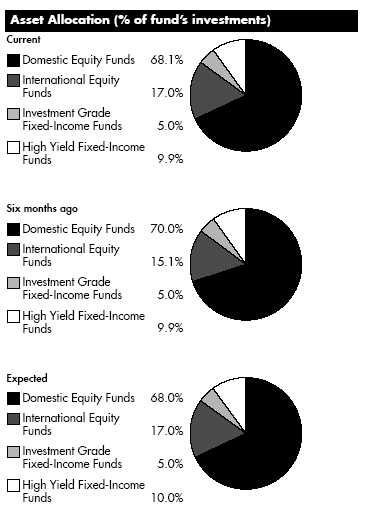
The fund invests according to an asset allocation strategy that becomes increasingly conservative over time. The ”six months ago” allocation is based on the fund’s holdings as of September 30, 2005. The ”current” allocation is based on the fund’s holdings as of March 31, 2006. The ”expected” allocation represents the fund’s anticipated allocation at September 30, 2006. Beginning in March 2006, the fund changed its asset allocation strategy, resulting in an increased emphasis on international equity.
Annual Report 66
| Fidelity Advisor Freedom 2040 Fund | | |
| Investments March 31, 2006 |
| Showing Percentage of Total Value of Investment in Securities |
| |
| Equity Funds 85.1% | | | | | | |
| | | | | Shares | | Value (Note 1) |
| Domestic Equity Funds 68.1% | | | | | | |
| Fidelity Advisor Dividend Growth Fund | | | | | | |
| Institutional Class | | | | 3,923,946 | | $ 50,226,515 |
| Fidelity Advisor Equity Growth Fund | | | | | | |
| Institutional Class (a) | | | | 554,402 | | 29,383,301 |
| Fidelity Advisor Equity Income Fund | | | | | | |
| Institutional Class | | | | 1,671,589 | | 49,947,084 |
| Fidelity Advisor Growth & Income Fund | | | | | | |
| Institutional Class | | | | 1,993,266 | | 37,473,410 |
| Fidelity Advisor Large Cap Fund | | | | | | |
| Institutional Class | | | | 2,065,366 | | 37,176,582 |
| Fidelity Advisor Mid Cap Fund | | | | | | |
| Institutional Class | | | | 745,462 | | 19,695,112 |
| Fidelity Advisor Small Cap Fund | | | | | | |
| Institutional Class | | | | 574,334 | | 14,191,794 |
| |
| TOTAL DOMESTIC EQUITY FUNDS | | | | | | 238,093,798 |
| International Equity Funds 17.0% | | | | | | |
| Fidelity Advisor Diversified International | | | | | | |
| Fund Institutional Class | | | | 1,273,123 | | 29,854,743 |
| Fidelity Advisor Overseas Fund | | | | | | |
| Institutional Class | | | | 1,375,942 | | 29,500,193 |
| |
| TOTAL INTERNATIONAL EQUITY FUNDS | | | | | | 59,354,936 |
| |
| TOTAL EQUITY FUNDS | | | | | | |
| (Cost $264,001,949) | | | | | | 297,448,734 |
| |
| Fixed Income Funds 14.9% | | | | | | |
| |
| High Yield Fixed-Income Funds – 9.9% | | | | | | |
| Fidelity Advisor High Income | | | | | | |
| Advantage Fund Institutional Class | | | | 3,555,889 | | 34,527,678 |
| Investment Grade Fixed Income Funds 5.0% | | | | | | |
| Fidelity Advisor Government Investment | | | | | | |
| Fund Institutional Class | | | | 868,325 | | 8,457,481 |
| Fidelity Advisor Intermediate Bond Fund | | | | | | |
| Institutional Class | | | | 791,274 | | 8,482,452 |
| Fidelity Advisor Strategic Real Return | | | | | | |
| Fund Institutional Class | | | | 55,974 | | 558,057 |
| |
| TOTAL INVESTMENT GRADE FIXED-INCOME FUNDS | | | | | | 17,497,990 |
| |
| TOTAL FIXED-INCOME FUNDS | | | | | | |
| (Cost $51,377,683) | | | | | | 52,025,668 |
| TOTAL INVESTMENT IN SECURITIES 100% | | | | | | |
| (Cost $315,379,632) | | | | | | $ 349,474,402 |
Legend
(a) Non-income producing
|
See accompanying notes which are an integral part of the financial statements.
67 Annual Report
| Fidelity Advisor Freedom 2040 Fund | | | | | | |
| |
| Financial Statements | | | | | | |
| |
| |
| Statement of Assets and Liabilities | | | | | | |
| | | | | March 31, 2006 |
| |
| Assets | | | | | | |
| Investment in securities, at value (cost $315,379,632) — See accompanying schedule | | | | | | $ 349,474,402 |
| Cash | | | | | | 6 |
| Receivable for investments sold | | | | | | 9,500 |
| Receivable for fund shares sold | | | | | | 1,532,115 |
| Total assets | | | | | | 351,016,023 |
| |
| Liabilities | | | | | | |
| Payable for investments purchased | | | | $ 1,027,751 | | |
| Payable for fund shares redeemed | | | | 513,902 | | |
| Distribution fees payable | | | | 139,763 | | |
| Other affiliated payables | | | | 6,912 | | |
| Total liabilities | | | | | | 1,688,328 |
| |
| Net Assets | | | | | | $ 349,327,695 |
| Net Assets consist of: | | | | | | |
| Paid in capital | | | | | | $ 308,584,162 |
| Undistributed net investment income | | | | | | 155,872 |
| Accumulated undistributed net realized gain (loss) on investments | | | | | | 6,492,891 |
| Net unrealized appreciation (depreciation) on investments | | | | | | 34,094,770 |
| Net Assets | | | | | | $ 349,327,695 |
| Calculation of Maximum Offering Price | | | | | | |
| Class A: | | | | | | |
| Net Asset Value and redemption price per share ($133,817,369 ÷ 9,677,102 shares) | | | | | | $ 13.83 |
| Maximum offering price per share (100/94.25 of $13.83) | | | | | | $ 14.67 |
| Class T: | | | | | | |
| Net Asset Value and redemption price per share ($136,678,653 ÷ 9,909,900 shares) | | | | | | $ 13.79 |
| Maximum offering price per share (100/96.50 of $13.79) | | | | | | $ 14.29 |
| Class B: | | | | | | |
| Net Asset Value and offering price per share ($32,658,207 ÷ 2,383,695 shares)A | | | | | | $ 13.70 |
| Class C: | | | | | | |
| Net Asset Value and offering price per share ($38,946,608 ÷ 2,843,691 shares)A | | | | | | $ 13.70 |
| Institutional Class: | | | | | | |
| Net Asset Value, offering price and redemption price per share ($7,226,858 ÷ 521,117 shares) | | | | | | $ 13.87 |
| A Redemption price per share is equal to net asset value less any applicable contingent deferred sales charge. | | | | | | |
| |
| Statement of Operations | | | | | | |
| | | | | Year ended March 31, 2006 |
| |
| Investment Income | | | | | | |
| Income distributions from underlying funds | | | | | | $ 3,482,841 |
| |
| Expenses | | | | | | |
| Management fee | | | | $ 13,998 | | |
| Distribution fees | | | | 1,240,320 | | |
| Independent trustees’ compensation | | | | 959 | | |
| Total expenses before reductions | | | | 1,255,277 | | |
| Expense reductions | | | | (4,008) | | 1,251,269 |
| |
| Net investment income (loss) | | | | | | 2,231,572 |
| Realized and Unrealized Gain (Loss) | | | | | | |
| Realized gain (loss) on sale of underlying fund shares | | | | 18,879 | | |
| Capital gain distributions from underlying funds | | | | 7,157,905 | | 7,176,784 |
| Change in net unrealized appreciation (depreciation) on underlying funds | | | | | | 29,421,318 |
| Net gain (loss) | | | | | | 36,598,102 |
| Net increase (decrease) in net assets resulting from operations | | | | | | $ 38,829,674 |
See accompanying notes which are an integral part of the financial statements.
| | |
| Annual Report | | 68 |
| Statement of Changes in Net Assets | | | | | | | | | | |
| | | | | Year ended | | | | Year ended |
| | | | | March 31, | | | | March 31, |
| | | | | 2006 | | | | 2005 |
| Increase (Decrease) in Net Assets | | | | | | | | |
| Operations | | | | | | | | |
| Net investment income (loss) | | | | $ 2,231,572 | | | | $ 1,078,538 |
| Net realized gain (loss) | | | | 7,176,784 | | | | 530,762 |
| Change in net unrealized appreciation (depreciation) | | | | 29,421,318 | | | | 3,286,735 |
| Net increase (decrease) in net assets resulting from operations | | | | 38,829,674 | | | | 4,896,035 |
| Distributions to shareholders from net investment income | | | | (2,075,700) | | | | (1,190,067) |
| Distributions to shareholders from net realized gain | | | | (1,111,246) | | | | — |
| Total distributions | | | | (3,186,946) | | | | (1,190,067) |
| Share transactions - net increase (decrease) | | | | 151,023,971 | | | | 115,613,636 |
| Total increase (decrease) in net assets | | | | 186,666,699 | | | | 119,319,604 |
| |
| Net Assets | | | | | | | | |
| Beginning of period | | | | 162,660,996 | | | | 43,341,392 |
| End of period (including undistributed net investment income of $155,872 and undistributed net investment income of | | | | | | | | |
| $26,420, respectively) | | | | $ 349,327,695 | | | | $ 162,660,996 |
| |
| Financial Highlights Class A | | | | | | | | | | |
| Years ended March 31, | | 2006 | | | | 2005 | | | | 2004G |
| Selected Per-Share Data | | | | | | | | | | |
| Net asset value, beginning of period | | $ 12.03 | | | | $ 11.62 | | | | $ 10.00 |
| Income from Investment Operations | | | | | | | | | | |
| Net investment income (loss)E | | .15 | | | | .18 | | | | .12 |
| Net realized and unrealized gain (loss) | | 1.84 | | | | .39 | | | | 1.60 |
| Total from investment operations | | 1.99 | | | | .57 | | | | 1.72 |
| Distributions from net investment income | | (.12) | | | | (.16) | | | | (.10) |
| Distributions from net realized gain | | (.07) | | | | — | | | | — |
| Total distributions | | (.19) | | | | (.16) | | | | (.10) |
| Net asset value, end of period | | $ 13.83 | | | | $ 12.03 | | | | $ 11.62 |
| Total Return B,C,D | | 16.65% | | | | 4.87% | | | | 17.19% |
| Ratios to Average Net Assets F,H | | | | | | | | | | |
| Expenses before reductions | | .26% | | | | .35% | | | | .35%A |
| Expenses net of fee waivers, if any | | .26% | | | | .33% | | | | .33%A |
| Expenses net of all reductions | | .26% | | | | .33% | | | | .33%A |
| Net investment income (loss) | | 1.18% | | | | 1.50% | | | | 1.53%A |
| Supplemental Data | | | | | | | | | | |
| Net assets, end of period (000 omitted) | | $133,817 | | | | $ 51,718 | | | | $ 9,666 |
| Portfolio turnover rate | | 4% | | | | 3% | | | | 3%A |
A Annualized
B Total returns for periods of less than one year are not annualized.
C Total returns would have been lower had certain expenses not been reduced during the periods shown.
D Total returns do not include the effect of the sales charges.
E Calculated based on average shares outstanding during the period.
F Amounts do not include the activity of the underlying funds.
G For the period July 24, 2003 (commencement of operations) to March 31, 2004.
H Expense ratios reflect operating expenses of the class. Expenses before reductions do not reflect amounts reimbursed by the investment adviser or expense offset arrangements and do not represent the amount paid by the class during periods when
reimbursements or reductions occur. Expense ratios before reductions for start up periods may not be representative of longer term operating periods. Expenses net of fee waivers reflect expenses after reimbursement by the investment adviser but prior to
reductions from expense offset arrangements. Expenses net of all reductions represent the net expenses paid by the class but do not include expenses of the investment companies in which the fund invests.
|
See accompanying notes which are an integral part of the financial statements.
|
69 Annual Report
| Financial Highlights Class T | | | | | | |
| Years ended March 31, | | 2006 | | 2005 | | 2004G |
| Selected Per-Share Data | | | | | | |
| Net asset value, beginning of period | | $ 12.00 | | $ 11.60 | | $ 10.00 |
| Income from Investment Operations | | | | | | |
| Net investment income (loss)E | | .12 | | .15 | | .10 |
| Net realized and unrealized gain (loss) | | 1.83 | | .38 | | 1.59 |
| Total from investment operations | | 1.95 | | .53 | | 1.69 |
| Distributions from net investment income | | (.10) | | (.13) | | (.09) |
| Distributions from net realized gain | | (.06) | | — | | — |
| Total distributions | | (.16) | | (.13) | | (.09) |
| Net asset value, end of period | | $ 13.79 | | $ 12.00 | | $ 11.60 |
| Total Return B,C,D | | 16.35% | | 4.57% | | 16.93% |
| Ratios to Average Net Assets F,H | | | | | | |
| Expenses before reductions | | .51% | | .60% | | .60%A |
| Expenses net of fee waivers, if any | | .51% | | .58% | | .58%A |
| Expenses net of all reductions | | .51% | | .58% | | .58%A |
| Net investment income (loss) | | .93% | | 1.25% | | 1.28%A |
| Supplemental Data | | | | | | |
| Net assets, end of period (000 omitted) | | $ 136,679 | | $ 66,136 | | $ 19,191 |
| Portfolio turnover rate | | 4% | | 3% | | 3%A |
A Annualized
B Total returns for periods of less than one year are not annualized.
C Total returns would have been lower had certain expenses not been reduced during the periods shown.
D Total returns do not include the effect of the sales charges.
E Calculated based on average shares outstanding during the period.
F Amounts do not include the activity of the underlying funds.
G For the period July 24, 2003 (commencement of operations) to March 31, 2004.
H Expense ratios reflect operating expenses of the class. Expenses before reductions do not reflect amounts reimbursed by the investment adviser or expense offset arrangements and do not represent the amount paid by the class during periods when
reimbursements or reductions occur. Expense ratios before reductions for start up periods may not be representative of longer term operating periods. Expenses net of fee waivers reflect expenses after reimbursement by the investment adviser but
prior to reductions from expense offset arrangements. Expenses net of all reductions represent the net expenses paid by the class but do not include expenses of the investment companies in which the fund invests.
|
| Financial Highlights Class B | | | | | | |
| Years ended March 31, | | 2006 | | 2005 | | 2004G |
| Selected Per-Share Data | | | | | | |
| Net asset value, beginning of period | | $ 11.94 | | $ 11.57 | | $ 10.00 |
| Income from Investment Operations | | | | | | |
| Net investment income (loss)E | | .05 | | .09 | | .06 |
| Net realized and unrealized gain (loss) | | 1.83 | | .38 | | 1.60 |
| Total from investment operations | | 1.88 | | .47 | | 1.66 |
| Distributions from net investment income | | (.06) | | (.10) | | (.09) |
| Distributions from net realized gain | | (.06) | | — | | — |
| Total distributions | | (.12) | | (.10) | | (.09) |
| Net asset value, end of period | | $ 13.70 | | $ 11.94 | | $ 11.57 |
| Total Return B,C,D | | 15.81% | | 4.04% | | 16.58% |
| Ratios to Average Net Assets F,H | | | | | | |
| Expenses before reductions | | 1.01% | | 1.10% | | 1.10%A |
| Expenses net of fee waivers, if any | | 1.01% | | 1.08% | | 1.08%A |
| Expenses net of all reductions | | 1.01% | | 1.08% | | 1.08%A |
| Net investment income (loss) | | .43% | | .75% | | .78%A |
| Supplemental Data | | | | | | |
| Net assets, end of period (000 omitted) | | $ 32,658 | | $ 18,541 | | $ 7,232 |
| Portfolio turnover rate | | 4% | | 3% | | 3%A |
A Annualized
B Total returns for periods of less than one year are not annualized.
C Total returns would have been lower had certain expenses not been reduced during the periods shown.
D Total returns do not include the effect of the contingent deferred sales charge.
E Calculated based on average shares outstanding during the period.
F Amounts do not include the activity of the underlying funds.
G For the period July 24, 2003 (commencement of operations) to March 31, 2004.
H Expense ratios reflect operating expenses of the class. Expenses before reductions do not reflect amounts reimbursed by the investment adviser or expense offset arrangements and do not represent the amount paid by the class during periods when
reimbursements or reductions occur. Expense ratios before reductions for start up periods may not be representative of longer term operating periods. Expenses net of fee waivers reflect expenses after reimbursement by the investment adviser but
prior to reductions from expense offset arrangements. Expenses net of all reductions represent the net expenses paid by the class but do not include expenses of the investment companies in which the fund invests.
|
See accompanying notes which are an integral part of the financial statements.
| | |
| Annual Report | | 70 |
| Financial Highlights Class C | | | | | | |
| Years ended March 31, | | 2006 | | 2005 | | 2004G |
| Selected Per-Share Data | | | | | | |
| Net asset value, beginning of period | | $ 11.94 | | $ 11.57 | | $ 10.00 |
| Income from Investment Operations | | | | | | |
| Net investment income (loss)E | | .05 | | .09 | | .06 |
| Net realized and unrealized gain (loss) | | 1.83 | | .38 | | 1.59 |
| Total from investment operations | | 1.88 | | .47 | | 1.65 |
| Distributions from net investment income | | (.06) | | (.10) | | (.08) |
| Distributions from net realized gain | | (.06) | | — | | — |
| Total distributions | | (.12) | | (.10) | | (.08) |
| Net asset value, end of period | | $ 13.70 | | $ 11.94 | | $ 11.57 |
| Total Return B,C,D | | 15.82% | | 4.04% | | 16.53% |
| Ratios to Average Net Assets F,H | | | | | | |
| Expenses before reductions | | 1.01% | | 1.10% | | 1.10%A |
| Expenses net of fee waivers, if any | | 1.01% | | 1.08% | | 1.08%A |
| Expenses net of all reductions | | 1.01% | | 1.08% | | 1.08%A |
| Net investment income (loss) | | .43% | | .75% | | .78%A |
| Supplemental Data | | | | | | |
| Net assets, end of period (000 omitted) | | $ 38,947 | | $ 21,792 | | $ 6,958 |
| Portfolio turnover rate | | 4% | | 3% | | 3%A |
A Annualized
B Total returns for periods of less than one year are not annualized.
C Total returns would have been lower had certain expenses not been reduced during the periods shown.
D Total returns do not include the effect of the contingent deferred sales charge.
E Calculated based on average shares outstanding during the period.
F Amounts do not include the activity of the underlying funds.
G For the period July 24, 2003 (commencement of operations) to March 31, 2004.
H Expense ratios reflect operating expenses of the class. Expenses before reductions do not reflect amounts reimbursed by the investment adviser or expense offset arrangements and do not represent the amount paid by the class during periods when
reimbursements or reductions occur. Expense ratios before reductions for start up periods may not be representative of longer term operating periods. Expenses net of fee waivers reflect expenses after reimbursement by the investment adviser but
prior to reductions from expense offset arrangements. Expenses net of all reductions represent the net expenses paid by the class but do not include expenses of the investment companies in which the fund invests.
|
| Financial Highlights Institutional Class | | | | | | |
| Years ended March 31, | | 2006 | | 2005 | | 2004F |
| Selected Per-Share Data | | | | | | |
| Net asset value, beginning of period | | $ 12.05 | | $ 11.63 | | $ 10.00 |
| Income from Investment Operations | | | | | | |
| Net investment income (loss)D | | .18 | | .21 | | .13 |
| Net realized and unrealized gain (loss) | | 1.85 | | .38 | | 1.60 |
| Total from investment operations | | 2.03 | | .59 | | 1.73 |
| Distributions from net investment income | | (.14) | | (.17) | | (.10) |
| Distributions from net realized gain | | (.07) | | — | | — |
| Total distributions | | (.21) | | (.17) | | (.10) |
| Net asset value, end of period | | $ 13.87 | | $ 12.05 | | $ 11.63 |
| Total Return B,C | | 16.99% | | 5.07% | | 17.34% |
| Ratios to Average Net Assets E,G | | | | | | |
| Expenses before reductions | | .01% | | .10% | | .10%A |
| Expenses net of fee waivers, if any | | .00% | | .08% | | .08%A |
| Expenses net of all reductions | | .00% | | .08% | | .08%A |
| Net investment income (loss) | | 1.43% | | 1.75% | | 1.78%A |
| Supplemental Data | | | | | | |
| Net assets, end of period (000 omitted) | | $ 7,227 | | $ 4,474 | | $ 294 |
| Portfolio turnover rate | | 4% | | 3% | | 3%A |
A Annualized
B Total returns for periods of less than one year are not annualized.
C Total returns would have been lower had certain expenses not been reduced during the periods shown.
D Calculated based on average shares outstanding during the period.
E Amounts do not include the activity of the underlying funds.
F For the period July 24, 2003 (commencement of operations) to March 31, 2004.
G Expense ratios reflect operating expenses of the class. Expenses before reductions do not reflect amounts reimbursed by the investment adviser or expense offset arrangements and do not represent the amount paid by the class during periods when
reimbursements or reductions occur. Expense ratios before reductions for start up periods may not be representative of longer term operating periods. Expenses net of fee waivers reflect expenses after reimbursement by the investment adviser but
prior to reductions from expense offset arrangements. Expenses net of all reductions represent the net expenses paid by the class but do not include expenses of the investment companies in which the fund invests.
|
See accompanying notes which are an integral part of the financial statements.
|
71 Annual Report
Notes to Financial Statements
For the period ended March 31, 2006
|
1. Significant Accounting Policies.
|
Fidelity Advisor Freedom Income Fund, Advisor Freedom 2005 Fund, Advisor Freedom 2010 Fund, Advisor Freedom 2015 Fund, Advisor Freedom 2020 Fund, Advisor Freedom 2025 Fund, Advisor Freedom 2030 Fund, Advisor Freedom 2035 Fund and Advisor Freedom 2040 Fund (the funds) are funds of Fidelity Aberdeen Street Trust (the trust). The trust is registered under the Investment Company Act of 1940, as amended (the 1940 Act), as an open end management investment company organized as a Delaware statutory trust. Each fund is authorized to issue an unlimited number of shares. The funds invest primarily in a combination of other Fidelity equity, fixed income, and money market funds (the Underlying Funds) managed by Fidelity Management & Research Company (FMR). Each fund offers Class A, Class T, Class B, Class C, and Institutional Class shares, each of which has equal rights as to assets and voting privileges. Each class has exclusive voting rights with respect to matters that affect that class. Class B shares will automatically convert to Class A shares after a holding period of seven years from the initial date of purchase. Investment income, realized and unrealized capital gains and losses, the common expenses of the fund, and certain fund level expense reductions, if any, are allocated on a pro rata basis to each class based on the relative net assets of each class to the total net assets of the fund. Each class differs with respect to distribution and service plan fees incurred. Certain expense reductions also differ by class. The financial statements have been prepared in conformity with accounting principles generally accepted in the United States of America, which require management to make certain estimates and assumptions at the date of the financial statements. The following summarizes the significant accounting policies of the funds:
Security Valuation. Net asset value per share is calculated as of the close of business of the New York Stock Exchange, normally 4:00 p.m. Eastern time. Investments in the Underlying Funds are valued at their net asset value each business day. Short term securities with remaining maturities of sixty days or less for which quotations are not readily available are valued on the basis of amortized cost.
Investment Transactions and Income. Security transactions, normally shares of the Underlying Funds, are accounted for as of trade date. Gains and losses on securities sold are determined on the basis of identified cost. Income and capital gain distributions from the Underlying Funds, if any, are recorded on the ex dividend date. Interest income is accrued as earned. Interest income includes coupon interest and amortization of premium and accretion of discount on debt securities.
Expenses. Most expenses of the trust can be directly attributed to a fund. Expenses which cannot be directly attributed are apportioned among each fund in the trust. Expenses included in the accompanying financial statements reflect the expenses of each fund and do not include any expenses associated with the Underlying Funds.
Income Tax Information and Distributions to Shareholders. Each year, each fund intends to qualify as a regulated investment company by distributing all of its taxable income and realized gains under Subchapter M of the Internal Revenue Code. As a result, no provision for income taxes is required in the accompanying financial statements.
Distributions are recorded on the ex dividend date. Income dividends and capital gain distributions are declared separately for each class. Income and capital gain distributions are determined in accordance with income tax regulations, which may differ from generally accepted accounting principles. In addition, certain funds will claim a portion of the payment made to redeeming shareholders as a distribution for income tax purposes.
Capital accounts within the financial statements are adjusted for permanent book tax differences. These adjustments have no impact on net assets or the results of operations. Temporary book tax differences will reverse in a subsequent period.
Book tax differences are primarily due to short term capital gain distributions from Underlying Funds and losses deferred due to wash sales and excise tax regulations.
| The tax basis components of distributable earnings and the federal tax cost as of period end were as follows for each fund: | | | | |
| |
| | | | | | | | | | | | | | | Net Unrealized |
| | | Cost for Federal | | | | Unrealized | | | | Unrealized | | | | Appreciation/ |
| | | Income Tax Purposes | | | | Appreciation | | | | Depreciation | | | | (Depreciation) |
| Advisor Freedom Income | | $ 69,700,308 | | | | $ 2,099,665 | | | | $ (1,130,204) | | | | $ 969,461 |
| Advisor Freedom 2005 | | 40,887,918 | | | | 2,510,537 | | | | (430,743) | | | | 2,079,794 |
| Advisor Freedom 2010 | | 354,761,350 | | | | 23,151,864 | | | | (4,844,121) | | | | 18,307,743 |
| Advisor Freedom 2015 | | 330,312,966 | | | | 22,699,974 | | | | (3,138,919) | | | | 19,561,055 |
| Advisor Freedom 2020 | | 674,851,445 | | | | 65,715,328 | | | | (5,440,227) | | | | 60,275,101 |
| Advisor Freedom 2025 | | 245,036,083 | | | | 21,565,559 | | | | (1,438,952) | | | | 20,126,607 |
| Advisor Freedom 2030 | | 390,888,878 | | | | 43,757,852 | | | | (1,566,518) | | | | 42,191,334 |
| Advisor Freedom 2035 | | 114,771,413 | | | | 10,557,946 | | | | (396,605) | | | | 10,161,341 |
| Advisor Freedom 2040 | | 315,380,054 | | | | 34,832,513 | | | | (738,165) | | | | 34,094,348 |
| 1. Significant Accounting Policies continued | | | | | | | | | | | | | | |
| |
| Income Tax Information and Distributions to Shareholders continued | | | | | | | | | | | | |
| |
| | | | | | | | | | | | | | | Undistributed |
| | | | | | | | | | | Undistributed | | | | Long-term |
| | | | | | | | | | | Ordinary Income | | | | Capital Gain |
| Advisor Freedom Income | | | | | | | | | | $ 219,609 | | | | $ 442,156 |
| Advisor Freedom 2005 | | | | | | | | | | 162,644 | | | | 518,830 |
| Advisor Freedom 2010 | | | | | | | | | | 1,447,647 | | | | 4,760,938 |
| Advisor Freedom 2015 | | | | | | | | | | 984,245 | | | | 4,733,886 |
| Advisor Freedom 2020 | | | | | | | | | | 1,867,050 | | | | 13,384,984 |
| Advisor Freedom 2025 | | | | | | | | | | 443,575 | | | | 4,477,357 |
| Advisor Freedom 2030 | | | | | | | | | | 565,464 | | | | 7,844,928 |
| Advisor Freedom 2035 | | | | | | | | | | 111,066 | | | | 2,134,322 |
| Advisor Freedom 2040 | | | | | | | | | | 356,945 | | | | 6,292,237 |
| |
| The tax character of distributions paid was as follows: | | | | | | | | | | | | | | |
| |
| March 31, 2006 | | | | | | | | | | | | | | |
| | | | | | | Ordinary | | | | Long-term | | | | |
| | | | | | | Income | | | | Capital Gains | | | | Total |
| Advisor Freedom Income | | | | | | $ 1,513,067 | | | | $ 144,130 | | | | $ 1,657,197 |
| Advisor Freedom 2005 | | | | | | 621,106 | | | | 89,791 | | | | 710,897 |
| Advisor Freedom 2010 | | | | | | 5,639,391 | | | | 775,835 | | | | 6,415,226 |
| Advisor Freedom 2015 | | | | | | 3,990,749 | | | | 477,777 | | | | 4,468,526 |
| Advisor Freedom 2020 | | | | | | 7,886,283 | | | | 1,712,913 | | | | 9,599,196 |
| Advisor Freedom 2025 | | | | | | 2,446,690 | | | | 248,535 | | | | 2,695,225 |
| Advisor Freedom 2030 | | | | | | 3,352,916 | | | | 826,847 | | | | 4,179,763 |
| Advisor Freedom 2035 | | | | | | 889,584 | | | | 93,495 | | | | 983,079 |
| Advisor Freedom 2040 | | | | | | 2,735,694 | | | | 451,252 | | | | 3,186,946 |
| |
| March 31, 2005 | | | | | | | | | | | | | | |
| | | | | | | Ordinary | | | | Long-term | | | | |
| | | | | | | Income | | | | Capital Gains | | | | Total |
| Advisor Freedom Income | | | | | | $ 704,332 | | | | $ 35,147 | | | | $ 739,479 |
| Advisor Freedom 2005 | | | | | | 231,296 | | | | 3,243 | | | | 234,539 |
| Advisor Freedom 2010 | | | | | | 2,581,854 | | | | 17,590 | | | | 2,599,444 |
| Advisor Freedom 2015 | | | | | | 1,216,211 | | | | 6,337 | | | | 1,222,548 |
| Advisor Freedom 2020 | | | | | | 4,439,939 | | | | 68,080 | | | | 4,508,019 |
| Advisor Freedom 2025 | | | | | | 647,465 | | | | 1,629 | | | | 649,094 |
| Advisor Freedom 2030 | | | | | | 1,985,403 | | | | 16,365 | | | | 2,001,768 |
| Advisor Freedom 2035 | | | | | | 330,752 | | | | 21,694 | | | | 352,446 |
| Advisor Freedom 2040 | | | | | | 1,190,067 | | | | — | | | | 1,190,067 |
| |
| 2. Operating Policies. | | | | | | | | | | | | | | |
Repurchase Agreements. FMR has received an Exemptive Order from the Securities and Exchange Commission (the SEC) which permits certain funds and other affiliated entities of FMR to transfer uninvested cash balances into joint trading accounts which are then invested in repurchase agreements. Certain funds may also invest directly with institutions in repurchase agreements. Repurchase agreements are collateralized by government or non government securities. Upon settlement date, collateral is held in segregated accounts with custodian banks and may be obtained in the event of a default of the counterparty. Each applicable fund monitors, on a daily basis, the value of the collateral to ensure it is at least equal to the principal amount of the repurchase agreement (including accrued interest). In the event of a default by the counterparty, realization of the collateral proceeds could be delayed, during which time the value of the collateral may decline.
73 Annual Report
| Notes to Financial Statements continued | | | | |
| |
| |
| |
| 3. Purchases and Sales of Investments. | | | | |
| |
Purchases and redemptions of the underlying fund shares are noted in the table below.
| | | | |
| | | | | Purchases ($) | | Redemptions ($) |
| Advisor Freedom Income | | | | 24,713,712 | | 13,299,690 |
| Advisor Freedom 2005 | | | | 29,342,440 | | 11,337,422 |
| Advisor Freedom 2010 | | | | 148,806,647 | | 21,225,849 |
| Advisor Freedom 2015 | | | | 188,651,266 | | 8,880,461 |
| Advisor Freedom 2020 | | | | 304,380,004 | | 34,179,267 |
| Advisor Freedom 2025 | | | | 132,628,269 | | 8,807,768 |
| Advisor Freedom 2030 | | | | 182,902,917 | | 11,088,376 |
| Advisor Freedom 2035 | | | | 74,728,399 | | 3,429,443 |
| Advisor Freedom 2040 | | | | 166,901,729 | | 9,607,568 |
| |
| 4. Fees and Other Transactions with Affiliates. | | | | |
Management Fee. Strategic Advisers, Inc. (Strategic Advisers), an affiliate of FMR, provides the funds with investment management related ser vices. As of May 1, 2005, Strategic Advisers contractually agreed to eliminate the .10% management fee. On May 19, 2005, the Board of Trustees ap proved amendments to the management contracts. Under the amended contracts the funds no longer pay management fees.
Prior to May 19, 2005, the funds paid a monthly management fee to Strategic Advisers. The management fee was computed at an annual rate of .10% of the funds’ average net assets. The management fee was reduced by an amount equal to the fees and expenses paid by the funds to the independent Trustees.
Other Transactions. Strategic Advisers has entered into an administration agreement with FMR under which FMR provides management and admin istrative services (other than investment advisory services) necessary for the operation of each fund. Pursuant to this agreement, FMR pays all ex penses of each fund, excluding the compensation of the independent Trustees and certain other expenses such as interest expense. FMR also contracts with other Fidelity companies to perform the services necessary for the operation of each fund. The funds do not pay any fees for these services. Effec tive May 19, 2005, FMR no longer received fees for services under the administration agreement.
Distribution and Service Plan. In accordance with Rule 12b 1 of the 1940 Act, the fund has adopted separate Distribution and Service Plans for each class of shares. Certain classes pay Fidelity Distributors Corporation (FDC), an affiliate of FMR, separate Distribution and Service Fees, each of which is based on an annual percentage of each class’ average net assets. In addition, FDC may pay financial intermediaries for selling shares of the fund and providing shareholder support services. For the period, the Distribution and Service Fee rates and the total amounts paid to and retained by FDC were as follows:
| | | Distribution | | Service | | | | Paid to | | | | Retained |
| Advisor Freedom Income | | Fee | | Fee | | | | FDC | | | | by FDC |
| Class A | | 0% | | .25% | | | | $ 34,548 | | | | $ 56 |
| Class T | | .25% | | .25% | | | | 155,124 | | | | — |
| Class B | | .75% | | .25% | | | | 46,860 | | | | 35,147 |
| Class C | | .75% | | .25% | | | | 143,907 | | | | 36,856 |
| | | | | | | | | $ 380,439 | | | | $ 72,059 |
| Advisor Freedom 2005 | | | | | | | | | | | | |
| Class A | | 0% | | .25% | | | | $ 25,895 | | | | $ 559 |
| Class T | | .25% | | .25% | | | | 63,139 | | | | 842 |
| Class B | | .75% | | .25% | | | | 33,541 | | | | 25,712 |
| Class C | | .75% | | .25% | | | | 64,757 | | | | 27,171 |
| | | | | | | | | $ 187,332 | | | | $ 54,284 |
| Advisor Freedom 2010 | | | | | | | | | | | | |
| Class A | | 0% | | .25% | | | | $ 269,607 | | | | $ 816 |
| Class T | | .25% | | .25% | | | | 593,381 | | | | 369 |
| Class B | | .75% | | .25% | | | | 305,776 | | | | 229,333 |
| Class C | | .75% | | .25% | | | | 328,340 | | | | 108,873 |
| | | | | | | | | $ 1,497,104 | | | | $ 339,391 |
| Advisor Freedom 2015 | | | | | | | | | | | | |
| Class A | | 0% | | .25% | | | | $ 204,082 | | | | $ 488 |
| Class T | | .25% | | .25% | | | | 448,360 | | | | — |
| Class B | | .75% | | .25% | | | | 263,580 | | | | 197,685 |
| Class C | | .75% | | .25% | | | | 266,485 | | | | 134,804 |
| | | | | | | | | $ 1,182,507 | | | | $ 332,977 |
| 4. Fees and Other Transactions with Affiliates continued | | | | | | | | | | | | |
| |
| Distribution and Service Plan continued | | | | | | | | | | | | | | |
| | | | | Distribution | | Service | | | | Paid to | | | | Retained |
| Advisor Freedom 2020 | | | | Fee | | Fee | | | | FDC | | | | by FDC |
| Class A | | | | 0% | | .25% | | | | $ 503,132 | | | | $ 1,026 |
| Class T | | | | .25% | | .25% | | | | 1,162,864 | | | | — |
| Class B | | | | .75% | | .25% | | | | 600,717 | | | | 450,537 |
| Class C | | | | .75% | | .25% | | | | 499,565 | | | | 164,969 |
| | | | | | | | | | | $ 2,766,278 | | | | $ 616,532 |
| Advisor Freedom 2025 | | | | | | | | | | | | | | |
| Class A | | | | 0% | | .25% | | | | $ 221,027 | | | | $ 452 |
| Class T | | | | .25% | | .25% | | | | 293,934 | | | | — |
| Class B | | | | .75% | | .25% | | | | 204,351 | | | | 153,263 |
| Class C | | | | .75% | | .25% | | | | 154,052 | | | | 65,008 |
| | | | | | | | | | | $ 873,364 | | | | $ 218,723 |
| Advisor Freedom 2030 | | | | | | | | | | | | | | |
| Class A | | | | 0% | | .25% | | | | $ 263,620 | | | | $ 273 |
| Class T | | | | .25% | | .25% | | | | 670,634 | | | | 732 |
| Class B | | | | .75% | | .25% | | | | 349,300 | | | | 261,976 |
| Class C | | | | .75% | | .25% | | | | 292,010 | | | | 91,580 |
| | | | | | | | | | | $ 1,575,564 | | | | $ 354,561 |
| Advisor Freedom 2035 | | | | | | | | | | | | | | |
| Class A | | | | 0% | | .25% | | | | $ 74,063 | | | | $ 329 |
| Class T | | | | .25% | | .25% | | | | 144,640 | | | | — |
| Class B | | | | .75% | | .25% | | | | 111,658 | | | | 83,744 |
| Class C | | | | .75% | | .25% | | | | 83,016 | | | | 45,501 |
| | | | | | | | | | | $ 413,377 | | | | $ 129,574 |
| Advisor Freedom 2040 | | | | | | | | | | | | | | |
| Class A | | | | 0% | | .25% | | | | $ 216,852 | | | | $ 149 |
| Class T | | | | .25% | | .25% | | | | 477,308 | | | | — |
| Class B | | | | .75% | | .25% | | | | 252,659 | | | | 189,495 |
| Class C | | | | .75% | | .25% | | | | 293,501 | | | | 112,270 |
| | | | | | | | | | | $ 1,240,320 | | | | $ 301,914 |
Sales Load. FDC receives a front end sales charge of up to 5.75% for selling Class A shares, and 3.50% for selling Class T shares, some of which is paid to financial intermediaries for selling shares of the fund. FDC receives the proceeds of contingent deferred sales charges levied on Class A, Class T, Class B, and Class C redemptions. These charges depend on the holding period. The deferred sales charges range from 5% to 1% for Class B, 1% for Class C, 1.00% to .50% for certain purchases of Class A shares (.25% prior to February 24, 2006) and .25% for certain purchases of Class T shares.
| For the period, sales charge amounts retained by FDC were as follows: | | | | |
| |
| | | | | Retained |
| Advisor Freedom Income | | | | by FDC |
| Class A | | | | $ 19,148 |
| Class T | | | | 6,026 |
| Class B* | | | | 15,880 |
| Class C* | | | | 2,141 |
| | | | | $ 43,195 |
| Advisor Freedom 2005 | | | | |
| Class A | | | | $ 25,187 |
| Class T | | | | 6,041 |
| Class B* | | | | 5,814 |
| Class C* | | | | 1,760 |
| | | | | $ 38,802 |
75 Annual Report
| Notes to Financial Statements continued | | | | | | |
| |
| |
| |
| 4. Fees and Other Transactions with Affiliates continued | | | | |
| |
| Sales Load continued | | | | | | |
| |
| | | | | | | Retained |
| Advisor Freedom 2010 | | | | | | by FDC |
| Class A | | | | | | $ 110,780 |
| Class T | | | | | | 28,167 |
| Class B* | | | | | | 88,191 |
| Class C* | | | | | | 6,243 |
| | | | | | | $ 233,381 |
| Advisor Freedom 2015 | | | | | | |
| Class A | | | | | | $ 169,873 |
| Class T | | | | | | 33,577 |
| Class B* | | | | | | 43,281 |
| Class C* | | | | | | 7,170 |
| | | | | | | $ 253,901 |
| Advisor Freedom 2020 | | | | | | |
| Class A | | | | | | $ 238,254 |
| Class T | | | | | | 46,834 |
| Class B* | | | | | | 139,225 |
| Class C* | | | | | | 9,106 |
| | | | | | | $ 433,419 |
| Advisor Freedom 2025 | | | | | | |
| Class A | | | | | | $ 145,000 |
| Class T | | | | | | 22,639 |
| Class B* | | | | | | 53,085 |
| Class C* | | | | | | 4,097 |
| | | | | | | $ 224,821 |
| Advisor Freedom 2030 | | | | | | |
| Class A | | | | | | $ 139,670 |
| Class T | | | | | | 29,995 |
| Class B* | | | | | | 90,562 |
| Class C* | | | | | | 5,622 |
| | | | | | | $ 265,849 |
| Advisor Freedom 2035 | | | | | | |
| Class A | | | | | | $ 77,413 |
| Class T | | | | | | 12,495 |
| Class B* | | | | | | 28,435 |
| Class C* | | | | | | 2,020 |
| | | | | | | $ 120,363 |
| Advisor Freedom 2040 | | | | | | |
| Class A | | | | | | $ 128,065 |
| Class T | | | | | | 20,786 |
| Class B* | | | | | | 65,798 |
| Class C* | | | | | | 6,512 |
| | | | | | | $ 221,161 |
| |
| * When Class B and Class C shares are initially sold, FDC pays commissions from its own resources to financial intermediaries through which the sales are made. | | | | |
FMR voluntarily agreed to reimburse funds to the extent annual operating expenses exceeded certain levels of average net assets as noted in the table below. Some expenses, for example interest expense, are excluded from this reimbursement.
The following classes of each applicable fund were in reimbursement during the period:
| | | Expense | | Reimbursement |
| | | Limitations | | from adviser |
| Advisor Freedom Income | | | | | | | | |
| Class A | | .33% - .25%* | | | | $ 243 |
| Class T | | .58% - .50%* | | | | 617 |
| Class B | | 1.08% - 1.00%* | | | | 89 |
| Class C | | 1.08% - 1.00%* | | | | 300 |
| Institutional Class | | .08% - .00%* | | | | 14 |
| Advisor Freedom 2005 | | | | | | | | |
| Class A | | .33% - .25%* | | | | 156 |
| Class T | | .58% - .50%* | | | | 184 |
| Class B | | 1.08% - 1.00%* | | | | 56 |
| Class C | | 1.08% - 1.00%* | | | | 116 |
| Institutional Class | | .08% - .00%* | | | | 15 |
| Advisor Freedom 2010 | | | | | | | | |
| Class A | | .33% - .25%* | | | | 1,803 |
| Class T | | .58% - .50%* | | | | 2,047 |
| Class B | | 1.08% - 1.00%* | | | | 580 |
| Class C | | 1.08% - 1.00%* | | | | 608 |
| Institutional Class | | .08% - .00%* | | | | 130 |
| Advisor Freedom 2015 | | | | | | | | |
| Class A | | .33% - .25%* | | | | 1,146 |
| Class T | | .58% - .50%* | | | | 1,372 |
| Class B | | 1.08% - 1.00%* | | | | 443 |
| Class C | | 1.08% - 1.00%* | | | | 449 |
| Institutional Class | | .08% - .00%* | | | | 288 |
| Advisor Freedom 2020 | | | | | | | | |
| Class A | | .33% - .25%* | | | | 3,180 |
| Class T | | .58% - .50%* | | | | 3,941 |
| Class B | | 1.08% - 1.00%* | | | | 1,073 |
| Class C | | 1.08% - 1.00%* | | | | 887 |
| Institutional Class | | .08% - .00%* | | | | 268 |
| Advisor Freedom 2025 | | | | | | | | |
| Class A | | .33% - .25%* | | | | 1,364 |
| Class T | | .58% - .50%* | | | | 887 |
| Class B | | 1.08% - 1.00%* | | | | 323 |
| Class C | | 1.08% - 1.00%* | | | | 246 |
| Institutional Class | | .08% - .00%* | | | | 51 |
| Advisor Freedom 2030 | | | | | | | | |
| Class A | | .33% - .25%* | | | | 1,605 |
| Class T | | .58% - .50%* | | | | 2,251 |
| Class B | | 1.08% - 1.00%* | | | | 618 |
| Class C | | 1.08% - 1.00%* | | | | 496 |
| Institutional Class | | .08% - .00%* | | | | 164 |
77 Annual Report
| Notes to Financial Statements continued | | | | | | |
| |
| |
| 5. Expense Reductions - continued | | | | | | |
| |
| | | | | Expense | | Reimbursement |
| | | | | Limitations | | from adviser |
| Advisor Freedom 2035 | | | | | | | | |
| Class A | | | | .33% - .25%* | | 397 |
| Class T | | | | .58% - .50%* | | 405 |
| Class B | | | | 1.08% - 1.00%* | | 162 |
| Class C | | | | 1.08% - 1.00%* | | 131 |
| Institutional Class | | | | .08% - .00%* | | 13 |
| Advisor Freedom 2040 | | | | | | | | |
| Class A | | | | .33% - .25%* | | 1,278 |
| Class T | | | | .58% - .50%* | | 1,549 |
| Class B | | | | 1.08% - 1.00%* | | 427 |
| Class C | | | | 1.08% - 1.00%* | | 504 |
| Institutional Class | | | | .08% - .00%* | | 96 |
| * Expense limitation in effect at period end. | | | | | | | | |
In addition, through arrangements with each applicable fund’s custodian, credits realized as a result of uninvested cash balances were used to reduce each applicable fund’s management fee. During the period, these credits reduced management fee by the following amounts:
| Advisor Freedom Income | | $ 3 |
| Advisor Freedom 2005 | | 4 |
| Advisor Freedom 2010 | | 81 |
| Advisor Freedom 2015 | | 13 |
| Advisor Freedom 2020 | | 267 |
| Advisor Freedom 2025 | | 4 |
| Advisor Freedom 2030 | | 190 |
| Advisor Freedom 2035 | | 17 |
| Advisor Freedom 2040 | | 154 |
| |
| 6. Other. | | |
The funds’ organizational documents provide former and current trustees and officers with a limited indemnification against liabilities arising in connection with the performance of their duties to the funds. In the normal course of business, the funds may also enter into contracts that provide general indemnifications. The funds’ maximum exposure under these arrangements is unknown as this would be dependent on future claims that may be made against the funds. The risk of material loss from such claims is considered remote.
The funds do not invest in the Underlying Funds for the purpose of exercising management or control; however, investments by the funds within their principal investment strategies may represent a significant portion of the Underlying Fund’s net assets. The funds, in aggregate, were the owners of record of more than 20% of the total outstanding shares of the following Underlying Funds.
| Fund | | % of shares held |
| |
| Fidelity Advisor Large Cap Fund | | 25% |
| Fidelity Advisor Government Investment Fund | | 28% |
| 7. Distributions to Shareholders. | | | | | | |
| |
Distributions to shareholders of each class were as follows:
| | | | | | |
| | | Years ended March 31, |
| | | 2006 | | | | 2005 |
| Advisor Freedom Income | | | | | | |
| From net investment income | | | | | | |
| Class A | | $ 360,423 | | | | $ 156,915 |
| Class T | | 716,147 | | | | 358,648 |
| Class B | | 85,800 | | | | 44,872 |
| Class C | | 263,465 | | | | 134,067 |
| Institutional Class | | 29,580 | | | | 10,148 |
| Total | | $ 1,455,415 | | | | $ 704,650 |
| From net realized gain | | | | | | |
| Class A | | $ 35,475 | | | | $ 5,263 |
| Class T | | 101,688 | | | | 15,048 |
| Class B | | 15,014 | | | | 3,971 |
| Class C | | 47,334 | | | | 10,183 |
| Institutional Class | | 2,271 | | | | 364 |
| Total | | $ 201,782 | | | | $ 34,829 |
| Advisor Freedom 2005 | | | | | | |
| From net investment income | | | | | | |
| Class A | | $ 206,518 | | | | $ 72,744 |
| Class T | | 208,572 | | | | 71,074 |
| Class B | | 38,357 | | | | 23,488 |
| Class C | | 78,865 | | | | 54,062 |
| Institutional Class | | 27,052 | | | | 9,928 |
| Total | | $ 559,364 | | | | $ 231,296 |
| From net realized gain | | | | | | |
| Class A | | $ 40,250 | | | | $ 817 |
| Class T | | 62,014 | | | | 951 |
| Class B | | 14,837 | | | | 646 |
| Class C | | 29,953 | | | | 641 |
| Institutional Class | | 4,479 | | | | 188 |
| Total | | $ 151,533 | | | | $ 3,243 |
| Advisor Freedom 2010 | | | | | | |
| From net investment income | | | | | | |
| Class A | | $ 2,171,009 | | | | $ 896,266 |
| Class T | | 2,009,465 | | | | 1,070,938 |
| Class B | | 367,156 | | | | 244,225 |
| Class C | | 407,816 | | | | 262,890 |
| Institutional Class | | 180,656 | | | | 104,924 |
| Total | | $ 5,136,102 | | | | $ 2,579,243 |
| From net realized gain | | | | | | |
| Class A | | $ 441,149 | | | | $ 6,722 |
| Class T | | 514,332 | | | | 7,134 |
| Class B | | 144,772 | | | | 3,175 |
| Class C | | 147,544 | | | | 2,556 |
| Institutional Class | | 31,327 | | | | 614 |
| Total | | $ 1,279,124 | | | | $ 20,201 |
79 Annual Report
| Notes to Financial Statements continued | | | | | | | | |
| |
| |
| |
| 7. Distributions to Shareholders - continued | | | | | | | | |
| | | | | | | Years ended March 31, |
| | | | | | | 2006 | | | | 2005 |
| Advisor Freedom 2015 | | | | | | | | | | |
| From net investment income | | | | | | | | | | |
| Class A | | | | | | $ 1,356,176 | | | | $ 362,175 |
| Class T | | | | | | 1,245,899 | | | | 450,450 |
| Class B | | | | | | 232,461 | | | | 125,071 |
| Class C | | | | | | 245,384 | | | | 117,958 |
| Institutional Class | | | | | | 257,756 | | | | 160,357 |
| Total | | | | | | $ 3,337,676 | | | | $ 1,216,011 |
| From net realized gain | | | | | | | | | | |
| Class A | | | | | | $ 361,841 | | | | $ 1,578 |
| Class T | | | | | | 431,884 | | | | 1,718 |
| Class B | | | | | | 129,149 | | | | 1,172 |
| Class C | | | | | | 130,303 | | | | 898 |
| Institutional Class | | | | | | 77,673 | | | | 1,171 |
| Total | | | | | | $ 1,130,850 | | | | $ 6,537 |
| Advisor Freedom 2020 | | | | | | | | | | |
| From net investment income | | | | | | | | | | |
| Class A | | | | | | $ 2,883,663 | | | | $ 1,730,029 |
| Class T | | | | | | 2,628,309 | | | | 1,789,888 |
| Class B | | | | | | 420,463 | | | | 435,029 |
| Class C | | | | | | 364,285 | | | | 327,289 |
| Institutional Class | | | | | | 243,104 | | | | 157,704 |
| Total | | | | | | $ 6,539,824 | | | | $ 4,439,939 |
| From net realized gain | | | | | | | | | | |
| Class A | | | | | | $ 1,061,003 | | | | $ 27,378 |
| Class T | | | | | | 1,308,678 | | | | 23,535 |
| Class B | | | | | | 326,977 | | | | 9,581 |
| Class C | | | | | | 276,300 | | | | 6,642 |
| Institutional Class | | | | | | 86,414 | | | | 944 |
| Total | | | | | | $ 3,059,372 | | | | $ 68,080 |
| Advisor Freedom 2025 | | | | | | | | | | |
| From net investment income | | | | | | | | | | |
| Class A | | | | | | $ 1,121,310 | | | | $ 224,481 |
| Class T | | | | | | 596,908 | | | | 274,089 |
| Class B | | | | | | 141,241 | | | | 77,176 |
| Class C | | | | | | 106,449 | | | | 61,009 |
| Institutional Class | | | | | | 40,310 | | | | 10,710 |
| Total | | | | | | $ 2,006,218 | | | | $ 647,465 |
| From net realized gain | | | | | | | | | | |
| Class A | | | | | | $ 347,287 | | | | $ 430 |
| Class T | | | | | | 210,648 | | | | 395 |
| Class B | | | | | | 67,889 | | | | 443 |
| Class C | | | | | | 51,620 | | | | 333 |
| Institutional Class | | | | | | 11,563 | | | | 28 |
| Total | | | | | | $ 689,007 | | | | $ 1,629 |
| 7. Distributions to Shareholders - continued | | | | | | |
| | | Years ended March 31, |
| | | 2006 | | | | 2005 |
| Advisor Freedom 2030 | | | | | | |
| From net investment income | | | | | | |
| Class A | | $ 1,047,937 | | | | $ 638,944 |
| Class T | | 974,321 | | | | 938,314 |
| Class B | | 133,986 | | | | 178,105 |
| Class C | | 126,130 | | | | 146,090 |
| Institutional Class | | 94,967 | | | | 83,950 |
| Total | | $ 2,377,341 | | | | $ 1,985,403 |
| From net realized gain | | | | | | |
| Class A | | $ 622,840 | | | | $ 5,495 |
| Class T | | 768,934 | | | | 5,920 |
| Class B | | 191,018 | | | | 2,610 |
| Class C | | 157,380 | | | | 1,897 |
| Institutional Class | | 62,250 | | | | 443 |
| Total | | $ 1,802,422 | | | | $ 16,365 |
| Advisor Freedom 2035 | | | | | | |
| From net investment income | | | | | | |
| Class A | | $ 336,621 | | | | $ 138,492 |
| Class T | | 271,292 | | | | 124,168 |
| Class B | | 62,536 | | | | 48,334 |
| Class C | | 46,277 | | | | 34,996 |
| Institutional Class | | 16,641 | | | | 5,668 |
| Total | | $ 733,367 | | | | $ 351,658 |
| From net realized gain | | | | | | |
| Class A | | $ 92,405 | | | | $ 272 |
| Class T | | 90,299 | | | | 213 |
| Class B | | 36,328 | | | | 175 |
| Class C | | 27,177 | | | | 105 |
| Institutional Class | | 3,503 | | | | 23 |
| Total | | $ 249,712 | | | | $ 788 |
| Advisor Freedom 2040 | | | | | | |
| From net investment income | | | | | | |
| Class A | | $ 950,126 | | | | $ 357,270 |
| Class T | | 792,429 | | | | 516,094 |
| Class B | | 121,700 | | | | 124,906 |
| Class C | | 148,642 | | | | 140,661 |
| Institutional Class | | 62,803 | | | | 51,136 |
| Total | | $ 2,075,700 | | | | $ 1,190,067 |
| From net realized gain | | | | | | |
| Class A | | $ 407,878 | | | | $ — |
| Class T | | 422,998 | | | | — |
| Class B | | 116,257 | | | | — |
| Class C | | 134,587 | | | | — |
| Institutional Class | | 29,526 | | | | — |
| Total | | $ 1,111,246 | | | | $ — |
81 Annual Report
| Notes to Financial Statements continued | | | | | | | | | | | | |
| |
| |
| |
| 8. Share Transactions. | | | | | | | | | | | | | | |
| |
| Transactions for each class of shares were as follows: | | | | | | | | | | | | |
| |
| | | | | Shares | | | | Dollars |
| | | | | Years ended March 31, | | | | Years ended March 31, |
| | | | | 2006 | | 2005 | | | | 2006 | | | | 2005 |
| Advisor Freedom Income | | | | | | | | | | | | | | |
| Class A | | | | | | | | | | | | | | |
| Shares sold | | | | 1,248,334 | | 728,210 | | | | $ 13,023,137 | | | | $ 7,481,125 |
| Reinvestment of distributions | | | | 34,742 | | 13,977 | | | | 361,381 | | | | 144,254 |
| Shares redeemed | | | | (504,418) | | (241,418) | | | | (5,262,926) | | | | (2,487,639) |
| Net increase (decrease) | | | | 778,658 | | 500,769 | | | | $ 8,121,592 | | | | $ 5,137,740 |
| Class T | | | | | | | | | | | | | | |
| Shares sold | | | | 1,413,853 | | 2,252,617 | | | | $ 14,717,233 | | | | $ 23,261,446 |
| Reinvestment of distributions | | | | 74,755 | | 34,674 | | | | 776,259 | | | | 358,020 |
| Shares redeemed | | | | (1,217,170) | | 868,775) | | | | (12,681,876) | | | | (8,962,920) |
| Net increase (decrease) | | | | 271,438 | | 1,418,516 | | | | $ 2,811,616 | | | | $ 14,656,546 |
| Class B | | | | | | | | | | | | | | |
| Shares sold | | | | 151,645 | | 202,570 | | | | $ 1,576,981 | | | | $ 2,078,692 |
| Reinvestment of distributions | | | | 8,915 | | 4,403 | | | | 92,494 | | | | 45,378 |
| Shares redeemed | | | | (129,511) | | (125,605) | | | | (1,343,127) | | | | (1,287,886) |
| Net increase (decrease) | | | | 31,049 | | 81,368 | | | | $ 326,348 | | | | $ 836,184 |
| Class C | | | | | | | | | | | | | | |
| Shares sold | | | | 424,993 | | 888,712 | | | | $ 4,420,146 | | | | $ 9,098,996 |
| Reinvestment of distributions | | | | 22,295 | | 10,052 | | | | 231,247 | | | | 103,577 |
| Shares redeemed | | | | (514,989) | | (419,464) | | | | (5,366,087) | | | | (4,313,437) |
| Net increase (decrease) | | | | (67,701) | | 479,300 | | | | $ (714,694) | | | | $ 4,889,136 |
| Institutional Class | | | | | | | | | | | | | | |
| Shares sold | | | | 110,433 | | 42,061 | | | | $ 1,154,968 | | | | $ 432,907 |
| Reinvestment of distributions | | | | 2,279 | | 760 | | | | 23,731 | | | | 7,846 |
| Shares redeemed | | | | (65,692) | | (16,642) | | | | (691,013) | | | | (170,939) |
| Net increase (decrease) | | | | 47,020 | | 26,179 | | | | $ 487,686 | | | | $ 269,814 |
| Advisor Freedom 2005 | | | | | | | | | | | | | | |
| Class A | | | | | | | | | | | | | | |
| Shares sold | | | | 1,045,087 | | 585,329 | | | | $ 11,488,136 | | | | $ 6,132,477 |
| Reinvestment of distributions | | | | 20,715 | | 6,487 | | | | 227,182 | | | | 69,326 |
| Shares redeemed | | | | (201,347) | | (159,401) | | | | (2,219,234) | | | | (1,685,117) |
| Net increase (decrease) | | | | 864,455 | | 432,415 | | | | $ 9,496,084 | | | | $ 4,516,686 |
| Class T | | | | | | | | | | | | | | |
| Shares sold | | | | 1,419,295 | | 772,833 | | | | $ 15,260,795 | | | | $ 8,098,797 |
| Reinvestment of distributions | | | | 24,717 | | 6,710 | | | | 269,302 | | | | 71,635 |
| Shares redeemed | | | | (970,234) | | (218,069) | | | | (10,565,587) | | | | (2,293,607) |
| Net increase (decrease) | | | | 473,778 | | 561,474 | | | | $ 4,964,510 | | | | $ 5,876,825 |
| Class B | | | | | | | | | | | | | | |
| Shares sold | | | | 122,820 | | 192,162 | | | | $ 1,330,376 | | | | $ 2,010,191 |
| Reinvestment of distributions | | | | 4,304 | | 1,998 | | | | 46,985 | | | | 21,257 |
| Shares redeemed | | | | (48,057) | | (48,192) | | | | (526,073) | | | | (503,088) |
| Net increase (decrease) | | | | 79,067 | | 145,968 | | | | $ 851,288 | | | | $ 1,528,360 |
| Class C | | | | | | | | | | | | | | |
| Shares sold | | | | 316,798 | | 478,945 | | | | $ 3,462,176 | | | | $ 4,977,613 |
| Reinvestment of distributions | | | | 8,537 | | 4,388 | | | | 93,176 | | | | 46,808 |
| Shares redeemed | | | | (185,035) | | (48,603) | | | | (2,016,625) | | | | (512,104) |
| Net increase (decrease) | | | | 140,300 | | 434,730 | | | | $ 1,538,727 | | | | $ 4,512,317 |
| Institutional Class | | | | | | | | | | | | | | |
| Shares sold | | | | 89,143 | | 34,319 | | | | $ 967,402 | | | | $ 360,945 |
| Reinvestment of distributions | | | | 2,817 | | 860 | | | | 31,000 | | | | 9,166 |
| Shares redeemed | | | | (32,274) | | (11,601) | | | | (357,310) | | | | (125,056) |
| Net increase (decrease) | | | | 59,686 | | 23,578 | | | | $ 641,092 | | | | $ 245,055 |
| 8. Share Transactions - continued | | | | | | | | | | | | |
| |
| | | Shares | | | | Dollars |
| | | Years ended March 31, | | | | Years ended March 31, |
| | | 2006 | | 2005 | | | | 2006 | | | | 2005 |
| Advisor Freedom 2010 | | | | | | | | | | | | |
| Class A | | | | | | | | | | | | |
| Shares sold | | 7,739,808 | | 4,608,995 | | | | $ 88,298,046 | | | | $ 50,250,054 |
| Reinvestment of distributions | | 223,520 | | 78,688 | | | | 2,536,606 | | | | 872,410 |
| Shares redeemed | | (2,250,375) | | (950,972) | | | | (25,763,889) | | | | (10,395,541) |
| Net increase (decrease) | | 5,712,953 | | 3,736,711 | | | | $ 65,070,763 | | | | $ 40,726,923 |
| Class T | | | | | | | | | | | | |
| Shares sold | | 7,216,617 | | 7,487,847 | | | | $ 81,687,336 | | | | $ 81,779,426 |
| Reinvestment of distributions | | 222,039 | | 96,564 | | | | 2,509,373 | | | | 1,069,348 |
| Shares redeemed | | (3,900,266) | | (1,698,806) | | | | (44,179,760) | | | | (18,462,716) |
| Net increase (decrease) | | 3,538,390 | | 5,885,605 | | | | $ 40,016,949 | | | | $ 64,386,058 |
| Class B | | | | | | | | | | | | |
| Shares sold | | 834,087 | | 1,378,429 | | | | $ 9,388,818 | | | | $ 14,897,988 |
| Reinvestment of distributions | | 40,955 | | 20,499 | | | | 460,771 | | | | 226,286 |
| Shares redeemed | | (499,400) | | (292,158) | | | | (5,655,011) | | | | (3,159,106) |
| Net increase (decrease) | | 375,642 | | 1,106,770 | | | | $ 4,194,578 | | | | $ 11,965,168 |
| Class C | | | | | | | | | | | | |
| Shares sold | | 1,335,196 | | 1,743,474 | | | | $ 15,082,752 | | | | $ 18,868,200 |
| Reinvestment of distributions | | 43,770 | | 20,727 | | | | 492,426 | | | | 228,983 |
| Shares redeemed | | (585,637) | | (295,172) | | | | (6,617,347) | | | | (3,194,192) |
| Net increase (decrease) | | 793,329 | | 1,469,029 | | | | $ 8,957,831 | | | | $ 15,902,991 |
| Institutional Class | | | | | | | | | | | | |
| Shares sold | | 700,184 | | 496,890 | | | | $ 8,032,090 | | | | $ 5,380,233 |
| Reinvestment of distributions | | 14,123 | | 6,067 | | | | 160,978 | | | | 67,159 |
| Shares redeemed | | (282,482) | | (155,576) | | | | (3,270,359) | | | | (1,710,806) |
| Net increase (decrease) | | 431,825 | | 347,381 | | | | $ 4,922,709 | | | | $ 3,736,586 |
| Advisor Freedom 2015 | | | | | | | | | | | | |
| Class A | | | | | | | | | | | | |
| Shares sold | | 7,755,416 | | 4,003,451 | | | | $ 87,784,785 | | | | $ 42,707,661 |
| Reinvestment of distributions | | 148,528 | | 31,923 | | | | 1,681,279 | | | | 349,281 |
| Shares redeemed | | (1,248,688) | | (307,000) | | | | (14,243,836) | | | | (3,266,298) |
| Net increase (decrease) | | 6,655,256 | | 3,728,374 | | | | $ 75,222,228 | | | | $ 39,790,644 |
| Class T | | | | | | | | | | | | |
| Shares sold | | 7,331,499 | | 5,141,514 | | | | $ 82,443,787 | | | | $ 54,603,890 |
| Reinvestment of distributions | | 146,891 | | 40,873 | | | | 1,655,344 | | | | 446,960 |
| Shares redeemed | | (2,069,563) | | (458,057) | | | | (23,392,515) | | | | (4,861,368) |
| Net increase (decrease) | | 5,408,827 | | 4,724,330 | | | | $ 60,706,616 | | | | $ 50,189,482 |
| Class B | | | | | | | | | | | | |
| Shares sold | | 1,320,734 | | 1,449,464 | | | | $ 14,714,003 | | | | $ 15,307,338 |
| Reinvestment of distributions | | 29,554 | | 10,737 | | | | 331,712 | | | | 117,212 |
| Shares redeemed | | (246,964) | | (109,668) | | | | (2,776,985) | | | | (1,158,377) |
| Net increase(decrease) | | 1,103,324 | | 1,350,533 | | | | $ 12,268,730 | | | | $ 14,266,173 |
| Class C | | | | | | | | | | | | |
| Shares sold | | 1,634,319 | | 1,505,221 | | | | $ 18,295,083 | | | | $ 15,938,225 |
| Reinvestment of distributions | | 29,172 | | 8,911 | | | | 327,542 | | | | 97,350 |
| Shares redeemed | | (398,401) | | (90,162) | | | | (4,467,845) | | | | (956,104) |
| Net increase (decrease) | | 1,265,090 | | 1,423,970 | | | | $ 14,154,780 | | | | $ 15,079,471 |
| Institutional Class | | | | | | | | | | | | |
| Shares sold | | 1,374,943 | | 1,325,729 | | | | $ 15,910,190 | | | | $ 14,281,479 |
| Reinvestment of distributions | | 27,882 | | 14,118 | | | | 315,005 | | | | 154,581 |
| Shares redeemed | | (330,682) | | (176,462) | | | | (3,761,478) | | | | (1,867,613) |
| Net increase (decrease) | | 1,072,143 | | 1,163,385 | | | | $ 12,463,717 | | | | $ 12,568,447 |
83 Annual Report
| Notes to Financial Statements continued | | | | | | | | | | | | |
| |
| |
| |
| 8. Share Transactions - continued | | | | | | | | | | | | |
| |
| | | | | Shares | | | | Dollars |
| | | | | Years ended March 31, | | | | Years ended March 31, |
| | | | | 2006 | | 2005 | | | | 2006 | | | | 2005 |
| Advisor Freedom 2020 | | | | | | | | | | | | | | |
| Class A | | | | | | | | | | | | | | |
| Shares sold | | | | 14,590,446 | | 6,713,038 | | | | $ 177,880,434 | | | | $ 76,292,402 |
| Reinvestment of distributions | | | | 318,258 | | 146,966 | | | | 3,855,895 | | | | 1,714,049 |
| Shares redeemed | | | | (4,501,371) | | (1,527,689) | | | | (55,311,034) | | | | (17,327,477) |
| Net increase (decrease) | | | | 10,407,333 | | 5,332,315 | | | | $ 126,425,295 | | | | $ 60,678,974 |
| Class T | | | | | | | | | | | | | | |
| Shares sold | | | | 13,438,162 | | 12,699,220 | | | | $ 162,737,119 | | | | $ 143,541,530 |
| Reinvestment of distributions | | | | 323,423 | | 153,474 | | | | 3,903,406 | | | | 1,793,543 |
| Shares redeemed | | | | (6,053,700) | | (2,089,785) | | | | (73,680,929) | | | | (23,854,402) |
| Net increase (decrease) | | | | 7,707,885 | | 10,762,909 | | | | $ 92,959,596 | | | | $ 121,480,671 |
| Class B | | | | | | | | | | | | | | |
| Shares sold | | | | 1,799,544 | | 2,516,778 | | | | $ 21,593,687 | | | | $ 28,294,743 |
| Reinvestment of distributions | | | | 59,314 | | 36,057 | | | | 711,860 | | | | 420,877 |
| Shares redeemed | | | | (589,847) | | (314,860) | | | | (7,123,757) | | | | (3,560,956) |
| Net increase (decrease) | | | | 1,269,011 | | 2,237,975 | | | | $ 15,181,790 | | | | $ 25,154,664 |
| Class C | | | | | | | | | | | | | | |
| Shares sold | | | | 2,110,159 | | 2,324,713 | | | | $ 25,285,625 | | | | $ 26,225,111 |
| Reinvestment of distributions | | | | 47,015 | | 24,834 | | | | 564,041 | | | | 289,805 |
| Shares redeemed | | | | (773,044) | | (332,947) | | | | (9,282,747) | | | | (3,727,954) |
| Net increase (decrease) | | | | 1,384,130 | | 2,016,600 | | | | $ 16,566,919 | | | | $ 22,786,962 |
| Institutional Class | | | | | | | | | | | | | | |
| Shares sold | | | | 845,222 | | 926,868 | | | | $ 10,376,829 | | | | $ 10,370,986 |
| Reinvestment of distributions | | | | 22,706 | | 10,712 | | | | 275,559 | | | | 125,784 |
| Shares redeemed | | | | (254,821) | | (107,358) | | | | (3,125,257) | | | | (1,238,107) |
| Net increase (decrease) | | | | 613,107 | | 830,222 | | | | $ 7,527,131 | | | | $ 9,258,663 |
| Advisor Freedom 2025 | | | | | | | | | | | | | | |
| Class A | | | | | | | | | | | | | | |
| Shares sold | | | | 6,210,144 | | 5,276,780 | | | | $ 72,280,640 | | | | $ 57,517,460 |
| Reinvestment of distributions | | | | 124,720 | | 19,938 | | | | 1,454,965 | | | | 222,747 |
| Shares redeemed | | | | (1,339,389) | | (94,969) | | | | (15,549,227) | | | | (1,026,036) |
| Net increase(decrease) | | | | 4,995,475 | | 5,201,749 | | | | $ 58,186,378 | | | | $ 56,714,171 |
| Class T | | | | | | | | | | | | | | |
| Shares sold | | | | 4,779,347 | | 3,762,442 | | | | $ 55,329,806 | | | | $ 40,548,861 |
| Reinvestment of distributions | | | | 68,757 | | 24,426 | | | | 804,360 | | | | 273,522 |
| Shares redeemed | | | | (1,422,431) | | (656,224) | | | | (16,584,794) | | | | (7,186,110) |
| Net increase (decrease) | | | | 3,425,673 | | 3,130,644 | | | | $ 39,549,372 | | | | $ 33,636,273 |
| Class B | | | | | | | | | | | | | | |
| Shares sold | | | | 1,133,308 | | 1,071,244 | | | | $ 12,946,544 | | | | $ 11,424,918 |
| Reinvestment of distributions | | | | 17,249 | | 6,592 | | | | 200,192 | | | | 73,482 |
| Shares redeemed | | | | (169,943) | | (108,115) | | | | (1,979,347) | | | | (1,143,060) |
| Net increase (decrease) | | | | 980,614 | | 969,721 | | | | $ 11,167,389 | | | | $ 10,355,340 |
| Class C | | | | | | | | | | | | | | |
| Shares sold | | | | 835,184 | | 854,961 | | | | $ 9,579,811 | | | | $ 9,116,240 |
| Reinvestment of distributions | | | | 11,884 | | 4,495 | | | | 137,922 | | | | 50,136 |
| Shares redeemed | | | | (185,560) | | (64,614) | | | | (2,143,096) | | | | (685,152) |
| Net increase (decrease) | | | | 661,508 | | 794,842 | | | | $ 7,574,637 | | | | $ 8,481,224 |
| Institutional Class | | | | | | | | | | | | | | |
| Shares sold | | | | 395,871 | | 190,349 | | | | $ 4,647,168 | | | | $ 2,059,061 |
| Reinvestment of distributions | | | | 4,061 | | 854 | | | | 47,460 | | | | 9,558 |
| Shares redeemed | | | | (157,588) | | (37,209) | | | | (1,829,481) | | | | (408,139) |
| Net increase (decrease) | | | | 242,344 | | 153,994 | | | | $ 2,865,147 | | | | $ 1,660,480 |
| 8. Share Transactions - continued | | | | | | | | | | | | |
| |
| | | Shares | | | | Dollars |
| | | Years ended March 31, | | | | Years ended March 31, |
| | | 2006 | | 2005 | | | | 2006 | | | | 2005 |
| Advisor Freedom 2030 | | | | | | | | | | | | |
| Class A | | | | | | | | | | | | |
| Shares sold | | 7,622,210 | | 3,725,720 | | | | $ 95,830,636 | | | | $ 43,285,155 |
| Reinvestment of distributions | | 131,003 | | 52,499 | | | | 1,642,629 | | | | 630,708 |
| Shares redeemed | | (1,657,097) | | (653,805) | | | | (20,896,249) | | | | (7,592,923) |
| Net increase (decrease) | | 6,096,116 | | 3,124,414 | | | | $ 76,577,016 | | | | $ 36,322,940 |
| Class T | | | | | | | | | | | | |
| Shares sold | | 8,271,712 | | 7,556,712 | | | | $ 103,937,897 | | | | $ 87,295,265 |
| Reinvestment of distributions | | 138,114 | | 76,945 | | | | 1,718,369 | | | | 924,403 |
| Shares redeemed | | (3,379,705) | | (1,335,355) | | | | (42,137,889) | | | | (15,591,463) |
| Net increase (decrease) | | 5,030,121 | | 6,298,302 | | | | $ 63,518,377 | | | | $ 72,628,205 |
| Class B | | | | | | | | | | | | |
| Shares sold | | 1,157,095 | | 1,441,453 | | | | $ 14,320,376 | | | | $ 16,551,682 |
| Reinvestment of distributions | | 25,279 | | 14,367 | | | | 311,100 | | | | 172,589 |
| Shares redeemed | | (314,426) | | (169,554) | | | | (3,917,552) | | | | (1,953,216) |
| Net increase (decrease) | | 867,948 | | 1,286,266 | | | | $ 10,713,924 | | | | $ 14,771,055 |
| Class C | | | | | | | | | | | | |
| Shares sold | | 1,235,865 | | 1,214,477 | | | | $ 15,380,567 | | | | $ 13,923,553 |
| Reinvestment of distributions | | 20,600 | | 10,905 | | | | 254,461 | | | | 131,015 |
| Shares redeemed | | (314,678) | | (179,159) | | | | (3,929,603) | | | �� | (2,091,102) |
| Net increase (decrease) | | 941,787 | | 1,046,223 | | | | $ 11,705,425 | | | | $ 11,963,466 |
| Institutional Class | | | | | | | | | | | | |
| Shares sold | | 327,266 | | 648,019 | | | | $ 4,137,340 | | | | $ 7,437,369 |
| Reinvestment of distributions | | 9,043 | | 4,103 | | | | 113,199 | | | | 49,211 |
| Shares redeemed | | (190,476) | | (79,362) | | | | (2,392,711) | | | | (930,147) |
| Net increase (decrease) | | 145,833 | | 572,760 | | | | $ 1,857,828 | | | | $ 6,556,433 |
| Advisor Freedom 2035 | | | | | | | | | | | | |
| Class A | | | | | | | | | | | | |
| Shares sold | | 2,810,083 | | 1,306,403 | | | | $ 33,259,729 | | | | $ 14,223,336 |
| Reinvestment of distributions | | 34,961 | | 12,002 | | | | 418,335 | | | | 135,434 |
| Shares redeemed | | (291,205) | | (112,316) | | | | (3,451,031) | | | | (1,200,215) |
| Net increase (decrease) | | 2,553,839 | | 1,206,089 | | | | $ 30,227,033 | | | | $ 13,158,555 |
| Class T | | | | | | | | | | | | |
| Shares sold | | 2,779,197 | | 1,582,067 | | | | $ 32,690,026 | | | | $ 17,237,692 |
| Reinvestment of distributions | | 30,222 | | 10,972 | | | | 359,343 | | | | 123,545 |
| Shares redeemed | | (700,210) | | (199,783) | | | | (8,256,703) | | | | (2,193,255) |
| Net increase (decrease) | | 2,109,209 | | 1,393,256 | | | | $ 24,792,666 | | | | $ 15,167,982 |
| Class B | | | | | | | | | | | | |
| Shares sold | | 677,778 | | 567,399 | | | | $ 7,827,768 | | | | $ 6,107,462 |
| Reinvestment of distributions | | 8,197 | | 4,279 | | | | 96,381 | | | | 48,075 |
| Shares redeemed | | (92,314) | | (46,723) | | | | (1,090,117) | | | | (510,531) |
| Net increase (decrease) | | 593,661 | | 524,955 | | | | $ 6,834,032 | | | | $ 5,645,006 |
| Class C | | | | | | | | | | | | |
| Shares sold | | 594,915 | | 394,064 | | | | $ 6,913,576 | | | | $ 4,222,523 |
| Reinvestment of distributions | | 5,735 | | 2,802 | | | | 67,452 | | | | 31,509 |
| Shares redeemed | | (106,161) | | (16,996) | | | | (1,246,975) | | | | (184,466) |
| Net increase (decrease) | | 494,489 | | 379,870 | | | | $ 5,734,053 | | | | $ 4,069,566 |
| Institutional Class | | | | | | | | | | | | |
| Shares sold | | 153,700 | | 23,012 | | | | $ 1,815,954 | | | | $ 248,080 |
| Reinvestment of distributions | | 1,611 | | 480 | | | | 19,381 | | | | 5,406 |
| Shares redeemed | | (23,805) | | (1,465) | | | | (285,436) | | | | (15,843) |
| Net increase (decrease) | | 131,506 | | 22,027 | | | | $ 1,549,899 | | | | $ 237,643 |
85 Annual Report
| Notes to Financial Statements continued | | | | | | | | | | | | |
| |
| |
| |
| 8. Share Transactions - continued | | | | | | | | | | | | |
| |
| | | | | Shares | | | | Dollars |
| | | | | Years ended March 31, | | | | Years ended March 31, |
| | | | | 2006 | | 2005 | | | | 2006 | | | | 2005 |
| Advisor Freedom 2040 | | | | | | | | | | | | | | |
| Class A | | | | | | | | | | | | | | |
| Shares sold | | | | 6,594,125 | | 3,857,042 | | | | $ 84,779,212 | | | | $ 45,930,304 |
| Reinvestment of distributions | | | | 103,322 | | 28,564 | | | | 1,336,258 | | | | 350,714 |
| Shares redeemed | | | | (1,319,831) | | (417,971) | | | | (17,027,651) | | | | (4,959,405) |
| Net increase (decrease) | | | | 5,377,616 | | 3,467,635 | | | | $ 69,087,819 | | | | $ 41,321,613 |
| Class T | | | | | | | | | | | | | | |
| Shares sold | | | | 6,934,246 | | 4,878,040 | | | | $ 88,873,959 | | | | $ 57,327,142 |
| Reinvestment of distributions | | | | 94,278 | | 41,907 | | | | 1,212,995 | | | | 514,396 |
| Shares redeemed | | | | (2,629,297) | | (1,063,534) | | | | (33,492,621) | | | | (12,602,134) |
| Net increase (decrease) | | | | 4,399,227 | | 3,856,413 | | | | $ 56,594,333 | | | | $ 45,239,404 |
| Class B | | | | | | | | | | | | | | |
| Shares sold | | | | 1,066,326 | | 1,020,115 | | | | $ 13,457,885 | | | | $ 11,904,851 |
| Reinvestment of distributions | | | | 18,114 | | 9,751 | | | | 229,826 | | | | 119,452 |
| Shares redeemed | | | | (252,957) | | (102,560) | | | | (3,223,373) | | | | (1,209,741) |
| Net increase (decrease) | | | | 831,483 | | 927,306 | | | | $ 10,464,338 | | | | $ 10,814,562 |
| Class C | | | | | | | | | | | | | | |
| Shares sold | | | | 1,277,719 | | 1,473,064 | | | | $ 16,223,875 | | | | $ 17,144,955 |
| Reinvestment of distributions | | | | 20,564 | | 10,547 | | | | 261,225 | | | | 129,196 |
| Shares redeemed | | | | (279,598) | | (259,960) | | | | (3,548,799) | | | | (3,017,274) |
| Net increase (decrease) | | | | 1,018,685 | | 1,223,651 | | | | $ 12,936,301 | | | | $ 14,256,877 |
| Institutional Class | | | | | | | | | | | | | | |
| Shares sold | | | | 291,937 | | 384,780 | | | | $ 3,766,408 | | | | $ 4,445,168 |
| Reinvestment of distributions | | | | 5,062 | | 2,257 | | | | 65,359 | | | | 27,746 |
| Shares redeemed | | | | (147,050) | | (41,149) | | | | (1,890,587) | | | | (491,734) |
| Net increase (decrease) | | | | 149,949 | | 345,888 | | | | $ 1,941,180 | | | | $ 3,981,180 |
Report of Independent Registered Public Accounting Firm
To the Trustees of Fidelity Aberdeen Street Trust and the Shareholders of Fidelity Advisor Freedom Income Fund, Fidelity Advisor Freedom 2005 Fund, Fidelity Advisor Freedom 2010 Fund, Fidelity Advisor Freedom 2015 Fund, Fidelity Advisor Freedom 2020 Fund, Fidelity Advisor Freedom 2025 Fund, Fidelity Advisor Freedom 2030 Fund, Fidelity Advisor Freedom 2035 Fund and Fidelity Advisor Freedom 2040 Fund:
We have audited the accompanying statements of assets and liabilities of Fidelity Advisor Freedom Income Fund, Fidelity Advisor Freedom 2005 Fund, Fidelity Advisor Freedom 2010 Fund, Fidelity Advisor Freedom 2015 Fund, Fidelity Advisor Freedom 2020 Fund, Fidelity Advisor Freedom 2025 Fund, Fidelity Advisor Freedom 2030 Fund, Fidelity Advisor Freedom 2035 Fund and Fidelity Advisor Freedom 2040 Fund (the Funds) each a fund of Fidelity Aberdeen Street Trust, including the schedules of investments, as of March 31, 2006, and the related statements of operations for the year then ended, the statements of changes in net assets for each of the two years in the period then ended, and the financial highlights for each of the periods pre sented. These financial statements and financial highlights are the responsibility of the Funds’ management. Our responsibility is to express an opinion on these financial statements and financial highlights based on our audits.
We conducted our audits in accordance with standards of the Public Company Accounting Oversight Board (United States). Those standards require that we plan and perform the audit to obtain reasonable assurance about whether the financial statements and financial highlights are free of material misstatement. The Funds are not required to have, nor were we engaged to perform, an audit of their internal control over financial reporting. Our audits included consideration of internal control over financial reporting as a basis for designing audit procedures that are appropriate in the circum stances, but not for the purpose of expressing an opinion on the effectiveness of the Fund’s internal control over financial reporting. Accordingly, we express no such opinion. An audit also includes examining, on a test basis, evidence supporting the amounts and disclosures in the financial state ments, assessing the accounting principles used and significant estimates made by management, as well as evaluating the overall financial statement presentation. Our procedures included confirmation of securities owned as of March 31, 2006, by correspondence with the custodians and brokers; where replies were not received from brokers, we performed other auditing procedures. We believe that our audits provide a reasonable basis for our opinion.
In our opinion, the financial statements and financial highlights referred to above present fairly, in all material respects, the financial positions of Fidelity Advisor Freedom Income Fund, Fidelity Advisor Freedom 2005 Fund, Fidelity Advisor Freedom 2010 Fund, Fidelity Advisor Freedom 2015 Fund, Fidelity Advisor Freedom 2020 Fund, Fidelity Advisor Freedom 2025 Fund, Fidelity Advisor Freedom 2030 Fund, Fidelity Advisor Freedom 2035 Fund and Fidelity Advisor Freedom 2040 Fund as of March 31, 2006, the results of their operations for the year then ended, the changes in their net assets for each of the two years in the period then ended, and their financial highlights for each of the respective stated periods ended, in conformity with accounting principles generally accepted in the United States of America.
/s/ Deloitte & Touche LLP
|
DELOITTE & TOUCHE LLP
Boston, Massachusetts
May 16, 2006
|
87 Annual Report
The Trustees, Members of the Advisory Board, and executive officers of the trust and funds, as applicable, are listed below. The Board of Trustees governs each Advisor Freedom Fund and is responsible for protecting the interests of shareholders. The Trustees are experienced executives who meet periodically throughout the year to oversee each Advisor Freedom Fund’s activities, review contractual arrangements with companies that provide services to each Advisor Freedom Fund, and review each Advisor Freedom Fund’s performance. If the interests of an Advisor Freedom Fund and an underlying Fidelity fund were to diverge, a conflict of interest could arise and affect how the Trustees and Members of the Advisory Board fulfill their fiduciary duties to the affected funds. Strategic Advisers has structured the Advisor Freedom Funds to avoid these potential conflicts, although there may be situations where a conflict of interest is unavoidable. In such instances, Strategic Advisers, the Trustees, and Members of the Advisory Board would take reasonable steps to minimize and, if possible, eliminate the conflict. Except for William O. McCoy and Albert R. Gamper, Jr., each of the Trustees oversees 330 funds advised by FMR or an affiliate. Mr. McCoy oversees 332 funds advised by FMR or an affiliate. Mr. Gamper oversees 262 funds advised by FMR or an affiliate.
The Trustees hold office without limit in time except that (a) any Trustee may resign; (b) any Trustee may be removed by written instrument, signed by at least two thirds of the number of Trustees prior to such removal; (c) any Trustee who requests to be retired or who has become incapac itated by illness or injury may be retired by written instrument signed by a majority of the other Trustees; and (d) any Trustee may be removed at any special meeting of shareholders by a two thirds vote of the outstanding voting securities of the trust. Each Trustee who is not an interested person (as defined in the 1940 Act) (Independent Trustee), shall retire not later than the last day of the calendar year in which his or her 72nd birthday occurs. The Independent Trustees may waive this mandatory retirement age policy with respect to individual Trustees. The executive officers and Advisory Board Members hold office without limit in time, except that any officer and Advisory Board Member may resign or may be removed by a vote of a majority of the Trustees at any regular meeting or any special meeting of the Trustees. Except as indicated, each individual has held the office shown or other offices in the same company for the past five years.
The funds’ Statement of Additional Information (SAI) includes more information about the Trustees. To request a free copy, call Fidelity at 1-877-208-0098.
Correspondence intended for each Trustee who is an interested person may be sent to Fidelity Investments, 82 Devonshire Street, Boston, Massachusetts 02109.
| | Name, Age; Principal Occupation
Edward C. Johnson 3d (75)
|
Year of Election or Appointment: 1991
Mr. Johnson is Chairman of the Board of Trustees. Mr. Johnson serves as Chief Executive Officer, Chairman, and a Director of FMR Corp.; a Director and Chairman of the Board and of the Executive Committee of FMR; Chairman and a Director of Fidelity Management & Research (Far East) Inc.; Chairman and a Director of Fidelity Investments Money Management, Inc.; and Chairman (2001 present) and a Director (2000 present) of FMR Co., Inc.
Year of Election or Appointment: 2005
Mr. Jonas is Senior Vice President of Advisor Freedom Income (2005 present), Advisor Freedom 2005 (2005 present), Advisor Freedom 2010 (2005 present), Advisor Freedom 2015 (2005 present), Advisor Freedom 2020 (2005 present), Advisor Freedom 2025 (2005 present), Advisor Freedom 2030 (2005 present), Advisor Freedom 2035 (2005 present), Advisor Freedom 2040 (2005 present), Advisor Freedom 2045 (2006 present), and Advisor Freedom 2050 (2006 present). He also serves as Senior Vice President of other Fidelity funds (2005 present). Mr. Jonas is Executive Director of FMR (2005 present). Previously, Mr. Jonas served as President of Fidelity Enterprise Operations and Risk Services (2004 2005), Chief Administrative Officer (2002 2004), and Chief Financial Officer of FMR Co. (1998 2000). Mr. Jonas has been with Fidelity Investments since 1987 and has held various financial and management positions including Chief Financial Officer of FMR. In addition, he serves on the Boards of Boston Ballet (2003 present) and Simmons College (2003 present).
Year of Election or Appointment: 2003
Mr. Reynolds is a Director (2003 present) and Chief Operating Officer (2002 present) of FMR Corp. He also serves on the Board at Fidelity Investments Canada, Ltd. (2000 present). Previously, Mr. Reynolds served as President of Fidelity Investments Institutional Retirement Group (1996 2000).
* Trustees have been determined to be “Interested Trustees” by virtue of, among other things, their affiliation with the trust or various entities under common control with FMR.
Correspondence intended for each Independent Trustee (that is, the Trustees other than the Interested Trustees) may be sent to Fidelity Investments, P.O. Box 55235, Boston, Massachusetts 02205-5235.
| | Name, Age; Principal Occupation
Dennis J. Dirks (57)
|
Year of Election or Appointment: 2005
Prior to his retirement in May 2003, Mr. Dirks was Chief Operating Officer and a member of the Board of The Depository Trust & Clearing Corporation (DTCC) (1999 2003). He also served as President, Chief Operating Officer, and Board member of The Depository Trust Company (DTC) (1999 2003) and President and Board member of the National Securities Clearing Corporation (NSCC) (1999 2003). In addition, Mr. Dirks served as Chief Executive Officer and Board member of the Government Securities Clearing Corporation (2001 2003) and Chief Executive Officer and Board member of the Mortgage Backed Securities Clearing Corporation (2001 2003). Mr. Dirks also serves as a Trustee and a member of the Finance Committee of Manhattan College (2005 present) and a Trustee and a member of the Finance Committee of AHRC of Nassau County (2006 present).
| | Albert R. Gamper, Jr. (64)
|
Year of Election or Appointment: 2006
Mr. Gamper also serves as a Trustee (2006 present) or Member of the Advisory Board (2005 present) of other investment companies advised by FMR. Prior to his retirement in December 2004, Mr. Gamper served as Chairman of the Board of CIT Group Inc. (commercial finance). During his tenure with CIT Group Inc. Mr. Gamper served in numerous senior management positions, includ ing Chairman (1987 1989; 1999 2001; 2002 2004), Chief Executive Officer (1987 2004), and President (1989 2002). He currently serves as a member of the Board of Directors of Public Service Enterprise Group (utilities, 2001 present), Chairman of the Board of Governors, Rutgers University (2004 present), and Chairman of the Board of Saint Barnabas Health Care System.
Year of Election or Appointment: 1997
Dr. Gates is Chairman of the Independent Trustees (2006 present). Dr. Gates is President of Texas A&M University (2002 present). He was Director of the Central Intelligence Agency (CIA) from 1991 to 1993. From 1989 to 1991, Dr. Gates served as Assistant to the President of the United States and Deputy National Security Advisor. Dr. Gates is a Director of NACCO Industries, Inc. (mining and manufacturing), Parker Drilling Co., Inc. (drilling and rental tools for the energy industry, 2001 present), and Brinker International (restaurant management, 2003 present). Previously, Dr. Gates served as a Director of LucasVarity PLC (automotive components and diesel engines), a Director of TRW Inc. (automotive, space, defense, and information technology), and Dean of the George Bush School of Government and Public Service at Texas A&M University (1999 2001).
Year of Election or Appointment: 2004
Dr. Heilmeier is Chairman Emeritus of Telcordia Technologies (communication software and systems), where prior to his retirement, he served as company Chairman and Chief Executive Officer. He currently serves on the Boards of Directors of The Mitre Corporation (systems engineering and information technology support for the government), and HRL Laboratories (private research and development, 2004 present). He is Chairman of the General Motors Science & Technology Advisory Board and a Life Fellow of the Institute of Electrical and Electronics Engineers (IEEE). Dr. Heilmeier is a member of the Defense Science Board and the National Security Agency Advisory Board. He is also a member of the National Academy of Engineering, the American Academy of Arts and Sciences, and the Board of Overseers of the School of Engineering and Applied Science of the University of Pennsylvania. Previously, Dr. Heilmeier served as a Director of TRW Inc. (automotive, space, defense, and information technology, 1992 2002), Compaq (1994 2002), Automatic Data Processing, Inc. (ADP) (technology based business outsourcing, 1995 2002), INET Technologies Inc. (telecommunications network surveillance, 2001 2004), and Teletech Holdings (customer management services). He is the recipient of the 2005 Kyoto Prize in Advanced Technology for his invention of the liquid crystal display.
Year of Election or Appointment: 2001
Prior to Ms. Knowles’ retirement in June 2000, she served as Executive Vice President and Chief Financial Officer of Atlantic Richfield Company (ARCO) (diversified energy, 1996 2000). From 1993 to 1996, she was a Senior Vice President of ARCO and President of ARCO Transportation Company. She served as a Director of ARCO from 1996 to 1998. She currently serves as a Director of Phelps Dodge Corporation (copper mining and manufacturing) and McKesson Corporation (healthcare service, 2002 present). Ms. Knowles is a Trustee of the Brookings Institution and the Catalina Island Conservancy and also serves as a member of the Advisory Board for the School of Engineering of the University of Southern California.
89 Annual Report
Trustees and Officers - continued
|
| | Name, Age; Principal Occupation
Ned C. Lautenbach (62)
|
Year of Election or Appointment: 2000
Mr. Lautenbach has been a partner of Clayton, Dubilier & Rice, Inc. (private equity investment firm) since September 1998. Previously, Mr. Lautenbach was with the International Business Machines Corporation (IBM) from 1968 until his retirement in 1998. Mr. Lautenbach serves as a Director of Italtel Holding S.p.A. (telecommunications (Milan, Italy), 2004 present) and Eaton Corporation (diversified industrial) as well as the Philharmonic Center for the Arts in Naples, Florida. He also is a member of the Board of Trustees of Fairfield University (2005 present), as well as a member of the Council on Foreign Relations.
Year of Election or Appointment: 1997
Prior to his retirement in December 1994, Mr. McCoy was Vice Chairman of the Board of BellSouth Corporation (telecommunications) and President of BellSouth Enterprises. He is currently a Director of Duke Realty Corporation (real estate) and Progress Energy, Inc. (electric utility). He is also a partner of Franklin Street Partners (private investment management firm) and a member of the Research Triangle Foundation Board. In addition, Mr. McCoy served as the Interim Chancellor (1999 2000) and a member of the Board of Visitors for the University of North Carolina at Chapel Hill and currently serves as Chairman of the Board of Directors of the University of North Carolina Health Care System and the Board of Visitors of the Kenan Flagler Business School (University of North Carolina at Chapel Hill). He also served as Vice President of Finance for the University of North Carolina (16 school system).
Year of Election or Appointment: 2005
Ms. Small is a member (2000 present) and Chairperson (2002 present) of the Investment Committee, and a member (2002 present) of the Board of Trustees of Smith College. Previously, she served as Chief Investment Officer (1999 2000), Director of Global Equity Investments (1996 1999), and a member of the Board of Directors of Scudder, Stevens & Clark (1990 1997) and Scudder Kemper Investments (1997 1999). In addition, Ms. Small served as Co Chair (2000 2003) of the Annual Fund for the Fletcher School of Law and Diplomacy.
| | William S. Stavropoulos (66)
|
Year of Election or Appointment: 2001
Mr. Stavropoulos is Chairman of the Board (2000 present) and a Member of the Board of Directors of The Dow Chemical Company. Since joining The Dow Chemical Company in 1967, Mr. Stavropoulos served in numerous senior management positions, including President (1993 2000; 2002 2003), CEO (1995 2000; 2002 2004), and Chairman of the Executive Committee (2000 2004). Currently, he is a Director of NCR Corporation (data warehousing and technology solutions), BellSouth Corporation (telecommunications), Chemical Financial Corporation, Maersk Inc. (industrial conglomerate, 2002 present), and Metalmark Capital (private equity investment firm, 2005 present). He also serves as a member of the Board of Trustees of the American Enterprise Institute for Public Policy Research. In addition, Mr. Stavropoulos is a member of The Business Council, J.P. Morgan International Council and the University of Notre Dame Advisory Council for the College of Science.
Year of Election or Appointment: 2005
Prior to his retirement in 2001, Mr. Wolfe was Chairman and Chief Executive Officer of Hershey Foods Corporation (1993 2001). He currently serves as a member of the boards of Adelphia Communications Corporation (2003 present), Bausch & Lomb, Inc., and Revlon Inc. (2004 present).
Advisory Board Members and Executive Officers:
|
Correspondence intended for Mr. Keyes may be sent to Fidelity Investments, P.O. Box 55235, Boston, Massachusetts 02205-5235. Correspondence intended for each executive officer and Mr. Lynch may be sent to Fidelity Investments, 82 Devonshire Street, Boston, Massachusetts 02109.
| | Name, Age; Principal Occupation
James H. Keyes (65)
|
Year of Election or Appointment: 2006
Member of the Advisory Board of Fidelity Aberdeen Street Trust. Prior to his retirement in 2003, Mr. Keyes was Chairman, President, and Chief Executive Officer of Johnson Controls, Inc. (automotive supplier, 1993 2003). He currently serves as a member of the boards of LSI Logic Corporation (semiconductor technologies, 1984 present), Navistar International Corporation (manufacture and sale of trucks, buses, and diesel engines, 2002 present), and Pitney Bowes, Inc. (integrated mail, messaging, and document management solutions, 1998 present).
Year of Election or Appointment: 2003
Member of the Advisory Board of Fidelity Aberdeen Street Trust. Vice Chairman and a Director of FMR, and Vice Chairman (2001 present) and a Director (2000 present) of FMR Co., Inc. Previously, Mr. Lynch served as a Trustee of the Fidelity funds (1990 2003). In addition, he serves as a Trustee of Boston College, Massachusetts Eye & Ear Infirmary, Historic Deerfield, John F. Kennedy Library, and the Museum of Fine Arts of Boston.
Year of Election or Appointment: 2005 or 2006
Vice President of Advisor Freedom Income (2005 present), Advisor Freedom 2005 (2005 present), Advisor Freedom 2010 (2005 present), Advisor Freedom 2015 (2005 present), Advisor Freedom 2020 (2005 present), Advisor Freedom 2025 (2005 present), Advisor Freedom 2030 (2005 present), Advisor Freedom 2035 (2005 present), Advisor Freedom 2040 (2005 present), Advisor Freedom 2045 (2006 present), and Advisor Freedom 2050 (2006 present). Mr. Greer also serves as Vice President of certain Equity Funds (2005 present), certain Asset Allocation Funds (2005 present), and a Trustee of other investment companies advised by FMR (2003 present). He is an Executive Vice President of FMR (2005 present) and FMR Co., Inc. (2005 present). Previously, Mr. Greer served as a Director and Managing Director of Strategic Advisers, Inc. (2002 2005), and Executive Vice President (2000 2002) and Money Market Group Leader (1997 2002) of the Fidelity Investments Fixed Income Division. He also served as Vice President of Fidelity’s Money Market Funds (1997 2002), Senior Vice President of FMR (1997 2002), and Vice President of FIMM (1998 2002).
Year of Election or Appointment: 2003 or 2006
Vice President of Advisor Freedom Income (2003 present), Advisor Freedom 2005 (2003 present), Advisor Freedom 2010 (2003 present), Advisor Freedom 2015 (2003 present), Advisor Freedom 2020 (2003 present), Advisor Freedom 2025 (2003 present), Advisor Freedom 2030 (2003 present), Advisor Freedom 2035 (2003 present), Advisor Freedom 2040 (2003 present), Advisor Freedom 2045 (2006 present), and Advisor Freedom 2050 (2006 present). Mr. Cheng also serves as Vice President of other funds advised by Strategic Advisers Inc., including the Fidelity Freedom Funds®. Prior to assuming his current responsibilities, Mr. Cheng worked as a portfolio manager. Mr. Cheng also serves as Vice President of FMR (2002) and FMR Co., Inc. (2002).
Year of Election or Appointment: 2003 or 2006
Secretary of Advisor Freedom Income (2003 present), Advisor Freedom 2005 (2003 present), Advisor Freedom 2010 (2003 present), Advisor Freedom 2015 (2003 present), Advisor Freedom 2020 (2003 present), Advisor Freedom 2025 (2003 present), Advisor Freedom 2030 (2003 present), Advisor Freedom 2035 (2003 present), Advisor Freedom 2040 (2003 present), Advisor Freedom 2045 (2006 present), and Advisor Freedom 2050 (2006 present). He also serves as Secretary of other Fidelity funds; Vice President, General Counsel, and Secretary of FMR Co., Inc. (2001 present) and FMR; Assistant Secretary of Fidelity Management & Research (U.K.) Inc. (2001 present), Fidelity Research & Analysis Company (2001 present), and Fidelity Investments Money Management, Inc. (2001 present). Mr. Roiter is an Adjunct Member, Faculty of Law, at Boston College Law School (2003 present). Previously, Mr. Roiter served as Vice President and Secretary of Fidelity Distributors Corporation (FDC) (1998 2005).
91 Annual Report
Trustees and Officers - continued
|
| | Name, Age; Principal Occupation
|
Year of Election or Appointment: 2003 or 2006
Assistant Secretary of Advisor Freedom Income (2003 present), Advisor Freedom 2005 (2003 present), Advisor Freedom 2010 (2003 present), Advisor Freedom 2015 (2003 present), Advisor Freedom 2020 (2003 present), Advisor Freedom 2025 (2003 present), Advisor Freedom 2030 (2003 present), Advisor Freedom 2035 (2003 present), Advisor Freedom 2040 (2003 present), Advisor Freedom 2045 (2006 present), and Advisor Freedom 2050 (2006 present). Mr. Fross also serves as Assistant Secretary of other Fidelity funds (2003 present), Vice President and Secretary of FDC (2005 present), and is an employee of FMR.
Year of Election or Appointment: 2004 or 2006
President and Treasurer of Advisor Freedom Income (2004 present), Advisor Freedom 2005 (2004 present), Advisor Freedom 2010 (2004 present), Advisor Freedom 2015 (2004 present), Advisor Freedom 2020 (2004 present), Advisor Freedom 2025 (2004 present), Advisor Freedom 2030 (2004 present), Advisor Freedom 2035 (2004 present), Advisor Freedom 2040 (2004 present), Advisor Freedom 2045 (2006 present), and Advisor Freedom 2050 (2006 present). Ms. Reynolds also serves as President and Treasurer of other Fidelity funds (2004 present) and is a Vice President (2003 present) and an employee (2002 present) of FMR. Before joining Fidelity Investments, Ms. Reynolds worked at PricewaterhouseCoopers LLP (PwC) (1980 2002), where she was most recently an audit partner with PwC’s investment management practice.
Year of Election or Appointment: 2006
Anti Money Laundering (AML) officer of Advisor Freedom Income, Advisor Freedom 2005, Advisor Freedom 2010, Advisor Freedom 2015, Advisor Freedom 2020, Advisor Freedom 2025, Advisor Freedom 2030, Advisor Freedom 2035, Advisor Freedom 2040, Advisor Freedom 2045, and Advisor Freedom 2050. Mr. Ganis also serves as AML officer of other Fidelity funds (2006 present) and FMR Corp. (2003 present). Before joining Fidelity Investments, Mr. Ganis practiced law at Goodwin Procter, LLP (2000 2002).
Year of Election or Appointment: 2005 or 2006
Chief Financial Officer of Advisor Freedom Income (2005 present), Advisor Freedom 2005 (2005 present), Advisor Freedom 2010 (2005 present), Advisor Freedom 2015 (2005 present), Advisor Freedom 2020 (2005 present), Advisor Freedom 2025 (2005 present), Advisor Freedom 2030 (2005 present), Advisor Freedom 2035 (2005 present), Advisor Freedom 2040 (2005 present), Advisor Freedom 2045 (2006 present), and Advisor Freedom 2050 (2006 present). Mr. Murphy also serves as Chief Financial Officer of other Fidelity funds (2005 present). He also serves as Senior Vice President of Fidelity Pricing and Cash Management Services Group (FPCMS).
| | Kenneth A. Rathgeber (58)
|
Year of Election or Appointment: 2004 or 2006
Chief Compliance Officer of Advisor Freedom Income (2004 present), Advisor Freedom 2005 (2004 present), Advisor Freedom 2010 (2004 present), Advisor Freedom 2015 (2004 present), Advisor Freedom 2020 (2004 present), Advisor Freedom 2025 (2004 present), Advisor Freedom 2030 (2004 present), Advisor Freedom 2035 (2004 present), Advisor Freedom 2040 (2004 present), Advisor Freedom 2045 (2006 present), and Advisor Freedom 2050 (2006 present). Mr. Rathgeber also serves as Chief Compliance Officer of other Fidelity funds (2004 present) and Executive Vice President of Risk Oversight for Fidelity Investments (2002 present). He is Chief Compliance Officer of FMR (2005 present), FMR Co., Inc. (2005 present), Fidelity Management & Research (U.K.) Inc. (2005 present), Fidelity Research & Analysis Company (2005 present), Fidelity Investments Money Management, Inc. (2005 present), and Strategic Advisers, Inc. (2005 present). Previously, Mr. Rathgeber served as Executive Vice President and Chief Operating Officer for Fidelity Investments Institutional Services Company, Inc. (1998 2002).
Year of Election or Appointment: 2005 or 2006
Deputy Treasurer of Advisor Freedom Income (2005 present), Advisor Freedom 2005 (2005 present), Advisor Freedom 2010 (2005 present), Advisor Freedom 2015 (2005 present), Advisor Freedom 2020 (2005 present), Advisor Freedom 2025 (2005 present), Advisor Freedom 2030 (2005 present), Advisor Freedom 2035 (2005 present), Advisor Freedom 2040 (2005 present), Advisor Freedom 2045 (2006 present), and Advisor Freedom 2050 (2006 present). Mr. Mehrmann also serves as Deputy Treasurer of other Fidelity funds (2005 present) and is an employee of FMR. Previously, Mr. Mehrmann served as Vice President of Fidelity Investments Institutional Services Group (FIIS)/Fidelity Investments Institutional Operations Corporation, Inc. (FIIOC) Client Services (1998 2004).
Name, Age; Principal Occupation
Kimberley H. Monasterio (42)
|
Year of Election or Appointment: 2004 or 2006
Deputy Treasurer of Advisor Freedom Income (2004 present), Advisor Freedom 2005 (2004 present), Advisor Freedom 2010 (2004 present), Advisor Freedom 2015 (2004 present), Advisor Freedom 2020 (2004 present), Advisor Freedom 2025 (2004 present), Advisor Freedom 2030 (2004 present), Advisor Freedom 2035 (2004 present), Advisor Freedom 2040 (2004 present), Advisor Freedom 2045 (2006 present), and Advisor Freedom 2050 (2006 present). Ms. Monasterio also serves as Deputy Treasurer of other Fidelity funds (2004) and is an employee of FMR (2004). Before joining Fidelity Investments, Ms. Monasterio served as Treasurer (2000 2004) and Chief Financial Officer (2002 2004) of the Franklin Templeton Funds and Senior Vice President of Franklin Templeton Services, LLC (2000 2004).
Year of Election or Appointment: 2005 or 2006
Deputy Treasurer ofAdvisor Freedom Income (2005 present), Advisor Freedom 2005 (2005 present), Advisor Freedom 2010 (2005 present), Advisor Freedom 2015 (2005 present), Advisor Freedom 2020 (2005 present), Advisor Freedom 2025 (2005 present), Advisor Freedom 2030 (2005 present), Advisor Freedom 2035 (2005 present), Advisor Freedom 2040 (2005 present), Advisor Freedom 2045 (2006 present), and Advisor Freedom 2050 (2006 present). Mr. Robins also serves as Deputy Treasurer of other Fidelity funds (2005 present) and is an employee of FMR (2004 present). Before joining Fidelity Invest ments, Mr. Robins worked at KPMG LLP, where he was a partner in KPMG’s department of professional practice (2002 2004) and a Senior Manager (1999 2000). In addition, Mr. Robins served as Assistant Chief Accountant, United States Securities and Exchange Commission (2000 2002).
Year of Election or Appointment: 2005 or 2006
Assistant Treasurer of Advisor Freedom Income (2005 present), Advisor Freedom 2005 (2005 present), Advisor Freedom 2010 (2005 present), Advisor Freedom 2015 (2005 present), Advisor Freedom 2020 (2005 present), Advisor Freedom 2025 (2005 present), Advisor Freedom 2030 (2005 present), Advisor Freedom 2035 (2005 present), Advisor Freedom 2040 (2005 present), Advisor Freedom 2045 (2006 present), and Advisor Freedom 2050 (2006 present). Mr. Byrnes also serves as Assistant Treasurer of other Fidelity funds (2005 present) and is an employee of FMR (2005 present). Previously, Mr. Byrnes served as Vice President of FPCMS (2003 2005). Before joining Fidelity Investments, Mr. Byrnes worked at Deutsche Asset Management where he served as Vice President of the Investment Operations Group (2000 2003).
Year of Election or Appointment: 2003 or 2006
Assistant Treasurer of Advisor Freedom Income (2003 present), Advisor Freedom 2005 (2003 present), Advisor Freedom 2010 (2003 present), Advisor Freedom 2015 (2003 present), Advisor Freedom 2020 (2003 present), Advisor Freedom 2025 (2003 present), Advisor Freedom 2030 (2003 present), Advisor Freedom 2035 (2003 present), Advisor Freedom 2040 (2003 present), Advisor Freedom 2045 (2006 present), and Advisor Freedom 2050 (2006 present). Mr. Costello also serves as Assistant Treasurer of other Fidelity funds and is an employee of FMR.
Year of Election or Appointment: 2004 or 2006
Assistant Treasurer of Advisor Freedom Income (2004 present), Advisor Freedom 2005 (2004 present), Advisor Freedom 2010 (2004 present), Advisor Freedom 2015 (2004 present), Advisor Freedom 2020 (2004 present), Advisor Freedom 2025 (2004 present), Advisor Freedom 2030 (2004 present), Advisor Freedom 2035 (2004 present), Advisor Freedom 2040 (2004 present), Advisor Freedom 2045 (2006 present), and Advisor Freedom 2050 (2006 present). Mr. Lydecker also serves as Assistant Treasurer of other Fidelity funds (2004) and is an employee of FMR.
Year of Election or Appointment: 2003 or 2006
Assistant Treasurer of Advisor Freedom Income (2003 present), Advisor Freedom 2005 (2003 present), Advisor Freedom 2010 (2003 present), Advisor Freedom 2015 (2003 present), Advisor Freedom 2020 (2003 present), Advisor Freedom 2025 (2003 present), Advisor Freedom 2030 (2003 present), Advisor Freedom 2035 (2003 present), Advisor Freedom 2040 (2003 present), Advisor Freedom 2045 (2006 present), and Advisor Freedom 2050 (2006 present). Mr. Osterheld also serves as Assistant Treasurer of other Fidelity funds (2002) and is an employee of FMR.
93 Annual Report
Trustees and Officers - continued
|
| | Name, Age; Principal Occupation
Gary W. Ryan (47)
|
Year of Election or Appointment: 2005 or 2006
Assistant Treasurer of Advisor Freedom Income (2005 present), Advisor Freedom 2005 (2005 present), Advisor Freedom 2010 (2005 present), Advisor Freedom 2015 (2005 present), Advisor Freedom 2020 (2005 present), Advisor Freedom 2025 (2005 present), Advisor Freedom 2030 (2005 present), Advisor Freedom 2035 (2005 present), Advisor Freedom 2040 (2005 present), Advisor Freedom 2045 (2006 present), and Advisor Freedom 2050 (2006 present). Mr. Ryan also serves as Assistant Treasurer of other Fidelity funds (2005 present) and is an employee of FMR (2005 present). Previously, Mr. Ryan served as Vice President of Fund Reporting in FPCMS (1999 2005).
Year of Election or Appointment: 2005 or 2006
Assistant Treasurer of Advisor Freedom Income (2005 present), Advisor Freedom 2005 (2005 present), Advisor Freedom 2010 (2005 present), Advisor Freedom 2015 (2005 present), Advisor Freedom 2020 (2005 present), Advisor Freedom 2025 (2005 present), Advisor Freedom 2030 (2005 present), Advisor Freedom 2035 (2005 present), Advisor Freedom 2040 (2005 present), Advisor Freedom 2045 (2006 present), and Advisor Freedom 2050 (2006 present). Mr. Schiavone also serves as Assistant Treasurer of other Fidelity funds (2005 present) and is an employee of FMR (2005 present). Before joining Fidelity Investments, Mr. Schiavone worked at Deutsche Asset Management, where he most recently served as Assistant Treasurer (2003 2005) of the Scudder Funds and Vice President and Head of Fund Reporting (1996 2003).
The Board of Trustees of each fund voted to pay to shareholders of record at the opening of business on record date, the following distributions per share derived from capital gains realized from sales of portfolio securities, and dividends derived from net investment income:
| Institutional Class | | Pay Date | | Record Date | | Dividends | | Capital Gains |
| Advisor Freedom Income | | 5/08/06 | | 5/05/06 | | $.028 | | $.070 |
| Advisor Freedom 2005 | | 5/08/06 | | 5/05/06 | | $.050 | | $.140 |
| Advisor Freedom 2010 | | 5/08/06 | | 5/05/06 | | $.052 | | $.160 |
| Advisor Freedom 2015 | | 5/08/06 | | 5/05/06 | | $.041 | | $.155 |
| Advisor Freedom 2020 | | 5/08/06 | | 5/05/06 | | $.036 | | $.235 |
| Advisor Freedom 2025 | | 5/15/06 | | 5/12/06 | | $.024 | | $.203 |
| Advisor Freedom 2030 | | 5/15/06 | | 5/12/06 | | $.031 | | $.230 |
| Advisor Freedom 2035 | | 5/15/06 | | 5/12/06 | | $.006 | | $.217 |
| Advisor Freedom 2040 | | 5/15/06 | | 5/12/06 | | $.018 | | $.245 |
The funds hereby designate as capital gain dividends the amounts noted below for the taxable year indicated or for dividends for the taxable year ended 2006, or, if subsequently determined to be different, the net capital gain of such year.
| Institutional Class | | |
| Advisor Freedom Income | | 454,893 |
| Advisor Freedom 2005 | | 562,544 |
| Advisor Freedom 2010 | | 4,792,513 |
| Advisor Freedom 2015 | | 4,761,838 |
| Advisor Freedom 2020 | | 13,533,685 |
| Advisor Freedom 2025 | | 4,482,425 |
| Advisor Freedom 2030 | | 7,869,781 |
| Advisor Freedom 2035 | | 2,151,852 |
| Advisor Freedom 2040 | | 6,342,520 |
A percentage of the dividends distributed during the fiscal year for the following funds was derived from interest on U.S. Government securities which is generally exempt from state income tax:
| | | Institutional Class |
| Advisor Freedom Income | | 18.12% |
| Advisor Freedom 2005 | | 14.61% |
| Advisor Freedom 2010 | | 14.87% |
| Advisor Freedom 2015 | | 10.86% |
| Advisor Freedom 2020 | | 8.26% |
| Advisor Freedom 2025 | | 6.50% |
A percentage of the dividends distributed during the fiscal year for the following funds qualifies for the dividends received deduction for corporate shareholders:
| Advisor Freedom Income | | Institutional Class |
| April 2005 | | 4% |
| May 2005 | | 4% |
| June 2005 | | 4% |
| July 2005 | | 4% |
| August 2005 | | 4% |
| September 2005 | | 4% |
| October 2005 | | 4% |
| November 2005 | | 4% |
| December 2005 (ex date 12/03) | | 4% |
| December 2005 (ex date 12/29) | | 5% |
| February 2006 | | 1% |
| March 2006 | | 1% |
95 Annual Report
| | Distributions - continued
|
| Advisor Freedom 2005 | | Institutional Class |
| May 2005 | | 7% |
| December 2005 | | 10% |
| Advisor Freedom 2010 | | |
| May 2005 | | 7% |
| December 2005 | | 11% |
| Advisor Freedom 2015 | | |
| May 2005 | | 10% |
| December 2005 | | 14% |
| Advisor Freedom 2020 | | |
| May 2005 | | 16% |
| December 2005 | | 19% |
| Advisor Freedom 2025 | | |
| May 2005 | | 24% |
| December 2005 | | 21% |
| Advisor Freedom 2030 | | |
| May 2005 | | 42% |
| December 2005 | | 26% |
| Advisor Freedom 2035 | | |
| May 2005 | | — |
| December 2005 | | 25% |
| Advisor Freedom 2040 | | |
| May 2005 | | 55% |
| December 2005 | | 24% |
A percentage of the dividends distributed during the fiscal year for the following may be taken into account as a dividend for purposes of the maximum rate under section 1(h)(11) of the Internal Revenue Code.
| Advisor Freedom Income | | Institutional Class |
| April 2005 | | — |
| May 2005 | | 5% |
| June 2005 | | 5% |
| July 2005 | | 5% |
| August 2005 | | 6% |
| September 2005 | | 6% |
| October 2005 | | 5% |
| November 2005 | | 6% |
| December 2005 (ex date 12/03) | | 6% |
| December 2005 (ex date 12/29) | | 6% |
| February 2006 | | 1% |
| March 2006 | | 1% |
| Advisor Freedom 2005 | | |
| May 2005 | | 7% |
| December 2005 | | 15% |
| Advisor Freedom 2010 | | |
| May 2005 | | 7% |
| December 2005 | | 16% |
| Advisor Freedom 2015 | | |
| May 2005 | | 11% |
| December 2005 | | 23% |
| Advisor Freedom 2020 | | |
| May 2005 | | 17% |
| December 2005 | | 29% |
| Advisor Freedom 2025 | | Institutional Class |
| May 2005 | | 26% |
| December 2005 | | 32% |
| Advisor Freedom 2030 | | |
| May 2005 | | 47% |
| December 2005 | | 40% |
| Advisor Freedom 2035 | | |
| May 2005 | | — |
| December 2005 | | 40% |
| Advisor Freedom 2040 | | |
| May 2005 | | 58% |
| December 2005 | | 40% |
Fidelity Advisor Income designates $1,570,562 of distributions paid during the fiscal year ended March 31, 2006 as qualifying to be taxed as interest-related dividends for nonresident alien shareholders.
The funds will notify shareholders in January 2007 of amounts for use in preparing 2006 income tax returns.
97 Annual Report
Proxy Voting Results
A special meeting of the funds’ shareholders was held on May 11, 2005. The results of votes taken among shareholders on proposals before them are reported below. Each vote reported represents one dollar of net asset value held on the record date for the meeting.
| PROPOSAL 1 | | | | |
| To elect a Board of Trustees.A | | | | |
| | | # of | | % of |
| | | Votes | | Votes |
| |
| Laura B. Cronin | | | | |
| Affirmative | | 14,239,751,820.01 | | 94.148 |
| Withheld | | 885,124,580.88 | | 5.852 |
| TOTAL | | 15,124,876,400.89 | | 100.000 |
| Dennis J. Dirks | | | | |
| Affirmative | | 14,214,711,536.39 | | 93.982 |
| Withheld | | 910,164,864.50 | | 6.018 |
| TOTAL | | 15,124,876,400.89 | | 100.000 |
| Robert M. Gates | | | | |
| Affirmative | | 14,201,606,421.24 | | 93.896 |
| Withheld | | 923,269,979.65 | | 6.104 |
| TOTAL | | 15,124,876,400.89 | | 100.000 |
| George H. Heilmeier | | | | |
| Affirmative | | 14,204,274,887.85 | | 93.913 |
| Withheld | | 920,601,513.04 | | 6.087 |
| TOTAL | | 15,124,876,400.89 | | 100.000 |
| Abigail P. Johnson | | | | |
| Affirmative | | 14,182,349,317.20 | | 93.768 |
| Withheld | | 942,527,083.69 | | 6.232 |
| TOTAL | | 15,124,876,400.89 | | 100.000 |
| Edward C. Johnson 3d | | | | |
| Affirmative | | 14,170,946,355.46 | | 93.693 |
| Withheld | | 953,930,045.43 | | 6.307 |
| TOTAL | | 15,124,876,400.89 | | 100.000 |
| Marie L. Knowles | | | | |
| Affirmative | | 14,215,316,094.83 | | 93.986 |
| Withheld | | 909,560,306.06 | | 6.014 |
| TOTAL | | 15,124,876,400.89 | | 100.000 |
| Ned C. Lautenbach | | | | |
| Affirmative | | 14,218,303,274.43 | | 94.006 |
| Withheld | | 906,573,126.46 | | 5.994 |
| TOTAL | | 15,124,876,400.89 | | 100.000 |
| Marvin L. Mann | | | | |
| Affirmative | | 14,204,487,663.39 | | 93.915 |
| Withheld | | 920,388,737.50 | | 6.085 |
| TOTAL | | 15,124,876,400.89 | | 100.000 |
| William O. McCoy | | | | |
| Affirmative | | 14,207,936,637.38 | | 93.938 |
| Withheld | | 916,939,763.51 | | 6.062 |
| TOTAL | | 15,124,876,400.89 | | 100.000 |
| Robert L. Reynolds | | | | |
| Affirmative | | 14,217,076,502.23 | | 93.998 |
| Withheld | | 907,799,898.66 | | 6.002 |
| TOTAL | | 15,124,876,400.89 | | 100.000 |
| | | # of | | % of |
| | | Votes | | Votes |
| |
| Cornelia M. Small | | | | |
| Affirmative | | 14,218,030,163.22 | | 94.004 |
| Withheld | | 906,846,237.67 | | 5.996 |
| TOTAL | | 15,124,876,400.89 | | 100.000 |
| |
| William S. Stavropoulos | | | | |
| Affirmative | | 14,211,272,772.82 | | 93.960 |
| Withheld | | 913,603,628.07 | | 6.040 |
| TOTAL | | 15,124,876,400.89 | | 100.000 |
| |
| Kenneth L. Wolfe | | | | |
| Affirmative | | 14,212,093,506.53 | | 93.965 |
| Withheld | | 912,782,894.36 | | 6.035 |
| TOTAL | | 15,124,876,400.89 | | 100.000 |
A Denotes trust-wide proposals and voting results.
Annual Report 98
99 Annual Report
Investment Adviser
Strategic Advisers, Inc.
Boston, MA
General Distributor
Fidelity Distributors Corporation
Boston, MA
Transfer and Service Agents
Fidelity Investments Institutional Operations Company, Inc.
Boston, MA
Fidelity Service Company, Inc.
Boston, MA
Custodian
The Bank of New York
New York, NY
|
AFFI UANN-0506
1.792135.102
|

Fidelity Freedom Funds®
Income, 2000, 2005, 2010, 2015, 2020, 2025,
2030, 2035, 2040
|

Annual Report
March 31, 2006
|

| Contents | | | | |
| |
| |
| |
| Chairman’s Message | | A-4 | | Ned Johnson’s message to shareholders. |
| Performance | | A-5 | | How the funds have done over time. |
| Management’s Discussion | | A-15 | | The managers’ review of fund performance, strategy and outlook. |
| Shareholder Expense Example | | A-16 | | An example of shareholder expenses. |
| Freedom Income | | A-18 | | Investment Changes |
| | | | | A-19 | | Investments |
| | | | | A-20 | | Financial Statements |
| Freedom 2000 | | A-22 | | Investment Changes |
| | | | | A-23 | | Investments |
| | | | | A-24 | | Financial Statements |
| Freedom 2005 | | A-26 | | Investment Changes |
| | | | | A-27 | | Investments |
| | | | | A-28 | | Financial Statements |
| Freedom 2010 | | A-30 | | Investment Changes |
| | | | | A-31 | | Investments |
| | | | | A-32 | | Financial Statements |
| Freedom 2015 | | A-34 | | Investment Changes |
| | | | | A-35 | | Investments |
| | | | | A-36 | | Financial Statements |
| Freedom 2020 | | A-38 | | Investment Changes |
| | | | | A-39 | | Investments |
| | | | | A-40 | | Financial Statements |
| Freedom 2025 | | A-42 | | Investment Changes |
| | | | | A-43 | | Investments |
| | | | | A-44 | | Financial Statements |
| Freedom 2030 | | A-46 | | Investment Changes |
| | | | | A-47 | | Investments |
| | | | | A-48 | | Financial Statements |
| Freedom 2035 | | A-50 | | Investment Changes |
| | | | | A-51 | | Investments |
| | | | | A-52 | | Financial Statements |
| Freedom 2040 | | A-54 | | Investment Changes |
| | | | | A-55 | | Investments |
| | | | | A-56 | | Financial Statements |
| Notes | | | | A-58 | | Notes to the financial statements. |
| Report of Independent Registered Public | | A-63 | | |
| Accounting Firm | | | | |
| Trustees and Officers | | A-64 | | |
| Distributions | | A-70 | | |
| Proxy Voting Results | | A-72 | | |
| Prospectus | | P-1 | | |
To view a fund’s proxy voting guidelines and proxy voting record for the 12 month period ended June 30, visit www.fidelity.com/proxyvotingresults or visit the
Securities and Exchange Commission’s (SEC) web site at www.sec.gov. You may also call 1-800-544-8544 to request a free copy of the proxy voting guidelines.
Standard & Poor’s, S&P and S&P 500 are registered service marks of The McGraw Hill Companies, Inc. and have been licensed for use by Fidelity Distributors
Corporation.
Other third party marks appearing herein are the property of their respective owners.
All other marks appearing herein are registered or unregistered trademarks or service marks of FMR Corp. or an affiliated company.
|
This report and the financial statements contained herein are submitted for the general information of the shareholders of the funds. This report is not authorized for
distribution to prospective investors in the funds unless preceded or accompanied by an effective prospectus.
A fund files its complete schedule of portfolio holdings with the SEC for the first and third quarters of each fiscal year on Form N Q. Forms N Q are available on the
SEC’s web site at http://www.sec.gov. A fund’s Forms N Q may be reviewed and copied at the SEC’s Public Reference Room in Washington, DC. Information regard
ing the operation of the SEC’s Public Reference Room may be obtained by calling 1-800-SEC-0330. For a complete list of a fund’s portfolio holdings, view the most
recent quarterly holdings report, semiannual report, or annual report on Fidelity’s web site at http://www.fidelity.com/holdings.
NOT FDIC INSURED · MAY LOSE VALUE · NO BANK GUARANTEE
Neither the funds nor Fidelity Distributors Corporation is a bank.
|
A-3 Annual Report
Chairman’s Message
(photograph of Edward C. Johnson 3d)
Dear Shareholder:
Although many securities markets made gains in early 2006, there is only one certainty when it comes to investing: There is no sure thing. There are, however, a number of time tested, fundamental investment principles that can put the historical odds in your favor.
One of the basic tenets is to invest for the long term. Over time, riding out the markets’ inevitable ups and downs has proven much more effective than selling into panic or chasing the hottest trend. Even missing only a few of the markets’ best days can significantly diminish investor returns. Patience also affords the benefits of compounding of earning interest on additional income or reinvested dividends and capital gains. There are tax advantages and cost benefits to consider as well. The more you sell, the more taxes you pay, and the more you trade, the higher the costs. While staying the course doesn’t eliminate risk, it can considerably lessen the effect of short term declines.
You can further manage your investing risk through diversification. And today, more than ever, geographic diversification should be taken into account. Studies indicate that asset allocation is the single most important determinant of a portfolio’s long term success. The right mix of stocks, bonds and cash aligned to your particular risk tolerance and investment objective is very import ant. Age appropriate rebalancing is also an essential aspect of asset allocation. For younger investors, an emphasis on equities which historically have been the best perform ing asset class over time is encouraged. As investors near their specific goal, such as retirement or sending a child to college, consideration may be given to replacing volatile assets (e.g. common stocks) with more stable fixed investments (bonds or savings plans).
A third investment principle investing regularly can help lower the average cost of your purchases. Investing a certain amount of money each month or quarter helps ensure you won’t pay for all your shares at market highs. This strategy known as dollar cost averaging also reduces unconstructive “emotion” from investing, helping shareholders avoid selling weak performers just prior to an upswing, or chasing a hot performer just before a correction.
We invite you to contact us via the Internet, through our Investor Centers or over the phone. It is our privilege to provide you the information you need to make the invest ments that are right for you.
Sincerely,
/s/ Edward C. Johnson 3d
Edward C. Johnson 3d
Annual Report A-4
Fidelity Freedom Income Fund®
Performance: The Bottom Line
|
Average annual total return reflects the change in the value of an investment, assuming reinvestment of the fund’s dividend income and capital gains (the profits earned upon the sale of securities that have grown in value) and assuming a constant rate of performance each year. The $10,000 table and the fund’s returns do not reflect the deduction of taxes that a shareholder would pay on fund distributions or the redemption of fund shares. During periods of reimbursement by Fidelity, a fund’s total return will be greater than it would be had the reimbursement not occurred. How a fund did yesterday is no guarantee of how it will do tomorrow.
| Average Annual Total Returns | | | | | | |
| Periods ended March 31, 2006 | | Past 1 | | Past 5 | | Life of |
| | | year | | years | | fundA |
| Fidelity Freedom Income Fund® | | 5.71% | | 3.95% | | 5.83% |
A From October 17, 1996.
$10,000 Over Life of Fund
Let’s say hypothetically that $10,000 was invested in Fidelity Freedom Income Fund® on October 17, 1996, when the fund started. The chart shows how the value of your investment would have changed, and also shows how the Lehman Brothers® Aggregate Bond Index performed over the same period.
A-5 Annual Report
Fidelity Freedom 2000 Fund®
Performance: The Bottom Line
|
Average annual total return reflects the change in the value of an investment, assuming reinvestment of the fund’s dividend income and capital gains (the profits earned upon the sale of securities that have grown in value) and assuming a constant rate of performance each year. The $10,000 table and the fund’s returns do not reflect the deduction of taxes that a shareholder would pay on fund distributions or the redemption of fund shares. During periods of reimbursement by Fidelity, a fund’s total return will be greater than it would be had the reimbursement not occurred. How a fund did yesterday is no guarantee of how it will do tomorrow.
| Average Annual Total Returns | | | | | | |
| Periods ended March 31, 2006 | | Past 1 | | Past 5 | | Life of |
| | | year | | years | | fundA |
| Fidelity Freedom 2000 Fund® | | 6.40% | | 4.10% | | 6.89% |
A From October 17, 1996.
$10,000 Over Life of Fund
Let’s say hypothetically that $10,000 was invested in Fidelity Freedom 2000 Fund® on October 17, 1996, when the fund started. The chart shows how the value of your investment would have changed, and also shows how the Lehman Brothers Aggregate Bond Index performed over the same period.
Annual Report A-6
Fidelity Freedom 2005 Fund®
Performance: The Bottom Line
|
Average annual total return reflects the change in the value of an investment, assuming reinvestment of the fund’s dividend income and capital gains (the profits earned upon the sale of securities that have grown in value) and assuming a constant rate of performance each year. The $10,000 table and the fund’s returns do not reflect the deduction of taxes that a shareholder would pay on fund distributions or the redemption of fund shares. During periods of reimbursement by Fidelity, a fund’s total return will be greater than it would be had the reimbursement not occurred. How a fund did yesterday is no guarantee of how it will do tomorrow.
| Average Annual Total Returns | | | | |
| Periods ended March 31, 2006 | | Past 1 | | Life of |
| | | year | | fundA |
| Fidelity Freedom 2005 Fund® | | 10.05% | | 7.81% |
A From November 6, 2003.
$10,000 Over Life of Fund
Let’s say hypothetically that $10,000 was invested in Fidelity Freedom 2005 Fund® on November 6, 2003, when the fund started. The chart shows how the value of your investment would have changed, and also shows how the Lehman Brothers Aggregate Bond Index performed over the same period.
A-7 Annual Report
Fidelity Freedom 2010 Fund®
Performance: The Bottom Line
|
Average annual total return reflects the change in the value of an investment, assuming reinvestment of the fund’s dividend income and capital gains (the profits earned upon the sale of securities that have grown in value) and assuming a constant rate of performance each year. The $10,000 table and the fund’s returns do not reflect the deduction of taxes that a shareholder would pay on fund distributions or the redemption of fund shares. During periods of reimbursement by Fidelity, a fund’s total return will be greater than it would be had the reimbursement not occurred. How a fund did yesterday is no guarantee of how it will do tomorrow.
| Average Annual Total Returns | | | | | | |
| Periods ended March 31, 2006 | | Past 1 | | Past 5 | | Life of |
| | | year | | years | | fundA |
| Fidelity Freedom 2010 Fund® | | 10.54% | | 5.50% | | 8.42% |
A From October 17, 1996.
$10,000 Over Life of Fund
Let’s say hypothetically that $10,000 was invested in Fidelity Freedom 2010 Fund® on October 17, 1996, when the fund started. The chart shows how the value of your investment would have changed, and also shows how the Lehman Brothers Aggregate Bond Index performed over the same period.
Annual Report A-8
Fidelity Freedom 2015 Fund®
Performance: The Bottom Line
|
Average annual total return reflects the change in the value of an investment, assuming reinvestment of the fund’s dividend income and capital gains (the profits earned upon the sale of securities that have grown in value) and assuming a constant rate of performance each year. The $10,000 table and the fund’s returns do not reflect the deduction of taxes that a shareholder would pay on fund distributions or the redemption of fund shares. During periods of reimbursement by Fidelity, a fund’s total return will be greater than it would be had the reimbursement not occurred. How a fund did yesterday is no guarantee of how it will do tomorrow.
| Average Annual Total Returns | | | | |
| Periods ended March 31, 2006 | | Past 1 | | Life of |
| | | year | | fundA |
| Fidelity Freedom 2015 Fund® | | 12.83% | | 9.70% |
A From November 6, 2003.
$10,000 Over Life of Fund
Let’s say hypothetically that $10,000 was invested in Fidelity Freedom 2015 Fund® on November 6, 2003, when the fund started. The chart shows how the value of your investment would have changed, and also shows how the Standard & Poor’s 500SM Index (S&P 500®) performed over the same period.

A-9 Annual Report
Fidelity Freedom 2020 Fund®
Performance: The Bottom Line
|
Average annual total return reflects the change in the value of an investment, assuming reinvestment of the fund’s dividend income and capital gains (the profits earned upon the sale of securities that have grown in value) and assuming a constant rate of performance each year. The $10,000 table and the fund’s returns do not reflect the deduction of taxes that a shareholder would pay on fund distributions or the redemption of fund shares. During periods of reimbursement by Fidelity, a fund’s total return will be greater than it would be had the reimbursement not occurred. How a fund did yesterday is no guarantee of how it will do tomorrow.
| Average Annual Total Returns | | | | | | |
| Periods ended March 31, 2006 | | Past 1 | | Past 5 | | Life of |
| | | year | | years | | fundA |
| Fidelity Freedom 2020 Fund® | | 14.64% | | 6.07% | | 8.89% |
A From October 17, 1996.
$10,000 Over Life of Fund
Let’s say hypothetically that $10,000 was invested in Fidelity Freedom 2020 Fund® on October 17, 1996, when the fund started. The chart shows how the value of your investment would have changed, and also shows how the S&P 500 Index performed over the same period.
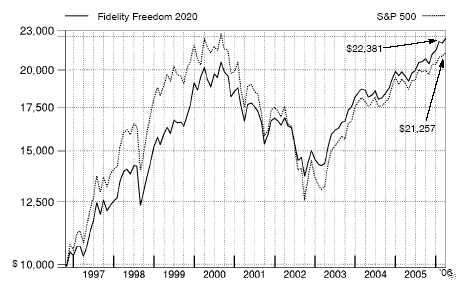
Annual Report A-10
Fidelity Freedom 2025 Fund®
Performance: The Bottom Line
|
Average annual total return reflects the change in the value of an investment, assuming reinvestment of the fund’s dividend income and capital gains (the profits earned upon the sale of securities that have grown in value) and assuming a constant rate of performance each year. The $10,000 table and the fund’s returns do not reflect the deduction of taxes that a shareholder would pay on fund distributions or the redemption of fund shares. Dur ing periods of reimbursement by Fidelity, a fund’s total return will be greater than it would be had the reimbursement not occurred. How a fund did yesterday is no guarantee of how it will do tomorrow.
| Average Annual Total Returns | | | | |
| Periods ended March 31, 2006 | | Past 1 | | Life of |
| | | year | | fundA |
| Fidelity Freedom 2025 Fund® | | 15.41% | | 11.54% |
A From November 6, 2003.
$10,000 Over Life of Fund
Let’s say hypothetically that $10,000 was invested in Fidelity Freedom 2025 Fund® on November 6, 2003, when the fund started. The chart shows how the value of your investment would have changed, and also shows how the S&P 500 Index performed over the same period.
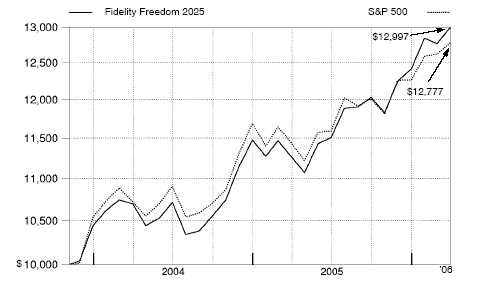
A-11 Annual Report
Fidelity Freedom 2030 Fund®
Performance: The Bottom Line
|
Average annual total return reflects the change in the value of an investment, assuming reinvestment of the fund’s dividend income and capital gains (the profits earned upon the sale of securities that have grown in value) and assuming a constant rate of performance each year. The $10,000 table and the fund’s returns do not reflect the deduction of taxes that a shareholder would pay on fund distributions or the redemption of fund shares. During periods of reimbursement by Fidelity, a fund’s total return will be greater than it would be had the reimbursement not occurred. How a fund did yesterday is no guarantee of how it will do tomorrow.
| Average Annual Total Returns | | | | | | |
| Periods ended March 31, 2006 | | Past 1 | | Past 5 | | Life of |
| | | year | | years | | fundA |
| Fidelity Freedom 2030 Fund® | | 16.86% | | 6.12% | | 8.79% |
A From October 17, 1996.
$10,000 Over Life of Fund
Let’s say hypothetically that $10,000 was invested in Fidelity Freedom 2030 Fund® on October 17, 1996, when the fund started. The chart shows how the value of your investment would have changed, and also shows how the S&P 500 Index performed over the same period.
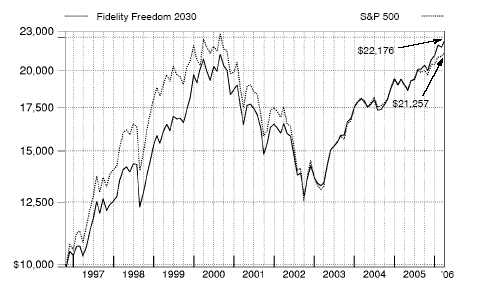
Annual Report A-12
Fidelity Freedom 2035 Fund®
Performance: The Bottom Line
|
Average annual total return reflects the change in the value of an investment, assuming reinvestment of the fund’s dividend income and capital gains (the profits earned upon the sale of securities that have grown in value) and assuming a constant rate of performance each year. The $10,000 table and the fund’s returns do not reflect the deduction of taxes that a shareholder would pay on fund distributions or the redemption of fund shares. Dur ing periods of reimbursement by Fidelity, a fund’s total return will be greater than it would be had the reimbursement not occurred. How a fund did yesterday is no guarantee of how it will do tomorrow.
| Average Annual Total Returns | | | | |
| Periods ended March 31, 2006 | | Past 1 | | Life of |
| | | year | | fundA |
| Fidelity Freedom 2035 Fund® | | 17.18% | | 12.82% |
A From November 6, 2003.
$10,000 Over Life of Fund
Let’s say hypothetically that $10,000 was invested in Fidelity Freedom 2035 Fund® on November 6, 2003, when the fund started. The chart shows how the value of your investment would have changed, and also shows how the S&P 500 Index performed over the same period.
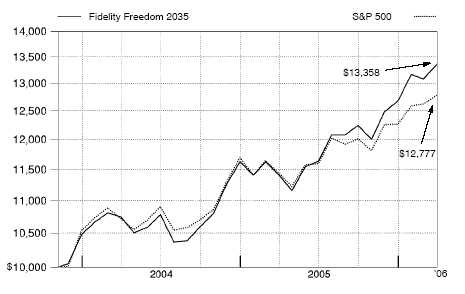
A-13 Annual Report
Fidelity Freedom 2040 Fund®
Performance: The Bottom Line
|
Average annual total return reflects the change in the value of an investment, assuming reinvestment of the fund’s dividend income and capital gains (the profits earned upon the sale of securities that have grown in value) and assuming a constant rate of performance each year. The $10,000 table and the fund’s returns do not reflect the deduction of taxes that a shareholder would pay on fund distributions or the redemption of fund shares. During periods of reimbursement by Fidelity, a fund’s total return will be greater than it would be had the reimbursement not occurred. How a fund did yesterday is no guarantee of how it will do tomorrow.
| Average Annual Total Returns | | | | | | |
| Periods ended March 31, 2006 | | Past 1 | | Past 5 | | Life of |
| | | year | | years | | fundA |
| Fidelity Freedom 2040 Fund® | | 17.65% | | 6.07% | | 0.53% |
A From September 6, 2000.
$10,000 Over Life of Fund
Let’s say hypothetically that $10,000 was invested in Fidelity Freedom 2040 Fund® on September 6, 2000, when the fund started. The chart shows how the value of your investment would have changed, and also shows how the S&P 500 Index performed over the same period.
Annual Report A-14
Management’s Discussion of Fund Performance
Comments from Ren Cheng and Jonathan Shelon, Co Portfolio Managers of Fidelity Freedom Funds®
Stocks registered widespread gains for the 12 months ending March 31, 2006, as most major equity market benchmarks turned in double digit returns. Strong corporate earnings and healthy economic growth helped fuel U.S. equities in spite of mounting concerns about inflation, a softening of the housing market and higher short term interest rates. Of the 10 broad market sectors measured by the Standard & Poor’s 500SM Index, energy had the best performance, followed by financials and telecommunication services, which also did well. Consumer discretionary had the weakest results, held back by poor performing automobile and traditional media stocks. For the 12 month period overall, the S&P 500® gained 11.73%; the NASDAQ Compos ite® Index, benefiting from more exposure to better performing mid and small cap stocks, was up 18.03%; and the Morgan Stanley Capital Interna tionalSM Europe, Australasia, Far East (MSCI® EAFE®) Index a broad benchmark of the international equity markets was up 24.62% . Turning to fixed income results, continued short term interest hikes by the Federal Reserve Board contributed to mixed returns for many sectors of the taxable, investment grade bond market during the period. The Lehman Brothers® Aggregate Bond Index a broad measure of the investment grade bond market returned 2.26% . High yield bonds represented the best performing debt category, bolstered by improving issuer fundamentals and low default rates, with the Merrill Lynch® U.S. High Yield Master II Index returning 7.23% ..
During the 12 months ending March 31, 2006, the Freedom Funds performed in line with our expectations, with each of the funds in the series produc ing results consistent with its age appropriate asset allocation. Each of the Funds outperformed its respective composite benchmark during the period. The biggest factor in the Funds’ outperformance was a continuation of the robust absolute performance in both the domestic and international equity markets which, along with favorable stock selection, drove strong returns in the Freedom Funds’ underlying mutual funds. The Dow Jones Wilshire 5000 Composite IndexSM the broad market index the Freedom Funds use to measure the performance of U.S. equities in their composite bench marks gained 14.72%, while the MSCI EAFE index’s hefty gain reflected the especially strong performance of foreign equities during the period. Performance within the fixed income asset classes was less pronounced during the period, as rising short term interest rates and gathering inflation fears continued to put pressure on bond prices. An exception to this overall trend was the performance of high yield bonds, where the lower rated sectors of that category produced the strongest results, driving both of the underlying high yield funds to outperform their benchmark index. The Funds’ investment grade bond allocation performed slightly ahead of the 2.26% rise in its benchmark. Meanwhile, the short term asset class’s return was slightly behind the 3.55% gain of its benchmark, the Lehman Brothers 3 Month Treasury Bill Index, but still provided a better absolute return than investment grade bonds during this period of rapidly rising short term interest rates.
The views expressed above reflect those of the portfolio manager(s) only through the end of the period as stated on the cover of this report and do not necessarily represent the views of Fidelity or any other person in the Fidelity organization. Any such views are subject to change at any time based upon market or other conditions and Fidelity disclaims any responsibility to update such views. These views may not be relied on as investment advice and, because investment decisions for a Fidelity fund are based on numerous factors, may not be relied on as an indication of trading intent on behalf of any Fidelity fund.
Shareholder Expense Example
|
As a shareholder of a Fund, you incur two types of costs: (1) transaction costs, and (2) ongoing costs, including other Fund expenses. This Example is intended to help you understand your ongoing costs (in dollars) of investing in the Funds and to compare these costs with the ongoing costs of invest ing in other mutual funds.
The Example is based on an investment of $1,000 invested at the beginning of the period and held for the entire period (October 1, 2005 to March 31, 2006).
The first line of the table below for each fund provides information about actual account values and actual expenses. You may use the information in this line, together with the amount you invested, to estimate the expenses that you paid over the period. Simply divide your account value by $1,000.00 (for example, an $8,600 account value divided by $1,000.00 = 8.6), then multiply the result by the number in the first line for a fund under the heading entitled “Expenses Paid During Period” to estimate the expenses you paid on your account during this period. A small balance maintenance fee of $12.00 that is charged once a year may apply for certain accounts with a value of less than $2,000. This fee is not included in the table below. If it was, the estimate of expenses you paid during the period would be higher, and your ending account value lower, by this amount. In addition, each fund, as a shareholder in underlying Fidelity funds, will indirectly bear its pro rata share of the fees and expenses incurred by the underlying Fidelity funds. These fees and expenses are not included in each fund’s annualized expense ratio used to calculate the expense estimates in the table below.
Hypothetical Example for Comparison Purposes
|
The second line of the table below for each fund provides information about hypothetical account values and hypothetical expenses based on a fund’s actual expense ratio and an assumed rate of return of 5% per year before expenses, which is not the Fund’s actual return. The hypothetical account values and expenses may not be used to estimate the actual ending account balance or expenses you paid for the period. You may use this information to compare the ongoing costs of investing in the Fund and other funds. To do so, compare this 5% hypothetical example with the 5% hypothetical examples that appear in the shareholder reports of the other funds. A small balance maintenance fee of $12.00 that is charged once a year may apply for certain accounts with a value of less than $2,000. This fee is not included in the table below. If it was, the estimate of expenses you paid during the period would be higher, and your ending account value lower, by this amount. In addition, each fund, as a shareholder in underlying Fidelity funds, will indirectly bear its pro rata share of the fees and expenses incurred by the underlying Fidelity funds. These fees and expenses are not included in each fund’s annualized expense ratio used to calculate the expense estimates in the table below.
Please note that the expenses shown in the table are meant to highlight your ongoing costs only and do not reflect any transaction costs. Therefore, the second line of the table is useful in comparing ongoing costs only, and will not help you determine the relative total costs of owning different funds.
| | | | | | | | | Expenses Paid |
| | | Beginning | | Ending | | During Period* |
| | | Account Value | | Account Value | | October 1, 2005 to |
| | | October 1, 2005 | | March 31, 2006 | | March 31, 2006 |
| Freedom Income | | | | | | | | |
| Actual | | $ 1,000.00 | | | | $ 1,027.60 | | $ — |
| HypotheticalA | | $ 1,000.00 | | | | $ 1,024.93 | | $ — |
| Freedom 2000 | | | | | | | | |
| Actual | | $ 1,000.00 | | | | $ 1,031.20 | | $ — |
| HypotheticalA | | $ 1,000.00 | | | | $ 1,024.93 | | $ — |
| Freedom 2005 | | | | | | | | |
| Actual | | $ 1,000.00 | | | | $ 1,051.00 | | $ — |
| HypotheticalA | | $ 1,000.00 | | | | $ 1,024.93 | | $ — |
| Freedom 2010 | | | | | | | | |
| Actual | | $ 1,000.00 | | | | $ 1,053.30 | | $ — |
| HypotheticalA | | $ 1,000.00 | | | | $ 1,024.93 | | $ — |
| Freedom 2015 | | | | | | | | |
| Actual | | $ 1,000.00 | | | | $ 1,065.30 | | $ — |
| HypotheticalA | | $ 1,000.00 | | | | $ 1,024.93 | | $ — |
| Freedom 2020 | | | | | | | | |
| Actual | | $ 1,000.00 | | | | $ 1,076.50 | | $ — |
| HypotheticalA | | $ 1,000.00 | | | | $ 1,024.93 | | $ — |
| Freedom 2025 | | | | | | | | |
| Actual | | $ 1,000.00 | | | | $ 1,080.50 | | $ — |
| HypotheticalA | | $ 1,000.00 | | | | $ 1,024.93 | | $ — |
| Freedom 2030 | | | | | | | | |
| Actual | | $ 1,000.00 | | | | $ 1,089.60 | | $ — |
| HypotheticalA | | $ 1,000.00 | | | | $ 1,024.93 | | $ — |
| Freedom 2035 | | | | | | | | |
| Actual | | $ 1,000.00 | | | | $ 1,091.70 | | $ — |
| HypotheticalA | | $ 1,000.00 | | | | $ 1,024.93 | | $ — |
| | | | | | | | | Expenses Paid |
| | | Beginning | | Ending | | During Period* |
| | | Account Value | | Account Value | | October 1, 2005 to |
| | | October 1, 2005 | | March 31, 2006 | | March 31, 2006 |
| Freedom 2040 | | | | | | | | |
| Actual | | $ 1,000.00 | | | | $ 1,094.30 | | $ — |
| HypotheticalA | | $ 1,000.00 | | | | $ 1,024.93 | | $ — |
| |
| A 5% return per year before expenses | | | | | | | | |
* Expenses are equal to each Fund’s annualized expense ratio (shown in the table below); multiplied by the average account value over the period, multiplied by 182/365 (to reflect the one-half year period). The fees and expenses of the underlying Fidelity funds in which the fund invests are not included in the fund’s annualized expense ratio.
| | | Annualized |
| | | Expense Ratio |
| Freedom Income | | 0.00% |
| Freedom 2000 | | 0.00% |
| Freedom 2005 | | 0.00% |
| Freedom 2010 | | 0.00% |
| Freedom 2015 | | 0.00% |
| Freedom 2020 | | 0.00% |
| Freedom 2025 | | 0.00% |
| Freedom 2030 | | 0.00% |
| Freedom 2035 | | 0.00% |
| Freedom 2040 | | 0.00% |
| Fidelity Freedom Income Fund | | |
| Investment Changes | | |
| |
| |
| Fund Holdings as of March 31, 2006 | | |
| | | % of fund’s | | % of fund’s investments |
| | | investments | | 6 months ago |
| Domestic Equity Funds | | | | |
| Fidelity Blue Chip Growth Fund | | 3.0 | | 3.1 |
| Fidelity Disciplined Equity Fund | | 3.1 | | 3.3 |
| Fidelity Equity Income Fund | | 3.1 | | 3.2 |
| Fidelity Fund | | 1.6 | | 2.1 |
| Fidelity Growth & Income Portfolio | | 3.2 | | 3.2 |
| Fidelity Growth Company Fund | | 2.0 | | 2.0 |
| Fidelity Mid Cap Stock Fund | | 2.1 | | 2.1 |
| Fidelity OTC Portfolio | | 1.6 | | 1.7 |
| Fidelity Small Cap Growth Fund | | 0.1 | | 0.1 |
| Fidelity Small Cap Independence | | | | |
| Fund | | 0.3 | | 0.1 |
| Fidelity Small Cap Value Fund | | 0.1 | | 0.1 |
| Fidelity Value Fund | | 0.9 | | 0.3 |
| | | 21.1 | | 21.3 |
| High Yield Fixed-Income Funds | | | | |
| Fidelity Capital & Income Fund | | 0.9 | | 0.2 |
| Fidelity High Income Fund | | 0.8 | | 0.1 |
| | | 1.7 | | 0.3 |
| Investment Grade Fixed-Income | | | | |
| Funds | | | | |
| Fidelity Government Income Fund | | 13.5 | | 14.7 |
| Fidelity Intermediate Bond Fund | | 8.8 | | 9.6 |
| Fidelity Investment Grade Bond | | | | |
| Fund | | 13.9 | | 14.9 |
| Fidelity Strategic Real Return Fund | | 1.0 | | 0.0 |
| | | 37.2 | | 39.2 |
| Short-Term Funds | | | | |
| Fidelity Retirement Money Market | | | | |
| Portfolio | | 26.3 | | 37.4 |
| Fidelity Short Term Bond Fund | | 13.7 | | 1.8 |
| | | 40.0 | | 39.2 |
| | | 100.0 | | 100.0 |
The “six months ago” allocation is based on the fund’s holdings as of September 30, 2005. The “current” allocation is based on the fund’s holdings as of March 31, 2006.
Annual Report A-18
| Fidelity Freedom Income Fund | | | | |
| Investments March 31, 2006 |
| Showing Percentage of Total Value of Investment in Securities |
| |
| Equity Funds 21.1% | | | | | | |
| | | | | Shares | | Value (Note 1) |
| Domestic Equity Funds 21.1% | | | | | | |
| Fidelity Blue Chip Growth Fund | | | | 1,436,388 | | $ 63,445,266 |
| Fidelity Disciplined Equity Fund | | | | 2,296,120 | | 66,564,515 |
| Fidelity Equity Income Fund | | | | 1,215,346 | | 66,467,275 |
| Fidelity Fund | | | | 1,022,315 | | 34,145,312 |
| Fidelity Growth & Income Portfolio | | | | 1,941,099 | | 69,452,531 |
| Fidelity Growth Company Fund (a) | | | | 620,300 | | 42,174,219 |
| Fidelity Mid Cap Stock Fund | | | | 1,503,094 | | 45,288,221 |
| Fidelity OTC Portfolio (a) | | | | 834,956 | | 33,398,255 |
| Fidelity Small Cap Growth Fund | | | | 133,223 | | 1,941,060 |
| Fidelity Small Cap Independence Fund | | | | 285,913 | | 6,481,643 |
| Fidelity Small Cap Value Fund | | | | 134,834 | | 1,945,658 |
| Fidelity Value Fund | | | | 234,461 | | 18,967,891 |
| TOTAL EQUITY FUNDS | | | | | | |
| (Cost $364,891,236) | | | | | | 450,271,846 |
| |
| Fixed Income Funds 38.9% | | | | | | |
| |
| High Yield Fixed-Income Funds – 1.7% | | | | | | |
| Fidelity Capital & Income Fund | | | | 2,107,132 | | 17,994,908 |
| Fidelity High Income Fund | | | | 2,024,568 | | 17,978,165 |
| |
| TOTAL HIGH YIELD FIXED INCOME FUNDS | | | | | | 35,973,073 |
| Investment Grade Fixed Income Funds 37.2% | | | | | | |
| Fidelity Government Income Fund | | | | 28,897,725 | | 287,532,362 |
| Fidelity Intermediate Bond Fund | | | | 18,553,336 | | 188,501,893 |
| Fidelity Investment Grade Bond Fund | | | | 40,761,876 | | 296,338,840 |
| Fidelity Strategic Real Return Fund | | | | 2,147,144 | | 21,407,024 |
| |
| TOTAL INVESTMENT GRADE FIXED-INCOME FUNDS | | | | | | 793,780,119 |
| |
| TOTAL FIXED-INCOME FUNDS | | | | | | |
| (Cost $842,148,661) | | | | | | 829,753,192 |
| |
| Short Term Funds 40.0% | | | | | | |
| |
| Fidelity Retirement Money Market | | | | | | |
| Portfolio | | | | 559,597,374 | | 559,597,376 |
| Fidelity Short Term Bond Fund | | | | 33,152,949 | | 292,409,013 |
| TOTAL SHORT TERM FUNDS | | | | | | |
| (Cost $853,151,056) | | | | | | 852,006,389 |
| TOTAL INVESTMENT IN SECURITIES 100% | | | | | | |
| (Cost $2,060,190,953) | | | | | | $ 2,132,031,427 |
Legend
(a) Non-income producing
|
See accompanying notes which are an integral part of the financial statements.
A-19 Annual Report
| Fidelity Freedom Income Fund | | | | |
| |
| Financial Statements | | | | |
| |
| |
| Statement of Assets and Liabilities | | | | |
| | | | | | | | | March 31, 2006 |
| |
| Assets | | | | | | | | |
| Investment in securities, at value (cost | | | | | | | | |
| $2,060,190,953) — See accom- | | | | | | | | |
| panying schedule | | | | | | | | $ 2,132,031,427 |
| Receivable for investments sold | | | | | | | | 134,818 |
| Receivable for fund shares sold | | | | | | | | 24,964,899 |
| Total assets | | | | | | | | 2,157,131,144 |
| |
| Liabilities | | | | | | | | |
| Payable to custodian bank | | | | $ 6 | | | | |
| Payable for investments purchased | | | | 22,373,400 | | | | |
| Payable for fund shares redeemed | | | | 2,726,922 | | | | |
| Total liabilities | | | | | | | | 25,100,328 |
| |
| Net Assets | | | | | | | | $ 2,132,030,816 |
| Net Assets consist of: | | | | | | | | |
| Paid in capital | | | | | | | | $ 2,045,080,356 |
| Undistributed net investment income | | | | | | | | 8,718,884 |
| Accumulated undistributed net real- | | | | | | | | |
| ized gain (loss) on investments | | | | | | | | 6,391,102 |
| Net unrealized appreciation | | | | | | | | |
| (depreciation) on investments | | | | | | | | 71,840,474 |
| Net Assets, for 185,524,078 shares | | | | | | | | |
| outstanding | | | | | | | | $ 2,132,030,816 |
| Net Asset Value, offering price and | | | | | | | | |
| redemption price per share | | | | | | | | |
| ($2,132,030,816 ÷ | | | | | | | | |
| 185,524,078 shares) | | | | | | | | $ 11.49 |
| Statement of Operations | | | | |
| | | | | Year ended March 31, 2006 |
| |
| Investment Income | | | | | | |
| Income distributions from underlying | | | | | | |
| funds | | | | | | $ 62,804,458 |
| Interest | | | | | | 326 |
| Total income | | | | | | 62,804,784 |
| |
| Expenses | | | | | | |
| Management fee | | | | $ 162,432 | | |
| Independent trustees’ compensation | | | | 7,804 | | |
| Total expenses before reductions | | | | 170,236 | | |
| Expense reductions | | | | (40,269) | | 129,967 |
| |
| Net investment income (loss) | | | | | | 62,674,817 |
| Realized and Unrealized Gain | | | | | | |
| (Loss) | | | | | | |
| Realized gain (loss) on sale of | | | | | | |
| underlying fund shares | | | | 978,567 | | |
| Capital gain distributions from | | | | | | |
| underlying funds | | | | 15,662,296 | | 16,640,863 |
| Change in net unrealized appreci- | | | | | | |
| ation (depreciation) on underlying | | | | | | |
| funds | | | | | | 35,028,244 |
| Net gain (loss) | | | | | | 51,669,107 |
| Net increase (decrease) in net | | | | | | |
| assets resulting from operations | | | | | | $ 114,343,924 |
See accompanying notes which are an integral part of the financial statements.
| | |
| Annual Report | | A-20 |
| Statement of Changes in Net Assets | | | | | | | | | | | | | | | | | | |
| | | | | | | | | Year ended | | | | Year ended |
| | | | | | | | | March 31, | | | | March 31, |
| | | | | | | | | 2006 | | | | 2005 |
| Increase (Decrease) in Net Assets | | | | | | | | | | | | | | | | | | |
| Operations | | | | | | | | | | | | | | | | | | |
| Net investment income (loss) | | | | | | | | | | $ 62,674,817 | | | | $ 36,154,871 |
| Net realized gain (loss) | | | | | | | | | | 16,640,863 | | | | 458,266 |
| Change in net unrealized appreciation (depreciation) | | | | | | | | | | 35,028,244 | | | | (2,097,017) |
| Net increase (decrease) in net assets resulting from operations | | | | | | | | | | 114,343,924 | | | | 34,516,120 |
| Distributions to shareholders from net investment income | | | | | | | | | | (55,780,710) | | | | (37,716,016) |
| Distributions to shareholders from net realized gain | | | | | | | | | | (5,309,530) | | | | (2,625,103) |
| Total distributions | | | | | | | | | | (61,090,240) | | | | (40,341,119) |
| Share transactions | | | | | | | | | | | | | | |
| Proceeds from sales of shares | | | | | | | | | | 707,988,889 | | | | 774,226,897 |
| Reinvestment of distributions | | | | | | | | | | 60,320,633 | | | | 39,691,028 |
| Cost of shares redeemed | | | | | | | | | | (634,435,737) | | | | (616,475,282) |
| Net increase (decrease) in net assets resulting from share transactions | | | | | | | | | | 133,873,785 | | | | 197,442,643 |
| Total increase (decrease) in net assets | | | | | | | | | | 187,127,469 | | | | 191,617,644 |
| |
| Net Assets | | | | | | | | | | | | | | | | |
| Beginning of period | | | | | | | | | | 1,944,903,347 | | 1,753,285,703 |
| End of period (including undistributed net investment income of $8,718,884 and undistributed net investment income | | | | | | | | | | | | | | | | |
| of $5,551,735, respectively) | | | | | | | | | | $ 2,132,030,816 | | $ 1,944,903,347 |
| |
| Other Information | | | | | | | | | | | | | | | | |
| Shares | | | | | | | | | | | | | | | | |
| Sold | | | | | | | | | | 62,311,783 | | | | 69,450,255 |
| Issued in reinvestment of distributions | | | | | | | | | | 5,324,456 | | | | 3,558,661 |
| Redeemed | | | | | | | | | | (55,841,448) | | | | (55,311,687) |
| Net increase (decrease) | | | | | | | | | | 11,794,791 | | | | 17,697,229 |
| |
| Financial Highlights | | | | | | | | | | | | | | | | | | |
| Years ended March 31, | | 2006 | | 2005 | | 2004 | | 2003 | | | | 2002 |
| Selected Per Share Data | | | | | | | | | | | | | | | | |
| Net asset value, beginning of period | | $ 11.20 | | $ 11.24 | | $ 10.59 | | $ 10.89 | | | | | | $ 10.93 |
| Income from Investment Operations | | | | | | | | | | | | | | |
| Net investment income (loss)B | | .35 | | .22 | | .18 | | .24 | | | | | | .36 |
| Net realized and unrealized gain (loss) | | .28 | | (.01) | | .75 | | (.27) | | | | | | .05 |
| Total from investment operations | | .63 | | .21 | | .93 | | (.03) | | | | | | .41 |
| Distributions from net investment income | | (.31) | | (.23) | | (.22) | | (.27) | | | | | | (.38) |
| Distributions from net realized gain | | (.03) | | (.02) | | (.06) | | — | | | | | | (.07) |
| Total distributions | | (.34) | | (.25) | | (.28) | | (.27) | | | | | | (.45) |
| Net asset value, end of period | | $ 11.49 | | $ 11.20 | | $ 11.24 | | $ 10.59 | | | | | | $ 10.89 |
| Total ReturnA | | 5.71% | | 1.86% | | 8.87% | | (.23)% | | | | | | 3.78% |
| Ratios to Average Net AssetsC,D | | | | | | | | | | | | | | |
| Expenses before reductions | | .01% | | .10% | | .10% | | .10% | | | | | | .10% |
| Expenses net of fee waivers, if any | | .01% | | .08% | | .08% | | .08% | | | | | | .08% |
| Expenses net of all reductions | | .01% | | .08% | | .08% | | .08% | | | | | | .07% |
| Net investment income (loss) | | 3.07% | | 1.97% | | 1.68% | | 2.28% | | | | | | 3.27% |
| Supplemental Data | | | | | | | | | | | | | | |
| Net assets, end of period (000 omitted) | | $2,132,031 | | $1,944,903 | | $1,753,286 | | $1,242,816 | | | | | | $ 960,976 |
| Portfolio turnover rate | | 18% | | 7% | | 6% | | 7% | | | | | | 9% |
A Total returns would have been lower had certain expenses not been reduced during the periods shown.
B Calculated based on average shares outstanding during the period.
C Amounts do not include the activity of the underlying funds.
D Expense ratios reflect operating expenses of the fund. Expenses before reductions do not reflect amounts reimbursed by the investment adviser or expense offset arrangements and do not represent the amount paid by the fund during periods
when reimbursements or reductions occur. Expenses net of fee waivers reflect expenses after reimbursement by the investment adviser but prior to reductions from expense offset arrangements. Expenses net of all reductions represent the net
expenses paid by the fund but do not include expenses of the investment companies in which the fund invests.
|
See accompanying notes which are an integral part of the financial statements.
|
| Fidelity Freedom 2000 Fund | | |
| Investment Changes | | |
| |
| |
| Fund Holdings as of March 31, 2006 | | |
| | | % of fund’s | | % of fund’s investments |
| | | investments | | 6 months ago |
| Domestic Equity Funds | | | | |
| Fidelity Blue Chip Growth Fund | | 3.6 | | 3.5 |
| Fidelity Disciplined Equity Fund | | 4.0 | | 3.9 |
| Fidelity Equity Income Fund | | 4.0 | | 3.9 |
| Fidelity Fund | | 1.7 | | 2.2 |
| Fidelity Growth & Income Portfolio | | 4.0 | | 3.6 |
| Fidelity Growth Company Fund | | 2.6 | | 2.3 |
| Fidelity Mid Cap Stock Fund | | 2.7 | | 2.4 |
| Fidelity OTC Portfolio | | 1.9 | | 1.8 |
| Fidelity Small Cap Growth Fund | | 0.1 | | 0.0 |
| Fidelity Small Cap Independence | | | | |
| Fund | | 0.2 | | 0.0 |
| Fidelity Small Cap Value Fund | | 0.1 | | 0.0 |
| Fidelity Value Fund | | 0.7 | | 0.1 |
| | | 25.6 | | 23.7 |
| International Equity Funds | | | | |
| Fidelity Diversified International | | | | |
| Fund | | 0.2 | | 0.1 |
| Fidelity Europe Fund | | 0.2 | | 0.2 |
| Fidelity Japan Fund | | 0.1 | | 0.1 |
| Fidelity Overseas Fund | | 0.1 | | 0.1 |
| Fidelity Southeast Asia Fund | | 0.0 | | 0.0 |
| | | 0.6 | | 0.5 |
| High Yield Fixed-Income Funds | | | | |
| Fidelity Capital & Income Fund | | 0.8 | | 0.4 |
| Fidelity High Income Fund | | 0.7 | | 0.3 |
| | | 1.5 | | 0.7 |
| Investment Grade Fixed-Income | | | | |
| Funds | | | | |
| Fidelity Government Income Fund | | 13.0 | | 14.4 |
| Fidelity Intermediate Bond Fund | | 8.6 | | 9.5 |
| Fidelity Investment Grade Bond | | | | |
| Fund | | 13.4 | | 14.5 |
| Fidelity Strategic Real Return Fund | | 0.9 | | 0.0 |
| | | 35.9 | | 38.4 |
| Short-Term Funds | | | | |
| Fidelity Retirement Money Market | | | | |
| Portfolio | | 25.6 | | 36.3 |
| Fidelity Short Term Bond Fund | | 10.8 | | 0.4 |
| | | 36.4 | | 36.7 |
| | | 100.0 | | 100.0 |
The “current” allocation is based on the fund’s holdings as of March 31, 2006. The “expected” allocation represents the fund’s anticipated allocation at September 30, 2006. In March 2006, the target date for combining the fund with the Freedom Income Fund was extended by approximately five years result ing in a greater allocation to equity funds. Also, beginning in March 2006, the fund increased its allocation to international equity. The “six months ago” alloca tion is based on the fund’s holdings as of September 30, 2005, reflecting the prior allocation.
Annual Report A-22
| Fidelity Freedom 2000 Fund | | | | |
| Investments March 31, 2006 |
| Showing Percentage of Total Value of Investment in Securities |
| |
| Equity Funds 26.2% | | | | |
| | | Shares | | Value (Note 1) |
| Domestic Equity Funds 25.6% | | | | |
| Fidelity Blue Chip Growth Fund | | 1,309,421 | | $ 57,837,127 |
| Fidelity Disciplined Equity Fund | | 2,208,237 | | 64,016,786 |
| Fidelity Equity Income Fund | | 1,173,999 | | 64,206,024 |
| Fidelity Fund | | 820,666 | | 27,410,248 |
| Fidelity Growth & Income Portfolio | | 1,760,527 | | 62,991,667 |
| Fidelity Growth Company Fund (a) | | 605,315 | | 41,155,397 |
| Fidelity Mid Cap Stock Fund | | 1,452,945 | | 43,777,226 |
| Fidelity OTC Portfolio (a) | | 772,674 | | 30,906,942 |
| Fidelity Small Cap Growth Fund | | 74,187 | | 1,080,906 |
| Fidelity Small Cap Independence Fund | | 139,896 | | 3,171,445 |
| Fidelity Small Cap Value Fund | | 74,293 | | 1,072,048 |
| Fidelity Value Fund | | 140,497 | | 11,366,223 |
| |
| TOTAL DOMESTIC EQUITY FUNDS | | | | 408,992,039 |
| International Equity Funds 0.6% | | | | |
| Fidelity Diversified International Fund | | 68,596 | | 2,447,489 |
| Fidelity Europe Fund | | 93,572 | | 3,736,320 |
| Fidelity Japan Fund | | 50,812 | | 955,266 |
| Fidelity Overseas Fund | | 51,133 | | 2,287,162 |
| Fidelity Southeast Asia Fund | | 27,327 | | 640,270 |
| |
| TOTAL INTERNATIONAL EQUITY FUNDS | | | | 10,066,507 |
| |
| TOTAL EQUITY FUNDS | | | | |
| (Cost $348,086,302) | | | | 419,058,546 |
| |
| Fixed Income Funds 37.4% | | | | |
| |
| High Yield Fixed-Income Funds – 1.5% | | | | |
| Fidelity Capital & Income Fund | | 1,509,353 | | 12,889,874 |
| Fidelity High Income Fund | | 1,322,488 | | 11,743,691 |
| |
| TOTAL HIGH YIELD FIXED INCOME FUNDS | | | | 24,633,565 |
| Investment Grade Fixed Income Funds 35.9% | | | | |
| Fidelity Government Income Fund | | 20,971,427 | | 208,665,697 |
| Fidelity Intermediate Bond Fund | | 13,552,691 | | 137,695,337 |
| Fidelity Investment Grade Bond Fund | | 29,486,979 | | 214,370,334 |
| Fidelity Strategic Real Return Fund | | 1,421,035 | | 14,167,723 |
| |
| TOTAL INVESTMENT GRADE FIXED-INCOME FUNDS | | | | 574,899,091 |
| |
| TOTAL FIXED-INCOME FUNDS | | | | |
| (Cost $597,605,721) | | | | 599,532,656 |
| Short Term Funds 36.4% | | | | |
| | | Shares | | Value (Note 1) |
| Fidelity Retirement Money Market | | | | |
| Portfolio | | 410,392,685 | | $ 410,392,686 |
| Fidelity Short Term Bond Fund | | 19,517,431 | | 172,143,743 |
| TOTAL SHORT TERM FUNDS | | | | |
| (Cost $583,014,164) | | | | 582,536,429 |
| TOTAL INVESTMENT IN SECURITIES 100% | | | | |
| (Cost $1,528,706,187) | | | | $ 1,601,127,631 |
Legend
(a) Non-income producing
|
See accompanying notes which are an integral part of the financial statements.
A-23 Annual Report
| Fidelity Freedom 2000 Fund | | | | |
| |
| Financial Statements | | |
| |
| |
| Statement of Assets and Liabilities | | |
| | | | | | | March 31, 2006 |
| |
| Assets | | | | | | |
| Investment in securities, at value (cost | | | | | | |
| $1,528,706,187) — See accompa- | | | | | | |
| nying schedule | | | | | | $1,601,127,631 |
| Cash | | | | | | 7 |
| Receivable for investments sold | | | | | | 896,933 |
| Receivable for fund shares sold | | | | | | 20,238,980 |
| Total assets | | | | | | 1,622,263,551 |
| |
| Liabilities | | | | | | |
| Payable for investments purchased | | | | $ 18,942,907 | | |
| Payable for fund shares redeemed | | | | 2,193,429 | | |
| Total liabilities | | | | | | 21,136,336 |
| |
| Net Assets | | | | | | $ 1,601,127,215 |
| Net Assets consist of: | | | | | | |
| Paid in capital | | | | | | $1,514,347,558 |
| Undistributed net investment income | | | | | | 10,582,757 |
| Accumulated undistributed net | | | | | | |
| realized gain (loss) on investments | | | | | | 3,775,456 |
| Net unrealized appreciation | | | | | | |
| (depreciation) on investments | | | | | | 72,421,444 |
| Net Assets, for 129,067,464 shares | | | | | | |
| outstanding | | | | | | $ 1,601,127,215 |
| Net Asset Value, offering price and | | | | | | |
| redemption price per share | | | | | | |
| ($1,601,127,215 ÷ 129,067,464 | | | | | | |
| shares) | | | | | | $ 12.41 |
| Statement of Operations | | | | | | |
| | | | | Year ended March 31, 2006 |
| |
| Investment Income | | | | | | |
| Income distributions from underlying | | | | | | |
| funds | | | | | | $ 47,199,696 |
| Interest | | | | | | 79 |
| Total income | | | | | | 47,199,775 |
| |
| Expenses | | | | | | |
| Management fee | | | | $ 131,030 | | |
| Independent trustees’ compensation | | | | 6,089 | | |
| Total expenses before reductions | | | | 137,119 | | |
| Expense reductions | | | | (32,274) | | 104,845 |
| |
| Net investment income (loss) | | | | | | 47,094,930 |
| Realized and Unrealized Gain (Loss) | | | | | | |
| Realized gain (loss) on sale of | | | | | | |
| underlying fund shares | | | | (1,544,369) | | |
| Capital gain distributions from | | | | | | |
| underlying funds | | | | 13,433,697 | | 11,889,328 |
| Change in net unrealized appreci- | | | | | | |
| ation (depreciation) on underlying | | | | | | |
| funds | | | | | | 37,942,703 |
| Net gain (loss) | | | | | | 49,832,031 |
| Net increase (decrease) in net assets | | | | | | |
| resulting from operations | | | | | | $ 96,926,961 |
See accompanying notes which are an integral part of the financial statements.
Annual Report A-24
| Statement of Changes in Net Assets | | | | | | | | | | | | | | | | | | |
| | | | | | | | | Year ended | | | | Year ended |
| | | | | | | | | March 31, | | | | March 31, |
| | | | | | | | | 2006 | | | | 2005 |
| Increase (Decrease) in Net Assets | | | | | | | | | | | | | | | | | | |
| Operations | | | | | | | | | | | | | | | | | | |
| Net investment income (loss) | | | | | | | | $ 47,094,930 | | | | $ 31,851,861 |
| Net realized gain (loss) | | | | | | | | 11,889,328 | | | | 531,818 |
| Change in net unrealized appreciation (depreciation) | | | | | | | | 37,942,703 | | | | 2,001,302 |
| Net increase (decrease) in net assets resulting from operations | | | | | | | | 96,926,961 | | | | 34,384,981 |
| Distributions to shareholders from net investment income | | | | | | | | (41,865,016) | | | | (30,275,451) |
| Distributions to shareholders from net realized gain | | | | | | | | (2,614,295) | | | | — |
| Total distributions | | | | | | | | (44,479,311) | | | | (30,275,451) |
| Share transactions | | | | | | | | | | | | |
| Proceeds from sales of shares | | | | | | | | 383,853,505 | | | | 396,321,970 |
| Reinvestment of distributions | | | | | | | | 44,282,778 | | | | 30,116,568 |
| Cost of shares redeemed | | | | | | | | (455,350,550) | | | | (446,721,830) |
| Net increase (decrease) in net assets resulting from share transactions | | | | | | | | (27,214,267) | | | | (20,283,292) |
| Total increase (decrease) in net assets | | | | | | | | 25,233,383 | | | | (16,173,762) |
| |
| Net Assets | | | | | | | | | | | | |
| Beginning of period | | | | | | | | 1,575,893,832 | | | | 1,592,067,594 |
| End of period (including undistributed net investment income of $10,582,757 and undistributed net investment income | | | | | | | | | | |
| of $7,967,137, respectively) | | | | | | | | $ 1,601,127,215 | | | | $ 1,575,893,832 |
| |
| Other Information | | | | | | | | | | | | |
| Shares | | | | | | | | | | | | |
| Sold | | | | | | | | 31,323,504 | | | | 33,212,772 |
| Issued in reinvestment of distributions | | | | | | | | 3,639,361 | | | | 2,508,864 |
| Redeemed | | | | | | | | (37,173,069) | | | | (37,437,542) |
| Net increase (decrease) | | | | | | | | (2,210,204) | | | | (1,715,906) |
| |
| Financial Highlights | | | | | | | | | | | | | | | | | | |
| Years ended March 31, | | 2006 | | | | 2005 | | 2004 | | 2003 | | | | 2002 |
| Selected Per Share Data | | | | | | | | | | | | | | | | | | |
| Net asset value, beginning of period | | $ 12.00 | | | | $ 11.97 | | $ 11.01 | | $ 11.52 | | | | | | $ 11.43 |
| Income from Investment Operations | | | | | | | | | | | | | | | | |
| Net investment income (loss)B | | .36 | | | | .24 | | .21 | | .26 | | | | | | .37 |
| Net realized and unrealized gain (loss) | | .40 | | | | .02 | | .99 | | (.47) | | | | | | —E |
| Total from investment operations | | .76 | | | | .26 | | 1.20 | | (.21) | | | | | | .37 |
| Distributions from net investment income | | (.33) | | | | (.23) | | (.24) | | (.30) | | | | | | (.28) |
| Distributions from net realized gain | | (.02) | | | | — | | — | | — | | | | | | — |
| Total distributions | | (.35) | | | | (.23) | | (.24) | | (.30) | | | | | | (.28) |
| Net asset value, end of period | | $ 12.41 | | | | $ 12.00 | | $ 11.97 | | $ 11.01 | | | | | | $ 11.52 |
| Total ReturnA | | 6.40% | | | | 2.18% | | 10.97% | | (1.81)% | | | | | | 3.21% |
| Ratios to Average Net AssetsC,D | | | | | | | | | | | | | | | | |
| Expenses before reductions | | .01% | | | | .10% | | .10% | | .10% | | | | | | .10% |
| Expenses net of fee waivers, if any | | .01% | | | | .08% | | .08% | | .08% | | | | | | .08% |
| Expenses net of all reductions | | .01% | | | | .08% | | .08% | | .08% | | | | | | .07% |
| Net investment income (loss) | | 2.98% | | | | 2.02% | | 1.79% | | 2.37% | | | | | | 3.19% |
| Supplemental Data | | | | | | | | | | | | | | | | |
| Net assets, end of period (000 omitted) | | $1,601,127 | | | | $1,575,894 | | $1,592,068 | | $1,265,181 | | | | | | $1,111,543 |
| Portfolio turnover rate | | 20% | | | | 11% | | 7% | | 7% | | | | | | 13% |
A Total returns would have been lower had certain expenses not been reduced during the periods shown.
B Calculated based on average shares outstanding during the period.
C Amounts do not include the activity of the underlying funds.
D Expense ratios reflect operating expenses of the fund. Expenses before reductions do not reflect amounts reimbursed by the investment adviser or expense offset arrangements and do not represent the amount paid by the fund during periods when
reimbursements or reductions occur. Expenses net of fee waivers reflect expenses after reimbursement by the investment adviser but prior to reductions from expense offset arrangements. Expenses net of all reductions represent the net expenses
paid by the fund but do not include expenses of the investment companies in which the fund invests.
E Amount represents less than $.01 per share.
|
See accompanying notes which are an integral part of the financial statements.
|
| Fidelity Freedom 2005 Fund | | |
| Investment Changes | | |
| |
| |
| Fund Holdings as of March 31, 2006 | | |
| | | % of fund’s | | % of fund’s investments |
| | | investments | | 6 months ago |
| Domestic Equity Funds | | | | |
| Fidelity Blue Chip Growth Fund | | 5.8 | | 5.9 |
| Fidelity Disciplined Equity Fund | | 5.9 | | 6.0 |
| Fidelity Equity Income Fund | | 5.9 | | 5.9 |
| Fidelity Fund | | 1.9 | | 3.4 |
| Fidelity Growth & Income Portfolio | | 6.5 | | 6.4 |
| Fidelity Growth Company Fund | | 3.7 | | 3.7 |
| Fidelity Mid Cap Stock Fund | | 3.8 | | 3.7 |
| Fidelity OTC Portfolio | | 2.9 | | 2.9 |
| Fidelity Small Cap Growth Fund | | 0.2 | | 0.2 |
| Fidelity Small Cap Independence | | | | |
| Fund | | 0.8 | | 0.7 |
| Fidelity Small Cap Value Fund | | 0.2 | | 0.2 |
| Fidelity Value Fund | | 2.3 | | 1.4 |
| | | 39.9 | | 40.4 |
| International Equity Funds | | | | |
| Fidelity Diversified International | | | | |
| Fund | | 1.9 | | 1.2 |
| Fidelity Europe Fund | | 2.7 | | 1.7 |
| Fidelity Japan Fund | | 0.8 | | 0.6 |
| Fidelity Overseas Fund | | 1.9 | | 1.2 |
| Fidelity Southeast Asia Fund | | 0.4 | | 0.3 |
| | | 7.7 | | 5.0 |
| High Yield Fixed-Income Funds | | | | |
| Fidelity Capital & Income Fund | | 2.5 | | 2.4 |
| Fidelity High Income Fund | | 2.5 | | 2.5 |
| | | 5.0 | | 4.9 |
| Investment Grade Fixed-Income | | | | |
| Funds | | | | |
| Fidelity Government Income Fund | | 12.1 | | 14.3 |
| Fidelity Intermediate Bond Fund | | 8.3 | | 9.3 |
| Fidelity Investment Grade Bond | | | | |
| Fund | | 13.1 | | 14.2 |
| Fidelity Strategic Real Return Fund | | 2.0 | | 0.0 |
| | | 35.5 | | 37.8 |
| Short-Term Funds | | | | |
| Fidelity Retirement Money Market | | | | |
| Portfolio | | 7.5 | | 10.7 |
| Fidelity Short Term Bond Fund | | 4.4 | | 1.2 |
| | | 11.9 | | 11.9 |
| | | 100.0 | | 100.0 |
The “current” allocation is based on the fund’s holdings as of March 31, 2006. The “expected” allocation represents the fund’s anticipated allocation at September 30, 2006. In March 2006, the target date for combining the fund with the Freedom Income Fund was extended by approximately five years resulting in a greater allocation to equity funds. Also, beginning in March 2006, the fund increased its allocation to international equity. The “six months ago” allocation is based on the fund’s holdings as of September 30, 2005, reflecting the prior allocation.
Annual Report A-26
| Fidelity Freedom 2005 Fund | | | | |
| Investments March 31, 2006 |
| Showing Percentage of Total Value of Investment in Securities |
| |
| Equity Funds 47.6% | | | | |
| | | Shares | | Value (Note 1) |
| Domestic Equity Funds 39.9% | | | | |
| Fidelity Blue Chip Growth Fund | | 700,484 | | $ 30,940,399 |
| Fidelity Disciplined Equity Fund | | 1,072,969 | | 31,105,383 |
| Fidelity Equity Income Fund | | 569,597 | | 31,151,249 |
| Fidelity Fund | | 307,351 | | 10,265,524 |
| Fidelity Growth & Income Portfolio | | 963,416 | | 34,471,039 |
| Fidelity Growth Company Fund (a) | | 289,881 | | 19,709,042 |
| Fidelity Mid Cap Stock Fund | | 667,200 | | 20,102,728 |
| Fidelity OTC Portfolio (a) | | 391,199 | | 15,647,969 |
| Fidelity Small Cap Growth Fund | | 74,133 | | 1,080,123 |
| Fidelity Small Cap Independence Fund | | 187,797 | | 4,257,350 |
| Fidelity Small Cap Value Fund | | 74,549 | | 1,075,745 |
| Fidelity Value Fund | | 147,583 | | 11,939,437 |
| |
| TOTAL DOMESTIC EQUITY FUNDS | | | | 211,745,988 |
| International Equity Funds 7.7% | | | | |
| Fidelity Diversified International Fund | | 286,783 | | 10,232,421 |
| Fidelity Europe Fund | | 353,958 | | 14,133,540 |
| Fidelity Japan Fund | | 221,262 | | 4,159,735 |
| Fidelity Overseas Fund | | 228,856 | | 10,236,735 |
| Fidelity Southeast Asia Fund | | 87,275 | | 2,044,859 |
| |
| TOTAL INTERNATIONAL EQUITY FUNDS | | | | 40,807,290 |
| |
| TOTAL EQUITY FUNDS | | | | |
| (Cost $227,629,008) | | | | 252,553,278 |
| |
| Fixed Income Funds 40.5% | | | | |
| |
| High Yield Fixed-Income Funds – 5.0% | | | | |
| Fidelity Capital & Income Fund | | 1,548,973 | | 13,228,225 |
| Fidelity High Income Fund | | 1,483,309 | | 13,171,785 |
| |
| TOTAL HIGH YIELD FIXED INCOME FUNDS | | | | 26,400,010 |
| Investment Grade Fixed Income Funds 35.5% | | | | |
| Fidelity Government Income Fund | | 6,434,459 | | 64,022,865 |
| Fidelity Intermediate Bond Fund | | 4,336,638 | | 44,060,239 |
| Fidelity Investment Grade Bond Fund | | 9,557,136 | | 69,480,379 |
| Fidelity Strategic Real Return Fund | | 1,053,514 | | 10,503,534 |
| |
| TOTAL INVESTMENT GRADE FIXED-INCOME FUNDS | | | | 188,067,017 |
| |
| TOTAL FIXED-INCOME FUNDS | | | | |
| (Cost $218,714,635) | | | | 214,467,027 |
| Short Term Funds 11.9% | | | | |
| | | Shares | | Value (Note 1) |
| Fidelity Retirement Money Market | | | | |
| Portfolio | | 39,957,372 | | $ 39,957,372 |
| Fidelity Short Term Bond Fund | | 2,634,705 | | 23,238,096 |
| TOTAL SHORT TERM FUNDS | | | | |
| (Cost $63,308,659) | | | | 63,195,468 |
| TOTAL INVESTMENT IN SECURITIES 100% | | | | |
| (Cost $509,652,302) | | | | $ 530,215,773 |
Legend
(a) Non-income producing
|
See accompanying notes which are an integral part of the financial statements.
A-27 Annual Report
| Fidelity Freedom 2005 Fund | | | | | | |
| |
| Financial Statements | | | | |
| |
| |
| Statement of Assets and Liabilities | | | | |
| | | | | | | | | March 31, 2006 |
| |
| Assets | | | | | | | | |
| Investment in securities, at value (cost | | | | | | | | |
| $509,652,302) — See accompa- | | | | | | | | |
| nying schedule | | | | | | | | $ 530,215,773 |
| Cash | | | | | | | | 50 |
| Receivable for investments sold | | | | | | | | 41,031 |
| Receivable for fund shares sold | | | | | | | | 46,909,065 |
| Total assets | | | | | | | | 577,165,919 |
| |
| Liabilities | | | | | | | | |
| Payable for investments purchased | | | | $ 46,429,215 | | | | |
| Payable for fund shares redeemed | | | | 520,971 | | | | |
| Total liabilities | | | | | | | | 46,950,186 |
| |
| Net Assets | | | | | | | | $ 530,215,733 |
| Net Assets consist of: | | | | | | | | |
| Paid in capital | | | | | | | | $ 502,383,669 |
| Undistributed net investment income | | | | | | | | 2,812,640 |
| Accumulated undistributed net | | | | | | | | |
| realized gain (loss) on investments | | | | | | | | 4,455,953 |
| Net unrealized appreciation | | | | | | | | |
| (depreciation) on investments | | | | | | | | 20,563,471 |
| Net Assets, for 46,330,604 shares | | | | | | | | |
| outstanding | | | | | | | | $ 530,215,733 |
| Net Asset Value, offering price and | | | | | | | | |
| redemption price per share | | | | | | | | |
| ($530,215,733 ÷ 46,330,604 | | | | | | | | |
| shares) | | | | | | | | $ 11.44 |
| Statement of Operations | | | | |
| | | | | Year ended March 31, 2006 |
| |
| Investment Income | | | | | | |
| Income distributions from underlying | | | | | | |
| funds | | | | | | $ 9,026,743 |
| Interest | | | | | | 38 |
| Total income | | | | | | 9,026,781 |
| |
| Expenses | | | | | | |
| Management fee | | | | $ 20,417 | | |
| Independent trustees’ compensation | | | | 1,265 | | |
| Total expenses before reductions | | | | 21,682 | | |
| Expense reductions | | | | (5,354) | | 16,328 |
| |
| Net investment income (loss) | | | | | | 9,010,453 |
| Realized and Unrealized Gain | | | | | | |
| (Loss) | | | | | | |
| Realized gain (loss) on sale of | | | | | | |
| underlying fund shares | | | | 296,468 | | |
| Capital gain distributions from | | | | | | |
| underlying funds | | | | 6,048,670 | | 6,345,138 |
| Change in net unrealized appreci- | | | | | | |
| ation (depreciation) on underlying | | | | | | |
| funds | | | | | | 18,878,383 |
| Net gain (loss) | | | | | | 25,223,521 |
| Net increase (decrease) in net | | | | | | |
| assets resulting from operations | | | | | | $ 34,233,974 |
See accompanying notes which are an integral part of the financial statements.
| | |
| Annual Report | | A-28 |
| Statement of Changes in Net Assets | | | | | | | | | | | | | | |
| | | | | Year ended | | | | Year ended |
| | | | | March 31, | | | | March 31, |
| | | | | 2006 | | | | 2005 |
| Increase (Decrease) in Net Assets | | | | | | | | |
| Operations | | | | | | | | |
| Net investment income (loss) | | | | $ 9,010,453 | | | | $ 2,445,844 |
| Net realized gain (loss) | | | | 6,345,138 | | | | 700,763 |
| Change in net unrealized appreciation (depreciation) | | | | 18,878,383 | | | | 1,300,771 |
| Net increase (decrease) in net assets resulting from operations | | | | 34,233,974 | | | | 4,447,378 |
| Distributions to shareholders from net investment income | | | | (6,943,785) | | | | (1,801,817) |
| Distributions to shareholders from net realized gain | | | | (2,453,402) | | | | (128,392) |
| Total distributions | | | | (9,397,187) | | | | (1,930,209) |
| Share transactions | | | | | | | | |
| Proceeds from sales of shares | | | | 399,971,947 | | | | 246,497,542 |
| Reinvestment of distributions | | | | 9,339,468 | | | | 1,919,878 |
| Cost of shares redeemed | | | | (132,176,701) | | | | (59,173,494) |
| Net increase (decrease) in net assets resulting from share transactions | | | | 277,134,714 | | | | 189,243,926 |
| Total increase (decrease) in net assets | | | | 301,971,501 | | | | 191,761,095 |
| |
| Net Assets | | | | | | | | |
| Beginning of period | | | | 228,244,232 | | | | 36,483,137 |
| End of period (including undistributed net investment income of $2,812,640 and undistributed net investment income | | | | | | | | |
| of $955,989, respectively) | | | | $ 530,215,733 | | | | $ 228,244,232 |
| |
| Other Information | | | | | | | | |
| Shares | | | | | | | | |
| Sold | | | | 36,001,118 | | | | 23,321,727 |
| Issued in reinvestment of distributions | | | | 844,860 | | | | 178,736 |
| Redeemed | | | | (11,914,522) | | | | (5,581,161) |
| Net increase (decrease) | | | | 24,931,456 | | | | 17,919,302 |
| |
| Financial Highlights | | | | | | | | | | | | | | |
| Years ended March 31, | | | | 2006 | | | | 2005 | | | | | | 2004F |
| Selected Per Share Data | | | | | | | | | | | | | | |
| Net asset value, beginning of period | | | | $ 10.67 | | | | $ 10.48 | | | | | | $ 10.00 |
| Income from Investment Operations | | | | | | | | | | | | | | |
| Net investment income (loss)D | | | | .28 | | | | .23 | | | | | | .08 |
| Net realized and unrealized gain (loss) | | | | .78 | | | | .13 | | | | | | .44 |
| Total from investment operations | | | | 1.06 | | | | .36 | | | | | | .52 |
| Distributions from net investment income | | | | (.21) | | | | (.16) | | | | | | (.04) |
| Distributions from net realized gain | | | | (.08) | | | | (.01) | | | | | | — |
| Total distributions | | | | (.29) | | | | (.17) | | | | | | (.04) |
| Net asset value, end of period | | | | $ 11.44 | | | | $ 10.67 | | | | | | $ 10.48 |
| Total ReturnB,C | | | | 10.05% | | | | 3.44% | | | | | | 5.21% |
| Ratios to Average Net AssetsE,G | | | | | | | | | | | | | | |
| Expenses before reductions | | | | .01% | | | | .10% | | | | | | .10%A |
| Expenses net of fee waivers, if any | | | | .00% | | | | .08% | | | | | | .08%A |
| Expenses net of all reductions | | | | .00% | | | | .08% | | | | | | .08%A |
| Net investment income (loss) | | | | 2.55% | | | | 2.18% | | | | | | 2.03%A |
| Supplemental Data | | | | | | | | | | | | | | |
| Net assets, end of period (000 omitted) | | | | $ 530,216 | | | | $ 228,244 | | | | | | $ 36,483 |
| Portfolio turnover rate | | | | 4% | | | | 7% | | | | | | 22%A |
A Annualized
B Total returns for periods of less than one year are not annualized.
C Total returns would have been lower had certain expenses not been reduced during the periods shown.
D Calculated based on average shares outstanding during the period.
E Amounts do not include the activity of the underlying funds.
F For the period November 6, 2003 (commencement of operations) to March 31, 2004.
G Expense ratios reflect operating expenses of the fund. Expenses before reductions do not reflect amounts reimbursed by the investment adviser or expense offset arrangements and do not represent the amount paid by the fund during periods when
reimbursements or reductions occur. Expense ratios before reductions for start up periods may not be representative of longer term operating periods. Expenses net of fee waivers reflect expenses after reimbursement by the investment adviser but
prior to reductions from expense offset arrangements. Expenses net of all reductions represent the net expenses paid by the fund but do not include expenses of the investment companies in which the fund invests.
|
See accompanying notes which are an integral part of the financial statements.
|
| Fidelity Freedom 2010 Fund | | |
| Investment Changes | | |
| |
| |
| Fund Holdings as of March 31, 2006 | | |
| | | % of fund’s | | % of fund’s investments |
| | | investments | | 6 months ago |
| Domestic Equity Funds | | | | |
| Fidelity Blue Chip Growth Fund | | 5.8 | | 6.1 |
| Fidelity Disciplined Equity Fund | | 6.0 | | 6.5 |
| Fidelity Equity Income Fund | | 6.0 | | 6.3 |
| Fidelity Fund | | 3.5 | | 5.2 |
| Fidelity Growth & Income Portfolio | | 6.5 | | 6.3 |
| Fidelity Growth Company Fund | | 3.9 | | 4.0 |
| Fidelity Mid Cap Stock Fund | | 4.1 | | 4.0 |
| Fidelity OTC Portfolio | | 3.0 | | 3.1 |
| Fidelity Small Cap Growth Fund | | 0.2 | | 0.1 |
| Fidelity Small Cap Independence | | | | |
| Fund | | 0.7 | | 0.3 |
| Fidelity Small Cap Value Fund | | 0.2 | | 0.1 |
| Fidelity Value Fund | | 1.9 | | 0.6 |
| | | 41.8 | | 42.6 |
| International Equity Funds | | | | |
| Fidelity Diversified International | | | | |
| Fund | | 1.9 | | 1.5 |
| Fidelity Europe Fund | | 2.6 | | 2.3 |
| Fidelity Japan Fund | | 0.8 | | 0.6 |
| Fidelity Overseas Fund | | 1.9 | | 1.4 |
| Fidelity Southeast Asia Fund | | 0.4 | | 0.3 |
| | | 7.6 | | 6.1 |
| High Yield Fixed-Income Funds | | | | |
| Fidelity Capital & Income Fund | | 2.6 | | 3.3 |
| Fidelity High Income Fund | | 2.5 | | 2.3 |
| | | 5.1 | | 5.6 |
| Investment Grade Fixed-Income | | | | |
| Funds | | | | |
| Fidelity Government Income Fund | | 12.8 | | 14.0 |
| Fidelity Intermediate Bond Fund | | 8.6 | | 9.0 |
| Fidelity Investment Grade Bond | | | | |
| Fund | | 13.4 | | 14.0 |
| Fidelity Strategic Real Return Fund | | 1.2 | | 0.0 |
| | | 36.0 | | 37.0 |
| Short-Term Funds | | | | |
| Fidelity Retirement Money Market | | | | |
| Portfolio | | 5.8 | | 8.3 |
| Fidelity Short Term Bond Fund | | 3.7 | | 0.4 |
| | | 9.5 | | 8.7 |
| | | 100.0 | | 100.0 |
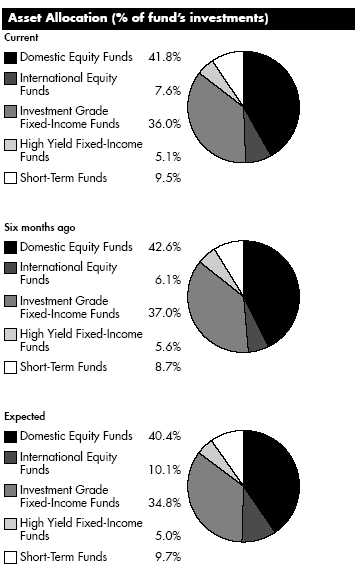
The “current” allocation is based on the fund’s holdings as of March 31, 2006. The “expected” allocation represents the fund’s anticipated allocation at September 30, 2006. In March 2006, the target date for combining the fund with the Freedom Income Fund was extended by approximately five years resulting in a greater allocation to equity funds. Also, beginning in March 2006, the fund increased its allocation to international equity. The “six months ago” allocation is based on the fund’s holdings as of September 30, 2005, reflecting the prior allocation.
Annual Report A-30
| Fidelity Freedom 2010 Fund | | | | |
| Investments March 31, 2006 |
| Showing Percentage of Total Value of Investment in Securities |
| |
| Equity Funds 49.4% | | | | |
| | | Shares | | Value (Note 1) |
| Domestic Equity Funds 41.8% | | | | |
| Fidelity Blue Chip Growth Fund | | 14,132,163 | | $ 624,217,642 |
| Fidelity Disciplined Equity Fund | | 22,168,459 | | 642,663,620 |
| Fidelity Equity Income Fund | | 11,751,004 | | 642,662,415 |
| Fidelity Fund | | 11,092,394 | | 370,485,976 |
| Fidelity Growth & Income Portfolio | | 19,286,908 | | 690,085,558 |
| Fidelity Growth Company Fund (a) | | 6,132,634 | | 416,957,778 |
| Fidelity Mid Cap Stock Fund | | 14,649,236 | | 441,381,485 |
| Fidelity OTC Portfolio (a) | | 8,015,901 | | 320,636,022 |
| Fidelity Small Cap Growth Fund | | 1,361,803 | | 19,841,468 |
| Fidelity Small Cap Independence Fund | | 3,363,059 | | 76,240,550 |
| Fidelity Small Cap Value Fund | | 1,451,105 | | 20,939,440 |
| Fidelity Value Fund | | 2,537,366 | | 205,272,895 |
| |
| TOTAL DOMESTIC EQUITY FUNDS | | | | 4,471,384,849 |
| International Equity Funds 7.6% | | | | |
| Fidelity Diversified International Fund | | 5,664,371 | | 202,104,773 |
| Fidelity Europe Fund | | 7,073,843 | | 282,458,563 |
| Fidelity Japan Fund | | 4,415,794 | | 83,016,921 |
| Fidelity Overseas Fund | | 4,501,672 | | 201,359,787 |
| Fidelity Southeast Asia Fund | | 1,744,827 | | 40,881,294 |
| |
| TOTAL INTERNATIONAL EQUITY FUNDS | | | | 809,821,338 |
| |
| TOTAL EQUITY FUNDS | | | | |
| (Cost $4,406,110,386) | | | | 5,281,206,187 |
| |
| Fixed Income Funds 41.1% | | | | |
| |
| High Yield Fixed-Income Funds – 5.1% | | | | |
| Fidelity Capital & Income Fund | | 32,958,576 | | 281,466,239 |
| Fidelity High Income Fund | | 30,013,367 | | 266,518,695 |
| |
| TOTAL HIGH YIELD FIXED INCOME FUNDS | | | | 547,984,934 |
| Investment Grade Fixed Income Funds 36.0% | | | | |
| Fidelity Government Income Fund | | 137,164,052 | | 1,364,782,318 |
| Fidelity Intermediate Bond Fund | | 90,346,136 | | 917,916,737 |
| Fidelity Investment Grade Bond Fund | | 197,207,754 | | 1,433,700,375 |
| Fidelity Strategic Real Return Fund | | 12,718,318 | | 126,801,627 |
| |
| TOTAL INVESTMENT GRADE FIXED-INCOME FUNDS | | | | 3,843,201,057 |
| |
| TOTAL FIXED-INCOME FUNDS | | | | |
| (Cost $4,407,426,993) | | | | 4,391,185,991 |
| Short Term Funds 9.5% | | | | |
| | | Shares | | Value (Note 1) |
| Fidelity Retirement Money Market | | | | |
| Portfolio | | 620,024,953 | | $ 620,024,953 |
| Fidelity Short Term Bond Fund | | 44,995,084 | | 396,856,640 |
| TOTAL SHORT TERM FUNDS | | | | |
| (Cost $1,018,382,176) | | | | 1,016,881,593 |
| TOTAL INVESTMENT IN SECURITIES 100% | | | | |
| (Cost $9,831,919,555) | | | | $ 10,689,273,771 |
Legend
(a) Non-income producing
|
See accompanying notes which are an integral part of the financial statements.
A-31 Annual Report
| Fidelity Freedom 2010 Fund | | | | |
| |
| Financial Statements | | |
| |
| |
| Statement of Assets and Liabilities | | |
| | | | | | | March 31, 2006 |
| |
| Assets | | | | | | |
| Investment in securities, at value (cost | | | | |
| $9,831,919,555) — See accom- | | | | | | |
| panying schedule | | | | | | $ 10,689,273,771 |
| Cash | | | | | | 5 |
| Receivable for investments sold | | | | | | 2,729,933 |
| Receivable for fund shares sold | | | | | | 118,992,568 |
| Total assets | | | | | | 10,810,996,277 |
| |
| Liabilities | | | | | | |
| Payable for investments purchased | | | | $ 110,885,134 | | |
| Payable for fund shares redeemed | | | | 10,840,359 | | |
| Total liabilities | | | | | | 121,725,493 |
| |
| Net Assets | | | | | | $ 10,689,270,784 |
| Net Assets consist of: | | | | | | |
| Paid in capital | | | | | | $ 9,701,488,363 |
| Undistributed net investment income | | | | | | 55,899,006 |
| Accumulated undistributed net | | | | | | |
| realized gain (loss) on investments | | | | | | 74,529,199 |
| Net unrealized appreciation | | | | | | |
| (depreciation) on investments | | | | | | 857,354,216 |
| Net Assets, for 738,450,241 shares | | | | | | |
| outstanding | | | | | | $ 10,689,270,784 |
| Net Asset Value, offering price and | | | | | | |
| redemption price per share | | | | | | |
| ($10,689,270,784 ÷ | | | | | | |
| 738,450,241 shares) | | | | | | $ 14.48 |
| Statement of Operations | | | | |
| | | | | Year ended March 31, 2006 |
| |
| Investment Income | | | | | | |
| Income distributions from underlying | | | | | | |
| funds | | | | | | $ 237,377,258 |
| Interest | | | | | | 3,720 |
| Total income | | | | | | 237,380,978 |
| |
| Expenses | | | | | | |
| Management fee | | | | $ 724,484 | | |
| Independent trustees’ compensation | | | | 36,009 | | |
| Interest | | | | 962 | | |
| Total expenses before reductions | | | | 761,455 | | |
| Expense reductions | | | | (180,859) | | 580,596 |
| |
| Net investment income (loss) | | | | | | 236,800,382 |
| Realized and Unrealized Gain | | | | | | |
| (Loss) | | | | | | |
| Realized gain (loss) on sale of | | | | | | |
| underlying fund shares | | | | (18,625,679) | | |
| Capital gain distributions from | | | | | | |
| underlying funds | | | | 156,811,850 | | 138,186,171 |
| Change in net unrealized appreci- | | | | | | |
| ation (depreciation) on underlying | | | | | | |
| funds | | | | | | 583,275,019 |
| Net gain (loss) | | | | | | 721,461,190 |
| Net increase (decrease) in net | | | | | | |
| assets resulting from operations | | | | | | $ 958,261,572 |
See accompanying notes which are an integral part of the financial statements.
| | |
| Annual Report | | A-32 |
| Statement of Changes in Net Assets | | | | | | | | | | | | | | | | | | |
| | | | | | | | | Year ended | | | | Year ended |
| | | | | | | | | March 31 | | | | March 31, |
| | | | | | | | | 2006 | | | | 2005 |
| Increase (Decrease) in Net Assets | | | | | | | | | | | | |
| Operations | | | | | | | | | | | | |
| Net investment income (loss) | | | | | | | | $ 236,800,382 | | | | $ 166,362,993 |
| Net realized gain (loss) | | | | | | | | 138,186,171 | | | | 48,793,837 |
| Change in net unrealized appreciation (depreciation) | | | | | | | | 583,275,019 | | | | 67,477,735 |
| Net increase (decrease) in net assets resulting from operations | | | | | | | | 958,261,572 | | | | 282,634,565 |
| Distributions to shareholders from net investment income | | | | | | | | (206,242,560) | | | | (173,342,801) |
| Distributions to shareholders from net realized gain | | | | | | | | (46,432,435) | | | | (26,257,845) |
| Total distributions | | | | | | | | (252,674,995) | | | | (199,600,646) |
| Share transactions | | | | | | | | | | | | |
| Proceeds from sales of shares | | | | | | | | 3,085,283,033 | | | | 2,597,566,024 |
| Reinvestment of distributions | | | | | | | | 251,913,287 | | | | 198,984,818 |
| Cost of shares redeemed | | | | | | | | (2,047,023,706) | | | | (1,573,936,218) |
| Net increase (decrease) in net assets resulting from share transactions | | | | | | | | 1,290,172,614 | | | | 1,222,614,624 |
| Total increase (decrease) in net assets | | | | | | | | 1,995,759,191 | | | | 1,305,648,543 |
| |
| Net Assets | | | | | | | | | | | | |
| Beginning of period | | | | | | | | 8,693,511,593 | | | | 7,387,863,050 |
| End of period (including undistributed net investment income of $55,899,006 and undistributed net investment | | | | | | | | | | | | |
| income of $38,369,709, respectively) | | | | | | | | $10,689,270,784 | | | | $ 8,693,511,593 |
| |
| Other Information | | | | | | | | | | | | |
| Shares | | | | | | | | | | | | |
| Sold | | | | | | | | 220,380,588 | | | | 195,180,090 |
| Issued in reinvestment of distributions | | | | | | | | 18,118,645 | | | | 14,843,268 |
| Redeemed | | | | | | | | (146,600,739) | | | | (118,610,316) |
| Net increase (decrease) | | | | | | | | 91,898,494 | | | | 91,413,042 |
| |
| Financial Highlights | | | | | | | | | | | | | | | | |
| Years ended March 31, | | 2006 | | | | 2005 | | 2004 | | | | 2003 | | | | 2002 |
| Selected Per Share Data | | | | | | | | | | | | | | | | |
| Net asset value, beginning of period | | $ 13.45 | | | | $ 13.31 | | $ 11.40 | | | | $ 12.61 | | | | $ 12.94 |
| Income from Investment Operations | | | | | | | | | | | | | | | | |
| Net investment income (loss)B | | .35 | | | | .28 | | .26 | | | | .28 | | | | .36 |
| Net realized and unrealized gain (loss) | | 1.05 | | | | .20 | | 2.02 | | | | (1.18) | | | | (.05) |
| Total from investment operations | | 1.40 | | | | .48 | | 2.28 | | | | (.90) | | | | .31 |
| Distributions from net investment income | | (.30) | | | | (.29) | | (.28) | | | | (.31) | | | | (.37) |
| Distributions from net realized gain | | (.07) | | | | (.05) | | (.09) | | | | — | | | | (.27) |
| Total distributions | | (.37) | | | | (.34) | | (.37) | | | | (.31) | | | | (.64) |
| Net asset value, end of period | | $ 14.48 | | | | $ 13.45 | | $ 13.31 | | | | $ 11.40 | | | | $ 12.61 |
| Total ReturnA | | 10.54% | | | | 3.59% | | 20.15% | | | | (7.17)% | | | | 2.31% |
| Ratios to Average Net AssetsC,D | | | | | | | | | | | | | | | | |
| Expenses before reductions | | .01% | | | | .10% | | .10% | | | | .10% | | | | .10% |
| Expenses net of fee waivers, if any | | .01% | | | | .08% | | .08% | | | | .08% | | | | .08% |
| Expenses net of all reductions | | .01% | | | | .08% | | .08% | | | | .08% | | | | .07% |
| Net investment income (loss) | | 2.48% | | | | 2.11% | | 2.07% | | | | 2.44% | | | | 2.84% |
| Supplemental Data | | | | | | | | | | | | | | | | |
| Net assets, end of period (000 omitted) | | $10,689,271 | | | | $8,693,512 | | $7,387,863 | | | | $4,682,513 | | | | $4,063,699 |
| Portfolio turnover rate | | 8% | | | | 1% | | 4% | | | | 8% | | | | 10% |
A Total returns would have been lower had certain expenses not been reduced during the periods shown.
B Calculated based on average shares outstanding during the period.
C Amounts do not include the activity of the underlying funds.
D Expense ratios reflect operating expenses of the fund. Expenses before reductions do not reflect amounts reimbursed by the investment adviser or expense offset arrangements and do not represent the amount paid by the fund during periods when
reimbursements or reductions occur. Expenses net of fee waivers reflect expenses after reimbursement by the investment adviser but prior to reductions from expense offset arrangements. Expenses net of all reductions represent the net expenses
paid by the fund but do not include expenses of the investment companies in which the fund invests.
|
See accompanying notes which are an integral part of the financial statements.
|
| Fidelity Freedom 2015 Fund | | |
| Investment Changes | | |
| |
| |
| Fund Holdings as of March 31, 2006 | | |
| | | % of fund’s | | % of fund’s investments |
| | | investments | | 6 months ago |
| Domestic Equity Funds | | | | |
| Fidelity Blue Chip Growth Fund | | 7.2 | | 7.5 |
| Fidelity Disciplined Equity Fund | | 7.1 | | 7.6 |
| Fidelity Equity Income Fund | | 7.1 | | 7.6 |
| Fidelity Fund | | 2.1 | | 4.2 |
| Fidelity Growth & Income Portfolio | | 7.9 | | 8.1 |
| Fidelity Growth Company Fund | | 4.6 | | 4.7 |
| Fidelity Mid Cap Stock Fund | | 4.6 | | 4.8 |
| Fidelity OTC Portfolio | | 3.6 | | 3.6 |
| Fidelity Small Cap Growth Fund | | 0.2 | | 0.2 |
| Fidelity Small Cap Independence | | | | |
| Fund | | 1.0 | | 0.8 |
| Fidelity Small Cap Value Fund | | 0.3 | | 0.3 |
| Fidelity Value Fund | | 2.8 | | 1.8 |
| | | 48.5 | | 51.2 |
| International Equity Funds | | | | |
| Fidelity Diversified International | | | | |
| Fund | | 2.6 | | 2.1 |
| Fidelity Europe Fund | | 3.6 | | 3.0 |
| Fidelity Japan Fund | | 1.1 | | 0.9 |
| Fidelity Overseas Fund | | 2.6 | | 2.2 |
| Fidelity Southeast Asia Fund | | 0.5 | | 0.4 |
| | | 10.4 | | 8.6 |
| High Yield Fixed-Income Funds | | | | |
| Fidelity Capital & Income Fund | | 3.3 | | 3.3 |
| Fidelity High Income Fund | | 3.2 | | 3.4 |
| | | 6.5 | | 6.7 |
| Investment Grade Fixed-Income | | | | |
| Funds | | | | |
| Fidelity Government Income Fund | | 10.2 | | 11.2 |
| Fidelity Intermediate Bond Fund | | 7.1 | | 7.4 |
| Fidelity Investment Grade Bond | | | | |
| Fund | | 11.2 | | 11.2 |
| Fidelity Strategic Real Return Fund | | 2.0 | | 0.0 |
| | | 30.5 | | 29.8 |
| Short-Term Funds | | | | |
| Fidelity Retirement Money Market | | | | |
| Portfolio | | 2.6 | | 3.3 |
| Fidelity Short Term Bond Fund | | 1.5 | | 0.4 |
| | | 4.1 | | 3.7 |
| | | 100.0 | | 100.0 |
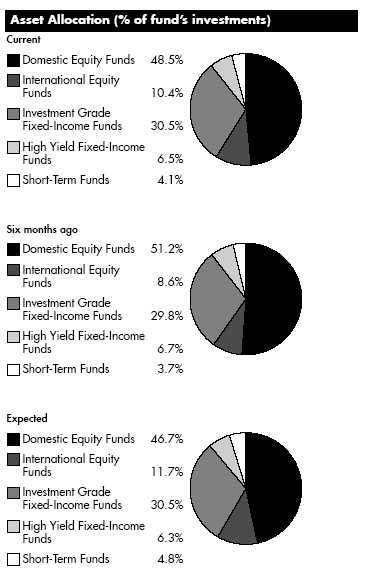
The fund invests according to an asset allocation strategy that becomes increasingly conservative over time. The “six months ago” allocation is based on the fund’s holdings as of September 30, 2005. The “current” allocation is based on the fund’s holdings as of March 31, 2006. The “expected” allocation represents the fund’s anticipated allocation at September 30, 2006. Beginning in March 2006, the fund changed its asset allocation strategy, resulting in an increased emphasis on international equity.
Annual Report A-34
| Fidelity Freedom 2015 Fund | | | | |
| Investments March 31, 2006 |
| Showing Percentage of Total Value of Investment in Securities |
| |
| Equity Funds 58.9% | | | | |
| | | Shares | | Value (Note 1) |
| Domestic Equity Funds 48.5% | | | | |
| Fidelity Blue Chip Growth Fund | | 4,333,017 | | $ 191,389,356 |
| Fidelity Disciplined Equity Fund | | 6,586,388 | | 190,939,380 |
| Fidelity Equity Income Fund | | 3,492,826 | | 191,022,665 |
| Fidelity Fund | | 1,657,678 | | 55,366,443 |
| Fidelity Growth & Income Portfolio | | 5,940,881 | | 212,564,740 |
| Fidelity Growth Company Fund (a) | | 1,801,447 | | 122,480,412 |
| Fidelity Mid Cap Stock Fund | | 4,081,197 | | 122,966,466 |
| Fidelity OTC Portfolio (a) | | 2,433,375 | | 97,335,013 |
| Fidelity Small Cap Growth Fund | | 453,220 | | 6,603,417 |
| Fidelity Small Cap Independence Fund | | 1,177,231 | | 26,687,817 |
| Fidelity Small Cap Value Fund | | 459,506 | | 6,630,668 |
| Fidelity Value Fund | | 921,386 | | 74,540,152 |
| |
| TOTAL DOMESTIC EQUITY FUNDS | | | | 1,298,526,529 |
| International Equity Funds 10.4% | | | | |
| Fidelity Diversified International Fund | | 1,952,200 | | 69,654,483 |
| Fidelity Europe Fund | | 2,385,675 | | 95,259,993 |
| Fidelity Japan Fund | | 1,583,883 | | 29,776,991 |
| Fidelity Overseas Fund | | 1,566,162 | | 70,054,429 |
| Fidelity Southeast Asia Fund | | 598,189 | | 14,015,576 |
| |
| TOTAL INTERNATIONAL EQUITY FUNDS | | | | 278,761,472 |
| |
| TOTAL EQUITY FUNDS | | | | |
| (Cost $1,429,251,179) | | 1,577,288,001 |
| |
| Fixed Income Funds 37.0% | | | | |
| |
| High Yield Fixed-Income Funds – 6.5% | | | | |
| Fidelity Capital & Income Fund | | 10,191,279 | | 87,033,527 |
| Fidelity High Income Fund | | 9,757,227 | | 86,644,179 |
| |
| TOTAL HIGH YIELD FIXED INCOME FUNDS | | | | 173,677,706 |
| Investment Grade Fixed Income Funds 30.5% | | | | |
| Fidelity Government Income Fund | | 27,427,339 | | 272,902,024 |
| Fidelity Intermediate Bond Fund | | 18,626,630 | | 189,246,563 |
| Fidelity Investment Grade Bond Fund | | 41,311,547 | | 300,334,946 |
| Fidelity Strategic Real Return Fund | | 5,378,230 | | 53,620,952 |
| |
| TOTAL INVESTMENT GRADE FIXED-INCOME FUNDS | | | | 816,104,485 |
| |
| TOTAL FIXED-INCOME FUNDS | | | | |
| (Cost $1,004,604,728) | | | | 989,782,191 |
| Short Term Funds 4.1% | | | | |
| | | Shares | | Value (Note 1) |
| Fidelity Retirement Money Market | | | | |
| Portfolio | | 69,404,800 | | $ 69,404,800 |
| Fidelity Short Term Bond Fund | | 4,682,987 | | 41,303,945 |
| TOTAL SHORT TERM FUNDS | | | | |
| (Cost $110,883,194) | | | | 110,708,745 |
| TOTAL INVESTMENT IN SECURITIES 100% | | | | |
| (Cost $2,544,739,101) | | | | $ 2,677,778,937 |
Legend
(a) Non-income producing
|
See accompanying notes which are an integral part of the financial statements.
A-35 Annual Report
| Fidelity Freedom 2015 Fund | | | | | | |
| |
| Financial Statements | | | | |
| |
| |
| Statement of Assets and Liabilities | | | | |
| | | | | | | | | March 31, 2006 |
| |
| Assets | | | | | | | | |
| Investment in securities, at value (cost | | | | | | | | |
| $2,544,739,101) — See accom- | | | | | | | | |
| panying schedule | | | | | | | | $2,677,778,937 |
| Receivable for investments sold | | | | | | | | 229,267 |
| Receivable for fund shares sold | | | | | | | | 209,509,018 |
| Total assets | | | | | | | | 2,887,517,222 |
| |
| Liabilities | | | | | | | | |
| Payable for investments purchased | | | | $ 207,653,293 | | | | |
| Payable for fund shares redeemed | | | | 2,085,377 | | | | |
| Total liabilities | | | | | | | | 209,738,670 |
| |
| Net Assets | | | | | | | | $ 2,677,778,552 |
| Net Assets consist of: | | | | | | | | |
| Paid in capital | | | | | | | | $2,507,016,154 |
| Undistributed net investment income | | | | | | | | 8,665,079 |
| Accumulated undistributed net | | | | | | | | |
| realized gain (loss) on investments | | | | | | | | 29,057,483 |
| Net unrealized appreciation | | | | | | | | |
| (depreciation) on investments | | | | | | | | 133,039,836 |
| Net Assets, for 223,573,331 shares | | | | | | | | |
| outstanding | | | | | | | | $ 2,677,778,552 |
| Net Asset Value, offering price and | | | | | | | | |
| redemption price per share | | | | | | | | |
| ($2,677,778,552 ÷ | | | | | | | | |
| 223,573,331 shares) | | | | | | | | $ 11.98 |
| Statement of Operations | | | | |
| | | | | Year ended March 31, 2006 |
| |
| Investment Income | | | | | | |
| Income distributions from underlying | | | | | | |
| funds | | | | | | $ 34,693,090 |
| Interest | | | | | | 816 |
| Total income | | | | | | 34,693,906 |
| |
| Expenses | | | | | | |
| Management fee | | | | $ 79,182 | | |
| Independent trustees’ compensation | | | | 5,484 | | |
| Total expenses before reductions | | | | 84,666 | | |
| Expense reductions | | | | (21,403) | | 63,263 |
| |
| Net investment income (loss) | | | | | | 34,630,643 |
| Realized and Unrealized Gain | | | | | | |
| (Loss) | | | | | | |
| Realized gain (loss) on sale of | | | | | | |
| underlying fund shares | | | | 1,283,964 | | |
| Capital gain distributions from | | | | | | |
| underlying funds | | | | 35,857,226 | | 37,141,190 |
| Change in net unrealized appreci- | | | | | | |
| ation (depreciation) on underlying | | | | | | |
| funds | | | | | | 122,725,107 |
| Net gain (loss) | | | | | | 159,866,297 |
| Net increase (decrease) in net | | | | | | |
| assets resulting from operations | | | | | | $ 194,496,940 |
See accompanying notes which are an integral part of the financial statements.
Annual Report A-36
| Statement of Changes in Net Assets | | | | | | | | | | | | | | |
| | | | | Year ended | | | | Year ended |
| | | | | March 31, | | | | March 31, |
| | | | | 2006 | | | | 2005 |
| Increase (Decrease) in Net Assets | | | | | | | | | | |
| Operations | | | | | | | | | | |
| Net investment income (loss) | | | | $ 34,630,643 | | | | $ 8,277,717 |
| Net realized gain (loss) | | | | 37,141,190 | | | | 2,804,789 |
| Change in net unrealized appreciation (depreciation) | | | | 122,725,107 | | | | 9,373,614 |
| Net increase (decrease) in net assets resulting from operations | | | | 194,496,940 | | | | 20,456,120 |
| Distributions to shareholders from net investment income | | | | (27,970,696) | | | | (6,293,545) |
| Distributions to shareholders from net realized gain | | | | (10,642,857) | | | | (573,772) |
| Total distributions | | | | (38,613,553) | | | | (6,867,317) |
| Share transactions | | | | | | | | |
| Proceeds from sales of shares | | | | 1,847,831,476 | | | | 877,794,443 |
| Reinvestment of distributions | | | | 38,532,294 | | | | 6,853,844 |
| Cost of shares redeemed | | | | (276,961,461) | | | | (100,078,893) |
| Net increase (decrease) in net assets resulting from share transactions | | | | 1,609,402,309 | | | | 784,569,394 |
| Total increase (decrease) in net assets | | | | 1,765,285,696 | | | | 798,158,197 |
| |
| Net Assets | | | | | | | | |
| Beginning of period | | | | 912,492,856 | | | | 114,334,659 |
| End of period (including undistributed net investment income of $8,665,079 and undistributed net investment income | | | | | | | | |
| of $2,927,282, respectively) | | | | $ 2,677,778,552 | | | | $ 912,492,856 |
| |
| Other Information | | | | | | | | |
| Shares | | | | | | | | |
| Sold | | | | 160,428,368 | | | | 81,759,492 |
| Issued in reinvestment of distributions | | | | 3,362,406 | | | | 623,570 |
| Redeemed | | | | (24,131,931) | | | | (9,283,179) |
| Net increase (decrease) | | | | 139,658,843 | | | | 73,099,883 |
| |
| Financial Highlights | | | | | | | | | | | | | | |
| Years ended March 31, | | | | 2006 | | | | 2005 | | | | 2004F |
| Selected Per Share Data | | | | | | | | | | | | |
| Net asset value, beginning of period | | | | $ 10.87 | | | | $ 10.57 | | | | $ 10.00 |
| Income from Investment Operations | | | | | | | | | | | | |
| Net investment income (loss)D | | | | .25 | | | | .21 | | | | .07 |
| Net realized and unrealized gain (loss) | | | | 1.13 | | | | .25 | | | | .54 |
| Total from investment operations | | | | 1.38 | | | | .46 | | | | .61 |
| Distributions from net investment income | | | | (.19) | | | | (.14) | | | | (.04) |
| Distributions from net realized gain | | | | (.08) | | | | (.02) | | | | — |
| Total distributions | | | | (.27) | | | | (.16) | | | | (.04) |
| Net asset value, end of period | | | | $ 11.98 | | | | $ 10.87 | | | | $ 10.57 |
| Total ReturnB,C | | | | 12.83% | | | | 4.30% | | | | 6.11% |
| Ratios to Average Net AssetsE,G | | | | | | | | | | | | |
| Expenses before reductions | | | | .01% | | | | .10% | | | | .10%A |
| Expenses net of fee waivers, if any | | | | .00% | | | | .08% | | | | .08%A |
| Expenses net of all reductions | | | | .00% | | | | .08% | | | | .08%A |
| Net investment income (loss) | | | | 2.20% | | | | 2.01% | | | | 1.79%A |
| Supplemental Data | | | | | | | | | | | | |
| Net assets, end of period (000 omitted) | | | | $2,677,779 | | | | $ 912,493 | | | | $ 114,335 |
| Portfolio turnover rate | | | | 1% | | | | 0% | | | | 2%A |
A Annualized
B Total returns for periods of less than one year are not annualized.
C Total returns would have been lower had certain expenses not been reduced during the periods shown.
D Calculated based on average shares outstanding during the period.
E Amounts do not include the activity of the underlying funds.
F For the period November 6, 2003 (commencement of operations) to March 31, 2004.
G Expense ratios reflect operating expenses of the fund. Expenses before reductions do not reflect amounts reimbursed by the investment adviser or expense offset arrangements and do not represent the amount paid by the fund during periods when
reimbursements or reductions occur. Expense ratios before reductions for start up periods may not be representative of longer term operating periods. Expenses net of fee waivers reflect expenses after reimbursement by the investment adviser but
prior to reductions from expense offset arrangements. Expenses net of all reductions represent the net expenses paid by the fund but do not include expenses of the investment companies in which the fund invests.
|
See accompanying notes which are an integral part of the financial statements.
|
| Fidelity Freedom 2020 Fund | | |
| Investment Changes | | |
| |
| |
| Fund Holdings as of March 31, 2006 | | |
| | | % of fund’s | | % of fund’s investments |
| | | investments | | 6 months ago |
| Domestic Equity Funds | | | | |
| Fidelity Blue Chip Growth Fund | | 8.1 | | 8.6 |
| Fidelity Disciplined Equity Fund | | 8.2 | | 9.1 |
| Fidelity Equity Income Fund | | 8.3 | | 8.8 |
| Fidelity Fund | | 4.9 | | 7.1 |
| Fidelity Growth & Income Portfolio | | 9.0 | | 9.0 |
| Fidelity Growth Company Fund | | 5.2 | | 5.6 |
| Fidelity Mid Cap Stock Fund | | 5.5 | | 5.6 |
| Fidelity OTC Portfolio | | 4.1 | | 4.3 |
| Fidelity Small Cap Growth Fund | | 0.3 | | 0.2 |
| Fidelity Small Cap Independence | | | | |
| Fund | | 1.1 | | 0.5 |
| Fidelity Small Cap Value Fund | | 0.3 | | 0.2 |
| Fidelity Value Fund | | 2.9 | | 1.2 |
| | | 57.9 | | 60.2 |
| International Equity Funds | | | | |
| Fidelity Diversified International | | | | |
| Fund | | 3.0 | | 2.7 |
| Fidelity Europe Fund | | 4.2 | | 4.1 |
| Fidelity Japan Fund | | 1.2 | | 1.1 |
| Fidelity Overseas Fund | | 3.0 | | 2.6 |
| Fidelity Southeast Asia Fund | | 0.6 | | 0.6 |
| | | 12.0 | | 11.1 |
| High Yield Fixed-Income Funds | | | | |
| Fidelity Capital & Income Fund | | 3.6 | | 3.9 |
| Fidelity High Income Fund | | 3.6 | | 3.6 |
| | | 7.2 | | 7.5 |
| Investment Grade Fixed-Income | | | | |
| Funds | | | | |
| Fidelity Government Income Fund | | 7.9 | | 8.0 |
| Fidelity Intermediate Bond Fund | | 5.4 | | 5.1 |
| Fidelity Investment Grade Bond | | | | |
| Fund | | 8.5 | | 8.0 |
| Fidelity Strategic Real Return Fund | | 1.0 | | 0.0 |
| | | 22.8 | | 21.1 |
| Short-Term Funds | | | | |
| Fidelity Retirement Money Market | | | | |
| Portfolio | | 0.1 | | 0.1 |
| Fidelity Short Term Bond Fund | | 0.0 | | 0.0 |
| | | 0.1 | | 0.1 |
| | | 100.0 | | 100.0 |
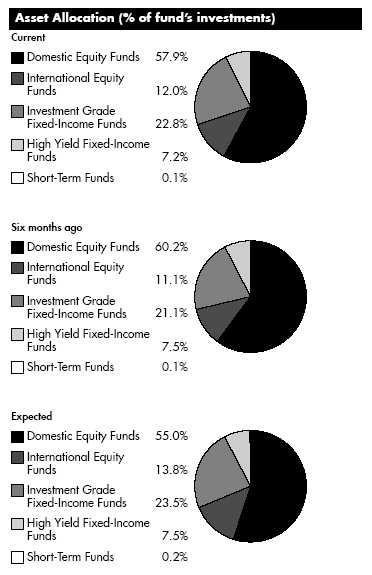
The fund invests according to an asset allocation strategy that becomes increasingly conservative over time. The “six months ago” allocation is based on the fund’s holdings as of September 30, 2005. The “current” allocation is based on the fund’s holdings as of March 31, 2006. The “expected” allocation represents the fund’s anticipated allocation at September 30, 2006. Beginning in March 2006, the fund changed its asset allocation strategy, resulting in an increased emphasis on international equity.
Annual Report A-38
| Fidelity Freedom 2020 Fund | | | | |
| Investments March 31, 2006 |
| Showing Percentage of Total Value of Investment in Securities |
| |
| Equity Funds 69.9% | | | | | | |
| | | | | Shares | | Value (Note 1) |
| Domestic Equity Funds 57.9% | | | | | | |
| Fidelity Blue Chip Growth Fund | | | | 25,574,801 | | $ 1,129,638,958 |
| Fidelity Disciplined Equity Fund | | | | 39,331,555 | | 1,140,221,792 |
| Fidelity Equity Income Fund | | | | 20,913,680 | | 1,143,769,165 |
| Fidelity Fund | | | | 20,253,712 | | 676,473,984 |
| Fidelity Growth & Income Portfolio | | | | 34,992,991 | | 1,252,049,236 |
| Fidelity Growth Company Fund (a) | | | | 10,635,527 | | 723,109,490 |
| Fidelity Mid Cap Stock Fund | | | | 25,441,181 | | 766,542,772 |
| Fidelity OTC Portfolio (a) | | | | 14,217,837 | | 568,713,467 |
| Fidelity Small Cap Growth Fund | | | | 2,632,504 | | 38,355,588 |
| Fidelity Small Cap Independence | | | | | | |
| Fund | | | | 6,719,402 | | 152,328,851 |
| Fidelity Small Cap Value Fund | | | | 2,686,650 | | 38,768,361 |
| Fidelity Value Fund | | | | 4,896,219 | | 396,104,090 |
| |
| TOTAL DOMESTIC EQUITY FUNDS | | | | | | 8,026,075,754 |
| International Equity Funds 12.0% | | | | | | |
| Fidelity Diversified International Fund | | | | 11,591,481 | | 413,584,056 |
| Fidelity Europe Fund | | | | 14,335,436 | | 572,413,948 |
| Fidelity Japan Fund | | | | 9,084,446 | | 170,787,577 |
| Fidelity Overseas Fund | | | | 9,245,168 | | 413,536,354 |
| Fidelity Southeast Asia Fund | | | | 3,583,654 | | 83,965,022 |
| |
| TOTAL INTERNATIONAL EQUITY FUNDS | | | | | | 1,654,286,957 |
| |
| TOTAL EQUITY FUNDS | | | | | | |
| (Cost $7,990,855,591) | | | | | | 9,680,362,711 |
| |
| Fixed Income Funds 30.0% | | | | | | |
| |
| High Yield Fixed-Income Funds – 7.2% | | | | | | |
| Fidelity Capital & Income Fund | | | | 58,283,372 | | 497,739,999 |
| Fidelity High Income Fund | | | | 55,674,019 | | 494,385,287 |
| |
| TOTAL HIGH YIELD FIXED INCOME FUNDS | | | | | | 992,125,286 |
| Investment Grade Fixed Income Funds 22.8% | | | | | | |
| Fidelity Government Income Fund | | | | 110,756,319 | | 1,102,025,378 |
| Fidelity Intermediate Bond Fund | | | | 73,719,553 | | 748,990,663 |
| Fidelity Investment Grade Bond Fund | | | | 161,235,963 | | 1,172,185,451 |
| Fidelity Strategic Real Return Fund | | | | 13,451,981 | | 134,116,247 |
| |
| TOTAL INVESTMENT GRADE FIXED-INCOME FUNDS | | | | | | 3,157,317,739 |
| |
| TOTAL FIXED-INCOME FUNDS | | | | | | |
| (Cost $4,155,047,386) | | | | | | 4,149,443,025 |
| Short Term Funds 0.1% | | | | | | |
| | | Shares | | | | Value (Note 1) |
| Fidelity Retirement Money Market | | | | | | |
| Portfolio | | 10,327,368 | | | | $ 10,327,368 |
| Fidelity Short Term Bond Fund | | 812,550 | | | | 7,166,692 |
| TOTAL SHORT TERM FUNDS | | | | | | |
| (Cost $17,530,803) | | | | | | 17,494,060 |
| TOTAL INVESTMENT IN SECURITIES 100% | | | | | | |
| (Cost $12,163,433,780) | | | | | | $13,847,299,796 |
Legend
(a) Non-income producing
|
See accompanying notes which are an integral part of the financial statements.
A-39 Annual Report
| Fidelity Freedom 2020 Fund | | | | |
| |
| Financial Statements | | |
| |
| |
| Statement of Assets and Liabilities | | |
| | | | | March 31, 2006 |
| |
| Assets | | | | |
| Investment in securities, at value | | | | |
| (cost $12,163,433,780) — See | | | | |
| accompanying schedule | | | | $ 13,847,299,796 |
| Cash | | | | 11 |
| Receivable for investments sold | | | | 1,000,000 |
| Receivable for fund shares sold | | | | 187,579,385 |
| Total assets | | | | 14,035,879,192 |
| |
| Liabilities | | | | |
| Payable for investments purchased | | $174,997,758 | | |
| Payable for fund shares redeemed | | 13,583,398 | | |
| Total liabilities | | | | 188,581,156 |
| |
| Net Assets | | | | $ 13,847,298,036 |
| Net Assets consist of: | | | | |
| Paid in capital | | | | $ 11,926,785,277 |
| Undistributed net investment income | | | | 39,872,822 |
| Accumulated undistributed net | | | | |
| realized gain (loss) on | | | | |
| investments | | | | 196,773,921 |
| Net unrealized appreciation | | | | |
| (depreciation) on investments | | | | 1,683,866,016 |
| Net Assets, for 901,076,338 | | | | |
| shares outstanding | | | | $ 13,847,298,036 |
| Net Asset Value, offering price and | | | | |
| redemption price per share | | | | |
| ($13,847,298,036 ÷ | | | | |
| 901,076,338 shares) | | | | $ 15.37 |
| Statement of Operations | | | | |
| | | | | Year ended March 31, 2006 |
| |
| Investment Income | | | | | | |
| Income distributions from underlying | | | | | | |
| funds | | | | | | $ 215,838,079 |
| Interest | | | | | | 6,169 |
| Total income | | | | | | 215,844,248 |
| |
| Expenses | | | | | | |
| Management fee | | | | $ 827,570 | | |
| Independent trustees’ compensation | | | | 42,984 | | |
| Interest | | | | 2,219 | | |
| Total expenses before reductions | | | | 872,773 | | |
| Expense reductions | | | | (208,636) | | 664,137 |
| |
| Net investment income (loss) | | | | | | 215,180,111 |
| Realized and Unrealized Gain | | | | | | |
| (Loss) | | | | | | |
| Realized gain (loss) on sale of | | | | | | |
| underlying fund shares | | | | (17,106,067) | | |
| Capital gain distributions from | | | | | | |
| underlying funds | | | | 275,527,395 | | 258,421,328 |
| Change in net unrealized appreci- | | | | | | |
| ation (depreciation) on underlying | | | | | | |
| funds | | | | | | 1,118,615,027 |
| Net gain (loss) | | | | | | 1,377,036,355 |
| Net increase (decrease) in net | | | | | | |
| assets resulting from operations | | | | | | $ 1,592,216,466 |
See accompanying notes which are an integral part of the financial statements.
Annual Report A-40
| Statement of Changes in Net Assets | | | | | | | | | | | | | | | | | | |
| | | | | | | | | Year ended | | | | Year ended |
| | | | | | | | | March 31, | | | | March 31, |
| | | | | | | | | 2006 | | | | 2005 |
| Increase (Decrease) in Net Assets | | | | | | | | | | | | |
| Operations | | | | | | | | | | | | |
| Net investment income (loss) | | | | | | | | $ 215,180,111 | | | | $ 152,146,703 |
| Net realized gain (loss) | | | | | | | | 258,421,328 | | | | 52,283,801 |
| Change in net unrealized appreciation (depreciation) | | | | | | | | 1,118,615,027 | | | | 227,628,964 |
| Net increase (decrease) in net assets resulting from operations | | | | | | | | 1,592,216,466 | | | | 432,059,468 |
| Distributions to shareholders from net investment income | | | | | | | | (186,835,535) | | | | (167,221,106) |
| Distributions to shareholders from net realized gain | | | | | | | | (73,505,183) | | | | (21,140,380) |
| Total distributions | | | | | | | | (260,340,718) | | | | (188,361,486) |
| Share transactions | | | | | | | | | | | | |
| Proceeds from sales of shares | | | | | | | | 4,400,017,334 | | | | 3,407,977,638 |
| Reinvestment of distributions | | | | | | | | 259,887,224 | | | | 187,972,530 |
| Cost of shares redeemed | | | | | | | | (2,060,303,055) | | | | (1,465,258,981) |
| Net increase (decrease) in net assets resulting from share transactions | | | | | | | | 2,599,601,503 | | | | 2,130,691,187 |
| Total increase (decrease) in net assets | | | | | | | | 3,931,477,251 | | | | 2,374,389,169 |
| |
| Net Assets | | | | | | | | | | | | |
| Beginning of period | | | | | | | | 9,915,820,785 | | | | 7,541,431,616 |
| End of period (including undistributed net investment income of $39,872,822 and undistributed net investment | | | | | | | | | | | | |
| income of $22,498,986, respectively) | | | | | | | | $ 13,847,298,036 | | | | $ 9,915,820,785 |
| |
| Other Information | | | | | | | | | | | | |
| Shares | | | | | | | | | | | | |
| Sold | | | | | | | | 302,147,223 | | | | 253,234,444 |
| Issued in reinvestment of distributions | | | | | | | | 17,970,360 | | | | 13,779,674 |
| Redeemed | | | | | | | | (142,121,404) | | | | (109,285,908) |
| Net increase (decrease) | | | | | | | | 177,996,179 | | | | 157,728,210 |
| |
| Financial Highlights | | | | | | | | | | | | | | | | |
| Years ended March 31, | | 2006 | | | | 2005 | | 2004 | | | | 2003 | | | | 2002 |
| Selected Per Share Data | | | | | | | | | | | | | | | | |
| Net asset value, beginning of period | | $ 13.71 | | | | $ 13.34 | | $ 10.50 | | | | $ 12.60 | | | | $ 13.11 |
| Income from Investment Operations | | | | | | | | | | | | | | | | |
| Net investment income (loss)B | | .27 | | | | .24 | | .23 | | | | .21 | | | | .26 |
| Net realized and unrealized gain (loss) | | 1.72 | | | | .43 | | 2.87 | | | | (2.09) | | | | (.08) |
| Total from investment operations | | 1.99 | | | | .67 | | 3.10 | | | | (1.88) | | | | .18 |
| Distributions from net investment income | | (.23) | | | | (.26) | | (.22) | | | | (.22) | | | | (.26) |
| Distributions from net realized gain | | (.10) | | | | (.04) | | (.04) | | | | — | | | | (.43) |
| Total distributions | | (.33) | | | | (.30) | | (.26) | | | | (.22) | | | | (.69) |
| Net asset value, end of period | | $ 15.37 | | | | $ 13.71 | | $ 13.34 | | | | $ 10.50 | | | | $ 12.60 |
| Total ReturnA | | 14.64% | | | | 5.01% | | 29.68% | | | | (14.96)% | | | | 1.12% |
| Ratios to Average Net AssetsC,D | | | | | | | | | | | | | | | | |
| Expenses before reductions | | .01% | | | | .10% | | .10% | | | | .10% | | | | .10% |
| Expenses net of fee waivers, if any | | .01% | | | | .08% | | .08% | | | | .08% | | | | .08% |
| Expenses net of all reductions | | .01% | | | | .08% | | .08% | | | | .08% | | | | .07% |
| Net investment income (loss) | | 1.87% | | | | 1.79% | | 1.85% | | | | 1.96% | | | | 2.03% |
| Supplemental Data | | | | | | | | | | | | | | | | |
| Net assets, end of period (000 omitted) | | $13,847,298 | | | | $9,915,821 | | $7,541,432 | | | | $4,087,602 | | | | $3,285,294 |
| Portfolio turnover rate | | 4% | | | | 0% | | 3% | | | | 6% | | | | 10% |
A Total returns would have been lower had certain expenses not been reduced during the periods shown.
B Calculated based on average shares outstanding during the period.
C Amounts do not include the activity of the underlying funds.
D Expense ratios reflect operating expenses of the fund. Expenses before reductions do not reflect amounts reimbursed by the investment adviser or expense offset arrangements and do not represent the amount paid by the fund during periods when
reimbursements or reductions occur. Expenses net of fee waivers reflect expenses after reimbursement by the investment adviser but prior to reductions from expense offset arrangements. Expenses net of all reductions represent the net expenses
paid by the fund but do not include expenses of the investment companies in which the fund invests.
|
See accompanying notes which are an integral part of the financial statements.
|
| Fidelity Freedom 2025 Fund | | |
| Investment Changes | | |
| |
| |
| Fund Holdings as of March 31, 2006 | | |
| | | % of fund’s | | % of fund’s investments |
| | | investments | | 6 months ago |
| Domestic Equity Funds | | | | |
| Fidelity Blue Chip Growth Fund | | 8.9 | | 9.4 |
| Fidelity Disciplined Equity Fund | | 8.9 | | 9.5 |
| Fidelity Equity Income Fund | | 8.9 | | 9.5 |
| Fidelity Fund | | 2.5 | | 5.1 |
| Fidelity Growth & Income Portfolio | | 9.9 | | 10.1 |
| Fidelity Growth Company Fund | | 5.6 | | 5.8 |
| Fidelity Mid Cap Stock Fund | | 5.7 | | 6.0 |
| Fidelity OTC Portfolio | | 4.5 | | 4.5 |
| Fidelity Small Cap Growth Fund | | 0.3 | | 0.3 |
| Fidelity Small Cap Independence | | | | |
| Fund | | 1.2 | | 1.0 |
| Fidelity Small Cap Value Fund | | 0.3 | | 0.4 |
| Fidelity Value Fund | | 3.4 | | 2.3 |
| | | 60.1 | | 63.9 |
| International Equity Funds | | | | |
| Fidelity Diversified International | | | | |
| Fund | | 3.3 | | 2.7 |
| Fidelity Europe Fund | | 4.4 | | 3.8 |
| Fidelity Japan Fund | | 1.4 | | 1.2 |
| Fidelity Overseas Fund | | 3.3 | | 2.7 |
| Fidelity Southeast Asia Fund | | 0.7 | | 0.6 |
| | | 13.1 | | 11.0 |
| High Yield Fixed-Income Funds | | | | |
| Fidelity Capital & Income Fund | | 3.8 | | 3.7 |
| Fidelity High Income Fund | | 3.7 | | 3.7 |
| | | 7.5 | | 7.4 |
| Investment Grade Fixed-Income | | | | |
| Funds | | | | |
| Fidelity Government Income Fund | | 6.4 | | 6.7 |
| Fidelity Intermediate Bond Fund | | 4.5 | | 4.3 |
| Fidelity Investment Grade Bond | | | | |
| Fund | | 7.1 | | 6.7 |
| Fidelity Strategic Real Return Fund | | 1.3 | | 0.0 |
| | | 19.3 | | 17.7 |
| | | 100.0 | | 100.0 |
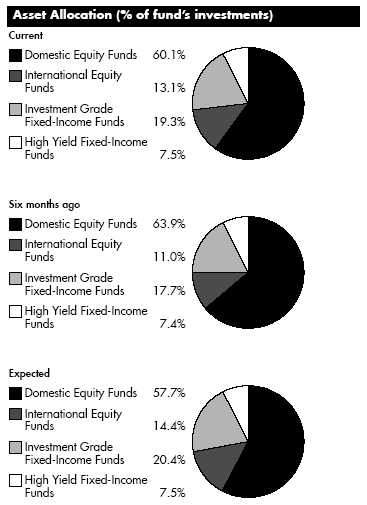
The fund invests according to an asset allocation strategy that becomes increasingly conservative over time. The “six months ago” allocation is based on the fund’s holdings as of September 30, 2005. The “current” allocation is based on the fund’s holdings as of March 31, 2006. The “expected” allocation represents the fund’s anticipated allocation at September 30, 2006. Beginning in March 2006, the fund changed its asset allocation strategy, resulting in an increased emphasis on international equity.
Annual Report A-42
| Fidelity Freedom 2025 Fund | | | | |
| Investments March 31, 2006 |
| Showing Percentage of Total Value of Investment in Securities |
| |
| Equity Funds 73.2% | | | | |
| | | Shares | | Value (Note 1) |
| Domestic Equity Funds 60.1% | | | | |
| Fidelity Blue Chip Growth Fund | | 4,215,424 | | $ 186,195,299 |
| Fidelity Disciplined Equity Fund | | 6,448,373 | | 186,938,327 |
| Fidelity Equity Income Fund | | 3,409,120 | | 186,444,758 |
| Fidelity Fund | | 1,544,547 | | 51,587,868 |
| Fidelity Growth & Income Portfolio | | 5,795,484 | | 207,362,401 |
| Fidelity Growth Company Fund (a) | | 1,742,595 | | 118,479,041 |
| Fidelity Mid Cap Stock Fund | | 4,000,734 | | 120,542,104 |
| Fidelity OTC Portfolio (a) | | 2,364,382 | | 94,575,290 |
| Fidelity Small Cap Growth Fund | | 451,645 | | 6,580,469 |
| Fidelity Small Cap Independence Fund | | 1,141,738 | | 25,883,198 |
| Fidelity Small Cap Value Fund | | 444,044 | | 6,407,551 |
| Fidelity Value Fund | | 891,580 | | 72,128,812 |
| |
| TOTAL DOMESTIC EQUITY FUNDS | | | | 1,263,125,118 |
| International Equity Funds 13.1% | | | | |
| Fidelity Diversified International Fund . | | 1,927,782 | | 68,783,255 |
| Fidelity Europe Fund | | 2,339,775 | | 93,427,229 |
| Fidelity Japan Fund | | 1,582,819 | | 29,756,988 |
| Fidelity Overseas Fund | | 1,551,678 | | 69,406,579 |
| Fidelity Southeast Asia Fund | | 587,965 | | 13,776,029 |
| |
| TOTAL INTERNATIONAL EQUITY FUNDS | | | | 275,150,080 |
| |
| TOTAL EQUITY FUNDS | | | | |
| (Cost $1,395,804,235) | | | | 1,538,275,198 |
| |
| Fixed Income Funds 26.8% | | | | |
| |
| High Yield Fixed-Income Funds – 7.5% | | | | |
| Fidelity Capital & Income Fund | | 9,202,152 | | 78,586,375 |
| Fidelity High Income Fund | | 8,813,175 | | 78,260,994 |
| |
| TOTAL HIGH YIELD FIXED INCOME FUNDS | | | | 156,847,369 |
| Investment Grade Fixed Income Funds 19.3% | | | | |
| Fidelity Government Income Fund | | 13,581,220 | | 135,133,143 |
| Fidelity Intermediate Bond Fund | | 9,234,890 | | 93,826,482 |
| Fidelity Investment Grade Bond Fund | | 20,466,330 | | 148,790,222 |
| Fidelity Strategic Real Return Fund | | 2,701,899 | | 26,937,930 |
| |
| TOTAL INVESTMENT GRADE FIXED INCOME FUNDS | | | | 404,687,777 |
| |
| TOTAL FIXED-INCOME FUNDS | | | | |
| (Cost $567,881,675) | | | | 561,535,146 |
| TOTAL INVESTMENT IN SECURITIES 100% | | | | |
| (Cost $1,963,685,910) | | | | $ 2,099,810,344 |
Legend
(a) Non-income producing
|
See accompanying notes which are an integral part of the financial statements.
A-43 Annual Report
| Fidelity Freedom 2025 Fund | | | | | | |
| |
| Financial Statements | | | | |
| |
| |
| Statement of Assets and Liabilities | | | | |
| | | | | | | | | March 31, 2006 |
| |
| Assets | | | | | | | | |
| Investment in securities, at value (cost | | | | | | | | |
| $1,963,685,910) — See accom- | | | | | | | | |
| panying schedule | | | | | | | | $2,099,810,344 |
| Cash | | | | | | | | 46 |
| Receivable for investments sold | | | | | | | | 212,141 |
| Receivable for fund shares sold | | | | | | | | 116,039,753 |
| Total assets | | | | | | | | 2,216,062,284 |
| |
| Liabilities | | | | | | | | |
| Payable for investments purchased | | | | $ 114,998,037 | | | | |
| Payable for fund shares redeemed | | | | 1,254,080 | | | | |
| Total liabilities | | | | | | | | 116,252,117 |
| |
| Net Assets | | | | | | | | $ 2,099,810,167 |
| Net Assets consist of: | | | | | | | | |
| Paid in capital | | | | | | | | $1,930,342,356 |
| Undistributed net investment income | | | | | | | | 5,649,658 |
| Accumulated undistributed net real- | | | | | | | | |
| ized gain (loss) on investments | | | | | | | | 27,693,719 |
| Net unrealized appreciation | | | | | | | | |
| (depreciation) on investments | | | | | | | | 136,124,434 |
| Net Assets, for 167,672,447 shares | | | | | | |
| outstanding | | | | | | | | $ 2,099,810,167 |
| Net Asset Value, offering price and | | | | | | | | |
| redemption price per share | | | | | | | | |
| ($2,099,810,167 ÷ | | | | | | | | |
| 167,672,447 shares) | | | | | | | | $ 12.52 |
| Statement of Operations | | | | |
| | | | | Year ended March 31, 2006 |
| |
| Investment Income | | | | | | |
| Income distributions from underlying | | | | | | |
| funds | | | | | | $ 21,365,882 |
| Interest | | | | | | 742 |
| Total income | | | | | | 21,366,624 |
| |
| Expenses | | | | | | |
| Management fee | | | | $ 58,737 | | |
| Independent trustees’ compensation | | | | 4,220 | | |
| Total expenses before reductions | | | | 62,957 | | |
| Expense reductions | | | | (16,033) | | 46,924 |
| |
| Net investment income (loss) | | | | | | 21,319,700 |
| Realized and Unrealized Gain | | | | | | |
| (Loss) | | | | | | |
| Realized gain (loss) on sale of | | | | | | |
| underlying fund shares | | | | 1,220,344 | | |
| Capital gain distributions from | | | | | | |
| underlying funds | | | | 34,915,462 | | 36,135,806 |
| Change in net unrealized appreci- | | | | | | |
| ation (depreciation) on underlying | | | | | | |
| funds | | | | | | 126,091,211 |
| Net gain (loss) | | | | | | 162,227,017 |
| Net increase (decrease) in net | | | | | | |
| assets resulting from operations | | | | | | $ 183,546,717 |
See accompanying notes which are an integral part of the financial statements.
| | |
| Annual Report | | A-44 |
| Statement of Changes in Net Assets | | | | | | | | | | | | | | |
| | | | | Year ended | | | | Year ended |
| | | | | March 31, | | | | March 31, |
| | | | | 2006 | | | | 2005 |
| Increase (Decrease) in Net Assets | | | | | | | | |
| Operations | | | | | | | | |
| Net investment income (loss) | | | | $ 21,319,700 | | | | $ 4,614,068 |
| Net realized gain (loss) | | | | 36,135,806 | | | | 2,006,547 |
| Change in net unrealized appreciation (depreciation) | | | | 126,091,211 | | | | 9,283,353 |
| Net increase (decrease) in net assets resulting from operations | | | | 183,546,717 | | | | 15,903,968 |
| Distributions to shareholders from net investment income | | | | (16,674,108) | | | | (3,727,700) |
| Distributions to shareholders from net realized gain | | | | (10,143,500) | | | | (334,233) |
| Total distributions | | | | (26,817,608) | | | | (4,061,933) |
| Share transactions | | | | | | | | |
| Proceeds from sales of shares | | | | 1,430,171,607 | | | | 653,296,979 |
| Reinvestment of distributions | | | | 26,801,156 | | | | 4,057,208 |
| Cost of shares redeemed | | | | (196,390,229) | | | | (53,120,578) |
| Net increase (decrease) in net assets resulting from share transactions | | | | 1,260,582,534 | | | | 604,233,609 |
| Total increase (decrease) in net assets | | | | 1,417,311,643 | | | | 616,075,644 |
| |
| Net Assets | | | | | | | | |
| Beginning of period | | | | 682,498,524 | | | | 66,422,880 |
| End of period (including undistributed net investment income of $5,649,658 and undistributed net investment income | | | | | | | | |
| of $1,348,251, respectively) | | | | $ 2,099,810,167 | | | | $ 682,498,524 |
| |
| Other Information | | | | | | | | |
| Shares | | | | | | | | |
| Sold | | | | 120,312,980 | | | | 59,896,551 |
| Issued in reinvestment of distributions | | | | 2,257,270 | | | | 361,175 |
| Redeemed | | | | (16,551,042) | | | | (4,846,144) |
| Net increase (decrease) | | | | 106,019,208 | | | | 55,411,582 |
| |
| Financial Highlights | | | | | | | | | | | | |
| Years ended March 31, | | | | 2006 | | | | 2005 | | | | 2004F |
| Selected Per Share Data | | | | | | | | | | | | |
| Net asset value, beginning of period | | | | $ 11.07 | | | | $ 10.64 | | | | $ 10.00 |
| Income from Investment Operations | | | | | | | | | | | | |
| Net investment income (loss)D | | | | .21 | | | | .18 | | | | .06 |
| Net realized and unrealized gain (loss) | | | | 1.48 | | | | .39 | | | | .63 |
| Total from investment operations | | | | 1.69 | | | | .57 | | | | .69 |
| Distributions from net investment income | | | | (.15) | | | | (.13) | | | | (.05) |
| Distributions from net realized gain | | | | (.10) | | | | (.01) | | | | — |
| Total distributions | | | | (.24)H | | | | (.14) | | | | (.05) |
| Net asset value, end of period | | | | $ 12.52 | | | | $ 11.07 | | | | $ 10.64 |
| Total ReturnB,C | | | | 15.41% | | | | 5.33% | | | | 6.92% |
| Ratios to Average Net AssetsE,G | | | | | | | | | | | | |
| Expenses before reductions | | | | .01% | | | | .10% | | | | .10%A |
| Expenses net of fee waivers, if any | | | | .00% | | | | .08% | | | | .08%A |
| Expenses net of all reductions | | | | .00% | | | | .08% | | | | .08%A |
| Net investment income (loss) | | | | 1.75% | | | | 1.67% | | | | 1.53%A |
| Supplemental Data | | | | | | | | | | | | |
| Net assets, end of period (000 omitted) | | | | $2,099,810 | | | | $ 682,499 | | | | $ 66,423 |
| Portfolio turnover rate | | | | 1% | | | | 0% | | | | 7%A |
A Annualized
B Total returns for periods of less than one year are not annualized.
C Total returns would have been lower had certain expenses not been reduced during the periods shown.
D Calculated based on average shares outstanding during the period.
E Amounts do not include the activity of the underlying funds.
F For the period November 6, 2003 (commencement of operations) to March 31, 2004.
G Expense ratios reflect operating expenses of the fund. Expenses before reductions do not reflect amounts reimbursed by the investment adviser or expense offset arrangements and do not represent the amount paid by the fund during periods when
reimbursements or reductions occur. Expense ratios before reductions for start up periods may not be representative of longer term operating periods. Expenses net of fee waivers reflect expenses after reimbursement by the investment adviser but
prior to reductions from expense offset arrangements. Expenses net of all reductions represent the net expenses paid by the fund but do not include expenses of the investment companies in which the fund invests.
H Total distributions of $.24 per share is comprised of distributions from net investment income of $.145 and distributions from net realized gains of $.095 per share.
|
See accompanying notes which are an integral part of the financial statements.
|
| Fidelity Freedom 2030 Fund | | |
| Investment Changes | | |
| |
| |
| Fund Holdings as of March 31, 2006 | | |
| | | % of fund’s | | % of fund’s investments |
| | | investments | | 6 months ago |
| Domestic Equity Funds | | | | |
| Fidelity Blue Chip Growth Fund | | 9.7 | | 10.0 |
| Fidelity Disciplined Equity Fund | | 9.8 | | 10.5 |
| Fidelity Equity Income Fund | | 9.8 | | 10.2 |
| Fidelity Fund | | 5.2 | | 7.8 |
| Fidelity Growth & Income Portfolio | | 10.8 | | 10.5 |
| Fidelity Growth Company Fund | | 6.2 | | 6.5 |
| Fidelity Mid Cap Stock Fund | | 6.3 | | 6.5 |
| Fidelity OTC Portfolio | | 4.9 | | 5.0 |
| Fidelity Small Cap Growth Fund | | 0.3 | | 0.2 |
| Fidelity Small Cap Independence | | | | |
| Fund | | 1.3 | | 0.7 |
| Fidelity Small Cap Value Fund | | 0.4 | | 0.2 |
| Fidelity Value Fund | | 3.5 | | 1.5 |
| | | 68.2 | | 69.6 |
| International Equity Funds | | | | |
| Fidelity Diversified International | | | | |
| Fund | | 3.7 | | 3.4 |
| Fidelity Europe Fund | | 5.1 | | 5.0 |
| Fidelity Japan Fund | | 1.5 | | 1.4 |
| Fidelity Overseas Fund | | 3.7 | | 3.2 |
| Fidelity Southeast Asia Fund | | 0.8 | | 0.7 |
| | | 14.8 | | 13.7 |
| High Yield Fixed-Income Funds | | | | |
| Fidelity Capital & Income Fund | | 3.6 | | 3.9 |
| Fidelity High Income Fund | | 3.6 | | 3.6 |
| | | 7.2 | | 7.5 |
| Investment Grade Fixed-Income | | | | |
| Funds | | | | |
| Fidelity Government Income Fund | | 3.4 | | 3.5 |
| Fidelity Intermediate Bond Fund | | 2.3 | | 2.2 |
| Fidelity Investment Grade Bond | | | | |
| Fund | | 3.7 | | 3.5 |
| Fidelity Strategic Real Return Fund | | 0.4 | | 0.0 |
| | | 9.8 | | 9.2 |
| | | 100.0 | | 100.0 |

The fund invests according to an asset allocation strategy that becomes increasingly conservative over time. The “six months ago” allocation is based on the fund’s holdings as of September 30, 2005. The “current” allocation is based on the fund’s holdings as of March 31, 2006. The “expected” allocation represents the fund’s anticipated allocation at September 30, 2006. Beginning in March 2006, the fund changed its asset allocation strategy, resulting in an increased emphasis on international equity.
Annual Report A-46
| Fidelity Freedom 2030 Fund | | | | |
| Investments March 31, 2006 |
| Showing Percentage of Total Value of Investment in Securities |
| |
| Equity Funds 83.0% | | | | |
| | | Shares | | Value (Note 1) |
| Domestic Equity Funds 68.2% | | | | |
| Fidelity Blue Chip Growth Fund | | 18,787,322 | | $ 829,836,005 |
| Fidelity Disciplined Equity Fund | | 28,782,528 | | 834,405,476 |
| Fidelity Equity Income Fund | | 15,291,239 | | 836,277,854 |
| Fidelity Fund | | 13,375,168 | | 446,730,616 |
| Fidelity Growth & Income Portfolio | | 25,751,905 | | 921,403,159 |
| Fidelity Growth Company Fund (a) | | 7,759,453 | | 527,565,212 |
| Fidelity Mid Cap Stock Fund | | 17,940,307 | | 540,541,455 |
| Fidelity OTC Portfolio (a) | | 10,439,532 | | 417,581,282 |
| Fidelity Small Cap Growth Fund | | 1,975,070 | | 28,776,764 |
| Fidelity Small Cap Independence Fund | | . 5,020,985 | | 113,825,729 |
| Fidelity Small Cap Value Fund | | 1,995,003 | | 28,787,888 |
| Fidelity Value Fund | | 3,734,664 | | 302,134,309 |
| |
| TOTAL DOMESTIC EQUITY FUNDS | | | | 5,827,865,749 |
| International Equity Funds 14.8% | | | | |
| Fidelity Diversified International Fund | | 8,913,690 | | 318,040,447 |
| Fidelity Europe Fund | | 11,002,092 | | 439,313,542 |
| Fidelity Japan Fund | | 6,953,873 | | 130,732,809 |
| Fidelity Overseas Fund | | 7,116,978 | | 318,342,411 |
| Fidelity Southeast Asia Fund | | 2,719,906 | | 63,727,394 |
| |
| TOTAL INTERNATIONAL EQUITY FUNDS | | | | 1,270,156,603 |
| |
| TOTAL EQUITY FUNDS | | | | |
| (Cost $5,983,415,112) | | | | 7,098,022,352 |
| |
| Fixed Income Funds 17.0% | | | | |
| |
| High Yield Fixed-Income Funds – 7.2% | | | | |
| Fidelity Capital & Income Fund | | 36,136,515 | | 308,605,834 |
| Fidelity High Income Fund | | 34,572,147 | | 307,000,669 |
| |
| TOTAL HIGH YIELD FIXED INCOME FUNDS | | | | 615,606,503 |
| Investment Grade Fixed Income Funds 9.8% | | | | |
| Fidelity Government Income Fund | | 29,389,556 | | 292,426,084 |
| Fidelity Intermediate Bond Fund | | 19,545,993 | | 198,587,293 |
| Fidelity Investment Grade Bond Fund | | 42,735,163 | | 310,684,634 |
| Fidelity Strategic Real Return Fund | | 3,528,338 | | 35,177,526 |
| |
| TOTAL INVESTMENT GRADE FIXED INCOME FUNDS | | | | 836,875,537 |
| |
| TOTAL FIXED-INCOME FUNDS | | | | |
| (Cost $1,442,441,692) | | | | 1,452,482,040 |
| TOTAL INVESTMENT IN SECURITIES 100% | | | | |
| (Cost $7,425,856,804) | | | | $ 8,550,504,392 |
Legend
(a) Non-income producing
|
See accompanying notes which are an integral part of the financial statements.
A-47 Annual Report
| Fidelity Freedom 2030 Fund | | | | | | |
| |
| Financial Statements | | | | |
| |
| |
| Statement of Assets and Liabilities | | | | |
| | | | | | | | | March 31, 2006 |
| |
| Assets | | | | | | | | |
| Investment in securities, at value (cost | | | | | | | | |
| $7,425,856,804) — See accom- | | | | | | | | |
| panying schedule | | | | | | | | $8,550,504,392 |
| Cash | | | | | | | | 13 |
| Receivable for investments sold | | | | | | | | 1,000,000 |
| Receivable for fund shares sold | | | | | | | | 76,721,945 |
| Total assets | | | | | | | | 8,628,226,350 |
| |
| Liabilities | | | | | | | | |
| Payable for investments purchased | | | | $ 69,156,655 | | | | |
| Payable for fund shares redeemed | | | | 8,566,035 | | | | |
| Total liabilities | | | | | | | | 77,722,690 |
| |
| Net Assets | | | | | | | | $ 8,550,503,660 |
| Net Assets consist of: | | | | | | | | |
| Paid in capital | | | | | | | | $7,282,642,801 |
| Undistributed net investment income | | | | | | | | 13,216,238 |
| Accumulated undistributed net real- | | | | | | | | |
| ized gain (loss) on investments | | | | | | | | 129,997,033 |
| Net unrealized appreciation | | | | | | | | |
| (depreciation) on investments | | | | | | | | 1,124,647,588 |
| Net Assets, for 540,549,254 shares | | | | | | | | |
| outstanding | | | | | | | | $ 8,550,503,660 |
| Net Asset Value, offering price and | | | | | | | | |
| redemption price per share | | | | | | | | |
| ($8,550,503,660 ÷ | | | | | | | | |
| 540,549,254 shares) | | | | | | | | $ 15.82 |
| Statement of Operations | | | | |
| | | | | Year ended March 31, 2006 |
| |
| Investment Income | | | | | | |
| Income distributions from underlying | | | | | | |
| funds | | | | | | $ 102,688,661 |
| Interest | | | | | | 5,010 |
| Total income | | | | | | 102,693,671 |
| |
| Expenses | | | | | | |
| Management fee | | | | $ 488,940 | | |
| Independent trustees’ compensation | | | | 25,678 | | |
| Interest | | | | 1,734 | | |
| Total expenses before reductions | | | | 516,352 | | |
| Expense reductions | | | | (123,490) | | 392,862 |
| |
| Net investment income (loss) | | | | | | 102,300,809 |
| Realized and Unrealized Gain | | | | | | |
| (Loss) | | | | | | |
| Realized gain (loss) on sale of | | | | | | |
| underlying fund shares | | | | (26,253,636) | | |
| Capital gain distributions from | | | | | | |
| underlying funds | | | | 192,909,580 | | 166,655,944 |
| Change in net unrealized appreci- | | | | | | |
| ation (depreciation) on underlying | | | | | | |
| funds | | | | | | 827,718,237 |
| Net gain (loss) | | | | | | 994,374,181 |
| Net increase (decrease) in net | | | | | | |
| assets resulting from operations | | | | | | $ 1,096,674,990 |
See accompanying notes which are an integral part of the financial statements.
Annual Report A-48
| Statement of Changes in Net Assets | | | | | | | | | | | | | | | | | | |
| | | | | | | | | Year ended | | Year ended |
| | | | | | | | | March 31, | | March 31, |
| | | | | | | | | 2006 | | 2005 |
| Increase (Decrease) in Net Assets | | | | | | | | | | |
| Operations | | | | | | | | | | |
| Net investment income (loss) | | | | | | | | $ 102,300,809 | | $ 75,168,093 |
| Net realized gain (loss) | | | | | | | | 166,655,944 | | 28,102,801 |
| Change in net unrealized appreciation (depreciation) | | | | | | | | 827,718,237 | | 187,294,996 |
| Net increase (decrease) in net assets resulting from operations | | | | | | | | 1,096,674,990 | | 290,565,890 |
| Distributions to shareholders from net investment income | | | | | | | | (89,395,734) | | (83,244,934) |
| Distributions to shareholders from net realized gain | | | | | | | | (50,329,442) | | — |
| Total distributions | | | | | | | | (139,725,176) | | (83,244,934) |
| Share transactions | | | | | | | | | | |
| Proceeds from sales of shares | | | | | | | | 2,868,245,229 | | 2,113,722,920 |
| Reinvestment of distributions | | | | | | | | 139,589,694 | | 83,157,721 |
| Cost of shares redeemed | | | | | | | | (1,271,096,644) | | (910,987,108) |
| Net increase (decrease) in net assets resulting from share transactions | | | | | | | | 1,736,738,279 | | 1,285,893,533 |
| Total increase (decrease) in net assets | | | | | | | | 2,693,688,093 | | 1,493,214,489 |
| |
| Net Assets | | | | | | | | | | |
| Beginning of period | | | | | | | | 5,856,815,567 | | 4,363,601,078 |
| End of period (including undistributed net investment income of $13,216,238 and undistributed net investment income | | | | | | | | | | |
| of $5,486,524, respectively) | | | | | | | | $ 8,550,503,660 | | $ 5,856,815,567 |
| |
| Other Information | | | | | | | | | | |
| Shares | | | | | | | | | | |
| Sold | | | | | | | | 193,397,312 | | 157,092,508 |
| Issued in reinvestment of distributions | | | | | | | | 9,474,303 | | 5,986,195 |
| Redeemed | | | | | | | | (86,363,640) | | (67,870,981) |
| Net increase (decrease) | | | | | | | | 116,507,975 | | 95,207,722 |
| |
| Financial Highlights | | | | | | | | | | |
| Years ended March 31, | | 2006 | | 2005 | | 2004 | | 2003 | | 2002 |
| Selected Per Share Data | | | | | | | | | | |
| Net asset value, beginning of period | | $ 13.81 | | $ 13.27 | | $ 10.04 | | $ 12.58 | | $ 13.23 |
| Income from Investment Operations | | | | | | | | | | |
| Net investment income (loss)B | | .22 | | .20 | | .19 | | .16 | | .19 |
| Net realized and unrealized gain (loss) | | 2.09 | | .56 | | 3.23 | | (2.55) | | (.11) |
| Total from investment operations | | 2.31 | | .76 | | 3.42 | | (2.39) | | .08 |
| Distributions from net investment income | | (.19) | | (.22) | | (.19) | | (.15) | | (.20) |
| Distributions from net realized gain | | (.11) | | — | | — | | — | | (.53) |
| Total distributions | | (.30) | | (.22) | | (.19) | | (.15) | | (.73) |
| Net asset value, end of period | | $ 15.82 | | $ 13.81 | | $ 13.27 | | $ 10.04 | | $ 12.58 |
| Total ReturnA | | 16.86% | | 5.72% | | 34.22% | | (19.05)% | | .28% |
| Ratios to Average Net AssetsC,D | | | | | | | | | | |
| Expenses before reductions | | .01% | | .10% | | .10% | | .10% | | .10% |
| Expenses net of fee waivers, if any | | .01% | | .08% | | .08% | | .08% | | .08% |
| Expenses net of all reductions | | .01% | | .08% | | .08% | | .08% | | .07% |
| Net investment income (loss) | | 1.48% | | 1.52% | | 1.58% | | 1.52% | | 1.50% |
| Supplemental Data | | | | | | | | | | |
| Net assets, end of period (000 omitted) | | $8,550,504 | | $5,856,816 | | $4,363,601 | | $2,335,210 | | $1,995,302 |
| Portfolio turnover rate | | 5% | | 0% | | 2% | | 4% | | 5% |
A Total returns would have been lower had certain expenses not been reduced during the periods shown.
B Calculated based on average shares outstanding during the period.
C Amounts do not include the activity of the underlying funds.
D Expense ratios reflect operating expenses of the fund. Expenses before reductions do not reflect amounts reimbursed by the investment adviser or expense offset arrangements and do not represent the amount paid by the fund during periods when
reimbursements or reductions occur. Expenses net of fee waivers reflect expenses after reimbursement by the investment adviser but prior to reductions from expense offset arrangements. Expenses net of all reductions represent the net expenses
paid by the fund but do not include expenses of the investment companies in which the fund invests.
|
See accompanying notes which are an integral part of the financial statements.
|
| Fidelity Freedom 2035 Fund | | |
| Investment Changes | | |
| |
| |
| Fund Holdings as of March 31, 2006 | | |
| | | % of fund’s | | % of fund’s investments |
| | | investments | | 6 months ago |
| Domestic Equity Funds | | | | |
| Fidelity Blue Chip Growth Fund | | 10.0 | | 10.4 |
| Fidelity Disciplined Equity Fund | | 10.2 | | 10.4 |
| Fidelity Equity Income Fund | | 10.1 | | 10.4 |
| Fidelity Fund | | 2.5 | | 5.3 |
| Fidelity Growth & Income Portfolio | | 11.3 | | 11.1 |
| Fidelity Growth Company Fund | | 6.3 | | 6.5 |
| Fidelity Mid Cap Stock Fund | | 6.6 | | 6.4 |
| Fidelity OTC Portfolio | | 5.0 | | 5.0 |
| Fidelity Small Cap Growth Fund | | 0.4 | | 0.4 |
| Fidelity Small Cap Independence | | | | |
| Fund | | 1.4 | | 1.1 |
| Fidelity Small Cap Value Fund | | 0.4 | | 0.4 |
| Fidelity Value Fund | | 3.9 | | 2.5 |
| | | 68.1 | | 69.9 |
| International Equity Funds | | | | |
| Fidelity Diversified International | | | | |
| Fund | | 3.9 | | 3.4 |
| Fidelity Europe Fund | | 5.2 | | 4.7 |
| Fidelity Japan Fund | | 1.6 | | 1.5 |
| Fidelity Overseas Fund | | 3.8 | | 3.4 |
| Fidelity Southeast Asia Fund | | 0.8 | | 0.7 |
| | | 15.3 | | 13.7 |
| High Yield Fixed-Income Funds | | | | |
| Fidelity Capital & Income Fund | | 4.0 | | 4.2 |
| Fidelity High Income Fund | | 4.0 | | 4.3 |
| | | 8.0 | | 8.5 |
| Investment Grade Fixed-Income | | | | |
| Funds | | | | |
| Fidelity Government Income Fund | | 2.9 | | 3.0 |
| Fidelity Intermediate Bond Fund | | 2.0 | | 1.9 |
| Fidelity Investment Grade Bond | | | | |
| Fund | | 3.1 | | 3.0 |
| Fidelity Strategic Real Return Fund | | 0.6 | | 0.0 |
| | | 8.6 | | 7.9 |
| | | 100.0 | | 100.0 |

The fund invests according to an asset allocation strategy that becomes increasingly conservative over time. The “six months ago” allocation is based on the fund’s holdings as of September 30, 2005. The “current” allocation is based on the fund’s holdings as of March 31, 2006. The “expected” allocation represents the fund’s anticipated allocation at September 30, 2006. Beginning in March 2006, the fund changed its asset allocation strategy, resulting in an increased emphasis on international equity.
Annual Report A-50
| Fidelity Freedom 2035 Fund | | | | |
| Investments March 31, 2006 |
| Showing Percentage of Total Value of Investment in Securities |
| |
| Equity Funds 83.4% | | | | |
| | | Shares | | Value (Note 1) |
| Domestic Equity Funds 68.1% | | | | |
| Fidelity Blue Chip Growth Fund | | 2,609,889 | | $115,278,812 |
| Fidelity Disciplined Equity Fund | | 4,081,408 | | 118,320,028 |
| Fidelity Equity Income Fund | | 2,139,744 | | 117,022,595 |
| Fidelity Fund | | 857,875 | | 28,653,027 |
| Fidelity Growth & Income Portfolio | | 3,646,433 | | 130,469,362 |
| Fidelity Growth Company Fund (a) | | 1,074,881 | | 73,081,159 |
| Fidelity Mid Cap Stock Fund | | 2,547,370 | | 76,752,252 |
| Fidelity OTC Portfolio (a) | | 1,453,604 | | 58,144,153 |
| Fidelity Small Cap Growth Fund | | 280,754 | | 4,090,583 |
| Fidelity Small Cap Independence Fund . | | 707,438 | | 16,037,619 |
| Fidelity Small Cap Value Fund | | 279,568 | | 4,034,170 |
| Fidelity Value Fund | | 564,153 | | 45,639,985 |
| |
| TOTAL DOMESTIC EQUITY FUNDS | | | | 787,523,745 |
| International Equity Funds 15.3% | | | | |
| Fidelity Diversified International Fund | | 1,257,485 | | 44,867,048 |
| Fidelity Europe Fund | | 1,500,007 | | 59,895,299 |
| Fidelity Japan Fund | | 1,018,305 | | 19,144,142 |
| Fidelity Overseas Fund | | 995,900 | | 44,546,603 |
| Fidelity Southeast Asia Fund | | 374,497 | | 8,774,464 |
| |
| TOTAL INTERNATIONAL EQUITY FUNDS | | | | 177,227,556 |
| |
| TOTAL EQUITY FUNDS | | | | |
| (Cost $877,817,552) | | | | 964,751,301 |
| |
| Fixed Income Funds 16.6% | | | | |
| |
| High Yield Fixed-Income Funds – 8.0% | | | | |
| Fidelity Capital & Income Fund | | 5,447,904 | | 46,525,100 |
| Fidelity High Income Fund | | 5,205,988 | | 46,229,175 |
| |
| TOTAL HIGH YIELD FIXED INCOME FUNDS | | | | 92,754,275 |
| Investment Grade Fixed Income Funds 8.6% | | | | |
| Fidelity Government Income Fund | | 3,281,521 | | 32,651,133 |
| Fidelity Intermediate Bond Fund | | 2,263,578 | | 22,997,948 |
| Fidelity Investment Grade Bond Fund | | 4,962,379 | | 36,076,493 |
| Fidelity Strategic Real Return Fund | | 668,463 | | 6,664,577 |
| |
| TOTAL INVESTMENT GRADE FIXED INCOME FUNDS | | | | 98,390,151 |
| |
| TOTAL FIXED-INCOME FUNDS | | | | |
| (Cost $192,109,492) | | | | 191,144,426 |
| TOTAL INVESTMENT IN SECURITIES 100% | | | | |
| (Cost $1,069,927,044) | | | | $1,155,895,727 |
Legend
(a) Non-income producing
|
See accompanying notes which are an integral part of the financial statements.
A-51 Annual Report
| Fidelity Freedom 2035 Fund | | | | | | |
| |
| Financial Statements | | | | |
| |
| |
| Statement of Assets and Liabilities | | | | |
| | | | | | | | | March 31, 2006 |
| |
| Assets | | | | | | | | |
| Investment in securities, at value (cost | | | | | | | | |
| $1,069,927,044) — See accom- | | | | | | | | |
| panying schedule | | | | | | | | $1,155,895,727 |
| Cash | | | | | | | | 33 |
| Receivable for investments sold | | | | | | | | 119,213 |
| Receivable for fund shares sold | | | | | | | | 26,241,318 |
| Total assets | | | | | | | | 1,182,256,291 |
| |
| Liabilities | | | | | | | | |
| Payable for investments purchased | | | | $ 25,566,166 | | | | |
| Payable for fund shares redeemed | | | | 784,016 | | | | |
| Total liabilities | | | | | | | | 26,350,182 |
| |
| Net Assets | | | | | | | | $ 1,155,906,109 |
| Net Assets consist of: | | | | | | | | |
| Paid in capital | | | | | | | | $1,051,139,424 |
| Undistributed net investment income | | | | | | | | 1,977,290 |
| Accumulated undistributed net real- | | | | | | | | |
| ized gain (loss) on investments | | | | | | | | 16,820,712 |
| Net unrealized appreciation | | | | | | | | |
| (depreciation) on investments | | | | | | | | 85,968,683 |
| Net Assets, for 89,668,955 shares | | | | | | | | |
| outstanding | | | | | | | | $ 1,155,906,109 |
| Net Asset Value, offering price and | | | | | | | | |
| redemption price per share | | | | | | | | |
| ($1,155,906,109 ÷ 89,668,955 | | | | | | | | |
| shares) | | | | | | | | $ 12.89 |
| Statement of Operations | | | | |
| | | | | Year ended March 31, 2006 |
| |
| Investment Income | | | | | | |
| Income distributions from underlying | | | | | | |
| funds | | | | | | $ 9,777,517 |
| Interest | | | | | | 487 |
| Total income | | | | | | 9,778,004 |
| |
| Expenses | | | | | | |
| Management fee | | | | $ 30,515 | | |
| Independent trustees’ compensation | | | | 2,265 | | |
| Total expenses before reductions | | | | 32,780 | | |
| Expense reductions | | | | (8,408) | | 24,372 |
| |
| Net investment income (loss) | | | | | | 9,753,632 |
| Realized and Unrealized Gain | | | | | | |
| (Loss) | | | | | | |
| Realized gain (loss) on sale of | | | | | | |
| underlying fund shares | | | | 704,973 | | |
| Capital gain distributions from | | | | | | |
| underlying funds | | | | 21,302,068 | | 22,007,041 |
| Change in net unrealized appreci- | | | | | | |
| ation (depreciation) on underlying | | | | | | |
| funds | | | | | | 79,791,676 |
| Net gain (loss) | | | | | | 101,798,717 |
| Net increase (decrease) in net | | | | | | |
| assets resulting from operations | | | | | | $ 111,552,349 |
See accompanying notes which are an integral part of the financial statements.
| | |
| Annual Report | | A-52 |
| Statement of Changes in Net Assets | | | | | | | | | | | | | | |
| | | | | Year ended | | | | Year ended |
| | | | | March 31, | | | | March 31, |
| | | | | 2006 | | | | 2005 |
| Increase (Decrease) in Net Assets | | | | | | | | |
| Operations | | | | | | | | |
| Net investment income (loss) | | | | $ 9,753,632 | | | | $ 2,133,656 |
| Net realized gain (loss) | | | | 22,007,041 | | | | 986,537 |
| Change in net unrealized appreciation (depreciation) | | | | 79,791,676 | | | | 5,834,445 |
| Net increase (decrease) in net assets resulting from operations | | | | 111,552,349 | | | | 8,954,638 |
| Distributions to shareholders from net investment income | | | | (8,057,826) | | | | (1,855,868) |
| Distributions to shareholders from net realized gain | | | | (6,197,986) | | | | — |
| Total distributions | | | | (14,255,812) | | | | (1,855,868) |
| Share transactions | | | | | | | | |
| Proceeds from sales of shares | | | | 810,298,913 | | | | 343,792,868 |
| Reinvestment of distributions | | | | 14,249,651 | | | | 1,855,011 |
| Cost of shares redeemed | | | | (118,030,363) | | | | (28,598,735) |
| Net increase (decrease) in net assets resulting from share transactions | | | | 706,518,201 | | | | 317,049,144 |
| Total increase (decrease) in net assets | | | | 803,814,738 | | | | 324,147,914 |
| |
| Net Assets | | | | | | | | |
| Beginning of period | | | | 352,091,371 | | | | 27,943,457 |
| End of period (including undistributed net investment income of $1,977,290 and undistributed net investment income | | | | | | | | |
| of $458,671, respectively) | | | | $ 1,155,906,109 | | | | $ 352,091,371 |
| |
| Other Information | | | | | | | | |
| Shares | | | | | | | | |
| Sold | | | | 66,855,909 | | | | 31,199,027 |
| Issued in reinvestment of distributions | | | | 1,174,172 | | | | 162,738 |
| Redeemed | | | | (9,749,789) | | | | (2,586,363) |
| Net increase (decrease) | | | | 58,280,292 | | | | 28,775,402 |
| |
| Financial Highlights | | | | | | | | |
| Years ended March 31, | | 2006 | | 2005 | | | | 2004F |
| Selected Per Share Data | | | | | | | | |
| Net asset value, beginning of period | | $ 11.22 | | $ 10.69 | | | | $ 10.00 |
| Income from Investment Operations | | | | | | | | |
| Net investment income (loss)D | | .18 | | .17 | | | | .06 |
| Net realized and unrealized gain (loss) | | 1.73 | | .49 | | | | .68 |
| Total from investment operations | | 1.91 | | .66 | | | | .74 |
| Distributions from net investment income | | (.13) | | (.13) | | | | (.05) |
| Distributions from net realized gain | | (.11) | | — | | | | — |
| Total distributions | | (.24) | | (.13) | | | | (.05) |
| Net asset value, end of period | | $ 12.89 | | $ 11.22 | | | | $ 10.69 |
| Total ReturnB,C | | 17.18% | | 6.12% | | | | 7.42% |
| Ratios to Average Net AssetsE,G | | | | | | | | |
| Expenses before reductions | | .00% | | .10% | | | | .10%A |
| Expenses net of fee waivers, if any | | .00% | | .08% | | | | .08%A |
| Expenses net of all reductions | | .00% | | .08% | | | | .08%A |
| Net investment income (loss) | | 1.48% | | 1.56% | | | | 1.49%A |
| Supplemental Data | | | | | | | | |
| Net assets, end of period (000 omitted) | | $1,155,906 | | $ 352,091 | | | | $ 27,943 |
| Portfolio turnover rate | | 1% | | 0% | | | | 18%A |
A Annualized
B Total returns for periods of less than one year are not annualized.
C Total returns would have been lower had certain expenses not been reduced during the periods shown.
D Calculated based on average shares outstanding during the period.
E Amounts do not include the activity of the underlying funds.
F For the period November 6, 2003 (commencement of operations) to March 31, 2004.
G Expense ratios reflect operating expenses of the fund. Expenses before reductions do not reflect amounts reimbursed by the investment adviser or expense offset arrangements and do not represent the amount paid by the fund during periods when
reimbursements or reductions occur. Expense ratios before reductions for start up periods may not be representative of longer term operating periods. Expenses net of fee waivers reflect expenses after reimbursement by the investment adviser but
prior to reductions from expense offset arrangements. Expenses net of all reductions represent the net expenses paid by the fund but do not include expenses of the investment companies in which the fund invests.
|
See accompanying notes which are an integral part of the financial statements.
|
| Fidelity Freedom 2040 Fund | | |
| Investment Changes | | |
| |
| |
| Fund Holdings as of March 31, 2006 | | |
| | | % of fund’s | | % of fund’s investments |
| | | investments | | 6 months ago |
| Domestic Equity Funds | | | | |
| Fidelity Blue Chip Growth Fund | | 10.0 | | 10.2 |
| Fidelity Disciplined Equity Fund | | 10.0 | | 10.3 |
| Fidelity Equity Income Fund | | 10.0 | | 10.2 |
| Fidelity Fund | | 3.5 | | 7.0 |
| Fidelity Growth & Income Portfolio | | 11.1 | | 10.9 |
| Fidelity Growth Company Fund | | 6.4 | | 6.4 |
| Fidelity Mid Cap Stock Fund | | 6.4 | | 6.4 |
| Fidelity OTC Portfolio | | 5.1 | | 4.9 |
| Fidelity Small Cap Growth Fund | | 0.3 | | 0.3 |
| Fidelity Small Cap Independence | | | | |
| Fund | | 1.4 | | 1.0 |
| Fidelity Small Cap Value Fund | | 0.4 | | 0.3 |
| Fidelity Value Fund | | 3.8 | | 2.3 |
| | | 68.4 | | 70.2 |
| International Equity Funds | | | | |
| Fidelity Diversified International | | | | |
| Fund | | 4.1 | | 3.7 |
| Fidelity Europe Fund | | 5.5 | | 5.4 |
| Fidelity Japan Fund | | 1.7 | | 1.6 |
| Fidelity Overseas Fund | | 4.1 | | 3.8 |
| Fidelity Southeast Asia Fund | | 0.8 | | 0.8 |
| | | 16.2 | | 15.3 |
| High Yield Fixed-Income Funds | | | | |
| Fidelity Capital & Income Fund | | 5.1 | | 4.8 |
| Fidelity High Income Fund | | 5.1 | | 4.9 |
| | | 10.2 | | 9.7 |
| Investment Grade Fixed-Income | | | | |
| Funds | | | | |
| Fidelity Government Income Fund | | 1.8 | | 1.8 |
| Fidelity Intermediate Bond Fund | | 1.2 | | 1.2 |
| Fidelity Investment Grade Bond | | | | |
| Fund | | 1.9 | | 1.8 |
| Fidelity Strategic Real Return Fund | | 0.3 | | 0.0 |
| | | 5.2 | | 4.8 |
| | | 100.0 | | 100.0 |
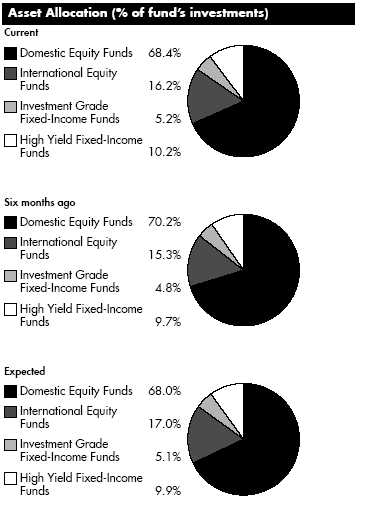
The fund invests according to an asset allocation strategy that becomes increasingly conservative over time. The “six months ago” allocation is based on the fund’s holdings as of September 30, 2005. The “current” allocation is based on the fund’s holdings as of March 31, 2006. The “expected” allocation represents the fund’s anticipated allocation at September 30, 2006. Beginning in March 2006, the fund changed its asset allocation strategy, resulting in an increased emphasis on international equity.
Annual Report A-54
| Fidelity Freedom 2040 Fund | | | | |
| Investments March 31, 2006 |
| Showing Percentage of Total Value of Investment in Securities |
| |
| Equity Funds 84.6% | | | | |
| | | Shares | | Value (Note 1) |
| Domestic Equity Funds 68.4% | | | | |
| Fidelity Blue Chip Growth Fund | | 8,769,563 | | $ 387,351,616 |
| Fidelity Disciplined Equity Fund | | 13,316,052 | | 386,032,347 |
| Fidelity Equity Income Fund | | 7,067,715 | | 386,533,342 |
| Fidelity Fund | | 4,053,112 | | 135,373,942 |
| Fidelity Growth & Income Portfolio | | 12,003,847 | | 429,497,653 |
| Fidelity Growth Company Fund (a) | | 3,647,096 | | 247,966,090 |
| Fidelity Mid Cap Stock Fund | | 8,232,570 | | 248,047,338 |
| Fidelity OTC Portfolio (a) | | 4,927,386 | | 197,095,448 |
| Fidelity Small Cap Growth Fund | | 921,974 | | 13,433,164 |
| Fidelity Small Cap Independence Fund | | 2,383,659 | | 54,037,555 |
| Fidelity Small Cap Value Fund | | 933,519 | | 13,470,674 |
| Fidelity Value Fund | | 1,814,173 | | 146,766,560 |
| |
| TOTAL DOMESTIC EQUITY FUNDS | | | | 2,645,605,729 |
| International Equity Funds 16.2% | | | | |
| Fidelity Diversified International Fund . | | 4,400,095 | | 156,995,381 |
| Fidelity Europe Fund | | 5,330,755 | | 212,857,053 |
| Fidelity Japan Fund | | 3,553,095 | | 66,798,180 |
| Fidelity Overseas Fund | | 3,535,333 | | 158,135,466 |
| Fidelity Southeast Asia Fund | | 1,334,319 | | 31,263,106 |
| |
| TOTAL INTERNATIONAL EQUITY FUNDS | | | | 626,049,186 |
| |
| TOTAL EQUITY FUNDS | | | | |
| (Cost $2,743,020,285) | | | | 3,271,654,915 |
| |
| Fixed Income Funds 15.4% | | | | |
| |
| High Yield Fixed-Income Funds – 10.2% | | | | |
| Fidelity Capital & Income Fund | | 23,077,602 | | 197,082,717 |
| Fidelity High Income Fund | | 22,085,416 | | 196,118,491 |
| |
| TOTAL HIGH YIELD FIXED INCOME FUNDS | | | | 393,201,208 |
| Investment Grade Fixed Income Funds 5.2% | | | | |
| Fidelity Government Income Fund | | 6,841,574 | | 68,073,662 |
| Fidelity Intermediate Bond Fund | | 4,635,610 | | 47,097,794 |
| Fidelity Investment Grade Bond Fund | | 10,276,618 | | 74,711,016 |
| Fidelity Strategic Real Return Fund | | 1,318,624 | | 13,146,681 |
| |
| TOTAL INVESTMENT GRADE FIXED INCOME FUNDS | | | | 203,029,153 |
| |
| TOTAL FIXED-INCOME FUNDS | | | | |
| (Cost $584,365,188) | | | | 596,230,361 |
| TOTAL INVESTMENT IN SECURITIES 100% | | | | |
| (Cost $3,327,385,473) | | | | $3,867,885,276 |
Legend
(a) Non-income producing
|
See accompanying notes which are an integral part of the financial statements.
A-55 Annual Report
| Fidelity Freedom 2040 Fund | | | | | | |
| |
| Financial Statements | | | | |
| |
| |
| Statement of Assets and Liabilities | | | | |
| | | | | | | | | March 31, 2006 |
| |
| Assets | | | | | | | | |
| Investment in securities, at value (cost | | | | | | | | |
| $3,327,385,473) — See accom- | | | | | | | | $3,867,885,276 |
| panying schedule | | | | | | | | |
| Cash | | | | | | | | 80 |
| Receivable for investments sold | | | | | | | | 536,445 |
| Receivable for fund shares sold | | | | | | | | 40,673,701 |
| Total assets | | | | | | | | 3,909,095,502 |
| |
| Liabilities | | | | | | | | |
| Payable for investments purchased | | | | $ 36,525,572 | | | | |
| Payable for fund shares redeemed | | | | 4,684,911 | | | | |
| Total liabilities | | | | | | | | 41,210,483 |
| |
| Net Assets | | | | | | | | $ 3,867,885,019 |
| Net Assets consist of: | | | | | | | | |
| Paid in capital | | | | | | | | $3,251,119,992 |
| Undistributed net investment income | | | | | | | | 8,635,299 |
| Accumulated undistributed net | | | | | | | | |
| realized gain (loss) on investments | | | | | | | | 67,629,925 |
| Net unrealized appreciation | | | | | | | | |
| (depreciation) on investments | | | | | | | | 540,499,803 |
| Net Assets, for 414,452,894 shares | | | | | | | | |
| outstanding | | | | | | | | $ 3,867,885,019 |
| Net Asset Value, offering price and | | | | | | | | |
| redemption price per share | | | | | | | | |
| ($3,867,885,019 ÷ | | | | | | | | |
| 414,452,894 shares) | | | | | | | | $ 9.33 |
| Statement of Operations | | | | |
| | | | | Year ended March 31, 2006 |
| |
| Investment Income | | | | | | |
| Income distributions from underlying | | | | | | |
| funds | | | | | | $ 41,021,900 |
| Interest | | | | | | 5,777 |
| Total income | | | | | | 41,027,677 |
| |
| Expenses | | | | | | |
| Management fee | | | | $ 179,587 | | |
| Independent trustees’ compensation | | | | 10,214 | | |
| Interest | | | | 1,093 | | |
| Total expenses before reductions | | | | 190,894 | | |
| Expense reductions | | | | (46,235) | | 144,659 |
| |
| Net investment income (loss) | | | | | | 40,883,018 |
| Realized and Unrealized Gain | | | | | | |
| (Loss) | | | | | | |
| Realized gain (loss) on sale of | | | | | | |
| underlying fund shares | | | | 5,366,282 | | |
| Capital gain distributions from | | | | | | |
| underlying funds | | | | 84,918,741 | | 90,285,023 |
| Change in net unrealized appreci- | | | | | | |
| ation (depreciation) on underlying | | | | | | |
| funds | | | | | | 341,600,643 |
| Net gain (loss) | | | | | | 431,885,666 |
| Net increase (decrease) in net | | | | | | |
| assets resulting from operations | | | | | | $ 472,768,684 |
See accompanying notes which are an integral part of the financial statements.
| | |
| Annual Report | | A-56 |
| Statement of Changes in Net Assets | | | | | | | | | | | | |
| | | | | | | | | Year ended | | | | Year ended |
| | | | | | | | | March 31, | | | | March 31, |
| | | | | | | | | 2006 | | | | 2005 |
| Increase (Decrease) in Net Assets | | | | | | | | | | | | |
| Operations | | | | | | | | | | | | |
| Net investment income (loss) | | | | | | | | $ 40,883,018 | | | | $ 23,486,808 |
| Net realized gain (loss) | | | | | | | | 90,285,023 | | | | 8,108,740 |
| Change in net unrealized appreciation (depreciation) | | | | | | | | 341,600,643 | | | | 73,081,826 |
| Net increase (decrease) in net assets resulting from operations | | | | | | | | 472,768,684 | | | | 104,677,374 |
| Distributions to shareholders from net investment income | | | | | | | | (32,543,730) | | | | (26,617,323) |
| Distributions to shareholders from net realized gain | | | | | | | | (29,066,944) | | | | (2,646,056) |
| Total distributions | | | | | | | | (61,610,674) | | | | (29,263,379) |
| Share transactions | | | | | | | | | | | | |
| Proceeds from sales of shares | | | | | | | | 1,979,220,860 | | | | 1,218,547,274 |
| Reinvestment of distributions | | | | | | | | 61,529,413 | | | | 29,218,767 |
| Cost of shares redeemed | | | | | | | | (722,125,077) | | | | (480,380,279) |
| Net increase (decrease) in net assets resulting from share transactions | | | | | | | | 1,318,625,196 | | | | 767,385,762 |
| Total increase (decrease) in net assets | | | | | | | | 1,729,783,206 | | | | 842,799,757 |
| |
| Net Assets | | | | | | | | | | | | |
| Beginning of period | | | | | | | | 2,138,101,813 | | | | 1,295,302,056 |
| End of period (including undistributed net investment income of $8,635,299 and undistributed net investment income | | | | | | | | | | | | |
| of $1,678,127, respectively) | | | | | | | | $ 3,867,885,019 | | | | $ 2,138,101,813 |
| |
| Other Information | | | | | | | | | | | | |
| Shares | | | | | | | | | | | | |
| Sold | | | | | | | | 226,884,158 | | | | 154,616,707 |
| Issued in reinvestment of distributions | | | | | | | | 7,070,550 | | | | 3,637,109 |
| Redeemed | | | | | | | | (83,478,836) | | | | (61,367,293) |
| Net increase (decrease) | | | | | | | | 150,475,872 | | | | 96,886,523 |
| |
| Financial Highlights | | | | | | | | | | | | | | | | |
| Years ended March 31, | | 2006 | | 2005 | | | | 2004 | | | | 2003 | | | | 2002 |
| Selected Per Share Data | | | | | | | | | | | | | | | | |
| Net asset value, beginning of period | | $ 8.10 | | $ 7.75 | | | | $ 5.72 | | | | $ 7.41 | | | | $ 7.62 |
| Income from Investment Operations | | | | | | | | | | | | | | | | |
| Net investment income (loss)B | | .13 | | .11 | | | | .11 | | | | .08 | | | | .09 |
| Net realized and unrealized gain (loss) | | 1.29 | | .38 | | | | 2.04 | | | | (1.69) | | | | (.11) |
| Total from investment operations | | 1.42 | | .49 | | | | 2.15 | | | | (1.61) | | | | (.02) |
| Distributions from net investment income | | (.10) | | (.13) | | | | (.09) | | | | (.07) | | | | (.07) |
| Distributions from net realized gain | | (.09) | | (.02) | | | | (.03) | | | | (.01) | | | | (.12) |
| Total distributions | | (.19) | | (.14)E | | | | (.12) | | | | (.08) | | | | (.19) |
| Net asset value, end of period | | $ 9.33 | | $ 8.10 | | | | $ 7.75 | | | | $ 5.72 | | | | $ 7.41 |
| Total ReturnA | | 17.65% | | 6.35% | | | | 37.75% | | | | (21.79)% | | | | (.40)% |
| Ratios to Average Net AssetsC,D | | | | | | | | | | | | | | | | |
| Expenses before reductions | | .01% | | .10% | | | | .10% | | | | .10% | | | | .10% |
| Expenses net of fee waivers, if any | | .01% | | .08% | | | | .08% | | | | .08% | | | | .08% |
| Expenses net of all reductions | | .01% | | .08% | | | | .08% | | | | .08% | | | | .08% |
| Net investment income (loss) | | 1.45% | | 1.45% | | | | 1.55% | | | | 1.38% | | | | 1.24% |
| Supplemental Data | | | | | | | | | | | | | | | | |
| Net assets, end of period (000 omitted) | | $3,867,885 | | $2,138,102 | | | | $1,295,302 | | | | $ 482,708 | | | | $ 256,113 |
| Portfolio turnover rate | | 4% | | 1% | | | | 3% | | | | 4% | | | | 5% |
A Total returns would have been lower had certain expenses not been reduced during the periods shown.
B Calculated based on average shares outstanding during the period.
C Amounts do not include the activity of the underlying funds.
D Expense ratios reflect operating expenses of the fund. Expenses before reductions do not reflect amounts reimbursed by the investment adviser or expense offset arrangements and do not represent the amount paid by the fund during periods when
reimbursements or reductions occur. Expenses net of fee waivers reflect expenses after reimbursement by the investment adviser but prior to reductions from expense offset arrangements. Expenses net of all reductions represent the net expenses
paid by the fund but do not include expenses of the investment companies in which the fund invests.
E Total distribution of $.14 per share is comprised of distributions from net investment income of $.125 and distributions from net realized gain of $.015 per share.
|
See accompanying notes which are an integral part of the financial statements.
|
Notes to Financial Statements
For the period ended March 31, 2006
|
1. Significant Accounting Policies.
|
Freedom Income Fund, Freedom 2000 Fund, Freedom 2005 Fund, Freedom 2010 Fund, Freedom 2015 Fund, Freedom 2020 Fund, Freedom 2025 Fund, Freedom 2030 Fund, Freedom 2035 Fund and Freedom 2040 Fund (the funds) are funds of Fidelity Aberdeen Street Trust (the trust). The trust is registered under the Investment Company Act of 1940, as amended (the 1940 Act), as an open end management investment company organized as a Delaware statutory trust. Each fund is authorized to issue an unlimited number of shares. The funds invest primarily in a combination of other Fidelity equity, fixed income, and money market funds (the Underlying Funds) managed by Fidelity Management & Research Company (FMR). The financial statements have been prepared in conformity with accounting principles generally accepted in the United States of America, which require manage ment to make certain estimates and assumptions at the date of the financial statements. The following summarizes the significant accounting policies of the funds:
Security Valuation. Net asset value per share is calculated as of the close of business of the New York Stock Exchange, normally 4:00 p.m. Eastern time. Investments in the Underlying Funds are valued at their net asset value each business day. Short term securities with remaining maturities of sixty days or less for which quotations are not readily available are valued on the basis of amortized cost.
Investment Transactions and Income. Security transactions, normally shares of the Underlying Funds, are accounted for as of trade date. Gains and losses on securities sold are determined on the basis of identified cost. Income and capital gain distributions from the Underlying Funds, if any, are recorded on the ex dividend date. Interest income is accrued as earned. Interest income includes coupon interest and amortization of premium and accretion of discount on debt securities.
Expenses. Most expenses of the trust can be directly attributed to a fund. Expenses which cannot be directly attributed are apportioned among each fund in the trust. Expenses included in the accompanying financial statements reflect the expenses of each fund and do not include any expenses associated with the Underlying Funds.
Income Tax Information and Distributions to Shareholders. Each year, each fund intends to qualify as a regulated investment company by distributing all of its taxable income and realized gains under Subchapter M of the Internal Revenue Code. As a result, no provision for income taxes is required in the accompanying financial statements.
Distributions are recorded on the ex dividend date. Income and capital gain distributions are determined in accordance with income tax regulations, which may differ from generally accepted accounting principles.
Capital accounts within the financial statements are adjusted for permanent book tax differences. These adjustments have no impact on net assets or the results of operations. Temporary book tax differences will reverse in a subsequent period.
Book tax differences are primarily due to the short term gain distributions from the Underlying Funds and losses deferred due to wash sales.
The tax basis components of distributable earnings and the federal tax cost as of period end were as follows for each fund:
| | | Cost for Federal | | | | | | Net Unrealized |
| | | Income Tax | | Unrealized | | Unrealized | | Appreciation/ |
| | | Purposes | | Appreciation | | Depreciation | | (Depreciation) |
| Freedom Income | | $ 2,061,388,536 | | $ 90,828,466 | | $ (20,185,575) | | $ 70,642,891 |
| Freedom 2000 | | 1,530,691,905 | | 79,269,928 | | (8,834,202) | | 70,435,726 |
| Freedom 2005 | | 509,652,640 | | 26,166,163 | | (5,603,030) | | 20,563,133 |
| Freedom 2010 | | 9,853,492,041 | | 1,001,232,683 | | (165,450,953) | | 835,781,730 |
| Freedom 2015 | | 2,544,739,250 | | 155,887,197 | | (22,847,510) | | 133,039,687 |
| Freedom 2020 | | 12,177,847,767 | | 1,848,078,724 | | (178,626,695) | | 1,669,452,029 |
| Freedom 2025 | | 1,963,686,022 | | 150,055,812 | | (13,931,490) | | 136,124,322 |
| Freedom 2030 | | 7,435,084,048 | | 1,249,701,951 | | (134,281,607) | | 1,115,420,344 |
| Freedom 2035 | | 1,069,927,145 | | 91,605,655 | | (5,637,073) | | 85,968,582 |
| Freedom 2040 | | 3,328,229,810 | | 556,213,676 | | (16,558,210) | | 539,655,466 |
| 1. Significant Accounting Policies continued | | | | | | | | | | | | | | |
| |
| Income Tax Information and Distributions to Shareholders continued | | | | | | | | | | | | |
| |
| | | | | | | | | | | | | Undistributed |
| | | | | | | | | Undistributed | | | | Long-term |
| | | | | | | | | Ordinary Income | | | | Capital Gain |
| Freedom Income | | | | | | | | | | $ 8,718,884 | | | | $ 7,588,684 |
| Freedom 2000 | | | | | | | | | | 11,937,853 | | | | 4,406,074 |
| Freedom 2005 | | | | | | | | | | 2,812,640 | | | | 4,456,291 |
| Freedom 2010 | | | | | | | | | | 61,189,921 | | | | 90,810,771 |
| Freedom 2015 | | | | | | | | | | 9,990,380 | | | | 27,732,329 |
| Freedom 2020 | | | | | | | | | | 41,135,226 | | | | 209,925,503 |
| Freedom 2025 | | | | | | | | | | 6,387,098 | | | | 26,956,393 |
| Freedom 2030 | | | | | | | | | | 13,216,239 | | | | 139,224,275 |
| Freedom 2035 | | | | | | | | | | 2,127,188 | | | | 16,670,913 |
| Freedom 2040 | | | | | | | | | | 9,437,275 | | | | 67,672,285 |
| |
| The tax character of distributions paid was as follows: | | | | | | | | | | | | | | |
| |
| March 31, 2006 | | | | | | | | | | | | | | |
| | | | | | | Ordinary | | | | Long-term | | | | |
| | | | | | | Income | | | | Capital Gains | | | | Total |
| Freedom Income | | | | | | $ 61,090,240 | | | | $ — | | | | $ 61,090,240 |
| Freedom 2000 | | | | | | 44,479,311 | | | | — | | | | 44,479,311 |
| Freedom 2005 | | | | | | 7,877,590 | | | | 1,519,597 | | | | 9,397,187 |
| Freedom 2010 | | | | | | 233,132,207 | | | | 19,542,788 | | | | 252,674,995 |
| Freedom 2015 | | | | | | 32,043,407 | | | | 6,570,146 | | | | 38,613,553 |
| Freedom 2020 | | | | | | 230,713,449 | | | | 29,627,269 | | | | 260,340,718 |
| Freedom 2025 | | | | | | 20,627,967 | | | | 6,189,641 | | | | 26,817,608 |
| Freedom 2030 | | | | | | 117,974,238 | | | | 21,750,938 | | | | 139,725,176 |
| Freedom 2035 | | | | | | 10,802,445 | | | | 3,453,367 | | | | 14,255,812 |
| Freedom 2040 | | | | | | 44,312,876 | | | | 17,297,798 | | | | 61,610,674 |
| |
| March 31, 2005 | | | | | | | | | | | | | | |
| | | | | | | Ordinary | | | | Long-term | | | | |
| | | | | | | Income | | | | Capital Gains | | | | Total |
| Freedom Income | | | | | | $ 38,070,374 | | | | $ 2,270,745 | | | | $ 40,341,119 |
| Freedom 2000 | | | | | | 30,275,451 | | | | — | | | | 30,275,451 |
| Freedom 2005 | | | | | | 1,801,817 | | | | 128,392 | | | | 1,930,209 |
| Freedom 2010 | | | | | | 173,342,801 | | | | 26,257,845 | | | | 199,600,646 |
| Freedom 2015 | | | | | | 6,293,545 | | | | 573,772 | | | | 6,867,317 |
| Freedom 2020 | | | | | | 167,221,106 | | | | 21,140,380 | | | | 188,361,486 |
| Freedom 2025 | | | | | | 3,727,700 | | | | 334,233 | | | | 4,061,933 |
| Freedom 2030 | | | | | | 83,244,934 | | | | — | | | | 83,244,934 |
| Freedom 2035 | | | | | | 1,855,868 | | | | — | | | | 1,855,868 |
| Freedom 2040 | | | | | | 26,617,323 | | | | 2,646,056 | | | | 29,263,379 |
| |
| 2. Operating Policies. | | | | | | | | | | | | | | |
Repurchase Agreements. FMR has received an Exemptive Order from the Securities and Exchange Commission (the SEC) which permits certain funds and other affiliated entities of FMR to transfer uninvested cash balances into joint trading accounts which are then invested in repurchase agreements. Certain funds may also invest directly with institutions in repurchase agreements. Repurchase agreements are collateralized by government or non government securities. Upon settlement date, collateral is held in segregated accounts with custodian banks and may be obtained in the event of a default of the counterparty. Each applicable fund monitors, on a daily basis, the value of the collateral to ensure it is at least equal to the principal amount of the repurchase agreement (including accrued interest). In the event of a default by the counterparty, realization of the collateral proceeds could be delayed, during which time the value of the collateral may decline.
| Notes to Financial Statements continued | | | | |
| |
| |
| |
| 3. Purchases and Sales of Investments. | | | | |
| |
| Purchases and redemptions of the underlying fund shares are noted in the table below. | | | | |
| |
| | | | | Purchases ($) | | Redemptions ($) |
| Freedom Income | | | | 518,082,982 | | 366,937,344 |
| Freedom 2000 | | | | 313,728,603 | | 324,873,047 |
| Freedom 2005 | | | | 297,518,085 | | 14,718,941 |
| Freedom 2010 | | | | 2,189,455,904 | | 758,235,176 |
| Freedom 2015 | | | | 1,655,303,071 | | 14,016,460 |
| Freedom 2020 | | | | 3,313,522,427 | | 483,431,093 |
| Freedom 2025 | | | | 1,303,155,995 | | 13,148,708 |
| Freedom 2030 | | | | 2,212,204,673 | | 319,908,801 |
| Freedom 2035 | | | | 731,379,318 | | 8,068,009 |
| Freedom 2040 | | | | 1,501,261,836 | | 118,420,047 |
| |
| 4. Fees and Other Transactions with Affiliates. | | | | |
Management Fee. Strategic Advisers, Inc. (Strategic Advisers), an affiliate of FMR, provides the funds with investment management related ser vices. As of May 1, 2005, Strategic Advisers contractually agreed to eliminate the .10% management fee. On May 19, 2005, the Board of Trustees ap proved amendments to the management contracts. Under the amended contracts the funds no longer pay management fees.
Prior to May 19, 2005, the funds paid a monthly management fee to Strategic Advisers. The management fee was computed at an annual rate of .10% of the funds’ average net assets. The management fee was reduced by an amount equal to the fees and expenses paid by the funds to the independent Trustees.
Other Transactions. Strategic Advisers has entered into an administration agreement with FMR under which FMR provides management and admin istrative services (other than investment advisory services) necessary for the operation of each fund. Pursuant to this agreement, FMR pays all ex penses of each fund, excluding the compensation of the independent Trustees and certain other expenses such as interest expense. FMR also contracts with other Fidelity companies to perform the services necessary for the operation of each fund. The funds do not pay any fees for these services. Effec tive May 19, 2005, FMR no longer received fees for services under the administration agreement.
Each fund is permitted to have bank borrowings for temporary or emergency purposes to fund shareholder redemptions. Each fund has established borrowing arrangements with certain banks. The interest rate on the borrowings is the bank’s base rate, as revised from time to time. Each applicable fund’s activity in this program during the period for which loans were outstanding was as follows:
| | | Average Daily | | Weighted Average |
| | | Loan Balance | | Interest Rate |
| Freedom 2010 | | $ 8,385,000 | | 4.13% |
| Freedom 2020 | | $ 9,756,500 | | 4.09% |
| Freedom 2030 | | $ 7,630,000 | | 4.09% |
| Freedom 2040 | | $ 9,684,000 | | 4.06% |
FMR voluntarily agreed to reimburse funds to the extent annual operating expenses exceeded certain levels of average net assets as noted in the table below. Some expenses, for example interest expense, are excluded from this reimbursement.
| The following funds were in reimbursement during the period: | | | | | | | | |
| |
| | | Expense | | Reimbursement |
| | | Limitations | | from adviser |
| Freedom Income | | .08% - .00%* | | | | $ 40,268 |
| Freedom 2000 | | .08% - .00%* | | | | $ 32,273 |
| Freedom 2005 | | .08% - .00%* | | | | $ 5,350 |
| Freedom 2010 | | .08% - .00%* | | | | $ 180,846 |
| Freedom 2015 | | .08% - .00%* | | | | $ 21,402 |
| Freedom 2020 | | .08% - .00%* | | | | $ 208,496 |
| Freedom 2025 | | .08% - .00%* | | | | $ 16,032 |
| Freedom 2030 | | .08% - .00%* | | | | $ 123,488 |
| Freedom 2035 | | .08% - .00%* | | | | $ 8,407 |
| Freedom 2040 | | .08% - .00%* | | | | $ 46,234 |
| * Expense limitation in effect at period end. | | | | | | | | |
In addition, through arrangements with each applicable fund’s custodian, credits realized as a result of uninvested cash balances were used to reduce each applicable fund’s management fee. During the period, these credits reduced management fee by the following amounts:
| Freedom Income | | $ 1 |
| Freedom 2000 | | 1 |
| Freedom 2005 | | 4 |
| Freedom 2010 | | 13 |
| Freedom 2015 | | 1 |
| Freedom 2020 | | 140 |
| Freedom 2025 | | 1 |
| Freedom 2030 | | 2 |
| Freedom 2035 | | 1 |
| Freedom 2040 | | 1 |
| |
| 7. Other. | | |
The funds’ organizational documents provide former and current trustees and officers with a limited indemnification against liabilities arising in connection with the performance of their duties to the funds. In the normal course of business, the funds may also enter into contracts that provide general indemnifications. The funds’ maximum exposure under these arrangements is unknown as this would be dependent on future claims that may be made against the funds. The risk of material loss from such claims is considered remote.
The funds do not invest in the Underlying Funds for the purpose of exercising management or control; however, investments by the funds within their principal investment strategies may represent a significant portion of the Underlying Fund’s net assets. At the end of the period, the following Freedom Funds were the owners of record of 10% or more of the total outstanding shares of the Underlying Funds.
| | | Freedom 2010 | | Freedom 2020 | | Freedom 2030 |
| Fidelity Disciplined Equity Fund | | — | | 17% | | 13% |
| Fidelity Europe Fund | | — | | 18% | | 14% |
| Fidelity Government Income Fund | | 24% | | 19% | | — |
| Fidelity High Income Fund | | — | | 14% | | — |
| Fidelity Intermediate Bond Fund | | 12% | | — | | — |
| Fidelity Investment Grade Bond Fund | | 18% | | 15% | | — |
| Fidelity Strategic Real Return Fund | | 13% | | 14% | | — |
| Notes to Financial Statements continued | | |
| |
| |
| |
| 7. Other continued | | | | |
| |
| The funds, in aggregate, were the owners of record of more than 20% of the total outstanding shares of the following Underlying Funds. | | |
| |
| Fund | | | | % of shares held |
| Fidelity Capital & Income Fund | | | | 26% |
| Fidelity Disciplined Equity Fund | | | | 55% |
| Fidelity Europe Fund | | | | 55% |
| Fidelity Government Income Fund | | | | 67% |
| Fidelity High Income Fund | | | | 42% |
| Fidelity Intermediate Bond Fund | | | | 34% |
| Fidelity Investment Grade Bond Fund | | | | 52% |
| Fidelity Japan Fund | | | | 26% |
| Fidelity Mid Cap Stock Fund | | | | 20% |
| Fidelity OTC Fund | | | | 21% |
| Fidelity Overseas Fund | | | | 21% |
| Fidelity Southeast Asia Fund | | | | 20% |
| Fidelity Small Cap Growth Fund | | | | 29% |
| Fidelity Strategic Real Return Fund | | | | 46% |
Report of Independent Registered Public Accounting Firm
To the Trustees of Fidelity Aberdeen Street Trust and the Shareholders of Fidelity Freedom Income Fund, Fidelity Freedom 2000 Fund, Fidelity Freedom 2005 Fund, Fidelity Freedom 2010 Fund, Fidelity Freedom 2015 Fund, Fidelity Freedom 2020 Fund, Fidelity Freedom 2025 Fund, Fidelity Freedom 2030 Fund, Fidelity Freedom 2035 Fund and Fidelity Freedom 2040 Fund:
In our opinion, the accompanying statements of assets and liabilities, including the schedules of investments, and the related statements of operations and of changes in net assets and the financial highlights present fairly, in all material respects, the financial position of Fidelity Freedom Income Fund, Fidelity Freedom 2000 Fund, Fidelity Freedom 2005 Fund, Fidelity Freedom 2010 Fund, Fidelity Freedom 2015 Fund, Fidelity Freedom 2020 Fund, Fidelity Freedom 2025 Fund, Fidelity Freedom 2030 Fund, Fidelity Freedom 2035 Fund and Fidelity Freedom 2040 Fund (funds of Fidelity Aberdeen Street Trust) at March 31, 2006, and the results of their operations, the changes in their net assets and the financial highlights for the periods indicated, in conformity with accounting principles generally accepted in the United States of America. These financial statements and financial highlights (hereafter referred to as “financial statements”) are the responsibility of the Fidelity Aberdeen Street Trust’s management; our responsibility is to express an opinion on these financial statements based on our audits. We conducted our audits of these financial statements in accordance with the standards of the Public Company Accounting Oversight Board (United States). Those standards require that we plan and perform the audit to obtain reasonable assurance about whether the financial statements are free of material misstatement. An audit includes examining, on a test basis, evidence supporting the amounts and disclosures in the financial statements, assessing the accounting principles used and significant estimates made by management, and evaluating the overall financial statement presentation. We believe that our audits, which included confirmation of securities at March 31, 2006 by correspondence with the custodian and brokers, provide a reasonable basis for our opinion.
/s/ PricewaterhouseCoopers LLP
PricewaterhouseCoopers LLP
Boston, Massachusetts
May 19, 2006
|
The Trustees, Members of the Advisory Board, and executive officers of the trust and funds, as applicable, are listed below. The Board of Trustees governs each Freedom Fund and is responsible for protecting the interests of shareholders. The Trustees are experienced executives who meet periodically throughout the year to oversee each Freedom Fund’s activities, review contractual arrangements with companies that provide services to each Freedom Fund, and review each Freedom Fund’s performance. If the interests of a Freedom Fund and an underlying Fidelity fund were to diverge, a conflict of interest could arise and affect how the Trustees and Members of the Advisory Board fulfill their fiduciary duties to the affected funds. Strategic Advisers has structured the Freedom Funds to avoid these potential conflicts, although there may be situations where a conflict of interest is unavoidable. In such instances, Strategic Advisers, the Trustees, and Members of the Advisory Board would take reasonable steps to minimize and, if possible, eliminate the conflict. Except for William O. McCoy and Albert R. Gamper, Jr., each of the Trustees oversees 330 funds advised by FMR or an affiliate. Mr. McCoy oversees 332 funds advised by FMR or an affiliate. Mr. Gamper oversees 262 funds advised by FMR or an affiliate.
The Trustees hold office without limit in time except that (a) any Trustee may resign; (b) any Trustee may be removed by written instrument, signed by at least two thirds of the number of Trustees prior to such removal; (c) any Trustee who requests to be retired or who has become incapac itated by illness or injury may be retired by written instrument signed by a majority of the other Trustees; and (d) any Trustee may be removed at any special meeting of shareholders by a two thirds vote of the outstanding voting securities of the trust. Each Trustee who is not an interested person (as defined in the 1940 Act) (Independent Trustee), shall retire not later than the last day of the calendar year in which his or her 72nd birthday occurs. The Independent Trustees may waive this mandatory retirement age policy with respect to individual Trustees. The executive officers and Advisory Board Members hold office without limit in time, except that any officer and Advisory Board Member may resign or may be removed by a vote of a majority of the Trustees at any regular meeting or any special meeting of the Trustees. Except as indicated, each individual has held the office shown or other offices in the same company for the past five years.
The funds’ Statement of Additional Information (SAI) includes more information about the Trustees. To request a free copy, call Fidelity at 1-800-544-8544.
Correspondence intended for each Trustee who is an interested person may be sent to Fidelity Investments, 82 Devonshire Street, Boston, Massachusetts 02109.
| | Name, Age; Principal Occupation
Edward C. Johnson 3d (75)
|
Year of Election or Appointment: 1991
Mr. Johnson is Chairman of the Board of Trustees. Mr. Johnson serves as Chief Executive Officer, Chairman, and a Director of FMR Corp.; a Director and Chairman of the Board and of the Executive Committee of FMR; Chairman and a Director of Fidelity Management & Research (Far East) Inc.; Chairman and a Director of Fidelity Investments Money Management, Inc.; and Chairman (2001 present) and a Director (2000 present) of FMR Co., Inc.
Year of Election or Appointment: 2005
Mr. Jonas is Senior Vice President of Freedom Income (2005 present), Freedom 2000 (2005 present), Freedom 2005
(2005 present), Freedom 2010 (2005 present), Freedom 2015 (2005 present), Freedom 2020 (2005 present), Freedom 2025 (2005 present), Freedom 2030 (2005 present), Freedom 2035 (2005 present), Freedom 2040 (2005 present), Freedom 2045 (2006 present), and Freedom 2050 (2006 present). He also serves as Senior Vice President of other Fidelity funds (2005 present). Mr. Jonas is Executive Director of FMR (2005 present). Previously, Mr. Jonas served as President of Fidelity Enterprise Operations and Risk Services (2004 2005), Chief Administrative Officer (2002 2004), and Chief Financial Officer of FMR Co. (1998 2000). Mr. Jonas has been with Fidelity Investments since 1987 and has held various financial and management positions including Chief Financial Officer of FMR. In addition, he serves on the Boards of Boston Ballet (2003 present) and Simmons College (2003 present).
Year of Election or Appointment: 2003
Mr. Reynolds is a Director (2003 present) and Chief Operating Officer (2002 present) of FMR Corp. He also serves on the Board at Fidelity Investments Canada, Ltd. (2000 present). Previously, Mr. Reynolds served as President of Fidelity Investments Institutional Retirement Group (1996 2000).
* Trustees have been determined to be “Interested Trustees” by virtue of, among other things, their affiliation with the trust or various entities under common control with FMR.
Correspondence intended for each Independent Trustee (that is, the Trustees other than the Interested Trustees) may be sent to Fidelity Investments, P.O. Box 55235, Boston, Massachusetts 02205-5235.
| | Name, Age; Principal Occupation
Dennis J. Dirks (57)
|
Year of Election or Appointment: 2005
Prior to his retirement in May 2003, Mr. Dirks was Chief Operating Officer and a member of the Board of The Depository Trust & Clearing Corporation (DTCC) (1999 2003). He also served as President, Chief Operating Officer, and Board member of The De pository Trust Company (DTC) (1999 2003) and President and Board member of the National Securities Clearing Corporation (NSCC) (1999 2003). In addition, Mr. Dirks served as Chief Executive Officer and Board member of the Government Securities Clearing Corporation (2001 2003) and Chief Executive Officer and Board member of the Mortgage Backed Securities Clearing Corporation (2001 2003). Mr. Dirks also serves as a Trustee and a member of the Finance Committee of Manhattan College (2005 present) and a Trustee and a member of the Finance Committee of AHRC of Nassau County (2006 present).
| | Albert R. Gamper, Jr. (64)
|
Year of Election or Appointment: 2006
Mr. Gamper also serves as a Trustee (2006 present) or Member of the Advisory Board (2005 present) of other investment compa nies advised by FMR. Prior to his retirement in December 2004, Mr. Gamper served as Chairman of the Board of CIT Group Inc. (commercial finance). During his tenure with CIT Group Inc. Mr. Gamper served in numerous senior management positions, includ ing Chairman (1987 1989; 1999 2001; 2002 2004), Chief Executive Officer (1987 2004), and President (1989 2002). He cur rently serves as a member of the Board of Directors of Public Service Enterprise Group (utilities, 2001 present), Chairman of the Board of Governors, Rutgers University (2004 present), and Chairman of the Board of Saint Barnabas Health Care System.
Year of Election or Appointment: 1997
Dr. Gates is Chairman of the Independent Trustees (2006 present). Dr. Gates is President of Texas A&M University (2002 present). He was Director of the Central Intelligence Agency (CIA) from 1991 to 1993. From 1989 to 1991, Dr. Gates served as Assistant to the President of the United States and Deputy National Security Advisor. Dr. Gates is a Director of NACCO Industries, Inc. (mining and manufacturing), Parker Drilling Co., Inc. (drilling and rental tools for the energy industry, 2001 present), and Brinker International (restaurant management, 2003 present). Previously, Dr. Gates served as a Director of LucasVarity PLC (automotive components and diesel engines), a Director of TRW Inc. (automotive, space, defense, and information technology), and Dean of the George Bush School of Government and Public Service at Texas A&M University (1999 2001).
Year of Election or Appointment: 2004
Dr. Heilmeier is Chairman Emeritus of Telcordia Technologies (communication software and systems), where prior to his retirement, he served as company Chairman and Chief Executive Officer. He currently serves on the Boards of Directors of The Mitre Corpo ration (systems engineering and information technology support for the government), and HRL Laboratories (private research and development, 2004 present). He is Chairman of the General Motors Science & Technology Advisory Board and a Life Fellow of the Institute of Electrical and Electronics Engineers (IEEE). Dr. Heilmeier is a member of the Defense Science Board and the National Security Agency Advisory Board. He is also a member of the National Academy of Engineering, the American Academy of Arts and Sciences, and the Board of Overseers of the School of Engineering and Applied Science of the University of Pennsylvania. Previously, Dr. Heilmeier served as a Director of TRW Inc. (automotive, space, defense, and information technology, 1992 2002), Compaq (1994 2002), Automatic Data Processing, Inc. (ADP) (technology based business outsourcing, 1995 2002), INET Technologies Inc. (telecommunications network surveillance, 2001 2004), and Teletech Holdings (customer management services). He is the recipient of the 2005 Kyoto Prize in Advanced Technology for his invention of the liquid crystal display.
Year of Election or Appointment: 2001
Prior to Ms. Knowles’ retirement in June 2000, she served as Executive Vice President and Chief Financial Officer of Atlantic Rich field Company (ARCO) (diversified energy, 1996 2000). From 1993 to 1996, she was a Senior Vice President of ARCO and President of ARCO Transportation Company. She served as a Director of ARCO from 1996 to 1998. She currently serves as a Director of Phelps Dodge Corporation (copper mining and manufacturing) and McKesson Corporation (healthcare service, 2002 present). Ms. Knowles is a Trustee of the Brookings Institution and the Catalina Island Conservancy and also serves as a member of the Advisory Board for the School of Engineering of the University of Southern California.
Trustees and Officers - continued
|
| | Name, Age; Principal Occupation
Ned C. Lautenbach (62)
|
Year of Election or Appointment: 2000
Mr. Lautenbach has been a partner of Clayton, Dubilier & Rice, Inc. (private equity investment firm) since September 1998. Previously, Mr. Lautenbach was with the International Business Machines Corporation (IBM) from 1968 until his retirement in 1998. Mr. Lautenbach serves as a Director of Italtel Holding S.p.A. (telecommunications (Milan, Italy), 2004 present) and Eaton Corporation (diversified industrial) as well as the Philharmonic Center for the Arts in Naples, Florida. He also is a member of the Board of Trustees of Fairfield University (2005 present), as well as a member of the Council on Foreign Relations.
Year of Election or Appointment: 1997
Prior to his retirement in December 1994, Mr. McCoy was Vice Chairman of the Board of BellSouth Corporation (telecommunications) and President of BellSouth Enterprises. He is currently a Director of Duke Realty Corporation (real estate) and Progress Energy, Inc. (electric utility). He is also a partner of Franklin Street Partners (private investment management firm) and a member of the Research Triangle Foundation Board. In addition, Mr. McCoy served as the Interim Chancellor (1999 2000) and a member of the Board of Visitors for the University of North Carolina at Chapel Hill and currently serves as Chairman of the Board of Directors of the University of North Carolina Health Care System and the Board of Visitors of the Kenan Flagler Business School (University of North Carolina at Chapel Hill). He also served as Vice President of Finance for the University of North Carolina (16 school system).
Year of Election or Appointment: 2005
Ms. Small is a member (2000 present) and Chairperson (2002 present) of the Investment Committee, and a member (2002 present) of the Board of Trustees of Smith College. Previously, she served as Chief Investment Officer (1999 2000), Director of Global Equity Investments (1996 1999), and a member of the Board of Directors of Scudder, Stevens & Clark (1990 1997) and Scudder Kemper Investments (1997 1999). In addition, Ms. Small served as Co Chair (2000 2003) of the Annual Fund for the Fletcher School of Law and Diplomacy.
| | William S. Stavropoulos (66)
|
Year of Election or Appointment: 2001
Mr. Stavropoulos is Chairman of the Board (2000 present) and a Member of the Board of Directors of The Dow Chemical Company. Since joining The Dow Chemical Company in 1967, Mr. Stavropoulos served in numerous senior management posi tions, including President (1993 2000; 2002 2003), CEO (1995 2000; 2002 2004), and Chairman of the Executive Committee (2000 2004). Currently, he is a Director of NCR Corporation (data warehousing and technology solutions), BellSouth Corporation (telecommunications), Chemical Financial Corporation, Maersk Inc. (industrial conglomerate, 2002 present), and Metalmark Capi tal (private equity investment firm, 2005 present). He also serves as a member of the Board of Trustees of the American Enterprise Institute for Public Policy Research. In addition, Mr. Stavropoulos is a member of The Business Council, J.P. Morgan International Council and the University of Notre Dame Advisory Council for the College of Science.
Year of Election or Appointment: 2005
Prior to his retirement in 2001, Mr. Wolfe was Chairman and Chief Executive Officer of Hershey Foods Corporation (1993 2001). He currently serves as a member of the boards of Adelphia Communications Corporation (2003 present), Bausch & Lomb, Inc., and Revlon Inc. (2004 present).
Advisory Board Members and Executive Officers:
|
Correspondence intended for Mr. Keyes may be sent to Fidelity Investments, P.O. Box 55235, Boston, Massachusetts 02205-5235. Correspondence intended for each executive officer and Mr. Lynch may be sent to Fidelity Investments, 82 Devonshire Street, Boston, Massachusetts 02109.
| | Name, Age; Principal Occupation
James H. Keyes (65)
|
Year of Election or Appointment: 2006
Member of the Advisory Board of Fidelity Aberdeen Street Trust. Prior to his retirement in 2003, Mr. Keyes was Chairman, Presi dent, and Chief Executive Officer of Johnson Controls, Inc. (automotive supplier, 1993 2003). He currently serves as a member of the boards of LSI Logic Corporation (semiconductor technologies, 1984 present), Navistar International Corporation (manufacture and sale of trucks, buses, and diesel engines, 2002 present), and Pitney Bowes, Inc. (integrated mail, messaging, and document management solutions, 1998 present).
Name, Age; Principal Occupation
Peter S. Lynch (62)
|
Year of Election or Appointment: 2003
Member of the Advisory Board of Fidelity Aberdeen Street Trust. Vice Chairman and a Director of FMR, and Vice Chairman (2001 present) and a Director (2000 present) of FMR Co., Inc. Previously, Mr. Lynch served as a Trustee of the Fidelity funds (1990 2003). In addition, he serves as a Trustee of Boston College, Massachusetts Eye & Ear Infirmary, Historic Deerfield, John F. Kennedy Library, and the Museum of Fine Arts of Boston.
Year of Election or Appointment: 2005 or 2006
Vice President of Freedom Income (2005 present), Freedom 2000 (2005 present), Freedom 2005 (2005 present), Freedom 2010 (2005 present), Freedom 2015 (2005 present), Freedom 2020 (2005 present), Freedom 2025 (2005 present), Freedom 2030 (2005 present), Freedom 2035 (2005 present), Freedom 2040 (2005 present), Freedom 2045 (2006 present), and Freedom 2050 (2006 present). Mr. Greer also serves as Vice President of certain Equity Funds (2005 present), certain Asset Allocation Funds (2005 present), and a Trustee of other investment companies advised by FMR (2003 present). He is an Executive Vice President of FMR (2005 present) and FMR Co., Inc. (2005 present). Previously, Mr. Greer served as a Director and Managing Director of Strategic Advisers, Inc. (2002 2005), and Executive Vice President (2000 2002) and Money Market Group Leader (1997 2002) of the Fidelity Investments Fixed Income Division. He also served as Vice President of Fidelity’s Money Market Funds (1997 2002), Senior Vice President of FMR (1997 2002), and Vice President of FIMM (1998 2002).
Year of Election or Appointment: 1996, 2000, 2003, or 2006
Vice President of Freedom Income (1996 present), Freedom 2000 (1996 present), Freedom 2005 (2003 present), Freedom 2010 (1996 present), Freedom 2015 (2003 present), Freedom 2020 (1996 present), Freedom 2025 (2003 present), Freedom 2030 (1996 present), Freedom 2035 (2003 present), Freedom 2040 (2000 present), Freedom 2045 (2006 present), and Freedom 2050 (2006 present). Mr. Cheng also serves as Vice President of other funds advised by Strategic Advisers, Inc., including the Fidelity Advisor Freedom Funds®. Prior to assuming his current responsibilities, Mr. Cheng worked as a porfolio manager. Mr. Cheng also serves as Vice President of FMR (2002) and FMR Co., Inc. (2002).
Year of Election or Appointment: 1998, 2000, 2003, or 2006
Secretary of Freedom Income (1998 present), Freedom 2000 (1998 present), Freedom 2005 (2003 present), Freedom 2010 (1998 present), Freedom 2015 (2003 present), Freedom 2020 (1998 present), Freedom 2025 (2003 present), Freedom 2030 (1998 present), Freedom 2035 (2003 present), Freedom 2040 (2000 present), Freedom 2045 (2006 present), and Freedom 2050 (2006 present). He also serves as Secretary of other Fidelity funds; Vice President, General Counsel, and Secretary of FMR Co., Inc. (2001 present) and FMR; Assistant Secretary of Fidelity Management & Research (U.K.) Inc. (2001 present), Fidelity Research & Analysis Company (2001 present), and Fidelity Investments Money Management, Inc. (2001 present). Mr. Roiter is an Adjunct Member, Faculty of Law, at Boston College Law School (2003 present). Previously, Mr. Roiter served as Vice President and Secretary of Fidelity Distributors Corporation (FDC) (1998 2005).
Year of Election or Appointment: 2003 or 2006
Assistant Secretary of Freedom Income (2003 present), Freedom 2000 (2003 present), Freedom 2005 (2003 present), Freedom 2010 (2003 present), Freedom 2015 (2003 present), Freedom 2020 (2003 present), Freedom 2025 (2003 present), Freedom 2030 (2003 present), Freedom 2035 (2003 present), Freedom 2040 (2003 present), Freedom 2045 (2006 present), and Freedom 2050 (2006 present). Mr. Fross also serves as Assistant Secretary of other Fidelity funds (2003 present), Vice President and Secretary of FDC (2005 present), and is an employee of FMR.
Year of Election or Appointment: 2004 or 2006
President and Treasurer of Freedom Income (2004 present), Freedom 2000 (2004 present), Freedom 2005 (2004 present), Freedom 2010 (2004 present), Freedom 2015 (2004 present), Freedom 2020 (2004 present), Freedom 2025 (2004 present), Freedom 2030 (2004 present), Freedom 2035 (2004 present), Freedom 2040 (2004 present), Freedom 2045 (2006 present), and Freedom 2050 (2006 present). Ms. Reynolds also serves as President and Treasurer of other Fidelity funds (2004 present) and is a Vice President (2003 present) and an employee (2002 present) of FMR. Before joining Fidelity Investments, Ms. Reynolds worked at PricewaterhouseCoopers LLP (PwC) (1980 2002), where she was most recently an audit partner with PwC’s investment management practice.
Trustees and Officers - continued
|
| | Name, Age; Principal Occupation
R. Stephen Ganis (40)
|
Year of Election or Appointment: 2006
Anti Money Laundering (AML) officer of Freedom Income, Freedom 2000, Freedom 2005, Freedom 2010, Freedom 2015, Free dom 2020, Freedom 2025, Freedom 2030, Freedom 2035, Freedom 2040, Freedom 2045, and Freedom 2050. Mr. Ganis also serves as AML officer of other Fidelity funds (2006 present) and FMR Corp. (2003 present). Before joining Fidelity Investments, Mr. Ganis practiced law at Goodwin Procter, LLP (2000 2002).
Year of Election or Appointment: 2005 or 2006
Chief Financial Officer of Freedom Income (2005 present), Freedom 2000 (2005 present), Freedom 2005 (2005 present), Free dom 2010 (2005 present), Freedom 2015 (2005 present), Freedom 2020 (2005 present), Freedom 2025 (2005 present), Freedom 2030 (2005 present), Freedom 2035 (2005 present), Freedom 2040 (2005 present), Freedom 2045 (2006 present), and Freedom 2050 (2006 present). Mr. Murphy also serves as Chief Financial Officer of other Fidelity funds (2005 present). He also serves as Senior Vice President of Fidelity Pricing and Cash Management Services Group (FPCMS).
| | Kenneth A. Rathgeber (58)
|
Year of Election or Appointment: 2004 or 2006
Chief Compliance Officer of Freedom Income (2004 present), Freedom 2000 (2004 present), Freedom 2005 (2004 present), Freedom 2010 (2004 present), Freedom 2015 (2004 present), Freedom 2020 (2004 present), Freedom 2025 (2004 present), Freedom 2030 (2004 present), Freedom 2035 (2004 present), Freedom 2040 (2004 present), Freedom 2045 (2006 present), and Freedom 2050 (2006 present). Mr. Rathgeber also serves as Chief Compliance Officer of other Fidelity funds (2004 present) and Executive Vice President of Risk Oversight for Fidelity Investments (2002 present). He is Chief Compliance Officer of FMR (2005 present), FMR Co., Inc. (2005 present), Fidelity Management & Research (U.K.) Inc. (2005 present), Fidelity Research & Analysis Company (2005 present), Fidelity Investments Money Management, Inc. (2005 present), and Strategic Advisers, Inc. (2005 present). Previously, Mr. Rathgeber served as Executive Vice President and Chief Operating Officer for Fidelity Investments Institutional Services Company, Inc. (1998 2002).
Year of Election or Appointment: 2005 or 2006
Deputy Treasurer of Freedom Income (2005 present), Freedom 2000 (2005 present), Freedom 2005 (2005 present), Freedom 2010 (2005 present), Freedom 2015 (2005 present), Freedom 2020 (2005 present), Freedom 2025 (2005 present), Freedom 2030 (2005 present), Freedom 2035 (2005 present), Freedom 2040 (2005 present), Freedom 2045 (2006 present), and Free dom 2050 (2006 present). Mr. Mehrmann also serves as Deputy Treasurer of other Fidelity funds (2005 present) and is an em ployee of FMR. Previously, Mr. Mehrmann served as Vice President of Fidelity Investments Institutional Services Group (FIIS)/Fidelity Investments Institutional Operations Corporation, Inc. (FIIOC) Client Services (1998 2004).
| | Kimberley H. Monasterio (42)
|
Year of Election or Appointment: 2004 or 2006
Deputy Treasurer of Freedom Income (2004 present), Freedom 2000 (2004 present), Freedom 2005 (2004 present), Freedom 2010 (2004 present), Freedom 2015 (2004 present), Freedom 2020 (2004 present), Freedom 2025 (2004 present), Freedom 2030 (2004 present), Freedom 2035 (2004 present), Freedom 2040 (2004 present), Freedom 2045 (2006 present), and Freedom 2050 (2006 present). Ms. Monasterio also serves as Deputy Treasurer of other Fidelity funds (2004) and is an employee of FMR (2004). Before joining Fidelity Investments, Ms. Monasterio served as Treasurer (2000 2004) and Chief Financial Officer (2002 2004) of the Franklin Templeton Funds and Senior Vice President of Franklin Templeton Services, LLC (2000 2004).
Year of Election or Appointment: 2005 or 2006
Deputy Treasurer of Freedom Income (2005 present), Freedom 2000 (2005 present), Freedom 2005 (2005 present), Freedom 2010 (2005 present), Freedom 2015 (2005 present), Freedom 2020 (2005 present), Freedom 2025 (2005 present), Freedom 2030 (2005 present), Freedom 2035 (2005 present), Freedom 2040 (2005 present), Freedom 2045 (2006 present), and Free dom 2050 (2006 present). Mr. Robins also serves as Deputy Treasurer of other Fidelity funds (2005 present) and is an employee of FMR (2004 present). Before joining Fidelity Investments, Mr. Robins worked at KPMG LLP, where he was a partner in KPMG’s department of professional practice (2002 2004) and a Senior Manager (1999 2000). In addition, Mr. Robins served as Assistant Chief Accountant, United States Securities and Exchange Commission (2000 2002).
Name, Age; Principal Occupation
Robert G. Byrnes (39)
|
Year of Election or Appointment: 2005 or 2006
Assistant Treasurer of Freedom Income (2005 present), Freedom 2000 (2005 present), Freedom 2005 (2005 present), Freedom 2010 (2005 present), Freedom 2015 (2005 present), Freedom 2020 (2005 present), Freedom 2025 (2005 present), Freedom 2030 (2005 present), Freedom 2035 (2005 present), Freedom 2040 (2005 present), Freedom 2045 (2006 present), and Freedom 2050 (2006 present). Mr. Byrnes also serves as Assistant Treasurer of other Fidelity funds (2005 present) and is an employee of FMR (2005 present). Previously, Mr. Byrnes served as Vice President of FPCMS (2003 2005). Before joining Fidelity Investments, Mr. Byrnes worked at Deutsche Asset Management where he served as Vice President of the Investment Operations Group (2000 2003).
Year of Election or Appointment: 1996, 2000, 2003, or 2006
Assistant Treasurer of Freedom Income (1996 present), Freedom 2000 (1996 present), Freedom 2005 (2003 present), Freedom 2010 (1996 present), Freedom 2015 (2003 present), Freedom 2020 (1996 present), Freedom 2025 (2003 present), Freedom 2030 (1996 present), Freedom 2035 (2003 present), Freedom 2040 (2000 present), Freedom 2045 (2006 present), and Freedom 2050 (2006 present). Mr. Costello also serves as Assistant Treasurer of other Fidelity funds and is an employee of FMR.
Year of Election or Appointment: 2004 or 2006
Assistant Treasurer of Freedom Income (2004 present), Freedom 2000 (2004 present), Freedom 2005 (2004 present), Freedom 2010 (2004 present), Freedom 2015 (2004 present), Freedom 2020 (2004 present), Freedom 2025 (2004 present), Freedom 2030 (2004 present), Freedom 2035 (2004 present), Freedom 2040 (2004 present), Freedom 2045 (2006 present), and Freedom 2050 (2006 present). Mr. Lydecker also serves as Assistant Treasurer of other Fidelity funds (2004) and is an employee of FMR.
Year of Election or Appointment: 2002, 2003, or 2006
Assistant Treasurer of Freedom Income (2002 present), Freedom 2000 (2002 present), Freedom 2005 (2003 present), Freedom 2010 (2002 present), Freedom 2015 (2003 present), Freedom 2020 (2002 present), Freedom 2025 (2003 present), Freedom 2030 (2002 present), Freedom 2035 (2003 present), Freedom 2040 (2002 present), Freedom 2045 (2006 present), and Freedom 2050 (2006 present). Mr. Osterheld also serves as Assistant Treasurer of other Fidelity funds (2002) and is an employee of FMR.
Year of Election or Appointment: 2005 or 2006
Assistant Treasurer of Freedom Income (2005 present), Freedom 2000 (2005 present), Freedom 2005 (2005 present), Freedom 2010 (2005 present), Freedom 2015 (2005 present), Freedom 2020 (2005 present), Freedom 2025 (2005 present), Freedom 2030 (2005 present), Freedom 2035 (2005 present), Freedom 2040 (2005 present), Freedom 2045 (2006 present), and Freedom 2050 (2006 present). Mr. Ryan also serves as Assistant Treasurer of other Fidelity funds (2005 present) and is an employee of FMR (2005 present). Previously, Mr. Ryan served as Vice President of Fund Reporting in FPCMS (1999 2005).
Year of Election or Appointment: 2005 or 2006
Assistant Treasurer of Freedom Income (2005 present), Freedom 2000 (2005 present), Freedom 2005 (2005 present), Freedom 2010 (2005 present), Freedom 2015 (2005 present), Freedom 2020 (2005 present), Freedom 2025 (2005 present), Freedom 2030 (2005 present), Freedom 2035 (2005 present), Freedom 2040 (2005 present), Freedom 2045 (2006 present), and Freedom 2050 (2006 present). Mr. Schiavone also serves as Assistant Treasurer of other Fidelity funds (2005 present) and is an em ployee of FMR (2005 present). Before joining Fidelity Investments, Mr. Schiavone worked at Deutsche Asset Management, where he most recently served as Assistant Treasurer (2003 2005) of the Scudder Funds and Vice President and Head of Fund Reporting (1996 2003).
The Board of Trustees of each fund voted to pay to shareholders of record at the opening of business on record date, the following distributions per share derived from capital gains realized from sales of portfolio securities, and dividends derived from net investment income:
| Fund | | Pay Date | | Record Date | | Dividends | | Capital Gains |
| Freedom Income | | 05/08/06 | | 05/05/06 | | $.04 | | $.04 |
| Freedom 2000 | | 05/08/06 | | 05/05/06 | | $.09 | | $.04 |
| Freedom 2005 | | 05/08/06 | | 05/05/06 | | $.06 | | $.09 |
| Freedom 2010 | | 05/08/06 | | 05/05/06 | | $.08 | | $.13 |
| Freedom 2015 | | 05/08/06 | | 05/05/06 | | $.03 | | $.13 |
| Freedom 2020 | | 05/15/06 | | 05/12/06 | | $.05 | | $.23 |
| Freedom 2025 | | 05/15/06 | | 05/12/06 | | $.03 | | $.155 |
| Freedom 2030 | | 05/15/06 | | 05/12/06 | | $.03 | | $.25 |
| Freedom 2035 | | 05/15/06 | | 05/12/06 | | $.03 | | $.17 |
| Freedom 2040 | | 05/15/06 | | 05/12/06 | | $.02 | | $.16 |
The funds hereby designate as capital gain dividends the amounts noted below for the taxable year indicated or for dividends for the taxable year ended 2006, and if subsequently determined to be different, the net capital gain of such year.
| Fund | | 2006 |
| Freedom Income | | $ 7,588,684 |
| Freedom 2000 | | 4,406,074 |
| Freedom 2005 | | 5,621,687 |
| Freedom 2010 | | 93,799,198 |
| Freedom 2015 | | 32,665,473 |
| Freedom 2020 | | 209,925,503 |
| Freedom 2025 | | 31,788,806 |
| Freedom 2030 | | 139,896,821 |
| Freedom 2035 | | 19,289,767 |
| Freedom 2040 | | 78,381,672 |
A percentage of the dividends distributed during the fiscal year for the following funds was derived from interest on U.S. Government securities which is generally exempt from state income tax:
| Freedom Income | | 12.71% |
| Freedom 2000 | | 12.60% |
| Freedom 2005 | | 10.63% |
| Freedom 2010 | | 10.59% |
| Freedom 2015 | | 7.94% |
| Freedom 2020 | | 5.63% |
The Fidelity Freedom Income Fund designates $59,526,453 of distributions paid during the fiscal year ended March 31, 2006 as qualifying to be taxed as interest-related dividends for nonresident alien shareholders.
A percentage of the dividends distributed during the fiscal year for the following funds qualifies for the dividends received deduction for cor porate shareholders:
| Freedom Income | | | | |
| May 2005 | | 4% | | |
| June 2005 | | 7% | | |
| July 2005 | | 7% | | |
| August 2005 | | 7% | | |
| September 2005 | | 7% | | |
| October 2005 | | 7% | | |
| November 2005 | | 7% | | |
| December 2005 | | 7% | | |
| (ex date 12/02) | | | | |
| December 2005 | | 7% | | |
| (ex date 12/02) | | | | |
| February 2006 | | 1% | | |
| March 2006 | | 1% | | |
| |
| | | May 2005 | | December 2005 |
| Freedom 2000 | | 2% | | 8% |
| Freedom 2005 | | 2% | | 15% |
| Freedom 2010 | | 2% | | 16% |
| Freedom 2015 | | 6% | | 20% |
| Freedom 2020 | | 8% | | 26% |
| Freedom 2025 | | 6% | | 29% |
| Freedom 2030 | | 17% | | 33% |
| Freedom 2035 | | 12% | | 32% |
| Freedom 2040 | | 24% | | 36% |
A percentage of the dividends distributed during the fiscal year for the following funds may be taken into account as a dividend for purposes of the maximum rate under section 1(h)(11) of the Internal Revenue Code.
| Freedom Income | | | | |
| May 2005 | | 5% | | |
| June 2005 | | 8% | | |
| July 2005 | | 8% | | |
| August 2005 | | 8% | | |
| September 2005 | | 8% | | |
| October 2005 | | 8% | | |
| November 2005 | | 8% | | |
| December 2005 | | 8% | | |
| (ex date 12/02) | | | | |
| December 2005 | | 8% | | |
| (ex date 12/29) | | | | |
| February 2006 | | 2% | | |
| March 2006 | | 2% | | |
| |
| | | May 2005 | | December 2005 |
| Freedom 2000 | | 3% | | 9% |
| Freedom 2005 | | 2% | | 19% |
| Freedom 2010 | | 3% | | 20% |
| Freedom 2015 | | 8% | | 27% |
| Freedom 2020 | | 9% | | 33% |
| Freedom 2025 | | 7% | | 39% |
| Freedom 2030 | | 19% | | 43% |
| Freedom 2035 | | 14% | | 44% |
| Freedom 2040 | | 29% | | 48% |
The funds will notify shareholders in January 2007 of amounts for use in preparing 2006 income tax returns.
Proxy Voting Results
A special meeting of the funds’ shareholders was held on May 11, 2005. The results of votes taken among shareholders on proposals before them are reported below. Each vote reported represents one dollar of net asset value held on the record date for the meeting.
| PROPOSAL 1 | | | | |
| To elect a Board of Trustees.A | | | | |
| | | # of | | % of |
| | | Votes | | Votes |
| |
| Laura B. Cronin | | | | |
| Affirmative | | 14,239,751,820.01 | | 94.148 |
| Withheld | | 885,124,580.88 | | 5.852 |
| TOTAL | | 15,124,876,400.89 | | 100.000 |
| Dennis J. Dirks | | | | |
| Affirmative | | 14,214,711,536.39 | | 93.982 |
| Withheld | | 910,164,864.50 | | 6.018 |
| TOTAL | | 15,124,876,400.89 | | 100.000 |
| Robert M. Gates | | | | |
| Affirmative | | 14,201,606,421.24 | | 93.896 |
| Withheld | | 923,269,979.65 | | 6.104 |
| TOTAL | | 15,124,876,400.89 | | 100.000 |
| George H. Heilmeier | | | | |
| Affirmative | | 14,204,274,887.85 | | 93.913 |
| Withheld | | 920,601,513.04 | | 6.087 |
| TOTAL | | 15,124,876,400.89 | | 100.000 |
| Abigail P. Johnson | | | | |
| Affirmative | | 14,182,349,317.20 | | 93.768 |
| Withheld | | 942,527,083.69 | | 6.232 |
| TOTAL | | 15,124,876,400.89 | | 100.000 |
| Edward C. Johnson 3d | | | | |
| Affirmative | | 14,170,946,355.46 | | 93.693 |
| Withheld | | 953,930,045.43 | | 6.307 |
| TOTAL | | 15,124,876,400.89 | | 100.000 |
| Marie L. Knowles | | | | |
| Affirmative | | 14,215,316,094.83 | | 93.986 |
| Withheld | | 909,560,306.06 | | 6.014 |
| TOTAL | | 15,124,876,400.89 | | 100.000 |
| Ned C. Lautenbach | | | | |
| Affirmative | | 14,218,303,274.43 | | 94.006 |
| Withheld | | 906,573,126.46 | | 5.994 |
| TOTAL | | 15,124,876,400.89 | | 100.000 |
| Marvin L. Mann | | | | |
| Affirmative | | 14,204,487,663.39 | | 93.915 |
| Withheld | | 920,388,737.50 | | 6.085 |
| TOTAL | | 15,124,876,400.89 | | 100.000 |
| William O. McCoy | | | | |
| Affirmative | | 14,207,936,637.38 | | 93.938 |
| Withheld | | 916,939,763.51 | | 6.062 |
| TOTAL | | 15,124,876,400.89 | | 100.000 |
| Robert L. Reynolds | | | | |
| Affirmative | | 14,217,076,502.23 | | 93.998 |
| Withheld | | 907,799,898.66 | | 6.002 |
| TOTAL | | 15,124,876,400.89 | | 100.000 |
| | | # of | | % of |
| | | Votes | | Votes |
| |
| Cornelia M. Small | | | | |
| Affirmative | | 14,218,030,163.22 | | 94.004 |
| Withheld | | 906,846,237.67 | | 5.996 |
| TOTAL | | 15,124,876,400.89 | | 100.000 |
| William S. Stavropoulos | | | | |
| Affirmative | | 14,211,272,772.82 | | 93.960 |
| Withheld | | 913,603,628.07 | | 6.040 |
| TOTAL | | 15,124,876,400.89 | | 100.000 |
| Kenneth L. Wolfe | | | | |
| Affirmative | | 14,212,093,506.53 | | 93.965 |
| Withheld | | 912,782,894.36 | | 6.035 |
| TOTAL | | 15,124,876,400.89 | | 100.000 |
| PROPOSAL 2 | | | | |
| To modify the fundamental investment objective of each of Fidelity |
| Freedom 2000 Fund, Fidelity Freedom 2005 Fund, Fidelity Free |
| dom 2010 Fund, Fidelity Freedom 2015 Fund, Fidelity Freedom |
| 2020 Fund, Fidelity Freedom 2025 Fund, Fidelity Freedom 2030 |
| Fund, Fidelity Freedom 2035 Fund, and Fidelity Freedom 2040 |
| Fund. | | | | |
| | | # of | | % of |
| | | Votes | | Votes |
| |
| Fidelity Freedom 2000 Fund | | | | |
| Affirmative | | 762,872,577.94 | | 89.160 |
| Against | | 35,664,525.35 | | 4.168 |
| Abstain | | 55,135,624.10 | | 6.444 |
| Broker Non Votes | | 1,952,743.28 | | .228 |
| TOTAL | | 855,625,470.67 | | 100.000 |
| Fidelity Freedom 2005 Fund | | | | |
| | | # of | | % of |
| | | Votes | | Votes |
| Affirmative | | 60,686,984.24 | | 88.274 |
| Against | | 3,308,477.62 | | 4.813 |
| Abstain | | 4,742,497.46 | | 6.898 |
| Broker Non Votes | | 10,311.53 | | .015 |
| TOTAL | | 68,748,270.85 | | 100.000 |
| Fidelity Freedom 2010 Fund | | | | |
| | | # of | | % of |
| | | Votes | | Votes |
| Affirmative | | 3,746,482,581.07 | | 88.339 |
| Against | | 172,607,517.50 | | 4.070 |
| Abstain | | 302,164,790.98 | | 7.125 |
| Broker Non Votes | | 19,759,438.71 | | .466 |
| TOTAL | | 4,241,014,328.26 | | 100.000 |
Annual Report A-72
| Fidelity Freedom 2015 Fund | | | | |
| | | # of | | % of |
| | | Votes | | Votes |
| Affirmative | | 230,733,655.77 | | 88.417 |
| Against | | 6,128,244.65 | | 2.348 |
| Abstain | | 23,780,662.88 | | 9.113 |
| Broker Non Votes | | 318,389.00 | | .122 |
| TOTAL | | 260,960,952.30 | | 100.000 |
| Fidelity Freedom 2020 Fund | | | | |
| | | # of | | % of |
| | | Votes | | Votes |
| Affirmative | | 3,957,012,379.56 | | 87.417 |
| Against | | 190,916,759.67 | | 4.218 |
| Abstain | | 372,206,370.93 | | 8.222 |
| Broker Non Votes | | 6,452,566.92 | | .143 |
| TOTAL | | 4,526,588,077.08 | | 100.000 |
| Fidelity Freedom 2025 Fund | | | | |
| | | # of | | % of |
| | | Votes | | Votes |
| Affirmative | | 143,691,980.90 | | 87.022 |
| Against | | 3,898,059.01 | | 2.361 |
| Abstain | | 17,442,537.54 | | 10.563 |
| Broker Non Votes | | 88,919.35 | | .054 |
| TOTAL | | 165,121,496.80 | | 100.000 |
| Fidelity Freedom 2030 Fund | | | | |
| | | # of | | % of |
| | | Votes | | Votes |
| Affirmative | | 2,281,367,044.28 | | 86.046 |
| Against | | 106,268,028.92 | | 4.008 |
| Abstain | | 259,122,280.24 | | 9.773 |
| Broker Non Votes | | 4,566,516.60 | | .173 |
| TOTAL | | 2,651,323,870.04 | | 100.000 |
| Fidelity Freedom 2035 Fund | | | | |
| | | # of | | % of |
| | | Votes | | Votes |
| Affirmative | | 69,273,663.08 | | 84.801 |
| Against | | 2,419,373.01 | | 2.961 |
| Abstain | | 9,978,107.35 | | 12.215 |
| Broker Non Votes | | 18,882.72 | | .023 |
| TOTAL | | 81,690,026.16 | | 100.000 |
| Fidelity Freedom 2040 Fund | | | | |
| | | # of | | % of |
| | | Votes | | Votes |
| Affirmative | | 769,648,765.52 | | 87.764 |
| Against | | 33,833,662.76 | | 3.858 |
| Abstain | | 71,729,530.91 | | 8.179 |
| Broker Non Votes | | 1,745,541.00 | | .199 |
| TOTAL | | 876,957,500.19 | | 100.000 |
A Denotes trust-wide proposals and voting results.
A-73 Annual Report
Investment Adviser
Strategic Advisers, Inc.
Boston, MA
General Distributor
Fidelity Distributors Corporation
Boston, MA
Transfer and Service Agents
Fidelity Investments Institutional
Operations Company, Inc.
Boston, MA
Fidelity Service Company, Inc.
Boston, MA
Custodian
The Bank of New York
New York, NY
|
| The Fidelity Telephone Connection |
| Mutual Fund 24-Hour Service |
| Exchanges/Redemptions | | |
| and Account Assistance | | 1-800-544-6666 |
| Product Information | | 1-800-544-6666 |
| Retirement Accounts | | 1-800-544-4774 |
| (8 a.m. 9 p.m.) | | |
| TDD Service | | 1-800-544-0118 |
| for the deaf and hearing impaired |
| (9 a.m. 9 p.m. Eastern time) |
| Fidelity Automated Service |
| Telephone (FAST® )(automated phone logo) | | 1-800-544-5555 |
| (automated phone logo) Automated line for quickest service |

P.O. Box 193
Boston, MA 02101
|
FF UANNPRO 0506
1.814503.101
|
Item 2. Code of Ethics
As of the end of the period, March 31, 2006, Fidelity Aberdeen Street Trust (the trust) has adopted a code of ethics, as defined in Item 2 of Form N-CSR, that applies to its President and Treasurer and its Chief Financial Officer. A copy of the code of ethics is filed as an exhibit to this Form N-CSR.
Item 3. Audit Committee Financial Expert
The Board of Trustees of the trust has determined that Marie L. Knowles is an audit committee financial expert, as defined in Item 3 of Form N-CSR. Ms. Knowles is independent for purposes of Item 3 of Form N-CSR.
Item 4. Principal Accountant Fees and Services
(a) Audit Fees.
For the fiscal years ended March 31, 2006 and March 31, 2005, the aggregate Audit Fees billed by PricewaterhouseCoopers LLP (PwC) for professional services rendered for the audits of the financial statements, or services that are normally provided in connection with statutory and regulatory filings or engagements for those fiscal years, for Fidelity Freedom Income Fund, Fidelity Freedom 2000 Fund, Fidelity Freedom 2005 Fund, Fidelity Freedom 2010 Fund, Fidelity Freedom 2015 Fund, Fidelity Freedom 2020 Fund, Fidelity Freedom 2025 Fund, Fidelity Freedom 2030 Fund, Fidelity Freedom 2035 Fund, and Fidelity Freedom 2040 Fund (the funds) and for all funds in the Fidelity Group of Funds are shown in the table below.
Fund | 2006A | 2005A |
Fidelity Freedom Income Fund | $26,000 | $23,000 |
Fidelity Freedom 2000 Fund | $25,000 | $23,000 |
Fidelity Freedom 2005 Fund | $21,000 | $19,000 |
Fidelity Freedom 2010 Fund | $47,000 | $39,000 |
Fidelity Freedom 2015 Fund | $24,000 | $20,000 |
Fidelity Freedom 2020 Fund | $53,000 | $41,000 |
Fidelity Freedom 2025 Fund | $23,000 | $19,000 |
Fidelity Freedom 2030 Fund | $40,000 | $31,000 |
Fidelity Freedom 2035 Fund | $22,000 | $19,000 |
Fidelity Freedom 2040 Fund | $28,000 | $22,000 |
All funds in the Fidelity Group of Funds audited by PwC | $12,500,000 | $11,100,000 |
A | Aggregate amounts may reflect rounding. |
For the fiscal years ended March 31, 2006 and March 31, 2005, the aggregate Audit Fees billed by Deloitte & Touche LLP, the member firms of Deloitte Touche Tohmatsu, and their respective affiliates (collectively, "Deloitte Entities") for professional services rendered for the audits of the financial statements, or services that are normally provided in connection with statutory and regulatory filings or engagements for those fiscal years, for Fidelity Advisor Freedom Income Fund, Fidelity Advisor Freedom 2005 Fund, Fidelity Advisor Freedom 2010 Fund, Fidelity Advisor Freedom 2015 Fund, Fidelity Advisor Freedom 2020 Fund, Fidelity Advisor Freedom 2025 Fund, Fidelity Advisor Freedom 2030 Fund, Fidelity Advisor Freedom 2035 Fund, and Fidelity Advisor Freedom 2040 Fund (the funds) and for all funds in the Fidelity Group of Funds are shown in the table below.
Fund | 2006A | 2005A |
Fidelity Advisor Freedom Income Fund | $17,000 | $13,000 |
Fidelity Advisor Freedom 2005 Fund | $17,000 | $12,000 |
Fidelity Advisor Freedom 2010 Fund | $18,000 | $12,000 |
Fidelity Advisor Freedom 2015 Fund | $18,000 | $12,000 |
Fidelity Advisor Freedom 2020 Fund | $18,000 | $12,000 |
Fidelity Advisor Freedom 2025 Fund | $18,000 | $12,000 |
Fidelity Advisor Freedom 2030 Fund | $18,000 | $12,000 |
Fidelity Advisor Freedom 2035 Fund | $17,000 | $12,000 |
Fidelity Advisor Freedom 2040 Fund | $18,000 | $12,000 |
All funds in the Fidelity Group of Funds audited by Deloitte Entities | $5,900,000 | $4,600,000 |
A | Aggregate amounts may reflect rounding. |
(b) Audit-Related Fees.
In each of the fiscal years ended March 31, 2006 and March 31, 2005, the aggregate Audit-Related Fees billed by PwC for services rendered for assurance and related services to each fund that are reasonably related to the performance of the audit or review of the fund's financial statements, but not reported as Audit Fees, are shown in the table below.
Fund | 2006A | 2005A |
Fidelity Freedom Income Fund | $0 | $0 |
Fidelity Freedom 2005 Fund | $0 | $0 |
Fidelity Freedom 2010 Fund | $0 | $0 |
Fidelity Freedom 2015 Fund | $0 | $0 |
Fidelity Freedom 2020 Fund | $0 | $0 |
Fidelity Freedom 2025 Fund | $0 | $0 |
Fidelity Freedom 2030 Fund | $0 | $0 |
Fidelity Freedom 2035 Fund | $0 | $0 |
Fidelity Freedom 2040 Fund | $0 | $0 |
A | Aggregate amounts may reflect rounding. |
In each of the fiscal years ended March 31, 2006 and March 31, 2005, the aggregate Audit-Related Fees billed by Deloitte Entities for services rendered for assurance and related services to each fund that are reasonably related to the performance of the audit or review of the fund's financial statements, but not reported as Audit Fees, are shown in the table below.
Fund | 2006A | 2005A |
Fidelity Advisor Freedom Income Fund | $0 | $0 |
Fidelity Advisor Freedom 2005 Fund | $0 | $0 |
Fidelity Advisor Freedom 2010 Fund | $0 | $0 |
Fidelity Advisor Freedom 2015 Fund | $0 | $0 |
Fidelity Advisor Freedom 2020 Fund | $0 | $0 |
Fidelity Advisor Freedom 2025 Fund | $0 | $0 |
Fidelity Advisor Freedom 2030 Fund | $0 | $0 |
Fidelity Advisor Freedom 2035 Fund | $0 | $0 |
Fidelity Advisor Freedom 2040 Fund | $0 | $0 |
A | Aggregate amounts may reflect rounding. |
In each of the fiscal years ended March 31, 2006 and March 31, 2005, the aggregate Audit-Related Fees that were billed by PwC and Deloitte Entities that were required to be approved by the Audit Committee for services rendered on behalf of Fidelity Management & Research Company (FMR) and entities controlling, controlled by, or under common control with FMR (not including any sub-adviser whose role is primarily portfolio management and is subcontracted with or overseen by another investment adviser) that provide ongoing services to the funds ("Fund Service Providers") for assurance and related services that relate directly to the operations and financial reporting of each fund that are reasonably related to the performance of the audit or review of the fund's financial statements, but not reported as Audit Fees, are shown in the table below.
Billed By | 2006A | 2005A |
PwC | $0 | $0 |
Deloitte Entities | $0 | $0 |
A | Aggregate amounts may reflect rounding. |
Fees included in the audit-related category comprise assurance and related services (e.g., due diligence services) that are traditionally performed by the independent registered public accounting firm. These audit-related services include due diligence related to mergers and acquisitions, accounting consultations and audits in connection with acquisitions, internal control reviews, attest services that are not required by statute or regulation and consultation concerning financial accounting and reporting standards.
(c) Tax Fees.
In each of the fiscal years ended March 31, 2006 and March 31, 2005, the aggregate Tax Fees billed by PwC for professional services rendered for tax compliance, tax advice, and tax planning for each fund is shown in the table below.
Fund | 2006A | 2005A |
Fidelity Freedom Income Fund | $1,600 | $1,500 |
Fidelity Freedom 2000 Fund | $1,600 | $1,500 |
Fidelity Freedom 2005 Fund | $1,600 | $1,500 |
Fidelity Freedom 2010 Fund | $1,600 | $1,500 |
Fidelity Freedom 2015 Fund | $1,600 | $1,500 |
Fidelity Freedom 2020 Fund | $1,600 | $1,500 |
Fidelity Freedom 2025 Fund | $1,600 | $1,500 |
Fidelity Freedom 2030 Fund | $1,600 | $1,500 |
Fidelity Freedom 2035 Fund | $1,600 | $1,500 |
Fidelity Freedom 2040 Fund | $1,600 | $1,500 |
A | Aggregate amounts may reflect rounding. |
In each of the fiscal years ended March 31, 2006 and March 31, 2005, the aggregate Tax Fees billed by Deloitte Entities for professional services rendered for tax compliance, tax advice, and tax planning for each fund is shown in the table below.
Fund | 2006A | 2005A |
Fidelity Advisor Freedom Income Fund | $1,900 | $1,800 |
Fidelity Advisor Freedom 2005 Fund | $1,800 | $1,600 |
Fidelity Advisor Freedom 2010 Fund | $1,800 | $1,600 |
Fidelity Advisor Freedom 2015 Fund | $1,800 | $1,600 |
Fidelity Advisor Freedom 2020 Fund | $1,800 | $1,600 |
Fidelity Advisor Freedom 2025 Fund | $1,800 | $1,600 |
Fidelity Advisor Freedom 2030 Fund | $1,800 | $1,600 |
Fidelity Advisor Freedom 2035 Fund | $1,800 | $1,600 |
Fidelity Advisor Freedom 2040 Fund | $1,800 | $1,600 |
A | Aggregate amounts may reflect rounding. |
In each of the fiscal years ended March 31, 2006 and March 31, 2005, the aggregate Tax Fees billed by PwC and Deloitte Entities that were required to be approved by the Audit Committee for professional services rendered on behalf of the Fund Service Providers for tax compliance, tax advice, and tax planning that relate directly to the operations and financial reporting of each fund is shown in the table below.
Billed By | 2006A | 2005A |
PwC | $0 | $0 |
Deloitte Entities | $0 | $0 |
A | Aggregate amounts may reflect rounding. |
Fees included in the Tax Fees category comprise all services performed by professional staff in the independent registered public accounting firm's tax division except those services related to the audit. Typically, this category would include fees for tax compliance, tax planning, and tax advice. Tax compliance, tax advice, and tax planning services include preparation of original and amended tax returns, claims for refund and tax payment-planning services, assistance with tax audits and appeals, tax advice related to mergers and acquisitions and requests for rulings or technical advice from taxing authorities.
(d) All Other Fees.
In each of the fiscal years ended March 31, 2006 and March 31, 2005, the aggregate Other Fees billed by PwC for all other non-audit services rendered to the funds is shown in the table below.
Fund | 2006A | 2005A |
Fidelity Freedom Income Fund | $2,000 | $2,200 |
Fidelity Freedom 2000 Fund | $1,700 | $2,000 |
Fidelity Freedom 2005 Fund | $1,100 | $1,100 |
Fidelity Freedom 2010 Fund | $6,100 | $6,200 |
Fidelity Freedom 2015 Fund | $1,700 | $1,300 |
Fidelity Freedom 2020 Fund | $7,200 | $6,700 |
Fidelity Freedom 2025 Fund | $1,600 | $1,200 |
Fidelity Freedom 2030 Fund | $4,700 | $4,300 |
Fidelity Freedom 2035 Fund | $1,200 | $1,100 |
Fidelity Freedom 2040 Fund | $2,400 | $2,100 |
A | Aggregate amounts may reflect rounding. |
In each of the fiscal years ended March 31, 2006 and March 31, 2005, the aggregate Other Fees billed by Deloitte Entities for all other non-audit services rendered to the funds is shown in the table below.
Fund | 2006A | 2005A |
Fidelity Advisor Freedom Income Fund | $0 | $0 |
Fidelity Advisor Freedom 2005 Fund | $0 | $0 |
Fidelity Advisor Freedom 2010 Fund | $0 | $0 |
Fidelity Advisor Freedom 2015 Fund | $0 | $0 |
Fidelity Advisor Freedom 2020 Fund | $0 | $0 |
Fidelity Advisor Freedom 2025 Fund | $0 | $0 |
Fidelity Advisor Freedom 2030 Fund | $0 | $0 |
Fidelity Advisor Freedom 2035 Fund | $0 | $0 |
Fidelity Advisor Freedom 2040 Fund | $0 | $0 |
A | Aggregate amounts may reflect rounding. |
In each of the fiscal years ended March 31, 2006 and March 31, 2005, the aggregate Other Fees billed by PwC and Deloitte Entities that were required to be approved by the Audit Committee for all other non-audit services rendered on behalf of the Fund Service Providers that relate directly to the operations and financial reporting of each fund is shown in the table below.
Billed By | 2006A | 2005A |
PwC | $155,000 | $450,000 |
Deloitte Entities | $160,000 | $510,000 |
A | Aggregate amounts may reflect rounding. |
Fees included in the All Other Fees category include services related to internal control reviews, strategy and other consulting, financial information systems design and implementation, consulting on other information systems, and other tax services unrelated to the fund.
(e) (1) | Audit Committee Pre-Approval Policies and Procedures: |
The trust's Audit Committee must pre-approve all audit and non-audit services provided by the independent registered public accounting firm relating to the operations or financial reporting of the funds. Prior to the commencement of any audit or non-audit services to a fund, the Audit Committee reviews the services to determine whether they are appropriate and permissible under applicable law.
The trust's Audit Committee has adopted policies and procedures to, among other purposes, provide a framework for the Committee's consideration of non-audit services by the audit firms that audit the Fidelity funds. The policies and procedures require that any non-audit service provided by a fund audit firm to a Fidelity Fund and any non-audit service provided by a fund auditor to a Fund Service Provider that relates directly to the operations and financial reporting of a Fidelity fund (Covered Service) are subject to approval by the Audit Committee before such service is provided. Non-audit services provided by a fund audit firm for a Fund Service Provider that do not relate directly to the operations and financial reporting of a Fidelity fund (Non-Covered Service) but that are expected to exceed $50,000 are also subject to pre-approval by the Audit Committee.
All Covered Services, as well as Non-Covered Services that are expected to exceed $50,000, must be approved in advance of provision of the service either: (i) by formal resolution of the Audit Committee, or (ii) by oral or written approval of the service by the Chair of the Audit Committee (or if the Chair is unavailable, such other member of the Audit Committee as may be designated by the Chair to act in the Chair's absence). The approval contemplated by (ii) above is permitted where the Treasurer determines that action on such an engagement is necessary before the next meeting of the Audit Committee. Neither pre-approval nor advance notice of Non-Covered Service engagements for which fees are not expected to exceed $50,000 is required; such engagements are to be reported to the Audit Committee monthly.
(e) (2) | Services approved pursuant to paragraph (c)(7)(i)(C) of Rule 2-01 of Regulation S-X: |
Audit-Related Fees:
There were no amounts that were approved by the Audit Committee pursuant to the de minimis exception for the fiscal years ended March 31, 2006 and March 31, 2005 on behalf of each fund.
There were no amounts that were required to be approved by the Audit Committee pursuant to the de minimis exception for the fiscal years ended March 31, 2006 and March 31, 2005 on behalf of the Fund Service Providers that relate directly to the operations and financial reporting of each fund.
Tax Fees:
There were no amounts that were approved by the Audit Committee pursuant to the de minimis exception for the fiscal years ended March 31, 2006 and March 31, 2005 on behalf of each fund.
There were no amounts that were required to be approved by the Audit Committee pursuant to the de minimis exception for the fiscal years ended March 31, 2006 and March 31, 2005 on behalf of the Fund Service Providers that relate directly to the operations and financial reporting of each fund.
All Other Fees:
There were no amounts that were approved by the Audit Committee pursuant to the de minimis exception for the fiscal years ended March 31, 2006 and March 31, 2005 on behalf of each fund.
There were no amounts that were required to be approved by the Audit Committee pursuant to the de minimis exception for the fiscal years ended March 31, 2006 and March 31, 2005 on behalf of the Fund Service Providers that relate directly to the operations and financial reporting of each fund.
(f) Not applicable.
(g) For the fiscal years ended March 31, 2006 and March 31, 2005, the aggregate fees billed by PwC of $1,075,000A and $1,500,000A,B for non-audit services rendered on behalf of the funds, FMR (not including any sub-adviser whose role is primarily portfolio management and is subcontracted with or overseen by another investment adviser) and Fund Service Providers relating to Covered Services and Non-Covered Services are shown in the table below.
| 2006A | 2005A |
Covered Services | $200,000 | $500,000 |
Non-Covered Services | $875,000 | $1,000,000B |
A | Aggregate amounts may reflect rounding. |
B | Reflects current period presentation. |
For the fiscal years ended March 31, 2006 and March 31, 2005, the aggregate fees billed by Deloitte Entities of $355,000A and $800,000A,B for non-audit services rendered on behalf of the fund, FMR (not including any sub-adviser whose role is primarily portfolio management and is subcontracted with or overseen by another investment adviser) and Fund Service Providers relating to Covered Services and Non-Covered Services are shown in the table below.
| 2006A | 2005A |
Covered Services | $180,000 | $500,000 |
Non-Covered Services | $175,000 | $300,000B |
A | Aggregate amounts may reflect rounding. |
B | Reflects current period presentation. |
(h) The trust's Audit Committee has considered Non-Covered Services that were not pre-approved that were provided by PwC and Deloitte Entities to Fund Service Providers to be compatible with maintaining the independence of PwC and Deloitte Entities in their audit of the funds, taking into account representations from PwC and Deloitte Entities, in accordance with Independence Standards Board Standard No.1, regarding their independence from the funds and their related entities.
Item 5. Audit Committee of Listed Registrants
Not applicable.
Item 6. Schedule of Investments
Not applicable.
Item 7. Disclosure of Proxy Voting Policies and Procedures for Closed-End Management Investment Companies
Not applicable.
Item 8. Portfolio Managers of Closed-End Management Investment Companies
Not applicable.
Item 9. Purchase of Equity Securities by Closed-End Management Investment Company and Affiliated Purchasers
Not applicable.
Item 10. Submission of Matters to a Vote of Security Holders
There were no material changes to the procedures by which shareholders may recommend nominees to the trust's Board of Trustees.
Item 11. Controls and Procedures
(a)(i) The President and Treasurer and the Chief Financial Officer have concluded that the trust's disclosure controls and procedures (as defined in Rule 30a-3(c) under the Investment Company Act) provide reasonable assurances that material information relating to the trust is made known to them by the appropriate persons, based on their evaluation of these controls and procedures as of a date within 90 days of the filing date of this report.
(a)(ii) There was no change in the trust's internal control over financial reporting (as defined in Rule 30a-3(d) under the Investment Company Act) that occurred during the second fiscal quarter of the period covered by this report that has materially affected, or is reasonably likely to materially affect, the trust's internal control over financial reporting.
Item 12. Exhibits
(a) | (1) | Code of Ethics pursuant to Item 2 of Form N-CSR is filed and attached hereto as EX-99.CODE ETH. |
(a) | (2) | Certification pursuant to Rule 30a-2(a) under the Investment Company Act of 1940 (17 CFR 270.30a-2(a)) is filed and attached hereto as Exhibit 99.CERT. |
(a) | (3) | Not applicable. |
(b) | | Certification pursuant to Rule 30a-2(b) under the Investment Company Act of 1940 (17 CFR 270.30a-2(b)) is furnished and attached hereto as Exhibit 99.906CERT. |
SIGNATURES
Pursuant to the requirements of the Securities Exchange Act of 1934 and the Investment Company Act of 1940, the registrant has duly caused this report to be signed on its behalf by the undersigned, thereunto duly authorized.
Fidelity Aberdeen Street Trust
By: | /s/Christine Reynolds |
| Christine Reynolds |
| President and Treasurer |
| |
Date: | May 22, 2006 |
Pursuant to the requirements of the Securities Exchange Act of 1934 and the Investment Company Act of 1940, this report has been signed below by the following persons on behalf of the registrant and in the capacities and on the dates indicated.
By: | /s/Christine Reynolds |
| Christine Reynolds |
| President and Treasurer |
| |
Date: | May 22, 2006 |
By: | /s/Paul M. Murphy |
| Paul M. Murphy |
| Chief Financial Officer |
| |
Date: | May 22, 2006 |