UNITED STATES
SECURITIES AND EXCHANGE COMMISSION
Washington, D.C. 20549
FORM N-CSR
CERTIFIED SHAREHOLDER REPORT OF REGISTERED
MANAGEMENT INVESTMENT COMPANIES
Investment Company Act file number 811-6440
Fidelity Aberdeen Street Trust
(Exact name of registrant as specified in charter)
82 Devonshire St., Boston, Massachusetts 02109
(Address of principal executive offices) (Zip code)
Eric D. Roiter, Secretary
82 Devonshire St.
Boston, Massachusetts 02109
(Name and address of agent for service)
Registrant's telephone number, including area code: 617-563-7000
Date of fiscal year end: | March 31 |
| |
Date of reporting period: | March 31, 2005 |
Item 1. Reports to Stockholders
Fidelity Advisor Freedom Funds®-
Income, 2005, 2010, 2015, 2020, 2025, 2030, 2035, 2040 - Class A, Class T, Class B and Class C
Annual Report
March 31, 2005
(2_fidelity_logos) (Registered_Trademark)
Contents
To view a fund's proxy voting guidelines and proxy voting record for the 12-month period ended June 30, visit www.fidelity.com/proxyvotingresults or visit the Securities and Exchange Commission's (SEC) web site at www.sec.gov. You may also call 1-877-208-0098 to request a free copy of the proxy voting guidelines.
Standard & Poor's, S&P and S&P 500 are registered service marks of The McGraw-Hill Companies, Inc. and have been licensed for use by Fidelity Distributors Corporation.
Other third party marks appearing herein are the property of their respective owners.
All other marks appearing herein are registered or unregistered trademarks or service marks of FMR Corp. or an affiliated company.
Annual Report
This report and the financial statements contained herein are submitted for the general information of the shareholders of the funds. This report is not authorized for distribution to prospective investors in the fund unless preceded or accompanied by an effective prospectus.
A fund files its complete schedule of portfolio holdings with the SEC for the first and third quarters of each fiscal year on Form N-Q. Forms N-Q are available on the SEC's web site at http://www.sec.gov. A fund's Forms N-Q may be reviewed and copied at the SEC's Public Reference Room in Washington, DC. Information regarding the operation of the SEC's Public Reference Room may be obtained by calling 1-800-SEC-0330. For a complete list of a fund's portfolio holdings, view the most recent quarterly holdings report, semiannual report, or annual report on Fidelity's web site at http://www.advisor.fidelity.com.
NOT FDIC INSURED · MAY LOSE VALUE · NO BANK GUARANTEE
Neither the funds nor Fidelity Distributors Corporation is a bank.
Annual Report
Chairman's Message
(Photograph of Edward C. Johnson 3d.)
Dear Shareholder:
During the past year or so, much has been reported about the mutual fund industry, and much of it has been more critical than I believe is warranted. Allegations that some companies have been less than forthright with their shareholders have cast a shadow on the entire industry. I continue to find these reports disturbing, and assert that they do not create an accurate picture of the industry overall. Therefore, I would like to remind everyone where Fidelity stands on these issues. I will say two things specifically regarding allegations that some mutual fund companies were in violation of the Securities and Exchange Commission's forward pricing rules or were involved in so-called "market timing" activities.
First, Fidelity has no agreements that permit customers who buy fund shares after 4 p.m. to obtain the 4 p.m. price. This is not a new policy. This is not to say that someone could not deceive the company through fraudulent acts. However, we are extremely diligent in preventing fraud from occurring in this manner - and in every other. But I underscore again that Fidelity has no so-called "agreements" that sanction illegal practices.
Second, Fidelity continues to stand on record, as we have for years, in opposition to predatory short-term trading that adversely affects shareholders in a mutual fund. Back in the 1980s, we initiated a fee - which is returned to the fund and, therefore, to investors - to discourage this activity. Further, we took the lead several years ago in developing a Fair Value Pricing Policy to prevent market timing on foreign securities in our funds. I am confident we will find other ways to make it more difficult for predatory traders to operate. However, this will only be achieved through close cooperation among regulators, legislators and the industry.
Yes, there have been unfortunate instances of unethical and illegal activity within the mutual fund industry from time to time. That is true of any industry. When this occurs, confessed or convicted offenders should be dealt with appropriately. But we are still concerned about the risk of over-regulation and the quick application of simplistic solutions to intricate problems. Every system can be improved, and we support and applaud well thought out improvements by regulators, legislators and industry representatives that achieve the common goal of building and protecting the value of investors' holdings.
For nearly 60 years, Fidelity has worked very hard to improve its products and service to justify your trust. When our family founded this company in 1946, we had only a few hundred customers. Today, we serve more than 18 million customers including individual investors and participants in retirement plans across America.
Let me close by saying that we do not take your trust in us for granted, and we realize that we must always work to improve all aspects of our service to you. In turn, we urge you to continue your active participation with your financial matters, so that your interests can be well served.
Best regards,
/s/Edward C. Johnson 3d
Edward C. Johnson 3d
Annual Report
Fidelity Advisor Freedom Income Fund® - Class A, T, B, and C
Performance: The Bottom Line
Average annual total return reflects the change in the value of an investment, assuming reinvestment of the fund's dividend income and capital gains (the profits earned upon the sale of securities that have grown in value) and assuming a constant rate of performance each year. The $10,000 table and each class's returns do not reflect the deduction of taxes that a shareholder would pay on fund distributions or the redemption of fund shares. During periods of reimbursement by Fidelity, a fund's total return will be greater than it would be had the reimbursement not occurred. How a fund did yesterday is no guarantee of how it will do tomorrow.
Average Annual Total Returns
Periods ended March 31, 2005 | Past 1
year | Life of
fund A |
Class A | 0.99% | 3.50% |
Class A (incl. 5.75% sales charge) | -4.82% | -0.07% |
Class T | 0.79% | 3.29% |
Class T (incl. 3.50% sales charge) | -2.74% | 1.13% |
Class B | 0.23% | 2.75% |
Class B (incl. contingent deferred sales charge) B | -4.73% | 0.40% |
Class C | 0.24% | 2.73% |
Class C (incl. contingent deferred sales charge) C | -0.75% | 2.73% |
A From July 24, 2003.
B Class B shares' contingent deferred sales charges included in the past one year and life of fund total return figures are 5% and 4%, respectively.
C Class C shares' contingent deferred sales charges included in the past one year and life of fund total return figures are 1% and 0%, respectively.
$10,000 Over Life of Fund
Let's say hypothetically that $10,000 was invested in Fidelity Advisor Freedom Income - Class T on July 24, 2003, when the fund started, and the current 3.50% sales charge was paid. The chart shows how the value of your investment would have changed, and also shows how the Lehman Brothers® Aggregate Bond Index performed over the same period.
Annual Report
Fidelity Advisor Freedom 2005 Fund ® - Class A, T, B, and C
Performance: The Bottom Line
Average annual total return reflects the change in the value of an investment, assuming reinvestment of the fund's dividend income and capital gains (the profits earned upon the sale of securities that have grown in value) and assuming a constant rate of performance each year. The $10,000 table and each class's returns do not reflect the deduction of taxes that a shareholder would pay on fund distributions or the redemption of fund shares. During periods of reimbursement by Fidelity, a fund's total return will be greater than it would be had the reimbursement not occurred. How a fund did yesterday is no guarantee of how it will do tomorrow.
Average Annual Total Returns
Periods ended March 31, 2005 | | Past 1
year | Life of
fund A |
Class A | | 2.38% | 5.67% |
Class A (incl. 5.75% sales charge) | | -3.50% | 1.30% |
Class T | | 2.17% | 5.41% |
Class T (incl. 3.50% sales charge) | | -1.41% | 2.76% |
Class B | | 1.64% | 4.91% |
Class B (incl. contingent deferred sales charge) B | | -3.36% | 2.09% |
Class C | | 1.74% | 4.98% |
Class C (incl. contingent deferred sales charge) C | | 0.74% | 4.98% |
A From November 6, 2003.
B Class B shares' contingent deferred sales charges included in the past one year and life of fund total return figures are 5% and 4%, respectively.
C Class C shares' contingent deferred sales charges included in the past one year and life of fund total return figures are 1% and 0%, respectively.
$10,000 Over Life of Fund
Let's say hypothetically that $10,000 was invested in Fidelity Advisor Freedom 2005 - Class T on November 6, 2003, when the fund started, and the current 3.50% sales charge was paid. The chart shows how the value of your investment would have changed, and also shows how the Lehman Brothers Aggregate Bond Index performed over the same period.
Annual Report
Fidelity Advisor Freedom 2010 Fund ® - Class A, T, B, and C
Performance: The Bottom Line
Average annual total return reflects the change in the value of an investment, assuming reinvestment of the fund's dividend income and capital gains (the profits earned upon the sale of securities that have grown in value) and assuming a constant rate of performance each year. The $10,000 table and each class's returns do not reflect the deduction of taxes that a shareholder would pay on fund distributions or the redemption of fund shares. During periods of reimbursement by Fidelity, a fund's total return will be greater than it would be had the reimbursement not occurred. How a fund did yesterday is no guarantee of how it will do tomorrow.
Average Annual Total Returns
Periods ended March 31, 2005 | | Past 1
year | Life of
fund A |
Class A | | 2.48% | 7.31% |
Class A (incl. 5.75% sales charge) | | -3.41% | 3.61% |
Class T | | 2.18% | 7.01% |
Class T (incl. 3.50% sales charge) | | -1.40% | 4.77% |
Class B | | 1.72% | 6.49% |
Class B (incl. contingent deferred sales charge) B | | -3.28% | 4.20% |
Class C | | 1.72% | 6.49% |
Class C (incl. contingent deferred sales charge) C | | 0.72% | 6.49% |
A From July 24, 2003.
B Class B shares' contingent deferred sales charges included in the past one year and life of fund total return figures are 5% and 4%, respectively.
C Class C shares' contingent deferred sales charges included in the past one year and life of fund total return figures are 1% and 0%, respectively.
$10,000 Over Life of Fund
Let's say hypothetically that $10,000 was invested in Fidelity Advisor Freedom 2010 - Class T on July 31, 2003, shortly after the fund started, and the current 3.50% sales charge was paid. The chart shows how the value of your investment would have changed, and also shows how the Standard & Poor's 500SM Index and the Lehman Brothers Aggregate Bond Index(dagger) performed over the same period.
* Going forward the Fidelity Advisor Freedom 2010 Fund will use the Lehman Brothers Aggregate Bond Index, rather than the S&P 500 Index, as its
SEC benchmark. The Lehman Brothers Aggregate Bond Index more closely represents the fund's investment strategy as fixed-income and short-term funds
currently represent the majority of the fund's assets.
Annual Report
Fidelity Advisor Freedom 2015 Fund® - Class A, T, B, and C
Performance: The Bottom Line
Average annual total return reflects the change in the value of an investment, assuming reinvestment of the fund's dividend income and capital gains (the profits earned upon the sale of securities that have grown in value) and assuming a constant rate of performance each year. The $10,000 table and each class's returns do not reflect the deduction of taxes that a shareholder would pay on fund distributions or the redemption of fund shares. During periods of reimbursement by Fidelity, a fund's total return will be greater than it would be had the reimbursement not occurred. How a fund did yesterday is no guarantee of how it will do tomorrow.
Average Annual Total Returns
Periods ended March 31, 2005 | | Past 1
year | Life of
fund A |
Class A | | 3.22% | 6.87% |
Class A (incl. 5.75% sales charge) | | -2.71% | 2.44% |
Class T | | 3.01% | 6.68% |
Class T (incl. 3.50% sales charge) | | -0.59% | 4.00% |
Class B | | 2.49% | 6.21% |
Class B (incl. contingent deferred sales charge) B | | -2.51% | 3.41% |
Class C | | 2.47% | 6.16% |
Class C (incl. contingent deferred sales charge) C | | 1.47% | 6.16% |
A From November 6, 2003.
B Class B shares' contingent deferred sales charges included in the past one year and life of fund total return figures are 5% and 4%, respectively.
C Class C shares' contingent deferred sales charges included in the past one year and life of fund total return figures are 1% and 0%, respectively.
$10,000 Over Life of Fund
Let's say hypothetically that $10,000 was invested in Fidelity Advisor Freedom 2015 - Class T on November 6, 2003, when the fund started, and the current 3.50% sales charge was paid. The chart shows how the value of your investment would have changed, and also shows how the Standard & Poor's 500 Index performed over the same period.
Annual Report
Fidelity Advisor Freedom 2020 Fund® - Class A, T, B, and C
Performance: The Bottom Line
Average annual total return reflects the change in the value of an investment, assuming reinvestment of the fund's dividend income and capital gains (the profits earned upon the sale of securities that have grown in value) and assuming a constant rate of performance each year. The $10,000 table and each class's returns do not reflect the deduction of taxes that a shareholder would pay on fund distributions or the redemption of fund shares. During periods of reimbursement by Fidelity, a fund's total return will be greater than it would be had the reimbursement not occurred. How a fund did yesterday is no guarantee of how it will do tomorrow.
Average Annual Total Returns
Periods ended March 31, 2005 | | Past 1
year | Life of
fund A |
Class A | | 3.75% | 10.33% |
Class A (incl. 5.75% sales charge) | | -2.21% | 6.53% |
Class T | | 3.46% | 10.12% |
Class T (incl. 3.50% sales charge) | | -0.16% | 7.82% |
Class B | | 2.93% | 9.58% |
Class B (incl. contingent deferred sales charge) B | | -2.07% | 7.34% |
Class C | | 3.02% | 9.61% |
Class C (incl. contingent deferred sales charge) C | | 2.02% | 9.61% |
A From July 24, 2003.
B Class B shares' contingent deferred sales charges included in the past one year and life of fund total return figures are 5% and 4%, respectively.
C Class C shares' contingent deferred sales charges included in the past one year and life of fund total return figures are 1% and 0%, respectively.
$10,000 Over Life of Fund
Let's say hypothetically that $10,000 was invested in Fidelity Advisor Freedom 2020 - Class T on July 24, 2003, when the fund started, and the current 3.50% sales charge was paid. The chart shows how the value of your investment would have changed, and also shows how the Standard & Poor's 500 Index performed over the same period.

Annual Report
Fidelity Advisor Freedom 2025 Fund® - Class A, T, B, and C
Performance: The Bottom Line
Average annual total return reflects the change in the value of an investment, assuming reinvestment of the fund's dividend income and capital gains (the profits earned upon the sale of securities that have grown in value) and assuming a constant rate of performance each year. The $10,000 table and each class's returns do not reflect the deduction of taxes that a shareholder would pay on fund distributions or the redemption of fund shares. During periods of reimbursement by Fidelity, a fund's total return will be greater than it would be had the reimbursement not occurred. How a fund did yesterday is no guarantee of how it will do tomorrow.
Average Annual Total Returns
Periods ended March 31, 2005 | | Past 1
year | Life of
fund A |
Class A | | 3.96% | 8.13% |
Class A (incl. 5.75% sales charge) | | -2.02% | 3.65% |
Class T | | 3.75% | 8.13% |
Class T (incl. 3.50% sales charge) | | 0.12% | 5.41% |
Class B | | 3.29% | 7.39% |
Class B (incl. contingent deferred sales charge) B | | -1.71% | 4.59% |
Class C | | 3.19% | 7.34% |
Class C (incl. contingent deferred sales charge) C | | 2.19% | 7.34% |
A From November 6, 2003.
B Class B shares' contingent deferred sales charges included in the past one year and life of fund total return figures are 5% and 4%, respectively.
C Class C shares' contingent deferred sales charges included in the past one year and life of fund total return figures are 1% and 0%, respectively.
$10,000 Over Life of Fund
Let's say hypothetically that $10,000 was invested in Fidelity Advisor Freedom 2025 - Class T on November 6, 2003, when the fund started, and the current 3.50% sales charge was paid. The chart shows how the value of your investment would have changed, and also shows how the Standard & Poor's 500 Index performed over the same period.
Annual Report
Fidelity Advisor Freedom 2030 Fund® - Class A, T, B, and C
Performance: The Bottom Line
Average annual total return reflects the change in the value of an investment, assuming reinvestment of the fund's dividend income and capital gains (the profits earned upon the sale of securities that have grown in value) and assuming a constant rate of performance each year. The $10,000 table and each class's returns do not reflect the deduction of taxes that a shareholder would pay on fund distributions or the redemption of fund shares. During periods of reimbursement by Fidelity, a fund's total return will be greater than it would be had the reimbursement not occurred. How a fund did yesterday is no guarantee of how it will do tomorrow.
Average Annual Total Returns
Periods ended March 31, 2005 | | Past 1
year | Life of
fund A |
Class A | | 4.19% | 11.70% |
Class A (incl. 5.75% sales charge) | | -1.80% | 7.85% |
Class T | | 3.91% | 11.43% |
Class T (incl. 3.50% sales charge) | | 0.27% | 9.10% |
Class B | | 3.41% | 10.88% |
Class B (incl. contingent deferred sales charge) B | | -1.59% | 8.66% |
Class C | | 3.41% | 10.88% |
Class C (incl. contingent deferred sales charge)C | | 2.41% | 10.88% |
A From July 24, 2003.
B Class B shares' contingent deferred sales charges included in the past one year and life of fund total return figures are 5% and 4%, respectively.
C Class C shares' contingent deferred sales charges included in the past one year and life of fund total return figures are 1% and 0%, respectively.
$10,000 Over Life of Fund
Let's say hypothetically that $10,000 was invested in Fidelity Advisor Freedom 2030 - Class T on July 24, 2003, when the fund started, and the current 3.50% sales charge was paid. The chart shows how the value of your investment would have changed, and also shows how the Standard & Poor's 500 Index performed over the same period.
Annual Report
Fidelity Advisor Freedom 2035 Fund® - Class A, T, B, and C
Performance: The Bottom Line
Average annual total return reflects the change in the value of an investment, assuming reinvestment of the fund's dividend income and capital gains (the profits earned upon the sale of securities that have grown in value) and assuming a constant rate of performance each year. The $10,000 table and each class's returns do not reflect the deduction of taxes that a shareholder would pay on fund distributions or the redemption of fund shares. During periods of reimbursement by Fidelity, a fund's total return will be greater than it would be had the reimbursement not occurred. How a fund did yesterday is no guarantee of how it will do tomorrow.
Average Annual Total Returns
Periods ended March 31, 2005 | | Past 1
year | Life of
fund A |
Class A | | 4.76% | 9.14% |
Class A (incl. 5.75% sales charge) | | -1.26% | 4.62% |
Class T | | 4.37% | 8.74% |
Class T (incl. 3.50% sales charge) | | 0.72% | 6.00% |
Class B | | 3.88% | 8.19% |
Class B (incl. contingent deferred sales charge) B | | -1.12% | 5.40% |
Class C | | 3.87% | 8.25% |
Class C (incl. contingent deferred sales charge)C | | 2.87% | 8.25% |
A From November 6, 2003.
B Class B shares' contingent deferred sales charges included in the past one year and life of fund total return figures are 5% and 4%, respectively.
C Class C shares' contingent deferred sales charges included in the past one year and life of fund total return figures are 1% and 0%, respectively.
$10,000 Over Life of Fund
Let's say hypothetically that $10,000 was invested in Fidelity Advisor Freedom 2035 - Class T on November 6, 2003, when the fund started, and the current 3.50% sales charge was paid. The chart shows how the value of your investment would have changed, and also shows how the Standard & Poor's 500 Index performed over the same period.
Annual Report
Fidelity Advisor Freedom 2040 Fund® - Class A, T, B, and C
Performance: The Bottom Line
Average annual total return reflects the change in the value of an investment, assuming reinvestment of the fund's dividend income and capital gains (the profits earned upon the sale of securities that have grown in value) and assuming a constant rate of performance each year. The $10,000 table and each class's returns do not reflect the deduction of taxes that a shareholder would pay on fund distributions or the redemption of fund shares. During periods of reimbursement by Fidelity, a fund's total return will be greater than it would be had the reimbursement not occurred. How a fund did yesterday is no guarantee of how it will do tomorrow.
Average Annual Total Returns
Periods ended March 31, 2005 | | Past 1
year | Life of
fund A |
Class A | | 4.87% | 12.99% |
Class A (incl. 5.75% sales charge) | | -1.16% | 9.09% |
Class T | | 4.57% | 12.65% |
Class T (incl. 3.50% sales charge) | | 0.91% | 10.30% |
Class B | | 4.04% | 12.11% |
Class B (incl. contingent deferred sales charge) B | | -0.96% | 9.91% |
Class C | | 4.04% | 12.09% |
Class C (incl. contingent deferred sales charge) C | | 3.04% | 12.09% |
A From July 24, 2003.
B Class B shares' contingent deferred sales charges included in the past one year and life of fund total return figures are 5% and 4%, respectively.
C Class C shares' contingent deferred sales charges included in the past one year and life of fund total return figures are 1% and 0%, respectively.
$10,000 Over Life of Fund
Let's say hypothetically that $10,000 was invested in Fidelity Advisor Freedom 2040 - Class T on July 24, 2003, when the fund started, and the current 3.50% sales charge was paid. The chart shows how the value of your investment would have changed, and also shows how the Standard & Poor's 500 Index performed over the same period.
Annual Report
Managements' Discussion of Fund Performance
Comments from Ren Cheng and Jonathan Shelon, Co-Portfolio Managers of Fidelity Advisor Freedom Funds®
Major U.S. equity benchmarks posted modest gains for the 12 months ending March 31, 2005. Stocks soared in the final quarter of 2004 in response to falling oil prices, a clear-cut conclusion to the presidential election, and positive economic and employment reports. The late-year surge accounted for nearly all of the 2004 calendar year's positive return. But the markets reversed course in the first quarter of 2005, as oil prices hit a record high of $57 per barrel and gasoline prices surged. Inflation concerns also took a toll, and the Federal Reserve Board hiked short-term interest rates seven times during the period. Despite the turmoil, most bellwether measures of U.S. equity market performance finished the period in the black. The broad-based Dow Jones Wilshire 5000 Composite IndexSM gained 7.19%. By comparison, overseas equity markets fared much better, helped in part by the U.S. dollar's weakness versus major foreign currencies for most of the year. The Morgan Stanley Capital InternationalSM Europe, Australasia, Far East (MSCI® EAFE®) Index, a proxy for the performance of overseas markets, rose 15.22%. Turning to fixed-income results, investment-grade bonds had only slightly positive returns for the year overall, tempered by rising interest rates and inflation concerns. The Lehman Brothers® Aggregate Bond Index returned 1.15%. High-yield bonds were the best-performing debt category, as evidenced by the 6.94% increase in the Merrill Lynch® U.S. High Yield Master II Index, bolstered by improving issuer fundamentals and very low default rates.
The Advisor Freedom Funds generally performed in line with our expectations during the year ending March 31, 2005, delivering a range of absolute returns appropriate for a series of portfolios with different asset allocations. (For specific performance results, please refer to the portfolio performance section of the Shareholder Update.) On a relative basis, the Advisor Freedom Funds trailed their respective benchmarks, due mainly to the Funds not participating in the strength of the domestic and international equity markets at the smaller end of the capitalization spectrum. More specifically, the Funds' underlying large-cap, growth-oriented funds, such as Fidelity® Advisor Large Cap Fund and Fidelity Advisor Equity Growth Fund, underperformed the Wilshire 5000 index. Within fixed income, Fidelity Advisor Intermediate Bond Fund was a notable laggard, while Fidelity Advisor High Income Advantage Fund was a strong outperformer in the high-yield category. In international equities, despite the tail wind of a strong European market and a weak U.S. dollar, our underlying international funds were poor relative performers during the period.
The views expressed in this statement reflect those of the portfolio managers only through the end of the period of the report as stated on the cover and do not necessarily represent the views of Fidelity or any other person in the Fidelity organization. Any such views are subject to change at any time based upon market or other conditions and Fidelity disclaims any responsibility to update such views. These views may not be relied on as investment advice and, because investment decisions for a Fidelity fund are based on numerous factors, may not be relied on as an indication of trading intent on behalf of any Fidelity fund.
Annual Report
Shareholder Expense Example
As a shareholder of a Fund, you incur two types of costs: (1) transaction costs, including sales charges (loads) on purchase payments or redemption proceeds, and (2) ongoing costs, including management fees, distribution and/or service (12b-1) fees and other Fund expenses. This Example is intended to help you understand your ongoing costs (in dollars) of investing in the Funds and to compare these costs with the ongoing costs of investing in other mutual funds.
The Example is based on an investment of $1,000 invested at the beginning of the period and held for the entire period (October 1, 2004 to March 31, 2005).
Actual Expenses
The first line of the table below for each class of each fund provides information about actual account values and actual expenses. You may use the information in this line, together with the amount you invested, to estimate the expenses that you paid over the period. Simply divide your account value by $1,000.00 (for example, an $8,600 account value divided by $1,000.00 = 8.6), then multiply the result by the number in the first line for a class of the fund under the heading entitled "Expenses Paid During Period" to estimate the expenses you paid on your account during this period. In addition, each fund, as a shareholder in underlying Fidelity funds, will indirectly bear its pro rata share of the fees and expenses incurred by the underlying Fidelity funds. These fees and expenses are not included in each fund's annualized expense ratio used to calculate the expense estimates in the table below. If they were, the estimate of expense you paid during the period would be higher, and your ending account value lower.
Hypothetical Example for Comparison Purposes
The second line of the table below for each class of each fund provides information about hypothetical account values and hypothetical expenses based on a Class' actual expense ratio and an assumed rate of return of 5% per year before expenses, which is not the Class' actual return. The hypothetical account values and expenses may not be used to estimate the actual ending account balance or expenses you paid for the period. You may use this information to compare the ongoing costs of investing in the Fund and other funds. To do so, compare this 5% hypothetical example with the 5% hypothetical examples that appear in the shareholder reports of the other funds. In addition, each fund, as a shareholder in underlying Fidelity funds, will indirectly bear its pro rata share of the fees and expenses incurred by the underlying Fidelity funds. These fees and expenses are not included in each fund's annualized expense ratio used to calculate the expense estimates in the table below. If they were, the estimate of expense you paid during the period would be higher, and your ending account value lower.
Please note that the expenses shown in the table are meant to highlight your ongoing costs only and do not reflect any transaction costs. Therefore, the second line of the table is useful in comparing ongoing costs only, and will not help you determine the relative total costs of owning different funds. In addition, if these transactional costs were included, your costs would have been higher.
| Beginning
Account Value
October 1, 2004 | Ending
Account Value
March 31, 2005 | Expenses Paid
During Period*
October 1, 2004
to March 31, 2005 |
Advisor Freedom Income | | | |
Class A | | | |
Actual | $ 1,000.00 | $ 1,013.70 | $ 1.66** |
HypotheticalA | $ 1,000.00 | $ 1,023.29 | $ 1.66** |
Class T | | | |
Actual | $ 1,000.00 | $ 1,013.10 | $ 2.91** |
HypotheticalA | $ 1,000.00 | $ 1,022.04 | $ 2.92** |
Class B | | | |
Actual | $ 1,000.00 | $ 1,011.20 | $ 5.42** |
HypotheticalA | $ 1,000.00 | $ 1,019.55 | $ 5.44** |
Class C | | | |
Actual | $ 1,000.00 | $ 1,010.20 | $ 5.41** |
HypotheticalA | $ 1,000.00 | $ 1,019.55 | $ 5.44** |
Institutional Class | | | |
Actual | $ 1,000.00 | $ 1,015.60 | $ .40** |
HypotheticalA | $ 1,000.00 | $ 1,024.53 | $ .40** |
Advisor Freedom 2005 | | | |
Class A | | | |
Actual | $ 1,000.00 | $ 1,035.50 | $ 1.67** |
HypotheticalA | $ 1,000.00 | $ 1,023.29 | $ 1.66** |
Class T | | | |
Actual | $ 1,000.00 | $ 1,034.70 | $ 2.94** |
HypotheticalA | $ 1,000.00 | $ 1,022.04 | $ 2.92** |
Class B | | | |
Actual | $ 1,000.00 | $ 1,031.90 | $ 5.47** |
HypotheticalA | $ 1,000.00 | $ 1,019.55 | $ 5.44** |
| Beginning
Account Value
October 1, 2004 | Ending
Account Value
March 31, 2005 | Expenses Paid
During Period*
October 1, 2004
to March 31, 2005 |
Class C | | | |
Actual | $ 1,000.00 | $ 1,032.80 | $ 5.47** |
HypotheticalA | $ 1,000.00 | $ 1,019.55 | $ 5.44** |
Institutional Class | | | |
Actual | $ 1,000.00 | $ 1,037.40 | $ .41** |
HypotheticalA | $ 1,000.00 | $ 1,024.53 | $ .40** |
Advisor Freedom 2010 | | | |
Class A | | | |
Actual | $ 1,000.00 | $ 1,037.00 | $ 1.68** |
HypotheticalA | $ 1,000.00 | $ 1,023.29 | $ 1.66** |
Class T | | | |
Actual | $ 1,000.00 | $ 1,035.20 | $ 2.94** |
HypotheticalA | $ 1,000.00 | $ 1,022.04 | $ 2.92** |
Class B | | | |
Actual | $ 1,000.00 | $ 1,032.60 | $ 5.47** |
HypotheticalA | $ 1,000.00 | $ 1,019.55 | $ 5.44** |
Class C | | | |
Actual | $ 1,000.00 | $ 1,032.60 | $ 5.47** |
HypotheticalA | $ 1,000.00 | $ 1,019.55 | $ 5.44** |
Institutional Class | | | |
Actual | $ 1,000.00 | $ 1,037.80 | $ .41** |
HypotheticalA | $ 1,000.00 | $ 1,024.53 | $ .40** |
Advisor Freedom 2015 | | | |
Class A | | | |
Actual | $ 1,000.00 | $ 1,048.90 | $ 1.69** |
HypotheticalA | $ 1,000.00 | $ 1,023.29 | $ 1.66** |
Class T | | | |
Actual | $ 1,000.00 | $ 1,048.00 | $ 2.96** |
HypotheticalA | $ 1,000.00 | $ 1,022.04 | $ 2.92** |
Class B | | | |
Actual | $ 1,000.00 | $ 1,045.30 | $ 5.51** |
HypotheticalA | $ 1,000.00 | $ 1,019.55 | $ 5.44** |
Class C | | | |
Actual | $ 1,000.00 | $ 1,045.30 | $ 5.51** |
HypotheticalA | $ 1,000.00 | $ 1,019.55 | $ 5.44** |
Institutional Class | | | |
Actual | $ 1,000.00 | $ 1,050.60 | $ .41** |
HypotheticalA | $ 1,000.00 | $ 1,024.53 | $ .40** |
Advisor Freedom 2020 | | | |
Class A | | | |
Actual | $ 1,000.00 | $ 1,056.70 | $ 1.69** |
HypotheticalA | $ 1,000.00 | $ 1,023.29 | $ 1.66** |
Class T | | | |
Actual | $ 1,000.00 | $ 1,055.90 | $ 2.97** |
HypotheticalA | $ 1,000.00 | $ 1,022.04 | $ 2.92** |
Class B | | | |
Actual | $ 1,000.00 | $ 1,053.40 | $ 5.53** |
HypotheticalA | $ 1,000.00 | $ 1,019.55 | $ 5.44** |
Class C | | | |
Actual | $ 1,000.00 | $ 1,053.40 | $ 5.53** |
HypotheticalA | $ 1,000.00 | $ 1,019.55 | $ 5.44** |
Institutional Class | | | |
Actual | $ 1,000.00 | $ 1,058.30 | $ .41** |
HypotheticalA | $ 1,000.00 | $ 1,024.53 | $ .40** |
Advisor Freedom 2025 | | | |
Class A | | | |
Actual | $ 1,000.00 | $ 1,062.60 | $ 1.70** |
HypotheticalA | $ 1,000.00 | $ 1,023.29 | $ 1.66** |
| Beginning
Account Value
October 1, 2004 | Ending
Account Value
March 31, 2005 | Expenses Paid
During Period*
October 1, 2004
to March 31, 2005 |
Class T | | | |
Actual | $ 1,000.00 | $ 1,061.50 | $ 2.98** |
HypotheticalA | $ 1,000.00 | $ 1,022.04 | $ 2.92** |
Class B | | | |
Actual | $ 1,000.00 | $ 1,058.60 | $ 5.54** |
HypotheticalA | $ 1,000.00 | $ 1,019.55 | $ 5.44** |
Class C | | | |
Actual | $ 1,000.00 | $ 1,058.60 | $ 5.54** |
HypotheticalA | $ 1,000.00 | $ 1,019.55 | $ 5.44** |
Institutional Class | | | |
Actual | $ 1,000.00 | $ 1,063.30 | $ .41** |
HypotheticalA | $ 1,000.00 | $ 1,024.53 | $ .40** |
Advisor Freedom 2030 | | | |
Class A | | | |
Actual | $ 1,000.00 | $ 1,065.70 | $ 1.70** |
HypotheticalA | $ 1,000.00 | $ 1,023.29 | $ 1.66** |
Class T | | | |
Actual | $ 1,000.00 | $ 1,065.00 | $ 2.99** |
HypotheticalA | $ 1,000.00 | $ 1,022.04 | $ 2.92** |
Class B | | | |
Actual | $ 1,000.00 | $ 1,061.70 | $ 5.55** |
HypotheticalA | $ 1,000.00 | $ 1,019.55 | $ 5.44** |
Class C | | | |
Actual | $ 1,000.00 | $ 1,061.70 | $ 5.55** |
HypotheticalA | $ 1,000.00 | $ 1,019.55 | $ 5.44** |
Institutional Class | | | |
Actual | $ 1,000.00 | $ 1,067.40 | $ .41** |
HypotheticalA | $ 1,000.00 | $ 1,024.53 | $ .40** |
Advisor Freedom 2035 | | | |
Class A | | | |
Actual | $ 1,000.00 | $ 1,072.00 | $ 1.70** |
HypotheticalA | $ 1,000.00 | $ 1,023.29 | $ 1.66** |
Class T | | | |
Actual | $ 1,000.00 | $ 1,070.30 | $ 2.99** |
HypotheticalA | $ 1,000.00 | $ 1,022.04 | $ 2.92** |
Class B | | | |
Actual | $ 1,000.00 | $ 1,067.70 | $ 5.57** |
HypotheticalA | $ 1,000.00 | $ 1,019.55 | $ 5.44** |
Class C | | | |
Actual | $ 1,000.00 | $ 1,067.60 | $ 5.57** |
HypotheticalA | $ 1,000.00 | $ 1,019.55 | $ 5.44** |
Institutional Class | | | |
Actual | $ 1,000.00 | $ 1,072.80 | $ .41** |
HypotheticalA | $ 1,000.00 | $ 1,024.53 | $ .40** |
Advisor Freedom 2040 | | | |
Class A | | | |
Actual | $ 1,000.00 | $ 1,074.70 | $ 1.71** |
HypotheticalA | $ 1,000.00 | $ 1,023.29 | $ 1.66** |
Class T | | | |
Actual | $ 1,000.00 | $ 1,073.20 | $ 3.00** |
HypotheticalA | $ 1,000.00 | $ 1,022.04 | $ 2.92** |
Class B | | | |
Actual | $ 1,000.00 | $ 1,070.00 | $ 5.57** |
HypotheticalA | $ 1,000.00 | $ 1,019.55 | $ 5.44** |
| Beginning
Account Value
October 1, 2004 | Ending
Account Value
March 31, 2005 | Expenses Paid
During Period*
October 1, 2004
to March 31, 2005 |
Class C | | | |
Actual | $ 1,000.00 | $ 1,070.90 | $ 5.58** |
HypotheticalA | $ 1,000.00 | $ 1,019.55 | $ 5.44** |
Institutional Class | | | |
Actual | $ 1,000.00 | $ 1,075.50 | $ .41** |
HypotheticalA | $ 1,000.00 | $ 1,024.53 | $ .40** |
A 5% return per year before expenses
* Expenses are equal to each Class' annualized expense ratio (shown in the table below); multiplied by the average account value over the period, multiplied by 182/ 365 (to reflect the one-half year period). The fees and expenses of the underlying Fidelity funds in which the fund invests are not included in the fund's annualized expense ratio.
| Annualized
Expense Ratio |
Advisor Freedom Income | |
Class A | .33%** |
Class T | .58%** |
Class B | 1.08%** |
Class C | 1.08%** |
Institutional Class | .08%** |
Advisor Freedom 2005 | |
Class A | .33%** |
Class T | .58%** |
Class B | 1.08%** |
Class C | 1.08%** |
Institutional Class | .08%** |
Advisor Freedom 2010 | |
Class A | .33%** |
Class T | .58%** |
Class B | 1.08%** |
Class C | 1.08%** |
Institutional Class | .08%** |
Advisor Freedom 2015 | |
Class A | .33%** |
Class T | .58%** |
Class B | 1.08%** |
Class C | 1.08%** |
Institutional Class | .08%** |
Advisor Freedom 2020 | |
Class A | .33%** |
Class T | .58%** |
Class B | 1.08%** |
Class C | 1.08%** |
Institutional Class | .08%** |
Advisor Freedom 2025 | |
Class A | .33%** |
Class T | .58%** |
Class B | 1.08%** |
Class C | 1.08%** |
Institutional Class | .08%** |
Advisor Freedom 2030 | |
Class A | .33%** |
Class T | .58%** |
Class B | 1.08%** |
Class C | 1.08%** |
Institutional Class | .08%** |
| Annualized
Expense Ratio |
Advisor Freedom 2035 | |
Class A | .33%** |
Class T | .58%** |
Class B | 1.08%** |
Class C | 1.08%** |
Institutional Class | .08%** |
Advisor Freedom 2040 | |
Class A | .33%** |
Class T | .58%** |
Class B | 1.08%** |
Class C | 1.08%** |
Institutional Class | .08%** |
** As of May 1, 2005, Strategic Advisers agreed to waive the .10% management fee. On May 19, 2005, the Board of Trustees approved amendments to the management contracts. Under the amended contracts, the Funds no longer pay management fees. If this had been in effect during the period, the annualized expense ratio and expenses paid in the actual and hypothetical examples above (not including the fees and expenses of the underlying funds) would have been as follows:
| Annualized
Expense Ratio | Expenses
Paid |
Advisor Freedom Income | | |
Class A | .25% | |
Actual | | $ 1.26 |
HypotheticalA | | $ 1.26 |
Class T | .50% | |
Actual | | $ 2.51 |
HypotheticalA | | $ 2.52 |
Class B | 1.00% | |
Actual | | $ 5.02 |
HypotheticalA | | $ 5.04 |
Class C | 1.00% | |
Actual | | $ 5.01 |
HypotheticalA | | $ 5.04 |
Institutional Class | .00% | |
Actual | | $ .00 |
HypotheticalA | | $ .00 |
Advisor Freedom 2005 | | |
Class A | .25% | |
Actual | | $ 1.27 |
HypotheticalA | | $ 1.26 |
Class T | .50% | |
Actual | | $ 2.54 |
HypotheticalA | | $ 2.52 |
Class B | 1.00% | |
Actual | | $ 5.07 |
HypotheticalA | | $ 5.04 |
Class C | 1.00% | |
Actual | | $ 5.07 |
HypotheticalA | | $ 5.04 |
Institutional Class | .00% | |
Actual | | $ .00 |
HypotheticalA | | $ .00 |
Advisor Freedom 2010 | | |
Class A | .25% | |
Actual | | $ 1.27 |
HypotheticalA | | $ 1.26 |
| Annualized
Expense Ratio | Expenses
Paid |
Class T | .50% | |
Actual | | $ 2.54 |
HypotheticalA | | $ 2.52 |
Class B | 1.00% | |
Actual | | $ 5.07 |
HypotheticalA | | $ 5.04 |
Class C | 1.00% | |
Actual | | $ 5.07 |
HypotheticalA | | $ 5.04 |
Institutional Class | .00% | |
Actual | | $ .00 |
HypotheticalA | | $ .00 |
Advisor Freedom 2015 | | |
Class A | .25% | |
Actual | | $ 1.28 |
HypotheticalA | | $ 1.26 |
Class T | .50% | |
Actual | | $ 2.55 |
HypotheticalA | | $ 2.52 |
Class B | 1.00% | |
Actual | | $ 5.10 |
HypotheticalA | | $ 5.04 |
Class C | 1.00% | |
Actual | | $ 5.10 |
HypotheticalA | | $ 5.04 |
Institutional Class | .00% | |
Actual | | $ .00 |
HypotheticalA | | $ .00 |
Advisor Freedom 2020 | | |
Class A | .25% | |
Actual | | $ 1.28 |
HypotheticalA | | $ 1.26 |
Class T | .50% | |
Actual | | $ 2.56 |
HypotheticalA | | $ 2.52 |
Class B | 1.00% | |
Actual | | $ 5.12 |
HypotheticalA | | $ 5.04 |
Class C | 1.00% | |
Actual | | $ 5.12 |
HypotheticalA | | $ 5.04 |
Institutional Class | .00% | |
Actual | | $ .00 |
HypotheticalA | | $ .00 |
Advisor Freedom 2025 | | |
Class A | .25% | |
Actual | | $ 1.29 |
HypotheticalA | | $ 1.26 |
Class T | .50% | |
Actual | | $ 2.57 |
HypotheticalA | | $ 2.52 |
Class B | 1.00% | |
Actual | | $ 5.13 |
HypotheticalA | | $ 5.04 |
Class C | 1.00% | |
Actual | | $ 5.13 |
HypotheticalA | | $ 5.04 |
Institutional Class | .00% | |
Actual | | $ .00 |
HypotheticalA | | $ .00 |
| Annualized
Expense Ratio | Expenses
Paid |
Advisor Freedom 2030 | | |
Class A | .25% | |
Actual | | $ 1.29 |
HypotheticalA | | $ 1.26 |
Class T | .50% | |
Actual | | $ 2.57 |
HypotheticalA | | $ 2.52 |
Class B | 1.00% | |
Actual | | $ 5.14 |
HypotheticalA | | $ 5.04 |
Class C | 1.00% | |
Actual | | $ 5.14 |
HypotheticalA | | $ 5.04 |
Institutional Class | .00% | |
Actual | | $ .00 |
HypotheticalA | | $ .00 |
Advisor Freedom 2035 | | |
Class A | .25% | |
Actual | | $ 1.29 |
HypotheticalA | | $ 1.26 |
Class T | .50% | |
Actual | | $ 2.58 |
HypotheticalA | | $ 2.52 |
Class B | 1.00% | |
Actual | | $ 5.16 |
HypotheticalA | | $ 5.04 |
Class C | 1.00% | |
Actual | | $ 5.16 |
HypotheticalA | | $ 5.04 |
Institutional Class | .00% | |
Actual | | $ .00 |
HypotheticalA | | $ .00 |
Advisor Freedom 2040 | | |
Class A | .25% | |
Actual | | $ 1.29 |
HypotheticalA | | $ 1.26 |
Class T | .50% | |
Actual | | $ 2.58 |
HypotheticalA | | $ 2.52 |
Class B | 1.00% | |
Actual | | $ 5.16 |
HypotheticalA | | $ 5.04 |
Class C | 1.00% | |
Actual | | $ 5.16 |
HypotheticalA | | $ 5.04 |
Institutional Class | .00% | |
Actual | | $ .00 |
HypotheticalA | | $ .00 |
A 5% return per year before expenses
Annual Report
Fidelity Advisor Freedom Income Fund
Investment Changes
Fund Holdings as of March 31, 2005 |
| % of fund's
investments | % of fund's investments
6 months ago |
Domestic Equity Funds | | |
Fidelity Advisor Dividend Growth Fund Institutional Class | 3.9 | 3.8 |
Fidelity Advisor Equity Growth Fund Institutional Class | 1.9 | 1.9 |
Fidelity Advisor Equity Income Fund Institutional Class | 4.3 | 4.1 |
Fidelity Advisor Growth & Income Fund Institutional Class | 4.0 | 3.9 |
Fidelity Advisor Large Cap Fund Institutional Class | 3.9 | 3.8 |
Fidelity Advisor Mid-Cap Fund Institutional Class | 1.3 | 1.2 |
Fidelity Advisor Small Cap Fund Institutional Class | 1.4 | 1.3 |
| 20.7 | 20.0 |
Investment Grade Fixed-Income Funds |
Fidelity Advisor Government Investment Fund Institutional Class | 20.0 | 20.2 |
Fidelity Advisor Intermediate Bond Fund Institutional Class | 19.9 | 20.2 |
| 39.9 | 40.4 |
Short-Term Funds | | |
Fidelity Advisor Short-Fixed Income Fund Institutional Class | 15.7 | 15.9 |
Fidelity Cash Reserves Fund | 23.7 | 23.7 |
| 39.4 | 39.6 |
| 100.0 | 100.0 |
Asset Allocation (% of fund's investments) |
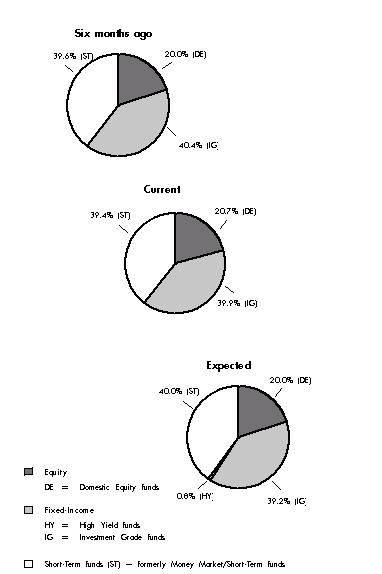
The fund invests according to an asset allocation strategy that becomes increasingly conservative over time. The six months ago allocation is based on the fund's holdings as of September 30, 2004. On or about June 1, 2005, the Fixed-Income funds allocation will begin to include high yield funds. The current allocation is based on the fund's holdings as of March 31, 2005. The expected allocation represents the fund's anticipated target asset allocation at September 30, 2005.
Annual Report
Fidelity Advisor Freedom Income Fund
Investments March 31, 2005
Showing Percentage of Total Value of Investment in Securities
Equity Funds - 20.7% |
| Shares | | Value (Note 1) |
Domestic Equity Funds - 20.7% |
Fidelity Advisor Dividend Growth Fund Institutional Class | 200,578 | | $ 2,282,574 |
Fidelity Advisor Equity Growth Fund Institutional Class | 24,674 | | 1,138,448 |
Fidelity Advisor Equity Income Fund Institutional Class | 87,626 | | 2,487,716 |
Fidelity Advisor Growth & Income Fund Institutional Class | 140,914 | | 2,320,849 |
Fidelity Advisor Large Cap Fund Institutional Class | 155,353 | | 2,302,333 |
Fidelity Advisor Mid-Cap Fund Institutional Class | 31,130 | | 754,274 |
Fidelity Advisor Small Cap Fund Institutional Class | 32,289 | | 791,401 |
TOTAL EQUITY FUNDS (Cost $11,479,871) | 12,077,595 |
Fixed-Income Funds - 39.9% |
| | | |
Investment Grade Fixed-Income Funds - 39.9% |
Fidelity Advisor Government Investment Fund Institutional Class | 1,174,937 | | 11,667,121 |
Fidelity Advisor Intermediate Bond Fund Institutional Class | 1,058,137 | | 11,607,759 |
TOTAL FIXED-INCOME FUNDS (Cost $23,662,804) | 23,274,880 |
Short-Term Funds - 39.4% |
| | | |
Fidelity Cash Reserves Fund | 13,809,418 | | 13,809,418 |
Fidelity Advisor Short-Fixed Income Fund Institutional Class | 973,383 | | 9,198,470 |
TOTAL SHORT-TERM FUNDS (Cost $23,112,895) | 23,007,888 |
TOTAL INVESTMENT IN SECURITIES - 100% (Cost $58,255,570) | $ 58,360,363 |
See accompanying notes which are an integral part of the financial statements.
Annual Report
Fidelity Advisor Freedom Income Fund
Financial Statements
Statement of Assets and Liabilities
| March 31, 2005 |
| | |
Assets | | |
Investment in securities, at value (cost $58,255,570) - See accompanying schedule | | $ 58,360,363 |
Cash | | 14,042 |
Receivable for investments sold | | 153,397 |
Receivable for fund shares sold | | 28,267 |
Receivable from investment adviser for expense reductions | | 634 |
Total assets | | 58,556,703 |
| | |
Liabilities | | |
Payable for investments purchased | $ 164 | |
Payable for fund shares redeemed | 212,314 | |
Accrued management fee | 4,841 | |
Distribution fees payable | 29,474 | |
Total liabilities | | 246,793 |
| | |
Net Assets | | $ 58,309,910 |
Net Assets consist of: | | |
Paid in capital | | $ 57,987,724 |
Undistributed net investment income | | 86,109 |
Accumulated undistributed net realized gain (loss) on investments | | 131,284 |
Net unrealized appreciation (depreciation) on investments | | 104,793 |
Net Assets | | $ 58,309,910 |
Calculation of Maximum Offering Price | | |
Class A:
Net Asset Value and redemption price per share ($10,120,151 ÷ 982,219 shares) | | $ 10.30 |
| | |
Maximum offering price per share (100/94.25 of $10.30) | | $ 10.93 |
| | |
Class T:
Net Asset Value and redemption price per share ($29,012,941 ÷ 2,817,197 shares) | | $ 10.30 |
| | |
Maximum offering price per share (100/96.50 of $10.30) | | $ 10.67 |
| | |
Class B:
Net Asset Value and offering price per share ($4,454,390 ÷ 432,999 shares)A | | $ 10.29 |
| | |
Class C:
Net Asset Value and offering price per share ($14,096,658 ÷ 1,370,793 shares)A | | $ 10.28 |
| | |
Institutional Class:
Net Asset Value, offering price and redemption price per share ($625,770 ÷ 60,671 shares) | | $ 10.31 |
A Redemption price per share is equal to net asset value less any applicable contingent deferred sales charge.
Statement of Operations
| Year ended March 31, 2005 |
Investment Income | | |
Income distributions from underlying funds | | $ 1,072,976 |
| | |
Expenses | | |
Management fee | $ 46,677 | |
Distribution fees | 296,813 | |
Independent trustees' compensation | 237 | |
Total expenses before reductions | 343,727 | |
Expense reductions | (9,808) | 333,919 |
Net investment income (loss) | | 739,057 |
Realized and Unrealized Gain (Loss) Realized gain (loss) on sale of underlying fund shares | (76,944) | |
Capital gain distributions from underlying funds | 258,599 | 181,655 |
Change in net unrealized appreciation (depreciation) on underlying funds | | (460,298) |
Net gain (loss) | | (278,643) |
Net increase (decrease) in net assets resulting from operations | | $ 460,414 |
See accompanying notes which are an integral part of the financial statements.
Annual Report
Fidelity Advisor Freedom Income Fund
Financial Statements - continued
Statement of Changes in Net Assets
| Year ended
March 31,
2005 | July 24, 2003
(commencement of
operations) to
March 31, 2004 |
Increase (Decrease) in Net Assets | | |
Operations | | |
Net investment income (loss) | $ 739,057 | $ 153,905 |
Net realized gain (loss) | 181,655 | 38,625 |
Change in net unrealized appreciation (depreciation) | (460,298) | 565,091 |
Net increase (decrease) in net assets resulting from operations | 460,414 | 757,621 |
Distributions to shareholders from net investment income | (704,650) | (156,368) |
Distributions to shareholders from net realized gain | (34,829) | - |
Total distributions | (739,479) | (156,368) |
Share transactions - net increase (decrease) | 25,789,420 | 32,198,302 |
Total increase (decrease) in net assets | 25,510,355 | 32,799,555 |
| | |
Net Assets | | |
Beginning of period | 32,799,555 | - |
End of period (including undistributed net investment income of $86,109 and undistributed net investment income of $1,120, respectively) | $ 58,309,910 | $ 32,799,555 |
Financial Highlights - Class A
Years ended March 31, | 2005 | 2004F |
Selected Per-Share Data | | |
Net asset value, beginning of period | $ 10.40 | $ 10.00 |
Income from Investment Operations | | |
Net investment income (loss)E | .20 | .13 |
Net realized and unrealized gain (loss) | (.10) | .36 |
Total from investment operations | .10 | .49 |
Distributions from net investment income | (.19) | (.09) |
Distributions from net realized gain | (.01) | - |
Total distributions | (.20) | (.09) |
Net asset value, end of period | $ 10.30 | $ 10.40 |
Total ReturnB,C,D | .99% | 4.95% |
Ratios to Average Net AssetsG, H | | |
Expenses before expense reductions | .35% | .35%A |
Expenses net of voluntary waivers, if any | .33% | .33%A |
Expenses net of all reductions | .33% | .33%A |
Net investment income (loss) | 1.96% | 1.81%A |
Supplemental Data | | |
Net assets, end of period (000 omitted) | $ 10,120 | $ 5,009 |
Portfolio turnover rate | 18% | 46%A |
A Annualized
B Total returns for periods of less than one year are not annualized.
C Total returns would have been lower had certain expenses not been reduced during the periods shown.
D Total returns do not include the effect of the sales charges.
E Calculated based on average shares outstanding during the period.
F For the period July 24, 2003 (commencement of operations) to March 31, 2004.
G Expense ratios reflect operating expenses of the class. Expenses before reductions do not reflect amounts reimbursed by the investment adviser or reductions from brokerage service arrangements or other expense offset arrangements and do not represent the amount paid by the class during periods when reimbursements or reductions occur. Expenses net of any voluntary waivers reflect expenses after reimbursement by the investment adviser but prior to reductions from brokerage service arrangements or other expense offset arrangements. Expenses net of all reductions represent the net expenses paid by the class.
H Amounts do not include the activity of the underlying funds.
See accompanying notes which are an integral part of the financial statements.
Annual Report
Financial Highlights - Class T
Years ended March 31, | 2005 | 2004F |
Selected Per-Share Data | | |
Net asset value, beginning of period | $ 10.39 | $ 10.00 |
Income from Investment Operations | | |
Net investment income (loss)E | .18 | .11 |
Net realized and unrealized gain (loss) | (.10) | .37 |
Total from investment operations | .08 | .48 |
Distributions from net investment income | (.16) | (.09) |
Distributions from net realized gain | (.01) | - |
Total distributions | (.17) | (.09) |
Net asset value, end of period | $ 10.30 | $ 10.39 |
Total ReturnB,C,D | .79% | 4.78% |
Ratios to Average Net AssetsG, H | | |
Expenses before expense reductions | .60% | .60%A |
Expenses net of voluntary waivers, if any | .58% | .58%A |
Expenses net of all reductions | .58% | .58%A |
Net investment income (loss) | 1.71% | 1.56%A |
Supplemental Data | | |
Net assets, end of period (000 omitted) | $ 29,013 | $ 14,535 |
Portfolio turnover rate | 18% | 46%A |
A Annualized
B Total returns for periods of less than one year are not annualized.
C Total returns would have been lower had certain expenses not been reduced during the periods shown.
D Total returns do not include the effect of the sales charges.
E Calculated based on average shares outstanding during the period.
F For the period July 24, 2003 (commencement of operations) to March 31, 2004.
G Expense ratios reflect operating expenses of the class. Expenses before reductions do not reflect amounts reimbursed by the investment adviser or reductions from brokerage service arrangements or other expense offset arrangements and do not represent the amount paid by the class during periods when reimbursements or reductions occur. Expenses net of any voluntary waivers reflect expenses after reimbursement by the investment adviser but prior to reductions from brokerage service arrangements or other expense offset arrangements. Expenses net of all reductions represent the net expenses paid by the class.
H Amounts do not include the activity of the underlying funds.
Financial Highlights - Class B
Years ended March 31, | 2005 | 2004F |
Selected Per-Share Data | | |
Net asset value, beginning of period | $ 10.38 | $ 10.00 |
Income from Investment Operations | | |
Net investment income (loss)E | .12 | .07 |
Net realized and unrealized gain (loss) | (.10) | .37 |
Total from investment operations | .02 | .44 |
Distributions from net investment income | (.10) | (.06) |
Distributions from net realized gain | (.01) | - |
Total distributions | (.11) | (.06) |
Net asset value, end of period | $ 10.29 | $ 10.38 |
Total ReturnB,C,D | .23% | 4.45% |
Ratios to Average Net AssetsG, H | | |
Expenses before expense reductions | 1.10% | 1.10%A |
Expenses net of voluntary waivers, if any | 1.08% | 1.08%A |
Expenses net of all reductions | 1.08% | 1.08%A |
Net investment income (loss) | 1.21% | 1.06%A |
Supplemental Data | | |
Net assets, end of period (000 omitted) | $ 4,454 | $ 3,649 |
Portfolio turnover rate | 18% | 46%A |
A Annualized
B Total returns for periods of less than one year are not annualized.
C Total returns would have been lower had certain expenses not been reduced during the periods shown.
D Total returns do not include the effect of the contingent deferred sales charge.
E Calculated based on average shares outstanding during the period.
F For the period July 24, 2003 (commencement of operations) to March 31, 2004.
G Expense ratios reflect operating expenses of the class. Expenses before reductions do not reflect amounts reimbursed by the investment adviser or reductions from brokerage service arrangements or other expense offset arrangements and do not represent the amount paid by the class during periods when reimbursements or reductions occur. Expenses net of any voluntary waivers reflect expenses after reimbursement by the investment adviser but prior to reductions from brokerage service arrangements or other expense offset arrangements. Expenses net of all reductions represent the net expenses paid by the class.
H Amounts do not include the activity of the underlying funds.
See accompanying notes which are an integral part of the financial statements.
Annual Report
Financial Highlights - Class C
Years ended March 31, | 2005 | 2004F |
Selected Per-Share Data | | |
Net asset value, beginning of period | $ 10.37 | $ 10.00 |
Income from Investment Operations | | |
Net investment income (loss)E | .12 | .07 |
Net realized and unrealized gain (loss) | (.09) | .37 |
Total from investment operations | .03 | .44 |
Distributions from net investment income | (.11) | (.07) |
Distributions from net realized gain | (.01) | - |
Total distributions | (.12) | (.07) |
Net asset value, end of period | $ 10.28 | $ 10.37 |
Total ReturnB,C,D | .24% | 4.39% |
Ratios to Average Net AssetsG, H | | |
Expenses before expense reductions | 1.10% | 1.10%A |
Expenses net of voluntary waivers, if any | 1.08% | 1.08%A |
Expenses net of all reductions | 1.08% | 1.08%A |
Net investment income (loss) | 1.21% | 1.06%A |
Supplemental Data | | |
Net assets, end of period (000 omitted) | $ 14,097 | $ 9,248 |
Portfolio turnover rate | 18% | 46%A |
A Annualized
B Total returns for periods of less than one year are not annualized.
C Total returns would have been lower had certain expenses not been reduced during the periods shown.
D Total returns do not include the effect of the contingent deferred sales charge.
E Calculated based on average shares outstanding during the period.
F For the period July 24, 2003 (commencement of operations) to March 31, 2004.
G Expense ratios reflect operating expenses of the class. Expenses before reductions do not reflect amounts reimbursed by the investment adviser or reductions from brokerage service arrangements or other expense offset arrangements and do not represent the amount paid by the class during periods when reimbursements or reductions occur. Expenses net of any voluntary waivers reflect expenses after reimbursement by the investment adviser but prior to reductions from brokerage service arrangements or other expense offset arrangements. Expenses net of all reductions represent the net expenses paid by the class.
H Amounts do not include the activity of the underlying funds.
Financial Highlights - Institutional Class
Years ended March 31, | 2005 | 2004E |
Selected Per-Share Data | | |
Net asset value, beginning of period | $ 10.41 | $ 10.00 |
Income from Investment Operations | | |
Net investment income (loss)D | .23 | .14 |
Net realized and unrealized gain (loss) | (.11) | .37 |
Total from investment operations | .12 | .51 |
Distributions from net investment income | (.21) | (.10) |
Distributions from net realized gain | (.01) | - |
Total distributions | (.22) | (.10) |
Net asset value, end of period | $ 10.31 | $ 10.41 |
Total ReturnB,C | 1.21% | 5.16% |
Ratios to Average Net AssetsF, G | | |
Expenses before expense reductions | .10% | .10%A |
Expenses net of voluntary waivers, if any | .08% | .08%A |
Expenses net of all reductions | .08% | .08%A |
Net investment income (loss) | 2.21% | 2.05%A |
Supplemental Data | | |
Net assets, end of period (000 omitted) | $ 626 | $ 359 |
Portfolio turnover rate | 18% | 46%A |
A Annualized
B Total returns for periods of less than one year are not annualized.
C Total returns would have been lower had certain expenses not been reduced during the periods shown.
D Calculated based on average shares outstanding during the period.
E For the period July 24, 2003 (commencement of operations) to March 31, 2004.
F Expense ratios reflect operating expenses of the class. Expenses before reductions do not reflect amounts reimbursed by the investment adviser or reductions from brokerage service arrangements or other expense offset arrangements and do not represent the amount paid by the class during periods when reimbursements or reductions occur. Expenses net of any voluntary waivers reflect expenses after reimbursement by the investment adviser but prior to reductions from brokerage service arrangements or other expense offset arrangements. Expenses net of all reductions represent the net expenses paid by the class.
G Amounts do not include the activity of the underlying funds.
See accompanying notes which are an integral part of the financial statements.
Annual Report
Fidelity Advisor Freedom 2005 Fund
Investment Changes
Fund Holdings as of March 31, 2005 |
| % of fund's
investments | % of fund's investments
6 months ago |
Domestic Equity Funds | | |
Fidelity Advisor Dividend Growth Fund Institutional Class | 7.6 | 7.6 |
Fidelity Advisor Equity Growth Fund Institutional Class | 3.9 | 3.8 |
Fidelity Advisor Equity Income Fund Institutional Class | 8.1 | 7.9 |
Fidelity Advisor Growth & Income Fund Institutional Class | 7.8 | 7.7 |
Fidelity Advisor Large Cap Fund Institutional Class | 7.7 | 7.6 |
Fidelity Advisor Mid-Cap Fund Institutional Class | 2.5 | 2.4 |
Fidelity Advisor Small Cap Fund Institutional Class | 2.6 | 2.4 |
| 40.2 | 39.4 |
International Equity Funds | | |
Fidelity Advisor Diversified International Fund Institutional Class | 2.7 | 2.5 |
Fidelity Advisor Overseas Fund Institutional Class | 2.7 | 2.5 |
| 5.4 | 5.0 |
High Yield Fixed-Income Funds | | |
Fidelity Advisor High Income Advantage Fund Institutional Class | 5.3 | 5.1 |
Investment Grade Fixed-Income Funds |
Fidelity Advisor Government Investment Fund Institutional Class | 19.7 | 20.3 |
Fidelity Advisor Intermediate Bond Fund Institutional Class | 19.6 | 20.2 |
| 39.3 | 40.5 |
Short-Term Funds | | |
Fidelity Advisor Short-Fixed Income Fund Institutional Class | 3.9 | 4.0 |
Fidelity Cash Reserves Fund | 5.9 | 6.0 |
| 9.8 | 10.0 |
| 100.0 | 100.0 |
Asset Allocation (% of fund's investments) |

The fund invests according to an asset allocation strategy that becomes increasingly conservative over time. The six months ago allocation is based on the fund's holdings as of September 30, 2004. The current allocation is based on the fund's holdings as of March 31, 2005. The expected allocation represents the fund's anticipated target asset allocation at September 30, 2005.
Annual Report
Fidelity Advisor Freedom 2005 Fund
Investments March 31, 2005
Showing Percentage of Total Value of Investment in Securities
Equity Funds - 45.6% |
| Shares | | Value (Note 1) |
Domestic Equity Funds - 40.2% |
Fidelity Advisor Dividend Growth Fund Institutional Class | 154,374 | | $ 1,756,776 |
Fidelity Advisor Equity Growth Fund Institutional Class | 19,252 | | 888,268 |
Fidelity Advisor Equity Income Fund Institutional Class | 65,953 | | 1,872,408 |
Fidelity Advisor Growth & Income Fund Institutional Class | 109,340 | | 1,800,823 |
Fidelity Advisor Large Cap Fund Institutional Class | 120,106 | | 1,779,978 |
Fidelity Advisor Mid-Cap Fund Institutional Class | 23,556 | | 570,754 |
Fidelity Advisor Small Cap Fund Institutional Class | 24,120 | | 591,182 |
TOTAL DOMESTIC EQUITY FUNDS | | 9,260,189 |
International Equity Funds - 5.4% |
Fidelity Advisor Diversified International Fund Institutional Class | 33,319 | | 628,066 |
Fidelity Advisor Overseas Fund Institutional Class | 34,877 | | 607,213 |
TOTAL INTERNATIONAL EQUITY FUNDS | | 1,235,279 |
TOTAL EQUITY FUNDS (Cost $10,158,848) | 10,495,468 |
Fixed-Income Funds - 44.6% |
| | | |
High Yield Fixed-Income Funds - 5.3% |
Fidelity Advisor High Income Advantage Fund Institutional Class | 128,782 | | 1,213,127 |
Investment Grade Fixed-Income Funds - 39.3% |
Fidelity Advisor Government Investment Fund Institutional Class | 456,742 | | 4,535,449 |
Fidelity Advisor Intermediate Bond Fund Institutional Class | 411,534 | | 4,514,525 |
TOTAL INVESTMENT GRADE FIXED-INCOME FUNDS | | 9,049,974 |
TOTAL FIXED-INCOME FUNDS (Cost $10,396,981) | 10,263,101 |
Short-Term Funds - 9.8% |
| | | |
Fidelity Cash Reserves Fund | 1,355,509 | | 1,355,509 |
Fidelity Advisor Short-Fixed Income Fund Institutional Class | 95,205 | | 899,684 |
TOTAL SHORT-TERM FUNDS (Cost $2,266,001) | 2,255,193 |
TOTAL INVESTMENT IN SECURITIES - 100% (Cost $22,821,830) | $ 23,013,762 |
See accompanying notes which are an integral part of the financial statements.
Annual Report
Fidelity Advisor Freedom 2005 Fund
Financial Statements
Statement of Assets and Liabilities
| March 31, 2005 |
| | |
Assets | | |
Investment in securities, at value (cost $22,821,830) - See accompanying schedule | | $ 23,013,762 |
Cash | | 4 |
Receivable for investments sold | | 169,792 |
Receivable for fund shares sold | | 15,963 |
Receivable from investment adviser for expense reductions | | 124 |
Total assets | | 23,199,645 |
| | |
Liabilities | | |
Payable for investments purchased | $ 3,296 | |
Payable for fund shares redeemed | 182,391 | |
Accrued management fee | 1,946 | |
Distribution fees payable | 11,746 | |
Total liabilities | | 199,379 |
| | |
Net Assets | | $ 23,000,266 |
Net Assets consist of: | | |
Paid in capital | | $ 22,695,741 |
Undistributed net investment income | | 66,592 |
Accumulated undistributed net realized gain (loss) on investments | | 46,001 |
Net unrealized appreciation (depreciation) on investments | | 191,932 |
Net Assets | | $ 23,000,266 |
Calculation of Maximum Offering Price Class A:
Net Asset Value and redemption price per share ($5,969,905 ÷ 564,626 shares) | | $ 10.57 |
| | |
Maximum offering price per share (100/94.25 of $10.57) | | $ 11.21 |
| | |
Class T:
Net Asset Value and redemption price per share ($7,977,337 ÷ 755,275 shares) | | $ 10.56 |
| | |
Maximum offering price per share (100/96.50 of $10.56) | | $ 10.94 |
| | |
Class B:
Net Asset Value and offering price per share ($2,747,023 ÷ 260,862 shares)A | | $ 10.53 |
| | |
Class C:
Net Asset Value and offering price per share ($5,655,240 ÷ 537,233 shares)A | | $ 10.53 |
| | |
Institutional Class:
Net Asset Value, offering price and redemption price per share ($650,761 ÷ 61,413 shares) | | $ 10.60 |
A Redemption price per share is equal to net asset value less any applicable contingent deferred sales charge.
Statement of Operations
| Year ended March 31, 2005 |
| | |
Investment Income | | |
Income distributions from underlying funds | | $ 371,016 |
Interest | | 3 |
Total income | | 371,019 |
| | |
Expenses | | |
Management fee | $ 15,052 | |
Distribution fees | 92,337 | |
Independent trustees' compensation | 72 | |
Total expenses before reductions | 107,461 | |
Expense reductions | (3,412) | 104,049 |
Net investment income (loss) | | 266,970 |
Realized and Unrealized Gain (Loss) Realized gain (loss) on sale of underlying fund shares | (41,764) | |
Capital gain distributions from underlying funds | 108,525 | 66,761 |
Change in net unrealized appreciation (depreciation) on underlying funds | | 131,084 |
Net gain (loss) | | 197,845 |
Net increase (decrease) in net assets resulting from operations | | $ 464,815 |
See accompanying notes which are an integral part of the financial statements.
Annual Report
Fidelity Advisor Freedom 2005 Fund
Financial Statements - continued
Statement of Changes in Net Assets
| Year ended
March 31,
2005 | November 6, 2003
(commencement of
operations) to
March 31, 2004 |
Increase (Decrease) in Net Assets | | |
Operations | | |
Net investment income (loss) | $ 266,970 | $ 18,551 |
Net realized gain (loss) | 66,761 | 3,417 |
Change in net unrealized appreciation (depreciation) | 131,084 | 60,848 |
Net increase (decrease) in net assets resulting from operations | 464,815 | 82,816 |
Distributions to shareholders from net investment income | (231,296) | (8,568) |
Distributions to shareholders from net realized gain | (3,243) | - |
Total distributions | (234,539) | (8,568) |
Share transactions - net increase (decrease) | 16,679,243 | 6,016,499 |
Total increase (decrease) in net assets | 16,909,519 | 6,090,747 |
| | |
Net Assets | | |
Beginning of period | 6,090,747 | - |
End of period (including undistributed net investment income of $66,592 and undistributed net investment income of $10,206, respectively) | $ 23,000,266 | $ 6,090,747 |
Financial Highlights - Class A
Years ended March 31, | 2005 | 2004F |
Selected Per-Share Data | | |
Net asset value, beginning of period | $ 10.49 | $ 10.00 |
Income from Investment Operations | | |
Net investment income (loss)E | .22 | .09 |
Net realized and unrealized gain (loss) | .03 | .46 |
Total from investment operations | .25 | .55 |
Distributions from net investment income | (.17) | (.06) |
Distributions from net realized gain | -H | - |
Total distributions | (.17) | (.06) |
Net asset value, end of period | $ 10.57 | $ 10.49 |
Total ReturnB,C,D | 2.38% | 5.52% |
Ratios to Average Net AssetsG, I | | |
Expenses before expense reductions | .35% | .35%A |
Expenses net of voluntary waivers, if any | .33% | .33%A |
Expenses net of all reductions | .33% | .33%A |
Net investment income (loss) | 2.13% | 2.21%A |
Supplemental Data | | |
Net assets, end of period (000 omitted) | $ 5,970 | $ 1,386 |
Portfolio turnover rate | 24% | 9%A |
A Annualized
B Total returns for periods of less than one year are not annualized.
C Total returns would have been lower had certain expenses not been reduced during the periods shown.
D Total returns do not include the effect of the sales charges.
E Calculated based on average shares outstanding during the period.
F For the period November 6, 2003 (commencement of operations) to March 31, 2004.
G Expense ratios reflect operating expenses of the class. Expenses before reductions do not reflect amounts reimbursed by the investment adviser or reductions from brokerage service arrangements or other expense offset arrangements and do not represent the amount paid by the class during periods when reimbursements or reductions occur. Expenses net of any voluntary waivers reflect expenses after reimbursement by the investment adviser but prior to reductions from brokerage service arrangements or other expense offset arrangements. Expenses net of all reductions represent the net expenses paid by the class.
H Amount represents less than $.01 per share.
I Amounts do not include the activity of the underlying funds.
See accompanying notes which are an integral part of the financial statements.
Annual Report
Financial Highlights - Class T
Years ended March 31, | 2005 | 2004F |
Selected Per-Share Data | | |
Net asset value, beginning of period | $ 10.48 | $ 10.00 |
Income from Investment Operations | | |
Net investment income (loss)E | .20 | .08 |
Net realized and unrealized gain (loss) | .03 | .46 |
Total from investment operations | .23 | .54 |
Distributions from net investment income | (.14) | (.06) |
Distributions from net realized gain | -H | - |
Total distributions | (.15)I | (.06) |
Net asset value, end of period | $ 10.56 | $ 10.48 |
Total ReturnB,C,D | 2.17% | 5.36% |
Ratios to Average Net AssetsG, J | | |
Expenses before expense reductions | .60% | .60%A |
Expenses net of voluntary waivers, if any | .58% | .58%A |
Expenses net of all reductions | .58% | .58%A |
Net investment income (loss) | 1.88% | 1.97%A |
Supplemental Data | | |
Net assets, end of period (000 omitted) | $ 7,977 | $ 2,031 |
Portfolio turnover rate | 24% | 9%A |
A Annualized
B Total returns for periods of less than one year are not annualized.
C Total returns would have been lower had certain expenses not been reduced during the periods shown.
D Total returns do not include the effect of the sales charges.
E Calculated based on average shares outstanding during the period.
F For the period November 6, 2003 (commencement of operations) to March 31, 2004.
G Expense ratios reflect operating expenses of the class. Expenses before reductions do not reflect amounts reimbursed by the investment adviser or reductions from brokerage service arrangements or other expense offset arrangements and do not represent the amount paid by the class during periods when reimbursements or reductions occur. Expenses net of any voluntary waivers reflect expenses after reimbursement by the investment adviser but prior to reductions from brokerage service arrangements or other expense offset arrangements. Expenses net of all reductions represent the net expenses paid by the class.
H Amount represents less than $.01 per share.
I Total distributions of $.148 per share is comprised of distributions from net investment income of $.144 per share and distributions from net realized gain of $.004 per share.
J Amounts do not include the activity of the underlying funds.
Financial Highlights - Class B
Years ended March 31, | 2005 | 2004F |
Selected Per-Share Data | | |
Net asset value, beginning of period | $ 10.47 | $ 10.00 |
Income from Investment Operations | | |
Net investment income (loss)E | .14 | .06 |
Net realized and unrealized gain (loss) | .03 | .46 |
Total from investment operations | .17 | .52 |
Distributions from net investment income | (.11) | (.05) |
Distributions from net realized gain | -H | - |
Total distributions | (.11) | (.05) |
Net asset value, end of period | $ 10.53 | $ 10.47 |
Total ReturnB,C,D | 1.64% | 5.21% |
Ratios to Average Net AssetsG, I | | |
Expenses before expense reductions | 1.10% | 1.10%A |
Expenses net of voluntary waivers, if any | 1.08% | 1.08%A |
Expenses net of all reductions | 1.08% | 1.08%A |
Net investment income (loss) | 1.38% | 1.47%A |
Supplemental Data | | |
Net assets, end of period (000 omitted) | $ 2,747 | $ 1,203 |
Portfolio turnover rate | 24% | 9%A |
A Annualized
B Total returns for periods of less than one year are not annualized.
C Total returns would have been lower had certain expenses not been reduced during the periods shown.
D Total returns do not include the effect of the contingent deferred sales charge.
E Calculated based on average shares outstanding during the period.
F For the period November 6, 2003 (commencement of operations) to March 31, 2004.
G Expense ratios reflect operating expenses of the class. Expenses before reductions do not reflect amounts reimbursed by the investment adviser or reductions from brokerage service arrangements or other expense offset arrangements and do not represent the amount paid by the class during periods when reimbursements or reductions occur. Expenses net of any voluntary waivers reflect expenses after reimbursement by the investment adviser but prior to reductions from brokerage service arrangements or other expense offset arrangements. Expenses net of all reductions represent the net expenses paid by the class.
H Amount represents less than $.01 per share.
I Amounts do not include the activity of the underlying funds.
See accompanying notes which are an integral part of the financial statements.
Annual Report
Financial Highlights - Class C
Years ended March 31, | 2005 | 2004F |
Selected Per-Share Data | | |
Net asset value, beginning of period | $ 10.47 | $ 10.00 |
Income from Investment Operations | | |
Net investment income (loss)E | .14 | .06 |
Net realized and unrealized gain (loss) | .04 | .46 |
Total from investment operations | .18 | .52 |
Distributions from net investment income | (.12) | (.05) |
Distributions from net realized gain | -H | - |
Total distributions | (.12) | (.05) |
Net asset value, end of period | $ 10.53 | $ 10.47 |
Total ReturnB,C,D | 1.74% | 5.21% |
Ratios to Average Net AssetsG, I | | |
Expenses before expense reductions | 1.10% | 1.10%A |
Expenses net of voluntary waivers, if any | 1.08% | 1.08%A |
Expenses net of all reductions | 1.08% | 1.08%A |
Net investment income (loss) | 1.38% | 1.47%A |
Supplemental Data | | |
Net assets, end of period (000 omitted) | $ 5,655 | $ 1,073 |
Portfolio turnover rate | 24% | 9%A |
A Annualized
B Total returns for periods of less than one year are not annualized.
C Total returns would have been lower had certain expenses not been reduced during the periods shown.
D Total returns do not include the effect of the contingent deferred sales charge.
E Calculated based on average shares outstanding during the period.
F For the period November 6, 2003 (commencement of operations) to March 31, 2004.
G Expense ratios reflect operating expenses of the class. Expenses before reductions do not reflect amounts reimbursed by the investment adviser or reductions from brokerage service arrangements or other expense offset arrangements and do not represent the amount paid by the class during periods when reimbursements or reductions occur. Expenses net of any voluntary waivers reflect expenses after reimbursement by the investment adviser but prior to reductions from brokerage service arrangements or other expense offset arrangements. Expenses net of all reductions represent the net expenses paid by the class.
H Amount represents less than $.01 per share.
I Amounts do not include the activity of the underlying funds.
Financial Highlights - Institutional Class
Years ended March 31, | 2005 | 2004E |
Selected Per-Share Data | | |
Net asset value, beginning of period | $ 10.49 | $ 10.00 |
Income from Investment Operations | | |
Net investment income (loss)D | .25 | .10 |
Net realized and unrealized gain (loss) | .04 | .45 |
Total from investment operations | .29 | .55 |
Distributions from net investment income | (.18) | (.06) |
Distributions from net realized gain | -G | - |
Total distributions | (.18) | (.06) |
Net asset value, end of period | $ 10.60 | $ 10.49 |
Total ReturnB,C | 2.79% | 5.52% |
Ratios to Average Net AssetsF, H | | |
Expenses before expense reductions | .10% | .10%A |
Expenses net of voluntary waivers, if any | .08% | .08%A |
Expenses net of all reductions | .08% | .08%A |
Net investment income (loss) | 2.38% | 2.46%A |
Supplemental Data | | |
Net assets, end of period (000 omitted) | $ 651 | $ 397 |
Portfolio turnover rate | 24% | 9%A |
A Annualized
B Total returns for periods of less than one year are not annualized.
C Total returns would have been lower had certain expenses not been reduced during the periods shown.
D Calculated based on average shares outstanding during the period.
E For the period November 6, 2003 (commencement of operations) to March 31, 2004.
F Expense ratios reflect operating expenses of the class. Expenses before reductions do not reflect amounts reimbursed by the investment adviser or reductions from brokerage service arrangements or other expense offset arrangements and do not represent the amount paid by the class during periods when reimbursements or reductions occur. Expenses net of any voluntary waivers reflect expenses after reimbursement by the investment adviser but prior to reductions from brokerage service arrangements or other expense offset arrangements. Expenses net of all reductions represent the net expenses paid by the class.
G Amount represents less than $.01 per share.
H Amounts do not include the activity of the underlying funds.
See accompanying notes which are an integral part of the financial statements.
Annual Report
Fidelity Advisor Freedom 2010 Fund
Investment Changes
Fund Holdings as of March 31, 2005 |
| % of fund's
investments | % of fund's investments
6 months ago |
Domestic Equity Funds | | |
Fidelity Advisor Dividend Growth Fund Institutional Class | 7.7 | 7.6 |
Fidelity Advisor Equity Growth Fund Institutional Class | 3.9 | 3.8 |
Fidelity Advisor Equity Income Fund Institutional Class | 8.2 | 8.0 |
Fidelity Advisor Growth & Income Fund Institutional Class | 7.8 | 7.8 |
Fidelity Advisor Large Cap Fund Institutional Class | 7.8 | 7.6 |
Fidelity Advisor Mid-Cap Fund Institutional Class | 2.5 | 2.4 |
Fidelity Advisor Small Cap Fund Institutional Class | 2.6 | 2.5 |
| 40.5 | 39.7 |
International Equity Funds | | |
Fidelity Advisor Diversified International Fund Institutional Class | 2.8 | 2.6 |
Fidelity Advisor Overseas Fund Institutional Class | 2.7 | 2.5 |
| 5.5 | 5.1 |
High Yield Fixed-Income Funds | | |
Fidelity Advisor High Income Advantage Fund Institutional Class | 5.3 | 5.2 |
Investment Grade Fixed-Income Funds |
Fidelity Advisor Government Investment Fund Institutional Class | 19.6 | 20.2 |
Fidelity Advisor Intermediate Bond Fund Institutional Class | 19.6 | 20.1 |
| 39.2 | 40.3 |
Short-Term Funds | | |
Fidelity Advisor Short-Fixed Income Fund Institutional Class | 3.8 | 3.9 |
Fidelity Cash Reserves Fund | 5.7 | 5.8 |
| 9.5 | 9.7 |
| 100.0 | 100.0 |
Asset Allocation (% of fund's investments) |

The fund invests according to an asset allocation strategy that becomes increasingly conservative over time. The six months ago allocation is based on the fund's holdings as of September 30, 2004. The current allocation is based on the fund's holdings as of March 31, 2005. The expected allocation represents the fund's anticipated target asset allocation at September 30, 2005.
Annual Report
Fidelity Advisor Freedom 2010 Fund
Investments March 31, 2005
Showing Percentage of Total Value of Investment in Securities
Equity Funds - 46.0% |
| Shares | | Value (Note 1) |
Domestic Equity Funds - 40.5% |
Fidelity Advisor Dividend Growth Fund Institutional Class | 1,546,160 | | $ 17,595,304 |
Fidelity Advisor Equity Growth Fund Institutional Class | 192,296 | | 8,872,536 |
Fidelity Advisor Equity Income Fund Institutional Class | 664,627 | | 18,868,759 |
Fidelity Advisor Growth & Income Fund Institutional Class | 1,091,643 | | 17,979,367 |
Fidelity Advisor Large Cap Fund Institutional Class | 1,200,605 | | 17,792,967 |
Fidelity Advisor Mid-Cap Fund Institutional Class | 236,426 | | 5,728,590 |
Fidelity Advisor Small Cap Fund Institutional Class | 244,211 | | 5,985,622 |
TOTAL DOMESTIC EQUITY FUNDS | | 92,823,145 |
International Equity Funds - 5.5% |
Fidelity Advisor Diversified International Fund Institutional Class | 338,291 | | 6,376,787 |
Fidelity Advisor Overseas Fund Institutional Class | 352,300 | | 6,133,548 |
TOTAL INTERNATIONAL EQUITY FUNDS | | 12,510,335 |
TOTAL EQUITY FUNDS (Cost $101,456,935) | 105,333,480 |
Fixed-Income Funds - 44.5% |
| | | |
High Yield Fixed-Income Funds - 5.3% |
Fidelity Advisor High Income Advantage Fund Institutional Class | 1,302,626 | | 12,270,739 |
Investment Grade Fixed-Income Funds - 39.2% |
Fidelity Advisor Government Investment Fund Institutional Class | 4,529,203 | | 44,974,982 |
Fidelity Advisor Intermediate Bond Fund Institutional Class | 4,081,430 | | 44,773,289 |
TOTAL INVESTMENT GRADE FIXED-INCOME FUNDS | | 89,748,271 |
TOTAL FIXED-INCOME FUNDS (Cost $103,438,050) | 102,019,010 |
Short-Term Funds - 9.5% |
| | | |
Fidelity Cash Reserves Fund | 13,145,823 | | 13,145,823 |
Fidelity Advisor Short-Fixed Income Fund Institutional Class | 921,435 | | 8,707,564 |
TOTAL SHORT-TERM FUNDS (Cost $21,958,554) | 21,853,387 |
TOTAL INVESTMENT IN SECURITIES - 100% (Cost $226,853,539) | $ 229,205,877 |
See accompanying notes which are an integral part of the financial statements.
Annual Report
Fidelity Advisor Freedom 2010 Fund
Financial Statements
Statement of Assets and Liabilities
| March 31, 2005 |
| | |
Assets | | |
Investment in securities, at value (cost $226,853,539) - See accompanying schedule | | $ 229,205,877 |
Cash | | 3,500 |
Receivable for investments sold | | 641,985 |
Receivable for fund shares sold | | 4,416,454 |
Receivable from investment adviser for expense reductions | | 1,886 |
Total assets | | 234,269,702 |
| | |
Liabilities | | |
Payable for investments purchased | $ 4,085,906 | |
Payable for fund shares redeemed | 1,004,203 | |
Accrued management fee | 18,686 | |
Distribution fees payable | 98,899 | |
Total liabilities | | 5,207,694 |
| | |
Net Assets | | $ 229,062,008 |
Net Assets consist of: | | |
Paid in capital | | $ 225,249,095 |
Undistributed net investment income | | 718,326 |
Accumulated undistributed net realized gain (loss) on investments | | 742,249 |
Net unrealized appreciation (depreciation) on investments | | 2,352,338 |
Net Assets | | $ 229,062,008 |
Calculation of Maximum Offering Price Class A:
Net Asset Value and redemption price per share ($74,013,230 ÷ 6,724,565 shares) | | $ 11.01 |
| | |
Maximum offering price per share (100/94.25 of $11.01) | | $ 11.68 |
| | |
Class T:
Net Asset Value and redemption price per share ($94,744,229 ÷ 8,634,748 shares) | | $ 10.97 |
| | |
Maximum offering price per share (100/96.50 of $10.97) | | $ 11.37 |
| | |
Class B:
Net Asset Value and offering price per share ($27,098,137 ÷ 2,476,948 shares)A | | $ 10.94 |
| | |
Class C:
Net Asset Value and offering price per share ($27,668,398 ÷ 2,531,717 shares)A | | $ 10.93 |
| | |
Institutional Class:
Net Asset Value, offering price and redemption price per share ($5,538,014 ÷ 502,068 shares) | | $ 11.03 |
A Redemption price per share is equal to net asset value less any applicable contingent deferred sales charge.
Statement of Operations
| Year ended March 31, 2005 |
| | |
Investment Income | | |
Income distributions from underlying funds | | $ 3,819,817 |
Interest | | 2 |
Total income | | 3,819,819 |
| | |
Expenses | | |
Management fee | $ 156,388 | |
Distribution fees | 840,865 | |
Independent trustees' compensation | 768 | |
Total expenses before reductions | 998,021 | |
Expense reductions | (34,348) | 963,673 |
Net investment income (loss) | | 2,856,146 |
Realized and Unrealized Gain (Loss) Realized gain (loss) on sale of underlying fund shares | (124,487) | |
Capital gain distributions from underlying funds | 1,073,948 | 949,461 |
Change in net unrealized appreciation (depreciation) on underlying funds | | 417,464 |
Net gain (loss) | | 1,366,925 |
Net increase (decrease) in net assets resulting from operations | | $ 4,223,071 |
See accompanying notes which are an integral part of the financial statements.
Annual Report
Fidelity Advisor Freedom 2010 Fund
Financial Statements - continued
Statement of Changes in Net Assets
| Year ended
March 31,
2005 | July 24, 2003
(commencement of
operations) to
March 31, 2004 |
Increase (Decrease) in Net Assets | | |
Operations | | |
Net investment income (loss) | $ 2,856,146 | $ 430,765 |
Net realized gain (loss) | 949,461 | 19,958 |
Change in net unrealized appreciation (depreciation) | 417,464 | 1,934,874 |
Net increase (decrease) in net assets resulting from operations | 4,223,071 | 2,385,597 |
Distributions to shareholders from net investment income | (2,579,243) | (196,312) |
Distributions to shareholders from net realized gain | (20,201) | - |
Total distributions | (2,599,444) | (196,312) |
Share transactions - net increase (decrease) | 136,717,726 | 88,531,370 |
Total increase (decrease) in net assets | 138,341,353 | 90,720,655 |
| | |
Net Assets | | |
Beginning of period | 90,720,655 | - |
End of period (including undistributed net investment income of $718,326 and undistributed net investment income of $239,489, respectively) | $ 229,062,008 | $ 90,720,655 |
Financial Highlights - Class A
Years ended March 31, | 2005 | 2004F |
Selected Per-Share Data | | |
Net asset value, beginning of period | $ 10.92 | $ 10.00 |
Income from Investment Operations | | |
Net investment income (loss)E | .23 | .16 |
Net realized and unrealized gain (loss) | .04 | .83 |
Total from investment operations | .27 | .99 |
Distributions from net investment income | (.18) | (.07) |
Distributions from net realized gain | -H | - |
Total distributions | (.18) | (.07) |
Net asset value, end of period | $ 11.01 | $ 10.92 |
Total ReturnB,C,D | 2.48% | 9.92% |
Ratios to Average Net AssetsG, I | | |
Expenses before expense reductions | .35% | .35%A |
Expenses net of voluntary waivers, if any | .33% | .33%A |
Expenses net of all reductions | .33% | .33%A |
Net investment income (loss) | 2.10% | 2.14%A |
Supplemental Data | | |
Net assets, end of period (000 omitted) | $ 74,013 | $ 32,615 |
Portfolio turnover rate | 5% | 103%A |
A Annualized
B Total returns for periods of less than one year are not annualized.
C Total returns would have been lower had certain expenses not been reduced during the periods shown.
D Total returns do not include the effect of the sales charges.
E Calculated based on average shares outstanding during the period.
F For the period July 24, 2003 (commencement of operations) to March 31, 2004.
G Expense ratios reflect operating expenses of the class. Expenses before reductions do not reflect amounts reimbursed by the investment adviser or reductions from brokerage service arrangements or other expense offset arrangements and do not represent the amount paid by the class during periods when reimbursements or reductions occur. Expenses net of any voluntary waivers reflect expenses after reimbursement by the investment adviser but prior to reductions from brokerage service arrangements or other expense offset arrangements. Expenses net of all reductions represent the net expenses paid by the class.
H Amount represents less than $.01 per share.
I Amounts do not include the activity of the underlying funds.
See accompanying notes which are an integral part of the financial statements.
Annual Report
Financial Highlights - Class T
Years ended March 31, | 2005 | 2004F |
Selected Per-Share Data | | |
Net asset value, beginning of period | $ 10.90 | $ 10.00 |
Income from Investment Operations | | |
Net investment income (loss)E | .20 | .14 |
Net realized and unrealized gain (loss) | .04 | .83 |
Total from investment operations | .24 | .97 |
Distributions from net investment income | (.17) | (.07) |
Distributions from net realized gain | -H | - |
Total distributions | (.17) | (.07) |
Net asset value, end of period | $ 10.97 | $ 10.90 |
Total ReturnB,C,D | 2.18% | 9.72% |
Ratios to Average Net AssetsG, I | | |
Expenses before expense reductions | .60% | .60%A |
Expenses net of voluntary waivers, if any | .58% | .58%A |
Expenses net of all reductions | .58% | .58%A |
Net investment income (loss) | 1.86% | 1.89%A |
Supplemental Data | | |
Net assets, end of period (000 omitted) | $ 94,744 | $ 29,964 |
Portfolio turnover rate | 5% | 103%A |
A Annualized
B Total returns for periods of less than one year are not annualized.
C Total returns would have been lower had certain expenses not been reduced during the periods shown.
D Total returns do not include the effect of the sales charges.
E Calculated based on average shares outstanding during the period.
F For the period July 24, 2003 (commencement of operations) to March 31, 2004.
G Expense ratios reflect operating expenses of the class. Expenses before reductions do not reflect amounts reimbursed by the investment adviser or reductions from brokerage service arrangements or other expense offset arrangements and do not represent the amount paid by the class during periods when reimbursements or reductions occur. Expenses net of any voluntary waivers reflect expenses after reimbursement by the investment adviser but prior to reductions from brokerage service arrangements or other expense offset arrangements. Expenses net of all reductions represent the net expenses paid by the class.
H Amount represents less than $.01 per share.
I Amounts do not include the activity of the underlying funds.
Financial Highlights - Class B
Years ended March 31, | 2005 | 2004F |
Selected Per-Share Data | | |
Net asset value, beginning of period | $ 10.87 | $ 10.00 |
Income from Investment Operations | | |
Net investment income (loss)E | .15 | .10 |
Net realized and unrealized gain (loss) | .04 | .83 |
Total from investment operations | .19 | .93 |
Distributions from net investment income | (.12) | (.06) |
Distributions from net realized gain | -H | - |
Total distributions | (.12) | (.06) |
Net asset value, end of period | $ 10.94 | $ 10.87 |
Total ReturnB,C,D | 1.72% | 9.32% |
Ratios to Average Net AssetsG, I | | |
Expenses before expense reductions | 1.10% | 1.10%A |
Expenses net of voluntary waivers, if any | 1.08% | 1.08%A |
Expenses net of all reductions | 1.08% | 1.08%A |
Net investment income (loss) | 1.35% | 1.39%A |
Supplemental Data | | |
Net assets, end of period (000 omitted) | $ 27,098 | $ 14,897 |
Portfolio turnover rate | 5% | 103%A |
A Annualized
B Total returns for periods of less than one year are not annualized.
C Total returns would have been lower had certain expenses not been reduced during the periods shown.
D Total returns do not include the effect of the contingent deferred sales charge.
E Calculated based on average shares outstanding during the period.
F For the period July 24, 2003 (commencement of operations) to March 31, 2004.
G Expense ratios reflect operating expenses of the class. Expenses before reductions do not reflect amounts reimbursed by the investment adviser or reductions from brokerage service arrangements or other expense offset arrangements and do not represent the amount paid by the class during periods when reimbursements or reductions occur. Expenses net of any voluntary waivers reflect expenses after reimbursement by the investment adviser but prior to reductions from brokerage service arrangements or other expense offset arrangements. Expenses net of all reductions represent the net expenses paid by the class.
H Amount represents less than $.01 per share.
I Amounts do not include the activity of the underlying funds.
See accompanying notes which are an integral part of the financial statements.
Annual Report
Financial Highlights - Class C
Years ended March 31, | 2005 | 2004F |
Selected Per-Share Data | | |
Net asset value, beginning of period | $ 10.87 | $ 10.00 |
Income from Investment Operations | | |
Net investment income (loss)E | .15 | .10 |
Net realized and unrealized gain (loss) | .04 | .83 |
Total from investment operations | .19 | .93 |
Distributions from net investment income | (.13) | (.06) |
Distributions from net realized gain | -H | - |
Total distributions | (.13) | (.06) |
Net asset value, end of period | $ 10.93 | $ 10.87 |
Total ReturnB,C,D | 1.72% | 9.32% |
Ratios to Average Net AssetsG, I | | |
Expenses before expense reductions | 1.10% | 1.10%A |
Expenses net of voluntary waivers, if any | 1.08% | 1.08%A |
Expenses net of all reductions | 1.08% | 1.08%A |
Net investment income (loss) | 1.36% | 1.39%A |
Supplemental Data | | |
Net assets, end of period (000 omitted) | $ 27,668 | $ 11,552 |
Portfolio turnover rate | 5% | 103%A |
A Annualized
B Total returns for periods of less than one year are not annualized.
C Total returns would have been lower had certain expenses not been reduced during the periods shown.
D Total returns do not include the effect of the contingent deferred sales charge.
E Calculated based on average shares outstanding during the period.
F For the period July 24, 2003 (commencement of operations) to March 31, 2004.
G Expense ratios reflect operating expenses of the class. Expenses before reductions do not reflect amounts reimbursed by the investment adviser or reductions from brokerage service arrangements or other expense offset arrangements and do not represent the amount paid by the class during periods when reimbursements or reductions occur. Expenses net of any voluntary waivers reflect expenses after reimbursement by the investment adviser but prior to reductions from brokerage service arrangements or other expense offset arrangements. Expenses net of all reductions represent the net expenses paid by the class.
H Amount represents less than $.01 per share.
I Amounts do not include the activity of the underlying funds.
Financial Highlights - Institutional Class
Years ended March 31, | 2005 | 2004E |
Selected Per-Share Data | | |
Net asset value, beginning of period | $ 10.93 | $ 10.00 |
Income from Investment Operations | | |
Net investment income (loss)D | .26 | .17 |
Net realized and unrealized gain (loss) | .05 | .83 |
Total from investment operations | .31 | 1.00 |
Distributions from net investment income | (.20) | (.07) |
Distributions from net realized gain | -G | - |
Total distributions | (.21)H | (.07) |
Net asset value, end of period | $ 11.03 | $ 10.93 |
Total ReturnB,C | 2.80% | 10.02% |
Ratios to Average Net AssetsF, I | | |
Expenses before expense reductions | .10% | .10%A |
Expenses net of voluntary waivers, if any | .08% | .08%A |
Expenses net of all reductions | .08% | .08%A |
Net investment income (loss) | 2.35% | 2.38%A |
Supplemental Data | | |
Net assets, end of period (000 omitted) | $ 5,538 | $ 1,691 |
Portfolio turnover rate | 5% | 103%A |
A Annualized
B Total returns for periods of less than one year are not annualized.
C Total returns would have been lower had certain expenses not been reduced during the periods shown.
D Calculated based on average shares outstanding during the period.
E For the period July 24, 2003 (commencement of operations) to March 31, 2004.
F Expense ratios reflect operating expenses of the class. Expenses before reductions do not reflect amounts reimbursed by the investment adviser or reductions from brokerage service arrangements or other expense offset arrangements and do not represent the amount paid by the class during periods when reimbursements or reductions occur. Expenses net of any voluntary waivers reflect expenses after reimbursement by the investment adviser but prior to reductions from brokerage service arrangements or other expense offset arrangements. Expenses net of all reductions represent the net expenses paid by the class.
G Amount represents less than $.01 per share.
H Total distributions of $.206 per share is comprised of distributions from net investment income of $.204 per share and distributions from net realized gain of $.002 per share.
I Amounts do not include the activity of the underlying funds.
See accompanying notes which are an integral part of the financial statements.
Annual Report
Fidelity Advisor Freedom 2015 Fund
Investment Changes
Fund Holdings as of March 31, 2005 |
| % of fund's
investments | % of fund's investments
6 months ago |
Domestic Equity Funds | | |
Fidelity Advisor Dividend Growth Fund Institutional Class | 9.6 | 10.0 |
Fidelity Advisor Equity Growth Fund Institutional Class | 4.9 | 5.0 |
Fidelity Advisor Equity Income Fund Institutional Class | 10.2 | 10.3 |
Fidelity Advisor Growth & Income Fund Institutional Class | 9.9 | 10.2 |
Fidelity Advisor Large Cap Fund Institutional Class | 9.8 | 10.0 |
Fidelity Advisor Mid-Cap Fund Institutional Class | 3.1 | 3.1 |
Fidelity Advisor Small Cap Fund Institutional Class | 3.2 | 3.2 |
| 50.7 | 51.8 |
International Equity Funds | | |
Fidelity Advisor Diversified International Fund Institutional Class | 4.1 | 4.2 |
Fidelity Advisor Overseas Fund Institutional Class | 4.0 | 4.1 |
| 8.1 | 8.3 |
High Yield Fixed-Income Funds | | |
Fidelity Advisor High Income Advantage Fund Institutional Class | 6.6 | 6.7 |
Investment Grade Fixed-Income Funds |
Fidelity Advisor Government Investment Fund Institutional Class | 15.1 | 14.7 |
Fidelity Advisor Intermediate Bond Fund Institutional Class | 15.0 | 14.7 |
| 30.1 | 29.4 |
Short-Term Funds | | |
Fidelity Advisor Short-Fixed Income Fund Institutional Class | 1.8 | 1.5 |
Fidelity Cash Reserves Fund | 2.7 | 2.3 |
| 4.5 | 3.8 |
| 100.0 | 100.0 |
Asset Allocation (% of fund's investments) |
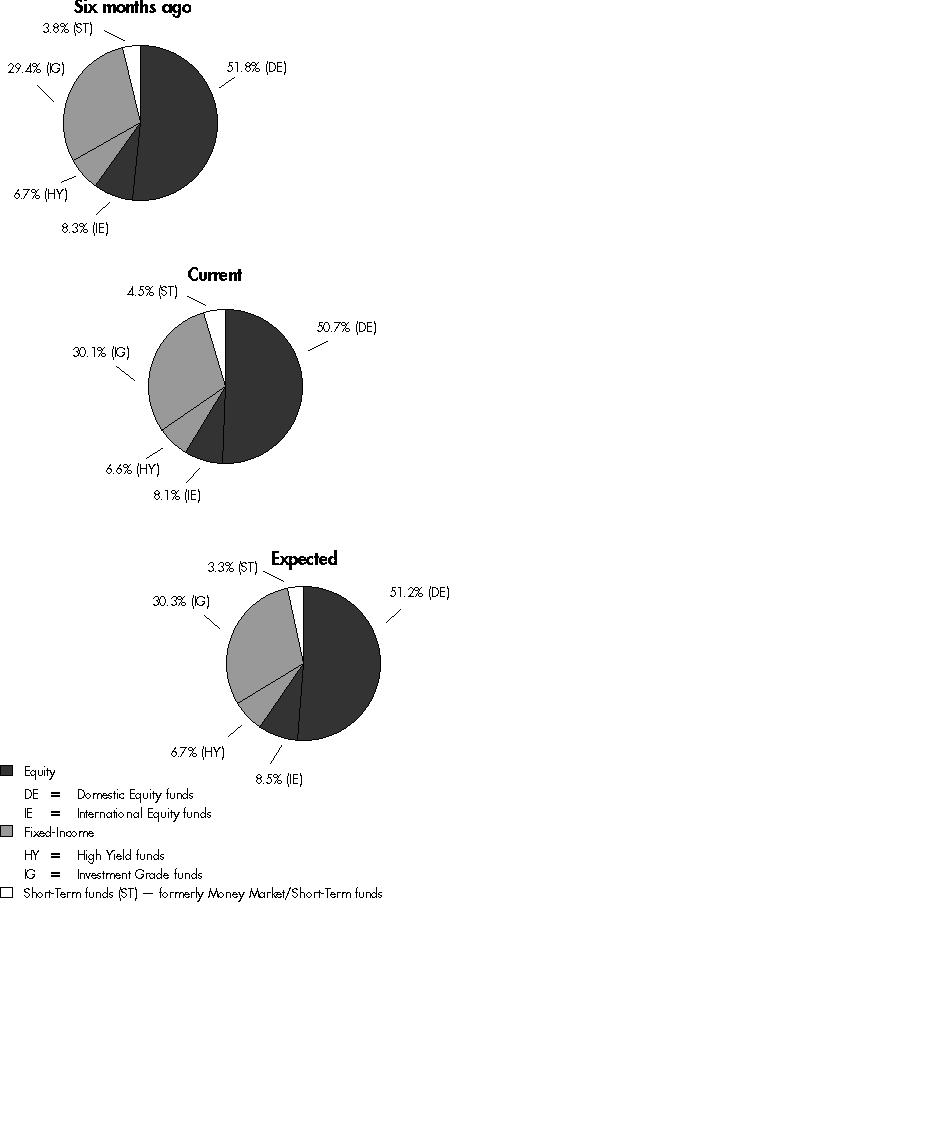
The fund invests according to an asset allocation strategy that becomes increasingly conservative over time. The six months ago allocation is based on the fund's holdings as of September 30, 2004. The current allocation is based on the fund's holdings as of March 31, 2005. The expected allocation represents the fund's anticipated target asset allocation at September 30, 2005.
Annual Report
Fidelity Advisor Freedom 2015 Fund
Investments March 31, 2005
Showing Percentage of Total Value of Investment in Securities
Equity Funds - 58.8% |
| Shares | | Value (Note 1) |
Domestic Equity Funds - 50.7% |
Fidelity Advisor Dividend Growth Fund Institutional Class | 1,287,899 | | $ 14,656,296 |
Fidelity Advisor Equity Growth Fund Institutional Class | 161,262 | | 7,440,639 |
Fidelity Advisor Equity Income Fund Institutional Class | 543,480 | | 15,429,392 |
Fidelity Advisor Growth & Income Fund Institutional Class | 910,652 | | 14,998,441 |
Fidelity Advisor Large Cap Fund Institutional Class | 1,000,296 | | 14,824,385 |
Fidelity Advisor Mid-Cap Fund Institutional Class | 193,318 | | 4,684,094 |
Fidelity Advisor Small Cap Fund Institutional Class | 196,540 | | 4,817,200 |
TOTAL DOMESTIC EQUITY FUNDS | | 76,850,447 |
International Equity Funds - 8.1% |
Fidelity Advisor Diversified International Fund Institutional Class | 331,744 | | 6,253,384 |
Fidelity Advisor Overseas Fund Institutional Class | 349,790 | | 6,089,852 |
TOTAL INTERNATIONAL EQUITY FUNDS | | 12,343,236 |
TOTAL EQUITY FUNDS (Cost $87,353,811) | 89,193,683 |
Fixed-Income Funds - 36.7% |
| | | |
High Yield Fixed-Income Funds - 6.6% |
Fidelity Advisor High Income Advantage Fund Institutional Class | 1,059,003 | | 9,975,808 |
Investment Grade Fixed-Income Funds - 30.1% |
Fidelity Advisor Government Investment Fund Institutional Class | 2,299,253 | | 22,831,580 |
Fidelity Advisor Intermediate Bond Fund Institutional Class | 2,072,587 | | 22,736,276 |
TOTAL INVESTMENT GRADE FIXED-INCOME FUNDS | | 45,567,856 |
TOTAL FIXED-INCOME FUNDS (Cost $56,193,689) | 55,543,664 |
Short-Term Funds - 4.5% |
| | | |
Fidelity Cash Reserves Fund | 4,140,822 | | 4,140,822 |
Fidelity Advisor Short-Fixed Income Fund Institutional Class | 291,958 | | 2,759,000 |
TOTAL SHORT-TERM FUNDS (Cost $6,927,879) | 6,899,822 |
TOTAL INVESTMENT IN SECURITIES - 100% (Cost $150,475,379) | $ 151,637,169 |
See accompanying notes which are an integral part of the financial statements.
Annual Report
Fidelity Advisor Freedom 2015 Fund
Financial Statements
Statement of Assets and Liabilities
| March 31, 2005 |
| | |
Assets | | |
Investment in securities, at value (cost $150,475,379) - See accompanying schedule | | $ 151,637,169 |
Cash | | 109 |
Receivable for investments sold | | 68 |
Receivable for fund shares sold | | 1,193,846 |
Receivable from investment adviser for expense reductions | | 787 |
Total assets | | 152,831,979 |
| | |
Liabilities | | |
Payable for investments purchased | $ 1,080,156 | |
Payable for fund shares redeemed | 103,837 | |
Accrued management fee | 12,287 | |
Distribution fees payable | 62,215 | |
Total liabilities | | 1,258,495 |
| | |
Net Assets | | $ 151,573,484 |
Net Assets consist of: | | |
Paid in capital | | $ 149,643,615 |
Undistributed net investment income | | 318,954 |
Accumulated undistributed net realized gain (loss) on investments | | 449,125 |
Net unrealized appreciation (depreciation) on investments | | 1,161,790 |
Net Assets | | $ 151,573,484 |
Calculation of Maximum Offering Price Class A:
Net Asset Value and redemption price per share ($45,028,023 ÷ 4,179,704 shares) | | $ 10.77 |
| | |
Maximum offering price per share (100/94.25 of $10.77) | | $ 11.43 |
| | |
Class T:
Net Asset Value and redemption price per share ($55,944,755 ÷ 5,200,943 shares) | | $ 10.76 |
| | |
Maximum offering price per share (100/96.50 of $10.76) | | $ 11.15 |
| | |
Class B:
Net Asset Value and offering price per share ($18,812,950 ÷ 1,753,882 shares)A | | $ 10.73 |
| | |
Class C:
Net Asset Value and offering price per share ($18,926,366 ÷ 1,764,243 shares)A | | $ 10.73 |
| | |
Institutional Class:
Net Asset Value, offering price and redemption price per share ($12,861,390 ÷ 1,189,970 shares) | | $ 10.81 |
A Redemption price per share is equal to net asset value less any applicable contingent deferred sales charge.
Statement of Operations
| Year ended March 31, 2005 |
| | |
Investment Income | | |
Income distributions from underlying funds | | $ 1,868,916 |
Interest | | 168 |
Total income | | 1,869,084 |
| | |
Expenses | | |
Management fee | $ 79,236 | |
Distribution fees | 411,837 | |
Independent trustees' compensation | 357 | |
Total expenses before reductions | 491,430 | |
Expense reductions | (18,239) | 473,191 |
Net investment income (loss) | | 1,395,893 |
Realized and Unrealized Gain (Loss) Realized gain (loss) on sale of underlying fund shares | (41,219) | |
Capital gain distributions from underlying funds | 609,695 | 568,476 |
Change in net unrealized appreciation (depreciation) on underlying funds | | 992,415 |
Net gain (loss) | | 1,560,891 |
Net increase (decrease) in net assets resulting from operations | | $ 2,956,784 |
See accompanying notes which are an integral part of the financial statements.
Annual Report
Fidelity Advisor Freedom 2015 Fund
Financial Statements - continued
Statement of Changes in Net Assets
| Year ended
March 31,
2005 | November 6, 2003
(commencement of operations) to
March 31, 2004 |
Increase (Decrease) in Net Assets | | |
Operations | | |
Net investment income (loss) | $ 1,395,893 | $ 39,142 |
Net realized gain (loss) | 568,476 | 5,637 |
Change in net unrealized appreciation (depreciation) | 992,415 | 169,375 |
Net increase (decrease) in net assets resulting from operations | 2,956,784 | 214,154 |
Distributions to shareholders from net investment income | (1,216,011) | (18,521) |
Distributions to shareholders from net realized gain | (6,537) | - |
Total distributions | (1,222,548) | (18,521) |
Share transactions - net increase (decrease) | 131,894,217 | 17,749,398 |
Total increase (decrease) in net assets | 133,628,453 | 17,945,031 |
| | |
Net Assets | | |
Beginning of period | 17,945,031 | - |
End of period (including undistributed net investment income of $318,954 and undistributed net investment income of $20,910, respectively) | $ 151,573,484 | $ 17,945,031 |
Financial Highlights - Class A
Years ended March 31, | 2005 | 2004F |
Selected Per-Share Data | | |
Net asset value, beginning of period | $ 10.57 | $ 10.00 |
Income from Investment Operations | | |
Net investment income (loss)E | .21 | .07 |
Net realized and unrealized gain (loss) | .13 | .56 |
Total from investment operations | .34 | .63 |
Distributions from net investment income | (.14) | (.06) |
Distributions from net realized gain | -H | - |
Total distributions | (.14) | (.06) |
Net asset value, end of period | $ 10.77 | $ 10.57 |
Total ReturnB,C,D | 3.22% | 6.32% |
Ratios to Average Net AssetsG, I | | |
Expenses before expense reductions | .35% | .35%A |
Expenses net of voluntary waivers, if any | .33% | .33%A |
Expenses net of all reductions | .33% | .33%A |
Net investment income (loss) | 2.02% | 1.84%A |
Supplemental Data | | |
Net assets, end of period (000 omitted) | $ 45,028 | $ 4,773 |
Portfolio turnover rate | 3% | 5%A |
A Annualized
B Total returns for periods of less than one year are not annualized.
C Total returns would have been lower had certain expenses not been reduced during the periods shown.
D Total returns do not include the effect of the sales charges.
E Calculated based on average shares outstanding during the period.
F For the period November 6, 2003 (commencement of operations) to March 31, 2004.
G Expense ratios reflect operating expenses of the class. Expenses before reductions do not reflect amounts reimbursed by the investment adviser or reductions from brokerage service arrangements or other expense offset arrangements and do not represent the amount paid by the class during periods when reimbursements or reductions occur. Expenses net of any voluntary waivers reflect expenses after reimbursement by the investment adviser but prior to reductions from brokerage service arrangements or other expense offset arrangements. Expenses net of all reductions represent the net expenses paid by the class.
H Amount represents less than $.01 per share.
I Amounts do not include the activity of the underlying funds.
See accompanying notes which are an integral part of the financial statements.
Annual Report
Financial Highlights - Class T
Years ended March 31, | 2005 | 2004F |
Selected Per-Share Data | | |
Net asset value, beginning of period | $ 10.57 | $ 10.00 |
Income from Investment Operations | | |
Net investment income (loss)E | .19 | .06 |
Net realized and unrealized gain (loss) | .13 | .57 |
Total from investment operations | .32 | .63 |
Distributions from net investment income | (.13) | (.06) |
Distributions from net realized gain | -H | - |
Total distributions | (.13) | (.06) |
Net asset value, end of period | $ 10.76 | $ 10.57 |
Total ReturnB,C,D | 3.01% | 6.27% |
Ratios to Average Net AssetsG, I | | |
Expenses before expense reductions | .60% | .60%A |
Expenses net of voluntary waivers, if any | .58% | .58%A |
Expenses net of all reductions | .58% | .58%A |
Net investment income (loss) | 1.77% | 1.59%A |
Supplemental Data | | |
Net assets, end of period (000 omitted) | $ 55,945 | $ 5,038 |
Portfolio turnover rate | 3% | 5%A |
A Annualized
B Total returns for periods of less than one year are not annualized.
C Total returns would have been lower had certain expenses not been reduced during the periods shown.
D Total returns do not include the effect of the sales charges.
E Calculated based on average shares outstanding during the period.
F For the period November 6, 2003 (commencement of operations) to March 31, 2004.
G Expense ratios reflect operating expenses of the class. Expenses before reductions do not reflect amounts reimbursed by the investment adviser or reductions from brokerage service arrangements or other expense offset arrangements and do not represent the amount paid by the class during periods when reimbursements or reductions occur. Expenses net of any voluntary waivers reflect expenses after reimbursement by the investment adviser but prior to reductions from brokerage service arrangements or other expense offset arrangements. Expenses net of all reductions represent the net expenses paid by the class.
H Amount represents less than $.01 per share.
I Amounts do not include the activity of the underlying funds.
Financial Highlights - Class B
Years ended March 31, | 2005 | 2004F |
Selected Per-Share Data | | |
Net asset value, beginning of period | $ 10.56 | $ 10.00 |
Income from Investment Operations | | |
Net investment income (loss)E | .13 | .04 |
Net realized and unrealized gain (loss) | .13 | .58 |
Total from investment operations | .26 | .62 |
Distributions from net investment income | (.09) | (.06) |
Distributions from net realized gain | -H | - |
Total distributions | (.09) | (.06) |
Net asset value, end of period | $ 10.73 | $ 10.56 |
Total ReturnB,C,D | 2.49% | 6.17% |
Ratios to Average Net AssetsG, I | | |
Expenses before expense reductions | 1.10% | 1.10%A |
Expenses net of voluntary waivers, if any | 1.08% | 1.08%A |
Expenses net of all reductions | 1.08% | 1.08%A |
Net investment income (loss) | 1.28% | 1.09%A |
Supplemental Data | | |
Net assets, end of period (000 omitted) | $ 18,813 | $ 4,259 |
Portfolio turnover rate | 3% | 5%A |
A Annualized
B Total returns for periods of less than one year are not annualized.
C Total returns would have been lower had certain expenses not been reduced during the periods shown.
D Total returns do not include the effect of the contingent deferred sales charge.
E Calculated based on average shares outstanding during the period.
F For the period November 6, 2003 (commencement of operations) to March 31, 2004.
G Expense ratios reflect operating expenses of the class. Expenses before reductions do not reflect amounts reimbursed by the investment adviser or reductions from brokerage service arrangements or other expense offset arrangements and do not represent the amount paid by the class during periods when reimbursements or reductions occur. Expenses net of any voluntary waivers reflect expenses after reimbursement by the investment adviser but prior to reductions from brokerage service arrangements or other expense offset arrangements. Expenses net of all reductions represent the net expenses paid by the class.
H Amount represents less than $.01 per share.
I Amounts do not include the activity of the underlying funds.
See accompanying notes which are an integral part of the financial statements.
Annual Report
Financial Highlights - Class C
Years ended March 31, | 2005 | 2004F |
Selected Per-Share Data | | |
Net asset value, beginning of period | $ 10.56 | $ 10.00 |
Income from Investment Operations | | |
Net investment income (loss)E | .13 | .04 |
Net realized and unrealized gain (loss) | .13 | .57 |
Total from investment operations | .26 | .61 |
Distributions from net investment income | (.09) | (.05) |
Distributions from net realized gain | -H | - |
Total distributions | (.09) | (.05) |
Net asset value, end of period | $ 10.73 | $ 10.56 |
Total ReturnB,C,D | 2.47% | 6.12% |
Ratios to Average Net AssetsG, I | | |
Expenses before expense reductions | 1.10% | 1.10%A |
Expenses net of voluntary waivers, if any | 1.08% | 1.08%A |
Expenses net of all reductions | 1.08% | 1.08%A |
Net investment income (loss) | 1.28% | 1.09%A |
Supplemental Data | | |
Net assets, end of period (000 omitted) | $ 18,926 | $ 3,593 |
Portfolio turnover rate | 3% | 5%A |
A Annualized
B Total returns for periods of less than one year are not annualized.
C Total returns would have been lower had certain expenses not been reduced during the periods shown.
D Total returns do not include the effect of the contingent deferred sales charge.
E Calculated based on average shares outstanding during the period.
F For the period November 6, 2003 (commencement of operations) to March 31, 2004.
G Expense ratios reflect operating expenses of the class. Expenses before reductions do not reflect amounts reimbursed by the investment adviser or reductions from brokerage service arrangements or other expense offset arrangements and do not represent the amount paid by the class during periods when reimbursements or reductions occur. Expenses net of any voluntary waivers reflect expenses after reimbursement by the investment adviser but prior to reductions from brokerage service arrangements or other expense offset arrangements. Expenses net of all reductions represent the net expenses paid by the class.
H Amount represents less than $.01 per share.
I Amounts do not include the activity of the underlying funds.
Financial Highlights - Institutional Class
Years ended March 31, | 2005 | 2004E |
Selected Per-Share Data | | |
Net asset value, beginning of period | $ 10.59 | $ 10.00 |
Income from Investment Operations | | |
Net investment income (loss)D | .24 | .09 |
Net realized and unrealized gain (loss) | .13 | .56 |
Total from investment operations | .37 | .65 |
Distributions from net investment income | (.15) | (.06) |
Distributions from net realized gain | -G | - |
Total distributions | (.15) | (.06) |
Net asset value, end of period | $ 10.81 | $ 10.59 |
Total ReturnB,C | 3.52% | 6.52% |
Ratios to Average Net AssetsF, H | | |
Expenses before expense reductions | .10% | .10%A |
Expenses net of voluntary waivers, if any | .08% | .08%A |
Expenses net of all reductions | .08% | .08%A |
Net investment income (loss) | 2.27% | 2.09%A |
Supplemental Data | | |
Net assets, end of period (000 omitted) | $ 12,861 | $ 282 |
Portfolio turnover rate | 3% | 5%A |
A Annualized
B Total returns for periods of less than one year are not annualized.
C Total returns would have been lower had certain expenses not been reduced during the periods shown.
D Calculated based on average shares outstanding during the period.
E For the period November 6, 2003 (commencement of operations) to March 31, 2004.
F Expense ratios reflect operating expenses of the class. Expenses before reductions do not reflect amounts reimbursed by the investment adviser or reductions from brokerage service arrangements or other expense offset arrangements and do not represent the amount paid by the class during periods when reimbursements or reductions occur. Expenses net of any voluntary waivers reflect expenses after reimbursement by the investment adviser but prior to reductions from brokerage service arrangements or other expense offset arrangements. Expenses net of all reductions represent the net expenses paid by the class.
G Amount represents less than $.01 per share.
H Amounts do not include the activity of the underlying funds.
See accompanying notes which are an integral part of the financial statements.
Annual Report
Fidelity Advisor Freedom 2020 Fund
Investment Changes
Fund Holdings as of March 31, 2005 |
| % of fund's investments | % of fund's investments 6 months ago |
Domestic Equity Funds | | |
Fidelity Advisor Dividend Growth Fund Institutional Class | 11.3 | 11.4 |
Fidelity Advisor Equity Growth Fund Institutional Class | 5.7 | 5.7 |
Fidelity Advisor Equity Income Fund Institutional Class | 12.1 | 12.0 |
Fidelity Advisor Growth & Income Fund Institutional Class | 11.6 | 11.6 |
Fidelity Advisor Large Cap Fund Institutional Class | 11.4 | 11.4 |
Fidelity Advisor Mid-Cap Fund Institutional Class | 3.7 | 3.6 |
Fidelity Advisor Small Cap Fund Institutional Class | 3.8 | 3.7 |
| 59.6 | 59.4 |
International Equity Funds | | |
Fidelity Advisor Diversified International Fund Institutional Class | 5.5 | 5.2 |
Fidelity Advisor Overseas Fund Institutional Class | 5.2 | 5.0 |
| 10.7 | 10.2 |
High Yield Fixed-Income Funds | | |
Fidelity Advisor High Income Advantage Fund Institutional Class | 7.8 | 7.7 |
Investment Grade Fixed-Income Funds |
Fidelity Advisor Government Investment Fund Institutional Class | 10.9 | 11.4 |
Fidelity Advisor Intermediate Bond Fund Institutional Class | 10.9 | 11.3 |
| 21.8 | 22.7 |
Short-Term Funds | | |
Fidelity Advisor Short-Fixed Income Fund Institutional Class | 0.0 | 0.0 |
Fidelity Cash Reserves Fund | 0.1 | 0.0 |
| 0.1 | 0.0 |
| 100.0 | 100.0 |
Asset Allocation (% of fund's investments) |

The fund invests according to an asset allocation strategy that becomes increasingly conservative over time. The six months ago allocation is based on the fund's holdings as of September 30, 2004. The current allocation is based on the fund's holdings as of March 31, 2005. The expected allocation represents the fund's anticipated target asset allocation at September 30, 2005.
Annual Report
Fidelity Advisor Freedom 2020 Fund
Investments March 31, 2005
Showing Percentage of Total Value of Investment in Securities
Equity Funds - 70.3% |
| Shares | | Value (Note 1) |
Domestic Equity Funds - 59.6% |
Fidelity Advisor Dividend Growth Fund Institutional Class | 4,103,125 | | $ 46,693,558 |
Fidelity Advisor Equity Growth Fund Institutional Class | 509,821 | | 23,523,140 |
Fidelity Advisor Equity Income Fund Institutional Class | 1,765,382 | | 50,119,190 |
Fidelity Advisor Growth & Income Fund Institutional Class | 2,899,189 | | 47,749,639 |
Fidelity Advisor Large Cap Fund Institutional Class | 3,186,334 | | 47,221,476 |
Fidelity Advisor Mid-Cap Fund Institutional Class | 626,743 | | 15,185,980 |
Fidelity Advisor Small Cap Fund Institutional Class | 647,531 | | 15,870,991 |
TOTAL DOMESTIC EQUITY FUNDS | | 246,363,974 |
International Equity Funds - 10.7% |
Fidelity Advisor Diversified International Fund Institutional Class | 1,192,713 | | 22,482,642 |
Fidelity Advisor Overseas Fund Institutional Class | 1,241,755 | | 21,618,951 |
TOTAL INTERNATIONAL EQUITY FUNDS | | 44,101,593 |
TOTAL EQUITY FUNDS (Cost $278,949,830) | 290,465,567 |
Fixed-Income Funds - 29.6% |
| | | |
High Yield Fixed-Income Funds - 7.8% |
Fidelity Advisor High Income Advantage Fund Institutional Class | 3,432,960 | | 32,338,486 |
Investment Grade Fixed-Income Funds - 21.8% |
Fidelity Advisor Government Investment Fund Institutional Class | 4,560,602 | | 45,286,778 |
Fidelity Advisor Intermediate Bond Fund Institutional Class | 4,108,254 | | 45,067,546 |
TOTAL INVESTMENT GRADE FIXED-INCOME FUNDS | | 90,354,324 |
TOTAL FIXED-INCOME FUNDS (Cost $123,766,241) | 122,692,810 |
Short-Term Funds - 0.1% |
| | | |
Fidelity Cash Reserves Fund | 194,974 | | 194,974 |
Fidelity Advisor Short-Fixed Income Fund Institutional Class | 14,109 | | 133,332 |
TOTAL SHORT-TERM FUNDS (Cost $329,306) | 328,306 |
TOTAL INVESTMENT IN SECURITIES - 100% (Cost $403,045,377) | $ 413,486,683 |
See accompanying notes which are an integral part of the financial statements.
Annual Report
Fidelity Advisor Freedom 2020 Fund
Financial Statements
Statement of Assets and Liabilities
| March 31, 2005 |
| | |
Assets | | |
Investment in securities, at value (cost $403,045,377) - See accompanying schedule | | $ 413,486,683 |
Cash | | 1,131 |
Receivable for fund shares sold | | 1,256,041 |
Receivable from investment adviser for expense reductions | | 3,494 |
Total assets | | 414,747,349 |
| | |
Liabilities | | |
Payable for investments purchased | $ 792,551 | |
Payable for fund shares redeemed | 463,108 | |
Accrued management fee | 34,084 | |
Distribution fees payable | 174,010 | |
Total liabilities | | 1,463,753 |
| | |
Net Assets | | $ 413,283,596 |
Net Assets consist of: | | |
Paid in capital | | $ 400,641,408 |
Undistributed net investment income | | 637,463 |
Accumulated undistributed net realized gain (loss) on investments | | 1,563,419 |
Net unrealized appreciation (depreciation) on investments | | 10,441,306 |
Net Assets | | $ 413,283,596 |
Calculation of Maximum Offering Price Class A:
Net Asset Value and redemption price per share ($135,306,262 ÷ 11,737,823 shares) | | $ 11.53 |
| | |
Maximum offering price per share (100/94.25 of $11.53) | | $ 12.23 |
| | |
Class T:
Net Asset Value and redemption price per share ($177,336,477 ÷ 15,396,286 shares) | | $ 11.52 |
| | |
Maximum offering price per share (100/96.50 of $11.52) | | $ 11.94 |
| | |
Class B:
Net Asset Value and offering price per share ($49,398,409 ÷ 4,303,386 shares)A | | $ 11.48 |
| | |
Class C:
Net Asset Value and offering price per share ($39,310,089 ÷ 3,425,616 shares)A | | $ 11.48 |
| | |
Institutional Class:
Net Asset Value, offering price and redemption price per share ($11,932,359 ÷ 1,031,563 shares) | | $ 11.57 |
A Redemption price per share is equal to net asset value less any applicable contingent deferred sales charge.
Statement of Operations
| Year ended March 31, 2005 |
| | |
Investment Income | | |
Income distributions from underlying funds | | $ 6,088,176 |
| | |
Expenses | | |
Management fee | $ 284,340 | |
Distribution fees | 1,461,705 | |
Independent trustees' compensation | 1,399 | |
Total expenses before reductions | 1,747,444 | |
Expense reductions | (61,992) | 1,685,452 |
Net investment income (loss) | | 4,402,724 |
Realized and Unrealized Gain (Loss) Realized gain (loss) on sale of underlying fund shares | (54,524) | |
Capital gain distributions from underlying funds | 2,019,894 | 1,965,370 |
Change in net unrealized appreciation (depreciation) on underlying funds | | 5,996,006 |
Net gain (loss) | | 7,961,376 |
Net increase (decrease) in net assets resulting from operations | | $ 12,364,100 |
See accompanying notes which are an integral part of the financial statements.
Annual Report
Fidelity Advisor Freedom 2020 Fund
Financial Statements - continued
Statement of Changes in Net Assets
| Year ended
March 31,
2005 | July 24, 2003
(commencement of
operations) to
March 31, 2004 |
Increase (Decrease) in Net Assets | | |
Operations | | |
Net investment income (loss) | $ 4,402,724 | $ 621,362 |
Net realized gain (loss) | 1,965,370 | 66,377 |
Change in net unrealized appreciation (depreciation) | 5,996,006 | 4,445,300 |
Net increase (decrease) in net assets resulting from operations | 12,364,100 | 5,133,039 |
Distributions to shareholders from net investment income | (4,439,939) | (346,934) |
Distributions to shareholders from net realized gain | (68,080) | - |
Total distributions | (4,508,019) | (346,934) |
Share transactions - net increase (decrease) | 239,359,934 | 161,281,476 |
Total increase (decrease) in net assets | 247,216,015 | 166,067,581 |
| | |
Net Assets | | |
Beginning of period | 166,067,581 | - |
End of period (including undistributed net investment income of $637,463 and undistributed net investment income of $278,597, respectively) | $ 413,283,596 | $ 166,067,581 |
Financial Highlights - Class A
Years ended March 31, | 2005 | 2004F |
Selected Per-Share Data | | |
Net asset value, beginning of period | $ 11.29 | $ 10.00 |
Income from Investment Operations | | |
Net investment income (loss)E | .20 | .13 |
Net realized and unrealized gain (loss) | .23 | 1.25 |
Total from investment operations | .43 | 1.38 |
Distributions from net investment income | (.18) | (.09) |
Distributions from net realized gain | -H | - |
Total distributions | (.19)I | (.09) |
Net asset value, end of period | $ 11.53 | $ 11.29 |
Total ReturnB,C,D | 3.75% | 13.78% |
Ratios to Average Net AssetsG, J | | |
Expenses before expense reductions | .35% | .35%A |
Expenses net of voluntary waivers, if any | .33% | .33%A |
Expenses net of all reductions | .33% | .33%A |
Net investment income (loss) | 1.80% | 1.74%A |
Supplemental Data | | |
Net assets, end of period (000 omitted) | $ 135,306 | $ 72,334 |
Portfolio turnover rate | 1% | 4%A |
A Annualized
B Total returns for periods of less than one year are not annualized.
C Total returns would have been lower had certain expenses not been reduced during the periods shown.
D Total returns do not include the effect of the sales charges.
E Calculated based on average shares outstanding during the period.
F For the period July 24, 2003 (commencement of operations) to March 31, 2004.
G Expense ratios reflect operating expenses of the class. Expenses before reductions do not reflect amounts reimbursed by the investment adviser or reductions from brokerage service arrangements or other expense offset arrangements and do not represent the amount paid by the class during periods when reimbursements or reductions occur. Expenses net of any voluntary waivers reflect expenses after reimbursement by the investment adviser but prior to reductions from brokerage service arrangements or other expense offset arrangements. Expenses net of all reductions represent the net expenses paid by the class.
H Amount represents less than $.01 per share.
I Total distributions of $.185 per share is comprised of distributions from net investment income of $.181 per share and distributions from net realized gain of $.004 per share.
J Amounts do not include the activity of the underlying funds.
See accompanying notes which are an integral part of the financial statements.
Annual Report
Financial Highlights - Class T
Years ended March 31, | 2005 | 2004F |
Selected Per-Share Data | | |
Net asset value, beginning of period | $ 11.29 | $ 10.00 |
Income from Investment Operations | | |
Net investment income (loss)E | .18 | .11 |
Net realized and unrealized gain (loss) | .21 | 1.26 |
Total from investment operations | .39 | 1.37 |
Distributions from net investment income | (.16) | (.08) |
Distributions from net realized gain | -H | - |
Total distributions | (.16) | (.08) |
Net asset value, end of period | $ 11.52 | $ 11.29 |
Total ReturnB,C,D | 3.46% | 13.73% |
Ratios to Average Net AssetsG, I | | |
Expenses before expense reductions | .60% | .60%A |
Expenses net of voluntary waivers, if any | .58% | .58%A |
Expenses net of all reductions | .58% | .58%A |
Net investment income (loss) | 1.55% | 1.49%A |
Supplemental Data | | |
Net assets, end of period (000 omitted) | $ 177,336 | $ 52,310 |
Portfolio turnover rate | 1% | 4%A |
A Annualized
B Total returns for periods of less than one year are not annualized.
C Total returns would have been lower had certain expenses not been reduced during the periods shown.
D Total returns do not include the effect of the sales charges.
E Calculated based on average shares outstanding during the period.
F For the period July 24, 2003 (commencement of operations) to March 31, 2004.
G Expense ratios reflect operating expenses of the class. Expenses before reductions do not reflect amounts reimbursed by the investment adviser or reductions from brokerage service arrangements or other expense offset arrangements and do not represent the amount paid by the class during periods when reimbursements or reductions occur. Expenses net of any voluntary waivers reflect expenses after reimbursement by the investment adviser but prior to reductions from brokerage service arrangements or other expense offset arrangements. Expenses net of all reductions represent the net expenses paid by the class.
H Amount represents less than $.01 per share.
I Amounts do not include the activity of the underlying funds.
Financial Highlights - Class B
Years ended March 31, | 2005 | 2004F |
Selected Per-Share Data | | |
Net asset value, beginning of period | $ 11.27 | $ 10.00 |
Income from Investment Operations | | |
Net investment income (loss)E | .12 | .07 |
Net realized and unrealized gain (loss) | .21 | 1.27 |
Total from investment operations | .33 | 1.34 |
Distributions from net investment income | (.12) | (.07) |
Distributions from net realized gain | -H | - |
Total distributions | (.12) | (.07) |
Net asset value, end of period | $ 11.48 | $ 11.27 |
Total ReturnB,C,D | 2.93% | 13.37% |
Ratios to Average Net AssetsG, I | | |
Expenses before expense reductions | 1.10% | 1.10%A |
Expenses net of voluntary waivers, if any | 1.08% | 1.08%A |
Expenses net of all reductions | 1.08% | 1.08%A |
Net investment income (loss) | 1.05% | .99%A |
Supplemental Data | | |
Net assets, end of period (000 omitted) | $ 49,398 | $ 23,274 |
Portfolio turnover rate | 1% | 4%A |
A Annualized
B Total returns for periods of less than one year are not annualized.
C Total returns would have been lower had certain expenses not been reduced during the periods shown.
D Total returns do not include the effect of the contingent deferred sales charge.
E Calculated based on average shares outstanding during the period.
F For the period July 24, 2003 (commencement of operations) to March 31, 2004.
G Expense ratios reflect operating expenses of the class. Expenses before reductions do not reflect amounts reimbursed by the investment adviser or reductions from brokerage service arrangements or other expense offset arrangements and do not represent the amount paid by the class during periods when reimbursements or reductions occur. Expenses net of any voluntary waivers reflect expenses after reimbursement by the investment adviser but prior to reductions from brokerage service arrangements or other expense offset arrangements. Expenses net of all reductions represent the net expenses paid by the class.
H Amount represents less than $.01 per share.
I Amounts do not include the activity of the underlying funds.
See accompanying notes which are an integral part of the financial statements.
Annual Report
Financial Highlights - Class C
Years ended March 31, | 2005 | 2004F |
Selected Per-Share Data | | |
Net asset value, beginning of period | $ 11.26 | $ 10.00 |
Income from Investment Operations | | |
Net investment income (loss)E | .12 | .07 |
Net realized and unrealized gain (loss) | .22 | 1.26 |
Total from investment operations | .34 | 1.33 |
Distributions from net investment income | (.12) | (.07) |
Distributions from net realized gain | -H | - |
Total distributions | (.12) | (.07) |
Net asset value, end of period | $ 11.48 | $ 11.26 |
Total ReturnB,C,D | 3.02% | 13.32% |
Ratios to Average Net AssetsG, I | | |
Expenses before expense reductions | 1.10% | 1.10%A |
Expenses net of voluntary waivers, if any | 1.08% | 1.08%A |
Expenses net of all reductions | 1.08% | 1.08%A |
Net investment income (loss) | 1.05% | .99%A |
Supplemental Data | | |
Net assets, end of period (000 omitted) | $ 39,310 | $ 15,871 |
Portfolio turnover rate | 1% | 4%A |
A Annualized
B Total returns for periods of less than one year are not annualized.
C Total returns would have been lower had certain expenses not been reduced during the periods shown.
D Total returns do not include the effect of the contingent deferred sales charge.
E Calculated based on average shares outstanding during the period.
F For the period July 24, 2003 (commencement of operations) to March 31, 2004.
G Expense ratios reflect operating expenses of the class. Expenses before reductions do not reflect amounts reimbursed by the investment adviser or reductions from brokerage service arrangements or other expense offset arrangements and do not represent the amount paid by the class during periods when reimbursements or reductions occur. Expenses net of any voluntary waivers reflect expenses after reimbursement by the investment adviser but prior to reductions from brokerage service arrangements or other expense offset arrangements. Expenses net of all reductions represent the net expenses paid by the class.
H Amount represents less than $.01 per share.
I Amounts do not include the activity of the underlying funds.
Financial Highlights - Institutional Class
Years ended March 31, | 2005 | 2004E |
Selected Per-Share Data | | |
Net asset value, beginning of period | $ 11.31 | $ 10.00 |
Income from Investment Operations | | |
Net investment income (loss)D | .23 | .15 |
Net realized and unrealized gain (loss) | .23 | 1.25 |
Total from investment operations | .46 | 1.40 |
Distributions from net investment income | (.20) | (.09) |
Distributions from net realized gain | -G | - |
Total distributions | (.20) | (.09) |
Net asset value, end of period | $ 11.57 | $ 11.31 |
Total ReturnB,C | 4.06% | 14.03% |
Ratios to Average Net AssetsF, H | | |
Expenses before expense reductions | .10% | .10%A |
Expenses net of voluntary waivers, if any | .08% | .08%A |
Expenses net of all reductions | .08% | .08%A |
Net investment income (loss) | 2.05% | 1.98%A |
Supplemental Data | | |
Net assets, end of period (000 omitted) | $ 11,932 | $ 2,278 |
Portfolio turnover rate | 1% | 4%A |
A Annualized
B Total returns for periods of less than one year are not annualized.
C Total returns would have been lower had certain expenses not been reduced during the periods shown.
D Calculated based on average shares outstanding during the period.
E For the period July 24, 2003 (commencement of operations) to March 31, 2004.
F Expense ratios reflect operating expenses of the class. Expenses before reductions do not reflect amounts reimbursed by the investment adviser or reductions from brokerage service arrangements or other expense offset arrangements and do not represent the amount paid by the class during periods when reimbursements or reductions occur. Expenses net of any voluntary waivers reflect expenses after reimbursement by the investment adviser but prior to reductions from brokerage service arrangements or other expense offset arrangements. Expenses net of all reductions represent the net expenses paid by the class.
G Amount represents less than $.01 per share.
H Amounts do not include the activity of the underlying funds.
See accompanying notes which are an integral part of the financial statements.
Annual Report
Fidelity Advisor Freedom 2025 Fund
Investment Changes
Fund Holdings as of March 31, 2005 |
| % of fund's
investments | % of fund's investments
6 months ago |
Domestic Equity Funds | | |
Fidelity Advisor Dividend Growth Fund Institutional Class | 12.4 | 12.6 |
Fidelity Advisor Equity Growth Fund Institutional Class | 6.3 | 6.4 |
Fidelity Advisor Equity Income Fund Institutional Class | 12.9 | 13.1 |
Fidelity Advisor Growth & Income Fund Institutional Class | 12.6 | 12.9 |
Fidelity Advisor Large Cap Fund Institutional Class | 12.5 | 12.7 |
Fidelity Advisor Mid-Cap Fund Institutional Class | 3.9 | 3.9 |
Fidelity Advisor Small Cap Fund Institutional Class | 4.0 | 4.1 |
| 64.6 | 65.7 |
International Equity Funds | | |
Fidelity Advisor Diversified International Fund Institutional Class | 5.9 | 5.9 |
Fidelity Advisor Overseas Fund Institutional Class | 5.7 | 5.7 |
| 11.6 | 11.6 |
High Yield Fixed-Income Funds | | |
Fidelity Advisor High Income Advantage Fund Institutional Class | 7.7 | 7.7 |
Investment Grade Fixed-Income Funds |
Fidelity Advisor Government Investment Fund Institutional Class | 8.1 | 7.5 |
Fidelity Advisor Intermediate Bond Fund Institutional Class | 8.0 | 7.5 |
| 16.1 | 15.0 |
| 100.0 | 100.0 |
Asset Allocation (% of fund's investments) |
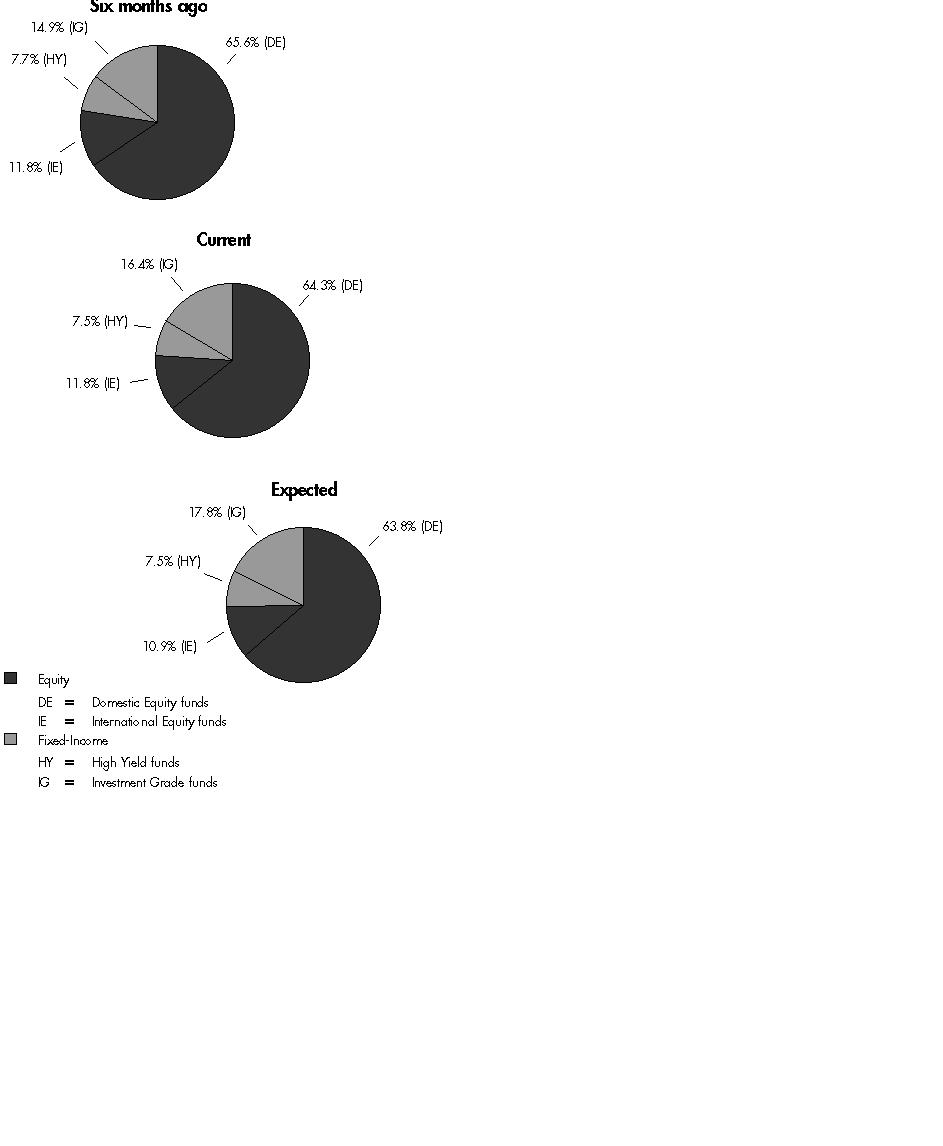
The fund invests according to an asset allocation strategy that becomes increasingly conservative over time. The six months ago allocation is based on the fund's holdings as of September 30, 2004. The current allocation is based on the fund's holdings as of March 31, 2005. The expected allocation represents the fund's anticipated target asset allocation at September 30, 2005.
Annual Report
Fidelity Advisor Freedom 2025 Fund
Investments March 31, 2005
Showing Percentage of Total Value of Investment in Securities
Equity Funds - 76.2% |
| Shares | | Value (Note 1) |
Domestic Equity Funds - 64.6% |
Fidelity Advisor Dividend Growth Fund Institutional Class | 1,336,028 | | $ 15,203,995 |
Fidelity Advisor Equity Growth Fund Institutional Class | 167,390 | | 7,723,365 |
Fidelity Advisor Equity Income Fund Institutional Class | 556,006 | | 15,785,020 |
Fidelity Advisor Growth & Income Fund Institutional Class | 938,029 | | 15,449,338 |
Fidelity Advisor Large Cap Fund Institutional Class | 1,034,857 | | 15,336,586 |
Fidelity Advisor Mid-Cap Fund Institutional Class | 196,583 | | 4,763,205 |
Fidelity Advisor Small Cap Fund Institutional Class | 199,741 | | 4,895,645 |
TOTAL DOMESTIC EQUITY FUNDS | | 79,157,154 |
International Equity Funds - 11.6% |
Fidelity Advisor Diversified International Fund Institutional Class | 381,378 | | 7,188,975 |
Fidelity Advisor Overseas Fund Institutional Class | 405,715 | | 7,063,498 |
TOTAL INTERNATIONAL EQUITY FUNDS | | 14,252,473 |
TOTAL EQUITY FUNDS (Cost $91,717,808) | 93,409,627 |
Fixed-Income Funds - 23.8% |
| | | |
High Yield Fixed-Income Funds - 7.7% |
Fidelity Advisor High Income Advantage Fund Institutional Class | 995,039 | | 9,373,269 |
Investment Grade Fixed-Income Funds - 16.1% |
Fidelity Advisor Government Investment Fund Institutional Class | 997,180 | | 9,901,994 |
Fidelity Advisor Intermediate Bond Fund Institutional Class | 899,884 | | 9,871,730 |
TOTAL INVESTMENT GRADE FIXED-INCOME FUNDS | | 19,773,724 |
TOTAL FIXED-INCOME FUNDS (Cost $29,338,753) | 29,146,993 |
TOTAL INVESTMENT IN SECURITIES - 100% (Cost $121,056,561) | $ 122,556,620 |
See accompanying notes which are an integral part of the financial statements.
Annual Report
Fidelity Advisor Freedom 2025 Fund
Financial Statements
Statement of Assets and Liabilities
| March 31, 2005 |
| | |
Assets | | |
Investment in securities, at value (cost $121,056,561) - See accompanying schedule | | $ 122,556,620 |
Cash | | 41 |
Receivable for fund shares sold | | 27,779,861 |
Receivable from investment adviser for expense reductions | | 356 |
Total assets | | 150,336,878 |
| | |
Liabilities | | |
Payable for investments purchased | $ 27,718,942 | |
Payable for fund shares redeemed | 60,684 | |
Accrued management fee | 7,666 | |
Distribution fees payable | 40,952 | |
Total liabilities | | 27,828,244 |
| | |
Net Assets | | $ 122,508,634 |
Net Assets consist of: | | |
Paid in capital | | $ 120,669,665 |
Undistributed net investment income | | 95,450 |
Accumulated undistributed net realized gain (loss) on investments | | 243,460 |
Net unrealized appreciation (depreciation) on investments | | 1,500,059 |
Net Assets | | $ 122,508,634 |
Calculation of Maximum Offering Price Class A:
Net Asset Value and redemption price per share ($59,347,461 ÷ 5,415,869 shares) | | $ 10.96 |
| | |
Maximum offering price per share (100/94.25 of $10.96) | | $ 11.63 |
| | |
Class T:
Net Asset Value and redemption price per share ($36,966,355 ÷ 3,369,675 shares) | | $ 10.97 |
| | |
Maximum offering price per share (100/96.50 of $10.97) | | $ 11.37 |
| | |
Class B:
Net Asset Value and offering price per share ($13,414,787 ÷ 1,230,107 shares)A | | $ 10.91 |
| | |
Class C:
Net Asset Value and offering price per share ($10,859,294 ÷ 995,602 shares)A | | $ 10.91 |
| | |
Institutional Class:
Net Asset Value, offering price and redemption price per share ($1,920,737 ÷ 174,754 shares) | | $ 10.99 |
A Redemption price per share is equal to net asset value less any applicable contingent deferred sales charge.
Statement of Operations
| Year ended March 31, 2005 |
| | |
Investment Income | | |
Income distributions from underlying funds | | $ 962,877 |
Interest | | 228 |
Total income | | 963,105 |
| | |
Expenses | | |
Management fee | $ 46,072 | |
Distribution fees | 265,801 | |
Independent trustees' compensation | 203 | |
Total expenses before reductions | 312,076 | |
Expense reductions | (10,963) | 301,113 |
Net investment income (loss) | | 661,992 |
Realized and Unrealized Gain (Loss) Realized gain (loss) on sale of underlying fund shares | (50,370) | |
Capital gain distributions from underlying funds | 369,871 | 319,501 |
Change in net unrealized appreciation (depreciation) on underlying funds | | 1,358,607 |
Net gain (loss) | | 1,678,108 |
Net increase (decrease) in net assets resulting from operations | | $ 2,340,100 |
See accompanying notes which are an integral part of the financial statements.
Annual Report
Fidelity Advisor Freedom 2025 Fund
Financial Statements - continued
Statement of Changes in Net Assets
| Year ended
March 31,
2005 | November 6, 2003
(commencement of operations) to
March 31, 2004 |
Increase (Decrease) in Net Assets | | |
Operations | | |
Net investment income (loss) | $ 661,992 | $ 17,856 |
Net realized gain (loss) | 319,501 | 488 |
Change in net unrealized appreciation (depreciation) | 1,358,607 | 141,452 |
Net increase (decrease) in net assets resulting from operations | 2,340,100 | 159,796 |
Distributions to shareholders from net investment income | (647,465) | (11,834) |
Distributions to shareholders from net realized gain | (1,629) | - |
Total distributions | (649,094) | (11,834) |
Share transactions - net increase (decrease) | 110,847,488 | 9,822,178 |
Total increase (decrease) in net assets | 112,538,494 | 9,970,140 |
| | |
Net Assets | | |
Beginning of period | 9,970,140 | - |
End of period (including undistributed net investment income of $95,450 and undistributed net investment income of $6,118, respectively) | $ 122,508,634 | $ 9,970,140 |
Financial Highlights - Class A
Years ended March 31, | 2005 | 2004F |
Selected Per-Share Data | | |
Net asset value, beginning of period | $ 10.67 | $ 10.00 |
Income from Investment Operations | | |
Net investment income (loss)E | .19 | .06 |
Net realized and unrealized gain (loss) | .23 | .67 |
Total from investment operations | .42 | .73 |
Distributions from net investment income | (.13) | (.06) |
Distributions from net realized gain | -H | - |
Total distributions | (.13) | (.06) |
Net asset value, end of period | $ 10.96 | $ 10.67 |
Total ReturnB,C,D | 3.96% | 7.32% |
Ratios to Average Net AssetsG, I | | |
Expenses before expense reductions | .35% | .35%A |
Expenses net of voluntary waivers, if any | .33% | .33%A |
Expenses net of all reductions | .33% | .33%A |
Net investment income (loss) | 1.76% | 1.59%A |
Supplemental Data | | |
Net assets, end of period (000 omitted) | $ 59,347 | $ 2,284 |
Portfolio turnover rate | 10% | 6%A |
A Annualized
B Total returns for periods of less than one year are not annualized.
C Total returns would have been lower had certain expenses not been reduced during the periods shown.
D Total returns do not include the effect of the sales charges.
E Calculated based on average shares outstanding during the period.
F For the period November 6, 2003 (commencement of operations) to March 31, 2004.
G Expense ratios reflect operating expenses of the class. Expenses before reductions do not reflect amounts reimbursed by the investment adviser or reductions from brokerage service arrangements or other expense offset arrangements and do not represent the amount paid by the class during periods when reimbursements or reductions occur. Expenses net of any voluntary waivers reflect expenses after reimbursement by the investment adviser but prior to reductions from brokerage service arrangements or other expense offset arrangements. Expenses net of all reductions represent the net expenses paid by the class.
H Amount represents less than $.01 per share.
I Amounts do not include the activity of the underlying funds.
See accompanying notes which are an integral part of the financial statements.
Annual Report
Financial Highlights - Class T
Years ended March 31, | 2005 | 2004F |
Selected Per-Share Data | | |
Net asset value, beginning of period | $ 10.69 | $ 10.00 |
Income from Investment Operations | | |
Net investment income (loss)E | .16 | .05 |
Net realized and unrealized gain (loss) | .24 | .70 |
Total from investment operations | .40 | .75 |
Distributions from net investment income | (.12) | (.06) |
Distributions from net realized gain | -H | - |
Total distributions | (.12) | (.06) |
Net asset value, end of period | $ 10.97 | $ 10.69 |
Total ReturnB,C,D | 3.75% | 7.52% |
Ratios to Average Net AssetsG, I | | |
Expenses before expense reductions | .60% | .60%A |
Expenses net of voluntary waivers, if any | .58% | .58%A |
Expenses net of all reductions | .58% | .58%A |
Net investment income (loss) | 1.51% | 1.34%A |
Supplemental Data | | |
Net assets, end of period (000 omitted) | $ 36,966 | $ 2,556 |
Portfolio turnover rate | 10% | 6%A |
A Annualized
B Total returns for periods of less than one year are not annualized.
C Total returns would have been lower had certain expenses not been reduced during the periods shown.
D Total returns do not include the effect of the sales charges.
E Calculated based on average shares outstanding during the period.
F For the period November 6, 2003 (commencement of operations) to March 31, 2004.
G Expense ratios reflect operating expenses of the class. Expenses before reductions do not reflect amounts reimbursed by the investment adviser or reductions from brokerage service arrangements or other expense offset arrangements and do not represent the amount paid by the class during periods when reimbursements or reductions occur. Expenses net of any voluntary waivers reflect expenses after reimbursement by the investment adviser but prior to reductions from brokerage service arrangements or other expense offset arrangements. Expenses net of all reductions represent the net expenses paid by the class.
H Amount represents less than $.01 per share.
I Amounts do not include the activity of the underlying funds.
Financial Highlights - Class B
Years ended March 31, | 2005 | 2004F |
Selected Per-Share Data | | |
Net asset value, beginning of period | $ 10.64 | $ 10.00 |
Income from Investment Operations | | |
Net investment income (loss)E | .11 | .03 |
Net realized and unrealized gain (loss) | .24 | .67 |
Total from investment operations | .35 | .70 |
Distributions from net investment income | (.08) | (.06) |
Distributions from net realized gain | -H | - |
Total distributions | (.08) | (.06) |
Net asset value, end of period | $ 10.91 | $ 10.64 |
Total ReturnB,C,D | 3.29% | 6.97% |
Ratios to Average Net AssetsG, I | | |
Expenses before expense reductions | 1.10% | 1.10%A |
Expenses net of voluntary waivers, if any | 1.08% | 1.08%A |
Expenses net of all reductions | 1.08% | 1.08%A |
Net investment income (loss) | 1.01% | .84%A |
Supplemental Data | | |
Net assets, end of period (000 omitted) | $ 13,415 | $ 2,771 |
Portfolio turnover rate | 10% | 6%A |
A Annualized
B Total returns for periods of less than one year are not annualized.
C Total returns would have been lower had certain expenses not been reduced during the periods shown.
D Total returns do not include the effect of the contingent deferred sales charge.
E Calculated based on average shares outstanding during the period.
F For the period November 6, 2003 (commencement of operations) to March 31, 2004.
G Expense ratios reflect operating expenses of the class. Expenses before reductions do not reflect amounts reimbursed by the investment adviser or reductions from brokerage service arrangements or other expense offset arrangements and do not represent the amount paid by the class during periods when reimbursements or reductions occur. Expenses net of any voluntary waivers reflect expenses after reimbursement by the investment adviser but prior to reductions from brokerage service arrangements or other expense offset arrangements. Expenses net of all reductions represent the net expenses paid by the class.
H Amount represents less than $.01 per share.
I Amounts do not include the activity of the underlying funds.
See accompanying notes which are an integral part of the financial statements.
Annual Report
Financial Highlights - Class C
Years ended March 31, | 2005 | 2004F |
Selected Per-Share Data | | |
Net asset value, beginning of period | $ 10.65 | $ 10.00 |
Income from Investment Operations | | |
Net investment income (loss)E | .11 | .03 |
Net realized and unrealized gain (loss) | .23 | .67 |
Total from investment operations | .34 | .70 |
Distributions from net investment income | (.08) | (.05) |
Distributions from net realized gain | -H | - |
Total distributions | (.08) | (.05) |
Net asset value, end of period | $ 10.91 | $ 10.65 |
Total ReturnB,C,D | 3.19% | 7.02% |
Ratios to Average Net AssetsG, I | | |
Expenses before expense reductions | 1.10% | 1.10%A |
Expenses net of voluntary waivers, if any | 1.08% | 1.08%A |
Expenses net of all reductions | 1.08% | 1.08%A |
Net investment income (loss) | 1.01% | .84%A |
Supplemental Data | | |
Net assets, end of period (000 omitted) | $ 10,859 | $ 2,137 |
Portfolio turnover rate | 10% | 6%A |
A Annualized
B Total returns for periods of less than one year are not annualized.
C Total returns would have been lower had certain expenses not been reduced during the periods shown.
D Total returns do not include the effect of the contingent deferred sales charge.
E Calculated based on average shares outstanding during the period.
F For the period November 6, 2003 (commencement of operations) to March 31, 2004.
G Expense ratios reflect operating expenses of the class. Expenses before reductions do not reflect amounts reimbursed by the investment adviser or reductions from brokerage service arrangements or other expense offset arrangements and do not represent the amount paid by the class during periods when reimbursements or reductions occur. Expenses net of any voluntary waivers reflect expenses after reimbursement by the investment adviser but prior to reductions from brokerage service arrangements or other expense offset arrangements. Expenses net of all reductions represent the net expenses paid by the class.
H Amount represents less than $.01 per share.
I Amounts do not include the activity of the underlying funds.
Financial Highlights - Institutional Class
Years ended March 31, | 2005 | 2004E |
Selected Per-Share Data | | |
Net asset value, beginning of period | $ 10.68 | $ 10.00 |
Income from Investment Operations | | |
Net investment income (loss)D | .22 | .08 |
Net realized and unrealized gain (loss) | .24 | .66 |
Total from investment operations | .46 | .74 |
Distributions from net investment income | (.15) | (.06) |
Distributions from net realized gain | -G | - |
Total distributions | (.15) | (.06) |
Net asset value, end of period | $ 10.99 | $ 10.68 |
Total ReturnB,C | 4.25% | 7.42% |
Ratios to Average Net AssetsF, H | | |
Expenses before expense reductions | .10% | .10%A |
Expenses net of voluntary waivers, if any | .08% | .08%A |
Expenses net of all reductions | .08% | .08%A |
Net investment income (loss) | 2.01% | 1.84%A |
Supplemental Data | | |
Net assets, end of period (000 omitted) | $ 1,921 | $ 222 |
Portfolio turnover rate | 10% | 6%A |
A Annualized
B Total returns for periods of less than one year are not annualized.
C Total returns would have been lower had certain expenses not been reduced during the periods shown.
D Calculated based on average shares outstanding during the period.
E For the period November 6, 2003 (commencement of operations) to March 31, 2004.
F Expense ratios reflect operating expenses of the class. Expenses before reductions do not reflect amounts reimbursed by the investment adviser or reductions from brokerage service arrangements or other expense offset arrangements and do not represent the amount paid by the class during periods when reimbursements or reductions occur. Expenses net of any voluntary waivers reflect expenses after reimbursement by the investment adviser but prior to reductions from brokerage service arrangements or other expense offset arrangements. Expenses net of all reductions represent the net expenses paid by the class.
G Amount represents less than $.01 per share.
H Amounts do not include the activity of the underlying funds.
See accompanying notes which are an integral part of the financial statements.
Annual Report
Fidelity Advisor Freedom 2030 Fund
Investment Changes
Fund Holdings as of March 31, 2005 |
| % of fund's
investments | % of fund's investments
6 months ago |
Domestic Equity Funds | | |
Fidelity Advisor Dividend Growth Fund Institutional Class | 13.2 | 13.4 |
Fidelity Advisor Equity Growth Fund Institutional Class | 6.6 | 6.7 |
Fidelity Advisor Equity Income Fund Institutional Class | 14.1 | 14.0 |
Fidelity Advisor Growth & Income Fund Institutional Class | 13.4 | 13.5 |
Fidelity Advisor Large Cap Fund Institutional Class | 13.3 | 13.3 |
Fidelity Advisor Mid-Cap Fund Institutional Class | 4.3 | 4.2 |
Fidelity Advisor Small Cap Fund Institutional Class | 4.4 | 4.4 |
| 69.3 | 69.5 |
International Equity Funds | | |
Fidelity Advisor Diversified International Fund Institutional Class | 6.7 | 6.5 |
Fidelity Advisor Overseas Fund Institutional Class | 6.5 | 6.2 |
| 13.2 | 12.7 |
High Yield Fixed-Income Funds | | |
Fidelity Advisor High Income Advantage Fund Institutional Class | 7.8 | 7.7 |
Investment Grade Fixed-Income Funds |
Fidelity Advisor Government Investment Fund Institutional Class | 4.9 | 5.1 |
Fidelity Advisor Intermediate Bond Fund Institutional Class | 4.8 | 5.0 |
| 9.7 | 10.1 |
| 100.0 | 100.0 |
Asset Allocation (% of fund's investments) |

The fund invests according to an asset allocation strategy that becomes increasingly conservative over time. The six months ago allocation is based on the fund's holdings as of September 30, 2004. The current allocation is based on the fund's holdings as of March 31, 2005. The expected allocation represents the fund's anticipated target asset allocation at September 30, 2005.
Annual Report
Fidelity Advisor Freedom 2030 Fund
Investments March 31, 2005
Showing Percentage of Total Value of Investment in Securities
Equity Funds - 82.5% |
| Shares | | Value (Note 1) |
Domestic Equity Funds - 69.3% |
Fidelity Advisor Dividend Growth Fund Institutional Class | 2,609,126 | | $ 29,691,852 |
Fidelity Advisor Equity Growth Fund Institutional Class | 324,987 | | 14,994,902 |
Fidelity Advisor Equity Income Fund Institutional Class | 1,117,078 | | 31,713,829 |
Fidelity Advisor Growth & Income Fund Institutional Class | 1,841,462 | | 30,328,882 |
Fidelity Advisor Large Cap Fund Institutional Class | 2,025,243 | | 30,014,107 |
Fidelity Advisor Mid-Cap Fund Institutional Class | 396,298 | | 9,602,308 |
Fidelity Advisor Small Cap Fund Institutional Class | 408,675 | | 10,016,614 |
TOTAL DOMESTIC EQUITY FUNDS | | 156,362,494 |
International Equity Funds - 13.2% |
Fidelity Advisor Diversified International Fund Institutional Class | 806,592 | | 15,204,257 |
Fidelity Advisor Overseas Fund Institutional Class | 842,603 | | 14,669,720 |
TOTAL INTERNATIONAL EQUITY FUNDS | | 29,873,977 |
TOTAL EQUITY FUNDS (Cost $179,397,991) | 186,236,471 |
Fixed-Income Funds - 17.5% |
| | | |
High Yield Fixed-Income Funds - 7.8% |
Fidelity Advisor High Income Advantage Fund Institutional Class | 1,870,195 | | 17,617,233 |
Investment Grade Fixed-Income Funds - 9.7% |
Fidelity Advisor Government Investment Fund Institutional Class | 1,098,890 | | 10,911,981 |
Fidelity Advisor Intermediate Bond Fund Institutional Class | 990,176 | | 10,862,234 |
TOTAL INVESTMENT GRADE FIXED-INCOME FUNDS | | 21,774,215 |
TOTAL FIXED-INCOME FUNDS (Cost $39,583,636) | 39,391,448 |
TOTAL INVESTMENT IN SECURITIES - 100% (Cost $218,981,627) | $ 225,627,919 |
See accompanying notes which are an integral part of the financial statements.
Annual Report
Fidelity Advisor Freedom 2030 Fund
Financial Statements
Statement of Assets and Liabilities
| March 31, 2005 |
| | |
Assets | | |
Investment in securities, at value (cost $218,981,627) - See accompanying schedule | | $ 225,627,919 |
Receivable for investments sold | | 942 |
Receivable for fund shares sold | | 1,233,750 |
Receivable from investment adviser for expense reductions | | 1,677 |
Total assets | | 226,864,288 |
| | |
Liabilities | | |
Payable to custodian bank | $ 1 | |
Payable for investments purchased | 980,272 | |
Payable for fund shares redeemed | 262,584 | |
Accrued management fee | 18,626 | |
Distribution fees payable | 96,732 | |
Total liabilities | | 1,358,215 |
| | |
Net Assets | | $ 225,506,073 |
Net Assets consist of: | | |
Paid in capital | | $ 217,926,274 |
Undistributed net investment income | | 131,528 |
Accumulated undistributed net realized gain (loss) on investments | | 801,979 |
Net unrealized appreciation (depreciation) on investments | | 6,646,292 |
Net Assets | | $ 225,506,073 |
Calculation of Maximum Offering Price Class A:
Net Asset Value and redemption price per share ($65,593,290 ÷ 5,552,872 shares) | | $ 11.81 |
| | |
Maximum offering price per share (100/94.25 of $11.81) | | $ 12.53 |
| | |
Class T:
Net Asset Value and redemption price per share ($102,153,469 ÷ 8,670,791 shares) | | $ 11.78 |
| | |
Maximum offering price per share (100/96.50 of $11.78) | | $ 12.21 |
| | |
Class B:
Net Asset Value and offering price per share ($27,653,403 ÷ 2,355,267 shares)A | | $ 11.74 |
| | |
Class C:
Net Asset Value and offering price per share ($22,264,895 ÷ 1,896,050 shares)A | | $ 11.74 |
| | |
Institutional Class:
Net Asset Value, offering price and redemption price per share ($7,841,016 ÷ 662,406 shares) | | $ 11.84 |
A Redemption price per share is equal to net asset value less any applicable contingent deferred sales charge.
Statement of Operations
| Year ended March 31, 2005 |
| | |
Investment Income | | |
Income distributions from underlying funds | | $ 2,740,223 |
| | |
Expenses | | |
Management fee | $ 145,552 | |
Distribution fees | 775,221 | |
Independent trustees' compensation | 702 | |
Total expenses before reductions | 921,475 | |
Expense reductions | (32,323) | 889,152 |
Net investment income (loss) | | 1,851,071 |
Realized and Unrealized Gain (Loss) Realized gain (loss) on sale of underlying fund shares | (30,396) | |
Capital gain distributions from underlying funds | 1,047,268 | 1,016,872 |
Change in net unrealized appreciation (depreciation) on underlying funds | | 4,336,680 |
Net gain (loss) | | 5,353,552 |
Net increase (decrease) in net assets resulting from operations | | $ 7,204,623 |
See accompanying notes which are an integral part of the financial statements.
Annual Report
Fidelity Advisor Freedom 2030 Fund
Financial Statements - continued
Statement of Changes in Net Assets
| Year ended
March 31,
2005 | July 24, 2003
(commencement of operations) to
March 31, 2004 |
Increase (Decrease) in Net Assets | | |
Operations | | |
Net investment income (loss) | $ 1,851,071 | $ 228,370 |
Net realized gain (loss) | 1,016,872 | 13,865 |
Change in net unrealized appreciation (depreciation) | 4,336,680 | 2,309,612 |
Net increase (decrease) in net assets resulting from operations | 7,204,623 | 2,551,847 |
Distributions to shareholders from net investment income | (1,985,403) | (174,903) |
Distributions to shareholders from net realized gain | (16,365) | - |
Total distributions | (2,001,768) | (174,903) |
Share transactions - net increase (decrease) | 142,242,099 | 75,684,175 |
Total increase (decrease) in net assets | 147,444,954 | 78,061,119 |
| | |
Net Assets | | |
Beginning of period | 78,061,119 | - |
End of period (including undistributed net investment income of $131,528 and undistributed net investment income of $54,472, respectively) | $ 225,506,073 | $ 78,061,119 |
Financial Highlights - Class A
Years ended March 31, | 2005 | 2004F |
Selected Per-Share Data | | |
Net asset value, beginning of period | $ 11.48 | $ 10.00 |
Income from Investment Operations | | |
Net investment income (loss)E | .18 | .11 |
Net realized and unrealized gain (loss) | .30 | 1.46 |
Total from investment operations | .48 | 1.57 |
Distributions from net investment income | (.15) | (.09) |
Distributions from net realized gain | -H | - |
Total distributions | (.15) | (.09) |
Net asset value, end of period | $ 11.81 | $ 11.48 |
Total ReturnB,C,D | 4.19% | 15.68% |
Ratios to Average Net AssetsG, I | | |
Expenses before expense reductions | .35% | .35%A |
Expenses net of voluntary waivers, if any | .33% | .33%A |
Expenses net of all reductions | .33% | .33%A |
Net investment income (loss) | 1.55% | 1.44%A |
Supplemental Data | | |
Net assets, end of period (000 omitted) | $ 65,593 | $ 27,879 |
Portfolio turnover rate | 2% | 2%A |
A Annualized
B Total returns for periods of less than one year are not annualized.
C Total returns would have been lower had certain expenses not been reduced during the periods shown.
D Total returns do not include the effect of the sales charges.
E Calculated based on average shares outstanding during the period.
F For the period July 24, 2003 (commencement of operations) to March 31, 2004.
G Expense ratios reflect operating expenses of the class. Expenses before reductions do not reflect amounts reimbursed by the investment adviser or reductions from brokerage service arrangements or other expense offset arrangements and do not represent the amount paid by the class during periods when reimbursements or reductions occur. Expenses net of any voluntary waivers reflect expenses after reimbursement by the investment adviser but prior to reductions from brokerage service arrangements or other expense offset arrangements. Expenses net of all reductions represent the net expenses paid by the class.
H Amount represents less than $.01 per share.
I Amounts do not include the activity of the underlying funds.
See accompanying notes which are an integral part of the financial statements.
Annual Report
Financial Highlights - Class T
Years ended March 31, | 2005 | 2004F |
Selected Per-Share Data | | |
Net asset value, beginning of period | $ 11.47 | $ 10.00 |
Income from Investment Operations | | |
Net investment income (loss)E | .15 | .09 |
Net realized and unrealized gain (loss) | .30 | 1.46 |
Total from investment operations | .45 | 1.55 |
Distributions from net investment income | (.14) | (.08) |
Distributions from net realized gain | -H | - |
Total distributions | (.14) | (.08) |
Net asset value, end of period | $ 11.78 | $ 11.47 |
Total ReturnB,C,D | 3.91% | 15.53% |
Ratios to Average Net AssetsG, I | | |
Expenses before expense reductions | .60% | .60%A |
Expenses net of voluntary waivers, if any | .58% | .58%A |
Expenses net of all reductions | .58% | .58%A |
Net investment income (loss) | 1.30% | 1.19%A |
Supplemental Data | | |
Net assets, end of period (000 omitted) | $ 102,153 | $ 27,201 |
Portfolio turnover rate | 2% | 2%A |
A Annualized
B Total returns for periods of less than one year are not annualized.
C Total returns would have been lower had certain expenses not been reduced during the periods shown.
D Total returns do not include the effect of the sales charges.
E Calculated based on average shares outstanding during the period.
F For the period July 24, 2003 (commencement of operations) to March 31, 2004.
G Expense ratios reflect operating expenses of the class. Expenses before reductions do not reflect amounts reimbursed by the investment adviser or reductions from brokerage service arrangements or other expense offset arrangements and do not represent the amount paid by the class during periods when reimbursements or reductions occur. Expenses net of any voluntary waivers reflect expenses after reimbursement by the investment adviser but prior to reductions from brokerage service arrangements or other expense offset arrangements. Expenses net of all reductions represent the net expenses paid by the class.
H Amount represents less than $.01 per share.
I Amounts do not include the activity of the underlying funds.
Financial Highlights - Class B
Years ended March 31, | 2005 | 2004F |
Selected Per-Share Data | | |
Net asset value, beginning of period | $ 11.44 | $ 10.00 |
Income from Investment Operations | | |
Net investment income (loss)E | .09 | .05 |
Net realized and unrealized gain (loss) | .30 | 1.46 |
Total from investment operations | .39 | 1.51 |
Distributions from net investment income | (.09) | (.07) |
Distributions from net realized gain | -H | - |
Total distributions | (.09) | (.07) |
Net asset value, end of period | $ 11.74 | $ 11.44 |
Total ReturnB,C,D | 3.41% | 15.12% |
Ratios to Average Net AssetsG, I | | |
Expenses before expense reductions | 1.10% | 1.10%A |
Expenses net of voluntary waivers, if any | 1.08% | 1.08%A |
Expenses net of all reductions | 1.08% | 1.08%A |
Net investment income (loss) | .80% | .69%A |
Supplemental Data | | |
Net assets, end of period (000 omitted) | $ 27,653 | $ 12,229 |
Portfolio turnover rate | 2% | 2%A |
A Annualized
B Total returns for periods of less than one year are not annualized.
C Total returns would have been lower had certain expenses not been reduced during the periods shown.
D Total returns do not include the effect of the contingent deferred sales charge.
E Calculated based on average shares outstanding during the period.
F For the period July 24, 2003 (commencement of operations) to March 31, 2004.
G Expense ratios reflect operating expenses of the class. Expenses before reductions do not reflect amounts reimbursed by the investment adviser or reductions from brokerage service arrangements or other expense offset arrangements and do not represent the amount paid by the class during periods when reimbursements or reductions occur. Expenses net of any voluntary waivers reflect expenses after reimbursement by the investment adviser but prior to reductions from brokerage service arrangements or other expense offset arrangements. Expenses net of all reductions represent the net expenses paid by the class.
H Amount represents less than $.01 per share.
I Amounts do not include the activity of the underlying funds.
See accompanying notes which are an integral part of the financial statements.
Annual Report
Financial Highlights - Class C
Years ended March 31, | 2005 | 2004F |
Selected Per-Share Data | | |
Net asset value, beginning of period | $ 11.44 | $ 10.00 |
Income from Investment Operations | | |
Net investment income (loss)E | .09 | .05 |
Net realized and unrealized gain (loss) | .30 | 1.46 |
Total from investment operations | .39 | 1.51 |
Distributions from net investment income | (.09) | (.07) |
Distributions from net realized gain | -H | - |
Total distributions | (.09) | (.07) |
Net asset value, end of period | $ 11.74 | $ 11.44 |
Total ReturnB,C,D | 3.41% | 15.12% |
Ratios to Average Net AssetsG, I | | |
Expenses before expense reductions | 1.10% | 1.10%A |
Expenses net of voluntary waivers, if any | 1.08% | 1.08%A |
Expenses net of all reductions | 1.08% | 1.08%A |
Net investment income (loss) | .80% | .69%A |
Supplemental Data | | |
Net assets, end of period (000 omitted) | $ 22,265 | $ 9,722 |
Portfolio turnover rate | 2% | 2%A |
A Annualized
B Total returns for periods of less than one year are not annualized.
C Total returns would have been lower had certain expenses not been reduced during the periods shown.
D Total returns do not include the effect of the contingent deferred sales charge.
E Calculated based on average shares outstanding during the period.
F For the period July 24, 2003 (commencement of operations) to March 31, 2004.
G Expense ratios reflect operating expenses of the class. Expenses before reductions do not reflect amounts reimbursed by the investment adviser or reductions from brokerage service arrangements or other expense offset arrangements and do not represent the amount paid by the class during periods when reimbursements or reductions occur. Expenses net of any voluntary waivers reflect expenses after reimbursement by the investment adviser but prior to reductions from brokerage service arrangements or other expense offset arrangements. Expenses net of all reductions represent the net expenses paid by the class.
H Amount represents less than $.01 per share.
I Amounts do not include the activity of the underlying funds.
Financial Highlights - Institutional Class
Years ended March 31, | 2005 | 2004E |
Selected Per-Share Data | | |
Net asset value, beginning of period | $ 11.49 | $ 10.00 |
Income from Investment Operations | | |
Net investment income (loss)D | .21 | .13 |
Net realized and unrealized gain (loss) | .31 | 1.45 |
Total from investment operations | .52 | 1.58 |
Distributions from net investment income | (.17) | (.09) |
Distributions from net realized gain | -G | - |
Total distributions | (.17) | (.09) |
Net asset value, end of period | $ 11.84 | $ 11.49 |
Total ReturnB,C | 4.50% | 15.83% |
Ratios to Average Net AssetsF, H | | |
Expenses before expense reductions | .10% | .10%A |
Expenses net of voluntary waivers, if any | .08% | .08%A |
Expenses net of all reductions | .08% | .07%A |
Net investment income (loss) | 1.80% | 1.69%A |
Supplemental Data | | |
Net assets, end of period (000 omitted) | $ 7,841 | $ 1,030 |
Portfolio turnover rate | 2% | 2%A |
A Annualized
B Total returns for periods of less than one year are not annualized.
C Total returns would have been lower had certain expenses not been reduced during the periods shown.
D Calculated based on average shares outstanding during the period.
E For the period July 24, 2003 (commencement of operations) to March 31, 2004.
F Expense ratios reflect operating expenses of the class. Expenses before reductions do not reflect amounts reimbursed by the investment adviser or reductions from brokerage service arrangements or other expense offset arrangements and do not represent the amount paid by the class during periods when reimbursements or reductions occur. Expenses net of any voluntary waivers reflect expenses after reimbursement by the investment adviser but prior to reductions from brokerage service arrangements or other expense offset arrangements. Expenses net of all reductions represent the net expenses paid by the class.
G Amount represents less than $.01 per share.
H Amounts do not include the activity of the underlying funds.
See accompanying notes which are an integral part of the financial statements.
Annual Report
Fidelity Advisor Freedom 2035 Fund
Investment Changes
Fund Holdings as of March 31, 2005 |
| % of fund's
investments | % of fund's investments
6 months ago |
Domestic Equity Funds | | |
Fidelity Advisor Dividend Growth Fund Institutional Class | 13.3 | 13.4 |
Fidelity Advisor Equity Growth Fund Institutional Class | 6.7 | 6.7 |
Fidelity Advisor Equity Income Fund Institutional Class | 13.9 | 13.9 |
Fidelity Advisor Growth & Income Fund Institutional Class | 13.5 | 13.6 |
Fidelity Advisor Large Cap Fund Institutional Class | 13.4 | 13.4 |
Fidelity Advisor Mid-Cap Fund Institutional Class | 4.2 | 4.2 |
Fidelity Advisor Small Cap Fund Institutional Class | 4.3 | 4.3 |
| 69.3 | 69.5 |
International Equity Funds | | |
Fidelity Advisor Diversified International Fund Institutional Class | 7.8 | 7.7 |
Fidelity Advisor Overseas Fund Institutional Class | 7.6 | 7.4 |
| 15.4 | 15.1 |
High Yield Fixed-Income Funds | | |
Fidelity Advisor High Income Advantage Fund Institutional Class | 10.0 | 10.3 |
Investment Grade Fixed-Income Funds |
Fidelity Advisor Government Investment Fund Institutional Class | 2.7 | 2.6 |
Fidelity Advisor Intermediate Bond Fund Institutional Class | 2.6 | 2.5 |
| 5.3 | 5.1 |
| 100.0 | 100.0 |
Asset Allocation (% of fund's investments) |

The fund invests according to an asset allocation strategy that becomes increasingly conservative over time. The six months ago allocation is based on the fund's holdings as of September 30, 2004. The current allocation is based on the fund's holdings as of March 31, 2005. The expected allocation represents the fund's anticipated target asset allocation at September 30, 2005.
Annual Report
Fidelity Advisor Freedom 2035 Fund
Investments March 31, 2005
Showing Percentage of Total Value of Investment in Securities
Equity Funds - 84.7% |
| Shares | | Value (Note 1) |
Domestic Equity Funds - 69.3% |
Fidelity Advisor Dividend Growth Fund Institutional Class | 514,827 | | $ 5,858,732 |
Fidelity Advisor Equity Growth Fund Institutional Class | 64,521 | | 2,977,003 |
Fidelity Advisor Equity Income Fund Institutional Class | 216,316 | | 6,141,211 |
Fidelity Advisor Growth & Income Fund Institutional Class | 363,187 | | 5,981,683 |
Fidelity Advisor Large Cap Fund Institutional Class | 399,408 | | 5,919,223 |
Fidelity Advisor Mid-Cap Fund Institutional Class | 76,459 | | 1,852,612 |
Fidelity Advisor Small Cap Fund Institutional Class | 77,960 | | 1,910,797 |
TOTAL DOMESTIC EQUITY FUNDS | | 30,641,261 |
International Equity Funds - 15.4% |
Fidelity Advisor Diversified International Fund Institutional Class | 182,668 | | 3,443,289 |
Fidelity Advisor Overseas Fund Institutional Class | 193,301 | | 3,365,375 |
TOTAL INTERNATIONAL EQUITY FUNDS | | 6,808,664 |
TOTAL EQUITY FUNDS (Cost $36,646,618) | 37,449,925 |
Fixed-Income Funds - 15.3% |
| | | |
High Yield Fixed-Income Funds - 10.0% |
Fidelity Advisor High Income Advantage Fund Institutional Class | 470,304 | | 4,430,262 |
Investment Grade Fixed-Income Funds - 5.3% |
Fidelity Advisor Government Investment Fund Institutional Class | 117,520 | | 1,166,974 |
Fidelity Advisor Intermediate Bond Fund Institutional Class | 105,945 | | 1,162,222 |
TOTAL INVESTMENT GRADE FIXED-INCOME FUNDS | | 2,329,196 |
TOTAL FIXED-INCOME FUNDS (Cost $6,787,413) | 6,759,458 |
TOTAL INVESTMENT IN SECURITIES - 100% (Cost $43,434,031) | $ 44,209,383 |
See accompanying notes which are an integral part of the financial statements.
Annual Report
Fidelity Advisor Freedom 2035 Fund
Financial Statements
Statement of Assets and Liabilities
| March 31, 2005 |
| | |
Assets | | |
Investment in securities, at value (cost $43,434,031) - See accompanying schedule | | $ 44,209,383 |
Cash | | 7 |
Receivable for fund shares sold | | 262,426 |
Receivable from investment adviser for expense reductions | | 159 |
Total assets | | 44,471,975 |
| | |
Liabilities | | |
Payable for investments purchased | $ 189,448 | |
Payable for fund shares redeemed | 72,886 | |
Accrued management fee | 3,555 | |
Distribution fees payable | 19,402 | |
Total liabilities | | 285,291 |
| | |
Net Assets | | $ 44,186,684 |
Net Assets consist of: | | |
Paid in capital | | $ 43,335,425 |
Accumulated undistributed net realized gain (loss) on investments | | 75,907 |
Net unrealized appreciation (depreciation) on investments | | 775,352 |
Net Assets | | $ 44,186,684 |
Calculation of Maximum Offering Price Class A:
Net Asset Value and redemption price per share ($15,280,953 ÷ 1,382,233 shares) | | $ 11.06 |
| | |
Maximum offering price per share (100/94.25 of $11.06) | | $ 11.73 |
| | |
Class T:
Net Asset Value and redemption price per share ($16,432,305 ÷ 1,491,163 shares) | | $ 11.02 |
| | |
Maximum offering price per share (100/96.50 of $11.02) | | $ 11.42 |
| | |
Class B:
Net Asset Value and offering price per share ($6,917,167 ÷ 630,202 shares)A | | $ 10.98 |
| | |
Class C:
Net Asset Value and offering price per share ($5,089,067 ÷ 463,223 shares)A | | $ 10.99 |
| | |
Institutional Class:
Net Asset Value, offering price and redemption price per share ($467,192 ÷ 42,193 shares) | | $ 11.07 |
A Redemption price per share is equal to net asset value less any applicable contingent deferred sales charge.
Statement of Operations
| Year ended March 31, 2005 |
| | |
Investment Income | | |
Income distributions from underlying funds | | $ 429,995 |
Interest | | 25 |
Total income | | 430,020 |
| | |
Expenses | | |
Management fee | $ 21,052 | |
Distribution fees | 118,684 | |
Independent trustees' compensation | 93 | |
Total expenses before reductions | 139,829 | |
Expense reductions | (5,043) | 134,786 |
Net investment income (loss) | | 295,234 |
Realized and Unrealized Gain (Loss) Realized gain (loss) on sale of underlying fund shares | (24,619) | |
Capital gain distributions from underlying funds | 155,576 | 130,957 |
Change in net unrealized appreciation (depreciation) on underlying funds | | 674,970 |
Net gain (loss) | | 805,927 |
Net increase (decrease) in net assets resulting from operations | | $ 1,101,161 |
See accompanying notes which are an integral part of the financial statements.
Annual Report
Fidelity Advisor Freedom 2035 Fund
Financial Statements - continued
Statement of Changes in Net Assets
| Year ended
March 31,
2005 | November 6, 2003
(commencement of
operations) to
March 31, 2004 |
Increase (Decrease) in Net Assets | | |
Operations | | |
Net investment income (loss) | $ 295,234 | $ 13,710 |
Net realized gain (loss) | 130,957 | 450 |
Change in net unrealized appreciation (depreciation) | 674,970 | 100,382 |
Net increase (decrease) in net assets resulting from operations | 1,101,161 | 114,542 |
Distributions to shareholders from net investment income | (351,658) | (11,997) |
Distributions to shareholders from net realized gain | (788) | - |
Total distributions | (352,446) | (11,997) |
Share transactions - net increase (decrease) | 38,278,752 | 5,056,672 |
Total increase (decrease) in net assets | 39,027,467 | 5,159,217 |
| | |
Net Assets | | |
Beginning of period | 5,159,217 | - |
End of period (including undistributed net investment income of $0 and undistributed net investment income of $1,743, respectively) | $ 44,186,684 | $ 5,159,217 |
Financial Highlights - Class A
Years ended March 31, | 2005 | 2004F |
Selected Per-Share Data | | |
Net asset value, beginning of period | $ 10.70 | $ 10.00 |
Income from Investment Operations | | |
Net investment income (loss)E | .19 | .07 |
Net realized and unrealized gain (loss) | .32 | .72 |
Total from investment operations | .51 | .79 |
Distributions from net investment income | (.15) | (.09) |
Distributions from net realized gain | -H | - |
Total distributions | (.15) | (.09) |
Net asset value, end of period | $ 11.06 | $ 10.70 |
Total ReturnB,C,D | 4.76% | 7.88% |
Ratios to Average Net AssetsG, I | | |
Expenses before expense reductions | .35% | .35%A |
Expenses net of voluntary waivers, if any | .33% | .33%A |
Expenses net of all reductions | .33% | .33%A |
Net investment income (loss) | 1.71% | 1.80%A |
Supplemental Data | | |
Net assets, end of period (000 omitted) | $ 15,281 | $ 1,884 |
Portfolio turnover rate | 5% | 1%A |
A Annualized
B Total returns for periods of less than one year are not annualized.
C Total returns would have been lower had certain expenses not been reduced during the periods shown.
D Total returns do not include the effect of the sales charges.
E Calculated based on average shares outstanding during the period.
F For the period November 6, 2003 (commencement of sale of shares) to March 31, 2004.
G Expense ratios reflect operating expenses of the class. Expenses before reductions do not reflect amounts reimbursed by the investment adviser or reductions from brokerage service arrangements or other expense offset arrangements and do not represent the amount paid by the class during periods when reimbursements or reductions occur. Expenses net of any voluntary waivers reflect expenses after reimbursement by the investment adviser but prior to reductions from brokerage service arrangements or other expense offset arrangements. Expenses net of all reductions represent the net expenses paid by the class.
H Amount represents less than $.01 per share.
I Amounts do not include the activity of the underlying funds.
See accompanying notes which are an integral part of the financial statements.
Annual Report
Financial Highlights - Class T
Years ended March 31, | 2005 | 2004F |
Selected Per-Share Data | | |
Net asset value, beginning of period | $ 10.69 | $ 10.00 |
Income from Investment Operations | | |
Net investment income (loss)E | .16 | .06 |
Net realized and unrealized gain (loss) | .31 | .71 |
Total from investment operations | .47 | .77 |
Distributions from net investment income | (.14) | (.08) |
Distributions from net realized gain | -H | - |
Total distributions | (.14) | (.08) |
Net asset value, end of period | $ 11.02 | $ 10.69 |
Total ReturnB,C,D | 4.37% | 7.73% |
Ratios to Average Net AssetsG, I | | |
Expenses before expense reductions | .60% | .60%A |
Expenses net of voluntary waivers, if any | .58% | .58%A |
Expenses net of all reductions | .58% | .58%A |
Net investment income (loss) | 1.46% | 1.55%A |
Supplemental Data | | |
Net assets, end of period (000 omitted) | $ 16,432 | $ 1,047 |
Portfolio turnover rate | 5% | 1%A |
A Annualized
B Total returns for periods of less than one year are not annualized.
C Total returns would have been lower had certain expenses not been reduced during the periods shown.
D Total returns do not include the effect of the sales charges.
E Calculated based on average shares outstanding during the period.
F For the period November 6, 2003 (commencement of sale of shares) to March 31, 2004.
G Expense ratios reflect operating expenses of the class. Expenses before reductions do not reflect amounts reimbursed by the investment adviser or reductions from brokerage service arrangements or other expense offset arrangements and do not represent the amount paid by the class during periods when reimbursements or reductions occur. Expenses net of any voluntary waivers reflect expenses after reimbursement by the investment adviser but prior to reductions from brokerage service arrangements or other expense offset arrangements. Expenses net of all reductions represent the net expenses paid by the class.
H Amount represents less than $.01 per share.
I Amounts do not include the activity of the underlying funds.
Financial Highlights - Class B
Years ended March 31, | 2005 | 2004F |
Selected Per-Share Data | | |
Net asset value, beginning of period | $ 10.67 | $ 10.00 |
Income from Investment Operations | | |
Net investment income (loss)E | .10 | .04 |
Net realized and unrealized gain (loss) | .32 | .71 |
Total from investment operations | .42 | .75 |
Distributions from net investment income | (.11) | (.08) |
Distributions from net realized gain | -H | - |
Total distributions | (.11) | (.08) |
Net asset value, end of period | $ 10.98 | $ 10.67 |
Total ReturnB,C,D | 3.88% | 7.48% |
Ratios to Average Net AssetsG, I | | |
Expenses before expense reductions | 1.10% | 1.10%A |
Expenses net of voluntary waivers, if any | 1.08% | 1.08%A |
Expenses net of all reductions | 1.08% | 1.08%A |
Net investment income (loss) | .96% | 1.05%A |
Supplemental Data | | |
Net assets, end of period (000 omitted) | $ 6,917 | $ 1,123 |
Portfolio turnover rate | 5% | 1%A |
A Annualized
B Total returns for periods of less than one year are not annualized.
C Total returns would have been lower had certain expenses not been reduced during the periods shown.
D Total returns do not include the effect of the contingent deferred sales charge.
E Calculated based on average shares outstanding during the period.
F For the period November 6, 2003 (commencement of sale of shares) to March 31, 2004.
G Expense ratios reflect operating expenses of the class. Expenses before reductions do not reflect amounts reimbursed by the investment adviser or reductions from brokerage service arrangements or other expense offset arrangements and do not represent the amount paid by the class during periods when reimbursements or reductions occur. Expenses net of any voluntary waivers reflect expenses after reimbursement by the investment adviser but prior to reductions from brokerage service arrangements or other expense offset arrangements. Expenses net of all reductions represent the net expenses paid by the class.
H Amount represents less than $.01 per share.
I Amounts do not include the activity of the underlying funds.
See accompanying notes which are an integral part of the financial statements.
Annual Report
Financial Highlights - Class C
Years ended March 31, | 2005 | 2004F |
Selected Per-Share Data | | |
Net asset value, beginning of period | $ 10.68 | $ 10.00 |
Income from Investment Operations | | |
Net investment income (loss)E | .10 | .04 |
Net realized and unrealized gain (loss) | .32 | .72 |
Total from investment operations | .42 | .76 |
Distributions from net investment income | (.11) | (.08) |
Distributions from net realized gain | -H | - |
Total distributions | (.11) | (.08) |
Net asset value, end of period | $ 10.99 | $ 10.68 |
Total ReturnB,C,D | 3.87% | 7.58% |
Ratios to Average Net AssetsG, I | | |
Expenses before expense reductions | 1.10% | 1.10%A |
Expenses net of voluntary waivers, if any | 1.08% | 1.08%A |
Expenses net of all reductions | 1.08% | 1.08%A |
Net investment income (loss) | .96% | 1.05%A |
Supplemental Data | | |
Net assets, end of period (000 omitted) | $ 5,089 | $ 890 |
Portfolio turnover rate | 5% | 1%A |
A Annualized
B Total returns for periods of less than one year are not annualized.
C Total returns would have been lower had certain expenses not been reduced during the periods shown.
D Total returns do not include the effect of the contingent deferred sales charge.
E Calculated based on average shares outstanding during the period.
F For the period November 6, 2003 (commencement of sale of shares) to March 31, 2004.
G Expense ratios reflect operating expenses of the class. Expenses before reductions do not reflect amounts reimbursed by the investment adviser or reductions from brokerage service arrangements or other expense offset arrangements and do not represent the amount paid by the class during periods when reimbursements or reductions occur. Expenses net of any voluntary waivers reflect expenses after reimbursement by the investment adviser but prior to reductions from brokerage service arrangements or other expense offset arrangements. Expenses net of all reductions represent the net expenses paid by the class.
H Amount represents less than $.01 per share.
I Amounts do not include the activity of the underlying funds.
Financial Highlights - Institutional Class
Years ended March 31, | 2005 | 2004E |
Selected Per-Share Data | | |
Net asset value, beginning of period | $ 10.71 | $ 10.00 |
Income from Investment Operations | | |
Net investment income (loss)D | .21 | .08 |
Net realized and unrealized gain (loss) | .31 | .72 |
Total from investment operations | .52 | .80 |
Distributions from net investment income | (.16) | (.09) |
Distributions from net realized gain | -G | - |
Total distributions | (.16) | (.09) |
Net asset value, end of period | $ 11.07 | $ 10.71 |
Total ReturnB,C | 4.87% | 7.98% |
Ratios to Average Net AssetsF, H | | |
Expenses before expense reductions | .10% | .10%A |
Expenses net of voluntary waivers, if any | .08% | .08%A |
Expenses net of all reductions | .08% | .08%A |
Net investment income (loss) | 1.96% | 2.04%A |
Supplemental Data | | |
Net assets, end of period (000 omitted) | $ 467 | $ 216 |
Portfolio turnover rate | 5% | 1%A |
A Annualized
B Total returns for periods of less than one year are not annualized.
C Total returns would have been lower had certain expenses not been reduced during the periods shown.
D Calculated based on average shares outstanding during the period.
E For the period November 6, 2003 (commencement of sale of shares) to March 31, 2004.
F Expense ratios reflect operating expenses of the class. Expenses before reductions do not reflect amounts reimbursed by the investment adviser or reductions from brokerage service arrangements or other expense offset arrangements and do not represent the amount paid by the class during periods when reimbursements or reductions occur. Expenses net of any voluntary waivers reflect expenses after reimbursement by the investment adviser but prior to reductions from brokerage service arrangements or other expense offset arrangements. Expenses net of all reductions represent the net expenses paid by the class.
G Amount represents less than $.01 per share.
H Amounts do not include the activity of the underlying funds.
See accompanying notes which are an integral part of the financial statements.
Annual Report
Fidelity Advisor Freedom 2040 Fund
Investment Changes
Fund Holdings as of March 31, 2005 |
| % of fund's
investments | % of fund's investments
6 months ago |
Domestic Equity Funds | | |
Fidelity Advisor Dividend Growth Fund Institutional Class | 13.9 | 14.3 |
Fidelity Advisor Equity Growth Fund Institutional Class | 7.0 | 7.2 |
Fidelity Advisor Equity Income Fund Institutional Class | 14.7 | 15.0 |
Fidelity Advisor Growth & Income Fund Institutional Class | 14.2 | 14.5 |
Fidelity Advisor Large Cap Fund Institutional Class | 14.0 | 14.3 |
Fidelity Advisor Mid-Cap Fund Institutional Class | 4.5 | 4.5 |
Fidelity Advisor Small Cap Fund Institutional Class | 4.6 | 4.6 |
| 72.9 | 74.4 |
International Equity Funds | | |
Fidelity Advisor Diversified International Fund Institutional Class | 8.0 | 7.8 |
Fidelity Advisor Overseas Fund Institutional Class | 7.7 | 7.5 |
| 15.7 | 15.3 |
High Yield Fixed-Income Funds | | |
Fidelity Advisor High Income Advantage Fund Institutional Class | 10.3 | 10.3 |
Investment Grade Fixed-Income Funds |
Fidelity Advisor Government Investment Fund Institutional Class | 0.6 | 0.0 |
Fidelity Advisor Intermediate Bond Fund Institutional Class | 0.5 | 0.0 |
| 1.1 | 0.0 |
| 100.0 | 100.0 |
Asset Allocation (% of fund's investments) |
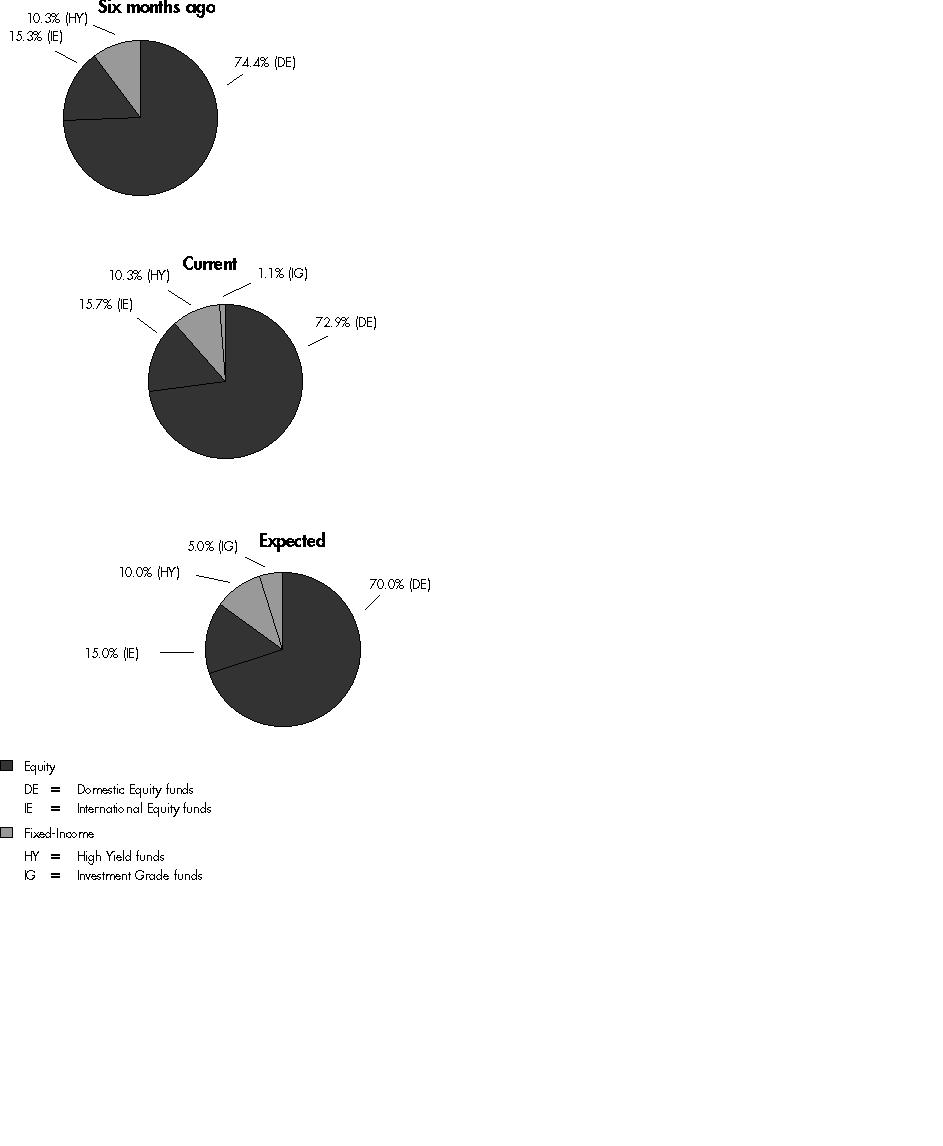
The fund invests according to an asset allocation strategy that becomes increasingly conservative over time. The six months ago allocation is based on the fund's holdings as of September 30, 2004. The current allocation is based on the fund's holdings as of March 31, 2005. The expected allocation represents the fund's anticipated target asset allocation at September 30, 2005.
Annual Report
Fidelity Advisor Freedom 2040 Fund
Investments March 31, 2005
Showing Percentage of Total Value of Investment in Securities
Equity Funds - 88.6% |
| Shares | | Value (Note 1) |
Domestic Equity Funds - 72.9% |
Fidelity Advisor Dividend Growth Fund Institutional Class | 1,984,444 | | $ 22,582,977 |
Fidelity Advisor Equity Growth Fund Institutional Class | 247,634 | | 11,425,817 |
Fidelity Advisor Equity Income Fund Institutional Class | 842,904 | | 23,930,043 |
Fidelity Advisor Growth & Income Fund Institutional Class | 1,399,892 | | 23,056,222 |
Fidelity Advisor Large Cap Fund Institutional Class | 1,539,565 | | 22,816,352 |
Fidelity Advisor Mid-Cap Fund Institutional Class | 299,318 | | 7,252,466 |
Fidelity Advisor Small Cap Fund Institutional Class | 306,910 | | 7,522,373 |
TOTAL DOMESTIC EQUITY FUNDS | | 118,586,250 |
International Equity Funds - 15.7% |
Fidelity Advisor Diversified International Fund Institutional Class | 687,447 | | 12,958,384 |
Fidelity Advisor Overseas Fund Institutional Class | 722,147 | | 12,572,578 |
TOTAL INTERNATIONAL EQUITY FUNDS | | 25,530,962 |
TOTAL EQUITY FUNDS (Cost $139,559,693) | 144,117,212 |
Fixed-Income Funds - 11.4% |
| | | |
High Yield Fixed-Income Funds - 10.3% |
Fidelity Advisor High Income Advantage Fund Institutional Class | 1,775,890 | | 16,728,884 |
Investment Grade Fixed-Income Funds - 1.1% |
Fidelity Advisor Government Investment Fund Institutional Class | 95,495 | | 948,267 |
Fidelity Advisor Intermediate Bond Fund Institutional Class | 86,206 | | 945,680 |
TOTAL INVESTMENT GRADE FIXED-INCOME FUNDS | | 1,893,947 |
TOTAL FIXED-INCOME FUNDS (Cost $18,506,898) | 18,622,831 |
TOTAL INVESTMENT IN SECURITIES - 100% (Cost $158,066,591) | $ 162,740,043 |
See accompanying notes which are an integral part of the financial statements.
Annual Report
Fidelity Advisor Freedom 2040 Fund
Financial Statements
Statement of Assets and Liabilities
| March 31, 2005 |
| | |
Assets | | |
Investment in securities, at value (cost $158,066,591) - See accompanying schedule | | $ 162,740,043 |
Receivable for investments sold | | 58,402 |
Receivable for fund shares sold | | 10,935,965 |
Receivable from investment adviser for expense reductions | | 1,037 |
Total assets | | 173,735,447 |
| | |
Liabilities | | |
Payable for investments purchased | $ 10,723,569 | |
Payable for fund shares redeemed | 270,645 | |
Accrued management fee | 12,356 | |
Distribution fees payable | 67,881 | |
Total liabilities | | 11,074,451 |
| | |
Net Assets | | $ 162,660,996 |
Net Assets consist of: | | |
Paid in capital | | $ 157,560,189 |
Undistributed net investment income | | 26,420 |
Accumulated undistributed net realized gain (loss) on investments | | 400,935 |
Net unrealized appreciation (depreciation) on investments | | 4,673,452 |
Net Assets | | $ 162,660,996 |
Calculation of Maximum Offering Price Class A:
Net Asset Value and redemption price per share ($51,717,906 ÷ 4,299,486 shares) | | $ 12.03 |
| | |
Maximum offering price per share (100/94.25 of $12.03) | | $ 12.76 |
| | |
Class T:
Net Asset Value and redemption price per share ($66,136,138 ÷ 5,510,673 shares) | | $ 12.00 |
| | |
Maximum offering price per share (100/96.50 of $12.00) | | $ 12.44 |
| | |
Class B:
Net Asset Value and offering price per share ($18,540,931 ÷ 1,552,212 shares)A | | $ 11.94 |
| | |
Class C:
Net Asset Value and offering price per share ($21,791,990 ÷ 1,825,006 shares)A | | $ 11.94 |
| | |
Institutional Class:
Net Asset Value, offering price and redemption price per share ($4,474,031 ÷ 371,168 shares) | | $ 12.05 |
A Redemption price per share is equal to net asset value less any applicable contingent deferred sales charge.
Statement of Operations
| Year ended March 31, 2005 |
| | |
Investment Income | | |
Income distributions from underlying funds | | $ 1,672,523 |
| | |
Expenses | | |
Management fee | $ 91,040 | |
Distribution fees | 522,849 | |
Independent trustees' compensation | 434 | |
Total expenses before reductions | 614,323 | |
Expense reductions | (20,338) | 593,985 |
Net investment income (loss) | | 1,078,538 |
Realized and Unrealized Gain (Loss) Realized gain (loss) on sale of underlying fund shares | (71,321) | |
Capital gain distributions from underlying funds | 602,083 | 530,762 |
Change in net unrealized appreciation (depreciation) on underlying funds | | 3,286,735 |
Net gain (loss) | | 3,817,497 |
Net increase (decrease) in net assets resulting from operations | | $ 4,896,035 |
See accompanying notes which are an integral part of the financial statements.
Annual Report
Fidelity Advisor Freedom 2040 Fund
Financial Statements - continued
Statement of Changes in Net Assets
| Year ended
March 31,
2005 | July 24, 2003
(commencement of
operations) to
March 31, 2004 |
Increase (Decrease) in Net Assets | | |
Operations | | |
Net investment income (loss) | $ 1,078,538 | $ 127,323 |
Net realized gain (loss) | 530,762 | (2,741) |
Change in net unrealized appreciation (depreciation) | 3,286,735 | 1,386,717 |
Net increase (decrease) in net assets resulting from operations | 4,896,035 | 1,511,299 |
Distributions to shareholders from net investment income | (1,190,067) | (116,460) |
Share transactions - net increase (decrease) | 115,613,636 | 41,946,553 |
Total increase (decrease) in net assets | 119,319,604 | 43,341,392 |
| | |
Net Assets | | |
Beginning of period | 43,341,392 | - |
End of period (including undistributed net investment income of $26,420 and undistributed net investment income of $10,863, respectively) | $ 162,660,996 | $ 43,341,392 |
Financial Highlights - Class A
Years ended March 31, | 2005 | 2004F |
Selected Per-Share Data | | |
Net asset value, beginning of period | $ 11.62 | $ 10.00 |
Income from Investment Operations | | |
Net investment income (loss)E | .18 | .12 |
Net realized and unrealized gain (loss) | .39 | 1.60 |
Total from investment operations | .57 | 1.72 |
Distributions from net investment income | (.16) | (.10) |
Net asset value, end of period | $ 12.03 | $ 11.62 |
Total ReturnB,C,D | 4.87% | 17.19% |
Ratios to Average Net AssetsG, H | | |
Expenses before expense reductions | .35% | .35%A |
Expenses net of voluntary waivers, if any | .33% | .33%A |
Expenses net of all reductions | .33% | .33%A |
Net investment income (loss) | 1.50% | 1.53%A |
Supplemental Data | | |
Net assets, end of period (000 omitted) | $ 51,718 | $ 9,666 |
Portfolio turnover rate | 3% | 3%A |
A Annualized
B Total returns for periods of less than one year are not annualized.
C Total returns would have been lower had certain expenses not been reduced during the periods shown.
D Total returns do not include the effect of the sales charges.
E Calculated based on average shares outstanding during the period.
F For the period July 24, 2003 (commencement of operations) to March 31, 2004.
G Expense ratios reflect operating expenses of the class. Expenses before reductions do not reflect amounts reimbursed by the investment adviser or reductions from brokerage service arrangements or other expense offset arrangements and do not represent the amount paid by the class during periods when reimbursements or reductions occur. Expenses net of any voluntary waivers reflect expenses after reimbursement by the investment adviser but prior to reductions from brokerage service arrangements or other expense offset arrangements. Expenses net of all reductions represent the net expenses paid by the class.
H Amounts do not include the activity of the underlying funds.
See accompanying notes which are an integral part of the financial statements.
Annual Report
Financial Highlights - Class T
Years ended March 31, | 2005 | 2004F |
Selected Per-Share Data | | |
Net asset value, beginning of period | $ 11.60 | $ 10.00 |
Income from Investment Operations | | |
Net investment income (loss)E | .15 | .10 |
Net realized and unrealized gain (loss) | .38 | 1.59 |
Total from investment operations | .53 | 1.69 |
Distributions from net investment income | (.13) | (.09) |
Net asset value, end of period | $ 12.00 | $ 11.60 |
Total ReturnB,C,D | 4.57% | 16.93% |
Ratios to Average Net AssetsG, H | | |
Expenses before expense reductions | .60% | .60%A |
Expenses net of voluntary waivers, if any | .58% | .58%A |
Expenses net of all reductions | .58% | .58%A |
Net investment income (loss) | 1.25% | 1.28%A |
Supplemental Data | | |
Net assets, end of period (000 omitted) | $ 66,136 | $ 19,191 |
Portfolio turnover rate | 3% | 3%A |
A Annualized
B Total returns for periods of less than one year are not annualized.
C Total returns would have been lower had certain expenses not been reduced during the periods shown.
D Total returns do not include the effect of the sales charges.
E Calculated based on average shares outstanding during the period.
F For the period July 24, 2003 (commencement of operations) to March 31, 2004.
G Expense ratios reflect operating expenses of the class. Expenses before reductions do not reflect amounts reimbursed by the investment adviser or reductions from brokerage service arrangements or other expense offset arrangements and do not represent the amount paid by the class during periods when reimbursements or reductions occur. Expenses net of any voluntary waivers reflect expenses after reimbursement by the investment adviser but prior to reductions from brokerage service arrangements or other expense offset arrangements. Expenses net of all reductions represent the net expenses paid by the class.
H Amounts do not include the activity of the underlying funds.
Financial Highlights - Class B
Years ended March 31, | 2005 | 2004F |
Selected Per-Share Data | | |
Net asset value, beginning of period | $ 11.57 | $ 10.00 |
Income from Investment Operations | | |
Net investment income (loss)E | .09 | .06 |
Net realized and unrealized gain (loss) | .38 | 1.60 |
Total from investment operations | .47 | 1.66 |
Distributions from net investment income | (.10) | (.09) |
Net asset value, end of period | $ 11.94 | $ 11.57 |
Total ReturnB,C,D | 4.04% | 16.58% |
Ratios to Average Net AssetsG, H | | |
Expenses before expense reductions | 1.10% | 1.10%A |
Expenses net of voluntary waivers, if any | 1.08% | 1.08%A |
Expenses net of all reductions | 1.08% | 1.08%A |
Net investment income (loss) | .75% | .78%A |
Supplemental Data | | |
Net assets, end of period (000 omitted) | $ 18,541 | $ 7,232 |
Portfolio turnover rate | 3% | 3%A |
A Annualized
B Total returns for periods of less than one year are not annualized.
C Total returns would have been lower had certain expenses not been reduced during the periods shown.
D Total returns do not include the effect of the contingent deferred sales charge.
E Calculated based on average shares outstanding during the period.
F For the period July 24, 2003 (commencement of operations) to March 31, 2004.
G Expense ratios reflect operating expenses of the class. Expenses before reductions do not reflect amounts reimbursed by the investment adviser or reductions from brokerage service arrangements or other expense offset arrangements and do not represent the amount paid by the class during periods when reimbursements or reductions occur. Expenses net of any voluntary waivers reflect expenses after reimbursement by the investment adviser but prior to reductions from brokerage service arrangements or other expense offset arrangements. Expenses net of all reductions represent the net expenses paid by the class.
H Amounts do not include the activity of the underlying funds.
See accompanying notes which are an integral part of the financial statements.
Annual Report
Financial Highlights - Class C
Years ended March 31, | 2005 | 2004F |
Selected Per-Share Data | | |
Net asset value, beginning of period | $ 11.57 | $ 10.00 |
Income from Investment Operations | | |
Net investment income (loss)E | .09 | .06 |
Net realized and unrealized gain (loss) | .38 | 1.59 |
Total from investment operations | .47 | 1.65 |
Distributions from net investment income | (.10) | (.08) |
Net asset value, end of period | $ 11.94 | $ 11.57 |
Total ReturnB,C,D | 4.04% | 16.53% |
Ratios to Average Net AssetsG, H | | |
Expenses before expense reductions | 1.10% | 1.10%A |
Expenses net of voluntary waivers, if any | 1.08% | 1.08%A |
Expenses net of all reductions | 1.08% | 1.08%A |
Net investment income (loss) | .75% | .78%A |
Supplemental Data | | |
Net assets, end of period (000 omitted) | $ 21,792 | $ 6,958 |
Portfolio turnover rate | 3% | 3%A |
A Annualized
B Total returns for periods of less than one year are not annualized.
C Total returns would have been lower had certain expenses not been reduced during the periods shown.
D Total returns do not include the effect of the contingent deferred sales charge.
E Calculated based on average shares outstanding during the period.
F For the period July 24, 2003 (commencement of operations) to March 31, 2004.
G Expense ratios reflect operating expenses of the class. Expenses before reductions do not reflect amounts reimbursed by the investment adviser or reductions from brokerage service arrangements or other expense offset arrangements and do not represent the amount paid by the class during periods when reimbursements or reductions occur. Expenses net of any voluntary waivers reflect expenses after reimbursement by the investment adviser but prior to reductions from brokerage service arrangements or other expense offset arrangements. Expenses net of all reductions represent the net expenses paid by the class.
H Amounts do not include the activity of the underlying funds.
Financial Highlights - Institutional Class
Years ended March 31, | 2005 | 2004E |
Selected Per-Share Data | | |
Net asset value, beginning of period | $ 11.63 | $ 10.00 |
Income from Investment Operations | | |
Net investment income (loss)D | .21 | .13 |
Net realized and unrealized gain (loss) | .38 | 1.60 |
Total from investment operations | .59 | 1.73 |
Distributions from net investment income | (.17) | (.10) |
Net asset value, end of period | $ 12.05 | $ 11.63 |
Total ReturnB,C | 5.07% | 17.34% |
Ratios to Average Net AssetsF, G | | |
Expenses before expense reductions | .10% | .10%A |
Expenses net of voluntary waivers, if any | .08% | .08%A |
Expenses net of all reductions | .08% | .08%A |
Net investment income (loss) | 1.75% | 1.78%A |
Supplemental Data | | |
Net assets, end of period (000 omitted) | $ 4,474 | $ 294 |
Portfolio turnover rate | 3% | 3%A |
A Annualized
B Total returns for periods of less than one year are not annualized.
C Total returns would have been lower had certain expenses not been reduced during the periods shown.
D Calculated based on average shares outstanding during the period.
E For the period July 24, 2003 (commencement of operations) to March 31, 2004.
F Expense ratios reflect operating expenses of the class. Expenses before reductions do not reflect amounts reimbursed by the investment adviser or reductions from brokerage service arrangements or other expense offset arrangements and do not represent the amount paid by the class during periods when reimbursements or reductions occur. Expenses net of any voluntary waivers reflect expenses after reimbursement by the investment adviser but prior to reductions from brokerage service arrangements or other expense offset arrangements. Expenses net of all reductions represent the net expenses paid by the class.
G Amounts do not include the activity of the underlying funds.
See accompanying notes which are an integral part of the financial statements.
Annual Report
Notes to Financial Statements
For the period ended March 31, 2005
1. Significant Accounting Policies.
Fidelity Advisor Freedom Income Fund, Advisor Freedom 2005 Fund, Advisor Freedom 2010 Fund, Advisor Freedom 2015 Fund, Advisor Freedom 2020 Fund, Advisor Freedom 2025 Fund, Advisor Freedom 2030 Fund, Advisor Freedom 2035 Fund and Advisor Freedom 2040 Fund (the funds) are funds of Fidelity Aberdeen Street Trust (the trust). The trust is registered under the Investment Company Act of 1940, as amended (the 1940 Act), as a diversified open-end management investment company organized as a Delaware statutory trust. Each fund is authorized to issue an unlimited number of shares. The funds invest primarily in a combination of other Fidelity equity, fixed income, and money market funds (the Underlying Funds) managed by Fidelity Management & Research Company (FMR). Each fund offers Class A, Class T, Class B, Class C, and Institutional Class shares, each of which has equal rights as to assets and voting privileges. Each class has exclusive voting rights with respect to matters that affect that class. Class B shares will automatically convert to Class A shares after a holding period of seven years from the initial date of purchase. Investment income, realized and unrealized capital gains and losses, the common expenses of the fund, and certain fund-level expense reductions, if any, are allocated on a pro rata basis to each class based on the relative net assets of each class to the total net assets of the fund. Each class differs with respect to distribution and service plan fees incurred. Certain expense reductions also differ by class. The financial statements have been prepared in conformity with accounting principles generally accepted in the United States of America, which require management to make certain estimates and assumptions at the date of the financial statements. The following summarizes the significant accounting policies of the funds:
Security Valuation. Net asset value per share is calculated as of the close of business of the New York Stock Exchange, normally 4:00 p.m. Eastern time. Investments in the Underlying Funds are valued at their net asset value each business day. Short-term securities with remaining maturities of sixty days or less for which quotations are not readily available are valued on the basis of amortized cost.
Investment Transactions and Income. Security transactions, normally shares of the Underlying Funds, are accounted for as of trade date. Gains and losses on securities sold are determined on the basis of identified cost. Income and capital gain distributions from the Underlying Funds, if any, are recorded on the ex-dividend date. Interest income is accrued as earned. Interest income includes coupon interest and amortization of premium and accretion of discount on debt securities.
Expenses. Most expenses of the trust can be directly attributed to a fund. Expenses which cannot be directly attributed are apportioned among each fund in the trust. Expenses included in the accompanying financial statements reflect the expenses of each fund and do not include any expenses associated with the Underlying Funds.
Income Tax Information and Distributions to Shareholders. Each year, each fund intends to qualify as a regulated investment company by distributing all of its taxable income and realized gains under Subchapter M of the Internal Revenue Code. As a result, no provision for income taxes is required in the accompanying financial statements.
Distributions are recorded on the ex-dividend date. Income dividends and capital gain distributions are declared separately for each class. Income and capital gain distributions are determined in accordance with income tax regulations, which may differ from generally accepted accounting principles. In addition, certain funds will claim a portion of the payment made to redeeming shareholders as a distribution for income tax purposes. Capital accounts within the financial statements are adjusted for permanent book-tax differences. These adjustments have no impact on net assets or the results of operations. Temporary book-tax differences will reverse in a subsequent period.
Book-tax differences are primarily due to short-term capital gain distributions from the Underlying Funds and losses deferred due to wash sales.
The tax-basis components of distributable earnings and the federal tax cost as of period end were as follows for each fund:
| Cost for Federal
Income Tax Purposes | Unrealized
Appreciation | Unrealized
Depreciation | Net Unrealized
Appreciation/
(Depreciation) |
Advisor Freedom Income | $ 58,255,680 | $ 675,153 | $ (570,470) | $ 104,683 |
Advisor Freedom 2005 | 22,821,903 | 423,939 | (232,080) | 191,859 |
Advisor Freedom 2010 | 226,855,554 | 4,791,248 | (2,440,925) | 2,350,323 |
Advisor Freedom 2015 | 150,476,079 | 2,784,265 | (1,623,175) | 1,161,090 |
Advisor Freedom 2020 | 403,046,171 | 13,780,829 | (3,340,317) | 10,440,512 |
Advisor Freedom 2025 | 121,056,564 | 2,314,186 | (814,130) | 1,500,056 |
Advisor Freedom 2030 | 218,981,643 | 8,269,489 | (1,623,213) | 6,646,276 |
Advisor Freedom 2035 | 43,434,087 | 1,172,493 | (397,197) | 775,296 |
Advisor Freedom 2040 | 158,066,664 | 5,731,090 | (1,057,711) | 4,673,379 |
Annual Report
Notes to Financial Statements - continued
1. Significant Accounting Policies - continued
Income Tax Information and Distributions to Shareholders - continued
| Undistributed
Ordinary Income | Undistributed
Long-term Capital Gain |
Advisor Freedom Income | $ 86,109 | $ 131,393 |
Advisor Freedom 2005 | 66,592 | 46,077 |
Advisor Freedom 2010 | 718,326 | 744,259 |
Advisor Freedom 2015 | 318,954 | 449,826 |
Advisor Freedom 2020 | 637,463 | 1,564,213 |
Advisor Freedom 2025 | 95,450 | 243,467 |
Advisor Freedom 2030 | 131,528 | 801,993 |
Advisor Freedom 2035 | - | 75,963 |
Advisor Freedom 2040 | 26,459 | 400,970 |
The tax character of distributions paid was as follows:
March 31, 2005 | | | |
| Ordinary
Income | Long-term
Capital Gains | Total |
Advisor Freedom Income | $ 704,332 | $ 35,147 | $ 739,479 |
Advisor Freedom 2005 | 231,296 | 3,243 | 234,539 |
Advisor Freedom 2010 | 2,581,854 | 17,590 | 2,599,444 |
Advisor Freedom 2015 | 1,216,211 | 6,337 | 1,222,548 |
Advisor Freedom 2020 | 4,439,939 | 68,080 | 4,508,019 |
Advisor Freedom 2025 | 647,465 | 1,629 | 649,094 |
Advisor Freedom 2030 | 1,985,403 | 16,365 | 2,001,768 |
Advisor Freedom 2035 | 330,752 | 21,694 | 352,446 |
Advisor Freedom 2040 | 1,190,067 | - | 1,190,067 |
March 31, 2004 | | | |
| Ordinary
Income | Long-term
Capital Gains | Total |
Advisor Freedom Income | $ 156,368 | $ - | $ 156,368 |
Advisor Freedom 2005 | 8,568 | - | 8,568 |
Advisor Freedom 2010 | 196,312 | - | 196,312 |
Advisor Freedom 2015 | 18,521 | - | 18,521 |
Advisor Freedom 2020 | 346,934 | - | 346,934 |
Advisor Freedom 2025 | 11,834 | - | 11,834 |
Advisor Freedom 2030 | 174,903 | - | 174,903 |
Advisor Freedom 2035 | 11,997 | - | 11,997 |
Advisor Freedom 2040 | 116,460 | - | 116,460 |
2. Operating Policies.
Repurchase Agreements. FMR has received an Exemptive Order from the Securities and Exchange Commission (the SEC) which permits certain funds and other affiliated entities of FMR to transfer uninvested cash balances into joint trading accounts which are then invested in repurchase agreements. Certain funds may also invest directly with institutions in repurchase agreements. Repurchase agreements are collateralized by government or non-government securities. Collateral is held in segregated accounts with custodian banks and may be obtained in the event of a default of the counterparty. Each applicable fund monitors, on a daily basis, the value of the collateral to ensure it is at least equal to the principal amount of the repurchase agreement (including accrued interest). In the event of a default by the counterparty, realization of the collateral proceeds could be delayed, during which time the value of the collateral may decline.
Annual Report
3. Purchases and Sales of Investments.
Purchases and redemptions of the underlying fund shares are noted in the table below.
| Purchases ($) | Redemptions ($) |
Advisor Freedom Income | 34,474,049 | 8,377,330 |
Advisor Freedom 2005 | 20,361,269 | 3,515,931 |
Advisor Freedom 2010 | 146,134,802 | 7,958,044 |
Advisor Freedom 2015 | 134,991,022 | 2,254,549 |
Advisor Freedom 2020 | 243,842,016 | 2,446,880 |
Advisor Freedom 2025 | 115,974,412 | 4,701,515 |
Advisor Freedom 2030 | 145,592,696 | 2,373,222 |
Advisor Freedom 2035 | 39,368,688 | 970,248 |
Advisor Freedom 2040 | 118,651,696 | 2,492,686 |
4. Fees and Other Transactions with Affiliates.
Management Fee. Strategic Advisers, Inc. (Strategic Advisers), an affiliate of FMR, provides the funds with investment management related services. For these services the funds pay a monthly management fee to Strategic Advisers. The management fee is computed at an annual rate of ..10% of the funds' average net assets. The management fee is reduced by an amount equal to the fees and expenses paid by the funds to the independent Trustees. As of May 1, 2005, Strategic Advisers agreed to waive the .10% management fee. On May 19, 2005, the Board of Trustees approved amendments to the management contracts. Under the amended contracts, the Funds no longer pay management fees.
Other Transactions. Strategic Advisers has entered into an administration agreement with FMR under which FMR provides management and administrative services (other than investment advisory services) necessary for the operation of each fund. Pursuant to this agreement, FMR pays all expenses of each fund, except the compensation of the independent Trustees and certain exceptions such as interest expense. FMR also contracts with other Fidelity companies to perform the services necessary for the operation of each fund. For the services under the agreement, Strategic Advisers pays FMR a monthly administration fee equal to the management fee received by Strategic Advisers, minus an amount equal to an annual rate of .02% of each fund's average net assets. The funds do not pay any fees for these services.
Distribution and Service Plan. In accordance with Rule 12b-1 of the 1940 Act, the funds have adopted separate Distribution and Service Plans for each class of shares. Certain classes pay Fidelity Distributors Corporation (FDC), an affiliate of FMR, separate Distribution and Service Fees, each of which is based on an annual percentage of each class' average net assets. In addition, FDC may pay financial intermediaries for selling shares of the fund and providing shareholder support services. For the period, the Distribution and Service Fee rates and the total amounts paid to and retained by FDC were as follows:
Advisor Freedom Income | Distribution
Fee | Service
Fee | Paid to
FDC | Retained
by FDC |
Class A | 0% | .25% | $ 20,423 | $ 23 |
Class T | .25% | .25% | 106,282 | 325 |
Class B | .75% | .25% | 43,846 | 32,902 |
Class C | .75% | .25% | 126,262 | 89,878 |
| | | $ 296,813 | $ 123,128 |
Advisor Freedom 2005 | | | | |
Class A | 0% | .25% | $ 9,536 | $ 541 |
Class T | .25% | .25% | 24,638 | 1,199 |
Class B | .75% | .25% | 21,313 | 16,524 |
Class C | .75% | .25% | 36,850 | 29,188 |
| | | $ 92,337 | $ 47,452 |
Advisor Freedom 2010 | | | | |
Class A | 0% | .25% | $ 127,020 | $ 58 |
Class T | .25% | .25% | 299,898 | 599 |
Class B | .75% | .25% | 216,353 | 162,354 |
Class C | .75% | .25% | 197,594 | 133,151 |
| | | $ 840,865 | $ 296,162 |
Advisor Freedom 2015 | | | | |
Class A | 0% | .25% | $ 53,773 | $ 100 |
Class T | .25% | .25% | 139,456 | 824 |
Class B | .75% | .25% | 114,672 | 86,191 |
Class C | .75% | .25% | 103,936 | 82,854 |
| | | $ 411,837 | $ 169,969 |
Annual Report
Notes to Financial Statements - continued
4. Fees and Other Transactions with Affiliates - continued
Distribution and Service Plan - continued
Advisor Freedom 2020 | Distribution
Fee | Service
Fee | Paid to
FDC | Retained
by FDC |
Class A | 0% | .25% | $ 247,756 | $ 119 |
Class T | .25% | .25% | 576,620 | 1,778 |
Class B | .75% | .25% | 368,111 | 276,168 |
Class C | .75% | .25% | 269,218 | 169,815 |
| | | $ 1,461,705 | $ 447,880 |
Advisor Freedom 2025 | | | | |
Class A | 0% | .25% | $ 34,726 | $ 138 |
Class T | .25% | .25% | 84,130 | 676 |
Class B | .75% | .25% | 82,291 | 61,925 |
Class C | .75% | .25% | 64,654 | 50,792 |
| | | $ 265,801 | $ 113,531 |
Advisor Freedom 2030 | | | | |
Class A | 0% | .25% | $ 108,199 | $ 47 |
Class T | .25% | .25% | 312,765 | 430 |
Class B | .75% | .25% | 198,696 | 149,042 |
Class C | .75% | .25% | 155,561 | 82,354 |
| | | $ 775,221 | $ 231,873 |
Advisor Freedom 2035 | | | | |
Class A | 0% | .25% | $ 18,048 | $ 176 |
Class T | .25% | .25% | 35,288 | 1,127 |
Class B | .75% | .25% | 38,162 | 29,153 |
Class C | .75% | .25% | 27,186 | 22,669 |
| | | $ 118,684 | $ 53,125 |
Advisor Freedom 2040 | | | | |
Class A | 0% | .25% | $ 54,205 | $ - |
Class T | .25% | .25% | 202,404 | - |
Class B | .75% | .25% | 125,076 | 93,822 |
Class C | .75% | .25% | 141,164 | 102,792 |
| | | $ 522,849 | $ 196,614 |
Sales Load. FDC receives a front-end sales charge of up to 5.75% for selling Class A shares, and 3.50% for selling Class T shares, some of which is paid to financial intermediaries for selling shares of the fund. FDC receives the proceeds of contingent deferred sales charges levied on Class A, Class T, Class B, and Class C redemptions. These charges depend on the holding period. The deferred sales charges range from 5% to 1% for Class B, 1% for Class C, and .25% for certain purchases of Class A and Class T shares.
For the period, sales charge amounts retained by FDC were as follows:
Advisor Freedom Income | Retained
by FDC |
Class A | $ 33,054 |
Class T | 8,122 |
Class B* | 19,099 |
Class C* | 9,294 |
| $ 69,569 |
Advisor Freedom 2005 | |
Class A | $ 29,410 |
Class T | 6,445 |
Class B* | 5,468 |
Class C* | 1,722 |
| $ 43,045 |
Annual Report
4. Fees and Other Transactions with Affiliates - continued
Sales Load - continued
Advisor Freedom 2010 | Retained
by FDC |
Class A | $ 174,190 |
Class T | 35,996 |
Class B* | 69,043 |
Class C* | 6,339 |
| $ 285,568 |
Advisor Freedom 2015 | |
Class A | $ 170,386 |
Class T | 38,350 |
Class B* | 25,092 |
Class C* | 2,734 |
| $ 236,562 |
Advisor Freedom 2020 | |
Class A | $ 261,720 |
Class T | 47,093 |
Class B* | 93,213 |
Class C* | 8,647 |
| $ 410,673 |
Advisor Freedom 2025 | |
Class A | $ 123,169 |
Class T | 24,118 |
Class B* | 32,977 |
Class C* | 794 |
| $ 181,058 |
Advisor Freedom 2030 | |
Class A | $ 146,952 |
Class T | 30,735 |
Class B* | 51,770 |
Class C* | 3,175 |
| $ 232,632 |
Advisor Freedom 2035 | |
Class A | $ 55,616 |
Class T | 9,685 |
Class B* | 10,482 |
Class C* | 622 |
| $ 76,405 |
Advisor Freedom 2040 | |
Class A | $ 125,061 |
Class T | 26,602 |
Class B* | 29,968 |
Class C* | 6,272 |
| $ 187,903 |
* When Class B and Class C shares are initially sold, FDC pays commissions from its own resources to financial intermediaries through which the sales are made.
Annual Report
Notes to Financial Statements - continued
5. Expense Reductions.
FMR agreed to reimburse the funds to the extent annual operating expenses exceeded certain levels of average net assets as noted in the table below. Some expenses, for example interest expense, are excluded from this reimbursement.
| Expense
Limitations | Reimbursement
from adviser |
Advisor Freedom Income | | |
Class A | .33% | $ 1,660 |
Class T | .58% | 4,609 |
Class B | 1.08% | 888 |
Class C | 1.08% | 2,530 |
Institutional Class | .08% | 96 |
Advisor Freedom 2005 | | |
Class A | .33% | 819 |
Class T | .58% | 1,122 |
Class B | 1.08% | 484 |
Class C | 1.08% | 873 |
Institutional Class | .08% | 114 |
Advisor Freedom 2010 | | |
Class A | .33% | 10,538 |
Class T | .58% | 13,631 |
Class B | 1.08% | 4,692 |
Class C | 1.08% | 4,448 |
Institutional Class | .08% | 1,003 |
Advisor Freedom 2015 | | |
Class A | .33% | 4,730 |
Class T | .58% | 6,561 |
Class B | 1.08% | 2,693 |
Class C | 1.08% | 2,552 |
Institutional Class | .08% | 1,701 |
Advisor Freedom 2020 | | |
Class A | .33% | 20,522 |
Class T | .58% | 25,525 |
Class B | 1.08% | 8,166 |
Class C | 1.08% | 6,140 |
Institutional Class | .08% | 1,540 |
Advisor Freedom 2025 | | |
Class A | .33% | 3,148 |
Class T | .58% | 4,168 |
Class B | 1.08% | 1,917 |
Class C | 1.08% | 1,546 |
Institutional Class | .08% | 181 |
Advisor Freedom 2030 | | |
Class A | .33% | 9,109 |
Class T | .58% | 14,137 |
Class B | 1.08% | 4,431 |
Class C | 1.08% | 3,564 |
Institutional Class | .08% | 1,021 |
Annual Report
5. Expense Reductions - continued
Advisor Freedom 2035 | Expense
Limitations | Reimbursement
from adviser |
Class A | .33% | $ 1,597 |
Class T | .58% | 1,759 |
Class B | 1.08% | 955 |
Class C | 1.08% | 664 |
Institutional Class | .08% | 67 |
Advisor Freedom 2040 | | |
Class A | .33% | 4,731 |
Class T | .58% | 8,889 |
Class B | 1.08% | 2,861 |
Class C | 1.08% | 3,269 |
Institutional Class | .08% | 548 |
In addition, through arrangements with each applicable fund's custodian, credits realized as a result of uninvested cash balances were used to reduce each applicable fund's management fee. During the period, these credits reduced management fees by the following amounts:
Advisor Freedom Income | $ 25 |
Advisor Freedom 2010 | 36 |
Advisor Freedom 2015 | 2 |
Advisor Freedom 2020 | 99 |
Advisor Freedom 2025 | 3 |
Advisor Freedom 2030 | 61 |
Advisor Freedom 2035 | 1 |
Advisor Freedom 2040 | 40 |
6. Other.
The funds' organizational documents provide former and current trustees and officers with a limited indemnification against liabilities arising in connection with the performance of their duties to the funds. In the normal course of business, the funds may also enter into contracts that provide general indemnifications. The funds' maximum exposure under these arrangements is unknown as this would be dependent on future claims that may be made against the funds. The risk of material loss from such claims is considered remote.
The funds do not invest in the Underlying Funds for the purpose of exercising management or control; however, investments by the funds within their principal investment strategies may represent a significant portion of the Underlying Funds' net assets. The funds, in aggregate, were the owners of record of more than 20% of the total outstanding shares of the following Underlying Funds.
Fund | % of shares held |
Fidelity Advisor Large Cap Fund | 20% |
In addition, at the end of the period, FMR or its affiliates and certain otherwise unaffiliated shareholders each were owners of record of more than 10% of the outstanding shares of the following funds:
| Affiliated % | Number of
Unaffiliated
Shareholders | Unaffiliated
Shareholders % |
Advisor Freedom Income | - | 1 | 10% |
Advisor Freedom 2005 | - | 1 | 12% |
Advisor Freedom 2020 | - | 1 | 10% |
Annual Report
Notes to Financial Statements - continued
7. Distributions to Shareholders.
Distributions to shareholders of each class were as follows:
| Years ended March 31, |
Advisor Freedom Income | 2005 | 2004 A, B |
From net investment income | | |
Class A | $ 156,915 | $ 19,649 |
Class T | 358,648 | 79,678 |
Class B | 44,872 | 18,877 |
Class C | 134,067 | 34,941 |
Institutional Class | 10,148 | 3,223 |
Total | $ 704,650 | $ 156,368 |
From net realized gain | | |
Class A | $ 5,263 | $ - |
Class T | 15,048 | - |
Class B | 3,971 | - |
Class C | 10,183 | - |
Institutional Class | 364 | - |
Total | $ 34,829 | $ - |
Advisor Freedom 2005 | | |
From net investment income | | |
Class A | $ 72,744 | $ 1,826 |
Class T | 71,074 | 1,280 |
Class B | 23,488 | 1,542 |
Class C | 54,062 | 1,663 |
Institutional Class | 9,928 | 2,257 |
Total | $ 231,296 | $ 8,568 |
From net realized gain | | |
Class A | $ 817 | $ - |
Class T | 951 | - |
Class B | 646 | - |
Class C | 641 | - |
Institutional Class | 188 | - |
Total | $ 3,243 | $ - |
Advisor Freedom 2010 | | |
From net investment income | | |
Class A | $ 896,266 | $ 43,977 |
Class T | 1,070,938 | 66,548 |
Class B | 244,225 | 49,040 |
Class C | 262,890 | 34,840 |
Institutional Class | 104,924 | 1,907 |
Total | $ 2,579,243 | $ 196,312 |
From net realized gain | | |
Class A | $ 6,722 | $ - |
Class T | 7,134 | - |
Class B | 3,175 | - |
Class C | 2,556 | - |
Institutional Class | 614 | - |
Total | $ 20,201 | $ - |
Advisor Freedom 2015 | | |
From net investment income | | |
Class A | $ 362,175 | $ 5,218 |
Class T | 450,450 | 5,119 |
Class B | 125,071 | 4,459 |
Class C | 117,958 | 2,525 |
Institutional Class | 160,357 | 1,200 |
Total | $ 1,216,011 | $ 18,521 |
Annual Report
7. Distributions to Shareholders - continued
| Years ended March 31, |
Advisor Freedom 2015 - continued | 2005 | 2004 A, B |
From net realized gain | | |
Class A | $ 1,578 | $ - |
Class T | 1,718 | - |
Class B | 1,172 | - |
Class C | 898 | - |
Institutional Class | 1,171 | - |
Total | $ 6,537 | $ - |
Advisor Freedom 2020 | | |
From net investment income | | |
Class A | $ 1,730,029 | $ 89,794 |
Class T | 1,789,888 | 125,405 |
Class B | 435,029 | 78,799 |
Class C | 327,289 | 50,035 |
Institutional Class | 157,704 | 2,901 |
Total | $ 4,439,939 | $ 346,934 |
From net realized gain | | |
Class A | $ 27,378 | $ - |
Class T | 23,535 | - |
Class B | 9,581 | - |
Class C | 6,642 | - |
Institutional Class | 944 | - |
Total | $ 68,080 | $ - |
Advisor Freedom 2025 | | |
From net investment income | | |
Class A | $ 224,481 | $ 2,746 |
Class T | 274,089 | 1,859 |
Class B | 77,176 | 3,827 |
Class C | 61,009 | 2,202 |
Institutional Class | 10,710 | 1,200 |
Total | $ 647,465 | $ 11,834 |
From net realized gain | | |
Class A | $ 430 | $ - |
Class T | 395 | - |
Class B | 443 | - |
Class C | 333 | - |
Institutional Class | 28 | - |
Total | $ 1,629 | $ - |
Advisor Freedom 2030 | | |
From net investment income | | |
Class A | $ 638,944 | $ 35,680 |
Class T | 938,314 | 69,540 |
Class B | 178,105 | 38,645 |
Class C | 146,090 | 29,038 |
Institutional Class | 83,950 | 2,000 |
Total | $ 1,985,403 | $ 174,903 |
From net realized gain | | |
Class A | $ 5,495 | $ - |
Class T | 5,920 | - |
Class B | 2,610 | - |
Class C | 1,897 | - |
Institutional Class | 443 | - |
Total | $ 16,365 | $ - |
Annual Report
Notes to Financial Statements - continued
7. Distributions to Shareholders - continued
| Years ended March 31, |
Advisor Freedom 2035 | 2005 | 2004 A, B |
From net investment income | | |
Class A | $ 138,492 | $ 3,119 |
Class T | 124,168 | 1,638 |
Class B | 48,334 | 3,169 |
Class C | 34,996 | 2,371 |
Institutional Class | 5,668 | 1,700 |
Total | $ 351,658 | $ 11,997 |
From net realized gain | | |
Class A | $ 272 | $ - |
Class T | 213 | - |
Class B | 175 | - |
Class C | 105 | - |
Institutional Class | 23 | - |
Total | $ 788 | $ - |
Advisor Freedom 2040 | | |
From net investment income | | |
Class A | $ 357,270 | $ 17,994 |
Class T | 516,094 | 50,760 |
Class B | 124,906 | 23,869 |
Class C | 140,661 | 21,670 |
Institutional Class | 51,136 | 2,167 |
Total | $ 1,190,067 | $ 116,460 |
A For the period July 24, 2003 (commencement of operations) to March 31, 2004 for Fidelity Advisor Freedom Income Fund, Fidelity Advisor Freedom 2010 Fund, Fidelity Advisor Freedom 2020 Fund, Fidelity Advisor Freedom 2030 Fund and Fidelity Advisor Freedom 2040 Fund.
B For the period November 6, 2003 (commencement of operations) to March 31, 2004 for Fidelity Advisor Freedom 2005 Fund, Fidelity Advisor Freedom 2015 Fund, Fidelity Advisor Freedom 2025 Fund and Fidelity Advisor Freedom 2035 Fund.
8. Share Transactions.
Transactions for each class of shares were as follows:
| Shares | Dollars |
| Years ended March 31, | Years ended March 31, |
Advisor Freedom Income | 2005 | 2004 A,B | 2005 | 2004 A, B |
Class A | | | | |
Shares sold | 728,210 | 556,120 | $ 7,481,125 | $ 5,708,669 |
Reinvestment of distributions | 13,977 | 1,560 | 144,254 | 16,075 |
Shares redeemed | (241,418) | (76,230) | (2,487,639) | (789,030) |
Net increase(decrease) | 500,769 | 481,450 | $ 5,137,740 | $ 4,935,714 |
Class T | | | | |
Shares sold | 2,252,617 | 1,803,899 | $ 23,261,446 | $ 18,395,637 |
Reinvestment of distributions | 34,674 | 7,538 | 358,020 | 77,485 |
Shares redeemed | (868,775) | (412,756) | (8,962,920) | (4,222,818) |
Net increase(decrease) | 1,418,516 | 1,398,681 | $ 14,656,546 | $ 14,250,304 |
Class B | | | | |
Shares sold | 202,570 | 406,170 | $ 2,078,692 | $ 4,116,167 |
Reinvestment of distributions | 4,403 | 1,783 | 45,378 | 18,299 |
Shares redeemed | (125,605) | (56,322) | (1,287,886) | (578,381) |
Net increase(decrease) | 81,368 | 351,631 | $ 836,184 | $ 3,556,085 |
Class C | | | | |
Shares sold | 888,712 | 968,910 | $ 9,098,996 | $ 9,906,406 |
Reinvestment of distributions | 10,052 | 2,293 | 103,577 | 23,551 |
Shares redeemed | (419,464) | (79,710) | (4,313,437) | (821,157) |
Net increase(decrease) | 479,300 | 891,493 | $ 4,889,136 | $ 9,108,800 |
Institutional Class | | | | |
Shares sold | 42,061 | 34,289 | $ 432,907 | $ 345,318 |
Reinvestment of distributions | 760 | 204 | 7,846 | 2,087 |
Shares redeemed | (16,642) | (1) | (170,939) | (6) |
Net increase(decrease) | 26,179 | 34,492 | $ 269,814 | $ 347,399 |
Annual Report
8. Share Transactions - continued
| Shares | Dollars |
| Years ended March 31, | Years ended March 31, |
Advisor Freedom 2005 | 2005 | 2004 A,B | 2005 | 2004 A, B |
Class A | | | | |
Shares sold | 585,329 | 132,035 | $ 6,132,477 | $ 1,369,748 |
Reinvestment of distributions | 6,487 | 177 | 69,326 | 1,810 |
Shares redeemed | (159,401) | (1) | (1,685,117) | (15) |
Net increase(decrease) | 432,415 | 132,211 | $ 4,516,686 | $ 1,371,543 |
Class T | | | | |
Shares sold | 772,833 | 194,308 | $ 8,098,797 | $ 2,020,332 |
Reinvestment of distributions | 6,710 | 125 | 71,635 | 1,280 |
Shares redeemed | (218,069) | (632) | (2,293,607) | (6,663) |
Net increase(decrease) | 561,474 | 193,801 | $ 5,876,825 | $ 2,014,949 |
Class B | | | | |
Shares sold | 192,162 | 119,966 | $ 2,010,191 | $ 1,241,061 |
Reinvestment of distributions | 1,998 | 141 | 21,257 | 1,444 |
Shares redeemed | (48,192) | (5,213) | (503,088) | (54,663) |
Net increase(decrease) | 145,968 | 114,894 | $ 1,528,360 | $ 1,187,842 |
Class C | | | | |
Shares sold | 478,945 | 104,471 | $ 4,977,613 | $ 1,080,313 |
Reinvestment of distributions | 4,388 | 163 | 46,808 | 1,663 |
Shares redeemed | (48,603) | (2,131) | (512,104) | (22,078) |
Net increase(decrease) | 434,730 | 102,503 | $ 4,512,317 | $ 1,059,898 |
Institutional Class | | | | |
Shares sold | 34,319 | 37,614 | $ 360,945 | $ 380,010 |
Reinvestment of distributions | 860 | 221 | 9,166 | 2,257 |
Shares redeemed | (11,601) | - | (125,056) | - |
Net increase(decrease) | 23,578 | 37,835 | $ 245,055 | $ 382,267 |
Advisor Freedom 2010 | | | | |
Class A | | | | |
Shares sold | 4,608,995 | 6,011,846 | $ 50,250,054 | $ 64,179,052 |
Reinvestment of distributions | 78,688 | 3,950 | 872,410 | 41,954 |
Shares redeemed | (950,972) | (3,027,942) | (10,395,541) | (32,337,081) |
Net increase(decrease) | 3,736,711 | 2,987,854 | $ 40,726,923 | $ 31,883,925 |
Class T | | | | |
Shares sold | 7,487,847 | 3,031,245 | $ 81,779,426 | $ 32,349,186 |
Reinvestment of distributions | 96,564 | 6,169 | 1,069,348 | 65,456 |
Shares redeemed | (1,698,806) | (288,271) | (18,462,716) | (3,097,922) |
Net increase(decrease) | 5,885,605 | 2,749,143 | $ 64,386,058 | $ 29,316,720 |
Class B | | | | |
Shares sold | 1,378,429 | 1,431,674 | $ 14,897,988 | $ 15,072,786 |
Reinvestment of distributions | 20,499 | 4,375 | 226,286 | 46,370 |
Shares redeemed | (292,158) | (65,871) | (3,159,106) | (697,008) |
Net increase(decrease) | 1,106,770 | 1,370,178 | $ 11,965,168 | $ 14,422,148 |
Class C | | | | |
Shares sold | 1,743,474 | 1,108,463 | $ 18,868,200 | $ 11,728,611 |
Reinvestment of distributions | 20,727 | 2,998 | 228,983 | 31,779 |
Shares redeemed | (295,172) | (48,773) | (3,194,192) | (528,477) |
Net increase(decrease) | 1,469,029 | 1,062,688 | $ 15,902,991 | $ 11,231,913 |
Institutional Class | | | | |
Shares sold | 496,890 | 161,267 | $ 5,380,233 | $ 1,748,838 |
Reinvestment of distributions | 6,067 | 143 | 67,159 | 1,516 |
Shares redeemed | (155,576) | (6,723) | (1,710,806) | (73,690) |
Net increase(decrease) | 347,381 | 154,687 | $ 3,736,586 | $ 1,676,664 |
Annual Report
Notes to Financial Statements - continued
8. Share Transactions - continued
| Shares | Dollars |
| Years ended March 31, | Years ended March 31, |
Advisor Freedom 2015 | 2005 | 2004 A,B | 2005 | 2004 A, B |
Class A | | | | |
Shares sold | 4,003,451 | 453,543 | $ 42,707,661 | $ 4,740,621 |
Reinvestment of distributions | 31,923 | 503 | 349,281 | 5,159 |
Shares redeemed | (307,000) | (2,716) | (3,266,298) | (28,286) |
Net increase(decrease) | 3,728,374 | 451,330 | $ 39,790,644 | $ 4,717,494 |
Class T | | | | |
Shares sold | 5,141,514 | 478,142 | $ 54,603,890 | $ 5,005,957 |
Reinvestment of distributions | 40,873 | 498 | 446,960 | 5,107 |
Shares redeemed | (458,057) | (2,027) | (4,861,368) | (21,269) |
Net increase(decrease) | 4,724,330 | 476,613 | $ 50,189,482 | $ 4,989,795 |
Class B | | | | |
Shares sold | 1,449,464 | 403,545 | $ 15,307,338 | $ 4,213,233 |
Reinvestment of distributions | 10,737 | 434 | 117,212 | 4,450 |
Shares redeemed | (109,668) | (630) | (1,158,377) | (6,636) |
Net increase(decrease) | 1,350,533 | 403,349 | $ 14,266,173 | $ 4,211,047 |
Class C | | | | |
Shares sold | 1,505,221 | 343,634 | $ 15,938,225 | $ 3,596,889 |
Reinvestment of distributions | 8,911 | 237 | 97,350 | 2,428 |
Shares redeemed | (90,162) | (3,598) | (956,104) | (38,127) |
Net increase(decrease) | 1,423,970 | 340,273 | $ 15,079,471 | $ 3,561,190 |
Institutional Class | | | | |
Shares sold | 1,325,729 | 26,468 | $ 14,281,479 | $ 268,672 |
Reinvestment of distributions | 14,118 | 117 | 154,581 | 1,200 |
Shares redeemed | (176,462) | - | (1,867,613) | - |
Net increase(decrease) | 1,163,385 | 26,585 | $ 12,568,447 | $ 269,872 |
Advisor Freedom 2020 | | | | |
Class A | | | | |
Shares sold | 6,713,038 | 7,039,702 | $ 76,292,402 | $ 77,494,120 |
Reinvestment of distributions | 146,966 | 7,871 | 1,714,049 | 85,955 |
Shares redeemed | (1,527,689) | (642,065) | (17,327,477) | (7,227,956) |
Net increase(decrease) | 5,332,315 | 6,405,508 | $ 60,678,974 | $ 70,352,119 |
Class T | | | | |
Shares sold | 12,699,220 | 4,882,894 | $ 143,541,530 | $ 53,798,538 |
Reinvestment of distributions | 153,474 | 11,313 | 1,793,543 | 123,537 |
Shares redeemed | (2,089,785) | (260,830) | (23,854,402) | (2,914,264) |
Net increase(decrease) | 10,762,909 | 4,633,377 | $ 121,480,671 | $ 51,007,811 |
Class B | | | | |
Shares sold | 2,516,778 | 2,121,988 | $ 28,294,743 | $ 22,935,276 |
Reinvestment of distributions | 36,057 | 6,931 | 420,877 | 75,615 |
Shares redeemed | (314,860) | (63,508) | (3,560,956) | (709,002) |
Net increase(decrease) | 2,237,975 | 2,065,411 | $ 25,154,664 | $ 22,301,889 |
Class C | | | | |
Shares sold | 2,324,713 | 1,436,597 | $ 26,225,111 | $ 15,662,940 |
Reinvestment of distributions | 24,834 | 3,975 | 289,805 | 43,369 |
Shares redeemed | (332,947) | (31,556) | (3,727,954) | (351,618) |
Net increase(decrease) | 2,016,600 | 1,409,016 | $ 22,786,962 | $ 15,354,691 |
Institutional Class | | | | |
Shares sold | 926,868 | 213,708 | $ 10,370,986 | $ 2,403,565 |
Reinvestment of distributions | 10,712 | 165 | 125,784 | 1,800 |
Shares redeemed | (107,358) | (12,532) | (1,238,107) | (140,399) |
Net increase(decrease) | 830,222 | 201,341 | $ 9,258,663 | $ 2,264,966 |
Annual Report
8. Share Transactions - continued
| Shares | Dollars |
| Years ended March 31, | Years ended March 31, |
Advisor Freedom 2025 | 2005 | 2004 A,B | 2005 | 2004 A, B |
Class A | | | | |
Shares sold | 5,276,780 | 214,014 | $ 57,517,460 | $ 2,244,093 |
Reinvestment of distributions | 19,938 | 267 | 222,747 | 2,746 |
Shares redeemed | (94,969) | (161) | (1,026,036) | (1,730) |
Net increase(decrease) | 5,201,749 | 214,120 | $ 56,714,171 | $ 2,245,109 |
Class T | | | | |
Shares sold | 3,762,442 | 243,313 | $ 40,548,861 | $ 2,566,782 |
Reinvestment of distributions | 24,426 | 168 | 273,522 | 1,733 |
Shares redeemed | (656,224) | (4,450) | (7,186,110) | (47,326) |
Net increase(decrease) | 3,130,644 | 239,031 | $ 33,636,273 | $ 2,521,189 |
Class B | | | | |
Shares sold | 1,071,244 | 261,803 | $ 11,424,918 | $ 2,752,450 |
Reinvestment of distributions | 6,592 | 362 | 73,482 | 3,722 |
Shares redeemed | (108,115) | (1,779) | (1,143,060) | (19,098) |
Net increase(decrease) | 969,721 | 260,386 | $ 10,355,340 | $ 2,737,074 |
Class C | | | | |
Shares sold | 854,961 | 205,102 | $ 9,116,240 | $ 2,156,679 |
Reinvestment of distributions | 4,495 | 195 | 50,136 | 2,008 |
Shares redeemed | (64,614) | (4,537) | (685,152) | (48,091) |
Net increase(decrease) | 794,842 | 200,760 | $ 8,481,224 | $ 2,110,596 |
Institutional Class | | | | |
Shares sold | 190,349 | 20,644 | $ 2,059,061 | $ 207,010 |
Reinvestment of distributions | 854 | 116 | 9,558 | 1,200 |
Shares redeemed | (37,209) | - | (408,139) | - |
Net increase(decrease) | 153,994 | 20,760 | $ 1,660,480 | $ 208,210 |
Advisor Freedom 2030 | | | | |
Class A | | | | |
Shares sold | 3,725,720 | 2,657,168 | $ 43,285,155 | $ 29,782,835 |
Reinvestment of distributions | 52,499 | 3,132 | 630,708 | 34,676 |
Shares redeemed | (653,805) | (231,842) | (7,592,923) | (2,650,316) |
Net increase(decrease) | 3,124,414 | 2,428,458 | $ 36,322,940 | $ 27,167,195 |
Class T | | | | |
Shares sold | 7,556,712 | 2,514,746 | $ 87,295,265 | $ 28,024,586 |
Reinvestment of distributions | 76,945 | 6,254 | 924,403 | 69,167 |
Shares redeemed | (1,335,355) | (148,511) | (15,591,463) | (1,683,269) |
Net increase(decrease) | 6,298,302 | 2,372,489 | $ 72,628,205 | $ 26,410,484 |
Class B | | | | |
Shares sold | 1,441,453 | 1,105,667 | $ 16,551,682 | $ 12,159,059 |
Reinvestment of distributions | 14,367 | 3,296 | 172,589 | 36,421 |
Shares redeemed | (169,554) | (39,962) | (1,953,216) | (454,012) |
Net increase(decrease) | 1,286,266 | 1,069,001 | $ 14,771,055 | $ 11,741,468 |
Class C | | | | |
Shares sold | 1,214,477 | 892,318 | $ 13,923,553 | $ 9,844,674 |
Reinvestment of distributions | 10,905 | 2,197 | 131,015 | 24,276 |
Shares redeemed | (179,159) | (44,688) | (2,091,102) | (510,933) |
Net increase(decrease) | 1,046,223 | 849,827 | $ 11,963,466 | $ 9,358,017 |
Institutional Class | | | | |
Shares sold | 648,019 | 95,905 | $ 7,437,369 | $ 1,079,123 |
Reinvestment of distributions | 4,103 | 173 | 49,211 | 1,916 |
Shares redeemed | (79,362) | (6,432) | (930,147) | (74,028) |
Net increase(decrease) | 572,760 | 89,646 | $ 6,556,433 | $ 1,007,011 |
Annual Report
Notes to Financial Statements - continued
8. Share Transactions - continued
| Shares | Dollars |
| Years ended March 31, | Years ended March 31, |
Advisor Freedom 2035 | 2005 | 2004 A,B | 2005 | 2004 A, B |
Class A | | | | |
Shares sold | 1,306,403 | 177,071 | $ 14,223,336 | $ 1,865,742 |
Reinvestment of distributions | 12,002 | 299 | 135,434 | 3,084 |
Shares redeemed | (112,316) | (1,226) | (1,200,215) | (13,000) |
Net increase(decrease) | 1,206,089 | 176,144 | $ 13,158,555 | $ 1,855,826 |
Class T | | | | |
Shares sold | 1,582,067 | 97,843 | $ 17,237,692 | $ 1,031,539 |
Reinvestment of distributions | 10,972 | 159 | 123,545 | 1,638 |
Shares redeemed | (199,783) | (95) | (2,193,255) | (1,015) |
Net increase(decrease) | 1,393,256 | 97,907 | $ 15,167,982 | $ 1,032,162 |
Class B | | | | |
Shares sold | 567,399 | 105,253 | $ 6,107,462 | $ 1,097,083 |
Reinvestment of distributions | 4,279 | 308 | 48,075 | 3,169 |
Shares redeemed | (46,723) | (314) | (510,531) | (3,293) |
Net increase(decrease) | 524,955 | 105,247 | $ 5,645,006 | $ 1,096,959 |
Class C | | | | |
Shares sold | 394,064 | 83,351 | $ 4,222,523 | $ 870,026 |
Reinvestment of distributions | 2,802 | 220 | 31,509 | 2,265 |
Shares redeemed | (16,996) | (218) | (184,466) | (2,276) |
Net increase(decrease) | 379,870 | 83,353 | $ 4,069,566 | $ 870,015 |
Institutional Class | | | | |
Shares sold | 23,012 | 20,001 | $ 248,080 | $ 200,010 |
Reinvestment of distributions | 480 | 165 | 5,406 | 1,700 |
Shares redeemed | (1,465) | - | (15,843) | - |
Net increase(decrease) | 22,027 | 20,166 | $ 237,643 | $ 201,710 |
Advisor Freedom 2040 | | | | |
Class A | | | | |
Shares sold | 3,857,042 | 937,469 | $ 45,930,304 | $ 10,645,307 |
Reinvestment of distributions | 28,564 | 1,597 | 350,714 | 17,851 |
Shares redeemed | (417,971) | (107,215) | (4,959,405) | (1,237,201) |
Net increase(decrease) | 3,467,635 | 831,851 | $ 41,321,613 | $ 9,425,957 |
Class T | | | | |
Shares sold | 4,878,040 | 1,768,005 | $ 57,327,142 | $ 19,891,891 |
Reinvestment of distributions | 41,907 | 4,509 | 514,396 | 50,369 |
Shares redeemed | (1,063,534) | (118,254) | (12,602,134) | (1,362,835) |
Net increase(decrease) | 3,856,413 | 1,654,260 | $ 45,239,404 | $ 18,579,425 |
Class B | | | | |
Shares sold | 1,020,115 | 653,746 | $ 11,904,851 | $ 7,321,660 |
Reinvestment of distributions | 9,751 | 2,047 | 119,452 | 22,842 |
Shares redeemed | (102,560) | (30,887) | (1,209,741) | (356,280) |
Net increase(decrease) | 927,306 | 624,906 | $ 10,814,562 | $ 6,988,222 |
Class C | | | | |
Shares sold | 1,473,064 | 634,471 | $ 17,144,955 | $ 7,073,358 |
Reinvestment of distributions | 10,547 | 1,860 | 129,196 | 20,761 |
Shares redeemed | (259,960) | (34,976) | (3,017,274) | (401,419) |
Net increase(decrease) | 1,223,651 | 601,355 | $ 14,256,877 | $ 6,692,700 |
Institutional Class | | | | |
Shares sold | 384,780 | 25,651 | $ 4,445,168 | $ 264,662 |
Reinvestment of distributions | 2,257 | 183 | 27,746 | 2,044 |
Shares redeemed | (41,149) | (554) | (491,734) | (6,457) |
Net increase(decrease) | 345,888 | 25,280 | $ 3,981,180 | $ 260,249 |
A For the period July 24, 2003 (commencement of operations) to March 31, 2004 for Fidelity Advisor Freedom Income Fund, Fidelity Advisor Freedom 2010 Fund, Fidelity Advisor Freedom 2020 Fund, Fidelity Advisor Freedom 2030 Fund and Fidelity Advisor Freedom 2040 Fund.
B For the period November 6, 2003 (commencement of operations) to March 31, 2004 for Fidelity Advisor Freedom 2005 Fund, Fidelity Advisor Freedom 2015 Fund, Fidelity Advisor Freedom 2025 Fund and Fidelity Advisor Freedom 2035 Fund.
Annual Report
Report of Independent Registered Public Accounting Firm
To the Trustees of Fidelity Aberdeen Street Trust and the Shareholders of Fidelity Advisor Freedom Income Fund, Fidelity Advisor Freedom 2005 Fund, Fidelity Advisor Freedom 2010 Fund, Fidelity Advisor Freedom 2015 Fund, Fidelity Advisor Freedom 2020 Fund, Fidelity Advisor Freedom 2025 Fund, Fidelity Advisor Freedom 2030 Fund, Fidelity Advisor Freedom 2035 Fund and Fidelity Advisor Freedom 2040 Fund:
We have audited the accompanying statements of assets and liabilities of Fidelity Advisor Freedom Income Fund, Fidelity Advisor Freedom 2005 Fund, Fidelity Advisor Freedom 2010 Fund, Fidelity Advisor Freedom 2015 Fund, Fidelity Advisor Freedom 2020 Fund, Fidelity Advisor Freedom 2025 Fund, Fidelity Advisor Freedom 2030 Fund, Fidelity Advisor Freedom 2035 Fund and Fidelity Advisor Freedom 2040 Fund (the Funds), each a fund of the Fidelity Aberdeen Street Trust, including the portfolios of investments, as of March 31, 2005, and the related statements of operations for the year then ended, and the statements of changes in net assets and the financial highlights for each of the periods presented. These financial statements and financial highlights are the responsibility of the Funds' management. Our responsibility is to express an opinion on these financial statements and financial highlights based on our audits.
We conducted our audits in accordance with standards of the Public Company Accounting Oversight Board (United States). Those standards require that we plan and perform the audit to obtain reasonable assurance about whether the financial statements and financial highlights are free of material misstatement. The Funds are not required to have, nor were we engaged to perform, an audit of their internal control over financial reporting. Our audit included consideration of internal control over financial reporting as a basis for designing audit procedures that are appropriate in the circumstances, but not for the purposes of expressing an opinion on the effectiveness of the Funds' internal control over financial reporting. Accordingly, we express no such opinion. An audit also includes examining, on a test basis, evidence supporting the amounts and disclosures in the financial statements, assessing the accounting principles used and significant estimates made by management, as well as evaluating the overall financial statement presentation. Our procedures included confirmation of securities owned as of March 31, 2005, by correspondence with the custodian and brokers; where replies were not received from brokers, we performed other auditing procedures. We believe that our audits provide a reasonable basis for our opinion.
In our opinion, the financial statements and financial highlights referred to above present fairly, in all material respects, the financial position of the Funds as of March 31, 2005, the results of their operations for the year then ended, and the changes in their net assets and their financial highlights for the respective stated periods, in conformity with accounting principles generally accepted in the United States of America.
/s/ Deloitte & Touche LLP
DELOITTE & TOUCHE LLP
Boston, Massachusetts
May 19, 2005
Annual Report
Trustees and Officers
The Trustees, Member of the Advisory Board, and executive officers of the trust and funds, as applicable, are listed below. The Board of Trustees governs each Advisor Freedom Fund and is responsible for protecting the interests of shareholders. The Trustees are experienced executives who meet periodically throughout the year to oversee each Advisor Freedom Fund's activities, review contractual arrangements with companies that provide services to each Advisor Freedom Fund, and review each Advisor Freedom Fund's performance. If the interests of an Advisor Freedom Fund and an underlying Fidelity fund were to diverge, a conflict of interest could arise and affect how the Trustees and Member of the Advisory Board fulfill their fiduciary duties to the affected funds. Strategic Advisers has structured the Advisor Freedom Funds to avoid these potential conflicts, although there may be situations where a conflict of interest is unavoidable. In such instances, Strategic Advisers, the Trustees, and Member of the Advisory Board would take reasonable steps to minimize and, if possible, eliminate the conflict. Except for William O. McCoy, Dennis J. Dirks, and Kenneth L. Wolfe, each of the Trustees oversees 308 funds advised by FMR or an affiliate. Mr. McCoy oversees 310 funds advised by FMR or an affiliate. Mr. Dirks and Mr. Wolfe oversee 297 funds advised by FMR or an affiliate.
The Trustees hold office without limit in time except that (a) any Trustee may resign; (b) any Trustee may be removed by written instrument, signed by at least two-thirds of the number of Trustees prior to such removal; (c) any Trustee who requests to be retired or who has become incapacitated by illness or injury may be retired by written instrument signed by a majority of the other Trustees; and (d) any Trustee may be removed at any special meeting of shareholders by a two-thirds vote of the outstanding voting securities of the trust. In any event, each Trustee who is not an "interested person" (as defined in the 1940 Act) (Independent Trustee) shall retire not later than the last day of the calendar year in which his or her 72nd birthday occurs. The executive officers and Advisory Board Member hold office without limit in time, except that any officer and Advisory Board Member may resign or may be removed by a vote of a majority of the Trustees at any regular meeting or any special meeting of the Trustees. Except as indicated, each individual has held the office shown or other offices in the same company for the past five years.
The funds' Statement of Additional Information (SAI) includes more information about the Trustees. To request a free copy, call Fidelity at 1-877-208-0098.
Interested Trustees*:
Correspondence intended for each Trustee who is an "interested person" may be sent to Fidelity Investments, 82 Devonshire Street, Boston, Massachusetts 02109.
Name, Age; Principal Occupation |
Edward C. Johnson 3d (74)** |
| Year of Election or Appointment: 1991 Mr. Johnson is Chairman of the Board of Trustees. Mr. Johnson serves as Chief Executive Officer, Chairman, and a Director of FMR Corp.; a Director and Chairman of the Board and of the Executive Committee of FMR; Chairman and a Director of Fidelity Management & Research (Far East) Inc.; Chairman and a Director of Fidelity Investments Money Management, Inc.; and Chairman (2001-present) and a Director (2000-present) of FMR Co., Inc. |
Abigail P. Johnson (43)** |
| Year of Election or Appointment: 2001 Senior Vice President of Advisor Freedom Income (2003), Advisor Freedom 2005 (2003), Advisor Freedom 2010 (2003), Advisor Freedom 2015 (2003), Advisor Freedom 2020 (2003), Advisor Freedom 2025 (2003), Advisor Freedom 2030 (2003), Advisor Freedom 2035 (2003), and Advisor Freedom 2040 (2003). Ms. Johnson also serves as Senior Vice President of other Fidelity funds (2001-present). She is President and a Director of FMR (2001-present), Fidelity Investments Money Management, Inc. (2001-present), FMR Co., Inc. (2001-present), and a Director of FMR Corp. Previously, Ms. Johnson managed a number of Fidelity funds. |
Laura B. Cronin (50) |
| Year of Election or Appointment: 2003 Ms. Cronin is an Executive Vice President (2002-present) and Chief Financial Officer (2002-present) of FMR Corp. Previously, Ms. Cronin served as Chief Financial Officer of FMR (1999-2001), Fidelity Personal Investments (2001), and Fidelity Brokerage Company (2001-2002). |
Robert L. Reynolds (53) |
| Year of Election or Appointment: 2003 Mr. Reynolds is a Director (2003-present) and Chief Operating Officer (2002-present) of FMR Corp. He also serves on the Board at Fidelity Investments Canada, Ltd. (2000-present). Previously, Mr. Reynolds served as President of Fidelity Investments Institutional Retirement Group (1996-2000). |
* Trustees have been determined to be "Interested Trustees" by virtue of, among other things, their affiliation with the trust or various entities under common control with FMR.
** Edward C. Johnson 3d, Trustee, is Abigail P. Johnson's father.
Annual Report
Independent Trustees:
Correspondence intended for each Independent Trustee (that is, the Trustees other than the Interested Trustees) may be sent to Fidelity Investments, P.O. Box 55235, Boston, Massachusetts 02205-5235.
Name, Age; Principal Occupation |
Dennis J. Dirks (56) |
| Year of Election or Appointment: 2005 Mr. Dirks also serves as a Trustee (2005-present) or Member of the Advisory Board (2004-present) of other investment companies advised by FMR. Prior to his retirement in May 2003, Mr. Dirks was Chief Operating Officer and a member of the Board of The Depository Trust & Clearing Corporation (DTCC) (1999-2003). He also served as President, Chief Operating Officer, and Board member of The Depository Trust Company (DTC) (1999-2003) and President and Board member of the National Securities Clearing Corporation (NSCC) (1999-2003). In addition, Mr. Dirks served as Chief Executive Officer and Board member of the Government Securities Clearing Corporation (2001-2003) and Chief Executive Officer and Board member of the Mortgage-Backed Securities Clearing Corporation (2001-2003). |
Robert M. Gates (61) |
| Year of Election or Appointment: 1997 Dr. Gates is Vice Chairman of the Independent Trustees (2005-present). Dr. Gates is President of Texas A&M University (2002-present). He was Director of the Central Intelligence Agency (CIA) from 1991 to 1993. From 1989 to 1991, Dr. Gates served as Assistant to the President of the United States and Deputy National Security Advisor. Dr. Gates is a Director of NACCO Industries, Inc. (mining and manufacturing), Parker Drilling Co., Inc. (drilling and rental tools for the energy industry, 2001-present), and Brinker International (restaurant management, 2003-present). He also serves as a member of the Advisory Board of VoteHere.net (secure internet voting, 2001-present). Previously, Dr. Gates served as a Director of LucasVarity PLC (automotive components and diesel engines), a Director of TRW Inc. (automotive, space, defense, and information technology), and Dean of the George Bush School of Government and Public Service at Texas A&M University (1999-2001). Dr. Gates also is a Trustee of the Forum for International Policy. |
George H. Heilmeier (68) |
| Year of Election or Appointment: 2004 Dr. Heilmeier is Chairman Emeritus of Telcordia Technologies (communication software and systems), where prior to his retirement, he served as company Chairman and Chief Executive Officer. He currently serves on the Boards of Directors of The Mitre Corporation (systems engineering and information technology support for the government), Teletech Holdings (customer management services), and HRL Laboratories (private research and development, 2004-present). He is Chairman of the General Motors Technology Advisory Committee and a Life Fellow of the Institute of Electrical and Electronics Engineers (IEEE) (2000-present). Dr. Heilmeier is a member of the Defense Science Board and the National Security Agency Advisory Board. He is also a member of the National Academy of Engineering, the American Academy of Arts and Sciences, and the Board of Overseers of the School of Engineering and Applied Science of the University of Pennsylvania. Previously, Dr. Heilmeier served as a Director of TRW Inc. (automotive, space, defense, and information technology, 1992-2002), Compaq (1994-2002), Automatic Data Processing, Inc. (ADP) (technology-based business outsourcing, 1995-2002), and INET Technologies Inc. (telecommunications network surveillance, 2001-2004). |
Marie L. Knowles (58) |
| Year of Election or Appointment: 2001 Prior to Ms. Knowles' retirement in June 2000, she served as Executive Vice President and Chief Financial Officer of Atlantic Richfield Company (ARCO) (diversified energy, 1996-2000). From 1993 to 1996, she was a Senior Vice President of ARCO and President of ARCO Transportation Company. She served as a Director of ARCO from 1996 to 1998. She currently serves as a Director of Phelps Dodge Corporation (copper mining and manufacturing) and McKesson Corporation (healthcare service, 2002-present). Ms. Knowles is a Trustee of the Brookings Institution and the Catalina Island Conservancy and also serves as a member of the Advisory Board for the School of Engineering of the University of Southern California. |
Ned C. Lautenbach (61) |
| Year of Election or Appointment: 2000 Mr. Lautenbach has been a partner of Clayton, Dubilier & Rice, Inc. (private equity investment firm) since September 1998. Previously, Mr. Lautenbach was with the International Business Machines Corporation (IBM) from 1968 until his retirement in 1998. He was most recently Senior Vice President and Group Executive of Worldwide Sales and Services. From 1993 to 1995, he was Chairman of IBM World Trade Corporation, and from 1994 to 1998 was a member of IBM's Corporate Executive Committee. Mr. Lautenbach serves as a Director of Italtel Holding S.p.A. (telecommunications (Milan, Italy), 2004-present) and Eaton Corporation (diversified industrial) as well as the Philharmonic Center for the Arts in Naples, Florida. He also is a member of the Council on Foreign Relations. |
Marvin L. Mann (71) |
| Year of Election or Appointment: 1993 Mr. Mann is Chairman of the Independent Trustees (2001-present). He is Chairman Emeritus of Lexmark International, Inc. (computer peripherals), where he served as CEO until April 1998, retired as Chairman May 1999, and remains a member of the Board. Prior to 1991, he held the positions of Vice President of International Business Machines Corporation (IBM) and President and General Manager of various IBM divisions and subsidiaries. He is a member of the Executive Committee of the Independent Director's Council of the Investment Company Institute. In addition, Mr. Mann is a member of the President's Cabinet at the University of Alabama and the Board of Visitors of the Culverhouse College of Commerce and Business Administration at the University of Alabama. |
William O. McCoy (71) |
| Year of Election or Appointment: 1997 Prior to his retirement in December 1994, Mr. McCoy was Vice Chairman of the Board of BellSouth Corporation (telecommunications) and President of BellSouth Enterprises. He is currently a Director of Liberty Corporation (holding company), Duke Realty Corporation (real estate), and Progress Energy, Inc. (electric utility). He is also a partner of Franklin Street Partners (private investment management firm) and a member of the Research Triangle Foundation Board. In addition, Mr. McCoy served as the Interim Chancellor (1999-2000) and a member of the Board of Visitors for the University of North Carolina at Chapel Hill and currently serves on the Board of Directors of the University of North Carolina Health Care System and the Board of Visitors of the Kenan-Flagler Business School (University of North Carolina at Chapel Hill). He also served as Vice President of Finance for the University of North Carolina (16-school system). |
Cornelia M. Small (60) |
| Year of Election or Appointment: 2005 Ms. Small is a member (2000-present) and Chairperson (2002-present) of the Investment Committee, and a member (2002-present) of the Board of Trustees of Smith College. Previously, she served as Chief Investment Officer (1999-2000), Director of Global Equity Investments (1996-1999), and a member of the Board of Directors of Scudder, Stevens & Clark (1990-1997) and Scudder Kemper Investments (1997-1998). In addition, Ms. Small served as Co-Chair (2000-2003) of the Annual Fund for the Fletcher School of Law and Diplomacy. |
William S. Stavropoulos (65) |
| Year of Election or Appointment: 2001 Mr. Stavropoulos is Chairman of the Board (2000-present) and a Member of the Board of Directors of The Dow Chemical Company. Since joining The Dow Chemical Company in 1967, Mr. Stavropoulos served in numerous senior management positions, including President (1993-2000; 2002-2003), CEO (1995-2000; 2000-2004), and Chairman of the Executive Committee (2000-2004). Currently, he is a Director of NCR Corporation (data warehousing and technology solutions), BellSouth Corporation (telecommunications), Chemical Financial Corporation, and Maersk Inc. (industrial conglomerate, 2002-present). He also serves as a member of the Board of Trustees of the American Enterprise Institute for Public Policy Research. In addition, Mr. Stavropoulos is a member of The Business Council, J.P. Morgan International Council and the University of Notre Dame Advisory Council for the College of Science. |
Kenneth L. Wolfe (66) |
| Year of Election or Appointment: 2005 Mr. Wolfe also serves as a Trustee (2005-present) or Member of the Advisory Board (2004-present) of other investment companies advised by FMR. Prior to his retirement in 2001, Mr. Wolfe was Chairman and Chief Executive Officer of Hershey Foods Corporation (1993-2001). He currently serves as a member of the boards of Adelphia Communications Corporation (2003-present), Bausch & Lomb, Inc., and Revlon Inc. (2004-present). |
Annual Report
Advisory Board Member and Executive Officers:
Correspondence intended for each executive officer and Mr. Lynch may be sent to Fidelity Investments, 82 Devonshire Street, Boston, Massachusetts 02109.
Name, Age; Principal Occupation |
Peter S. Lynch (62) |
| Year of Election or Appointment: 2003 Member of the Advisory Board of Fidelity Aberdeen Street Trust. Vice Chairman and a Director of FMR, and Vice Chairman (2001-present) and a Director (2000-present) of FMR Co., Inc. Previously, Mr. Lynch served as a Trustee of the Fidelity funds (1990-2003). In addition, he serves as a Trustee of Boston College, Massachusetts Eye & Ear Infirmary, Historic Deerfield, John F. Kennedy Library, and the Museum of Fine Arts of Boston. |
Bart A. Grenier (46) |
| Year of Election or Appointment: 2003 Vice President of Advisor Freedom Income, Advisor Freedom 2005, Advisor Freedom 2010, Advisor Freedom 2015, Advisor Freedom 2020, Advisor Freedom 2025, Advisor Freedom 2030, Advisor Freedom 2035, and Advisor Freedom 2040. Mr. Grenier also serves as Vice President of certain Equity Funds (2001), a position he previously held from 1999 to 2000, and Vice President of certain High Income Funds (2002). He is Senior Vice President of FMR (1999) and FMR Co., Inc. (2001), and President and Director of Strategic Advisers, Inc. (2002). He also heads Fidelity's Asset Allocation Group (2000), Fidelity's Growth and Income Group (2001), Fidelity's Value Group (2001), and Fidelity's High Income Division (2001). Previously, Mr. Grenier served as President of Fidelity Ventures (2000), Vice President of certain High Income Funds (1997-2000), High Income Division Head (1997-2000), Group Leader of the Income-Growth and Asset Allocation-Income Groups (1996-2000), and Assistant Equity Division Head (1997-2000). |
Ren Y. Cheng (48) |
| Year of Election or Appointment: 2003 Vice President of Advisor Freedom Income, Advisor Freedom 2005, Advisor Freedom 2010, Advisor Freedom 2015, Advisor Freedom 2020, Advisor Freedom 2025, Advisor Freedom 2030, Advisor Freedom 2035, and Advisor Freedom 2040. Mr. Cheng also serves as Vice President of other funds advised by Strategic Advisers Inc., including the Fidelity Freedom Funds. Prior to assuming his current responsibilities, Mr. Cheng managed a variety of Fidelity funds. Mr. Cheng also serves as Vice President of FMR (2002), FMR Co., Inc. (2002) and Strategic Advisors, Inc. (2003). |
Eric D. Roiter (56) |
| Year of Election or Appointment: 2003 Secretary of Advisor Freedom Income, Advisor Freedom 2005, Advisor Freedom 2010, Advisor Freedom 2015, Advisor Freedom 2020, Advisor Freedom 2025, Advisor Freedom 2030, Advisor Freedom 2035, and Advisor Freedom 2040. He also serves as Secretary of other Fidelity funds; Vice President, General Counsel, and Secretary of FMR Co., Inc. (2001-present) and FMR; Assistant Secretary of Fidelity Management & Research (U.K.) Inc. (2001-present), Fidelity Management & Research (Far East) Inc. (2001-present), and Fidelity Investments Money Management, Inc. (2001-present). Mr. Roiter is an Adjunct Member, Faculty of Law, at Boston College Law School (2003-present). Previously. Mr. Roiter served as Vice President and Secretary of Fidelity Distributors Corporation (FDC) (1998-2005). |
Stuart Fross (45) |
| Year of Election or Appointment: 2003 Assistant Secretary of Advisor Freedom Income, Advisor Freedom 2005, Advisor Freedom 2010, Advisor Freedom 2015, Advisor Freedom 2020, Advisor Freedom 2025, Advisor Freedom 2030, Advisor Freedom 2035, and Advisor Freedom 2040. Mr. Fross also serves as Assistant Secretary of other Fidelity funds (2003-present), Vice President and Secretary of FDC (2005-present), and is an employee of FMR. |
Christine Reynolds (46) |
| Year of Election or Appointment: 2004 President, Treasurer, and Anti-Money Laundering (AML) officer of Advisor Freedom Income, Advisor Freedom 2005, Advisor Freedom 2010, Advisor Freedom 2015, Advisor Freedom 2020, Advisor Freedom 2025, Advisor Freedom 2030, Advisor Freedom 2035, and Advisor Freedom 2040. Ms. Reynolds also serves as President, Treasurer, and AML officer of other Fidelity funds (2004) and is a Vice President (2003) and an employee (2002) of FMR. Before joining Fidelity Investments, Ms. Reynolds worked at PricewaterhouseCoopers LLP (PwC) (1980-2002), where she was most recently an audit partner with PwC's investment management practice. |
Timothy F. Hayes (54) |
| Year of Election or Appointment: 2003 Chief Financial Officer of Advisor Freedom Income, Advisor Freedom 2005, Advisor Freedom 2010, Advisor Freedom 2015, Advisor Freedom 2020, Advisor Freedom 2025, Advisor Freedom 2030, Advisor Freedom 2035, and Advisor Freedom 2040. Mr. Hayes also serves as Chief Financial Officer of other Fidelity funds (2002). Recently he was appointed President of Fidelity Service Company (2003) where he also serves as a Director. Mr. Hayes also serves as President of Fidelity Investments Operations Group (FIOG, 2002), which includes Fidelity Pricing and Cash Management Services Group (FPCMS), where he was appointed President in 1998. Previously, Mr. Hayes served as Chief Financial Officer of Fidelity Investments Corporate Systems and Service Group (1998) and Fidelity Systems Company (1997-1998). |
Kenneth A. Rathgeber (57) |
| Year of Election or Appointment: 2004 Chief Compliance Officer of Advisor Freedom Income, Advisor Freedom 2005, Advisor Freedom 2010, Advisor Freedom 2015, Advisor Freedom 2020, Advisor Freedom 2025, Advisor Freedom 2030, Advisor Freedom 2035, and Advisor Freedom 2040. Mr. Rathgeber also serves as Chief Compliance Officer of other Fidelity funds (2004) and Executive Vice President of Risk Oversight for Fidelity Investments (2002). Previously, he served as Executive Vice President and Chief Operating Officer for Fidelity Investments Institutional Services Company, Inc. (1998-2002). |
John R. Hebble (46) |
| Year of Election or Appointment: 2003 Deputy Treasurer of Advisor Freedom Income, Advisor Freedom 2005, Advisor Freedom 2010, Advisor Freedom 2015, Advisor Freedom 2020, Advisor Freedom 2025, Advisor Freedom 2030, Advisor Freedom 2035, and Advisor Freedom 2040. Mr. Hebble also serves as Deputy Treasurer of other Fidelity funds (2003), and is an employee of FMR. Before joining Fidelity Investments, Mr. Hebble worked at Deutsche Asset Management where he served as Director of Fund Accounting (2002-2003) and Assistant Treasurer of the Scudder Funds (1998-2003). |
Bryan A. Mehrmann (43) |
| Year of Election or Appointment: 2005 Deputy Treasurer of Advisor Freedom Income, Advisor Freedom 2005, Advisor Freedom 2010, Advisor Freedom 2015, Advisor Freedom 2020, Advisor Freedom 2025, Advisor Freedom 2030, Advisor Freedom 2035, and Advisor Freedom 2040. Mr. Mehrmann also serves as Deputy Treasurer of other Fidelity funds (2005-present) and is an employee of FMR. Previously, Mr. Mehrmann served as Vice President of Fidelity Investments Institutional Services Group (FIIS)/Fidelity Investments Institutional Operations Corporation, Inc. (FIIOC) Client Services (1998-2004). |
Kimberley H. Monasterio (41) |
| Year of Election or Appointment: 2004 Deputy Treasurer of Advisor Freedom Income, Advisor Freedom 2005, Advisor Freedom 2010, Advisor Freedom 2015, Advisor Freedom 2020, Advisor Freedom 2025, Advisor Freedom 2030, Advisor Freedom 2035, and Advisor Freedom 2040. Ms. Monasterio also serves as Deputy Treasurer of other Fidelity funds (2004) and is an employee of FMR (2004). Before joining Fidelity Investments, Ms. Monasterio served as Treasurer (2000-2004) and Chief Financial Officer (2002-2004) of the Franklin Templeton Funds and Senior Vice President of Franklin Templeton Services, LLC (2000-2004). |
Kenneth B. Robins (35) |
| Year of Election or Appointment: 2005 Deputy Treasurer of Advisor Freedom Income, Advisor Freedom 2005, Advisor Freedom 2010, Advisor Freedom 2015, Advisor Freedom 2020, Advisor Freedom 2025, Advisor Freedom 2030, Advisor Freedom 2035, and Advisor Freedom 2040. Mr. Robins also serves as Deputy Treasurer of other Fidelity funds (2005-present) and is an employee of FMR (2004-present). Before joining Fidelity Investments, Mr. Robins worked at KPMG LLP, where he was a partner in KPMG's department of professional practice (2002-2004) and a Senior Manager (1999-2000). In addition, Mr. Robins served as Assistant Chief Accountant, United States Securities and Exchange Commission (2000-2002). |
John H. Costello (58) |
| Year of Election or Appointment: 2003 Assistant Treasurer of Advisor Freedom Income, Advisor Freedom 2005, Advisor Freedom 2010, Advisor Freedom 2015, Advisor Freedom 2020, Advisor Freedom 2025, Advisor Freedom 2030, Advisor Freedom 2035, and Advisor Freedom 2040. Mr. Costello also serves as Assistant Treasurer of other Fidelity funds and is an employee of FMR. |
Peter L. Lydecker (51) |
| Year of Election or Appointment: 2004 Assistant Treasurer of Advisor Freedom Income, Advisor Freedom 2005, Advisor Freedom 2010, Advisor Freedom 2015, Advisor Freedom 2020, Advisor Freedom 2025, Advisor Freedom 2030, Advisor Freedom 2035, and Advisor Freedom 2040. Mr. Lydecker also serves as Assistant Treasurer of other Fidelity funds (2004) and is an employee of FMR. |
Mark Osterheld (49) |
| Year of Election or Appointment: 2003 Assistant Treasurer of Advisor Freedom Income, Advisor Freedom 2005, Advisor Freedom 2010, Advisor Freedom 2015, Advisor Freedom 2020, Advisor Freedom 2025, Advisor Freedom 2030, Advisor Freedom 2035, and Advisor Freedom 2040. Mr. Osterheld also serves as Assistant Treasurer of other Fidelity funds (2002) and is an employee of FMR. |
Annual Report
Distributions
The Board of Trustees of each fund voted to pay to shareholders of record at the opening of business on record date, the following distributions per share derived from capital gains realized from sales of portfolio securities, and dividends derived from net investment income:
Advisor Freedom Income | Pay Date | Record Date | Dividends | Capital Gains |
Class A | 05/09/05 | 05/06/05 | $.009 | $.035 |
Class T | 05/09/05 | 05/06/05 | $.007 | $.035 |
Class B | 05/09/05 | 05/06/05 | $.002 | $.035 |
Class C | 05/09/05 | 05/06/05 | $.002 | $.035 |
Advisor Freedom 2005 | Pay Date | Record Date | Dividends | Capital Gains |
Class A | 05/09/05 | 05/06/05 | $.02 | $.03 |
Class T | 05/09/05 | 05/06/05 | $.019 | $.03 |
Class B | 05/09/05 | 05/06/05 | $.002 | $.03 |
Class C | 05/09/05 | 05/06/05 | $.002 | $.03 |
Advisor Freedom 2010 | Pay Date | Record Date | Dividends | Capital Gains |
Class A | 05/09/05 | 05/06/05 | $.03 | $.045 |
Class T | 05/09/05 | 05/06/05 | $.023 | $.045 |
Class B | 05/09/05 | 05/06/05 | $.011 | $.045 |
Class C | 05/09/05 | 05/06/05 | $.011 | $.045 |
Advisor Freedom 2015 | Pay Date | Record Date | Dividends | Capital Gains |
Class A | 05/09/05 | 05/06/05 | $.016 | $.04 |
Class T | 05/09/05 | 05/06/05 | $.011 | $.04 |
Class B | 05/09/05 | 05/06/05 | - | $.04 |
Class C | 05/09/05 | 05/06/05 | - | $.04 |
Advisor Freedom 2020 | Pay Date | Record Date | Dividends | Capital Gains |
Class A | 05/09/05 | 05/06/05 | $.014 | $.055 |
Class T | 05/09/05 | 05/06/05 | $.008 | $.055 |
Class B | 05/09/05 | 05/06/05 | - | $.049 |
Class C | 05/09/05 | 05/06/05 | - | $.051 |
Advisor Freedom 2025 | Pay Date | Record Date | Dividends | Capital Gains |
Class A | 05/16/05 | 05/13/05 | $.004 | $.03 |
Class T | 05/16/05 | 05/13/05 | - | $.026 |
Class B | 05/16/05 | 05/13/05 | - | $.02 |
Class C | 05/16/05 | 05/13/05 | - | $.02 |
Advisor Freedom 2030 | Pay Date | Record Date | Dividends | Capital Gains |
Class A | 05/16/05 | 05/13/05 | - | $.054 |
Class T | 05/16/05 | 05/13/05 | - | $.047 |
Class B | 05/16/05 | 05/13/05 | - | $.04 |
Class C | 05/16/05 | 05/13/05 | - | $.04 |
Advisor Freedom 2035 | Pay Date | Record Date | Dividends | Capital Gains |
Class A | 05/16/05 | 05/13/05 | - | $.02 |
Class T | 05/16/05 | 05/13/05 | - | $.02 |
Class B | 05/16/05 | 05/13/05 | - | $.02 |
Class C | 05/16/05 | 05/13/05 | - | $.02 |
Advisor Freedom 2040 | Pay Date | Record Date | Dividends | Capital Gains |
Class A | 05/16/05 | 05/13/05 | - | $.036 |
Class T | 05/16/05 | 05/13/05 | - | $.03 |
Class B | 05/16/05 | 05/13/05 | - | $.03 |
Class C | 05/16/05 | 05/13/05 | - | $.03 |
Annual Report
The funds hereby designate as capital gain dividends the amounts noted below for the taxable year indicated or for dividends for the taxable year ended 2005, if subsequently determined to be different, the net capital gain of such year; and for dividends for the taxable year ended 2004, if subsequently determined to be different, the excess of: (a) the net capital gain of such year, over (b) amounts previously designated as capital gain dividends with respect to such year.
Fund | 2005 | 2004 |
Advisor Freedom Income | 131,393 | 35,147 |
Advisor Freedom 2005 | 46,126 | 3,194 |
Advisor Freedom 2010 | 744,259 | 17,590 |
Advisor Freedom 2015 | 450,993 | 5,169 |
Advisor Freedom 2020 | 1,569,597 | 62,696 |
Advisor Freedom 2025 | 244,701 | 394 |
Advisor Freedom 2030 | 805,486 | 12,872 |
Advisor Freedom 2035 | 97,237 | 421 |
Advisor Freedom 2040 | 400,970 | - |
A percentage of the dividends distributed during the fiscal year for the following funds was derived from interest on U.S. Government securities which is generally exempt from state income tax:
Fund | Class A | Class T | Class B | Class C |
Advisor Freedom Income | 12.23% | 12.23% | 12.23% | 12.23% |
Advisor Freedom 2005 | 8.43% | 8.43% | 8.43% | 8.43% |
Advisor Freedom 2010 | 9.02% | 9.02% | 9.02% | 9.02% |
Advisor Freedom 2015 | 5.55% | 5.55% | 5.55% | 5.55% |
Advisor Freedom 2020 | 5.17% | 5.17% | 5.17% | 5.17% |
A percentage of the dividends distributed during the fiscal year for the following funds qualifies for the dividends-received deduction for corporate shareholders:
Fund | Class A | Class T | Class B | Class C |
Advisor Freedom Income | | | | |
May 2004 | 13% | 18% | 22% | 22% |
June 2004 | 13% | 18% | 22% | 22% |
July 2004 | 13% | 18% | 22% | 22% |
August 2004 | 13% | 18% | 22% | 22% |
September 2004 | 13% | 18% | 22% | 22% |
October 2004 | 13% | 18% | 22% | 22% |
November 2004 | 13% | 18% | 22% | 22% |
December 2004 (ex date 12/03) | 13% | 18% | 22% | 22% |
December 2004 (ex date 12/29) | 13% | 18% | 22% | 22% |
February 2005 | 5% | 7% | 9% | 10% |
March 2005 | 5% | 7% | 9% | 10% |
Advisor Freedom 2005 | | | | |
May 2004 | 5% | 5% | 9% | 9% |
December 2004 | 24% | 28% | 36% | 33% |
Advisor Freedom 2010 | | | | |
May 2004 | 4% | 5% | 8% | 7% |
December 2004 | 25% | 24% | 38% | 34% |
Advisor Freedom 2015 | | | | |
May 2004 | 8% | 13% | 29% | - |
December 2004 | 35% | 38% | 50% | 49% |
Fund | Class A | Class T | Class B | Class C |
Advisor Freedom 2020 | | | | |
May 2004 | 10% | 10% | 26% | 25% |
December 2004 | 36% | 41% | 53% | 53% |
Advisor Freedom 2025 | | | | |
May 2004 | 13% | 15% | 100% | - |
December 2004 | 45% | 50% | 72% | 72% |
Advisor Freedom 2030 | | | | |
May 2004 | 20% | 28% | - | - |
December 2004 | 49% | 52% | 76% | 76% |
Advisor Freedom 2035 | | | | |
May 2004 | 21% | 31% | - | - |
December 2004 | 41% | 43% | 57% | 55% |
Advisor Freedom 2040 | | | | |
May 2004 | 28% | 25% | - | - |
December 2004 | 50% | 56% | 74% | 76% |
A percentage of the dividends distributed during the fiscal year for the following funds may be taken into account as a dividend for purposes of the maximum rate under section 1(h)(11) of the Internal Revenue Code.
Fund | Class A | Class T | Class B | Class C |
Advisor Freedom Income | | | | |
May 2004 | 18% | 18% | 18% | 18% |
June 2004 | 18% | 18% | 18% | 18% |
July 2004 | 18% | 18% | 18% | 18% |
August 2004 | 18% | 18% | 18% | 18% |
September 2004 | 18% | 18% | 18% | 18% |
October 2004 | 18% | 18% | 18% | 18% |
November 2004 | 18% | 18% | 18% | 18% |
December 2004 (ex date 12/03) | 18% | 18% | 18% | 18% |
December 2004 (ex date 12/29) | 18% | 18% | 18% | 18% |
February 2005 | 10% | 10% | 10% | 10% |
March 2005 | 10% | 10% | 10% | 10% |
Advisor Freedom 2005 | | | | |
May 2004 | 5% | 6% | 9% | 9% |
December 2004 | 27% | 31% | 40% | 36% |
Advisor Freedom 2010 | | | | |
May 2004 | 5% | 6% | 9% | 9% |
December 2004 | 27% | 29% | 40% | 36% |
Advisor Freedom 2015 | | | | |
May 2004 | 9% | 11% | 41% | - |
December 2004 | 39% | 42% | 56% | 56% |
Advisor Freedom 2020 | | | | |
May 2004 | 11% | 13% | 28% | 28% |
December 2004 | 41% | 47% | 60% | 60% |
Advisor Freedom 2025 | | | | |
May 2004 | 14% | 16% | 100% | - |
December 2004 | 52% | 57% | 81% | 81% |
Advisor Freedom 2030 | | | | |
May 2004 | 23% | 31% | - | - |
December 2004 | 55% | 60% | 86% | 86% |
Fund | Class A | Class T | Class B | Class C |
Advisor Freedom 2035 | | | | |
May 2004 | 23% | 34% | - | - |
December 2004 | 48% | 51% | 66% | 66% |
Advisor Freedom 2040 | | | | |
May 2004 | 31% | 82% | - | - |
December 2004 | 57% | 66% | 85% | 85% |
The funds will notify shareholders in January 2006 of amounts for use in preparing 2005 income tax returns.
Annual Report
Annual Report
Annual Report
Investment Adviser
Strategic Advisers, Inc.
Boston, MA
General Distributor
Fidelity Distributors Corporation
Boston, MA
Transfer Agent
Fidelity Investments Institutional Operations Company, Inc.
Boston, MA
Shareholder Servicing Agent
Fidelity Service Company, Inc.
Boston, MA
Custodian
The Bank of New York
New York, NY
(Fidelity Investment logo)(registered trademark)
AFF-UANN-0505
1.792134.101
Fidelity Advisor Freedom Funds®-
Income, 2005, 2010, 2015, 2020, 2025, 2030, 2035, 2040 - Institutional Class
Annual Report
March 31, 2005
(2_fidelity_logos) (Registered_Trademark)
Contents
To view a fund's proxy voting guidelines and proxy voting record for the 12-month period ended June 30, visit www.fidelity.com/proxyvotingresults or visit the Securities and Exchange Commission's (SEC) web site at www.sec.gov. You may also call 1-877-208-0098 to request a free copy of the proxy voting guidelines.
Standard & Poor's, S&P and S&P 500 are registered service marks of The McGraw-Hill Companies, Inc. and have been licensed for use by Fidelity Distributors Corporation.
Other third party marks appearing herein are the property of their respective owners.
All other marks appearing herein are registered or unregistered trademarks or service marks of FMR Corp. or an affiliated company.
This report and the financial statements contained herein are submitted for the general information of the shareholders of the funds. This report is not authorized for distribution to prospective investors in the fund unless preceded or accompanied by an effective prospectus.
A fund files its complete schedule of portfolio holdings with the SEC for the first and third quarters of each fiscal year on Form N-Q. Forms N-Q are available on the SEC's web site at http://www.sec.gov. A fund's Forms N-Q may be reviewed and copied at the SEC's Public Reference Room in Washington, DC. Information regarding the operation of the SEC's Public Reference Room may be obtained by calling 1-800-SEC-0330. For a complete list of a fund's portfolio holdings, view the most recent quarterly holdings report, semiannual report, or annual report on Fidelity's web site at http://www.advisor.fidelity.com.
NOT FDIC INSURED · MAY LOSE VALUE · NO BANK GUARANTEE
Neither the funds nor Fidelity Distributors Corporation is a bank.
Annual Report
Chairman's Message
(Photograph of Edward C. Johnson 3d.)
Dear Shareholder:
During the past year or so, much has been reported about the mutual fund industry, and much of it has been more critical than I believe is warranted. Allegations that some companies have been less than forthright with their shareholders have cast a shadow on the entire industry. I continue to find these reports disturbing, and assert that they do not create an accurate picture of the industry overall. Therefore, I would like to remind everyone where Fidelity stands on these issues. I will say two things specifically regarding allegations that some mutual fund companies were in violation of the Securities and Exchange Commission's forward pricing rules or were involved in so-called "market timing" activities.
First, Fidelity has no agreements that permit customers who buy fund shares after 4 p.m. to obtain the 4 p.m. price. This is not a new policy. This is not to say that someone could not deceive the company through fraudulent acts. However, we are extremely diligent in preventing fraud from occurring in this manner - and in every other. But I underscore again that Fidelity has no so-called "agreements" that sanction illegal practices.
Second, Fidelity continues to stand on record, as we have for years, in opposition to predatory short-term trading that adversely affects shareholders in a mutual fund. Back in the 1980s, we initiated a fee - which is returned to the fund and, therefore, to investors - to discourage this activity. Further, we took the lead several years ago in developing a Fair Value Pricing Policy to prevent market timing on foreign securities in our funds. I am confident we will find other ways to make it more difficult for predatory traders to operate. However, this will only be achieved through close cooperation among regulators, legislators and the industry.
Yes, there have been unfortunate instances of unethical and illegal activity within the mutual fund industry from time to time. That is true of any industry. When this occurs, confessed or convicted offenders should be dealt with appropriately. But we are still concerned about the risk of over-regulation and the quick application of simplistic solutions to intricate problems. Every system can be improved, and we support and applaud well thought out improvements by regulators, legislators and industry representatives that achieve the common goal of building and protecting the value of investors' holdings.
For nearly 60 years, Fidelity has worked very hard to improve its products and service to justify your trust. When our family founded this company in 1946, we had only a few hundred customers. Today, we serve more than 18 million customers including individual investors and participants in retirement plans across America.
Let me close by saying that we do not take your trust in us for granted, and we realize that we must always work to improve all aspects of our service to you. In turn, we urge you to continue your active participation with your financial matters, so that your interests can be well served.
Best regards,
/s/Edward C. Johnson 3d
Edward C. Johnson 3d
Annual Report
Fidelity Advisor Freedom Income Fund® - Institutional Class
Performance: The Bottom Line
Average annual total return reflects the change in the value of an investment, assuming reinvestment of the class' dividend income and capital gains (the profits earned upon the sale of securities that have grown in value) and assuming a constant rate of performance each year. The $10,000 table and the class's returns do not reflect the deduction of taxes that a shareholder would pay on fund distributions or the redemption of fund shares. During periods of reimbursement by Fidelity, a fund's total return will be greater than it would be had the reimbursement not occurred. How a fund did yesterday is no guarantee of how it will do tomorrow.
Average Annual Total Returns
Periods ended March 31, 2005 | | Past 1
year | Life of
fund A |
Institutional Class | | 1.21% | 3.76% |
A From July 24, 2003.
$10,000 Over Life of Fund
Let's say hypothetically that $10,000 was invested in Fidelity Advisor Freedom Income - Institutional Class on July 24, 2003, when the fund started. The chart shows how the value of your investment would have changed, and also shows how the Lehman Brothers® Aggregate Bond Index performed over the same period.
Annual Report
Fidelity Advisor Freedom 2005 Fund ® - Institutional Class
Performance: The Bottom Line
Average annual total return reflects the change in the value of an investment, assuming reinvestment of the fund's dividend income and capital gains (the profits earned upon the sale of securities that have grown in value) and assuming a constant rate of performance each year. The $10,000 table and the class's returns do not reflect the deduction of taxes that a shareholder would pay on fund distributions or the redemption of fund shares. During periods of reimbursement by Fidelity, a fund's total return will be greater than it would be had the reimbursement not occurred. How a fund did yesterday is no guarantee of how it will do tomorrow.
Average Annual Total Returns
Periods ended March 31, 2005 | Past 1
year | Life of
fund A |
Institutional Class | 2.79% | 5.97% |
A From November 6, 2003.
$10,000 Over Life of Fund
Let's say hypothetically that $10,000 was invested in Fidelity Advisor Freedom 2005 - Institutional Class on November 6, 2003, when the fund started. The chart shows how the value of your investment would have changed, and also shows how the Lehman Brothers Aggregate Bond Index performed over the same period.

Annual Report
Fidelity Advisor Freedom 2010 Fund ® - Institutional Class
Performance: The Bottom Line
Average annual total return reflects the change in the value of an investment, assuming reinvestment of the class' dividend income and capital gains (the profits earned upon the sale of securities that have grown in value) and assuming a constant rate of performance each year. The $10,000 table and the class's returns do not reflect the deduction of taxes that a shareholder would pay on fund distributions or the redemption of fund shares. During periods of reimbursement by Fidelity, a fund's total return will be greater than it would be had the reimbursement not occurred. How a fund did yesterday is no guarantee of how it will do tomorrow.
Average Annual Total Returns
Periods ended March 31, 2005 | Past 1
year | Life of
fund A |
Institutional Class | 2.80% | 7.57% |
A From July 24, 2003.
$10,000 Over Life of Fund
Let's say hypothetically that $10,000 was invested in Fidelity Advisor Freedom 2010 - Institutional Class on July 31, 2003, shortly after the fund started. The chart shows how the value of your investment would have changed, and also shows how the Standard & Poor's 500SM Index and the Lehman Brothers Aggregate Bond Index(dagger) performed over the same period.

* Going forward the Fidelity Advisor Freedom 2010 Fund will use the Lehman Brothers Aggregate Bond Index, rather than the S&P 500 Index, as its SEC benchmark.
The Lehman Brothers Aggregate Bond Index more closely represents the fund's investment strategy as fixed-income and short-term funds currently represent the majority of the fund's assets.
Annual Report
Fidelity Advisor Freedom 2015 Fund ® - Institutional Class
Performance: The Bottom Line
Average annual total return reflects the change in the value of an investment, assuming reinvestment of the fund's dividend income and capital gains (the profits earned upon the sale of securities that have grown in value) and assuming a constant rate of performance each year. The $10,000 table and the class's returns do not reflect the deduction of taxes that a shareholder would pay on fund distributions or the redemption of fund shares. During periods of reimbursement by Fidelity, a fund's total return will be greater than it would be had the reimbursement not occurred. How a fund did yesterday is no guarantee of how it will do tomorrow.
Average Annual Total Returns
Periods ended March 31, 2005 | Past 1
year | Life of
fund A |
Institutional Class | 3.52% | 7.23% |
A From November 6, 2003.
$10,000 Over Life of Fund
Let's say hypothetically that $10,000 was invested in Fidelity Advisor Freedom 2015 - Institutional Class on November 6, 2003, when the fund started. The chart shows how the value of your investment would have changed, and also shows how the Standard & Poor's 500 Index performed over the same period.
Annual Report
Fidelity Advisor Freedom 2020 Fund ® - Institutional Class
Performance: The Bottom Line
Average annual total return reflects the change in the value of an investment, assuming reinvestment of the class' dividend income and capital gains (the profits earned upon the sale of securities that have grown in value) and assuming a constant rate of performance each year. The $10,000 table and the class's returns do not reflect the deduction of taxes that a shareholder would pay on fund distributions or the redemption of fund shares. During periods of reimbursement by Fidelity, a fund's total return will be greater than it would be had the reimbursement not occurred. How a fund did yesterday is no guarantee of how it will do tomorrow.
Average Annual Total Returns
Periods ended March 31, 2005 | | Past 1
year | Life of
fund A |
Institutional Class | | 4.06% | 10.67% |
A From July 24, 2003.
$10,000 Over Life of Fund
Let's say hypothetically that $10,000 was invested in Fidelity Advisor Freedom 2020 - Institutional Class on July 24, 2003, when the fund started. The chart shows how the value of your investment would have changed, and also shows how the Standard & Poor's 500 Index performed over the same period.
Annual Report
Fidelity Advisor Freedom 2025 Fund ® - Institutional Class
Performance: The Bottom Line
Average annual total return reflects the change in the value of an investment, assuming reinvestment of the fund's dividend income and capital gains (the profits earned upon the sale of securities that have grown in value) and assuming a constant rate of performance each year. The $10,000 table and the class's returns do not reflect the deduction of taxes that a shareholder would pay on fund distributions or the redemption of fund shares. During periods of reimbursement by Fidelity, a fund's total return will be greater than it would be had the reimbursement not occurred. How a fund did yesterday is no guarantee of how it will do tomorrow.
Average Annual Total Returns
Periods ended March 31, 2005 | Past 1
year | Life of
fund A |
Institutional Class | 4.25% | 8.42% |
A From November 6, 2003.
$10,000 Over Life of Fund
Let's say hypothetically that $10,000 was invested in Fidelity Advisor Freedom 2025 - Institutional Class on November 6, 2003, when the fund started. The chart shows how the value of your investment would have changed, and also shows how the Standard & Poor's 500 Index performed over the same period.
Annual Report
Fidelity Advisor Freedom 2030 Fund ® - Institutional Class
Performance: The Bottom Line
Average annual total return reflects the change in the value of an investment, assuming reinvestment of the class' dividend income and capital gains (the profits earned upon the sale of securities that have grown in value) and assuming a constant rate of performance each year. The $10,000 table and the class's returns do not reflect the deduction of taxes that a shareholder would pay on fund distributions or the redemption of fund shares. During periods of reimbursement by Fidelity, a fund's total return will be greater than it would be had the reimbursement not occurred. How a fund did yesterday is no guarantee of how it will do tomorrow.
Average Annual Total Returns
Periods ended March 31, 2005 | | Past 1
year | Life of
fund A |
Institutional Class | | 4.50% | 11.98% |
A From July 24, 2003.
$10,000 Over Life of Fund
Let's say hypothetically that $10,000 was invested in Fidelity Advisor Freedom 2030 - Institutional Class on July 24, 2003, when the fund started. The chart shows how the value of your investment would have changed, and also shows how the Standard & Poor's 500 Index performed over the same period.
Annual Report
Fidelity Advisor Freedom 2035 Fund ® - Institutional Class
Performance: The Bottom Line
Average annual total return reflects the change in the value of an investment, assuming reinvestment of the fund's dividend income and capital gains (the profits earned upon the sale of securities that have grown in value) and assuming a constant rate of performance each year. The $10,000 table and the class's returns do not reflect the deduction of taxes that a shareholder would pay on fund distributions or the redemption of fund shares. During periods of reimbursement by Fidelity, a fund's total return will be greater than it would be had the reimbursement not occurred. How a fund did yesterday is no guarantee of how it will do tomorrow.
Average Annual Total Returns
Periods ended March 31, 2005 | Past 1
year | Life of
fund A |
Institutional Class | 4.87% | 9.29% |
A From November 6, 2003.
$10,000 Over Life of Fund
Let's say hypothetically that $10,000 was invested in Fidelity Advisor Freedom 2035 - Institutional Class on November 6, 2003, when the fund started. The chart shows how the value of your investment would have changed, and also shows how the Standard & Poor's 500 Index performed over the same period.
Annual Report
Fidelity Advisor Freedom 2040 Fund® - Institutional Class
Performance: The Bottom Line
Average annual total return reflects the change in the value of an investment, assuming reinvestment of the class' dividend income and capital gains (the profits earned upon the sale of securities that have grown in value) and assuming a constant rate of performance each year. The $10,000 table and the class's returns do not reflect the deduction of taxes that a shareholder would pay on fund distributions or the redemption of fund shares. During periods of reimbursement by Fidelity, a fund's total return will be greater than it would be had the reimbursement not occurred. How a fund did yesterday is no guarantee of how it will do tomorrow.
Average Annual Total Returns
Periods ended March 31, 2005 | | Past 1
year | Life of
fund A |
Institutional Class | | 5.07% | 13.20% |
A From July 24, 2003.
$10,000 Over Life of Fund
Let's say hypothetically that $10,000 was invested in Fidelity Advisor Freedom 2040 - Institutional Class on July 24, 2003, when the fund started. The chart shows how the value of your investment would have changed, and also shows how the Standard & Poor's 500 Index performed over the same period.

Annual Report
Managements' Discussion of Fund Performance
Comments from Ren Cheng and Jonathan Shelon, Co-Portfolio Managers of Fidelity Advisor Freedom Funds®
Major U.S. equity benchmarks posted modest gains for the 12 months ending March 31, 2005. Stocks soared in the final quarter of 2004 in response to falling oil prices, a clear-cut conclusion to the presidential election, and positive economic and employment reports. The late-year surge accounted for nearly all of the 2004 calendar year's positive return. But the markets reversed course in the first quarter of 2005, as oil prices hit a record high of $57 per barrel and gasoline prices surged. Inflation concerns also took a toll, and the Federal Reserve Board hiked short-term interest rates seven times during the period. Despite the turmoil, most bellwether measures of U.S. equity market performance finished the period in the black. The broad-based Dow Jones Wilshire 5000 Composite IndexSM gained 7.19%. By comparison, overseas equity markets fared much better, helped in part by the U.S. dollar's weakness versus major foreign currencies for most of the year. The Morgan Stanley Capital InternationalSM Europe, Australasia, Far East (MSCI® EAFE®) Index, a proxy for the performance of overseas markets, rose 15.22%. Turning to fixed-income results, investment-grade bonds had only slightly positive returns for the year overall, tempered by rising interest rates and inflation concerns. The Lehman Brothers® Aggregate Bond Index returned 1.15%. High-yield bonds were the best-performing debt category, as evidenced by the 6.94% increase in the Merrill Lynch® U.S. High Yield Master II Index, bolstered by improving issuer fundamentals and very low default rates.
The Advisor Freedom Funds generally performed in line with our expectations during the year ending March 31, 2005, delivering a range of absolute returns appropriate for a series of portfolios with different asset allocations. (For specific performance results, please refer to the portfolio performance section of the Shareholder Update.) On a relative basis, the Advisor Freedom Funds trailed their respective benchmarks, due mainly to the Funds not participating in the strength of the domestic and international equity markets at the smaller end of the capitalization spectrum. More specifically, the Funds' underlying large-cap, growth-oriented funds, such as Fidelity® Advisor Large Cap Fund and Fidelity Advisor Equity Growth Fund, underperformed the Wilshire 5000 index. Within fixed income, Fidelity Advisor Intermediate Bond Fund was a notable laggard, while Fidelity Advisor High Income Advantage Fund was a strong outperformer in the high-yield category. In international equities, despite the tail wind of a strong European market and a weak U.S. dollar, our underlying international funds were poor relative performers during the period.
The views expressed in this statement reflect those of the portfolio managers only through the end of the period of the report as stated on the cover and do not necessarily represent the views of Fidelity or any other person in the Fidelity organization. Any such views are subject to change at any time based upon market or other conditions and Fidelity disclaims any responsibility to update such views. These views may not be relied on as investment advice and, because investment decisions for a Fidelity fund are based on numerous factors, may not be relied on as an indication of trading intent on behalf of any Fidelity fund.
Annual Report
Shareholder Expense Example
As a shareholder of a Fund, you incur two types of costs: (1) transaction costs, including sales charges (loads) on purchase payments or redemption proceeds, and (2) ongoing costs, including management fees, distribution and/or service (12b-1) fees and other Fund expenses. This Example is intended to help you understand your ongoing costs (in dollars) of investing in the Funds and to compare these costs with the ongoing costs of investing in other mutual funds.
The Example is based on an investment of $1,000 invested at the beginning of the period and held for the entire period (October 1, 2004 to March 31, 2005).
Actual Expenses
The first line of the table below for each class of each fund provides information about actual account values and actual expenses. You may use the information in this line, together with the amount you invested, to estimate the expenses that you paid over the period. Simply divide your account value by $1,000.00 (for example, an $8,600 account value divided by $1,000.00 = 8.6), then multiply the result by the number in the first line for a class of the fund under the heading entitled "Expenses Paid During Period" to estimate the expenses you paid on your account during this period. In addition, each fund, as a shareholder in underlying Fidelity funds, will indirectly bear its pro rata share of the fees and expenses incurred by the underlying Fidelity funds. These fees and expenses are not included in each fund's annualized expense ratio used to calculate the expense estimates in the table below. If they were, the estimate of expense you paid during the period would be higher, and your ending account value lower.
Hypothetical Example for Comparison Purposes
The second line of the table below for each class of each fund provides information about hypothetical account values and hypothetical expenses based on a Class' actual expense ratio and an assumed rate of return of 5% per year before expenses, which is not the Class' actual return. The hypothetical account values and expenses may not be used to estimate the actual ending account balance or expenses you paid for the period. You may use this information to compare the ongoing costs of investing in the Fund and other funds. To do so, compare this 5% hypothetical example with the 5% hypothetical examples that appear in the shareholder reports of the other funds. In addition, each fund, as a shareholder in underlying Fidelity funds, will indirectly bear its pro rata share of the fees and expenses incurred by the underlying Fidelity funds. These fees and expenses are not included in each fund's annualized expense ratio used to calculate the expense estimates in the table below. If they were, the estimate of expense you paid during the period would be higher, and your ending account value lower.
Please note that the expenses shown in the table are meant to highlight your ongoing costs only and do not reflect any transaction costs. Therefore, the second line of the table is useful in comparing ongoing costs only, and will not help you determine the relative total costs of owning different funds. In addition, if these transactional costs were included, your costs would have been higher.
| Beginning
Account Value
October 1, 2004 | Ending
Account Value
March 31, 2005 | Expenses Paid
During Period*
October 1, 2004
to March 31, 2005 |
Advisor Freedom Income | | | |
Class A | | | |
Actual | $ 1,000.00 | $ 1,013.70 | $ 1.66** |
HypotheticalA | $ 1,000.00 | $ 1,023.29 | $ 1.66** |
Class T | | | |
Actual | $ 1,000.00 | $ 1,013.10 | $ 2.91** |
HypotheticalA | $ 1,000.00 | $ 1,022.04 | $ 2.92** |
Class B | | | |
Actual | $ 1,000.00 | $ 1,011.20 | $ 5.42** |
HypotheticalA | $ 1,000.00 | $ 1,019.55 | $ 5.44** |
Class C | | | |
Actual | $ 1,000.00 | $ 1,010.20 | $ 5.41** |
HypotheticalA | $ 1,000.00 | $ 1,019.55 | $ 5.44** |
Institutional Class | | | |
Actual | $ 1,000.00 | $ 1,015.60 | $ .40** |
HypotheticalA | $ 1,000.00 | $ 1,024.53 | $ .40** |
Advisor Freedom 2005 | | | |
Class A | | | |
Actual | $ 1,000.00 | $ 1,035.50 | $ 1.67** |
HypotheticalA | $ 1,000.00 | $ 1,023.29 | $ 1.66** |
Class T | | | |
Actual | $ 1,000.00 | $ 1,034.70 | $ 2.94** |
HypotheticalA | $ 1,000.00 | $ 1,022.04 | $ 2.92** |
Class B | | | |
Actual | $ 1,000.00 | $ 1,031.90 | $ 5.47** |
HypotheticalA | $ 1,000.00 | $ 1,019.55 | $ 5.44** |
| Beginning
Account Value
October 1, 2004 | Ending
Account Value
March 31, 2005 | Expenses Paid
During Period*
October 1, 2004
to March 31, 2005 |
Class C | | | |
Actual | $ 1,000.00 | $ 1,032.80 | $ 5.47** |
HypotheticalA | $ 1,000.00 | $ 1,019.55 | $ 5.44** |
Institutional Class | | | |
Actual | $ 1,000.00 | $ 1,037.40 | $ .41** |
HypotheticalA | $ 1,000.00 | $ 1,024.53 | $ .40** |
Advisor Freedom 2010 | | | |
Class A | | | |
Actual | $ 1,000.00 | $ 1,037.00 | $ 1.68** |
HypotheticalA | $ 1,000.00 | $ 1,023.29 | $ 1.66** |
Class T | | | |
Actual | $ 1,000.00 | $ 1,035.20 | $ 2.94** |
HypotheticalA | $ 1,000.00 | $ 1,022.04 | $ 2.92** |
Class B | | | |
Actual | $ 1,000.00 | $ 1,032.60 | $ 5.47** |
HypotheticalA | $ 1,000.00 | $ 1,019.55 | $ 5.44** |
Class C | | | |
Actual | $ 1,000.00 | $ 1,032.60 | $ 5.47** |
HypotheticalA | $ 1,000.00 | $ 1,019.55 | $ 5.44** |
Institutional Class | | | |
Actual | $ 1,000.00 | $ 1,037.80 | $ .41** |
HypotheticalA | $ 1,000.00 | $ 1,024.53 | $ .40** |
Advisor Freedom 2015 | | | |
Class A | | | |
Actual | $ 1,000.00 | $ 1,048.90 | $ 1.69** |
HypotheticalA | $ 1,000.00 | $ 1,023.29 | $ 1.66** |
Class T | | | |
Actual | $ 1,000.00 | $ 1,048.00 | $ 2.96** |
HypotheticalA | $ 1,000.00 | $ 1,022.04 | $ 2.92** |
Class B | | | |
Actual | $ 1,000.00 | $ 1,045.30 | $ 5.51** |
HypotheticalA | $ 1,000.00 | $ 1,019.55 | $ 5.44** |
Class C | | | |
Actual | $ 1,000.00 | $ 1,045.30 | $ 5.51** |
HypotheticalA | $ 1,000.00 | $ 1,019.55 | $ 5.44** |
Institutional Class | | | |
Actual | $ 1,000.00 | $ 1,050.60 | $ .41** |
HypotheticalA | $ 1,000.00 | $ 1,024.53 | $ .40** |
Advisor Freedom 2020 | | | |
Class A | | | |
Actual | $ 1,000.00 | $ 1,056.70 | $ 1.69** |
HypotheticalA | $ 1,000.00 | $ 1,023.29 | $ 1.66** |
Class T | | | |
Actual | $ 1,000.00 | $ 1,055.90 | $ 2.97** |
HypotheticalA | $ 1,000.00 | $ 1,022.04 | $ 2.92** |
Class B | | | |
Actual | $ 1,000.00 | $ 1,053.40 | $ 5.53** |
HypotheticalA | $ 1,000.00 | $ 1,019.55 | $ 5.44** |
Class C | | | |
Actual | $ 1,000.00 | $ 1,053.40 | $ 5.53** |
HypotheticalA | $ 1,000.00 | $ 1,019.55 | $ 5.44** |
Institutional Class | | | |
Actual | $ 1,000.00 | $ 1,058.30 | $ .41** |
HypotheticalA | $ 1,000.00 | $ 1,024.53 | $ .40** |
Advisor Freedom 2025 | | | |
Class A | | | |
Actual | $ 1,000.00 | $ 1,062.60 | $ 1.70** |
HypotheticalA | $ 1,000.00 | $ 1,023.29 | $ 1.66** |
| Beginning
Account Value
October 1, 2004 | Ending
Account Value
March 31, 2005 | Expenses Paid
During Period*
October 1, 2004
to March 31, 2005 |
Class T | | | |
Actual | $ 1,000.00 | $ 1,061.50 | $ 2.98** |
HypotheticalA | $ 1,000.00 | $ 1,022.04 | $ 2.92** |
Class B | | | |
Actual | $ 1,000.00 | $ 1,058.60 | $ 5.54** |
HypotheticalA | $ 1,000.00 | $ 1,019.55 | $ 5.44** |
Class C | | | |
Actual | $ 1,000.00 | $ 1,058.60 | $ 5.54** |
HypotheticalA | $ 1,000.00 | $ 1,019.55 | $ 5.44** |
Institutional Class | | | |
Actual | $ 1,000.00 | $ 1,063.30 | $ .41** |
HypotheticalA | $ 1,000.00 | $ 1,024.53 | $ .40** |
Advisor Freedom 2030 | | | |
Class A | | | |
Actual | $ 1,000.00 | $ 1,065.70 | $ 1.70** |
HypotheticalA | $ 1,000.00 | $ 1,023.29 | $ 1.66** |
Class T | | | |
Actual | $ 1,000.00 | $ 1,065.00 | $ 2.99** |
HypotheticalA | $ 1,000.00 | $ 1,022.04 | $ 2.92** |
Class B | | | |
Actual | $ 1,000.00 | $ 1,061.70 | $ 5.55** |
HypotheticalA | $ 1,000.00 | $ 1,019.55 | $ 5.44** |
Class C | | | |
Actual | $ 1,000.00 | $ 1,061.70 | $ 5.55** |
HypotheticalA | $ 1,000.00 | $ 1,019.55 | $ 5.44** |
Institutional Class | | | |
Actual | $ 1,000.00 | $ 1,067.40 | $ .41** |
HypotheticalA | $ 1,000.00 | $ 1,024.53 | $ .40** |
Advisor Freedom 2035 | | | |
Class A | | | |
Actual | $ 1,000.00 | $ 1,072.00 | $ 1.70** |
HypotheticalA | $ 1,000.00 | $ 1,023.29 | $ 1.66** |
Class T | | | |
Actual | $ 1,000.00 | $ 1,070.30 | $ 2.99** |
HypotheticalA | $ 1,000.00 | $ 1,022.04 | $ 2.92** |
Class B | | | |
Actual | $ 1,000.00 | $ 1,067.70 | $ 5.57** |
HypotheticalA | $ 1,000.00 | $ 1,019.55 | $ 5.44** |
Class C | | | |
Actual | $ 1,000.00 | $ 1,067.60 | $ 5.57** |
HypotheticalA | $ 1,000.00 | $ 1,019.55 | $ 5.44** |
Institutional Class | | | |
Actual | $ 1,000.00 | $ 1,072.80 | $ .41** |
HypotheticalA | $ 1,000.00 | $ 1,024.53 | $ .40** |
Advisor Freedom 2040 | | | |
Class A | | | |
Actual | $ 1,000.00 | $ 1,074.70 | $ 1.71** |
HypotheticalA | $ 1,000.00 | $ 1,023.29 | $ 1.66** |
Class T | | | |
Actual | $ 1,000.00 | $ 1,073.20 | $ 3.00** |
HypotheticalA | $ 1,000.00 | $ 1,022.04 | $ 2.92** |
Class B | | | |
Actual | $ 1,000.00 | $ 1,070.00 | $ 5.57** |
HypotheticalA | $ 1,000.00 | $ 1,019.55 | $ 5.44** |
| Beginning
Account Value
October 1, 2004 | Ending
Account Value
March 31, 2005 | Expenses Paid
During Period*
October 1, 2004
to March 31, 2005 |
Class C | | | |
Actual | $ 1,000.00 | $ 1,070.90 | $ 5.58** |
HypotheticalA | $ 1,000.00 | $ 1,019.55 | $ 5.44** |
Institutional Class | | | |
Actual | $ 1,000.00 | $ 1,075.50 | $ .41** |
HypotheticalA | $ 1,000.00 | $ 1,024.53 | $ .40** |
A 5% return per year before expenses
* Expenses are equal to each Class' annualized expense ratio (shown in the table below); multiplied by the average account value over the period, multiplied by 182/ 365 (to reflect the one-half year period). The fees and expenses of the underlying Fidelity funds in which the fund invests are not included in the fund's annualized expense ratio.
| Annualized
Expense Ratio |
Advisor Freedom Income | |
Class A | .33%** |
Class T | .58%** |
Class B | 1.08%** |
Class C | 1.08%** |
Institutional Class | .08%** |
Advisor Freedom 2005 | |
Class A | .33%** |
Class T | .58%** |
Class B | 1.08%** |
Class C | 1.08%** |
Institutional Class | .08%** |
Advisor Freedom 2010 | |
Class A | .33%** |
Class T | .58%** |
Class B | 1.08%** |
Class C | 1.08%** |
Institutional Class | .08%** |
Advisor Freedom 2015 | |
Class A | .33%** |
Class T | .58%** |
Class B | 1.08%** |
Class C | 1.08%** |
Institutional Class | .08%** |
Advisor Freedom 2020 | |
Class A | .33%** |
Class T | .58%** |
Class B | 1.08%** |
Class C | 1.08%** |
Institutional Class | .08%** |
Advisor Freedom 2025 | |
Class A | .33%** |
Class T | .58%** |
Class B | 1.08%** |
Class C | 1.08%** |
Institutional Class | .08%** |
Advisor Freedom 2030 | |
Class A | .33%** |
Class T | .58%** |
Class B | 1.08%** |
Class C | 1.08%** |
Institutional Class | .08%** |
| Annualized
Expense Ratio |
Advisor Freedom 2035 | |
Class A | .33%** |
Class T | .58%** |
Class B | 1.08%** |
Class C | 1.08%** |
Institutional Class | .08%** |
Advisor Freedom 2040 | |
Class A | .33%** |
Class T | .58%** |
Class B | 1.08%** |
Class C | 1.08%** |
Institutional Class | .08%** |
** As of May 1, 2005, Strategic Advisers agreed to waive the .10% management fee. On May 19, 2005, the Board of Trustees approved amendments to the management contracts. Under the amended contracts, the Funds no longer pay management fees. If this had been in effect during the period, the annualized expense ratio and expenses paid in the actual and hypothetical examples above (not including the fees and expenses of the underlying funds) would have been as follows:
| Annualized
Expense Ratio | Expenses
Paid |
Advisor Freedom Income | | |
Class A | .25% | |
Actual | | $ 1.26 |
HypotheticalA | | $ 1.26 |
Class T | .50% | |
Actual | | $ 2.51 |
HypotheticalA | | $ 2.52 |
Class B | 1.00% | |
Actual | | $ 5.02 |
HypotheticalA | | $ 5.04 |
Class C | 1.00% | |
Actual | | $ 5.01 |
HypotheticalA | | $ 5.04 |
Institutional Class | .00% | |
Actual | | $ .00 |
HypotheticalA | | $ .00 |
Advisor Freedom 2005 | | |
Class A | .25% | |
Actual | | $ 1.27 |
HypotheticalA | | $ 1.26 |
Class T | .50% | |
Actual | | $ 2.54 |
HypotheticalA | | $ 2.52 |
Class B | 1.00% | |
Actual | | $ 5.07 |
HypotheticalA | | $ 5.04 |
Class C | 1.00% | |
Actual | | $ 5.07 |
HypotheticalA | | $ 5.04 |
Institutional Class | .00% | |
Actual | | $ .00 |
HypotheticalA | | $ .00 |
Advisor Freedom 2010 | | |
Class A | .25% | |
Actual | | $ 1.27 |
HypotheticalA | | $ 1.26 |
| Annualized
Expense Ratio | Expenses
Paid |
Class T | .50% | |
Actual | | $ 2.54 |
HypotheticalA | | $ 2.52 |
Class B | 1.00% | |
Actual | | $ 5.07 |
HypotheticalA | | $ 5.04 |
Class C | 1.00% | |
Actual | | $ 5.07 |
HypotheticalA | | $ 5.04 |
Institutional Class | .00% | |
Actual | | $ .00 |
HypotheticalA | | $ .00 |
Advisor Freedom 2015 | | |
Class A | .25% | |
Actual | | $ 1.28 |
HypotheticalA | | $ 1.26 |
Class T | .50% | |
Actual | | $ 2.55 |
HypotheticalA | | $ 2.52 |
Class B | 1.00% | |
Actual | | $ 5.10 |
HypotheticalA | | $ 5.04 |
Class C | 1.00% | |
Actual | | $ 5.10 |
HypotheticalA | | $ 5.04 |
Institutional Class | .00% | |
Actual | | $ .00 |
HypotheticalA | | $ .00 |
Advisor Freedom 2020 | | |
Class A | .25% | |
Actual | | $ 1.28 |
HypotheticalA | | $ 1.26 |
Class T | .50% | |
Actual | | $ 2.56 |
HypotheticalA | | $ 2.52 |
Class B | 1.00% | |
Actual | | $ 5.12 |
HypotheticalA | | $ 5.04 |
Class C | 1.00% | |
Actual | | $ 5.12 |
HypotheticalA | | $ 5.04 |
Institutional Class | .00% | |
Actual | | $ .00 |
HypotheticalA | | $ .00 |
Advisor Freedom 2025 | | |
Class A | .25% | |
Actual | | $ 1.29 |
HypotheticalA | | $ 1.26 |
Class T | .50% | |
Actual | | $ 2.57 |
HypotheticalA | | $ 2.52 |
Class B | 1.00% | |
Actual | | $ 5.13 |
HypotheticalA | | $ 5.04 |
Class C | 1.00% | |
Actual | | $ 5.13 |
HypotheticalA | | $ 5.04 |
Institutional Class | .00% | |
Actual | | $ .00 |
HypotheticalA | | $ .00 |
| Annualized
Expense Ratio | Expenses
Paid |
Advisor Freedom 2030 | | |
Class A | .25% | |
Actual | | $ 1.29 |
HypotheticalA | | $ 1.26 |
Class T | .50% | |
Actual | | $ 2.57 |
HypotheticalA | | $ 2.52 |
Class B | 1.00% | |
Actual | | $ 5.14 |
HypotheticalA | | $ 5.04 |
Class C | 1.00% | |
Actual | | $ 5.14 |
HypotheticalA | | $ 5.04 |
Institutional Class | .00% | |
Actual | | $ .00 |
HypotheticalA | | $ .00 |
Advisor Freedom 2035 | | |
Class A | .25% | |
Actual | | $ 1.29 |
HypotheticalA | | $ 1.26 |
Class T | .50% | |
Actual | | $ 2.58 |
HypotheticalA | | $ 2.52 |
Class B | 1.00% | |
Actual | | $ 5.16 |
HypotheticalA | | $ 5.04 |
Class C | 1.00% | |
Actual | | $ 5.16 |
HypotheticalA | | $ 5.04 |
Institutional Class | .00% | |
Actual | | $ .00 |
HypotheticalA | | $ .00 |
Advisor Freedom 2040 | | |
Class A | .25% | |
Actual | | $ 1.29 |
HypotheticalA | | $ 1.26 |
Class T | .50% | |
Actual | | $ 2.58 |
HypotheticalA | | $ 2.52 |
Class B | 1.00% | |
Actual | | $ 5.16 |
HypotheticalA | | $ 5.04 |
Class C | 1.00% | |
Actual | | $ 5.16 |
HypotheticalA | | $ 5.04 |
Institutional Class | .00% | |
Actual | | $ .00 |
HypotheticalA | | $ .00 |
A 5% return per year before expenses
Annual Report
Fidelity Advisor Freedom Income Fund
Investment Changes
Fund Holdings as of March 31, 2005 |
| % of fund's
investments | % of fund's investments
6 months ago |
Domestic Equity Funds | | |
Fidelity Advisor Dividend Growth Fund Institutional Class | 3.9 | 3.8 |
Fidelity Advisor Equity Growth Fund Institutional Class | 1.9 | 1.9 |
Fidelity Advisor Equity Income Fund Institutional Class | 4.3 | 4.1 |
Fidelity Advisor Growth & Income Fund Institutional Class | 4.0 | 3.9 |
Fidelity Advisor Large Cap Fund Institutional Class | 3.9 | 3.8 |
Fidelity Advisor Mid-Cap Fund Institutional Class | 1.3 | 1.2 |
Fidelity Advisor Small Cap Fund Institutional Class | 1.4 | 1.3 |
| 20.7 | 20.0 |
Investment Grade Fixed-Income Funds |
Fidelity Advisor Government Investment Fund Institutional Class | 20.0 | 20.2 |
Fidelity Advisor Intermediate Bond Fund Institutional Class | 19.9 | 20.2 |
| 39.9 | 40.4 |
Short-Term Funds | | |
Fidelity Advisor Short-Fixed Income Fund Institutional Class | 15.7 | 15.9 |
Fidelity Cash Reserves Fund | 23.7 | 23.7 |
| 39.4 | 39.6 |
| 100.0 | 100.0 |
Asset Allocation (% of fund's investments) |
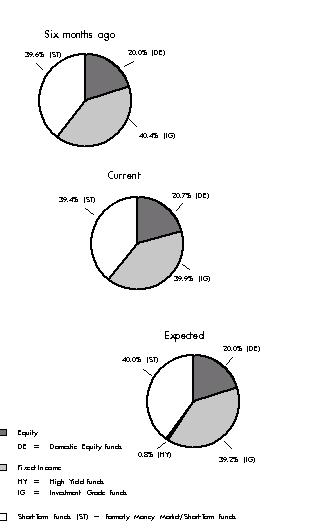
The fund invests according to an asset allocation strategy that becomes increasingly conservative over time. The six months ago allocation is based on the fund's holdings as of September 30, 2004. On or about June 1, 2005, the Fixed-Income funds allocation will begin to include high yield funds. The current allocation is based on the fund's holdings as of March 31, 2005. The expected allocation represents the fund's anticipated target asset allocation at September 30, 2005.
Annual Report
Fidelity Advisor Freedom Income Fund
Investments March 31, 2005
Showing Percentage of Total Value of Investment in Securities
Equity Funds - 20.7% |
| Shares | | Value (Note 1) |
Domestic Equity Funds - 20.7% |
Fidelity Advisor Dividend Growth Fund Institutional Class | 200,578 | | $ 2,282,574 |
Fidelity Advisor Equity Growth Fund Institutional Class | 24,674 | | 1,138,448 |
Fidelity Advisor Equity Income Fund Institutional Class | 87,626 | | 2,487,716 |
Fidelity Advisor Growth & Income Fund Institutional Class | 140,914 | | 2,320,849 |
Fidelity Advisor Large Cap Fund Institutional Class | 155,353 | | 2,302,333 |
Fidelity Advisor Mid-Cap Fund Institutional Class | 31,130 | | 754,274 |
Fidelity Advisor Small Cap Fund Institutional Class | 32,289 | | 791,401 |
TOTAL EQUITY FUNDS (Cost $11,479,871) | 12,077,595 |
Fixed-Income Funds - 39.9% |
| | | |
Investment Grade Fixed-Income Funds - 39.9% |
Fidelity Advisor Government Investment Fund Institutional Class | 1,174,937 | | 11,667,121 |
Fidelity Advisor Intermediate Bond Fund Institutional Class | 1,058,137 | | 11,607,759 |
TOTAL FIXED-INCOME FUNDS (Cost $23,662,804) | 23,274,880 |
Short-Term Funds - 39.4% |
| | | |
Fidelity Cash Reserves Fund | 13,809,418 | | 13,809,418 |
Fidelity Advisor Short-Fixed Income Fund Institutional Class | 973,383 | | 9,198,470 |
TOTAL SHORT-TERM FUNDS (Cost $23,112,895) | 23,007,888 |
TOTAL INVESTMENT IN SECURITIES - 100% (Cost $58,255,570) | $ 58,360,363 |
See accompanying notes which are an integral part of the financial statements.
Annual Report
Fidelity Advisor Freedom Income Fund
Financial Statements
Statement of Assets and Liabilities
| March 31, 2005 |
| | |
Assets | | |
Investment in securities, at value (cost $58,255,570) - See accompanying schedule | | $ 58,360,363 |
Cash | | 14,042 |
Receivable for investments sold | | 153,397 |
Receivable for fund shares sold | | 28,267 |
Receivable from investment adviser for expense reductions | | 634 |
Total assets | | 58,556,703 |
| | |
Liabilities | | |
Payable for investments purchased | $ 164 | |
Payable for fund shares redeemed | 212,314 | |
Accrued management fee | 4,841 | |
Distribution fees payable | 29,474 | |
Total liabilities | | 246,793 |
| | |
Net Assets | | $ 58,309,910 |
Net Assets consist of: | | |
Paid in capital | | $ 57,987,724 |
Undistributed net investment income | | 86,109 |
Accumulated undistributed net realized gain (loss) on investments | | 131,284 |
Net unrealized appreciation (depreciation) on investments | | 104,793 |
Net Assets | | $ 58,309,910 |
Calculation of Maximum Offering Price | | |
Class A:
Net Asset Value and redemption price per share ($10,120,151 ÷ 982,219 shares) | | $ 10.30 |
| | |
Maximum offering price per share (100/94.25 of $10.30) | | $ 10.93 |
| | |
Class T:
Net Asset Value and redemption price per share ($29,012,941 ÷ 2,817,197 shares) | | $ 10.30 |
| | |
Maximum offering price per share (100/96.50 of $10.30) | | $ 10.67 |
| | |
Class B:
Net Asset Value and offering price per share ($4,454,390 ÷ 432,999 shares)A | | $ 10.29 |
| | |
Class C:
Net Asset Value and offering price per share ($14,096,658 ÷ 1,370,793 shares)A | | $ 10.28 |
| | |
Institutional Class:
Net Asset Value, offering price and redemption price per share ($625,770 ÷ 60,671 shares) | | $ 10.31 |
A Redemption price per share is equal to net asset value less any applicable contingent deferred sales charge.
Statement of Operations
| Year ended March 31, 2005 |
Investment Income | | |
Income distributions from underlying funds | | $ 1,072,976 |
| | |
Expenses | | |
Management fee | $ 46,677 | |
Distribution fees | 296,813 | |
Independent trustees' compensation | 237 | |
Total expenses before reductions | 343,727 | |
Expense reductions | (9,808) | 333,919 |
Net investment income (loss) | | 739,057 |
Realized and Unrealized Gain (Loss) Realized gain (loss) on sale of underlying fund shares | (76,944) | |
Capital gain distributions from underlying funds | 258,599 | 181,655 |
Change in net unrealized appreciation (depreciation) on underlying funds | | (460,298) |
Net gain (loss) | | (278,643) |
Net increase (decrease) in net assets resulting from operations | | $ 460,414 |
See accompanying notes which are an integral part of the financial statements.
Annual Report
Fidelity Advisor Freedom Income Fund
Financial Statements - continued
Statement of Changes in Net Assets
| Year ended
March 31,
2005 | July 24, 2003
(commencement of
operations) to
March 31, 2004 |
Increase (Decrease) in Net Assets | | |
Operations | | |
Net investment income (loss) | $ 739,057 | $ 153,905 |
Net realized gain (loss) | 181,655 | 38,625 |
Change in net unrealized appreciation (depreciation) | (460,298) | 565,091 |
Net increase (decrease) in net assets resulting from operations | 460,414 | 757,621 |
Distributions to shareholders from net investment income | (704,650) | (156,368) |
Distributions to shareholders from net realized gain | (34,829) | - |
Total distributions | (739,479) | (156,368) |
Share transactions - net increase (decrease) | 25,789,420 | 32,198,302 |
Total increase (decrease) in net assets | 25,510,355 | 32,799,555 |
| | |
Net Assets | | |
Beginning of period | 32,799,555 | - |
End of period (including undistributed net investment income of $86,109 and undistributed net investment income of $1,120, respectively) | $ 58,309,910 | $ 32,799,555 |
Financial Highlights - Class A
Years ended March 31, | 2005 | 2004F |
Selected Per-Share Data | | |
Net asset value, beginning of period | $ 10.40 | $ 10.00 |
Income from Investment Operations | | |
Net investment income (loss)E | .20 | .13 |
Net realized and unrealized gain (loss) | (.10) | .36 |
Total from investment operations | .10 | .49 |
Distributions from net investment income | (.19) | (.09) |
Distributions from net realized gain | (.01) | - |
Total distributions | (.20) | (.09) |
Net asset value, end of period | $ 10.30 | $ 10.40 |
Total ReturnB,C,D | .99% | 4.95% |
Ratios to Average Net AssetsG, H | | |
Expenses before expense reductions | .35% | .35%A |
Expenses net of voluntary waivers, if any | .33% | .33%A |
Expenses net of all reductions | .33% | .33%A |
Net investment income (loss) | 1.96% | 1.81%A |
Supplemental Data | | |
Net assets, end of period (000 omitted) | $ 10,120 | $ 5,009 |
Portfolio turnover rate | 18% | 46%A |
A Annualized
B Total returns for periods of less than one year are not annualized.
C Total returns would have been lower had certain expenses not been reduced during the periods shown.
D Total returns do not include the effect of the sales charges.
E Calculated based on average shares outstanding during the period.
F For the period July 24, 2003 (commencement of operations) to March 31, 2004.
G Expense ratios reflect operating expenses of the class. Expenses before reductions do not reflect amounts reimbursed by the investment adviser or reductions from brokerage service arrangements or other expense offset arrangements and do not represent the amount paid by the class during periods when reimbursements or reductions occur. Expenses net of any voluntary waivers reflect expenses after reimbursement by the investment adviser but prior to reductions from brokerage service arrangements or other expense offset arrangements. Expenses net of all reductions represent the net expenses paid by the class.
H Amounts do not include the activity of the underlying funds.
See accompanying notes which are an integral part of the financial statements.
Annual Report
Financial Highlights - Class T
Years ended March 31, | 2005 | 2004F |
Selected Per-Share Data | | |
Net asset value, beginning of period | $ 10.39 | $ 10.00 |
Income from Investment Operations | | |
Net investment income (loss)E | .18 | .11 |
Net realized and unrealized gain (loss) | (.10) | .37 |
Total from investment operations | .08 | .48 |
Distributions from net investment income | (.16) | (.09) |
Distributions from net realized gain | (.01) | - |
Total distributions | (.17) | (.09) |
Net asset value, end of period | $ 10.30 | $ 10.39 |
Total ReturnB,C,D | .79% | 4.78% |
Ratios to Average Net AssetsG, H | | |
Expenses before expense reductions | .60% | .60%A |
Expenses net of voluntary waivers, if any | .58% | .58%A |
Expenses net of all reductions | .58% | .58%A |
Net investment income (loss) | 1.71% | 1.56%A |
Supplemental Data | | |
Net assets, end of period (000 omitted) | $ 29,013 | $ 14,535 |
Portfolio turnover rate | 18% | 46%A |
A Annualized
B Total returns for periods of less than one year are not annualized.
C Total returns would have been lower had certain expenses not been reduced during the periods shown.
D Total returns do not include the effect of the sales charges.
E Calculated based on average shares outstanding during the period.
F For the period July 24, 2003 (commencement of operations) to March 31, 2004.
G Expense ratios reflect operating expenses of the class. Expenses before reductions do not reflect amounts reimbursed by the investment adviser or reductions from brokerage service arrangements or other expense offset arrangements and do not represent the amount paid by the class during periods when reimbursements or reductions occur. Expenses net of any voluntary waivers reflect expenses after reimbursement by the investment adviser but prior to reductions from brokerage service arrangements or other expense offset arrangements. Expenses net of all reductions represent the net expenses paid by the class.
H Amounts do not include the activity of the underlying funds.
Financial Highlights - Class B
Years ended March 31, | 2005 | 2004F |
Selected Per-Share Data | | |
Net asset value, beginning of period | $ 10.38 | $ 10.00 |
Income from Investment Operations | | |
Net investment income (loss)E | .12 | .07 |
Net realized and unrealized gain (loss) | (.10) | .37 |
Total from investment operations | .02 | .44 |
Distributions from net investment income | (.10) | (.06) |
Distributions from net realized gain | (.01) | - |
Total distributions | (.11) | (.06) |
Net asset value, end of period | $ 10.29 | $ 10.38 |
Total ReturnB,C,D | .23% | 4.45% |
Ratios to Average Net AssetsG, H | | |
Expenses before expense reductions | 1.10% | 1.10%A |
Expenses net of voluntary waivers, if any | 1.08% | 1.08%A |
Expenses net of all reductions | 1.08% | 1.08%A |
Net investment income (loss) | 1.21% | 1.06%A |
Supplemental Data | | |
Net assets, end of period (000 omitted) | $ 4,454 | $ 3,649 |
Portfolio turnover rate | 18% | 46%A |
A Annualized
B Total returns for periods of less than one year are not annualized.
C Total returns would have been lower had certain expenses not been reduced during the periods shown.
D Total returns do not include the effect of the contingent deferred sales charge.
E Calculated based on average shares outstanding during the period.
F For the period July 24, 2003 (commencement of operations) to March 31, 2004.
G Expense ratios reflect operating expenses of the class. Expenses before reductions do not reflect amounts reimbursed by the investment adviser or reductions from brokerage service arrangements or other expense offset arrangements and do not represent the amount paid by the class during periods when reimbursements or reductions occur. Expenses net of any voluntary waivers reflect expenses after reimbursement by the investment adviser but prior to reductions from brokerage service arrangements or other expense offset arrangements. Expenses net of all reductions represent the net expenses paid by the class.
H Amounts do not include the activity of the underlying funds.
See accompanying notes which are an integral part of the financial statements.
Annual Report
Financial Highlights - Class C
Years ended March 31, | 2005 | 2004F |
Selected Per-Share Data | | |
Net asset value, beginning of period | $ 10.37 | $ 10.00 |
Income from Investment Operations | | |
Net investment income (loss)E | .12 | .07 |
Net realized and unrealized gain (loss) | (.09) | .37 |
Total from investment operations | .03 | .44 |
Distributions from net investment income | (.11) | (.07) |
Distributions from net realized gain | (.01) | - |
Total distributions | (.12) | (.07) |
Net asset value, end of period | $ 10.28 | $ 10.37 |
Total ReturnB,C,D | .24% | 4.39% |
Ratios to Average Net AssetsG, H | | |
Expenses before expense reductions | 1.10% | 1.10%A |
Expenses net of voluntary waivers, if any | 1.08% | 1.08%A |
Expenses net of all reductions | 1.08% | 1.08%A |
Net investment income (loss) | 1.21% | 1.06%A |
Supplemental Data | | |
Net assets, end of period (000 omitted) | $ 14,097 | $ 9,248 |
Portfolio turnover rate | 18% | 46%A |
A Annualized
B Total returns for periods of less than one year are not annualized.
C Total returns would have been lower had certain expenses not been reduced during the periods shown.
D Total returns do not include the effect of the contingent deferred sales charge.
E Calculated based on average shares outstanding during the period.
F For the period July 24, 2003 (commencement of operations) to March 31, 2004.
G Expense ratios reflect operating expenses of the class. Expenses before reductions do not reflect amounts reimbursed by the investment adviser or reductions from brokerage service arrangements or other expense offset arrangements and do not represent the amount paid by the class during periods when reimbursements or reductions occur. Expenses net of any voluntary waivers reflect expenses after reimbursement by the investment adviser but prior to reductions from brokerage service arrangements or other expense offset arrangements. Expenses net of all reductions represent the net expenses paid by the class.
H Amounts do not include the activity of the underlying funds.
Financial Highlights - Institutional Class
Years ended March 31, | 2005 | 2004E |
Selected Per-Share Data | | |
Net asset value, beginning of period | $ 10.41 | $ 10.00 |
Income from Investment Operations | | |
Net investment income (loss)D | .23 | .14 |
Net realized and unrealized gain (loss) | (.11) | .37 |
Total from investment operations | .12 | .51 |
Distributions from net investment income | (.21) | (.10) |
Distributions from net realized gain | (.01) | - |
Total distributions | (.22) | (.10) |
Net asset value, end of period | $ 10.31 | $ 10.41 |
Total ReturnB,C | 1.21% | 5.16% |
Ratios to Average Net AssetsF, G | | |
Expenses before expense reductions | .10% | .10%A |
Expenses net of voluntary waivers, if any | .08% | .08%A |
Expenses net of all reductions | .08% | .08%A |
Net investment income (loss) | 2.21% | 2.05%A |
Supplemental Data | | |
Net assets, end of period (000 omitted) | $ 626 | $ 359 |
Portfolio turnover rate | 18% | 46%A |
A Annualized
B Total returns for periods of less than one year are not annualized.
C Total returns would have been lower had certain expenses not been reduced during the periods shown.
D Calculated based on average shares outstanding during the period.
E For the period July 24, 2003 (commencement of operations) to March 31, 2004.
F Expense ratios reflect operating expenses of the class. Expenses before reductions do not reflect amounts reimbursed by the investment adviser or reductions from brokerage service arrangements or other expense offset arrangements and do not represent the amount paid by the class during periods when reimbursements or reductions occur. Expenses net of any voluntary waivers reflect expenses after reimbursement by the investment adviser but prior to reductions from brokerage service arrangements or other expense offset arrangements. Expenses net of all reductions represent the net expenses paid by the class.
G Amounts do not include the activity of the underlying funds.
See accompanying notes which are an integral part of the financial statements.
Annual Report
Fidelity Advisor Freedom 2005 Fund
Investment Changes
Fund Holdings as of March 31, 2005 |
| % of fund's
investments | % of fund's investments
6 months ago |
Domestic Equity Funds | | |
Fidelity Advisor Dividend Growth Fund Institutional Class | 7.6 | 7.6 |
Fidelity Advisor Equity Growth Fund Institutional Class | 3.9 | 3.8 |
Fidelity Advisor Equity Income Fund Institutional Class | 8.1 | 7.9 |
Fidelity Advisor Growth & Income Fund Institutional Class | 7.8 | 7.7 |
Fidelity Advisor Large Cap Fund Institutional Class | 7.7 | 7.6 |
Fidelity Advisor Mid-Cap Fund Institutional Class | 2.5 | 2.4 |
Fidelity Advisor Small Cap Fund Institutional Class | 2.6 | 2.4 |
| 40.2 | 39.4 |
International Equity Funds | | |
Fidelity Advisor Diversified International Fund Institutional Class | 2.7 | 2.5 |
Fidelity Advisor Overseas Fund Institutional Class | 2.7 | 2.5 |
| 5.4 | 5.0 |
High Yield Fixed-Income Funds | | |
Fidelity Advisor High Income Advantage Fund Institutional Class | 5.3 | 5.1 |
Investment Grade Fixed-Income Funds |
Fidelity Advisor Government Investment Fund Institutional Class | 19.7 | 20.3 |
Fidelity Advisor Intermediate Bond Fund Institutional Class | 19.6 | 20.2 |
| 39.3 | 40.5 |
Short-Term Funds | | |
Fidelity Advisor Short-Fixed Income Fund Institutional Class | 3.9 | 4.0 |
Fidelity Cash Reserves Fund | 5.9 | 6.0 |
| 9.8 | 10.0 |
| 100.0 | 100.0 |
Asset Allocation (% of fund's investments) |
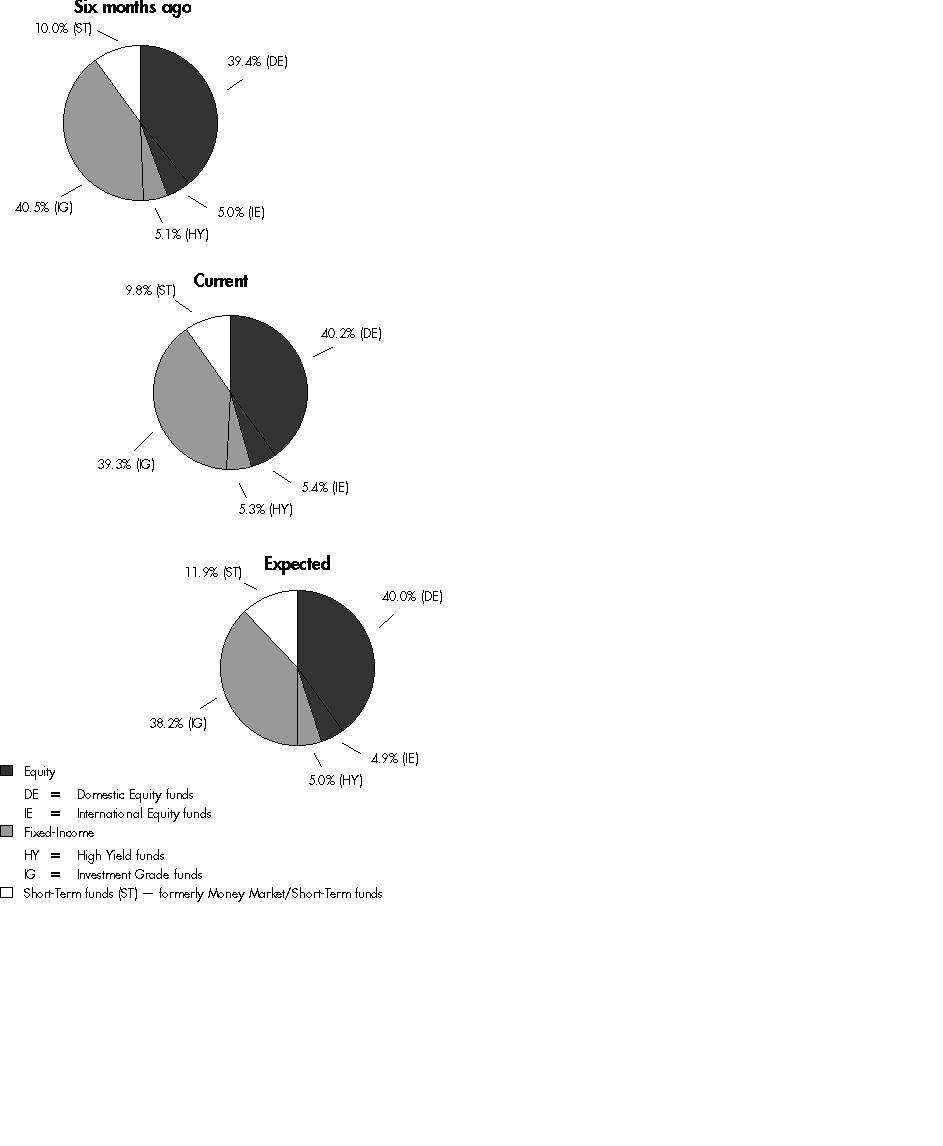
The fund invests according to an asset allocation strategy that becomes increasingly conservative over time. The six months ago allocation is based on the fund's holdings as of September 30, 2004. The current allocation is based on the fund's holdings as of March 31, 2005. The expected allocation represents the fund's anticipated target asset allocation at September 30, 2005.
Annual Report
Fidelity Advisor Freedom 2005 Fund
Investments March 31, 2005
Showing Percentage of Total Value of Investment in Securities
Equity Funds - 45.6% |
| Shares | | Value (Note 1) |
Domestic Equity Funds - 40.2% |
Fidelity Advisor Dividend Growth Fund Institutional Class | 154,374 | | $ 1,756,776 |
Fidelity Advisor Equity Growth Fund Institutional Class | 19,252 | | 888,268 |
Fidelity Advisor Equity Income Fund Institutional Class | 65,953 | | 1,872,408 |
Fidelity Advisor Growth & Income Fund Institutional Class | 109,340 | | 1,800,823 |
Fidelity Advisor Large Cap Fund Institutional Class | 120,106 | | 1,779,978 |
Fidelity Advisor Mid-Cap Fund Institutional Class | 23,556 | | 570,754 |
Fidelity Advisor Small Cap Fund Institutional Class | 24,120 | | 591,182 |
TOTAL DOMESTIC EQUITY FUNDS | | 9,260,189 |
International Equity Funds - 5.4% |
Fidelity Advisor Diversified International Fund Institutional Class | 33,319 | | 628,066 |
Fidelity Advisor Overseas Fund Institutional Class | 34,877 | | 607,213 |
TOTAL INTERNATIONAL EQUITY FUNDS | | 1,235,279 |
TOTAL EQUITY FUNDS (Cost $10,158,848) | 10,495,468 |
Fixed-Income Funds - 44.6% |
| | | |
High Yield Fixed-Income Funds - 5.3% |
Fidelity Advisor High Income Advantage Fund Institutional Class | 128,782 | | 1,213,127 |
Investment Grade Fixed-Income Funds - 39.3% |
Fidelity Advisor Government Investment Fund Institutional Class | 456,742 | | 4,535,449 |
Fidelity Advisor Intermediate Bond Fund Institutional Class | 411,534 | | 4,514,525 |
TOTAL INVESTMENT GRADE FIXED-INCOME FUNDS | | 9,049,974 |
TOTAL FIXED-INCOME FUNDS (Cost $10,396,981) | 10,263,101 |
Short-Term Funds - 9.8% |
| | | |
Fidelity Cash Reserves Fund | 1,355,509 | | 1,355,509 |
Fidelity Advisor Short-Fixed Income Fund Institutional Class | 95,205 | | 899,684 |
TOTAL SHORT-TERM FUNDS (Cost $2,266,001) | 2,255,193 |
TOTAL INVESTMENT IN SECURITIES - 100% (Cost $22,821,830) | $ 23,013,762 |
See accompanying notes which are an integral part of the financial statements.
Annual Report
Fidelity Advisor Freedom 2005 Fund
Financial Statements
Statement of Assets and Liabilities
| March 31, 2005 |
| | |
Assets | | |
Investment in securities, at value (cost $22,821,830) - See accompanying schedule | | $ 23,013,762 |
Cash | | 4 |
Receivable for investments sold | | 169,792 |
Receivable for fund shares sold | | 15,963 |
Receivable from investment adviser for expense reductions | | 124 |
Total assets | | 23,199,645 |
| | |
Liabilities | | |
Payable for investments purchased | $ 3,296 | |
Payable for fund shares redeemed | 182,391 | |
Accrued management fee | 1,946 | |
Distribution fees payable | 11,746 | |
Total liabilities | | 199,379 |
| | |
Net Assets | | $ 23,000,266 |
Net Assets consist of: | | |
Paid in capital | | $ 22,695,741 |
Undistributed net investment income | | 66,592 |
Accumulated undistributed net realized gain (loss) on investments | | 46,001 |
Net unrealized appreciation (depreciation) on investments | | 191,932 |
Net Assets | | $ 23,000,266 |
Calculation of Maximum Offering Price Class A:
Net Asset Value and redemption price per share ($5,969,905 ÷ 564,626 shares) | | $ 10.57 |
| | |
Maximum offering price per share (100/94.25 of $10.57) | | $ 11.21 |
| | |
Class T:
Net Asset Value and redemption price per share ($7,977,337 ÷ 755,275 shares) | | $ 10.56 |
| | |
Maximum offering price per share (100/96.50 of $10.56) | | $ 10.94 |
| | |
Class B:
Net Asset Value and offering price per share ($2,747,023 ÷ 260,862 shares)A | | $ 10.53 |
| | |
Class C:
Net Asset Value and offering price per share ($5,655,240 ÷ 537,233 shares)A | | $ 10.53 |
| | |
Institutional Class:
Net Asset Value, offering price and redemption price per share ($650,761 ÷ 61,413 shares) | | $ 10.60 |
A Redemption price per share is equal to net asset value less any applicable contingent deferred sales charge.
Statement of Operations
| Year ended March 31, 2005 |
| | |
Investment Income | | |
Income distributions from underlying funds | | $ 371,016 |
Interest | | 3 |
Total income | | 371,019 |
| | |
Expenses | | |
Management fee | $ 15,052 | |
Distribution fees | 92,337 | |
Independent trustees' compensation | 72 | |
Total expenses before reductions | 107,461 | |
Expense reductions | (3,412) | 104,049 |
Net investment income (loss) | | 266,970 |
Realized and Unrealized Gain (Loss) Realized gain (loss) on sale of underlying fund shares | (41,764) | |
Capital gain distributions from underlying funds | 108,525 | 66,761 |
Change in net unrealized appreciation (depreciation) on underlying funds | | 131,084 |
Net gain (loss) | | 197,845 |
Net increase (decrease) in net assets resulting from operations | | $ 464,815 |
See accompanying notes which are an integral part of the financial statements.
Annual Report
Fidelity Advisor Freedom 2005 Fund
Financial Statements - continued
Statement of Changes in Net Assets
| Year ended
March 31,
2005 | November 6, 2003
(commencement of
operations) to
March 31, 2004 |
Increase (Decrease) in Net Assets | | |
Operations | | |
Net investment income (loss) | $ 266,970 | $ 18,551 |
Net realized gain (loss) | 66,761 | 3,417 |
Change in net unrealized appreciation (depreciation) | 131,084 | 60,848 |
Net increase (decrease) in net assets resulting from operations | 464,815 | 82,816 |
Distributions to shareholders from net investment income | (231,296) | (8,568) |
Distributions to shareholders from net realized gain | (3,243) | - |
Total distributions | (234,539) | (8,568) |
Share transactions - net increase (decrease) | 16,679,243 | 6,016,499 |
Total increase (decrease) in net assets | 16,909,519 | 6,090,747 |
| | |
Net Assets | | |
Beginning of period | 6,090,747 | - |
End of period (including undistributed net investment income of $66,592 and undistributed net investment income of $10,206, respectively) | $ 23,000,266 | $ 6,090,747 |
Financial Highlights - Class A
Years ended March 31, | 2005 | 2004F |
Selected Per-Share Data | | |
Net asset value, beginning of period | $ 10.49 | $ 10.00 |
Income from Investment Operations | | |
Net investment income (loss)E | .22 | .09 |
Net realized and unrealized gain (loss) | .03 | .46 |
Total from investment operations | .25 | .55 |
Distributions from net investment income | (.17) | (.06) |
Distributions from net realized gain | -H | - |
Total distributions | (.17) | (.06) |
Net asset value, end of period | $ 10.57 | $ 10.49 |
Total ReturnB,C,D | 2.38% | 5.52% |
Ratios to Average Net AssetsG, I | | |
Expenses before expense reductions | .35% | .35%A |
Expenses net of voluntary waivers, if any | .33% | .33%A |
Expenses net of all reductions | .33% | .33%A |
Net investment income (loss) | 2.13% | 2.21%A |
Supplemental Data | | |
Net assets, end of period (000 omitted) | $ 5,970 | $ 1,386 |
Portfolio turnover rate | 24% | 9%A |
A Annualized
B Total returns for periods of less than one year are not annualized.
C Total returns would have been lower had certain expenses not been reduced during the periods shown.
D Total returns do not include the effect of the sales charges.
E Calculated based on average shares outstanding during the period.
F For the period November 6, 2003 (commencement of operations) to March 31, 2004.
G Expense ratios reflect operating expenses of the class. Expenses before reductions do not reflect amounts reimbursed by the investment adviser or reductions from brokerage service arrangements or other expense offset arrangements and do not represent the amount paid by the class during periods when reimbursements or reductions occur. Expenses net of any voluntary waivers reflect expenses after reimbursement by the investment adviser but prior to reductions from brokerage service arrangements or other expense offset arrangements. Expenses net of all reductions represent the net expenses paid by the class.
H Amount represents less than $.01 per share.
I Amounts do not include the activity of the underlying funds.
See accompanying notes which are an integral part of the financial statements.
Annual Report
Financial Highlights - Class T
Years ended March 31, | 2005 | 2004F |
Selected Per-Share Data | | |
Net asset value, beginning of period | $ 10.48 | $ 10.00 |
Income from Investment Operations | | |
Net investment income (loss)E | .20 | .08 |
Net realized and unrealized gain (loss) | .03 | .46 |
Total from investment operations | .23 | .54 |
Distributions from net investment income | (.14) | (.06) |
Distributions from net realized gain | -H | - |
Total distributions | (.15)I | (.06) |
Net asset value, end of period | $ 10.56 | $ 10.48 |
Total ReturnB,C,D | 2.17% | 5.36% |
Ratios to Average Net AssetsG, J | | |
Expenses before expense reductions | .60% | .60%A |
Expenses net of voluntary waivers, if any | .58% | .58%A |
Expenses net of all reductions | .58% | .58%A |
Net investment income (loss) | 1.88% | 1.97%A |
Supplemental Data | | |
Net assets, end of period (000 omitted) | $ 7,977 | $ 2,031 |
Portfolio turnover rate | 24% | 9%A |
A Annualized
B Total returns for periods of less than one year are not annualized.
C Total returns would have been lower had certain expenses not been reduced during the periods shown.
D Total returns do not include the effect of the sales charges.
E Calculated based on average shares outstanding during the period.
F For the period November 6, 2003 (commencement of operations) to March 31, 2004.
G Expense ratios reflect operating expenses of the class. Expenses before reductions do not reflect amounts reimbursed by the investment adviser or reductions from brokerage service arrangements or other expense offset arrangements and do not represent the amount paid by the class during periods when reimbursements or reductions occur. Expenses net of any voluntary waivers reflect expenses after reimbursement by the investment adviser but prior to reductions from brokerage service arrangements or other expense offset arrangements. Expenses net of all reductions represent the net expenses paid by the class.
H Amount represents less than $.01 per share.
I Total distributions of $.148 per share is comprised of distributions from net investment income of $.144 per share and distributions from net realized gain of $.004 per share.
J Amounts do not include the activity of the underlying funds.
Financial Highlights - Class B
Years ended March 31, | 2005 | 2004F |
Selected Per-Share Data | | |
Net asset value, beginning of period | $ 10.47 | $ 10.00 |
Income from Investment Operations | | |
Net investment income (loss)E | .14 | .06 |
Net realized and unrealized gain (loss) | .03 | .46 |
Total from investment operations | .17 | .52 |
Distributions from net investment income | (.11) | (.05) |
Distributions from net realized gain | -H | - |
Total distributions | (.11) | (.05) |
Net asset value, end of period | $ 10.53 | $ 10.47 |
Total ReturnB,C,D | 1.64% | 5.21% |
Ratios to Average Net AssetsG, I | | |
Expenses before expense reductions | 1.10% | 1.10%A |
Expenses net of voluntary waivers, if any | 1.08% | 1.08%A |
Expenses net of all reductions | 1.08% | 1.08%A |
Net investment income (loss) | 1.38% | 1.47%A |
Supplemental Data | | |
Net assets, end of period (000 omitted) | $ 2,747 | $ 1,203 |
Portfolio turnover rate | 24% | 9%A |
A Annualized
B Total returns for periods of less than one year are not annualized.
C Total returns would have been lower had certain expenses not been reduced during the periods shown.
D Total returns do not include the effect of the contingent deferred sales charge.
E Calculated based on average shares outstanding during the period.
F For the period November 6, 2003 (commencement of operations) to March 31, 2004.
G Expense ratios reflect operating expenses of the class. Expenses before reductions do not reflect amounts reimbursed by the investment adviser or reductions from brokerage service arrangements or other expense offset arrangements and do not represent the amount paid by the class during periods when reimbursements or reductions occur. Expenses net of any voluntary waivers reflect expenses after reimbursement by the investment adviser but prior to reductions from brokerage service arrangements or other expense offset arrangements. Expenses net of all reductions represent the net expenses paid by the class.
H Amount represents less than $.01 per share.
I Amounts do not include the activity of the underlying funds.
See accompanying notes which are an integral part of the financial statements.
Annual Report
Financial Highlights - Class C
Years ended March 31, | 2005 | 2004F |
Selected Per-Share Data | | |
Net asset value, beginning of period | $ 10.47 | $ 10.00 |
Income from Investment Operations | | |
Net investment income (loss)E | .14 | .06 |
Net realized and unrealized gain (loss) | .04 | .46 |
Total from investment operations | .18 | .52 |
Distributions from net investment income | (.12) | (.05) |
Distributions from net realized gain | -H | - |
Total distributions | (.12) | (.05) |
Net asset value, end of period | $ 10.53 | $ 10.47 |
Total ReturnB,C,D | 1.74% | 5.21% |
Ratios to Average Net AssetsG, I | | |
Expenses before expense reductions | 1.10% | 1.10%A |
Expenses net of voluntary waivers, if any | 1.08% | 1.08%A |
Expenses net of all reductions | 1.08% | 1.08%A |
Net investment income (loss) | 1.38% | 1.47%A |
Supplemental Data | | |
Net assets, end of period (000 omitted) | $ 5,655 | $ 1,073 |
Portfolio turnover rate | 24% | 9%A |
A Annualized
B Total returns for periods of less than one year are not annualized.
C Total returns would have been lower had certain expenses not been reduced during the periods shown.
D Total returns do not include the effect of the contingent deferred sales charge.
E Calculated based on average shares outstanding during the period.
F For the period November 6, 2003 (commencement of operations) to March 31, 2004.
G Expense ratios reflect operating expenses of the class. Expenses before reductions do not reflect amounts reimbursed by the investment adviser or reductions from brokerage service arrangements or other expense offset arrangements and do not represent the amount paid by the class during periods when reimbursements or reductions occur. Expenses net of any voluntary waivers reflect expenses after reimbursement by the investment adviser but prior to reductions from brokerage service arrangements or other expense offset arrangements. Expenses net of all reductions represent the net expenses paid by the class.
H Amount represents less than $.01 per share.
I Amounts do not include the activity of the underlying funds.
Financial Highlights - Institutional Class
Years ended March 31, | 2005 | 2004E |
Selected Per-Share Data | | |
Net asset value, beginning of period | $ 10.49 | $ 10.00 |
Income from Investment Operations | | |
Net investment income (loss)D | .25 | .10 |
Net realized and unrealized gain (loss) | .04 | .45 |
Total from investment operations | .29 | .55 |
Distributions from net investment income | (.18) | (.06) |
Distributions from net realized gain | -G | - |
Total distributions | (.18) | (.06) |
Net asset value, end of period | $ 10.60 | $ 10.49 |
Total ReturnB,C | 2.79% | 5.52% |
Ratios to Average Net AssetsF, H | | |
Expenses before expense reductions | .10% | .10%A |
Expenses net of voluntary waivers, if any | .08% | .08%A |
Expenses net of all reductions | .08% | .08%A |
Net investment income (loss) | 2.38% | 2.46%A |
Supplemental Data | | |
Net assets, end of period (000 omitted) | $ 651 | $ 397 |
Portfolio turnover rate | 24% | 9%A |
A Annualized
B Total returns for periods of less than one year are not annualized.
C Total returns would have been lower had certain expenses not been reduced during the periods shown.
D Calculated based on average shares outstanding during the period.
E For the period November 6, 2003 (commencement of operations) to March 31, 2004.
F Expense ratios reflect operating expenses of the class. Expenses before reductions do not reflect amounts reimbursed by the investment adviser or reductions from brokerage service arrangements or other expense offset arrangements and do not represent the amount paid by the class during periods when reimbursements or reductions occur. Expenses net of any voluntary waivers reflect expenses after reimbursement by the investment adviser but prior to reductions from brokerage service arrangements or other expense offset arrangements. Expenses net of all reductions represent the net expenses paid by the class.
G Amount represents less than $.01 per share.
H Amounts do not include the activity of the underlying funds.
See accompanying notes which are an integral part of the financial statements.
Annual Report
Fidelity Advisor Freedom 2010 Fund
Investment Changes
Fund Holdings as of March 31, 2005 |
| % of fund's
investments | % of fund's investments
6 months ago |
Domestic Equity Funds | | |
Fidelity Advisor Dividend Growth Fund Institutional Class | 7.7 | 7.6 |
Fidelity Advisor Equity Growth Fund Institutional Class | 3.9 | 3.8 |
Fidelity Advisor Equity Income Fund Institutional Class | 8.2 | 8.0 |
Fidelity Advisor Growth & Income Fund Institutional Class | 7.8 | 7.8 |
Fidelity Advisor Large Cap Fund Institutional Class | 7.8 | 7.6 |
Fidelity Advisor Mid-Cap Fund Institutional Class | 2.5 | 2.4 |
Fidelity Advisor Small Cap Fund Institutional Class | 2.6 | 2.5 |
| 40.5 | 39.7 |
International Equity Funds | | |
Fidelity Advisor Diversified International Fund Institutional Class | 2.8 | 2.6 |
Fidelity Advisor Overseas Fund Institutional Class | 2.7 | 2.5 |
| 5.5 | 5.1 |
High Yield Fixed-Income Funds | | |
Fidelity Advisor High Income Advantage Fund Institutional Class | 5.3 | 5.2 |
Investment Grade Fixed-Income Funds |
Fidelity Advisor Government Investment Fund Institutional Class | 19.6 | 20.2 |
Fidelity Advisor Intermediate Bond Fund Institutional Class | 19.6 | 20.1 |
| 39.2 | 40.3 |
Short-Term Funds | | |
Fidelity Advisor Short-Fixed Income Fund Institutional Class | 3.8 | 3.9 |
Fidelity Cash Reserves Fund | 5.7 | 5.8 |
| 9.5 | 9.7 |
| 100.0 | 100.0 |
Asset Allocation (% of fund's investments) |
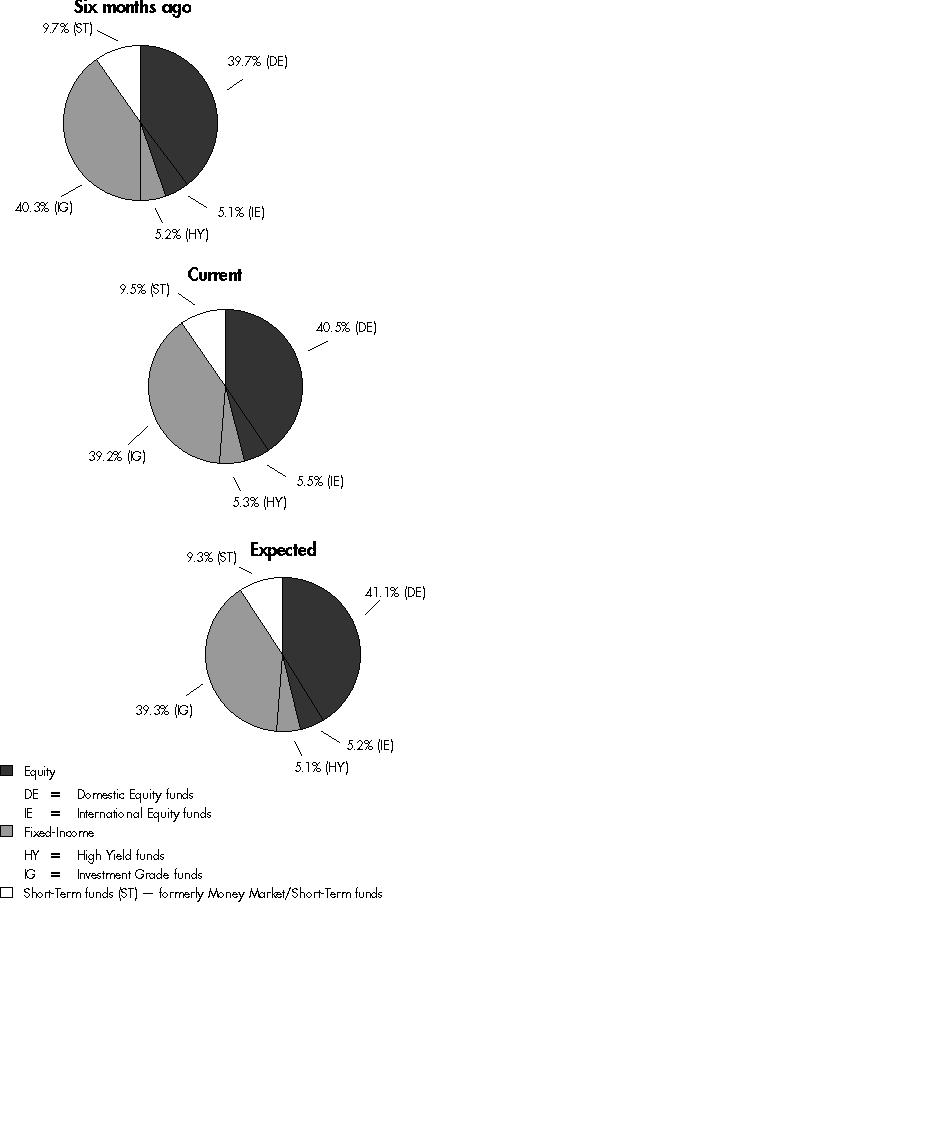
The fund invests according to an asset allocation strategy that becomes increasingly conservative over time. The six months ago allocation is based on the fund's holdings as of September 30, 2004. The current allocation is based on the fund's holdings as of March 31, 2005. The expected allocation represents the fund's anticipated target asset allocation at September 30, 2005.
Annual Report
Fidelity Advisor Freedom 2010 Fund
Investments March 31, 2005
Showing Percentage of Total Value of Investment in Securities
Equity Funds - 46.0% |
| Shares | | Value (Note 1) |
Domestic Equity Funds - 40.5% |
Fidelity Advisor Dividend Growth Fund Institutional Class | 1,546,160 | | $ 17,595,304 |
Fidelity Advisor Equity Growth Fund Institutional Class | 192,296 | | 8,872,536 |
Fidelity Advisor Equity Income Fund Institutional Class | 664,627 | | 18,868,759 |
Fidelity Advisor Growth & Income Fund Institutional Class | 1,091,643 | | 17,979,367 |
Fidelity Advisor Large Cap Fund Institutional Class | 1,200,605 | | 17,792,967 |
Fidelity Advisor Mid-Cap Fund Institutional Class | 236,426 | | 5,728,590 |
Fidelity Advisor Small Cap Fund Institutional Class | 244,211 | | 5,985,622 |
TOTAL DOMESTIC EQUITY FUNDS | | 92,823,145 |
International Equity Funds - 5.5% |
Fidelity Advisor Diversified International Fund Institutional Class | 338,291 | | 6,376,787 |
Fidelity Advisor Overseas Fund Institutional Class | 352,300 | | 6,133,548 |
TOTAL INTERNATIONAL EQUITY FUNDS | | 12,510,335 |
TOTAL EQUITY FUNDS (Cost $101,456,935) | 105,333,480 |
Fixed-Income Funds - 44.5% |
| | | |
High Yield Fixed-Income Funds - 5.3% |
Fidelity Advisor High Income Advantage Fund Institutional Class | 1,302,626 | | 12,270,739 |
Investment Grade Fixed-Income Funds - 39.2% |
Fidelity Advisor Government Investment Fund Institutional Class | 4,529,203 | | 44,974,982 |
Fidelity Advisor Intermediate Bond Fund Institutional Class | 4,081,430 | | 44,773,289 |
TOTAL INVESTMENT GRADE FIXED-INCOME FUNDS | | 89,748,271 |
TOTAL FIXED-INCOME FUNDS (Cost $103,438,050) | 102,019,010 |
Short-Term Funds - 9.5% |
| | | |
Fidelity Cash Reserves Fund | 13,145,823 | | 13,145,823 |
Fidelity Advisor Short-Fixed Income Fund Institutional Class | 921,435 | | 8,707,564 |
TOTAL SHORT-TERM FUNDS (Cost $21,958,554) | 21,853,387 |
TOTAL INVESTMENT IN SECURITIES - 100% (Cost $226,853,539) | $ 229,205,877 |
See accompanying notes which are an integral part of the financial statements.
Annual Report
Fidelity Advisor Freedom 2010 Fund
Financial Statements
Statement of Assets and Liabilities
| March 31, 2005 |
| | |
Assets | | |
Investment in securities, at value (cost $226,853,539) - See accompanying schedule | | $ 229,205,877 |
Cash | | 3,500 |
Receivable for investments sold | | 641,985 |
Receivable for fund shares sold | | 4,416,454 |
Receivable from investment adviser for expense reductions | | 1,886 |
Total assets | | 234,269,702 |
| | |
Liabilities | | |
Payable for investments purchased | $ 4,085,906 | |
Payable for fund shares redeemed | 1,004,203 | |
Accrued management fee | 18,686 | |
Distribution fees payable | 98,899 | |
Total liabilities | | 5,207,694 |
| | |
Net Assets | | $ 229,062,008 |
Net Assets consist of: | | |
Paid in capital | | $ 225,249,095 |
Undistributed net investment income | | 718,326 |
Accumulated undistributed net realized gain (loss) on investments | | 742,249 |
Net unrealized appreciation (depreciation) on investments | | 2,352,338 |
Net Assets | | $ 229,062,008 |
Calculation of Maximum Offering Price Class A:
Net Asset Value and redemption price per share ($74,013,230 ÷ 6,724,565 shares) | | $ 11.01 |
| | |
Maximum offering price per share (100/94.25 of $11.01) | | $ 11.68 |
| | |
Class T:
Net Asset Value and redemption price per share ($94,744,229 ÷ 8,634,748 shares) | | $ 10.97 |
| | |
Maximum offering price per share (100/96.50 of $10.97) | | $ 11.37 |
| | |
Class B:
Net Asset Value and offering price per share ($27,098,137 ÷ 2,476,948 shares)A | | $ 10.94 |
| | |
Class C:
Net Asset Value and offering price per share ($27,668,398 ÷ 2,531,717 shares)A | | $ 10.93 |
| | |
Institutional Class:
Net Asset Value, offering price and redemption price per share ($5,538,014 ÷ 502,068 shares) | | $ 11.03 |
A Redemption price per share is equal to net asset value less any applicable contingent deferred sales charge.
Statement of Operations
| Year ended March 31, 2005 |
| | |
Investment Income | | |
Income distributions from underlying funds | | $ 3,819,817 |
Interest | | 2 |
Total income | | 3,819,819 |
| | |
Expenses | | |
Management fee | $ 156,388 | |
Distribution fees | 840,865 | |
Independent trustees' compensation | 768 | |
Total expenses before reductions | 998,021 | |
Expense reductions | (34,348) | 963,673 |
Net investment income (loss) | | 2,856,146 |
Realized and Unrealized Gain (Loss) Realized gain (loss) on sale of underlying fund shares | (124,487) | |
Capital gain distributions from underlying funds | 1,073,948 | 949,461 |
Change in net unrealized appreciation (depreciation) on underlying funds | | 417,464 |
Net gain (loss) | | 1,366,925 |
Net increase (decrease) in net assets resulting from operations | | $ 4,223,071 |
See accompanying notes which are an integral part of the financial statements.
Annual Report
Fidelity Advisor Freedom 2010 Fund
Financial Statements - continued
Statement of Changes in Net Assets
| Year ended
March 31,
2005 | July 24, 2003
(commencement of
operations) to
March 31, 2004 |
Increase (Decrease) in Net Assets | | |
Operations | | |
Net investment income (loss) | $ 2,856,146 | $ 430,765 |
Net realized gain (loss) | 949,461 | 19,958 |
Change in net unrealized appreciation (depreciation) | 417,464 | 1,934,874 |
Net increase (decrease) in net assets resulting from operations | 4,223,071 | 2,385,597 |
Distributions to shareholders from net investment income | (2,579,243) | (196,312) |
Distributions to shareholders from net realized gain | (20,201) | - |
Total distributions | (2,599,444) | (196,312) |
Share transactions - net increase (decrease) | 136,717,726 | 88,531,370 |
Total increase (decrease) in net assets | 138,341,353 | 90,720,655 |
| | |
Net Assets | | |
Beginning of period | 90,720,655 | - |
End of period (including undistributed net investment income of $718,326 and undistributed net investment income of $239,489, respectively) | $ 229,062,008 | $ 90,720,655 |
Financial Highlights - Class A
Years ended March 31, | 2005 | 2004F |
Selected Per-Share Data | | |
Net asset value, beginning of period | $ 10.92 | $ 10.00 |
Income from Investment Operations | | |
Net investment income (loss)E | .23 | .16 |
Net realized and unrealized gain (loss) | .04 | .83 |
Total from investment operations | .27 | .99 |
Distributions from net investment income | (.18) | (.07) |
Distributions from net realized gain | -H | - |
Total distributions | (.18) | (.07) |
Net asset value, end of period | $ 11.01 | $ 10.92 |
Total ReturnB,C,D | 2.48% | 9.92% |
Ratios to Average Net AssetsG, I | | |
Expenses before expense reductions | .35% | .35%A |
Expenses net of voluntary waivers, if any | .33% | .33%A |
Expenses net of all reductions | .33% | .33%A |
Net investment income (loss) | 2.10% | 2.14%A |
Supplemental Data | | |
Net assets, end of period (000 omitted) | $ 74,013 | $ 32,615 |
Portfolio turnover rate | 5% | 103%A |
A Annualized
B Total returns for periods of less than one year are not annualized.
C Total returns would have been lower had certain expenses not been reduced during the periods shown.
D Total returns do not include the effect of the sales charges.
E Calculated based on average shares outstanding during the period.
F For the period July 24, 2003 (commencement of operations) to March 31, 2004.
G Expense ratios reflect operating expenses of the class. Expenses before reductions do not reflect amounts reimbursed by the investment adviser or reductions from brokerage service arrangements or other expense offset arrangements and do not represent the amount paid by the class during periods when reimbursements or reductions occur. Expenses net of any voluntary waivers reflect expenses after reimbursement by the investment adviser but prior to reductions from brokerage service arrangements or other expense offset arrangements. Expenses net of all reductions represent the net expenses paid by the class.
H Amount represents less than $.01 per share.
I Amounts do not include the activity of the underlying funds.
See accompanying notes which are an integral part of the financial statements.
Annual Report
Financial Highlights - Class T
Years ended March 31, | 2005 | 2004F |
Selected Per-Share Data | | |
Net asset value, beginning of period | $ 10.90 | $ 10.00 |
Income from Investment Operations | | |
Net investment income (loss)E | .20 | .14 |
Net realized and unrealized gain (loss) | .04 | .83 |
Total from investment operations | .24 | .97 |
Distributions from net investment income | (.17) | (.07) |
Distributions from net realized gain | -H | - |
Total distributions | (.17) | (.07) |
Net asset value, end of period | $ 10.97 | $ 10.90 |
Total ReturnB,C,D | 2.18% | 9.72% |
Ratios to Average Net AssetsG, I | | |
Expenses before expense reductions | .60% | .60%A |
Expenses net of voluntary waivers, if any | .58% | .58%A |
Expenses net of all reductions | .58% | .58%A |
Net investment income (loss) | 1.86% | 1.89%A |
Supplemental Data | | |
Net assets, end of period (000 omitted) | $ 94,744 | $ 29,964 |
Portfolio turnover rate | 5% | 103%A |
A Annualized
B Total returns for periods of less than one year are not annualized.
C Total returns would have been lower had certain expenses not been reduced during the periods shown.
D Total returns do not include the effect of the sales charges.
E Calculated based on average shares outstanding during the period.
F For the period July 24, 2003 (commencement of operations) to March 31, 2004.
G Expense ratios reflect operating expenses of the class. Expenses before reductions do not reflect amounts reimbursed by the investment adviser or reductions from brokerage service arrangements or other expense offset arrangements and do not represent the amount paid by the class during periods when reimbursements or reductions occur. Expenses net of any voluntary waivers reflect expenses after reimbursement by the investment adviser but prior to reductions from brokerage service arrangements or other expense offset arrangements. Expenses net of all reductions represent the net expenses paid by the class.
H Amount represents less than $.01 per share.
I Amounts do not include the activity of the underlying funds.
Financial Highlights - Class B
Years ended March 31, | 2005 | 2004F |
Selected Per-Share Data | | |
Net asset value, beginning of period | $ 10.87 | $ 10.00 |
Income from Investment Operations | | |
Net investment income (loss)E | .15 | .10 |
Net realized and unrealized gain (loss) | .04 | .83 |
Total from investment operations | .19 | .93 |
Distributions from net investment income | (.12) | (.06) |
Distributions from net realized gain | -H | - |
Total distributions | (.12) | (.06) |
Net asset value, end of period | $ 10.94 | $ 10.87 |
Total ReturnB,C,D | 1.72% | 9.32% |
Ratios to Average Net AssetsG, I | | |
Expenses before expense reductions | 1.10% | 1.10%A |
Expenses net of voluntary waivers, if any | 1.08% | 1.08%A |
Expenses net of all reductions | 1.08% | 1.08%A |
Net investment income (loss) | 1.35% | 1.39%A |
Supplemental Data | | |
Net assets, end of period (000 omitted) | $ 27,098 | $ 14,897 |
Portfolio turnover rate | 5% | 103%A |
A Annualized
B Total returns for periods of less than one year are not annualized.
C Total returns would have been lower had certain expenses not been reduced during the periods shown.
D Total returns do not include the effect of the contingent deferred sales charge.
E Calculated based on average shares outstanding during the period.
F For the period July 24, 2003 (commencement of operations) to March 31, 2004.
G Expense ratios reflect operating expenses of the class. Expenses before reductions do not reflect amounts reimbursed by the investment adviser or reductions from brokerage service arrangements or other expense offset arrangements and do not represent the amount paid by the class during periods when reimbursements or reductions occur. Expenses net of any voluntary waivers reflect expenses after reimbursement by the investment adviser but prior to reductions from brokerage service arrangements or other expense offset arrangements. Expenses net of all reductions represent the net expenses paid by the class.
H Amount represents less than $.01 per share.
I Amounts do not include the activity of the underlying funds.
See accompanying notes which are an integral part of the financial statements.
Annual Report
Financial Highlights - Class C
Years ended March 31, | 2005 | 2004F |
Selected Per-Share Data | | |
Net asset value, beginning of period | $ 10.87 | $ 10.00 |
Income from Investment Operations | | |
Net investment income (loss)E | .15 | .10 |
Net realized and unrealized gain (loss) | .04 | .83 |
Total from investment operations | .19 | .93 |
Distributions from net investment income | (.13) | (.06) |
Distributions from net realized gain | -H | - |
Total distributions | (.13) | (.06) |
Net asset value, end of period | $ 10.93 | $ 10.87 |
Total ReturnB,C,D | 1.72% | 9.32% |
Ratios to Average Net AssetsG, I | | |
Expenses before expense reductions | 1.10% | 1.10%A |
Expenses net of voluntary waivers, if any | 1.08% | 1.08%A |
Expenses net of all reductions | 1.08% | 1.08%A |
Net investment income (loss) | 1.36% | 1.39%A |
Supplemental Data | | |
Net assets, end of period (000 omitted) | $ 27,668 | $ 11,552 |
Portfolio turnover rate | 5% | 103%A |
A Annualized
B Total returns for periods of less than one year are not annualized.
C Total returns would have been lower had certain expenses not been reduced during the periods shown.
D Total returns do not include the effect of the contingent deferred sales charge.
E Calculated based on average shares outstanding during the period.
F For the period July 24, 2003 (commencement of operations) to March 31, 2004.
G Expense ratios reflect operating expenses of the class. Expenses before reductions do not reflect amounts reimbursed by the investment adviser or reductions from brokerage service arrangements or other expense offset arrangements and do not represent the amount paid by the class during periods when reimbursements or reductions occur. Expenses net of any voluntary waivers reflect expenses after reimbursement by the investment adviser but prior to reductions from brokerage service arrangements or other expense offset arrangements. Expenses net of all reductions represent the net expenses paid by the class.
H Amount represents less than $.01 per share.
I Amounts do not include the activity of the underlying funds.
Financial Highlights - Institutional Class
Years ended March 31, | 2005 | 2004E |
Selected Per-Share Data | | |
Net asset value, beginning of period | $ 10.93 | $ 10.00 |
Income from Investment Operations | | |
Net investment income (loss)D | .26 | .17 |
Net realized and unrealized gain (loss) | .05 | .83 |
Total from investment operations | .31 | 1.00 |
Distributions from net investment income | (.20) | (.07) |
Distributions from net realized gain | -G | - |
Total distributions | (.21)H | (.07) |
Net asset value, end of period | $ 11.03 | $ 10.93 |
Total ReturnB,C | 2.80% | 10.02% |
Ratios to Average Net AssetsF, I | | |
Expenses before expense reductions | .10% | .10%A |
Expenses net of voluntary waivers, if any | .08% | .08%A |
Expenses net of all reductions | .08% | .08%A |
Net investment income (loss) | 2.35% | 2.38%A |
Supplemental Data | | |
Net assets, end of period (000 omitted) | $ 5,538 | $ 1,691 |
Portfolio turnover rate | 5% | 103%A |
A Annualized
B Total returns for periods of less than one year are not annualized.
C Total returns would have been lower had certain expenses not been reduced during the periods shown.
D Calculated based on average shares outstanding during the period.
E For the period July 24, 2003 (commencement of operations) to March 31, 2004.
F Expense ratios reflect operating expenses of the class. Expenses before reductions do not reflect amounts reimbursed by the investment adviser or reductions from brokerage service arrangements or other expense offset arrangements and do not represent the amount paid by the class during periods when reimbursements or reductions occur. Expenses net of any voluntary waivers reflect expenses after reimbursement by the investment adviser but prior to reductions from brokerage service arrangements or other expense offset arrangements. Expenses net of all reductions represent the net expenses paid by the class.
G Amount represents less than $.01 per share.
H Total distributions of $.206 per share is comprised of distributions from net investment income of $.204 per share and distributions from net realized gain of $.002 per share.
I Amounts do not include the activity of the underlying funds.
See accompanying notes which are an integral part of the financial statements.
Annual Report
Fidelity Advisor Freedom 2015 Fund
Investment Changes
Fund Holdings as of March 31, 2005 |
| % of fund's
investments | % of fund's investments
6 months ago |
Domestic Equity Funds | | |
Fidelity Advisor Dividend Growth Fund Institutional Class | 9.6 | 10.0 |
Fidelity Advisor Equity Growth Fund Institutional Class | 4.9 | 5.0 |
Fidelity Advisor Equity Income Fund Institutional Class | 10.2 | 10.3 |
Fidelity Advisor Growth & Income Fund Institutional Class | 9.9 | 10.2 |
Fidelity Advisor Large Cap Fund Institutional Class | 9.8 | 10.0 |
Fidelity Advisor Mid-Cap Fund Institutional Class | 3.1 | 3.1 |
Fidelity Advisor Small Cap Fund Institutional Class | 3.2 | 3.2 |
| 50.7 | 51.8 |
International Equity Funds | | |
Fidelity Advisor Diversified International Fund Institutional Class | 4.1 | 4.2 |
Fidelity Advisor Overseas Fund Institutional Class | 4.0 | 4.1 |
| 8.1 | 8.3 |
High Yield Fixed-Income Funds | | |
Fidelity Advisor High Income Advantage Fund Institutional Class | 6.6 | 6.7 |
Investment Grade Fixed-Income Funds |
Fidelity Advisor Government Investment Fund Institutional Class | 15.1 | 14.7 |
Fidelity Advisor Intermediate Bond Fund Institutional Class | 15.0 | 14.7 |
| 30.1 | 29.4 |
Short-Term Funds | | |
Fidelity Advisor Short-Fixed Income Fund Institutional Class | 1.8 | 1.5 |
Fidelity Cash Reserves Fund | 2.7 | 2.3 |
| 4.5 | 3.8 |
| 100.0 | 100.0 |
Asset Allocation (% of fund's investments) |

The fund invests according to an asset allocation strategy that becomes increasingly conservative over time. The six months ago allocation is based on the fund's holdings as of September 30, 2004. The current allocation is based on the fund's holdings as of March 31, 2005. The expected allocation represents the fund's anticipated target asset allocation at September 30, 2005.
Annual Report
Fidelity Advisor Freedom 2015 Fund
Investments March 31, 2005
Showing Percentage of Total Value of Investment in Securities
Equity Funds - 58.8% |
| Shares | | Value (Note 1) |
Domestic Equity Funds - 50.7% |
Fidelity Advisor Dividend Growth Fund Institutional Class | 1,287,899 | | $ 14,656,296 |
Fidelity Advisor Equity Growth Fund Institutional Class | 161,262 | | 7,440,639 |
Fidelity Advisor Equity Income Fund Institutional Class | 543,480 | | 15,429,392 |
Fidelity Advisor Growth & Income Fund Institutional Class | 910,652 | | 14,998,441 |
Fidelity Advisor Large Cap Fund Institutional Class | 1,000,296 | | 14,824,385 |
Fidelity Advisor Mid-Cap Fund Institutional Class | 193,318 | | 4,684,094 |
Fidelity Advisor Small Cap Fund Institutional Class | 196,540 | | 4,817,200 |
TOTAL DOMESTIC EQUITY FUNDS | | 76,850,447 |
International Equity Funds - 8.1% |
Fidelity Advisor Diversified International Fund Institutional Class | 331,744 | | 6,253,384 |
Fidelity Advisor Overseas Fund Institutional Class | 349,790 | | 6,089,852 |
TOTAL INTERNATIONAL EQUITY FUNDS | | 12,343,236 |
TOTAL EQUITY FUNDS (Cost $87,353,811) | 89,193,683 |
Fixed-Income Funds - 36.7% |
| | | |
High Yield Fixed-Income Funds - 6.6% |
Fidelity Advisor High Income Advantage Fund Institutional Class | 1,059,003 | | 9,975,808 |
Investment Grade Fixed-Income Funds - 30.1% |
Fidelity Advisor Government Investment Fund Institutional Class | 2,299,253 | | 22,831,580 |
Fidelity Advisor Intermediate Bond Fund Institutional Class | 2,072,587 | | 22,736,276 |
TOTAL INVESTMENT GRADE FIXED-INCOME FUNDS | | 45,567,856 |
TOTAL FIXED-INCOME FUNDS (Cost $56,193,689) | 55,543,664 |
Short-Term Funds - 4.5% |
| | | |
Fidelity Cash Reserves Fund | 4,140,822 | | 4,140,822 |
Fidelity Advisor Short-Fixed Income Fund Institutional Class | 291,958 | | 2,759,000 |
TOTAL SHORT-TERM FUNDS (Cost $6,927,879) | 6,899,822 |
TOTAL INVESTMENT IN SECURITIES - 100% (Cost $150,475,379) | $ 151,637,169 |
See accompanying notes which are an integral part of the financial statements.
Annual Report
Fidelity Advisor Freedom 2015 Fund
Financial Statements
Statement of Assets and Liabilities
| March 31, 2005 |
| | |
Assets | | |
Investment in securities, at value (cost $150,475,379) - See accompanying schedule | | $ 151,637,169 |
Cash | | 109 |
Receivable for investments sold | | 68 |
Receivable for fund shares sold | | 1,193,846 |
Receivable from investment adviser for expense reductions | | 787 |
Total assets | | 152,831,979 |
| | |
Liabilities | | |
Payable for investments purchased | $ 1,080,156 | |
Payable for fund shares redeemed | 103,837 | |
Accrued management fee | 12,287 | |
Distribution fees payable | 62,215 | |
Total liabilities | | 1,258,495 |
| | |
Net Assets | | $ 151,573,484 |
Net Assets consist of: | | |
Paid in capital | | $ 149,643,615 |
Undistributed net investment income | | 318,954 |
Accumulated undistributed net realized gain (loss) on investments | | 449,125 |
Net unrealized appreciation (depreciation) on investments | | 1,161,790 |
Net Assets | | $ 151,573,484 |
Calculation of Maximum Offering Price Class A:
Net Asset Value and redemption price per share ($45,028,023 ÷ 4,179,704 shares) | | $ 10.77 |
| | |
Maximum offering price per share (100/94.25 of $10.77) | | $ 11.43 |
| | |
Class T:
Net Asset Value and redemption price per share ($55,944,755 ÷ 5,200,943 shares) | | $ 10.76 |
| | |
Maximum offering price per share (100/96.50 of $10.76) | | $ 11.15 |
| | |
Class B:
Net Asset Value and offering price per share ($18,812,950 ÷ 1,753,882 shares)A | | $ 10.73 |
| | |
Class C:
Net Asset Value and offering price per share ($18,926,366 ÷ 1,764,243 shares)A | | $ 10.73 |
| | |
Institutional Class:
Net Asset Value, offering price and redemption price per share ($12,861,390 ÷ 1,189,970 shares) | | $ 10.81 |
A Redemption price per share is equal to net asset value less any applicable contingent deferred sales charge.
Statement of Operations
| Year ended March 31, 2005 |
| | |
Investment Income | | |
Income distributions from underlying funds | | $ 1,868,916 |
Interest | | 168 |
Total income | | 1,869,084 |
| | |
Expenses | | |
Management fee | $ 79,236 | |
Distribution fees | 411,837 | |
Independent trustees' compensation | 357 | |
Total expenses before reductions | 491,430 | |
Expense reductions | (18,239) | 473,191 |
Net investment income (loss) | | 1,395,893 |
Realized and Unrealized Gain (Loss) Realized gain (loss) on sale of underlying fund shares | (41,219) | |
Capital gain distributions from underlying funds | 609,695 | 568,476 |
Change in net unrealized appreciation (depreciation) on underlying funds | | 992,415 |
Net gain (loss) | | 1,560,891 |
Net increase (decrease) in net assets resulting from operations | | $ 2,956,784 |
See accompanying notes which are an integral part of the financial statements.
Annual Report
Fidelity Advisor Freedom 2015 Fund
Financial Statements - continued
Statement of Changes in Net Assets
| Year ended
March 31,
2005 | November 6, 2003
(commencement of operations) to
March 31, 2004 |
Increase (Decrease) in Net Assets | | |
Operations | | |
Net investment income (loss) | $ 1,395,893 | $ 39,142 |
Net realized gain (loss) | 568,476 | 5,637 |
Change in net unrealized appreciation (depreciation) | 992,415 | 169,375 |
Net increase (decrease) in net assets resulting from operations | 2,956,784 | 214,154 |
Distributions to shareholders from net investment income | (1,216,011) | (18,521) |
Distributions to shareholders from net realized gain | (6,537) | - |
Total distributions | (1,222,548) | (18,521) |
Share transactions - net increase (decrease) | 131,894,217 | 17,749,398 |
Total increase (decrease) in net assets | 133,628,453 | 17,945,031 |
| | |
Net Assets | | |
Beginning of period | 17,945,031 | - |
End of period (including undistributed net investment income of $318,954 and undistributed net investment income of $20,910, respectively) | $ 151,573,484 | $ 17,945,031 |
Financial Highlights - Class A
Years ended March 31, | 2005 | 2004F |
Selected Per-Share Data | | |
Net asset value, beginning of period | $ 10.57 | $ 10.00 |
Income from Investment Operations | | |
Net investment income (loss)E | .21 | .07 |
Net realized and unrealized gain (loss) | .13 | .56 |
Total from investment operations | .34 | .63 |
Distributions from net investment income | (.14) | (.06) |
Distributions from net realized gain | -H | - |
Total distributions | (.14) | (.06) |
Net asset value, end of period | $ 10.77 | $ 10.57 |
Total ReturnB,C,D | 3.22% | 6.32% |
Ratios to Average Net AssetsG, I | | |
Expenses before expense reductions | .35% | .35%A |
Expenses net of voluntary waivers, if any | .33% | .33%A |
Expenses net of all reductions | .33% | .33%A |
Net investment income (loss) | 2.02% | 1.84%A |
Supplemental Data | | |
Net assets, end of period (000 omitted) | $ 45,028 | $ 4,773 |
Portfolio turnover rate | 3% | 5%A |
A Annualized
B Total returns for periods of less than one year are not annualized.
C Total returns would have been lower had certain expenses not been reduced during the periods shown.
D Total returns do not include the effect of the sales charges.
E Calculated based on average shares outstanding during the period.
F For the period November 6, 2003 (commencement of operations) to March 31, 2004.
G Expense ratios reflect operating expenses of the class. Expenses before reductions do not reflect amounts reimbursed by the investment adviser or reductions from brokerage service arrangements or other expense offset arrangements and do not represent the amount paid by the class during periods when reimbursements or reductions occur. Expenses net of any voluntary waivers reflect expenses after reimbursement by the investment adviser but prior to reductions from brokerage service arrangements or other expense offset arrangements. Expenses net of all reductions represent the net expenses paid by the class.
H Amount represents less than $.01 per share.
I Amounts do not include the activity of the underlying funds.
See accompanying notes which are an integral part of the financial statements.
Annual Report
Financial Highlights - Class T
Years ended March 31, | 2005 | 2004F |
Selected Per-Share Data | | |
Net asset value, beginning of period | $ 10.57 | $ 10.00 |
Income from Investment Operations | | |
Net investment income (loss)E | .19 | .06 |
Net realized and unrealized gain (loss) | .13 | .57 |
Total from investment operations | .32 | .63 |
Distributions from net investment income | (.13) | (.06) |
Distributions from net realized gain | -H | - |
Total distributions | (.13) | (.06) |
Net asset value, end of period | $ 10.76 | $ 10.57 |
Total ReturnB,C,D | 3.01% | 6.27% |
Ratios to Average Net AssetsG, I | | |
Expenses before expense reductions | .60% | .60%A |
Expenses net of voluntary waivers, if any | .58% | .58%A |
Expenses net of all reductions | .58% | .58%A |
Net investment income (loss) | 1.77% | 1.59%A |
Supplemental Data | | |
Net assets, end of period (000 omitted) | $ 55,945 | $ 5,038 |
Portfolio turnover rate | 3% | 5%A |
A Annualized
B Total returns for periods of less than one year are not annualized.
C Total returns would have been lower had certain expenses not been reduced during the periods shown.
D Total returns do not include the effect of the sales charges.
E Calculated based on average shares outstanding during the period.
F For the period November 6, 2003 (commencement of operations) to March 31, 2004.
G Expense ratios reflect operating expenses of the class. Expenses before reductions do not reflect amounts reimbursed by the investment adviser or reductions from brokerage service arrangements or other expense offset arrangements and do not represent the amount paid by the class during periods when reimbursements or reductions occur. Expenses net of any voluntary waivers reflect expenses after reimbursement by the investment adviser but prior to reductions from brokerage service arrangements or other expense offset arrangements. Expenses net of all reductions represent the net expenses paid by the class.
H Amount represents less than $.01 per share.
I Amounts do not include the activity of the underlying funds.
Financial Highlights - Class B
Years ended March 31, | 2005 | 2004F |
Selected Per-Share Data | | |
Net asset value, beginning of period | $ 10.56 | $ 10.00 |
Income from Investment Operations | | |
Net investment income (loss)E | .13 | .04 |
Net realized and unrealized gain (loss) | .13 | .58 |
Total from investment operations | .26 | .62 |
Distributions from net investment income | (.09) | (.06) |
Distributions from net realized gain | -H | - |
Total distributions | (.09) | (.06) |
Net asset value, end of period | $ 10.73 | $ 10.56 |
Total ReturnB,C,D | 2.49% | 6.17% |
Ratios to Average Net AssetsG, I | | |
Expenses before expense reductions | 1.10% | 1.10%A |
Expenses net of voluntary waivers, if any | 1.08% | 1.08%A |
Expenses net of all reductions | 1.08% | 1.08%A |
Net investment income (loss) | 1.28% | 1.09%A |
Supplemental Data | | |
Net assets, end of period (000 omitted) | $ 18,813 | $ 4,259 |
Portfolio turnover rate | 3% | 5%A |
A Annualized
B Total returns for periods of less than one year are not annualized.
C Total returns would have been lower had certain expenses not been reduced during the periods shown.
D Total returns do not include the effect of the contingent deferred sales charge.
E Calculated based on average shares outstanding during the period.
F For the period November 6, 2003 (commencement of operations) to March 31, 2004.
G Expense ratios reflect operating expenses of the class. Expenses before reductions do not reflect amounts reimbursed by the investment adviser or reductions from brokerage service arrangements or other expense offset arrangements and do not represent the amount paid by the class during periods when reimbursements or reductions occur. Expenses net of any voluntary waivers reflect expenses after reimbursement by the investment adviser but prior to reductions from brokerage service arrangements or other expense offset arrangements. Expenses net of all reductions represent the net expenses paid by the class.
H Amount represents less than $.01 per share.
I Amounts do not include the activity of the underlying funds.
See accompanying notes which are an integral part of the financial statements.
Annual Report
Financial Highlights - Class C
Years ended March 31, | 2005 | 2004F |
Selected Per-Share Data | | |
Net asset value, beginning of period | $ 10.56 | $ 10.00 |
Income from Investment Operations | | |
Net investment income (loss)E | .13 | .04 |
Net realized and unrealized gain (loss) | .13 | .57 |
Total from investment operations | .26 | .61 |
Distributions from net investment income | (.09) | (.05) |
Distributions from net realized gain | -H | - |
Total distributions | (.09) | (.05) |
Net asset value, end of period | $ 10.73 | $ 10.56 |
Total ReturnB,C,D | 2.47% | 6.12% |
Ratios to Average Net AssetsG, I | | |
Expenses before expense reductions | 1.10% | 1.10%A |
Expenses net of voluntary waivers, if any | 1.08% | 1.08%A |
Expenses net of all reductions | 1.08% | 1.08%A |
Net investment income (loss) | 1.28% | 1.09%A |
Supplemental Data | | |
Net assets, end of period (000 omitted) | $ 18,926 | $ 3,593 |
Portfolio turnover rate | 3% | 5%A |
A Annualized
B Total returns for periods of less than one year are not annualized.
C Total returns would have been lower had certain expenses not been reduced during the periods shown.
D Total returns do not include the effect of the contingent deferred sales charge.
E Calculated based on average shares outstanding during the period.
F For the period November 6, 2003 (commencement of operations) to March 31, 2004.
G Expense ratios reflect operating expenses of the class. Expenses before reductions do not reflect amounts reimbursed by the investment adviser or reductions from brokerage service arrangements or other expense offset arrangements and do not represent the amount paid by the class during periods when reimbursements or reductions occur. Expenses net of any voluntary waivers reflect expenses after reimbursement by the investment adviser but prior to reductions from brokerage service arrangements or other expense offset arrangements. Expenses net of all reductions represent the net expenses paid by the class.
H Amount represents less than $.01 per share.
I Amounts do not include the activity of the underlying funds.
Financial Highlights - Institutional Class
Years ended March 31, | 2005 | 2004E |
Selected Per-Share Data | | |
Net asset value, beginning of period | $ 10.59 | $ 10.00 |
Income from Investment Operations | | |
Net investment income (loss)D | .24 | .09 |
Net realized and unrealized gain (loss) | .13 | .56 |
Total from investment operations | .37 | .65 |
Distributions from net investment income | (.15) | (.06) |
Distributions from net realized gain | -G | - |
Total distributions | (.15) | (.06) |
Net asset value, end of period | $ 10.81 | $ 10.59 |
Total ReturnB,C | 3.52% | 6.52% |
Ratios to Average Net AssetsF, H | | |
Expenses before expense reductions | .10% | .10%A |
Expenses net of voluntary waivers, if any | .08% | .08%A |
Expenses net of all reductions | .08% | .08%A |
Net investment income (loss) | 2.27% | 2.09%A |
Supplemental Data | | |
Net assets, end of period (000 omitted) | $ 12,861 | $ 282 |
Portfolio turnover rate | 3% | 5%A |
A Annualized
B Total returns for periods of less than one year are not annualized.
C Total returns would have been lower had certain expenses not been reduced during the periods shown.
D Calculated based on average shares outstanding during the period.
E For the period November 6, 2003 (commencement of operations) to March 31, 2004.
F Expense ratios reflect operating expenses of the class. Expenses before reductions do not reflect amounts reimbursed by the investment adviser or reductions from brokerage service arrangements or other expense offset arrangements and do not represent the amount paid by the class during periods when reimbursements or reductions occur. Expenses net of any voluntary waivers reflect expenses after reimbursement by the investment adviser but prior to reductions from brokerage service arrangements or other expense offset arrangements. Expenses net of all reductions represent the net expenses paid by the class.
G Amount represents less than $.01 per share.
H Amounts do not include the activity of the underlying funds.
See accompanying notes which are an integral part of the financial statements.
Annual Report
Fidelity Advisor Freedom 2020 Fund
Investment Changes
Fund Holdings as of March 31, 2005 |
| % of fund's investments | % of fund's investments 6 months ago |
Domestic Equity Funds | | |
Fidelity Advisor Dividend Growth Fund Institutional Class | 11.3 | 11.4 |
Fidelity Advisor Equity Growth Fund Institutional Class | 5.7 | 5.7 |
Fidelity Advisor Equity Income Fund Institutional Class | 12.1 | 12.0 |
Fidelity Advisor Growth & Income Fund Institutional Class | 11.6 | 11.6 |
Fidelity Advisor Large Cap Fund Institutional Class | 11.4 | 11.4 |
Fidelity Advisor Mid-Cap Fund Institutional Class | 3.7 | 3.6 |
Fidelity Advisor Small Cap Fund Institutional Class | 3.8 | 3.7 |
| 59.6 | 59.4 |
International Equity Funds | | |
Fidelity Advisor Diversified International Fund Institutional Class | 5.5 | 5.2 |
Fidelity Advisor Overseas Fund Institutional Class | 5.2 | 5.0 |
| 10.7 | 10.2 |
High Yield Fixed-Income Funds | | |
Fidelity Advisor High Income Advantage Fund Institutional Class | 7.8 | 7.7 |
Investment Grade Fixed-Income Funds |
Fidelity Advisor Government Investment Fund Institutional Class | 10.9 | 11.4 |
Fidelity Advisor Intermediate Bond Fund Institutional Class | 10.9 | 11.3 |
| 21.8 | 22.7 |
Short-Term Funds | | |
Fidelity Advisor Short-Fixed Income Fund Institutional Class | 0.0 | 0.0 |
Fidelity Cash Reserves Fund | 0.1 | 0.0 |
| 0.1 | 0.0 |
| 100.0 | 100.0 |
Asset Allocation (% of fund's investments) |
The fund invests according to an asset allocation strategy that becomes increasingly conservative over time. The six months ago allocation is based on the fund's holdings as of September 30, 2004. The current allocation is based on the fund's holdings as of March 31, 2005. The expected allocation represents the fund's anticipated target asset allocation at September 30, 2005.
Annual Report
Fidelity Advisor Freedom 2020 Fund
Investments March 31, 2005
Showing Percentage of Total Value of Investment in Securities
Equity Funds - 70.3% |
| Shares | | Value (Note 1) |
Domestic Equity Funds - 59.6% |
Fidelity Advisor Dividend Growth Fund Institutional Class | 4,103,125 | | $ 46,693,558 |
Fidelity Advisor Equity Growth Fund Institutional Class | 509,821 | | 23,523,140 |
Fidelity Advisor Equity Income Fund Institutional Class | 1,765,382 | | 50,119,190 |
Fidelity Advisor Growth & Income Fund Institutional Class | 2,899,189 | | 47,749,639 |
Fidelity Advisor Large Cap Fund Institutional Class | 3,186,334 | | 47,221,476 |
Fidelity Advisor Mid-Cap Fund Institutional Class | 626,743 | | 15,185,980 |
Fidelity Advisor Small Cap Fund Institutional Class | 647,531 | | 15,870,991 |
TOTAL DOMESTIC EQUITY FUNDS | | 246,363,974 |
International Equity Funds - 10.7% |
Fidelity Advisor Diversified International Fund Institutional Class | 1,192,713 | | 22,482,642 |
Fidelity Advisor Overseas Fund Institutional Class | 1,241,755 | | 21,618,951 |
TOTAL INTERNATIONAL EQUITY FUNDS | | 44,101,593 |
TOTAL EQUITY FUNDS (Cost $278,949,830) | 290,465,567 |
Fixed-Income Funds - 29.6% |
| | | |
High Yield Fixed-Income Funds - 7.8% |
Fidelity Advisor High Income Advantage Fund Institutional Class | 3,432,960 | | 32,338,486 |
Investment Grade Fixed-Income Funds - 21.8% |
Fidelity Advisor Government Investment Fund Institutional Class | 4,560,602 | | 45,286,778 |
Fidelity Advisor Intermediate Bond Fund Institutional Class | 4,108,254 | | 45,067,546 |
TOTAL INVESTMENT GRADE FIXED-INCOME FUNDS | | 90,354,324 |
TOTAL FIXED-INCOME FUNDS (Cost $123,766,241) | 122,692,810 |
Short-Term Funds - 0.1% |
| | | |
Fidelity Cash Reserves Fund | 194,974 | | 194,974 |
Fidelity Advisor Short-Fixed Income Fund Institutional Class | 14,109 | | 133,332 |
TOTAL SHORT-TERM FUNDS (Cost $329,306) | 328,306 |
TOTAL INVESTMENT IN SECURITIES - 100% (Cost $403,045,377) | $ 413,486,683 |
See accompanying notes which are an integral part of the financial statements.
Annual Report
Fidelity Advisor Freedom 2020 Fund
Financial Statements
Statement of Assets and Liabilities
| March 31, 2005 |
| | |
Assets | | |
Investment in securities, at value (cost $403,045,377) - See accompanying schedule | | $ 413,486,683 |
Cash | | 1,131 |
Receivable for fund shares sold | | 1,256,041 |
Receivable from investment adviser for expense reductions | | 3,494 |
Total assets | | 414,747,349 |
| | |
Liabilities | | |
Payable for investments purchased | $ 792,551 | |
Payable for fund shares redeemed | 463,108 | |
Accrued management fee | 34,084 | |
Distribution fees payable | 174,010 | |
Total liabilities | | 1,463,753 |
| | |
Net Assets | | $ 413,283,596 |
Net Assets consist of: | | |
Paid in capital | | $ 400,641,408 |
Undistributed net investment income | | 637,463 |
Accumulated undistributed net realized gain (loss) on investments | | 1,563,419 |
Net unrealized appreciation (depreciation) on investments | | 10,441,306 |
Net Assets | | $ 413,283,596 |
Calculation of Maximum Offering Price Class A:
Net Asset Value and redemption price per share ($135,306,262 ÷ 11,737,823 shares) | | $ 11.53 |
| | |
Maximum offering price per share (100/94.25 of $11.53) | | $ 12.23 |
| | |
Class T:
Net Asset Value and redemption price per share ($177,336,477 ÷ 15,396,286 shares) | | $ 11.52 |
| | |
Maximum offering price per share (100/96.50 of $11.52) | | $ 11.94 |
| | |
Class B:
Net Asset Value and offering price per share ($49,398,409 ÷ 4,303,386 shares)A | | $ 11.48 |
| | |
Class C:
Net Asset Value and offering price per share ($39,310,089 ÷ 3,425,616 shares)A | | $ 11.48 |
| | |
Institutional Class:
Net Asset Value, offering price and redemption price per share ($11,932,359 ÷ 1,031,563 shares) | | $ 11.57 |
A Redemption price per share is equal to net asset value less any applicable contingent deferred sales charge.
Statement of Operations
| Year ended March 31, 2005 |
| | |
Investment Income | | |
Income distributions from underlying funds | | $ 6,088,176 |
| | |
Expenses | | |
Management fee | $ 284,340 | |
Distribution fees | 1,461,705 | |
Independent trustees' compensation | 1,399 | |
Total expenses before reductions | 1,747,444 | |
Expense reductions | (61,992) | 1,685,452 |
Net investment income (loss) | | 4,402,724 |
Realized and Unrealized Gain (Loss) Realized gain (loss) on sale of underlying fund shares | (54,524) | |
Capital gain distributions from underlying funds | 2,019,894 | 1,965,370 |
Change in net unrealized appreciation (depreciation) on underlying funds | | 5,996,006 |
Net gain (loss) | | 7,961,376 |
Net increase (decrease) in net assets resulting from operations | | $ 12,364,100 |
See accompanying notes which are an integral part of the financial statements.
Annual Report
Fidelity Advisor Freedom 2020 Fund
Financial Statements - continued
Statement of Changes in Net Assets
| Year ended
March 31,
2005 | July 24, 2003
(commencement of
operations) to
March 31, 2004 |
Increase (Decrease) in Net Assets | | |
Operations | | |
Net investment income (loss) | $ 4,402,724 | $ 621,362 |
Net realized gain (loss) | 1,965,370 | 66,377 |
Change in net unrealized appreciation (depreciation) | 5,996,006 | 4,445,300 |
Net increase (decrease) in net assets resulting from operations | 12,364,100 | 5,133,039 |
Distributions to shareholders from net investment income | (4,439,939) | (346,934) |
Distributions to shareholders from net realized gain | (68,080) | - |
Total distributions | (4,508,019) | (346,934) |
Share transactions - net increase (decrease) | 239,359,934 | 161,281,476 |
Total increase (decrease) in net assets | 247,216,015 | 166,067,581 |
| | |
Net Assets | | |
Beginning of period | 166,067,581 | - |
End of period (including undistributed net investment income of $637,463 and undistributed net investment income of $278,597, respectively) | $ 413,283,596 | $ 166,067,581 |
Financial Highlights - Class A
Years ended March 31, | 2005 | 2004F |
Selected Per-Share Data | | |
Net asset value, beginning of period | $ 11.29 | $ 10.00 |
Income from Investment Operations | | |
Net investment income (loss)E | .20 | .13 |
Net realized and unrealized gain (loss) | .23 | 1.25 |
Total from investment operations | .43 | 1.38 |
Distributions from net investment income | (.18) | (.09) |
Distributions from net realized gain | -H | - |
Total distributions | (.19)I | (.09) |
Net asset value, end of period | $ 11.53 | $ 11.29 |
Total ReturnB,C,D | 3.75% | 13.78% |
Ratios to Average Net AssetsG, J | | |
Expenses before expense reductions | .35% | .35%A |
Expenses net of voluntary waivers, if any | .33% | .33%A |
Expenses net of all reductions | .33% | .33%A |
Net investment income (loss) | 1.80% | 1.74%A |
Supplemental Data | | |
Net assets, end of period (000 omitted) | $ 135,306 | $ 72,334 |
Portfolio turnover rate | 1% | 4%A |
A Annualized
B Total returns for periods of less than one year are not annualized.
C Total returns would have been lower had certain expenses not been reduced during the periods shown.
D Total returns do not include the effect of the sales charges.
E Calculated based on average shares outstanding during the period.
F For the period July 24, 2003 (commencement of operations) to March 31, 2004.
G Expense ratios reflect operating expenses of the class. Expenses before reductions do not reflect amounts reimbursed by the investment adviser or reductions from brokerage service arrangements or other expense offset arrangements and do not represent the amount paid by the class during periods when reimbursements or reductions occur. Expenses net of any voluntary waivers reflect expenses after reimbursement by the investment adviser but prior to reductions from brokerage service arrangements or other expense offset arrangements. Expenses net of all reductions represent the net expenses paid by the class.
H Amount represents less than $.01 per share.
I Total distributions of $.185 per share is comprised of distributions from net investment income of $.181 per share and distributions from net realized gain of $.004 per share.
J Amounts do not include the activity of the underlying funds.
See accompanying notes which are an integral part of the financial statements.
Annual Report
Financial Highlights - Class T
Years ended March 31, | 2005 | 2004F |
Selected Per-Share Data | | |
Net asset value, beginning of period | $ 11.29 | $ 10.00 |
Income from Investment Operations | | |
Net investment income (loss)E | .18 | .11 |
Net realized and unrealized gain (loss) | .21 | 1.26 |
Total from investment operations | .39 | 1.37 |
Distributions from net investment income | (.16) | (.08) |
Distributions from net realized gain | -H | - |
Total distributions | (.16) | (.08) |
Net asset value, end of period | $ 11.52 | $ 11.29 |
Total ReturnB,C,D | 3.46% | 13.73% |
Ratios to Average Net AssetsG, I | | |
Expenses before expense reductions | .60% | .60%A |
Expenses net of voluntary waivers, if any | .58% | .58%A |
Expenses net of all reductions | .58% | .58%A |
Net investment income (loss) | 1.55% | 1.49%A |
Supplemental Data | | |
Net assets, end of period (000 omitted) | $ 177,336 | $ 52,310 |
Portfolio turnover rate | 1% | 4%A |
A Annualized
B Total returns for periods of less than one year are not annualized.
C Total returns would have been lower had certain expenses not been reduced during the periods shown.
D Total returns do not include the effect of the sales charges.
E Calculated based on average shares outstanding during the period.
F For the period July 24, 2003 (commencement of operations) to March 31, 2004.
G Expense ratios reflect operating expenses of the class. Expenses before reductions do not reflect amounts reimbursed by the investment adviser or reductions from brokerage service arrangements or other expense offset arrangements and do not represent the amount paid by the class during periods when reimbursements or reductions occur. Expenses net of any voluntary waivers reflect expenses after reimbursement by the investment adviser but prior to reductions from brokerage service arrangements or other expense offset arrangements. Expenses net of all reductions represent the net expenses paid by the class.
H Amount represents less than $.01 per share.
I Amounts do not include the activity of the underlying funds.
Financial Highlights - Class B
Years ended March 31, | 2005 | 2004F |
Selected Per-Share Data | | |
Net asset value, beginning of period | $ 11.27 | $ 10.00 |
Income from Investment Operations | | |
Net investment income (loss)E | .12 | .07 |
Net realized and unrealized gain (loss) | .21 | 1.27 |
Total from investment operations | .33 | 1.34 |
Distributions from net investment income | (.12) | (.07) |
Distributions from net realized gain | -H | - |
Total distributions | (.12) | (.07) |
Net asset value, end of period | $ 11.48 | $ 11.27 |
Total ReturnB,C,D | 2.93% | 13.37% |
Ratios to Average Net AssetsG, I | | |
Expenses before expense reductions | 1.10% | 1.10%A |
Expenses net of voluntary waivers, if any | 1.08% | 1.08%A |
Expenses net of all reductions | 1.08% | 1.08%A |
Net investment income (loss) | 1.05% | .99%A |
Supplemental Data | | |
Net assets, end of period (000 omitted) | $ 49,398 | $ 23,274 |
Portfolio turnover rate | 1% | 4%A |
A Annualized
B Total returns for periods of less than one year are not annualized.
C Total returns would have been lower had certain expenses not been reduced during the periods shown.
D Total returns do not include the effect of the contingent deferred sales charge.
E Calculated based on average shares outstanding during the period.
F For the period July 24, 2003 (commencement of operations) to March 31, 2004.
G Expense ratios reflect operating expenses of the class. Expenses before reductions do not reflect amounts reimbursed by the investment adviser or reductions from brokerage service arrangements or other expense offset arrangements and do not represent the amount paid by the class during periods when reimbursements or reductions occur. Expenses net of any voluntary waivers reflect expenses after reimbursement by the investment adviser but prior to reductions from brokerage service arrangements or other expense offset arrangements. Expenses net of all reductions represent the net expenses paid by the class.
H Amount represents less than $.01 per share.
I Amounts do not include the activity of the underlying funds.
See accompanying notes which are an integral part of the financial statements.
Annual Report
Financial Highlights - Class C
Years ended March 31, | 2005 | 2004F |
Selected Per-Share Data | | |
Net asset value, beginning of period | $ 11.26 | $ 10.00 |
Income from Investment Operations | | |
Net investment income (loss)E | .12 | .07 |
Net realized and unrealized gain (loss) | .22 | 1.26 |
Total from investment operations | .34 | 1.33 |
Distributions from net investment income | (.12) | (.07) |
Distributions from net realized gain | -H | - |
Total distributions | (.12) | (.07) |
Net asset value, end of period | $ 11.48 | $ 11.26 |
Total ReturnB,C,D | 3.02% | 13.32% |
Ratios to Average Net AssetsG, I | | |
Expenses before expense reductions | 1.10% | 1.10%A |
Expenses net of voluntary waivers, if any | 1.08% | 1.08%A |
Expenses net of all reductions | 1.08% | 1.08%A |
Net investment income (loss) | 1.05% | .99%A |
Supplemental Data | | |
Net assets, end of period (000 omitted) | $ 39,310 | $ 15,871 |
Portfolio turnover rate | 1% | 4%A |
A Annualized
B Total returns for periods of less than one year are not annualized.
C Total returns would have been lower had certain expenses not been reduced during the periods shown.
D Total returns do not include the effect of the contingent deferred sales charge.
E Calculated based on average shares outstanding during the period.
F For the period July 24, 2003 (commencement of operations) to March 31, 2004.
G Expense ratios reflect operating expenses of the class. Expenses before reductions do not reflect amounts reimbursed by the investment adviser or reductions from brokerage service arrangements or other expense offset arrangements and do not represent the amount paid by the class during periods when reimbursements or reductions occur. Expenses net of any voluntary waivers reflect expenses after reimbursement by the investment adviser but prior to reductions from brokerage service arrangements or other expense offset arrangements. Expenses net of all reductions represent the net expenses paid by the class.
H Amount represents less than $.01 per share.
I Amounts do not include the activity of the underlying funds.
Financial Highlights - Institutional Class
Years ended March 31, | 2005 | 2004E |
Selected Per-Share Data | | |
Net asset value, beginning of period | $ 11.31 | $ 10.00 |
Income from Investment Operations | | |
Net investment income (loss)D | .23 | .15 |
Net realized and unrealized gain (loss) | .23 | 1.25 |
Total from investment operations | .46 | 1.40 |
Distributions from net investment income | (.20) | (.09) |
Distributions from net realized gain | -G | - |
Total distributions | (.20) | (.09) |
Net asset value, end of period | $ 11.57 | $ 11.31 |
Total ReturnB,C | 4.06% | 14.03% |
Ratios to Average Net AssetsF, H | | |
Expenses before expense reductions | .10% | .10%A |
Expenses net of voluntary waivers, if any | .08% | .08%A |
Expenses net of all reductions | .08% | .08%A |
Net investment income (loss) | 2.05% | 1.98%A |
Supplemental Data | | |
Net assets, end of period (000 omitted) | $ 11,932 | $ 2,278 |
Portfolio turnover rate | 1% | 4%A |
A Annualized
B Total returns for periods of less than one year are not annualized.
C Total returns would have been lower had certain expenses not been reduced during the periods shown.
D Calculated based on average shares outstanding during the period.
E For the period July 24, 2003 (commencement of operations) to March 31, 2004.
F Expense ratios reflect operating expenses of the class. Expenses before reductions do not reflect amounts reimbursed by the investment adviser or reductions from brokerage service arrangements or other expense offset arrangements and do not represent the amount paid by the class during periods when reimbursements or reductions occur. Expenses net of any voluntary waivers reflect expenses after reimbursement by the investment adviser but prior to reductions from brokerage service arrangements or other expense offset arrangements. Expenses net of all reductions represent the net expenses paid by the class.
G Amount represents less than $.01 per share.
H Amounts do not include the activity of the underlying funds.
See accompanying notes which are an integral part of the financial statements.
Annual Report
Fidelity Advisor Freedom 2025 Fund
Investment Changes
Fund Holdings as of March 31, 2005 |
| % of fund's
investments | % of fund's investments
6 months ago |
Domestic Equity Funds | | |
Fidelity Advisor Dividend Growth Fund Institutional Class | 12.4 | 12.6 |
Fidelity Advisor Equity Growth Fund Institutional Class | 6.3 | 6.4 |
Fidelity Advisor Equity Income Fund Institutional Class | 12.9 | 13.1 |
Fidelity Advisor Growth & Income Fund Institutional Class | 12.6 | 12.9 |
Fidelity Advisor Large Cap Fund Institutional Class | 12.5 | 12.7 |
Fidelity Advisor Mid-Cap Fund Institutional Class | 3.9 | 3.9 |
Fidelity Advisor Small Cap Fund Institutional Class | 4.0 | 4.1 |
| 64.6 | 65.7 |
International Equity Funds | | |
Fidelity Advisor Diversified International Fund Institutional Class | 5.9 | 5.9 |
Fidelity Advisor Overseas Fund Institutional Class | 5.7 | 5.7 |
| 11.6 | 11.6 |
High Yield Fixed-Income Funds | | |
Fidelity Advisor High Income Advantage Fund Institutional Class | 7.7 | 7.7 |
Investment Grade Fixed-Income Funds |
Fidelity Advisor Government Investment Fund Institutional Class | 8.1 | 7.5 |
Fidelity Advisor Intermediate Bond Fund Institutional Class | 8.0 | 7.5 |
| 16.1 | 15.0 |
| 100.0 | 100.0 |
Asset Allocation (% of fund's investments) |
The fund invests according to an asset allocation strategy that becomes increasingly conservative over time. The six months ago allocation is based on the fund's holdings as of September 30, 2004. The current allocation is based on the fund's holdings as of March 31, 2005. The expected allocation represents the fund's anticipated target asset allocation at September 30, 2005.
Annual Report
Fidelity Advisor Freedom 2025 Fund
Investments March 31, 2005
Showing Percentage of Total Value of Investment in Securities
Equity Funds - 76.2% |
| Shares | | Value (Note 1) |
Domestic Equity Funds - 64.6% |
Fidelity Advisor Dividend Growth Fund Institutional Class | 1,336,028 | | $ 15,203,995 |
Fidelity Advisor Equity Growth Fund Institutional Class | 167,390 | | 7,723,365 |
Fidelity Advisor Equity Income Fund Institutional Class | 556,006 | | 15,785,020 |
Fidelity Advisor Growth & Income Fund Institutional Class | 938,029 | | 15,449,338 |
Fidelity Advisor Large Cap Fund Institutional Class | 1,034,857 | | 15,336,586 |
Fidelity Advisor Mid-Cap Fund Institutional Class | 196,583 | | 4,763,205 |
Fidelity Advisor Small Cap Fund Institutional Class | 199,741 | | 4,895,645 |
TOTAL DOMESTIC EQUITY FUNDS | | 79,157,154 |
International Equity Funds - 11.6% |
Fidelity Advisor Diversified International Fund Institutional Class | 381,378 | | 7,188,975 |
Fidelity Advisor Overseas Fund Institutional Class | 405,715 | | 7,063,498 |
TOTAL INTERNATIONAL EQUITY FUNDS | | 14,252,473 |
TOTAL EQUITY FUNDS (Cost $91,717,808) | 93,409,627 |
Fixed-Income Funds - 23.8% |
| | | |
High Yield Fixed-Income Funds - 7.7% |
Fidelity Advisor High Income Advantage Fund Institutional Class | 995,039 | | 9,373,269 |
Investment Grade Fixed-Income Funds - 16.1% |
Fidelity Advisor Government Investment Fund Institutional Class | 997,180 | | 9,901,994 |
Fidelity Advisor Intermediate Bond Fund Institutional Class | 899,884 | | 9,871,730 |
TOTAL INVESTMENT GRADE FIXED-INCOME FUNDS | | 19,773,724 |
TOTAL FIXED-INCOME FUNDS (Cost $29,338,753) | 29,146,993 |
TOTAL INVESTMENT IN SECURITIES - 100% (Cost $121,056,561) | $ 122,556,620 |
See accompanying notes which are an integral part of the financial statements.
Annual Report
Fidelity Advisor Freedom 2025 Fund
Financial Statements
Statement of Assets and Liabilities
| March 31, 2005 |
| | |
Assets | | |
Investment in securities, at value (cost $121,056,561) - See accompanying schedule | | $ 122,556,620 |
Cash | | 41 |
Receivable for fund shares sold | | 27,779,861 |
Receivable from investment adviser for expense reductions | | 356 |
Total assets | | 150,336,878 |
| | |
Liabilities | | |
Payable for investments purchased | $ 27,718,942 | |
Payable for fund shares redeemed | 60,684 | |
Accrued management fee | 7,666 | |
Distribution fees payable | 40,952 | |
Total liabilities | | 27,828,244 |
| | |
Net Assets | | $ 122,508,634 |
Net Assets consist of: | | |
Paid in capital | | $ 120,669,665 |
Undistributed net investment income | | 95,450 |
Accumulated undistributed net realized gain (loss) on investments | | 243,460 |
Net unrealized appreciation (depreciation) on investments | | 1,500,059 |
Net Assets | | $ 122,508,634 |
Calculation of Maximum Offering Price Class A:
Net Asset Value and redemption price per share ($59,347,461 ÷ 5,415,869 shares) | | $ 10.96 |
| | |
Maximum offering price per share (100/94.25 of $10.96) | | $ 11.63 |
| | |
Class T:
Net Asset Value and redemption price per share ($36,966,355 ÷ 3,369,675 shares) | | $ 10.97 |
| | |
Maximum offering price per share (100/96.50 of $10.97) | | $ 11.37 |
| | |
Class B:
Net Asset Value and offering price per share ($13,414,787 ÷ 1,230,107 shares)A | | $ 10.91 |
| | |
Class C:
Net Asset Value and offering price per share ($10,859,294 ÷ 995,602 shares)A | | $ 10.91 |
| | |
Institutional Class:
Net Asset Value, offering price and redemption price per share ($1,920,737 ÷ 174,754 shares) | | $ 10.99 |
A Redemption price per share is equal to net asset value less any applicable contingent deferred sales charge.
Statement of Operations
| Year ended March 31, 2005 |
| | |
Investment Income | | |
Income distributions from underlying funds | | $ 962,877 |
Interest | | 228 |
Total income | | 963,105 |
| | |
Expenses | | |
Management fee | $ 46,072 | |
Distribution fees | 265,801 | |
Independent trustees' compensation | 203 | |
Total expenses before reductions | 312,076 | |
Expense reductions | (10,963) | 301,113 |
Net investment income (loss) | | 661,992 |
Realized and Unrealized Gain (Loss) Realized gain (loss) on sale of underlying fund shares | (50,370) | |
Capital gain distributions from underlying funds | 369,871 | 319,501 |
Change in net unrealized appreciation (depreciation) on underlying funds | | 1,358,607 |
Net gain (loss) | | 1,678,108 |
Net increase (decrease) in net assets resulting from operations | | $ 2,340,100 |
See accompanying notes which are an integral part of the financial statements.
Annual Report
Fidelity Advisor Freedom 2025 Fund
Financial Statements - continued
Statement of Changes in Net Assets
| Year ended
March 31,
2005 | November 6, 2003
(commencement of operations) to
March 31, 2004 |
Increase (Decrease) in Net Assets | | |
Operations | | |
Net investment income (loss) | $ 661,992 | $ 17,856 |
Net realized gain (loss) | 319,501 | 488 |
Change in net unrealized appreciation (depreciation) | 1,358,607 | 141,452 |
Net increase (decrease) in net assets resulting from operations | 2,340,100 | 159,796 |
Distributions to shareholders from net investment income | (647,465) | (11,834) |
Distributions to shareholders from net realized gain | (1,629) | - |
Total distributions | (649,094) | (11,834) |
Share transactions - net increase (decrease) | 110,847,488 | 9,822,178 |
Total increase (decrease) in net assets | 112,538,494 | 9,970,140 |
| | |
Net Assets | | |
Beginning of period | 9,970,140 | - |
End of period (including undistributed net investment income of $95,450 and undistributed net investment income of $6,118, respectively) | $ 122,508,634 | $ 9,970,140 |
Financial Highlights - Class A
Years ended March 31, | 2005 | 2004F |
Selected Per-Share Data | | |
Net asset value, beginning of period | $ 10.67 | $ 10.00 |
Income from Investment Operations | | |
Net investment income (loss)E | .19 | .06 |
Net realized and unrealized gain (loss) | .23 | .67 |
Total from investment operations | .42 | .73 |
Distributions from net investment income | (.13) | (.06) |
Distributions from net realized gain | -H | - |
Total distributions | (.13) | (.06) |
Net asset value, end of period | $ 10.96 | $ 10.67 |
Total ReturnB,C,D | 3.96% | 7.32% |
Ratios to Average Net AssetsG, I | | |
Expenses before expense reductions | .35% | .35%A |
Expenses net of voluntary waivers, if any | .33% | .33%A |
Expenses net of all reductions | .33% | .33%A |
Net investment income (loss) | 1.76% | 1.59%A |
Supplemental Data | | |
Net assets, end of period (000 omitted) | $ 59,347 | $ 2,284 |
Portfolio turnover rate | 10% | 6%A |
A Annualized
B Total returns for periods of less than one year are not annualized.
C Total returns would have been lower had certain expenses not been reduced during the periods shown.
D Total returns do not include the effect of the sales charges.
E Calculated based on average shares outstanding during the period.
F For the period November 6, 2003 (commencement of operations) to March 31, 2004.
G Expense ratios reflect operating expenses of the class. Expenses before reductions do not reflect amounts reimbursed by the investment adviser or reductions from brokerage service arrangements or other expense offset arrangements and do not represent the amount paid by the class during periods when reimbursements or reductions occur. Expenses net of any voluntary waivers reflect expenses after reimbursement by the investment adviser but prior to reductions from brokerage service arrangements or other expense offset arrangements. Expenses net of all reductions represent the net expenses paid by the class.
H Amount represents less than $.01 per share.
I Amounts do not include the activity of the underlying funds.
See accompanying notes which are an integral part of the financial statements.
Annual Report
Financial Highlights - Class T
Years ended March 31, | 2005 | 2004F |
Selected Per-Share Data | | |
Net asset value, beginning of period | $ 10.69 | $ 10.00 |
Income from Investment Operations | | |
Net investment income (loss)E | .16 | .05 |
Net realized and unrealized gain (loss) | .24 | .70 |
Total from investment operations | .40 | .75 |
Distributions from net investment income | (.12) | (.06) |
Distributions from net realized gain | -H | - |
Total distributions | (.12) | (.06) |
Net asset value, end of period | $ 10.97 | $ 10.69 |
Total ReturnB,C,D | 3.75% | 7.52% |
Ratios to Average Net AssetsG, I | | |
Expenses before expense reductions | .60% | .60%A |
Expenses net of voluntary waivers, if any | .58% | .58%A |
Expenses net of all reductions | .58% | .58%A |
Net investment income (loss) | 1.51% | 1.34%A |
Supplemental Data | | |
Net assets, end of period (000 omitted) | $ 36,966 | $ 2,556 |
Portfolio turnover rate | 10% | 6%A |
A Annualized
B Total returns for periods of less than one year are not annualized.
C Total returns would have been lower had certain expenses not been reduced during the periods shown.
D Total returns do not include the effect of the sales charges.
E Calculated based on average shares outstanding during the period.
F For the period November 6, 2003 (commencement of operations) to March 31, 2004.
G Expense ratios reflect operating expenses of the class. Expenses before reductions do not reflect amounts reimbursed by the investment adviser or reductions from brokerage service arrangements or other expense offset arrangements and do not represent the amount paid by the class during periods when reimbursements or reductions occur. Expenses net of any voluntary waivers reflect expenses after reimbursement by the investment adviser but prior to reductions from brokerage service arrangements or other expense offset arrangements. Expenses net of all reductions represent the net expenses paid by the class.
H Amount represents less than $.01 per share.
I Amounts do not include the activity of the underlying funds.
Financial Highlights - Class B
Years ended March 31, | 2005 | 2004F |
Selected Per-Share Data | | |
Net asset value, beginning of period | $ 10.64 | $ 10.00 |
Income from Investment Operations | | |
Net investment income (loss)E | .11 | .03 |
Net realized and unrealized gain (loss) | .24 | .67 |
Total from investment operations | .35 | .70 |
Distributions from net investment income | (.08) | (.06) |
Distributions from net realized gain | -H | - |
Total distributions | (.08) | (.06) |
Net asset value, end of period | $ 10.91 | $ 10.64 |
Total ReturnB,C,D | 3.29% | 6.97% |
Ratios to Average Net AssetsG, I | | |
Expenses before expense reductions | 1.10% | 1.10%A |
Expenses net of voluntary waivers, if any | 1.08% | 1.08%A |
Expenses net of all reductions | 1.08% | 1.08%A |
Net investment income (loss) | 1.01% | .84%A |
Supplemental Data | | |
Net assets, end of period (000 omitted) | $ 13,415 | $ 2,771 |
Portfolio turnover rate | 10% | 6%A |
A Annualized
B Total returns for periods of less than one year are not annualized.
C Total returns would have been lower had certain expenses not been reduced during the periods shown.
D Total returns do not include the effect of the contingent deferred sales charge.
E Calculated based on average shares outstanding during the period.
F For the period November 6, 2003 (commencement of operations) to March 31, 2004.
G Expense ratios reflect operating expenses of the class. Expenses before reductions do not reflect amounts reimbursed by the investment adviser or reductions from brokerage service arrangements or other expense offset arrangements and do not represent the amount paid by the class during periods when reimbursements or reductions occur. Expenses net of any voluntary waivers reflect expenses after reimbursement by the investment adviser but prior to reductions from brokerage service arrangements or other expense offset arrangements. Expenses net of all reductions represent the net expenses paid by the class.
H Amount represents less than $.01 per share.
I Amounts do not include the activity of the underlying funds.
See accompanying notes which are an integral part of the financial statements.
Annual Report
Financial Highlights - Class C
Years ended March 31, | 2005 | 2004F |
Selected Per-Share Data | | |
Net asset value, beginning of period | $ 10.65 | $ 10.00 |
Income from Investment Operations | | |
Net investment income (loss)E | .11 | .03 |
Net realized and unrealized gain (loss) | .23 | .67 |
Total from investment operations | .34 | .70 |
Distributions from net investment income | (.08) | (.05) |
Distributions from net realized gain | -H | - |
Total distributions | (.08) | (.05) |
Net asset value, end of period | $ 10.91 | $ 10.65 |
Total ReturnB,C,D | 3.19% | 7.02% |
Ratios to Average Net AssetsG, I | | |
Expenses before expense reductions | 1.10% | 1.10%A |
Expenses net of voluntary waivers, if any | 1.08% | 1.08%A |
Expenses net of all reductions | 1.08% | 1.08%A |
Net investment income (loss) | 1.01% | .84%A |
Supplemental Data | | |
Net assets, end of period (000 omitted) | $ 10,859 | $ 2,137 |
Portfolio turnover rate | 10% | 6%A |
A Annualized
B Total returns for periods of less than one year are not annualized.
C Total returns would have been lower had certain expenses not been reduced during the periods shown.
D Total returns do not include the effect of the contingent deferred sales charge.
E Calculated based on average shares outstanding during the period.
F For the period November 6, 2003 (commencement of operations) to March 31, 2004.
G Expense ratios reflect operating expenses of the class. Expenses before reductions do not reflect amounts reimbursed by the investment adviser or reductions from brokerage service arrangements or other expense offset arrangements and do not represent the amount paid by the class during periods when reimbursements or reductions occur. Expenses net of any voluntary waivers reflect expenses after reimbursement by the investment adviser but prior to reductions from brokerage service arrangements or other expense offset arrangements. Expenses net of all reductions represent the net expenses paid by the class.
H Amount represents less than $.01 per share.
I Amounts do not include the activity of the underlying funds.
Financial Highlights - Institutional Class
Years ended March 31, | 2005 | 2004E |
Selected Per-Share Data | | |
Net asset value, beginning of period | $ 10.68 | $ 10.00 |
Income from Investment Operations | | |
Net investment income (loss)D | .22 | .08 |
Net realized and unrealized gain (loss) | .24 | .66 |
Total from investment operations | .46 | .74 |
Distributions from net investment income | (.15) | (.06) |
Distributions from net realized gain | -G | - |
Total distributions | (.15) | (.06) |
Net asset value, end of period | $ 10.99 | $ 10.68 |
Total ReturnB,C | 4.25% | 7.42% |
Ratios to Average Net AssetsF, H | | |
Expenses before expense reductions | .10% | .10%A |
Expenses net of voluntary waivers, if any | .08% | .08%A |
Expenses net of all reductions | .08% | .08%A |
Net investment income (loss) | 2.01% | 1.84%A |
Supplemental Data | | |
Net assets, end of period (000 omitted) | $ 1,921 | $ 222 |
Portfolio turnover rate | 10% | 6%A |
A Annualized
B Total returns for periods of less than one year are not annualized.
C Total returns would have been lower had certain expenses not been reduced during the periods shown.
D Calculated based on average shares outstanding during the period.
E For the period November 6, 2003 (commencement of operations) to March 31, 2004.
F Expense ratios reflect operating expenses of the class. Expenses before reductions do not reflect amounts reimbursed by the investment adviser or reductions from brokerage service arrangements or other expense offset arrangements and do not represent the amount paid by the class during periods when reimbursements or reductions occur. Expenses net of any voluntary waivers reflect expenses after reimbursement by the investment adviser but prior to reductions from brokerage service arrangements or other expense offset arrangements. Expenses net of all reductions represent the net expenses paid by the class.
G Amount represents less than $.01 per share.
H Amounts do not include the activity of the underlying funds.
See accompanying notes which are an integral part of the financial statements.
Annual Report
Fidelity Advisor Freedom 2030 Fund
Investment Changes
Fund Holdings as of March 31, 2005 |
| % of fund's
investments | % of fund's investments
6 months ago |
Domestic Equity Funds | | |
Fidelity Advisor Dividend Growth Fund Institutional Class | 13.2 | 13.4 |
Fidelity Advisor Equity Growth Fund Institutional Class | 6.6 | 6.7 |
Fidelity Advisor Equity Income Fund Institutional Class | 14.1 | 14.0 |
Fidelity Advisor Growth & Income Fund Institutional Class | 13.4 | 13.5 |
Fidelity Advisor Large Cap Fund Institutional Class | 13.3 | 13.3 |
Fidelity Advisor Mid-Cap Fund Institutional Class | 4.3 | 4.2 |
Fidelity Advisor Small Cap Fund Institutional Class | 4.4 | 4.4 |
| 69.3 | 69.5 |
International Equity Funds | | |
Fidelity Advisor Diversified International Fund Institutional Class | 6.7 | 6.5 |
Fidelity Advisor Overseas Fund Institutional Class | 6.5 | 6.2 |
| 13.2 | 12.7 |
High Yield Fixed-Income Funds | | |
Fidelity Advisor High Income Advantage Fund Institutional Class | 7.8 | 7.7 |
Investment Grade Fixed-Income Funds |
Fidelity Advisor Government Investment Fund Institutional Class | 4.9 | 5.1 |
Fidelity Advisor Intermediate Bond Fund Institutional Class | 4.8 | 5.0 |
| 9.7 | 10.1 |
| 100.0 | 100.0 |
Asset Allocation (% of fund's investments) |

The fund invests according to an asset allocation strategy that becomes increasingly conservative over time. The six months ago allocation is based on the fund's holdings as of September 30, 2004. The current allocation is based on the fund's holdings as of March 31, 2005. The expected allocation represents the fund's anticipated target asset allocation at September 30, 2005.
Annual Report
Fidelity Advisor Freedom 2030 Fund
Investments March 31, 2005
Showing Percentage of Total Value of Investment in Securities
Equity Funds - 82.5% |
| Shares | | Value (Note 1) |
Domestic Equity Funds - 69.3% |
Fidelity Advisor Dividend Growth Fund Institutional Class | 2,609,126 | | $ 29,691,852 |
Fidelity Advisor Equity Growth Fund Institutional Class | 324,987 | | 14,994,902 |
Fidelity Advisor Equity Income Fund Institutional Class | 1,117,078 | | 31,713,829 |
Fidelity Advisor Growth & Income Fund Institutional Class | 1,841,462 | | 30,328,882 |
Fidelity Advisor Large Cap Fund Institutional Class | 2,025,243 | | 30,014,107 |
Fidelity Advisor Mid-Cap Fund Institutional Class | 396,298 | | 9,602,308 |
Fidelity Advisor Small Cap Fund Institutional Class | 408,675 | | 10,016,614 |
TOTAL DOMESTIC EQUITY FUNDS | | 156,362,494 |
International Equity Funds - 13.2% |
Fidelity Advisor Diversified International Fund Institutional Class | 806,592 | | 15,204,257 |
Fidelity Advisor Overseas Fund Institutional Class | 842,603 | | 14,669,720 |
TOTAL INTERNATIONAL EQUITY FUNDS | | 29,873,977 |
TOTAL EQUITY FUNDS (Cost $179,397,991) | 186,236,471 |
Fixed-Income Funds - 17.5% |
| | | |
High Yield Fixed-Income Funds - 7.8% |
Fidelity Advisor High Income Advantage Fund Institutional Class | 1,870,195 | | 17,617,233 |
Investment Grade Fixed-Income Funds - 9.7% |
Fidelity Advisor Government Investment Fund Institutional Class | 1,098,890 | | 10,911,981 |
Fidelity Advisor Intermediate Bond Fund Institutional Class | 990,176 | | 10,862,234 |
TOTAL INVESTMENT GRADE FIXED-INCOME FUNDS | | 21,774,215 |
TOTAL FIXED-INCOME FUNDS (Cost $39,583,636) | 39,391,448 |
TOTAL INVESTMENT IN SECURITIES - 100% (Cost $218,981,627) | $ 225,627,919 |
See accompanying notes which are an integral part of the financial statements.
Annual Report
Fidelity Advisor Freedom 2030 Fund
Financial Statements
Statement of Assets and Liabilities
| March 31, 2005 |
| | |
Assets | | |
Investment in securities, at value (cost $218,981,627) - See accompanying schedule | | $ 225,627,919 |
Receivable for investments sold | | 942 |
Receivable for fund shares sold | | 1,233,750 |
Receivable from investment adviser for expense reductions | | 1,677 |
Total assets | | 226,864,288 |
| | |
Liabilities | | |
Payable to custodian bank | $ 1 | |
Payable for investments purchased | 980,272 | |
Payable for fund shares redeemed | 262,584 | |
Accrued management fee | 18,626 | |
Distribution fees payable | 96,732 | |
Total liabilities | | 1,358,215 |
| | |
Net Assets | | $ 225,506,073 |
Net Assets consist of: | | |
Paid in capital | | $ 217,926,274 |
Undistributed net investment income | | 131,528 |
Accumulated undistributed net realized gain (loss) on investments | | 801,979 |
Net unrealized appreciation (depreciation) on investments | | 6,646,292 |
Net Assets | | $ 225,506,073 |
Calculation of Maximum Offering Price Class A:
Net Asset Value and redemption price per share ($65,593,290 ÷ 5,552,872 shares) | | $ 11.81 |
| | |
Maximum offering price per share (100/94.25 of $11.81) | | $ 12.53 |
| | |
Class T:
Net Asset Value and redemption price per share ($102,153,469 ÷ 8,670,791 shares) | | $ 11.78 |
| | |
Maximum offering price per share (100/96.50 of $11.78) | | $ 12.21 |
| | |
Class B:
Net Asset Value and offering price per share ($27,653,403 ÷ 2,355,267 shares)A | | $ 11.74 |
| | |
Class C:
Net Asset Value and offering price per share ($22,264,895 ÷ 1,896,050 shares)A | | $ 11.74 |
| | |
Institutional Class:
Net Asset Value, offering price and redemption price per share ($7,841,016 ÷ 662,406 shares) | | $ 11.84 |
A Redemption price per share is equal to net asset value less any applicable contingent deferred sales charge.
Statement of Operations
| Year ended March 31, 2005 |
| | |
Investment Income | | |
Income distributions from underlying funds | | $ 2,740,223 |
| | |
Expenses | | |
Management fee | $ 145,552 | |
Distribution fees | 775,221 | |
Independent trustees' compensation | 702 | |
Total expenses before reductions | 921,475 | |
Expense reductions | (32,323) | 889,152 |
Net investment income (loss) | | 1,851,071 |
Realized and Unrealized Gain (Loss) Realized gain (loss) on sale of underlying fund shares | (30,396) | |
Capital gain distributions from underlying funds | 1,047,268 | 1,016,872 |
Change in net unrealized appreciation (depreciation) on underlying funds | | 4,336,680 |
Net gain (loss) | | 5,353,552 |
Net increase (decrease) in net assets resulting from operations | | $ 7,204,623 |
See accompanying notes which are an integral part of the financial statements.
Annual Report
Fidelity Advisor Freedom 2030 Fund
Financial Statements - continued
Statement of Changes in Net Assets
| Year ended
March 31,
2005 | July 24, 2003
(commencement of operations) to
March 31, 2004 |
Increase (Decrease) in Net Assets | | |
Operations | | |
Net investment income (loss) | $ 1,851,071 | $ 228,370 |
Net realized gain (loss) | 1,016,872 | 13,865 |
Change in net unrealized appreciation (depreciation) | 4,336,680 | 2,309,612 |
Net increase (decrease) in net assets resulting from operations | 7,204,623 | 2,551,847 |
Distributions to shareholders from net investment income | (1,985,403) | (174,903) |
Distributions to shareholders from net realized gain | (16,365) | - |
Total distributions | (2,001,768) | (174,903) |
Share transactions - net increase (decrease) | 142,242,099 | 75,684,175 |
Total increase (decrease) in net assets | 147,444,954 | 78,061,119 |
| | |
Net Assets | | |
Beginning of period | 78,061,119 | - |
End of period (including undistributed net investment income of $131,528 and undistributed net investment income of $54,472, respectively) | $ 225,506,073 | $ 78,061,119 |
Financial Highlights - Class A
Years ended March 31, | 2005 | 2004F |
Selected Per-Share Data | | |
Net asset value, beginning of period | $ 11.48 | $ 10.00 |
Income from Investment Operations | | |
Net investment income (loss)E | .18 | .11 |
Net realized and unrealized gain (loss) | .30 | 1.46 |
Total from investment operations | .48 | 1.57 |
Distributions from net investment income | (.15) | (.09) |
Distributions from net realized gain | -H | - |
Total distributions | (.15) | (.09) |
Net asset value, end of period | $ 11.81 | $ 11.48 |
Total ReturnB,C,D | 4.19% | 15.68% |
Ratios to Average Net AssetsG, I | | |
Expenses before expense reductions | .35% | .35%A |
Expenses net of voluntary waivers, if any | .33% | .33%A |
Expenses net of all reductions | .33% | .33%A |
Net investment income (loss) | 1.55% | 1.44%A |
Supplemental Data | | |
Net assets, end of period (000 omitted) | $ 65,593 | $ 27,879 |
Portfolio turnover rate | 2% | 2%A |
A Annualized
B Total returns for periods of less than one year are not annualized.
C Total returns would have been lower had certain expenses not been reduced during the periods shown.
D Total returns do not include the effect of the sales charges.
E Calculated based on average shares outstanding during the period.
F For the period July 24, 2003 (commencement of operations) to March 31, 2004.
G Expense ratios reflect operating expenses of the class. Expenses before reductions do not reflect amounts reimbursed by the investment adviser or reductions from brokerage service arrangements or other expense offset arrangements and do not represent the amount paid by the class during periods when reimbursements or reductions occur. Expenses net of any voluntary waivers reflect expenses after reimbursement by the investment adviser but prior to reductions from brokerage service arrangements or other expense offset arrangements. Expenses net of all reductions represent the net expenses paid by the class.
H Amount represents less than $.01 per share.
I Amounts do not include the activity of the underlying funds.
See accompanying notes which are an integral part of the financial statements.
Annual Report
Financial Highlights - Class T
Years ended March 31, | 2005 | 2004F |
Selected Per-Share Data | | |
Net asset value, beginning of period | $ 11.47 | $ 10.00 |
Income from Investment Operations | | |
Net investment income (loss)E | .15 | .09 |
Net realized and unrealized gain (loss) | .30 | 1.46 |
Total from investment operations | .45 | 1.55 |
Distributions from net investment income | (.14) | (.08) |
Distributions from net realized gain | -H | - |
Total distributions | (.14) | (.08) |
Net asset value, end of period | $ 11.78 | $ 11.47 |
Total ReturnB,C,D | 3.91% | 15.53% |
Ratios to Average Net AssetsG, I | | |
Expenses before expense reductions | .60% | .60%A |
Expenses net of voluntary waivers, if any | .58% | .58%A |
Expenses net of all reductions | .58% | .58%A |
Net investment income (loss) | 1.30% | 1.19%A |
Supplemental Data | | |
Net assets, end of period (000 omitted) | $ 102,153 | $ 27,201 |
Portfolio turnover rate | 2% | 2%A |
A Annualized
B Total returns for periods of less than one year are not annualized.
C Total returns would have been lower had certain expenses not been reduced during the periods shown.
D Total returns do not include the effect of the sales charges.
E Calculated based on average shares outstanding during the period.
F For the period July 24, 2003 (commencement of operations) to March 31, 2004.
G Expense ratios reflect operating expenses of the class. Expenses before reductions do not reflect amounts reimbursed by the investment adviser or reductions from brokerage service arrangements or other expense offset arrangements and do not represent the amount paid by the class during periods when reimbursements or reductions occur. Expenses net of any voluntary waivers reflect expenses after reimbursement by the investment adviser but prior to reductions from brokerage service arrangements or other expense offset arrangements. Expenses net of all reductions represent the net expenses paid by the class.
H Amount represents less than $.01 per share.
I Amounts do not include the activity of the underlying funds.
Financial Highlights - Class B
Years ended March 31, | 2005 | 2004F |
Selected Per-Share Data | | |
Net asset value, beginning of period | $ 11.44 | $ 10.00 |
Income from Investment Operations | | |
Net investment income (loss)E | .09 | .05 |
Net realized and unrealized gain (loss) | .30 | 1.46 |
Total from investment operations | .39 | 1.51 |
Distributions from net investment income | (.09) | (.07) |
Distributions from net realized gain | -H | - |
Total distributions | (.09) | (.07) |
Net asset value, end of period | $ 11.74 | $ 11.44 |
Total ReturnB,C,D | 3.41% | 15.12% |
Ratios to Average Net AssetsG, I | | |
Expenses before expense reductions | 1.10% | 1.10%A |
Expenses net of voluntary waivers, if any | 1.08% | 1.08%A |
Expenses net of all reductions | 1.08% | 1.08%A |
Net investment income (loss) | .80% | .69%A |
Supplemental Data | | |
Net assets, end of period (000 omitted) | $ 27,653 | $ 12,229 |
Portfolio turnover rate | 2% | 2%A |
A Annualized
B Total returns for periods of less than one year are not annualized.
C Total returns would have been lower had certain expenses not been reduced during the periods shown.
D Total returns do not include the effect of the contingent deferred sales charge.
E Calculated based on average shares outstanding during the period.
F For the period July 24, 2003 (commencement of operations) to March 31, 2004.
G Expense ratios reflect operating expenses of the class. Expenses before reductions do not reflect amounts reimbursed by the investment adviser or reductions from brokerage service arrangements or other expense offset arrangements and do not represent the amount paid by the class during periods when reimbursements or reductions occur. Expenses net of any voluntary waivers reflect expenses after reimbursement by the investment adviser but prior to reductions from brokerage service arrangements or other expense offset arrangements. Expenses net of all reductions represent the net expenses paid by the class.
H Amount represents less than $.01 per share.
I Amounts do not include the activity of the underlying funds.
See accompanying notes which are an integral part of the financial statements.
Annual Report
Financial Highlights - Class C
Years ended March 31, | 2005 | 2004F |
Selected Per-Share Data | | |
Net asset value, beginning of period | $ 11.44 | $ 10.00 |
Income from Investment Operations | | |
Net investment income (loss)E | .09 | .05 |
Net realized and unrealized gain (loss) | .30 | 1.46 |
Total from investment operations | .39 | 1.51 |
Distributions from net investment income | (.09) | (.07) |
Distributions from net realized gain | -H | - |
Total distributions | (.09) | (.07) |
Net asset value, end of period | $ 11.74 | $ 11.44 |
Total ReturnB,C,D | 3.41% | 15.12% |
Ratios to Average Net AssetsG, I | | |
Expenses before expense reductions | 1.10% | 1.10%A |
Expenses net of voluntary waivers, if any | 1.08% | 1.08%A |
Expenses net of all reductions | 1.08% | 1.08%A |
Net investment income (loss) | .80% | .69%A |
Supplemental Data | | |
Net assets, end of period (000 omitted) | $ 22,265 | $ 9,722 |
Portfolio turnover rate | 2% | 2%A |
A Annualized
B Total returns for periods of less than one year are not annualized.
C Total returns would have been lower had certain expenses not been reduced during the periods shown.
D Total returns do not include the effect of the contingent deferred sales charge.
E Calculated based on average shares outstanding during the period.
F For the period July 24, 2003 (commencement of operations) to March 31, 2004.
G Expense ratios reflect operating expenses of the class. Expenses before reductions do not reflect amounts reimbursed by the investment adviser or reductions from brokerage service arrangements or other expense offset arrangements and do not represent the amount paid by the class during periods when reimbursements or reductions occur. Expenses net of any voluntary waivers reflect expenses after reimbursement by the investment adviser but prior to reductions from brokerage service arrangements or other expense offset arrangements. Expenses net of all reductions represent the net expenses paid by the class.
H Amount represents less than $.01 per share.
I Amounts do not include the activity of the underlying funds.
Financial Highlights - Institutional Class
Years ended March 31, | 2005 | 2004E |
Selected Per-Share Data | | |
Net asset value, beginning of period | $ 11.49 | $ 10.00 |
Income from Investment Operations | | |
Net investment income (loss)D | .21 | .13 |
Net realized and unrealized gain (loss) | .31 | 1.45 |
Total from investment operations | .52 | 1.58 |
Distributions from net investment income | (.17) | (.09) |
Distributions from net realized gain | -G | - |
Total distributions | (.17) | (.09) |
Net asset value, end of period | $ 11.84 | $ 11.49 |
Total ReturnB,C | 4.50% | 15.83% |
Ratios to Average Net AssetsF, H | | |
Expenses before expense reductions | .10% | .10%A |
Expenses net of voluntary waivers, if any | .08% | .08%A |
Expenses net of all reductions | .08% | .07%A |
Net investment income (loss) | 1.80% | 1.69%A |
Supplemental Data | | |
Net assets, end of period (000 omitted) | $ 7,841 | $ 1,030 |
Portfolio turnover rate | 2% | 2%A |
A Annualized
B Total returns for periods of less than one year are not annualized.
C Total returns would have been lower had certain expenses not been reduced during the periods shown.
D Calculated based on average shares outstanding during the period.
E For the period July 24, 2003 (commencement of operations) to March 31, 2004.
F Expense ratios reflect operating expenses of the class. Expenses before reductions do not reflect amounts reimbursed by the investment adviser or reductions from brokerage service arrangements or other expense offset arrangements and do not represent the amount paid by the class during periods when reimbursements or reductions occur. Expenses net of any voluntary waivers reflect expenses after reimbursement by the investment adviser but prior to reductions from brokerage service arrangements or other expense offset arrangements. Expenses net of all reductions represent the net expenses paid by the class.
G Amount represents less than $.01 per share.
H Amounts do not include the activity of the underlying funds.
See accompanying notes which are an integral part of the financial statements.
Annual Report
Fidelity Advisor Freedom 2035 Fund
Investment Changes
Fund Holdings as of March 31, 2005 |
| % of fund's
investments | % of fund's investments
6 months ago |
Domestic Equity Funds | | |
Fidelity Advisor Dividend Growth Fund Institutional Class | 13.3 | 13.4 |
Fidelity Advisor Equity Growth Fund Institutional Class | 6.7 | 6.7 |
Fidelity Advisor Equity Income Fund Institutional Class | 13.9 | 13.9 |
Fidelity Advisor Growth & Income Fund Institutional Class | 13.5 | 13.6 |
Fidelity Advisor Large Cap Fund Institutional Class | 13.4 | 13.4 |
Fidelity Advisor Mid-Cap Fund Institutional Class | 4.2 | 4.2 |
Fidelity Advisor Small Cap Fund Institutional Class | 4.3 | 4.3 |
| 69.3 | 69.5 |
International Equity Funds | | |
Fidelity Advisor Diversified International Fund Institutional Class | 7.8 | 7.7 |
Fidelity Advisor Overseas Fund Institutional Class | 7.6 | 7.4 |
| 15.4 | 15.1 |
High Yield Fixed-Income Funds | | |
Fidelity Advisor High Income Advantage Fund Institutional Class | 10.0 | 10.3 |
Investment Grade Fixed-Income Funds |
Fidelity Advisor Government Investment Fund Institutional Class | 2.7 | 2.6 |
Fidelity Advisor Intermediate Bond Fund Institutional Class | 2.6 | 2.5 |
| 5.3 | 5.1 |
| 100.0 | 100.0 |
Asset Allocation (% of fund's investments) |

The fund invests according to an asset allocation strategy that becomes increasingly conservative over time. The six months ago allocation is based on the fund's holdings as of September 30, 2004. The current allocation is based on the fund's holdings as of March 31, 2005. The expected allocation represents the fund's anticipated target asset allocation at September 30, 2005.
Annual Report
Fidelity Advisor Freedom 2035 Fund
Investments March 31, 2005
Showing Percentage of Total Value of Investment in Securities
Equity Funds - 84.7% |
| Shares | | Value (Note 1) |
Domestic Equity Funds - 69.3% |
Fidelity Advisor Dividend Growth Fund Institutional Class | 514,827 | | $ 5,858,732 |
Fidelity Advisor Equity Growth Fund Institutional Class | 64,521 | | 2,977,003 |
Fidelity Advisor Equity Income Fund Institutional Class | 216,316 | | 6,141,211 |
Fidelity Advisor Growth & Income Fund Institutional Class | 363,187 | | 5,981,683 |
Fidelity Advisor Large Cap Fund Institutional Class | 399,408 | | 5,919,223 |
Fidelity Advisor Mid-Cap Fund Institutional Class | 76,459 | | 1,852,612 |
Fidelity Advisor Small Cap Fund Institutional Class | 77,960 | | 1,910,797 |
TOTAL DOMESTIC EQUITY FUNDS | | 30,641,261 |
International Equity Funds - 15.4% |
Fidelity Advisor Diversified International Fund Institutional Class | 182,668 | | 3,443,289 |
Fidelity Advisor Overseas Fund Institutional Class | 193,301 | | 3,365,375 |
TOTAL INTERNATIONAL EQUITY FUNDS | | 6,808,664 |
TOTAL EQUITY FUNDS (Cost $36,646,618) | 37,449,925 |
Fixed-Income Funds - 15.3% |
| | | |
High Yield Fixed-Income Funds - 10.0% |
Fidelity Advisor High Income Advantage Fund Institutional Class | 470,304 | | 4,430,262 |
Investment Grade Fixed-Income Funds - 5.3% |
Fidelity Advisor Government Investment Fund Institutional Class | 117,520 | | 1,166,974 |
Fidelity Advisor Intermediate Bond Fund Institutional Class | 105,945 | | 1,162,222 |
TOTAL INVESTMENT GRADE FIXED-INCOME FUNDS | | 2,329,196 |
TOTAL FIXED-INCOME FUNDS (Cost $6,787,413) | 6,759,458 |
TOTAL INVESTMENT IN SECURITIES - 100% (Cost $43,434,031) | $ 44,209,383 |
See accompanying notes which are an integral part of the financial statements.
Annual Report
Fidelity Advisor Freedom 2035 Fund
Financial Statements
Statement of Assets and Liabilities
| March 31, 2005 |
| | |
Assets | | |
Investment in securities, at value (cost $43,434,031) - See accompanying schedule | | $ 44,209,383 |
Cash | | 7 |
Receivable for fund shares sold | | 262,426 |
Receivable from investment adviser for expense reductions | | 159 |
Total assets | | 44,471,975 |
| | |
Liabilities | | |
Payable for investments purchased | $ 189,448 | |
Payable for fund shares redeemed | 72,886 | |
Accrued management fee | 3,555 | |
Distribution fees payable | 19,402 | |
Total liabilities | | 285,291 |
| | |
Net Assets | | $ 44,186,684 |
Net Assets consist of: | | |
Paid in capital | | $ 43,335,425 |
Accumulated undistributed net realized gain (loss) on investments | | 75,907 |
Net unrealized appreciation (depreciation) on investments | | 775,352 |
Net Assets | | $ 44,186,684 |
Calculation of Maximum Offering Price Class A:
Net Asset Value and redemption price per share ($15,280,953 ÷ 1,382,233 shares) | | $ 11.06 |
| | |
Maximum offering price per share (100/94.25 of $11.06) | | $ 11.73 |
| | |
Class T:
Net Asset Value and redemption price per share ($16,432,305 ÷ 1,491,163 shares) | | $ 11.02 |
| | |
Maximum offering price per share (100/96.50 of $11.02) | | $ 11.42 |
| | |
Class B:
Net Asset Value and offering price per share ($6,917,167 ÷ 630,202 shares)A | | $ 10.98 |
| | |
Class C:
Net Asset Value and offering price per share ($5,089,067 ÷ 463,223 shares)A | | $ 10.99 |
| | |
Institutional Class:
Net Asset Value, offering price and redemption price per share ($467,192 ÷ 42,193 shares) | | $ 11.07 |
A Redemption price per share is equal to net asset value less any applicable contingent deferred sales charge.
Statement of Operations
| Year ended March 31, 2005 |
| | |
Investment Income | | |
Income distributions from underlying funds | | $ 429,995 |
Interest | | 25 |
Total income | | 430,020 |
| | |
Expenses | | |
Management fee | $ 21,052 | |
Distribution fees | 118,684 | |
Independent trustees' compensation | 93 | |
Total expenses before reductions | 139,829 | |
Expense reductions | (5,043) | 134,786 |
Net investment income (loss) | | 295,234 |
Realized and Unrealized Gain (Loss) Realized gain (loss) on sale of underlying fund shares | (24,619) | |
Capital gain distributions from underlying funds | 155,576 | 130,957 |
Change in net unrealized appreciation (depreciation) on underlying funds | | 674,970 |
Net gain (loss) | | 805,927 |
Net increase (decrease) in net assets resulting from operations | | $ 1,101,161 |
See accompanying notes which are an integral part of the financial statements.
Annual Report
Fidelity Advisor Freedom 2035 Fund
Financial Statements - continued
Statement of Changes in Net Assets
| Year ended
March 31,
2005 | November 6, 2003
(commencement of
operations) to
March 31, 2004 |
Increase (Decrease) in Net Assets | | |
Operations | | |
Net investment income (loss) | $ 295,234 | $ 13,710 |
Net realized gain (loss) | 130,957 | 450 |
Change in net unrealized appreciation (depreciation) | 674,970 | 100,382 |
Net increase (decrease) in net assets resulting from operations | 1,101,161 | 114,542 |
Distributions to shareholders from net investment income | (351,658) | (11,997) |
Distributions to shareholders from net realized gain | (788) | - |
Total distributions | (352,446) | (11,997) |
Share transactions - net increase (decrease) | 38,278,752 | 5,056,672 |
Total increase (decrease) in net assets | 39,027,467 | 5,159,217 |
| | |
Net Assets | | |
Beginning of period | 5,159,217 | - |
End of period (including undistributed net investment income of $0 and undistributed net investment income of $1,743, respectively) | $ 44,186,684 | $ 5,159,217 |
Financial Highlights - Class A
Years ended March 31, | 2005 | 2004F |
Selected Per-Share Data | | |
Net asset value, beginning of period | $ 10.70 | $ 10.00 |
Income from Investment Operations | | |
Net investment income (loss)E | .19 | .07 |
Net realized and unrealized gain (loss) | .32 | .72 |
Total from investment operations | .51 | .79 |
Distributions from net investment income | (.15) | (.09) |
Distributions from net realized gain | -H | - |
Total distributions | (.15) | (.09) |
Net asset value, end of period | $ 11.06 | $ 10.70 |
Total ReturnB,C,D | 4.76% | 7.88% |
Ratios to Average Net AssetsG, I | | |
Expenses before expense reductions | .35% | .35%A |
Expenses net of voluntary waivers, if any | .33% | .33%A |
Expenses net of all reductions | .33% | .33%A |
Net investment income (loss) | 1.71% | 1.80%A |
Supplemental Data | | |
Net assets, end of period (000 omitted) | $ 15,281 | $ 1,884 |
Portfolio turnover rate | 5% | 1%A |
A Annualized
B Total returns for periods of less than one year are not annualized.
C Total returns would have been lower had certain expenses not been reduced during the periods shown.
D Total returns do not include the effect of the sales charges.
E Calculated based on average shares outstanding during the period.
F For the period November 6, 2003 (commencement of sale of shares) to March 31, 2004.
G Expense ratios reflect operating expenses of the class. Expenses before reductions do not reflect amounts reimbursed by the investment adviser or reductions from brokerage service arrangements or other expense offset arrangements and do not represent the amount paid by the class during periods when reimbursements or reductions occur. Expenses net of any voluntary waivers reflect expenses after reimbursement by the investment adviser but prior to reductions from brokerage service arrangements or other expense offset arrangements. Expenses net of all reductions represent the net expenses paid by the class.
H Amount represents less than $.01 per share.
I Amounts do not include the activity of the underlying funds.
See accompanying notes which are an integral part of the financial statements.
Annual Report
Financial Highlights - Class T
Years ended March 31, | 2005 | 2004F |
Selected Per-Share Data | | |
Net asset value, beginning of period | $ 10.69 | $ 10.00 |
Income from Investment Operations | | |
Net investment income (loss)E | .16 | .06 |
Net realized and unrealized gain (loss) | .31 | .71 |
Total from investment operations | .47 | .77 |
Distributions from net investment income | (.14) | (.08) |
Distributions from net realized gain | -H | - |
Total distributions | (.14) | (.08) |
Net asset value, end of period | $ 11.02 | $ 10.69 |
Total ReturnB,C,D | 4.37% | 7.73% |
Ratios to Average Net AssetsG, I | | |
Expenses before expense reductions | .60% | .60%A |
Expenses net of voluntary waivers, if any | .58% | .58%A |
Expenses net of all reductions | .58% | .58%A |
Net investment income (loss) | 1.46% | 1.55%A |
Supplemental Data | | |
Net assets, end of period (000 omitted) | $ 16,432 | $ 1,047 |
Portfolio turnover rate | 5% | 1%A |
A Annualized
B Total returns for periods of less than one year are not annualized.
C Total returns would have been lower had certain expenses not been reduced during the periods shown.
D Total returns do not include the effect of the sales charges.
E Calculated based on average shares outstanding during the period.
F For the period November 6, 2003 (commencement of sale of shares) to March 31, 2004.
G Expense ratios reflect operating expenses of the class. Expenses before reductions do not reflect amounts reimbursed by the investment adviser or reductions from brokerage service arrangements or other expense offset arrangements and do not represent the amount paid by the class during periods when reimbursements or reductions occur. Expenses net of any voluntary waivers reflect expenses after reimbursement by the investment adviser but prior to reductions from brokerage service arrangements or other expense offset arrangements. Expenses net of all reductions represent the net expenses paid by the class.
H Amount represents less than $.01 per share.
I Amounts do not include the activity of the underlying funds.
Financial Highlights - Class B
Years ended March 31, | 2005 | 2004F |
Selected Per-Share Data | | |
Net asset value, beginning of period | $ 10.67 | $ 10.00 |
Income from Investment Operations | | |
Net investment income (loss)E | .10 | .04 |
Net realized and unrealized gain (loss) | .32 | .71 |
Total from investment operations | .42 | .75 |
Distributions from net investment income | (.11) | (.08) |
Distributions from net realized gain | -H | - |
Total distributions | (.11) | (.08) |
Net asset value, end of period | $ 10.98 | $ 10.67 |
Total ReturnB,C,D | 3.88% | 7.48% |
Ratios to Average Net AssetsG, I | | |
Expenses before expense reductions | 1.10% | 1.10%A |
Expenses net of voluntary waivers, if any | 1.08% | 1.08%A |
Expenses net of all reductions | 1.08% | 1.08%A |
Net investment income (loss) | .96% | 1.05%A |
Supplemental Data | | |
Net assets, end of period (000 omitted) | $ 6,917 | $ 1,123 |
Portfolio turnover rate | 5% | 1%A |
A Annualized
B Total returns for periods of less than one year are not annualized.
C Total returns would have been lower had certain expenses not been reduced during the periods shown.
D Total returns do not include the effect of the contingent deferred sales charge.
E Calculated based on average shares outstanding during the period.
F For the period November 6, 2003 (commencement of sale of shares) to March 31, 2004.
G Expense ratios reflect operating expenses of the class. Expenses before reductions do not reflect amounts reimbursed by the investment adviser or reductions from brokerage service arrangements or other expense offset arrangements and do not represent the amount paid by the class during periods when reimbursements or reductions occur. Expenses net of any voluntary waivers reflect expenses after reimbursement by the investment adviser but prior to reductions from brokerage service arrangements or other expense offset arrangements. Expenses net of all reductions represent the net expenses paid by the class.
H Amount represents less than $.01 per share.
I Amounts do not include the activity of the underlying funds.
See accompanying notes which are an integral part of the financial statements.
Annual Report
Financial Highlights - Class C
Years ended March 31, | 2005 | 2004F |
Selected Per-Share Data | | |
Net asset value, beginning of period | $ 10.68 | $ 10.00 |
Income from Investment Operations | | |
Net investment income (loss)E | .10 | .04 |
Net realized and unrealized gain (loss) | .32 | .72 |
Total from investment operations | .42 | .76 |
Distributions from net investment income | (.11) | (.08) |
Distributions from net realized gain | -H | - |
Total distributions | (.11) | (.08) |
Net asset value, end of period | $ 10.99 | $ 10.68 |
Total ReturnB,C,D | 3.87% | 7.58% |
Ratios to Average Net AssetsG, I | | |
Expenses before expense reductions | 1.10% | 1.10%A |
Expenses net of voluntary waivers, if any | 1.08% | 1.08%A |
Expenses net of all reductions | 1.08% | 1.08%A |
Net investment income (loss) | .96% | 1.05%A |
Supplemental Data | | |
Net assets, end of period (000 omitted) | $ 5,089 | $ 890 |
Portfolio turnover rate | 5% | 1%A |
A Annualized
B Total returns for periods of less than one year are not annualized.
C Total returns would have been lower had certain expenses not been reduced during the periods shown.
D Total returns do not include the effect of the contingent deferred sales charge.
E Calculated based on average shares outstanding during the period.
F For the period November 6, 2003 (commencement of sale of shares) to March 31, 2004.
G Expense ratios reflect operating expenses of the class. Expenses before reductions do not reflect amounts reimbursed by the investment adviser or reductions from brokerage service arrangements or other expense offset arrangements and do not represent the amount paid by the class during periods when reimbursements or reductions occur. Expenses net of any voluntary waivers reflect expenses after reimbursement by the investment adviser but prior to reductions from brokerage service arrangements or other expense offset arrangements. Expenses net of all reductions represent the net expenses paid by the class.
H Amount represents less than $.01 per share.
I Amounts do not include the activity of the underlying funds.
Financial Highlights - Institutional Class
Years ended March 31, | 2005 | 2004E |
Selected Per-Share Data | | |
Net asset value, beginning of period | $ 10.71 | $ 10.00 |
Income from Investment Operations | | |
Net investment income (loss)D | .21 | .08 |
Net realized and unrealized gain (loss) | .31 | .72 |
Total from investment operations | .52 | .80 |
Distributions from net investment income | (.16) | (.09) |
Distributions from net realized gain | -G | - |
Total distributions | (.16) | (.09) |
Net asset value, end of period | $ 11.07 | $ 10.71 |
Total ReturnB,C | 4.87% | 7.98% |
Ratios to Average Net AssetsF, H | | |
Expenses before expense reductions | .10% | .10%A |
Expenses net of voluntary waivers, if any | .08% | .08%A |
Expenses net of all reductions | .08% | .08%A |
Net investment income (loss) | 1.96% | 2.04%A |
Supplemental Data | | |
Net assets, end of period (000 omitted) | $ 467 | $ 216 |
Portfolio turnover rate | 5% | 1%A |
A Annualized
B Total returns for periods of less than one year are not annualized.
C Total returns would have been lower had certain expenses not been reduced during the periods shown.
D Calculated based on average shares outstanding during the period.
E For the period November 6, 2003 (commencement of sale of shares) to March 31, 2004.
F Expense ratios reflect operating expenses of the class. Expenses before reductions do not reflect amounts reimbursed by the investment adviser or reductions from brokerage service arrangements or other expense offset arrangements and do not represent the amount paid by the class during periods when reimbursements or reductions occur. Expenses net of any voluntary waivers reflect expenses after reimbursement by the investment adviser but prior to reductions from brokerage service arrangements or other expense offset arrangements. Expenses net of all reductions represent the net expenses paid by the class.
G Amount represents less than $.01 per share.
H Amounts do not include the activity of the underlying funds.
See accompanying notes which are an integral part of the financial statements.
Annual Report
Fidelity Advisor Freedom 2040 Fund
Investment Changes
Fund Holdings as of March 31, 2005 |
| % of fund's
investments | % of fund's investments
6 months ago |
Domestic Equity Funds | | |
Fidelity Advisor Dividend Growth Fund Institutional Class | 13.9 | 14.3 |
Fidelity Advisor Equity Growth Fund Institutional Class | 7.0 | 7.2 |
Fidelity Advisor Equity Income Fund Institutional Class | 14.7 | 15.0 |
Fidelity Advisor Growth & Income Fund Institutional Class | 14.2 | 14.5 |
Fidelity Advisor Large Cap Fund Institutional Class | 14.0 | 14.3 |
Fidelity Advisor Mid-Cap Fund Institutional Class | 4.5 | 4.5 |
Fidelity Advisor Small Cap Fund Institutional Class | 4.6 | 4.6 |
| 72.9 | 74.4 |
International Equity Funds | | |
Fidelity Advisor Diversified International Fund Institutional Class | 8.0 | 7.8 |
Fidelity Advisor Overseas Fund Institutional Class | 7.7 | 7.5 |
| 15.7 | 15.3 |
High Yield Fixed-Income Funds | | |
Fidelity Advisor High Income Advantage Fund Institutional Class | 10.3 | 10.3 |
Investment Grade Fixed-Income Funds |
Fidelity Advisor Government Investment Fund Institutional Class | 0.6 | 0.0 |
Fidelity Advisor Intermediate Bond Fund Institutional Class | 0.5 | 0.0 |
| 1.1 | 0.0 |
| 100.0 | 100.0 |
Asset Allocation (% of fund's investments) |

The fund invests according to an asset allocation strategy that becomes increasingly conservative over time. The six months ago allocation is based on the fund's holdings as of September 30, 2004. The current allocation is based on the fund's holdings as of March 31, 2005. The expected allocation represents the fund's anticipated target asset allocation at September 30, 2005.
Annual Report
Fidelity Advisor Freedom 2040 Fund
Investments March 31, 2005
Showing Percentage of Total Value of Investment in Securities
Equity Funds - 88.6% |
| Shares | | Value (Note 1) |
Domestic Equity Funds - 72.9% |
Fidelity Advisor Dividend Growth Fund Institutional Class | 1,984,444 | | $ 22,582,977 |
Fidelity Advisor Equity Growth Fund Institutional Class | 247,634 | | 11,425,817 |
Fidelity Advisor Equity Income Fund Institutional Class | 842,904 | | 23,930,043 |
Fidelity Advisor Growth & Income Fund Institutional Class | 1,399,892 | | 23,056,222 |
Fidelity Advisor Large Cap Fund Institutional Class | 1,539,565 | | 22,816,352 |
Fidelity Advisor Mid-Cap Fund Institutional Class | 299,318 | | 7,252,466 |
Fidelity Advisor Small Cap Fund Institutional Class | 306,910 | | 7,522,373 |
TOTAL DOMESTIC EQUITY FUNDS | | 118,586,250 |
International Equity Funds - 15.7% |
Fidelity Advisor Diversified International Fund Institutional Class | 687,447 | | 12,958,384 |
Fidelity Advisor Overseas Fund Institutional Class | 722,147 | | 12,572,578 |
TOTAL INTERNATIONAL EQUITY FUNDS | | 25,530,962 |
TOTAL EQUITY FUNDS (Cost $139,559,693) | 144,117,212 |
Fixed-Income Funds - 11.4% |
| | | |
High Yield Fixed-Income Funds - 10.3% |
Fidelity Advisor High Income Advantage Fund Institutional Class | 1,775,890 | | 16,728,884 |
Investment Grade Fixed-Income Funds - 1.1% |
Fidelity Advisor Government Investment Fund Institutional Class | 95,495 | | 948,267 |
Fidelity Advisor Intermediate Bond Fund Institutional Class | 86,206 | | 945,680 |
TOTAL INVESTMENT GRADE FIXED-INCOME FUNDS | | 1,893,947 |
TOTAL FIXED-INCOME FUNDS (Cost $18,506,898) | 18,622,831 |
TOTAL INVESTMENT IN SECURITIES - 100% (Cost $158,066,591) | $ 162,740,043 |
See accompanying notes which are an integral part of the financial statements.
Annual Report
Fidelity Advisor Freedom 2040 Fund
Financial Statements
Statement of Assets and Liabilities
| March 31, 2005 |
| | |
Assets | | |
Investment in securities, at value (cost $158,066,591) - See accompanying schedule | | $ 162,740,043 |
Receivable for investments sold | | 58,402 |
Receivable for fund shares sold | | 10,935,965 |
Receivable from investment adviser for expense reductions | | 1,037 |
Total assets | | 173,735,447 |
| | |
Liabilities | | |
Payable for investments purchased | $ 10,723,569 | |
Payable for fund shares redeemed | 270,645 | |
Accrued management fee | 12,356 | |
Distribution fees payable | 67,881 | |
Total liabilities | | 11,074,451 |
| | |
Net Assets | | $ 162,660,996 |
Net Assets consist of: | | |
Paid in capital | | $ 157,560,189 |
Undistributed net investment income | | 26,420 |
Accumulated undistributed net realized gain (loss) on investments | | 400,935 |
Net unrealized appreciation (depreciation) on investments | | 4,673,452 |
Net Assets | | $ 162,660,996 |
Calculation of Maximum Offering Price Class A:
Net Asset Value and redemption price per share ($51,717,906 ÷ 4,299,486 shares) | | $ 12.03 |
| | |
Maximum offering price per share (100/94.25 of $12.03) | | $ 12.76 |
| | |
Class T:
Net Asset Value and redemption price per share ($66,136,138 ÷ 5,510,673 shares) | | $ 12.00 |
| | |
Maximum offering price per share (100/96.50 of $12.00) | | $ 12.44 |
| | |
Class B:
Net Asset Value and offering price per share ($18,540,931 ÷ 1,552,212 shares)A | | $ 11.94 |
| | |
Class C:
Net Asset Value and offering price per share ($21,791,990 ÷ 1,825,006 shares)A | | $ 11.94 |
| | |
Institutional Class:
Net Asset Value, offering price and redemption price per share ($4,474,031 ÷ 371,168 shares) | | $ 12.05 |
A Redemption price per share is equal to net asset value less any applicable contingent deferred sales charge.
Statement of Operations
| Year ended March 31, 2005 |
| | |
Investment Income | | |
Income distributions from underlying funds | | $ 1,672,523 |
| | |
Expenses | | |
Management fee | $ 91,040 | |
Distribution fees | 522,849 | |
Independent trustees' compensation | 434 | |
Total expenses before reductions | 614,323 | |
Expense reductions | (20,338) | 593,985 |
Net investment income (loss) | | 1,078,538 |
Realized and Unrealized Gain (Loss) Realized gain (loss) on sale of underlying fund shares | (71,321) | |
Capital gain distributions from underlying funds | 602,083 | 530,762 |
Change in net unrealized appreciation (depreciation) on underlying funds | | 3,286,735 |
Net gain (loss) | | 3,817,497 |
Net increase (decrease) in net assets resulting from operations | | $ 4,896,035 |
See accompanying notes which are an integral part of the financial statements.
Annual Report
Fidelity Advisor Freedom 2040 Fund
Financial Statements - continued
Statement of Changes in Net Assets
| Year ended
March 31,
2005 | July 24, 2003
(commencement of
operations) to
March 31, 2004 |
Increase (Decrease) in Net Assets | | |
Operations | | |
Net investment income (loss) | $ 1,078,538 | $ 127,323 |
Net realized gain (loss) | 530,762 | (2,741) |
Change in net unrealized appreciation (depreciation) | 3,286,735 | 1,386,717 |
Net increase (decrease) in net assets resulting from operations | 4,896,035 | 1,511,299 |
Distributions to shareholders from net investment income | (1,190,067) | (116,460) |
Share transactions - net increase (decrease) | 115,613,636 | 41,946,553 |
Total increase (decrease) in net assets | 119,319,604 | 43,341,392 |
| | |
Net Assets | | |
Beginning of period | 43,341,392 | - |
End of period (including undistributed net investment income of $26,420 and undistributed net investment income of $10,863, respectively) | $ 162,660,996 | $ 43,341,392 |
Financial Highlights - Class A
Years ended March 31, | 2005 | 2004F |
Selected Per-Share Data | | |
Net asset value, beginning of period | $ 11.62 | $ 10.00 |
Income from Investment Operations | | |
Net investment income (loss)E | .18 | .12 |
Net realized and unrealized gain (loss) | .39 | 1.60 |
Total from investment operations | .57 | 1.72 |
Distributions from net investment income | (.16) | (.10) |
Net asset value, end of period | $ 12.03 | $ 11.62 |
Total ReturnB,C,D | 4.87% | 17.19% |
Ratios to Average Net AssetsG, H | | |
Expenses before expense reductions | .35% | .35%A |
Expenses net of voluntary waivers, if any | .33% | .33%A |
Expenses net of all reductions | .33% | .33%A |
Net investment income (loss) | 1.50% | 1.53%A |
Supplemental Data | | |
Net assets, end of period (000 omitted) | $ 51,718 | $ 9,666 |
Portfolio turnover rate | 3% | 3%A |
A Annualized
B Total returns for periods of less than one year are not annualized.
C Total returns would have been lower had certain expenses not been reduced during the periods shown.
D Total returns do not include the effect of the sales charges.
E Calculated based on average shares outstanding during the period.
F For the period July 24, 2003 (commencement of operations) to March 31, 2004.
G Expense ratios reflect operating expenses of the class. Expenses before reductions do not reflect amounts reimbursed by the investment adviser or reductions from brokerage service arrangements or other expense offset arrangements and do not represent the amount paid by the class during periods when reimbursements or reductions occur. Expenses net of any voluntary waivers reflect expenses after reimbursement by the investment adviser but prior to reductions from brokerage service arrangements or other expense offset arrangements. Expenses net of all reductions represent the net expenses paid by the class.
H Amounts do not include the activity of the underlying funds.
See accompanying notes which are an integral part of the financial statements.
Annual Report
Financial Highlights - Class T
Years ended March 31, | 2005 | 2004F |
Selected Per-Share Data | | |
Net asset value, beginning of period | $ 11.60 | $ 10.00 |
Income from Investment Operations | | |
Net investment income (loss)E | .15 | .10 |
Net realized and unrealized gain (loss) | .38 | 1.59 |
Total from investment operations | .53 | 1.69 |
Distributions from net investment income | (.13) | (.09) |
Net asset value, end of period | $ 12.00 | $ 11.60 |
Total ReturnB,C,D | 4.57% | 16.93% |
Ratios to Average Net AssetsG, H | | |
Expenses before expense reductions | .60% | .60%A |
Expenses net of voluntary waivers, if any | .58% | .58%A |
Expenses net of all reductions | .58% | .58%A |
Net investment income (loss) | 1.25% | 1.28%A |
Supplemental Data | | |
Net assets, end of period (000 omitted) | $ 66,136 | $ 19,191 |
Portfolio turnover rate | 3% | 3%A |
A Annualized
B Total returns for periods of less than one year are not annualized.
C Total returns would have been lower had certain expenses not been reduced during the periods shown.
D Total returns do not include the effect of the sales charges.
E Calculated based on average shares outstanding during the period.
F For the period July 24, 2003 (commencement of operations) to March 31, 2004.
G Expense ratios reflect operating expenses of the class. Expenses before reductions do not reflect amounts reimbursed by the investment adviser or reductions from brokerage service arrangements or other expense offset arrangements and do not represent the amount paid by the class during periods when reimbursements or reductions occur. Expenses net of any voluntary waivers reflect expenses after reimbursement by the investment adviser but prior to reductions from brokerage service arrangements or other expense offset arrangements. Expenses net of all reductions represent the net expenses paid by the class.
H Amounts do not include the activity of the underlying funds.
Financial Highlights - Class B
Years ended March 31, | 2005 | 2004F |
Selected Per-Share Data | | |
Net asset value, beginning of period | $ 11.57 | $ 10.00 |
Income from Investment Operations | | |
Net investment income (loss)E | .09 | .06 |
Net realized and unrealized gain (loss) | .38 | 1.60 |
Total from investment operations | .47 | 1.66 |
Distributions from net investment income | (.10) | (.09) |
Net asset value, end of period | $ 11.94 | $ 11.57 |
Total ReturnB,C,D | 4.04% | 16.58% |
Ratios to Average Net AssetsG, H | | |
Expenses before expense reductions | 1.10% | 1.10%A |
Expenses net of voluntary waivers, if any | 1.08% | 1.08%A |
Expenses net of all reductions | 1.08% | 1.08%A |
Net investment income (loss) | .75% | .78%A |
Supplemental Data | | |
Net assets, end of period (000 omitted) | $ 18,541 | $ 7,232 |
Portfolio turnover rate | 3% | 3%A |
A Annualized
B Total returns for periods of less than one year are not annualized.
C Total returns would have been lower had certain expenses not been reduced during the periods shown.
D Total returns do not include the effect of the contingent deferred sales charge.
E Calculated based on average shares outstanding during the period.
F For the period July 24, 2003 (commencement of operations) to March 31, 2004.
G Expense ratios reflect operating expenses of the class. Expenses before reductions do not reflect amounts reimbursed by the investment adviser or reductions from brokerage service arrangements or other expense offset arrangements and do not represent the amount paid by the class during periods when reimbursements or reductions occur. Expenses net of any voluntary waivers reflect expenses after reimbursement by the investment adviser but prior to reductions from brokerage service arrangements or other expense offset arrangements. Expenses net of all reductions represent the net expenses paid by the class.
H Amounts do not include the activity of the underlying funds.
See accompanying notes which are an integral part of the financial statements.
Annual Report
Financial Highlights - Class C
Years ended March 31, | 2005 | 2004F |
Selected Per-Share Data | | |
Net asset value, beginning of period | $ 11.57 | $ 10.00 |
Income from Investment Operations | | |
Net investment income (loss)E | .09 | .06 |
Net realized and unrealized gain (loss) | .38 | 1.59 |
Total from investment operations | .47 | 1.65 |
Distributions from net investment income | (.10) | (.08) |
Net asset value, end of period | $ 11.94 | $ 11.57 |
Total ReturnB,C,D | 4.04% | 16.53% |
Ratios to Average Net AssetsG, H | | |
Expenses before expense reductions | 1.10% | 1.10%A |
Expenses net of voluntary waivers, if any | 1.08% | 1.08%A |
Expenses net of all reductions | 1.08% | 1.08%A |
Net investment income (loss) | .75% | .78%A |
Supplemental Data | | |
Net assets, end of period (000 omitted) | $ 21,792 | $ 6,958 |
Portfolio turnover rate | 3% | 3%A |
A Annualized
B Total returns for periods of less than one year are not annualized.
C Total returns would have been lower had certain expenses not been reduced during the periods shown.
D Total returns do not include the effect of the contingent deferred sales charge.
E Calculated based on average shares outstanding during the period.
F For the period July 24, 2003 (commencement of operations) to March 31, 2004.
G Expense ratios reflect operating expenses of the class. Expenses before reductions do not reflect amounts reimbursed by the investment adviser or reductions from brokerage service arrangements or other expense offset arrangements and do not represent the amount paid by the class during periods when reimbursements or reductions occur. Expenses net of any voluntary waivers reflect expenses after reimbursement by the investment adviser but prior to reductions from brokerage service arrangements or other expense offset arrangements. Expenses net of all reductions represent the net expenses paid by the class.
H Amounts do not include the activity of the underlying funds.
Financial Highlights - Institutional Class
Years ended March 31, | 2005 | 2004E |
Selected Per-Share Data | | |
Net asset value, beginning of period | $ 11.63 | $ 10.00 |
Income from Investment Operations | | |
Net investment income (loss)D | .21 | .13 |
Net realized and unrealized gain (loss) | .38 | 1.60 |
Total from investment operations | .59 | 1.73 |
Distributions from net investment income | (.17) | (.10) |
Net asset value, end of period | $ 12.05 | $ 11.63 |
Total ReturnB,C | 5.07% | 17.34% |
Ratios to Average Net AssetsF, G | | |
Expenses before expense reductions | .10% | .10%A |
Expenses net of voluntary waivers, if any | .08% | .08%A |
Expenses net of all reductions | .08% | .08%A |
Net investment income (loss) | 1.75% | 1.78%A |
Supplemental Data | | |
Net assets, end of period (000 omitted) | $ 4,474 | $ 294 |
Portfolio turnover rate | 3% | 3%A |
A Annualized
B Total returns for periods of less than one year are not annualized.
C Total returns would have been lower had certain expenses not been reduced during the periods shown.
D Calculated based on average shares outstanding during the period.
E For the period July 24, 2003 (commencement of operations) to March 31, 2004.
F Expense ratios reflect operating expenses of the class. Expenses before reductions do not reflect amounts reimbursed by the investment adviser or reductions from brokerage service arrangements or other expense offset arrangements and do not represent the amount paid by the class during periods when reimbursements or reductions occur. Expenses net of any voluntary waivers reflect expenses after reimbursement by the investment adviser but prior to reductions from brokerage service arrangements or other expense offset arrangements. Expenses net of all reductions represent the net expenses paid by the class.
G Amounts do not include the activity of the underlying funds.
See accompanying notes which are an integral part of the financial statements.
Annual Report
Notes to Financial Statements
For the period ended March 31, 2005
1. Significant Accounting Policies.
Fidelity Advisor Freedom Income Fund, Advisor Freedom 2005 Fund, Advisor Freedom 2010 Fund, Advisor Freedom 2015 Fund, Advisor Freedom 2020 Fund, Advisor Freedom 2025 Fund, Advisor Freedom 2030 Fund, Advisor Freedom 2035 Fund and Advisor Freedom 2040 Fund (the funds) are funds of Fidelity Aberdeen Street Trust (the trust). The trust is registered under the Investment Company Act of 1940, as amended (the 1940 Act), as a diversified open-end management investment company organized as a Delaware statutory trust. Each fund is authorized to issue an unlimited number of shares. The funds invest primarily in a combination of other Fidelity equity, fixed income, and money market funds (the Underlying Funds) managed by Fidelity Management & Research Company (FMR). Each fund offers Class A, Class T, Class B, Class C, and Institutional Class shares, each of which has equal rights as to assets and voting privileges. Each class has exclusive voting rights with respect to matters that affect that class. Class B shares will automatically convert to Class A shares after a holding period of seven years from the initial date of purchase. Investment income, realized and unrealized capital gains and losses, the common expenses of the fund, and certain fund-level expense reductions, if any, are allocated on a pro rata basis to each class based on the relative net assets of each class to the total net assets of the fund. Each class differs with respect to distribution and service plan fees incurred. Certain expense reductions also differ by class. The financial statements have been prepared in conformity with accounting principles generally accepted in the United States of America, which require management to make certain estimates and assumptions at the date of the financial statements. The following summarizes the significant accounting policies of the funds:
Security Valuation. Net asset value per share is calculated as of the close of business of the New York Stock Exchange, normally 4:00 p.m. Eastern time. Investments in the Underlying Funds are valued at their net asset value each business day. Short-term securities with remaining maturities of sixty days or less for which quotations are not readily available are valued on the basis of amortized cost.
Investment Transactions and Income. Security transactions, normally shares of the Underlying Funds, are accounted for as of trade date. Gains and losses on securities sold are determined on the basis of identified cost. Income and capital gain distributions from the Underlying Funds, if any, are recorded on the ex-dividend date. Interest income is accrued as earned. Interest income includes coupon interest and amortization of premium and accretion of discount on debt securities.
Expenses. Most expenses of the trust can be directly attributed to a fund. Expenses which cannot be directly attributed are apportioned among each fund in the trust. Expenses included in the accompanying financial statements reflect the expenses of each fund and do not include any expenses associated with the Underlying Funds.
Income Tax Information and Distributions to Shareholders. Each year, each fund intends to qualify as a regulated investment company by distributing all of its taxable income and realized gains under Subchapter M of the Internal Revenue Code. As a result, no provision for income taxes is required in the accompanying financial statements.
Distributions are recorded on the ex-dividend date. Income dividends and capital gain distributions are declared separately for each class. Income and capital gain distributions are determined in accordance with income tax regulations, which may differ from generally accepted accounting principles. In addition, certain funds will claim a portion of the payment made to redeeming shareholders as a distribution for income tax purposes. Capital accounts within the financial statements are adjusted for permanent book-tax differences. These adjustments have no impact on net assets or the results of operations. Temporary book-tax differences will reverse in a subsequent period.
Book-tax differences are primarily due to short-term capital gain distributions from the Underlying Funds and losses deferred due to wash sales.
The tax-basis components of distributable earnings and the federal tax cost as of period end were as follows for each fund:
| Cost for Federal
Income Tax Purposes | Unrealized
Appreciation | Unrealized
Depreciation | Net Unrealized
Appreciation/
(Depreciation) |
Advisor Freedom Income | $ 58,255,680 | $ 675,153 | $ (570,470) | $ 104,683 |
Advisor Freedom 2005 | 22,821,903 | 423,939 | (232,080) | 191,859 |
Advisor Freedom 2010 | 226,855,554 | 4,791,248 | (2,440,925) | 2,350,323 |
Advisor Freedom 2015 | 150,476,079 | 2,784,265 | (1,623,175) | 1,161,090 |
Advisor Freedom 2020 | 403,046,171 | 13,780,829 | (3,340,317) | 10,440,512 |
Advisor Freedom 2025 | 121,056,564 | 2,314,186 | (814,130) | 1,500,056 |
Advisor Freedom 2030 | 218,981,643 | 8,269,489 | (1,623,213) | 6,646,276 |
Advisor Freedom 2035 | 43,434,087 | 1,172,493 | (397,197) | 775,296 |
Advisor Freedom 2040 | 158,066,664 | 5,731,090 | (1,057,711) | 4,673,379 |
Annual Report
Notes to Financial Statements - continued
1. Significant Accounting Policies - continued
Income Tax Information and Distributions to Shareholders - continued
| Undistributed
Ordinary Income | Undistributed
Long-term Capital Gain |
Advisor Freedom Income | $ 86,109 | $ 131,393 |
Advisor Freedom 2005 | 66,592 | 46,077 |
Advisor Freedom 2010 | 718,326 | 744,259 |
Advisor Freedom 2015 | 318,954 | 449,826 |
Advisor Freedom 2020 | 637,463 | 1,564,213 |
Advisor Freedom 2025 | 95,450 | 243,467 |
Advisor Freedom 2030 | 131,528 | 801,993 |
Advisor Freedom 2035 | - | 75,963 |
Advisor Freedom 2040 | 26,459 | 400,970 |
The tax character of distributions paid was as follows:
March 31, 2005 | | | |
| Ordinary
Income | Long-term
Capital Gains | Total |
Advisor Freedom Income | $ 704,332 | $ 35,147 | $ 739,479 |
Advisor Freedom 2005 | 231,296 | 3,243 | 234,539 |
Advisor Freedom 2010 | 2,581,854 | 17,590 | 2,599,444 |
Advisor Freedom 2015 | 1,216,211 | 6,337 | 1,222,548 |
Advisor Freedom 2020 | 4,439,939 | 68,080 | 4,508,019 |
Advisor Freedom 2025 | 647,465 | 1,629 | 649,094 |
Advisor Freedom 2030 | 1,985,403 | 16,365 | 2,001,768 |
Advisor Freedom 2035 | 330,752 | 21,694 | 352,446 |
Advisor Freedom 2040 | 1,190,067 | - | 1,190,067 |
March 31, 2004 | | | |
| Ordinary
Income | Long-term
Capital Gains | Total |
Advisor Freedom Income | $ 156,368 | $ - | $ 156,368 |
Advisor Freedom 2005 | 8,568 | - | 8,568 |
Advisor Freedom 2010 | 196,312 | - | 196,312 |
Advisor Freedom 2015 | 18,521 | - | 18,521 |
Advisor Freedom 2020 | 346,934 | - | 346,934 |
Advisor Freedom 2025 | 11,834 | - | 11,834 |
Advisor Freedom 2030 | 174,903 | - | 174,903 |
Advisor Freedom 2035 | 11,997 | - | 11,997 |
Advisor Freedom 2040 | 116,460 | - | 116,460 |
2. Operating Policies.
Repurchase Agreements. FMR has received an Exemptive Order from the Securities and Exchange Commission (the SEC) which permits certain funds and other affiliated entities of FMR to transfer uninvested cash balances into joint trading accounts which are then invested in repurchase agreements. Certain funds may also invest directly with institutions in repurchase agreements. Repurchase agreements are collateralized by government or non-government securities. Collateral is held in segregated accounts with custodian banks and may be obtained in the event of a default of the counterparty. Each applicable fund monitors, on a daily basis, the value of the collateral to ensure it is at least equal to the principal amount of the repurchase agreement (including accrued interest). In the event of a default by the counterparty, realization of the collateral proceeds could be delayed, during which time the value of the collateral may decline.
Annual Report
3. Purchases and Sales of Investments.
Purchases and redemptions of the underlying fund shares are noted in the table below.
| Purchases ($) | Redemptions ($) |
Advisor Freedom Income | 34,474,049 | 8,377,330 |
Advisor Freedom 2005 | 20,361,269 | 3,515,931 |
Advisor Freedom 2010 | 146,134,802 | 7,958,044 |
Advisor Freedom 2015 | 134,991,022 | 2,254,549 |
Advisor Freedom 2020 | 243,842,016 | 2,446,880 |
Advisor Freedom 2025 | 115,974,412 | 4,701,515 |
Advisor Freedom 2030 | 145,592,696 | 2,373,222 |
Advisor Freedom 2035 | 39,368,688 | 970,248 |
Advisor Freedom 2040 | 118,651,696 | 2,492,686 |
4. Fees and Other Transactions with Affiliates.
Management Fee. Strategic Advisers, Inc. (Strategic Advisers), an affiliate of FMR, provides the funds with investment management related services. For these services the funds pay a monthly management fee to Strategic Advisers. The management fee is computed at an annual rate of ..10% of the funds' average net assets. The management fee is reduced by an amount equal to the fees and expenses paid by the funds to the independent Trustees. As of May 1, 2005, Strategic Advisers agreed to waive the .10% management fee. On May 19, 2005, the Board of Trustees approved amendments to the management contracts. Under the amended contracts, the Funds no longer pay management fees.
Other Transactions. Strategic Advisers has entered into an administration agreement with FMR under which FMR provides management and administrative services (other than investment advisory services) necessary for the operation of each fund. Pursuant to this agreement, FMR pays all expenses of each fund, except the compensation of the independent Trustees and certain exceptions such as interest expense. FMR also contracts with other Fidelity companies to perform the services necessary for the operation of each fund. For the services under the agreement, Strategic Advisers pays FMR a monthly administration fee equal to the management fee received by Strategic Advisers, minus an amount equal to an annual rate of .02% of each fund's average net assets. The funds do not pay any fees for these services.
Distribution and Service Plan. In accordance with Rule 12b-1 of the 1940 Act, the funds have adopted separate Distribution and Service Plans for each class of shares. Certain classes pay Fidelity Distributors Corporation (FDC), an affiliate of FMR, separate Distribution and Service Fees, each of which is based on an annual percentage of each class' average net assets. In addition, FDC may pay financial intermediaries for selling shares of the fund and providing shareholder support services. For the period, the Distribution and Service Fee rates and the total amounts paid to and retained by FDC were as follows:
Advisor Freedom Income | Distribution
Fee | Service
Fee | Paid to
FDC | Retained
by FDC |
Class A | 0% | .25% | $ 20,423 | $ 23 |
Class T | .25% | .25% | 106,282 | 325 |
Class B | .75% | .25% | 43,846 | 32,902 |
Class C | .75% | .25% | 126,262 | 89,878 |
| | | $ 296,813 | $ 123,128 |
Advisor Freedom 2005 | | | | |
Class A | 0% | .25% | $ 9,536 | $ 541 |
Class T | .25% | .25% | 24,638 | 1,199 |
Class B | .75% | .25% | 21,313 | 16,524 |
Class C | .75% | .25% | 36,850 | 29,188 |
| | | $ 92,337 | $ 47,452 |
Advisor Freedom 2010 | | | | |
Class A | 0% | .25% | $ 127,020 | $ 58 |
Class T | .25% | .25% | 299,898 | 599 |
Class B | .75% | .25% | 216,353 | 162,354 |
Class C | .75% | .25% | 197,594 | 133,151 |
| | | $ 840,865 | $ 296,162 |
Advisor Freedom 2015 | | | | |
Class A | 0% | .25% | $ 53,773 | $ 100 |
Class T | .25% | .25% | 139,456 | 824 |
Class B | .75% | .25% | 114,672 | 86,191 |
Class C | .75% | .25% | 103,936 | 82,854 |
| | | $ 411,837 | $ 169,969 |
Annual Report
Notes to Financial Statements - continued
4. Fees and Other Transactions with Affiliates - continued
Distribution and Service Plan - continued
Advisor Freedom 2020 | Distribution
Fee | Service
Fee | Paid to
FDC | Retained
by FDC |
Class A | 0% | .25% | $ 247,756 | $ 119 |
Class T | .25% | .25% | 576,620 | 1,778 |
Class B | .75% | .25% | 368,111 | 276,168 |
Class C | .75% | .25% | 269,218 | 169,815 |
| | | $ 1,461,705 | $ 447,880 |
Advisor Freedom 2025 | | | | |
Class A | 0% | .25% | $ 34,726 | $ 138 |
Class T | .25% | .25% | 84,130 | 676 |
Class B | .75% | .25% | 82,291 | 61,925 |
Class C | .75% | .25% | 64,654 | 50,792 |
| | | $ 265,801 | $ 113,531 |
Advisor Freedom 2030 | | | | |
Class A | 0% | .25% | $ 108,199 | $ 47 |
Class T | .25% | .25% | 312,765 | 430 |
Class B | .75% | .25% | 198,696 | 149,042 |
Class C | .75% | .25% | 155,561 | 82,354 |
| | | $ 775,221 | $ 231,873 |
Advisor Freedom 2035 | | | | |
Class A | 0% | .25% | $ 18,048 | $ 176 |
Class T | .25% | .25% | 35,288 | 1,127 |
Class B | .75% | .25% | 38,162 | 29,153 |
Class C | .75% | .25% | 27,186 | 22,669 |
| | | $ 118,684 | $ 53,125 |
Advisor Freedom 2040 | | | | |
Class A | 0% | .25% | $ 54,205 | $ - |
Class T | .25% | .25% | 202,404 | - |
Class B | .75% | .25% | 125,076 | 93,822 |
Class C | .75% | .25% | 141,164 | 102,792 |
| | | $ 522,849 | $ 196,614 |
Sales Load. FDC receives a front-end sales charge of up to 5.75% for selling Class A shares, and 3.50% for selling Class T shares, some of which is paid to financial intermediaries for selling shares of the fund. FDC receives the proceeds of contingent deferred sales charges levied on Class A, Class T, Class B, and Class C redemptions. These charges depend on the holding period. The deferred sales charges range from 5% to 1% for Class B, 1% for Class C, and .25% for certain purchases of Class A and Class T shares.
For the period, sales charge amounts retained by FDC were as follows:
Advisor Freedom Income | Retained
by FDC |
Class A | $ 33,054 |
Class T | 8,122 |
Class B* | 19,099 |
Class C* | 9,294 |
| $ 69,569 |
Advisor Freedom 2005 | |
Class A | $ 29,410 |
Class T | 6,445 |
Class B* | 5,468 |
Class C* | 1,722 |
| $ 43,045 |
Annual Report
4. Fees and Other Transactions with Affiliates - continued
Sales Load - continued
Advisor Freedom 2010 | Retained
by FDC |
Class A | $ 174,190 |
Class T | 35,996 |
Class B* | 69,043 |
Class C* | 6,339 |
| $ 285,568 |
Advisor Freedom 2015 | |
Class A | $ 170,386 |
Class T | 38,350 |
Class B* | 25,092 |
Class C* | 2,734 |
| $ 236,562 |
Advisor Freedom 2020 | |
Class A | $ 261,720 |
Class T | 47,093 |
Class B* | 93,213 |
Class C* | 8,647 |
| $ 410,673 |
Advisor Freedom 2025 | |
Class A | $ 123,169 |
Class T | 24,118 |
Class B* | 32,977 |
Class C* | 794 |
| $ 181,058 |
Advisor Freedom 2030 | |
Class A | $ 146,952 |
Class T | 30,735 |
Class B* | 51,770 |
Class C* | 3,175 |
| $ 232,632 |
Advisor Freedom 2035 | |
Class A | $ 55,616 |
Class T | 9,685 |
Class B* | 10,482 |
Class C* | 622 |
| $ 76,405 |
Advisor Freedom 2040 | |
Class A | $ 125,061 |
Class T | 26,602 |
Class B* | 29,968 |
Class C* | 6,272 |
| $ 187,903 |
* When Class B and Class C shares are initially sold, FDC pays commissions from its own resources to financial intermediaries through which the sales are made.
Annual Report
Notes to Financial Statements - continued
5. Expense Reductions.
FMR agreed to reimburse the funds to the extent annual operating expenses exceeded certain levels of average net assets as noted in the table below. Some expenses, for example interest expense, are excluded from this reimbursement.
| Expense
Limitations | Reimbursement
from adviser |
Advisor Freedom Income | | |
Class A | .33% | $ 1,660 |
Class T | .58% | 4,609 |
Class B | 1.08% | 888 |
Class C | 1.08% | 2,530 |
Institutional Class | .08% | 96 |
Advisor Freedom 2005 | | |
Class A | .33% | 819 |
Class T | .58% | 1,122 |
Class B | 1.08% | 484 |
Class C | 1.08% | 873 |
Institutional Class | .08% | 114 |
Advisor Freedom 2010 | | |
Class A | .33% | 10,538 |
Class T | .58% | 13,631 |
Class B | 1.08% | 4,692 |
Class C | 1.08% | 4,448 |
Institutional Class | .08% | 1,003 |
Advisor Freedom 2015 | | |
Class A | .33% | 4,730 |
Class T | .58% | 6,561 |
Class B | 1.08% | 2,693 |
Class C | 1.08% | 2,552 |
Institutional Class | .08% | 1,701 |
Advisor Freedom 2020 | | |
Class A | .33% | 20,522 |
Class T | .58% | 25,525 |
Class B | 1.08% | 8,166 |
Class C | 1.08% | 6,140 |
Institutional Class | .08% | 1,540 |
Advisor Freedom 2025 | | |
Class A | .33% | 3,148 |
Class T | .58% | 4,168 |
Class B | 1.08% | 1,917 |
Class C | 1.08% | 1,546 |
Institutional Class | .08% | 181 |
Advisor Freedom 2030 | | |
Class A | .33% | 9,109 |
Class T | .58% | 14,137 |
Class B | 1.08% | 4,431 |
Class C | 1.08% | 3,564 |
Institutional Class | .08% | 1,021 |
Annual Report
5. Expense Reductions - continued
Advisor Freedom 2035 | Expense
Limitations | Reimbursement
from adviser |
Class A | .33% | $ 1,597 |
Class T | .58% | 1,759 |
Class B | 1.08% | 955 |
Class C | 1.08% | 664 |
Institutional Class | .08% | 67 |
Advisor Freedom 2040 | | |
Class A | .33% | 4,731 |
Class T | .58% | 8,889 |
Class B | 1.08% | 2,861 |
Class C | 1.08% | 3,269 |
Institutional Class | .08% | 548 |
In addition, through arrangements with each applicable fund's custodian, credits realized as a result of uninvested cash balances were used to reduce each applicable fund's management fee. During the period, these credits reduced management fees by the following amounts:
Advisor Freedom Income | $ 25 |
Advisor Freedom 2010 | 36 |
Advisor Freedom 2015 | 2 |
Advisor Freedom 2020 | 99 |
Advisor Freedom 2025 | 3 |
Advisor Freedom 2030 | 61 |
Advisor Freedom 2035 | 1 |
Advisor Freedom 2040 | 40 |
6. Other.
The funds' organizational documents provide former and current trustees and officers with a limited indemnification against liabilities arising in connection with the performance of their duties to the funds. In the normal course of business, the funds may also enter into contracts that provide general indemnifications. The funds' maximum exposure under these arrangements is unknown as this would be dependent on future claims that may be made against the funds. The risk of material loss from such claims is considered remote.
The funds do not invest in the Underlying Funds for the purpose of exercising management or control; however, investments by the funds within their principal investment strategies may represent a significant portion of the Underlying Funds' net assets. The funds, in aggregate, were the owners of record of more than 20% of the total outstanding shares of the following Underlying Funds.
Fund | % of shares held |
Fidelity Advisor Large Cap Fund | 20% |
In addition, at the end of the period, FMR or its affiliates and certain otherwise unaffiliated shareholders each were owners of record of more than 10% of the outstanding shares of the following funds:
| Affiliated % | Number of
Unaffiliated
Shareholders | Unaffiliated
Shareholders % |
Advisor Freedom Income | - | 1 | 10% |
Advisor Freedom 2005 | - | 1 | 12% |
Advisor Freedom 2020 | - | 1 | 10% |
Annual Report
Notes to Financial Statements - continued
7. Distributions to Shareholders.
Distributions to shareholders of each class were as follows:
| Years ended March 31, |
Advisor Freedom Income | 2005 | 2004 A, B |
From net investment income | | |
Class A | $ 156,915 | $ 19,649 |
Class T | 358,648 | 79,678 |
Class B | 44,872 | 18,877 |
Class C | 134,067 | 34,941 |
Institutional Class | 10,148 | 3,223 |
Total | $ 704,650 | $ 156,368 |
From net realized gain | | |
Class A | $ 5,263 | $ - |
Class T | 15,048 | - |
Class B | 3,971 | - |
Class C | 10,183 | - |
Institutional Class | 364 | - |
Total | $ 34,829 | $ - |
Advisor Freedom 2005 | | |
From net investment income | | |
Class A | $ 72,744 | $ 1,826 |
Class T | 71,074 | 1,280 |
Class B | 23,488 | 1,542 |
Class C | 54,062 | 1,663 |
Institutional Class | 9,928 | 2,257 |
Total | $ 231,296 | $ 8,568 |
From net realized gain | | |
Class A | $ 817 | $ - |
Class T | 951 | - |
Class B | 646 | - |
Class C | 641 | - |
Institutional Class | 188 | - |
Total | $ 3,243 | $ - |
Advisor Freedom 2010 | | |
From net investment income | | |
Class A | $ 896,266 | $ 43,977 |
Class T | 1,070,938 | 66,548 |
Class B | 244,225 | 49,040 |
Class C | 262,890 | 34,840 |
Institutional Class | 104,924 | 1,907 |
Total | $ 2,579,243 | $ 196,312 |
From net realized gain | | |
Class A | $ 6,722 | $ - |
Class T | 7,134 | - |
Class B | 3,175 | - |
Class C | 2,556 | - |
Institutional Class | 614 | - |
Total | $ 20,201 | $ - |
Advisor Freedom 2015 | | |
From net investment income | | |
Class A | $ 362,175 | $ 5,218 |
Class T | 450,450 | 5,119 |
Class B | 125,071 | 4,459 |
Class C | 117,958 | 2,525 |
Institutional Class | 160,357 | 1,200 |
Total | $ 1,216,011 | $ 18,521 |
Annual Report
7. Distributions to Shareholders - continued
| Years ended March 31, |
Advisor Freedom 2015 - continued | 2005 | 2004 A, B |
From net realized gain | | |
Class A | $ 1,578 | $ - |
Class T | 1,718 | - |
Class B | 1,172 | - |
Class C | 898 | - |
Institutional Class | 1,171 | - |
Total | $ 6,537 | $ - |
Advisor Freedom 2020 | | |
From net investment income | | |
Class A | $ 1,730,029 | $ 89,794 |
Class T | 1,789,888 | 125,405 |
Class B | 435,029 | 78,799 |
Class C | 327,289 | 50,035 |
Institutional Class | 157,704 | 2,901 |
Total | $ 4,439,939 | $ 346,934 |
From net realized gain | | |
Class A | $ 27,378 | $ - |
Class T | 23,535 | - |
Class B | 9,581 | - |
Class C | 6,642 | - |
Institutional Class | 944 | - |
Total | $ 68,080 | $ - |
Advisor Freedom 2025 | | |
From net investment income | | |
Class A | $ 224,481 | $ 2,746 |
Class T | 274,089 | 1,859 |
Class B | 77,176 | 3,827 |
Class C | 61,009 | 2,202 |
Institutional Class | 10,710 | 1,200 |
Total | $ 647,465 | $ 11,834 |
From net realized gain | | |
Class A | $ 430 | $ - |
Class T | 395 | - |
Class B | 443 | - |
Class C | 333 | - |
Institutional Class | 28 | - |
Total | $ 1,629 | $ - |
Advisor Freedom 2030 | | |
From net investment income | | |
Class A | $ 638,944 | $ 35,680 |
Class T | 938,314 | 69,540 |
Class B | 178,105 | 38,645 |
Class C | 146,090 | 29,038 |
Institutional Class | 83,950 | 2,000 |
Total | $ 1,985,403 | $ 174,903 |
From net realized gain | | |
Class A | $ 5,495 | $ - |
Class T | 5,920 | - |
Class B | 2,610 | - |
Class C | 1,897 | - |
Institutional Class | 443 | - |
Total | $ 16,365 | $ - |
Annual Report
Notes to Financial Statements - continued
7. Distributions to Shareholders - continued
| Years ended March 31, |
Advisor Freedom 2035 | 2005 | 2004 A, B |
From net investment income | | |
Class A | $ 138,492 | $ 3,119 |
Class T | 124,168 | 1,638 |
Class B | 48,334 | 3,169 |
Class C | 34,996 | 2,371 |
Institutional Class | 5,668 | 1,700 |
Total | $ 351,658 | $ 11,997 |
From net realized gain | | |
Class A | $ 272 | $ - |
Class T | 213 | - |
Class B | 175 | - |
Class C | 105 | - |
Institutional Class | 23 | - |
Total | $ 788 | $ - |
Advisor Freedom 2040 | | |
From net investment income | | |
Class A | $ 357,270 | $ 17,994 |
Class T | 516,094 | 50,760 |
Class B | 124,906 | 23,869 |
Class C | 140,661 | 21,670 |
Institutional Class | 51,136 | 2,167 |
Total | $ 1,190,067 | $ 116,460 |
A For the period July 24, 2003 (commencement of operations) to March 31, 2004 for Fidelity Advisor Freedom Income Fund, Fidelity Advisor Freedom 2010 Fund, Fidelity Advisor Freedom 2020 Fund, Fidelity Advisor Freedom 2030 Fund and Fidelity Advisor Freedom 2040 Fund.
B For the period November 6, 2003 (commencement of operations) to March 31, 2004 for Fidelity Advisor Freedom 2005 Fund, Fidelity Advisor Freedom 2015 Fund, Fidelity Advisor Freedom 2025 Fund and Fidelity Advisor Freedom 2035 Fund.
8. Share Transactions.
Transactions for each class of shares were as follows:
| Shares | Dollars |
| Years ended March 31, | Years ended March 31, |
Advisor Freedom Income | 2005 | 2004 A,B | 2005 | 2004 A, B |
Class A | | | | |
Shares sold | 728,210 | 556,120 | $ 7,481,125 | $ 5,708,669 |
Reinvestment of distributions | 13,977 | 1,560 | 144,254 | 16,075 |
Shares redeemed | (241,418) | (76,230) | (2,487,639) | (789,030) |
Net increase(decrease) | 500,769 | 481,450 | $ 5,137,740 | $ 4,935,714 |
Class T | | | | |
Shares sold | 2,252,617 | 1,803,899 | $ 23,261,446 | $ 18,395,637 |
Reinvestment of distributions | 34,674 | 7,538 | 358,020 | 77,485 |
Shares redeemed | (868,775) | (412,756) | (8,962,920) | (4,222,818) |
Net increase(decrease) | 1,418,516 | 1,398,681 | $ 14,656,546 | $ 14,250,304 |
Class B | | | | |
Shares sold | 202,570 | 406,170 | $ 2,078,692 | $ 4,116,167 |
Reinvestment of distributions | 4,403 | 1,783 | 45,378 | 18,299 |
Shares redeemed | (125,605) | (56,322) | (1,287,886) | (578,381) |
Net increase(decrease) | 81,368 | 351,631 | $ 836,184 | $ 3,556,085 |
Class C | | | | |
Shares sold | 888,712 | 968,910 | $ 9,098,996 | $ 9,906,406 |
Reinvestment of distributions | 10,052 | 2,293 | 103,577 | 23,551 |
Shares redeemed | (419,464) | (79,710) | (4,313,437) | (821,157) |
Net increase(decrease) | 479,300 | 891,493 | $ 4,889,136 | $ 9,108,800 |
Institutional Class | | | | |
Shares sold | 42,061 | 34,289 | $ 432,907 | $ 345,318 |
Reinvestment of distributions | 760 | 204 | 7,846 | 2,087 |
Shares redeemed | (16,642) | (1) | (170,939) | (6) |
Net increase(decrease) | 26,179 | 34,492 | $ 269,814 | $ 347,399 |
Annual Report
8. Share Transactions - continued
| Shares | Dollars |
| Years ended March 31, | Years ended March 31, |
Advisor Freedom 2005 | 2005 | 2004 A,B | 2005 | 2004 A, B |
Class A | | | | |
Shares sold | 585,329 | 132,035 | $ 6,132,477 | $ 1,369,748 |
Reinvestment of distributions | 6,487 | 177 | 69,326 | 1,810 |
Shares redeemed | (159,401) | (1) | (1,685,117) | (15) |
Net increase(decrease) | 432,415 | 132,211 | $ 4,516,686 | $ 1,371,543 |
Class T | | | | |
Shares sold | 772,833 | 194,308 | $ 8,098,797 | $ 2,020,332 |
Reinvestment of distributions | 6,710 | 125 | 71,635 | 1,280 |
Shares redeemed | (218,069) | (632) | (2,293,607) | (6,663) |
Net increase(decrease) | 561,474 | 193,801 | $ 5,876,825 | $ 2,014,949 |
Class B | | | | |
Shares sold | 192,162 | 119,966 | $ 2,010,191 | $ 1,241,061 |
Reinvestment of distributions | 1,998 | 141 | 21,257 | 1,444 |
Shares redeemed | (48,192) | (5,213) | (503,088) | (54,663) |
Net increase(decrease) | 145,968 | 114,894 | $ 1,528,360 | $ 1,187,842 |
Class C | | | | |
Shares sold | 478,945 | 104,471 | $ 4,977,613 | $ 1,080,313 |
Reinvestment of distributions | 4,388 | 163 | 46,808 | 1,663 |
Shares redeemed | (48,603) | (2,131) | (512,104) | (22,078) |
Net increase(decrease) | 434,730 | 102,503 | $ 4,512,317 | $ 1,059,898 |
Institutional Class | | | | |
Shares sold | 34,319 | 37,614 | $ 360,945 | $ 380,010 |
Reinvestment of distributions | 860 | 221 | 9,166 | 2,257 |
Shares redeemed | (11,601) | - | (125,056) | - |
Net increase(decrease) | 23,578 | 37,835 | $ 245,055 | $ 382,267 |
Advisor Freedom 2010 | | | | |
Class A | | | | |
Shares sold | 4,608,995 | 6,011,846 | $ 50,250,054 | $ 64,179,052 |
Reinvestment of distributions | 78,688 | 3,950 | 872,410 | 41,954 |
Shares redeemed | (950,972) | (3,027,942) | (10,395,541) | (32,337,081) |
Net increase(decrease) | 3,736,711 | 2,987,854 | $ 40,726,923 | $ 31,883,925 |
Class T | | | | |
Shares sold | 7,487,847 | 3,031,245 | $ 81,779,426 | $ 32,349,186 |
Reinvestment of distributions | 96,564 | 6,169 | 1,069,348 | 65,456 |
Shares redeemed | (1,698,806) | (288,271) | (18,462,716) | (3,097,922) |
Net increase(decrease) | 5,885,605 | 2,749,143 | $ 64,386,058 | $ 29,316,720 |
Class B | | | | |
Shares sold | 1,378,429 | 1,431,674 | $ 14,897,988 | $ 15,072,786 |
Reinvestment of distributions | 20,499 | 4,375 | 226,286 | 46,370 |
Shares redeemed | (292,158) | (65,871) | (3,159,106) | (697,008) |
Net increase(decrease) | 1,106,770 | 1,370,178 | $ 11,965,168 | $ 14,422,148 |
Class C | | | | |
Shares sold | 1,743,474 | 1,108,463 | $ 18,868,200 | $ 11,728,611 |
Reinvestment of distributions | 20,727 | 2,998 | 228,983 | 31,779 |
Shares redeemed | (295,172) | (48,773) | (3,194,192) | (528,477) |
Net increase(decrease) | 1,469,029 | 1,062,688 | $ 15,902,991 | $ 11,231,913 |
Institutional Class | | | | |
Shares sold | 496,890 | 161,267 | $ 5,380,233 | $ 1,748,838 |
Reinvestment of distributions | 6,067 | 143 | 67,159 | 1,516 |
Shares redeemed | (155,576) | (6,723) | (1,710,806) | (73,690) |
Net increase(decrease) | 347,381 | 154,687 | $ 3,736,586 | $ 1,676,664 |
Annual Report
Notes to Financial Statements - continued
8. Share Transactions - continued
| Shares | Dollars |
| Years ended March 31, | Years ended March 31, |
Advisor Freedom 2015 | 2005 | 2004 A,B | 2005 | 2004 A, B |
Class A | | | | |
Shares sold | 4,003,451 | 453,543 | $ 42,707,661 | $ 4,740,621 |
Reinvestment of distributions | 31,923 | 503 | 349,281 | 5,159 |
Shares redeemed | (307,000) | (2,716) | (3,266,298) | (28,286) |
Net increase(decrease) | 3,728,374 | 451,330 | $ 39,790,644 | $ 4,717,494 |
Class T | | | | |
Shares sold | 5,141,514 | 478,142 | $ 54,603,890 | $ 5,005,957 |
Reinvestment of distributions | 40,873 | 498 | 446,960 | 5,107 |
Shares redeemed | (458,057) | (2,027) | (4,861,368) | (21,269) |
Net increase(decrease) | 4,724,330 | 476,613 | $ 50,189,482 | $ 4,989,795 |
Class B | | | | |
Shares sold | 1,449,464 | 403,545 | $ 15,307,338 | $ 4,213,233 |
Reinvestment of distributions | 10,737 | 434 | 117,212 | 4,450 |
Shares redeemed | (109,668) | (630) | (1,158,377) | (6,636) |
Net increase(decrease) | 1,350,533 | 403,349 | $ 14,266,173 | $ 4,211,047 |
Class C | | | | |
Shares sold | 1,505,221 | 343,634 | $ 15,938,225 | $ 3,596,889 |
Reinvestment of distributions | 8,911 | 237 | 97,350 | 2,428 |
Shares redeemed | (90,162) | (3,598) | (956,104) | (38,127) |
Net increase(decrease) | 1,423,970 | 340,273 | $ 15,079,471 | $ 3,561,190 |
Institutional Class | | | | |
Shares sold | 1,325,729 | 26,468 | $ 14,281,479 | $ 268,672 |
Reinvestment of distributions | 14,118 | 117 | 154,581 | 1,200 |
Shares redeemed | (176,462) | - | (1,867,613) | - |
Net increase(decrease) | 1,163,385 | 26,585 | $ 12,568,447 | $ 269,872 |
Advisor Freedom 2020 | | | | |
Class A | | | | |
Shares sold | 6,713,038 | 7,039,702 | $ 76,292,402 | $ 77,494,120 |
Reinvestment of distributions | 146,966 | 7,871 | 1,714,049 | 85,955 |
Shares redeemed | (1,527,689) | (642,065) | (17,327,477) | (7,227,956) |
Net increase(decrease) | 5,332,315 | 6,405,508 | $ 60,678,974 | $ 70,352,119 |
Class T | | | | |
Shares sold | 12,699,220 | 4,882,894 | $ 143,541,530 | $ 53,798,538 |
Reinvestment of distributions | 153,474 | 11,313 | 1,793,543 | 123,537 |
Shares redeemed | (2,089,785) | (260,830) | (23,854,402) | (2,914,264) |
Net increase(decrease) | 10,762,909 | 4,633,377 | $ 121,480,671 | $ 51,007,811 |
Class B | | | | |
Shares sold | 2,516,778 | 2,121,988 | $ 28,294,743 | $ 22,935,276 |
Reinvestment of distributions | 36,057 | 6,931 | 420,877 | 75,615 |
Shares redeemed | (314,860) | (63,508) | (3,560,956) | (709,002) |
Net increase(decrease) | 2,237,975 | 2,065,411 | $ 25,154,664 | $ 22,301,889 |
Class C | | | | |
Shares sold | 2,324,713 | 1,436,597 | $ 26,225,111 | $ 15,662,940 |
Reinvestment of distributions | 24,834 | 3,975 | 289,805 | 43,369 |
Shares redeemed | (332,947) | (31,556) | (3,727,954) | (351,618) |
Net increase(decrease) | 2,016,600 | 1,409,016 | $ 22,786,962 | $ 15,354,691 |
Institutional Class | | | | |
Shares sold | 926,868 | 213,708 | $ 10,370,986 | $ 2,403,565 |
Reinvestment of distributions | 10,712 | 165 | 125,784 | 1,800 |
Shares redeemed | (107,358) | (12,532) | (1,238,107) | (140,399) |
Net increase(decrease) | 830,222 | 201,341 | $ 9,258,663 | $ 2,264,966 |
Annual Report
8. Share Transactions - continued
| Shares | Dollars |
| Years ended March 31, | Years ended March 31, |
Advisor Freedom 2025 | 2005 | 2004 A,B | 2005 | 2004 A, B |
Class A | | | | |
Shares sold | 5,276,780 | 214,014 | $ 57,517,460 | $ 2,244,093 |
Reinvestment of distributions | 19,938 | 267 | 222,747 | 2,746 |
Shares redeemed | (94,969) | (161) | (1,026,036) | (1,730) |
Net increase(decrease) | 5,201,749 | 214,120 | $ 56,714,171 | $ 2,245,109 |
Class T | | | | |
Shares sold | 3,762,442 | 243,313 | $ 40,548,861 | $ 2,566,782 |
Reinvestment of distributions | 24,426 | 168 | 273,522 | 1,733 |
Shares redeemed | (656,224) | (4,450) | (7,186,110) | (47,326) |
Net increase(decrease) | 3,130,644 | 239,031 | $ 33,636,273 | $ 2,521,189 |
Class B | | | | |
Shares sold | 1,071,244 | 261,803 | $ 11,424,918 | $ 2,752,450 |
Reinvestment of distributions | 6,592 | 362 | 73,482 | 3,722 |
Shares redeemed | (108,115) | (1,779) | (1,143,060) | (19,098) |
Net increase(decrease) | 969,721 | 260,386 | $ 10,355,340 | $ 2,737,074 |
Class C | | | | |
Shares sold | 854,961 | 205,102 | $ 9,116,240 | $ 2,156,679 |
Reinvestment of distributions | 4,495 | 195 | 50,136 | 2,008 |
Shares redeemed | (64,614) | (4,537) | (685,152) | (48,091) |
Net increase(decrease) | 794,842 | 200,760 | $ 8,481,224 | $ 2,110,596 |
Institutional Class | | | | |
Shares sold | 190,349 | 20,644 | $ 2,059,061 | $ 207,010 |
Reinvestment of distributions | 854 | 116 | 9,558 | 1,200 |
Shares redeemed | (37,209) | - | (408,139) | - |
Net increase(decrease) | 153,994 | 20,760 | $ 1,660,480 | $ 208,210 |
Advisor Freedom 2030 | | | | |
Class A | | | | |
Shares sold | 3,725,720 | 2,657,168 | $ 43,285,155 | $ 29,782,835 |
Reinvestment of distributions | 52,499 | 3,132 | 630,708 | 34,676 |
Shares redeemed | (653,805) | (231,842) | (7,592,923) | (2,650,316) |
Net increase(decrease) | 3,124,414 | 2,428,458 | $ 36,322,940 | $ 27,167,195 |
Class T | | | | |
Shares sold | 7,556,712 | 2,514,746 | $ 87,295,265 | $ 28,024,586 |
Reinvestment of distributions | 76,945 | 6,254 | 924,403 | 69,167 |
Shares redeemed | (1,335,355) | (148,511) | (15,591,463) | (1,683,269) |
Net increase(decrease) | 6,298,302 | 2,372,489 | $ 72,628,205 | $ 26,410,484 |
Class B | | | | |
Shares sold | 1,441,453 | 1,105,667 | $ 16,551,682 | $ 12,159,059 |
Reinvestment of distributions | 14,367 | 3,296 | 172,589 | 36,421 |
Shares redeemed | (169,554) | (39,962) | (1,953,216) | (454,012) |
Net increase(decrease) | 1,286,266 | 1,069,001 | $ 14,771,055 | $ 11,741,468 |
Class C | | | | |
Shares sold | 1,214,477 | 892,318 | $ 13,923,553 | $ 9,844,674 |
Reinvestment of distributions | 10,905 | 2,197 | 131,015 | 24,276 |
Shares redeemed | (179,159) | (44,688) | (2,091,102) | (510,933) |
Net increase(decrease) | 1,046,223 | 849,827 | $ 11,963,466 | $ 9,358,017 |
Institutional Class | | | | |
Shares sold | 648,019 | 95,905 | $ 7,437,369 | $ 1,079,123 |
Reinvestment of distributions | 4,103 | 173 | 49,211 | 1,916 |
Shares redeemed | (79,362) | (6,432) | (930,147) | (74,028) |
Net increase(decrease) | 572,760 | 89,646 | $ 6,556,433 | $ 1,007,011 |
Annual Report
Notes to Financial Statements - continued
8. Share Transactions - continued
| Shares | Dollars |
| Years ended March 31, | Years ended March 31, |
Advisor Freedom 2035 | 2005 | 2004 A,B | 2005 | 2004 A, B |
Class A | | | | |
Shares sold | 1,306,403 | 177,071 | $ 14,223,336 | $ 1,865,742 |
Reinvestment of distributions | 12,002 | 299 | 135,434 | 3,084 |
Shares redeemed | (112,316) | (1,226) | (1,200,215) | (13,000) |
Net increase(decrease) | 1,206,089 | 176,144 | $ 13,158,555 | $ 1,855,826 |
Class T | | | | |
Shares sold | 1,582,067 | 97,843 | $ 17,237,692 | $ 1,031,539 |
Reinvestment of distributions | 10,972 | 159 | 123,545 | 1,638 |
Shares redeemed | (199,783) | (95) | (2,193,255) | (1,015) |
Net increase(decrease) | 1,393,256 | 97,907 | $ 15,167,982 | $ 1,032,162 |
Class B | | | | |
Shares sold | 567,399 | 105,253 | $ 6,107,462 | $ 1,097,083 |
Reinvestment of distributions | 4,279 | 308 | 48,075 | 3,169 |
Shares redeemed | (46,723) | (314) | (510,531) | (3,293) |
Net increase(decrease) | 524,955 | 105,247 | $ 5,645,006 | $ 1,096,959 |
Class C | | | | |
Shares sold | 394,064 | 83,351 | $ 4,222,523 | $ 870,026 |
Reinvestment of distributions | 2,802 | 220 | 31,509 | 2,265 |
Shares redeemed | (16,996) | (218) | (184,466) | (2,276) |
Net increase(decrease) | 379,870 | 83,353 | $ 4,069,566 | $ 870,015 |
Institutional Class | | | | |
Shares sold | 23,012 | 20,001 | $ 248,080 | $ 200,010 |
Reinvestment of distributions | 480 | 165 | 5,406 | 1,700 |
Shares redeemed | (1,465) | - | (15,843) | - |
Net increase(decrease) | 22,027 | 20,166 | $ 237,643 | $ 201,710 |
Advisor Freedom 2040 | | | | |
Class A | | | | |
Shares sold | 3,857,042 | 937,469 | $ 45,930,304 | $ 10,645,307 |
Reinvestment of distributions | 28,564 | 1,597 | 350,714 | 17,851 |
Shares redeemed | (417,971) | (107,215) | (4,959,405) | (1,237,201) |
Net increase(decrease) | 3,467,635 | 831,851 | $ 41,321,613 | $ 9,425,957 |
Class T | | | | |
Shares sold | 4,878,040 | 1,768,005 | $ 57,327,142 | $ 19,891,891 |
Reinvestment of distributions | 41,907 | 4,509 | 514,396 | 50,369 |
Shares redeemed | (1,063,534) | (118,254) | (12,602,134) | (1,362,835) |
Net increase(decrease) | 3,856,413 | 1,654,260 | $ 45,239,404 | $ 18,579,425 |
Class B | | | | |
Shares sold | 1,020,115 | 653,746 | $ 11,904,851 | $ 7,321,660 |
Reinvestment of distributions | 9,751 | 2,047 | 119,452 | 22,842 |
Shares redeemed | (102,560) | (30,887) | (1,209,741) | (356,280) |
Net increase(decrease) | 927,306 | 624,906 | $ 10,814,562 | $ 6,988,222 |
Class C | | | | |
Shares sold | 1,473,064 | 634,471 | $ 17,144,955 | $ 7,073,358 |
Reinvestment of distributions | 10,547 | 1,860 | 129,196 | 20,761 |
Shares redeemed | (259,960) | (34,976) | (3,017,274) | (401,419) |
Net increase(decrease) | 1,223,651 | 601,355 | $ 14,256,877 | $ 6,692,700 |
Institutional Class | | | | |
Shares sold | 384,780 | 25,651 | $ 4,445,168 | $ 264,662 |
Reinvestment of distributions | 2,257 | 183 | 27,746 | 2,044 |
Shares redeemed | (41,149) | (554) | (491,734) | (6,457) |
Net increase(decrease) | 345,888 | 25,280 | $ 3,981,180 | $ 260,249 |
A For the period July 24, 2003 (commencement of operations) to March 31, 2004 for Fidelity Advisor Freedom Income Fund, Fidelity Advisor Freedom 2010 Fund, Fidelity Advisor Freedom 2020 Fund, Fidelity Advisor Freedom 2030 Fund and Fidelity Advisor Freedom 2040 Fund.
B For the period November 6, 2003 (commencement of operations) to March 31, 2004 for Fidelity Advisor Freedom 2005 Fund, Fidelity Advisor Freedom 2015 Fund, Fidelity Advisor Freedom 2025 Fund and Fidelity Advisor Freedom 2035 Fund.
Annual Report
Report of Independent Registered Public Accounting Firm
To the Trustees of Fidelity Aberdeen Street Trust and the Shareholders of Fidelity Advisor Freedom Income Fund, Fidelity Advisor Freedom 2005 Fund, Fidelity Advisor Freedom 2010 Fund, Fidelity Advisor Freedom 2015 Fund, Fidelity Advisor Freedom 2020 Fund, Fidelity Advisor Freedom 2025 Fund, Fidelity Advisor Freedom 2030 Fund, Fidelity Advisor Freedom 2035 Fund and Fidelity Advisor Freedom 2040 Fund:
We have audited the accompanying statements of assets and liabilities of Fidelity Advisor Freedom Income Fund, Fidelity Advisor Freedom 2005 Fund, Fidelity Advisor Freedom 2010 Fund, Fidelity Advisor Freedom 2015 Fund, Fidelity Advisor Freedom 2020 Fund, Fidelity Advisor Freedom 2025 Fund, Fidelity Advisor Freedom 2030 Fund, Fidelity Advisor Freedom 2035 Fund and Fidelity Advisor Freedom 2040 Fund (the Funds), each a fund of the Fidelity Aberdeen Street Trust, including the portfolios of investments, as of March 31, 2005, and the related statements of operations for the year then ended, and the statements of changes in net assets and the financial highlights for each of the periods presented. These financial statements and financial highlights are the responsibility of the Funds' management. Our responsibility is to express an opinion on these financial statements and financial highlights based on our audits.
We conducted our audits in accordance with standards of the Public Company Accounting Oversight Board (United States). Those standards require that we plan and perform the audit to obtain reasonable assurance about whether the financial statements and financial highlights are free of material misstatement. The Funds are not required to have, nor were we engaged to perform, an audit of their internal control over financial reporting. Our audit included consideration of internal control over financial reporting as a basis for designing audit procedures that are appropriate in the circumstances, but not for the purposes of expressing an opinion on the effectiveness of the Funds' internal control over financial reporting. Accordingly, we express no such opinion. An audit also includes examining, on a test basis, evidence supporting the amounts and disclosures in the financial statements, assessing the accounting principles used and significant estimates made by management, as well as evaluating the overall financial statement presentation. Our procedures included confirmation of securities owned as of March 31, 2005, by correspondence with the custodian and brokers; where replies were not received from brokers, we performed other auditing procedures. We believe that our audits provide a reasonable basis for our opinion.
In our opinion, the financial statements and financial highlights referred to above present fairly, in all material respects, the financial position of the Funds as of March 31, 2005, the results of their operations for the year then ended, and the changes in their net assets and their financial highlights for the respective stated periods, in conformity with accounting principles generally accepted in the United States of America.
/s/ Deloitte & Touche LLP
DELOITTE & TOUCHE LLP
Boston, Massachusetts
May 19, 2005
Annual Report
Trustees and Officers
The Trustees, Member of the Advisory Board, and executive officers of the trust and funds, as applicable, are listed below. The Board of Trustees governs each Advisor Freedom Fund and is responsible for protecting the interests of shareholders. The Trustees are experienced executives who meet periodically throughout the year to oversee each Advisor Freedom Fund's activities, review contractual arrangements with companies that provide services to each Advisor Freedom Fund, and review each Advisor Freedom Fund's performance. If the interests of an Advisor Freedom Fund and an underlying Fidelity fund were to diverge, a conflict of interest could arise and affect how the Trustees and Member of the Advisory Board fulfill their fiduciary duties to the affected funds. Strategic Advisers has structured the Advisor Freedom Funds to avoid these potential conflicts, although there may be situations where a conflict of interest is unavoidable. In such instances, Strategic Advisers, the Trustees, and Member of the Advisory Board would take reasonable steps to minimize and, if possible, eliminate the conflict. Except for William O. McCoy, Dennis J. Dirks, and Kenneth L. Wolfe, each of the Trustees oversees 308 funds advised by FMR or an affiliate. Mr. McCoy oversees 310 funds advised by FMR or an affiliate. Mr. Dirks and Mr. Wolfe oversee 297 funds advised by FMR or an affiliate.
The Trustees hold office without limit in time except that (a) any Trustee may resign; (b) any Trustee may be removed by written instrument, signed by at least two-thirds of the number of Trustees prior to such removal; (c) any Trustee who requests to be retired or who has become incapacitated by illness or injury may be retired by written instrument signed by a majority of the other Trustees; and (d) any Trustee may be removed at any special meeting of shareholders by a two-thirds vote of the outstanding voting securities of the trust. In any event, each Trustee who is not an "interested person" (as defined in the 1940 Act) (Independent Trustee) shall retire not later than the last day of the calendar year in which his or her 72nd birthday occurs. The executive officers and Advisory Board Member hold office without limit in time, except that any officer and Advisory Board Member may resign or may be removed by a vote of a majority of the Trustees at any regular meeting or any special meeting of the Trustees. Except as indicated, each individual has held the office shown or other offices in the same company for the past five years.
The funds' Statement of Additional Information (SAI) includes more information about the Trustees. To request a free copy, call Fidelity at 1-877-208-0098.
Interested Trustees*:
Correspondence intended for each Trustee who is an "interested person" may be sent to Fidelity Investments, 82 Devonshire Street, Boston, Massachusetts 02109.
Name, Age; Principal Occupation |
Edward C. Johnson 3d (74)** |
| Year of Election or Appointment: 1991 Mr. Johnson is Chairman of the Board of Trustees. Mr. Johnson serves as Chief Executive Officer, Chairman, and a Director of FMR Corp.; a Director and Chairman of the Board and of the Executive Committee of FMR; Chairman and a Director of Fidelity Management & Research (Far East) Inc.; Chairman and a Director of Fidelity Investments Money Management, Inc.; and Chairman (2001-present) and a Director (2000-present) of FMR Co., Inc. |
Abigail P. Johnson (43)** |
| Year of Election or Appointment: 2001 Senior Vice President of Advisor Freedom Income (2003), Advisor Freedom 2005 (2003), Advisor Freedom 2010 (2003), Advisor Freedom 2015 (2003), Advisor Freedom 2020 (2003), Advisor Freedom 2025 (2003), Advisor Freedom 2030 (2003), Advisor Freedom 2035 (2003), and Advisor Freedom 2040 (2003). Ms. Johnson also serves as Senior Vice President of other Fidelity funds (2001-present). She is President and a Director of FMR (2001-present), Fidelity Investments Money Management, Inc. (2001-present), FMR Co., Inc. (2001-present), and a Director of FMR Corp. Previously, Ms. Johnson managed a number of Fidelity funds. |
Laura B. Cronin (50) |
| Year of Election or Appointment: 2003 Ms. Cronin is an Executive Vice President (2002-present) and Chief Financial Officer (2002-present) of FMR Corp. Previously, Ms. Cronin served as Chief Financial Officer of FMR (1999-2001), Fidelity Personal Investments (2001), and Fidelity Brokerage Company (2001-2002). |
Robert L. Reynolds (53) |
| Year of Election or Appointment: 2003 Mr. Reynolds is a Director (2003-present) and Chief Operating Officer (2002-present) of FMR Corp. He also serves on the Board at Fidelity Investments Canada, Ltd. (2000-present). Previously, Mr. Reynolds served as President of Fidelity Investments Institutional Retirement Group (1996-2000). |
* Trustees have been determined to be "Interested Trustees" by virtue of, among other things, their affiliation with the trust or various entities under common control with FMR.
** Edward C. Johnson 3d, Trustee, is Abigail P. Johnson's father.
Annual Report
Independent Trustees:
Correspondence intended for each Independent Trustee (that is, the Trustees other than the Interested Trustees) may be sent to Fidelity Investments, P.O. Box 55235, Boston, Massachusetts 02205-5235.
Name, Age; Principal Occupation |
Dennis J. Dirks (56) |
| Year of Election or Appointment: 2005 Mr. Dirks also serves as a Trustee (2005-present) or Member of the Advisory Board (2004-present) of other investment companies advised by FMR. Prior to his retirement in May 2003, Mr. Dirks was Chief Operating Officer and a member of the Board of The Depository Trust & Clearing Corporation (DTCC) (1999-2003). He also served as President, Chief Operating Officer, and Board member of The Depository Trust Company (DTC) (1999-2003) and President and Board member of the National Securities Clearing Corporation (NSCC) (1999-2003). In addition, Mr. Dirks served as Chief Executive Officer and Board member of the Government Securities Clearing Corporation (2001-2003) and Chief Executive Officer and Board member of the Mortgage-Backed Securities Clearing Corporation (2001-2003). |
Robert M. Gates (61) |
| Year of Election or Appointment: 1997 Dr. Gates is Vice Chairman of the Independent Trustees (2005-present). Dr. Gates is President of Texas A&M University (2002-present). He was Director of the Central Intelligence Agency (CIA) from 1991 to 1993. From 1989 to 1991, Dr. Gates served as Assistant to the President of the United States and Deputy National Security Advisor. Dr. Gates is a Director of NACCO Industries, Inc. (mining and manufacturing), Parker Drilling Co., Inc. (drilling and rental tools for the energy industry, 2001-present), and Brinker International (restaurant management, 2003-present). He also serves as a member of the Advisory Board of VoteHere.net (secure internet voting, 2001-present). Previously, Dr. Gates served as a Director of LucasVarity PLC (automotive components and diesel engines), a Director of TRW Inc. (automotive, space, defense, and information technology), and Dean of the George Bush School of Government and Public Service at Texas A&M University (1999-2001). Dr. Gates also is a Trustee of the Forum for International Policy. |
George H. Heilmeier (68) |
| Year of Election or Appointment: 2004 Dr. Heilmeier is Chairman Emeritus of Telcordia Technologies (communication software and systems), where prior to his retirement, he served as company Chairman and Chief Executive Officer. He currently serves on the Boards of Directors of The Mitre Corporation (systems engineering and information technology support for the government), Teletech Holdings (customer management services), and HRL Laboratories (private research and development, 2004-present). He is Chairman of the General Motors Technology Advisory Committee and a Life Fellow of the Institute of Electrical and Electronics Engineers (IEEE) (2000-present). Dr. Heilmeier is a member of the Defense Science Board and the National Security Agency Advisory Board. He is also a member of the National Academy of Engineering, the American Academy of Arts and Sciences, and the Board of Overseers of the School of Engineering and Applied Science of the University of Pennsylvania. Previously, Dr. Heilmeier served as a Director of TRW Inc. (automotive, space, defense, and information technology, 1992-2002), Compaq (1994-2002), Automatic Data Processing, Inc. (ADP) (technology-based business outsourcing, 1995-2002), and INET Technologies Inc. (telecommunications network surveillance, 2001-2004). |
Marie L. Knowles (58) |
| Year of Election or Appointment: 2001 Prior to Ms. Knowles' retirement in June 2000, she served as Executive Vice President and Chief Financial Officer of Atlantic Richfield Company (ARCO) (diversified energy, 1996-2000). From 1993 to 1996, she was a Senior Vice President of ARCO and President of ARCO Transportation Company. She served as a Director of ARCO from 1996 to 1998. She currently serves as a Director of Phelps Dodge Corporation (copper mining and manufacturing) and McKesson Corporation (healthcare service, 2002-present). Ms. Knowles is a Trustee of the Brookings Institution and the Catalina Island Conservancy and also serves as a member of the Advisory Board for the School of Engineering of the University of Southern California. |
Ned C. Lautenbach (61) |
| Year of Election or Appointment: 2000 Mr. Lautenbach has been a partner of Clayton, Dubilier & Rice, Inc. (private equity investment firm) since September 1998. Previously, Mr. Lautenbach was with the International Business Machines Corporation (IBM) from 1968 until his retirement in 1998. He was most recently Senior Vice President and Group Executive of Worldwide Sales and Services. From 1993 to 1995, he was Chairman of IBM World Trade Corporation, and from 1994 to 1998 was a member of IBM's Corporate Executive Committee. Mr. Lautenbach serves as a Director of Italtel Holding S.p.A. (telecommunications (Milan, Italy), 2004-present) and Eaton Corporation (diversified industrial) as well as the Philharmonic Center for the Arts in Naples, Florida. He also is a member of the Council on Foreign Relations. |
Marvin L. Mann (71) |
| Year of Election or Appointment: 1993 Mr. Mann is Chairman of the Independent Trustees (2001-present). He is Chairman Emeritus of Lexmark International, Inc. (computer peripherals), where he served as CEO until April 1998, retired as Chairman May 1999, and remains a member of the Board. Prior to 1991, he held the positions of Vice President of International Business Machines Corporation (IBM) and President and General Manager of various IBM divisions and subsidiaries. He is a member of the Executive Committee of the Independent Director's Council of the Investment Company Institute. In addition, Mr. Mann is a member of the President's Cabinet at the University of Alabama and the Board of Visitors of the Culverhouse College of Commerce and Business Administration at the University of Alabama. |
William O. McCoy (71) |
| Year of Election or Appointment: 1997 Prior to his retirement in December 1994, Mr. McCoy was Vice Chairman of the Board of BellSouth Corporation (telecommunications) and President of BellSouth Enterprises. He is currently a Director of Liberty Corporation (holding company), Duke Realty Corporation (real estate), and Progress Energy, Inc. (electric utility). He is also a partner of Franklin Street Partners (private investment management firm) and a member of the Research Triangle Foundation Board. In addition, Mr. McCoy served as the Interim Chancellor (1999-2000) and a member of the Board of Visitors for the University of North Carolina at Chapel Hill and currently serves on the Board of Directors of the University of North Carolina Health Care System and the Board of Visitors of the Kenan-Flagler Business School (University of North Carolina at Chapel Hill). He also served as Vice President of Finance for the University of North Carolina (16-school system). |
Cornelia M. Small (60) |
| Year of Election or Appointment: 2005 Ms. Small is a member (2000-present) and Chairperson (2002-present) of the Investment Committee, and a member (2002-present) of the Board of Trustees of Smith College. Previously, she served as Chief Investment Officer (1999-2000), Director of Global Equity Investments (1996-1999), and a member of the Board of Directors of Scudder, Stevens & Clark (1990-1997) and Scudder Kemper Investments (1997-1998). In addition, Ms. Small served as Co-Chair (2000-2003) of the Annual Fund for the Fletcher School of Law and Diplomacy. |
William S. Stavropoulos (65) |
| Year of Election or Appointment: 2001 Mr. Stavropoulos is Chairman of the Board (2000-present) and a Member of the Board of Directors of The Dow Chemical Company. Since joining The Dow Chemical Company in 1967, Mr. Stavropoulos served in numerous senior management positions, including President (1993-2000; 2002-2003), CEO (1995-2000; 2000-2004), and Chairman of the Executive Committee (2000-2004). Currently, he is a Director of NCR Corporation (data warehousing and technology solutions), BellSouth Corporation (telecommunications), Chemical Financial Corporation, and Maersk Inc. (industrial conglomerate, 2002-present). He also serves as a member of the Board of Trustees of the American Enterprise Institute for Public Policy Research. In addition, Mr. Stavropoulos is a member of The Business Council, J.P. Morgan International Council and the University of Notre Dame Advisory Council for the College of Science. |
Kenneth L. Wolfe (66) |
| Year of Election or Appointment: 2005 Mr. Wolfe also serves as a Trustee (2005-present) or Member of the Advisory Board (2004-present) of other investment companies advised by FMR. Prior to his retirement in 2001, Mr. Wolfe was Chairman and Chief Executive Officer of Hershey Foods Corporation (1993-2001). He currently serves as a member of the boards of Adelphia Communications Corporation (2003-present), Bausch & Lomb, Inc., and Revlon Inc. (2004-present). |
Annual Report
Advisory Board Member and Executive Officers:
Correspondence intended for each executive officer and Mr. Lynch may be sent to Fidelity Investments, 82 Devonshire Street, Boston, Massachusetts 02109.
Name, Age; Principal Occupation |
Peter S. Lynch (62) |
| Year of Election or Appointment: 2003 Member of the Advisory Board of Fidelity Aberdeen Street Trust. Vice Chairman and a Director of FMR, and Vice Chairman (2001-present) and a Director (2000-present) of FMR Co., Inc. Previously, Mr. Lynch served as a Trustee of the Fidelity funds (1990-2003). In addition, he serves as a Trustee of Boston College, Massachusetts Eye & Ear Infirmary, Historic Deerfield, John F. Kennedy Library, and the Museum of Fine Arts of Boston. |
Bart A. Grenier (46) |
| Year of Election or Appointment: 2003 Vice President of Advisor Freedom Income, Advisor Freedom 2005, Advisor Freedom 2010, Advisor Freedom 2015, Advisor Freedom 2020, Advisor Freedom 2025, Advisor Freedom 2030, Advisor Freedom 2035, and Advisor Freedom 2040. Mr. Grenier also serves as Vice President of certain Equity Funds (2001), a position he previously held from 1999 to 2000, and Vice President of certain High Income Funds (2002). He is Senior Vice President of FMR (1999) and FMR Co., Inc. (2001), and President and Director of Strategic Advisers, Inc. (2002). He also heads Fidelity's Asset Allocation Group (2000), Fidelity's Growth and Income Group (2001), Fidelity's Value Group (2001), and Fidelity's High Income Division (2001). Previously, Mr. Grenier served as President of Fidelity Ventures (2000), Vice President of certain High Income Funds (1997-2000), High Income Division Head (1997-2000), Group Leader of the Income-Growth and Asset Allocation-Income Groups (1996-2000), and Assistant Equity Division Head (1997-2000). |
Ren Y. Cheng (48) |
| Year of Election or Appointment: 2003 Vice President of Advisor Freedom Income, Advisor Freedom 2005, Advisor Freedom 2010, Advisor Freedom 2015, Advisor Freedom 2020, Advisor Freedom 2025, Advisor Freedom 2030, Advisor Freedom 2035, and Advisor Freedom 2040. Mr. Cheng also serves as Vice President of other funds advised by Strategic Advisers Inc., including the Fidelity Freedom Funds. Prior to assuming his current responsibilities, Mr. Cheng managed a variety of Fidelity funds. Mr. Cheng also serves as Vice President of FMR (2002), FMR Co., Inc. (2002) and Strategic Advisors, Inc. (2003). |
Eric D. Roiter (56) |
| Year of Election or Appointment: 2003 Secretary of Advisor Freedom Income, Advisor Freedom 2005, Advisor Freedom 2010, Advisor Freedom 2015, Advisor Freedom 2020, Advisor Freedom 2025, Advisor Freedom 2030, Advisor Freedom 2035, and Advisor Freedom 2040. He also serves as Secretary of other Fidelity funds; Vice President, General Counsel, and Secretary of FMR Co., Inc. (2001-present) and FMR; Assistant Secretary of Fidelity Management & Research (U.K.) Inc. (2001-present), Fidelity Management & Research (Far East) Inc. (2001-present), and Fidelity Investments Money Management, Inc. (2001-present). Mr. Roiter is an Adjunct Member, Faculty of Law, at Boston College Law School (2003-present). Previously. Mr. Roiter served as Vice President and Secretary of Fidelity Distributors Corporation (FDC) (1998-2005). |
Stuart Fross (45) |
| Year of Election or Appointment: 2003 Assistant Secretary of Advisor Freedom Income, Advisor Freedom 2005, Advisor Freedom 2010, Advisor Freedom 2015, Advisor Freedom 2020, Advisor Freedom 2025, Advisor Freedom 2030, Advisor Freedom 2035, and Advisor Freedom 2040. Mr. Fross also serves as Assistant Secretary of other Fidelity funds (2003-present), Vice President and Secretary of FDC (2005-present), and is an employee of FMR. |
Christine Reynolds (46) |
| Year of Election or Appointment: 2004 President, Treasurer, and Anti-Money Laundering (AML) officer of Advisor Freedom Income, Advisor Freedom 2005, Advisor Freedom 2010, Advisor Freedom 2015, Advisor Freedom 2020, Advisor Freedom 2025, Advisor Freedom 2030, Advisor Freedom 2035, and Advisor Freedom 2040. Ms. Reynolds also serves as President, Treasurer, and AML officer of other Fidelity funds (2004) and is a Vice President (2003) and an employee (2002) of FMR. Before joining Fidelity Investments, Ms. Reynolds worked at PricewaterhouseCoopers LLP (PwC) (1980-2002), where she was most recently an audit partner with PwC's investment management practice. |
Timothy F. Hayes (54) |
| Year of Election or Appointment: 2003 Chief Financial Officer of Advisor Freedom Income, Advisor Freedom 2005, Advisor Freedom 2010, Advisor Freedom 2015, Advisor Freedom 2020, Advisor Freedom 2025, Advisor Freedom 2030, Advisor Freedom 2035, and Advisor Freedom 2040. Mr. Hayes also serves as Chief Financial Officer of other Fidelity funds (2002). Recently he was appointed President of Fidelity Service Company (2003) where he also serves as a Director. Mr. Hayes also serves as President of Fidelity Investments Operations Group (FIOG, 2002), which includes Fidelity Pricing and Cash Management Services Group (FPCMS), where he was appointed President in 1998. Previously, Mr. Hayes served as Chief Financial Officer of Fidelity Investments Corporate Systems and Service Group (1998) and Fidelity Systems Company (1997-1998). |
Kenneth A. Rathgeber (57) |
| Year of Election or Appointment: 2004 Chief Compliance Officer of Advisor Freedom Income, Advisor Freedom 2005, Advisor Freedom 2010, Advisor Freedom 2015, Advisor Freedom 2020, Advisor Freedom 2025, Advisor Freedom 2030, Advisor Freedom 2035, and Advisor Freedom 2040. Mr. Rathgeber also serves as Chief Compliance Officer of other Fidelity funds (2004) and Executive Vice President of Risk Oversight for Fidelity Investments (2002). Previously, he served as Executive Vice President and Chief Operating Officer for Fidelity Investments Institutional Services Company, Inc. (1998-2002). |
John R. Hebble (46) |
| Year of Election or Appointment: 2003 Deputy Treasurer of Advisor Freedom Income, Advisor Freedom 2005, Advisor Freedom 2010, Advisor Freedom 2015, Advisor Freedom 2020, Advisor Freedom 2025, Advisor Freedom 2030, Advisor Freedom 2035, and Advisor Freedom 2040. Mr. Hebble also serves as Deputy Treasurer of other Fidelity funds (2003), and is an employee of FMR. Before joining Fidelity Investments, Mr. Hebble worked at Deutsche Asset Management where he served as Director of Fund Accounting (2002-2003) and Assistant Treasurer of the Scudder Funds (1998-2003). |
Bryan A. Mehrmann (43) |
| Year of Election or Appointment: 2005 Deputy Treasurer of Advisor Freedom Income, Advisor Freedom 2005, Advisor Freedom 2010, Advisor Freedom 2015, Advisor Freedom 2020, Advisor Freedom 2025, Advisor Freedom 2030, Advisor Freedom 2035, and Advisor Freedom 2040. Mr. Mehrmann also serves as Deputy Treasurer of other Fidelity funds (2005-present) and is an employee of FMR. Previously, Mr. Mehrmann served as Vice President of Fidelity Investments Institutional Services Group (FIIS)/Fidelity Investments Institutional Operations Corporation, Inc. (FIIOC) Client Services (1998-2004). |
Kimberley H. Monasterio (41) |
| Year of Election or Appointment: 2004 Deputy Treasurer of Advisor Freedom Income, Advisor Freedom 2005, Advisor Freedom 2010, Advisor Freedom 2015, Advisor Freedom 2020, Advisor Freedom 2025, Advisor Freedom 2030, Advisor Freedom 2035, and Advisor Freedom 2040. Ms. Monasterio also serves as Deputy Treasurer of other Fidelity funds (2004) and is an employee of FMR (2004). Before joining Fidelity Investments, Ms. Monasterio served as Treasurer (2000-2004) and Chief Financial Officer (2002-2004) of the Franklin Templeton Funds and Senior Vice President of Franklin Templeton Services, LLC (2000-2004). |
Kenneth B. Robins (35) |
| Year of Election or Appointment: 2005 Deputy Treasurer of Advisor Freedom Income, Advisor Freedom 2005, Advisor Freedom 2010, Advisor Freedom 2015, Advisor Freedom 2020, Advisor Freedom 2025, Advisor Freedom 2030, Advisor Freedom 2035, and Advisor Freedom 2040. Mr. Robins also serves as Deputy Treasurer of other Fidelity funds (2005-present) and is an employee of FMR (2004-present). Before joining Fidelity Investments, Mr. Robins worked at KPMG LLP, where he was a partner in KPMG's department of professional practice (2002-2004) and a Senior Manager (1999-2000). In addition, Mr. Robins served as Assistant Chief Accountant, United States Securities and Exchange Commission (2000-2002). |
John H. Costello (58) |
| Year of Election or Appointment: 2003 Assistant Treasurer of Advisor Freedom Income, Advisor Freedom 2005, Advisor Freedom 2010, Advisor Freedom 2015, Advisor Freedom 2020, Advisor Freedom 2025, Advisor Freedom 2030, Advisor Freedom 2035, and Advisor Freedom 2040. Mr. Costello also serves as Assistant Treasurer of other Fidelity funds and is an employee of FMR. |
Peter L. Lydecker (51) |
| Year of Election or Appointment: 2004 Assistant Treasurer of Advisor Freedom Income, Advisor Freedom 2005, Advisor Freedom 2010, Advisor Freedom 2015, Advisor Freedom 2020, Advisor Freedom 2025, Advisor Freedom 2030, Advisor Freedom 2035, and Advisor Freedom 2040. Mr. Lydecker also serves as Assistant Treasurer of other Fidelity funds (2004) and is an employee of FMR. |
Mark Osterheld (49) |
| Year of Election or Appointment: 2003 Assistant Treasurer of Advisor Freedom Income, Advisor Freedom 2005, Advisor Freedom 2010, Advisor Freedom 2015, Advisor Freedom 2020, Advisor Freedom 2025, Advisor Freedom 2030, Advisor Freedom 2035, and Advisor Freedom 2040. Mr. Osterheld also serves as Assistant Treasurer of other Fidelity funds (2002) and is an employee of FMR. |
Annual Report
Distributions
The Board of Trustees of each fund voted to pay to shareholders of record at the opening of business on record date, the following distributions per share derived from capital gains realized from sales of portfolio securities, and dividends derived from net investment income:
Institutional Class | Pay Date | Record Date | Dividends | Capital Gains |
Advisor Freedom Income | 05/09/05 | 05/06/05 | $.011 | $.035 |
Advisor Freedom 2005 | 05/09/05 | 05/06/05 | $.027 | $.03 |
Advisor Freedom 2010 | 05/09/05 | 05/06/05 | $.035 | $.045 |
Advisor Freedom 2015 | 05/09/05 | 05/06/05 | $.021 | $.04 |
Advisor Freedom 2020 | 05/09/05 | 05/06/05 | $.02 | $.055 |
Advisor Freedom 2025 | 05/16/05 | 05/13/05 | $.007 | $.03 |
Advisor Freedom 2030 | 05/16/05 | 05/13/05 | - | $.059 |
Advisor Freedom 2035 | 05/16/05 | 05/13/05 | - | $.02 |
Advisor Freedom 2040 | 05/16/05 | 05/13/05 | - | $.04 |
The funds hereby designate as capital gain dividends the amounts noted below for the taxable year indicated or for dividends for the taxable year ended 2005, if subsequently determined to be different, the net capital gain of such year; and for dividends for the taxable year ended 2004, if subsequently determined to be different, the excess of: (a) the net capital gain of such year, over (b) amounts previously designated as capital gain dividends with respect to such year.
Institutional Class | 2005 | 2004 |
Advisor Freedom Income | 131,393 | 35,147 |
Advisor Freedom 2005 | 46,126 | 3,194 |
Advisor Freedom 2010 | 744,259 | 17,590 |
Advisor Freedom 2015 | 450,993 | 5,169 |
Advisor Freedom 2020 | 1,569,597 | 62,696 |
Advisor Freedom 2025 | 244,701 | 394 |
Advisor Freedom 2030 | 805,486 | 12,872 |
Advisor Freedom 2035 | 97,237 | 421 |
Advisor Freedom 2040 | 400,970 | - |
A percentage of the dividends distributed during the fiscal year for the following funds was derived from interest on U.S. Government securities which is generally exempt from state income tax:
| Institutional Class |
Advisor Freedom Income | 12.23% |
Advisor Freedom 2005 | 8.43% |
Advisor Freedom 2010 | 9.02% |
Advisor Freedom 2015 | 5.55% |
Advisor Freedom 2020 | 5.17% |
A percentage of the dividends distributed during the fiscal year for the following funds qualifies for the dividends-received deduction for corporate shareholders:
| Institutional Class |
Advisor Freedom Income | |
May 2004 | 11% |
June 2004 | 11% |
July 2004 | 11% |
August 2004 | 11% |
September 2004 | 11% |
October 2004 | 11% |
November 2004 | 11% |
December 2004 (ex date 12/03) | 11% |
December 2004 (ex date 12/29) | 11% |
February 2005 | 5% |
March 2005 | 5% |
| Institutional Class |
Advisor Freedom 2005 | |
May 2004 | 4% |
December 2004 | 23% |
Advisor Freedom 2010 | |
May 2004 | 4% |
December 2004 | 23% |
Advisor Freedom 2015 | |
May 2004 | 4% |
December 2004 | 32% |
Advisor Freedom 2020 | |
May 2004 | 8% |
December 2004 | 34% |
Advisor Freedom 2025 | |
May 2004 | 9% |
December 2004 | 43% |
Advisor Freedom 2030 | |
May 2004 | 14% |
December 2004 | 46% |
Advisor Freedom 2035 | |
May 2004 | 16% |
December 2004 | 39% |
Advisor Freedom 2040 | |
May 2004 | 20% |
December 2004 | 47% |
A percentage of the dividends distributed during the fiscal year for the following may be taken into account as a dividend for purposes of the maximum rate under section 1(h)(11) of the Internal Revenue Code.
| Institutional Class |
Advisor Freedom Income | |
May 2004 | 18% |
June 2004 | 18% |
July 2004 | 18% |
August 2004 | 18% |
September 2004 | 18% |
October 2004 | 18% |
November 2004 | 18% |
December 2004 (ex date 12/03) | 18% |
December 2004 (ex date 12/29) | 18% |
February 2005 | 10% |
March 2005 | 10% |
Advisor Freedom 2005 | |
May 2004 | 5% |
December 2004 | 25% |
Advisor Freedom 2010 | |
May 2004 | 4% |
December 2004 | 24% |
Advisor Freedom 2015 | |
May 2004 | 7% |
December 2004 | 36% |
| Institutional Class |
Advisor Freedom 2020 | |
May 2004 | 9% |
December 2004 | 39% |
Advisor Freedom 2025 | |
May 2004 | 12% |
December 2004 | 48% |
Advisor Freedom 2030 | |
May 2004 | 16% |
December 2004 | 52% |
Advisor Freedom 2035 | |
May 2004 | 17% |
December 2004 | 45% |
Advisor Freedom 2040 | |
May 2004 | 21% |
December 2004 | 53% |
The funds will notify shareholders in January 2006 of amounts for use in preparing 2005 income tax returns.
Annual Report
Annual Report
Annual Report
Annual Report
Investment Adviser
Strategic Advisers, Inc.
Boston, MA
General Distributor
Fidelity Distributors Corporation
Boston, MA
Transfer Agent
Fidelity Investments Institutional Operations Company, Inc.
Boston, MA
Service Agent
Fidelity Service Company, Inc.
Boston, MA
Custodian
The Bank of New York
New York, NY
(Fidelity Investment logo)(registered trademark)
AFFI-UANN-0505
1.792135.101
Fidelity Freedom Funds ® -
Income, 2000, 2005, 2010, 2015, 2020, 2025, 2030, 2035, 2040
Annual Report
March 31, 2005
(2_fidelity_logos) (Registered_Trademark)
Contents
To view a fund's proxy voting guidelines and proxy voting record for the 12-month period ended June 30, visit www.fidelity.com/proxyvotingresults or visit the Securities and Exchange Commission's (SEC) web site at www.sec.gov. You may also call 1-800-544-8544 to request a free copy of the proxy voting guidelines.
Standard & Poor's, S&P and S&P 500 are registered service marks of The McGraw-Hill Companies, Inc. and have been licensed for use by Fidelity Distributors Corporation.
Other third party marks appearing herein are the property of their respective owners.
All other marks appearing herein are registered or unregistered trademarks or service marks of FMR Corp. or an affiliated company.
Annual Report
This report and the financial statements contained herein are submitted for the general information of the shareholders of the funds. This report is not authorized for distribution to prospective investors in the funds unless preceded or accompanied by an effective prospectus.
A fund files its complete schedule of portfolio holdings with the SEC for the first and third quarters of each fiscal year on Form N-Q. Forms N-Q are available on the SEC's web site at http://www.sec.gov. A fund's Forms N-Q may be reviewed and copied at the SEC's Public Reference Room in Washington, DC. Information regarding the operation of the SEC's Public Reference Room may be obtained by calling 1-800-SEC-0330. For a complete list of a fund's portfolio holdings, view the most recent quarterly holdings report, semiannual report, or annual report on Fidelity's web site at http://www.fidelity.com/holdings.
NOT FDIC INSURED · MAY LOSE VALUE · NO BANK GUARANTEE
Neither the funds nor Fidelity Distributors Corporation is a bank.
Annual Report
Chairman's Message
(Photograph of Edward C. Johnson 3d.)
Dear Shareholder:
During the past year or so, much has been reported about the mutual fund industry, and much of it has been more critical than I believe is warranted. Allegations that some companies have been less than forthright with their shareholders have cast a shadow on the entire industry. I continue to find these reports disturbing, and assert that they do not create an accurate picture of the industry overall. Therefore, I would like to remind everyone where Fidelity stands on these issues. I will say two things specifically regarding allegations that some mutual fund companies were in violation of the Securities and Exchange Commission's forward pricing rules or were involved in so-called "market timing" activities.
First, Fidelity has no agreements that permit customers who buy fund shares after 4 p.m. to obtain the 4 p.m. price. This is not a new policy. This is not to say that someone could not deceive the company through fraudulent acts. However, we are extremely diligent in preventing fraud from occurring in this manner - and in every other. But I underscore again that Fidelity has no so-called "agreements" that sanction illegal practices.
Second, Fidelity continues to stand on record, as we have for years, in opposition to predatory short-term trading that adversely affects shareholders in a mutual fund. Back in the 1980s, we initiated a fee - which is returned to the fund and, therefore, to investors - to discourage this activity. Further, we took the lead several years ago in developing a Fair Value Pricing Policy to prevent market timing on foreign securities in our funds. I am confident we will find other ways to make it more difficult for predatory traders to operate. However, this will only be achieved through close cooperation among regulators, legislators and the industry.
Yes, there have been unfortunate instances of unethical and illegal activity within the mutual fund industry from time to time. That is true of any industry. When this occurs, confessed or convicted offenders should be dealt with appropriately. But we are still concerned about the risk of over-regulation and the quick application of simplistic solutions to intricate problems. Every system can be improved, and we support and applaud well thought out improvements by regulators, legislators and industry representatives that achieve the common goal of building and protecting the value of investors' holdings.
For nearly 60 years, Fidelity has worked very hard to improve its products and service to justify your trust. When our family founded this company in 1946, we had only a few hundred customers. Today, we serve more than 18 million customers including individual investors and participants in retirement plans across America.
Let me close by saying that we do not take your trust in us for granted, and we realize that we must always work to improve all aspects of our service to you. In turn, we urge you to continue your active participation with your financial matters, so that your interests can be well served.
Best regards,
/s/Edward C. Johnson 3d
Edward C. Johnson 3d
Annual Report
Fidelity Freedom Income Fund®
Performance: The Bottom Line
Average annual total return reflects the change in the value of an investment, assuming reinvestment of the fund's dividend income and capital gains (the profits earned upon the sale of securities that have grown in value) and assuming a constant rate of performance each year. The $10,000 table and the fund's returns do not reflect the deduction of taxes that a shareholder would pay on fund distributions or the redemption of fund shares. During periods of reimbursement by Fidelity, a fund's total return will be greater than it would be had the reimbursement not occurred. How a fund did yesterday is no guarantee of how it will do tomorrow.
Average Annual Total Returns
Periods ended March 31, 2005 | Past 1
year | Past 5
years | Life of
fundA |
Fidelity Freedom Income Fund® | 1.86% | 3.16% | 5.85% |
A From October 17, 1996.
$10,000 Over Life of Fund
Let's say hypothetically that $10,000 was invested in Fidelity Freedom Income Fund® on October 17, 1996, when the fund started. The chart shows how the value of your investment would have changed, and also shows how the Lehman Brothers® Aggregate Bond Index performed over the same period.
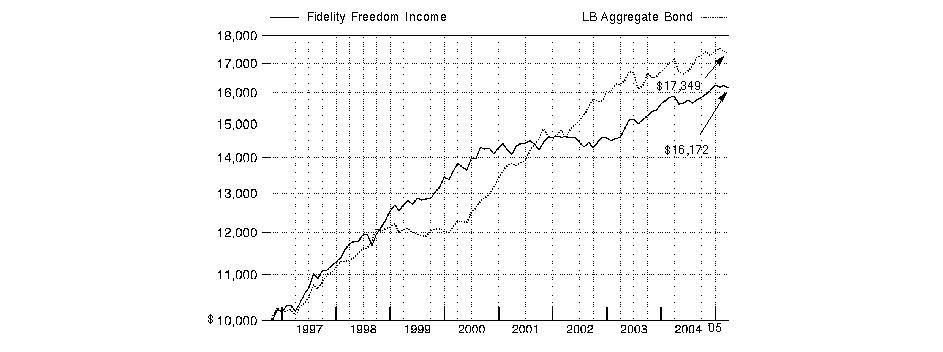
Annual Report
Fidelity Freedom 2000 Fund®
Performance: The Bottom Line
Average annual total return reflects the change in the value of an investment, assuming reinvestment of the fund's dividend income and capital gains (the profits earned upon the sale of securities that have grown in value) and assuming a constant rate of performance each year. The $10,000 table and the fund's returns do not reflect the deduction of taxes that a shareholder would pay on fund distributions or the redemption of fund shares. During periods of reimbursement by Fidelity, a fund's total return will be greater than it would be had the reimbursement not occurred. How a fund did yesterday is no guarantee of how it will do tomorrow.
Average Annual Total Returns
Periods ended March 31, 2005 | Past 1
year | Past 5
years | Life of
fundA |
Fidelity Freedom 2000 Fund® | 2.18% | 2.21% | 6.95% |
A From October 17, 1996.
$10,000 Over Life of Fund
Let's say hypothetically that $10,000 was invested in Fidelity Freedom 2000 Fund® on October 17, 1996, when the fund started. The chart shows how the value of your investment would have changed, and also shows how the Lehman Brothers Aggregate Bond Index performed over the same period.
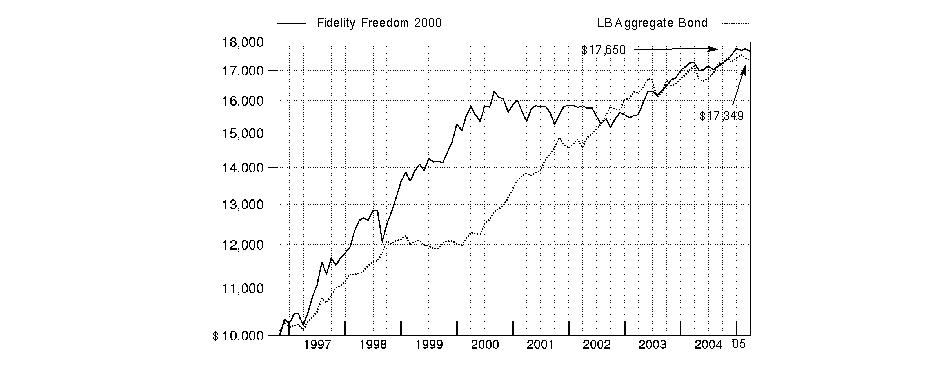
Annual Report
Fidelity Freedom 2005 Fund®
Performance: The Bottom Line
Average annual total return reflects the change in the value of an investment, assuming reinvestment of the fund's dividend income and capital gains (the profits earned upon the sale of securities that have grown in value) and assuming a constant rate of performance each year. The $10,000 table and the fund's returns do not reflect the deduction of taxes that a shareholder would pay on fund distributions or the redemption of fund shares. During periods of reimbursement by Fidelity, a fund's total return will be greater than it would be had the reimbursement not occurred. How a fund did yesterday is no guarantee of how it will do tomorrow.
Average Annual Total Returns
Periods ended March 31, 2005 | | Past 1
year | Life of
fundA |
Fidelity Freedom 2005 Fund® | | 3.44% | 6.23% |
A From November 6, 2003.
$10,000 Over Life of Fund
Let's say hypothetically that $10,000 was invested in Fidelity Freedom 2005 Fund® on November 6, 2003, when the fund started. The chart shows how the value of your investment would have changed, and also shows how the Lehman Brothers Aggregate Bond Index performed over the same period.
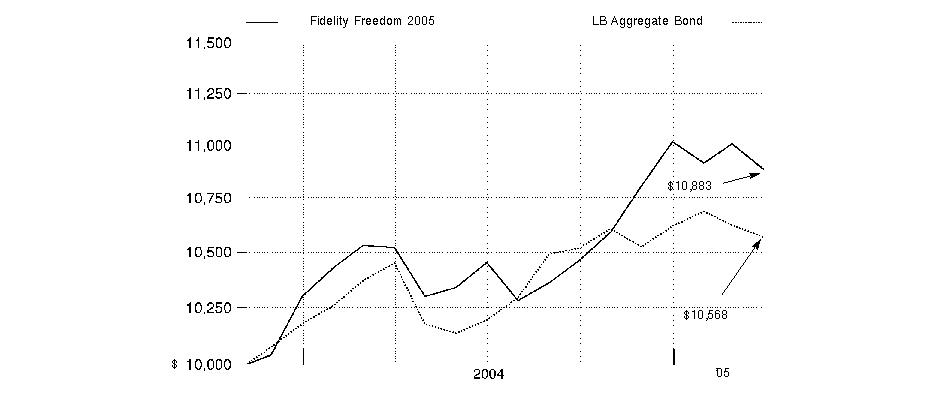
Annual Report
Fidelity Freedom 2010 Fund®
Performance: The Bottom Line
Average annual total return reflects the change in the value of an investment, assuming reinvestment of the fund's dividend income and capital gains (the profits earned upon the sale of securities that have grown in value) and assuming a constant rate of performance each year. The $10,000 table and the fund's returns do not reflect the deduction of taxes that a shareholder would pay on fund distributions or the redemption of fund shares. During periods of reimbursement by Fidelity, a fund's total return will be greater than it would be had the reimbursement not occurred. How a fund did yesterday is no guarantee of how it will do tomorrow.
Average Annual Total Returns
Periods ended March 31, 2005 | Past 1
year | Past 5
years | Life of
fundA |
Fidelity Freedom 2010 Fund® | 3.59% | 1.25% | 8.17% |
A From October 17, 1996.
$10,000 Over Life of Fund
Let's say hypothetically that $10,000 was invested in Fidelity Freedom 2010 Fund® on October 31, 1996, shortly after the fund started. The chart shows how the value of your investment would have changed, and also shows how the S&P 500® Index and the Lehman Brothers Aggregate Bond Index performed over the same period.
Going forward the Freedom 2010 Fund will use the Lehman Brothers Aggregate Bond Index, rather than the S&P 500, as its SEC benchmark. The Aggregate Bond Index more closely represents the fund's investment strategy as fixed-income and short-term funds currently represent the majority of the fund's assets.
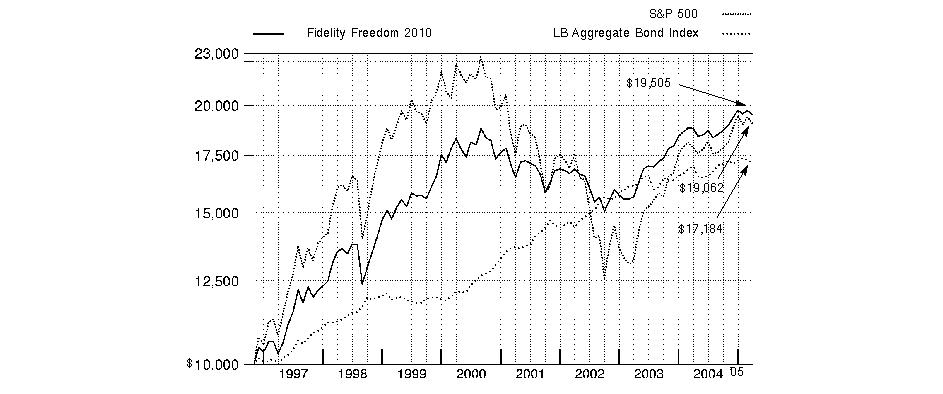
Annual Report
Fidelity Freedom 2015 Fund®
Performance: The Bottom Line
Average annual total return reflects the change in the value of an investment, assuming reinvestment of the fund's dividend income and capital gains (the profits earned upon the sale of securities that have grown in value) and assuming a constant rate of performance each year. The $10,000 table and the fund's returns do not reflect the deduction of taxes that a shareholder would pay on fund distributions or the redemption of fund shares. During periods of reimbursement by Fidelity, a fund's total return will be greater than it would be had the reimbursement not occurred. How a fund did yesterday is no guarantee of how it will do tomorrow.
Average Annual Total Returns
Periods ended March 31, 2005 | | Past 1
year | Life of
fundA |
Fidelity Freedom 2015 Fund® | | 4.30% | 7.52% |
A From November 6, 2003.
$10,000 Over Life of Fund
Let's say hypothetically that $10,000 was invested in Fidelity Freedom 2015 Fund® on November 6, 2003, when the fund started. The chart shows how the value of your investment would have changed, and also shows how the S&P 500 Index performed over the same period.

Annual Report
Fidelity Freedom 2020 Fund®
Performance: The Bottom Line
Average annual total return reflects the change in the value of an investment, assuming reinvestment of the fund's dividend income and capital gains (the profits earned upon the sale of securities that have grown in value) and assuming a constant rate of performance each year. The $10,000 table and the fund's returns do not reflect the deduction of taxes that a shareholder would pay on fund distributions or the redemption of fund shares. During periods of reimbursement by Fidelity, a fund's total return will be greater than it would be had the reimbursement not occurred. How a fund did yesterday is no guarantee of how it will do tomorrow.
Average Annual Total Returns
Periods ended March 31, 2005 | Past 1
year | Past 5
years | Life of
fundA |
Fidelity Freedom 2020 Fund® | 5.01% | -0.62% | 8.23% |
A From October 17, 1996.
$10,000 Over Life of Fund
Let's say hypothetically that $10,000 was invested in Fidelity Freedom 2020 Fund® on October 17, 1996, when the fund started. The chart shows how the value of your investment would have changed, and also shows how the S&P 500 Index performed over the same period.
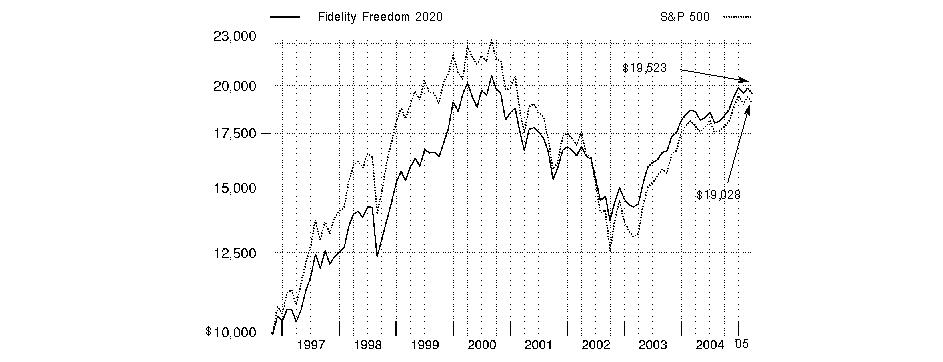
Annual Report
Fidelity Freedom 2025 Fund®
Performance: The Bottom Line
Average annual total return reflects the change in the value of an investment, assuming reinvestment of the fund's dividend income and capital gains (the profits earned upon the sale of securities that have grown in value) and assuming a constant rate of performance each year. The $10,000 table and the fund's returns do not reflect the deduction of taxes that a shareholder would pay on fund distributions or the redemption of fund shares. During periods of reimbursement by Fidelity, a fund's total return will be greater than it would be had the reimbursement not occurred. How a fund did yesterday is no guarantee of how it will do tomorrow.
Average Annual Total Returns
Periods ended March 31, 2005 | | Past 1
year | Life of
fundA |
Fidelity Freedom 2025 Fund® | | 5.33% | 8.86% |
A From November 6, 2003.
$10,000 Over Life of Fund
Let's say hypothetically that $10,000 was invested in Fidelity Freedom 2025 Fund® on November 6, 2003, when the fund started. The chart shows how the value of your investment would have changed, and also shows how the S&P 500 Index performed over the same period.
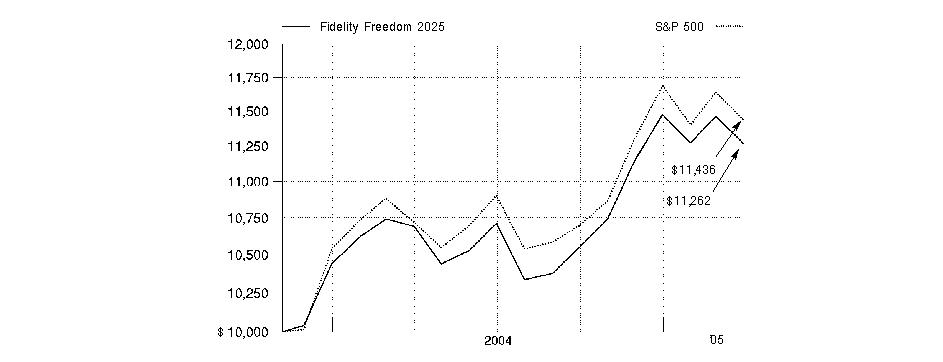
Annual Report
Fidelity Freedom 2030 Fund®
Performance: The Bottom Line
Average annual total return reflects the change in the value of an investment, assuming reinvestment of the fund's dividend income and capital gains (the profits earned upon the sale of securities that have grown in value) and assuming a constant rate of performance each year. The $10,000 table and the fund's returns do not reflect the deduction of taxes that a shareholder would pay on fund distributions or the redemption of fund shares. During periods of reimbursement by Fidelity, a fund's total return will be greater than it would be had the reimbursement not occurred. How a fund did yesterday is no guarantee of how it will do tomorrow.
Average Annual Total Returns
Periods ended March 31, 2005 | Past 1
year | Past 5
years | Life of
fundA |
Fidelity Freedom 2030 Fund® | 5.72% | -1.81% | 7.87% |
A From October 17, 1996.
$10,000 Over Life of Fund
Let's say hypothetically that $10,000 was invested in Fidelity Freedom 2030 Fund® on October 17, 1996, when the fund started. The chart shows how the value of your investment would have changed, and also shows how the S&P 500 Index performed over the same period.
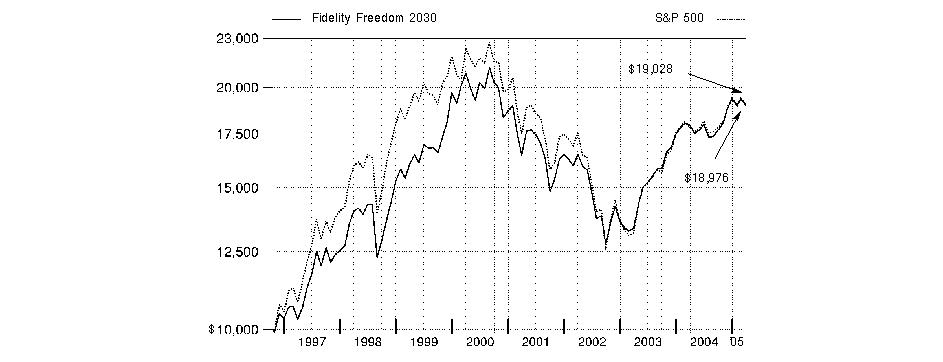
Annual Report
Fidelity Freedom 2035 Fund®
Performance: The Bottom Line
Average annual total return reflects the change in the value of an investment, assuming reinvestment of the fund's dividend income and capital gains (the profits earned upon the sale of securities that have grown in value) and assuming a constant rate of performance each year. The $10,000 table and the fund's returns do not reflect the deduction of taxes that a shareholder would pay on fund distributions or the redemption of fund shares. During periods of reimbursement by Fidelity, a fund's total return will be greater than it would be had the reimbursement not occurred. How a fund did yesterday is no guarantee of how it will do tomorrow.
Average Annual Total Returns
Periods ended March 31, 2005 | Past 1
year | Life of
fundA |
Fidelity Freedom 2035 Fund® | 6.12% | 9.81% |
A From November 6, 2003.
$10,000 Over Life of Fund
Let's say hypothetically that $10,000 was invested in Fidelity Freedom 2035 Fund® on November 6, 2003, when the fund started. The chart shows how the value of your investment would have changed, and also shows how the S&P 500 Index performed over the same period.
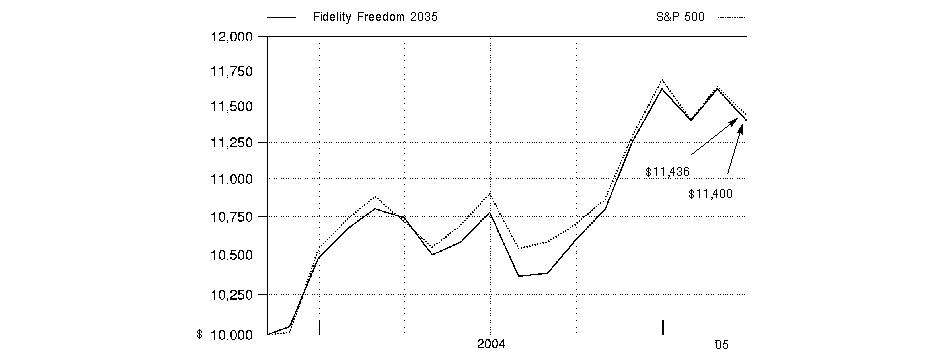
Annual Report
Fidelity Freedom 2040 Fund®
Performance: The Bottom Line
Average annual total return reflects the change in the value of an investment, assuming reinvestment of the fund's dividend income and capital gains (the profits earned upon the sale of securities that have grown in value) and assuming a constant rate of performance each year. The $10,000 table and the fund's returns do not reflect the deduction of taxes that a shareholder would pay on fund distributions or the redemption of fund shares. During periods of reimbursement by Fidelity, a fund's total return will be greater than it would be had the reimbursement not occurred. How a fund did yesterday is no guarantee of how it will do tomorrow.
Average Annual Total Returns
Periods ended March 31, 2005 | Past 1
year | Life of
fundA |
Fidelity Freedom 2040 Fund® | 6.35% | -2.87% |
A From September 6, 2000.
$10,000 Over Life of Fund
Let's say hypothetically that $10,000 was invested in Fidelity Freedom 2040 Fund® on September 6, 2000, when the fund started. The chart shows how the value of your investment would have changed, and also shows how the S&P 500 Index performed over the same period.
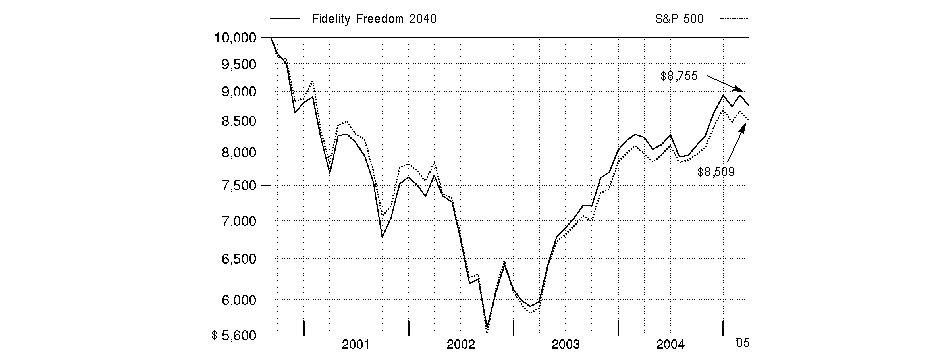
Annual Report
Management's Discussion of Fund Performance
Comments from Ren Cheng, Portfolio Manager of Fidelity Freedom Funds®, and Jonathan Shelon, who became co-manager of the Funds on March 14, 2005
Major U.S. equity benchmarks posted modest gains for the 12 months ending March 31, 2005. Stocks soared in the final quarter of 2004 in response to falling oil prices, a clear-cut conclusion to the presidential election, and positive economic and employment reports. The late-year surge accounted for nearly all of the 2004 calendar year's positive return. But the markets reversed course in the first quarter of 2005, as oil prices hit a record high of $57 per barrel and gasoline prices surged. Inflation concerns also took a toll, and the Federal Reserve Board hiked short-term interest rates seven times during the period. Despite the turmoil, most bellwether measures of U.S. equity market performance finished the period in the black. The broad-based Dow Jones Wilshire 5000 Composite IndexSM gained 7.19%. By comparison, overseas equity markets fared much better, helped in part by the U.S. dollar's weakness versus major foreign currencies for most of the year. The Morgan Stanley Capital InternationalSM Europe, Australasia, Far East (MSCI® EAFE®) Index, a proxy for the performance of overseas markets, rose 15.22%. Turning to fixed-income results, investment-grade bonds had only slightly positive returns for the year overall, tempered by rising interest rates and inflation concerns. The Lehman Brothers® Aggregate Bond Index returned 1.15%. High-yield bonds were the best-performing debt category, as evidenced by the 6.94% increase in the Merrill Lynch® U.S. High Yield Master II Index, bolstered by improving issuer fundamentals and very low default rates.
The Freedom Funds generally performed in line with our expectations during the year ending March 31, 2005, delivering a range of absolute returns appropriate for a series of portfolios with different asset allocations. (For specific performance results, please refer to the portfolio performance section of the Shareholder Update.) On a relative basis, the Freedom Funds trailed their respective benchmarks, due mainly to the Funds not participating in the strength of the domestic and international equity markets at the smaller end of the capitalization spectrum. More specifically, the Funds' underlying large-cap, growth-oriented funds, such as Fidelity® Blue Chip Growth Fund and Fidelity Growth Company Fund, underperformed the Wilshire 5000 index. A bright spot on the international equities side was Fidelity Europe Fund, which outperformed the MSCI EAFE index by nearly 10 percentage points. Within fixed income, Fidelity Intermediate Bond Fund was a notable laggard, while Fidelity Capital & Income Fund was a strong outperformer in the high-yield category.
The views expressed in this statement reflect those of the portfolio managers only through the end of the period of the report as stated on the cover and do not necessarily represent the views of Fidelity or any other person in the Fidelity organization. Any such views are subject to change at any time based upon market or other conditions and Fidelity disclaims any responsibility to update such views. These views may not be relied on as investment advice and, because investment decisions for a Fidelity fund are based on numerous factors, may not be relied on as an indication of trading intent on behalf of any Fidelity fund.
Annual Report
Shareholder Expense Example
As a shareholder of a Fund, you incur two types of costs: (1) transaction costs, and (2) ongoing costs, including management fees and other Fund expenses. This Example is intended to help you understand your ongoing costs (in dollars) of investing in the Funds and to compare these costs with the ongoing costs of investing in other mutual funds.
The Example is based on an investment of $1,000 invested at the beginning of the period and held for the entire period (October 1, 2004 to March 31, 2005).
Actual Expenses
The first line of the table below for each fund provides information about actual account values and actual expenses. You may use the information in this line, together with the amount you invested, to estimate the expenses that you paid over the period. Simply divide your account value by $1,000.00 (for example, an $8,600 account value divided by $1,000.00 = 8.6), then multiply the result by the number in the first line for a fund under the heading entitled "Expenses Paid During Period" to estimate the expenses you paid on your account during this period. A small balance maintenance fee of $12.00 that is charged once a year may apply for certain accounts with a value of less than $2,000. This fee is not included in the table below. If it was, the estimate of expenses you paid during the period would be higher, and your ending account value lower, by this amount. In addition, each fund, as a shareholder in underlying Fidelity funds, will indirectly bear its pro rata share of the fees and expenses incurred by the underlying Fidelity funds. These fees and expenses are not included in each fund's annualized expense ratio used to calculate the expense estimates in the table below. If they were, the estimate of expense you paid during the period would be higher, and your ending account value lower.
Hypothetical Example for Comparison Purposes
The second line of the table below for each fund provides information about hypothetical account values and hypothetical expenses based on a fund's actual expense ratio and an assumed rate of return of 5% per year before expenses, which is not the Fund's actual return. The hypothetical account values and expenses may not be used to estimate the actual ending account balance or expenses you paid for the period. You may use this information to compare the ongoing costs of investing in the Fund and other funds. To do so, compare this 5% hypothetical example with the 5% hypothetical examples that appear in the shareholder reports of the other funds. A small balance maintenance fee of $12.00 that is charged once a year may apply for certain accounts with a value of less than $2,000. This fee is not included in the table below. If it was, the estimate of expenses you paid during the period would be higher, and your ending account value lower, by this amount. In addition, each fund, as a shareholder in underlying Fidelity funds, will indirectly bear its pro rata share of the fees and expenses incurred by the underlying Fidelity funds. These fees and expenses are not included in each fund's annualized expense ratio used to calculate the expense estimates in the table below. If they were, the estimate of expense you paid during the period would be higher, and your ending account value lower.
Please note that the expenses shown in the table are meant to highlight your ongoing costs only and do not reflect any transaction costs. Therefore, the second line of the table is useful in comparing ongoing costs only, and will not help you determine the relative total costs of owning different funds.
| Beginning
Account Value
October 1, 2004 | Ending
Account Value
March 31, 2005 | Expenses Paid
During Period*
October 1, 2004
to March 31, 2005 |
Freedom Income | | | |
Actual | $ 1,000.00 | $ 1,019.80 | $ .40 * * |
HypotheticalA | $ 1,000.00 | $ 1,024.53 | $ .40 * * |
Freedom 2000 | | | |
Actual | $ 1,000.00 | $ 1,023.40 | $ .40 * * |
HypotheticalA | $ 1,000.00 | $ 1,024.53 | $ .40 * * |
Freedom 2005 | | | |
Actual | $ 1,000.00 | $ 1,040.30 | $ .41 * * |
HypotheticalA | $ 1,000.00 | $ 1,024.53 | $ .40 * * |
Freedom 2010 | | | |
Actual | $ 1,000.00 | $ 1,042.40 | $ .41 * * |
HypotheticalA | $ 1,000.00 | $ 1,024.53 | $ .40 * * |
Freedom 2015 | | | |
Actual | $ 1,000.00 | $ 1,052.40 | $ .41 * * |
HypotheticalA | $ 1,000.00 | $ 1,024.53 | $ .40 * * |
Freedom 2020 | | | |
Actual | $ 1,000.00 | $ 1,062.30 | $ .41 * * |
HypotheticalA | $ 1,000.00 | $ 1,024.53 | $ .40 * * |
Freedom 2025 | | | |
Actual | $ 1,000.00 | $ 1,067.50 | $ .41 * * |
HypotheticalA | $ 1,000.00 | $ 1,024.53 | $ .40 * * |
Freedom 2030 | | | |
Actual | $ 1,000.00 | $ 1,072.50 | $ .41 * * |
HypotheticalA | $ 1,000.00 | $ 1,024.53 | $ .40 * * |
Freedom 2035 | | | |
Actual | $ 1,000.00 | $ 1,075.80 | $ .41 * * |
HypotheticalA | $ 1,000.00 | $ 1,024.53 | $ .40 * * |
| Beginning
Account Value
October 1, 2004 | Ending
Account Value
March 31, 2005 | Expenses Paid
During Period*
October 1, 2004
to March 31, 2005 |
Freedom 2040 | | | |
Actual | $ 1,000.00 | $ 1,080.10 | $ .41 * * |
HypotheticalA | $ 1,000.00 | $ 1,024.53 | $ .40 * * |
A 5% return per year before expenses
* Expenses are equal to each Fund's annualized expense ratio (shown in the table below); multiplied by the average account value over the period, multiplied by 182/365 (to reflect the one-half year period). The fees and expenses of the underlying Fidelity funds in which the fund invests are not included in the fund's annualized expense ratio.
| Annualized
Expense Ratio |
Freedom Income | .08% * * |
Freedom 2000 | .08% * * |
Freedom 2005 | .08% * * |
Freedom 2010 | .08% * * |
Freedom 2015 | .08% * * |
Freedom 2020 | .08% * * |
Freedom 2025 | .08% * * |
Freedom 2030 | .08% * * |
Freedom 2035 | .08% * * |
Freedom 2040 | .08% * * |
* * As of May 1, 2005, Strategic Advisers agreed to waive the .10% management fee. On May 19, 2005, the Board of Trustees approved amendments to the management contracts. Under the amended contracts, the Funds no longer pay mangement fees. If this had been in effect during the period, the annualized expense ratio and expenses paid in the actual and hypothetical examples above (not including the fees and expenses of the underlying funds) would have been as follows:
| Annualized
Expense Ratio | Expenses
Paid |
Freedom Income | | |
Actual | .00% | $ .00 |
HypotheticalA | .00% | $ .00 |
Freedom 2000 | | |
Actual | .00% | $ .00 |
HypotheticalA | .00% | $ .00 |
Freedom 2005 | | |
Actual | .00% | $ .00 |
HypotheticalA | .00% | $ .00 |
Freedom 2010 | | |
Actual | .00% | $ .00 |
HypotheticalA | .00% | $ .00 |
Freedom 2015 | | |
Actual | .00% | $ .00 |
HypotheticalA | .00% | $ .00 |
Freedom 2020 | | |
Actual | .00% | $ .00 |
HypotheticalA | .00% | $ .00 |
Freedom 2025 | | |
Actual | .00% | $ .00 |
HypotheticalA | .00% | $ .00 |
Freedom 2030 | | |
Actual | .00% | $ .00 |
HypotheticalA | .00% | $ .00 |
Freedom 2035 | | |
Actual | .00% | $ .00 |
HypotheticalA | .00% | $ .00 |
Freedom 2040 | | |
Actual | .00% | $ .00 |
HypotheticalA | .00% | $ .00 |
A 5% return per year before expenses
Annual Report
Fidelity Freedom Income Fund
Investment Changes
Fund Holdings as of March 31, 2005 |
| % of fund's
investments | % of fund's investments
6 months ago |
Domestic Equity Funds | | |
Fidelity Blue Chip Growth Fund | 2.8 | 3.1 |
Fidelity Disciplined Equity Fund | 3.2 | 3.2 |
Fidelity Equity-Income Fund | 3.2 | 3.4 |
Fidelity Fund | 2.1 | 3.2 |
Fidelity Growth & Income Portfolio | 3.0 | 3.2 |
Fidelity Growth Company Fund | 1.8 | 1.8 |
Fidelity Mid-Cap Stock Fund | 1.8 | 1.9 |
Fidelity OTC Portfolio | 1.3 | 1.4 |
| 19.2 | 21.2 |
Investment Grade Fixed-Income Funds | | |
Fidelity Government Income Fund | 15.1 | 15.1 |
Fidelity Intermediate Bond Fund | 9.9 | 9.9 |
Fidelity Investment Grade Bond Fund | 15.3 | 15.2 |
| 40.3 | 40.2 |
Short-Term Funds | | |
Fidelity Retirement Money Market Portfolio | 40.5 | 38.6 |
| 100.0 | 100.0 |
Asset Allocation (% of fund's investments) |
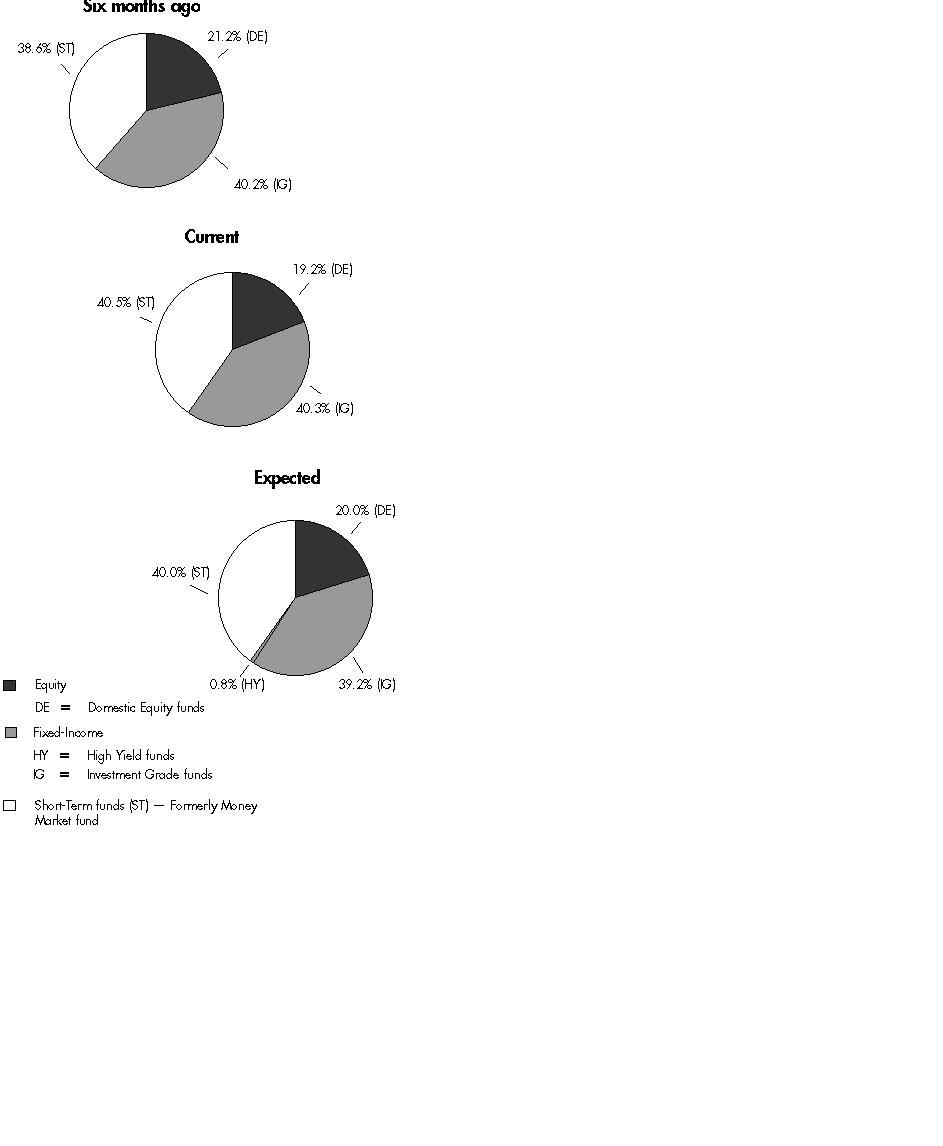
The six months ago allocation is based on the fund's holdings as of September 30, 2004. The current allocation is based on the fund's holdings as of March 31, 2005. On or about June 1, 2005, the Fixed-Income funds allocation will begin to include High Yield funds. The expected allocation represents the fund's anticipated target asset allocation at September 30, 2005.
Annual Report
Fidelity Freedom Income Fund
Investments March 31, 2005
Showing Percentage of Total Value of Investment in Securities
Equity Funds - 19.2% |
| Shares | | Value (Note 1) |
Domestic Equity Funds - 19.2% |
Fidelity Blue Chip Growth Fund | 1,367,790 | | $ 54,779,986 |
Fidelity Disciplined Equity Fund | 2,428,051 | | 61,672,502 |
Fidelity Equity-Income Fund | 1,206,438 | | 61,842,028 |
Fidelity Fund | 1,404,526 | | 41,321,152 |
Fidelity Growth & Income Portfolio | 1,552,116 | | 57,847,369 |
Fidelity Growth Company Fund | 649,721 | | 34,357,263 |
Fidelity Mid-Cap Stock Fund | 1,519,040 | | 34,345,490 |
Fidelity OTC Portfolio | 805,337 | | 26,213,717 |
TOTAL EQUITY FUNDS (Cost $336,839,749) | 372,379,507 |
Fixed-Income Funds - 40.3% |
| | | |
Investment Grade Fixed-Income Funds - 40.3% |
Fidelity Government Income Fund | 29,034,360 | | 294,118,064 |
Fidelity Intermediate Bond Fund | 18,521,536 | | 191,697,900 |
Fidelity Investment Grade Bond Fund | 40,095,255 | | 298,308,700 |
TOTAL FIXED-INCOME FUNDS (Cost $782,852,192) | 784,124,664 |
Short-Term Funds - 40.5% |
| | | |
Fidelity Retirement Money Market Portfolio (Cost $788,374,807) | 788,374,807 | | 788,374,807 |
TOTAL INVESTMENT IN SECURITIES - 100% (Cost $1,908,066,748) | $ 1,944,878,978 |
See accompanying notes which are an integral part of the financial statements.
Annual Report
Fidelity Freedom Income Fund
Financial Statements
Statement of Assets and Liabilities
| March 31, 2005 |
| | |
Assets | | |
Investment in securities, at value (cost $1,908,066,748) - See accompanying schedule | | $ 1,944,878,978 |
Cash | | 12 |
Receivable for investments sold | | 571,031 |
Receivable for fund shares sold | | 3,093,334 |
Receivable from investment adviser for expense reductions | | 32,006 |
Total assets | | 1,948,575,361 |
| | |
Liabilities | | |
Payable for investments purchased | $ 88,806 | |
Payable for fund shares redeemed | 3,420,536 | |
Accrued management fee | 162,672 | |
Total liabilities | | 3,672,014 |
| | |
Net Assets | | $ 1,944,903,347 |
Net Assets consist of: | | |
Paid in capital | | $ 1,911,206,570 |
Undistributed net investment income | | 5,551,735 |
Accumulated undistributed net realized gain (loss) on investments | | (8,667,188) |
Net unrealized appreciation (depreciation) on investments | | 36,812,230 |
Net Assets, for 173,729,287 shares outstanding | | $ 1,944,903,347 |
Net Asset Value, offering price and redemption price per share ($1,944,903,347 ÷ 173,729,287 shares) | | $ 11.20 |
Statement of Operations
| Year ended March 31, 2005 |
| | |
Investment Income | | |
Income distributions from underlying funds | | $ 37,623,532 |
Interest | | 97 |
Total income | | 37,623,629 |
| | |
Expenses | | |
Management fee | $ 1,827,406 | |
Independent trustees' compensation | 9,719 | |
Total expenses before reductions | 1,837,125 | |
Expense reductions | (368,367) | 1,468,758 |
Net investment income (loss) | | 36,154,871 |
Realized and Unrealized Gain (Loss) Realized gain (loss) on sale of underlying fund shares | (8,545,798) | |
Capital gain distributions from underlying funds | 9,004,064 | 458,266 |
Change in net unrealized appreciation (depreciation) on underlying funds | | (2,097,017) |
Net gain (loss) | | (1,638,751) |
Net increase (decrease) in net assets resulting from operations | | $ 34,516,120 |
See accompanying notes which are an integral part of the financial statements.
Annual Report
Statement of Changes in Net Assets
| Year ended
March 31,
2005 | Year ended
March 31,
2004 |
Increase (Decrease) in Net Assets | | |
Operations | | |
Net investment income (loss) | $ 36,154,871 | $ 25,223,038 |
Net realized gain (loss) | 458,266 | 20,108,967 |
Change in net unrealized appreciation (depreciation) | (2,097,017) | 77,459,245 |
Net increase (decrease) in net assets resulting from operations | 34,516,120 | 122,791,250 |
Distributions to shareholders from net investment income | (37,716,016) | (29,935,758) |
Distributions to shareholders from net realized gain | (2,625,103) | (8,680,228) |
Total distributions | (40,341,119) | (38,615,986) |
Share transactions
Proceeds from sales of shares | 774,226,897 | 1,036,318,179 |
Reinvestment of distributions | 39,691,028 | 37,978,019 |
Cost of shares redeemed | (616,475,282) | (648,001,570) |
Net increase (decrease) in net assets resulting from share transactions | 197,442,643 | 426,294,628 |
Total increase (decrease) in net assets | 191,617,644 | 510,469,892 |
| | |
Net Assets | | |
Beginning of period | 1,753,285,703 | 1,242,815,811 |
End of period (including undistributed net investment income of $5,551,735 and undistributed net investment income of $4,504,251, respectively) | $ 1,944,903,347 | $ 1,753,285,703 |
Other Information Shares | | |
Sold | 69,450,255 | 94,086,862 |
Issued in reinvestment of distributions | 3,558,661 | 3,451,194 |
Redeemed | (55,311,687) | (58,840,442) |
Net increase (decrease) | 17,697,229 | 38,697,614 |
Financial Highlights
Years ended March 31, | 2005 | 2004 | 2003 | 2002 | 2001 |
Selected Per-Share Data | | | | | |
Net asset value, beginning of period | $ 11.24 | $ 10.59 | $ 10.89 | $ 10.93 | $ 11.58 |
Income from Investment Operations | | | | | |
Net investment income (loss) B | .22 | .18 | .24 | .36 | .57 |
Net realized and unrealized gain (loss) | (.01) | .75 | (.27) | .05 | (.37) |
Total from investment operations | .21 | .93 | (.03) | .41 | .20 |
Distributions from net investment income | (.23) | (.22) | (.27) | (.38) | (.59) |
Distributions from net realized gain | (.02) | (.06) | - | (.07) | (.26) |
Total distributions | (.25) | (.28) | (.27) | (.45) | (.85) |
Net asset value, end of period | $ 11.20 | $ 11.24 | $ 10.59 | $ 10.89 | $ 10.93 |
Total Return A | 1.86% | 8.87% | (.23)% | 3.78% | 1.77% |
Ratios to Average Net Assets C, D | | | | | |
Expenses before expense reductions | .10% | .10% | .10% | .10% | .10% |
Expenses net of voluntary waivers, if any | .08% | .08% | .08% | .08% | .08% |
Expenses net of all reductions | .08% | .08% | .08% | .07% | .06% |
Net investment income (loss) | 1.97% | 1.68% | 2.28% | 3.27% | 5.07% |
Supplemental Data | | | | | |
Net assets, end of period (000 omitted) | $ 1,944,903 | $ 1,753,286 | $ 1,242,816 | $ 960,976 | $ 618,169 |
Portfolio turnover rate | 7% | 6% | 7% | 9% | 40% |
A Total returns would have been lower had certain expenses not been reduced during the periods shown.
B Calculated based on average shares outstanding during the period.
C Amounts do not include the activity of the underlying funds.
D Expense ratios reflect operating expenses of the fund. Expenses before reductions do not reflect amounts reimbursed by the investment adviser or reductions from brokerage service arrangements or other expense offset arrangements and do not represent the amount paid by the fund during periods when reimbursements or reductions occur. Expenses net of any voluntary waivers reflect expenses after reimbursement by the investment adviser but prior to reductions from brokerage service arrangements or other expense offset arrangements. Expenses net of all reductions represent the net expenses paid by the fund.
See accompanying notes which are an integral part of the financial statements.
Annual Report
Fidelity Freedom 2000 Fund
Investment Changes
Fund Holdings as of March 31, 2005 |
| % of fund's investments | % of fund's investments 6 months ago |
Domestic Equity Funds | | |
Fidelity Blue Chip Growth Fund | 3.3 | 3.5 |
Fidelity Disciplined Equity Fund | 3.8 | 3.8 |
Fidelity Equity-Income Fund | 3.8 | 4.0 |
Fidelity Fund | 2.4 | 3.7 |
Fidelity Growth & Income Portfolio | 3.5 | 3.7 |
Fidelity Growth Company Fund | 2.1 | 2.1 |
Fidelity Mid-Cap Stock Fund | 2.1 | 2.2 |
Fidelity OTC Portfolio | 1.6 | 1.6 |
| 22.6 | 24.6 |
International Equity Funds | | |
Fidelity Diversified International Fund | 0.1 | 0.2 |
Fidelity Europe Fund | 0.2 | 0.4 |
Fidelity Japan Fund | 0.1 | 0.1 |
Fidelity Overseas Fund | 0.1 | 0.2 |
Fidelity Southeast Asia Fund | 0.0 | 0.1 |
| 0.5 | 1.0 |
High Yield Fixed-Income Funds | | |
Fidelity Capital & Income Fund | 0.4 | 0.7 |
Fidelity High Income Fund | 0.3 | 0.5 |
| 0.7 | 1.2 |
Investment Grade Fixed-Income Funds | | |
Fidelity Government Income Fund | 15.1 | 15.4 |
Fidelity Intermediate Bond Fund | 9.8 | 10.1 |
Fidelity Investment Grade Bond Fund | 15.3 | 15.5 |
| 40.2 | 41.0 |
Short-Term Funds | | |
Fidelity Retirement Money Market Portfolio | 36.0 | 32.2 |
| 100.0 | 100.0 |
Asset Allocation (% of fund's investments) |
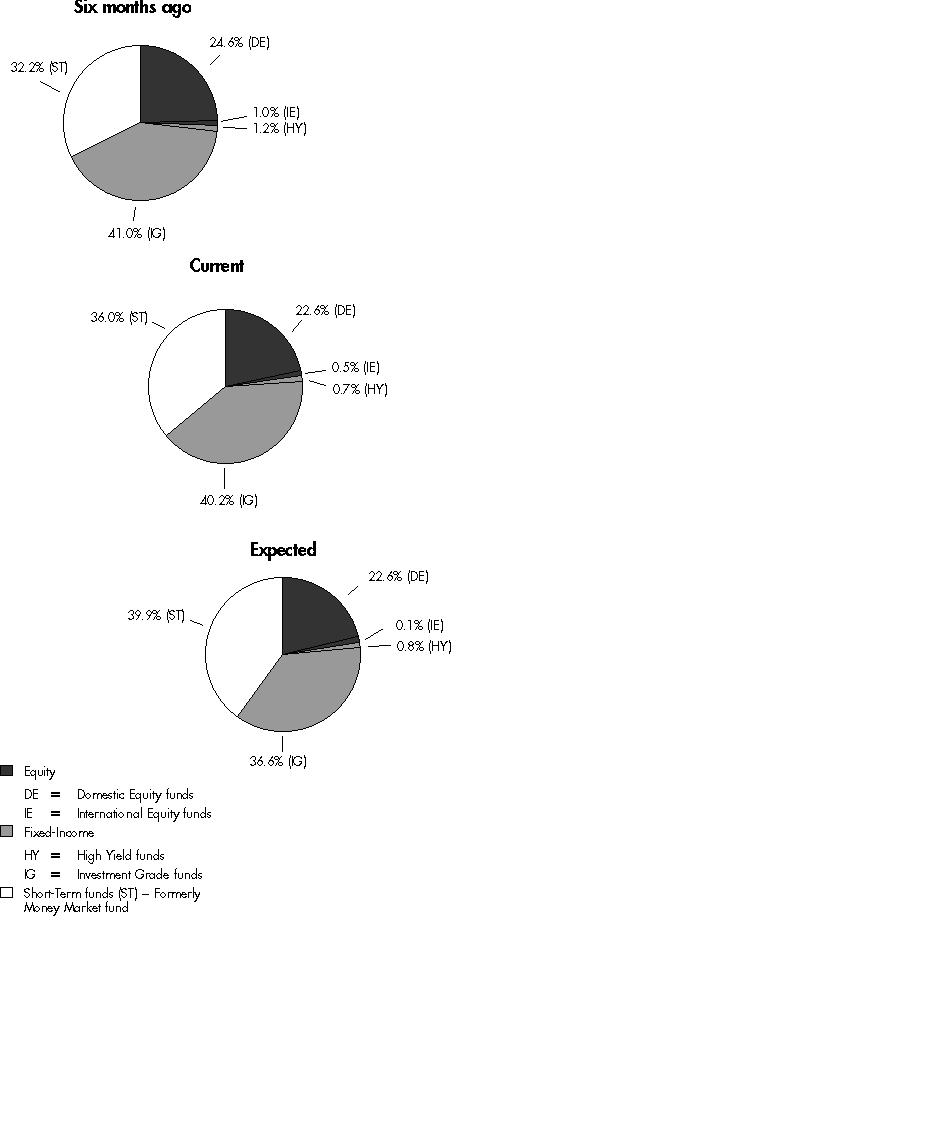
The fund invests according to an asset allocation strategy that becomes increasingly conservative over time. The six months ago allocation is based on the fund's holdings as of September 30, 2004. The current allocation is based on the fund's holdings as of March 31, 2005. The expected allocation represents the fund's anticipated target asset allocation at September 30, 2005.
Annual Report
Fidelity Freedom 2000 Fund
Investments March 31, 2005
Showing Percentage of Total Value of Investment in Securities
Equity Funds - 23.1% |
| Shares | | Value (Note 1) |
Domestic Equity Funds - 22.6% |
Fidelity Blue Chip Growth Fund | 1,305,886 | | $ 52,300,752 |
Fidelity Disciplined Equity Fund | 2,340,367 | | 59,445,310 |
Fidelity Equity-Income Fund | 1,173,739 | | 60,165,863 |
Fidelity Fund | 1,302,978 | | 38,333,604 |
Fidelity Growth & Income Portfolio | 1,491,677 | | 55,594,799 |
Fidelity Growth Company Fund | 620,817 | | 32,828,817 |
Fidelity Mid-Cap Stock Fund | 1,457,009 | | 32,942,970 |
Fidelity OTC Portfolio | 772,063 | | 25,130,637 |
TOTAL DOMESTIC EQUITY FUNDS | | 356,742,752 |
International Equity Funds - 0.5% |
Fidelity Diversified International Fund | 71,297 | | 2,044,791 |
Fidelity Europe Fund | 91,091 | | 3,173,610 |
Fidelity Japan Fund | 50,287 | | 635,627 |
Fidelity Overseas Fund | 53,587 | | 1,866,964 |
Fidelity Southeast Asia Fund | 27,023 | | 459,934 |
TOTAL INTERNATIONAL EQUITY FUNDS | | 8,180,926 |
TOTAL EQUITY FUNDS (Cost $341,155,384) | 364,923,678 |
Fixed-Income Funds - 40.9% |
| | | |
High Yield Fixed-Income Funds - 0.7% |
Fidelity Capital & Income Fund | 766,474 | | 6,354,069 |
Fidelity High Income Fund | 565,089 | | 4,967,133 |
TOTAL HIGH YIELD FIXED-INCOME FUNDS | | 11,321,202 |
Investment Grade Fixed-Income Funds - 40.2% |
Fidelity Government Income Fund | 23,413,351 | | 237,177,248 |
Fidelity Intermediate Bond Fund | 14,929,387 | | 154,519,155 |
Fidelity Investment Grade Bond Fund | 32,399,824 | | 241,054,693 |
TOTAL INVESTMENT GRADE FIXED-INCOME FUNDS | | 632,751,096 |
TOTAL FIXED-INCOME FUNDS (Cost $633,361,851) | 644,072,298 |
Short-Term Funds - 36.0% |
| | | |
Fidelity Retirement Money Market Portfolio (Cost $566,877,765) | 566,877,765 | | 566,877,765 |
TOTAL INVESTMENT IN SECURITIES - 100% (Cost $1,541,395,000) | $ 1,575,873,741 |
Income Tax Information |
At March 31, 2005, the fund had a capital loss carryforward of approximately $2,030,732 of which $436,587 and $1,594,145 will expire on March 31, 2011 and 2013, respectively. |
See accompanying notes which are an integral part of the financial statements.
Annual Report
Fidelity Freedom 2000 Fund
Financial Statements
Statement of Assets and Liabilities
| March 31, 2005 |
| | |
Assets | | |
Investment in securities, at value (cost $1,541,395,000) - See accompanying schedule | | $ 1,575,873,741 |
Receivable for investments sold | | 126,470 |
Receivable for fund shares sold | | 2,833,412 |
Receivable from investment adviser for expense reductions | | 26,305 |
Total assets | | 1,578,859,928 |
| | |
Liabilities | | |
Payable for investments purchased | $ 1,134,302 | |
Payable for fund shares redeemed | 1,699,925 | |
Accrued management fee | 131,869 | |
Total liabilities | | 2,966,096 |
| | |
Net Assets | | $ 1,575,893,832 |
Net Assets consist of: | | |
Paid in capital | | $ 1,541,561,824 |
Undistributed net investment income | | 7,967,137 |
Accumulated undistributed net realized gain (loss) on investments | | (8,113,870) |
Net unrealized appreciation (depreciation) on investments | | 34,478,741 |
Net Assets, for 131,277,668 shares outstanding | | $ 1,575,893,832 |
Net Asset Value, offering price and redemption price per share ($1,575,893,832 ÷ 131,277,668 shares) | | $ 12.00 |
Statement of Operations
| Year ended March 31, 2005 |
| | |
Investment Income | | |
Income distributions from underlying funds | | $ 33,115,584 |
Interest | | 25 |
Total income | | 33,115,609 |
| | |
Expenses | | |
Management fee | $ 1,571,426 | |
Independent trustees' compensation | 8,460 | |
Total expenses before reductions | 1,579,886 | |
Expense reductions | (316,138) | 1,263,748 |
Net investment income (loss) | | 31,851,861 |
Realized and Unrealized Gain (Loss) Realized gain (loss) on sale of underlying fund shares | (7,786,190) | |
Capital gain distributions from underlying funds | 8,318,008 | 531,818 |
Change in net unrealized appreciation (depreciation) on underlying funds | | 2,001,302 |
Net gain (loss) | | 2,533,120 |
Net increase (decrease) in net assets resulting from operations | | $ 34,384,981 |
See accompanying notes which are an integral part of the financial statements.
Annual Report
Statement of Changes in Net Assets
| Year ended
March 31,
2005 | Year ended
March 31,
2004 |
Increase (Decrease) in Net Assets | | |
Operations | | |
Net investment income (loss) | $ 31,851,861 | $ 25,921,578 |
Net realized gain (loss) | 531,818 | 23,145,889 |
Change in net unrealized appreciation (depreciation) | 2,001,302 | 97,696,438 |
Net increase (decrease) in net assets resulting from operations | 34,384,981 | 146,763,905 |
Distributions to shareholders from net investment income | (30,275,451) | (29,821,507) |
Share transactions
Proceeds from sales of shares | 396,321,970 | 677,171,698 |
Reinvestment of distributions | 30,116,568 | 29,685,123 |
Cost of shares redeemed | (446,721,830) | (496,912,877) |
Net increase (decrease) in net assets resulting from share transactions | (20,283,292) | 209,943,944 |
Total increase (decrease) in net assets | (16,173,762) | 326,886,342 |
| | |
Net Assets | | |
Beginning of period | 1,592,067,594 | 1,265,181,252 |
End of period (including undistributed net investment income of $7,967,137 and undistributed net investment income of $9,033,441, respectively) | $ 1,575,893,832 | $ 1,592,067,594 |
Other Information Shares | | |
Sold | 33,212,772 | 58,221,202 |
Issued in reinvestment of distributions | 2,508,864 | 2,553,873 |
Redeemed | (37,437,542) | (42,674,105) |
Net increase (decrease) | (1,715,906) | 18,100,970 |
Financial Highlights
Years ended March 31, | 2005 | 2004 | 2003 | 2002 | 2001 |
Selected Per-Share Data | | | | | |
Net asset value, beginning of period | $ 11.97 | $ 11.01 | $ 11.52 | $ 11.43 | $ 13.47 |
Income from Investment Operations | | | | | |
Net investment income (loss) B | .24 | .21 | .26 | .37 | .55 |
Net realized and unrealized gain (loss) | .02 | .99 | (.47) | -E | (.91) |
Total from investment operations | .26 | 1.20 | (.21) | .37 | (.36) |
Distributions from net investment income | (.23) | (.24) | (.30) | (.28) | (.75) |
Distributions from net realized gain | - | - | - | - | (.93) |
Total distributions | (.23) | (.24) | (.30) | (.28) | (1.68) |
Net asset value, end of period | $ 12.00 | $ 11.97 | $ 11.01 | $ 11.52 | $ 11.43 |
Total Return A | 2.18% | 10.97% | (1.81)% | 3.21% | (2.95)% |
Ratios to Average Net Assets C, D | | | | | |
Expenses before expense reductions | .10% | .10% | .10% | .10% | .10% |
Expenses net of voluntary waivers, if any | .08% | .08% | .08% | .08% | .08% |
Expenses net of all reductions | .08% | .08% | .08% | .07% | .06% |
Net investment income (loss) | 2.02% | 1.79% | 2.37% | 3.19% | 4.41% |
Supplemental Data | | | | | |
Net assets, end of period (000 omitted) | $ 1,575,894 | $ 1,592,068 | $ 1,265,181 | $ 1,111,543 | $ 900,651 |
Portfolio turnover rate | 11% | 7% | 7% | 13% | 51% |
A Total returns would have been lower had certain expenses not been reduced during the periods shown.
B Calculated based on average shares outstanding during the period.
C Amounts do not include the activity of the underlying funds.
D Expense ratios reflect operating expenses of the fund. Expenses before reductions do not reflect amounts reimbursed by the investment adviser or reductions from brokerage service arrangements or other expense offset arrangements and do not represent the amount paid by the fund during periods when reimbursements or reductions occur. Expenses net of any voluntary waivers reflect expenses after reimbursement by the investment adviser but prior to reductions from brokerage service arrangements or other expense offset arrangements. Expenses net of all reductions represent the net expenses paid by the fund.
E Amount represents less than $.01 per share.
See accompanying notes which are an integral part of the financial statements.
Annual Report
Fidelity Freedom 2005 Fund
Investment Changes
Fund Holdings as of March 31, 2005 |
| % of fund's investments | % of fund's investments 6 months ago |
Domestic Equity Funds | | |
Fidelity Blue Chip Growth Fund | 6.1 | 5.8 |
Fidelity Disciplined Equity Fund | 6.4 | 6.0 |
Fidelity Equity-Income Fund | 6.3 | 6.0 |
Fidelity Fund | 4.1 | 5.9 |
Fidelity Growth & Income Portfolio | 6.2 | 6.0 |
Fidelity Growth Company Fund | 3.7 | 3.5 |
Fidelity Mid-Cap Stock Fund | 3.7 | 3.5 |
Fidelity OTC Portfolio | 2.8 | 2.7 |
| 39.3 | 39.4 |
International Equity Funds | | |
Fidelity Diversified International Fund | 1.4 | 1.3 |
Fidelity Europe Fund | 2.0 | 1.8 |
Fidelity Japan Fund | 0.5 | 0.5 |
Fidelity Overseas Fund | 1.3 | 1.2 |
Fidelity Southeast Asia Fund | 0.3 | 0.3 |
| 5.5 | 5.1 |
High Yield Fixed-Income Funds | | |
Fidelity Capital & Income Fund | 2.6 | 2.6 |
Fidelity High Income Fund | 2.5 | 2.5 |
| 5.1 | 5.1 |
Investment Grade Fixed-Income Funds | | |
Fidelity Government Income Fund | 15.1 | 15.2 |
Fidelity Intermediate Bond Fund | 9.8 | 10.0 |
Fidelity Investment Grade Bond Fund | 15.2 | 15.3 |
| 40.1 | 40.5 |
Short-Term Funds | | |
Fidelity Retirement Money Market Portfolio | 10.0 | 9.9 |
| 100.0 | 100.0 |
Asset Allocation (% of fund's investments) |

The fund invests according to an asset allocation strategy that becomes increasingly conservative over time. The six months ago allocation is based on the fund's holdings as of September 30, 2004. The current allocation is based on the fund's holdings as of March 31, 2005. The expected allocation represents the fund's anticipated target asset allocation at September 30, 2005.
Annual Report
Fidelity Freedom 2005 Fund
Investments March 31, 2005
Showing Percentage of Total Value of Investment in Securities
Equity Funds - 44.8% |
| Shares | | Value (Note 1) |
Domestic Equity Funds - 39.3% |
Fidelity Blue Chip Growth Fund | 345,153 | | $ 13,823,385 |
Fidelity Disciplined Equity Fund | 578,126 | | 14,684,397 |
Fidelity Equity-Income Fund | 279,773 | | 14,341,142 |
Fidelity Fund | 321,537 | | 9,459,614 |
Fidelity Growth & Income Portfolio | 379,603 | | 14,147,821 |
Fidelity Growth Company Fund | 158,577 | | 8,385,549 |
Fidelity Mid-Cap Stock Fund | 376,229 | | 8,506,536 |
Fidelity OTC Portfolio | 198,590 | | 6,464,090 |
TOTAL DOMESTIC EQUITY FUNDS | | 89,812,534 |
International Equity Funds - 5.5% |
Fidelity Diversified International Fund | 107,849 | | 3,093,107 |
Fidelity Europe Fund | 130,465 | | 4,545,415 |
Fidelity Japan Fund | 93,095 | | 1,176,726 |
Fidelity Overseas Fund | 86,426 | | 3,011,078 |
Fidelity Southeast Asia Fund | 36,991 | | 629,579 |
TOTAL INTERNATIONAL EQUITY FUNDS | | 12,455,905 |
TOTAL EQUITY FUNDS (Cost $99,320,192) | 102,268,439 |
Fixed-Income Funds - 45.2% |
| | | |
High Yield Fixed-Income Funds - 5.1% |
Fidelity Capital & Income Fund | 714,832 | | 5,925,957 |
Fidelity High Income Fund | 658,188 | | 5,785,475 |
TOTAL HIGH YIELD FIXED-INCOME FUNDS | | 11,711,432 |
Investment Grade Fixed-Income Funds - 40.1% |
Fidelity Government Income Fund | 3,400,714 | | 34,449,229 |
Fidelity Intermediate Bond Fund | 2,165,475 | | 22,412,663 |
Fidelity Investment Grade Bond Fund | 4,641,087 | | 34,529,688 |
TOTAL INVESTMENT GRADE FIXED-INCOME FUNDS | | 91,391,580 |
TOTAL FIXED-INCOME FUNDS (Cost $104,366,171) | 103,103,012 |
Short-Term Funds - 10.0% |
| | | |
Fidelity Retirement Money Market Portfolio (Cost $22,870,327) | 22,870,327 | | 22,870,327 |
TOTAL INVESTMENT IN SECURITIES - 100% (Cost $226,556,690) | $ 228,241,778 |
See accompanying notes which are an integral part of the financial statements.
Annual Report
Fidelity Freedom 2005 Fund
Financial Statements
Statement of Assets and Liabilities
| March 31, 2005 |
| | |
Assets | | |
Investment in securities, at value (cost $226,556,690) - See accompanying schedule | | $ 228,241,778 |
Receivable for investments sold | | 18,001 |
Receivable for fund shares sold | | 731,931 |
Receivable from investment adviser for expense reductions | | 3,330 |
Total assets | | 228,995,040 |
| | |
Liabilities | | |
Payable for investments purchased | $ 339,517 | |
Payable for fund shares redeemed | 392,434 | |
Accrued management fee | 18,857 | |
Total liabilities | | 750,808 |
| | |
Net Assets | | $ 228,244,232 |
Net Assets consist of: | | |
Paid in capital | | $ 225,248,955 |
Undistributed net investment income | | 955,989 |
Accumulated undistributed net realized gain (loss) on investments | | 354,200 |
Net unrealized appreciation (depreciation) on investments | | 1,685,088 |
Net Assets, for 21,399,148 shares outstanding | | $ 228,244,232 |
Net Asset Value, offering price and redemption price per share ($228,244,232 ÷ 21,399,148 shares) | | $ 10.67 |
Statement of Operations
| Year ended March 31, 2005 |
| | |
Investment Income | | |
Income distributions from underlying funds | | $ 2,535,049 |
Interest | | 106 |
Total income | | 2,535,155 |
| | |
Expenses | | |
Management fee | $ 112,108 | |
Independent trustees' compensation | 493 | |
Total expenses before reductions | 112,601 | |
Expense reductions | (23,290) | 89,311 |
Net investment income (loss) | | 2,445,844 |
Realized and Unrealized Gain (Loss) Realized gain (loss) on sale of underlying fund shares | (15,902) | |
Capital gain distributions from underlying funds | 716,665 | 700,763 |
Change in net unrealized appreciation (depreciation) on underlying funds | | 1,300,771 |
Net gain (loss) | | 2,001,534 |
Net increase (decrease) in net assets resulting from operations | | $ 4,447,378 |
See accompanying notes which are an integral part of the financial statements.
Annual Report
Statement of Changes in Net Assets
| Year ended
March 31,
2005 | For the period
November 6, 2003
(commencement
of operations) to
March 31, 2004 |
Increase (Decrease) in Net Assets | | |
Operations | | |
Net investment income (loss) | $ 2,445,844 | $ 129,979 |
Net realized gain (loss) | 700,763 | (6,715) |
Change in net unrealized appreciation (depreciation) | 1,300,771 | 384,317 |
Net increase (decrease) in net assets resulting from operations | 4,447,378 | 507,581 |
Distributions to shareholders from net investment income | (1,801,817) | (29,473) |
Distributions to shareholders from net realized gain | (128,392) | - |
Total distributions | (1,930,209) | (29,473) |
Share transactions
Proceeds from sales of shares | 246,497,542 | 40,964,747 |
Reinvestment of distributions | 1,919,878 | 29,049 |
Cost of shares redeemed | (59,173,494) | (4,988,767) |
Net increase (decrease) in net assets resulting from share transactions | 189,243,926 | 36,005,029 |
Total increase (decrease) in net assets | 191,761,095 | 36,483,137 |
| | |
Net Assets | | |
Beginning of period | 36,483,137 | - |
End of period (including undistributed net investment income of $955,989 and undistributed net investment income of $111,038, respectively) | $ 228,244,232 | $ 36,483,137 |
Other Information Shares | | |
Sold | 23,321,727 | 3,957,673 |
Issued in reinvestment of distributions | 178,736 | 2,848 |
Redeemed | (5,581,161) | (480,675) |
Net increase (decrease) | 17,919,302 | 3,479,846 |
Financial Highlights
Years ended March 31, | 2005 | 2004F |
Selected Per-Share Data | | |
Net asset value, beginning of period | $ 10.48 | $ 10.00 |
Income from Investment Operations | | |
Net investment income (loss)D | .23 | .08 |
Net realized and unrealized gain (loss) | .13 | .44 |
Total from investment operations | .36 | .52 |
Distributions from net investment income | (.16) | (.04) |
Distributions from net realized gain | (.01) | - |
Total distributions | (.17) | (.04) |
Net asset value, end of period | $ 10.67 | $ 10.48 |
Total ReturnB,C | 3.44% | 5.21% |
Ratios to Average Net AssetsE,G | | |
Expenses before expense reductions | .10% | .10%A |
Expenses net of voluntary waivers, if any | .08% | .08%A |
Expenses net of all reductions | .08% | .08%A |
Net investment income (loss) | 2.18% | 2.03%A |
Supplemental Data | | |
Net assets, end of period (000 omitted) | $ 228,244 | $ 36,483 |
Portfolio turnover rate | 7% | 22%A |
A Annualized
B Total returns for periods of less than one year are not annualized.
C Total returns would have been lower had certain expenses not been reduced during the periods shown.
D Calculated based on average shares outstanding during the period.
E Amounts do not include the activity of the underlying funds.
F For the period November 6, 2003 (commencement of operations) to March 31, 2004.
G Expense ratios reflect operating expenses of the fund. Expenses before reductions do not reflect amounts reimbursed by the investment adviser or reductions from brokerage service arrangements or other expense offset arrangements and do not represent the amount paid by the fund during periods when reimbursements or reductions occur. Expenses net of any voluntary waivers reflect expenses after reimbursement by the investment adviser but prior to reductions from brokerage service arrangements or other expense offset arrangements. Expenses net of all reductions represent the net expenses paid by the fund.
See accompanying notes which are an integral part of the financial statements.
Annual Report
Fidelity Freedom 2010 Fund
Investment Changes
Fund Holdings as of March 31, 2005 |
| % of fund's investments | % of fund's investments 6 months ago |
Domestic Equity Funds | | |
Fidelity Blue Chip Growth Fund | 6.0 | 5.9 |
Fidelity Disciplined Equity Fund | 6.7 | 6.3 |
Fidelity Equity-Income Fund | 6.7 | 6.6 |
Fidelity Fund | 6.1 | 6.3 |
Fidelity Growth & Income Portfolio | 6.3 | 6.2 |
Fidelity Growth Company Fund | 3.7 | 3.6 |
Fidelity Mid-Cap Stock Fund | 3.7 | 3.6 |
Fidelity OTC Portfolio | 2.8 | 2.7 |
| 42.0 | 41.2 |
International Equity Funds | | |
Fidelity Diversified International Fund | 1.6 | 1.4 |
Fidelity Europe Fund | 2.4 | 2.1 |
Fidelity Japan Fund | 0.5 | 0.5 |
Fidelity Overseas Fund | 1.4 | 1.3 |
Fidelity Southeast Asia Fund | 0.3 | 0.3 |
| 6.2 | 5.6 |
High Yield Fixed-Income Funds | | |
Fidelity Capital & Income Fund | 3.7 | 3.7 |
Fidelity High Income Fund | 2.2 | 2.2 |
| 5.9 | 5.9 |
Investment Grade Fixed-Income Funds | | |
Fidelity Government Income Fund | 14.1 | 14.5 |
Fidelity Intermediate Bond Fund | 9.1 | 9.5 |
Fidelity Investment Grade Bond Fund | 14.2 | 14.6 |
| 37.4 | 38.6 |
Short-Term Funds | | |
Fidelity Retirement Money Market Portfolio | 8.5 | 8.7 |
| 100.0 | 100.0 |
Asset Allocation (% of fund's investments) |
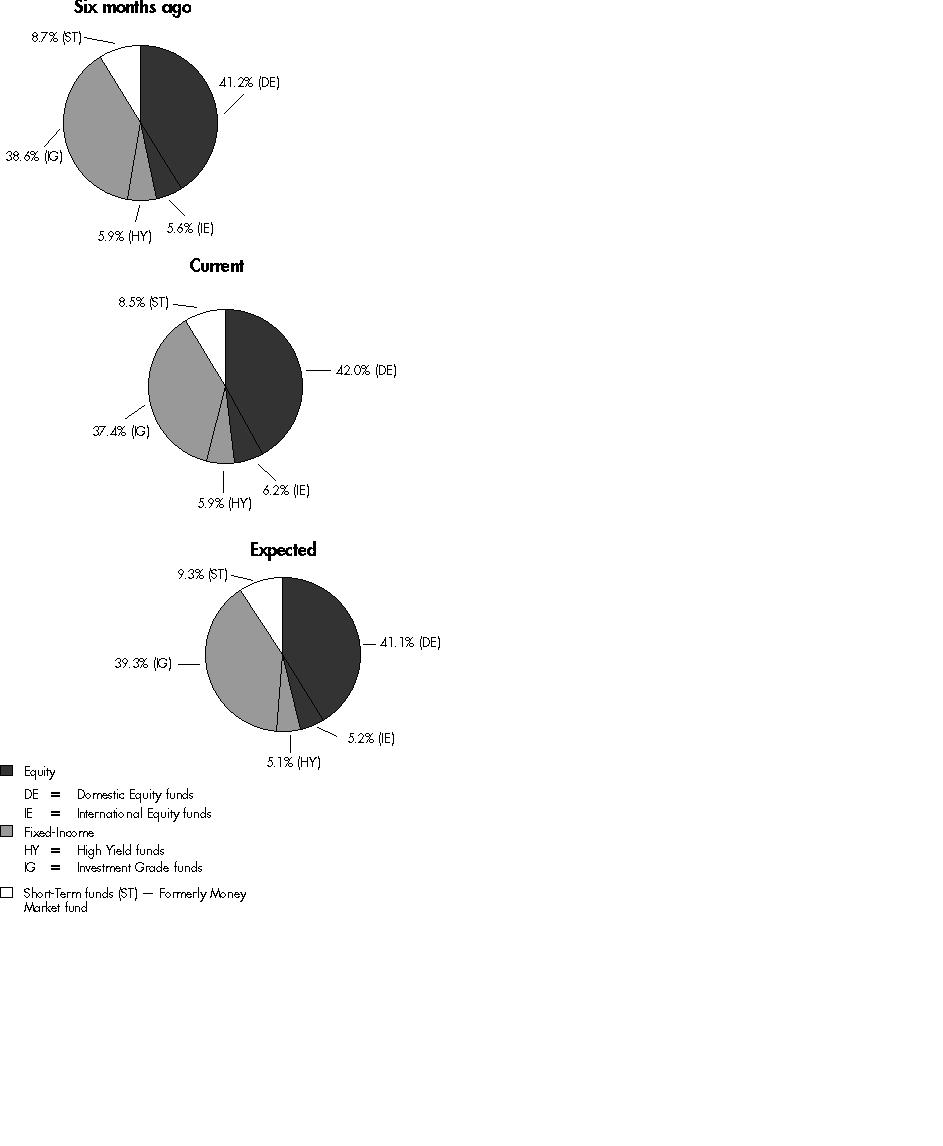
The fund invests according to an asset allocation strategy that becomes increasingly conservative over time. The six months ago allocation is based on the fund's holdings as of September 30, 2004. The current allocation is based on the fund's holdings as of March 31, 2005. The expected allocation represents the fund's anticipated target asset allocation at September 30, 2005.
Annual Report
Fidelity Freedom 2010 Fund
Investments March 31, 2005
Showing Percentage of Total Value of Investment in Securities
Equity Funds - 48.2% |
| Shares | | Value (Note 1) |
Domestic Equity Funds - 42.0% |
Fidelity Blue Chip Growth Fund | 12,912,002 | | $ 517,125,669 |
Fidelity Disciplined Equity Fund | 22,893,730 | | 581,500,753 |
Fidelity Equity-Income Fund | 11,365,579 | | 582,599,570 |
Fidelity Fund | 18,110,969 | | 532,824,721 |
Fidelity Growth & Income Portfolio | 14,663,540 | | 546,510,151 |
Fidelity Growth Company Fund | 6,078,511 | | 321,431,666 |
Fidelity Mid-Cap Stock Fund | 14,308,407 | | 323,513,072 |
Fidelity OTC Portfolio | 7,526,819 | | 244,997,969 |
TOTAL DOMESTIC EQUITY FUNDS | | 3,650,503,571 |
International Equity Funds - 6.2% |
Fidelity Diversified International Fund | 4,730,617 | | 135,674,093 |
Fidelity Europe Fund | 5,910,003 | | 205,904,514 |
Fidelity Japan Fund | 3,623,232 | | 45,797,652 |
Fidelity Overseas Fund | 3,545,535 | | 123,526,437 |
Fidelity Southeast Asia Fund | 1,605,386 | | 27,323,677 |
TOTAL INTERNATIONAL EQUITY FUNDS | | 538,226,373 |
TOTAL EQUITY FUNDS (Cost $3,952,117,547) | 4,188,729,944 |
Fixed-Income Funds - 43.3% |
| | | |
High Yield Fixed-Income Funds - 5.9% |
Fidelity Capital & Income Fund | 38,918,725 | | 322,636,233 |
Fidelity High Income Fund | 21,571,883 | | 189,616,850 |
TOTAL HIGH YIELD FIXED-INCOME FUNDS | | 512,253,083 |
Investment Grade Fixed-Income Funds - 37.4% |
Fidelity Government Income Fund | 120,411,762 | | 1,219,771,153 |
Fidelity Intermediate Bond Fund | 76,693,770 | | 793,780,520 |
Fidelity Investment Grade Bond Fund | 166,015,461 | | 1,235,155,026 |
TOTAL INVESTMENT GRADE FIXED-INCOME FUNDS | | 3,248,706,699 |
TOTAL FIXED-INCOME FUNDS (Cost $3,723,492,982) | 3,760,959,782 |
Short-Term Funds - 8.5% |
| | | |
Fidelity Retirement Money Market Portfolio (Cost $743,713,977) | 743,713,977 | | 743,713,977 |
TOTAL INVESTMENT IN SECURITIES - 100% (Cost $8,419,324,506) | $ 8,693,403,703 |
See accompanying notes which are an integral part of the financial statements.
Annual Report
Fidelity Freedom 2010 Fund
Financial Statements
Statement of Assets and Liabilities
| March 31, 2005 |
| | |
Assets | | |
Investment in securities, at value (cost $8,419,324,506) - See accompanying schedule | | $ 8,693,403,703 |
Cash | | 4 |
Receivable for investments sold | | 973,475 |
Receivable for fund shares sold | | 14,383,629 |
Receivable from investment adviser for expense reductions | | 142,065 |
Total assets | | 8,708,902,876 |
| | |
Liabilities | | |
Payable for investments purchased | $ 6,536,195 | |
Payable for fund shares redeemed | 8,128,951 | |
Accrued management fee | 726,137 | |
Total liabilities | | 15,391,283 |
| | |
Net Assets | | $ 8,693,511,593 |
Net Assets consist of: | | |
Paid in capital | | $ 8,411,315,750 |
Undistributed net investment income | | 38,369,709 |
Accumulated undistributed net realized gain (loss) on investments | | (30,253,063) |
Net unrealized appreciation (depreciation) on investments | | 274,079,197 |
Net Assets, for 646,551,747 shares outstanding | | $ 8,693,511,593 |
Net Asset Value, offering price and redemption price per share ($8,693,511,593 ÷ 646,551,747 shares) | | $ 13.45 |
Statement of Operations
| Year ended March 31, 2005 |
| | |
Investment Income | | |
Income distributions from underlying funds | | $ 172,672,713 |
Interest | | 263 |
Total income | | 172,672,976 |
| | |
Expenses | | |
Management fee | $ 7,852,505 | |
Independent trustees' compensation | 41,499 | |
Total expenses before reductions | 7,894,004 | |
Expense reductions | (1,584,021) | 6,309,983 |
Net investment income (loss) | | 166,362,993 |
Realized and Unrealized Gain (Loss) Realized gain (loss) on sale of underlying fund shares | (622,982) | |
Capital gain distributions from underlying funds | 49,416,819 | 48,793,837 |
Change in net unrealized appreciation (depreciation) on underlying funds | | 67,477,735 |
Net gain (loss) | | 116,271,572 |
Net increase (decrease) in net assets resulting from operations | | $ 282,634,565 |
See accompanying notes which are an integral part of the financial statements.
Annual Report
Statement of Changes in Net Assets
| Year ended
March 31,
2005 | Year ended
March 31,
2004 |
Increase (Decrease) in Net Assets | | |
Operations | | |
Net investment income (loss) | $ 166,362,993 | $ 127,090,420 |
Net realized gain (loss) | 48,793,837 | 103,254,352 |
Change in net unrealized appreciation (depreciation) | 67,477,735 | 830,502,101 |
Net increase (decrease) in net assets resulting from operations | 282,634,565 | 1,060,846,873 |
Distributions to shareholders from net investment income | (173,342,801) | (137,172,581) |
Distributions to shareholders from net realized gain | (26,257,845) | (45,734,256) |
Total distributions | (199,600,646) | (182,906,837) |
Share transactions
Proceeds from sales of shares | 2,597,566,024 | 2,848,469,702 |
Reinvestment of distributions | 198,984,818 | 182,406,439 |
Cost of shares redeemed | (1,573,936,218) | (1,203,465,830) |
Net increase (decrease) in net assets resulting from share transactions | 1,222,614,624 | 1,827,410,311 |
Total increase (decrease) in net assets | 1,305,648,543 | 2,705,350,347 |
| | |
Net Assets | | |
Beginning of period | 7,387,863,050 | 4,682,512,703 |
End of period (including undistributed net investment income of $38,369,709 and undistributed net investment income of $39,579,230, respectively) | $ 8,693,511,593 | $ 7,387,863,050 |
Other Information Shares | | |
Sold | 195,180,090 | 224,495,492 |
Issued in reinvestment of distributions | 14,843,268 | 14,269,108 |
Redeemed | (118,610,316) | (94,459,409) |
Net increase (decrease) | 91,413,042 | 144,305,191 |
Financial Highlights
Years ended March 31, | 2005 | 2004 | 2003 | 2002 | 2001 |
Selected Per-Share Data | | | | | |
Net asset value, beginning of period | $ 13.31 | $ 11.40 | $ 12.61 | $ 12.94 | $ 15.55 |
Income from Investment Operations | | | | | |
Net investment income (loss) B | .28 | .26 | .28 | .36 | .49 |
Net realized and unrealized gain (loss) | .20 | 2.02 | (1.18) | (.05) | (1.97) |
Total from investment operations | .48 | 2.28 | (.90) | .31 | (1.48) |
Distributions from net investment income | (.29) | (.28) | (.31) | (.37) | (.46) |
Distributions from net realized gain | (.05) | (.09) | - | (.27) | (.67) |
Total distributions | (.34) | (.37) | (.31) | (.64) | (1.13) |
Net asset value, end of period | $ 13.45 | $ 13.31 | $ 11.40 | $ 12.61 | $ 12.94 |
Total Return A | 3.59% | 20.15% | (7.17)% | 2.31% | (10.00)% |
Ratios to Average Net Assets C, D | | | | | |
Expenses before expense reductions | .10% | .10% | .10% | .10% | .10% |
Expenses net of voluntary waivers, if any | .08% | .08% | .08% | .08% | .08% |
Expenses net of all reductions | .08% | .08% | .08% | .07% | .06% |
Net investment income (loss) | 2.11% | 2.07% | 2.44% | 2.84% | 3.43% |
Supplemental Data | | | | | |
Net assets, end of period (000 omitted) | $ 8,693,512 | $ 7,387,863 | $ 4,682,513 | $ 4,063,699 | $ 2,813,123 |
Portfolio turnover rate | 1% | 4% | 8% | 10% | 42% |
A Total returns would have been lower had certain expenses not been reduced during the periods shown.
B Calculated based on average shares outstanding during the period.
C Amounts do not include the activity of the underlying funds.
D Expense ratios reflect operating expenses of the fund. Expenses before reductions do not reflect amounts reimbursed by the investment adviser or reductions from brokerage service arrangements or other expense offset arrangements and do not represent the amount paid by the fund during periods when reimbursements or reductions occur. Expenses net of any voluntary waivers reflect expenses after reimbursement by the investment adviser but prior to reductions from brokerage service arrangements or other expense offset arrangements. Expenses net of all reductions represent the net expenses paid by the fund.
See accompanying notes which are an integral part of the financial statements.
Annual Report
Fidelity Freedom 2015 Fund
Investment Changes
Fund Holdings as of March 31, 2005 |
| % of fund's investments | % of fund's investments 6 months ago |
Domestic Equity Funds | | |
Fidelity Blue Chip Growth Fund | 7.5 | 7.7 |
Fidelity Disciplined Equity Fund | 8.0 | 7.9 |
Fidelity Equity-Income Fund | 7.8 | 7.9 |
Fidelity Fund | 6.5 | 7.8 |
Fidelity Growth & Income Portfolio | 7.7 | 7.9 |
Fidelity Growth Company Fund | 4.6 | 4.6 |
Fidelity Mid-Cap Stock Fund | 4.6 | 4.6 |
Fidelity OTC Portfolio | 3.5 | 3.5 |
| 50.2 | 51.9 |
International Equity Funds | | |
Fidelity Diversified International Fund | 2.0 | 2.1 |
Fidelity Europe Fund | 2.9 | 3.0 |
Fidelity Japan Fund | 0.8 | 0.8 |
Fidelity Overseas Fund | 1.9 | 2.1 |
Fidelity Southeast Asia Fund | 0.4 | 0.4 |
| 8.0 | 8.4 |
High Yield Fixed-Income Funds | | |
Fidelity Capital & Income Fund | 3.2 | 3.4 |
Fidelity High Income Fund | 3.1 | 3.3 |
| 6.3 | 6.7 |
Investment Grade Fixed-Income Funds | | |
Fidelity Government Income Fund | 11.5 | 11.0 |
Fidelity Intermediate Bond Fund | 7.5 | 7.2 |
Fidelity Investment Grade Bond Fund | 11.6 | 11.1 |
| 30.6 | 29.3 |
Short-Term Funds | | |
Fidelity Retirement Money Market Portfolio | 4.9 | 3.7 |
| 100.0 | 100.0 |
Asset Allocation (% of fund's investments) |

The fund invests according to an asset allocation strategy that becomes increasingly conservative over time. The six months ago allocation is based on the fund's holdings as of September 30, 2004. The current allocation is based on the fund's holdings as of March 31, 2005. The expected allocation represents the fund's anticipated target asset allocation at September 30, 2005.
Annual Report
Fidelity Freedom 2015 Fund
Investments March 31, 2005
Showing Percentage of Total Value of Investment in Securities
Equity Funds - 58.2% |
| Shares | | Value (Note 1) |
Domestic Equity Funds - 50.2% |
Fidelity Blue Chip Growth Fund | 1,715,627 | | $ 68,710,876 |
Fidelity Disciplined Equity Fund | 2,864,001 | | 72,745,621 |
Fidelity Equity-Income Fund | 1,386,104 | | 71,051,690 |
Fidelity Fund | 2,006,799 | | 59,040,020 |
Fidelity Growth & Income Portfolio | 1,883,912 | | 70,213,412 |
Fidelity Growth Company Fund | 790,770 | | 41,815,896 |
Fidelity Mid-Cap Stock Fund | 1,867,044 | | 42,213,864 |
Fidelity OTC Portfolio | 989,256 | | 32,200,272 |
TOTAL DOMESTIC EQUITY FUNDS | | 457,991,651 |
International Equity Funds - 8.0% |
Fidelity Diversified International Fund | 635,607 | | 18,229,195 |
Fidelity Europe Fund | 771,291 | | 26,871,765 |
Fidelity Japan Fund | 550,963 | | 6,964,175 |
Fidelity Overseas Fund | 509,460 | | 17,749,572 |
Fidelity Southeast Asia Fund | 216,777 | | 3,689,541 |
TOTAL INTERNATIONAL EQUITY FUNDS | | 73,504,248 |
TOTAL EQUITY FUNDS (Cost $517,260,334) | 531,495,899 |
Fixed-Income Funds - 36.9% |
| | | |
High Yield Fixed-Income Funds - 6.3% |
Fidelity Capital & Income Fund | 3,502,098 | | 29,032,395 |
Fidelity High Income Fund | 3,228,294 | | 28,376,705 |
TOTAL HIGH YIELD FIXED-INCOME FUNDS | | 57,409,100 |
Investment Grade Fixed-Income Funds - 30.6% |
Fidelity Government Income Fund | 10,386,931 | | 105,219,607 |
Fidelity Intermediate Bond Fund | 6,614,382 | | 68,458,851 |
Fidelity Investment Grade Bond Fund | 14,166,434 | | 105,398,271 |
TOTAL INVESTMENT GRADE FIXED-INCOME FUNDS | | 279,076,729 |
TOTAL FIXED-INCOME FUNDS (Cost $340,406,665) | 336,485,829 |
Short-Term Funds - 4.9% |
| | | |
Fidelity Retirement Money Market Portfolio (Cost $44,501,527) | 44,501,527 | | 44,501,527 |
TOTAL INVESTMENT IN SECURITIES - 100% (Cost $902,168,526) | $ 912,483,255 |
See accompanying notes which are an integral part of the financial statements.
Annual Report
Fidelity Freedom 2015 Fund
Financial Statements
Statement of Assets and Liabilities
| March 31, 2005 |
| | |
Assets | | |
Investment in securities, at value (cost $902,168,526) - See accom-panying schedule | | $ 912,483,255 |
Receivable for investments sold | | 69,572 |
Receivable for fund shares sold | | 4,873,987 |
Receivable from investment adviser for expense reductions | | 12,948 |
Total assets | | 917,439,762 |
| | |
Liabilities | | |
Payable for investments purchased | $ 4,141,101 | |
Payable for fund shares redeemed | 732,920 | |
Accrued management fee | 72,885 | |
Total liabilities | | 4,946,906 |
| | |
Net Assets | | $ 912,492,856 |
Net Assets consist of: | | |
Paid in capital | | $ 897,613,843 |
Undistributed net investment income | | 2,927,282 |
Accumulated undistributed net realized gain (loss) on investments | | 1,637,002 |
Net unrealized appreciation (depreciation) on investments | | 10,314,729 |
Net Assets, for 83,914,488 shares outstanding | | $ 912,492,856 |
Net Asset Value, offering price and redemption price per share ($912,492,856 ÷ 83,914,488 shares) | | $ 10.87 |
Statement of Operations
| Year ended March 31, 2005 |
| | |
Investment Income | | |
Income distributions from underlying funds | | $ 8,605,952 |
Interest | | 274 |
Total income | | 8,606,226 |
| | |
Expenses | | |
Management fee | $ 412,274 | |
Independent trustees' compensation | 1,785 | |
Total expenses before reductions | 414,059 | |
Expense reductions | (85,550) | 328,509 |
Net investment income (loss) | | 8,277,717 |
Realized and Unrealized Gain (Loss) Realized gain (loss) on sale of underlying fund shares | (20,164) | |
Capital gain distributions from underlying funds | 2,824,953 | 2,804,789 |
Change in net unrealized appreciation (depreciation) on underlying funds | | 9,373,614 |
Net gain (loss) | | 12,178,403 |
Net increase (decrease) in net assets resulting from operations | | $ 20,456,120 |
See accompanying notes which are an integral part of the financial statements.
Annual Report
Statement of Changes in Net Assets
| Year ended
March 31,
2005 | For the period
November 6, 2003
(commencement
of operations) to
March 31, 2004 |
Increase (Decrease) in Net Assets | | |
Operations | | |
Net investment income (loss) | $ 8,277,717 | $ 330,000 |
Net realized gain (loss) | 2,804,789 | 82,759 |
Change in net unrealized appreciation (depreciation) | 9,373,614 | 941,115 |
Net increase (decrease) in net assets resulting from operations | 20,456,120 | 1,353,874 |
Distributions to shareholders from net investment income | (6,293,545) | (63,664) |
Distributions to shareholders from net realized gain | (573,772) | - |
Total distributions | (6,867,317) | (63,664) |
Share transactions
Proceeds from sales of shares | 877,794,443 | 119,563,790 |
Reinvestment of distributions | 6,853,844 | 63,367 |
Cost of shares redeemed | (100,078,893) | (6,582,708) |
Net increase (decrease) in net assets resulting from share transactions | 784,569,394 | 113,044,449 |
Total increase (decrease) in net assets | 798,158,197 | 114,334,659 |
| | |
Net Assets | | |
Beginning of period | 114,334,659 | - |
End of period (including undistributed net investment income of $2,927,282 and undistributed net investment income of $299,550, respectively) | $ 912,492,856 | $ 114,334,659 |
Other Information Shares | | |
Sold | 81,759,492 | 11,437,447 |
Issued in reinvestment of distributions | 623,570 | 6,188 |
Redeemed | (9,283,179) | (629,030) |
Net increase (decrease) | 73,099,883 | 10,814,605 |
Financial Highlights
Years ended March 31, | 2005 | 2004 F |
Selected Per-Share Data | | |
Net asset value, beginning of period | $ 10.57 | $ 10.00 |
Income from Investment Operations | | |
Net investment income (loss) D | .21 | .07 |
Net realized and unrealized gain (loss) | .25 | .54 |
Total from investment operations | .46 | .61 |
Distributions from net investment income | (.14) | (.04) |
Distributions from net realized gain | (.02) | - |
Total distributions | (.16) | (.04) |
Net asset value, end of period | $ 10.87 | $ 10.57 |
Total Return B, C | 4.30% | 6.11% |
Ratios to Average Net Assets E, G | | |
Expenses before expense reductions | .10% | .10% A |
Expenses net of voluntary waivers, if any | .08% | .08% A |
Expenses net of all reductions | .08% | .08% A |
Net investment income (loss) | 2.01% | 1.79% A |
Supplemental Data | | |
Net assets, end of period (000 omitted) | $ 912,493 | $ 114,335 |
Portfolio turnover rate | 0% | 2% A |
A Annualized
B Total returns for periods of less than one year are not annualized.
C Total returns would have been lower had certain expenses not been reduced during the periods shown.
D Calculated based on average shares outstanding during the period.
E Amounts do not include the activity of the underlying funds.
F For the period November 6, 2003 (commencement of operations) to March 31, 2004.
G Expense ratios reflect operating expenses of the fund. Expenses before reductions do not reflect amounts reimbursed by the investment adviser or reductions from brokerage service arrangements or other expense offset arrangements and do not represent the amount paid by the fund during periods when reimbursements or reductions occur. Expenses net of any voluntary waivers reflect expenses after reimbursement by the investment adviser but prior to reductions from brokerage service arrangements or other expense offset arrangements. Expenses net of all reductions represent the net expenses paid by the fund.
See accompanying notes which are an integral part of the financial statements.
Annual Report
Fidelity Freedom 2020 Fund
Investment Changes
Fund Holdings as of March 31, 2005 |
| % of fund's investments | % of fund's investments 6 months ago |
Domestic Equity Funds | | |
Fidelity Blue Chip Growth Fund | 8.6 | 8.6 |
Fidelity Disciplined Equity Fund | 9.5 | 9.1 |
Fidelity Equity-Income Fund | 9.5 | 9.5 |
Fidelity Fund | 8.7 | 9.1 |
Fidelity Growth & Income Portfolio | 9.0 | 9.0 |
Fidelity Growth Company Fund | 5.3 | 5.2 |
Fidelity Mid-Cap Stock Fund | 5.3 | 5.3 |
Fidelity OTC Portfolio | 4.0 | 3.9 |
| 59.9 | 59.7 |
International Equity Funds | | |
Fidelity Diversified International Fund | 2.9 | 2.7 |
Fidelity Europe Fund | 4.4 | 3.9 |
Fidelity Japan Fund | 1.0 | 1.0 |
Fidelity Overseas Fund | 2.6 | 2.5 |
Fidelity Southeast Asia Fund | 0.6 | 0.6 |
| 11.5 | 10.7 |
High Yield Fixed-Income Funds | | |
Fidelity Capital & Income Fund | 4.4 | 4.5 |
Fidelity High Income Fund | 3.7 | 3.8 |
| 8.1 | 8.3 |
Investment Grade Fixed-Income Funds | | |
Fidelity Government Income Fund | 7.7 | 8.0 |
Fidelity Intermediate Bond Fund | 5.0 | 5.2 |
Fidelity Investment Grade Bond Fund | 7.8 | 8.1 |
| 20.5 | 21.3 |
Short-Term Funds | | |
Fidelity Retirement Money Market Portfolio | 0.0 | 0.0 |
| 100.0 | 100.0 |
Asset Allocation (% of fund's investments) |
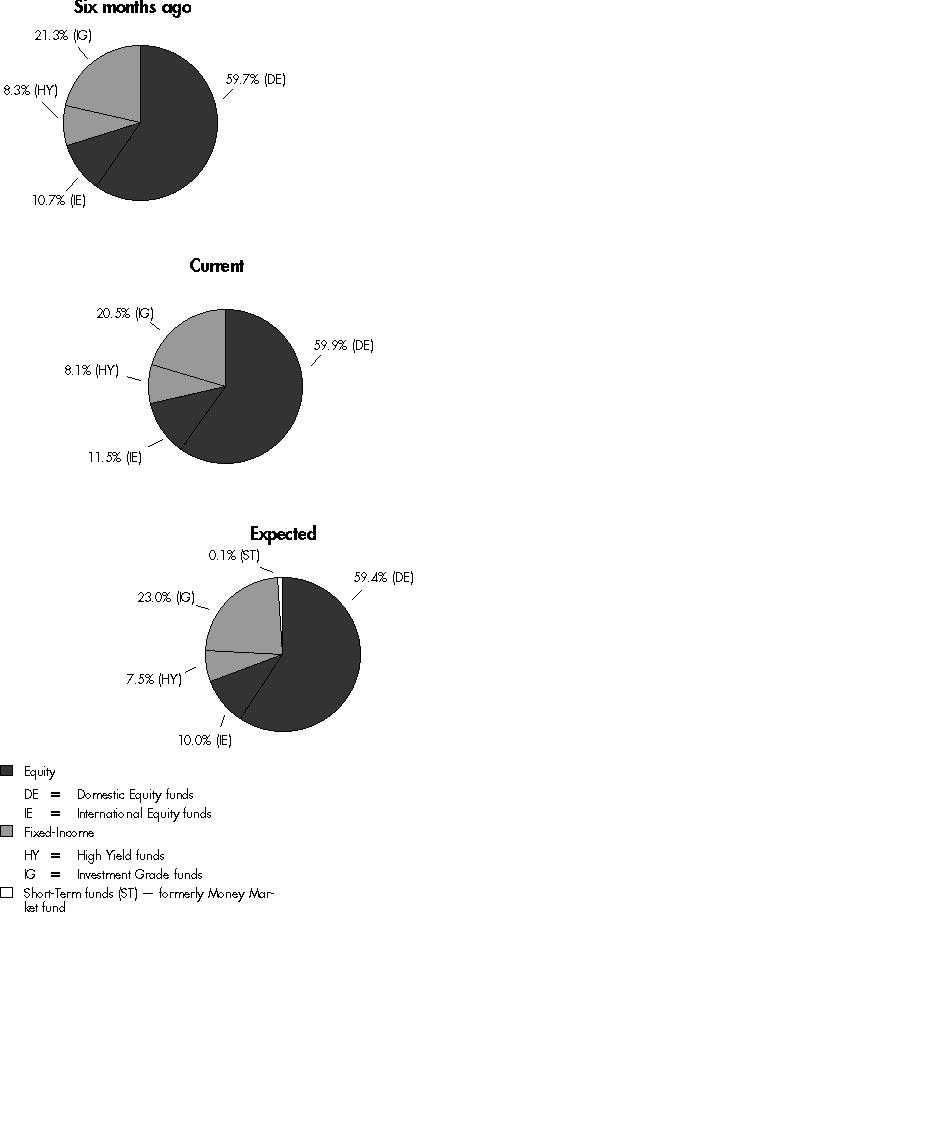
The fund invests according to an asset allocation strategy that becomes increasingly conservative over time. The six months ago allocation is based on the fund's holdings as of September 30, 2004. The current allocation is based on the fund's holdings as of March 31, 2005. The expected allocation represents the fund's anticipated target asset allocation at September 30, 2005.
Annual Report
Fidelity Freedom 2020 Fund
Investments March 31, 2005
Showing Percentage of Total Value of Investment in Securities
Equity Funds - 71.4% |
| Shares | | Value (Note 1) |
Domestic Equity Funds - 59.9% |
Fidelity Blue Chip Growth Fund | 21,178,300 | | $ 848,190,914 |
Fidelity Disciplined Equity Fund | 37,189,157 | | 944,604,587 |
Fidelity Equity-Income Fund | 18,380,965 | | 942,208,280 |
Fidelity Fund | 29,294,683 | | 861,849,576 |
Fidelity Growth & Income Portfolio | 23,910,443 | | 891,142,205 |
Fidelity Growth Company Fund | 9,942,560 | | 525,762,550 |
Fidelity Mid-Cap Stock Fund | 23,407,660 | | 529,247,199 |
Fidelity OTC Portfolio | 12,276,174 | | 399,589,470 |
TOTAL DOMESTIC EQUITY FUNDS | | 5,942,594,781 |
International Equity Funds - 11.5% |
Fidelity Diversified International Fund | 9,952,530 | | 285,438,574 |
Fidelity Europe Fund | 12,450,899 | | 433,789,310 |
Fidelity Japan Fund | 7,789,524 | | 98,459,589 |
Fidelity Overseas Fund | 7,549,070 | | 263,009,616 |
Fidelity Southeast Asia Fund | 3,372,281 | | 57,396,226 |
TOTAL INTERNATIONAL EQUITY FUNDS | | 1,138,093,315 |
TOTAL EQUITY FUNDS (Cost $6,548,091,600) | 7,080,688,096 |
Fixed-Income Funds - 28.6% |
| | | |
High Yield Fixed-Income Funds - 8.1% |
Fidelity Capital & Income Fund | 52,179,085 | | 432,564,618 |
Fidelity High Income Fund | 41,949,279 | | 368,734,164 |
TOTAL HIGH YIELD FIXED-INCOME FUNDS | | 801,298,782 |
Investment Grade Fixed-Income Funds - 20.5% |
Fidelity Government Income Fund | 75,256,822 | | 762,351,611 |
Fidelity Intermediate Bond Fund | 47,932,907 | | 496,105,590 |
Fidelity Investment Grade Bond Fund | 103,604,778 | | 770,819,549 |
TOTAL INVESTMENT GRADE FIXED-INCOME FUNDS | | 2,029,276,750 |
TOTAL FIXED-INCOME FUNDS (Cost $2,797,921,039) | 2,830,575,532 |
Short-Term Funds - 0.0% |
| | | |
Fidelity Retirement Money Market Portfolio (Cost $4,435,873) | 4,435,873 | | 4,435,873 |
TOTAL INVESTMENT IN SECURITIES - 100% (Cost $9,350,448,512) | $ 9,915,699,501 |
See accompanying notes which are an integral part of the financial statements.
Annual Report
Fidelity Freedom 2020 Fund
Financial Statements
Statement of Assets and Liabilities
| March 31, 2005 |
| | |
Assets | | |
Investment in securities, at value (cost $9,350,448,512) - See accompanying schedule | | $ 9,915,699,501 |
Cash | | 18 |
Receivable for investments sold | | 834,370 |
Receivable for fund shares sold | | 20,670,675 |
Receivable from investment adviser for expense reductions | | 159,884 |
Total assets | | 9,937,364,448 |
| | |
Liabilities | | |
Payable for investments purchased | $ 11,841,318 | |
Payable for fund shares redeemed | 8,876,444 | |
Accrued management fee | 825,901 | |
Total liabilities | | 21,543,663 |
| | |
Net Assets | | $ 9,915,820,785 |
Net Assets consist of: | | |
Paid in capital | | $ 9,327,183,766 |
Undistributed net investment income | | 22,498,986 |
Accumulated undistributed net realized gain (loss) on investments | | 887,044 |
Net unrealized appreciation (depreciation) on investments | | 565,250,989 |
Net Assets, for 723,080,159 shares outstanding | | $ 9,915,820,785 |
Net Asset Value, offering price and redemption price per share ($9,915,820,785 ÷ 723,080,159 shares) | | $ 13.71 |
Statement of Operations
| Year ended March 31, 2005 |
| | |
Investment Income | | |
Income distributions from underlying funds | | $ 158,922,244 |
Interest | | 1,119 |
Total income | | 158,923,363 |
| | |
Expenses | | |
Management fee | $ 8,437,733 | |
Independent trustees' compensation | 44,049 | |
Total expenses before reductions | 8,481,782 | |
Expense reductions | (1,705,122) | 6,776,660 |
Net investment income (loss) | | 152,146,703 |
Realized and Unrealized Gain (Loss) Realized gain (loss) on sale of underlying fund shares | (234,075) | |
Capital gain distributions from underlying funds | 52,517,876 | 52,283,801 |
Change in net unrealized appreciation (depreciation) on underlying funds | | 227,628,964 |
Net gain (loss) | | 279,912,765 |
Net increase (decrease) in net assets resulting from operations | | $ 432,059,468 |
See accompanying notes which are an integral part of the financial statements.
Annual Report
Statement of Changes in Net Assets
| Year ended
March 31,
2005 | Year ended
March 31,
2004 |
Increase (Decrease) in Net Assets | | |
Operations | | |
Net investment income (loss) | $ 152,146,703 | $ 108,418,490 |
Net realized gain (loss) | 52,283,801 | 73,984,180 |
Change in net unrealized appreciation (depreciation) | 227,628,964 | 1,210,523,965 |
Net increase (decrease) in net assets resulting from operations | 432,059,468 | 1,392,926,635 |
Distributions to shareholders from net investment income | (167,221,106) | (107,292,278) |
Distributions to shareholders from net realized gain | (21,140,380) | (20,270,970) |
Total distributions | (188,361,486) | (127,563,248) |
Share transactions
Proceeds from sales of shares | 3,407,977,638 | 3,024,604,608 |
Reinvestment of distributions | 187,972,530 | 127,344,836 |
Cost of shares redeemed | (1,465,258,981) | (963,483,193) |
Net increase (decrease) in net assets resulting from share transactions | 2,130,691,187 | 2,188,466,251 |
Total increase (decrease) in net assets | 2,374,389,169 | 3,453,829,638 |
| | |
Net Assets | | |
Beginning of period | 7,541,431,616 | 4,087,601,978 |
End of period (including undistributed net investment income of $22,498,986 and undistributed net investment income of $31,958,994, respectively) | $ 9,915,820,785 | $ 7,541,431,616 |
Other Information Shares | | |
Sold | 253,234,444 | 243,258,376 |
Issued in reinvestment of distributions | 13,779,674 | 10,065,943 |
Redeemed | (109,285,908) | (77,230,607) |
Net increase (decrease) | 157,728,210 | 176,093,712 |
Financial Highlights
Years ended March 31, | 2005 | 2004 | 2003 | 2002 | 2001 |
Selected Per-Share Data | | | | | |
Net asset value, beginning of period | $ 13.34 | $ 10.50 | $ 12.60 | $ 13.11 | $ 17.28 |
Income from Investment Operations | | | | | |
Net investment income (loss) B | .24 | .23 | .21 | .26 | .35 |
Net realized and unrealized gain (loss) | .43 | 2.87 | (2.09) | (.08) | (3.17) |
Total from investment operations | .67 | 3.10 | (1.88) | .18 | (2.82) |
Distributions from net investment income | (.26) | (.22) | (.22) | (.26) | (.39) |
Distributions from net realized gain | (.04) | (.04) | - | (.43) | (.96) |
Total distributions | (.30) | (.26) | (.22) | (.69) | (1.35) |
Net asset value, end of period | $ 13.71 | $ 13.34 | $ 10.50 | $ 12.60 | $ 13.11 |
Total Return A | 5.01% | 29.68% | (14.96)% | 1.12% | (17.23)% |
Ratios to Average Net Assets C, D | | | | | |
Expenses before expense reductions | .10% | .10% | .10% | .10% | .10% |
Expenses net of voluntary waivers, if any | .08% | .08% | .08% | .08% | .08% |
Expenses net of all reductions | .08% | .08% | .08% | .07% | .06% |
Net investment income (loss) | 1.79% | 1.85% | 1.96% | 2.03% | 2.29% |
Supplemental Data | | | | | |
Net assets, end of period (000 omitted) | $ 9,915,821 | $ 7,541,432 | $ 4,087,602 | $ 3,285,294 | $ 2,189,361 |
Portfolio turnover rate | 0% | 3% | 6% | 10% | 50% |
A Total returns would have been lower had certain expenses not been reduced during the periods shown.
B Calculated based on average shares outstanding during the period.
C Amounts do not include the activity of the underlying funds.
D Expense ratios reflect operating expenses of the fund. Expenses before reductions do not reflect amounts reimbursed by the investment adviser or reductions from brokerage service arrangements or other expense offset arrangements and do not represent the amount paid by the fund during periods when reimbursements or reductions occur. Expenses net of any voluntary waivers reflect expenses after reimbursement by the investment adviser but prior to reductions from brokerage service arrangements or other expense offset arrangements. Expenses net of all reductions represent the net expenses paid by the fund.
See accompanying notes which are an integral part of the financial statements.
Annual Report
Fidelity Freedom 2025 Fund
Investment Changes
Fund Holdings as of March 31, 2005 |
| % of fund's investments | % of fund's investments 6 months ago |
Domestic Equity Funds | | |
Fidelity Blue Chip Growth Fund | 9.7 | 9.7 |
Fidelity Disciplined Equity Fund | 10.2 | 9.9 |
Fidelity Equity-Income Fund | 10.0 | 10.0 |
Fidelity Fund | 8.1 | 9.9 |
Fidelity Growth & Income Portfolio | 9.9 | 10.0 |
Fidelity Growth Company Fund | 5.9 | 5.8 |
Fidelity Mid-Cap Stock Fund | 6.0 | 5.9 |
Fidelity OTC Portfolio | 4.5 | 4.4 |
| 64.3 | 65.6 |
International Equity Funds | | |
Fidelity Diversified International Fund | 2.9 | 2.9 |
Fidelity Europe Fund | 4.3 | 4.3 |
Fidelity Japan Fund | 1.1 | 1.1 |
Fidelity Overseas Fund | 2.9 | 2.9 |
Fidelity Southeast Asia Fund | 0.6 | 0.6 |
| 11.8 | 11.8 |
High Yield Fixed-Income Funds | | |
Fidelity Capital & Income Fund | 3.8 | 3.9 |
Fidelity High Income Fund | 3.7 | 3.8 |
| 7.5 | 7.7 |
Investment Grade Fixed-Income Funds | | |
Fidelity Government Income Fund | 6.2 | 5.6 |
Fidelity Intermediate Bond Fund | 4.0 | 3.7 |
Fidelity Investment Grade Bond Fund | 6.2 | 5.6 |
| 16.4 | 14.9 |
| 100.0 | 100.0 |
Asset Allocation (% of fund's investments) |
The fund invests according to an asset allocation strategy that becomes increasingly conservative over time. The six months ago allocation is based on the fund's holdings as of September 30, 2004. The current allocation is based on the fund's holdings as of March 31, 2005. The expected allocation represents the fund's anticipated target asset allocation at September 30, 2005.
Annual Report
Fidelity Freedom 2025 Fund
Investments March 31, 2005
Showing Percentage of Total Value of Investment in Securities
Equity Funds - 76.1% |
| Shares | | Value (Note 1) |
Domestic Equity Funds - 64.3% |
Fidelity Blue Chip Growth Fund | 1,657,205 | | $ 66,371,061 |
Fidelity Disciplined Equity Fund | 2,752,925 | | 69,924,305 |
Fidelity Equity-Income Fund | 1,334,397 | | 68,401,192 |
Fidelity Fund | 1,872,845 | | 55,099,085 |
Fidelity Growth & Income Portfolio | 1,815,458 | | 67,662,103 |
Fidelity Growth Company Fund | 758,000 | | 40,083,027 |
Fidelity Mid-Cap Stock Fund | 1,798,879 | | 40,672,654 |
Fidelity OTC Portfolio | 953,636 | | 31,040,858 |
TOTAL DOMESTIC EQUITY FUNDS | | 439,254,285 |
International Equity Funds - 11.8% |
Fidelity Diversified International Fund | 695,349 | | 19,942,606 |
Fidelity Europe Fund | 835,751 | | 29,117,560 |
Fidelity Japan Fund | 604,373 | | 7,639,279 |
Fidelity Overseas Fund | 559,622 | | 19,497,218 |
Fidelity Southeast Asia Fund | 239,456 | | 4,075,543 |
TOTAL INTERNATIONAL EQUITY FUNDS | | 80,272,206 |
TOTAL EQUITY FUNDS (Cost $507,653,717) | 519,526,491 |
Fixed-Income Funds - 23.9% |
| | | |
High Yield Fixed-Income Funds - 7.5% |
Fidelity Capital & Income Fund | 3,109,629 | | 25,778,827 |
Fidelity High Income Fund | 2,873,854 | | 25,261,180 |
TOTAL HIGH YIELD FIXED-INCOME FUNDS | | 51,040,007 |
Investment Grade Fixed-Income Funds - 16.4% |
Fidelity Government Income Fund | 4,167,334 | | 42,215,094 |
Fidelity Intermediate Bond Fund | 2,652,642 | | 27,454,849 |
Fidelity Investment Grade Bond Fund | 5,679,444 | | 42,255,061 |
TOTAL INVESTMENT GRADE FIXED-INCOME FUNDS | | 111,925,004 |
TOTAL FIXED-INCOME FUNDS (Cost $164,804,562) | 162,965,011 |
TOTAL INVESTMENT IN SECURITIES - 100% (Cost $672,458,279) | $ 682,491,502 |
See accompanying notes which are an integral part of the financial statements.
Annual Report
Fidelity Freedom 2025 Fund
Financial Statements
Statement of Assets and Liabilities
| March 31, 2005 |
| | |
Assets | | |
Investment in securities, at value (cost $672,458,279) - See accompanying schedule | | $ 682,491,502 |
Receivable for investments sold | | 51,820 |
Receivable for fund shares sold | | 4,914,504 |
Receivable from investment adviser for expense reductions | | 9,546 |
Total assets | | 687,467,372 |
| | |
Liabilities | | |
Payable for investments purchased | $ 4,293,852 | |
Payable for fund shares redeemed | 620,709 | |
Accrued management fee | 54,287 | |
Total liabilities | | 4,968,848 |
| | |
Net Assets | | $ 682,498,524 |
Net Assets consist of: | | |
Paid in capital | | $ 669,759,822 |
Undistributed net investment income | | 1,348,251 |
Accumulated undistributed net realized gain (loss) on investments | | 1,357,228 |
Net unrealized appreciation (depreciation) on investments | | 10,033,223 |
Net Assets, for 61,653,239 shares outstanding | | $ 682,498,524 |
Net Asset Value, offering price and redemption price per share ($682,498,524 ÷ 61,653,239 shares) | | $ 11.07 |
Statement of Operations
| Year ended March 31, 2005 |
| | |
Investment Income | | |
Income distributions from underlying funds | | $ 4,834,135 |
Interest | | 307 |
Total income | | 4,834,442 |
| | |
Expenses | | |
Management fee | $ 277,139 | |
Independent trustees' compensation | 1,155 | |
Total expenses before reductions | 278,294 | |
Expense reductions | (57,920) | 220,374 |
Net investment income (loss) | | 4,614,068 |
Realized and Unrealized Gain (Loss) Realized gain (loss) on sale of underlying fund shares | (2,323) | |
Capital gain distributions from underlying funds | 2,008,870 | 2,006,547 |
Change in net unrealized appreciation (depreciation) on underlying funds | | 9,283,353 |
Net gain (loss) | | 11,289,900 |
Net increase (decrease) in net assets resulting from operations | | $ 15,903,968 |
See accompanying notes which are an integral part of the financial statements.
Annual Report
Statement of Changes in Net Assets
| Year ended
March 31,
2005 | For the period
November 6, 2003
(commencement
of operations) to
March 31, 2004 |
Increase (Decrease) in Net Assets | | |
Operations | | |
Net investment income (loss) | $ 4,614,068 | $ 167,735 |
Net realized gain (loss) | 2,006,547 | 30,111 |
Change in net unrealized appreciation (depreciation) | 9,283,353 | 749,870 |
Net increase (decrease) in net assets resulting from operations | 15,903,968 | 947,716 |
Distributions to shareholders from net investment income | (3,727,700) | (51,049) |
Distributions to shareholders from net realized gain | (334,233) | - |
Total distributions | (4,061,933) | (51,049) |
Share transactions
Proceeds from sales of shares | 653,296,979 | 70,184,741 |
Reinvestment of distributions | 4,057,208 | 50,972 |
Cost of shares redeemed | (53,120,578) | (4,709,500) |
Net increase (decrease) in net assets resulting from share transactions | 604,233,609 | 65,526,213 |
Total increase (decrease) in net assets | 616,075,644 | 66,422,880 |
| | |
Net Assets | | |
Beginning of period | 66,422,880 | - |
End of period (including undistributed net investment income of $1,348,251 and undistributed net investment income of $140,453, respectively) | $ 682,498,524 | $ 66,422,880 |
Other Information Shares | | |
Sold | 59,896,551 | 6,683,071 |
Issued in reinvestment of distributions | 361,175 | 4,963 |
Redeemed | (4,846,144) | (446,377) |
Net increase (decrease) | 55,411,582 | 6,241,657 |
Financial Highlights
Years ended March 31, | 2005 | 2004F |
Selected Per-Share Data | | |
Net asset value, beginning of period | $ 10.64 | $ 10.00 |
Income from Investment Operations | | |
Net investment income (loss)D | .18 | .06 |
Net realized and unrealized gain (loss) | .39 | .63 |
Total from investment operations | .57 | .69 |
Distributions from net investment income | (.13) | (.05) |
Distributions from net realized gain | (.01) | - |
Total distributions | (.14) | (.05) |
Net asset value, end of period | $ 11.07 | $ 10.64 |
Total ReturnB,C | 5.33% | 6.92% |
Ratios to Average Net AssetsE,G | | |
Expenses before expense reductions | .10% | .10%A |
Expenses net of voluntary waivers, if any | .08% | .08%A |
Expenses net of all reductions | .08% | .08%A |
Net investment income (loss) | 1.67% | 1.53%A |
Supplemental Data | | |
Net assets, end of period (000 omitted) | $ 682,499 | $ 66,423 |
Portfolio turnover rate | 0% | 7%A |
A Annualized
B Total returns for periods of less than one year are not annualized.
C Total returns would have been lower had certain expenses not been reduced during the periods shown.
D Calculated based on average shares outstanding during the period.
E Amounts do not include the activity of the underlying funds.
F For the period November 6, 2003 (commencement of operations) to March 31, 2004.
G Expense ratios reflect operating expenses of the fund. Expenses before reductions do not reflect amounts reimbursed by the investment adviser or reductions from brokerage service arrangements or other expense offset arrangements and do not represent the amount paid by the fund during periods when reimbursements or reductions occur. Expenses net of any voluntary waivers reflect expenses after reimbursement by the investment adviser but prior to reductions from brokerage service arrangements or other expense offset arrangements. Expenses net of all reductions represent the net expenses paid by the fund.
See accompanying notes which are an integral part of the financial statements.
Annual Report
Fidelity Freedom 2030 Fund
Investment Changes
Fund Holdings as of March 31, 2005 |
| % of fund's investments | % of fund's investments 6 months ago |
Domestic Equity Funds | | |
Fidelity Blue Chip Growth Fund | 9.8 | 10.0 |
Fidelity Disciplined Equity Fund | 10.9 | 10.5 |
Fidelity Equity-Income Fund | 10.9 | 10.9 |
Fidelity Fund | 9.9 | 10.4 |
Fidelity Growth & Income Portfolio | 10.3 | 10.4 |
Fidelity Growth Company Fund | 6.1 | 6.0 |
Fidelity Mid-Cap Stock Fund | 6.2 | 6.1 |
Fidelity OTC Portfolio | 4.6 | 4.6 |
| 68.7 | 68.9 |
International Equity Funds | | |
Fidelity Diversified International Fund | 3.6 | 3.4 |
Fidelity Europe Fund | 5.4 | 4.9 |
Fidelity Japan Fund | 1.2 | 1.2 |
Fidelity Overseas Fund | 3.3 | 3.1 |
Fidelity Southeast Asia Fund | 0.7 | 0.7 |
| 14.2 | 13.3 |
High Yield Fixed-Income Funds | | |
Fidelity Capital & Income Fund | 4.4 | 4.5 |
Fidelity High Income Fund | 3.7 | 3.8 |
| 8.1 | 8.3 |
Investment Grade Fixed-Income Funds | | |
Fidelity Government Income Fund | 3.4 | 3.6 |
Fidelity Intermediate Bond Fund | 2.2 | 2.3 |
Fidelity Investment Grade Bond Fund | 3.4 | 3.6 |
| 9.0 | 9.5 |
| 100.0 | 100.0 |
Asset Allocation (% of fund's investments) |
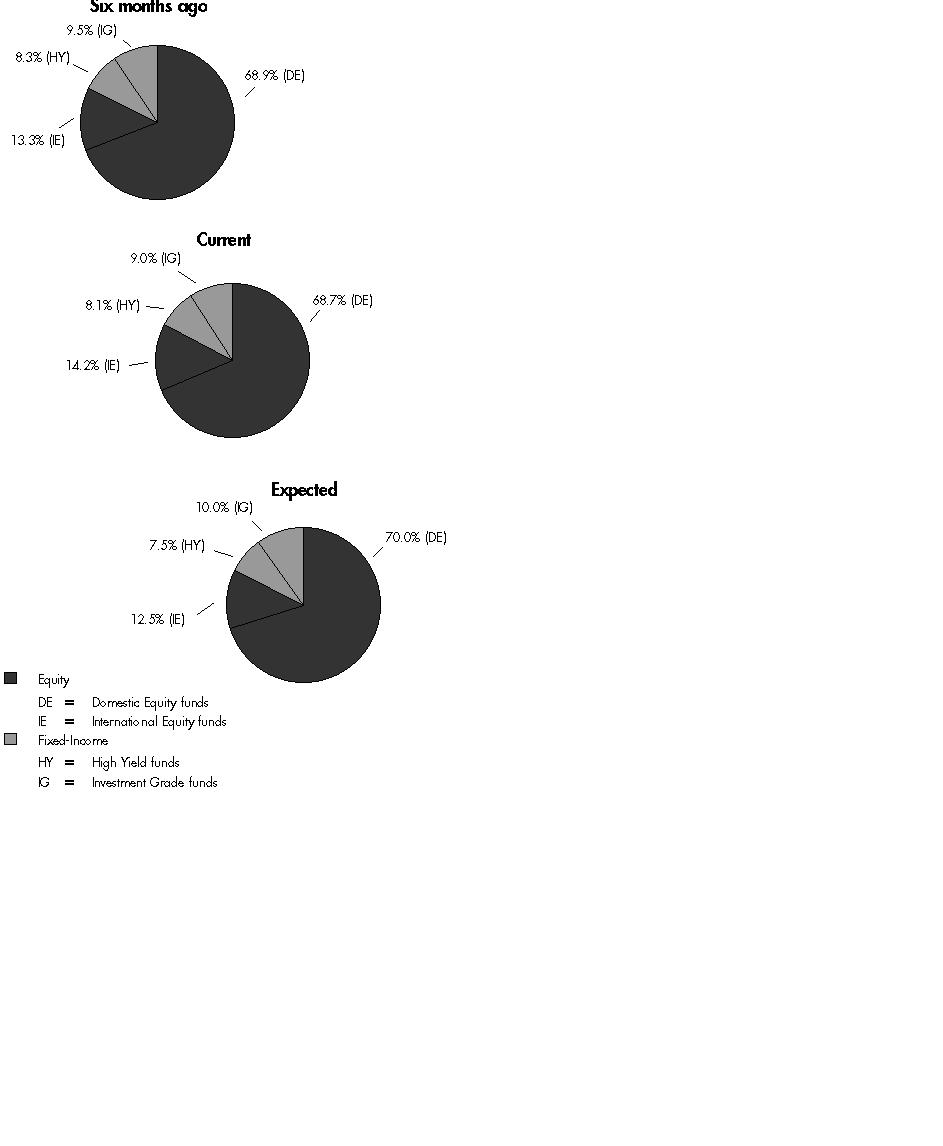
The fund invests according to an asset allocation strategy that becomes increasingly conservative over time. The six months ago allocation is based on the fund's holdings as of September 30, 2004. The current allocation is based on the fund's holdings as of March 31, 2005. The expected allocation represents the fund's anticipated target asset allocation at September 30, 2005.
Annual Report
Fidelity Freedom 2030 Fund
Investments March 31, 2005
Showing Percentage of Total Value of Investment in Securities
Equity Funds - 82.9% |
| Shares | | Value (Note 1) |
Domestic Equity Funds - 68.7% |
Fidelity Blue Chip Growth Fund | 14,367,301 | | $ 575,410,392 |
Fidelity Disciplined Equity Fund | 25,200,181 | | 640,084,598 |
Fidelity Equity-Income Fund | 12,451,142 | | 638,245,564 |
Fidelity Fund | 19,665,578 | | 578,561,319 |
Fidelity Growth & Income Portfolio | 16,210,862 | | 604,178,834 |
Fidelity Growth Company Fund | 6,745,279 | | 356,690,352 |
Fidelity Mid-Cap Stock Fund | 15,880,651 | | 359,061,519 |
Fidelity OTC Portfolio | 8,330,045 | | 271,142,960 |
TOTAL DOMESTIC EQUITY FUNDS | | 4,023,375,538 |
International Equity Funds - 14.2% |
Fidelity Diversified International Fund | 7,290,716 | | 209,097,734 |
Fidelity Europe Fund | 9,127,251 | | 317,993,421 |
Fidelity Japan Fund | 5,710,176 | | 72,176,623 |
Fidelity Overseas Fund | 5,536,777 | | 192,901,303 |
Fidelity Southeast Asia Fund | 2,467,012 | | 41,988,537 |
TOTAL INTERNATIONAL EQUITY FUNDS | | 834,157,618 |
TOTAL EQUITY FUNDS (Cost $4,573,596,391) | 4,857,533,156 |
Fixed-Income Funds - 17.1% |
| | | |
High Yield Fixed-Income Funds - 8.1% |
Fidelity Capital & Income Fund | 30,937,976 | | 256,475,820 |
Fidelity High Income Fund | 24,615,014 | | 216,365,977 |
TOTAL HIGH YIELD FIXED-INCOME FUNDS | | 472,841,797 |
Investment Grade Fixed-Income Funds - 9.0% |
Fidelity Government Income Fund | 19,516,881 | | 197,706,003 |
Fidelity Intermediate Bond Fund | 12,442,802 | | 128,783,002 |
Fidelity Investment Grade Bond Fund | 26,865,586 | | 199,879,961 |
TOTAL INVESTMENT GRADE FIXED-INCOME FUNDS | | 526,368,966 |
TOTAL FIXED-INCOME FUNDS (Cost $986,218,177) | 999,210,763 |
TOTAL INVESTMENT IN SECURITIES - 100% (Cost $5,559,814,568) | $ 5,856,743,919 |
See accompanying notes which are an integral part of the financial statements.
Annual Report
Fidelity Freedom 2030 Fund
Financial Statements
Statement of Assets and Liabilities
| March 31, 2005 |
| | |
Assets | | |
Investment in securities, at value (cost $5,559,814,568) - See accompanying schedule | | $ 5,856,743,919 |
Receivable for investments sold | | 518,812 |
Receivable for fund shares sold | | 14,110,063 |
Receivable from investment adviser for expense reductions | | 94,254 |
Total assets | | 5,871,467,048 |
| | |
Liabilities | | |
Payable to custodian bank | $ 2,978 | |
Payable for investments purchased | 8,466,601 | |
Payable for fund shares redeemed | 5,694,695 | |
Accrued management fee | 487,207 | |
Total liabilities | | 14,651,481 |
| | |
Net Assets | | $ 5,856,815,567 |
Net Assets consist of: | | |
Paid in capital | | $ 5,545,904,522 |
Undistributed net investment income | | 5,486,524 |
Accumulated undistributed net realized gain (loss) on investments | | 8,495,170 |
Net unrealized appreciation (depreciation) on investments | | 296,929,351 |
Net Assets, for 424,041,279 shares outstanding | | $ 5,856,815,567 |
Net Asset Value, offering price and redemption price per share ($5,856,815,567 ÷ 424,041,279 shares) | | $ 13.81 |
Statement of Operations
| Year ended March 31, 2005 |
| | |
Investment Income | | |
Income distributions from underlying funds | | $ 79,127,901 |
Interest | | 836 |
Total income | | 79,128,737 |
| | |
Expenses | | |
Management fee | $ 4,931,476 | |
Independent trustees' compensation | 25,692 | |
Total expenses before reductions | 4,957,168 | |
Expense reductions | (996,524) | 3,960,644 |
Net investment income (loss) | | 75,168,093 |
Realized and Unrealized Gain (Loss) Realized gain (loss) on sale of underlying fund shares | (1,221,134) | |
Capital gain distributions from underlying funds | 29,323,935 | 28,102,801 |
Change in net unrealized appreciation (depreciation) on underlying funds | | 187,294,996 |
Net gain (loss) | | 215,397,797 |
Net increase (decrease) in net assets resulting from operations | | $ 290,565,890 |
See accompanying notes which are an integral part of the financial statements.
Annual Report
Statement of Changes in Net Assets
| Year ended
March 31,
2005 | Year ended
March 31,
2004 |
Increase (Decrease) in Net Assets | | |
Operations | | |
Net investment income (loss) | $ 75,168,093 | $ 53,507,885 |
Net realized gain (loss) | 28,102,801 | 34,369,957 |
Change in net unrealized appreciation (depreciation) | 187,294,996 | 822,607,092 |
Net increase (decrease) in net assets resulting from operations | 290,565,890 | 910,484,934 |
Distributions to shareholders from net investment income | (83,244,934) | (54,155,489) |
Share transactions
Proceeds from sales of shares | 2,113,722,920 | 1,741,268,563 |
Reinvestment of distributions | 83,157,721 | 54,098,665 |
Cost of shares redeemed | (910,987,108) | (623,305,522) |
Net increase (decrease) in net assets resulting from share transactions | 1,285,893,533 | 1,172,061,706 |
Total increase (decrease) in net assets | 1,493,214,489 | 2,028,391,151 |
| | |
Net Assets | | |
Beginning of period | 4,363,601,078 | 2,335,209,927 |
End of period (including undistributed net investment income of $5,486,524 and undistributed net investment income of $13,119,744, respectively) | $ 5,856,815,567 | $ 4,363,601,078 |
Other Information Shares | | |
Sold | 157,092,508 | 142,532,558 |
Issued in reinvestment of distributions | 5,986,195 | 4,366,371 |
Redeemed | (67,870,981) | (50,732,438) |
Net increase (decrease) | 95,207,722 | 96,166,491 |
Financial Highlights
Years ended March 31, | 2005 | 2004 | 2003 | 2002 | 2001 |
Selected Per-Share Data | | | | | |
Net asset value, beginning of period | $ 13.27 | $ 10.04 | $ 12.58 | $ 13.23 | $ 17.84 |
Income from Investment Operations | | | | | |
Net investment income (loss) B | .20 | .19 | .16 | .19 | .28 |
Net realized and unrealized gain (loss) | .56 | 3.23 | (2.55) | (.11) | (3.84) |
Total from investment operations | .76 | 3.42 | (2.39) | .08 | (3.56) |
Distributions from net investment income | (.22) | (.19) | (.15) | (.20) | (.34) |
Distributions from net realized gain | - | - | - | (.53) | (.71) |
Total distributions | (.22) | (.19) | (.15) | (.73) | (1.05) |
Net asset value, end of period | $ 13.81 | $ 13.27 | $ 10.04 | $ 12.58 | $ 13.23 |
Total Return A | 5.72% | 34.22% | (19.05)% | .28% | (20.78)% |
Ratios to Average Net Assets C, D | | | | | |
Expenses before expense reductions | .10% | .10% | .10% | .10% | .10% |
Expenses net of voluntary waivers, if any | .08% | .08% | .08% | .08% | .08% |
Expenses net of all reductions | .08% | .08% | .08% | .07% | .06% |
Net investment income (loss) | 1.52% | 1.58% | 1.52% | 1.50% | 1.75% |
Supplemental Data | | | | | |
Net assets, end of period (000 omitted) | $ 5,856,816 | $ 4,363,601 | $ 2,335,210 | $ 1,995,302 | $ 1,376,774 |
Portfolio turnover rate | 0% | 2% | 4% | 5% | 37% |
A Total returns would have been lower had certain expenses not been reduced during the periods shown.
B Calculated based on average shares outstanding during the period.
C Amounts do not include the activity of the underlying funds.
D Expense ratios reflect operating expenses of the fund. Expenses before reductions do not reflect amounts reimbursed by the investment adviser or reductions from brokerage service arrangements or other expense offset arrangements and do not represent the amount paid by the fund during periods when reimbursements or reductions occur. Expenses net of any voluntary waivers reflect expenses after reimbursement by the investment adviser but prior to reductions from brokerage service arrangements or other expense offset arrangements. Expenses net of all reductions represent the net expenses paid by the fund.
See accompanying notes which are an integral part of the financial statements.
Annual Report
Fidelity Freedom 2035 Fund
Investment Changes
Fund Holdings as of March 31, 2005 |
| % of fund's investments | % of fund's investments
6 months ago |
Domestic Equity Funds | | |
Fidelity Blue Chip Growth Fund | 10.6 | 10.3 |
Fidelity Disciplined Equity Fund | 11.1 | 10.5 |
Fidelity Equity-Income Fund | 10.9 | 10.6 |
Fidelity Fund | 8.3 | 10.4 |
Fidelity Growth & Income Portfolio | 10.8 | 10.5 |
Fidelity Growth Company Fund | 6.4 | 6.2 |
Fidelity Mid-Cap Stock Fund | 6.5 | 6.2 |
Fidelity OTC Portfolio | 4.9 | 4.7 |
| 69.5 | 69.4 |
International Equity Funds | | |
Fidelity Diversified International Fund | 3.8 | 3.8 |
Fidelity Europe Fund | 5.6 | 5.5 |
Fidelity Japan Fund | 1.5 | 1.4 |
Fidelity Overseas Fund | 3.7 | 3.7 |
Fidelity Southeast Asia Fund | 0.8 | 0.8 |
| 15.4 | 15.2 |
High Yield Fixed-Income Funds | | |
Fidelity Capital & Income Fund | 4.9 | 5.2 |
Fidelity High Income Fund | 4.8 | 5.1 |
| 9.7 | 10.3 |
Investment Grade Fixed-Income Funds | | |
Fidelity Government Income Fund | 2.0 | 1.9 |
Fidelity Intermediate Bond Fund | 1.3 | 1.3 |
Fidelity Investment Grade Bond Fund | 2.1 | 1.9 |
| 5.4 | 5.1 |
| 100.0 | 100.0 |
Asset Allocation (% of fund's investments) |

The fund invests according to an asset allocation strategy that becomes increasingly conservative over time. The six months ago allocation is based on the fund's holdings as of September 30, 2004. The current allocation is based on the fund's holdings as of March 31, 2005. The expected allocation represents the fund's anticipated target asset allocation at September 30, 2005.
Annual Report
Fidelity Freedom 2035 Fund
Investments March 31, 2005
Showing Percentage of Total Value of Investment in Securities
Equity Funds - 84.9% |
| Shares | | Value (Note 1) |
Domestic Equity Funds - 69.5% |
Fidelity Blue Chip Growth Fund | 929,388 | | $ 37,221,987 |
Fidelity Disciplined Equity Fund | 1,539,341 | | 39,099,250 |
Fidelity Equity-Income Fund | 746,848 | | 38,283,411 |
Fidelity Fund | 999,105 | | 29,393,658 |
Fidelity Growth & Income Portfolio | 1,017,013 | | 37,904,072 |
Fidelity Growth Company Fund | 425,738 | | 22,513,003 |
Fidelity Mid-Cap Stock Fund | 1,008,138 | | 22,794,004 |
Fidelity OTC Portfolio | 535,107 | | 17,417,728 |
TOTAL DOMESTIC EQUITY FUNDS | | 244,627,113 |
International Equity Funds - 15.4% |
Fidelity Diversified International Fund | 470,408 | | 13,491,299 |
Fidelity Europe Fund | 564,210 | | 19,657,062 |
Fidelity Japan Fund | 410,074 | | 5,183,333 |
Fidelity Overseas Fund | 379,139 | | 13,209,192 |
Fidelity Southeast Asia Fund | 161,593 | | 2,750,317 |
TOTAL INTERNATIONAL EQUITY FUNDS | | 54,291,203 |
TOTAL EQUITY FUNDS (Cost $292,204,334) | 298,918,316 |
Fixed-Income Funds - 15.1% |
| | | |
High Yield Fixed-Income Funds - 9.7% |
Fidelity Capital & Income Fund | 2,069,854 | | 17,159,092 |
Fidelity High Income Fund | 1,913,514 | | 16,819,789 |
TOTAL HIGH YIELD FIXED-INCOME FUNDS | | 33,978,881 |
Investment Grade Fixed-Income Funds - 5.4% |
Fidelity Government Income Fund | 713,442 | | 7,227,168 |
Fidelity Intermediate Bond Fund | 457,033 | | 4,730,291 |
Fidelity Investment Grade Bond Fund | 972,193 | | 7,233,112 |
TOTAL INVESTMENT GRADE FIXED-INCOME FUNDS | | 19,190,571 |
TOTAL FIXED-INCOME FUNDS (Cost $53,706,427) | 53,169,452 |
TOTAL INVESTMENT IN SECURITIES - 100% (Cost $345,910,761) | $ 352,087,768 |
See accompanying notes which are an integral part of the financial statements.
Annual Report
Fidelity Freedom 2035 Fund
Financial Statements
Statement of Assets and Liabilities
| March 31, 2005 |
| | |
Assets | | |
Investment in securities, at value (cost $345,910,761) - See accom-panying schedule | | $ 352,087,768 |
Receivable for investments sold | | 26,541 |
Receivable for fund shares sold | | 3,435,024 |
Receivable from investment adviser for expense reductions | | 4,891 |
Total assets | | 355,554,224 |
| | |
Liabilities | | |
Payable for investments purchased | $ 2,995,764 | |
Payable for fund shares redeemed | 439,285 | |
Accrued management fee | 27,804 | |
Total liabilities | | 3,462,853 |
| | |
Net Assets | | $ 352,091,371 |
Net Assets consist of: | | |
Paid in capital | | $ 344,621,223 |
Undistributed net investment income | | 458,671 |
Accumulated undistributed net realized gain (loss) on investments | | 834,470 |
Net unrealized appreciation (depreciation) on investments | | 6,177,007 |
Net Assets, for 31,388,663 shares outstanding | | $ 352,091,371 |
Net Asset Value, offering price and redemption price per share ($352,091,371 ÷ 31,388,663 shares) | | $ 11.22 |
Statement of Operations
| Year ended March 31, 2005 |
| | |
Investment Income | | |
Income distributions from underlying funds | | $ 2,242,065 |
Interest | | 165 |
Total income | | 2,242,230 |
| | |
Expenses | | |
Management fee | $ 136,568 | |
Independent trustees' compensation | 561 | |
Total expenses before reductions | 137,129 | |
Expense reductions | (28,555) | 108,574 |
Net investment income (loss) | | 2,133,656 |
Realized and Unrealized Gain (Loss) Realized gain (loss) on sale of underlying fund shares | (1,167) | |
Capital gain distributions from underlying funds | 987,704 | 986,537 |
Change in net unrealized appreciation (depreciation) on underlying funds | | 5,834,445 |
Net gain (loss) | | 6,820,982 |
Net increase (decrease) in net assets resulting from operations | | $ 8,954,638 |
See accompanying notes which are an integral part of the financial statements.
Annual Report
Statement of Changes in Net Assets
| Year ended
March 31,
2005 | For the period
November 6, 2003
(commencement
of operations) to
March 31, 2004 |
Increase (Decrease) in Net Assets | | |
Operations | | |
Net investment income (loss) | $ 2,133,656 | $ 65,486 |
Net realized gain (loss) | 986,537 | (15,554) |
Change in net unrealized appreciation (depreciation) | 5,834,445 | 342,562 |
Net increase (decrease) in net assets resulting from operations | 8,954,638 | 392,494 |
Distributions to shareholders from net investment income | (1,855,868) | (21,115) |
Share transactions
Proceeds from sales of shares | 343,792,868 | 29,915,978 |
Reinvestment of distributions | 1,855,011 | 21,115 |
Cost of shares redeemed | (28,598,735) | (2,365,015) |
Net increase (decrease) in net assets resulting from share transactions | 317,049,144 | 27,572,078 |
Total increase (decrease) in net assets | 324,147,914 | 27,943,457 |
| | |
Net Assets | | |
Beginning of period | 27,943,457 | - |
End of period (including undistributed net investment income of $458,671 and undistributed net investment income of $54,094, respectively) | $ 352,091,371 | $ 27,943,457 |
Other Information Shares | | |
Sold | 31,199,027 | 2,836,707 |
Issued in reinvestment of distributions | 162,738 | 2,052 |
Redeemed | (2,586,363) | (225,498) |
Net increase (decrease) | 28,775,402 | 2,613,261 |
Financial Highlights
Years ended March 31, | 2005 | 2004 F |
Selected Per-Share Data | | |
Net asset value, beginning of period | $ 10.69 | $ 10.00 |
Income from Investment Operations | | |
Net investment income (loss) D | .17 | .06 |
Net realized and unrealized gain (loss) | .49 | .68 |
Total from investment operations | .66 | .74 |
Distributions from net investment income | (.13) | (.05) |
Net asset value, end of period | $ 11.22 | $ 10.69 |
Total Return B, C | 6.12% | 7.42% |
Ratios to Average Net Assets E, G | | |
Expenses before expense reductions | .10% | .10% A |
Expenses net of voluntary waivers, if any | .08% | .08% A |
Expenses net of all reductions | .08% | .08% A |
Net investment income (loss) | 1.56% | 1.49% A |
Supplemental Data | | |
Net assets, end of period (000 omitted) | $ 352,091 | $ 27,943 |
Portfolio turnover rate | 0% | 18% A |
A Annualized
B Total returns for periods of less than one year are not annualized.
C Total returns would have been lower had certain expenses not been reduced during the periods shown.
D Calculated based on average shares outstanding during the period.
E Amounts do not include the activity of the underlying funds.
F For the period November 6, 2003 (commencement of operations) to March 31, 2004.
G Expense ratios reflect operating expenses of the fund. Expenses before reductions do not reflect amounts reimbursed by the investment adviser or reductions from brokerage service arrangements or other expense offset arrangements and do not represent the amount paid by the fund during periods when reimbursements or reductions occur. Expenses net of any voluntary waivers reflect expenses after reimbursement by the investment adviser but prior to reductions from brokerage service arrangements or other expense offset arrangements. Expenses net of all reductions represent the net expenses paid by the fund.
See accompanying notes which are an integral part of the financial statements.
Annual Report
Fidelity Freedom 2040 Fund
Investment Changes
Fund Holdings as of March 31, 2005 |
| % of fund's investments | % of fund's investments 6 months ago |
Domestic Equity Funds | | |
Fidelity Blue Chip Growth Fund | 10.6 | 10.7 |
Fidelity Disciplined Equity Fund | 11.5 | 11.2 |
Fidelity Equity-Income Fund | 11.4 | 11.5 |
Fidelity Fund | 9.6 | 11.1 |
Fidelity Growth & Income Portfolio | 11.0 | 11.1 |
Fidelity Growth Company Fund | 6.6 | 6.6 |
Fidelity Mid-Cap Stock Fund | 6.6 | 6.5 |
Fidelity OTC Portfolio | 5.0 | 4.8 |
| 72.3 | 73.5 |
International Equity Funds | | |
Fidelity Diversified International Fund | 4.1 | 3.9 |
Fidelity Europe Fund | 6.2 | 5.7 |
Fidelity Japan Fund | 1.5 | 1.4 |
Fidelity Overseas Fund | 3.9 | 3.7 |
Fidelity Southeast Asia Fund | 0.8 | 0.8 |
| 16.5 | 15.5 |
High Yield Fixed-Income Funds | | |
Fidelity Capital & Income Fund | 5.1 | 5.3 |
Fidelity High Income Fund | 5.1 | 5.3 |
| 10.2 | 10.6 |
Investment Grade Fixed-Income Funds | | |
Fidelity Government Income Fund | 0.4 | 0.1 |
Fidelity Intermediate Bond Fund | 0.2 | 0.1 |
Fidelity Investment Grade Bond Fund | 0.4 | 0.2 |
| 1.0 | 0.4 |
| 100.0 | 100.0 |
Asset Allocation (% of fund's investments) |

The fund invests according to an asset allocation strategy that becomes increasingly conservative over time. The six months ago allocation is based on the fund's holdings as of September 30, 2004. The current allocation is based on the fund's holdings as of March 31, 2005. The expected allocation represents the fund's anticipated target asset allocation at September 30, 2005.
Annual Report
Fidelity Freedom 2040 Fund
Investments March 31, 2005
Showing Percentage of Total Value of Investment in Securities
Equity Funds - 88.8% |
| Shares | | Value (Note 1) |
Domestic Equity Funds - 72.3% |
Fidelity Blue Chip Growth Fund | 5,640,968 | | $ 225,920,777 |
Fidelity Disciplined Equity Fund | 9,723,309 | | 246,972,048 |
Fidelity Equity-Income Fund | 4,772,666 | | 244,646,877 |
Fidelity Fund | 6,976,881 | | 205,259,843 |
Fidelity Growth & Income Portfolio | 6,304,100 | | 234,953,819 |
Fidelity Growth Company Fund | 2,688,638 | | 142,175,154 |
Fidelity Mid-Cap Stock Fund | 6,208,255 | | 140,368,653 |
Fidelity OTC Portfolio | 3,252,444 | | 105,867,049 |
TOTAL DOMESTIC EQUITY FUNDS | | 1,546,164,220 |
International Equity Funds - 16.5% |
Fidelity Diversified International Fund | 3,051,174 | | 87,507,679 |
Fidelity Europe Fund | 3,813,187 | | 132,851,429 |
Fidelity Japan Fund | 2,486,819 | | 31,433,388 |
Fidelity Overseas Fund | 2,366,585 | | 82,451,808 |
Fidelity Southeast Asia Fund | 1,029,697 | | 17,525,440 |
TOTAL INTERNATIONAL EQUITY FUNDS | | 351,769,744 |
TOTAL EQUITY FUNDS (Cost $1,709,120,285) | 1,897,933,964 |
Fixed-Income Funds - 11.2% |
| | | |
High Yield Fixed-Income Funds - 10.2% |
Fidelity Capital & Income Fund | 13,300,006 | | 110,257,053 |
Fidelity High Income Fund | 12,370,342 | | 108,735,307 |
TOTAL HIGH YIELD FIXED-INCOME FUNDS | | 218,992,360 |
Investment Grade Fixed-Income Funds - 1.0% |
Fidelity Government Income Fund | 788,124 | | 7,983,696 |
Fidelity Intermediate Bond Fund | 500,236 | | 5,177,441 |
Fidelity Investment Grade Bond Fund | 1,073,804 | | 7,989,101 |
TOTAL INVESTMENT GRADE FIXED-INCOME FUNDS | | 21,150,238 |
TOTAL FIXED-INCOME FUNDS (Cost $230,057,117) | 240,142,598 |
TOTAL INVESTMENT IN SECURITIES - 100% (Cost $1,939,177,402) | $ 2,138,076,562 |
See accompanying notes which are an integral part of the financial statements.
Annual Report
Fidelity Freedom 2040 Fund
Financial Statements
Statement of Assets and Liabilities
| March 31, 2005 |
| | |
Assets | | |
Investment in securities, at value (cost $1,939,177,402) - See accompanying schedule | | $ 2,138,076,562 |
Cash | | 13 |
Receivable for investments sold | | 172,574 |
Receivable for fund shares sold | | 9,287,396 |
Receivable from investment adviser for expense reductions | | 33,334 |
Total assets | | 2,147,569,879 |
| | |
Liabilities | | |
Payable for investments purchased | $ 7,106,975 | |
Payable for fund shares redeemed | 2,186,451 | |
Accrued management fee | 174,640 | |
Total liabilities | | 9,468,066 |
| | |
Net Assets | | $ 2,138,101,813 |
Net Assets consist of: | | |
Paid in capital | | $ 1,932,494,798 |
Undistributed net investment income | | 1,678,127 |
Accumulated undistributed net realized gain (loss) on investments | | 5,029,728 |
Net unrealized appreciation (depreciation) on investments | | 198,899,160 |
Net Assets, for 263,977,022 shares outstanding | | $ 2,138,101,813 |
Net Asset Value, offering price and redemption price per share ($2,138,101,813 ÷ 263,977,022 shares) | | $ 8.10 |
Statement of Operations
| Year ended March 31, 2005 |
| | |
Investment Income | | |
Income distributions from underlying funds | | $ 24,779,476 |
Interest | | 424 |
Total income | | 24,779,900 |
| | |
Expenses | | |
Management fee | $ 1,611,276 | |
Independent trustees' compensation | 8,216 | |
Total expenses before reductions | 1,619,492 | |
Expense reductions | (326,400) | 1,293,092 |
Net investment income (loss) | | 23,486,808 |
Realized and Unrealized Gain (Loss) Realized gain (loss) on sale of underlying fund shares | (1,038,153) | |
Capital gain distributions from underlying funds | 9,146,893 | 8,108,740 |
Change in net unrealized appreciation (depreciation) on underlying funds | | 73,081,826 |
Net gain (loss) | | 81,190,566 |
Net increase (decrease) in net assets resulting from operations | | $ 104,677,374 |
See accompanying notes which are an integral part of the financial statements.
Annual Report
Statement of Changes in Net Assets
| Year ended
March 31,
2005 | Year ended
March 31,
2004 |
Increase (Decrease) in Net Assets | | |
Operations | | |
Net investment income (loss) | $ 23,486,808 | $ 13,125,781 |
Net realized gain (loss) | 8,108,740 | 8,802,992 |
Change in net unrealized appreciation (depreciation) | 73,081,826 | 210,847,160 |
Net increase (decrease) in net assets resulting from operations | 104,677,374 | 232,775,933 |
Distributions to shareholders from net investment income | (26,617,323) | (11,153,888) |
Distributions to shareholders from net realized gain | (2,646,056) | (4,018,883) |
Total distributions | (29,263,379) | (15,172,771) |
Share transactions
Proceeds from sales of shares | 1,218,547,274 | 945,253,767 |
Reinvestment of distributions | 29,218,767 | 15,153,948 |
Cost of shares redeemed | (480,380,279) | (365,417,074) |
Net increase (decrease) in net assets resulting from share transactions | 767,385,762 | 594,990,641 |
Total increase (decrease) in net assets | 842,799,757 | 812,593,803 |
| | |
Net Assets | | |
Beginning of period | 1,295,302,056 | 482,708,253 |
End of period (including undistributed net investment income of $1,678,127 and undistributed net investment income of $3,848,676, respectively) | $ 2,138,101,813 | $ 1,295,302,056 |
Other Information Shares | | |
Sold | 154,616,707 | 131,314,763 |
Issued in reinvestment of distributions | 3,637,109 | 2,078,771 |
Redeemed | (61,367,293) | (50,681,969) |
Net increase (decrease) | 96,886,523 | 82,711,565 |
Financial Highlights
Years ended March 31, | 2005 | 2004 | 2003 | 2002 | 2001 F |
Selected Per-Share Data | | | | | |
Net asset value, beginning of period | $ 7.75 | $ 5.72 | $ 7.41 | $ 7.62 | $ 10.00 |
Income from Investment Operations | | | | | |
Net investment income (loss) D | .11 | .11 | .08 | .09 | .07 |
Net realized and unrealized gain (loss) | .38 | 2.04 | (1.69) | (.11) | (2.39) |
Total from investment operations | .49 | 2.15 | (1.61) | (.02) | (2.32) |
Distributions from net investment income | (.13) | (.09) | (.07) | (.07) | (.06) |
Distributions from net realized gain | (.02) | (.03) | (.01) | (.12) | - |
Total distributions | (.14) H | (.12) | (.08) | (.19) | (.06) |
Net asset value, end of period | $ 8.10 | $ 7.75 | $ 5.72 | $ 7.41 | $ 7.62 |
Total Return B, C | 6.35% | 37.75% | (21.79)% | (.40)% | (23.28)% |
Ratios to Average Net Assets E, G | | | | | |
Expenses before expense reductions | .10% | .10% | .10% | .10% | .10% A |
Expenses net of voluntary waivers, if any | .08% | .08% | .08% | .08% | .08% A |
Expenses net of all reductions | .08% | .08% | .08% | .08% | .08% A |
Net investment income (loss) | 1.45% | 1.55% | 1.38% | 1.24% | 1.46% A |
Supplemental Data | | | | | |
Net assets, end of period (000 omitted) | $ 2,138,102 | $ 1,295,302 | $ 482,708 | $ 256,113 | $ 72,621 |
Portfolio turnover rate | 1% | 3% | 4% | 5% | 38% A |
A Annualized
B Total returns for periods of less than one year are not annualized.
C Total returns would have been lower had certain expenses not been reduced during the periods shown.
D Calculated based on average shares outstanding during the period.
E Amounts do not include the activity of the underlying funds.
F For the period September 6, 2000 (commencement of operations) to March 31, 2001.
G Expense ratios reflect operating expenses of the fund. Expenses before reductions do not reflect amounts reimbursed by the investment adviser or reductions from brokerage service arrangements or other expense offset arrangements and do not represent the amount paid by the fund during periods when reimbursements or reductions occur. Expenses net of any voluntary waivers reflect expenses after reimbursement by the investment adviser but prior to reductions from brokerage service arrangements or other expense offset arrangements. Expenses net of all reductions represent the net expenses paid by the fund.
H Total distributions of $.14 per share is comprised of distributions from net investment income of $.125 and distributions from net realized gains of $.015 per share.
See accompanying notes which are an integral part of the financial statements.
Annual Report
Notes to Financial Statements
For the period ended March 31, 2005
1. Significant Accounting Policies.
Freedom Income Fund, Freedom 2000 Fund, Freedom 2005 Fund, Freedom 2010 Fund, Freedom 2015 Fund, Freedom 2020 Fund, Freedom 2025 Fund, Freedom 2030 Fund, Freedom 2035 Fund and Freedom 2040 Fund (the funds) are funds of Fidelity Aberdeen Street Trust (the trust). The trust is registered under the Investment Company Act of 1940, as amended (the 1940 Act), as a diversified, open-end management investment company organized as a Delaware statutory trust. Each fund is authorized to issue an unlimited number of shares. The funds invest primarily in a combination of other Fidelity equity, fixed income, and money market funds (the Underlying Funds) managed by Fidelity Management & Research Company (FMR). The financial statements have been prepared in conformity with accounting principles generally accepted in the United States of America, which require management to make certain estimates and assumptions at the date of the financial statements. The following summarizes the significant accounting policies of the funds:
Security Valuation. Net asset value per share is calculated as of the close of business of the New York Stock Exchange, normally 4:00 p.m. Eastern time. Investments in the Underlying Funds are valued at their net asset value each business day. Short-term securities with remaining maturities of sixty days or less for which quotations are not readily available are valued on the basis of amortized cost.
Investment Transactions and Income. Security transactions, normally shares of the Underlying Funds, are accounted for as of trade date. Gains and losses on securities sold are determined on the basis of identified cost. Income and capital gain distributions from the Underlying Funds, if any, are recorded on the ex-dividend date. Interest income is accrued as earned. Interest income includes coupon interest and amortization of premium and accretion of discount on debt securities.
Expenses. Most expenses of the trust can be directly attributed to a fund. Expenses which cannot be directly attributed are apportioned among each fund in the trust. Expenses included in the accompanying financial statements reflect the expenses of each fund and do not include any expenses associated with the Underlying Funds.
Income Tax Information and Distributions to Shareholders. Each year, each fund intends to qualify as a regulated investment company by distributing all of its taxable income and realized gains under Subchapter M of the Internal Revenue Code. As a result, no provision for income taxes is required in the accompanying financial statements.
Distributions are recorded on the ex-dividend date. Income and capital gain distributions are determined in accordance with income tax regulations, which may differ from generally accepted accounting principles. Capital accounts within the financial statements are adjusted for permanent book-tax differences. These adjustments have no impact on net assets or the results of operations. Temporary book-tax differences will reverse in a subsequent period.
Book-tax differences are primarily due to the short-term gain distributions from the Underlying Funds, capital loss carryforwards and losses deferred due to wash sales and excise tax regulations.
The tax-basis components of distributable earnings and the federal tax cost as of period end were as follows for each fund:
| Cost for Federal
Income Tax
Purposes | Unrealized
Appreciation | Unrealized
Depreciation | Net Unrealized
Appreciation/
(Depreciation) |
Freedom Income | $ 1,909,523,429 | $ 49,411,193 | $ (14,055,644) | $ 35,355,549 |
Freedom 2000 | 1,543,592,968 | 43,690,113 | (11,409,340) | 32,280,773 |
Freedom 2005 | 226,556,691 | 3,666,749 | (1,981,662) | 1,685,087 |
Freedom 2010 | 8,466,131,928 | 472,270,042 | (244,998,267) | 227,271,775 |
Freedom 2015 | 902,168,526 | 18,468,648 | (8,153,919) | 10,314,729 |
Freedom 2020 | 9,379,328,199 | 792,815,943 | (256,444,641) | 536,371,302 |
Freedom 2025 | 672,458,279 | 16,022,473 | (5,989,250) | 10,033,223 |
Freedom 2030 | 5,572,397,790 | 518,452,941 | (234,106,812) | 284,346,129 |
Freedom 2035 | 345,910,803 | 9,167,528 | (2,990,563) | 6,176,965 |
Freedom 2040 | 1,940,736,088 | 215,108,825 | (17,768,351) | 197,340,474 |
Annual Report
1. Significant Accounting Policies - continued
Income Tax Information and Distributions to Shareholders - continued
| Undistributed
Ordinary Income | Undistributed
Long-term Capital
Gain | Capital Loss
Carryforward |
Freedom Income | $ 5,551,735 | $ - | $ - |
Freedom 2000 | 7,967,137 | - | (2,030,732) |
Freedom 2005 | 955,989 | 354,200 | - |
Freedom 2010 | 38,369,709 | 16,554,361 | - |
Freedom 2015 | 2,927,282 | 1,637,002 | - |
Freedom 2020 | 22,498,986 | 29,766,731 | - |
Freedom 2025 | 1,348,251 | 1,357,228 | - |
Freedom 2030 | 5,486,524 | 21,078,392 | - |
Freedom 2035 | 458,671 | 834,512 | - |
Freedom 2040 | 1,678,127 | 6,588,411 | - |
The tax character of distributions paid was as follows:
March 31, 2005 | | | |
| Ordinary
Income | Long-term
Capital Gains | Total |
Freedom Income | $ 38,070,374 | $ 2,270,745 | $ 40,341,119 |
Freedom 2000 | 30,275,451 | - | 30,275,451 |
Freedom 2005 | 1,801,817 | 128,392 | 1,930,209 |
Freedom 2010 | 173,342,801 | 26,257,845 | 199,600,646 |
Freedom 2015 | 6,293,545 | 573,772 | 6,867,317 |
Freedom 2020 | 167,221,106 | 21,140,380 | 188,361,486 |
Freedom 2025 | 3,727,700 | 334,233 | 4,061,933 |
Freedom 2030 | 83,244,934 | - | 83,244,934 |
Freedom 2035 | 1,855,868 | - | 1,855,868 |
Freedom 2040 | 26,617,323 | 2,646,056 | 29,263,379 |
March 31, 2004 | | | |
| Ordinary
Income | Long-term
Capital Gains | Total |
Freedom Income | $ 31,382,463 | $ 7,233,523 | $ 38,615,986 |
Freedom 2000 | 29,821,507 | - | 29,821,507 |
Freedom 2005 | 29,473 | - | 29,473 |
Freedom 2010 | 147,335,749 | 35,571,088 | 182,906,837 |
Freedom 2015 | 63,664 | - | 63,664 |
Freedom 2020 | 107,292,278 | 20,270,970 | 127,563,248 |
Freedom 2025 | 51,049 | - | 51,049 |
Freedom 2030 | 54,155,489 | - | 54,155,489 |
Freedom 2035 | 21,115 | - | 21,115 |
Freedom 2040 | 13,833,144 | 1,339,627 | 15,172,771 |
2. Operating Policies.
Repurchase Agreements. FMR has received an Exemptive Order from the Securities and Exchange Commission (the SEC) which permits certain funds and other affiliated entities of FMR to transfer uninvested cash balances into joint trading accounts which are then invested in repurchase agreements. Certain funds may also invest directly with institutions in repurchase agreements. Repurchase agreements are collateralized by government or non-government securities. Collateral is held in segregated accounts with custodian banks and may be obtained in the event of a default of the counterparty. Each applicable fund monitors, on a daily basis, the value of the collateral to ensure it is at least equal to the principal amount of the repurchase agreement (including accrued interest). In the event of a default by the counterparty, realization of the collateral proceeds could be delayed, during which time the value of the collateral may decline.
Annual Report
Notes to Financial Statements - continued
3. Purchases and Sales of Investments.
Purchases and redemptions of the underlying fund shares are noted in the table below.
| Purchases ($) | Redemptions ($) |
Freedom Income | 324,708,570 | 122,452,080 |
Freedom 2000 | 167,876,388 | 178,266,050 |
Freedom 2005 | 198,262,034 | 7,788,103 |
Freedom 2010 | 1,305,415,631 | 66,643,734 |
Freedom 2015 | 789,714,931 | 919,260 |
Freedom 2020 | 2,184,195,713 | 37,237,246 |
Freedom 2025 | 606,984,523 | 196,610 |
Freedom 2030 | 1,325,357,236 | 18,238,779 |
Freedom 2035 | 318,411,571 | 100,409 |
Freedom 2040 | 790,733,862 | 19,989,481 |
4. Fees and Other Transactions with Affiliates.
Management Fee. Strategic Advisers, Inc. (Strategic Advisers), an affiliate of FMR, provides the funds with investment management related services. For these services the funds pay a monthly management fee to Strategic Advisers. The management fee is computed at an annual rate of ..10% of the funds' average net assets. The management fee is reduced by an amount equal to the fees and expenses paid by the funds to the independent Trustees. As of May 1, 2005, Strategic Advisers agreed to waive the .10% management fee. On May 19, 2005, the Board of Trustees approved amendments to the management contracts. Under the amended contracts, the Funds no longer pay management fees.
Other Transactions. Strategic Advisers has entered into an administration agreement with FMR under which FMR provides management and administrative services (other than investment advisory services) necessary for the operation of each fund. Pursuant to this agreement, FMR pays all expenses of each fund, except the compensation of the independent Trustees and certain exceptions such as interest expense. FMR also contracts with other Fidelity companies to perform the services necessary for the operation of each fund. For the services under the agreement, Strategic Advisers pays FMR a monthly administration fee equal to the management fee received by Strategic Advisers, minus an amount equal to an annual rate of .02% of each fund's average net assets. The funds do not pay any fees for these services.
5. Expense Reductions.
FMR agreed to reimburse the funds to the extent annual operating expenses exceeded certain levels of average net assets as noted in the table below. Some expenses, for example interest expense, are excluded from this reimbursement.
| Expense
Limitations | Reimbursement
from adviser |
Freedom Income | .08% | $ 368,366 |
Freedom 2000 | .08% | 316,138 |
Freedom 2005 | .08% | 23,289 |
Freedom 2010 | .08% | 1,584,017 |
Freedom 2015 | .08% | 85,549 |
Freedom 2020 | .08% | 1,705,118 |
Freedom 2025 | .08% | 57,919 |
Freedom 2030 | .08% | 996,517 |
Freedom 2035 | .08% | 28,554 |
Freedom 2040 | .08% | 326,392 |
Annual Report
5. Expense Reductions - continued
In addition, through arrangements with each applicable fund's custodian, credits realized as a result of uninvested cash balances were used to reduce each applicable fund's management fee. During the period, these credits reduced management fees by the following amounts:
Freedom Income | $ 1 | |
Freedom 2005 | 1 | |
Freedom 2010 | 4 | |
Freedom 2015 | 1 | |
Freedom 2020 | 4 | |
Freedom 2025 | 1 | |
Freedom 2030 | 7 | |
Freedom 2035 | 1 | |
Freedom 2040 | 8 | |
6. Other.
The funds' organizational documents provide former and current trustees and officers with a limited indemnification against liabilities arising in connection with the performance of their duties to the funds. In the normal course of business, the funds may also enter into contracts that provide general indemnifications. The funds' maximum exposure under these arrangements is unknown as this would be dependent on future claims that may be made against the funds. The risk of material loss from such claims is considered remote.
The funds do not invest in the Underlying Funds for the purpose of exercising management or control; however, investments by the funds within their principal investment strategies may represent a significant portion of the Underlying Fund's net assets. At the end of the period, the following Freedom Funds were the owners of record of 10% or more of the total outstanding shares of the Underlying Funds.
| Freedom 2010 | Freedom 2020 | Freedom 2030 |
Fidelity Disciplined Equity | 11% | 18% | 12% |
Fidelity Europe Fund | - | 18% | 13% |
Fidelity Government Income Fund | 26% | 16% | - |
Fidelity High Income Fund | - | 12% | - |
Fidelity Intermediate Bond Fund | 11% | - | - |
Fidelity Investment Grade Bond Fund | 19% | 12% | - |
Fidelity Japan Fund | - | 14% | - |
Fidelity Southeast Asia Fund | - | 10% | - |
The funds, in aggregate, were the owners of record of more than 20% of the total outstanding shares of the following Underlying Funds.
Fund | % of shares held |
Fidelity Government Income Fund | 62% |
Fidelity Disciplined Equity Fund | 52% |
Fidelity Europe Fund | 48% |
Fidelity Investment Grade Bond Fund | 45% |
Fidelity Japan Fund | 37% |
Fidelity High Income Fund | 31% |
Fidelity Southeast Asia Fund | 27% |
Fidelity Intermediate Bond Fund | 26% |
Fidelity Capital & Income Fund | 24% |
Fidelity Fund | 23% |
In addition, at the end of the period, certain otherwise unaffiliated shareholders were owners of record of more than 10% of the outstanding shares of the following funds:
| Number of
Unaffiliated
Shareholders |
Unaffiliated
Shareholders %
|
Freedom 2005 | 1 | 17% |
Freedom 2025 | 1 | 13% |
Freedom 2035 | 1 | 11% |
Annual Report
Report of Independent Registered Public Accounting Firm
To the Trustees of Fidelity Aberdeen Street Trust and the Shareholders of Fidelity Freedom Income Fund, Fidelity Freedom 2000 Fund, Fidelity Freedom 2005 Fund, Fidelity Freedom 2010 Fund, Fidelity Freedom 2015 Fund, Fidelity Freedom 2020 Fund, Fidelity Freedom 2025 Fund, Fidelity Freedom 2030 Fund, Fidelity Freedom 2035 Fund and Fidelity Freedom 2040 Fund:
In our opinion, the accompanying statements of assets and liabilities, including the schedules of investments, and the related statements of operations and of changes in net assets and the financial highlights present fairly, in all material respects, the financial position of Fidelity Freedom Income Fund, Fidelity Freedom 2000 Fund, Fidelity Freedom 2005 Fund, Fidelity Freedom 2010 Fund, Fidelity Freedom 2015 Fund, Fidelity Freedom 2020 Fund, Fidelity Freedom 2025 Fund, Fidelity Freedom 2030 Fund, Fidelity Freedom 2035 Fund and Fidelity Freedom 2040 Fund (funds of Fidelity Aberdeen Street Trust) at March 31, 2005, and the results of their operations, the changes in their net assets and the financial highlights for the periods indicated, in conformity with accounting principles generally accepted in the United States of America. These financial statements and financial highlights (hereafter referred to as "financial statements") are the responsibility of the Fidelity Aberdeen Street Trust's management; our responsibility is to express an opinion on these financial statements based on our audits. We conducted our audits of these financial statements in accordance with the standards of the Public Company Accounting Oversight Board (United States). Those standards require that we plan and perform the audit to obtain reasonable assurance about whether the financial statements are free of material misstatement. An audit includes examining, on a test basis, evidence supporting the amounts and disclosures in the financial statements, assessing the accounting principles used and significant estimates made by management, and evaluating the overall financial statement presentation. We believe that our audits, which included confirmation of securities at March 31, 2005 by correspondence with the custodian and brokers, provide a reasonable basis for our opinion.
/s/ PricewaterhouseCoopers LLP
PricewaterhouseCoopers LLP
Boston, Massachusetts
May 13, 2005
Annual Report
Trustees and Officers
The Trustees, Member of the Advisory Board, and executive officers of the trust and funds, as applicable, are listed below. The Board of Trustees governs each Freedom Fund and is responsible for protecting the interests of shareholders. The Trustees are experienced executives who meet periodically throughout the year to oversee each Freedom Fund's activities, review contractual arrangements with companies that provide services to each Freedom Fund, and review each Freedom Fund's performance. If the interests of a Freedom Fund and an underlying Fidelity fund were to diverge, a conflict of interest could arise and affect how the Trustees and Member of the Advisory Board fulfill their fiduciary duties to the affected funds. Strategic Advisers has structured the Freedom Funds to avoid these potential conflicts, although there may be situations where a conflict of interest is unavoidable. In such instances, Strategic Advisers, the Trustees, and Member of the Advisory Board would take reasonable steps to minimize and, if possible, eliminate the conflict. Except for William O. McCoy, Dennis J. Dirks, and Kenneth L. Wolfe, each of the Trustees oversees 308 funds advised by FMR or an affiliate. Mr. McCoy oversees 310 funds advised by FMR or an affiliate. Mr. Dirks and Mr. Wolfe oversee 297 funds advised by FMR or an affiliate.
The Trustees hold office without limit in time except that (a) any Trustee may resign; (b) any Trustee may be removed by written instrument, signed by at least two-thirds of the number of Trustees prior to such removal; (c) any Trustee who requests to be retired or who has become incapacitated by illness or injury may be retired by written instrument signed by a majority of the other Trustees; and (d) any Trustee may be removed at any special meeting of shareholders by a two-thirds vote of the outstanding voting securities of the trust. In any event, each Trustee who is not an "interested person" (as defined in the 1940 Act)(Independent Trustee), shall retire not later than the last day of the calendar year in which his or her 72nd birthday occurs. The executive officers and Advisory Board Member hold office without limit in time, except that any officer and Advisory Board Member may resign or may be removed by a vote of a majority of the Trustees at any regular meeting or any special meeting of the Trustees. Except as indicated, each individual has held the office shown or other offices in the same company for the past five years.
The funds' Statement of Additional Information (SAI) includes more information about the Trustees. To request a free copy, call Fidelity at 1-800-544-8544.
Interested Trustees*:
Correspondence intended for each Trustee who is an "interested person" may be sent to Fidelity Investments, 82 Devonshire Street, Boston, Massachusetts 02109.
Name, Age; Principal Occupation |
Edward C. Johnson 3d (74)** |
| Year of Election or Appointment: 1991 Mr. Johnson is Chairman of the Board of Trustees. Mr. Johnson serves as Chief Executive Officer, Chairman, and a Director of FMR Corp.; a Director and Chairman of the Board and of the Executive Committee of FMR; Chairman and a Director of Fidelity Management & Research (Far East) Inc.; Chairman and a Director of Fidelity Investments Money Management, Inc.; and Chairman (2001-present) and a Director (2000-present) of FMR Co., Inc. |
Abigail P. Johnson (43)** |
| Year of Election or Appointment: 2001 Senior Vice President of Freedom Income (2001-present), Freedom 2000 (2001-present), Freedom 2005 (2003-present), Freedom 2010 (2001-present), Freedom 2015 (2003-present), Freedom 2020 (2001-present), Freedom 2025 (2003-present), Freedom 2030 (2001-present), Freedom 2035 (2003-present), and Freedom 2040 (2001-present). Ms. Johnson also serves as Senior Vice President of other Fidelity funds (2001-present). She is President and a Director of FMR (2001-present), Fidelity Investments Money Management, Inc. (2001-present), FMR Co., Inc. (2001-present), and a Director of FMR Corp. Previously, Ms. Johnson managed a number of Fidelity funds. |
Laura B. Cronin (50) |
| Year of Election or Appointment: 2003 Ms. Cronin is an Executive Vice President (2002-present) and Chief Financial Officer (2002-present) of FMR Corp. Previously, Ms. Cronin served as Chief Financial Officer of FMR (1999-2001), Fidelity Personal Investments (2001), and Fidelity Brokerage Company (2001-2002). |
Robert L. Reynolds (53) |
| Year of Election or Appointment: 2003 Mr. Reynolds is a Director (2003-present) and Chief Operating Officer (2002-present) of FMR Corp. He also serves on the Board at Fidelity Investments Canada, Ltd. (2000-present). Previously, Mr. Reynolds served as President of Fidelity Investments Institutional Retirement Group (1996-2000). |
* Trustees have been determined to be "Interested Trustees" by virtue of, among other things, their affiliation with the trust or various entities under common control with FMR.
** Edward C. Johnson 3d, Trustee, is Abigail P. Johnson's father.
Annual Report
Trustees and Officers - continued
Independent Trustees:
Correspondence intended for each Independent Trustee (that is, the Trustees other than the Interested Trustees) may be sent to Fidelity Investments, P.O. Box 55235, Boston, Massachusetts 02205-5235.
Name, Age; Principal Occupation |
Dennis J. Dirks (56) |
| Year of Election or Appointment: 2005 Mr. Dirks also serves as a Trustee (2005-present) or Member of the Advisory Board (2004-present) of other investment companies advised by FMR. Prior to his retirement in May 2003, Mr. Dirks was Chief Operating Officer and a member of the Board of The Depository Trust & Clearing Corporation (DTCC) (1999-2003). He also served as President, Chief Operating Officer, and Board member of The Depository Trust Company (DTC) (1999-2003) and President and Board member of the National Securities Clearing Corporation (NSCC) (1999-2003). In addition, Mr. Dirks served as Chief Executive Officer and Board member of the Government Securities Clearing Corporation (2001-2003) and Chief Executive Officer and Board member of the Mortgage-Backed Securities Clearing Corporation (2001-2003). |
Robert M. Gates (61) |
| Year of Election or Appointment: 1997 Dr. Gates is Vice Chairman of the Independent Trustees (2005-present). Dr. Gates is President of Texas A&M University (2002-present). He was Director of the Central Intelligence Agency (CIA) from 1991 to 1993. From 1989 to 1991, Dr. Gates served as Assistant to the President of the United States and Deputy National Security Advisor. Dr. Gates is a Director of NACCO Industries, Inc. (mining and manufacturing), Parker Drilling Co., Inc. (drilling and rental tools for the energy industry, 2001-present), and Brinker International (restaurant management, 2003-present). He also serves as a member of the Advisory Board of VoteHere.net (secure internet voting, 2001-present). Previously, Dr. Gates served as a Director of LucasVarity PLC (automotive components and diesel engines), a Director of TRW Inc. (automotive, space, defense, and information technology), and Dean of the George Bush School of Government and Public Service at Texas A&M University (1999-2001). Dr. Gates also is a Trustee of the Forum for International Policy. |
George H. Heilmeier (68) |
| Year of Election or Appointment: 2004 Dr. Heilmeier is Chairman Emeritus of Telcordia Technologies (communication software and systems), where prior to his retirement, he served as company Chairman and Chief Executive Officer. He currently serves on the Boards of Directors of The Mitre Corporation (systems engineering and information technology support for the government), Teletech Holdings (customer management services), and HRL Laboratories (private research and development, 2004-present). He is Chairman of the General Motors Technology Advisory Committee and a Life Fellow of the Institute of Electrical and Electronics Engineers (IEEE) (2000-present). Dr. Heilmeier is a member of the Defense Science Board and the National Security Agency Advisory Board. He is also a member of the National Academy of Engineering, the American Academy of Arts and Sciences, and the Board of Overseers of the School of Engineering and Applied Science of the University of Pennsylvania. Previously, Dr. Heilmeier served as a Director of TRW Inc. (automotive, space, defense, and information technology, 1992-2002), Compaq (1994-2002), Automatic Data Processing, Inc. (ADP) (technology-based business outsourcing, 1995-2002), and INET Technologies Inc. (telecommunications network surveillance, 2001-2004). |
Marie L. Knowles (58) |
| Year of Election or Appointment: 2001 Prior to Ms. Knowles' retirement in June 2000, she served as Executive Vice President and Chief Financial Officer of Atlantic Richfield Company (ARCO) (diversified energy, 1996-2000). From 1993 to 1996, she was a Senior Vice President of ARCO and President of ARCO Transportation Company. She served as a Director of ARCO from 1996 to 1998. She currently serves as a Director of Phelps Dodge Corporation (copper mining and manufacturing) and McKesson Corporation (healthcare service, 2002-present). Ms. Knowles is a Trustee of the Brookings Institution and the Catalina Island Conservancy and also serves as a member of the Advisory Board for the School of Engineering of the University of Southern California. |
Ned C. Lautenbach (61) |
| Year of Election or Appointment: 2000 Mr. Lautenbach has been a partner of Clayton, Dubilier & Rice, Inc. (private equity investment firm) since September 1998. Previously, Mr. Lautenbach was with the International Business Machines Corporation (IBM) from 1968 until his retirement in 1998. He was most recently Senior Vice President and Group Executive of Worldwide Sales and Services. From 1993 to 1995, he was Chairman of IBM World Trade Corporation, and from 1994 to 1998 was a member of IBM's Corporate Executive Committee. Mr. Lautenbach serves as a Director of Italtel Holding S.p.A. (telecommunications (Milan, Italy), 2004-present) and Eaton Corporation (diversified industrial) as well as the Philharmonic Center for the Arts in Naples, Florida. He also is a member of the Council on Foreign Relations. |
Marvin L. Mann (71) |
| Year of Election or Appointment: 1993 Mr. Mann is Chairman of the Independent Trustees (2001-present). He is Chairman Emeritus of Lexmark International, Inc. (computer peripherals), where he served as CEO until April 1998, retired as Chairman May 1999, and remains a member of the Board. Prior to 1991, he held the positions of Vice President of International Business Machines Corporation (IBM) and President and General Manager of various IBM divisions and subsidiaries. He is a member of the Executive Committee of the Independent Director's Council of the Investment Company Institute. In addition, Mr. Mann is a member of the President's Cabinet at the University of Alabama and the Board of Visitors of the Culverhouse College of Commerce and Business Administration at the University of Alabama. |
William O. McCoy (71) |
| Year of Election or Appointment: 1997 Prior to his retirement in December 1994, Mr. McCoy was Vice Chairman of the Board of BellSouth Corporation (telecommunications) and President of BellSouth Enterprises. He is currently a Director of Liberty Corporation (holding company), Duke Realty Corporation (real estate), and Progress Energy, Inc. (electric utility). He is also a partner of Franklin Street Partners (private investment management firm) and a member of the Research Triangle Foundation Board. In addition, Mr. McCoy served as the Interim Chancellor (1999-2000) and a member of the Board of Visitors for the University of North Carolina at Chapel Hill and currently serves on the Board of Directors of the University of North Carolina Health Care System and the Board of Visitors of the Kenan-Flagler Business School (University of North Carolina at Chapel Hill). He also served as Vice President of Finance for the University of North Carolina (16-school system). |
Cornelia M. Small (60) |
| Year of Election or Appointment: 2005 Ms. Small is a member (2000-present) and Chairperson (2002-present) of the Investment Committee, and a member (2002-present) of the Board of Trustees of Smith College. Previously, she served as Chief Investment Officer (1999-2000), Director of Global Equity Investments (1996-1999), and a member of the Board of Directors of Scudder, Stevens & Clark (1990-1997) and Scudder Kemper Investments (1997-1998). In addition, Ms. Small served as Co-Chair (2000-2003) of the Annual Fund for the Fletcher School of Law and Diplomacy. |
William S. Stavropoulos (65) |
| Year of Election or Appointment: 2001 Mr. Stavropoulos is Chairman of the Board (2000-present) and a Member of the Board of Directors of The Dow Chemical Company. Since joining The Dow Chemical Company in 1967, Mr. Stavropoulos served in numerous senior management positions, including President (1993-2000; 2002-2003), CEO (1995-2000; 2000-2004), and Chairman of the Executive Committee (2000-2004). Currently, he is a Director of NCR Corporation (data warehousing and technology solutions), BellSouth Corporation (telecommunications), Chemical Financial Corporation, and Maersk Inc. (industrial conglomerate, 2002-present). He also serves as a member of the Board of Trustees of the American Enterprise Institute for Public Policy Research. In addition, Mr. Stavropoulos is a member of The Business Council, J.P. Morgan International Council and the University of Notre Dame Advisory Council for the College of Science. |
Kenneth L. Wolfe (66) |
| Year of Election or Appointment: 2005 Mr. Wolfe also serves as a Trustee (2005-present) or Member of the Advisory Board (2004-present) of other investment companies advised by FMR. Prior to his retirement in 2001, Mr. Wolfe was Chairman and Chief Executive Officer of Hershey Foods Corporation (1993-2001). He currently serves as a member of the boards of Adelphia Communications Corporation (2003-present), Bausch & Lomb, Inc., and Revlon Inc. (2004-present). |
Advisory Board Member and Executive Officers:
Correspondence intended for each executive officer and Mr. Lynch may be sent to Fidelity Investments, 82 Devonshire Street, Boston, Massachusetts 02109.
Name, Age; Principal Occupation |
Peter S. Lynch (62) |
| Year of Election or Appointment: 2003 Member of the Advisory Board of Fidelity Aberdeen Street Trust. Vice Chairman and a Director of FMR, and Vice Chairman (2001-present) and a Director (2000-present) of FMR Co., Inc. Previously, Mr. Lynch served as a Trustee of the Fidelity funds (1990-2003). In addition, he serves as a Trustee of Boston College, Massachusetts Eye & Ear Infirmary, Historic Deerfield, John F. Kennedy Library, and the Museum of Fine Arts of Boston. |
Bart A. Grenier (46) |
| Year of Election or Appointment: 2003 Vice President of Freedom Income, Freedom 2000, Freedom 2005, Freedom 2010, Freedom 2015, Freedom 2020, Freedom 2025, Freedom 2030, Freedom 2035, and Freedom 2040. Mr. Grenier also serves as Vice President of certain Equity Funds (2001), a position he previously held from 1999 to 2000, and Vice President of certain High Income Funds (2002). He is Senior Vice President of FMR (1999) and FMR Co., Inc. (2001), and President and Director of Strategic Advisers, Inc. (2002). He also heads Fidelity's Asset Allocation Group (2000), Fidelity's Growth and Income Group (2001), Fidelity's Value Group (2001), and Fidelity's High Income Division (2001). Previously, Mr. Grenier served as President of Fidelity Ventures (2000), Vice President of certain High Income Funds (1997-2000), High Income Division Head (1997-2000), Group Leader of the Income-Growth and Asset Allocation-Income Groups (1996-2000), and Assistant Equity Division Head (1997-2000). |
Ren Y. Cheng (48) |
| Year of Election or Appointment: 1998, 2000, or 2003 Vice President of Freedom Income (1998), Freedom 2000 (1998), Freedom 2005 (2003), Freedom 2010 (1998), Freedom 2015 (2003), Freedom 2020 (1998), Freedom 2025 (2003), Freedom 2030 (1998), Freedom 2035 (2003), and Freedom 2040 (2000). Mr. Cheng also serves as Vice President of other funds advised by Strategic Advisers, Inc., including the Fidelity Advisor Freedom FundsSM. Prior to assuming his current responsibilities, Mr. Cheng managed a variety of Fidelity funds. Mr. Cheng also serves as Vice President of FMR (2002), FMR Co., Inc. (2002) and Strategic Advisers, Inc. (2003). |
Eric D. Roiter (56) |
| Year of Election or Appointment: 1998, 2000, or 2003 Secretary of Freedom Income (1998), Freedom 2000 (1998), Freedom 2005 (2003), Freedom 2010 (1998), Freedom 2015 (2003), Freedom 2020 (1998), Freedom 2025 (2003), Freedom 2030 (1998), Freedom 2035 (2003), and Freedom 2040 (2000). He also serves as Secretary of other Fidelity funds; Vice President, General Counsel, and Secretary of FMR Co., Inc. (2001-present) and FMR; Assistant Secretary of Fidelity Management & Research (U.K.) Inc. (2001-present), Fidelity Management & Research (Far East) Inc. (2001-present), and Fidelity Investments Money Management, Inc. (2001-present). Mr. Roiter is an Adjunct Member, Faculty of Law, at Boston College Law School (2003-present). Previously, Mr. Roiter served as Vice President and Secretary of Fidelity Distributors Corporation (FDC) (1998-2005). |
Stuart Fross (45) |
| Year of Election or Appointment: 2003 Assistant Secretary of Freedom Income, Freedom 2000, Freedom 2005, Freedom 2010, Freedom 2015, Freedom 2020, Freedom 2025, Freedom 2030, Freedom 2035, and Freedom 2040. Mr. Fross also serves as Assistant Secretary of other Fidelity funds (2003-present), Vice President and Secretary of FDC (2005-present), and is an employee of FMR. |
Christine Reynolds (46) |
| Year of Election or Appointment: 2004 President, Treasurer, and Anti-Money Laundering (AML) officer of Freedom Income, Freedom 2000, Freedom 2005, Freedom 2010, Freedom 2015, Freedom 2020, Freedom 2025, Freedom 2030, Freedom 2035, and Freedom 2040. Ms. Reynolds also serves as President, Treasurer, and AML officer of other Fidelity funds (2004) and is a Vice President (2003) and an employee (2002) of FMR. Before joining Fidelity Investments, Ms. Reynolds worked at PricewaterhouseCoopers LLP (PwC) (1980-2002), where she was most recently an audit partner with PwC's investment management practice. |
Timothy F. Hayes (54) |
| Year of Election or Appointment: 2002 or 2003 Chief Financial Officer of Freedom Income (2002), Freedom 2000 (2002), Freedom 2005 (2003), Freedom 2010 (2002), Freedom 2015 (2003), Freedom 2020 (2002), Freedom 2025 (2003), Freedom 2030 (2002), Freedom 2035 (2003), and Freedom 2040 (2002). Mr. Hayes also serves as Chief Financial Officer of other Fidelity funds (2002). Recently he was appointed President of Fidelity Service Company (2003) where he also serves as a Director. Mr. Hayes also serves as President of Fidelity Investments Operations Group (FIOG, 2002), which includes Fidelity Pricing and Cash Management Services Group (FPCMS), where he was appointed President in 1998. Previously, Mr. Hayes served as Chief Financial Officer of Fidelity Investments Corporate Systems and Service Group (1998) and Fidelity Systems Company (1997-1998). |
Kenneth A. Rathgeber (57) |
| Year of Election or Appointment: 2004 Chief Compliance Officer of Freedom Income, Freedom 2000, Freedom 2005, Freedom 2010, Freedom 2015, Freedom 2020, Freedom 2025, Freedom 2030, Freedom 2035, and Freedom 2040. Mr. Rathgeber also serves as Chief Compliance Officer of other Fidelity funds (2004) and Executive Vice President of Risk Oversight for Fidelity Investments (2002). Previously, he served as Executive Vice President and Chief Operating Officer for Fidelity Investments Institutional Services Company, Inc. (1998-2002). |
John R. Hebble (46) |
| Year of Election or Appointment: 2003 Deputy Treasurer of Freedom Income, Freedom 2000, Freedom 2005, Freedom 2010, Freedom 2015, Freedom 2020, Freedom 2025, Freedom 2030, Freedom 2035, and Freedom 2040. Mr. Hebble also serves as Deputy Treasurer of other Fidelity funds (2003), and is an employee of FMR. Before joining Fidelity Investments, Mr. Hebble worked at Deutsche Asset Management where he served as Director of Fund Accounting (2002-2003) and Assistant Treasurer of the Scudder Funds (1998-2003). |
Bryan A. Mehrmann (43) |
| Year of Election or Appointment: 2005 Deputy Treasurer of Freedom Income, Freedom 2000, Freedom 2005, Freedom 2010, Freedom 2015, Freedom 2020, Freedom 2025, Freedom 2030, Freedom 2035, and Freedom 2040. Mr. Mehrmann also serves as Deputy Treasurer of other Fidelity funds (2005-present) and is an employee of FMR. Previously, Mr. Mehrmann served as Vice President of Fidelity Investments Institutional Services Group (FIIS)/Fidelity Investments Institutional Operations Corporation, Inc. (FIIOC) Client Services (1998-2004). |
Kimberley H. Monasterio (41) |
| Year of Election or Appointment: 2004 Deputy Treasurer of Freedom Income, Freedom 2000, Freedom 2005, Freedom 2010, Freedom 2015, Freedom 2020, Freedom 2025, Freedom 2030, Freedom 2035, and Freedom 2040. Ms. Monasterio also serves as Deputy Treasurer of other Fidelity funds (2004) and is an employee of FMR (2004). Before joining Fidelity Investments, Ms. Monasterio served as Treasurer (2000-2004) and Chief Financial Officer (2002-2004) of the Franklin Templeton Funds and Senior Vice President of Franklin Templeton Services, LLC (2000-2004). |
Kenneth B. Robins (35) |
| Year of Election or Appointment: 2005 Deputy Treasurer of Freedom Income, Freedom 2000, Freedom 2005, Freedom 2010, Freedom 2015, Freedom 2020, Freedom 2025, Freedom 2030, Freedom 2035, and Freedom 2040. Mr. Robins also serves as Deputy Treasurer of other Fidelity funds (2005-present) and is an employee of FMR (2004-present). Before joining Fidelity Investments, Mr. Robins worked at KPMG LLP, where he was a partner in KPMG's department of professional practice (2002-2004) and a Senior Manager (1999-2000). In addition, Mr. Robins served as Assistant Chief Accountant, United States Securities and Exchange Commission (2000-2002). |
John H. Costello (58) |
| Year of Election or Appointment: 1996, 2000, or 2003 Assistant Treasurer of Freedom Income (1996), Freedom 2000 (1996), Freedom 2005 (2003), Freedom 2010 (1996), Freedom 2015 (2003), Freedom 2020 (1996), Freedom 2025 (2003), Freedom 2030 (1996), Freedom 2035 (2003), and Freedom 2040 (2000). Mr. Costello also serves as Assistant Treasurer of other Fidelity funds and is an employee of FMR. |
Peter L. Lydecker (51) |
| Year of Election or Appointment: 2004 Assistant Treasurer of Freedom Income, Freedom 2000, Freedom 2005, Freedom 2010, Freedom 2015, Freedom 2020, Freedom 2025, Freedom 2030, Freedom 2035, and Freedom 2040. Mr. Lydecker also serves as Assistant Treasurer of other Fidelity funds (2004) and is an employee of FMR. |
Mark Osterheld (49) |
| Year of Election or Appointment: 2002 or 2003 Assistant Treasurer of Freedom Income (2002), Freedom 2000 (2002), Freedom 2005 (2003), Freedom 2010 (2002), Freedom 2015 (2003), Freedom 2020 (2002), Freedom 2025 (2003), Freedom 2030 (2002), Freedom 2035 (2003), and Freedom 2040 (2002). Mr. Osterheld also serves as Assistant Treasurer of other Fidelity funds (2002) and is an employee of FMR. |
Annual Report
Distributions
The Board of Trustees of each fund voted to pay to shareholders of record at the opening of business on record date, the following distributions per share derived from capital gains realized from sales of portfolio securities, and dividends derived from net investment income:
Fund | Pay Date | Record Date | Dividends | Capital Gains |
Freedom Income | 05/09/05 | 05/06/05 | $.01 | $.02 |
Freedom 2000 | 05/09/05 | 05/06/05 | $.05 | $.02 |
Freedom 2005 | 05/09/05 | 05/06/05 | $.03 | $.03 |
Freedom 2010 | 05/09/05 | 05/06/05 | $.04 | $.05 |
Freedom 2015 | 05/09/05 | 05/06/05 | $.03 | $.03 |
Freedom 2020 | 05/16/05 | 05/13/05 | $.02 | $.055 |
Freedom 2025 | 05/16/05 | 05/13/05 | $.015 | $.025 |
Freedom 2030 | 05/16/05 | 05/13/05 | $.005 | $.06 |
Freedom 2035 | 05/16/05 | 05/13/05 | $.01 | $.03 |
Freedom 2040 | 05/16/05 | 05/13/05 | $.005 | $.03 |
The funds hereby designate as capital gain dividends the amounts noted below for the taxable year indicated or for dividends for the taxable year ended 2005, if subsequently determined to be different, the net capital gain of such year; and for dividends for the taxable year ended 2004, if subsequently determined to be different, the excess of: (a) the net capital gain of such year, over (b) amounts previously designated as capital gain dividends with respect to such year.
Fund | 2005 | 2004 |
Freedom Income | $ 1,319,791 | $ 950,954 |
Freedom 2005 | 482,592 | - |
Freedom 2010 | 29,174,025 | 13,638,181 |
Freedom 2015 | 2,161,229 | 49,545 |
Freedom 2020 | 37,994,860 | 12,912,251 |
Freedom 2025 | 1,685,118 | 6,343 |
Freedom 2030 | 21,078,392 | - |
Freedom 2035 | 834,513 | - |
Freedom 2040 | 6,800,272 | 2,434,195 |
A percentage of the dividends distributed during the fiscal year for the following funds was derived from interest on U.S. Government securities which is generally exempt from state income tax:
Freedom Income | 13.00% | |
Freedom 2000 | 12.52% | |
Freedom 2005 | 8.80% | |
Freedom 2010 | 9.91% | |
Freedom 2015 | 6.26% | |
Freedom 2020 | 5.90% | |
A percentage of the dividends distributed during the fiscal year for the following funds qualifies for the dividends-received deduction for corporate shareholders:
Freedom Income | |
April 2004 | 12% | |
May 2004 | 12% | |
June 2004 | 12% | |
July 2004 | 12% | |
August 2004 | 12% | |
September 2004 | 12% | |
October 2004 | 12% | |
November 2004 | 12% | |
December 2004 (ex date 12/03) | 12% | |
December 2004 (ex date 12/29) | 12% | |
February 2005 | 2% | |
March 2005 | 2% | |
| May 2004 | December 2004 |
Freedom 2000 | 17% | 14% |
Freedom 2005 | 15% | 26% |
Freedom 2010 | 16% | 22% |
Freedom 2015 | 26% | 35% |
Freedom 2020 | 27% | 35% |
Freedom 2025 | 39% | 48% |
Freedom 2030 | 51% | 44% |
Freedom 2035 | 42% | 50% |
Freedom 2040 | 36% | 51% |
A percentage of the dividends distributed during the fiscal year for the following funds may be taken into account as a dividend for purposes of the maximum rate under section 1(h)(11) of the Internal Revenue Code.
Freedom Income | |
April 2004 | 11% | |
May 2004 | 13% | |
June 2004 | 13% | |
July 2004 | 13% | |
August 2004 | 13% | |
September 2004 | 13% | |
October 2004 | 13% | |
November 2004 | 13% | |
December 2004 (ex date 12/03) | 13% | |
December 2004 (ex date 12/29) | 13% | |
February 2005 | 3% | |
March 2005 | 3% | |
| May 2004 | December 2004 |
Freedom 2000 | 13% | 15% |
Freedom 2005 | 11% | 29% |
Freedom 2010 | 14% | 25% |
Freedom 2015 | 19% | 41% |
Freedom 2020 | 24% | 40% |
Freedom 2025 | 28% | 56% |
Freedom 2030 | 46% | 51% |
Freedom 2035 | 32% | 61% |
Freedom 2040 | 33% | 59% |
The funds will notify shareholders in January 2006 of amounts for use in preparing 2005 income tax returns.
Annual Report
Annual Report
Investment Adviser
Strategic Advisers, Inc.
Boston, MA
General Distributor
Fidelity Distributors Corporation
Boston, MA
Transfer and Shareholder
Servicing Agent
Fidelity Investments Institutional
Operations Company, Inc.
Boston, MA
Fidelity Service Company, Inc.
Boston, MA
Custodian
The Bank of New York
New York, NY
The Fidelity Telephone Connection
Mutual Fund 24-Hour Service
Exchanges/Redemptions
and Account Assistance 1-800-544-6666
Product Information 1-800-544-6666
Retirement Accounts 1-800-544-4774
(8 a.m. - 9 p.m.)
TDD Service 1-800-544-0118
for the deaf and hearing impaired
(9 a.m. - 9 p.m. Eastern time)
Fidelity Automated Service
Telephone (FAST®) (automated graphic) 1-800-544-5555
(automated graphic) Automated line for quickest service
FF-UANNPRO-0505
1.814503.100
Item 2. Code of Ethics
As of the end of the period, March 31, 2005, Fidelity Aberdeen Street Trust (the trust) has adopted a code of ethics, as defined in Item 2 of Form N-CSR, that applies to its President and Treasurer and its Chief Financial Officer. A copy of the code of ethics is filed as an exhibit to this Form N-CSR.
Item 3. Audit Committee Financial Expert
The Board of Trustees of the trust has determined that Marie L. Knowles is an audit committee financial expert, as defined in Item 3 of Form N-CSR. Ms. Knowles is independent for purposes of Item 3 of Form N-CSR.
Item 4. Principal Accountant Fees and Services
(a) Audit Fees.
For the fiscal years ended March 31, 2005 and March 31, 2004, the aggregate Audit Fees billed by PricewaterhouseCoopers LLP (PwC) for professional services rendered for the audits of the financial statements, or services that are normally provided in connection with statutory and regulatory filings or engagements for those fiscal years, for Fidelity Freedom Income Fund, Fidelity Freedom 2000 Fund, Fidelity Freedom 2005 Fund, Fidelity Freedom 2010 Fund, Fidelity Freedom 2015 Fund, Fidelity Freedom 2020 Fund, Fidelity Freedom 2025 Fund, Fidelity Freedom 2030 Fund, Fidelity Freedom 2035 Fund and Fidelity Freedom 2040 Fund (the funds) and for all funds in the Fidelity Group of Funds are shown in the table below.
Fund | 2005A | 2004A, B |
Fidelity Freedom Income Fund | $23,000 | $17,000 |
Fidelity Freedom 2000 Fund | $23,000 | $17,000 |
Fidelity Freedom 2005 Fund | $19,000 | $11,000 |
Fidelity Freedom 2010 Fund | $39,000 | $29,000 |
Fidelity Freedom 2015 Fund | $20,000 | $11,000 |
Fidelity Freedom 2020 Fund | $41,000 | $28,000 |
Fidelity Freedom 2025 Fund | $19,000 | $11,000 |
Fidelity Freedom 2030 Fund | $31,000 | $22,000 |
Fidelity Freedom 2035 Fund | $19,000 | $11,000 |
Fidelity Freedom 2040 Fund | $22,000 | $15,000 |
All funds in the Fidelity Group of Funds audited by PwC | $11,100,000 | $10,600,000 |
A | Aggregate amounts may reflect rounding. |
B | Fidelity Freedom 2005 Fund, Fidelity Freedom 2015 Fund, Fidelity Freedom 2025 Fund and Fidelity Freedom 2035 Fund commenced operations on November 6, 2003. |
For the fiscal years ended March 31, 2005 and March 31, 2004, the aggregate Audit Fees billed by Deloitte & Touche LLP, the member firms of Deloitte Touche Tohmatsu, and their respective affiliates (collectively, "Deloitte Entities") for professional services rendered for the audits of the financial statements, or services that are normally provided in connection with statutory and regulatory filings or engagements for those fiscal years, for Fidelity Advisor Freedom Income Fund, Fidelity Advisor Freedom 2005 Fund, Fidelity Advisor Freedom 2010 Fund, Fidelity Advisor Freedom 2015 Fund, Fidelity Advisor Freedom 2020 Fund, Fidelity Advisor Freedom 2025 Fund, Fidelity Advisor Freedom 2030 Fund, Fidelity Advisor Freedom 2035 Fund and Fidelity Advisor Freedom 2040 Fund (the funds) and for all funds in the Fidelity Group of Funds are shown in the table below.
Fund | 2005A | 2004A, B, C |
Fidelity Advisor Freedom Income Fund | $13,000 | $11,000 |
Fidelity Advisor Freedom 2005 Fund | $12,000 | $10,000 |
Fidelity Advisor Freedom 2010 Fund | $12,000 | $10,000 |
Fidelity Advisor Freedom 2015 Fund | $12,000 | $10,000 |
Fidelity Advisor Freedom 2020 Fund | $12,000 | $10,000 |
Fidelity Advisor Freedom 2025 Fund | $12,000 | $10,000 |
Fidelity Advisor Freedom 2030 Fund | $12,000 | $10,000 |
Fidelity Advisor Freedom 2035 Fund | $12,000 | $10,000 |
Fidelity Advisor Freedom 2040 Fund | $12,000 | $10,000 |
All funds in the Fidelity Group of Funds audited by Deloitte Entities | $4,600,000 | $4,200,000 |
A | Aggregate amounts may reflect rounding. |
B | Fidelity Advisor Freedom 2005 Fund, Fidelity Advisor Freedom 2015 Fund, Fidelity Advisor Freedom 2025 Fund and Fidelity Advisor Freedom 2035 Fund commenced operations on November 6, 2003. |
C | Fidelity Advisor Freedom Income Fund, Fidelity Advisor Freedom 2010 Fund, Fidelity Advisor Freedom 2020 Fund, Fidelity Advisor Freedom 2030 Fund, and Fidelity Advisor Freedom 2040 Fund commenced operations on July 24, 2003. |
(b) Audit-Related Fees.
In each of the fiscal years ended March 31, 2005 and March 31, 2004, the aggregate Audit-Related Fees billed by PwC for services rendered for assurance and related services to each fund that are reasonably related to the performance of the audit or review of the fund's financial statements, but not reported as Audit Fees, are shown in the table below.
Fund | 2005A | 2004 A, B, C |
Fidelity Freedom Income Fund | $0 | $0 |
Fidelity Freedom 2000 Fund | $0 | $0 |
Fidelity Freedom 2005 Fund | $0 | $0 |
Fidelity Freedom 2010 Fund | $0 | $0 |
Fidelity Freedom 2015 Fund | $0 | $0 |
Fidelity Freedom 2020 Fund | $0 | $0 |
Fidelity Freedom 2025 Fund | $0 | $0 |
Fidelity Freedom 2030 Fund | $0 | $0 |
Fidelity Freedom 2035 Fund | $0 | $0 |
Fidelity Freedom 2040 Fund | $0 | $0 |
A | Aggregate amounts may reflect rounding. |
B | Includes amounts related to non-audit services prior to May 6, 2003 that would have been subject to pre-approval if the SEC rules relating to the pre-approval of non-audit services had been in effect at that time. |
C | Fidelity Freedom 2005 Fund, Fidelity Freedom 2015 Fund, Fidelity Freedom 2025 Fund and Fidelity Freedom 2035 Fund commenced operations on November 6, 2003. |
In each of the fiscal years ended March 31, 2005 and March 31, 2004, the aggregate Audit-Related Fees billed by Deloitte Entities for services rendered for assurance and related services to each fund that are reasonably related to the performance of the audit or review of the fund's financial statements, but not reported as Audit Fees, are shown in the table below.
Fund | 2005A | 2004 A,B,C,D |
Fidelity Advisor Freedom Income Fund | $0 | $0 |
Fidelity Advisor Freedom 2005 Fund | $0 | $0 |
Fidelity Advisor Freedom 2010 Fund | $0 | $0 |
Fidelity Advisor Freedom 2015 Fund | $0 | $0 |
Fidelity Advisor Freedom 2020 Fund | $0 | $0 |
Fidelity Advisor Freedom 2025 Fund | $0 | $0 |
Fidelity Advisor Freedom 2030 Fund | $0 | $0 |
Fidelity Advisor Freedom 2035 Fund | $0 | $0 |
Fidelity Advisor Freedom 2040 Fund | $0 | $0 |
A | Aggregate amounts may reflect rounding. |
B | Includes amounts related to non-audit services prior to May 6, 2003 that would have been subject to pre-approval if the SEC rules relating to the pre-approval of non-audit services had been in effect at that time. |
C | Fidelity Advisor Freedom 2005 Fund, Fidelity Advisor Freedom 2015 Fund, Fidelity Advisor Freedom 2025 Fund and Fidelity Advisor Freedom 2035 Fund commenced operations on November 6, 2003. |
D | Fidelity Advisor Freedom Income Fund, Fidelity Advisor Freedom 2010 Fund, Fidelity Advisor Freedom 2020 Fund, Fidelity Advisor Freedom 2030 Fund, and Fidelity Advisor Freedom 2040 Fund commenced operations on July 24, 2003. |
In each of the fiscal years ended March 31, 2005 and March 31, 2004, the aggregate Audit-Related Fees that were billed by PwC and Deloitte Entities that were required to be approved by the Audit Committee for services rendered on behalf of Fidelity Management & Research Company (FMR) and entities controlling, controlled by, or under common control with FMR (not including any sub-adviser whose role is primarily portfolio management and is subcontracted with or overseen by another investment adviser) that provide ongoing services to the funds ("Fund Service Providers") for assurance and related services that relate directly to the operations and financial reporting of each fund that are reasonably related to the performance of the audit or review of the fund's financial statements, but not reported as Audit Fees, are shown in the table below.
Billed By | 2005 A | 2004A, B, C |
PwC | $0 | $50,000 |
Deloitte Entities | $0 | $0 |
A | Aggregate amounts may reflect rounding. |
B | Includes amounts related to non-audit services prior to May 6, 2003 that would have been subject to pre-approval if the SEC rules relating to the pre-approval of non-audit services had been in effect at that time. |
C | May include amounts billed prior to the funds' commencement of operations. |
Fees included in the audit-related category comprise assurance and related services (e.g., due diligence services) that are traditionally performed by the independent registered public accounting firm. These audit-related services include due diligence related to mergers and acquisitions, accounting consultations and audits in connection with acquisitions, internal control reviews, attest services that are not required by statute or regulation and consultation concerning financial accounting and reporting standards.
(c) Tax Fees.
In each of the fiscal years ended March 31, 2005 and March 31, 2004, the aggregate Tax Fees billed by PwC for professional services rendered for tax compliance, tax advice, and tax planning for each fund is shown in the table below.
Fund | 2005A | 2004A, B, C |
Fidelity Freedom Income Fund | $1,500 | $1,400 |
Fidelity Freedom 2000 Fund | $1,500 | $1,400 |
Fidelity Freedom 2005 Fund | $1,500 | $1,300 |
Fidelity Freedom 2010 Fund | $1,500 | $1,400 |
Fidelity Freedom 2015 Fund | $1,500 | $1,300 |
Fidelity Freedom 2020 Fund | $1,500 | $1,400 |
Fidelity Freedom 2025 Fund | $1,500 | $1,300 |
Fidelity Freedom 2030 Fund | $1,500 | $1,400 |
Fidelity Freedom 2035 Fund | $1,500 | $1,300 |
Fidelity Freedom 2040 Fund | $1,500 | $1,400 |
A | Aggregate amounts may reflect rounding. |
B | Includes amounts related to non-audit services prior to May 6, 2003 that would have been subject to pre-approval if the SEC rules relating to the pre-approval of non-audit services had been in effect at that time. |
C | Fidelity Freedom 2005 Fund, Fidelity Freedom 2015 Fund, Fidelity Freedom 2025 Fund and Fidelity Freedom 2035 Fund commenced operations on November 6, 2003. |
In each of the fiscal years ended March 31, 2005 and March 31, 2004, the aggregate Tax Fees billed by Deloitte Entities for professional services rendered for tax compliance, tax advice, and tax planning for each fund is shown in the table below.
Fund | 2005A | 2004A,B,C,D |
Fidelity Advisor Freedom Income Fund | $1,800 | $1,600 |
Fidelity Advisor Freedom 2005 Fund | $1,600 | $1,500 |
Fidelity Advisor Freedom 2010 Fund | $1,600 | $1,500 |
Fidelity Advisor Freedom 2015 Fund | $1,600 | $1,500 |
Fidelity Advisor Freedom 2020 Fund | $1,600 | $1,500 |
Fidelity Advisor Freedom 2025 Fund | $1,600 | $1,500 |
Fidelity Advisor Freedom 2030 Fund | $1,600 | $1,500 |
Fidelity Advisor Freedom 2035 Fund | $1,600 | $1,500 |
Fidelity Advisor Freedom 2040 Fund | $1,600 | $1,500 |
A | Aggregate amounts may reflect rounding. |
B | Includes amounts related to non-audit services prior to May 6, 2003 that would have been subject to pre-approval if the SEC rules relating to the pre-approval of non-audit services had been in effect at that time. |
C | Fidelity Advisor Freedom 2005 Fund, Fidelity Advisor Freedom 2015 Fund, Fidelity Advisor Freedom 2025 Fund and Fidelity Advisor Freedom 2035 Fund commenced operations on November 6, 2003. |
D | Fidelity Advisor Freedom Income Fund, Fidelity Advisor Freedom 2010 Fund, Fidelity Advisor Freedom 2020 Fund, Fidelity Advisor Freedom 2030 Fund, and Fidelity Advisor Freedom 2040 Fund commenced operations on July 24, 2003. |
In each of the fiscal years ended March 31, 2005 and March 31, 2004, the aggregate Tax Fees billed by PwC and Deloitte Entities that were required to be approved by the Audit Committee for professional services rendered on behalf of the Fund Service Providers for tax compliance, tax advice, and tax planning that relate directly to the operations and financial reporting of each fund is shown in the table below.
Billed By | 2005A | 2004A, B, C |
PwC | $0 | $0 |
Deloitte Entities | $0 | $0 |
A | Aggregate amounts may reflect rounding. |
B | Includes amounts related to non-audit services prior to May 6, 2003 that would have been subject to pre-approval if the SEC rules relating to the pre-approval of non-audit services had been in effect at that time. |
C | May include amounts billed prior to the funds' commencement of operations. |
Fees included in the Tax Fees category comprise all services performed by professional staff in the independent registered public accounting firm's tax division except those services related to the audit. Typically, this category would include fees for tax compliance, tax planning, and tax advice. Tax compliance, tax advice, and tax planning services include preparation of original and amended tax returns, claims for refund and tax payment-planning services, assistance with tax audits and appeals, tax advice related to mergers and acquisitions and requests for rulings or technical advice from taxing authorities.
(d) All Other Fees.
In each of the fiscal years ended March 31, 2005 and March 31, 2004, the aggregate Other Fees billed by PwC for all other non-audit services rendered to the funds is shown in the table below.
Fund | 2005A | 2004A, B, C |
Fidelity Freedom Income Fund | $2,200 | $1,800 |
Fidelity Freedom 2000 Fund | $2,000 | $1,800 |
Fidelity Freedom 2005 Fund | $1,100 | $500 |
Fidelity Freedom 2010 Fund | $6,200 | $4,700 |
Fidelity Freedom 2015 Fund | $1,300 | $500 |
Fidelity Freedom 2020 Fund | $6,700 | $4,600 |
Fidelity Freedom 2025 Fund | $1,200 | $500 |
Fidelity Freedom 2030 Fund | $4,300 | $3,000 |
Fidelity Freedom 2035 Fund | $1,100 | $500 |
Fidelity Freedom 2040 Fund | $2,100 | $1,400 |
A | Aggregate amounts may reflect rounding. |
B | Includes amounts related to non-audit services prior to May 6, 2003 that would have been subject to pre-approval if the SEC rules relating to the pre-approval of non-audit services had been in effect at that time. |
C | Fidelity Freedom 2005 Fund, Fidelity Freedom 2015 Fund, Fidelity Freedom 2025 Fund and Fidelity Freedom 2035 Fund commenced operations on November 6, 2003. |
In each of the fiscal years ended March 31, 2005 and March 31, 2004, the aggregate Other Fees billed by Deloitte Entities for all other non-audit services rendered to the funds is shown in the table below.
Fund | 2005A | 2004A,B,C,D |
Fidelity Advisor Freedom Income Fund | $0 | $0 |
Fidelity Advisor Freedom 2005 Fund | $0 | $0 |
Fidelity Advisor Freedom 2010 Fund | $0 | $0 |
Fidelity Advisor Freedom 2015 Fund | $0 | $0 |
Fidelity Advisor Freedom 2020 Fund | $0 | $0 |
Fidelity Advisor Freedom 2025 Fund | $0 | $0 |
Fidelity Advisor Freedom 2030 Fund | $0 | $0 |
Fidelity Advisor Freedom 2035 Fund | $0 | $0 |
Fidelity Advisor Freedom 2040 Fund | $0 | $0 |
A | Aggregate amounts may reflect rounding. |
B | Includes amounts related to non-audit services prior to May 6, 2003 that would have been subject to pre-approval if the SEC rules relating to the pre-approval of non-audit services had been in effect at that time. |
C | Fidelity Advisor Freedom 2005 Fund, Fidelity Advisor Freedom 2015 Fund, Fidelity Advisor Freedom 2025 Fund and Fidelity Advisor Freedom 2035 Fund commenced operations on November 6, 2003. |
D | Fidelity Advisor Freedom Income Fund, Fidelity Advisor Freedom 2010 Fund, Fidelity Advisor Freedom 2020 Fund, Fidelity Advisor Freedom 2030 Fund, and Fidelity Advisor Freedom 2040 Fund commenced operations on July 24, 2003. |
In each of the fiscal years ended March 31, 2005 and March 31, 2004, the aggregate Other Fees billed by PwC and Deloitte Entities that were required to be approved by the Audit Committee for all other non-audit services rendered on behalf of the Fund Service Providers that relate directly to the operations and financial reporting of each fund is shown in the table below.
Billed By | 2005A | 2004A, B, C |
PwC | $450,000 | $210,000 |
Deloitte Entities | $510,000 | $500,000 |
A | Aggregate amounts may reflect rounding. |
B | Includes amounts related to non-audit services prior to May 6, 2003 that would have been subject to pre-approval if the SEC rules relating to the pre-approval of non-audit services had been in effect at that time. |
C | May include amounts billed prior to the funds' commencement of operations. |
Fees included in the All Other Fees category include services related to internal control reviews, strategy and other consulting, financial information systems design and implementation, consulting on other information systems, and other tax services unrelated to the fund.
(e) (1) | Audit Committee Pre-Approval Policies and Procedures: |
The trust's Audit Committee must pre-approve all audit and non-audit services provided by the independent registered public accounting firm relating to the operations or financial reporting of the funds. Prior to the commencement of any audit or non-audit services to a fund, the Audit Committee reviews the services to determine whether they are appropriate and permissible under applicable law.
The trust's Audit Committee has adopted policies and procedures to, among other purposes, provide a framework for the Committee's consideration of non-audit services by the audit firms that audit the Fidelity funds. The policies and procedures require that any non-audit service provided by a fund audit firm to a Fidelity Fund and any non-audit service provided by a fund auditor to a Fund Service Provider that relates directly to the operations and financial reporting of a Fidelity fund (Covered Service) are subject to approval by the Audit Committee before such service is provided. Non-audit services provided by a fund audit firm for a Fund Service Provider that do not relate directly to the operations and financial reporting of a Fidelity fund (Non-Covered Service) but that are expected to exceed $50,000 are also subject to pre-approval by the Audit Committee.
All Covered Services, as well as Non-Covered Services that are expected to exceed $50,000, must be approved in advance of provision of the service either: (i) by formal resolution of the Audit Committee, or (ii) by oral or written approval of the service by the Chair of the Audit Committee (or if the Chair is unavailable, such other member of the Audit Committee as may be designated by the Chair to act in the Chair's absence). The approval contemplated by (ii) above is permitted where the Treasurer determines that action on such an engagement is necessary before the next meeting of the Audit Committee. Neither pre-approval nor advance notice of Non-Covered Service engagements for which fees are not expected to exceed $50,000 is required; such engagements are to be reported to the Audit Committee monthly.
(e) (2) | Services approved pursuant to paragraph (c)(7)(i)(C) of Rule 2-01 of Regulation S-X: |
Audit-Related Fees:
There were no amounts, including amounts related to non-audit services prior to May 6, 2003 that would have been subject to pre-approval if the SEC rules relating to the pre-approval of non-audit services had been in effect at that time, that were approved by the Audit Committee pursuant to the de minimis exception for the fiscal years ended March 31, 2005 and March 31, 2004 on behalf of each fund.
There were no amounts, including amounts related to non-audit services prior to May 6, 2003 that would have been subject to pre-approval if the SEC rules relating to the pre-approval of non-audit services had been in effect at that time, that were required to be approved by the Audit Committee pursuant to the de minimis exception for the fiscal years ended March 31, 2005 and March 31, 2004 on behalf of the Fund Service Providers that relate directly to the operations and financial reporting of each fund.
Tax Fees:
There were no amounts, including amounts related to non-audit services prior to May 6, 2003 that would have been subject to pre-approval if the SEC rules relating to the pre-approval of non-audit services had been in effect at that time, that were approved by the Audit Committee pursuant to the de minimis exception for the fiscal years ended March 31, 2005 and March 31, 2004 on behalf of each fund.
There were no amounts, including amounts related to non-audit services prior to May 6, 2003 that would have been subject to pre-approval if the SEC rules relating to the pre-approval of non-audit services had been in effect at that time, that were required to be approved by the Audit Committee pursuant to the de minimis exception for the fiscal years ended March 31, 2005 and March 31, 2004 on behalf of the Fund Service Providers that relate directly to the operations and financial reporting of each fund.
All Other Fees:
There were no amounts, including amounts related to non-audit services prior to May 6, 2003 that would have been subject to pre-approval if the SEC rules relating to the pre-approval of non-audit services had been in effect at that time, that were approved by the Audit Committee pursuant to the de minimis exception for the fiscal years ended March 31, 2005 and March 31, 2004 on behalf of each fund.
There were no amounts, including amounts related to non-audit services prior to May 6, 2003 that would have been subject to pre-approval if the SEC rules relating to the pre-approval of non-audit services had been in effect at that time, that were required to be approved by the Audit Committee pursuant to the de minimis exception for the fiscal years ended March 31, 2005 and March 31, 2004 on behalf of the Fund Service Providers that relate directly to the operations and financial reporting of each fund.
(f) According to PwC for the fiscal year ended March 31, 2005, the percentage of hours spent on the audit of each fund's financial statements for the most recent fiscal year that were attributed to work performed by persons who are not full-time, permanent employees of PwC is as follows:
Fund | 2005 |
Fidelity Freedom Income Fund | 0% |
Fidelity Freedom 2000 Fund | 0% |
Fidelity Freedom 2005 Fund | 0% |
Fidelity Freedom 2010 Fund | 0% |
Fidelity Freedom 2015 Fund | 0% |
Fidelity Freedom 2020 Fund | 0% |
Fidelity Freedom 2025 Fund | 0% |
Fidelity Freedom 2030 Fund | 0% |
Fidelity Freedom 2035 Fund | 0% |
Fidelity Freedom 2040 Fund | 0% |
According to Deloitte Entities for the fiscal year ended March 31, 2005, the percentage of hours spent on the audit of each fund's financial statements for the most recent fiscal year that were attributed to work performed by persons who are not full-time, permanent employees of Deloitte Entities is as follows:
Fund | 2005 |
Fidelity Advisor Freedom Income Fund | 0% |
Fidelity Advisor Freedom 2005 Fund | 0% |
Fidelity Advisor Freedom 2010 Fund | 0% |
Fidelity Advisor Freedom 2015 Fund | 0% |
Fidelity Advisor Freedom 2020 Fund | 0% |
Fidelity Advisor Freedom 2025 Fund | 0% |
Fidelity Advisor Freedom 2030 Fund | 0% |
Fidelity Advisor Freedom 2035 Fund | 0% |
Fidelity Advisor Freedom 2040 Fund | 0% |
(g) For the fiscal years ended March 31, 2005 and March 31, 2004, the aggregate fees billed by PwC of $3,150,000A and $2,200,000A,B,C for non-audit services rendered on behalf of the funds, FMR (not including any sub-adviser whose role is primarily portfolio management and is subcontracted with or overseen by another investment adviser) and Fund Service Providers relating to Covered Services and Non-Covered Services are shown in the table below.
| 2005A | 2004A,B,C |
Covered Services | $500,000 | $300,000 |
Non-Covered Services | $2,650,000 | $1,900,000 |
A | Aggregate amounts may reflect rounding. |
B | Includes amounts related to non-audit services prior to May 6, 2003 that would have been subject to pre-approval if the SEC rules relating to the pre-approval of non-audit services had been in effect at that time. |
C | May include amounts billed prior to the funds' commencement of operations. |
For the fiscal years ended March 31, 2005 and March 31, 2004, the aggregate fees billed by Deloitte Entities of $900,000A and $1,700,000A,B,C for non-audit services rendered on behalf of the fund, FMR (not including any sub-adviser whose role is primarily portfolio management and is subcontracted with or overseen by another investment adviser) and Fund Service Providers relating to Covered Services and Non-Covered Services are shown in the table below.
| 2005A | 2004A,B,C |
Covered Services | $500,000 | $500,000 |
Non-Covered Services | $400,000 | $1,200,000 |
A | Aggregate amounts may reflect rounding. |
B | Includes amounts related to non-audit services prior to May 6, 2003 that would have been subject to pre-approval if the SEC rules relating to the pre-approval of non-audit services had been in effect at that time. |
C | May include amounts billed prior to the funds' commencement of operations. |
(h) The trust's Audit Committee has considered Non-Covered Services that were not pre-approved that were provided by PwC and Deloitte Entities to Fund Service Providers to be compatible with maintaining the independence of PwC and Deloitte Entities in their audit of the funds, taking into account representations from PwC and Deloitte Entities, in accordance with Independence Standards Board Standard No.1, regarding their independence from the funds and their related entities.
Item 5. Audit Committee of Listed Registrants
Not applicable.
Item 6. Schedule of Investments
Not applicable.
Item 7. Disclosure of Proxy Voting Policies and Procedures for Closed-End Management Investment Companies
Not applicable.
Item 8. Portfolio Managers of Closed-End Management Investment Companies
Not applicable.
Item 9. Purchase of Equity Securities by Closed-End Management Investment Company and Affiliated Purchasers
Not applicable.
Item 10. Submission of Matters to a Vote of Security Holders
There were no material changes to the procedures by which shareholders may recommend nominees to the trust's Board of Trustees.
Item 11. Controls and Procedures
(a)(i) The President and Treasurer and the Chief Financial Officer have concluded that the trust's disclosure controls and procedures (as defined in Rule 30a-3(c) under the Investment Company Act) provide reasonable assurances that material information relating to the trust is made known to them by the appropriate persons, based on their evaluation of these controls and procedures as of a date within 90 days of the filing date of this report.
(a)(ii) There was no change in the trust's internal control over financial reporting (as defined in Rule 30a-3(d) under the Investment Company Act) that occurred during the second fiscal quarter of the period covered by this report that has materially affected, or is reasonably likely to materially affect, the trust's internal control over financial reporting.
Item 12. Exhibits
(a) | (1) | Code of Ethics pursuant to Item 2 of Form N-CSR is filed and attached hereto as EX-99.CODE ETH. |
(a) | (2) | Certification pursuant to Rule 30a-2(a) under the Investment Company Act of 1940 (17 CFR 270.30a-2(a)) is filed and attached hereto as Exhibit 99.CERT. |
(a) | (3) | Not applicable. |
(b) | | Certification pursuant to Rule 30a-2(b) under the Investment Company Act of 1940 (17 CFR 270.30a-2(b)) is furnished and attached hereto as Exhibit 99.906CERT. |
SIGNATURES
Pursuant to the requirements of the Securities Exchange Act of 1934 and the Investment Company Act of 1940, the registrant has duly caused this report to be signed on its behalf by the undersigned, thereunto duly authorized.
Fidelity Aberdeen Street Trust
By: | /s/Christine Reynolds |
| Christine Reynolds |
| President and Treasurer |
| |
Date: | May 23, 2005 |
Pursuant to the requirements of the Securities Exchange Act of 1934 and the Investment Company Act of 1940, this report has been signed below by the following persons on behalf of the registrant and in the capacities and on the dates indicated.
By: | /s/Christine Reynolds |
| Christine Reynolds |
| President and Treasurer |
| |
Date: | May 23, 2005 |
By: | /s/Timothy F. Hayes |
| Timothy F. Hayes |
| Chief Financial Officer |
| |
Date: | May 23, 2005 |